
SRK Consulting - Maaden
315
SRK Consulting Engineers and Scientists AN INDEPENDENT MINERAL EXPERTS’ REPORT ON THE GOLD MINING AND EXPLORATION ASSETS OF SAUDI ARABIAN MINING COMPANY (Ma’aden) Prepared for: Saudi Arabian Mining Company (Ma’aden), Riyadh Head Office P.O. Box 68861 Riyadh 11537, Al Riyadh Province, Kingdom of Saudi Arabia. JPMorgan Chase Bank N.A., 8th Floor, Al Faisaliyah Tower, Al-Olaya, Riyadh 11491, Al Riyadh Province, Kingdom of Saudi Arabia. Prepared by: SRK Consulting (UK) Limited 5 th Floor Churchill House, 17 Churchill Way, City and County of Cardiff, CF10 2HH, Wales, United Kingdom. Tel: +44-(0)29-2034 8150 Fax: +44-(0)29-2034 8199 U3330_Ma'aden MER.doc November, 2007
-
Upload
khangminh22 -
Category
Documents
-
view
2 -
download
0
Transcript of SRK Consulting - Maaden

SRK ConsultingEngineers and Scientists
AN INDEPENDENT MINERAL EXPERTS’ REPORT ON THE GOLD MINING AND EXPLORATION ASSETS
OF SAUDI ARABIAN MINING COMPANY (Ma’aden)
Prepared for: Saudi Arabian Mining Company (Ma’aden), Riyadh Head Office P.O. Box 68861 Riyadh 11537, Al Riyadh Province, Kingdom of Saudi Arabia.
JPMorgan Chase Bank N.A.,8th Floor, Al Faisaliyah Tower,
Al-Olaya, Riyadh 11491,
Al Riyadh Province,Kingdom of Saudi Arabia.
Prepared by:
SRK Consulting (UK) Limited 5th Floor Churchill House,
17 Churchill Way, City and County of Cardiff,
CF10 2HH, Wales, United Kingdom.
Tel: +44-(0)29-2034 8150 Fax: +44-(0)29-2034 8199
U3330_Ma'aden MER.doc November, 2007

SRK Consulting Ma'aden Gold MER – Report Details
U3330_Ma'aden MER.doc November, 2007
COPYRIGHT
Copyright of all text and other matter in this document, including the manner of presentation, is the exclusive property of SRK Consulting (UK) Limited. It is a criminal offence to publish this document or any part of the document under a different cover, or to reproduce and/or use, without written consent, any technical procedure and/or technique contained in this document. The intellectual property reflected in the contents resides with SRK Consulting (UK) Limited and shall not be used for any activity that does not involve SRK Consulting (UK) Limited, without the written consent of SRK Consulting (UK) Limited.
Project Manager Signed Date Mark Campodonic, Senior Consultant.
November, 2007
Project Director Signed Date Iestyn Humphreys, Director.
November, 2007
Job No.: Report Name:
UK3330 U3330_Ma'aden MER.Doc
Copy No.:
Name/Title Company Copy Date Authorised by
APPROVAL SIGNATURE:
SRK Consulting Ma'aden Gold MER – Executive Summary Table of Contents
U3330_Ma'aden MER.doc November, 2007 Page i
TABLE OF CONTENTS – Executive Summary Section Description Page No. 1.0E INTRODUCTION i 1.1E Background i 1.2E Review Process ii 2.0E THE GOLD ASSETS v 2.1E Introduction v 2.2E Ma’aden Gold v 2.2.1E History x 2.2.2E Strategy xi 2.3E Mining Business xi 2.3.1E Description of Properties xi 2.3.2E Exploration xii 2.4E Overview of the Gold Assets xii 2.4.1E Mahd Ad’Dahab xii 2.4.2E Al Amar xiv 2.4.3E Bulghah xvi 2.4.4E Sukhaybarat xix 2.4.5E Al Hajar xx 2.4.6E Ad Duwayhi xxii 2.4.7E Exploration Assets xxiv 2.4.8E Head Office xxv 3.0E MINERAL RESOURCES AND ORE RESERVES xxvi 4.0E GENERAL SRK COMMENTS xxix 4.1E Introduction xxix 4.2E Mineral Resources and Ore Reserves xxix 4.3E Environmental xxx 5.0E VALUATION xxxi 5.1E Limitations and Reliance on Information xxxi 5.1.1E Limitations xxxi 5.1.2E Reliance on Information xxxi 5.2E Valuation Methodology xxxii 5.3E Enterprise Value: Basis of Valuation xxxii 5.4E Enterprise Value: Post-Tax–Pre-Finance Cashflows xxxiii 5.5E Enterprise Value: Net Present Value and Sensitivities xxxiv 5.6E Valuation of Advanced Exploration Properties xxxv 5.7E Valuation Adjustments xxxvi 5.7.1E Derivative Instruments xxxvi 5.7.2E Unallocated Head Office expenditures xxxvi 5.7.3E Net (Debt)/Cash position xxxvi 5.7.4E Summary of Valuation Adjustments xxxvi 6.0E RISKS AND OPPORTUNITIES xxxvii 6.1E Introduction xxxvii 6.2E General Risks and Opportunities xxxvii 6.3E Specific Risks and Opportunities xxxviii 7.0E COMPANY EQUITY VALUE xl 7.1E Introduction xl 7.2E Equity Value xl 7.3E Comparable Transaction Analysis xli 8.0E CONCLUDING REMARKS xliii
LIST OF TABLES – EXECUTIVE SUMMARY Table No. Description Page No. 2.1E Gold Assets vi 2.2E Ma’aden Gold: salient historical (2004-2007H1 inclusive) and forecast (2007H2, 2008)
operating statistics vi 2.3E Mining Assets: human resource statistics (historical and forecast) vi 2.4E Gold Assets: environmental (biophysical and social) liabilities vii 2.5E Mining Assets: safety statistics vii

SRK Consulting Ma'aden Gold MER – Executive Summary Table of Contents
U3330_Ma'aden MER.doc November, 2007 Page ii
2.6E Ma’aden Gold: Plant production capacities and throughputs xii 2.7E Mahd Ad’Dahab: historical and forecast operating results xiv 2.8E Al Amar: historical and forecast operating results xvi 2.9E Bulghah: historical and forecast operating results xix 2.10E Sukhaybarat: historical and forecast operating results xx 2.11E Al Hajar: historical and forecast operating results xxii 2.12E Exploration Assets (including Ad Duwayhi) Mineral Resource statements (1 July 2007)
xxiv 2.13E Exploration Assets(1): Historical and forecast exploration expenditures xxv 2.14E Exploration Assets(1): Historical and forecast exploration expenditures xxv 2.15E Head office: historical and forecast operating results xxvi 3.1E Ma’aden Gold: Total Mineral Resource and Ore Reserves (1 July 2007)(1) xxvi 3.2E Ma’aden Gold: Total Ore Reserve Sensitivity (1 July 2007) xxvii 3.3E Ma’aden Gold: Mineral Resources and Ore Reserves by asset (1 July 2007) xxvii 3.4E Mining Assets: Ore Reserve Economic Viability Assessment xxix 5.1E Base case commodity price and macro-economic projections(1),(2) xxxiii 5.2E Weighted Average Cost of Capital calculations for the Mining Assets xxxiii 5.3E Plant, Property and Equipment Net Book Value as at 1 July 2007 xxxiii 5.4E Ma’aden Gold: Financial Model in US$ real terms (1 July 2007) xxxiv 5.5E Mining Assets (excluding Head office): NPV (US$m) at various discount factors xxxiv 5.6E Mining Assets (excluding Head office): Sales Revenue and Total Working Cost
simultaneous sensitivity at a real DCF of 10% xxxv 5.7E Mining Assets (detail): NPV (US$m) at various discount factors xxxv 5.8E Head Office: NPV (US$m) at various discount factors xxxv 5.9E Commodity (gold) derivatives xxxvi 5.10E Summary of Valuation Adjustments xxxvi 7.1E Ma’aden Gold Equity Value xli 7.2E Ma’aden Gold Equity Value: discount factor sensitivity analysis xli 7.3E Ma’aden Gold Equity Value: sales revenue and total working cost sensitivity xli 7.4E Comparable Transactions – population analysis xlii
LIST OF FIGURES – EXECUTIVE SUMMARY Figure No. Description Page No. 1.1E Ma’aden Gold: Divisional Structure iv 2.1E Ma’aden Gold: location of Gold Assets viii 2.2E Ma’aden Gold: company cash cost curve analysis (calendar 2006 results) ix 2.3E Mining Assets: mine cash cost curve analysis (calendar 2006 results) ix 2.4E Ma’aden Gold: LoMp equivalent gold production (koz) and cash costs (US$/oz) xi 7.1E Comparable transaction cumulative frequency: global database (producing assets) non-
time value adjusted (US$/oz) xlii 7.2E Comparable transaction cumulative frequency: global database (producing assets), time
value adjusted and gold price indexed (US$/oz) xliii 7.3E Comparable Transaction data plot: Transacted unit price versus transacted ounce xliii

Registered Address: 21 Gold Tops, Newport, NP9 4PG, Wales, United Kingdom.
SRK Consulting (UK) Limited Reg No 1575403 (England and Wales)
Offices in Asia, Australia, Europe, North America, South Africa, South America
SRK Consulting (UK) Limited, 5th Floor Churchill House, 17 Churchill Way, Cardiff CF10 2HH, Wales, United Kingdom. E-mail: [email protected] URL:http://www.srk.co.uk/ Tel: +44 (0)29-2034 8150 Fax: +44 (0)29-2034 8199
SRK ConsultingEngineers and Scientists
AN INDEPENDENT MINERAL EXPERTS’ REPORT ON THE GOLD MINING AND
EXPLORATION ASSETS OF SAUDI ARABIAN MINING COMPANY (Ma’aden) - EXECUTIVE SUMMARY
1.0E INTRODUCTION 1.1E Background
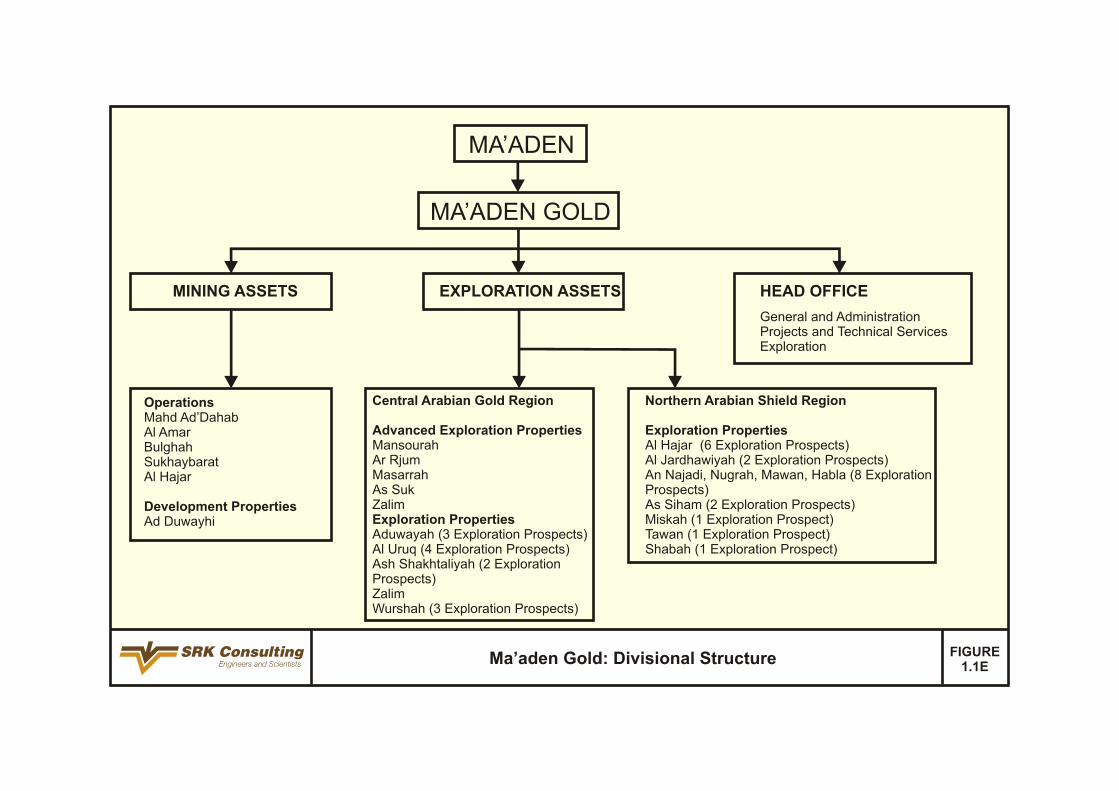
SRK Consulting (UK) Limited (“SRK”) is an associate company of the international group holding company, SRK Global Limited (the “SRK Group”). SRK has been commissioned by the board of directors of Saudi Arabian Mining Company (“Ma’aden” also referred to as the “Company”) to prepare an independent mineral experts’ report (“MER”) on the gold mining assets (the “Mining Assets”) and gold exploration assets (the “Exploration Assets”), collectively referred to as the “Gold Assets” of the Company (Figure 1.1E).
The MER (available in full electronically on the Company’s website and by hard copy on request from the Company) has been prepared by SRK. An extract from the MER will be included in its entirety in the prospectus (the “Prospectus”) to be published by the Company in connection with the simultaneous offering (the “Offer”) of ordinary shares in the Company and the proposed admission (the “Admission”) of such shares to trading on the Saudi Stock Exchange.
The MER has been prepared in accordance with the Listing Rules as defined by the Capital Market Law (the “CMA”) issued by Royal Decree No M/30 dated 1 August 2003, hereinafter referred to as the “CMA Listing Rules”. In the absence of any detailed specific rules relating to the disclosure requirements for resource companies, SRK has in generating the MER, relied on the following for guidance:
• “CESR’s recommendations for the consistent implementation of the European Commission’s Regulation on Prospectuses No. 909/2004”, published in January 2005: specifically paragraphs 131 to 132, section 1b – Mineral Companies, hereinafter referred to as the “CESR Recommendations”; and
• The “Guidance note for Mining, Oil and Gas Companies, March 2006”: specifically the content requirements at Appendix 2 and the summaries set out in Appendices 1 and 3 ( a document published by the London Stock Exchange Limited (the “LSE”) in accordance with the Alternative Investment Market Rules of the LSE.
The MER contains a detailed valuation of the Gold Assets, accordingly the MER constitutes a competent person’s report within the meaning of Chapter 19 of the United Kingdom Listing Authorities’ (“UKLA”) Listing Rules as it existed on 30 June, 2005 (prior to its deletion upon the implementation in the UK on 1 July 2005 of the Prospectus Directive as published by the Financial Services Authority from time to time and governed by the UKLA. Accordingly the valuation of the Gold Assets is limited to the valuation of the Ore Reserves and specifically excludes all other assets of the Company’s gold division (”Ma’aden Gold”).

SRK Consulting Ma'aden Gold MER – Executive Summary
U3330_Ma'aden MER.doc November, 2007 Page ii
The standard adopted for the reporting of the Mineral Resources and Ore Reserve statements for the Mining Assets is that defined by the terms and definitions given in The 2004 Australasian Code for Reporting of Exploration Results, Mineral Resources and Ore Reserves (the “JORC Code”) as published by the Joint Ore Reserves Committee of the Australasian Institute of Mining and Metallurgy, Australian Institute of Geoscientists and Minerals Council of Australia. The JORC Code is an internationally recognised Mineral Resource and Ore Reserve reporting code.
The MER has been prepared under the direction of the Competent Persons’ (the “CPs”, see Section 1.2E) as defined by the JORC Code who assume overall professional responsibility for the document. The MER however is published by SRK, the commissioned entity, and accordingly SRK assumes responsibility for the views expressed herein. Consequently with respect to all references to CPs and SRK: ‘all references to SRK mean the CP and vice-versa’.
The MER is addressed to the Company and JPMorgan Chase Bank N.A. (the “Financial Advisor”). Drafts of the MER were provided to the Company, but only for the purpose of confirming both the accuracy of factual information and the reasonableness of assumptions relied upon in the MER.
SRK has given and has not withdrawn its written consent to the inclusion of the Executive Summary of its MER set out in “Prospectus: Mineral Expert’s Report” and references to its report and its name in the form and context in which they are respectively included and has authorised the contents of its report and context in which they are respectively included and has authorised the contents of its report for the purposes of compliance with the Listing Rules.
In respect of all matters in relation to Limitations, Reliance on Information, Declarations, Consent and Copyright, the reader is referred to Section 1.6 of the MER (main report).
The MER includes technical information, which requires subsequent calculations to derive subtotals, totals and weighted averages. Such calculations may involve a degree of rounding and consequently introduce an error. Where such errors occur, SRK does not consider them to be material.
1.2E Review Process
The MER is dependent upon technical, financial and legal input. The technical information as provided to and taken in good faith by SRK has not been independently verified by SRK by means of complete re-calculation of the Mineral Resources and Ore Reserves. SRK has, however, conducted a review and assessment of all material technical issues likely to influence the future performance of the Mining Assets which included the following:
• Inspection visits to the Mining Assets’ mining and processing facilities, surface structures and associated infrastructure undertaken most recently April 2006;
• Discussion and enquiry following access, to key project and head office personnel between June 2007 and October 2007;
• An examination of historical information (2004, 2005, 2006 and 2007H1) and results made available by Ma’aden Gold in respect of the Mining Assets; and
• A review and where considered appropriate by SRK, modification of Ma’aden Gold’s production forecasts contained in the Life-of-Mine plans (“LoMp”).
SRK has also:
• Assumed certain macro-economic parameters and commodity prices and relied on these

SRK Consulting Ma'aden Gold MER – Executive Summary
U3330_Ma'aden MER.doc November, 2007 Page iii
as inputs to undertake a break even analysis of Ma’aden Gold’s Ore Reserve estimates (hereinafter referred to as the Ore Reserve economic viability assessment - the “Ore Reserve EVA”) and to derive the Equity Value of Ma’aden Gold; and
• Satisfied itself that such information is both appropriate and valid for the Ore Reserve EVA and derivation of the Equity Value as reported herein.
Where fundamental base data has been provided (LoMp, capital expenditures, operating budgets etc) for the purposes of review, SRK has performed all necessary validation and verification procedures deemed appropriate in order to place an appropriate level of reliance on such information.
The forecast of commodity prices in real terms (Table 5.1E) are based on the following:
• For gold, a combination of the short term and long term price profiles as provided by Brook Hunt & Associates Limited (“Brook Hunt”); and
• For silver, zinc, copper and lead the consensus market forecasts (annual averages of various market analysts’ forecasts).
In undertaking the Ore Reserve EVA a break even gold price which:
• Is equivalent to the weighted average LoMp real terms total costs;
• Reflects the current (2007H1) cash costs reported on a by-product basis; and
• Is required to return a zero Net Present Value at a real terms discount factor of 10%.
The individuals who have provided input to this MER, who are listed below, have extensive experience in the mining and smelting industry and are members in good standing of appropriate professional institutions.
• Christopher Wilson, MAusIMM, PhD;
• David Pattinson, CEng, MIMMM, PhD;
• David Pearce, F.AusIMM, CPMin, MBA, M.Eng.;
• Fiona Cessford, CBio (UK), PrSciNat, MSc;
• Howard Baker, MAIMM, MSc;
• Ian Brackley, CEng, MICE, MIMMM, FSAIMM, BSc, PhD;
• Iestyn Humphreys, MIMMM, AIME, PhD;
• Jane Joughin, PrSciNat, MSc;
• Lucy Roberts, GMAusIMM, PhD;
• Mark Campodonic, FGS, AIQ, MSc;
• Martin Pittuck, CEng, MIMMM, MSc; and
• Richard Connelly, CGeol, CEng, FIMMM, FGS, FIQ, FACE, MSc.
The Competent Person with overall responsibility for reporting of Mineral Resources is Mr Martin Pittuck, CEng, MIMMM, MSc who is an employee of SRK. Mr Martin Pittuck is a mining geologist with 12 years experience in the mining industry and has been responsible for the reporting of Mineral Resources on various properties internationally during the past five years.
The Competent Person with overall responsibility for reporting of Ore Reserves is Mr David Pearce CEng, A AusMMM, MSc, MBA, who is an employee of SRK. Mr David Pearce is a mining engineer with 20 years experience in the mining industry and has been involved in the reporting of Ore Reserves on various properties internationally during the past five years.

SRK Consulting Ma'aden Gold MER – Executive Summary
U3330_Ma'aden MER.doc November, 2007 Page v
2.0E THE GOLD ASSETS 2.1E Introduction
Cash costs as reported in this MER have been standardised on a gold by-product basis with gold production as the denominator. In recognition that the operating mines produce gold, silver and base metals in varying proportions, SRK has also included cash costs reported on a co-product basis where the gross operating cash costs (excluding by-product credits) are divided by equivalent gold production determined by the prevailing commodity prices determined during the reporting period.
2.2E Ma’aden Gold The Company intends to become a public listed company on Tadawul, the Saudi Arabian Stock Exchange. Ma’aden Gold maintains its principal executive offices in the city of Jeddah, Mecca Province, Saudi Arabia.
Ma’aden Gold’s principal activities include exploration, development, and operation of gold mines and metallurgical processing facilities which in addition to gold and silver also produce (Mahd Ad’Dahab and Al Amar) precious metals rich copper and zinc concentrates for third party toll smelting. Ma’aden Gold’s assets are all located in Saudi Arabia which include: five operations (Mahd Ad’Dahab, Al Amar, Bulghah, Sukhaybarat (processing facility only), and Al Hajar); one Development Property (Ad Duwayhi); five advanced exploration properties (Mansourah, Ar Rjum, Masarrah, As Suk and Zalim) and 33 other exploration properties (Figure 2.1E, Table 2.1E).
As at 1 July 2007, Ma’aden Gold (Table 3.1E) had Ore Reserves of 1.3Moz of gold contained within 21.7Mt and grading 1.9g/t Au and Mineral Resources of 10.0Moz of gold (10.1Moz gold equivalent) contained within 132.8Mt and grading 2.3g/t Au (2.4g/t Au Eq).
In 2006, Ma’aden Gold (Table 2.2E) processed approximately 5.4Mt of ore and produced approximately 167koz of gold (193koz gold equivalent) at a by-product cash cost of US$283/oz. For the six months period ended 30 June 2007, Ma’aden Gold processed approximately 2.1Mt of ore and produced approximately 75koz of gold (86koz gold equivalent) at a by-product cash cost of US$292/oz.
Ma’aden Gold employs a total of 728 (Table 2.3E) total employees costed (“TEC”), 607 of whom are employed directly at the Mining Assets: Mahd Ad’Dahab (234), Al Amar (112), Bulghah (106), Sukhaybarat (94), Al Hajar (61); and a further 121 are employed at Ma’aden Gold’s head office in Jeddah.
Total Environmental Liabilities (Table 2.4E) comprise biophysical and social (Terminal Benefits) of US$27.1m (Biophysical – US$19.0m; Terminal Benefits – US$8.1m). At 30 June 2007, Ma’aden Gold had total Plant Property and Equipment (“PP&E”) valued at US$62.2m.
An analysis of international gold companies based on 2006 calendar statistics indicates that Ma’aden Gold is ranked 46th in respect of production and 18th in respect of cash costs. Figure 2.1E presents the industry cash cost curve for mining companies based on equity participation and by-product reporting principles. Figure 2.2E presents the industry cash cost curve for mining operations based on equity participation and by-product reporting principles.

SRK Consulting Ma'aden Gold MER – Executive Summary
U3330_Ma'aden MER.doc November, 2007 Page vi
Table 2.1E Gold Assets(1)
Gold Assets Type(2) Licence Expiry(3) Area (km2)
Mining Operations 110.3Mahd Ad'Dahab u/g Mahd Ad‘Dahab Dec-2017 10.3Al Amar u/g Al Amar Dec-2026 5.0Bulghah o/p Bulghah Dec-2030 39.0Sukhaybarat s/f Sukhaybarat Dec-2017 50.0Al Hajar s/f Al Hajar Jun-2027 6.0Development Property 646.0Ad Duwayhi o/p Aduwayah Oct-2007 646.0Exploration Advanced Exploration Properties 10,923.8Mansourah o/p Al Uruq Jul-2008 4,302.3Ar Rjum o/p Ash Shakhtaliyah Feb-2007 6,333.0Masarrah o/p Ash Shakhtaliyah Feb-2007 6,333.0As Suk o/p Ash Shakhtaliyah Feb-2007 6,333.0Zalim o/p Zalim Jun-2008 288.5Other Exploration Properties 36,597.23 Prospects n/d Aduwayah Oct-2007 646.06 Prospects n/d Al Hajar Dec-2007 1,499.52 Prospects n/d Al Jardhawiyah Aug-2006 7,609.04 Prospects n/d Al Uruq Jul-2008 4,302.38 Prospects n/d An Najadi, Nugrah, Mawan, Habla Dec-2009 1,847.12 Prospects n/d As Siham Jun-2007 5,504.42 Prospects n/d Ash Shakhtaliyah Feb-2007 6,333.01 Prospects n/d Miskah Aug-2007 7,013.01 Prospects n/d Tawan Nov-2006 415.71 Prospects n/d Shabah Sep-2006 6,944.53 Prospects n/d Wurshah Sep-2006 5,764.0(1) The Mining Licences and the Exploitation Licences reflect the anticipated position by the Company for Ma’aden Gold following relinquishment
of certain areas in accordance with the licence conditions. (2) u/g – underground; o/p – open-pit; s/f – surface sources; n/d – not determined. (3) For all licences which are expired as of 30 June 2007 or are due to expire in 2007, SRK has been informed that the necessary applications for
renewal have been lodged with the regulatory authorities.
Table 2.2E Ma’aden Gold: salient historical (2004-2007H1 inclusive) and forecast (2007H2, 2008) operating statistics
Statistics Units 2004 2005 2006 2007H1(1) 2007H2 2008Processing Tonnage (kt) 5,638 5,813 5,449 2,134 2,208 5,100Grade (g/t Au) 1.9 1.6 1.2 1.3 1.3 1.5Production Gold (koz Au) 265 240 167 75 71 182Silver (koz Ag) 467 434 293 149 133 379Zinc (t Zn) 0 0 983 294 617 6,150Copper (t Cu) 660 668 730 425 329 1,476Lead (t Pb) 0 0 0 88 96 193Gold Equivalent (koz Au Eq) 279 256 192 86 81 233Expenditures Cash Cost(2) - on mine (US$/t) 11.14 9.33 10.57 12.04 14.73 15.10Cash Cost(3) - Co-product (US$/oz) 233 220 317 320 425 376Cash Cost(4) - By-product (US$/oz) 225 207 283 292 391 293Capital Expenditure (US$m) 9.77 26.59 20.28 10.45 5.60 10.55
(1) The reduced cash operating costs for 2007H1 compared with 2007H2 is impacted by the significant (US$5.8m) under spend of corporate overheads (General and Administration, Projects and Technical Services, and Exploration). This under spend equates to a unit cash cost (by-product) basis of US$70/oz and is not assumed to continue in the current LoMp.
(2) On mine cash costs excluding concentrate and bullion related treatment, refining and realisation charges. (3) Co-product cash cost based on cash cost excluding by-product credits divided by gold equivalent production (payable). (4) By-product cash cost based on cash costs net of by-product credits divided by gold production (payable).
Table 2.3E Mining Assets: human resource statistics (historical and forecast) Human Resources Units 2004 2005 2006 2007H1 2007H2 2008Mahd Ad'Dahab (No) 227 223 229 234 234 234Al Amar (No) 7 20 84 112 0 170Bulghah (No) 127 97 98 106 106 106Sukhaybarat (No) 85 85 92 94 94 94Al Hajar (No) 64 60 77 61 61 61Head Office (No) 143 109 124 121 121 121Total (No) 653 594 704 728 616 786
The Company’s Health, Safety and Environmental Policy commits to the establishment of a health, safety and environmental management system. Ma’aden Gold has designed a environmental management system (“EMS”) manual and a occupational health and safety

SRK Consulting Ma'aden Gold MER – Executive Summary
U3330_Ma'aden MER.doc November, 2007 Page vii
system (“OHSS”) manual and intends to introduce these in the second half of 2007.
The Company is not currently ISO 14001 compliant and SRK notes that the proposed EMS system and policy statement does not reference compliance with the World Bank, Equator Principles or the principles established by the International Council of Mining and Metals (“ICMM”). Notwithstanding this limitation, the Company has employed external consultants for the generation of certain regulatory documentation: specifically Environmental Impact Assessments (“EIAs”) for some mines and closure plans for some mines.
SRK has assessed Ma’aden Gold’s performance in this area in respect of compliance with World Bank, Equator Principles, ICMM and local regulatory requirements. Details regarding these components are given in the site specific sections of the MER.
Based on the items defined at each operation and discussions held with the Company, SRK has estimated the total Environmental (biophysical closure) liabilities and Social (terminal benefits liabilities – “TBL”) for the Gold Assets as summarised in Table 2.4E. To date, no cash provision has been made in respect of funding this liability. Whilst not a requirement it is understood that the liability will be funded from future cashflows as generated by implementation of the current LoMp.
Table 2.4E Gold Assets: environmental (biophysical and social) liabilities Assets Biophysical Closure Terminal Benefits Liability Total Closure
(US$m) (US$m) (US$m) (Year)Mahd Ad'Dahab 6.4 1.8 8.2 2012Al Amar 2.0 2.1 4.1 2014Bulghah 2.5 0.4 2.9 2011Sukhaybarat 4.0 0.6 4.6 2014Al Hajar 2.1 0.3 2.4 2010Head Office(1) 2.0 2.9 4.8 2014Total 19.0 8.1 27.1 2014
Table 2.5E presents the safety statistics for the Gold Assets and includes the lost time injury frequency rate (“LTIFR”) for 2005 through 2007H1 inclusive. These have been determined from the reported lost time accidents recorded and converted to a rate per million hours worked assuming the reported TEC per period, 48 working weeks per annum, five working days per week and eight hours per day. The overall safety performance of the Mining Assets during 2007H1 (measured against performance during 2006) is summarised as follows: no fatalities; an increase in the LTIFR from 9.74 to 15.64 per million man hours worked. For comparison, the Ontario benchmark target is 0.15 per million man hours for fatality rates and 7.50 per million man hours for LTIFR.
Table 2.5E Mining Assets: safety statistics
Assets 2005 2006 2007H1LTIFR Mahd Ad'Dahab 2.34 4.55 17.81Al Amar 0.00 6.20 27.90Bulghah 5.37 5.31 9.83Sukhaybarat 0.00 22.64 11.08Al Hajar 0.00 20.29 17.08Exploration 0.00 8.40 0.00Total 1.95 9.74 15.64

SRK Consulting Ma'aden Gold MER – Executive Summary
U3330_Ma'aden MER.doc November, 2007 Page ix
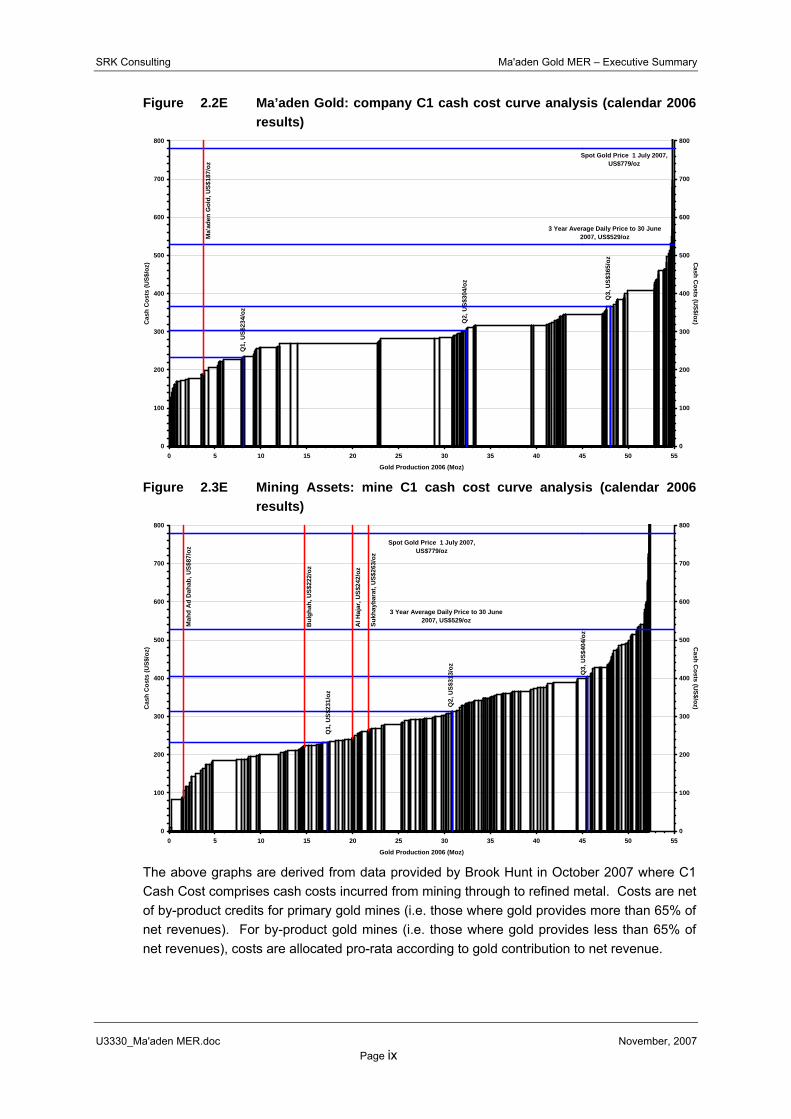
Figure 2.2E Ma’aden Gold: company C1 cash cost curve analysis (calendar 2006 results)
Spot Gold Price 1 July 2007, US$779/oz
3 Year Average Daily Price to 30 June 2007, US$529/oz
Q1,
US$
234/
oz
Q2,
US$
304/
oz
Q3,
US$
365/
oz
Ma'
aden
Gol
d, U
S$18
7/oz
0
100
200
300
400
500
600
700
800
0 5 10 15 20 25 30 35 40 45 50 55
Gold Production 2006 (Moz)
Cas
h C
osts
(US$
/oz)
0
100
200
300
400
500
600
700
800
Cash C
osts (US$/oz)
Figure 2.3E Mining Assets: mine C1 cash cost curve analysis (calendar 2006
results)
Spot Gold Price 1 July 2007, US$779/oz
3 Year Average Daily Price to 30 June 2007, US$529/oz
Q1,
US$
231/
oz
Q2,
US$
313/
oz
Q3,
US$
404/
oz
Mah
d A
d D
ahab
, US$
87/o
z
Bul
ghah
, US$
222/
oz
Al H
ajar
, US$
242/
oz
Sukh
ayba
rat,
US$
263/
oz
0
100
200
300
400
500
600
700
800
0 5 10 15 20 25 30 35 40 45 50 55
Gold Production 2006 (Moz)
Cas
h C
osts
(US$
/oz)
0
100
200
300
400
500
600
700
800
Cash C
osts (US$/oz)
The above graphs are derived from data provided by Brook Hunt in October 2007 where C1 Cash Cost comprises cash costs incurred from mining through to refined metal. Costs are net of by-product credits for primary gold mines (i.e. those where gold provides more than 65% of net revenues). For by-product gold mines (i.e. those where gold provides less than 65% of net revenues), costs are allocated pro-rata according to gold contribution to net revenue.

SRK Consulting Ma'aden Gold MER – Executive Summary
U3330_Ma'aden MER.doc November, 2007 Page x
2.2.1E History The Company was established as a Saudi Arabian joint stock company (“JSC”) in March 1997 under Royal Decree M/17. The Company’s formation was largely driven by the need for diversification of the national economy through expansion of the country’s non-oil activities and resulted in the unification of several separate mining-related activities in Saudi Arabia, partly held through various state held equity interests. The principal milestones achieved subsequent to its formation are:
• The commissioning of a zinc plant at Mahd Ad’Dahab in 1997;
• The commissioning of the Al Hajar mining and processing operation in 2001;
• The commissioning of the Bulghah mining and processing operation in October 2002;
• The construction of the Al Amar mining and processing operation in 2007H1;
• The completion of a pre-feasibility study for the Ad-Duwayhi Development Property in 2007H1; and
• Continued success in the development of the Central Arabian Gold Project through exploration activities at the Advanced Exploration Properties (“AEPs”) culminating in the delineation of Mineral Resources totalling 7.9Moz of gold contained within 103.2Mt at a grade of 2.4g/t Au.
2.2.2E Strategy
Ma’aden Gold’s strategy is represented in the following four key areas:
• Operations:
− Al Amar, specifically addressing the potential dilution risk and providing adequate technical/management support to ensure that the production build-up is achieved as projected in the LoMp,
− Bulghah, specifically addressing (1) the current non-achievement of stacked production at the heap leach facility, (2) the potential to investigate the current positive bias between grade control estimates and exploration model estimates, (3) the economic risk associated with processing of lower (<0.8g/t Au) grade fresh ore with lower (50%) metallurgical recoveries,
− Sukhaybarat, specifically addressing the ability to maintain economic processing of fresh ore mined at Bulghah and processed at Sukhaybarat beyond 2010 should gold prices fall below US$600/oz;
• Mineral Resource and Ore Reserves: Enhancing the management systems at the operating mines specifically in respect of addressing the currency of the LoMps and establishing systems which enable annual updating on a routine basis as well as provide the foundation for longer term strategic planning. Key in this regard will be harmonising the long term commodity price assumptions used to support the Ore Reserve declaration;
• Central Arabian Gold Project (“CAG Project”): Establishing the technical and economic viability of the CAG Project to increase equivalent gold production to 250koz per annum by 2011 in the short term and establishing a growth base to expand beyond this by a further 250koz per annum in the long term (>2013) through:
− completion of a feasibility study for Ad Duwayhi by 2008Q4, − completion of a feasibility study for the Taif water pipeline project in 2008H2, − completion of pre-feasibility studies for Mansourah, Ar Rjum, Masarrah, As Suk and
Zalim in 2008; and

SRK Consulting Ma'aden Gold MER – Executive Summary
U3330_Ma'aden MER.doc November, 2007 Page xi
• Exploration: Continuation of the current successful strategy targeting exploration properties in the Central Arabian Gold Region (“CAG Region”) and the Northern Arabian Shield Region (“NAS Region”) as exemplified by the 7.9Moz attributed to the Development Property and the advanced exploration property (resource definition cost of US$5.2/oz). The total licence areas under management will reduce from 71,044.0km2 to 47,521.0km2, of which 10,923.8km2 represent licences in which the AEPs are contained and 36,597.2km2 represent licences in which only Exploration Properties (“EPs”) are managed. The current exploration programme (2007H2 to 2010 inclusive) assumes further operating expenditures amounting to US$33.5m, the larger portion (52%) of which is to be expended on Exploration Licences in the NAS Region.
Figure 2.4E Ma’aden Gold: LoMp equivalent gold production (koz) and cash costs (US$/oz)
0
50
100
150
200
250
2004
2005
2006
2007
2008
2009
2010
2011
2012
2013
2014
Years (Calendar)
Ann
ual P
rodu
ctio
n (k
oz)
0
50
100
150
200
250
300
350
Cash C
ost (US$/oz)
Mahd Ad'Dahab Al Amar Bulghah SukhaybaratHISTORY FORECAST
2.3E Mining Business 2.3.1E Description of properties
The Gold Assets comprise operational mining licence areas which total 110.3km2. The Ore Reserves as stated for these Mining Assets are planned for depletion prior to expiry of the current Exploitation Licences. Ma’aden Gold manages Exploration Licences which total 47,521.0km2 which cover 38 properties (5 AEPs and 33 EPs) located in the CAS Region and the NAS Region. Certain of the Exploration Licences are due to expire or have expired in 2007. SRK has been informed by Ma’aden Gold that all necessary applications for renewal have been submitted and that the areas stated are net of the necessary reductions required in accordance with the licence conditions. Furthermore, Ma’aden Gold confirms that all minimum expenditures necessitated by the licence conditions have been fulfilled and that it expects renewal of all licences reviewed in this MER.
Table 2.6E gives the details of production capacities and throughputs attributable to the operating Mining Assets.

SRK Consulting Ma'aden Gold MER – Executive Summary
U3330_Ma'aden MER.doc November, 2007 Page xii
Table 2.6E Ma’aden Gold: Plant production capacities and throughputs
Asset Design Capacity 2007H1 LoMp Annualised Throughput Average Max (ktpa) (ktpa) (ktpa) (ktpa)
Mahd Ad'Dahab 185 233 184 184Al Amar 200 0 194 201Bulghah 4,500 2,872 3,331 3,400Sukhaybarat 600 624 600 600Al Hajar 750 538 720 720
2.3.2E Exploration
Exploration activities at the Gold Assets are largely focused on the following key areas:
• Extension drilling at the operating mines to test the dip and strike extent of currently delineated orebodies as well as infill drilling to upgrade resource classification ahead of mining activity;
• Extension drilling at the AEPs, specifically targeting extension drilling and infill drilling to extend the currently defined resource base and upgrade resource classification ahead of completing pre-feasibility studies; and
• Greenfield exploration activity comprising, GIS analysis, regional reconnaissance prospecting, geophysical mapping (regional and local), geochemical soil/rock sampling, surface trenching, target generation and pre-resource drilling.
Exploration expenditures on the exploration properties and Ad Duwayhi up to 2007H1 total US$42.1m, 85% of which was expended on Exploration Licences situated in the CAG Region. The current exploration programme (2007H2 to 2010 inclusive) assumes further operating expenditures amounting to US$33.5m, the larger portion (52%) of which is to be expended on Exploration Licences in the NAS Region.
2.4E Overview of the Gold Assets 2.4.1E Mahd Ad’Dahab
Introduction: Mahd Ad’Dahab comprises an underground mine (the “Mahd Ad’Dahab Mine”) processing a gold rich polymetallic ore at the Mahd Ad’Dahab processing facility (the “Mahd Ad’Dahab Plant”) at a rate of 185ktpa to produce gold in doré and copper and zinc concentrates which are sold to third parties for toll smelting and refining. Ma’aden Gold has a 100% interest in Mahd Ad’Dahab and as at 30 June 2007, the value of the PP&E is US$4.2m. From 1 January 2004 to 30 June 2007, Mahd Ad’Dahab processed 741kt of ore and surface sources grading 9.2g/t Au with an average recovery of 91.0% to produce 199koz of gold (249koz gold equivalent) at an average cash cost (by-product basis) of US$154/oz (US$223/oz co-product basis).
Location: Mahd Ad’Dahab is situated in the western region of the country known as the Hejaz in the Al Madinah Province, Saudi Arabia, approximately 610km west-southwest of Riyadh, the capital city of Saudi Arabia. Located at latitude 23°30’N and longitude 40°52’E, at an elevation of 1,050m above mean sea level (“amsl”), the site is some 165km southeast of the provincial capital Medina.
Title and Rights: The current Exploitation Licence (Royal Decree No. M/9) extends over an area of 10.3km2 and is valid until December 2017 which is 5 years subsequent to the depletion of the current Ore Reserves.
Geology: Located on the Precambrian Shield of Saudi Arabia, the host rocks comprise a mafic to felsic volcanic-sedimentary sequence which forms an east trending homoclinal structure trending east with a northerly dip from 30° to 75°. These rocks have been complexly

SRK Consulting Ma'aden Gold MER – Executive Summary
U3330_Ma'aden MER.doc November, 2007 Page xiii
faulted by steeply dipping north to north-northwest and northwest trending faults. The orebodies comprise vein complexes (intruded by dykes) which trend north-northwest to north with some veins trending northwest. These are contained within a broad belt approximately 900m long and 900m wide. Mineralisation is associated with multiphase quartz veining and silicification developed along predominant north to north-northwest trending faults and economic gold mineralisation is associated with quartz, pyrite, chalcopyrite, sphalerite, galena and silver. The quartz and massive sulphide vein systems are subdivided into four specific zones: SAMS; Western Zone; Eastern Zone; and Northern Zone. The individual veins are generally narrow (0.5m to 2.0m) and the stockwork zones (specifically in the Eastern Zone) range up to 20.0m. All vein systems indicate steeply north pitching ore shoots.
Ore Reserves and Mineral Resources: As at 1 July 2007, Mahd Ad’Dahab has Ore Reserves of 347koz of gold (360koz gold equivalent) contained within 1.2Mt and grading 8.7g/t Au (9.0g/t Au Eq). This Ore Reserve includes a total of 232kt of surface sources grading 0.8g/t Au (0.9g/t Au Eq) containing 6koz of gold (7koz gold equivalent). Total Mineral Resources comprise 643koz of gold (665koz gold equivalent) contained within 1.2Mt and grading 16.1g/t Au (16.6g/t Au Eq).
Mining Operations comprise underground mining at a rate of 185ktpa using a combination of fully mechanised sub-level stoping and cut-and-fill mining methods. The mine is accessed by a primary decline to the main production levels, the deepest of which is some 190m below the general desert surface (1,060m amsl). A further production level is also accessed via a mountainside adit. Waste rock from primary development is used for filling the stopes in the cut-and-fill mining method. Underground mining of the Ore Reserve is planned to continue at the projected rate of 185ktpa until depletion in 2012.
Processing Plants: The Mahd Ad’Dahab Plant processes ore mined from the underground operation as well as reclaimed tailings as direct feed to the zinc circuit. The processing facility comprises a comminution circuit (rated capacity 185ktpa), a copper circuit, a gold circuit and a zinc circuit which produces copper and zinc concentrates for third party toll smelting and gold in doré from for third party refining. Ore processing involves crushing (primary through tertiary) in the comminution circuit to produce a blended ore which is then reclaimed to feed the copper circuit. The copper circuit comprises milling and flotation to produce a copper concentrate with the tails feeding the Carbon-in-Pulp (“CIP”) gold circuit. Tailings arising from the gold circuit are then onwards processed together with the reclaimed high grade zinc tailings (2004 and 2005 tailings production) in the zinc circuit by flotation to produce zinc concentrate. Final tailings are then thickened and filtered prior to transportation by truck to two dry-tailings storage facilities (“TSF”). A new TSF was commissioned in 2005 located some 0.6km south-east of the Mahd Ad’Dahab Plant. Overall payable gold recovery for 2007H1 is estimated at 91.6%.
Capital Projects: Other than sustaining capital there are no specific capital projects associated with the Ore Reserves. For 2007H2 Ma’aden Gold has budgeted capital expenditures of US$1.3m and the total capital commitment from 1 July 2007 through to 2012 is US$10.3m.
Environmental Liabilities (See Table 2.4E).
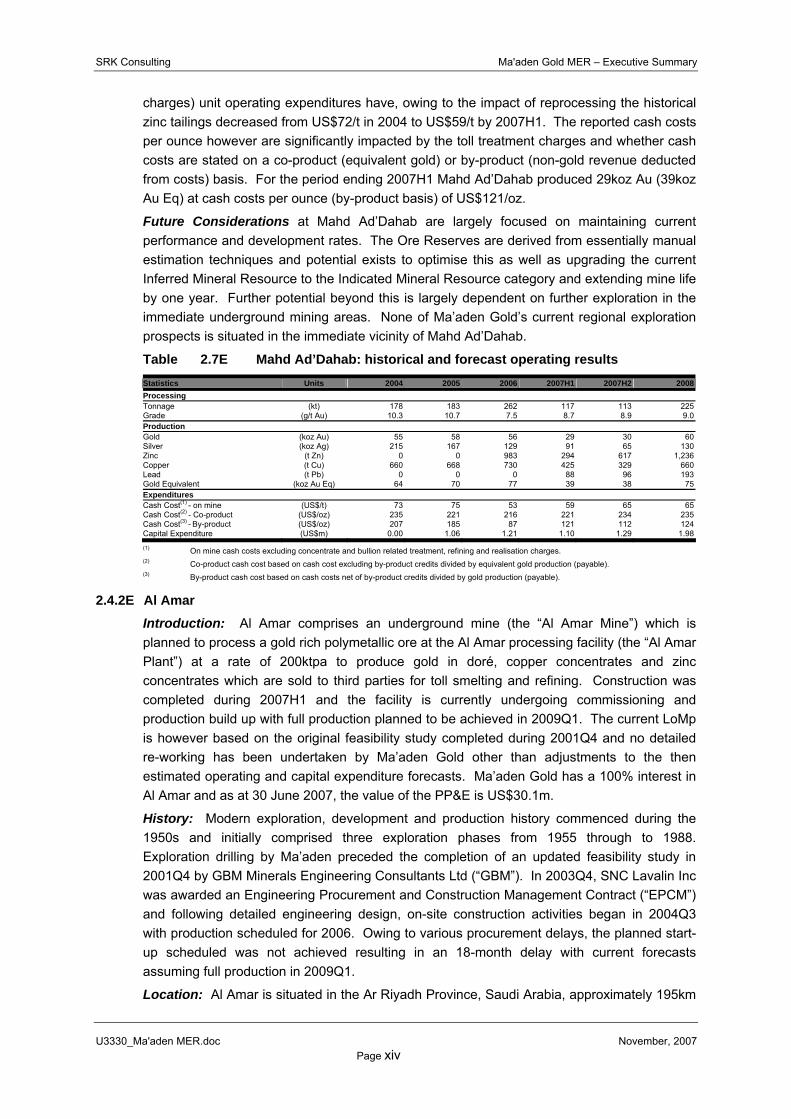
Operating Performance (Table 2.7E): Milled tonnage has remained relatively constant since 2004 with head grades steadily increasing to in excess of 11g/t Au and leading to an increase in gold production from 55koz to an annualised amount of 60koz based on operating performance in 2007H1. On-mine (excluding by-product credits and concentrate treatment
SRK Consulting Ma'aden Gold MER – Executive Summary
U3330_Ma'aden MER.doc November, 2007 Page xiv
charges) unit operating expenditures have, owing to the impact of reprocessing the historical zinc tailings decreased from US$72/t in 2004 to US$59/t by 2007H1. The reported cash costs per ounce however are significantly impacted by the toll treatment charges and whether cash costs are stated on a co-product (equivalent gold) or by-product (non-gold revenue deducted from costs) basis. For the period ending 2007H1 Mahd Ad’Dahab produced 29koz Au (39koz Au Eq) at cash costs per ounce (by-product basis) of US$121/oz.
Future Considerations at Mahd Ad’Dahab are largely focused on maintaining current performance and development rates. The Ore Reserves are derived from essentially manual estimation techniques and potential exists to optimise this as well as upgrading the current Inferred Mineral Resource to the Indicated Mineral Resource category and extending mine life by one year. Further potential beyond this is largely dependent on further exploration in the immediate underground mining areas. None of Ma’aden Gold’s current regional exploration prospects is situated in the immediate vicinity of Mahd Ad’Dahab.
Table 2.7E Mahd Ad’Dahab: historical and forecast operating results
Statistics Units 2004 2005 2006 2007H1 2007H2 2008Processing Tonnage (kt) 178 183 262 117 113 225Grade (g/t Au) 10.3 10.7 7.5 8.7 8.9 9.0Production Gold (koz Au) 55 58 56 29 30 60Silver (koz Ag) 215 167 129 91 65 130Zinc (t Zn) 0 0 983 294 617 1,236Copper (t Cu) 660 668 730 425 329 660Lead (t Pb) 0 0 0 88 96 193Gold Equivalent (koz Au Eq) 64 70 77 39 38 75Expenditures Cash Cost(1) - on mine (US$/t) 73 75 53 59 65 65Cash Cost(2) - Co-product (US$/oz) 235 221 216 221 234 235Cash Cost(3) - By-product (US$/oz) 207 185 87 121 112 124Capital Expenditure (US$m) 0.00 1.06 1.21 1.10 1.29 1.98
(1) On mine cash costs excluding concentrate and bullion related treatment, refining and realisation charges. (2) Co-product cash cost based on cash cost excluding by-product credits divided by equivalent gold production (payable). (3) By-product cash cost based on cash costs net of by-product credits divided by gold production (payable).
2.4.2E Al Amar
Introduction: Al Amar comprises an underground mine (the “Al Amar Mine”) which is planned to process a gold rich polymetallic ore at the Al Amar processing facility (the “Al Amar Plant”) at a rate of 200ktpa to produce gold in doré, copper concentrates and zinc concentrates which are sold to third parties for toll smelting and refining. Construction was completed during 2007H1 and the facility is currently undergoing commissioning and production build up with full production planned to be achieved in 2009Q1. The current LoMp is however based on the original feasibility study completed during 2001Q4 and no detailed re-working has been undertaken by Ma’aden Gold other than adjustments to the then estimated operating and capital expenditure forecasts. Ma’aden Gold has a 100% interest in Al Amar and as at 30 June 2007, the value of the PP&E is US$30.1m.
History: Modern exploration, development and production history commenced during the 1950s and initially comprised three exploration phases from 1955 through to 1988. Exploration drilling by Ma’aden preceded the completion of an updated feasibility study in 2001Q4 by GBM Minerals Engineering Consultants Ltd (“GBM”). In 2003Q4, SNC Lavalin Inc was awarded an Engineering Procurement and Construction Management Contract (“EPCM”) and following detailed engineering design, on-site construction activities began in 2004Q3 with production scheduled for 2006. Owing to various procurement delays, the planned start-up scheduled was not achieved resulting in an 18-month delay with current forecasts assuming full production in 2009Q1.
Location: Al Amar is situated in the Ar Riyadh Province, Saudi Arabia, approximately 195km

SRK Consulting Ma'aden Gold MER – Executive Summary
U3330_Ma'aden MER.doc November, 2007 Page xv
southwest of Riyadh, the capital city of Saudi Arabia. Located at latitude 23°46’N and longitude 45°04’E, at an elevation of 994m amsl, the site is some 14km south of the town of Quai on the main highway travelling west wards from Riyadh to Jeddah.
Title and Rights: The current Exploitation Licence (Royal Decree No. M/17) covers an area of 5.0km2 and is valid until December 2026 which is 12 years subsequent to the depletion of the current Ore Reserves.
Geology: The deposit is located in a north-south trending belt of felsic to mafic volcanic rocks comprising the Al Amar Group which is intruded by granodiorite, trondhjemite, gabbro and quartz diorite rocks. Structurally the Al Amar Group rocks have been subjected to complex folding and faulting. Structures at the Al Amar deposit are dominated by northwest-southeast and west northwest-east southeast fault systems and are associated with mineralisation. Three spatially discrete zones of mineralisation have been identified at Al Amar: the North Vein Zone; the Stockwork Zone; and the South Vein Zone.
The main mineralised zone is the North Vein Zone which strikes east-west with a dip of 69° to 80° to the south and has been demonstrated to extend 550m along strike to a depth of 350m. The zone is reported to be 10m to 45m wide, within which two vein systems have been identified: the hangingwall vein and the footwall vein systems. These vein systems comprise a series of sub-vertical, discontinuous quartz veins up to 0.5m thick associated with sub-massive sphalerite, pyrite and minor chalcopyrite mineralisation. The footwall vein is characterized by high copper values, high zinc and sporadic high gold values. Contrastingly the hangingwall vein is associated with moderate copper, zinc and gold values and elevated lead levels. Mineralisation is open laterally and at depth and a northeast-southwest trending fault cuts off mineralisation to the west.
The Stockwork Zone and South Vein Zones are comprised of irregular stockwork and discontinuous vein systems respectively. The South Vein Zone is structurally complex and shows little continuity along strike or down dip. The Al Amar deposit is cut by numerous intermediate to mafic dykes that are believed to post date mineralisation. A prominent dyke ranging from 10m to 20m in width with a north-south (mine grid) strike and a 60° east dip separates mineralisation to the east and west.
Ore Reserves and Mineral Resources: As at 1 July 2007, Al Amar has Ore Reserves of 429koz of gold (441koz gold equivalent) contained within 1.4Mt and grading 9.9g/t Au (10.2g/t Au Eq). Total Mineral Resources comprise 722koz of gold (742koz gold equivalent) contained within 2.0Mt and grading 11.2g/t Au (11.5g/t Au Eq).
Mining Operations assume underground mining at a rate of 200ktpa using a fully mechanised long-hole open stoping method with subsequent backfilling using waste development. For the lower (<790mRL) levels of the mine the level spacing will be reduced from 30m to 20m and the mining sequence changed from a “bottom-up” approach to a “top-down” sequence utilising rib pillars for additional local and regional support. Access to the mine is by a new primary decline to the main production levels extending some 300m below surface to the 590mRL. Underground mining of the Ore Reserve is planned to continue at the projected rate of 200ktpa until depletion in 2014.
Processing Plants: The Al Amar Plant will process ore mined from the underground operation at a production rate of 200ktpa. The process facility comprises a comminution circuit, a copper circuit, a gold circuit and a zinc circuit which produces copper and zinc concentrates for third party toll smelting and gold in doré form for third party refining. Ore processing involves crushing (primary through tertiary) in the comminution circuit to produce a

SRK Consulting Ma'aden Gold MER – Executive Summary
U3330_Ma'aden MER.doc November, 2007 Page xvi
blended ore which is then reclaimed to feed the copper circuit. The copper circuit comprises milling and flotation to produce a copper concentrate with the tails feeding the Carbon-in-Leach (“CIL”) gold circuit. Tailings arising from the gold circuit are then onwards processed in the zinc circuit by flotation to produce a zinc concentrate. Final tailings are then thickened and filtered prior to transportation by truck to a dry-tailings storage facility situated 1.2km north-west of the Al Amar Plant. The LoM metallurgical recoveries (payable metals) are assumed at: 89.9% for gold; 81.3% for silver; 62.7% for zinc; and 76.0% for copper.
Capital Projects: Other than sustaining capital and pre-production expenses there are no specific capital projects associated with the Ore Reserves. For 2007H2 Ma’aden Gold has budgeted capital expenditures of US$2.7m and the total capital commitment from 1 July 2007 through to 2014 is US$19.4m.
Environmental Liabilities (See Table 2.4E).
Operating Performance (Table 2.8E): To date all activities at Al Amar have been focused on the construction completion and has resulted in total capital expenditures of US$55.0m. No substantial production is forecast for 2007H2 and milled tonnage for 2008 is assumed at 155ktpa at a gold grade of 9.1g/t Au. On-mine operating expenditures are estimated at US$91/t reducing to US$84/t as full production is achieved in 2009. The reported cash costs per ounce however are significantly impacted by the toll treatment charges and whether cash costs are stated on a co-product (equivalent gold) or by-product (non-gold revenue deducted from costs) basis. For the period ending 2008 production is forecasted at 39koz Au (72koz Au Eq) at a cash cost per ounce of negative US$23/oz (by-product basis) and US$300/oz (co-product basis).
Future Considerations at Al Amar are largely focused on achieving the projected production build up schedule. Notwithstanding this aspect, SRK notes that the basis of the current LoMp are the forecast parameters as included in the feasibility study with US CPI adjustments for future operating and capital expenditures. In the interim additional information has been collated as well as indications that the current Ore Reserve may be negatively impacted due to higher than planned dilution arising from wider development and the larger than planned underground equipment procured. Upside potential however exists in respect of upgrading the currently delineated Inferred Mineral Resource and testing the strike and depth extensions of the currently delineated orebodies. None of Ma’aden Gold’s current regional exploration prospects is situated in the immediate vicinity of Al Amar.
Table 2.8E Al Amar: historical and forecast operating results
Statistics Units 2004 2005 2006 2007H1 2007H2 2008Processing Tonnage (kt) 0 0 0 0 0 155Grade (g/t Au) 0.0 0.0 0.0 0.0 0.0 9.1Production Gold (koz Au) 0 0 0 0 0 39Silver (koz Ag) 0 0 0 0 0 112Zinc (t Zn) 0 0 0 0 0 4,915Copper (t Cu) 0 0 0 0 0 817Gold Equivalent (koz Au Eq) 0 0 0 0 0 72Expenditures Cash Cost(1) - on mine (US$/t) 0 0 0 0 0 91Cash Cost(2) - Co-product (US$/oz) 0 0 0 0 0 300Cash Cost(3) - By-product (US$/oz) 0 0 0 0 0 -23Capital Expenditure (US$m) 7.28 21.08 18.18 8.44 2.68 5.99
(1) On mine cash costs excluding concentrate and bullion related treatment, refining and realisation charges. (2) Co-product cash cost based on cash cost excluding by-product credits divided by equivalent gold production (payable). (3) By-product cash cost based on cash costs net of by-product credits divided by gold production (payable).
2.4.3E Bulghah
Introduction: Bulghah comprises an open-pit mine (the “Bulghah Mine”) which mines lower

SRK Consulting Ma'aden Gold MER – Executive Summary
U3330_Ma'aden MER.doc November, 2007 Page xvii
grade (<1.0g/t Au) ore for processing at the Bulghah heap leach processing facility (the “Bulghah Plant”) and higher grade (>1.0g/t Au) ore for processing at the Sukhaybarat CIL processing facility (the “Sukhaybarat Plant”) located some 66km northeast at Sukhaybarat. The combined process throughput is limited to 4.0Mtpa, with 3.4Mtpa processed at the Bulghah Plant and 0.6Mtpa processed at the Sukhaybarat Plant. In both instances doré is produced and transported to third parties for precious metals refining to produce saleable gold and silver.
Commissioned in October 2002, Bulghah is currently in a transitional phase as the oxide ore is depleted and future production is increasingly dominated by transitional and sulphide ores. The current LoMp is largely based on: the results of a technical study published by external consultants in September 2005; depletion to 30 June 2007; the 2007H2 budget; and the assumption of significantly lower metallurgical recoveries than currently achieved (from current >70% to <50%). This latter factor combined with the currency (September 2005) of the LoMp and the planned increase in contribution from fresh ore presents an elevated level of operational risk in respect of attaining the forecasts as presented herein. Furthermore the current LoMp assumes treating of marginal ore which in the case of processing at Sukhaybarat presents further economic risk at gold prices less than US$600/oz. Ma’aden has a 100% interest in Bulghah and as at 30 June 2007, the value of the PP&E is US$18.9m.
History: Modern exploration, development and production history commenced during the early 1990s which lead to the completion of a pre-feasibility by Ma’aden in 1997. In August 2000 a feasibility study was completed by independent consultants who proposed the construction of a open-pit mining operation processing 4.0Mtpa of ore through a heap leach processing facility and producing 84koz of gold per annum. Construction at Bulghah commenced in March 2001 and the facility was commissioned in October 2002 at a capital cost of US$70m.
Location: Bulghah is situated in the western region of the country known as the Hejaz in the Al Madinah Province, Saudi Arabia, approximately 520km west-northwest of Riyadh, the capital city of Saudi Arabia. Located at latitude 24°59’N and longitude 41°36’E, at an elevation of 950m amsl, the site is some 210km northeast of the provincial capital Medina.
Title and Rights: The current Exploitation Licence extends over an area of 39.0km2 and is valid until December 2030 which is 20 years subsequent to the depletion of the current Ore Reserves.
Geology: The Bulghah deposit lies within Precambrian rocks of the Arabian Shield, located in the western part of the Arabian Peninsula. Gold mineralisation is hosted within an intrusion, which strikes roughly north-south. The intrusion is fault/shear bounded on the east and west sides, with the contacts dipping roughly 60° towards the east. The intrusion ranges from 200m to 500m wide, narrowing towards the south, and extends to the north and south for approximately 1,000m with a depth of about 450m. The area is also structurally complex and the intrusion is cross-cut by numerous dykes, which are sub-horizontal, and frequently have irregular geometries.
Mineralisation occurs predominately as an intrusive body along quartz filled fractures zones, shears, and joints and is associated with north-south striking and steeply dipping faults. Sulphide minerals associated with the gold mineralisation include arsenopyrite, pyrite (± minor pyrhotite), chalcopyrite, sphalerite and other trace sulphides. Mineralisation is subdivided into oxide, transitional and sulphide ore. Oxide mineralisation extends from surface to 30m to 35m below and sulphide mineralisation occurs just below the “redox” boundary at depths of

SRK Consulting Ma'aden Gold MER – Executive Summary
U3330_Ma'aden MER.doc November, 2007 Page xviii
24m or greater. A transition zone of about 5m occurs between the base of oxide mineralisation and sulphide mineralisation.
Ore Reserves and Mineral Resources: As at 1 July 2007, Bulghah has Ore Reserves of 428koz of gold contained within 16.8Mt and grading 0.8g/t Au. Total Mineral Resources comprise 617koz of gold contained within 24.0Mt and grading 0.8g/t Au.
Mining Operations comprise a conventional drill-blast-load-truck operation with a total material moved capacity of 5.6Mtpa. The current LoMp assumes mining to a depth of 120m below surface to the 830mRL and includes the staged development of four pits (Pit 1 >90% of ore) with overall slope angles ranging from 32° to 52° and a low stripping ratio of 0.2twaste:tore (currently 0.4). All material is drilled and blasted prior to loading by front-end loaders into 40t haul trucks. Open-pit mining of the Ore Reserve is planned to continue until depletion in 2010.
Processing Plants: The Bulghah Plant comprises a conventional heap-leach facility with a design capacity of 4.0Mtpa. The flowsheet includes a comminution circuit, a lined heap leach pad (“HLP”), collection pond and an adsorption circuit. Crushed ore is agglomerated, stacked in 6m lifts on the HLP and then irrigated with cyanide solution. The precious metals pregnant solution is then further processed in a carbon adsorption plant using activated carbon and all loaded carbon is trucked to the Sukhaybarat Plant for stripping and gold refining. Overall payable gold recovery for 2007H1 is estimated at 74.7%.
Capital Projects: Other than sustaining capital and pre-production expenses there are no specific capital projects associated with the Ore Reserves. For 2007H2 Ma’aden Gold has budgeted capital expenditures of US$0.4m and the total capital commitment from 1 July 2007 through to 2011 is US$3.4m.
Environmental Liabilities (See Table 2.4E).
Operating Performance (Table 2.9E): Process throughput at the Bulghah Plant has reduced from in excess of 4.0Mtpa to annualised production of 2.9Mtpa for 2007H1. Further the gold grades have also reduced (currently reporting 0.7g/t Au) which in combination with the reduction in production has resulted in some 50% reduction in annualised gold production since 2005 and an increase in unit cash costs. For the period ending 30 June 2007 Bulghah produced 24koz Au (25koz Au Eq) at a cash cost per ounce (by-product basis) of US$258/oz.
Future Considerations at Bulghah are largely focused on maximising metallurgical recoveries given the increasing contribution of fresh ore planned for delivery to the HLP. The current Ore Reserve was derived from pit designs based on a gold price of US$380/oz and in combination with the positive bias in the current grade-control estimates (not factored into the Ore Reserve statements) presents an opportunity for re-estimation and further optimisation at current commodity prices. Three of the exploration prospects are situated within 30km to 50km of Bulghah (Nuqrah, Jardawiyah and Humaymah) however none of these has identified JORC Code compliant Mineral Resources to date.

SRK Consulting Ma'aden Gold MER – Executive Summary
U3330_Ma'aden MER.doc November, 2007 Page xix
Table 2.9E Bulghah: historical and forecast operating results Statistics Units 2004 2005 2006 2007H1 2007H2 2008Processing Tonnage (kt) 4,223 4,479 3,865 1,436 1,435 3,400Grade (g/t Au) 1.0 0.9 0.6 0.7 0.7 0.8Production Gold (koz Au) 108 100 57 24 24 51Silver (koz Ag) 0 7 5 2 2 5Gold Equivalent (koz Au Eq) 108 100 57 24 25 51Expenditures Cash Cost(1) - on mine (US$/t) 3.29 2.74 3.27 4.44 4.41 4.01Cash Cost(2) - Co-product (US$/oz) 128 123 222 263 259 266Cash Cost(3) - By-product (US$/oz) 128 123 222 263 258 265Capital Expenditure (US$m) 1.74 0.31 0.65 0.46 0.39 0.92(1) On mine cash costs excluding concentrate and bullion related treatment, refining and realisation charges. (2) Co-product cash cost based on cash cost excluding by-product credits divided by equivalent gold production (payable). (3) By-product cash cost based on cash costs net of by-product credits divided by gold production (payable).
2.4.4E Sukhaybarat
Introduction: Sukhaybarat comprises a closed open-pit mine and the Sukhaybarat Plant which processes ore transported from Bulghah. Commissioned in 1991 the Sukhaybarat Plant has a rated capacity of 600ktpa and is planned to continue operations until 2014. The current LoMp is solely dependent on Bulghah Mine and specifically the planned future processing of lower grade ore. Doré is transported to third parties for precious metals refining to produce saleable gold and silver. Specifically, a combination of reducing head grades and recoveries results in significant economic risk at gold prices less than US$600/oz. Ma’aden has a 100% interest in Sukhaybarat and as at 30 June 2007, the value of the PP&E is US$6.6m.
History: Modern exploration, development and production history commenced during the 1980s which following completion of a feasibility study lead to the construction of an open-pit operation with a heap leach pad in 1986 followed by a CIL processing facility in 1991 with then Ore Reserves of 8.0Mt grading 2.7g/t Au.
Location: Sukhaybarat is situated in the western region of the country known as the Hejaz in the Al Madinah Province, Saudi Arabia, approximately 485km west-northwest of Riyadh, the capital city of Saudi Arabia. Located at latitude 25°27’N and longitude 42°00’E, at an elevation of 830m amsl, the site is some 265km northeast of the provincial capital Medina.
Title and Rights: The current Exploitation Licence (Royal Decree M/10) extends over an area of 50.0km2 and is valid until December 2017 which is 3.6 years subsequent to the depletion of the current Ore Reserves at Bulghah as well as the surface stockpiles at Sukhaybarat.
Geology: Mining operations at Sukhaybarat ceased in August 2004 on depletion of the then Ore Reserves. Currently the only material remaining at Sukhaybarat are the ore stockpiles transported from Bulghah for processing in the Sukhaybarat Plant.
Ore Reserves and Mineral Resources: As at 1 July 2007, Sukhaybarat has Ore Reserves of 2koz of gold contained within 0.2Mt and grading 0.4g/t Au. Total Mineral Resources comprise 2koz of gold contained within 0.2Mt and grading 0.4g/t Au.
Mining Operations are limited to the transportation of ore from Bulghah a travelled distance of 75km.
Processing Plants: The Sukhaybarat Plant comprises a conventional milling-CIL-elution and electrowinning circuit to produce gold in doré form. The plant has an operating capacity of 600ktpa and also treats loaded carbon from the adsorption circuit at the Bulghah Plant. Overall gold recovery for 2007H1 is estimated at 85.4%. Tailings are deposited in a new facility developed to the north of the two existing closed facilities.

SRK Consulting Ma'aden Gold MER – Executive Summary
U3330_Ma'aden MER.doc November, 2007 Page xx
Capital Projects: Other than sustaining capital and pre-production expenses there are no specific capital projects associated with the Ore Reserves. For 2007H2 Ma’aden Gold has budgeted capital expenditures of US$0.3m and the total capital commitment from 1 July 2007 through to 2014 is US$4.5m.
Environmental Liabilities (See Table 2.4E).
Operating Performance (Table 2.10E): Process throughput at the Sukhaybarat Plant has increased since 2005 to the current annualised throughout of 624ktpa. The head grade has however reduced significantly since 2005 and has reduced by 50% to the current 1.4g/t Au. In combination with the reduction in production this has resulted in some 50% reduction in annualised gold production since 2005 and accordingly unit cash costs have increased. For the period ending 30 June 2007 Sukhaybarat produced 12koz Au at a cash cost per ounce (by-product basis) of US$309/oz.
Future Considerations at Sukhaybarat are largely focused on maximising metallurgical recoveries given the increasing contribution of lower grade ore planned for delivery from Bulghah. Should commodity prices decrease below US$600/oz as currently forecasted, annual cashflows beyond 2010 are likely to remain negative at some US$2m until closure in 2014. Six of the exploration prospects are situated within 30km of Sukhaybarat (Hablah South, Red Hill, La Prospect, Aurifjan and Al Habla) however none of these have identified JORC Code compliant Mineral Resources to date.
Table 2.10E Sukhaybarat: historical and forecast operating results Statistics Units 2004 2005 2006 2007H1 2007H2 2008Processing Tonnage (kt) 571 540 565 312 300 600Grade (g/t Au) 3.6 2.9 1.8 1.4 1.1 1.1Production Gold (koz Au) 63 42 27 12 9 18Silver (koz Ag) 0 4 4 2 1 2Gold Equivalent (koz Au Eq) 63 42 27 12 9 18Expenditures Cash Cost(1) - on mine (US$/t) 12.49 13.08 12.62 12.27 12.40 12.40Cash Cost(2) - Co-product (US$/oz) 113 170 263 309 411 412Cash Cost(3) - By-product (US$/oz) 113 170 263 309 411 412Capital Expenditure (US$m) 0.00 3.12 0.24 0.26 0.32 0.64
(1) On mine cash costs excluding concentrate and bullion related treatment, refining and realisation charges. (2) Co-product cash cost based on cash cost excluding by-product credits divided by equivalent gold production (payable). (3) By-product cash cost based on cash costs net of by-product credits divided by gold production (payable).
2.4.5E Al Hajar
Introduction: Al Hajar comprises a closed open-pit mine and the Al Hajar heap leach facility (“Al Hajar Plant”) which is currently re-processing previously stacked and leached material. Commissioned in 2001, Al Hajar with a rated capacity of 750ktpa continued mining and processing operations until depletion of the open-pit Ore Reserves in 2006. The original comminution circuit did not include a secondary crusher until installation in October 2005. Prior to the installation of this secondary crusher, Ma’aden Gold considered that stacked ore was sub-optimally crushed resulting in lower recoveries than planned. Subsequent metallurgical testing of the stacked and leached ore indicates that the material leached has residual gold grades of 1.3g/t Au. The current LoMp assumes that material stacked prior to October 2005 can be economically reclaimed, re-crushed (to less than 20mm) and re-stacked on a new HLP with a metallurgical recovery of 51.9% for gold. Ma’aden has a 100% interest in Al Hajar and as at 30 June 2007, the value of the PP&E is US$1.6m.
History: Modern exploration, development and production history commenced during the 1980s leading to the establishment of a heap leach mining operation in 2001 albeit with a limited Ore Reserve base. In 2005, Ma’aden commenced mining at Jadmah, a satellite

SRK Consulting Ma'aden Gold MER – Executive Summary
U3330_Ma'aden MER.doc November, 2007 Page xxi
deposit situated some 4km west of Al Hajar. In 2006, Ma’aden completed a technical study investigating the potential for re-crushing material stacked and leached up until October 2005. In 2007, the re-crushing programme commenced which has to date resulted in the re-processing of 0.3Mt of material grading 1.5g/t Au.
Location: Al Hajar is situated in the Asir Province, Saudi Arabia, approximately 710km southwest of Riyadh, the capital city of Saudi Arabia. Located at latitude 19°59’N and longitude 42°00’E, at an elevation of 1,600m amsl, the site is some 203km north-northwest of the provincial capital Abhā.
Title and Rights: the current Exploitation Licence (Royal Decree M/3) extends over an area of 6.0km2 and is valid until June 2027 which is 17 years subsequent to the depletion of the current Ore Reserves.
Geology: Mining operations at Al Hajar ceased in December 2006 on depletion of the then Ore Reserves.
Ore Reserves and Mineral Resources: As at 1 July 2007, Al Hajar has Ore Reserves of 87koz of gold contained within 2.1Mt and grading 1.3g/t Au. Total Mineral Resources comprise 87koz of gold contained within 2.1Mt and grading 1.3g/t Au.
Mining Operations are limited to the reclaiming of historically stacked material.
Processing Plants: The Al Hajar Plant comprises a conventional heap leach facility with a design capacity of 750ktpa. The flowsheet includes a crushing circuit, a lined HLP, collection pond and an adsorption circuit. Crushed ore is agglomerated and stacked in 8m lifts on the HLP and is then irrigated with cyanide solution. The precious metals pregnant solution is then further processed in a Merrill-Crowe process and the precipitate is filtered and dried, and smelted to produce doré. Overall payable gold recovery for 2007H1 is estimated at 66.4%.
Capital Projects: Other than sustaining capital and pre-production expenses there are no specific capital projects associated with the Ore Reserves. In 2007H2 Ma’aden has budgeted capital expenditures of US$0.9m and the total capital commitment from 1 July 2007 through to 2010 is US$3.0m.
Environmental Liabilities (See Table 2.4E).
Operating Performance (Table 2.11E): Process throughput at the Al Hajar Plant increased from 2004 to 2006, however current performance (2007H1) indicates poor performance at 25% below budget. Furthermore the head grade has reduced significantly since 2004 from 3.5g/t Au to the current 1.5g/t Au. Accordingly this has resulted in a 50% reduction in gold production and a 50% increase in cash operating costs. For the period ending 2007H1 Al Hajar produced 9koz Au (11koz Au Eq) at a cash cost per ounce (by-product basis) of US$194/oz.
Future Considerations at Al Hajar are largely focused on attaining the forecast production rates and unit operating expenditures as forecast in the latest LoMp. Potential beyond this is largely focused on the regional exploration properties situated within the Al Hajar Exploration Licence area. Six of the exploration prospects are situated within 30km of Al Hajar (Hajeej, Sheers, Jadmah, Gossan-14, Waqba and Sha’abat Al Hamra) however none of these has identified JORC Code compliant Mineral Resources to date.

SRK Consulting Ma'aden Gold MER – Executive Summary
U3330_Ma'aden MER.doc November, 2007 Page xxii
Table 2.11E Al Hajar: historical and forecast operating results Statistics Units 2004 2005 2006 2007H1 2007H2 2008Processing Tonnage (kt) 666 610 756 269 360 720Grade (g/t Au) 3.5 2.9 1.9 1.5 1.3 1.3Production Gold (koz Au) 39 39 26 9 8 15Silver (koz Ag) 252 257 155 54 65 129Gold Equivalent (koz Au Eq) 45 44 30 11 9 17Expenditures Cash Cost(1) - on mine (US$/t) 9.97 12.11 10.43 8.32 8.32 8.32Cash Cost(2) - Co-product (US$/oz) 156 176 269 226 344 357Cash Cost(3) - By-product (US$/oz) 135 147 242 194 290 306Capital Expenditure (US$m) 0.75 1.02 0.00 0.18 0.93 1.02
(1) On mine cash costs excluding concentrate and bullion related treatment, refining and realisation charges. (2) Co-product cash cost based on cash cost excluding by-product credits divided by equivalent gold production (payable). (3) By-product cash cost based on cash costs net of by-product credits divided by gold production (payable).
2.4.6E Ad Duwayhi
Introduction: Ad Duwayhi is a Development Property upon which a pre-feasibility study has recently (April 2007) been completed. The study envisages the construction of an open-pit mining operation processing at a rate of 1Mtpa through a gravity-CIL plant. The total capital commitment for construction is currently estimated at US$91.2m and further technical studies are underway to complete a feasibility study (anticipated 2008H2). A key constraint to the development of the project is securing a sustainable water supply. Whilst a local well-field could be developed at a site some 25km distant, there is insufficient capacity to meet Ad Duwayhi’s requirements. Furthermore, the potential development of the AEPs is similarly limited by the availability of water supply, and these properties in conjunction with Ad Duwayhi are the subject of the CAG Project. The most likely option for securing the necessary water supply is the construction (at a cost of US$90m) of a 500km pipeline from Taif (the “Taif Project”) to transport effluent water arising from an existing sewage water treatment plant servicing the city of Taif. The pipeline capacity is estimated at 417m3/hr with an annual operating cost of US$1.5mp.
Consequently the likely development of Ad Duwayhi is conditional on demonstrating the technical feasibility and economic viability of the CAG Project including pre-feasibility studies for the AEPs (2008Q4), and feasibility studies for Ad Duwayhi and the Taif Project (anticipated 2008H2). Assuming the results of these are positive, the completion of necessary detailed engineering design studies, current lead times for delivery of major equipment, and a construction period of 1.5 to 2.0 years, then the earliest period for Ad Duwayhi attaining full production is calendar 2011.
History: Modern exploration commenced during the 1950s comprising limited pitting excavations. From 2004, Ma’aden Gold commissioned various technical studies inclusive of metallurgical testwork which culminated in the publication of a pre-feasibility study in April 2007 by SRK. Currently the company is engaged in completing a feasibility study which is planned for completion in 2008H2.
Location: Ad Duwayhi is situated in the Mecca Province, Saudi Arabia, approximately 440km southwest of Riyadh, the capital city of Saudi Arabia. Located at latitude 22°17’N and longitude 43°17’E, at an elevation of 980m amsl, the site is some 380km west-northwest of the provincial capital of the Mecca.
Title and Rights: The current Exploitation Licence (Royal Decree No. M/17) covers an area of 646.6km2 and is valid until October 2007. SRK has been informed that an application for extension is in process and has been lodged with the regulatory authorities.
Geology: The Ad Duwayhi deposit lies at the southern end of a zone of Pre-Cambrian

SRK Consulting Ma'aden Gold MER – Executive Summary
U3330_Ma'aden MER.doc November, 2007 Page xxiii
volcano-sedimentary rock, which have been overprinted by greenschist facies metamorphism. The deposit stratigraphy is cut by multiple intrusive dykes and sills of dolerite, rhyolite, porphyritic granite and a polymict breccia pipe. Mineralisation is associated with a curved thrust structure with an average strike of 045° and dip of 45° southeast, curving from a northerly direction in the southwest to an easterly direction in the northeast. The thrust structure is typically between 2m to 10m thick with heavily deformed cataclastic rocks with well developed quartz veins. Thin, high grade gold veins are also found outside of the main mineralised vein. Gold is typically found associated with pyrite and tetrahedrite, and is found in the form of fine grained free gold (>5μm). Gold mineralisation is also present as placer deposits in the vicinity of the deposit, within the colluvial material.
Ore Reserves and Mineral Resources: As at 1 July 2007, Ad Duwayhi has total Mineral Resources of 2.1Moz of gold contained within 17.1Mt and grading 3.9g/t Au.
Mining Operations as proposed in the pre-feasibility study assume a conventional drill-blast-load-truck operation with a total material moved capacity of 9.5Mtpa. The current LoMp assumes mining to a depth of 145m below surface to the 835mRL and includes the staged development of two pits with overall slope angles ranging from 45° to 58° and a stripping ratio of 6.8twaste:tore. All material will be drilled and blasted prior to loading by hydraulic shovels into 80t rear dump haul trucks. Open-pit mining of the Ore Reserve is planned to continue until depletion some 9 years after commencement of operations.
Processing Plants: Ad Duwayhi will process ore mined from the open-pit operation at a production rate of 1.0Mtpa. The process facility proposed comprises a comminution circuit with a parallel gravity circuit for recovery of coarse grained free gold and a CIL circuit followed by elution, electrowinning and smelting to produce gold in doré form for third party refining. Tailings arising from the CIL circuit will be thickened and dried to enable dry storage and minimise water usage. The LoM metallurgical recoveries (payable metals) are assumed at 92.9% for gold.
Capital Projects: The current estimate of capital expenditure required for Ad Duwayhi amounts to US$105.4m over the projected LoMp comprising US$91.2m as the initial construction capital and the remainder being sustaining capital expended over the planned operating life. This capital estimate excludes the capital expenditure required for construction of the regional water pipeline necessary for development of Ad Duwayhi and its requirement for a water supply of 70m3/hr. The total capital estimate for the water pipeline is currently assumed at US$90m for the construction of a 500km pipeline (capacity 417m3/hr) from the town of Taif situated 315km southwest of Ad Duwayhi.
Environmental Liabilities: (See Table 2.4E).
Operating Performance: To date all activities at Ad Duwayhi have been focused on completion of technical studies and advancing the metallurgical testwork. On attaining full production at 1.0Mtpa, Ad Duwayhi is forecast to process ore at an average grade of 3.5g/t Au and a metallurgical recovery of 93.0% (92.9% payable) to produce gold at an average LoM cash cost of US$224/oz.
Future Considerations at Ad Duwayhi are focused on completing a feasibility study to an overall level of accuracy of 10%. In addition Ma’aden Gold is also undertaking further technical studies to assess the potential for underground mining beyond the planned ultimate pit depth. Further potential beyond this will depend on further drilling targeting potential depth and strike extensions. In the absence of governmental/other funding for the construction of the regional water supply pipeline, the development of Ad Duwayhi is however conditional on

SRK Consulting Ma'aden Gold MER – Executive Summary
U3330_Ma'aden MER.doc November, 2007 Page xxiv
completion of pre-feasibility studies for the other AEPs which in combination with Ad Duwayhi represent the CAG Project. This in addition to completion of a feasibility study for the Taif water pipeline project (the “Taif Project”) will enable Ma’aden Gold to assess the technical feasibility and economic viability of the CAG Project as a whole, specifically its ability to repay the capital construction (US$90m) and operating costs (US$1.5mpa) associated with the Taif Project.
2.4.7E Exploration Assets
To date, Ma’aden Gold has determined a total Mineral Resource of 7.9Moz contained within 103.2Mt grading 2.4g/t Au. Table 2.12E gives the Mineral Resource statements for the Exploration Properties and Ad Duwayhi as at 1 July 2007. Historical expenditures in the CAG Region from 1999 through to 2007H1 inclusive amount to US$35m which indicates a resource definition cost of US$5.2/oz of gold with some 53% of the total content classified as Measured and Indicated Mineral Resources.
Table 2.12E Exploration Assets (including Ad Duwayhi) Mineral Resource statements (1 July 2007)
JORC Code Statements Tonnage Grade Content(kt) (g/t Au) (koz Au)
Measured Ad Duwayhi 7,222 2.8 648Subtotal 7,222 2.8 648Indicated Ad Duwayhi 6,359 5.7 1,169Mansourah 18,135 2.4 1,388Masarrah 13,501 2.3 981Subtotal 37,995 2.9 3,538Measured + Indicated Ad Duwayhi 13,581 0.0 1,817Mansourah 18,135 2.4 1,388Masarrah 13,501 2.3 981Total Measured + Indicated 45,216 2.9 4,186Inferred Ad Duwayhi 3,493 2.7 299Mansourah 3,558 2.0 228Ar Rjum 35,886 1.9 2,225Masarrah 2,603 2.1 176As Suk 1,728 4.1 228Zalim 10,753 1.7 590Subtotal 58,021 2.0 3,747Mineral Resources Ad Duwayhi 17,074 3.9 2,116Mansourah 21,693 2.3 1,616Ar Rjum 35,886 1.9 2,225Masarrah 16,104 2.2 1,157As Suk 1,728 4.1 228Zalim 10,753 1.7 590Total Mineral Resources 103,237 2.4 7,933
Ma’aden Gold’s exploration portfolio includes some 38 properties located in two principal regions: CAG Region and NAS Region. These properties are collectively managed within their Exploration Licence and the AEPs (EPs with Resource statements) are all contained within the CAG Region. Following successful re-application and the necessary relinquishment of licence areas (currently in process) the total licence areas under management will reduce from 71,044.0km2 to 47,521.0km2, of which 10,923.8km2 represent licences in which the AEPs are contained and 36,597.2km2 represent licences in which only EPs are managed.
In the CAG Region there are a total of 17 exploration assets (Table 2.13E), of which five are classified as AEPs (resource definition) and 12 as EPs (pre-resource exploration). In the NAS Region there are a total of 21 exploration assets, all of which are classified as EPs.
Total exploration expenditures from 1999 through 30 June 2007 inclusive amount to US$35m (Table 2.13E), 85% of which was expended on Exploration Licences situated in the CAG

SRK Consulting Ma'aden Gold MER – Executive Summary
U3330_Ma'aden MER.doc November, 2007 Page xxv
Region. The current exploration programme (2007H2 to 2010 inclusive) assumes further expenditures amounting to US$33.5m, the larger portion (52%) of which is to be expended on Exploration Licences in the NAS Region.
The principal exploration activities at the Exploration Assets comprise: regional mapping; geochemical sampling (rock and soil); Drilling (Post holes, Reverse Circulation drill holes, Diamond Drill holes); and drill intercept sampling. To date Ma’aden Gold has collected 46 thousand geochemical samples, undertaken some 424km of drilling and submitted 358,000 intercept samples (Table 2.14E) in respect of exploration activities in the CAG Region and NAS Region collectively.
Table 2.13E Exploration Assets(1): Historical and forecast exploration expenditures
Region AEPs EPs Expenditure Pre 2004 2004 2005 2006 2007H1 2007H2 2008 (No) (No) (US$m) (US$m) (US$m) (US$m) (US$m) (US$m) (US$m)
CAG Region(2) 5 12 14.16 6.04 7.03 6.36 2.21 4.39 4.23NAS Region(3) 0 21 0.73 0.46 0.99 2.33 1.16 0.79 4.97Other 0 0 0.00 0.59 0.01 0.02 0.00 0.00 0.00Total 5 33 14.89 6.50 8.03 8.71 3.37 5.19 9.20(1) Inclusive of Ad Duwayhi Development Property. (2) CAG Region includes the following Exploration Licences: Ad Duwayhi; Al Uruq; Ash Shakhtaliyah; Wurshah and Zalim. (3) NAS Region includes the following Exploration Licences: Al Hajar; Al Jardhawiyah; An Najadi, Nugrah, Mawan, Habla; As Siham; Miskah;
Tawan; and Shabah.
Table 2.14E Exploration Assets(1): Historical exploration statistics Region AEPs EPs Geochemical Samples Drillholes Drilling Drill Samples
(No) (No) (m) (No)CAG Region 5 12 10,053 27,582 326,836 282,656NAS Region 0 21 35,858 6,053 96,672 75,499Total 5 33 45,911 33,635 423,508 358,155
2.4.8E Head Office
The Head Office for Ma’aden Gold is located in the city of Jeddah, Mecca Province, Saudi Arabia some 845km southwest of Riyadh the capital city of Saudi Arabia and 70km west-northwest of the provincial capital of Mecca. The Head Office provides management services to each of the operating mines through the following: General and Administration Division (Management; Operations; Industrial Relations; and Finance); Projects and Technical Services Division; and Exploration Division.
Capital Projects: Capital expenditures for 2007 calendar year are currently budgeted at US$0.5m for the G&A Division, US$3.4m for the Technical Services Division and US$0.2m for the Exploration Division. This level of expenditure is assumed to continue until 2010, thereafter reducing in accordance with the forecast reduction in operating assets as the Ore Reserves are depleted, specifically from 2011 onwards.
Environmental Liabilities (See Table 2.4E)
Operating Performance (Table 2.15E): Operating Expenditures from 2004 through 2006 vary significantly and other than for 2004, the most significant contributions are directly related to exploration activities. The operating expenditures and capital expenditures incurred in 2007H1 indicated a significant under spend when compared against that budgeted, and the current LoMps assume that such under spend is not planned to continue. This under spend is also directly responsible for the lower operating unit cash costs noted in 2007H1 versus that projected in 2007H2 and onwards.
Future Considerations at Ma’aden Gold’s Head Office are dependent upon the success of the proposed exploration programme as this contributes a significant portion for 2007H2 through 2010 inclusive. Furthermore, SRK considers that scope exists for rationalisation of

SRK Consulting Ma'aden Gold MER – Executive Summary
U3330_Ma'aden MER.doc November, 2007 Page xxvi
such expenditures and, given the current under spend, consideration should be given to reviewing the forecast expenditures from 2007H2 onwards, specifically in respect of G&A and Project Technical Services.
Table 2.15E Ma’aden Gold’s head Office: historical and forecast operating results Statistics Units 2004 2005 2006 2007H1(1) 2007H2 2008Expenditures G&A (US$m) 12.60 4.55 5.90 2.19 4.21 7.20Project and Technical Services (US$m) 1.77 1.11 1.46 0.81 2.77 4.92Exploration (US$m) 6.68 8.03 8.71 3.37 5.19 9.20Total Operating Expenditure (US$m) 21.05 13.69 16.07 6.37 12.17 21.32Capital Expenditure (US$m) 4.38 0.44 0.03 0.10 0.08 4.13Unit Expenditures Cash Cost(2) - on mine (US$/t) 24.93 2.36 2.95 2.98 5.51 4.18Cash Cost(3) - Co-product (US$/oz) 195 53 84 74 151 91Cash Cost(4) - By-product (US$/oz) 224 57 96 85 171 117Capital Expenditure (US$m) 4.38 0.44 0.03 0.10 0.08 4.13
(1) The reduced cash operating costs for 2007(H1) compared with 2007(H2) is impacted by the significant (US$5.8m) under spend of corporate overheads (General and Administration, Projects and Technical Services and Exploration). This under spend equates to a unit cash cost (by-product) basis of US$70/oz and is not assumed to continue in the current LoMp.
(2) On mine cash costs excluding concentrate and bullion related treatment, refining and realisation charges. (3) Co-product cash cost based on cash cost excluding by-product credits divided by gold equivalent production (payable). (4) By-product cash cost based on cash costs net of by-product credits divided by gold production (payable).
3.0E MINERAL RESOURCES AND ORE RESERVES
SRK has not re-estimated the Mineral Resource and Ore Reserve statements for the Gold Assets as estimated by Ma’aden Gold. SRK has, however, undertaken sufficient check calculations and where appropriate, made necessary adjustments to the estimates as presented herein and incorporated such adjustments into the respective Mineral Resource and Ore Reserve statements and LoMps.
Table 3.1E through Table 3.3E inclusive summarise SRK’s statements of Mineral Resources and Ore Reserves. The terms and definitions are those given in The 2004 Australasian Code for Reporting of Exploration Results, Mineral Resources and Ore Reserves as published by the Joint Ore Reserves Committee of the Australasian Institute of Mining and Metallurgy, Australian Institute of Geoscientists and Minerals Council of Australia.
Table 3.1E Ma’aden Gold: Total Mineral Resource and Ore Reserves (1 July 2007)(1)
Ore Reserves Tonnage Grade Content Mineral Resources Tonnage Grade Content (kt) (g/t Au) (g/t Au Eq) (koz Au) (koz Au Eq) (kt) (g/t Au) (g/t Au Eq) (koz Au) (koz Au Eq)
Proved Measured u/g 447 10.6 11.0 153 158 u/g 344 21.3 21.9 235 243o/p 0 0.0 0.0 0 0 o/p 7,222 2.8 2.8 648 648Subtotal 447 10.6 11.0 153 158 Subtotal 7,566 3.6 3.7 884 891Probable Indicated u/g 1,910 10.1 10.4 618 636 u/g 2,359 13.0 13.4 987 1,016o/p 16,694 0.8 0.8 427 427 o/p 59,458 2.1 2.1 4,098 4,098s/f 2,614 1.1 1.3 95 108 s/f 2,614 1.1 1.3 95 108Subtotal 21,218 1.7 1.7 1,140 1,172 Subtotal 64,430 2.5 2.5 5,181 5,223Ore Reserves Measured + indicated u/g 2,357 10.2 10.5 770 794 u/g 2,703 14.1 14.5 1,223 1,259o/p 16,694 0.8 0.8 427 427 o/p 66,679 2.2 2.2 4,746 4,746s/f 2,614 1.1 1.3 95 108 s/f 2,614 1.1 1.3 95 108Total Ore Reserves 21,665 1.9 1.9 1,293 1,329 Total 71,996 2.6 2.6 6,064 6,113
Inferred u/g 314 13.5 14.0 137 142 o/p 60,452 2.0 2.0 3,803 3,803 s/f 0 0.0 0.0 0 0 Subtotal 60,766 2.0 2.0 3,939 3,944 Mineral Resources u/g 3,018 14.0 14.4 1,359 1,400 o/p 127,131 2.1 2.1 8,549 8,549 s/f 2,614 1.1 1.3 95 108 Total 132,762 2.3 2.4 10,004 10,058
(1) u/g – underground; o/p – open-pit; s/f – surface sources (stockpiles).

SRK Consulting Ma'aden Gold MER – Executive Summary
U3330_Ma'aden MER.doc November, 2007 Page xxvii
Table 3.2E Ma’aden Gold: Total Ore Reserve Sensitivity (1 July 2007) Gold Price Tonnage Grade Content (US$/oz) (kt) (g/t Au) (g/t Au Eq) (koz Au) (koz Eq Au)350 8,700 2.9 3.0 817 831450 14,178 2.4 2.5 1,087 1,117550 21,665 1.9 1.9 1,293 1,329650 22,204 1.8 1.9 1,293 1,332750 31,636 1.5 1.6 1,565 1,607
Table 3.3E Ma’aden Gold: Mineral Resources and Ore Reserves by asset (1 July 2007)
JORC Code Statements Tonnage Grade Content (kt) (g/t Au) (g/t Au Eq) (koz Au) (koz Au Eq)
Ore Reserves Proved Mahd Ad'Dahab 447 10.6 11.0 153 158Subtotal 447 10.6 11.0 153 158Probable Mahd Ad'Dahab 792 7.6 7.9 194 202Al Amar 1,350 9.9 10.2 429 441Bulghah 16,768 0.8 0.8 428 428Sukhaybarat 164 0.4 0.4 2 2Al Hajar 2,143 1.3 1.4 87 99Subtotal 21,218 1.7 1.7 1,140 1,172Ore Reserves Mahd Ad'Dahab 1,239 8.7 9.0 347 360Al Amar 1,350 9.9 10.2 429 441Bulghah 16,768 0.8 0.8 428 428Sukhaybarat 164 0.4 0.4 2 2Al Hajar 2,143 1.3 1.4 87 99Total Ore Reserves 21,665 1.9 1.9 1,293 1,329Mineral Resources Measured Mahd Ad'Dahab 344 21.3 21.9 235 243Ad Duwayhi 7,222 2.8 2.8 648 648Subtotal 7,566 3.6 3.7 884 891Indicated Mahd Ad'Dahab 727 13.4 13.9 313 325Al Amar 1,864 11.3 11.6 679 698Bulghah 21,537 0.8 0.8 561 561Sukhaybarat 164 0.4 0.4 2 2Al Hajar 2,143 1.3 1.4 87 99Ad Duwayhi 6,359 5.7 5.7 1,169 1,169Advanced Exploration Projects 31,635 2.3 2.3 2,369 2,369Subtotal 64,430 2.5 2.5 5,181 5,223Measured + Indicated Mahd Ad'Dahab 1,071 15.9 16.5 549 568Al Amar 1,864 11.3 11.6 679 698Bulghah 21,537 0.8 0.8 561 561Sukhaybarat 164 0.4 0.4 2 2Al Hajar 2,143 1.3 1.4 87 99Ad Duwayhi 13,581 4.2 4.2 1,817 1,817Advanced Exploration Projects 31,635 2.3 2.3 2,369 2,369Total Measured + Indicated 71,996 2.6 2.6 6,064 6,113Inferred Mahd Ad'Dahab 174 16.8 17.5 94 98Al Amar 141 9.5 9.7 43 44Bulghah 2,431 0.7 0.7 56 56Ad Duwayhi 3,493 2.7 2.7 299 299Advanced Exploration Projects 54,528 2.0 2.0 3,448 3,448Subtotal 60,766 2.0 2.0 3,939 3,944Mineral Resources Mahd Ad'Dahab 1,245 16.1 16.6 643 665Al Amar 2,005 11.2 11.5 722 742Bulghah 23,968 0.8 0.8 617 617Sukhaybarat 164 0.4 0.4 2 2Al Hajar 2,143 1.3 1.4 87 99Ad Duwayhi 17,074 3.9 3.9 2,116 2,116Advanced Exploration Projects 86,164 2.1 2.1 5,817 5,817Total Mineral Resources 132,762 2.3 2.4 10,004 10,058
When considering the Mineral Resource and Ore Reserve statements as presented herein, the following points apply:
• Measured and Indicated Mineral Resources are inclusive of those Mineral Resources modified to produce Ore Reserves;
• Mineral Resources are quoted at an appropriate in-situ economic cut-off grade which satisfies the requirement of ‘potentially economically mineable’ for open-pit and underground mining assets separately. Furthermore, the commodity prices incorporated

SRK Consulting Ma'aden Gold MER – Executive Summary
U3330_Ma'aden MER.doc November, 2007 Page xxviii
into the in-situ cut-off grade calculations are as follows: US$550/oz for gold; US$9.00/oz for silver; USc65/lb for zinc; and USc140/lb for copper. The resulting cut-off grades have then in general been discounted by 25% to report Mineral Resources and to accommodate the ‘potentially economically mineable’ consideration. SRK notes however that where potential exists for both open-pit and underground mining (specifically the Development Properties (the “DPs”) and the AEPs) the stated Mineral Resources have not been sub-divided into those Mineral Resources which are potentially economically mineable by open-pit methods (typically by using a optimisation shell at higher commodity prices than that used for the Ore Reserves) and underground methods (higher cut-off grades). Accordingly consideration at this stage for Ore Reserve potential within the AEPs is difficult given this limitation;
• Ore Reserves are due to currency of the LoMps (i.e. Al Amar feasibility study 2001; Bulghah mining study 2005Q4) based on a range of commodity prices which are generally lower than the current three year average as derived from daily closing prices. Notwithstanding this aspect, SRK has confirmed the validity of the statements as presented at the following long term commodity prices: gold at US$550/oz; silver at US$9.00/oz; zinc at USc65/lb; and copper at USc140/lb;
• Mineral Resources and Ore Reserves were originally prepared by Ma’aden Gold based on various LoMps. These statements have not been adjusted by means of re-estimation but have been adjusted by SRK to reflect depletion and any other necessary adjustments deemed necessary to reflect JORC Code compliant statements as at 1 July 2007;
• Unless otherwise stated all Mineral Resources and Ore Reserves are quoted on an equity attributable basis assuming 100% ownership as at 1 July 2007;
• All Ore Reserves are quoted in terms of RoM tonnage and grades as delivered to the metallurgical processing plants and are therefore inclusive of all appropriate modifying factors;
• Ore Reserve statements are derived from LoMp which are based solely on Measured and Indicated Mineral Resources and specifically exclude Inferred Mineral Resources;
• Ore Reserve sensitivities, where reasonable to estimate, have been derived from application of the relevant in-situ cut-off grades and application of modifying factors at a range of commodity prices for gold, silver, zinc and copper. In respect of the open-pits incremental optimised shells were developed for the range of commodity prices which were then used to constrain the open-pitable Ore Reserves. It should, however, be noted that these are not supported by appropriately detailed LoMps and should therefore be considered as incremental changes to the declarations as reported herein;
• All references to Mineral Resources and Ore Reserves are stated in accordance with the JORC Code; and
• Surface sources at the Mining Assets comprise low grade stockpiles which are notoriously difficult to sample, given the range of particle sizes commonly present and the resultant heterogeneity of grade encountered during small-scale sampling operations. Notwithstanding the fact that certain of the stockpiles are an integral part of the mining and processing operations and are in current use, SRK has classified all stockpiles as Indicated Mineral Resources and where planned to be processed economically reported these as Probable Ore Reserves.
Table 3.4E presents the results of the Ore Reserve EVA for the Mining Assets whereby the

SRK Consulting Ma'aden Gold MER – Executive Summary
U3330_Ma'aden MER.doc November, 2007 Page xxix
current (2007H1) cash costs (by-product basis) are compared with the LoMp weighted averages and the commodity prices required to return the post-tax pre-finance break even position at a real terms discount factor of 10% are stated.
Table 3.4E Mining Assets: Ore Reserve Economic Viability Assessment Mining Asset Cash Costs (by-product basis) +ve NPV
2007H1 LoMp Gold Price (US$/oz) (US$/oz) (US$/oz)
Mahd Ad'Dahab 121 170 266Al Amar 0 94 296Bulghah 263 349 308Sukhaybarat 309 551 601Al Hajar 194 298 441Head office 85 125 n/aMa’aden Gold 292 337 438
4.0E GENERAL SRK COMMENTS 4.1E Introduction
The following section includes general comments on technical aspects which, where applicable, are considered common to all of the Gold Assets.
4.2E Mineral Resource and Ore Reserves Mineral Resource and Ore Reserve estimation and classification at the Mining Assets are generally deficient to varying degrees in respect of the following:
• The application and documentation of Quality Control and Quality Assurance: SRK recognises that a QA/QC system was implemented in 2001, however the estimates of certain assets are dependent upon data which was collated prior to this date. Furthermore whilst Ma’aden Gold conducts round robin assay tests between on-mine laboratories and an external laboratory on a bi-annual basis, no evidence was readily available in respect of the following:
− The accreditation (“ISO 17025” or other international/local standard) status of the laboratories,
− The proportion of the databases which was collated prior to 2001, − The results of recent QA/QC analysis; and
• The lack of a formal Mineral Resource and Ore Reserve Management system: In deriving the estimates as presented herein, SRK has relied on various documentation which range both in respect of currency (Base Information Date) as well as the adequacy in respect of supporting technical analysis. SRK considers these deficiencies as indication of the need for substantive reform, specifically to address:
− The wide range of data currency necessitated by the lack of routine updating on a structured timeline which in turn limits consideration of the impacts of additional data as well as the results of grade-control and reconciliation exercises, for example, Bulghah,
− The lack of detailed integrated and simultaneous reconciliation of exploration vs grade control, grade control vs mining, and mining vs milling e.g. Mahd Ad’Dahab,
− The limitations imposed by application of essentially manual methods which do not readily allow updating and input into a detailed mine planning process, for example, Mahd Ad’Dahab,
− The lack of constraints applied to ensure reporting of Mineral Resources which are potentially economically mineable by open-pit and underground methods,
− The lack of mine design and production scheduling beyond the budget reporting period (1 year – January to December) for all Mining Assets,

SRK Consulting Ma'aden Gold MER – Executive Summary
U3330_Ma'aden MER.doc November, 2007 Page xxx
− The lack of a multi-disciplinary approach with set minimum standards for reporting of Mineral Resources and Ore Reserves,
− The limited professional registration of on-site practitioners, − Consistency of approach across all of the Gold Assets.
Key to implementing such a strategy is the development of a formal corporate policy and establishing an in-house team with sufficient capacity to implement the appropriate systems, ensure common practice, and enable on-going reporting requirements as a listed company.
4.3E Environmental The Company’s Health, Safety and Environmental Policy commits to the establishment of a health, safety and environmental management system. To this end the Company has designed EMS and OHSS manuals and intends to introduce these to Ma’aden Gold in the second half of 2007.
Currently none of the mines has a well-established environmental and social management and the following key issues are noted:
• Environmental and social assessment: No EIAs (the term EIA is used in Saudi Arabian legislation) have been undertaken for Mahd Ad’Dahab and Sukhaybarat. The closure plan for Mahd Ad’Dahab does include a brief social impact assessment, focused on closure of the mine. The social element of the EIAs for the other gold mines is generally rudimentary and this can be attributed to the limited public involvement in the EIA process;
• Community engagement: The EIAs for the mines were undertaken with limited public involvement, mainly in the form of unofficial consultations with local communities. The Saudi Arabian Public Environmental Law and Rules for Implementation do not specify any formal requirement to undertake public involvement in an EIA for a project (actually, they specifically exclude public involvement). Public consultations are considered to be the responsibility of government officials.
Approval of a mining lease application requires clearance from relevant interest government departments. The Ministry of Petroleum and Mineral Resources assumes the role of lead agency and pursues the application on behalf of the mining company. The application is sent to the province/district level for consideration by the relevant departments whose jurisdictions are likely to be infringed by the mining lease area to be awarded. These generally include the agriculture, water and rural development departments. If there are any affected communities the local government assesses the impacts and negotiates the terms of compensation. The project proponent is not required to directly engage in dialogue with affected communities to assess their losses and determine compensation.
There is no evidence of formal, documented systems of ongoing community engagement at any of the Mining Assets (at Bulghah, the Security Supervisor is the person responsible for liaison with the surrounding community);
• Monitoring: There is no evidence of comprehensive monitoring programmes including field measurements, inspections and audits at any of the sites. The Mining Assets do not have adequate field-measurement monitoring data; and
• Compliance: All Mining Assets that are operational were granted mining leases (now called Exploitation Licences) when the Old Mining Code (promulgated by Royal Decree

SRK Consulting Ma'aden Gold MER – Executive Summary
U3330_Ma'aden MER.doc November, 2007 Page xxxi
No. M/21, dated July 1972) was in effect. While the leases/licences remain valid under the new Mining Code, they were granted before the recent general environmental legislation and mining-specific legislation came into effect. The mining leases for Mahd Ad’Dahab, Al Amar, Sukhaybarat and Al Hajar were granted in November 1998, September 1997, May 1998 and November 1998, respectively. The mining lease for Bulghah Mine was granted in October 2001 (in the same month that the Public Environmental Law was promulgated published). The general environmental legislation, by means of Article 15 of the Implementing Regulations, allows all projects existing at the time of issue of the regulations a maximum grace period of five years (until September 2008) to ensure their compliance with both the Public Environmental Law and the Implementing Regulations. If it becomes apparent that this period is not sufficient for projects with special nature, the grace period can be extended by a decision of the Council of Ministers based on a proposal by the Minister of Defence and Aviation and Inspector General.
5.0E VALUATION 5.1E Limitations and Reliance on Information 5.1.1E Limitations
SRK does not assume any responsibility and will not accept any liability to any other person for any loss suffered by any such other person as a result of, arising out of, or in connection with this MER or statements contained therein, required by and given solely for the purpose of complying with the CMA Listing Rules, consenting to its inclusion in the Prospectus.
The Company has confirmed in writing to SRK that to its knowledge the information provided by it (when providing) was complete and not incorrect or misleading in any material respect. SRK has no reason to believe that any material facts have been withheld and the Company has confirmed in writing to SRK that it believes it has provided all material information.
The achievability of the LoMps are neither warranted nor guaranteed by SRK. The LoMps as discussed presented and discussed herein have been proposed by the Company’s management and adjusted where appropriate by SRK, and cannot be assured; they are necessarily based on economic assumptions, many of which are beyond the control of the Company. Future cashflows and profits derived from such forecasts are inherently uncertain and actual results may be significantly more or less favourable.
5.1.2E Reliance on Information SRK believes that its opinion must be considered as a whole and that selecting portions of the analysis or factors considered by it, without considering all factors and analyses together, could create a misleading view of the process underlying the opinions presented in the MER. The preparation of a MER is a complex process and does not lend itself to partial analysis or summary.
SRK’s Equity Value for the Company is effective at 1 July 2007 and is based on information provided by the Company throughout the course of SRK’s investigations, which in turn reflect various technical-economic conditions prevailing at the date of this report. In particular, the Equity Value and Ore Reserve EVA are based on expectations regarding the commodity prices and exchange rates prevailing at the date of this report. These and the underlying Technical Economic Parameters (“TEPs”) can change significantly over relatively short periods of time. Should these change materially the Equity Value could be materially different in these changed circumstances. Further, SRK has no obligation or undertaking to advise any person of any change in circumstances which comes to its attention after the date of this
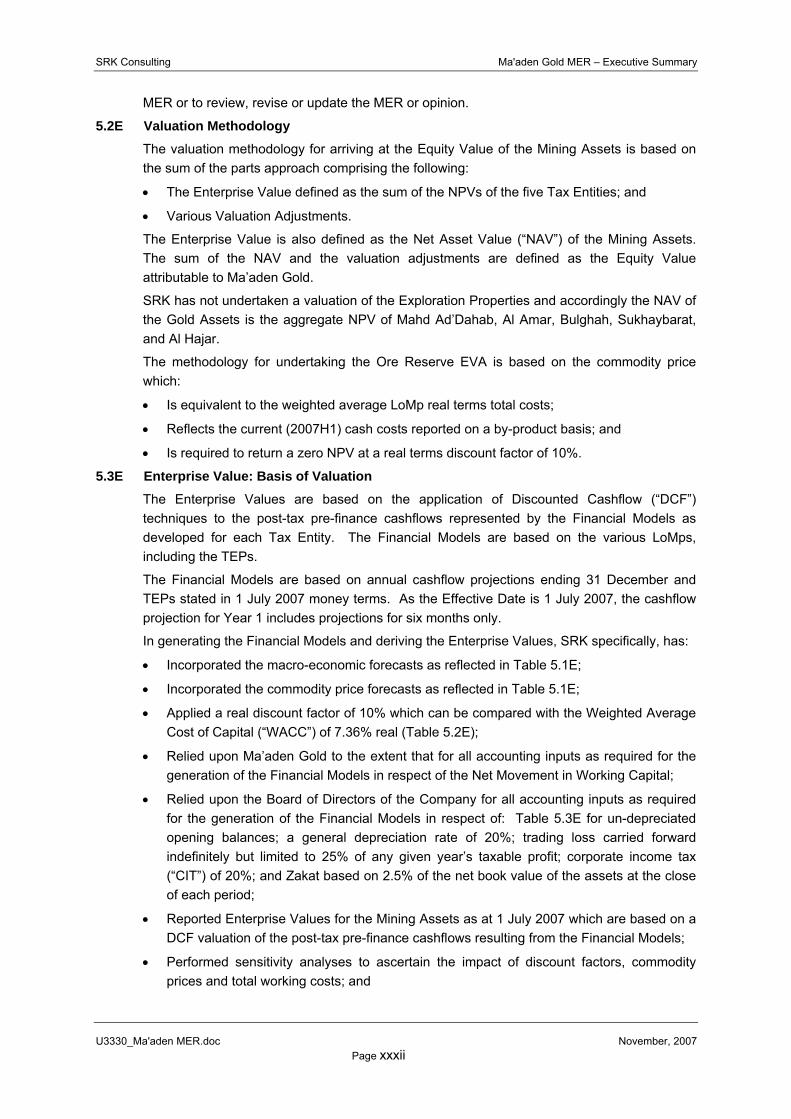
SRK Consulting Ma'aden Gold MER – Executive Summary
U3330_Ma'aden MER.doc November, 2007 Page xxxii
MER or to review, revise or update the MER or opinion.
5.2E Valuation Methodology The valuation methodology for arriving at the Equity Value of the Mining Assets is based on the sum of the parts approach comprising the following:
• The Enterprise Value defined as the sum of the NPVs of the five Tax Entities; and
• Various Valuation Adjustments.
The Enterprise Value is also defined as the Net Asset Value (“NAV”) of the Mining Assets. The sum of the NAV and the valuation adjustments are defined as the Equity Value attributable to Ma’aden Gold.
SRK has not undertaken a valuation of the Exploration Properties and accordingly the NAV of the Gold Assets is the aggregate NPV of Mahd Ad’Dahab, Al Amar, Bulghah, Sukhaybarat, and Al Hajar.
The methodology for undertaking the Ore Reserve EVA is based on the commodity price which:
• Is equivalent to the weighted average LoMp real terms total costs;
• Reflects the current (2007H1) cash costs reported on a by-product basis; and
• Is required to return a zero NPV at a real terms discount factor of 10%.
5.3E Enterprise Value: Basis of Valuation The Enterprise Values are based on the application of Discounted Cashflow (“DCF”) techniques to the post-tax pre-finance cashflows represented by the Financial Models as developed for each Tax Entity. The Financial Models are based on the various LoMps, including the TEPs.
The Financial Models are based on annual cashflow projections ending 31 December and TEPs stated in 1 July 2007 money terms. As the Effective Date is 1 July 2007, the cashflow projection for Year 1 includes projections for six months only.
In generating the Financial Models and deriving the Enterprise Values, SRK specifically, has:
• Incorporated the macro-economic forecasts as reflected in Table 5.1E;
• Incorporated the commodity price forecasts as reflected in Table 5.1E;
• Applied a real discount factor of 10% which can be compared with the Weighted Average Cost of Capital (“WACC”) of 7.36% real (Table 5.2E);
• Relied upon Ma’aden Gold to the extent that for all accounting inputs as required for the generation of the Financial Models in respect of the Net Movement in Working Capital;
• Relied upon the Board of Directors of the Company for all accounting inputs as required for the generation of the Financial Models in respect of: Table 5.3E for un-depreciated opening balances; a general depreciation rate of 20%; trading loss carried forward indefinitely but limited to 25% of any given year’s taxable profit; corporate income tax (“CIT”) of 20%; and Zakat based on 2.5% of the net book value of the assets at the close of each period;
• Reported Enterprise Values for the Mining Assets as at 1 July 2007 which are based on a DCF valuation of the post-tax pre-finance cashflows resulting from the Financial Models;
• Performed sensitivity analyses to ascertain the impact of discount factors, commodity prices and total working costs; and

SRK Consulting Ma'aden Gold MER – Executive Summary
U3330_Ma'aden MER.doc November, 2007 Page xxxiii
• Excluded the impact of salvage value on cessation of operations.
Table 5.1E Base case commodity price and macro-economic projections(1),(2) Parameter Units 2007H2 2008 2009 2010 2011 2012
Commodity Prices - Real Gold (US$/oz) 675 676 577 544 511 511Silver (US$/oz) 13.22 12.75 11.53 10.52 9.50 9.50Zinc (USc/lb) 160 144 113 89 65 65Copper (USc/lb) 318 294 245 192 140 140Lead (USc/lb) 91 78 67 54 40 40Commodity Prices - Nominal Gold (US$/oz) 693 713 624 604 583 599Silver (US$/oz) 14 13 12 12 11 11Zinc (USc/lb) 164 152 122 99 74 76Copper (USc/lb) 327 310 265 214 160 164Lead (USc/lb) 93 83 73 60 46 47Macro-Economics US CPI (%) 2.7% 2.7% 2.7% 2.7% 2.7% 2.7%SA CPI (%) 3.0% 3.0% 3.0% 3.0% 3.0% 3.0%Exchange Rate - Real (US$:SAR) 3.75 3.75 3.75 3.75 3.75 3.75Exchange Rate - Nominal (US$:SAR) 3.75 3.75 3.75 3.75 3.75 3.75
(1) All commodity prices are quoted at the closing period of 31 December. (2) CPI rates for 2007 are annualised.
Table 5.2E Weighted Average Cost of Capital calculations for the Mining Assets Assumptions Units Saudi ArabiaCorporate Tax Rate (%) 20.00%Long Term Inflation (%) 2.69%Debt as a % of Capital (%) 10.00%Cost of Debt Pre-tax cost of debt - LT (%) 4.80%Less: tax shield (%) -0.96%After-tax cost of debt (%) 3.84%Cost of Equity Risk-free rate (%) 5.10%Country Risk (%) -0.44%Beta-weighted market risk premium - Equity market risk premium (%) 4.80%- Proxy beta (%) 1.31Cost of equity (%) 10.95%Weighted Average Cost of Capital Debt (10%) (%) 0.38%Equity (90%) (%) 9.86%WACC (Nominal) (%) 10.24%Project Risk Premium (%) 0.0%WACC (Nominal) - inc risk premium (%) 10.24%WACC (Real) - inc risk premium (%) 7.36%
Table 5.3E Plant, Property and Equipment Net Book Value as at 1 July 2007 Assets PP&E
(US$m)Ma'ahd Ad'Dahab 4.2Al Amar 30.1Bulghah 18.9Sukhaybarat 6.6Al Hajar 1.6Head Office 0.9Total 62.2
5.4E Enterprise Value: Post-Tax–Pre-Finance Cashflows
Table 5.4E presents the consolidated cashflows for the Mining Assets as well as the Head Office expenditure accordingly this is included for summary presentation purposes only. The first period 2007H1 reports the forecast six-month projections to 31 December 2007, thereafter the projections are annual ending 31 December.
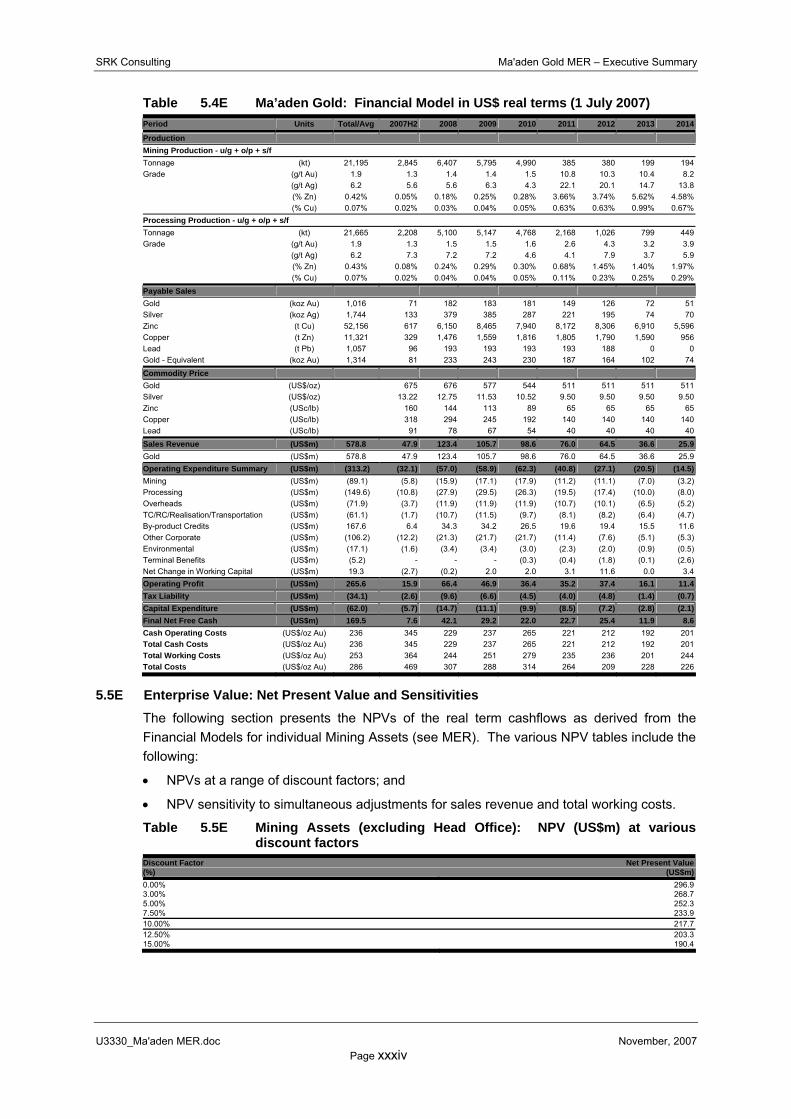
SRK Consulting Ma'aden Gold MER – Executive Summary
U3330_Ma'aden MER.doc November, 2007 Page xxxiv
Table 5.4E Ma’aden Gold: Financial Model in US$ real terms (1 July 2007) Period Units Total/Avg 2007H2 2008 2009 2010 2011 2012 2013 2014
Production Mining Production - u/g + o/p + s/f Tonnage (kt) 21,195 2,845 6,407 5,795 4,990 385 380 199 194Grade (g/t Au) 1.9 1.3 1.4 1.4 1.5 10.8 10.3 10.4 8.2
(g/t Ag) 6.2 5.6 5.6 6.3 4.3 22.1 20.1 14.7 13.8 (% Zn) 0.42% 0.05% 0.18% 0.25% 0.28% 3.66% 3.74% 5.62% 4.58% (% Cu) 0.07% 0.02% 0.03% 0.04% 0.05% 0.63% 0.63% 0.99% 0.67%
Processing Production - u/g + o/p + s/f Tonnage (kt) 21,665 2,208 5,100 5,147 4,768 2,168 1,026 799 449Grade (g/t Au) 1.9 1.3 1.5 1.5 1.6 2.6 4.3 3.2 3.9
(g/t Ag) 6.2 7.3 7.2 7.2 4.6 4.1 7.9 3.7 5.9 (% Zn) 0.43% 0.08% 0.24% 0.29% 0.30% 0.68% 1.45% 1.40% 1.97% (% Cu) 0.07% 0.02% 0.04% 0.04% 0.05% 0.11% 0.23% 0.25% 0.29%
Payable Sales Gold (koz Au) 1,016 71 182 183 181 149 126 72 51Silver (koz Ag) 1,744 133 379 385 287 221 195 74 70Zinc (t Cu) 52,156 617 6,150 8,465 7,940 8,172 8,306 6,910 5,596Copper (t Zn) 11,321 329 1,476 1,559 1,816 1,805 1,790 1,590 956Lead (t Pb) 1,057 96 193 193 193 193 188 0 0Gold - Equivalent (koz Au) 1,314 81 233 243 230 187 164 102 74
Commodity Price Gold (US$/oz) 675 676 577 544 511 511 511 511Silver (US$/oz) 13.22 12.75 11.53 10.52 9.50 9.50 9.50 9.50Zinc (USc/lb) 160 144 113 89 65 65 65 65Copper (USc/lb) 318 294 245 192 140 140 140 140Lead (USc/lb) 91 78 67 54 40 40 40 40
Sales Revenue (US$m) 578.8 47.9 123.4 105.7 98.6 76.0 64.5 36.6 25.9Gold (US$m) 578.8 47.9 123.4 105.7 98.6 76.0 64.5 36.6 25.9Operating Expenditure Summary (US$m) (313.2) (32.1) (57.0) (58.9) (62.3) (40.8) (27.1) (20.5) (14.5)Mining (US$m) (89.1) (5.8) (15.9) (17.1) (17.9) (11.2) (11.1) (7.0) (3.2)Processing (US$m) (149.6) (10.8) (27.9) (29.5) (26.3) (19.5) (17.4) (10.0) (8.0)Overheads (US$m) (71.9) (3.7) (11.9) (11.9) (11.9) (10.7) (10.1) (6.5) (5.2)TC/RC/Realisation/Transportation (US$m) (61.1) (1.7) (10.7) (11.5) (9.7) (8.1) (8.2) (6.4) (4.7)By-product Credits (US$m) 167.6 6.4 34.3 34.2 26.5 19.6 19.4 15.5 11.6Other Corporate (US$m) (106.2) (12.2) (21.3) (21.7) (21.7) (11.4) (7.6) (5.1) (5.3)Environmental (US$m) (17.1) (1.6) (3.4) (3.4) (3.0) (2.3) (2.0) (0.9) (0.5)Terminal Benefits (US$m) (5.2) - - - (0.3) (0.4) (1.8) (0.1) (2.6)Net Change in Working Capital (US$m) 19.3 (2.7) (0.2) 2.0 2.0 3.1 11.6 0.0 3.4Operating Profit (US$m) 265.6 15.9 66.4 46.9 36.4 35.2 37.4 16.1 11.4Tax Liability (US$m) (34.1) (2.6) (9.6) (6.6) (4.5) (4.0) (4.8) (1.4) (0.7)Capital Expenditure (US$m) (62.0) (5.7) (14.7) (11.1) (9.9) (8.5) (7.2) (2.8) (2.1)Final Net Free Cash (US$m) 169.5 7.6 42.1 29.2 22.0 22.7 25.4 11.9 8.6Cash Operating Costs (US$/oz Au) 236 345 229 237 265 221 212 192 201Total Cash Costs (US$/oz Au) 236 345 229 237 265 221 212 192 201Total Working Costs (US$/oz Au) 253 364 244 251 279 235 236 201 244Total Costs (US$/oz Au) 286 469 307 288 314 264 209 228 226
5.5E Enterprise Value: Net Present Value and Sensitivities
The following section presents the NPVs of the real term cashflows as derived from the Financial Models for individual Mining Assets (see MER). The various NPV tables include the following:
• NPVs at a range of discount factors; and
• NPV sensitivity to simultaneous adjustments for sales revenue and total working costs.
Table 5.5E Mining Assets (excluding Head Office): NPV (US$m) at various discount factors
Discount Factor Net Present Value(%) (US$m)0.00% 296.93.00% 268.75.00% 252.37.50% 233.910.00% 217.712.50% 203.315.00% 190.4

SRK Consulting Ma'aden Gold MER – Executive Summary
U3330_Ma'aden MER.doc November, 2007 Page xxxv
Table 5.6E Mining Assets (excluding Head Office): Sales Revenue and Total Working Cost simultaneous sensitivity at a real DCF of 10%
NPV (US$m) Sales Revenue Sensitivity -30% -20% -10% 0% 10% 20% 30% -15% 120.9 164.1 205.2 246.0 286.5 326.8 367.1
Total -10% 109.8 154.2 195.6 236.6 277.1 317.4 357.8Working Cost -5% 98.5 144.0 185.9 227.2 267.6 308.1 348.4Sensitivity 0% 87.0 133.6 176.2 217.7 258.2 298.7 339.1
5% 75.3 122.7 166.3 208.0 248.8 289.3 329.7 10% 63.6 111.4 156.2 198.4 239.4 279.8 320.3 15% 51.8 99.8 145.9 188.7 229.8 270.4 310.9
Table 5.7E Mining Assets (detail): NPV (US$m) at various discount factors Discount Factor Ma'ahd Ad'Dahab Al Amar Bulghah Sukhaybarat Al Hajar NPV(%) (US$m) (US$m) (US$m) (US$m) (US$m) (US$m)0.00% 105.2 138.5 49.0 (5.2) 9.4 296.93.00% 96.3 121.4 45.9 (3.8) 8.9 268.75.00% 91.0 111.7 44.0 (3.0) 8.6 252.37.50% 85.1 101.0 41.8 (2.2) 8.2 233.910.00% 79.8 91.7 39.9 (1.4) 7.8 217.712.50% 75.0 83.5 38.1 (0.8) 7.5 203.315.00% 70.7 76.4 36.4 (0.3) 7.2 190.4
Table 5.8 Head Office: NPV (US$m) at various discount factors Discount Factor Net Present Value(%) (US$m)0.00% (127.3)3.00% (115.8)5.00% (109.1)7.50% (101.5)10.00% (94.8)12.50% (88.8)15.00% (83.5)
5.6E Valuation of Advanced Exploration Properties
The Mineral Resource statements for the Development Property of Ad Duwayhi and the Advanced Exploration Properties of Mansourah, Ar Rjum, Masarrah, As Suk and Zalim comprise a total Mineral Resource of 7.9Moz of gold contained within 103.2Mt at a grade of 2.4g/t Au. Ad Duwayhi, the most advanced of these has a total Mineral Resource of 2.1Moz of gold contained within 17.1Mt at a grade of 3.9g/t Au representing some 25% of the total gold content of the Mineral Resources reporting as DPs and AEPs.
SRK has not valued the DP (Ad Duwayhi) or the AEPs (Mansourah, Ar Rjum, Masarrah, As Suk and Zalim). Notwithstanding this limitation, SRK notes the following:
• Ad Duwayhi: A pre-feasibility study was completed for the Ad Duwayhi Development Property in February 2007 by SRK. The pre-feasibility study assumes the construction (in 2010) of an open-pit mining operation processing through a CIL plant with a rated processing capacity of 1Mtpa at a capital cost of US$92m. The pre-feasibility study was multi-disciplinary in scope, demonstrated the technical feasibility of the project as well as its economic viability given certain assumptions and included a discounted cashflow valuation for the project. Development of the project is however, dependent upon the establishment of regional infrastructure, specifically a water pipeline, the total capital expenditure requirement for which (to be expended in 2010) is some US$90m (at 10% DCF this equates to US$64.4m in 1 July 2007 money terms).
The pre-feasibility study assumes that the capital cost for the development of this regional infrastructure is funded by third parties and that off-takers (Ad Duwayhi) are then charged for water supply. The pricing for this supply assumes recovery of the capital costs over a 20 year period in addition to the annual unit operating costs which also assume that other off-takers (including some of the AEPs) have been developed.
Accordingly given that Ad Duwayhi on a stand alone basis, does not justify the development of the pipeline, and the conditionality of economic viability on this

SRK Consulting Ma'aden Gold MER – Executive Summary
U3330_Ma'aden MER.doc November, 2007 Page xxxvi
assumption, no Ore Reserves are declared for the Ad Duwayhi development project. Based on the commodity price forecasts as included herein, SRK has updated its cashflow model and at a discount factor of 10% real this results in a NPV of US$40m excluding the capital cost for the construction of the regional water pipeline. The project assumes a LoMp inventory of 10.2Mt mined at a grade of 3.5g/t Au, metallurgical recoveries of 93.0%, a processing rate of 1Mtpa and LoMp weighted cash cost of production of US$224/oz; and
• The technical studies completed for the AEPs are generally at the conceptual level and would require the completion of a scoping study followed by a pre-feasibility study to advance these to a similar level of confidence as Ad Duwayhi. Furthermore, their development is also constrained by the availability of a reliable water source. Accordingly Ma’aden Gold considers their potential development in combination with Ad Duwayhi.
SRK considers that the scope as presented in the Ad Duwayhi pre-feasibility study to be an appropriate proxy for any assessment of the potential development of the CAG Project.
5.7E Valuation Adjustments 5.7.1E Derivative Instruments
SRK has been informed that Ma’aden Gold has the following derivative instruments as at 1 July 2007:
• Commodity contracts for gold amounting to 29,615oz at a weighted average strike price of US$279/oz; and
• Commodity contracts for gold amounting to 190,452oz at a weighted average strike price of US$374/oz.
This amounts to a total of 220,067oz of gold with a weighted average strike price of US$361/oz (Table 5.9E).
Table 5.9E Commodity (gold) derivatives Item Units Totals/Avg. 2007H2 2008 2009 2010 2011 2012Hedge (koz) 220 68 29 30 32 36 25Strike Price (US$/oz) 361 332 374 374 374 374 374
Based on the spot price as at 1 July 2007 of US$779/oz, the market to market value: estimated by the net difference between the spot price and the weighted average strike price multiplied by the hedged ounces: is estimated at a negative US$92.08m.
5.7.2E Unallocated Head Office expenditures The NPV at 10% real of the unallocated Head Office expenditures are estimated at negative US$94.8m.
5.7.3E Net (Debt)/Cash position As at 30 June 2007, Ma’aden Gold had net (debt)/cash position of US$31.9m.
5.7.4E Summary of Valuation Adjustments Table 5.10E presents a summary of the valuation adjustments for derivation of the Equity Value of Ma’aden Gold.
Table 5.10E Summary of Valuation Adjustments Valuation Adjustment Units AmountCommodity Derivatives - mark-to-market value(1) (US$m) (92.1)Net (Debt)/Cash position (US$m) 31.9Unallocated Head Office Expenditures (US$m) (94.8)Total(2) (US$m) (155.0)(1) Subsequent Events: Since the preparation of this MER we have been informed by the Company that it has unwound its gold hedge position
represented by the derivative instruments described above at a cost of US$119.25m. As a result the valuation adjustment for the commodity

SRK Consulting Ma'aden Gold MER – Executive Summary
U3330_Ma'aden MER.doc November, 2007 Page xxxvii
derivative shown in Table 5.10E is no longer appropriate and no such adjustment would be made to any valuation of Ma'aden Gold prepared as at date of the Prospectus.
(2) Accordingly and given (1) above the Total as presented in Table 5.10E would be adjusted to a negative US$62.9m.
6.0E RISKS AND OPPORTUNITIES 6.1E Introduction
SRK has included its view on the achievement of the LoMp and the appropriateness of the Mineral Resource and Ore Reserve statements when presenting technical and financial data in this MER. As of the Effective Date (1 July 2007) SRK considers these projections to be achievable.
In all likelihood many of the identified risks and/or opportunities will have an impact on the cashflows as presented in Section 5.0E, some positive and some negative. The impact of one or a combination of risks and opportunities occurring cannot be specifically quantified to present a meaningful assessment. SRK has however provided a sensitivity table for simultaneous (twin) parameters. The sensitivity range covers the anticipated range of accuracy in respect of commodity prices, operating expenditures and capital expenditure projections. In this way the general risks are, with the aid of the sensitivity table, adequately covered.
6.2E General Risks and Opportunities The Mining Assets are subject to certain inherent risks and opportunities, which apply to some degree to all participants of the international precious metals mining industry. These include:
• Commodity Price Fluctuations: These many be influenced, inter alia, by commodity demand-supply balances for gold, silver, zinc, copper and lead. In the case of gold and silver this is also impacted by consumption in industry and jewellery, actual or expected sales by central banks, sales by gold and silver producers in forward transactions and production cost levels for gold and silver in major producing countries. In the three year period between 1 July 2004 and 30 June 2007 the following apply:
− gold price ranging between US$387/oz and US$651/oz with a resulting three year average of US$529/oz which can be compared with the long term price of US$511/oz and the current 1 October 2007 spot price of US$743/oz,
− silver price ranging between US$5.88/oz and US$14.94/oz with a resulting three year average of US$9.64/oz which can be compared with the long term price of US$9.50/oz and the current 1 October 2007 spot price of US$13.78/oz,
− zinc price ranging between USc43/lb and USc210/lb with a resulting three year average of USc104/lb which can be compared with the long term price of USc65/lb and the current 1 October 2007 spot price of USc138/lb,
− copper price ranging between USc121/lb and USc398/lb with a resulting three year average of USc230/lb which can be compared with the long term price of USc140/lb and the current 1 October 2007 spot price of USc369/lb,
− lead price ranging between USc37/lb and USc163/lb with a resulting three year average of USc63/lb which can be compared with the long term price of USc40/lb and the current 1 October 2007 spot price of USc156/lb;
• Exchange Rate Fluctuations: Specifically related to the related strength of the US$, the currency in which commodity prices are generally quoted. During the period between 1 July 2004 and 30 June 2007 the US$:SAR exchange rate was pegged at 3.75;
• Inflation Rate Fluctuations: Specifically related to the macro-economic policies of the individual countries. During the period between 1 July 2004 and 30 June 2007, United

SRK Consulting Ma'aden Gold MER – Executive Summary
U3330_Ma'aden MER.doc November, 2007 Page xxxviii
States CPI ranged between 1.3% and 4.7% reported on a 12-month basis. During the period between 1 July 2004 and 30 June 2007, Saudi CPI ranged between -0.2% and 3.6%;
• Country Risk: Specifically country risk including: political, economic, legal, tax, operational and security risks;
• Legislative Risk: Specifically changes to future legislation (tenure, mining activity, labour, occupational health, safety and environmental) within Saudi Arabia;
• Exploration Risk: Resulting from the elapsed time between discovery of deposits, development of economic feasibility studies to bankable standards and associated uncertainty of outcome;
• Mining Risk: Specifically Ore Reserve estimate risks, uninsured risks, industrial accidents, labour disputes, unanticipated groundwater conditions, human resource management and safety performance; and
• Development Project Risk: Specifically technical risks associated with green field projects for which technical studies are limited to pre-feasibility studies or less and development and production has not commenced.
In addition to those stated above, the Mining Assets are subject to certain specific risks and opportunities, which independently may not be classified to have material impact (that is likely to affect more than 10% of the Tax Entities annual pre-tax profits), but in combination may do so.
6.3E Specific Risks and Opportunities In addition to the specific risks and opportunities identified below, addressing the general deficiencies identified in Section 4.0E of the MER (General SRK Comments) are key to: unlocking the potential of the Gold Assets; to further assess the impact of lower recoveries at Bulghah and Sukhaybarat; and to maintain and increase production beyond 2010. The deficiencies identified in Section 4.0E are:
• Mineral Resource and Ore Reserve:
− The application and documentation of Quality Control and Quality Assurance, − The lack of a formal Mineral Resource and Ore Reserve Management system as
exemplified by the currency of core data (>2 years), lack of detailed reconciliation, reliance on manual methods, lack of detailed mine design and production scheduling beyond the immediate budget (1 year) reporting period; and
• Environmental Management, specifically the limitations in respect of:
− EIAs for Mahd Ad’Dahab and Sukhaybarat, − Rudimentary social assessments arising from the limited public involvement, − Monitoring processes.
The additional specific risks and opportunities are:
• Environmental Risk: The inability of the Mining Assets to fund the environmental liabilities from estimated operating cashflows, should operations cease prior to that projected in the LoMp. This would result in an unfunded liability since the estimated rehabilitation expenditure is not currently funded. As at 1 July 2007, Ma’aden Gold’s environmental liability is estimated at US$19.0m. SRK notes that certain components of this risk may be mitigated as no assumptions have been made regarding the ability to generate revenue through recovery of metals or sale of scrap when reporting this
SRK Consulting Ma'aden Gold MER – Executive Summary
U3330_Ma'aden MER.doc November, 2007 Page xxxix
environmental liability. Specific environmental risks at each of the Gold Assets include:
− At Sukhaybarat, the seepage from the TSFs and the cessation of abstraction of polluted water emanating from the site,
− Some 2.2Moz of the total 5.8Moz of gold associated with the Exploration Properties is attributed to the Ar Rjum AEP which is located within the Mahazat Assaid Conservation Area which was established in the 1980s as a safe haven for endangered species such as the Arabian Oryx and indigenous Arabian Ostrich. Conversion of the Exploration Licence for Ar Rjum to an Exploitation Licence will require completion of a feasibility study and an Environmental Impact Study. In this respect a risk remains that the completion of such environmental work will not adequately address all environmental issues satisfactorily to ensure the conversion to an Exploitation Licence;
• Environmental Compliance: All Mining Assets that are operational were granted mining leases (now called Exploitation Licences) when the Old Mining Code (promulgated by Royal Decree No. M/21, dated July 1972) was in effect. The general environmental legislation, by means of Article 15 of the Implementing Regulations, allows all projects existing at the time of issue of the regulations a maximum grace period of five years (until September 2008) to ensure their compliance with both the Public Environmental Law and the Implementing Regulations. Accordingly, whilst an extension is possible it is crucial that the Company adheres to a process to achieve the intended deadline;
• Exploration Risk: During 2007 the Company significantly reduced the area of exploration licences under direct management to 47,521.0km2. Ma’aden Gold’s current strategy assumes a further reduction to 14,000.0km2 and total operating expenditures of US$33.5m. The exploration programme in the NAS Region (US$17.4m) includes target generation where no JORC Code compliant Mineral Resources have been defined. Accordingly there remains a risk that the necessity to relinquish further licence area in the near future may not allow sufficient time to advance these properties as planned. This risk is further heightened by the fact that historical activity to date in the NAS Region in respect of drilling appears significant by comparison with the CAG Region;
• Terminal Benefits Liability Risk: The inability of the Mining Assets to fund the terminal benefits liabilities from estimated operating cashflows, should operations cease prior to that projected in the LoMp. This would result in an unfunded liability since the estimated terminal benefits expenditure is not currently funded. As at 1 July 2007, Ma’aden Gold’s terminal benefits liability is estimated at US$8.1m;
• The combined operational and economic risk as reflected in the LoMps, specifically:
− at Al Amar, that projected dilution is greater than that envisaged in the 2001 Feasibility Study given the current development dimensions and the acquisition of larger underground equipment than initially planned. In addition the planned processing expenditures are some 17% lower than currently experienced at Mahd Ad’Dahab Plant, despite the similarities in respect of planned production rates and flowsheet arrangements.
− at Bulghah, specifically in respect of the planned significant increase in the processing of lower grade fresh ore with significantly reduced metallurgical recoveries,
− at Sukhaybarat, the projected decline in processed grades beyond 2009 resulting in cash operating costs in excess of US$600/oz,

SRK Consulting Ma'aden Gold MER – Executive Summary
U3330_Ma'aden MER.doc November, 2007 Page xl
− Al Hajar’s re-crushing project given the estimation risks associated with sampling historically stacked heap leach material and ensuring the representivity of metallurgical testwork;
• Development risks associated with the Development Property and the Advanced Exploration Properties given:
− that only a pre-feasibility study has been completed for Ad Duwayhi, − that only conceptual/scoping studies have been completed for Mansourah, Ar Rjum,
Masarrah, As Suk, and Zalim, − that all of the above are to some degree dependent upon the establishment of a
regional water pipeline at an overall capital cost of US$90m; • The opportunity to increase Ore Reserves, through:
− upgrading of Inferred Mineral Resources at the AEPs through further drilling as well as completion of appropriate technical studies demonstrating the technical feasibility and economic viability of the CAG Project,
− re-optimisation of open-pits at Bulghah at the long term commodity prices and consideration of the applicability of the current positive bias between grade control models and exploration models,
− upgrading of Inferred Mineral Resources at Mahd Ad’Dahab, Al Amar and Bulghah to the Indicated Mineral Resource category through further drilling and completion of the necessary technical studies for modification to Probable Ore Reserves; and
• The opportunity to increase Mineral Resources through:
− further drilling, specifically targeting the areas which have not been closed off by drilling at Ad Duwayhi and the AEPs;
− application of improved geological wireframing at certain of the AEPs specifically Mansourah where the current Mineral Resource could be significantly expanded without the benefit of further drilling,
− further exploration at the six prospects situated within 30km of Sukhaybarat: Hablah South; Red Hill; La prospect; and Al Habla;
− further exploration at the six prospects situated within 30km of Al Hajar: Hajeej; Sheers; Jadmah; Gossan-14; Waqba and Shabat Al Hamra;
− implementation of the planned exploration at the Exploration Properties which have not yet reported JORC Code compliant Mineral Resources.
SRK has not been informed of the use of proceeds from the Admission and accordingly cannot comment on whether this will be utilised in the further development of Ma’aden Gold.
7.0E COMPANY EQUITY VALUE 7.1E Introduction
The following section includes an assessment of the Equity Value of the Company which is based on the sum of the parts approach combining: the valuation of the Mining Assets as represented by the Enterprise Values and the Valuation Adjustments.
7.2E Equity Value Table 7.1E gives the Equity Value of Ma’aden Gold at a discount factor of 10% real. Table 7.2E gives the Equity Value at a range of real discount factors and Table 7.3E gives the sensitivity of the Equity Value to changes in sales revenue and total working costs for the Enterprise Values and the value of unallocated Head Office overheads.

SRK Consulting Ma'aden Gold MER – Executive Summary
U3330_Ma'aden MER.doc November, 2007 Page xli
Table 7.1E Ma’aden Gold Equity Value Valuation Component Units ValuationEnterprise Value (Mining Assets) Mahd Ad'Dahab (US$m) 79.8Al Amar (US$m) 91.7Bulghah (US$m) 39.9Sukhaybarat (US$m) (1.4)Al Hajar (US$m) 7.8Subtotal (US$m) 217.7Exploration Assets (US$m) -Gold Assets (Net Asset Value) (US$m) 217.7Valuation Adjustments(1) (US$m) (155.0)Equity Value (US$m) 62.7Mineral Resources (Gold Assets) (koz Au Eq) 10,058Ore Reserves (Gold Assets) (koz Au Eq) 1,329Equity Value per Mineral Resource Unit(2) (US$/oz Au Eq) 6Equity Value per Ore Reserve Unit (US$/oz Au Eq) 47(1) Subsequent Events: Since the preparation of this MER we have been informed by the Company that it has unwound its gold hedge position
represented by the derivative instruments described above at a cost of US$119.25m. As a result the valuation adjustment for the commodity derivative shown in Table 7.1E is no longer appropriate and would be reduced to a negative US$62.9m, which would result in a revised Equity Value of US$154.8m.
(2) The Equity Value per Mineral Resource unit of gold contained within the Mining Assets (2.1Moz) is estimated at US$30/oz.
Table 7.2E Ma’aden Gold Equity Value: discount factor sensitivity analysis Discount Factor Mining Assets Head Office Other Valuation Adjustments(1) Equity Value(%) (US$m) (US$m) (US$m) (US$m)0.00% 296.9 (127.3) (60.2) 109.33.00% 268.7 (115.8) (60.2) 92.75.00% 252.3 (109.1) (60.2) 83.07.50% 233.9 (101.5) (60.2) 72.210.00% 217.7 (94.8) (60.2) 62.712.50% 203.3 (88.8) (60.2) 54.315.00% 190.4 (83.5) (60.2) 46.7(1) Subsequent Events: Since the preparation of this MER we have been informed by the Company that it has unwound its gold hedge position
represented by the derivative instruments described above at a cost of US$119.25m. As a result the valuation adjustment for the commodity derivative shown in Table 7.2E is no longer appropriate and would be reduced to a positive US$31.9m, which would result in a revised Equity Value of US$154.8m.
Table 7.3E Ma’aden Gold Equity Value: sales revenue and total working cost sensitivity(1)
NPV (US$m) Sales Revenue Sensitivity -30% -20% -10% 0% 10% 20% 30% -15% (22.1) 21.1 62.2 103.0 143.5 183.8 224.1
Total -10% (37.2) 7.2 48.6 89.6 130.1 170.4 210.8Working Cost -5% (52.5) (7.0) 34.9 76.2 116.7 157.1 197.4Sensitivity 0% (68.0) (21.4) 21.2 62.7 103.2 143.7 184.1
5% (83.7) (36.3) 7.3 49.1 89.8 130.3 170.7 10% (99.4) (51.6) (6.7) 35.4 76.4 116.9 157.3 15% (115.2) (67.1) (21.1) 21.7 62.8 103.4 143.9
(1) Subsequent Events: Since the preparation of this Extract we have been informed by the Company that it has unwound its gold hedge position represented by the derivative instruments described above at a cost of US$119.25m. As a result the Equity Value of US$62.7m would be revised to US$154.8m
7.3E Comparable Transaction Analysis
SRK has undertaken an analysis of comparable transaction analyses undertaken from the ©Metals Economics Group gold acquisition project database (30 June 2007) for the following population databases:
• Global: all project transactions irrespective of development status;
• Global – Production: project transactions limited to production only status; and
• Africa – All: all project transactions irrespective of development status.
Independent statistics comprising cumulative frequency position for the first quartile, second quartile, third quartile, mean and median are presented for the following:
• Content: the 100% equivalent of transacted equivalent ounces of gold;
• NTVA (Non-time value adjusted): the transacted acquisition price per ounce of equivalent

SRK Consulting Ma'aden Gold MER – Executive Summary
U3330_Ma'aden MER.doc November, 2007 Page xlii
gold;
• TVA-GPI (Time value adjusted and gold price indexed): the transacted acquisition price per ounce of equivalent gold but adjusted for money terms and also the ratio of the current (30 June 2007) gold price to the spot gold price at the date of the transaction.
SRK notes that the implied Equity Value (Table 7.1E) per Mineral Resource unit for Ma’aden Gold is US$6/oz Au Eq and the implied Equity Value (Table 7.1E) per Ore Reserve unit for Ma’aden Gold is US$47/oz Au Eq. Furthermore the Equity Value per Mineral Resource ounce attributable to the Mining Assets is estimated at US$30/oz. It should be noted however that this is derived from mining operations where all substantive capital has been expended and that only sustaining capital remains to service the depletion of the Ore Reserve.
Table 7.4E Comparable Transactions – population analysis Population Statistic Units Q1 Q2 Q3 Mean Median
25% 50% 75% Global - All Content (Eq. koz Au) 731 1,483 2,910 2,711 1,483Global - All NTVA Price (US$/oz) 13 29 58 49 29Global - All TVA-GPI Price (US$/oz) 22 46 101 79 46Global - Production Content (Eq. koz Au) 648 1,434 4,026 3,020 1,434Global - Production NTVA Price (US$/oz) 17 34 68 57 34Global - Production TVA-GPI Price (US$/oz) 25 66 117 94 66Global - exc Production Content (Eq. koz Au) 843 1,598 2,886 2,722 1,598Global - exc Production NTVA Price (US$/oz) 12 22 41 38 22Global - exc Production TVA-GPI Price (US$/oz) 19 36 69 59 36Africa - All Content (Eq. koz Au) 1,077 1,614 2,542 2,706 1,614Africa - All NTVA Price (US$/oz) 10 24 38 32 24Africa - All TVA-GPI Price (US$/oz) 21 42 76 58 42Africa - Production Content (Eq. koz Au) 1,197 1,608 2,952 3,068 1,608Africa - Production NTVA Price (US$/oz) 10 26 37 32 26Africa - Production TVA-GPI Price (US$/oz) 21 50 79 60 50Africa - exc Production Content (Eq. koz Au) 927 1,668 1,932 2,156 1,668Africa - exc Production NTVA Price (US$/oz) 10 19 41 33 19Africa - exc Production TVA-GPI Price (US$/oz) 22 41 63 56 41
Figure 7.1E through 7.3E present various comparable statistics for transacted unit prices. Table 7.4E presents a statistical summary list of comparable transactions as sourced from the ©Metals Economics Group gold acquisition project database (30 June 2007).
Figure 7.1E Comparable transaction cumulative frequency: global database (producing assets) non-time value adjusted (US$/oz)
0.0%
10.0%
20.0%
30.0%
40.0%
50.0%
60.0%
70.0%
80.0%
90.0%
100.0%
0 10 20 30 40 50 60 70 80 90 100 110 120 130 140 150
Cum
ulat
ive
%
NTVA_EG - (US$/oz) Q1 Q2 Q3 Ma'aden Gold

SRK Consulting Ma'aden Gold MER – Executive Summary
U3330_Ma'aden MER.doc November, 2007 Page xliii
Figure 7.2E Comparable transaction cumulative frequency: global database (producing assets), time value adjusted and gold price indexed (US$/oz)
0.0%
10.0%
20.0%
30.0%
40.0%
50.0%
60.0%
70.0%
80.0%
90.0%
100.0%
0 10 20 30 40 50 60 70 80 90 100 110 120 130 140 150
Cum
ulat
ive
%
TVA-GPI_EG - (US$/oz) Q1 Q2 Q3 Ma'aden Gold
Figure 7.3E Comparable Transaction data plot: Transacted unit price versus transacted ounce
0
10
20
30
40
50
60
70
80
90
100
110
120
130
140
150
0 1,000 2,000 3,000 4,000 5,000 6,000 7,000 8,000 9,000 10,000 11,000 12,000 13,000 14,000 15,000
Transacted Ounces (koz Au Eq)
Acq
uisi
tion
Pric
e (U
S$/o
z)
Data Set Ma'aden Gold
8.0E CONCLUDING REMARKS
Ma’aden Gold’s Mineral Resource and Ore Reserve statement (Table 3.1E) as included in this Executive Summary includes a total Mineral Resource of 10.0Moz of gold contained within a tonnage of 132.8Mt grading 2.3g/t Au (2/4g/t Au Eq) and total Ore Reserves of 1.3Moz of gold contained within a tonnage of 21.7Mt grading 1.9g/t Au.
In assessing the potential beyond this, the reader is referred to the various Ore Reserve sensitivities and SRK’s comments regarding the advanced exploration properties and the

SRK Consulting Ma'aden Gold MER – Executive Summary
U3330_Ma'aden MER.doc November, 2007 Page xliv
exploration properties. The sensitivities, however, are not based on detailed LoMp and should only be considered on a relative basis.
SRK concludes that the Mineral Resources and Ore Reserves as stated herein are compliant with the JORC Code and should these be reported in accordance with Industry Guide 7 they would be identical.
The Equity Value of the Company as stated in this Executive Summary at US$62.7m should be considered in conjunction with the accompanying sensitivity analyses as reported in Section 5.0E.
SRK has not been informed of the use of proceeds from the Admission and accordingly cannot comment on whether this will be utilised in the further development of Ma’aden Gold.
For and behalf of SRK Consulting (UK) Limited
Martin Pittuck, Principal Consultant, SRK Consulting
David Pearce,Corporate Consultant,
SRK Consulting
Iestyn Humphreys, Director, SRK Consulting

SRK Consulting Ma'aden Gold MER – Table of Contents
U3330_Ma'aden MER.doc November, 2007 Page i
GLOSSARY OF TERMS activated carbon Carbon, mostly of vegetable origin, and of high
adsorptive capacity.
Admission The proposed admission of ordinary shares of the Company to trading on the Saudi Stock Exchange.
Advanced Exploration Properties Exploration Properties on which Mineral Resources have been defined: Mansourah; Ar Rjum; Masarrah; As Suk; Zalim.
agglomerate A breccia composed largely or entirely of fragments of volcanic rocks.
agglomeration In beneficiation, a concentration process based on the adhesion of pulp particles to water. Loosely bonded associations of particles and bubbles are formed that are heavier than water; flowing-film gravity concentration is used to separate the agglomerates from non-agglomerated particles. Agglomeration also refers to briquetting, nodulizing, sintering, etc.
Al Amar An operating mining asset of Ma’aden Gold comprising the Al Amar Mine and the Al Amar Plant.
Al Amar Mine The underground mine at Al Amar.
Al Amar Plant The metallurgical processing facility at Al Amar.
Al Hajar An operating asset of Ma’aden Gold comprising the Al Hajar Plant.
Al Hajar Plant The metallurgical processing facility at Al Hajar.
anomaly A geological feature, especially in the subsurface, distinguished by geological, geophysical, or geochemical means, which is different from the general surroundings and is often of potential economic value.
Arabian Shield An exposure of Precambrian crystalline rocks on the flanks of the Red Sea.
arsenopyrite A monoclinic mineral; pseudo-orthorhombic, prismatic, and metallic silver-white to steel gray; the most common arsenic mineral and principal ore of arsenic; occurs in many sulphide ore deposits, particularly those containing lead, silver, and gold.; arsenical pyrite; white pyrite; white mundic.
assay To analyse the proportions of metals in an ore; to test an ore or mineral for composition, purity, weight, or other properties of commercial interest.
backfill Waste sand or rock used to support the roof or walls after removal of ore from a stope.
Bankable Standards A feasibility study in which technical feasibility and economic viability has been demonstrated to a sufficient level to enable project financing with limited conditions

SRK Consulting Ma'aden Gold MER – Table of Contents
U3330_Ma'aden MER.doc November, 2007 Page ii
precedent.
Base Information Date 1 January 2007.
base metal A classification of metals usually considered to be of low value and higher chemical activity when compared with the noble metals (gold, silver, platinum, etc.). This non-specific term generally refers to the high-volume, low-value metals copper, lead, tin, and zinc.
Biophysical Closure That portion of an environmental liability which is related to the physical closure of a mining operation and specifically excludes any social liabilities.
breccia A coarse-grained clastic rock, composed of angular broken rock fragments held together by a mineral cement or in a fine-grained matrix; it differs from conglomerate in that the fragments have sharp edges and unworn corners. Breccia may originate as a result of talus accumulation, explosive igneous processes, collapse of rock material, or faulting.
Brook Hunt Brook Hunt & Associates Limited.
Bulghah an operating mining asset of Ma’aden Gold comprising an open-pit mine and the Bulghah Plant.
Bulghah Mine The open-pit mine at Bulghah.
Bulghah Plant The metallurgical processing plant at Bulghah.
bullion Refined gold or silver, un-coined, in the shape of bars, ingots, or comparable masses.
by-product Secondary products of commercial value which are reflected as a credit to the operating expenditures.
by-product cash cost A form of cash cost reporting in which the numerator is reduced by the sales revenue sourced from by-products.
CAG Project Central Arabian Gold Project.
CAG Region Central Arabian Gold Region.
capital expenditure Expenditures incurred during the process of commencing, expanding or sustaining production.
carbon adsorption Recovery of dissolved soluble constituents onto activated carbon due to some form of chemical sorption at the active sites. Carbon adsorption is particularly useful for removing gold and silver from cyanide leach solutions or dissolved organics from process solutions.
Carbon-in-Leach A process step wherein granular activated carbon particles much larger than the ground ore particles are introduced into the ore pulp. Cyanide leaching and precious metals adsorption onto the activated carbon occur simultaneously. The loaded activated carbon is mechanically screened to separate it from the barren ore pulp and processed to remove the precious metals and

SRK Consulting Ma'aden Gold MER – Table of Contents
U3330_Ma'aden MER.doc November, 2007 Page iii
prepare it for reuse.
Carbon-in-Pulp A precious metals leaching technique in which granular activated carbon particles much larger than the ground ore particles are added to the cyanidation pulp after the precious metals have been solubilised. The activated carbon and pulp are agitated together to enable the solubilised precious metals to become adsorbed onto the activated carbon. The loaded activated carbon is mechanically screened to separate it from the barren ore pulp and processed to remove the precious metals and prepare it for reuse.
cash cost An internationally recognised metric for stating operating costs per unit of saleable commodity: including direct smelting costs, direct overhead costs, by-product credits, consulting fees, management fees, transportation and distribution charges.
cataclastic Pertaining to the structure produced in a rock by the action of severe mechanical stress during dynamic metamorphism; characteristic features include the bending, breaking, and granulation of the minerals. Also said of the rocks exhibiting such structures.
CESR Recommendations CESR’s recommendations for the consistent implementation of the European Commission’s Regulation on Prospectuses No. 909/2004”, published in January 2005: specifically paragraphs 131 to 132, section 1b – Mineral Companies.
chalcopyrite Tetragonal mineral, CuFeS2; brass-yellow with bluish tarnish; massive; softer than pyrite; occurs in late magmatic hydrothermal veins and secondary enrichment zones; the most important source of copper; yellow pyrite; yellow copper.
Chapter 19 Chapter 19 of the UKLA's Listing Rules as it existed on June 30, 2005 (prior to its deletion upon the implementation in the UK on July 1, 2005 of the Prospectus Directive).
colluvial Loose bodies of sediment that have been deposited or built up at the bottom of a low grade slope or against a barrier on that slope, transported by gravity.
comminution The breaking, crushing, or grinding by mechanical means of stone, coal, or ore, for direct use or further processing.
Company Ma’aden.
Competent Person a person who is a Member or Fellow of The Australasian Institute of Mining and Metallurgy, or of the Australian Institute of Geoscientists, or of a ‘Recognised Overseas

SRK Consulting Ma'aden Gold MER – Table of Contents
U3330_Ma'aden MER.doc November, 2007 Page iv
Professional Organisation’ included in a list promulgated from time to time. A ‘Competent Person’ must have a minimum of five years experience which is relevant to the style of mineralisation and type of deposit under consideration and to the activity which that person is undertaking.
concentrate The clean product recovered in froth flotation.
copper A reddish metallic element that takes on a bright metallic luster and is malleable, ductile, and a good conductor of heat and electricity. Symbol, Cu. Occasionally occurs native, and is found in many minerals such as cuprite, malachite, azurite, chalcopyrite, and bornite.
copper concentrate A base metals sulphide concentrate in which copper is the predominant payable metal.
co-product cash cost A form of cash cost reporting in which the denominator is based on an equivalent unit of production/sales i.e. gold equivalent.
CMA Listing Rules the Listing Rules as defined by the Capital Market Law issued by Royal Decree No M/30 dated 1 August 2003.
Consensus Market Forecasts Commodity prices determined by analysis of the median/range of forecasts by various financial institutions.
creditors A party (e.g. person, organization, company, or government) that claims that a second party owes the first party some properties or services.
crushing Size reduction into relatively coarse particles by stamps, crushers, or rolls.
cut-and-fill A stoping method in which the ore is excavated by successive flat or inclined slices, working upward from the level, as in shrinkage stoping. However, after each slice is blasted down, all broken ore is removed, and the stope is filled with waste up to within a few feet of the back before the next slice is taken out, just enough room being left between the top of the waste pile and the back of the stope to provide working space. The term cut-and-fill stoping implies a definite and characteristic sequence of operations: (1) breaking a slice of ore from the back; (2) removing the broken ore; and (3) introducing filling.
cut-back See push-back.
cut-off grade The lowest grade of mineralised material that qualifies as ore in a given deposit; rock of the lowest assay included in an ore estimate.
decline A sloping underground opening for machine access from level to level or from surface; also called a ramp.

SRK Consulting Ma'aden Gold MER – Table of Contents
U3330_Ma'aden MER.doc November, 2007 Page v
debtors The opposite of a Creditor who is someone you owe money to.
depletion The act of emptying, reducing, or exhausting, as the depletion of natural resources. In mining, specifically said of ore reserves.
depreciation Term used to describe any method of attributing the cost of an asset across the useful life of the asset.
derivative instruments Financial instruments whose value is derived from the value of something else. They generally take the form of contracts under which the parties agree to payments between them based upon the value of an underlying asset or other data at a particular point in time. The main types of derivatives are futures, forwards, options, and swaps.
development The work done in a mine to open up the paying ground or roof and, in particular, to from drives or haulages around blocks of ore. Also subdivided into Stope development and capital development.
Development Property A Mining Asset which is not currently operational e.g. Ad Duwayhi.
dilution The contamination of ore with barren or grade bearing wall rock in stoping. The assay of the ore after mining is frequently lower than when sampled in place. Dilution(1) relates to the proportion of waste that is contained in the Run-of-Mine ore delivered to the metallurgical processing plant. Dilution(2) relates to diluting tonnage expressed as a percentage of in-situ ore mined.
dip The angle at which a bed, stratum, or vein is inclined from the horizontal, measured perpendicular to the strike and in the vertical plane.
discount factor The discounted value of a cashflow is determined by reducing its value by the appropriate discount rate for each unit of time between the time when the cashflow is to be valued to the time of the cashflow. Most often the discount rate is expressed as an annual rate.
dolerite In British usage, the preferred term for what is called diabase in the United States. A fine-grained character of the rock that makes it difficult to identify megascopically.
doré Gold and silver bullion that remains in a cupelling furnace after the lead has been oxidised and skimmed off.
dyke Tabular igneous intrusion that cuts across the bedding or foliation of the country rock.
Effective Date 1 July 2007.
electrowinning An electrochemical process in which a metal dissolved

SRK Consulting Ma'aden Gold MER – Table of Contents
U3330_Ma'aden MER.doc November, 2007 Page vi
within an electrolyte is plated onto an electrode. Used to recover metals such as cobalt, copper, gold, and nickel from solution in the leaching of ores, concentrates, precipitates, matte, etc.
elution The process of recovering gold from activated carbon through acid washing.
Enterprise Value The sum of the Net Present Values of the Mining Assets.
Environmental Impact Assessment An assessment which is prepared for a regulatory agency with regard to a permit, and is required under the majority of mining codes. The EIA may include but is not limited to the environmental consequences which may arise from the proposed development.
Environmental Liabilities The sum of the biophysical liabilities and the terminal benefits liabilities associated with an exploration/mining property.
Equator Principles A set of voluntary environmental and social guidelines for ethical project finance. These principles commit banks and other signatories to not finance projects that fail to meet these guidelines.
Equity Value The nets sum of Net Asset Value of the Gold Assets and the valuation adjustments.
Exploitation Licence A licence issued in the Kingdom of Saudi Arabia for the purpose of undertaking mining activity.
Exploration The search for coal, mineral, or ore by (1) geological surveys; (2) geophysical prospecting (may be ground, aerial, or both); (3) boreholes and trial pits; or (4) surface or underground headings, drifts, or tunnels. Exploration aims at locating the presence of economic deposits and establishing their nature, shape, and grade, and the investigation may be divided into (1) preliminary and (2) final.
Exploration Assets Advanced Exploration Properties and the Exploration Properties.
Exploration Licence A licence issued in the Kingdom of Saudi Arabia for the purpose of undertaking exploration activity.
exploration model Generally the block model for any deposit which grades are largely based on exploration assay data.
Exploration Property All Exploration Assets (AEPs and EPs) contained within the Exploration Licences.
Exploration Prospect An exploration target identified within an Exploration Licence.
extension drilling A drilling programme aimed at extending the currently defined geological boundaries of an orebody.
fault A fracture or a fracture zone in crustal rocks along which

SRK Consulting Ma'aden Gold MER – Table of Contents
U3330_Ma'aden MER.doc November, 2007 Page vii
there has been displacement of the two sides relative to one another parallel to the fracture. The displacement may be a few inches or many miles long.
Feasibility Study A technical and economic study which demonstrates the technical and economic viability of a mining project to within a range of accuracy of 15% and to an appropriate degree of detail such that a decision for proceeding to the project development stage may be made without substantive revision to either scope or scale.
felsic Derived from feldspar, lenad or feldspathoid, and silica, and applied to light-coloured rocks containing an abundance of one or all of these constituents. Also applied to the minerals themselves, the chief felsic minerals being quartz, feldspar, feldspathoid, and muscovite.
Financial Advisor JPMorgan Chase Bank N.A.
Financial Models The pre-finance post-tax cashflow models for the Mining Assets.
filtering To subject to the action of a filter; to pass a liquid or a gas through a filter for the purpose of purifying, or separating, or both. To act as a filter; to remove from a fluid by means of a filter; to percolate
flotation Processes of concentration in which levitation in water of particles heavier than water was obtained. Thus, if some particles were retained in an oil layer or at the interface between an oil layer and a water layer, the process was spoken of as bulk-oil flotation; if the particles were retained at a free water surface as a layer one particle deep, the process was skin flotation; and if the particles were retained in a foamy layer several inches thick, the process was froth flotation. Froth flotation is the process that has survived the test of time, and the term flotation is now used universally to describe froth flotation.
fold A curve or bend of a planar structure such as rock strata, bedding planes, foliation, or cleavage. A fold is usually a product of deformation, although its definition is descriptive and not genetic and may include primary structures.
footwall The part of the country rock that lies below the ore deposit.
free-gold Gold un-combined with other substances.
fresh ore See sulphide ore.
gabbro A group of dark-coloured, basic intrusive igneous rocks composed principally of basic plagioclase (commonly labradorite or bytownite) and clinopyroxene (augite), with

SRK Consulting Ma'aden Gold MER – Table of Contents
U3330_Ma'aden MER.doc November, 2007 Page viii
or without olivine and orthopyroxene; also, any member of that group.
galena An isometric mineral, 4[PbS]; cubic cleavage; forms cubes and octahedra, also coarse- or fine-grained masses; specific gravity, 7.6; occurs with sphalerite in hydrothermal veins, also in sedimentary rocks as replacement deposits; an important source of lead and silver.
geochemical sampling The search for economic mineral deposits or petroleum by detection of abnormal concentrations of elements or hydrocarbons in surficial materials or organisms, usually accomplished by instrumental, spot-test, or quickie techniques that may be applied in the field.
geophysics Branch of physics dealing with the Earth, including its atmosphere and hydrosphere. It includes the use of seismic, gravitational, electrical, thermal, radiometric, and magnetic phenomena to elucidate processes of dynamical geology and physical geography, and makes use of geodesy, geology, seismology, meteorology, oceanography, magnetism, and other Earth sciences in collecting and interpreting Earth data. Geophysical methods have been applied successfully to the identification of underground structures in the Earth and to the search for structures of a particular type, as, for example, those associated with oil-bearing sands.
GIS Geographic Information System.
gold An isometric mineral; commonly alloyed with silver or copper, possibly with bismuth, mercury, or the platinum-group metals; metallic yellow; soft and malleable; specific gravity, 19.3 if pure; occurs in hydrothermal veins with quartz and various sulphides and alluvial deposits.
Gold Assets Mining Assets and Exploration Assets.
gossan An iron-bearing weathered product overlying a sulphide deposit. It is formed by the oxidation of sulphides and the leaching-out of the sulphur and most metals, leaving hydrated iron oxides and rarely sulphates.
grade The relative quantity or the percentage of ore-mineral or metal content in an orebody.
grade control The process of monitoring the estimation of grade in the mining operation by comparison of estimates based on exploration drilling, infill drilling, blast-hole sampling and mining/milling reconciliation exercises.
grade control model The block model which is derived from interpolation of grades using both exploration drilling and grade control

SRK Consulting Ma'aden Gold MER – Table of Contents
U3330_Ma'aden MER.doc November, 2007 Page ix
drilling results.
granite Plutonic rock in which quartz constitutes 10% to 50% of the felsic components and in which the alkali feldspar/total feldspar ratio is generally restricted to the range of 65% to 90%.
granodiorite A group of coarse-grained plutonic rocks intermediate in composition between quartz diorite and quartz monzonite, containing quartz, plagioclase (oligoclase or andesine), and potassium feldspar, with biotite, hornblende, or, more rarely, pyroxene, as the mafic components.
gravity concentration Separation of mineral particles, with the aid of water or air, according to the differences in their specific gravities.
greenschist A schistose metamorphic rock whose green colour is due to the presence of chlorite, epidote, or actinolite.
hangingwall The overlying side of an orebody, fault, or mine working, esp. the wall rock above an inclined vein or fault.
Heap Leach A process used for the recovery of copper, uranium, and precious metals from weathered low-grade ore. The crushed material is laid on a slightly sloping, impervious pad and uniformly leached by the percolation of the leach liquor trickling through the beds by gravity to ponds. The metals are recovered by conventional methods from the solution.
Heap Leach Pad The foundations, generally impermeable, upon which crushed ore and a leaching agent is placed, specifically a Heap Leach Facility.
host rock Body of rock serving as a host for other rocks or for mineral deposits; for example, a pluton containing xenoliths, or any rock in which ore deposits occur. It is a somewhat more specific term than country rock.
hydraulic excavator An excavator used in open-pit mines powered by hydraulic means.
import duty A tax on foreign goods upon importation.
Indicated Mineral Resources That part of a Mineral Resource for which tonnage, densities, shape, physical characteristics, grade and mineral content can be estimated with a reasonable level of confidence. It is based on exploration, sampling and testing information gathered through appropriate techniques from locations such as outcrops, trenches, pits, workings and drillholes. The locations are too widely or inappropriately spaced to confirm geological and/or grade continuity but are spaced closely enough for continuity to be assumed.
Inferred Mineral Resources That part of a Mineral Resource for which tonnage,

SRK Consulting Ma'aden Gold MER – Table of Contents
U3330_Ma'aden MER.doc November, 2007 Page x
grade and mineral content can be estimated with a low level of confidence. It is inferred from geological evidence and assumed but not verified geological and/or grade continuity. It is based on information gathered through appropriate techniques from locations such as outcrops, trenches, pits, workings and drill holes which may be limited or of uncertain quality and reliability.
infill drilling The process of secondary drilling to aid further definition of an exploration and/or mining target.
intercept That portion included between two points in a borehole, as between the point where the hole first encounters a specific rock or mineral body and where the hole enters a different or underlying rock formation.
ISO 14001 Environmental management standards exist to help organizations (a) minimize how their operations (processes, etc.) negatively affect the environment (i.e. cause adverse changes to air, water, or land); (b) comply with applicable laws, regulations, and other environmentally oriented requirements, and (c) continually improve in the above.
ISO 17025 The main standard used by testing and calibration laboratories.
intrusion In geology, a mass of igneous rock that, while molten, was forced into or between other rocks.
joint A divisional plane or surface that divides a rock and along which there has been no visible movement parallel to the plane or surface.
JORC Code The 2004 Australasian Code for Reporting of Exploration Results, Mineral Resources and Ore Reserves as published by the Joint Ore Reserves Committee of the Australasian Institute of Mining and Metallurgy, Australian Institute of Geoscientists and Minerals Council of Australia.
lead A bluish-white metal of bright luster, very soft, highly malleable, ductile, and a poor conductor of electricity; very resistant to corrosion; a cumulative poison. Symbol, Pb. Rarely occurs in native form; chiefly obtained from galena (PbS). Lead is used in storage batteries, cable covering.
long-hole open stoping Stoping method in which blastholes exceeding 3m in length are used.
Ma’aden Saudi Arabian Mining Company.
Ma’aden Gold The gold division of Ma’aden.
Mahd Ad’Dahab An operating mining asset of Ma’aden Gold comprising an underground mine and the Mahd Ad’Dahab Plant.

SRK Consulting Ma'aden Gold MER – Table of Contents
U3330_Ma'aden MER.doc November, 2007 Page xi
Mahd Ad’Dahab Mine The underground mining operation at Mahd Ad’Dahab.
Mahd Ad’Dahab Plant The metallurgical processing facility at Mahd Ad’Dahab.
mafic Pertaining to or composed dominantly of the ferromagnesian rock-forming silicates; said of some igneous rocks and their constituent minerals.
mark to market The act of assigning a value to a position held in a financial instrument based on the current market price for that instrument or similar instruments. For example, the final value of a futures contract that expires in 9 months will not be known until it expires. If it is marked to market, for accounting purposes it is assigned the value that it would fetch in the open market currently.
Measured Mineral Resources That part of a Mineral Resource for which tonnage, densities, shape, physical characteristics, grade and mineral content can be estimated with a high level of confidence. It is based on detailed and reliable exploration, sampling and testing information gathered through appropriate techniques from locations such as outcrops, trenches, pits, workings and drill holes. The locations are spaced closely enough to confirm geological and grade continuity.
Merrill-Crowe process Removal of gold from pregnant cyanide solution by deoxygenation, followed by precipitation on zinc dust, followed by filtration to recover the resultant auriferous gold slimes.
metallurgical testwork Laboratory testwork undertaken to determine the most appropriate process route for the economic recovery of valuable minerals/metals.
metamorphism The mineralogical, chemical, and structural adjustment of solid rocks to physical and chemical conditions that have generally been imposed at depth below the surface zones of weathering and cementation, and that differ from the conditions under which the rocks in question originated.
milling The grinding or crushing of ore. The term may include the operation of removing valueless or harmful constituents.
Mineral Resource A concentration or occurrence of material of intrinsic economic interest in or on the Earth’s crust in such form, quality and quantity that there are reasonable prospects for eventual economic extraction. The location, quantity, grade, geological characteristics and continuity of a Mineral Resource are known, estimated or interpreted from specific geological evidence and knowledge. Mineral Resources are sub-divided, in order of increasing geological confidence, into Inferred, Indicated

SRK Consulting Ma'aden Gold MER – Table of Contents
U3330_Ma'aden MER.doc November, 2007 Page xii
and Measured categories.
Mining Assets Mahd Ad’Dahab, Al Amar, Bulghah, Sukhaybarat, Al Hajar, Ad Duwayhi.
Mining Code The Mining Investment Code of the Kingdom of Saudi Arabia issued by Royal Decree number 47/M dated 5 October 2004.
mining royalty A royalty levied against the payable metal content of products produced at a mining operation. Typically less than 5%.
modifying factors The term ‘Modifying Factors’ is defined to include mining, metallurgical, economic, marketing, legal, environmental, social and governmental considerations.
NAS Region Northern Arabian Shield Region.
net asset value The net (of historical depreciation) value ascribed to an asset at the end of a financial reporting period.
net movement in working capital The net change between the opening balance and closing balance in respect of debtors, creditors and stores.
net present value A standard method for the financial appraisal of long-term projects whereby future cashflows are discounted to present day terms by application of a discount factor.
nominal Expenditures/revenues stated in money of the day terms i.e. all items irrespective of historic or forecasts are stated in the different money terms for each period.
Offer The offering of ordinary shares in the Company.
Old Mining Code promulgated by Royal Decree No. M/21, dated July 1972.
Ontario benchmark An internationally recognised benchmark for the comparative assessment of safety statistics.
open-pit A mine working or excavation open to the surface.
open stoping Stoping in which no regular artificial method of support is employed, although occasional props or cribs may be used to hold local patches of insecure ground. The walls and roof are self-supporting, and open stopes can be used only where the ore and wall rocks are firm.
operating expenditure All expenditures of a non capital nature necessary to realise projected sales revenue in any given reporting period.
optimised shell An undersigned pit shell obtained from the process of open-pit optimisation.
Ore Reserves The economically mineable part of a Measured and/or Indicated Mineral Resource. It includes diluting materials and allowances for losses, which may occur when the material is mined. Appropriate assessments and studies

SRK Consulting Ma'aden Gold MER – Table of Contents
U3330_Ma'aden MER.doc November, 2007 Page xiii
have been carried out, and include consideration of and modification by realistically assumed mining, metallurgical, economic, marketing, legal, environmental, social and governmental factors. These assessments demonstrate at the time of reporting that extraction could reasonably be justified. Ore Reserves are sub-divided in order of increasing confidence into Probable Ore Reserves and Proved Ore Reserves.
Ore Reserve EVA A break even analysis of Ma’aden Gold’s Ore Reserve estimates. The economic viability assessment of the Ore Reserves as undertaken by SRK which includes the commodity price which: is equivalent to the weighted average LoMp real terms total costs; reflects the current (2007H2) cash costs; and is required to return a zero NPV at a real terms discount factor of 10%.
ore shoot A large and visually rich aggregation of mineral in a vein. It is a more or less vertical zone or chimney of rich vein matter extending from wall to wall, and has a definite width laterally. Sometimes called pay streak, although the latter applies more specif. to placers.
oxide ore Ore comprising one of several minerals containing negative oxygen ions bonded to one or more positive metallic ions.
payable metal The metal content of a concentrate for which payment is made and typically allows for deductions for toll treatment losses e.g. smelting and refining.
pillar A block of ore entirely surrounded by stoping, left intentionally for purposes for ground control or on account of low value.
porphyritic Said of the texture of an igneous rock in which larger crystals (phenocrysts) are set in a finer-grained groundmass, which may be crystalline or glassy or both. Also, said of a rock with such texture, or of the mineral forming the phenocrysts.
postholes Shallow exploration holes (<6m) drilled by manual or mechanical methods.
potentially economically mineable A portion of the mineral inventory which can be demonstrated to be mined at a profit and normally determined by application of an appropriate in-situ cut-off grade.
Pre-Cambrian Rocks older than the Cambrian age. Name refers to the great shield-shaped areas of ancient mineral-bearing rocks. These ancient rocks occur in many parts of the world.
Pre-feasibility study A technical and economic study which demonstrates the

SRK Consulting Ma'aden Gold MER – Table of Contents
U3330_Ma'aden MER.doc November, 2007 Page xiv
technical and economic viability of a mining project to within a range of accuracy of 25% and to an appropriate degree of detail such that a decision for proceeding to the project development stage may be made without substantive revision to either scope or scale.
primary crushing In ore dressing, the first stage in which crushers take run-of-mine ore and reduce it to a size small enough to be taken by the next crusher in the series. Ordinarily, the Blake jaw crusher or a gyratory crusher is used.
Probable Ore Reserves The economically mineable part of an Indicated, and in some circumstances, a Measured Mineral Resource. It includes diluting materials and allowances for losses which may occur when the material is mined. Appropriate assessments and studies have been carried out, and include consideration of and modification by realistically assumed mining, metallurgical, economic, marketing, legal, environmental, social and governmental factors. These assessments demonstrate at the time of reporting that extraction could reasonably be justified. A Probable Ore Reserve has a lower level of confidence than a Proved Ore Reserve but is of sufficient quality to serve as the basis for a decision on the development of the deposit.
project capital The capital expenditure required as the initial development capital and/or for increasing production capacity.
prospectus The Prospectus in relation to the Offer in which the Executive Summary of the MER is contained.
Proved Ore Reserves A ‘Proved Ore Reserve’ is the economically mineable part of a Measured Mineral Resource. It includes diluting materials and allowances for losses which may occur when the material is mined. Appropriate assessments and studies have been carried out, and include consideration of and modification by realistically assumed mining, metallurgical, economic, marketing, legal, environmental, social and governmental factors. These assessments demonstrate at the time of reporting that extraction could reasonably be justified. A Proved Ore Reserve represents the highest confidence category of reserve estimate. The style of mineralisation or other factors could mean that Proved Ore Reserves are not achievable in some deposits.
pyrite An isometric mineral, FeS2 which occurs in veins, as magmatic segregation, as accessory in igneous rocks, and in metamorphic rocks.
quartz A hard, metamorphic rock which was originally

SRK Consulting Ma'aden Gold MER – Table of Contents
U3330_Ma'aden MER.doc November, 2007 Page xv
sandstone.
reverse circulation The circulation of bit-coolant and cuttings-removal liquids, drilling fluid, mud, air, or gas down the borehole outside the drill rods and upward inside the drill rods.
real Expenditures/revenues stated in constant money terms i.e. all items irrespective of historic or forecasts are stated in money terms at a given date.
rear-dump haul trucks Any wheeled vehicle, usually self-propelled, used to transport heavy articles or materials. In mining, usually applied to dump and/or bottom-dump semi-trailers used to transport mined waste and ore materials.
reconciliation The process whereby comparisons of volume, tonnage, grade and metal content are made between the exploration model, the grade control model and mining-mill measurements.
refining The purification of crude metallic products.
rhyolite A group of extrusive igneous rocks.
rib pillar A pillar whose length is large compared with its width, generally separates stopes on strike.
round robin A test (measurement, analysis, or experiment) performed independently several times which involves multiple independent laboratories performing the test with the use of the same method in different equipment.
Run-of-Mine grade The diluted grade of RoM ore as delivered to the processing facility. Normally this may be back calculated by estimation of the total precious metal accounted for (recovered metal + tailings metal).
SAG Mill A mill in which the secondary grinding of ore by tumbling in a revolving cylinder with limited balls or bars taking part in the operation (semi-autogenous grinding).
sampling The gathering of specimens of ore or wall rock for appraisal of an orebody. Since the average of many samples may be used, representative sampling is crucial. The term is usually modified to indicate the mode or locality; e.g., hand sampling, mine sampling, and channel sampling.
secondary crushing In ore dressing, the second stage of grinding in which the discharge from the primary crusher is broken down to a size suitable for feed to fine grinding machines.
sedimentary Formed by the deposition of sediment.
shear A deformation resulting from stresses that cause or tend to cause contiguous parts of a body to slide relatively to each other in a direction parallel to their plane of contact.
silicification The introduction of, or replacement by, silica, generally

SRK Consulting Ma'aden Gold MER – Table of Contents
U3330_Ma'aden MER.doc November, 2007 Page xvi
resulting in the formation of fine-grained quartz, chalcedony, or opal, which may fill pores and replace existing minerals.
sill A concordant sheet of igneous rock lying nearly horizontal.
silver A white metallic element that is very ductile and malleable. Symbol, Ag. Occurs native and in ores such as argentite and horn silver; lead, lead-zinc, copper, gold, and copper-nickel ores are its principal sources. Used for jewellery, photography, dental alloys, and coinage.
slope angle The slop (angle) at which the wall of an open-pit or cut stands as measured along an imaginary plane extended along the crests of the berms or from the slope crest to its toe.
smelting A process distinct from roasting, sintering, fire refining, and other pyrometallurgical operations.
sphalerite A zinc sulphide mineral; the most common ore mineral of zinc. An isometric mineral, ZnS , with Zn replaced by Fe with minor Mn, As, and Cd; occurs with galena in veins and irregular replacement in limestone.
SRK SRK Consulting (UK) Limited.
SRK Group SRK Global Limited.
stacking The process of depositing layered horizontal sections in a heap leach pad.
stockwork A mineral deposit consisting of a three-dimensional network of planar to irregular veinlets closely enough spaced that the whole mass can be mined.
stopes An excavation from which ore has been removed in a series of steps.
stores The value of stores at the end of a financial reporting period.
strike The course or bearing of the outcrop of an inclined bed, vein, or fault plane on a level surface; the direction of a horizontal line perpendicular to the direction of the dip.
stripping ratio The unit amount of spoil or overburden that must be removed to gain access to a unit amount of ore or mineral material.
sub-level stoping method of mining best adapted to steeply inclined deposits that have strong ore and strong walls. The ore is usually blocked out by two horizontal drifts separated vertically by 3m to 61m and raises between the two horizontal drifts, the latter separated by comparable distances. Vertical pillars may be left between stopes on the same level, and horizontal ones to support the main

SRK Consulting Ma'aden Gold MER – Table of Contents
U3330_Ma'aden MER.doc November, 2007 Page xvii
haulage. After the main blocks of ore have been completely mined, it is common practice to rob the pillars, and the walls of the stope may collapse after the pillars have been robbed.
Sukhaybarat an operating asset of Ma’aden Gold comprising the Sukhaybarat Plant.
Sukhaybarat Plant The Sukhaybarat metallurgical processing plant.
sulphide A mineral compound characterized by the linkage of sulphur with a metal or semimetal; e.g., galena, PbS, or pyrite, FeS2.
sustaining capital Capital expenditure required to sustain operations at current level of production, generally to replace aging equipment.
Tadawul The Saudi Stock Exchange.
Taif Project The construction (at a cost of US$90m) of a 500km pipeline from the city of Taif to transport effluent water arising from an existing sewage water treatment plant servicing the city of Taif.
tailings Portion of tailings containing some mineral that cannot be economically removed.
Tailings Storage Facility An impoundment used to deposit tailings arising as waste from a metallurgical processing facility.
target generation The process of identifying specific areas of geologic interest for subsequent investigation i.e. drilling.
Tax Entity The Financial Models representing Mahd Ad’Dahab; Al Amar; Bulghah; Sukhaybarat; and Al Hajar.
Tax Law Saudi Arabian Tax Law (March 2004).
Terminal Benefits Statutory expenditures to be incurred by a business on termination of employment.
tertiary crushing The preliminary breaking down of run-of-mine ore and sometimes coal. In metal mines, the tertiary crushing may be performed at a central point underground.
tetrahedrite An isometric mineral which occurs in hydrothermal veins and contact metamorphic deposits; a source of copper and other metals.
thickening Reducing the proportion of water in a pulp by means of sedimentation
toll smelting Situation in which the owner of ore or concentrate contracts the refining of the metal to another party for a fee, but the refined metal remains under the original ownership for final sale or disposition.
total cash costs Cash costs and the incremental components, including royalties, but excluding taxes paid. Consequently in this case Total Cash Costs equal Cash Costs as incurred.

SRK Consulting Ma'aden Gold MER – Table of Contents
U3330_Ma'aden MER.doc November, 2007 Page xviii
total costs Summation of total working costs, net movement in working capital and capital expenditure.
total employees costed The total number of employees whose operating expenses are included in Cash Costs.
total working costs Total Cash Cost and the incremental components, including terminal separation liabilities, reclamation and closure costs (the net difference between the total environmental liability and the current trust fund provision) but excluding non-cash items such as depreciation and amortisation.
transitional A rock mass which reflects a gradational change from fresh ore to oxide ore.
trench In geological exploration, a narrow, shallow ditch cut across a mineral deposit to obtain samples or to observe character.
trenching In geological exploration, a narrow, shallow ditch cut across a mineral deposit to obtain samples or to observe character.
trondhjemite A light-coloured plutonic rock composed primarily of sodic plagioclase (esp. oligoclase), quartz, sparse biotite, and little or no alkali feldspar. Its name, given by Goldschmidt in 1916, is derived from Trondhjem, Norway. Also spelled: trondjemite; trondheimite.
Valuation Adjustments The necessary adjustments to the Net Asset Value to arrive at the Equity Value for Ma’aden, specifically: the valuation of derivative instruments; the net cash/(debt) position as of the Effective Date; and the NPV of unallocated head office expenditures.
vein An epigenetic mineral filling of a fault or other fracture in a host rock, in tabular or sheetlike form, often with associated replacement of the host rock; a mineral deposit of this form and origin.
volcanic Characteristic of, pertaining to, situated in or upon, formed in, or derived from volcanoes.
weighted average cost of capital Used in finance to measure a firm's cost of capital as a discount rate for financed projects, as the cost of financing (capital) is regarded by some as a logical discount rate (required rate of return) to use. Weighted Average Cost of Capital is the return a firm must earn on existing assets to keep its stock price constant and satisfy its creditors and owners.
working capital The amount of day-by-day operating liquidity available to a business.
World Bank Group of five international organizations responsible for providing finance and advice to countries for the

SRK Consulting Ma'aden Gold MER – Table of Contents
U3330_Ma'aden MER.doc November, 2007 Page xix
purposes of economic development and poverty.
Zakat A religious tax, levied on Saudi nationals, wholly Saudi-owned companies and the Saudi shareholders’ share of profits of companies with foreign participation in accordance with Sharia’ Law. Zakat is estimated based on application of the 2.5% rate to the net book value of the assets at the close of each reporting period.
zinc The native metallic element, Zn. A bluish-white lustrous metal. Employed to form numerous alloys with other metals including brass, nickel silver, commercial bronze, spring brass, soft solder, and aluminium solder. Used extensively by the automotive, electrical, and hardware industries
zinc concentrate A base metals sulphide concentrate in which zinc is the predominant payable metal.
zinc precipitation See Merrill Crowe process.
ABBREVIATIONS AEPs Advanced Exploration Properties
Ag Silver.
AIM Alternative Investment Market.
Amsl Above mean sea level
Au Gold.
CEng. Chartered Engineer.
CGeol Chartered Geologist.
CESR Committee of European Securities Regulators.
CIL Carbon-in-Leach.
CIP Carbon-in-Pulp.
CIT Corporate Income Tax.
CMA Capital Market Law.
CPI Consumer Price Indices.
CPs Competent Persons.
Cu Copper.
DCF Discounted Cashflow.
DP Development Property.
E East.
EIA Environmental Impact Assessment.
EL Exploration Licence.
EMS Environmental Management System.
EPCM Engineering Procurement and Construction Management Contract.

SRK Consulting Ma'aden Gold MER – Table of Contents
U3330_Ma'aden MER.doc November, 2007 Page xx
EPs Exploration Properties.
EV Equity Value.
EVA Economic Viability Assessment.
F.AusIMM Fellow of the Australian Institute of Mining and Metallurgy.
GBM GBM Minerals Engineering Consultants Ltd.
H1 first six months of the financial (calendar) year.
H2 second six months of the financial (calendar) year.
HLP Heap Leach Pad.
ICMM International Council of Mining and Metals.
JSC Joint Stock Company.
LoMps Life-of-Mine plans.
LSE London Stock Exchange.
LTIFR Lost time injury frequency rate.
M.Eng Master of Engineering.
MER Mineral Experts’ Report.
MBA Masters of Business Administration.
MIMMM Member of the Institute of Mining, Metallurgy and Materials.
MSc Master of Science.
NAS Region Northern Arabian Shield Region
n/d not determined.
N North
NAV Net Asset Value.
No number.
NPV Net Present Value.
NTVA Non-time value adjusted.
OHSS Occupational health and safety system.
OK Ordinary Kriging.
o/p open-pit.
Pb Lead.
PP&E Plant Property and Equipment.
QA/QC Quality Assurance and Quality Control.
Q1 The first quarter of the financial (calendar) year ending 31 March.
Q2 The second quarter of the financial (calendar) year ending 30 June.
Q3 The third quarter of the financial (calendar) year ending 30 September.
Q4 The fourth quarter of the financial (calendar) year ending

SRK Consulting Ma'aden Gold MER – Table of Contents
U3330_Ma'aden MER.doc November, 2007 Page xxi
31 December.
RoM Run-of-Mine.
S South.
SAG Semi-autogenous grinding.
SA CPI Saudi Arabian Consumer Price Index.
SAR Saudi Arabian Riyals.
s/f Surface sources.
TBL Terminal benefits liabilities.
TEC Total Employees Costed.
TSF Tailings Storage Facilities.
TVA-GPI Time value adjusted and gold price indexed.
u/g underground.
UKLA United Kingdom Listing Authority.
US CPI United States Consumer Price Index.
VAT Value Added Taxation.
W West.
WACC Weight Adjusted Cost of Capital
Zn Zinc.
UNITS g/t Au Grammes per metric tonne of gold.
g/t Au Eq Grammes per metric tonne of gold equivalent.
g/t Ag Grammes per metric tonne of silver.
km A kilometre.
km2 A square kilometre.
koz Ag A thousand ounces of silver.
koz Au A thousand ounces of gold.
koz Au Eq A thousand ounces of gold equivalent.
kt A thousand metric tonnes.
ktpa A thousand metric tonnes per annum.
m A metre.
m2 A square metre.
m3 A cubic metre.
m3/hr A cubic metre per hour.
Moz A million troy ounces.
Moz Au Eq A million troy ounces of gold equivalent.
Mt A million metric tonnes.
Mtpa A million tonnes per annum.
oz A troy ounce.

SRK Consulting Ma'aden Gold MER – Table of Contents
U3330_Ma'aden MER.doc November, 2007 Page xxii
t A metric tonne.
t/m3 A metric tonne per cubic metre
t Cu A metric tonne of copper.
t Pb A metric tonne of lead.
t/TEC/month A metric tonne per total employee costed per month.
twaste:tore The ratio of the metric tonnes of waste to metric tonnes of ore.
t Zn A metric tonne of Zinc
USc/lb A United States cent per imperial pound.
US$ A United States dollar.
US$/t A United States dollar per metric tonne.
US$k A thousand United States dollars.
US$m A million United States dollars.
US$mpa A million United States dollars per annum.
US$/oz A United States dollar per troy ounce.
US$:SAR The number of Saudi Arabian Riyals per United States Dollar.
% A percentage.
% Cu Percentage copper.
% Pb Percentage lead.
% Zn Percentage zinc.
° A degree.
°C A degree celsius.
‘ A minute.

SRK Consulting Ma'aden Gold MER – Table of Contents
U3330_Ma'aden MER.doc November, 2007 Page i
TABLE OF CONTENTS – Main Report Section Description Page No.
1 INTRODUCTION 1 1.1 Background 1 1.2 Requirement, Structure and Compliance 2 1.2.1 Requirement 2 1.2.2 Structure 2 1.2.3 Compliance 3 1.3 Effective date and Base Technical Information date 4 1.4 Verification, Validation and Reliance 4 1.4.1 Technical Reliance 4 1.4.2 Financial Reliance 5 1.4.3 Legal Reliance 5 1.5 Valuation Basis and Ore Reserve EVA 5 1.6 Limitations, Reliance on Information, Declaration, Consent and Copyright 7 1.6.1 Limitations 7 1.6.2 Reliance on Information 7 1.6.3 Declaration 8 1.6.4 Consent 8 1.6.5 Copyright 8 1.6.6 Disclaimers and Cautionary Statements for US Investors 9 1.7 Qualifications of Consultants 9 2 THE GOLD ASSETS 12 2.1 Introduction 12 2.2 Ma’aden Gold 12 2.2.1 History 15 2.2.2 Strategy 15 2.3 Mining business 17 2.3.1 Description of properties 17 2.3.2 Exploration 18 2.3.3 Geology 19 2.3.4 Mining 19 2.3.5 Metallurgical processing 20 2.3.6 Services, supplies and Material Contracts 21 2.3.7 Human resources management 22 2.3.8 Occupational Health and Safety 22 2.3.9 Environmental 23 2.4 Overview of the Gold Assets 24 2.4.1 Mahd Ad’Dahab 24 2.4.2 Al Amar 26 2.4.3 Bulghah 29 2.4.4 Sukhaybarat 32 2.4.5 Al Hajar 34 2.4.6 Ad Duwayhi 36 2.4.7 Exploration Assets 38 2.4.8 Head Office 40 2.5 Saudi Arabia Country Description 41 2.5.1 Mining and Exploration licensing 44 2.5.2 Environmental regulations 45 2.5.3 Labour legislation 46 2.5.4 Taxation 46 3 COMMODITY PRICES AND MACRO-ECONOMIC FORECASTS 55 3.1 Introduction 55 3.2 Commodity Prices 55 3.2.1 Precious Metals - Historical and Forecast Data 55 3.2.2 Base Metals - Historical and Forecast Data 56 3.3 Commodity Prices and Macro Economics - historical and forecast summary data 57

SRK Consulting Ma'aden Gold MER – Table of Contents
U3330_Ma'aden MER.doc November, 2007 Page ii
4 GENERAL SRK COMMENTS 58 4.1 Introduction 58 4.2 Mineral Resource and Ore Reserves 58 4.3 Environmental 59 5 EXPLORATION ASSETS 60 5.1 Introduction 60 5.2 Exploration Assets and Strategy 60 5.2.1 Historical Expenditures and Activities 62 5.2.2 Exploration Programme 63 5.3 Advanced Exploration Properties 64 5.3.1 Ar Rjum Advanced Exploration Property 65 5.3.2 Mansourah Advanced Exploration Property 66 5.3.3 Masarrah Advanced Exploration Property 68 5.3.4 Zalim Advanced Exploration Property 70 5.3.5 As Suk Advanced Exploration Property 71 5.4 Other Exploration Properties 73 5.4.1 Aduwayah Exploration Licence 73 5.4.2 Al Hajar Exploration Licence 74 5.4.3 Al Jardhawiyah Exploration Licence 75 5.4.4 Al Uruq Exploration Licence 76 5.4.5 Habla Exploration Licence 76 5.4.6 Mawan Exploration Licence 77 5.4.7 As Siham Exploration Licence 78 5.4.8 Ash Shakhtaliyah Exploration Licence 79 5.4.9 Miskhah Exploration Licence 80 5.4.10 Tawan Exploration Licence 81 5.4.11 Wurshah Exploration Licence 81 5.4.12 Other Prospects 82 5.5 Risks and Opportunities 82 6 MAHD AD‘DAHAB 89 6.1 Introduction 89 6.2 Geology 89 6.3 Mineral Resources and Ore Reserves 90 6.3.1 Quality and quantity of data 90 6.3.2 Geological modelling, grade and tonnage estimation 90 6.3.3 Classification 91 6.3.4 Selective Mining Units 92 6.3.5 Grade control and reconciliation 92 6.3.6 Economic potential and Grade-Tonnage analysis 92 6.3.7 Ore Reserve estimation 93 6.3.8 Mineral Resource and Ore Reserve statements 93 6.3.9 Mineral Resource and Ore Reserve potential 95 6.4 Mining Engineering 95 6.4.1 Mining Access and Mining Method 95 6.4.2 Historical and short term mining operating statistics 95 6.4.3 Mining LoMp 96 6.5 Metallurgical Processing 96 6.5.1 Processing Facilities 96 6.5.2 Historical and short term processing operating statistics 97 6.5.3 Metallurgical Processing LoMp 97 6.6 Tailings Storage Facilities 98 6.7 Engineering Infrastructure, Overheads and Capital Expenditure 98 6.7.1 Access, Power, Water and Engineering Infrastructure 98 6.7.2 Overhead Operating Expenditure 98 6.7.3 Capital Expenditure 99 6.8 Human Resources 99 6.9 Environmental 99 6.9.1 Environmental Setting 99

SRK Consulting Ma'aden Gold MER – Table of Contents
U3330_Ma'aden MER.doc November, 2007 Page iii
6.9.2 Compliance 100 6.9.3 Environmental Management 100 6.9.4 Key Environmental Issues 100 6.9.5 Environmental Liabilities 101 6.10 Commodity Sales 101 6.11 Risks and Opportunities 102 7 AL AMAR 106 7.1 Introduction 106 7.2 Geology 106 7.3 Mineral Resources and Ore Reserves 107 7.3.1 Quality and quantity of data 107 7.3.2 Geological modelling, grade and tonnage estimation 108 7.3.3 Classification 109 7.3.4 Selective Mining Units 109 7.3.5 Grade control and reconciliation 109 7.3.6 Economic potential and Grade-Tonnage analysis 109 7.3.7 Ore Reserve estimation 110 7.3.8 Mineral Resource and Ore Reserve statements 111 7.3.9 Mineral Resource and Ore Reserve potential 112 7.4 Mining Engineering 112 7.4.1 Mining Access and Mining Method 112 7.4.2 Mining LoMp 113 7.5 Metallurgical Processing 113 7.5.1 Processing Facilities 113 7.5.2 Metallurgical Processing LoMp 114 7.6 Tailings Storage Facilities 115 7.7 Engineering Infrastructure, Overheads and Capital Expenditure 115 7.7.1 Access, Power, Water and Engineering Infrastructure 115 7.7.2 Overhead Operating Expenditure 115 7.7.3 Capital Expenditure 115 7.8 Human Resources 116 7.9 Environmental 116 7.9.1 Environmental Setting 116 7.9.2 Compliance 116 7.9.3 Environmental Management 117 7.9.4 Key Environmental Issues 117 7.9.5 Environmental Liabilities 117 7.10 Commodity Sales 118 7.11 Risks and Opportunities 118 8 BULGAH 124 8.1 Introduction 124 8.2 Geology 124 8.3 Mineral Resources and Ore Reserves 125 8.3.1 Quality and quantity of data 125 8.3.2 Geological modelling, grade and tonnage estimation 126 8.3.3 Classification 127 8.3.4 Selective Mining Units 127 8.3.5 Grade control and reconciliation 127 8.3.6 Economic potential and Grade-Tonnage analysis 128 8.3.7 Ore Reserve estimation 129 8.3.8 Mineral Resource and Ore Reserve statements 129 8.3.9 Mineral Resource and Ore Reserve potential 130 8.4 Mining Engineering 130 8.4.1 Mining Access and Mining Method 130 8.4.2 Historical and short term mining operating statistics 131 8.4.3 Mining LoMp 131 8.5 Metallurgical Processing 131 8.5.1 Processing Facilities 132

SRK Consulting Ma'aden Gold MER – Table of Contents
U3330_Ma'aden MER.doc November, 2007 Page iv
8.5.2 Historical and short term processing operating statistics 132 8.5.3 Metallurgical Processing LoMp 132 8.6 Engineering Infrastructure, Overheads and Capital Expenditure 133 8.6.1 Access, Power, Water and Engineering Infrastructure 133 8.6.2 Overhead Operating Expenditure 133 8.6.3 Capital Expenditure 133 8.7 Human Resources 133 8.8 Environmental 134 8.8.1 Environmental Setting 134 8.8.2 Compliance 134 8.8.3 Environmental Management 134 8.8.4 Key Environmental Issues 134 8.8.5 Environmental Liabilities 135 8.9 Risks and Opportunities 136 9 SUKHAYBARAT 142 9.1 Introduction 142 9.2 Mineral Resources and Ore Reserve statements 142 9.3 Ore Transportation 142 9.4 Metallurgical Processing 143 9.4.1 Processing Facilities 143 9.4.2 Historical and short term processing operating statistics 143 9.4.3 Metallurgical Processing LoMp 143 9.5 Tailings Storage Facilities 144 9.6 Engineering Infrastructure, Overheads and Capital Expenditure 144 9.6.1 Access, Power, Water and Engineering Infrastructure 144 9.6.2 Overhead Operating Expenditure 144 9.6.3 Capital Expenditure 145 9.7 Human Resources 145 9.8 Environmental 145 9.8.1 Environmental Setting 145 9.8.2 Compliance 146 9.8.3 Environmental Management 146 9.8.4 Key Environmental Issues 146 9.8.5 Environmental Liabilities 147 9.9 Risks and Opportunities 147 10 AL HAJAR 149 10.1 Introduction 149 10.2 Mineral Resource and Ore Reserves 149 10.2.1 Mineral Resource and Ore Reserve statements 150 10.3 Metallurgical Processing 150 10.3.1 Processing Facilities 150 10.3.2 Historical and short term processing operating statistics 151 10.3.3 Metallurgical Processing LoMp 151 10.4 Engineering Infrastructure, Overheads and Capital Expenditure 151 10.4.1 Access, Power, Water and Engineering Infrastructure 151 10.4.2 Capital Expenditure 152 10.5 Human Resources 152 10.6 Environmental 152 10.6.1 Environmental Setting 152 10.6.2 Compliance 153 10.6.3 Environmental Management 153 10.6.4 Key Environmental Issues 153 10.6.5 Environmental Liabilities 154 10.7 Risks and Opportunities 154 11 AD DUWAYHI 157 11.1 Introduction 157 11.2 Geology 157 11.3 Mineral Resources and Ore Reserves 157

SRK Consulting Ma'aden Gold MER – Table of Contents
U3330_Ma'aden MER.doc November, 2007 Page v
11.3.1 Quality and quantity of data 157 11.3.2 Geological modelling, grade and tonnage estimation 159 11.3.3 Classification 160 11.3.4 Selective Mining Units 161 11.3.5 Grade control and reconciliation 161 11.3.6 Economic potential and Grade-Tonnage analysis 161 11.3.7 Pre-feasibility study LoMp modified resource estimation 162 11.3.8 Mineral Resource and Ore Reserve statements 162 11.3.9 Mineral Resource and Ore Reserve potential 163 11.4 Mining Engineering 163 11.4.1 Mining Access and Mining Method 163 11.4.2 Mining LoMp 163 11.5 Metallurgical Processing 164 11.5.1 Processing Facilities 164 11.5.2 Metallurgical Processing LoMp 164 11.6 Tailings Storage Facilities 165 11.7 Engineering Infrastructure, Overheads and Capital Expenditure 165 11.7.1 Access, Power, Water and Engineering Infrastructure 165 11.7.2 Overhead Operating Expenditure 165 11.7.3 Capital Expenditure 165 11.8 Human Resources 166 11.9 Environmental 166 11.9.1 Environmental Setting 166 11.9.2 Compliance 166 11.9.3 Environmental Management 167 11.9.4 Key Environmental Issues 167 11.9.5 Environmental Liabilities 167 11.10 Risks and Opportunities 167 12 HEAD OFFICE 171 12.1 Introduction 171 12.2 Services 171 12.3 Manpower 171 12.4 Historical and short term forecasts 171 12.5 LoMp forecasts 171 12.6 Environmental 172 12.7 Risks and Opportunities 172 13 GOLD ASSETS VALUATION 172 13.1 Introduction 172 13.2 Limitations and Reliance on Information 172 13.2.1 Limitations 172 13.2.2 Reliance on Information 173 13.3 Valuation Methodology 173 13.4 Enterprise Value: Basis of Valuation 173 13.5 Enterprise Value: Post-Tax–Pre-Finance Cashflows 175 13.6 Enterprise Value: Net Present Value and Sensitivities 179 13.6.1 Mahd Ad’Dahab 179 13.6.2 Al Amar 180 13.6.3 Bulghah 180 13.6.4 Sukhaybarat 180 13.6.5 Al Hajar 181 13.6.6 Mining Assets 181 13.6.7 Head Office 181 13.7 Valuation of Advanced Exploration Properties 182 13.8 Valuation Adjustments 183 13.8.1 Derivative Instruments 183 13.8.2 Unallocated Head Office expenditures 183 13.8.3 Net (Debt)/Cash position 183 13.8.4 Summary of Valuation Adjustments 183

SRK Consulting Ma'aden Gold MER – Table of Contents
U3330_Ma'aden MER.doc November, 2007 Page vi
14 RISKS AND OPPORTUNITIES 183 14.1 Introduction 183 14.2 General Risks and Opportunities 184 14.3 Specific Risks and Opportunities 185 15 COMPANY EQUITY VALUE 187 15.1 Introduction 187 15.2 Equity Value 187 15.3 Comparable Transaction Analysis 188 16 CONCLUDING REMARKS 193 16.1 Introduction 193 16.2 Mineral Resources and Ore Reserves 193 16.3 Equity Value of Ma’aden Gold 194
LIST OF TABLES – MAIN REPORT
Table No. Description Page No. Table 1.1 Gold Assets(1) 1 Table 1.2 Base case commodity price and macro-economic projections(1),(2) 7 Table 2.1 Ma’aden Gold: Mineral Resource and Ore Reserve statements as at 1 July 2007 13 Table 2.2 Ma’aden Gold: salient historical (2004-2007H1 inclusive) and forecast (2007H2,
2008) operating statistics 15 Table 2.3 Gold Assets(1): licence status 18 Table 2.4 Plant production capacities and throughputs 18 Table 2.5 Mining Assets: human resource statistics (historical and forecast) 22 Table 2.6 Gold Assets: safety statistics 23 Table 2.7 Gold Assets: environmental (bio-physical and social) liabilities 23 Table 2.8 Mahd Ad’Dahab: historical and forecast operating results 26 Table 2.9 Al Amar: forecast operating results 29 Table 2.10 Bulghah: historical and forecast operating results 32 Table 2.11 Sukhaybarat: historical and forecast operating results 34 Table 2.12 Al Hajar: historical and forecast operating results 36 Table 2.13 Exploration Assets (including Ad Duwayhi) Mineral Resource statements (1 July
2007) 39 Table 2.14 Exploration Assets(1): Historical and forecast exploration expenditures 40 Table 2.15 Exploration Assets 40 Table 2.16 Head office: historical and forecast operating results 41 Table 2.17 Saudi Arabia: comparison of 2006 economic and demographic statistics with GCC
members(1) 44 Table 2.18 Saudi Arabia: economic and demographic statistics(1) 44 Table 3.1 Historical and Forecast commodity prices and macro-economics 58 Table 5.1 Exploration Assets: AEPs Mineral Resource statement (1 July 2007) 61 Table 5.2 Exploration Assets 62 Table 5.3 Exploration Assets: historical exploration expenditures(1) 63 Table 5.4 Exploration Assets: historical activities 63 Table 5.5 Exploration Assets: exploration programmes 64 Table 6.1 Mahd Ad’Dahab: modifying factors 93 Table 6.2 Mahd Ad’Dahab: Mineral Resource and Ore Reserve Statement (1 July 2007) 94 Table 6.3 Mahd Ad’Dahab: Mineral Resource and Ore Reserves detail (1 July 2007) 94 Table 6.4 Mahd Ad’Dahab: Ore Reserve sensitivity (1 July 2007) 94 Table 6.5 Mahd Ad’Dahab: historical and short term operating mining statistics 96 Table 6.6 Mahd Ad’Dahab: LoMp mining operating statistics 96 Table 6.7 Mahd Ad’Dahab: historical and short term processing operating statistics(1) 97 Table 6.8 Mahd Ad’Dahab: LoMp operating processing statistics 98 Table 6.9 Mahd Ad’Dahab: historical and short term forecast overhead operating statistics 99 Table 6.10 Mahd Ad’Dahab: LoMp operating overhead statistics 99 Table 6.11 Mahd Ad’Dahab: LoMp capital expenditure statistics 99 Table 6.12 Mahd Ad’Dahab: historical and forecast human resources statistics 99 Table 6.13 Mahd Ad’Dahab: environmental (biophysical and social) liabilities 101

SRK Consulting Ma'aden Gold MER – Table of Contents
U3330_Ma'aden MER.doc November, 2007 Page vii
Table 6.14 Mahd Ad’Dahab: concentrate and commodity sales 102 Table 7.1 Al Amar: modifying factors 111 Table 7.2 Al Amar: Mineral Resource and Ore Reserves (1 July 2007)(1) 111 Table 7.3 Al Amar: Mineral Resource and Ore Reserves detail (1 July 2007)(1) 112 Table 7.4 Al Amar: Ore Reserve sensitivity (1 July 2007) 112 Table 7.5 Al Amar: LoMp mining operating statistics 113 Table 7.6 Al Amar: LoMp processing operating statistics 115 Table 7.7 Al Amar: LoMp overhead operating statistics 115 Table 7.8 Al Amar: LoMp capital expenditure statistics 116 Table 7.9 Al Amar: historical and forecast human resources statistics 116 Table 7.10 Al Amar: environmental (biophysical and social) liabilities 117 Table 7.11 Al Amar: concentrate and commodity sales 118 Table 8.1 Bulghah: modifying factors 129 Table 8.2 Bulghah: Mineral Resource and Ore Reserves statement (1 July 2007) 130 Table 8.3 Bulghah: Ore Reserve sensitivity (1 July 2007)(1), (2) 130 Table 8.4 Bulghah: historical and short term mining operating statistics 131 Table 8.5 Bulghah: LoMp mining operating statistics 131 Table 8.6 Bulghah: historical and short term processing operating statistics 132 Table 8.7 Bulghah: LoMp processing operating statistics 132 Table 8.8 Bulghah: historical and forecast overhead operating statistics 133 Table 8.9 Bulghah: LoMp overhead operating statistics 133 Table 8.10 Bulghah: LoMp capital expenditure statistics 133 Table 8.11 Bulghah: historical and forecast human resources statistics 134 Table 8.12 Bulghah: environmental (biophysical and social) liabilities 136 Table 9.1 Sukhaybarat: Mineral Resource and Ore Reserves (1 July 2007) 142 Table 9.2 Sukhaybarat: Ore Reserve sensitivity (1 July 2007) 142 Table 9.3 Sukhaybarat: historical and short term ore transportation operating statistics 143 Table 9.4 Sukhaybarat: LoMp ore transportation operating statistics 143 Table 9.5 Sukhaybarat: historical and short term processing operating statistics 143 Table 9.6 Sukhaybarat: LoMp processing operating statistics 144 Table 9.7 Sukhaybarat: historical and forecast overhead operating statistics 144 Table 9.8 Sukhaybarat: LoMp overhead operating statistics 145 Table 9.9 Sukhaybarat: LoMp capital expenditure statistics 145 Table 9.10 Sukhaybarat: historical and forecast human resource statistics 145 Table 9.11 Sukhaybarat: environmental (biophysical and social) liabilities 147 Table 10.1 Al Hajar: modifying factors 150 Table 10.2 Al Hajar: Mineral Resource and Ore Reserves (1 July 2007) 150 Table 10.3 Al Hajar: Ore Reserve sensitivity (1 July 2007) 150 Table 10.4 Al Hajar: historical and short term processing operating statistics(1) 151 Table 10.5 Al Hajar: LoMp processing operating statistics(1) 151 Table 10.6 Al Hajar: LoMp capital expenditure statistics 152 Table 10.7 Al Hajar: historical and forecast human resources statistics 152 Table 10.8 Al Hajar: environmental (bio-physical and social) liabilities 154 Table 11.1 Ad Duwayhi: modifying factors 162 Table 11.2 Ad Duwayhi: Mineral Resource (1 July 2007)(1) 162 Table 11.3 Ad Duwayhi Mineral Resource sensitivity (1 July 2007)(1) 163 Table 11.4 Ad Duwayhi: LoMp mining operating statistics 164 Table 11.5 Ad Duwayhi: LoMp processing operating statistics 164 Table 11.6 Ad Duwayhi: LoMp overhead operating expenditure statistics 165 Table 11.7 Ad Duwayhi: Pre-feasibility study capital expenditures 166 Table 11.8 Ad Duwayhi: Pre-feasibility study Human Resources statistics 166 Table 11.9 Ad Duwayhi: environmental (bio-physical and social) liabilities 167 Table 12.1 Head Office: historical and forecast human resource statistics 171 Table 12.2 Head Office: historical and short term forecast operating and capital expenditures
171 Table 12.3 Head Office: LoMp forecast operating and capital expenditures 172 Table 13.1 Weight Adjusted Cost of Capital calculations for the Mining Assets 174 Table 13.2 Working Capital input parameters as at 1 July 2007 (opening balances) 174 Table 13.3 Working Capital input parameters as at 1 July 2007 (days) 174

SRK Consulting Ma'aden Gold MER – Table of Contents
U3330_Ma'aden MER.doc November, 2007 Page viii
Table 13.4 Plant, Property and Equipment Net Book Value as at 1 July 2007 175 Table 13.5 Mahd Ad’Dahab: Financial Model in US$ real terms (1 July 2007) 175 Table 13.6 Al Amar: Financial Model in US$ real terms (1 July 2007) 176 Table 13.7 Bulghah: Financial Model in US$ real terms (1 July 2007) 177 Table 13.8 Sukhaybarat: Financial Model in US$ real terms (1 July 2007) 177 Table 13.9 Al Hajar: Financial Model in US$ real terms (1 July 2007) 178 Table 13.10 Head Office: Financial Model in US$ real terms (1 July 2007) 178 Table 13.11 Ma’aden Gold: Financial Model in US$ real terms (1 July 2007) 179 Table 13.12 Mahd Ad’Dahab: NPV (US$m) at various discount factors 179 Table 13.13 Mahd Ad’Dahab: Sales Revenue and Total Working Cost simultaneous sensitivity
at a real DCF of 10% 180 Table 13.14 Al Amar: NPV (US$m) at various discount factors 180 Table 13.15 Al Amar: Sales Revenue and Total Working Cost simultaneous sensitivity at a real
DCF of 10% 180 Table 13.16 Bulghah: NPV (US$m) at various discount factors 180 Table 13.17 Bulghah: Sales Revenue and Total Working Cost simultaneous sensitivity at a
real DCF of 10% 180 Table 13.18 Sukhaybarat: NPV (US$m) at various discount factors 180 Table 13.19 Sukhaybarat: Sales Revenue and Total Working Cost simultaneous sensitivity at
a real DCF of 10% 181 Table 13.20 Al Hajar: NPV (US$m) at various discount factors 181 Table 13.21 Al Hajar: Sales Revenue and Total Working Cost simultaneous sensitivity at a real
DCF of 10% 181 Table 13.22 Mining Assets: NPV (US$m) at various discount factors 181 Table 13.23 Mining Assets: Sales Revenue and Total Working Cost simultaneous sensitivity at
a real DCF of 10% 181 Table 13.24 Head Office: NPV (US$m) at various discount factors 181 Table 13.25 Head Office: Total Working Cost simultaneous sensitivity at a real DCF of 10%182 Table 13.26 Commodity (gold) derivatives 183 Table 13.27 Summary of Valuation Adjustments 183 Table 15.1 Ma’aden Gold Equity Value 188 Table 15.2 Ma’aden Gold Equity Value: discount factor sensitivity analysis 188 Table 15.3 Ma’aden Gold Equity Value: sales revenue and total working cost sensitivity(1) 188 Table 15.4 Comparable Transactions – population analysis 189 Table 15.5 Recent Gold Transactions (Africa Production): © Metals Economics Group(1), (2), (3)
192 Table 16.1 Ma’aden Gold: Total Mineral Resource and Ore Reserves statement (1 July 2007)(1)
193 Table 16.2 Ma’aden Gold: Total Ore Reserve Sensitivity (1 July 2007) 194 Table 16.3 Mining Assets: Ore Reserve Economic Viability Assessment 194
LIST OF FIGURES Figure No. Description Page No. Figure 1.1 Ma’aden Gold: Divisional Structure 11 Figure 2.1 Ma’aden Gold: company C1 cash cost curve analysis (calendar 2006 results) 14 Figure 2.2 Mining Assets: mine C1 cash cost curve analysis (calendar 2006 results) 14 Figure 2.3 Ma’aden Gold: LoMp equivalent gold production (koz) and cash costs (US$/oz) 17 Figure 2.4 Ma’aden Gold: location of Gold Assets 48 Figure 2.5 Ma’aden Gold: location of Mahd Ad’Dahab 49 Figure 2.6 Ma’aden Gold: location of Al Amar 50 Figure 2.7 Ma’aden Gold: location of Bulghah and Sukhaybarat 51 Figure 2.8 Ma’aden Gold: location of Al Hajar 52 Figure 2.9 Ma’aden Gold: location of Gold Assets (licences) 53 Figure 2.10 Ma’aden Gold location of Gold Assets (Al Hajar) 54 Figure 3.1 Gold Price: historical (1975 to 30 June 2007) and forecast to long term price
assumptions (1 July 2007 to 2012) 55 Figure 3.2 Silver Price: historical (1975 to 30 June 2007) and forecast to long term price
assumptions (1 July 2007 to 2012) 56

SRK Consulting Ma'aden Gold MER – Table of Contents
U3330_Ma'aden MER.doc November, 2007 Page ix
Figure 3.3 Zinc Price: historical (1975 to 30 June 2007) and forecast to long term price assumptions (1 July 2007 to 2012) 56
Figure 3.4 Copper Price: historical (1975 to 30 June 2007) and forecast to long term price assumptions (1 July 2007 to 2012) 57
Figure 3.5 Lead Price: historical (1975 to 30 June 2007) and forecast to long term price assumptions (1 July 2007 to 2012) 57
Figure 5.1 Ma’aden Gold: Ar Rjum Advanced Exploration Property 84 Figure 5.2 Ma’aden Gold: Mansourah Advanced Exploration Property 85 Figure 5.3 Ma’aden Gold: Masarah Advanced Exploration Property 86 Figure 5.4 Ma’aden Gold: Zalim Advanced Exploration Property 87 Figure 5.5 Ma’aden Gold: As Suk Advanced Exploration Property 88 Figure 6.1 Mahd Ad’Dahab grade-tonnage curve(1), (2) 92 Figure 6.2 Ma’aden Gold: Mahd Ad’Dahab 3D data density and surface topography 104 Figure 6.3 Ma’aden Gold: Mahd Ad’Dahab Plant process flowsheet 105 Figure 7.1 Al Amar grade-tonnage curve(1), (2), (3) 110 Figure 7.2 Ma’aden Gold: Al Amar 3D geological wireframes 120 Figure 7.3 Ma’aden Gold: Al Amar block model Mineral Resource classification 121 Figure 7.4 Ma’aden Gold: Al Amar block model gold equivalent grade distribution 122 Figure 7.5 Ma’aden Gold: Al Amar Plant process flowsheet 123 Figure 8.1 Bulghah grade-tonnage curve(1), (2) 128 Figure 8.2 Ma’aden Gold: Bulghah ore type distribution 138 Figure 8.3 Ma’aden Gold: Bulghah block model Mineral Resource classification 139 Figure 8.4 Ma’aden Gold: Bulghah block model gold grade distribution 140 Figure 8.5 Ma’aden Gold: Bulghah Plant process flowsheet 141 Figure 9.1 Ma’aden Gold: Sukhaybarat Plant process flowsheet 148 Figure 10.1 Ma’aden Gold: Al Hajar Plant process flowsheet (reclamation of existing heap leach
stacked material) 156 Figure 11.1 Ad Duwayhi grade-tonnage curve(1) 161 Figure 11.2 Ma’aden Gold: Ad Duwayhi 3D geological wireframes 169 Figure 11.3 Ma’aden Gold: Al Hajar Plant process flowsheet 170 Figure 15.1 Comparable transaction cumulative frequency: global database (producing assets)
non-time value adjusted (US$/oz) 190 Figure 15.2 Comparable transaction cumulative frequency: global database (producing assets),
time value adjusted and gold price indexed (US$/oz) 190 Figure 15.3 Comparable Transaction data plot: Transacted unit price versus transacted ounce
191 Figure 16.1 Ma’aden Gold: LoMp equivalent gold production (koz) and cash costs (US$/oz) 194

Registered Address: 21 Gold Tops, Newport, NP9 4PG, Wales, United Kingdom.
SRK Consulting (UK) Limited Reg No 1575403 (England and Wales)
Offices in Asia, Australia, Europe, North America, South Africa, South America
SRK Consulting (UK) Limited, 5th Floor Churchill House, 17 Churchill Way, Cardiff CF10 2HH, Wales, United Kingdom. E-mail: [email protected] URL:http://www.srk.co.uk/ Tel: +44 (0)29-2034 8150 Fax: +44 (0)29-2034 8199
SRK ConsultingEngineers and Scientists
AN INDEPENDENT MINERAL EXPERTS’ REPORT ON THE GOLD MINING AND
EXPLORATION ASSETS OF SAUDI ARABIAN MINING COMPANY (Ma’aden) 1 INTRODUCTION
1.1 Background SRK Consulting (UK) Limited (“SRK”) is an associate company of the international group holding company, SRK Global Limited (the “SRK Group”). SRK has been commissioned by the board of directors of Saudi Arabian Mining Company (“Ma’aden” also referred to as the “Company”) to prepare an independent mineral experts’ report (“MER”) on the gold mining assets (the “Mining Assets”) and gold exploration assets (the “Exploration Assets”), collectively referred to as the “Gold Assets” of the Company. The Gold Assets are managed by a division of the Company, the gold division, hereinafter referred to as “Ma’aden Gold”. The Gold Assets reviewed by SRK are subdivided (Table 1.1) into: the Mining Assets comprising Mahd Ad’Dahab, Al Amar, Bulghah, Sukhaybarat, Al Hajar (collectively “the operations”) and Ad Duwayhi a Development Property (“DP”); and the Exploration Assets comprising the advanced exploration properties (“AEPs”) and the exploration properties (“EPs”).
Table 1.1 Gold Assets(1) Gold Assets Type(2) Licence Expiry(3) Area
(km2)Mining Operations 110.3Mahd Ad'Dahab u/g Mahd Ad’Dahab Dec-2017 10.3Al Amar u/g Al Amar Dec-2026 5.0Bulghah o/p Bulghah Dec-2030 39.0Sukhaybarat s/f Sukhaybarat Dec-2017 50.0Al Hajar s/f Al Hajar Jun-2027 6.0Development Property 646.0Ad Duwayhi o/p Aduwayah Oct-2007 646.0Exploration Advanced Exploration Properties 10,923.8Mansourah o/p Al Uruq Jul-2008 4,302.3Ar Rjum o/p Ash Shakhtaliyah Feb-2007 6,333.0Masarrah o/p Ash Shakhtaliyah Feb-2007 6,333.0As Suk o/p Ash Shakhtaliyah Feb-2007 6,333.0Zalim o/p Zalim Jun-2008 288.5Other Exploration Properties 36,597.23 Prospects n/d Aduwayah Oct-2007 646.06 Prospects n/d Al Hajar Dec-2007 1,499.52 Prospects n/d Al Jardhawiyah Aug-2006 7,609.04 Prospects n/d Al Uruq Jul-2008 4,302.38 Prospects n/d An Najadi, Nugrah, Mawan, Habla Dec-2009 1,847.12 Prospects n/d As Siham Jun-2007 5,504.42 Prospects n/d Ash Shakhtaliyah Feb-2007 6,333.01 Prospects n/d Miskah Aug-2007 7,013.01 Prospects n/d Tawan Nov-2006 415.71 Prospects n/d Shabah Sep-2006 6,944.53 Prospects n/d Wurshah Sep-2006 5,764.0
(1) The Mining Licences and the Exploration Licences reflect the anticipated position by the Company for Ma’aden Gold following relinquishment of certain areas in accordance with the licence conditions.
(2) u/g – underground; o/p – open-pit; s/f – surface sources; n/d – not determined. (3) For all licences which are expired as of 30 June 2007 or are due to expire in 2007, SRK has been informed that the necessary applications for
renewal have been lodged with the regulatory authorities.

SRK Consulting Ma'aden Gold MER – Main Report
U3330_Ma'aden MER.doc November, 2007 Page 2
In addition to the above SRK has reviewed the operating expenditures associated with the provision of management, support and exploration services from the Ma’aden Gold’s head office (“Head Office”). This MER assumes that the business structure (Figure 1.1) as well as the equity participation represented in Table 1.1 is effective as at 1 July 2007. Save for those defined in Table 1.1, SRK has been informed by Ma’aden Gold that it has no other material Gold Assets held through holdings in direct subsidiaries, indirect subsidiaries, joint ventures and associate companies.
For the purpose of the reliance statements in Section 1.4 of this MER, reliance was sought from Ma’aden Gold, as appropriate for the relevant Gold Assets, and reference to Ma’aden Gold should be construed as such.
1.2 Requirement, Structure and Compliance
1.2.1 Requirement The MER has been prepared by SRK and will be included in the prospectus (the “Prospectus”) to be published by the Company. The Prospectus is published by the Company in connection with the simultaneous offering (the “Offer”) of ordinary shares in the Company and the proposed admission (the “Admission”) of such shares to trading on the Saudi Stock Exchange (the “Tadawul”).
The MER has been prepared in accordance with the Listing Rules as defined by the Capital Market Law (the “CMA”) issued by Royal Decree No M/30 dated 1 August 2003, hereinafter referred to as the “CMA Listing Rules”. In the absence of any detailed specific rules relating to the disclosure requirements for resource companies, SRK has in generating the MER, relied on the following for guidance:
• “CESR’s recommendations for the consistent implementation of the European Commission’s Regulation on Prospectuses No. 909/2004”, published in January 2005: specifically paragraphs 131 to 132, section 1b – Mineral Companies, hereinafter referred to as the “CESR Recommendations”; and
• The “Guidance note for Mining, Oil and Gas Companies, March 2006”: specifically the content requirements at Appendix 2 and the summaries set out in Appendices 1 and 3 (a document published by the London Stock Exchange Limited (the “LSE”) in accordance with the Alternative Investment Market Rules (the “AIM Rules”) of the LSE.
The MER contains a valuation of the Mining Assets (excluding Ad Duwayhi), accordingly the MER constitutes a competent person’s report within the meaning of Chapter 19 of the United Kingdom Listing Authority’s (the “UKLA”) Listing Rules as it existed on 30 June, 2005 prior to its deletion upon the implementation in the UK on 1 July, 2005 of the Prospectus Directive as published by the Financial Services Authority from time to time and governed by the UKLA. Accordingly the valuation of the Gold Assets is limited to the valuation of the Ore Reserves and specifically excludes all other Gold Assets of Ma’aden Gold.
The MER is addressed to the Company and JPMorgan Chase Bank N.A. (the “Financial Advisor”). Drafts of the MER were provided to the Company, but only for the purpose of confirming both the accuracy of factual information and the reasonableness of assumptions relied upon in the MER.
1.2.2 Structure The Gold Assets comprise five operating Mining Assets; one DP; five AEPs; and 33 EPs. This MER has been structured with separate sections for each of the Mining Assets,

SRK Consulting Ma'aden Gold MER – Main Report
U3330_Ma'aden MER.doc November, 2007 Page 3
Exploration Assets in total as well as Ma’aden Gold’s Head Office. In respect of each of the Mining Assets, technical details are presented on a discipline basis with following principal headings: Geology; Mineral Resources and Ore Reserves; Mining; Metallurgical Processing; Tailings Storage Facilities; Infrastructure, Capital Expenditure and Overheads; Human Resources and Environmental.
The MER includes technical information, which requires subsequent calculations to derive subtotals, totals and weighted averages. Such calculations may involve a degree of rounding and consequently introduce an error. Where such errors occur, SRK does not consider them to be material.
1.2.3 Compliance This MER has been prepared in accordance with the CMA Listing Rules in conjunction with the CESR Recommendations and the AIM Rules.
The standard adopted for the reporting of the Mineral Resources and Ore Reserve statements for the Mining Assets is that defined by the terms and definitions given in The 2004 Australasian Code for Reporting of Exploration Results, Mineral Resources and Ore Reserves (the “JORC Code”) as published by the Joint Ore Reserves Committee of the Australasian Institute of Mining and Metallurgy, Australian Institute of Geoscientists and Minerals Council of Australia. The JORC Code is an internationally recognised Mineral Resource and Ore Reserve reporting code.
The MER has been prepared under the direction of the Competent Persons’ (the “CPs”, see Section 1.7) as defined by the JORC Code who assume overall professional responsibility for the document. The MER however is published by SRK, the commissioned entity, and accordingly SRK assumes responsibility for the views expressed herein. Consequently with respect to all references to CPs and SRK: ‘all references to SRK mean the CPs and vice-versa’.
SRK is responsible for this MER, an extract of which is published as part of the Prospectus and declares that it has taken all reasonable care to ensure that the information contained in this report is, to the best of its knowledge, in accordance with the facts and contains no omission likely to affect its import.
Notwithstanding the above SRK notes the following:
• A detailed statement of all legal proceedings relevant to the Gold Assets or an appropriate negative statement has been included in the Prospectus;
• Brief summaries of the Company’s existing and proposed directors are included in the Prospectus and details relating to qualifications of key technical and managerial staff have been excluded from this MER for practical purposes of volume; and
• SRK has during the course of its investigations reviewed technical plans in order to support its opinions on the geology, Mineral Resource and Ore Reserves, mining schedules and processing facilities, land holdings, lease areas and surface infrastructure. Due to volume and scale of these plans it is not appropriate to include detailed copies for all technical aspects relating to the Gold Assets into this MER.
SRK confirms that the presentation of information contained elsewhere in the Prospectus which relates to information in the MER is accurate, balanced and not inconsistent with the MER.
SRK notes that this MER has undergone regulatory review. SRK understands that the

SRK Consulting Ma'aden Gold MER – Main Report
U3330_Ma'aden MER.doc November, 2007 Page 4
Company’s Advisors will also conduct an internal review of this MER.
1.3 Effective date and Base Technical Information date The effective date (the “Effective Date”) of this MER is deemed to be 1 July 2007, and is co-incident with the Valuation Date and cashflow projections as incorporated herein. To the knowledge of SRK, as informed by Ma’aden Gold, there has been no material change in respect of the Gold Assets since 1 July 2007. The Ore Reserves and the valuation of the Mining Assets are dependent upon the following:
• Technical information as generated by the Company in accordance with its annual planning process defined as the Base Information Date (“BID”), which is 1 January 2007; and
• Appropriate adjustments made by SRK to technical information which inter alia includes any additional material information provided by the Company from the BID to the Effective Date.
1.4 Verification, Validation and Reliance This MER is dependent upon technical, financial and legal input. The technical information as provided to and taken in good faith by SRK has not been independently verified by it by means of re-calculation. SRK has, however, conducted a review and assessment of all material technical issues likely to influence the future performance of the Mining Assets, which included the following:
• Inspection visits to the Mining Assets’ mining and processing facilities, surface structures and associated infrastructure undertaken most recently April 2006;
• Discussion and enquiry following access, to key project and head office personnel between June 2007 and October 2007;
• An examination of historical information (2004, 2005, 2006 and 2007H1) and results made available by Ma’aden Gold in respect of the Mining Assets; and
• A review and where considered appropriate by SRK, modification of Ma’aden Gold’s production forecasts contained in the Life-of-Mine plans (“LoMp”).
SRK has also:
• Assumed certain macro-economic parameters and commodity prices and relied on these as inputs to undertake a break even analysis of Ma’aden Gold’s Ore Reserve estimates (hereinafter referred to as the Ore Reserve economic viability assessment – the “Ore Reserve EVA”) and to derive the Equity Value of Ma’aden Gold; and
• Satisfied itself that such information is both appropriate and valid for the Ore Reserve EVA and derivation of the Equity Value as reported herein.
Where fundamental base data has been provided (LoMp, capital expenditures, operating budgets etc) for the purposes of review, SRK has performed all necessary validation and verification procedures deemed appropriate in order to place an appropriate level of reliance on such information.
To the knowledge of SRK, as informed by Ma’aden Gold, there has been no material change in respect of the Mining Assets since 1 July 2007.
1.4.1 Technical Reliance SRK places reliance on Ma’aden Gold and its technical representatives that all technical information provided to SRK as at 1 July 2007, is accurate. The technical representative for

SRK Consulting Ma'aden Gold MER – Main Report
U3330_Ma'aden MER.doc November, 2007 Page 5
Ma’aden Gold’s Mineral Resources and Ore Reserves is Dr M Hany Al-Dabbagh. He is the Vice President of precious and base metals as well as President of Ma’aden Gold and responsible for all technical matters in respect of Mineral Resources and Ore Reserves at Ma’aden Gold and has over 20 years experience in the mining industry.
1.4.2 Financial Reliance In consideration of all financial aspects relating to the Gold Assets and the Equity Valuation of Ma’aden Gold, SRK has placed reliance on Ma’aden Gold that the following information and incorporation in the financial models (the “Financial Models”) for the Mining Assets is appropriate as at 1 July 2007:
• Taxation;
• Depreciation;
• Assessed losses;
• Opening balances for debtors, creditors and stores and associated working capital calculations;
• Balance sheet items, specifically cash on hand, debt and mark to market value of derivative instruments and other liabilities required to present the Equity Value of Ma’aden Gold.
The financial information referred to above has been prepared under the direction of Mr Abdullah I. Al-Fallaj and Deloitte & Touche Bakr Abulkhair & Co (the “Auditors”) on behalf of the Board of Directors of the Company. Mr Al-Fallaj is the Vice President Finance of the Company and has more than 20 years experience in financial management.
1.4.3 Legal Reliance In consideration of all legal aspects relating to the Gold Assets, SRK has placed reliance on the representations by the Company that the following are correct as at 1 July 2007 and remain correct until the date of the Prospectus:
• That save as disclosed in the Prospectus, the Directors of the Company are not aware of any legal proceedings that may have an influence on the rights to explore for minerals;
• That the legal owners of all mineral and surface rights have been verified; and
• That save expressly mentioned in the Risk Factors of the main body of the prospectus that no significant legal issue exists which would affect the likely viability of the Gold Assets and/or on the estimation and classification of the Mineral Resources and Ore Reserves as reported herein.
The legal representatives of the Company are Baker & McKenzie.
1.5 Valuation Basis and Ore Reserve EVA The Equity Valuation and Ore Reserve EVA of the Mining Assets is based upon the following;
• The LoMp as provided;
• Enterprise Values for each of the Tax Entities. The Enterprise Values are derived using discounted cashflow (“DCF”) techniques applied to post-tax pre-finance cashflows contained in the Financial Models (commencing 1 July 2007 and reported in financial years ending 31 December) derived from the underlying LoMp and the associated Technical Economic Parameters (“TEPs”). The Enterprise Values are reported as Net Present Values (“NPVs”) quoted at a real discount factor of 10%. As the valuation date is

SRK Consulting Ma'aden Gold MER – Main Report
U3330_Ma'aden MER.doc November, 2007 Page 6
1 July 2007, the cashflow projections for the first period represent a six month period to 31 December 2007; and
• Valuation Adjustments including unallocated corporate expenses, net (debt)/cash, mark to market value of derivative instruments and other liabilities as at 1 July 2007.
The post-tax pre-finance cashflows presented for each operating entity incorporate the commodity prices and macro-economic projections as presented in Table 1.2 below. These commodity prices and macro-economic forecasts include:
• Real and Nominal commodity prices for gold and silver by inflating the real terms (1 July 2007) forecasts derived from consensus market forecasts and market experts. In respect of gold, the forecast prices are based on the detailed demand-supply-price analysis undertaken by Brook Hunt & Associates Limited (“Brook Hunt”), the result of which is published in the main body of the Prospectus. In respect of all other commodities: silver, zinc, copper, and lead; prices are derived based on consensus market forecasts, estimated as the median of analysts forecasts available as at 1 July 2007. Consensus market forecasts are generally limited to annual forecasts for three years and a long term price thereafter;
• Macro-economic forecasts based on the closing period statistics determined as at 30 June 2007 and including:
− Consumer Price Indices (“CPI”) for the Kingdom of Saudi Arabia (“Saudi Arabia”) and the United States,
− Saudi Arabian Riyal (“SAR”) exchange rates quoted against a denomination of one United States Dollar (“US$”),
− Nominal exchange rates for the SAR are currently fixed against the US$; • Ore Reserves are due to currency of the LoMps (that is Al Amar feasibility study 2001;
Bulghah mining study 2005Q4) based on a range of commodity prices which are generally lower than the current three year average as derived from daily closing prices. Notwithstanding this aspect, SRK has confirmed the validity of the statements as presented at the following long term commodity prices: gold at US$550/oz; silver at US$9.00/oz; zinc at USc65/lb; and copper at USc140/lb;
• For each operating entity SRK has developed Financial Models per entity, the results of which are presented in Section 13 of this MER. The Financial Models presented in real terms are based on annual cashflow projections determined at end-point, that is to say 31 December of each year and TEPs stated in 1 July 2007 money terms; and
• In the three year period between 1 July 2004 and 30 June 2007 the following apply:
− gold price ranging between US$387/oz and US$651/oz with a resulting three year average of US$529/oz which can be compared with the long term price of US$511/oz and the current 1 October 2007 spot price of US$743/oz,
− silver price ranging between US$5.88/oz and US$14.94/oz with a resulting three year average of US$9.64/oz which can be compared with the long term price of US$9.50/oz and the current 1 October 2007 spot price of US$13.78/oz,
− zinc price ranging between USc43/lb and USc210/lb with a resulting three year average of USc104/lb which can be compared with the long term price of USc65/lb and the current 1 October 2007 spot price of USc138/lb,

SRK Consulting Ma'aden Gold MER – Main Report
U3330_Ma'aden MER.doc November, 2007 Page 7
− copper price ranging between USc121/lb and USc398/lb with a resulting three year average of USc230/lb which can be compared with the long term price of USc140/lb and the current 1 October 2007 spot price of USc369/lb,
− lead price ranging between USc37/lb and USc163/lb with a resulting three year average of USc63/lb which can be compared with the long term price of USc40/lb and the current 1 October 2007 spot price of USc156/lb.
Taking cognisance of the volatile nature of both the commodity prices and the exchange rates above, SRK presents sensitivities of NPVs for US$ long term (2010 onwards) commodity price ranges of between -30% and +30 % assuming the forecasts as included in Table 1.2.
Table 1.2 Base case commodity price and macro-economic projections(1),(2) Parameter Units 2007H2 2008 2009 2010 2011 2012
Commodity Prices - Real Gold (US$/oz) 675 676 577 544 511 511Silver (US$/oz) 13.22 12.75 11.53 10.52 9.50 9.50Zinc (USc/lb) 160 144 113 89 65 65Copper (USc/lb) 318 294 245 192 140 140Lead (USc/lb) 91 78 67 54 40 40Commodity Prices - Nominal Gold (US$/oz) 693 713 624 604 583 599Silver (US$/oz) 14 13 12 12 11 11Zinc (USc/lb) 164 152 122 99 74 76Copper (USc/lb) 327 310 265 214 160 164Lead (USc/lb) 93 83 73 60 46 47Macro-Economics US CPI (%) 2.7% 2.7% 2.7% 2.7% 2.7% 2.7%SA CPI (%) 3.0% 3.0% 3.0% 3.0% 3.0% 3.0%Exchange Rate - Real (US$:SAR) 3.75 3.75 3.75 3.75 3.75 3.75Exchange Rate - Nominal (US$:SAR) 3.75 3.75 3.75 3.75 3.75 3.75
(1) All commodity prices are quoted at the closing period of 31 December. (2) CPI rates for 2007 are annualised.
The Ore Reserve EVA includes the above and assesses the commodity price which:
• Is equivalent to the weighted average LoMp real terms total costs;
• Reflects the current (2007H1) cash costs reported on a by-product basis; and
• Is required to return a zero NPV at a real terms discount factor of 10%.
1.6 Limitations, Reliance on Information, Declaration, Consent and Copyright
1.6.1 Limitations SRK does not assume any responsibility and will not accept any liability to any other person for any loss suffered by any such other person as a result of, arising out of, or in connection with this MER or statements contained therein, required by and given solely for the purpose of complying with the CMA Listing Rules, consenting to its inclusion in the Prospectus.
The Company has confirmed in writing to SRK that, to its knowledge, the information provided by it (when providing) was complete and not incorrect or misleading in any material respect. SRK has no reason to believe that any material facts have been withheld and the Company has confirmed in writing to SRK that it believes it has provided all material information.
The achievability of the LoMps are neither warranted nor guaranteed by SRK. The LoMps as presented and discussed herein have been proposed by the Company’s management and adjusted where appropriate by SRK, and cannot be assured; they are necessarily based on economic assumptions, many of which are beyond the control of the Company. Future cashflows and profits derived from such forecasts are inherently uncertain and actual results may be significantly more or less favourable.
1.6.2 Reliance on Information SRK believes that its opinion must be considered as a whole and that selecting portions of the

SRK Consulting Ma'aden Gold MER – Main Report
U3330_Ma'aden MER.doc November, 2007 Page 8
analysis or factors considered by it, without considering all factors and analyses together, could create a misleading view of the process underlying the opinions presented in the MER. The preparation of a MER is a complex process and does not lend itself to partial analysis or summary.
SRK’s Equity Value for the Company is effective at 1 July 2007 and is based on information provided by the Company throughout the course of SRK’s investigations, which in turn reflect various technical-economic conditions prevailing at the date of this report. In particular, the Equity Value and Ore Reserve EVA are based on expectations regarding the commodity prices and exchange rates prevailing at the date of this report. These and the underlying TEPs can change significantly over relatively short periods of time. Should these change materially the Equity Value could be materially different in these changed circumstances. Further, SRK has no obligation or undertaking to advise any person of any change in circumstances which comes to its attention after the date of this MER or to review, revise or update the MER or opinion.
1.6.3 Declaration SRK will receive a fee for the preparation of this report in accordance with normal professional consulting practice. This fee is not contingent on the outcome of the Offer and SRK will receive no other benefit for the preparation of this report. SRK does not have any pecuniary or other interests that could reasonably be regarded as capable of affecting its ability to provide an unbiased opinion in relation to the Mineral Resources, the Ore Reserves, the LoMp and the Equity Value of the Company.
Neither SRK, the Competent Persons nor any Directors of SRK have at the date of this report, nor have had within the previous two years, any shareholding in the Company, the Mining Assets or advisors of the Company. Consequently, SRK, the Competent Persons and the Directors of SRK consider themselves to be independent of the Company.
In this MER, SRK provides assurances to the Board of Directors of the Company that the TEPs, including production profiles, operating expenditures and capital expenditures, of the Mining Assets as provided to SRK by the Company and reviewed and where appropriate modified by SRK are reasonable, given the information currently available.
This MER includes technical information, which requires subsequent calculations to derive subtotals, totals and weighted averages. Such calculations may involve a degree of rounding and consequently introduce an error. Where such errors occur, SRK does not consider them to be material.
1.6.4 Consent SRK has given and has not withdrawn its written consent to the inclusion of its MER set out in “Prospectus: Mineral Expert’s Report” and references to its report and its name in the form and context in which they are respectively included and has authorised the contents of its report and context in which they are respectively included and has authorised the contents of its report for the purposes of compliance with the CMA Listing Rules.
1.6.5 Copyright Copyright of all text and other matter in this document, including the manner of presentation, is the exclusive property of SRK. It is an offence to publish this document or any part of the document under a different cover, or to reproduce and/or use, without written consent, any technical procedure and/or technique contained in this document. The intellectual property

SRK Consulting Ma'aden Gold MER – Main Report
U3330_Ma'aden MER.doc November, 2007 Page 9
reflected in the contents resides with SRK and shall not be used for any activity that does not involve SRK, without the written consent of SRK.
1.6.6 Disclaimers and Cautionary Statements for US Investors The United States Securities and Exchange Commission (the “SEC”) permits mining companies, in their filings with the SEC, to disclose only those mineral deposits that a company can economically and legally extract or produce from. Certain terms are used in this report, such as “resources”, that the SEC guidelines strictly prohibit companies from including in filings.
Ore Reserve estimates are based on many factors, including, in this case, data with respect to drilling and sampling. Ore Reserves are derived from estimates of future technical factors, future production costs, future capital expenditure, future product prices and the exchange rate between the SAR and the US$. The Ore Reserve estimates contained in this report should not be interpreted as assurances of the economic life of the Mining Assets or the future profitability of operations. As Ore Reserves are only estimates based on the factors and assumptions described herein, future Ore Reserve estimates may need to be revised. For example, if production costs increase or product prices decrease, a portion of the current Mineral Resources, from which the Ore Reserves are derived, may become uneconomical to recover and would therefore result in lower estimated Ore Reserves.
The LoMp, the TEPs and the Financial Models include forward-looking statements. These forward-looking statements are necessary estimates and involve a number of risks and uncertainties that could cause actual results to differ materially.
1.7 Qualifications of Consultants The SRK Group comprises 700 staff, offering expertise in a wide range of resource engineering disciplines. The SRK Group’s independence is ensured by the fact that it holds no equity in any project. This permits the SRK Group to provide its clients with conflict-free and objective recommendations on crucial judgment issues. The SRK Group has a demonstrated track record in undertaking independent assessments of resources and reserves, project evaluations and audits, MERs and independent feasibility evaluations to bankable standards on behalf of exploration and mining companies and financial institutions worldwide. The SRK Group has also worked with a large number of major international mining companies and their projects, providing mining industry consultancy service inputs. SRK also has specific experience in commissions of this nature.
This MER has been prepared based on a technical and economic review by a team of 12 consultants sourced from the SRK Group’s offices in the United Kingdom over a three-month period. These consultants are specialists in the fields of geology, resource and reserve estimation and classification, underground and open-pit mining, rock engineering, metallurgical processing, hydrogeology and hydrology, tailings management, infrastructure, environmental management and mineral economics.
The individuals who have provided input to this MER, who are listed below, have extensive experience in the mining and smelting industry and are members in good standing of appropriate professional institutions.
• Christopher Wilson, MAusIMM, PhD;
• David Pattinson, CEng, MIMMM, PhD;
• David Pearce, F.AusIMM, CPMin, MBA, M Eng.;
SRK Consulting Ma'aden Gold MER – Main Report
U3330_Ma'aden MER.doc November, 2007 Page 10
• Fiona Cessford, CBio (UK), PrSciNat, MSc;
• Howard Baker, MAIMM, MSc;
• Ian Brackley, CEng, MICE, MIMMM, FSAIMM, BSc, PhD;
• Iestyn Humphreys, MIMMM, AIME, PhD;
• Jane Joughin, PrSciNat, MSc;
• Lucy Roberts, GMAusIMM, PhD;
• Mark Campodonic, FGS, AIQ, MSc;
• Martin Pittuck, CEng, MIMMM, MSc; and
• Richard Connelly, CGeol, CEng, FIMMM, FGS, FIQ, FACE, MSc.
The Competent Person with overall responsibility for reporting of Mineral Resources is Mr Martin Pittuck, CEng, MIMMM, MSc who is an employee of SRK. Mr Martin Pittuck is a mining geologist with 12 years experience in the mining industry and has been responsible for the reporting of Mineral Resources on various properties internationally during the past five years.
The Competent Person with overall responsibility for reporting of Ore Reserves is Mr David Pearce, CEng, A.AusMMM, MSc, MBA, who is an employee of SRK. Mr David Pearce is a mining engineer with 20 years experience in the mining industry and has been involved in the reporting of Ore Reserves on various properties internationally during the past five years.


SRK Consulting Ma'aden Gold MER – Main Report
U3330_Ma'aden MER.doc November, 2007 Page 12
2 THE GOLD ASSETS
2.1 Introduction This section gives an overview of Ma’aden Gold including historical development, location and property description and historical (2004, 2005, 2006, 2007H1) and forecast (2007H2, 2008) operating results. Specifically where reference is made to legal compliance (in respect of title) within the regulatory environments in which the Company operates, SRK has placed reliance on the Company.
The historical production and expenditure statistics as reported in this section have on an asset by asset basis, unless otherwise stated, been derived from Ma’aden Gold’s management accounts and on-mine statistics. These in addition to historical information reported in other technical sections of this MER may differ from the Company’s/Ma’aden Gold’s published financial statements which are subject to equity reporting principles or such adjustments which may be included for public domain reporting. Furthermore, the cash cost statistics are reported on the basis of metal produced, as is industry practice, and not metal sold.
Cash costs as reported in this MER have been standardised on a gold by-product basis with gold production as the denominator. In recognition that the operating mines produce gold, silver and base metals in varying proportions, SRK has also included cash costs reported on a co-product basis where the gross operating cash costs (excluding by-product credits) are divided by equivalent gold production determined by the prevailing commodity prices determined during the reporting period.
2.2 Ma’aden Gold The Company intends to become a public listed company on Tadawul, the Saudi Arabian Stock Exchange. Ma’aden Gold maintains its principal executive offices in the city of Jeddah, Mecca Province, Saudi Arabia.
Ma’aden Gold’s principal activities include exploration, development, and operation of gold mines and metallurgical processing facilities which in addition to gold and silver also produce (Mahd Ad’Dahab and Al Amar) precious metals rich copper and zinc concentrates for third party toll smelting. Ma’aden Gold’s assets are all located in Saudi Arabia which include: five operations (Mahd Ad’Dahab, Al Amar, Bulghah, Sukhaybarat (processing facility only), and Al Hajar); one development property (Ad Duwayhi); five advanced exploration properties (Mansourah, Ar Rjum, Masarrah, As Suk and Zalim) and 33 other exploration properties (Figure 2.4).
Ma’aden Gold acts solely as an operating division of the Company and derives its revenues entirely from its Mining Assets. The exploitation licences (the “Exploitation Licences”) are held by Ma’aden and its subsidiary. Exploration and development activities are conducted through its head office which manages the licences for the development property, the advanced exploration properties and the exploration properties. Ma’aden Gold also provides management services to each of the operating mines through the following: General and Administration Division (Management; Operations; Industrial Relations; and Finance); Projects and Technical Services Division; and Exploration Division.
As at 1 July 2007 (Table 2.1), Ma’aden Gold had Ore Reserves of 1.3Moz of gold contained within 21.7Mt and grading 1.9g/t Au and Mineral Resources of 10.0Moz of gold (10.1Moz gold equivalent) contained within 132.8Mt and grading 2.3g/t Au (2.4g/t Au Eq).

SRK Consulting Ma'aden Gold MER – Main Report
U3330_Ma'aden MER.doc November, 2007 Page 13
Table 2.1 Ma’aden Gold: Mineral Resource and Ore Reserve statements as at 1 July 2007
JORC Code Statements Tonnage Grade Content (kt) (g/t Au) (g/t Au Eq) (koz Au) (koz Au Eq)
Ore Reserves Proved Mahd Ad'Dahab 447 10.6 11.0 153 158Subtotal 447 10.6 11.0 153 158Probable Mahd Ad'Dahab 792 7.6 7.9 194 202Al Amar 1,350 9.9 10.2 429 441Bulghah 16,768 0.8 0.8 428 428Sukhaybarat 164 0.4 0.4 2 2Al Hajar 2,143 1.3 1.4 87 99Subtotal 21,218 1.7 1.7 1,140 1,172Ore Reserves Mahd Ad'Dahab 1,239 8.7 9.0 347 360Al Amar 1,350 9.9 10.2 429 441Bulghah 16,768 0.8 0.8 428 428Sukhaybarat 164 0.4 0.4 2 2Al Hajar 2,143 1.3 1.4 87 99Total Ore Reserves 21,665 1.9 1.9 1,293 1,329Mineral Resources Measured Mahd Ad'Dahab 344 21.3 21.9 235 243Ad Duwayhi 7,222 2.8 2.8 648 648Subtotal 7,566 3.6 3.7 884 891Indicated Mahd Ad'Dahab 727 13.4 13.9 313 325Al Amar 1,864 11.3 11.6 679 698Bulghah 21,537 0.8 0.8 561 561Sukhaybarat 164 0.4 0.4 2 2Al Hajar 2,143 1.3 1.4 87 99Ad Duwayhi 6,359 5.7 5.7 1,169 1,169Advanced Exploration Projects 31,635 2.3 2.3 2,369 2,369Subtotal 64,430 2.5 2.5 5,181 5,223Measured + Indicated Mahd Ad'Dahab 1,071 15.9 16.5 549 568Al Amar 1,864 11.3 11.6 679 698Bulghah 21,537 0.8 0.8 561 561Sukhaybarat 164 0.4 0.4 2 2Al Hajar 2,143 1.3 1.4 87 99Ad Duwayhi 13,581 4.2 4.2 1,817 1,817Advanced Exploration Projects 31,635 2.3 2.3 2,369 2,369Total Measured + Indicated 71,996 2.6 2.6 6,064 6,113Inferred Mahd Ad'Dahab 174 16.8 17.5 94 98Al Amar 141 9.5 9.7 43 44Bulghah 2,431 0.7 0.7 56 56Ad Duwayhi 3,493 2.7 2.7 299 299Advanced Exploration Projects 54,528 2.0 2.0 3,448 3,448Subtotal 60,766 2.0 2.0 3,939 3,944Mineral Resources Mahd Ad'Dahab 1,245 16.1 16.6 643 665Al Amar 2,005 11.2 11.5 722 742Bulghah 23,968 0.8 0.8 617 617Sukhaybarat 164 0.4 0.4 2 2Al Hajar 2,143 1.3 1.4 87 99Ad Duwayhi 17,074 3.9 3.9 2,116 2,116Advanced Exploration Projects 86,164 2.1 2.1 5,817 5,817Total Mineral Resources 132,762 2.3 2.4 10,004 10,058
In 2006, Ma’aden Gold processed approximately 5.4Mt of ore and produced approximately 167koz of gold (193koz gold equivalent) at a by-product cash cost of US$283/oz. For the six months period ended 30 June 2007, Ma’aden Gold processed approximately 2.1Mt of ore and produced approximately 75koz of gold (86koz gold equivalent) at a by-product cash cost of US$292/oz.
Ma’aden Gold employs a total of 728 total employees costed (“TEC”), 607 of whom are employed directly at the Mining Assets: Mahd Ad’Dahab (234), Al Amar (112), Bulghah (106), Sukhaybarat (94), Al Hajar (61); and a further 121 are employed at Ma’aden Gold’s head office in Jeddah.
Total Environmental Liabilities comprise biophysical and social (Terminal Benefits) of US$27.1m (Biophysical – US$19.0m; Terminal Benefits – US$8.1m). At 30 June 2007, Ma’aden Gold had total Plant Property and Equipment (“PP&E”) valued at US$62.2m.
An analysis of international gold companies based on 2006 calendar statistics indicates that

SRK Consulting Ma'aden Gold MER – Main Report
U3330_Ma'aden MER.doc November, 2007 Page 14
Ma’aden Gold is ranked 46th in respect of production and 18th in respect of cash costs. Figure 2.1 presents the industry cash cost curve for mining companies based on equity participation and by-product reporting principles. Figure 2.2 presents the industry cash cost curve for mining operations based on equity participation and by-product reporting principles.
Figure 2.1 Ma’aden Gold: company C1 cash cost curve analysis (calendar 2006 results)
Spot Gold Price 1 July 2007, US$779/oz
3 Year Average Daily Price to 30 June 2007, US$529/oz
Q1,
US$
234/
oz
Q2,
US$
304/
oz
Q3,
US$
365/
oz
Ma'
aden
Gol
d, U
S$18
7/oz
0
100
200
300
400
500
600
700
800
0 5 10 15 20 25 30 35 40 45 50 55
Gold Production 2006 (Moz)
Cas
h C
osts
(US$
/oz)
0
100
200
300
400
500
600
700
800
Cash C
osts (US$/oz)
Figure 2.2 Mining Assets: mine C1 cash cost curve analysis (calendar 2006
results)
Spot Gold Price 1 July 2007, US$779/oz
3 Year Average Daily Price to 30 June 2007, US$529/oz
Q1,
US$
231/
oz
Q2,
US$
313/
oz
Q3,
US$
404/
oz
Mah
d A
d D
ahab
, US$
87/o
z
Bul
ghah
, US$
222/
oz
Al H
ajar
, US$
242/
oz
Sukh
ayba
rat,
US$
263/
oz
0
100
200
300
400
500
600
700
800
0 5 10 15 20 25 30 35 40 45 50 55
Gold Production 2006 (Moz)
Cas
h C
osts
(US$
/oz)
0
100
200
300
400
500
600
700
800
Cash C
osts (US$/oz)
The above graphs are derived from data provided by Brook Hunt in October 2007 where C1 Cash Cost comprises cash costs incurred from mining through to refined metal. Costs are net of by-product credits for primary gold mines (i.e. those where gold provides more than 65% of net revenues). For by-product gold mines (i.e. those where gold provides less than 65% of

SRK Consulting Ma'aden Gold MER – Main Report
U3330_Ma'aden MER.doc November, 2007 Page 15
net revenues), costs are allocated pro-rata according to gold contribution to net revenue.
2.2.1 History The Company was established as a Saudi Arabian joint stock company (“JSC”) in March 1997 under Royal Decree M/17. The Company’s formation was largely driven by the need for diversification of the national economy through expansion of the country’s non-oil activities and resulted in the unification of several separate mining-related activities in Saudi Arabia, partly held through various state held equity interests. The principal milestones achieved subsequent to its formation are:
• The commissioning of a zinc plant at Mahd Ad’Dahab in 1997;
• The commissioning of the Al Hajar mining and processing operation in 2001;
• The commissioning of the Bulghah mining and processing operation in October 2002;
• The construction of the Al Amar mining and processing operation in 2007H1;
• The completion of a pre-feasibility study for the Ad-Duwayhi Development Property in 2007H1; and
• Continued success in the development of the Central Arabian Gold Region (“CAG Region”) through exploration activities at the AEPs culminating in the delineation of Mineral Resources totalling 7.9Moz of gold contained within 103.2Mt at a grade of 2.4g/t Au.
Table 2.2 presents selected historical and forecast operating statistics for Ma’aden Gold.
Table 2.2 Ma’aden Gold: salient historical (2004-2007H1 inclusive) and forecast (2007H2, 2008) operating statistics
Statistics Units 2004 2005 2006 2007H1(1) 2007H2 2008Processing Tonnage (kt) 5,638 5,813 5,449 2,134 2,208 5,100Grade (g/t Au) 1.9 1.6 1.2 1.3 1.3 1.5Production Gold (koz Au) 265 240 167 75 71 182Silver (koz Ag) 467 434 293 149 133 379Zinc (t Zn) 0 0 983 294 617 6,150Copper (t Cu) 660 668 730 425 329 1,476Lead (t Pb) 0 0 0 88 96 193Gold Equivalent (koz Au Eq) 279 256 192 86 81 233Expenditures Cash Cost(2) - on mine (US$/t) 11.14 9.33 10.57 12.04 14.73 15.10Cash Cost(3) - Co-product (US$/oz) 233 220 317 320 425 376Cash Cost(4) - By-product (US$/oz) 225 207 283 292 391 293Capital Expenditure (US$m) 9.77 26.59 20.28 10.45 5.60 10.55
(1) The reduced cash operating costs for 2007H1 compared with 2007H2 is impacted by the significant (US$5.8m) under spend of corporate overheads (General and Administration, Projects and Technical Services, and Exploration). This under spend equates to a unit cash cost (by-product) basis of US$70/oz and is not assumed to continue in the current LoMp.
(2) On mine cash costs excluding concentrate and bullion related treatment, refining and realisation charges. (3) Co-product cash cost based on cash cost excluding by-product credits divided by gold equivalent production (payable). (4) By-product cash cost based on cash costs net of by-product credits divided by gold production (payable).
2.2.2 Strategy Ma’aden Gold’s strategy is represented in the following four key areas:
• Operations:
− Al Amar, specifically addressing the potential dilution risk and providing adequate technical/management support to ensure that the production build-up is achieved as projected in the LoMp,
− Bulghah, specifically addressing (1) the current non-achievement of stacked production at the heap leach facility, (2) the potential to investigate the current positive bias between grade control estimates and exploration model estimates, (3)

SRK Consulting Ma'aden Gold MER – Main Report
U3330_Ma'aden MER.doc November, 2007 Page 16
the economic risk associated with processing of lower (<0.8g/t Au) grade fresh ore with lower (50%) metallurgical recoveries,
− Sukhaybarat, specifically addressing the ability to maintain economic processing of fresh ore mined at Bulghah and processed at Sukhaybarat beyond 2010 should gold prices fall below US$600/oz;
• Mineral Resource and Ore Reserves: Enhancing the management systems at the operating mines specifically in respect of addressing the currency of the LoMps and establishing systems which enable annual updating on a routine basis as well as provide the foundation for longer term strategic planning. Key in this regard will be harmonising the long term commodity price assumptions used to support the Ore Reserve declaration;
• Central Arabian Gold Project (“CAG Project”): Establishing the technical and economic viability of the CAG Project to increase equivalent gold production to 250koz per annum by 2011 in the short term and establishing a growth base to expand beyond this by a further 250koz per annum in the long term (>2013) through:
− completion of a feasibility study for Ad Duwayhi by 2008Q4, − completion of a feasibility study for the Taif water pipeline project in 2008H2, − completion of pre-feasibility studies for Mansourah, Ar Rjum, Masarrah, As Suk and
Zalim in 2008; and • Exploration: Continuation of the current successful strategy targeting exploration
properties in the CAG Region and the Northern Arabian Shield Region (“NAS Region”) as exemplified by the 7.9Moz attributed to the Development Property and the advanced exploration property (resource definition cost of US$5.2/oz). The total licence areas under management will reduce from 71,044.0km2 to 47,521.0km2, of which 10,923.8km2 represent licences in which the AEPs are contained and 36,597.2km2 represent licences in which only EPs are managed. The current exploration programme (2007H2 to 2010 inclusive) assumes further expenditures amounting to US$33.5m, the larger portion (52%) of which is to be expended on Exploration Licences in the NAS Region.

SRK Consulting Ma'aden Gold MER – Main Report
U3330_Ma'aden MER.doc November, 2007 Page 17
Figure 2.3 Ma’aden Gold: LoMp equivalent gold production (koz) and cash costs (US$/oz)
0
50
100
150
200
250
2004
2005
2006
2007
2008
2009
2010
2011
2012
2013
2014
Years (Calendar)
Ann
ual P
rodu
ctio
n (k
oz)
0
50
100
150
200
250
300
350
Cash C
ost (US$/oz)
Mahd Ad'Dahab Al Amar Bulghah Sukhaybarat
HISTORY FORECAST
2.3 Mining business
2.3.1 Description of properties The Gold Assets comprise operational mining licence areas which total 110.3km2 (Table 2.3). The Ore Reserves as stated for these Mining Assets are planned for depletion prior to expiry of the current Exploitation Licences. Ma’aden Gold manages Exploration Licences which total 47,521.0km2 which cover 38 properties (5 AEPs and 33 EPs) located in the CAS Region and the NAS Region. Certain of the Exploration Licences are due to expire or have expired in 2007. SRK has been informed by Ma’aden Gold that all necessary applications for renewal have been submitted and that the areas stated are net of the necessary reductions required in accordance with the licence conditions. Furthermore Ma’aden Gold confirms that all minimum expenditures necessitated by the licence conditions have been fulfilled and that it expects renewal of all licences reviewed in this MER.
Table 2.4 gives the details of production capacities and throughputs attributable to the operating Mining Assets.
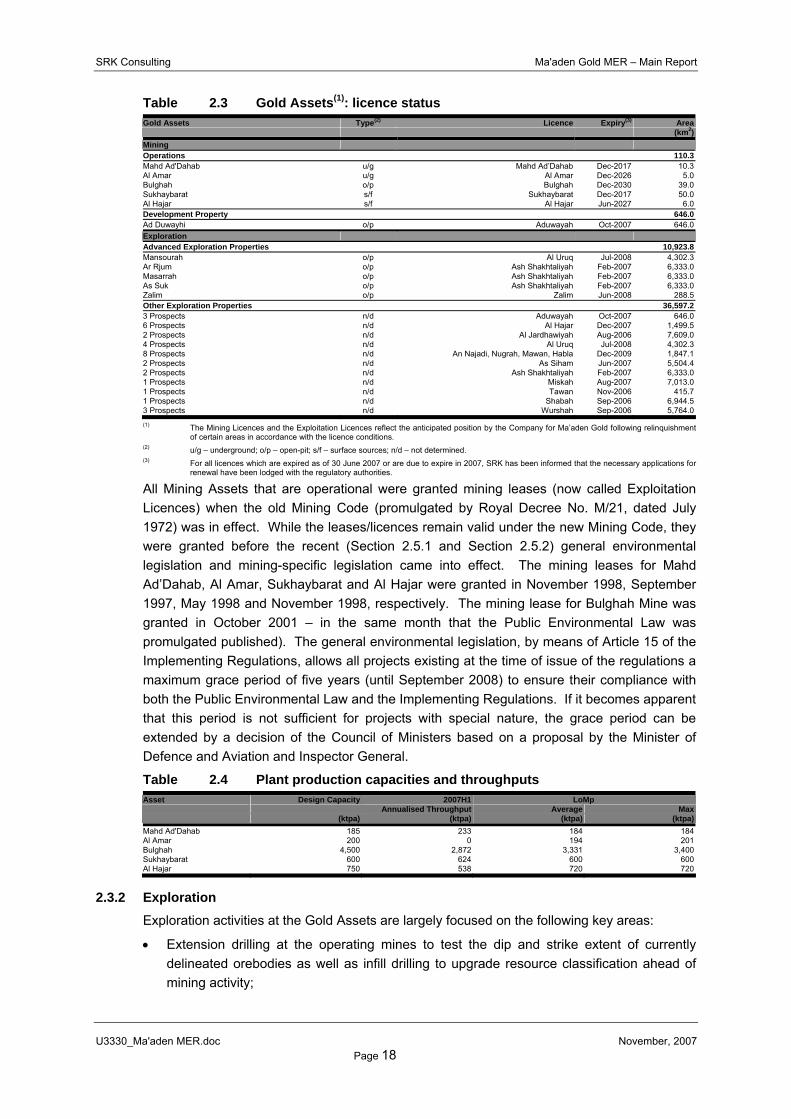
SRK Consulting Ma'aden Gold MER – Main Report
U3330_Ma'aden MER.doc November, 2007 Page 18
Table 2.3 Gold Assets(1): licence status Gold Assets Type(2) Licence Expiry(3) Area
(km2)Mining Operations 110.3Mahd Ad'Dahab u/g Mahd Ad’Dahab Dec-2017 10.3Al Amar u/g Al Amar Dec-2026 5.0Bulghah o/p Bulghah Dec-2030 39.0Sukhaybarat s/f Sukhaybarat Dec-2017 50.0Al Hajar s/f Al Hajar Jun-2027 6.0Development Property 646.0Ad Duwayhi o/p Aduwayah Oct-2007 646.0Exploration Advanced Exploration Properties 10,923.8Mansourah o/p Al Uruq Jul-2008 4,302.3Ar Rjum o/p Ash Shakhtaliyah Feb-2007 6,333.0Masarrah o/p Ash Shakhtaliyah Feb-2007 6,333.0As Suk o/p Ash Shakhtaliyah Feb-2007 6,333.0Zalim o/p Zalim Jun-2008 288.5Other Exploration Properties 36,597.23 Prospects n/d Aduwayah Oct-2007 646.06 Prospects n/d Al Hajar Dec-2007 1,499.52 Prospects n/d Al Jardhawiyah Aug-2006 7,609.04 Prospects n/d Al Uruq Jul-2008 4,302.38 Prospects n/d An Najadi, Nugrah, Mawan, Habla Dec-2009 1,847.12 Prospects n/d As Siham Jun-2007 5,504.42 Prospects n/d Ash Shakhtaliyah Feb-2007 6,333.01 Prospects n/d Miskah Aug-2007 7,013.01 Prospects n/d Tawan Nov-2006 415.71 Prospects n/d Shabah Sep-2006 6,944.53 Prospects n/d Wurshah Sep-2006 5,764.0
(1) The Mining Licences and the Exploitation Licences reflect the anticipated position by the Company for Ma’aden Gold following relinquishment of certain areas in accordance with the licence conditions.
(2) u/g – underground; o/p – open-pit; s/f – surface sources; n/d – not determined. (3) For all licences which are expired as of 30 June 2007 or are due to expire in 2007, SRK has been informed that the necessary applications for
renewal have been lodged with the regulatory authorities.
All Mining Assets that are operational were granted mining leases (now called Exploitation Licences) when the old Mining Code (promulgated by Royal Decree No. M/21, dated July 1972) was in effect. While the leases/licences remain valid under the new Mining Code, they were granted before the recent (Section 2.5.1 and Section 2.5.2) general environmental legislation and mining-specific legislation came into effect. The mining leases for Mahd Ad’Dahab, Al Amar, Sukhaybarat and Al Hajar were granted in November 1998, September 1997, May 1998 and November 1998, respectively. The mining lease for Bulghah Mine was granted in October 2001 – in the same month that the Public Environmental Law was promulgated published). The general environmental legislation, by means of Article 15 of the Implementing Regulations, allows all projects existing at the time of issue of the regulations a maximum grace period of five years (until September 2008) to ensure their compliance with both the Public Environmental Law and the Implementing Regulations. If it becomes apparent that this period is not sufficient for projects with special nature, the grace period can be extended by a decision of the Council of Ministers based on a proposal by the Minister of Defence and Aviation and Inspector General.
Table 2.4 Plant production capacities and throughputs Asset Design Capacity 2007H1 LoMp
Annualised Throughput Average Max (ktpa) (ktpa) (ktpa) (ktpa)
Mahd Ad'Dahab 185 233 184 184Al Amar 200 0 194 201Bulghah 4,500 2,872 3,331 3,400Sukhaybarat 600 624 600 600Al Hajar 750 538 720 720
2.3.2 Exploration Exploration activities at the Gold Assets are largely focused on the following key areas:
• Extension drilling at the operating mines to test the dip and strike extent of currently delineated orebodies as well as infill drilling to upgrade resource classification ahead of mining activity;

SRK Consulting Ma'aden Gold MER – Main Report
U3330_Ma'aden MER.doc November, 2007 Page 19
• Extension drilling at the AEPs, specifically targeting extension drilling and infill drilling to extend the currently defined resource base and upgrade resource classification ahead of completing pre-feasibility studies; and
• Greenfield exploration activity comprising, GIS analysis, regional reconnaissance prospecting, geophysical mapping (regional and local), geochemical soil/rock sampling, surface trenching, target generation and pre-resource drilling.
Ma’aden Gold’s Exploration Division comprises 59 TECs which are also supported by the Project and Technical Services Division. Exploration expenditures on the exploration properties and Ad Duwayhi up to 2007H1 total US$42.1m, 85% of which was expended on Exploration Licences situated in the CAG Region. The current exploration programme (2007H2 to 2010 inclusive) assumes further expenditures amounting to US$33.5m, the larger portion (52%) of which is to be expended on Exploration Licences in the NAS Region.
2.3.3 Geology Historical mining activities on the Arabian Peninsula dated to 2100 BC and by carbon dating of smelting charcoal confirmed at 1000 BC. Between 750 AD and 1150 AD over 1,000 mines and workings were developed in the Arabian Shield with gold, silver and copper the principal metals sought. Mining activities during this period used stone hammers and fire setting, the thermal shattering of rock, often to depths of 15m and occasionally to 80m. The inflow of groundwater at depth usually caused mining to cease. Mineral processing was by crushing and grinding, using hammers and stone querns, smelting recovered gold, silver and copper using charcoal and bellows and also the use of fluorite as a flux. Following the decline of the Caliphates, mining activity decreased until the 20th century with the introduction of modern machinery at Mahd Ad’Dahab in the 1930s.
Saudi Arabia is located between the African Shield to the south and the more recent Alpine-Himalayan Zagros mountains to the north. This geological junction has been active over the past thousand million years, and has given rise to a number of important mineral deposits that were formed during the geological development of Saudi Arabia.
The geology of Saudi Arabia can be divided into two main zones: the Shield area in the west, adjacent to the Red Sea, covering about one third of the country, and the surrounding sedimentary rocks that dip gently towards the Arabian Gulf. The Shield, formed during the period about 1,000Ma to 500Ma, is geologically part of the African plate that extends south into Egypt and Sudan. During this time interval, a number of important geological events occurred including volcanic outpourings, the intrusion of numerous granites and the rapid recycling of eroded sediments. These events took place in an ocean island arc environment which eventually came together to from the land mass now underlying the country.
Several types of mineralisation have been identified, including gold associated with intrusions, gold and base metals in hydrothermal systems, and gold associated with shear zones.
2.3.4 Mining The mining process can be divided into two main phases for both underground and open-pit operations: creating access to the orebody; and mining the orebody. These basic processes apply to all of the Mining Assets.
For underground mining the following apply:
• Access to the orebody: In the underground mines, access to the orebody is by means of surface declines and/or adits developed horizontally to access orebodies located within

SRK Consulting Ma'aden Gold MER – Main Report
U3330_Ma'aden MER.doc November, 2007 Page 20
topographical highs. These declines combined with horizontal development at various intervals (known as levels) extend access to the horizon of the orebody to be mined. Orebody development then provides specific mining access; and
• Mining the orebody: The process of ore removal starts with drilling and blasting the accessible ore. The blasted stopes are then cleaned and the ore is transferred to the transport system. In the underground mines, once ore has been broken, mine trucks collect from the stopes and transfer it directly to surface via the declines. Once on surface ore is transported either by conveyor belts directly or via roads to the metallurgical processing plants. In addition to ore, waste rock broken to access the orebodies may similarly be transported and placed on waste rock dumps if not stowed underground.
For open-pit mining the following apply:
• Access to the orebody: At the open-pits, the orebodies where not outcropping, are exposed through the process of pre-stripping where generally non-mineralised waste is removed to enable access to economic ore. Deepening of the open-pits occurs in stages, termed push-backs where waste material is mined sufficiently in advance to establish an inventory of pre-stripped ore. Access to the open-pits is via ramps whose gradients are generally less than 8% and enable truck access for transportation of both ore to Run-of-Mine (“RoM”) stockpiles and waste to dedicated rock dumps. Depending on the diggability of the rock, waste may either be free-digging or require drilling and blasting prior to excavation. Slope angles are generally softened closer to the surface, specifically in weathered material and mining progresses from each push-back, increasing in depth and haul distance to the ultimate pit design; and
• Mining the orebody: Once exposed, ore mining progresses in benches which are subdivided into vertical sections termed flitches. Depending on the strength of the rock-mass, the ore may require drilling and blasting prior to excavating and loading into dedicated mine trucks for hauling to the RoM stockpile or directly to the RoM crusher. Where drilling and blasting is required, vertical/sub-vertical blast-holes are drilled on each bench to the next bench elevation prior to blasting. During this process grade control techniques are employed to differentiate between economic ore, marginal ore and waste material in order to determine the optimal blast-hole loading with explosives. In free dig material, similar sampling techniques are used to establish dig lines in order to differentiate between economic ore, marginal ore and waste accordingly. Sampling of blast-holes and blasted material enables further reconciliation between exploration resource models, grade control models, mining and metallurgical processing.
2.3.5 Metallurgical processing Ma’aden Gold currently has five main metallurgical processing complexes. The principal extraction processes employed at the metallurgical processing complexes employ a range of techniques which are largely sub-divided into those applicable for direct cyanidation via heap leaching and those involving more complex process routes involving Carbon-in-Pulp (“CIP”) or Carbon-in-Leach (“CIL”) for gold recovery and flotation to recover precious metals rich copper and zinc concentrates.
Heap leaching operations at both Bulghah and Al Hajar comprise processing of RoM ore through a comminution (crushing only) circuit to produce a slurry which is then agglomerated with cement and cyanide prior to stacking in layers on a slightly sloping, impervious (plastic and/or clay lined) pad. A cyanide solution is applied either via sprinklers or drip irrigation (to

SRK Consulting Ma'aden Gold MER – Main Report
U3330_Ma'aden MER.doc November, 2007 Page 21
minimise evaporation and drift losses). The solution containing the precious metals ("pregnant solution") percolates through the crushed ore until it reaches the liner at the bottom of the heap where it drains into a storage (pregnant solution) pond. Maximum recovery is attained, typically over a time period not less than 100 days.
The pregnant solution is then pumped to the gold recovery plant where suspended solids are removed and the solution is then processed in a conventional Merrill-Crowe (Al Hajar) precious metal circuit via zinc precipitation, thereafter being smelted to produce a precious metals doré.
At Bulghah, the pregnant solution is recovered by carbon adsorption to produce a loaded carbon product which is then transported to Sukhaybarat for processing in its elution circuit and electrowinning circuit to produce gold in doré form.
After separating the precious metals from the pregnant solution, the dilute cyanide solution (now called "barren solution") is normally re-used in the heap leach process or occasionally sent to an industrial water treatment facility where the residual cyanide is treated and residual metals are removed.
For ores requiring a greater degree of comminution to recover gold as well as base metal concentrates the principal processes involved are:
• Comminution: The process of breaking up the ore to expose and liberate sulphide materials from the waste rock for onward treatment. Conventionally, this process occurs in multi-stage crushing and milling circuits, which includes the use of primary crushing (jaw crushing), secondary and tertiary crushing (cone), milling (SAG), ball milling and centrifugal gravity concentration (specifically for gold). Typically ore must be ground to a minimum size before proceeding to the next stage of treatment.
Any gold recovered in the comminution circuit is either directly smelted to produce a doré or further processed by conventional leaching in cyanide, using CIP or CIL techniques; and
• Flotation: A selective process for separating minerals whereby the ground ore (base metals bearing slurry) is mixed with xanthate reagents, which react with the sulphide mineral to make their surfaces hydrophobic. The slurry of hydrophobic mineral-bearing ore and hydrophilic gangue is then introduced to an agitated tank which is aerated, creating bubbles. The hydrophobic particles of mineral-bearing ore attach to the air bubbles, which rise to the surface, forming a froth. The froth is removed and the concentrated mineral (“concentrate”) is thickened and water removed by filtration prior to drying. Typically, the concentrations of base metals from RoM feed to the comminution circuit are as follows: the copper concentrate content will increase from 1.0% Cu to in excess of 18% Cu; and the zinc concentrate content will increase from 1.5% Zn (5.0% Zn at Al Amar) to in excess of 50% Zn. The concentrates which also contain gold and silver are then sold to third parties for toll smelting.
Precious metals produced in doré form at the operations are subsequently refined by third parties to produce gold and silver bullion.
Base metals concentrates are treated by pyrometallurgical (smelting) methods, by third parties, which are used to produce copper and zinc metal and recover gold and silver.
2.3.6 Services, supplies and Material Contracts Mining activities, especially when located in remote areas require extensive services which include mining engineering, planning, mineral resource management, provision of supplies

SRK Consulting Ma'aden Gold MER – Main Report
U3330_Ma'aden MER.doc November, 2007 Page 22
and materials, and other logistical support. These services are currently supplied by a combination of both in-house and external contractors and consultants. The majority of the contracts entered into during the course of 2007 and/or in effect during 2007H1 relate to the offtake agreements in respect of:
• Sales of copper concentrates at Jeddah Commercial Sea Port, Mecca Province situated on the Read Sea to third parties for toll treating at various international smelters;
• Sales of zinc concentrates at Yanbu Commercial Sea Port, Medina Province situated on the Read Sea to third parties for toll treating at various international smelters; and
• Sales of doré to third parties for toll refining located at the L’azurde Refinery in Riyadh city, Saudi Arabia.
2.3.7 Human resources management Ma’aden Gold comprises a management team based in Jeddah which comprises three main divisions:
• General and Administration including: Management Division, Operations Division, Industrial Relations Division and Finance Division;
• Exploration; and
• Projects & Technical Services.
Each operational management team comprises of a general mine manager supported by discipline managers in the following areas: ore reserves and mineral resources, mining, metallurgical processing, engineering, financial, and Safety, Health and Environment (“SHE”) .
The Company has specific policies and practices in place which address, on an integrated basis, its human resource requirements: specifically in respect of training and development; productivity initiatives; remuneration; and industrial relations. Recruitment is informed in the main by the operational requirements for the Mining assets for specific skills, by the extent of labour turnover levels and by relevant legislation.
Table 2.5 gives the historical and forecast human resource distribution per calendar period for the Mining Assets and Head Office.
Table 2.5 Mining Assets: human resource statistics (historical and forecast) Human Resources Units 2004 2005 2006 2007H1 2007H2 2008Mahd Ad'Dahab (No) 227 223 229 234 234 234Al Amar (No) 7 20 84 112 0 170Bulghah (No) 127 97 98 106 106 106Sukhaybarat (No) 85 85 92 94 94 94Al Hajar (No) 64 60 77 61 61 61Head Office (No) 143 109 124 121 121 121Total (No) 653 594 704 728 616 786
2.3.8 Occupational Health and Safety The Safety, Health and Environment at the Company provides support services to all operations, exploration sites and projects and promotes the implementation of the Company’s health and safety policy. The Company is not formally accredited in respect of compliance with OHSAS 18001 however the Company currently utilises the information contained in OHSAS 18001 and Title 30 Code of Federal Regulation (US Department of Labour) (“30 CFR”) as a guide to occupational health and safety and has also developed a Safety, Health and Environmental management system manual.
The principal occupational health issues at hard rock mining operations include silica dust exposure and silicosis, occupational lung diseases and noise induced hearing losses. No evidence was however provided by the Company in respect of details supporting the

SRK Consulting Ma'aden Gold MER – Main Report
U3330_Ma'aden MER.doc November, 2007 Page 23
assessment and the extent to which such occupational health issues impact on the current labour force.
Table 2.6 presents the safety statistics for the Gold Assets and includes the lost time injury frequency rate (“LTIFR”) for 2005 through 2007H1 inclusive. These have been determined from the reported lost time accidents recorded and converted to a rate per million hours worked assuming the reported TEC per period, 48 working weeks per annum, five working days per week and eight hours per day. The overall safety performance of the Mining Assets during 2007H1 (measured against performance during 2006) is summarised as follows: no fatalities; an increase in the LTIFR from 9.74 to 15.64 per million man hours worked. For comparison the Ontario benchmark target is 0.15 per million man hours for fatality rates and 7.50 per million man hours for LTIFR.
Table 2.6 Gold Assets: safety statistics Assets 2005 2006 2007H1LTIFR Mahd Ad'Dahab 2.34 4.55 17.81Al Amar 0.00 6.20 27.90Bulghah 5.37 5.31 9.83Sukhaybarat 0.00 22.64 11.08Al Hajar 0.00 20.29 17.08Exploration 0.00 8.40 0.00Total 1.95 9.74 15.64
2.3.9 Environmental The Company’s Health, Safety and Environmental Policy commits to the establishment of a health, safety and environmental management system. Ma’aden has designed an environmental management system (“EMS”) and an occupational health and safety system (“OHSS”) manuals and intends to introduce these to the whole Ma’aden group in the second half of 2007.
The Company is not currently ISO 14001 compliant and SRK notes that the proposed EMS system and policy statement does not reference compliance with the World Bank, Equator Principles or the principles established by the International Council of Mining and Metals (“ICMM”). Notwithstanding this limitation, the Company has employed external consultants for the generation of certain regulatory documentation: specifically Environmental Impact Assessments (“EIAs”) for some mines and closure plans for other mines.
SRK has assessed Ma’aden Gold’s performance in this area in respect of compliance with World Bank, Equator Principles, ICMM and local regulatory requirements. Details regarding these components are given in the site specific sections of this MER.
Based on the items defined at each operation and discussions held with the Company, SRK has estimated the total Environmental (biophysical closure) liabilities and Social (terminal benefits liabilities – “TBL”) for the Gold Assets as summarised in Table 2.7. To date, no cash provision has been made in respect of funding this liability. Whilst not a requirement it is understood that the liability will be funded from future cashflows as generated by implementation of the current LoMps.
Table 2.7 Gold Assets: environmental (bio-physical and social) liabilities Assets Biophysical Closure Terminal Benefits Liability Total Closure
(US$m) (US$m) (US$m) (Year)Mahd Ad'Dahab 6.4 1.8 8.2 2012Al Amar 2.0 2.1 4.1 2014Bulghah 2.5 0.4 2.9 2011Sukhaybarat 4.0 0.6 4.6 2014Al Hajar 2.1 0.3 2.4 2010Head Office(1) 2.0 2.9 4.8 2014Total 19.0 8.1 27.1 2014(1) Head Office biophysical closures assumed for exploration properties amounting to 39 sites at US$50k per site.

SRK Consulting Ma'aden Gold MER – Main Report
U3330_Ma'aden MER.doc November, 2007 Page 24
2.4 Overview of the Gold Assets
2.4.1 Mahd Ad’Dahab Introduction: Mahd Ad’Dahab comprises an underground mine (the “Mahd Ad’Dahab Mine”) processing a gold rich polymetallic ore at the Mahd Ad’Dahab processing facility (the “Mahd Ad’Dahab Plant”) at a rate of 185ktpa to produce gold in doré and copper and zinc concentrates which are sold to third parties for toll smelting and refining. Ma’aden Gold has a 100% interest in Mahd Ad’Dahab and as at 30 June 2007, the value of the PP&E is US$4.2m.
History: Modern exploration, development and production history commenced with the re-discovery of the deposit in 1932 and the formation of the Saudi Arabian Mining Syndicate (“SAMS”): a joint venture between the Government of Saudi Arabia (“GoSA”) and the American Smelting and Refining Company (“ASRC”). This resulted in commercial production in 1939 with the treatment of ancient (pre 1250 AD) tailings and the sinking of three shafts, an adit level and four other main levels down to 200m below surface. The operation employed 400 people and produced some 0.7Moz of gold and 0.9Moz of silver until cessation of operations in 1954 due to increasing production costs and the then low price of gold. In the 1970s exploration activity identified new orebodies some 0.5km to the south of the previous operations which lead to the completion of a feasibility study in 1983 to establish an underground mine producing copper-gold concentrate for toll smelting and gold in doré. Commercial production commenced in June 1988 and has continued uninterrupted to date resulting in the processing of 3.6Mt of ore grading 19.5g/t Au containing 2.2Moz of gold to produce 2.0Moz of gold.
In 1992, a Saudi private company was commissioned to establish a 40m deep open-pit operation which combined with a heap leach operation (1995) processed a total of 1.7Mt of ore grading 2.5g/t Au to produce 80koz of gold by 31 December 2001. In 1997, a zinc plant was commissioned which operated until December 2003 prior to mothballing due to the prevailing zinc price. In January 2006, the zinc circuit was re-commissioned and currently treats gold circuit tails as well as some of the historically produced tailings.
From 1 January 2004 to 30 June 2007, Mahd Ad’Dahab processed 741kt of ore and surface sources grading 9.2g/t Au with an average recovery of 91.0% to produce 199koz of gold (249koz gold equivalent) at an average cash cost (by-product basis) of US$154/oz (US$223/oz co-product basis).
Location: Mahd Ad’Dahab is situated in the western region of the country known as the Hejaz in the Al Madinah Province, Saudi Arabia, approximately 610km west-southwest of Riyadh, the capital city of Saudi Arabia. Located at latitude 23°30’N and longitude 40°52’E, at an elevation of 1,050m above mean sea level (“amsl”), the site is some 165km southeast of the provincial capital Medina. The site is accessed (Figure 2.5) along a combination of national (109km – northwest from Medina to Hanakiyah along highway 60) and local (176km – south from Hanakiyah) roads, a total travelled distance of 284km from Medina. The town of Mahd Ad’Dahab with a population of 1,500 borders the eastern boundary of the Exploitation Licence and is situated in the GMT+3 time zone.
Terrain: The landform is dominated by the Harrat Kishb mountain range and the orebodies lie within and beneath the Jabal Mahd hill, the crest of which extends to 1,231m amsl. The natural topography is typical for the central desert plateau region of Saudi Arabia comprising a rugged dry surface where wide shallow channels, originally formed from rainfall run-off and smoothed out by wind erosion, report to wadis. Vegetation on the central plateau region is sparse and is classified as xeromorphic dwarf-shrublands. Accordingly, agricultural land

SRK Consulting Ma'aden Gold MER – Main Report
U3330_Ma'aden MER.doc November, 2007 Page 25
capability is limited and includes cultivation along the wadis and goat herding.
Climate: The climate is classed as desert with hot summers, cold winters and low humidity. Mean daily temperatures of 41.9ºC (maximum) and 7ºC (minimum) and extreme maximum temperatures of 47ºC have been recorded in the region of the mine. The average annual rainfall is in the order of 50mm, with high variations from year to year. Precipitation falls as short and heavy showers. The total water deficit of evaporation over precipitation is 1,065mm per year.
Title and Rights: The current Exploitation Licence (Royal Decree No. M/9) extends over an area of 10.3km2 and is valid until December 2017 which is 5 years subsequent to the depletion of the current Ore Reserves.
Geology: Located on the Precambrian Shield of Saudi Arabia, the host rocks comprise a mafic to felsic volcanic-sedimentary sequence which forms an east trending homoclinal structure trending east with a northerly dip from 30° to 75°. These rocks have been complexly faulted by steeply dipping north to north-northwest and northwest trending faults. The orebodies comprise vein complexes (intruded by dykes) which trend north-northwest to north with some veins trending northwest. These are contained within a broad belt approximately 900m long and 900m wide. Mineralisation is associated with multiphase quartz veining and silicification developed along predominant north to north-northwest trending faults and economic gold mineralisation is associated with quartz, pyrite, chalcopyrite, sphalerite, galena and silver. The quartz and massive sulphide vein systems are subdivided into four specific zones: SAMS; Western Zone; Eastern Zone; and Northern Zone. The individual veins are generally narrow (0.5m to 2.0m) and the stockwork zones (specifically in the Eastern Zone) range up to 20.0m. All vein systems indicate steeply north pitching ore shoots.
Ore Reserves and Mineral Resources: As at 1 July 2007, Mahd Ad’Dahab has Ore Reserves of 347koz of gold (360koz gold equivalent) contained within 1.2Mt and grading 8.7g/t Au (9.0g/t Au Eq). This Ore Reserve includes a total of 232kt of surface sources grading 0.8g/t Au (0.9g/t Au Eq) containing 6koz of gold (7koz gold equivalent). Total Mineral Resources comprise 643koz of gold (665koz gold equivalent) contained within 1.2Mt and grading 16.1g/t Au (16.6g/t Au Eq).
Mining Operations comprise underground mining at a rate of 185ktpa using a combination of fully mechanised sub-level stoping and cut-and-fill mining methods. The mine is accessed by a primary decline to the main production levels, the deepest of which is some 190m below the general desert surface (1,060m amsl). A further production level is also accessed via a mountainside adit. Waste rock from primary development is used for filling the stopes in the cut-and-fill mining method. Underground mining of the Ore Reserve is planned to continue at the projected rate of 185ktpa until depletion in 2012.
Processing Plants: The Mahd Ad’Dahab Plant processes ore mined from the underground operation as well as reclaimed tailings as direct feed to the zinc circuit. The processing facility comprises a comminution circuit (rated capacity 185ktpa), a copper circuit, a gold circuit and a zinc circuit which produces copper and zinc concentrates for third party toll smelting and gold in doré form for third party refining. Ore processing involves crushing (primary through tertiary) in the comminution circuit to produce a blended ore which is then reclaimed to feed the copper circuit. The copper circuit comprises milling and flotation to produce a copper concentrate with the tails feeding the CIP gold circuit. Tailings arising from the gold circuit are then onwards processed together with the reclaimed high grade zinc tailings (2004 and 2005 tailings production) in the zinc circuit by flotation to produce a zinc concentrate. Final tailings

SRK Consulting Ma'aden Gold MER – Main Report
U3330_Ma'aden MER.doc November, 2007 Page 26
are then thickened and filtered prior to transportation by truck to two dry-tailings storage facilities (“TSF”). A new TSF was commissioned in 2005 located some 0.6km south-east of the Mahd Ad’Dahab Plant. Overall payable gold recovery for 2007H1 is estimated at 91.6%.
Capital Projects: Other than sustaining capital there are no specific capital projects associated with the Ore Reserves. In 2007H2 Ma’aden Gold has budgeted capital expenditures of US$1.3m and the total capital commitment from 1 July 2007 through to 2012 is US$10.3m.
Human Resources: The TEC in 2007H1 is 234 which is planned to remain constant throughout the LoMp until depletion of the Ore Reserves in 2012.
Environmental Liabilities comprising biophysical and social (Terminal Benefits liability) for the current LoMp at Mahd Ad’Dahab amount to US$8.1m: Biophysical – US$6.4m; Terminal Benefits – US$1.7m.
Operating Performance (Table 2.8): Milled tonnage has remained relatively constant since 2004 with head grades steadily increasing to in excess of 11g/t Au and leading to an increase in gold production from 55koz to an annualised amount of 60koz based on operating performance in 2007H1. On-mine (excluding by-product credits and concentrate treatment charges) unit operating expenditures have, owing to the impact of reprocessing the historical zinc tailings decreased from US$73/t in 2004 to US$59/t by 2007H1. The reported cash costs per ounce however are significantly impacted by the toll treatment charges and whether cash costs are stated on a co-product (equivalent gold) or by-product (non-gold revenue deducted from costs) basis. For the period ending 2007H1 Mahd Ad’Dahab produced 29koz Au (39koz Au Eq) at cash costs per ounce (by-product basis) of US$121/oz.
Future Considerations at Mahd Ad’Dahab are largely focused on maintaining current performance and development rates. The Ore Reserves are derived from essentially manual estimation techniques and potential exists to optimise this as well as upgrading the current Inferred Mineral Resource to the Indicated Mineral Resource category and extending mine life by one year. Further potential beyond this is largely dependent on further exploration in the immediate underground mining areas. None of Ma’aden Gold’s current regional exploration prospects are situated in the immediate vicinity of Mahd Ad’Dahab.
Table 2.8 Mahd Ad’Dahab: historical and forecast operating results Statistics Units 2004 2005 2006 2007H1 2007H2 2008Processing Tonnage (kt) 178 183 262 117 113 225Grade (g/t Au) 10.3 10.7 7.5 8.7 8.9 9.0Production Gold (koz Au) 55 58 56 29 30 60Silver (koz Ag) 215 167 129 91 65 130Zinc (t Zn) 0 0 983 294 617 1,236Copper (t Cu) 660 668 730 425 329 660Lead (t Pb) 0 0 0 88 96 193Gold Equivalent (koz Au Eq) 64 70 77 39 38 75Expenditures Cash Cost(1) - on mine (US$/t) 73 75 53 59 65 65Cash Cost(2) - Co-product (US$/oz) 235 221 216 221 234 235Cash Cost(3) - By-product (US$/oz) 207 185 87 121 112 124Capital Expenditure (US$m) 0.00 1.06 1.21 1.10 1.29 1.98
(1) On mine cash costs excluding concentrate and bullion related treatment, refining and realisation charges. (2) Co-product cash cost based on cash cost excluding by-product credits divided by equivalent gold production (payable). (3) By-product cash cost based on cash costs net of by-product credits divided by gold production (payable).
2.4.2 Al Amar Introduction: Al Amar comprises an underground mine (the “Al Amar Mine”) which is planned to process a gold rich polymetallic ore at the Al Amar processing facility (the “Al Amar Plant”) at a rate of 200ktpa to produce gold in doré and copper and zinc concentrates which are sold to third parties for toll smelting and refining. Construction was completed during

SRK Consulting Ma'aden Gold MER – Main Report
U3330_Ma'aden MER.doc November, 2007 Page 27
2007H1 and the facility is currently undergoing commissioning and production build up with full production planned to be achieved in 2009Q1. The current LoMp is however based on the original feasibility study completed during 2001Q4 and no detailed re-working has been undertaken by Ma’aden Gold other than adjustments to the then estimated operating and capital expenditure forecasts. Ma’aden Gold has a 100% interest in Al Amar and as at 30 June 2007, the value of the PP&E is US$30.1m.
History: Modern exploration, development and production history commenced during the 1950s and initially comprised three exploration phases from 1955 through to 1988: Directorate of Oil and Mineral Affairs (1955-1964); Bureau de Recherches Géologiques et Minières (“BRGM”) (1968-1978); and Riofinex (1982-1988). In 1990 Ma’aden Gold carried out detailed exploration on the north vein zone by drilling an additional 12 drillholes which lead to the development of a feasibility study, completed by SRK in 1994. In 1997 the company was awarded a mining licence and commenced on a pre-production development stage and developed a new decline in addition to establishing vein development on five levels. Further exploration drilling by Ma’aden preceded the completion of an updated feasibility study in 2001Q4 by GBM Minerals Engineering Consultants Ltd (“GBM”).
In 2003Q4, SNC Lavalin Inc was awarded an Engineering Procurement and Construction Management Contract (“EPCM”) and following detailed engineering design, on-site construction activities began in 2004Q3 with production scheduled for 2006. Owing to various procurement delays, the planned start-up scheduled was not achieved resulting in a 18-month delay with current forecasts assuming full production in 2009Q1.
Location: Al Amar is situated in the Ar Riyadh Province, Saudi Arabia, approximately 195km southwest of Riyadh, the capital city of Saudi Arabia. Located at latitude 23°46’N and longitude 45°04’E, at an elevation of 994m amsl, the site is some 14km south of the town of Quai on the main highway travelling west wards from Riyadh to Jeddah. The site is accessed (Figure 2.6) along a combination of national (205km – west from Riyadh to Quai along highway 40) and local (18km – south from Quai past the village of Al’Amar) roads, a total travelled distance of 223km from Riyadh. The village of Al’Amar and its surrounding area has a population of 1,500 and is situated in the GMT+3 time zone.
Terrain: The site is located on an outcrop of a north-south trending range of low hills of volcanic strata close to the eastern edge of the Arabian Shield located 30km to the east of the site. Immediately to the west of the volcanic range is Wadi as Sirdah, which forms a flat bottomed valley, approximately two to three kilometres in width. The wadi forms a base level approximately 880m to 900m amsl and the crests of the hills around Al Amar reach up to 1,000m amsl. The natural topography is typical for the central and southern plains region of Saudi Arabia where vegetation is sparse and is classified as xeromorphic dwarf-shrublands. Accordingly land capability ranges from wilderness to rough grazing and nomadic herding.
Climate: The climate is classed as desert with hot summers, cold winters and low humidity. Average annual temperatures are of the order of 25°C to 30°C and extreme maximum temperatures of 45ºC (summer) and minimum temperatures of 8°C (winter) can be expected in the region of the mine site. The average annual rainfall is in the order of 92mm, with high variations from year to year. Precipitation falls as short and heavy showers. The total water deficit of evaporation over precipitation is 1,700mm per year.
Title and Rights: The current Exploitation Licence (Royal Decree No. M/17) covers an area of 5.0km2 and is valid until December 2026 which is 12 years subsequent to the depletion of the current Ore Reserves.

SRK Consulting Ma'aden Gold MER – Main Report
U3330_Ma'aden MER.doc November, 2007 Page 28
Geology: The deposit is located in a north-south trending belt of felsic to mafic volcanic rocks comprising the Al Amar Group which is intruded by granodiorite, trondhjemite, gabbro and quartz diorite rocks. Structurally, the Al Amar Group rocks have been subjected to complex folding and faulting. Structures at the Al Amar deposit are dominated by northwest-southeast and west northwest-east southeast fault systems and are associated with mineralisation. Three spatially discrete zones of mineralisation have been identified at Al Amar: the North Vein Zone; the Stockwork Zone; and the South Vein Zone.
The main mineralised zone is the North Vein Zone which strikes east-west with a dip of 69° to 80° to the south and has been demonstrated to extend 550m along strike to a depth of 350m. The zone is reported to be 10m to 45m wide, within which two vein systems have been identified: the hangingwall vein and the footwall vein systems. These vein systems comprise a series of sub-vertical, discontinuous quartz veins up to 0.5m thick associated with sub-massive sphalerite, pyrite and minor chalcopyrite mineralisation. The footwall vein is characterized by high copper values, high zinc and sporadic high gold values. Contrastingly the hangingwall vein is associated with moderate copper, zinc and gold values and elevated lead levels. Mineralisation is open laterally and at depth and a northeast-southwest trending fault cuts off mineralisation to the west.
The Stockwork Zone and South Vein Zones are comprised of irregular stockwork and discontinuous vein systems respectively. The South Vein Zone is structurally complex and shows little continuity along strike or down dip. The Al Amar deposit is cut by numerous intermediate to mafic dykes that are believed to post date mineralisation. A prominent dyke ranging from 10m to 20m in width with a north-south (mine grid) strike and a 60° east dip separates mineralisation to the east and west.
Ore Reserves and Mineral Resources: As at 1 July 2007, Al Amar has Ore Reserves of 429koz of gold (441koz gold equivalent) contained within 1.4Mt and grading 9.9g/t Au (10.2g/t Au Eq). Total Mineral Resources comprise 722koz of gold (742koz gold equivalent) contained within 2.0Mt and grading 11.2g/t Au (11.5g/t Au Eq).
Mining Operations assume an underground mining rate of 200ktpa using a fully mechanised long-hole open stoping method with subsequent backfilling using waste development. For the lower (<790mRL) levels of the mine the level spacing will be reduced from 30m to 20m and the mining sequence changed from a “bottom-up” approach to a “top-down” sequence utilising rib pillars for additional local and regional support. Access to the mine is by a new primary decline to the main production levels extending some 300m below surface to the 590mRL. Underground mining of the Ore Reserve is planned to continue at the projected rate of 200ktpa until depletion in 2014.
Processing Plants: The Al Amar Plant will process ore mined from the underground operation at a production rate of 200ktpa. The process facility comprises a comminution circuit, a copper circuit, a gold circuit and a zinc circuit which produces copper and zinc concentrates for third party toll smelting and gold in doré form for third party refining. Ore processing involves crushing (primary through tertiary) in the comminution circuit to produce a blended ore which is then reclaimed to feed the copper circuit. The copper circuit comprises milling and flotation to produce a copper concentrate with the tails feeding the CIL gold circuit. Tailings arising from the gold circuit are then onwards processed in the zinc circuit by flotation to produce a zinc concentrate. Final tailings are then thickened and filtered prior to transportation by truck to a dry-tailings storage facility situated 1.2km north-west of the Al Amar Plant. The LoM metallurgical recoveries (payable metals) are assumed at: 89.9% for

SRK Consulting Ma'aden Gold MER – Main Report
U3330_Ma'aden MER.doc November, 2007 Page 29
gold; 81.3% for silver; 62.7% for zinc; and 76.0% for copper.
Capital Projects: Other than sustaining capital and pre-production expenses there are no specific capital projects associated with the Ore Reserves. For 2007H2 Ma’aden Gold has budgeted capital expenditures of US$2.7m and the total capital commitment from 1 July 2007 through to 2014 is US$19.4m.
Human Resources: The TEC in 2007H1 is 112 which is planned to increase to a total complement of 177 on attaining full production and remaining constant throughout the LoMp until depletion of the Ore Reserves in 2014.
Environmental Liabilities comprising biophysical and social (Terminal Benefits liability) for the current LoMp at Al Amar amount to US$4.2m: Biophysical – US$2.0m; Terminal Benefits – US$2.1m.
Operating Performance (Table 2.9): To date all activities at Al Amar have been focused on the construction completion and has resulted in total capital expenditures of US$55.0m. No substantial production is forecast for 2007H2 and milled tonnage for 2008 is assumed at 155ktpa at a gold grade of 9.1g/t Au. On-mine operating expenditures are estimated at US$91/t reducing to US$84/t as full production is achieved in 2009. The reported cash costs per ounce however are significantly impacted by the toll treatment charges and whether cash costs are stated on a co-product (equivalent gold) or by-product (non-gold revenue deducted from costs) basis. For the period ending 2008 production is forecast at 39koz Au (72koz Au Eq) at a cash cost per ounce of negative US$23/oz (by-product basis) and US$300/oz (co-product basis).
Future Considerations at Al Amar are largely focused on achieving the projected production build up schedule. Notwithstanding this aspect, SRK notes that the basis of the current LoMp are the forecast parameters as included in the feasibility study with US CPI adjustments for future operating and capital expenditures. In the interim additional information has been collated as well as indications that the current Ore Reserve may be negatively impacted due to higher than planned dilution arising from wider development and the larger than planned underground equipment procured. Upside potential however exists in respect of upgrading the currently delineated Inferred Mineral Resource and testing the strike and depth extensions of the currently delineated orebodies. None of Ma’aden Gold’s current regional exploration prospects are situated in the immediate vicinity of Al Amar.
Table 2.9 Al Amar: forecast operating results Statistics Units 2004 2005 2006 2007H1 2007H2 2008Processing Tonnage (kt) 0 0 0 0 0 155Grade (g/t Au) 0.0 0.0 0.0 0.0 0.0 9.1Production Gold (koz Au) 0 0 0 0 0 39Silver (koz Ag) 0 0 0 0 0 112Zinc (t Zn) 0 0 0 0 0 4,915Copper (t Cu) 0 0 0 0 0 817Gold Equivalent (koz Au Eq) 0 0 0 0 0 72Expenditures Cash Cost(1) - on mine (US$/t) 0 0 0 0 0 91Cash Cost(2) - Co-product (US$/oz) 0 0 0 0 0 300Cash Cost(3) - By-product (US$/oz) 0 0 0 0 0 -23Capital Expenditure (US$m) 7.28 21.08 18.18 8.44 2.68 5.99
(1) On mine cash costs excluding concentrate and bullion related treatment, refining and realisation charges. (2) Co-product cash cost based on cash cost excluding by-product credits divided by equivalent gold production (payable). (3) By-product cash cost based on cash costs net of by-product credits divided by gold production (payable).
2.4.3 Bulghah Introduction: Bulghah comprises an open-pit mine (the “Bulghah Mine”) which mines lower grade (<1.0g/t Au) ore for processing at the Bulghah heap leach processing facility (the

SRK Consulting Ma'aden Gold MER – Main Report
U3330_Ma'aden MER.doc November, 2007 Page 30
“Bulghah Plant”) and higher grade (>1.0g/t Au) ore for processing at the Sukhaybarat CIL processing facility (the “Sukhaybarat Plant”) located some 66km northeast at Sukhaybarat. The combined process throughput is limited to 4.0Mtpa with 3.4Mtpa processed at the Bulghah Plant and 0.6Mtpa processed at the Sukhaybarat Plant. In both instances doré is produced and transported to third parties for precious metals refining to produce saleable gold and silver.
Commissioned in October 2002, Bulghah is currently in a transitional phase as the oxide ore is depleted and future production is increasingly dominated by transitional and sulphide ores. The current LoMp is largely based on: the results of a technical study published by external consultants in September 2005; depletion to 30 June 2007; the 2007H2 budget; and the assumption of significantly lower metallurgical recoveries than currently achieved (from current >70% to <50%). This latter factor combined with the currency (September 2005) of the LoMp and the planned increase in contribution from fresh ore presents an elevated level of operational risk in respect of attaining the forecasts as presented herein. Furthermore the current LoMp assumes treating of marginal ore which in the case of processing at Sukhaybarat presents further economic risk at gold prices less than US$600/oz. Ma’aden has a 100% interest in Bulghah and as at 30 June 2007, the value of the PP&E is US$18.9m.
History: Modern exploration, development and production history commenced during the early 1990s which lead to the completion of a pre-feasibility by Ma’aden in 1997. In August 2000, a feasibility study was completed by independent consultants who proposed the construction of a open-pit mining operation processing 4.0Mtpa of ore through a heap leach processing facility and producing 84koz of gold per annum. Construction at Bulghah commenced in March 2001 and the facility was commissioned in October 2002 at a capital cost of US$70m.
Location: Bulghah is situated in the western region of the country known as the Hejaz in the Al Madinah Province, Saudi Arabia, approximately 520km west-northwest of Riyadh, the capital city of Saudi Arabia. Located at latitude 24°59’N and longitude 41°36’E, at an elevation of 950m amsl, the site is some 210km northeast of the provincial capital Medina. The site is accessed along a combination of national (258km – northwest from Medina to Hanakiyah along highway 60) and local (97km – south towards the village of Bilghah) roads, a total travelled distance of 355km from Medina. The village of Bilghah is located 5km to the south of the Exploitation Licence and is situated in the GMT+3 time zone.
Terrain: The site is located on the central plain of the Crystalline Najd (the Arabian Shield), east of the Tuwayq escarpment. The topography on and around Bulghah is relatively flat, but shows a very slight downward slope from west to east. The elevation of the mine site is generally about 950m amsl, but there are several rocky outcrops with peak elevations ranging from 960m amsl to up to 983m amsl. The natural topography is typical for the central and southern plains region of Saudi Arabia where vegetation is sparse and is classified as xeromorphic dwarf-shrublands. Accordingly land capability ranges from wilderness to rough grazing and nomadic herding.
Climate: The climate is classed as desert with hot summers, cold winters and low humidity. Average annual temperatures are of the order of 25°C to 30°C and extreme maximum temperatures of 54ºC (summer) and minimum temperatures of 8°C (winter) have been recorded in the region of the mine site. The average annual rainfall is in the order of 100mm, with high variations from year to year. Precipitation falls as short and heavy showers.
Title and Rights: The current Exploitation Licence (Figure 2.7) extends over an area of

SRK Consulting Ma'aden Gold MER – Main Report
U3330_Ma'aden MER.doc November, 2007 Page 31
39.0km2 and is valid until December 2030 which is 20 years subsequent to the depletion of the current Ore Reserves.
Geology: The Bulghah deposit lies within Precambrian rocks of the Arabian Shield, located in the western part of the Arabian Peninsula. Gold mineralisation is hosted within an intrusion, which strikes roughly north-south. The intrusion is fault/shear bounded on the east and west sides, with the contacts dipping roughly 60° towards the east. The intrusion ranges from 200m to 500m wide, narrowing towards the south, and extends to the north and south for approximately 1,000m with a depth of about 450m. The area is also structurally complex and the intrusion is cross-cut by numerous dykes, which are sub-horizontal, and frequently have irregular geometries.
Mineralisation occurs predominately as an intrusive body along quartz filled fractures zones, shears, and joints and is associated with north-south striking and steeply dipping faults. Sulphide minerals associated with the gold mineralisation include arsenopyrite, pyrite (± minor pyrhotite), chalcopyrite, sphalerite and other trace sulphides. Mineralisation is subdivided into oxide, transitional and sulphide ore. Oxide mineralisation extends from surface to 30m to 35m below and sulphide mineralisation occurs just below the “redox” boundary at depths of 24m or greater. A transition zone of about 5m occurs between the base of oxide mineralisation and sulphide mineralisation.
Ore Reserves and Mineral Resources: As at 1 July 2007, Bulghah has Ore Reserves of 428koz of gold contained within 16.8Mt and grading 0.8g/t Au. Total Mineral Resources comprise 617koz of gold contained within 24.0Mt and grading 0.8g/t Au.
Mining Operations comprise a conventional drill-blast-load-truck operation with a total material moved capacity of 5.6Mtpa. The current LoMp assumes mining to a depth of 120m below surface to the 830mRL and includes the staged development of four pits (Pit 1 >90% of ore) with overall slope angles ranging from 32° to 52° and a low stripping ratio of 0.2twaste:tore (currently 0.4). All material is drilled and blasted prior to loading by front-end loaders into 40t haul trucks. Open-pit mining of the Ore Reserve is planned to continue until depletion in 2010.
Processing Plants: The Bulghah Plant comprises a conventional heap-leach facility with a design capacity of 4.5Mtpa. The flowsheet includes a comminution circuit, a lined heap leach pad (“HLP”), collection pond and an adsorption circuit. Crushed ore is agglomerated, stacked in 6m lifts on the HLP and then irrigated with cyanide solution. The precious metals pregnant solution is then further processed in a carbon adsorption plant using activated carbon and all loaded carbon is trucked to the Sukhaybarat Plant for stripping and gold refining. Overall payable gold recovery for 2007H1 is estimated at 74.7%.
Capital Projects: Other than sustaining capital and pre-production expenses there are no specific capital projects associated with the Ore Reserves. For 2007H2 Ma’aden Gold has budgeted capital expenditures of US$0.4m and the total capital commitment from 1 July 2007 through to 2011 is US$3.4m.
Human Resources: The TEC in 2007H1 is 106 which is planned to remain constant throughout the LoMp until cessation of processing in 2011.
Environmental Liabilities comprising biophysical and social (Terminal Benefits) for the current LoMp at Bulghah amount to US$2.9m (Biophysical – US$2.5m; Terminal Benefits – US$0.4m).
Operating Performance (Table 2.10): Process throughput at the Bulghah Plant has reduced from in excess of 4.0Mtpa to annualised production of 2.9Mtpa for 2007H1. Further the gold
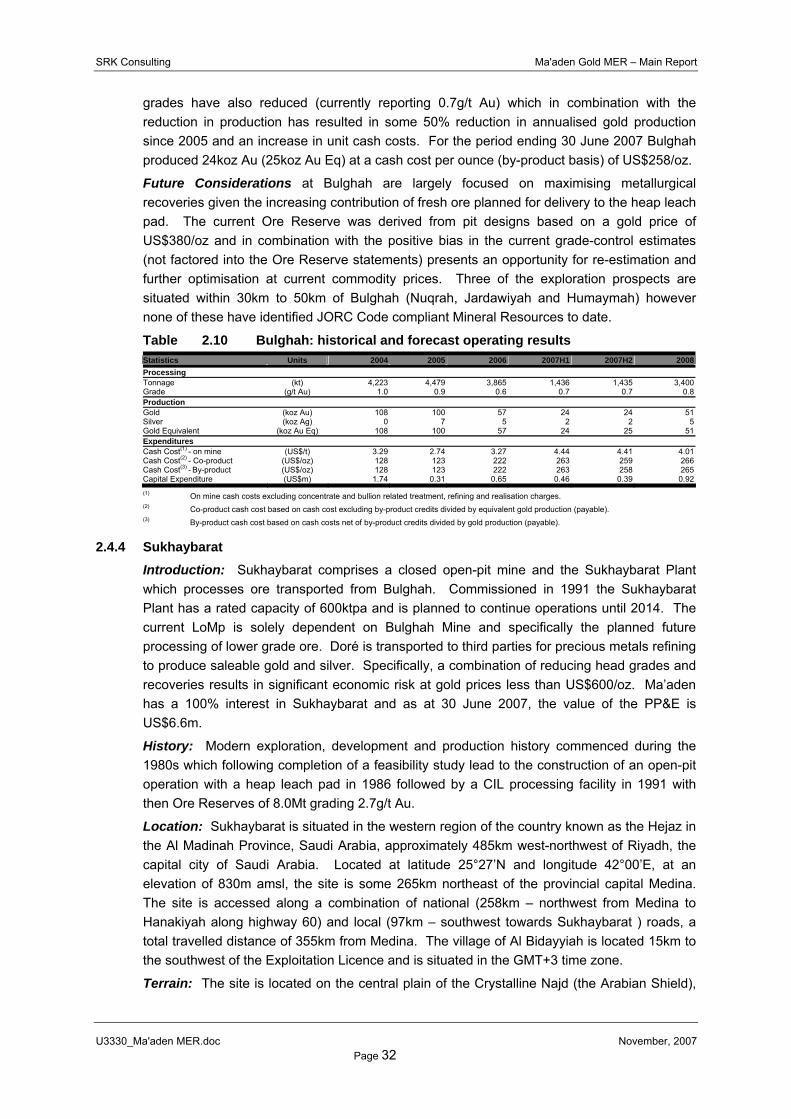
SRK Consulting Ma'aden Gold MER – Main Report
U3330_Ma'aden MER.doc November, 2007 Page 32
grades have also reduced (currently reporting 0.7g/t Au) which in combination with the reduction in production has resulted in some 50% reduction in annualised gold production since 2005 and an increase in unit cash costs. For the period ending 30 June 2007 Bulghah produced 24koz Au (25koz Au Eq) at a cash cost per ounce (by-product basis) of US$258/oz.
Future Considerations at Bulghah are largely focused on maximising metallurgical recoveries given the increasing contribution of fresh ore planned for delivery to the heap leach pad. The current Ore Reserve was derived from pit designs based on a gold price of US$380/oz and in combination with the positive bias in the current grade-control estimates (not factored into the Ore Reserve statements) presents an opportunity for re-estimation and further optimisation at current commodity prices. Three of the exploration prospects are situated within 30km to 50km of Bulghah (Nuqrah, Jardawiyah and Humaymah) however none of these have identified JORC Code compliant Mineral Resources to date.
Table 2.10 Bulghah: historical and forecast operating results Statistics Units 2004 2005 2006 2007H1 2007H2 2008Processing Tonnage (kt) 4,223 4,479 3,865 1,436 1,435 3,400Grade (g/t Au) 1.0 0.9 0.6 0.7 0.7 0.8Production Gold (koz Au) 108 100 57 24 24 51Silver (koz Ag) 0 7 5 2 2 5Gold Equivalent (koz Au Eq) 108 100 57 24 25 51Expenditures Cash Cost(1) - on mine (US$/t) 3.29 2.74 3.27 4.44 4.41 4.01Cash Cost(2) - Co-product (US$/oz) 128 123 222 263 259 266Cash Cost(3) - By-product (US$/oz) 128 123 222 263 258 265Capital Expenditure (US$m) 1.74 0.31 0.65 0.46 0.39 0.92(1) On mine cash costs excluding concentrate and bullion related treatment, refining and realisation charges. (2) Co-product cash cost based on cash cost excluding by-product credits divided by equivalent gold production (payable). (3) By-product cash cost based on cash costs net of by-product credits divided by gold production (payable).
2.4.4 Sukhaybarat Introduction: Sukhaybarat comprises a closed open-pit mine and the Sukhaybarat Plant which processes ore transported from Bulghah. Commissioned in 1991 the Sukhaybarat Plant has a rated capacity of 600ktpa and is planned to continue operations until 2014. The current LoMp is solely dependent on Bulghah Mine and specifically the planned future processing of lower grade ore. Doré is transported to third parties for precious metals refining to produce saleable gold and silver. Specifically, a combination of reducing head grades and recoveries results in significant economic risk at gold prices less than US$600/oz. Ma’aden has a 100% interest in Sukhaybarat and as at 30 June 2007, the value of the PP&E is US$6.6m.
History: Modern exploration, development and production history commenced during the 1980s which following completion of a feasibility study lead to the construction of an open-pit operation with a heap leach pad in 1986 followed by a CIL processing facility in 1991 with then Ore Reserves of 8.0Mt grading 2.7g/t Au.
Location: Sukhaybarat is situated in the western region of the country known as the Hejaz in the Al Madinah Province, Saudi Arabia, approximately 485km west-northwest of Riyadh, the capital city of Saudi Arabia. Located at latitude 25°27’N and longitude 42°00’E, at an elevation of 830m amsl, the site is some 265km northeast of the provincial capital Medina. The site is accessed along a combination of national (258km – northwest from Medina to Hanakiyah along highway 60) and local (97km – southwest towards Sukhaybarat ) roads, a total travelled distance of 355km from Medina. The village of Al Bidayyiah is located 15km to the southwest of the Exploitation Licence and is situated in the GMT+3 time zone.
Terrain: The site is located on the central plain of the Crystalline Najd (the Arabian Shield),
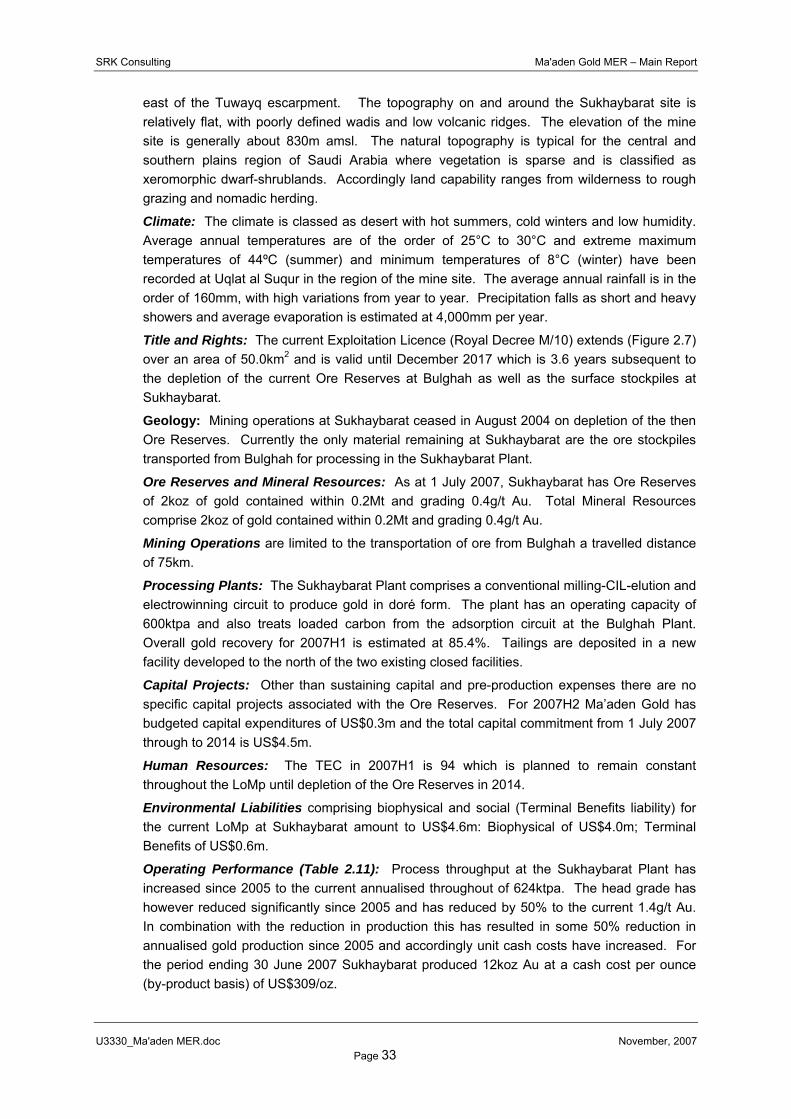
SRK Consulting Ma'aden Gold MER – Main Report
U3330_Ma'aden MER.doc November, 2007 Page 33
east of the Tuwayq escarpment. The topography on and around the Sukhaybarat site is relatively flat, with poorly defined wadis and low volcanic ridges. The elevation of the mine site is generally about 830m amsl. The natural topography is typical for the central and southern plains region of Saudi Arabia where vegetation is sparse and is classified as xeromorphic dwarf-shrublands. Accordingly land capability ranges from wilderness to rough grazing and nomadic herding.
Climate: The climate is classed as desert with hot summers, cold winters and low humidity. Average annual temperatures are of the order of 25°C to 30°C and extreme maximum temperatures of 44ºC (summer) and minimum temperatures of 8°C (winter) have been recorded at Uqlat al Suqur in the region of the mine site. The average annual rainfall is in the order of 160mm, with high variations from year to year. Precipitation falls as short and heavy showers and average evaporation is estimated at 4,000mm per year.
Title and Rights: The current Exploitation Licence (Royal Decree M/10) extends (Figure 2.7) over an area of 50.0km2 and is valid until December 2017 which is 3.6 years subsequent to the depletion of the current Ore Reserves at Bulghah as well as the surface stockpiles at Sukhaybarat.
Geology: Mining operations at Sukhaybarat ceased in August 2004 on depletion of the then Ore Reserves. Currently the only material remaining at Sukhaybarat are the ore stockpiles transported from Bulghah for processing in the Sukhaybarat Plant.
Ore Reserves and Mineral Resources: As at 1 July 2007, Sukhaybarat has Ore Reserves of 2koz of gold contained within 0.2Mt and grading 0.4g/t Au. Total Mineral Resources comprise 2koz of gold contained within 0.2Mt and grading 0.4g/t Au.
Mining Operations are limited to the transportation of ore from Bulghah a travelled distance of 75km.
Processing Plants: The Sukhaybarat Plant comprises a conventional milling-CIL-elution and electrowinning circuit to produce gold in doré form. The plant has an operating capacity of 600ktpa and also treats loaded carbon from the adsorption circuit at the Bulghah Plant. Overall gold recovery for 2007H1 is estimated at 85.4%. Tailings are deposited in a new facility developed to the north of the two existing closed facilities.
Capital Projects: Other than sustaining capital and pre-production expenses there are no specific capital projects associated with the Ore Reserves. For 2007H2 Ma’aden Gold has budgeted capital expenditures of US$0.3m and the total capital commitment from 1 July 2007 through to 2014 is US$4.5m.
Human Resources: The TEC in 2007H1 is 94 which is planned to remain constant throughout the LoMp until depletion of the Ore Reserves in 2014.
Environmental Liabilities comprising biophysical and social (Terminal Benefits liability) for the current LoMp at Sukhaybarat amount to US$4.6m: Biophysical of US$4.0m; Terminal Benefits of US$0.6m.
Operating Performance (Table 2.11): Process throughput at the Sukhaybarat Plant has increased since 2005 to the current annualised throughout of 624ktpa. The head grade has however reduced significantly since 2005 and has reduced by 50% to the current 1.4g/t Au. In combination with the reduction in production this has resulted in some 50% reduction in annualised gold production since 2005 and accordingly unit cash costs have increased. For the period ending 30 June 2007 Sukhaybarat produced 12koz Au at a cash cost per ounce (by-product basis) of US$309/oz.

SRK Consulting Ma'aden Gold MER – Main Report
U3330_Ma'aden MER.doc November, 2007 Page 34
Future Considerations at Sukhaybarat are largely focused on maximising metallurgical recoveries given the increasing contribution of lower grade ore planned for delivery from Bulghah. Should commodity prices decrease below US$600/oz as currently forecasted, annual cashflows beyond 2010 are likely to remain negative at some US$2m until closure in 2014. Six of the exploration prospects are situated within 30km of Sukhaybarat (Hablah South, Red Hill, La Prospect, Aurifjan and Al Habla) however none of these have identified JORC Code compliant Mineral Resources to date.
Table 2.11 Sukhaybarat: historical and forecast operating results Statistics Units 2004 2005 2006 2007H1 2007H2 2008Processing Tonnage (kt) 571 540 565 312 300 600Grade (g/t Au) 3.6 2.9 1.8 1.4 1.1 1.1Production Gold (koz Au) 63 42 27 12 9 18Silver (koz Ag) 0 4 4 2 1 2Gold Equivalent (koz Au Eq) 63 42 27 12 9 18Expenditures Cash Cost(1) - on mine (US$/t) 12.49 13.08 12.62 12.27 12.40 12.40Cash Cost(2) - Co-product (US$/oz) 113 170 263 309 411 412Cash Cost(3) - By-product (US$/oz) 113 170 263 309 411 412Capital Expenditure (US$m) 0.00 3.12 0.24 0.26 0.32 0.64
(1) On mine cash costs excluding concentrate and bullion related treatment, refining and realisation charges. (2) Co-product cash cost based on cash cost excluding by-product credits divided by equivalent gold production (payable). (3) By-product cash cost based on cash costs net of by-product credits divided by gold production (payable).
2.4.5 Al Hajar Introduction: Al Hajar comprises a closed open-pit mine and the Al Hajar heap leach facility (“Al Hajar Plant”) which is currently re-processing previously stacked and leached material. Commissioned in 2001, Al Hajar with a rated capacity of 750ktpa continued mining and processing operations until depletion of the open-pit Ore Reserves in 2006. The original comminution circuit did not include a secondary crusher until installation in October 2005. Prior to the installation of this secondary crusher, Ma’aden Gold considered that stacked ore was sub-optimally crushed resulting in lower recoveries than planned. Subsequent metallurgical testing of the stacked and leached ore indicates that the material leached has residual gold grades of 1.3g/t Au. The current LoMp assumes that material stacked prior to October 2005 can be economically reclaimed, re-crushed (to less than 20mm) and re-stacked on a new HLP with a metallurgical recovery of 51.9% for gold. Ma’aden has a 100% interest in Al Hajar and as at 30 June 2007, the value of the PP&E is US$1.6m.
History: Modern exploration, development and production history commenced during the 1980s leading to the establishment of a heap leach mining operation in 2001 albeit with a limited Ore Reserve base. In 2005, Ma’aden Gold commenced mining at Jadmah, a satellite deposit situated some 4km west of Al Hajar. In 2006, Ma’aden Gold completed a technical study investigating the potential for re-crushing material stacked and leached up until October 2005. In 2007, the re-crushing programme commenced which has to date resulted in the re-processing of 0.3Mt of material grading 1.5g/t Au.
Location: Al Hajar is situated in the Asir Province, Saudi Arabia, approximately 710km southwest of Riyadh, the capital city of Saudi Arabia. Located at latitude 19°59’N and longitude 42°00’E, at an elevation of 1,600m amsl, the site is some 203km north-northwest of the provincial capital Abhā. The site is accessed (Figure 2.8) along a combination of national (239km – north from Abhā along highways 10 and 15) and local (17km – northeast towards the village of Al Wakabah) roads, a total travelled distance of 263km from Abhā. The village of Al Wakabah is located 7km to the southwest of the Exploitation Licence and is situated in the GMT+3 time zone.

SRK Consulting Ma'aden Gold MER – Main Report
U3330_Ma'aden MER.doc November, 2007 Page 35
Terrain: The site is located at the eastern margin of the Asir Highlands, close to the boundary with the Asir Plateau and the Najd pediplain which ranges from 760m amsl to 1,520m amsl with isolated rocky outcrops or spires (inselbergs). The local area is of variable topographical relief consisting of several narrow channels less than 20m wide incising the surrounding undulating to rolling low hills. The moderately inclined hills are of low relief ranging up to 100m above the main drainage lines. The variation in rock strength has resulted in a generally rugged land surface with rock exposed over the majority of the landscape. The regional vegetation unit at Al Hajar is related to the Acacia etbaica and Acacia gerrardii plant communities. Land capability ranges from wilderness to rough grazing and nomadic herding, however there is irrigated farming in the upper reaches of Wadi Ranyah. This area of significant agricultural activity is more than 25km from the licence area.
Climate: The climate is classed as desert with hot summers, cold winters and low humidity. Average annual temperatures are of the order of 30°C and extreme maximum temperatures of 40ºC (summer) and minimum temperatures of 9°C (winter) have been recorded at Muwaih in the region of the mine site. The average annual rainfall is in the order of 105mm, with high variations from year to year. Precipitation falls as short and heavy showers and average evaporation is estimated at 1,690mm per year.
Title and Rights: the current Exploitation Licence (Royal Decree M/3) extends over an area of 6.0km2 and is valid until June 2027 which is 17 years subsequent to the depletion of the current Ore Reserves.
Geology: Mining operations at Al Hajar ceased in December 2006 on depletion of the then Ore Reserves.
Ore Reserves and Mineral Resources: As at 1 July 2007, Al Hajar has Ore Reserves of 87koz of gold contained within 2.1Mt and grading 1.3g/t Au. Total Mineral Resources comprise 87koz of gold contained within 2.1Mt and grading 1.3g/t Au.
Mining Operations are limited to the reclaiming of historically stacked material.
Processing Plants: The Al Hajar Plant comprises a conventional heap leach facility with a design capacity of 750ktpa. The flowsheet includes a crushing circuit, a lined HLP, collection pond and an adsorption circuit. Crushed ore is agglomerated and stacked in 8m lifts on the HLP and is then irrigated with cyanide solution. The precious metals pregnant solution is then further processed in a Merrill-Crowe process and the precipitate is filtered and dried, and smelted to produce doré. Overall payable gold recovery for 2007H1 is estimated at 66.4%.
Capital Projects: Other than sustaining capital and pre-production expenses there are no specific capital projects associated with the Ore Reserves. For 2007H2 Ma’aden Gold has budgeted capital expenditures of US$0.9m and the total capital commitment from 1 July 2007 through to 2010 is US$3.0m.
Human Resources: The TEC for 2007H1 is 61 which is planned to remain constant throughout the LoMp until depletion of the Ore Reserves in 2010.
Environmental Liabilities comprising biophysical and social (Terminal Benefits liabilities) for the current LoMp at Al Hajar amount to US$2.4m: Biophysical of US$2.1m; Terminal Benefits of US$0.3m).
Operating Performance (Table 2.12): Process throughput at the Al Hajar Plant increased from 2004 to 2006, however current performance (2007H1) indicates poor performance at 25% below budget. Furthermore the head grade has reduced significantly since 2004 from 3.5g/t Au to the current 1.5g/t Au. Accordingly this has resulted in a 50% reduction in gold

SRK Consulting Ma'aden Gold MER – Main Report
U3330_Ma'aden MER.doc November, 2007 Page 36
production and a 50% increase in cash operating costs. For the period ending 2007H1 Al Hajar produced 9koz Au (11koz Au Eq) at a cash cost per ounce (by-product basis) of US$194/oz.
Future Considerations at Al Hajar are largely focused on attaining the forecast production rates and unit operating expenditures as forecast in the latest LoMp. Potential beyond this is largely focused on the regional exploration properties situated within the Al Hajar Exploration Licence area. Six of the exploration prospects are situated within 30km of Al Hajar (Hajeej, Sheers, Jadmah, Gossan-14, Waqba and Sha’abat Al Hamra) however none of these have identified JORC Code compliant Mineral Resources to date.
Table 2.12 Al Hajar: historical and forecast operating results Statistics Units 2004 2005 2006 2007H1 2007H2 2008Processing Tonnage (kt) 666 610 756 269 360 720Grade (g/t Au) 3.5 2.9 1.9 1.5 1.3 1.3Production Gold (koz Au) 39 39 26 9 8 15Silver (koz Ag) 252 257 155 54 65 129Gold Equivalent (koz Au Eq) 45 44 30 11 9 17Expenditures Cash Cost(1) - on mine (US$/t) 9.97 12.11 10.43 8.32 8.32 8.32Cash Cost(2) - Co-product (US$/oz) 156 176 269 226 344 357Cash Cost(3) - By-product (US$/oz) 135 147 242 194 290 306Capital Expenditure (US$m) 0.75 1.02 0.00 0.18 0.93 1.02
(1) On mine cash costs excluding concentrate and bullion related treatment, refining and realisation charges. (2) Co-product cash cost based on cash cost excluding by-product credits divided by equivalent gold production (payable). (3) By-product cash cost based on cash costs net of by-product credits divided by gold production (payable).
2.4.6 Ad Duwayhi Introduction: Ad Duwayhi is a Development Property upon which a pre-feasibility study has recently (April 2007) been completed. The study envisages the construction of an open-pit mining operation processing at a rate of 1Mtpa through a gravity-CIL plant. The total capital commitment for construction is currently estimated at US$91.2m and further technical studies are underway to complete a feasibility study (anticipated 2008H2). A key constraint to the development of the project is securing a sustainable water supply. Whilst a local well-field could be developed at a site some 25km distant, there is insufficient capacity to meet Ad Duwayhi’s requirements. Furthermore, the potential development of the AEPs is similarly limited by the availability of water supply, and these properties in conjunction with Ad Duwayhi are the subject of the CAG Project. The most likely option for securing the necessary water supply is the construction (at a cost of US$90m) of a 500km pipeline from Taif (the “Taif Project”) to transport effluent water arising from an existing sewage water treatment plant servicing the city of Taif. The pipeline capacity is estimated at 417m3/hr with an annual operating cost of US$1.5mp.
Consequently the likely development of Ad Duwayhi is conditional on demonstrating the technical feasibility and economic viability of the CAG Project including pre-feasibility studies for the AEPs (2008Q4), and feasibility studies for Ad Duwayhi and the Taif Project (anticipated 2008H2). Assuming the results of these are positive, the completion of necessary detailed engineering design studies, current lead times for delivery of major equipment, and a construction period of 1.5 to 2.0 years, then the earliest period for Ad Duwayhi attaining full production is calendar 2011.
History: Modern exploration commenced during the 1950s comprising limited pitting excavations. In the early 1980s extensive exploration was completed by BRGM resulting in the drilling of 25 holes in conjunction with mapping, trenching, geochemical and geophysical studies. Further exploration in the 1990s by the United States Geological Survey (“USGS”)

SRK Consulting Ma'aden Gold MER – Main Report
U3330_Ma'aden MER.doc November, 2007 Page 37
preceded the work undertaken by Ma’aden Gold in 2003 which underpins the current Mineral Resource estimate as determined by Snowden Mining Industry Consultants Pty Ltd (“Snowden”) in 2004. From 2004 Ma’aden Gold commissioned various technical studies inclusive of metallurgical testwork which culminated in the publication of a pre-feasibility study in April 2007 by SRK. Currently the Company is engaged in completing a feasibility study which is planned for completion in 2008H2.
Location: Ad Duwayhi is situated in the Mecca Province, Saudi Arabia, approximately 440km southwest of Riyadh, the capital city of Saudi Arabia. Located at latitude 22°17’N and longitude 43°17’E, at an elevation of 980m amsl, the site is some 380km west-northwest of the provincial capital of the Mecca. The site is accessed along a combination of national (393km) and local roads (144km) travelling northwest from Mecca along highways (5, 14, 40) towards Al Houmiat (also referred to as Al Humiyah or Al Hufayyirah) a settlement on highway 40, thereafter south-southwest some 90km from Al Houmiat on local roads to the current exploration camp. The village of Kutayfan, with a population of 1,000 is situated some 60km to the south-west in the GMT+3 time zone.
Terrain: Ad Duwayhi is located on plains (980m amsl) overlain by a thin veneer of rock debris, alluvium and aeolian material and combined with low rocky hills. The prospect occupies a shallow basin of approximately 1km2 covered with alluvial material and partially surrounded by hills rising as high as 50m above the central basin floor. The predominant landforms are low hills, pediplain and aeolian dunes. The natural topography is typical for the region where vegetation is sparse and dominated by the Lycium – Gymnocarpus - Tripogon plant community. Accordingly land capability ranges from wilderness to rough grazing and nomadic herding.
Climate: The climate is classed as desert with hot summers, cold winters and low humidity. Average annual temperatures are of the order of 29°C and extreme maximum temperatures of 47ºC (summer) and minimum temperatures of 7°C (winter) can be expected in the region of the mine site. The average annual rainfall is in the order of 129mm, with high variations from year to year. Precipitation falls as short and heavy showers. The total water deficit of evaporation over precipitation is 2,600mm per year.
Title and Rights: The current Exploitation Licence (Royal Decree No. M/17) covers an area of 646.6km2 and is valid until October 2007. SRK has been informed that an application for an extension is in process and has been lodged with the regulatory authorities.
Geology: The Ad Duwayhi deposit lies at the southern end of a zone of Pre-Cambrian volcano-sedimentary rock, which have been overprinted by greenschist facies metamorphism. The deposit stratigraphy is cut by multiple intrusive dykes and sills of dolerite, rhyolite, porphyritic granite and a polymict breccia pipe. Mineralisation is associated with a curved thrust structure with an average strike of 045° and dip of 45° southeast, curving from a northerly direction in the southwest to an easterly direction in the northeast. The thrust structure is typically between 2m to 10m thick with heavily deformed cataclastic rocks with well developed quartz veins. Thin, high grade gold veins are also found outside of the main mineralised vein. Gold is typically found associated with pyrite and tetrahedrite, and is found in the form of fine grained free gold (>5μm). Gold mineralisation is also present as placer deposits in the vicinity of the deposit, within the colluvial material.
Ore Reserves and Mineral Resources: As at 1 July 2007, Ad Duwayhi has total Mineral Resources of 2.1Moz of gold contained within 17.1Mt and grading 3.9g/t Au.
Mining Operations as proposed in the pre-feasibility study assume a conventional drill-blast-

SRK Consulting Ma'aden Gold MER – Main Report
U3330_Ma'aden MER.doc November, 2007 Page 38
load-truck operation with a total material moved capacity of 9.5Mtpa. The current LoMp assumes mining to a depth of 145m below surface to the 835mRL and includes the staged development of two pits with overall slope angles ranging from 45° to 58° and a stripping ratio of 6.8twaste:tore. All material will be drilled and blasted prior to loading by hydraulic shovels into 80t rear dump haul trucks. Open-pit mining of the Ore Reserve is planned to continue until depletion some 9 years after commencement of operations.
Processing Plants: Ad Duwayhi will process ore mined from the open-pit operation at a production rate of 1.0Mtpa. The process facility proposed comprises a comminution circuit with a parallel gravity circuit for recovery of coarse grained free gold and a CIL circuit followed by elution, electrowinning and smelting to produce gold in doré form for third party refining. Tailings arising from the CIL circuit will be thickened and dried to enable dry storage and minimise water usage. The LoMp metallurgical recoveries (payable metals) are assumed at 92.9% for gold.
Capital Projects: The current estimate of capital expenditure required for Ad Duwayhi amounts to US$105.4m over the projected LoMp comprising US$91.2m as the initial construction capital and the remainder being sustaining capital expended over the planned operating life. This capital estimate excludes the capital expenditure required for construction of the regional water pipeline necessary for development of Ad Duwayhi and its requirement for a water supply of 70m3/hr. The total capital estimate for the water pipeline is currently assumed at US$90m for the construction of a 500km pipeline (capacity 417m3/hr) from the town of Taif situated 315km southwest of Ad Duwayhi.
Human Resources: On attaining full production the TEC is assumed at 456 and will remain constant throughout the LoMp until depletion of the Ore Reserves.
Environmental Liabilities: Following construction, attaining full production and execution of the LoMp the biophysical and social (Terminal Benefits liability) for Ad Duwayhi would amount to US$8.8m: Biophysical of US$3.7m; and Terminal Benefits of US$5.1m.
Operating Performance: To date all activities at Ad Duwayhi have been focused on completion of technical studies and advancing the metallurgical testwork. On attaining full production at 1.0Mtpa, Ad Duwayhi is forecast to process ore at an average grade of 3.5g/t Au and a metallurgical recovery of 93.0% (92.9% payable) to produce gold at an average LoMp cash cost of US$224/oz.
Future Considerations at Ad Duwayhi are focused on completing a feasibility study to an overall level of accuracy of 10%. In addition Ma’aden Gold is also undertaking further technical studies to assess the potential for underground mining beyond the planned ultimate pit depth. Further potential beyond this will depend on further drilling targeting potential depth and strike extensions. In the absence of governmental/other funding for the construction of the regional water supply pipeline, the development of Ad Duwayhi is however conditional on completion of pre-feasibility studies for the other AEPs which in combination with Ad Duwayhi represents the CAG Project. This in addition to completion of a feasibility study for the Taif Project will enable Ma’aden Gold to assess the technical feasibility and economic viability of the CAG Project as a whole, specifically its ability to repay the capital construction (US$90m) and operating costs (US$1.5mpa) associated with the Taif Project.
2.4.7 Exploration Assets To date, Ma’aden Gold has determined a total Mineral Resource of 7.9Moz contained within 103.2Mt grading 2.4g/t Au. Table 2.13 gives the Mineral Resource statements for the

SRK Consulting Ma'aden Gold MER – Main Report
U3330_Ma'aden MER.doc November, 2007 Page 39
Exploration Properties and Ad Duwayhi as at 1 July 2007. Historical expenditures from 1999 through to 2007H1 inclusive amount to US$35m which indicates a resource definition cost of US$5.2/oz of gold with some 53% of the total content classified as Measured and Indicated Mineral Resources.
Table 2.13 Exploration Assets (including Ad Duwayhi) Mineral Resource statements (1 July 2007)
JORC Code Statements Tonnage Grade Content(kt) (g/t Au) (koz Au)
Measured Ad Duwayhi 7,222 2.8 648Subtotal 7,222 2.8 648Indicated Ad Duwayhi 6,359 5.7 1,169Mansourah 18,135 2.4 1,388Masarrah 13,501 2.3 981Subtotal 37,995 2.9 3,538Measured + Indicated Ad Duwayhi 13,581 0.0 1,817Mansourah 18,135 2.4 1,388Masarrah 13,501 2.3 981Total Measured + Indicated 45,216 2.9 4,186Inferred Ad Duwayhi 3,493 2.7 299Mansourah 3,558 2.0 228Ar Rjum 35,886 1.9 2,225Masarrah 2,603 2.1 176As Suk 1,728 4.1 228Zalim 10,753 1.7 590Subtotal 58,021 2.0 3,747Mineral Resources Ad Duwayhi 17,074 3.9 2,116Mansourah 21,693 2.3 1,616Ar Rjum 35,886 1.9 2,225Masarrah 16,104 2.2 1,157As Suk 1,728 4.1 228Zalim 10,753 1.7 590Total Mineral Resources 103,237 2.4 7,933
Ma’aden Gold’s exploration portfolio includes (Figure 2.9 and Figure 2.10) some 38 properties located in two principal regions: CAG Region and NAS Region. These properties are collectively managed within their Exploration Licence (“EL”) and the AEPs (EPs with Resource statements) are all contained within the CAG Region. Following successful re-application and the necessary relinquishment of licence areas (currently in process) the total licence areas under management will reduce from 71,044.0km2 to 47,521.0km2, of which 10,923.8km2 represent licences in which the AEPs are contained and 36,597.2km2 represent licences in which only EPs are managed.
In the CAG Region there are a total of 17 exploration assets (Table 2.14), of which five are classified as AEPs (resource definition) and 12 as EPs (pre-resource exploration). In the NAS Region there are a total of 21 exploration assets, all of which are classified as EPs.
Total exploration expenditures from 1999 through 30 June 2007 inclusive amount to US$42.1m (Table 2.14), 85% of which was expended on Exploration Licences situated in the CAG Region. The current exploration programme (2007H2 to 2010 inclusive) assumes further expenditures amounting to US$33.5m, the larger portion (52%) of which is to be expended on Exploration Licences in the NAS Region.
The principal exploration activities at the Exploration Assets comprise: regional mapping; geochemical sampling (rock and soil); Drilling (P/holes, Reverse Circulation drill holes, Diamond Drill holes); and drill intercept sampling. To date Ma’aden Gold has collected 46,000 geochemical samples, undertaken some 424km of drilling and submitted 358,000 intercept samples (Table 2.15) in respect of exploration activities in the CAG Region and NAS Region collectively.
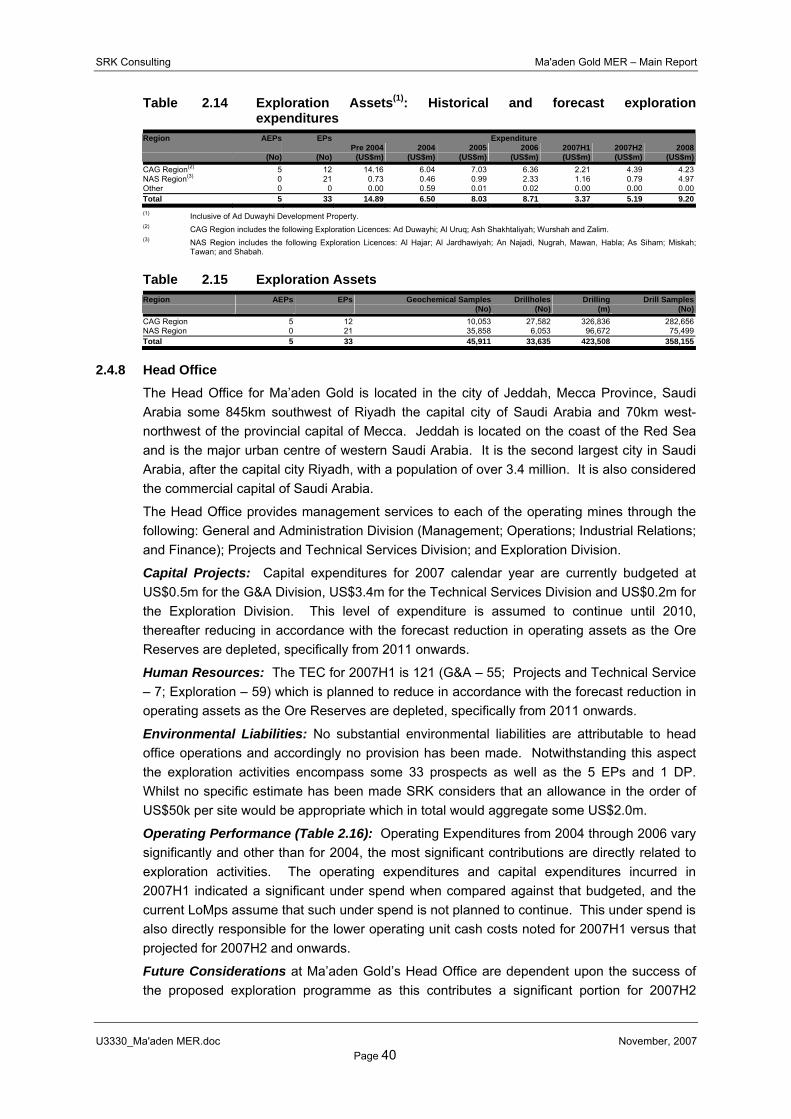
SRK Consulting Ma'aden Gold MER – Main Report
U3330_Ma'aden MER.doc November, 2007 Page 40
Table 2.14 Exploration Assets(1): Historical and forecast exploration expenditures
Region AEPs EPs Expenditure Pre 2004 2004 2005 2006 2007H1 2007H2 2008 (No) (No) (US$m) (US$m) (US$m) (US$m) (US$m) (US$m) (US$m)
CAG Region(2) 5 12 14.16 6.04 7.03 6.36 2.21 4.39 4.23NAS Region(3) 0 21 0.73 0.46 0.99 2.33 1.16 0.79 4.97Other 0 0 0.00 0.59 0.01 0.02 0.00 0.00 0.00Total 5 33 14.89 6.50 8.03 8.71 3.37 5.19 9.20(1) Inclusive of Ad Duwayhi Development Property. (2) CAG Region includes the following Exploration Licences: Ad Duwayhi; Al Uruq; Ash Shakhtaliyah; Wurshah and Zalim. (3) NAS Region includes the following Exploration Licences: Al Hajar; Al Jardhawiyah; An Najadi, Nugrah, Mawan, Habla; As Siham; Miskah;
Tawan; and Shabah.
Table 2.15 Exploration Assets Region AEPs EPs Geochemical Samples Drillholes Drilling Drill Samples
(No) (No) (m) (No)CAG Region 5 12 10,053 27,582 326,836 282,656NAS Region 0 21 35,858 6,053 96,672 75,499Total 5 33 45,911 33,635 423,508 358,155
2.4.8 Head Office The Head Office for Ma’aden Gold is located in the city of Jeddah, Mecca Province, Saudi Arabia some 845km southwest of Riyadh the capital city of Saudi Arabia and 70km west-northwest of the provincial capital of Mecca. Jeddah is located on the coast of the Red Sea and is the major urban centre of western Saudi Arabia. It is the second largest city in Saudi Arabia, after the capital city Riyadh, with a population of over 3.4 million. It is also considered the commercial capital of Saudi Arabia.
The Head Office provides management services to each of the operating mines through the following: General and Administration Division (Management; Operations; Industrial Relations; and Finance); Projects and Technical Services Division; and Exploration Division.
Capital Projects: Capital expenditures for 2007 calendar year are currently budgeted at US$0.5m for the G&A Division, US$3.4m for the Technical Services Division and US$0.2m for the Exploration Division. This level of expenditure is assumed to continue until 2010, thereafter reducing in accordance with the forecast reduction in operating assets as the Ore Reserves are depleted, specifically from 2011 onwards.
Human Resources: The TEC for 2007H1 is 121 (G&A – 55; Projects and Technical Service – 7; Exploration – 59) which is planned to reduce in accordance with the forecast reduction in operating assets as the Ore Reserves are depleted, specifically from 2011 onwards.
Environmental Liabilities: No substantial environmental liabilities are attributable to head office operations and accordingly no provision has been made. Notwithstanding this aspect the exploration activities encompass some 33 prospects as well as the 5 EPs and 1 DP. Whilst no specific estimate has been made SRK considers that an allowance in the order of US$50k per site would be appropriate which in total would aggregate some US$2.0m.
Operating Performance (Table 2.16): Operating Expenditures from 2004 through 2006 vary significantly and other than for 2004, the most significant contributions are directly related to exploration activities. The operating expenditures and capital expenditures incurred in 2007H1 indicated a significant under spend when compared against that budgeted, and the current LoMps assume that such under spend is not planned to continue. This under spend is also directly responsible for the lower operating unit cash costs noted for 2007H1 versus that projected for 2007H2 and onwards.
Future Considerations at Ma’aden Gold’s Head Office are dependent upon the success of the proposed exploration programme as this contributes a significant portion for 2007H2

SRK Consulting Ma'aden Gold MER – Main Report
U3330_Ma'aden MER.doc November, 2007 Page 41
through 2010 inclusive. Furthermore, SRK considers that scope exists for rationalisation of such expenditures and given the current under spend, consideration should be given to reviewing the forecast expenditures from 2007H2 onwards, specifically in respect of G&A and Project and Technical Services.
Table 2.16 Head office: historical and forecast operating results Statistics Units 2004 2005 2006 2007H1(1) 2007H2 2008Expenditures G&A (US$m) 12.60 4.55 5.90 2.19 4.21 7.20Project and Technical Services (US$m) 1.77 1.11 1.46 0.81 2.77 4.92Exploration (US$m) 6.68 8.03 8.71 3.37 5.19 9.20Total Operating Expenditure (US$m) 21.05 13.69 16.07 6.37 12.17 21.32Capital Expenditure (US$m) 4.38 0.44 0.03 0.10 0.08 4.13Unit Expenditures Cash Cost(2) - on mine (US$/t) 24.93 2.36 2.95 2.98 5.51 4.18Cash Cost(3) - Co-product (US$/oz) 195 53 84 74 151 91Cash Cost(4) - By-product (US$/oz) 224 57 96 85 171 117Capital Expenditure (US$m) 4.38 0.44 0.03 0.10 0.08 4.13
(1) The reduced cash operating costs for 2007(H1) compared with 2007(H2) is impacted by the significant (US$5.8m) under spend of corporate overheads (General and Administration, Projects and Technical Services and Exploration). This under spend equates to a unit cash cost (by-product) basis of US$70/oz and is not assumed to continue in the current LoMp.
(2) On mine cash costs excluding concentrate and bullion related treatment, refining and realisation charges. (3) Co-product cash cost based on cash cost excluding by-product credits divided by gold equivalent production (payable). (4) By-product cash cost based on cash costs net of by-product credits divided by gold production (payable).
2.5 Saudi Arabia Country Description Saudi Arabia, officially the Kingdom of Saudi Arabia, is the largest country on the Arabian Peninsula. A series of regional conflicts between 1902 and 1926 led to the unification of Al-Hasa, Al-Qatif, Nejd and Hijaz (the “Kingdom”) to form Saudi Arabia on 23 September 1932.
The discovery of oil in March 1938 led to post (second world) war development programmes which commenced in 1946 leading to substantive oil production by 1949. To present day an absolute monarchy presides and following a period of isolationalist policies (to 1953), the 1960s were marked be economic mismanagement, regional power challenges and the six-day (Arab-Israeli) war. Regional tension increased during the 1970s through to the 1990s with the 1973 Arab-Israeli war, the Iran-Iraq war and the Gulf war. This period was also marked by inter-monarchy rivalry culminating in the assassination of King Faisal in 1975 and substantially higher oil prices dramatically increasing Saudi Arabia’s wealth and political influence. King Fahd appointed in 1982 oversaw the necessary economic adjustments following sharply lower oil revenues resulting from declining global oil prices and was largely attributed for brokering the 1988 ceasefire in the Iran-Iraq conflict and establishing the regional allies in support of Kuwait during the Gulf War. Upon King Fahd’s death in 2005 King Abdullah assumed the throne.
Current challenges include the implementation of various 5 year development plans (currently the 8th) which are specifically targeting economic diversification and the development of a greater role for the private sector in the Saudi economy as well as minimising reliance on non-Saudi nationals in the labour force.
Saudi Arabia’s status is marked by membership, of and participation in: the Organization of Petroleum Exporting Countries (“OPEC”); the International Finance Corporation (the “IFC”); the International Monetary Fund (the “IMF”); the International Labour Organisation (the “ILO”); and the World Trade Organisation (“WTO”).
By World Bank measures, Saudi Arabia is grouped in the non-OECD (Organisation for Economic Co-operation and Development) group and is classed as High Income Category: where Gross National Income (“GNI”) reported on an annual basis is US$10,726 or more.
Saudi Arabia is a member of the Co-operation Council for the Arab States of the Gulf (also referred to as the Gulf Cooperative Countries, the “GCC”). Formed on 25 May 1981, the GCC

SRK Consulting Ma'aden Gold MER – Main Report
U3330_Ma'aden MER.doc November, 2007 Page 42
comprises the Persian Gulf states of the Kingdom of Bahrain (“Bahrain”), the State of Kuwait (“Kuwait”), the Sultanate of Oman (“Oman”), the State of Qatar (“Qatar”) and Saudi Arabia.
Table 2.17 gives the relative economic and demographic statistics of Saudi Arabia to other benchmark countries comprising the Persian Gulf states, and Table 2.18 gives a seven year history of key economic and demographic statistics.
Geographically Saudi Arabia, with co-ordinates 25°00’N and 45°00’E extends over 2.2 million km2 extending over the Middle East. Saudi Arabia borders on the Republic of Iraq (“Iraq”), the Hashemite Kingdom of Jordan (“Jordan”), Kuwait, Oman, Qatar, the United Arab Emirates (“UAE”), and the Republic of Yemen (“Yemen”) and its coastline comprises the Persian Gulf as well as the Red Sea.
Saudi’s terrain is dominated by its vastly uninhabited Empty Quarter, al-Rub’al-Khali, which is the largest single body of sand in the world. The topography varies from vast stretches of sand to rugged mountain ranges. From the Gulf of Aqaba south to Yemen lies a dry, narrow coastal plain bordering the Red Sea (the Southwest Region). East of the plain, a narrow chain of mountains rises to 3,000m. This entire region, traditionally called the Hijaz, is now known as the Western Region. The same mountain chain rises to 3,660m and becomes more rugged in the south near Yemen. This portion, known as the Asir, has more rainfall than any other part of the country and is typified by its dense population, villages, terraced farms and green forests. The Nejd (the Central Region) region contains the heaviest concentration of nomadic Bedouin and remains relatively underdeveloped with respect to infrastructure. The Eastern Region, Al-Hasa, although largely desert, contains most of the nation’s oilfields and two large oases (Qatif and Houf), support substantial agricultural production.
The climate is generally classified as dry desert with extreme heat and aridity characteristic of most of Saudi Arabia. The average winter temperature ranges from 8° to 20°C in January in interior cities such as Riyadh and 19°C to 29°C in Jeddah on the Red Sea coast. The average summer range in July is 27°C to 43°C in Riyadh and 27°C to 38°C in Jeddah. Annual precipitation is usually sparse (up to 100mm in most regions), although sudden downpours can lead to violent flash floods in wadis. Annual rainfall in Riyadh averages 100mm and falls almost exclusively between January and May; the average in Jeddah is 54mm and occurs between November and January.
Land use is distributed as follows: arable land (1.67%); permanent crops (0.09%); and other 98.24%. Some 16,200km2 is currently irrigated.
The transport system in Saudi Arabia comprises a network of roads and railways which connect a number of ports, harbours and airports. The road network comprises a total of 152,044km of which 45,461km are paved. The city highways and other major highways are well maintained such as the roads in Riyadh however the government is currently rehabilitating some of the outer city highways such as the one linking from coast to coast. Saudi Arabia has several hundred route kilometres of standard gauge railways linking the capital Riyadh with the Persian Gulf. In October 2006, tenders were called by the Saudi Railways Organization (“SRO”) to build a new 440km Makkah-Madinah Rail Link (“MMRL”). Saudi Arabia has a total of 71 airports with paved runways 32 of which are longer than 3km. A series of ports and harbours service the Persian Gulf (5) and the Red Sea (6).
The political and administrative structure in Saudi Arabia is a monarchy and is governed according to Sharia’ (Islamic) Law. The Basic Law which articulates the government’s rights and responsibilities was introduced in 1993. The executive branch comprises the chief of state in the form of a King and Prime Minister where the monarch is both chief of state and

SRK Consulting Ma'aden Gold MER – Main Report
U3330_Ma'aden MER.doc November, 2007 Page 43
the head of the government. The Council of Ministers is appointed by the monarch and includes many royal family members. There are no elections and the monarch is hereditary. The legislative branch comprises a consultative council (120 members and a chairman appointed by the monarch for four year terms). In October 2003, the Council of Ministers announced its intent to introduce elections for half of the members of the local and provincial assemblies and a third of the members of the national consultative council incrementally over a period of four to five years. In November 2004, the Ministry of Municipal and Rural Affairs initiated voter registration for partial municipal council elections held nationwide from February through April 2005. The judicial branch is represented by the Supreme Council of Justice.
Saudi Arabia, extending over a single time zone (GMT+3) is divided into 13 administrative divisions termed Provinces, each of which has its own regional capital. The capital Riyadh city is situated in Al Riyadh Province.
The legal system is based on Sharia’ Law and several secular codes have been introduced. Commercial disputes are managed by special committees and Saudi Arabia has not accepted compulsory ICJ jurisdiction.
The official language is Arabic and the practicing religion is dominantly Muslim. The ethnic groups comprise 90% Arab and 10% Afro-Asian.
The Economic Structure of Saudi Arabia is dominated by the oil industry accompanied with strong governmental controls over all major economic activities. The petroleum sector accounts roughly for 75% of budget revenues, 45% of GDP and 90% of export earnings and approximately 45% of GDP is derived from the private sector.
Current growth in GDP is estimated at 4.1% with inflation forecast (2007) at 3.04%.
Growth in GDP is estimated at 4.1% increasing to US$374.5bn in 2007. CPI is currently estimated at 3.04% (2007) and the exchange rate of the SAR against the US$ at 30 June 2007 was 3.75.
No estimate of the population living below the poverty line is available. The labour force includes some 5.5 million foreign workers specifically in the oil and service sectors. The total labour force is estimated at 7 million comprising agriculture (12%), industry (25%) and services (63%).
Principal industries comprise crude oil production, petroleum refining, basic petrochemicals, cement, construction, fertilizer and plastics.
Export commodities (US$206bn) are dominated (90%) by petroleum and petroleum products. The principal export partners are the United States (18.9%), Japan (15.9%), South Korea (10.3%), Singapore (5.2%) and China (4.7%).
Import commodities (US$64bn) comprise machinery and equipment, foodstuffs, chemicals, motor vehicles and textiles. The principal import partners are the United States (11.1%), Japan (8.7%), Germany (7.5%), United Kingdom (4.9%), France (4.8%) and Italy (4.0%).
As part of its effort to attract foreign investment and diversify the economy, Saudi Arabia acceded to the WTO in December 2005. High oil revenues have continued to results in budget surpluses and the government has announced plans to establish six economic cities in different regions of the country to promote development and diversification.

SRK Consulting Ma'aden Gold MER – Main Report
U3330_Ma'aden MER.doc November, 2007 Page 44
Table 2.17 Saudi Arabia: comparison of 2006 economic and demographic statistics with GCC members(1)
Statistics Units Bahrain Kuwait Oman Qatar Saudi ArabiaEconomy GDP - annual (current) (US$bn) 15.4 95.9 36.0 52.7 349.1GDP - annual growth (current) (%) 7.6% 5.0% 5.9% 10.3% 4.3%GDP per capita (current) (US$/capita) 20,759 30,983 13,848 62,914 14,733Lending Rate (%) 8.1% 8.6% 7.4% n/a n/aExchange Rate (US$: Local) 2.66 3.46 0.38 3.64 3.75Inflation CPI (%) 2.92% 3.64% 3.50% n/a 2.88%Demographics Population (millions) 0.7 3.1 2.6 0.8 23.7Population growth - annual (%) 1.8% 2.5% 2.2% 1.8% 2.4%
(1) Includes forecasts. Table 2.18 Saudi Arabia: economic and demographic statistics(1) Statistics Units 2000 2001 2002 2003 2004 2005 2006 2007Economy GDP - annual (current) (US$bn) 188.7 183.3 188.8 214.9 250.7 315.8 349.1 374.5GDP - annual growth (current) (%) 4.9% 0.5% 0.1% 7.7% 5.3% 6.1% 4.3% 4.1%GDP per capita (current) (US$/capita) 9,216 8,737 8,785 9,758 11,127 13,658 14,733 15,417Foreign Direct Investment (US$bn) 1.9 0.0 0.6 0.6 0.3 2.4 n/a n/aExchange Rate (US$:SAR) 3.75 3.75 3.75 3.75 3.75 3.75 3.75 3.75Inflation CPI (%) -1.80% -0.61% 0.72% 0.61% 0.40% 1.21% 2.88% 3.04%Demographics Population (millions) 20.5 21.0 21.5 22.0 22.5 23.1 23.7 24.3Population growth - annual (%) 2.5% 2.5% 2.5% 2.5% 2.3% 2.6% 2.5% 2.5%
(1) Includes forecasts, specifically for 2007 and aspects of 2006.
2.5.1 Mining and Exploration licensing Mining and exploration licensing arrangements in Saudi Arabia are largely governed by the Mining Investment Code (the “Mining Code”) of the Kingdom of Saudi Arabia issued by Royal Decree number 47/M dated 5 October 2004. This is further supported by the Mining Investment Regulations (the “MIR”) and issued simultaneously with the Mining Code by the Ministry of Petroleum and Mineral Resources (the “MPMR”).
The Mining Code vests ownership of all minerals in the state and specifically excludes petroleum, natural gas and derivatives thereof in addition to marine organic substances (pearls, corals). The supervising agency for the implementation of the Mining Code is the MPMR who is also responsible for coordination with other government agencies. The various types of licences include:
• Reconnaissance Licence;
• Exploration Licence;
• Material Collection Licence; and
• Exploitation Licences which include:
− Mining Licence, − Raw Materials Quarry Licence, − Small Mining Licence, − Building Materials Quarry Licence.
Furthermore in respect of all environmental matters the holder of an Exploitation Licence (Building Materials Quarry Licence excepted) must: (a) conduct an environmental evaluation study to be approved by the General Presidency for Metrological and Environmental Protection; (b) undertake rehabilitation of the licence area as prescribed by the MIR; (c) report to the Ministry any archaeological sites identified within the licence area.
An Exploration Licence may be issued for an area not exceeding 100km2 for a period not exceeding five years, which may be renewed or extended for a period or periods not

SRK Consulting Ma'aden Gold MER – Main Report
U3330_Ma'aden MER.doc November, 2007 Page 45
exceeding five years. The accompanying MIR state requirements for minimum expenditures, submittal of half-yearly reports and all drill core obtained from the licence area. Minimum expenditures extend from SAR750 in the first year increasing to SAR7,500 in the tenth year.
A Mining Licence can be issued for a period of not exceeding 30 years, over an area not exceeding 50km2.
Financial provisions included in the Mining Code comprise general fees for application, renewal, extension, and transfer, in addition the following apply for gold assets:
• The state shall collect from each holder of a mining licence who is not subject to income tax, a severance fee representing 25% of his annual net income or the equivalent of the income tax, whichever is lower and the Zakat due from him shall be deducted from this amount. Accordingly the licensee must keep appropriate records in respect of technical, financial and statistical reports including revenues, net income and production quantities;
• The licensee shall enjoy the incentives as stipulated by the income tax code and foreign investment code;
• The licensee shall be exempt from customs duties and spare parts necessary for the execution of any licensed project under the Mining Code; and
• The holder of a Mining Licence shall pay surface rental in the amount of SAR10,000 per km2.
The MIR also states that the holder of an Exploitation Licence must submit a feasibility study, an environmental study, and a rehabilitation plan prior to any development or mining activity.
2.5.2 Environmental regulations Environmental management by mines in Saudi Arabia is largely governed by two sets of legislation and regulatory authorities as outlined below.
• General environmental legislation is set out in the Public Environmental Law (promulgated by Royal Decree No. M/34, dated 15 October 2001) and the corresponding Rules for Implementation (approved by Ministerial Resolution No. 1/1/4/5/1/924, dated 30 September 2003). The government agency responsible for the implementation of the legislation is the Meteorology and Environmental Protection Administration (“MEPA”), which operates under the jurisdiction of the Minister of Defence and Aviation and Inspector General; and
• Protection of the environment by mines is specifically dealt with in the Mining Investment Code of the Kingdom of Saudi Arabia (issued by Royal Decree number 47/M, dated October 2004) and the corresponding Mining Investment Regulations. The MPMR is responsible for the implementation of this legislation.
Site-specific legal requirements are imposed on projects through the Environmental Impact Assessment (“EIA”) conditions of approval. An EIA report has to be submitted to MEPA for review and approval. When satisfied, MEPA will issue a statement of approval of the validity of the information, together with conditions of approval. The project owner must then sign consent to comply with the attached conditions.
The Mining Code and corresponding MIR require that licensees comply with the environmental regulations and standards of the Kingdom of Saudi Arabia. The Mining Code allows for granting of easement rights to state-owned land outside the licence area including surface and undergroundwater required for the licensees operations, provided this does not prejudice Water Conservation priorities. (The Mining Code defines “easement” as follows:

SRK Consulting Ma'aden Gold MER – Main Report
U3330_Ma'aden MER.doc November, 2007 Page 46
“The right of use of roads, railways, communication and telephone lines, pipelines and other facilities that exist outside the licence area which are needed for exploitation purposes in accordance with the licence.” ) The MIR requires that an application is made to the MPMR for specific easement rights. A permit or permits will then be issued for the easement rights.
Important requirements of the Mining Code and the MIR in respect of environmental matters are listed below:
• An environmental assessment must be undertaken by holders of exploitation licences and must be approved by MEPA;
• The licence area must be rehabilitated and left in a safe, orderly state. A rehabilitation plan must be produced and the first version of this should appear in the environmental assessment report;
• The cost of rehabilitation must be taken into account in the feasibility study (which has to be submitted to MPMR by an exploitation licence holder before any development or mining is undertaken) and must be updated on a progressive basis as exploitation progresses;
• A licensee must identify hazardous material resulting from the site and dispose of accordingly, abide by and comply with environmental regulations of Saudi Arabia;
• A licensee must report annually on the implementation of environmental management and the results of monitoring programmes pertaining to environmental management;
• A licensee must immediately notify the MPMR and any other relevant authority should any incident or activity cause serious harm to the environment;
• A licensee must ensure protection of sites of archaeological interest and report the finding to the MPMR. MPMR will then inform the concerned authority about the sites.
2.5.3 Labour legislation Labour legislation in Saudi Arabia is governed by the Saudi Labour Law (the “Labour Law”) issued by Royal Decree M/51 (27 September 2005) which superseded the Labour and Workmen Law (1969). The Labour Law covers the key areas of: employee’s rights and remuneration; working hours; wages and benefits including pensions and social insurance; labour management relations; and employment of foreigners. Specifically, the Labour Law does not allow the formation of labour and trade unions in Saudi Arabia, however, in April 2002, the Ministry of Labour issued rules allowing the formation of labour committees in companies employing more than 100 Saudi Nationals.
2.5.4 Taxation Under the current provisions of the Saudi Arabian Tax Law (March 2004) (the “Tax Law”), mining related taxation levied by the GoSA is summarised below. The tax system of Saudi Arabia is promulgated by the central government through royal decrees, ministerial decisions and circulars of the Department of Zakat and Income Tax (“DZIT”):
• Tax Period in respect of income tax: generally 12 months ending 31 December, however a company may select any date as its accounting year end date;
• Corporate Income Tax (“CIT”): a fixed non-graduated rate of 20% where the following deductions apply:
− 100% deduction of production expenses including labour, social fund contributions, insurance costs, repairs and maintenance costs (limited to 4% of the fixed asset

SRK Consulting Ma'aden Gold MER – Main Report
U3330_Ma'aden MER.doc November, 2007 Page 47
balance), excluding mining royalties. Payments made by employers off their employees contributions to a legal pension fund, social insurance or savings funds are not deductible,
− Depreciation based on five main categories: (1) permanent buildings at 5%; (2) industrial and agricultural moveable buildings at 10%; (3) factories, machines, engines, hardware and software (computer software) and equipment, including passenger cars, and cargo vehicles at 25%; (4) geological surveying, drilling, exploration, and other preliminary work to exploit and develop natural resources at 20%; and all other tangible and intangible depreciable assets not included in previous categories, such as furniture, planes, ships, trains and goodwill at 10%. Depreciation should be calculated annually for each of the groups applying the rates against the balance of the group at the end of the taxable year,
− trading losses carried forward for an indefinite period after the expiry of tax holiday periods. The maximum amount of loss allowed in this way in any one tax year is restricted to 25% of that year’s profit as reported in the tax return.
In respect of each Exploitation Licence, SRK has determined both CIT and Zakat and assumed that the greater of the two shall be the applicable tax paid in any given reporting period in respect of the Financial Models;
• Zakat: A religious tax, levied on Saudi nationals, wholly Saudi-owned companies and the Saudi shareholders’ share of profits of companies with foreign participation in accordance with Sharia’ Law. For this purpose GCC nationals and companies are treated as Saudis and Zakat is payable annually on the Zakat payer’s total capital resources and income, excluding amounts invested in fixed assets. Notwithstanding this aspect, SRK has been advised by the Company that Zakat should be estimated based on application of the 2.5% rate to the net book value of the assets at the close of each reporting period;
• Value Added Taxation (“VAT”): No VAT is levied in Saudi Arabia;
• Import Duties: None applicable;
• Mining Royalties: None applicable;
• Withholding Taxes: 5% on distributed dividends, withheld by the enterprise on behalf of the recipient (resident or non-resident); and
• Other Taxes:
− personal income taxes levied as Zakat at 2.5% of gross salaries, and − social contribution at 11% of gross salaries of Saudi workers, which covers
occupational hazards (2%) and pensions (9%). For foreign workers salaries, only the 2% is payable to cover their occupational hazards, and no payments into the national pension system are required.


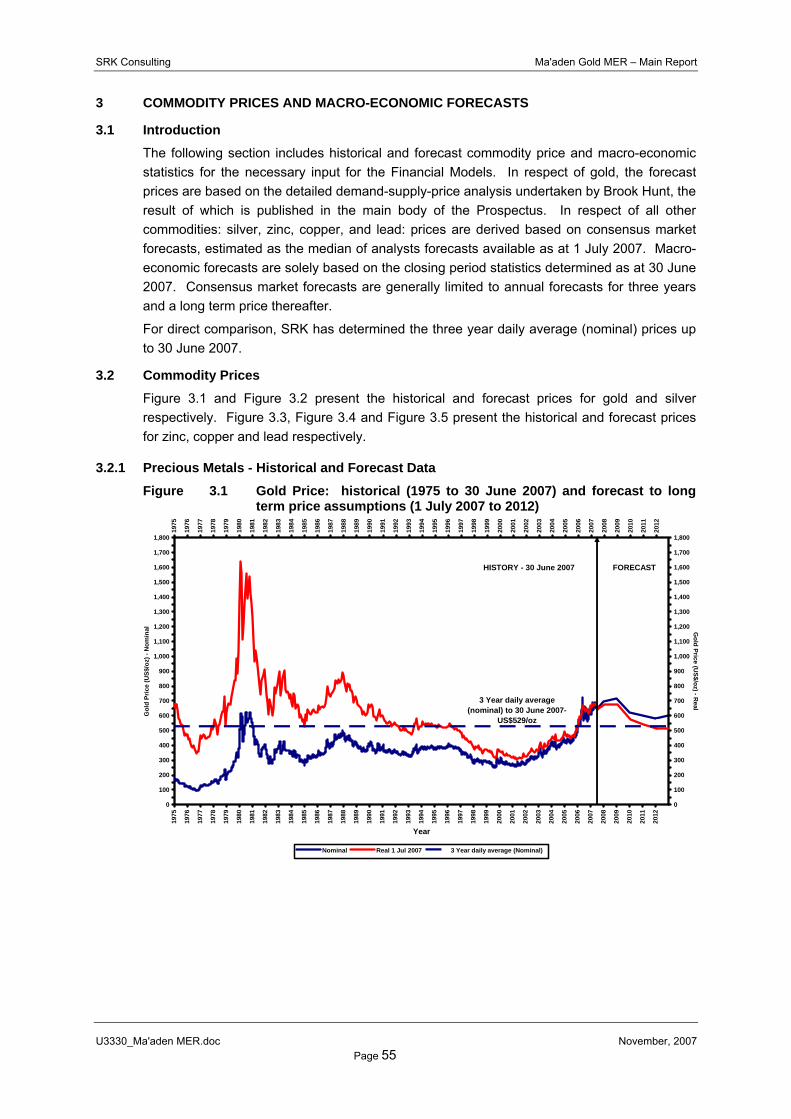
SRK Consulting Ma'aden Gold MER – Main Report
U3330_Ma'aden MER.doc November, 2007 Page 55
3 COMMODITY PRICES AND MACRO-ECONOMIC FORECASTS
3.1 Introduction The following section includes historical and forecast commodity price and macro-economic statistics for the necessary input for the Financial Models. In respect of gold, the forecast prices are based on the detailed demand-supply-price analysis undertaken by Brook Hunt, the result of which is published in the main body of the Prospectus. In respect of all other commodities: silver, zinc, copper, and lead: prices are derived based on consensus market forecasts, estimated as the median of analysts forecasts available as at 1 July 2007. Macro-economic forecasts are solely based on the closing period statistics determined as at 30 June 2007. Consensus market forecasts are generally limited to annual forecasts for three years and a long term price thereafter.
For direct comparison, SRK has determined the three year daily average (nominal) prices up to 30 June 2007.
3.2 Commodity Prices Figure 3.1 and Figure 3.2 present the historical and forecast prices for gold and silver respectively. Figure 3.3, Figure 3.4 and Figure 3.5 present the historical and forecast prices for zinc, copper and lead respectively.
3.2.1 Precious Metals - Historical and Forecast Data Figure 3.1 Gold Price: historical (1975 to 30 June 2007) and forecast to long
term price assumptions (1 July 2007 to 2012)
3 Year daily average (nominal) to 30 June 2007-
US$529/oz
0
100
200
300
400
500
600
700
800
900
1,000
1,100
1,200
1,300
1,400
1,500
1,600
1,700
1,800
1975
1976
1977
1978
1979
1980
1981
1982
1983
1984
1985
1986
1987
1988
1989
1990
1991
1992
1993
1994
1995
1996
1997
1998
1999
2000
2001
2002
2003
2004
2005
2006
2007
2008
2009
2010
2011
2012
Year
Gol
d Pr
ice
(US$
/oz)
- N
omin
al
0
100
200
300
400
500
600
700
800
900
1,000
1,100
1,200
1,300
1,400
1,500
1,600
1,700
1,800
1975
1976
1977
1978
1979
1980
1981
1982
1983
1984
1985
1986
1987
1988
1989
1990
1991
1992
1993
1994
1995
1996
1997
1998
1999
2000
2001
2002
2003
2004
2005
2006
2007
2008
2009
2010
2011
2012
Gold Price (U
S$/oz) - Real
Nominal Real 1 Jul 2007 3 Year daily average (Nominal)
FORECASTHISTORY - 30 June 2007

SRK Consulting Ma'aden Gold MER – Main Report
U3330_Ma'aden MER.doc November, 2007 Page 56
Figure 3.2 Silver Price: historical (1975 to 30 June 2007) and forecast to long term price assumptions (1 July 2007 to 2012)
3 Year daily average (nominal) to 30 June 2007 -
US$9.64/oz
0.00
5.00
10.00
15.00
20.00
25.00
30.00
35.00
40.00
45.00
50.00
1975
1976
1977
1978
1979
1980
1981
1982
1983
1984
1985
1986
1987
1988
1989
1990
1991
1992
1993
1994
1995
1996
1997
1998
1999
2000
2001
2002
2003
2004
2005
2006
2007
2008
2009
2010
2011
2012
Year
Silv
er P
rice
(US$
/oz)
- N
omin
al
0.00
5.00
10.00
15.00
20.00
25.00
30.00
35.00
40.00
45.00
50.00
1975
1976
1977
1978
1979
1980
1981
1982
1983
1984
1985
1986
1987
1988
1989
1990
1991
1992
1993
1994
1995
1996
1997
1998
1999
2000
2001
2002
2003
2004
2005
2006
2007
2008
2009
2010
2011
2012
Silver Price (US$/oz) - R
eal
Nominal Real 1 Jul 2007 3 Year daily average (Nominal)
HISTORY - 30 June 2007 FORECAST
3.2.2 Base Metals - Historical and Forecast Data
Figure 3.3 Zinc Price: historical (1975 to 30 June 2007) and forecast to long term price assumptions (1 July 2007 to 2012)
3 Year daily average (nominal) to 30 June 2007 -
USc105c/lb
0
20
40
60
80
100
120
140
160
180
200
1975
1976
1977
1978
1979
1980
1981
1982
1983
1984
1985
1986
1987
1988
1989
1990
1991
1992
1993
1994
1995
1996
1997
1998
1999
2000
2001
2002
2003
2004
2005
2006
2007
2008
2009
2010
2011
2012
Year
Zinc
Pric
e (U
Sc/lb
) - N
omin
al
0
20
40
60
80
100
120
140
160
180
200
1975
1976
1977
1978
1979
1980
1981
1982
1983
1984
1985
1986
1987
1988
1989
1990
1991
1992
1993
1994
1995
1996
1997
1998
1999
2000
2001
2002
2003
2004
2005
2006
2007
2008
2009
2010
2011
2012
Zinc Price (USc/lb) - R
eal
Nominal Real 1 Jul 2007 3 Year daily average (Nominal)
HISTORY - 30 June 2007 FORECAST

SRK Consulting Ma'aden Gold MER – Main Report
U3330_Ma'aden MER.doc November, 2007 Page 57
Figure 3.4 Copper Price: historical (1975 to 30 June 2007) and forecast to long term price assumptions (1 July 2007 to 2012)
3 Year daily average (nominal) to 30 June 2007 -
USc231c/lb
0
50
100
150
200
250
300
350
400
450
500
1975
1976
1977
1978
1979
1980
1981
1982
1983
1984
1985
1986
1987
1988
1989
1990
1991
1992
1993
1994
1995
1996
1997
1998
1999
2000
2001
2002
2003
2004
2005
2006
2007
2008
2009
2010
2011
2012
Year
Cop
per P
rice
(USc
/lb) -
Nom
inal
0
50
100
150
200
250
300
350
400
450
500
1975
1976
1977
1978
1979
1980
1981
1982
1983
1984
1985
1986
1987
1988
1989
1990
1991
1992
1993
1994
1995
1996
1997
1998
1999
2000
2001
2002
2003
2004
2005
2006
2007
2008
2009
2010
2011
2012
Copper Price (U
Sc/lb) - Real
Nominal Real 1 Jul 2005 3 Year daily average (Nominal)
HISTORY - 30 June 2007 FORECAST
Figure 3.5 Lead Price: historical (1975 to 30 June 2007) and forecast to long term price assumptions (1 July 2007 to 2012)
3 Year daily average (nominal) to 30 June 2007 -
USc56c/lb
0
10
20
30
40
50
60
70
80
90
100
110
120
130
140
150
1975
1976
1977
1978
1979
1980
1981
1982
1983
1984
1985
1986
1987
1988
1989
1990
1991
1992
1993
1994
1995
1996
1997
1998
1999
2000
2001
2002
2003
2004
2005
2006
2007
2008
2009
2010
2011
2012
Year
Lead
Pric
e (U
Sc/lb
) - N
omin
al
0
10
20
30
40
50
60
70
80
90
100
110
120
130
140
150
1975
1976
1977
1978
1979
1980
1981
1982
1983
1984
1985
1986
1987
1988
1989
1990
1991
1992
1993
1994
1995
1996
1997
1998
1999
2000
2001
2002
2003
2004
2005
2006
2007
2008
2009
2010
2011
2012
Lead Price (USc/lb) - R
eal
Nominal Real 1 Jul 2007 3 Year daily average (Nominal)
HISTORY - 30 June 2007 FORECAST
3.3 Commodity Prices and Macro Economics - historical and forecast summary data Table 3.1 presents the historical and forecast summary of commodity prices and macro-economic data.
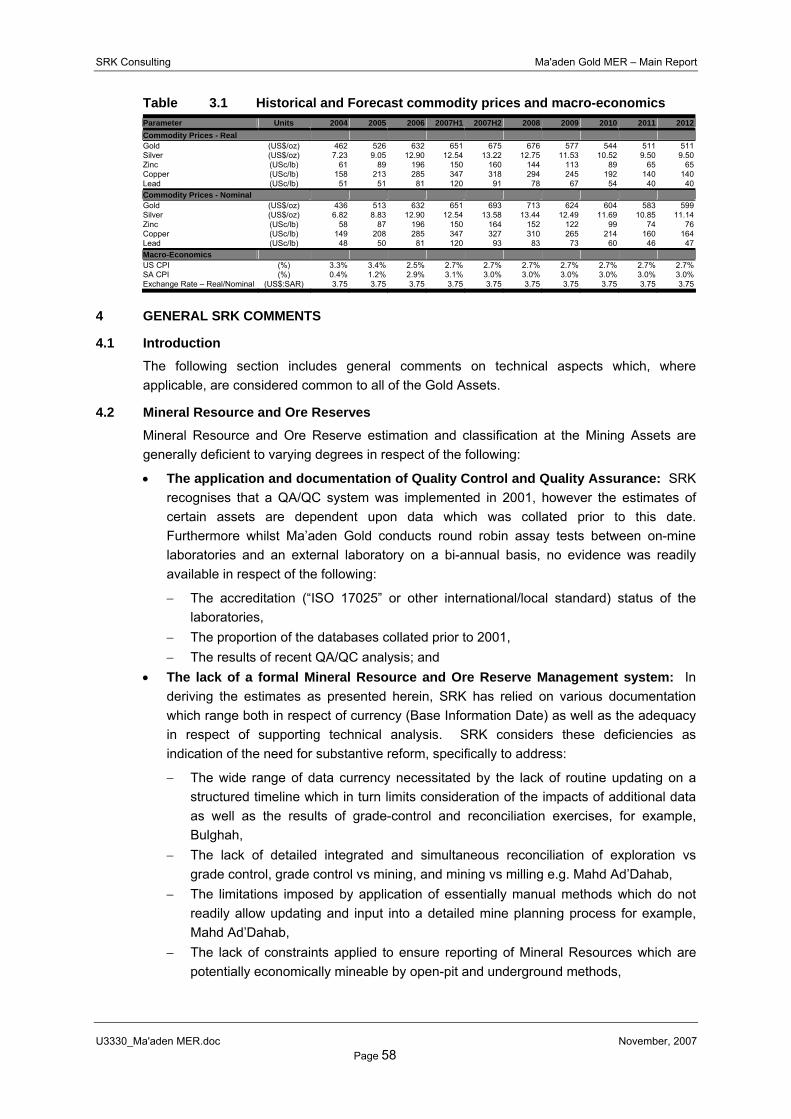
SRK Consulting Ma'aden Gold MER – Main Report
U3330_Ma'aden MER.doc November, 2007 Page 58
Table 3.1 Historical and Forecast commodity prices and macro-economics Parameter Units 2004 2005 2006 2007H1 2007H2 2008 2009 2010 2011 2012Commodity Prices - Real Gold (US$/oz) 462 526 632 651 675 676 577 544 511 511Silver (US$/oz) 7.23 9.05 12.90 12.54 13.22 12.75 11.53 10.52 9.50 9.50Zinc (USc/lb) 61 89 196 150 160 144 113 89 65 65Copper (USc/lb) 158 213 285 347 318 294 245 192 140 140Lead (USc/lb) 51 51 81 120 91 78 67 54 40 40Commodity Prices - Nominal Gold (US$/oz) 436 513 632 651 693 713 624 604 583 599Silver (US$/oz) 6.82 8.83 12.90 12.54 13.58 13.44 12.49 11.69 10.85 11.14Zinc (USc/lb) 58 87 196 150 164 152 122 99 74 76Copper (USc/lb) 149 208 285 347 327 310 265 214 160 164Lead (USc/lb) 48 50 81 120 93 83 73 60 46 47Macro-Economics US CPI (%) 3.3% 3.4% 2.5% 2.7% 2.7% 2.7% 2.7% 2.7% 2.7% 2.7%SA CPI (%) 0.4% 1.2% 2.9% 3.1% 3.0% 3.0% 3.0% 3.0% 3.0% 3.0%Exchange Rate – Real/Nominal (US$:SAR) 3.75 3.75 3.75 3.75 3.75 3.75 3.75 3.75 3.75 3.75
4 GENERAL SRK COMMENTS
4.1 Introduction The following section includes general comments on technical aspects which, where applicable, are considered common to all of the Gold Assets.
4.2 Mineral Resource and Ore Reserves Mineral Resource and Ore Reserve estimation and classification at the Mining Assets are generally deficient to varying degrees in respect of the following:
• The application and documentation of Quality Control and Quality Assurance: SRK recognises that a QA/QC system was implemented in 2001, however the estimates of certain assets are dependent upon data which was collated prior to this date. Furthermore whilst Ma’aden Gold conducts round robin assay tests between on-mine laboratories and an external laboratory on a bi-annual basis, no evidence was readily available in respect of the following:
− The accreditation (“ISO 17025” or other international/local standard) status of the laboratories,
− The proportion of the databases collated prior to 2001, − The results of recent QA/QC analysis; and
• The lack of a formal Mineral Resource and Ore Reserve Management system: In deriving the estimates as presented herein, SRK has relied on various documentation which range both in respect of currency (Base Information Date) as well as the adequacy in respect of supporting technical analysis. SRK considers these deficiencies as indication of the need for substantive reform, specifically to address:
− The wide range of data currency necessitated by the lack of routine updating on a structured timeline which in turn limits consideration of the impacts of additional data as well as the results of grade-control and reconciliation exercises, for example, Bulghah,
− The lack of detailed integrated and simultaneous reconciliation of exploration vs grade control, grade control vs mining, and mining vs milling e.g. Mahd Ad’Dahab,
− The limitations imposed by application of essentially manual methods which do not readily allow updating and input into a detailed mine planning process for example, Mahd Ad’Dahab,
− The lack of constraints applied to ensure reporting of Mineral Resources which are potentially economically mineable by open-pit and underground methods,

SRK Consulting Ma'aden Gold MER – Main Report
U3330_Ma'aden MER.doc November, 2007 Page 59
− The lack of mine design and production scheduling beyond the budget reporting period (1 year – January to December) e.g. all Mining Assets,
− The lack of a multi-disciplinary approach with set minimum standards for reporting of Mineral Resources and Ore Reserves,
− The limited professional registration of on-site practitioners, − Consistency of approach across all of the Gold Assets.
Key to implementing such a strategy is the development of a formal corporate policy and establishing an in-house team with sufficient capacity to implement the appropriate systems, ensure common practice and enable on-going reporting requirements as a listed company.
4.3 Environmental The Company’s SHE Policy commits to the establishment of a health, safety and environmental management system. To this end the Company has designed EMS and OHSS manuals and intends to introduce these to Ma’aden Gold in the second half of 2007.
Currently none of the mines has a well-established environmental and social management and the following key issues are noted:
• Environmental and social assessment: No EIA (the term EIA is used in Saudi Arabian legislation) have been undertaken for Mahd Ad’Dahab and Sukhaybarat. The closure plan for Mahd Ad’Dahab does include a brief social impact assessment, focused on closure of the mine. The social element of the EIAs for the other gold mines is generally rudimentary and this can be attributed to the limited public involvement in the EIA process;
• Community engagement: The EIA for the mines were undertaken with limited public involvement, mainly in the form of unofficial consultations with local communities. The Saudi Arabian Public Environmental Law and Rules for Implementation do not specify any formal requirement to undertake public involvement in an EIA for a project (actually, they specifically exclude public involvement). Public consultations are considered to be the responsibility of government officials.
Approval of a mining lease application requires clearance from relevant interest government departments. The Ministry of Petroleum and Mineral Resources assumes the role of lead agency and pursues the application on behalf of the mining company. The application is sent to the province/district level for consideration by the relevant departments whose jurisdictions are likely to be infringed by the mining lease area to be awarded. These generally include the agriculture, water and rural development departments. If there are any affected communities the local government assesses the impacts and negotiates the terms of compensation. The project proponent is not required to directly engage in dialogue with affected communities to assess their losses and determine compensation.
There is no evidence of formal, documented systems of ongoing community engagement at any of the Mining Assets (at Bulghah, the Security Supervisor is the person responsible for liaison with the surrounding community);
• Monitoring: There is no evidence of comprehensive monitoring programmes including field measurements, inspections and audits at any of the sites. The Mining Assets do not have adequate field-measurement monitoring data
• Compliance: All Mining Assets that are operational were granted mining leases (now

SRK Consulting Ma'aden Gold MER – Main Report
U3330_Ma'aden MER.doc November, 2007 Page 60
called Exploitation Licences) when the Old Mining Code (promulgated by Royal Decree No. M/21, dated July 1972) was in effect. While the leases/licences remain valid under the new Mining Code, they were granted before the recent (Section 2.5.1 and Section 2.5.2) general environmental legislation and mining-specific legislation came into effect. The mining leases for Mahd Ad’Dahab, Al Amar, Sukhaybarat and Al Hajar were granted in November 1998, September 1997, May 1998 and November 1998, respectively. The mining lease for Bulghah Mine was granted in October 2001 (in the same month that the Public Environmental Law was promulgated published). The general environmental legislation, by means of Article 15 of the Implementing Regulations, allows all projects existing at the time of issue of the regulations a maximum grace period of five years (until September 2008) to ensure their compliance with both the Public Environmental Law and the Implementing Regulations. If it becomes apparent that this period is not sufficient for projects with special nature, the grace period can be extended by a decision of the Council of Ministers based on a proposal by the Minister of Defence and Aviation and Inspector General.
5 EXPLORATION ASSETS
5.1 Introduction This section includes discussion and comment on the technical aspects of the Exploration Assets of Ma’aden Gold. In addition historical expenditures and activities are discussed as well as SRK’s opinion of the proposed Exploration Programme as developed by Ma’aden Gold. Additional detail is provided on the Advanced Exploration Properties as these report Mineral Resources which account for some 5.8Moz of gold contained within 86.2Mt at grade of 2.1g/t Au. Where such resources are reported supporting technical detail in respect of geology and Mineral Resource estimation is also provided. Ad Duwayhi is classified as a Development Property within the Mining Assets and accordingly technical detail is discussed separately in Section 11.0 of this MER.
5.2 Exploration Assets and Strategy To date Ma’aden Gold has determined a total Mineral Resource of 5.8Moz of gold contained within 86.2Mt at grade of 2.1g/t Au (Table 5.1). Ma’aden Gold’s exploration portfolio includes some 38 properties located in two principal regions: CAG Region and NAS Region. These properties are collectively managed within their Exploration Licence and the AEPs (EPs with defined Mineral Resources) are all contained within the CAG Region. Following successful re-application and the necessary relinquishment of licence areas (currently in process) the total licence areas under management will reduce from 71,044.0km2 to 47,521.0km2, of which 10,923.8km2 represent licences in which the AEPs are contained and 36,597.2km2 represent licences in which only EPs are managed.
In the CAG Region there are 17 exploration assets (Table 5.2), of which five are classified as AEPs and 12 as EPs (pre-resource exploration). In the NAS Region there are a total of 21 exploration assets, all of which are classified as EPs. Total exploration expenditures from 1999 through 30 June 2007 inclusive amount to US$42.1m (Table 5.3), 85% of which was expended on Exploration Licences situated in the CAG Region.
The principal exploration activities at the Exploration Assets comprise: regional mapping; geochemical sampling (rock and soil); drilling (Reverse Circulation drill holes, Diamond Drill holes); and drill intercept sampling. To date Ma’aden Gold has collected 46,000 geochemical samples, undertaken some 424km of drilling and submitted 358,000 intercept samples (Table

SRK Consulting Ma'aden Gold MER – Main Report
U3330_Ma'aden MER.doc November, 2007 Page 61
5.4) in respect of exploration activities in the CAG Region and NAS Region collectively.
Assuming expenditures of US$35.80m for the CAG Region, the cost per unit of resource ounce is estimated at US$4.5/oz Au for a total of 7.9Moz of gold.
Ma’aden Gold’s current exploration strategy is focused on advancing the delineation of Mineral Resources in order to establish a foundation for sustaining and increasing equivalent production to 250koz of gold by 2011 and to grow this by a further 250koz of gold per annum in the longer term (>2013). To this end the focus is on expanding the resource base in the CAG Region and undertaking pre-resource definition drilling as well as target generation in the NAS Region which, if successfull, will be incorporated into the current pre-feasibility studies planned for the CAG Project in 2008. Specifically in the CAG Region where the currently delineated Mineral Resources (excluding Ad Duwayhi) are estimated at 5.8Moz of gold (Table 5.1), additional drilling is also planned to upgrade the classification to a minimum of Indicated Mineral Resource and a quantum sufficient to establish technical feasibility and economic viability.
Table 5.1 Exploration Assets: AEPs Mineral Resource statement (1 July 2007) JORC Code Statements Tonnage Grade Content
(kt) (g/t Au) (koz Au)Indicated Mansourah 18,135 2.4 1,388Masarrah 13,501 2.3 981Subtotal 31,635 2.3 2,369Measured + Indicated Mansourah 18,135 2.4 1,388Masarrah 13,501 2.3 981Total Measured + Indicated 31,635 2.3 2,369Inferred Mansourah 3,558 2.0 228Ar Rjum 35,886 1.9 2,225Masarrah 2,603 2.1 176As Suk 1,728 4.1 228Zalim 10,753 1.7 590Subtotal 54,528 2.0 3,448Mineral Resources Mansourah 21,693 2.3 1,616Ar Rjum 35,886 1.9 2,225Masarrah 16,104 2.2 1,157As Suk 1,728 4.1 228Zalim 10,753 1.7 590Total Mineral Resources 86,164 2.1 5,817

SRK Consulting Ma'aden Gold MER – Main Report
U3330_Ma'aden MER.doc November, 2007 Page 62
Table 5.2 Exploration Assets Region Exploration Licence Exploration Assets ProspectCAG Region Aduwayah Exploration Property Ad Duwayhi Placer
Exploration Property NE Flats Exploration Property North Farthah
NAS Region Al Hajar Exploration Property Gossan-14 Exploration Property Hajeej Exploration Property Sha'abat Al Hamra Exploration Property Waqba Exploration Property Sheers Exploration Property Jadmah
NAS Region Al Jardhawiyah Exploration Property Aurifjan Exploration Property Jardawiyah
CAG Region Al Uruq Advanced Exploration Property Mansourah Exploration Property NE Flats Exploration Property Amana Exploration Property Mansourah North Exploration Property Umm Selam
NAS Region An Najadi, Nugrah, Mawan, Habla Exploration Property Red Hill Exploration Property Al Habla Exploration Property Shaba Deposit Exploration Property Tarfawi Prospect Exploration Property Nuqrah Exploration Property Bulghah North Exploration Property Hablah South Exploration Property Hablah North
NAS Region As Siham Exploration Property Jabal Geza Exploration Property Jedib Guzail
CAG Region Ash Shakhtaliyah Advanced Exploration Property Ar Rjum Advanced Exploration Property Masarrah Advanced Exploration Property As Suk Exploration Property Bir Tawilah Exploration Property Jabal Ghadarah
NAS Region Miskah Exploration Property Humaymah (Makhruqah)NAS Region Tawan Exploration Property South An NayzahNAS Region Shabah Exploration Property ShabaCAG Region Wurshah Exploration Property North Breccia
Exploration Property Bir Wurshah & Urgub Wurshah Exploration Property Umm Mattirah
CAG Region Zalim Advanced Exploration Property Zalim
Specific milestones defined for 2007:
• Expansion and upgrading of the Mineral Resources at Ar Rjum;
• Increasing the Mansourah North Mineral Resource to a minimum of 1.5Moz by testing the deeper resources of the main zone at depth and infill diamond drilling the Mansourah North prospect;
• Revise and advance resource estimation and other technical studies at Mansourah, Ar Rjum and Masarrah;
• Evaluate the potential of the Mansourah-trend gold prospects including: Bir Tawilah, Mansourah North, Umm Selam and Amana;
• Evaluate the Bulghah North gold target on a fast-track basis;
• Advance the Humaymah gold project to resource definition stage;
• Undertake area selection and regional reconnaissance prospecting on most licences and already identified targets; and
• Reduce tenement area by up to a further 50% in 2008.
To date, SRK considers the Company’s exploration strategy has been broadly successful in advancing exploration work, specifically in the CAG Region. The current work programmes and strategies as developed are appropriate and SRK considers the related exploration properties as properties of merit in this respect.
5.2.1 Historical Expenditures and Activities Table 5.3 presents the historical exploration expenditures incurred to date at the Exploration Assets. Table 5.4 presents a summary of the historical activities completed to date at the Exploration Assets.

SRK Consulting Ma'aden Gold MER – Main Report
U3330_Ma'aden MER.doc November, 2007 Page 63
Table 5.3 Exploration Assets: historical exploration expenditures(1) Region Exploration Licence AEPs EPs Expenditure
Pre 2004 2004 2005 2006 2007H1 (No) (No) (US$m) (US$m) (US$m) (US$m) (US$m)
CAG Region Aduwayah 0 3 9.66 0.21 0.12 0.12 0.09NAS Region Al Hajar 0 6 0.00 0.00 0.00 0.11 0.01NAS Region Al Jardhawiyah 0 2 0.22 0.09 0.11 0.15 0.00CAG Region Al Uruq 1 4 0.63 3.61 2.72 2.06 0.09NAS Region An Najadi, Nugrah, Mawan, Habla 0 8 0.10 0.00 0.19 1.19 1.03NAS Region As Siham 0 2 0.00 0.12 0.17 0.24 0.08CAG Region Ash Shakhtaliyah 3 2 2.49 1.95 4.12 3.96 2.02NAS Region Miskah 0 1 0.35 0.13 0.36 0.48 0.03NAS Region Tawan 0 1 0.00 0.00 0.06 0.06 0.00NAS Region Shabah 0 1 0.07 0.11 0.10 0.10 0.00CAG Region Wurshah 0 3 0.26 0.26 0.08 0.21 0.02CAG Region Zalim 1 0 1.11 0.00 0.00 0.00 0.00Other Sukhaybarat Regional n/a n/a 0.00 0.58 0.01 0.00 0.00Other Ma'ahd Ad'Dahab Regional n/a n/a 0.00 0.00 0.00 0.00 0.00Other Exploration Office n/a n/a 0.00 0.01 0.00 0.01 0.00Total 5 33 14.89 7.08 8.03 8.71 3.37Regional Division CAG Region 5 12 14.16 6.04 7.03 6.36 2.21NAS Region 0 21 0.73 0.46 0.99 2.33 1.16Other 0 0 0.00 0.59 0.01 0.02 0.00Total 5 33 14.89 7.08 8.03 8.71 3.37(1) Inclusive of expenditures on the Ad Duwayhi Development Property.
Table 5.4 Exploration Assets: historical activities Region Exploration Licence AEPs EPs Geochemical Samples Drill Drilling Drill Samples
(No) (No) (m) (No)
CAG Region Aduwayah 0 3 1,171 6,262 73,105 70,589NAS Region Al Hajar 0 6 105 0 0 300NAS Region Al Jardhawiyah 0 2 5,755 1,564 9,858 3,734CAG Region Al Uruq 1 4 669 2,787 77,436 76,189NAS Region An Najadi, Nugrah, Mawan, Habla 0 8 14,579 1,522 68,459 60,669NAS Region As Siham 0 2 7,119 2,244 9,919 2,183CAG Region Ash Shakhtaliyah 3 2 5,912 6,967 130,605 113,118NAS Region Miskah 0 1 7,177 76 4,501 6,124NAS Region Tawan 0 1 0 0 0 0NAS Region Shabah 0 1 1,123 647 3,936 2,489CAG Region Wurshah 0 3 2,301 4,307 14,086 7,693CAG Region Zalim 1 0 0 7,259 31,604 15,067Total 5 33 45,911 33,635 423,508 358,155Regional Division CAG Region 5 12 10,053 27,582 326,836 282,656NAS Region 0 21 35,858 6,053 96,672 75,499Total 5 33 45,911 33,635 423,508 358,155
5.2.2 Exploration Programme Ma’aden Gold has developed a detailed exploration programme for 2007 which incorporates physical activities and associated expenditures (Table 5.5). The current programme extends to 2010 and assumes further operating expenditures amounting to US$33.5m, the larger portion (52%) of which is to be expended on Exploration Licences in the NAS Region.
The exploration programme for 2007 comprises the following key elements:
• Increase and upgrade the Mineral Resources through diamond drillholes (“DD”) programmes on the CAG Region projects, specifically Ar Rjum, Masarrah and other prospects on the Mansourah-trend;
• To advance exploration in the NAS Region through identification of new drill targets as well as core drilling at the Bulghah North and Humaymah exploration properties;
• To advance work on all Exploration Licences to identify new drill targets and to satisfy the minimum work expenditure requirement of the Ministry; and
• To further reduce the Exploration Licence area under direct management of Ma’aden Gold to some 14,000km2 comprising the most promising areas with known gold occurrences and to offer to local or foreign joint-venture partners to finance exploration work in these areas to earn interest or to buy the mineral rights from Ma’aden Gold. Should this not be successful, it is likely that Ma’aden Gold will be forced to make a second round of licence reduction in the near future.

SRK Consulting Ma'aden Gold MER – Main Report
U3330_Ma'aden MER.doc November, 2007 Page 64
Table 5.5 Exploration Assets: exploration programmes Exploration Licence Contribution (%) Total 2007H2 2008 2009 2010Operating Expenditure (US$m) (US$m) (US$m) (US$m) (US$m)Aduwayah 0.0% 0.00 0.00 0.00 0.00 0.00Al Hajar 2.3% 0.77 0.05 0.12 0.20 0.40Al Jardhawiyah 1.7% 0.55 0.17 0.15 0.09 0.15Al Uruq 7.9% 2.65 0.91 0.40 0.67 0.67An Najadi, Nugrah, Mawan, Habla 27.2% 9.10 0.35 2.73 2.88 3.13As Siham 2.3% 0.75 0.05 0.33 0.23 0.15Ash Shakhtaliyah 29.8% 10.00 3.20 3.33 2.27 1.20Miskah 15.4% 5.17 0.09 1.52 1.83 1.73Tawan 0.0% 0.00 0.00 0.00 0.00 0.00Shabah 3.2% 1.08 0.09 0.12 0.20 0.67Wurshah 10.3% 3.44 0.28 0.49 1.20 1.47Sukhaybarat Regional 0.0% 0.00 0.00 0.00 0.00 0.00Ma'ahd Ad'Dahab Regional 0.0% 0.00 0.00 0.00 0.00 0.00Subtotal 100.0% 33.51 5.19 9.20 9.56 9.56CAG Region 48.0% 16.09 4.39 4.23 4.13 3.33NAS Region 52.0% 17.42 0.79 4.97 5.43 6.23Capital Expenditure 0.57 0.00 0.19 0.19 0.19Total Expenditure 34.07 5.19 9.39 9.75 9.75
Key activities underway in 2007 are:
• Generative Programme:
− Continue compiling existing regional data, − Continue field prospecting and regional geochemical sampling, − 43,500m postholes and deep holes Reverse Circulation (“RC”) exploration drilling –
all sites, − 7,050 regional prospecting surface rock grab samples – all sites;
• Advanced Exploration Projects:
− At the Ar Rjum Project to continue delineation and infill drilling of Wasemah and Um-Naam with 24,000m of diamond drilling,
− At the Mansourah-Trend Projects to continue delineation and infill drilling with 11,400m DD,
− At Masarrah carry out delineation and infill drilling with 12,000m diamond drilling; • Brownfields Exploration:
− At Bulghah North to complete delineation and infill drilling on fast track basis with 4,000m of DD and 10,000m of RC drilling,
− At Humaymah carry out delineation and infill drilling with 7,200m of diamond drilling; and
• Application for new exploration licences at Mahd Ad’Dahab and Umm Shalahib (Al Amar area).
5.3 Advanced Exploration Properties The following section includes discussion and comment on the exploration properties for which Mineral Resources are reported. SRK’s review of Ma’aden Gold’s estimates has incorporated a re-calculation based on inter alia the assay data as well as geological wireframes. The global estimates as reported by Ma’aden Gold have largely been confirmed, however given various issues in respect of supporting documentation, specifically addressing quality assurance and quality control, as well as estimation methodology, SRK has reclassified the estimates with respect to Mineral Resource categories. Accordingly, no Measured Mineral Resources are reported and the highest category attributed is Indicated Mineral Resources. Other considerations also include the geological complexity, lack of top cuts, and appropriate de-clustering techniques.
With the exception of the Um-Naam project which has been estimated by a computerised sectional method, all projects were estimated by Ordinary Kriging (“OK”) or by Inverse

SRK Consulting Ma'aden Gold MER – Main Report
U3330_Ma'aden MER.doc November, 2007 Page 65
Distance Weighting Squared (“IDW2”) methodologies.
For projects estimated by OK, SRK has conducted an independent check estimation using an IDW2 approach. Standard search criteria have been applied to each respective estimation by applying de-clustering techniques (octant search and sample restriction per drillhole) and by generating search ellipses in line with the drillhole spacing. An initial search ellipse with a diameter of one and a half times the main sample spacing along strike directions was applied. This was doubled for a second pass at the estimation with a large search used to estimate the unfilled blocks in the third pass.
For projects estimated by IDW2, SRK has validated the model by conducting an independent check estimation using IDW2 and by validating the model through sectional slices of the drill sample data and block model.
For the Um-Naam deposit, SRK has undertaken check calculations on the string and drillhole data provided for the deposit.
5.3.1 Ar Rjum Advanced Exploration Property The project lies within the fenced Mahazat Assaid Conservation Area which was established in the 1980s as a safe haven for endangered species such as the Arabian Oryx and indigenous Arabian Ostrich. Ma’aden Gold has been granted the right to explore select areas within the Conversation Area. Three gold prospects have been explored within the Ar Rjum prospect boundary PE1 (or Ghazal), PE2 (or Um-Naam) and PE3 (or Wasemah), which occur along a regionally significant north-northwest trending sub-vertical shear zone. The Ar Rjum East/North (Al-Maha) gold target and Ar Rjum zinc target are yet to be explored.
The following text describes the basis of the Mineral Resource estimates as presented for Ar Rjum, specifically Wasemah and Um-Naam. There is no estimate of the resources for Ghazel which is at a much earlier stage of exploration.
Geology: The Wasemah deposit occurs on a regionally extensive north-northwest trending sub vertical shear zone and comprises as a series of anatomising lenses which are associated with, or are directly adjacent to, discrete shears. Individual lenses dip eastwards at 45° to 70° and are up to 40m wide, in excess of 100m long and have a depth extension of at least 100m. Average grades vary from 1.5g/t Au to 5.5g/t Au. Mineralisation in this deposit is associated with quartz veins hosted in diorite-granodiorite. Pyrite content various from between 1% to 10% and minor chalcopyrite (<1%) may be present. Chalcocite, covellite, sphalerite and molybdenite occur in trace amounts. Fine grained visible gold occurs within and adjacent to pyrite, within growth bands in goethite and associated with chlorite. The vertical depth of potential resource ranges from approximately 165m to 205m. Mineralisation has been defined over a strike length of 950m and remains open to the south and down dip.
The Um-Naam deposit is geologically similar to the Wasemah deposit and consists of numerous sub-parallel east-dipping shear structures which crosscut diorite, mafic volcanics and quartz-feldspar porphyry units. Mineralisation occurs along all shear structures. However, the highest grades and widest sections occur where shears cut diorite units.
The Ghazal Prospect (PE1) is characterised by an outcropping quartz vein which was the focus of ancient mining and is covered by small pits. The quartz vein is hosted in a tuff unit with occasional diorites. Gold is associated with sheared quartz veins and occurs over a strike length of approximately 400m. An infill drill programme is proposed.
Data Quantity and Quality: The Wasema deposit has been explored with a total of 6 trenches totalling 500m in length, 12 percussion drillholes totalling some 850m in depth, 5 RC

SRK Consulting Ma'aden Gold MER – Main Report
U3330_Ma'aden MER.doc November, 2007 Page 66
holes totalling some 175m depth and 220 diamond drilled holes totalling some 30,500m at a spacing of some 50m by 25 m. The Um-Naam deposit has been explored with a total of 6 trenches totalling 700m in length, 25 percussion drillholes totalling some 1,600m in depth, and 175 diamond drilled holes totalling some 26,300m at a spacing of some 50m by 50m. The Ghazel deposit has been explored with a total of 3 trenches totalling 280m in length, 7 percussion drillholes totalling some 500m in depth, and 12 diamond drilled holes totalling some 850m.
All trenching and percussion drilling was undertaken by BRGM and all subsequent diamond and RC drilling by Ma’aden Gold. It is not documented how well the later Ma’aden Gold data compares with historical BRGM work and whether the quality has been confirmed. All sample preparation and analysis of the samples were undertaken at the Al Amri laboratory, however detailed descriptions of the procedures and techniques followed are not available. Internal and external laboratory checks have routinely been undertaken at the Al Amri Laboratory with the samples submitted for the Ar Rjum deposits. Results for standards submitted and external checks at ALS Chemex’s internationally accredited laboratory in Canada show results within acceptable levels of precision, accuracy and repeatability. No detailed density analysis has been undertaken and a single value is used for all rock types in all deposits.
Domaining: For Wasema, a computerised Mineral Resource estimate has been undertaken and mineralisation wireframes created for four separate zones, however due to the complexity and lack of understanding all domains have been grouped together for statistical and geostatistical studies and grade interpolation. No attempt has been made to distinguish between weathered and unweathered material (oxide/transition/sulphide).
For Um-Naam, a cross-sectional polygonal estimate has been undertaken using 0.3 g/t Au cut-off to define mineralised/barren contacts, and projecting interpretations between 25m spaced cross-sections. The complexity of the polygons and general lack of geological continuity results in minimal internal geological dilution.
Statistical Studies: Statistical studies have been undertaken on the domained sample data sets for both deposit areas and show typical skewed distributions as would be expected from these types of gold deposits. A top-cut value of 20g/t Au was applied to the Wasemah sample dataset.
Variography: Reports explaining the geostatistical studies undertaken for Wasemah in order to determine the OK interpolation parameters are limited; however comments are made as to the use of omni-directional variogram models.
Block Modelling, Grade Interpolation and Validation: For Wasemah, a 10m by 10m by 10m block model framework was created covering the wireframe model. Grade was interpolated using orientated isotropic search parameters and ordinary kriging with unknown parameters. No block model has been created for Um-Naam due to the polygonal estimation methodology undertaken.
Classification: Given the data quality issues, lack of detailed reports supporting the data, geological complexity and quality of grade estimation, SRK considers the Wasemah Mineral Resources to be classified as Inferred in accordance with the JORC Code.
Figure 5.1 presents a 3D image of the geological wireframes, block model classification and block model gold grades for the Ar Rjum AEP.
5.3.2 Mansourah Advanced Exploration Property The Mansourah gold deposit is located approximately 50km east of the town of Zalim. The

SRK Consulting Ma'aden Gold MER – Main Report
U3330_Ma'aden MER.doc November, 2007 Page 67
deposit forms part of a north-south trending belt of gold deposits and occurrences with a strike length of at least 50km.
Geology: The Mansourah deposit forms part of a north-south trending belt of gold deposits and occurrences with a strike length of at least 50km which coincide with the contact between older Siham Group schists (mafic metavolcanics) and younger less deformed Bani Ghavy Group sedimentary rocks. The contact zone is marked by a variably altered serpentinised ultramafic unit and diorite and quartz-feldspar porphyry intrusives, which occupy a westerly dipping regional thrust fault zone. The thrust fault zone represents a suture zone between the Afif and Asir Terranes which formed during the Nabitah orogeny.
This zone is repeatedly offset by later sinistral strike-slip faults associated with the Najd orogeny. The latter structures offset mineralisation and crosscut the youngest intrusives. The serpentinised ultramafic unit is commonly listwaenite-altered (quartz-carbonate-fuchsite altered). Remnants of the serpentinite occur along the margins of the listwaenite and especially along the footwall side.
Gold mineralisation is strongly associated with quartz veins and breccia zones preferentially developed within listwaenite. Mineralisation is developed over significant widths (from a few metres up to 60m) both within the quartz veins and listwaenite wall rock, and shows good continuity over a strike length of approximately one kilometre. Quartz veins and mineralisation are developed to a lesser extent within the diorite and porphyry intrusives which have been deformed and are sub parallel to the regional structural grain. Gold mineralisation has been intersected within the footwall greywackes and shales of the Bani Ghavy Group, but forms narrower and less continuous zones compared to the mineralisation within the listwaenite.
High grade zones are associated with chlorite-graphite-pyrite-arsenopyrite in fractures or brecciated quartz veins, disseminated and semi-massive pyrite-arsenopyrite veinlets in sheared diorite. Low grade zones are associated with networks of centimetre scale quartz stockworks in listwaenite-breccia zones and with disseminated pyrite-arsenopyrite in almost all fractured rocks including the footwall sediment and quartz-feldspar porphyry dykes.
The deposit is thought to be intrusive related orogenic vein and disseminated type gold mineralisation.
Data Quantity and Quality: Following promising surface grab sample results, and a programme of surface mapping, 21 shallow RC holes (total 1,295m) were initially drilled at 100m spacing to test the zone. Based on the results of the RC holes an aggressive diamond drilling programme was commenced in 2003 and infill drilling of the uppermost 150m of the deposit on 25m centres was completed in 2005. A programme of deeper diamond drilling was undertaken in 2006 and 2007 and infill the deposit at depth to both 50m by 25m and 25m by 25m spacing. All resource definition drilling has been undertaken in NQ diameter core.
The electronic database dated 2007 contains 5 RC holes totalling 1,100m, and 313 diamond drilled holes totalling 64,000m. The database is very comprehensive containing all lithological, alteration, structural, mineralisation, oxidation details, as well as required drillhole information such as downhole survey and surveyed collar locations. Limited metallurgical testwork is reported to have been conducted.
It is understood that all sample preparation and analysis of the samples were undertaken at the Al Amri Laboratory, however detailed descriptions of the procedures and techniques followed are not available. Internal and external laboratory checks have routinely been undertaken at the Al Amri Laboratory with the samples submitted for the Mansourah deposits.

SRK Consulting Ma'aden Gold MER – Main Report
U3330_Ma'aden MER.doc November, 2007 Page 68
Results for standards submitted and external checks at ALS Chemex’s internationally accredited laboratory in Canada show results within acceptable levels of precision, accuracy and repeatability.
Some 630 density samples have been tested representing all of the mineralised and unmineralised material. Some 150 samples within the mineralisation have been split into oxide and sulphide for the respective densities of 2.80t/m3 and 2.85t/m3.
Domaining: Ma’aden Gold has undertaken computerised wireframe modelling of the mineralisation and split it into four main domains, which are steeply dipping at and trending 070° to the east. The four main domains are from east to west, the As Siham volcano-sedimentary sequence, diorite to granodiorite intrusive rocks and associated felsic dykes, altered ultramafic rocks and footwall clastic sediments.
Statistical Studies: Statistical studies have been undertaken on the domained sample data sets for both deposit areas but at an unknown composite length and show typical log-normal distributions as would be expected from these types of gold deposits. There is no information as to whether top-cuts were applied during grade interpolation.
Variography: No detail is available which explains the geostatistical studies undertaken for Mansourah in order to determine the OK interpolation parameters.
Block Modelling, Grade Interpolation and Validation: For Mansourah a 10m by 10m by 10m block model framework has been created covering the wireframe model. Grade has been interpolated using un-documented estimation and search parameters.
Classification: The Ma’aden Gold classification is based on the search parameters used in the estimation. All blocks estimated during the first run of the estimation are classified as a Measured Mineral Resource, blocks estimated in the second run classed as an Indicated Mineral Resource and all those estimated in the third estimation pass classified as Inferred Mineral Resources. Ma’aden Gold has applied reasonable search volumes for the estimation that is based on drill spacing and increasing search volumes used for subsequent estimation runs. However, no consideration is given to de-clustering of the data and a low minimum sample restriction of four samples is applied to the estimation. This results in the majority of the blocks being estimated in run one of the estimation and therefore being classified as a Measured Mineral Resource.
Given the lack of detailed reports supporting the data, SRK has downgraded the Measured Mineral Resources to Indicated Mineral Resources and kept the Indicated Mineral Resources and the Inferred Mineral Resources material in their respective classification categories as good quality QA/QC data and close spaced drilling provides enough confidence in the geological modelling to classify the majority of the data as an Indicated Mineral Resource.
Figure 5.2 presents a 3D image of the geological wireframes, block model classification and block model gold grades for the Mansourah AEP.
5.3.3 Masarrah Advanced Exploration Property The Masarrah prospect is located 50km east of Zalim and approximately 8km north of the Mansourah deposit, along the same north-south trending mineralised zone which includes Mansourah, Bihr Tawilah, Jabal Ghadarah and Baqarah.
Along with Mansourah and Ad Duwayhi, Masarrah is one of Ma’aden Gold’s more advanced exploration projects.
Geology: The prospect is located in the same geological and structural setting as that described for the Mansourah deposit and gold mineralisation has been intersected over a

SRK Consulting Ma'aden Gold MER – Main Report
U3330_Ma'aden MER.doc November, 2007 Page 69
strike length of 3km. Mineralisation is hosted largely within listwaenite and is strongly associated with stylolitic sulphidic quartz veins. The geological settings of Mansourah and Masarrah deposits are similar and may represent one deposit displaced (6.5km) by late northwest trending fault system (Najd). As at Mansourrah, gold mineralisation is strongly associated with quartz veins and breccia zones preferentially developed within listwaenite. Mineralisation is developed over significant widths (from a few metres up to 60m) both within the quartz veins and listwaenite wall rock, and shows good continuity over a strike length of approximately one kilometre. The deposit is thought to be intrusive related orogenic vein and disseminated type gold mineralisation.
Data Quantity and Quality: The Masarrah project was discovered in 2004 during a reconnaissance mapping and rock-chip sampling programme. This was followed by a shallow RC post hole drilling programme comprising 3,803 holes for a total of 12,887 metres. Diamond drilling has recently been completed to infill the project at 50m by 25m spacing. A total of 34,115m of diamond drilling has been completed on the Masarrah project. Limited metallurgical testwork is reported to have been conducted.
It is understood that all sample preparation and analysis of the samples were undertaken at the Al Amri Laboratory, however detailed descriptions of the procedures and techniques followed have not been provided. Internal and external laboratory checks have routinely been undertaken at the Al Amri Laboratory with the samples submitted for the Masarrah deposits. Results for standards submitted and external checks at ALS Chemex’s internationally accredited laboratory in Canada show results within acceptable levels of precision, accuracy and repeatability. Limited density work has been undertaken and values similar to the Mansourah deposit have been assumed.
Domaining: Ma’aden Gold has undertaken computerised wireframe modelling of the mineralisation and defined one domain which is steeply dipping and split this into oxide and sulphide. There is however limited detailed information on the domaining or any other criteria applied.
Statistical Studies: Statistical studies have been undertaken on the domained sample data sets for both deposit areas but at an unknown composite length and show typical log-normal distributions as would be expected from these types of gold deposits. There is no information as to whether top-cuts were applied during grade interpolation.
Variography: No report has been provided that explains the geostatistical studies undertaken for Masarah in order to determine the OK interpolation parameters.
Block Modelling, Grade Interpolation and Validation: For Masarah a 10m by 10m by 10m block model framework has been created covering the wireframe model. Grade has been interpolated using un-documented estimation and search parameters.
Classification: The classification is based on the search parameters used in the estimation. All blocks estimated during the first run of the estimation are classified as a Measured Mineral Resource, blocks estimated in the second run classed as Indicated Mineral Resource and all those estimated in the third estimation pass classified as Inferred Mineral Resources.
Given the, lack of detailed reports supporting the data, and the lack of consideration of geological complexity, the quality of estimation given the small block sizes, SRK has downgraded the Measured Mineral Resources to Indicated Mineral Resources and kept the Indicated Mineral Resources and Inferred Mineral Resources material in their respective classification categories as good quality QA/QC data and close spaced drilling provides enough confidence in the geological modelling to classify the majority of the data as an

SRK Consulting Ma'aden Gold MER – Main Report
U3330_Ma'aden MER.doc November, 2007 Page 70
Indicated Mineral Resource.
Figure 5.3 presents a 3D image of the geological wireframes, block model classification and block model gold grades for the Masarah AEP.
5.3.4 Zalim Advanced Exploration Property The Zalim gold deposit is located 1.0km to the east of the Zalim town straddling the Jeddah-Riyadh expressway. No work was carried out on the Zalim Exploration Licence during the year with the total resources remaining the same. Previous studies have shown that the resource will not support a stand alone operation. However if a mining operation is established at either As Suk, Mansourah or Ar Rjum prospects in the future then there may be an opportunity to truck the higher grade parts of the resource to either of these sites.
Geology: The Zalim project is located in the Nabitah orogenic belt, a 100km wide major north-south structure of the shield that separates the Hijaz and Asir Arc terranes to the west of the Afif continental terrane to the east. The belt is a zone of crustal deformation, metamorphism and plutonism, marked by parallel north-south faults injected by ultramafic rocks. The central region is characterised by the presence of volcano-sedimentary and sedimentary rocks, discontinuously exposed between intrusive bodies or as roof pendants within these intrusions. The Hulayfah group of volcano-sedimentary rocks are present around Zalim, mostly comprising quartzite, porphyritic dacite, mafic lava, locally porphyritic and amphibole. Late plutonic rocks are also found in the area. The area is mostly underlain by gabbroic-granitic rocks. The prospect is about 5km long (northeast-southwest) and 2km wide, with a main 050° to 055° structure cutting through the prospect, and several other secondary structures present.
Gold mineralisation is associated with an alteration envelope, up to 20m thick and several hundreds of metres long, and within it numerous quartz microveinlets, veinlets and veins present which are up to several metres thick. The hydrothermal alteration is characterised by the development of sericite, carbonate, rutile, and disseminated sulphides. Locally the vein system can be very dense and of a stockwork type. The veins are generally not very continuous and difficult to follow between boreholes.
Two main mineralised zones have been delineated, the Eastern Main Zone (Zone 1) comprising shallow dipping (~30° south-southwest) low-grade mineralisation, which averages 10m true thickness with less-well defined lower grade footwall zones of ~15m thickness about 50m below, and the Highway Prospect (Zone 2) also comprising shallow dipping low-grade mineralisation, but at ~30°northwest and a true thickness of some 20m to 25m and also includes a lower grade footwall zone about 20m below the main zone.
Mineralisation comprises dominantly pyrite, common arsenopyrite, traces of galena, sphalerite, chalcopyrite and native gold. The two main characteristics of the Zalim mineralisation are the extensional shear-zone-related quartz veins and mineralisation hosted mainly by gabbroic-granitic late intrusive rocks. Weathering is generally down to 20m depth, with the first fresh sulphide minerals between 15m to 20m.
Data Quantity and Quality: The geological database for Zalim comprises geological mapping information, trenching, RC and DD information, geology and assay information. In summary the database comprised 25 trenches (BRGM), 36 RC holes (BRGM), 19 diamond cored holes (BRGM) and 105 diamond cored holes (Ma’aden Gold). It is understood that all sample preparation and analysis of the samples were undertaken at the regional laboratories for BRGM data and the Al Amri Laboratory for the Ma’aden Gold sampling, however detailed

SRK Consulting Ma'aden Gold MER – Main Report
U3330_Ma'aden MER.doc November, 2007 Page 71
descriptions of the procedures and techniques followed have not been provided. The Zalim database pre-dates the use of blanks and standards and the quality of the data used in the resource estimation can not be verified by SRK.
Limited data analysis work is available and densities for oxide and sulphide of 2.65t/m3 and 2.75t/m3 respectively are reported.
Domaining: Wireframe solids representing the two main mineralisation domains were modelled using a 2.5g/t Au cut-off grade to delineate mineralisation/barren contacts and considering a 0.25g/t Au lower cut-off in order to maintain geological continuity. Zone 1 generally strikes east-west and Zone 2 north-south. The distribution of assay grades is reported to be very discontinuous with higher grades randomly distributed amongst the lower grades. Multiple iterations of geological wireframe modelling have been undertaken along long-section, cross-section and level plans in order to obtain a robust wireframe model. The two main wireframe domains have been used to zone the composited sample data for further statistical/geostatistical studies and grade estimation.
Statistical Studies were undertaken on the domained sample data sets for both deposit areas on 1m composite samples. No clear relationship between logged geological codes and assay distributions could be identified, however the two domains showed clear differences in overall populations. Overall the average grade of the mineralised zones is low at ~1.7g/t Au for Zone 1 and 0.85g/t Au for Zone 2. In addition there were clear differences in the statistical populations between the different sampling types (trenches, RC, and diamond cored) and therefore only core samples (the majority of the data set) were used. In general the statistical studies showed the sample data to be log-normal distributions, typical of these types of gold deposits. No top-cut values were applied to the sample dataset.
Variography: Due to the sample density, and scarcity of assay sample data no variographic analysis was attempted.
Block Modelling, Grade Interpolation and Validation: A 10m by 10m by 5m block model framework has been created covering the wireframe model. Grade has been interpolated using anisotropic orientated search parameters (relatively large search) and grade interpolated separately into the respective domains using IDW2 and the application of octants for de-clustering.
Classification: The classification for Zalim interpreted was that all of the material was Inferred Mineral Resources due to the combination of the absence of QA/QC data and complex grade continuity.
Figure 5.4 presents a 3D image of the geological wireframes, block model classification and block model gold grades for the Zalim AEP.
5.3.5 As Suk Advanced Exploration Property Over the past several years exploration programs were carried out by BRGM and Petromin to evaluate the gold potential. In 1997 a ‘feasibility study’ was completed by international consultants on behalf of Petromin and estimated the ‘indicated resource’ base of the deposit to be 4.4Mt at a grade of 1.9g/t Au. A historical ‘Ore Reserve’ of 1.96Mt at a grade of 2.9g/t Au was reported however the project has been dormant for the last 10 years due to limited orebody size.
Gold mineralisation is associated with a north-south trending zone of flat-dipping quartz veins and associated stringer zones within metasediments and metvolcanics of the As Siham Formation. The deposit is an epigenetic gold and silver orebody comprising both oxide and

SRK Consulting Ma'aden Gold MER – Main Report
U3330_Ma'aden MER.doc November, 2007 Page 72
sulphide phases occurring within a series of steeply dipping volcanic sediments at the northwest margin and dioritic-gabbroic intrusive complex. The mineralisation is localised in narrow, shallow dipping quartz veins.
The mineralised quartz veining has an overall strike length of at least 1.2km and extends at depth to at least 120m. The sediments hosting the mineralisation comprise graphitic, dolomitic and cherty mudstones, siltstones and tuffaceous sandstones.
Data Quantity and Quality: The As Suk deposit has been drilled using both RC and diamond drilling techniques, as of 1997 with 10,970m of diamond drilling and 2,316m of RC drilling and 10,223m of percussion drilling. The drilling is generally spaced on 50m by 25m spacing. Metallurgical testwork was undertaken in the late 1990s including bottle roll tests and column leach tests which indicated recoveries as follow: 79% in oxide, 51% in transition, 62% in sulphide/fresh and 90% in high grade milling.
It is understood that all sample preparation and analysis of the samples was undertaken at the Al Amri Laboratory, however detailed descriptions of the procedures and techniques followed were not available. It is understood that internal and external laboratory checks have routinely been undertaken at the Al Amri Laboratory with the samples submitted for the As Suk deposits. Results for standards submitted and external checks at ALS Chemex’s internationally accredited laboratory in Canada show results within acceptable levels of precision, accuracy and repeatability.
The resource estimation description is said to contain comments on the comparisons between nearby percussion and diamond drillholes and that the percussion holes show markedly higher gold grades, and therefore removed these holes for resource estimation. Limited density analysis data is available for As Suk however a summary table indicates densities for oxide, transition and sulphide of 2.55t/m3, 2.65t/m3 and 2.70t/m3 respectively.
Domaining: The feasibility study included wireframe solids/surface domains for oxide, transition, sulphide and high sulphide, representing the two principle types of mineralisation and quartz veining, namely milky white quartz veins and dirty coloured limonite stained vein sets. The first being more dominant up to 3m true width and the second more steeply dipping comprising small quartz stringers and stockwork. The four wireframe domains were used to zone the sample data for further studies and estimation.
Statistical Studies were undertaken on the domained sample data sets for both deposit areas but at an unknown composite length and show typical negatively skewed distributions as would be expected from these types of gold deposits. There is mention of a second high grade population within the dataset. In general the data can be described as log-normal and ordinary kriging chosen as the estimation method. A top-cut value of 20g/t Au was applied to the sample dataset.
Variography: No detail was available in respect of the variography, specifically the basis for determination of the OK interpolation parameters; however comments are made as to the use of directional variogram models.
Block Modelling, Grade Interpolation and Validation: A 10m by 10m by 10m block model framework was created covering the wireframe model. Grade was interpolated using an anisotropic orientated search parameters and ordinary kriging.
Classification: In summary, there would appear to be little information to support the original QA/QC in respect of the assay data or the basis of the resource estimation techniques. Consequently SRK has re-classified all mineral resources as Inferred Mineral Resources. Notwithstanding this statement SRK considers that the geological and grade continuity to be

SRK Consulting Ma'aden Gold MER – Main Report
U3330_Ma'aden MER.doc November, 2007 Page 73
relatively well understood.
Figure 5.5 presents a 3D image of the geological wireframes, block model classification and block model gold grades for the As Suk AEP.
5.4 Other Exploration Properties
5.4.1 Aduwayah Exploration Licence The Aduwayah EL situated in the CAG Region extends over 646km2 and is contained within the Wurshah Exploitation Licence and includes the Ad Duwayhi Development Property and the following prospects: Ad Duwayhi Placer, Barud, North Breccia and North Farthah. Total expenditure to 2007H1 amounts to US$10.20m, US$0.09m of which was expended in 2007H1. Other than for Ad Duwayhi, no significant expenditures are planned for 2007H2 onwards. Exploration activity to date comprises 1,171 geochemical samples, 6,262 drill holes for 73,105m yielding 70,589 drill samples.
Ad Duwayhi Placer Prospect: Extensive ancient workings at Ad Duwayhi were focused on secondary placer gold deposits located to the immediate west of the main deposit. These workings were dated by BRGM as Abassid in age (8th to 10th century AD).
The Ad Duwayhi hard rock gold deposit trends east-northeast across a colluviums/alluvium-filled semi-circular central basin of some 600m in diameter, ringed by low hills of exposed bedrock on the north, east and south sides. Gold bearing indurated alluvial gravels, topped by unconsolidated alluvium/colluvium sand, gravel and eolian sands overlie the central basin and extend down the slope to the west in an alluvial fan on desert pediment.
The placer gold potential had been the subject of limited exploration works by BRGM and USGS which excavated few trenches to collect samples from the colluvium/alluvium beds. The overall overburden depths in the central basin ranges in the order of 1.5m to 5.0m and the “pay” gravels thickness is between 0.3m to 2.0m.
Scott Wilson Group Plc (“Scott Wilson”) were contracted to complete a two-phase placer gold evaluation programme to evaluate the placer gold potential of the colluvium/alluvium surface deposits at Ad Duwayhi. Disaggregating and panning of four alluvium samples produced very fine sand concentrates with few powder gold grains (50μm to ≤200μm) and apparent low grades. This work confirmed the USGS work which found low sub-economic grades in all but two of the seven samples reported. Analysis of the Scott Wilson sample concentrates by bottle roll cyanide leach (ALS Chemex laboratory, Reno, Nevada, USA) returned negligible gold grades of <1mg/m3 and confirmed low grades estimated from grain counts.
Scott Wilson estimated the potential quantum of pay gravels in the mapped area in the order of 140,000m3 to 280,000m3. At a target grade of 500mg/m3 the target placer gold potential is between 2koz to 9koz of gold. Given the subdued results of the Phase I placer gold evaluation programme, the proposed Phase II evaluation programme was suspended.
Barud Prospect: The Barud Prospect is located in the north-western corner of the licence area approximately 30km north west of Ad Duwayhi where it straddles the boundary between the Wurshah and Al Uruq Exploration Licences. The Barud prospect comprises three to four thick, north-northwest trending quartz vein systems. Surface rock chip sampling by Ma’aden Gold returned values of up to 50g/t Au. An initial post-hole drilling programme was completed on a 400m by 50m grid in 2004 and defined several anomalous areas. A total of 308 post holes (total 1,030.5m) were drilled in 2005 on 100m by 50m centres but failed to identify a coherent gold anomaly.
North Farthah Prospect: The North Farthah Prospect comprises three sub parallel

SRK Consulting Ma'aden Gold MER – Main Report
U3330_Ma'aden MER.doc November, 2007 Page 74
northwest trending zones of mineralisation which have returned values in the range 4g/t Au to 13g/t Au from surface rock samples. A post-hole drilling programme has been completed over the full 900m strike length of the system. Analysis of existing information by Ma’aden Gold concluded that three BRGM drill holes were drilled parallel to the south-easterly dip of the zone. Ma’aden Gold plans to drill several holes to confirm the orientation of mineralisation.
North Breccia Prospect: The Northern Breccia Prospect is located approximately 17km to the northeast of the Ad Duwayhi deposit. Quartz veins and breccias zones are developed over a strike length of 700m, are up to 15m wide and are bounded by 4m to 5m thick zones of stockwork veins. These zones dip to the southwest and are thought to form part of a regional northwest trending en echelon array of quartz vein and breccias which may relate to the Najd fault system. Initial rock chip sampling by Ma’aden Gold highlighted a gold anomalous area where quartz veins assayed up to 34g/t Au. A post hole programme was completed in 2004 and was followed by a small RC programme designed to test outcropping quartz vein breccias and areas of anomalous geochemistry. The holes intersected wide areas of buck quartz with insignificant geochemistry and no further work is warranted.
5.4.2 Al Hajar Exploration Licence The Al Hajar EL situated in the NAS Region extends over 1,449.5km2 and includes six prospects as well as the Al Hajar Exploitation Licence (6.0km2). The prospects are: Gossan-14; Hajeej; Sha'abat Al Hamra; Waqba; Sheers; and Jadmah. Total expenditure to 2007H1 amounts to US$0.13m, with no expenditures recorded in 2007H1. The current Exploration Programme assumes expenditures of US$0.77m from 2007H2 onwards. Exploration activity to date comprises 105 geochemical samples and 300 drill samples. Excluded from the above statistics however, is the work undertaken for the Sheers prospect as well as other prospects by the mine personnel at Al Hajar. Recent exploration activity within the Al Hajar EL is focused on securing feed for continued operations at Al Hajar. Three key prospects namely Hajeej, Waqba and Gossan-14 have been identified.
Hajeej Prospect: The Hajeej Prospect is located some 30km north of Al Hajar, situated near the southern banks of Wadi Turbah. The mineralised zone is represented by a north trending lenticular gossan associated with cherty ironstone and rhyodacitic lapilli crystal tuffs, similar to the Jadmah prospect located 4.5km west of Al Hajar. Previous channel chip surface samples of gossanous cap and bleached silicified tuff returned supergene enrichment of precious metals due to intensive weathering, leaching and oxidation of massive and semi-massive primary pyretic sulphide lenses.
A total of 746m of RC drilling in 11 holes was completed along 50 spaced sections. Due to the friable nature of the oxide material, recovery was poor and drilling advance was delayed due to frequent collapsing of holes and jamming of drill rods. Three holes were abandoned before reaching their target due to technical problems.
Almost all of the RC holes intersected weak to moderately gold enriched zones. However, the overall results of the current exploration programme are not conclusive. A new electrical power grid and the power line service road are passing through the centre of the deposit. This is seen as an obstacle to any future development work on the prospect.
Waqba Prospect: The Waqba prospect is located some 7km to 8km south of Al Hajar and 1.0km south of the Gossan-14 prospect. Copper mineralisation is manifested on surface as malachite and azurite filled fractures in bleached and weathered dacitic tuff exposed in a circular ancient shallow pit close to the contact of carbonate lenses. Extensive slag was

SRK Consulting Ma'aden Gold MER – Main Report
U3330_Ma'aden MER.doc November, 2007 Page 75
noted near the ancient pit.
Detailed lithogeochemical samples were collected along 200m spaced east-west oriented lines at 50m intervals covering the area between Waqba and Gossan-14 prospects. Low to moderate gold geochemical anomaly with corresponding strong copper and zinc anomalies were recorded around the basalt-dacite contact zone. A total of 366m of RC drilling in three holes was completed. All three holes intersected wide zones of low grade mineralisation.
Further regional litho-geochemical sampling and deep RC exploration drilling is recommended to fully evaluate the polymetallic potential of this prospect.
Gossan-14 Prospect: Gossan-14 is located about 1.0km north of the Waqba prospect and the prospect is characterized by 200m long and 10m to 15m wide lenticular ferruginous gossan with weak malachite stains outcropping on the side of steep north facing hill. The prospect has been the subject of several Petromin and BRGM surface channel chip sampling programmes.
During the current programme 350m of RC drilling in four holes was completed. All four holes intersected wide zones of low grade base metal (Cu-Zn) mineralisation.
Sha’abat Al Hamra: At the Sha’abat Al Hamra prospect located 30km west of Al Hajar cleaning and re-sampling of four old Petromin trenches were completed. A total of 93 chip channel samples were collected at 2.0m intervals. Samples were analysed for gold, silver, copper, lead and zinc. Assay results indicated low gold anomalies between 0.2g/t Au to 1.1g/t Au associated with metabasalt host rock. However, wide zones with significant copper and zinc anomalies were reported in trenches.
Regional Reconnaissance Prospecting: Regional reconnaissance prospecting was carried out to evaluate the potential of several satellite prospects in the Wadi Shwas and Wadi Turbah areas including Hajeej, Guhaifah, Liswaenite zone north of Wadi Turbah, Waqba, Gossan-14 and Saha’abat Al Hamrah prospects. A total of 563 grab rock samples were collected. Samples were analysed for gold, silver, copper, lead and zinc. Gold assay results were discouraging. Copper and zinc anomalies up to maximum of 6,043ppm and 3,758ppm, respectively were reported from felsic tuff, cherty ironstones and gossan outcrops. Significant base metal anomalous sites will be checked during subsequent follow up programmes.
5.4.3 Al Jardhawiyah Exploration Licence The Al Jardhawiyah EL situated in the NAS Region extending over 7,609km2, surrounds the Nuqrah, Halah South and Mawan Exploration Licences and contains two prospects: Aurifan and Jardawiyah. Total expenditure to 2007H1 amounts to US$0.57m none of which was expended in 2007H1. Expenditure from 2007H2 onwards is forecast at US$0.55m. Exploration activity to date comprises 5,755 geochemical samples, 1,564 drill holes totalling 9,858m yielding 3,734 drill samples.
Exploration to date has focussed primarily on rock chip and soil geochemical surveys, a limited post hole programme and some RC drilling. The principal prospect is the Aurifijan Prospect located south of Sukhaybarat where surface soil geochemical sampling has been completed. The objective of the survey was to confirm an earlier grab sample site with significant gold assay result and to close an open soil geochemical anomaly in the area. Soil samples were collected on a 400m by 200m spacing. A cluster of isolated gold anomalies with maximum value of 0.166ppm was reported. No exploration activity was undertaken in 2007H1.

SRK Consulting Ma'aden Gold MER – Main Report
U3330_Ma'aden MER.doc November, 2007 Page 76
5.4.4 Al Uruq Exploration Licence The Al Uruq EL situated in the CAG Region extends over 4,302.3km2 and contains the Mansourah AEP as well as four prospects: NE Flats; Amana; Mansourah North; and Umm Selam. Total expenditure to 2007H1 amounts to US$9.11m, US$0.09m of which was expended in 2007H1. Expenditure from 2007H2 onwards is forecast at US$2.65m. Exploration activity to date comprises 669 geochemical samples, 2,787 drill holes for 77,436m yielding 76,189 drill samples.
The Al Uruq EL holds the Mansourah deposit and the southern extension of the structure (termed the Masarah-Mansourah Trend by Ma’aden Gold) that hosts the Masarah and Mansourah deposits. The Masarah-Mansourah Trend is approximately six kilometres long and forms a zone of serpentinised and listwaenised ultramafics which is bounded to the east by a major thrust fault with significant strike-slip movement. Ma’aden Gold commenced reconnaissance exploration in the Al Uruq licence in 2002 and started an aggressive drilling programme of the main Mansourah Deposit in 2004. Regional exploration of the Masarah-Mansourah trend to the south of Mansourah resulted in the discovery of the Amana Prospect 20km south of Mansourah.
NE Flats Prospect: The NE Flats Prospect comprises northwest trending quartz vein outcrops. The prospect was planned to be tested by post-hole drilling in 2006 on a 100m by 100m grid with planned later infill at 50m by 50m spacing.
Amana Prospect: The Amana Prospect is located approximately 20km south of the Mansourah Deposit and has a similar style of mineralisation and geology. Assays from rock chip grab samples taken from a sub-cropping 10m to 15m wide, listwaenite altered zone with quartz-carbonate veins and listwaenite, assayed up to 2.8g/t Au. Shallow RC post holes and 21 deeper RC holes tested a 1.5km long zone. The deeper RC holes intercepted wide zones of serpentinite and listwaenite and included several very significant intercepts. More drilling is planned as diamond drill rigs become available.
Mansourah North Prospect: The Mansourah North Prospect is located 1.5km northwest of the main Mansourah deposit. This prospect is hosted by northwest trending Najd fault system with pinching and swelling listwaenite lenses. The current programme was designed to confirm the continuity of significant mineralisation in RC holes. During the current programme nine holes with total length of 905m were drilled. Most of the holes intercepted wide fracture/fault zone with intensive fault gouge/clay development and talc-serpentine and silica carbonate altered ultramafic rocks. A Follow up drilling programme will be planned after compilation and interpretation of the current results.
Umm Selam Prospect: The Umm Selam Prospect is located south of Mansourah, with a best drilled intersect 30m wide gold mineralised zone grading 3.1g/t Au.
5.4.5 Habla Exploration Licence The Habla EL situated in the NAS Region is collectively with the An Najadi EL, Nuqrah EL and Mawan EL managed as a single entity by Ma’aden Gold. The total area under management is 1,847.1km2 and comprises 8 prospects. Total expenditure to 2007H1 amounts to US$2.51m, US$1.03m of which was expended in 2007H1. Expenditure from 2007H2 onwards is forecast at US$9.10m. Exploration activity to date comprises 14,579 geochemical samples, 1,522 drill holes for 68,459m yielding 60,669 drill samples.
The Habla EL (143km2) and the Hablah South EL (61km2) includes three prospects: Hablah North, Hablah South and La Prospect.
SRK Consulting Ma'aden Gold MER – Main Report
U3330_Ma'aden MER.doc November, 2007 Page 77
The Hablah prospects are located approximately 30km east-northeast of Sukhaybarat. Gold mineralisation is hosted with three sub-parallel north-northeast trending quartz vein zones which are developed largely within granite and proximal to contacts with metavolcanic units. The three zones vary in strike length from 350m to 1,600m, and extend north towards a major east-west trending thrust fault that separated a largely flat granite dominated southern terrane from a metasedimentary and metavolcanic sequence that forms a range of hills to the north.
Habla North and South Prospects: Soil geochemical and postholes drilling programmes carried out as part of the 2005 exploration programmes have delineated an 800m long, north-east trending anomalous zone in the vicinity of the old Red Hill pit. The anomalous zone appears to be coincident with a lithological contact between granodiorite (to the west) and diorite/metasediment (to the east). A two phase RC drilling programme, was undertaken over an area located 1km south of the Red Hill mine pit. The Phase I programme comprised of 33 inclined holes at 50m collar spacing and a maximum depth of 60m with total advance of 1,980m were initially completed. Subsequently, 19 RC drill holes with total advance of 1,139m were completed in the Phase II programme.
La Prospect: At the La Prospect located 4km south east of the Red Hill pit a posthole drilling programme to test an initial soil anomalous zone was undertaken. A total of 108 postholes with total advance of 409m were completed. In the current programme 120 bedrock samples were collected and analysed for gold at the Al Amri Laboratory in Jeddah. Gold anomalies were reported to be low.
5.4.6 Mawan Exploration Licence The Mawan EL situated in the NAS Region is collectively with the An Najadi EL, Nuqrah EL and Habla EL managed as a single entity by Ma’aden Gold. The total area under management is 1,847.1km2 and comprises 8 prospects.
The Mawan (261km2) EL surrounds the Bulghah Exploitation Licence (39km2) and the principal prospect is Bulghah North located 4.0km from the open-pit at Bulghah.
Geochemical soil/rock and subsequent postholes investigations carried out towards the end of 2005 programme identified a significant gold anomaly (1.6km by 1.0km in size) with corresponding high arsenic values approximately 3.0km north of the Bulghah open-pit, referred to as the Bulghah North Prospect. RC exploration drilling commenced early in 2006 along 400m spaced east-west oriented lines at 200m centres. Subsequently the spacing was later tightened to a 200m by 100m grid.
The current LoMp for Bulghah is largely dependent upon the depletion of lower grade fresh ore with reduced metallurgical recoveries. The limited availability of oxide resources has necessitated the evaluation of the Bulghah North Prospect on a fast-track basis with the objective of delineating near surface oxidized to partially oxidized material. To this effect, one to three RC rigs were deployed for most part of the year.
Compilation of the assay results received from the 200m by 100m grid RC exploration drilling from Bulghah North highlighted the presence of two roughly north-south-trending broadly mineralized zones. The western zone which has been tested over 800m strike length is about 100m in width. This zone seems to have a good potential of hosting low grade near surface bulk tonnage gold resource. The Bulghah North gold mineralisation is associated with disseminated pyritic sulphides and quartz stringer zones in a tonalitic intrusive host rock similar to the open-pits at Bulghah.
During 2006 a combination of 100m by 50m infill drilling and testing the lateral extension of

SRK Consulting Ma'aden Gold MER – Main Report
U3330_Ma'aden MER.doc November, 2007 Page 78
the mineralised zone at 100m by 100m grid spacing was in progress.
During 2007 a total advance of 21,628m of combined RC and diamond core drilling comprising of 17,803m RC and 3,825m of DD was achieved. Over the last three years a total exploration and infill drilling advance of 38,240m RC in 483 holes and 5,121m of diamond core drilling in 35 holes were completed. The diamond core holes were twinned on selected RC drill holes to confirm the reverse circulation results. The current drilling programme completes the 50m by 50m grid drilling on the two main zones. Preliminary resource estimation will be undertaken after collating and interpreting of all available exploration information.
5.4.7 As Siham Exploration Licence The As Siham EL situated in the NAS Region extends over 5,504.4km2 and contains two prospects: Jabal Geza and Jedib Guzail. Total expenditure to 2007H1 amounts to US$0.61m, of which US$0.08m was expended in 2007H1. Expenditure from 2007H2 onwards is forecast at US$0.75m. Exploration activity to date comprises 7,119 geochemical samples, 2,224 drill holes for 9,919m yielding 2,183 drill samples.
Exploration within the As Siham EL is at an early stage relative to other licence areas. Ma’aden Gold has completed systematic regional mapping, soil sampling and rock chip geochemical sampling programmes which resulted in 2,224 post holes being drilled. Twenty diamond drill holes were drilled at the Jabal Geza Prospect to test zones of anomalous mineralisation.
The Jabal Geza Prospect is the most advanced and located approximately 115km north of Zalim and is spatially associated with the Ad Dafina discontinuity that defines the western margin of the Afif terrane. Gold mineralisation is intermittently developed along a strike length of 3km and is associated with discontinuous quartz veins hosted within a 200m wide shear zone developed in felsic metavolcanics. The shear zone is located in the footwall to a regional-scale thrust, which is marked locally by listwaenite bodies up to 50m thick. High gold grades were reported from some surface rock chip sampling.
Ma’aden Gold drilled 10 diamond drill holes in 1993 which all intersected zones up to 10m wide hosting gossanous quartz veins in strongly silica-sericite-pyrite altered sheared felsic metavolcanics.
Regional: Detailed geochemical soil and rock sampling on 500m spaced east-west oriented lines and 100m centres were carried out on four selected grids near the northwest corner of the As Siham EL in the vicinity of the Jabal Geza listwaenite and the Jedib Guzail prospect. At the As Siham EL a total of 3,026 soil/rock grab samples was collected and shipped to Al Amri Laboratory in Jeddah for gold, silver, copper, zinc, molybdenum and arsenic analysis. In grid G-4 northeast of Jabal Geza gold assay results were generally low apart from three consecutive samples, which returned gold values between 1.1g/t Au and 3.3g/t Au.
In the vicinity of the Sabkhat Manjur area south of the Afif–Zalim asphalt road, grab samples collected from a north-south trending listwaenite decorated fault/fracture zone returned three significant assay results of 0.6g/t Au, 2.2g/t Au and 3.6g/t Au, respectively.
Results of the current regional prospecting and detailed geochemical investigation were not encouraging. Therefore a large segment of the As Siham EL will be relinquished in two stages. An anomalous area northwest of the licence will be the subject of tight grid sampling at 100m by 100m spacing to better define the anomalous sites recorded in the current programme.

SRK Consulting Ma'aden Gold MER – Main Report
U3330_Ma'aden MER.doc November, 2007 Page 79
5.4.8 Ash Shakhtaliyah Exploration Licence The Ash Shakhtaliyah EL situated in the CAG Region extends over 6,333.0km2 and contains three AEPs (Ar Rjum; Masarah and As Suk) and two prospects: Bir Tawilah and Jabal Ghadarah. It is divided into two distinct areas: As Shakhtaliyah 1 (5,114km2) which includes the Zalim EL, As Suk and Masarah AEPs, Bir Tawilah and Jabal Ghadarah; and As Shakhtaliyah 2 (1,219km2) which includes the Ar Rjum AEP. Other prospects within the licence area include West and East Shakhtaliyah, Houmaidan, and Lamisah.
Total expenditure to 2007H1 amounts to US$14.54m, of which US$2.02m was expended in 2007H1. Expenditure from 2007H2 onwards is forecast at US$10.00m. Exploration activity to date for the AEPs and the prospects comprises 5,912 geochemical samples, 6,967 drill holes for 130,605m yielding 113,118 drill samples.
Bihr Tawilah: The Bihr Tawilah Prospect is located 5km north of Masarah, immediately south of the Jabal Ghadarah Prospect and lies along the same regional thrust fault zone that hosts the Masarah and Mansourah deposits. Bihr Tawilah comprises two prospect areas (“West” and “Main”). Previous drilling by BRGM beneath ancient workings at Bihr Tawilah Main appears to have defined a high grade shoots of limited extent. A BRGM soil geochemical survey at Bihr Tawilah West outlined a north-south oriented elongate anomaly (>0.1ppm Au; >500ppm As) with a strike extension of over 200m and a width of approximately 400m.
The RC drilling programme which started in 2005 was completed in 2006, with total advance for the current year of 967m in 7 holes. Ma’aden Gold considers that the Bihr Tawilah Main prospect has the potential to host a bulk tonnage low grade near-surface resource. The objective of the current programme was to test lateral extension of high grade mineralisation intersected in previous core drilling programmes and evaluate the potential of near surface low grade bulk tonnage resources, north east of the main Bir Tawilah gold zone. Drilling has been temporarily suspended to test promising satellite prospects around Al Hajar.
Jabal Ghadarah: Jabal Ghadarah is located some 55km east-northeast of Zalim and 10km north of Bihr Tawilah and lies along the same structural zone that hosts the Bihr Tawilah prospect and Masarah and Mansourah deposits. Mineralisation is associated with a listwaenite-altered ultramafic lens which immediately overlies a granodiorite body intruded into metasediments. Parts of the mineralised structure have been diamond drill tested on 100m centres. Recent geological mapping indicates that the mineralised structure has a strike length of over 2km and Ma’aden Gold plans to fully drill test the prospect as drill rigs become available.
West Ash Shakhtaliyah: Reconnaissance prospecting and prospect-scale mapping was undertaken north and northwest of the town of Al Muwahh in the Manal, Hufrah (MODS BMJ006) and Humaydan West (MODS 3304) prospects located along the Ash Shakhtaliyah and Ar Rjum trend or other sub-parallel structures.
Systematic rock sampling and detailed mapping of the altered zone in Hufrah area (MODS 3359 – BMJ006) was carried out. The current investigation shows that the area is underlain by ultrabasic rocks of metamorphosed dunite, harzburgite and gabbro. A Liswanite zone was delineated traceable for up to 1.3km and a 330° trend. The Liswanite body has quartz veins and veinlets locally forming stockworks. Blue gray quartz veinlets and fuchsite were also noted. The widest exposure of the liswaenite outcrop of 15m by 80m is located in the southern part of the area. Chemical analysis results of an extensive rock chip sampling programme on the Hufrah area returned very poor gold values. Therefore, no further follow up

SRK Consulting Ma'aden Gold MER – Main Report
U3330_Ma'aden MER.doc November, 2007 Page 80
work is currently recommended in this area. Similarly assay results of grab and rock chip samples from the Manal prospect were negative.
Houmidan Prospect: Field reconnaissance prospecting and mapping activity in the Houmidan Prospect, located 12km northwest of the town of Al Muwayh concentrated in the vicinity of a north-south trending ancient workings. Rock chip grab, quartz and wall-rock float samples were collected from the ancient dumps, altered, sheared and foliated metavolcanic rocks. Significant gold assay results have been received from the Houmidan prospect and a first-pass RC drilling programme to date has resulted in 27 holes for 2,640m drilled and 469 soil and 132 grab rock samples. Soil sampling on a 200m by 50m grid is in progress to test for possible southern extension of the Houmidan Prospect structure.
5.4.9 Miskhah Exploration Licence The Miskhah EL situated in the NAS Region extends over 7,013.0km2 and contains one main prospect: Humaymah. The Miskhah EL is divided into two distinct areas: As Miskhah 1 (6,580km2); and Miskhah 2 (433km2).
Total expenditure to 2007H1 amounts to US$1.34m, of which US$0.03m was expended in 2007H1. Expenditure from 2007H2 onwards is forecast at US$5.17m. Exploration activity to date comprises 7,177 geochemical samples, 76 drill holes for 4,501m yielding 6,124 drill samples.
Exploration within the Miskhah EL is at an early stage relative to other licence areas. Ma’aden Gold has completed a regional soil sampling programme on a 500m by 1,000m grid, in conjunction with rock chip geochemical sampling of interesting outcrops. This has resulted in the generation of a regional geochemical database which forms the basis for follow-up work in the area. Infill and delineation DD drilling is planned for 2007H2.
Humaymah (Makhruqah) Prospect: The Humaymah Prospect previously known as Makhruqah is located approximately 35km south-southeast of Bulghah. The prospect was evaluated by two phases of a RC drilling programme in 2005 along 200m by 50m grid. As part of the 2006 programme, a total of 4,115m in 27 diamond core holes were completed to confirm the significant RC results of the previous programme. The main prospect has been tested along 100m sections and 50m centres. At Humaymah, gold mineralisation hosted in dioritic to gabbroic intrusion near the contact of volcano-sedimentary rocks associated with buff coloured marble lenses suspected to be metasomatic alteration product of ultramafic to mafic intrusives. Gold mineralisation is associated with disseminated mostly pyritic sulphides and visible gold in white milky quartz veins and stringers. Gold mineralisation is still open in all directions and further in-fill and delineation drilling programmes are planned to increase and upgrade the resources to Measured Mineral Resource and Indicated Mineral Resource categories.
Regional Scale: Regional soil geochemical surveys which commenced near the end of 2005 continued on three grids to the north of the main Humaymah Prospect. The aim of the geochemical survey was to cover areas underlain by similar lithologies to that hosting the gold mineralisation at the Humaymah Prospect.
Soil geochemical survey on four sites (G1 to G4) was undertaken at 400m spaced east-west oriented lines and 100m intervals. Samples are collected from 15cm to 25cm below surface and are submitted to the laboratory without screening. A total of 1,966 soil samples were collected and analysed for gold, silver, copper, zinc, molybdenum and arsenic at the Al Amri Laboratory in Jeddah.

SRK Consulting Ma'aden Gold MER – Main Report
U3330_Ma'aden MER.doc November, 2007 Page 81
Chemical analysis results indicate several clusters of low gold anomalies ranging in value between 20ppb to 76ppb with corresponding arsenic, rare molybdenum and lead anomalies were outlined. Further follow up soil and or postholes drilling programmes will be undertaken over selected sites. The elevated gold values are hosted predominantly in quartz veins, but also occur in andesite, granodiorite and some soil samples. First-pass RC exploration drilling will be undertaken to test all the anomalous sites.
5.4.10 Tawan Exploration Licence The Tawan EL situated in the NAS Region extends over 415.7km2 and has one main prospect: South An Nayzah. Total expenditure to 2007H1 amounts to US$0.13m, none of which was expended in 2007H1. No expenditure from 2007H2 onwards is forecast.
Regional reconnaissance prospecting and geochemical soil/rock sampling programmes were undertaken on the northern part of the Tawan licence area in the South An Nayzah prospect. Soil/rock grab samples were collected along 200m spaced east-west oriented profiles and at 100m centres. Soil and grab rock samples have been collected and analysed for gold, silver, copper, lead and zinc. Gold anomalies were generally subdued and no major base metal anomalies were recorded. No further work has been undertaken during 2007.
5.4.11 Wurshah Exploration Licence The Wurshah EL situated in the NAS Region extends over 5,764.0km2, and includes the Aduwayah EL containing three prospects: North Breccia, Bir Wurshah and Urgub Wurshah and Umm Mattirah Humaymah. Total expenditure to 2007H1 amounts to US$0.83m, of which US$0.21m was expended in 2007H1. Expenditure from 2007H2 onwards is forecast at US$3.44m. Exploration activity to date comprises 2,301 geochemical samples, 4307 drill holes for 14,086m yielding 7,693 drill samples.
The Wurshah Licence extends approximately 100km to the south of the Aduwayah EL to encompass a northwest trending belt of folded metasediments and plutonic rocks. Much of the licence is overlain by extensive sand dunes. Regional prospecting is ongoing and is focused on the follow-up of ancient workings as well as discovering new sites of mineralisation. The majority of the ancient workings are documented as “MODS occurrence” through the work of BRGM and USGS. Limited information is available in respect of the North Breccia prospect.
Bir Wurshah & Urgub Wurshah Prospect: The Bir Wurshah and Urgub Wurshah prospects were mapped by Ma’aden Gold at a scale of 1:1000 and over 1,000 rock chip soil samples have been collected. A total of 13,489m of reconnaissance drilling has been completed which defined zones of potentially economic mineralisation which require further drilling.
Umm Mattirah Prospect: The Umm Mattirah prospect is located in the southern extreme of the Wurshah EL approximately 90km south of Ad Duwayhi along a northwest-trending belt of gold mineralisation which includes the Ad Duwayhi gold deposit in the extreme northwest. The prospect is situated immediately north of the Najd fault zone and comprises three sub parallel zones of north-northeast trending quartz veins which dip to the west at approximately 40º and have a strike extent of some 700m. Numerous ancient workings are associated with the quartz veins. The prospect was previously drilled by USGS and DMMR who only assayed obvious zones of mineralisation.
Ma’aden Gold considers that the mineralisation defined by the USGS and DMMR is open to the north and at depth and that the Umm Mattirah Prospect has good potential to host an economic orebody. Potential also exists for additional zones of mineralisation to be defined

SRK Consulting Ma'aden Gold MER – Main Report
U3330_Ma'aden MER.doc November, 2007 Page 82
by sampling those parts of the core not previously sampled by the USGS.
In 1996, the USGS mission completed 32 diamond core holes and intersected significant mineralised intersections. Despite its promising potential of hosting significant gold deposit this has been dormant for many years due to poor access and its remote isolated location. The newly constructed all weather paved road between the town of Ranya and Wadi Dawasir passing 29km south of Umm Mattirah has made the prospect accessible for exploration. Ma’aden Gold has commenced desk top compilation of all previous exploration information in the area. Furthermore, reconnaissance systematic geochemical soil and rock sampling has commenced to identify possible lateral extensions of the main Um Mattirah mineralised zone.
5.4.12 Other Prospects Other exploration licences documented but not reported here include An Najadi, Nugrah and the Shabah EL. Exploration activity to date is limited and the Exploration Programme is largely limited to early stage investigations.
The Shabah EL situated in the NAS Region extends over an area of 6.944km2. Total expenditure to 2007H1 amounts to US$0.39m, none of which was expended in 2007H1. Expenditure from 2007H2 onwards is forecast at US$1.08m. Exploration activity to date comprises 1,123 geochemical samples, 647 drill holes for 3,936m yielding 2,489 drill samples.
Regional Aeromagnetic Survey: Airborne magnetic and radiometric survey covering the areas of eastern Ash Shakhtaliyah, Al Uruq and Ad Duwayhi licences was undertaken by Sander Geophysics of Ottawa, Ontario, Canada, on behalf Ma’aden Gold. The survey was carried out during the period January to May 2006 from Taif. A total of 26,865 line-km were flown along 501 traverse lines at 200m line spacing in an east-west direction and 143 north-south oriented tie-lines spaced at a distance of 2,000m. The survey was flown at an altitude 100m in a drape surface, designed to provide the lowest possible surface which the aircraft can follow consistently.
Grey scale and coloured total magnetic contour, reduced pole total magnetic and first vertical derivative (TMIVD plans and radiometrics TC, K, U and Th) and tertiary plots were submitted in hard copy and digital format.
The objective of the survey was to test if the airborne magnetic survey could record any magnetic responses of the subsurface lithologies and structures underlain by a thick blanket of alluvial sand/gravel and the Nafud Al-Suba’e sand dunes extending from east of Mansourah in the north to the Aduwayah EL in the south.
Preliminary review of the magnetic maps indicate prominent north-south trending lineaments representing the north-south trending Nabitah suture/thrust fault zone and northwest trending Najd fault systems and associated fracture and fault systems. The Jabal Ghadarah-Mansourah trend which is part of the Nabitah fault system is clearly marked as low magnetic linear feature and the result of the survey has clearly demonstrated that this gold hosting structure extends further south buried below a thick sand cover. Circular intrusive outlines were also detected below the sand dunes and thick unconsolidated sand/gravel overburden.
5.5 Risks and Opportunities The principal risk associated with the Exploration Properties is related to the success of the planned exploration programme. Specifically, SRK notes that US$17.42m (52.0%) is planned to be expended in the NAS Region which has to date not yielded any JORC Code compliant Mineral Resources despite 6,053 drillholes for 96,672m and 75,499 drill samples as well as 35,858 geochemical samples. All of the AEPs are located in the CAG Region and some

SRK Consulting Ma'aden Gold MER – Main Report
U3330_Ma'aden MER.doc November, 2007 Page 83
US$16.09m is planned for future expenditure from 2007H2 onwards representing 48.0% of the planned expenditures included in the Exploration Programme.
Furthermore, some 2.2Moz of the total 5.8Moz of gold associated with the Exploration Properties is attributed to the Ar Rjum AEP which is located within the Mahazat Assaid Conservation Area which was established in the 1980s as a safe haven for endangered species such as the Arabian Oryx and indigenous Arabian Ostrich. Conversion of the EL for Ar Rjum to an Exploitation Licence will require completion of a feasibility study and an Environmental Impact Study. In this respect a risk remains that the completion of such environmental work will not adequately address all environmental issues satisfactorily to ensure the conversion to an Exploitation Licence.
The principal opportunities associated with the Exploration Properties include:
• The opportunity to extend the Mineral Resources currently identified at the five AEPs: Ar Rjum, Mansourah, Masarah, Zalim, and As Suk; and
• The opportunity to test the 33 current exploration projects contained within each Exploration Licence by implementation of the current Exploration Programme.


SRK Consulting Ma'aden Gold MER – Main Report
U3330_Ma'aden MER.doc November, 2007 Page 89
6 MAHD AD‘DAHAB
6.1 Introduction The following section includes discussion and comment on the following technical aspects: geology; Mineral Resources and Ore Reserves; mining; metallurgical processing; tailings storage facilities; infrastructure, overheads and capital expenditure; human resources; and environmental. Where appropriate, historical and forecast tables are also presented to support the assumptions as included in the LoMp.
6.2 Geology Mine area rocks are composed of a mafic to felsic volcanic-sedimentary sequence. The volcanic sequence consists of a Lower Andesite overlain by the Lower Agglomerate unit, a Lower Tuff, the Upper Agglomerate, and Upper Tuff units. A rhyolite porphyry stock occurs to the north of the mine and is exposed in the SAMS area. This stock may be part of a much larger intrusive body at depth.
The rock sequence forms an east trending homoclinal structure trending east with a northerly dip from 30° to 75°. At depth the sequence is sub-vertical to overturned. These rocks have been complexly faulted by steeply dipping north to north-northwest and northwest trending faults. Vein complexes trend north-northwest to north with some veins trending northwest.
Mineralisation is associated with multiphase quartz veining and silicification developed along predominant north to north-northwest trending faults. Some veins are developed along northeast and northwest trends. Quartz veining is associated with intense silicification, massive, laminated and brecciated veins. Veins are vertical to sub-vertical. Major vein systems can be traced across the mine area and are preferentially developed in the Lower and Upper Agglomerate Units. Veins are more poorly developed in the andesite and tuff units. Economic gold mineralisation is associated with quartz, pyrite, chalcopyrite, sphalerite, galena and silver.
Moderate to intense sericite and chlorite alteration is associated with the vein systems. Carbonate alteration and quartz veinlets form at the peripheries of the vein systems. Near surface mineralisation is oxidized to a depth of 10m grading into a transitional zone that extends to depths of 20m to 60m.
Mineralisation occurs in epithermal to mesothermal vein systems. Typically mineralisation is zoned according to the temperature and boiling point of hydrothermal fluids. Often lower temperature zones or epithermal environments are associated with high levels of gold mineralisation. Mesothermal environments are associated with massive metal sulphides and possibly a lower tenor of gold mineralisation. In a general overview of the upper regions of Mahd Ad’Dahab, vein systems show epithermal characteristics and are associated with high grade gold mineralisation. The deeper regions of the vein systems may represent a higher temperature regime and thus are associated with massive sulphide mineralisation with lower gold grades. Fluid inclusion studies indicate that veining occurred in epithermal to low mesothermal temperatures.
Mafic dykes intrude quartz veins. Dykes are believed to be post or contemporaneous with mineralisation.
Quartz and massive sulphide vein system at Mahd Ad’Dahab are subdivided into four zones comprising:
• SAMS: comprising 70% of ore currently mined, economic veins include veins 1, 4, 8, 14, 15, 16, 17 and D complex (veins D1 to D4);

SRK Consulting Ma'aden Gold MER – Main Report
U3330_Ma'aden MER.doc November, 2007 Page 90
• Western Zone: comprising 4 complex, 3 west, 2 west, F, F1, F2 and a number of narrow high grade veins from 0.4m to 0.5m wide including veins S, 10 West, 8 West, 6 West, 7 West, diluted grade of narrow veins about 10g/t Au;
• Eastern Zone: comprising 10 East, 11 East veins and the M vein complex; and
• Northern Zone: comprising the Northern, 678, 345, T veins and the two vein complex, the near surface mineralisation of vein 678 was mined out as high grade mineralisation extracted through a small open-pit operation.
6.3 Mineral Resources and Ore Reserves Mineral Resource estimation at Mahd Ad’Dahab is largely undertaken using conventional polygonal methods manually, as are the derivation of Ore Reserves. SRK’s comments below are based on the estimate reported as at 1 January 2007 and this estimate has inter alia been subsequently adjusted by SRK in respect of depletion and modifying factors.
6.3.1 Quality and quantity of data The Mahd Ad’Dahab deposit has been drilled through a combination of 3,357 underground and surface diamond drillholes. Sampling methods comprise underground development sampling, channel sampling and long-hole grab sampling. Channel samples (2kg to 5kg) are collected by chipping a channel (using a geological hammer) across the entire width of mineralisation and placed in plastic bags. Long-hole grab sampling is occasionally carried out from the stoping muck piles where a randomly selected 10kg sample is collected and compared with a similar sample collected from the ore stockpile after it has been trucked to surface.
All samples are then dispatched to the on-mine laboratory and analysed for gold, silver, copper and zinc. Analysis includes fire assay for gold and silver and atomic absorption spectroscopy for copper and zinc. Sample preparation comprises primary jaw crushing to 1 inch, secondary crushing followed by ring and puck pulverizing to 75% passing 100mesh. The fire assay lab uses 10g charge for assays.
Ma’aden Gold reports that certified and in-house standards are run every sample set as necessitated by the QAQC system implemented in 2001. Round robin assay tests between the Mahd Ad’Dahab on-mine laboratories and an outside laboratory is also reportedly run twice a year. Further no evidence was provided in respect of the following: the accreditation status of the external laboratories; the proportion of the supplied drillhole data which was drilled prior to 2001; the results of recent quality assurance and quality control data.
Notwithstanding the above, SRK considers that the inclusion of Ore Reserves that are based on analyses from non-accredited laboratories is justified in that there has been no significant change in the procedures used at the laboratories since the previous Ore Reserve statements that would have a material effect on the current Ore Reserve statement. Furthermore, Mahd Ad’Dahab has a significant history of gold production and reconciliation. Accordingly, SRK does not consider that the accompanying Mineral Resource statements would not be significantly biased due to the non-accreditation of the laboratories.
6.3.2 Geological modelling, grade and tonnage estimation Mineral Resource estimation for the underground mine at Mahd Ad’Dahab is undertaken using manual polygonal methods where lithological information obtained from drill logs, underground mapping, chip sampling and channel sampling are used to define mineralised zones within which vein outlines are digitised on section using a cut-off grade of 7.0g/t Au and

SRK Consulting Ma'aden Gold MER – Main Report
U3330_Ma'aden MER.doc November, 2007 Page 91
a minimum width of 0.9m. Mined out areas are separately defined and specifically excluded from the estimation process. In certain instances due to practical considerations lower grade material may also be incorporated into these higher grade zones as delineated. Using half the distance to adjoining sections (12m drill lines) gold, silver, zinc and copper grades are averaged for each polygon.
The polygon grade is generated by weighted drillhole assay data only and a 50g/t Au cap is applied. A density of 2.7t/m3 is applied to all the polygons which are extrapolated 6.25m either side of the section line to generate a block tonnage in Surpac.
All blocks are validated by updating the grade with additional roof, face or grab samples. It is estimated that approximately 60% to 70% of the blocks are updated with additional sample data.
The current LoMp assumes the re-processing of zinc tailings stockpiled during the temporary cessation of the zinc circuit in 2004 and 2005. The total amount of tailings arising during this period was 355kt grading 0.43g/t Au, 6.30g/t Ag, 1.55% Zn and 0.11% Cu. The current LoMp assumes the processing of 232kt grading 0.80g/t Au, 10.0g/t Ag, 1.50% Zn and 0.00% Cu. Overall recoveries and reconciliation within the zinc circuit indicate that the material currently being processed (2006 and 2007H1) indicate higher gold and silver grades and accordingly the planned total has been accepted as equivalent to an Indicated Mineral Resource. SRK notes however that no detailed re-sampling of the tailings material has been undertaken and reliance for the estimate is largely based on historical records as well as production results from January 2006 to June 2007.
6.3.3 Classification Classification of the Mineral Resource at Mahd Ad’Dahab is based on the following criteria:
• Measured Mineral Resources: Ore that is blocked out on at least one side by fully evaluated levels and supported by face and roof samples collected perpendicular to the strike at intervals of 5m or less. A maximum interpolation on dip of 12m is used between exposed sill levels. Where the ore block is exposed on only one side, a maximum interpolation on dip of 6m is used. All measured blocks are extrapolated 6.25m from the plane of section. Additional assumptions applied include a geological cut-off grade of 7.0g/t Au and a minimum vein width of 0.5m;
• Indicated Mineral Resources: Ore blocks above, below or between “measured” blocks with incomplete or partial exposure, and where full exposure has been achieved either by drillhole and/or channel samples, but not to a standard to classify as Measured Mineral Resources. Where blocks are not exposed, individual veins have to correlate between two or more sections. In each case the maximum interpolation and extrapolation is limited to 15m up and down dip, and 6.25m along strike. Additional assumptions applied include a geological cut-off grade of 7.0g/t Au and a minimum vein width of 0.5m; and
• Inferred Mineral Resources: Ore blocks which have been blocked out by lower confidence envelopes extending up and down dip and plunge from higher confidence resource blocks are classified as Inferred Mineral Resources. The inferred category has also been assigned to all blocks with no exposure, though blocks must be supported by drillhole intersections. The maximum interpolation and extrapolation is limited to 50m up and down dip, and 6.25m along strike, based on geological continuity.

SRK Consulting Ma'aden Gold MER – Main Report
U3330_Ma'aden MER.doc November, 2007 Page 92
6.3.4 Selective Mining Units Mining practice at Mahd Ad’Dahab dictates that selectivity is based on stope outlines as defined within the LoMp and extends a minimum of 6m from each section line over the full dip extent of the individual veins. A minimum mining width of 0.5m has been applied in respect of Mineral Resource definition however reconciliation between resource grades and RoM grades would appear that this is rarely achieved and that dilution is higher than planned.
6.3.5 Grade control and reconciliation Grade control measures implement at Mahd Ad’Dahab include daily sampling based on the methods described in 6.3.1, assays are normally turned around in the same day. Reconciliation exercises to date have not identified the principal reasons for the significant disparity between Mineral Resource grades (>16g/t Au) and the Ore Reserve grades as reflected by historical RoM grades (>10g/t Au). Based on check calculations and accepting the limitations of the absence of 3D geological domaining, SRK notes that the impact of capping at 50g/t Au versus 25g/t Au is significant and that this coupled with mining off-plan or material not-in-reserve and higher than planned dilution are likely to be the key contributors. This issue further exemplified the need for more detailed analysis and incorporation of recent computerised techniques to improve both the underlying estimates and the reconciliation issues.
6.3.6 Economic potential and Grade-Tonnage analysis Figure 6.1 presents a grade vs tonnage curve for the current Mineral Resource at Mahd Ad’Dahab. The in-situ cut-off grade reference points include:
• 7.2g/t Au Eq (-25% of the in-situ LoMp cut-off grade) for reporting of Mineral Resources (Table 6.1); and
• 9.6g/t Au Eq for reporting of Ore Reserves (Table 6.1).
Figure 6.1 Mahd Ad’Dahab grade-tonnage curve(1), (2)
0.78Mt
1.01Mt
7.2g
/t A
u Eq
23.7g/t Au Eq
5.98Moz Au Eq
9.6g
/t A
u Eq
20.2g/t Au Eq
6.60Moz Eq Au
0.00
0.50
1.00
1.50
2.00
2.50
3.00
0.00
1.00
2.00
3.00
4.00
5.00
6.00
7.00
8.00
9.00
10.0
0
11.0
0
12.0
0
13.0
0
14.0
0
15.0
0
In-Situ COG (g/t Au Eq)
Tonn
age
(Mt)
0.00
5.00
10.00
15.00
20.00
25.00
30.00
0.00
1.00
2.00
3.00
4.00
5.00
6.00
7.00
8.00
9.00
10.0
0
11.0
0
12.0
0
13.0
0
14.0
0
15.0
0
Grade (g/t A
u, g/t Au Eq); C
ontent (Moz A
u, Moz A
u Eq)
Tonnage (Mt) Grade (g/t Au) Grade (g/t Au Eq) Content (Moz Au) Content (Moz Au Eq) ICOG-2P ICOG-3R (1) ICOG-2P: the in-situ cut-off grade applied to the Mineral Resource base to determine the Measured and
Indicated Mineral Resources which are incorporated in the LoMp (2P – Proved and Probable Ore Reserves).

SRK Consulting Ma'aden Gold MER – Main Report
U3330_Ma'aden MER.doc November, 2007 Page 93
(2) ICOG-3R: the in-situ cut-off grade applied to the Mineral Resource base to determine the Measured and Indicated Mineral Resources which satisfy the requirement of “potentially economically mineable” (3R – Measured, Indicated and Inferred).
Note that in Figure 6.1 the tonnage, grade and content reported are derived from in-situ Mineral Resources and accordingly exclude the impact of any modifying factors to produce RoM equivalents.
6.3.7 Ore Reserve estimation The Ore Reserve estimation process at Mahd Ad’Dahab is largely manual based on factorisation and scheduling of targeted Mineral Resource blocks. Furthermore, the degree of factorisation as opposed to distinct block by block scheduling is a limitation and detail is mainly provided for the one year budget with production thereafter inter alia based on production capacities.
Table 6.1 presents the modifying factors applied in derivation of the Ore Reserves as well as the in-situ cut-off grades used for reporting Mineral Resources. Reconciliation between both historical and current Mineral Resource and Ore Reserve statements necessitate the application of both dilution and grade factors. Identifying the contribution to these factors by estimation and mining efficiency is difficult and cannot be undertaken without further detailed assessments. Accordingly in the absence of such studies and a detailed LoMp SRK has assessed: the current Mineral Resource base; limited the LoMp to Ore Reserve depletion; and considered historically mined grades.
Table 6.1 Mahd Ad’Dahab: modifying factors Statistics Units Underground Physical Factors Extraction Ratio (%) 77% Dilution (%) 49% Grade Factors (% Au) 88.8%
(% Ag) 100.0% (% Zn) 101.0% (% Cu) 101.4%
Financial Factors Mining (US$/t) 19.92 Processing (US$/t) 32.54 Overheads (US$/t) 16.05 Product Charges (US$/t) 11.16 Total (US$/t) 79.67 Commodity Prices Payability Gold Equivalents Gold (US$/oz) 550 (% Au) 91.8% 1.00000 Silver (US$/oz) 9.00 (% Ag) 72.3% 0.01289 Zinc (USc/lb) 65 (% Zn) 32.8% 0.00006 Copper (USc/lb) 140 (% Cu) 71.6% 0.00014 Cut-off-Grades RoM (g/t Au Eq) 4.9 ICOG (g/t Au Eq) 9.6 Resource COG (g/t Au Eq) 7.2
6.3.8 Mineral Resource and Ore Reserve statements Table 6.2 through Table 6.4 present the Mineral Resource and Ore Reserve statements (1 July 2007) where: Table 6.2 is the summary statement including gold and gold equivalent grades; Table 6.3 is the detailed statements including silver, zinc and copper grades; and Table 6.4 presents the Ore Reserve sensitivities at a range of commodity prices. The suffix (1) and (2) respectively represent those Mineral Resources used as a base for modification to determine Ore Reserves and those Mineral Resources which have not been used as abase for modification to determine Ore Reserves. The following nomenclature also applies: u/g – underground; s/f – surface.
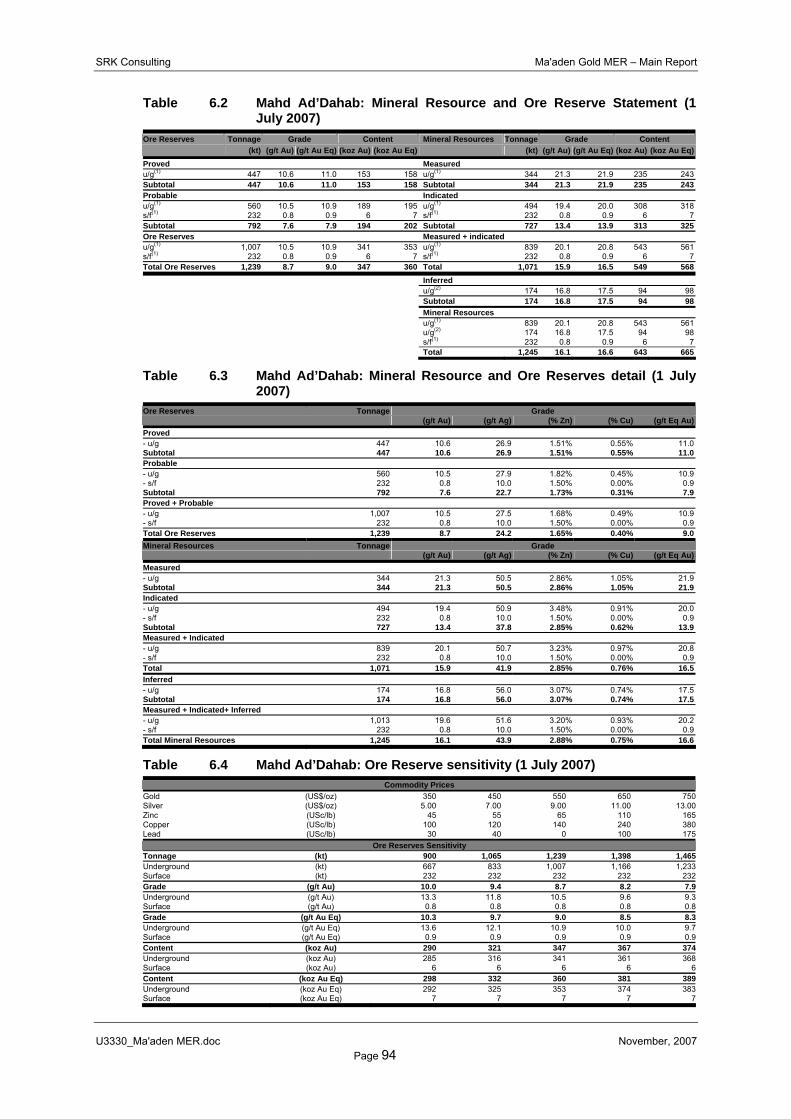
SRK Consulting Ma'aden Gold MER – Main Report
U3330_Ma'aden MER.doc November, 2007 Page 94
Table 6.2 Mahd Ad’Dahab: Mineral Resource and Ore Reserve Statement (1 July 2007)
Ore Reserves Tonnage Grade Content Mineral Resources Tonnage Grade Content (kt) (g/t Au) (g/t Au Eq) (koz Au) (koz Au Eq) (kt) (g/t Au) (g/t Au Eq) (koz Au) (koz Au Eq)Proved Measured u/g(1) 447 10.6 11.0 153 158 u/g(1) 344 21.3 21.9 235 243Subtotal 447 10.6 11.0 153 158 Subtotal 344 21.3 21.9 235 243Probable Indicated u/g(1) 560 10.5 10.9 189 195 u/g(1) 494 19.4 20.0 308 318s/f(1) 232 0.8 0.9 6 7 s/f(1) 232 0.8 0.9 6 7Subtotal 792 7.6 7.9 194 202 Subtotal 727 13.4 13.9 313 325Ore Reserves Measured + indicated u/g(1) 1,007 10.5 10.9 341 353 u/g(1) 839 20.1 20.8 543 561s/f(1) 232 0.8 0.9 6 7 s/f(1) 232 0.8 0.9 6 7Total Ore Reserves 1,239 8.7 9.0 347 360 Total 1,071 15.9 16.5 549 568
Inferred u/g(2) 174 16.8 17.5 94 98 Subtotal 174 16.8 17.5 94 98 Mineral Resources u/g(1) 839 20.1 20.8 543 561 u/g(2) 174 16.8 17.5 94 98 s/f(1) 232 0.8 0.9 6 7 Total 1,245 16.1 16.6 643 665
Table 6.3 Mahd Ad’Dahab: Mineral Resource and Ore Reserves detail (1 July 2007)
Ore Reserves Tonnage Grade (g/t Au) (g/t Ag) (% Zn) (% Cu) (g/t Eq Au)
Proved - u/g 447 10.6 26.9 1.51% 0.55% 11.0Subtotal 447 10.6 26.9 1.51% 0.55% 11.0Probable - u/g 560 10.5 27.9 1.82% 0.45% 10.9- s/f 232 0.8 10.0 1.50% 0.00% 0.9Subtotal 792 7.6 22.7 1.73% 0.31% 7.9Proved + Probable - u/g 1,007 10.5 27.5 1.68% 0.49% 10.9- s/f 232 0.8 10.0 1.50% 0.00% 0.9Total Ore Reserves 1,239 8.7 24.2 1.65% 0.40% 9.0Mineral Resources Tonnage Grade
(g/t Au) (g/t Ag) (% Zn) (% Cu) (g/t Eq Au)Measured - u/g 344 21.3 50.5 2.86% 1.05% 21.9Subtotal 344 21.3 50.5 2.86% 1.05% 21.9Indicated - u/g 494 19.4 50.9 3.48% 0.91% 20.0- s/f 232 0.8 10.0 1.50% 0.00% 0.9Subtotal 727 13.4 37.8 2.85% 0.62% 13.9Measured + Indicated - u/g 839 20.1 50.7 3.23% 0.97% 20.8- s/f 232 0.8 10.0 1.50% 0.00% 0.9Total 1,071 15.9 41.9 2.85% 0.76% 16.5Inferred - u/g 174 16.8 56.0 3.07% 0.74% 17.5Subtotal 174 16.8 56.0 3.07% 0.74% 17.5Measured + Indicated+ Inferred - u/g 1,013 19.6 51.6 3.20% 0.93% 20.2- s/f 232 0.8 10.0 1.50% 0.00% 0.9Total Mineral Resources 1,245 16.1 43.9 2.88% 0.75% 16.6
Table 6.4 Mahd Ad’Dahab: Ore Reserve sensitivity (1 July 2007) Commodity Prices
Gold (US$/oz) 350 450 550 650 750Silver (US$/oz) 5.00 7.00 9.00 11.00 13.00Zinc (USc/lb) 45 55 65 110 165Copper (USc/lb) 100 120 140 240 380Lead (USc/lb) 30 40 0 100 175
Ore Reserves Sensitivity Tonnage (kt) 900 1,065 1,239 1,398 1,465Underground (kt) 667 833 1,007 1,166 1,233Surface (kt) 232 232 232 232 232Grade (g/t Au) 10.0 9.4 8.7 8.2 7.9Underground (g/t Au) 13.3 11.8 10.5 9.6 9.3Surface (g/t Au) 0.8 0.8 0.8 0.8 0.8Grade (g/t Au Eq) 10.3 9.7 9.0 8.5 8.3Underground (g/t Au Eq) 13.6 12.1 10.9 10.0 9.7Surface (g/t Au Eq) 0.9 0.9 0.9 0.9 0.9Content (koz Au) 290 321 347 367 374Underground (koz Au) 285 316 341 361 368Surface (koz Au) 6 6 6 6 6Content (koz Au Eq) 298 332 360 381 389Underground (koz Au Eq) 292 325 353 374 383Surface (koz Au Eq) 7 7 7 7 7

SRK Consulting Ma'aden Gold MER – Main Report
U3330_Ma'aden MER.doc November, 2007 Page 95
6.3.9 Mineral Resource and Ore Reserve potential Mineral Resource potential at Mahd Ad’Dahab is largely focused on strike and dip extensions to currently delineated orebodies as well as other areas not drilled within the broader mineralised zone. Exploration potential beyond this is currently the focus of drilling campaigns in the North (SAMS) area within and nearby the vicinity of the Mahd national road and additional drillholes are planned in the vicinity of the mill site, surface ore stockpiles and dumpsite areas. To date some 517 holes have been drilled: 394 underground holes, and 123 surface holes.
Ore Reserve potential is dependent on the success of adding further Mineral Resources as well as the upgrading of the currently defined Inferred Mineral Resource. In the absence of any further information upgrading may at most lead to one additional year of mining.
6.4 Mining Engineering Mining operations at Mahd Ad’Dahab comprise mining of underground and surface sources (see Section 6.5). The underground Ore Reserves are currently planned for depletion in 2012 and are mined at a rate of 184ktpa.
6.4.1 Mining Access and Mining Method The main access to the underground operations is provided by a 1:9 decline, 4m by 4m in cross section which runs from the portal at 1,065m amsl to the 852m level. Access from this decline to the orebodies is via ramps and cross-cut haulages.
Mining methods include fully mechanised sub-level stoping and cut-and-fill with application depending on orebody dimensions. Currently some 75% of underground ore production is sourced from cut-and-fill mining methods with the fill being waste rock. Each cut is either 2m or 4m depending on orebody geometry and fill is placed in the stopes after each cut and topped with sand (>50cm), which also acts as a marker between ore and waste.
All primary waste development, ore development and the cut-and-fill stopes are drilled using electro-hydraulic drill rigs.
Monthly production is currently 15.3kt of ore and 4kt of waste which is hauled up the decline to surface by Wagner dumptrucks loaded by Wagner load-haul-dumps (“LHDs”). Current haul distances result in round trips of some 30 minutes to surface and back to the loading point.
Mining operations extend to a depth of 190m from the general desert surface. Ground conditions are generally good although (ground conditions) in localised areas is poor which necessitates the use of roof-bolts, sometimes in combination with mesh. No formal support system is left in the stopes, however low grade areas are left in-situ which also limit mining spans.
Mining activities are serviced with compressed air from a central facility with an installed capacity of 231m3/min provided by five compressors, three of which are operational at any one time. Ventilation is provided via the main decline and all air is exhausted via a separate incline. Mine water is settled underground at the lower levels and pumped to the main header tank situated near the main decline portal on surface.
6.4.2 Historical and short term mining operating statistics Table 6.5 presents the historical and short term mining statistics for the underground mining operations. RoM tonnage has increased since 2004 which in combination with the reduced waste tonnage mined reduced operating costs by some 17% over the period from 2004 through 2007H1 inclusive. Mined grades have shown a marginal improvement and

SRK Consulting Ma'aden Gold MER – Main Report
U3330_Ma'aden MER.doc November, 2007 Page 96
development metres appear to be broadly on plan.
Table 6.5 Mahd Ad’Dahab: historical and short term operating mining statistics Operating Statistics (Units) 2004 2005 2006 2007H1 2007H2 2008
Tonnage (kt) 154 178 173 88 92 184Grade (g/t Au) 10.3 10.7 10.7 11.1 10.8 10.8Development (m) 3,318 3,801 2,977 1,837 1,912 3,839Waste mined (kt) 115 91 74 40 41 83Operating Expenditures (US$/t) 23 19 18 19 20 20
6.4.3 Mining LoMp Table 6.6 presents the forecast LoMp mining performance statistics for the underground mining operation. In summary the tonnage forecasts show a marginal improvement of some 4% which largely reverses the current marginal underperformance. All other aspects are aligned with historical performance.
Table 6.6 Mahd Ad’Dahab: LoMp mining operating statistics Operating Statistics (Units) LoMp 2007H2 2008 2009 2010 2011 2012Tonnage (kt) 1,007 92 184 184 184 184 179Grade (g/t Au) 10.5 10.8 10.8 10.8 10.5 10.5 10.0Development (m) 21,006 1,912 3,839 3,839 3,839 3,839 3,738Waste mined (kt) 453 41 83 83 83 83 81Operating Expenditures (US$/t) 20 20 20 20 20 20 20
6.5 Metallurgical Processing The Mahd Ad’Dahab Plant processes ore mined from the underground operation as well as reclaimed tailings as direct feed to the zinc circuit. The process facility has a rated capacity of 185ktpa and comprises (Figure 6.3) a comminution circuit, a copper circuit, a gold circuit and a zinc circuit which produces copper and zinc concentrates for third party toll smelting and gold in doré form for third party refining.
In 2004 and 2005, the zinc circuit was mothballed given the low zinc price environment and all tailings arising in this period were separately stockpiled for future processing. The zinc circuit was re-commissioned in January 2006 and is currently treating the historical zinc tailings as well as current tailings from the gold circuit.
6.5.1 Processing Facilities In the comminution circuit RoM ore from the underground operation is crushed in a three-stage crushing circuit comprising a primary jaw crusher, secondary and tertiary crushers operating in open circuit. The crushing circuit reduces ore to -10mm and feeds the stockpile ahead of ball milling which further reduces the ore to 75% passing 75μm.
All slurry from the milling circuit feeds the copper flotation circuit where flotation reagents are added to recover copper concentrates using froth flotation with rougher, scavenger and cleaner cells. Copper concentrates are then thickened, filtered and bagged (2t bags) for shipping.
Copper flotation tailings are then thickened and processed in the gold circuit where cyanide solution is added to dissolve the contained fine grained gold and silver in a six stage CIP tank. The precious metals are then adsorbed onto activated carbon which is then screened from the pulp, acid washed and eluted with hot concentrated cyanide solution under pressure using a batch Zadra process. Precious metals are then recovered through electrowinning to produce precious metals sludge. This is then dried ahead of smelting in an induction furnace to produce 17kg to 20kg doré bars.
Tailings from the gold circuit feed the zinc circuit where zinc flotation reagents are used to recover zinc concentrates using froth flotation. Zinc concentrates are then thickened, filtered
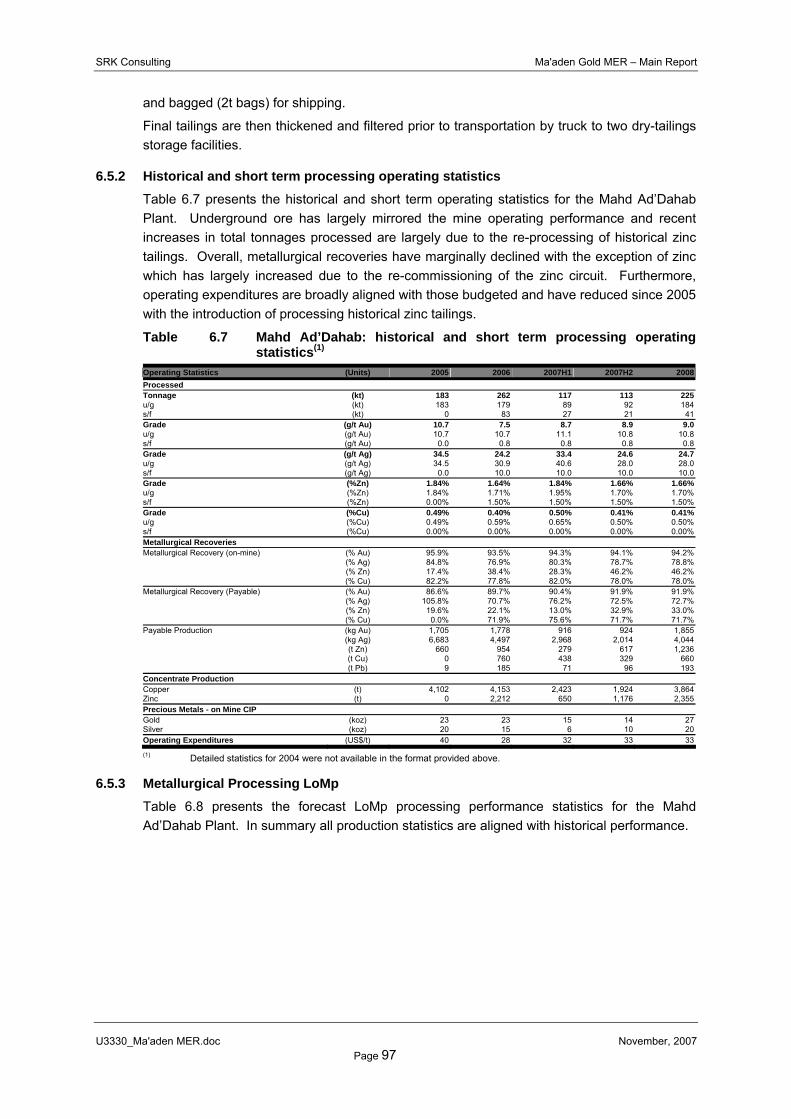
SRK Consulting Ma'aden Gold MER – Main Report
U3330_Ma'aden MER.doc November, 2007 Page 97
and bagged (2t bags) for shipping.
Final tailings are then thickened and filtered prior to transportation by truck to two dry-tailings storage facilities.
6.5.2 Historical and short term processing operating statistics Table 6.7 presents the historical and short term operating statistics for the Mahd Ad’Dahab Plant. Underground ore has largely mirrored the mine operating performance and recent increases in total tonnages processed are largely due to the re-processing of historical zinc tailings. Overall, metallurgical recoveries have marginally declined with the exception of zinc which has largely increased due to the re-commissioning of the zinc circuit. Furthermore, operating expenditures are broadly aligned with those budgeted and have reduced since 2005 with the introduction of processing historical zinc tailings.
Table 6.7 Mahd Ad’Dahab: historical and short term processing operating statistics(1)
Operating Statistics (Units) 2005 2006 2007H1 2007H2 2008Processed Tonnage (kt) 183 262 117 113 225u/g (kt) 183 179 89 92 184s/f (kt) 0 83 27 21 41Grade (g/t Au) 10.7 7.5 8.7 8.9 9.0u/g (g/t Au) 10.7 10.7 11.1 10.8 10.8s/f (g/t Au) 0.0 0.8 0.8 0.8 0.8Grade (g/t Ag) 34.5 24.2 33.4 24.6 24.7u/g (g/t Ag) 34.5 30.9 40.6 28.0 28.0s/f (g/t Ag) 0.0 10.0 10.0 10.0 10.0Grade (%Zn) 1.84% 1.64% 1.84% 1.66% 1.66%u/g (%Zn) 1.84% 1.71% 1.95% 1.70% 1.70%s/f (%Zn) 0.00% 1.50% 1.50% 1.50% 1.50%Grade (%Cu) 0.49% 0.40% 0.50% 0.41% 0.41%u/g (%Cu) 0.49% 0.59% 0.65% 0.50% 0.50%s/f (%Cu) 0.00% 0.00% 0.00% 0.00% 0.00%Metallurgical Recoveries Metallurgical Recovery (on-mine) (% Au) 95.9% 93.5% 94.3% 94.1% 94.2%
(% Ag) 84.8% 76.9% 80.3% 78.7% 78.8% (% Zn) 17.4% 38.4% 28.3% 46.2% 46.2% (% Cu) 82.2% 77.8% 82.0% 78.0% 78.0%
Metallurgical Recovery (Payable) (% Au) 86.6% 89.7% 90.4% 91.9% 91.9% (% Ag) 105.8% 70.7% 76.2% 72.5% 72.7% (% Zn) 19.6% 22.1% 13.0% 32.9% 33.0% (% Cu) 0.0% 71.9% 75.6% 71.7% 71.7%
Payable Production (kg Au) 1,705 1,778 916 924 1,855 (kg Ag) 6,683 4,497 2,968 2,014 4,044 (t Zn) 660 954 279 617 1,236 (t Cu) 0 760 438 329 660 (t Pb) 9 185 71 96 193
Concentrate Production Copper (t) 4,102 4,153 2,423 1,924 3,864Zinc (t) 0 2,212 650 1,176 2,355Precious Metals - on Mine CIP Gold (koz) 23 23 15 14 27Silver (koz) 20 15 6 10 20Operating Expenditures (US$/t) 40 28 32 33 33
(1) Detailed statistics for 2004 were not available in the format provided above.
6.5.3 Metallurgical Processing LoMp Table 6.8 presents the forecast LoMp processing performance statistics for the Mahd Ad’Dahab Plant. In summary all production statistics are aligned with historical performance.

SRK Consulting Ma'aden Gold MER – Main Report
U3330_Ma'aden MER.doc November, 2007 Page 98
Table 6.8 Mahd Ad’Dahab: LoMp operating processing statistics Operating Statistics (Units) LoMp 2007H2 2008 2009 2010 2011 2012Processed Tonnage (kt) 1,239 113 225 225 225 225 225u/g (kt) 1,007 92 184 184 184 184 179s/f (kt) 232 21 41 41 41 41 46Grade (g/t Au) 8.7 8.9 9.0 9.0 8.7 8.7 8.1u/g (g/t Au) 10.5 10.8 10.8 10.8 10.5 10.5 10.0s/f (g/t Au) 0.8 0.8 0.8 0.8 0.8 0.8 0.8Grade (g/t Ag) 24.2 24.6 24.7 24.7 24.7 24.7 21.9u/g (g/t Ag) 27.5 28.0 28.0 28.0 28.0 28.0 25.0s/f (g/t Ag) 10.0 10.0 10.0 10.0 10.0 10.0 10.0Grade (%Zn) 1.65% 1.66% 1.66% 1.66% 1.66% 1.66% 1.58%u/g (%Zn) 1.68% 1.70% 1.70% 1.70% 1.70% 1.70% 1.60%s/f (%Zn) 1.50% 1.50% 1.50% 1.50% 1.50% 1.50% 1.50%Grade (%Cu) 0.40% 0.41% 0.41% 0.41% 0.41% 0.41% 0.36%u/g (%Cu) 0.49% 0.50% 0.50% 0.50% 0.50% 0.50% 0.45%s/f (%Cu) 0.00% 0.00% 0.00% 0.00% 0.00% 0.00% 0.00%Metallurgical Recoveries Metallurgical Recovery (on-mine) (% Au) 94.1% 94.1% 94.2% 94.2% 94.1% 94.1% 93.8%
(% Ag) 78.6% 78.7% 78.8% 78.8% 78.8% 78.8% 77.3% (% Zn) 46.1% 46.2% 46.2% 46.2% 46.2% 46.2% 45.6% (% Cu) 78.0% 78.0% 78.0% 78.0% 78.0% 78.0% 78.0%
Metallurgical Recovery (Payable) (% Au) 91.8% 91.9% 91.9% 91.9% 91.9% 91.9% 91.6% (% Ag) 72.3% 72.5% 72.7% 72.7% 72.7% 72.7% 70.6% (% Zn) 32.8% 32.9% 33.0% 33.0% 33.0% 33.0% 32.1% (% Cu) 71.6% 71.7% 71.7% 71.7% 71.7% 71.7% 71.0%
Payable Production (kg Au) 9,911 924 1,855 1,855 1,803 1,803 1,672 (kg Ag) 21,677 2,014 4,044 4,044 4,044 4,044 3,487 (t Zn) 6,701 617 1,236 1,236 1,235 1,235 1,142 (t Cu) 3,539 329 660 660 660 660 572 (t Pb) 1,057 96 193 193 193 193 188
Concentrate Production Copper (t) 21,142 1,924 3,864 3,864 3,864 3,864 3,762Zinc (t) 12,815 1,176 2,355 2,355 2,355 2,355 2,220Precious Metals - on Mine Gold (koz) 145 14 27 27 26 26 24Silver (koz) 107 10 20 20 20 20 17Operating Expenditures (US$/t) 33 33 33 33 33 33 33
6.6 Tailings Storage Facilities A new (28 Hectare) TSF was commissioned in 2005 located some 0.6km south-east of the Mahd Ad’Dahab Plant. This comprises two unlined paddocks, to store 1,400,000m3 (total 2.2Mt) of tailings behind a compacted earth fill peripheral berm 6m high. The remaining storage capacity as at 30 June 2007 is estimated at 1.8Mt which exceeds the current LoMp requirement of 1.2Mt.
6.7 Engineering Infrastructure, Overheads and Capital Expenditure
6.7.1 Access, Power, Water and Engineering Infrastructure Road access to Mahd Ad’Dahab is via a combination of national (109km – northwest from Medina to Hanakiyah along highway 60) and local (176km – south from Hanakiyah) roads, a total travelled distance of 284km from Medina. The town of Mahd Ad’Dahab with a population of 1,500, borders the eastern boundary of the Exploitation Licence.
The power supply system on site comprises five installed diesel engine and generator sets complete with switchgear. These facilitate the supply of power for compressed air generation, ventilation and power for the processing facility.
Mahd Ad’Dahab access water from four main individual water sources: boreholes #1 to #9 drilled within the environs of the industrial site; the Wadi Suleim (30km north-west of the mine site, five wells); undergroundwater from the current mining operations; and Sufaynah.
In summary, SRK considers that the current power, water and engineering infrastructure is adequate to meet the requirements of the LoMp.
6.7.2 Overhead Operating Expenditure Table 6.9 presents the historical and short term overhead operating expenditures for Mahd Ad’Dahab. The total quantum of expenditures has increased by some 14% since 2005 and is

SRK Consulting Ma'aden Gold MER – Main Report
U3330_Ma'aden MER.doc November, 2007 Page 99
forecasted at some US$3.63m per annum.
Table 6.9 Mahd Ad’Dahab: historical and short term forecast overhead operating statistics
Operating Statistics (Units) 2004 2005 2006 2007H1 2007H2 2008Tonnage (kt) 178 183 262 117 113 225Operating Expenditures (US$/t) 16 17 13 13 16 16
(US$m) 2.83 3.20 3.34 1.52 1.82 3.63
Table 6.10 presents the forecast LoMp overhead operating statistics for Mahd Ad’Dahab where all statistics are aligned with historical performance.
Table 6.10 Mahd Ad’Dahab: LoMp operating overhead statistics Operating Statistics (Units) LoMp 2007H2 2008 2009 2010 2011 2012Tonnage (kt) 1,239 113 225 225 225 225 225Operating Expenditures (US$/t) 16 16 16 16 16 16 16
(US$m) 19.9 1.82 3.63 3.63 3.63 3.63 3.54
6.7.3 Capital Expenditure Table 6.11 presents the forecast capital expenditure for Mahd Ad’Dahab which amounts to US$10.62m over the LoMp. This solely comprises sustaining capital and no expansion capital is planned for depletion of the Ore Reserve. The sustaining capital is based on a provision of 7% of on-mine operating expenditures and also includes the forecast capital development schedules as developed by Ma’aden Gold.
Table 6.11 Mahd Ad’Dahab: LoMp capital expenditure statistics Operating Statistics (Units) LoMp 2007H2 2008 2009 2010 2011 2012Capital Expenditure (US$m) 10.62 1.29 1.98 1.90 1.82 1.82 1.79Project (US$m) 0.00 0.00 0.00 0.00 0.00 0.00 0.00Sustaining (US$m) 10.62 1.29 1.98 1.90 1.82 1.82 1.79
6.8 Human Resources Table 6.12 presents the historical and forecast TEC and productivities for Mahd Ad’Dahab. The forecasts largely reflect historical performance in respect of tonnage productivities (tonnes per TEC per month) and gold production productivities (grams of gold equivalent per TEC per month). The increase in tonnage productivity is largely derived from the re-processing of historical zinc tailings.
Table 6.12 Mahd Ad’Dahab: historical and forecast human resources statistics Operating Statistics (Units) LoMp 2004 2005 2006 2007H1 2007H2 2008TEC Mine (No) 61 65 65 62 61 61 61Mill (No) 117 124 123 120 117 117 117Administration (No) 56 37 35 47 56 56 56Total (No) 234 227 223 229 234 234 234Productivity Tonnage (t/TEC/month) 81 66 69 96 83 80 80Gold Equivalent (g/TEC/month) 786 727 813 872 855 839 828
6.9 Environmental
6.9.1 Environmental Setting The mine site is located on the divide between the following drainage lines:
• Sha’ib al Ma’dan, which flows into Wadi al ’Arj, a tributary of Wadi Ash Shu’bah, which drains into the Qa Hadawda salt pan about 30km east of Al Madinah;
• Wadi Sayilah, which enters the Qa’ as Suwayriqyah salt pan about 35km south-west of the mine; and
• Shaib al Aslaq, which drains into the Qa al Kura’ salt pan, about 25km south-south west of the site.
The mine is remote from human settlements, except for the town of Mahd Ad’Dahab, which is

SRK Consulting Ma'aden Gold MER – Main Report
U3330_Ma'aden MER.doc November, 2007 Page 100
about 1km west of the site, and Bedouin camps in the region. The town is a government administrative centre and has a diversity of private and public businesses mostly managed independently of the mine. It was estimated to have a population of about 12,000 in 2001. The old and current mines have the potential for producing acid rock drainage (“ARD”).
6.9.2 Compliance Other than a closure plan and a closure cost estimate, Mahd Ad’Dahab does not have any of the documents required in terms of legislation on environmental management by mines in Saudi Arabia. Accordingly Mahd Ad’Dahab is operating within the five-year grace period for existing projects to achieve compliance with the Public Environmental Law and the Implementing Regulations, which ends in September 2008.
The current closure plan was completed in 2002 by external consultants and is based on the assumption that the mine would close in 2003 and accordingly does not take into account the current LoMp.
6.9.3 Environmental Management The Company’s Health, Safety and Environmental Policy commits to the establishment of a health, safety and environmental management system. To this end, the Company has designed EMS and OHS manuals and intends to introduce these to Ma’aden Gold in the second half of 2007.
6.9.4 Key Environmental Issues Key areas which require specific attention are as follows:
• Water supply: Specifically the decrease in availability of water to surrounding water users. Information on water abstraction by the mine and the potential impacts of this on other water users is limited and requires further assessment;
• Water Pollution: The spread of polluted water on the mine site will be restricted by the arid climate, however pollution plumes could be driven by water ponding in the open-pit, sustained leaks in the lining of the heap leach pad (and associated ponds) and seepage from the unlined tailings dams (tailings are deposited as a dry ‘cake’ at approximately 20% moisture content). An understanding of potential impacts on downstream water resources and water users, including potential impacts of ARD after closure, requires further assessment.
The risk of decanting of water from the mine workings has been predicted to be low, however this needs to be confirmed by means of a detailed groundwater investigation;
• Subsidence above the mine workings: There is evidence of surface subsidence over the old SAMS underground workings and the SAMS mining area. Further investigative geotechnical work is required in order to determine the limits of historical mining activities as well as execution of the current LoMp. Remedial works could comprise sand backfill of the stopes, controlled blasting to collapse identified voids and sinkholes and backfilling of surface voids. Fencing and safety notices of the surface area subject to existing or potential subsidence may also be required;
• Dust in the town of Mahd Ad’Dahab: The town of Mahd Ad’Dahab abuts the eastern boundary of the exploitation licence. There is no air quality monitoring data available to provide background information on the impact of the mine on dust levels in the town of Mahd Ad’Dahab;

SRK Consulting Ma'aden Gold MER – Main Report
U3330_Ma'aden MER.doc November, 2007 Page 101
• Socio-economic impacts at closure: A socio-economic review included in the closure plan indicates that the impact of mine closure on the Mahd Ad’Dahab town will be softened due to the current diversified local economy. Notwithstanding this aspect a number of areas requiring further work have been identified, however no clear plan in respect of addressing these impacts has been established; and
• Lack of environmental monitoring data: Environmental monitoring by the mine to date is insufficient to demonstrate compliance with relevant environmental standards, to demonstrate certainty about the adequacy of environmental management measures applied by the mine and to further define closure criteria.
6.9.5 Environmental Liabilities The current closure cost estimate for Mahd Ad’Dahab is forecast at US$8.2m comprising US$6.4m for bio-physical closure and US$1.8m for TBL. These estimates are largely based on the original derivation by external consultants and have been adjusted to account for inflation from the date of estimation as well as certain provisions for the rehabilitation of the new TSF and provisions for post-closure monitoring.
Table 6.13 Mahd Ad’Dahab: environmental (biophysical and social) liabilities Environmental Liability Units AmountBio-physical Closure (US$m) 6.4Civil Demolition (US$m) 1.8Operation and Maintenance (US$m) 2.5PP&E Decommissioning (US$m) 0.5Management (US$m) 0.3Tailings Storage Facility (US$m) 0.3Post-closure monitoring (US$m) 0.2Design and Management (US$m) 0.3Contingency (US$m) 0.6Terminal Benefits (US$m) 1.8Total (US$m) 8.2
SRK notes that the above closure cost estimates due to a combination of uncertainty of occurrence and the absence of detailed information upon which to determine estimates, do not take account of the following:
• The cost of stabilisation of the SAMS area, but provision is made for fencing;
• The cost of capping of water-supply wells and removal of infrastructure as it is assumed that these can be retained as a regional asset; and
• The possible sale value of plant, equipment and infrastructure, or of saleable commodities which may be recovered during site clearance.
6.10 Commodity Sales Table 6.14 presents the commodity sales forecast for Mahd Ad’Dahab over the LoM. The production of base metals concentrates contribute both significant by-product sales revenue (payable metals) as well as associated operating expenditures in the form of transportation charges and third party toll smelting and refining: treatment charges (“TC”); refining charges (“RC”); realisation charges (“ReC”); and price-participation charges (“PP”).
The payment terms in respect of base metals concentrates are largely based on annual frame contracts which are generally benchmarked against annual international agreements between major producers and consumers. The resulting net smelter return (“NSR”) per tonne of concentrate is therefore dependent upon the commodity price forecasts as presented in Table 1.2 of this MER as well as the specific structure of the frame contracts. SRK has reviewed these contracts and incorporated these within the various Financial Models.
Refining charges in respect of precious metals are largely based on units per ounce of doré or

SRK Consulting Ma'aden Gold MER – Main Report
U3330_Ma'aden MER.doc November, 2007 Page 102
per units of precious metals contained within the total doré mass. These are largely price independent and have been included in the Financial Models in accordance with the various third party toll refining agreements.
Table 6.14 Mahd Ad’Dahab: concentrate and commodity sales Product Charges Units LoMp 2007H2 2008 2009 2010 2011 2012Copper Concentrates Tonnage (t) 21,142 1,924 3,864 3,864 3,864 3,864 3,762Payable Copper (t Cu) 3,539 329 660 660 660 660 572Transportation (US$/t) 15 15 15 15 15 15 15Product Charges (US$/t) 513 516 516 516 516 516 498
(USc/lb) 139 137 137 137 137 137 148NSR (US$/t) 5,416 6,928 6,806 5,709 5,042 4,508 4,232Zinc Concentrates Tonnage (t) 12,815 1,176 2,355 2,355 2,355 2,355 2,220Payable Zinc (t Zn) 5,703 523 1,048 1,048 1,048 1,048 988Transportation (US$/t) 43 43 43 43 43 43 43Product Charges (US$/t) 230 382 394 261 178 96 96
(USc/lb) 23 39 40 27 18 10 10NSR (US$/t) 871 1,252 1,160 958 790 625 620Precious Metals Doré Produced (koz) 251 23 47 47 46 46 42
(US$/oz) 0.78 0.78 0.78 0.78 0.78 0.78 0.78
6.11 Risks and Opportunities The principal on-mine risks at Mahd Ad’Dahab are:
• Mineral Resource and Ore Reserve Management: The limited use of computerised techniques in combination with the Mineral Resource estimation method limits the application of more modern approaches including: 3D-domaining; statistical studies; variography; block modelling; validation; reconciliation, specifically exploration model to grade-control model to mining/milling; and capping methodology.
Given the high degree of complexity of the gold bearing systems in combination with extensive geological database (12m section line spacing; face mapping; and surveyed contact data) SRK considers that a fundamental change in approach is warranted. Such approach would focus on the formation of 3-D domains which in turn would facilitate the generation of grade distribution models as well as providing enhanced focus in respect of exploration targeting;
• LoMp generation: Coupled with the former Ore Reserve aspects are the fact that the current focus in generating the LoMp is largely limited to the development of a one year budget. Notwithstanding the limitations of the current manual approach, SRK considers the supporting detail for forecasts beyond the one year budget to be inadequate and that the absence of such detail and excessive reliance on factoring in itself fails to address potential issues which may arise on completion of the appropriate level of detail, specifically development and production scheduling; and
• Environmental management and liabilities: Given the current regulatory deadlines (2008) in respect of conversion to the new licence arrangements, there is a pressing need to ensure demonstrable progress in completing the necessary documentation. Coupled with the implementation of the EMS as intended these represent an opportunity to commence addressing the potential risks associated with the following:
− Water abstraction assessments, − Potential impact of ARD as well as the spread of polluted water, − Mining induced subsidence, − The lack of environmental monitoring data.
The principal on-mine opportunities at Mahd Ad’Dahab are:
• Mineral Resource Potential following completion of successful exploration in the

SRK Consulting Ma'aden Gold MER – Main Report
U3330_Ma'aden MER.doc November, 2007 Page 103
regional licence area, the broader mineralised zones and the depth and strike extensions of currently delineated orebodies; and
• Ore Reserve Potential following upgrading of the currently defined Mineral Resource as well as introducing more modern resource estimation and mine planning techniques which may enable improved optimisation of the current LoMp.


SRK Consulting Ma'aden Gold MER – Main Report
U3330_Ma'aden MER.doc November, 2007 Page 106
7 AL AMAR
7.1 Introduction The following section includes discussion and comment on the following technical aspects: geology; Mineral Resources and Ore Reserves; mining; metallurgical processing; tailings storage facilities; infrastructure, overheads and capital expenditure; human resources; and environmental. Where appropriate historical and forecast tables are also presented to support the assumptions as included in the LoMp.
SRK notes that Ma’aden Gold, whilst progressing with the commissioning of this new development, has not updated any of the substantive technical forecasts as included in the feasibility study. Consequently, SRK has largely relied on the technical documentation as generated in 2001 and made appropriate adjustments to assess the impact of increased commodity prices, increased operating and capital expenditures (assuming CPI to 30 June 2007) and the most recent third party offtake agreements for base metals concentrates and precious metals refining.
7.2 Geology Rocks of the Al Amar region are part of the Ar Rayn Terrane, a regional tectono-stratigraphic unit. This unit is separated from the western Abt Schist Belt by the regional Al Amar-Idas fault. Rocks of the Ar Rayn Terrane are overlain by Paleozoic sedimentary rocks to the north-east and south.
The deposit is located in a north-south trending belt of felsic to mafic volcanic rocks comprising the Al Amar Group. Rocks of the Al Amar Group are transitional in composition from tholeiitic to calc-alkaline. The rocks are comprised of volcanics, submarine exhalatives, carbonates and cherts. The Al Amar Group rocks are intruded by granodiorite, trondhjemite, gabbro and quartz diorite rocks coeval or following tectonism of the group dated at 700Ma to 600Ma. Post tectonic granites dating 580Ma also intrude the Al Amar rocks. The metamorphic grade of rocks in this region ranges from lower greenschist facies to the west and amphibolite facies to the east.
Structurally the Al Amar Group rocks have been subjected to complex folding and faulting. Predominant structures trend north-south and northeast-southwest. Structures at the Al Amar deposit are dominated by northwest-southeast and west northwest-east southeast fault systems and are associated with mineralisation.
Three spatially discrete zones of mineralisation have been identified at Al Amar (Figure 7.2). The main mineralised zone is the North Vein Zone (the “NVZ”). This zone strikes east-west with a dip of 69° to 80° to the south. The NVZ has been identified extending 550m along strike and to a depth of 350m. The zone is reported to be 10m to 45m wide. Mineralisation in this zone has been interpreted to occupy a tension fracture system developed late during deformation processes. It is hosted by progressively higher stratigraphic units from east to west. Two sub-parallel vein systems have been identified within the zone. The vein systems occur as a series of sub-vertical, discontinuous quartz veins up to 0.5m thick associated with sub-massive sphalerite, pyrite and minor chalcopyrite mineralisation. The Footwall Vein (“FWV”) is characterized by high copper values, high zinc and sporadic high gold values. Contrastingly the Hanging Wall Vein (“HWV”) is associated with moderate copper, zinc and gold values and elevated lead levels. Mineralisation is open laterally and at depth. A northeast-southwest trending fault cuts off mineralisation to the west.
The Stockwork Zone (“SZ”) and South Vein Zones (“SVZ”) are comprised of irregular

SRK Consulting Ma'aden Gold MER – Main Report
U3330_Ma'aden MER.doc November, 2007 Page 107
stockwork and discontinuous vein systems respectively. Both zones are hosted in Unit 3. Mineralisation in the SZ is similar to mineralisation in the NVZ. The SVZ is associated with talc carbonate beds. The SVZ occurs in a wide fault zone 20m to 30m wide. This zone is structurally complex and shows little continuity along strike or down dip.
Rocks of the Al Amar deposit comprise a volcanic sequence starting at the footwall of the main zone of mineralisation. The units are outlined below:
• UNIT 1: A massive basal unit comprising mafic to intermediate pyroclastic rocks including agglomerate, crystal and lapilli tuffs. The unit is pyritised and highly competent;
• UNIT 2: A sequence of coarse rhyolite pyroclastic rocks associated with jasper, chert and fine grained tuff units. The top portion of the unit is characterised by coarse agglomerate with siliceous interstitial filling;
• UNIT 3: Felsic to intermediate pyroclastic rocks. Highly carbonitised and silicified. Locally talcose, shearing and fractures associated with talcose lenses;
• UNIT 4: Finely bedded volcaniclastic siltstone and gritstone with minor tuff and carbonate beds. Minor gypsum stringers; and
• UNIT 5: Coarse volcaniclastic rocks with large volcaniclastics in a carbonitised matrix.
The Al Amar deposit is cut by numerous intermediate to mafic dykes that are believed to post date mineralisation. A prominent dyke ranging from 10m to 20m in width with a north-south (mine grid) strike and a 60° east dip separates mineralisation to the east and west. Displacement along the dyke is reported at 1m to 2m.
7.3 Mineral Resources and Ore Reserves Mineral Resource and Ore Reserve estimates for Al Amar were derived as part of the feasibility study completed by independent consultants in 2004 and were largely based on the generation of 3D block models and detailed mine designs. SRK’s comments below are based on the estimates reported in the feasibility and where appropriate these estimates have been subsequently adjusted by SRK.
7.3.1 Quality and quantity of data The Al Amar deposit was delineated by 473 drillholes for a total of 89,160m and chip sampling over 2,625m of development along the FWV and HWV. The latest Mineral Resource estimate was completed in 2001 by external consultants. Four mineralised domains comprising the HWV, the FWV, the SZ and SVZ. Unmineralised zones included two dolerite dykes. Weathered portions of the HWV and FWV were assumed to extend 30m from surface and were not considered economic. Samples of the veins were composited at 1m intervals and stockwork zones were composited at 2m intervals.
Samples from Al Amar were assayed at Mahd Ad’Dahab’s assay laboratory. The laboratory received half core, underground chip samples and bulk grab samples from Al Amar, each weighing from 5kg to 10kg. The sample preparation procedure comprised: drying; jaw crushing to -5 mm; riffle split to approximately 500g; roll crushing to 100% -1mm; riffle splitting to approximately 250g; Tema mill to 100 % -75 microns; homogenise pulp; and riffle splitting to 100g.
All samples were analysed by atomic absorption spectrophotometry (“AAS”) for all metals (Au, Ag, Zn, Cu) and fire assay checks were carried out for samples with gold values >50g/t. Assaying was carried out on a 1g aliquot for base metals and 2g or 5g for gold and silver. Only one analysis was carried out per sample.
SRK Consulting Ma'aden Gold MER – Main Report
U3330_Ma'aden MER.doc November, 2007 Page 108
No documented QA/QC practices have been reported for the Al Amar deposit and as previously stated, the Mahd Ad’Dahab laboratory is not accredited.
A bulk density 3.0t/m3 was used to determine resource tonnes. This value is based on a limited number of samples.
7.3.2 Geological modelling, grade and tonnage estimation The feasibility study included the generation of two separate block models, one for the area representing the HWV and the FWV, and one for the SZ. Assay data used in the estimation included the surface and underground diamond drillholes and a series of chip samples taken from the upper levels of the deposit. The SZ has not been included in the LoMp and accordingly the comments below focus on the estimates representing the HWV and the FWV.
Solid wireframe domains were generated for the HWV and FWV. A surface oxide layer was generated by translating the surface topography down by 30m. Insufficient information was present for a detailed interpretation of this layer.
Coarse wireframes were generated for the HWV and FWV with multiple self intersecting surfaces being present within individual veins and across vein boundaries. The complex geology combined with the interpretation approach has resulted in unrealistic surfaces. SRK considers that re-interpretation is required to smooth the ore envelopes between sections, especially as certain areas including overlaps have been classified as an Indicated Mineral Resource within zones of informing data.
The statistical analysis concluded that all diamond drillhole data and chip sample data was suitable for estimation. Quantile-Quantile plots of the two sets of data showed no material differences. The drillhole and chip assay data was filtered in Datamine software to produce individual datasets of points lying inside the FWV and HWV domains. The drillhole and chip assay datasets were then combined for each domain and a 1m composite file was produced, this being similar to the mean sample length of the original data. A top cut to the 99th percentile was applied. Variography on Au, Ag, Cu and Zn after the production of fan plots to determine the main strike direction of the gold mineralisation resulted in robust variograms.
Vein zones were estimated into an empty block model with the parent cell dimensions of 10mE by 3mN and by 10mRL. Sub cells of 5m by 1.5m by 5m were used to honour the geology with estimation being into parent cells only.
Suitably orientated search parameters were used with the search ellipse doubled for run two and finally, to ensure that all blocks were estimated a ten fold increase in the search ellipse was chosen for the third run. The minimum number of samples was also reduced accordingly with latter runs in the estimation. In addition to the search parameters used in the estimation, de-clustering measures were also applied. Each block was limited to two samples from each drillhole and a limited octant search of two sectors was used.
Validation checks included visual checks and model validation slices that compare the composite and model grades that lie between a set clipping distance either side of the reported section or bench level. The global resource estimate showed reasonable comparisons, however even when taking into account the effects of smoothing and clustering, SRK noted that local estimates in certain areas varied by as much as ±30%, further highlighting poor local block grade estimation.
Notwithstanding the above, SRK considers the estimate to be appropriate for this type of deposit although some of the finer points in the estimation methodology are not known. Consequently, further work is required in respect of the following: detailed data investigation

SRK Consulting Ma'aden Gold MER – Main Report
U3330_Ma'aden MER.doc November, 2007 Page 109
(diamond vs chip samples); more accurate wire-framing to remove overlaps and “jaggedness”; the application of dynamic anisotropy to the estimation; and the consideration of different block sizes in relation to the drill spacing.
7.3.3 Classification Classification of the Mineral Resource at Al Amar (Figure 7.3) is based on the following criteria:
• Measured Mineral Resources: Blocks associated with the vein interpretation and grade information immediately surrounding underground developments and in areas of fan drilling intersections, where these are in the order of 10m apart or less. Given the issues highlighted above, SRK has however re-classified all previously stated Measured Mineral Resources as Indicated Mineral Resources;
• Indicated Mineral Resources: Blocks extending through the vein zones with approximately 20m by 20m drill intersection spacing and estimated with either the first or second search pass; and
• Inferred Mineral Resources: Blocks which did not fall into the above constraints. These areas are typically at the edges, and particularly at depth in the vein zones.
7.3.4 Selective Mining Units Mining practice at Al Amar dictates that selectivity will be based on stope outlines as defined within the LoMp and extends across the width of the orebodies mined, 20m to 30m (maximum of 60m on dip) vertically and up to 25m along strike. A minimum mining width of 1.2m has been applied in respect of resource definition, however in areas where the orebody widths are less than 3m (the then planned development widths) further dilution has been added to attain a minimum width of 3m when reporting Ore Reserves.
Further, SRK notes that the dimensions of mining equipment purchased to date is likely to require development ends which are 4m wide. In areas where the planned mining widths are less than this additional dilution of some 33% may be required. The extent to which this impacts on the current Ore Reserve has not been determined and therefore remains a risk.
7.3.5 Grade control and reconciliation As production to date is limited no grade control and reconciliation results are available.
7.3.6 Economic potential and Grade-Tonnage analysis Figure 7.1 presents a grade-tonnage curve for the current Mineral Resource at Al Amar. The in-situ cut-off grade reference points include:
• 6.3g/t Au Eq (-25% of the in-situ LoMp cut-off grade) for reporting of Mineral Resources (Table 7.1); and
• 8.4g/t Au Eq for reporting of Ore Reserves (Table 7.1).
Note that the tonnage, grade and content reported are derived from in-situ Mineral Resources and accordingly exclude the impact of any modifying factors to produce RoM equivalents. Figure 7.4 presents a 3D view of the block model equivalent gold grade.

SRK Consulting Ma'aden Gold MER – Main Report
U3330_Ma'aden MER.doc November, 2007 Page 110
Figure 7.1 Al Amar grade-tonnage curve(1), (2), (3)
1.39Mt
2.00Mt
6.3g
/t A
u Eq
13.4g/t Au Eq
6.02Moz Au Eq
8.4g
/t A
u Eq
11.5g/t Au Eq
7.43Moz Eq Au
0.00
0.50
1.00
1.50
2.00
2.50
3.00
3.50
4.00
4.50
5.00
0.00
1.00
2.00
3.00
4.00
5.00
6.00
7.00
8.00
9.00
10.0
0
11.0
0
12.0
0
13.0
0
14.0
0
15.0
0
In-Situ COG (g/t Au Eq)
Tonn
age
(Mt)
0.00
5.00
10.00
15.00
20.00
25.00
30.00
35.00
40.00
45.00
50.00
0.00
1.00
2.00
3.00
4.00
5.00
6.00
7.00
8.00
9.00
10.0
0
11.0
0
12.0
0
13.0
0
14.0
0
15.0
0
Grade (g/t A
u, g/t Au Eq); C
ontent (Moz A
u, Moz A
u Eq)
Tonnage (Mt) Grade (g/t Au) Grade (g/t Au Eq) Content (Moz Au) Content (Moz Au Eq) ICOG-2P ICOG-3R (1) ICOG-2P: the in-situ cut-off grade applied to the Mineral Resource base to determine the Measured and
Indicated Mineral Resources which are incorporated in the LoMp (2P – Proved and Probable Ore Reserves).
(2) ICOG-3R: the in-situ cut-off grade applied to the Mineral Resource base to determine the Measured and Indicated Mineral Resources which are satisfies the requirement of “potentially economically mineable” (3R – Measured, Indicated and Inferred).
(3) Excludes the stockwork zone which at 6.0g/t Au is estimated 262kt grading 8.5g/t Au, 11.4g/t Ag, 3.29% Zn and 0.34% Cu.
7.3.7 Ore Reserve estimation The Ore Reserve estimation process at Al Amar included the generation of a computerised LoMp whereby development and production schedules were established using general mine planning software. Given the commodity prices prevailing at the time of generation, no Ore Reserves were declared for Al Amar as the overall project was deemed to be uneconomic.
Table 7.1 presents the modifying factors applied in derivation of the Ore Reserves as well as the in-situ cut-off grades used for reporting Mineral Resources. SRK has reassessed the economic viability based on current long term prices and therefore re-stated both the Mineral Resources and Ore Reserves in accordance with the modifying factors as stated in Table 7.1 below. Notwithstanding this issue, SRK notes that an unquantified risk remains in that the dilution for a portion of the Ore Reserves may be understated by as much as 33%. Accordingly SRK considers that this should be revisited following the revisions to the resource estimates discussed above as well as updating with any additional data gathered subsequent to completion of the feasibility study.

SRK Consulting Ma'aden Gold MER – Main Report
U3330_Ma'aden MER.doc November, 2007 Page 111
Table 7.1 Al Amar: modifying factors Statistics Units Underground Physical Factors Extraction Ratio (%) 88% Dilution (%) 15% Grade Factors (% Au) 87.9%
(% Ag) 95.7% (% Zn) 100.4% (% Cu) 93.9%
Financial Factors Mining (US$/t) 25.49 Processing (US$/t) 34.23 Overheads (US$/t) 24.74 Product Charges (US$/t) 28.38 Total (US$/t) 112.84 Commodity Prices Payability Gold Equivalents Gold (US$/oz) 550 (% Au) 89.9% 1.00000 Silver (US$/oz) 9.00 (% Ag) 81.3% 0.01481 Zinc (USc/lb) 65 (% Zn) 62.7% 0.00007 Copper (USc/lb) 140 (% Cu) 76.0% 0.00016 Cut-off Grades RoM (g/t Au Eq) 7.1 ICOG (g/t Au Eq) 8.4 Resource COG (g/t Au Eq) 6.3
7.3.8 Mineral Resource and Ore Reserve statements Table 7.2 through Table 7.4 present the Mineral Resource and Ore Reserve statements (1 July 2007) where: Table 7.2 is the summary statement including gold and gold equivalent grades; Table 7.3 contains the detailed statements including gold, silver, zinc and copper grades; and Table 7.4 presents the Ore Reserve sensitivity presented at a range of commodity prices. The suffix (1) and (2) respectively represent those Mineral Resources used as a base for modification to determine Ore Reserves and those Mineral Resources which have not been used as a base for modification to determine Ore Reserves. The following nomenclature also applies: u/g – underground.
Table 7.2 Al Amar: Mineral Resource and Ore Reserves (1 July 2007)(1) Ore Reserves Tonnage Grade Content Mineral Resources Tonnage Grade Content (kt) (g/t Au) (g/t Au Eq) (koz Au) (koz Au Eq) (kt) (g/t Au) (g/t Au Eq) (koz Au) (koz Au Eq)Proved Measured u/g(1) 0 0.0 0.0 0 0 u/g(1) 0 0.0 0.0 0 0Subtotal 0 0.0 0.0 0 0 Subtotal 0 0.0 0.0 0 0Probable Indicated u/g(1) 1,350 9.9 10.2 429 441 u/g(1) 1,864 11.3 11.6 679 698Subtotal 1,350 9.9 10.2 429 441 Subtotal 1,864 11.3 11.6 679 698Ore Reserves Measured + indicated u/g(1) 1,350 9.9 10.2 429 441 u/g(1) 1,864 11.3 11.6 679 698Total Ore Reserves 1,350 9.9 10.2 429 441 Total 1,864 11.3 11.6 679 698
Inferred u/g(2) 141 9.5 9.7 43 44 Subtotal 141 9.5 9.7 43 44 Mineral Resources u/g(1) 1,864 11.3 11.6 679 698 u/g(2) 141 9.5 9.7 43 44 Total 2,005 11.2 11.5 722 742
(1) Excludes the stockwork zone which at a cut-off grade 6.0g/t Au is estimated at 262kt grading 8.5g/t Au, 11.41g/t Ag, 3.29% Zn and0.34% Cu.

SRK Consulting Ma'aden Gold MER – Main Report
U3330_Ma'aden MER.doc November, 2007 Page 112
Table 7.3 Al Amar: Mineral Resource and Ore Reserves detail (1 July 2007)(1) Ore Reserves Tonnage Grade
(g/t Au) (g/t Ag) (% Zn) (% Cu) (g/t Eq Au)Proved - u/g 0 0.0 0.0 0.00% 0.00% 0.0Subtotal 0 0.0 0.0 0.00% 0.00% 0.0Probable - u/g 1,350 9.9 18.0 5.37% 0.76% 10.2Subtotal 1,350 9.9 18.0 5.37% 0.76% 10.2Proved + Probable - u/g 1,350 9.9 18.0 5.37% 0.76% 10.2Total Ore Reserves 1,350 9.9 18.0 5.37% 0.76% 10.2Mineral Resources Tonnage Grade
(g/t Au) (g/t Ag) (% Zn) (% Cu) (g/t Eq Au)Measured - u/g 0 0.0 0.0 0.00% 0.00% 0.0Subtotal 0 0.0 0.0 0.00% 0.00% 0.0Indicated - u/g 1,864 11.3 20.2 6.00% 0.88% 11.6Subtotal 1,864 11.3 20.2 6.00% 0.88% 11.6Measured + Indicated - u/g 1,864 11.3 20.2 6.00% 0.88% 11.6Total Mineral Resources 1,864 11.3 20.2 6.00% 0.88% 11.6Inferred - u/g 141 9.5 13.9 5.39% 0.76% 9.7Subtotal 141 9.5 13.9 5.39% 0.76% 9.7Measured + Indicated+ Inferred - u/g 2,005 11.2 19.8 5.96% 0.87% 11.5Total Mineral Resources 2,005 11.2 19.8 5.96% 0.87% 11.5(1) Excludes the stockwork zone which at a cut-off grade of 6.0g/t Au is estimated 262kt grading 8.5g/t Au, 11.41g/t Ag, 3.29% Zn and0.34% Cu.
Table 7.4 Al Amar: Ore Reserve sensitivity (1 July 2007)
Commodity Prices Gold (US$/oz) 350 450 550 650 750Silver (US$/oz) 5.00 7.00 9.00 11.00 13.00Zinc (USc/lb) 45 55 65 110 165Copper (USc/lb) 100 120 140 240 380Lead (USc/lb) 30 40 0 100 175
Ore Reserves Sensitivity Tonnage (kt) 614 923 1,350 1,350 1,607Grade (g/t Au) 13.0 11.4 9.9 9.9 9.2Grade (g/t Au Eq) 13.3 11.7 10.2 10.2 9.5Content (koz Au) 257 338 429 429 475Content (koz Au Eq) 262 346 441 441 489
7.3.9 Mineral Resource and Ore Reserve potential Mineral Resource potential at Al Amar is largely focused on strike and dip extensions to the currently delineated orebodies.
Ore Reserve potential is dependent on the success of adding further Mineral Resources as well as upgrading of the currently defined Inferred Mineral Resource. In the absence of any further information upgrading may at most lead to one additional year of mining.
7.4 Mining Engineering Mining operations at Al Amar will comprise mining of underground sources. The current Ore Reserves are planned for depletion in 2014 and are mined at an annual rate of 200ktpa.
7.4.1 Mining Access and Mining Method The main access to the underground operations is via a surface decline (14%) which will provide access for personnel and material, and intake ventilation. Ore and waste will be hauled from the mine using articulated trucks and backfill (development waste) which will be distributed from a surface waste pass back into the mine. Cross cut accesses to the stopes will be positioned at 30m vertical intervals above 790mRL and will be developed at 20m intervals below this point.
Ventilation will exhaust from the mine via a series of raises that connect each level with the previously developed decline and the main exhaust fan will be located at the old decline portal. In addition a second means of egress, or escape way, will be established to the

SRK Consulting Ma'aden Gold MER – Main Report
U3330_Ma'aden MER.doc November, 2007 Page 113
surface from the lowest stoping areas.
Geotechnical designs as included in the feasibility study were based on historical investigations and no further data assessment has been undertaken. The ultimate mining depth is currently forecast to reach some 300m below surface and the immediate hangingwall comprises volcanic rock which is classified as competent, with the exception of areas where talc zones are present.
The mining method employed in the upper levels between 790m amsl and 880m amsl will be a fully mechanised typical long-hole retreat mining method with subsequent backfilling using waste development. In this area the existing mine development provides a 30m level spacing. Given the irregular nature of the stope hangingwall and in order to minimise dilution over this vertical height, it will be necessary to drill an integrated pattern of blast holes from both the upper and lower levels of each stope. In the lower levels (below 790m amsl) the sublevel interval will be reduced to 20m and a top-down dip mining method, mined down dip on retreat from the limits of the orebody will be utilised. In these areas rib pillars will be incorporated into the layout for additional and local support.
Mining equipment has been selected based on similar fleet configuration at Mahd Ad’Dahab which includes development jumbos, long-hole production drill rigs, truck loaders and general utility vehicles.
Mining services include: compressed air generators; four generator sets installed to supply power for both underground and surface operations; and water supply from a combination of undergroundwater make supplemented by process water where required.
7.4.2 Mining LoMp Table 7.5 presents the forecast LoMp mining operating statistics for the underground mining operations. SRK notes that as part of the anticipated production build-up underground mining activity commenced during 2007H1, however the production results are limited and given that no update of the original feasibility study is available, SRK has assumed that the production build up will be limited to 155kt in 2008 rising to full production of 200ktpa in 2009.
Table 7.5 Al Amar: LoMp mining operating statistics Operating Statistics (Units) LoMp 2007H2 2008 2009 2010 2011 2012 2013 2014Tonnage (kt) 1,350 0 155 201 200 201 201 199 194Grade (g/t Au) 9.9 0.0 9.1 9.0 10.7 11.1 10.5 10.4 8.2Development (m) 15,570 0 1,242 4,443 4,005 2,439 2,032 1,255 154Waste mined (kt) 340 0 31 111 64 63 51 20 0Operating Expenditures (US$/t) 25 0 27 27 32 26 27 24 15
7.5 Metallurgical Processing The Al Amar Plant processes ore mined from the underground operation. The process facility (Figure 7.5) is largely based on the Mahd Ad’Dahab Plant, has a rated capacity of 200ktpa and comprises a comminution circuit, a copper circuit, a gold circuit and a zinc circuit which produces copper and zinc concentrates for third party toll smelting and gold in doré form for third party refining.
The Al Amar Plant is currently in start-up mode following construction and is anticipated to process some 155ktpa in 2008 leading up to full capacity in 2009. No detailed process results are available for 2007H2 and accordingly all forecast operating statistics are largely as included in the Feasibility Study.
7.5.1 Processing Facilities In the comminution circuit RoM ore from the underground operations is crushed in a three-

SRK Consulting Ma'aden Gold MER – Main Report
U3330_Ma'aden MER.doc November, 2007 Page 114
stage crushing circuit comprising a primary jaw crusher, a secondary cone crusher and tertiary cone crusher operating in closed circuit. The crushing circuit reduces RoM ore with 300mm top size to -12.5mm and feeds the ball mill which further reduces the ore to 80% passing 75μm.
All slurry from the milling circuit feeds the copper circuit where copper flotation reagents are added to recover copper concentrates using froth flotation with rougher, scavenger and cleaner cells. Copper concentrates are then thickened, filtered and bagged (2t bags) for shipping.
Flotation tailings are then thickened and processed in the gold circuit where cyanide solution is added to dissolve the contained fine grained gold and silver in a six stage CIP tank. The precious metals are then absorbed onto activated carbon which is then screened from the pulp, washed and eluted with hot concentrated cyanide solution under pressure using a batch Zadra process. Precious metals are then recovered through electrowinning to produce precious metals sludge. This is then dried ahead of smelting in an induction furnace to produce 17kg to 20kg doré bars.
Tailings from the gold circuit feed the zinc circuit where zinc flotation reagents are used to recover zinc concentrates using froth flotation. Zinc concentrates are then thickened, filtered and bagged (2t bags) for shipping.
Final tailings are then thickened and filtered prior to transportation by truck to a dry-tailings storage facility.
7.5.2 Metallurgical Processing LoMp Table 7.6 presents the forecast LoMp processing performance statistics for the Al Amar Plant. Milled throughput is planned to increase through 2008 with full production achieved in 2009. Payable recoveries are estimated at 89.9% for gold; 81.3% for silver; 62.7% for zinc and 76.0% for copper. Overall the LoMp operating costs are forecast at some US$34/t which is less than that achieved by Mahd Ad’Dahab whilst only processing underground ore (US$40/t in 2005). The Al Amar Plant is, however, new and, accordingly, is assumed to obtain improved efficiencies.
Although substantial metallurgical testwork was undertaken as part of the feasibility study process, some risk remains given difficulties in arriving at representative samples and the general inconsistency of the results achieved. A 4,000t bulk sample was run through the Mahd Ad’Dahab Plant and the head grades tested were somewhat lower than that forecast in the study. Whilst the forecasts included in the LoMp are based on the latest available data, any uncertainties relating to such forecasts will remain until receipt and analyses of current plant performance during the start-up/build-up phase.

SRK Consulting Ma'aden Gold MER – Main Report
U3330_Ma'aden MER.doc November, 2007 Page 115
Table 7.6 Al Amar: LoMp processing operating statistics Operating Statistics (Units) LoMp 2007H2 2008 2009 2010 2011 2012 2013 2014Processed Tonnage (kt) 1,350 0 155 201 200 201 201 199 194Grade (g/t Au) 9.9 0.0 9.1 9.0 10.7 11.1 10.5 10.4 8.2Grade (g/t Ag) 18.0 0.0 27.6 22.2 17.3 16.8 15.7 14.7 13.8Grade (%Zn) 5.37% 0.00% 5.33% 5.58% 5.32% 5.45% 5.66% 5.62% 4.58%Grade (%Cu) 0.76% 0.00% 0.72% 0.62% 0.76% 0.75% 0.79% 0.99% 0.67%Metallurgical Recoveries Metallurgical Recovery (on-mine) (% Au) 92.5% 0.0% 88.4% 93.0% 93.0% 93.0% 93.0% 93.0% 93.0%
(% Ag) 90.4% 0.0% 88.7% 90.8% 90.8% 90.8% 90.8% 90.8% 90.8% (% Zn) 80.8% 0.0% 76.6% 81.0% 81.4% 81.3% 81.3% 81.8% 81.3% (% Cu) 83.3% 0.0% 80.7% 79.8% 83.5% 83.3% 84.3% 87.6% 80.8%
Metallurgical Recovery (Payable) (% Au) 89.9% 0.0% 85.6% 90.1% 90.5% 90.5% 90.3% 90.4% 90.3% (% Ag) 81.3% 0.0% 81.8% 84.0% 81.5% 81.4% 80.5% 77.6% 81.1% (% Zn) 62.7% 0.0% 59.6% 64.3% 63.1% 63.3% 63.1% 61.7% 63.1% (% Cu) 76.0% 0.0% 73.5% 72.0% 76.2% 76.0% 76.9% 80.6% 73.7%
Payable Production (kg Au) 11,987 0 1,200 1,635 1,938 2,023 1,898 1,868 1,424 (kg Ag) 19,756 0 3,496 3,754 2,806 2,747 2,526 2,269 2,159 (t Zn) 45,455 0 4,915 7,229 6,705 6,936 7,164 6,910 5,596 (t Cu) 7,782 0 817 899 1,157 1,145 1,218 1,590 956
Concentrate Production Copper (t) 48,644 0 5,110 5,619 7,227 7,160 7,616 9,937 5,974Zinc (t) 103,299 0 11,168 16,430 15,227 15,758 16,289 15,706 12,721Precious Metals - on Mine Gold (koz) 256 0 25 35 41 43 41 40 30Silver (koz) 250 0 44 46 35 35 32 30 27Operating Expenditures (US$/t) 34 0 34 34 34 34 34 34 34
7.6 Tailings Storage Facilities The TSF is situated approximately 1.2km north-west of the Al Amar Plant and occupies an area of some 0.7km2. The TSF is a terraced hill slope depository and each lift will be retained behind a compacted embankment. The final tailings are dewatered to 20% moisture to form a filter cake which is then trucked to the TSF. The LoMp requires storage of some 1.2Mt of material which does not exceed the design capacity as included in the feasibility study.
7.7 Engineering Infrastructure, Overheads and Capital Expenditure
7.7.1 Access, Power, Water and Engineering Infrastructure Road access to Al Amar is along a combination of national (205km – west from Riyadh to Quai along highway 40) and local (18km – south from Quai past the village of Al’Amar) roads, a total travelled distance of 223km from Riyadh. The village of Al’Amar and its surrounding area has a population of 1,500.
Power supply to the operation is by diesel generators and all water is provided from three wells in the Wadi As Sirdah located some 9km and 20km distant from the mine site.
7.7.2 Overhead Operating Expenditure Table 7.7 presents the forecast LoMp overhead performance statistics for Al Amar where all statistics are derived from the feasibility study. By comparison the projected overheads at US$4.5m per annum are some 20% higher than that currently experienced at Mahd Ad’Dahab.
Table 7.7 Al Amar: LoMp overhead operating statistics Operating Statistics (Units) LoMp 2007H2 2008 2009 2010 2011 2012 2013 2014Tonnage (kt) 1,350 0 155 201 200 201 201 199 194Operating Expenditures (US$/t) 23 0 29 22 22 22 22 22 22
(US$m) 31.18 0.00 4.47 4.47 4.47 4.47 4.47 4.47 4.34
7.7.3 Capital Expenditure Table 7.8 presents the forecast capital expenditure for Al Amar which amounts to US$19.4m over the LoMp. This solely comprises sustaining capital and no expansion capital is planned for depletion of the Ore Reserve. The sustaining capital is based on a provision of 2% of historical capital expenditure to 30 June 2007 and also includes the forecast capital mining

SRK Consulting Ma'aden Gold MER – Main Report
U3330_Ma'aden MER.doc November, 2007 Page 116
sustaining schedules as included in the feasibility study.
Table 7.8 Al Amar: LoMp capital expenditure statistics Operating Statistics (Units) LoMp 2007H2 2008 2009 2010 2011 2012 2013 2014Capital Expenditure (US$m) 19.39 2.68 5.99 2.46 2.41 2.57 2.45 0.57 0.28Project (US$m) 0.00 0.00 0.00 0.00 0.00 0.00 0.00 0.00 0.00Sustaining (US$m) 19.39 2.68 5.99 2.46 2.41 2.57 2.45 0.57 0.28
7.8 Human Resources Table 7.9 presents the forecast TEC and productivities for Al Amar. The forecasts are presented in respect of tonnage productivities (tonnes per TEC per month) and gold production productivities (grams of gold equivalent per TEC per month). The tonnage throughput is higher than at Mahd Ad’Dahab and in addition the manpower compliment is significantly less, which results in a 50% higher productivity. Whilst SRK expects that the new facility should have improved efficiencies, SRK does however consider this to remain a risk.
Table 7.9 Al Amar: historical and forecast human resources statistics Operating Statistics (Units) LoMp 2008 2009 2010 2011 2012 2013 2014TEC Mine (No) 58 58 65 65 65 65 58 58Mill (No) 57 61 61 61 61 61 61 61Administration (No) 48 51 51 51 51 51 51 51Total (No) 162 170 177 177 177 177 170 170Productivity Tonnage (t/TEC/month) 93 76 95 94 95 94 98 98Gold Equivalent (g/TEC/month) 1,294 1,093 1,385 1,424 1,363 1,318 1,379 1,077
7.9 Environmental
7.9.1 Environmental Setting The mine site is on the outcrop of a north-south trending range of low hills of volcanic strata. The crests of the volcanic hills reach up to 1,000m amsl, about 100m above the base level of the wadis. The site is drained principally by two sha'ibs (small dry waterways): Sha'ib Umm Qayah and Sha'ib Al Amar. These flow westwards into Wadi as Sirdah, which drains southwards and ends in desert sands about 90km south of the mine.
There are a number of settlements in the region of the mine. The villages of Al Amar, Umm ad Daba and Batda Nathil are 1km, 3km and 5km from the mine respectively. There are several hundred residents in the former and latter villages. None of the above-mentioned villages are in the same catchment as the mine. The small village of Al Fahia/Al Jarwiyah is about 10km downstream of the mine on Wadi as Sirdah.
Most water in the environment of the mine occurs as subsurface flow in wadis and in secondary aquifers in structures below some of the wadis. Wells are generally excavated in wadi alluvium and into the top of the bedrock, to depths of up to 40m. There are numerous wells in all of the identified villages in the region of the mine. The water from the wells is mainly used for agriculture.
The ore and waste rock have strong potential for acid generation.
Public consultation was undertaken in 1999, as part of an environmental baseline study for Al Amar, and in January 2005, as part of the EIA. Issues raised by interested and affected parties (“IAPs”) pertained to: employment opportunities; potential impacts on the availability of water to surrounding communities; structural damage to buildings caused by blasting and dust.
7.9.2 Compliance Al Amar has an EIA report generated by external consultants, which includes a review of closure issues and actions and a preliminary closure cost estimate. Notwithstanding this, Al

SRK Consulting Ma'aden Gold MER – Main Report
U3330_Ma'aden MER.doc November, 2007 Page 117
Amar does not have all of the documents required in terms of legislation on environmental management by mines in Saudi Arabia. Accordingly Al Amar is operating within the five-year grace period for existing projects to achieve compliance with the Public Environmental Law and the Implementing Regulations, which ends in September 2008. Furthermore the legal status of the EIA is unknown, both in respect of submission to the MEPA for review and approval, and whether official conditions of approval were issued.
7.9.3 Environmental Management The Company’s Health, Safety and Environmental Policy commits to the establishment of a health, safety and environmental management system. To this end, the Company has designed EMS and OHSS manuals and intends to introduce these to Ma’aden Gold in the second half of 2007.
7.9.4 Key Environmental Issues Key areas which require specific attention are as follows:
• Water Supply: Specifically the decrease in availability of water to surrounding water users. The EIA for the mine states that mining at Al Amar is not expected to impact on water resources in surrounding villages because it is not in the same catchment as these villages and the strata within which mining occurs is not sufficiently permeable to transmit any groundwater impacts to these villages;
• Potential Water Pollution: The spread of polluted water on the mine site is expected to be restricted by the arid climate, but if polluted water gets into the wadi sediments it can migrate quickly. There are no major pollution-plume driving forces on the mine site. The tailings dam is lined and tailings are deposited as a dry ‘cake’ at approximately 20% moisture content;
• Dust impacts and damage caused by vibrations: People living in settlements near to the mine site have expressed concern that they could be affected by dust from the mine and vibrations from blasting. Whilst this risk may be limited in impact, continued monitoring will be necessary in order to monitor and effect any remedial measures; and
• Lack of environmental monitoring data: Notwithstanding the production build-up phase environmental monitoring by the mine to date is insufficient to demonstrate compliance with relevant environmental standards and to demonstrate certainty about the adequacy of environmental management measures to be applied.
7.9.5 Environmental Liabilities The current closure cost estimate for Al Amar is forecast at US$4.1m comprising US$2.0m for bio-physical closure and US$2.1m for TBL. These estimates are largely based on the original derivation by external consultants and have been adjusted to account for inflation from the date of estimation.
Table 7.10 Al Amar: environmental (biophysical and social) liabilities Environmental Liability Units AmountBio-physical Closure (US$m) 2.0Civil Demolition (US$m) 1.8Operation and Maintenance (US$m) 0.1PP&E Decommissioning (US$m) 0.0Management (US$m) 0.0Tailings Storage Facility (US$m) 0.1Post-closure monitoring (US$m) 0.0Design and Management (US$m) 0.0Contingency (US$m) 0.0Terminal Benefits (US$m) 2.1Total (US$m) 4.1

SRK Consulting Ma'aden Gold MER – Main Report
U3330_Ma'aden MER.doc November, 2007 Page 118
SRK notes that the above closure cost estimates due to a combination of uncertainty of occurrence and the absence of detailed information upon which to determine estimates, do not take account of the possible sale value of plant, equipment and infrastructure, or of the value of saleable commodities which may be recovered during site clearance.
7.10 Commodity Sales Table 7.11 presents the commodity sales forecasts for Al Amar for the LoMp. Similar comments apply in this regard to that previously stated in section 6.10.
Table 7.11 Al Amar: concentrate and commodity sales Product Charges Units LoMp 2007H2 2008 2009 2010 2011 2012 2013 2014Copper Concentrates Tonnage (t) 48,644 0 5,110 5,619 7,227 7,160 7,616 9,937 5,974Payable Copper (t Cu) 7,782 0 817 899 1,157 1,145 1,218 1,590 956Transportation (US$/t) 14 0 14 14 14 14 14 14 14Product Charges (US$/t) 226 0 236 239 236 222 220 217 220
(USc/lb) 64 0 67 68 67 63 62 61 62NSR (US$/t) 441 0 857 685 493 320 316 308 314Zinc Concentrates Tonnage (t) 103,299 0 11,168 16,430 15,227 15,758 16,289 15,706 12,721Payable Zinc (t Zn) 8,264 0 893 1,314 1,218 1,261 1,303 1,257 1,018Transportation (US$/t) 16 0 16 16 16 16 16 16 16Product Charges (US$/t) 329 0 551 434 345 256 256 256 256
(USc/lb) 187 0 312 246 196 145 145 145 145NSR (US$/t) 530 0 903 702 555 409 408 409 409Precious Metals Dore Produced (koz) 562 0 77 90 85 86 81 78 64
(US$/oz) 0.75 0.00 0.75 0.75 0.75 0.75 0.75 0.75 0.75
7.11 Risks and Opportunities The principal on-mine risks at Al Amar are:
• Mineral Resource and Ore Reserve Management: Ma’aden Gold has not updated the Mineral Resource and Ore Reserve statements as originally included in the feasibility study. Since completion of this process additional data has been collected and commodity prices, operating expenditures and offtake-agreements have increased significantly. Furthermore, SRK considers that the following aspects require further analysis:
− Wireframing of the HWV and FWV with the intention of smoothing the ore envelopes between sections,
− Assessing the potential impact of increased dilution due to the requirement for 4m wide development ends as opposed to 3m;
• Metallurgical Performance: The feasibility study highlights certain concerns in respect of the representivity of the bulk samples and variability of test results. Whilst this remains a risk, early indication of any negative impact should be available given the current build-up to full production. Furthermore, it appears that processing operating expenditures are some 17% lower than at Mahd Ad’Dahab and accordingly given the general flowsheet similarities there remains some risk in this regard; and
• Environmental Management and Liabilities: Given the current regulatory deadlines (2008) in respect of conversion to the new licence arrangements, there is a pressing need to ensure demonstrable progress in completing the necessary documentation. Coupled with the implementation of the EMS as intended these represent an opportunity to commence addressing the potential risks associated with the following:
− Water abstraction assessments, − Potential impact of ARD as well as the spread of polluted water, − The lack of a formalised process for collection of environmental monitoring data.
The principal on-mine opportunities at Al Amar are:

SRK Consulting Ma'aden Gold MER – Main Report
U3330_Ma'aden MER.doc November, 2007 Page 119
• Mineral Resource Potential following completion of successful exploration in the regional licence area, and the depth and strike extensions of currently delineated orebodies; and
• Ore Reserve Potential following upgrading of the currently defined Inferred Mineral Resources in both the vein and the stockwork zones.


SRK Consulting Ma'aden Gold MER – Main Report
U3330_Ma'aden MER.doc November, 2007 Page 124
8 BULGAH
8.1 Introduction The following section includes discussion and comment on the following technical aspects: geology; Mineral Resources and Ore Reserves; mining; metallurgical processing; tailings storage facilities; infrastructure, overheads and capital expenditure; human resources; and environmental. Where appropriate historical and forecast tables are also presented to support the assumptions as included in the LoMps. Bulghah currently mines both oxide and fresh ore, higher grade components of which are transported for processing at Sukhaybarat situated some 75km distant.
SRK notes however, that the current LoMp is largely based on a study undertaken by external consultants in 2005, combined with a review of historical performance and depletion to 30 June 2007 and the current process capacities. In this process, SRK has reviewed the information provided by Ma’aden Gold which primarily relates to a one year operating budget as well as its view of the Mineral Resource and Ore Reserve statements as at 30 June 2007. In the absence of a detailed and updated LoMp the forecasts as provided herein have been developed based on the information available. Given the risks associated with increased reliance on fresh ore with lower metallurgical recoveries than previously experienced there remains an elevated level of risk in respect of the Ore Reserve statement for Bulghah.
8.2 Geology The Bulghah deposit lies within Pre-Cambrian rocks of the Arabian Shield, located in the western part of the Arabian Peninsula. Gold mineralisation is predominantly hosted by mesothermal gold veins, often associated with a 680Ma to 640Ma orogeny that amalgamated various terranes into the Arabian Shield. Gold is also associated with a 615Ma phase of diorite-granodiorite magmatism in the north-eastern Shield, and post 640Ma strike-slip faulting in the Najd fault system.
Gold mineralisation at Bulghah is hosted by a tonalite/diorite intrusion, which strikes roughly north-south. The tonalite/diorite intrusion is fault/shear bounded on the east and west sides, with the contacts dipping roughly 60° towards the east. The intrusion ranges from 200m to 500m wide, narrowing towards the south, and extends to the north and south for approximately 1,000m with a depth of about 450m. The intrusion is bounded to the east by meta-volcanics, primarily andesite, and by meta-sediments to the west. The meta-sediments include a distinct marble unit. The intrusion grades from tonalite to diorite in the southeast and northern parts of the project area. The diorite has a coarser texture, with hornblende and plagioclase phenocrysts in a light coloured matrix. The intrusion is cross-cut by numerous aplite dykes, which are sub-horizontal, and frequently have irregular geometries. The aplite dykes also occur on or near the contacts between the country rock and the intrusion.
The area is also structurally complex, with three phases of deformation identified in the area. The first phase was east-west extension, resulting in north-south trending, steep to moderate cataclastic faults, which are thought to have acted as the conduits for mineralising fluids. This was followed by an east-west compressional tectonic event, resulting in north-south trending thrust faults that resulted in displacement of mineralisation by shallow dipping north-south striking thrust faults. The final phase was the development of east-west striking faults, which, cross-cut the gold mineralisation and displace it laterally. The intrusion is thought to have been emplaced during the first stage of deformation. Gold mineralisation occurs along the contact faults, and into the footwall and hangingwall rocks. The thrust faults have been mapped in the pit and appear to offset the mineralisation.

SRK Consulting Ma'aden Gold MER – Main Report
U3330_Ma'aden MER.doc November, 2007 Page 125
Gold mineralisation is structurally complex, associated with fault zones, micro-fractures, quartz (± carbonate) veinlets and with haematite alteration. In general, mineralisation occurs predominately as an intrusive body along quartz filled fractures zones, shears, and joints and is associated with north-south striking and steeply dipping faults. Sulphide minerals associated with the gold mineralisation include arsenopyrite, pyrite (± minor pyrhotite), chalcopyrite, sphalerite and other trace sulphides. There is a close association between gold and arsenic, with visible gold often occurring with arsenopyrite. Fine disseminated pyrite occurs throughout the area, and is not necessarily associated with gold mineralisation. There is some quartz veining in the area, but these are considered to be of limited continuity, and are rarely associated with the gold mineralisation.
Mineralisation is subdivided into oxide and sulphide ore. Supergene mineralisation extends from surface to 30m to 35m below surface. Mineralisation is associated with iron oxides, primarily limonite and minor hematite. Sulphide mineralisation occurs just below the “redox” boundary at depths of 24m or greater. A transition zone of about 5m occurs between the base of oxide mineralisation and sulphide mineralisation. Microprobe and microscopic studies indicate that gold is associated with borders and fractures within arsenopyrite grains. Gold mineralisation is associated to a lesser extent with quartz and calcite and rarely with pyrite. In the supergene zone gold is associated with hematite after sulphides. Quartz veinlets and hematite staining are generally indicators of high grade mineralisation and the presence of pyrhotite is also noted in some portions of the pit.
Hydrothermal alteration of the intrusive follows structural preparation related to the first phase of north-south striking cataclastic zones, and related fractures and veins. The unfractured tonalite is generally unaltered. The fractured tonalite grades from weak propyllitic to phyllic alteration destroying the rock fabric. Silicification and feldspathisation are associated with veining and correlate with sulphide intensity. Calcite veinlets and stringers are associated with low and high grade mineralisation.
Mafic dykes less than 1m in width intrude the mine area. These dykes are unmineralised and are not believed to affect the tenor of mineralisation. Larger (aplitic) dykes consisting of andesite porphyry and quartz porphyry have been noted with maximum widths or 4m.
High grade gold mineralisation is associated with structures with a strike of 025° and 030° with dips of 75° southeast and 45° to 75° southwest.
In summary, the geology and major controls on the mineralisation appear to be well understood, aiding the ability to model the deposit effectively and appropriately.
8.3 Mineral Resources and Ore Reserves Mineral Resource estimation at Al Amar has been undertaken using computerised 3D modelling techniques by external consultants (September 2005) as was the derivation of Ore Reserves. SRK’s comments below are based on the estimate reported as of this date (September 2005) which has inter alia been subsequently adjusted by SRK in respect of depletion and modifying factors.
8.3.1 Quality and quantity of data The deposit is documented to have been explored using 829 drillholes totalling some 79,900m, and comprising of 67 diamond cored holes and 762 RC holes. The drilling has been completed predominantly on a 50m by 50m grid spacing within the open-pit area, with significant key areas in-filled on a 25m by 25m grid and several small areas on a 12.5m by 12.5m grid. The bulk of the drilling was completed prior to 1998.

SRK Consulting Ma'aden Gold MER – Main Report
U3330_Ma'aden MER.doc November, 2007 Page 126
In addition to the exploration drilling described above there is a comprehensively drilled grade control database for blasthole sampling with bench composite grades. Notwithstanding the above SRK notes the concerns highlighted in respect of the drilling methodology with particular emphasis on the application of wet RC drilling and lack of downhole survey information. Furthermore whilst electronic topographic survey data was provided including surveys up to the end of August 2007, the surveying methodology is not described.
The drillhole data is stored in a database system with separate files for exploration boreholes and grade control drillholes. The estimate was supported by validation of the electronic database against core photos, logs and available hard-copy information.
A small twinned drilling programme was undertaken in order to compare diamond verses RC drilling which concluded that the RC holes displayed longer and higher grade intercepts indicating bias. All boreholes have been logged and sampled using standard methodologies in an appropriate manner, with the exception of a few bad practices including splitting of core by chisel and not recording sample recovery. A comparison of the exploration drillhole data versus the grade control data indicated a relative bias between the data sets with the grade control data consistently higher grade.
All analysis was undertaken at the Sukhaybarat laboratory and this laboratory was used primarily to prepare and analyse samples using fire assay techniques. Different charges were used over time for the assay database, changing from 10g to 30g. This laboratory is not accredited by an internationally recognised body.
SRK notes that the QA/QC measures for the entire drilling and sampling programme are absent. No repeat, duplicate or standard data are recorded for the database used for the estimate. Notwithstanding this statement a series of QA/QC checks on the laboratory were conducted between 2004 and 2005 which appeared to give reasonable results.
No bulk density analysis was included as a routine basis in the drillhole database, with only a minor number of samples collected, however, being an operating mine the density values used should now be fairly well understood.
8.3.2 Geological modelling, grade and tonnage estimation Gold mineralisation at Bulghah is primarily hosted by the tonalite and diorite intrusive units and definition of the lithological domains were suitable for the grade estimation framework. Five lithological domains were generated to domain the estimation and 3D wireframe models created, these are:
• ZC10: covering a small amount of mineralisation hosted by the metasedimentary units to the west of the main tonalite intrusive;
• ZC20: the bulk of the mineralisation hosted by the tonalite;
• ZC30: mineralisation within the diorite;
• ZC40: mineralisation hosted by the metavolcanics to the east of the main tonalite intrusive; and
• ZC50: models the relatively barren aplite dykes within the tonalite and diorite units.
Three different oxidation states have also been modelled from the drillhole logging data with an oxidised, transitional and fresh domain being generated (Figure 8.2). The wireframe geological/mineralisation domains appear to reflect the different mineralisation domains evident within the deposit and exhibit good geological continuity through the deposit.
Following flagging of the sample data within the modelled domains, the samples are

SRK Consulting Ma'aden Gold MER – Main Report
U3330_Ma'aden MER.doc November, 2007 Page 127
composited to regular 2m intervals, honouring the geological boundaries for mineralisation and oxidation. The domains show skewed grade distributions for gold grade, with outliers that have been cut for the OK grade estimates. These cuts have been investigated through various histogram and probability plots in addition to de-clustering exercises and are considered appropriate. No grade cuts were applied for the Multiple Indicator Kriging (“MIK”) estimation. Appropriate Indicator thresholds for the MIK estimate were chosen using Q-Q analysis based on grade, metal content and cumulative metal content.
A 3-D block model has been created with a block size of 20m by 25m by 5m in order to enable grade estimation using OK and MIK. This model was coded with the various mineralisation domains and sub-blocking methodologies used to allow effective volume representation. The OK model (ZC10, ZC40 and ZC50) was estimated using the cut Au values, using a search from the centre of each block. The MIK model estimated the grade for the whole blocks, and then applied a post-processing support correction to indicate the level of selectivity that may exist within each of the parent blocks. The sub-cells tested were 10m by 12.5m by 5m, so half of the parent block. The resource model was subsequently validated using both visual and statistical methodologies.
For ZC10, ZC40, and ZC50, the whole block OK model was reported above a cut-off grade, whereas for the MIK model in ZC20 and ZC30, the smaller sub-cell model was interrogated above a cut-off. SRK has interrogated the whole block model, and re-reported the estimate based on the whole blocks. This has provided broadly similar figures to the sub-cell model. The sub-cells are relatively large compared to the parent cells, which is reflected in the slight differences between the two models.
8.3.3 Classification Classification of the Mineral Resources at Bulghah (Figure 8.3) is based on the development of broad wireframes which take into account the confidence in geology, domaining, data quality, drillhole density, spatial variability, and mining method. The wireframes were subdivided into those representing “moderate confidence” and “low confidence” categories. These wireframes were used to code the block model, and were used to report the “moderate confidence” as Indicated Mineral Resources and the “low confidence” as Inferred Mineral Resources.
Accordingly no blocks were classified as Measured Mineral Resources, with the main reasons being: the lack of QA/QC information and protocols; and the lack of detailed reconciliation analysis in fresh ore which supports the degree of mining selectivity as assumed in the 2005 estimate of Mineral Resources and Ore Reserves.
8.3.4 Selective Mining Units Mining practice at Bulghah is limited to the current blasthole drilling patterns and the current mining equipment. The current block model and the previously reported Mineral Resource and Ore Reserve statements assumed selective mining within the 20m by 25m by 5m blocks. Whilst mining practice to date may well support selective mining within these, the quality of reconciliation assessments to date is inadequate to confirm that such selectivity is attainable given the planned reduction in oxide ore and significant increase in fresh ore production.
8.3.5 Grade control and reconciliation The grade control assay data indicate a consistent positive bias over the exploration assay data of the order of 10%. However, reconciliation to date has focused on mine to mill

SRK Consulting Ma'aden Gold MER – Main Report
U3330_Ma'aden MER.doc November, 2007 Page 128
reconciliation separately for ore processed at Bulghah and Sukhaybarat. Records do not appear to distinguish between oxide, transitional or fresh ore, however analysis of the data collated from January 2005 through June 2007 indicates the following:
• Mill head grades at Sukhaybarat which are some 9% less than mine sampled grades; and
• Conveyor feed grades at Bulghah which are some 7% less than the mine sampled grades.
In addition to the above there would appear to be no detailed reconciliation undertaken between the exploration block model and the grade control model or between the grade control model and mining/processing results. The absence of such analysis both in total and for oxide and fresh material separately is problematic and accordingly no justifiable adjustment can be made to the current Mineral Resource statement.
8.3.6 Economic potential and Grade-Tonnage analysis Figure 8.1 presents a grade-tonnage curve for the current Mineral Resource at Bulghah. The in-situ cut-off grade reference points include:
• 0.5g/t Au Eq (-25% of the in-situ LoMp cut-off grade) for reporting of Mineral Resources (Table 8.1); and
• 0.6g/t Au Eq for reporting of Ore Reserves (Table 8.1).
Note that the tonnage, grade and content reported are derived from in-situ Mineral Resources and accordingly exclude the impact of any modifying factors to produce RoM equivalents. Figure 8.4 presents the block model gold grades.
Figure 8.1 Bulghah grade-tonnage curve(1), (2)
16.78Mt
23.89Mt
0.5g
/t A
u Eq 0.9g/t Au Eq
4.92Moz Au Eq
0.6g
/t A
u Eq
0.8g/t Au Eq
6.18Moz Eq Au
0.00
5.00
10.00
15.00
20.00
25.00
30.00
35.00
40.00
0.00
0.10
0.20
0.30
0.40
0.50
0.60
0.70
0.80
0.90
1.00
1.10
1.20
1.30
1.40
1.50
1.60
1.70
1.80
1.90
2.00
In-Situ COG (g/t Au Eq)
Tonn
age
(Mt)
0.00
0.50
1.00
1.50
2.00
2.50
3.00
3.50
4.00
4.50
5.00
5.50
6.00
6.50
7.00
7.50
8.00
0.00
0.10
0.20
0.30
0.40
0.50
0.60
0.70
0.80
0.90
1.00
1.10
1.20
1.30
1.40
1.50
1.60
1.70
1.80
1.90
2.00
Grade (g/t A
u, g/t Au Eq); C
ontent (Moz A
u, Moz A
u Eq)
Tonnage (Mt) Grade (g/t Au) Grade (g/t Au Eq) Content (Moz Au) Content (Moz Au Eq) ICOG-2P ICOG-3R (1) ICOG-2P: the in-situ cut-off-grade applied to the Mineral Resource base to determine the Measured and
Indicated Mineral Resources which are incorporated in the LoMp (2P – Proved and Probable Ore Reserves).
(2) ICOG-3R: the in-situ cut-off-grade applied to the Mineral Resource base to determine the Measured and Indicated Mineral Resources which are satisfies the requirement of “potentially economically mineable” (3R – Measured, Indicated and Inferred).
Table 8.1 presents the modifying factors applicable to ore processed at Bulghah (heap leach)

SRK Consulting Ma'aden Gold MER – Main Report
U3330_Ma'aden MER.doc November, 2007 Page 129
and Sukhaybarat (CIL) assuming a long term gold price of US$550/oz. As no specific distinction is applied in the block model for material to be processed at Sukhaybarat or Bulghah, SRK has assumed a single in situ cut-off grade of 0.5g/t Au for reporting Mineral Resources which is similar to that used for the statements reported in 2005. The current LoMp assumes reporting of Ore Reserves within pit design based on a optimised shell established using a gold price of US$380/oz (this being the basis of the study undertaken in 2005).
Table 8.1 Bulghah: modifying factors Statistics Units Heap Leach Ore CIL Ore Physical Factors Extraction Ratio (%) 100% 100% Dilution (%) 0% 0% Grade Factors (% Au) 100% 100% Payability (% Au) 62.0% 81.2% Financial Factors Mining (US$/t) 1.02 3.64 Processing (US$/t) 1.79 5.37 Overheads (US$/t) 0.52 3.40 Product Charges (US$/t) 0.01 0.01 Total (US$/t) 3.35 12.41 Commodity Prices Gold (US$/oz) 550 550 Cut-off Grades RoM (g/t Au Eq) 0.3 0.9 ICOG (g/t Au Eq) 0.3 0.9 Resource COG (g/t Au Eq) 0.5 0.5
8.3.7 Ore Reserve estimation The Ore Reserve estimation process at Bulghah is largely based on the technical studies undertaken in 2005 with appropriate modification for depletion to 30 June 2007 and other necessary adjustments. The ultimate pit design within which the Ore Reserves are reported is based on an optimised shell derived using a gold price of US$380/oz. The current LoMp is based on depletion of the remaining Ore Reserves reporting within the ultimate pit design and the current (30 June 2007) surface topography and accordingly allows for all necessary waste stripping and other engineering considerations.
Furthermore, SRK notes that the current Ore Reserve estimate assumes the processing of significant amounts of fresh ore both at Sukhaybarat and Bulghah. Metallurgical recoveries achieved to date predominantly reflect the processing of oxide ore and only limited transitional and fresh ore has occurred to date. Whilst the recoveries assumed may be considered conservative, they remain unsubstantiated and inherently carry some risk.
Given the prevailing commodity prices and the issues highlighted above, SRK considers that further analysis is required to address the following: grade control and reconciliation; optimisation at current commodity prices; monitoring of metallurgical performance specifically in respect of increased contribution of fresh ore; and establishment of a current LoMp.
8.3.8 Mineral Resource and Ore Reserve statements Table 8.2 and Table 8.3 present the Mineral Resource and Ore Reserve statements (1 July 2007) where: Table 8.2 presents the summary statement including gold and gold equivalent grades; and Table 8.3 presents the Ore Reserve sensitivities presented at a range of commodity prices. The suffix (1) and (2) respectively in Table 8.2 represent those Mineral Resources used as a base for modification to determine Ore Reserves and those Mineral Resources which have not been used as a base for modification to determine Ore Reserves. The following nomenclature also applies: o/p – open-pit; and s/f – surface stockpiles.

SRK Consulting Ma'aden Gold MER – Main Report
U3330_Ma'aden MER.doc November, 2007 Page 130
Table 8.2 Bulghah: Mineral Resource and Ore Reserves statement (1 July 2007) Ore Reserves Tonnage Grade Content Mineral Resources Tonnage Grade Content (kt) (g/t Au) (g/t Au Eq) (koz Au) (koz Au Eq) (kt) (g/t Au) (g/t Au Eq) (koz Au) (koz Au Eq)Proved Measured o/p(1) 0 0.0 0.0 0 0 o/p(1) 0 0.0 0.0 0 0Subtotal 0 0.0 0.0 0 0 Subtotal 0 0.0 0.0 0 0Probable Indicated o/p(1) 16,694 0.8 0.8 427 427 o/p(1) 21,463 0.8 0.8 560 560s/f(1) 74 0.3 0.3 1 1 s/f(1) 74 0.3 0.3 1 1Subtotal 16,768 0.8 0.8 428 428 Subtotal 21,537 0.8 0.8 561 561Ore Reserves Measured + indicated o/p(1) 16,694 0.8 0.8 427 427 o/p(1) 21,463 0.8 0.8 560 560s/f(1) 74 0.3 0.3 1 1 s/f(1) 74 0.3 0.3 1 1Total Ore Reserves 16,768 0.8 0.8 428 428 Total 21,537 0.8 0.8 561 561
Inferred o/p(2) 2,431 0.7 0.7 56 56 Subtotal 2,431 0.7 0.7 56 56 Mineral Resources o/p(1) 21,463 0.8 0.8 560 560 o/p(2) 2,431 0.7 0.7 56 56 s/f(1) 74 0.3 0.3 1 1 Total 23,968 0.8 0.8 617 617
Table 8.3 Bulghah: Ore Reserve sensitivity (1 July 2007)(1), (2)
Commodity Prices Gold (US$/oz) 350 450 550 650 750Silver (US$/oz) 5.00 7.00 9.00 11.00 13.00Zinc (USc/lb) 45 55 65 110 165Copper (USc/lb) 100 120 140 240 380Lead (USc/lb) 30 40 0 100 175
Ore Reserves Sensitivity Tonnage (kt) 7,186 10,045 16,694 17,075 26,183Grade (g/t Au) 1.2 1.1 0.8 0.7 0.7Grade (g/t Au Eq) 1.2 1.1 0.8 0.7 0.7Content (koz Au) 270 341 427 408 626Content (koz Au Eq) 270 341 427 408 626
(1) Ore Reserve sensitivity excludes stockpiled material as at 1 July 2007. (2) Ore Reserve sensitivity is based on querying the block model without the benefit of optimised shells generated at the
various commodity prices.
8.3.9 Mineral Resource and Ore Reserve potential Mineral Resource potential at Bulghah is largely focused on local exploration, specifically Bulghah North and the regional exploration at Nurqah, Jardawiyah and Humaymah situated within 50km of the mine site.
Ore Reserve potential is largely dependent on re-optimisation using current long term commodity prices as well as the upgrading of Inferred Mineral Resources through infill drilling. Based on currently reported Inferred Mineral Resources this is likely to add only some 0.5 years of production.
8.4 Mining Engineering Mining operations at Bulghah comprise open-pit mining with the current Ore Reserves depleted by 2010.
8.4.1 Mining Access and Mining Method Mine access to the open-pits is via a single haul road developed to each of the four pits with pit No.1 extending from surface to 830m amsl, some 120m below surface. The open-pits are designed with the following parameters: 18m wide ramps at a gradient of 10% and overall slope angles ranging from 32° to 52°. Final slopes are geotechnically domained and include batter angles ranging from 45° to 75°, berm widths from 10m to 20m and face heights from 15m to 20m. All cut-backs and pit base widths are established at a minimum of 30m.
Mining methods comprise standard drill-blast-load-truck with a total material moved capacity of 5.6Mtpa. Mining occurs by drilling and blasting 5m high benches with 102mm blast holes. Loaders with 5.6m3 bucket capacities load blasted ore and waste into 41t rear-dump haul

SRK Consulting Ma'aden Gold MER – Main Report
U3330_Ma'aden MER.doc November, 2007 Page 131
trucks. Additional service equipment comprise graders, tracked dozers, water trucks and general service vehicles.
8.4.2 Historical and short term mining operating statistics Table 8.4 presents the historical and short term mining operating statistics for Bulghah. Total tonnage mined has remained relatively constant at 5.6Mt (2007H1 annualised) however operating expenditures have reduced to some US$1.02/t moved. Overall mined grades have declined from 1.0g/t Au to 0.8g/t Au resulting from both reductions in grade in heap leach ore as well as CIL ore.
Table 8.4 Bulghah: historical and short term mining operating statistics Operating Statistics (Units) 2004 2005 2006 2007H1 2007H2 2008Tonnage (kt) 4,833 3,804 4,194 2,019 2,393 5,348Heap Leach Ore (kt) 4,338 3,412 3,668 1,678 1,632 3,841CIL Ore (kt) 495 392 526 341 761 1,507Grade (g/t Au) 1.3 1.0 0.8 0.8 0.9 0.9Heap Leach Ore (g/t Au) 1.0 0.9 0.7 0.6 0.8 0.8CIL Ore (g/t Au) 3.6 2.6 1.9 1.4 1.3 1.1Waste mined (kt) 863 739 1,462 840 433 304Total Mined (kt) 5,696 4,543 5,656 2,859 2,826 5,652Stripping Ratio (twaste:tore) 0.2 0.2 0.3 0.4 0.2 0.1Operating Expenditures (US$/t) 1.24 1.37 1.11 1.02 1.02 1.02
8.4.3 Mining LoMp Table 8.5 presents the forecast LoMp mining operating statistics for Bulghah. The production forecast however is not fully supported by detailed schedules beyond 2007 and is largely based on the mining fleet capacity, the processing capacity of both plants and the total tonnages of ore and waste contained within the ultimate pit design. Detailed re-scheduling of both waste and ore has not been undertaken and accordingly all grades presented are averaged for the particular material type. Accordingly there remains a risk that the current LoMp as forecast may not be practically achievable given the distribution of ore types and waste within the final design pit.
In the absence of any detailed planning SRK has constrained the production forecast to the current (2007H1) mining fleet production rate as well as the operating expenditure achieved for 2007H1. The mined ore includes marginal ore grade material and SRK has also assumed that this is also processed. The latter assumption is primarily the reason for the reduction in the grade of the CIL ore to be processed at Sukhaybarat.
Table 8.5 Bulghah: LoMp mining operating statistics Operating Statistics (Units) LoMp 2007H2 2008 2009 2010Tonnage (kt) 16,694 2,393 5,348 4,690 4,263Heap Leach Ore (kt) 12,702 1,632 3,841 3,787 3,442CIL Ore (kt) 3,992 761 1,507 903 821Grade (g/t Au) 0.8 0.9 0.9 0.7 0.7Heap Leach Ore (g/t Au) 0.8 0.8 0.8 0.8 0.8CIL Ore (g/t Au) 0.9 1.3 1.1 0.5 0.5Waste mined (kt) 2,996 433 304 963 1,297Total Mined (kt) 19,690 2,826 5,652 5,652 5,560Stripping Ratio (twaste:tore) 0.2 0.2 0.1 0.2 0.3Operating Expenditures (US$/t) 1.02 1.02 1.02 1.02 1.02
8.5 Metallurgical Processing The Bulghah Plant (Figure 8.5) processes ore mined from the open-pit operation. The process has a rated capacity of 4.5Mtpa and comprises a crushing circuit, a lined HLP, collection pond and an adsorption circuit. Loaded carbon is trucked to the Sukhaybarat Plant for stripping and gold refining. Eluted carbon is reclaimed for re-use. Higher grade ore from the open-pit is trucked directly to Sukhaybarat for processing using CIL process at a rate of 0.6Mtpa.
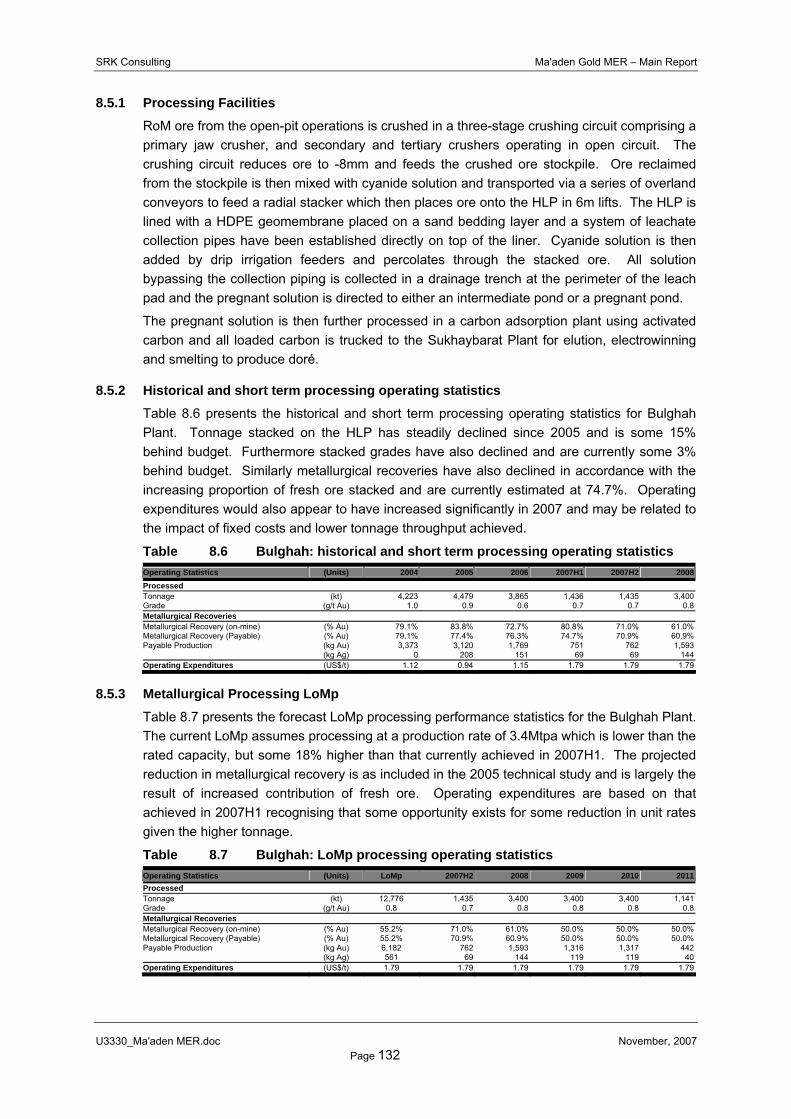
SRK Consulting Ma'aden Gold MER – Main Report
U3330_Ma'aden MER.doc November, 2007 Page 132
8.5.1 Processing Facilities RoM ore from the open-pit operations is crushed in a three-stage crushing circuit comprising a primary jaw crusher, and secondary and tertiary crushers operating in open circuit. The crushing circuit reduces ore to -8mm and feeds the crushed ore stockpile. Ore reclaimed from the stockpile is then mixed with cyanide solution and transported via a series of overland conveyors to feed a radial stacker which then places ore onto the HLP in 6m lifts. The HLP is lined with a HDPE geomembrane placed on a sand bedding layer and a system of leachate collection pipes have been established directly on top of the liner. Cyanide solution is then added by drip irrigation feeders and percolates through the stacked ore. All solution bypassing the collection piping is collected in a drainage trench at the perimeter of the leach pad and the pregnant solution is directed to either an intermediate pond or a pregnant pond.
The pregnant solution is then further processed in a carbon adsorption plant using activated carbon and all loaded carbon is trucked to the Sukhaybarat Plant for elution, electrowinning and smelting to produce doré.
8.5.2 Historical and short term processing operating statistics Table 8.6 presents the historical and short term processing operating statistics for Bulghah Plant. Tonnage stacked on the HLP has steadily declined since 2005 and is some 15% behind budget. Furthermore stacked grades have also declined and are currently some 3% behind budget. Similarly metallurgical recoveries have also declined in accordance with the increasing proportion of fresh ore stacked and are currently estimated at 74.7%. Operating expenditures would also appear to have increased significantly in 2007 and may be related to the impact of fixed costs and lower tonnage throughput achieved.
Table 8.6 Bulghah: historical and short term processing operating statistics
Operating Statistics (Units) 2004 2005 2006 2007H1 2007H2 2008Processed Tonnage (kt) 4,223 4,479 3,865 1,436 1,435 3,400Grade (g/t Au) 1.0 0.9 0.6 0.7 0.7 0.8Metallurgical Recoveries Metallurgical Recovery (on-mine) (% Au) 79.1% 83.8% 72.7% 80.8% 71.0% 61.0%Metallurgical Recovery (Payable) (% Au) 79.1% 77.4% 76.3% 74.7% 70.9% 60.9%Payable Production (kg Au) 3,373 3,120 1,769 751 762 1,593
(kg Ag) 0 208 151 69 69 144Operating Expenditures (US$/t) 1.12 0.94 1.15 1.79 1.79 1.79
8.5.3 Metallurgical Processing LoMp Table 8.7 presents the forecast LoMp processing performance statistics for the Bulghah Plant. The current LoMp assumes processing at a production rate of 3.4Mtpa which is lower than the rated capacity, but some 18% higher than that currently achieved in 2007H1. The projected reduction in metallurgical recovery is as included in the 2005 technical study and is largely the result of increased contribution of fresh ore. Operating expenditures are based on that achieved in 2007H1 recognising that some opportunity exists for some reduction in unit rates given the higher tonnage.
Table 8.7 Bulghah: LoMp processing operating statistics Operating Statistics (Units) LoMp 2007H2 2008 2009 2010 2011Processed Tonnage (kt) 12,776 1,435 3,400 3,400 3,400 1,141Grade (g/t Au) 0.8 0.7 0.8 0.8 0.8 0.8Metallurgical Recoveries Metallurgical Recovery (on-mine) (% Au) 55.2% 71.0% 61.0% 50.0% 50.0% 50.0%Metallurgical Recovery (Payable) (% Au) 55.2% 70.9% 60.9% 50.0% 50.0% 50.0%Payable Production (kg Au) 6,182 762 1,593 1,316 1,317 442
(kg Ag) 561 69 144 119 119 40Operating Expenditures (US$/t) 1.79 1.79 1.79 1.79 1.79 1.79

SRK Consulting Ma'aden Gold MER – Main Report
U3330_Ma'aden MER.doc November, 2007 Page 133
8.6 Engineering Infrastructure, Overheads and Capital Expenditure
8.6.1 Access, Power, Water and Engineering Infrastructure Road access to Bulghah is along a combination of national (258km – northwest from Medina to Hanakiyah along highway 60) and local (97km – south towards the village of Bilghah) roads, a total travelled distance of 345km from Medina. The village of Bilghah is located 5km to the south of the Exploitation Licence.
The power supply system on site comprises five installed diesel engine and generator sets complete with switchgear. The sets are mounted in weatherproof housing and controlled/ monitored by a common control system.
The mine obtains process water from well fields in Wadi Ghayhab and Wadi Raghwah. The mining and mineral processing operations require water at the average rate of 58m3/h. The process water pumped to site is highly saline and requires treatment with lime to remove dissolved magnesium salts prior to its use in processing.
8.6.2 Overhead Operating Expenditure Table 8.8 presents the historical and short term overhead operating expenditures for Bulghah. The total quantum of expenditures has reduced since 2004 and is currently forecasted at some US$1.74m per annum.
Table 8.8 Bulghah: historical and forecast overhead operating statistics Operating Statistics (Units) 2004 2005 2006 2007H1 2007H2 2008Tonnage (kt) 4,223 4,479 3,865 1,436 1,435 3,400Operating Expenditures (US$/t) 0.50 0.42 0.50 0.61 0.61 0.51
(US$m) 2.11 1.87 1.94 0.87 0.87 1.74
Table 8.9 presents the forecast LoMp overhead operating expenditure for Bulghah where all expenditures are aligned with historical performance.
Table 8.9 Bulghah: LoMp overhead operating statistics Operating Statistics (Units) LoMp 2007H2 2008 2009 2010 2011Tonnage (kt) 12,776 1,435 3,400 3,400 3,400 1,141Operating Expenditures (US$/t) 0.52 0.61 0.51 0.51 0.51 0.51
(US$m) 6.69 0.87 1.74 1.74 1.74 0.59
8.6.3 Capital Expenditure Table 8.10 presents the forecast capital expenditure for Bulghah which amounts to US$3.44m over the LoMp. This solely comprises sustaining capital and no expansion capital is planned for depletion of the Ore Reserve. The sustaining capital is based on a provision of 15% of on-mine process operating expenditures.
Table 8.10 Bulghah: LoMp capital expenditure statistics Operating Statistics (Units) LoMp 2007H2 2008 2009 2010 2011 2012Capital Expenditure (US$m) 3.44 0.39 0.92 0.92 0.92 0.31 0.00Project (US$m) 0.00 0.00 0.00 0.00 0.00 0.00 0.00Sustaining (US$m) 3.44 0.39 0.92 0.92 0.92 0.31 0.00
8.7 Human Resources Table 8.11 presents the historical and forecast TEC and productivities for Bulghah. The forecasts largely reflect historical (2007H1) performance in respect of tonnage productivities (tonnes per TEC per month) and gold production productivities (grams of gold equivalent per TEC per month).

SRK Consulting Ma'aden Gold MER – Main Report
U3330_Ma'aden MER.doc November, 2007 Page 134
Table 8.11 Bulghah: historical and forecast human resources statistics Operating Statistics (Units) LoMp 2004 2005 2006 2007H1 2007H2 2008TEC Mine (No) 29 60 30 26 29 29 29Mill (No) 51 53 53 51 51 51 51Administration (No) 26 14 14 21 26 26 26Total (No) 106 127 97 98 106 106 106Productivity Tonnage (t/TEC/month) 2,619 2,771 3,848 3,287 2,258 2,256 2,673Gold Equivalent (g/TEC/month) 1,115 2,213 2,685 1,508 1,185 1,200 1,255
8.8 Environmental
8.8.1 Environmental Setting Bulghah Mine is located in the catchment of Wadi Mabuj, which drains into Wadi Sahuq in the basin of Wadi al Rimah. The mine is remote from human settlements, except for Bulghah village which is about 5km south and upstream of the mine. There are no obvious users of water from Wadi Mabuj for several kilometres downstream of the mine.
The mine obtains process water upstream of the mine site from well fields in Wadi Ghayhab and Wadi Raghwah, which are tributaries of Wadi Mabuj upstream of the mine site. Drinking water is supplied to the mine from the Bulghah Village wells, which are in Wadi Mabuj, downstream of the well fields and upstream of the mine site.
Bulghah Village falls on one of the traditional camel routes used by the Bedouins for goat herding. The population of the village is about 350. A few of the village residents are employed by the mine, however many residents are engaged in activities servicing the mine, including the supply of drinking water and fuel to the mine.
8.8.2 Compliance An EIA report was recently (2007) completed for Bulghah and has been submitted to MEPA for review and approval. The EIA report includes a conceptual closure plan. When MEPA approves the EIA it will issue conditions of approval and the Company will sign consent to comply with these conditions.
Bulghah has not been operating entirely without an EIA. The application to obtain the mining lease (Exploitation Licence) for the mine included an environmental baseline study (2000) that was undertaken concurrently with the feasibility study for the mine. The environmental baseline study included a preliminary EIA and a brief closure plan.
Bulghah is not compliant with environmental law in that its environmental monitoring has been insubstantial to date. The mine does however intend to undertake detailed environmental monitoring as specified in the environmental management plan in the March 2007 EIA report.
8.8.3 Environmental Management The Company’s Health, Safety and Environmental Policy commits to the establishment of a health, safety and environmental management system. To this end the Company has designed EMS and OHSS manuals and intends to introduce these to Ma’aden Gold in the second half of 2007. The 2007 EIA for Bulghah also identifies elements of an EMS that are essential to the effective implementation of the environmental management plan.
8.8.4 Key Environmental Issues Key areas which require specific attention are as follows:
• Water supply: Specifically the decrease in availability of water to surrounding water users. The abstraction of process water from the well fields on Wadi Ghayhab and Wadi

SRK Consulting Ma'aden Gold MER – Main Report
U3330_Ma'aden MER.doc November, 2007 Page 135
Ragwah could influence the availability of water for abstraction from Wadi Mabuj at Bulghah Village. This requires careful monitoring as the rate of groundwater recharge is very low;
• Water pollution: The type of water pollution that could occur on the mine site is as follows: suspended solids; elevated salinity; elevated hardness; acid mine drainage; elevated nitrogen; hydrocarbons; and traces of reagents used on the mine. The spread of polluted water on the mine site will be restricted by the arid climate, but pollution plumes could be driven by a sustained leak/leaks in the lining of the heap leach pad and associated ponds and by water ponding in the open-pit workings. Should such seepage plumes develop, it is expected that only the plume arising from ponding in the open-pit workings would persist following mine closure;
• Bird kills: Bulghah has a problem with birds drinking water containing cyanide from the ponds in the heap leaching area. Measures taken to address this have not entirely eliminated the problem. The ponds in the heap leach area have been fenced and covered with netting. In addition, measures have been taken to prevent ponding of solution on top of the heap leach dump and the mine has built a bird pond, which is kept full of potable water, near to but outside of the heap leach area;
• Dust impacts on public health and damage caused by vibrations: Bulghah residents perceive that the crushing operation at the mine site has contributed to increased dust levels in air and has thereby affected public health. They also perceive that the vibrations caused by use of the explosives at the mine site are gradually damaging residential and other buildings in the village. They have reported their concerns to the MPMR and to the Company, but have not yet received a formal response. They believe that they should be compensated in some manner for the losses suffered.
An air quality study, undertaken as part of the EIA for Bulghah Mine, predicted that the impact of the mine on local air quality will be measurable but will remain within World Bank and Saudi Arabian guidelines. Monitoring would be required to verify this prediction; and
• Lack of environmental monitoring data: There is a lack of environmental monitoring data available for the above issues. This means that the confidence in the predicted significance of impacts is not high and there is uncertainty as to the adequacy of management measures applied by the mine to address the impacts. It also limits the definition of closure criteria for the mine. Furthermore, it limits the mine’s ability to counter claims of adverse effects on public health and welfare. Environmental monitoring that needs to be undertaken by the mine is identified in Chapter 8 of the EIA (2007). The monitoring programmes have to date not been implemented.
8.8.5 Environmental Liabilities The current closure cost estimate for Bulghah is forecast at US$2.9m comprising US$2.5m for bio-physical closure and US$0.4m for TBL. These estimates are largely based on the original derivation by external consultants and have been adjusted to account for inflation. The estimate however is not based on engineering take offs and is considered to be only at a conceptual level. Accordingly there remains a risk that a detailed closure estimate based on appropriate engineering studies will increase the current biophysical component of the environmental liability.

SRK Consulting Ma'aden Gold MER – Main Report
U3330_Ma'aden MER.doc November, 2007 Page 136
Table 8.12 Bulghah: environmental (biophysical and social) liabilities Environmental Liability Units AmountBio-physical Closure (US$m) 2.5Civil Demolition (US$m) 0.1Operation and Maintenance (US$m) 0.8PP&E Decommissioning (US$m) 0.4Management (US$m) 0.0Tailings Storage Facility (US$m) 0.5Post-closure monitoring (US$m) 0.2Design and Management (US$m) 0.1Contingency (US$m) 0.4Terminal Benefits (US$m) 0.4Total (US$m) 2.9
8.9 Risks and Opportunities The principal on-mine risks at Bulghah are:
• Ore Reserves: The current Ore Reserves are dependent upon maintaining fresh ore grades at 0.8g/t Au which in part has incorporated a degree of selectivity within the estimate. Notwithstanding this aspect current plant head grade comparisons to mine samples indicated an overestimate of some 9% for CIL ore and 7% for heap leach ore. In contrast the grade control sampling data indicate significantly higher assays when compared with the exploration hole assays (the basis of the Ore Reserve estimate). Furthermore, SRK notes that historical experience is largely focus on oxide ore and that future production will be largely dominated by fresh ore, accordingly there is limited experience in respect of reconciliation focused separately on oxide and fresh components of heap leach and CIL ore. Accordingly further analysis is required in order to confirm the validity of the ore grades as forecast;
• LoMp: The LoMp as presented in this MER carries a higher degree of risk given the absence of detailed annual production schedules beyond 2007. The current forecast is based on the constraints imposed by process capacities for heap leach ore and CIL ore, mining fleet capacity and the ultimate pit design within the spreadsheet environment. The availability of ore types classified by process route requires confirmation by the necessary annual scheduling that accompanies detailed planning;
• Production throughput: Stacked ore production at Bulghah has declined from 4.4Mt (2005) to 2.9Mt (annualised 2007H1) and is assumed to recover in 2008 to 3.4Mt. Production is stated to have been negatively impacted due to mechanical availability as well as certain limitations in respect of the availability of oxide ore. This issue requires further management focus and assessment in conjunction with the development of a revised and appropriately detailed LoMp; and
• Metallurgical Recoveries: The metallurgical recoveries for fresh ore as included in the 2005 studies and factored into the LoMp have yet to be verified through production experience. At 50% in 2009 for fresh heap leach ore the recoveries are substantially less than that currently achieved (Bulghah Plant currently 74.7%). Further analysis is required to confirm the validity of the LoMp assumption and to ascertain the timeline for which this reduction will occur.
The principal on-mine opportunities at Bulghah are:
• Mineral Resources: Potential at Bulghah is largely focused on local exploration, specifically Bulghah North and the regional exploration at Nurqah, Jardawiyah and Humaymah, situated within 50km of the mine site;
• Ore Reserves: The Ore Reserves are derived from an ultimate pit design which was based on an optimised shell established at a gold price of US$380/oz. Accordingly

SRK Consulting Ma'aden Gold MER – Main Report
U3330_Ma'aden MER.doc November, 2007 Page 137
potential exists to revise the optimisation gold price to current gold prices as well as upgrading of Inferred Mineral Resources; and
• Processing Operating Expenditures: The LoMp assumes unit rates as achieved in 2007H1 at US$1.70/t which accompanies a annualised throughput of 2.9Mt. Historical production at 3.9Mt (2006) resulted in unit operating expenditures of US$1.15/t, indicating the impact of certain fixed and variable components. Accordingly potential exists to reduce unit costs further assuming the increased production rate of 3.4Mtpa is achieved.
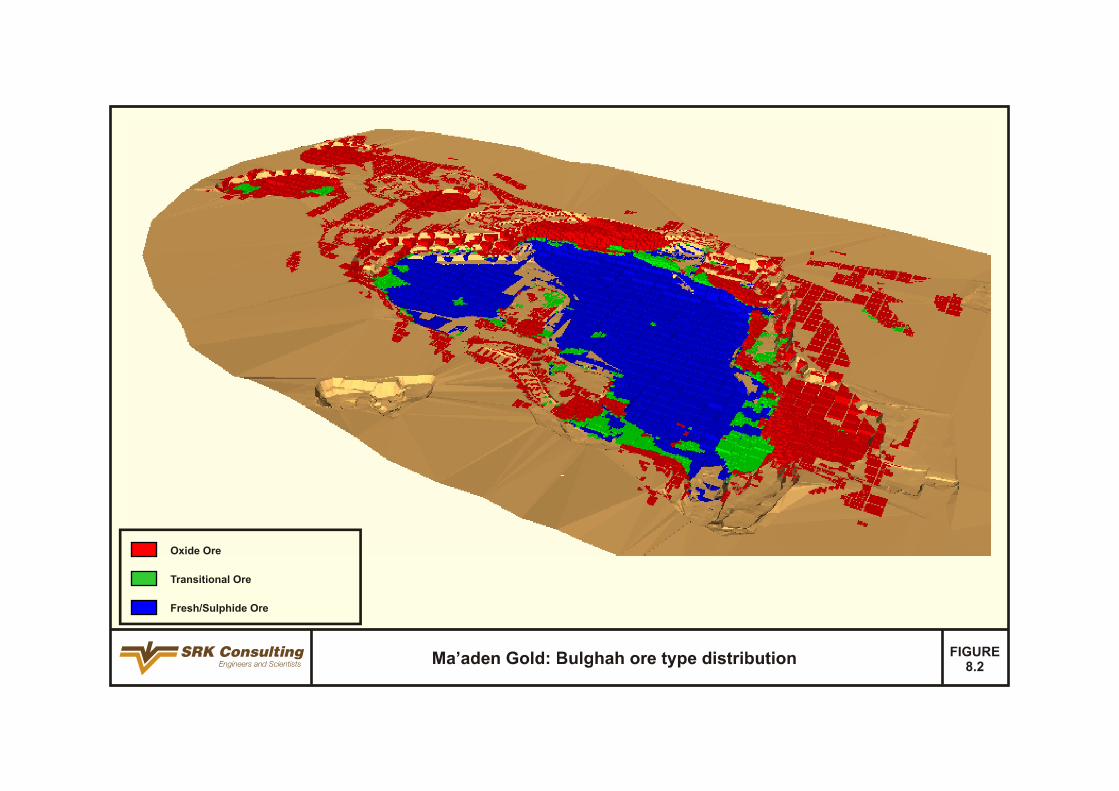


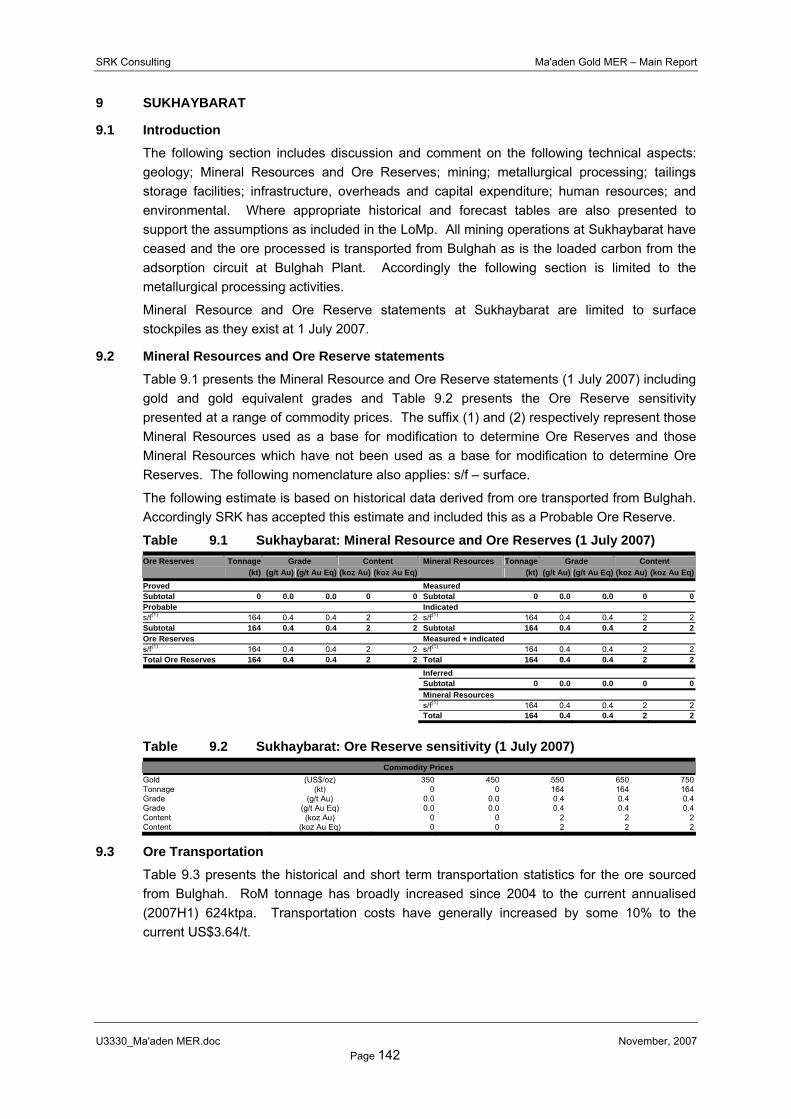
SRK Consulting Ma'aden Gold MER – Main Report
U3330_Ma'aden MER.doc November, 2007 Page 142
9 SUKHAYBARAT
9.1 Introduction The following section includes discussion and comment on the following technical aspects: geology; Mineral Resources and Ore Reserves; mining; metallurgical processing; tailings storage facilities; infrastructure, overheads and capital expenditure; human resources; and environmental. Where appropriate historical and forecast tables are also presented to support the assumptions as included in the LoMp. All mining operations at Sukhaybarat have ceased and the ore processed is transported from Bulghah as is the loaded carbon from the adsorption circuit at Bulghah Plant. Accordingly the following section is limited to the metallurgical processing activities.
Mineral Resource and Ore Reserve statements at Sukhaybarat are limited to surface stockpiles as they exist at 1 July 2007.
9.2 Mineral Resources and Ore Reserve statements Table 9.1 presents the Mineral Resource and Ore Reserve statements (1 July 2007) including gold and gold equivalent grades and Table 9.2 presents the Ore Reserve sensitivity presented at a range of commodity prices. The suffix (1) and (2) respectively represent those Mineral Resources used as a base for modification to determine Ore Reserves and those Mineral Resources which have not been used as a base for modification to determine Ore Reserves. The following nomenclature also applies: s/f – surface.
The following estimate is based on historical data derived from ore transported from Bulghah. Accordingly SRK has accepted this estimate and included this as a Probable Ore Reserve.
Table 9.1 Sukhaybarat: Mineral Resource and Ore Reserves (1 July 2007) Ore Reserves Tonnage Grade Content Mineral Resources Tonnage Grade Content (kt) (g/t Au) (g/t Au Eq) (koz Au) (koz Au Eq) (kt) (g/t Au) (g/t Au Eq) (koz Au) (koz Au Eq)Proved Measured Subtotal 0 0.0 0.0 0 0 Subtotal 0 0.0 0.0 0 0Probable Indicated s/f(1) 164 0.4 0.4 2 2 s/f(1) 164 0.4 0.4 2 2Subtotal 164 0.4 0.4 2 2 Subtotal 164 0.4 0.4 2 2Ore Reserves Measured + indicated s/f(1) 164 0.4 0.4 2 2 s/f(1) 164 0.4 0.4 2 2Total Ore Reserves 164 0.4 0.4 2 2 Total 164 0.4 0.4 2 2
Inferred Subtotal 0 0.0 0.0 0 0 Mineral Resources s/f(1) 164 0.4 0.4 2 2 Total 164 0.4 0.4 2 2
Table 9.2 Sukhaybarat: Ore Reserve sensitivity (1 July 2007)
Commodity Prices Gold (US$/oz) 350 450 550 650 750Tonnage (kt) 0 0 164 164 164Grade (g/t Au) 0.0 0.0 0.4 0.4 0.4Grade (g/t Au Eq) 0.0 0.0 0.4 0.4 0.4Content (koz Au) 0 0 2 2 2Content (koz Au Eq) 0 0 2 2 2
9.3 Ore Transportation Table 9.3 presents the historical and short term transportation statistics for the ore sourced from Bulghah. RoM tonnage has broadly increased since 2004 to the current annualised (2007H1) 624ktpa. Transportation costs have generally increased by some 10% to the current US$3.64/t.

SRK Consulting Ma'aden Gold MER – Main Report
U3330_Ma'aden MER.doc November, 2007 Page 143
Table 9.3 Sukhaybarat: historical and short term ore transportation operating statistics
Operating Statistics (Units) 2004 2005 2006 2007H1 2007H2 2008Tonnage (kt) 571 540 565 312 300 600Operating Expenditures (US$/t) 3.24 3.40 3.58 3.64 3.64 3.64
Table 9.4 presents the forecast LoMp transportation operating statistics for the higher grade ore transported from Bulghah. In summary all components are aligned with historical components.
Table 9.4 Sukhaybarat: LoMp ore transportation operating statistics Operating Statistics (Units) LoMp 2007H2 2008 2009 2010 2011 2012 2013 2014Tonnage (kt) 3,992 300 600 600 600 600 600 600 92Operating Expenditures (US$/t) 3.64 3.64 3.64 3.64 3.64 3.64 3.64 3.64 3.64
9.4 Metallurgical Processing The Sukhaybarat Plant (Figure 9.1) processes higher grade ore mined from the open-pit operations at Bulghah. The process facility has a rated capacity of 600ktpa and a conventional milling-CIL-elution and electrowinning circuit to produce gold in doré form.
9.4.1 Processing Facilities RoM ore from Bulghah and the existing stockpiled material at Sukhaybarat is crushed in a three stage crushing circuit comprising a primary jaw crusher, a secondary crusher operating in open circuit and a tertiary crusher operating in closed circuit. The crushing circuit reduces ore to -10mm and feeds the stockpile ahead of rod and ball milling which further reduces the ore to 75% passing 75μm.
All slurry from the milling circuit feeds a seven stage CIL circuit and loaded carbon is combined with the loaded carbon from Bulghah ahead of the acid wash in the elution column. The eluted carbon is returned to the carbon regeneration kiln prior to returning to the CIL circuit. The eluate containing the precious metal is then processed through electrowinning and smelted in an induction furnace to produce 17kg to 20kg doré bars.
Mill tailings are pumped to a tailings pond located to the south of the plant site and a new tailings dam facility has been developed on site to the north of the two existing facilities.
9.4.2 Historical and short term processing operating statistics Table 9.5 presents the historical and short term processing operating statistics for the Sukhaybarat Plant. Tonnage throughput has increased since 2004 to the current annualised (2007H1) 624ktpa. Processed grades have however reduced significantly since 2004 to the current 1.4g/t Au which also in combination with increased processing of fresh ore, has resulted in lower metallurgical recoveries (85.4% 2007H1). In line with the increase in throughput operating expenditures have reduced to the current US$5.37/t.
Table 9.5 Sukhaybarat: historical and short term processing operating statistics
Operating Statistics (Units) 2004 2005 2006 2007H1 2007H2 2008Processed Tonnage (kt) 571 540 565 312 300 600Grade (g/t Au) 3.6 2.9 1.8 1.4 1.1 1.1Metallurgical Recoveries Metallurgical Recovery (on-mine) (% Au) 91.3% 89.5% 85.0% 85.4% 83.7% 83.7%Metallurgical Recovery (Payable) (% Au) 96.6% 82.6% 83.0% 88.2% 83.6% 83.6%Payable Production (kg Au) 1,957 1,294 844 385 281 561
(kg Ag) 0 111 113 51 37 75Operating Expenditures (US$/t) 5.85 6.13 5.75 5.37 5.37 5.37
9.4.3 Metallurgical Processing LoMp Table 9.6 presents the forecast LoMp processing operating statistics for the Sukhaybarat

SRK Consulting Ma'aden Gold MER – Main Report
U3330_Ma'aden MER.doc November, 2007 Page 144
Plant. In summary all production statistics are aligned with historical performance with the exception of head grades which are assumed to reduce with the processing of higher contributions of fresh ore as well as lower grade marginal ore mined at Bulghah.
Table 9.6 Sukhaybarat: LoMp processing operating statistics Operating Statistics (Units) LoMp 2007H2 2008 2009 2010 2011 2012 2013 2014Processed Tonnage (kt) 4,156 300 600 600 600 600 600 600 256Grade (g/t Au) 0.8 1.1 1.1 0.9 0.8 0.8 0.8 0.8 0.8Metallurgical Recoveries Metallurgical Recovery (on-mine) (% Au) 81.3% 83.7% 83.7% 81.6% 80.1% 80.1% 80.1% 80.1% 80.1%Metallurgical Recovery (Payable) (% Au) 81.2% 83.6% 83.6% 81.5% 80.0% 80.0% 80.0% 80.0% 80.0%Payable Production (kg Au) 2,869 281 561 429 361 361 361 361 154
(kg Ag) 383 37 75 57 48 48 48 48 21Operating Expenditures (US$/t) 5.37 5.37 5.37 5.37 5.37 5.37 5.37 5.37 5.37
9.5 Tailings Storage Facilities Until September 1995, tailings were placed in an unlined tailings facility (“TSF1”). Thereafter, they were deposited in a new 60mm HDPE lined tailings facility (“TSF2”). While TSF1 was operational, about 2.4 million m3 of water seeped from TSF1 into the groundwater system. This leakage has formed a plume in the East and South Wadis that is migrating from the tailings facility and threatening the groundwater resource (2000).
A geochemical study in 2002 established that there was pollution emanating from both TSF1 and TSF2. Various tailings disposal options were then explored (2003) and it was concluded that construction of a new facility within the property or extending beyond the property was the preferred option. A new tailings dam facility has been developed on site to the north of the two existing facilities which the Company has confirmed is sufficient to meet the additional 4.2Mt processed in the current LoMp.
9.6 Engineering Infrastructure, Overheads and Capital Expenditure
9.6.1 Access, Power, Water and Engineering Infrastructure Road access to Sukhaybarat is via a combination of national (258km – northwest from Medina to Hanakiyah along highway 60) and local (97km – southwest towards Sukhaybarat) roads, a total travelled distance of 355km from Medina. The village of Al Bidayyiah is located 15km to the southwest of the Exploitation Licence.
Power supply at Sukhaybarat is via diesel powered generator sets which facilitate the supply of power for the processing facility. Water supply is from various wells and boreholes situated close to the processing facilities. In summary SRK considers that the current power, water and engineering infrastructure is adequate to meet the requirements of the LoMp.
9.6.2 Overhead Operating Expenditure Table 9.7 presents the historical and short term forecast overhead operating expenditures for Sukhaybarat. The total quantum of expenditures has remained relatively constant since 2005 and is currently forecast at some US$2.04m per annum.
Table 9.7 Sukhaybarat: historical and forecast overhead operating statistics Operating Statistics (Units) 2004 2005 2006 2007H1 2007H2 2008Tonnage (kt) 571 540 565 312 300 600Operating Expenditures (US$/t) 3.70 3.55 3.29 3.27 3.40 3.40
(US$m) 2.11 1.92 1.86 1.02 1.02 2.04
Table 9.8 presents the forecast LoMp overhead operating expenditure statistics for Sukhaybarat where all statistics are aligned with historical performance.

SRK Consulting Ma'aden Gold MER – Main Report
U3330_Ma'aden MER.doc November, 2007 Page 145
Table 9.8 Sukhaybarat: LoMp overhead operating statistics Operating Statistics (Units) LoMp 2007H2 2008 2009 2010 2011 2012 2013 2014Tonnage (kt) 4,156 300 600 600 600 600 600 600 256Operating Expenditures (US$/t) 3.40 3.40 3.40 3.40 3.40 3.40 3.40 3.40 3.40
(US$m) 14.13 1.02 2.04 2.04 2.04 2.04 2.04 2.04 0.87
9.6.3 Capital Expenditure Table 9.9 presents the forecast capital expenditure for Sukhaybarat which amounts to US$4.46m over the LoMp. This solely comprises sustaining capital and no expansion capital is planned for depletion of the Ore Reserve. The sustaining capital is based on a provision of 20% of on-mine operating processing expenditures.
Table 9.9 Sukhaybarat: LoMp capital expenditure statistics Operating Statistics (Units) LoMp 2007H2 2008 2009 2010 2011 2012 2013 2014Capital Expenditure (US$m) 4.46 0.32 0.64 0.64 0.64 0.64 0.64 0.64 0.27Project (US$m) 0.00 0.00 0.00 0.00 0.00 0.00 0.00 0.00 0.00Sustaining (US$m) 4.46 0.32 0.64 0.64 0.64 0.64 0.64 0.64 0.27
9.7 Human Resources Table 9.10 presents the historical and forecast TEC and productivities for Sukhaybarat. In the main the forecasts largely reflect historical performance in respect of tonnage productivities (tonnes per TEC per month) and gold production productivities (grams of gold equivalent per TEC per month) have declined with the reduction in head grade.
Table 9.10 Sukhaybarat: historical and forecast human resource statistics Operating Statistics (Units) LoMp 2004 2005 2006 2007H1 2007H2 2008TEC Mine (No) 0 1 1 0 0 0 0Mill (No) 59 60 60 57 59 59 59Administration (No) 35 24 24 35 35 35 35Total (No) 94 85 85 92 94 94 94Productivity Tonnage (t/TEC/month) 532 560 529 512 553 532 532Gold Equivalent (g/TEC/month) 368 1,918 1,271 768 687 499 498
9.8 Environmental
9.8.1 Environmental Setting The topography on and around the Sukhaybarat site is relatively flat and the site elevation is 830m amsl. The site is in the catchment of Wadi Sahuq in the basin of Wadi al Rimah. The site is fairly remote from human settlements, except for Budeyah Village and Sukhaybarat town. Budeyah Village is about 8km south-east of the site. Budeyah Village is downstream of the mine site – the East Wadi, one of two wadis draining the site, flows through the village. The old mine workings, ore stockpiles, waste rock dump and tailings have the potential for producing ARD.
The site is drained by two wadis (ephemeral stream channels). While wadis are dry most of the time, a good deal of surface runoff in the wadis infiltrates the ground and recharges aquifers. Both wadis flow into Wadi Urayfan, which is a tributary of Wadi Sahuq. The South Wadi drains southwards and the East Wadi drains eastwards and then turns south through Budeyah Village and then to its confluence with Wadi Urayfan.
Groundwater flows through fractures and joints in bedrock and locally through sands in wadis. Any surface contamination around the site is likely to be washed into the wadis and into the groundwater system whenever there is sufficient rainfall to generate runoff or infiltration. Groundwater is typically brackish with total dissolved solids ranging from 1,000mg/l to 2,000mg/l. Several years ago, it was found that pollution from the site had reached some of the Budeyah Village wells – pollutants of concern include cyanide and mercury. In response

SRK Consulting Ma'aden Gold MER – Main Report
U3330_Ma'aden MER.doc November, 2007 Page 146
to this, a project was implemented to capture and pump contaminated water from the East Wadi before it reaches wells. The contaminated water is pumped back to the mine site where it is used as process water.
Extensive groundwater investigations were undertaken to understand the sources of pollution emanating from the site. It was found that the original unlined tailings facility was the primary source, particularly when it was still operational. In 2002, it was found that the second lined tailings facility was also a source of pollution. Further it was predicted that the load of pollutants from the site was lower than in the past. In addition, it was noted that most of cyanide is complexed with iron or other metals and is not biologically available. Since then, a third tailings disposal facility has been established on the site and the second tailings disposal facility has been decommissioned.
Sukhaybarat has however stopped abstraction of polluted water emanating from the site, mainly because of vandalism of boreholes.
9.8.2 Compliance Other than a conceptual closure plan Sukhaybarat does not have all of the documents required in terms of legislation on environmental management by mines in Saudi Arabia. Accordingly Sukhaybarat is operating within the five-year grace period for existing projects to achieve compliance with the Public Environmental Law and the Implementing Regulations, which ends in September 2008.
The conceptual closure plan for Sukhaybarat was completed in 2000. A closure cost estimate, based on engineering take offs, was included in this closure plan. The closure plan needs to be updated to take account of new developments on the mine site including the development of a third tailings disposal facility and the ongoing mineral processing operations on behalf of Bulghah.
9.8.3 Environmental Management The Company’s Health, Safety and Environmental Policy commits to the establishment of a health, safety and environmental management system. To this end the Company has designed EMS and OHSS manuals and intends to introduce these to Ma’aden Gold in the second half of 2007.
9.8.4 Key Environmental Issues As no detailed assessment of the environmental and social impacts of the Sukhaybarat operation has been undertaken to date the key areas which require specific attention are as follows:
• Water Supply: Specifically the decrease in availability of water to surrounding water users. Information on water abstraction by the operations and the potential impacts of this on other water users is limited and further detailed assessment is required;
• Potential Water Pollution: There has been no groundwater evaluation to justify the cessation of back pumping of polluted water emanating from the Sukhaybarat site. Past groundwater investigations have focused on the existing pollution emanating from the site and the identification of sources of this pollution. The investigations do not provide perspective on the pollution that could emanate from the site post closure; and
• Socio-economic impacts: There is no information available on the site’s socio-economic setting and impacts however the site is fairly remote from human settlements.

SRK Consulting Ma'aden Gold MER – Main Report
U3330_Ma'aden MER.doc November, 2007 Page 147
9.8.5 Environmental Liabilities The current closure cost estimate for Sukhaybarat is forecast at US$4.6m comprising US$4.0m for bio-physical closure and US$0.6m for TBL. These estimates are largely based on the original derivation by external consultants and have been adjusted to account for inflation from the date of estimation; provision for the new TSFs; and an adjustment provision for continued abstraction of polluted groundwater emanating from the mine site and for continued supply of fresh water to Budeyah Village for a period of 10 years.
Table 9.11 Sukhaybarat: environmental (biophysical and social) liabilities Environmental Liability Units AmountBio-physical Closure (US$m) 4.0Civil Demolition (US$m) 0.1Operation and Maintenance (US$m) 0.7PP&E Decommissioning (US$m) 0.5Management (US$m) 0.0Tailings Storage Facility (US$m) 0.7Post-closure monitoring (US$m) 1.5Design and Management (US$m) 0.2Contingency (US$m) 0.3Terminal Benefits (US$m) 0.6Total (US$m) 4.6
The closure cost estimates do not take account of the possible sale value of plant, equipment and infrastructure, or of the value of gold retrieved during site clearance. The cost estimate does take account of capping of water-supply wells and removal of infrastructure even though these could be retained as a regional asset. Notwithstanding the above the principal uncertainties are as follows:
• Abstraction of polluted water emanating from the site and supply of fresh water to Budeyah Village should only cease following a detailed assessment of the groundwater conditions which supports this action. As such detailed work has not been completed there remains a risk that the current cessation of abstraction may result in further pollution; and
• There is no evidence that the material that has been used for capping of the original tailings disposal facility and is to be used for capping of the current tailings disposal facility is fit for purpose in terms of compaction, and chemical and permeability characteristics. There remains a concern that old heap leach material has been used instead of clay.
9.9 Risks and Opportunities The principal on-mine risks at Sukhaybarat are:
• Economic risk associated with continued processing of Bulghah ore from 2010 onwards assuming that gold prices reduce to less than US$600/oz;
• Metallurgical risk associated with the increased processing of fresh ore; and
• Environmental risk associated with seepage from TSFs and the cessation of abstraction of polluted water emanating from the site.
The principal on-mine opportunity at Sukhaybarat is:
• The opportunity to identify additional Mineral Resources at the exploration properties specifically at six of the exploration prospects which are situated within 30km of Sukhaybarat (Hablah South, Red Hill, La Prospect, Aurifjan and Al Habla).


SRK Consulting Ma'aden Gold MER – Main Report
U3330_Ma'aden MER.doc November, 2007 Page 149
10 AL HAJAR
10.1 Introduction The following section includes discussion and comment on the following technical aspects: geology; Mineral Resources and Ore Reserves; mining; metallurgical processing; tailings storage facilities; infrastructure, overheads and capital expenditure; human resources; and environmental. Where appropriate historical and forecast tables are also presented to support the assumptions as included in the LoMps. All mining operations at Al Hajar have ceased and processing is limited to the reclamation of historically stacked heap leach ore. Accordingly the following section is limited to the metallurgical processing activities.
The original comminution circuit at Al Hajar did not include a secondary crusher until installation in October 2005. Prior to the installation of this secondary crusher, Ma’aden Gold considered that stacked ore was sub-optimally crushed resulting in lower recoveries than planned. Subsequent metallurgical testing of the stacked and leached ore indicated that the material leached has residual gold grades of the 1.3g/t Au. The current LoMp assumes that material stacked prior to October 2005 can be economically reclaimed, re-crushed (to <20mm) and re-stacked on a new HLP with gold metallurgical recovery of 51.9%.
Mineral Resource and Ore Reserve statements at Al Hajar are limited to surface stockpiles as they exist at 1 July 2007.
10.2 Mineral Resource and Ore Reserves Mineral Resource estimation at Al Hajar is largely based on an assessment of historically stacked heap leach material which included:
• Analysis of old heap samples which indicate average grades of 1.25g/t gold and 25g/t silver. A sample subject to screen analysis indicated a grade of 1.01g/t Au and 23.44g/t Ag; and
• Bulk samples were also subject to metallurgical tests comprising 50kg columns and a 400t pilot heap where both tests confirmed a potential recovery rate of 51.9% for gold and 15.1% for silver.
To 30 June 2007 some 369kt of stacked ore has been reclaimed re-crushed and stacked on a new HLP with sampled head grades estimated at 1.5g/t Au and metallurgical recoveries to date approximating 66.4%.
The documentation relating to QA/QC procedures and protocols followed in respect of the sample data gathered is limited. Notwithstanding this aspect the current estimate is supported by a combination of historical data comprising stacked tonnages and grades and recoveries to October 2005: 2004–0.7Mt with RoM grade of 3.5g/t Au and residue grade of 1.6g/t Au; 2005–0.6Mt and with RoM grade of 2.9g/t Au and residue grade of 1.0g/t Au; as well as the recent sampling programmes. This coupled with the current processing of some 370kt to date with a head grade of 1.5g/t Au has been accepted as appropriate for the estimation of an Indicated Mineral Resource at 30 June 2007 of 2.1Mt grading 1.3g/t Au. There remains a risk however that the estimates as provided may not be substantiated given the difficulties associated with obtaining representative samples from historically stacked heap leach pads to determine both grade and metallurgical performance. Accordingly SRK considers that continued sampling of the reclaimed material is crucial in order to sustain economic recovery.
Table 10.1 presents the modifying factors for Al Hajar.

SRK Consulting Ma'aden Gold MER – Main Report
U3330_Ma'aden MER.doc November, 2007 Page 150
Table 10.1 Al Hajar: modifying factors Statistics Units Reclaimed Heap Leach Ore Physical Factors Extraction Ratio (%) 100% Dilution (%) 0% Grade Factors (% Au) 100.0% Financial Factors Processing (US$/t) 8.32 Product Charges (US$/t) 0.34 Total (US$/t) 8.66 Commodity Prices Payability Gold Equivalents Gold (US$/oz) 550 (% Au) 51.9% 1.00000 Cut-off-Grades RoM (g/t Au Eq) 0.9 ICOG (g/t Au Eq) 0.9 Resource COG (g/t Au Eq) 0.7
10.2.1 Mineral Resource and Ore Reserve statements Table 10.2 presents the Mineral Resource and Ore Reserve statements (1 July 2007) and Table 10.3 presents the Ore Reserve sensitivity presented at a range of commodity prices. The suffix (1) and (2) respectively represent those Mineral Resources used as a base for modification to determine Ore Reserves and those Mineral Resources which have not been used as abase for modification to determine Ore Reserves. The following nomenclature also applies: s/f – surface stockpiles.
Table 10.2 Al Hajar: Mineral Resource and Ore Reserves (1 July 2007) Ore Reserves Tonnage Grade Content Mineral Resources Tonnage Grade Content (kt) (g/t Au) (g/t Au Eq) (koz Au) (koz Au Eq) (kt) (g/t Au) (g/t Au Eq) (koz Au) (koz Au Eq)Proved Measured Subtotal 0 0.0 0.0 0 0 Subtotal 0 0.0 0.0 0 0Probable Indicated s/f(1) 2,143 1.3 1.4 87 99 s/f(1) 2,143 1.3 1.4 87 99Subtotal 2,143 1.3 1.4 87 99 Subtotal 2,143 1.3 1.4 87 99Ore Reserves Measured + indicated s/f(1) 2,143 1.3 1.4 87 99 s/f(1) 2,143 1.3 1.4 87 99Total Ore Reserves 2,143 1.3 1.4 87 99 Total 2,143 1.3 1.4 87 99
Inferred s/f(1) 0 0.0 0.0 0 0 Subtotal 0 0.0 0.0 0 0 Mineral Resources s/f(1) 2,143 1.3 1.4 87 99 Total 2,143 1.3 1.4 87 99
Table 10.3 Al Hajar: Ore Reserve sensitivity (1 July 2007)
Commodity Prices Gold (US$/oz) 350 450 550 650 750Tonnage (kt) 0 2,143 2,143 2,143 2,143Grade (g/t Au) 0.0 1.3 1.3 1.3 1.3Grade (g/t Au Eq) 0.0 1.4 1.4 1.4 1.4Content (koz Au) 0 87 87 87 87Content (koz Au Eq) 0 98 99 99 100
Potential beyond this is largely focused on the regional exploration properties situated within the Al Hajar Exploration Licence area. Six of the exploration prospects are situated within 30km of Al Hajar (Hajeej, Sheers, Jadmah, Gossan-14, Waqba and Sha’abat Al Hamra) however none of these have identified JORC Code compliant Mineral Resources to date.
10.3 Metallurgical Processing The Al Hajar Plant (Figure 10.1) processes reclaimed surface sources from historically stacked ore.
10.3.1 Processing Facilities The Al Hajar Plant comprises a conventional heap-leach facility with a design capacity of 720ktpa. The flowsheet includes a crushing circuit, a lined HLP, collection pond and an adsorption circuit. Crushed ore is agglomerated and stacked in 8m lifts on the HLP and is then irrigated with cyanide solution. The precious metals pregnant solution is then further

SRK Consulting Ma'aden Gold MER – Main Report
U3330_Ma'aden MER.doc November, 2007 Page 151
processed in a Merrill-Crowe process whereafter the precipitate is filtered and dried, prior to smelting to produce doré.
A new HLP of approximately 40,000m2 has been established south east of the existing HLP to accommodate some 1.2Mt of reclaimed and re-crushed ore. This is planned to excavate a considerable surface area at the old heap which will then accommodate the re-stacking of the remaining 1.1Mt. To facilitate the transportation of ore from the old HLP, a new 600m long conveyor system has been installed to enable direct discharge into the crusher hopper.
10.3.2 Historical and short term processing operating statistics Table 10.4 presents the historical and short term processing operating statistics for the Al Hajar Plant. Tonnage throughput has increased since 2004, however current throughput is some 23% behind budget at an annualised 540ktpa (2007H1). Head grades have in the main reduced specifically after the introduction of processing stockpiled and reclaimed material. Metallurgical recoveries would appear however to be impacted by re-crushing where similar recoveries were obtained (2005) at substantially higher head grades. Operating expenditures have however increased to the current US$8.32/t which has been assumed as the basis for the LoMp forecasts.
Table 10.4 Al Hajar: historical and short term processing operating statistics(1) Operating Statistics (Units) 2004 2005 2006 2007H1 2007H2 2008Processed Tonnage (kt) 666 610 756 269 360 720Grade (g/t Au) 3.5 2.9 1.9 1.5 1.3 1.3Metallurgical Recoveries Metallurgical Recovery (on-mine) (% Au) 53.3% 67.1% 57.4% 66.4% 51.9% 51.9%Metallurgical Recovery (Payable) (% Au) 53.3% 67.1% 57.4% 66.4% 51.9% 51.9%Payable Production (kg Au) 1,257 1,117 970 255 243 467
(kg Ag) 7,834 7,982 4,829 1,677 2,008 4,015Operating Expenditures (US$/t) 6.37 7.28 6.13 8.32 8.32 8.32
(1) Process costs include all on-site overheads.
10.3.3 Metallurgical Processing LoMp Table 10.5 presents the forecast LoMp processing operating statistics for the Al Hajar Plant. Tonnage throughput at 720ktpa is assumed to be maintained and the current 23% underperformance reversed. Metallurgical recoveries are based on the testwork and at 51.9% are less than that currently achieved (66.4% – 2007H1).
Table 10.5 Al Hajar: LoMp processing operating statistics(1) Operating Statistics (Units) LoMp 2007H2 2008 2009 2010Processed Tonnage (kt) 2,143 360 720 720 343Grade (g/t Au) 1.3 1.3 1.3 1.3 1.3Metallurgical Recoveries Metallurgical Recovery (on-mine) (% Au) 51.9% 51.9% 51.9% 51.9% 51.9%Metallurgical Recovery (Payable) (% Au) 51.9% 51.9% 51.9% 51.9% 51.9%Payable Production (kg Au) 1,399 243 467 467 223
(kg Ag) 11,953 2,008 4,015 4,015 1,915Operating Expenditures (US$/t) 8.32 8.32 8.32 8.32 8.32
(1) Process costs include all on-site overheads.
10.4 Engineering Infrastructure, Overheads and Capital Expenditure
10.4.1 Access, Power, Water and Engineering Infrastructure Road access to Al Hajar is along a combination of national (239km – north from Abhā along highways 10 and 15) and local (17km – northeast towards the village of Al Wakabah) roads, a total travelled distance of 263km from Abhā. The village of Al Wakabah is located 7km to the southwest of the Exploitation Licence.
Power is supplied by the Saudi Electric Company with backup by diesel generators. Water is

SRK Consulting Ma'aden Gold MER – Main Report
U3330_Ma'aden MER.doc November, 2007 Page 152
supplied from well fields which are sited in Wadi Ibn an Na’a, approximately 15km from the site.
10.4.2 Capital Expenditure Table 10.6 presents the forecast LoMp capital expenditure for Al Hajar which amounts to US$2.97m. This solely comprises sustaining capital and no expansion capital is planned for depletion of the Ore Reserve. The sustaining capital is based on a provision of 2% of on-mine process operating expenditures.
Table 10.6 Al Hajar: LoMp capital expenditure statistics Operating Statistics (Units) LoMp 2007H2 2008 2009Capital Expenditure (US$m) 2.97 0.93 1.02 1.02Project (US$m) 0.00 0.00 0.00 0.00Sustaining (US$m) 2.97 0.93 1.02 1.02
10.5 Human Resources Table 10.7 presents the historical and forecast TEC and productivities for Al Hajar. In the main the forecasts largely reflect historical (2007H1) performance in respect of tonnage productivities (tonnes per TEC per month) assuming that current underperformance is reversed. Gold production productivities (grams of gold equivalent per TEC per month) are assumed to reduce in accordance with the planned reduction in head grade.
Table 10.7 Al Hajar: historical and forecast human resources statistics Operating Statistics (Units) LoMp 2004 2005 2006 2007H1 2007H2 2008TEC Mine (No) 0 8 9 8 0 0 0Mill (No) 40 43 42 42 40 40 40Administration (No) 21 13 9 27 21 21 21Total (No) 61 64 60 77 61 61 61Productivity Tonnage (t/TEC/month) 984 867 847 818 735 984 984Gold Equivalent (g/TEC/month) 749 1,805 1,897 1,024 900 771 741
10.6 Environmental
10.6.1 Environmental Setting The site is on the divide between Wadi Ibn an Na’a and Wadi Thah, which flows into Wadi Tabalah. These wadis are in the basins of Wadi Ranyah and Wadi Bishah, respectively. The sources of Wadi Ranyah and Wadi Bishah are in the Asir Highlands, where the rainfall can be as high as 400mmpa. These wadis drain in a north-easterly direction and disappear into a common sand accumulation basin in central Saudi Arabia, more than 200km from the mine site.
The site is remote from human settlements but numerous Bedouin drive camels, sheep and goats through Wadi Ranyah and Wadi Tabalah. Bedouin that prepare honey are present during the autumn. They bring their hives to the wadis, where the bees take pollen from the flowering Siddr (Zizyphus spina-Christi) trees. There is irrigated farming in the upper reaches of Wadi Ranyah, more than 25km from the site. The local Bedouin population in Wadi Ibn an Na’a and Wadi Thah is relatively small, it consists of 10 family groups. The families camp within 2km to 5km of the mine site and have houses in Al-Botnayn, near to the town of Tabalah.
Most water in the environment of the site occurs as subsurface flow in wadis. The rocks are generally of low permeability and are poor aquifers, but the wadis constitute good primary aquifers and some good secondary aquifers can be expected in structures below some of the wadis. There are local springs on hillsides which are short-lived after the rainy season. Water abstraction in the region of the site is limited to small supplies for the Bedouin.

SRK Consulting Ma'aden Gold MER – Main Report
U3330_Ma'aden MER.doc November, 2007 Page 153
The mineral processing infrastructure, including the heap leach pad, are located in the catchment of Wadi Ibn an Na’a. The north pit is on the divide between Wadi Ibn an Na’a and Wadi Thah. The waste rock dump and south pit are in the catchment of Wadi Thah.
Historically, there was much copper mining in the region of Al Hajar. A few artefacts such as rock grinding stones and pieces of slag have been found on the site. They are believed to be unimportant, but this has not been confirmed with an appropriately qualified archaeologist.
There is a Bedouin graveyard at the head of Wadi Ibn an Na’a which contains at least 45 grave sites. Petroglyphs, depicting human figures, and Wasums, tribal signs, are inscribed on exposed bedrock in Wadi Ibn an Na’a. The EIA for the mine recommended that the mine fences these sites to protect them from damage. It is unknown whether this has been done.
10.6.2 Compliance An EIA report was completed by independent consultants for Al Hajar in 2000 which includes a review of closure issues and actions and a preliminary closure cost estimate. Al Hajar does not have all of the documents required in terms of legislation on environmental management by mines in Saudi Arabia. Accordingly Al Hajar is operating within the five-year grace period for existing projects to achieve compliance with the Public Environmental Law and the Implementing Regulations, which ends in September 2008. Furthermore the legal status of the EIA is unknown, both in respect of submission to the MEPA for review and approval and whether official conditions of approval were issued.
10.6.3 Environmental Management The Company’s Health, Safety and Environmental Policy commits to the establishment of a health, safety and environmental management system. To this end the Company has designed EMS and OHSS manuals and intends to introduce these to the Ma’aden Gold in the second half of 2007.
10.6.4 Key Environmental Issues Key areas which require specific attention are as follows:
• Water Supply: Specifically any decrease in availability of water to surrounding water users. The site’s abstraction of water from wells in Wadi Ibn an Na’a could have a long term impact on the availability of water to other water users. No detailed investigation has been undertaken to assess the extent of this issue;
• Potential Water Pollution: The spread of polluted water on the site is expected to be restricted by the arid climate, but once seepage gets into the wadi sediments it can migrate quickly. Pollution-plume driving forces that could arise on the mine site are: water ponding in the open-pit workings; a sustained leak through the lining of the heap leach dump; and uncontrolled discharges during an extreme storm event. Should such pollution plumes develop, it is expected that only the plumes arising from ponding in the open-pit workings would persist following mine closure. The extent of ponding and the consequent plumes will be small because rain will be the only source of recharge – the open-pits are above the groundwater table;
• Closure planning: A detailed costed closure plan is urgently required for the mine. Closure criteria need to be defined in consultation with the relevant authorities, particularly with respect to groundwater contamination, to remove potential future liabilities and to define monitoring responsibilities and final site sign off requirements; and
• Lack of environmental monitoring data: There is a lack of environmental monitoring

SRK Consulting Ma'aden Gold MER – Main Report
U3330_Ma'aden MER.doc November, 2007 Page 154
data available for all the above issues. Consequently, there is uncertainty as to the adequacy of management measures applied by the mine to address the impacts.
10.6.5 Environmental Liabilities The current closure cost estimate for Al Hajar is forecasted at US$2.4m comprising US$2.1m for bio-physical closure and US$0.3m for TBL. These estimates are largely based on the original derivation by external consultants and have been adjusted to account for inflation from the date of estimation.
Table 10.8 Al Hajar: environmental (bio-physical and social) liabilities Environmental Liability Units AmountBio-physical Closure (US$m) 2.1Civil Demolition (US$m) 0.1Operation and Maintenance (US$m) 0.7PP&E Decommissioning (US$m) 0.4Management (US$m) 0.0Tailings Storage Facility (US$m) 0.5Post-closure monitoring (US$m) 0.0Design and Management (US$m) 0.1Contingency (US$m) 0.4Terminal Benefits (US$m) 0.3Total (US$m) 2.4
The above closure cost estimate does not take account of the possible sale value of plant, equipment and infrastructure, or of the value of gold retrieved during site clearance. It does take account of capping of water-supply wells and removal of infrastructure even though these could be retained as a regional asset.
10.7 Risks and Opportunities The principal on-site risks at Al Hajar are:
• Mineral Resources and Ore Reserves: The current estimates are based on sampling of historically stacked and leached ore. Sampling of such surface sources is difficult specifically in respect of obtaining representative samples for both resource estimation as well as metallurgical performance. Notwithstanding this limitation, SRK notes that historical re-processing from 1 January 2007 to 30 June 2007 has confirmed grade estimation and metallurgical performance (grade at 1.5g/t Au; recovery at 66.4%), however there remains a risk of lower grades and lower metallurgical recoveries;
• Metallurgical Performance: Tonnage throughput to date (30 June 2007) is some 23% behind budget (720ktpa) at an annualised 540ktpa (2007H1). The current LoMp assumes that this underperformance is reversed and the contributing issues (mechanical availability etc) are addressed; and
• Environmental: The principal risks comprise the lack of a detailed closure plan given assumed closure in 2010. Key in this respect is a lack of environmental monitoring data to enable definition of closure criteria in consultation with the relevant authorities, particularly with respect to groundwater contamination.
The principal on-site opportunities at Al Hajar are:
• Mineral Resources: Potential beyond the current surface sources is largely focused on the regional exploration properties situated within the Al Hajar Exploration Licence area. Six of the exploration prospects are situated within 30km of Al Hajar (Hajeej, Sheers, Jadmah, Gossan-14, Waqba and Sha’abat Al Hamra).
• Metallurgical Processing operating expenditures: Current operating expenditures are based on performance in 2007H1. Should production increase to the forecast 720ktpa there is a possibility that a reduction in the impact of fixed costs may enable reductions to

SRK Consulting Ma'aden Gold MER – Main Report
U3330_Ma'aden MER.doc November, 2007 Page 155
attain unit expenditures achieved in 2004 through 2006 inclusive.


SRK Consulting Ma'aden Gold MER – Main Report
U3330_Ma'aden MER.doc November, 2007 Page 157
11 AD DUWAYHI
11.1 Introduction The following section includes discussion and comment on the following technical aspects: geology; Mineral Resources; mining; metallurgical processing; tailings storage facilities; infrastructure, overheads and capital expenditure; human resources; and environmental. Where appropriate forecast tables are also presented to support the assumptions as included in the LoMp. This information is sourced from the pre-feasibility study completed in 2007 and whilst no feasibility study has been completed SRK has assumed a timeline in which this as well as the assessment of the CAG Project is completed. Given the conditionality of the development of the Taif Project in respect of developing Ad Duwayhi, no Ore Reserves are presented for the Ad Duwayhi Development Property.
11.2 Geology Ad Duwayhi lies within the Afif composite terrain in the central Arabian Shield. The Afif terrain consists of a complex assemblage of volcanic arc sequences and a continental microplate that are overlain by successor-basin volcano-sedimentary sequences (Bani Ghayy and Murdama Groups). All these rocks were intruded by post-tectonic granitic rocks.
The deposit lies at the southern end of a zone of Pre-Cambrian volcano-sedimentary rock, which have been overprinted by greenschist facies metamorphism. The deposit is located to the north of a fault bounded belt of folded meta-sediments and plutonic rocks. A granodiorite body lies to the east of the deposit, with the deposit stratigraphy cut by multiple intrusive dykes and sills of dolerite, rhyolite, porphyritic granite and a polymict breccia pipe.
The main mineralisation (Figure 11.2) is associated with a curved thrust structure with an average strike of 045° and dip of 45° southeast, curving from a northerly direction in the southwest to an easterly direction in the northeast. There are other more minor mineralised structures on different trends.
Hydrothermal alteration is common across the deposit area comprising silicification (ever-present), quartz-sericite-pyrite, potassic and propylitic. The quartz-sericite-pyrite alteration is most closely associated with the gold mineralisation.
The main mineralisation is structurally controlled by the curved thrust structure, with a thrust zone typically between 2m to 10m thick with heavily deformed cataclastic rocks with well developed quartz veins. Thin, high-grade gold veins are also found outside of the main mineralised vein.
Gold is typically found associated with pyrite and tetrahedrite (3% to 5% by volume), and is found in the form of fine grained free gold (>5μm), not locked within other sulphides, although some is found in gold and silver tellurides.
It should be noted that gold mineralisation is also present as placer deposits in the vicinity of the deposit, within the colluvial material.
In summary, the geology and major controls on the mineralisation appear to be well understood, aiding the ability to model the deposit effectively and appropriately. The deposit exhibits typical features of shear-zone gold deposits.
11.3 Mineral Resources and Ore Reserves
11.3.1 Quality and quantity of data The deposit is documented to have been explored with 625 boreholes, 47 percussion holes (3,966m), 275 RC holes (12,723m) and 303 diamond holes (66,600m). Preliminary

SRK Consulting Ma'aden Gold MER – Main Report
U3330_Ma'aden MER.doc November, 2007 Page 158
metallurgical samples have also been taken. As part of the exploration, a confirmatory drilling programme was initially undertaken to validate the previous exploration work undertaken by BRGM and USGS, followed by an expansion of the exploration area and additional drilling and sampling.
To understand the close spaced variability of the mineralisation, exploration drilling stepped down from 100m by 100m to 50m by 50m down to 25m by 25m and included the drilling of a more closely spaced “geostatistical” cross of data. Ma’aden Gold also re-interpreted and re-logged previous remaining drill core following further understanding of the deposit nature in order to produce more reliable geological models and resource estimates.
The digital data was amassed up to December 2003 and comprised:
• Topographic Data: The topography was re-surveyed by Ma’aden Gold in 2003 using Trimble differential GPS, and subsequently all co-ordinates converted to UTM values. The survey covers the area adequately and in a sufficient level of detail; and
• Sampling Data: All of the drillhole data was stored in a database system, with all collar locations surveyed by Trimble differential GPS. The quantity of drilling data captured electronically is reported to be 574 holes totalling 1,992m of percussion drilling, 12,064m of RC drilling, and 60,031m of diamond drilling (HQ-diameter core, 67mm). Downhole drillhole surveys are reported to have been undertaken using Tropari instruments at 30m intervals for the holes drilled by Ma’aden Gold (although most were vertical).
Sampling procedures are relatively unknown for the early BRGM and USGS sampling, however recent sampling of the drill core was done initially on 1m intervals regardless of lithology, and later at 1m intervals honouring the lithology down to a minimum sample interval of 20cm. Detailed geological logging was undertaken including lithology, alteration, mineralogy and structure as well as geotechnical logging. Due to the competent nature of the siliceous rocks, the core recovery is very high averaging some 99%, with over 97% of the data with greater than 80% recovery. Ma’aden Gold has undertaken comprehensive re-logging of the drill core following detailed protocols.
Sample preparation was undertaken at Ma’aden Gold’s own facilities at other mining operations in Saudi Arabia and at an independent laboratory. There is no reporting of any QA/QC exercises to assess the introduction of any bias at the sample preparation stage as well as no confirmation as to the accreditation status of the laboratories. A number of different laboratories have been used to analyse samples from the Ad Duwayhi project, with some 8 different laboratories used to analyse some 81,600 samples. Most of the samples were analysed by fire assay techniques with an AAS finish.
Ma’aden Gold used several laboratories but eventually the Al Amri laboratory in Jeddah became the primary laboratory (about 63% of total number of samples) with Bondar-Clegg/ALS Chemex subsequently used for repeat external verification (about 17% of total samples). Other laboratories used historically include BRGM, DMMR, Lakefield, SCPM, SGS and BGM.
Repeat samples were routinely introduced both to external laboratories and internally as blind duplicates within the laboratories. During Ma’aden Gold’s exploration some 11% of the total samples were submitted for external repeat analysis. The results of the gold analysis show minor differences, but within acceptable limits of repeatability, with the exception of a single month batch of samples. As would be expected, the internal repeat samples show excellent repeatability.
Standards were not used systematically, however grade ranged commercially produced

SRK Consulting Ma'aden Gold MER – Main Report
U3330_Ma'aden MER.doc November, 2007 Page 159
standards were introduced later in Ma’aden Gold’s exploration, one for every twentieth sample. The Al Amri laboratory also introduced its own internal standards. The standards analysis show acceptable precision of analysis and do not identify any significant bias, although does highlight some minor problems with data management and possible mislabelling of samples.
A study was undertaken to further investigate high grade gold samples, which demonstrated that although the absolute grade value was not always repeated, high grade was repeating as high grade within acceptable limits
A twin-hole drilling programme was undertaken by Ma’aden Gold involving the drilling of 16 holes twinned against existing and planned diamond (9 twins) and RC (7 twins) boreholes spatially covering the deposit area. The diamond verses RC twins show an acceptable correlation, with high grade spikes in similar downhole positions, however the RC holes generally appear to show significantly smaller gold peaks, possibly due to some of the fine fraction of the gold mineralisation being lost. Due to the differences highlighted, the RC data was not used in the geostatistical study and subsequent grade interpolation, but could be used for determining the limits of the mineralisation during geological modelling. The diamond twin holes versus diamond holes show a very good correlation, with some minor differences that are likely to represent the natural close-spaced variability of the mineralisation as opposed to any potential bias.
A comprehensive density (specific gravity) study was undertaken by Ma’aden Gold in 2003, involving the analysis of some 2,500 samples. These values were applied per mineralisation type in the block model and ranged between 2.65t/m3 to 2.74t/m3.
11.3.2 Geological modelling, grade and tonnage estimation The modelling process has incorporated both geological and lithological information in addition to gold grades, and has been completed on parallel regularly orientated sections. Three main mineralisation domains were created:
• Main Vein – quartz vein in proximity to the major controlling fault/shear;
• Vein Halo – quartz and alteration halo surrounding the “Main Vein” defined using a 1.0g/t Au cut-off; and
• Hanging wall/hanging wall extension – sub-horizontal quartz veinlets defined using a 0.5g/t Au cut-off.
80% of the gold mineralisation is contained within the Main Vein and the Vein Halo. Four other lithological domains incorporated within the block model include square quartz porphyry; granite; polmict breccia pipe; and overburden/alluvials.
For all of the mineralisation/lithological domains, 3D wireframe models were created, specifically wireframe solid models for all except the Main Vein which was modelled as two wireframe surfaces with the application of a 0.25m minimum horizontal thickness. In addition, oxidation wireframe surfaces were created using logged weathering and oxidation from the drill core and have been used to apply appropriate density values.
The raw un-composited statistics for the entire database show the gold to have a typical high positively skewed population with a separate high grade population greater than 10g/t Au, with no major correlations with other elements. The raw statistics of the various drilling phases have also been investigated and show that the early BRGM and USGS exploration programmes intersected a different grade distribution and were therefore removed from the estimation process. Raw statistics per drilling method were also computed and demonstrated
SRK Consulting Ma'aden Gold MER – Main Report
U3330_Ma'aden MER.doc November, 2007 Page 160
that the percussion and RC drilling intersected much lower grades and a much lower grade distribution not comparable with the diamond drilling and were therefore excluded from the estimation process. Raw statistics were also calculated per mineralisation zone and demonstrated multi-modality within the Main Vein domain, with distinct low and high grade domains, a result of including low grade samples in the mineralisation model in order to maintain geological continuity. Following the preliminary statistical study the data was composited to 1m following an analysis of varying the composite lengths. Top-cutting was applied to the composites following a detailed analysis of their effect on the statistics and was done to reduce the co-efficient of variation to below 2, whilst maintaining the mean to within 10% of the un-cut value. The top-cuts applied are generally between 10g/t Au and 30g/t Au for the majority of the mineralised domains, and 400g/t Au in the Main Vein.
A comprehensive variography study has been undertaken on the top-cut composited data for each of the mineralisation domains using directional normalised log variograms fitted with spherical models. For the major mineralised domains the nugget is low at 30%, and for the high grade Main Vein domain very low at 5%, reflecting the good grade continuity.
In general, the downhole and directional variograms show very good structure for this type of shear zone gold deposit, although the minor axis variograms are generally poor. The ranges of the semi-variograms are generally 35m down dip and 80m along strike, which is relatively long, again reflecting the good grade continuity.
OK was used to interpolate the grades into the block model on the basis of the statistical and variography studies per domain. A QKNA was used to optimise and select the block sizes and estimation parameters to minimise the conditional bias of estimated block grades. The QKNA study indicated that a model with parent block sizes of 15m by 15m by 10m would be the most appropriate. Sub-blocking in order to honour the geometry of the deposit was done to a minimum sub-block size of 1m in all directions.
The other estimation parameters, such as search ellipses, block discretisation, minimum and maximum number of samples, etc, were chosen on the basis of the QKNA study. The search ellipses were also defined using the variogram parameters and the QKNA results and generally follow the major geological orientations. Several passes of interpolation applying larger search ellipses and varying minimum and maximum numbers of samples have been undertaken to ensure all blocks within the mineralisation domains were interpolated with a grade.
The validation of the resultant block model has been done both statistically by comparing the block statistics with the composite statistics (also de-clustered), by interpolation using a different method and spatially by presenting easting, northing and level slices through the deposit displaying graphs of the different mean grades and numbers of samples. The grade profiles generally show that grade trends in the block model follow the grade trends in the composite borehole data. Further validation of the block model was also undertaken looking at de-clustered mean grades per mineralisation domain.
11.3.3 Classification Classification of the Mineral Resources at Ad Duwayhi is based on the development of wireframes based on confidence in the geology, domaining, data quality, drillhole density and spatial variability. Wireframes are created to represent “potentially measured” category material based on the variography on the basis of 25m drill spacing.

SRK Consulting Ma'aden Gold MER – Main Report
U3330_Ma'aden MER.doc November, 2007 Page 161
• Measured Mineral Resources: Zones within the defined wireframes which are not subject to further downgrading;
• Indicated Mineral Resources: Zones representing the Main Vein portions (due to their complexity) contained within the wireframes; and
• Inferred Mineral Resources: Mineralised zones not contained within the wireframes and representing minor geological domains.
11.3.4 Selective Mining Units The pre-feasibility study undertook various assessments to determine the impact of different SMUs. The study concluded that in general the resource model is insensitive to change of support issues for open-pit mining, however it is highly sensitive to the use of small SMU’s on the Main Vein. Based on the equipment selection and blast-hole spacing assumed for the pre-feasibility study a SMU of 5m by 5m by 5m was chosen.
11.3.5 Grade control and reconciliation On development of the project it is assumed that grade control drilling will be based on blast-hole sampling which in conjunction with in-pit mapping will be used to develop a grade control model. The results from this will then be used for short term mine planning as well as comparisons with the exploration and mine-mill reconciliations.
11.3.6 Economic potential and Grade-Tonnage analysis Figure 11.1 presents a grade-tonnage curve for the current Mineral Resource at Ad Duwayhi. The in-situ cut-off grade has been re-estimated using a gold price of US$550/oz and equates to 0.8g/t Au however the Mineral Resource as reported is as per the pre-feasibility study which used an in-situ cut-off grade of 1.0g/t Au.
Figure 11.1 Ad Duwayhi grade-tonnage curve(1)
1.0g
/t A
u Eq
17.07Mt
3.9g/t Au Eq
0.00
5.00
10.00
15.00
20.00
0.00
1.00
2.00
3.00
4.00
5.00
6.00
7.00
8.00
9.00
10.0
0
In-Situ COG (g/t Au)
Tonn
age
(Mt)
0.00
5.00
10.00
15.00
20.00
0.00
1.00
2.00
3.00
4.00
5.00
6.00
7.00
8.00
9.00
10.0
0
Grade (g/t A
u); Content (M
oz Au)
Tonnage (Mt) Grade (g/t Au) Content (Moz Au) ICOG-3R (1) ICOG-3R: the in-situ cut-off-grade applied to the Mineral Resource base to determine the Measured and
Indicated Mineral Resources which are satisfies the requirement of “potentially economically mineable” (3R – Measured, Indicated and Inferred).
Table 11.1 presents the modifying factors applicable to future ore mined at Ad Duwayhi

SRK Consulting Ma'aden Gold MER – Main Report
U3330_Ma'aden MER.doc November, 2007 Page 162
assuming a long term gold price of US$550/oz.
Table 11.1 Ad Duwayhi: modifying factors Statistics Units Open-Pit Ore Physical Factors Extraction Ratio (%) 100% Dilution (%) 0% Grade Factors (% Au) 100.0% Financial Factors Mining (US$/t) 1.47 Processing (US$/t) 10.92 Overheads (US$/t) 1.06 Product Charges (US$/t) 0.05 Total (US$/t) 13.50 Commodity Prices Payability Gold Equivalents Gold (US$/oz) 550 (% Au) 92.9% 1.00000 Cut-off Grades RoM (g/t Au Eq) 0.8 ICOG (g/t Au Eq) 0.8 Resource COG (g/t Au Eq) 0.8
11.3.7 Pre-feasibility study LoMp modified resource estimation The estimation of modified resources at Ad Duwayhi was based on technical studies undertaken as part of the pre-feasibility study published 2007Q1. The ultimate pit design within which the modified resources are reported is based on an optimised shell derived using a gold price of US$340/oz and reporting of all economic material within this ultimate pit design using US$450/oz. The design pits incorporate all necessary waste stripping and other engineering considerations. The modified resources were limited to those classified as Measured and Indicated Mineral Resources and were scheduled on a monthly basis to meet the various production criteria.
Accordingly given the relatively low commodity prices used, potential exist to revise the optimisation as well as the economic cut-off grades used to determined the economic modified resources.
11.3.8 Mineral Resource and Ore Reserve statements Table 11.2 presents the Mineral Resource (1 July 2007) statement and Table 11.3 presents the Mineral Resource sensitivity presented at a range of commodity prices. The suffix (1) and (2) respectively represent those Mineral Resources used as a base for modification to determine Modified Resources and those Mineral Resources which have not been used as a base for modification to determine Modified Resources. The following nomenclature also applies: o/p – open-pit.
Table 11.2 Ad Duwayhi: Mineral Resource (1 July 2007)(1) Mineral Resources Tonnage Grade Content (kt) (g/t Au) (g/t Au Eq) (koz Au) (koz Au Eq)Measured o/p(1) 7,222 2.8 2.8 648 648Subtotal 7,222 2.8 2.8 648 648Indicated o/p(1) 6,359 5.7 5.7 1,169 1,169Subtotal 6,359 5.7 5.7 1,169 1,169Measured + indicated o/p(1) 13,581 4.2 4.2 1,817 1,817Total 13,581 4.2 4.2 1,817 1,817Inferred o/p(1) 3,493 2.7 2.7 299 299Subtotal 3,493 2.7 2.7 299 299Mineral Resources o/p(1) 17,074 3.9 3.9 2,116 2,116Total 17,074 3.9 3.9 2,116 2,116
(1) The pre-feasibility study for Ad Duwayhi assumes an optimised shell derived at a gold price of US$340/oz.

SRK Consulting Ma'aden Gold MER – Main Report
U3330_Ma'aden MER.doc November, 2007 Page 163
Table 11.3 Ad Duwayhi Mineral Resource sensitivity (1 July 2007)(1) Commodity Prices
Gold (US$/oz) 350 450 550 650 750Mineral Resource Sensitivity
Tonnage (kt) 7,963 10,213 11,279 11,916 12,447Grade (g/t Au) 3.7 3.5 3.4 3.4 3.4Grade (g/t Au Eq) 3.7 3.5 3.4 3.4 3.4Content (koz Au) 957 1,156 1,250 1,304 1,343Content (koz Au Eq) 957 1,156 1,250 1,304 1,343
(1) Mineral Resources reporting to various optimised shells corresponding to various commodity prices.
11.3.9 Mineral Resource and Ore Reserve potential Mineral Resource potential at Ad Duwayhi is largely focused on exploration targeting potential extensions to the currently defined Mineral Resources. In addition to this, SRK notes the potential of the colluvial sands and gravels which to date have not been adequately sampled to establish a Mineral Resource.
Ore Reserve potential at Ad Duwayhi is largely dependent upon completion of the feasibility study as well as demonstrating the technical feasibility and economic viability of the Taif Project water pipeline. In conjunction with this, consideration for increasing the commodity prices used is warranted which may further justify deepening of the proposed open-pit.
11.4 Mining Engineering On execution of the development plan for Ad Duwayhi, mining operations will comprise open-pit mining resulting in depletion of the modified Mineral Resources by 2020, assuming commencement of processing in 2011.
11.4.1 Mining Access and Mining Method Mine access to the open-pits is via a single haul road developed as part of the starter pit and the final pit and extending from surface to a depth of 145m below surface. The open-pit is designed with the following parameters: 20m wide ramps with a gradient of 10% and overall slope angles ranging from 45° to 58°. Other final design aspects are: bench heights of 15m; batter angles of 75°; and berm widths of 8m.
Mining methods comprise standard drill-blast-load-haul with a total material moved capacity of 9.5Mtpa. Mining occurs by drilling and blasting 5m high sub-benches with 120mm to 200mm blast holes. Hydraulic excavators with 8.4m3 bucket capacities load blasted ore and 10.0m3 bucket capacities load waste into 80t rear-dump haul trucks. Additional service equipment comprise graders, tracked dozers, water trucks and general service vehicles.
11.4.2 Mining LoMp Table 11.4 presents the forecast LoMp mining operating statistics for Ad Duwayhi. The production forecasts is as per the pre-feasibility study and is largely constrained by the mining fleet capacity and the requirement to meet the 1.0Mtpa processing capacity. Practical constraints combined with the grade distribution necessitate reduced ore mining from 2014 through 2016 inclusive when the focus is the waste stripping required. The LoMp assumes the mining of 10.2Mt of ore at a grade of 3.5g/t Au and a stripping ratio of 6.8twaste:tore.

SRK Consulting Ma'aden Gold MER – Main Report
U3330_Ma'aden MER.doc November, 2007 Page 164
Table 11.4 Ad Duwayhi: LoMp mining operating statistics Operating Statistics (Units) 2010 2011 2012 2013 2014 2015Tonnage (kt) 0 1,011 2,272 1,105 283 588Grade (g/t Au) 0.0 2.1 2.7 6.3 2.1 2.0Waste mined (kt) 700 8,489 7,228 8,395 9,217 8,912Total Mined (kt) 700 9,500 9,500 9,500 9,500 9,500Stripping Ratio (twaste:tore) 0.0 8.4 3.2 7.6 32.6 15.2Operating Expenditures (US$/t) 1.53 1.39 1.44 1.45 1.34 1.38Operating Statistics (Units) 2016 2017 2018 2019 2020 LoMpTonnage (kt) 772 977 1,153 1,619 432 10,213Grade (g/t Au) 2.4 3.1 3.9 4.9 4.2 3.5Waste mined (kt) 8,728 7,023 5,847 4,381 660 69,578Total Mined (kt) 9,500 8,000 7,000 6,000 1,091 79,791Stripping Ratio (twaste:tore) 11.3 7.2 5.1 2.7 1.5 6.8Operating Expenditures (US$/t) 1.41 1.54 1.68 1.86 1.33 1.47
11.5 Metallurgical Processing The Ad Duwayhi Plant (Figure 11.3) will process ore mined from the open-pit operation. The process has a rated capacity of 1.0Mtpa and comprises a comminution circuit, a parallel gravity circuit for recovery of coarse grained free gold and a CIL circuit followed by elution, electrowinning and smelting to produce gold in doré form for third party refining.
11.5.1 Processing Facilities RoM ore from the open-pit operations will be crushed in a single stage primary crusher fed by direct dump or front-end loader which in turn will establish a live crushed primary ore stockpile. Following reclamation by conveyor, crushed ore will be milled in a semi-autogenous grinding mill (“SAG”) with pebble recycling and a ball mill operating in closed circuit. The combined SAG and ball mill discharge will be pumped to hydro-cyclones to produce a nominally 80% passing 75μm product. Cyclone underflow will be treated in a gravity circuit to recover free gold before recycling to the ball mill.
Slurry from the comminution circuit will be thickened prior to leaching in a six stage CIL circuit ahead of elution (AARL circuit), electrowinning and smelted along with the gravity concentrates to produce doré.
Tailings arising from the CIL circuit will be thickened and filtered to enable dry storage and minimise water usage.
11.5.2 Metallurgical Processing LoMp Table 11.5 presents the forecast LoMp processing performance statistics for the Ad Duwayhi Plant. The current LoMp assumes processing at a production rate of 1.0Mtpa and a metallurgical recovery of 93%. Operating expenditures as per the pre-feasibility study assume process operating expenditures of US$10.92/t.
Table 11.5 Ad Duwayhi: LoMp processing operating statistics Operating Statistics (Units) 2010 2011 2012 2013 2014 2015Processed Tonnage (kt) 0 1,000 1,000 1,000 1,000 1,000Grade (g/t Au) 0.0 2.1 3.2 3.7 3.8 3.0Metallurgical Recoveries Metallurgical Recovery (on-mine) (% Au) 0.0% 93.0% 93.0% 93.0% 93.0% 93.0%Metallurgical Recovery (Payable) (% Au) 0.0% 92.9% 92.9% 92.9% 92.9% 92.9%Payable Production (kg Au) 0 1,970 3,001 3,395 3,492 2,783Operating Expenditures (US$/t) 0.00 10.92 10.92 10.92 10.92 10.92Operating Statistics (Units) 2016 2017 2018 2019 2020 LoMpTonnage (kt) 1,000 1,000 1,000 1,000 1,000 10,213Grade (g/t Au) 2.9 3.0 4.0 5.2 4.2 3.5Metallurgical Recoveries Metallurgical Recovery (on-mine) (% Au) 93.0% 93.0% 93.0% 93.0% 93.0% 93.0%Metallurgical Recovery (Payable) (% Au) 92.9% 92.9% 92.9% 92.9% 92.9% 92.9%Payable Production (kg Au) 2,703 2,819 3,686 4,831 3,893 33,408Operating Expenditures (US$/t) 10.92 10.92 10.92 10.92 10.92 10.92

SRK Consulting Ma'aden Gold MER – Main Report
U3330_Ma'aden MER.doc November, 2007 Page 165
11.6 Tailings Storage Facilities The pre-feasibility study assumes the requirement to store 10.2Mt with 80% of the tailings particles being finer than 80μm and 80% solids by mass after filtration. The specific gravity of the tailings is currently unknown due to limited testwork but has been assumed to be 1.6t/m3.
Filtered tailings will be trucked to a facility (0.5km2) situated southwest (500m) of the process plant. On deposition tailings will be distributed and compacted in layers and given the high evaporation, no bleed water is expected from the site. The impoundment will be surrounded by a waste rock wall with around 2m freeboard.
11.7 Engineering Infrastructure, Overheads and Capital Expenditure
11.7.1 Access, Power, Water and Engineering Infrastructure The site is accessed along a combination of national (393km) and local roads (144km) travelling northwest from Mecca along highways (5, 14 , 40) towards Al Houmiat (also referred to as Al Humiyah or Al Hufayyirah) a settlement on highway 40, thereafter south-southwest some 90km from Al Houmiat on local roads to the current exploration camp. The village of Kutayfan, with a population of 1,000 is situated some 60km to the south-west.
All power will be supplied by on-site diesel generators.
The pre-feasibility study indicated that certain of the water supply could be delivered by establishing a well-field at some 25km distant from the mine. Given the projected operating life and water demand from the plant it is apparent that a high level of risk remains in pursuing the well field option. The principal alternative is the development of the Taif Project which assumes the construction (at a cost of US$90m) of a 500km pipeline from Taif to transport effluent water arising from an existing sewage water treatment plant servicing the city of Taif. The pipeline capacity is estimated at 417m3/hr with a operating cost of US$1.5mpa.
11.7.2 Overhead Operating Expenditure Table 11.6 presents the forecast LoMp overhead operating expenditure for Ad Duwayhi which is estimated at approximately US$1.06mpa.
Table 11.6 Ad Duwayhi: LoMp overhead operating expenditure statistics Operating Statistics (Units) 2010 2011 2012 2013 2014 2015Tonnage (kt) 0 1,000 1,000 1,000 1,000 1,000Operating Expenditures (US$/t) 0.00 1.06 1.06 1.06 1.06 1.06
(US$m) 0.00 1.06 1.06 1.06 1.06 1.06Operating Statistics (Units) 2016 2017 2018 2019 2020 LoMpTonnage (kt) 1,000 1,000 1,000 1,000 1,000 10,213Operating Expenditures (US$/t) 1.06 1.06 1.06 1.06 1.06 1.06
(US$m) 1.06 1.06 1.06 1.06 1.06 10.8
11.7.3 Capital Expenditure Table 11.7 presents the forecast capital expenditure for Ad Duwayhi which amounts to US$105.39m over the LoMp. The project capital is estimated at US$91.18m and includes contingencies of 20% for processing, tailings disposal, on-site infrastructure and off-site infrastructure. All capital expenditure from 2011 is in essence sustaining in nature and includes fleet replacement costs in 2017. Further sustaining capital allowances are provided and include: 2% of the processing project capital per annum; and 1% of the on-site and off-site infrastructure project capital expenditures per annum.

SRK Consulting Ma'aden Gold MER – Main Report
U3330_Ma'aden MER.doc November, 2007 Page 166
Table 11.7 Ad Duwayhi: Pre-feasibility study capital expenditures Operating Statistics (Units) 2010 2011 2012 2013 2014 2015Capital Expenditure (US$m) 91.18 0.92 0.92 0.92 1.11 3.09Project Capital (US$m) 91.18 0.00 0.00 0.00 0.19 2.18Mining (US$m) 18.87 0.00 0.00 0.00 0.19 2.18Processing (US$m) 36.89 0.00 0.00 0.00 0.00 0.00Tailings Disposal (US$m) 5.17 0.00 0.00 0.00 0.00 0.00On Site Infrastructure (US$m) 6.91 0.00 0.00 0.00 0.00 0.00Off Site Infrastructure (US$m) 11.08 0.00 0.00 0.00 0.00 0.00Owner's Costs (US$m) 12.25 0.00 0.00 0.00 0.00 0.00Sustaining Capital (US$m) 0.00 0.92 0.92 0.92 0.92 0.92Operating Statistics (Units) 2016 2017 2018 2019 2020 LoMpCapital Expenditure (US$m) 0.92 5.43 0.92 0.00 0.00 105.39Project Capital (US$m) 0.00 4.51 0.00 0.00 0.00 98.05Mining (US$m) 0.00 4.51 0.00 0.00 0.00 25.75Processing (US$m) 0.00 0.00 0.00 0.00 0.00 36.89Tailings Disposal (US$m) 0.00 0.00 0.00 0.00 0.00 5.17On Site Infrastructure (US$m) 0.00 0.00 0.00 0.00 0.00 6.91Off Site Infrastructure (US$m) 0.00 0.00 0.00 0.00 0.00 11.08Owner's Costs (US$m) 0.00 0.00 0.00 0.00 0.00 12.25Sustaining Capital (US$m) 0.92 0.92 0.92 0.00 0.00 7.34
11.8 Human Resources Table 11.8 presents the forecast TEC and productivities for Ad Duwayhi.
Table 11.8 Ad Duwayhi: Pre-feasibility study Human Resources statistics Operating Statistics (Units) 2010 2011 2012 2013 2014 2015TEC Mine (No) 187 189 189 189 189Mill (No) 66 66 66 66 66Administration (No) 38 38 38 38 38Total (No) 0 291 293 293 293 293Productivity Tonnage (t/TEC/month) 0 286 284 284 284 284Gold Equivalent (g/TEC/month) 0 564 853 965 992 791Operating Statistics (Units) 2016 2017 2018 2019 2020 LoMpTEC Mine (No) 190 182 182 170 170 185Mill (No) 66 66 66 66 66 66Administration (No) 38 37 37 35 35 37Total (No) 294 285 285 271 271 283Productivity Tonnage (t/TEC/month) 283 292 292 307 307 292Gold Equivalent (g/TEC/month) 765 824 1,077 1,483 1,195 956
11.9 Environmental
11.9.1 Environmental Setting The project site is in an extremely remote setting. Duwayah, which is about 5km from the project site, comprises little more than wells, a shop and a petrol pump. The nearest villages are Kutayfan, some 60km to the south-west, and Warshah, about 50km to the south east.
There are no well defined wadi drainage systems in the area of the site. Drainage lines on the site dissipate into sand or salt pans. Groundwater movement is predominantly restricted to flow in fractures and groundwater levels are generally 20m to 23m below the ground surface. Groundwater sampled at the site was found to be saline and to contain natural radionuclides (alpha emitters, traces of beta emitters and gamma emitters). The most likely source of this radiation is the natural uranium thorium decay series.
The ARD potential of ore and waste rock has not yet been determined. Gold is associated with pyrite and other sulphides.
11.9.2 Compliance Ad Duwayhi is currently a Development Property for which a pre-feasibility study has been completed. In accordance with local legislation an EIA, closure plan and a closure cost estimate will only be required for the project when the project proceeds to a feasibility study level.

SRK Consulting Ma'aden Gold MER – Main Report
U3330_Ma'aden MER.doc November, 2007 Page 167
11.9.3 Environmental Management The Company’s Health, Safety and Environmental Policy commits to the establishment of a health, safety and environmental management system. To this end the Company has designed EMS and OHSS manuals and intends to introduce these to Ma’aden Gold in the second half of 2007.
11.9.4 Key Environmental Issues An environmental baseline study has been undertaken for Ad Duwayhi by external consultants in 2003. The following issues require particular attention in the EIA for the mine, should the project be advanced to the feasibility study stage:
• Potential Water Pollution: The spread of polluted water on the mine site is expected to be restricted by the arid climate and it appears that there are no well defined water pathways for the transport of pollutants. Nevertheless, the potential water pollution impacts of the project need to be understood, particularly of ARD impacts at the site after closure; and
• Water Supply: Specifically any decrease in availability of water to surrounding water users. The impact of water abstraction by the mine on water availability to other water users needs to be determined.
11.9.5 Environmental Liabilities The current closure cost estimate for Ad Duwayhi is forecast at US$8.8m comprising US$3.7m for bio-physical closure and US$5.1m for TBL. These estimates are largely based on the original derivation by SRK. The estimate however is not based on engineering take-offs and is considered to be only at a conceptual level. Accordingly there remains a risk that a detailed closure estimate based on appropriate engineering studies will increase the current bio-physical component of the environmental liability. Notwithstanding the above, SRK notes that these liabilities will only materialise should the decision be taken to construct and commission the project upon completion of a feasibility study. Accordingly as at 1 July 2007 the total attributable liability is US$0.0m.
Table 11.9 Ad Duwayhi: environmental (bio-physical and social) liabilities Environmental Liability Units AmountBio-physical Closure (US$m) 3.7Civil Demolition (US$m) 0.5PP&E Decommissioning (US$m) 1.4Tailings Storage Facility (US$m) 1.7Post-closure monitoring (US$m) 0.2Terminal Benefits (US$m) 5.1Total (US$m) 8.8
11.10 Risks and Opportunities The principal on-mine risk at Ad Duwayhi is:
• The development risk given the dependency on both water supply from the Taif Project and establishing technical feasibility and economic viability of the CAG Project.
The principal on-mine opportunities at Ad Duwayhi are:
• Mineral Resources: Exploration targeting potential extensions to the currently defined Mineral Resources and the exploration potential of the colluvial sands and gravels; and
• Ore Reserves: Consideration for increasing the commodity prices used for the pre-feasibility study may further justify deepening of the proposed open-pit as well as upgrading of the currently defined Inferred Mineral Resources to the Indicated Mineral

SRK Consulting Ma'aden Gold MER – Main Report
U3330_Ma'aden MER.doc November, 2007 Page 168
Resource category.
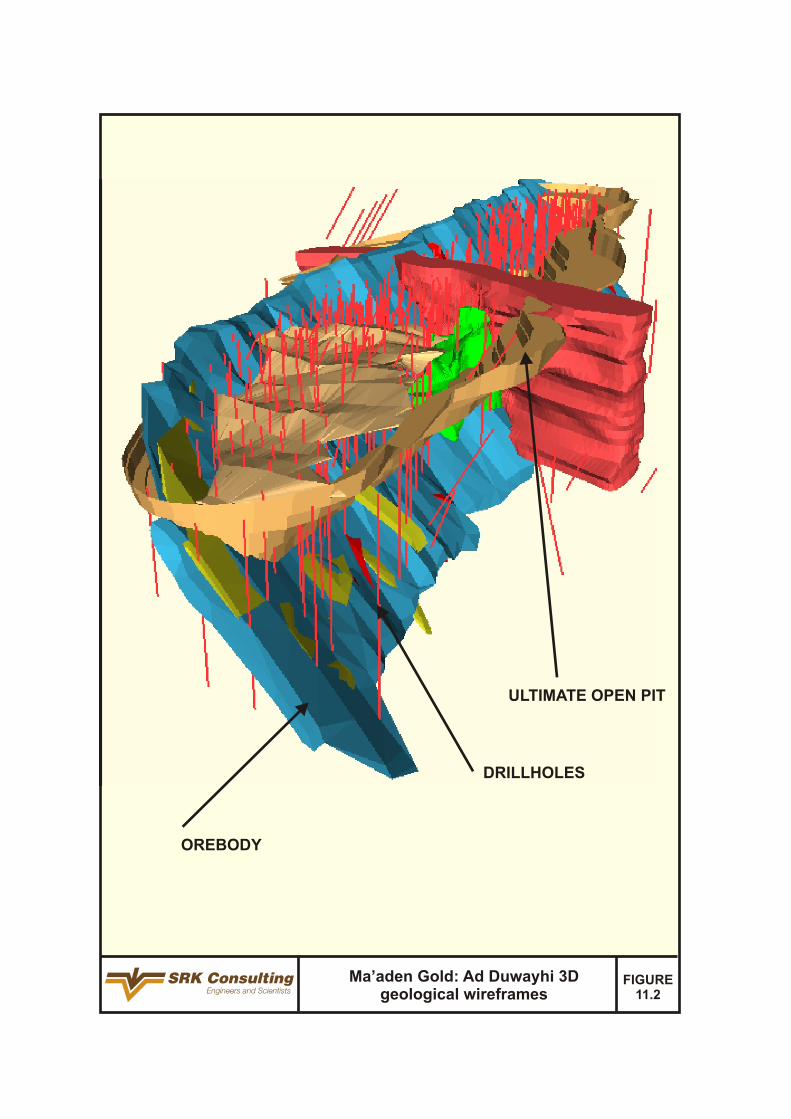


SRK Consulting Ma'aden Gold MER – Main Report
U3330_Ma'aden MER.doc November, 2007 Page 171
12 HEAD OFFICE
12.1 Introduction The following section presents discussion and comment on the Head Office services as provided by Ma’aden Gold. Historical and forecasts statistics presented also include summaries of the exploration expenditures.
12.2 Services The Head Office provides management services to each of the operating mines through the following: General and Administration Division (Management; Operations; Industrial Relations; and Finance); Projects and Technical Services Division; and Exploration Division.
12.3 Manpower The total TEC currently employed at the Ma’aden Gold’s Head Office is 121 (Table 12.1) with 55 attributed to the G&A Division, seven in the Projects and Technical Services Division and 59 in exploration. This level of expenditure is assumed to continue until 2010, thereafter reducing in accordance with the forecast reduction in operating assets as the Ore Reserves are depleted, specifically from 2011 onwards.
Table 12.1 Head Office: historical and forecast human resource statistics Human Resources Units 2004 2005 2006 2007H1 2007H2 2008General & Administration (No) 92 53 55 55 55 55Projects and Technical Services (No) 7 7 7 7 7 7Exploration (No) 44 49 62 59 59 59Total (No) 143 109 124 121 121 121
12.4 Historical and short term forecasts Table 12.2 presents the historical and short term forecast operating and capital expenditure statistics for Ma’aden Gold’s Head Office. Operating expenditures from 2004 through 2006 vary significantly and other than for 2004, the principal contributions are directly related to exploration activities. The operating expenditures and capital expenditures incurred in 2007H1 indicated a significant underspend when compared against that budgeted, and the current LoMp assumes that such underspend is not planned to continue. This under spend is also directly responsible for the lower operating unit cash costs noted in 2007H1 versus that projected in 2007H2 and onwards.
Table 12.2 Head Office: historical and short term forecast operating and capital expenditures
Statistics Units 2004 2005 2006 2007H1 2007H2 2008Expenditures General and Administration (US$m) 13.67 4.55 5.90 2.19 4.21 7.20Project and Technical Services (US$m) 1.77 1.11 1.46 0.81 2.77 4.92Exploration (US$m) 6.68 8.03 8.71 3.37 5.19 9.20Total Operating Expenditure (US$m) 22.12 13.69 16.07 6.37 12.17 21.32Capital Expenditure (US$m) 4.38 0.44 0.03 0.10 0.08 4.13
12.5 LoMp forecasts Table 12.3 presents the LoMp forecast operating and capital expenditure statistics for Ma’aden Gold’s Head Office. These expenditures are largely dependent upon the success of the proposed exploration programme as this contributes a significant portion for 2007H2 through 2010 inclusive. Furthermore, SRK considers that scope exists for rationalisation of such expenditures and, given the current under spend, consideration should be given to reviewing the forecast expenditures from 2007H2 onwards, specifically in respect of G&A and Project Technical Services.
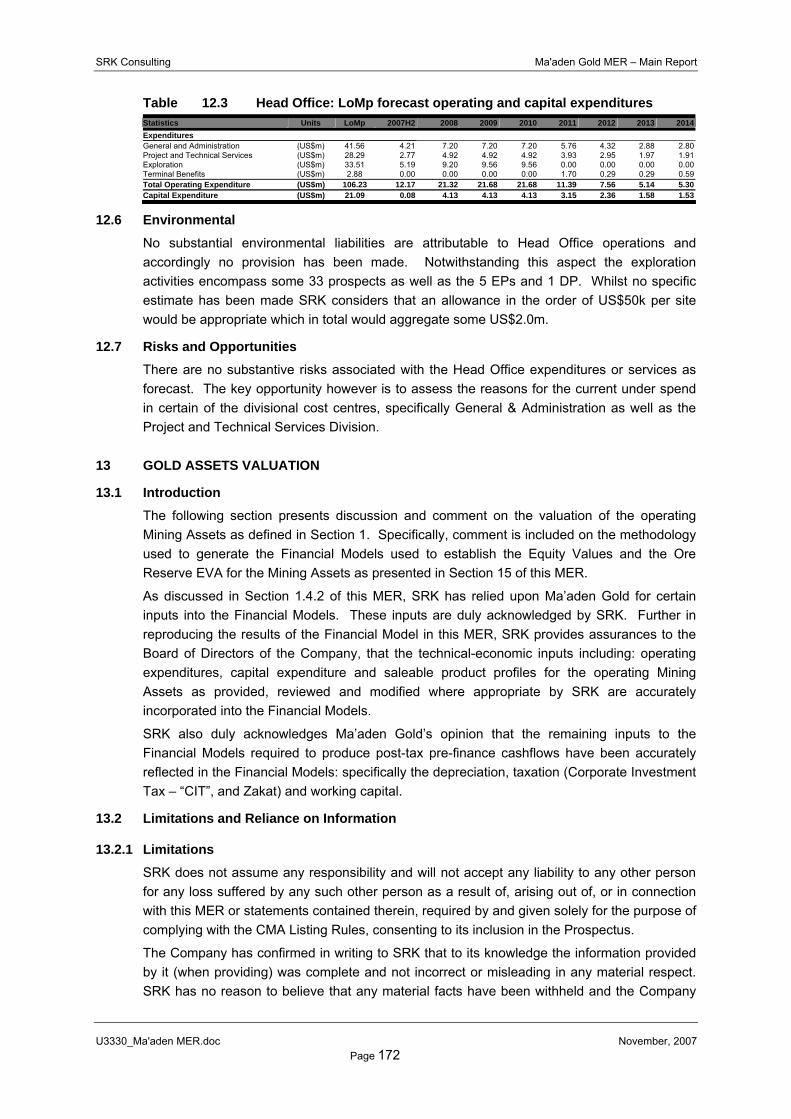
SRK Consulting Ma'aden Gold MER – Main Report
U3330_Ma'aden MER.doc November, 2007 Page 172
Table 12.3 Head Office: LoMp forecast operating and capital expenditures Statistics Units LoMp 2007H2 2008 2009 2010 2011 2012 2013 2014Expenditures General and Administration (US$m) 41.56 4.21 7.20 7.20 7.20 5.76 4.32 2.88 2.80Project and Technical Services (US$m) 28.29 2.77 4.92 4.92 4.92 3.93 2.95 1.97 1.91Exploration (US$m) 33.51 5.19 9.20 9.56 9.56 0.00 0.00 0.00 0.00Terminal Benefits (US$m) 2.88 0.00 0.00 0.00 0.00 1.70 0.29 0.29 0.59Total Operating Expenditure (US$m) 106.23 12.17 21.32 21.68 21.68 11.39 7.56 5.14 5.30Capital Expenditure (US$m) 21.09 0.08 4.13 4.13 4.13 3.15 2.36 1.58 1.53
12.6 Environmental No substantial environmental liabilities are attributable to Head Office operations and accordingly no provision has been made. Notwithstanding this aspect the exploration activities encompass some 33 prospects as well as the 5 EPs and 1 DP. Whilst no specific estimate has been made SRK considers that an allowance in the order of US$50k per site would be appropriate which in total would aggregate some US$2.0m.
12.7 Risks and Opportunities There are no substantive risks associated with the Head Office expenditures or services as forecast. The key opportunity however is to assess the reasons for the current under spend in certain of the divisional cost centres, specifically General & Administration as well as the Project and Technical Services Division.
13 GOLD ASSETS VALUATION
13.1 Introduction The following section presents discussion and comment on the valuation of the operating Mining Assets as defined in Section 1. Specifically, comment is included on the methodology used to generate the Financial Models used to establish the Equity Values and the Ore Reserve EVA for the Mining Assets as presented in Section 15 of this MER.
As discussed in Section 1.4.2 of this MER, SRK has relied upon Ma’aden Gold for certain inputs into the Financial Models. These inputs are duly acknowledged by SRK. Further in reproducing the results of the Financial Model in this MER, SRK provides assurances to the Board of Directors of the Company, that the technical-economic inputs including: operating expenditures, capital expenditure and saleable product profiles for the operating Mining Assets as provided, reviewed and modified where appropriate by SRK are accurately incorporated into the Financial Models.
SRK also duly acknowledges Ma’aden Gold’s opinion that the remaining inputs to the Financial Models required to produce post-tax pre-finance cashflows have been accurately reflected in the Financial Models: specifically the depreciation, taxation (Corporate Investment Tax – “CIT”, and Zakat) and working capital.
13.2 Limitations and Reliance on Information
13.2.1 Limitations SRK does not assume any responsibility and will not accept any liability to any other person for any loss suffered by any such other person as a result of, arising out of, or in connection with this MER or statements contained therein, required by and given solely for the purpose of complying with the CMA Listing Rules, consenting to its inclusion in the Prospectus.
The Company has confirmed in writing to SRK that to its knowledge the information provided by it (when providing) was complete and not incorrect or misleading in any material respect. SRK has no reason to believe that any material facts have been withheld and the Company

SRK Consulting Ma'aden Gold MER – Main Report
U3330_Ma'aden MER.doc November, 2007 Page 173
has confirmed in writing to SRK that it believes it has provided all material information.
The achievability of the LoMps are neither warranted nor guaranteed by SRK. The LoMps as discussed presented and discussed herein have been proposed by the Company’s management and adjusted where appropriate by SRK, and cannot be assured; they are necessarily based on economic assumptions, many of which are beyond the control of the Company. Future cashflows and profits derived from such forecasts are inherently uncertain and actual results may be significantly more or less favourable.
13.2.2 Reliance on Information SRK believes that its opinion must be considered as a whole and that selecting portions of the analysis or factors considered by it, without considering all factors and analyses together, could create a misleading view of the process underlying the opinions presented in the MER. The preparation of a MER is a complex process and does not lend itself to partial analysis or summary.
SRK’s Equity Value for the Company is effective at 1 July 2007 and is based on information provided by the Company throughout the course of SRK’s investigations, which in turn reflect various technical-economic conditions prevailing at the date of this report. In particular, the Equity Value and Ore Reserve EVA is based on expectations regarding the commodity prices and exchange rates prevailing at the date of this report. These and the underlying TEPs can change significantly over relatively short periods of time. Should these change materially the Equity Value could be materially different in these changed circumstances. Further, SRK has no obligation or undertaking to advise any person of any change in circumstances which comes to its attention after the date of this MER or to review, revise or update the MER or opinion.
13.3 Valuation Methodology The valuation methodology for arriving at the Equity Value of the Mining Assets is based on the sum of the parts approach comprising the following:
• The Enterprise Value defined as the sum of the NPVs of the five Tax Entities; and
• Various Valuation Adjustments.
The Enterprise Value is also defined as the Net Asset Value (“NAV”) of the Mining Assets. The sum of the NAV and the valuation adjustments is defined as the Equity Value attributable to Ma’aden Gold.
SRK has not undertaken a valuation of the Exploration Properties and accordingly the NAV of the Gold Assets is the aggregate NPV of Mahd Ad’Dahab, Al Amar, Bulghah, Sukhaybarat, and Al Hajar.
The methodology for undertaking the Ore Reserve EVA is based on the commodity price which:
• Is equivalent to the weighted average LoMp real terms total costs;
• Reflects the current (2007H1) cash costs reported on a by-product basis; and
• Is required to return a zero NPV at a real terms discount factor of 10%.
13.4 Enterprise Value: Basis of Valuation The Enterprise Values are based on the application of DCF techniques to the post-tax pre-finance cashflows represented by the Financial Models as developed for each Tax Entity. The Financial Models are based on the various LoMps, including the TEPs as previously

SRK Consulting Ma'aden Gold MER – Main Report
U3330_Ma'aden MER.doc November, 2007 Page 174
discussed in the individual technical sections.
The Financial Models are based on annual cashflow projections ending 31 December and TEPs stated in 1 July 2007 money terms. As the Effective Date is 1 July 2007, the cashflow projection for Year 1 includes projections for six months only.
In generating the Financial Models and deriving the Enterprise Values, SRK specifically, has:
• Incorporated the macro-economic forecasts as reflected in Table 1.2;
• Incorporated the commodity price forecasts as reflected in Table 1.2;
• Applied a real discount factor of 10% which can be compared with the Weight Adjusted Cost of Capital (“WACC”) of 7.36% real (Table 13.1);
• Relied upon Ma’aden Gold to the extent that for all accounting inputs as required for the generation of the Financial Models in respect of the Net Movement in Working Capital (Table 13.2, Table 13.3);
• Relied upon the Board of Directors of the Company for all accounting inputs as required for the generation of the Financial Models in respect of Taxation (Table 13.4).
• Reported Enterprise Values for the Mining Assets as at 1 July 2007 which are based on a DCF valuation of the post-tax pre-finance cashflows resulting from the Financial Models;
• Performed sensitivity analyses to ascertain the impact of discount factors, commodity prices and total working costs; and
• Excluded the impact of salvage value on cessation of operations.
Table 13.1 Weight Adjusted Cost of Capital calculations for the Mining Assets Assumptions Units Saudi ArabiaCorporate Tax Rate (%) 20.00%Long Term Inflation (%) 2.69%Debt as a % of Capital (%) 10.00%Cost of Debt Pre-tax cost of debt – Long term (%) 4.80%Less: tax shield (%) -0.96%After-tax cost of debt (%) 3.84%Cost of Equity Risk-free rate (%) 5.10%Country Risk (%) -0.44%Beta-weighted market risk premium - Equity market risk premium (%) 4.80%- Proxy beta (%) 1.31Cost of equity (%) 10.95%Weighted Average Cost of Capital Debt (10%) (%) 0.38%Equity (90%) (%) 9.86%WACC (Nominal) (%) 10.24%Project Risk Premium (%) 0.0%WACC (Nominal) - inc risk premium (%) 10.24%WACC (Real) - inc risk premium (%) 7.36%
Table 13.2 Working Capital input parameters as at 1 July 2007 (opening
balances) Assets Units Debtors Creditors StoresMa'ahd Ad'Dahab (US$m) 2.6 (1.1) 8.8Al Amar (US$m) - - 3.2Bulghah (US$m) 1.0 (1.5) 2.6Sukhaybarat (US$m) 0.6 (0.9) 2.6Al Hajar (US$m) 0.4 (0.4) 1.4Total (US$m) 4.6 (3.9) 18.6
Table 13.3 Working Capital input parameters as at 1 July 2007 (days) Assets Units Debtors Creditors StoresMa'ahd Ad'Dahab (days) 40 30 60Al Amar (days) 40 30 60Bulghah (days) 40 30 60Sukhaybarat (days) 40 30 60Al Hajar (days) 40 30 60

SRK Consulting Ma'aden Gold MER – Main Report
U3330_Ma'aden MER.doc November, 2007 Page 175
Table 13.4 Plant, Property and Equipment Net Book Value as at 1 July 2007 Assets PP&E
(US$m)Ma'ahd Ad'Dahab 4.2Al Amar 30.1Bulghah 18.9Sukhaybarat 6.6Al Hajar 1.6Head Office 0.9Total 62.2
13.5 Enterprise Value: Post-Tax–Pre-Finance Cashflows Table 13.5 through to Table 13.10 inclusive present the post-tax pre-finance cashflows for the operating Mining Assets as well as Head Office. Table 13.11 presents the consolidated cashflows for the Mining Assets, and is included for presentation purposes only and specifically includes the Head Office expenditures.
Table 13.5 through Table 13.11 inclusive are not financial statements (Income Statements; Cashflow Statements; and Balance Sheet Statements) as may be customary for determining the consolidated financial statements for companies. The first period 2007H1 reports the forecast six-month projections to 31 December 2007, thereafter the projections are annual ending 31 December.
Table 13.5 Mahd Ad’Dahab: Financial Model in US$ real terms (1 July 2007) Period Units Total/Avg 2007H2 2008 2009 2010 2011 2012 2013 2014
Production Mining Production - u/g Tonnage (kt) 1,007 92 184 184 184 184 179 0 0Grade (g/t Au) 10.5 10.8 10.8 10.8 10.5 10.5 10.0 0.0 0.0
(g/t Ag) 27.5 28.0 28.0 28.0 28.0 28.0 25.0 0.0 0.0 (% Zn) 1.68% 1.70% 1.70% 1.70% 1.70% 1.70% 1.60% 0.00% 0.00% (% Cu) 0.49% 0.50% 0.50% 0.50% 0.50% 0.50% 0.45% 0.00% 0.00%
Processing Production - u/g + s/f Tonnage (kt) 1,239 113 225 225 225 225 225 0 0Grade (g/t Au) 8.7 8.9 9.0 9.0 8.7 8.7 8.1 0.0 0.0
(g/t Ag) 24.2 24.6 24.7 24.7 24.7 24.7 21.9 0.0 0.0 (% Zn) 1.65% 1.66% 1.66% 1.66% 1.66% 1.66% 1.58% 0.00% 0.00% (% Cu) 0.40% 0.41% 0.41% 0.41% 0.41% 0.41% 0.36% 0.00% 0.00%
Payable Sales Gold (koz Au) 319 30 60 60 58 58 54 0 0Silver (koz Ag) 697 65 130 130 130 130 112 0 0Zinc (t Cu) 6,701 617 1,236 1,236 1,235 1,235 1,142 0 0Copper (t Zn) 3,539 329 660 660 660 660 572 0 0Lead (t Pb) 1,057 96 193 193 193 193 188 0 0Gold - Equivalent (koz Au Eq) 388 38 75 74 71 68 63 0 0Commodity Price Gold (US$/oz) 675 676 577 544 511 511 511 511Silver (US$/oz) 13.22 12.75 11.53 10.52 9.50 9.50 9.50 9.50Zinc (USc/lb) 160 144 113 89 65 65 65 65Copper (USc/lb) 318 294 245 192 140 140 140 140Lead (USc/lb) 91 78 67 54 40 40 40 40Sales Revenue (US$m) 183.3 20.0 40.3 34.4 31.5 29.6 27.4 - -Gold (US$m) 183.3 20.0 40.3 34.4 31.5 29.6 27.4 - -Operating Expenditure Summary (US$m) (51.5) (6.7) (8.6) (9.3) (11.0) (12.5) (3.4) - -Mining (US$m) (20.1) (1.8) (3.7) (3.7) (3.7) (3.7) (3.6) - -Processing (US$m) (40.3) (3.7) (7.3) (7.3) (7.3) (7.3) (7.3) - -Overheads (US$m) (19.9) (1.8) (3.6) (3.6) (3.6) (3.6) (3.5) - -TC/RC/Realisation/Transportation (US$m) (14.1) (1.5) (2.9) (2.7) (2.5) (2.3) (2.2) - -By-product Credits (US$m) 40.8 5.5 10.2 8.4 6.8 5.2 4.6 - -Environmental (US$m) (6.4) (0.6) (1.2) (1.2) (1.2) (1.2) (1.1) - -Terminal Benefits (US$m) (1.8) - - - - - (1.8) - -Net Change in Working Capital (US$m) 10.3 (2.8) (0.0) 0.8 0.5 0.4 11.5 - -Operating Profit (US$m) 131.8 13.3 31.8 25.1 20.5 17.1 24.0 - -Tax Liability (US$m) (16.0) (1.3) (4.7) (3.3) (2.2) (1.7) (2.9) - -Capital Expenditure (US$m) (10.6) (1.3) (2.0) (1.9) (1.8) (1.8) (1.8) - -Final Net Free Cash (US$m) 105.2 10.7 25.1 20.0 16.5 13.6 19.3 - -Cash Operating Costs (US$/oz Au) 168 112 124 149 178 202 223 - -Total Cash Costs (US$/oz Au) 168 112 124 149 178 202 223 - -Total Working Costs (US$/oz Au) 194 131 143 168 198 222 278 - -Total Costs (US$/oz Au) 195 269 177 187 221 247 97 - -

SRK Consulting Ma'aden Gold MER – Main Report
U3330_Ma'aden MER.doc November, 2007 Page 176
Table 13.6 Al Amar: Financial Model in US$ real terms (1 July 2007) Period Units Total/Avg 2007H2 2008 2009 2010 2011 2012 2013 2014
Production Mining Production - u/g Tonnage (kt) 1,350 0 155 201 200 201 201 199 194Grade (g/t Au) 9.9 0.0 9.1 9.0 10.7 11.1 10.5 10.4 8.2
(g/t Ag) 18.0 0.0 27.6 22.2 17.3 16.8 15.7 14.7 13.8 (% Zn) 5.37% 0.00% 5.33% 5.58% 5.32% 5.45% 5.66% 5.62% 4.58% (% Cu) 0.76% 0.00% 0.72% 0.62% 0.76% 0.75% 0.79% 0.99% 0.67%
Processing Production - u/g Tonnage (kt) 1,350 0 155 201 200 201 201 199 194Grade (g/t Au) 9.9 0.0 9.1 9.0 10.7 11.1 10.5 10.4 8.2
(g/t Ag) 18.0 0.0 27.6 22.2 17.3 16.8 15.7 14.7 13.8 (% Zn) 5.37% 0.00% 5.33% 5.58% 5.32% 5.45% 5.66% 5.62% 4.58% (% Cu) 0.76% 0.00% 0.72% 0.62% 0.76% 0.75% 0.79% 0.99% 0.67%
Payable Sales Gold (koz Au) 385 0 39 53 62 65 61 60 46Silver (koz Ag) 635 0 112 121 90 88 81 73 69Zinc (t Cu) 45,455 0 4,915 7,229 6,705 6,936 7,164 6,910 5,596Copper (t Zn) 7,782 0 817 899 1,157 1,145 1,218 1,590 956Gold - Equivalent (koz Au Eq) 606 0 72 95 97 93 90 90 69
Commodity Price Gold (US$/oz) 675 676 577 544 511 511 511 511Silver (US$/oz) 13.22 12.75 11.53 10.52 9.50 9.50 9.50 9.50Zinc (USc/lb) 160 144 113 89 65 65 65 65Copper (USc/lb) 318 294 245 192 140 140 140 140
Sales Revenue (US$m) 208.7 - 26.1 30.3 33.9 33.2 31.2 30.7 23.4Gold (US$m) 208.7 - 26.1 30.3 33.9 33.2 31.2 30.7 23.4Operating Expenditure Summary (US$m) (37.0) - 0.6 (2.0) (5.9) (8.0) (8.1) (7.4) (6.2)Mining (US$m) (34.4) - (4.2) (5.4) (6.3) (5.3) (5.4) (4.8) (2.9)Processing (US$m) (46.2) - (5.3) (6.9) (6.8) (6.9) (6.9) (6.8) (6.6)Overheads (US$m) (31.2) - (4.5) (4.5) (4.5) (4.5) (4.5) (4.5) (4.3)TC/RC/Realisation/Transportation (US$m) (46.1) - (7.5) (8.6) (7.1) (5.8) (6.0) (6.4) (4.7)By-product Credits (US$m) 121.9 - 22.4 24.2 19.0 14.3 14.8 15.5 11.6Environmental (US$m) (2.0) - (0.3) (0.3) (0.3) (0.3) (0.3) (0.3) (0.3)Terminal Benefits (US$m) (2.1) - - - - - - (0.1) (2.0)Net Change in Working Capital (US$m) 3.2 - (0.0) (0.5) 0.1 0.5 0.1 0.0 3.0Operating Profit (US$m) 171.8 - 26.7 28.4 27.9 25.2 23.1 23.3 17.2Tax Liability (US$m) (13.9) (0.7) (1.9) (2.7) (2.3) (2.3) (1.9) (1.4) (0.7)Capital Expenditure (US$m) (19.4) (2.7) (6.0) (2.5) (2.4) (2.6) (2.4) (0.6) (0.3)Final Net Free Cash (US$m) 138.5 (3.4) 18.7 23.2 23.2 20.4 18.7 21.3 16.2Cash Operating Costs (US$/oz Au) 94 0 -23 22 92 125 130 117 151Total Cash Costs (US$/oz Au) 94 0 -23 22 92 125 130 117 151Total Working Costs (US$/oz Au) 104 0 -15 28 97 130 135 123 201Total Costs (US$/oz Au) 146 0 140 84 134 162 173 132 142

SRK Consulting Ma'aden Gold MER – Main Report
U3330_Ma'aden MER.doc November, 2007 Page 177
Table 13.7 Bulghah: Financial Model in US$ real terms (1 July 2007) Period Units Total/Avg 2007H2 2008 2009 2010 2011 2012 2013 2014
Production Mining Production - o/p Tonnage (kt) 16,694 2,393 5,348 4,690 4,263 0 0 0 0Grade (g/t Au) 0.8 0.9 0.9 0.7 0.7 0.0 0.0 0.0 0.0Processing Production - o/p + s/f Tonnage (kt) 12,776 1,435 3,400 3,400 3,400 1,141 0 0 0Grade (g/t Au) 0.8 0.7 0.8 0.8 0.8 0.8 0.0 0.0 0.0Payable Sales Gold (koz Au) 175 24 51 42 42 14 0 0 0Silver (koz Ag) 16 2 5 4 4 1 0 0 0Gold - Equivalent (koz Au Eq) 175 25 51 42 42 14 0 0 0
Commodity Price Gold (US$/oz) 675 676 577 544 511 511 511 511Silver (US$/oz) 13.22 12.75 11.53 10.52 9.50 9.50 9.50 9.50
Sales Revenue (US$m) 105.9 16.5 34.7 24.4 23.0 7.3 - - -Gold (US$m) 105.9 16.5 34.7 24.4 23.0 7.3 - - -Operating Expenditure Summary (US$m) (50.4) (7.8) (14.4) (13.1) (14.0) (1.0) - - -Mining (US$m) (20.1) (2.9) (5.8) (5.8) (5.7) - - - -Processing (US$m) (22.9) (2.6) (6.1) (6.1) (6.1) (2.0) - - -Overheads (US$m) (6.7) (0.9) (1.7) (1.7) (1.7) (0.6) - - -TC/RC/Realisation/Transportation (US$m) (0.1) (0.0) (0.0) (0.0) (0.0) (0.0) - - -By-product Credits (US$m) 0.2 0.0 0.1 0.0 0.0 0.0 - - -Environmental (US$m) (2.5) (0.3) (0.7) (0.7) (0.7) (0.2) - - -Terminal Benefits (US$m) (0.4) - - - - (0.4) - - -Net Change in Working Capital (US$m) 2.1 (1.2) (0.2) 1.1 0.1 2.2 - - -Operating Profit (US$m) 55.5 8.7 20.2 11.3 9.0 6.3 - - -Tax Liability (US$m) (3.1) (0.2) (2.3) (0.6) - (0.0) - - -Capital Expenditure (US$m) (3.4) (0.4) (0.9) (0.9) (0.9) (0.3) - - -Final Net Free Cash (US$m) 49.0 8.1 17.1 9.8 8.1 6.0 - - -Cash Operating Costs (US$/oz Au) 284 258 265 321 319 185 - -Total Cash Costs (US$/oz Au) 284 258 265 321 319 185 - - -Total Working Costs (US$/oz Au) 301 271 278 337 334 226 - - -Total Costs (US$/oz Au) 308 336 299 332 352 91 - - -
Table 13.8 Sukhaybarat: Financial Model in US$ real terms (1 July 2007) Period Units Total/Avg 2007H2 2008 2009 2010 2011 2012 2013 2014
Production Mining Production - o/p Tonnage (kt) 3,992 761 1,507 903 821 0 0 0 0Grade (g/t Au) 0.9 1.3 1.1 0.5 0.5 0.0 0.0 0.0 0.0Processing Production - o/p + s/f Tonnage (kt) 4,156 300 600 600 600 600 600 600 256Grade (g/t Au) 0.8 1.1 1.1 0.9 0.8 0.8 0.8 0.8 0.8
Payable Sales Gold (koz Au) 92 9 18 14 12 12 12 12 5Silver (koz Ag) 12 1 2 2 2 2 2 2 1Gold - Equivalent (koz Au Eq) 92 9 18 14 12 12 12 12 5
Commodity Price Gold (US$/oz) 675 676 577 544 511 511 511 511Silver (US$/oz) 13.22 12.75 11.53 10.52 9.50 9.50 9.50 9.50Sales Revenue (US$m) 52.9 6.1 12.2 8.0 6.3 5.9 5.9 5.9 2.5Gold (US$m) 52.9 6.1 12.2 8.0 6.3 5.9 5.9 5.9 2.5Operating Expenditure Summary (US$m) (53.2) (2.8) (8.0) (7.5) (7.8) (8.0) (8.0) (8.0) (3.0)Mining (US$m) (14.5) (1.1) (2.2) (2.2) (2.2) (2.2) (2.2) (2.2) (0.3)Processing (US$m) (22.3) (1.6) (3.2) (3.2) (3.2) (3.2) (3.2) (3.2) (1.4)Overheads (US$m) (14.1) (1.0) (2.0) (2.0) (2.0) (2.0) (2.0) (2.0) (0.9)TC/RC/Realisation/Transportation (US$m) (0.0) (0.0) (0.0) (0.0) (0.0) (0.0) (0.0) (0.0) (0.0)By-product Credits (US$m) 0.1 0.0 0.0 0.0 0.0 0.0 0.0 0.0 0.0Environmental (US$m) (4.0) (0.3) (0.6) (0.6) (0.6) (0.6) (0.6) (0.6) (0.2)Terminal Benefits (US$m) (0.6) - - - - - - - (0.6)Net Change in Working Capital (US$m) 2.3 1.2 (0.0) 0.5 0.2 0.0 0.0 (0.0) 0.4Operating Profit (US$m) (0.3) 3.3 4.2 0.4 (1.5) (2.0) (2.1) (2.1) (0.5)Tax Liability (US$m) (0.5) (0.2) (0.3) - - - - - -Capital Expenditure (US$m) (4.5) (0.3) (0.6) (0.6) (0.6) (0.6) (0.6) (0.6) (0.3)Final Net Free Cash (US$m) (5.2) 2.8 3.3 (0.2) (2.2) (2.7) (2.7) (2.7) (0.8)Cash Operating Costs (US$/oz Au) 551 411 412 538 640 640 640 640 520Total Cash Costs (US$/oz Au) 551 411 412 538 640 640 640 640 520Total Working Costs (US$/oz Au) 601 443 444 580 690 690 690 690 692Total Costs (US$/oz Au) 625 345 480 593 730 742 745 746 664

SRK Consulting Ma'aden Gold MER – Main Report
U3330_Ma'aden MER.doc November, 2007 Page 178
Table 13.9 Al Hajar: Financial Model in US$ real terms (1 July 2007) Period Units Total/Avg 2007H2 2008 2009 2010 2011 2012 2013 2014
Production Mining Production - s/f Tonnage (kt) 2,143 360 720 720 343 0 0 0 0Grade (g/t Au) 1.3 1.3 1.3 1.3 1.3 0.0 0.0 0.0 0.0
(g/t Ag) 37.2 37.2 37.2 37.2 37.2 0.0 0.0 0.0 0.0Processing Production - s/f Tonnage (kt) 2,143 360 720 720 343 0 0 0 0Grade (g/t Au) 1.3 1.3 1.3 1.3 1.3 0.0 0.0 0.0 0.0
(g/t Ag) 37.2 37.2 37.2 37.2 37.2 0.0 0.0 0.0 0.0
Payable Sales Gold (koz Au) 45 8 15 15 7 0 0 0 0Silver (koz Ag) 384 65 129 129 62 0 0 0 0Gold - Equivalent (koz Au Eq) 52 9 17 18 8 0 0 0 0
Commodity Price Gold (US$/oz) 675 676 577 544 511 511 511 511Silver (US$/oz) 13.22 12.75 11.53 10.52 9.50 9.50 9.50 9.50Sales Revenue (US$m) 28.0 5.3 10.2 8.7 3.9 - - - -Gold (US$m) 28.0 5.3 10.2 8.7 3.9 - - - -Operating Expenditure Summary (US$k) (14.9) (2.5) (5.3) (5.3) (1.8) - - - -Mining (US$m) - - - - - - - - -Processing (US$m) (17.8) (3.0) (6.0) (6.0) (2.9) - - - -Overheads (US$m) - - - - - - - - -TC/RC/Realisation/Transportation (US$m) (0.7) (0.1) (0.2) (0.2) (0.1) - - - -By-product Credits (US$m) 4.6 0.9 1.6 1.5 0.6 - - - -Environmental (US$m) (2.1) (0.4) (0.7) (0.7) (0.3) - - - -Terminal Benefits (US$m) (0.3) - - - (0.3) - - - -Net Change in Working Capital (US$m) 1.4 0.1 0.0 0.2 1.1 - - - -Operating Profit (US$m) 13.0 2.7 4.9 3.4 2.1 - - - -Tax Liability (US$m) (0.6) (0.1) (0.5) (0.0) - - - - -Capital Expenditure (US$m) (3.0) (0.9) (1.0) (1.0) - - - - -Final Net Free Cash (US$m) 9.4 1.7 3.4 2.3 2.1 - - - -Cash Operating Costs (US$/oz Au) 310 290 306 316 325 - - - -Total Cash Costs (US$/oz Au) 310 290 306 316 325 - - - -Total Working Costs (US$/oz Au) 363 336 354 364 412 - - - -Total Costs (US$/oz Au) 398 445 419 420 255 - - - -
Table 13.10 Head Office: Financial Model in US$ real terms (1 July 2007) Period Units Total/Avg 2007H2 2008 2009 2010 2011 2012 2013 2014
Operating Expenditure Summary (US$m) (106.2) (12.2) (21.3) (21.7) (21.7) (11.4) (7.6) (5.1) (5.3)Operating Profit (US$m) (106.2) (12.2) (21.3) (21.7) (21.7) (11.4) (7.6) (5.1) (5.3)Tax Liability (US$m) - - - - - - - - -Capital Expenditure (US$m) (21.1) (0.1) (4.1) (4.1) (4.1) (3.2) (2.4) (1.6) (1.5)Final Net Free Cash (US$m) (127.3) (12.3) (25.4) (25.8) (25.8) (14.5) (9.9) (6.7) (6.8)Cash Operating Costs (US$/oz Au) 105 171 117 118 119 77 60 72 104Total Cash Costs (US$/oz Au) 105 171 117 118 119 77 60 72 104Total Working Costs (US$/oz Au) 105 171 117 118 119 77 60 72 104Total Costs (US$/oz Au) 125 172 139 141 142 98 79 94 135

SRK Consulting Ma'aden Gold MER – Main Report
U3330_Ma'aden MER.doc November, 2007 Page 179
Table 13.11 Ma’aden Gold: Financial Model in US$ real terms (1 July 2007) Period Units Total/Avg 2007H2 2008 2009 2010 2011 2012 2013 2014
Production Mining Production - u/g + o/p + s/f Tonnage (kt) 21,195 2,845 6,407 5,795 4,990 385 380 199 194Grade (g/t Au) 1.9 1.3 1.4 1.4 1.5 10.8 10.3 10.4 8.2
(g/t Ag) 6.2 5.6 5.6 6.3 4.3 22.1 20.1 14.7 13.8 (% Zn) 0.42% 0.05% 0.18% 0.25% 0.28% 3.66% 3.74% 5.62% 4.58% (% Cu) 0.07% 0.02% 0.03% 0.04% 0.05% 0.63% 0.63% 0.99% 0.67%
Processing Production - u/g + o/p + s/f Tonnage (kt) 21,665 2,208 5,100 5,147 4,768 2,168 1,026 799 449Grade (g/t Au) 1.9 1.3 1.5 1.5 1.6 2.6 4.3 3.2 3.9
(g/t Ag) 6.2 7.3 7.2 7.2 4.6 4.1 7.9 3.7 5.9 (% Zn) 0.43% 0.08% 0.24% 0.29% 0.30% 0.68% 1.45% 1.40% 1.97% (% Cu) 0.07% 0.02% 0.04% 0.04% 0.05% 0.11% 0.23% 0.25% 0.29%
Payable Sales Gold (koz Au) 1,016 71 182 183 181 149 126 72 51Silver (koz Ag) 1,744 133 379 385 287 221 195 74 70Zinc (t Cu) 52,156 617 6,150 8,465 7,940 8,172 8,306 6,910 5,596Copper (t Zn) 11,321 329 1,476 1,559 1,816 1,805 1,790 1,590 956Lead (t Pb) 1,057 96 193 193 193 193 188 0 0Gold - Equivalent (koz Au Eq) 1,314 81 233 243 230 187 164 102 74
Commodity Price Gold (US$/oz) 675 676 577 544 511 511 511 511Silver (US$/oz) 13.22 12.75 11.53 10.52 9.50 9.50 9.50 9.50Zinc (USc/lb) 160 144 113 89 65 65 65 65Copper (USc/lb) 318 294 245 192 140 140 140 140Lead (USc/lb) 91 78 67 54 40 40 40 40
Sales Revenue (US$m) 578.8 47.9 123.4 105.7 98.6 76.0 64.5 36.6 25.9Gold (US$m) 578.8 47.9 123.4 105.7 98.6 76.0 64.5 36.6 25.9Operating Expenditure Summary (US$m) (313.2) (32.1) (57.0) (58.9) (62.3) (40.8) (27.1) (20.5) (14.5)Mining (US$m) (89.1) (5.8) (15.9) (17.1) (17.9) (11.2) (11.1) (7.0) (3.2)Processing (US$m) (149.6) (10.8) (27.9) (29.5) (26.3) (19.5) (17.4) (10.0) (8.0)Overheads (US$m) (71.9) (3.7) (11.9) (11.9) (11.9) (10.7) (10.1) (6.5) (5.2)TC/RC/Realisation/Transportation (US$m) (61.1) (1.7) (10.7) (11.5) (9.7) (8.1) (8.2) (6.4) (4.7)By-product Credits (US$m) 167.6 6.4 34.3 34.2 26.5 19.6 19.4 15.5 11.6Other Corporate (US$m) (106.2) (12.2) (21.3) (21.7) (21.7) (11.4) (7.6) (5.1) (5.3)Environmental (US$m) (17.1) (1.6) (3.4) (3.4) (3.0) (2.3) (2.0) (0.9) (0.5)Terminal Benefits (US$m) (5.2) - - - (0.3) (0.4) (1.8) (0.1) (2.6)Net Change in Working Capital (US$m) 19.3 (2.7) (0.2) 2.0 2.0 3.1 11.6 0.0 3.4Operating Profit (US$m) 265.6 15.9 66.4 46.9 36.4 35.2 37.4 16.1 11.4Tax Liability (US$m) (34.1) (2.6) (9.6) (6.6) (4.5) (4.0) (4.8) (1.4) (0.7)Capital Expenditure (US$m) (62.0) (5.7) (14.7) (11.1) (9.9) (8.5) (7.2) (2.8) (2.1)Final Net Free Cash (US$m) 169.5 7.6 42.1 29.2 22.0 22.7 25.4 11.9 8.6Cash Operating Costs (US$/oz Au) 236 345 229 237 265 221 212 192 201Total Cash Costs (US$/oz Au) 236 345 229 237 265 221 212 192 201Total Working Costs (US$/oz Au) 253 364 244 251 279 235 236 201 244Total Costs (US$/oz Au) 286 469 307 288 314 264 209 228 226
13.6 Enterprise Value: Net Present Value and Sensitivities The following section presents the NPVs of the real term cashflows as derived from the Financial Models for the operating Mining Assets, Head Office and the consolidation for Ma’aden Gold. The various NPV tables include the following:
• NPVs at a range of discount factors; and
• NPV sensitivity to simultaneous adjustments for sales revenue and total working costs.
13.6.1 Mahd Ad’Dahab Table 13.12 Mahd Ad’Dahab: NPV (US$m) at various discount factors Discount Factor Net Present Value(%) (US$m)0.00% 105.23.00% 96.35.00% 91.07.50% 85.110.00% 79.812.50% 75.015.00% 70.7

SRK Consulting Ma'aden Gold MER – Main Report
U3330_Ma'aden MER.doc November, 2007 Page 180
Table 13.13 Mahd Ad’Dahab: Sales Revenue and Total Working Cost simultaneous sensitivity at a real DCF of 10%
NPV (US$m) Sales Revenue Sensitivity -30% -20% -10% 0% 10% 20% 30% -15% 49.3 62.2 74.8 87.7 100.3 112.9 125.5
Total -10% 46.7 59.5 72.1 85.1 97.7 110.3 122.8Working Cost -5% 44.0 56.9 69.5 82.4 95.0 107.6 120.2Sensitivity 0% 41.2 54.2 66.8 79.8 92.4 104.9 117.5
5% 38.2 51.5 64.2 77.1 89.7 102.3 114.9 10% 35.2 48.8 61.5 74.5 87.0 99.6 112.2 15% 32.1 46.0 58.8 71.8 84.4 97.0 109.6
13.6.2 Al Amar
Table 13.14 Al Amar: NPV (US$m) at various discount factors Discount Factor Net Present Value(%) (US$m)0.00% 138.53.00% 121.45.00% 111.77.50% 101.010.00% 91.712.50% 83.515.00% 76.4
Table 13.15 Al Amar: Sales Revenue and Total Working Cost simultaneous
sensitivity at a real DCF of 10% NPV (US$m) Sales Revenue Sensitivity
-30% -20% -10% 0% 10% 20% 30% -15% 52.8 69.3 84.7 100.0 115.3 130.6 146.0
Total -10% 49.0 66.5 81.9 97.2 112.5 127.9 143.2Working Cost -5% 45.1 63.5 79.1 94.4 109.8 125.1 140.4Sensitivity 0% 41.3 60.2 76.4 91.7 107.0 122.3 137.6
5% 37.5 56.6 73.5 88.9 104.2 119.5 134.8 10% 33.6 52.8 70.6 86.1 101.4 116.7 132.1 15% 29.8 48.9 67.5 83.3 98.7 114.0 129.3
13.6.3 Bulghah Table 13.16 Bulghah: NPV (US$m) at various discount factors Discount Factor Net Present Value(%) (US$m)0.00% 49.03.00% 45.95.00% 44.07.50% 41.810.00% 39.912.50% 38.115.00% 36.4
Table 13.17 Bulghah: Sales Revenue and Total Working Cost simultaneous
sensitivity at a real DCF of 10% NPV (US$m) Sales Revenue Sensitivity
-30% -20% -10% 0% 10% 20% 30% -15% 22.9 30.5 37.8 44.6 51.5 58.3 65.1
Total -10% 21.0 28.7 36.1 43.1 49.9 56.7 63.5Working Cost -5% 18.9 26.8 34.3 41.5 48.3 55.1 62.0Sensitivity 0% 16.8 24.9 32.6 39.9 46.7 53.6 60.4
5% 14.7 23.0 30.7 38.1 45.2 52.0 58.8 10% 12.6 21.0 28.8 36.4 43.6 50.4 57.2 15% 10.4 18.9 26.9 34.6 41.9 48.8 55.7
13.6.4 Sukhaybarat
Table 13.18 Sukhaybarat: NPV (US$m) at various discount factors Discount Factor Net Present Value(%) (US$m)0.00% (5.2)3.00% (3.8)5.00% (3.0)7.50% (2.2)10.00% (1.4)12.50% (0.8)15.00% (0.3)

SRK Consulting Ma'aden Gold MER – Main Report
U3330_Ma'aden MER.doc November, 2007 Page 181
Table 13.19 Sukhaybarat: Sales Revenue and Total Working Cost simultaneous sensitivity at a real DCF of 10%
NPV (US$m) Sales Revenue Sensitivity -30% -20% -10% 0% 10% 20% 30% -15% (6.8) (3.1) 0.5 4.0 7.6 11.0 14.4
Total -10% (8.7) (4.9) (1.3) 2.2 5.8 9.2 12.7Working Cost -5% (10.6) (6.8) (3.2) 0.4 3.9 7.5 10.9Sensitivity 0% (12.6) (8.7) (5.0) (1.4) 2.1 5.7 9.2
5% (14.6) (10.7) (6.9) (3.3) 0.3 3.9 7.4 10% (16.5) (12.6) (8.8) (5.1) (1.5) 2.0 5.6 15% (18.5) (14.6) (10.7) (6.9) (3.4) 0.2 3.8
13.6.5 Al Hajar
Table 13.20 Al Hajar: NPV (US$m) at various discount factors Discount Factor Net Present Value(%) (US$m)0.00% 9.43.00% 8.95.00% 8.67.50% 8.210.00% 7.812.50% 7.515.00% 7.2
Table 13.21 Al Hajar: Sales Revenue and Total Working Cost simultaneous
sensitivity at a real DCF of 10% NPV (US$m) Sales Revenue Sensitivity
-30% -20% -10% 0% 10% 20% 30% -15% 2.7 5.1 7.4 9.6 11.8 14.0 16.1
Total -10% 1.9 4.4 6.8 9.0 11.2 13.4 15.5Working Cost -5% 1.1 3.7 6.1 8.4 10.6 12.8 14.9Sensitivity 0% 0.3 3.0 5.5 7.8 10.0 12.2 14.3
5% (0.5) 2.2 4.8 7.2 9.4 11.6 13.8 10% (1.3) 1.4 4.1 6.5 8.8 11.0 13.2 15% (2.1) 0.6 3.3 5.8 8.2 10.4 12.6
13.6.6 Mining Assets
Table 13.22 Mining Assets: NPV (US$m) at various discount factors Discount Factor Net Present Value(%) (US$m)0.00% 296.93.00% 268.75.00% 252.37.50% 233.910.00% 217.712.50% 203.315.00% 190.4
Table 13.23 Mining Assets: Sales Revenue and Total Working Cost simultaneous
sensitivity at a real DCF of 10% NPV (US$m) Sales Revenue Sensitivity
-30% -20% -10% 0% 10% 20% 30% -15% 120.9 164.1 205.2 246.0 286.5 326.8 367.1
Total -10% 109.8 154.2 195.6 236.6 277.1 317.4 357.8Working Cost -5% 98.5 144.0 185.9 227.2 267.6 308.1 348.4Sensitivity 0% 87.0 133.6 176.2 217.7 258.2 298.7 339.1
5% 75.3 122.7 166.3 208.0 248.8 289.3 329.7 10% 63.6 111.4 156.2 198.4 239.4 279.8 320.3 15% 51.8 99.8 145.9 188.7 229.8 270.4 310.9
13.6.7 Head Office Table 13.24 Head Office: NPV (US$m) at various discount factors Discount Factor Net Present Value(%) (US$m)0.00% (127.3)3.00% (115.8)5.00% (109.1)7.50% (101.5)10.00% (94.8)12.50% (88.8)15.00% (83.5)

SRK Consulting Ma'aden Gold MER – Main Report
U3330_Ma'aden MER.doc November, 2007 Page 182
Table 13.25 Head Office: Total Working Cost simultaneous sensitivity at a real DCF of 10%
NPV (US$m)
-15% (82.8)Total -10% (86.8)Working Cost -5% (90.8)Sensitivity 0% (94.8)
5% (98.8) 10% (102.8) 15% (106.8)
13.7 Valuation of Advanced Exploration Properties The Mineral Resource statements for the Ad Duwayhi Development Property and the Advanced Exploration Properties of Mansourah, Ar Rjum, Masarah, As Suk and Zalim comprise a total Mineral Resource of 7.9Moz of gold contained within 103.2Mt at a grade of 2.4g/t Au. Ad Duwayhi, the most advanced of these has a total Mineral Resource of 2.1Moz of gold contained within 17.1Mt at a grade of 3.9g/t Au representing some 25% of the total gold content of the Mineral Resources reporting as DPs and AEPs.
SRK has not valued the DP (Ad Duwayhi) or the AEPs (Mansourah, Ar Rjum, Masarah, As Suk and Zalim). Notwithstanding this limitation, SRK notes the following:
• Ad Duwayhi: A pre-feasibility study was completed for the Ad Duwayhi Development Property in February 2007 by SRK. The pre-feasibility study assumes the construction (in 2010) of an open-pit mining operation processing through a CIL plant with a rated processing capacity of 1Mtpa at a capital cost of US$92m. The pre-feasibility study was multi-disciplinary in scope, demonstrated the technical feasibility of the project as well as its economic viability given certain assumptions and included a discounted cashflow valuation for the project. Development of the project is however, dependent upon the establishment of regional infrastructure, specifically a water pipeline, the total capital expenditure requirement for which (to be expended in 2010) is US$90m (at 10% DCF this equates to US$64.4m in 1 July 2007 money terms).
The pre-feasibility study assumes that the capital cost for the development of this regional infrastructure is funded by third parties and that off-takers (Ad Duwayhi) are then charged for water supply. The pricing for this supply assumes recovery of the capital costs over a 20 year period in addition to the annual unit operating costs which also assumes that other off-takers (including some of the AEPs) have been developed.
Accordingly given that Ad Duwayhi on a stand alone basis, does not justify the development of the pipeline, and the conditionality of economic viability on this assumption, no Ore Reserves are declared for the Ad Duwayhi development project. Based on the commodity price forecasts as included herein, SRK has updated its cashflow model and at a discount factor of 10% real this results in a NPV of US$40m excluding the capital cost for the construction of the regional water pipeline. The project assumes a LoMp inventory of 10.2Mt mined at a grade of 3.5g/t Au, metallurgical recoveries of 93.0%, a processing rate of 1Mtpa and LoMp weighted cash cost of production of US$224/oz; and
• The technical studies completed for the AEPs are generally at the conceptual level and would require the completion of a scoping study followed by a pre-feasibility study to advance these to a similar level of confidence as Ad Duwayhi. Furthermore, their development is also constrained by the availability of a reliable water source. Accordingly Ma’aden Gold considers their potential development to be realisable only in combination with Ad Duwayhi.

SRK Consulting Ma'aden Gold MER – Main Report
U3330_Ma'aden MER.doc November, 2007 Page 183
SRK considers that the scope as presented in the Ad Duwayhi pre-feasibility study to be an appropriate proxy for any assessment of the potential development of the CAG Project.
13.8 Valuation Adjustments
13.8.1 Derivative Instruments SRK has been informed that Ma’aden Gold has the following derivative instruments as at 1 July 2007:
• Commodity contracts for gold amounting to 29,615oz at a weighted average strike price of US$279/oz; and
• Commodity contracts for gold amounting to 190,452oz at a weighted average strike price of US$374/oz.
This amounts to a total of 220,067oz of gold with a weighted average strike price of US$361/oz (Table 13.26).
Table 13.26 Commodity (gold) derivatives Item Units Totals/Avg. 2007H2 2008 2009 2010 2011 2012Hedge (koz) 220 68 29 30 32 36 25Strike Price (US$/oz) 361 332 374 374 374 374 374
Based on the spot price as at 1 July 2007 of US$779/oz, the mark to market value: estimated by the net difference between the spot price and the weighted average strike price multiplied by the hedged ounces: is estimated at a negative US$92.08m.
13.8.2 Unallocated Head Office expenditures The NPV at 10% real of the unallocated Head Office expenditures are estimated at negative US$94.8m.
13.8.3 Net (Debt)/Cash position As at 30 June 2007, Ma’aden Gold had net (debt)/cash position of positive US$31.9m.
13.8.4 Summary of Valuation Adjustments Table 13.27 presents a summary of the valuation adjustments for derivation of the Equity Value of Ma’aden Gold.
Table 13.27 Summary of Valuation Adjustments Valuation Adjustment Units AmountCommodity Derivatives - mark to market value(1) (US$m) (92.1)Net (Debt)/Cash position (US$m) 31.9Unallocated Head Office Expenditures (US$m) (94.8)Total(2) (US$m) (155.0)(1) Subsequent Events: Since the preparation of this MER we have been informed by the Company that it has unwound its gold hedge position
represented by the derivative instruments described above at a cost of US$119.25m. As a result the valuation adjustment for the commodity derivative shown in Table 13.27 is no longer appropriate and no such adjustment would be made to any valuation of Ma'aden Gold prepared as at date of the Prospectus.
(2) Accordingly and given (1) above the Total as presented in Table 13.27 would be adjusted to a negative US$62.9m. 14 RISKS AND OPPORTUNITIES
14.1 Introduction SRK has included its view on the achievement of the LoMp and the appropriateness of the Mineral Resource and Ore Reserve statements when presenting technical and financial data in this MER. As of the Effective Date SRK considers these projections to be achievable.
In all likelihood many of the identified risks and/or opportunities will have an impact on the cashflows as presented in Section 13.0, some positive and some negative. The impact of one

SRK Consulting Ma'aden Gold MER – Main Report
U3330_Ma'aden MER.doc November, 2007 Page 184
or a combination of risks and opportunities occurring cannot be specifically quantified to present a meaningful assessment. SRK has however provided sensitivity tables for simultaneous (twin) parameters. The sensitivity range covers the anticipated range of accuracy in respect of commodity prices and operating expenditures. In this way the general risks are, with the aid of sensitivity tables, adequately covered.
14.2 General Risks and Opportunities The Mining Assets are subject to certain inherent risks and opportunities, which apply to some degree to all participants of the international precious metals mining industry. These include:
• Commodity Price Fluctuations: These many be influenced, inter alia, by commodity demand-supply balances for gold, silver, zinc, copper and lead. In the case of gold and silver this is also impacted by consumption in industry and jewellery, actual or expected sales by central banks, sales by gold and silver producers in forward transactions and production cost levels for gold and silver in major producing countries. In the three year period between 1 July 2004 and 30 June 2007 the following apply:
− gold price ranging between US$387/oz and US$651/oz with a resulting three year average of US$529/oz which can be compared with the long term price of US$511/oz and the current 1 October 2007 spot price of US$743/oz,
− silver price ranging between US$5.88/oz and US$14.94/oz with a resulting three year average of US$9.64/oz which can be compared with the long term price of US$9.50/oz and the current 1 October 2007 spot price of US$13.78/oz,
− zinc price ranging between USc43/lb and USc210/lb with a resulting three year average of USc104/lb which can be compared with the long term price of USc65/lb and the current 1 October 2007 spot price of USc138/lb,
− copper price ranging between USc121/lb and USc398/lb with a resulting three year average of USc230/lb which can be compared with the long term price of USc140/lb and the current 1 October 2007 spot price of USc369/lb,
− lead price ranging between USc37/lb and USc163/lb with a resulting three year average of USc63/lb which can be compared with the long term price of USc40/lb and the current 1 October 2007 spot price of USc156/lb;
• Exchange Rate Fluctuations: Specifically related to the related strength of the US$, the currency in which commodity prices are generally quoted. During the period between 1 July 2004 and 30 June 2007 the US$:SAR exchange rate was pegged at 3.75;
• Inflation Rate Fluctuations: Specifically related to the macro-economic policies of the individual countries. During the period between 1 July 2004 and 30 June 2007, United States CPI ranged between 1.3% and 4.7% reported on a 12-month basis. During the period between 1 July 2004 and 30 June 2007, Saudi CPI ranged between -0.2% and 3.6%;
• Country Risk: Specifically country risk including: political, economic, legal, tax, operational and security risks;
• Legislative Risk: Specifically changes to future legislation (tenure, mining activity, labour, occupational health, safety and environmental) within Saudi Arabia;
• Exploration Risk: Resulting from the elapsed time between discovery of deposits, development of economic feasibility studies to bankable standards and associated uncertainty of outcome;
• Mining Risk: Specifically Ore Reserve estimate risks, uninsured risks, industrial

SRK Consulting Ma'aden Gold MER – Main Report
U3330_Ma'aden MER.doc November, 2007 Page 185
accidents, labour disputes, unanticipated groundwater conditions, human resource management and safety performance; and
• Development Project Risk: Specifically technical risks associated with green field projects for which technical studies are limited to pre-feasibility studies or less and development and production has not commenced.
In addition to those stated above, the Mining Assets are subject to certain specific risks and opportunities, which independently may not be classified to have material impact (that is likely to affect more than 10% of the Tax Entities annual pre-tax profits), but in combination may do so.
14.3 Specific Risks and Opportunities In addition to the specific risks and opportunities identified below, addressing the general deficiencies identified in Section 4.0 of this MER (General SRK Comments) are key to: unlocking the potential of the Gold Assets; to further assess the impact of lower recoveries at Bulghah and Sukhaybarat; and to maintain and increase production beyond 2010 (Figure 16.1). The deficiencies identified in Section 4.0 are:
• Mineral Resource and Ore Reserve:
− The application and documentation of Quality Control and Quality Assurance, − The lack of a formal Mineral Resource and Ore Reserve Management system as
exemplified by the currency of core data (>2 years), lack of detailed reconciliation, reliance on manual methods, lack of detailed mine design and production scheduling beyond the immediate budget (1 year) reporting period; and
• Environmental Management, specifically the limitations in respect of:
− EIAs for Mahd Ad’Dahab and Sukhaybarat, − Rudimentary social assessments arising from the limited public involvement, − Monitoring processes.
The additional specific risks and opportunities are:
• Environmental Risk: The inability of the Mining Assets to fund the environmental liabilities from estimated operating cashflows, should operations cease prior to that projected in the LoMp. This would result in an unfunded liability since the estimated rehabilitation expenditure is not currently funded. As at 1 July 2007, Ma’aden Gold’s environmental liability is estimated at US$19.0m. SRK notes that certain components of this risk may be mitigated as no assumptions have been made regarding the ability to generate revenue through recovery of metals or sale of scrap when reporting this environmental liability. Specific environmental risks at each of the Gold Assets include:
− At Sukhaybarat, the seepage from the TSFs and the cessation of abstraction of polluted water emanating from the site,
− Some 2.2Moz of the total 5.8Moz of gold associated with the Exploration Properties is attributed to the Ar Rjum AEP which is located within the Mahazat Assaid Conservation Area which was established in the 1980s as a safe haven for endangered species such as the Arabian Oryx and indigenous Arabian Ostrich. Conversion of the EL for Ar Rjum to an Exploitation Licence will require completion of a feasibility study and an Environmental Impact Study. In this respect a risk remains that the completion of such environmental work will not adequately address all environmental issues satisfactorily to ensure the conversion to an Exploitation Licence;

SRK Consulting Ma'aden Gold MER – Main Report
U3330_Ma'aden MER.doc November, 2007 Page 186
• Environmental Compliance: All Mining Assets that are operational were granted mining leases (now called Exploitation Licences) when the Old Mining Code (promulgated by Royal Decree No. M/21, dated July 1972) was in effect. While the leases/licences remain valid under the new Mining Code, they were granted before the recent (Section 2.5.1 and Section 2.5.2) general environmental legislation and mining-specific legislation came into effect. The mining leases for Mahd Ad’Dahab, Al Amar, Sukhaybarat and Al Hajar were granted in November 1998, September 1997, May 1998 and November 1998, respectively. The mining lease for Bulghah Mine was granted in October 2001 – in the same month that the Public Environmental Law was promulgated published). The general environmental legislation, by means of Article 15 of the Implementing Regulations, allows all projects existing at the time of issue of the regulations a maximum grace period of five years (until September 2008) to ensure their compliance with both the Public Environmental Law and the Implementing Regulations. Accordingly whilst an extension is possible it is crucial that the Company adheres to a process to achieve the intended deadline;
• Exploration Risk: During 2007 the Company significantly reduced the area of exploration licences under direct management to 47,521.0km2. Ma’aden Gold’s current strategy assumes a further reduction to 14,000.0km2 and total expenditures of US$34.1m. The exploration programme in the NAS Region (US$20.9m) includes target generation where no JORC Code compliant Mineral Resources have been defined. Accordingly there remains a risk that the necessity to relinquish further licence area in the near future may not allow sufficient time to advance these properties as planned. This risk is further heightened by the fact that historical activity to date in the NAS Region in respect of drilling appears significant by comparison with the CAG Region;
• Terminal Benefits Liability Risk: The inability of the Mining Assets to fund the terminal benefits liabilities from estimated operating cashflows, should operations cease prior to that projected in the LoMp. This would result in an unfunded liability since the estimated terminal benefits expenditure is not currently funded. As at 1 July 2007, Ma’aden Gold’s terminal benefits liability is estimated at US$8.1m;
• The combined operational and economic risk as reflected in the LoMps, specifically:
− at Al Amar, that projected dilution is greater than that envisaged in the 2001 Feasibility Study given the current development dimensions and the acquisition of larger underground equipment than initially planned. In addition the planned processing expenditures are some 17% lower than currently experienced at Mahd Ad’Dahab Plant, despite the similarities in respect of planned production rates and flowsheet arrangements.
− at Bulghah, specifically in respect of the planned significant increase in the processing of lower grade fresh ore with significantly reduced metallurgical recoveries,
− at Sukhaybarat, the projected decline in processed grades beyond 2009 resulting in cash operating costs in excess of US$600/oz,
− Al Hajar’s re-crushing project given the estimation risks associated with sampling historically stacked heap leach material and ensuring the representivity of metallurgical testwork;
• Development risks associated with the Development Property and the Advanced Exploration Properties given:
SRK Consulting Ma'aden Gold MER – Main Report
U3330_Ma'aden MER.doc November, 2007 Page 187
− that only a pre-feasibility study has been completed for Ad Duwayhi, − that only conceptual/scoping studies have been completed for Mansourah, Ar Rjum,
Masarah, As Suk, and Zalim, − that all of the above are to some degree dependent upon the establishment of a
regional water pipeline at an overall capital cost of US$90m; • The opportunity to increase Ore Reserves, through:
− upgrading of Inferred Mineral Resources at the AEPs through further drilling as well as completion of appropriate technical studies demonstrating the technical feasibility and economic viability of the CAG Project,
− re-optimisation of open-pits at Bulghah at the long term commodity prices and consideration of the applicability of the current positive bias between grade control models and exploration models,
− upgrading of Inferred Mineral Resources at Mahd Ad’Dahab, Al Amar and Bulghah to the Indicated Mineral Resource category through further drilling and completion of the necessary technical studies for modification to Probable Ore Reserves; and
• The opportunity to increase Mineral Resources through:
− further drilling, specifically targeting the areas which have not been closed off by drilling at Ad Duwayhi and the AEPs;
− application of improved geological wireframing at certain of the AEPs specifically Mansourah where the current Mineral Resource could be significantly expanded without the benefit of further drilling,
− further exploration at the six prospects situated within 30km of Sukhaybarat: Hablah South; Red Hill; La prospect; and Al Habla;
− further exploration at the six prospects situated within 30km of Al Hajar: Hajeej; Sheers; Jadmah; Gossan-14; Waqba and Shabat Al Hamra;
− implementation of the planned exploration at the Exploration Properties which have not yet reported JORC Code compliant Mineral Resources.
SRK has not been informed of the use of proceeds from the Admission and accordingly cannot comment on whether this will be utilised in the further development of Ma’aden Gold.
15 COMPANY EQUITY VALUE
15.1 Introduction The following section includes an assessment of the Equity Value of the Company which is based on the sum of the parts approach combining: the valuation of the Mining Assets as represented by the Enterprise Values and the Valuation Adjustments.
15.2 Equity Value Table 15.1 gives the Equity Value of Ma’aden Gold at a discount factor of 10% real. Table 15.2 gives the Equity Value at a range of real discount factors and Table 15.3 gives the sensitivity of the Equity Value to changes in sales revenue and total working costs for the Enterprise Values and the value of unallocated Head Office overheads.

SRK Consulting Ma'aden Gold MER – Main Report
U3330_Ma'aden MER.doc November, 2007 Page 188
Table 15.1 Ma’aden Gold Equity Value Valuation Component Units ValuationEnterprise Value (Mining Assets) Mahd Ad'Dahab (US$m) 79.8Al Amar (US$m) 91.7Bulghah (US$m) 39.9Sukhaybarat (US$m) (1.4)Al Hajar (US$m) 7.8Subtotal (US$m) 217.7Exploration Assets (US$m) -Gold Assets (Net Asset Value) (US$m) 217.7Valuation Adjustments(1) (US$m) (155.0)Equity Value (US$m) 62.7Mineral Resources (Gold Assets) (koz Au Eq) 10,058Ore Reserves (Gold Assets) (koz Au Eq) 1,329Equity Value per Mineral Resource Unit(2) (US$/oz Au Eq) 6Equity Value per Ore Reserve Unit (US$/oz Au Eq) 47(1) Subsequent Events: Since the preparation of this MER we have been informed by the Company that it has unwound its gold hedge position
represented by the derivative instruments described above at a cost of US$119.25m. As a result the valuation adjustment for the commodity derivative shown in Table 15.1 is no longer appropriate and would be reduced to a negative US$62.9m, which would result in a revised Equity Value of US$154.8m.
(2) The Equity Value per Mineral Resource unit of gold contained within the Mining Assets (2.1Moz) is estimated at US$30/oz.
Table 15.2 Ma’aden Gold Equity Value: discount factor sensitivity analysis Discount Factor Mining Assets Head Office Other Valuation Adjustments(1) Equity Value(%) (US$m) (US$m) (US$m) (US$m)0.00% 296.9 (127.3) (60.2) 109.33.00% 268.7 (115.8) (60.2) 92.75.00% 252.3 (109.1) (60.2) 83.07.50% 233.9 (101.5) (60.2) 72.210.00% 217.7 (94.8) (60.2) 62.712.50% 203.3 (88.8) (60.2) 54.315.00% 190.4 (83.5) (60.2) 46.7(1) Subsequent Events: Since the preparation of this MER we have been informed by the Company that it has unwound its gold hedge position
represented by the derivative instruments described above at a cost of US$119.25m. As a result the valuation adjustment for the commodity derivative shown in Table 15.2E is no longer appropriate and would be reduced to a positive US$31.9m, which would result in a revised Equity Value of US$154.8m.
Table 15.3 Ma’aden Gold Equity Value: sales revenue and total working cost
sensitivity(1) NPV (US$m) Sales Revenue Sensitivity
-30% -20% -10% 0% 10% 20% 30% -15% (22.1) 21.1 62.2 103.0 143.5 183.8 224.1
Total -10% (37.2) 7.2 48.6 89.6 130.1 170.4 210.8Working Cost -5% (52.5) (7.0) 34.9 76.2 116.7 157.1 197.4Sensitivity 0% (68.0) (21.4) 21.2 62.7 103.2 143.7 184.1
5% (83.7) (36.3) 7.3 49.1 89.8 130.3 170.7 10% (99.4) (51.6) (6.7) 35.4 76.4 116.9 157.3 15% (115.2) (67.1) (21.1) 21.7 62.8 103.4 143.9
(1) Subsequent Events: Since the preparation of this Extract we have been informed by the Company that it has unwound its gold hedge position represented by the derivative instruments described above at a cost of US$119.25m. As a result the Equity Value of US$62.7m would be revised to US$154.8m.
15.3 Comparable Transaction Analysis Table 15.4 presents a statistical summary of the results of comparable transaction analyses undertaken from the ©Metals Economics Group gold acquisition project database (30 June 2007) for the following population databases:
• Global: all project transactions irrespective of development status;
• Global – Production: project transactions limited to production only status; and
• Africa – All: all project transactions irrespective of development status.
Independent statistics comprising cumulative frequency position for the first quartile, second quartile, third quartile, mean and median are presented for the following:
• Content: the 100% equivalent of transacted equivalent ounces of gold;
• NTVA (Non-time value adjusted): the transacted acquisition price per ounce of equivalent

SRK Consulting Ma'aden Gold MER – Main Report
U3330_Ma'aden MER.doc November, 2007 Page 189
gold;
• TVA-GPI (Time value adjusted and gold price indexed): the transacted acquisition price per ounce of equivalent gold but adjusted for money terms and also the ratio of the current (30 June 2007) gold price to the spot gold price at the date of the transaction.
SRK notes that the implied Equity Value (Table 15.1) per Mineral Resource unit for Ma’aden Gold is US$6/oz Au Eq and the implied Equity Value (Table 15.1) per Ore Reserve unit for Ma’aden Gold is US$47/oz Au Eq. Furthermore the Equity Value per Mineral Resource ounce attributable to the Mining Assets is estimated at US$30/oz. It should be noted however that this is derived from mining operations where all substantive capital has been expended and that only sustaining capital remains to service the depletion of the Ore Reserve.
Table 15.4 Comparable Transactions – population analysis Population Statistic Units Q1 Q2 Q3 Mean Median
25% 50% 75% Global - All Content (Eq. koz Au) 731 1,483 2,910 2,711 1,483Global - All NTVA Price (US$/oz) 13 29 58 49 29Global - All TVA-GPI Price (US$/oz) 22 46 101 79 46Global - Production Content (Eq. koz Au) 648 1,434 4,026 3,020 1,434Global - Production NTVA Price (US$/oz) 17 34 68 57 34Global - Production TVA-GPI Price (US$/oz) 25 66 117 94 66Global - exc Production Content (Eq. koz Au) 843 1,598 2,886 2,722 1,598Global - exc Production NTVA Price (US$/oz) 12 22 41 38 22Global - exc Production TVA-GPI Price (US$/oz) 19 36 69 59 36Africa - All Content (Eq. koz Au) 1,077 1,614 2,542 2,706 1,614Africa - All NTVA Price (US$/oz) 10 24 38 32 24Africa - All TVA-GPI Price (US$/oz) 21 42 76 58 42Africa - Production Content (Eq. koz Au) 1,197 1,608 2,952 3,068 1,608Africa - Production NTVA Price (US$/oz) 10 26 37 32 26Africa - Production TVA-GPI Price (US$/oz) 21 50 79 60 50Africa - exc Production Content (Eq. koz Au) 927 1,668 1,932 2,156 1,668Africa - exc Production NTVA Price (US$/oz) 10 19 41 33 19Africa - exc Production TVA-GPI Price (US$/oz) 22 41 63 56 41
Figure 15.1 through 15.3 present various comparable statistics for transacted unit prices. Table 15.5 presents a list of comparable transactions limited to producing assets on the African continent as sourced from the ©Metals Economics Group gold acquisition project database (30 June 2007).

SRK Consulting Ma'aden Gold MER – Main Report
U3330_Ma'aden MER.doc November, 2007 Page 190
Figure 15.1 Comparable transaction cumulative frequency: global database (producing assets) non-time value adjusted (US$/oz)
0.0%
10.0%
20.0%
30.0%
40.0%
50.0%
60.0%
70.0%
80.0%
90.0%
100.0%
0 10 20 30 40 50 60 70 80 90 100 110 120 130 140 150
Cum
ulat
ive
%
NTVA_EG - (US$/oz) Q1 Q2 Q3 Ma'aden Gold Figure 15.2 Comparable transaction cumulative frequency: global database
(producing assets), time value adjusted and gold price indexed (US$/oz)
0.0%
10.0%
20.0%
30.0%
40.0%
50.0%
60.0%
70.0%
80.0%
90.0%
100.0%
0 10 20 30 40 50 60 70 80 90 100 110 120 130 140 150
Cum
ulat
ive
%
TVA-GPI_EG - (US$/oz) Q1 Q2 Q3 Ma'aden Gold

SRK Consulting Ma'aden Gold MER – Main Report
U3330_Ma'aden MER.doc November, 2007 Page 191
Figure 15.3 Comparable Transaction data plot: Transacted unit price versus transacted ounce
0
10
20
30
40
50
60
70
80
90
100
110
120
130
140
150
0 1,000 2,000 3,000 4,000 5,000 6,000 7,000 8,000 9,000 10,000 11,000 12,000 13,000 14,000 15,000
Transacted Ounces (koz Au Eq)
Acq
uisi
tion
Pric
e (U
S$/o
z)Data Set Ma'aden Gold

SRK Consulting Ma'aden Gold MER – Main Report
U3330_Ma'aden MER.doc November, 2007 Page 192
Table 15.5 Recent Gold Transactions (Africa Production): © Metals Economics Group(1), (2), (3) Project Transaction
Date Gold Price Location Status % Acquired Seller Buyer Price Paid Au Equivalent Tonnage Grade Price Paid
(US$/oz) (US$m) (koz) (Mt) (g/t Au) (US$/oz)
Barberton 2006 Q3 632 South Africa PRD 20.00% Crew Gold Corp Metorex Ltd 11.7 507 10.67 7.4 23
Bibiani 2006 Q3 632 Ghana PRD 100.00% Anglogold Ashanti Ltd Central African Gold Plc 36 1,355 25.13 1.7 27
Lefa Corridor 2006 Q3 632 Guinea PRD 15.00% Government Of Guinea Crew Gold Corp 30 1,044 137.70 1.6 29
Lefa Corridor 2005 Q4 513 Guinea PRD 85.00% Guinor Gold Corp (Defunct) Crew Gold Corp 328 3,698 86.90 1.6 89
Kalgold 2003 Q4 416 South Africa PRD 100.00% Harmony Gold Mining Co Ltd Uranium One Africa Ltd 40 602 8.90 2.1 66
North Mara 2003 Q3 416 Tanzania PRD 100.00% East African Gold Mines Ltd Placer Dome Inc (Barrick Gold) (Defunct) 252.4 2,952 24.60 3.7 86
Syama 2003 Q2 416 Mali PRD 80.00% Randgold Resources Ltd Resolute Mining Ltd 15.6 4,247 51.60 3.2 4
Etc 2003 Q1 416 South Africa PRD 100.00% Avgold Ltd (Harmony Gold) Shanduka Resources;Metorex Ltd;Crew Gold Corp 36.2 578 1.90 9.5 63
Golden Reefs 2002 Q4 347 South Africa PRD 100.00% Eagc Ventures Corp (Defunct) Bema Gold Corp (Defunct) 63.6 1,620 15.50 3.3 39
East Rand 2002 Q4 347 South Africa PRD 100.00% Enderbrooke Investments Ltd Drdgold Ltd 10 6,664 229.57 0.9 2
St Helena 2002 Q2 347 South Africa PRD 100.00% Gold Fields Ltd Harmony Gold Mining Co Ltd 11.9 322 2.00 5.0 37
Crown Gold 2002 Q1 347 South Africa PRD 60.00% Drdgold Ltd Khumo Bathong Holdings 9.5 944 72.00 0.7 10
Damang 2001 Q4 277 Ghana PRD 90.00% Ranger Minerals Ltd Gold Fields Ltd;Repadre Capital Corp (Defunct) 41.2 1,447 26.61 1.9 28
Free State & Joel 2001 Q4 277 South Africa PRD 100.00% Anglogold Ashanti Ltd Harmony Gold Mining Co Ltd 292 12,204 52.00 7.3 24
Ity 2001 Q4 277 Ivory Coast PRD 51.00% Normandy Mining Ltd (Defunct) Areva 10.8 336 4.10 5.0 32
President Steyn 2001 Q4 277 South Africa PRD 100.00% President Steyn Gold Mines (Thistle Mining) Thistle Mining Inc 32.1 1,248 6.93 5.6 26
Elandsrand 2000 Q4 274 South Africa PRD 100.00% Anglogold Ashanti Ltd Harmony Gold Mining Co Ltd 130 10,150 41.00 7.7 13
Barbrook 2000 Q4 274 South Africa PRD 100.00% Caledonia Mining Corp Spring Hills Trading Ltd 13.6 2,398 12.50 6.0 6
Eersteling 2000 Q4 274 South Africa PRD 96.00% Caledonia Mining Corp Spring Hills Trading Ltd 0.4 509 2.65 6.2 1
Teberebie 2000 Q2 274 Ghana PRD 90.00% Pioneer Group Inc Ashanti Goldfields Co Ltd (Defunct) 18.8 4,127 126.19 1.1 5
East Rand 2000 Q1 274 South Africa PRD 100.00% East Rand Proprietary Mines Ltd Enderbrooke Investments Ltd 9.1 1,943 37.98 1.6 5
Randfontein 2000 Q1 274 South Africa PRD 100.00% Randfontein Estates Gold (Harmony) Harmony Gold Mining Co Ltd 143 5,402 27.10 6.2 26
Sukhaybarat 1999 Q4 290 Saudi Arabia PRD 50.00% Boliden Ab Saudi Arabian Mining Co (Gov'T Of Saudi Arab 6.9 810 44.04 1.1 9
Bogoso 1999 Q3 290 Ghana PRD 90.00% International Finance Corp Anvil Mining Ltd; Golden Star Resources Ltd 13.4 1,415 16.30 3.0 9
Golden Pride 1999 Q3 290 Tanzania PRD 50.00% Anglogold Ashanti Ltd Resolute Mining Ltd 20 541 10.87 3.1 37
Hartebeestfontein 1999 Q3 290 South Africa PRD 100.00% Avgold Ltd (Harmony Gold) Drdgold Ltd 7.4 1,702 7.21 7.3 4
Navachab 1999 Q3 290 Namibia PRD 20.00% Inmet Mining Corp Anglogold Ashanti Ltd 3.6 60 4.90 1.9 60
Bogoso 1999 Q2 290 Ghana PRD 90.00% International Finance Corp Anvil Mining Ltd; Golden Star Resources Ltd 51 1,426 16.17 3.0 36
Golden Pride 1999 Q2 290 Tanzania PRD 50.00% Anglogold Ashanti Ltd Resolute Mining Ltd 39 541 10.87 3.1 72
Goldridge 1999 Q2 290 South Africa PRD 100.00% (Harmony); Kalahari Goldridge Mining Co Ltd Harmony Gold Mining Co Ltd 48.8 2,061 43.60 1.5 24
Tarkwa 1999 Q1 290 Ghana PRD 18.90% Golden Knight Resources Inc (Defunct) Repadre Capital Corp (Defunct) 14.9 2,535 298.00 1.4 6
East Rand 1998 Q4 288 South Africa PRD 100.00% Harmony Gold Mining Co Ltd Petmin Ltd 15.1 1,531 7.17 6.6 10
Lega Dembi 1998 Q3 288 Ethiopia PRD 98.00% Government Of Ethiopia Midroc Ethiopia 172 1,797 13.30 4.3 96
Indarama 1997 Q4 290 Zimbabwe PRD 80.00% Private Interests Consolidated Trillion Resources Ltd (Defunct) 16.5 1,108 13.50 3.2 15
Obotan 1997 Q2 290 Ghana PRD 7.50% Obotan Minerals Resolute Mining Ltd 2.4 120 22.31 2.2 20
Knights 1996 Q3 369 South Africa PRD 24.30% Knights Gold Mining Co Continental Goldfields Ltd 5.7 0 84.00 0.0 0
Sabi 1996 Q3 369 Zimbabwe PRD 55.00% Guyana Goldfields Inc Zimbabwe Mining Development Corp 8 658 6.78 5.5 12
Syama 1996 Q3 369 Mali PRD 65.00% Bhp Billiton Group Randgold Resources Ltd 84 1,425 15.53 4.4 59
Tarkwa 1996 Q3 369 Ghana PRD 12.50% Cabo Frio Investments Golden Knight Resources Inc (Defunct) 47 1,619 294.10 1.4 29
Bibiani 1996 Q2 369 Ghana PRD 45.00% International Gold Resources Inc Ashanti Goldfields Co Ltd(Defunct) 99.28 714 27.40 1.8 139
Indarama 1996 Q2 369 Zimbabwe PRD 20.00% International Exploration Mining Company Consolidated Trillion Resources Ltd(Defunct) 3 101 7.50 2.1 30
Sabi 1995 Q1 387 Zimbabwe PRD 55.00% Zimbabwe Mining Development Corp Guyana Goldfields Inc 9 563 5.67 5.6 16
(1) ©Metals Economics Group. The information presented in the above table may not be presented without MEG’s permission. (2) The gold price stated is the closing commodity price for each calendar period and it is this price inter alia which has been used to determine the equivalent gold. (3) The following abbreviations apply: FEA – feasibility; PRD – production; PRE – pre-production; and RD – Reserve Development.

SRK Consulting Ma'aden Gold MER – Main Report
U3330_Ma'aden MER.doc November, 2007 Page 193
16 CONCLUDING REMARKS
16.1 Introduction The following section includes a summary of SRK’s opinion on the Mining Assets and the resulting Equity Values and Ore Reserve EVA as derived.
SRK has conducted a comprehensive review and assessment of all material issues likely to influence the future operations of the Mining Assets. The LoMps for the Mining Assets, as provided and taken in good faith by SRK, have been reviewed and adjusted by SRK where considered appropriate.
16.2 Mineral Resources and Ore Reserves Ma’aden Gold’s Mineral Resource and Ore Reserve statement (Table 16.1) as included in this MER includes a total Mineral Resource of 10.0Moz of gold contained within a tonnage of 132.8Mt grading 2.3g/t Au (2.4g/t Au Eq) and total Ore Reserves of 1.3Moz of gold contained within a tonnage of 21.7Mt grading 1.9g/t Au.
In assessing the potential beyond this, the reader is referred to the various Ore Reserve sensitivities below and SRK’s comments regarding the advanced exploration properties and the exploration properties. The sensitivities, however, are not based on detailed LoMps and should only be considered on a relative basis.
SRK concludes that the Mineral Resources and Ore Reserves as stated herein are compliant with the JORC Code and should these be reported in accordance with Industry Guide 7 they would be identical.
Table 16.1 Ma’aden Gold: Total Mineral Resource and Ore Reserves statement (1 July 2007)(1)
Ore Reserves Tonnage Grade Content Mineral Resources Tonnage Grade Content (kt) (g/t Au) (g/t Au Eq) (koz Au) (koz Au Eq) (kt) (g/t Au) (g/t Au Eq) (koz Au) (koz Au Eq)
Proved Measured u/g 447 10.6 11.0 153 158 u/g 344 21.3 21.9 235 243o/p 0 0.0 0.0 0 0 o/p 7,222 2.8 2.8 648 648Subtotal 447 10.6 11.0 153 158 Subtotal 7,566 3.6 3.7 884 891Probable Indicated u/g 1,910 10.1 10.4 618 636 u/g 2,359 13.0 13.4 987 1,016o/p 16,694 0.8 0.8 427 427 o/p 59,458 2.1 2.1 4,098 4,098s/f 2,614 1.1 1.3 95 108 s/f 2,614 1.1 1.3 95 108Subtotal 21,218 1.7 1.7 1,140 1,172 Subtotal 64,430 2.5 2.5 5,181 5,223Ore Reserves Measured + indicated u/g 2,357 10.2 10.5 770 794 u/g 2,703 14.1 14.5 1,223 1,259o/p 16,694 0.8 0.8 427 427 o/p 66,679 2.2 2.2 4,746 4,746s/f 2,614 1.1 1.3 95 108 s/f 2,614 1.1 1.3 95 108Total Ore Reserves 21,665 1.9 1.9 1,293 1,329 Total 71,996 2.6 2.6 6,064 6,113
Inferred u/g 314 13.5 14.0 137 142 o/p 60,452 2.0 2.0 3,803 3,803 s/f 0 0.0 0.0 0 0 Subtotal 60,766 2.0 2.0 3,939 3,944 Mineral Resources u/g 3,018 14.0 14.4 1,359 1,400 o/p 127,131 2.1 2.1 8,549 8,549 s/f 2,614 1.1 1.3 95 108 Total 132,762 2.3 2.4 10,004 10,058
(1) u/g – underground; o/p – open-pit; s/f – surface sources (stockpiles).

SRK Consulting Ma'aden Gold MER – Main Report
U3330_Ma'aden MER.doc November, 2007 Page 194
Table 16.2 Ma’aden Gold: Total Ore Reserve Sensitivity (1 July 2007) Gold Price Tonnage Grade Content (US$/oz) (kt) (g/t Au) (g/t Au Eq) (koz Au) (koz Eq Au)350 8,700 2.9 3.0 817 831450 14,178 2.4 2.5 1,087 1,117550 21,665 1.9 1.9 1,293 1,329650 22,204 1.8 1.9 1,293 1,332750 31,636 1.5 1.6 1,565 1,607
Table 16.3 presents the results of the Ore Reserve EVA for the Mining Assets whereby the current (2007H1) cash costs (by-product basis) are compared with the LoMp weighted averages and the commodity prices required to return the post-tax pre-finance break-even position at a real terms discount factor of 10% are stated.
Table 16.3 Mining Assets: Ore Reserve Economic Viability Assessment Mining Asset Cash Costs (by-product basis) +ve NPV
2007H1 LoMp Gold Price (US$/oz) (US$/oz) (US$/oz)
Mahd Ad'Dahab 121 170 266Al Amar 0 94 296Bulghah 263 349 308Sukhaybarat 309 551 601Al Hajar 194 298 441Head office 85 125 n/aMa’aden Gold 292 337 438
Figure 16.1 presents the historical and forecast equivalent gold production and the cash cost (by-product basis) for Ma’aden Gold. The replacement production required beyond 2010 is dependent upon the CAG Project specifically the completion of the necessary technical studies.
Figure 16.1 Ma’aden Gold: LoMp equivalent gold production (koz) and cash costs (US$/oz)
0
50
100
150
200
250
2004
2005
2006
2007
2008
2009
2010
2011
2012
2013
2014
Years (Calendar)
Ann
ual P
rodu
ctio
n (k
oz)
0
50
100
150
200
250
300
350
Cash C
ost (US$/oz)
Mahd Ad'Dahab Al Amar Bulghah Sukhaybarat
HISTORY FORECAST
16.3 Equity Value of Ma’aden Gold The Equity Value of the Company as stated in this MER at US$62.7m should be considered

SRK Consulting Ma'aden Gold MER – Main Report
U3330_Ma'aden MER.doc November, 2007 Page 195
in conjunction with the accompanying sensitivity analyses as reported in Section 14.0.
Notwithstanding this statement SRK notes that the principal issues as they relate to the Gold Assets are:
• Mineral Resource and Ore Reserve Management:
− the application and documentation of Quality Control and Quality Assurance, − the lack of a formal Mineral Resource and Ore Reserve Management system as
exemplified by the currency of core data (>2 years), − lack of detailed reconciliation, reliance on manual methods, − lack of detailed mine design and production scheduling beyond the immediate budget
(1 year) reporting period; • Environmental Management, specifically the limitations in respect of:
− no EIAs for Mahd Ad’Dahab and Sukhaybarat, − rudimentary social assessments arising from the limited public involvement, − limited monitoring at the Mining Assets;
• The combined operational and economic risk as reflected in the LoMps, specifically:
− at Al Amar, that projected dilution is greater than that envisaged in the 2001 Feasibility Study given the current development dimensions and the acquisition of larger underground equipment than initially planned,
− at Bulghah, specifically in respect of the planned significant increase in the processing of lower grade fresh ore with significantly reduced metallurgical recoveries,
− at Sukhaybarat, the projected decline in processed grades beyond 2009 resulting in cash operating costs in excess of US$600/oz,
− Al Hajar’s re-crushing project given the estimation risks associated with sampling historically stacked heap leach material and ensuring the representivity of metallurgical testwork;
• Development risks associated with the Development Property and the Advanced Exploration Properties given:
− that only a pre-feasibility study has been completed for Ad Duwayhi, − that only conceptual/scoping studies have been completed for Mansourah, Ar Rjum,
Masarah, As Suk, and Zalim, − that all of the above are to some degree dependent upon the establishment of a
regional water pipeline at an overall capital cost of US$90m; • The opportunity to increase Ore Reserves, through:
− upgrading of Inferred Mineral Resources at the AEPs through further drilling as well as completion of appropriate technical studies demonstrating the technical feasibility and economic viability of the CAG Project,
− re-optimisation of open-pits at Bulghah at the long term commodity prices and consideration of the applicability of the current positive bias between grade control models and exploration models,
− upgrading of Inferred Mineral Resources at Mahd Ad’Dahab, Al Amar and Bulghah to the Indicated Mineral Resource category through further drilling and completion of the necessary technical studies for modification to Probable Ore Reserves; and
• The opportunity to increase Mineral Resources through:

SRK Consulting Ma'aden Gold MER – Main Report
U3330_Ma'aden MER.doc November, 2007 Page 196
− further drilling, specifically targeting the areas which have not been closed off by drilling at Ad Duwayhi and the AEPs,
− application of improved geological wireframing at certain of the AEPs specifically Mansourah where the current Mineral Resource could be significantly expanded without the benefit of further drilling,
− implementation of the planned exploration at the Exploration Properties which have not yet reported JORC Code compliant Mineral Resources.
SRK has not been informed of the use of proceeds from the Admission and accordingly cannot comment on whether this will be utilised in the further development of Ma’aden Gold.
For and behalf of SRK Consulting (UK) Limited
Martin Pittuck, Principal Consultant, SRK Consulting
David Pearce,Corporate Consultant,
SRK Consulting
Iestyn Humphreys, Director, SRK Consulting
SRK Consulting Ma'aden Gold MER – Main Report
U3330_Ma'aden MER.doc November, 2007 Page 197
GLOSSARY OF TERMS acid rock/mine drainage Drainage with a pH of 2.0 to 4.5 from mines and mine
wastes. It results from the oxidation of sulphides exposed during mining, which produces sulphuric acid and sulphate salts. The acid dissolves minerals in the rocks, further degrading the quality of the drainage water.
activated carbon Carbon, mostly of vegetable origin, and of high adsorptive capacity.
adit A horizontal passage driven into a mine from the side of a hill.
Admission The proposed admission of ordinary shares of the Company to trading on the Saudi Stock Exchange.
Advanced Exploration Properties Exploration Properties on which Mineral Resources have been defined: Mansourah; Ar Rjum; Masarrah; As Suk; Zalim.
aeolian Pertaining to the wind; esp. said of such deposits as loess and dune sand, of sedimentary structures such as wind-formed ripple marks, or of erosion and deposition accomplished by the wind.
African Shield A geological entity located on the eastern horn of Africa and extending eastward to western Saudi Arabia and the eastern half of Madagascar.
agglomerate A breccia composed largely or entirely of fragments of volcanic rocks.
agglomeration In beneficiation, a concentration process based on the adhesion of pulp particles to water. Loosely bonded associations of particles and bubbles are formed that are heavier than water; flowing-film gravity concentration is used to separate the agglomerates from non-agglomerated particles. Agglomeration also refers to briquetting, nodulizing, sintering, etc.
AIM Rules Alternative Investment Market Rules.
airborne magnetic survey A technique of geophysical exploration of an area using an airborne magnetometer to survey that area.
Al Amar An operating mining asset of Ma’aden Gold comprising the Al Amar mine and the Al Amar Plant.
Al Amar Mine The underground mine at Al Amar.
Al Amar Plant The metallurgical processing facility at Al Amar.
Al Hajar An operating asset of Ma’aden Gold comprising the Al Hajar Plant.
Al Hajar Plant The metallurgical processing facility at Al Hajar.
alluvial gravels Said of a placer formed by the action of running water,

SRK Consulting Ma'aden Gold MER – Glossary, Abbreviations and Units
U3330_Ma'aden MER.doc November, 2007 Page 198
as in a stream channel or alluvial fan; also said of the valuable mineral, e.g., gold or diamond, associated with an alluvial placer.
alluvial fan A low, outspread, gently sloping mass of loose rock material, shaped in plan view like an open fan or a segment of a cone; deposited by a stream (esp. in a semiarid region) at the place where it issues from a narrow mountain valley upon a plain or broad valley, or where a tributary stream is near or at its junction with the main stream, or wherever a constriction in a valley abruptly ceases or the gradient of the stream suddenly decreases; it is steepest near the mouth of the valley where its apex points upstream, and it slopes gently and convexly outward with gradually decreasing gradient.; detrital fan; talus fan; dry delta.
alluvium A general term for clay, silt, sand, gravel, or similar unconsolidated detrital material, deposited during comparatively recent geologic time by a stream or other body of running water, (1) as sediment in the bed of the stream or on its flood plain or delta, (2) as a cone or fan at the base of a mountain slope; esp., such a deposit of fine-grained texture (silt or silty clay) deposited during time of flood.; alluvion.
amphibole A mineral group; characterized by double chains of silica tetrahedra; in the orthorhombic or monoclinic crystal systems, including actinolite, anthophyllite, arfvedsonite, cummingtonite, hornblende, richterite, glaucophane, grunerite, anthophyllite, riebeckite, tremolite, and others.
amphibolite A crystalloblastic rock consisting mainly of amphibole and plagioclase with little or no quartz. As the content of quartz increases, the rock grades into hornblende plagioclase gneiss.
andesite A dark-coloured, fine-grained extrusive rock that, when porphyritic, contains phenocrysts composed primarily of zoned sodic plagioclase (especially andesine) and one or more of the mafic minerals (e.g., biotite, hornblende, pyroxene), with a groundmass composed generally of the same minerals as the phenocrysts, although the plagioclase may be more sodic, and quartz is generally present; the extrusive equivalent of diorite.
anomaly A geological feature, especially in the subsurface, distinguished by geological, geophysical, or geochemical means, which is different from the general surroundings and is often of potential economic value.
aplite A light-coloured igneous rock characterized by a fine-grained saccharoidal (i.e., aplitic) texture.

SRK Consulting Ma'aden Gold MER – Glossary, Abbreviations and Units
U3330_Ma'aden MER.doc November, 2007 Page 199
Arabian Shield An exposure of Precambrian crystalline rocks on the flanks of the Red Sea.
arsenic A metallic, steel-gray, brittle element. Symbol, As. Found native in realgar and orpiment, and combined with heavy metals. Used in bronzing, pyrotechny, insecticides, and poisons, and as a doping agent in transistors. Gallium arsenide is used as a laser material to convert electricity directly into coherent light. Arsenic and its compounds are poisonous.
arsenopyrite A monoclinic mineral; pseudo-orthorhombic, prismatic, and metallic silver-white to steel gray; the most common arsenic mineral and principal ore of arsenic; occurs in many sulphide ore deposits, particularly those containing lead, silver, and gold.; arsenical pyrite; white pyrite; white mundic.
assay To analyse the proportions of metals in an ore; to test an ore or mineral for composition, purity, weight, or other properties of commercial interest.
assessed losses The assessed losses incurred by a company from historical trading.
atomic absorption spectrometry A technique for determining the concentration of a particular metal element in a sample.
Auditors Deloitte & Touche Bakr Abulkhair & Co.
backfill Waste sand or rock used to support the roof or walls after removal of ore from a stope.
ball mill A rotating horizontal cylinder with a diameter almost equal to the length supported by a frame or shaft, in which non-metallic materials are ground using various types of grinding media such as quartz pebbles, porcelain balls, etc.
Bankable Standards A feasibility study in which technical feasibility and economic viability has been demonstrated to a sufficient level to enable project financing with limited conditions precedent.
Bahrain Kingdom of Bahrain.
barren solution A solution in hydrometallurgical treatment from which all possible valuable constituents have been removed; it is usually recycled back to plant for reuse in process.
batter The inward slope from bottom to top of the face of a wall.
basalt A general term for dark-coloured mafic igneous rocks, commonly extrusive but locally intrusive (e.g., as dikes), composed chiefly of calcic plagioclase and clinopyroxene; the fine-grained equivalent of gabbro. Nepheline, olivine, orthopyroxene, or quartz may be present.

SRK Consulting Ma'aden Gold MER – Glossary, Abbreviations and Units
U3330_Ma'aden MER.doc November, 2007 Page 200
Base Information Date 1 January 2007.
base metal A classification of metals usually considered to be of low value and higher chemical activity when compared with the noble metals (gold, silver, platinum, etc.). This non-specific term generally refers to the high-volume, low-value metals copper, lead, tin, and zinc.
bench The horizontal step or floor along which coal, ore, stone, or overburden is mined.
berm A horizontal shelf or ledge built into the embankment or sloping wall of an open-pit or quarry to break the continuity of an otherwise long slope and to strengthen its stability or to catch and arrest slide material. A berm may be used as a haulage road or serve as a bench above which material is excavated from a bank or bench face.
Bio-physical Closure That portion of an environmental liability which is related to the physical closure of a mining operation and specifically excludes any social liabilities.
blast-hole A hole drilled in a material to be blasted, for the purpose of containing an explosive charge.
block model A three dimensional electronic model in which geological characteristics and qualities are housed.
bottle roll test A laboratory test in which pulverized ore is subject to cyanidation over a period of say 72hrs to determine metallurgical recovery by direct cyanidation. Total content of cyanide leachable gold, determined in the initial bottle roll test, can be used later for monitoring of following column tests or for detailed research on the determination of metallurgical characteristics of ore.
breccia A coarse-grained clastic rock, composed of angular broken rock fragments held together by a mineral cement or in a fine-grained matrix; it differs from conglomerate in that the fragments have sharp edges and unworn corners. Breccia may originate as a result of talus accumulation, explosive igneous processes, collapse of rock material, or faulting.
Brook Hunt Brook Hunt & Associates Limited.
Bulghah an operating mining asset of Ma’aden Gold comprising an open-pit mine and the Bulghah Plant.
Bulghah Mine The open-pit mine at Bulghah.
Bulghah Plant The metallurgical processing plant at Bulghah.
bullion Refined gold or silver, un-coined, in the shape of bars, ingots, or comparable masses.
by-product Secondary products of commercial value which are reflected as a credit to the operating expenditures.
SRK Consulting Ma'aden Gold MER – Glossary, Abbreviations and Units
U3330_Ma'aden MER.doc November, 2007 Page 201
by-product cash cost A form of cash cost reporting in which the numerator is reduced by the sales revenue sourced from by-products.
CAG Project Central Arabian Gold Project.
CAG Region Central Arabian Gold Region.
calc-alkaline Said of a series of igneous rocks in which the weight percentage of silica is between 56 and 61 when the weight percentages of CaO and of K2O + Na2O are equal.
caliphates The Islamic form of government representing the political unity and leadership of the Muslim world.
capital expenditure Expenditures incurred during the process of commencing, expanding or sustaining production.
carbon adsorption Recovery of dissolved soluble constituents onto activated carbon due to some form of chemical sorption at the active sites. Carbon adsorption is particularly useful for removing gold and silver from cyanide leach solutions or dissolved organics from process solutions.
carbonate One of several minerals containing one central carbon atom with strong covalent bonds to three oxygen atoms and typically having ionic bonds to one or more positive ions.
Carbon-in-Leach A process step wherein granular activated carbon particles much larger than the ground ore particles are introduced into the ore pulp. Cyanide leaching and precious metals adsorption onto the activated carbon occur simultaneously. The loaded activated carbon is mechanically screened to separate it from the barren ore pulp and processed to remove the precious metals and prepare it for reuse.
Carbon-in-Pulp A precious metals leaching technique in which granular activated carbon particles much larger than the ground ore particles are added to the cyanidation pulp after the precious metals have been solubilised. The activated carbon and pulp are agitated together to enable the solubilised precious metals to become adsorbed onto the activated carbon. The loaded activated carbon is mechanically screened to separate it from the barren ore pulp and processed to remove the precious metals and prepare it for re-use.
cash operating cost An internationally recognised metric for stating operating costs per unit of saleable commodity: including direct smelting costs, direct overhead costs, by-product credits, consulting fees, management fees, transportation and distribution charges.
cataclastic Pertaining to the structure produced in a rock by the

SRK Consulting Ma'aden Gold MER – Glossary, Abbreviations and Units
U3330_Ma'aden MER.doc November, 2007 Page 202
action of severe mechanical stress during dynamic metamorphism; characteristic features include the bending, breaking, and granulation of the minerals. Also said of the rocks exhibiting such structures.
CESR Recommendations CESR’s recommendations for the consistent implementation of the European Commission’s Regulation on Prospectuses No. 909/2004”, published in January 2005: specifically paragraphs 131 to 132, section 1b – Mineral Companies.
chalcocite A sulphide mineral of copper common in the zone of secondary enrichment.
chalcopyrite Tetragonal mineral, CuFeS2; brass-yellow with bluish tarnish; massive; softer than pyrite; occurs in late magmatic hydrothermal veins and secondary enrichment zones; the most important source of copper; yellow pyrite; yellow copper.
Chapter 19 Chapter 19 of the UKLA's Listing Rules as it existed on June 30, 2005 (prior to its deletion upon the implementation in the UK on July 1, 2005 of the Prospectus Directive).
channel sample A geological sample gathered by cutting across the true width of the mineralisation.
chert A hard, dense, dull to semi-vitreous, microcrystalline or cryptocrystalline sedimentary rock, consisting dominantly of interlocking crystals of quartz less than about 30μm in diameter. The term "flint" is essentially synonymous, although it has been used for the dark variety of chert.
chlorite A compound that contains this group, with chlorine in oxidation state +3. Chlorites are also known as salts of chlorous acid.
clastic Consisting of fragments of minerals, rocks, or organic structures that have been moved individually from their places of origin.
colluvial Loose bodies of sediment that have been deposited or built up at the bottom of a low grade slope or against a barrier on that slope, transported by gravity.
column leach test Simulation of in-situ leaching through the use of a long narrow column in which ore sample and solution are in contact for measuring the effects of typical variables encountered in actual in-situ leach mining.
comminution The breaking, crushing, or grinding by mechanical means of stone, coal, or ore, for direct use or further processing.
Company Ma’aden.
Competent Person a person who is a Member or Fellow of The Australasian

SRK Consulting Ma'aden Gold MER – Glossary, Abbreviations and Units
U3330_Ma'aden MER.doc November, 2007 Page 203
Institute of Mining and Metallurgy, or of the Australian Institute of Geoscientists, or of a ‘Recognised Overseas Professional Organisation’ included in a list promulgated from time to time. A ‘Competent Person’ must have a minimum of five years experience which is relevant to the style of mineralisation and type of deposit under consideration and to the activity which that person is undertaking.
composite A single sample generated by the aggregation of many other samples.
concentrate The clean product recovered in froth flotation.
cone crusher A machine for reducing the size of materials by means of a truncated cone revolving on its vertical axis within an outer chamber, the annular space between the outer chamber and cone being tapered.
core A solid, cylindrical sample of rock produced by an annular drill bit, generally rotatively driven but sometimes cut by percussive methods.
copper A reddish metallic element that takes on a bright metallic luster and is malleable, ductile, and a good conductor of heat and electricity. Symbol, Cu. Occasionally occurs native, and is found in many minerals such as cuprite, malachite, azurite, chalcopyrite, and bornite.
copper concentrate A base metals sulphide concentrate in which copper is the predominant payable metal.
co-product cash cost A form of cash cost reporting in which the denominator is based on an equivalent unit of production/sales i.e. gold equivalent.
country rock The rock enclosing or traversed by a mineral deposit. Originally a miners' term, it is somewhat less specific than host rock.
covellite A hexagonal mineral, CuS; metallic indigo blue with iridescent tarnish; soft; a supergene mineral in copper deposits; a source of copper.
CMA Listing Rules the Listing Rules as defined by the Capital Market Law issued by Royal Decree No M/30 dated 1 August 2003.
Consensus Market Forecasts Commodity prices determined by analysis of the median/range of forecasts by various financial institutions.
creditors A party (e.g. person, organization, company, or government) that claims that a second party owes the first party some properties or services.
cross-cut A horizontal opening driven across the course of a vein or in general across the direction of the main workings.
crushing Size reduction into relatively coarse particles by stamps,

SRK Consulting Ma'aden Gold MER – Glossary, Abbreviations and Units
U3330_Ma'aden MER.doc November, 2007 Page 204
crushers, or rolls.
cut-and-fill A stoping method in which the ore is excavated by successive flat or inclined slices, working upward from the level, as in shrinkage stoping. However, after each slice is blasted down, all broken ore is removed, and the stope is filled with waste up to within a few feet of the back before the next slice is taken out, just enough room being left between the top of the waste pile and the back of the stope to provide working space. The term cut-and-fill stoping implies a definite and characteristic sequence of operations: (1) breaking a slice of ore from the back; (2) removing the broken ore; and (3) introducing filling.
cut-back See push-back.
cut-off grade The lowest grade of mineralised material that qualifies as ore in a given deposit; rock of the lowest assay included in an ore estimate.
cyanide Usually refers to cyanide solution in circulation in a mill treating gold or silver ores. The stock or solution is of two main types: barren, from which all possible value has been extracted, and pregs or pregnant, which is charged with gold or silver and awaits their removal.
dacite A fine-grained extrusive rock with the same general composition as andesite, but having a less calcic plagioclase and more quartz; according to many, it is the extrusive equivalent of granodiorite. Ancient Roman province of Dacia.
decline A sloping underground opening for machine access from level to level or from surface; also called a ramp.
decline portal The rock face at which tunnel driving is started.
de-clustering technique A preliminary technique used to limit the influence of clustered data in the interpolation process.
debtors The opposite of a Creditor who is someone you owe money to.
depletion The act of emptying, reducing, or exhausting, as the depletion of natural resources. In mining, specifically said of ore reserves.
depreciation Term used to describe any method of attributing the cost of an asset across the useful life of the asset.
derivative instruments Financial instruments whose value is derived from the value of something else. They generally take the form of contracts under which the parties agree to payments between them based upon the value of an underlying asset or other data at a particular point in time. The main types of derivatives are futures, forwards, options,

SRK Consulting Ma'aden Gold MER – Glossary, Abbreviations and Units
U3330_Ma'aden MER.doc November, 2007 Page 205
and swaps.
desert pediment A broad, gently sloping rock-floored erosion surface or plain of low relief, typically developed by running water in an arid or semiarid region at the base of an abrupt and receding mountain front or plateau escarpment; underlain by bedrock that may be bare, but is more often partly mantled with a thin discontinuous veneer of alluvium derived from the upland masses and in transit across the surface.
development The work done in a mine to open up the paying ground or roof and, in particular, to from drives or haulages around blocks of ore. Also subdivided into Stope development and capital development.
development jumbo A drill carriage or mobile scaffold on which several drills of drifter type are mounted. It is used in tunnels and large headings.
Development Property A Mining Asset which is not currently operational e.g. Ad Duwayhi.
diamond drillhole A drill hole formed by the act or process of drilling boreholes using bits inset with diamonds as the rock-cutting tool. The bits are rotated by various types and sizes of mechanisms motivated by steam, internal-combustion, hydraulic, compressed-air, or electric engines or motors.
diesel generator A source of electricity, esp. one that transforms heat or mechanical work directly into electric energy, as opposed to a voltaic battery.
dilution The contamination of ore with barren or grade bearing wall rock in stoping. The assay of the ore after mining is frequently lower than when sampled in place. Dilution(1) relates to the proportion of waste that is contained in the Run-of-Mine ore delivered to the metallurgical processing plant. Dilution(2) relates to diluting tonnage expressed as a percentage of in-situ ore mined.
diorite A group of plutonic rocks intermediate in composition between acidic and basic, characteristically composed of dark-coloured amphibole (esp. hornblende), acid plagioclase (oligoclase, andesine), pyroxene, and sometimes a small amount of quartz; also, any rock in that group.
dip The angle at which a bed, stratum, or vein is inclined from the horizontal, measured perpendicular to the strike and in the vertical plane.
direct cyanidation A process of extracting gold and silver as cyanide slimes from their ores by treatment with dilute solutions of

SRK Consulting Ma'aden Gold MER – Glossary, Abbreviations and Units
U3330_Ma'aden MER.doc November, 2007 Page 206
potassium cyanide or sodium cyanide. The slimes are subsequently fused and cast into ingots or bullion.
discount factor The discounted value of a cashflow is determined by reducing its value by the appropriate discount rate for each unit of time between the time when the cashflow is to be valued to the time of the cashflow. Most often the discount rate is expressed as an annual rate.
dolerite In British usage, the preferred term for what is called diabase in the United States. A fine-grained character of the rock that makes it difficult to identify megascopically.
domain A domain in which the properties display similar characteristics.
doré Gold and silver bullion that remains in a cupelling furnace after the lead has been oxidized and skimmed off.
dozer A tractor on the front end of which is mounted a vertically curved steel blade held at a fixed distance by arms secured on a pivot or shaft near the horizontal centre of the tractor. The blade can be lowered or tilted vertically by cables or hydraulic rams. It is a highly versatile piece of earth excavating and moving equipment esp. useful in land clearing and levelling work, in stripping topsoil, in road and ramp building, and in floor or bench cleanup and gathering operations.
drillhole Technically, a circular hole drilled by forces applied percussively; loosely and commonly, the name applies to a circular hole drilled in any manner.
drillhole collar The formation of the front end of a drill hole, or the collar, which is the preliminary step in drilling to cause the drill bit to engage in the rock.
drip irrigation The process of applying cyanide solution to a Heap leach pad in order to minimises losses through evaporation.
dunite Peridotite in which the mafic mineral is almost entirely olivine, with accessory chromite almost always present. Named by Hochstetter in 1864 from Dun Mountain, New Zealand.
dyke Tabular igneous intrusion that cuts across the bedding or foliation of the country rock.
economic ore Tabular igneous intrusion that cuts across the bedding or foliation of the country rock.
Effective Date 1 July 2007.
electrowinning An electrochemical process in which a metal dissolved within an electrolyte is plated onto an electrode. Used to recover metals such as cobalt, copper, gold, and nickel

SRK Consulting Ma'aden Gold MER – Glossary, Abbreviations and Units
U3330_Ma'aden MER.doc November, 2007 Page 207
from solution in the leaching of ores, concentrates, precipitates, matte, etc.
eluate A weak acid solution in which gold is contained following carbon stripping.
elution The process of recovering gold from activated carbon through acid washing.
Enterprise Value The sum of the Net Present Value of the Mining Assets.
Environmental Impact Assessment An assessment which is prepared for a regulatory agency with regard to a permit, and is required under the majority of mining codes. The EIA may include but is not limited to the environmental consequences which may arise from the proposed development.
Environmental Liabilities The sum of the biophysical liabilities and the terminal benefits liabilities associated with an exploration/mining property.
Equator Principles A set of voluntary environmental and social guidelines for ethical project finance. These principles commit banks and other signatories to not finance projects that fail to meet these guidelines.
Equity Value The nets sum of Net Asset Value of the Gold Assets and the valuation adjustments.
escarpment A long, more or less continuous cliff or relatively steep slope facing in one general direction, breaking the continuity of the land by separating two level or gently sloping surfaces, and produced by erosion or by faulting. The term is often used synonymously with scarp, although escarpment is more often applied to a cliff formed by differential erosion.
evaporation The process by which a substance is converted from a liquid state into a vapor. Specif., the conversion of a liquid into vapor in order to remove it wholly or partly from a liquid of higher boiling point or from solids dissolved in or mixed with it.
Exploitation Licence A licence issued in the Kingdom of Saudi Arabia for the purpose of undertaking mining activity.
Exploration The search for coal, mineral, or ore by (1) geological surveys; (2) geophysical prospecting (may be ground, aerial, or both); (3) boreholes and trial pits; or (4) surface or underground headings, drifts, or tunnels. Exploration aims at locating the presence of economic deposits and establishing their nature, shape, and grade, and the investigation may be divided into (1) preliminary and (2) final.
Exploration Assets Advanced Exploration Properties and the Exploration Properties.

SRK Consulting Ma'aden Gold MER – Glossary, Abbreviations and Units
U3330_Ma'aden MER.doc November, 2007 Page 208
Exploration Licence A licence issued in the Kingdom of Saudi Arabia for the purpose of undertaking exploration activity.
exploration model Generally the block model for any deposit which grades are largely based on exploration assay data.
Exploration Property All Exploration Assets (AEPs and EPs) contained within the Exploration Licences.
Exploration Prospect An exploration target identified within an Exploration Licence.
extension drilling A drilling programme aimed at extending the currently defined geological boundaries of an orebody.
fault A fracture or a fracture zone in crustal rocks along which there has been displacement of the two sides relative to one another parallel to the fracture. The displacement may be a few inches or many miles long.
Feasibility Study A technical and economic study which demonstrates the technical and economic viability of a mining project to within a range of accuracy of 15% and to an appropriate degree of detail such that a decision for proceeding to the project development stage may be made without substantive revision to either scope or scale.
feldspar A group containing two high-temperature series, plagioclase and alkali feldspar; colourless or white and clear to translucent where pure. Constituting 60% of the Earth's crust, feldspar occurs in all rock types and decomposes to from much of the clay in soil, including kaolinite.
felsic Derived from feldspar, lenad or feldspathoid, and silica, and applied to light-coloured rocks containing an abundance of one or all of these constituents. Also applied to the minerals themselves, the chief felsic minerals being quartz, feldspar, feldspathoid, and muscovite.
felsite A general term for any light-coloured, fine-grained or aphanitic extrusive or hypabyssal rock, with or without phenocrysts, and composed chiefly of quartz and feldspar; a rock characterized by felsitic texture.
ferruginous Pertaining to or containing iron; e.g., a sandstone that is cemented with iron oxide.
Financial Advisor JPMorgan Chase Bank N.A.
Financial Models The pre-finance post-tax cashflow models for the Mining Assets.
filter cake The compacted solid or semisolid material separated from a liquid and remaining on a filter after pressure filtration.
filtering To subject to the action of a filter; to pass a liquid or a

SRK Consulting Ma'aden Gold MER – Glossary, Abbreviations and Units
U3330_Ma'aden MER.doc November, 2007 Page 209
gas through a filter for the purpose of purifying, or separating, or both. To act as a filter; to remove from a fluid by means of a filter; to percolate
fire assay The assaying of metallic ores, usually gold and silver, by methods requiring a furnace heat; commonly involves the processes of scorification, cupellation, etc.
firesetting The thermal shattering of rock by means of setting a fire against the rock face and quenching with water once a certain temperature has been reached.
flitch A vertical increment of a bench which is excavated (post blasting).
flotation Processes of concentration in which levitation in water of particles heavier than water was obtained. Thus, if some particles were retained in an oil layer or at the interface between an oil layer and a water layer, the process was spoken of as bulk-oil flotation; if the particles were retained at a free water surface as a layer one particle deep, the process was skin flotation; and if the particles were retained in a foamy layer several inches thick, the process was froth flotation. Froth flotation is the process that has survived the test of time, and the term flotation is now used universally to describe froth flotation.
fluorite An isometric mineral, CaF2; perfect octahedral cleavage; transparent to translucent; defines 4 on the Mohs hardness scale; in veins as a gangue mineral; in carbonate rocks; an accessory in igneous rocks.; fluor; Derbyshire spar.
flux In metal refining, a material used to remove undesirable substances; e.g., sand, ash, or dirt, as a molten mixture.
fold A curve or bend of a planar structure such as rock strata, bedding planes, foliation, or cleavage. A fold is usually a product of deformation, although its definition is descriptive and not genetic and may include primary structures.
footwall The part of the country rock that lies below the ore deposit.
free-digging Ore or waste which may be mechanically excavated without recourse to the use of explosives.
free-gold Gold un-combined with other substances.
fresh ore See sulphide ore.
fuchsite Bright-green chromium muscovite.
gabbro A group of dark-coloured, basic intrusive igneous rocks composed principally of basic plagioclase (commonly labradorite or bytownite) and clinopyroxene (augite), with or without olivine and orthopyroxene; also, any member

SRK Consulting Ma'aden Gold MER – Glossary, Abbreviations and Units
U3330_Ma'aden MER.doc November, 2007 Page 210
of that group.
galena An isometric mineral, 4[PbS]; cubic cleavage; forms cubes and octahedra, also coarse- or fine-grained masses; specific gravity, 7.6; occurs with sphalerite in hydrothermal veins, also in sedimentary rocks as replacement deposits; an important source of lead and silver.
geochemical anomaly A concentration of one or more elements in rock, soil, sediment, vegetation, or water that is markedly higher or lower than background. The term may also be applied to hydrocarbon concentrations in soils.
geochemical sampling The search for economic mineral deposits or petroleum by detection of abnormal concentrations of elements or hydrocarbons in surficial materials or organisms, usually accomplished by instrumental, spot-test, or quickie techniques that may be applied in the field.
geomembrane Synthetic products used to solve geotechnical problems.
geophysics Branch of physics dealing with the Earth, including its atmosphere and hydrosphere. It includes the use of seismic, gravitational, electrical, thermal, radiometric, and magnetic phenomena to elucidate processes of dynamical geology and physical geography, and makes use of geodesy, geology, seismology, meteorology, oceanography, magnetism, and other Earth sciences in collecting and interpreting Earth data. Geophysical methods have been applied successfully to the identification of underground structures in the Earth and to the search for structures of a particular type, as, for example, those associated with oil-bearing sands.
goethite A common weathering product of iron-bearing minerals; precipitates in bogs and springs; a major constituent of limonite and gossans, and a source of iron and a yellow ochre pigment.
gold An isometric mineral; commonly alloyed with silver or copper, possibly with bismuth, mercury, or the platinum-group metals; metallic yellow; soft and malleable; specific gravity, 19.3 if pure; occurs in hydrothermal veins with quartz and various sulphides and alluvial deposits.
Gold Assets Mining Assets and Exploration Assets.
gossan An iron-bearing weathered product overlying a sulphide deposit. It is formed by the oxidation of sulphides and the leaching-out of the sulphur and most metals, leaving hydrated iron oxides and rarely sulphates.
grade The relative quantity or the percentage of ore-mineral or

SRK Consulting Ma'aden Gold MER – Glossary, Abbreviations and Units
U3330_Ma'aden MER.doc November, 2007 Page 211
metal content in an orebody.
grade control The process of monitoring the estimation of grade in the mining operation by comparison of estimates based on exploration drilling, infill drilling, blast-hole sampling and mining/milling reconciliation exercises.
grade control model The block model which is derived from interpolation of grades using both exploration drilling and grade control drilling results.
grade interpolation Estimation of a statistical value from its mathematical or graphical position intermediate in a series of determined points.
grader A self-propelled or towed machine provided with a row of removing or digging teeth and (behind) a blade to spread and level the material.
granite Plutonic rock in which quartz constitutes 10% to 50% of the felsic components and in which the alkali feldspar/total feldspar ratio is generally restricted to the range of 65% to 90%.
granodiorite A group of coarse-grained plutonic rocks intermediate in composition between quartz diorite and quartz monzonite, containing quartz, plagioclase (oligoclase or andesine), and potassium feldspar, with biotite, hornblende, or, more rarely, pyroxene, as the mafic components.
graphite A hexagonal and trigonal mineral, native carbon, polymorphous with chaoite, diamond, and lonsdaleite; scaly, soft, lustrous, metallic; greasy feel; as crystals, flakes, scales, laminae, or grains in veins or bedded masses or disseminations in carbonaceous metamorphic rocks; conducts electricity well, is soft and unctuous; immune to most acids; extremely refractory.
gravity concentration Separation of mineral particles, with the aid of water or air, according to the differences in their specific gravities.
greenschist A schistose metamorphic rock whose green colour is due to the presence of chlorite, epidote, or actinolite.
greywacke A variety of sandstone generally characterized by its hardness, dark colour, and poorly-sorted, angular grains of quartz, feldspar, and small rock fragments set in a compact, clay-fine matrix.
grinding The process of erosion by which rock fragments are worn down, crushed, sharpened, or polished through the frictional effect of continued contact and pressure by larger fragments.
gritstone A sedimentary rock composed of coarse sand grains with inclusions of small stones.

SRK Consulting Ma'aden Gold MER – Glossary, Abbreviations and Units
U3330_Ma'aden MER.doc November, 2007 Page 212
gypsum A monoclinic mineral; colourless to white in crystals, but massive beds may range from red to yellow to brown, gray, or black; the most common natural sulphate; defines 2 on the Mohs hardness scale; commonly associated with rock salt (halite) and anhydrite; forms beds and lenses interstratified with limestone, shale, and clay, esp. in rocks of Permian to Triassic age; also in volcanic fumarolic deposits; an accessory mineral in metalliferous veins.
hangingwall The overlying side of an orebody, fault, or mine working, esp. the wall rock above an inclined vein or fault.
harzburgite A variety of peridotite that consists essentially of olivine and enstatite or bronzite.
Heap Leach A process used for the recovery of copper, uranium, and precious metals from weathered low-grade ore. The crushed material is laid on a slightly sloping, impervious pad and uniformly leached by the percolation of the leach liquor trickling through the beds by gravity to ponds. The metals are recovered by conventional methods from the solution.
Heap Leach Pad The foundations, generally impermeable, upon which crushed ore and a leaching agent is placed, specifically a Heap Leach Facility.
hornblende A felsic plutonic rock, generally adamellite or granodiorite, containing an amphibole (often hornblende) as an essential dark-coloured constituent; with decreasing quartz it grades through tonalite into normal diorite.
host rock Body of rock serving as a host for other rocks or for mineral deposits; e.g., a pluton containing xenoliths, or any rock in which ore deposits occur. It is a somewhat more specific term than country rock.
HQ-diameter core A letter name specifying the dimensions of bits, core barrels, and drill rods in the H-size and Q-group wireline diamond drilling system having a core diameter of 63.5mm and a hole diameter of 96mm.
hydraulic excavator An excavator used in open-pit mines powered by hydraulic means.
hydrogeology The part of hydrology that deals with the distribution and movement of groundwater in the soil and rocks of the Earth's crust.
hydrology The science that deals with global water (both liquid and solid), its properties, circulation, and distribution, on and under the Earth's surface and in the atmosphere, from the moment of its precipitation until it is returned to the

SRK Consulting Ma'aden Gold MER – Glossary, Abbreviations and Units
U3330_Ma'aden MER.doc November, 2007 Page 213
atmosphere through evapotranspiration or is discharged into the ocean. In recent years, the scope of hydrology has been expanded to include environmental and economic aspects.
hydrophilic A physical property of a molecule that can transiently bond with water through hydrogen bonding.
hydrophobic The physical property of a molecule (known as a hydrophobe) that is repelled from a mass of water.
hydrothermal Of or pertaining to hot water, to the action of hot water, or to the products of this action, such as a mineral deposit precipitated from a hot aqueous solution, with or without demonstrable association with igneous processes.
ICOG-2P In-situ cut-off grade for Ore Reserves.
ICOG-3R In-situ cut-off grade for Mineral Resources.
import duty A tax on foreign goods upon importation.
incline A shaft not vertical; usually on the dip of a vein.
Indicated Mineral Resources That part of a Mineral Resource for which tonnage, densities, shape, physical characteristics, grade and mineral content can be estimated with a reasonable level of confidence. It is based on exploration, sampling and testing information gathered through appropriate techniques from locations such as outcrops, trenches, pits, workings and drillholes. The locations are too widely or inappropriately spaced to confirm geological and/or grade continuity but are spaced closely enough for continuity to be assumed.
induction furnace An alternating-current electric furnace in which the primary conductor is coiled and generates, by electromagnetic induction, a secondary current that develops heat within the metal charge.
Inferred Mineral Resources That part of a Mineral Resource for which tonnage, grade and mineral content can be estimated with a low level of confidence. It is inferred from geological evidence and assumed but not verified geological and/or grade continuity. It is based on information gathered through appropriate techniques from locations such as outcrops, trenches, pits, workings and drill holes which may be limited or of uncertain quality and reliability.
infill drilling The process of secondary drilling to aid further definition of an exploration and/or mining target.
intercept That portion included between two points in a borehole, as between the point where the hole first encounters a specific rock or mineral body and where the hole enters a different or underlying rock formation.

SRK Consulting Ma'aden Gold MER – Glossary, Abbreviations and Units
U3330_Ma'aden MER.doc November, 2007 Page 214
interpolation Estimation of a statistical value from its mathematical or graphical position intermediate in a series of determined points.
Inverse Distance Weighting Squared
A method for interpolating spatial sample data and determining values between data points. A value interpolated for any spatial point is determined by applying a weighting factor based on distance between the spatial point and surrounding sample data. Selection of sample points to include in the calculation may be determined by minimum and/or maximum distance, azimuth orientation, and the minimum and/or maximum number of the nearest sample data points.
Iraq Republic of Iraq.
ironstone Any rock containing a substantial proportion of an iron compound, or any iron ore from which the metal may be smelted commercially; specif., an iron-rich sedimentary rock, either deposited directly as a ferruginous sediment or resulting from chemical replacement.
ISO 14001 Environmental management standards exist to help organizations (a) minimize how their operations (processes, etc.) negatively affect the environment (i.e. cause adverse changes to air, water, or land); (b) comply with applicable laws, regulations, and other environmentally oriented requirements, and (c) continually improve in the above.
ISO 17025 The main standard used by testing and calibration laboratories.
inselberg A prominent isolated residual knob, hill, or small mountain rising abruptly from an extensive erosion surface in a hot, dry region (as in the deserts of southern Africa or Arabia), generally bare and rocky, although partly buried by the debris derived from its slopes.
intrusion In geology, a mass of igneous rock that, while molten, was forced into or between other rocks.
jaw crusher A crushing machine consisting of a moving jaw, hinged at one end, which swings toward and away from a stationary jaw in a regular oscillatory cycle.
joint A divisional plane or surface that divides a rock and along which there has been no visible movement parallel to the plane or surface.
Jordan Hashemite Kingdom of Jordan.
JORC Code The 2004 Australasian Code for Reporting of Exploration Results, Mineral Resources and Ore Reserves as published by the Joint Ore Reserves Committee of the

SRK Consulting Ma'aden Gold MER – Glossary, Abbreviations and Units
U3330_Ma'aden MER.doc November, 2007 Page 215
Australasian Institute of Mining and Metallurgy, Australian Institute of Geoscientists and Minerals Council of Australia.
Kingdom Kingdom of Saudi Arabia.
kriging In the estimation of mineral resources by geostatistical methods, the use of a weighted, moving-average approach both to account for the estimated values of spatially distributed variables, and also to assess the probable error associated with the estimates.
Kuwait State of Kuwait.
Labour Law Saudi Labour Law issued by Royal Decree M/51 (27 September 2005).
lapilli Pyroclastics that may be either essential, accessory, or accidental in origin, of a size range that has been variously defined within the limits of 2mm and 64mm.
lead A bluish-white metal of bright luster, very soft, highly malleable, ductile, and a poor conductor of electricity; very resistant to corrosion; a cumulative poison. Symbol, Pb. Rarely occurs in native form; chiefly obtained from galena (PbS). Lead is used in storage batteries, cable covering.
limonite An oxidation product of iron (rust) or iron-bearing minerals and may be pseudomorphous after them; as a precipitate, both inorganic and biogenic, in bogs, lakes, springs, or marine deposits; and as a variety of stalactitic, reniform, botryoidal, or mammillary deposits.
listwaenite A carbonate-altered serpentinite commonly associated with gold and mercury mineralization.
lithogeochemical sampling Technique used to identify various forms of alteration.
lithology The character of a rock described in terms of its structure, colour, mineral composition, grain size, and arrangement of its component parts.
loaded carbon Carbon upon which gold has been adsorbed onto as in a Carbon-In-Pulp process.
log-normal distributions The single-tailed probability distribution of any random variable whose logarithm is normally distributed.
long-hole open stoping Stoping method in which blastholes exceeding 3m in length are used.
long-hole production drill rig Rotary or percussive-type drill used to drill underground blastholes to depths exceeding 3m.
lycium A genus of the nightshade family, containing about 90 species of plants native throughout much of the temperate and subtropical zones of the world. They are mostly found in dry, semi-saline environments.

SRK Consulting Ma'aden Gold MER – Glossary, Abbreviations and Units
U3330_Ma'aden MER.doc November, 2007 Page 216
Ma’aden Saudi Arabian Mining Company.
Ma’aden Gold the gold division of Ma’aden.
Mahd Ad’Dahab an operating mining asset of Ma’aden Gold comprising an underground mine and the Mahd Ad’Dahab Plant.
Mahd Ad’Dahab Mine The underground mining operation at Mahd Ad’Dahab.
Mahd Ad’Dahab Plant The metallurgical processing facility at Mahd Ad’Dahab.
malachite A monoclinic mineral; dimorphous with georgeite; bright green; occurs with azurite in oxidised zones of copper deposits; a source of copper.
mafic Pertaining to or composed dominantly of the ferromagnesian rock-forming silicates; said of some igneous rocks and their constituent minerals.
marble A metamorphic rock composed essentially of calcite, dolomite, or a combination of the two, with a fine- to coarse-grained crystalline texture.
marginal ore Ore which has a grade (metal concentration) higher than the marginal cut-off grade.
mark to market The act of assigning a value to a position held in a financial instrument based on the current market price for that instrument or similar instruments. For example, the final value of a futures contract that expires in 9 months will not be known until it expires. If it is marked to market, for accounting purposes it is assigned the value that it would fetch in the open market currently.
mass pull The quantum of concentrate expressed as a percentage of the total ore processed.
Measured Mineral Resources That part of a Mineral Resource for which tonnage, densities, shape, physical characteristics, grade and mineral content can be estimated with a high level of confidence. It is based on detailed and reliable exploration, sampling and testing information gathered through appropriate techniques from locations such as outcrops, trenches, pits, workings and drill holes. The locations are spaced closely enough to confirm geological and grade continuity.
mercury A liquid mineral; metallic silver to tin white; specifc gravity, 13.6; occurs as minute droplets in cinnabar and in some hot-spring deposits; amalgamates with many metals.
Merrill-Crowe Process Removal of gold from pregnant cyanide solution by deoxygenation, followed by precipitation on zinc dust, followed by filtration to recover the resultant auriferous gold slimes.
metallurgical testwork Laboratory testwork undertaken to determine the most appropriate process route for the economic recovery of

SRK Consulting Ma'aden Gold MER – Glossary, Abbreviations and Units
U3330_Ma'aden MER.doc November, 2007 Page 217
valuable minerals/metals.
metamorphism The mineralogical, chemical, and structural adjustment of solid rocks to physical and chemical conditions that have generally been imposed at depth below the surface zones of weathering and cementation, and that differ from the conditions under which the rocks in question originated.
metasomatic alteration Pertaining to the process of metasomatism and to its results. The term is esp. used in connection with the origin of ore deposits.
metavolcanic Said of partly metamorphosed volcanic rock.
mill 1. A mineral treatment plant in which crushing, wet grinding, and further treatment of ore is conducted. Also, separate components, such as ball mill, hammer mill, and rod mill. 2. A preparation facility within which metal ore is cleaned, concentrated, or otherwise processed before it is shipped to the customer, refiner, smelter, or manufacturer. A mill includes all ancillary operations and structures necessary to clean, concentrate, or otherwise process metal ore, such as ore and gangue storage areas and loading facilities.
milling The grinding or crushing of ore. The term may include the operation of removing valueless or harmful constituents.
Mineral Resource A concentration or occurrence of material of intrinsic economic interest in or on the Earth’s crust in such form, quality and quantity that there are reasonable prospects for eventual economic extraction. The location, quantity, grade, geological characteristics and continuity of a Mineral Resource are known, estimated or interpreted from specific geological evidence and knowledge. Mineral Resources are sub-divided, in order of increasing geological confidence, into Inferred, Indicated and Measured categories.
Mining Assets Mahd Ad’Dahab, Al Amar, Bulghah, Sukhaybarat, Al Hajar, Ad Duwayhi.
Mining Code The Mining Investment Code of the Kingdom of Saudi Arabia issued by Royal Decree number 47/M dated 5 October 2004.
mining royalty A royalty levied against the payable metal content of products produced at a mining operation. Typically less than 5%.
modifying factors The term ‘modifying factors’ is defined to include mining, metallurgical, economic, marketing, legal, environmental, social and governmental considerations.

SRK Consulting Ma'aden Gold MER – Glossary, Abbreviations and Units
U3330_Ma'aden MER.doc November, 2007 Page 218
molybdenite A hexagonal and trigonal mineral; polymorphous with jordisite; foliated; soft; metallic lead gray; an accessory in granites and deep veins; an ore of molybdenum.
molybdenum A silvery-white, very hard, metallic element. Symbol, Mo. Does not occur native, but is obtained principally from molybdenite. Wulfenite, and powellite are also minor commercial ores. Valuable as an alloying agent with steel and nickel. Used for electrodes in electrically heated glass furnaces, in nuclear energy applications, and for missile and aircraft parts.
mudstone A general term that includes clay, silt, claystone, siltstone, shale, and argillite.
multiple indicator kriging A more recent advance on other mineral deposit modelling and resource block model estimation techniques such as ordinary kriging. Initially, MIK showed considerable promise as a new method that could more accurately estimate overall global mineral deposit concentrations or grades
NAS Region Northern Arabian Shield Region.
native gold A metal occurring in nature in pure form, un-combined with other elements.
net asset value The net (of historical depreciation) value ascribed to an asset at the end of a financial reporting period.
net movement in working capital The net change between the opening balance and closing balance in respect of debtors, creditors and stores.
net present value A standard method for the financial appraisal of long-term projects whereby future cashflows are discounted to present day terms by application of a discount factor.
nominal Expenditures/revenues stated in money of the day terms i.e. all items irrespective of historic or forecasts are stated in the different money terms for each period.
NQ diameter core A letter name specifying the dimensions of bits, core barrels, and drill rods in the N-size and Q-group wireline diamond drilling system having a core diameter of 47.6mm and a hole diameter of 75.7mm.
Ocean Island Arc A group of islands having a curving, arclike pattern. Most island arcs lie near the continental masses, but inasmuch as they rise from the deep ocean floors, they are not a part of the continents proper.
Offer The offering of ordinary shares in the Company.
Off-take agreement An agreement between a producer (mining company) for the processing of concentrates/unrefined metal by a third party.
OHSAS 18001 An assessment specification for Occupational Health and
SRK Consulting Ma'aden Gold MER – Glossary, Abbreviations and Units
U3330_Ma'aden MER.doc November, 2007 Page 219
Safety Management Systems.
Old Mining Code promulgated by Royal Decree No. M/21, dated July 1972.
Oman Sultanate of Oman.
Ontario benchmark An internationally recognised benchmark for the comparative assessment of safety statistics.
open-pit A mine working or excavation open to the surface.
open stoping Stoping in which no regular artificial method of support is employed, although occasional props or cribs may be used to hold local patches of insecure ground. The walls and roof are self-supporting, and open stopes can be used only where the ore and wall rocks are firm.
operating expenditure All expenditures of a non capital nature necessary to realise projected sales revenue in any given reporting period.
optimised shell An undersigned pit shell obtained from the process of open-pit optimisation.
ordinary kriging A regression technique used in geostatistics to approximate or interpolate data.
Ore The naturally occurring material from which a mineral or minerals of economic value can be extracted profitably or to satisfy social or political objectives. The term is generally but not always used to refer to metalliferous material, and is often modified by the names of the valuable constituent; e.g., iron ore.; ore mineral.
Ore Reserves The economically mineable part of a Measured and/or Indicated Mineral Resource. It includes diluting materials and allowances for losses, which may occur when the material is mined. Appropriate assessments and studies have been carried out, and include consideration of and modification by realistically assumed mining, metallurgical, economic, marketing, legal, environmental, social and governmental factors. These assessments demonstrate at the time of reporting that extraction could reasonably be justified. Ore Reserves are sub-divided in order of increasing confidence into Probable Ore Reserves and Proved Ore Reserves.
Ore Reserve EVA A break-even analysis of Ma’aden Gold’s Ore Reserve estimates. The economic viability assessment of the Ore Reserves as undertaken by SRK which includes the commodity price which: is equivalent to the weighted average LoMp real terms total costs; reflects the current (2007H2) cash costs; and is required to return a zero NPV at a real terms discount factor of 10%.
ore shoot A large and visually rich aggregation of mineral in a vein.

SRK Consulting Ma'aden Gold MER – Glossary, Abbreviations and Units
U3330_Ma'aden MER.doc November, 2007 Page 220
It is a more or less vertical zone or chimney of rich vein matter extending from wall to wall, and has a definite width laterally. Sometimes called pay streak, although the latter applies more specif. to placers.
orogeny The process by which structures within fold-belt mountainous areas were formed, including thrusting, folding, and faulting in the outer and higher layers, and plastic folding, metamorphism, and plutonism in the inner and deeper layers.
oxide ore Ore comprising one of several minerals containing negative oxygen ions bonded to one or more positive metallic ions.
Paleozoic The earliest of three geologic eras of the Phanerozoic eon. The Paleozoic spanned from roughly 542Ma to roughly 251Ma.
parent cell The volume represented by a single block in a block model.
payable metal The metal content of a concentrate for which payment is made and typically allows for deductions for toll treatment losses e.g. smelting and refining.
pediplain Where pedimentation occurs over broad regions, the coalesced surface is termed a pediplain.
percussion drilling Drill in which the drilling bit falls with force onto rock. Also, a pneumatic drill in which a piston delivers hammer blows rapidly on the drill shank.
phenocryst A term for large crystals or mineral grains floating in the matrix or groundmass of a porphyry.
phyllic alteration Hydrothermal alteration typically resulting from removal of sodium, calcium, and magnesium from calc-alkalic rocks, with pervasive replacement of silicates, muting the original rock texture. It is a common style of alteration in porphyry base-metal systems around a central zone of potassic alteration.
pillar A block of ore entirely surrounded by stoping, left intentionally for purposes for ground control or on account of low value.
pit design A design for an open-pit which comprises all benches, berms, batter angles and haul roads.
pit optimisation A process whereby a series of optimised shells for open-pits are generated each corresponding to a specific commodity price assumption.
placer gold Gold occurring in more or less coarse grains or flakes and obtainable by washing the sand, gravel, etc., in which it is found. Also called alluvial gold.
plagioclase Common rock-forming minerals, have characteristic
SRK Consulting Ma'aden Gold MER – Glossary, Abbreviations and Units
U3330_Ma'aden MER.doc November, 2007 Page 221
polysynthetic twinning, and commonly display zoning.
plutonic Pertaining to rocks formed by any process at great depth.
plutonism A general term for the phenomena associated with the formation of plutons.
pollution-plume A volume of fluid contaminated by pollution e.g. downstream of a tailings dam which discharges
polymetallic Sulphide deposit rich in copper, zinc, lead, silver, or gold, which forms as a result of hydrothermal activity in the vicinity of mid-ocean spreading centres or tectonically active basins.
porphyritic Said of the texture of an igneous rock in which larger crystals (phenocrysts) are set in a finer-grained groundmass, which may be crystalline or glassy or both. Also, said of a rock with such texture, or of the mineral forming the phenocrysts.
postholes Shallow exploration holes (<6m) drilled by manual or mechanical methods.
potentially economically mineable A portion of the mineral inventory which can be demonstrated to be mined at a profit and normally determined by application of an appropriate in-situ cut-off grade.
Pre-Cambrian Rocks older than the Cambrian age. Name refers to the great shield-shaped areas of ancient mineral-bearing rocks. These ancient rocks occur in many parts of the world.
precipitation The process of separating mineral constituents from a solution; e.g., by evaporation (such as halite or anhydrite) or by cooling of magma (to form an igneous rock).
Pre-feasibility study A technical and economic study which demonstrates the technical and economic viability of a mining project to within a range of accuracy of 25% and to an appropriate degree of detail such that a decision for proceeding to the project development stage may be made without substantive revision to either scope or scale.
pregnant pond An impoundment in which a value-bearing solution in a hydrometallurgical operation is stored.
pregnant solution A value-bearing solution in a hydrometallurgical operation.
pre-resource drilling Exploration drilling which is used to test the extent of mineralisation but is of too large a spacing to establish a Mineral Resource.
pre-stripping The removal of earth or non ore rock materials as required to gain access to the desired coal, ore, or

SRK Consulting Ma'aden Gold MER – Glossary, Abbreviations and Units
U3330_Ma'aden MER.doc November, 2007 Page 222
mineral materials; the process of removing overburden or waste material in a surface mining operation.
primary crushing In ore dressing, the first stage in which crushers take run-of-mine ore and reduce it to a size small enough to be taken by the next crusher in the series. Ordinarily, the Blake jaw crusher or a gyratory crusher is used.
Probable Ore Reserves The economically mineable part of an Indicated, and in some circumstances, a Measured Mineral Resource. It includes diluting materials and allowances for losses which may occur when the material is mined. Appropriate assessments and studies have been carried out, and include consideration of and modification by realistically assumed mining, metallurgical, economic, marketing, legal, environmental, social and governmental factors. These assessments demonstrate at the time of reporting that extraction could reasonably be justified. A Probable Ore Reserve has a lower level of confidence than a Proved Ore Reserve but is of sufficient quality to serve as the basis for a decision on the development of the deposit.
project capital The capital expenditure required as the initial development capital and/or for increasing production capacity.
propyllitic alteration The result of low-pressure-temperature alteration around many orebodies.
prospectus The Prospectus in relation to the Offer in which the Executive Summary of the MER is contained.
Proved Ore Reserves A ‘Proved Ore Reserve’ is the economically mineable part of a Measured Mineral Resource. It includes diluting materials and allowances for losses which may occur when the material is mined. Appropriate assessments and studies have been carried out, and include consideration of and modification by realistically assumed mining, metallurgical, economic, marketing, legal, environmental, social and governmental factors. These assessments demonstrate at the time of reporting that extraction could reasonably be justified. A Proved Ore Reserve represents the highest confidence category of reserve estimate. The style of mineralisation or other factors could mean that Proved Ore Reserves are not achievable in some deposits.
pyrite An isometric mineral, FeS2 which occurs in veins, as magmatic segregation, as accessory in igneous rocks, and in metamorphic rocks.
pyrhotite Monoclinic and hexagonal mineral, FeS; in mafic igneous rocks, contact metamorphic deposits, high-temperature

SRK Consulting Ma'aden Gold MER – Glossary, Abbreviations and Units
U3330_Ma'aden MER.doc November, 2007 Page 223
veins, and granite pegmatites.
push back The staged mining increments as open-pits are expanded from the current surface to the ultimate pit design.
Pyroclastic Produced by explosive or aerial ejection of ash, fragments, and glassy material from a volcanic vent. Applied to the rocks and rock layers as well as to the textures so formed.
Quantile-Quantile Points taken at regular intervals from the cumulative distribution function of a random variable.
Qatar State of Qatar.
quartz A hard, metamorphic rock which was originally sandstone.
Radiometric survey Use of portable Geiger-Muller apparatus for field detection of emission count in search for radioactive minerals.
ramp Inclines connecting two levels in an open-pit.
reverse circulation The circulation of bit-coolant and cuttings-removal liquids, drilling fluid, mud, air, or gas down the borehole outside the drill rods and upward inside the drill rods.
real Expenditures/revenues stated in constant money terms i.e. all items irrespective of historic or forecasts are stated in money terms at a given date.
rear-dump haul trucks Any wheeled vehicle, usually self-propelled, used to transport heavy articles or materials. In mining, usually applied to dump and/or bottom-dump semi-trailers used to transport mined waste and ore materials.
reconciliation The process whereby comparisons of volume, tonnage, grade and metal content are made between the exploration model, the grade control model and mining-mill measurements.
refining The purification of crude metallic products.
rhyodacite The extrusive equivalent of granodiorite.
rhyolite A group of extrusive igneous rocks.
rib pillar A pillar whose length is large compared with its width, generally separates stopes on strike.
riffle splitter A device used to reduce the volume or weight of a sample consisting of a thin metal plate on which is mounted a series of metal strips to guide or deflect a small portion of the sample material into a separate container.
rock engineering Practical assessment of the behaviour of rock masses in response to engineering activity in mining operations.
roof pendant A downward projection of country rock into an igneous
SRK Consulting Ma'aden Gold MER – Glossary, Abbreviations and Units
U3330_Ma'aden MER.doc November, 2007 Page 224
intrusion.
rougher, scavenger, cleaner cells Rougher: flotation cells in which the bulk of the gangue is removed from the ore. Scavenger: in flotation, a rougher cell in which the tailings, before being rejected as waste, are subjected to a scavenging flotation treatment.
round robin A test (measurement, analysis, or experiment) performed independently several times which involves multiple independent laboratories performing the test with the use of the same method in different equipment.
Run-of-Mine grade The diluted grade of RoM ore as delivered to the processing facility. Normally this may be back calculated by estimation of the total precious metal accounted for (recovered metal + tailings metal).
rutile A tetragonal mineral in which titanium replaces iron; trimorphous with anatase and brookite; prismatic; in amphibolites, ecologites, granite pegmatites, veins, and placers; a source of titanium; also a gemstone.
SAG Mill A mill in which the secondary grinding of ore by tumbling in a revolving cylinder with limited balls or bars taking part in the operation (semi-autogenous grinding).
sampling The gathering of specimens of ore or wall rock for appraisal of an orebody. Since the average of many samples may be used, representative sampling is crucial. The term is usually modified to indicate the mode or locality; e.g., hand sampling, mine sampling, and channel sampling.
sandstone A medium-grained clastic sedimentary rock composed of fragments of sand size set in a fine-grained matrix (silt or clay) and more or less firmly united by a cementing material (commonly silica, iron oxide, or calcium carbonate).
schist A strongly foliated crystalline rock.
Scott Wilson Scott Wilson Group Plc.
search ellipses In interpolation the 3D volume from which assay data is used for interpolation of grades into any specific block within a block model.
secondary crushing In ore dressing, the second stage of grinding in which the discharge from the primary crusher is broken down to a size suitable for feed to fine grinding machines.
sedimentary Formed by the deposition of sediment.
sericite A white, fine-grained potassium mica occurring in small scales as an alteration product of various aluminosilicate minerals, having a silky luster, and found in various metamorphic rocks (esp. in schists and phyllites) or in

SRK Consulting Ma'aden Gold MER – Glossary, Abbreviations and Units
U3330_Ma'aden MER.doc November, 2007 Page 225
the wall rocks, fault gouge, and vein fillings of many ore deposits. It is commonly muscovite or very close to muscovite in composition, but may also include paragonite and illite.
selective mining unit A volume of ore which is practically deemed to be mineable selectively and is generally related to the size of loading equipment in open-pits and stope dimensions in underground mines.
semi-autogenous grinding see SAG mill.
serpentinite A rock comprised of one or more serpentine minerals.
shaft A vertical or inclined excavation in rock for the purpose of providing access to an orebody. Usually equipped with a hoist at the top, which lowers and raises a conveyance for handling workers and materials.
shale A fine-grained detrital sedimentary rock, formed by the consolidation (esp. by compression) of clay, silt, or mud.
shear A deformation resulting from stresses that cause or tend to cause contiguous parts of a body to slide relatively to each other in a direction parallel to their plane of contact.
shear zone A wide zone of distributed shearing in rock.
silicification The introduction of, or replacement by, silica, generally resulting in the formation of fine-grained quartz, chalcedony, or opal, which may fill pores and replace existing minerals.
sill A concordant sheet of igneous rock lying nearly horizontal.
siltstone An indurated silt having the texture and composition of shale but lacking its fine lamination or fissility.
silver A white metallic element that is very ductile and malleable. Symbol, Ag. Occurs native and in ores such as argentite and horn silver; lead, lead-zinc, copper, gold, and copper-nickel ores are its principal sources. Used for jewellery, photography, dental alloys, and coinage.
sinkhole A circular depression in a karst area. Its drainage is subterranean, its size is measured in meters or tens of meters, and it is commonly funnel shaped.
sinistral A fault on which the displacement is such that the side opposite the observer appears displaced to the left.
slag Material from the iron blast furnace, resulting from the fusion of fluxstone with coke ash and the siliceous and aluminous impurities remaining after separation of iron from the ore. Slag is also produced in steelmaking. Formerly a solid waste, slag is now utilised for various purposes, chiefly in construction.

SRK Consulting Ma'aden Gold MER – Glossary, Abbreviations and Units
U3330_Ma'aden MER.doc November, 2007 Page 226
slope angle The slop (angle) at which the wall of an open-pit or cut stands as measured along an imaginary plane extended along the crests of the berms or from the slope crest to its toe.
slurry A thin watery suspension; e.g., the feed to a filter press or other filtration equipment.
smelting A process distinct from roasting, sintering, fire refining, and other pyrometallurgical operations.
Snowden Snowden Mining Industry Consultants Pty Ltd.
sphalerite A zinc sulphide mineral; the most common ore mineral of zinc. An isometric mineral, ZnS , with Zn replaced by Fe with minor Mn, As, and Cd; occurs with galena in veins and irregular replacement in limestone.
SRK SRK Consulting (UK) Limited.
SRK Group SRK Global Limited.
stacking The process of depositing layered horizontal sections in a heap leach pad.
stockwork A mineral deposit consisting of a three-dimensional network of planar to irregular veinlets closely enough spaced that the whole mass can be mined.
stone quern A pair of stone tools for hand grinding a wide variety of materials. The lower, stationary, stone is called a quern, whilst the upper, mobile, stone is called a hand stone.
stopes An excavation from which ore has been removed in a series of steps.
stores The value of stores at the end of a financial reporting period.
strike The course or bearing of the outcrop of an inclined bed, vein, or fault plane on a level surface; the direction of a horizontal line perpendicular to the direction of the dip.
stripping ratio The unit amount of spoil or overburden that must be removed to gain access to a unit amount of ore or mineral material.
stylolitic An irregular discontinuity or non-structural fracture in limestone and other sedimentary rocks.
sub-cell A subdivision of a parent block (the largest block size) in a block model.
sub-level stoping Method of mining best adapted to steeply inclined deposits that have strong ore and strong walls. The ore is usually blocked out by two horizontal drifts separated vertically by 3m to 61m and raises between the two horizontal drifts, the latter separated by comparable distances. Vertical pillars may be left between stopes on the same level, and horizontal ones to support the main
SRK Consulting Ma'aden Gold MER – Glossary, Abbreviations and Units
U3330_Ma'aden MER.doc November, 2007 Page 227
haulage. After the main blocks of ore have been completely mined, it is common practice to rob the pillars, and the walls of the stope may collapse after the pillars have been robbed.
submarine exhalatives Ore deposits which are interpreted to have been formed by release of ore-bearing hydrothermal fluids into a water reservoir (usually the ocean), resulting in the precipitation of stratiform ore.
Sukhaybarat an operating asset of Ma’aden Gold comprising the Sukhaybarat Plant.
Sukhaybarat Plant The Sukhaybarat metallurgical processing plant.
sulphide A mineral compound characterised by the linkage of sulphur with a metal or semimetal; e.g., galena, PbS, or pyrite, FeS2.
supergene enrichment A mineral deposition process in which near-surface oxidation produces acidic solutions that leach metals, carry them downward, and re-precipitate them, thus enriching sulphide minerals already present.
sustaining capital Capital expenditure required to sustain operations at current level of production, generally to replace aging equipment.
Tadawul The Saudi Stock Exchange.
Taif Project The construction (at a cost of US$90m) of a 500km pipeline from the city of Taif to transport effluent water arising from an existing sewage water treatment plant servicing the city of Taif.
tailings Portion of tailings containing some mineral that cannot be economically removed.
Tailings Storage Facility An impoundment used to deposit tailings arising as waste from a metallurgical processing facility.
Talcose Resembling talc; e.g., a talcose rock that is soft and soapy to the touch.
target generation The process of identifying specific areas of geologic interest for subsequent investigation i.e. drilling.
Tax Entity The Financial Models representing Mahd Ad’Dahab; Al Amar; Bulghah; Sukhaybarat; and Al Hajar.
Tax Law Saudi Arabian Tax Law (March 2004).
telluride A mineral that is a compound of a metal and tellurium, such as hessite.
terrane A fault-bounded body of rock of regional extent, characterized by a geologic history different from that of contiguous terranes. A terrane is generally considered to be a discrete allochthonous fragment of oceanic or continental material added to a craton at an active

SRK Consulting Ma'aden Gold MER – Glossary, Abbreviations and Units
U3330_Ma'aden MER.doc November, 2007 Page 228
margin by accretion.
Terminal Benefits Statutory expenditures to be incurred by a business on termination of employment.
tertiary crushing The preliminary breaking down of Run-of-Mine ore and sometimes coal. In metal mines, the tertiary crushing may be performed at a central point underground.
tetrahedrite An isometric mineral which occurs in hydrothermal veins and contact metamorphic deposits; a source of copper and other metals.
thickening Reducing the proportion of water in a pulp by means of sedimentation.
tholeiitic An igneous rock, a type of basalt. Like all basalt, the rock type is dominated by clinopyroxene plus plagioclase, with minor iron-titanium oxides.
thrust A fault with a dip of 45° or less over much of its extent, on which the hanging wall appears to have moved upward relative to the footwall.
toll smelting Situation in which the owner of ore or concentrate contracts the refining of the metal to another party for a fee, but the refined metal remains under the original ownership for final sale or disposition.
top cut Outlying parts of a statistical population.
total cash costs Cash costs and the incremental components, including royalties, but excluding taxes paid. Consequently in this case Total Cash Costs equal Cash Costs as incurred.
total costs Summation of total working costs, net movement in working capital and capital expenditure.
total employees costed The total number of employees whose operating expenses are included in Cash Costs.
total working costs Total Cash Cost and the incremental components, including terminal separation liabilities, reclamation and closure costs (the net difference between the total environmental liability and the current trust fund provision) but excluding non-cash items such as depreciation and amortisation.
tuff A general term for all consolidated pyroclastic rocks. Not to be confused with tufa. Adj: tuffaceous.
transitional A rock mass which reflects a gradational change from fresh ore to oxide ore.
trench In geological exploration, a narrow, shallow ditch cut across a mineral deposit to obtain samples or to observe character.
trenching In geological exploration, a narrow, shallow ditch cut across a mineral deposit to obtain samples or to observe

SRK Consulting Ma'aden Gold MER – Glossary, Abbreviations and Units
U3330_Ma'aden MER.doc November, 2007 Page 229
character.
tripogon A subfamily of the true grass family.
trondhjemite A light-coloured plutonic rock composed primarily of sodic plagioclase (esp. oligoclase), quartz, sparse biotite, and little or no alkali feldspar. Its name, given by Goldschmidt in 1916, is derived from Trondhjem, Norway. Also spelled: trondjemite; trondheimite.
tropari A small simple to use directional surveying instrument that gives inclination and magnetic azimuth.
true thickness The width or thickness of a vein, stratum, etc., as measured perpendicular or normal to dip and strike. The true width is always the width of the vein, etc., at its narrowest point.
ultimate pit shell The optimised shell: generally corresponding to the commodity price used to define the Ore Reserves: chosen as the basis for generation of the final pit design.
ultrabasic Said of an igneous rock having a silica content lower than that of a basic rock. Percentage limitations are arbitrary; the upper limit was originally set at 44%. The term is frequently used interchangeably with ultramafic.
ultramafic Said of an igneous rock composed chiefly of mafic minerals, e.g., monomineralic rocks composed of hypersthene, augite, or olivine.
validation Assessing the quality of block model estimates by comparison with raw assay data.
Valuation Adjustments The necessary adjustments to the Net Asset Value to arrive at the Equity Value for Ma’aden, specifically: the valuation of derivative instruments; the net cash/(debt) position as of the Effective Date; and the NPV of unallocated head office expenditures.
variogram A plot of the variance (one-half the mean squared difference) of paired sample measurements as a function of the distance (and optionally of the direction) between samples.
variography The study of variograms.
vein An epigenetic mineral filling of a fault or other fracture in a host rock, in tabular or sheetlike form, often with associated replacement of the host rock; a mineral deposit of this form and origin.
volcanic Characteristic of, pertaining to, situated in or upon, formed in, or derived from volcanoes.
wadi A term used in the desert regions of Southwestern Asia and Northern Africa for a stream bed or channel, or a steep-sided and bouldery ravine, gully, or valley, or a dry wash, that is usually dry except during the rainy season,

SRK Consulting Ma'aden Gold MER – Glossary, Abbreviations and Units
U3330_Ma'aden MER.doc November, 2007 Page 230
and that often forms an oasis.
waste rock Barren or sub-marginal rock or ore that has been mined, but is not of sufficient value to warrant treatment and is therefore removed ahead of the milling processes.
waste rock dump The area where mine waste or spoil materials are disposed of, or piled.
weighted average cost of capital Used in finance to measure a firm's cost of capital as a discount rate for financed projects, as the cost of financing (capital) is regarded by some as a logical discount rate (required rate of return) to use. Weighted Average Cost of Capital is the return a firm must earn on existing assets to keep its stock price constant and satisfy its creditors and owners.
wireframe Three dimensional solids representing geological/mineralogical domains.
withholding taxes 5% on distributed dividends, withheld by the enterprise on behalf of the recipient (resident or non-resident).
working capital The amount of day-by-day operating liquidity available to a business.
World Bank Group of five international organizations responsible for providing finance and advice to countries for the purposes of economic development and poverty.
Yemen Republic of Yemen.
xanthate A salt of xanthic origin which is used as a reagent in flotation processes.
xeromorphic Plants or plant parts that are adapted for survival in dry conditions.
Zadra process A process requiring the circulation of a 1% sodium hydroxide and 0.1% sodium cyanide water based solution upflow through a stationary bed of loaded carbon at a flow rate of about 2 bed volumes per hour at about 93°C. Gold that was previously adsorbed on the carbon as a sodium or calcium/gold cyanide ion pair is desorbed from the carbon by a reversal of the adsorption kinetics. Gold is recovered from the pregnant strip solution by electrowinning onto steel wool.
Zakat A religious tax, levied on Saudi nationals, wholly Saudi-owned companies and the Saudi shareholders’ share of profits of companies with foreign participation in accordance with Sharia’ Law. Zakat is estimated based on application of the 2.5% rate to the net book value of the assets at the close of each reporting period.
zinc The native metallic element, Zn. A bluish-white lustrous metal. Employed to form numerous alloys with other metals including brass, nickel silver, commercial bronze,

SRK Consulting Ma'aden Gold MER – Glossary, Abbreviations and Units
U3330_Ma'aden MER.doc November, 2007 Page 231
spring brass, soft solder, and aluminium solder. Used extensively by the automotive, electrical, and hardware industries
zinc concentrate A base metals sulphide concentrate in which zinc is the predominant payable metal.
zinc precipitation See Merrill Crowe process.
ABBREVIATIONS AARL Anglo American Research Laboratory.
AAS Atomic absorption spectrophotometry.
AD Anno Domini.
AEPs Advanced Exploration Properties.
Ag Silver.
AIM Alternative Investment Market.
AIME American Institute of Mining Engineering.
AIQ Associate of the Institute of Quarrying.
Amsl Above mean sea level.
As Arsenic.
ARD Acid Rock Drainage.
ASRC American Smelting and Refining Company.
Au Gold.
BC Before Christ.
BID Base Information Date.
BRGM Bureau de Recherches Géologiques et Minières.
CBio Chartered Biologist.
CEng. Chartered Engineer.
CGeol Chartered Geologist.
CESR Committee of European Securities Regulators.
CIL Carbon-In-Leach.
CIP Carbon-In-Pulp.
CIT Corporate Income Tax.
CMA Capital Market Law.
CPI Consumer Price Indices.
CPs Competent Persons.
Cu Copper.
DCF Discounted Cashflow.
DD Diamond Drillhole.
DP Development Property.
DZIT Department of Zakat and Income Tax.
E East.
SRK Consulting Ma'aden Gold MER – Glossary, Abbreviations and Units
U3330_Ma'aden MER.doc November, 2007 Page 232
EIA Environmental Impact Assessment.
EL Exploration Licence.
EMS Environmental Management System.
EPCM Engineering Procurement and Construction Management Contract.
EPs Exploration Properties.
EVA Economic Viability Assessment.
EV Equity Value.
FACE Fellow of the Association of Consulting Engineers.
F.AusIMM Fellow of the Australian Institute of Mining and Metallurgy.
FGS Fellow of the Geological Society.
FIMMM Fellow of the Institute of Mining, Metallurgy and Materials.
FIQ Fellow of the Institute of Quarrying.
FWV Footwall Vein.
GBM GBM Minerals Engineering Consultants Ltd.
GCC Gulf Cooperative Countries.
GDP Gross Domestic Product.
GIS Geographic Information System.
GM.AusIMM Graduate member of the Australian Institute of Mining and Metallurgy.
GMT Greenwich mean Time.
GNI Gross National Income.
GoSA Government of Saudi Arabia.
GPS Global Positioning System.
H1 First six months of the financial (calendar) year.
H2 Second six months of the financial (calendar) year.
HDPE High Density Polyethylene.
HLP Heap Leach Pad.
HWV Hangingwall Vein.
IAP Interested and Affected Party.
ICMM International Council of Mining and Metals.
IDW2 Inverse Distance Weighting Squared.
IFC International Finance Corporation.
ILO International Labour Organisation.
IMF International Monetary Fund.
JSC Joint Stock Company.
LHD load-haul-dumps.
LoMps Life-of-Mine plans.

SRK Consulting Ma'aden Gold MER – Glossary, Abbreviations and Units
U3330_Ma'aden MER.doc November, 2007 Page 233
LSE London Stock Exchange
LTIFR Lost time injury frequency rate.
M.AusIMM Member of the Australian Institute of Mining and Metallurgy.
M.Eng Master of Engineering.
MER Mineral Experts’ Report.
MBA Masters of Business Administration.
MEPA Meteorology and Environmental Protection Administration.
MIK Multiple Indicator Kriging.
MIMMM Member of the Institute of Mining, Metallurgy and Materials.
MIR Mining Investment Regulations.
MMRL Makkah-Madinah Rail Link.
MPMR Ministry of Petroleum and Mineral Resources.
MSc Master of Science.
NAS Region Northern Arabian Shield Region
n/d not determined.
N North.
NAV Net Asset Value.
NVZ North Vein Zone.
No Number.
NPV Net Present Value.
NSR Net Smelter Return.
NTVA Non-time value adjusted.
OECD Organisation for Economic Co-operation and Development.
OHSS Occupational health and safety system.
OK Ordinary Kriging.
OPEC Organization of Petroleum Exporting Countries.
o/p Open-pit.
Pb Lead.
PP Price-participation charges.
PP&E Plant Property and Equipment.
PhD Doctor of Philosophy.
PrSciNat Professional Natural Scientist.
QA/QC Quality Assurance and Quality Control.
Q1 The first quarter of the financial (calendar) year ending 31 March.
Q2 The second quarter of the financial (calendar) year

SRK Consulting Ma'aden Gold MER – Glossary, Abbreviations and Units
U3330_Ma'aden MER.doc November, 2007 Page 234
ending 30 June.
Q3 The third quarter of the financial (calendar) year ending 30 September.
Q4 The fourth quarter of the financial (calendar) year ending 31 December.
RCh Refining Charges.
RC Reverse Circulation.
ReC Realisation Charges.
RL Reduced Level.
RoM Run-of-Mine.
RPTMI Reduced pole total magnetic.
S South.
SAG Semi-autogenous grinding.
SA CPI Saudi Arabian Consumer Price Index.
SAMS Saudi Arabian Mining Syndicate.
SAR Saudi Arabian Riyal.
SHE Safety, Health and Environment.
SEC United States Securities and Exchange Commission.
s/f Surface sources.
SMU Selective mining unit.
SRO Saudi Railways Organization.
SVZ South Vein Zone.
SZ Stockwork Zone.
TBL Terminal benefits liabilities.
TC Treatment charges.
TEC Total Employees Costed.
TEPs Technical Economic Parameters.
TMI Total magnetic contour.
TSF Tailings Storage Facilities.
TVA-GPI Time value adjusted and gold price indexed.
UAE United Arab Emirates.
u/g Underground.
UKLA United Kingdom Listing Authority.
USGS United States Geological Survey.
UTM Universal Transverse Mercator.
VAT Value Added Taxation.
W West.
WACC Weight Adjusted Cost of Capital
WTO World Trade Organisation.
Zn Zinc.

SRK Consulting Ma'aden Gold MER – Glossary, Abbreviations and Units
U3330_Ma'aden MER.doc November, 2007 Page 235
30 CFR Title 30 Code of Federal Regulation (US Department of Labour).
UNITS g/t Au Grammes per metric tonne of gold.
g/t Au Eq Grammes per metric tonne of gold equivalent.
g/t Ag Grammes per metric tonne of silver.
g/TEC/month Grams per total employees costed per month.
km A kilometre.
km2 A square kilometre.
koz Ag A thousand ounces of silver.
koz Au A thousand ounces of gold.
koz Au Eq A thousand ounces of gold equivalent.
kt A thousand metric tonnes.
ktpa A thousand metric tonnes per annum.
kV A thousand volts.
m A metre.
m2 A square metre.
m3 A cubic metre.
m3/hr A cubic metre per hour.
Ma A million years ago.
mg/l A milligram per litre.
mg/m3 A milligram per cubic metre.
mm A millimetre.
m/s2 A metre per second per second (acceleration).
Moz A million troy ounces.
Moz Au Eq A million troy ounces of gold equivalent.
Mt A million metric tonnes.
Mtpa A million tonnes per annum.
oz A troy ounce.
ppb Parts per billion.
ppm Parts per million.
t A metric tonne.
t/m3 A metric tonne per cubic metre.
tpd A metric tonne per day.
t Cu A metric tonne of copper.
t Pb A metric tonne of lead.
t/TEC/month A metric tonne per total employees costed per month.
twaste:tore The ratio of the metric tonnes of waste to metric tonnes of ore.

SRK Consulting Ma'aden Gold MER – Glossary, Abbreviations and Units
U3330_Ma'aden MER.doc November, 2007 Page 236
t Zn A metric tonne of zinc.
USc/lb A United States cent per imperial pound.
US$ A United States dollar.
US$bn A billion United States dollars.
US$/capita A United States dollar per capita.
US$/g A United States dollar per gramme.
US$/t A United States dollar per metric tonne.
US$k A thousand United States dollars.
US$:LDU The exchange rate between one United States dollar and a locally denominated unit (other local currency).
US$m A million United States dollars.
US$mpa A million United States dollars per annum.
US$/oz A United States dollar per troy ounce.
US$:SAR The number of Saudi Arabian Riyals per United States Dollar.
% A percentage.
% Cu Percentage copper.
% Pb Percentage lead.
% Zn Percentage zinc.
° A degree.
°C A degree centigrade.
‘ A minute.
μm A micro millimetre.