
ATMOSPHERIC IMPACT REPORT / AIR QUALITY ... - SRK Consulting
317
Managing Director: JG Potgieter AssmangCRW-AQIAReport_2020-PlannedSinterPlant_Sep2020_FD1.docx Page 1 of 317 COPYRIGHT WARNING ALL RIGHTS RESERVED. All information and conceptual designs contained within this document are the intellectual property of ENVIRONGAKA (Pty) Ltd. This document and/or the information contained herein may not be used, stored, reproduced, or copied in any manner, without the prior written consent of ENVIRONGAKA (Pty) Ltd. This document and/or the information and conceptual designs may not be disclosed or displayed to any third party without the prior written consent of ENVIRONGAKA (Pty) Ltd. ATMOSPHERIC IMPACT REPORT / AIR QUALITY IMPACT ASSESMENT for Assmang Limited Cato Ridge Alloys (Pty) Ltd. 2020 AQIA for Proposed Sinter Plant (Cato Ridge, KwaZulu-Natal Province) PREPARED FOR: Assmang Limited Cato Ridge Alloys (Pty) Ltd. PREPARED BY: JG Potgieter For and on Behalf of EnviroNgaka (Pty) Ltd.
-
Upload
khangminh22 -
Category
Documents
-
view
0 -
download
0
Transcript of ATMOSPHERIC IMPACT REPORT / AIR QUALITY ... - SRK Consulting

Managing Director: JG Potgieter
AssmangCRW-AQIAReport_2020-PlannedSinterPlant_Sep2020_FD1.docx Page 1 of 317
COPYRIGHT WARNING ALL RIGHTS RESERVED. All information and conceptual designs contained within this document are the intellectual property of ENVIRONGAKA (Pty) Ltd. This document and/or the information contained herein may not be used, stored, reproduced, or copied in any manner, without the prior written consent of ENVIRONGAKA (Pty) Ltd. This document and/or the information and conceptual designs may not be disclosed or displayed to any third party without the prior written consent of ENVIRONGAKA (Pty) Ltd.
ATMOSPHERIC IMPACT REPORT / AIR QUALITY IMPACT ASSESMENT
for
Assmang Limited Cato Ridge Alloys (Pty) Ltd. 2020 AQIA for Proposed Sinter Plant
(Cato Ridge, KwaZulu-Natal Province)
PREPARED FOR:
Assmang Limited Cato Ridge Alloys (Pty) Ltd.
PREPARED BY:
JG Potgieter
For and on Behalf of EnviroNgaka (Pty) Ltd.
Assmang Limited Cato Ridge Alloys (Pty) Ltd. 2020 AQIA for Sinter Plant EIA
Atmospheric Impact Report / Air Quality Impact Assessment
Document ID: AssmangCRW-AQIAReport_2020-PlannedSinterPlant_Sep2020_FD1.docx
Revision Date: 18Sep2020 Revision: FINAL_D1 Valid for: Assmang Cato Ridge, KwaZulu-Natal Province
Page 2 of 317
FINAL_D1 Compiled By: JG Potgieter
Approved By: JG Potgieter COPYRIGHT WARNING ALL RIGHTS RESERVED. All information and conceptual designs contained within this document are the intellectual property of ENVIRONGAKA (Pty) Ltd. This document and/or the information contained herein may not be used, stored, reproduced, or copied in any manner, without the prior written consent of ENVIRONGAKA (Pty) Ltd. This document and/or the information and conceptual designs may not be disclosed or displayed to any third party without the prior written consent of ENVIRONGAKA (Pty) Ltd.
EnviroNgaka
Executive Summary Assmang Limited Cato Ridge Alloys (Pty) Ltd. (ACRW) is located north of the N3 highway between Durban and Pietermaritzburg in the Cato Ridge area of the eThekwini Municipality of KwaZulu-Natal, approximately 60km from Durban. The most densely populated formal residential area of Cato Ridge lies 3km to the south-west. Other less populated residential areas or isolated informal or formal residential properties are: Inchanga, located 4km (and beyond) to the to the south-east of ACRW; Other less formal residential areas and schools are located in the hills less than 5km away to the north-east, north-west and west. Several commercial and or industrial properties are located between 1km and 3km to the north-east of ACRW in the direction / vicinity of the Cato Ridge Abattoir, 1km to 2km to the south south-east / south-east of ACRW in the vicinity of the R103 / Eddie Hagan Drive intersection (e.g. Metallica and Sangio Pipes), 1km to the south-west (Safal Steel), and 2km to the south-west (e.g. Gosswell Developments). Assmang Limited established the Cato Ridge Works (formerly Feralloys Limited) in 1956 when construction was started on a ferromanganese smelter. The ferromanganese smelter was commissioned in 1959 and originally consisted of two 9MVA submerged electric arc furnaces. The operations at the site was expanded and upgraded over the years and currently operations are six submerged electric arc furnaces, a refinery operation known as Cato Ridge Alloys (CRA) and a Metal Recovery Plant. The raw materials are delivered by rail and or road, and off loaded using wagon tipplers, and transported to the raw materials bays by conveyor belts. Manganese ore is railed from the various mines. Reductants in the form of metallurgical coke and anthracite peas form the source of carbon units required for the smelting reaction. The reaction in a furnace is a reduction reaction, with the reductants being the reducing agent. The site is also equipped with a Briquetting Plant which produces briquettes from recovered dust, ore and other materials, including binding agents. These briquettes also serve as feed material for the furnaces. The ores and or briquettes are combined with the reductants and heated. The carbon in the raw materials, in combination with electrical energy through the electrodes results in metallurgical reactions which produce molten ferromanganese metal and slag (by-product). As soon as enough melt is produced, the furnace is tapped to remove both metal and slag. Metal and slag are separated by means of density difference. Metal is allowed to solidify and cooled prior to being processed, crushed and screened, at the High Carbon and the Refined (Low Carbon) Crushing & Screening Plants to provide the final product for despatch by road and or rail to customers. Sufficiently cooled slag is transported to the Metal Recovery Plant so that entrapped metal and slag can be separated using magnetic and specific gravity techniques. Processed slag is deposited on the slag dump. Metal produced by the furnaces could also be used for the production of refined ferromanganese by means of a top blown bottom stirred converter by preferential oxidation of carbon (the CRA plant). The different processing units have gas cleaning equipment for the abatement of particulate matter emissions.
Assmang Limited Cato Ridge Alloys (Pty) Ltd. 2020 AQIA for Sinter Plant EIA
Atmospheric Impact Report / Air Quality Impact Assessment
Document ID: AssmangCRW-AQIAReport_2020-PlannedSinterPlant_Sep2020_FD1.docx
Revision Date: 18Sep2020 Revision: FINAL_D1 Valid for: Assmang Cato Ridge, KwaZulu-Natal Province
Page 3 of 317
FINAL_D1 Compiled By: JG Potgieter
Approved By: JG Potgieter COPYRIGHT WARNING ALL RIGHTS RESERVED. All information and conceptual designs contained within this document are the intellectual property of ENVIRONGAKA (Pty) Ltd. This document and/or the information contained herein may not be used, stored, reproduced, or copied in any manner, without the prior written consent of ENVIRONGAKA (Pty) Ltd. This document and/or the information and conceptual designs may not be disclosed or displayed to any third party without the prior written consent of ENVIRONGAKA (Pty) Ltd.
EnviroNgaka
In light of specific products produced, raw materials consumed and or specific process, with respect to ferromanganese, ACRW is currently licenced to operate the following Listed Activities in terms of Section 21 of NEM:AQA:
1. Storage and handling of ore and coal (Subcategory 5.1); 2. Agglomeration operations (Subcategory 4.11); 3. Production of alloys of iron with chromium, manganese, silicon or vanadium, the separation of titanium
slag from iron-containing minerals using heat (Subcategory 4.9); The purpose / objective of this investigation is to identify and quantify the expected effect of the Enterprise’s impact, emanating from atmospheric emissions on the surrounding ambient air quality. This study will assess the expected contribution of the Enterprise to the ambient air quality for the following scenarios:
a) Scenario 1: Baseline Conditions Impact assessment is done per the emissions of all relevant pollutants at expected/actual concentrations against actual baseline production capacity (achievable emissions and does not imply AEL emission limits); and includes no modifications or improvements made to the current process / additional abatement of secondary fugitive emissions from the furnaces (excluding Furnaces 3 and 4);
b) Scenario 2: Future Conditions Impact assessment is done per the emissions of all relevant pollutants at expected concentrations against full production capacity (achievable emissions and does not imply AEL emission limits); and includes an additional proposed Sinter Plant (Subcategory 4.5 of the Listed Activities in terms of Section 21 of NEM:AQA) to produce pellets from raw material as feed to the furnaces, with no modifications or improvements made to the current process / additional abatement of secondary fugitive emissions from the furnaces (excluding Furnaces 3 & 4);
Site specific meteorological data was simulated for a period from January 2017 to December 2019 based on observed/monitored data from a meteorological station located approximately 323m southeast of the centre of the site, and utilised for the impact assessment and data interpretation. The location for the simulated meteorological monitoring data is located in close proximity to the facility, approximately 399m southeast (29°43.0’S, 30°37.0’E) of the defined centre of the site at an elevation of approximately 793 mamsl, with the wind monitored at a height of 10m and the other parameters at 2m above ground level. 1. In terms of the referenced foreseen emission rates, concentrations and assumptions for the proposed / planned
Sinter Plant operation, dispersion modelling was conducted to determine the potential impact thereof on the surrounding ambient air quality. In terms of the National Ambient Air Quality Standards, it is was found that: 1.1) The expected increased zone of impact as a result of the planned Sinter Plant is marginal in comparison
with the baseline status and it is unlikely that the foreseen cumulative impact from the planned additional operation will adversely impact on the surrounding sensitive receptors;
1.2) Results indicated that there might be occurrences of high modelled concentrations in very close proximity to the fence line of the site. It is unlikely that the impact of the proposed future operation (inclusive of the
Assmang Limited Cato Ridge Alloys (Pty) Ltd. 2020 AQIA for Sinter Plant EIA
Atmospheric Impact Report / Air Quality Impact Assessment
Document ID: AssmangCRW-AQIAReport_2020-PlannedSinterPlant_Sep2020_FD1.docx
Revision Date: 18Sep2020 Revision: FINAL_D1 Valid for: Assmang Cato Ridge, KwaZulu-Natal Province
Page 4 of 317
FINAL_D1 Compiled By: JG Potgieter
Approved By: JG Potgieter COPYRIGHT WARNING ALL RIGHTS RESERVED. All information and conceptual designs contained within this document are the intellectual property of ENVIRONGAKA (Pty) Ltd. This document and/or the information contained herein may not be used, stored, reproduced, or copied in any manner, without the prior written consent of ENVIRONGAKA (Pty) Ltd. This document and/or the information and conceptual designs may not be disclosed or displayed to any third party without the prior written consent of ENVIRONGAKA (Pty) Ltd.
EnviroNgaka
proposed Sinter Plant) would exceed the National Ambient Air Quality Standards over populated sensitive receptors;
2. It should also be noted that this is a theoretical / modelling assessment and it should always be considered that there are several factors which influence the resulting uncertainty of such a study, as flagged/indicated by means of the comments made throughout the content of this report together with Appendix U and the results are limited to the assumptions made and the information contained in the report.
3. Key findings of Section 5.1 indicates the following matters: 3.1) PM10 & PM2.5:
3.1)1. It is foreseen to be “likely” that the secondary emissions contribute the most of all the sources, of which the roads and material processing / storage areas contributes the most;
3.1)2. It is foreseen to be “likely” that the Enterprise’s contribution to the PM10 and PM2.5 ambient air quality exceeds the relevant standards for a 24-hour average which is “likely” to occur within a distance of approximately 200m of the facility fence line for PM10 and PM2.5;
3.1)3. It is foreseen to be “unlikely” that the Enterprise’s contribution to the PM10 and PM2.5 ambient air quality exceeds the relevant standards for an annual average beyond the facility fence line for PM10 and PM2.5;
3.1)4. It is foreseen to be “likely” that the modelled ambient air concentrations will increase marginally through the different scenarios for both PM10 and PM2.5;
3.1)5. It is important that effective dust suppression measures need to be maintained on the current fugitive/secondary sources;
3.1)6. No threshold levels exist to indicate at what levels PM are having an adverse negative effect on animals and plants. In this light it was decided to use the same screening criteria applied to human health, i.e. the South African National Ambient Air Quality Standards (refer to AQIA report, section 5.1). Based on the simulated ambient concentrations (sections 5.1.3.PM10 to 5.1.3.PM2.5) exceedances are unlikely to occur beyond approximately 200m of the facility fence line as referred under 3.1)2.
3.2) SO2: 3.2)1. It is foreseen to be “likely” that the Enterprise’s contribution to the SO2 ambient air quality beyond
its fence line falls within the relevant standards for both scenarios 1 and 2; 3.2)2. Most of the current studies focusing on the impact of SO2 on animals concluded that immediate
physiological response and/or significant or permanent damage occurs in the low to upper mg/m3 concentration ranges. In this light it was decided to use the same screening criteria applied to human health, i.e. the South African National Ambient Air Quality Standards (refer to AQIA report, section 5.1). Based on the simulated ambient concentrations (sections 5.1.3.SO2) exceedances beyond the fence line of the Enterprise didn’t occur, therefore it is “likely” that the ambient concentrations falls within the NAAQS and the WHO annual guidelines for some plant species.
3.3) NO2: 3.3)1. It is foreseen to be “likely” that the Enterprise’s contribution to the NO2 ambient air quality exceeds
the relevant standards for a 1-hour average for scenarios 1 and 2 within a distance of approximately 1000m towards the west from the facility fence line;
3.3)2. It is foreseen to be “likely” that the Enterprise’s contribution to the NO2 ambient air quality beyond a distance of approximately 200m for its western fence line falls within the relevant standards for an annual average; Exceedences are likely to occur within the fence line and in very close proximity to the fence line;
3.3)3. It is foreseen to be “likely” that the modelled ambient air concentrations will marginally increase through the different scenarios;
3.3)4. It is foreseen that the secondary sources (diesel combustion fumes from vehicles used) contribute the most to the modelled concentrations, and that it is “as likely as not” that the 1-hour NO2 ambient air quality standard could be exceeded as a result of the secondary sources only, with due

Assmang Limited Cato Ridge Alloys (Pty) Ltd. 2020 AQIA for Sinter Plant EIA
Atmospheric Impact Report / Air Quality Impact Assessment
Document ID: AssmangCRW-AQIAReport_2020-PlannedSinterPlant_Sep2020_FD1.docx
Revision Date: 18Sep2020 Revision: FINAL_D1 Valid for: Assmang Cato Ridge, KwaZulu-Natal Province
Page 5 of 317
FINAL_D1 Compiled By: JG Potgieter
Approved By: JG Potgieter COPYRIGHT WARNING ALL RIGHTS RESERVED. All information and conceptual designs contained within this document are the intellectual property of ENVIRONGAKA (Pty) Ltd. This document and/or the information contained herein may not be used, stored, reproduced, or copied in any manner, without the prior written consent of ENVIRONGAKA (Pty) Ltd. This document and/or the information and conceptual designs may not be disclosed or displayed to any third party without the prior written consent of ENVIRONGAKA (Pty) Ltd.
EnviroNgaka
consideration that the diesel consumption rate could potentially have been conservatively overstated for both scenarios;
3.3)5. It was decided to use the same screening criteria for the impact on animals as applied to human health, i.e. the South African National Ambient Air Quality Standards (refer to AQIA report, section 5.1). Based on the simulated ambient concentrations in the AQIA (sections 5.1.3.NO2) it is “likely” that the ambient concentrations falls within the NAAQS beyond a distance of approximately 1500m from the facility;
3.3)6. The annual 4 µg/m3, 8.5 µg/m3 and 35.5 µg/m3 NO2 concentration isopleths are clearly distinguishable in section 5.1.3.NO2-2. This concentration will give rise to dry deposition load of 1.7 kg, 3.8 kg and 15 NO2/ha per year respectively;
3.3)7. Excluding wet deposition and deposition of other “N” containing species, comparing deposition loads of 1.7 kg and 3.8 kg NO2/ha and 15 NO2/ha per year to Table 5.33 in terms of kg N/ha per year, it is “likely” that the ambient NO2 concentrations beyond a distance of approximately 500m to the west beyond the facility, will not have a significant adverse effect on vegetation and ecosystems.
3.4) CO: 3.4)1. It is foreseen to be “likely” that the Enterprise’s contribution to the 1-hour average CO ambient air
quality falls within the relevant standards for scenarios 1 and 2; 3.4)2. It is foreseen to be “likely” that the Enterprise’s contribution to the CO ambient air quality exceeds
the relevant standards for a 8-hour average within a distance of approximately 200m to the west of the facility;
3.4)3. The impact of CO on animals Table 5.36 correlate with the South African NAAQS, thus the screening criteria applied to human health, i.e. the South African National Ambient Air Quality Standards will be used (section 5.1). Based on the simulated ambient concentrations in sections 5.1.3.CO it is “likely” that the ambient concentrations falls within the NAAQS beyond a distance of approximately 200m from the facility;
3.4)4. It was decided to use the same screening criteria on plants and ecosystems as applied to human health, i.e. the South African National Ambient Air Quality Standards (section 5.1). Based on the simulated ambient concentrations in sections 5.1.13.CO it is “likely” that the ambient concentrations falls within the NAAQS beyond a distance of approximately 200m from the facility.
3.5) NH3: 3.5)1. In the absence of a national air quality standard, the 24-hour average US EPA Reference
Concentration of 100µg.m-3 is used as a reference; 3.5)2. It is foreseen to be “likely” that the Enterprise’s contribution to the NH3 ambient air quality falls
well within the relevant reference for all scenarios; 3.5)3. Most of the current studies focusing on the impact of NH3 reference the US EPA Reference
Concentration. Based on the simulated ambient concentrations (section 5.1.3.NH3) exceedences didn’t occur, therefore it is “likely” that the ambient concentrations falls within the reference and adverse effects on the health of animals is unlikely.
3.6) Manganese (Mn): 3.6)1. In the absence of a national air quality standard, the annual average WHO ambient air quality
guideline of 0.15µg.m-3 is used as a reference; 3.6)2. It is foreseen to be “likely” that the Enterprise’s contribution to the Mn ambient air quality exceeds
the relevant guideline in terms of the following: 3.6)2.1. It is foreseen that the point sources contribute the most to the modelled concentrations, and
that it is “as likely as not” that the annual Mn guideline could be exceeded as a result of the point sources only;
Assmang Limited Cato Ridge Alloys (Pty) Ltd. 2020 AQIA for Sinter Plant EIA
Atmospheric Impact Report / Air Quality Impact Assessment
Document ID: AssmangCRW-AQIAReport_2020-PlannedSinterPlant_Sep2020_FD1.docx
Revision Date: 18Sep2020 Revision: FINAL_D1 Valid for: Assmang Cato Ridge, KwaZulu-Natal Province
Page 6 of 317
FINAL_D1 Compiled By: JG Potgieter
Approved By: JG Potgieter COPYRIGHT WARNING ALL RIGHTS RESERVED. All information and conceptual designs contained within this document are the intellectual property of ENVIRONGAKA (Pty) Ltd. This document and/or the information contained herein may not be used, stored, reproduced, or copied in any manner, without the prior written consent of ENVIRONGAKA (Pty) Ltd. This document and/or the information and conceptual designs may not be disclosed or displayed to any third party without the prior written consent of ENVIRONGAKA (Pty) Ltd.
EnviroNgaka
3.6)2.2. The additional contribution from the secondary sources reveal that it is foreseen to be “likely” that the annual Mn guideline could be exceeded within a distance of approximately 5km from the facility fence line for scenario 1 and approximately 6 to 6.5km for scenario 2;
3.6)2.3. A specialist health impact assessment would be required to determine specific potential health risks;
3.7) Dust Fallout (DFO): 3.7)1. The potential contribution from ACRW to DFO levels is assessed on an ongoing basis and the effect
of the secondary / fugitive sources are identified and managed by Site Management; 3.7)2. Compliance of these DFO levels with the National Dust Control Regulations (NDCR) is very good as
indicated by the data and fugitive and secondary emissions sources as well controlled; It is also noted that other sources in the area are also contributing to DFO levels sampled by ACRW;
3.7)3. It is however also noted that the possibility of fugitive dust from secondary sources such as roads and storage facilities, is foreseen to increase significantly during spring and some winter months;
3.8) Ambient Air Quality Monitoring: 3.8)1. Based on the data obtained from the two monitoring locations, it was assessed the quality of
ambient air in the region is fairly good and compliance of the gaseous compounds to the relevant ambient air quality standards is well;
3.8)2. The number of 24-hour average PM10 concentrations at the Cato Ridge Country Club CAAQMS which exceed the standard’s concentration, have decreased during the last year. The Radnor CAAQMS is located adjacent to a gravel road utilised as the entrance to a neighbouring industry and it is hence unfortunately subject to occurrences of high 24-hour average PM10 and PM2.5 concentrations, most of which are either related to the road or to regional pre-frontal synoptic conditions;
4. Site Management should review their air quality / pollution management plan with consideration of the phased risk/impact assessment provided in Appendix E and the possible actions for the air quality management plan as provided in Appendix F: 4.1) Maintain measures to minimise the release of abnormal emissions (raw gas and tapping/casting fugitives)
to an absolute minimum since the impact thereof is potentially significant; 4.2) Maintain the application of efficient dust abatement and suppression techniques in order to minimise
overall particulate emissions); 4.3) Limit vehicle movement and associated diesel consumption as far as possible; 4.4) Limit fugitive emissions 4.5) Aforementioned points will individually and collectively minimise emissions and impact of manganese;
Assmang Limited Cato Ridge Alloys (Pty) Ltd. 2020 AQIA for Sinter Plant EIA
Atmospheric Impact Report / Air Quality Impact Assessment
Document ID: AssmangCRW-AQIAReport_2020-PlannedSinterPlant_Sep2020_FD1.docx
Revision Date: 18Sep2020 Revision: FINAL_D1 Valid for: Assmang Cato Ridge, KwaZulu-Natal Province
Page 7 of 317
FINAL_D1 Compiled By: JG Potgieter
Approved By: JG Potgieter COPYRIGHT WARNING ALL RIGHTS RESERVED. All information and conceptual designs contained within this document are the intellectual property of ENVIRONGAKA (Pty) Ltd. This document and/or the information contained herein may not be used, stored, reproduced, or copied in any manner, without the prior written consent of ENVIRONGAKA (Pty) Ltd. This document and/or the information and conceptual designs may not be disclosed or displayed to any third party without the prior written consent of ENVIRONGAKA (Pty) Ltd.
EnviroNgaka
Table of Contents Executive Summary ............................................................................................................................................................................................................... 2 Table of Contents .................................................................................................................................................................................................................. 7 List of Figures ......................................................................................................................................................................................................................... 9 List of Tables ........................................................................................................................................................................................................................ 11 Nomenclature ...................................................................................................................................................................................................................... 14 1. SITE/ENTERPRISE DETAILS ................................................................................................................................................................................... 17
1.1 Site/Enterprise Details ................................................................................................................................................................................... 19 1.2 Location and Extent........................................................................................................................................................................................ 20 1.3 Authorisations: Atmospheric Emission License and Other ........................................................................................................................ 27
1.3.1 Atmospheric Emission License & Emission Control Officer ........................................................................................................... 27 1.3.2 Other Authorisations ........................................................................................................................................................................ 27
2. NATURE OF PROCESS........................................................................................................................................................................................... 28 2.1 Process description ........................................................................................................................................................................................ 28 2.2 Scenario 1: Baseline Conditions ................................................................................................................................................................... 30 2.3 Scenario 2: Future Conditions ...................................................................................................................................................................... 36
3. TECHNICAL INFORMATION ................................................................................................................................................................................. 43 3.1 Material Flows: Raw Material(s) Used & Production.................................................................................................................................. 43 3.2 Appliances & Abatement Equipment............................................................................................................................................................ 45
4. ATMOSPHERIC EMISSIONS.................................................................................................................................................................................. 47 4.1 Point Source Parameters ............................................................................................................................................................................... 47
4.1.1 Scenario 1: Baseline Conditions Point Source Parameters ........................................................................................................... 50 4.1.2 Scenario 2: Future Conditions Point Source Parameters .............................................................................................................. 51
4.2 Point Source Emissions (Normal Operating Conditions) ............................................................................................................................. 52 4.2.1 Scenario 1: Baseline Conditions Emissions (Normal) .................................................................................................................... 52 4.2.2 Scenario 2: Future Conditions Emissions (Normal) ....................................................................................................................... 53
4.3 Point Source Maximum Emission Rates (Abnormal: Start-up, Shut-down & Maintenance Conditions) ................................................ 53 4.3.1 Scenario 1: Baseline Conditions (Abnormal Conditions) ............................................................................................................... 54 4.3.2 Scenario 2: Future Conditions Emissions (Abnormal Conditions) ................................................................................................ 55
4.4 Fugitive / Secondary Emissions (area and or line sources) ......................................................................................................................... 56 4.4.1 Scenario 1: Baseline Conditions Fugitive / Secondary Emissions ................................................................................................. 57 4.4.2 Scenario 2: Future Conditions Fugitive / Secondary Emissions .................................................................................................... 59
4.5 Emergency incidents ...................................................................................................................................................................................... 61 5. IMPACT OF ENTERPRISE ON THE RECEIVING ENVIRONMENT .......................................................................................................................... 62
5.1 Analysis of Emissions’ Impact on Human Health ......................................................................................................................................... 62 5.1.1 Baseline/Current Ambient Air Quality............................................................................................................................................. 70
5.1.1.1 Monitoring Localities ........................................................................................................................................................................ 70 5.1.2 Dispersion Modelling Impact Assessment ...................................................................................................................................... 74 5.1.3 Expected Contribution to Ambient Air Quality Standards – Dispersion Modelling Scenarios’ Results ...................................... 77
5.1.3.PM10-1 Particulate Matter (PM10) – 24 hour, 99th percentile (Ambient Air Quality Standard: 75µg/m3) ................................... 78 5.1.3.PM10-2 Particulate Matter (PM10) – Annual Average (Ambient Air Quality Standard: 40µg/m3) ................................................ 82 5.1.3.PM2.5-1 Particulate Matter (PM2.5) – 24 hour, 99th percentile (Ambient Air Quality Standard: 40µg/m3) .................................. 86 5.1.3.PM2.5-2 Particulate Matter (PM2.5) – Annual Average (Ambient Air Quality Standard: 20µg/m3) ............................................... 90 5.1.3.SO2-1 Sulphur Dioxide (SO2) – 1 hour, 99th percentile (Ambient Air Quality Standard: 350µg/m3) ......................................... 94 5.1.3.SO2-2 Sulphur Dioxide (SO2) – 24 hour, 99th percentile (Ambient Air Quality Standard: 125µg/m3) ....................................... 98 5.1.3.SO2-3 Sulphur Dioxide (SO2) – Annual Average (Ambient Air Quality Standard: 50µg/m3) .................................................... 102 5.1.3.NO2-1 Nitrogen Dioxide (NO2) – 1 hour, 99th percentile (Ambient Air Quality Standard: 200µg/m3) ..................................... 106 5.1.3.NO2-2 Nitrogen Dioxide (NO2) – Annual Average (Ambient Air Quality Standard: 40µg/m3) .................................................. 112 5.1.3.CO-1 Carbon Monoxide (CO) – 1 hour, 99th percentile (Ambient Air Quality Standard: 30 000µg/m3) ..................................... 116 5.1.3.CO-2 Carbon Monoxide (CO) – 8 hour, 99th percentile (Ambient Air Quality Standard: 10 000µg/m3) ..................................... 120 5.1.3.Mn-1 Manganese (Mn) – Annual Average (WHO Ambient Air Quality Guideline: 0.15 µg/m3) .................................................. 124 5.1.3.NH3-1 Ammonia (NH3) – 24 hour, 99th percentile (US EPA Reference Concentration: 100 µg/m3) ........................................ 128 5.1.4 Modelled 1st Highest Concentrations ............................................................................................................................................ 130

Assmang Limited Cato Ridge Alloys (Pty) Ltd. 2020 AQIA for Sinter Plant EIA
Atmospheric Impact Report / Air Quality Impact Assessment
Document ID: AssmangCRW-AQIAReport_2020-PlannedSinterPlant_Sep2020_FD1.docx
Revision Date: 18Sep2020 Revision: FINAL_D1 Valid for: Assmang Cato Ridge, KwaZulu-Natal Province
Page 8 of 317
FINAL_D1 Compiled By: JG Potgieter
Approved By: JG Potgieter COPYRIGHT WARNING ALL RIGHTS RESERVED. All information and conceptual designs contained within this document are the intellectual property of ENVIRONGAKA (Pty) Ltd. This document and/or the information contained herein may not be used, stored, reproduced, or copied in any manner, without the prior written consent of ENVIRONGAKA (Pty) Ltd. This document and/or the information and conceptual designs may not be disclosed or displayed to any third party without the prior written consent of ENVIRONGAKA (Pty) Ltd.
EnviroNgaka
5.2 Analysis of Emissions’ Impact on the Environment ................................................................................................................................... 131 5.2.1 Impact of Particulate Matter ......................................................................................................................................................... 131
5.2.1.1 Animals ............................................................................................................................................................................................ 131 5.2.1.2 Vegetation ....................................................................................................................................................................................... 132
5.2.2 Impact of Sulphur Dioxide .............................................................................................................................................................. 134 5.2.2.1 Animals ............................................................................................................................................................................................ 134 5.2.2.2 Plants ............................................................................................................................................................................................... 134 5.2.2.3 Materials and cultural heritage ..................................................................................................................................................... 136
5.2.3 Impact of Nitrogen Dioxide ............................................................................................................................................................ 137 5.2.3.1 Animals ............................................................................................................................................................................................ 137 5.2.3.2 Plants and ecosystems.................................................................................................................................................................... 137 5.2.3.3 Effect on materials .......................................................................................................................................................................... 140
5.2.4 Impact of Carbon Monoxide .......................................................................................................................................................... 140 5.2.4.1 Animals ............................................................................................................................................................................................ 140 5.2.4.2 Plants and ecosystems.................................................................................................................................................................... 141
5.2.5 Impact of Ammonia ........................................................................................................................................................................ 142 5.2.5.1 Animals & Humans.......................................................................................................................................................................... 142 5.2.5.2 Vegetation ....................................................................................................................................................................................... 142
6. COMPLAINTS ...................................................................................................................................................................................................... 143 7. CURRENT OR PLANNED AIR QUALITY MANAGEMENT INTERVENTIONS ....................................................................................................... 143 8. COMPLIANCE AND ENFORCEMENT HISTORY .................................................................................................................................................. 143 9. ADDITIONAL INFORMATION – CONCLUDING COMMENTS & RECOMMENDATIONS ................................................................................... 144 10. FORMAL DECLARATIONS ................................................................................................................................................................................... 147
10.1 Declaration of Accuracy of Information by Applicants .............................................................................................................................. 147 10.2 Declaration of Independence by Practitioners preparing this Atmospheric Impact Report .................................................................. 147
11. REFERENCES ....................................................................................................................................................................................................... 148 Appendix A: Meteorological data ....................................................................................................................................................................... 156
A.1 Wind .............................................................................................................................................................................................................. 157 A.2 Ambient Temperature ................................................................................................................................................................................. 162 A.3 Precipitation / Rainfall ................................................................................................................................................................................. 164 A.4 Stability indices and mixing heights ............................................................................................................................................................ 165
Appendix B: Summary of the Ambient Air Quality ............................................................................................................................................ 177 B.DFO Assessment of Monitored Dust Fallout against the South African National Dust Control Regulation ..................................... 177 B.AAQ Assessment of air quality against South African Ambient Air Quality Standards ...................................................................... 185
B.AAQ.1 Data Capturing Statistics and Averages of Monitored Pollutants ........................................................................................................... 187 B.AAQ.2 Monitored Pollutant Concentrations in Ambient Air for the period July 2017 to June 2020 ............................................................... 195 B.AAQ.3 Compliance of Monitored Pollutant Concentrations in Ambient Air with Ambient Air Quality Standards ......................................... 222
B.M Comparison of Modelling Results versus Monitored Results ................................................................................................................... 243 Appendix C: Modelling Procedure and Settings ................................................................................................................................................ 244
C.1 Modelling Domain: Receptors, Modelled Facility and Terrain Features ................................................................................................. 244 Appendix D: Additional Emission Inventory Estimation Information ............................................................................................................... 256
D.1 Emission Inventory Summary of Assumptions and Calculations .............................................................................................................. 256 D.1.1 Scenarios’ Key Assumptions ........................................................................................................................................................... 256 D.1.3 Secondary/Fugitive area and or line sources ................................................................................................................................ 266
D.2 Blasting .......................................................................................................................................................................................................... 275 D.3 Material Handling Load-in/Load-out........................................................................................................................................................... 276 D.4 Wheel generated dust from unpaved roads .............................................................................................................................................. 277 D.5 Wind erosion from Industrial Areas and Mine Sites .................................................................................................................................. 279 D.6 Silt and moisture content of different materials ....................................................................................................................................... 282 D.7 Exhaust Emission Factors ............................................................................................................................................................................. 284
Appendix E: NEMA Potential Impact/Risk Assessment Methodology ............................................................................................................. 285 E.1 Significance Rating System .......................................................................................................................................................................... 285 E.2 Significance Rating: Project Phases ............................................................................................................................................................ 287
Assmang Limited Cato Ridge Alloys (Pty) Ltd. 2020 AQIA for Sinter Plant EIA
Atmospheric Impact Report / Air Quality Impact Assessment
Document ID: AssmangCRW-AQIAReport_2020-PlannedSinterPlant_Sep2020_FD1.docx
Revision Date: 18Sep2020 Revision: FINAL_D1 Valid for: Assmang Cato Ridge, KwaZulu-Natal Province
Page 9 of 317
FINAL_D1 Compiled By: JG Potgieter
Approved By: JG Potgieter COPYRIGHT WARNING ALL RIGHTS RESERVED. All information and conceptual designs contained within this document are the intellectual property of ENVIRONGAKA (Pty) Ltd. This document and/or the information contained herein may not be used, stored, reproduced, or copied in any manner, without the prior written consent of ENVIRONGAKA (Pty) Ltd. This document and/or the information and conceptual designs may not be disclosed or displayed to any third party without the prior written consent of ENVIRONGAKA (Pty) Ltd.
EnviroNgaka
E.2.1 Significance Impact Rating: Pre-Construction Phase ................................................................................................................... 287 E.2.2 Significance Impact Rating: Construction Phase.......................................................................................................................... 287 E.2.3 Significance Impact Rating: Operational Phase ........................................................................................................................... 288 E.2.4 Significance Impact Rating: Closure/Rehabilitation Phase ......................................................................................................... 289 E.2.5 Significance Impact Rating: Post-Closure Phase .......................................................................................................................... 290
Appendix F: Enterprise Air Quality Management – Key Actions / Plans .......................................................................................................... 291 F.1 Air Quality Management – Current Key Actions /Plans............................................................................................................................. 291 F.2 Air Quality Management – Planned Key Actions/Plans ............................................................................................................................. 292
Appendix RADM: Regulations Regarding Air Dispersion Modelling .................................................................................................................... 293 Appendix U: Dispersion Modelling Uncertainties .............................................................................................................................................. 311
U.1 Minimising / Managing Reducible Uncertainties: ...................................................................................................................................... 311 U.2 IPCC CONSISTENT GUIDANCE TO UNCERTAINTIES .................................................................................................................................... 313
Appendix X: Declaration of Independence – Practitioner ................................................................................................................................. 315 Appendix Y: Curriculum Vitae of Practitioner .................................................................................................................................................... 316 Appendix Z: Declaration of Accuracy of Information - Applicant ..................................................................................................................... 317
List of Figures Figure 1.1: Location of Enterprise ..................................................................................................................................................................................... 17 Figure 1.2: Regional Area surrounding the Enterprise (50km x 50km) .......................................................................................................................... 21 Figure 1.3: Area surrounding the Enterprise (with 5km radius from centre of operations)......................................................................................... 22 Figure 1.4: AQIA Study Area surrounding the Enterprise ................................................................................................................................................ 23 Figure 1.5: Enterprise Overview ........................................................................................................................................................................................ 24 Figure 1.6: AQIA Study Area Topography (relief contours in meters) of the area surrounding the Enterprise .......................................................... 25 Figure 1.7: AQIA Study Area Topography (surface profile) of the area surrounding the Enterprise ........................................................................... 26 Figure 2.1: Scenario 1 – Process Flow Diagram ................................................................................................................................................................ 34 Figure 2.2: Scenario 2 – Process Flow Diagram ................................................................................................................................................................ 41 Figure 4.1.1: Locations of the stack point sources – Scenario 1 ..................................................................................................................................... 48 Figure 4.1.2: Locations of the stack point sources – Scenario 2 ..................................................................................................................................... 49 Figure 4.2: Secondary Emissions (Area Sources) – Process/Plant Secondary Sources (applicable to all Scenarios) .................................................. 56 Figure 4.3: Secondary Emissions (Line Sources) – Process/Plant Secondary Sources (applicable to all Scenarios) ................................................... 57 Figure 5.1-1: Ambient monitoring locations .................................................................................................................................................................... 73 Figure 5.2.1: AQIA Modelling Domain indicating Surrounding Communities, Schools and Towns ............................................................................. 74 Figure 5.2.2: Modelling Domain indicating Receptor Grid and Enterprise .................................................................................................................... 75 Figure 5.2.3: Modelling Domain indicating Discrete Sensitive Receptors and Enterprise ............................................................................................ 76 Figure 5.3.PM10-1.1: All Sources, Scenario 1 vs Scenario 2– Particulate Matter (PM10) – 24hour, 99th percentile ................................................... 78 Figure 5.3.PM10-1.2: All Point Sources vs Abnormal Point Sources, Scenario 2 – Particulate Matter (PM10) – 24hour, 99th percentile ................. 79 Figure 5.3.PM10-1.3: All Secondary Sources, Scenario 2 – Particulate Matter (PM10) – 24hour, 99th percentile ...................................................... 80 Figure 5.3.PM10-2.1: All Sources, Scenario 1 vs Scenario 2– Particulate Matter (PM10) – Annual Average ............................................................... 82 Figure 5.3.PM10-2.2: All Point Sources vs Abnormal Point Sources, Scenario 2 – Particulate Matter (PM10) – Annual Average ............................. 83 Figure 5.3.PM10-2.3: All Secondary Sources, Scenario 2 – Particulate Matter (PM10) – Annual Average .................................................................. 84 Figure 5.3.PM2.5-1.1: All Sources, Scenario 1 vs Scenario 2– Particulate Matter (PM2.5) – 24 hour, 99th percentile ................................................ 86 Figure 5.3.PM2.5-1.2: All Point Sources vs Abnormal Point Sources, Scenario 2 – Particulate Matter (PM2.5) – 24 hour, 99th percentile .............. 87 Figure 5.3.PM2.5-1.3: All Secondary Sources, Scenario 2– Particulate Matter (PM2.5) – 24 hour, 99th percentile ..................................................... 88 Figure 5.3.PM2.5-2.1: All Sources, Scenario 1 vs Scenario 2– Particulate Matter (PM2.5) – Annual Average ............................................................. 90 Figure 5.3.PM2.5-2.2: All Point Sources vs Abnormal Point Sources, Scenario 2– Particulate Matter (PM2.5) – Annual Average ............................ 91 Figure 5.3.PM2.5-2.3: All Secondary Sources, Scenario 2– Particulate Matter (PM2.5) – Annual Average .................................................................. 92 Figure 5.3.SO2-1.1: All Sources, Scenario 1 vs Scenario 2– Sulphur Dioxide (SO2) – 1hour, 99th percentile ............................................................... 94 Figure 5.3.SO2-1.2: All Point Sources vs Abnormal Point Sources, Scenario 2 – Sulphur Dioxide (SO2) – 1hour, 99th percentile ............................. 95 Figure 5.3.SO2-1.3: All Secondary Sources, Scenario 2– Sulphur Dioxide (SO2) – 1hour, 99th percentile ................................................................... 96 Figure 5.3.SO2-2.1: All Sources, Scenario 1 vs Scenario 2– Sulphur Dioxide (SO2) – 24hour, 99th percentile ............................................................. 98 Figure 5.3.SO2-2.2: All Point Sources vs Abnormal Point Sources, Scenario 2– Sulphur Dioxide (SO2) – 24hour, 99th percentile ............................ 99
Assmang Limited Cato Ridge Alloys (Pty) Ltd. 2020 AQIA for Sinter Plant EIA
Atmospheric Impact Report / Air Quality Impact Assessment
Document ID: AssmangCRW-AQIAReport_2020-PlannedSinterPlant_Sep2020_FD1.docx
Revision Date: 18Sep2020 Revision: FINAL_D1 Valid for: Assmang Cato Ridge, KwaZulu-Natal Province
Page 10 of 317
FINAL_D1 Compiled By: JG Potgieter
Approved By: JG Potgieter COPYRIGHT WARNING ALL RIGHTS RESERVED. All information and conceptual designs contained within this document are the intellectual property of ENVIRONGAKA (Pty) Ltd. This document and/or the information contained herein may not be used, stored, reproduced, or copied in any manner, without the prior written consent of ENVIRONGAKA (Pty) Ltd. This document and/or the information and conceptual designs may not be disclosed or displayed to any third party without the prior written consent of ENVIRONGAKA (Pty) Ltd.
EnviroNgaka
Figure 5.3.SO2-2.3: All Secondary Sources, Scenario 2– Sulphur Dioxide (SO2) – 24hour, 99th percentile ............................................................... 100 Figure 5.3.SO2-3.1: All Sources, Scenario 1 vs Scenario 2– Sulphur Dioxide (SO2) – Annual Average ....................................................................... 102 Figure 5.3.SO2-3.2: All Point Sources vs Abnormal Point Sources, Scenario 2– Sulphur Dioxide (SO2) – Annual Average ...................................... 103 Figure 5.3.SO2-3.3: All Secondary Sources, Scenario 2– Sulphur Dioxide (SO2) – Annual Average ........................................................................... 104 Figure 5.3.NO2-1.1: All Sources, Scenario 1 vs Scenario 2– Nitrogen Dioxide (NO2) – 1hour, 99th percentile.......................................................... 106 Figure 5.3.NO2-1.2: All Point Sources vs Abnormal Point Sources, Scenario 2– Nitrogen Dioxide (NO2) – 1hour, 99th percentile ......................... 107 Figure 5.3.NO2-1.3: All Secondary Sources, Scenario 2– Nitrogen Dioxide (NO2) – 1hour, 99th percentile .............................................................. 108 Figure 5.3.NO2-1.TSR1S1: Scenario 1 – Nitrogen Dioxide (NO2), 1hour Time-Series Plot: D18 – Radnor CAAQMS ................................................ 110 Figure 5.3.NO2-1.TSR1S2: Scenario 2 – Nitrogen Dioxide (NO2), 1hour Time-Series Plot: D18 – Radnor CAAQMS ................................................ 111 Figure 5.3.NO2-2.1: All Sources, Scenario 1 vs Scenario 2– Nitrogen Dioxide (NO2) – Annual Average.................................................................... 112 Figure 5.3.NO2-2.2: All Point Sources vs Abnormal Point Sources, Scenario 2– Nitrogen Dioxide (NO2) – Annual Average ................................... 113 Figure 5.3.NO2-2.3: All Secondary Sources, Scenario 2– Nitrogen Dioxide (NO2) – Annual Average ........................................................................ 114 Figure 5.3.CO-1.1: All Sources, Scenario 1 vs Scenario 2– Carbon Monoxide (CO) – 1hour, 99th percentile ............................................................ 116 Figure 5.3.CO-1.2: All Point Sources vs Abnormal Point Sources, Scenario 2– Carbon Monoxide (CO) – 1hour, 99th percentile ........................... 117 Figure 5.3.CO-1.3: All Secondary Sources, Scenario 2– Carbon Monoxide (CO) – 1hour, 99th percentile ................................................................. 118 Figure 5.3.CO-2.1: All Sources, Scenario 1 vs Scenario 2– Carbon Monoxide (CO) – 8hour, 99th percentile ............................................................ 120 Figure 5.3.CO-2.2: All Point Sources vs Abnormal Point Sources, Scenario 2– Carbon Monoxide (CO) – 8hour, 99th percentile ........................... 121 Figure 5.3.CO-2.3: All Secondary Sources, Scenario 2– Carbon Monoxide (CO) – 8hour, 99th percentile ................................................................. 122 Figure 5.3.Mn-1.1: All Sources, Scenario 1 vs Scenario 2– Manganese (Mn) – Annual Average ............................................................................... 124 Figure 5.3.Mn-1.2: All Point Sources vs Abnormal Point Sources, Scenario 2– Manganese (Mn) ............................................................................. 125 Figure 5.3.Mn-1.3: All Secondary Sources, Scenario 2– Manganese (Mn) .................................................................................................................. 126 Figure 5.3.NH3-1.1: All Sources, Scenario 1 vs Scenario 2– Ammonia (NH3) – 24hour, 99th percentile .................................................................... 128 Figure A.1: Quarterly Wind Occurrence for 2017 to 2019 ............................................................................................................................................ 157 Figure A.2: Average quarterly wind speeds for 2017 to 2019 ...................................................................................................................................... 158 Figure A.3: Maximum quarterly wind speeds for 2017 to 2019 ................................................................................................................................... 159 Figure A.4: Average Quarterly Diurnal Wind Speed for 2017 to 2019 ......................................................................................................................... 160 Figure A.5: Site specific wind roses for 2017 to 2019 .................................................................................................................................................... 161 Figure A.5: Average Monthly Diurnal Ambient Temperature for 2017 to 2019 .......................................................................................................... 162 Figure A.6: Average Quarterly Diurnal Ambient Temperature for 2017 to 2019 ........................................................................................................ 163 Figure A.7: Precipitation / Rainfall for 2017 to 2019 ..................................................................................................................................................... 164 Figure A.8: 3D illustration of plume movement path and concentration profile ........................................................................................................ 165 Figure A.9: 2D illustration of vertical plume movement ............................................................................................................................................... 166 Figure A.10: Vertical wind profile (left), temperature profile (centre), and corresponding stack plume illustration .............................................. 167 Figure A.11: Annual monthly distribution of stability classes for 2017 to 2019 .......................................................................................................... 174 Figure B.DFO.1: Dust Fallout monitoring locations........................................................................................................................................................ 178 Figure B.DFO.2NR: Dust Fallout Rate: Latest 12 Months – Non-Residential Locations ............................................................................................. 182 Figure B.DFO.2R: Dust Fallout Rate: Latest 12 Months – Residential Locations ........................................................................................................ 182 Figure B.DFO.3NR: Dust Fallout Rate: Rolling Annual Averages – Non-Residential Locations .................................................................................. 183 Figure B.DFO.3R: Dust Fallout Rate: Rolling Annual Averages – Residential Locations ............................................................................................. 183 Figure B.DFO.4NR: Dust Fallout Rate: 3-Monthly Averages – Non-Residential Locations ......................................................................................... 184 Figure B.DFO.4R: Dust Fallout Rate: 3-Monthly Averages – Residential Locations .................................................................................................... 184 Figure B.AAQ.1: Ambient Air Quality Monitoring Locations ......................................................................................................................................... 186 Figure B.AAQ.S.PM10-24h: 24-hr Average PM10 – Jul2017 to Jun2018 ......................................................................................................................... 195 Figure B.AAQ.S.PM10-24h: 24-hr Average PM10 – Jul2018 to Jun2019 ......................................................................................................................... 196 Figure B.AAQ.S.PM10-24h: 24-hr Average PM10 – Jul2019 to Jun2020 ......................................................................................................................... 197 Figure B.AAQ.S.PM2.5-24h: 24-hr Average PM2.5 – Jul2017 to Jun2018........................................................................................................................ 198 Figure B.AAQ.S.PM2.5-24h: 24-hr Average PM2.5 – Jul2018 to Jun2019........................................................................................................................ 199 Figure B.AAQ.S.PM2.5-24h: 24-hr Average PM2.5 – Jul2019 to Jun2020........................................................................................................................ 200 Figure B.AAQ.S.PM10&PM2.5-Ann: Rolling Annual Averages for PM10 and PM2.5 – till end Jun2020 .......................................................................... 201 Figure B.AAQ.S.SO2-1h: 1-hr Average SO2 – Jul2017 to Jun2018 .................................................................................................................................. 202 Figure B.AAQ.S.SO2-1h: 1-hr Average SO2 – Jul2018 to Jun2019 .................................................................................................................................. 203 Figure B.AAQ.S.SO2-1h: 1-hr Average SO2 – Jul2019 to Jun2020 .................................................................................................................................. 204 Figure B.AAQ.S.SO2-24h: 24-hr Average SO2 – Jul2017 to Jun2018.............................................................................................................................. 205

Assmang Limited Cato Ridge Alloys (Pty) Ltd. 2020 AQIA for Sinter Plant EIA
Atmospheric Impact Report / Air Quality Impact Assessment
Document ID: AssmangCRW-AQIAReport_2020-PlannedSinterPlant_Sep2020_FD1.docx
Revision Date: 18Sep2020 Revision: FINAL_D1 Valid for: Assmang Cato Ridge, KwaZulu-Natal Province
Page 11 of 317
FINAL_D1 Compiled By: JG Potgieter
Approved By: JG Potgieter COPYRIGHT WARNING ALL RIGHTS RESERVED. All information and conceptual designs contained within this document are the intellectual property of ENVIRONGAKA (Pty) Ltd. This document and/or the information contained herein may not be used, stored, reproduced, or copied in any manner, without the prior written consent of ENVIRONGAKA (Pty) Ltd. This document and/or the information and conceptual designs may not be disclosed or displayed to any third party without the prior written consent of ENVIRONGAKA (Pty) Ltd.
EnviroNgaka
Figure B.AAQ.S.SO2-24h: 24-hr Average SO2 – Jul2018 to Jun2019.............................................................................................................................. 206 Figure B.AAQ.S.SO2-24h: 24-hr Average SO2 – Jul2019 to Jun2020.............................................................................................................................. 207 Figure B.AAQ.S.NO2-1h: 1-hr Average NO2 – Jul2017 to Jun2018 ................................................................................................................................ 208 Figure B.AAQ.S.NO2-1h: 1-hr Average NO2 – Jul2018 to Jun2019 ................................................................................................................................ 209 Figure B.AAQ.S.NO2-1h: 1-hr Average NO2 – Jul2019 to Jun2020 ................................................................................................................................ 210 Figure B.AAQ.S.CO-1h: 1-hr Average CO – Jul2017 to Jun2018 .................................................................................................................................... 211 Figure B.AAQ.S.CO-1h: 1-hr Average CO – Jul2018 to Jun2019 .................................................................................................................................... 212 Figure B.AAQ.S.CO-1h: 1-hr Average CO – Jul2019 to Jun2020 .................................................................................................................................... 213 Figure B.AAQ.S.CO-8h: 8-hr Average CO – Jul2017 to Jun2018 .................................................................................................................................... 214 Figure B.AAQ.S.CO-8h: 8-hr Average CO – Jul2018 to Jun2019 .................................................................................................................................... 215 Figure B.AAQ.S.CO-8h: 8-hr Average CO – Jul2019 to Jun2020 .................................................................................................................................... 216 Figure B.AAQ.S.O3-8h: 8-hr Average O3 – Jul2017 to Jun2018...................................................................................................................................... 217 Figure B.AAQ.S.O3-8h: 8-hr Average O3 – Jul2018 to Jun2019...................................................................................................................................... 218 Figure B.AAQ.S.O3-8h: 8-hr Average O3 – Jul2019 to Jun2020...................................................................................................................................... 219 Figure B.AAQ.S.Metals-Ann: Rolling Annual Average PM10 metal speciation– till end Jun2020 ................................................................................ 220 Figure B.AAQ.P.Bz-Mnth: Month Average Benzene Concentrations – Jul2017 to Jun2020 ....................................................................................... 221 Figure C.1: Modelling Domain: Modelled Receptors and Enterprise .......................................................................................................................... 246 Figure C.2: Modelling Domain indicating Sensitive Discrete Receptors and Enterprise ............................................................................................. 247 Figure C.3: AQIA Study Area Topography (relief contours in meters) of the area surrounding the Enterprise ........................................................ 248 Figure C.4: AQIA Study Area Topography (surface profile) of the area surrounding the Enterprise ......................................................................... 249 Figure C.5: Buildings included in the AQIA Study ........................................................................................................................................................... 250 Figure D.1: Watering control for unpaved travel surfaces (USEPA, 2003) ................................................................................................................... 279 Figure D.2: Relation of threshold friction velocity to size distribution mode (USEPA, 1988) ..................................................................................... 280 Figure D.3: Increase in threshold friction velocity with Lc (USEPA, 1988) .................................................................................................................... 281 Figure U.1: A depiction of evidence and agreement statements and their relationship to confidence (Confidence increases towards the top-right corner as suggested by the increasing strength of shading) .......................................................................................................................................... 313
List of Tables Table 1.1: Emission Control Officer Details ...................................................................................................................................................................... 27 Table 2.1: Unit processes: Scenario 1 – Baseline Conditions ......................................................................................................................................... 35 Table 2.2: Unit processes: Scenario 2 – Future Conditions ............................................................................................................................................ 42 Table 3.1.1: Material Flow: Scenarios 1 and 2 ................................................................................................................................................................ 43 Table 3.2: Appliances and measures to abate air pollution ............................................................................................................................................ 45 Table 4.1: Primary Pollutants ............................................................................................................................................................................................ 47 Table 4.1-1: Point Source Parameter – Scenario 1 .......................................................................................................................................................... 50 Table 4.1-2: Point Source Parameter – Scenario 2 .......................................................................................................................................................... 51 Table 4.2.1-1: Normal Operating Conditions Point Source Emissions – Scenario 1 ...................................................................................................... 52 Table 4.2.2-1: Normal Operating Conditions Point Source Emissions – Scenario 2 ...................................................................................................... 53 Table 4.3.1-1: Abnormal Operating Conditions Point Source Emissions – Scenario 1.................................................................................................. 54 Table 4.3.2-1: Abnormal Operating Conditions Point Source Emission Rates – Scenario 2 ......................................................................................... 55 Table 4.4.1-1: Fugitive / Secondary Emissions – Scenario 1 ........................................................................................................................................... 57 Table 4.4.2-1: Fugitive / Secondary Emissions – Scenario 2 ........................................................................................................................................... 59 Table 4.5-1: Emergency incidents ..................................................................................................................................................................................... 61 Table 5.1: Tolerated frequency of exceedances of ambient air guidelines ................................................................................................................... 62 Table 5.2.1: South African Ambient Air Quality Standards for the applicable gasses and particulate matter ........................................................... 62 Table 5.2.2: Other Ambient Air Quality Guidelines for Pollutants ................................................................................................................................. 63 Table 5.3: Interim ambient air quality standards for PM2.5 ............................................................................................................................................ 64 Table 5.4: Pollutants emitted to the atmosphere ........................................................................................................................................................... 65 Table 5.5: Abbreviations for “Exposure Routes, Symptoms and Target Organs” ......................................................................................................... 66 Table 5.6: Hazardous waste disposal technologies ......................................................................................................................................................... 68 Table 5.8-1: Emission Monitoring Point Source Description .......................................................................................................................................... 70 Table 5.8-2: Ambient Monitoring Locations & Description ............................................................................................................................................ 71 Table 5.PM10-1: Sensitive receptors: Maximum 24-hr PM10 concentrations (µg/m3) ................................................................................................. 81
Assmang Limited Cato Ridge Alloys (Pty) Ltd. 2020 AQIA for Sinter Plant EIA
Atmospheric Impact Report / Air Quality Impact Assessment
Document ID: AssmangCRW-AQIAReport_2020-PlannedSinterPlant_Sep2020_FD1.docx
Revision Date: 18Sep2020 Revision: FINAL_D1 Valid for: Assmang Cato Ridge, KwaZulu-Natal Province
Page 12 of 317
FINAL_D1 Compiled By: JG Potgieter
Approved By: JG Potgieter COPYRIGHT WARNING ALL RIGHTS RESERVED. All information and conceptual designs contained within this document are the intellectual property of ENVIRONGAKA (Pty) Ltd. This document and/or the information contained herein may not be used, stored, reproduced, or copied in any manner, without the prior written consent of ENVIRONGAKA (Pty) Ltd. This document and/or the information and conceptual designs may not be disclosed or displayed to any third party without the prior written consent of ENVIRONGAKA (Pty) Ltd.
EnviroNgaka
Table 5.PM10-2: Sensitive receptors: Annual PM10 concentrations (µg/m3) ................................................................................................................ 85 Table 5.PM2.5-1: Sensitive receptors: Maximum 24-hr PM2.5 concentrations (µg/m3) ............................................................................................... 89 Table 5.PM2.5-2: Sensitive receptors: Annual PM2.5 concentrations (µg/m3) .............................................................................................................. 93 Table 5.SO2-1: Sensitive receptors: Maximum 1-hr SO2 concentrations (µg/m3) ........................................................................................................ 97 Table 5.SO2-2: Sensitive receptors: Maximum 24-hr SO2 concentrations (µg/m3) .................................................................................................... 101 Table 5.SO2-3: Sensitive receptors: Annual SO2 concentrations (µg/m3).................................................................................................................... 105 Table 5.NO2-1: Sensitive receptors: Maximum 1-hr NO2 concentrations (µg/m3) ..................................................................................................... 109 Table 5.NO2-2: Sensitive receptors: Annual NO2 concentrations (µg/m3) .................................................................................................................. 115 Table 5.CO-1: Sensitive receptors: Maximum 1-hr CO concentrations (µg/m3) ......................................................................................................... 119 Table 5.CO-2: Sensitive receptors: Maximum 8-hr CO concentrations (µg/m3) ......................................................................................................... 123 Table 5.Mn-1: Sensitive receptors: Annual Mn concentrations (µg/m3) ..................................................................................................................... 127 Table 5.NH3-1: Sensitive receptors: Maximum 24-hr NH3 concentrations (µg/m3) ................................................................................................... 129 Table 5.30-1: Modelled 1st Highest / Maximum Concentrations for Scenario 1 ......................................................................................................... 130 Table 5.30-2: Modelled 1st Highest / Maximum Concentrations for Scenario 2 ......................................................................................................... 130 Table 5.31: WHO guideline values for impact on plant species (EC, 1997) ................................................................................................................. 135 Table 5.32: WHO guideline values for impact on materials (EC, 1997) ....................................................................................................................... 136 Table 5.33: Guidelines for nitrogen deposition to natural and semi natural freshwater and terrestrial ecosystems (WHO, 2000) ...................... 138 Table 5.34: Deposition velocities for selected species Vd (Brodzinsky et. al., 1984)................................................................................................... 139 Table 5.35: Annual dry deposition loads for selected annual ambient air concentrations ........................................................................................ 139 Table 5.36: Guidelines for carbon monoxide (CO) (WHO, 2000) ................................................................................................................................. 141 Table 6.1: Complaints ...................................................................................................................................................................................................... 143 Table 8.1: Compliance and Enforcement History .......................................................................................................................................................... 143 Table A.7: Summary of the monthly Stability indices for 2017 .................................................................................................................................... 170 Table A.8: Summary of the monthly Stability indices for 2018 .................................................................................................................................... 171 Table A.9: Summary of the monthly Stability indices for 2019 .................................................................................................................................... 172 Table A.10: Stability class Group distribution for 2017 ................................................................................................................................................. 173 Table A.11: Stability class Group distribution for 2018 ................................................................................................................................................. 173 Table A.12: Stability class Group distribution for 2019 ................................................................................................................................................. 174 Table A.13: Hourly average mixing height for 2017 ...................................................................................................................................................... 175 Table A.14: Hourly average mixing height for 2018 ...................................................................................................................................................... 175 Table A.15: Hourly average mixing height for 2019 ...................................................................................................................................................... 176 Table B.DFO.1: Dust Fallout Monitoring Locations ....................................................................................................................................................... 177 Table B.DFO.2: Monthly DFO Results: Off-Site Locations ............................................................................................................................................. 179 Table B.DFO.3: Rolling Annual Average DFO Results: Off-Site Locations .................................................................................................................... 180 Table B.DFO.4: Latest 12-Month NDCR Compliance Assessment: Off-Site Locations ................................................................................................ 181 Table B.AAQ.1: Ambient Monitoring Locations & Description .................................................................................................................................... 185 Table B.AAQ.S1.S: Continuous Ambient Monitoring Statistics – Country Club AQMS – Jul2017 to Jun2018 .......................................................... 187 Table B.AAQ.S1.S: Continuous Ambient Monitoring Statistics – Country Club AQMS – Jul2018 to Jun2019 .......................................................... 188 Table B.AAQ.S1.S: Continuous Ambient Monitoring Statistics – Country Club AQMS – Jul2019 to Jun2020 .......................................................... 189 Table B.AAQ.S1.MA: Monthly Average of Monitored Pollutants – Country Club AQMS – Jul2017 to Jun2018 ...................................................... 190 Table B.AAQ.S1.MA: Monthly Average of Monitored Pollutants – Country Club AQMS – Jul2018 to Jun2019 ...................................................... 190 Table B.AAQ.S1.MA: Monthly Average of Monitored Pollutants – Country Club AQMS – Jul2019 to Jun2020 ...................................................... 190 Table B.AAQ.S2.S: Continuous Ambient Monitoring Statistics – Radnor AQMS – Jul2017 to Jun2018 .................................................................... 191 Table B.AAQ.S2.S: Continuous Ambient Monitoring Statistics – Radnor AQMS – Jul2018 to Jun2019 .................................................................... 192 Table B.AAQ.S2.S: Continuous Ambient Monitoring Statistics – Radnor AQMS – Jul2019 to Jun2020 .................................................................... 193 Table B.AAQ.S2.MA: Monthly Average of Monitored Pollutants – Radnor AQMS – Jul2017 to Jun2018 ................................................................ 194 Table B.AAQ.S2.MA: Monthly Average of Monitored Pollutants – Radnor AQMS – Jul2018 to Jun2019 ................................................................ 194 Table B.AAQ.S2.MA: Monthly Average of Monitored Pollutants – Radnor AQMS – Jul2019 to Jun2020 ................................................................ 194 Table B.AAQ.P.Bz: Benzene passive sampling results and exceedances for July 2017 to June 2020........................................................................ 221 Table B.AAQ.S1.CA: Compliance with Ambient Air Quality Standards – Country Club AQMS – Jul2017 to Jun2018.............................................. 222 Table B.AAQ.S1.CA: Compliance with Ambient Air Quality Standards – Country Club AQMS – Jul2018 to Jun2019.............................................. 225 Table B.AAQ.S1.CA: Compliance with Ambient Air Quality Standards – Country Club AQMS – Jul2019 to Jun2020.............................................. 229 Table B.AAQ.S2.CA: Compliance with Ambient Air Quality Standards – Radnor AQMS – Jul2017 to Jun2018 ....................................................... 232
Assmang Limited Cato Ridge Alloys (Pty) Ltd. 2020 AQIA for Sinter Plant EIA
Atmospheric Impact Report / Air Quality Impact Assessment
Document ID: AssmangCRW-AQIAReport_2020-PlannedSinterPlant_Sep2020_FD1.docx
Revision Date: 18Sep2020 Revision: FINAL_D1 Valid for: Assmang Cato Ridge, KwaZulu-Natal Province
Page 13 of 317
FINAL_D1 Compiled By: JG Potgieter
Approved By: JG Potgieter COPYRIGHT WARNING ALL RIGHTS RESERVED. All information and conceptual designs contained within this document are the intellectual property of ENVIRONGAKA (Pty) Ltd. This document and/or the information contained herein may not be used, stored, reproduced, or copied in any manner, without the prior written consent of ENVIRONGAKA (Pty) Ltd. This document and/or the information and conceptual designs may not be disclosed or displayed to any third party without the prior written consent of ENVIRONGAKA (Pty) Ltd.
EnviroNgaka
Table B.AAQ.S2.CA: Compliance with Ambient Air Quality Standards – Radnor AQMS – Jul2018 to Jun2019 ....................................................... 235 Table B.AAQ.S2.CA: Compliance with Ambient Air Quality Standards – Radnor AQMS – Jul2019 to Jun2020 ....................................................... 239 Table C.1: Details of the on-site buildings used in the study ........................................................................................................................................ 244 Table C.2: Receptor grid spacing used ............................................................................................................................................................................ 244 Table C.3: Information of the Onsite Buildings included in the AQIA Study................................................................................................................ 251 Table D.0-1.1(a): Primary Point Sources and Associated Emissions for Scenario 1 (Includes estimated emission during abnormal incidents – when relevant) .................................................................................................................................................................................................................. 258 Table D.0-1.1(b): Primary Point Sources and Associated Emissions for Scenario 1 (Includes estimated emission during abnormal incidents – when relevant) .................................................................................................................................................................................................................. 259 Table D.0-1.1(c): Primary Point Sources and Associated Emissions for Scenario 1 (Includes estimated emission during abnormal incidents – when relevant) .................................................................................................................................................................................................................. 260 Table D.0-M: Secondary sources: Expected Manganese content. .............................................................................................................................. 274 Table D.1: Typical silt and moisture content of materials at various industries (USEPA, 1995a) .............................................................................. 283 Table D.2: Typical silt content values of surface material on industrial unpaved roads (USEPA, 2003) ................................................................... 284 Table D.3: Exhaust Emission Factors for Various Classes of Mining Equipment (NPI, 2001) ..................................................................................... 284 Table RADM.10: Information required in the Plan of Study......................................................................................................................................... 294 Table RADM.11: Information required in the Air Dispersion Modelling Study ........................................................................................................... 301 Table U.1: Likelihood Scale .............................................................................................................................................................................................. 314

Assmang Limited Cato Ridge Alloys (Pty) Ltd. 2020 AQIA for Sinter Plant EIA
Atmospheric Impact Report / Air Quality Impact Assessment
Document ID: AssmangCRW-AQIAReport_2020-PlannedSinterPlant_Sep2020_FD1.docx
Revision Date: 18Sep2020 Revision: FINAL_D1 Valid for: Assmang Cato Ridge, KwaZulu-Natal Province
Page 14 of 317
FINAL_D1 Compiled By: JG Potgieter
Approved By: JG Potgieter COPYRIGHT WARNING ALL RIGHTS RESERVED. All information and conceptual designs contained within this document are the intellectual property of ENVIRONGAKA (Pty) Ltd. This document and/or the information contained herein may not be used, stored, reproduced, or copied in any manner, without the prior written consent of ENVIRONGAKA (Pty) Ltd. This document and/or the information and conceptual designs may not be disclosed or displayed to any third party without the prior written consent of ENVIRONGAKA (Pty) Ltd.
EnviroNgaka
Nomenclature
amsl Above Mean Sea Level AEL Atmospheric Emissions License AERMOD American Meteorological Society/Environmental Protection Agency Regulatory Model AIR Atmospheric Impact Report ACRW Assmang Limited Cato Ridge Alloys (Pty) Ltd. APCE Air Pollution Control Equipment APPA Atmospheric Pollution Prevention Act AQA National Environmental Management: Air Quality Act AQIA Air Quality Impact Assessment AQMP Air Quality Management Plan CAAQMS Continuous Ambient Air Quality Monitoring Station ARM African Rainbow Minerals ASTM American Society of Testing and Materials BH Bagfilter / Baghouse BTEX Benzene, Toluene, Ethyl benzene and Xylene C&S Crushing & Screening CAAQMS Continuous Ambient Air Quality Monitoring Station CBD Central Business District CG Clean Gas CO Carbon Monoxide CO2 Carbon Dioxide Cr Chromium Cr(VI) Hexavalent Chromium DEFF (DEA)
National Department of Environment, Forestry and Fisheries (previously National Department of Environmental Affairs)
DME National Department of Minerals and Energy DFO Dust Fallout EAF Electric Arc Furnace EAP Environmental Assessment Practitioner EIA Environmental Impact Assessment EMP Environmental Management Program Enterprise Assmang Limited Cato Ridge Alloys (Pty) Ltd. EPA United States Environmental Protection Agency FeMn Ferromanganese I&AP Interested and Affected Parties ISO International Organization for Standardization I-TEQ International Toxic Equivalent GN General Notice HC Hydrocarbon

Assmang Limited Cato Ridge Alloys (Pty) Ltd. 2020 AQIA for Sinter Plant EIA
Atmospheric Impact Report / Air Quality Impact Assessment
Document ID: AssmangCRW-AQIAReport_2020-PlannedSinterPlant_Sep2020_FD1.docx
Revision Date: 18Sep2020 Revision: FINAL_D1 Valid for: Assmang Cato Ridge, KwaZulu-Natal Province
Page 15 of 317
FINAL_D1 Compiled By: JG Potgieter
Approved By: JG Potgieter COPYRIGHT WARNING ALL RIGHTS RESERVED. All information and conceptual designs contained within this document are the intellectual property of ENVIRONGAKA (Pty) Ltd. This document and/or the information contained herein may not be used, stored, reproduced, or copied in any manner, without the prior written consent of ENVIRONGAKA (Pty) Ltd. This document and/or the information and conceptual designs may not be disclosed or displayed to any third party without the prior written consent of ENVIRONGAKA (Pty) Ltd.
EnviroNgaka
HC C&S High Carbon Crushing & Screening HCl Hydrogen Chloride HF Hydrogen Fluoride IPCC Intergovernmental Panel on Climate Change ISO International Organisation for Standardisation LC C&S Low Carbon Crushing & Screening MEC Member of Executive Council MEP Metal Extraction Plant MRP Metal Recovery Plant Mn Manganese MS Monitoring station / Ambient air monitoring station MVA Mega-Volt-Ampere MW MegaWatt N/A Not applicable n/ap Not applicable n/av Not available NDCR National Dust Control Regulation NEM:AQA National Environmental Management: Air Quality Act NH3 Ammonia NO Nitrogen Oxide NO2 Nitrogen dioxide NOx Oxides of Nitrogen (expressed as NO2) NPI Australian National Pollutant Inventory OHS Occupational Health & Safety PCDD Dioxins PCDF Furans PCDD/PCDF Dioxins and Furans PCDD/F Dioxins and Furans PFD Process flow diagram PM Particulate Matter PM10 / PM10 Particulate Matter with an aerodynamic diameter of ≤ 10 micrometers PM2.5 / PM2.5 Particulate Matter with an aerodynamic diameter of ≤ 2.5 micrometers ppm Parts per million (g/Mg) PRIME Plume Rise Model Enhancements PSD Particle Size Distribution ROD Record of Decision ROM / R.O.M. Run-of-mine ore SA / S.A. South Africa SANS South African National Standard Site Assmang Limited Cato Ridge Alloys (Pty) Ltd. SO2 Sulphur dioxide SOx Oxides of sulphur TBD To be determined

Assmang Limited Cato Ridge Alloys (Pty) Ltd. 2020 AQIA for Sinter Plant EIA
Atmospheric Impact Report / Air Quality Impact Assessment
Document ID: AssmangCRW-AQIAReport_2020-PlannedSinterPlant_Sep2020_FD1.docx
Revision Date: 18Sep2020 Revision: FINAL_D1 Valid for: Assmang Cato Ridge, KwaZulu-Natal Province
Page 16 of 317
FINAL_D1 Compiled By: JG Potgieter
Approved By: JG Potgieter COPYRIGHT WARNING ALL RIGHTS RESERVED. All information and conceptual designs contained within this document are the intellectual property of ENVIRONGAKA (Pty) Ltd. This document and/or the information contained herein may not be used, stored, reproduced, or copied in any manner, without the prior written consent of ENVIRONGAKA (Pty) Ltd. This document and/or the information and conceptual designs may not be disclosed or displayed to any third party without the prior written consent of ENVIRONGAKA (Pty) Ltd.
EnviroNgaka
TOC Total Organic Compounds TP Transfer point(s) TSF Tailings Storage Facility TSP Total Suspended Particulates – Also refers to Particulate Matter with reference to this
report t/d tpd
Tonne per day
t/h tph
Tonne per hour
tpa Tonne per annum t/m tpm
Tonne per month
UK United Kingdom US / USA United States of America UTM Universal Transverse Mercator Coordinate System V Vanadium VOC Volatile Organic Compound WHO World Health Organization WML Waste Management License WS Wet Scrubber
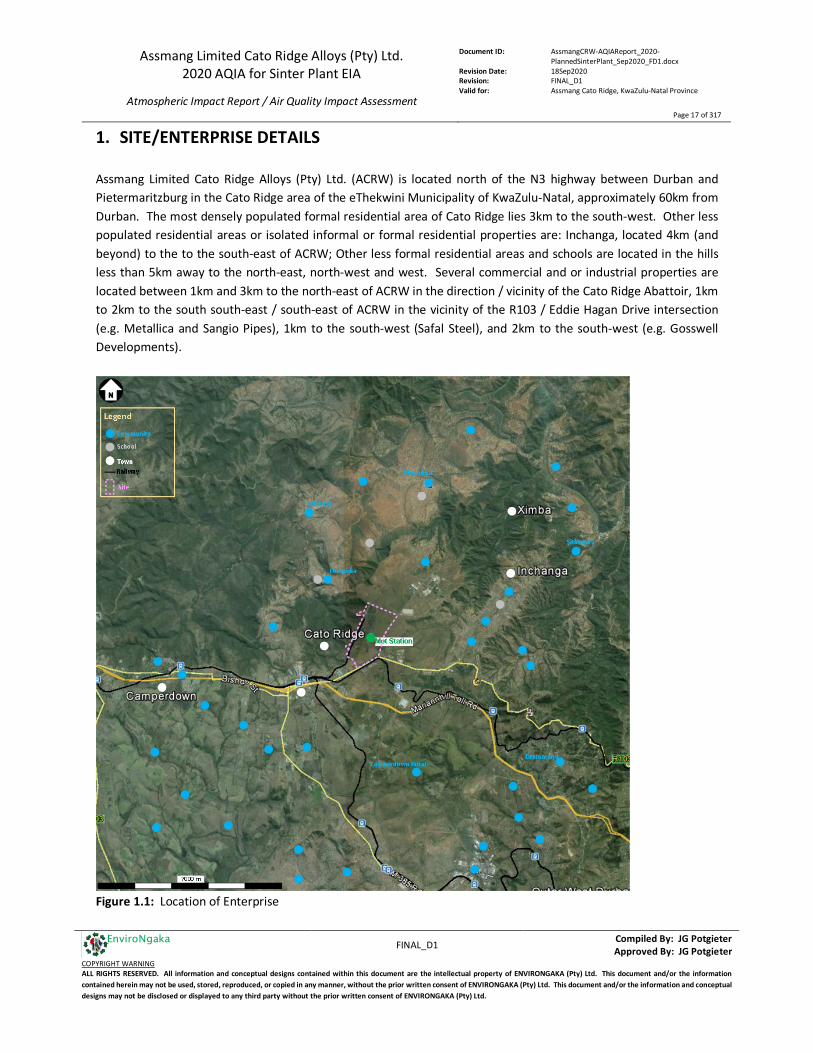
Assmang Limited Cato Ridge Alloys (Pty) Ltd. 2020 AQIA for Sinter Plant EIA
Atmospheric Impact Report / Air Quality Impact Assessment
Document ID: AssmangCRW-AQIAReport_2020-PlannedSinterPlant_Sep2020_FD1.docx
Revision Date: 18Sep2020 Revision: FINAL_D1 Valid for: Assmang Cato Ridge, KwaZulu-Natal Province
Page 17 of 317
FINAL_D1 Compiled By: JG Potgieter
Approved By: JG Potgieter COPYRIGHT WARNING ALL RIGHTS RESERVED. All information and conceptual designs contained within this document are the intellectual property of ENVIRONGAKA (Pty) Ltd. This document and/or the information contained herein may not be used, stored, reproduced, or copied in any manner, without the prior written consent of ENVIRONGAKA (Pty) Ltd. This document and/or the information and conceptual designs may not be disclosed or displayed to any third party without the prior written consent of ENVIRONGAKA (Pty) Ltd.
EnviroNgaka
1. SITE/ENTERPRISE DETAILS Assmang Limited Cato Ridge Alloys (Pty) Ltd. (ACRW) is located north of the N3 highway between Durban and Pietermaritzburg in the Cato Ridge area of the eThekwini Municipality of KwaZulu-Natal, approximately 60km from Durban. The most densely populated formal residential area of Cato Ridge lies 3km to the south-west. Other less populated residential areas or isolated informal or formal residential properties are: Inchanga, located 4km (and beyond) to the to the south-east of ACRW; Other less formal residential areas and schools are located in the hills less than 5km away to the north-east, north-west and west. Several commercial and or industrial properties are located between 1km and 3km to the north-east of ACRW in the direction / vicinity of the Cato Ridge Abattoir, 1km to 2km to the south south-east / south-east of ACRW in the vicinity of the R103 / Eddie Hagan Drive intersection (e.g. Metallica and Sangio Pipes), 1km to the south-west (Safal Steel), and 2km to the south-west (e.g. Gosswell Developments).
Figure 1.1: Location of Enterprise
Assmang Limited Cato Ridge Alloys (Pty) Ltd. 2020 AQIA for Sinter Plant EIA
Atmospheric Impact Report / Air Quality Impact Assessment
Document ID: AssmangCRW-AQIAReport_2020-PlannedSinterPlant_Sep2020_FD1.docx
Revision Date: 18Sep2020 Revision: FINAL_D1 Valid for: Assmang Cato Ridge, KwaZulu-Natal Province
Page 18 of 317
FINAL_D1 Compiled By: JG Potgieter
Approved By: JG Potgieter COPYRIGHT WARNING ALL RIGHTS RESERVED. All information and conceptual designs contained within this document are the intellectual property of ENVIRONGAKA (Pty) Ltd. This document and/or the information contained herein may not be used, stored, reproduced, or copied in any manner, without the prior written consent of ENVIRONGAKA (Pty) Ltd. This document and/or the information and conceptual designs may not be disclosed or displayed to any third party without the prior written consent of ENVIRONGAKA (Pty) Ltd.
EnviroNgaka
Assmang Limited established the Cato Ridge Works (formerly Feralloys Limited) in 1956 when construction was started on a ferromanganese smelter. The ferromanganese smelter was commissioned in 1959 and originally consisted of two 9MVA submerged electric arc furnaces. The operations at the site was expanded and upgraded over the years and currently operations are six submerged electric arc furnaces, a refinery operation known as Cato Ridge Alloys (CRA) and a Metal Recovery Plant. The raw materials are delivered by rail and or road, and off loaded using wagon tipplers, and transported to the raw materials bays by conveyor belts. Manganese ore is railed from the various mines. Reductants in the form of metallurgical coke and anthracite peas form the source of carbon units required for the smelting reaction. The reaction in a furnace is a reduction reaction, with the reductants being the reducing agent. The site is also equipped with a Briquetting Plant which produces briquettes from recovered dust, ore and other materials, including binding agents. These briquettes also serve as feed material for the furnaces. The ores and or briquettes are combined with the reductants and heated. The carbon in the raw materials, in combination with electrical energy through the electrodes results in metallurgical reactions which produce molten ferromanganese metal and slag (by-product). As soon as enough melt is produced, the furnace is tapped to remove both metal and slag. Metal and slag are separated by means of density difference. Metal is allowed to solidify and cooled prior to being processed, crushed and screened, at the High Carbon and the Refined (Low Carbon) Crushing & Screening Plants to provide the final product for despatch by road and or rail to customers. Sufficiently cooled slag is transported to the Metal Recovery Plant so that entrapped metal and slag can be separated using magnetic and specific gravity techniques. Processed slag is deposited on the slag dump. Metal produced by the furnaces could also be used for the production of refined ferromanganese by means of a top blown bottom stirred converter by preferential oxidation of carbon (the CRA plant). The different processing units have gas cleaning equipment for the abatement of particulate matter emissions. In light of specific products produced, raw materials consumed and or specific process, with respect to ferromanganese, ACRW is currently licenced to operate the following Listed Activities in terms of Section 21 of NEM:AQA:
1. Storage and handling of ore and coal (Subcategory 5.1); 2. Agglomeration operations (Subcategory 4.11); 3. Production of alloys of iron with chromium, manganese, silicon or vanadium, the separation of titanium
slag from iron-containing minerals using heat (Subcategory 4.9); The purpose / objective of this investigation is to identify and quantify the expected effect of the Enterprise’s impact, emanating from atmospheric emissions on the surrounding ambient air quality. This study will assess the expected contribution of the Enterprise to the ambient air quality for the following scenarios:
a) Scenario 1: Baseline Conditions
Assmang Limited Cato Ridge Alloys (Pty) Ltd. 2020 AQIA for Sinter Plant EIA
Atmospheric Impact Report / Air Quality Impact Assessment
Document ID: AssmangCRW-AQIAReport_2020-PlannedSinterPlant_Sep2020_FD1.docx
Revision Date: 18Sep2020 Revision: FINAL_D1 Valid for: Assmang Cato Ridge, KwaZulu-Natal Province
Page 19 of 317
FINAL_D1 Compiled By: JG Potgieter
Approved By: JG Potgieter COPYRIGHT WARNING ALL RIGHTS RESERVED. All information and conceptual designs contained within this document are the intellectual property of ENVIRONGAKA (Pty) Ltd. This document and/or the information contained herein may not be used, stored, reproduced, or copied in any manner, without the prior written consent of ENVIRONGAKA (Pty) Ltd. This document and/or the information and conceptual designs may not be disclosed or displayed to any third party without the prior written consent of ENVIRONGAKA (Pty) Ltd.
EnviroNgaka
Impact assessment is done per the emissions of all relevant pollutants at expected/actual concentrations against actual baseline production capacity (achievable emissions and does not imply AEL emission limits); and includes no modifications or improvements made to the current process / additional abatement of secondary fugitive emissions from the furnaces (excluding Furnaces 3 and 4);
b) Scenario 2: Future Conditions Impact assessment is done per the emissions of all relevant pollutants at expected concentrations against full production capacity (achievable emissions and does not imply AEL emission limits); and includes an additional proposed Sinter Plant (Subcategory 4.5 of the Listed Activities in terms of Section 21 of NEM:AQA) to produce pellets from raw material as feed to the furnaces, with no modifications or improvements made to the current process / additional abatement of secondary fugitive emissions from the furnaces (excluding Furnaces 3 & 4);
1.1 Site/Enterprise Details i) Company Name : Assmang Limited Cato Ridge Alloys (Pty) Ltd.
ii) Company Registration Number : Assmang Manganese Cato Ridge Works: 1935/007343/06 Cato Ridge Alloys (Pty) Ltd.: 97/00755/07
iii) Trading Name : Assmang Manganese Cato Ridge Works
iv) Contact details for the responsible person and his/her delegates
Responsible Person Name or
Emission Control Officer
(where appointed):
: Responsible Person: Mr. Paul Botha (General Works Manager) Emission Control Officer: Mr. Wessel Oosthuizen (Emission Control Officer)
Telephone Number: : Mr. Paul Botha: +27 (0) 31 782 5000 Mr. Wessel Oosthuizen: +27 (0) 31 782 5000
Cell Phone Number: : Mr. Wessel Oosthuizen: +27 (0) 82 453 6361
Fax Number: : +27 (0) 86 632 5077
E-mail Address: : Mr. Paul Botha: [email protected] Mr. Wessel Oosthuizen: [email protected]
After Hours Contact Details: : Mr. Wessel Oosthuizen: +27 (0) 82 453 6361
v) Physical Address of the Head
Office
: 1 Eddie Hagan Drive Cato Ridge KwaZulu-Natal Province
vi) Postal Address of the Head Office : P.O. Box 21 Cato Ridge, KwaZulu-Natal 3680

Assmang Limited Cato Ridge Alloys (Pty) Ltd. 2020 AQIA for Sinter Plant EIA
Atmospheric Impact Report / Air Quality Impact Assessment
Document ID: AssmangCRW-AQIAReport_2020-PlannedSinterPlant_Sep2020_FD1.docx
Revision Date: 18Sep2020 Revision: FINAL_D1 Valid for: Assmang Cato Ridge, KwaZulu-Natal Province
Page 20 of 317
FINAL_D1 Compiled By: JG Potgieter
Approved By: JG Potgieter COPYRIGHT WARNING ALL RIGHTS RESERVED. All information and conceptual designs contained within this document are the intellectual property of ENVIRONGAKA (Pty) Ltd. This document and/or the information contained herein may not be used, stored, reproduced, or copied in any manner, without the prior written consent of ENVIRONGAKA (Pty) Ltd. This document and/or the information and conceptual designs may not be disclosed or displayed to any third party without the prior written consent of ENVIRONGAKA (Pty) Ltd.
EnviroNgaka
1.2 Location and Extent i) Physical Address of the Enterprise : 1 Eddie Hagan Drive
Cato Ridge KwaZulu-Natal Province
ii) Physical Address of the Ancillary
Enterprise
: As above
iii) Description of Site (Erf) : 1 Eddie Hagan Drive Cato Ridge KwaZulu-Natal Province
iv) Coordinates of Approximate Centre of
Operations
: Latitude (North-South): 29.715252 S Longitude (East-West): 30.612879 E
v) Extent (km2) : 2.422 km2 (extended fenced area)
vi) Elevation Above Mean Sea Level (m) : 790 m
vii) Province : KwaZulu Natal Province
viii) Metropolitan/District Municipality : eThekwini
ix) Local Municipality : Cato Ridge
x) Designated Priority Area (if applicable) : Not applicable
Assmang Limited Cato Ridge Alloys (Pty) Ltd. (ACRW) is located north of the N3 highway between Durban and Pietermaritzburg in the Cato Ridge area of the eThekwini Municipality of KwaZulu-Natal, approximately 60km from Durban. The most densely populated formal residential area of Cato Ridge lies 3km to the south-west. Other less populated residential areas or isolated informal or formal residential properties are: Inchanga, located 4km (and beyond) to the to the south-east of ACRW; Other less formal residential areas and schools are located in the hills less than 5km away to the north-east, north-west and west. Several commercial and or industrial properties are located between 1km and 3km to the north-east of ACRW in the direction / vicinity of the Cato Ridge Abattoir, 1km to 2km to the south south-east / south-east of ACRW in the vicinity of the R103 / Eddie Hagan Drive intersection (e.g. Metallica and Sangio Pipes), 1km to the south-west (Safal Steel), and 2km to the south-west (e.g. Gosswell Developments).
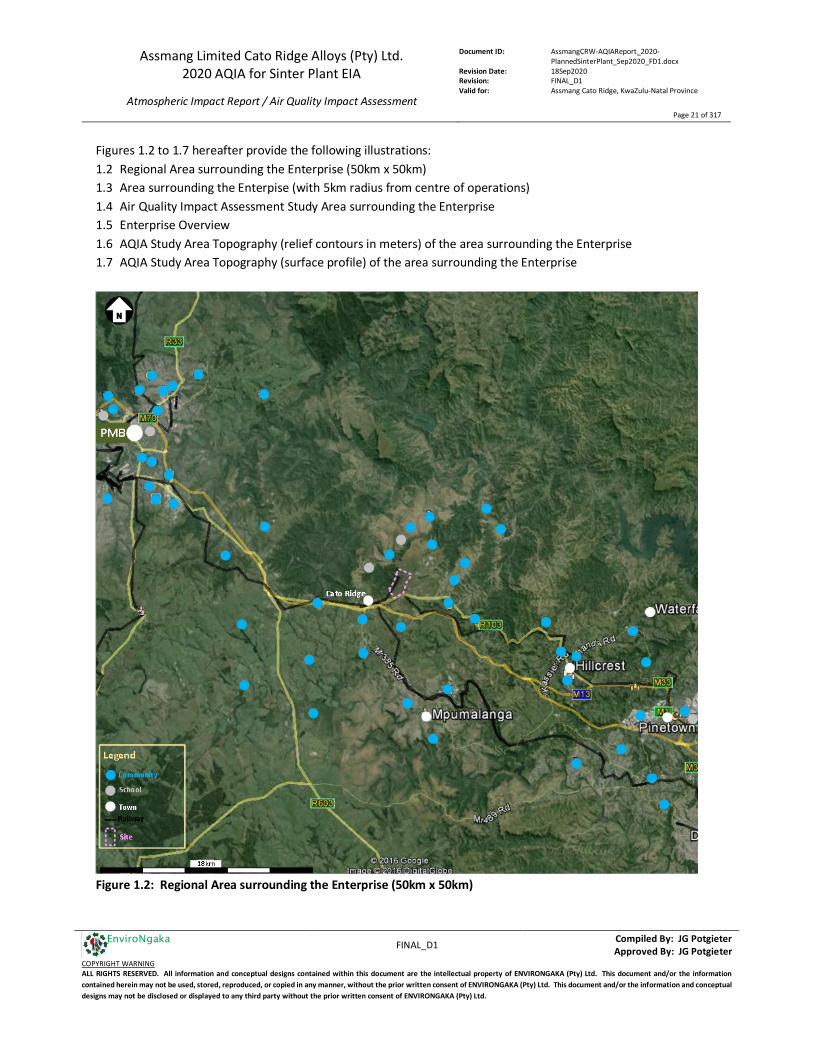
Assmang Limited Cato Ridge Alloys (Pty) Ltd. 2020 AQIA for Sinter Plant EIA
Atmospheric Impact Report / Air Quality Impact Assessment
Document ID: AssmangCRW-AQIAReport_2020-PlannedSinterPlant_Sep2020_FD1.docx
Revision Date: 18Sep2020 Revision: FINAL_D1 Valid for: Assmang Cato Ridge, KwaZulu-Natal Province
Page 21 of 317
FINAL_D1 Compiled By: JG Potgieter
Approved By: JG Potgieter COPYRIGHT WARNING ALL RIGHTS RESERVED. All information and conceptual designs contained within this document are the intellectual property of ENVIRONGAKA (Pty) Ltd. This document and/or the information contained herein may not be used, stored, reproduced, or copied in any manner, without the prior written consent of ENVIRONGAKA (Pty) Ltd. This document and/or the information and conceptual designs may not be disclosed or displayed to any third party without the prior written consent of ENVIRONGAKA (Pty) Ltd.
EnviroNgaka
Figures 1.2 to 1.7 hereafter provide the following illustrations: 1.2 Regional Area surrounding the Enterprise (50km x 50km) 1.3 Area surrounding the Enterpise (with 5km radius from centre of operations) 1.4 Air Quality Impact Assessment Study Area surrounding the Enterprise 1.5 Enterprise Overview 1.6 AQIA Study Area Topography (relief contours in meters) of the area surrounding the Enterprise 1.7 AQIA Study Area Topography (surface profile) of the area surrounding the Enterprise
Figure 1.2: Regional Area surrounding the Enterprise (50km x 50km)

Assmang Limited Cato Ridge Alloys (Pty) Ltd. 2020 AQIA for Sinter Plant EIA
Atmospheric Impact Report / Air Quality Impact Assessment
Document ID: AssmangCRW-AQIAReport_2020-PlannedSinterPlant_Sep2020_FD1.docx
Revision Date: 18Sep2020 Revision: FINAL_D1 Valid for: Assmang Cato Ridge, KwaZulu-Natal Province
Page 22 of 317
FINAL_D1 Compiled By: JG Potgieter
Approved By: JG Potgieter COPYRIGHT WARNING ALL RIGHTS RESERVED. All information and conceptual designs contained within this document are the intellectual property of ENVIRONGAKA (Pty) Ltd. This document and/or the information contained herein may not be used, stored, reproduced, or copied in any manner, without the prior written consent of ENVIRONGAKA (Pty) Ltd. This document and/or the information and conceptual designs may not be disclosed or displayed to any third party without the prior written consent of ENVIRONGAKA (Pty) Ltd.
EnviroNgaka
Figure 1.3: Area surrounding the Enterprise (with 5km radius from centre of operations)
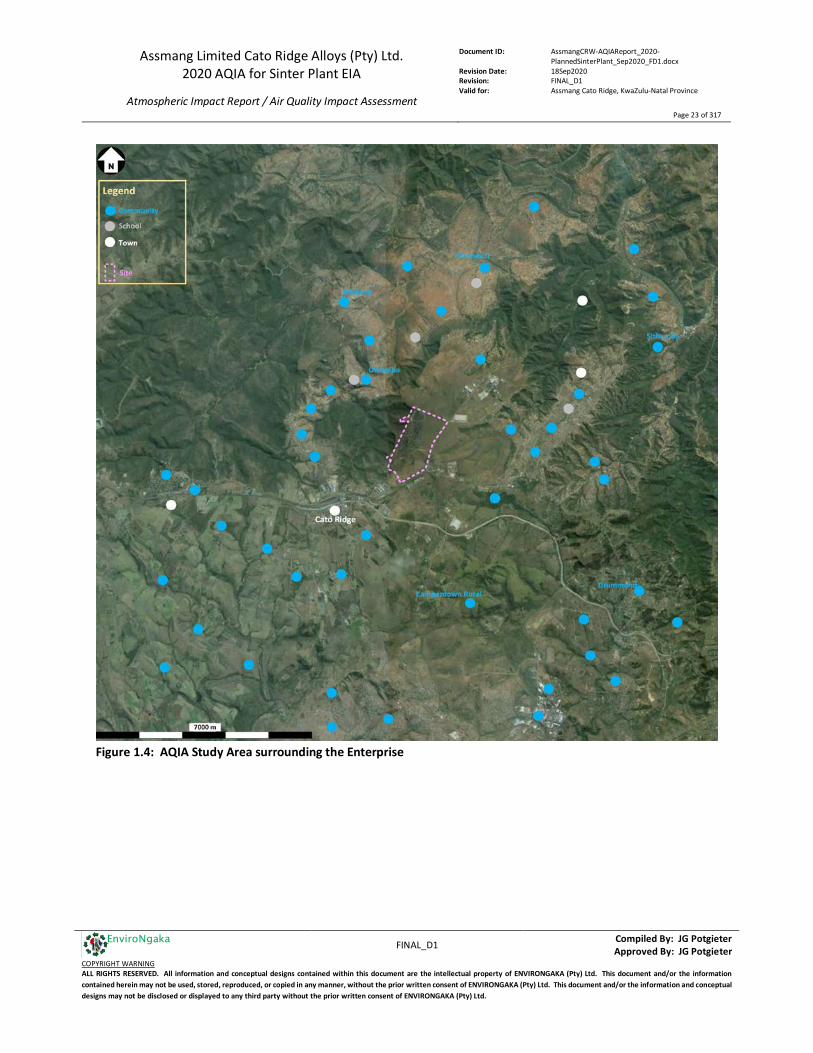
Assmang Limited Cato Ridge Alloys (Pty) Ltd. 2020 AQIA for Sinter Plant EIA
Atmospheric Impact Report / Air Quality Impact Assessment
Document ID: AssmangCRW-AQIAReport_2020-PlannedSinterPlant_Sep2020_FD1.docx
Revision Date: 18Sep2020 Revision: FINAL_D1 Valid for: Assmang Cato Ridge, KwaZulu-Natal Province
Page 23 of 317
FINAL_D1 Compiled By: JG Potgieter
Approved By: JG Potgieter COPYRIGHT WARNING ALL RIGHTS RESERVED. All information and conceptual designs contained within this document are the intellectual property of ENVIRONGAKA (Pty) Ltd. This document and/or the information contained herein may not be used, stored, reproduced, or copied in any manner, without the prior written consent of ENVIRONGAKA (Pty) Ltd. This document and/or the information and conceptual designs may not be disclosed or displayed to any third party without the prior written consent of ENVIRONGAKA (Pty) Ltd.
EnviroNgaka
Figure 1.4: AQIA Study Area surrounding the Enterprise
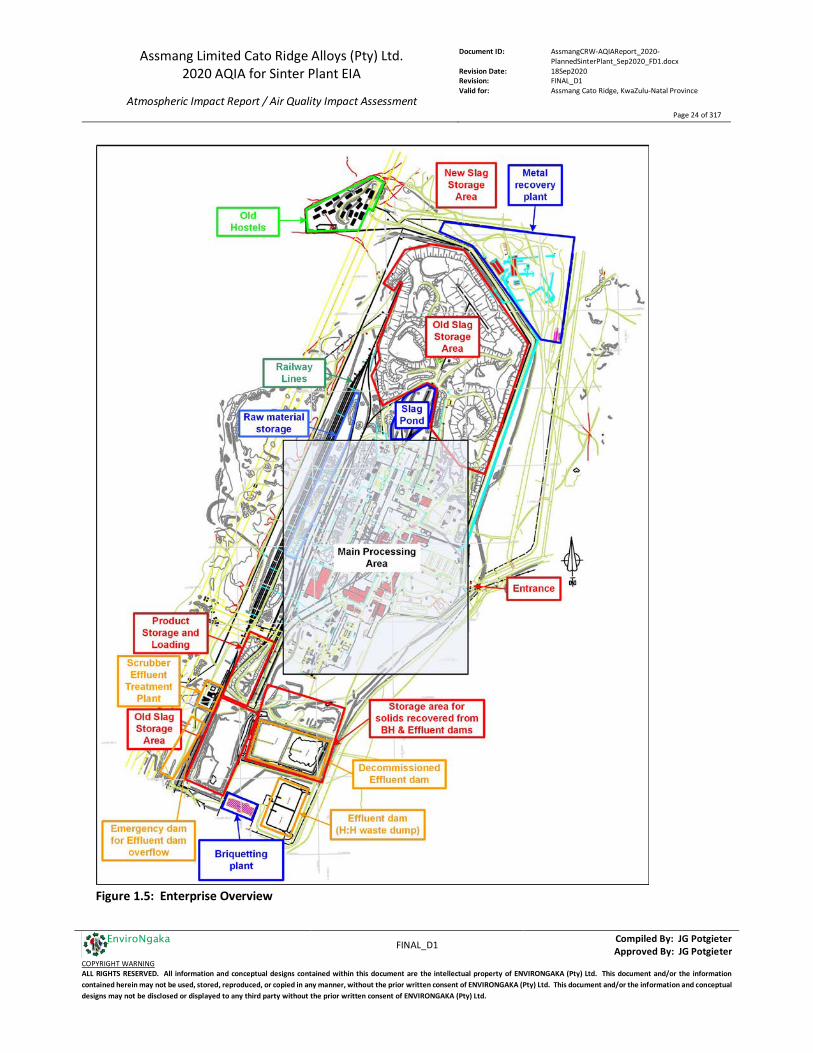
Assmang Limited Cato Ridge Alloys (Pty) Ltd. 2020 AQIA for Sinter Plant EIA
Atmospheric Impact Report / Air Quality Impact Assessment
Document ID: AssmangCRW-AQIAReport_2020-PlannedSinterPlant_Sep2020_FD1.docx
Revision Date: 18Sep2020 Revision: FINAL_D1 Valid for: Assmang Cato Ridge, KwaZulu-Natal Province
Page 24 of 317
FINAL_D1 Compiled By: JG Potgieter
Approved By: JG Potgieter COPYRIGHT WARNING ALL RIGHTS RESERVED. All information and conceptual designs contained within this document are the intellectual property of ENVIRONGAKA (Pty) Ltd. This document and/or the information contained herein may not be used, stored, reproduced, or copied in any manner, without the prior written consent of ENVIRONGAKA (Pty) Ltd. This document and/or the information and conceptual designs may not be disclosed or displayed to any third party without the prior written consent of ENVIRONGAKA (Pty) Ltd.
EnviroNgaka
Figure 1.5: Enterprise Overview
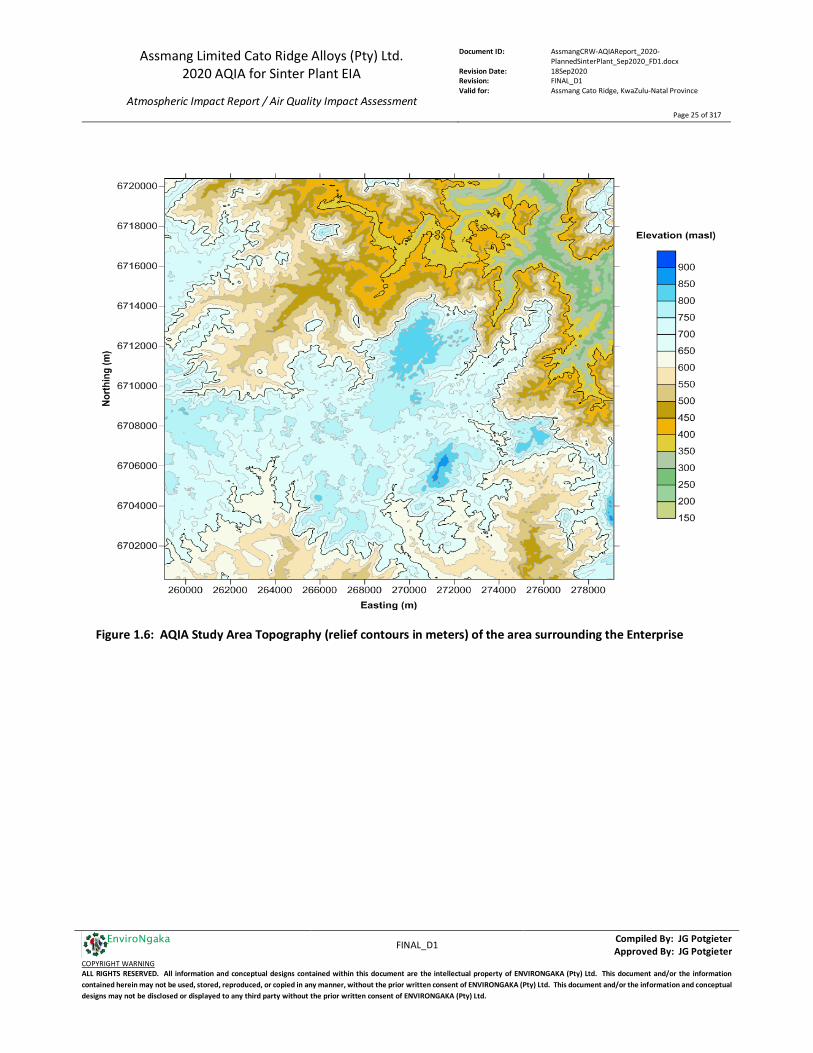
Assmang Limited Cato Ridge Alloys (Pty) Ltd. 2020 AQIA for Sinter Plant EIA
Atmospheric Impact Report / Air Quality Impact Assessment
Document ID: AssmangCRW-AQIAReport_2020-PlannedSinterPlant_Sep2020_FD1.docx
Revision Date: 18Sep2020 Revision: FINAL_D1 Valid for: Assmang Cato Ridge, KwaZulu-Natal Province
Page 25 of 317
FINAL_D1 Compiled By: JG Potgieter
Approved By: JG Potgieter COPYRIGHT WARNING ALL RIGHTS RESERVED. All information and conceptual designs contained within this document are the intellectual property of ENVIRONGAKA (Pty) Ltd. This document and/or the information contained herein may not be used, stored, reproduced, or copied in any manner, without the prior written consent of ENVIRONGAKA (Pty) Ltd. This document and/or the information and conceptual designs may not be disclosed or displayed to any third party without the prior written consent of ENVIRONGAKA (Pty) Ltd.
EnviroNgaka
Figure 1.6: AQIA Study Area Topography (relief contours in meters) of the area surrounding the Enterprise

Assmang Limited Cato Ridge Alloys (Pty) Ltd. 2020 AQIA for Sinter Plant EIA
Atmospheric Impact Report / Air Quality Impact Assessment
Document ID: AssmangCRW-AQIAReport_2020-PlannedSinterPlant_Sep2020_FD1.docx
Revision Date: 18Sep2020 Revision: FINAL_D1 Valid for: Assmang Cato Ridge, KwaZulu-Natal Province
Page 26 of 317
FINAL_D1 Compiled By: JG Potgieter
Approved By: JG Potgieter COPYRIGHT WARNING ALL RIGHTS RESERVED. All information and conceptual designs contained within this document are the intellectual property of ENVIRONGAKA (Pty) Ltd. This document and/or the information contained herein may not be used, stored, reproduced, or copied in any manner, without the prior written consent of ENVIRONGAKA (Pty) Ltd. This document and/or the information and conceptual designs may not be disclosed or displayed to any third party without the prior written consent of ENVIRONGAKA (Pty) Ltd.
EnviroNgaka
Figure 1.7: AQIA Study Area Topography (surface profile) of the area surrounding the Enterprise
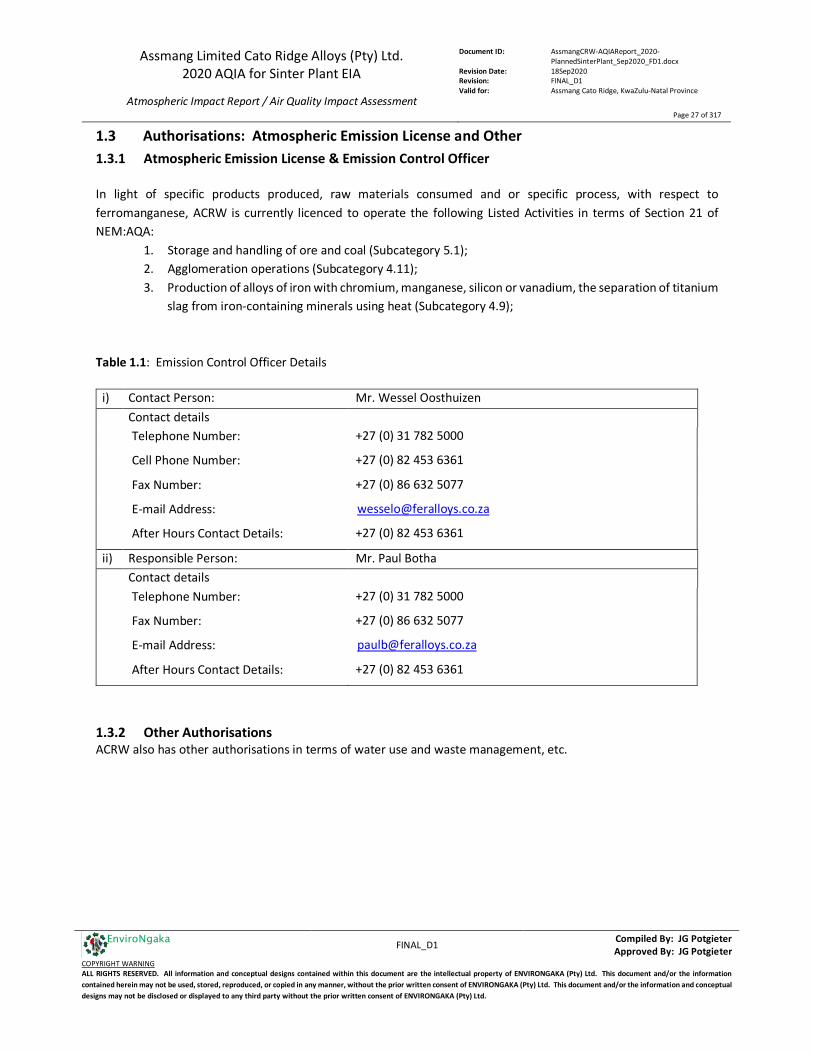
Assmang Limited Cato Ridge Alloys (Pty) Ltd. 2020 AQIA for Sinter Plant EIA
Atmospheric Impact Report / Air Quality Impact Assessment
Document ID: AssmangCRW-AQIAReport_2020-PlannedSinterPlant_Sep2020_FD1.docx
Revision Date: 18Sep2020 Revision: FINAL_D1 Valid for: Assmang Cato Ridge, KwaZulu-Natal Province
Page 27 of 317
FINAL_D1 Compiled By: JG Potgieter
Approved By: JG Potgieter COPYRIGHT WARNING ALL RIGHTS RESERVED. All information and conceptual designs contained within this document are the intellectual property of ENVIRONGAKA (Pty) Ltd. This document and/or the information contained herein may not be used, stored, reproduced, or copied in any manner, without the prior written consent of ENVIRONGAKA (Pty) Ltd. This document and/or the information and conceptual designs may not be disclosed or displayed to any third party without the prior written consent of ENVIRONGAKA (Pty) Ltd.
EnviroNgaka
1.3 Authorisations: Atmospheric Emission License and Other 1.3.1 Atmospheric Emission License & Emission Control Officer In light of specific products produced, raw materials consumed and or specific process, with respect to ferromanganese, ACRW is currently licenced to operate the following Listed Activities in terms of Section 21 of NEM:AQA:
1. Storage and handling of ore and coal (Subcategory 5.1); 2. Agglomeration operations (Subcategory 4.11); 3. Production of alloys of iron with chromium, manganese, silicon or vanadium, the separation of titanium
slag from iron-containing minerals using heat (Subcategory 4.9); Table 1.1: Emission Control Officer Details
i) Contact Person: Mr. Wessel Oosthuizen Contact details
Telephone Number: +27 (0) 31 782 5000
Cell Phone Number: +27 (0) 82 453 6361
Fax Number: +27 (0) 86 632 5077
E-mail Address: [email protected]
After Hours Contact Details: +27 (0) 82 453 6361
ii) Responsible Person: Mr. Paul Botha Contact details
Telephone Number: +27 (0) 31 782 5000
Fax Number: +27 (0) 86 632 5077
E-mail Address: [email protected]
After Hours Contact Details: +27 (0) 82 453 6361
1.3.2 Other Authorisations ACRW also has other authorisations in terms of water use and waste management, etc.
Assmang Limited Cato Ridge Alloys (Pty) Ltd. 2020 AQIA for Sinter Plant EIA
Atmospheric Impact Report / Air Quality Impact Assessment
Document ID: AssmangCRW-AQIAReport_2020-PlannedSinterPlant_Sep2020_FD1.docx
Revision Date: 18Sep2020 Revision: FINAL_D1 Valid for: Assmang Cato Ridge, KwaZulu-Natal Province
Page 28 of 317
FINAL_D1 Compiled By: JG Potgieter
Approved By: JG Potgieter COPYRIGHT WARNING ALL RIGHTS RESERVED. All information and conceptual designs contained within this document are the intellectual property of ENVIRONGAKA (Pty) Ltd. This document and/or the information contained herein may not be used, stored, reproduced, or copied in any manner, without the prior written consent of ENVIRONGAKA (Pty) Ltd. This document and/or the information and conceptual designs may not be disclosed or displayed to any third party without the prior written consent of ENVIRONGAKA (Pty) Ltd.
EnviroNgaka
2. NATURE OF PROCESS 2.1 Process description Assmang Limited established the Cato Ridge Works (formerly Feralloys Limited) in 1956 when construction was started on a ferromanganese smelter. The ferromanganese smelter was commissioned in 1959 and originally consisted of two 9MVA submerged electric arc furnaces. The operations at the site was expanded and upgraded over the years and currently operations are six submerged electric arc furnaces, a refinery operation known as Cato Ridge Alloys (CRA) and a Metal Recovery Plant. The raw materials are delivered by rail and or road, and off loaded using wagon tipplers, and transported to the raw materials bays by conveyor belts. Manganese ore is railed from the various mines. Reductants in the form of metallurgical coke and anthracite peas form the source of carbon units required for the smelting reaction. The reaction in a furnace is a reduction reaction, with the reductants being the reducing agent. The site is also equipped with a Briquetting Plant which produces briquettes from recovered dust, ore and other materials, including binding agents. These briquettes also serve as feed material for the furnaces. The ores and or briquettes are combined with the reductants and heated. The carbon in the raw materials, in combination with electrical energy through the electrodes results in metallurgical reactions which produce molten ferromanganese metal and slag (by-product). As soon as enough melt is produced, the furnace is tapped to remove both metal and slag. Metal and slag are separated by means of density difference. Metal is allowed to solidify and cooled prior to being processed, crushed and screened, at the High Carbon and the Refined (Low Carbon) Crushing & Screening Plants to provide the final product for despatch by road and or rail to customers. Sufficiently cooled slag is transported to the Metal Recovery Plant so that entrapped metal and slag can be separated using magnetic and specific gravity techniques. Processed slag is deposited on the slag dump. Metal produced by the furnaces could also be used for the production of refined ferromanganese by means of a top blown bottom stirred converter by preferential oxidation of carbon (the CRA plant). The different processing units have gas cleaning equipment for the abatement of particulate matter emissions. In light of specific products produced, raw materials consumed and or specific process, with respect to ferromanganese, ACRW is currently licenced to operate the following Listed Activities in terms of Section 21 of NEM:AQA:
1. Storage and handling of ore and coal (Subcategory 5.1); 2. Agglomeration operations (Subcategory 4.11); 3. Production of alloys of iron with chromium, manganese, silicon or vanadium, the separation of titanium
slag from iron-containing minerals using heat (Subcategory 4.9); The purpose / objective of this investigation is to identify and quantify the expected effect of the Enterprise’s impact, emanating from atmospheric emissions on the surrounding ambient air quality.
Assmang Limited Cato Ridge Alloys (Pty) Ltd. 2020 AQIA for Sinter Plant EIA
Atmospheric Impact Report / Air Quality Impact Assessment
Document ID: AssmangCRW-AQIAReport_2020-PlannedSinterPlant_Sep2020_FD1.docx
Revision Date: 18Sep2020 Revision: FINAL_D1 Valid for: Assmang Cato Ridge, KwaZulu-Natal Province
Page 29 of 317
FINAL_D1 Compiled By: JG Potgieter
Approved By: JG Potgieter COPYRIGHT WARNING ALL RIGHTS RESERVED. All information and conceptual designs contained within this document are the intellectual property of ENVIRONGAKA (Pty) Ltd. This document and/or the information contained herein may not be used, stored, reproduced, or copied in any manner, without the prior written consent of ENVIRONGAKA (Pty) Ltd. This document and/or the information and conceptual designs may not be disclosed or displayed to any third party without the prior written consent of ENVIRONGAKA (Pty) Ltd.
EnviroNgaka
This study will assess the expected contribution of the Enterprise to the ambient air quality for the following scenarios:
a) Scenario 1: Baseline Conditions Impact assessment is done per the emissions of all relevant pollutants at expected/actual concentrations against actual baseline production capacity (achievable emissions and does not imply AEL emission limits); and includes no modifications or improvements made to the current process / additional abatement of secondary fugitive emissions from the furnaces (excluding Furnaces 3 and 4);
b) Scenario 2: Future Conditions Impact assessment is done per the emissions of all relevant pollutants at expected concentrations against full production capacity (achievable emissions and does not imply AEL emission limits); and includes an additional proposed Sinter Plant (Subcategory 4.5 of the Listed Activities in terms of Section 21 of NEM:AQA) to produce pellets from raw material as feed to the furnaces, with no modifications or improvements made to the current process / additional abatement of secondary fugitive emissions from the furnaces (excluding Furnaces 3 & 4);
Assmang Limited Cato Ridge Alloys (Pty) Ltd. 2020 AQIA for Sinter Plant EIA
Atmospheric Impact Report / Air Quality Impact Assessment
Document ID: AssmangCRW-AQIAReport_2020-PlannedSinterPlant_Sep2020_FD1.docx
Revision Date: 18Sep2020 Revision: FINAL_D1 Valid for: Assmang Cato Ridge, KwaZulu-Natal Province
Page 30 of 317
FINAL_D1 Compiled By: JG Potgieter
Approved By: JG Potgieter COPYRIGHT WARNING ALL RIGHTS RESERVED. All information and conceptual designs contained within this document are the intellectual property of ENVIRONGAKA (Pty) Ltd. This document and/or the information contained herein may not be used, stored, reproduced, or copied in any manner, without the prior written consent of ENVIRONGAKA (Pty) Ltd. This document and/or the information and conceptual designs may not be disclosed or displayed to any third party without the prior written consent of ENVIRONGAKA (Pty) Ltd.
EnviroNgaka
2.2 Scenario 1: Baseline Conditions Impact assessment is done per the emissions of all relevant pollutants at expected/actual concentrations against actual baseline production capacity (achievable emissions and does not imply AEL emission limits); and includes no modifications or improvements made to the current process / additional abatement of secondary fugitive emissions from the furnaces. The production of the aforementioned products is achieved by means of the following unit processes: Tippler 1 and Tippler 2 The majority of the raw materials enter the site by train. The rail cars are tipped into a sump at the Tipplers. From there it is conveyed and stockpiled for later use. Batching South Plant (Furnace 1, 2, 3 and 4) Raw material is loaded into 24-hour bunkers via an ore bridge. From there the raw material is transported via vibrators and conveyors to be weighed then dispatched to the furnace 8-hour bins. Batching North Plant (Furnace 5 and 6) Raw material is loaded into 24-hour bunkers by means of an overhead “spacer car”. It is then conveyed to a weigh flask and fed to the furnace feed bins. Furnace 8-hr bins These are positioned above each furnace, and act as a surge capacity for feed to the furnace. Briquetting plant Dry dust from the furnaces and converter baghouses is stockpiled along with dried sludge and metal recovery plant middlings. It is then combined and mixed with a binding agent through a wet process in order to be formed into briquettes. The briquettes are stockpiled for reprocessing in the furnaces. The briquetting plant is equipped with a stack (point source). Furnaces The company has six furnaces in total. Three furnaces are semi-closed electric arc furnaces (Furnace 1, 2 and 5) and the other three are closed electric arc furnaces (Furnaces 3, 4 and 6). These furnaces are continually filled with raw material in order to keep the electrodes submerged. An arc is continually struck between the electrodes and the furnace hearth in order to provide the heat required to melt the raw materials. The carbon in the raw materials, in combination with the heat, allows the furnace to produce a molten high carbon ferro-manganese (HC FeMn). The by-product from the electric furnaces is slag. Other discharges are fumes and gas that are processed through the gas plant. Furnaces 3 and 4 have been excluded from this study since it is not foreseen for them to be operational in future. HC metal (high carbon) is cast into moulds consisting of metal fines. This molten metal solidifies, and it is then removed via a crane and loaded onto a tractor and transported to a concrete pad at the HC crushing and screening plant (HC C&S plant).
Assmang Limited Cato Ridge Alloys (Pty) Ltd. 2020 AQIA for Sinter Plant EIA
Atmospheric Impact Report / Air Quality Impact Assessment
Document ID: AssmangCRW-AQIAReport_2020-PlannedSinterPlant_Sep2020_FD1.docx
Revision Date: 18Sep2020 Revision: FINAL_D1 Valid for: Assmang Cato Ridge, KwaZulu-Natal Province
Page 31 of 317
FINAL_D1 Compiled By: JG Potgieter
Approved By: JG Potgieter COPYRIGHT WARNING ALL RIGHTS RESERVED. All information and conceptual designs contained within this document are the intellectual property of ENVIRONGAKA (Pty) Ltd. This document and/or the information contained herein may not be used, stored, reproduced, or copied in any manner, without the prior written consent of ENVIRONGAKA (Pty) Ltd. This document and/or the information and conceptual designs may not be disclosed or displayed to any third party without the prior written consent of ENVIRONGAKA (Pty) Ltd.
EnviroNgaka
HC C&S plant The metal cools further on the concrete pad, and when it is sufficiently cooled, it is crushed and screened in order to be separated into various size fractions. The different fractions are collected with a tractor and taken to their respective stockpiles. From the stockpiles, the product is weighed and trucked or railed out to the clients. Converter operation (CRA plant) This section allows the company to produce a medium and low carbon FeMn (MC & LC FeMn) product from the HC FeMn produced in the furnaces. The MC & LC FeMn metal is cast into moulds consisting of metal fines. The Molten metal solidifies, and is removed via a crane from where it is transported to a 10-tonne bay floor to be crushed. Refined (Low Carbon) C&S plant The MC & LC FeMn metal further cools on the concrete pad, and when it is sufficiently cooled, it is crushed and screened in order to be separated into various size fractions. The different fractions are collected with a tractor and taken to their respective stockpiles. From the stockpiles, the product is weighed and trucked or railed out to the clients. Slag Movement Slag is currently removed from plant via a locomotive and tipped into "slag ponds". It is recovered from the ponds with an excavator and then stored at the slag storage facility. Metal Recovery Plant (MRP) The slag from the slag storage facility is taken to the metal recovery plant (MRP). Here the slag is crushed in order to mechanically separate the remaining metal from the slag. The MRP is a wet process without the application of heat to recover metal. The metal is brought back into the plant where it is stockpiled to await export. The remainder of the processed slag is sold. Gas Plants The type of gas plant varies with each furnace type. The semi-closed furnaces (Furnaces 1, 2 and 5) each have a baghouse. A Baghouse has compartments that are filled with bags with a fine weave. The dust and fumes from the furnace enter the baghouse, are sucked though the bags. This results in cleaned gas leaving the baghouse while the dust remains in the bags. Two of the three baghouse are closed (Furnace 1 and 2), with the cleaned gas being emitted through individual stacks. The Furnace 5 baghouse is an open baghouse with no stack. Dust from the baghouse are removed via a tractor and taken to an onsite blocking plant. The Closed furnaces (Furnaces 3, 4 and 6) each have a gas scrubbing plant. Water, in a closed circuit, is used to wash the dust out of the off-gas. The clean gas exits each of the gas plants via a stack where it is flared. The effluent (sludge) from the scrubbing plants is pumped to the effluent treatment plant. The converter (ACP plant) also has a closed baghouse and a stack. Effluent treatment plant The effluent (sludge) from the closed furnace gas plants enter a thickener where the sludge is thickened. The clear water overflow of the thickener is returned to the gas plants. The thickened sludge is pumped to slimes dams where sludge settles and the clear water overflow is returned to filter plant. The sludge in the dams dries out and is later used in the blocking plant.

Assmang Limited Cato Ridge Alloys (Pty) Ltd. 2020 AQIA for Sinter Plant EIA
Atmospheric Impact Report / Air Quality Impact Assessment
Document ID: AssmangCRW-AQIAReport_2020-PlannedSinterPlant_Sep2020_FD1.docx
Revision Date: 18Sep2020 Revision: FINAL_D1 Valid for: Assmang Cato Ridge, KwaZulu-Natal Province
Page 32 of 317
FINAL_D1 Compiled By: JG Potgieter
Approved By: JG Potgieter COPYRIGHT WARNING ALL RIGHTS RESERVED. All information and conceptual designs contained within this document are the intellectual property of ENVIRONGAKA (Pty) Ltd. This document and/or the information contained herein may not be used, stored, reproduced, or copied in any manner, without the prior written consent of ENVIRONGAKA (Pty) Ltd. This document and/or the information and conceptual designs may not be disclosed or displayed to any third party without the prior written consent of ENVIRONGAKA (Pty) Ltd.
EnviroNgaka
Dust and fume extraction systems In accordance with the authorisation received from the Department of Agriculture, Environmental Affairs and Rural Development of KwaZulu-Natal, dated 12 September 2008 for these systems, dust and fume capturing and treatment systems are installed for the following sections:
• Installed: At the Furnace tapping fumes, and • At the High Carbon (HC) & Low Carbon (LC) Crushing and Screening (C&S) Plants
Furnace tapping fume treatment system A dust and fume extraction system was installed at the tap holes, launder and ladle for Furnaces No. 1 – 6. The system assists with reducing the emissions inside the furnace buildings. It also assists with limiting exposure of personnel to manganese containing dust and fumes. The extraction systems contain dust and fume canopy hoods for the tap holes, launders and ladle for all six furnaces. Furnaces No. 1 - 4 have a common ducting that joins with the common ducting for Furnaces No. 5 - 6 prior to entering a baghouse. Cleaned air from the baghouse is emitted through a stack next to the baghouse. Dust extraction and suppression systems at the Crushing and Screening Plants Dust alleviation systems are located at the following sections:
• the High Carbon Ferromanganese Crushing and Screening Plant (HC C&S); and • the Low Carbon Ferromanganese Crushing and Screening Plant (LC C&S) located at the CRA Plant
High Carbon Ferromanganese Crushing and Screening Plant (HC C&S) The dust extraction system for the HC C&S Plant is as follows:
• At the static grizzly / feed bin area: - Access for the front-end loader to load cooled ingots onto the static grizzly is limited to the southern
side only; - Water sprays are installed at the eastern and western walls of the static grizzly building; and - The tunnel underneath the static grizzly housing with the feed conveyor is enclosed with an industrial
strip curtain. • At the following areas all the components are enclosed and dust extraction systems installed:
- At the primary crusher area: the vibrating grizzly and primary crusher - The primary screening and secondary crusher area: - The secondary and tertiary screening area: - The final product bin
• The load-out points from the vibrating feeders at the final product section are equipped with dust suppression.
Low Carbon Ferromanganese Crushing and Screening Plant The dust extraction system for the LC C&S Plant is as follows: • The load in and load out stations will be equipped with dust suppression; • At the following areas all the components are enclosed and dust extraction systems installed:
- At the primary crusher area: the vibrating grizzly feeding into the primary crusher, it’s outlet chute and the primary crusher inlet and discharge;
Assmang Limited Cato Ridge Alloys (Pty) Ltd. 2020 AQIA for Sinter Plant EIA
Atmospheric Impact Report / Air Quality Impact Assessment
Document ID: AssmangCRW-AQIAReport_2020-PlannedSinterPlant_Sep2020_FD1.docx
Revision Date: 18Sep2020 Revision: FINAL_D1 Valid for: Assmang Cato Ridge, KwaZulu-Natal Province
Page 33 of 317
FINAL_D1 Compiled By: JG Potgieter
Approved By: JG Potgieter COPYRIGHT WARNING ALL RIGHTS RESERVED. All information and conceptual designs contained within this document are the intellectual property of ENVIRONGAKA (Pty) Ltd. This document and/or the information contained herein may not be used, stored, reproduced, or copied in any manner, without the prior written consent of ENVIRONGAKA (Pty) Ltd. This document and/or the information and conceptual designs may not be disclosed or displayed to any third party without the prior written consent of ENVIRONGAKA (Pty) Ltd.
EnviroNgaka
- The primary screen and the conveyor feeding it; - At the secondary crusher area: the conveyors feeding over-size material back to the secondary crusher, the
secondary crusher itself, and its discharge; - At the product screening and bin area: the conveyor feeding into the secondary screen, and the secondary
and tertiary screens. Each section is serviced by a baghouse which emits the cleaned air to the atmosphere via a stack. Export ore stockpile Assmang Manganese Cato Ridge Works is used as an intermediate storage location for export ore from other Assmang mining operations. The ore are delivered to the Site of Works by train, and dispatched to the Durban Harbour by road, or alternatively by rail. The new infrastructure installed at the Site of Works is as follows:
• Export ore are received via rail transport at Tippler 1 (which will be upgraded to facilitate a higher throughput) and from there they are conveyed and stockpiled;
• The conveyor system to the Export ore stockpile includes a Road Receiving section which ties in with the conveyor system to the storage area;
• The export ore received by road or rail, are conveyed to a Screening section where fines are recovered before it is conveyed to the storage area. The fines recovered from the export ore are stored in bins for use as raw material in the furnaces at the Site of Works;
• The export ore are stored on two conical shaped stockpiles with a capacity of 40 000 tonnes each; • The export ore are reclaimed from the stockpiles by frontend loaders which deposit the ore into one of
three frontend loader reclaim hoppers located next to the stockpile area and are conveyed to one of two dispatching areas;
• The export ore are conveyed to storage bins at either a Road load-out section or a Rail load-out section, depending on the transport method;
Dust suppression is assisted as follows:
• Road receiving - Reverse and Side tipping trucks dump ore on an enclosed grizzly; • Conveyor transfer towers – are enclosed chute transfer systems, but are 100% dust tight; • Conical stockpile – Screened ore are deposited by an open spiral chute; • Frontend loader reclaim hopper – Material is dumped at the machine’s dump height into the reclaim
hoppers; • Road Load-out – A shuttle conveyor fills the trucks with ore from the storage bins; • Rail load-out – A shuttle conveyor fills the rail trucks with ore from the storage bins;
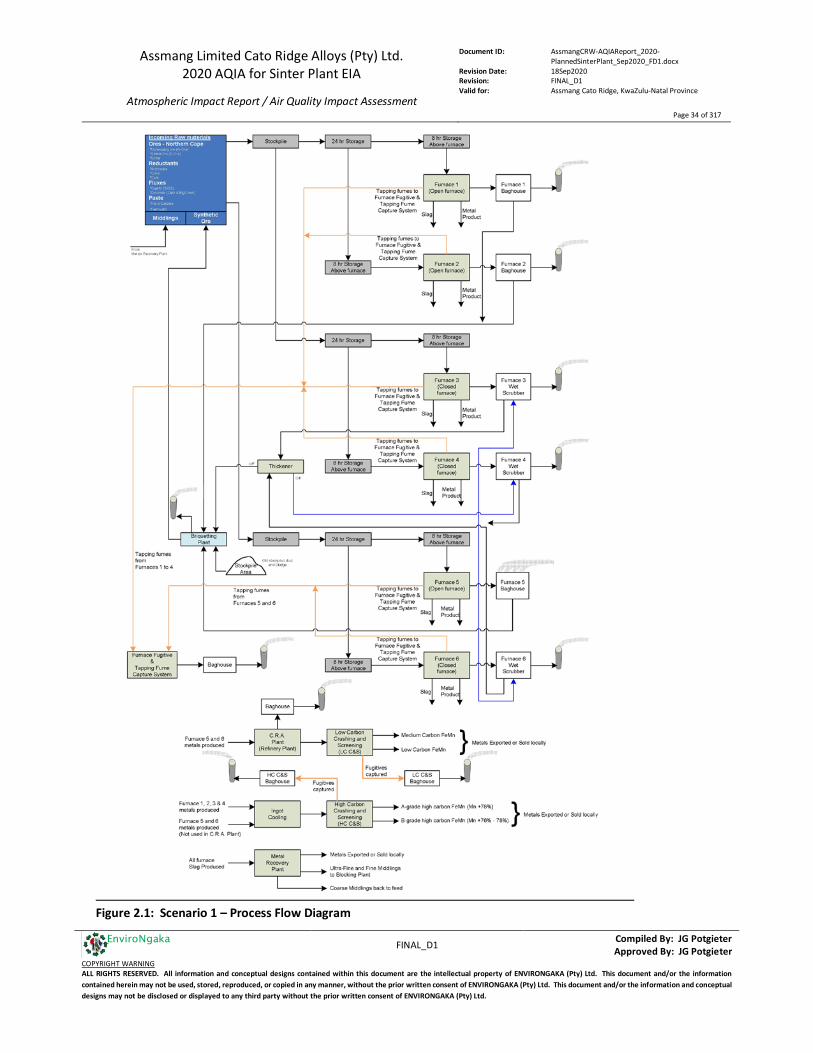
Assmang Limited Cato Ridge Alloys (Pty) Ltd. 2020 AQIA for Sinter Plant EIA
Atmospheric Impact Report / Air Quality Impact Assessment
Document ID: AssmangCRW-AQIAReport_2020-PlannedSinterPlant_Sep2020_FD1.docx
Revision Date: 18Sep2020 Revision: FINAL_D1 Valid for: Assmang Cato Ridge, KwaZulu-Natal Province
Page 34 of 317
FINAL_D1 Compiled By: JG Potgieter
Approved By: JG Potgieter COPYRIGHT WARNING ALL RIGHTS RESERVED. All information and conceptual designs contained within this document are the intellectual property of ENVIRONGAKA (Pty) Ltd. This document and/or the information contained herein may not be used, stored, reproduced, or copied in any manner, without the prior written consent of ENVIRONGAKA (Pty) Ltd. This document and/or the information and conceptual designs may not be disclosed or displayed to any third party without the prior written consent of ENVIRONGAKA (Pty) Ltd.
EnviroNgaka
Figure 2.1: Scenario 1 – Process Flow Diagram
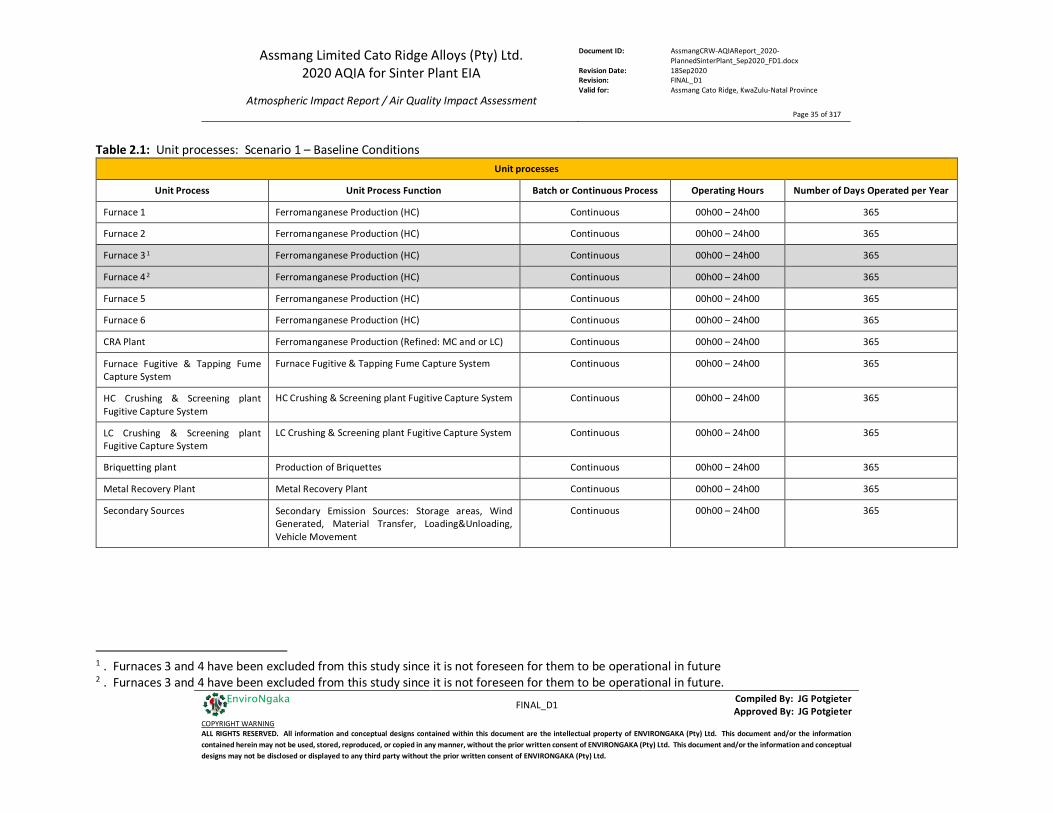
Assmang Limited Cato Ridge Alloys (Pty) Ltd. 2020 AQIA for Sinter Plant EIA
Atmospheric Impact Report / Air Quality Impact Assessment
Document ID: AssmangCRW-AQIAReport_2020-PlannedSinterPlant_Sep2020_FD1.docx
Revision Date: 18Sep2020 Revision: FINAL_D1 Valid for: Assmang Cato Ridge, KwaZulu-Natal Province
Page 35 of 317
FINAL_D1 Compiled By: JG Potgieter
Approved By: JG Potgieter COPYRIGHT WARNING ALL RIGHTS RESERVED. All information and conceptual designs contained within this document are the intellectual property of ENVIRONGAKA (Pty) Ltd. This document and/or the information contained herein may not be used, stored, reproduced, or copied in any manner, without the prior written consent of ENVIRONGAKA (Pty) Ltd. This document and/or the information and conceptual designs may not be disclosed or displayed to any third party without the prior written consent of ENVIRONGAKA (Pty) Ltd.
EnviroNgaka
Table 2.1: Unit processes: Scenario 1 – Baseline Conditions
Unit processes
Unit Process Unit Process Function Batch or Continuous Process Operating Hours Number of Days Operated per Year
Furnace 1 Ferromanganese Production (HC) Continuous 00h00 – 24h00 365
Furnace 2 Ferromanganese Production (HC) Continuous 00h00 – 24h00 365
Furnace 3 1 Ferromanganese Production (HC) Continuous 00h00 – 24h00 365
Furnace 4 2 Ferromanganese Production (HC) Continuous 00h00 – 24h00 365
Furnace 5 Ferromanganese Production (HC) Continuous 00h00 – 24h00 365
Furnace 6 Ferromanganese Production (HC) Continuous 00h00 – 24h00 365
CRA Plant Ferromanganese Production (Refined: MC and or LC) Continuous 00h00 – 24h00 365
Furnace Fugitive & Tapping Fume Capture System
Furnace Fugitive & Tapping Fume Capture System Continuous 00h00 – 24h00 365
HC Crushing & Screening plant Fugitive Capture System
HC Crushing & Screening plant Fugitive Capture System Continuous 00h00 – 24h00 365
LC Crushing & Screening plant Fugitive Capture System
LC Crushing & Screening plant Fugitive Capture System Continuous 00h00 – 24h00 365
Briquetting plant Production of Briquettes Continuous 00h00 – 24h00 365
Metal Recovery Plant Metal Recovery Plant Continuous 00h00 – 24h00 365
Secondary Sources Secondary Emission Sources: Storage areas, Wind Generated, Material Transfer, Loading&Unloading, Vehicle Movement
Continuous 00h00 – 24h00 365
1 . Furnaces 3 and 4 have been excluded from this study since it is not foreseen for them to be operational in future 2 . Furnaces 3 and 4 have been excluded from this study since it is not foreseen for them to be operational in future.
Assmang Limited Cato Ridge Alloys (Pty) Ltd. 2020 AQIA for Sinter Plant EIA
Atmospheric Impact Report / Air Quality Impact Assessment
Document ID: AssmangCRW-AQIAReport_2020-PlannedSinterPlant_Sep2020_FD1.docx
Revision Date: 18Sep2020 Revision: FINAL_D1 Valid for: Assmang Cato Ridge, KwaZulu-Natal Province
Page 36 of 317
FINAL_D1 Compiled By: JG Potgieter
Approved By: JG Potgieter COPYRIGHT WARNING ALL RIGHTS RESERVED. All information and conceptual designs contained within this document are the intellectual property of ENVIRONGAKA (Pty) Ltd. This document and/or the information contained herein may not be used, stored, reproduced, or copied in any manner, without the prior written consent of ENVIRONGAKA (Pty) Ltd. This document and/or the information and conceptual designs may not be disclosed or displayed to any third party without the prior written consent of ENVIRONGAKA (Pty) Ltd.
EnviroNgaka
2.3 Scenario 2: Future Conditions Impact assessment is done per the emissions of all relevant pollutants at expected concentrations against full production capacity (achievable emissions and does not imply AEL emission limits); and includes an additional proposed Sinter Plant (Subcategory 4.5 of the Listed Activities in terms of Section 21 of NEM:AQA) to produce pellets from raw material as feed to the furnaces, with no modifications or improvements made to the current process / additional abatement of secondary fugitive emissions from the furnaces. The production of the aforementioned products is achieved by means of the following unit processes: Tippler 1 and Tippler 2 The majority of the raw materials enter the site by train. The rail cars are tipped into a sump at the Tipplers. From there it is conveyed and stockpiled for later use. Batching South Plant (Furnace 1, 2, 3 and 4) Raw material is loaded into 24-hour bunkers via an ore bridge. From there the raw material is transported via vibrators and conveyors to be weighed then dispatched to the furnace 8-hour bins. Batching North Plant (Furnace 5 and 6) Raw material is loaded into 24-hour bunkers by means of an overhead “spacer car”. It is then conveyed to a weigh flask and fed to the furnace feed bins. Furnace 8-hr bins These are positioned above each furnace, and act as a surge capacity for feed to the furnace. Briquetting plant Dry dust from the furnaces and converter baghouses is stockpiled along with dried sludge and metal recovery plant middlings. It is then combined and mixed with a binding agent through a wet process in order to be formed into briquettes. The briquettes are stockpiled for reprocessing in the furnaces. The briquetting plant is equipped with a stack (point source). Furnaces The company has six furnaces in total. Three furnaces are semi-closed electric arc furnaces (Furnace 1, 2 and 5) and the other three are closed electric arc furnaces (Furnaces 3, 4 and 6). These furnaces are continually filled with raw material in order to keep the electrodes submerged. An arc is continually struck between the electrodes and the furnace hearth in order to provide the heat required to melt the raw materials. The carbon in the raw materials, in combination with the heat, allows the furnace to produce a molten high carbon ferro-manganese (HC FeMn). The by-product from the electric furnaces is slag. Other discharges are fumes and gas that are processed through the gas plant. . Furnaces 3 and 4 have been excluded from this study since it is not foreseen for them to be operational in future. HC metal (high carbon) is cast into moulds consisting of metal fines. This molten metal solidifies, and it is then removed via a crane and loaded onto a tractor and transported to a concrete pad at the HC crushing and screening plant (HC C&S plant).
Assmang Limited Cato Ridge Alloys (Pty) Ltd. 2020 AQIA for Sinter Plant EIA
Atmospheric Impact Report / Air Quality Impact Assessment
Document ID: AssmangCRW-AQIAReport_2020-PlannedSinterPlant_Sep2020_FD1.docx
Revision Date: 18Sep2020 Revision: FINAL_D1 Valid for: Assmang Cato Ridge, KwaZulu-Natal Province
Page 37 of 317
FINAL_D1 Compiled By: JG Potgieter
Approved By: JG Potgieter COPYRIGHT WARNING ALL RIGHTS RESERVED. All information and conceptual designs contained within this document are the intellectual property of ENVIRONGAKA (Pty) Ltd. This document and/or the information contained herein may not be used, stored, reproduced, or copied in any manner, without the prior written consent of ENVIRONGAKA (Pty) Ltd. This document and/or the information and conceptual designs may not be disclosed or displayed to any third party without the prior written consent of ENVIRONGAKA (Pty) Ltd.
EnviroNgaka
HC C&S plant The metal cools further on the concrete pad, and when it is sufficiently cooled, it is crushed and screened in order to be separated into various size fractions. The different fractions are collected with a tractor and taken to their respective stockpiles. From the stockpiles, the product is weighed and trucked or railed out to the clients. Converter operation (CRA plant) This section allows the company to produce a medium and low carbon FeMn (MC & LC FeMn) product from the HC FeMn produced in the furnaces. The MC & LC FeMn metal is cast into moulds consisting of metal fines. The Molten metal solidifies, and is removed via a crane from where it is transported to a 10-tonne bay floor to be crushed. Refined (Low Carbon) C&S plant The MC & LC FeMn metal further cools on the concrete pad, and when it is sufficiently cooled, it is crushed and screened in order to be separated into various size fractions. The different fractions are collected with a tractor and taken to their respective stockpiles. From the stockpiles, the product is weighed and trucked or railed out to the clients. Slag Movement Slag is currently removed from plant via a locomotive and tipped into "slag ponds". It is recovered from the ponds with an excavator and then stored at the slag storage facility. Metal Recovery Plant (MRP) The slag from the slag storage facility is taken to the metal recovery plant (MRP). Here the slag is crushed in order to mechanically separate the remaining metal from the slag. The MRP is a wet process without the application of heat to recover metal. The metal is brought back into the plant where it is stockpiled to await export. The remainder of the processed slag is sold. Gas Plants The type of gas plant varies with each furnace type. The semi-closed furnaces (Furnaces 1, 2 and 5) each have a baghouse. A Baghouse has compartments that are filled with bags with a fine weave. The dust and fumes from the furnace enter the baghouse, are sucked though the bags. This results in cleaned gas leaving the baghouse while the dust remains in the bags. Two of the three baghouse are closed (Furnace 1 and 2), with the cleaned gas being emitted through individual stacks. The Furnace 5 baghouse is an open baghouse with no stack. Dust from the baghouse are removed via a tractor and taken to an onsite blocking plant. The Closed furnaces (Furnaces 3, 4 and 6) each have a gas scrubbing plant. Water, in a closed circuit, is used to wash the dust out of the off-gas. The clean gas exits each of the gas plants via a stack where it is flared. The effluent (sludge) from the scrubbing plants is pumped to the effluent treatment plant. The converter (ACP plant) also has a closed baghouse and a stack. Effluent treatment plant The effluent (sludge) from the closed furnace gas plants enter a thickener where the sludge is thickened. The clear water overflow of the thickener is returned to the gas plants. The thickened sludge is pumped to slimes dams where sludge settles and the clear water overflow is returned to filter plant. The sludge in the dams dries out and is later used in the blocking plant.
Assmang Limited Cato Ridge Alloys (Pty) Ltd. 2020 AQIA for Sinter Plant EIA
Atmospheric Impact Report / Air Quality Impact Assessment
Document ID: AssmangCRW-AQIAReport_2020-PlannedSinterPlant_Sep2020_FD1.docx
Revision Date: 18Sep2020 Revision: FINAL_D1 Valid for: Assmang Cato Ridge, KwaZulu-Natal Province
Page 38 of 317
FINAL_D1 Compiled By: JG Potgieter
Approved By: JG Potgieter COPYRIGHT WARNING ALL RIGHTS RESERVED. All information and conceptual designs contained within this document are the intellectual property of ENVIRONGAKA (Pty) Ltd. This document and/or the information contained herein may not be used, stored, reproduced, or copied in any manner, without the prior written consent of ENVIRONGAKA (Pty) Ltd. This document and/or the information and conceptual designs may not be disclosed or displayed to any third party without the prior written consent of ENVIRONGAKA (Pty) Ltd.
EnviroNgaka
Dust and fume extraction systems In accordance with the authorisation received from the Department of Agriculture, Environmental Affairs and Rural Development of KwaZulu-Natal, dated 12 September 2008 for these systems, dust and fume capturing and treatment systems are installed for the following sections:
• Installed: At the Furnace tapping fumes, and • At the High Carbon (HC) & Low Carbon (LC) Crushing and Screening (C&S) Plants
Furnace tapping fume treatment system A dust and fume extraction system was installed at the tap holes, launder and ladle for Furnaces No. 1 – 6. The system assists with reducing the emissions inside the furnace buildings. It also assists with limiting exposure of personnel to manganese containing dust and fumes. The extraction systems contain dust and fume canopy hoods for the tap holes, launders and ladle for all six furnaces. Furnaces No. 1 - 4 have a common ducting that joins with the common ducting for Furnaces No. 5 - 6 prior to entering a baghouse. Cleaned air from the baghouse is emitted through a stack next to the baghouse. Dust extraction and suppression systems at the Crushing and Screening Plants Dust alleviation systems are located at the following sections:
• the High Carbon Ferromanganese Crushing and Screening Plant (HC C&S); and • the Low Carbon Ferromanganese Crushing and Screening Plant (LC C&S) located at the CRA Plant
High Carbon Ferromanganese Crushing and Screening Plant (HC C&S) The dust extraction system for the HC C&S Plant is as follows:
• At the static grizzly / feed bin area: - Access for the front-end loader to load cooled ingots onto the static grizzly is limited to the southern
side only; - Water sprays are installed at the eastern and western walls of the static grizzly building; and - The tunnel underneath the static grizzly housing with the feed conveyor is enclosed with an industrial
strip curtain. • At the following areas all the components are enclosed and dust extraction systems installed:
- At the primary crusher area: the vibrating grizzly and primary crusher - The primary screening and secondary crusher area: - The secondary and tertiary screening area: - The final product bin
• The load-out points from the vibrating feeders at the final product section are equipped with dust suppression.
Low Carbon Ferromanganese Crushing and Screening Plant The dust extraction system for the LC C&S Plant is as follows: • The load in and load out stations will be equipped with dust suppression; • At the following areas all the components are enclosed and dust extraction systems installed:

Assmang Limited Cato Ridge Alloys (Pty) Ltd. 2020 AQIA for Sinter Plant EIA
Atmospheric Impact Report / Air Quality Impact Assessment
Document ID: AssmangCRW-AQIAReport_2020-PlannedSinterPlant_Sep2020_FD1.docx
Revision Date: 18Sep2020 Revision: FINAL_D1 Valid for: Assmang Cato Ridge, KwaZulu-Natal Province
Page 39 of 317
FINAL_D1 Compiled By: JG Potgieter
Approved By: JG Potgieter COPYRIGHT WARNING ALL RIGHTS RESERVED. All information and conceptual designs contained within this document are the intellectual property of ENVIRONGAKA (Pty) Ltd. This document and/or the information contained herein may not be used, stored, reproduced, or copied in any manner, without the prior written consent of ENVIRONGAKA (Pty) Ltd. This document and/or the information and conceptual designs may not be disclosed or displayed to any third party without the prior written consent of ENVIRONGAKA (Pty) Ltd.
EnviroNgaka
- At the primary crusher area: the vibrating grizzly feeding into the primary crusher, it’s outlet chute and the primary crusher inlet and discharge;
- The primary screen and the conveyor feeding it; - At the secondary crusher area: the conveyors feeding over-size material back to the secondary crusher, the
secondary crusher itself, and its discharge; - At the product screening and bin area: the conveyor feeding into the secondary screen, and the secondary
and tertiary screens. Each section is serviced by a baghouse which emits the cleaned air to the atmosphere via a stack. Export ore stockpile Assmang Manganese Cato Ridge Works is used as an intermediate storage location for export ore from other Assmang mining operations. The ore are delivered to the Site of Works by train, and dispatched to the Durban Harbour by road, or alternatively by rail. The new infrastructure installed at the Site of Works is as follows:
• Export ore are received via rail transport at Tippler 1 (which will be upgraded to facilitate a higher throughput) and from there they are conveyed and stockpiled;
• The conveyor system to the Export ore stockpile includes a Road Receiving section which ties in with the conveyor system to the storage area;
• The export ore received by road or rail, are conveyed to a Screening section where fines are recovered before it is conveyed to the storage area. The fines recovered from the export ore are stored in bins for use as raw material in the furnaces at the Site of Works;
• The export ore are stored on two conical shaped stockpiles with a capacity of 40 000 tonnes each; • The export ore are reclaimed from the stockpiles by frontend loaders which deposit the ore into one of
three frontend loader reclaim hoppers located next to the stockpile area and are conveyed to one of two dispatching areas;
• The export ore are conveyed to storage bins at either a Road load-out section or a Rail load-out section, depending on the transport method;
Dust suppression is assisted as follows:
• Road receiving - Reverse and Side tipping trucks dump ore on an enclosed grizzly; • Conveyor transfer towers – are enclosed chute transfer systems, but are 100% dust tight; • Conical stockpile – Screened ore are deposited by an open spiral chute; • Frontend loader reclaim hopper – Material is dumped at the machine’s dump height into the reclaim
hoppers; • Road Load-out – A shuttle conveyor fills the trucks with ore from the storage bins; • Rail load-out – A shuttle conveyor fills the rail trucks with ore from the storage bins;
Proposed additional Sinter Plant It is intended to install a Traxys Brix (Pty) Ltd. Sinter Plant based on a proprietary Vessel-Sinter Technology at ACRW. The proposed additional sinter plant will produce 120000 tonne/annum of sintered raw material to serve as raw material for the furnaces. The plant does not require binders and will include a Proportioning System to mix raw materials according to pre-determined mixing recipes, which will be conveyed to, and stored in a mixture silo. The material is then conveyed to and passed through a pelletising disc into a buffer silo. The material is then sintered.

Assmang Limited Cato Ridge Alloys (Pty) Ltd. 2020 AQIA for Sinter Plant EIA
Atmospheric Impact Report / Air Quality Impact Assessment
Document ID: AssmangCRW-AQIAReport_2020-PlannedSinterPlant_Sep2020_FD1.docx
Revision Date: 18Sep2020 Revision: FINAL_D1 Valid for: Assmang Cato Ridge, KwaZulu-Natal Province
Page 40 of 317
FINAL_D1 Compiled By: JG Potgieter
Approved By: JG Potgieter COPYRIGHT WARNING ALL RIGHTS RESERVED. All information and conceptual designs contained within this document are the intellectual property of ENVIRONGAKA (Pty) Ltd. This document and/or the information contained herein may not be used, stored, reproduced, or copied in any manner, without the prior written consent of ENVIRONGAKA (Pty) Ltd. This document and/or the information and conceptual designs may not be disclosed or displayed to any third party without the prior written consent of ENVIRONGAKA (Pty) Ltd.
EnviroNgaka
Charcoal will be used as energy source for the sintering process. Hot sintered material is cooled in a cooling building which is also connected to air pollution control equipment in order to abate fumes emanated during the cooling process. Cooled material is then crushed and screened to specification. Sized Sinter are conveyed to the sinter silo from where it is transferred as feed for the furnaces. Emissions generated from the sintering process are captured and directed to air pollution control equipment. Emissions generated at the proportioning system, sintering process (including the off-gas from the charcoal utilised as energy source), the cooling building and the crushing and screening captured and directed to air pollution control equipment, which includes baghouses and a wet scrubber.
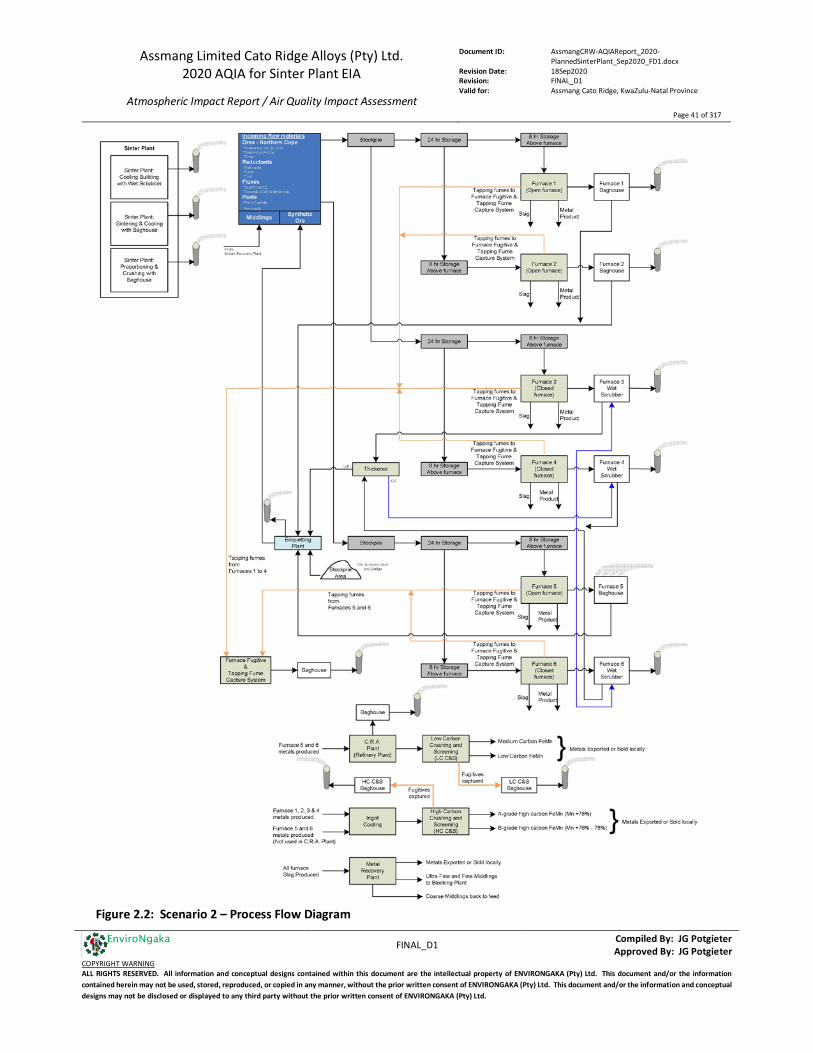
Assmang Limited Cato Ridge Alloys (Pty) Ltd. 2020 AQIA for Sinter Plant EIA
Atmospheric Impact Report / Air Quality Impact Assessment
Document ID: AssmangCRW-AQIAReport_2020-PlannedSinterPlant_Sep2020_FD1.docx
Revision Date: 18Sep2020 Revision: FINAL_D1 Valid for: Assmang Cato Ridge, KwaZulu-Natal Province
Page 41 of 317
FINAL_D1 Compiled By: JG Potgieter
Approved By: JG Potgieter COPYRIGHT WARNING ALL RIGHTS RESERVED. All information and conceptual designs contained within this document are the intellectual property of ENVIRONGAKA (Pty) Ltd. This document and/or the information contained herein may not be used, stored, reproduced, or copied in any manner, without the prior written consent of ENVIRONGAKA (Pty) Ltd. This document and/or the information and conceptual designs may not be disclosed or displayed to any third party without the prior written consent of ENVIRONGAKA (Pty) Ltd.
EnviroNgaka
Figure 2.2: Scenario 2 – Process Flow Diagram

Assmang Limited Cato Ridge Alloys (Pty) Ltd. 2020 AQIA for Sinter Plant EIA
Atmospheric Impact Report / Air Quality Impact Assessment
Document ID: AssmangCRW-AQIAReport_2020-PlannedSinterPlant_Sep2020_FD1.docx
Revision Date: 18Sep2020 Revision: FINAL_D1 Valid for: Assmang Cato Ridge, KwaZulu-Natal Province
Page 42 of 317
FINAL_D1 Compiled By: JG Potgieter
Approved By: JG Potgieter COPYRIGHT WARNING ALL RIGHTS RESERVED. All information and conceptual designs contained within this document are the intellectual property of ENVIRONGAKA (Pty) Ltd. This document and/or the information contained herein may not be used, stored, reproduced, or copied in any manner, without the prior written consent of ENVIRONGAKA (Pty) Ltd. This document and/or the information and conceptual designs may not be disclosed or displayed to any third party without the prior written consent of ENVIRONGAKA (Pty) Ltd.
EnviroNgaka
Table 2.2: Unit processes: Scenario 2 – Future Conditions
Unit processes
Unit Process Unit Process Function Batch or Continuous Process Operating Hours Number of Days Operated per Year
Furnace 1 Ferromanganese Production (HC) Continuous 00h00 – 24h00 365
Furnace 2 Ferromanganese Production (HC) Continuous 00h00 – 24h00 365
Furnace 3 3 Ferromanganese Production (HC) Continuous 00h00 – 24h00 365
Furnace 4 4 Ferromanganese Production (HC) Continuous 00h00 – 24h00 365
Furnace 5 Ferromanganese Production (HC) Continuous 00h00 – 24h00 365
Furnace 6 Ferromanganese Production (HC) Continuous 00h00 – 24h00 365
CRA Plant Ferromanganese Production (Refined: MC and or LC) Continuous 00h00 – 24h00 365
Furnace Fugitive & Tapping Fume Capture System
Furnace Fugitive & Tapping Fume Capture System Continuous 00h00 – 24h00 365
HC Crushing & Screening plant Fugitive Capture System
HC Crushing & Screening plant Fugitive Capture System Continuous 00h00 – 24h00 365
LC Crushing & Screening plant Fugitive Capture System
LC Crushing & Screening plant Fugitive Capture System Continuous 00h00 – 24h00 365
Briquetting plant Production of Briquettes Continuous 00h00 – 24h00 365
Metal Recovery Plant Metal Recovery Plant Continuous 00h00 – 24h00 365
Secondary Sources Secondary Emission Sources: Storage areas, Wind Generated, Material Transfer, Loading&Unloading, Vehicle Movement
Continuous 00h00 – 24h00 365
Sinter Plant Agglomeration of fine ore and sintering Continuous 00h00 – 24h00 365
3 . Furnaces 3 and 4 have been excluded from this study since it is not foreseen for them to be operational in future 4 . Furnaces 3 and 4 have been excluded from this study since it is not foreseen for them to be operational in future.
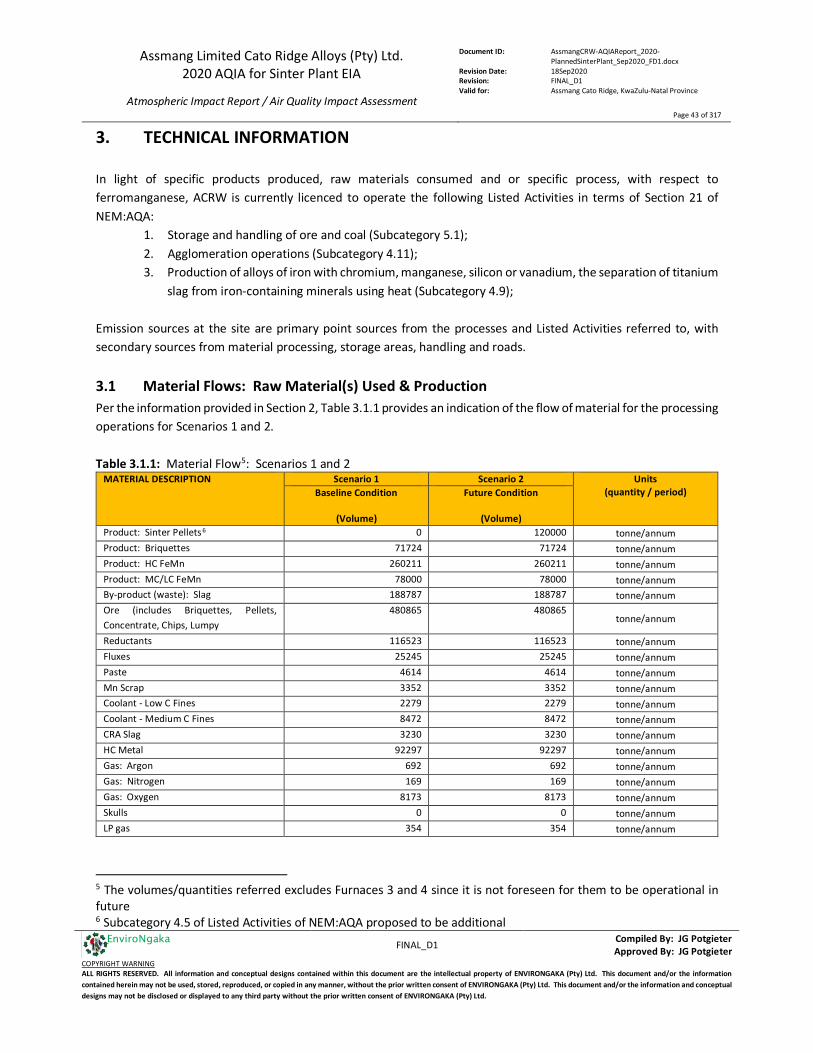
Assmang Limited Cato Ridge Alloys (Pty) Ltd. 2020 AQIA for Sinter Plant EIA
Atmospheric Impact Report / Air Quality Impact Assessment
Document ID: AssmangCRW-AQIAReport_2020-PlannedSinterPlant_Sep2020_FD1.docx
Revision Date: 18Sep2020 Revision: FINAL_D1 Valid for: Assmang Cato Ridge, KwaZulu-Natal Province
Page 43 of 317
FINAL_D1 Compiled By: JG Potgieter
Approved By: JG Potgieter COPYRIGHT WARNING ALL RIGHTS RESERVED. All information and conceptual designs contained within this document are the intellectual property of ENVIRONGAKA (Pty) Ltd. This document and/or the information contained herein may not be used, stored, reproduced, or copied in any manner, without the prior written consent of ENVIRONGAKA (Pty) Ltd. This document and/or the information and conceptual designs may not be disclosed or displayed to any third party without the prior written consent of ENVIRONGAKA (Pty) Ltd.
EnviroNgaka
3. TECHNICAL INFORMATION In light of specific products produced, raw materials consumed and or specific process, with respect to ferromanganese, ACRW is currently licenced to operate the following Listed Activities in terms of Section 21 of NEM:AQA:
1. Storage and handling of ore and coal (Subcategory 5.1); 2. Agglomeration operations (Subcategory 4.11); 3. Production of alloys of iron with chromium, manganese, silicon or vanadium, the separation of titanium
slag from iron-containing minerals using heat (Subcategory 4.9); Emission sources at the site are primary point sources from the processes and Listed Activities referred to, with secondary sources from material processing, storage areas, handling and roads. 3.1 Material Flows: Raw Material(s) Used & Production Per the information provided in Section 2, Table 3.1.1 provides an indication of the flow of material for the processing operations for Scenarios 1 and 2. Table 3.1.1: Material Flow5: Scenarios 1 and 2
MATERIAL DESCRIPTION Scenario 1 Scenario 2 Units (quantity / period) Baseline Condition
(Volume)
Future Condition
(Volume) Product: Sinter Pellets 6 0 120000 tonne/annum Product: Briquettes 71724 71724 tonne/annum Product: HC FeMn 260211 260211 tonne/annum Product: MC/LC FeMn 78000 78000 tonne/annum By-product (waste): Slag 188787 188787 tonne/annum Ore (includes Briquettes, Pellets, Concentrate, Chips, Lumpy
480865 480865 tonne/annum
Reductants 116523 116523 tonne/annum Fluxes 25245 25245 tonne/annum Paste 4614 4614 tonne/annum Mn Scrap 3352 3352 tonne/annum Coolant - Low C Fines 2279 2279 tonne/annum Coolant - Medium C Fines 8472 8472 tonne/annum CRA Slag 3230 3230 tonne/annum HC Metal 92297 92297 tonne/annum Gas: Argon 692 692 tonne/annum Gas: Nitrogen 169 169 tonne/annum Gas: Oxygen 8173 8173 tonne/annum Skulls 0 0 tonne/annum LP gas 354 354 tonne/annum
5 The volumes/quantities referred excludes Furnaces 3 and 4 since it is not foreseen for them to be operational in future 6 Subcategory 4.5 of Listed Activities of NEM:AQA proposed to be additional
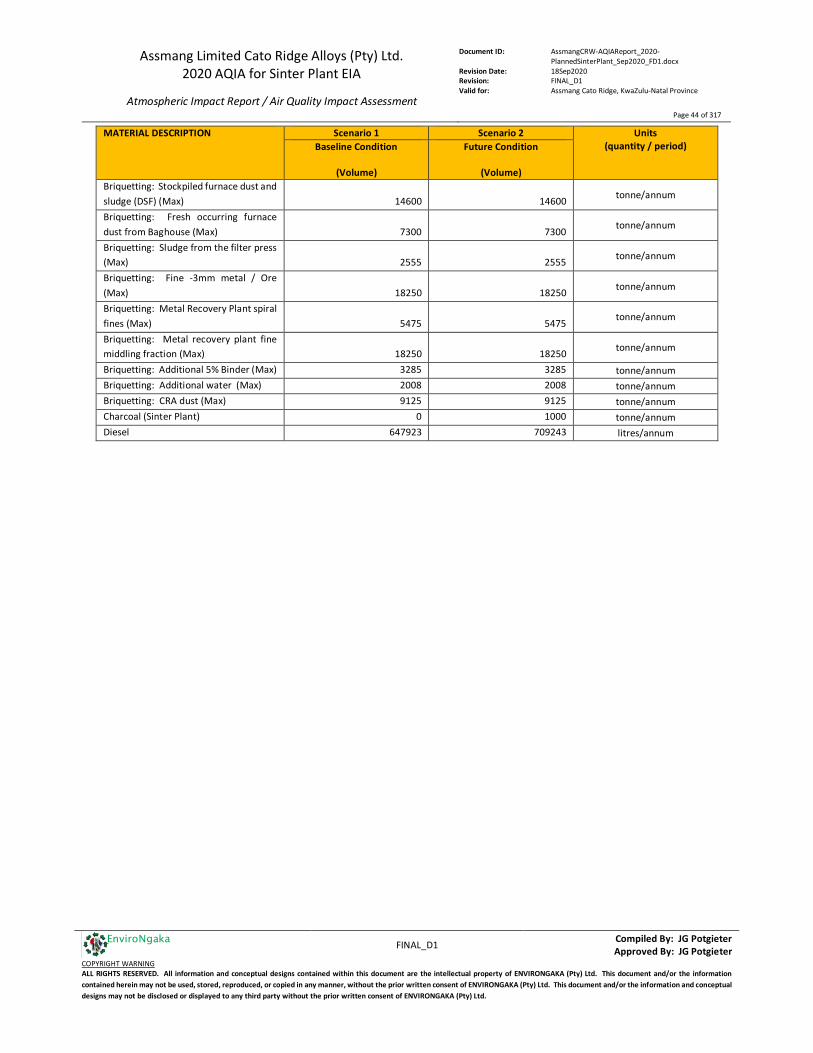
Assmang Limited Cato Ridge Alloys (Pty) Ltd. 2020 AQIA for Sinter Plant EIA
Atmospheric Impact Report / Air Quality Impact Assessment
Document ID: AssmangCRW-AQIAReport_2020-PlannedSinterPlant_Sep2020_FD1.docx
Revision Date: 18Sep2020 Revision: FINAL_D1 Valid for: Assmang Cato Ridge, KwaZulu-Natal Province
Page 44 of 317
FINAL_D1 Compiled By: JG Potgieter
Approved By: JG Potgieter COPYRIGHT WARNING ALL RIGHTS RESERVED. All information and conceptual designs contained within this document are the intellectual property of ENVIRONGAKA (Pty) Ltd. This document and/or the information contained herein may not be used, stored, reproduced, or copied in any manner, without the prior written consent of ENVIRONGAKA (Pty) Ltd. This document and/or the information and conceptual designs may not be disclosed or displayed to any third party without the prior written consent of ENVIRONGAKA (Pty) Ltd.
EnviroNgaka
MATERIAL DESCRIPTION Scenario 1 Scenario 2 Units (quantity / period) Baseline Condition
(Volume)
Future Condition
(Volume) Briquetting: Stockpiled furnace dust and sludge (DSF) (Max) 14600 14600 tonne/annum
Briquetting: Fresh occurring furnace dust from Baghouse (Max) 7300 7300
tonne/annum
Briquetting: Sludge from the filter press (Max) 2555 2555 tonne/annum
Briquetting: Fine -3mm metal / Ore (Max) 18250 18250 tonne/annum
Briquetting: Metal Recovery Plant spiral fines (Max) 5475 5475
tonne/annum
Briquetting: Metal recovery plant fine middling fraction (Max) 18250 18250 tonne/annum
Briquetting: Additional 5% Binder (Max) 3285 3285 tonne/annum Briquetting: Additional water (Max) 2008 2008 tonne/annum Briquetting: CRA dust (Max) 9125 9125 tonne/annum Charcoal (Sinter Plant) 0 1000 tonne/annum Diesel 647923 709243 litres/annum
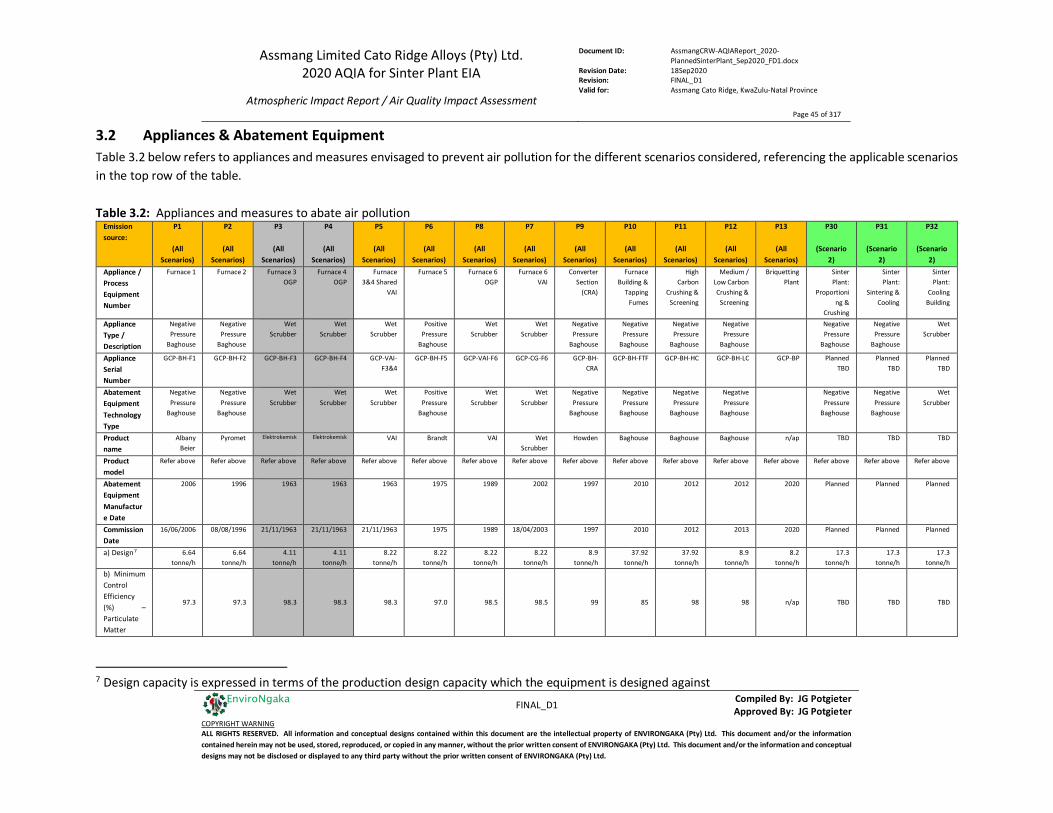
Assmang Limited Cato Ridge Alloys (Pty) Ltd. 2020 AQIA for Sinter Plant EIA
Atmospheric Impact Report / Air Quality Impact Assessment
Document ID: AssmangCRW-AQIAReport_2020-PlannedSinterPlant_Sep2020_FD1.docx
Revision Date: 18Sep2020 Revision: FINAL_D1 Valid for: Assmang Cato Ridge, KwaZulu-Natal Province
Page 45 of 317
FINAL_D1 Compiled By: JG Potgieter
Approved By: JG Potgieter COPYRIGHT WARNING ALL RIGHTS RESERVED. All information and conceptual designs contained within this document are the intellectual property of ENVIRONGAKA (Pty) Ltd. This document and/or the information contained herein may not be used, stored, reproduced, or copied in any manner, without the prior written consent of ENVIRONGAKA (Pty) Ltd. This document and/or the information and conceptual designs may not be disclosed or displayed to any third party without the prior written consent of ENVIRONGAKA (Pty) Ltd.
EnviroNgaka
3.2 Appliances & Abatement Equipment Table 3.2 below refers to appliances and measures envisaged to prevent air pollution for the different scenarios considered, referencing the applicable scenarios in the top row of the table. Table 3.2: Appliances and measures to abate air pollution
Emission source:
P1
(All Scenarios)
P2
(All Scenarios)
P3
(All Scenarios)
P4
(All Scenarios)
P5
(All Scenarios)
P6
(All Scenarios)
P8
(All Scenarios)
P7
(All Scenarios)
P9
(All Scenarios)
P10
(All Scenarios)
P11
(All Scenarios)
P12
(All Scenarios)
P13
(All Scenarios)
P30
(Scenario 2)
P31
(Scenario 2)
P32
(Scenario 2)
Appliance / Process Equipment Number
Furnace 1 Furnace 2 Furnace 3 OGP
Furnace 4 OGP
Furnace 3&4 Shared
VAI
Furnace 5 Furnace 6 OGP
Furnace 6 VAI
Converter Section
(CRA)
Furnace Building &
Tapping Fumes
High Carbon
Crushing & Screening
Medium / Low Carbon Crushing &
Screening
Briquetting Plant
Sinter Plant:
Proportioning &
Crushing
Sinter Plant:
Sintering & Cooling
Sinter Plant:
Cooling Building
Appliance Type / Description
Negative Pressure
Baghouse
Negative Pressure
Baghouse
Wet Scrubber
Wet Scrubber
Wet Scrubber
Positive Pressure
Baghouse
Wet Scrubber
Wet Scrubber
Negative Pressure
Baghouse
Negative Pressure
Baghouse
Negative Pressure
Baghouse
Negative Pressure
Baghouse
Negative Pressure
Baghouse
Negative Pressure
Baghouse
Wet Scrubber
Appliance Serial Number
GCP-BH-F1 GCP-BH-F2 GCP-BH-F3 GCP-BH-F4 GCP-VAI-F3&4
GCP-BH-F5 GCP-VAI-F6 GCP-CG-F6 GCP-BH-CRA
GCP-BH-FTF GCP-BH-HC GCP-BH-LC GCP-BP Planned TBD
Planned TBD
Planned TBD
Abatement Equipment Technology Type
Negative Pressure
Baghouse
Negative Pressure
Baghouse
Wet Scrubber
Wet Scrubber
Wet Scrubber
Positive Pressure
Baghouse
Wet Scrubber
Wet Scrubber
Negative Pressure
Baghouse
Negative Pressure
Baghouse
Negative Pressure
Baghouse
Negative Pressure
Baghouse
Negative Pressure
Baghouse
Negative Pressure
Baghouse
Wet Scrubber
Product name
Albany Beier
Pyromet Elektrokemisk Elektrokemisk VAI Brandt VAI Wet Scrubber
Howden Baghouse Baghouse Baghouse n/ap TBD TBD TBD
Product model
Refer above Refer above Refer above Refer above Refer above Refer above Refer above Refer above Refer above Refer above Refer above Refer above Refer above Refer above Refer above Refer above
Abatement Equipment Manufacture Date
2006 1996 1963 1963 1963 1975 1989 2002 1997 2010 2012 2012 2020 Planned Planned Planned
Commission Date
16/06/2006 08/08/1996 21/11/1963 21/11/1963 21/11/1963 1975 1989 18/04/2003 1997 2010 2012 2013 2020 Planned Planned Planned
a) Design7 6.64 tonne/h
6.64 tonne/h
4.11 tonne/h
4.11 tonne/h
8.22 tonne/h
8.22 tonne/h
8.22 tonne/h
8.22 tonne/h
8.9 tonne/h
37.92 tonne/h
37.92 tonne/h
8.9 tonne/h
8.2 tonne/h
17.3 tonne/h
17.3 tonne/h
17.3 tonne/h
b) Minimum Control Efficiency (%) – Particulate Matter
97.3 97.3 98.3 98.3 98.3 97.0 98.5 98.5 99 85 98 98 n/ap TBD TBD TBD
7 Design capacity is expressed in terms of the production design capacity which the equipment is designed against

Assmang Limited Cato Ridge Alloys (Pty) Ltd. 2020 AQIA for Sinter Plant EIA
Atmospheric Impact Report / Air Quality Impact Assessment
Document ID: AssmangCRW-AQIAReport_2020-PlannedSinterPlant_Sep2020_FD1.docx
Revision Date: 18Sep2020 Revision: FINAL_D1 Valid for: Assmang Cato Ridge, KwaZulu-Natal Province
Page 46 of 317
FINAL_D1 Compiled By: JG Potgieter
Approved By: JG Potgieter COPYRIGHT WARNING ALL RIGHTS RESERVED. All information and conceptual designs contained within this document are the intellectual property of ENVIRONGAKA (Pty) Ltd. This document and/or the information contained herein may not be used, stored, reproduced, or copied in any manner, without the prior written consent of ENVIRONGAKA (Pty) Ltd. This document and/or the information and conceptual designs may not be disclosed or displayed to any third party without the prior written consent of ENVIRONGAKA (Pty) Ltd.
EnviroNgaka
Emission source:
P1
(All Scenarios)
P2
(All Scenarios)
P3
(All Scenarios)
P4
(All Scenarios)
P5
(All Scenarios)
P6
(All Scenarios)
P8
(All Scenarios)
P7
(All Scenarios)
P9
(All Scenarios)
P10
(All Scenarios)
P11
(All Scenarios)
P12
(All Scenarios)
P13
(All Scenarios)
P30
(Scenario 2)
P31
(Scenario 2)
P32
(Scenario 2)
c) Minimum Utilisation (%)
98 98 98 98 98 98 98 98 99 98 98 98 99 100 100 100
Significant modifications and/or upgrades
Upgrade 1 Date
n/ap n/ap n/ap n/ap n/ap n/ap n/ap n/ap n/ap n/ap n/ap n/ap n/ap n/ap n/ap n/ap
Upgrade 1 Reason
n/ap n/ap n/ap n/ap n/ap n/ap n/ap n/ap n/ap n/ap n/ap n/ap n/ap n/ap n/ap n/ap
Upgrade 2 Date
n/ap n/ap n/ap n/ap n/ap n/ap n/ap n/ap n/ap n/ap n/ap n/ap n/ap n/ap n/ap n/ap
Upgrade 2 Reason
n/ap n/ap n/ap n/ap n/ap n/ap n/ap n/ap n/ap n/ap n/ap n/ap n/ap n/ap n/ap n/ap
Planned modifications within next 5 years
Nature of the
modification
n/av n/av n/av n/av n/av n/av n/av n/av n/av n/av n/av n/av n/av n/ap n/ap n/ap
Potential impact on
Atmospheric Emissions
n/av n/av n/av n/av n/av n/av n/av n/av n/av n/av n/av n/av n/av n/ap n/ap n/ap
Timetable
Installation n/av n/av n/av n/av n/av n/av n/av n/av n/av n/av n/av n/av n/av n/ap n/ap n/ap
Commission n/av n/av n/av n/av n/av n/av n/av n/av n/av n/av n/av n/av n/av n/ap n/ap n/ap
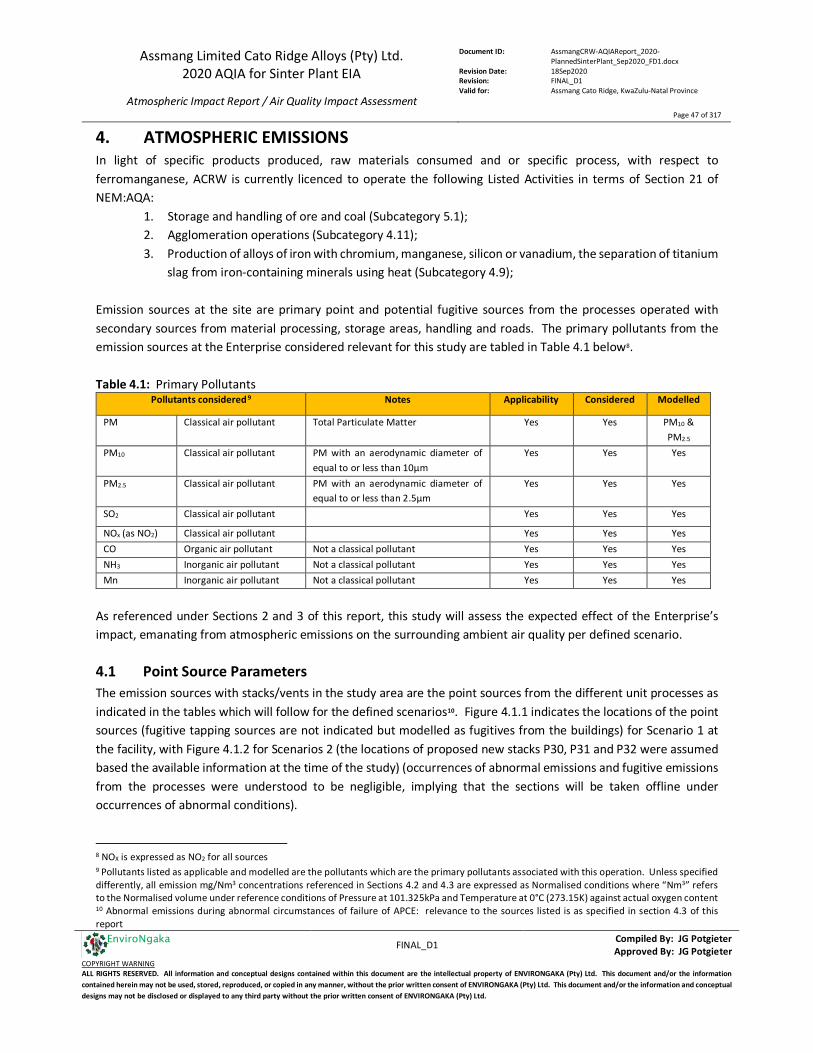
Assmang Limited Cato Ridge Alloys (Pty) Ltd. 2020 AQIA for Sinter Plant EIA
Atmospheric Impact Report / Air Quality Impact Assessment
Document ID: AssmangCRW-AQIAReport_2020-PlannedSinterPlant_Sep2020_FD1.docx
Revision Date: 18Sep2020 Revision: FINAL_D1 Valid for: Assmang Cato Ridge, KwaZulu-Natal Province
Page 47 of 317
FINAL_D1 Compiled By: JG Potgieter
Approved By: JG Potgieter COPYRIGHT WARNING ALL RIGHTS RESERVED. All information and conceptual designs contained within this document are the intellectual property of ENVIRONGAKA (Pty) Ltd. This document and/or the information contained herein may not be used, stored, reproduced, or copied in any manner, without the prior written consent of ENVIRONGAKA (Pty) Ltd. This document and/or the information and conceptual designs may not be disclosed or displayed to any third party without the prior written consent of ENVIRONGAKA (Pty) Ltd.
EnviroNgaka
4. ATMOSPHERIC EMISSIONS In light of specific products produced, raw materials consumed and or specific process, with respect to ferromanganese, ACRW is currently licenced to operate the following Listed Activities in terms of Section 21 of NEM:AQA:
1. Storage and handling of ore and coal (Subcategory 5.1); 2. Agglomeration operations (Subcategory 4.11); 3. Production of alloys of iron with chromium, manganese, silicon or vanadium, the separation of titanium
slag from iron-containing minerals using heat (Subcategory 4.9); Emission sources at the site are primary point and potential fugitive sources from the processes operated with secondary sources from material processing, storage areas, handling and roads. The primary pollutants from the emission sources at the Enterprise considered relevant for this study are tabled in Table 4.1 below8. Table 4.1: Primary Pollutants
Pollutants considered 9 Notes Applicability Considered Modelled
PM Classical air pollutant Total Particulate Matter Yes Yes PM10 & PM2.5
PM10 Classical air pollutant PM with an aerodynamic diameter of equal to or less than 10µm
Yes Yes Yes
PM2.5 Classical air pollutant PM with an aerodynamic diameter of equal to or less than 2.5µm
Yes Yes Yes
SO2 Classical air pollutant Yes Yes Yes
NOx (as NO2) Classical air pollutant Yes Yes Yes CO Organic air pollutant Not a classical pollutant Yes Yes Yes NH3 Inorganic air pollutant Not a classical pollutant Yes Yes Yes Mn Inorganic air pollutant Not a classical pollutant Yes Yes Yes
As referenced under Sections 2 and 3 of this report, this study will assess the expected effect of the Enterprise’s impact, emanating from atmospheric emissions on the surrounding ambient air quality per defined scenario. 4.1 Point Source Parameters The emission sources with stacks/vents in the study area are the point sources from the different unit processes as indicated in the tables which will follow for the defined scenarios10. Figure 4.1.1 indicates the locations of the point sources (fugitive tapping sources are not indicated but modelled as fugitives from the buildings) for Scenario 1 at the facility, with Figure 4.1.2 for Scenarios 2 (the locations of proposed new stacks P30, P31 and P32 were assumed based the available information at the time of the study) (occurrences of abnormal emissions and fugitive emissions from the processes were understood to be negligible, implying that the sections will be taken offline under occurrences of abnormal conditions). 8 NOX is expressed as NO2 for all sources 9 Pollutants listed as applicable and modelled are the pollutants which are the primary pollutants associated with this operation. Unless specified differently, all emission mg/Nm3 concentrations referenced in Sections 4.2 and 4.3 are expressed as Normalised conditions where “Nm3” refers to the Normalised volume under reference conditions of Pressure at 101.325kPa and Temperature at 0°C (273.15K) against actual oxygen content 10 Abnormal emissions during abnormal circumstances of failure of APCE: relevance to the sources listed is as specified in section 4.3 of this report
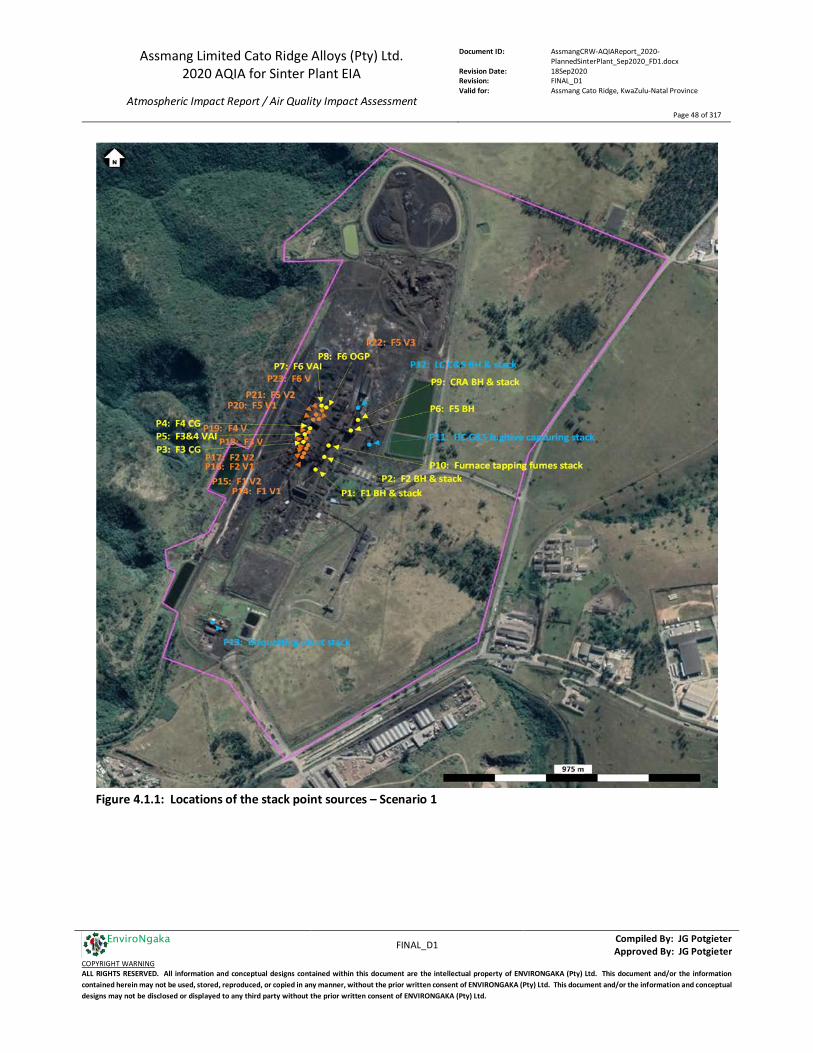
Assmang Limited Cato Ridge Alloys (Pty) Ltd. 2020 AQIA for Sinter Plant EIA
Atmospheric Impact Report / Air Quality Impact Assessment
Document ID: AssmangCRW-AQIAReport_2020-PlannedSinterPlant_Sep2020_FD1.docx
Revision Date: 18Sep2020 Revision: FINAL_D1 Valid for: Assmang Cato Ridge, KwaZulu-Natal Province
Page 48 of 317
FINAL_D1 Compiled By: JG Potgieter
Approved By: JG Potgieter COPYRIGHT WARNING ALL RIGHTS RESERVED. All information and conceptual designs contained within this document are the intellectual property of ENVIRONGAKA (Pty) Ltd. This document and/or the information contained herein may not be used, stored, reproduced, or copied in any manner, without the prior written consent of ENVIRONGAKA (Pty) Ltd. This document and/or the information and conceptual designs may not be disclosed or displayed to any third party without the prior written consent of ENVIRONGAKA (Pty) Ltd.
EnviroNgaka
Figure 4.1.1: Locations of the stack point sources – Scenario 1
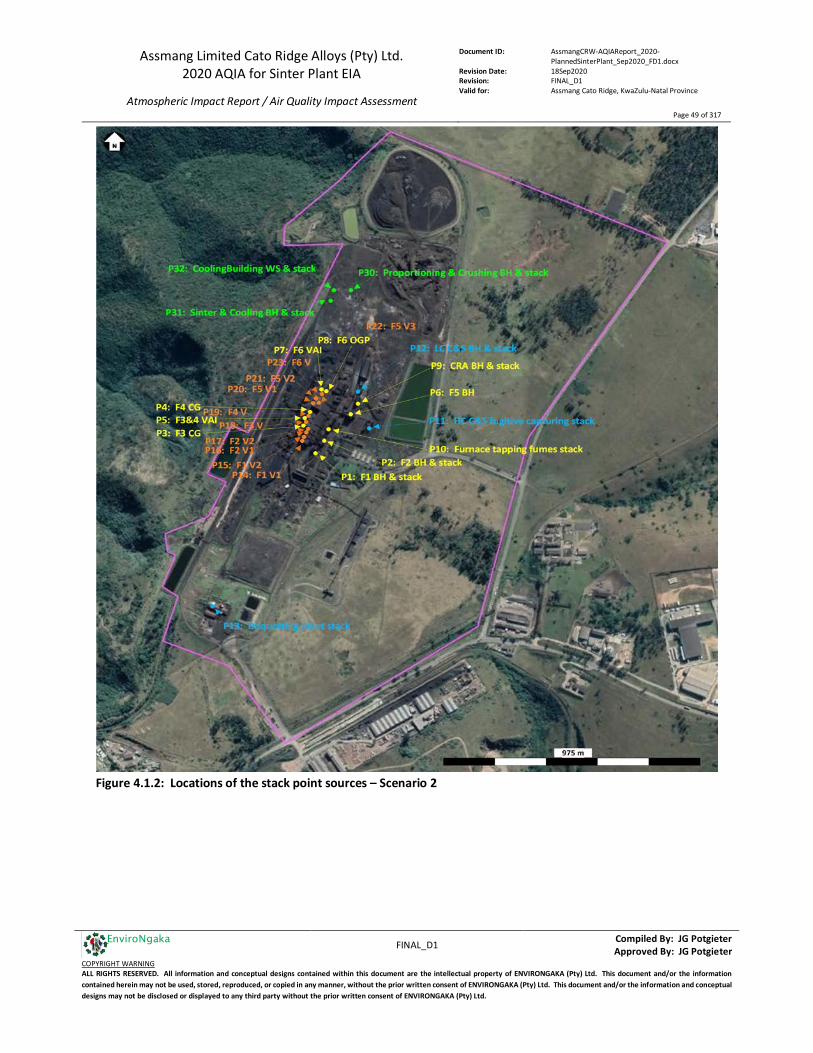
Assmang Limited Cato Ridge Alloys (Pty) Ltd. 2020 AQIA for Sinter Plant EIA
Atmospheric Impact Report / Air Quality Impact Assessment
Document ID: AssmangCRW-AQIAReport_2020-PlannedSinterPlant_Sep2020_FD1.docx
Revision Date: 18Sep2020 Revision: FINAL_D1 Valid for: Assmang Cato Ridge, KwaZulu-Natal Province
Page 49 of 317
FINAL_D1 Compiled By: JG Potgieter
Approved By: JG Potgieter COPYRIGHT WARNING ALL RIGHTS RESERVED. All information and conceptual designs contained within this document are the intellectual property of ENVIRONGAKA (Pty) Ltd. This document and/or the information contained herein may not be used, stored, reproduced, or copied in any manner, without the prior written consent of ENVIRONGAKA (Pty) Ltd. This document and/or the information and conceptual designs may not be disclosed or displayed to any third party without the prior written consent of ENVIRONGAKA (Pty) Ltd.
EnviroNgaka
Figure 4.1.2: Locations of the stack point sources – Scenario 2
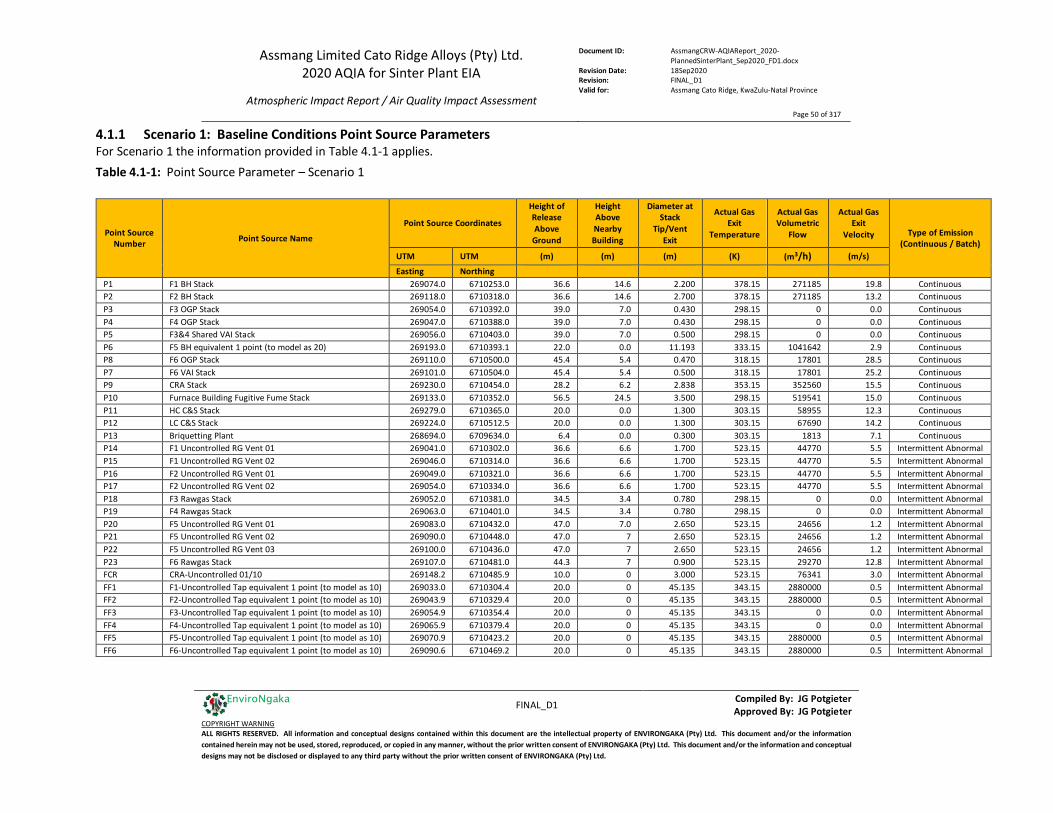
Assmang Limited Cato Ridge Alloys (Pty) Ltd. 2020 AQIA for Sinter Plant EIA
Atmospheric Impact Report / Air Quality Impact Assessment
Document ID: AssmangCRW-AQIAReport_2020-PlannedSinterPlant_Sep2020_FD1.docx
Revision Date: 18Sep2020 Revision: FINAL_D1 Valid for: Assmang Cato Ridge, KwaZulu-Natal Province
Page 50 of 317
FINAL_D1 Compiled By: JG Potgieter
Approved By: JG Potgieter COPYRIGHT WARNING ALL RIGHTS RESERVED. All information and conceptual designs contained within this document are the intellectual property of ENVIRONGAKA (Pty) Ltd. This document and/or the information contained herein may not be used, stored, reproduced, or copied in any manner, without the prior written consent of ENVIRONGAKA (Pty) Ltd. This document and/or the information and conceptual designs may not be disclosed or displayed to any third party without the prior written consent of ENVIRONGAKA (Pty) Ltd.
EnviroNgaka
4.1.1 Scenario 1: Baseline Conditions Point Source Parameters For Scenario 1 the information provided in Table 4.1-1 applies.
Table 4.1-1: Point Source Parameter – Scenario 1
Point Source Number Point Source Name
Point Source Coordinates
Height of Release Above
Ground
Height Above Nearby Building
Diameter at Stack
Tip/Vent Exit
Actual Gas Exit
Temperature
Actual Gas Volumetric
Flow
Actual Gas Exit
Velocity Type of Emission (Continuous / Batch)
UTM UTM (m) (m) (m) (K) (m3/h) (m/s)
Easting Northing P1 F1 BH Stack 269074.0 6710253.0 36.6 14.6 2.200 378.15 271185 19.8 Continuous P2 F2 BH Stack 269118.0 6710318.0 36.6 14.6 2.700 378.15 271185 13.2 Continuous P3 F3 OGP Stack 269054.0 6710392.0 39.0 7.0 0.430 298.15 0 0.0 Continuous P4 F4 OGP Stack 269047.0 6710388.0 39.0 7.0 0.430 298.15 0 0.0 Continuous P5 F3&4 Shared VAI Stack 269056.0 6710403.0 39.0 7.0 0.500 298.15 0 0.0 Continuous P6 F5 BH equivalent 1 point (to model as 20) 269193.0 6710393.1 22.0 0.0 11.193 333.15 1041642 2.9 Continuous P8 F6 OGP Stack 269110.0 6710500.0 45.4 5.4 0.470 318.15 17801 28.5 Continuous P7 F6 VAI Stack 269101.0 6710504.0 45.4 5.4 0.500 318.15 17801 25.2 Continuous P9 CRA Stack 269230.0 6710454.0 28.2 6.2 2.838 353.15 352560 15.5 Continuous P10 Furnace Building Fugitive Fume Stack 269133.0 6710352.0 56.5 24.5 3.500 298.15 519541 15.0 Continuous P11 HC C&S Stack 269279.0 6710365.0 20.0 0.0 1.300 303.15 58955 12.3 Continuous P12 LC C&S Stack 269224.0 6710512.5 20.0 0.0 1.300 303.15 67690 14.2 Continuous P13 Briquetting Plant 268694.0 6709634.0 6.4 0.0 0.300 303.15 1813 7.1 Continuous P14 F1 Uncontrolled RG Vent 01 269041.0 6710302.0 36.6 6.6 1.700 523.15 44770 5.5 Intermittent Abnormal P15 F1 Uncontrolled RG Vent 02 269046.0 6710314.0 36.6 6.6 1.700 523.15 44770 5.5 Intermittent Abnormal P16 F2 Uncontrolled RG Vent 01 269049.0 6710321.0 36.6 6.6 1.700 523.15 44770 5.5 Intermittent Abnormal P17 F2 Uncontrolled RG Vent 02 269054.0 6710334.0 36.6 6.6 1.700 523.15 44770 5.5 Intermittent Abnormal P18 F3 Rawgas Stack 269052.0 6710381.0 34.5 3.4 0.780 298.15 0 0.0 Intermittent Abnormal P19 F4 Rawgas Stack 269063.0 6710401.0 34.5 3.4 0.780 298.15 0 0.0 Intermittent Abnormal P20 F5 Uncontrolled RG Vent 01 269083.0 6710432.0 47.0 7.0 2.650 523.15 24656 1.2 Intermittent Abnormal P21 F5 Uncontrolled RG Vent 02 269090.0 6710448.0 47.0 7 2.650 523.15 24656 1.2 Intermittent Abnormal P22 F5 Uncontrolled RG Vent 03 269100.0 6710436.0 47.0 7 2.650 523.15 24656 1.2 Intermittent Abnormal P23 F6 Rawgas Stack 269107.0 6710481.0 44.3 7 0.900 523.15 29270 12.8 Intermittent Abnormal FCR CRA-Uncontrolled 01/10 269148.2 6710485.9 10.0 0 3.000 523.15 76341 3.0 Intermittent Abnormal FF1 F1-Uncontrolled Tap equivalent 1 point (to model as 10) 269033.0 6710304.4 20.0 0 45.135 343.15 2880000 0.5 Intermittent Abnormal FF2 F2-Uncontrolled Tap equivalent 1 point (to model as 10) 269043.9 6710329.4 20.0 0 45.135 343.15 2880000 0.5 Intermittent Abnormal FF3 F3-Uncontrolled Tap equivalent 1 point (to model as 10) 269054.9 6710354.4 20.0 0 45.135 343.15 0 0.0 Intermittent Abnormal FF4 F4-Uncontrolled Tap equivalent 1 point (to model as 10) 269065.9 6710379.4 20.0 0 45.135 343.15 0 0.0 Intermittent Abnormal FF5 F5-Uncontrolled Tap equivalent 1 point (to model as 10) 269070.9 6710423.2 20.0 0 45.135 343.15 2880000 0.5 Intermittent Abnormal FF6 F6-Uncontrolled Tap equivalent 1 point (to model as 10) 269090.6 6710469.2 20.0 0 45.135 343.15 2880000 0.5 Intermittent Abnormal
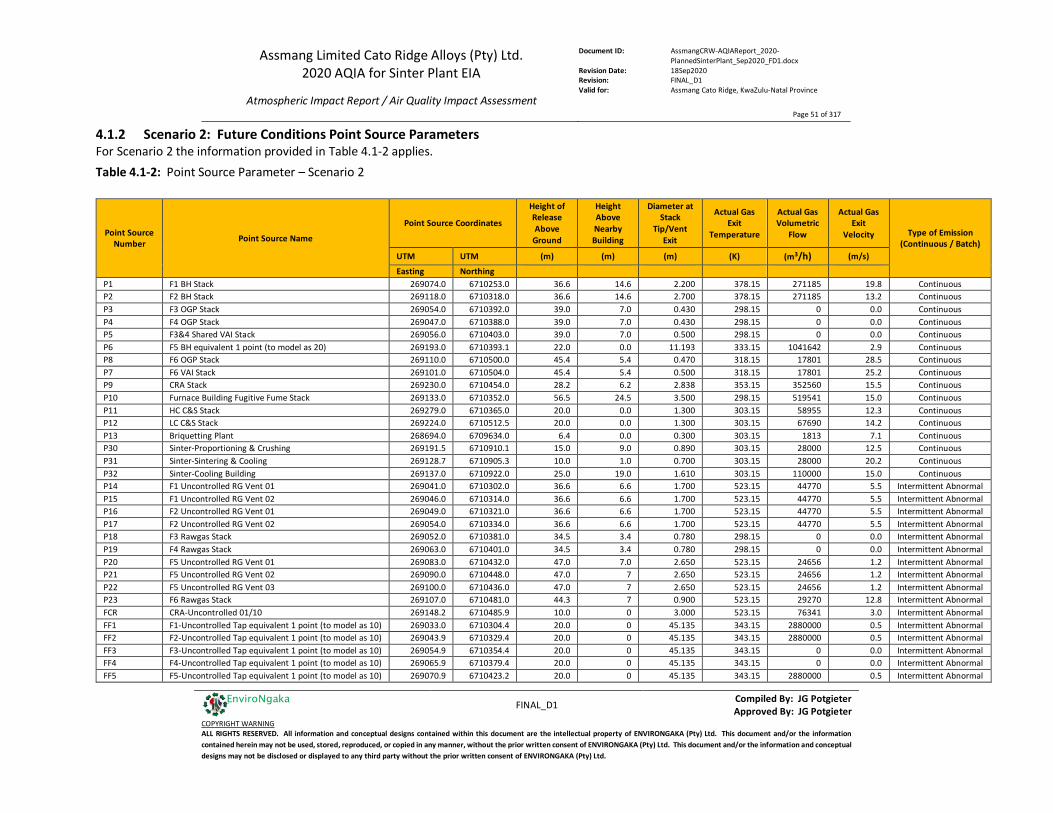
Assmang Limited Cato Ridge Alloys (Pty) Ltd. 2020 AQIA for Sinter Plant EIA
Atmospheric Impact Report / Air Quality Impact Assessment
Document ID: AssmangCRW-AQIAReport_2020-PlannedSinterPlant_Sep2020_FD1.docx
Revision Date: 18Sep2020 Revision: FINAL_D1 Valid for: Assmang Cato Ridge, KwaZulu-Natal Province
Page 51 of 317
FINAL_D1 Compiled By: JG Potgieter
Approved By: JG Potgieter COPYRIGHT WARNING ALL RIGHTS RESERVED. All information and conceptual designs contained within this document are the intellectual property of ENVIRONGAKA (Pty) Ltd. This document and/or the information contained herein may not be used, stored, reproduced, or copied in any manner, without the prior written consent of ENVIRONGAKA (Pty) Ltd. This document and/or the information and conceptual designs may not be disclosed or displayed to any third party without the prior written consent of ENVIRONGAKA (Pty) Ltd.
EnviroNgaka
4.1.2 Scenario 2: Future Conditions Point Source Parameters For Scenario 2 the information provided in Table 4.1-2 applies.
Table 4.1-2: Point Source Parameter – Scenario 2
Point Source Number Point Source Name
Point Source Coordinates
Height of Release Above
Ground
Height Above Nearby Building
Diameter at Stack
Tip/Vent Exit
Actual Gas Exit
Temperature
Actual Gas Volumetric
Flow
Actual Gas Exit
Velocity Type of Emission (Continuous / Batch)
UTM UTM (m) (m) (m) (K) (m3/h) (m/s)
Easting Northing P1 F1 BH Stack 269074.0 6710253.0 36.6 14.6 2.200 378.15 271185 19.8 Continuous P2 F2 BH Stack 269118.0 6710318.0 36.6 14.6 2.700 378.15 271185 13.2 Continuous P3 F3 OGP Stack 269054.0 6710392.0 39.0 7.0 0.430 298.15 0 0.0 Continuous P4 F4 OGP Stack 269047.0 6710388.0 39.0 7.0 0.430 298.15 0 0.0 Continuous P5 F3&4 Shared VAI Stack 269056.0 6710403.0 39.0 7.0 0.500 298.15 0 0.0 Continuous P6 F5 BH equivalent 1 point (to model as 20) 269193.0 6710393.1 22.0 0.0 11.193 333.15 1041642 2.9 Continuous P8 F6 OGP Stack 269110.0 6710500.0 45.4 5.4 0.470 318.15 17801 28.5 Continuous P7 F6 VAI Stack 269101.0 6710504.0 45.4 5.4 0.500 318.15 17801 25.2 Continuous P9 CRA Stack 269230.0 6710454.0 28.2 6.2 2.838 353.15 352560 15.5 Continuous P10 Furnace Building Fugitive Fume Stack 269133.0 6710352.0 56.5 24.5 3.500 298.15 519541 15.0 Continuous P11 HC C&S Stack 269279.0 6710365.0 20.0 0.0 1.300 303.15 58955 12.3 Continuous P12 LC C&S Stack 269224.0 6710512.5 20.0 0.0 1.300 303.15 67690 14.2 Continuous P13 Briquetting Plant 268694.0 6709634.0 6.4 0.0 0.300 303.15 1813 7.1 Continuous P30 Sinter-Proportioning & Crushing 269191.5 6710910.1 15.0 9.0 0.890 303.15 28000 12.5 Continuous P31 Sinter-Sintering & Cooling 269128.7 6710905.3 10.0 1.0 0.700 303.15 28000 20.2 Continuous P32 Sinter-Cooling Building 269137.0 6710922.0 25.0 19.0 1.610 303.15 110000 15.0 Continuous P14 F1 Uncontrolled RG Vent 01 269041.0 6710302.0 36.6 6.6 1.700 523.15 44770 5.5 Intermittent Abnormal P15 F1 Uncontrolled RG Vent 02 269046.0 6710314.0 36.6 6.6 1.700 523.15 44770 5.5 Intermittent Abnormal P16 F2 Uncontrolled RG Vent 01 269049.0 6710321.0 36.6 6.6 1.700 523.15 44770 5.5 Intermittent Abnormal P17 F2 Uncontrolled RG Vent 02 269054.0 6710334.0 36.6 6.6 1.700 523.15 44770 5.5 Intermittent Abnormal P18 F3 Rawgas Stack 269052.0 6710381.0 34.5 3.4 0.780 298.15 0 0.0 Intermittent Abnormal P19 F4 Rawgas Stack 269063.0 6710401.0 34.5 3.4 0.780 298.15 0 0.0 Intermittent Abnormal P20 F5 Uncontrolled RG Vent 01 269083.0 6710432.0 47.0 7.0 2.650 523.15 24656 1.2 Intermittent Abnormal P21 F5 Uncontrolled RG Vent 02 269090.0 6710448.0 47.0 7 2.650 523.15 24656 1.2 Intermittent Abnormal P22 F5 Uncontrolled RG Vent 03 269100.0 6710436.0 47.0 7 2.650 523.15 24656 1.2 Intermittent Abnormal P23 F6 Rawgas Stack 269107.0 6710481.0 44.3 7 0.900 523.15 29270 12.8 Intermittent Abnormal FCR CRA-Uncontrolled 01/10 269148.2 6710485.9 10.0 0 3.000 523.15 76341 3.0 Intermittent Abnormal FF1 F1-Uncontrolled Tap equivalent 1 point (to model as 10) 269033.0 6710304.4 20.0 0 45.135 343.15 2880000 0.5 Intermittent Abnormal FF2 F2-Uncontrolled Tap equivalent 1 point (to model as 10) 269043.9 6710329.4 20.0 0 45.135 343.15 2880000 0.5 Intermittent Abnormal FF3 F3-Uncontrolled Tap equivalent 1 point (to model as 10) 269054.9 6710354.4 20.0 0 45.135 343.15 0 0.0 Intermittent Abnormal FF4 F4-Uncontrolled Tap equivalent 1 point (to model as 10) 269065.9 6710379.4 20.0 0 45.135 343.15 0 0.0 Intermittent Abnormal FF5 F5-Uncontrolled Tap equivalent 1 point (to model as 10) 269070.9 6710423.2 20.0 0 45.135 343.15 2880000 0.5 Intermittent Abnormal

Assmang Limited Cato Ridge Alloys (Pty) Ltd. 2020 AQIA for Sinter Plant EIA
Atmospheric Impact Report / Air Quality Impact Assessment
Document ID: AssmangCRW-AQIAReport_2020-PlannedSinterPlant_Sep2020_FD1.docx
Revision Date: 18Sep2020 Revision: FINAL_D1 Valid for: Assmang Cato Ridge, KwaZulu-Natal Province
Page 52 of 317
FINAL_D1 Compiled By: JG Potgieter
Approved By: JG Potgieter COPYRIGHT WARNING ALL RIGHTS RESERVED. All information and conceptual designs contained within this document are the intellectual property of ENVIRONGAKA (Pty) Ltd. This document and/or the information contained herein may not be used, stored, reproduced, or copied in any manner, without the prior written consent of ENVIRONGAKA (Pty) Ltd. This document and/or the information and conceptual designs may not be disclosed or displayed to any third party without the prior written consent of ENVIRONGAKA (Pty) Ltd.
EnviroNgaka
FF6 F6-Uncontrolled Tap equivalent 1 point (to model as 10) 269090.6 6710469.2 20.0 0 45.135 343.15 2880000 0.5 Intermittent Abnormal
4.2 Point Source Emissions (Normal Operating Conditions)
4.2.1 Scenario 1: Baseline Conditions Emissions (Normal) The emission rates from the point sources under normal operating conditions provided for in Scenario 1, are per achieved emissions rates/concentrations based on historical emission data, AEL limits, design parameters and or estimations for pollutants and or sources which are not measured and or referenced in the AEL. Please refer to Appendix D for additional emission inventory related information. For Scenario 1 the information provided in Table 4.2.1-1 applies. Table 4.2.1-1: Normal Operating Conditions Point Source Emissions – Scenario 1
Point Source Number Point Source Name
Average Emission Concentration
Duration of Emissions PM10 PM2.5 SO2 NOX CO NH3 Mn Averaging
Period (mg/Nm3) (mg/Nm3) (mg/Nm3) (mg/Nm3) (mg/Nm3) (mg/Nm3) (µg/Nm3)
P1 F1 BH Stack 10 10 20 50 250 n/ap 3743 24h Continuous P2 F2 BH Stack 15 14 20 50 250 n/ap 5614 24h Continuous P3 F3 OGP Stack 0 0 0 0 184649 n/ap ERR 24h Continuous P4 F4 OGP Stack 0 0 0 0 184649 n/ap ERR 24h Continuous P5 F3&4 Shared VAI Stack 0 0 0 0 184649 n/ap ERR 24h Continuous P6 F5 BH equivalent 1 point (to model as 20) 10 10 10 50 71 n/ap 3743 24h Continuous P8 F6 OGP Stack 35 25 500 400 184649 n/ap 9330 24h Continuous P7 F6 VAI Stack 35 25 500 400 184649 n/ap 9330 24h Continuous P9 CRA Stack 30 29 39 18 167 n/ap 17015 24h Continuous P10 Furnace Building Fugitive Fume Stack 1 1 60 9 46 n/ap 60 24h Continuous P11 HC C&S Stack 20 19 12 10 5 n/ap 3000 24h Continuous P12 LC C&S Stack 30 29 3 10 5 n/ap 6000 24h Continuous P13 Briquetting Plant 30 30 0 1 0 30.00 4500 24h Continuous

Assmang Limited Cato Ridge Alloys (Pty) Ltd. 2020 AQIA for Sinter Plant EIA
Atmospheric Impact Report / Air Quality Impact Assessment
Document ID: AssmangCRW-AQIAReport_2020-PlannedSinterPlant_Sep2020_FD1.docx
Revision Date: 18Sep2020 Revision: FINAL_D1 Valid for: Assmang Cato Ridge, KwaZulu-Natal Province
Page 53 of 317
FINAL_D1 Compiled By: JG Potgieter
Approved By: JG Potgieter COPYRIGHT WARNING ALL RIGHTS RESERVED. All information and conceptual designs contained within this document are the intellectual property of ENVIRONGAKA (Pty) Ltd. This document and/or the information contained herein may not be used, stored, reproduced, or copied in any manner, without the prior written consent of ENVIRONGAKA (Pty) Ltd. This document and/or the information and conceptual designs may not be disclosed or displayed to any third party without the prior written consent of ENVIRONGAKA (Pty) Ltd.
EnviroNgaka
4.2.2 Scenario 2: Future Conditions Emissions (Normal) The emission rates from the point sources under normal operating conditions provided for in Scenario 2, are per achieved emissions rates/concentrations based on historical emission data, AEL limits, design parameters and or estimations for pollutants and or sources which are not measured and or referenced in the AEL. Please refer to Appendix D for additional emission inventory related information. For Scenario 2 the information provided in Table 4.2.2-1 applies. Table 4.2.2-1: Normal Operating Conditions Point Source Emissions – Scenario 2
Point Source Number Point Source Name
Average Emission Concentration
Duration of Emissions PM10 PM2.5 SO2 NOX CO NH3 Mn Averaging
Period (mg/Nm3) (mg/Nm3) (mg/Nm3) (mg/Nm3) (mg/Nm3) (mg/Nm3) (µg/Nm3)
P1 F1 BH Stack 10 10 20 50 250 n/ap 3743 24h Continuous P2 F2 BH Stack 15 14 20 50 250 n/ap 5614 24h Continuous P3 F3 OGP Stack 0 0 0 0 184649 n/ap ERR 24h Continuous P4 F4 OGP Stack 0 0 0 0 184649 n/ap ERR 24h Continuous P5 F3&4 Shared VAI Stack 0 0 0 0 184649 n/ap ERR 24h Continuous P6 F5 BH equivalent 1 point (to model as 20) 10 10 10 50 71 n/ap 3743 24h Continuous P8 F6 OGP Stack 35 25 500 400 184649 n/ap 9330 24h Continuous P7 F6 VAI Stack 35 25 500 400 184649 n/ap 9330 24h Continuous P9 CRA Stack 30 29 39 18 167 n/ap 17015 24h Continuous P10 Furnace Building Fugitive Fume Stack 1 1 60 9 46 n/ap 60 24h Continuous P11 HC C&S Stack 20 19 12 10 5 n/ap 3000 24h Continuous P12 LC C&S Stack 30 29 3 10 5 n/ap 6000 24h Continuous P13 Briquetting Plant 30 30 0 1 0 30.00 4500 24h Continuous P30 Sinter-Proportioning & Crushing 50 48 15 30 150 n/ap 5000 24h Continuous P31 Sinter-Sintering & Cooling 50 48 100 100 150 n/ap 10000 24h Continuous P32 Sinter-Cooling Building 50 38 100 100 10000 n/ap 5000 24h Continuous
4.3 Point Source Maximum Emission Rates (Abnormal: Start-up, Shut-down & Maintenance Conditions) Tapping occurs for approximately 10min during every 2hour operational cycle of a furnace. Based on site data it was assumed that approximately 95% of the tapping emissions are captured at 96% abatement efficiency, resulting in the balance of 5% of the fugitives remaining as fugitives; with furnace raw gas abnormal emissions occur 0.025% of production time, which equates to approximately 7.2min per month per furnace, and 0.14% for the CRA (60min per month), hence reference to an averaging period of 10minutes referenced in the following tables.

Assmang Limited Cato Ridge Alloys (Pty) Ltd. 2020 AQIA for Sinter Plant EIA
Atmospheric Impact Report / Air Quality Impact Assessment
Document ID: AssmangCRW-AQIAReport_2020-PlannedSinterPlant_Sep2020_FD1.docx
Revision Date: 18Sep2020 Revision: FINAL_D1 Valid for: Assmang Cato Ridge, KwaZulu-Natal Province
Page 54 of 317
FINAL_D1 Compiled By: JG Potgieter
Approved By: JG Potgieter COPYRIGHT WARNING ALL RIGHTS RESERVED. All information and conceptual designs contained within this document are the intellectual property of ENVIRONGAKA (Pty) Ltd. This document and/or the information contained herein may not be used, stored, reproduced, or copied in any manner, without the prior written consent of ENVIRONGAKA (Pty) Ltd. This document and/or the information and conceptual designs may not be disclosed or displayed to any third party without the prior written consent of ENVIRONGAKA (Pty) Ltd.
EnviroNgaka
4.3.1 Scenario 1: Baseline Conditions (Abnormal Conditions) Abnormal emissions for start-up, shut-down, maintenance and other abnormal emission conditions for these sources are in terms of APCE availability of the relevant processes. The estimated emission concentrations from these point sources under Start-up, Shut-down, Maintenance and other abnormal emission conditions are therefore provided for Scenario 1 below. Please also refer Appendix D for additional emission inventory related information. For Scenario 1, the estimated concentrations emitted from each point source under abnormal situations, are provided in Table 4.3.1-1.
Table 4.3.1-1: Abnormal Operating Conditions Point Source Emissions – Scenario 1
Point Source Number Point Source Name
Average Emission Concentration
Duration of Emissions PM10 PM2.5 SO2 NOX CO NH3 Mn Averaging
Period (mg/Nm3) (mg/Nm3) (mg/Nm3) (mg/Nm3) (mg/Nm3) (mg/Nm3) (µg/Nm3)
P14 F1 Uncontrolled RG Vent 01 2328 1862 84 209 1047 0.00 871251 10min Intermittent P15 F1 Uncontrolled RG Vent 02 2328 1862 84 209 1047 0.00 871251 10min Intermittent P16 F2 Uncontrolled RG Vent 01 2328 1862 84 209 1047 0.00 871251 10min Intermittent P17 F2 Uncontrolled RG Vent 02 2328 1862 84 209 1047 0.00 871251 10min Intermittent P18 F3 Rawgas Stack 0 0 0 n/av 0 0.00 ERR 10min Intermittent P19 F4 Rawgas Stack 0 0 0 n/av 0 0.00 ERR 10min Intermittent P20 F5 Uncontrolled RG Vent 01 3492 2793 222 1109 1571 0.00 1306877 10min Intermittent P21 F5 Uncontrolled RG Vent 02 3492 2793 222 1109 1571 0.00 1306877 10min Intermittent P22 F5 Uncontrolled RG Vent 03 3492 2793 222 1109 1571 0.00 1306877 10min Intermittent P23 F6 Rawgas Stack 5882 1765 500 400 184649 0.00 1568079 10min Intermittent FCR CRA-Uncontrolled 01/10 15882 13438 269 122 1141 0.00 9007627 10min Intermittent
FF1 F1-Uncontrolled Tap equivalent 1 point (to model as 10)
2 2 1 0 16 n/ap 94 10min Intermittent
FF2 F2-Uncontrolled Tap equivalent 1 point (to model as 10)
2 2 1 0 16 n/ap 94 10min Intermittent
FF3 F3-Uncontrolled Tap equivalent 1 point (to model as 10) 2 2 1 0 16 n/ap 94 10min Intermittent
FF4 F4-Uncontrolled Tap equivalent 1 point (to model as 10) 2 2 1 0 16 n/ap 94 10min Intermittent
FF5 F5-Uncontrolled Tap equivalent 1 point (to model as 10) 2 2 1 0 16 n/ap 94 10min Intermittent
FF6 F6-Uncontrolled Tap equivalent 1 point (to model as 10) 2 2 1 0 16 n/ap 94 10min Intermittent
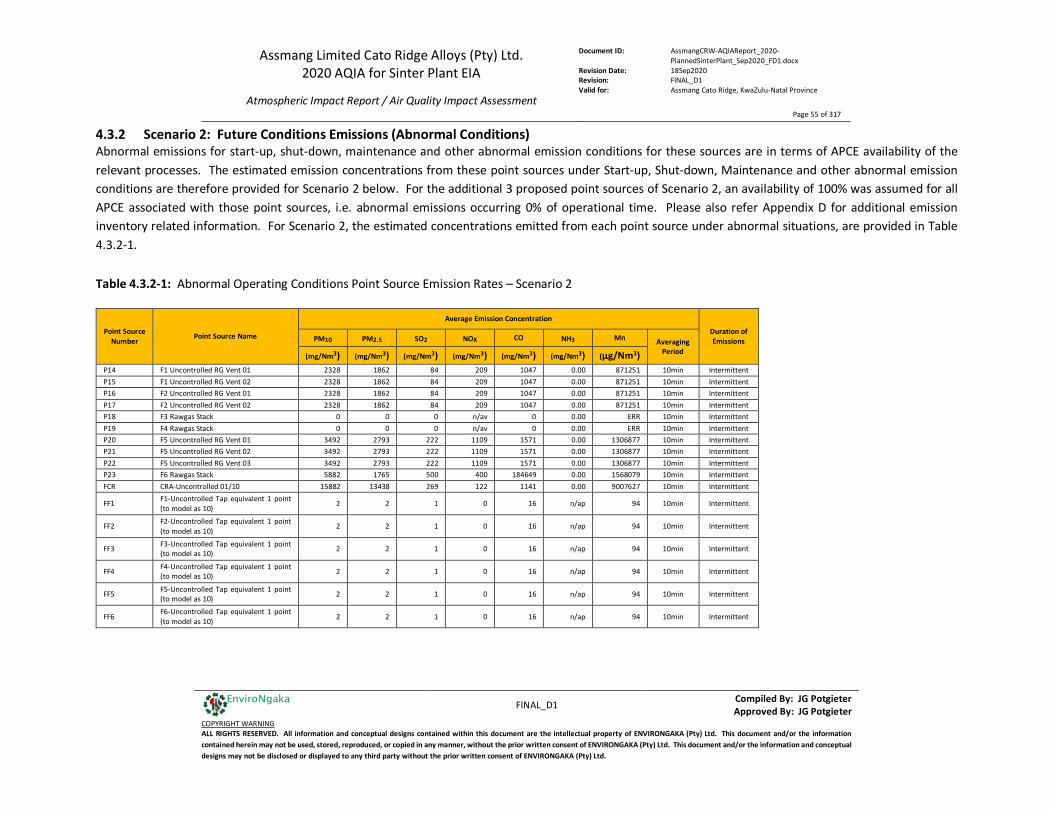
Assmang Limited Cato Ridge Alloys (Pty) Ltd. 2020 AQIA for Sinter Plant EIA
Atmospheric Impact Report / Air Quality Impact Assessment
Document ID: AssmangCRW-AQIAReport_2020-PlannedSinterPlant_Sep2020_FD1.docx
Revision Date: 18Sep2020 Revision: FINAL_D1 Valid for: Assmang Cato Ridge, KwaZulu-Natal Province
Page 55 of 317
FINAL_D1 Compiled By: JG Potgieter
Approved By: JG Potgieter COPYRIGHT WARNING ALL RIGHTS RESERVED. All information and conceptual designs contained within this document are the intellectual property of ENVIRONGAKA (Pty) Ltd. This document and/or the information contained herein may not be used, stored, reproduced, or copied in any manner, without the prior written consent of ENVIRONGAKA (Pty) Ltd. This document and/or the information and conceptual designs may not be disclosed or displayed to any third party without the prior written consent of ENVIRONGAKA (Pty) Ltd.
EnviroNgaka
4.3.2 Scenario 2: Future Conditions Emissions (Abnormal Conditions) Abnormal emissions for start-up, shut-down, maintenance and other abnormal emission conditions for these sources are in terms of APCE availability of the relevant processes. The estimated emission concentrations from these point sources under Start-up, Shut-down, Maintenance and other abnormal emission conditions are therefore provided for Scenario 2 below. For the additional 3 proposed point sources of Scenario 2, an availability of 100% was assumed for all APCE associated with those point sources, i.e. abnormal emissions occurring 0% of operational time. Please also refer Appendix D for additional emission inventory related information. For Scenario 2, the estimated concentrations emitted from each point source under abnormal situations, are provided in Table 4.3.2-1.
Table 4.3.2-1: Abnormal Operating Conditions Point Source Emission Rates – Scenario 2
Point Source Number
Point Source Name
Average Emission Concentration
Duration of Emissions PM10 PM2.5 SO2 NOX CO NH3 Mn Averaging
Period (mg/Nm3) (mg/Nm3) (mg/Nm3) (mg/Nm3) (mg/Nm3) (mg/Nm3) (µg/Nm3)
P14 F1 Uncontrolled RG Vent 01 2328 1862 84 209 1047 0.00 871251 10min Intermittent P15 F1 Uncontrolled RG Vent 02 2328 1862 84 209 1047 0.00 871251 10min Intermittent P16 F2 Uncontrolled RG Vent 01 2328 1862 84 209 1047 0.00 871251 10min Intermittent P17 F2 Uncontrolled RG Vent 02 2328 1862 84 209 1047 0.00 871251 10min Intermittent P18 F3 Rawgas Stack 0 0 0 n/av 0 0.00 ERR 10min Intermittent P19 F4 Rawgas Stack 0 0 0 n/av 0 0.00 ERR 10min Intermittent P20 F5 Uncontrolled RG Vent 01 3492 2793 222 1109 1571 0.00 1306877 10min Intermittent P21 F5 Uncontrolled RG Vent 02 3492 2793 222 1109 1571 0.00 1306877 10min Intermittent P22 F5 Uncontrolled RG Vent 03 3492 2793 222 1109 1571 0.00 1306877 10min Intermittent P23 F6 Rawgas Stack 5882 1765 500 400 184649 0.00 1568079 10min Intermittent FCR CRA-Uncontrolled 01/10 15882 13438 269 122 1141 0.00 9007627 10min Intermittent
FF1 F1-Uncontrolled Tap equivalent 1 point (to model as 10)
2 2 1 0 16 n/ap 94 10min Intermittent
FF2 F2-Uncontrolled Tap equivalent 1 point (to model as 10)
2 2 1 0 16 n/ap 94 10min Intermittent
FF3 F3-Uncontrolled Tap equivalent 1 point (to model as 10) 2 2 1 0 16 n/ap 94 10min Intermittent
FF4 F4-Uncontrolled Tap equivalent 1 point (to model as 10) 2 2 1 0 16 n/ap 94 10min Intermittent
FF5 F5-Uncontrolled Tap equivalent 1 point (to model as 10) 2 2 1 0 16 n/ap 94 10min Intermittent
FF6 F6-Uncontrolled Tap equivalent 1 point (to model as 10) 2 2 1 0 16 n/ap 94 10min Intermittent

Assmang Limited Cato Ridge Alloys (Pty) Ltd. 2020 AQIA for Sinter Plant EIA
Atmospheric Impact Report / Air Quality Impact Assessment
Document ID: AssmangCRW-AQIAReport_2020-PlannedSinterPlant_Sep2020_FD1.docx
Revision Date: 18Sep2020 Revision: FINAL_D1 Valid for: Assmang Cato Ridge, KwaZulu-Natal Province
Page 56 of 317
FINAL_D1 Compiled By: JG Potgieter
Approved By: JG Potgieter COPYRIGHT WARNING ALL RIGHTS RESERVED. All information and conceptual designs contained within this document are the intellectual property of ENVIRONGAKA (Pty) Ltd. This document and/or the information contained herein may not be used, stored, reproduced, or copied in any manner, without the prior written consent of ENVIRONGAKA (Pty) Ltd. This document and/or the information and conceptual designs may not be disclosed or displayed to any third party without the prior written consent of ENVIRONGAKA (Pty) Ltd.
EnviroNgaka
4.4 Fugitive / Secondary Emissions (area and or line sources) Secondary emission sources such as stockpiles, the handling (loading/unloading) of material, crushing and screening operations and gravel roads which give rise to secondary particulate matter emissions are present at the operation and therefore included in this study. The fugitive / secondary emissions at the Enterprise emanate from the following sources/operations:
• Raw Materials / Waste Storage facilities (loading / unloading); • Final product processing and stockpiles (crushing / screening); • Vehicles and roads.
The main sources of secondary emissions from the processes / plants are the roads, waste disposal / slag storage, as well as the material storage areas. When relevant/applicable secondary emissions from secondary area and or line sources such as stockpiles and gravel roads, are assessed in accordance with the information and methodology provided in Appendix D of this document in terms of the expected quantities of material consumed or processed and moved for different scenarios considered. Please refer to respectively to Figure 4.2 and 4.3, for process/plant secondary sources; material processing, storage/material handling area sources and roads applicable for all scenarios. It is also noted that the following prefixes are used in the tables which follow for the sources under the “Source Code” column: “A__A”: Area Source applicable to Scenario 1, and 2; “A__L”: Line Source applicable to Scenario 1, and 2; “2__A”: Area Source applicable to Scenario 2; “2__L”: Line Source applicable to Scenario 2;
Figure 4.2: Secondary Emissions (Area Sources) – Process/Plant Secondary Sources (applicable to all Scenarios)
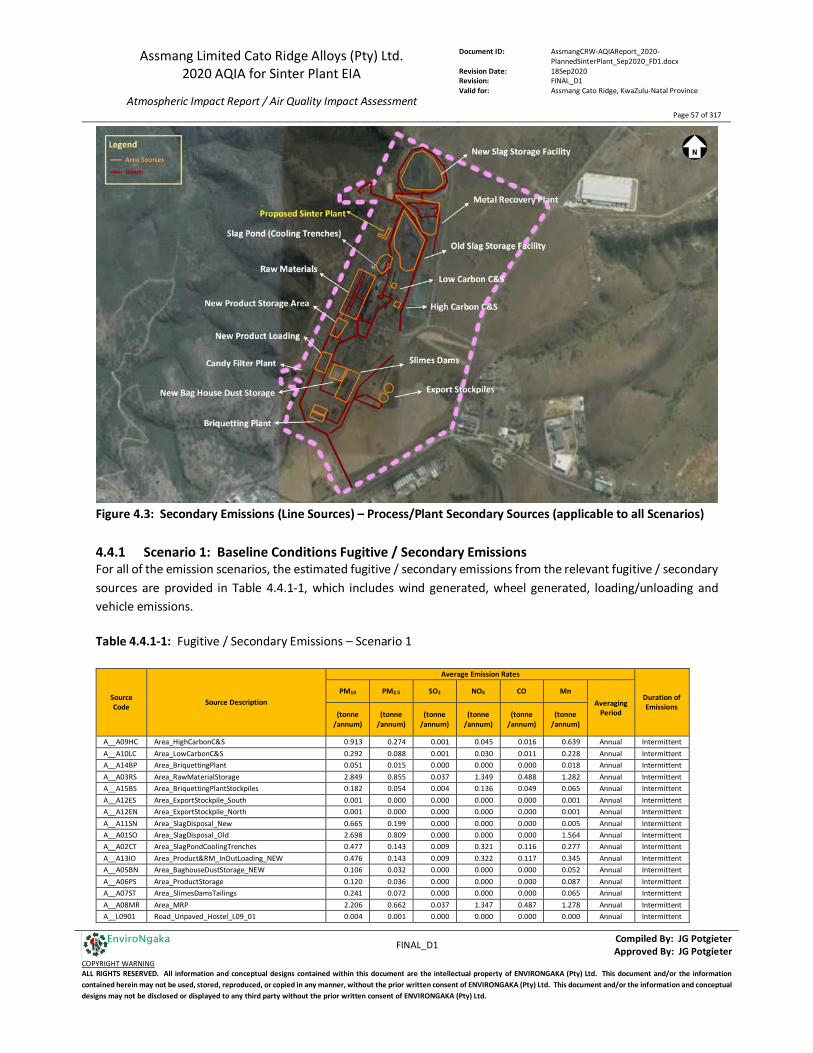
Assmang Limited Cato Ridge Alloys (Pty) Ltd. 2020 AQIA for Sinter Plant EIA
Atmospheric Impact Report / Air Quality Impact Assessment
Document ID: AssmangCRW-AQIAReport_2020-PlannedSinterPlant_Sep2020_FD1.docx
Revision Date: 18Sep2020 Revision: FINAL_D1 Valid for: Assmang Cato Ridge, KwaZulu-Natal Province
Page 57 of 317
FINAL_D1 Compiled By: JG Potgieter
Approved By: JG Potgieter COPYRIGHT WARNING ALL RIGHTS RESERVED. All information and conceptual designs contained within this document are the intellectual property of ENVIRONGAKA (Pty) Ltd. This document and/or the information contained herein may not be used, stored, reproduced, or copied in any manner, without the prior written consent of ENVIRONGAKA (Pty) Ltd. This document and/or the information and conceptual designs may not be disclosed or displayed to any third party without the prior written consent of ENVIRONGAKA (Pty) Ltd.
EnviroNgaka
Figure 4.3: Secondary Emissions (Line Sources) – Process/Plant Secondary Sources (applicable to all Scenarios) 4.4.1 Scenario 1: Baseline Conditions Fugitive / Secondary Emissions For all of the emission scenarios, the estimated fugitive / secondary emissions from the relevant fugitive / secondary sources are provided in Table 4.4.1-1, which includes wind generated, wheel generated, loading/unloading and vehicle emissions. Table 4.4.1-1: Fugitive / Secondary Emissions – Scenario 1
Source Code Source Description
Average Emission Rates
Duration of Emissions
PM10 PM2.5 SO2 NOX CO Mn Averaging
Period (tonne /annum)
(tonne /annum)
(tonne /annum)
(tonne /annum)
(tonne /annum)
(tonne /annum)
A__A09HC Area_HighCarbonC&S 0.913 0.274 0.001 0.045 0.016 0.639 Annual Intermittent A__A10LC Area_LowCarbonC&S 0.292 0.088 0.001 0.030 0.011 0.228 Annual Intermittent A__A14BP Area_BriquettingPlant 0.051 0.015 0.000 0.000 0.000 0.018 Annual Intermittent A__A03RS Area_RawMaterialStorage 2.849 0.855 0.037 1.349 0.488 1.282 Annual Intermittent A__A15BS Area_BriquettingPlantStockpiles 0.182 0.054 0.004 0.136 0.049 0.065 Annual Intermittent A__A12ES Area_ExportStockpile_South 0.001 0.000 0.000 0.000 0.000 0.001 Annual Intermittent A__A12EN Area_ExportStockpile_North 0.001 0.000 0.000 0.000 0.000 0.001 Annual Intermittent A__A11SN Area_SlagDisposal_New 0.665 0.199 0.000 0.000 0.000 0.005 Annual Intermittent A__A01SO Area_SlagDisposal_Old 2.698 0.809 0.000 0.000 0.000 1.564 Annual Intermittent A__A02CT Area_SlagPondCoolingTrenches 0.477 0.143 0.009 0.321 0.116 0.277 Annual Intermittent A__A13IO Area_Product&RM_InOutLoading_NEW 0.476 0.143 0.009 0.322 0.117 0.345 Annual Intermittent A__A05BN Area_BaghouseDustStorage_NEW 0.106 0.032 0.000 0.000 0.000 0.052 Annual Intermittent A__A06PS Area_ProductStorage 0.120 0.036 0.000 0.000 0.000 0.087 Annual Intermittent A__A07ST Area_SlimesDamsTailings 0.241 0.072 0.000 0.000 0.000 0.065 Annual Intermittent A__A08MR Area_MRP 2.206 0.662 0.037 1.347 0.487 1.278 Annual Intermittent A__L0901 Road_Unpaved_Hostel_L09_01 0.004 0.001 0.000 0.000 0.000 0.000 Annual Intermittent
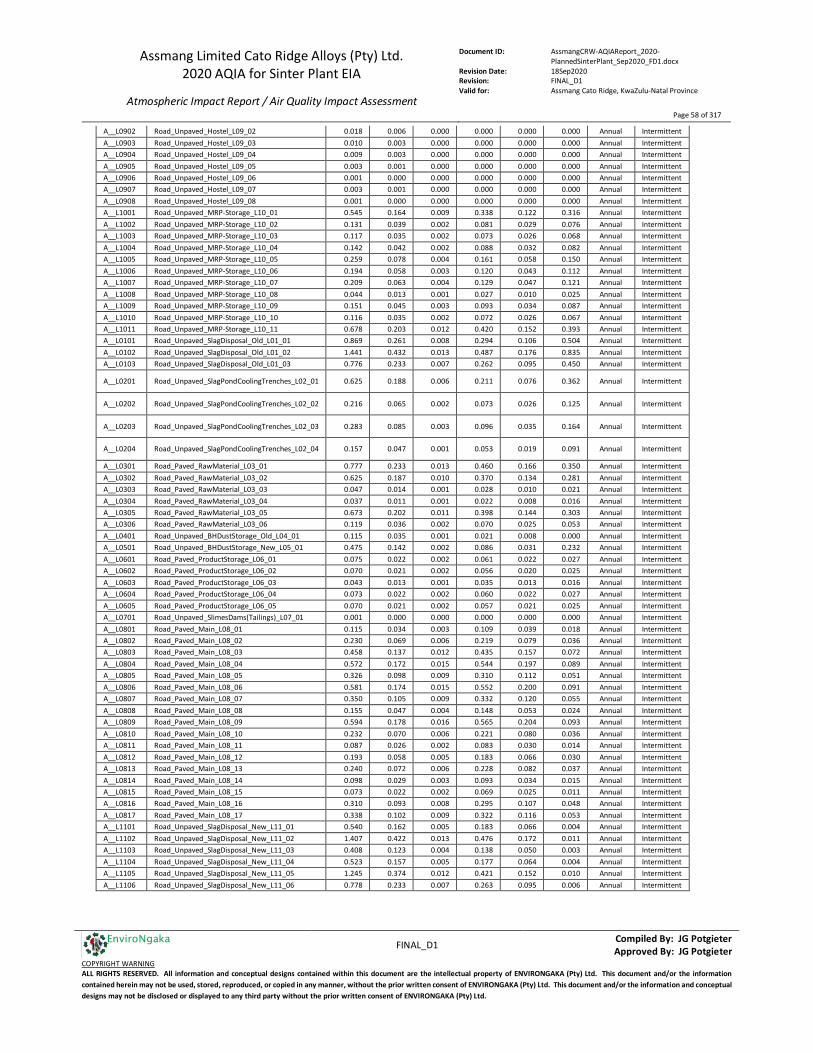
Assmang Limited Cato Ridge Alloys (Pty) Ltd. 2020 AQIA for Sinter Plant EIA
Atmospheric Impact Report / Air Quality Impact Assessment
Document ID: AssmangCRW-AQIAReport_2020-PlannedSinterPlant_Sep2020_FD1.docx
Revision Date: 18Sep2020 Revision: FINAL_D1 Valid for: Assmang Cato Ridge, KwaZulu-Natal Province
Page 58 of 317
FINAL_D1 Compiled By: JG Potgieter
Approved By: JG Potgieter COPYRIGHT WARNING ALL RIGHTS RESERVED. All information and conceptual designs contained within this document are the intellectual property of ENVIRONGAKA (Pty) Ltd. This document and/or the information contained herein may not be used, stored, reproduced, or copied in any manner, without the prior written consent of ENVIRONGAKA (Pty) Ltd. This document and/or the information and conceptual designs may not be disclosed or displayed to any third party without the prior written consent of ENVIRONGAKA (Pty) Ltd.
EnviroNgaka
A__L0902 Road_Unpaved_Hostel_L09_02 0.018 0.006 0.000 0.000 0.000 0.000 Annual Intermittent A__L0903 Road_Unpaved_Hostel_L09_03 0.010 0.003 0.000 0.000 0.000 0.000 Annual Intermittent A__L0904 Road_Unpaved_Hostel_L09_04 0.009 0.003 0.000 0.000 0.000 0.000 Annual Intermittent A__L0905 Road_Unpaved_Hostel_L09_05 0.003 0.001 0.000 0.000 0.000 0.000 Annual Intermittent A__L0906 Road_Unpaved_Hostel_L09_06 0.001 0.000 0.000 0.000 0.000 0.000 Annual Intermittent A__L0907 Road_Unpaved_Hostel_L09_07 0.003 0.001 0.000 0.000 0.000 0.000 Annual Intermittent A__L0908 Road_Unpaved_Hostel_L09_08 0.001 0.000 0.000 0.000 0.000 0.000 Annual Intermittent A__L1001 Road_Unpaved_MRP-Storage_L10_01 0.545 0.164 0.009 0.338 0.122 0.316 Annual Intermittent A__L1002 Road_Unpaved_MRP-Storage_L10_02 0.131 0.039 0.002 0.081 0.029 0.076 Annual Intermittent A__L1003 Road_Unpaved_MRP-Storage_L10_03 0.117 0.035 0.002 0.073 0.026 0.068 Annual Intermittent A__L1004 Road_Unpaved_MRP-Storage_L10_04 0.142 0.042 0.002 0.088 0.032 0.082 Annual Intermittent A__L1005 Road_Unpaved_MRP-Storage_L10_05 0.259 0.078 0.004 0.161 0.058 0.150 Annual Intermittent A__L1006 Road_Unpaved_MRP-Storage_L10_06 0.194 0.058 0.003 0.120 0.043 0.112 Annual Intermittent A__L1007 Road_Unpaved_MRP-Storage_L10_07 0.209 0.063 0.004 0.129 0.047 0.121 Annual Intermittent A__L1008 Road_Unpaved_MRP-Storage_L10_08 0.044 0.013 0.001 0.027 0.010 0.025 Annual Intermittent A__L1009 Road_Unpaved_MRP-Storage_L10_09 0.151 0.045 0.003 0.093 0.034 0.087 Annual Intermittent A__L1010 Road_Unpaved_MRP-Storage_L10_10 0.116 0.035 0.002 0.072 0.026 0.067 Annual Intermittent A__L1011 Road_Unpaved_MRP-Storage_L10_11 0.678 0.203 0.012 0.420 0.152 0.393 Annual Intermittent A__L0101 Road_Unpaved_SlagDisposal_Old_L01_01 0.869 0.261 0.008 0.294 0.106 0.504 Annual Intermittent A__L0102 Road_Unpaved_SlagDisposal_Old_L01_02 1.441 0.432 0.013 0.487 0.176 0.835 Annual Intermittent A__L0103 Road_Unpaved_SlagDisposal_Old_L01_03 0.776 0.233 0.007 0.262 0.095 0.450 Annual Intermittent
A__L0201 Road_Unpaved_SlagPondCoolingTrenches_L02_01 0.625 0.188 0.006 0.211 0.076 0.362 Annual Intermittent
A__L0202 Road_Unpaved_SlagPondCoolingTrenches_L02_02 0.216 0.065 0.002 0.073 0.026 0.125 Annual Intermittent
A__L0203 Road_Unpaved_SlagPondCoolingTrenches_L02_03 0.283 0.085 0.003 0.096 0.035 0.164 Annual Intermittent
A__L0204 Road_Unpaved_SlagPondCoolingTrenches_L02_04 0.157 0.047 0.001 0.053 0.019 0.091 Annual Intermittent
A__L0301 Road_Paved_RawMaterial_L03_01 0.777 0.233 0.013 0.460 0.166 0.350 Annual Intermittent A__L0302 Road_Paved_RawMaterial_L03_02 0.625 0.187 0.010 0.370 0.134 0.281 Annual Intermittent A__L0303 Road_Paved_RawMaterial_L03_03 0.047 0.014 0.001 0.028 0.010 0.021 Annual Intermittent A__L0304 Road_Paved_RawMaterial_L03_04 0.037 0.011 0.001 0.022 0.008 0.016 Annual Intermittent A__L0305 Road_Paved_RawMaterial_L03_05 0.673 0.202 0.011 0.398 0.144 0.303 Annual Intermittent A__L0306 Road_Paved_RawMaterial_L03_06 0.119 0.036 0.002 0.070 0.025 0.053 Annual Intermittent A__L0401 Road_Unpaved_BHDustStorage_Old_L04_01 0.115 0.035 0.001 0.021 0.008 0.000 Annual Intermittent A__L0501 Road_Unpaved_BHDustStorage_New_L05_01 0.475 0.142 0.002 0.086 0.031 0.232 Annual Intermittent A__L0601 Road_Paved_ProductStorage_L06_01 0.075 0.022 0.002 0.061 0.022 0.027 Annual Intermittent A__L0602 Road_Paved_ProductStorage_L06_02 0.070 0.021 0.002 0.056 0.020 0.025 Annual Intermittent A__L0603 Road_Paved_ProductStorage_L06_03 0.043 0.013 0.001 0.035 0.013 0.016 Annual Intermittent A__L0604 Road_Paved_ProductStorage_L06_04 0.073 0.022 0.002 0.060 0.022 0.027 Annual Intermittent A__L0605 Road_Paved_ProductStorage_L06_05 0.070 0.021 0.002 0.057 0.021 0.025 Annual Intermittent A__L0701 Road_Unpaved_SlimesDams(Tailings)_L07_01 0.001 0.000 0.000 0.000 0.000 0.000 Annual Intermittent A__L0801 Road_Paved_Main_L08_01 0.115 0.034 0.003 0.109 0.039 0.018 Annual Intermittent A__L0802 Road_Paved_Main_L08_02 0.230 0.069 0.006 0.219 0.079 0.036 Annual Intermittent A__L0803 Road_Paved_Main_L08_03 0.458 0.137 0.012 0.435 0.157 0.072 Annual Intermittent A__L0804 Road_Paved_Main_L08_04 0.572 0.172 0.015 0.544 0.197 0.089 Annual Intermittent A__L0805 Road_Paved_Main_L08_05 0.326 0.098 0.009 0.310 0.112 0.051 Annual Intermittent A__L0806 Road_Paved_Main_L08_06 0.581 0.174 0.015 0.552 0.200 0.091 Annual Intermittent A__L0807 Road_Paved_Main_L08_07 0.350 0.105 0.009 0.332 0.120 0.055 Annual Intermittent A__L0808 Road_Paved_Main_L08_08 0.155 0.047 0.004 0.148 0.053 0.024 Annual Intermittent A__L0809 Road_Paved_Main_L08_09 0.594 0.178 0.016 0.565 0.204 0.093 Annual Intermittent A__L0810 Road_Paved_Main_L08_10 0.232 0.070 0.006 0.221 0.080 0.036 Annual Intermittent A__L0811 Road_Paved_Main_L08_11 0.087 0.026 0.002 0.083 0.030 0.014 Annual Intermittent A__L0812 Road_Paved_Main_L08_12 0.193 0.058 0.005 0.183 0.066 0.030 Annual Intermittent A__L0813 Road_Paved_Main_L08_13 0.240 0.072 0.006 0.228 0.082 0.037 Annual Intermittent A__L0814 Road_Paved_Main_L08_14 0.098 0.029 0.003 0.093 0.034 0.015 Annual Intermittent A__L0815 Road_Paved_Main_L08_15 0.073 0.022 0.002 0.069 0.025 0.011 Annual Intermittent A__L0816 Road_Paved_Main_L08_16 0.310 0.093 0.008 0.295 0.107 0.048 Annual Intermittent A__L0817 Road_Paved_Main_L08_17 0.338 0.102 0.009 0.322 0.116 0.053 Annual Intermittent A__L1101 Road_Unpaved_SlagDisposal_New_L11_01 0.540 0.162 0.005 0.183 0.066 0.004 Annual Intermittent A__L1102 Road_Unpaved_SlagDisposal_New_L11_02 1.407 0.422 0.013 0.476 0.172 0.011 Annual Intermittent A__L1103 Road_Unpaved_SlagDisposal_New_L11_03 0.408 0.123 0.004 0.138 0.050 0.003 Annual Intermittent A__L1104 Road_Unpaved_SlagDisposal_New_L11_04 0.523 0.157 0.005 0.177 0.064 0.004 Annual Intermittent A__L1105 Road_Unpaved_SlagDisposal_New_L11_05 1.245 0.374 0.012 0.421 0.152 0.010 Annual Intermittent A__L1106 Road_Unpaved_SlagDisposal_New_L11_06 0.778 0.233 0.007 0.263 0.095 0.006 Annual Intermittent
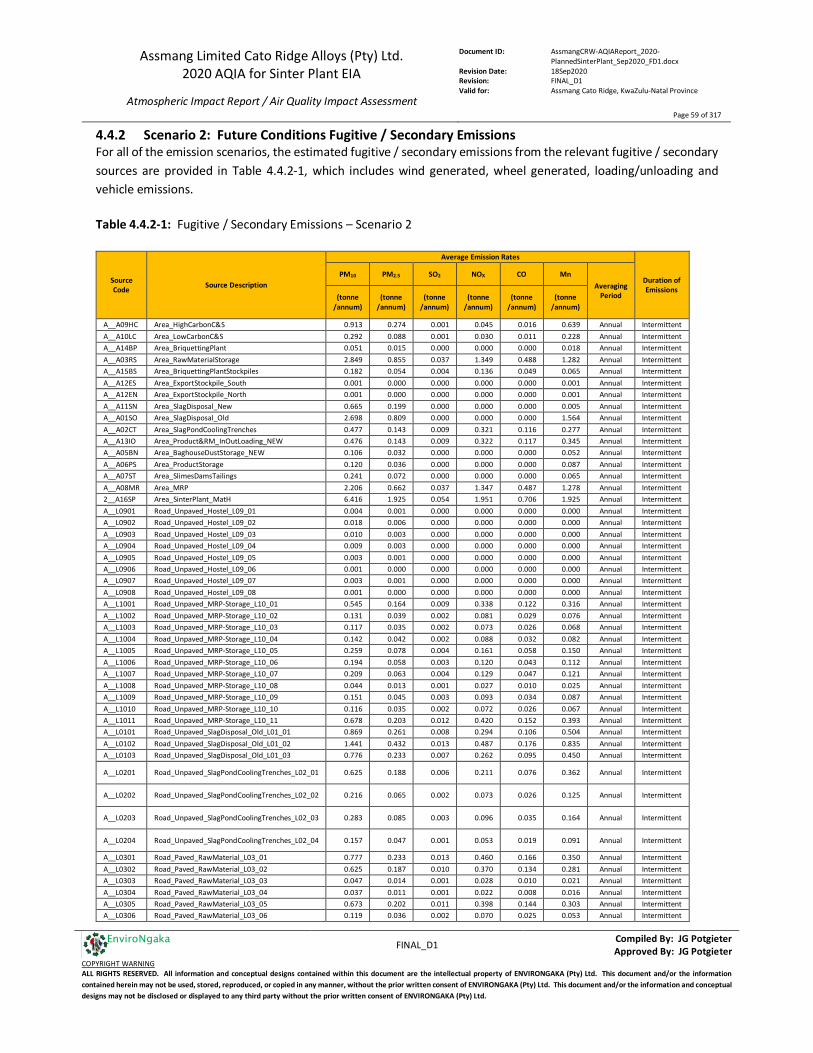
Assmang Limited Cato Ridge Alloys (Pty) Ltd. 2020 AQIA for Sinter Plant EIA
Atmospheric Impact Report / Air Quality Impact Assessment
Document ID: AssmangCRW-AQIAReport_2020-PlannedSinterPlant_Sep2020_FD1.docx
Revision Date: 18Sep2020 Revision: FINAL_D1 Valid for: Assmang Cato Ridge, KwaZulu-Natal Province
Page 59 of 317
FINAL_D1 Compiled By: JG Potgieter
Approved By: JG Potgieter COPYRIGHT WARNING ALL RIGHTS RESERVED. All information and conceptual designs contained within this document are the intellectual property of ENVIRONGAKA (Pty) Ltd. This document and/or the information contained herein may not be used, stored, reproduced, or copied in any manner, without the prior written consent of ENVIRONGAKA (Pty) Ltd. This document and/or the information and conceptual designs may not be disclosed or displayed to any third party without the prior written consent of ENVIRONGAKA (Pty) Ltd.
EnviroNgaka
4.4.2 Scenario 2: Future Conditions Fugitive / Secondary Emissions For all of the emission scenarios, the estimated fugitive / secondary emissions from the relevant fugitive / secondary sources are provided in Table 4.4.2-1, which includes wind generated, wheel generated, loading/unloading and vehicle emissions. Table 4.4.2-1: Fugitive / Secondary Emissions – Scenario 2
Source Code Source Description
Average Emission Rates
Duration of Emissions
PM10 PM2.5 SO2 NOX CO Mn Averaging
Period (tonne /annum)
(tonne /annum)
(tonne /annum)
(tonne /annum)
(tonne /annum)
(tonne /annum)
A__A09HC Area_HighCarbonC&S 0.913 0.274 0.001 0.045 0.016 0.639 Annual Intermittent A__A10LC Area_LowCarbonC&S 0.292 0.088 0.001 0.030 0.011 0.228 Annual Intermittent A__A14BP Area_BriquettingPlant 0.051 0.015 0.000 0.000 0.000 0.018 Annual Intermittent A__A03RS Area_RawMaterialStorage 2.849 0.855 0.037 1.349 0.488 1.282 Annual Intermittent A__A15BS Area_BriquettingPlantStockpiles 0.182 0.054 0.004 0.136 0.049 0.065 Annual Intermittent A__A12ES Area_ExportStockpile_South 0.001 0.000 0.000 0.000 0.000 0.001 Annual Intermittent A__A12EN Area_ExportStockpile_North 0.001 0.000 0.000 0.000 0.000 0.001 Annual Intermittent A__A11SN Area_SlagDisposal_New 0.665 0.199 0.000 0.000 0.000 0.005 Annual Intermittent A__A01SO Area_SlagDisposal_Old 2.698 0.809 0.000 0.000 0.000 1.564 Annual Intermittent A__A02CT Area_SlagPondCoolingTrenches 0.477 0.143 0.009 0.321 0.116 0.277 Annual Intermittent A__A13IO Area_Product&RM_InOutLoading_NEW 0.476 0.143 0.009 0.322 0.117 0.345 Annual Intermittent A__A05BN Area_BaghouseDustStorage_NEW 0.106 0.032 0.000 0.000 0.000 0.052 Annual Intermittent A__A06PS Area_ProductStorage 0.120 0.036 0.000 0.000 0.000 0.087 Annual Intermittent A__A07ST Area_SlimesDamsTailings 0.241 0.072 0.000 0.000 0.000 0.065 Annual Intermittent A__A08MR Area_MRP 2.206 0.662 0.037 1.347 0.487 1.278 Annual Intermittent 2__A16SP Area_SinterPlant_MatH 6.416 1.925 0.054 1.951 0.706 1.925 Annual Intermittent A__L0901 Road_Unpaved_Hostel_L09_01 0.004 0.001 0.000 0.000 0.000 0.000 Annual Intermittent A__L0902 Road_Unpaved_Hostel_L09_02 0.018 0.006 0.000 0.000 0.000 0.000 Annual Intermittent A__L0903 Road_Unpaved_Hostel_L09_03 0.010 0.003 0.000 0.000 0.000 0.000 Annual Intermittent A__L0904 Road_Unpaved_Hostel_L09_04 0.009 0.003 0.000 0.000 0.000 0.000 Annual Intermittent A__L0905 Road_Unpaved_Hostel_L09_05 0.003 0.001 0.000 0.000 0.000 0.000 Annual Intermittent A__L0906 Road_Unpaved_Hostel_L09_06 0.001 0.000 0.000 0.000 0.000 0.000 Annual Intermittent A__L0907 Road_Unpaved_Hostel_L09_07 0.003 0.001 0.000 0.000 0.000 0.000 Annual Intermittent A__L0908 Road_Unpaved_Hostel_L09_08 0.001 0.000 0.000 0.000 0.000 0.000 Annual Intermittent A__L1001 Road_Unpaved_MRP-Storage_L10_01 0.545 0.164 0.009 0.338 0.122 0.316 Annual Intermittent A__L1002 Road_Unpaved_MRP-Storage_L10_02 0.131 0.039 0.002 0.081 0.029 0.076 Annual Intermittent A__L1003 Road_Unpaved_MRP-Storage_L10_03 0.117 0.035 0.002 0.073 0.026 0.068 Annual Intermittent A__L1004 Road_Unpaved_MRP-Storage_L10_04 0.142 0.042 0.002 0.088 0.032 0.082 Annual Intermittent A__L1005 Road_Unpaved_MRP-Storage_L10_05 0.259 0.078 0.004 0.161 0.058 0.150 Annual Intermittent A__L1006 Road_Unpaved_MRP-Storage_L10_06 0.194 0.058 0.003 0.120 0.043 0.112 Annual Intermittent A__L1007 Road_Unpaved_MRP-Storage_L10_07 0.209 0.063 0.004 0.129 0.047 0.121 Annual Intermittent A__L1008 Road_Unpaved_MRP-Storage_L10_08 0.044 0.013 0.001 0.027 0.010 0.025 Annual Intermittent A__L1009 Road_Unpaved_MRP-Storage_L10_09 0.151 0.045 0.003 0.093 0.034 0.087 Annual Intermittent A__L1010 Road_Unpaved_MRP-Storage_L10_10 0.116 0.035 0.002 0.072 0.026 0.067 Annual Intermittent A__L1011 Road_Unpaved_MRP-Storage_L10_11 0.678 0.203 0.012 0.420 0.152 0.393 Annual Intermittent A__L0101 Road_Unpaved_SlagDisposal_Old_L01_01 0.869 0.261 0.008 0.294 0.106 0.504 Annual Intermittent A__L0102 Road_Unpaved_SlagDisposal_Old_L01_02 1.441 0.432 0.013 0.487 0.176 0.835 Annual Intermittent A__L0103 Road_Unpaved_SlagDisposal_Old_L01_03 0.776 0.233 0.007 0.262 0.095 0.450 Annual Intermittent
A__L0201 Road_Unpaved_SlagPondCoolingTrenches_L02_01 0.625 0.188 0.006 0.211 0.076 0.362 Annual Intermittent
A__L0202 Road_Unpaved_SlagPondCoolingTrenches_L02_02 0.216 0.065 0.002 0.073 0.026 0.125 Annual Intermittent
A__L0203 Road_Unpaved_SlagPondCoolingTrenches_L02_03 0.283 0.085 0.003 0.096 0.035 0.164 Annual Intermittent
A__L0204 Road_Unpaved_SlagPondCoolingTrenches_L02_04 0.157 0.047 0.001 0.053 0.019 0.091 Annual Intermittent
A__L0301 Road_Paved_RawMaterial_L03_01 0.777 0.233 0.013 0.460 0.166 0.350 Annual Intermittent A__L0302 Road_Paved_RawMaterial_L03_02 0.625 0.187 0.010 0.370 0.134 0.281 Annual Intermittent A__L0303 Road_Paved_RawMaterial_L03_03 0.047 0.014 0.001 0.028 0.010 0.021 Annual Intermittent A__L0304 Road_Paved_RawMaterial_L03_04 0.037 0.011 0.001 0.022 0.008 0.016 Annual Intermittent A__L0305 Road_Paved_RawMaterial_L03_05 0.673 0.202 0.011 0.398 0.144 0.303 Annual Intermittent A__L0306 Road_Paved_RawMaterial_L03_06 0.119 0.036 0.002 0.070 0.025 0.053 Annual Intermittent

Assmang Limited Cato Ridge Alloys (Pty) Ltd. 2020 AQIA for Sinter Plant EIA
Atmospheric Impact Report / Air Quality Impact Assessment
Document ID: AssmangCRW-AQIAReport_2020-PlannedSinterPlant_Sep2020_FD1.docx
Revision Date: 18Sep2020 Revision: FINAL_D1 Valid for: Assmang Cato Ridge, KwaZulu-Natal Province
Page 60 of 317
FINAL_D1 Compiled By: JG Potgieter
Approved By: JG Potgieter COPYRIGHT WARNING ALL RIGHTS RESERVED. All information and conceptual designs contained within this document are the intellectual property of ENVIRONGAKA (Pty) Ltd. This document and/or the information contained herein may not be used, stored, reproduced, or copied in any manner, without the prior written consent of ENVIRONGAKA (Pty) Ltd. This document and/or the information and conceptual designs may not be disclosed or displayed to any third party without the prior written consent of ENVIRONGAKA (Pty) Ltd.
EnviroNgaka
A__L0401 Road_Unpaved_BHDustStorage_Old_L04_01 0.115 0.035 0.001 0.021 0.008 0.000 Annual Intermittent A__L0501 Road_Unpaved_BHDustStorage_New_L05_01 0.475 0.142 0.002 0.086 0.031 0.232 Annual Intermittent A__L0601 Road_Paved_ProductStorage_L06_01 0.075 0.022 0.002 0.061 0.022 0.027 Annual Intermittent A__L0602 Road_Paved_ProductStorage_L06_02 0.070 0.021 0.002 0.056 0.020 0.025 Annual Intermittent A__L0603 Road_Paved_ProductStorage_L06_03 0.043 0.013 0.001 0.035 0.013 0.016 Annual Intermittent A__L0604 Road_Paved_ProductStorage_L06_04 0.073 0.022 0.002 0.060 0.022 0.027 Annual Intermittent A__L0605 Road_Paved_ProductStorage_L06_05 0.070 0.021 0.002 0.057 0.021 0.025 Annual Intermittent A__L0701 Road_Unpaved_SlimesDams(Tailings)_L07_01 0.001 0.000 0.000 0.000 0.000 0.000 Annual Intermittent A__L0801 Road_Paved_Main_L08_01 0.115 0.034 0.003 0.109 0.039 0.018 Annual Intermittent A__L0802 Road_Paved_Main_L08_02 0.230 0.069 0.006 0.219 0.079 0.036 Annual Intermittent A__L0803 Road_Paved_Main_L08_03 0.458 0.137 0.012 0.435 0.157 0.072 Annual Intermittent A__L0804 Road_Paved_Main_L08_04 0.572 0.172 0.015 0.544 0.197 0.089 Annual Intermittent A__L0805 Road_Paved_Main_L08_05 0.326 0.098 0.009 0.310 0.112 0.051 Annual Intermittent A__L0806 Road_Paved_Main_L08_06 0.581 0.174 0.015 0.552 0.200 0.091 Annual Intermittent A__L0807 Road_Paved_Main_L08_07 0.350 0.105 0.009 0.332 0.120 0.055 Annual Intermittent A__L0808 Road_Paved_Main_L08_08 0.155 0.047 0.004 0.148 0.053 0.024 Annual Intermittent A__L0809 Road_Paved_Main_L08_09 0.594 0.178 0.016 0.565 0.204 0.093 Annual Intermittent A__L0810 Road_Paved_Main_L08_10 0.232 0.070 0.006 0.221 0.080 0.036 Annual Intermittent A__L0811 Road_Paved_Main_L08_11 0.087 0.026 0.002 0.083 0.030 0.014 Annual Intermittent A__L0812 Road_Paved_Main_L08_12 0.193 0.058 0.005 0.183 0.066 0.030 Annual Intermittent A__L0813 Road_Paved_Main_L08_13 0.240 0.072 0.006 0.228 0.082 0.037 Annual Intermittent A__L0814 Road_Paved_Main_L08_14 0.098 0.029 0.003 0.093 0.034 0.015 Annual Intermittent A__L0815 Road_Paved_Main_L08_15 0.073 0.022 0.002 0.069 0.025 0.011 Annual Intermittent A__L0816 Road_Paved_Main_L08_16 0.310 0.093 0.008 0.295 0.107 0.048 Annual Intermittent A__L0817 Road_Paved_Main_L08_17 0.338 0.102 0.009 0.322 0.116 0.053 Annual Intermittent A__L1101 Road_Unpaved_SlagDisposal_New_L11_01 0.540 0.162 0.005 0.183 0.066 0.004 Annual Intermittent A__L1102 Road_Unpaved_SlagDisposal_New_L11_02 1.407 0.422 0.013 0.476 0.172 0.011 Annual Intermittent A__L1103 Road_Unpaved_SlagDisposal_New_L11_03 0.408 0.123 0.004 0.138 0.050 0.003 Annual Intermittent A__L1104 Road_Unpaved_SlagDisposal_New_L11_04 0.523 0.157 0.005 0.177 0.064 0.004 Annual Intermittent A__L1105 Road_Unpaved_SlagDisposal_New_L11_05 1.245 0.374 0.012 0.421 0.152 0.010 Annual Intermittent A__L1106 Road_Unpaved_SlagDisposal_New_L11_06 0.778 0.233 0.007 0.263 0.095 0.006 Annual Intermittent

Assmang Limited Cato Ridge Alloys (Pty) Ltd. 2020 AQIA for Sinter Plant EIA
Atmospheric Impact Report / Air Quality Impact Assessment
Document ID: AssmangCRW-AQIAReport_2020-PlannedSinterPlant_Sep2020_FD1.docx
Revision Date: 18Sep2020 Revision: FINAL_D1 Valid for: Assmang Cato Ridge, KwaZulu-Natal Province
Page 61 of 317
FINAL_D1 Compiled By: JG Potgieter
Approved By: JG Potgieter COPYRIGHT WARNING ALL RIGHTS RESERVED. All information and conceptual designs contained within this document are the intellectual property of ENVIRONGAKA (Pty) Ltd. This document and/or the information contained herein may not be used, stored, reproduced, or copied in any manner, without the prior written consent of ENVIRONGAKA (Pty) Ltd. This document and/or the information and conceptual designs may not be disclosed or displayed to any third party without the prior written consent of ENVIRONGAKA (Pty) Ltd.
EnviroNgaka
4.5 Emergency incidents Table 4.5-1 below provides a summary of the emergency incidents during the last 5 years which resulted in atmospheric emissions. Table 4.5-1: Emergency incidents
Emergency Incidents Description Nature & Cause Actions undertaken Immediately to Minimise Impact Actions undertaken Subsequently to Reduce Likelihood of
Reoccurrence Failure of APCE a) Problems with fume extraction;
b) Problems with scrubbers; c) Problems with baghouses;
1) Corrective action taken during operation; 2) If problem persists unit process is stopped; 3) Problem is investigated and rectified;
Reasons for incidents vary and actions are undertaken to reduce likelihood of re-occurrence following investigations
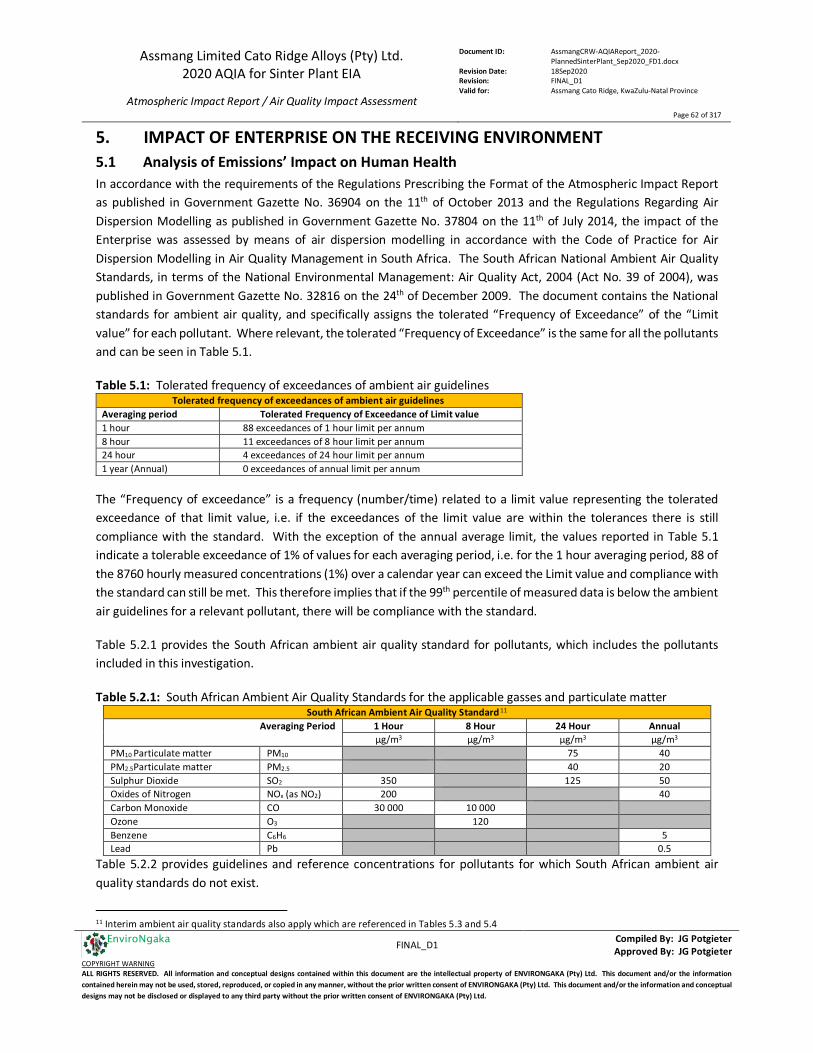
Assmang Limited Cato Ridge Alloys (Pty) Ltd. 2020 AQIA for Sinter Plant EIA
Atmospheric Impact Report / Air Quality Impact Assessment
Document ID: AssmangCRW-AQIAReport_2020-PlannedSinterPlant_Sep2020_FD1.docx
Revision Date: 18Sep2020 Revision: FINAL_D1 Valid for: Assmang Cato Ridge, KwaZulu-Natal Province
Page 62 of 317
FINAL_D1 Compiled By: JG Potgieter
Approved By: JG Potgieter COPYRIGHT WARNING ALL RIGHTS RESERVED. All information and conceptual designs contained within this document are the intellectual property of ENVIRONGAKA (Pty) Ltd. This document and/or the information contained herein may not be used, stored, reproduced, or copied in any manner, without the prior written consent of ENVIRONGAKA (Pty) Ltd. This document and/or the information and conceptual designs may not be disclosed or displayed to any third party without the prior written consent of ENVIRONGAKA (Pty) Ltd.
EnviroNgaka
5. IMPACT OF ENTERPRISE ON THE RECEIVING ENVIRONMENT 5.1 Analysis of Emissions’ Impact on Human Health In accordance with the requirements of the Regulations Prescribing the Format of the Atmospheric Impact Report as published in Government Gazette No. 36904 on the 11th of October 2013 and the Regulations Regarding Air Dispersion Modelling as published in Government Gazette No. 37804 on the 11th of July 2014, the impact of the Enterprise was assessed by means of air dispersion modelling in accordance with the Code of Practice for Air Dispersion Modelling in Air Quality Management in South Africa. The South African National Ambient Air Quality Standards, in terms of the National Environmental Management: Air Quality Act, 2004 (Act No. 39 of 2004), was published in Government Gazette No. 32816 on the 24th of December 2009. The document contains the National standards for ambient air quality, and specifically assigns the tolerated “Frequency of Exceedance” of the “Limit value” for each pollutant. Where relevant, the tolerated “Frequency of Exceedance” is the same for all the pollutants and can be seen in Table 5.1.
Table 5.1: Tolerated frequency of exceedances of ambient air guidelines Tolerated frequency of exceedances of ambient air guidelines
Averaging period Tolerated Frequency of Exceedance of Limit value 1 hour 88 exceedances of 1 hour limit per annum 8 hour 11 exceedances of 8 hour limit per annum 24 hour 4 exceedances of 24 hour limit per annum 1 year (Annual) 0 exceedances of annual limit per annum
The “Frequency of exceedance” is a frequency (number/time) related to a limit value representing the tolerated exceedance of that limit value, i.e. if the exceedances of the limit value are within the tolerances there is still compliance with the standard. With the exception of the annual average limit, the values reported in Table 5.1 indicate a tolerable exceedance of 1% of values for each averaging period, i.e. for the 1 hour averaging period, 88 of the 8760 hourly measured concentrations (1%) over a calendar year can exceed the Limit value and compliance with the standard can still be met. This therefore implies that if the 99th percentile of measured data is below the ambient air guidelines for a relevant pollutant, there will be compliance with the standard.
Table 5.2.1 provides the South African ambient air quality standard for pollutants, which includes the pollutants included in this investigation.
Table 5.2.1: South African Ambient Air Quality Standards for the applicable gasses and particulate matter South African Ambient Air Quality Standard 11
Averaging Period 1 Hour 8 Hour 24 Hour Annual μg/m3 μg/m3 μg/m3 μg/m3
PM10 Particulate matter PM10 75 40 PM2.5Particulate matter PM2.5 40 20 Sulphur Dioxide SO2 350 125 50 Oxides of Nitrogen NOx (as NO2) 200 40 Carbon Monoxide CO 30 000 10 000 Ozone O3 120 Benzene C6H6 5 Lead Pb 0.5
Table 5.2.2 provides guidelines and reference concentrations for pollutants for which South African ambient air quality standards do not exist.
11 Interim ambient air quality standards also apply which are referenced in Tables 5.3 and 5.4
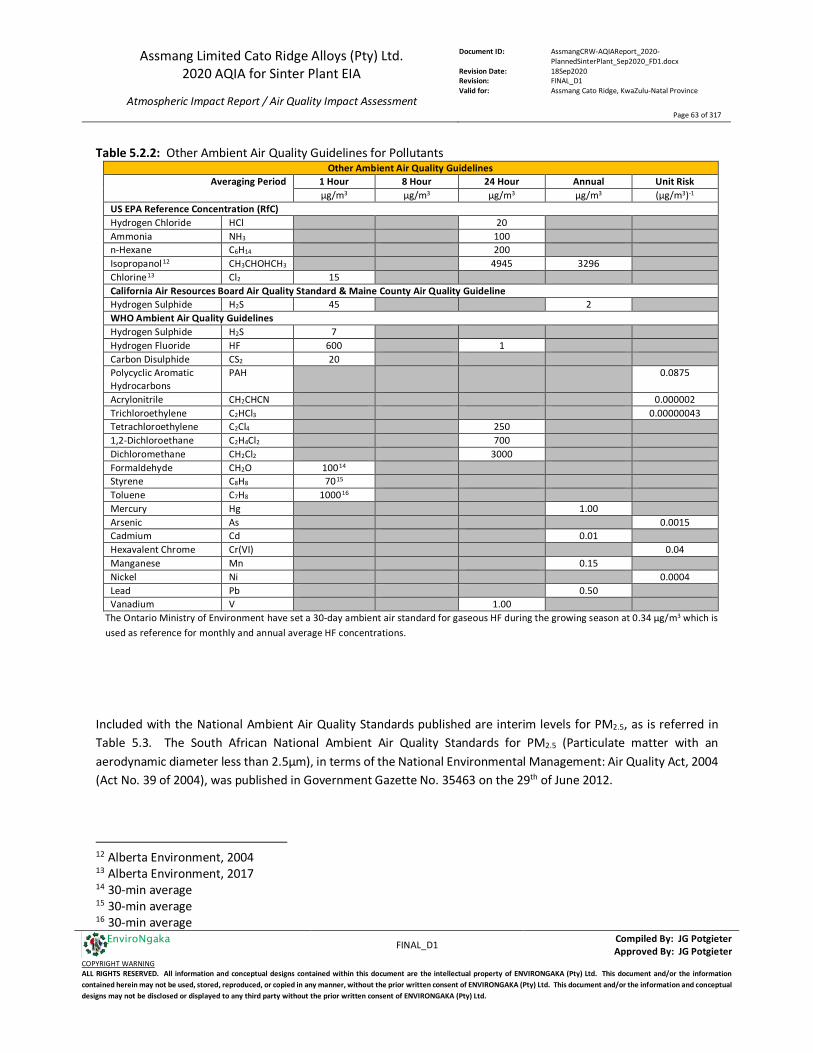
Assmang Limited Cato Ridge Alloys (Pty) Ltd. 2020 AQIA for Sinter Plant EIA
Atmospheric Impact Report / Air Quality Impact Assessment
Document ID: AssmangCRW-AQIAReport_2020-PlannedSinterPlant_Sep2020_FD1.docx
Revision Date: 18Sep2020 Revision: FINAL_D1 Valid for: Assmang Cato Ridge, KwaZulu-Natal Province
Page 63 of 317
FINAL_D1 Compiled By: JG Potgieter
Approved By: JG Potgieter COPYRIGHT WARNING ALL RIGHTS RESERVED. All information and conceptual designs contained within this document are the intellectual property of ENVIRONGAKA (Pty) Ltd. This document and/or the information contained herein may not be used, stored, reproduced, or copied in any manner, without the prior written consent of ENVIRONGAKA (Pty) Ltd. This document and/or the information and conceptual designs may not be disclosed or displayed to any third party without the prior written consent of ENVIRONGAKA (Pty) Ltd.
EnviroNgaka
Table 5.2.2: Other Ambient Air Quality Guidelines for Pollutants
Other Ambient Air Quality Guidelines Averaging Period 1 Hour 8 Hour 24 Hour Annual Unit Risk
μg/m3 μg/m3 μg/m3 μg/m3 (μg/m3)-1 US EPA Reference Concentration (RfC) Hydrogen Chloride HCl 20 Ammonia NH3 100 n-Hexane C6H14 200 Isopropanol 12 CH3CHOHCH3 4945 3296 Chlorine13 Cl2 15 California Air Resources Board Air Quality Standard & Maine County Air Quality Guideline Hydrogen Sulphide H2S 45 2 WHO Ambient Air Quality Guidelines Hydrogen Sulphide H2S 7 Hydrogen Fluoride HF 600 1 Carbon Disulphide CS2 20 Polycyclic Aromatic Hydrocarbons
PAH
0.0875
Acrylonitrile CH2CHCN 0.000002 Trichloroethylene C2HCl3 0.00000043 Tetrachloroethylene C2Cl4 250 1,2-Dichloroethane C2H4Cl2 700 Dichloromethane CH2Cl2 3000 Formaldehyde CH2O 10014 Styrene C8H8 7015 Toluene C7H8 100016 Mercury Hg 1.00 Arsenic As 0.0015 Cadmium Cd 0.01 Hexavalent Chrome Cr(VI) 0.04 Manganese Mn 0.15 Nickel Ni 0.0004 Lead Pb 0.50 Vanadium V 1.00
The Ontario Ministry of Environment have set a 30-day ambient air standard for gaseous HF during the growing season at 0.34 μg/m3 which is used as reference for monthly and annual average HF concentrations.
Included with the National Ambient Air Quality Standards published are interim levels for PM2.5, as is referred in Table 5.3. The South African National Ambient Air Quality Standards for PM2.5 (Particulate matter with an aerodynamic diameter less than 2.5μm), in terms of the National Environmental Management: Air Quality Act, 2004 (Act No. 39 of 2004), was published in Government Gazette No. 35463 on the 29th of June 2012.
12 Alberta Environment, 2004 13 Alberta Environment, 2017 14 30-min average 15 30-min average 16 30-min average
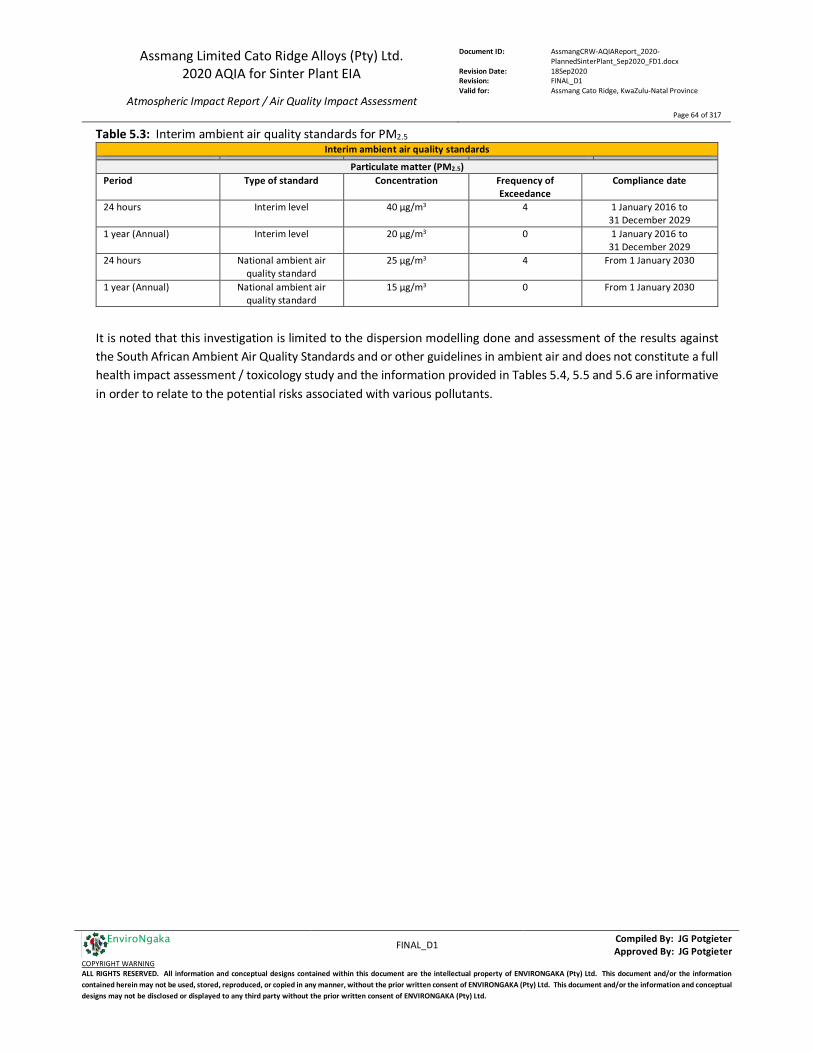
Assmang Limited Cato Ridge Alloys (Pty) Ltd. 2020 AQIA for Sinter Plant EIA
Atmospheric Impact Report / Air Quality Impact Assessment
Document ID: AssmangCRW-AQIAReport_2020-PlannedSinterPlant_Sep2020_FD1.docx
Revision Date: 18Sep2020 Revision: FINAL_D1 Valid for: Assmang Cato Ridge, KwaZulu-Natal Province
Page 64 of 317
FINAL_D1 Compiled By: JG Potgieter
Approved By: JG Potgieter COPYRIGHT WARNING ALL RIGHTS RESERVED. All information and conceptual designs contained within this document are the intellectual property of ENVIRONGAKA (Pty) Ltd. This document and/or the information contained herein may not be used, stored, reproduced, or copied in any manner, without the prior written consent of ENVIRONGAKA (Pty) Ltd. This document and/or the information and conceptual designs may not be disclosed or displayed to any third party without the prior written consent of ENVIRONGAKA (Pty) Ltd.
EnviroNgaka
Table 5.3: Interim ambient air quality standards for PM2.5 Interim ambient air quality standards
Particulate matter (PM2.5) Period Type of standard Concentration Frequency of
Exceedance Compliance date
24 hours Interim level 40 µg/m3 4 1 January 2016 to 31 December 2029
1 year (Annual) Interim level 20 µg/m3 0 1 January 2016 to 31 December 2029
24 hours National ambient air quality standard
25 µg/m3 4 From 1 January 2030
1 year (Annual) National ambient air quality standard
15 µg/m3 0 From 1 January 2030
It is noted that this investigation is limited to the dispersion modelling done and assessment of the results against the South African Ambient Air Quality Standards and or other guidelines in ambient air and does not constitute a full health impact assessment / toxicology study and the information provided in Tables 5.4, 5.5 and 5.6 are informative in order to relate to the potential risks associated with various pollutants.
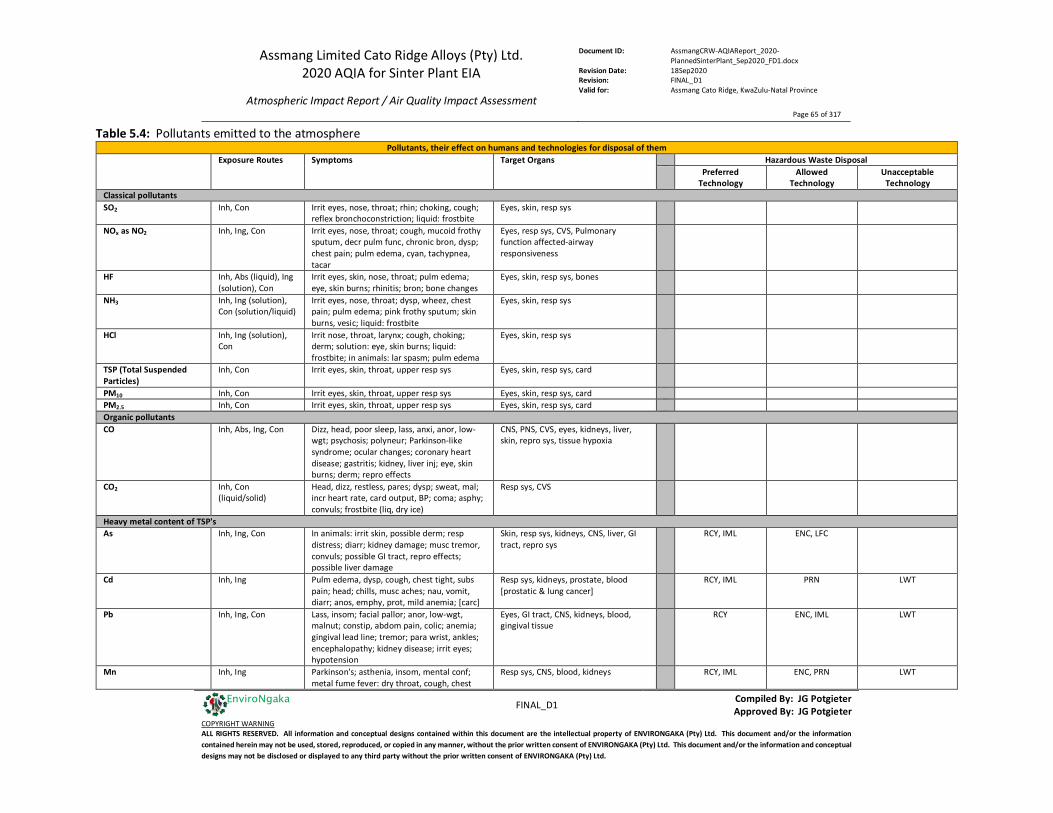
Assmang Limited Cato Ridge Alloys (Pty) Ltd. 2020 AQIA for Sinter Plant EIA
Atmospheric Impact Report / Air Quality Impact Assessment
Document ID: AssmangCRW-AQIAReport_2020-PlannedSinterPlant_Sep2020_FD1.docx
Revision Date: 18Sep2020 Revision: FINAL_D1 Valid for: Assmang Cato Ridge, KwaZulu-Natal Province
Page 65 of 317
FINAL_D1 Compiled By: JG Potgieter
Approved By: JG Potgieter COPYRIGHT WARNING ALL RIGHTS RESERVED. All information and conceptual designs contained within this document are the intellectual property of ENVIRONGAKA (Pty) Ltd. This document and/or the information contained herein may not be used, stored, reproduced, or copied in any manner, without the prior written consent of ENVIRONGAKA (Pty) Ltd. This document and/or the information and conceptual designs may not be disclosed or displayed to any third party without the prior written consent of ENVIRONGAKA (Pty) Ltd.
EnviroNgaka
Table 5.4: Pollutants emitted to the atmosphere Pollutants, their effect on humans and technologies for disposal of them
Exposure Routes Symptoms Target Organs Hazardous Waste Disposal Preferred
Technology Allowed
Technology Unacceptable
Technology Classical pollutants SO2 Inh, Con Irrit eyes, nose, throat; rhin; choking, cough;
reflex bronchoconstriction; liquid: frostbite Eyes, skin, resp sys
NOx as NO2 Inh, Ing, Con Irrit eyes, nose, throat; cough, mucoid frothy sputum, decr pulm func, chronic bron, dysp; chest pain; pulm edema, cyan, tachypnea, tacar
Eyes, resp sys, CVS, Pulmonary function affected-airway responsiveness
HF Inh, Abs (liquid), Ing (solution), Con
Irrit eyes, skin, nose, throat; pulm edema; eye, skin burns; rhinitis; bron; bone changes
Eyes, skin, resp sys, bones
NH3 Inh, Ing (solution), Con (solution/liquid)
Irrit eyes, nose, throat; dysp, wheez, chest pain; pulm edema; pink frothy sputum; skin burns, vesic; liquid: frostbite
Eyes, skin, resp sys
HCl Inh, Ing (solution), Con
Irrit nose, throat, larynx; cough, choking; derm; solution: eye, skin burns; liquid: frostbite; in animals: lar spasm; pulm edema
Eyes, skin, resp sys
TSP (Total Suspended Particles)
Inh, Con Irrit eyes, skin, throat, upper resp sys Eyes, skin, resp sys, card
PM10 Inh, Con Irrit eyes, skin, throat, upper resp sys Eyes, skin, resp sys, card PM2.5 Inh, Con Irrit eyes, skin, throat, upper resp sys Eyes, skin, resp sys, card Organic pollutants CO Inh, Abs, Ing, Con Dizz, head, poor sleep, lass, anxi, anor, low-
wgt; psychosis; polyneur; Parkinson-like syndrome; ocular changes; coronary heart disease; gastritis; kidney, liver inj; eye, skin burns; derm; repro effects
CNS, PNS, CVS, eyes, kidneys, liver, skin, repro sys, tissue hypoxia
CO2 Inh, Con (liquid/solid)
Head, dizz, restless, pares; dysp; sweat, mal; incr heart rate, card output, BP; coma; asphy; convuls; frostbite (liq, dry ice)
Resp sys, CVS
Heavy metal content of TSP's As Inh, Ing, Con In animals: irrit skin, possible derm; resp
distress; diarr; kidney damage; musc tremor, convuls; possible GI tract, repro effects; possible liver damage
Skin, resp sys, kidneys, CNS, liver, GI tract, repro sys
RCY, IML ENC, LFC
Cd Inh, Ing Pulm edema, dysp, cough, chest tight, subs pain; head; chills, musc aches; nau, vomit, diarr; anos, emphy, prot, mild anemia; [carc]
Resp sys, kidneys, prostate, blood [prostatic & lung cancer]
RCY, IML PRN LWT
Pb Inh, Ing, Con Lass, insom; facial pallor; anor, low-wgt, malnut; constip, abdom pain, colic; anemia; gingival lead line; tremor; para wrist, ankles; encephalopathy; kidney disease; irrit eyes; hypotension
Eyes, GI tract, CNS, kidneys, blood, gingival tissue
RCY ENC, IML LWT
Mn Inh, Ing Parkinson's; asthenia, insom, mental conf; metal fume fever: dry throat, cough, chest
Resp sys, CNS, blood, kidneys RCY, IML ENC, PRN LWT

Assmang Limited Cato Ridge Alloys (Pty) Ltd. 2020 AQIA for Sinter Plant EIA
Atmospheric Impact Report / Air Quality Impact Assessment
Document ID: AssmangCRW-AQIAReport_2020-PlannedSinterPlant_Sep2020_FD1.docx
Revision Date: 18Sep2020 Revision: FINAL_D1 Valid for: Assmang Cato Ridge, KwaZulu-Natal Province
Page 66 of 317
FINAL_D1 Compiled By: JG Potgieter
Approved By: JG Potgieter COPYRIGHT WARNING ALL RIGHTS RESERVED. All information and conceptual designs contained within this document are the intellectual property of ENVIRONGAKA (Pty) Ltd. This document and/or the information contained herein may not be used, stored, reproduced, or copied in any manner, without the prior written consent of ENVIRONGAKA (Pty) Ltd. This document and/or the information and conceptual designs may not be disclosed or displayed to any third party without the prior written consent of ENVIRONGAKA (Pty) Ltd.
EnviroNgaka
Pollutants, their effect on humans and technologies for disposal of them
Exposure Routes Symptoms Target Organs Hazardous Waste Disposal Preferred
Technology Allowed
Technology Unacceptable
Technology tight, dysp, rales, flu-like fever; low-back pain; vomit; mal; lass; kidney damage
Hg Inh, Abs, Ing, Con Irrit eyes, skin; cough, chest pain, dysp, bron, pneu; tremor, insom, irrity, indecision, head, lass; stomatitis, salv; GI dist, anor, low-wgt; prot
Eyes, skin, resp sys, CNS, kidneys RCY, IML ENC, OCR LWT
Ni Inh, Ing, Con Sens derm, allergic asthma, pneu; [carc] Nasal cavities, lungs, skin [lung and nasal cancer]
RCY, IML ENC, PRN LWT
Tl Inh, Abs, Ing, Con Nau, diarr, abdom pain, vomit; ptosis, strabismus; peri neuritis, tremor; retster tight, chest pain, pulm edema; convuls, chorea, psychosis; liver, kidney damage; alopecia; pares legs
Eyes, resp sys, CNS, liver, kidneys, GI tract, body hair
V (as V2O5) Inh, Ing, Con Irrit eyes, skin, throat; green tongue, metallic taste, eczema; cough; fine rales, wheez, bron, dysp
Eyes, skin, resp sys RCY, IML PRN LWT
Zn (as ZnO) Inh Metal fume fever: chills, musc ache, nau, fever, dry throat, cough; lass; metallic taste; head; blurred vision; low back pain; vomit; mal; chest tight; dysp, rales, decr pulm func
Resp sys
Table 5.5: Abbreviations for “Exposure Routes, Symptoms and Target Organs”
Abbreviations for the table showing "Exposure Routes, Symptoms, and Target Organs" abdom Abdominal irreg Irregular/Irregularities abnor Abnormal/Abnormalities irrit Irritation abs Skin absorption irrity Irritability album Albuminuria (presence of albumin (a water-soluble protein) in the urine) jaun Jaundice anes Anesthesia kera Keratitis (inflammation of the cornea) anor Anorexia lac Lacrimation (discharge of tears) anos Anosmia (loss of the sense of smell) lar Laryngeal anxi Anxiety lass Lassitude (weakness, exhaustion) arrhy Arrhythmias (an abnormality in the heart's rhythm) leucyt Leukocytosis (increased blood leukocytes) aspir Aspiration leupen Leukopenia (reduced blood leukocytes) asphy Asphyxia liq Liquid BP Blood pressure local Localized breath Breath/breathing low-wgt Weight loss bron Bronchitis mal Malaise (vague feeling of discomfort) BUN Blood urea nitrogen malig Malignant - clinical course that progresses rapidly to death [carc] Potential occupational carcinogen malnut Malnutrition card Cardiac mesot Mesothelioma - cancer from previous exposure to asbestos
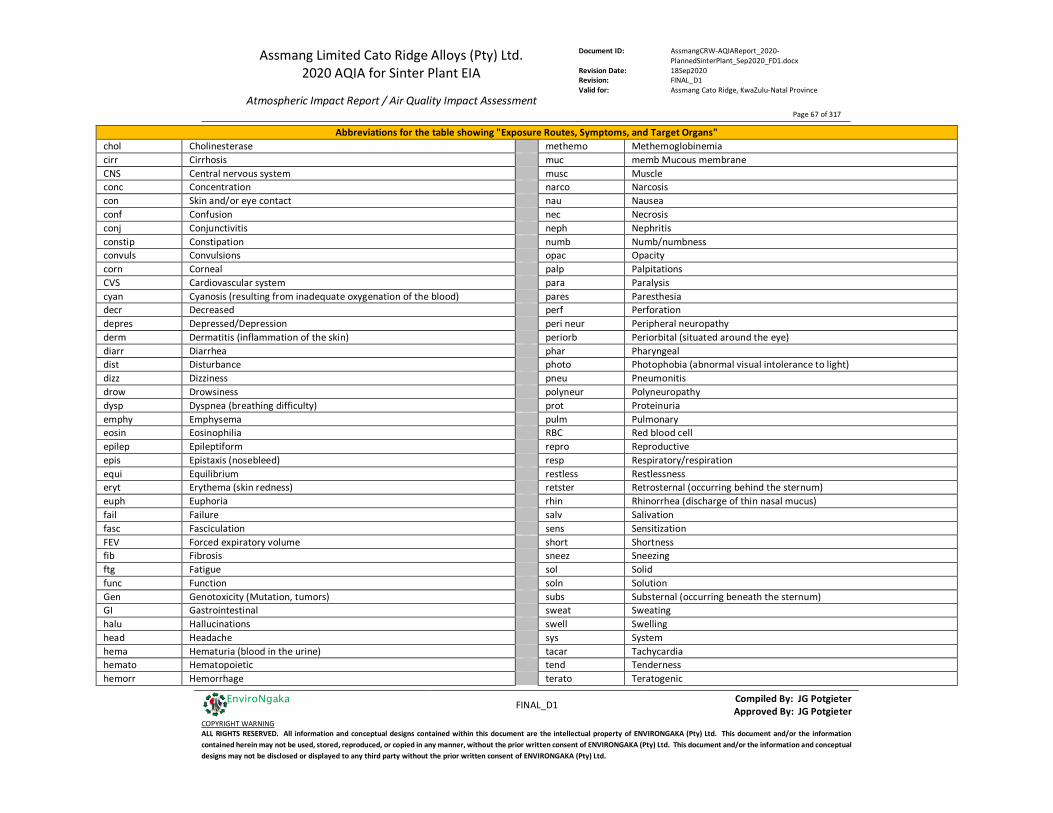
Assmang Limited Cato Ridge Alloys (Pty) Ltd. 2020 AQIA for Sinter Plant EIA
Atmospheric Impact Report / Air Quality Impact Assessment
Document ID: AssmangCRW-AQIAReport_2020-PlannedSinterPlant_Sep2020_FD1.docx
Revision Date: 18Sep2020 Revision: FINAL_D1 Valid for: Assmang Cato Ridge, KwaZulu-Natal Province
Page 67 of 317
FINAL_D1 Compiled By: JG Potgieter
Approved By: JG Potgieter COPYRIGHT WARNING ALL RIGHTS RESERVED. All information and conceptual designs contained within this document are the intellectual property of ENVIRONGAKA (Pty) Ltd. This document and/or the information contained herein may not be used, stored, reproduced, or copied in any manner, without the prior written consent of ENVIRONGAKA (Pty) Ltd. This document and/or the information and conceptual designs may not be disclosed or displayed to any third party without the prior written consent of ENVIRONGAKA (Pty) Ltd.
EnviroNgaka
Abbreviations for the table showing "Exposure Routes, Symptoms, and Target Organs" chol Cholinesterase methemo Methemoglobinemia cirr Cirrhosis muc memb Mucous membrane CNS Central nervous system musc Muscle conc Concentration narco Narcosis con Skin and/or eye contact nau Nausea conf Confusion nec Necrosis conj Conjunctivitis neph Nephritis constip Constipation numb Numb/numbness convuls Convulsions opac Opacity corn Corneal palp Palpitations CVS Cardiovascular system para Paralysis cyan Cyanosis (resulting from inadequate oxygenation of the blood) pares Paresthesia decr Decreased perf Perforation depres Depressed/Depression peri neur Peripheral neuropathy derm Dermatitis (inflammation of the skin) periorb Periorbital (situated around the eye) diarr Diarrhea phar Pharyngeal dist Disturbance photo Photophobia (abnormal visual intolerance to light) dizz Dizziness pneu Pneumonitis drow Drowsiness polyneur Polyneuropathy dysp Dyspnea (breathing difficulty) prot Proteinuria emphy Emphysema pulm Pulmonary eosin Eosinophilia RBC Red blood cell epilep Epileptiform repro Reproductive epis Epistaxis (nosebleed) resp Respiratory/respiration equi Equilibrium restless Restlessness eryt Erythema (skin redness) retster Retrosternal (occurring behind the sternum) euph Euphoria rhin Rhinorrhea (discharge of thin nasal mucus) fail Failure salv Salivation fasc Fasciculation sens Sensitization FEV Forced expiratory volume short Shortness fib Fibrosis sneez Sneezing ftg Fatigue sol Solid func Function soln Solution Gen Genotoxicity (Mutation, tumors) subs Substernal (occurring beneath the sternum) GI Gastrointestinal sweat Sweating halu Hallucinations swell Swelling head Headache sys System hema Hematuria (blood in the urine) tacar Tachycardia hemato Hematopoietic tend Tenderness hemorr Hemorrhage terato Teratogenic

Assmang Limited Cato Ridge Alloys (Pty) Ltd. 2020 AQIA for Sinter Plant EIA
Atmospheric Impact Report / Air Quality Impact Assessment
Document ID: AssmangCRW-AQIAReport_2020-PlannedSinterPlant_Sep2020_FD1.docx
Revision Date: 18Sep2020 Revision: FINAL_D1 Valid for: Assmang Cato Ridge, KwaZulu-Natal Province
Page 68 of 317
FINAL_D1 Compiled By: JG Potgieter
Approved By: JG Potgieter COPYRIGHT WARNING ALL RIGHTS RESERVED. All information and conceptual designs contained within this document are the intellectual property of ENVIRONGAKA (Pty) Ltd. This document and/or the information contained herein may not be used, stored, reproduced, or copied in any manner, without the prior written consent of ENVIRONGAKA (Pty) Ltd. This document and/or the information and conceptual designs may not be disclosed or displayed to any third party without the prior written consent of ENVIRONGAKA (Pty) Ltd.
EnviroNgaka
Abbreviations for the table showing "Exposure Routes, Symptoms, and Target Organs" hyperpig Hyperpigmentation throb Throbbing hypox Hypoxemia (reduced O2 in the blood) tight Tightness inco Incoordination twitch Twitching incr Increased uncon Unconsciousness inebri Inebriation vap Vapor inflamm Inflammation vesic Vesiculation ing Ingestion vis Visual inh Inhalation vomit Vomiting inj Injury weak Weak/weakness insom Insomnia wheez Wheezing
Table 5.6: Hazardous waste disposal technologies
Description of Abbreviations for Technology terms Abbreviation Technology Description CTR Chemical Treatment then landfill co-dispose
residues A chemical treatment procedure (unspecified), that can meet the requirements must be used prior to co-disposal to landfill.
DBI Detonation, Burning or Incineration Destruction by detonation, by burning or by controlled incineration as approved by the Chief Inspector of Explosives or the Government Mining Engineer.
ENC Encapsulation The containment of waste in drums or other approved containers in a reinforced concrete cell within a permitted hazardous waste landfill. Encapsulation of organic materials is permitted only in the absence of an appropriate and cost effective incineration facility.
HNR Hydrolyse & Neutralise then landfill codispose residues
Hydrolysis of a compound, organic or inorganic, using acid or base followed by neutralisation prior to codisposal to landfill.
IML Immobilisation then landfill This term includes all immobilisation techniques such as microencapsulation, vitrification and solidification but not macroencapsulation.
INC Incineration The controlled thermal destruction of the waste in a facility permitted for that type of waste. For chemical waste, appropriate pollution control equipment, e.g. for the scrubbing of acid gases, may be required.
LFL Landfilling not allowed Disposal of this waste to a landfill is not allowed. LFC Landfill codispose Mixing or blending of a Hazardous Waste with General Waste within a permitted landfill with a recommended
minimum ratio of 1 to 9 v/v. LWT Landfilling without treatment Landfilling of the waste is not allowed without appropriate pretreatment. LFB Landfill-ash blend Mixing or blending of a flammable waste with sufficient fly ash, bottom ash or other material approved by the
Department, so that the flash point is >61°C. Ash blending is considered a treatment process and therefore the resulting product must be landfill-codisposed with municipal or commercial waste.
NCR Neutralise then landfill codispose residues Addition acid or alkali to bring the pH in the region of 7. Lime is normally used to neutralise acid wastes prior to codisposal to landfill.
OCR Oxidation then landfill codispose residues Oxidise, e.g. by using chlorine or another oxidising agent, prior to codisposal to landfill. PRN Precipitation then landfill codispose residues Addition of lime, sodium sulphide or other reagent that results in the formation of insoluble compounds that
come out of solution. Usually the solids are separated from the liquids prior to codisposal to landfill.
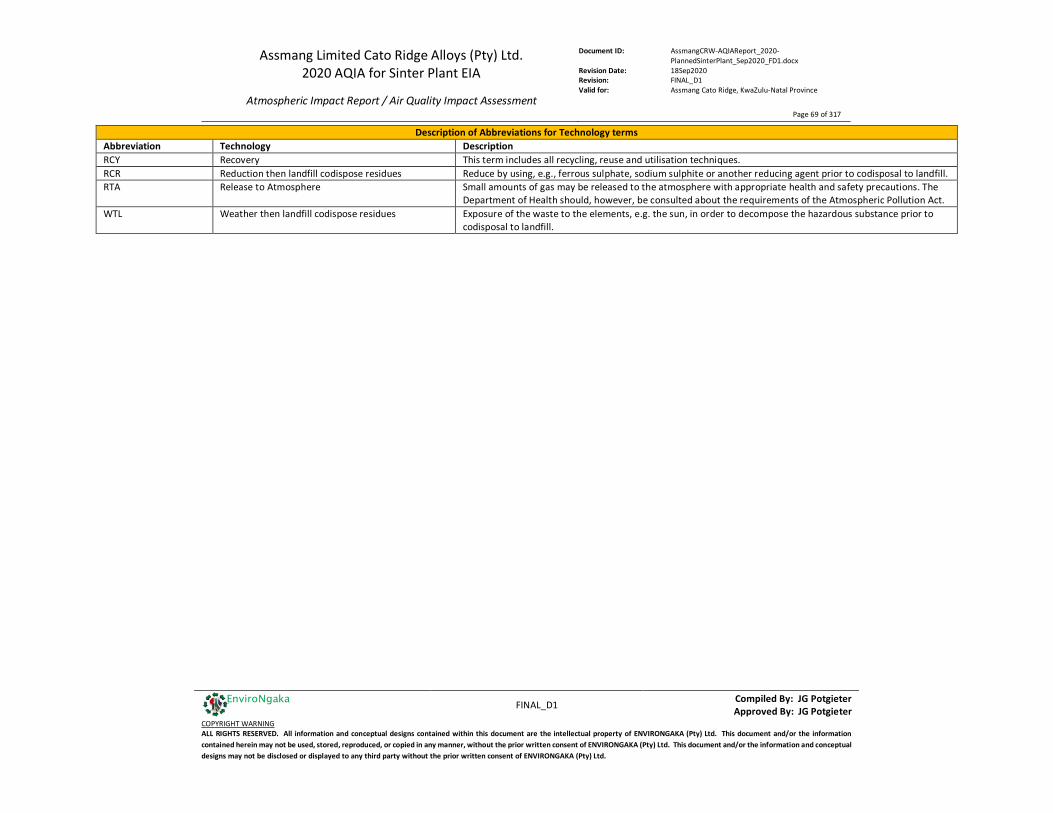
Assmang Limited Cato Ridge Alloys (Pty) Ltd. 2020 AQIA for Sinter Plant EIA
Atmospheric Impact Report / Air Quality Impact Assessment
Document ID: AssmangCRW-AQIAReport_2020-PlannedSinterPlant_Sep2020_FD1.docx
Revision Date: 18Sep2020 Revision: FINAL_D1 Valid for: Assmang Cato Ridge, KwaZulu-Natal Province
Page 69 of 317
FINAL_D1 Compiled By: JG Potgieter
Approved By: JG Potgieter COPYRIGHT WARNING ALL RIGHTS RESERVED. All information and conceptual designs contained within this document are the intellectual property of ENVIRONGAKA (Pty) Ltd. This document and/or the information contained herein may not be used, stored, reproduced, or copied in any manner, without the prior written consent of ENVIRONGAKA (Pty) Ltd. This document and/or the information and conceptual designs may not be disclosed or displayed to any third party without the prior written consent of ENVIRONGAKA (Pty) Ltd.
EnviroNgaka
Description of Abbreviations for Technology terms Abbreviation Technology Description RCY Recovery This term includes all recycling, reuse and utilisation techniques. RCR Reduction then landfill codispose residues Reduce by using, e.g., ferrous sulphate, sodium sulphite or another reducing agent prior to codisposal to landfill. RTA Release to Atmosphere Small amounts of gas may be released to the atmosphere with appropriate health and safety precautions. The
Department of Health should, however, be consulted about the requirements of the Atmospheric Pollution Act. WTL Weather then landfill codispose residues Exposure of the waste to the elements, e.g. the sun, in order to decompose the hazardous substance prior to
codisposal to landfill.
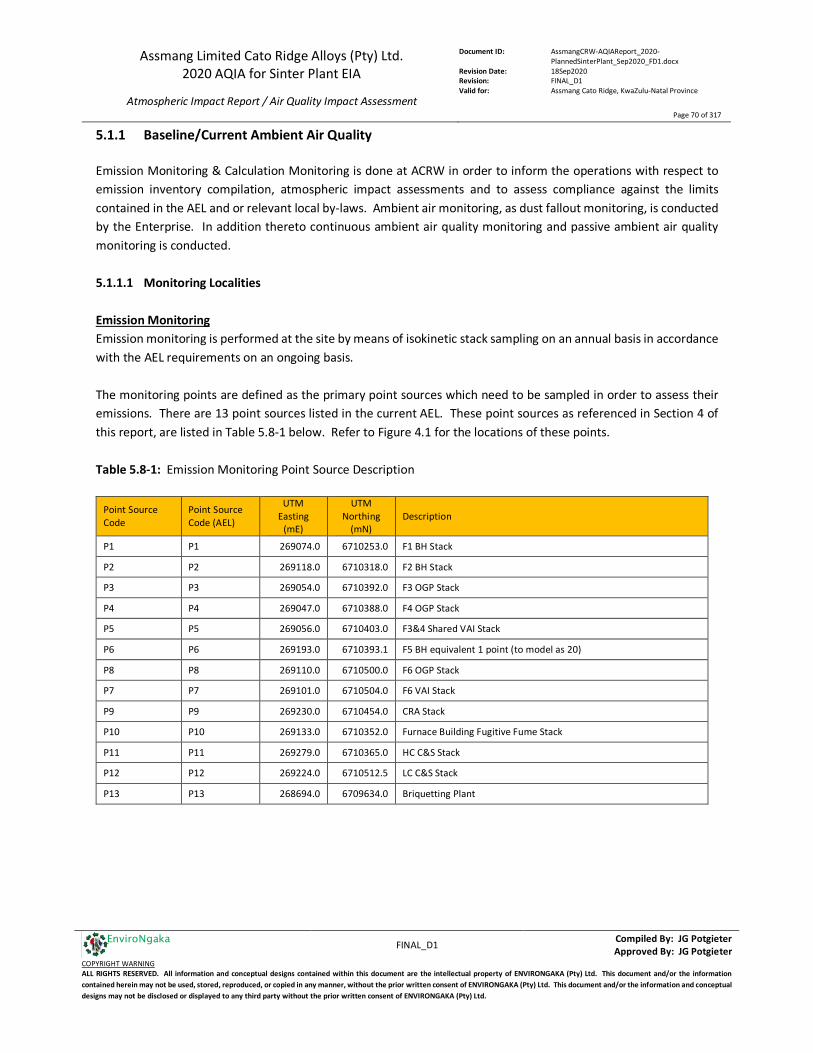
Assmang Limited Cato Ridge Alloys (Pty) Ltd. 2020 AQIA for Sinter Plant EIA
Atmospheric Impact Report / Air Quality Impact Assessment
Document ID: AssmangCRW-AQIAReport_2020-PlannedSinterPlant_Sep2020_FD1.docx
Revision Date: 18Sep2020 Revision: FINAL_D1 Valid for: Assmang Cato Ridge, KwaZulu-Natal Province
Page 70 of 317
FINAL_D1 Compiled By: JG Potgieter
Approved By: JG Potgieter COPYRIGHT WARNING ALL RIGHTS RESERVED. All information and conceptual designs contained within this document are the intellectual property of ENVIRONGAKA (Pty) Ltd. This document and/or the information contained herein may not be used, stored, reproduced, or copied in any manner, without the prior written consent of ENVIRONGAKA (Pty) Ltd. This document and/or the information and conceptual designs may not be disclosed or displayed to any third party without the prior written consent of ENVIRONGAKA (Pty) Ltd.
EnviroNgaka
5.1.1 Baseline/Current Ambient Air Quality Emission Monitoring & Calculation Monitoring is done at ACRW in order to inform the operations with respect to emission inventory compilation, atmospheric impact assessments and to assess compliance against the limits contained in the AEL and or relevant local by-laws. Ambient air monitoring, as dust fallout monitoring, is conducted by the Enterprise. In addition thereto continuous ambient air quality monitoring and passive ambient air quality monitoring is conducted. 5.1.1.1 Monitoring Localities Emission Monitoring Emission monitoring is performed at the site by means of isokinetic stack sampling on an annual basis in accordance with the AEL requirements on an ongoing basis. The monitoring points are defined as the primary point sources which need to be sampled in order to assess their emissions. There are 13 point sources listed in the current AEL. These point sources as referenced in Section 4 of this report, are listed in Table 5.8-1 below. Refer to Figure 4.1 for the locations of these points. Table 5.8-1: Emission Monitoring Point Source Description
Point Source Code
Point Source Code (AEL)
UTM Easting
(mE)
UTM Northing
(mN) Description
P1 P1 269074.0 6710253.0 F1 BH Stack
P2 P2 269118.0 6710318.0 F2 BH Stack
P3 P3 269054.0 6710392.0 F3 OGP Stack
P4 P4 269047.0 6710388.0 F4 OGP Stack
P5 P5 269056.0 6710403.0 F3&4 Shared VAI Stack
P6 P6 269193.0 6710393.1 F5 BH equivalent 1 point (to model as 20)
P8 P8 269110.0 6710500.0 F6 OGP Stack
P7 P7 269101.0 6710504.0 F6 VAI Stack
P9 P9 269230.0 6710454.0 CRA Stack
P10 P10 269133.0 6710352.0 Furnace Building Fugitive Fume Stack
P11 P11 269279.0 6710365.0 HC C&S Stack
P12 P12 269224.0 6710512.5 LC C&S Stack
P13 P13 268694.0 6709634.0 Briquetting Plant
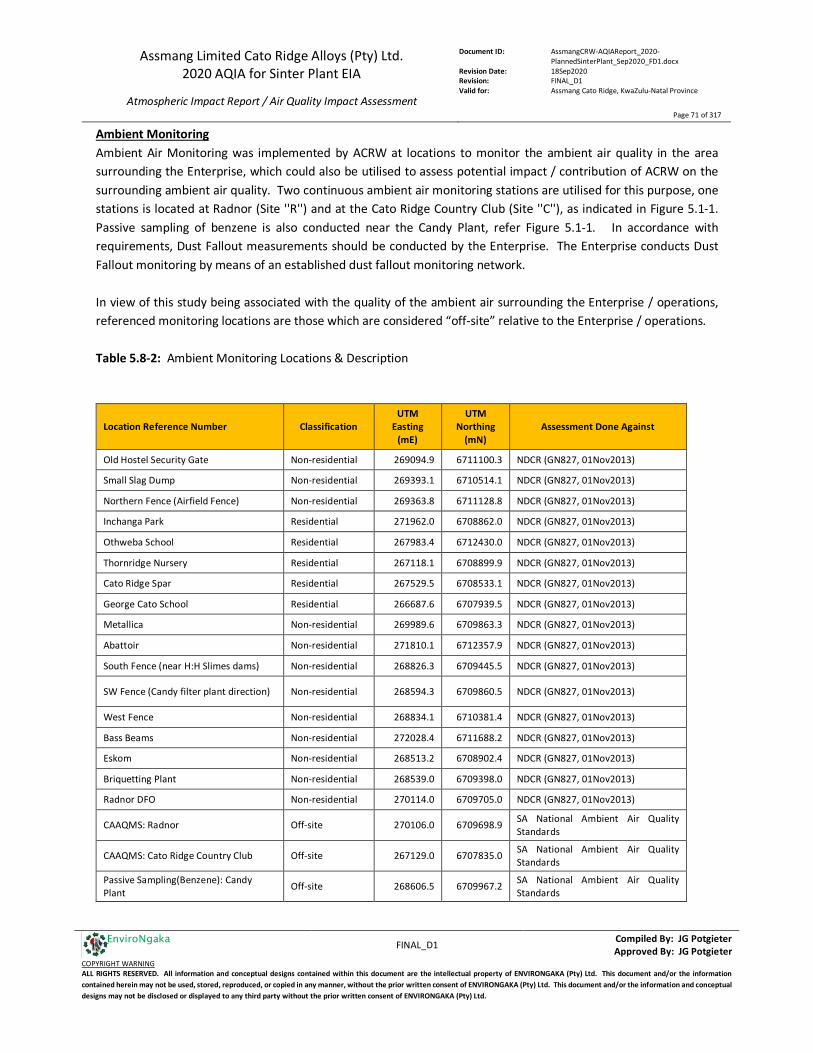
Assmang Limited Cato Ridge Alloys (Pty) Ltd. 2020 AQIA for Sinter Plant EIA
Atmospheric Impact Report / Air Quality Impact Assessment
Document ID: AssmangCRW-AQIAReport_2020-PlannedSinterPlant_Sep2020_FD1.docx
Revision Date: 18Sep2020 Revision: FINAL_D1 Valid for: Assmang Cato Ridge, KwaZulu-Natal Province
Page 71 of 317
FINAL_D1 Compiled By: JG Potgieter
Approved By: JG Potgieter COPYRIGHT WARNING ALL RIGHTS RESERVED. All information and conceptual designs contained within this document are the intellectual property of ENVIRONGAKA (Pty) Ltd. This document and/or the information contained herein may not be used, stored, reproduced, or copied in any manner, without the prior written consent of ENVIRONGAKA (Pty) Ltd. This document and/or the information and conceptual designs may not be disclosed or displayed to any third party without the prior written consent of ENVIRONGAKA (Pty) Ltd.
EnviroNgaka
Ambient Monitoring Ambient Air Monitoring was implemented by ACRW at locations to monitor the ambient air quality in the area surrounding the Enterprise, which could also be utilised to assess potential impact / contribution of ACRW on the surrounding ambient air quality. Two continuous ambient air monitoring stations are utilised for this purpose, one stations is located at Radnor (Site ''R'') and at the Cato Ridge Country Club (Site ''C''), as indicated in Figure 5.1-1. Passive sampling of benzene is also conducted near the Candy Plant, refer Figure 5.1-1. In accordance with requirements, Dust Fallout measurements should be conducted by the Enterprise. The Enterprise conducts Dust Fallout monitoring by means of an established dust fallout monitoring network. In view of this study being associated with the quality of the ambient air surrounding the Enterprise / operations, referenced monitoring locations are those which are considered “off-site” relative to the Enterprise / operations. Table 5.8-2: Ambient Monitoring Locations & Description
Location Reference Number Classification UTM
Easting (mE)
UTM Northing
(mN) Assessment Done Against
Old Hostel Security Gate Non-residential 269094.9 6711100.3 NDCR (GN827, 01Nov2013)
Small Slag Dump Non-residential 269393.1 6710514.1 NDCR (GN827, 01Nov2013)
Northern Fence (Airfield Fence) Non-residential 269363.8 6711128.8 NDCR (GN827, 01Nov2013)
Inchanga Park Residential 271962.0 6708862.0 NDCR (GN827, 01Nov2013)
Othweba School Residential 267983.4 6712430.0 NDCR (GN827, 01Nov2013)
Thornridge Nursery Residential 267118.1 6708899.9 NDCR (GN827, 01Nov2013)
Cato Ridge Spar Residential 267529.5 6708533.1 NDCR (GN827, 01Nov2013)
George Cato School Residential 266687.6 6707939.5 NDCR (GN827, 01Nov2013)
Metallica Non-residential 269989.6 6709863.3 NDCR (GN827, 01Nov2013)
Abattoir Non-residential 271810.1 6712357.9 NDCR (GN827, 01Nov2013)
South Fence (near H:H Slimes dams) Non-residential 268826.3 6709445.5 NDCR (GN827, 01Nov2013)
SW Fence (Candy filter plant direction) Non-residential 268594.3 6709860.5 NDCR (GN827, 01Nov2013)
West Fence Non-residential 268834.1 6710381.4 NDCR (GN827, 01Nov2013)
Bass Beams Non-residential 272028.4 6711688.2 NDCR (GN827, 01Nov2013)
Eskom Non-residential 268513.2 6708902.4 NDCR (GN827, 01Nov2013)
Briquetting Plant Non-residential 268539.0 6709398.0 NDCR (GN827, 01Nov2013)
Radnor DFO Non-residential 270114.0 6709705.0 NDCR (GN827, 01Nov2013)
CAAQMS: Radnor Off-site 270106.0 6709698.9 SA National Ambient Air Quality Standards
CAAQMS: Cato Ridge Country Club Off-site 267129.0 6707835.0 SA National Ambient Air Quality Standards
Passive Sampling(Benzene): Candy Plant
Off-site 268606.5 6709967.2 SA National Ambient Air Quality Standards
Assmang Limited Cato Ridge Alloys (Pty) Ltd. 2020 AQIA for Sinter Plant EIA
Atmospheric Impact Report / Air Quality Impact Assessment
Document ID: AssmangCRW-AQIAReport_2020-PlannedSinterPlant_Sep2020_FD1.docx
Revision Date: 18Sep2020 Revision: FINAL_D1 Valid for: Assmang Cato Ridge, KwaZulu-Natal Province
Page 72 of 317
FINAL_D1 Compiled By: JG Potgieter
Approved By: JG Potgieter COPYRIGHT WARNING ALL RIGHTS RESERVED. All information and conceptual designs contained within this document are the intellectual property of ENVIRONGAKA (Pty) Ltd. This document and/or the information contained herein may not be used, stored, reproduced, or copied in any manner, without the prior written consent of ENVIRONGAKA (Pty) Ltd. This document and/or the information and conceptual designs may not be disclosed or displayed to any third party without the prior written consent of ENVIRONGAKA (Pty) Ltd.
EnviroNgaka
Meteorological data (wind speed, wind direction and rainfall) obtained from a meteorological station located approximately 323m southeast of the centre of the site, is used for the monthly reporting of DFO results for the Enterprise in order to assess potential high wind speed incidents which could potentially contribute to high DFO results. It is noted that the simulated meteorological data used for this dispersion modelling study (refer Appendix A) might differ from the meteorological data referred to in the last mentioned DFO reports as a result of the difference in location. The Enterprise’s ambient monitoring network is indicated in Figure 5.1-1. Appendix B contains a summary of the results of ambient air monitoring conducted.
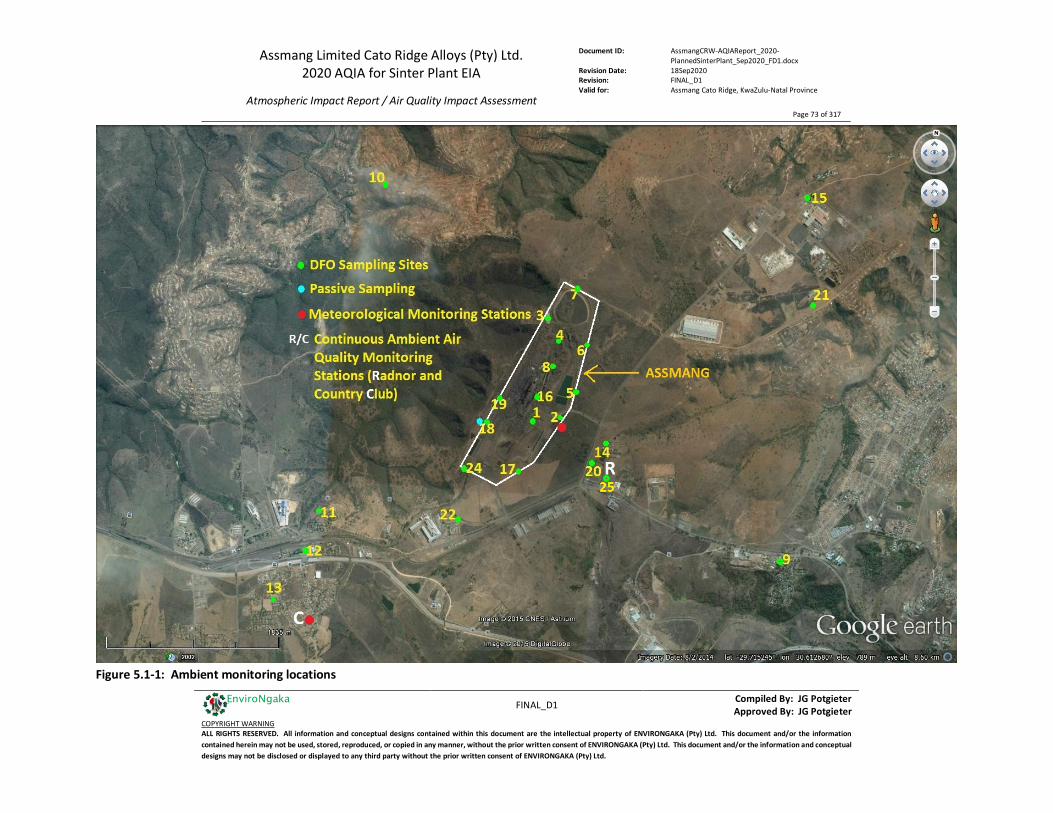
Assmang Limited Cato Ridge Alloys (Pty) Ltd. 2020 AQIA for Sinter Plant EIA
Atmospheric Impact Report / Air Quality Impact Assessment
Document ID: AssmangCRW-AQIAReport_2020-PlannedSinterPlant_Sep2020_FD1.docx
Revision Date: 18Sep2020 Revision: FINAL_D1 Valid for: Assmang Cato Ridge, KwaZulu-Natal Province
Page 73 of 317
FINAL_D1 Compiled By: JG Potgieter
Approved By: JG Potgieter COPYRIGHT WARNING ALL RIGHTS RESERVED. All information and conceptual designs contained within this document are the intellectual property of ENVIRONGAKA (Pty) Ltd. This document and/or the information contained herein may not be used, stored, reproduced, or copied in any manner, without the prior written consent of ENVIRONGAKA (Pty) Ltd. This document and/or the information and conceptual designs may not be disclosed or displayed to any third party without the prior written consent of ENVIRONGAKA (Pty) Ltd.
EnviroNgaka
Figure 5.1-1: Ambient monitoring locations
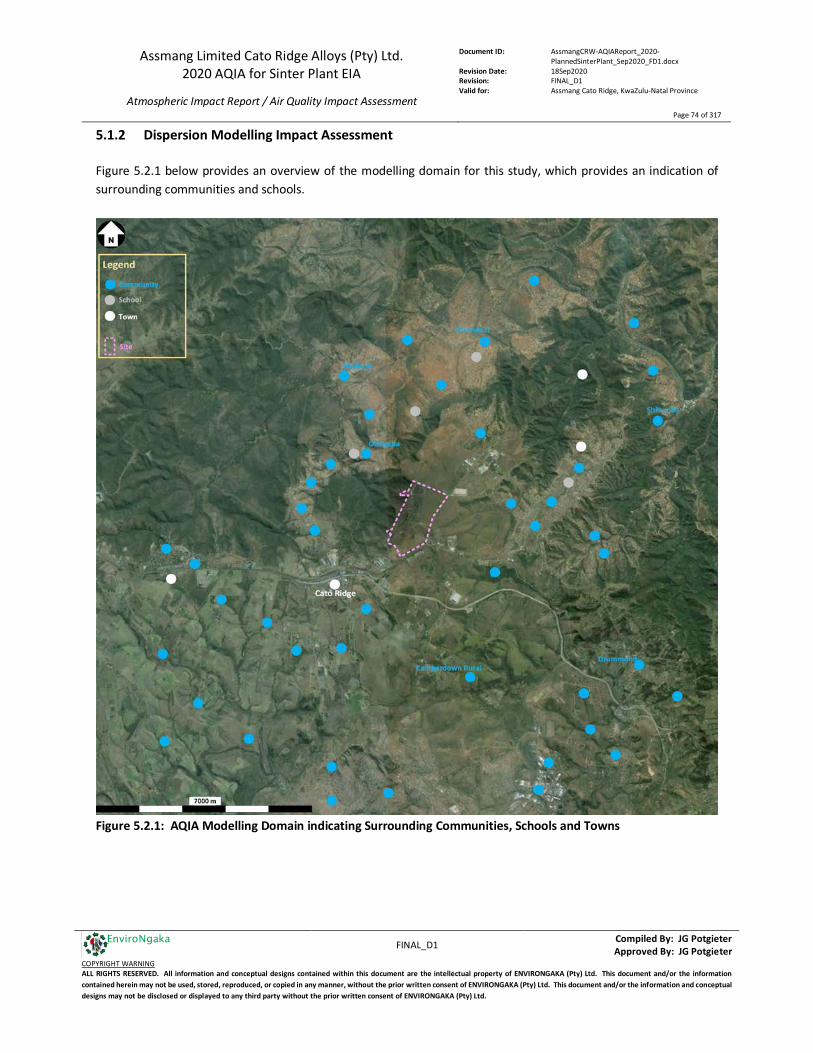
Assmang Limited Cato Ridge Alloys (Pty) Ltd. 2020 AQIA for Sinter Plant EIA
Atmospheric Impact Report / Air Quality Impact Assessment
Document ID: AssmangCRW-AQIAReport_2020-PlannedSinterPlant_Sep2020_FD1.docx
Revision Date: 18Sep2020 Revision: FINAL_D1 Valid for: Assmang Cato Ridge, KwaZulu-Natal Province
Page 74 of 317
FINAL_D1 Compiled By: JG Potgieter
Approved By: JG Potgieter COPYRIGHT WARNING ALL RIGHTS RESERVED. All information and conceptual designs contained within this document are the intellectual property of ENVIRONGAKA (Pty) Ltd. This document and/or the information contained herein may not be used, stored, reproduced, or copied in any manner, without the prior written consent of ENVIRONGAKA (Pty) Ltd. This document and/or the information and conceptual designs may not be disclosed or displayed to any third party without the prior written consent of ENVIRONGAKA (Pty) Ltd.
EnviroNgaka
5.1.2 Dispersion Modelling Impact Assessment Figure 5.2.1 below provides an overview of the modelling domain for this study, which provides an indication of surrounding communities and schools.
Figure 5.2.1: AQIA Modelling Domain indicating Surrounding Communities, Schools and Towns
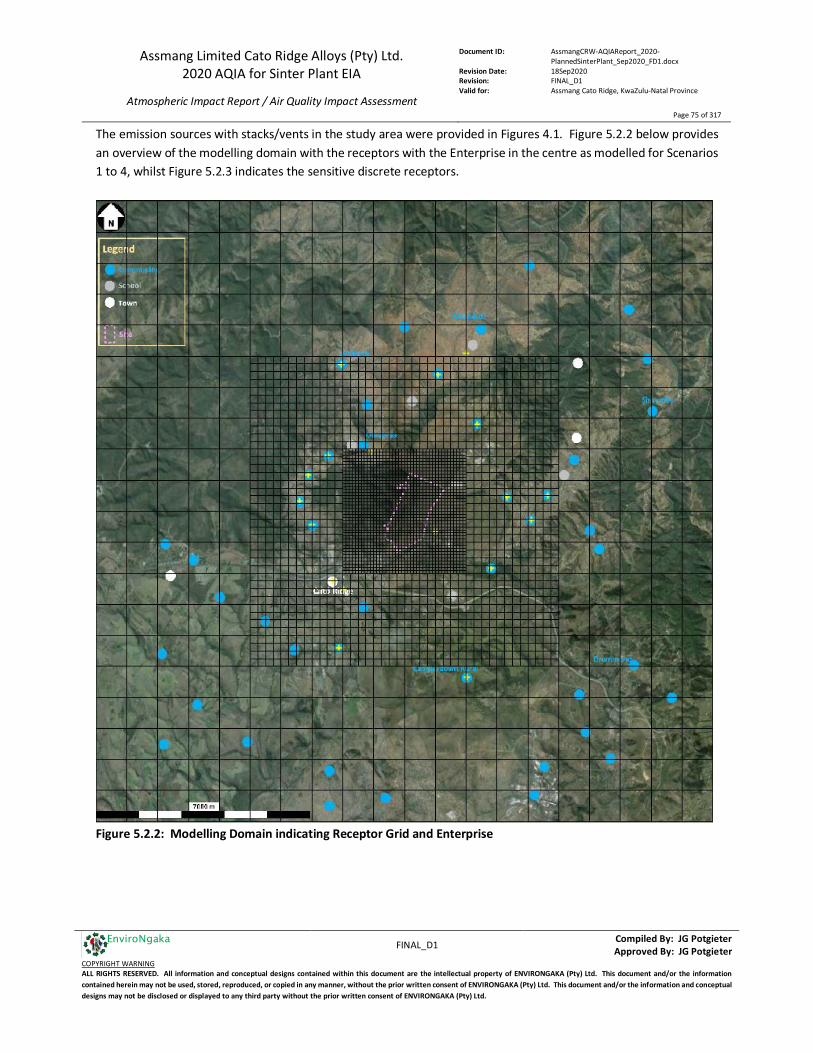
Assmang Limited Cato Ridge Alloys (Pty) Ltd. 2020 AQIA for Sinter Plant EIA
Atmospheric Impact Report / Air Quality Impact Assessment
Document ID: AssmangCRW-AQIAReport_2020-PlannedSinterPlant_Sep2020_FD1.docx
Revision Date: 18Sep2020 Revision: FINAL_D1 Valid for: Assmang Cato Ridge, KwaZulu-Natal Province
Page 75 of 317
FINAL_D1 Compiled By: JG Potgieter
Approved By: JG Potgieter COPYRIGHT WARNING ALL RIGHTS RESERVED. All information and conceptual designs contained within this document are the intellectual property of ENVIRONGAKA (Pty) Ltd. This document and/or the information contained herein may not be used, stored, reproduced, or copied in any manner, without the prior written consent of ENVIRONGAKA (Pty) Ltd. This document and/or the information and conceptual designs may not be disclosed or displayed to any third party without the prior written consent of ENVIRONGAKA (Pty) Ltd.
EnviroNgaka
The emission sources with stacks/vents in the study area were provided in Figures 4.1. Figure 5.2.2 below provides an overview of the modelling domain with the receptors with the Enterprise in the centre as modelled for Scenarios 1 to 4, whilst Figure 5.2.3 indicates the sensitive discrete receptors.
Figure 5.2.2: Modelling Domain indicating Receptor Grid and Enterprise
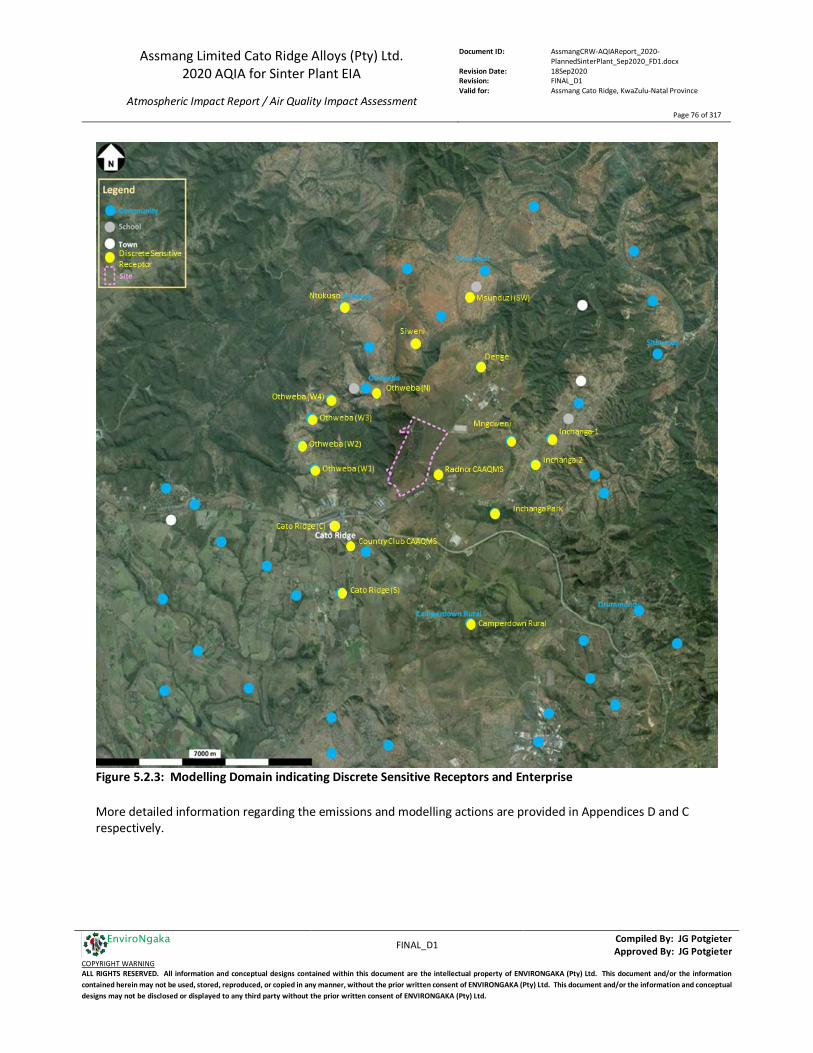
Assmang Limited Cato Ridge Alloys (Pty) Ltd. 2020 AQIA for Sinter Plant EIA
Atmospheric Impact Report / Air Quality Impact Assessment
Document ID: AssmangCRW-AQIAReport_2020-PlannedSinterPlant_Sep2020_FD1.docx
Revision Date: 18Sep2020 Revision: FINAL_D1 Valid for: Assmang Cato Ridge, KwaZulu-Natal Province
Page 76 of 317
FINAL_D1 Compiled By: JG Potgieter
Approved By: JG Potgieter COPYRIGHT WARNING ALL RIGHTS RESERVED. All information and conceptual designs contained within this document are the intellectual property of ENVIRONGAKA (Pty) Ltd. This document and/or the information contained herein may not be used, stored, reproduced, or copied in any manner, without the prior written consent of ENVIRONGAKA (Pty) Ltd. This document and/or the information and conceptual designs may not be disclosed or displayed to any third party without the prior written consent of ENVIRONGAKA (Pty) Ltd.
EnviroNgaka
Figure 5.2.3: Modelling Domain indicating Discrete Sensitive Receptors and Enterprise More detailed information regarding the emissions and modelling actions are provided in Appendices D and C respectively.

Assmang Limited Cato Ridge Alloys (Pty) Ltd. 2020 AQIA for Sinter Plant EIA
Atmospheric Impact Report / Air Quality Impact Assessment
Document ID: AssmangCRW-AQIAReport_2020-PlannedSinterPlant_Sep2020_FD1.docx
Revision Date: 18Sep2020 Revision: FINAL_D1 Valid for: Assmang Cato Ridge, KwaZulu-Natal Province
Page 77 of 317
FINAL_D1 Compiled By: JG Potgieter
Approved By: JG Potgieter COPYRIGHT WARNING ALL RIGHTS RESERVED. All information and conceptual designs contained within this document are the intellectual property of ENVIRONGAKA (Pty) Ltd. This document and/or the information contained herein may not be used, stored, reproduced, or copied in any manner, without the prior written consent of ENVIRONGAKA (Pty) Ltd. This document and/or the information and conceptual designs may not be disclosed or displayed to any third party without the prior written consent of ENVIRONGAKA (Pty) Ltd.
EnviroNgaka
5.1.3 Expected Contribution to Ambient Air Quality Standards – Dispersion Modelling Scenarios’ Results The results of the impact assessment conducted by means of air dispersion modelling are discussed in this section by means of isopleths as assessed against the South African National Ambient Air Quality Standards as referenced earlier in Section 5.1 of this report or ambient air guidelines for pollutants which do not have South African Ambient Air Quality Standards. It is important to note that isopleths are provided in a range of different coloured contours in the figures which will follow. In the figures, the site is in the centre of the map, and the location of the highest concentration modelled in each case is indicated by a white cross, with the concentration written next to it on the figure with a white background. As indicated earlier, there are also blue, grey and white markers (filled circles) on each map to indicate the locations of communities, schools and towns respectively. Please do not misinterpret them as isopleths/contours. The isopleths/contours are clearly distinguishable from these place markers. Results for the sensitive discrete receptors are tabulated at the end for each section or pollutant.
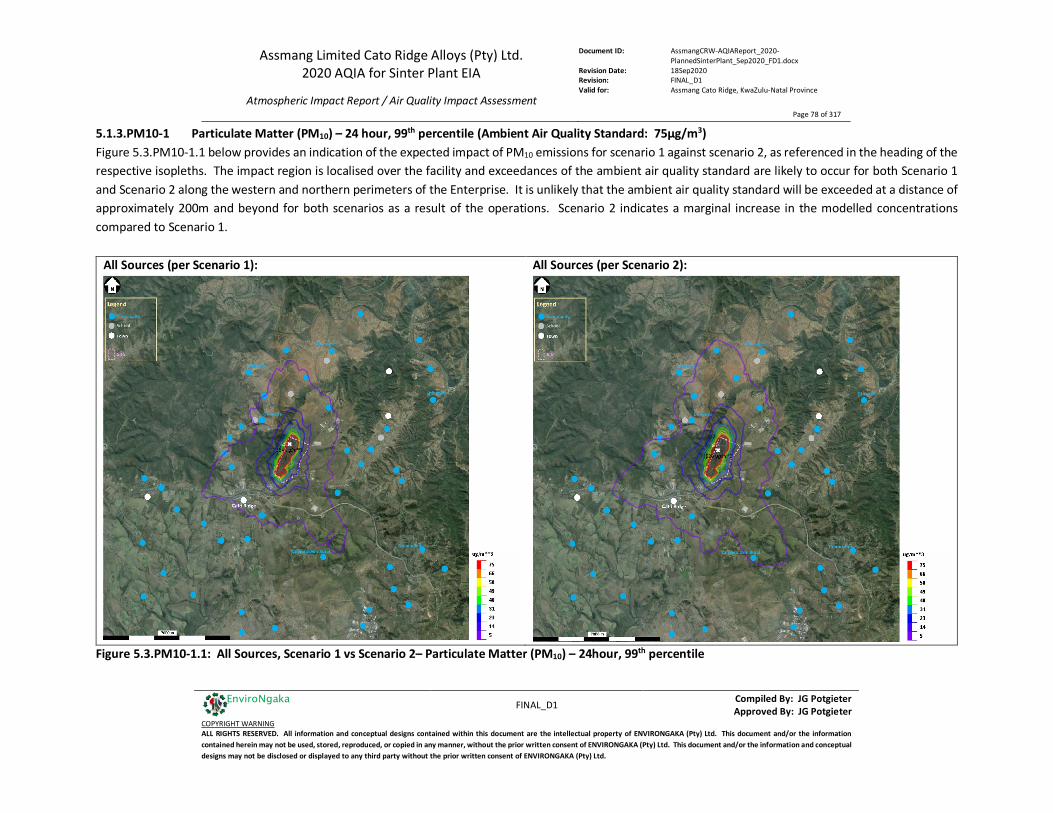
Assmang Limited Cato Ridge Alloys (Pty) Ltd. 2020 AQIA for Sinter Plant EIA
Atmospheric Impact Report / Air Quality Impact Assessment
Document ID: AssmangCRW-AQIAReport_2020-PlannedSinterPlant_Sep2020_FD1.docx
Revision Date: 18Sep2020 Revision: FINAL_D1 Valid for: Assmang Cato Ridge, KwaZulu-Natal Province
Page 78 of 317
FINAL_D1 Compiled By: JG Potgieter
Approved By: JG Potgieter COPYRIGHT WARNING ALL RIGHTS RESERVED. All information and conceptual designs contained within this document are the intellectual property of ENVIRONGAKA (Pty) Ltd. This document and/or the information contained herein may not be used, stored, reproduced, or copied in any manner, without the prior written consent of ENVIRONGAKA (Pty) Ltd. This document and/or the information and conceptual designs may not be disclosed or displayed to any third party without the prior written consent of ENVIRONGAKA (Pty) Ltd.
EnviroNgaka
5.1.3.PM10-1 Particulate Matter (PM10) – 24 hour, 99th percentile (Ambient Air Quality Standard: 75µg/m3) Figure 5.3.PM10-1.1 below provides an indication of the expected impact of PM10 emissions for scenario 1 against scenario 2, as referenced in the heading of the respective isopleths. The impact region is localised over the facility and exceedances of the ambient air quality standard are likely to occur for both Scenario 1 and Scenario 2 along the western and northern perimeters of the Enterprise. It is unlikely that the ambient air quality standard will be exceeded at a distance of approximately 200m and beyond for both scenarios as a result of the operations. Scenario 2 indicates a marginal increase in the modelled concentrations compared to Scenario 1.
All Sources (per Scenario 1):
All Sources (per Scenario 2):
Figure 5.3.PM10-1.1: All Sources, Scenario 1 vs Scenario 2– Particulate Matter (PM10) – 24hour, 99th percentile
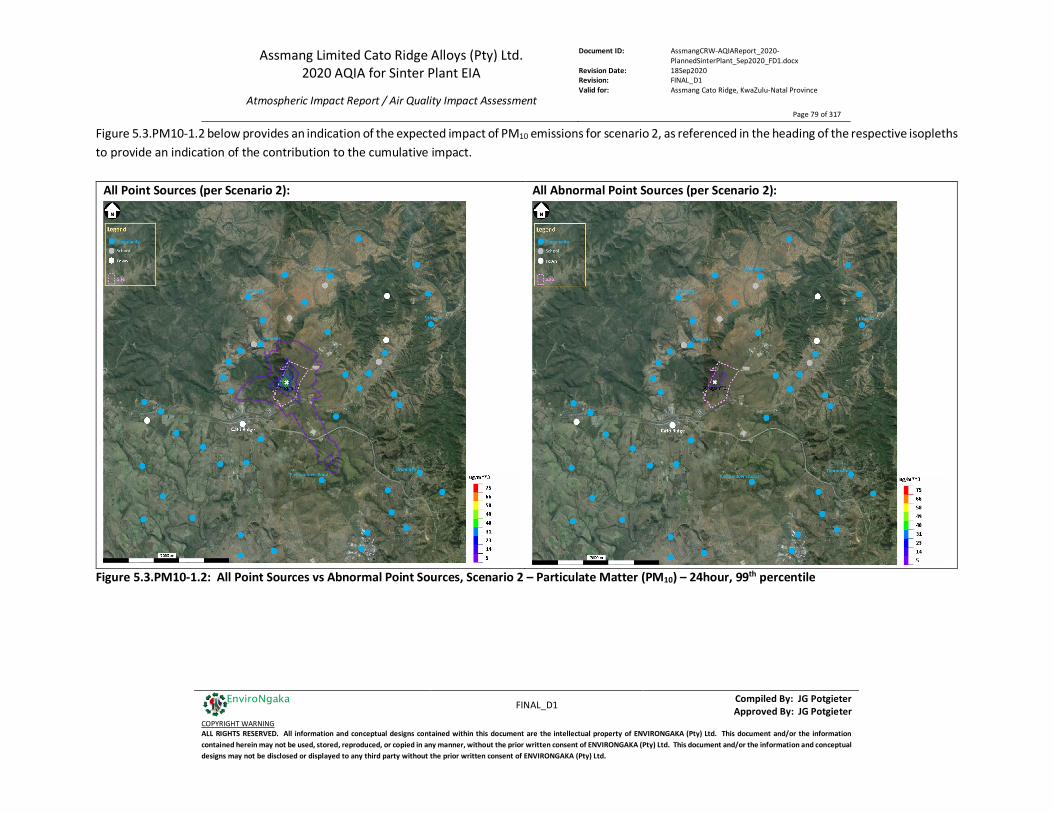
Assmang Limited Cato Ridge Alloys (Pty) Ltd. 2020 AQIA for Sinter Plant EIA
Atmospheric Impact Report / Air Quality Impact Assessment
Document ID: AssmangCRW-AQIAReport_2020-PlannedSinterPlant_Sep2020_FD1.docx
Revision Date: 18Sep2020 Revision: FINAL_D1 Valid for: Assmang Cato Ridge, KwaZulu-Natal Province
Page 79 of 317
FINAL_D1 Compiled By: JG Potgieter
Approved By: JG Potgieter COPYRIGHT WARNING ALL RIGHTS RESERVED. All information and conceptual designs contained within this document are the intellectual property of ENVIRONGAKA (Pty) Ltd. This document and/or the information contained herein may not be used, stored, reproduced, or copied in any manner, without the prior written consent of ENVIRONGAKA (Pty) Ltd. This document and/or the information and conceptual designs may not be disclosed or displayed to any third party without the prior written consent of ENVIRONGAKA (Pty) Ltd.
EnviroNgaka
Figure 5.3.PM10-1.2 below provides an indication of the expected impact of PM10 emissions for scenario 2, as referenced in the heading of the respective isopleths to provide an indication of the contribution to the cumulative impact.
All Point Sources (per Scenario 2):
All Abnormal Point Sources (per Scenario 2):
Figure 5.3.PM10-1.2: All Point Sources vs Abnormal Point Sources, Scenario 2 – Particulate Matter (PM10) – 24hour, 99th percentile
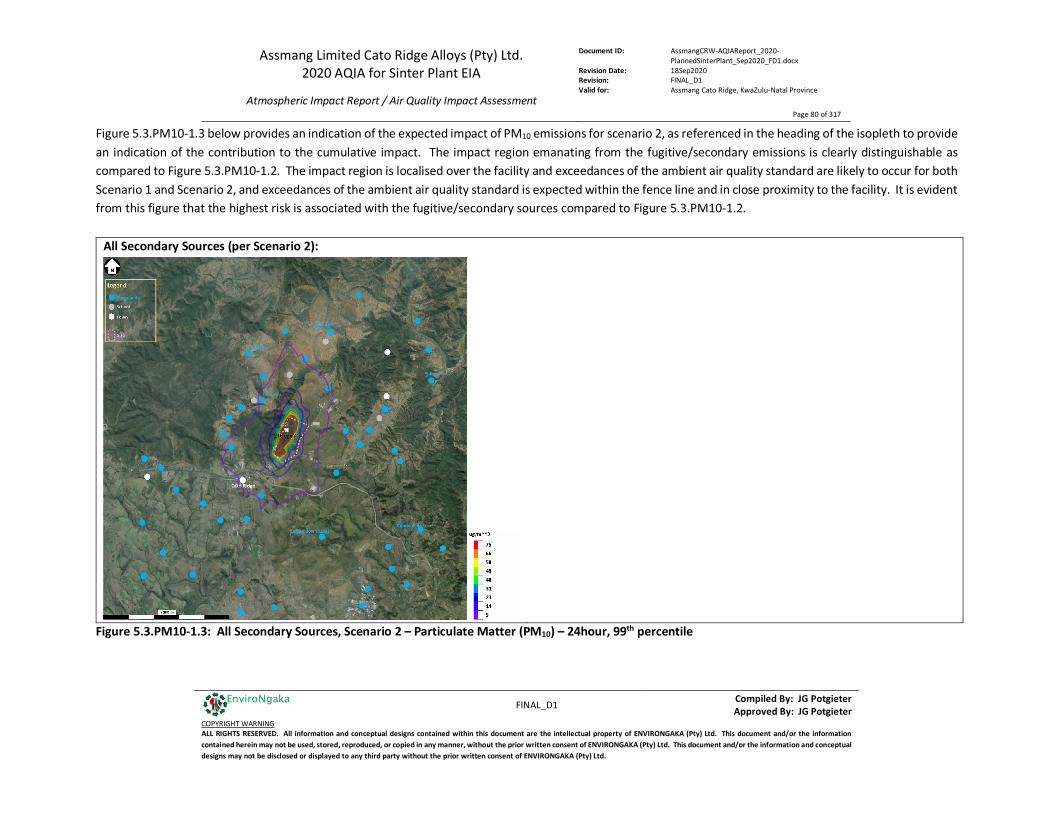
Assmang Limited Cato Ridge Alloys (Pty) Ltd. 2020 AQIA for Sinter Plant EIA
Atmospheric Impact Report / Air Quality Impact Assessment
Document ID: AssmangCRW-AQIAReport_2020-PlannedSinterPlant_Sep2020_FD1.docx
Revision Date: 18Sep2020 Revision: FINAL_D1 Valid for: Assmang Cato Ridge, KwaZulu-Natal Province
Page 80 of 317
FINAL_D1 Compiled By: JG Potgieter
Approved By: JG Potgieter COPYRIGHT WARNING ALL RIGHTS RESERVED. All information and conceptual designs contained within this document are the intellectual property of ENVIRONGAKA (Pty) Ltd. This document and/or the information contained herein may not be used, stored, reproduced, or copied in any manner, without the prior written consent of ENVIRONGAKA (Pty) Ltd. This document and/or the information and conceptual designs may not be disclosed or displayed to any third party without the prior written consent of ENVIRONGAKA (Pty) Ltd.
EnviroNgaka
Figure 5.3.PM10-1.3 below provides an indication of the expected impact of PM10 emissions for scenario 2, as referenced in the heading of the isopleth to provide an indication of the contribution to the cumulative impact. The impact region emanating from the fugitive/secondary emissions is clearly distinguishable as compared to Figure 5.3.PM10-1.2. The impact region is localised over the facility and exceedances of the ambient air quality standard are likely to occur for both Scenario 1 and Scenario 2, and exceedances of the ambient air quality standard is expected within the fence line and in close proximity to the facility. It is evident from this figure that the highest risk is associated with the fugitive/secondary sources compared to Figure 5.3.PM10-1.2.
All Secondary Sources (per Scenario 2):
Figure 5.3.PM10-1.3: All Secondary Sources, Scenario 2 – Particulate Matter (PM10) – 24hour, 99th percentile

Assmang Limited Cato Ridge Alloys (Pty) Ltd. 2020 AQIA for Sinter Plant EIA
Atmospheric Impact Report / Air Quality Impact Assessment
Document ID: AssmangCRW-AQIAReport_2020-PlannedSinterPlant_Sep2020_FD1.docx
Revision Date: 18Sep2020 Revision: FINAL_D1 Valid for: Assmang Cato Ridge, KwaZulu-Natal Province
Page 81 of 317
FINAL_D1 Compiled By: JG Potgieter
Approved By: JG Potgieter COPYRIGHT WARNING ALL RIGHTS RESERVED. All information and conceptual designs contained within this document are the intellectual property of ENVIRONGAKA (Pty) Ltd. This document and/or the information contained herein may not be used, stored, reproduced, or copied in any manner, without the prior written consent of ENVIRONGAKA (Pty) Ltd. This document and/or the information and conceptual designs may not be disclosed or displayed to any third party without the prior written consent of ENVIRONGAKA (Pty) Ltd.
EnviroNgaka
Table 5.PM10-1 summarises the maximum simulated 24-hr PM10 concentrations at the sensitive receptors in the region. The NAAQS for a 24-hr averaging period is 75µg/m3. Table 5.PM10-1: Sensitive receptors: Maximum 24-hr PM10 concentrations (µg/m3)
Sensitive Receptor Scenario 1 Scenario 2 Msunduzi (SW) 7.488 9.261 Denge 18.150 22.377 Mngcweni 7.214 8.165 Inchanga-1 3.997 4.707 Inchanga-2 4.428 5.769 Inchanga Park 4.755 4.975 Camperdown Rural 7.907 10.211 Country Club CAAQMS 11.652 14.301 Cato Ridge (S) 7.659 9.091 Cato Ridge (C) 10.135 11.384 Othweba (W1) 11.923 16.203 Othweba (W2) 6.743 8.656 Othweba (W3) 6.461 7.897 Othweba (W4) 11.046 13.522 Othweba (N) 13.991 15.338 Ntukuso 5.596 7.182 Siweni 15.073 17.605 Radnor CAAQMS 19.465 23.662
Per the tabled information for the sensitive receptors, red text illustrates for which sensitive receptors, the highest concentration modelled over the 3 year period will be in excess of the standard’s concentration. It was found that the highest concentration modelled over the period at each sensitive receptor was less than the standard’s concentration. An assessment of the time-series data was therefore not required.
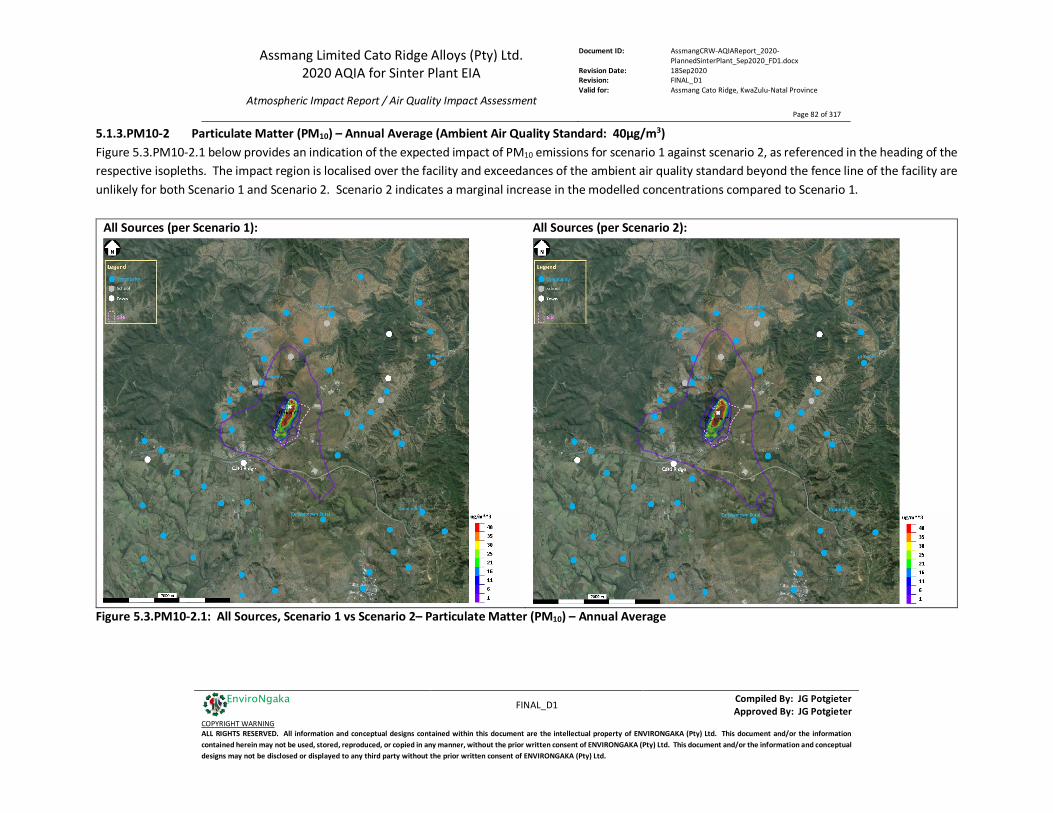
Assmang Limited Cato Ridge Alloys (Pty) Ltd. 2020 AQIA for Sinter Plant EIA
Atmospheric Impact Report / Air Quality Impact Assessment
Document ID: AssmangCRW-AQIAReport_2020-PlannedSinterPlant_Sep2020_FD1.docx
Revision Date: 18Sep2020 Revision: FINAL_D1 Valid for: Assmang Cato Ridge, KwaZulu-Natal Province
Page 82 of 317
FINAL_D1 Compiled By: JG Potgieter
Approved By: JG Potgieter COPYRIGHT WARNING ALL RIGHTS RESERVED. All information and conceptual designs contained within this document are the intellectual property of ENVIRONGAKA (Pty) Ltd. This document and/or the information contained herein may not be used, stored, reproduced, or copied in any manner, without the prior written consent of ENVIRONGAKA (Pty) Ltd. This document and/or the information and conceptual designs may not be disclosed or displayed to any third party without the prior written consent of ENVIRONGAKA (Pty) Ltd.
EnviroNgaka
5.1.3.PM10-2 Particulate Matter (PM10) – Annual Average (Ambient Air Quality Standard: 40µg/m3) Figure 5.3.PM10-2.1 below provides an indication of the expected impact of PM10 emissions for scenario 1 against scenario 2, as referenced in the heading of the respective isopleths. The impact region is localised over the facility and exceedances of the ambient air quality standard beyond the fence line of the facility are unlikely for both Scenario 1 and Scenario 2. Scenario 2 indicates a marginal increase in the modelled concentrations compared to Scenario 1.
All Sources (per Scenario 1):
All Sources (per Scenario 2):
Figure 5.3.PM10-2.1: All Sources, Scenario 1 vs Scenario 2– Particulate Matter (PM10) – Annual Average

Assmang Limited Cato Ridge Alloys (Pty) Ltd. 2020 AQIA for Sinter Plant EIA
Atmospheric Impact Report / Air Quality Impact Assessment
Document ID: AssmangCRW-AQIAReport_2020-PlannedSinterPlant_Sep2020_FD1.docx
Revision Date: 18Sep2020 Revision: FINAL_D1 Valid for: Assmang Cato Ridge, KwaZulu-Natal Province
Page 83 of 317
FINAL_D1 Compiled By: JG Potgieter
Approved By: JG Potgieter COPYRIGHT WARNING ALL RIGHTS RESERVED. All information and conceptual designs contained within this document are the intellectual property of ENVIRONGAKA (Pty) Ltd. This document and/or the information contained herein may not be used, stored, reproduced, or copied in any manner, without the prior written consent of ENVIRONGAKA (Pty) Ltd. This document and/or the information and conceptual designs may not be disclosed or displayed to any third party without the prior written consent of ENVIRONGAKA (Pty) Ltd.
EnviroNgaka
Figure 5.3.PM10-2.2 below provides an indication of the expected impact of PM10 emissions for scenario 2, as referenced in the heading of the respective isopleths to provide an indication of the contribution to the cumulative impact.
All Point Sources (per Scenario 2):
All Abnormal Point Sources (per Scenario 2):
Figure 5.3.PM10-2.2: All Point Sources vs Abnormal Point Sources, Scenario 2 – Particulate Matter (PM10) – Annual Average

Assmang Limited Cato Ridge Alloys (Pty) Ltd. 2020 AQIA for Sinter Plant EIA
Atmospheric Impact Report / Air Quality Impact Assessment
Document ID: AssmangCRW-AQIAReport_2020-PlannedSinterPlant_Sep2020_FD1.docx
Revision Date: 18Sep2020 Revision: FINAL_D1 Valid for: Assmang Cato Ridge, KwaZulu-Natal Province
Page 84 of 317
FINAL_D1 Compiled By: JG Potgieter
Approved By: JG Potgieter COPYRIGHT WARNING ALL RIGHTS RESERVED. All information and conceptual designs contained within this document are the intellectual property of ENVIRONGAKA (Pty) Ltd. This document and/or the information contained herein may not be used, stored, reproduced, or copied in any manner, without the prior written consent of ENVIRONGAKA (Pty) Ltd. This document and/or the information and conceptual designs may not be disclosed or displayed to any third party without the prior written consent of ENVIRONGAKA (Pty) Ltd.
EnviroNgaka
Figure 5.3.PM10-2.3 below provides an indication of the expected impact of PM10 emissions for scenario 2, as referenced in the heading of the isopleth to provide an indication of the contribution to the cumulative impact. The impact region emanating from the fugitive/secondary emissions is clearly distinguishable as compared to Figure 5.3.PM10-2.2. The impact region is localised and exceedances of the ambient air quality standard is expected within the fence line and in close proximity to the facility. It is evident from this figure that the highest risk associated with the fugitive/secondary sources compared to Figure 5.3.PM10-2.2.
All Secondary Sources (per Scenario 2):
Figure 5.3.PM10-2.3: All Secondary Sources, Scenario 2 – Particulate Matter (PM10) – Annual Average
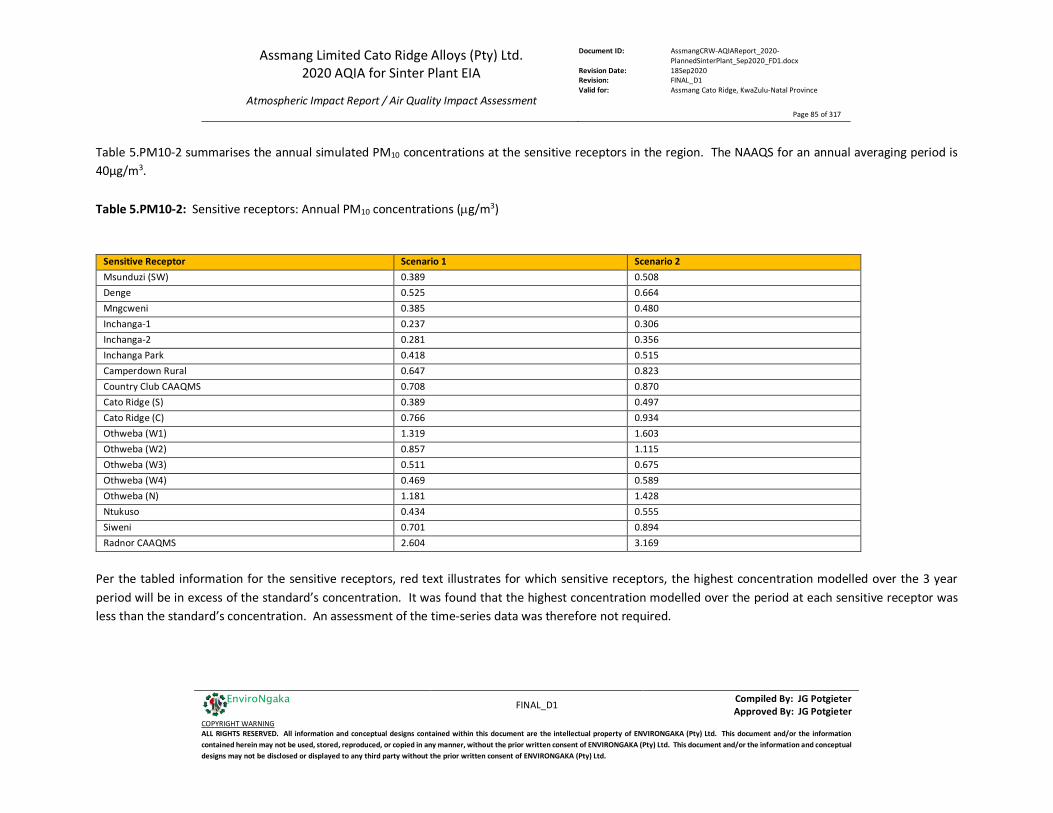
Assmang Limited Cato Ridge Alloys (Pty) Ltd. 2020 AQIA for Sinter Plant EIA
Atmospheric Impact Report / Air Quality Impact Assessment
Document ID: AssmangCRW-AQIAReport_2020-PlannedSinterPlant_Sep2020_FD1.docx
Revision Date: 18Sep2020 Revision: FINAL_D1 Valid for: Assmang Cato Ridge, KwaZulu-Natal Province
Page 85 of 317
FINAL_D1 Compiled By: JG Potgieter
Approved By: JG Potgieter COPYRIGHT WARNING ALL RIGHTS RESERVED. All information and conceptual designs contained within this document are the intellectual property of ENVIRONGAKA (Pty) Ltd. This document and/or the information contained herein may not be used, stored, reproduced, or copied in any manner, without the prior written consent of ENVIRONGAKA (Pty) Ltd. This document and/or the information and conceptual designs may not be disclosed or displayed to any third party without the prior written consent of ENVIRONGAKA (Pty) Ltd.
EnviroNgaka
Table 5.PM10-2 summarises the annual simulated PM10 concentrations at the sensitive receptors in the region. The NAAQS for an annual averaging period is 40µg/m3. Table 5.PM10-2: Sensitive receptors: Annual PM10 concentrations (µg/m3)
Sensitive Receptor Scenario 1 Scenario 2 Msunduzi (SW) 0.389 0.508 Denge 0.525 0.664 Mngcweni 0.385 0.480 Inchanga-1 0.237 0.306 Inchanga-2 0.281 0.356 Inchanga Park 0.418 0.515 Camperdown Rural 0.647 0.823 Country Club CAAQMS 0.708 0.870 Cato Ridge (S) 0.389 0.497 Cato Ridge (C) 0.766 0.934 Othweba (W1) 1.319 1.603 Othweba (W2) 0.857 1.115 Othweba (W3) 0.511 0.675 Othweba (W4) 0.469 0.589 Othweba (N) 1.181 1.428 Ntukuso 0.434 0.555 Siweni 0.701 0.894 Radnor CAAQMS 2.604 3.169
Per the tabled information for the sensitive receptors, red text illustrates for which sensitive receptors, the highest concentration modelled over the 3 year period will be in excess of the standard’s concentration. It was found that the highest concentration modelled over the period at each sensitive receptor was less than the standard’s concentration. An assessment of the time-series data was therefore not required.
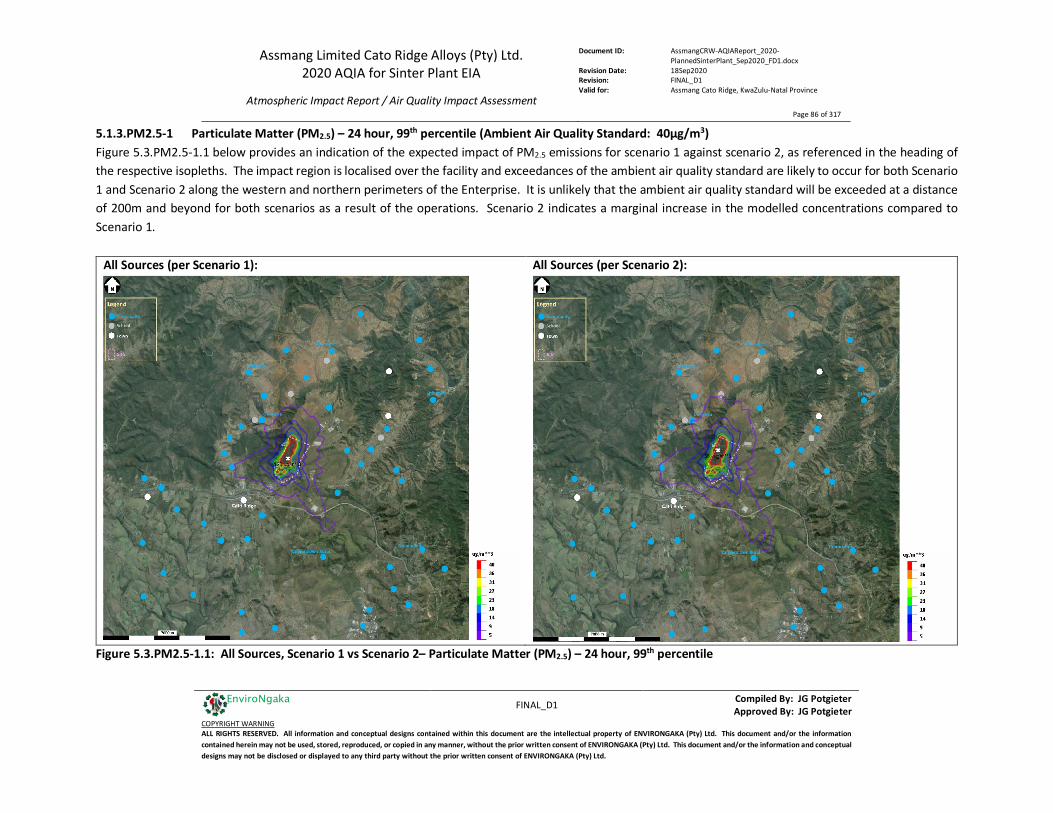
Assmang Limited Cato Ridge Alloys (Pty) Ltd. 2020 AQIA for Sinter Plant EIA
Atmospheric Impact Report / Air Quality Impact Assessment
Document ID: AssmangCRW-AQIAReport_2020-PlannedSinterPlant_Sep2020_FD1.docx
Revision Date: 18Sep2020 Revision: FINAL_D1 Valid for: Assmang Cato Ridge, KwaZulu-Natal Province
Page 86 of 317
FINAL_D1 Compiled By: JG Potgieter
Approved By: JG Potgieter COPYRIGHT WARNING ALL RIGHTS RESERVED. All information and conceptual designs contained within this document are the intellectual property of ENVIRONGAKA (Pty) Ltd. This document and/or the information contained herein may not be used, stored, reproduced, or copied in any manner, without the prior written consent of ENVIRONGAKA (Pty) Ltd. This document and/or the information and conceptual designs may not be disclosed or displayed to any third party without the prior written consent of ENVIRONGAKA (Pty) Ltd.
EnviroNgaka
5.1.3.PM2.5-1 Particulate Matter (PM2.5) – 24 hour, 99th percentile (Ambient Air Quality Standard: 40µg/m3) Figure 5.3.PM2.5-1.1 below provides an indication of the expected impact of PM2.5 emissions for scenario 1 against scenario 2, as referenced in the heading of the respective isopleths. The impact region is localised over the facility and exceedances of the ambient air quality standard are likely to occur for both Scenario 1 and Scenario 2 along the western and northern perimeters of the Enterprise. It is unlikely that the ambient air quality standard will be exceeded at a distance of 200m and beyond for both scenarios as a result of the operations. Scenario 2 indicates a marginal increase in the modelled concentrations compared to Scenario 1.
All Sources (per Scenario 1):
All Sources (per Scenario 2):
Figure 5.3.PM2.5-1.1: All Sources, Scenario 1 vs Scenario 2– Particulate Matter (PM2.5) – 24 hour, 99th percentile
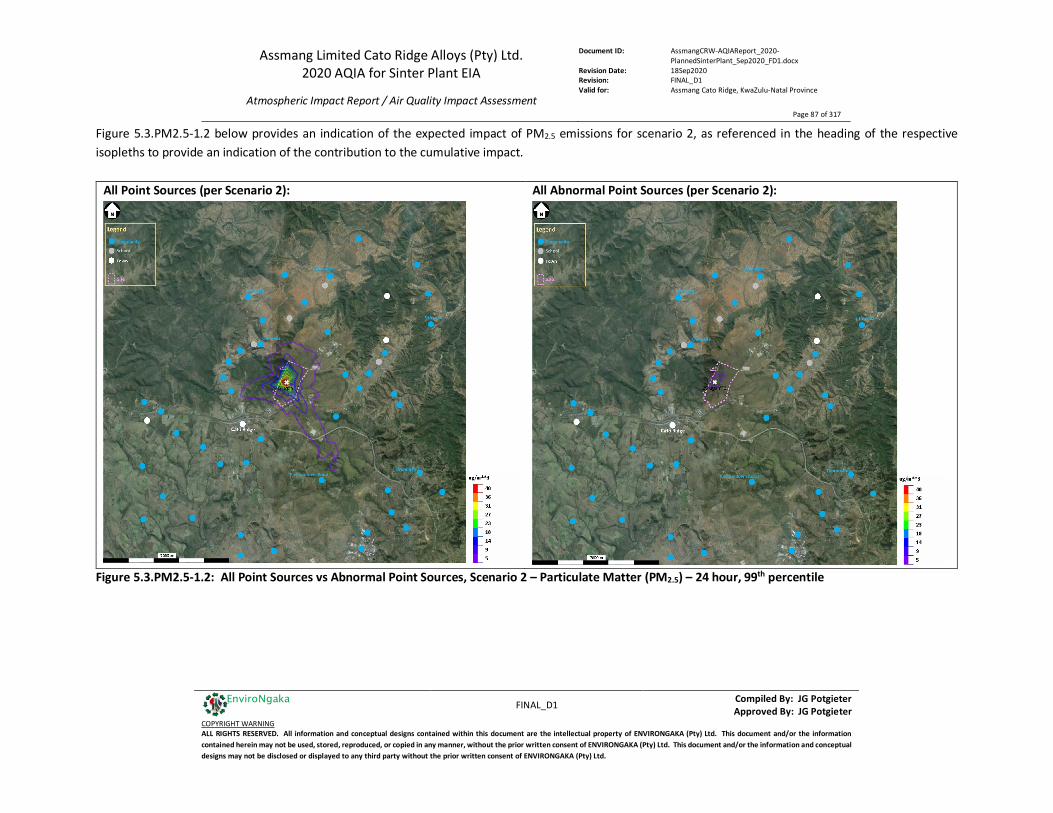
Assmang Limited Cato Ridge Alloys (Pty) Ltd. 2020 AQIA for Sinter Plant EIA
Atmospheric Impact Report / Air Quality Impact Assessment
Document ID: AssmangCRW-AQIAReport_2020-PlannedSinterPlant_Sep2020_FD1.docx
Revision Date: 18Sep2020 Revision: FINAL_D1 Valid for: Assmang Cato Ridge, KwaZulu-Natal Province
Page 87 of 317
FINAL_D1 Compiled By: JG Potgieter
Approved By: JG Potgieter COPYRIGHT WARNING ALL RIGHTS RESERVED. All information and conceptual designs contained within this document are the intellectual property of ENVIRONGAKA (Pty) Ltd. This document and/or the information contained herein may not be used, stored, reproduced, or copied in any manner, without the prior written consent of ENVIRONGAKA (Pty) Ltd. This document and/or the information and conceptual designs may not be disclosed or displayed to any third party without the prior written consent of ENVIRONGAKA (Pty) Ltd.
EnviroNgaka
Figure 5.3.PM2.5-1.2 below provides an indication of the expected impact of PM2.5 emissions for scenario 2, as referenced in the heading of the respective isopleths to provide an indication of the contribution to the cumulative impact.
All Point Sources (per Scenario 2):
All Abnormal Point Sources (per Scenario 2):
Figure 5.3.PM2.5-1.2: All Point Sources vs Abnormal Point Sources, Scenario 2 – Particulate Matter (PM2.5) – 24 hour, 99th percentile
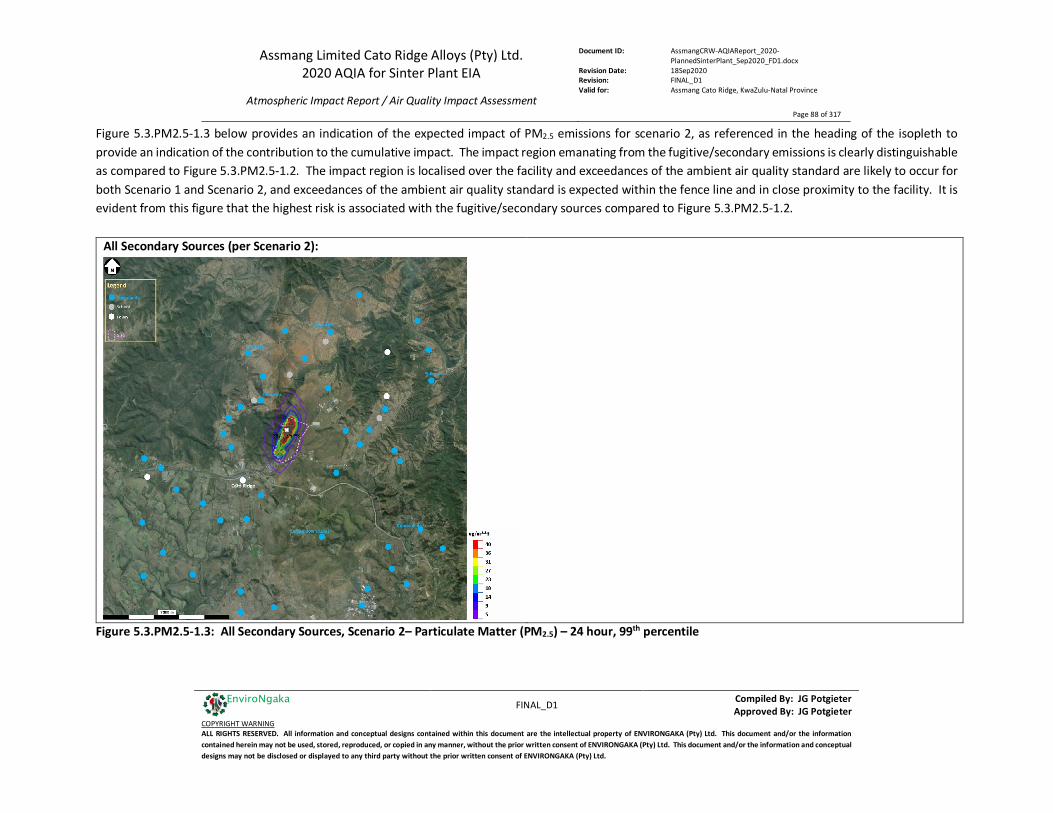
Assmang Limited Cato Ridge Alloys (Pty) Ltd. 2020 AQIA for Sinter Plant EIA
Atmospheric Impact Report / Air Quality Impact Assessment
Document ID: AssmangCRW-AQIAReport_2020-PlannedSinterPlant_Sep2020_FD1.docx
Revision Date: 18Sep2020 Revision: FINAL_D1 Valid for: Assmang Cato Ridge, KwaZulu-Natal Province
Page 88 of 317
FINAL_D1 Compiled By: JG Potgieter
Approved By: JG Potgieter COPYRIGHT WARNING ALL RIGHTS RESERVED. All information and conceptual designs contained within this document are the intellectual property of ENVIRONGAKA (Pty) Ltd. This document and/or the information contained herein may not be used, stored, reproduced, or copied in any manner, without the prior written consent of ENVIRONGAKA (Pty) Ltd. This document and/or the information and conceptual designs may not be disclosed or displayed to any third party without the prior written consent of ENVIRONGAKA (Pty) Ltd.
EnviroNgaka
Figure 5.3.PM2.5-1.3 below provides an indication of the expected impact of PM2.5 emissions for scenario 2, as referenced in the heading of the isopleth to provide an indication of the contribution to the cumulative impact. The impact region emanating from the fugitive/secondary emissions is clearly distinguishable as compared to Figure 5.3.PM2.5-1.2. The impact region is localised over the facility and exceedances of the ambient air quality standard are likely to occur for both Scenario 1 and Scenario 2, and exceedances of the ambient air quality standard is expected within the fence line and in close proximity to the facility. It is evident from this figure that the highest risk is associated with the fugitive/secondary sources compared to Figure 5.3.PM2.5-1.2.
All Secondary Sources (per Scenario 2):
Figure 5.3.PM2.5-1.3: All Secondary Sources, Scenario 2– Particulate Matter (PM2.5) – 24 hour, 99th percentile

Assmang Limited Cato Ridge Alloys (Pty) Ltd. 2020 AQIA for Sinter Plant EIA
Atmospheric Impact Report / Air Quality Impact Assessment
Document ID: AssmangCRW-AQIAReport_2020-PlannedSinterPlant_Sep2020_FD1.docx
Revision Date: 18Sep2020 Revision: FINAL_D1 Valid for: Assmang Cato Ridge, KwaZulu-Natal Province
Page 89 of 317
FINAL_D1 Compiled By: JG Potgieter
Approved By: JG Potgieter COPYRIGHT WARNING ALL RIGHTS RESERVED. All information and conceptual designs contained within this document are the intellectual property of ENVIRONGAKA (Pty) Ltd. This document and/or the information contained herein may not be used, stored, reproduced, or copied in any manner, without the prior written consent of ENVIRONGAKA (Pty) Ltd. This document and/or the information and conceptual designs may not be disclosed or displayed to any third party without the prior written consent of ENVIRONGAKA (Pty) Ltd.
EnviroNgaka
Table 5.PM2.5-1 summarises the maximum simulated 24-hr PM2.5 concentrations at the sensitive receptors in the region. The NAAQS for a 24-hr averaging period is 40µg/m3. Table 5.PM2.5-1: Sensitive receptors: Maximum 24-hr PM2.5 concentrations (µg/m3)
Sensitive Receptor Scenario 1 Scenario 2 Msunduzi (SW) 3.342 4.380 Denge 7.753 9.134 Mngcweni 4.942 5.554 Inchanga-1 3.142 3.475 Inchanga-2 3.015 3.691 Inchanga Park 3.715 4.013 Camperdown Rural 5.602 6.852 Country Club CAAQMS 3.906 5.198 Cato Ridge (S) 3.028 4.108 Cato Ridge (C) 4.502 5.116 Othweba (W1) 7.937 9.290 Othweba (W2) 3.809 4.406 Othweba (W3) 3.269 4.592 Othweba (W4) 4.114 5.008 Othweba (N) 6.710 7.622 Ntukuso 3.644 4.773 Siweni 6.237 7.443 Radnor CAAQMS 12.455 13.615
Per the tabled information for the sensitive receptors, red text illustrates for which sensitive receptors, the highest concentration modelled over the 3 year period will be in excess of the standard’s concentration. It was found that the highest concentration modelled over the period at each sensitive receptor was less than the standard’s concentration. An assessment of the time-series data was therefore not required.
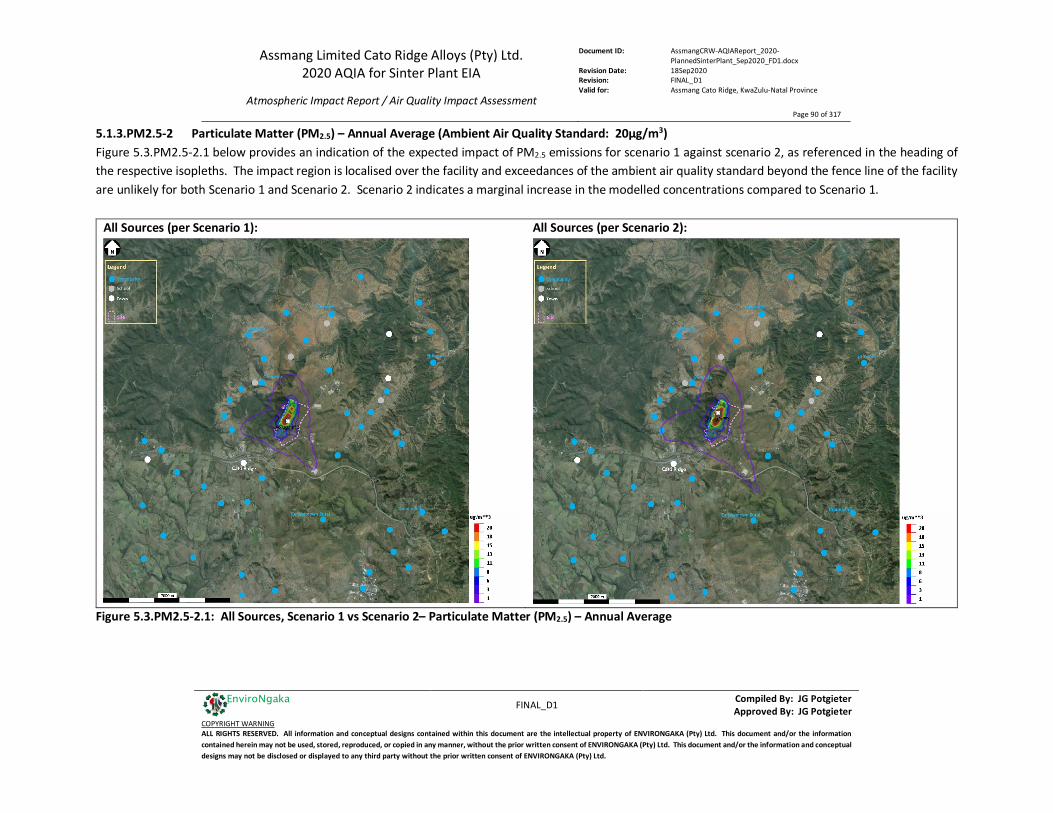
Assmang Limited Cato Ridge Alloys (Pty) Ltd. 2020 AQIA for Sinter Plant EIA
Atmospheric Impact Report / Air Quality Impact Assessment
Document ID: AssmangCRW-AQIAReport_2020-PlannedSinterPlant_Sep2020_FD1.docx
Revision Date: 18Sep2020 Revision: FINAL_D1 Valid for: Assmang Cato Ridge, KwaZulu-Natal Province
Page 90 of 317
FINAL_D1 Compiled By: JG Potgieter
Approved By: JG Potgieter COPYRIGHT WARNING ALL RIGHTS RESERVED. All information and conceptual designs contained within this document are the intellectual property of ENVIRONGAKA (Pty) Ltd. This document and/or the information contained herein may not be used, stored, reproduced, or copied in any manner, without the prior written consent of ENVIRONGAKA (Pty) Ltd. This document and/or the information and conceptual designs may not be disclosed or displayed to any third party without the prior written consent of ENVIRONGAKA (Pty) Ltd.
EnviroNgaka
5.1.3.PM2.5-2 Particulate Matter (PM2.5) – Annual Average (Ambient Air Quality Standard: 20µg/m3) Figure 5.3.PM2.5-2.1 below provides an indication of the expected impact of PM2.5 emissions for scenario 1 against scenario 2, as referenced in the heading of the respective isopleths. The impact region is localised over the facility and exceedances of the ambient air quality standard beyond the fence line of the facility are unlikely for both Scenario 1 and Scenario 2. Scenario 2 indicates a marginal increase in the modelled concentrations compared to Scenario 1.
All Sources (per Scenario 1):
All Sources (per Scenario 2):
Figure 5.3.PM2.5-2.1: All Sources, Scenario 1 vs Scenario 2– Particulate Matter (PM2.5) – Annual Average
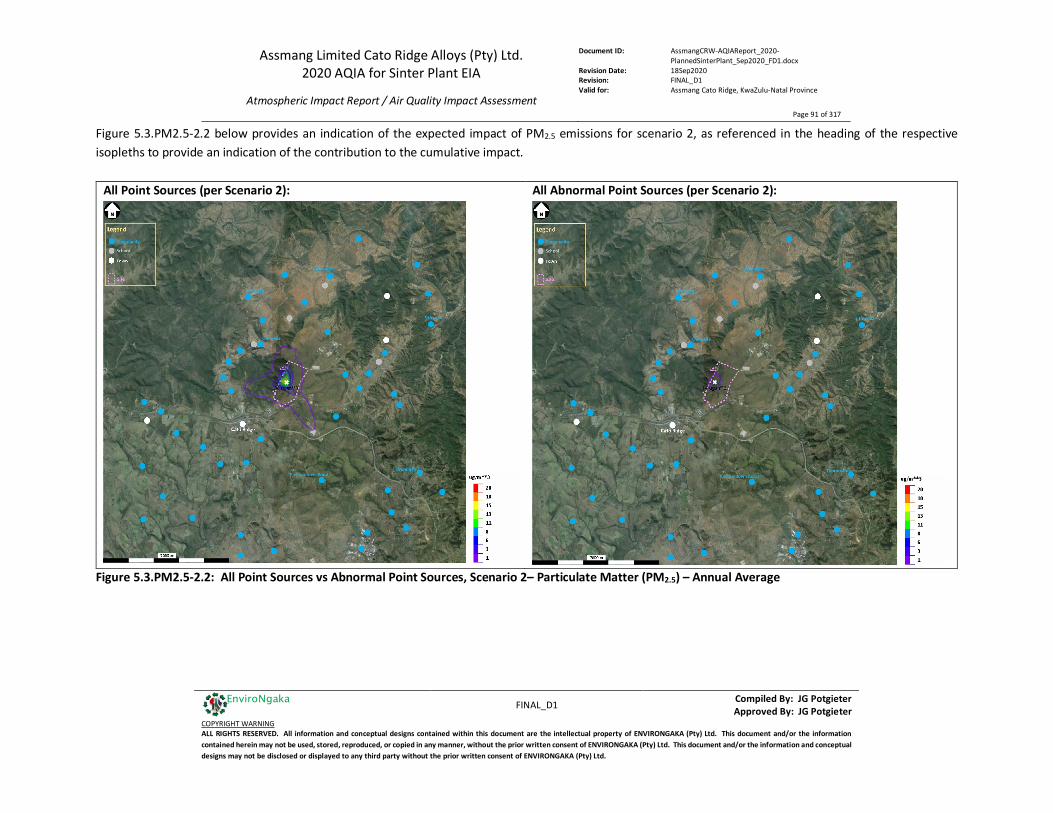
Assmang Limited Cato Ridge Alloys (Pty) Ltd. 2020 AQIA for Sinter Plant EIA
Atmospheric Impact Report / Air Quality Impact Assessment
Document ID: AssmangCRW-AQIAReport_2020-PlannedSinterPlant_Sep2020_FD1.docx
Revision Date: 18Sep2020 Revision: FINAL_D1 Valid for: Assmang Cato Ridge, KwaZulu-Natal Province
Page 91 of 317
FINAL_D1 Compiled By: JG Potgieter
Approved By: JG Potgieter COPYRIGHT WARNING ALL RIGHTS RESERVED. All information and conceptual designs contained within this document are the intellectual property of ENVIRONGAKA (Pty) Ltd. This document and/or the information contained herein may not be used, stored, reproduced, or copied in any manner, without the prior written consent of ENVIRONGAKA (Pty) Ltd. This document and/or the information and conceptual designs may not be disclosed or displayed to any third party without the prior written consent of ENVIRONGAKA (Pty) Ltd.
EnviroNgaka
Figure 5.3.PM2.5-2.2 below provides an indication of the expected impact of PM2.5 emissions for scenario 2, as referenced in the heading of the respective isopleths to provide an indication of the contribution to the cumulative impact.
All Point Sources (per Scenario 2):
All Abnormal Point Sources (per Scenario 2):
Figure 5.3.PM2.5-2.2: All Point Sources vs Abnormal Point Sources, Scenario 2– Particulate Matter (PM2.5) – Annual Average
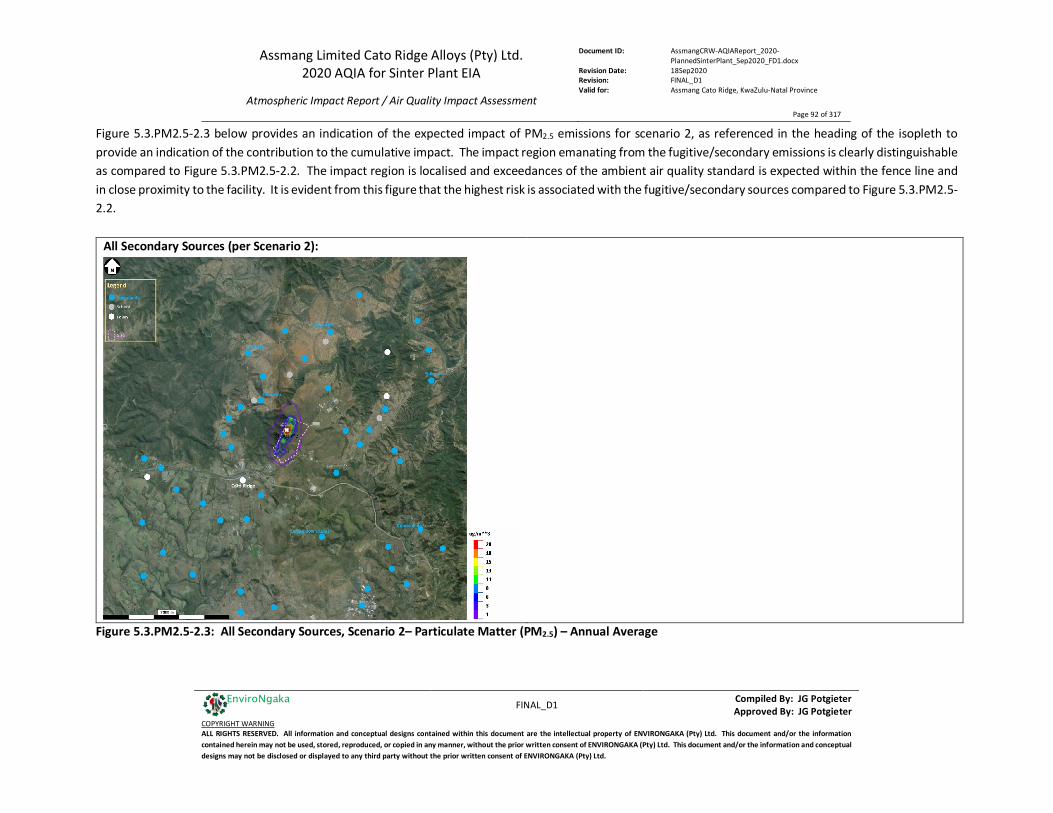
Assmang Limited Cato Ridge Alloys (Pty) Ltd. 2020 AQIA for Sinter Plant EIA
Atmospheric Impact Report / Air Quality Impact Assessment
Document ID: AssmangCRW-AQIAReport_2020-PlannedSinterPlant_Sep2020_FD1.docx
Revision Date: 18Sep2020 Revision: FINAL_D1 Valid for: Assmang Cato Ridge, KwaZulu-Natal Province
Page 92 of 317
FINAL_D1 Compiled By: JG Potgieter
Approved By: JG Potgieter COPYRIGHT WARNING ALL RIGHTS RESERVED. All information and conceptual designs contained within this document are the intellectual property of ENVIRONGAKA (Pty) Ltd. This document and/or the information contained herein may not be used, stored, reproduced, or copied in any manner, without the prior written consent of ENVIRONGAKA (Pty) Ltd. This document and/or the information and conceptual designs may not be disclosed or displayed to any third party without the prior written consent of ENVIRONGAKA (Pty) Ltd.
EnviroNgaka
Figure 5.3.PM2.5-2.3 below provides an indication of the expected impact of PM2.5 emissions for scenario 2, as referenced in the heading of the isopleth to provide an indication of the contribution to the cumulative impact. The impact region emanating from the fugitive/secondary emissions is clearly distinguishable as compared to Figure 5.3.PM2.5-2.2. The impact region is localised and exceedances of the ambient air quality standard is expected within the fence line and in close proximity to the facility. It is evident from this figure that the highest risk is associated with the fugitive/secondary sources compared to Figure 5.3.PM2.5-2.2.
All Secondary Sources (per Scenario 2):
Figure 5.3.PM2.5-2.3: All Secondary Sources, Scenario 2– Particulate Matter (PM2.5) – Annual Average

Assmang Limited Cato Ridge Alloys (Pty) Ltd. 2020 AQIA for Sinter Plant EIA
Atmospheric Impact Report / Air Quality Impact Assessment
Document ID: AssmangCRW-AQIAReport_2020-PlannedSinterPlant_Sep2020_FD1.docx
Revision Date: 18Sep2020 Revision: FINAL_D1 Valid for: Assmang Cato Ridge, KwaZulu-Natal Province
Page 93 of 317
FINAL_D1 Compiled By: JG Potgieter
Approved By: JG Potgieter COPYRIGHT WARNING ALL RIGHTS RESERVED. All information and conceptual designs contained within this document are the intellectual property of ENVIRONGAKA (Pty) Ltd. This document and/or the information contained herein may not be used, stored, reproduced, or copied in any manner, without the prior written consent of ENVIRONGAKA (Pty) Ltd. This document and/or the information and conceptual designs may not be disclosed or displayed to any third party without the prior written consent of ENVIRONGAKA (Pty) Ltd.
EnviroNgaka
Table 5.PM2.5-2 summarises the annual simulated PM2.5 concentrations at the sensitive receptors in the region. The NAAQS for an annual averaging period is 20µg/m3. Table 5.PM2.5-2: Sensitive receptors: Annual PM2.5 concentrations (µg/m3)
Sensitive Receptor Scenario 1 Scenario 2 Msunduzi (SW) 0.229 0.315 Denge 0.273 0.367 Mngcweni 0.237 0.304 Inchanga-1 0.149 0.200 Inchanga-2 0.180 0.235 Inchanga Park 0.240 0.309 Camperdown Rural 0.463 0.593 Country Club CAAQMS 0.335 0.444 Cato Ridge (S) 0.219 0.298 Cato Ridge (C) 0.376 0.489 Othweba (W1) 0.812 1.005 Othweba (W2) 0.543 0.726 Othweba (W3) 0.295 0.412 Othweba (W4) 0.257 0.338 Othweba (N) 0.662 0.810 Ntukuso 0.275 0.363 Siweni 0.379 0.513 Radnor CAAQMS 1.249 1.538
Per the tabled information for the sensitive receptors, red text illustrates for which sensitive receptors, the highest concentration modelled over the 3 year period will be in excess of the standard’s concentration. It was found that the highest concentration modelled over the period at each sensitive receptor was less than the standard’s concentration. An assessment of the time-series data was therefore not required.
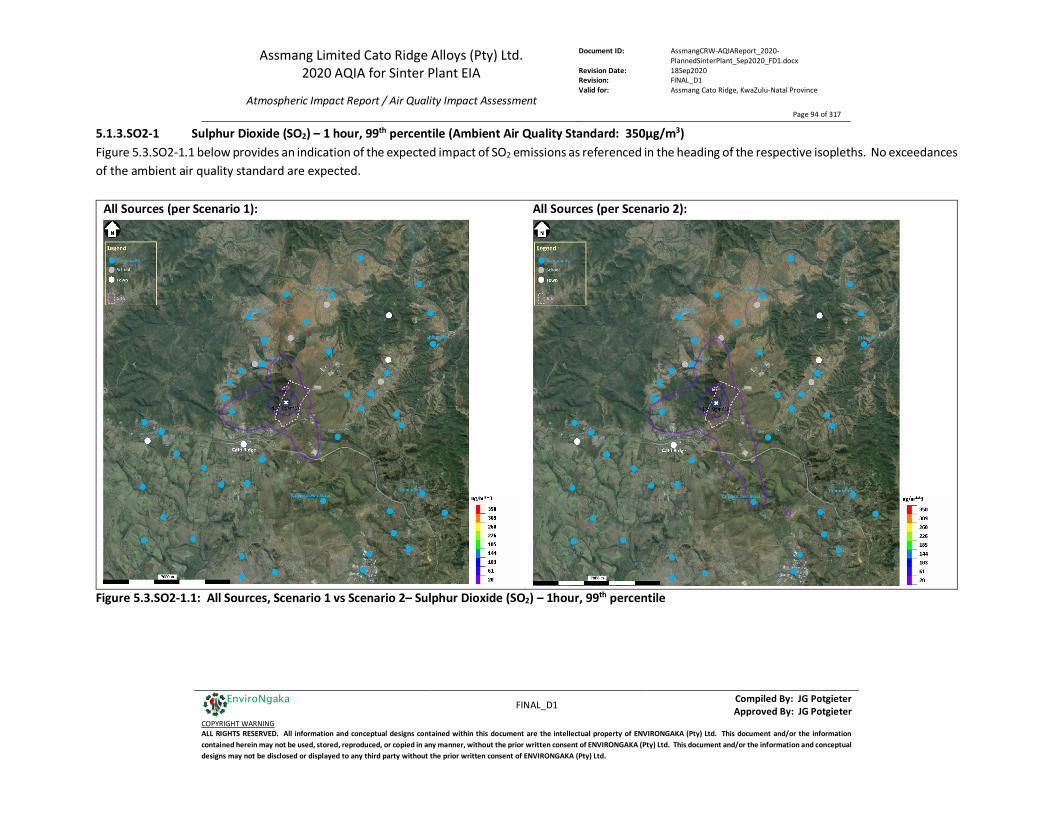
Assmang Limited Cato Ridge Alloys (Pty) Ltd. 2020 AQIA for Sinter Plant EIA
Atmospheric Impact Report / Air Quality Impact Assessment
Document ID: AssmangCRW-AQIAReport_2020-PlannedSinterPlant_Sep2020_FD1.docx
Revision Date: 18Sep2020 Revision: FINAL_D1 Valid for: Assmang Cato Ridge, KwaZulu-Natal Province
Page 94 of 317
FINAL_D1 Compiled By: JG Potgieter
Approved By: JG Potgieter COPYRIGHT WARNING ALL RIGHTS RESERVED. All information and conceptual designs contained within this document are the intellectual property of ENVIRONGAKA (Pty) Ltd. This document and/or the information contained herein may not be used, stored, reproduced, or copied in any manner, without the prior written consent of ENVIRONGAKA (Pty) Ltd. This document and/or the information and conceptual designs may not be disclosed or displayed to any third party without the prior written consent of ENVIRONGAKA (Pty) Ltd.
EnviroNgaka
5.1.3.SO2-1 Sulphur Dioxide (SO2) – 1 hour, 99th percentile (Ambient Air Quality Standard: 350µg/m3) Figure 5.3.SO2-1.1 below provides an indication of the expected impact of SO2 emissions as referenced in the heading of the respective isopleths. No exceedances of the ambient air quality standard are expected.
All Sources (per Scenario 1):
All Sources (per Scenario 2):
Figure 5.3.SO2-1.1: All Sources, Scenario 1 vs Scenario 2– Sulphur Dioxide (SO2) – 1hour, 99th percentile

Assmang Limited Cato Ridge Alloys (Pty) Ltd. 2020 AQIA for Sinter Plant EIA
Atmospheric Impact Report / Air Quality Impact Assessment
Document ID: AssmangCRW-AQIAReport_2020-PlannedSinterPlant_Sep2020_FD1.docx
Revision Date: 18Sep2020 Revision: FINAL_D1 Valid for: Assmang Cato Ridge, KwaZulu-Natal Province
Page 95 of 317
FINAL_D1 Compiled By: JG Potgieter
Approved By: JG Potgieter COPYRIGHT WARNING ALL RIGHTS RESERVED. All information and conceptual designs contained within this document are the intellectual property of ENVIRONGAKA (Pty) Ltd. This document and/or the information contained herein may not be used, stored, reproduced, or copied in any manner, without the prior written consent of ENVIRONGAKA (Pty) Ltd. This document and/or the information and conceptual designs may not be disclosed or displayed to any third party without the prior written consent of ENVIRONGAKA (Pty) Ltd.
EnviroNgaka
Figure 5.3.SO2-1.2 below provides an indication of the expected impact of SO2 emissions as referenced in the heading of the isopleths to provide an indication of the contribution to the cumulative impact.
All Point Sources (per Scenario 2):
All Abnormal Point Sources (per Scenario 2):
Figure 5.3.SO2-1.2: All Point Sources vs Abnormal Point Sources, Scenario 2 – Sulphur Dioxide (SO2) – 1hour, 99th percentile

Assmang Limited Cato Ridge Alloys (Pty) Ltd. 2020 AQIA for Sinter Plant EIA
Atmospheric Impact Report / Air Quality Impact Assessment
Document ID: AssmangCRW-AQIAReport_2020-PlannedSinterPlant_Sep2020_FD1.docx
Revision Date: 18Sep2020 Revision: FINAL_D1 Valid for: Assmang Cato Ridge, KwaZulu-Natal Province
Page 96 of 317
FINAL_D1 Compiled By: JG Potgieter
Approved By: JG Potgieter COPYRIGHT WARNING ALL RIGHTS RESERVED. All information and conceptual designs contained within this document are the intellectual property of ENVIRONGAKA (Pty) Ltd. This document and/or the information contained herein may not be used, stored, reproduced, or copied in any manner, without the prior written consent of ENVIRONGAKA (Pty) Ltd. This document and/or the information and conceptual designs may not be disclosed or displayed to any third party without the prior written consent of ENVIRONGAKA (Pty) Ltd.
EnviroNgaka
Figure 5.3.SO2-1.3 below provides an indication of the expected impact of SO2 emissions for scenario 2 as referenced in the heading of the isopleth to provide an indication of the contribution to the cumulative impact.
All Secondary Sources (per Scenario 2):
Figure 5.3.SO2-1.3: All Secondary Sources, Scenario 2– Sulphur Dioxide (SO2) – 1hour, 99th percentile
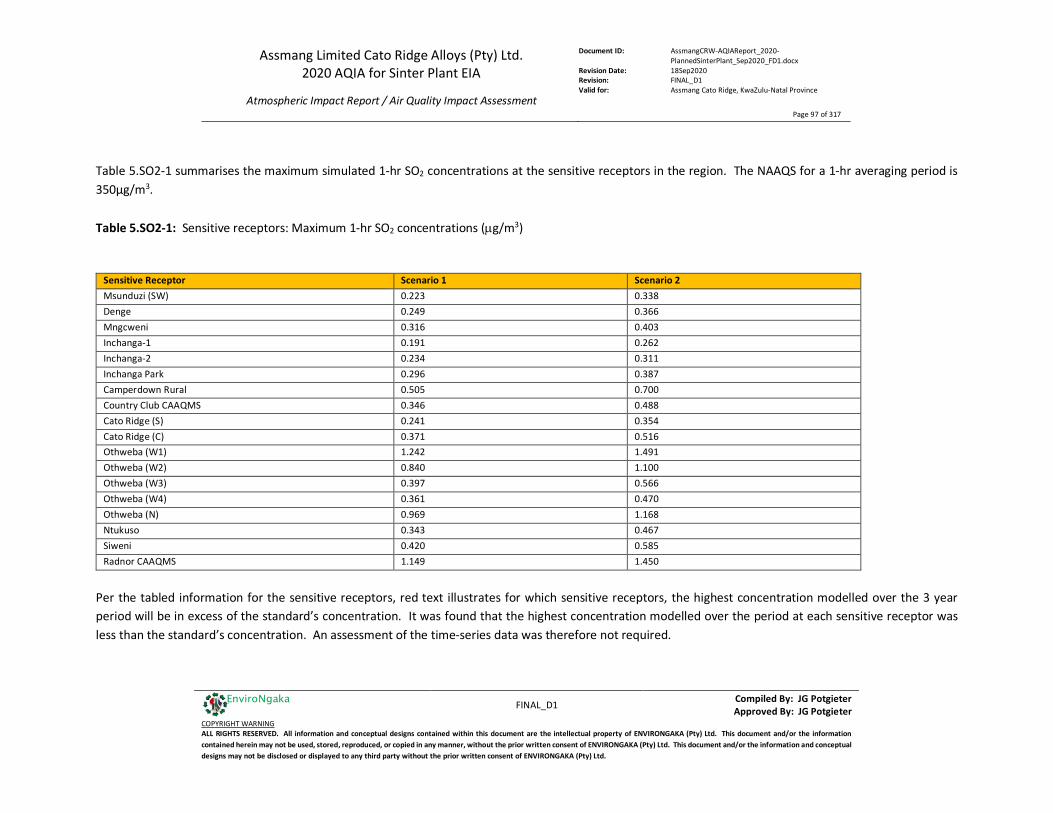
Assmang Limited Cato Ridge Alloys (Pty) Ltd. 2020 AQIA for Sinter Plant EIA
Atmospheric Impact Report / Air Quality Impact Assessment
Document ID: AssmangCRW-AQIAReport_2020-PlannedSinterPlant_Sep2020_FD1.docx
Revision Date: 18Sep2020 Revision: FINAL_D1 Valid for: Assmang Cato Ridge, KwaZulu-Natal Province
Page 97 of 317
FINAL_D1 Compiled By: JG Potgieter
Approved By: JG Potgieter COPYRIGHT WARNING ALL RIGHTS RESERVED. All information and conceptual designs contained within this document are the intellectual property of ENVIRONGAKA (Pty) Ltd. This document and/or the information contained herein may not be used, stored, reproduced, or copied in any manner, without the prior written consent of ENVIRONGAKA (Pty) Ltd. This document and/or the information and conceptual designs may not be disclosed or displayed to any third party without the prior written consent of ENVIRONGAKA (Pty) Ltd.
EnviroNgaka
Table 5.SO2-1 summarises the maximum simulated 1-hr SO2 concentrations at the sensitive receptors in the region. The NAAQS for a 1-hr averaging period is 350µg/m3. Table 5.SO2-1: Sensitive receptors: Maximum 1-hr SO2 concentrations (µg/m3)
Sensitive Receptor Scenario 1 Scenario 2 Msunduzi (SW) 0.223 0.338 Denge 0.249 0.366 Mngcweni 0.316 0.403 Inchanga-1 0.191 0.262 Inchanga-2 0.234 0.311 Inchanga Park 0.296 0.387 Camperdown Rural 0.505 0.700 Country Club CAAQMS 0.346 0.488 Cato Ridge (S) 0.241 0.354 Cato Ridge (C) 0.371 0.516 Othweba (W1) 1.242 1.491 Othweba (W2) 0.840 1.100 Othweba (W3) 0.397 0.566 Othweba (W4) 0.361 0.470 Othweba (N) 0.969 1.168 Ntukuso 0.343 0.467 Siweni 0.420 0.585 Radnor CAAQMS 1.149 1.450
Per the tabled information for the sensitive receptors, red text illustrates for which sensitive receptors, the highest concentration modelled over the 3 year period will be in excess of the standard’s concentration. It was found that the highest concentration modelled over the period at each sensitive receptor was less than the standard’s concentration. An assessment of the time-series data was therefore not required.
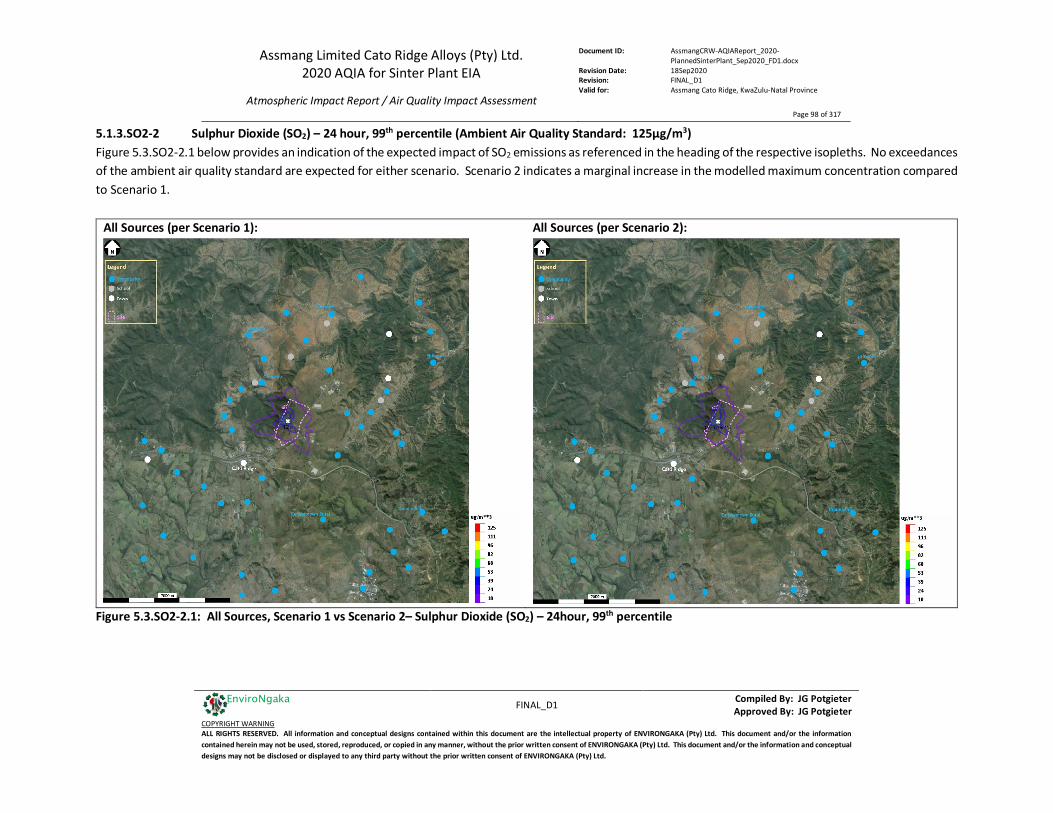
Assmang Limited Cato Ridge Alloys (Pty) Ltd. 2020 AQIA for Sinter Plant EIA
Atmospheric Impact Report / Air Quality Impact Assessment
Document ID: AssmangCRW-AQIAReport_2020-PlannedSinterPlant_Sep2020_FD1.docx
Revision Date: 18Sep2020 Revision: FINAL_D1 Valid for: Assmang Cato Ridge, KwaZulu-Natal Province
Page 98 of 317
FINAL_D1 Compiled By: JG Potgieter
Approved By: JG Potgieter COPYRIGHT WARNING ALL RIGHTS RESERVED. All information and conceptual designs contained within this document are the intellectual property of ENVIRONGAKA (Pty) Ltd. This document and/or the information contained herein may not be used, stored, reproduced, or copied in any manner, without the prior written consent of ENVIRONGAKA (Pty) Ltd. This document and/or the information and conceptual designs may not be disclosed or displayed to any third party without the prior written consent of ENVIRONGAKA (Pty) Ltd.
EnviroNgaka
5.1.3.SO2-2 Sulphur Dioxide (SO2) – 24 hour, 99th percentile (Ambient Air Quality Standard: 125µg/m3) Figure 5.3.SO2-2.1 below provides an indication of the expected impact of SO2 emissions as referenced in the heading of the respective isopleths. No exceedances of the ambient air quality standard are expected for either scenario. Scenario 2 indicates a marginal increase in the modelled maximum concentration compared to Scenario 1.
All Sources (per Scenario 1):
All Sources (per Scenario 2):
Figure 5.3.SO2-2.1: All Sources, Scenario 1 vs Scenario 2– Sulphur Dioxide (SO2) – 24hour, 99th percentile
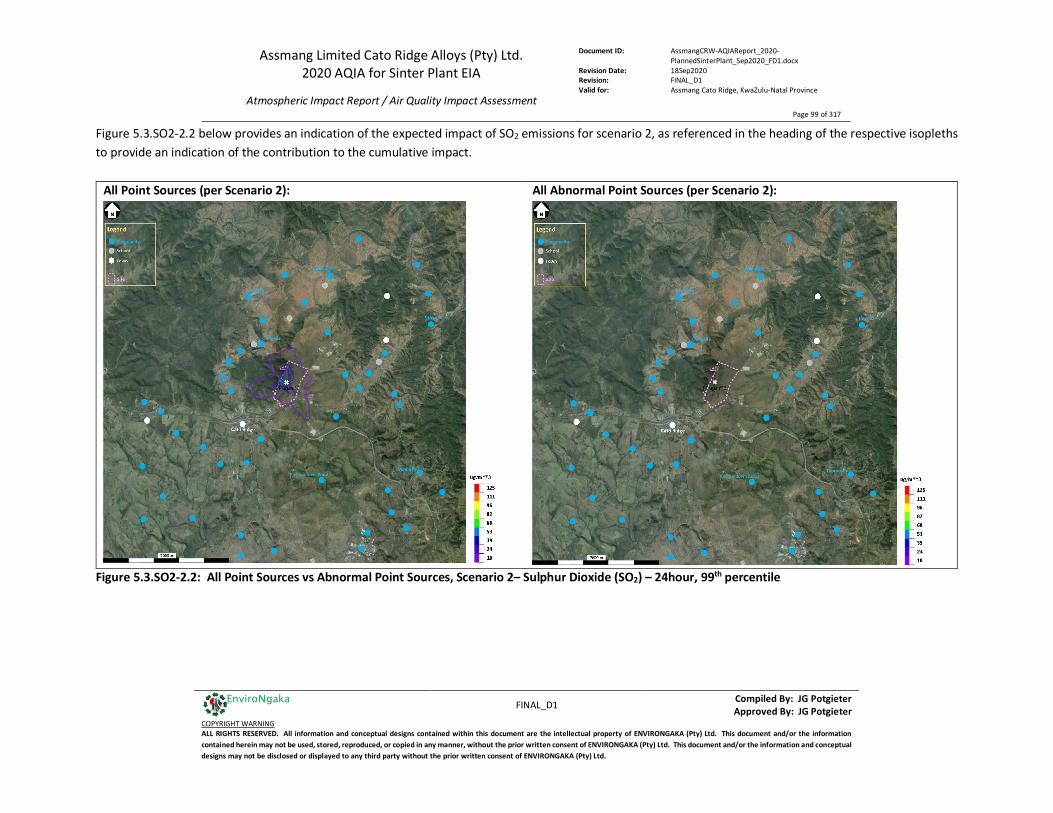
Assmang Limited Cato Ridge Alloys (Pty) Ltd. 2020 AQIA for Sinter Plant EIA
Atmospheric Impact Report / Air Quality Impact Assessment
Document ID: AssmangCRW-AQIAReport_2020-PlannedSinterPlant_Sep2020_FD1.docx
Revision Date: 18Sep2020 Revision: FINAL_D1 Valid for: Assmang Cato Ridge, KwaZulu-Natal Province
Page 99 of 317
FINAL_D1 Compiled By: JG Potgieter
Approved By: JG Potgieter COPYRIGHT WARNING ALL RIGHTS RESERVED. All information and conceptual designs contained within this document are the intellectual property of ENVIRONGAKA (Pty) Ltd. This document and/or the information contained herein may not be used, stored, reproduced, or copied in any manner, without the prior written consent of ENVIRONGAKA (Pty) Ltd. This document and/or the information and conceptual designs may not be disclosed or displayed to any third party without the prior written consent of ENVIRONGAKA (Pty) Ltd.
EnviroNgaka
Figure 5.3.SO2-2.2 below provides an indication of the expected impact of SO2 emissions for scenario 2, as referenced in the heading of the respective isopleths to provide an indication of the contribution to the cumulative impact.
All Point Sources (per Scenario 2):
All Abnormal Point Sources (per Scenario 2):
Figure 5.3.SO2-2.2: All Point Sources vs Abnormal Point Sources, Scenario 2– Sulphur Dioxide (SO2) – 24hour, 99th percentile
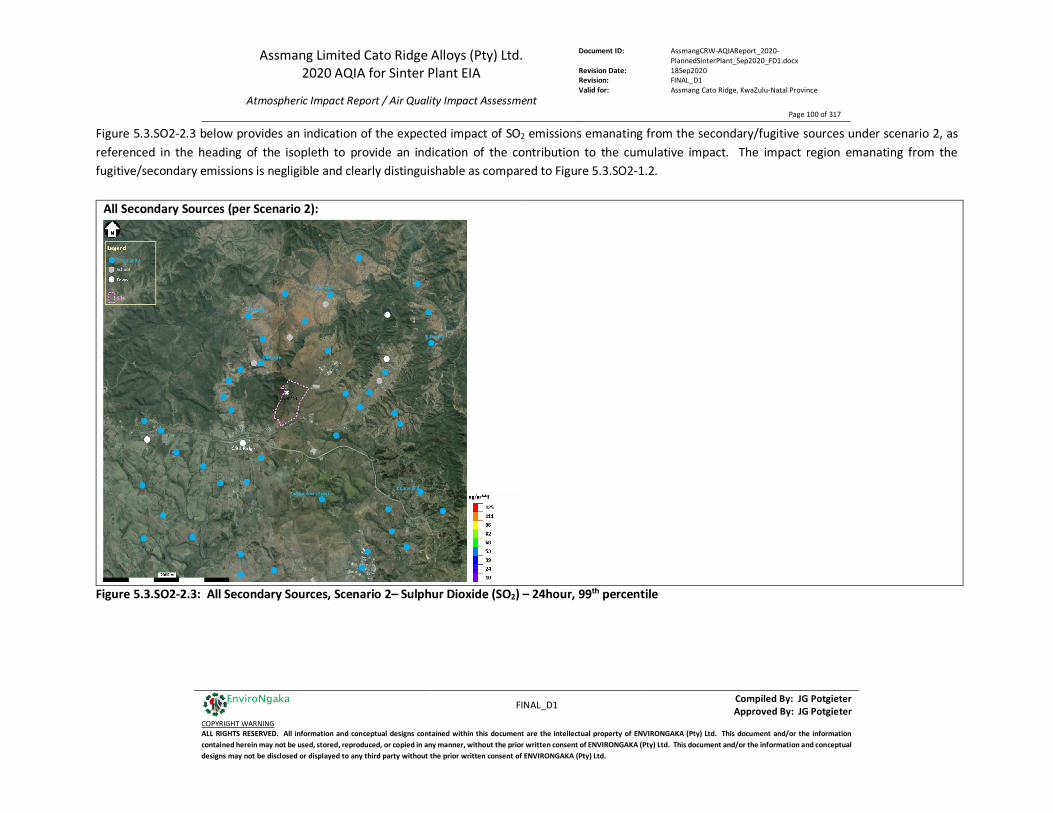
Assmang Limited Cato Ridge Alloys (Pty) Ltd. 2020 AQIA for Sinter Plant EIA
Atmospheric Impact Report / Air Quality Impact Assessment
Document ID: AssmangCRW-AQIAReport_2020-PlannedSinterPlant_Sep2020_FD1.docx
Revision Date: 18Sep2020 Revision: FINAL_D1 Valid for: Assmang Cato Ridge, KwaZulu-Natal Province
Page 100 of 317
FINAL_D1 Compiled By: JG Potgieter
Approved By: JG Potgieter COPYRIGHT WARNING ALL RIGHTS RESERVED. All information and conceptual designs contained within this document are the intellectual property of ENVIRONGAKA (Pty) Ltd. This document and/or the information contained herein may not be used, stored, reproduced, or copied in any manner, without the prior written consent of ENVIRONGAKA (Pty) Ltd. This document and/or the information and conceptual designs may not be disclosed or displayed to any third party without the prior written consent of ENVIRONGAKA (Pty) Ltd.
EnviroNgaka
Figure 5.3.SO2-2.3 below provides an indication of the expected impact of SO2 emissions emanating from the secondary/fugitive sources under scenario 2, as referenced in the heading of the isopleth to provide an indication of the contribution to the cumulative impact. The impact region emanating from the fugitive/secondary emissions is negligible and clearly distinguishable as compared to Figure 5.3.SO2-1.2.
All Secondary Sources (per Scenario 2):
Figure 5.3.SO2-2.3: All Secondary Sources, Scenario 2– Sulphur Dioxide (SO2) – 24hour, 99th percentile

Assmang Limited Cato Ridge Alloys (Pty) Ltd. 2020 AQIA for Sinter Plant EIA
Atmospheric Impact Report / Air Quality Impact Assessment
Document ID: AssmangCRW-AQIAReport_2020-PlannedSinterPlant_Sep2020_FD1.docx
Revision Date: 18Sep2020 Revision: FINAL_D1 Valid for: Assmang Cato Ridge, KwaZulu-Natal Province
Page 101 of 317
FINAL_D1 Compiled By: JG Potgieter
Approved By: JG Potgieter COPYRIGHT WARNING ALL RIGHTS RESERVED. All information and conceptual designs contained within this document are the intellectual property of ENVIRONGAKA (Pty) Ltd. This document and/or the information contained herein may not be used, stored, reproduced, or copied in any manner, without the prior written consent of ENVIRONGAKA (Pty) Ltd. This document and/or the information and conceptual designs may not be disclosed or displayed to any third party without the prior written consent of ENVIRONGAKA (Pty) Ltd.
EnviroNgaka
Table 5.SO2-2 summarises the maximum simulated 24-hr SO2 concentrations at the sensitive receptors in the region. The NAAQS for a 24-hr averaging period is 125µg/m3. Table 5.SO2-2: Sensitive receptors: Maximum 24-hr SO2 concentrations (µg/m3)
Sensitive Receptor Scenario 1 Scenario 2 Msunduzi (SW) 2.656 3.725 Denge 3.817 4.943 Mngcweni 6.070 6.637 Inchanga-1 3.722 4.178 Inchanga-2 3.611 4.048 Inchanga Park 4.779 5.166 Camperdown Rural 6.335 8.269 Country Club CAAQMS 2.391 4.137 Cato Ridge (S) 2.670 4.184 Cato Ridge (C) 2.517 3.831 Othweba (W1) 10.830 12.348 Othweba (W2) 5.613 6.697 Othweba (W3) 3.090 4.844 Othweba (W4) 3.128 3.746 Othweba (N) 9.940 11.174 Ntukuso 3.454 4.876 Siweni 5.157 6.423 Radnor CAAQMS 14.297 15.606
Per the tabled information for the sensitive receptors, red text illustrates for which sensitive receptors, the highest concentration modelled over the 3 year period will be in excess of the standard’s concentration. It was found that the highest concentration modelled over the period at each sensitive receptor was less than the standard’s concentration. An assessment of the time-series data was therefore not required.

Assmang Limited Cato Ridge Alloys (Pty) Ltd. 2020 AQIA for Sinter Plant EIA
Atmospheric Impact Report / Air Quality Impact Assessment
Document ID: AssmangCRW-AQIAReport_2020-PlannedSinterPlant_Sep2020_FD1.docx
Revision Date: 18Sep2020 Revision: FINAL_D1 Valid for: Assmang Cato Ridge, KwaZulu-Natal Province
Page 102 of 317
FINAL_D1 Compiled By: JG Potgieter
Approved By: JG Potgieter COPYRIGHT WARNING ALL RIGHTS RESERVED. All information and conceptual designs contained within this document are the intellectual property of ENVIRONGAKA (Pty) Ltd. This document and/or the information contained herein may not be used, stored, reproduced, or copied in any manner, without the prior written consent of ENVIRONGAKA (Pty) Ltd. This document and/or the information and conceptual designs may not be disclosed or displayed to any third party without the prior written consent of ENVIRONGAKA (Pty) Ltd.
EnviroNgaka
5.1.3.SO2-3 Sulphur Dioxide (SO2) – Annual Average (Ambient Air Quality Standard: 50µg/m3) Figure 5.3.SO2-3.1 below provides an indication of the expected impact of SO2 emissions as referenced in the heading of the respective isopleths. No exceedances of the ambient air quality standard are expected outside the perimeter of the Enterprise.
All Sources (per Scenario 1):
All Sources (per Scenario 2):
Figure 5.3.SO2-3.1: All Sources, Scenario 1 vs Scenario 2– Sulphur Dioxide (SO2) – Annual Average
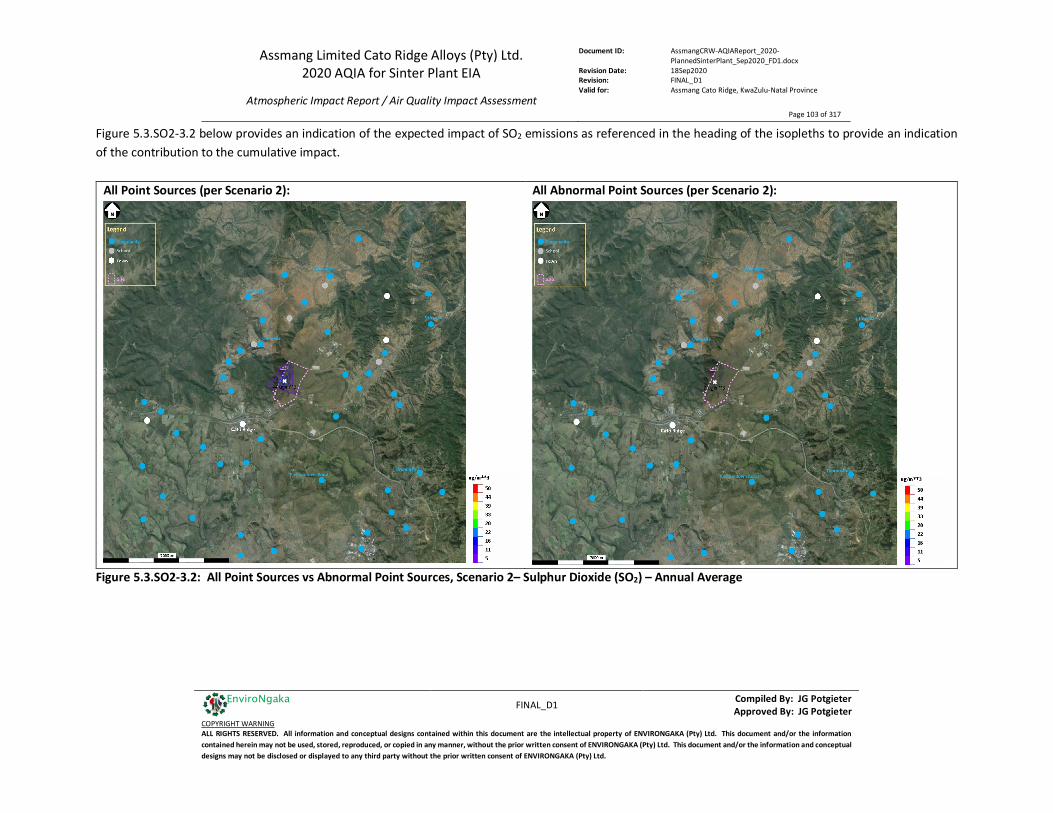
Assmang Limited Cato Ridge Alloys (Pty) Ltd. 2020 AQIA for Sinter Plant EIA
Atmospheric Impact Report / Air Quality Impact Assessment
Document ID: AssmangCRW-AQIAReport_2020-PlannedSinterPlant_Sep2020_FD1.docx
Revision Date: 18Sep2020 Revision: FINAL_D1 Valid for: Assmang Cato Ridge, KwaZulu-Natal Province
Page 103 of 317
FINAL_D1 Compiled By: JG Potgieter
Approved By: JG Potgieter COPYRIGHT WARNING ALL RIGHTS RESERVED. All information and conceptual designs contained within this document are the intellectual property of ENVIRONGAKA (Pty) Ltd. This document and/or the information contained herein may not be used, stored, reproduced, or copied in any manner, without the prior written consent of ENVIRONGAKA (Pty) Ltd. This document and/or the information and conceptual designs may not be disclosed or displayed to any third party without the prior written consent of ENVIRONGAKA (Pty) Ltd.
EnviroNgaka
Figure 5.3.SO2-3.2 below provides an indication of the expected impact of SO2 emissions as referenced in the heading of the isopleths to provide an indication of the contribution to the cumulative impact.
All Point Sources (per Scenario 2):
All Abnormal Point Sources (per Scenario 2):
Figure 5.3.SO2-3.2: All Point Sources vs Abnormal Point Sources, Scenario 2– Sulphur Dioxide (SO2) – Annual Average
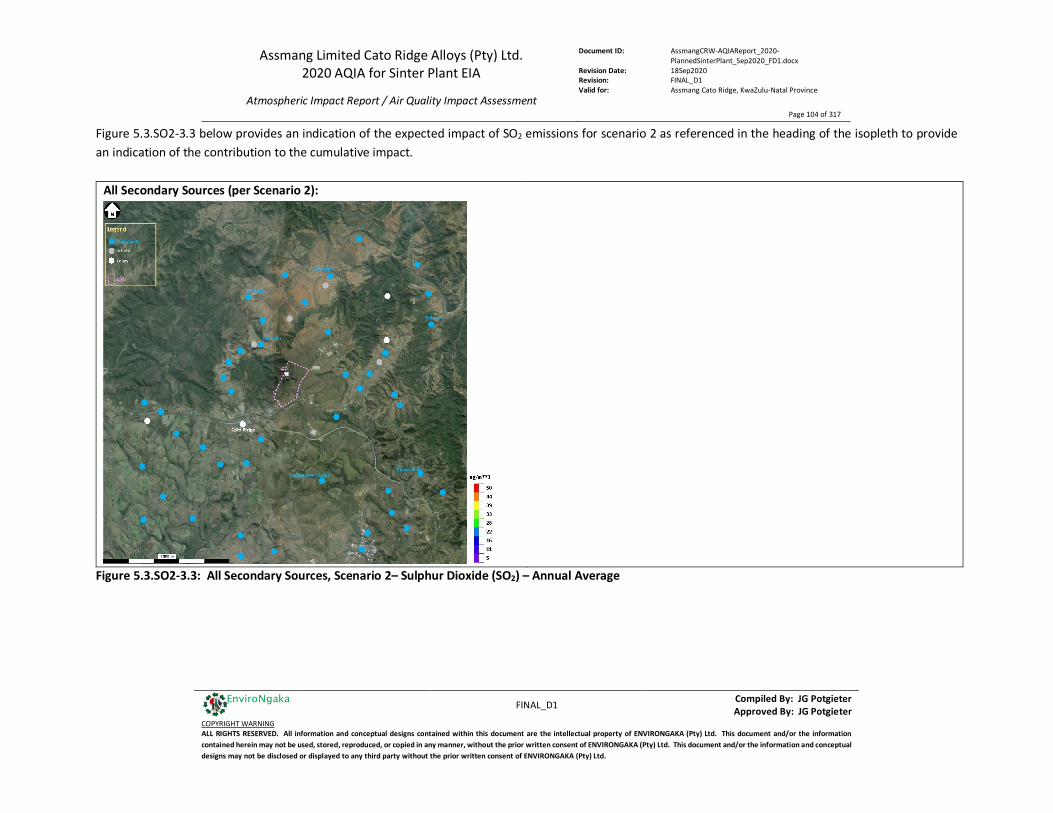
Assmang Limited Cato Ridge Alloys (Pty) Ltd. 2020 AQIA for Sinter Plant EIA
Atmospheric Impact Report / Air Quality Impact Assessment
Document ID: AssmangCRW-AQIAReport_2020-PlannedSinterPlant_Sep2020_FD1.docx
Revision Date: 18Sep2020 Revision: FINAL_D1 Valid for: Assmang Cato Ridge, KwaZulu-Natal Province
Page 104 of 317
FINAL_D1 Compiled By: JG Potgieter
Approved By: JG Potgieter COPYRIGHT WARNING ALL RIGHTS RESERVED. All information and conceptual designs contained within this document are the intellectual property of ENVIRONGAKA (Pty) Ltd. This document and/or the information contained herein may not be used, stored, reproduced, or copied in any manner, without the prior written consent of ENVIRONGAKA (Pty) Ltd. This document and/or the information and conceptual designs may not be disclosed or displayed to any third party without the prior written consent of ENVIRONGAKA (Pty) Ltd.
EnviroNgaka
Figure 5.3.SO2-3.3 below provides an indication of the expected impact of SO2 emissions for scenario 2 as referenced in the heading of the isopleth to provide an indication of the contribution to the cumulative impact.
All Secondary Sources (per Scenario 2):
Figure 5.3.SO2-3.3: All Secondary Sources, Scenario 2– Sulphur Dioxide (SO2) – Annual Average

Assmang Limited Cato Ridge Alloys (Pty) Ltd. 2020 AQIA for Sinter Plant EIA
Atmospheric Impact Report / Air Quality Impact Assessment
Document ID: AssmangCRW-AQIAReport_2020-PlannedSinterPlant_Sep2020_FD1.docx
Revision Date: 18Sep2020 Revision: FINAL_D1 Valid for: Assmang Cato Ridge, KwaZulu-Natal Province
Page 105 of 317
FINAL_D1 Compiled By: JG Potgieter
Approved By: JG Potgieter COPYRIGHT WARNING ALL RIGHTS RESERVED. All information and conceptual designs contained within this document are the intellectual property of ENVIRONGAKA (Pty) Ltd. This document and/or the information contained herein may not be used, stored, reproduced, or copied in any manner, without the prior written consent of ENVIRONGAKA (Pty) Ltd. This document and/or the information and conceptual designs may not be disclosed or displayed to any third party without the prior written consent of ENVIRONGAKA (Pty) Ltd.
EnviroNgaka
Table 5.SO2-3 summarises the annual simulated SO2 concentrations at the sensitive receptors in the region. The NAAQS for an annual averaging period is 50µg/m3. Table 5.SO2-3: Sensitive receptors: Annual SO2 concentrations (µg/m3)
Sensitive Receptor Scenario 1 Scenario 2 Msunduzi (SW) 0.223 0.338 Denge 0.249 0.366 Mngcweni 0.316 0.403 Inchanga-1 0.191 0.262 Inchanga-2 0.234 0.311 Inchanga Park 0.296 0.387 Camperdown Rural 0.505 0.700 Country Club CAAQMS 0.346 0.488 Cato Ridge (S) 0.241 0.354 Cato Ridge (C) 0.371 0.516 Othweba (W1) 1.242 1.491 Othweba (W2) 0.840 1.100 Othweba (W3) 0.397 0.566 Othweba (W4) 0.361 0.470 Othweba (N) 0.969 1.168 Ntukuso 0.343 0.467 Siweni 0.420 0.585 Radnor CAAQMS 1.149 1.450
Per the tabled information for the sensitive receptors, red text illustrates for which sensitive receptors, the highest concentration modelled over the 3 year period will be in excess of the standard’s concentration. It was found that the highest concentration modelled over the period at each sensitive receptor was less than the standard’s concentration. An assessment of the time-series data was therefore not required.
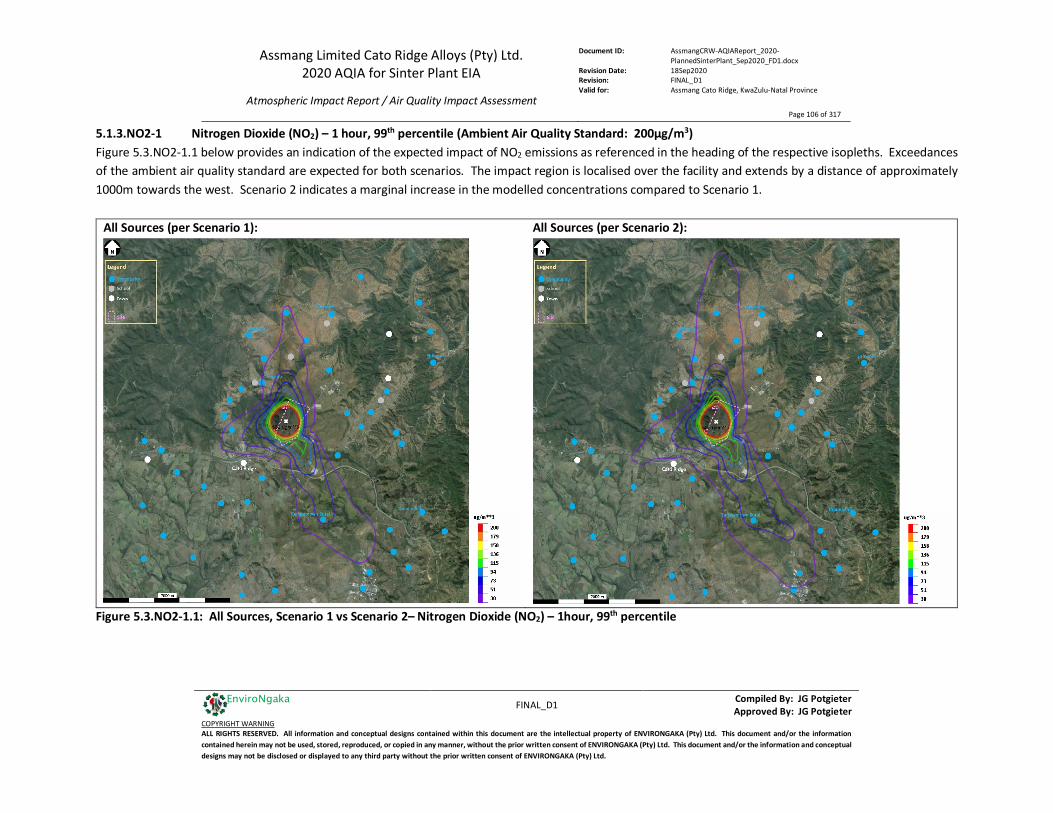
Assmang Limited Cato Ridge Alloys (Pty) Ltd. 2020 AQIA for Sinter Plant EIA
Atmospheric Impact Report / Air Quality Impact Assessment
Document ID: AssmangCRW-AQIAReport_2020-PlannedSinterPlant_Sep2020_FD1.docx
Revision Date: 18Sep2020 Revision: FINAL_D1 Valid for: Assmang Cato Ridge, KwaZulu-Natal Province
Page 106 of 317
FINAL_D1 Compiled By: JG Potgieter
Approved By: JG Potgieter COPYRIGHT WARNING ALL RIGHTS RESERVED. All information and conceptual designs contained within this document are the intellectual property of ENVIRONGAKA (Pty) Ltd. This document and/or the information contained herein may not be used, stored, reproduced, or copied in any manner, without the prior written consent of ENVIRONGAKA (Pty) Ltd. This document and/or the information and conceptual designs may not be disclosed or displayed to any third party without the prior written consent of ENVIRONGAKA (Pty) Ltd.
EnviroNgaka
5.1.3.NO2-1 Nitrogen Dioxide (NO2) – 1 hour, 99th percentile (Ambient Air Quality Standard: 200µg/m3) Figure 5.3.NO2-1.1 below provides an indication of the expected impact of NO2 emissions as referenced in the heading of the respective isopleths. Exceedances of the ambient air quality standard are expected for both scenarios. The impact region is localised over the facility and extends by a distance of approximately 1000m towards the west. Scenario 2 indicates a marginal increase in the modelled concentrations compared to Scenario 1.
All Sources (per Scenario 1):
All Sources (per Scenario 2):
Figure 5.3.NO2-1.1: All Sources, Scenario 1 vs Scenario 2– Nitrogen Dioxide (NO2) – 1hour, 99th percentile
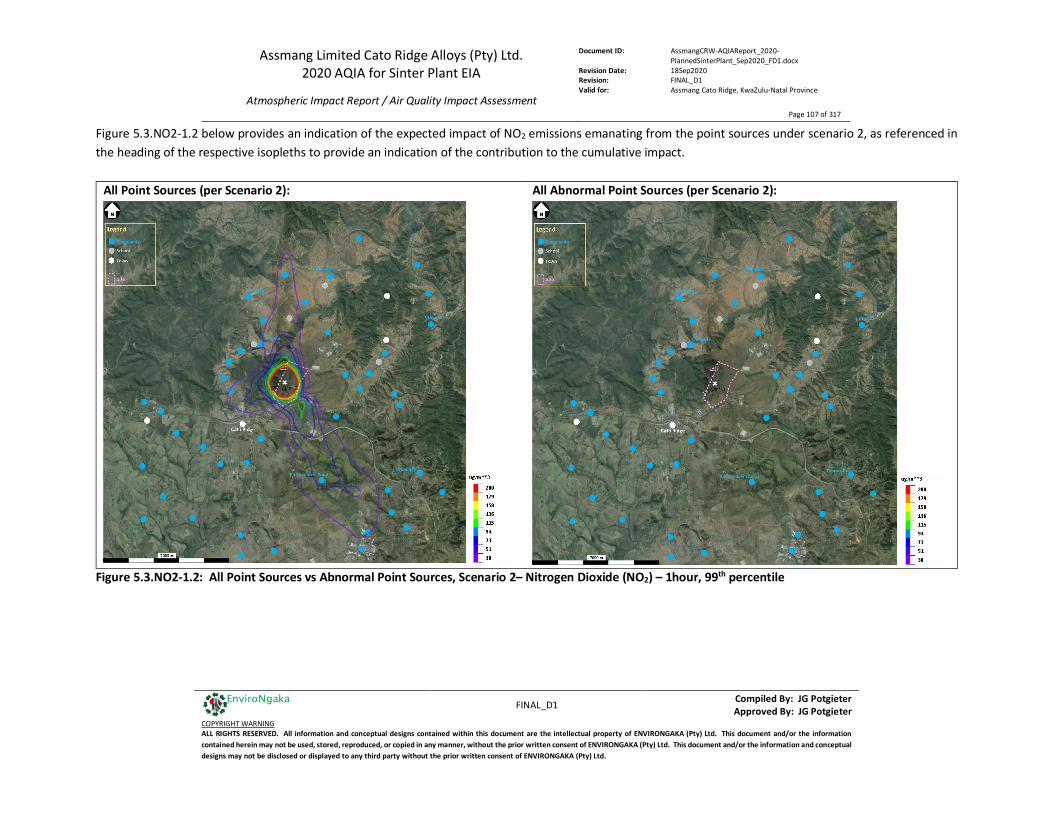
Assmang Limited Cato Ridge Alloys (Pty) Ltd. 2020 AQIA for Sinter Plant EIA
Atmospheric Impact Report / Air Quality Impact Assessment
Document ID: AssmangCRW-AQIAReport_2020-PlannedSinterPlant_Sep2020_FD1.docx
Revision Date: 18Sep2020 Revision: FINAL_D1 Valid for: Assmang Cato Ridge, KwaZulu-Natal Province
Page 107 of 317
FINAL_D1 Compiled By: JG Potgieter
Approved By: JG Potgieter COPYRIGHT WARNING ALL RIGHTS RESERVED. All information and conceptual designs contained within this document are the intellectual property of ENVIRONGAKA (Pty) Ltd. This document and/or the information contained herein may not be used, stored, reproduced, or copied in any manner, without the prior written consent of ENVIRONGAKA (Pty) Ltd. This document and/or the information and conceptual designs may not be disclosed or displayed to any third party without the prior written consent of ENVIRONGAKA (Pty) Ltd.
EnviroNgaka
Figure 5.3.NO2-1.2 below provides an indication of the expected impact of NO2 emissions emanating from the point sources under scenario 2, as referenced in the heading of the respective isopleths to provide an indication of the contribution to the cumulative impact.
All Point Sources (per Scenario 2):
All Abnormal Point Sources (per Scenario 2):
Figure 5.3.NO2-1.2: All Point Sources vs Abnormal Point Sources, Scenario 2– Nitrogen Dioxide (NO2) – 1hour, 99th percentile

Assmang Limited Cato Ridge Alloys (Pty) Ltd. 2020 AQIA for Sinter Plant EIA
Atmospheric Impact Report / Air Quality Impact Assessment
Document ID: AssmangCRW-AQIAReport_2020-PlannedSinterPlant_Sep2020_FD1.docx
Revision Date: 18Sep2020 Revision: FINAL_D1 Valid for: Assmang Cato Ridge, KwaZulu-Natal Province
Page 108 of 317
FINAL_D1 Compiled By: JG Potgieter
Approved By: JG Potgieter COPYRIGHT WARNING ALL RIGHTS RESERVED. All information and conceptual designs contained within this document are the intellectual property of ENVIRONGAKA (Pty) Ltd. This document and/or the information contained herein may not be used, stored, reproduced, or copied in any manner, without the prior written consent of ENVIRONGAKA (Pty) Ltd. This document and/or the information and conceptual designs may not be disclosed or displayed to any third party without the prior written consent of ENVIRONGAKA (Pty) Ltd.
EnviroNgaka
Figure 5.3.NO2-1.3 below provides an indication of the expected impact of NO2 emissions emanating from the secondary/fugitive sources under scenario 2, as referenced in the heading of the isopleth to provide an indication of the contribution to the cumulative impact.
All Secondary Sources (per Scenario 2):
Figure 5.3.NO2-1.3: All Secondary Sources, Scenario 2– Nitrogen Dioxide (NO2) – 1hour, 99th percentile
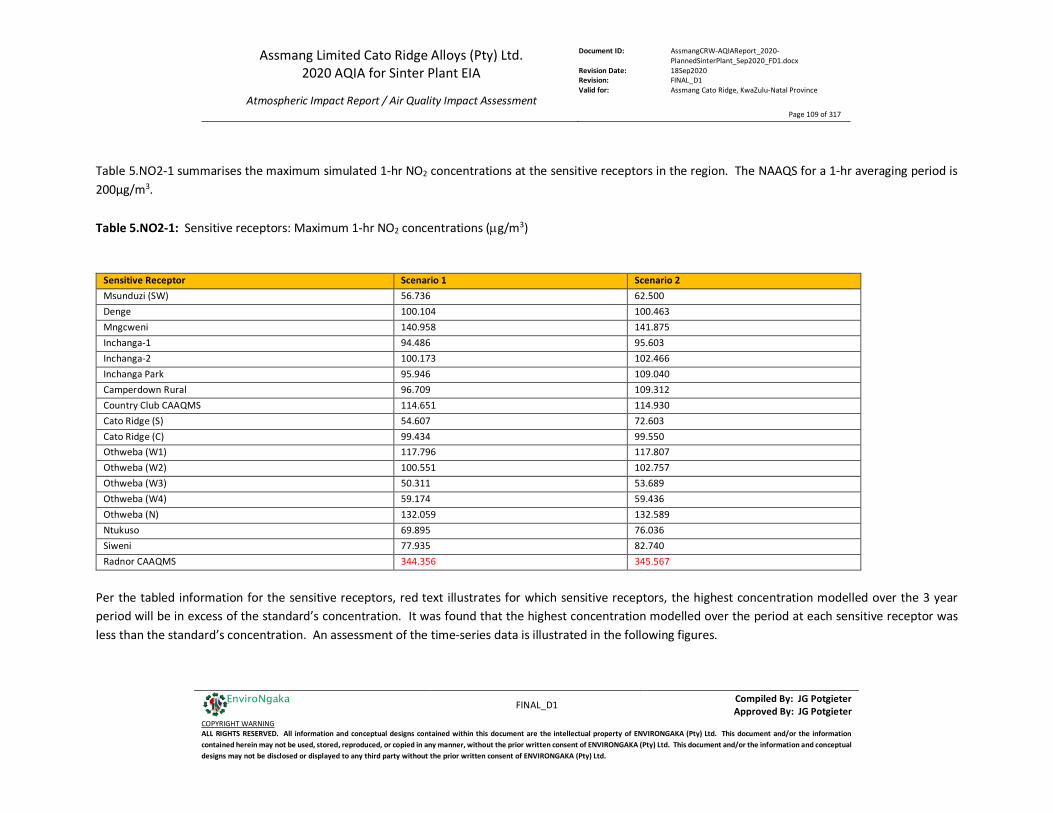
Assmang Limited Cato Ridge Alloys (Pty) Ltd. 2020 AQIA for Sinter Plant EIA
Atmospheric Impact Report / Air Quality Impact Assessment
Document ID: AssmangCRW-AQIAReport_2020-PlannedSinterPlant_Sep2020_FD1.docx
Revision Date: 18Sep2020 Revision: FINAL_D1 Valid for: Assmang Cato Ridge, KwaZulu-Natal Province
Page 109 of 317
FINAL_D1 Compiled By: JG Potgieter
Approved By: JG Potgieter COPYRIGHT WARNING ALL RIGHTS RESERVED. All information and conceptual designs contained within this document are the intellectual property of ENVIRONGAKA (Pty) Ltd. This document and/or the information contained herein may not be used, stored, reproduced, or copied in any manner, without the prior written consent of ENVIRONGAKA (Pty) Ltd. This document and/or the information and conceptual designs may not be disclosed or displayed to any third party without the prior written consent of ENVIRONGAKA (Pty) Ltd.
EnviroNgaka
Table 5.NO2-1 summarises the maximum simulated 1-hr NO2 concentrations at the sensitive receptors in the region. The NAAQS for a 1-hr averaging period is 200µg/m3. Table 5.NO2-1: Sensitive receptors: Maximum 1-hr NO2 concentrations (µg/m3)
Sensitive Receptor Scenario 1 Scenario 2 Msunduzi (SW) 56.736 62.500 Denge 100.104 100.463 Mngcweni 140.958 141.875 Inchanga-1 94.486 95.603 Inchanga-2 100.173 102.466 Inchanga Park 95.946 109.040 Camperdown Rural 96.709 109.312 Country Club CAAQMS 114.651 114.930 Cato Ridge (S) 54.607 72.603 Cato Ridge (C) 99.434 99.550 Othweba (W1) 117.796 117.807 Othweba (W2) 100.551 102.757 Othweba (W3) 50.311 53.689 Othweba (W4) 59.174 59.436 Othweba (N) 132.059 132.589 Ntukuso 69.895 76.036 Siweni 77.935 82.740 Radnor CAAQMS 344.356 345.567
Per the tabled information for the sensitive receptors, red text illustrates for which sensitive receptors, the highest concentration modelled over the 3 year period will be in excess of the standard’s concentration. It was found that the highest concentration modelled over the period at each sensitive receptor was less than the standard’s concentration. An assessment of the time-series data is illustrated in the following figures.
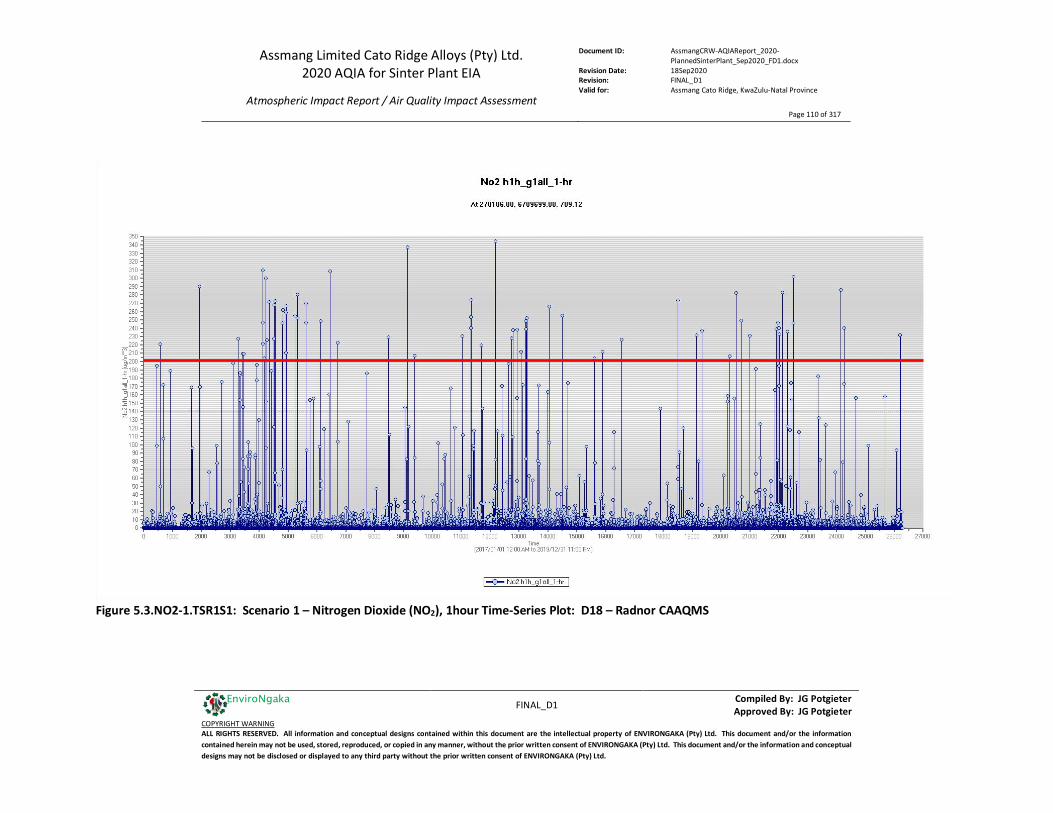
Assmang Limited Cato Ridge Alloys (Pty) Ltd. 2020 AQIA for Sinter Plant EIA
Atmospheric Impact Report / Air Quality Impact Assessment
Document ID: AssmangCRW-AQIAReport_2020-PlannedSinterPlant_Sep2020_FD1.docx
Revision Date: 18Sep2020 Revision: FINAL_D1 Valid for: Assmang Cato Ridge, KwaZulu-Natal Province
Page 110 of 317
FINAL_D1 Compiled By: JG Potgieter
Approved By: JG Potgieter COPYRIGHT WARNING ALL RIGHTS RESERVED. All information and conceptual designs contained within this document are the intellectual property of ENVIRONGAKA (Pty) Ltd. This document and/or the information contained herein may not be used, stored, reproduced, or copied in any manner, without the prior written consent of ENVIRONGAKA (Pty) Ltd. This document and/or the information and conceptual designs may not be disclosed or displayed to any third party without the prior written consent of ENVIRONGAKA (Pty) Ltd.
EnviroNgaka
Figure 5.3.NO2-1.TSR1S1: Scenario 1 – Nitrogen Dioxide (NO2), 1hour Time-Series Plot: D18 – Radnor CAAQMS
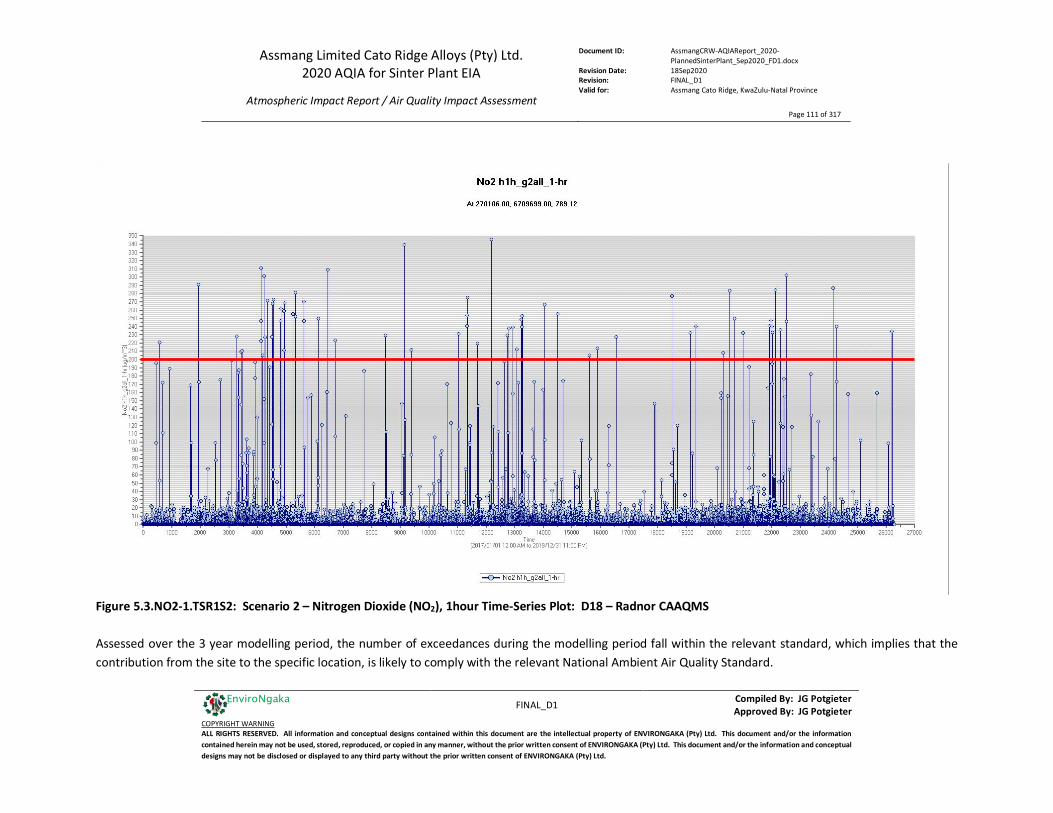
Assmang Limited Cato Ridge Alloys (Pty) Ltd. 2020 AQIA for Sinter Plant EIA
Atmospheric Impact Report / Air Quality Impact Assessment
Document ID: AssmangCRW-AQIAReport_2020-PlannedSinterPlant_Sep2020_FD1.docx
Revision Date: 18Sep2020 Revision: FINAL_D1 Valid for: Assmang Cato Ridge, KwaZulu-Natal Province
Page 111 of 317
FINAL_D1 Compiled By: JG Potgieter
Approved By: JG Potgieter COPYRIGHT WARNING ALL RIGHTS RESERVED. All information and conceptual designs contained within this document are the intellectual property of ENVIRONGAKA (Pty) Ltd. This document and/or the information contained herein may not be used, stored, reproduced, or copied in any manner, without the prior written consent of ENVIRONGAKA (Pty) Ltd. This document and/or the information and conceptual designs may not be disclosed or displayed to any third party without the prior written consent of ENVIRONGAKA (Pty) Ltd.
EnviroNgaka
Figure 5.3.NO2-1.TSR1S2: Scenario 2 – Nitrogen Dioxide (NO2), 1hour Time-Series Plot: D18 – Radnor CAAQMS Assessed over the 3 year modelling period, the number of exceedances during the modelling period fall within the relevant standard, which implies that the contribution from the site to the specific location, is likely to comply with the relevant National Ambient Air Quality Standard.
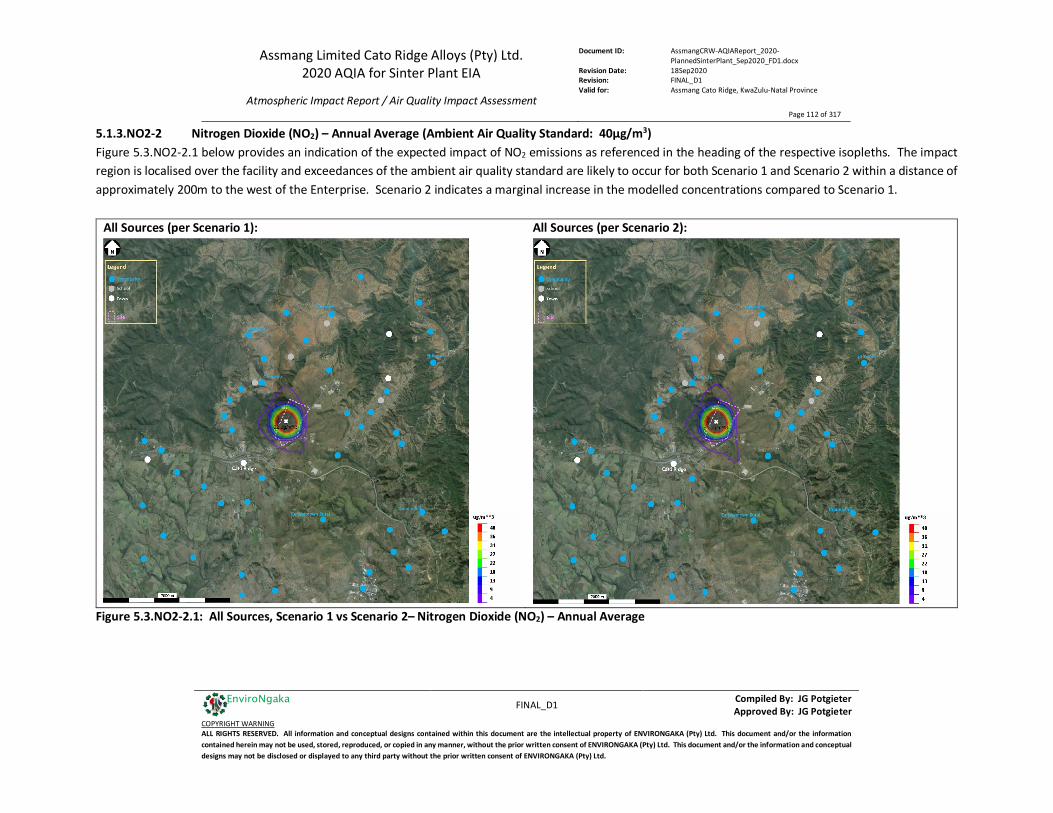
Assmang Limited Cato Ridge Alloys (Pty) Ltd. 2020 AQIA for Sinter Plant EIA
Atmospheric Impact Report / Air Quality Impact Assessment
Document ID: AssmangCRW-AQIAReport_2020-PlannedSinterPlant_Sep2020_FD1.docx
Revision Date: 18Sep2020 Revision: FINAL_D1 Valid for: Assmang Cato Ridge, KwaZulu-Natal Province
Page 112 of 317
FINAL_D1 Compiled By: JG Potgieter
Approved By: JG Potgieter COPYRIGHT WARNING ALL RIGHTS RESERVED. All information and conceptual designs contained within this document are the intellectual property of ENVIRONGAKA (Pty) Ltd. This document and/or the information contained herein may not be used, stored, reproduced, or copied in any manner, without the prior written consent of ENVIRONGAKA (Pty) Ltd. This document and/or the information and conceptual designs may not be disclosed or displayed to any third party without the prior written consent of ENVIRONGAKA (Pty) Ltd.
EnviroNgaka
5.1.3.NO2-2 Nitrogen Dioxide (NO2) – Annual Average (Ambient Air Quality Standard: 40µg/m3) Figure 5.3.NO2-2.1 below provides an indication of the expected impact of NO2 emissions as referenced in the heading of the respective isopleths. The impact region is localised over the facility and exceedances of the ambient air quality standard are likely to occur for both Scenario 1 and Scenario 2 within a distance of approximately 200m to the west of the Enterprise. Scenario 2 indicates a marginal increase in the modelled concentrations compared to Scenario 1.
All Sources (per Scenario 1):
All Sources (per Scenario 2):
Figure 5.3.NO2-2.1: All Sources, Scenario 1 vs Scenario 2– Nitrogen Dioxide (NO2) – Annual Average
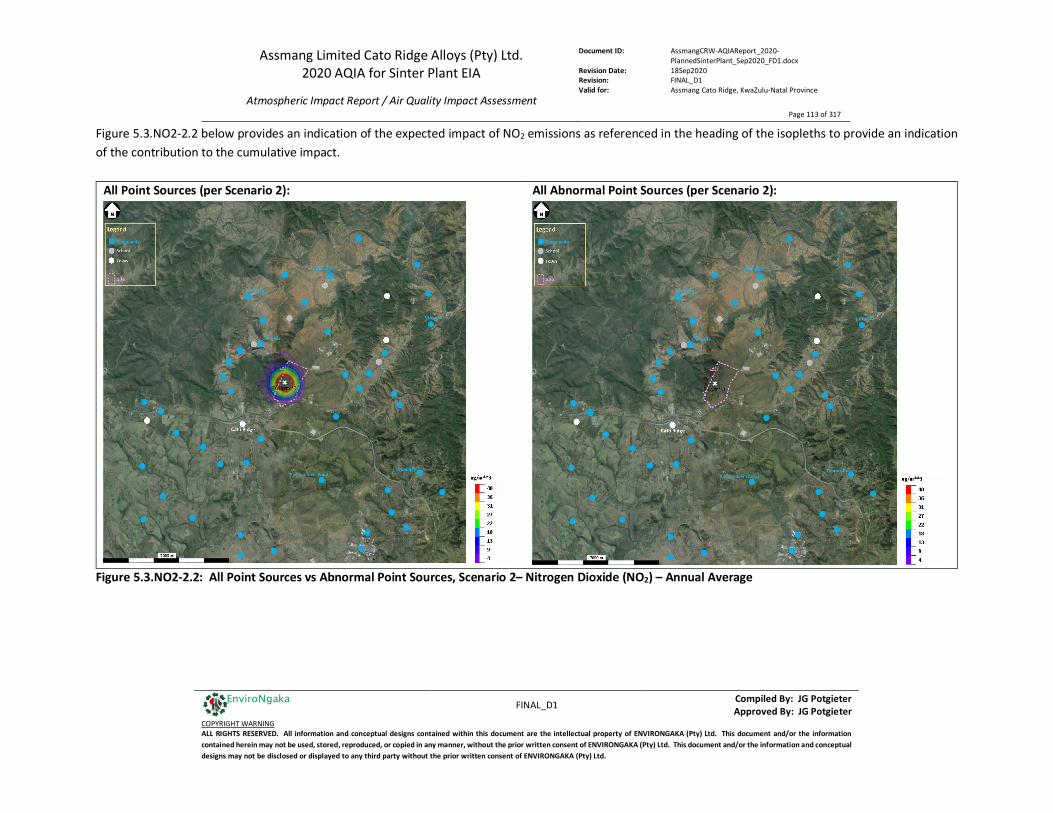
Assmang Limited Cato Ridge Alloys (Pty) Ltd. 2020 AQIA for Sinter Plant EIA
Atmospheric Impact Report / Air Quality Impact Assessment
Document ID: AssmangCRW-AQIAReport_2020-PlannedSinterPlant_Sep2020_FD1.docx
Revision Date: 18Sep2020 Revision: FINAL_D1 Valid for: Assmang Cato Ridge, KwaZulu-Natal Province
Page 113 of 317
FINAL_D1 Compiled By: JG Potgieter
Approved By: JG Potgieter COPYRIGHT WARNING ALL RIGHTS RESERVED. All information and conceptual designs contained within this document are the intellectual property of ENVIRONGAKA (Pty) Ltd. This document and/or the information contained herein may not be used, stored, reproduced, or copied in any manner, without the prior written consent of ENVIRONGAKA (Pty) Ltd. This document and/or the information and conceptual designs may not be disclosed or displayed to any third party without the prior written consent of ENVIRONGAKA (Pty) Ltd.
EnviroNgaka
Figure 5.3.NO2-2.2 below provides an indication of the expected impact of NO2 emissions as referenced in the heading of the isopleths to provide an indication of the contribution to the cumulative impact.
All Point Sources (per Scenario 2):
All Abnormal Point Sources (per Scenario 2):
Figure 5.3.NO2-2.2: All Point Sources vs Abnormal Point Sources, Scenario 2– Nitrogen Dioxide (NO2) – Annual Average

Assmang Limited Cato Ridge Alloys (Pty) Ltd. 2020 AQIA for Sinter Plant EIA
Atmospheric Impact Report / Air Quality Impact Assessment
Document ID: AssmangCRW-AQIAReport_2020-PlannedSinterPlant_Sep2020_FD1.docx
Revision Date: 18Sep2020 Revision: FINAL_D1 Valid for: Assmang Cato Ridge, KwaZulu-Natal Province
Page 114 of 317
FINAL_D1 Compiled By: JG Potgieter
Approved By: JG Potgieter COPYRIGHT WARNING ALL RIGHTS RESERVED. All information and conceptual designs contained within this document are the intellectual property of ENVIRONGAKA (Pty) Ltd. This document and/or the information contained herein may not be used, stored, reproduced, or copied in any manner, without the prior written consent of ENVIRONGAKA (Pty) Ltd. This document and/or the information and conceptual designs may not be disclosed or displayed to any third party without the prior written consent of ENVIRONGAKA (Pty) Ltd.
EnviroNgaka
Figure 5.3.NO2-2.3 below provides an indication of the expected impact of NO2 emissions emanating from the secondary/fugitive sources for scenario 2 as referenced in the heading of the isopleth to provide an indication of the contribution to the cumulative impact.
All Secondary Sources (per Scenario 2):
Figure 5.3.NO2-2.3: All Secondary Sources, Scenario 2– Nitrogen Dioxide (NO2) – Annual Average
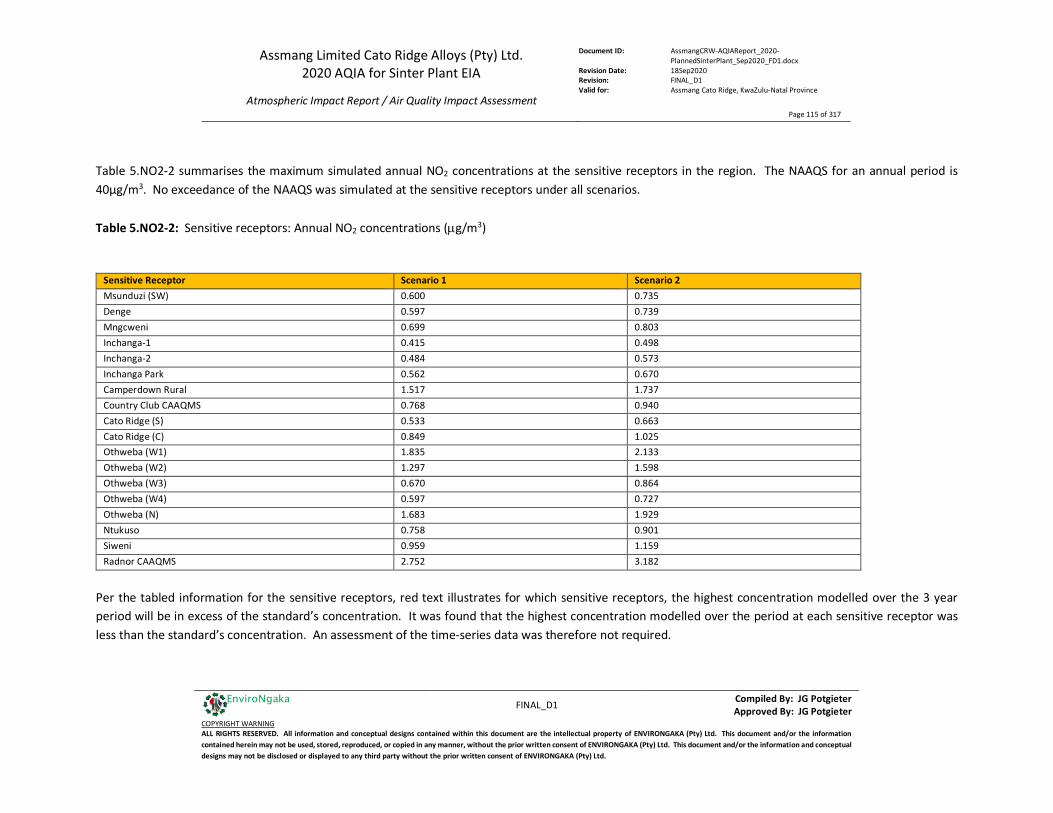
Assmang Limited Cato Ridge Alloys (Pty) Ltd. 2020 AQIA for Sinter Plant EIA
Atmospheric Impact Report / Air Quality Impact Assessment
Document ID: AssmangCRW-AQIAReport_2020-PlannedSinterPlant_Sep2020_FD1.docx
Revision Date: 18Sep2020 Revision: FINAL_D1 Valid for: Assmang Cato Ridge, KwaZulu-Natal Province
Page 115 of 317
FINAL_D1 Compiled By: JG Potgieter
Approved By: JG Potgieter COPYRIGHT WARNING ALL RIGHTS RESERVED. All information and conceptual designs contained within this document are the intellectual property of ENVIRONGAKA (Pty) Ltd. This document and/or the information contained herein may not be used, stored, reproduced, or copied in any manner, without the prior written consent of ENVIRONGAKA (Pty) Ltd. This document and/or the information and conceptual designs may not be disclosed or displayed to any third party without the prior written consent of ENVIRONGAKA (Pty) Ltd.
EnviroNgaka
Table 5.NO2-2 summarises the maximum simulated annual NO2 concentrations at the sensitive receptors in the region. The NAAQS for an annual period is 40µg/m3. No exceedance of the NAAQS was simulated at the sensitive receptors under all scenarios. Table 5.NO2-2: Sensitive receptors: Annual NO2 concentrations (µg/m3)
Sensitive Receptor Scenario 1 Scenario 2 Msunduzi (SW) 0.600 0.735 Denge 0.597 0.739 Mngcweni 0.699 0.803 Inchanga-1 0.415 0.498 Inchanga-2 0.484 0.573 Inchanga Park 0.562 0.670 Camperdown Rural 1.517 1.737 Country Club CAAQMS 0.768 0.940 Cato Ridge (S) 0.533 0.663 Cato Ridge (C) 0.849 1.025 Othweba (W1) 1.835 2.133 Othweba (W2) 1.297 1.598 Othweba (W3) 0.670 0.864 Othweba (W4) 0.597 0.727 Othweba (N) 1.683 1.929 Ntukuso 0.758 0.901 Siweni 0.959 1.159 Radnor CAAQMS 2.752 3.182
Per the tabled information for the sensitive receptors, red text illustrates for which sensitive receptors, the highest concentration modelled over the 3 year period will be in excess of the standard’s concentration. It was found that the highest concentration modelled over the period at each sensitive receptor was less than the standard’s concentration. An assessment of the time-series data was therefore not required.

Assmang Limited Cato Ridge Alloys (Pty) Ltd. 2020 AQIA for Sinter Plant EIA
Atmospheric Impact Report / Air Quality Impact Assessment
Document ID: AssmangCRW-AQIAReport_2020-PlannedSinterPlant_Sep2020_FD1.docx
Revision Date: 18Sep2020 Revision: FINAL_D1 Valid for: Assmang Cato Ridge, KwaZulu-Natal Province
Page 116 of 317
FINAL_D1 Compiled By: JG Potgieter
Approved By: JG Potgieter COPYRIGHT WARNING ALL RIGHTS RESERVED. All information and conceptual designs contained within this document are the intellectual property of ENVIRONGAKA (Pty) Ltd. This document and/or the information contained herein may not be used, stored, reproduced, or copied in any manner, without the prior written consent of ENVIRONGAKA (Pty) Ltd. This document and/or the information and conceptual designs may not be disclosed or displayed to any third party without the prior written consent of ENVIRONGAKA (Pty) Ltd.
EnviroNgaka
5.1.3.CO-1 Carbon Monoxide (CO) – 1 hour, 99th percentile (Ambient Air Quality Standard: 30 000µg/m3) Figure 5.3.CO-1.1 below provides an indication of the expected impact of CO emissions as referenced in the heading of the respective isopleths. The impact region is localised over the facility and exceedances of the ambient air quality standard beyond the fence line of the facility are unlikely for both Scenario 1 and Scenario 2. Scenario 2 indicates a marginal increase in the modelled concentrations compared to Scenario 1.
All Sources (per Scenario 1):
All Sources (per Scenario 2):
Figure 5.3.CO-1.1: All Sources, Scenario 1 vs Scenario 2– Carbon Monoxide (CO) – 1hour, 99th percentile

Assmang Limited Cato Ridge Alloys (Pty) Ltd. 2020 AQIA for Sinter Plant EIA
Atmospheric Impact Report / Air Quality Impact Assessment
Document ID: AssmangCRW-AQIAReport_2020-PlannedSinterPlant_Sep2020_FD1.docx
Revision Date: 18Sep2020 Revision: FINAL_D1 Valid for: Assmang Cato Ridge, KwaZulu-Natal Province
Page 117 of 317
FINAL_D1 Compiled By: JG Potgieter
Approved By: JG Potgieter COPYRIGHT WARNING ALL RIGHTS RESERVED. All information and conceptual designs contained within this document are the intellectual property of ENVIRONGAKA (Pty) Ltd. This document and/or the information contained herein may not be used, stored, reproduced, or copied in any manner, without the prior written consent of ENVIRONGAKA (Pty) Ltd. This document and/or the information and conceptual designs may not be disclosed or displayed to any third party without the prior written consent of ENVIRONGAKA (Pty) Ltd.
EnviroNgaka
Figure 5.3.CO-1.2 below provides an indication of the expected impact of CO emissions emanating from the point sources under scenario 2, as referenced in the heading of the respective isopleths to provide an indication of the contribution to the cumulative impact.
All Point Sources (per Scenario 2):
All Abnormal Point Sources (per Scenario 2):
Figure 5.3.CO-1.2: All Point Sources vs Abnormal Point Sources, Scenario 2– Carbon Monoxide (CO) – 1hour, 99th percentile

Assmang Limited Cato Ridge Alloys (Pty) Ltd. 2020 AQIA for Sinter Plant EIA
Atmospheric Impact Report / Air Quality Impact Assessment
Document ID: AssmangCRW-AQIAReport_2020-PlannedSinterPlant_Sep2020_FD1.docx
Revision Date: 18Sep2020 Revision: FINAL_D1 Valid for: Assmang Cato Ridge, KwaZulu-Natal Province
Page 118 of 317
FINAL_D1 Compiled By: JG Potgieter
Approved By: JG Potgieter COPYRIGHT WARNING ALL RIGHTS RESERVED. All information and conceptual designs contained within this document are the intellectual property of ENVIRONGAKA (Pty) Ltd. This document and/or the information contained herein may not be used, stored, reproduced, or copied in any manner, without the prior written consent of ENVIRONGAKA (Pty) Ltd. This document and/or the information and conceptual designs may not be disclosed or displayed to any third party without the prior written consent of ENVIRONGAKA (Pty) Ltd.
EnviroNgaka
Figure 5.3.CO-1.3 below provides an indication of the expected impact of CO emissions emanating from the secondary/fugitive sources under scenario 2, as referenced in the heading of the isopleth to provide an indication of the contribution to the cumulative impact.
All Secondary Sources (per Scenario 2):
Figure 5.3.CO-1.3: All Secondary Sources, Scenario 2– Carbon Monoxide (CO) – 1hour, 99th percentile
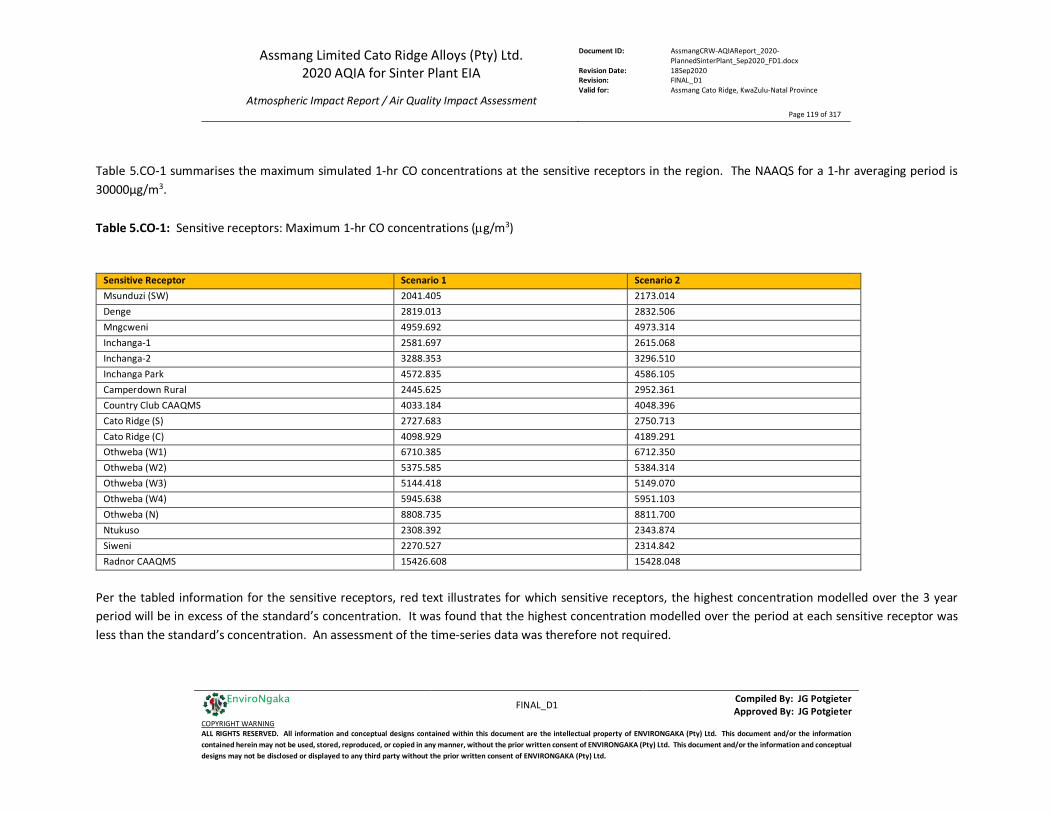
Assmang Limited Cato Ridge Alloys (Pty) Ltd. 2020 AQIA for Sinter Plant EIA
Atmospheric Impact Report / Air Quality Impact Assessment
Document ID: AssmangCRW-AQIAReport_2020-PlannedSinterPlant_Sep2020_FD1.docx
Revision Date: 18Sep2020 Revision: FINAL_D1 Valid for: Assmang Cato Ridge, KwaZulu-Natal Province
Page 119 of 317
FINAL_D1 Compiled By: JG Potgieter
Approved By: JG Potgieter COPYRIGHT WARNING ALL RIGHTS RESERVED. All information and conceptual designs contained within this document are the intellectual property of ENVIRONGAKA (Pty) Ltd. This document and/or the information contained herein may not be used, stored, reproduced, or copied in any manner, without the prior written consent of ENVIRONGAKA (Pty) Ltd. This document and/or the information and conceptual designs may not be disclosed or displayed to any third party without the prior written consent of ENVIRONGAKA (Pty) Ltd.
EnviroNgaka
Table 5.CO-1 summarises the maximum simulated 1-hr CO concentrations at the sensitive receptors in the region. The NAAQS for a 1-hr averaging period is 30000µg/m3. Table 5.CO-1: Sensitive receptors: Maximum 1-hr CO concentrations (µg/m3)
Sensitive Receptor Scenario 1 Scenario 2 Msunduzi (SW) 2041.405 2173.014 Denge 2819.013 2832.506 Mngcweni 4959.692 4973.314 Inchanga-1 2581.697 2615.068 Inchanga-2 3288.353 3296.510 Inchanga Park 4572.835 4586.105 Camperdown Rural 2445.625 2952.361 Country Club CAAQMS 4033.184 4048.396 Cato Ridge (S) 2727.683 2750.713 Cato Ridge (C) 4098.929 4189.291 Othweba (W1) 6710.385 6712.350 Othweba (W2) 5375.585 5384.314 Othweba (W3) 5144.418 5149.070 Othweba (W4) 5945.638 5951.103 Othweba (N) 8808.735 8811.700 Ntukuso 2308.392 2343.874 Siweni 2270.527 2314.842 Radnor CAAQMS 15426.608 15428.048
Per the tabled information for the sensitive receptors, red text illustrates for which sensitive receptors, the highest concentration modelled over the 3 year period will be in excess of the standard’s concentration. It was found that the highest concentration modelled over the period at each sensitive receptor was less than the standard’s concentration. An assessment of the time-series data was therefore not required.

Assmang Limited Cato Ridge Alloys (Pty) Ltd. 2020 AQIA for Sinter Plant EIA
Atmospheric Impact Report / Air Quality Impact Assessment
Document ID: AssmangCRW-AQIAReport_2020-PlannedSinterPlant_Sep2020_FD1.docx
Revision Date: 18Sep2020 Revision: FINAL_D1 Valid for: Assmang Cato Ridge, KwaZulu-Natal Province
Page 120 of 317
FINAL_D1 Compiled By: JG Potgieter
Approved By: JG Potgieter COPYRIGHT WARNING ALL RIGHTS RESERVED. All information and conceptual designs contained within this document are the intellectual property of ENVIRONGAKA (Pty) Ltd. This document and/or the information contained herein may not be used, stored, reproduced, or copied in any manner, without the prior written consent of ENVIRONGAKA (Pty) Ltd. This document and/or the information and conceptual designs may not be disclosed or displayed to any third party without the prior written consent of ENVIRONGAKA (Pty) Ltd.
EnviroNgaka
5.1.3.CO-2 Carbon Monoxide (CO) – 8 hour, 99th percentile (Ambient Air Quality Standard: 10 000µg/m3) Figure 5.3.CO-2.1 below provides an indication of the expected impact of CO emissions as referenced in the heading of the respective isopleths. Exceedances of the ambient air quality standard are expected for both scenarios. The impact region is localised over the facility and extends by a distance of approximately 200m towards the west. Scenario 2 indicates a marginal increase in the modelled concentrations compared to Scenario 1.
All Sources (per Scenario 1):
All Sources (per Scenario 2):
Figure 5.3.CO-2.1: All Sources, Scenario 1 vs Scenario 2– Carbon Monoxide (CO) – 8hour, 99th percentile

Assmang Limited Cato Ridge Alloys (Pty) Ltd. 2020 AQIA for Sinter Plant EIA
Atmospheric Impact Report / Air Quality Impact Assessment
Document ID: AssmangCRW-AQIAReport_2020-PlannedSinterPlant_Sep2020_FD1.docx
Revision Date: 18Sep2020 Revision: FINAL_D1 Valid for: Assmang Cato Ridge, KwaZulu-Natal Province
Page 121 of 317
FINAL_D1 Compiled By: JG Potgieter
Approved By: JG Potgieter COPYRIGHT WARNING ALL RIGHTS RESERVED. All information and conceptual designs contained within this document are the intellectual property of ENVIRONGAKA (Pty) Ltd. This document and/or the information contained herein may not be used, stored, reproduced, or copied in any manner, without the prior written consent of ENVIRONGAKA (Pty) Ltd. This document and/or the information and conceptual designs may not be disclosed or displayed to any third party without the prior written consent of ENVIRONGAKA (Pty) Ltd.
EnviroNgaka
Figure 5.3.CO-2.2 below provides an indication of the expected impact of CO emissions as referenced in the heading of the isopleths to provide an indication of the contribution to the cumulative impact.
All Point Sources (per Scenario 2):
All Abnormal Point Sources (per Scenario 2):
Figure 5.3.CO-2.2: All Point Sources vs Abnormal Point Sources, Scenario 2– Carbon Monoxide (CO) – 8hour, 99th percentile
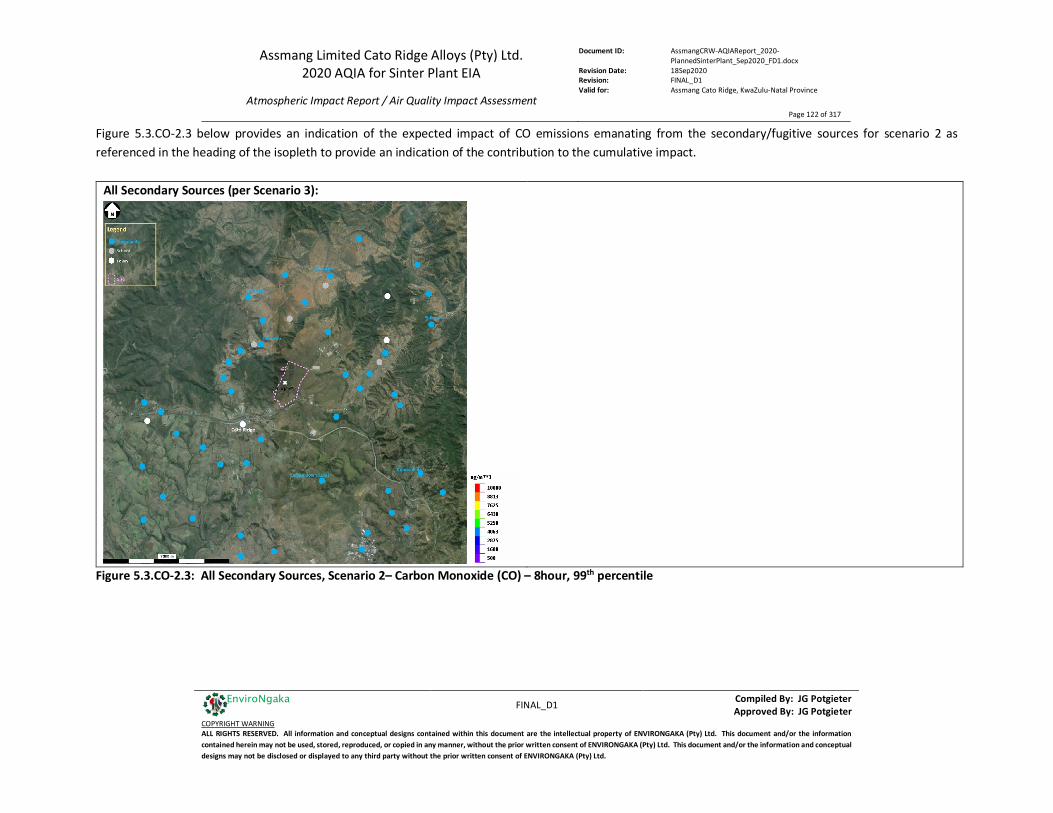
Assmang Limited Cato Ridge Alloys (Pty) Ltd. 2020 AQIA for Sinter Plant EIA
Atmospheric Impact Report / Air Quality Impact Assessment
Document ID: AssmangCRW-AQIAReport_2020-PlannedSinterPlant_Sep2020_FD1.docx
Revision Date: 18Sep2020 Revision: FINAL_D1 Valid for: Assmang Cato Ridge, KwaZulu-Natal Province
Page 122 of 317
FINAL_D1 Compiled By: JG Potgieter
Approved By: JG Potgieter COPYRIGHT WARNING ALL RIGHTS RESERVED. All information and conceptual designs contained within this document are the intellectual property of ENVIRONGAKA (Pty) Ltd. This document and/or the information contained herein may not be used, stored, reproduced, or copied in any manner, without the prior written consent of ENVIRONGAKA (Pty) Ltd. This document and/or the information and conceptual designs may not be disclosed or displayed to any third party without the prior written consent of ENVIRONGAKA (Pty) Ltd.
EnviroNgaka
Figure 5.3.CO-2.3 below provides an indication of the expected impact of CO emissions emanating from the secondary/fugitive sources for scenario 2 as referenced in the heading of the isopleth to provide an indication of the contribution to the cumulative impact.
All Secondary Sources (per Scenario 3):
Figure 5.3.CO-2.3: All Secondary Sources, Scenario 2– Carbon Monoxide (CO) – 8hour, 99th percentile
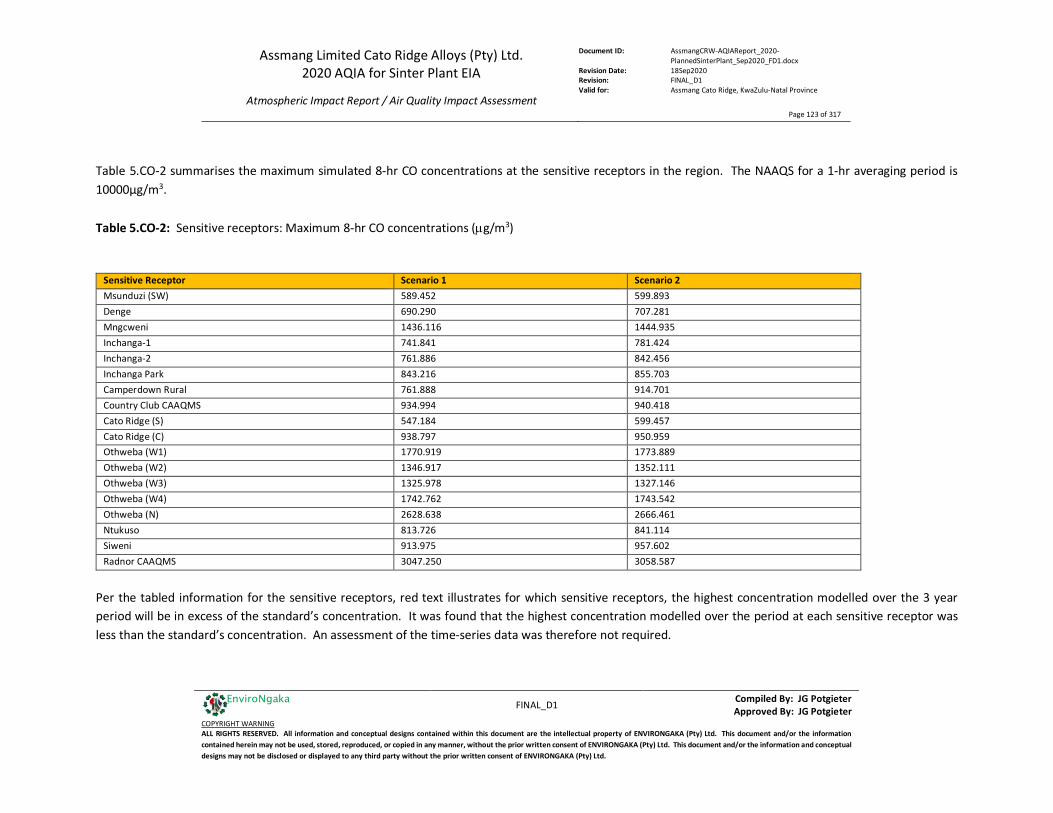
Assmang Limited Cato Ridge Alloys (Pty) Ltd. 2020 AQIA for Sinter Plant EIA
Atmospheric Impact Report / Air Quality Impact Assessment
Document ID: AssmangCRW-AQIAReport_2020-PlannedSinterPlant_Sep2020_FD1.docx
Revision Date: 18Sep2020 Revision: FINAL_D1 Valid for: Assmang Cato Ridge, KwaZulu-Natal Province
Page 123 of 317
FINAL_D1 Compiled By: JG Potgieter
Approved By: JG Potgieter COPYRIGHT WARNING ALL RIGHTS RESERVED. All information and conceptual designs contained within this document are the intellectual property of ENVIRONGAKA (Pty) Ltd. This document and/or the information contained herein may not be used, stored, reproduced, or copied in any manner, without the prior written consent of ENVIRONGAKA (Pty) Ltd. This document and/or the information and conceptual designs may not be disclosed or displayed to any third party without the prior written consent of ENVIRONGAKA (Pty) Ltd.
EnviroNgaka
Table 5.CO-2 summarises the maximum simulated 8-hr CO concentrations at the sensitive receptors in the region. The NAAQS for a 1-hr averaging period is 10000µg/m3. Table 5.CO-2: Sensitive receptors: Maximum 8-hr CO concentrations (µg/m3)
Sensitive Receptor Scenario 1 Scenario 2 Msunduzi (SW) 589.452 599.893 Denge 690.290 707.281 Mngcweni 1436.116 1444.935 Inchanga-1 741.841 781.424 Inchanga-2 761.886 842.456 Inchanga Park 843.216 855.703 Camperdown Rural 761.888 914.701 Country Club CAAQMS 934.994 940.418 Cato Ridge (S) 547.184 599.457 Cato Ridge (C) 938.797 950.959 Othweba (W1) 1770.919 1773.889 Othweba (W2) 1346.917 1352.111 Othweba (W3) 1325.978 1327.146 Othweba (W4) 1742.762 1743.542 Othweba (N) 2628.638 2666.461 Ntukuso 813.726 841.114 Siweni 913.975 957.602 Radnor CAAQMS 3047.250 3058.587
Per the tabled information for the sensitive receptors, red text illustrates for which sensitive receptors, the highest concentration modelled over the 3 year period will be in excess of the standard’s concentration. It was found that the highest concentration modelled over the period at each sensitive receptor was less than the standard’s concentration. An assessment of the time-series data was therefore not required.
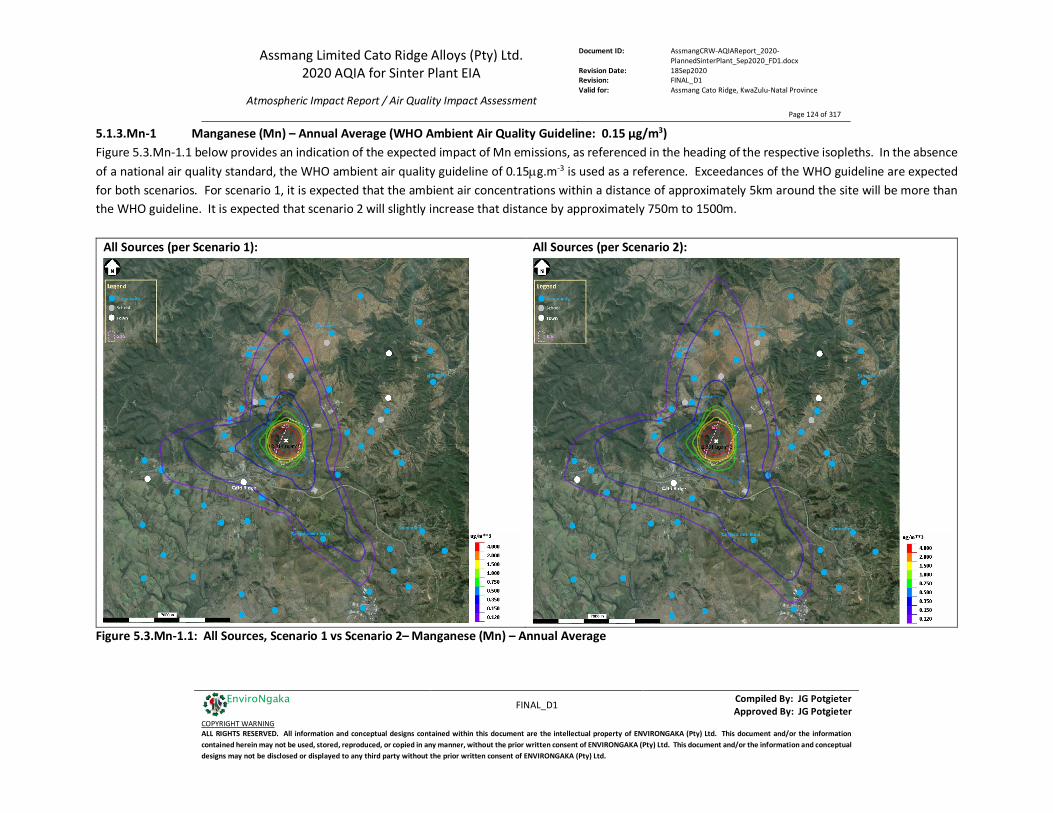
Assmang Limited Cato Ridge Alloys (Pty) Ltd. 2020 AQIA for Sinter Plant EIA
Atmospheric Impact Report / Air Quality Impact Assessment
Document ID: AssmangCRW-AQIAReport_2020-PlannedSinterPlant_Sep2020_FD1.docx
Revision Date: 18Sep2020 Revision: FINAL_D1 Valid for: Assmang Cato Ridge, KwaZulu-Natal Province
Page 124 of 317
FINAL_D1 Compiled By: JG Potgieter
Approved By: JG Potgieter COPYRIGHT WARNING ALL RIGHTS RESERVED. All information and conceptual designs contained within this document are the intellectual property of ENVIRONGAKA (Pty) Ltd. This document and/or the information contained herein may not be used, stored, reproduced, or copied in any manner, without the prior written consent of ENVIRONGAKA (Pty) Ltd. This document and/or the information and conceptual designs may not be disclosed or displayed to any third party without the prior written consent of ENVIRONGAKA (Pty) Ltd.
EnviroNgaka
5.1.3.Mn-1 Manganese (Mn) – Annual Average (WHO Ambient Air Quality Guideline: 0.15 µg/m3) Figure 5.3.Mn-1.1 below provides an indication of the expected impact of Mn emissions, as referenced in the heading of the respective isopleths. In the absence of a national air quality standard, the WHO ambient air quality guideline of 0.15µg.m-3 is used as a reference. Exceedances of the WHO guideline are expected for both scenarios. For scenario 1, it is expected that the ambient air concentrations within a distance of approximately 5km around the site will be more than the WHO guideline. It is expected that scenario 2 will slightly increase that distance by approximately 750m to 1500m.
All Sources (per Scenario 1):
All Sources (per Scenario 2):
Figure 5.3.Mn-1.1: All Sources, Scenario 1 vs Scenario 2– Manganese (Mn) – Annual Average
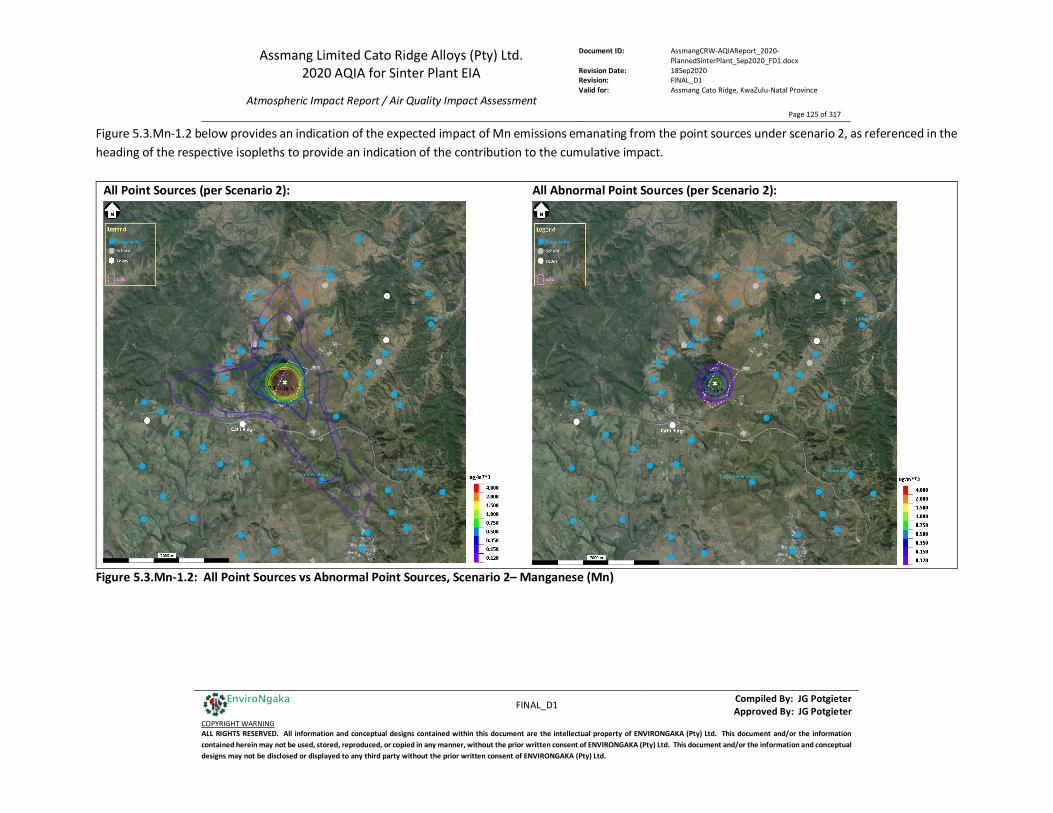
Assmang Limited Cato Ridge Alloys (Pty) Ltd. 2020 AQIA for Sinter Plant EIA
Atmospheric Impact Report / Air Quality Impact Assessment
Document ID: AssmangCRW-AQIAReport_2020-PlannedSinterPlant_Sep2020_FD1.docx
Revision Date: 18Sep2020 Revision: FINAL_D1 Valid for: Assmang Cato Ridge, KwaZulu-Natal Province
Page 125 of 317
FINAL_D1 Compiled By: JG Potgieter
Approved By: JG Potgieter COPYRIGHT WARNING ALL RIGHTS RESERVED. All information and conceptual designs contained within this document are the intellectual property of ENVIRONGAKA (Pty) Ltd. This document and/or the information contained herein may not be used, stored, reproduced, or copied in any manner, without the prior written consent of ENVIRONGAKA (Pty) Ltd. This document and/or the information and conceptual designs may not be disclosed or displayed to any third party without the prior written consent of ENVIRONGAKA (Pty) Ltd.
EnviroNgaka
Figure 5.3.Mn-1.2 below provides an indication of the expected impact of Mn emissions emanating from the point sources under scenario 2, as referenced in the heading of the respective isopleths to provide an indication of the contribution to the cumulative impact.
All Point Sources (per Scenario 2):
All Abnormal Point Sources (per Scenario 2):
Figure 5.3.Mn-1.2: All Point Sources vs Abnormal Point Sources, Scenario 2– Manganese (Mn)
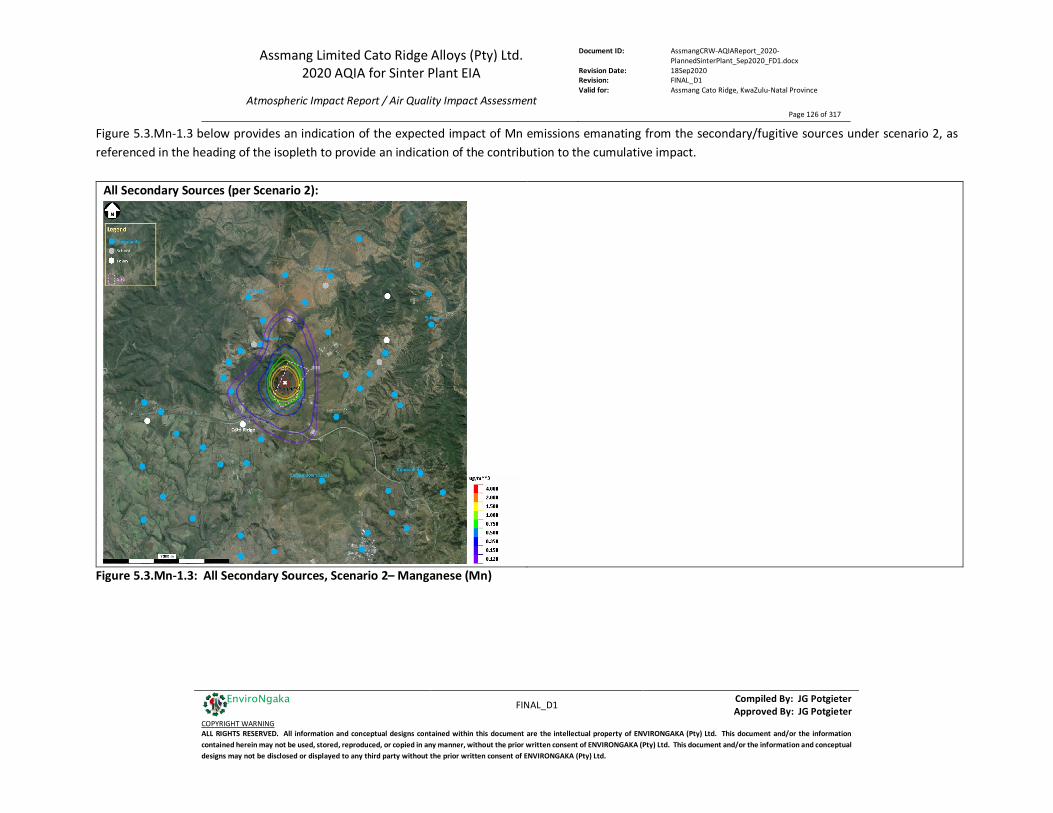
Assmang Limited Cato Ridge Alloys (Pty) Ltd. 2020 AQIA for Sinter Plant EIA
Atmospheric Impact Report / Air Quality Impact Assessment
Document ID: AssmangCRW-AQIAReport_2020-PlannedSinterPlant_Sep2020_FD1.docx
Revision Date: 18Sep2020 Revision: FINAL_D1 Valid for: Assmang Cato Ridge, KwaZulu-Natal Province
Page 126 of 317
FINAL_D1 Compiled By: JG Potgieter
Approved By: JG Potgieter COPYRIGHT WARNING ALL RIGHTS RESERVED. All information and conceptual designs contained within this document are the intellectual property of ENVIRONGAKA (Pty) Ltd. This document and/or the information contained herein may not be used, stored, reproduced, or copied in any manner, without the prior written consent of ENVIRONGAKA (Pty) Ltd. This document and/or the information and conceptual designs may not be disclosed or displayed to any third party without the prior written consent of ENVIRONGAKA (Pty) Ltd.
EnviroNgaka
Figure 5.3.Mn-1.3 below provides an indication of the expected impact of Mn emissions emanating from the secondary/fugitive sources under scenario 2, as referenced in the heading of the isopleth to provide an indication of the contribution to the cumulative impact.
All Secondary Sources (per Scenario 2):
Figure 5.3.Mn-1.3: All Secondary Sources, Scenario 2– Manganese (Mn)
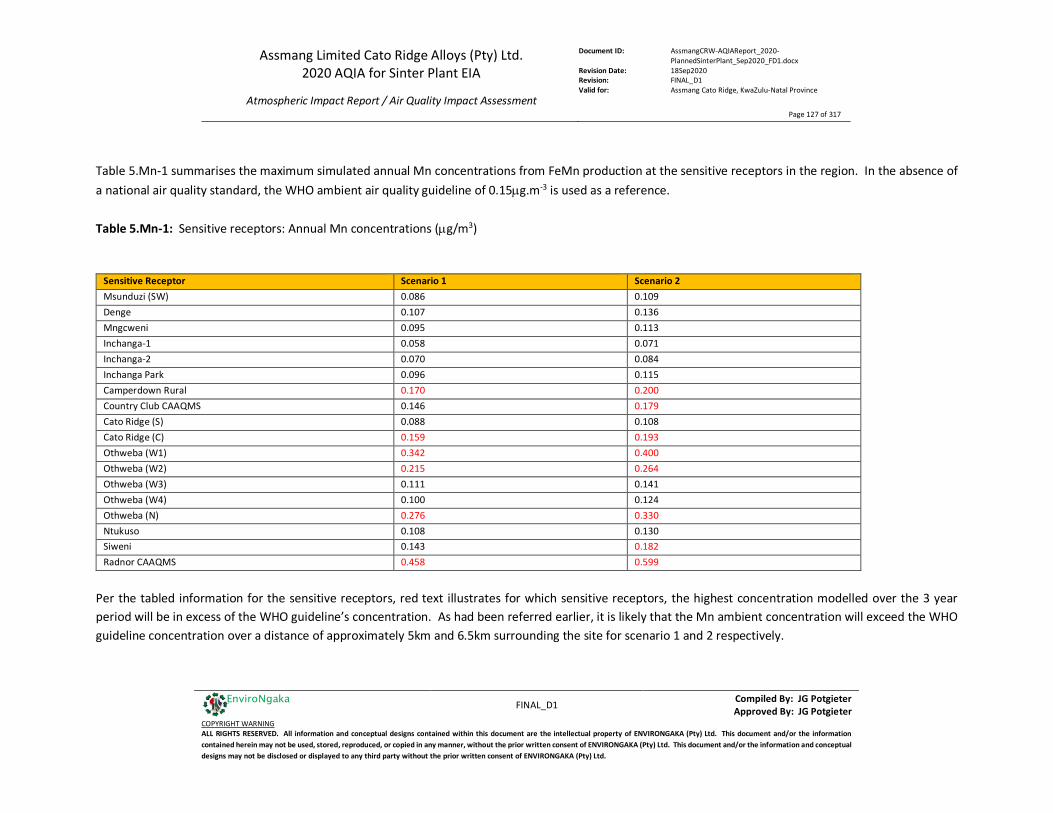
Assmang Limited Cato Ridge Alloys (Pty) Ltd. 2020 AQIA for Sinter Plant EIA
Atmospheric Impact Report / Air Quality Impact Assessment
Document ID: AssmangCRW-AQIAReport_2020-PlannedSinterPlant_Sep2020_FD1.docx
Revision Date: 18Sep2020 Revision: FINAL_D1 Valid for: Assmang Cato Ridge, KwaZulu-Natal Province
Page 127 of 317
FINAL_D1 Compiled By: JG Potgieter
Approved By: JG Potgieter COPYRIGHT WARNING ALL RIGHTS RESERVED. All information and conceptual designs contained within this document are the intellectual property of ENVIRONGAKA (Pty) Ltd. This document and/or the information contained herein may not be used, stored, reproduced, or copied in any manner, without the prior written consent of ENVIRONGAKA (Pty) Ltd. This document and/or the information and conceptual designs may not be disclosed or displayed to any third party without the prior written consent of ENVIRONGAKA (Pty) Ltd.
EnviroNgaka
Table 5.Mn-1 summarises the maximum simulated annual Mn concentrations from FeMn production at the sensitive receptors in the region. In the absence of a national air quality standard, the WHO ambient air quality guideline of 0.15µg.m-3 is used as a reference. Table 5.Mn-1: Sensitive receptors: Annual Mn concentrations (µg/m3)
Sensitive Receptor Scenario 1 Scenario 2 Msunduzi (SW) 0.086 0.109 Denge 0.107 0.136 Mngcweni 0.095 0.113 Inchanga-1 0.058 0.071 Inchanga-2 0.070 0.084 Inchanga Park 0.096 0.115 Camperdown Rural 0.170 0.200 Country Club CAAQMS 0.146 0.179 Cato Ridge (S) 0.088 0.108 Cato Ridge (C) 0.159 0.193 Othweba (W1) 0.342 0.400 Othweba (W2) 0.215 0.264 Othweba (W3) 0.111 0.141 Othweba (W4) 0.100 0.124 Othweba (N) 0.276 0.330 Ntukuso 0.108 0.130 Siweni 0.143 0.182 Radnor CAAQMS 0.458 0.599
Per the tabled information for the sensitive receptors, red text illustrates for which sensitive receptors, the highest concentration modelled over the 3 year period will be in excess of the WHO guideline’s concentration. As had been referred earlier, it is likely that the Mn ambient concentration will exceed the WHO guideline concentration over a distance of approximately 5km and 6.5km surrounding the site for scenario 1 and 2 respectively.
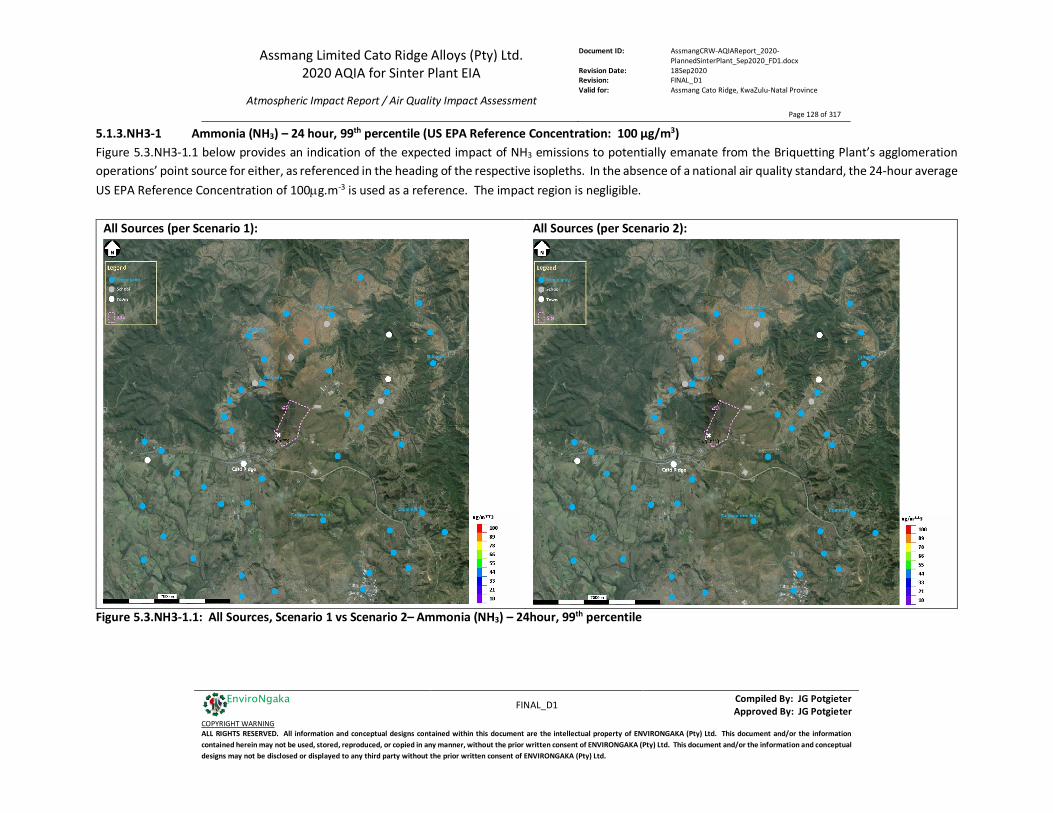
Assmang Limited Cato Ridge Alloys (Pty) Ltd. 2020 AQIA for Sinter Plant EIA
Atmospheric Impact Report / Air Quality Impact Assessment
Document ID: AssmangCRW-AQIAReport_2020-PlannedSinterPlant_Sep2020_FD1.docx
Revision Date: 18Sep2020 Revision: FINAL_D1 Valid for: Assmang Cato Ridge, KwaZulu-Natal Province
Page 128 of 317
FINAL_D1 Compiled By: JG Potgieter
Approved By: JG Potgieter COPYRIGHT WARNING ALL RIGHTS RESERVED. All information and conceptual designs contained within this document are the intellectual property of ENVIRONGAKA (Pty) Ltd. This document and/or the information contained herein may not be used, stored, reproduced, or copied in any manner, without the prior written consent of ENVIRONGAKA (Pty) Ltd. This document and/or the information and conceptual designs may not be disclosed or displayed to any third party without the prior written consent of ENVIRONGAKA (Pty) Ltd.
EnviroNgaka
5.1.3.NH3-1 Ammonia (NH3) – 24 hour, 99th percentile (US EPA Reference Concentration: 100 µg/m3) Figure 5.3.NH3-1.1 below provides an indication of the expected impact of NH3 emissions to potentially emanate from the Briquetting Plant’s agglomeration operations’ point source for either, as referenced in the heading of the respective isopleths. In the absence of a national air quality standard, the 24-hour average US EPA Reference Concentration of 100µg.m-3 is used as a reference. The impact region is negligible.
All Sources (per Scenario 1):
All Sources (per Scenario 2):
Figure 5.3.NH3-1.1: All Sources, Scenario 1 vs Scenario 2– Ammonia (NH3) – 24hour, 99th percentile
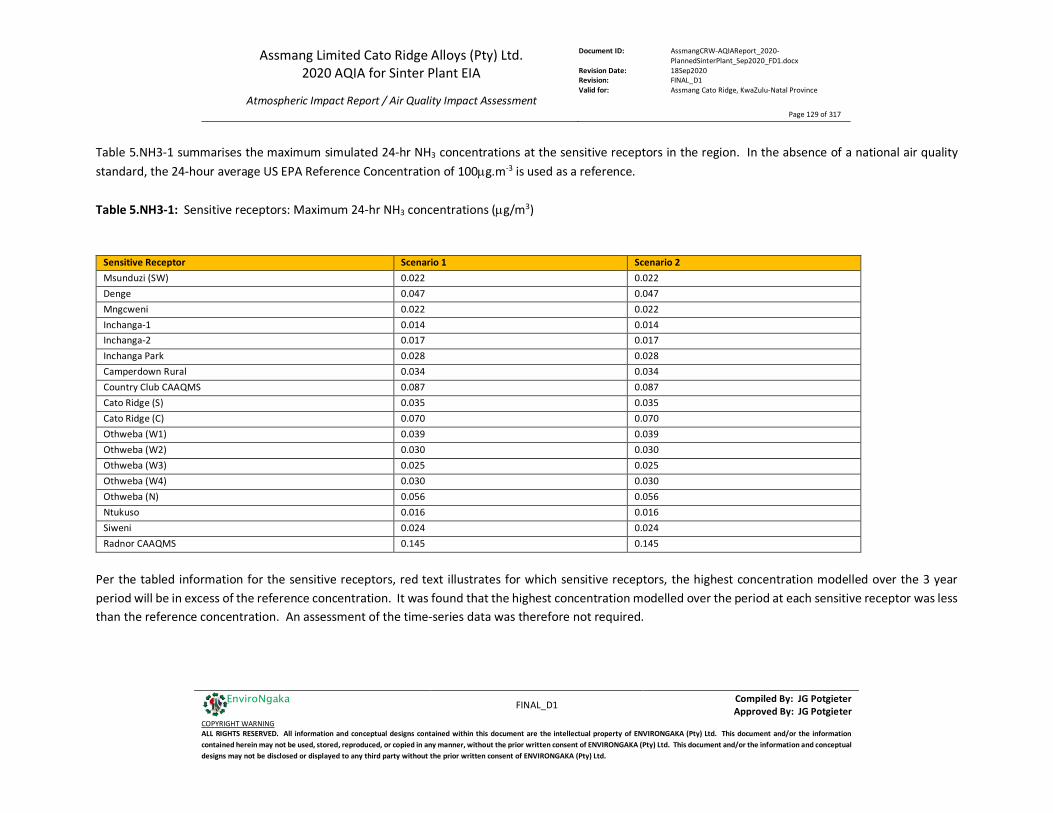
Assmang Limited Cato Ridge Alloys (Pty) Ltd. 2020 AQIA for Sinter Plant EIA
Atmospheric Impact Report / Air Quality Impact Assessment
Document ID: AssmangCRW-AQIAReport_2020-PlannedSinterPlant_Sep2020_FD1.docx
Revision Date: 18Sep2020 Revision: FINAL_D1 Valid for: Assmang Cato Ridge, KwaZulu-Natal Province
Page 129 of 317
FINAL_D1 Compiled By: JG Potgieter
Approved By: JG Potgieter COPYRIGHT WARNING ALL RIGHTS RESERVED. All information and conceptual designs contained within this document are the intellectual property of ENVIRONGAKA (Pty) Ltd. This document and/or the information contained herein may not be used, stored, reproduced, or copied in any manner, without the prior written consent of ENVIRONGAKA (Pty) Ltd. This document and/or the information and conceptual designs may not be disclosed or displayed to any third party without the prior written consent of ENVIRONGAKA (Pty) Ltd.
EnviroNgaka
Table 5.NH3-1 summarises the maximum simulated 24-hr NH3 concentrations at the sensitive receptors in the region. In the absence of a national air quality standard, the 24-hour average US EPA Reference Concentration of 100µg.m-3 is used as a reference. Table 5.NH3-1: Sensitive receptors: Maximum 24-hr NH3 concentrations (µg/m3)
Sensitive Receptor Scenario 1 Scenario 2 Msunduzi (SW) 0.022 0.022 Denge 0.047 0.047 Mngcweni 0.022 0.022 Inchanga-1 0.014 0.014 Inchanga-2 0.017 0.017 Inchanga Park 0.028 0.028 Camperdown Rural 0.034 0.034 Country Club CAAQMS 0.087 0.087 Cato Ridge (S) 0.035 0.035 Cato Ridge (C) 0.070 0.070 Othweba (W1) 0.039 0.039 Othweba (W2) 0.030 0.030 Othweba (W3) 0.025 0.025 Othweba (W4) 0.030 0.030 Othweba (N) 0.056 0.056 Ntukuso 0.016 0.016 Siweni 0.024 0.024 Radnor CAAQMS 0.145 0.145
Per the tabled information for the sensitive receptors, red text illustrates for which sensitive receptors, the highest concentration modelled over the 3 year period will be in excess of the reference concentration. It was found that the highest concentration modelled over the period at each sensitive receptor was less than the reference concentration. An assessment of the time-series data was therefore not required.
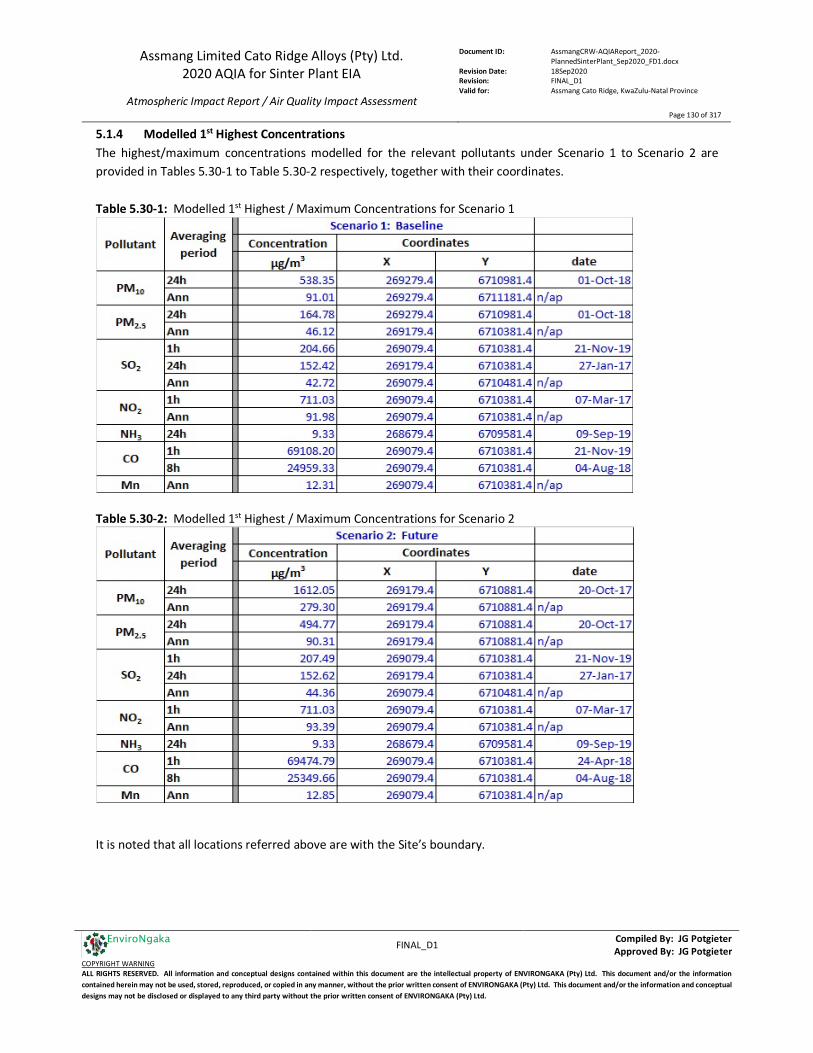
Assmang Limited Cato Ridge Alloys (Pty) Ltd. 2020 AQIA for Sinter Plant EIA
Atmospheric Impact Report / Air Quality Impact Assessment
Document ID: AssmangCRW-AQIAReport_2020-PlannedSinterPlant_Sep2020_FD1.docx
Revision Date: 18Sep2020 Revision: FINAL_D1 Valid for: Assmang Cato Ridge, KwaZulu-Natal Province
Page 130 of 317
FINAL_D1 Compiled By: JG Potgieter
Approved By: JG Potgieter COPYRIGHT WARNING ALL RIGHTS RESERVED. All information and conceptual designs contained within this document are the intellectual property of ENVIRONGAKA (Pty) Ltd. This document and/or the information contained herein may not be used, stored, reproduced, or copied in any manner, without the prior written consent of ENVIRONGAKA (Pty) Ltd. This document and/or the information and conceptual designs may not be disclosed or displayed to any third party without the prior written consent of ENVIRONGAKA (Pty) Ltd.
EnviroNgaka
5.1.4 Modelled 1st Highest Concentrations The highest/maximum concentrations modelled for the relevant pollutants under Scenario 1 to Scenario 2 are provided in Tables 5.30-1 to Table 5.30-2 respectively, together with their coordinates. Table 5.30-1: Modelled 1st Highest / Maximum Concentrations for Scenario 1
Table 5.30-2: Modelled 1st Highest / Maximum Concentrations for Scenario 2
It is noted that all locations referred above are with the Site’s boundary.
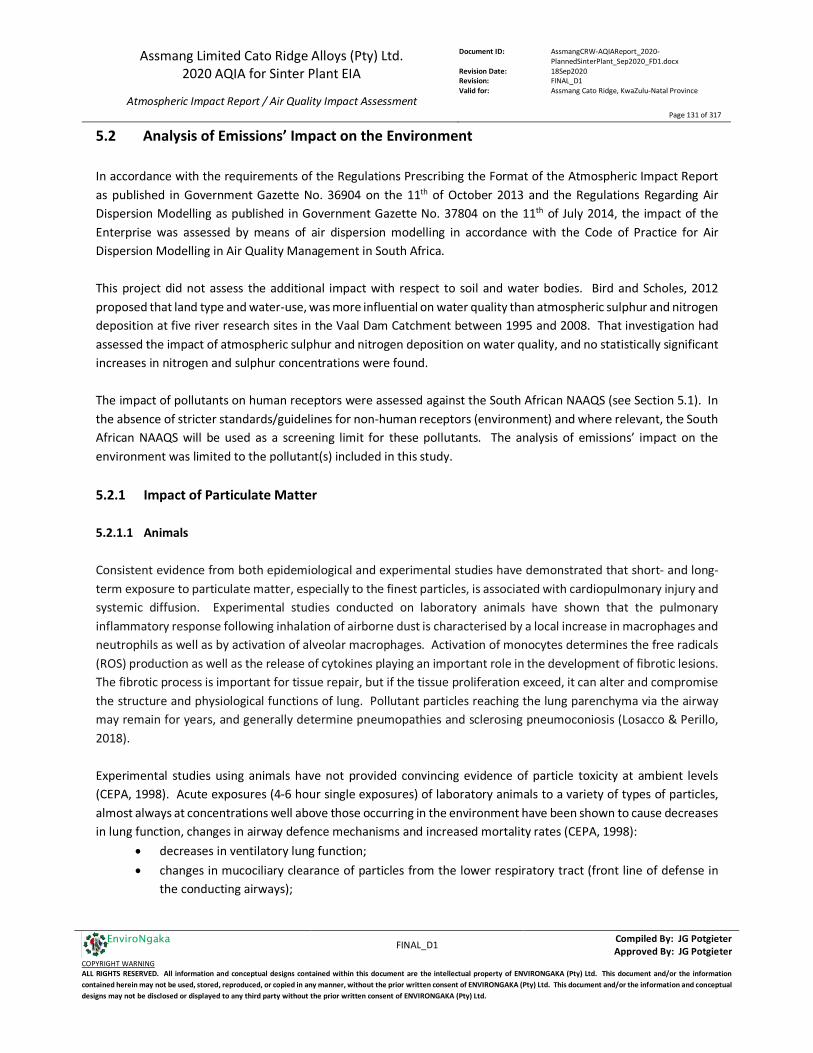
Assmang Limited Cato Ridge Alloys (Pty) Ltd. 2020 AQIA for Sinter Plant EIA
Atmospheric Impact Report / Air Quality Impact Assessment
Document ID: AssmangCRW-AQIAReport_2020-PlannedSinterPlant_Sep2020_FD1.docx
Revision Date: 18Sep2020 Revision: FINAL_D1 Valid for: Assmang Cato Ridge, KwaZulu-Natal Province
Page 131 of 317
FINAL_D1 Compiled By: JG Potgieter
Approved By: JG Potgieter COPYRIGHT WARNING ALL RIGHTS RESERVED. All information and conceptual designs contained within this document are the intellectual property of ENVIRONGAKA (Pty) Ltd. This document and/or the information contained herein may not be used, stored, reproduced, or copied in any manner, without the prior written consent of ENVIRONGAKA (Pty) Ltd. This document and/or the information and conceptual designs may not be disclosed or displayed to any third party without the prior written consent of ENVIRONGAKA (Pty) Ltd.
EnviroNgaka
5.2 Analysis of Emissions’ Impact on the Environment In accordance with the requirements of the Regulations Prescribing the Format of the Atmospheric Impact Report as published in Government Gazette No. 36904 on the 11th of October 2013 and the Regulations Regarding Air Dispersion Modelling as published in Government Gazette No. 37804 on the 11th of July 2014, the impact of the Enterprise was assessed by means of air dispersion modelling in accordance with the Code of Practice for Air Dispersion Modelling in Air Quality Management in South Africa. This project did not assess the additional impact with respect to soil and water bodies. Bird and Scholes, 2012 proposed that land type and water-use, was more influential on water quality than atmospheric sulphur and nitrogen deposition at five river research sites in the Vaal Dam Catchment between 1995 and 2008. That investigation had assessed the impact of atmospheric sulphur and nitrogen deposition on water quality, and no statistically significant increases in nitrogen and sulphur concentrations were found. The impact of pollutants on human receptors were assessed against the South African NAAQS (see Section 5.1). In the absence of stricter standards/guidelines for non-human receptors (environment) and where relevant, the South African NAAQS will be used as a screening limit for these pollutants. The analysis of emissions’ impact on the environment was limited to the pollutant(s) included in this study. 5.2.1 Impact of Particulate Matter 5.2.1.1 Animals Consistent evidence from both epidemiological and experimental studies have demonstrated that short- and long-term exposure to particulate matter, especially to the finest particles, is associated with cardiopulmonary injury and systemic diffusion. Experimental studies conducted on laboratory animals have shown that the pulmonary inflammatory response following inhalation of airborne dust is characterised by a local increase in macrophages and neutrophils as well as by activation of alveolar macrophages. Activation of monocytes determines the free radicals (ROS) production as well as the release of cytokines playing an important role in the development of fibrotic lesions. The fibrotic process is important for tissue repair, but if the tissue proliferation exceed, it can alter and compromise the structure and physiological functions of lung. Pollutant particles reaching the lung parenchyma via the airway may remain for years, and generally determine pneumopathies and sclerosing pneumoconiosis (Losacco & Perillo, 2018). Experimental studies using animals have not provided convincing evidence of particle toxicity at ambient levels (CEPA, 1998). Acute exposures (4-6 hour single exposures) of laboratory animals to a variety of types of particles, almost always at concentrations well above those occurring in the environment have been shown to cause decreases in lung function, changes in airway defence mechanisms and increased mortality rates (CEPA, 1998):
• decreases in ventilatory lung function; • changes in mucociliary clearance of particles from the lower respiratory tract (front line of defense in
the conducting airways);
Assmang Limited Cato Ridge Alloys (Pty) Ltd. 2020 AQIA for Sinter Plant EIA
Atmospheric Impact Report / Air Quality Impact Assessment
Document ID: AssmangCRW-AQIAReport_2020-PlannedSinterPlant_Sep2020_FD1.docx
Revision Date: 18Sep2020 Revision: FINAL_D1 Valid for: Assmang Cato Ridge, KwaZulu-Natal Province
Page 132 of 317
FINAL_D1 Compiled By: JG Potgieter
Approved By: JG Potgieter COPYRIGHT WARNING ALL RIGHTS RESERVED. All information and conceptual designs contained within this document are the intellectual property of ENVIRONGAKA (Pty) Ltd. This document and/or the information contained herein may not be used, stored, reproduced, or copied in any manner, without the prior written consent of ENVIRONGAKA (Pty) Ltd. This document and/or the information and conceptual designs may not be disclosed or displayed to any third party without the prior written consent of ENVIRONGAKA (Pty) Ltd.
EnviroNgaka
• increased number of alveolar macrophages and polymorphonuclear leukocytes in the alveoli (primary line of defense of the alveolar region against inhaled particles);
• alterations in immunologic responses (particle composition a factor, since particles with known cytotoxic properties, such as metals, affect the immune system to a significantly greater degree);
• changes in airway defense mechanisms against microbial infections (appears to be related to particle composition and not strictly a particle effect);
• increase or decrease in the ability of macrophages to phagocytize particles (also related to particle composition);
• a range of histologic, cellular and biochemical disturbances, including the production of proinflammatory cytokines and other mediators by the lungs alveolar macrophages (may be related to particle size, with greater effects occurring with ultrafine particles);
• increased electrocardiographic abnormalities (an indication of cardiovascular disturbance); • increased mortality.
The epidemiological finding of an association between 24-hour ambient particle levels below 100 µg/m3 and mortality has not been substantiated by animal studies as far as PM10 and PM2.5 are concerned. With the exception of ultrafine particles (0.1 µm), none of the other particle types and sizes used in animal inhalation studies cause such acute dramatic effects, including high mortality at ambient concentrations. The lowest concentration of PM2.5 reported that caused acute death in rats with acute pulmonary inflammation or chronic bronchitis was 250 g/m3 (3 days, 6 hr/day), using continuous exposure to concentrated ambient particles as presented by the Canadian Environmental Protection Agency (CEPA, 1998). Most of the current studies concurred that the main implication of dusty environments are causing animal stress which is detrimental to their health. However, no threshold levels exist to indicate at what levels these are having a negative effect. In this light it was decided to use the same screening criteria applied to human health, i.e. the South African National Ambient Air Quality Standards. An individual’s response depends on characteristics of the inhaled components (such as composition, particle size and antigenicity) and of the individual’s susceptibility, which is tempered by extant respiratory conditions. Based on the simulated ambient concentrations (sections 5.1.3.PM10 and 5.1.3.PM2.5) it is “likely” that the ambient concentrations falls within the NAAQS beyond 200m from the facility fence line. 5.2.1.2 Vegetation Ambient air pollutants have a potential adverse impact on biochemical parameters, which further leads to a reduction in the overall growth and development of plants. The impact of various atmospheric pollutants on plants both in terms of physiology and biochemistry has been under investigation for many years (Agrawal and Agrawal, 1989; Rai, 2011 a, b; Rai and Panda, 2014; Rai and Singh, 2015; Rai, 2016 a, b). Plant adaptation to changing environmental factors involves both short-term physiological responses and long-term physiological, structural and morphological modifications. These changes help plants minimize stress and maximize use of internal and external resources (Dineva, 2004).
Assmang Limited Cato Ridge Alloys (Pty) Ltd. 2020 AQIA for Sinter Plant EIA
Atmospheric Impact Report / Air Quality Impact Assessment
Document ID: AssmangCRW-AQIAReport_2020-PlannedSinterPlant_Sep2020_FD1.docx
Revision Date: 18Sep2020 Revision: FINAL_D1 Valid for: Assmang Cato Ridge, KwaZulu-Natal Province
Page 133 of 317
FINAL_D1 Compiled By: JG Potgieter
Approved By: JG Potgieter COPYRIGHT WARNING ALL RIGHTS RESERVED. All information and conceptual designs contained within this document are the intellectual property of ENVIRONGAKA (Pty) Ltd. This document and/or the information contained herein may not be used, stored, reproduced, or copied in any manner, without the prior written consent of ENVIRONGAKA (Pty) Ltd. This document and/or the information and conceptual designs may not be disclosed or displayed to any third party without the prior written consent of ENVIRONGAKA (Pty) Ltd.
EnviroNgaka
Since plants are constantly exposed to air, they are the primary receptors for both gaseous and particulate pollutants of the atmosphere. In terrestrial plant species, the enormous foliar surface area acts as a natural sink for pollutants especially the particulate ones. Vegetation is an effective indicator of the overall impact of air pollution particularly in context of particulate matter (PM). According to Rai 2016a and Rai 2016b, there are two main types of direct injury that PM pollution can cause on plants: acute and chronic injury. Acute injury results from exposure to a high concentration of gas for a relatively short period and is manifested by clear visible symptoms on the foliage, often in the form of necrotic lesions. While this type of injury is very easy to detect (although not necessarily to diagnose), chronic injury is much more subtle: it results from prolonged exposure to lower gas concentrations and takes the form of growth and/ or yield reductions, often with no clear visible symptoms. Plants that are constantly exposed to environmental pollutants absorb, accumulate and integrate these pollutants into their systems. It reported that depending on their sensitivity level, plants show visible changes which would include alteration in the biochemical processes or accumulation of certain metabolites (Agbaire and Esiefarienrhe, 2009). Pollutants can cause leaf injury, stomatal damage, premature senescence, decrease photosynthetic activity, disturb membrane permeability and reduce growth and yield in sensitive plant species (Tiwari et al., 2006). The long-term, low concentration exposures of air pollution produces harmful impacts on plant leaves without visible injury (Joshi et al., 2009). Several studies have been conducted to assess the effects of pollution on different aspects of plant life such as overall growth and development, foliar morphology, anatomy, and biochemical changes (Rai 2016). Morphological impact of PM on plants showed reduction in plant growth (Bender et al., 2002) through its effect on leaf gas exchange (Ernst, 1982), flowering and reproduction of plants (Saunders and Godzik, 1986), number of leaves and leaf area variables in growth analyses (Lambers et al., 1998). Reduction in leaf area and leaf number maybe due to decreased leaf production rate and enhanced senescence (Seyyednejad et al., 2011). Dust deposition also affect the stomata causing occlude stomata (Hirano et al., 1995) as the particles enter the leaf through stomatal opening and their toxicity disturb the physiological activity of plants (Farmer, 1993) such as the inhibition of plant growth, rate of photosynthesis (Armbrust, 1986), late flower and the hormonal imbalance (Farooqui et al.,1995). The inhibition of net photosynthesis would inhibit the assimilate translocation and eventually leaf area would decrease. Literature revealed that stomatal closure can help to protect plants against pollution damage (Mansfield and Majernik, 1970). Physiological and biochemical effect on plants or plant leaves includes leaf-extract pH, relative water content, pigment content, photosynthesis and stomata changes (Rai, 2016). In general, according to the Canadian Environmental Protection Agency (CEPA), air pollution adversely affects plants in one of two ways; either the quantity of output or yield is reduced, or the quality of the product is lowered. The former (invisible) injury results from pollutant impacts on plant physiological or biochemical processes and can lead to significant loss of growth or yield in nutritional quality (e.g. protein content). The latter (visible) may take the form of discolouration of the leaf surface caused by internal cellular damage. Such injury can reduce the market value of agricultural crops for which visual appearance is important (e.g. lettuce and spinach). Visible injury tends to be associated with acute exposures at high pollutant concentrations whilst invisible injury is generally a consequence of chronic exposures to moderately elevated pollutant concentrations. However, given the limited
Assmang Limited Cato Ridge Alloys (Pty) Ltd. 2020 AQIA for Sinter Plant EIA
Atmospheric Impact Report / Air Quality Impact Assessment
Document ID: AssmangCRW-AQIAReport_2020-PlannedSinterPlant_Sep2020_FD1.docx
Revision Date: 18Sep2020 Revision: FINAL_D1 Valid for: Assmang Cato Ridge, KwaZulu-Natal Province
Page 134 of 317
FINAL_D1 Compiled By: JG Potgieter
Approved By: JG Potgieter COPYRIGHT WARNING ALL RIGHTS RESERVED. All information and conceptual designs contained within this document are the intellectual property of ENVIRONGAKA (Pty) Ltd. This document and/or the information contained herein may not be used, stored, reproduced, or copied in any manner, without the prior written consent of ENVIRONGAKA (Pty) Ltd. This document and/or the information and conceptual designs may not be disclosed or displayed to any third party without the prior written consent of ENVIRONGAKA (Pty) Ltd.
EnviroNgaka
information available, specifically the lack of quantitative dose-effect information, it is not possible to define a Reference Level for vegetation and particulate matter (CEPA, 1998). While there is little direct evidence of what the impact of dust fall on vegetation is under an African context, a review of European studies has shown the potential for reduced growth and photosynthetic activity in Sunflower and Cotton plants exposed to dust fall rates greater than 400 mg/m²/day (Farmer, 1993). No threshold levels exist to indicate at what levels PM are having an adverse negative effect. In this light it was decided to use the same screening criteria applied to human health, i.e. the South African National Ambient Air Quality Standards. Based on the simulated ambient concentrations (sections 5.1.3.PM10 to 5.1.3.PM2.5) it is “likely” that the ambient concentrations falls within the NAAQS beyond 200m from the facility fence line. 5.2.2 Impact of Sulphur Dioxide 5.2.2.1 Animals Experimental studies on animals have shown the acute inhalation of SO2 produces bronchoconstriction, increases respiratory flow resistance, increases mucus production and has been shown to reduce abilities to resist bacterial infection in mice (Costa and Amdur, 1996). Short exposures to low concentrations of SO2 (~2.6 mg/m³) have been shown to have immediate physiological response without resulting in significant or permanent damage. In rabbits, acute exposures (16 mg/m³ for 4 hours) to SO2 gas was irritating to the eyes and resulted in conjunctivitis, infection and lacrimation (Von Burg, 1995). Short exposures (<30 min) to concentrations of 26 mg/m³ produced more significant respiratory changes in cats but were usually completely reversible once exposure had ceased (Corn et al., 1972). Sulphur dioxide can produce mild bronchial constriction, changes in metabolism and irritation of the respiratory tract and eyes in cattle (Coppock and Mostrum, 1997). An increase in airway resistance was reported in sensitized sheep after four hours of exposure to 13 mg/m³. Studies report chronic exposure can affect mucus secretions and result in respiratory damage similar to chronic bronchitis. These effects were reported at concentrations above typical ambient concentrations (26-1053 mg/m³) (Amdur, 1978). Exposure to air pollutants is expected to result in similar adverse effects in wildlife as in laboratory and domestic animals (Newman, 1984). Most of the current studies concluded that immediate physiological response and/or significant or permanent damage occurs in the low to upper mg/m3 concentration ranges. In this light it was decided to use the same screening criteria applied to human health, i.e. the South African National Ambient Air Quality Standards. Based on the simulated ambient concentrations (sections 5.1.3.SO2-1 to 5.1.SO2-3) it is “likely” that the ambient concentrations falls within the NAAQS. 5.2.2.2 Plants

Assmang Limited Cato Ridge Alloys (Pty) Ltd. 2020 AQIA for Sinter Plant EIA
Atmospheric Impact Report / Air Quality Impact Assessment
Document ID: AssmangCRW-AQIAReport_2020-PlannedSinterPlant_Sep2020_FD1.docx
Revision Date: 18Sep2020 Revision: FINAL_D1 Valid for: Assmang Cato Ridge, KwaZulu-Natal Province
Page 135 of 317
FINAL_D1 Compiled By: JG Potgieter
Approved By: JG Potgieter COPYRIGHT WARNING ALL RIGHTS RESERVED. All information and conceptual designs contained within this document are the intellectual property of ENVIRONGAKA (Pty) Ltd. This document and/or the information contained herein may not be used, stored, reproduced, or copied in any manner, without the prior written consent of ENVIRONGAKA (Pty) Ltd. This document and/or the information and conceptual designs may not be disclosed or displayed to any third party without the prior written consent of ENVIRONGAKA (Pty) Ltd.
EnviroNgaka
Sulphur dioxide penetrates into leaves primarily in gaseous form through the stomata, although there is evidence for a limited pathway via the cuticle. The aperture of the stomata is controlled largely by the prevailing environmental conditions, such as humidity, temperature and light intensity. These external factors thus influence the rate of uptake of sulphur dioxide and hence the degree of injury. When the stomata are closed, as occurs under dark or drought conditions, then resistance to gas uptake is very high and the plant has a very low degree of susceptibility to injury. However, unlike higher plants, mosses and lichens do not have a protective cuticle exposed to sulphur dioxide which is the major reason for their extreme sensitivity to SO2. SO2 directly affects vegetation by uptake through parts of the plants that are above the ground; the direct effects on leaves are mainly determined by air concentrations. Depending on the amount of SO2 taken up per unit of time, various kind of biochemical and physiological effects take place in the plant tissue; these include the degradation of chlorophyll, reduced photosynthesis, raised respiration rates, and changes in protein metabolism. The lower plants such as lichens and mosses, due to their structure have a particular sensitivity to SO2. The decisive factors in the action of SO2 on plants are existing stresses on the plant, the concentration of SO2, the duration of exposure, and the frequency and sequence of impact; within certain ranges of concentration and for a given dose (concentration times exposure duration), the extend of foliar injury increases with increasing concentration. The significance of very low concentrations of SO2 on growth and yield, and on changing plant sensitivity to other environmental stresses is now also recognized some plants can also recover in pollution-free periods if the duration of exposure to injuring concentrations is not too long and if the pollution-free period is sufficiently long (EC, 1997). Individual species and varieties, and individuals within a population, react with different degrees of sensitivity to stress resulting from air pollution. Sulphur is also an essential plant nutrient. In certain areas, where soils are deficient in sulphur (mainly calcareous-based on chalk and limestone), atmospheric sulphur may be taken up by leaves of some species and help contributing to the plant vitality but uptake is low and therefore not relevant to the setting of limit values. Due to falling emissions of SO2 in many areas in Europe and to the recognition of O3 and nitrogen compounds as being of much greater significance with regard to plant injury, the relative importance of SO2 as a phytotoxic pollutant has diminished to a certain extent. Nevertheless SO2 can locally play a role in vegetation damage, especially in combination with other pollutants (EC, 1997). The results of field observations and fumigation experiments have been used to determine quantitative dose-response relationship between SO2 concentrations and the effects on both annual and perennial plants and to derive guidelines accordingly. These guidelines are generally defined as annual and/or winter means and are tabulated in Table 5.31. Table 5.31: WHO guideline values for impact on plant species (EC, 1997)
Annual and winter mean value (µg/m3) Target Affected
30 Crops
20 Forests / Natural Vegetation
15 Sensitive Forests / Natural Vegetation
10 Lichens

Assmang Limited Cato Ridge Alloys (Pty) Ltd. 2020 AQIA for Sinter Plant EIA
Atmospheric Impact Report / Air Quality Impact Assessment
Document ID: AssmangCRW-AQIAReport_2020-PlannedSinterPlant_Sep2020_FD1.docx
Revision Date: 18Sep2020 Revision: FINAL_D1 Valid for: Assmang Cato Ridge, KwaZulu-Natal Province
Page 136 of 317
FINAL_D1 Compiled By: JG Potgieter
Approved By: JG Potgieter COPYRIGHT WARNING ALL RIGHTS RESERVED. All information and conceptual designs contained within this document are the intellectual property of ENVIRONGAKA (Pty) Ltd. This document and/or the information contained herein may not be used, stored, reproduced, or copied in any manner, without the prior written consent of ENVIRONGAKA (Pty) Ltd. This document and/or the information and conceptual designs may not be disclosed or displayed to any third party without the prior written consent of ENVIRONGAKA (Pty) Ltd.
EnviroNgaka
Based on the simulated ambient concentrations (section 5.1.3.SO2-3) it is “likely” that the ambient concentrations falls within the WHO annual guidelines in Table 5.31. 5.2.2.3 Materials and cultural heritage Deterioration of materials and objects of cultural heritage is a process which occurs at a rate which is determined by meteorological parameters such as relative humidity, temperature and precipitation, and by air pollutants. Since the time of wetness and temperature exhibit only small variations in the temperate climatic zone, the concentration of atmospheric pollutants is often the dominant variable affecting the rate of corrosion. Among the anthropogenic air pollutants, SO2 can be considered as the most important in deterioration of several materials. Many materials are affected; among them, e.g. stones used in historic and cultural monuments, which have resisted atmospheric attacks for hundreds or even thousands of years. But during recent decades, an accelerated degradation of their surface has been observed in many parts of Europe (EC, 1997). There are several ways how SO2 emissions can contribute to corrosion of materials: it deposits readily on surfaces and is then subsequently converted to sulphates; in ambient air, SO2 is also partly converted to sulphate particulates which may be deposited on surfaces and can also cause corrosion. Both SO2 and sulphate particulates may also dissolve in rain droplets and increase the acidity of precipitations thus enhancing the phenomena of corrosion (EC, 1997). The decisive effect of SO2 on corrosion of several materials like metals, calcareous stones, or stained medieval glass windows has been shown in several laboratory and field exposures. In the last years, however, a synergistic corrosive effect of SO2 and NO2 and later of SO2 and O3 has been discovered first in laboratory exposure; this has been confirmed later on by field exposure studies. They enhance the corrosive effect of SO2 by promoting its oxidation to sulphate. This underlines the necessity to treat the deterioration of materials taking into account the interrelated role of SO2, NO2 and O3 in a multi-pollutant situation. During the last decades, several field exposure programs have greatly contributed to enhancement of the present state of knowledge on the effects of acidifying air pollutants on materials. Field studies have shown that the dry deposition has, in most cases, the dominating effect and that SO2 exerts the strongest corrosive effect both in unsheltered end sheltered exposure. The effect of wet deposition is demonstrated only for unsheltered exposure. In practical and economic terms, the corrosion due to SO2 is closely tied to densely populated areas. Here, three conditions coincide: a high content of atmospheric pollutants, a high population density and a large use of materials. The corrosion rate decreases in general rapidly with increasing distance from the source of emission. In many regions, atmospheric corrosion is therefore a local effect. Based on the findings of various studies, experts are recommending the following guidelines (Table 5.32): Table 5.32: WHO guideline values for impact on materials (EC, 1997)
Annual mean value (µg/m3) Target Affected
15 Zinc, weathering steel
10 Bronze, limestone and sandstone
Based on the simulated ambient concentrations (section 5.1.3.SO2-3) it is “likely” that the ambient concentrations falls within the WHO annual guidelines in Table 5.32.

Assmang Limited Cato Ridge Alloys (Pty) Ltd. 2020 AQIA for Sinter Plant EIA
Atmospheric Impact Report / Air Quality Impact Assessment
Document ID: AssmangCRW-AQIAReport_2020-PlannedSinterPlant_Sep2020_FD1.docx
Revision Date: 18Sep2020 Revision: FINAL_D1 Valid for: Assmang Cato Ridge, KwaZulu-Natal Province
Page 137 of 317
FINAL_D1 Compiled By: JG Potgieter
Approved By: JG Potgieter COPYRIGHT WARNING ALL RIGHTS RESERVED. All information and conceptual designs contained within this document are the intellectual property of ENVIRONGAKA (Pty) Ltd. This document and/or the information contained herein may not be used, stored, reproduced, or copied in any manner, without the prior written consent of ENVIRONGAKA (Pty) Ltd. This document and/or the information and conceptual designs may not be disclosed or displayed to any third party without the prior written consent of ENVIRONGAKA (Pty) Ltd.
EnviroNgaka
5.2.3 Impact of Nitrogen Dioxide 5.2.3.1 Animals Although there are exceptions, the vast majority of lung biochemical studies show effects only after acute or sub-chronic exposure to levels of nitrogen dioxide exceeding 3160 μg/m3 (2 ppm) (US EPA, 1993 and Berglund, M. et. al., 1993). Nitrogen dioxide is toxic to various animals as well as to humans. Its toxicity relates to its ability to form nitric acid with water in the eye, lung, mucus membrane and skin. Studies of the health impacts of NO2 include experimental studies on animals, controlled laboratory studies on humans and observational studies. In animals, long-term exposure to nitrogen oxides increases susceptibility to respiratory infections lowering their resistance to such diseases as pneumonia and influenza. Laboratory studies show susceptible humans, such as asthmatics, exposed to high concentrations of NO2 can suffer lung irritation and potentially, lung damage. Epidemiological studies have also shown associations between NO2 concentrations and daily mortality from respiratory and cardiovascular causes and with hospital admissions for respiratory conditions. While results from these types of studies are not consistent, some suggest adverse effects may be associated with NO2 exposure at levels below existing guideline values. For example, Burnett et. al., (1998) found a 4.3% increase in all-cause mortality for an increase in 24-hour average NO2 levels of 47 µg/m3. Daily NO2 levels during the study ranged from 29 to 56 µg/m3. An evaluation of the health impacts of NO2 concentrations carried out by the Ministry for the Environment (New Zealand) in support of the derivation of ambient air quality guideline values concluded that the health impacts associated with low level exposure to NO2 were equivocal, and that the contribution of NO2 as one of a mixture of pollutants in the ambient environment was yet to be clearly defined (Dennison et al, 2002). In this light it was decided to use the same screening criteria applied to human health, i.e. the South African National Ambient Air Quality Standards. Based on the simulated ambient concentrations (sections 5.1.3.NO2-1 & 5.1.3.NO2-2) it is “likely” that the ambient concentrations falls within the NAAQS beyond a distance of approximately 500m from the facility. 5.2.3.2 Plants and ecosystems Nitrogen oxides are absorbed by vegetation in the same way as CO2 through stomata. Nitrogen oxides are dissolved in the stomata cavity water and form nitrite and nitrate, which in turn are reduced to NH3 and eventually incorporated into organic compounds (Wellburn, A.R., Wilson, J. and Aldrige, P.H. 1980). If too much NO2 is absorbed over time, acute damage may occur in form of necrosis. Biological membranes and chloroplasts are assumed to be damaged (Mudd et al. 1984). Acute effects occur at very high concentrations, which are seldom observed in ambient air, except near very large point sources. There is a range of long term exposure effects. Up to a certain level, no effects are observed. Above this, NO2 may stimulate growth. However, higher doses will decrease growth in relation to controls. There is at present a dispute over which nitrogen oxides are the most toxic. Further knowledge is necessary to assess the situation (EC, 1997).
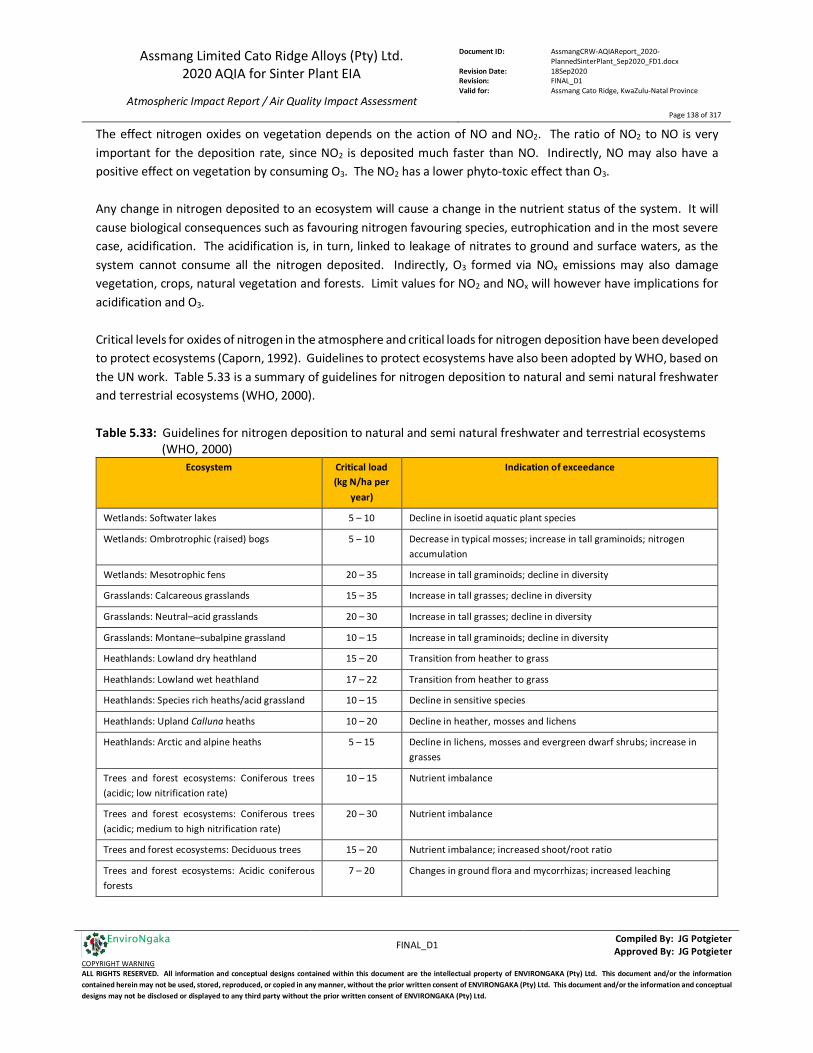
Assmang Limited Cato Ridge Alloys (Pty) Ltd. 2020 AQIA for Sinter Plant EIA
Atmospheric Impact Report / Air Quality Impact Assessment
Document ID: AssmangCRW-AQIAReport_2020-PlannedSinterPlant_Sep2020_FD1.docx
Revision Date: 18Sep2020 Revision: FINAL_D1 Valid for: Assmang Cato Ridge, KwaZulu-Natal Province
Page 138 of 317
FINAL_D1 Compiled By: JG Potgieter
Approved By: JG Potgieter COPYRIGHT WARNING ALL RIGHTS RESERVED. All information and conceptual designs contained within this document are the intellectual property of ENVIRONGAKA (Pty) Ltd. This document and/or the information contained herein may not be used, stored, reproduced, or copied in any manner, without the prior written consent of ENVIRONGAKA (Pty) Ltd. This document and/or the information and conceptual designs may not be disclosed or displayed to any third party without the prior written consent of ENVIRONGAKA (Pty) Ltd.
EnviroNgaka
The effect nitrogen oxides on vegetation depends on the action of NO and NO2. The ratio of NO2 to NO is very important for the deposition rate, since NO2 is deposited much faster than NO. Indirectly, NO may also have a positive effect on vegetation by consuming O3. The NO2 has a lower phyto-toxic effect than O3. Any change in nitrogen deposited to an ecosystem will cause a change in the nutrient status of the system. It will cause biological consequences such as favouring nitrogen favouring species, eutrophication and in the most severe case, acidification. The acidification is, in turn, linked to leakage of nitrates to ground and surface waters, as the system cannot consume all the nitrogen deposited. Indirectly, O3 formed via NOx emissions may also damage vegetation, crops, natural vegetation and forests. Limit values for NO2 and NOx will however have implications for acidification and O3. Critical levels for oxides of nitrogen in the atmosphere and critical loads for nitrogen deposition have been developed to protect ecosystems (Caporn, 1992). Guidelines to protect ecosystems have also been adopted by WHO, based on the UN work. Table 5.33 is a summary of guidelines for nitrogen deposition to natural and semi natural freshwater and terrestrial ecosystems (WHO, 2000). Table 5.33: Guidelines for nitrogen deposition to natural and semi natural freshwater and terrestrial ecosystems
(WHO, 2000) Ecosystem Critical load
(kg N/ha per year)
Indication of exceedance
Wetlands: Softwater lakes 5 – 10 Decline in isoetid aquatic plant species
Wetlands: Ombrotrophic (raised) bogs 5 – 10 Decrease in typical mosses; increase in tall graminoids; nitrogen accumulation
Wetlands: Mesotrophic fens 20 – 35 Increase in tall graminoids; decline in diversity
Grasslands: Calcareous grasslands 15 – 35 Increase in tall grasses; decline in diversity
Grasslands: Neutral–acid grasslands 20 – 30 Increase in tall grasses; decline in diversity
Grasslands: Montane–subalpine grassland 10 – 15 Increase in tall graminoids; decline in diversity
Heathlands: Lowland dry heathland 15 – 20 Transition from heather to grass
Heathlands: Lowland wet heathland 17 – 22 Transition from heather to grass
Heathlands: Species rich heaths/acid grassland 10 – 15 Decline in sensitive species
Heathlands: Upland Calluna heaths 10 – 20 Decline in heather, mosses and lichens
Heathlands: Arctic and alpine heaths 5 – 15 Decline in lichens, mosses and evergreen dwarf shrubs; increase in grasses
Trees and forest ecosystems: Coniferous trees (acidic; low nitrification rate)
10 – 15 Nutrient imbalance
Trees and forest ecosystems: Coniferous trees (acidic; medium to high nitrification rate)
20 – 30 Nutrient imbalance
Trees and forest ecosystems: Deciduous trees 15 – 20 Nutrient imbalance; increased shoot/root ratio
Trees and forest ecosystems: Acidic coniferous forests
7 – 20 Changes in ground flora and mycorrhizas; increased leaching
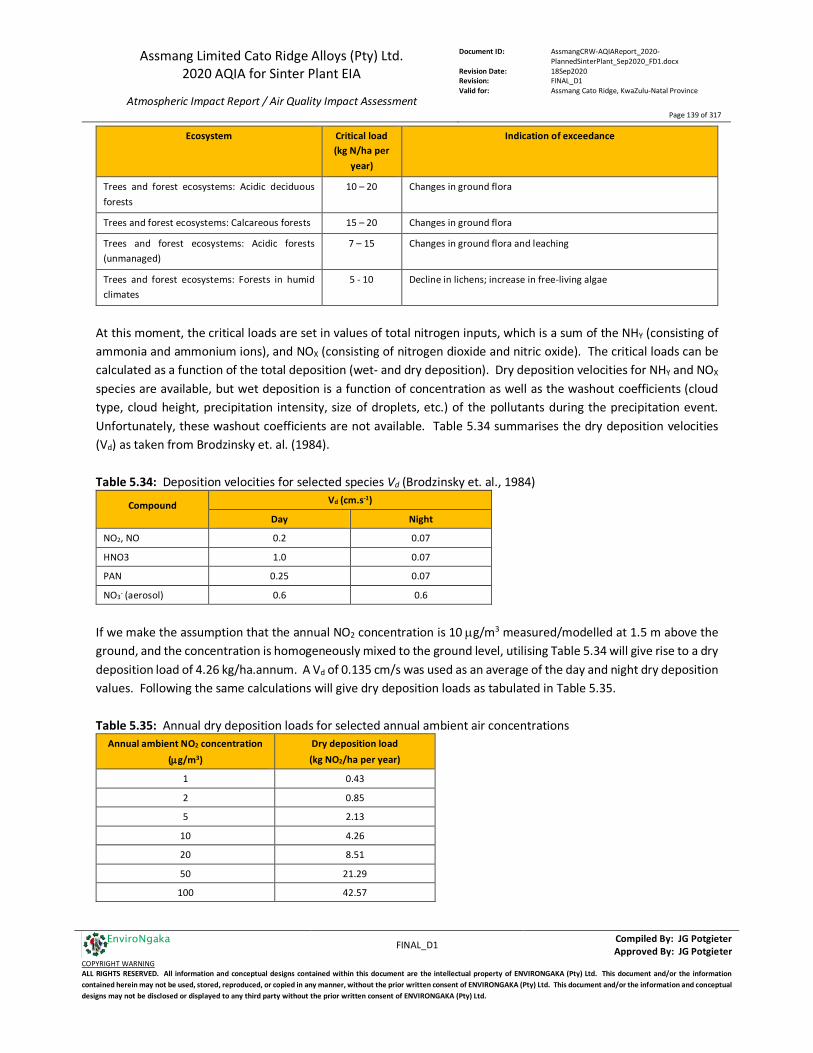
Assmang Limited Cato Ridge Alloys (Pty) Ltd. 2020 AQIA for Sinter Plant EIA
Atmospheric Impact Report / Air Quality Impact Assessment
Document ID: AssmangCRW-AQIAReport_2020-PlannedSinterPlant_Sep2020_FD1.docx
Revision Date: 18Sep2020 Revision: FINAL_D1 Valid for: Assmang Cato Ridge, KwaZulu-Natal Province
Page 139 of 317
FINAL_D1 Compiled By: JG Potgieter
Approved By: JG Potgieter COPYRIGHT WARNING ALL RIGHTS RESERVED. All information and conceptual designs contained within this document are the intellectual property of ENVIRONGAKA (Pty) Ltd. This document and/or the information contained herein may not be used, stored, reproduced, or copied in any manner, without the prior written consent of ENVIRONGAKA (Pty) Ltd. This document and/or the information and conceptual designs may not be disclosed or displayed to any third party without the prior written consent of ENVIRONGAKA (Pty) Ltd.
EnviroNgaka
Ecosystem Critical load (kg N/ha per
year)
Indication of exceedance
Trees and forest ecosystems: Acidic deciduous forests
10 – 20 Changes in ground flora
Trees and forest ecosystems: Calcareous forests 15 – 20 Changes in ground flora
Trees and forest ecosystems: Acidic forests (unmanaged)
7 – 15 Changes in ground flora and leaching
Trees and forest ecosystems: Forests in humid climates
5 - 10 Decline in lichens; increase in free-living algae
At this moment, the critical loads are set in values of total nitrogen inputs, which is a sum of the NHY (consisting of ammonia and ammonium ions), and NOX (consisting of nitrogen dioxide and nitric oxide). The critical loads can be calculated as a function of the total deposition (wet- and dry deposition). Dry deposition velocities for NHY and NOX species are available, but wet deposition is a function of concentration as well as the washout coefficients (cloud type, cloud height, precipitation intensity, size of droplets, etc.) of the pollutants during the precipitation event. Unfortunately, these washout coefficients are not available. Table 5.34 summarises the dry deposition velocities (Vd) as taken from Brodzinsky et. al. (1984). Table 5.34: Deposition velocities for selected species Vd (Brodzinsky et. al., 1984)
Compound Vd (cm.s-1)
Day Night
NO2, NO 0.2 0.07
HNO3 1.0 0.07
PAN 0.25 0.07
NO3- (aerosol) 0.6 0.6
If we make the assumption that the annual NO2 concentration is 10 µg/m3 measured/modelled at 1.5 m above the ground, and the concentration is homogeneously mixed to the ground level, utilising Table 5.34 will give rise to a dry deposition load of 4.26 kg/ha.annum. A Vd of 0.135 cm/s was used as an average of the day and night dry deposition values. Following the same calculations will give dry deposition loads as tabulated in Table 5.35. Table 5.35: Annual dry deposition loads for selected annual ambient air concentrations
Annual ambient NO2 concentration (µg/m3)
Dry deposition load (kg NO2/ha per year)
1 0.43
2 0.85
5 2.13
10 4.26
20 8.51
50 21.29
100 42.57
Assmang Limited Cato Ridge Alloys (Pty) Ltd. 2020 AQIA for Sinter Plant EIA
Atmospheric Impact Report / Air Quality Impact Assessment
Document ID: AssmangCRW-AQIAReport_2020-PlannedSinterPlant_Sep2020_FD1.docx
Revision Date: 18Sep2020 Revision: FINAL_D1 Valid for: Assmang Cato Ridge, KwaZulu-Natal Province
Page 140 of 317
FINAL_D1 Compiled By: JG Potgieter
Approved By: JG Potgieter COPYRIGHT WARNING ALL RIGHTS RESERVED. All information and conceptual designs contained within this document are the intellectual property of ENVIRONGAKA (Pty) Ltd. This document and/or the information contained herein may not be used, stored, reproduced, or copied in any manner, without the prior written consent of ENVIRONGAKA (Pty) Ltd. This document and/or the information and conceptual designs may not be disclosed or displayed to any third party without the prior written consent of ENVIRONGAKA (Pty) Ltd.
EnviroNgaka
The annual 4 µg/m3, 8.5 µg/m3 and 35.5 µg/m3 NO2 concentration isopleths are clearly distinguishable in section 5.1.3.NO2-2. These concentrations will give rise to dry deposition loads of 1.7 kg, 3.8 kg and 15 NO2/ha per year respectively. Excluding wet deposition and deposition of other “N” containing species, comparing deposition loads of 1.7 kg and 3.8 kg NO2/ha and 15 NO2/ha per year to Table 5.33 in terms of kg N/ha per year, it is “likely” that the ambient NO2 concentrations beyond a distance of approximately 500m to the west beyond the facility, will not have a significant adverse effect on vegetation and ecosystems. 5.2.3.3 Effect on materials The effect on materials of an individual air pollutant is difficult to separate from the effect of others. Many of the effect on materials have been ascribed to the multipollutant situation in the urban atmosphere than to the action of separate pollutants. Nitrogen oxides may contribute to damage in several ways, but their role is not yet clarified (EC, 1997). However, the role of nitrogen oxides is secondary compared to that of ozone for dyes, fabrics, plastics and elastomers, to that of oxygen, sulphur dioxide and wetting by rain, condensation, mist etc. on metals and to that of rain, carbon dioxide and sulphur dioxide for calcareous stonework. There is also a possibility that nitrate deposited on outdoor surfaces, can enhance the microbial activity and thus increase bio-degradation. Increased growth of algae due to deposition of nitrogen compounds on surface is considered as a soiling and undesirable effect. At present there is not sufficient data to enable a recommendation to be made for an air quality limit value for NO2 in order to protect material from air pollution damage (EC, 1997). In view of the above, light it was decided to use the same screening criteria applied to human health, i.e. the South African National Ambient Air Quality Standards. Based on the simulated ambient concentrations (sections 5.1.3.NO2-1 & 5.1.3.NO2-2) it is “likely” that the ambient concentrations falls within the NAAQS beyond a distance of approximately 500m from the facility. 5.2.4 Impact of Carbon Monoxide 5.2.4.1 Animals The binding of carbon monoxide with haemoglobin to form carboxyhaemoglobin (COHb) reduces the oxygen-carrying capacity of the blood and impairs the release of oxygen from haemoglobin to extravascular tissues, as well as transportation of oxygen around the body. This can impact on the brain, nervous tissues, heart muscle and other specialised tissues that require large amounts of oxygen to function. As a result of oxygen deprivation, these organs and tissues may suffer temporary or permanent damage (EC, 1999). CO reacts readily with haemoglobin in the blood to form COHb. The affinity of haemoglobin for CO is 200-250 times that for oxygen, and as a result this binding reduces the oxygen-carrying capacity of the blood and impairs the release

Assmang Limited Cato Ridge Alloys (Pty) Ltd. 2020 AQIA for Sinter Plant EIA
Atmospheric Impact Report / Air Quality Impact Assessment
Document ID: AssmangCRW-AQIAReport_2020-PlannedSinterPlant_Sep2020_FD1.docx
Revision Date: 18Sep2020 Revision: FINAL_D1 Valid for: Assmang Cato Ridge, KwaZulu-Natal Province
Page 141 of 317
FINAL_D1 Compiled By: JG Potgieter
Approved By: JG Potgieter COPYRIGHT WARNING ALL RIGHTS RESERVED. All information and conceptual designs contained within this document are the intellectual property of ENVIRONGAKA (Pty) Ltd. This document and/or the information contained herein may not be used, stored, reproduced, or copied in any manner, without the prior written consent of ENVIRONGAKA (Pty) Ltd. This document and/or the information and conceptual designs may not be disclosed or displayed to any third party without the prior written consent of ENVIRONGAKA (Pty) Ltd.
EnviroNgaka
of oxygen to extravascular tissues. The most important variables determining the COHb level are CO in inhaled air, duration of exposure and lung ventilation. During an exposure to a fixed concentration of CO, the COHb concentration increases rapidly at the onset of exposure, starts to level off after 3 hours, and reaches a steady-state after 6-8 hours of exposure. Physical exercise accelerates the CO uptake process. The formation of COHb is a reversible process, but because of the tight binding of CO to haemoglobin, the elimination half-life while breathing room air is 2-6.5 hours depending on the initial COHb level (EC, 1999). The toxic effects of CO become evident in organs and tissues with high oxygen consumption such as the brain, the heart, the exercising skeletal muscle. The effects of CO exposure at very high concentrations (well above ambient levels) are lethal. High concentrations may cause both reversible, short-lasting neurological deficits and severe, often delayed neurological damage. At COHb levels as low as 5.1-8.2% impaired coordination, vigilance and cognitive performance have been observed. In healthy subjects the endogenous production of CO results in COHb levels of 0.4-0.7% (EC, 1999). Those most susceptible to the health effects of ambient air exposure to CO include those with ischaemic heart disease, other forms of cardiac disease including cyanotic heart disease, hypoxaemic lung disease, cerebrovascular disease, peripheral vascular disease, those with anaemia and haemoglobin abnormalities, children, and developing foeti. The CO guidelines (Table 5.36) are based on the Coburn-Foster-Kane exponential equation, which takes into account all the known physiological variables affecting carbon monoxide uptake. The following guideline values (ppm values rounded) and periods of time-weighted average exposures have been determined in such a way that the COHb level of 2.5% is not exceeded, even when a normal subject engages in light or moderate exercise (WHO, 2000). Table 5.36: Guidelines for carbon monoxide (CO) (WHO, 2000)
CO concentration Time average
mg/m3 µg/m3
100 100 000 15 minutes
60 60 000 30 minutes
30 30 000 1 hour
10 10 000 8 hours
Table 5.36 correlate with the South African NAAQS, thus the screening criteria applied to human health, i.e. the South African National Ambient Air Quality Standards will be used. Based on the simulated ambient concentrations (sections 5.1.3.CO-1 & 5.1.3.CO-2) it is “likely” that the ambient concentrations falls within the NAAQS beyond a distance of approximately 200m from the facility. 5.2.4.2 Plants and ecosystems Adverse direct impacts on vegetation by CO at ambient concentrations have not been reported. As a precursor of carbon dioxide and ozone, CO indirectly contributes to global warming and to direct effects by ozone to vegetation and materials.
Assmang Limited Cato Ridge Alloys (Pty) Ltd. 2020 AQIA for Sinter Plant EIA
Atmospheric Impact Report / Air Quality Impact Assessment
Document ID: AssmangCRW-AQIAReport_2020-PlannedSinterPlant_Sep2020_FD1.docx
Revision Date: 18Sep2020 Revision: FINAL_D1 Valid for: Assmang Cato Ridge, KwaZulu-Natal Province
Page 142 of 317
FINAL_D1 Compiled By: JG Potgieter
Approved By: JG Potgieter COPYRIGHT WARNING ALL RIGHTS RESERVED. All information and conceptual designs contained within this document are the intellectual property of ENVIRONGAKA (Pty) Ltd. This document and/or the information contained herein may not be used, stored, reproduced, or copied in any manner, without the prior written consent of ENVIRONGAKA (Pty) Ltd. This document and/or the information and conceptual designs may not be disclosed or displayed to any third party without the prior written consent of ENVIRONGAKA (Pty) Ltd.
EnviroNgaka
In view of the above, light it was decided to use the same screening criteria applied to human health, i.e. the South African National Ambient Air Quality Standards. Based on the simulated ambient concentrations (sections 5.1.3.CO-1 & 5.1.3.CO-2) it is “likely” that the ambient concentrations falls within the NAAQS beyond a distance of approximately 200m from the facility. 5.2.5 Impact of Ammonia Ammonia released into air has an unpleasant odour, which is detectable even at low concentrations. 5.2.5.1 Animals & Humans Exposure to ammonia at environmental concentrations is unlikely to have adverse effects on health. However, exposure to high concentrations following an accidental release or in occupational settings could cause irritation of the eyes, nose and throat as well as burning the skin where there is direct contact. Short-term inhalation exposure to high levels of ammonia in humans can cause irritation and serious burns in the mouth, lungs, and eyes. Chronic exposure to airborne ammonia can increase the risk of respiratory irritation, cough, wheezing, tightness in the chest, and impaired lung function in humans. Studies in experimental animals similarly indicate that breathing ammonia at sufficiently high concentrations can result in effects on the respiratory system. Animal studies also suggest that exposure to high levels of ammonia in air may adversely affect other organs, such as the liver, kidney, and spleen (ATSDR, 2004). A sub chronic p-RfC (provisional inhalation Reference Concentration) of 0.1mg/m3 was derived by applying a composite uncertainty factor of 30 to the human NOAEL (no-observed-adverse-effect-level) of 2.3 mg/m3 (Holness et al., 1989). The animal LOAEL (lowest-observed-adverse-effect-level) of 1.62 mg/m3 is in close proximity to the human NOAEL and gives a sixteen-fold ceiling to the RfC of 0.1 mg/m3 (100μg/m3). Based on the simulated ambient concentrations (section 5.1.3.NH3-1) it is “likely” that the ambient concentrations falls within the abovementioned RfC. 5.2.5.2 Vegetation Ammonia is a plant nutrient and the low concentrations are not foreseen to impact negatively on the surrounding vegetation. At particularly high concentrations it can also harm vegetation. The harm caused by ammonia in water bodies is more serious, because it is very toxic to aquatic organisms. Low concentrations of ammonia in soil are natural and actually essential for plant nutrition. Over-fertilisation can however lead to excessive concentrations which result in leaching to water bodies. On a wider scale, ammonia plays a role in the transportation and enhanced deposition of acidic pollutants - resulting in acidification of ground and water bodies, which can harm plant and animal life (ATSDR, 2004).
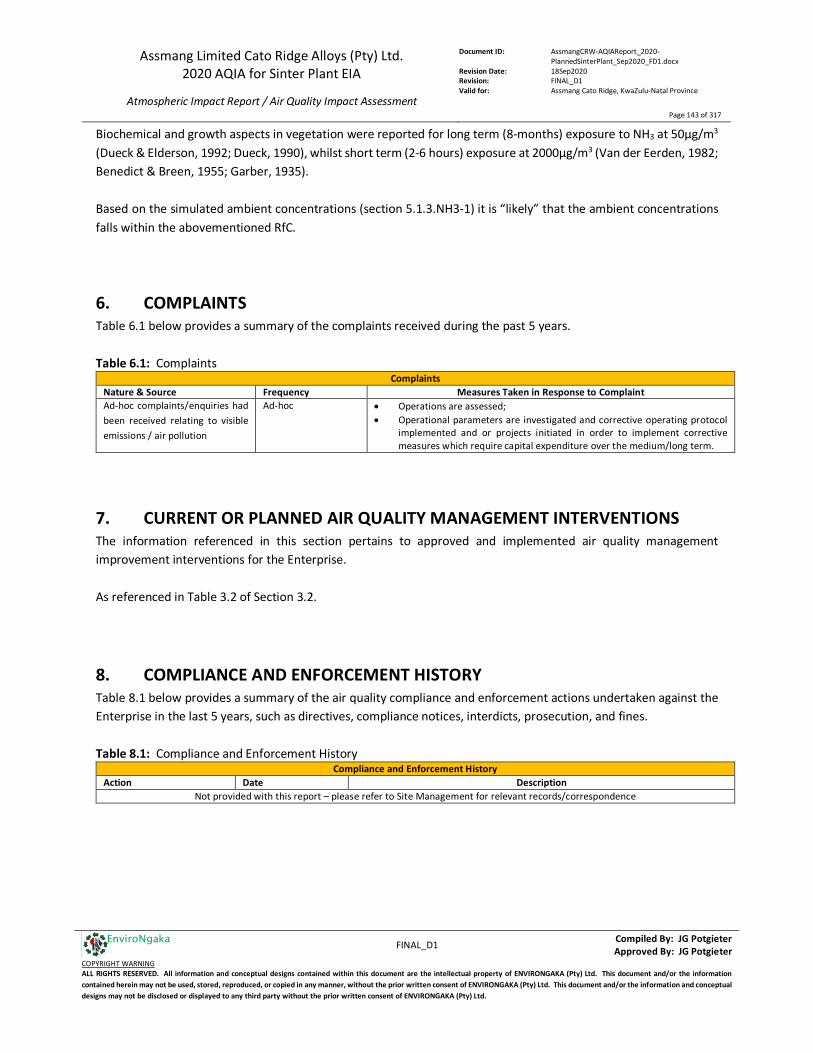
Assmang Limited Cato Ridge Alloys (Pty) Ltd. 2020 AQIA for Sinter Plant EIA
Atmospheric Impact Report / Air Quality Impact Assessment
Document ID: AssmangCRW-AQIAReport_2020-PlannedSinterPlant_Sep2020_FD1.docx
Revision Date: 18Sep2020 Revision: FINAL_D1 Valid for: Assmang Cato Ridge, KwaZulu-Natal Province
Page 143 of 317
FINAL_D1 Compiled By: JG Potgieter
Approved By: JG Potgieter COPYRIGHT WARNING ALL RIGHTS RESERVED. All information and conceptual designs contained within this document are the intellectual property of ENVIRONGAKA (Pty) Ltd. This document and/or the information contained herein may not be used, stored, reproduced, or copied in any manner, without the prior written consent of ENVIRONGAKA (Pty) Ltd. This document and/or the information and conceptual designs may not be disclosed or displayed to any third party without the prior written consent of ENVIRONGAKA (Pty) Ltd.
EnviroNgaka
Biochemical and growth aspects in vegetation were reported for long term (8-months) exposure to NH3 at 50μg/m3 (Dueck & Elderson, 1992; Dueck, 1990), whilst short term (2-6 hours) exposure at 2000μg/m3 (Van der Eerden, 1982; Benedict & Breen, 1955; Garber, 1935). Based on the simulated ambient concentrations (section 5.1.3.NH3-1) it is “likely” that the ambient concentrations falls within the abovementioned RfC. 6. COMPLAINTS Table 6.1 below provides a summary of the complaints received during the past 5 years. Table 6.1: Complaints
Complaints Nature & Source Frequency Measures Taken in Response to Complaint Ad-hoc complaints/enquiries had been received relating to visible emissions / air pollution
Ad-hoc • Operations are assessed; • Operational parameters are investigated and corrective operating protocol
implemented and or projects initiated in order to implement corrective measures which require capital expenditure over the medium/long term.
7. CURRENT OR PLANNED AIR QUALITY MANAGEMENT INTERVENTIONS The information referenced in this section pertains to approved and implemented air quality management improvement interventions for the Enterprise. As referenced in Table 3.2 of Section 3.2.
8. COMPLIANCE AND ENFORCEMENT HISTORY Table 8.1 below provides a summary of the air quality compliance and enforcement actions undertaken against the Enterprise in the last 5 years, such as directives, compliance notices, interdicts, prosecution, and fines. Table 8.1: Compliance and Enforcement History
Compliance and Enforcement History Action Date Description
Not provided with this report – please refer to Site Management for relevant records/correspondence
Assmang Limited Cato Ridge Alloys (Pty) Ltd. 2020 AQIA for Sinter Plant EIA
Atmospheric Impact Report / Air Quality Impact Assessment
Document ID: AssmangCRW-AQIAReport_2020-PlannedSinterPlant_Sep2020_FD1.docx
Revision Date: 18Sep2020 Revision: FINAL_D1 Valid for: Assmang Cato Ridge, KwaZulu-Natal Province
Page 144 of 317
FINAL_D1 Compiled By: JG Potgieter
Approved By: JG Potgieter COPYRIGHT WARNING ALL RIGHTS RESERVED. All information and conceptual designs contained within this document are the intellectual property of ENVIRONGAKA (Pty) Ltd. This document and/or the information contained herein may not be used, stored, reproduced, or copied in any manner, without the prior written consent of ENVIRONGAKA (Pty) Ltd. This document and/or the information and conceptual designs may not be disclosed or displayed to any third party without the prior written consent of ENVIRONGAKA (Pty) Ltd.
EnviroNgaka
9. ADDITIONAL INFORMATION – CONCLUDING COMMENTS & RECOMMENDATIONS Subject to the information and assumptions provided in this report, the following additional information is provided for the attention of the Enterprise’s Air Quality Officer / Manager: 1. In terms of the referenced foreseen emission rates, concentrations and assumptions for the proposed / planned
Sinter Plant operation, dispersion modelling was conducted to determine the potential impact thereof on the surrounding ambient air quality. In terms of the National Ambient Air Quality Standards, it is was found that: 1.1) The expected increased zone of impact as a result of the planned Sinter Plant is marginal in comparison
with the baseline status and it is unlikely that the foreseen cumulative impact from the planned additional operation will adversely impact on the surrounding sensitive receptors;
1.2) Results indicated that there might be occurrences of high modelled concentrations in very close proximity to the fence line of the site. It is unlikely that the impact of the proposed future operation (inclusive of the proposed Sinter Plant) would exceed the National Ambient Air Quality Standards over populated sensitive receptors;
2. It should also be noted that this is a theoretical / modelling assessment and it should always be considered that there are several factors which influence the resulting uncertainty of such a study, as flagged/indicated by means of the comments made throughout the content of this report together with Appendix U and the results are limited to the assumptions made and the information contained in the report.
3. Key findings of Section 5.1 indicates the following matters: 3.1) PM10 & PM2.5:
3.1)1. It is foreseen to be “likely” that the secondary emissions contribute the most of all the sources, of which the roads and material processing / storage areas contributes the most;
3.1)2. It is foreseen to be “likely” that the Enterprise’s contribution to the PM10 and PM2.5 ambient air quality exceeds the relevant standards for a 24-hour average which is “likely” to occur within a distance of approximately 200m of the facility fence line for PM10 and PM2.5;
3.1)3. It is foreseen to be “unlikely” that the Enterprise’s contribution to the PM10 and PM2.5 ambient air quality exceeds the relevant standards for an annual average beyond the facility fence line for PM10 and PM2.5;
3.1)4. It is foreseen to be “likely” that the modelled ambient air concentrations will increase marginally through the different scenarios for both PM10 and PM2.5;
3.1)5. It is important that effective dust suppression measures need to be maintained on the current fugitive/secondary sources;
3.1)6. No threshold levels exist to indicate at what levels PM are having an adverse negative effect on animals and plants. In this light it was decided to use the same screening criteria applied to human health, i.e. the South African National Ambient Air Quality Standards (refer to AQIA report, section 5.1). Based on the simulated ambient concentrations (sections 5.1.3.PM10 to 5.1.3.PM2.5) exceedances are unlikely to occur beyond approximately 200m of the facility fence line as referred under 3.1)2.
3.2) SO2: 3.2)1. It is foreseen to be “likely” that the Enterprise’s contribution to the SO2 ambient air quality beyond
its fence line falls within the relevant standards for both scenarios 1 and 2; 3.2)2. Most of the current studies focusing on the impact of SO2 on animals concluded that immediate
physiological response and/or significant or permanent damage occurs in the low to upper mg/m3 concentration ranges. In this light it was decided to use the same screening criteria applied to human health, i.e. the South African National Ambient Air Quality Standards (refer to AQIA report, section 5.1). Based on the simulated ambient concentrations (sections 5.1.3.SO2) exceedances

Assmang Limited Cato Ridge Alloys (Pty) Ltd. 2020 AQIA for Sinter Plant EIA
Atmospheric Impact Report / Air Quality Impact Assessment
Document ID: AssmangCRW-AQIAReport_2020-PlannedSinterPlant_Sep2020_FD1.docx
Revision Date: 18Sep2020 Revision: FINAL_D1 Valid for: Assmang Cato Ridge, KwaZulu-Natal Province
Page 145 of 317
FINAL_D1 Compiled By: JG Potgieter
Approved By: JG Potgieter COPYRIGHT WARNING ALL RIGHTS RESERVED. All information and conceptual designs contained within this document are the intellectual property of ENVIRONGAKA (Pty) Ltd. This document and/or the information contained herein may not be used, stored, reproduced, or copied in any manner, without the prior written consent of ENVIRONGAKA (Pty) Ltd. This document and/or the information and conceptual designs may not be disclosed or displayed to any third party without the prior written consent of ENVIRONGAKA (Pty) Ltd.
EnviroNgaka
beyond the fence line of the Enterprise didn’t occur, therefore it is “likely” that the ambient concentrations falls within the NAAQS and the WHO annual guidelines for some plant species.
3.3) NO2: 3.3)1. It is foreseen to be “likely” that the Enterprise’s contribution to the NO2 ambient air quality exceeds
the relevant standards for a 1-hour average for scenarios 1 and 2 within a distance of approximately 1000m towards the west from the facility fence line;
3.3)2. It is foreseen to be “likely” that the Enterprise’s contribution to the NO2 ambient air quality beyond a distance of approximately 200m for its western fence line falls within the relevant standards for an annual average; Exceedences are likely to occur within the fence line and in very close proximity to the fence line;
3.3)3. It is foreseen to be “likely” that the modelled ambient air concentrations will marginally increase through the different scenarios;
3.3)4. It is foreseen that the secondary sources (diesel combustion fumes from vehicles used) contribute the most to the modelled concentrations, and that it is “as likely as not” that the 1-hour NO2 ambient air quality standard could be exceeded as a result of the secondary sources only, with due consideration that the diesel consumption rate could potentially have been conservatively overstated for both scenarios;
3.3)5. It was decided to use the same screening criteria for the impact on animals as applied to human health, i.e. the South African National Ambient Air Quality Standards (refer to AQIA report, section 5.1). Based on the simulated ambient concentrations in the AQIA (sections 5.1.3.NO2) it is “likely” that the ambient concentrations falls within the NAAQS beyond a distance of approximately 1500m from the facility;
3.3)6. The annual 4 µg/m3, 8.5 µg/m3 and 35.5 µg/m3 NO2 concentration isopleths are clearly distinguishable in section 5.1.3.NO2-2. This concentration will give rise to dry deposition load of 1.7 kg, 3.8 kg and 15 NO2/ha per year respectively;
3.3)7. Excluding wet deposition and deposition of other “N” containing species, comparing deposition loads of 1.7 kg and 3.8 kg NO2/ha and 15 NO2/ha per year to Table 5.33 in terms of kg N/ha per year, it is “likely” that the ambient NO2 concentrations beyond a distance of approximately 500m to the west beyond the facility, will not have a significant adverse effect on vegetation and ecosystems.
3.4) CO: 3.4)1. It is foreseen to be “likely” that the Enterprise’s contribution to the 1-hour average CO ambient air
quality falls within the relevant standards for scenarios 1 and 2; 3.4)2. It is foreseen to be “likely” that the Enterprise’s contribution to the CO ambient air quality exceeds
the relevant standards for a 8-hour average within a distance of approximately 200m to the west of the facility;
3.4)3. The impact of CO on animals Table 5.36 correlate with the South African NAAQS, thus the screening criteria applied to human health, i.e. the South African National Ambient Air Quality Standards will be used (section 5.1). Based on the simulated ambient concentrations in sections 5.1.3.CO it is “likely” that the ambient concentrations falls within the NAAQS beyond a distance of approximately 200m from the facility;
3.4)4. It was decided to use the same screening criteria on plants and ecosystems as applied to human health, i.e. the South African National Ambient Air Quality Standards (section 5.1). Based on the simulated ambient concentrations in sections 5.1.13.CO it is “likely” that the ambient concentrations falls within the NAAQS beyond a distance of approximately 200m from the facility.
3.5) NH3: 3.5)1. In the absence of a national air quality standard, the 24-hour average US EPA Reference
Concentration of 100µg.m-3 is used as a reference;
Assmang Limited Cato Ridge Alloys (Pty) Ltd. 2020 AQIA for Sinter Plant EIA
Atmospheric Impact Report / Air Quality Impact Assessment
Document ID: AssmangCRW-AQIAReport_2020-PlannedSinterPlant_Sep2020_FD1.docx
Revision Date: 18Sep2020 Revision: FINAL_D1 Valid for: Assmang Cato Ridge, KwaZulu-Natal Province
Page 146 of 317
FINAL_D1 Compiled By: JG Potgieter
Approved By: JG Potgieter COPYRIGHT WARNING ALL RIGHTS RESERVED. All information and conceptual designs contained within this document are the intellectual property of ENVIRONGAKA (Pty) Ltd. This document and/or the information contained herein may not be used, stored, reproduced, or copied in any manner, without the prior written consent of ENVIRONGAKA (Pty) Ltd. This document and/or the information and conceptual designs may not be disclosed or displayed to any third party without the prior written consent of ENVIRONGAKA (Pty) Ltd.
EnviroNgaka
3.5)2. It is foreseen to be “likely” that the Enterprise’s contribution to the NH3 ambient air quality falls well within the relevant reference for all scenarios;
3.5)3. Most of the current studies focusing on the impact of NH3 reference the US EPA Reference Concentration. Based on the simulated ambient concentrations (section 5.1.3.NH3) exceedences didn’t occur, therefore it is “likely” that the ambient concentrations falls within the reference and adverse effects on the health of animals is unlikely.
3.6) Manganese (Mn): 3.6)1. In the absence of a national air quality standard, the annual average WHO ambient air quality
guideline of 0.15µg.m-3 is used as a reference; 3.6)2. It is foreseen to be “likely” that the Enterprise’s contribution to the Mn ambient air quality exceeds
the relevant guideline in terms of the following: 3.6)2.1. It is foreseen that the point sources contribute the most to the modelled concentrations, and
that it is “as likely as not” that the annual Mn guideline could be exceeded as a result of the point sources only;
3.6)2.2. The additional contribution from the secondary sources reveal that it is foreseen to be “likely” that the annual Mn guideline could be exceeded within a distance of approximately 5km from the facility fence line for scenario 1 and approximately 6 to 6.5km for scenario 2;
3.6)2.3. A specialist health impact assessment would be required to determine specific potential health risks;
3.7) Dust Fallout (DFO): 3.7)1. The potential contribution from ACRW to DFO levels is assessed on an ongoing basis and the effect
of the secondary / fugitive sources are identified and managed by Site Management; 3.7)2. Compliance of these DFO levels with the National Dust Control Regulations (NDCR) is very good as
indicated by the data and fugitive and secondary emissions sources as well controlled; It is also noted that other sources in the area are also contributing to DFO levels sampled by ACRW;
3.7)3. It is however also noted that the possibility of fugitive dust from secondary sources such as roads and storage facilities, is foreseen to increase significantly during spring and some winter months;
3.8) Ambient Air Quality Monitoring: 3.8)1. Based on the data obtained from the two monitoring locations, it was assessed the quality of
ambient air in the region is fairly good and compliance of the gaseous compounds to the relevant ambient air quality standards is well;
3.8)2. The number of 24-hour average PM10 concentrations at the Cato Ridge Country Club CAAQMS which exceed the standard’s concentration, have decreased during the last year. The Radnor CAAQMS is located adjacent to a gravel road utilised as the entrance to a neighbouring industry and it is hence unfortunately subject to occurrences of high 24-hour average PM10 and PM2.5 concentrations, most of which are either related to the road or to regional pre-frontal synoptic conditions;
4. Site Management should review their air quality / pollution management plan with consideration of the phased risk/impact assessment provided in Appendix E and the possible actions for the air quality management plan as provided in Appendix F: 4.1) Maintain measures to minimise the release of abnormal emissions (raw gas and tapping/casting fugitives)
to an absolute minimum since the impact thereof is potentially significant; 4.2) Maintain the application of efficient dust abatement and suppression techniques in order to minimise
overall particulate emissions); 4.3) Limit vehicle movement and associated diesel consumption as far as possible; 4.4) Limit fugitive emissions 4.5) Aforementioned points will individually and collectively minimise emissions and impact of manganese;

Assmang Limited Cato Ridge Alloys (Pty) Ltd. 2020 AQIA for Sinter Plant EIA
Atmospheric Impact Report / Air Quality Impact Assessment
Document ID: AssmangCRW-AQIAReport_2020-PlannedSinterPlant_Sep2020_FD1.docx
Revision Date: 18Sep2020 Revision: FINAL_D1 Valid for: Assmang Cato Ridge, KwaZulu-Natal Province
Page 147 of 317
FINAL_D1 Compiled By: JG Potgieter
Approved By: JG Potgieter COPYRIGHT WARNING ALL RIGHTS RESERVED. All information and conceptual designs contained within this document are the intellectual property of ENVIRONGAKA (Pty) Ltd. This document and/or the information contained herein may not be used, stored, reproduced, or copied in any manner, without the prior written consent of ENVIRONGAKA (Pty) Ltd. This document and/or the information and conceptual designs may not be disclosed or displayed to any third party without the prior written consent of ENVIRONGAKA (Pty) Ltd.
EnviroNgaka
10. FORMAL DECLARATIONS
10.1 Declaration of Accuracy of Information by Applicants Please refer Appendix Z.
10.2 Declaration of Independence by Practitioners preparing this Atmospheric Impact Report Please refer Appendix X.
Assmang Limited Cato Ridge Alloys (Pty) Ltd. 2020 AQIA for Sinter Plant EIA
Atmospheric Impact Report / Air Quality Impact Assessment
Document ID: AssmangCRW-AQIAReport_2020-PlannedSinterPlant_Sep2020_FD1.docx
Revision Date: 18Sep2020 Revision: FINAL_D1 Valid for: Assmang Cato Ridge, KwaZulu-Natal Province
Page 148 of 317
FINAL_D1 Compiled By: JG Potgieter
Approved By: JG Potgieter COPYRIGHT WARNING ALL RIGHTS RESERVED. All information and conceptual designs contained within this document are the intellectual property of ENVIRONGAKA (Pty) Ltd. This document and/or the information contained herein may not be used, stored, reproduced, or copied in any manner, without the prior written consent of ENVIRONGAKA (Pty) Ltd. This document and/or the information and conceptual designs may not be disclosed or displayed to any third party without the prior written consent of ENVIRONGAKA (Pty) Ltd.
EnviroNgaka
11. REFERENCES Agbaire, P.O. and Esiefarienrhe., E., 2009. Air pollution tolerance indices (APTI) of some plants around Otorogun gas plant in Delta State, Nigeria. J. Appl. Sci. Environ. Manag. 13(1), 11–14. Agency for Toxic Substances and Disease Registry (ATSDR). Toxicological Profile for Fluorides, Hydrogen Fluoride and Fluorine. U.S. Public Health Service, U.S. Department of Health and Human Services, Atlanta, GA. 2003. http://www.atsdr.cdc.gov/ToxProfiles/tp.asp?id=212&tid=38 Agency for Toxic Substances and Disease Registry (ATSDR). 2004. Toxicological Profile for Ammonia, Atlanta, GA: U.S. Public Health Service, U.S. Department of Health and Human Services. Agrawal, M., Agrawal, S.B., 1989. Phytomonitoring of air pollution around a thermal power plant. Atmos. Environ. 23(4), 763–769. Amdur, MO (1978) Effects of Sulfur Oxides on Animals. Sulphur in the Environment. Part II: Environmental Impacts. John Wiley and Sons, Toronto. pp 61-74. ANON. 2014. Department of Environmental Affairs: Regulations Regarding Air Dispersion Modelling. Code of Practice for Air Dispersion Modelling in Air Quality Management in South Africa, 2014. Armbrust, D.V., 1986. Effect of particulates (dust) on cotton growth, photosynthesis and respiration. Agron. Am. Soc. Agron. 6(78), 1078–1081. ATSDR (Agency for Toxic Substances & Disease Registry). Toxic Substances Portal - Hydrogen Chloride. 2019. https://www.atsdr.cdc.gov/mmg/mmg.asp?id=758&tid=147. Bender, M.H., Baskin, J.M., Baskin,C.C., 2002. Flowering requirements of Polymnia canadensis (Asteraceae) and their influence on its life history variation. Plant Ecol. 160, 113–124. http://dx.doi.org/10.1023/A:1015891702432. Benedict, H.M. & Breen, W.H. 1955. The use of weeds as a means of evaluating vegetation damage caused by air pollution. In: Proceedings of the 3rd National Air Pollution Symposium, Los Angeles, pp. 177–190. Berglund, M. et. al. 1993. Health risk evaluation of nitrogen oxides. Scandinavian journal of work, environment and health, 19 (Suppl. 2). Bird and Scholes, 2012 Brennan E, Leone I, Daines RH. 1965. Chlorine as a phytotoxic air pollutant. International Journal of Air and Water Pollution 9:791-797. Brodzinsky, R., Cantrell, B.K., Endlich, R.M. and Bhumralkar, C.M. 1984. A long range air pollution transport model for Eastern North America-II. Nitrogen oxides. Atmos. Environ., 18, 2361-2366.
Assmang Limited Cato Ridge Alloys (Pty) Ltd. 2020 AQIA for Sinter Plant EIA
Atmospheric Impact Report / Air Quality Impact Assessment
Document ID: AssmangCRW-AQIAReport_2020-PlannedSinterPlant_Sep2020_FD1.docx
Revision Date: 18Sep2020 Revision: FINAL_D1 Valid for: Assmang Cato Ridge, KwaZulu-Natal Province
Page 149 of 317
FINAL_D1 Compiled By: JG Potgieter
Approved By: JG Potgieter COPYRIGHT WARNING ALL RIGHTS RESERVED. All information and conceptual designs contained within this document are the intellectual property of ENVIRONGAKA (Pty) Ltd. This document and/or the information contained herein may not be used, stored, reproduced, or copied in any manner, without the prior written consent of ENVIRONGAKA (Pty) Ltd. This document and/or the information and conceptual designs may not be disclosed or displayed to any third party without the prior written consent of ENVIRONGAKA (Pty) Ltd.
EnviroNgaka
Burnett, R.T., Cakmak, S., Brook, J.R., 1998. The effect of the urban ambient air pollution mix on daily mortality rates in 11 Canadian cities. Canadian Journal of Public Health. 89(3):152–6. Calabrese E.J. and Kenyon E.M. Air Toxics and Risk Assessment. Lewis Publishers, Chelsea, MI. 1991. California Environmental Protection Agency (CalEPA). Air Toxics Hot Spots Program Risk Assessment Guidelines: Part III. Technical Support Document for the Determination of Noncancerous Chronic Reference Exposure Levels. SRP Draft. Office of Environmental Health Hazard Assessment, Berkeley, CA. 1999. California Environmental Protection Agency (CalEPA). Technical Support Document for the Determination of Noncancer Chronic Reference Exposure Levels. Office of Environmental Health Hazard Assessment, Berkeley, CA. 2000. Caporn, J.M. Critical levels for NO2. 1992. In: Ashmore, M.R. & R.B. Wilson (Eds.). Critical Levels of Air Pollutants for Europe. Background Papers Prep. for the UN Economic Commission for Europe, Egham Workshop 23-26 March 1992, Department of the Environment, London, pp. 48-52. Canadian APC Directorate. 1975. Inventory of Sources and Emissions of Vanadium, p. 9. CEPA/FPAC Working Group (1998). National Ambient Air Quality Objectives for Particulate Matter. Part 1: Science Assessment Document, A Report by the Canadian Environmental Protection Agency (CEPA) Federal- Provincial Advisory Committee (FPAC) on Air Quality Objectives and Guidelines. Chetty D., Gryffenberg L., Lekgetho T.B. and Molebale I.J. Automated SEM study of PGM distribution across a UG2 flotation concentrate bank: implications for understanding PGM floatability. The Journal of The Southern African Institute of Mining and Metallurgy. Vol. 109. October 2009. Coppock, RW and Mostrum MS, (1997) Toxicology of oilfield pollutants in cattle and other species. Alberta Research Council, ARCV97-R2, Vegreville, Alberta pp 45-114. Corn M, Kotsko N, Stanton D, Bell W, Thomas AP (1972). Response of Cats to Inhaled Mixtures of SO2 and SO2-NaCl Aerosol in Air. Arch. Environ. Health, 24:248-256. Costa, DL and MO Amdur. (1996) Air Pollution. In: Klaasen, CD, Amdur, MO, Doull, J (eds) Casarett and Doull’s Toxicology. The Basic Science of Poisons. 5th ed. pp 857-882 Dennison, L., Rolfe, K. and Graham, B. 2000. Review of the Ambient Air Quality Guidelines – Health effects of five common air contaminants and recommended protective ranges. Ministry for the Environment Technical report no. 12 (New Zealand). Dineva, S.B., 2004. Comparative studies of the leaf morphology and structure of white ash Fraxinusamericana L. and London plane tree Platanus acerifolia wild growing in polluted area. Dendrobiology. 52, 3–8.
Assmang Limited Cato Ridge Alloys (Pty) Ltd. 2020 AQIA for Sinter Plant EIA
Atmospheric Impact Report / Air Quality Impact Assessment
Document ID: AssmangCRW-AQIAReport_2020-PlannedSinterPlant_Sep2020_FD1.docx
Revision Date: 18Sep2020 Revision: FINAL_D1 Valid for: Assmang Cato Ridge, KwaZulu-Natal Province
Page 150 of 317
FINAL_D1 Compiled By: JG Potgieter
Approved By: JG Potgieter COPYRIGHT WARNING ALL RIGHTS RESERVED. All information and conceptual designs contained within this document are the intellectual property of ENVIRONGAKA (Pty) Ltd. This document and/or the information contained herein may not be used, stored, reproduced, or copied in any manner, without the prior written consent of ENVIRONGAKA (Pty) Ltd. This document and/or the information and conceptual designs may not be disclosed or displayed to any third party without the prior written consent of ENVIRONGAKA (Pty) Ltd.
EnviroNgaka
Dueck, T.A. 1990. Effects of ammonia and sulphur dioxide on the survival and growth of Calluna vulgaris (L.) Hull seedlings. Functional ecology, 4: 109–116. Dueck, T.A. & Elderson, J. 1992. Influence of NH3 and SO2 on the growth and competitive ability of Arnica montana L. and Viola canina L. New phytologist, 122: 507–514. Endress AG, TJ Swieki, OC Taylor. 1978b. Foliar and microscopic observations of bean leaves exposed to hydrogen chloride gas. Environ Exp Bot 18:139-149. Endress AG, JT Kitasako, and OC Taylor. 1978a. Ultracytopathological characterization of leaves following short-term exposures of hydrogen chloride gas. Atmos Environ 12:1383-1390. EnviroNgaka (Pty) Ltd. 2019. Appendix B of 2019 APR_ENVN_Assmang Air Emission Report per AEL & STP_Jul2018 to Jun2019 (LRF). 29 August 2019. EnviroNgaka (Pty) Ltd. 2020. Appendix B of 2020 APR_ENVN_Assmang Air Emission Report per AEL & STP_Jul2019 to Jun2020 (LRF). 27 August 2020. EnviroNgaka (Pty) Ltd. 2019. Appendix C of 2019 APR_ENVN_Assmang Annual Point Source Sampling Reports per AEL_Jul2018 to Jun2019. 29 August 2020. EnviroNgaka (Pty) Ltd. 2020. Appendix C of 2020 APR_ENVN_Assmang Annual Point Source Sampling Reports per AEL_Jul2019 to Jun2020. 27 August 2020. Ernst, W.H.O., 1982. Monitoring of particulate pollutants. In: Stebbing, L., Jager, H.J. (Eds.), Monitoring of Air Pollutants by Plants. Junk Publishers, The Hague, The Netherlands, pp. 121–128. eThekwini Municipality. 2018. Atmospheric Emission Licence AEL005/W2 issued to Assmang Limited Cato Ridge Works. 31 October 2018. European Commission (EC). 2017. Reference document on Best Available Techniques for the Non-Ferrous Metals Industries. 2017. European Commission (EC). 2004. Reference document on Best Available techniques for management of Tailings and Waste Rock in Mining Activities. July 2004. European Commission: Directorate General – Joint Research Centre (JRC): Institute for Prospective Technological Studies – Sustainability in Industry, Energy and Transport – European IPPC Bureau. Available from: http://www.epa.ie/downloads/advice/brefs/ European Commission (EC). 1999. Ambient Air Pollution: Carbon Monoxide. Draft Version 5.2. 17 March 1999. European Commission (EC). 1997. Ambient Air Pollution: Sulphur Dioxide. November 1997.
Assmang Limited Cato Ridge Alloys (Pty) Ltd. 2020 AQIA for Sinter Plant EIA
Atmospheric Impact Report / Air Quality Impact Assessment
Document ID: AssmangCRW-AQIAReport_2020-PlannedSinterPlant_Sep2020_FD1.docx
Revision Date: 18Sep2020 Revision: FINAL_D1 Valid for: Assmang Cato Ridge, KwaZulu-Natal Province
Page 151 of 317
FINAL_D1 Compiled By: JG Potgieter
Approved By: JG Potgieter COPYRIGHT WARNING ALL RIGHTS RESERVED. All information and conceptual designs contained within this document are the intellectual property of ENVIRONGAKA (Pty) Ltd. This document and/or the information contained herein may not be used, stored, reproduced, or copied in any manner, without the prior written consent of ENVIRONGAKA (Pty) Ltd. This document and/or the information and conceptual designs may not be disclosed or displayed to any third party without the prior written consent of ENVIRONGAKA (Pty) Ltd.
EnviroNgaka
European Commission (EC). 1997. Ambient Air Pollution: Nitrogen Dioxide. November 1997. Farmer, A.M., 1993. The effects of dust on vegetation - a review. Environ. Pollut. 79 (1), 63–75. Farooqui, A., Kulshreshtha, K., Srivastava, K., Singh, S.N., Farooqui, S.A., Pandey, V., Ahmad, K.J., 1995. Photosynthesis, stomatal response and metal accumulation in Cinerariamaritima Linn. and Centauria moschata Linn. grown in metal rich soil. Sci. Total Environ. 164, 203–207. Garber, K. 1935. Über die Physiologie der Einwirkung von Ammoniakgäse auf die Pflanze. Landwirtschaftliche Versuschs-Wesen, 123: 227–343. Griffiths R.F. and Smith L.E. 1990. Development of a vegetation-damage indicator as a means of post-accident investigation for chlorine releases. Journal of Hazardous Materials 23: 137-165. Harmens H, Mills G, Hayes F, Williams P and De Temmerman L (2005), Air Pollution and Vegetation. The International Cooperative Programme on Effects of Air Pollution on Natural Vegetation and Crops Annual Report 2004/2005. Hirano T, Kiyota M, and Aiga I (1995). Physical effects of dust on leaf physiology of cucumber and kidney bean plants. Environmental Pollution 89, 255–261. Hill, AC. 1969. Air quality standard for fluoride vegetation effects. J Air Pollu Control Assoc 19(5): 331-336. Holness, DL., Purdham, JT. & Nethercott, JR. 1989. Acute and chronic respiratory effects of occupational exposure to ammonia. American Industrial Hygiene Association Journal (AIHA J) 50: 646-650. http://dx.doi.org/10.1080/15298668991375308. Intergovernmental Panel on Climate Change (IPCC). 2010. Guidance Note for Lead Authors of the IPCC Fifth Assessment Report on Consistent Treatment of Uncertainties. July 2010. Joshi, N., Chauhan, A., Joshi, P.C., 2009. Impact of industrial air pollutants on some biochemical parameters and yield in wheat and mustard plants. Environmentalist 29, 398–404. Lambers, H., Chapin III, F.S., Pons, T.L., 1998. Plant Physiological Ecology. Springer, New York. Lerman S, OC Taylor, and EF Darley. 1976. Phytotoxicity of hydrogen chloride gas with a short-term exposure. Atmos Environ 10:873-878. Losacco, C. and Perillo, A. Particulate matter pollution and respiratory impact on humans and animals. Environmental Science and Pollution Research. Published online 04 October 2018. Maharaj L. Optimal Design of Secondary Milling Circuit for Treating Chromite-rich UG-2 Platinum Ores. PhD Thesis. University of KwaZulu-Natal. 18 June 2011.
Assmang Limited Cato Ridge Alloys (Pty) Ltd. 2020 AQIA for Sinter Plant EIA
Atmospheric Impact Report / Air Quality Impact Assessment
Document ID: AssmangCRW-AQIAReport_2020-PlannedSinterPlant_Sep2020_FD1.docx
Revision Date: 18Sep2020 Revision: FINAL_D1 Valid for: Assmang Cato Ridge, KwaZulu-Natal Province
Page 152 of 317
FINAL_D1 Compiled By: JG Potgieter
Approved By: JG Potgieter COPYRIGHT WARNING ALL RIGHTS RESERVED. All information and conceptual designs contained within this document are the intellectual property of ENVIRONGAKA (Pty) Ltd. This document and/or the information contained herein may not be used, stored, reproduced, or copied in any manner, without the prior written consent of ENVIRONGAKA (Pty) Ltd. This document and/or the information and conceptual designs may not be disclosed or displayed to any third party without the prior written consent of ENVIRONGAKA (Pty) Ltd.
EnviroNgaka
Mansfield, T.A., Majernik, O., 1970. Can stomata play a part in protecting plants against air pollutants? Environ. Pollut. 1, 149–154. MEAM. 2019. Test Report on Atmospheric Emission Sample: RA 068-19, February 2019. MEAM. 2019. Test Report on Atmospheric Emission Sample: RA 069-19, February 2019. MEAM. 2019. Test Report on Atmospheric Emission Sample: RA 070-19, February 2019. Michiels, A., et al., Impact of particulate matter and ammonia on average daily weight gain, mortality and lung lesions in pigs. PREVET (2015), http://dx.doi.org/10.1016/j.prevetmed.2015.06.011 Mudd et. al. 1984. Pollutants and plant cells: effects on membranes. In: Koziol, M.J. & Whately, F.R. (Eds.): Gaseous air pollutants and plant metabolism. Butterworth, London, 105-116. National Pollutant Inventory (NPI). 2001. Emission Estimation Technique Manual for Mining, Version 2.3, (5 December 2001) (part of the Mining Handbook). Available by download from the NPI website at: http://www.npi.gov.au/handbooks/approved_handbooks/pubs/mining.pdf Naidoo G and Chirkoot D (2004). The effects of coal dust on photosynthetic performance of the mangrove, Avicennia marina in Richards Bay, South Africa. Environmental Pollution 127 359–366. Newman, JR and Schreiber (1984). Animals as Indicators of Ecosystem Responses to Air Emissions. Environ. Mgmt., 8(4)309-324. PITTS, O. 2005. Improvement of Fugitive Particulate Matter Emission Estimation Techniques. Sinclair Knight Merz (SKM) Consulting. Pohanish, R.P. Sittig’s Handbook of Toxic and Hazardous Chemicals and Carcinogens. 6th ed. Elsevier Inc. Oxford, UK and Waltham, MA USA. 2012. Rai, P.K., 2011a. Dust deposition capacity of certain roadside plants in Aizawl, Mizoram: implications for environmental geomagnetic studies. In: Dwivedi, S.B., et al. Eds.), Recent Advances in Civil Engineering, pp.66–73. Rai, P.K., 2011b. Biomonitoring of particulates through magnetic properties of road side plant leaves. In: Tiwari, D. (Ed.), Advances in Environmental Chemistry. Excel India Publishers, New Delhi, pp.34–37. Rai, P.K., Panda, L.S., 2014. Dust capturing potential and air pollution tolerance index (APTI) of some road side tree vegetation in Aizawl, Mizoram, India: an Indo-Burma hotspot region. AirQual. Atmos. Health 7(1), 93–101. Rai, P.K., Singh, M.M., 2015. Lantana camara invasion in urban forests of an Indo-Burma hotspot region and its ecosustainable management implication through biomonitoring of particulate matter. J. Asia-Pac. Biodivers. 8(4), 75.

Assmang Limited Cato Ridge Alloys (Pty) Ltd. 2020 AQIA for Sinter Plant EIA
Atmospheric Impact Report / Air Quality Impact Assessment
Document ID: AssmangCRW-AQIAReport_2020-PlannedSinterPlant_Sep2020_FD1.docx
Revision Date: 18Sep2020 Revision: FINAL_D1 Valid for: Assmang Cato Ridge, KwaZulu-Natal Province
Page 153 of 317
FINAL_D1 Compiled By: JG Potgieter
Approved By: JG Potgieter COPYRIGHT WARNING ALL RIGHTS RESERVED. All information and conceptual designs contained within this document are the intellectual property of ENVIRONGAKA (Pty) Ltd. This document and/or the information contained herein may not be used, stored, reproduced, or copied in any manner, without the prior written consent of ENVIRONGAKA (Pty) Ltd. This document and/or the information and conceptual designs may not be disclosed or displayed to any third party without the prior written consent of ENVIRONGAKA (Pty) Ltd.
EnviroNgaka
Rai, P.K., 2016a. Biomagnetic Monitoring through Roadside Plants of an Indo-Burma Hot Spot Region. Elsevier, UK, p.196, ISBN: 978-0-12-805135-1. Rai, P.K., 2016b. Biodiversity of roadside plants and their response to air pollution in an Indo-Burma hotspot region: implications for urban ecosystem restoration. J. Asia-Pac. Biodivers. 9(1), 47–55. Rai, P.K., 2016. Impacts of particulate matter pollution on plants: Implications for environmental biomonitoring. Ecotoxicology and Environmental Safety 129, 120-136. Ricks, GR, and RJH Williams (1974) “Effects of atmospheric pollution on deciduous woodland part 2: effects of particulate matter upon stomatal diffusion resistance in leaves of Quercus petraes (Mattuschka) Leibl.” Environmental Pollution, 1974: 87–109. Saunders, P.J.W., Godzik, S., 1986. Terrestrial vegetation-air pollutant interactions: non-gaseous air pollutants. In: Air pollutants and their effects on the terrestrial ecosystem. In: Legge, A.H., Krupa, S.V. (Eds.), Advances in Environmental Science and Technology 18. Wiley, NewYork, USA, pp. 389–394. Scire, J.S., D.G. Strimaitis, and R.J. Yamartino. (2000). A User’s Guide for the CALPUFF Dispersion Model (Version 5), Earth Tech, Inc. Report, Concord, MA, January 2000. Schreuder M.D.J. and Brewer C.A. 2001. Effects of short-term, high exposure to chlorine gas on morphology and physiology of Pinus ponderosa and Pseudotuga menzieii. Annals of Botany 88: 187-195. Seyyednejad, S.M., Koochak, H., 2011. A study on air pollution-induced biochemical alterations in Eucalyptus camaldulensis. Aust. J. Basic Appl. Sci. 5(3), 601–606. Seyyednejad, S.M., Niknejad, M., Koochak, H., 2011. A review of some different effects of air pollution on plants. Res. J. Environ. Sci. 5, 302–309. Sittig, M. Handbook of Toxic and Hazardous Chemicals and Carcinogens. 2nd ed. Noyes Publications, Park Ridge, NJ. 1985. Spencer S (2001). Effects of coal dust on species composition of mosses and lichens in an arid environment. Arid Environments 49, 843-853. Texas Commission on Environmental Quality (TCEQ). 2015a. TCEQ Guidelines to Develop Toxicity Factors. Available from http://www.tceq.texas.gov/publications/rg/rg-442.html. The Merck Index. An Encyclopedia of Chemicals, Drugs, and Biologicals. 11th ed. Ed. S. Budavari. Merck and Co. Inc., Rahway, NJ. 1989.
Assmang Limited Cato Ridge Alloys (Pty) Ltd. 2020 AQIA for Sinter Plant EIA
Atmospheric Impact Report / Air Quality Impact Assessment
Document ID: AssmangCRW-AQIAReport_2020-PlannedSinterPlant_Sep2020_FD1.docx
Revision Date: 18Sep2020 Revision: FINAL_D1 Valid for: Assmang Cato Ridge, KwaZulu-Natal Province
Page 154 of 317
FINAL_D1 Compiled By: JG Potgieter
Approved By: JG Potgieter COPYRIGHT WARNING ALL RIGHTS RESERVED. All information and conceptual designs contained within this document are the intellectual property of ENVIRONGAKA (Pty) Ltd. This document and/or the information contained herein may not be used, stored, reproduced, or copied in any manner, without the prior written consent of ENVIRONGAKA (Pty) Ltd. This document and/or the information and conceptual designs may not be disclosed or displayed to any third party without the prior written consent of ENVIRONGAKA (Pty) Ltd.
EnviroNgaka
Tiwari, S., Agrawal, M., Marshall., F.M., 2006. Evaluation of ambient air pollution impact on carrot plants at a suburban site using open top chambers. Environ. Monit. Assess. 119, 15–30. Toxico-Logic Consulting Inc. Feb2006. Assessment Report on Hydrogen Fluoride for Developing Ambient Air Quality Objectives, for Alberta Environment. Traxys Brix. 2020. Aspects of Process – Equipment and Operations Brix Sintering Plant – Cato Ridge Works, June 2020. Traxys Brix. 2020. Process Description – Summary 120000 TPY Sintering Plant at Cato Ridge Works, April 2020. Traxys Brix. 2020. EMISSIONS FLOWCHART. Drawing No. CRW-EFC120k-001, 08 May 2020. Traxys Brix. 2020. GENERAL PROCESS FLOW DIAGRAM – 120000 tpy. Drawing No. CRW-PFD120K-001, 08 May 2020. Traxys Brix. 2020. VESSEL-SINTER PLANT SITE LOCATION. Drawing No. CRW-S-G001.1, 08 June 2020. Van der Eerden, L.J. 1982. Toxicity of ammonia to plants. Agriculture and environment, 7: 223–235. Von Burg, R (1995). Toxicological Update. J .Appl. Toxicol 16(4):365-371. Wellburn, A.R., Wilson, J., Aldridge, P.H. 1980. Biochemical responses of plants to nitric oxide polluted atmospheres. Environmental Pollution (Ser. A) 22:219-228. U.S. Department of Health and Human Services. Hazardous Substances Data Bank (HSDB, online database). National Toxicology Information Program, National Library of Medicine, Bethesda, MD. 1993. U.S. Department of Health and Human Services. Hazardous Substances Data Bank (HSDB, online database). National Toxicology Information Program, National Library of Medicine, Bethesda, MD. 2015. http://toxnet.nlm.nih.gov/newtoxnet/hsdb.htm U.S. Environmental Protection Agency. Integrated Risk Information System (IRIS) on Hydrogen Chloride. National Center for Environmental Assessment, Office of Research and Development, Washington, DC. 1999. U.S. Environmental Protection Agency. Integrated Risk Information System (IRIS) on Fluorine (soluble fluoride). National Center for Environmental Assessment, Office of Research and Development, Washington, DC. Last revised 1/31/1987. https://cfpub.epa.gov/ncea/iris2/chemicalLanding.cfm?substance_nmbr=53 U.S. Environmental Protection Agency (USEPA). 1988. AP-42 Section 13.2.5 Control of Open Fugitive Dust Sources. Downloaded from the USEPA website on 5 September 2008. Available by download from the website at: http://www.epa.gov/ttn/chief/old/ap42/ch13/s025/reference/ref_10c13s025_1995.pdf
Assmang Limited Cato Ridge Alloys (Pty) Ltd. 2020 AQIA for Sinter Plant EIA
Atmospheric Impact Report / Air Quality Impact Assessment
Document ID: AssmangCRW-AQIAReport_2020-PlannedSinterPlant_Sep2020_FD1.docx
Revision Date: 18Sep2020 Revision: FINAL_D1 Valid for: Assmang Cato Ridge, KwaZulu-Natal Province
Page 155 of 317
FINAL_D1 Compiled By: JG Potgieter
Approved By: JG Potgieter COPYRIGHT WARNING ALL RIGHTS RESERVED. All information and conceptual designs contained within this document are the intellectual property of ENVIRONGAKA (Pty) Ltd. This document and/or the information contained herein may not be used, stored, reproduced, or copied in any manner, without the prior written consent of ENVIRONGAKA (Pty) Ltd. This document and/or the information and conceptual designs may not be disclosed or displayed to any third party without the prior written consent of ENVIRONGAKA (Pty) Ltd.
EnviroNgaka
U.S. Environmental Protection Agency. Integrated Risk Information System (IRIS) on Chlorine. National Center for Environmental Assessment, Office of Research and Development, Washington, DC. 1999. U.S. Environmental Protection Agency (USEPA). 2005. Provisional Peer Reviewed Toxicity Values for Ammonia. US EPA Report No. EPA/690/R-05/006F Final 2-2-2005. Office of Research and Development, OH. U.S. Environmental Protection Agency (USEPA). 1993. Air quality criteria for oxides of nitrogen. US EPA Report No. EPA/600/8-91/049aF-cF. 3v. Research Triangle Park, NC. U.S. Environmental Protection Agency (USEPA). 1995a. AP-42 Section 13.2.4 Aggregate Handling and Storage Piles. Obtained from the “USEPA Air CHIEF 11” CD. U.S. Environmental Protection Agency (USEPA). 1995b. AP-42 Section 13.2.5 Industrial Wind Erosion. Obtained from the “USEPA Air CHIEF 11” CD. U.S. Environmental Protection Agency (USEPA). 1998. AP-42 Section 11.9 Western surface coal mining. Obtained from the “USEPA Air CHIEF 11” CD. U.S. Environmental Protection Agency (USEPA). 2003. AP-42 Section 13.2.2 Unpaved Roads. Obtained from the “USEPA Air CHIEF 11” CD. U.S. Environmental Protection Agency (USEPA). 2004. AP-42 Section 11.19.2 Crushed Stone Processing and Pulverised Mineral Processing. Obtained from the “USEPA Air CHIEF 11” CD. U.S. Environmental Protection Agency (USEPA). 2005. Revision to the Guideline on Air Quality Models: Adoption of a Preferred General Purpose (Flat and Complex Terrain) Dispersion Model and Other Revisions. North Carolina, U.S. Environmental Protection Agency, 2005. Federal Register / Vol. 70, No. 216 / Rules and Regulations. Appendix W of 40 CRF Part 51. U.S. Environmental Protection Agency. Drinking Water Criteria Document for Chlorine, Hypochlorous Acid and Hypochlorite Ion. (External Review Draft.) Environmental Criteria and Assessment Office, Office of Health and Environmental Assessment, Cincinnati, OH. 1992. Weinstein, LH. 1977. Fluoride and plant life. J Occup Med 19: 49-78. WHO: Air Quality Guidelines for Europe. 2000. Second Edition. WHO Regional Publications. European Series. No. 91. 288pp.

Assmang Limited Cato Ridge Alloys (Pty) Ltd. 2020 AQIA for Sinter Plant EIA
Atmospheric Impact Report / Air Quality Impact Assessment
Document ID: AssmangCRW-AQIAReport_2020-PlannedSinterPlant_Sep2020_FD1.docx
Revision Date: 18Sep2020 Revision: FINAL_D1 Valid for: Assmang Cato Ridge, KwaZulu-Natal Province
Page 156 of 317
FINAL_D1 Compiled By: JG Potgieter
Approved By: JG Potgieter COPYRIGHT WARNING ALL RIGHTS RESERVED. All information and conceptual designs contained within this document are the intellectual property of ENVIRONGAKA (Pty) Ltd. This document and/or the information contained herein may not be used, stored, reproduced, or copied in any manner, without the prior written consent of ENVIRONGAKA (Pty) Ltd. This document and/or the information and conceptual designs may not be disclosed or displayed to any third party without the prior written consent of ENVIRONGAKA (Pty) Ltd.
EnviroNgaka
Appendix A: Meteorological data
The Site of Works falls within the Highveld Climatic Zone. The meteorological characteristics present at a specific site, impact on the rate of emissions from fugitive sources, govern the dispersion, chemical transformation and the eventual removal of pollutants from the atmosphere (Pasquill and Smith, 1983; Godish, 1990). The extent to which pollution will accumulate or disperse in the atmosphere is dependent on the degree of thermal and mechanical turbulence within the earth’s boundary layer. Dispersion comprises vertical and horizontal components of motion. The vertical component is defined by the stability of the atmosphere and the depth of the surface mixing layer, whereas the horizontal dispersion of pollution in the boundary layer is primarily a function of the wind field. The wind speed will determine both the distance of downwind transport and the rate of dilution as a result of plume ‘stretching’. The generation of mechanical turbulence is similarly a function of the wind speed, in combination with the surface roughness. The wind direction and the variability in wind direction, will determine the general path pollutants follow, as well as the extent of crosswind spreading (Shaw and Munn, 1971; Pasquill and Smith, 1983; Oke, 1990). Therefore pollution concentration levels fluctuate in response to changes in atmospheric stability, concurrent variations in the mixing depth and to shifts in the wind field. Spatial variations, and diurnal and seasonal changes, in the wind field and stability regime are functions of atmospheric processes operating at various temporal and spatial scales (Goldreich and Tyson, 1988). Atmospheric processes at macro- and meso-scales have to be taken into account in order to accurately parameterise the atmospheric dispersion potential of a particular area. The analysis of hourly average meteorological data is necessary to facilitate a comprehensive understanding of the ventilation potential of the site and to provide the input requirements for the dispersion simulations. A comprehensive data set for a duration of at least one year of detailed hourly average wind speed, wind direction and temperature data are needed for the dispersion simulations. Site specific meteorological data was simulated for a period from January 2017 to December 2019 based on observed/monitored data from a meteorological station located approximately 323m southeast of the centre of the site, and utilised for the impact assessment and data interpretation. The location for the simulated meteorological monitoring data is located in close proximity to the facility, approximately 399m southeast (29°43.0’S, 30°37.0’E) of the defined centre of the site at an elevation of approximately 793 mamsl, with the wind monitored at a height of 10m and the other parameters at 2m above ground level. This specific data set was assessed and discussed below.
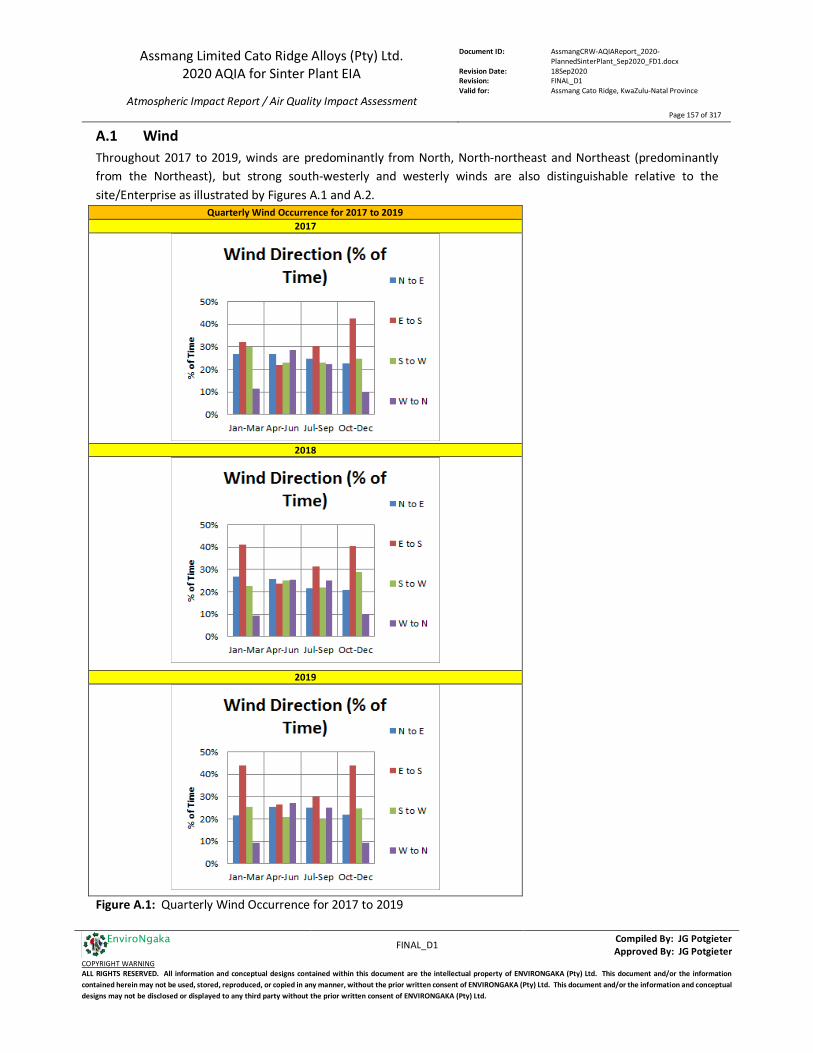
Assmang Limited Cato Ridge Alloys (Pty) Ltd. 2020 AQIA for Sinter Plant EIA
Atmospheric Impact Report / Air Quality Impact Assessment
Document ID: AssmangCRW-AQIAReport_2020-PlannedSinterPlant_Sep2020_FD1.docx
Revision Date: 18Sep2020 Revision: FINAL_D1 Valid for: Assmang Cato Ridge, KwaZulu-Natal Province
Page 157 of 317
FINAL_D1 Compiled By: JG Potgieter
Approved By: JG Potgieter COPYRIGHT WARNING ALL RIGHTS RESERVED. All information and conceptual designs contained within this document are the intellectual property of ENVIRONGAKA (Pty) Ltd. This document and/or the information contained herein may not be used, stored, reproduced, or copied in any manner, without the prior written consent of ENVIRONGAKA (Pty) Ltd. This document and/or the information and conceptual designs may not be disclosed or displayed to any third party without the prior written consent of ENVIRONGAKA (Pty) Ltd.
EnviroNgaka
A.1 Wind Throughout 2017 to 2019, winds are predominantly from North, North-northeast and Northeast (predominantly from the Northeast), but strong south-westerly and westerly winds are also distinguishable relative to the site/Enterprise as illustrated by Figures A.1 and A.2.
Quarterly Wind Occurrence for 2017 to 2019 2017
2018
2019
Figure A.1: Quarterly Wind Occurrence for 2017 to 2019
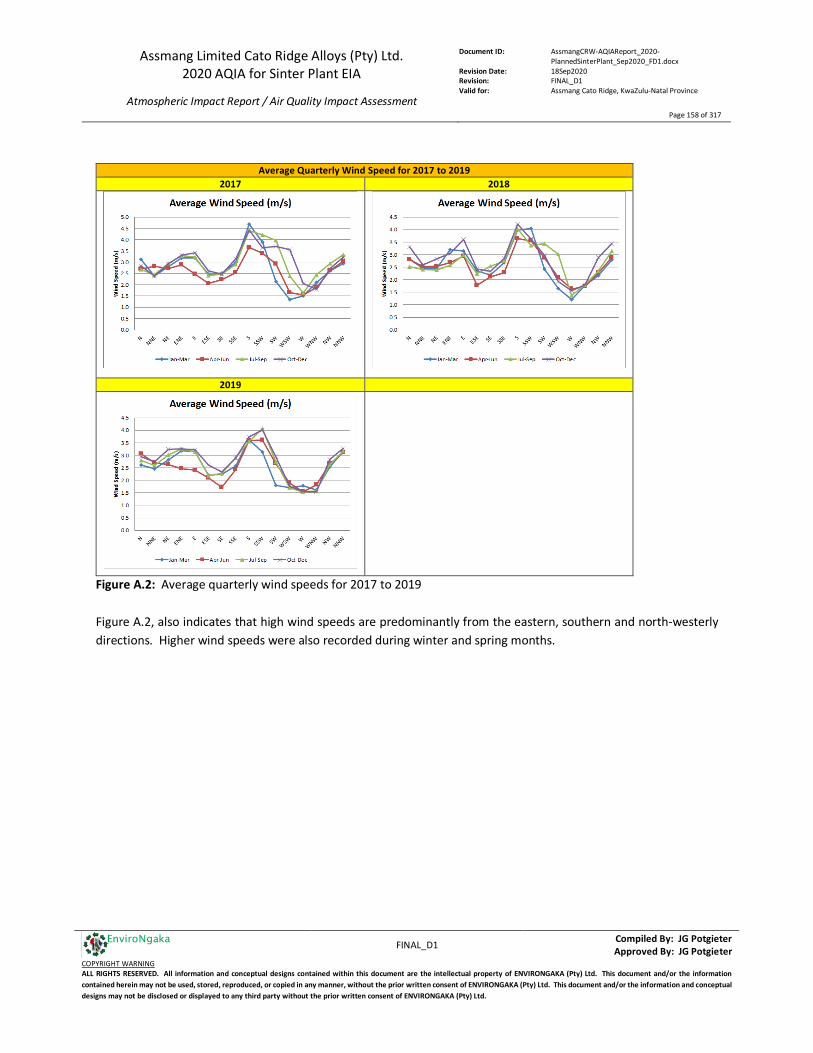
Assmang Limited Cato Ridge Alloys (Pty) Ltd. 2020 AQIA for Sinter Plant EIA
Atmospheric Impact Report / Air Quality Impact Assessment
Document ID: AssmangCRW-AQIAReport_2020-PlannedSinterPlant_Sep2020_FD1.docx
Revision Date: 18Sep2020 Revision: FINAL_D1 Valid for: Assmang Cato Ridge, KwaZulu-Natal Province
Page 158 of 317
FINAL_D1 Compiled By: JG Potgieter
Approved By: JG Potgieter COPYRIGHT WARNING ALL RIGHTS RESERVED. All information and conceptual designs contained within this document are the intellectual property of ENVIRONGAKA (Pty) Ltd. This document and/or the information contained herein may not be used, stored, reproduced, or copied in any manner, without the prior written consent of ENVIRONGAKA (Pty) Ltd. This document and/or the information and conceptual designs may not be disclosed or displayed to any third party without the prior written consent of ENVIRONGAKA (Pty) Ltd.
EnviroNgaka
Average Quarterly Wind Speed for 2017 to 2019 2017 2018
2019
Figure A.2: Average quarterly wind speeds for 2017 to 2019 Figure A.2, also indicates that high wind speeds are predominantly from the eastern, southern and north-westerly directions. Higher wind speeds were also recorded during winter and spring months.
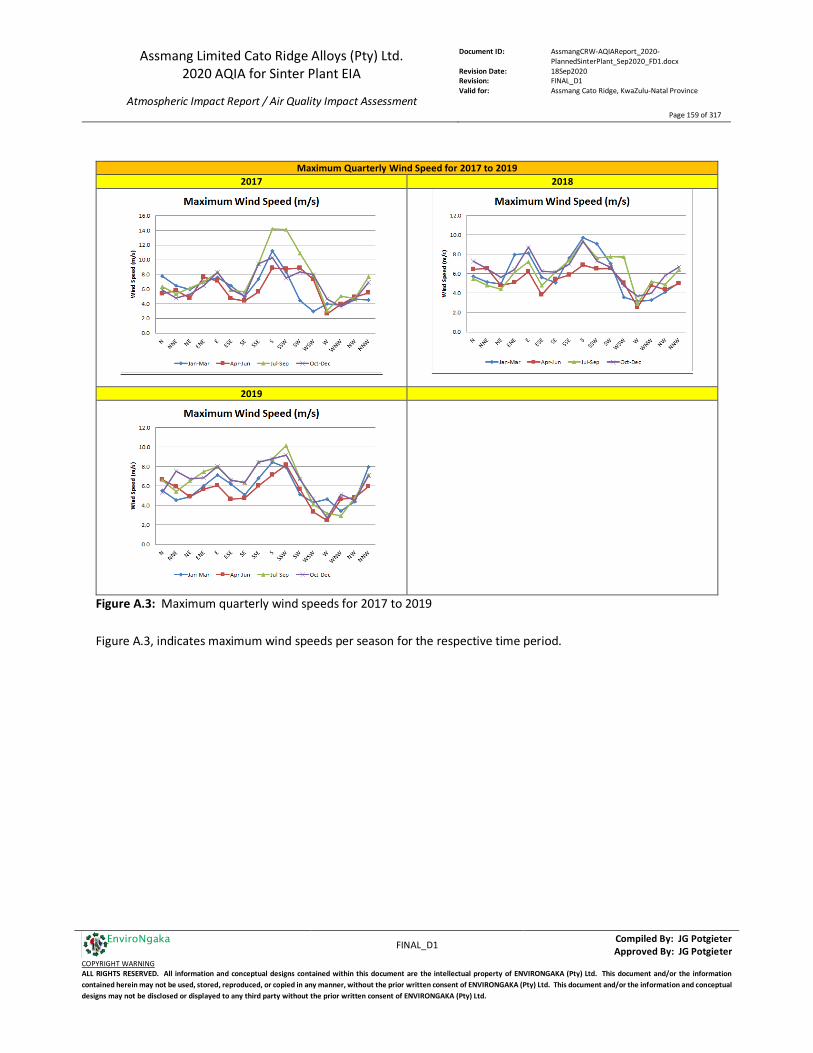
Assmang Limited Cato Ridge Alloys (Pty) Ltd. 2020 AQIA for Sinter Plant EIA
Atmospheric Impact Report / Air Quality Impact Assessment
Document ID: AssmangCRW-AQIAReport_2020-PlannedSinterPlant_Sep2020_FD1.docx
Revision Date: 18Sep2020 Revision: FINAL_D1 Valid for: Assmang Cato Ridge, KwaZulu-Natal Province
Page 159 of 317
FINAL_D1 Compiled By: JG Potgieter
Approved By: JG Potgieter COPYRIGHT WARNING ALL RIGHTS RESERVED. All information and conceptual designs contained within this document are the intellectual property of ENVIRONGAKA (Pty) Ltd. This document and/or the information contained herein may not be used, stored, reproduced, or copied in any manner, without the prior written consent of ENVIRONGAKA (Pty) Ltd. This document and/or the information and conceptual designs may not be disclosed or displayed to any third party without the prior written consent of ENVIRONGAKA (Pty) Ltd.
EnviroNgaka
Maximum Quarterly Wind Speed for 2017 to 2019 2017 2018
2019
Figure A.3: Maximum quarterly wind speeds for 2017 to 2019 Figure A.3, indicates maximum wind speeds per season for the respective time period.
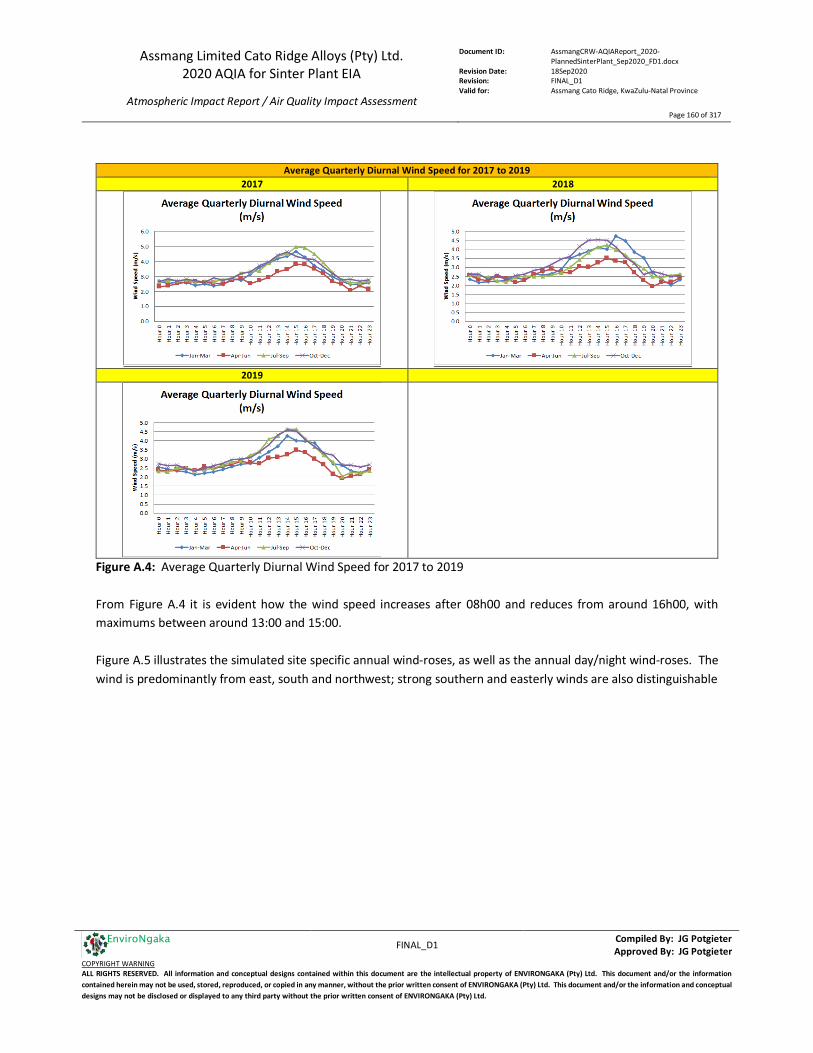
Assmang Limited Cato Ridge Alloys (Pty) Ltd. 2020 AQIA for Sinter Plant EIA
Atmospheric Impact Report / Air Quality Impact Assessment
Document ID: AssmangCRW-AQIAReport_2020-PlannedSinterPlant_Sep2020_FD1.docx
Revision Date: 18Sep2020 Revision: FINAL_D1 Valid for: Assmang Cato Ridge, KwaZulu-Natal Province
Page 160 of 317
FINAL_D1 Compiled By: JG Potgieter
Approved By: JG Potgieter COPYRIGHT WARNING ALL RIGHTS RESERVED. All information and conceptual designs contained within this document are the intellectual property of ENVIRONGAKA (Pty) Ltd. This document and/or the information contained herein may not be used, stored, reproduced, or copied in any manner, without the prior written consent of ENVIRONGAKA (Pty) Ltd. This document and/or the information and conceptual designs may not be disclosed or displayed to any third party without the prior written consent of ENVIRONGAKA (Pty) Ltd.
EnviroNgaka
Average Quarterly Diurnal Wind Speed for 2017 to 2019 2017 2018
2019
Figure A.4: Average Quarterly Diurnal Wind Speed for 2017 to 2019 From Figure A.4 it is evident how the wind speed increases after 08h00 and reduces from around 16h00, with maximums between around 13:00 and 15:00. Figure A.5 illustrates the simulated site specific annual wind-roses, as well as the annual day/night wind-roses. The wind is predominantly from east, south and northwest; strong southern and easterly winds are also distinguishable
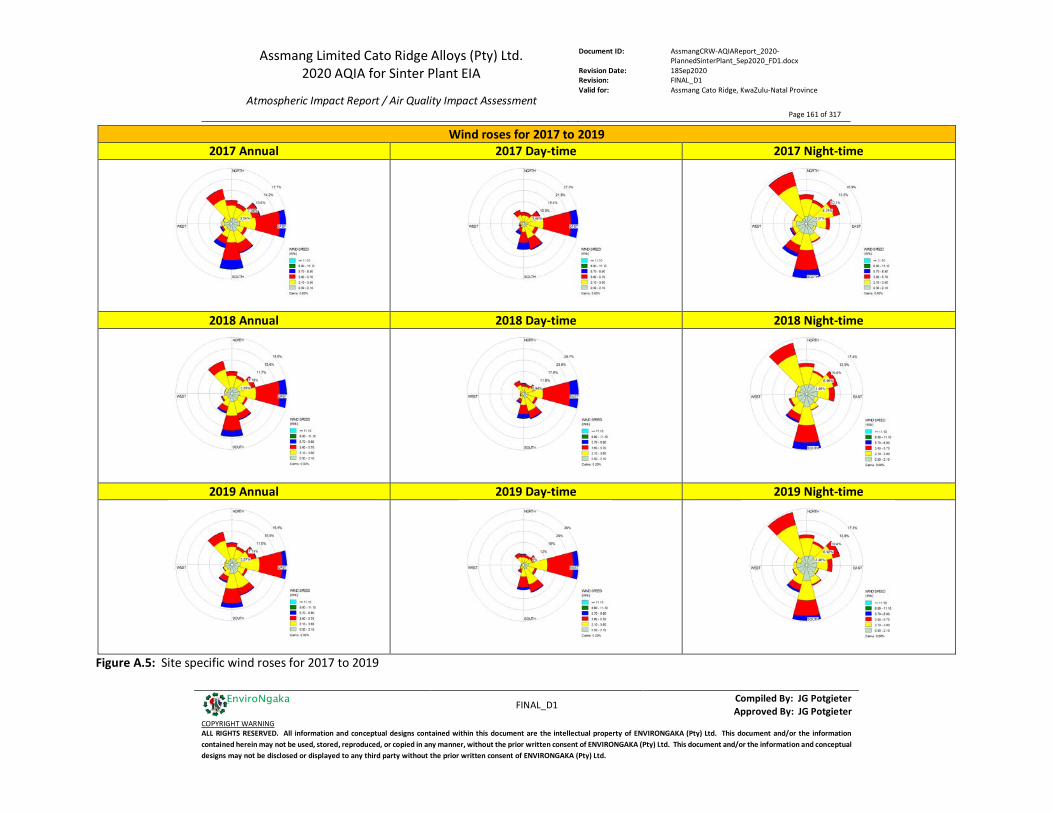
Assmang Limited Cato Ridge Alloys (Pty) Ltd. 2020 AQIA for Sinter Plant EIA
Atmospheric Impact Report / Air Quality Impact Assessment
Document ID: AssmangCRW-AQIAReport_2020-PlannedSinterPlant_Sep2020_FD1.docx
Revision Date: 18Sep2020 Revision: FINAL_D1 Valid for: Assmang Cato Ridge, KwaZulu-Natal Province
Page 161 of 317
FINAL_D1
Compiled By: JG Potgieter Approved By: JG Potgieter
COPYRIGHT WARNING ALL RIGHTS RESERVED. All information and conceptual designs contained within this document are the intellectual property of ENVIRONGAKA (Pty) Ltd. This document and/or the information contained herein may not be used, stored, reproduced, or copied in any manner, without the prior written consent of ENVIRONGAKA (Pty) Ltd. This document and/or the information and conceptual designs may not be disclosed or displayed to any third party without the prior written consent of ENVIRONGAKA (Pty) Ltd.
EnviroNgaka
Wind roses for 2017 to 2019 2017 Annual 2017 Day-time 2017 Night-time
2018 Annual 2018 Day-time 2018 Night-time
2019 Annual 2019 Day-time 2019 Night-time
Figure A.5: Site specific wind roses for 2017 to 2019
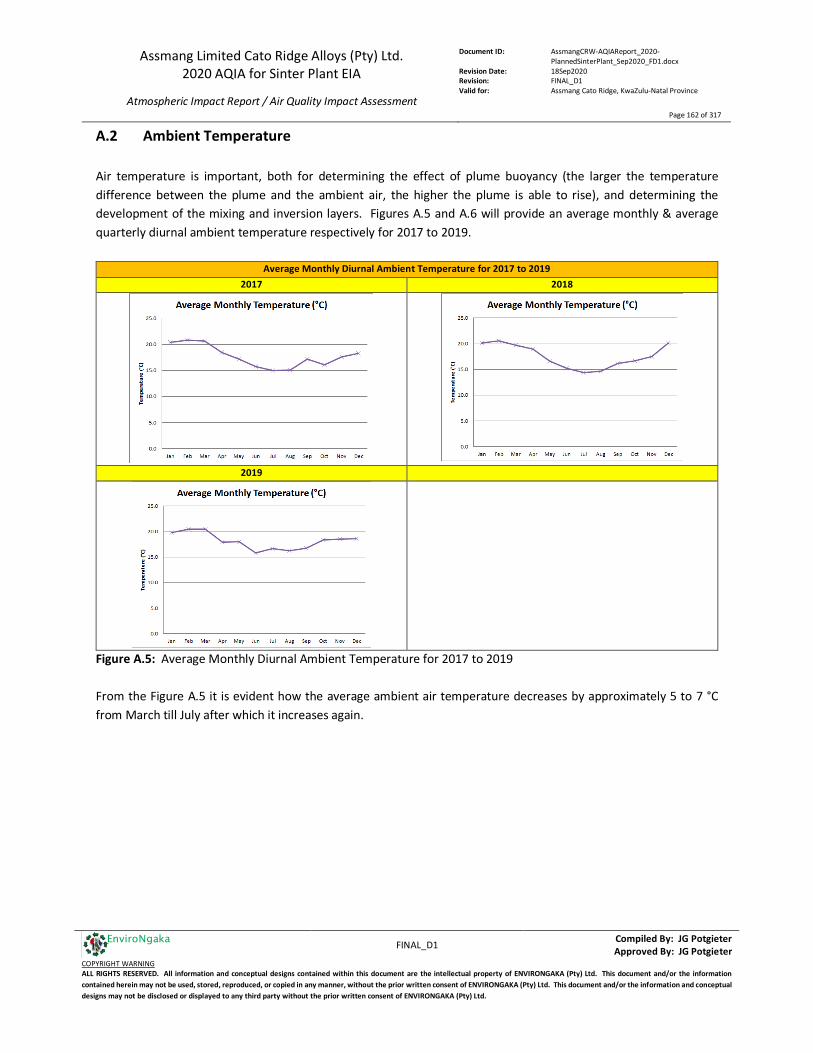
Assmang Limited Cato Ridge Alloys (Pty) Ltd. 2020 AQIA for Sinter Plant EIA
Atmospheric Impact Report / Air Quality Impact Assessment
Document ID: AssmangCRW-AQIAReport_2020-PlannedSinterPlant_Sep2020_FD1.docx
Revision Date: 18Sep2020 Revision: FINAL_D1 Valid for: Assmang Cato Ridge, KwaZulu-Natal Province
Page 162 of 317
FINAL_D1 Compiled By: JG Potgieter
Approved By: JG Potgieter COPYRIGHT WARNING ALL RIGHTS RESERVED. All information and conceptual designs contained within this document are the intellectual property of ENVIRONGAKA (Pty) Ltd. This document and/or the information contained herein may not be used, stored, reproduced, or copied in any manner, without the prior written consent of ENVIRONGAKA (Pty) Ltd. This document and/or the information and conceptual designs may not be disclosed or displayed to any third party without the prior written consent of ENVIRONGAKA (Pty) Ltd.
EnviroNgaka
A.2 Ambient Temperature Air temperature is important, both for determining the effect of plume buoyancy (the larger the temperature difference between the plume and the ambient air, the higher the plume is able to rise), and determining the development of the mixing and inversion layers. Figures A.5 and A.6 will provide an average monthly & average quarterly diurnal ambient temperature respectively for 2017 to 2019.
Average Monthly Diurnal Ambient Temperature for 2017 to 2019 2017 2018
2019
Figure A.5: Average Monthly Diurnal Ambient Temperature for 2017 to 2019 From the Figure A.5 it is evident how the average ambient air temperature decreases by approximately 5 to 7 °C from March till July after which it increases again.
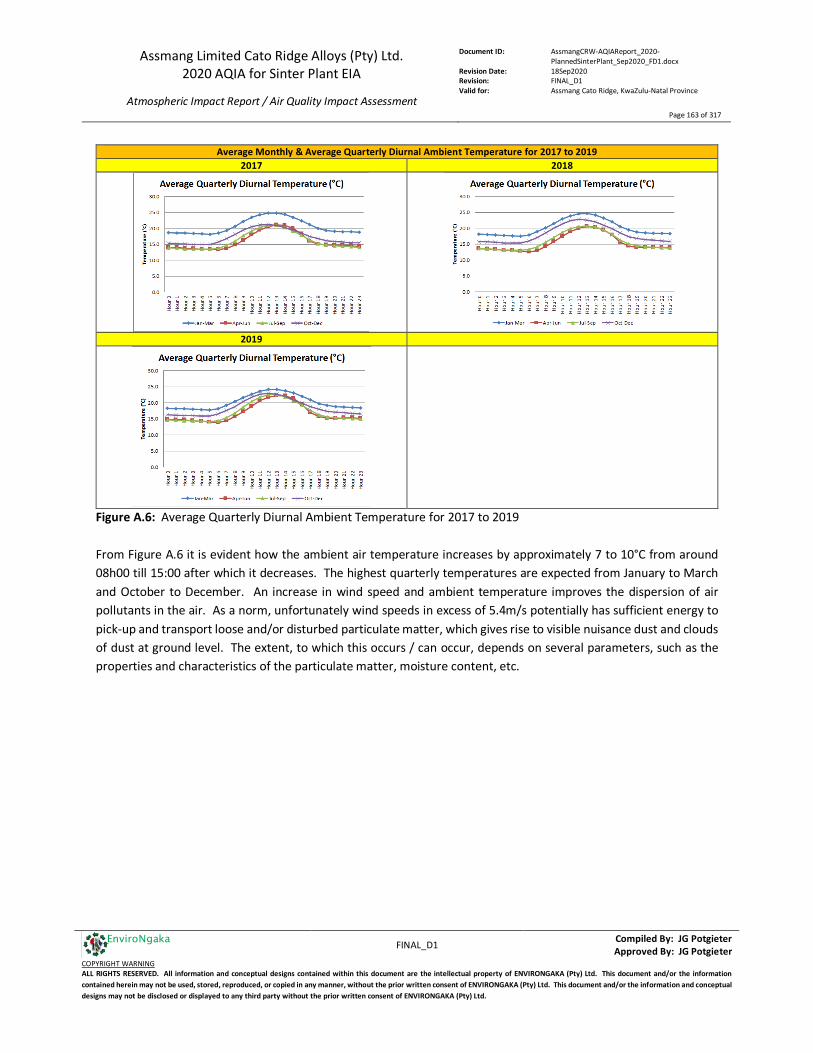
Assmang Limited Cato Ridge Alloys (Pty) Ltd. 2020 AQIA for Sinter Plant EIA
Atmospheric Impact Report / Air Quality Impact Assessment
Document ID: AssmangCRW-AQIAReport_2020-PlannedSinterPlant_Sep2020_FD1.docx
Revision Date: 18Sep2020 Revision: FINAL_D1 Valid for: Assmang Cato Ridge, KwaZulu-Natal Province
Page 163 of 317
FINAL_D1 Compiled By: JG Potgieter
Approved By: JG Potgieter COPYRIGHT WARNING ALL RIGHTS RESERVED. All information and conceptual designs contained within this document are the intellectual property of ENVIRONGAKA (Pty) Ltd. This document and/or the information contained herein may not be used, stored, reproduced, or copied in any manner, without the prior written consent of ENVIRONGAKA (Pty) Ltd. This document and/or the information and conceptual designs may not be disclosed or displayed to any third party without the prior written consent of ENVIRONGAKA (Pty) Ltd.
EnviroNgaka
Average Monthly & Average Quarterly Diurnal Ambient Temperature for 2017 to 2019
2017 2018
2019
Figure A.6: Average Quarterly Diurnal Ambient Temperature for 2017 to 2019 From Figure A.6 it is evident how the ambient air temperature increases by approximately 7 to 10°C from around 08h00 till 15:00 after which it decreases. The highest quarterly temperatures are expected from January to March and October to December. An increase in wind speed and ambient temperature improves the dispersion of air pollutants in the air. As a norm, unfortunately wind speeds in excess of 5.4m/s potentially has sufficient energy to pick-up and transport loose and/or disturbed particulate matter, which gives rise to visible nuisance dust and clouds of dust at ground level. The extent, to which this occurs / can occur, depends on several parameters, such as the properties and characteristics of the particulate matter, moisture content, etc.

Assmang Limited Cato Ridge Alloys (Pty) Ltd. 2020 AQIA for Sinter Plant EIA
Atmospheric Impact Report / Air Quality Impact Assessment
Document ID: AssmangCRW-AQIAReport_2020-PlannedSinterPlant_Sep2020_FD1.docx
Revision Date: 18Sep2020 Revision: FINAL_D1 Valid for: Assmang Cato Ridge, KwaZulu-Natal Province
Page 164 of 317
FINAL_D1 Compiled By: JG Potgieter
Approved By: JG Potgieter COPYRIGHT WARNING ALL RIGHTS RESERVED. All information and conceptual designs contained within this document are the intellectual property of ENVIRONGAKA (Pty) Ltd. This document and/or the information contained herein may not be used, stored, reproduced, or copied in any manner, without the prior written consent of ENVIRONGAKA (Pty) Ltd. This document and/or the information and conceptual designs may not be disclosed or displayed to any third party without the prior written consent of ENVIRONGAKA (Pty) Ltd.
EnviroNgaka
A.3 Precipitation / Rainfall Figure A.7 illustrates monthly rainfall (precipitation) for the selected years.
Precipitation / Rainfall for 2017 to 2019 2017 2018
2019
Figure A.7: Precipitation / Rainfall for 2017 to 2019 The total precipitation / rainfall measured at the site during 2017 to 2019:
2017: 883.6 mm; 2018: 755.3 mm; 2019: 839.6 mm.
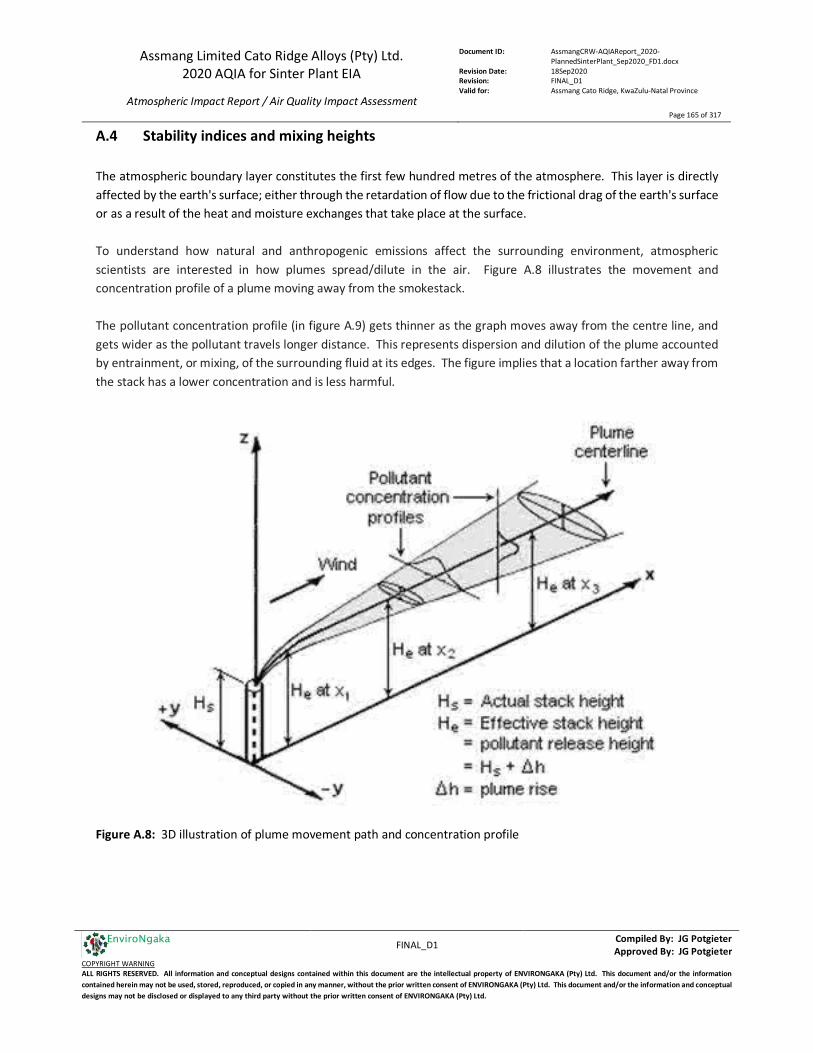
Assmang Limited Cato Ridge Alloys (Pty) Ltd. 2020 AQIA for Sinter Plant EIA
Atmospheric Impact Report / Air Quality Impact Assessment
Document ID: AssmangCRW-AQIAReport_2020-PlannedSinterPlant_Sep2020_FD1.docx
Revision Date: 18Sep2020 Revision: FINAL_D1 Valid for: Assmang Cato Ridge, KwaZulu-Natal Province
Page 165 of 317
FINAL_D1 Compiled By: JG Potgieter
Approved By: JG Potgieter COPYRIGHT WARNING ALL RIGHTS RESERVED. All information and conceptual designs contained within this document are the intellectual property of ENVIRONGAKA (Pty) Ltd. This document and/or the information contained herein may not be used, stored, reproduced, or copied in any manner, without the prior written consent of ENVIRONGAKA (Pty) Ltd. This document and/or the information and conceptual designs may not be disclosed or displayed to any third party without the prior written consent of ENVIRONGAKA (Pty) Ltd.
EnviroNgaka
A.4 Stability indices and mixing heights The atmospheric boundary layer constitutes the first few hundred metres of the atmosphere. This layer is directly affected by the earth's surface; either through the retardation of flow due to the frictional drag of the earth's surface or as a result of the heat and moisture exchanges that take place at the surface. To understand how natural and anthropogenic emissions affect the surrounding environment, atmospheric scientists are interested in how plumes spread/dilute in the air. Figure A.8 illustrates the movement and concentration profile of a plume moving away from the smokestack. The pollutant concentration profile (in figure A.9) gets thinner as the graph moves away from the centre line, and gets wider as the pollutant travels longer distance. This represents dispersion and dilution of the plume accounted by entrainment, or mixing, of the surrounding fluid at its edges. The figure implies that a location farther away from the stack has a lower concentration and is less harmful.
Figure A.8: 3D illustration of plume movement path and concentration profile
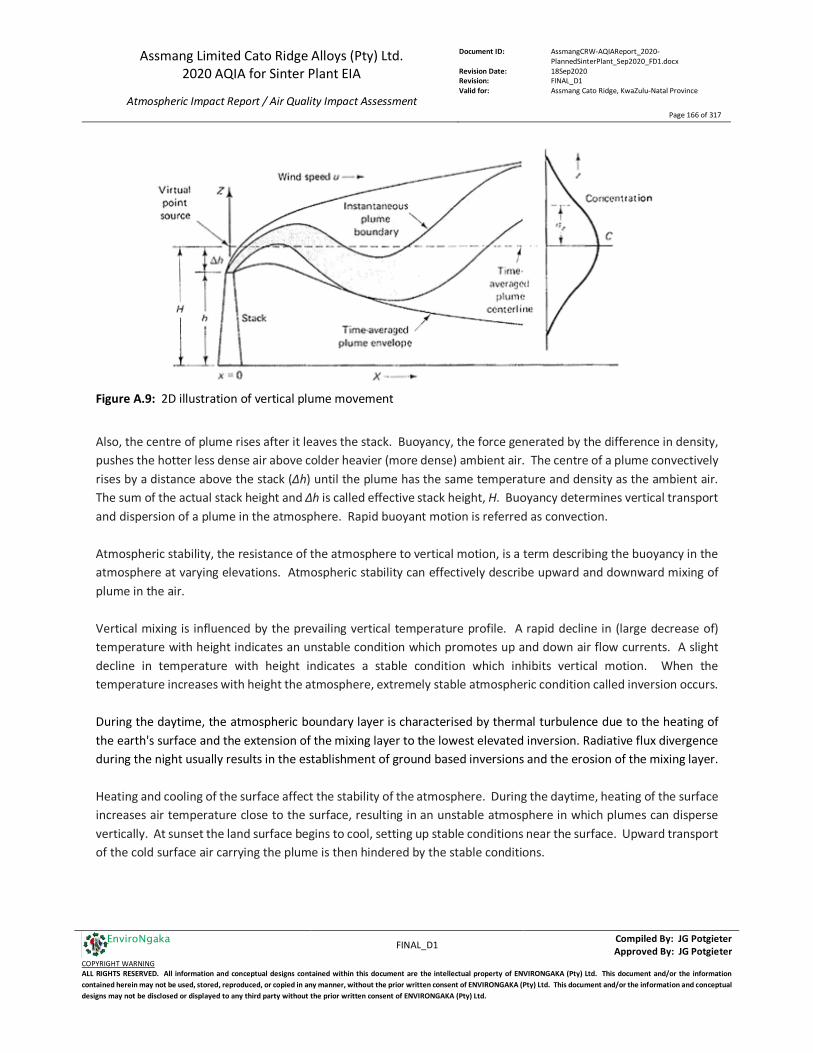
Assmang Limited Cato Ridge Alloys (Pty) Ltd. 2020 AQIA for Sinter Plant EIA
Atmospheric Impact Report / Air Quality Impact Assessment
Document ID: AssmangCRW-AQIAReport_2020-PlannedSinterPlant_Sep2020_FD1.docx
Revision Date: 18Sep2020 Revision: FINAL_D1 Valid for: Assmang Cato Ridge, KwaZulu-Natal Province
Page 166 of 317
FINAL_D1 Compiled By: JG Potgieter
Approved By: JG Potgieter COPYRIGHT WARNING ALL RIGHTS RESERVED. All information and conceptual designs contained within this document are the intellectual property of ENVIRONGAKA (Pty) Ltd. This document and/or the information contained herein may not be used, stored, reproduced, or copied in any manner, without the prior written consent of ENVIRONGAKA (Pty) Ltd. This document and/or the information and conceptual designs may not be disclosed or displayed to any third party without the prior written consent of ENVIRONGAKA (Pty) Ltd.
EnviroNgaka
Figure A.9: 2D illustration of vertical plume movement
Also, the centre of plume rises after it leaves the stack. Buoyancy, the force generated by the difference in density, pushes the hotter less dense air above colder heavier (more dense) ambient air. The centre of a plume convectively rises by a distance above the stack (Δh) until the plume has the same temperature and density as the ambient air. The sum of the actual stack height and Δh is called effective stack height, H. Buoyancy determines vertical transport and dispersion of a plume in the atmosphere. Rapid buoyant motion is referred as convection. Atmospheric stability, the resistance of the atmosphere to vertical motion, is a term describing the buoyancy in the atmosphere at varying elevations. Atmospheric stability can effectively describe upward and downward mixing of plume in the air. Vertical mixing is influenced by the prevailing vertical temperature profile. A rapid decline in (large decrease of) temperature with height indicates an unstable condition which promotes up and down air flow currents. A slight decline in temperature with height indicates a stable condition which inhibits vertical motion. When the temperature increases with height the atmosphere, extremely stable atmospheric condition called inversion occurs. During the daytime, the atmospheric boundary layer is characterised by thermal turbulence due to the heating of the earth's surface and the extension of the mixing layer to the lowest elevated inversion. Radiative flux divergence during the night usually results in the establishment of ground based inversions and the erosion of the mixing layer. Heating and cooling of the surface affect the stability of the atmosphere. During the daytime, heating of the surface increases air temperature close to the surface, resulting in an unstable atmosphere in which plumes can disperse vertically. At sunset the land surface begins to cool, setting up stable conditions near the surface. Upward transport of the cold surface air carrying the plume is then hindered by the stable conditions.

Assmang Limited Cato Ridge Alloys (Pty) Ltd. 2020 AQIA for Sinter Plant EIA
Atmospheric Impact Report / Air Quality Impact Assessment
Document ID: AssmangCRW-AQIAReport_2020-PlannedSinterPlant_Sep2020_FD1.docx
Revision Date: 18Sep2020 Revision: FINAL_D1 Valid for: Assmang Cato Ridge, KwaZulu-Natal Province
Page 167 of 317
FINAL_D1 Compiled By: JG Potgieter
Approved By: JG Potgieter COPYRIGHT WARNING ALL RIGHTS RESERVED. All information and conceptual designs contained within this document are the intellectual property of ENVIRONGAKA (Pty) Ltd. This document and/or the information contained herein may not be used, stored, reproduced, or copied in any manner, without the prior written consent of ENVIRONGAKA (Pty) Ltd. This document and/or the information and conceptual designs may not be disclosed or displayed to any third party without the prior written consent of ENVIRONGAKA (Pty) Ltd.
EnviroNgaka
Figure A.10 illustrates six general categories of plume movements, which vary with vertical temperature profile and wind profile. The caption below explains the atmospheric stability and the time of the day each plume is most likely to occur. Plume behaviour is a visible indicator of atmospheric stability. Early morning creates ideal condition for fumigation and fanning plumes, whose upward plume dispersion is hindered by inversion above the stack. This may raise pollutant concentrations at the ground to the hazardous level. Ventilation of cities tends to be suppressed at night and facilitated in the daytime. In winter when solar heating is weak, breaking of the inversion is difficult and accumulation of pollutants may result in severe air pollution episodes.
Figure A.10: Vertical wind profile (left), temperature profile (centre), and corresponding stack plume illustration Vertical wind profile (left), temperature profile (centre), and corresponding stack plume illustration with description: looping – strong instability during day time; coning – near neutral stability, neutral stability and small scale mechanical turbulence dominates during early morning; fanning – surface inversion during clear night time conditions; fumigation – aloft inversion; lofting – inversion below stack during early evening; trapping – inversion below and above stack height. The mixing layer is not easily measured and must therefore often be estimated using prognostic models that derive the thickness from parameters that are routinely measured, e.g. solar radiation and temperature. Atmospheric stability is frequently categorised into one of six Pasquill stability classes, and these are briefly described in Table A.6. In the dispersion model used here, atmospheric stability is calculated by the meteorological pre-processor as a continuous function, rather than as a discrete variable.
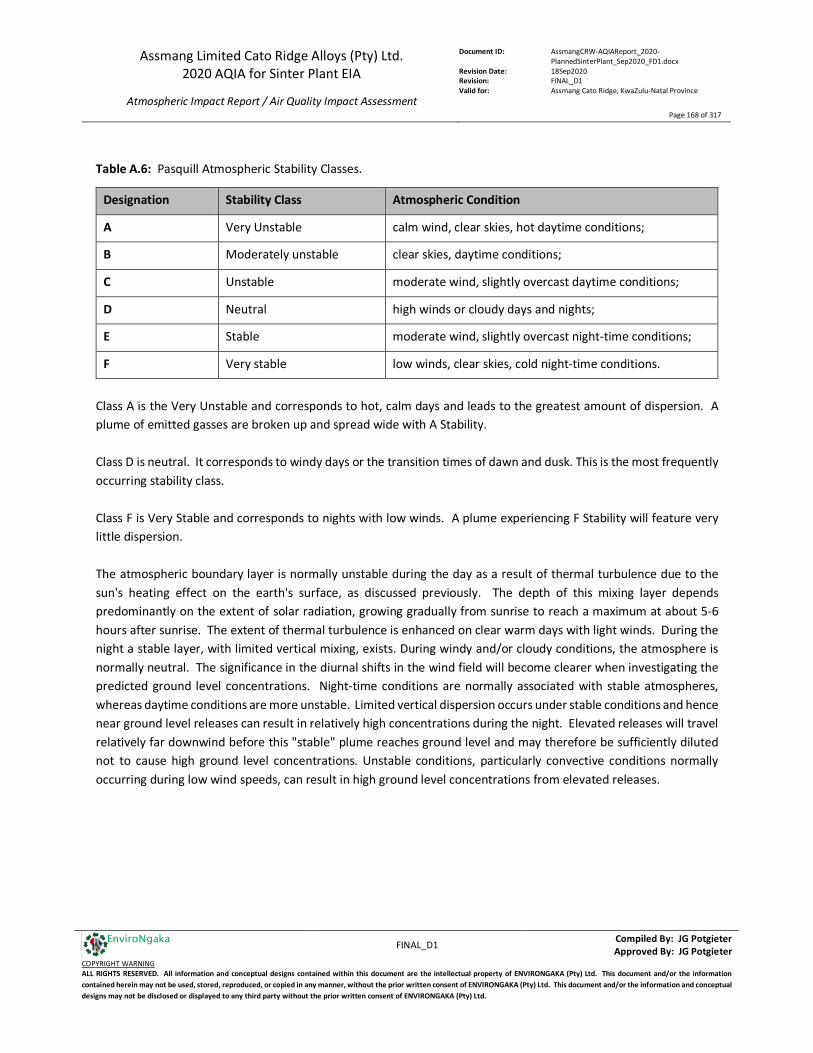
Assmang Limited Cato Ridge Alloys (Pty) Ltd. 2020 AQIA for Sinter Plant EIA
Atmospheric Impact Report / Air Quality Impact Assessment
Document ID: AssmangCRW-AQIAReport_2020-PlannedSinterPlant_Sep2020_FD1.docx
Revision Date: 18Sep2020 Revision: FINAL_D1 Valid for: Assmang Cato Ridge, KwaZulu-Natal Province
Page 168 of 317
FINAL_D1 Compiled By: JG Potgieter
Approved By: JG Potgieter COPYRIGHT WARNING ALL RIGHTS RESERVED. All information and conceptual designs contained within this document are the intellectual property of ENVIRONGAKA (Pty) Ltd. This document and/or the information contained herein may not be used, stored, reproduced, or copied in any manner, without the prior written consent of ENVIRONGAKA (Pty) Ltd. This document and/or the information and conceptual designs may not be disclosed or displayed to any third party without the prior written consent of ENVIRONGAKA (Pty) Ltd.
EnviroNgaka
Table A.6: Pasquill Atmospheric Stability Classes.
Designation Stability Class Atmospheric Condition
A Very Unstable calm wind, clear skies, hot daytime conditions;
B Moderately unstable clear skies, daytime conditions;
C Unstable moderate wind, slightly overcast daytime conditions;
D Neutral high winds or cloudy days and nights;
E Stable moderate wind, slightly overcast night-time conditions;
F Very stable low winds, clear skies, cold night-time conditions.
Class A is the Very Unstable and corresponds to hot, calm days and leads to the greatest amount of dispersion. A plume of emitted gasses are broken up and spread wide with A Stability. Class D is neutral. It corresponds to windy days or the transition times of dawn and dusk. This is the most frequently occurring stability class. Class F is Very Stable and corresponds to nights with low winds. A plume experiencing F Stability will feature very little dispersion. The atmospheric boundary layer is normally unstable during the day as a result of thermal turbulence due to the sun's heating effect on the earth's surface, as discussed previously. The depth of this mixing layer depends predominantly on the extent of solar radiation, growing gradually from sunrise to reach a maximum at about 5-6 hours after sunrise. The extent of thermal turbulence is enhanced on clear warm days with light winds. During the night a stable layer, with limited vertical mixing, exists. During windy and/or cloudy conditions, the atmosphere is normally neutral. The significance in the diurnal shifts in the wind field will become clearer when investigating the predicted ground level concentrations. Night-time conditions are normally associated with stable atmospheres, whereas daytime conditions are more unstable. Limited vertical dispersion occurs under stable conditions and hence near ground level releases can result in relatively high concentrations during the night. Elevated releases will travel relatively far downwind before this "stable" plume reaches ground level and may therefore be sufficiently diluted not to cause high ground level concentrations. Unstable conditions, particularly convective conditions normally occurring during low wind speeds, can result in high ground level concentrations from elevated releases.
Assmang Limited Cato Ridge Alloys (Pty) Ltd. 2020 AQIA for Sinter Plant EIA
Atmospheric Impact Report / Air Quality Impact Assessment
Document ID: AssmangCRW-AQIAReport_2020-PlannedSinterPlant_Sep2020_FD1.docx
Revision Date: 18Sep2020 Revision: FINAL_D1 Valid for: Assmang Cato Ridge, KwaZulu-Natal Province
Page 169 of 317
FINAL_D1 Compiled By: JG Potgieter
Approved By: JG Potgieter COPYRIGHT WARNING ALL RIGHTS RESERVED. All information and conceptual designs contained within this document are the intellectual property of ENVIRONGAKA (Pty) Ltd. This document and/or the information contained herein may not be used, stored, reproduced, or copied in any manner, without the prior written consent of ENVIRONGAKA (Pty) Ltd. This document and/or the information and conceptual designs may not be disclosed or displayed to any third party without the prior written consent of ENVIRONGAKA (Pty) Ltd.
EnviroNgaka
The Pasquill-Turner Stability Index can therefore be summarized as follows (a numerical value, in brackets, will be assigned to each category): A (1) Extremely Unstable (Greatest amount of dispersion) B (2) Unstable C (3) Slightly Unstable D (4) Neutral Stability E (5) Slightly Stable F (6) Stable The Pasquill Index is always neutral (D) for overcast conditions with a cloud ceiling that is less than 7000 feet (2 134 m). During "anticyclonic gloom", an inversion at a lower level could persist for days with a D Pasquill Index. Tables A.7 to A.9 are summaries of the monthly Stability indices for 2017 to 2019, using the numerical values assigned to each category as shown above. The table will show the hourly minimum, maximum and average stability indices. Each category will be labelled with a colour, which will be defined at the bottom of the table.
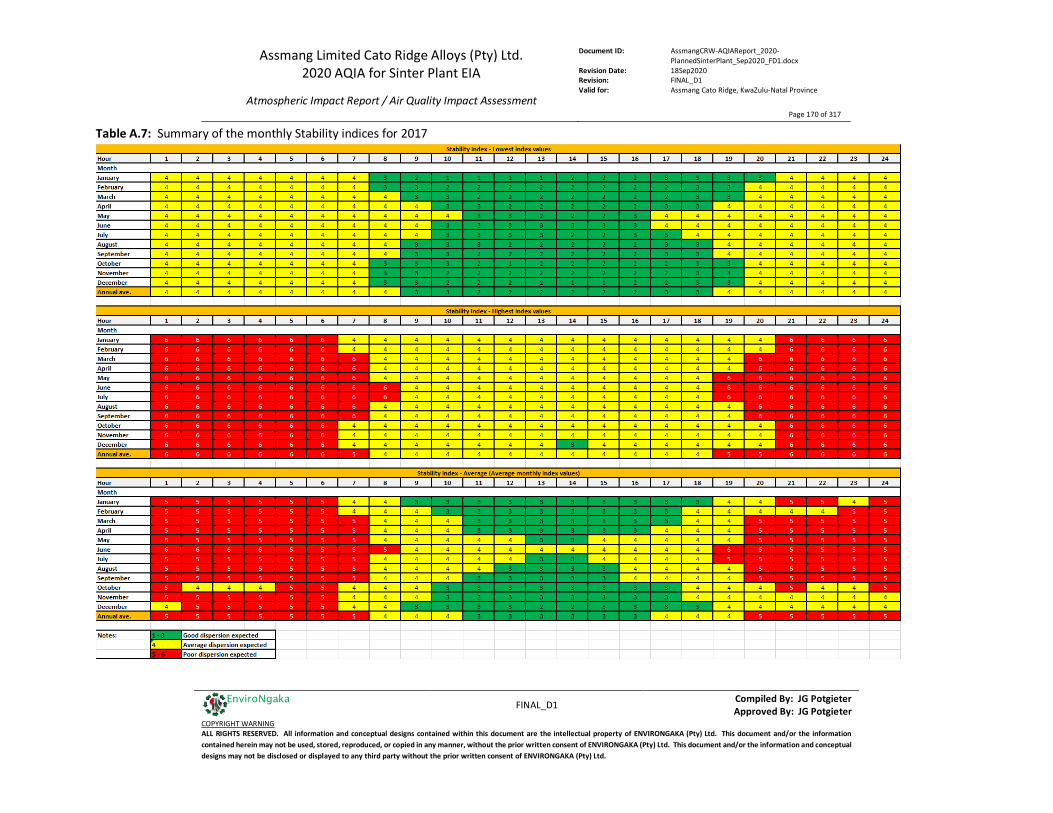
Assmang Limited Cato Ridge Alloys (Pty) Ltd. 2020 AQIA for Sinter Plant EIA
Atmospheric Impact Report / Air Quality Impact Assessment
Document ID: AssmangCRW-AQIAReport_2020-PlannedSinterPlant_Sep2020_FD1.docx
Revision Date: 18Sep2020 Revision: FINAL_D1 Valid for: Assmang Cato Ridge, KwaZulu-Natal Province
Page 170 of 317
FINAL_D1 Compiled By: JG Potgieter
Approved By: JG Potgieter COPYRIGHT WARNING ALL RIGHTS RESERVED. All information and conceptual designs contained within this document are the intellectual property of ENVIRONGAKA (Pty) Ltd. This document and/or the information contained herein may not be used, stored, reproduced, or copied in any manner, without the prior written consent of ENVIRONGAKA (Pty) Ltd. This document and/or the information and conceptual designs may not be disclosed or displayed to any third party without the prior written consent of ENVIRONGAKA (Pty) Ltd.
EnviroNgaka
Table A.7: Summary of the monthly Stability indices for 2017
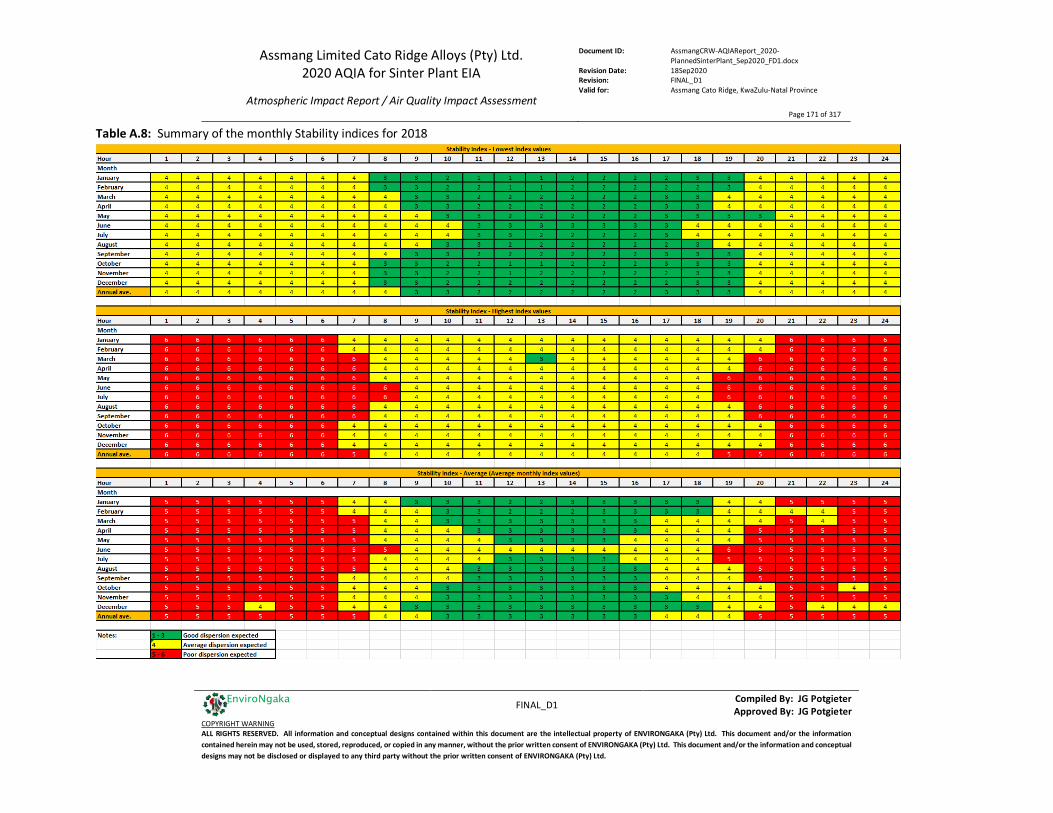
Assmang Limited Cato Ridge Alloys (Pty) Ltd. 2020 AQIA for Sinter Plant EIA
Atmospheric Impact Report / Air Quality Impact Assessment
Document ID: AssmangCRW-AQIAReport_2020-PlannedSinterPlant_Sep2020_FD1.docx
Revision Date: 18Sep2020 Revision: FINAL_D1 Valid for: Assmang Cato Ridge, KwaZulu-Natal Province
Page 171 of 317
FINAL_D1 Compiled By: JG Potgieter
Approved By: JG Potgieter COPYRIGHT WARNING ALL RIGHTS RESERVED. All information and conceptual designs contained within this document are the intellectual property of ENVIRONGAKA (Pty) Ltd. This document and/or the information contained herein may not be used, stored, reproduced, or copied in any manner, without the prior written consent of ENVIRONGAKA (Pty) Ltd. This document and/or the information and conceptual designs may not be disclosed or displayed to any third party without the prior written consent of ENVIRONGAKA (Pty) Ltd.
EnviroNgaka
Table A.8: Summary of the monthly Stability indices for 2018
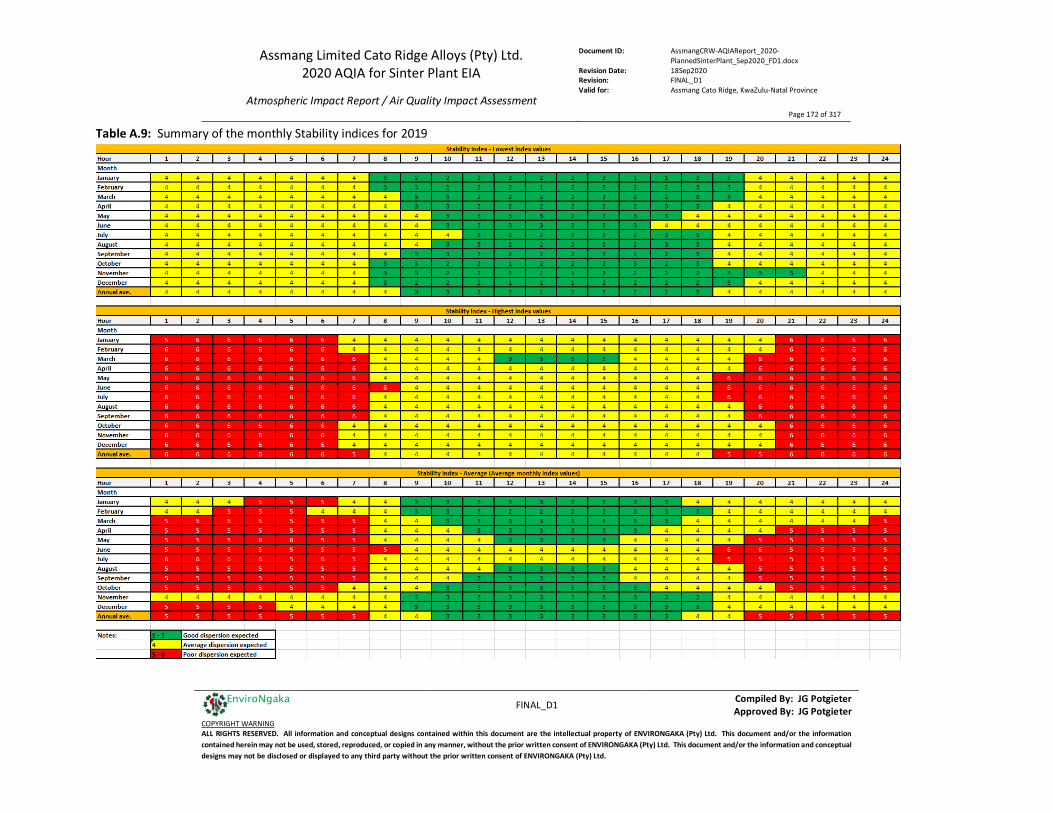
Assmang Limited Cato Ridge Alloys (Pty) Ltd. 2020 AQIA for Sinter Plant EIA
Atmospheric Impact Report / Air Quality Impact Assessment
Document ID: AssmangCRW-AQIAReport_2020-PlannedSinterPlant_Sep2020_FD1.docx
Revision Date: 18Sep2020 Revision: FINAL_D1 Valid for: Assmang Cato Ridge, KwaZulu-Natal Province
Page 172 of 317
FINAL_D1 Compiled By: JG Potgieter
Approved By: JG Potgieter COPYRIGHT WARNING ALL RIGHTS RESERVED. All information and conceptual designs contained within this document are the intellectual property of ENVIRONGAKA (Pty) Ltd. This document and/or the information contained herein may not be used, stored, reproduced, or copied in any manner, without the prior written consent of ENVIRONGAKA (Pty) Ltd. This document and/or the information and conceptual designs may not be disclosed or displayed to any third party without the prior written consent of ENVIRONGAKA (Pty) Ltd.
EnviroNgaka
Table A.9: Summary of the monthly Stability indices for 2019
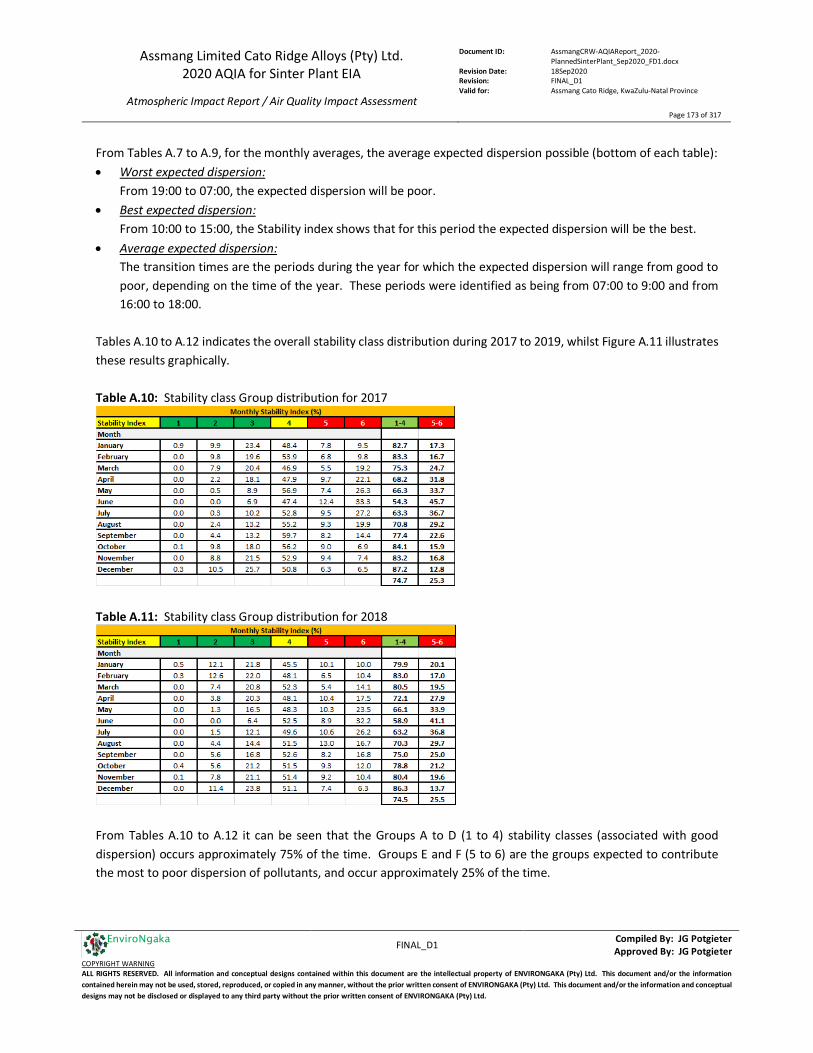
Assmang Limited Cato Ridge Alloys (Pty) Ltd. 2020 AQIA for Sinter Plant EIA
Atmospheric Impact Report / Air Quality Impact Assessment
Document ID: AssmangCRW-AQIAReport_2020-PlannedSinterPlant_Sep2020_FD1.docx
Revision Date: 18Sep2020 Revision: FINAL_D1 Valid for: Assmang Cato Ridge, KwaZulu-Natal Province
Page 173 of 317
FINAL_D1 Compiled By: JG Potgieter
Approved By: JG Potgieter COPYRIGHT WARNING ALL RIGHTS RESERVED. All information and conceptual designs contained within this document are the intellectual property of ENVIRONGAKA (Pty) Ltd. This document and/or the information contained herein may not be used, stored, reproduced, or copied in any manner, without the prior written consent of ENVIRONGAKA (Pty) Ltd. This document and/or the information and conceptual designs may not be disclosed or displayed to any third party without the prior written consent of ENVIRONGAKA (Pty) Ltd.
EnviroNgaka
From Tables A.7 to A.9, for the monthly averages, the average expected dispersion possible (bottom of each table): • Worst expected dispersion:
From 19:00 to 07:00, the expected dispersion will be poor. • Best expected dispersion:
From 10:00 to 15:00, the Stability index shows that for this period the expected dispersion will be the best. • Average expected dispersion:
The transition times are the periods during the year for which the expected dispersion will range from good to poor, depending on the time of the year. These periods were identified as being from 07:00 to 9:00 and from 16:00 to 18:00.
Tables A.10 to A.12 indicates the overall stability class distribution during 2017 to 2019, whilst Figure A.11 illustrates these results graphically. Table A.10: Stability class Group distribution for 2017
Table A.11: Stability class Group distribution for 2018
From Tables A.10 to A.12 it can be seen that the Groups A to D (1 to 4) stability classes (associated with good dispersion) occurs approximately 75% of the time. Groups E and F (5 to 6) are the groups expected to contribute the most to poor dispersion of pollutants, and occur approximately 25% of the time.
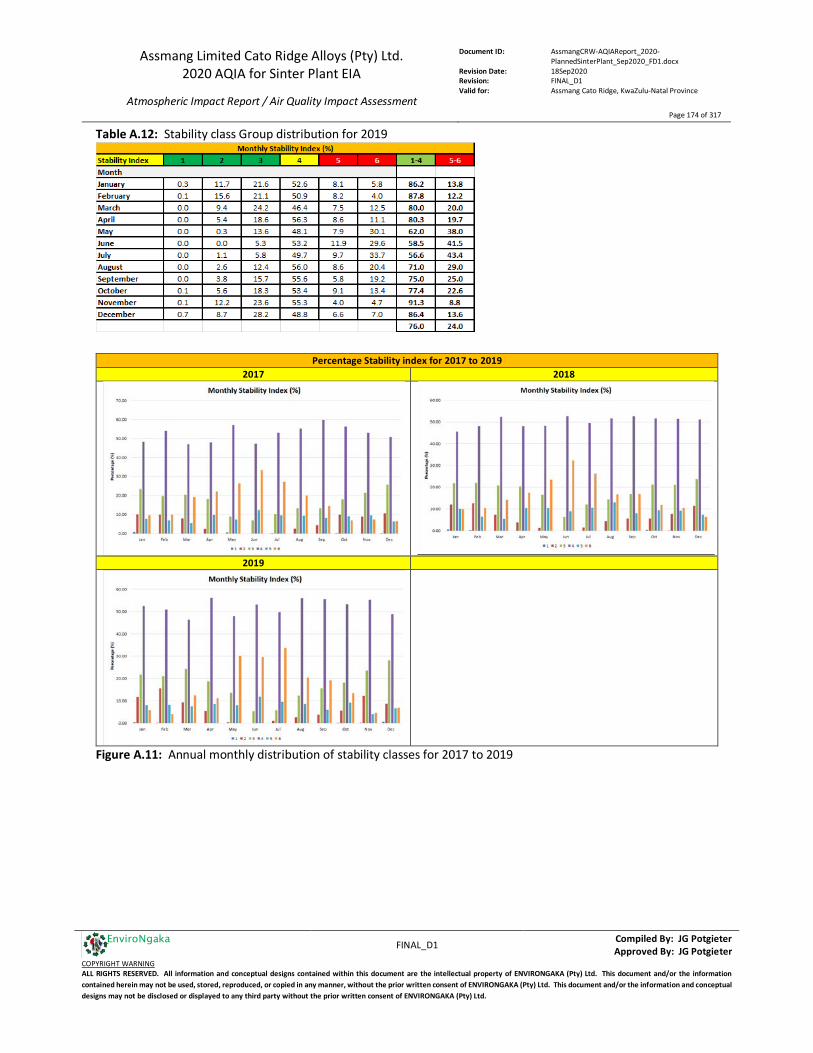
Assmang Limited Cato Ridge Alloys (Pty) Ltd. 2020 AQIA for Sinter Plant EIA
Atmospheric Impact Report / Air Quality Impact Assessment
Document ID: AssmangCRW-AQIAReport_2020-PlannedSinterPlant_Sep2020_FD1.docx
Revision Date: 18Sep2020 Revision: FINAL_D1 Valid for: Assmang Cato Ridge, KwaZulu-Natal Province
Page 174 of 317
FINAL_D1 Compiled By: JG Potgieter
Approved By: JG Potgieter COPYRIGHT WARNING ALL RIGHTS RESERVED. All information and conceptual designs contained within this document are the intellectual property of ENVIRONGAKA (Pty) Ltd. This document and/or the information contained herein may not be used, stored, reproduced, or copied in any manner, without the prior written consent of ENVIRONGAKA (Pty) Ltd. This document and/or the information and conceptual designs may not be disclosed or displayed to any third party without the prior written consent of ENVIRONGAKA (Pty) Ltd.
EnviroNgaka
Table A.12: Stability class Group distribution for 2019
Percentage Stability index for 2017 to 2019 2017 2018
2019
Figure A.11: Annual monthly distribution of stability classes for 2017 to 2019

Assmang Limited Cato Ridge Alloys (Pty) Ltd. 2020 AQIA for Sinter Plant EIA
Atmospheric Impact Report / Air Quality Impact Assessment
Document ID: AssmangCRW-AQIAReport_2020-PlannedSinterPlant_Sep2020_FD1.docx
Revision Date: 18Sep2020 Revision: FINAL_D1 Valid for: Assmang Cato Ridge, KwaZulu-Natal Province
Page 175 of 317
FINAL_D1 Compiled By: JG Potgieter
Approved By: JG Potgieter COPYRIGHT WARNING ALL RIGHTS RESERVED. All information and conceptual designs contained within this document are the intellectual property of ENVIRONGAKA (Pty) Ltd. This document and/or the information contained herein may not be used, stored, reproduced, or copied in any manner, without the prior written consent of ENVIRONGAKA (Pty) Ltd. This document and/or the information and conceptual designs may not be disclosed or displayed to any third party without the prior written consent of ENVIRONGAKA (Pty) Ltd.
EnviroNgaka
Tables A.13 to A.15 summarises the average hourly calculated mixing height for the specific months. These calculated mixing height varies between the low heights during 01:00 to 10:00 and 18:00 to 24:00, to maximum heights of ± 450 meters during 12:00 to 16:00. Table A.13: Hourly average mixing height for 2017
Table A.14: Hourly average mixing height for 2018
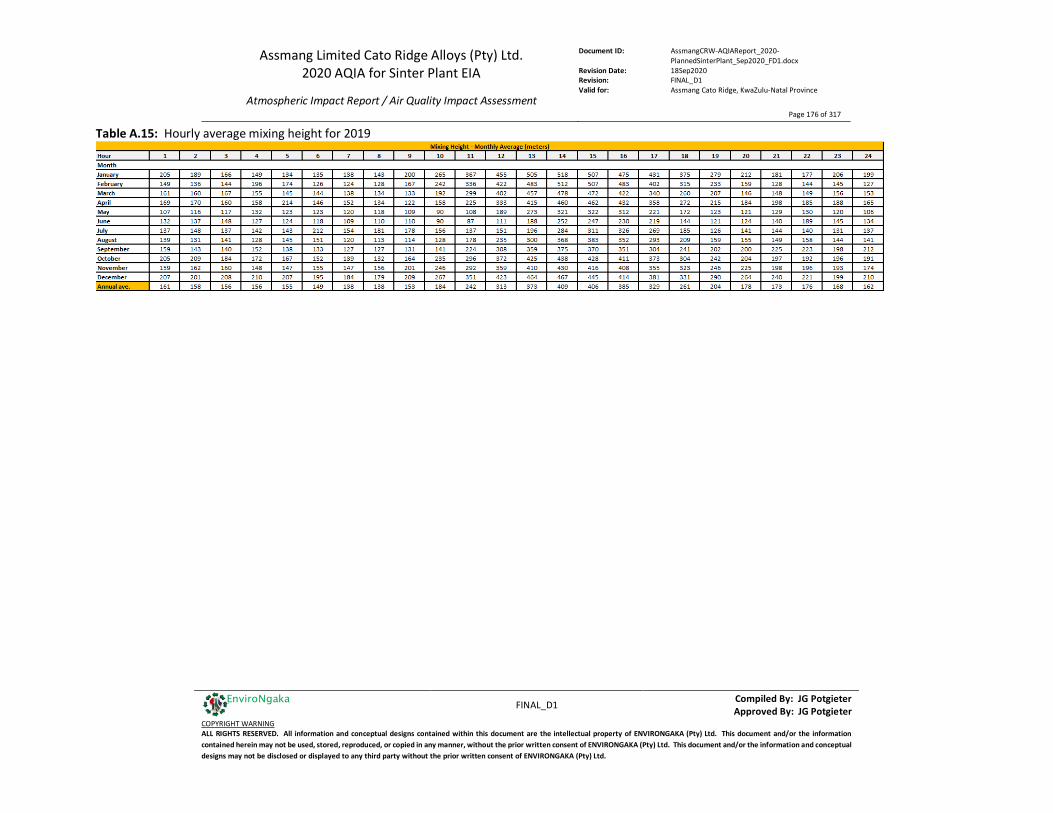
Assmang Limited Cato Ridge Alloys (Pty) Ltd. 2020 AQIA for Sinter Plant EIA
Atmospheric Impact Report / Air Quality Impact Assessment
Document ID: AssmangCRW-AQIAReport_2020-PlannedSinterPlant_Sep2020_FD1.docx
Revision Date: 18Sep2020 Revision: FINAL_D1 Valid for: Assmang Cato Ridge, KwaZulu-Natal Province
Page 176 of 317
FINAL_D1 Compiled By: JG Potgieter
Approved By: JG Potgieter COPYRIGHT WARNING ALL RIGHTS RESERVED. All information and conceptual designs contained within this document are the intellectual property of ENVIRONGAKA (Pty) Ltd. This document and/or the information contained herein may not be used, stored, reproduced, or copied in any manner, without the prior written consent of ENVIRONGAKA (Pty) Ltd. This document and/or the information and conceptual designs may not be disclosed or displayed to any third party without the prior written consent of ENVIRONGAKA (Pty) Ltd.
EnviroNgaka
Table A.15: Hourly average mixing height for 2019
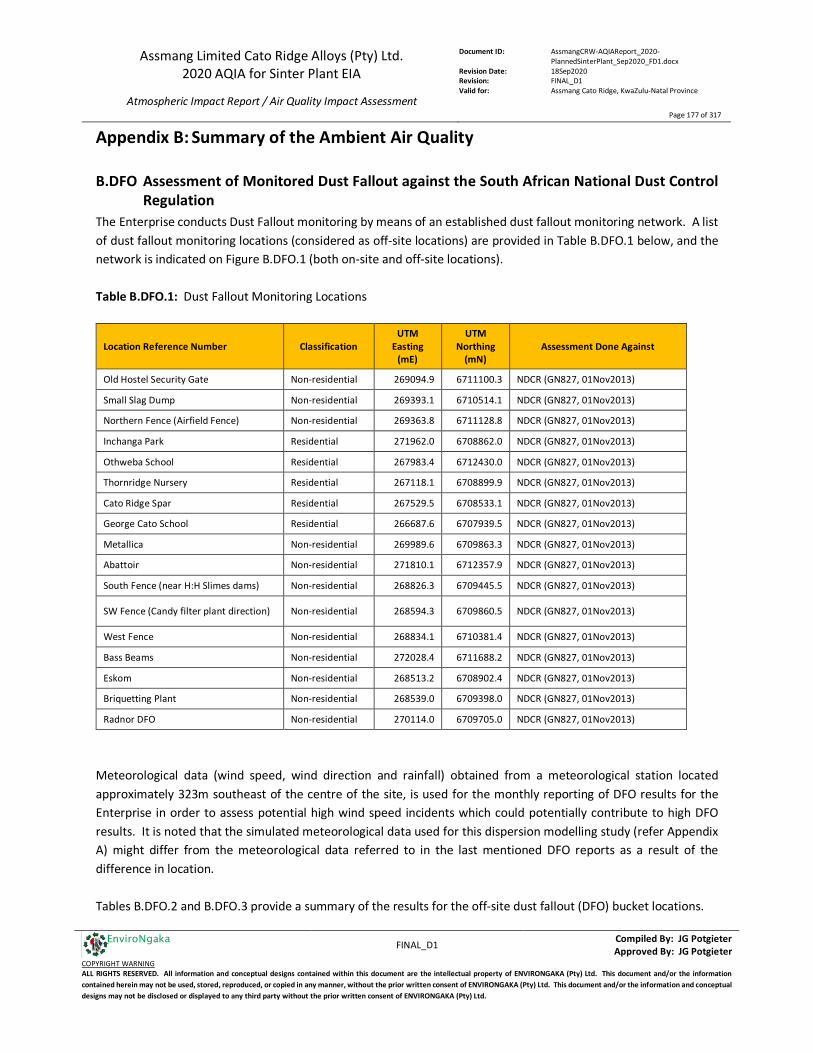
Assmang Limited Cato Ridge Alloys (Pty) Ltd. 2020 AQIA for Sinter Plant EIA
Atmospheric Impact Report / Air Quality Impact Assessment
Document ID: AssmangCRW-AQIAReport_2020-PlannedSinterPlant_Sep2020_FD1.docx
Revision Date: 18Sep2020 Revision: FINAL_D1 Valid for: Assmang Cato Ridge, KwaZulu-Natal Province
Page 177 of 317
FINAL_D1 Compiled By: JG Potgieter
Approved By: JG Potgieter COPYRIGHT WARNING ALL RIGHTS RESERVED. All information and conceptual designs contained within this document are the intellectual property of ENVIRONGAKA (Pty) Ltd. This document and/or the information contained herein may not be used, stored, reproduced, or copied in any manner, without the prior written consent of ENVIRONGAKA (Pty) Ltd. This document and/or the information and conceptual designs may not be disclosed or displayed to any third party without the prior written consent of ENVIRONGAKA (Pty) Ltd.
EnviroNgaka
Appendix B: Summary of the Ambient Air Quality
B.DFO Assessment of Monitored Dust Fallout against the South African National Dust Control Regulation
The Enterprise conducts Dust Fallout monitoring by means of an established dust fallout monitoring network. A list of dust fallout monitoring locations (considered as off-site locations) are provided in Table B.DFO.1 below, and the network is indicated on Figure B.DFO.1 (both on-site and off-site locations). Table B.DFO.1: Dust Fallout Monitoring Locations
Location Reference Number Classification UTM
Easting (mE)
UTM Northing
(mN) Assessment Done Against
Old Hostel Security Gate Non-residential 269094.9 6711100.3 NDCR (GN827, 01Nov2013)
Small Slag Dump Non-residential 269393.1 6710514.1 NDCR (GN827, 01Nov2013)
Northern Fence (Airfield Fence) Non-residential 269363.8 6711128.8 NDCR (GN827, 01Nov2013)
Inchanga Park Residential 271962.0 6708862.0 NDCR (GN827, 01Nov2013)
Othweba School Residential 267983.4 6712430.0 NDCR (GN827, 01Nov2013)
Thornridge Nursery Residential 267118.1 6708899.9 NDCR (GN827, 01Nov2013)
Cato Ridge Spar Residential 267529.5 6708533.1 NDCR (GN827, 01Nov2013)
George Cato School Residential 266687.6 6707939.5 NDCR (GN827, 01Nov2013)
Metallica Non-residential 269989.6 6709863.3 NDCR (GN827, 01Nov2013)
Abattoir Non-residential 271810.1 6712357.9 NDCR (GN827, 01Nov2013)
South Fence (near H:H Slimes dams) Non-residential 268826.3 6709445.5 NDCR (GN827, 01Nov2013)
SW Fence (Candy filter plant direction) Non-residential 268594.3 6709860.5 NDCR (GN827, 01Nov2013)
West Fence Non-residential 268834.1 6710381.4 NDCR (GN827, 01Nov2013)
Bass Beams Non-residential 272028.4 6711688.2 NDCR (GN827, 01Nov2013)
Eskom Non-residential 268513.2 6708902.4 NDCR (GN827, 01Nov2013)
Briquetting Plant Non-residential 268539.0 6709398.0 NDCR (GN827, 01Nov2013)
Radnor DFO Non-residential 270114.0 6709705.0 NDCR (GN827, 01Nov2013)
Meteorological data (wind speed, wind direction and rainfall) obtained from a meteorological station located approximately 323m southeast of the centre of the site, is used for the monthly reporting of DFO results for the Enterprise in order to assess potential high wind speed incidents which could potentially contribute to high DFO results. It is noted that the simulated meteorological data used for this dispersion modelling study (refer Appendix A) might differ from the meteorological data referred to in the last mentioned DFO reports as a result of the difference in location. Tables B.DFO.2 and B.DFO.3 provide a summary of the results for the off-site dust fallout (DFO) bucket locations.

Assmang Limited Cato Ridge Alloys (Pty) Ltd. 2020 AQIA for Sinter Plant EIA
Atmospheric Impact Report / Air Quality Impact Assessment
Document ID: AssmangCRW-AQIAReport_2020-PlannedSinterPlant_Sep2020_FD1.docx
Revision Date: 18Sep2020 Revision: FINAL_D1 Valid for: Assmang Cato Ridge, KwaZulu-Natal Province
Page 178 of 317
FINAL_D1 Compiled By: JG Potgieter
Approved By: JG Potgieter COPYRIGHT WARNING ALL RIGHTS RESERVED. All information and conceptual designs contained within this document are the intellectual property of ENVIRONGAKA (Pty) Ltd. This document and/or the information contained herein may not be used, stored, reproduced, or copied in any manner, without the prior written consent of ENVIRONGAKA (Pty) Ltd. This document and/or the information and conceptual designs may not be disclosed or displayed to any third party without the prior written consent of ENVIRONGAKA (Pty) Ltd.
EnviroNgaka
Figure B.DFO.1: Dust Fallout monitoring locations
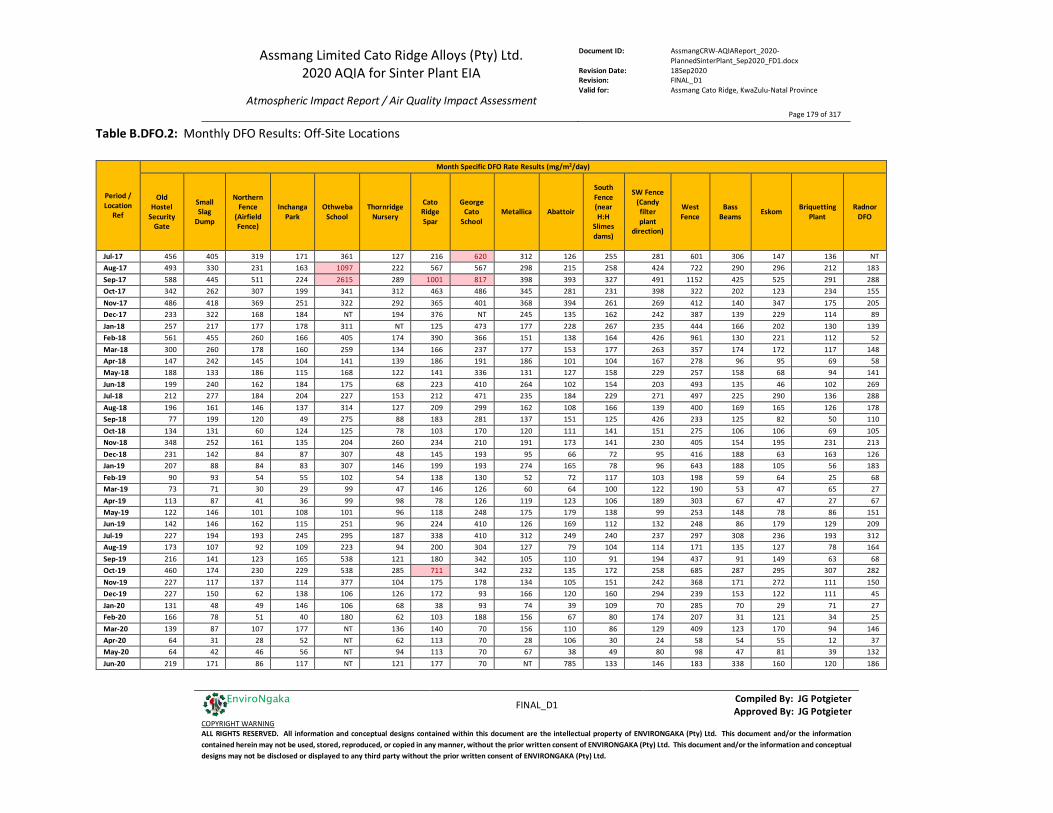
Assmang Limited Cato Ridge Alloys (Pty) Ltd. 2020 AQIA for Sinter Plant EIA
Atmospheric Impact Report / Air Quality Impact Assessment
Document ID: AssmangCRW-AQIAReport_2020-PlannedSinterPlant_Sep2020_FD1.docx
Revision Date: 18Sep2020 Revision: FINAL_D1 Valid for: Assmang Cato Ridge, KwaZulu-Natal Province
Page 179 of 317
FINAL_D1 Compiled By: JG Potgieter
Approved By: JG Potgieter COPYRIGHT WARNING ALL RIGHTS RESERVED. All information and conceptual designs contained within this document are the intellectual property of ENVIRONGAKA (Pty) Ltd. This document and/or the information contained herein may not be used, stored, reproduced, or copied in any manner, without the prior written consent of ENVIRONGAKA (Pty) Ltd. This document and/or the information and conceptual designs may not be disclosed or displayed to any third party without the prior written consent of ENVIRONGAKA (Pty) Ltd.
EnviroNgaka
Table B.DFO.2: Monthly DFO Results: Off-Site Locations
Period / Location
Ref
Month Specific DFO Rate Results (mg/m2/day)
Old Hostel
Security Gate
Small Slag
Dump
Northern Fence
(Airfield Fence)
Inchanga Park
Othweba School
Thornridge Nursery
Cato Ridge Spar
George Cato
School Metallica Abattoir
South Fence (near H:H
Slimes dams)
SW Fence (Candy filter plant
direction)
West Fence
Bass Beams
Eskom Briquetting Plant
Radnor DFO
Jul-17 456 405 319 171 361 127 216 620 312 126 255 281 601 306 147 136 NT Aug-17 493 330 231 163 1097 222 567 567 298 215 258 424 722 290 296 212 183 Sep-17 588 445 511 224 2615 289 1001 817 398 393 327 491 1152 425 525 291 288 Oct-17 342 262 307 199 341 312 463 486 345 281 231 398 322 202 123 234 155 Nov-17 486 418 369 251 322 292 365 401 368 394 261 269 412 140 347 175 205 Dec-17 233 322 168 184 NT 194 376 NT 245 135 162 242 387 139 229 114 89 Jan-18 257 217 177 178 311 NT 125 473 177 228 267 235 444 166 202 130 139 Feb-18 561 455 260 166 405 174 390 366 151 138 164 426 961 130 221 112 52 Mar-18 300 260 178 160 259 134 166 237 177 153 177 263 357 174 172 117 148 Apr-18 147 242 145 104 141 139 186 191 186 101 104 167 278 96 95 69 58 May-18 188 133 186 115 168 122 141 336 131 127 158 229 257 158 68 94 141 Jun-18 199 240 162 184 175 68 223 410 264 102 154 203 493 135 46 102 269 Jul-18 212 277 184 204 227 153 212 471 235 184 229 271 497 225 290 136 288 Aug-18 196 161 146 137 314 127 209 299 162 108 166 139 400 169 165 126 178 Sep-18 77 199 120 49 275 88 183 281 137 151 125 426 233 125 82 50 110 Oct-18 134 131 60 124 125 78 103 170 120 111 141 151 275 106 106 69 105 Nov-18 348 252 161 135 204 260 234 210 191 173 141 230 405 154 195 231 213 Dec-18 231 142 84 87 307 48 145 193 95 66 72 95 416 188 63 163 126 Jan-19 207 88 84 83 307 146 199 193 274 165 78 96 643 188 105 56 183 Feb-19 90 93 54 55 102 54 138 130 52 72 117 103 198 59 64 25 68 Mar-19 73 71 30 29 99 47 146 126 60 64 100 122 190 53 47 65 27 Apr-19 113 87 41 36 99 98 78 126 119 123 106 189 303 67 47 27 67 May-19 122 146 101 108 101 96 118 248 175 179 138 99 253 148 78 86 151 Jun-19 142 146 162 115 251 96 224 410 126 169 112 132 248 86 179 129 209 Jul-19 227 194 193 245 295 187 338 410 312 249 240 237 297 308 236 193 312 Aug-19 173 107 92 109 223 94 200 304 127 79 104 114 171 135 127 78 164 Sep-19 216 141 123 165 538 121 180 342 105 110 91 194 437 91 149 63 68 Oct-19 460 174 230 229 538 285 711 342 232 135 172 258 685 287 295 307 282 Nov-19 227 117 137 114 377 104 175 178 134 105 151 242 368 171 272 111 150 Dec-19 227 150 62 138 106 126 172 93 166 120 160 294 239 153 122 111 45 Jan-20 131 48 49 146 106 68 38 93 74 39 109 70 285 70 29 71 27 Feb-20 166 78 51 40 180 62 103 188 156 67 80 174 207 31 121 34 25 Mar-20 139 87 107 177 NT 136 140 70 156 110 86 129 409 123 170 94 146 Apr-20 64 31 28 52 NT 62 113 70 28 106 30 24 58 54 55 12 37 May-20 64 42 46 56 NT 94 113 70 67 38 49 80 98 47 81 39 132 Jun-20 219 171 86 117 NT 121 177 70 NT 785 133 146 183 338 160 120 186

Assmang Limited Cato Ridge Alloys (Pty) Ltd. 2020 AQIA for Sinter Plant EIA
Atmospheric Impact Report / Air Quality Impact Assessment
Document ID: AssmangCRW-AQIAReport_2020-PlannedSinterPlant_Sep2020_FD1.docx
Revision Date: 18Sep2020 Revision: FINAL_D1 Valid for: Assmang Cato Ridge, KwaZulu-Natal Province
Page 180 of 317
FINAL_D1 Compiled By: JG Potgieter
Approved By: JG Potgieter COPYRIGHT WARNING ALL RIGHTS RESERVED. All information and conceptual designs contained within this document are the intellectual property of ENVIRONGAKA (Pty) Ltd. This document and/or the information contained herein may not be used, stored, reproduced, or copied in any manner, without the prior written consent of ENVIRONGAKA (Pty) Ltd. This document and/or the information and conceptual designs may not be disclosed or displayed to any third party without the prior written consent of ENVIRONGAKA (Pty) Ltd.
EnviroNgaka
Table B.DFO.3: Rolling Annual Average DFO Results: Off-Site Locations
Period / Location
Ref
Rolling Annual Average DFO Rates (mg/m2/day)
Old Hostel
Security Gate
Small Slag
Dump
Northern Fence
(Airfield Fence)
Inchanga Park
Othweba School
Thornridge Nursery
Cato Ridge Spar
George Cato
School Metallica Abattoir
South Fence (near H:H
Slimes dams)
SW Fence (Candy filter plant
direction)
West Fence
Bass Beams
Eskom Briquetting Plant
Radnor DFO
Jun-18 354 311 251 175 563 189 351 446 254 199 210 302 532 197 206 149 157 Jul-18 334 300 240 178 551 191 351 432 248 204 207 302 524 190 218 149 168 Aug-18 309 286 233 175 480 182 321 408 237 195 200 278 497 180 207 142 168 Sep-18 266 265 200 161 267 164 253 359 215 175 183 272 420 155 170 122 153 Oct-18 249 255 180 155 247 143 223 331 196 161 176 252 416 147 168 108 149 Nov-18 238 241 162 145 237 140 212 313 181 143 166 249 416 148 156 113 149 Dec-18 237 226 155 137 243 126 193 303 169 137 158 236 418 152 142 117 152 Jan-19 233 215 148 129 242 128 199 280 177 132 142 225 435 154 134 110 156 Feb-19 194 185 130 120 217 118 178 260 169 126 138 198 371 148 121 103 157 Mar-19 175 169 118 109 204 111 176 251 159 119 132 186 357 138 110 99 147 Apr-19 172 156 109 103 200 107 167 245 153 121 132 188 359 136 106 95 148 May-19 167 157 102 102 195 105 165 238 157 125 131 177 359 135 107 95 149 Jun-19 162 149 102 97 201 107 166 238 145 130 127 171 338 131 118 97 144 Jul-19 163 143 103 100 207 110 176 233 152 136 128 168 322 138 114 102 146 Aug-19 161 138 99 98 199 107 175 233 149 133 123 166 303 135 111 98 145 Sep-19 173 133 99 108 221 110 175 239 146 130 120 147 320 132 116 99 141 Oct-19 200 137 113 116 255 127 226 253 156 132 123 156 354 147 132 119 156 Nov-19 190 125 111 115 270 115 221 250 151 126 123 157 351 148 138 109 151 Dec-19 190 126 109 119 253 121 223 242 157 131 131 173 336 145 143 104 144 Jan-20 183 123 106 124 236 115 210 234 140 120 133 171 306 136 137 106 131 Feb-20 190 122 106 123 243 115 207 238 149 120 130 177 307 133 142 106 127 Mar-20 195 123 112 135 256 123 206 234 157 124 129 178 325 139 152 109 137 Apr-20 191 118 111 136 272 120 209 229 149 123 123 164 305 138 153 107 135 May-20 186 110 107 132 290 120 209 214 140 111 115 162 292 130 153 103 133 Jun-20 193 112 100 132 295 122 205 186 141 162 117 164 286 151 151 103 131
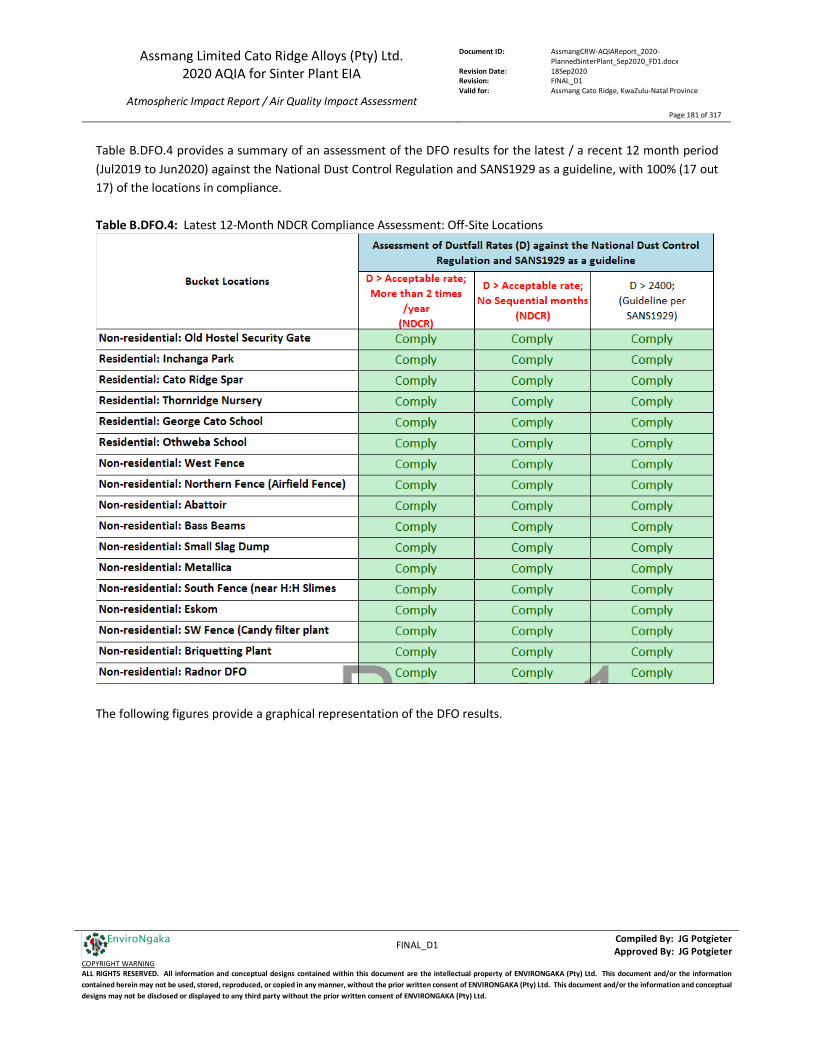
Assmang Limited Cato Ridge Alloys (Pty) Ltd. 2020 AQIA for Sinter Plant EIA
Atmospheric Impact Report / Air Quality Impact Assessment
Document ID: AssmangCRW-AQIAReport_2020-PlannedSinterPlant_Sep2020_FD1.docx
Revision Date: 18Sep2020 Revision: FINAL_D1 Valid for: Assmang Cato Ridge, KwaZulu-Natal Province
Page 181 of 317
FINAL_D1 Compiled By: JG Potgieter
Approved By: JG Potgieter COPYRIGHT WARNING ALL RIGHTS RESERVED. All information and conceptual designs contained within this document are the intellectual property of ENVIRONGAKA (Pty) Ltd. This document and/or the information contained herein may not be used, stored, reproduced, or copied in any manner, without the prior written consent of ENVIRONGAKA (Pty) Ltd. This document and/or the information and conceptual designs may not be disclosed or displayed to any third party without the prior written consent of ENVIRONGAKA (Pty) Ltd.
EnviroNgaka
Table B.DFO.4 provides a summary of an assessment of the DFO results for the latest / a recent 12 month period (Jul2019 to Jun2020) against the National Dust Control Regulation and SANS1929 as a guideline, with 100% (17 out 17) of the locations in compliance. Table B.DFO.4: Latest 12-Month NDCR Compliance Assessment: Off-Site Locations
The following figures provide a graphical representation of the DFO results.
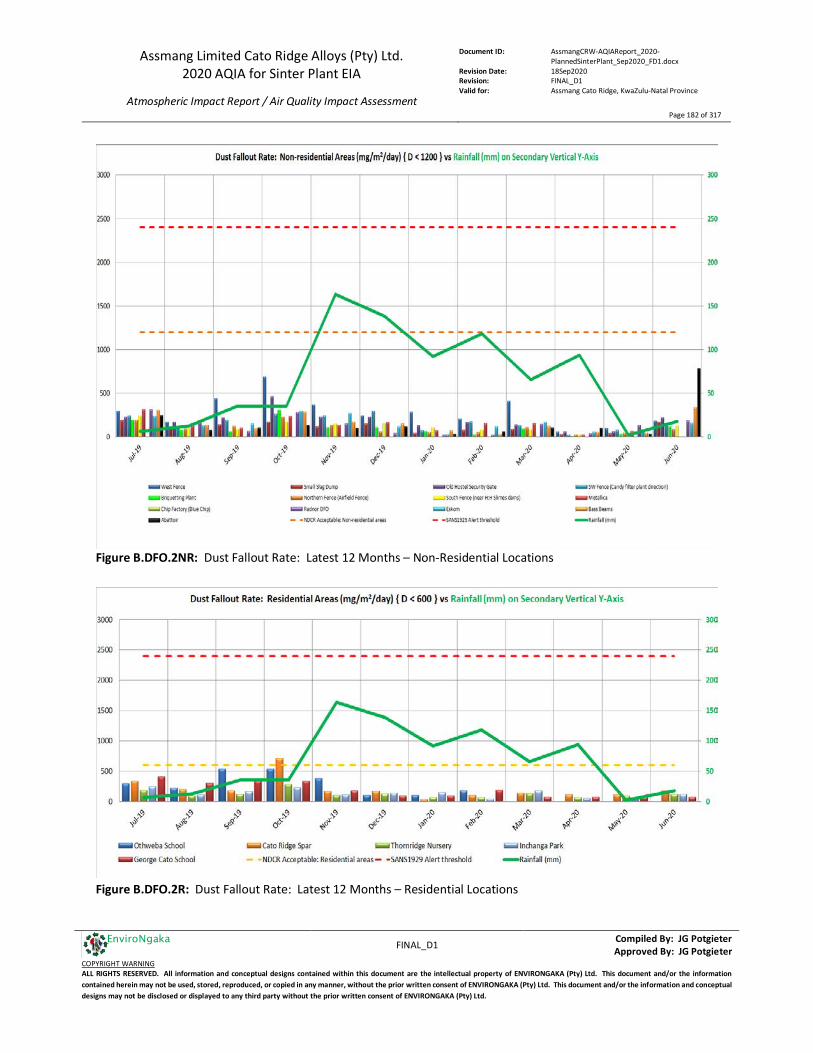
Assmang Limited Cato Ridge Alloys (Pty) Ltd. 2020 AQIA for Sinter Plant EIA
Atmospheric Impact Report / Air Quality Impact Assessment
Document ID: AssmangCRW-AQIAReport_2020-PlannedSinterPlant_Sep2020_FD1.docx
Revision Date: 18Sep2020 Revision: FINAL_D1 Valid for: Assmang Cato Ridge, KwaZulu-Natal Province
Page 182 of 317
FINAL_D1 Compiled By: JG Potgieter
Approved By: JG Potgieter COPYRIGHT WARNING ALL RIGHTS RESERVED. All information and conceptual designs contained within this document are the intellectual property of ENVIRONGAKA (Pty) Ltd. This document and/or the information contained herein may not be used, stored, reproduced, or copied in any manner, without the prior written consent of ENVIRONGAKA (Pty) Ltd. This document and/or the information and conceptual designs may not be disclosed or displayed to any third party without the prior written consent of ENVIRONGAKA (Pty) Ltd.
EnviroNgaka
Figure B.DFO.2NR: Dust Fallout Rate: Latest 12 Months – Non-Residential Locations
Figure B.DFO.2R: Dust Fallout Rate: Latest 12 Months – Residential Locations

Assmang Limited Cato Ridge Alloys (Pty) Ltd. 2020 AQIA for Sinter Plant EIA
Atmospheric Impact Report / Air Quality Impact Assessment
Document ID: AssmangCRW-AQIAReport_2020-PlannedSinterPlant_Sep2020_FD1.docx
Revision Date: 18Sep2020 Revision: FINAL_D1 Valid for: Assmang Cato Ridge, KwaZulu-Natal Province
Page 183 of 317
FINAL_D1 Compiled By: JG Potgieter
Approved By: JG Potgieter COPYRIGHT WARNING ALL RIGHTS RESERVED. All information and conceptual designs contained within this document are the intellectual property of ENVIRONGAKA (Pty) Ltd. This document and/or the information contained herein may not be used, stored, reproduced, or copied in any manner, without the prior written consent of ENVIRONGAKA (Pty) Ltd. This document and/or the information and conceptual designs may not be disclosed or displayed to any third party without the prior written consent of ENVIRONGAKA (Pty) Ltd.
EnviroNgaka
Figure B.DFO.3NR: Dust Fallout Rate: Rolling Annual Averages – Non-Residential Locations
Figure B.DFO.3R: Dust Fallout Rate: Rolling Annual Averages – Residential Locations
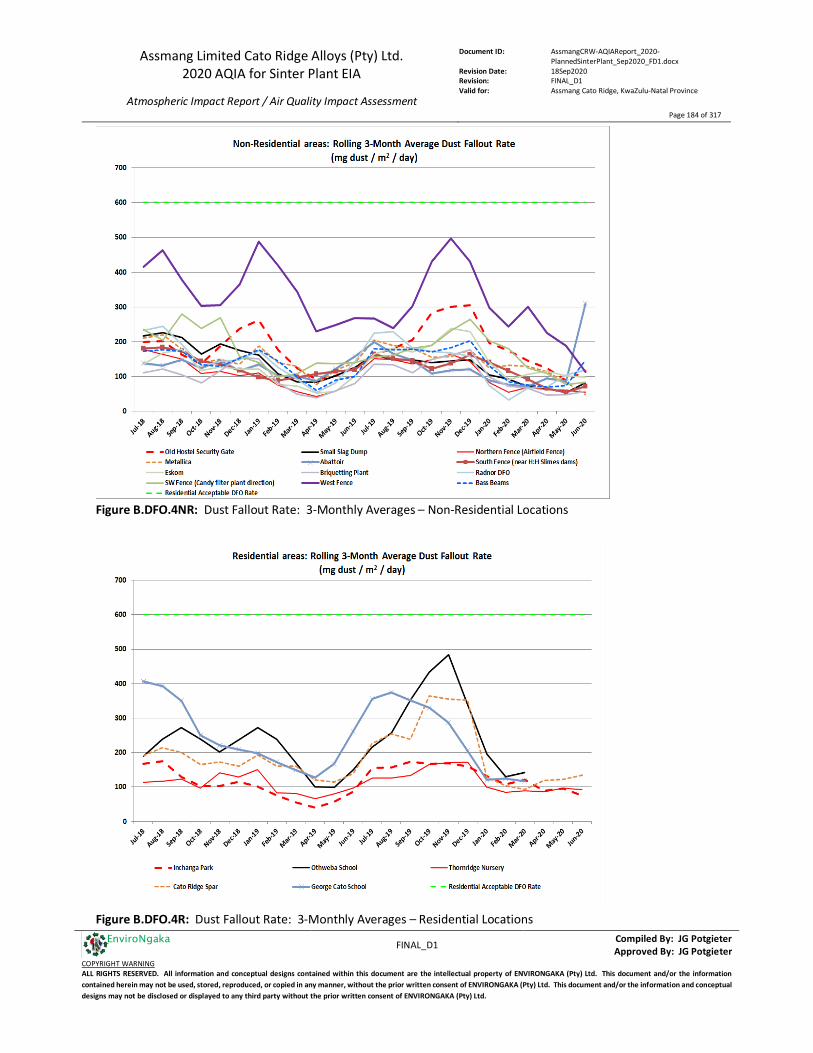
Assmang Limited Cato Ridge Alloys (Pty) Ltd. 2020 AQIA for Sinter Plant EIA
Atmospheric Impact Report / Air Quality Impact Assessment
Document ID: AssmangCRW-AQIAReport_2020-PlannedSinterPlant_Sep2020_FD1.docx
Revision Date: 18Sep2020 Revision: FINAL_D1 Valid for: Assmang Cato Ridge, KwaZulu-Natal Province
Page 184 of 317
FINAL_D1 Compiled By: JG Potgieter
Approved By: JG Potgieter COPYRIGHT WARNING ALL RIGHTS RESERVED. All information and conceptual designs contained within this document are the intellectual property of ENVIRONGAKA (Pty) Ltd. This document and/or the information contained herein may not be used, stored, reproduced, or copied in any manner, without the prior written consent of ENVIRONGAKA (Pty) Ltd. This document and/or the information and conceptual designs may not be disclosed or displayed to any third party without the prior written consent of ENVIRONGAKA (Pty) Ltd.
EnviroNgaka
Figure B.DFO.4NR: Dust Fallout Rate: 3-Monthly Averages – Non-Residential Locations
Figure B.DFO.4R: Dust Fallout Rate: 3-Monthly Averages – Residential Locations
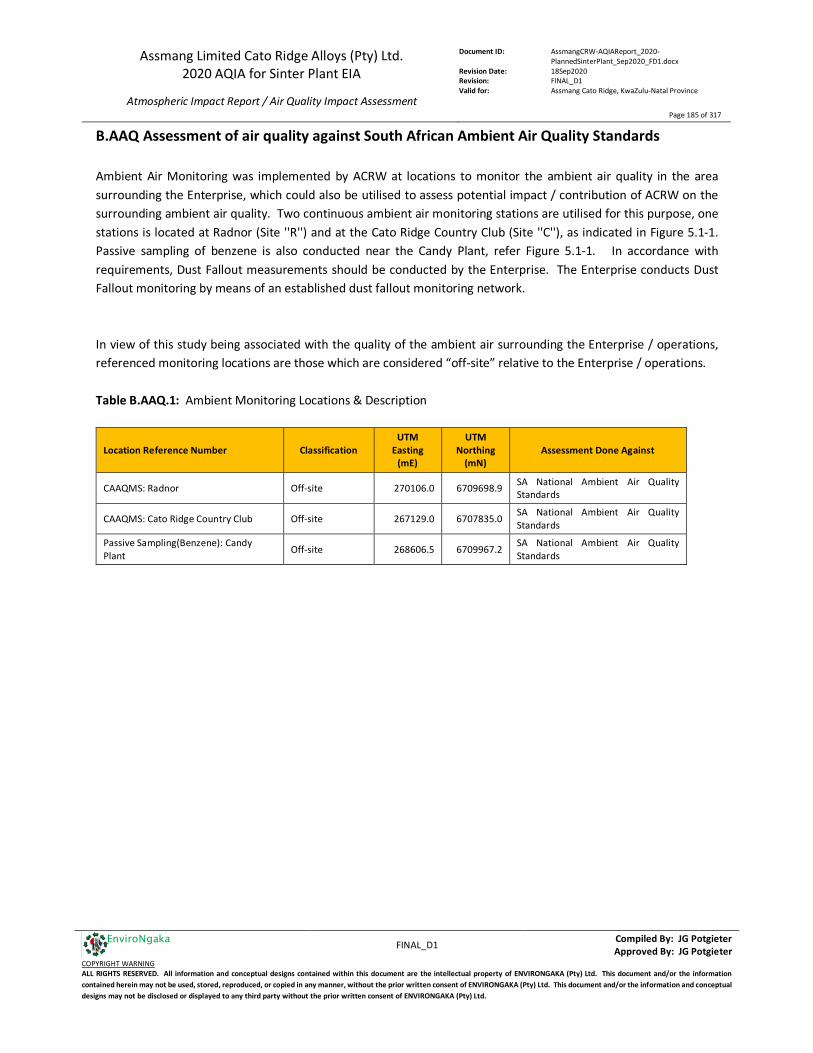
Assmang Limited Cato Ridge Alloys (Pty) Ltd. 2020 AQIA for Sinter Plant EIA
Atmospheric Impact Report / Air Quality Impact Assessment
Document ID: AssmangCRW-AQIAReport_2020-PlannedSinterPlant_Sep2020_FD1.docx
Revision Date: 18Sep2020 Revision: FINAL_D1 Valid for: Assmang Cato Ridge, KwaZulu-Natal Province
Page 185 of 317
FINAL_D1 Compiled By: JG Potgieter
Approved By: JG Potgieter COPYRIGHT WARNING ALL RIGHTS RESERVED. All information and conceptual designs contained within this document are the intellectual property of ENVIRONGAKA (Pty) Ltd. This document and/or the information contained herein may not be used, stored, reproduced, or copied in any manner, without the prior written consent of ENVIRONGAKA (Pty) Ltd. This document and/or the information and conceptual designs may not be disclosed or displayed to any third party without the prior written consent of ENVIRONGAKA (Pty) Ltd.
EnviroNgaka
B.AAQ Assessment of air quality against South African Ambient Air Quality Standards Ambient Air Monitoring was implemented by ACRW at locations to monitor the ambient air quality in the area surrounding the Enterprise, which could also be utilised to assess potential impact / contribution of ACRW on the surrounding ambient air quality. Two continuous ambient air monitoring stations are utilised for this purpose, one stations is located at Radnor (Site ''R'') and at the Cato Ridge Country Club (Site ''C''), as indicated in Figure 5.1-1. Passive sampling of benzene is also conducted near the Candy Plant, refer Figure 5.1-1. In accordance with requirements, Dust Fallout measurements should be conducted by the Enterprise. The Enterprise conducts Dust Fallout monitoring by means of an established dust fallout monitoring network. In view of this study being associated with the quality of the ambient air surrounding the Enterprise / operations, referenced monitoring locations are those which are considered “off-site” relative to the Enterprise / operations. Table B.AAQ.1: Ambient Monitoring Locations & Description
Location Reference Number Classification UTM
Easting (mE)
UTM Northing
(mN) Assessment Done Against
CAAQMS: Radnor Off-site 270106.0 6709698.9 SA National Ambient Air Quality Standards
CAAQMS: Cato Ridge Country Club Off-site 267129.0 6707835.0 SA National Ambient Air Quality Standards
Passive Sampling(Benzene): Candy Plant Off-site 268606.5 6709967.2
SA National Ambient Air Quality Standards

Assmang Limited Cato Ridge Alloys (Pty) Ltd. 2020 AQIA for Sinter Plant EIA
Atmospheric Impact Report / Air Quality Impact Assessment
Document ID: AssmangCRW-AQIAReport_2020-PlannedSinterPlant_Sep2020_FD1.docx
Revision Date: 18Sep2020 Revision: FINAL_D1 Valid for: Assmang Cato Ridge, KwaZulu-Natal Province
Page 186 of 317
FINAL_D1 Compiled By: JG Potgieter
Approved By: JG Potgieter COPYRIGHT WARNING ALL RIGHTS RESERVED. All information and conceptual designs contained within this document are the intellectual property of ENVIRONGAKA (Pty) Ltd. This document and/or the information contained herein may not be used, stored, reproduced, or copied in any manner, without the prior written consent of ENVIRONGAKA (Pty) Ltd. This document and/or the information and conceptual designs may not be disclosed or displayed to any third party without the prior written consent of ENVIRONGAKA (Pty) Ltd.
EnviroNgaka
Figure B.AAQ.1: Ambient Air Quality Monitoring Locations
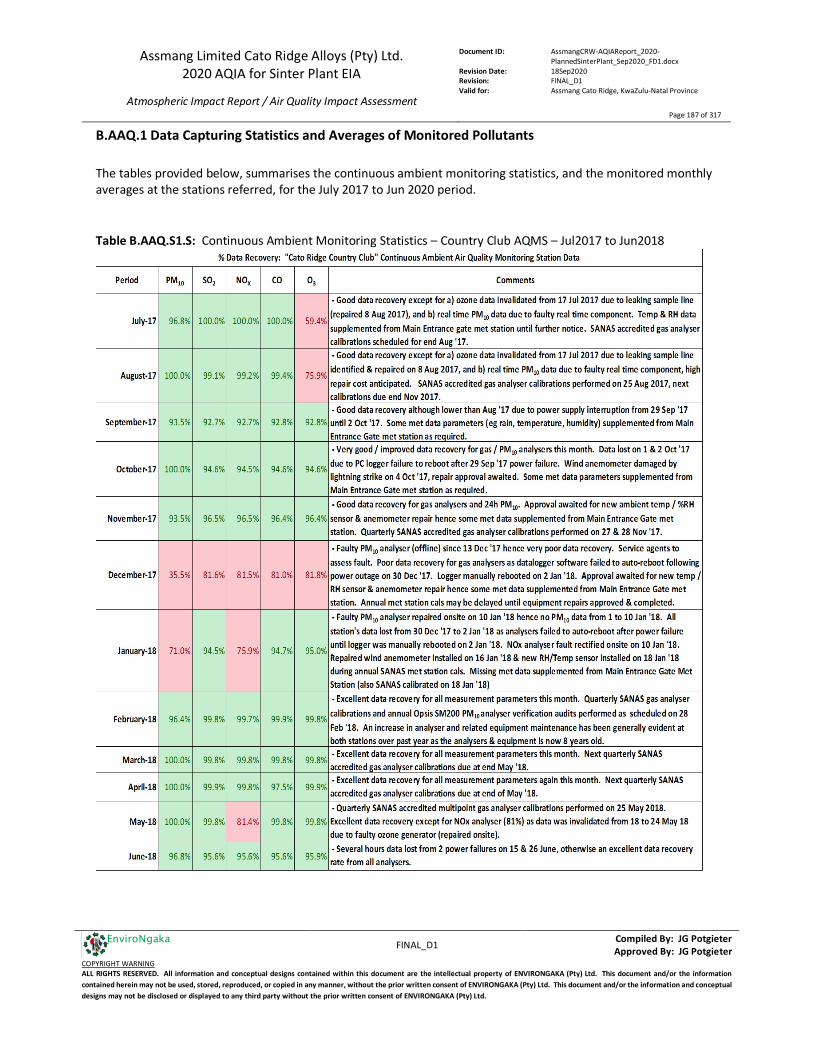
Assmang Limited Cato Ridge Alloys (Pty) Ltd. 2020 AQIA for Sinter Plant EIA
Atmospheric Impact Report / Air Quality Impact Assessment
Document ID: AssmangCRW-AQIAReport_2020-PlannedSinterPlant_Sep2020_FD1.docx
Revision Date: 18Sep2020 Revision: FINAL_D1 Valid for: Assmang Cato Ridge, KwaZulu-Natal Province
Page 187 of 317
FINAL_D1 Compiled By: JG Potgieter
Approved By: JG Potgieter COPYRIGHT WARNING ALL RIGHTS RESERVED. All information and conceptual designs contained within this document are the intellectual property of ENVIRONGAKA (Pty) Ltd. This document and/or the information contained herein may not be used, stored, reproduced, or copied in any manner, without the prior written consent of ENVIRONGAKA (Pty) Ltd. This document and/or the information and conceptual designs may not be disclosed or displayed to any third party without the prior written consent of ENVIRONGAKA (Pty) Ltd.
EnviroNgaka
B.AAQ.1 Data Capturing Statistics and Averages of Monitored Pollutants The tables provided below, summarises the continuous ambient monitoring statistics, and the monitored monthly averages at the stations referred, for the July 2017 to Jun 2020 period. Table B.AAQ.S1.S: Continuous Ambient Monitoring Statistics – Country Club AQMS – Jul2017 to Jun2018
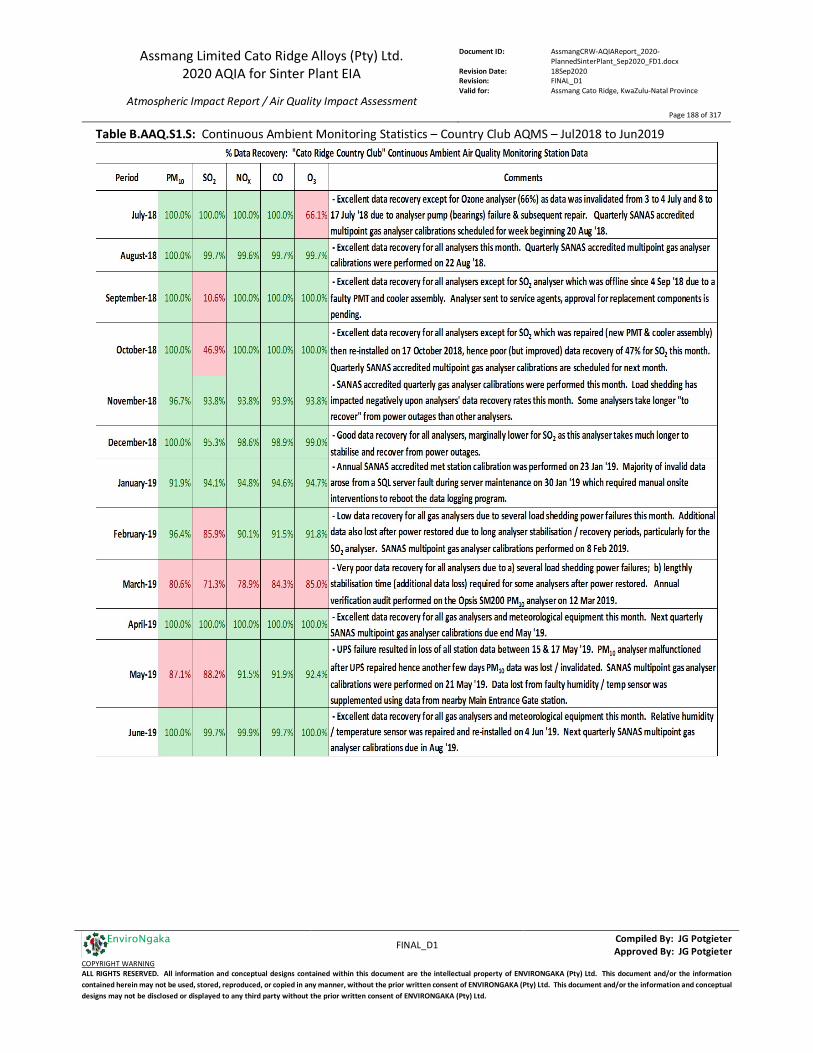
Assmang Limited Cato Ridge Alloys (Pty) Ltd. 2020 AQIA for Sinter Plant EIA
Atmospheric Impact Report / Air Quality Impact Assessment
Document ID: AssmangCRW-AQIAReport_2020-PlannedSinterPlant_Sep2020_FD1.docx
Revision Date: 18Sep2020 Revision: FINAL_D1 Valid for: Assmang Cato Ridge, KwaZulu-Natal Province
Page 188 of 317
FINAL_D1 Compiled By: JG Potgieter
Approved By: JG Potgieter COPYRIGHT WARNING ALL RIGHTS RESERVED. All information and conceptual designs contained within this document are the intellectual property of ENVIRONGAKA (Pty) Ltd. This document and/or the information contained herein may not be used, stored, reproduced, or copied in any manner, without the prior written consent of ENVIRONGAKA (Pty) Ltd. This document and/or the information and conceptual designs may not be disclosed or displayed to any third party without the prior written consent of ENVIRONGAKA (Pty) Ltd.
EnviroNgaka
Table B.AAQ.S1.S: Continuous Ambient Monitoring Statistics – Country Club AQMS – Jul2018 to Jun2019
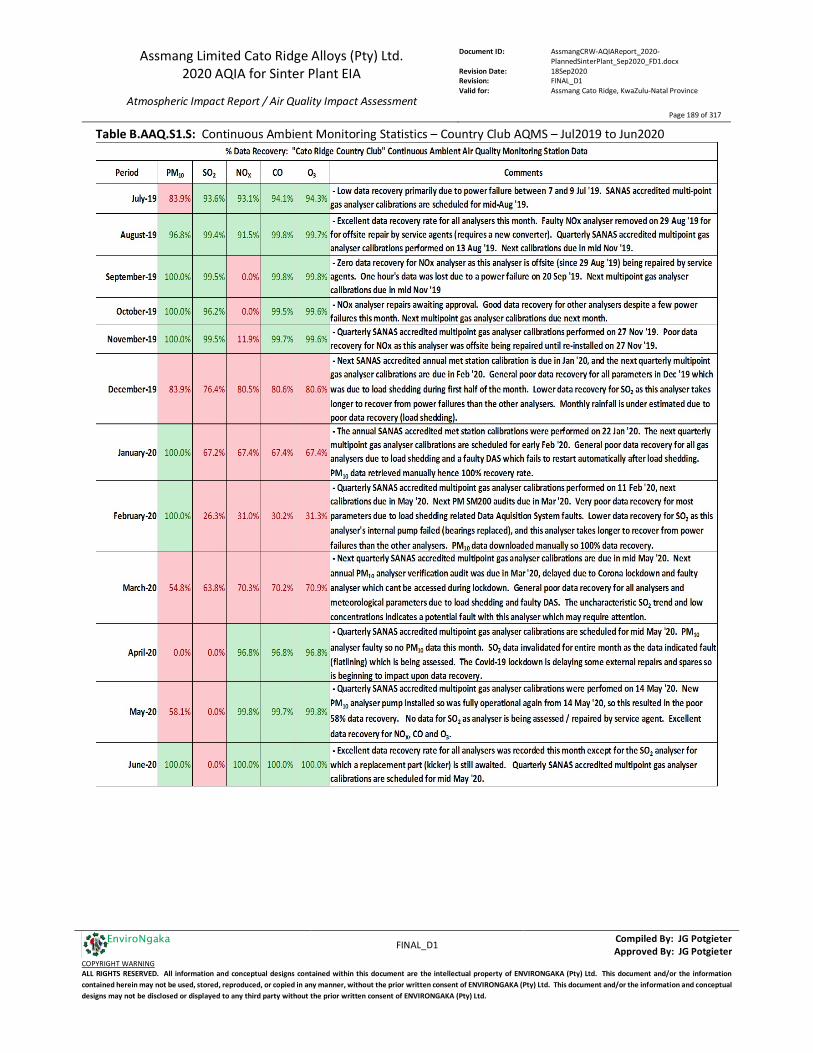
Assmang Limited Cato Ridge Alloys (Pty) Ltd. 2020 AQIA for Sinter Plant EIA
Atmospheric Impact Report / Air Quality Impact Assessment
Document ID: AssmangCRW-AQIAReport_2020-PlannedSinterPlant_Sep2020_FD1.docx
Revision Date: 18Sep2020 Revision: FINAL_D1 Valid for: Assmang Cato Ridge, KwaZulu-Natal Province
Page 189 of 317
FINAL_D1 Compiled By: JG Potgieter
Approved By: JG Potgieter COPYRIGHT WARNING ALL RIGHTS RESERVED. All information and conceptual designs contained within this document are the intellectual property of ENVIRONGAKA (Pty) Ltd. This document and/or the information contained herein may not be used, stored, reproduced, or copied in any manner, without the prior written consent of ENVIRONGAKA (Pty) Ltd. This document and/or the information and conceptual designs may not be disclosed or displayed to any third party without the prior written consent of ENVIRONGAKA (Pty) Ltd.
EnviroNgaka
Table B.AAQ.S1.S: Continuous Ambient Monitoring Statistics – Country Club AQMS – Jul2019 to Jun2020
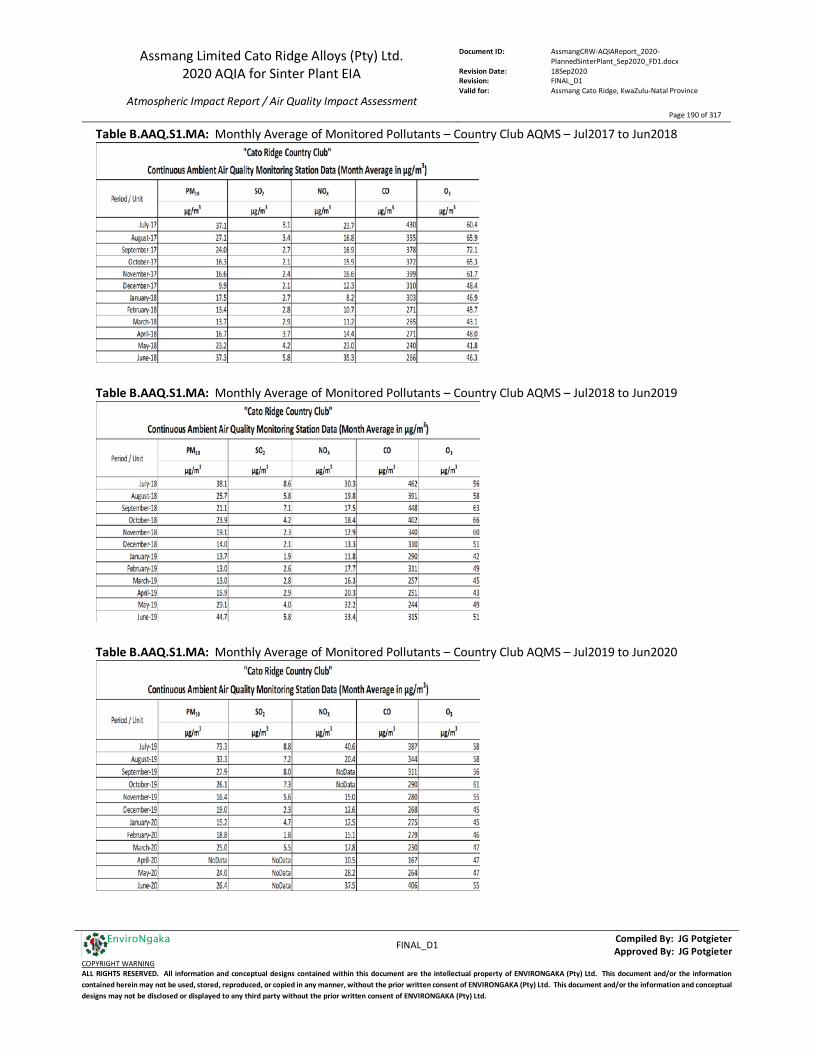
Assmang Limited Cato Ridge Alloys (Pty) Ltd. 2020 AQIA for Sinter Plant EIA
Atmospheric Impact Report / Air Quality Impact Assessment
Document ID: AssmangCRW-AQIAReport_2020-PlannedSinterPlant_Sep2020_FD1.docx
Revision Date: 18Sep2020 Revision: FINAL_D1 Valid for: Assmang Cato Ridge, KwaZulu-Natal Province
Page 190 of 317
FINAL_D1 Compiled By: JG Potgieter
Approved By: JG Potgieter COPYRIGHT WARNING ALL RIGHTS RESERVED. All information and conceptual designs contained within this document are the intellectual property of ENVIRONGAKA (Pty) Ltd. This document and/or the information contained herein may not be used, stored, reproduced, or copied in any manner, without the prior written consent of ENVIRONGAKA (Pty) Ltd. This document and/or the information and conceptual designs may not be disclosed or displayed to any third party without the prior written consent of ENVIRONGAKA (Pty) Ltd.
EnviroNgaka
Table B.AAQ.S1.MA: Monthly Average of Monitored Pollutants – Country Club AQMS – Jul2017 to Jun2018
Table B.AAQ.S1.MA: Monthly Average of Monitored Pollutants – Country Club AQMS – Jul2018 to Jun2019
Table B.AAQ.S1.MA: Monthly Average of Monitored Pollutants – Country Club AQMS – Jul2019 to Jun2020

Assmang Limited Cato Ridge Alloys (Pty) Ltd. 2020 AQIA for Sinter Plant EIA
Atmospheric Impact Report / Air Quality Impact Assessment
Document ID: AssmangCRW-AQIAReport_2020-PlannedSinterPlant_Sep2020_FD1.docx
Revision Date: 18Sep2020 Revision: FINAL_D1 Valid for: Assmang Cato Ridge, KwaZulu-Natal Province
Page 191 of 317
FINAL_D1 Compiled By: JG Potgieter
Approved By: JG Potgieter COPYRIGHT WARNING ALL RIGHTS RESERVED. All information and conceptual designs contained within this document are the intellectual property of ENVIRONGAKA (Pty) Ltd. This document and/or the information contained herein may not be used, stored, reproduced, or copied in any manner, without the prior written consent of ENVIRONGAKA (Pty) Ltd. This document and/or the information and conceptual designs may not be disclosed or displayed to any third party without the prior written consent of ENVIRONGAKA (Pty) Ltd.
EnviroNgaka
Table B.AAQ.S2.S: Continuous Ambient Monitoring Statistics – Radnor AQMS – Jul2017 to Jun2018
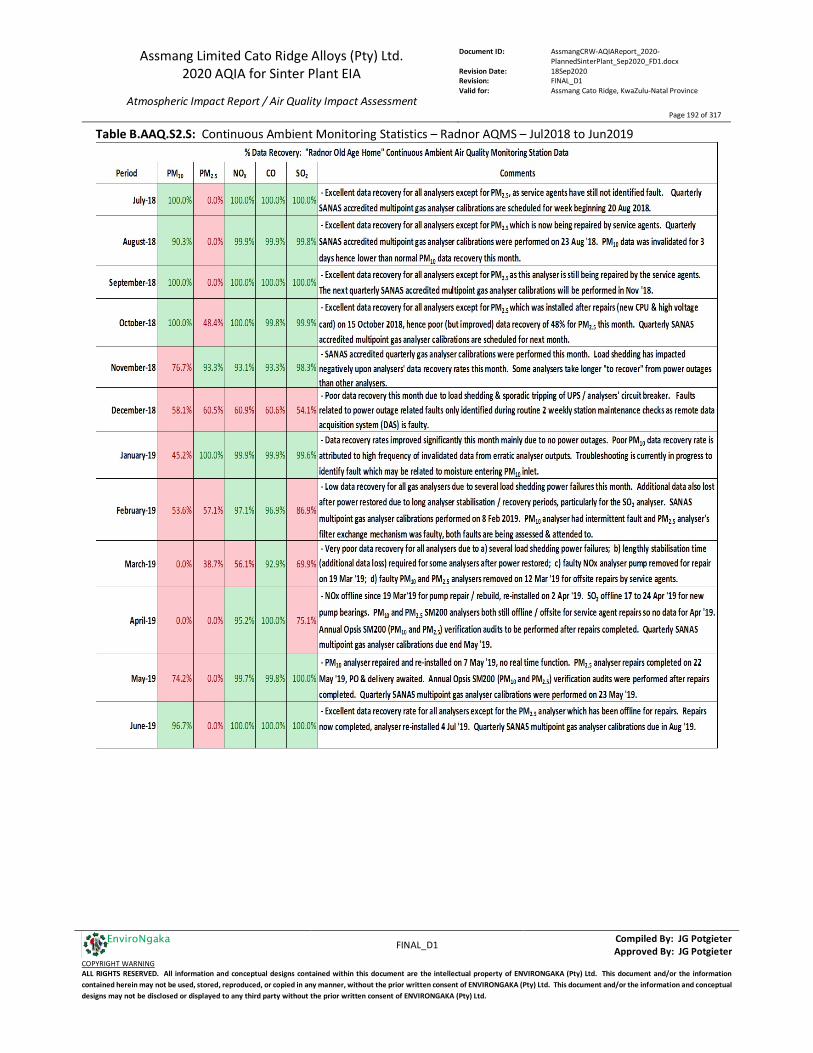
Assmang Limited Cato Ridge Alloys (Pty) Ltd. 2020 AQIA for Sinter Plant EIA
Atmospheric Impact Report / Air Quality Impact Assessment
Document ID: AssmangCRW-AQIAReport_2020-PlannedSinterPlant_Sep2020_FD1.docx
Revision Date: 18Sep2020 Revision: FINAL_D1 Valid for: Assmang Cato Ridge, KwaZulu-Natal Province
Page 192 of 317
FINAL_D1 Compiled By: JG Potgieter
Approved By: JG Potgieter COPYRIGHT WARNING ALL RIGHTS RESERVED. All information and conceptual designs contained within this document are the intellectual property of ENVIRONGAKA (Pty) Ltd. This document and/or the information contained herein may not be used, stored, reproduced, or copied in any manner, without the prior written consent of ENVIRONGAKA (Pty) Ltd. This document and/or the information and conceptual designs may not be disclosed or displayed to any third party without the prior written consent of ENVIRONGAKA (Pty) Ltd.
EnviroNgaka
Table B.AAQ.S2.S: Continuous Ambient Monitoring Statistics – Radnor AQMS – Jul2018 to Jun2019
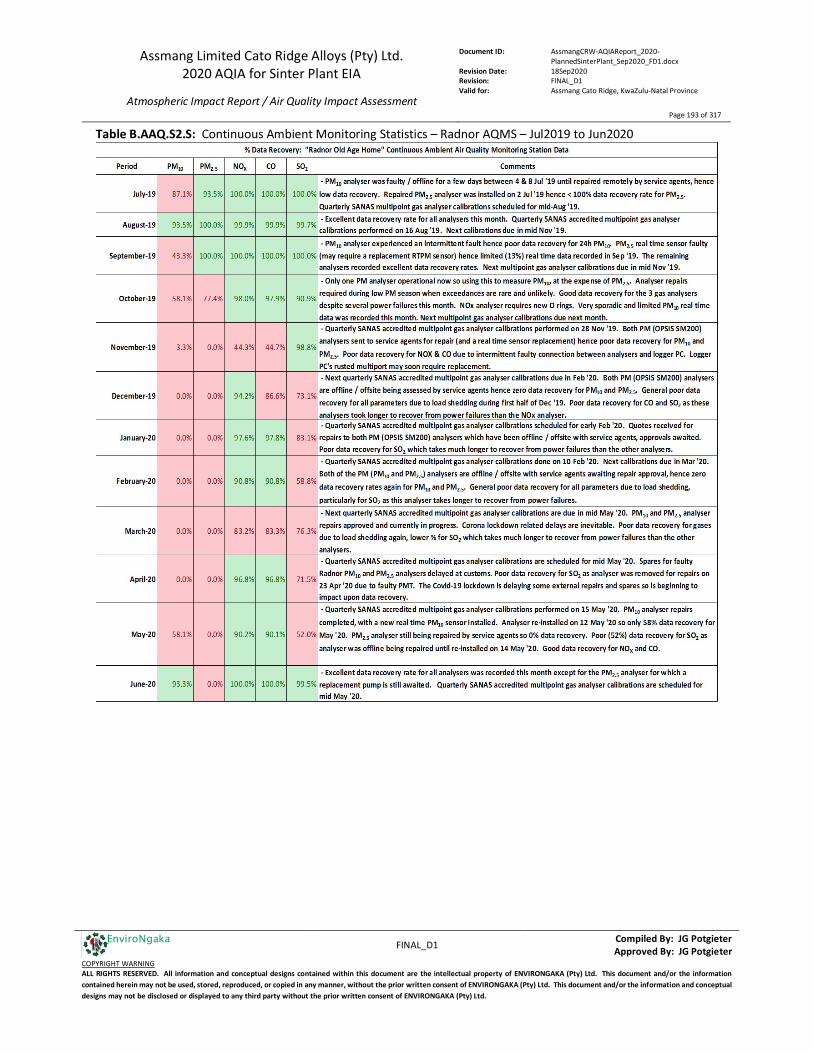
Assmang Limited Cato Ridge Alloys (Pty) Ltd. 2020 AQIA for Sinter Plant EIA
Atmospheric Impact Report / Air Quality Impact Assessment
Document ID: AssmangCRW-AQIAReport_2020-PlannedSinterPlant_Sep2020_FD1.docx
Revision Date: 18Sep2020 Revision: FINAL_D1 Valid for: Assmang Cato Ridge, KwaZulu-Natal Province
Page 193 of 317
FINAL_D1 Compiled By: JG Potgieter
Approved By: JG Potgieter COPYRIGHT WARNING ALL RIGHTS RESERVED. All information and conceptual designs contained within this document are the intellectual property of ENVIRONGAKA (Pty) Ltd. This document and/or the information contained herein may not be used, stored, reproduced, or copied in any manner, without the prior written consent of ENVIRONGAKA (Pty) Ltd. This document and/or the information and conceptual designs may not be disclosed or displayed to any third party without the prior written consent of ENVIRONGAKA (Pty) Ltd.
EnviroNgaka
Table B.AAQ.S2.S: Continuous Ambient Monitoring Statistics – Radnor AQMS – Jul2019 to Jun2020
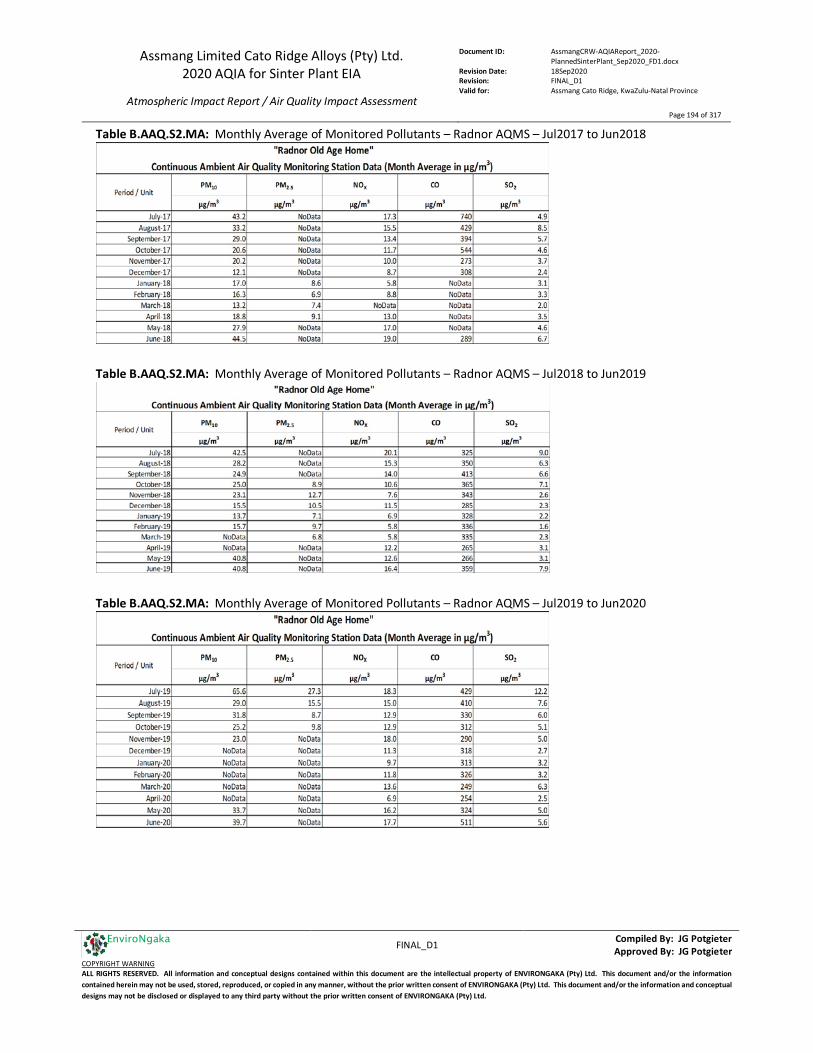
Assmang Limited Cato Ridge Alloys (Pty) Ltd. 2020 AQIA for Sinter Plant EIA
Atmospheric Impact Report / Air Quality Impact Assessment
Document ID: AssmangCRW-AQIAReport_2020-PlannedSinterPlant_Sep2020_FD1.docx
Revision Date: 18Sep2020 Revision: FINAL_D1 Valid for: Assmang Cato Ridge, KwaZulu-Natal Province
Page 194 of 317
FINAL_D1 Compiled By: JG Potgieter
Approved By: JG Potgieter COPYRIGHT WARNING ALL RIGHTS RESERVED. All information and conceptual designs contained within this document are the intellectual property of ENVIRONGAKA (Pty) Ltd. This document and/or the information contained herein may not be used, stored, reproduced, or copied in any manner, without the prior written consent of ENVIRONGAKA (Pty) Ltd. This document and/or the information and conceptual designs may not be disclosed or displayed to any third party without the prior written consent of ENVIRONGAKA (Pty) Ltd.
EnviroNgaka
Table B.AAQ.S2.MA: Monthly Average of Monitored Pollutants – Radnor AQMS – Jul2017 to Jun2018
Table B.AAQ.S2.MA: Monthly Average of Monitored Pollutants – Radnor AQMS – Jul2018 to Jun2019
Table B.AAQ.S2.MA: Monthly Average of Monitored Pollutants – Radnor AQMS – Jul2019 to Jun2020
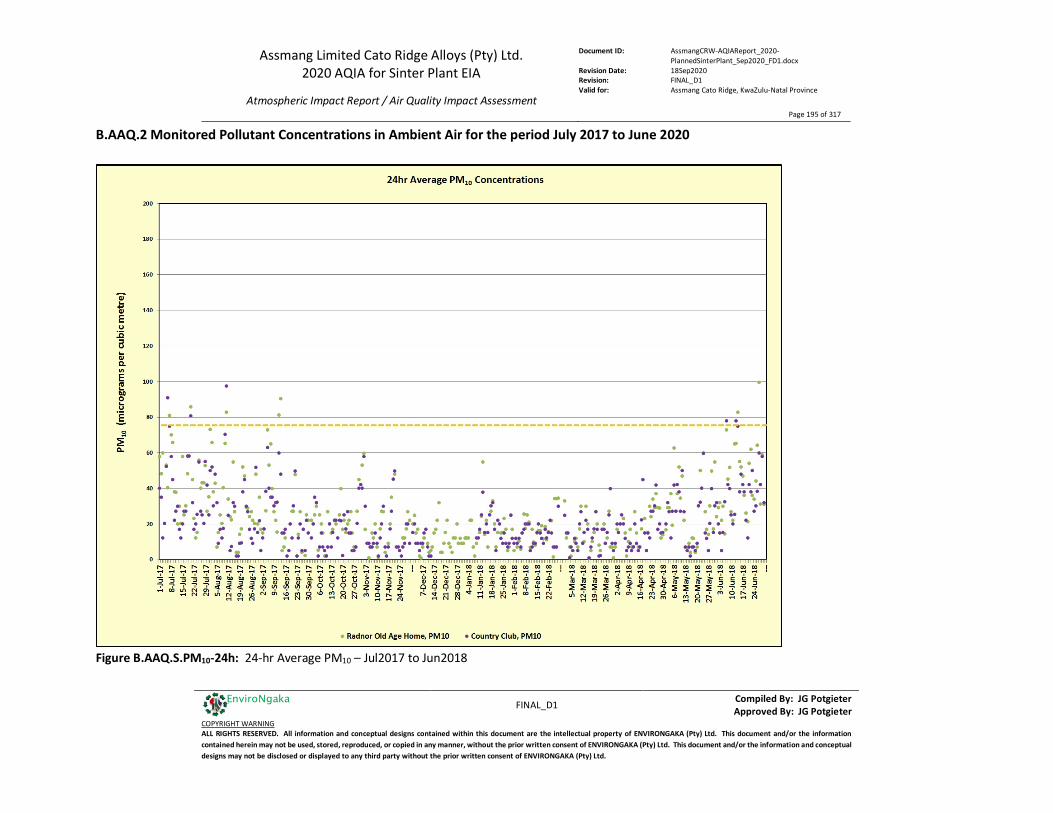
Assmang Limited Cato Ridge Alloys (Pty) Ltd. 2020 AQIA for Sinter Plant EIA
Atmospheric Impact Report / Air Quality Impact Assessment
Document ID: AssmangCRW-AQIAReport_2020-PlannedSinterPlant_Sep2020_FD1.docx
Revision Date: 18Sep2020 Revision: FINAL_D1 Valid for: Assmang Cato Ridge, KwaZulu-Natal Province
Page 195 of 317
FINAL_D1 Compiled By: JG Potgieter
Approved By: JG Potgieter COPYRIGHT WARNING ALL RIGHTS RESERVED. All information and conceptual designs contained within this document are the intellectual property of ENVIRONGAKA (Pty) Ltd. This document and/or the information contained herein may not be used, stored, reproduced, or copied in any manner, without the prior written consent of ENVIRONGAKA (Pty) Ltd. This document and/or the information and conceptual designs may not be disclosed or displayed to any third party without the prior written consent of ENVIRONGAKA (Pty) Ltd.
EnviroNgaka
B.AAQ.2 Monitored Pollutant Concentrations in Ambient Air for the period July 2017 to June 2020
Figure B.AAQ.S.PM10-24h: 24-hr Average PM10 – Jul2017 to Jun2018
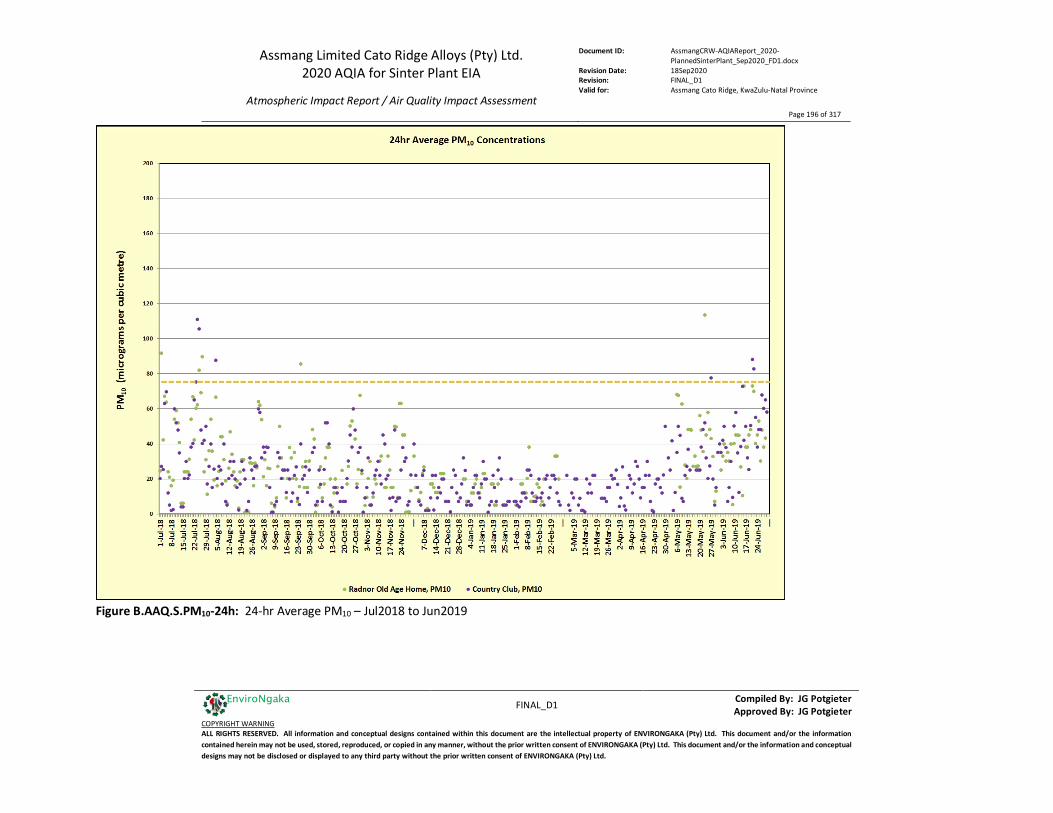
Assmang Limited Cato Ridge Alloys (Pty) Ltd. 2020 AQIA for Sinter Plant EIA
Atmospheric Impact Report / Air Quality Impact Assessment
Document ID: AssmangCRW-AQIAReport_2020-PlannedSinterPlant_Sep2020_FD1.docx
Revision Date: 18Sep2020 Revision: FINAL_D1 Valid for: Assmang Cato Ridge, KwaZulu-Natal Province
Page 196 of 317
FINAL_D1 Compiled By: JG Potgieter
Approved By: JG Potgieter COPYRIGHT WARNING ALL RIGHTS RESERVED. All information and conceptual designs contained within this document are the intellectual property of ENVIRONGAKA (Pty) Ltd. This document and/or the information contained herein may not be used, stored, reproduced, or copied in any manner, without the prior written consent of ENVIRONGAKA (Pty) Ltd. This document and/or the information and conceptual designs may not be disclosed or displayed to any third party without the prior written consent of ENVIRONGAKA (Pty) Ltd.
EnviroNgaka
Figure B.AAQ.S.PM10-24h: 24-hr Average PM10 – Jul2018 to Jun2019
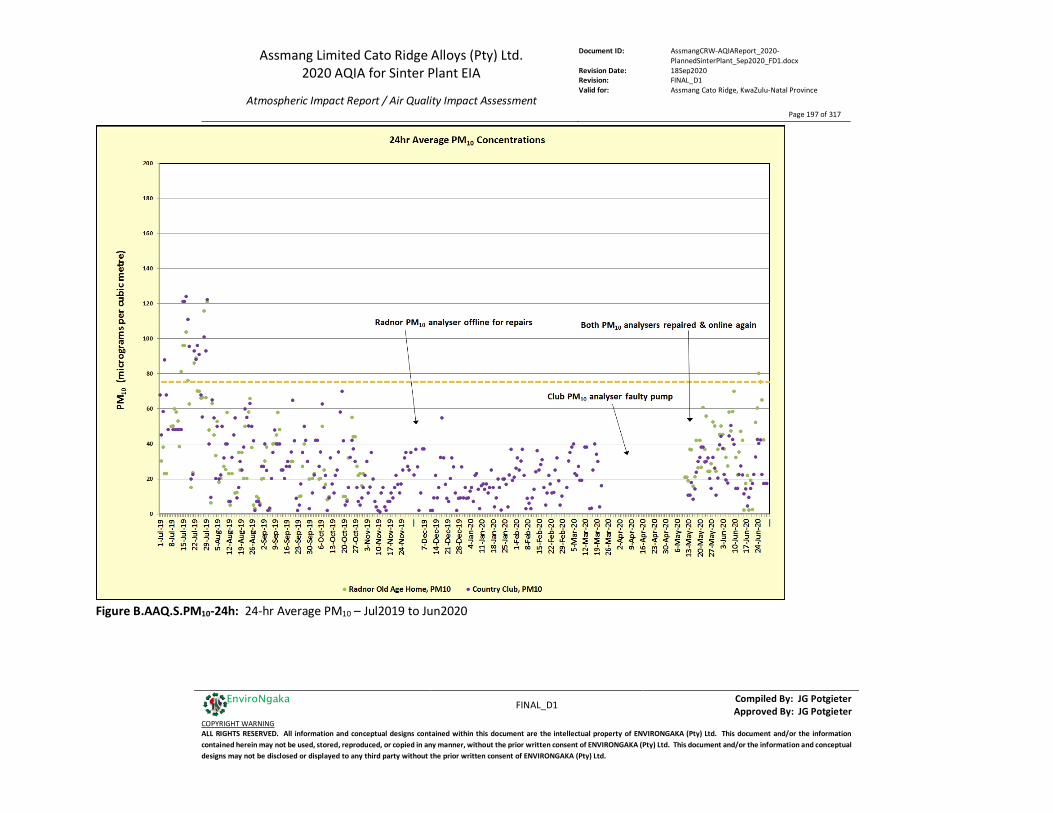
Assmang Limited Cato Ridge Alloys (Pty) Ltd. 2020 AQIA for Sinter Plant EIA
Atmospheric Impact Report / Air Quality Impact Assessment
Document ID: AssmangCRW-AQIAReport_2020-PlannedSinterPlant_Sep2020_FD1.docx
Revision Date: 18Sep2020 Revision: FINAL_D1 Valid for: Assmang Cato Ridge, KwaZulu-Natal Province
Page 197 of 317
FINAL_D1 Compiled By: JG Potgieter
Approved By: JG Potgieter COPYRIGHT WARNING ALL RIGHTS RESERVED. All information and conceptual designs contained within this document are the intellectual property of ENVIRONGAKA (Pty) Ltd. This document and/or the information contained herein may not be used, stored, reproduced, or copied in any manner, without the prior written consent of ENVIRONGAKA (Pty) Ltd. This document and/or the information and conceptual designs may not be disclosed or displayed to any third party without the prior written consent of ENVIRONGAKA (Pty) Ltd.
EnviroNgaka
Figure B.AAQ.S.PM10-24h: 24-hr Average PM10 – Jul2019 to Jun2020
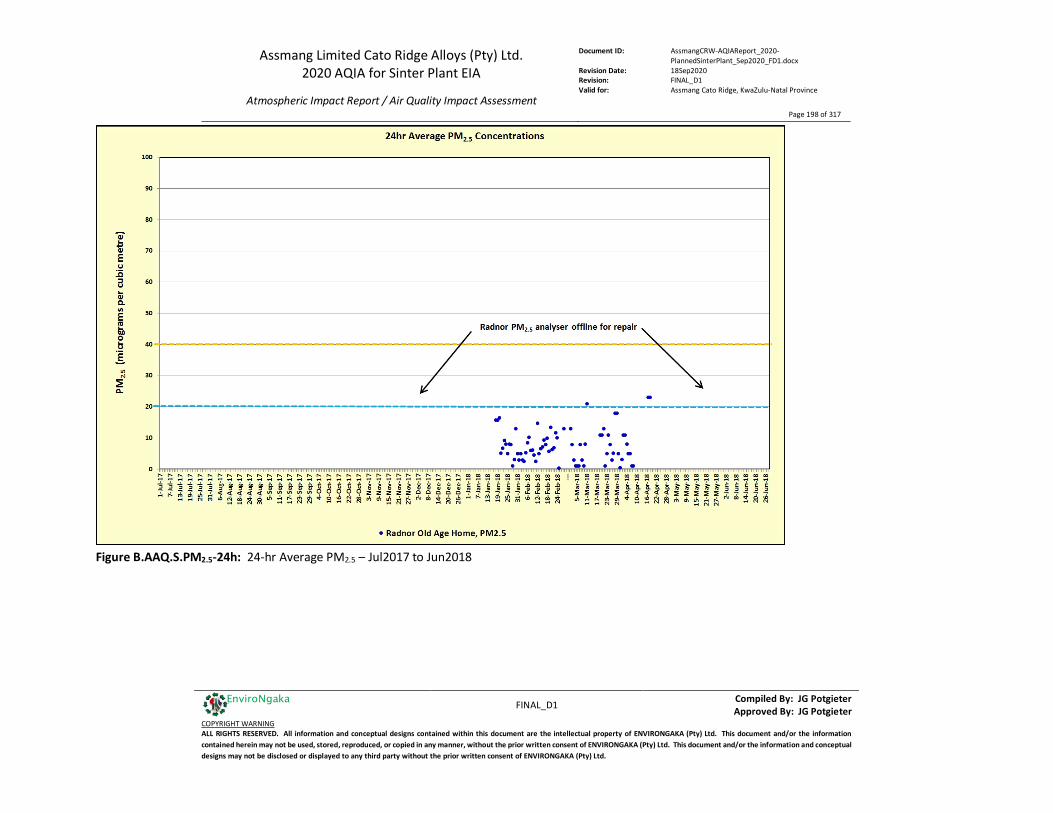
Assmang Limited Cato Ridge Alloys (Pty) Ltd. 2020 AQIA for Sinter Plant EIA
Atmospheric Impact Report / Air Quality Impact Assessment
Document ID: AssmangCRW-AQIAReport_2020-PlannedSinterPlant_Sep2020_FD1.docx
Revision Date: 18Sep2020 Revision: FINAL_D1 Valid for: Assmang Cato Ridge, KwaZulu-Natal Province
Page 198 of 317
FINAL_D1 Compiled By: JG Potgieter
Approved By: JG Potgieter COPYRIGHT WARNING ALL RIGHTS RESERVED. All information and conceptual designs contained within this document are the intellectual property of ENVIRONGAKA (Pty) Ltd. This document and/or the information contained herein may not be used, stored, reproduced, or copied in any manner, without the prior written consent of ENVIRONGAKA (Pty) Ltd. This document and/or the information and conceptual designs may not be disclosed or displayed to any third party without the prior written consent of ENVIRONGAKA (Pty) Ltd.
EnviroNgaka
Figure B.AAQ.S.PM2.5-24h: 24-hr Average PM2.5 – Jul2017 to Jun2018
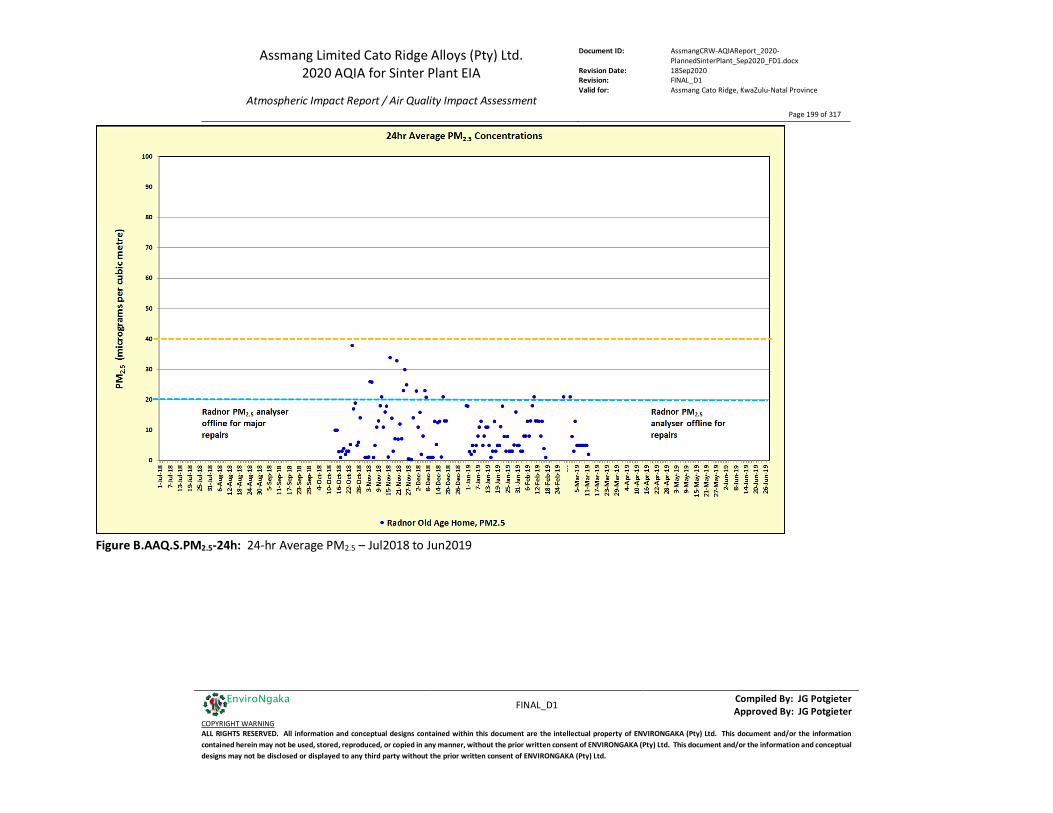
Assmang Limited Cato Ridge Alloys (Pty) Ltd. 2020 AQIA for Sinter Plant EIA
Atmospheric Impact Report / Air Quality Impact Assessment
Document ID: AssmangCRW-AQIAReport_2020-PlannedSinterPlant_Sep2020_FD1.docx
Revision Date: 18Sep2020 Revision: FINAL_D1 Valid for: Assmang Cato Ridge, KwaZulu-Natal Province
Page 199 of 317
FINAL_D1 Compiled By: JG Potgieter
Approved By: JG Potgieter COPYRIGHT WARNING ALL RIGHTS RESERVED. All information and conceptual designs contained within this document are the intellectual property of ENVIRONGAKA (Pty) Ltd. This document and/or the information contained herein may not be used, stored, reproduced, or copied in any manner, without the prior written consent of ENVIRONGAKA (Pty) Ltd. This document and/or the information and conceptual designs may not be disclosed or displayed to any third party without the prior written consent of ENVIRONGAKA (Pty) Ltd.
EnviroNgaka
Figure B.AAQ.S.PM2.5-24h: 24-hr Average PM2.5 – Jul2018 to Jun2019
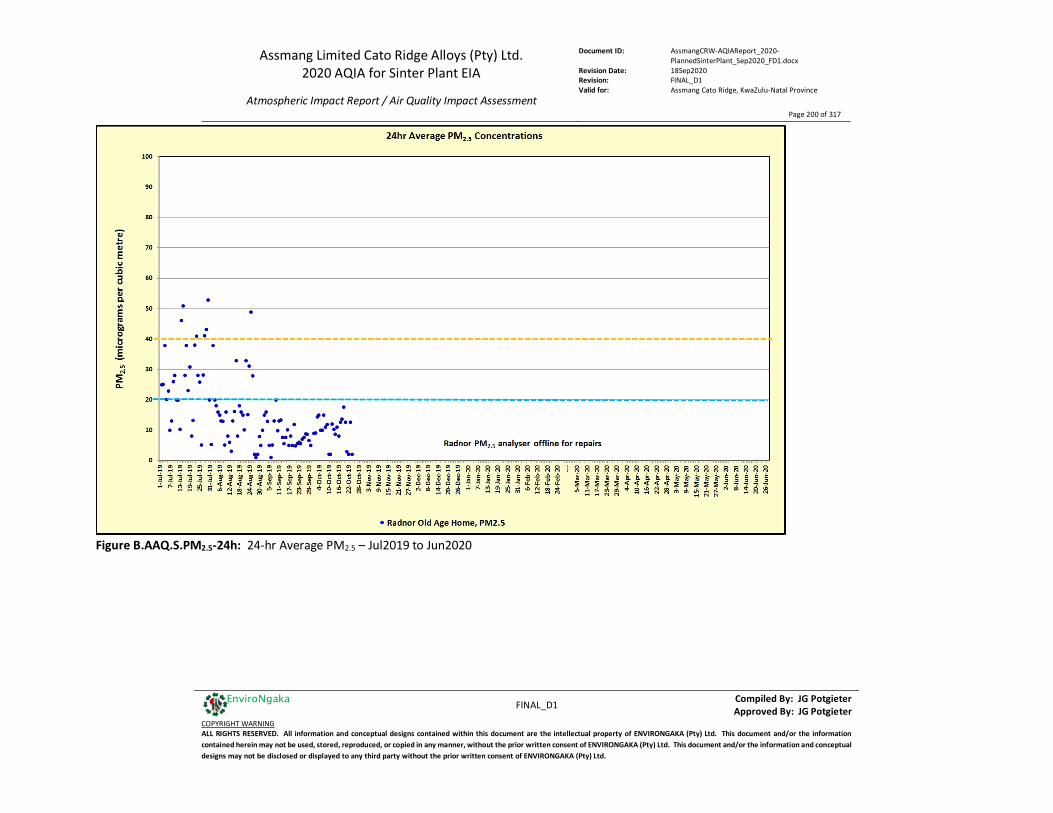
Assmang Limited Cato Ridge Alloys (Pty) Ltd. 2020 AQIA for Sinter Plant EIA
Atmospheric Impact Report / Air Quality Impact Assessment
Document ID: AssmangCRW-AQIAReport_2020-PlannedSinterPlant_Sep2020_FD1.docx
Revision Date: 18Sep2020 Revision: FINAL_D1 Valid for: Assmang Cato Ridge, KwaZulu-Natal Province
Page 200 of 317
FINAL_D1 Compiled By: JG Potgieter
Approved By: JG Potgieter COPYRIGHT WARNING ALL RIGHTS RESERVED. All information and conceptual designs contained within this document are the intellectual property of ENVIRONGAKA (Pty) Ltd. This document and/or the information contained herein may not be used, stored, reproduced, or copied in any manner, without the prior written consent of ENVIRONGAKA (Pty) Ltd. This document and/or the information and conceptual designs may not be disclosed or displayed to any third party without the prior written consent of ENVIRONGAKA (Pty) Ltd.
EnviroNgaka
Figure B.AAQ.S.PM2.5-24h: 24-hr Average PM2.5 – Jul2019 to Jun2020
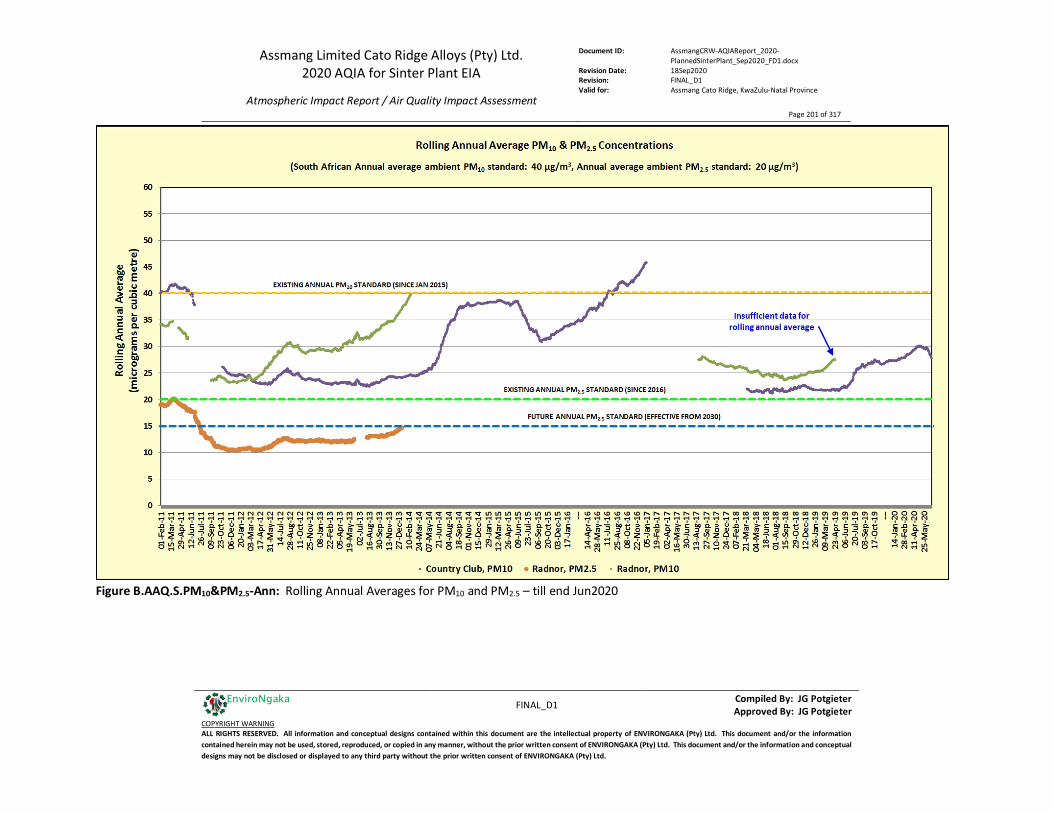
Assmang Limited Cato Ridge Alloys (Pty) Ltd. 2020 AQIA for Sinter Plant EIA
Atmospheric Impact Report / Air Quality Impact Assessment
Document ID: AssmangCRW-AQIAReport_2020-PlannedSinterPlant_Sep2020_FD1.docx
Revision Date: 18Sep2020 Revision: FINAL_D1 Valid for: Assmang Cato Ridge, KwaZulu-Natal Province
Page 201 of 317
FINAL_D1 Compiled By: JG Potgieter
Approved By: JG Potgieter COPYRIGHT WARNING ALL RIGHTS RESERVED. All information and conceptual designs contained within this document are the intellectual property of ENVIRONGAKA (Pty) Ltd. This document and/or the information contained herein may not be used, stored, reproduced, or copied in any manner, without the prior written consent of ENVIRONGAKA (Pty) Ltd. This document and/or the information and conceptual designs may not be disclosed or displayed to any third party without the prior written consent of ENVIRONGAKA (Pty) Ltd.
EnviroNgaka
Figure B.AAQ.S.PM10&PM2.5-Ann: Rolling Annual Averages for PM10 and PM2.5 – till end Jun2020
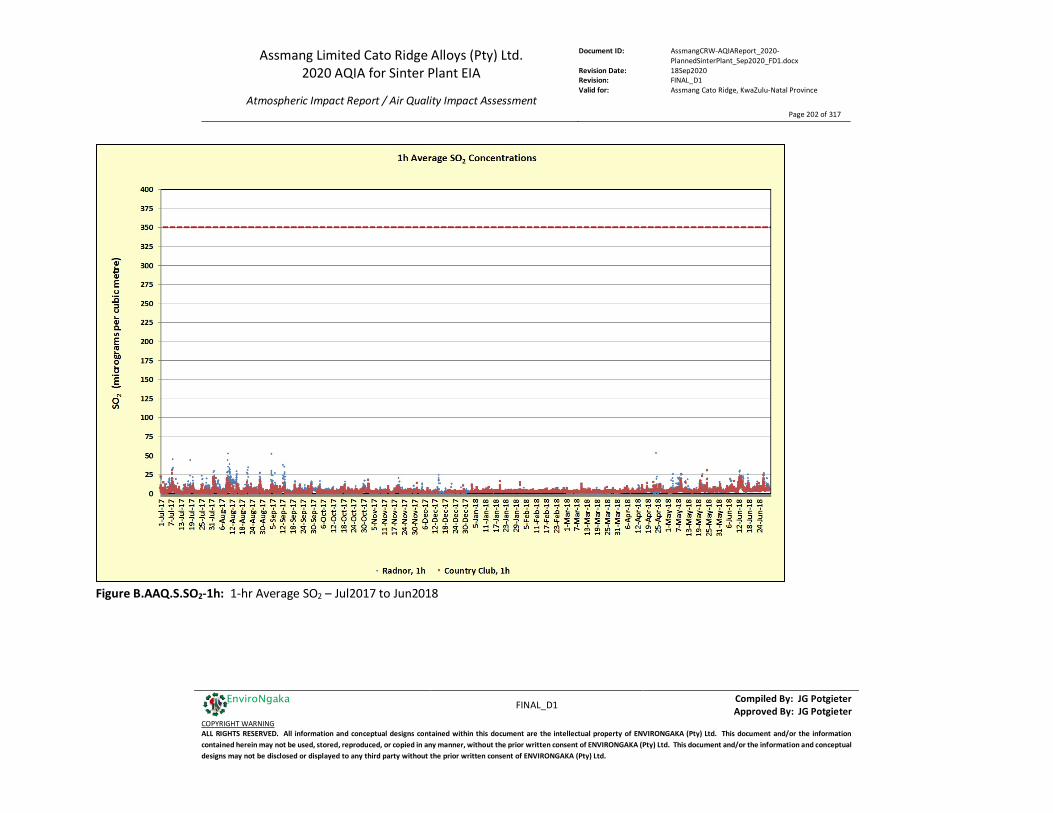
Assmang Limited Cato Ridge Alloys (Pty) Ltd. 2020 AQIA for Sinter Plant EIA
Atmospheric Impact Report / Air Quality Impact Assessment
Document ID: AssmangCRW-AQIAReport_2020-PlannedSinterPlant_Sep2020_FD1.docx
Revision Date: 18Sep2020 Revision: FINAL_D1 Valid for: Assmang Cato Ridge, KwaZulu-Natal Province
Page 202 of 317
FINAL_D1 Compiled By: JG Potgieter
Approved By: JG Potgieter COPYRIGHT WARNING ALL RIGHTS RESERVED. All information and conceptual designs contained within this document are the intellectual property of ENVIRONGAKA (Pty) Ltd. This document and/or the information contained herein may not be used, stored, reproduced, or copied in any manner, without the prior written consent of ENVIRONGAKA (Pty) Ltd. This document and/or the information and conceptual designs may not be disclosed or displayed to any third party without the prior written consent of ENVIRONGAKA (Pty) Ltd.
EnviroNgaka
Figure B.AAQ.S.SO2-1h: 1-hr Average SO2 – Jul2017 to Jun2018
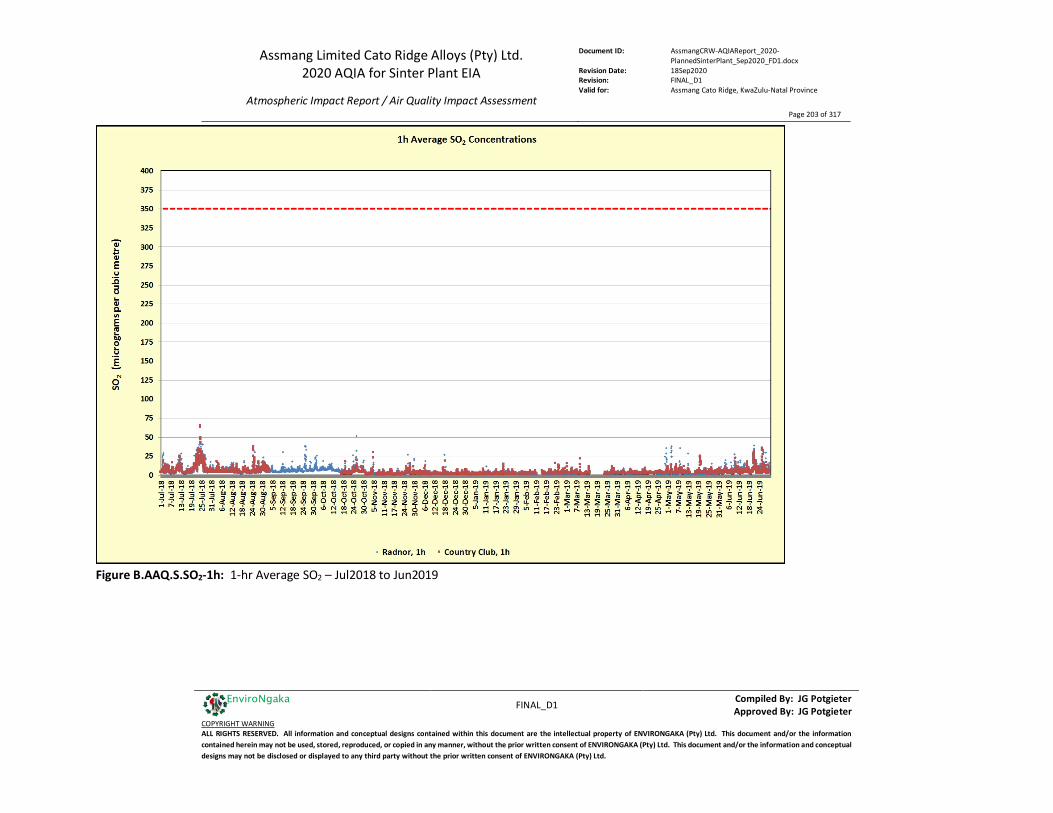
Assmang Limited Cato Ridge Alloys (Pty) Ltd. 2020 AQIA for Sinter Plant EIA
Atmospheric Impact Report / Air Quality Impact Assessment
Document ID: AssmangCRW-AQIAReport_2020-PlannedSinterPlant_Sep2020_FD1.docx
Revision Date: 18Sep2020 Revision: FINAL_D1 Valid for: Assmang Cato Ridge, KwaZulu-Natal Province
Page 203 of 317
FINAL_D1 Compiled By: JG Potgieter
Approved By: JG Potgieter COPYRIGHT WARNING ALL RIGHTS RESERVED. All information and conceptual designs contained within this document are the intellectual property of ENVIRONGAKA (Pty) Ltd. This document and/or the information contained herein may not be used, stored, reproduced, or copied in any manner, without the prior written consent of ENVIRONGAKA (Pty) Ltd. This document and/or the information and conceptual designs may not be disclosed or displayed to any third party without the prior written consent of ENVIRONGAKA (Pty) Ltd.
EnviroNgaka
Figure B.AAQ.S.SO2-1h: 1-hr Average SO2 – Jul2018 to Jun2019
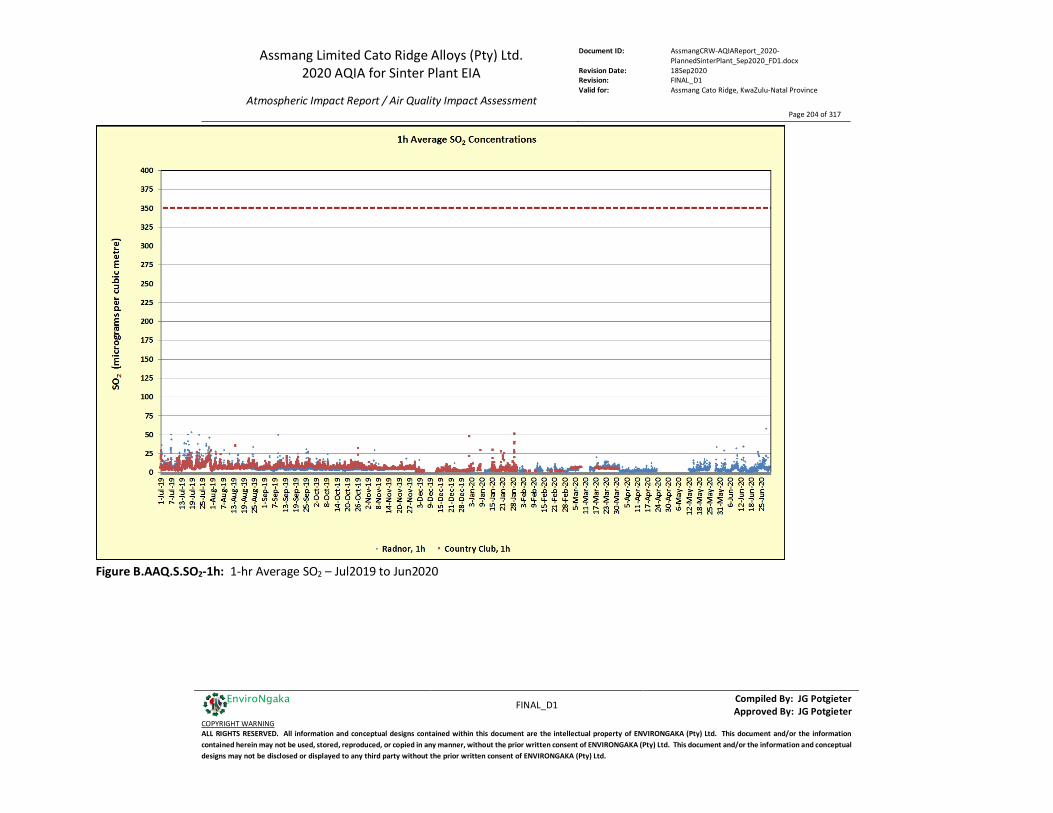
Assmang Limited Cato Ridge Alloys (Pty) Ltd. 2020 AQIA for Sinter Plant EIA
Atmospheric Impact Report / Air Quality Impact Assessment
Document ID: AssmangCRW-AQIAReport_2020-PlannedSinterPlant_Sep2020_FD1.docx
Revision Date: 18Sep2020 Revision: FINAL_D1 Valid for: Assmang Cato Ridge, KwaZulu-Natal Province
Page 204 of 317
FINAL_D1 Compiled By: JG Potgieter
Approved By: JG Potgieter COPYRIGHT WARNING ALL RIGHTS RESERVED. All information and conceptual designs contained within this document are the intellectual property of ENVIRONGAKA (Pty) Ltd. This document and/or the information contained herein may not be used, stored, reproduced, or copied in any manner, without the prior written consent of ENVIRONGAKA (Pty) Ltd. This document and/or the information and conceptual designs may not be disclosed or displayed to any third party without the prior written consent of ENVIRONGAKA (Pty) Ltd.
EnviroNgaka
Figure B.AAQ.S.SO2-1h: 1-hr Average SO2 – Jul2019 to Jun2020
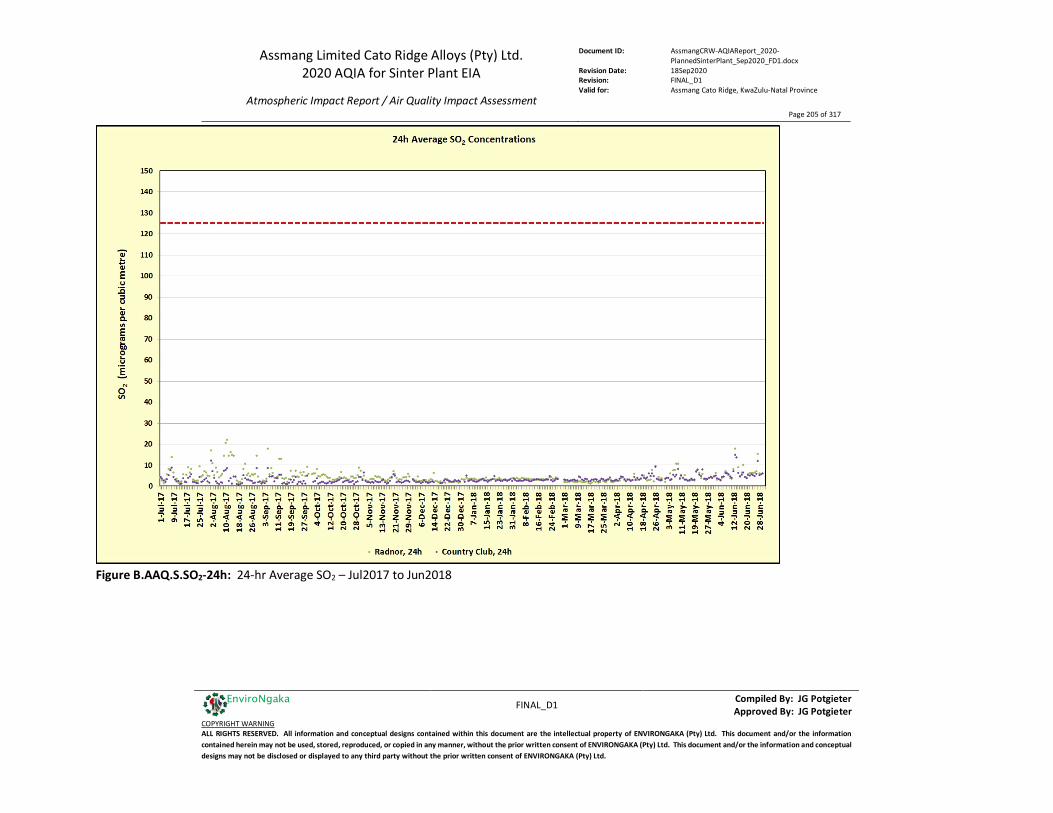
Assmang Limited Cato Ridge Alloys (Pty) Ltd. 2020 AQIA for Sinter Plant EIA
Atmospheric Impact Report / Air Quality Impact Assessment
Document ID: AssmangCRW-AQIAReport_2020-PlannedSinterPlant_Sep2020_FD1.docx
Revision Date: 18Sep2020 Revision: FINAL_D1 Valid for: Assmang Cato Ridge, KwaZulu-Natal Province
Page 205 of 317
FINAL_D1 Compiled By: JG Potgieter
Approved By: JG Potgieter COPYRIGHT WARNING ALL RIGHTS RESERVED. All information and conceptual designs contained within this document are the intellectual property of ENVIRONGAKA (Pty) Ltd. This document and/or the information contained herein may not be used, stored, reproduced, or copied in any manner, without the prior written consent of ENVIRONGAKA (Pty) Ltd. This document and/or the information and conceptual designs may not be disclosed or displayed to any third party without the prior written consent of ENVIRONGAKA (Pty) Ltd.
EnviroNgaka
Figure B.AAQ.S.SO2-24h: 24-hr Average SO2 – Jul2017 to Jun2018
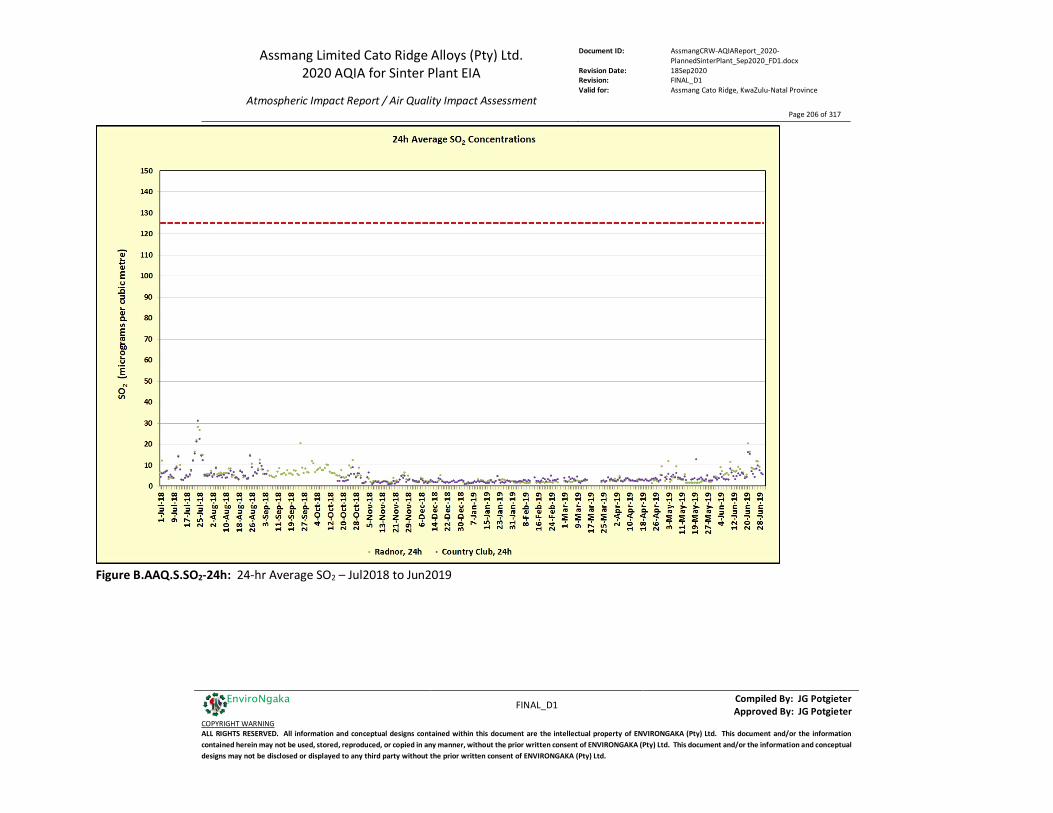
Assmang Limited Cato Ridge Alloys (Pty) Ltd. 2020 AQIA for Sinter Plant EIA
Atmospheric Impact Report / Air Quality Impact Assessment
Document ID: AssmangCRW-AQIAReport_2020-PlannedSinterPlant_Sep2020_FD1.docx
Revision Date: 18Sep2020 Revision: FINAL_D1 Valid for: Assmang Cato Ridge, KwaZulu-Natal Province
Page 206 of 317
FINAL_D1 Compiled By: JG Potgieter
Approved By: JG Potgieter COPYRIGHT WARNING ALL RIGHTS RESERVED. All information and conceptual designs contained within this document are the intellectual property of ENVIRONGAKA (Pty) Ltd. This document and/or the information contained herein may not be used, stored, reproduced, or copied in any manner, without the prior written consent of ENVIRONGAKA (Pty) Ltd. This document and/or the information and conceptual designs may not be disclosed or displayed to any third party without the prior written consent of ENVIRONGAKA (Pty) Ltd.
EnviroNgaka
Figure B.AAQ.S.SO2-24h: 24-hr Average SO2 – Jul2018 to Jun2019
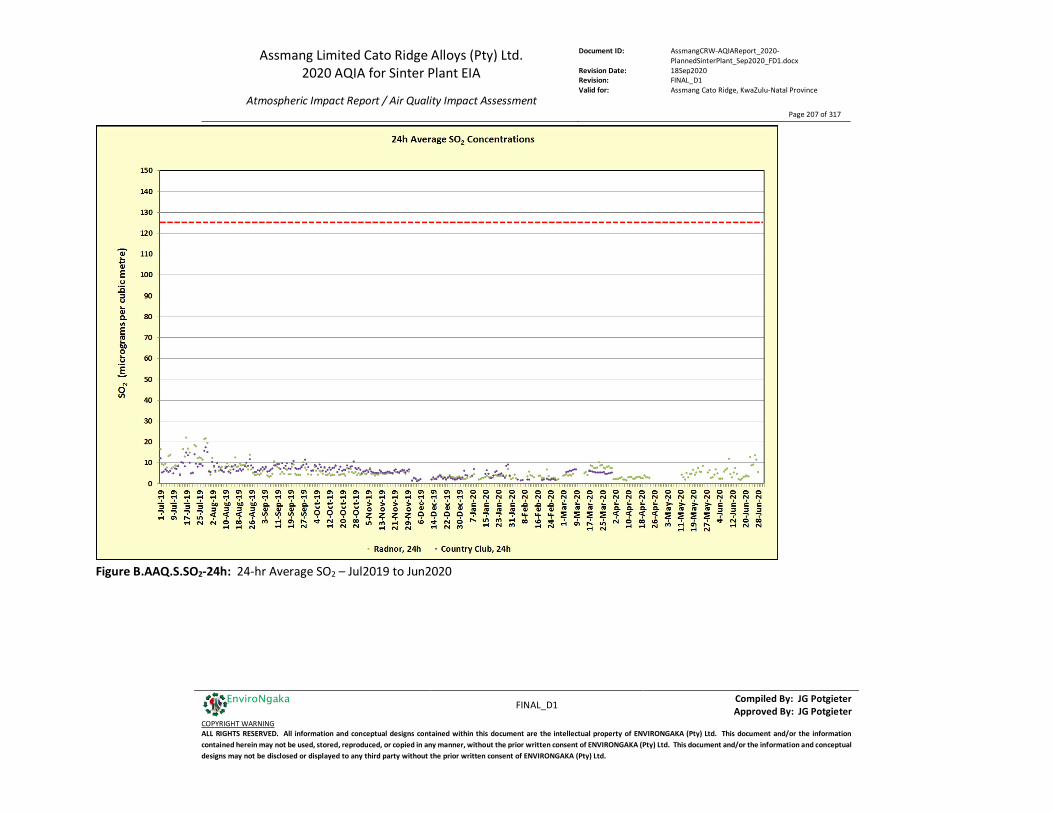
Assmang Limited Cato Ridge Alloys (Pty) Ltd. 2020 AQIA for Sinter Plant EIA
Atmospheric Impact Report / Air Quality Impact Assessment
Document ID: AssmangCRW-AQIAReport_2020-PlannedSinterPlant_Sep2020_FD1.docx
Revision Date: 18Sep2020 Revision: FINAL_D1 Valid for: Assmang Cato Ridge, KwaZulu-Natal Province
Page 207 of 317
FINAL_D1 Compiled By: JG Potgieter
Approved By: JG Potgieter COPYRIGHT WARNING ALL RIGHTS RESERVED. All information and conceptual designs contained within this document are the intellectual property of ENVIRONGAKA (Pty) Ltd. This document and/or the information contained herein may not be used, stored, reproduced, or copied in any manner, without the prior written consent of ENVIRONGAKA (Pty) Ltd. This document and/or the information and conceptual designs may not be disclosed or displayed to any third party without the prior written consent of ENVIRONGAKA (Pty) Ltd.
EnviroNgaka
Figure B.AAQ.S.SO2-24h: 24-hr Average SO2 – Jul2019 to Jun2020

Assmang Limited Cato Ridge Alloys (Pty) Ltd. 2020 AQIA for Sinter Plant EIA
Atmospheric Impact Report / Air Quality Impact Assessment
Document ID: AssmangCRW-AQIAReport_2020-PlannedSinterPlant_Sep2020_FD1.docx
Revision Date: 18Sep2020 Revision: FINAL_D1 Valid for: Assmang Cato Ridge, KwaZulu-Natal Province
Page 208 of 317
FINAL_D1 Compiled By: JG Potgieter
Approved By: JG Potgieter COPYRIGHT WARNING ALL RIGHTS RESERVED. All information and conceptual designs contained within this document are the intellectual property of ENVIRONGAKA (Pty) Ltd. This document and/or the information contained herein may not be used, stored, reproduced, or copied in any manner, without the prior written consent of ENVIRONGAKA (Pty) Ltd. This document and/or the information and conceptual designs may not be disclosed or displayed to any third party without the prior written consent of ENVIRONGAKA (Pty) Ltd.
EnviroNgaka
Figure B.AAQ.S.NO2-1h: 1-hr Average NO2 – Jul2017 to Jun2018
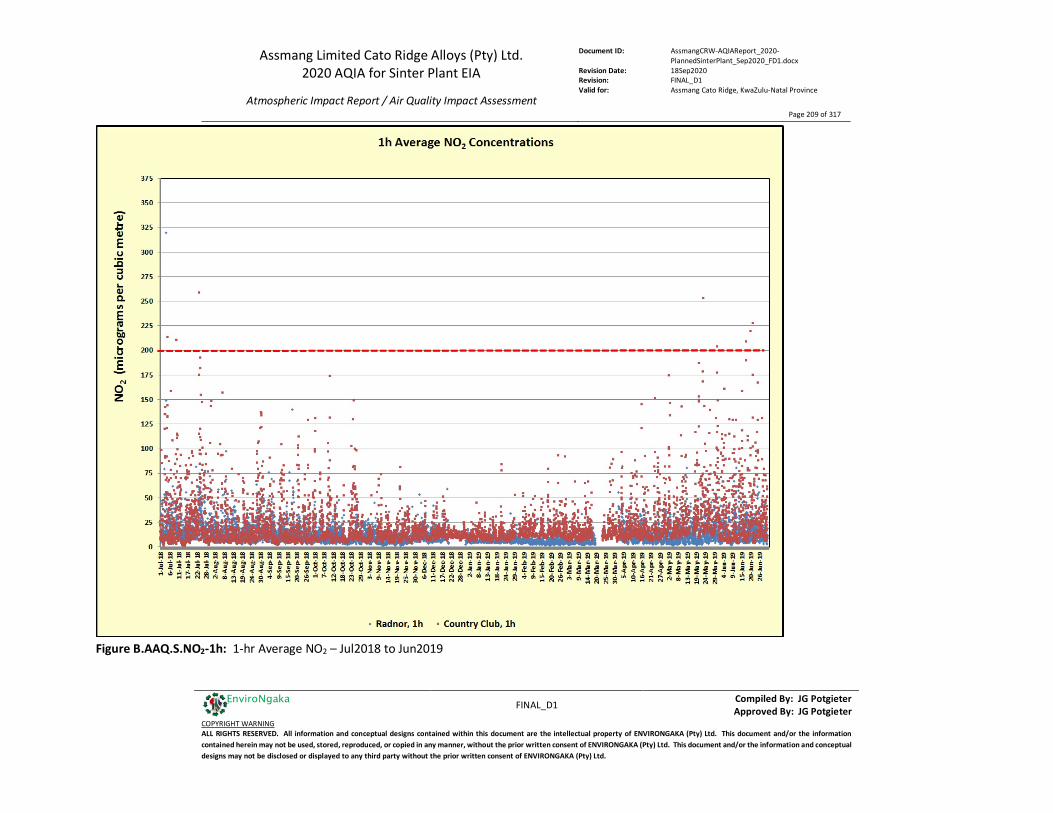
Assmang Limited Cato Ridge Alloys (Pty) Ltd. 2020 AQIA for Sinter Plant EIA
Atmospheric Impact Report / Air Quality Impact Assessment
Document ID: AssmangCRW-AQIAReport_2020-PlannedSinterPlant_Sep2020_FD1.docx
Revision Date: 18Sep2020 Revision: FINAL_D1 Valid for: Assmang Cato Ridge, KwaZulu-Natal Province
Page 209 of 317
FINAL_D1 Compiled By: JG Potgieter
Approved By: JG Potgieter COPYRIGHT WARNING ALL RIGHTS RESERVED. All information and conceptual designs contained within this document are the intellectual property of ENVIRONGAKA (Pty) Ltd. This document and/or the information contained herein may not be used, stored, reproduced, or copied in any manner, without the prior written consent of ENVIRONGAKA (Pty) Ltd. This document and/or the information and conceptual designs may not be disclosed or displayed to any third party without the prior written consent of ENVIRONGAKA (Pty) Ltd.
EnviroNgaka
Figure B.AAQ.S.NO2-1h: 1-hr Average NO2 – Jul2018 to Jun2019
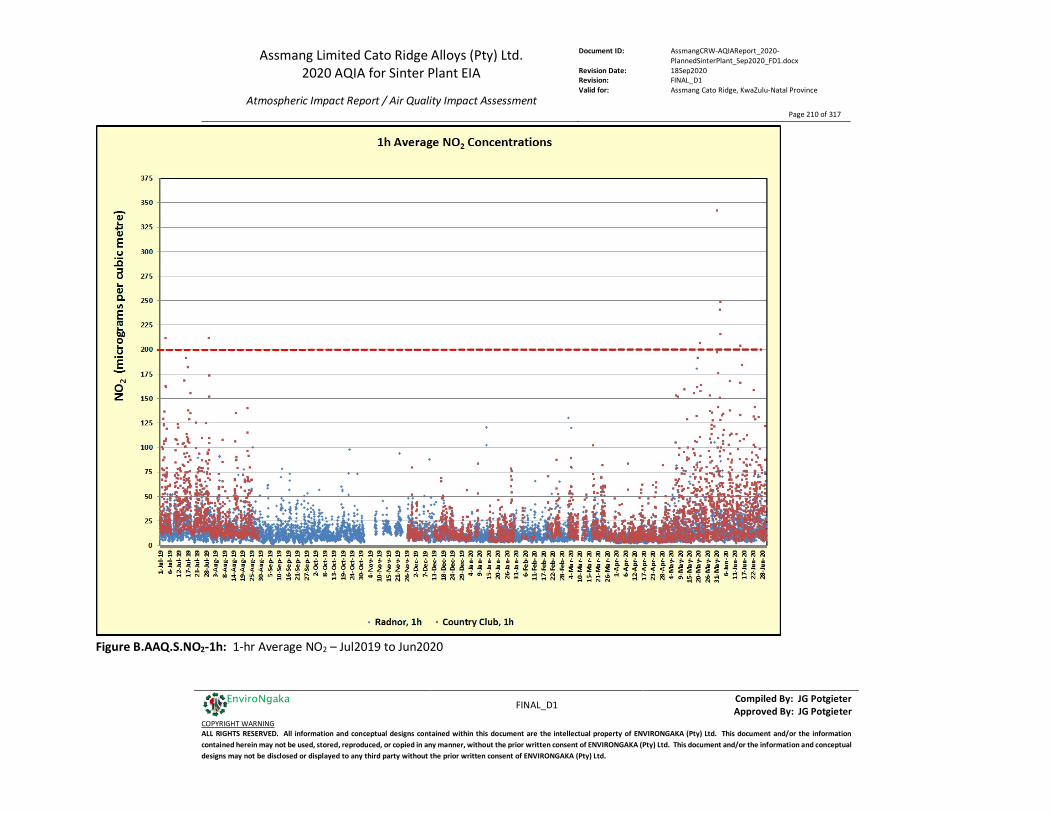
Assmang Limited Cato Ridge Alloys (Pty) Ltd. 2020 AQIA for Sinter Plant EIA
Atmospheric Impact Report / Air Quality Impact Assessment
Document ID: AssmangCRW-AQIAReport_2020-PlannedSinterPlant_Sep2020_FD1.docx
Revision Date: 18Sep2020 Revision: FINAL_D1 Valid for: Assmang Cato Ridge, KwaZulu-Natal Province
Page 210 of 317
FINAL_D1 Compiled By: JG Potgieter
Approved By: JG Potgieter COPYRIGHT WARNING ALL RIGHTS RESERVED. All information and conceptual designs contained within this document are the intellectual property of ENVIRONGAKA (Pty) Ltd. This document and/or the information contained herein may not be used, stored, reproduced, or copied in any manner, without the prior written consent of ENVIRONGAKA (Pty) Ltd. This document and/or the information and conceptual designs may not be disclosed or displayed to any third party without the prior written consent of ENVIRONGAKA (Pty) Ltd.
EnviroNgaka
Figure B.AAQ.S.NO2-1h: 1-hr Average NO2 – Jul2019 to Jun2020
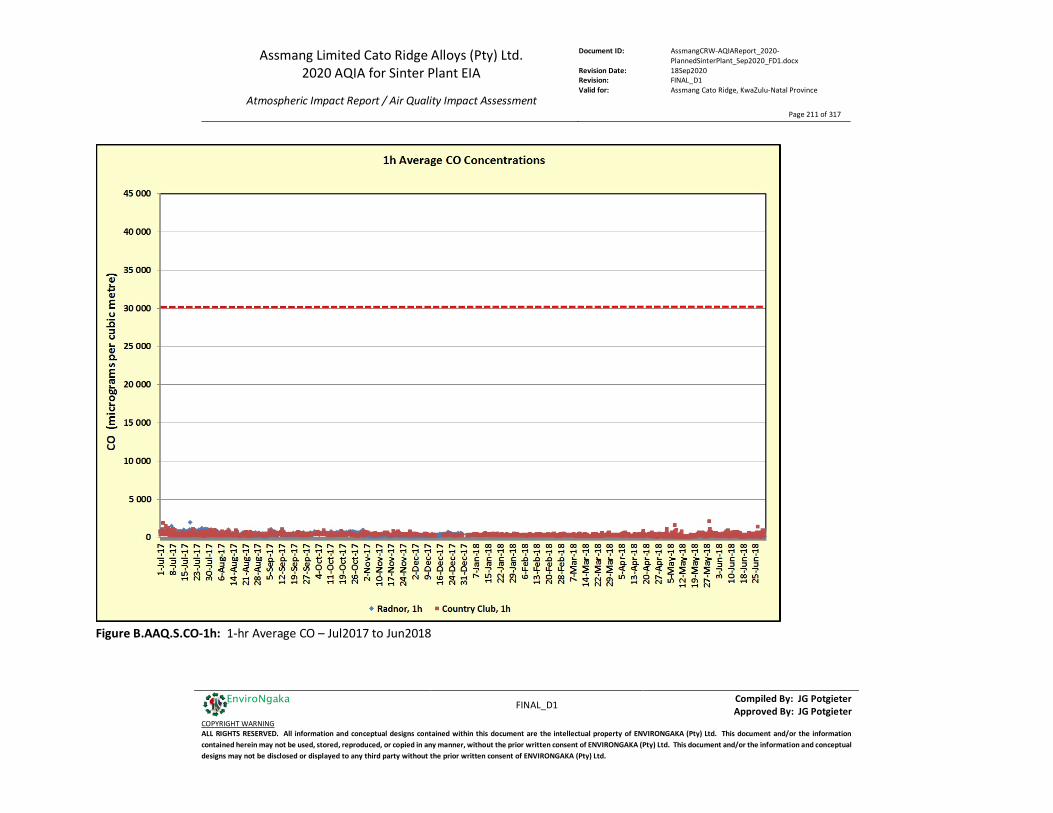
Assmang Limited Cato Ridge Alloys (Pty) Ltd. 2020 AQIA for Sinter Plant EIA
Atmospheric Impact Report / Air Quality Impact Assessment
Document ID: AssmangCRW-AQIAReport_2020-PlannedSinterPlant_Sep2020_FD1.docx
Revision Date: 18Sep2020 Revision: FINAL_D1 Valid for: Assmang Cato Ridge, KwaZulu-Natal Province
Page 211 of 317
FINAL_D1 Compiled By: JG Potgieter
Approved By: JG Potgieter COPYRIGHT WARNING ALL RIGHTS RESERVED. All information and conceptual designs contained within this document are the intellectual property of ENVIRONGAKA (Pty) Ltd. This document and/or the information contained herein may not be used, stored, reproduced, or copied in any manner, without the prior written consent of ENVIRONGAKA (Pty) Ltd. This document and/or the information and conceptual designs may not be disclosed or displayed to any third party without the prior written consent of ENVIRONGAKA (Pty) Ltd.
EnviroNgaka
Figure B.AAQ.S.CO-1h: 1-hr Average CO – Jul2017 to Jun2018
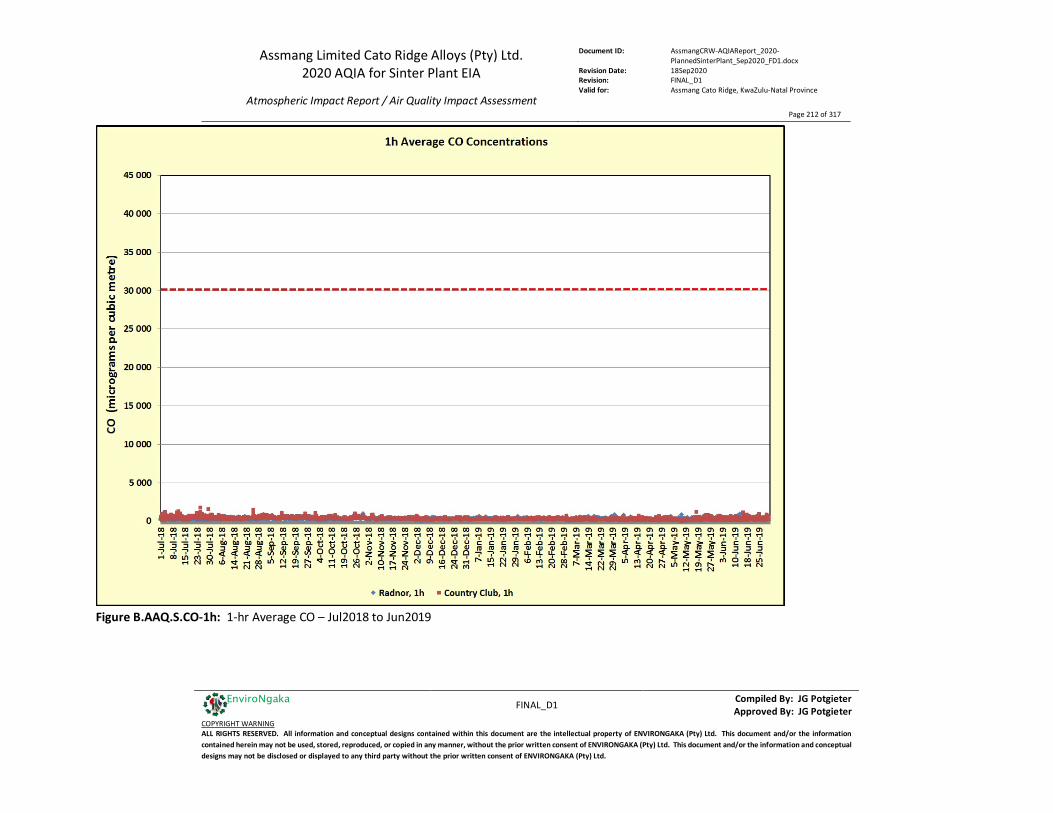
Assmang Limited Cato Ridge Alloys (Pty) Ltd. 2020 AQIA for Sinter Plant EIA
Atmospheric Impact Report / Air Quality Impact Assessment
Document ID: AssmangCRW-AQIAReport_2020-PlannedSinterPlant_Sep2020_FD1.docx
Revision Date: 18Sep2020 Revision: FINAL_D1 Valid for: Assmang Cato Ridge, KwaZulu-Natal Province
Page 212 of 317
FINAL_D1 Compiled By: JG Potgieter
Approved By: JG Potgieter COPYRIGHT WARNING ALL RIGHTS RESERVED. All information and conceptual designs contained within this document are the intellectual property of ENVIRONGAKA (Pty) Ltd. This document and/or the information contained herein may not be used, stored, reproduced, or copied in any manner, without the prior written consent of ENVIRONGAKA (Pty) Ltd. This document and/or the information and conceptual designs may not be disclosed or displayed to any third party without the prior written consent of ENVIRONGAKA (Pty) Ltd.
EnviroNgaka
Figure B.AAQ.S.CO-1h: 1-hr Average CO – Jul2018 to Jun2019
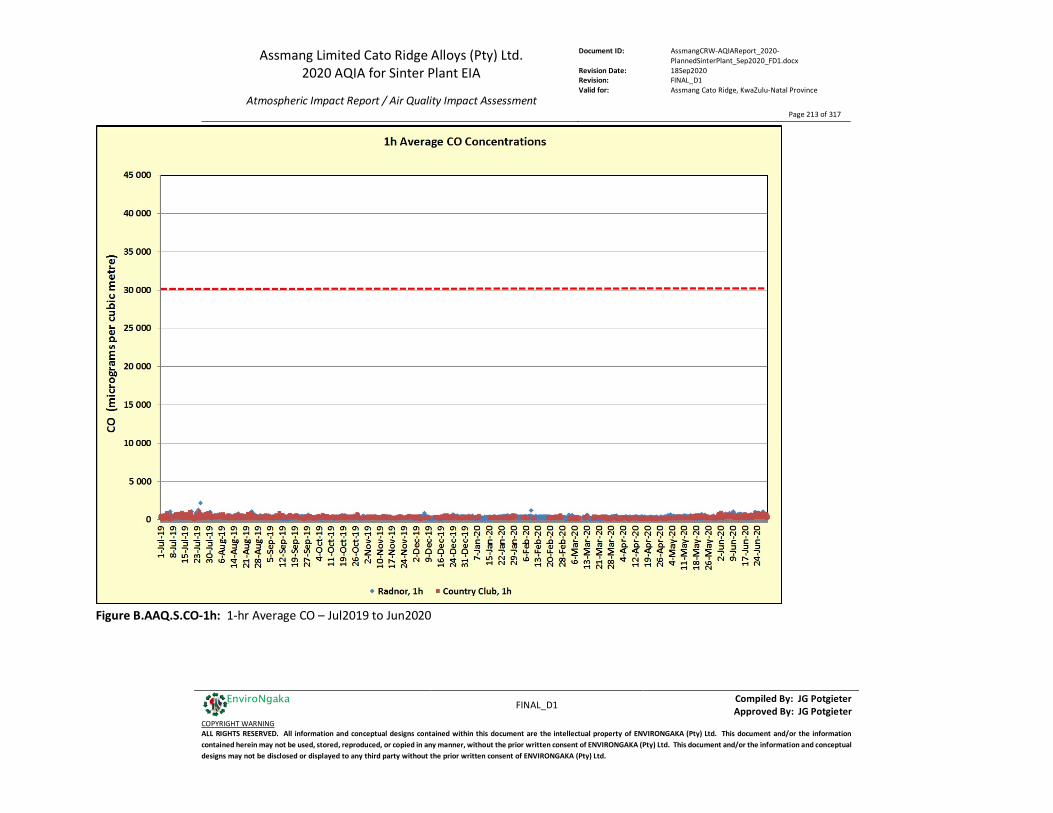
Assmang Limited Cato Ridge Alloys (Pty) Ltd. 2020 AQIA for Sinter Plant EIA
Atmospheric Impact Report / Air Quality Impact Assessment
Document ID: AssmangCRW-AQIAReport_2020-PlannedSinterPlant_Sep2020_FD1.docx
Revision Date: 18Sep2020 Revision: FINAL_D1 Valid for: Assmang Cato Ridge, KwaZulu-Natal Province
Page 213 of 317
FINAL_D1 Compiled By: JG Potgieter
Approved By: JG Potgieter COPYRIGHT WARNING ALL RIGHTS RESERVED. All information and conceptual designs contained within this document are the intellectual property of ENVIRONGAKA (Pty) Ltd. This document and/or the information contained herein may not be used, stored, reproduced, or copied in any manner, without the prior written consent of ENVIRONGAKA (Pty) Ltd. This document and/or the information and conceptual designs may not be disclosed or displayed to any third party without the prior written consent of ENVIRONGAKA (Pty) Ltd.
EnviroNgaka
Figure B.AAQ.S.CO-1h: 1-hr Average CO – Jul2019 to Jun2020
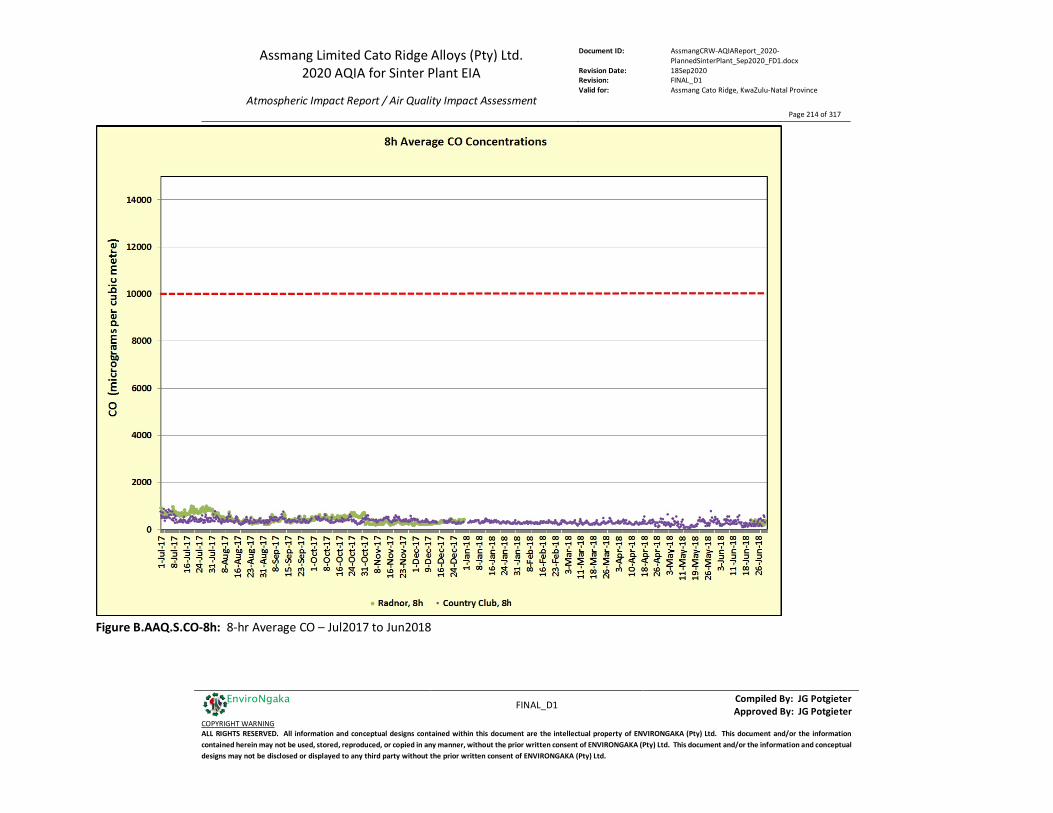
Assmang Limited Cato Ridge Alloys (Pty) Ltd. 2020 AQIA for Sinter Plant EIA
Atmospheric Impact Report / Air Quality Impact Assessment
Document ID: AssmangCRW-AQIAReport_2020-PlannedSinterPlant_Sep2020_FD1.docx
Revision Date: 18Sep2020 Revision: FINAL_D1 Valid for: Assmang Cato Ridge, KwaZulu-Natal Province
Page 214 of 317
FINAL_D1 Compiled By: JG Potgieter
Approved By: JG Potgieter COPYRIGHT WARNING ALL RIGHTS RESERVED. All information and conceptual designs contained within this document are the intellectual property of ENVIRONGAKA (Pty) Ltd. This document and/or the information contained herein may not be used, stored, reproduced, or copied in any manner, without the prior written consent of ENVIRONGAKA (Pty) Ltd. This document and/or the information and conceptual designs may not be disclosed or displayed to any third party without the prior written consent of ENVIRONGAKA (Pty) Ltd.
EnviroNgaka
Figure B.AAQ.S.CO-8h: 8-hr Average CO – Jul2017 to Jun2018
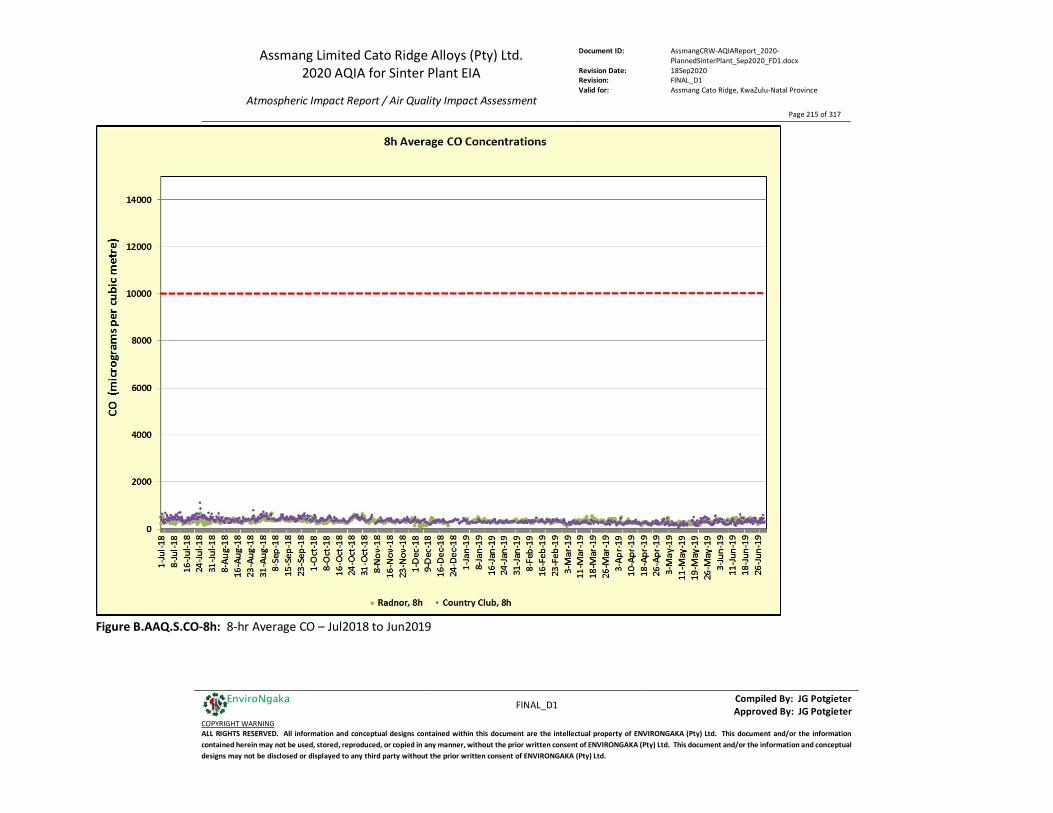
Assmang Limited Cato Ridge Alloys (Pty) Ltd. 2020 AQIA for Sinter Plant EIA
Atmospheric Impact Report / Air Quality Impact Assessment
Document ID: AssmangCRW-AQIAReport_2020-PlannedSinterPlant_Sep2020_FD1.docx
Revision Date: 18Sep2020 Revision: FINAL_D1 Valid for: Assmang Cato Ridge, KwaZulu-Natal Province
Page 215 of 317
FINAL_D1 Compiled By: JG Potgieter
Approved By: JG Potgieter COPYRIGHT WARNING ALL RIGHTS RESERVED. All information and conceptual designs contained within this document are the intellectual property of ENVIRONGAKA (Pty) Ltd. This document and/or the information contained herein may not be used, stored, reproduced, or copied in any manner, without the prior written consent of ENVIRONGAKA (Pty) Ltd. This document and/or the information and conceptual designs may not be disclosed or displayed to any third party without the prior written consent of ENVIRONGAKA (Pty) Ltd.
EnviroNgaka
Figure B.AAQ.S.CO-8h: 8-hr Average CO – Jul2018 to Jun2019

Assmang Limited Cato Ridge Alloys (Pty) Ltd. 2020 AQIA for Sinter Plant EIA
Atmospheric Impact Report / Air Quality Impact Assessment
Document ID: AssmangCRW-AQIAReport_2020-PlannedSinterPlant_Sep2020_FD1.docx
Revision Date: 18Sep2020 Revision: FINAL_D1 Valid for: Assmang Cato Ridge, KwaZulu-Natal Province
Page 216 of 317
FINAL_D1 Compiled By: JG Potgieter
Approved By: JG Potgieter COPYRIGHT WARNING ALL RIGHTS RESERVED. All information and conceptual designs contained within this document are the intellectual property of ENVIRONGAKA (Pty) Ltd. This document and/or the information contained herein may not be used, stored, reproduced, or copied in any manner, without the prior written consent of ENVIRONGAKA (Pty) Ltd. This document and/or the information and conceptual designs may not be disclosed or displayed to any third party without the prior written consent of ENVIRONGAKA (Pty) Ltd.
EnviroNgaka
Figure B.AAQ.S.CO-8h: 8-hr Average CO – Jul2019 to Jun2020
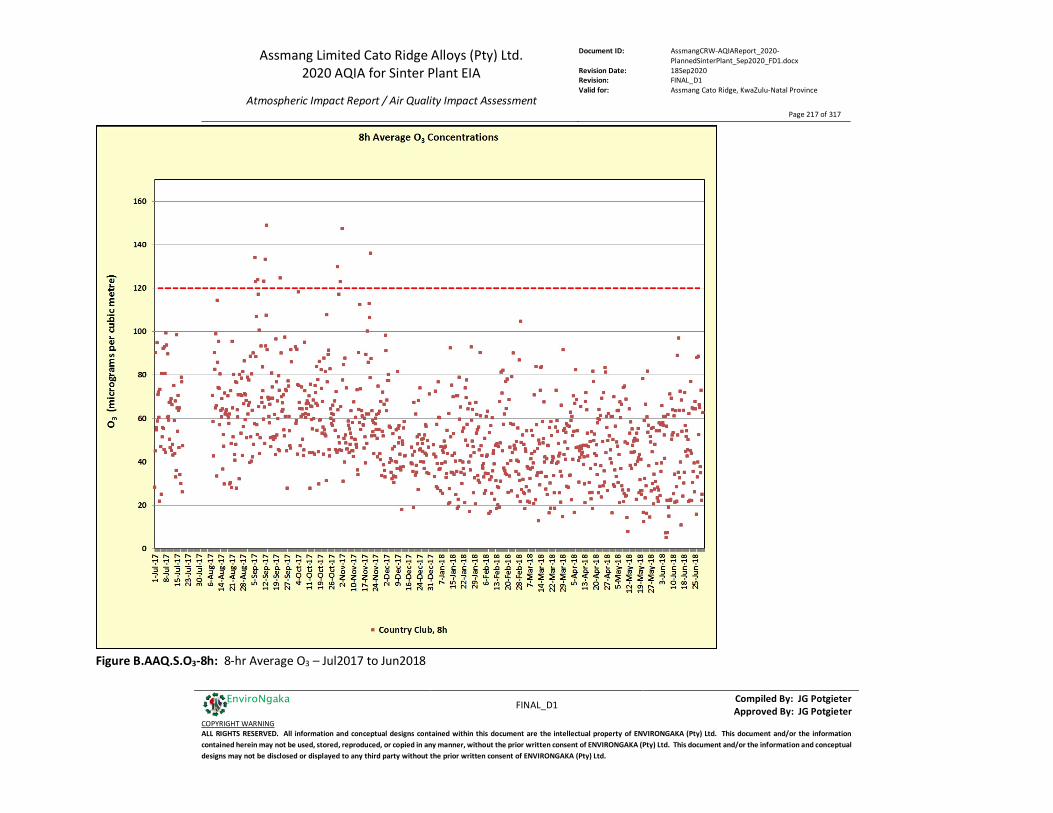
Assmang Limited Cato Ridge Alloys (Pty) Ltd. 2020 AQIA for Sinter Plant EIA
Atmospheric Impact Report / Air Quality Impact Assessment
Document ID: AssmangCRW-AQIAReport_2020-PlannedSinterPlant_Sep2020_FD1.docx
Revision Date: 18Sep2020 Revision: FINAL_D1 Valid for: Assmang Cato Ridge, KwaZulu-Natal Province
Page 217 of 317
FINAL_D1 Compiled By: JG Potgieter
Approved By: JG Potgieter COPYRIGHT WARNING ALL RIGHTS RESERVED. All information and conceptual designs contained within this document are the intellectual property of ENVIRONGAKA (Pty) Ltd. This document and/or the information contained herein may not be used, stored, reproduced, or copied in any manner, without the prior written consent of ENVIRONGAKA (Pty) Ltd. This document and/or the information and conceptual designs may not be disclosed or displayed to any third party without the prior written consent of ENVIRONGAKA (Pty) Ltd.
EnviroNgaka
Figure B.AAQ.S.O3-8h: 8-hr Average O3 – Jul2017 to Jun2018

Assmang Limited Cato Ridge Alloys (Pty) Ltd. 2020 AQIA for Sinter Plant EIA
Atmospheric Impact Report / Air Quality Impact Assessment
Document ID: AssmangCRW-AQIAReport_2020-PlannedSinterPlant_Sep2020_FD1.docx
Revision Date: 18Sep2020 Revision: FINAL_D1 Valid for: Assmang Cato Ridge, KwaZulu-Natal Province
Page 218 of 317
FINAL_D1 Compiled By: JG Potgieter
Approved By: JG Potgieter COPYRIGHT WARNING ALL RIGHTS RESERVED. All information and conceptual designs contained within this document are the intellectual property of ENVIRONGAKA (Pty) Ltd. This document and/or the information contained herein may not be used, stored, reproduced, or copied in any manner, without the prior written consent of ENVIRONGAKA (Pty) Ltd. This document and/or the information and conceptual designs may not be disclosed or displayed to any third party without the prior written consent of ENVIRONGAKA (Pty) Ltd.
EnviroNgaka
Figure B.AAQ.S.O3-8h: 8-hr Average O3 – Jul2018 to Jun2019
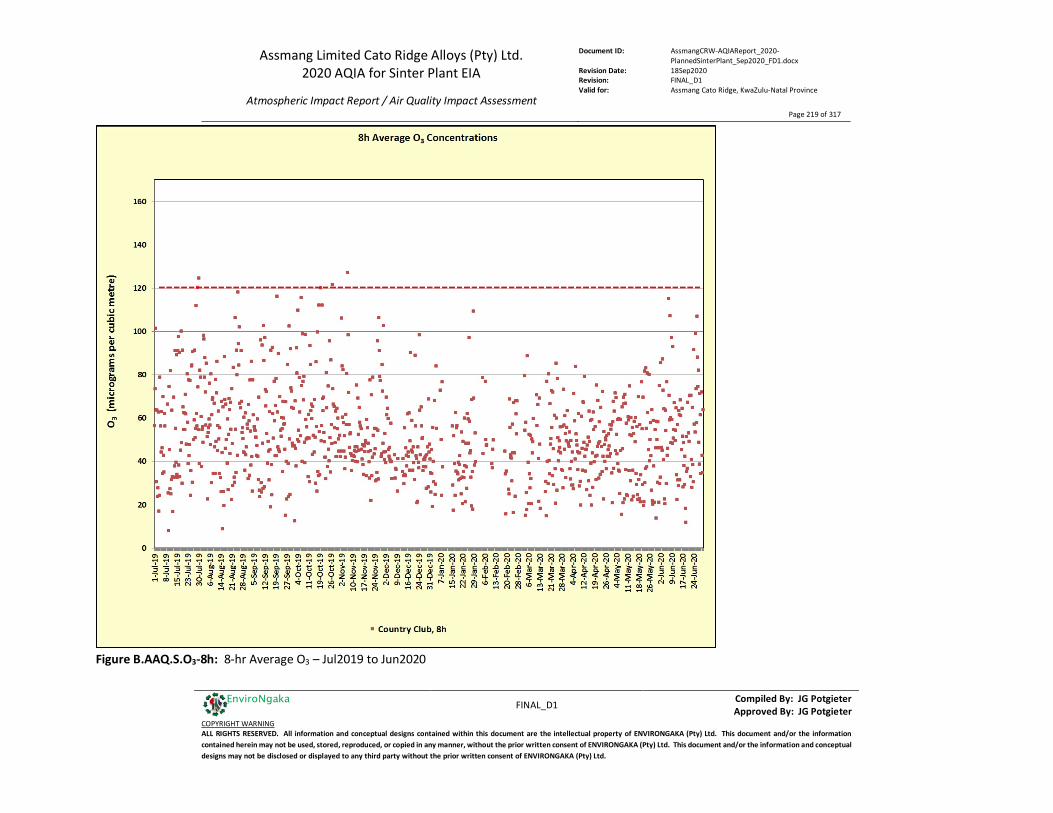
Assmang Limited Cato Ridge Alloys (Pty) Ltd. 2020 AQIA for Sinter Plant EIA
Atmospheric Impact Report / Air Quality Impact Assessment
Document ID: AssmangCRW-AQIAReport_2020-PlannedSinterPlant_Sep2020_FD1.docx
Revision Date: 18Sep2020 Revision: FINAL_D1 Valid for: Assmang Cato Ridge, KwaZulu-Natal Province
Page 219 of 317
FINAL_D1 Compiled By: JG Potgieter
Approved By: JG Potgieter COPYRIGHT WARNING ALL RIGHTS RESERVED. All information and conceptual designs contained within this document are the intellectual property of ENVIRONGAKA (Pty) Ltd. This document and/or the information contained herein may not be used, stored, reproduced, or copied in any manner, without the prior written consent of ENVIRONGAKA (Pty) Ltd. This document and/or the information and conceptual designs may not be disclosed or displayed to any third party without the prior written consent of ENVIRONGAKA (Pty) Ltd.
EnviroNgaka
Figure B.AAQ.S.O3-8h: 8-hr Average O3 – Jul2019 to Jun2020

Assmang Limited Cato Ridge Alloys (Pty) Ltd. 2020 AQIA for Sinter Plant EIA
Atmospheric Impact Report / Air Quality Impact Assessment
Document ID: AssmangCRW-AQIAReport_2020-PlannedSinterPlant_Sep2020_FD1.docx
Revision Date: 18Sep2020 Revision: FINAL_D1 Valid for: Assmang Cato Ridge, KwaZulu-Natal Province
Page 220 of 317
FINAL_D1 Compiled By: JG Potgieter
Approved By: JG Potgieter COPYRIGHT WARNING ALL RIGHTS RESERVED. All information and conceptual designs contained within this document are the intellectual property of ENVIRONGAKA (Pty) Ltd. This document and/or the information contained herein may not be used, stored, reproduced, or copied in any manner, without the prior written consent of ENVIRONGAKA (Pty) Ltd. This document and/or the information and conceptual designs may not be disclosed or displayed to any third party without the prior written consent of ENVIRONGAKA (Pty) Ltd.
EnviroNgaka
Figure B.AAQ.S.Metals-Ann: Rolling Annual Average PM10 metal speciation– till end Jun2020
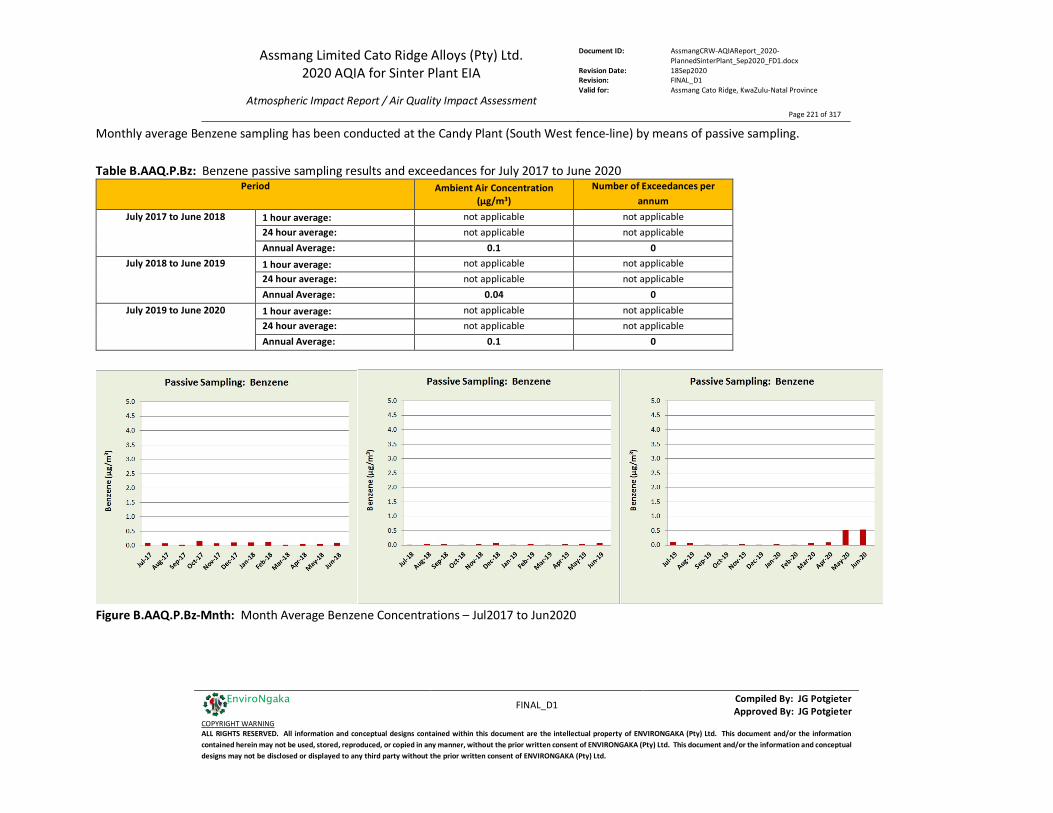
Assmang Limited Cato Ridge Alloys (Pty) Ltd. 2020 AQIA for Sinter Plant EIA
Atmospheric Impact Report / Air Quality Impact Assessment
Document ID: AssmangCRW-AQIAReport_2020-PlannedSinterPlant_Sep2020_FD1.docx
Revision Date: 18Sep2020 Revision: FINAL_D1 Valid for: Assmang Cato Ridge, KwaZulu-Natal Province
Page 221 of 317
FINAL_D1 Compiled By: JG Potgieter
Approved By: JG Potgieter COPYRIGHT WARNING ALL RIGHTS RESERVED. All information and conceptual designs contained within this document are the intellectual property of ENVIRONGAKA (Pty) Ltd. This document and/or the information contained herein may not be used, stored, reproduced, or copied in any manner, without the prior written consent of ENVIRONGAKA (Pty) Ltd. This document and/or the information and conceptual designs may not be disclosed or displayed to any third party without the prior written consent of ENVIRONGAKA (Pty) Ltd.
EnviroNgaka
Monthly average Benzene sampling has been conducted at the Candy Plant (South West fence-line) by means of passive sampling. Table B.AAQ.P.Bz: Benzene passive sampling results and exceedances for July 2017 to June 2020
Period Ambient Air Concentration (µg/m3)
Number of Exceedances per annum
July 2017 to June 2018 1 hour average: not applicable not applicable 24 hour average: not applicable not applicable Annual Average: 0.1 0
July 2018 to June 2019 1 hour average: not applicable not applicable 24 hour average: not applicable not applicable Annual Average: 0.04 0
July 2019 to June 2020 1 hour average: not applicable not applicable 24 hour average: not applicable not applicable Annual Average: 0.1 0
Figure B.AAQ.P.Bz-Mnth: Month Average Benzene Concentrations – Jul2017 to Jun2020
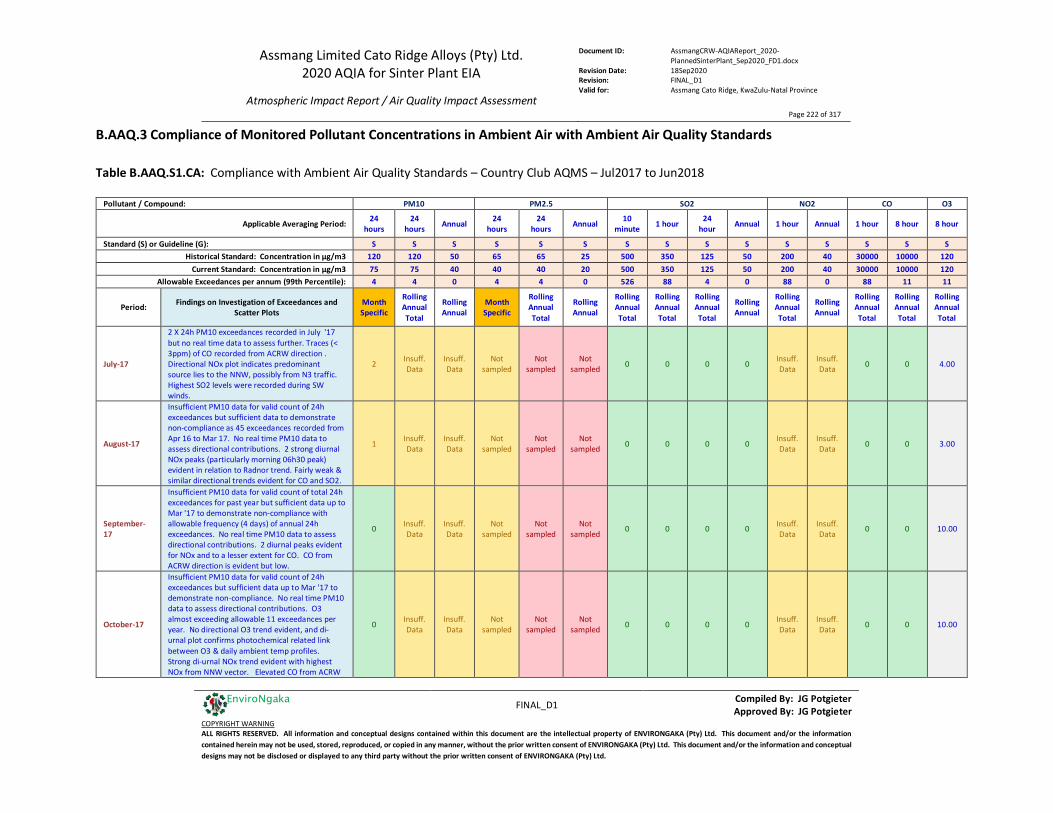
Assmang Limited Cato Ridge Alloys (Pty) Ltd. 2020 AQIA for Sinter Plant EIA
Atmospheric Impact Report / Air Quality Impact Assessment
Document ID: AssmangCRW-AQIAReport_2020-PlannedSinterPlant_Sep2020_FD1.docx
Revision Date: 18Sep2020 Revision: FINAL_D1 Valid for: Assmang Cato Ridge, KwaZulu-Natal Province
Page 222 of 317
FINAL_D1 Compiled By: JG Potgieter
Approved By: JG Potgieter COPYRIGHT WARNING ALL RIGHTS RESERVED. All information and conceptual designs contained within this document are the intellectual property of ENVIRONGAKA (Pty) Ltd. This document and/or the information contained herein may not be used, stored, reproduced, or copied in any manner, without the prior written consent of ENVIRONGAKA (Pty) Ltd. This document and/or the information and conceptual designs may not be disclosed or displayed to any third party without the prior written consent of ENVIRONGAKA (Pty) Ltd.
EnviroNgaka
B.AAQ.3 Compliance of Monitored Pollutant Concentrations in Ambient Air with Ambient Air Quality Standards Table B.AAQ.S1.CA: Compliance with Ambient Air Quality Standards – Country Club AQMS – Jul2017 to Jun2018
Pollutant / Compound: PM10 PM2.5 SO2 NO2 CO O3
Applicable Averaging Period: 24 hours
24 hours Annual 24
hours 24
hours Annual 10 minute 1 hour 24
hour Annual 1 hour Annual 1 hour 8 hour 8 hour
Standard (S) or Guideline (G): S S S S S S S S S S S S S S S Historical Standard: Concentration in µg/m3 120 120 50 65 65 25 500 350 125 50 200 40 30000 10000 120
Current Standard: Concentration in µg/m3 75 75 40 40 40 20 500 350 125 50 200 40 30000 10000 120 Allowable Exceedances per annum (99th Percentile): 4 4 0 4 4 0 526 88 4 0 88 0 88 11 11
Period: Findings on Investigation of Exceedances and Scatter Plots
Month Specific
Rolling Annual Total
Rolling Annual
Month Specific
Rolling Annual Total
Rolling Annual
Rolling Annual Total
Rolling Annual Total
Rolling Annual Total
Rolling Annual
Rolling Annual Total
Rolling Annual
Rolling Annual Total
Rolling Annual Total
Rolling Annual Total
July-17
2 X 24h PM10 exceedances recorded in July '17 but no real time data to assess further. Traces (< 3ppm) of CO recorded from ACRW direction . Directional NOx plot indicates predominant source lies to the NNW, possibly from N3 traffic. Highest SO2 levels were recorded during SW winds.
2 Insuff. Data
Insuff. Data
Not sampled
Not sampled
Not sampled 0 0 0 0 Insuff.
Data Insuff. Data 0 0 4.00
August-17
Insufficient PM10 data for valid count of 24h exceedances but sufficient data to demonstrate non-compliance as 45 exceedances recorded from Apr 16 to Mar 17. No real time PM10 data to assess directional contributions. 2 strong diurnal NOx peaks (particularly morning 06h30 peak) evident in relation to Radnor trend. Fairly weak & similar directional trends evident for CO and SO2.
1 Insuff. Data
Insuff. Data
Not sampled
Not sampled
Not sampled 0 0 0 0 Insuff.
Data Insuff. Data 0 0 3.00
September-17
Insufficient PM10 data for valid count of total 24h exceedances for past year but sufficient data up to Mar '17 to demonstrate non-compliance with allowable frequency (4 days) of annual 24h exceedances. No real time PM10 data to assess directional contributions. 2 diurnal peaks evident for NOx and to a lesser extent for CO. CO from ACRW direction is evident but low.
0 Insuff. Data
Insuff. Data
Not sampled
Not sampled
Not sampled 0 0 0 0 Insuff.
Data Insuff. Data 0 0 10.00
October-17
Insufficient PM10 data for valid count of 24h exceedances but sufficient data up to Mar '17 to demonstrate non-compliance. No real time PM10 data to assess directional contributions. O3 almost exceeding allowable 11 exceedances per year. No directional O3 trend evident, and di-urnal plot confirms photochemical related link between O3 & daily ambient temp profiles. Strong di-urnal NOx trend evident with highest NOx from NNW vector. Elevated CO from ACRW
0 Insuff. Data
Insuff. Data
Not sampled
Not sampled
Not sampled 0 0 0 0 Insuff.
Data Insuff. Data 0 0 10.00

Assmang Limited Cato Ridge Alloys (Pty) Ltd. 2020 AQIA for Sinter Plant EIA
Atmospheric Impact Report / Air Quality Impact Assessment
Document ID: AssmangCRW-AQIAReport_2020-PlannedSinterPlant_Sep2020_FD1.docx
Revision Date: 18Sep2020 Revision: FINAL_D1 Valid for: Assmang Cato Ridge, KwaZulu-Natal Province
Page 223 of 317
FINAL_D1 Compiled By: JG Potgieter
Approved By: JG Potgieter COPYRIGHT WARNING ALL RIGHTS RESERVED. All information and conceptual designs contained within this document are the intellectual property of ENVIRONGAKA (Pty) Ltd. This document and/or the information contained herein may not be used, stored, reproduced, or copied in any manner, without the prior written consent of ENVIRONGAKA (Pty) Ltd. This document and/or the information and conceptual designs may not be disclosed or displayed to any third party without the prior written consent of ENVIRONGAKA (Pty) Ltd.
EnviroNgaka
direction is barely evident & well below the standards.
November-17
No 24h PM10 exceedances in Nov '17. Insufficient PM10 data to assess compliance with anual standard. No real time PM10 data to assess directional contributions. O3 now exceeds allowable 11 exceedances of 8h standard per year. Weak directional O3 trend evident, most elevated from SE vector. Elevated SO2 from SE and NW vectors but well below the standard.
0 Insuff. Data
Insuff. Data
Not sampled
Not sampled
Not sampled 0 0 0 0 Insuff.
Data Insuff. Data 0 0 13.00
December-17
Compliance now recorded for annual PM10 exceedances of 24h standard, as fewer 24h exceedances in winter '17 compared to winter '16. SO2 predominantly originated from 100° to 200° (SE to S) vector in Dec '17. Elevated di-urnal SO2 at 4pm only occurred on 1 and 29 Dec '17. No strong directional trends for NOx, CO, O3. Ozone now complies with allowable 8h average exceedances (11 allowed).
0 3 0 Not sampled
Not sampled
Not sampled 0 0 0 0 Insuff.
Data Insuff. Data 0 0 11.00
January-18
Daily PM10 and 8h ozone currently compliant but by a narrow margin. Directional & di-urnal plots indicates SO2 source/s lying to the SE, with maximum levels recorded during mid-afternoons and evenings. Morning and evening di-urnal NOx peaks are evident. None of the pollutants measured indicate elevated impacts from direction of ACRW.
0 3 0 Not sampled
Not sampled
Not sampled 0 0 0 0 Insuff.
Data Insuff. Data 0 0 11.00
February-18
Daily PM10 and 8h ozone currently still compliant with annual allowable exceedances, but only by a narrow margin. Directional & di-urnal plots for Feb '18 once again indicates SO2 source/s lying to the ESE, with maximumimpacts recorded during mid to late afternoons. Morning (7am) and evening (9pm) di-urnal NOx peaks are evident. None of the directional pollutant plots indicated elevated impacts from direction of ACRW in Feb '18.
0 3 0 Not sampled
Not sampled
Not sampled 0 0 0 0 Insuff.
Data Insuff. Data 0 0 11.00
March-18
Daily PM10 and 8h ozone currently still compliant with annual allowable exceedances, but only by a narrow margin. Extremely high ozone levels recorded over short duration during thunderstorm on evening of 16 Mar '18. CO and NOx predominantly recorded from NNW direction in Mar '18, not from ACRW direction. Elevated (but compliant) SO2 levels were recorded from direction of ACRW for approx 1 hour during Mar '18
0 3 0 Not sampled
Not sampled
Not sampled 0 0 0 0 1 0 0 0 11.00
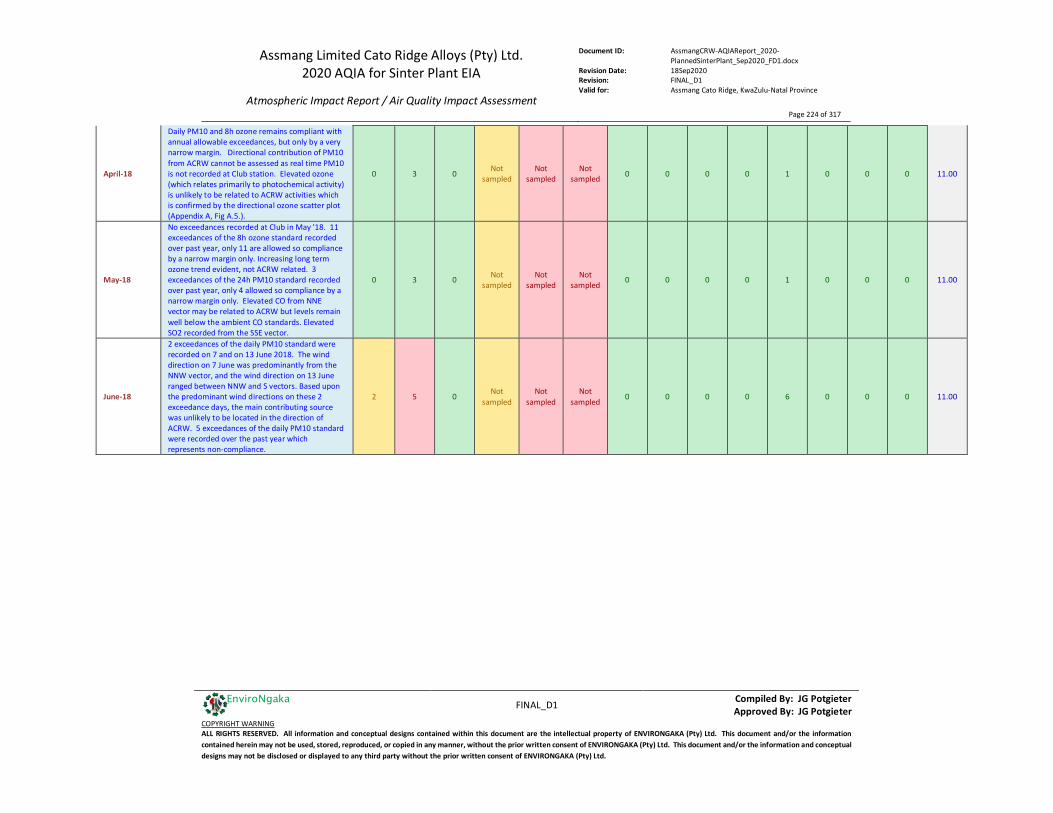
Assmang Limited Cato Ridge Alloys (Pty) Ltd. 2020 AQIA for Sinter Plant EIA
Atmospheric Impact Report / Air Quality Impact Assessment
Document ID: AssmangCRW-AQIAReport_2020-PlannedSinterPlant_Sep2020_FD1.docx
Revision Date: 18Sep2020 Revision: FINAL_D1 Valid for: Assmang Cato Ridge, KwaZulu-Natal Province
Page 224 of 317
FINAL_D1 Compiled By: JG Potgieter
Approved By: JG Potgieter COPYRIGHT WARNING ALL RIGHTS RESERVED. All information and conceptual designs contained within this document are the intellectual property of ENVIRONGAKA (Pty) Ltd. This document and/or the information contained herein may not be used, stored, reproduced, or copied in any manner, without the prior written consent of ENVIRONGAKA (Pty) Ltd. This document and/or the information and conceptual designs may not be disclosed or displayed to any third party without the prior written consent of ENVIRONGAKA (Pty) Ltd.
EnviroNgaka
April-18
Daily PM10 and 8h ozone remains compliant with annual allowable exceedances, but only by a very narrow margin. Directional contribution of PM10 from ACRW cannot be assessed as real time PM10 is not recorded at Club station. Elevated ozone (which relates primarily to photochemical activity) is unlikely to be related to ACRW activities which is confirmed by the directional ozone scatter plot (Appendix A, Fig A.5.).
0 3 0 Not sampled
Not sampled
Not sampled 0 0 0 0 1 0 0 0 11.00
May-18
No exceedances recorded at Club in May '18. 11 exceedances of the 8h ozone standard recorded over past year, only 11 are allowed so compliance by a narrow margin only. Increasing long term ozone trend evident, not ACRW related. 3 exceedances of the 24h PM10 standard recorded over past year, only 4 allowed so compliance by a narrow margin only. Elevated CO from NNE vector may be related to ACRW but levels remain well below the ambient CO standards. Elevated SO2 recorded from the SSE vector.
0 3 0 Not sampled
Not sampled
Not sampled 0 0 0 0 1 0 0 0 11.00
June-18
2 exceedances of the daily PM10 standard were recorded on 7 and on 13 June 2018. The wind direction on 7 June was predominantly from the NNW vector, and the wind direction on 13 June ranged between NNW and S vectors. Based upon the predominant wind directions on these 2 exceedance days, the main contributing source was unlikely to be located in the direction of ACRW. 5 exceedances of the daily PM10 standard were recorded over the past year which represents non-compliance.
2 5 0 Not sampled
Not sampled
Not sampled 0 0 0 0 6 0 0 0 11.00
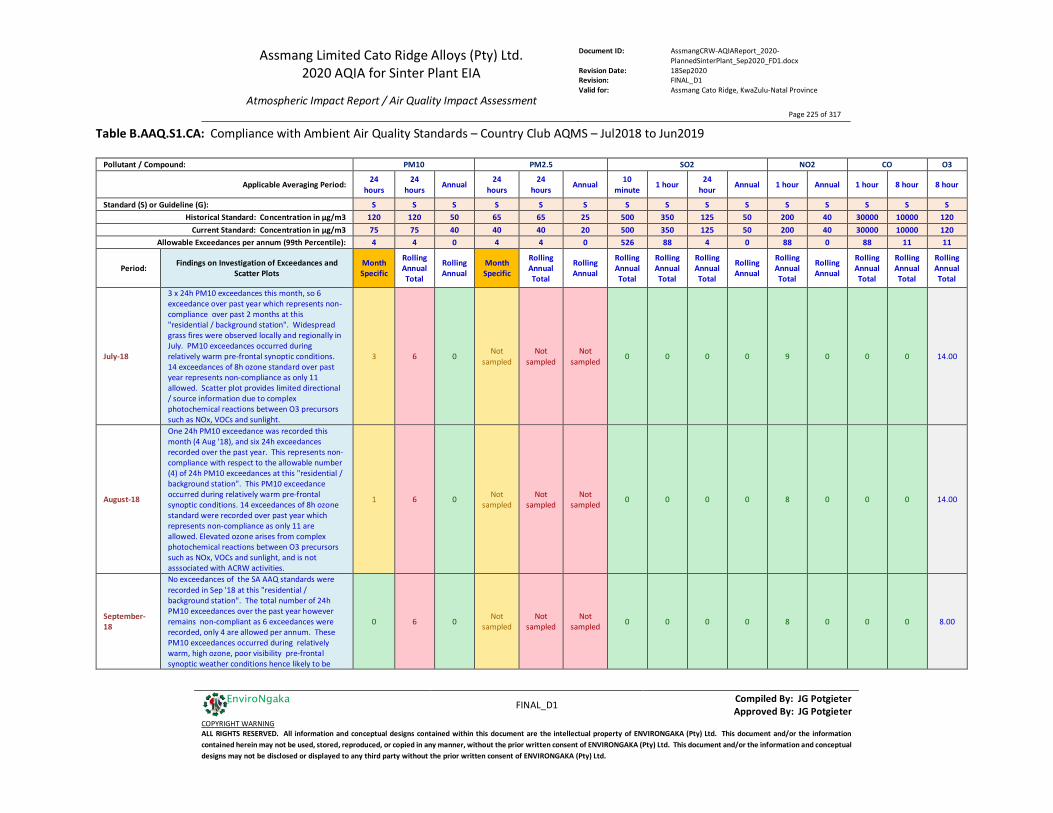
Assmang Limited Cato Ridge Alloys (Pty) Ltd. 2020 AQIA for Sinter Plant EIA
Atmospheric Impact Report / Air Quality Impact Assessment
Document ID: AssmangCRW-AQIAReport_2020-PlannedSinterPlant_Sep2020_FD1.docx
Revision Date: 18Sep2020 Revision: FINAL_D1 Valid for: Assmang Cato Ridge, KwaZulu-Natal Province
Page 225 of 317
FINAL_D1 Compiled By: JG Potgieter
Approved By: JG Potgieter COPYRIGHT WARNING ALL RIGHTS RESERVED. All information and conceptual designs contained within this document are the intellectual property of ENVIRONGAKA (Pty) Ltd. This document and/or the information contained herein may not be used, stored, reproduced, or copied in any manner, without the prior written consent of ENVIRONGAKA (Pty) Ltd. This document and/or the information and conceptual designs may not be disclosed or displayed to any third party without the prior written consent of ENVIRONGAKA (Pty) Ltd.
EnviroNgaka
Table B.AAQ.S1.CA: Compliance with Ambient Air Quality Standards – Country Club AQMS – Jul2018 to Jun2019
Pollutant / Compound: PM10 PM2.5 SO2 NO2 CO O3
Applicable Averaging Period: 24 hours
24 hours Annual 24
hours 24
hours Annual 10 minute 1 hour 24
hour Annual 1 hour Annual 1 hour 8 hour 8 hour
Standard (S) or Guideline (G): S S S S S S S S S S S S S S S Historical Standard: Concentration in µg/m3 120 120 50 65 65 25 500 350 125 50 200 40 30000 10000 120
Current Standard: Concentration in µg/m3 75 75 40 40 40 20 500 350 125 50 200 40 30000 10000 120 Allowable Exceedances per annum (99th Percentile): 4 4 0 4 4 0 526 88 4 0 88 0 88 11 11
Period: Findings on Investigation of Exceedances and Scatter Plots
Month Specific
Rolling Annual Total
Rolling Annual
Month Specific
Rolling Annual Total
Rolling Annual
Rolling Annual Total
Rolling Annual Total
Rolling Annual Total
Rolling Annual
Rolling Annual Total
Rolling Annual
Rolling Annual Total
Rolling Annual Total
Rolling Annual Total
July-18
3 x 24h PM10 exceedances this month, so 6 exceedance over past year which represents non-compliance over past 2 months at this "residential / background station". Widespread grass fires were observed locally and regionally in July. PM10 exceedances occurred during relatively warm pre-frontal synoptic conditions. 14 exceedances of 8h ozone standard over past year represents non-compliance as only 11 allowed. Scatter plot provides limited directional / source information due to complex photochemical reactions between O3 precursors such as NOx, VOCs and sunlight.
3 6 0 Not sampled
Not sampled
Not sampled 0 0 0 0 9 0 0 0 14.00
August-18
One 24h PM10 exceedance was recorded this month (4 Aug '18), and six 24h exceedances recorded over the past year. This represents non-compliance with respect to the allowable number (4) of 24h PM10 exceedances at this "residential / background station". This PM10 exceedance occurred during relatively warm pre-frontal synoptic conditions. 14 exceedances of 8h ozone standard were recorded over past year which represents non-compliance as only 11 are allowed. Elevated ozone arises from complex photochemical reactions between O3 precursors such as NOx, VOCs and sunlight, and is not asssociated with ACRW activities.
1 6 0 Not sampled
Not sampled
Not sampled 0 0 0 0 8 0 0 0 14.00
September-18
No exceedances of the SA AAQ standards were recorded in Sep '18 at this "residential / background station". The total number of 24h PM10 exceedances over the past year however remains non-compliant as 6 exceedances were recorded, only 4 are allowed per annum. These PM10 exceedances occurred during relatively warm, high ozone, poor visibility pre-frontal synoptic weather conditions hence likely to be
0 6 0 Not sampled
Not sampled
Not sampled 0 0 0 0 8 0 0 0 8.00
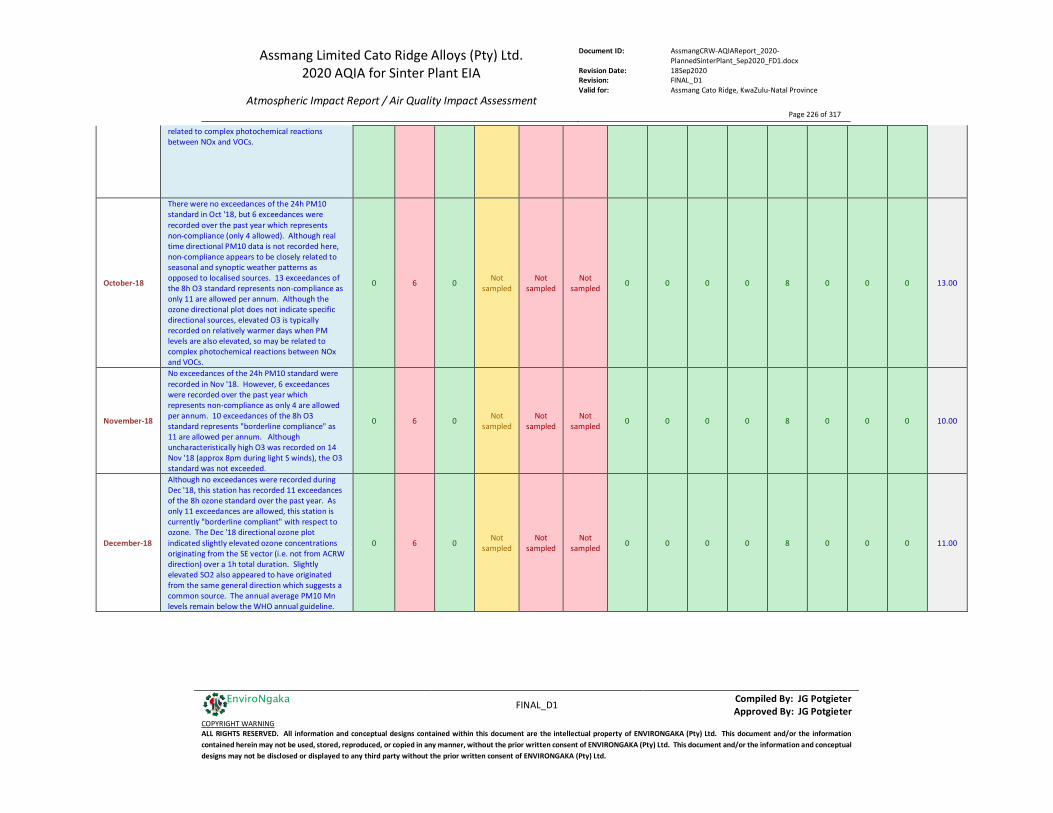
Assmang Limited Cato Ridge Alloys (Pty) Ltd. 2020 AQIA for Sinter Plant EIA
Atmospheric Impact Report / Air Quality Impact Assessment
Document ID: AssmangCRW-AQIAReport_2020-PlannedSinterPlant_Sep2020_FD1.docx
Revision Date: 18Sep2020 Revision: FINAL_D1 Valid for: Assmang Cato Ridge, KwaZulu-Natal Province
Page 226 of 317
FINAL_D1 Compiled By: JG Potgieter
Approved By: JG Potgieter COPYRIGHT WARNING ALL RIGHTS RESERVED. All information and conceptual designs contained within this document are the intellectual property of ENVIRONGAKA (Pty) Ltd. This document and/or the information contained herein may not be used, stored, reproduced, or copied in any manner, without the prior written consent of ENVIRONGAKA (Pty) Ltd. This document and/or the information and conceptual designs may not be disclosed or displayed to any third party without the prior written consent of ENVIRONGAKA (Pty) Ltd.
EnviroNgaka
related to complex photochemical reactions between NOx and VOCs.
October-18
There were no exceedances of the 24h PM10 standard in Oct '18, but 6 exceedances were recorded over the past year which represents non-compliance (only 4 allowed). Although real time directional PM10 data is not recorded here, non-compliance appears to be closely related to seasonal and synoptic weather patterns as opposed to localised sources. 13 exceedances of the 8h O3 standard represents non-compliance as only 11 are allowed per annum. Although the ozone directional plot does not indicate specific directional sources, elevated O3 is typically recorded on relatively warmer days when PM levels are also elevated, so may be related to complex photochemical reactions between NOx and VOCs.
0 6 0 Not sampled
Not sampled
Not sampled 0 0 0 0 8 0 0 0 13.00
November-18
No exceedances of the 24h PM10 standard were recorded in Nov '18. However, 6 exceedances were recorded over the past year which represents non-compliance as only 4 are allowed per annum. 10 exceedances of the 8h O3 standard represents "borderline compliance" as 11 are allowed per annum. Although uncharacteristically high O3 was recorded on 14 Nov '18 (approx 8pm during light S winds), the O3 standard was not exceeded.
0 6 0 Not sampled
Not sampled
Not sampled 0 0 0 0 8 0 0 0 10.00
December-18
Although no exceedances were recorded during Dec '18, this station has recorded 11 exceedances of the 8h ozone standard over the past year. As only 11 exceedances are allowed, this station is currently "borderline compliant" with respect to ozone. The Dec '18 directional ozone plot indicated slightly elevated ozone concentrations originating from the SE vector (i.e. not from ACRW direction) over a 1h total duration. Slightly elevated SO2 also appeared to have originated from the same general direction which suggests a common source. The annual average PM10 Mn levels remain below the WHO annual guideline.
0 6 0 Not sampled
Not sampled
Not sampled 0 0 0 0 8 0 0 0 11.00

Assmang Limited Cato Ridge Alloys (Pty) Ltd. 2020 AQIA for Sinter Plant EIA
Atmospheric Impact Report / Air Quality Impact Assessment
Document ID: AssmangCRW-AQIAReport_2020-PlannedSinterPlant_Sep2020_FD1.docx
Revision Date: 18Sep2020 Revision: FINAL_D1 Valid for: Assmang Cato Ridge, KwaZulu-Natal Province
Page 227 of 317
FINAL_D1 Compiled By: JG Potgieter
Approved By: JG Potgieter COPYRIGHT WARNING ALL RIGHTS RESERVED. All information and conceptual designs contained within this document are the intellectual property of ENVIRONGAKA (Pty) Ltd. This document and/or the information contained herein may not be used, stored, reproduced, or copied in any manner, without the prior written consent of ENVIRONGAKA (Pty) Ltd. This document and/or the information and conceptual designs may not be disclosed or displayed to any third party without the prior written consent of ENVIRONGAKA (Pty) Ltd.
EnviroNgaka
January-19
Since Jun '18 this station has remained non-compliant with respect to the maximum number of allowable exceedances of the 24h PM10 standard per annum. Over the current Feb '18 to Jan '19 review period, 6 exceedances were recorded, only 4 are allowed per annum. With regards to the 8h ozone standard, this station has recorded 12 exceedances over the past year, ie non-compliance as only 11 exceedances are allowed per annum. Although O3 is not commonly emitted from specific emission sources, the Jan '18 directional plot indicated the highest ozone concentrations originated from the SE vector and not from ACRW's direction. Slightly elevated SO2 also appeared to have originated from the same general direction, ie not from ACRW.
0 6 0 Not sampled
Not sampled
Not sampled 0 0 0 0 8 0 0 0 12.00
February-19
This station remains non-compliant with respect to the maximum number of allowable exceedances of the 24h PM10 standard per annum. 6 exceedances were recorded over the Mar '18 to Feb '19 review period, and only 4 are allowed per annum. With regards to the 8h ozone standard, this station also remains non-compliant as 12 exceedances were recorded over the past year and only 11 exceedances are allowed per annum. The Feb '19 directional plot indicated the highest ozone concentrations originated from the SSE vector. Slightly elevated SO2 appeared to have originated from the between the E and SSE vectors. These vectors do not coincide with the ACRW plant.
0 6 0 Not sampled
Not sampled
Not sampled 0 0 0 0 8 0 0 0 12.00
March-19
This station remains non-compliant with respect to the maximum number of allowable exceedances of the 24h PM10 standard per annum. 6 exceedances were recorded over the Apr '18 to Mar '19 review period, and only 4 are allowed per annum. With regards to the 8h ozone standard, this station also remains non-compliant as 12 exceedances were recorded over the past year and only 11 exceedances are allowed per annum. The Mar '19 directional plot indicated the highest ozone concentrations originated from the SE (140°) vector. Elevated SO2 was also recorded from the same SE vector which suggests a localised source of SO2 which does not coincide with the ACRW plant.
0 6 0 Not sampled
Not sampled
Not sampled 0 0 0 0 8 0 0 0 12.00
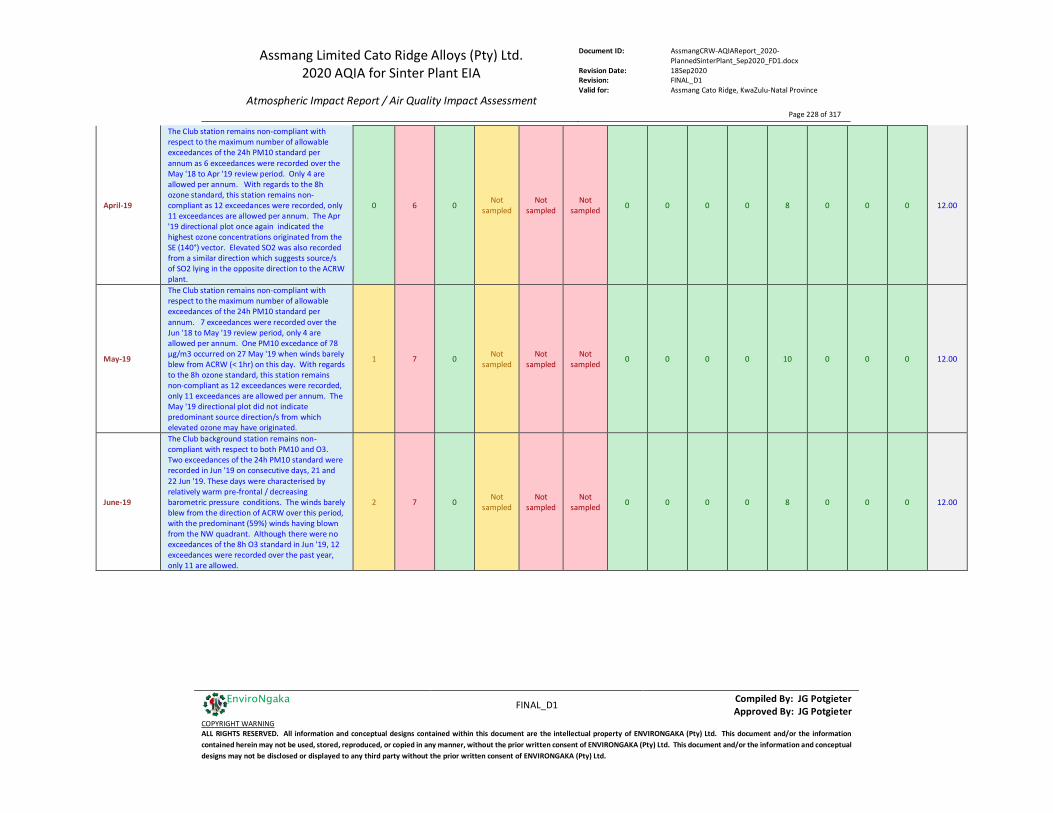
Assmang Limited Cato Ridge Alloys (Pty) Ltd. 2020 AQIA for Sinter Plant EIA
Atmospheric Impact Report / Air Quality Impact Assessment
Document ID: AssmangCRW-AQIAReport_2020-PlannedSinterPlant_Sep2020_FD1.docx
Revision Date: 18Sep2020 Revision: FINAL_D1 Valid for: Assmang Cato Ridge, KwaZulu-Natal Province
Page 228 of 317
FINAL_D1 Compiled By: JG Potgieter
Approved By: JG Potgieter COPYRIGHT WARNING ALL RIGHTS RESERVED. All information and conceptual designs contained within this document are the intellectual property of ENVIRONGAKA (Pty) Ltd. This document and/or the information contained herein may not be used, stored, reproduced, or copied in any manner, without the prior written consent of ENVIRONGAKA (Pty) Ltd. This document and/or the information and conceptual designs may not be disclosed or displayed to any third party without the prior written consent of ENVIRONGAKA (Pty) Ltd.
EnviroNgaka
April-19
The Club station remains non-compliant with respect to the maximum number of allowable exceedances of the 24h PM10 standard per annum as 6 exceedances were recorded over the May '18 to Apr '19 review period. Only 4 are allowed per annum. With regards to the 8h ozone standard, this station remains non-compliant as 12 exceedances were recorded, only 11 exceedances are allowed per annum. The Apr '19 directional plot once again indicated the highest ozone concentrations originated from the SE (140°) vector. Elevated SO2 was also recorded from a similar direction which suggests source/s of SO2 lying in the opposite direction to the ACRW plant.
0 6 0 Not sampled
Not sampled
Not sampled 0 0 0 0 8 0 0 0 12.00
May-19
The Club station remains non-compliant with respect to the maximum number of allowable exceedances of the 24h PM10 standard per annum. 7 exceedances were recorded over the Jun '18 to May '19 review period, only 4 are allowed per annum. One PM10 excedance of 78 µg/m3 occurred on 27 May '19 when winds barely blew from ACRW (< 1hr) on this day. With regards to the 8h ozone standard, this station remains non-compliant as 12 exceedances were recorded, only 11 exceedances are allowed per annum. The May '19 directional plot did not indicate predominant source direction/s from which elevated ozone may have originated.
1 7 0 Not sampled
Not sampled
Not sampled 0 0 0 0 10 0 0 0 12.00
June-19
The Club background station remains non-compliant with respect to both PM10 and O3. Two exceedances of the 24h PM10 standard were recorded in Jun '19 on consecutive days, 21 and 22 Jun '19. These days were characterised by relatively warm pre-frontal / decreasing barometric pressure conditions. The winds barely blew from the direction of ACRW over this period, with the predominant (59%) winds having blown from the NW quadrant. Although there were no exceedances of the 8h O3 standard in Jun '19, 12 exceedances were recorded over the past year, only 11 are allowed.
2 7 0 Not sampled
Not sampled
Not sampled 0 0 0 0 8 0 0 0 12.00
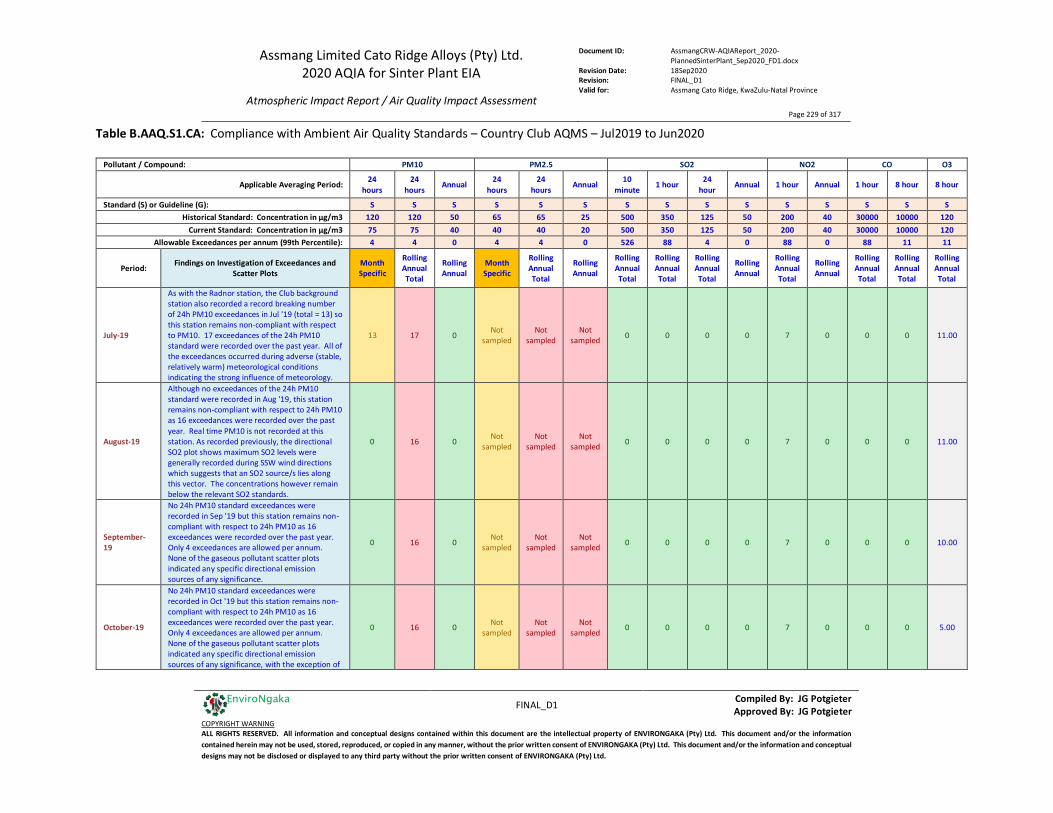
Assmang Limited Cato Ridge Alloys (Pty) Ltd. 2020 AQIA for Sinter Plant EIA
Atmospheric Impact Report / Air Quality Impact Assessment
Document ID: AssmangCRW-AQIAReport_2020-PlannedSinterPlant_Sep2020_FD1.docx
Revision Date: 18Sep2020 Revision: FINAL_D1 Valid for: Assmang Cato Ridge, KwaZulu-Natal Province
Page 229 of 317
FINAL_D1 Compiled By: JG Potgieter
Approved By: JG Potgieter COPYRIGHT WARNING ALL RIGHTS RESERVED. All information and conceptual designs contained within this document are the intellectual property of ENVIRONGAKA (Pty) Ltd. This document and/or the information contained herein may not be used, stored, reproduced, or copied in any manner, without the prior written consent of ENVIRONGAKA (Pty) Ltd. This document and/or the information and conceptual designs may not be disclosed or displayed to any third party without the prior written consent of ENVIRONGAKA (Pty) Ltd.
EnviroNgaka
Table B.AAQ.S1.CA: Compliance with Ambient Air Quality Standards – Country Club AQMS – Jul2019 to Jun2020
Pollutant / Compound: PM10 PM2.5 SO2 NO2 CO O3
Applicable Averaging Period: 24 hours
24 hours Annual 24
hours 24
hours Annual 10 minute 1 hour 24
hour Annual 1 hour Annual 1 hour 8 hour 8 hour
Standard (S) or Guideline (G): S S S S S S S S S S S S S S S Historical Standard: Concentration in µg/m3 120 120 50 65 65 25 500 350 125 50 200 40 30000 10000 120
Current Standard: Concentration in µg/m3 75 75 40 40 40 20 500 350 125 50 200 40 30000 10000 120 Allowable Exceedances per annum (99th Percentile): 4 4 0 4 4 0 526 88 4 0 88 0 88 11 11
Period: Findings on Investigation of Exceedances and Scatter Plots
Month Specific
Rolling Annual Total
Rolling Annual
Month Specific
Rolling Annual Total
Rolling Annual
Rolling Annual Total
Rolling Annual Total
Rolling Annual Total
Rolling Annual
Rolling Annual Total
Rolling Annual
Rolling Annual Total
Rolling Annual Total
Rolling Annual Total
July-19
As with the Radnor station, the Club background station also recorded a record breaking number of 24h PM10 exceedances in Jul '19 (total = 13) so this station remains non-compliant with respect to PM10. 17 exceedances of the 24h PM10 standard were recorded over the past year. All of the exceedances occurred during adverse (stable, relatively warm) meteorological conditions indicating the strong influence of meteorology.
13 17 0 Not sampled
Not sampled
Not sampled 0 0 0 0 7 0 0 0 11.00
August-19
Although no exceedances of the 24h PM10 standard were recorded in Aug '19, this station remains non-compliant with respect to 24h PM10 as 16 exceedances were recorded over the past year. Real time PM10 is not recorded at this station. As recorded previously, the directional SO2 plot shows maximum SO2 levels were generally recorded during SSW wind directions which suggests that an SO2 source/s lies along this vector. The concentrations however remain below the relevant SO2 standards.
0 16 0 Not sampled
Not sampled
Not sampled 0 0 0 0 7 0 0 0 11.00
September-19
No 24h PM10 standard exceedances were recorded in Sep '19 but this station remains non-compliant with respect to 24h PM10 as 16 exceedances were recorded over the past year. Only 4 exceedances are allowed per annum. None of the gaseous pollutant scatter plots indicated any specific directional emission sources of any significance.
0 16 0 Not sampled
Not sampled
Not sampled 0 0 0 0 7 0 0 0 10.00
October-19
No 24h PM10 standard exceedances were recorded in Oct '19 but this station remains non-compliant with respect to 24h PM10 as 16 exceedances were recorded over the past year. Only 4 exceedances are allowed per annum. None of the gaseous pollutant scatter plots indicated any specific directional emission sources of any significance, with the exception of
0 16 0 Not sampled
Not sampled
Not sampled 0 0 0 0 7 0 0 0 5.00
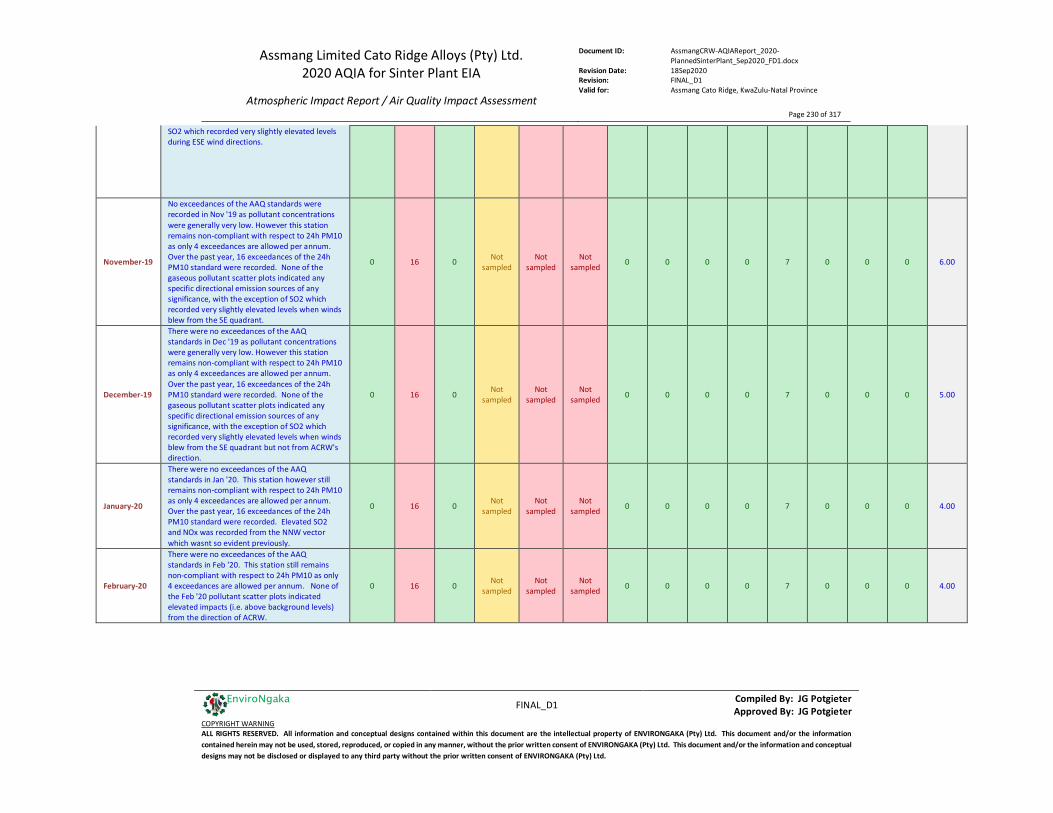
Assmang Limited Cato Ridge Alloys (Pty) Ltd. 2020 AQIA for Sinter Plant EIA
Atmospheric Impact Report / Air Quality Impact Assessment
Document ID: AssmangCRW-AQIAReport_2020-PlannedSinterPlant_Sep2020_FD1.docx
Revision Date: 18Sep2020 Revision: FINAL_D1 Valid for: Assmang Cato Ridge, KwaZulu-Natal Province
Page 230 of 317
FINAL_D1 Compiled By: JG Potgieter
Approved By: JG Potgieter COPYRIGHT WARNING ALL RIGHTS RESERVED. All information and conceptual designs contained within this document are the intellectual property of ENVIRONGAKA (Pty) Ltd. This document and/or the information contained herein may not be used, stored, reproduced, or copied in any manner, without the prior written consent of ENVIRONGAKA (Pty) Ltd. This document and/or the information and conceptual designs may not be disclosed or displayed to any third party without the prior written consent of ENVIRONGAKA (Pty) Ltd.
EnviroNgaka
SO2 which recorded very slightly elevated levels during ESE wind directions.
November-19
No exceedances of the AAQ standards were recorded in Nov '19 as pollutant concentrations were generally very low. However this station remains non-compliant with respect to 24h PM10 as only 4 exceedances are allowed per annum. Over the past year, 16 exceedances of the 24h PM10 standard were recorded. None of the gaseous pollutant scatter plots indicated any specific directional emission sources of any significance, with the exception of SO2 which recorded very slightly elevated levels when winds blew from the SE quadrant.
0 16 0 Not sampled
Not sampled
Not sampled 0 0 0 0 7 0 0 0 6.00
December-19
There were no exceedances of the AAQ standards in Dec '19 as pollutant concentrations were generally very low. However this station remains non-compliant with respect to 24h PM10 as only 4 exceedances are allowed per annum. Over the past year, 16 exceedances of the 24h PM10 standard were recorded. None of the gaseous pollutant scatter plots indicated any specific directional emission sources of any significance, with the exception of SO2 which recorded very slightly elevated levels when winds blew from the SE quadrant but not from ACRW's direction.
0 16 0 Not sampled
Not sampled
Not sampled 0 0 0 0 7 0 0 0 5.00
January-20
There were no exceedances of the AAQ standards in Jan '20. This station however still remains non-compliant with respect to 24h PM10 as only 4 exceedances are allowed per annum. Over the past year, 16 exceedances of the 24h PM10 standard were recorded. Elevated SO2 and NOx was recorded from the NNW vector which wasnt so evident previously.
0 16 0 Not sampled
Not sampled
Not sampled 0 0 0 0 7 0 0 0 4.00
February-20
There were no exceedances of the AAQ standards in Feb '20. This station still remains non-compliant with respect to 24h PM10 as only 4 exceedances are allowed per annum. None of the Feb '20 pollutant scatter plots indicated elevated impacts (i.e. above background levels) from the direction of ACRW.
0 16 0 Not sampled
Not sampled
Not sampled 0 0 0 0 7 0 0 0 4.00
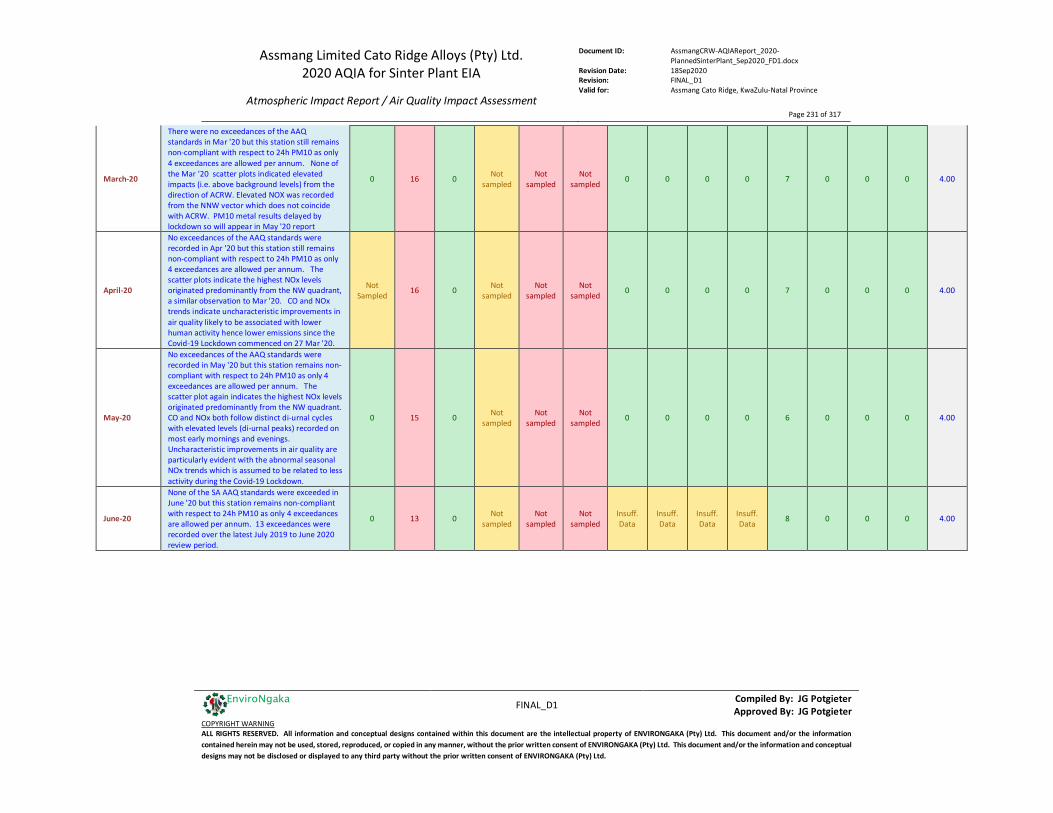
Assmang Limited Cato Ridge Alloys (Pty) Ltd. 2020 AQIA for Sinter Plant EIA
Atmospheric Impact Report / Air Quality Impact Assessment
Document ID: AssmangCRW-AQIAReport_2020-PlannedSinterPlant_Sep2020_FD1.docx
Revision Date: 18Sep2020 Revision: FINAL_D1 Valid for: Assmang Cato Ridge, KwaZulu-Natal Province
Page 231 of 317
FINAL_D1 Compiled By: JG Potgieter
Approved By: JG Potgieter COPYRIGHT WARNING ALL RIGHTS RESERVED. All information and conceptual designs contained within this document are the intellectual property of ENVIRONGAKA (Pty) Ltd. This document and/or the information contained herein may not be used, stored, reproduced, or copied in any manner, without the prior written consent of ENVIRONGAKA (Pty) Ltd. This document and/or the information and conceptual designs may not be disclosed or displayed to any third party without the prior written consent of ENVIRONGAKA (Pty) Ltd.
EnviroNgaka
March-20
There were no exceedances of the AAQ standards in Mar '20 but this station still remains non-compliant with respect to 24h PM10 as only 4 exceedances are allowed per annum. None of the Mar '20 scatter plots indicated elevated impacts (i.e. above background levels) from the direction of ACRW. Elevated NOX was recorded from the NNW vector which does not coincide with ACRW. PM10 metal results delayed by lockdown so will appear in May '20 report
0 16 0 Not sampled
Not sampled
Not sampled 0 0 0 0 7 0 0 0 4.00
April-20
No exceedances of the AAQ standards were recorded in Apr '20 but this station still remains non-compliant with respect to 24h PM10 as only 4 exceedances are allowed per annum. The scatter plots indicate the highest NOx levels originated predominantly from the NW quadrant, a similar observation to Mar '20. CO and NOx trends indicate uncharacteristic improvements in air quality likely to be associated with lower human activity hence lower emissions since the Covid-19 Lockdown commenced on 27 Mar '20.
Not Sampled 16 0 Not
sampled Not
sampled Not
sampled 0 0 0 0 7 0 0 0 4.00
May-20
No exceedances of the AAQ standards were recorded in May '20 but this station remains non-compliant with respect to 24h PM10 as only 4 exceedances are allowed per annum. The scatter plot again indicates the highest NOx levels originated predominantly from the NW quadrant. CO and NOx both follow distinct di-urnal cycles with elevated levels (di-urnal peaks) recorded on most early mornings and evenings. Uncharacteristic improvements in air quality are particularly evident with the abnormal seasonal NOx trends which is assumed to be related to less activity during the Covid-19 Lockdown.
0 15 0 Not sampled
Not sampled
Not sampled 0 0 0 0 6 0 0 0 4.00
June-20
None of the SA AAQ standards were exceeded in June '20 but this station remains non-compliant with respect to 24h PM10 as only 4 exceedances are allowed per annum. 13 exceedances were recorded over the latest July 2019 to June 2020 review period.
0 13 0 Not sampled
Not sampled
Not sampled
Insuff. Data
Insuff. Data
Insuff. Data
Insuff. Data 8 0 0 0 4.00
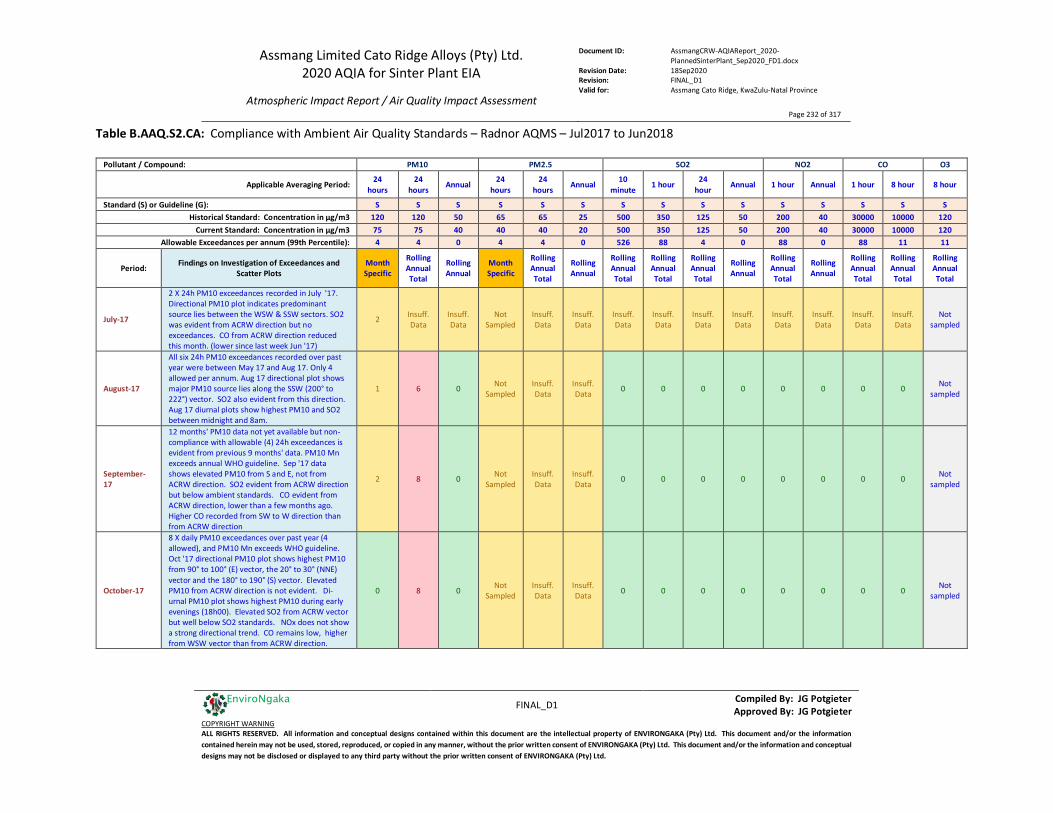
Assmang Limited Cato Ridge Alloys (Pty) Ltd. 2020 AQIA for Sinter Plant EIA
Atmospheric Impact Report / Air Quality Impact Assessment
Document ID: AssmangCRW-AQIAReport_2020-PlannedSinterPlant_Sep2020_FD1.docx
Revision Date: 18Sep2020 Revision: FINAL_D1 Valid for: Assmang Cato Ridge, KwaZulu-Natal Province
Page 232 of 317
FINAL_D1 Compiled By: JG Potgieter
Approved By: JG Potgieter COPYRIGHT WARNING ALL RIGHTS RESERVED. All information and conceptual designs contained within this document are the intellectual property of ENVIRONGAKA (Pty) Ltd. This document and/or the information contained herein may not be used, stored, reproduced, or copied in any manner, without the prior written consent of ENVIRONGAKA (Pty) Ltd. This document and/or the information and conceptual designs may not be disclosed or displayed to any third party without the prior written consent of ENVIRONGAKA (Pty) Ltd.
EnviroNgaka
Table B.AAQ.S2.CA: Compliance with Ambient Air Quality Standards – Radnor AQMS – Jul2017 to Jun2018
Pollutant / Compound: PM10 PM2.5 SO2 NO2 CO O3
Applicable Averaging Period: 24 hours
24 hours Annual 24
hours 24
hours Annual 10 minute 1 hour 24
hour Annual 1 hour Annual 1 hour 8 hour 8 hour
Standard (S) or Guideline (G): S S S S S S S S S S S S S S S Historical Standard: Concentration in µg/m3 120 120 50 65 65 25 500 350 125 50 200 40 30000 10000 120
Current Standard: Concentration in µg/m3 75 75 40 40 40 20 500 350 125 50 200 40 30000 10000 120 Allowable Exceedances per annum (99th Percentile): 4 4 0 4 4 0 526 88 4 0 88 0 88 11 11
Period: Findings on Investigation of Exceedances and Scatter Plots
Month Specific
Rolling Annual Total
Rolling Annual
Month Specific
Rolling Annual Total
Rolling Annual
Rolling Annual Total
Rolling Annual Total
Rolling Annual Total
Rolling Annual
Rolling Annual Total
Rolling Annual
Rolling Annual Total
Rolling Annual Total
Rolling Annual Total
July-17
2 X 24h PM10 exceedances recorded in July '17. Directional PM10 plot indicates predominant source lies between the WSW & SSW sectors. SO2 was evident from ACRW direction but no exceedances. CO from ACRW direction reduced this month. (lower since last week Jun '17)
2 Insuff. Data
Insuff. Data
Not Sampled
Insuff. Data
Insuff. Data
Insuff. Data
Insuff. Data
Insuff. Data
Insuff. Data
Insuff. Data
Insuff. Data
Insuff. Data
Insuff. Data
Not sampled
August-17
All six 24h PM10 exceedances recorded over past year were between May 17 and Aug 17. Only 4 allowed per annum. Aug 17 directional plot shows major PM10 source lies along the SSW (200° to 222°) vector. SO2 also evident from this direction. Aug 17 diurnal plots show highest PM10 and SO2 between midnight and 8am.
1 6 0 Not Sampled
Insuff. Data
Insuff. Data 0 0 0 0 0 0 0 0 Not
sampled
September-17
12 months' PM10 data not yet available but non-compliance with allowable (4) 24h exceedances is evident from previous 9 months' data. PM10 Mn exceeds annual WHO guideline. Sep '17 data shows elevated PM10 from S and E, not from ACRW direction. SO2 evident from ACRW direction but below ambient standards. CO evident from ACRW direction, lower than a few months ago. Higher CO recorded from SW to W direction than from ACRW direction
2 8 0 Not Sampled
Insuff. Data
Insuff. Data 0 0 0 0 0 0 0 0 Not
sampled
October-17
8 X daily PM10 exceedances over past year (4 allowed), and PM10 Mn exceeds WHO guideline. Oct '17 directional PM10 plot shows highest PM10 from 90° to 100° (E) vector, the 20° to 30° (NNE) vector and the 180° to 190° (S) vector. Elevated PM10 from ACRW direction is not evident. Di-urnal PM10 plot shows highest PM10 during early evenings (18h00). Elevated SO2 from ACRW vector but well below SO2 standards. NOx does not show a strong directional trend. CO remains low, higher from WSW vector than from ACRW direction.
0 8 0 Not Sampled
Insuff. Data
Insuff. Data 0 0 0 0 0 0 0 0 Not
sampled
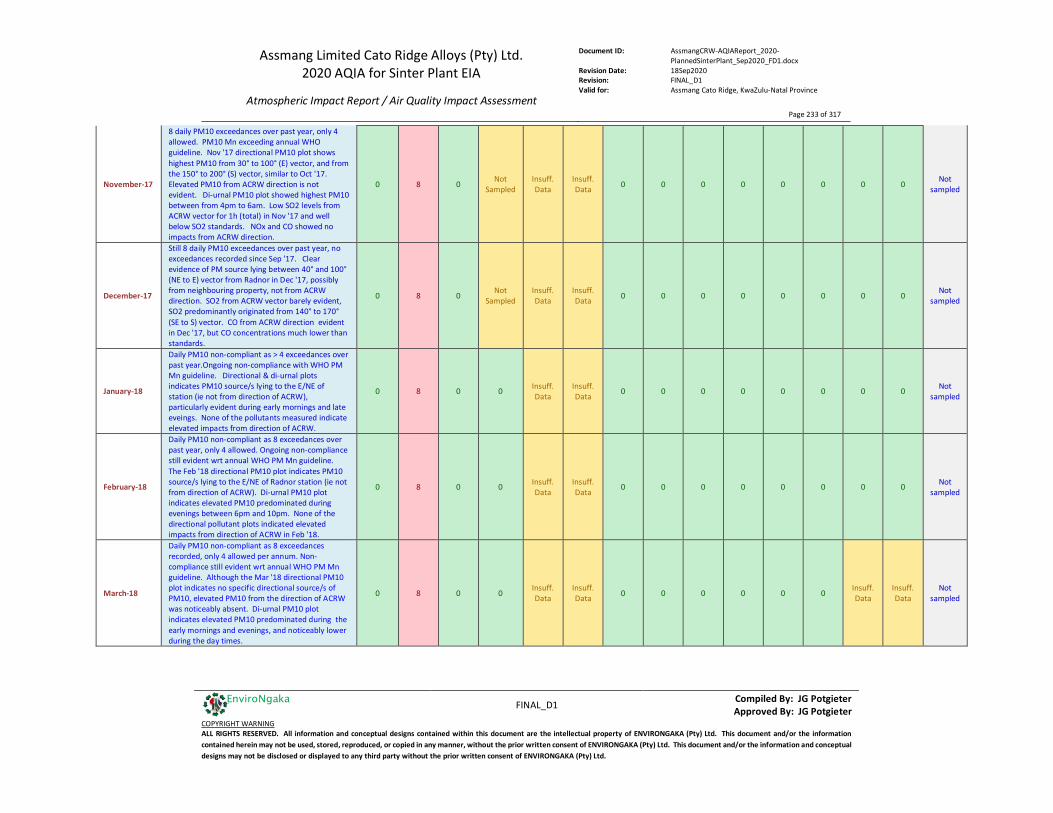
Assmang Limited Cato Ridge Alloys (Pty) Ltd. 2020 AQIA for Sinter Plant EIA
Atmospheric Impact Report / Air Quality Impact Assessment
Document ID: AssmangCRW-AQIAReport_2020-PlannedSinterPlant_Sep2020_FD1.docx
Revision Date: 18Sep2020 Revision: FINAL_D1 Valid for: Assmang Cato Ridge, KwaZulu-Natal Province
Page 233 of 317
FINAL_D1 Compiled By: JG Potgieter
Approved By: JG Potgieter COPYRIGHT WARNING ALL RIGHTS RESERVED. All information and conceptual designs contained within this document are the intellectual property of ENVIRONGAKA (Pty) Ltd. This document and/or the information contained herein may not be used, stored, reproduced, or copied in any manner, without the prior written consent of ENVIRONGAKA (Pty) Ltd. This document and/or the information and conceptual designs may not be disclosed or displayed to any third party without the prior written consent of ENVIRONGAKA (Pty) Ltd.
EnviroNgaka
November-17
8 daily PM10 exceedances over past year, only 4 allowed. PM10 Mn exceeding annual WHO guideline. Nov '17 directional PM10 plot shows highest PM10 from 30° to 100° (E) vector, and from the 150° to 200° (S) vector, similar to Oct '17. Elevated PM10 from ACRW direction is not evident. Di-urnal PM10 plot showed highest PM10 between from 4pm to 6am. Low SO2 levels from ACRW vector for 1h (total) in Nov '17 and well below SO2 standards. NOx and CO showed no impacts from ACRW direction.
0 8 0 Not Sampled
Insuff. Data
Insuff. Data 0 0 0 0 0 0 0 0 Not
sampled
December-17
Still 8 daily PM10 exceedances over past year, no exceedances recorded since Sep '17. Clear evidence of PM source lying between 40° and 100° (NE to E) vector from Radnor in Dec '17, possibly from neighbouring property, not from ACRW direction. SO2 from ACRW vector barely evident, SO2 predominantly originated from 140° to 170° (SE to S) vector. CO from ACRW direction evident in Dec '17, but CO concentrations much lower than standards.
0 8 0 Not Sampled
Insuff. Data
Insuff. Data 0 0 0 0 0 0 0 0 Not
sampled
January-18
Daily PM10 non-compliant as > 4 exceedances over past year.Ongoing non-compliance with WHO PM Mn guideline. Directional & di-urnal plots indicates PM10 source/s lying to the E/NE of station (ie not from direction of ACRW), particularly evident during early mornings and late eveings. None of the pollutants measured indicate elevated impacts from direction of ACRW.
0 8 0 0 Insuff. Data
Insuff. Data 0 0 0 0 0 0 0 0 Not
sampled
February-18
Daily PM10 non-compliant as 8 exceedances over past year, only 4 allowed. Ongoing non-compliance still evident wrt annual WHO PM Mn guideline. The Feb '18 directional PM10 plot indicates PM10 source/s lying to the E/NE of Radnor station (ie not from direction of ACRW). Di-urnal PM10 plot indicates elevated PM10 predominated during evenings between 6pm and 10pm. None of the directional pollutant plots indicated elevated impacts from direction of ACRW in Feb '18.
0 8 0 0 Insuff. Data
Insuff. Data 0 0 0 0 0 0 0 0 Not
sampled
March-18
Daily PM10 non-compliant as 8 exceedances recorded, only 4 allowed per annum. Non-compliance still evident wrt annual WHO PM Mn guideline. Although the Mar '18 directional PM10 plot indicates no specific directional source/s of PM10, elevated PM10 from the direction of ACRW was noticeably absent. Di-urnal PM10 plot indicates elevated PM10 predominated during the early mornings and evenings, and noticeably lower during the day times.
0 8 0 0 Insuff. Data
Insuff. Data 0 0 0 0 0 0 Insuff.
Data Insuff. Data
Not sampled
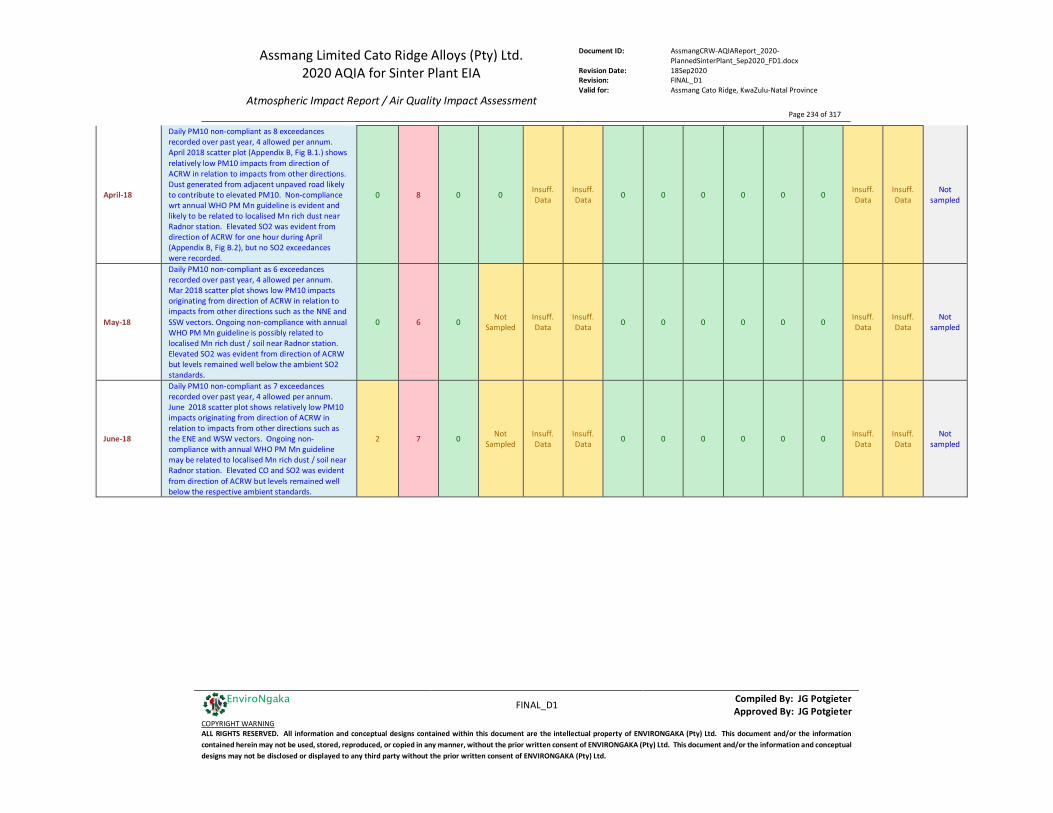
Assmang Limited Cato Ridge Alloys (Pty) Ltd. 2020 AQIA for Sinter Plant EIA
Atmospheric Impact Report / Air Quality Impact Assessment
Document ID: AssmangCRW-AQIAReport_2020-PlannedSinterPlant_Sep2020_FD1.docx
Revision Date: 18Sep2020 Revision: FINAL_D1 Valid for: Assmang Cato Ridge, KwaZulu-Natal Province
Page 234 of 317
FINAL_D1 Compiled By: JG Potgieter
Approved By: JG Potgieter COPYRIGHT WARNING ALL RIGHTS RESERVED. All information and conceptual designs contained within this document are the intellectual property of ENVIRONGAKA (Pty) Ltd. This document and/or the information contained herein may not be used, stored, reproduced, or copied in any manner, without the prior written consent of ENVIRONGAKA (Pty) Ltd. This document and/or the information and conceptual designs may not be disclosed or displayed to any third party without the prior written consent of ENVIRONGAKA (Pty) Ltd.
EnviroNgaka
April-18
Daily PM10 non-compliant as 8 exceedances recorded over past year, 4 allowed per annum. April 2018 scatter plot (Appendix B, Fig B.1.) shows relatively low PM10 impacts from direction of ACRW in relation to impacts from other directions. Dust generated from adjacent unpaved road likely to contribute to elevated PM10. Non-compliance wrt annual WHO PM Mn guideline is evident and likely to be related to localised Mn rich dust near Radnor station. Elevated SO2 was evident from direction of ACRW for one hour during April (Appendix B, Fig B.2), but no SO2 exceedances were recorded.
0 8 0 0 Insuff. Data
Insuff. Data 0 0 0 0 0 0 Insuff.
Data Insuff. Data
Not sampled
May-18
Daily PM10 non-compliant as 6 exceedances recorded over past year, 4 allowed per annum. Mar 2018 scatter plot shows low PM10 impacts originating from direction of ACRW in relation to impacts from other directions such as the NNE and SSW vectors. Ongoing non-compliance with annual WHO PM Mn guideline is possibly related to localised Mn rich dust / soil near Radnor station. Elevated SO2 was evident from direction of ACRW but levels remained well below the ambient SO2 standards.
0 6 0 Not Sampled
Insuff. Data
Insuff. Data 0 0 0 0 0 0 Insuff.
Data Insuff. Data
Not sampled
June-18
Daily PM10 non-compliant as 7 exceedances recorded over past year, 4 allowed per annum. June 2018 scatter plot shows relatively low PM10 impacts originating from direction of ACRW in relation to impacts from other directions such as the ENE and WSW vectors. Ongoing non-compliance with annual WHO PM Mn guideline may be related to localised Mn rich dust / soil near Radnor station. Elevated CO and SO2 was evident from direction of ACRW but levels remained well below the respective ambient standards.
2 7 0 Not Sampled
Insuff. Data
Insuff. Data 0 0 0 0 0 0 Insuff.
Data Insuff. Data
Not sampled
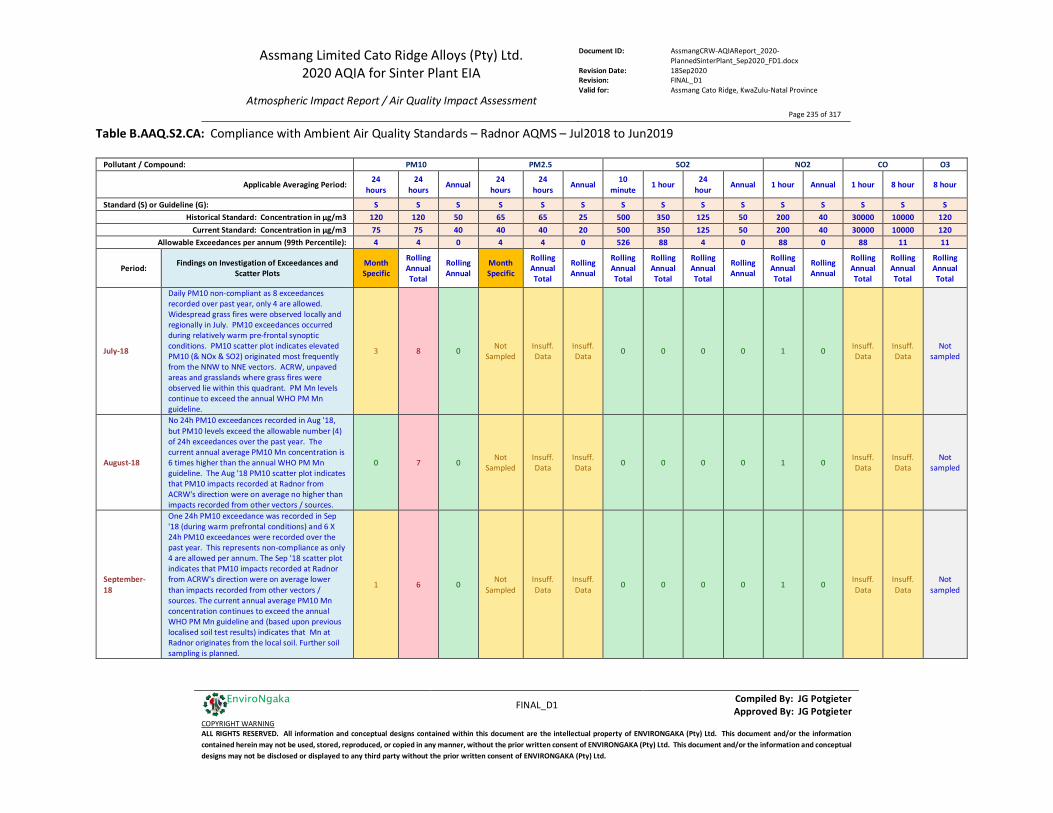
Assmang Limited Cato Ridge Alloys (Pty) Ltd. 2020 AQIA for Sinter Plant EIA
Atmospheric Impact Report / Air Quality Impact Assessment
Document ID: AssmangCRW-AQIAReport_2020-PlannedSinterPlant_Sep2020_FD1.docx
Revision Date: 18Sep2020 Revision: FINAL_D1 Valid for: Assmang Cato Ridge, KwaZulu-Natal Province
Page 235 of 317
FINAL_D1 Compiled By: JG Potgieter
Approved By: JG Potgieter COPYRIGHT WARNING ALL RIGHTS RESERVED. All information and conceptual designs contained within this document are the intellectual property of ENVIRONGAKA (Pty) Ltd. This document and/or the information contained herein may not be used, stored, reproduced, or copied in any manner, without the prior written consent of ENVIRONGAKA (Pty) Ltd. This document and/or the information and conceptual designs may not be disclosed or displayed to any third party without the prior written consent of ENVIRONGAKA (Pty) Ltd.
EnviroNgaka
Table B.AAQ.S2.CA: Compliance with Ambient Air Quality Standards – Radnor AQMS – Jul2018 to Jun2019
Pollutant / Compound: PM10 PM2.5 SO2 NO2 CO O3
Applicable Averaging Period: 24 hours
24 hours Annual 24
hours 24
hours Annual 10 minute 1 hour 24
hour Annual 1 hour Annual 1 hour 8 hour 8 hour
Standard (S) or Guideline (G): S S S S S S S S S S S S S S S Historical Standard: Concentration in µg/m3 120 120 50 65 65 25 500 350 125 50 200 40 30000 10000 120
Current Standard: Concentration in µg/m3 75 75 40 40 40 20 500 350 125 50 200 40 30000 10000 120 Allowable Exceedances per annum (99th Percentile): 4 4 0 4 4 0 526 88 4 0 88 0 88 11 11
Period: Findings on Investigation of Exceedances and Scatter Plots
Month Specific
Rolling Annual Total
Rolling Annual
Month Specific
Rolling Annual Total
Rolling Annual
Rolling Annual Total
Rolling Annual Total
Rolling Annual Total
Rolling Annual
Rolling Annual Total
Rolling Annual
Rolling Annual Total
Rolling Annual Total
Rolling Annual Total
July-18
Daily PM10 non-compliant as 8 exceedances recorded over past year, only 4 are allowed. Widespread grass fires were observed locally and regionally in July. PM10 exceedances occurred during relatively warm pre-frontal synoptic conditions. PM10 scatter plot indicates elevated PM10 (& NOx & SO2) originated most frequently from the NNW to NNE vectors. ACRW, unpaved areas and grasslands where grass fires were observed lie within this quadrant. PM Mn levels continue to exceed the annual WHO PM Mn guideline.
3 8 0 Not Sampled
Insuff. Data
Insuff. Data 0 0 0 0 1 0 Insuff.
Data Insuff. Data
Not sampled
August-18
No 24h PM10 exceedances recorded in Aug '18, but PM10 levels exceed the allowable number (4) of 24h exceedances over the past year. The current annual average PM10 Mn concentration is 6 times higher than the annual WHO PM Mn guideline. The Aug '18 PM10 scatter plot indicates that PM10 impacts recorded at Radnor from ACRW's direction were on average no higher than impacts recorded from other vectors / sources.
0 7 0 Not Sampled
Insuff. Data
Insuff. Data 0 0 0 0 1 0 Insuff.
Data Insuff. Data
Not sampled
September-18
One 24h PM10 exceedance was recorded in Sep '18 (during warm prefrontal conditions) and 6 X 24h PM10 exceedances were recorded over the past year. This represents non-compliance as only 4 are allowed per annum. The Sep '18 scatter plot indicates that PM10 impacts recorded at Radnor from ACRW's direction were on average lower than impacts recorded from other vectors / sources. The current annual average PM10 Mn concentration continues to exceed the annual WHO PM Mn guideline and (based upon previous localised soil test results) indicates that Mn at Radnor originates from the local soil. Further soil sampling is planned.
1 6 0 Not Sampled
Insuff. Data
Insuff. Data 0 0 0 0 1 0 Insuff.
Data Insuff. Data
Not sampled
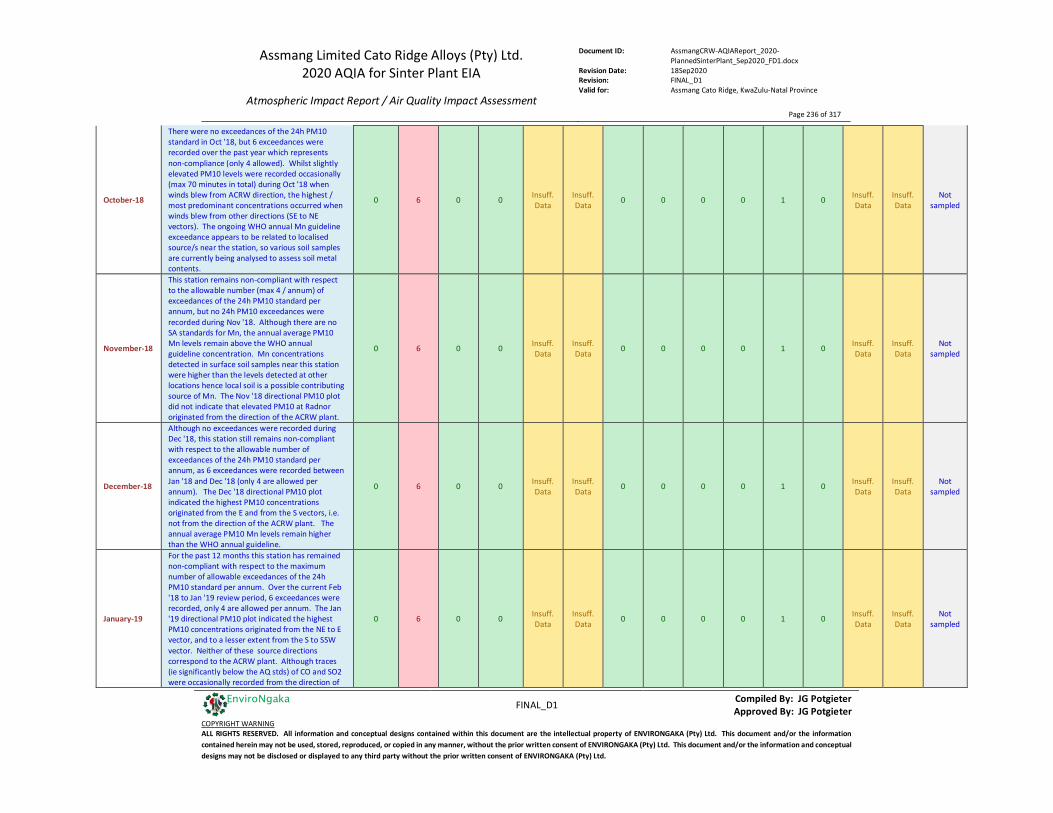
Assmang Limited Cato Ridge Alloys (Pty) Ltd. 2020 AQIA for Sinter Plant EIA
Atmospheric Impact Report / Air Quality Impact Assessment
Document ID: AssmangCRW-AQIAReport_2020-PlannedSinterPlant_Sep2020_FD1.docx
Revision Date: 18Sep2020 Revision: FINAL_D1 Valid for: Assmang Cato Ridge, KwaZulu-Natal Province
Page 236 of 317
FINAL_D1 Compiled By: JG Potgieter
Approved By: JG Potgieter COPYRIGHT WARNING ALL RIGHTS RESERVED. All information and conceptual designs contained within this document are the intellectual property of ENVIRONGAKA (Pty) Ltd. This document and/or the information contained herein may not be used, stored, reproduced, or copied in any manner, without the prior written consent of ENVIRONGAKA (Pty) Ltd. This document and/or the information and conceptual designs may not be disclosed or displayed to any third party without the prior written consent of ENVIRONGAKA (Pty) Ltd.
EnviroNgaka
October-18
There were no exceedances of the 24h PM10 standard in Oct '18, but 6 exceedances were recorded over the past year which represents non-compliance (only 4 allowed). Whilst slightly elevated PM10 levels were recorded occasionally (max 70 minutes in total) during Oct '18 when winds blew from ACRW direction, the highest / most predominant concentrations occurred when winds blew from other directions (SE to NE vectors). The ongoing WHO annual Mn guideline exceedance appears to be related to localised source/s near the station, so various soil samples are currently being analysed to assess soil metal contents.
0 6 0 0 Insuff. Data
Insuff. Data 0 0 0 0 1 0 Insuff.
Data Insuff. Data
Not sampled
November-18
This station remains non-compliant with respect to the allowable number (max 4 / annum) of exceedances of the 24h PM10 standard per annum, but no 24h PM10 exceedances were recorded during Nov '18. Although there are no SA standards for Mn, the annual average PM10 Mn levels remain above the WHO annual guideline concentration. Mn concentrations detected in surface soil samples near this station were higher than the levels detected at other locations hence local soil is a possible contributing source of Mn. The Nov '18 directional PM10 plot did not indicate that elevated PM10 at Radnor originated from the direction of the ACRW plant.
0 6 0 0 Insuff. Data
Insuff. Data 0 0 0 0 1 0 Insuff.
Data Insuff. Data
Not sampled
December-18
Although no exceedances were recorded during Dec '18, this station still remains non-compliant with respect to the allowable number of exceedances of the 24h PM10 standard per annum, as 6 exceedances were recorded between Jan '18 and Dec '18 (only 4 are allowed per annum). The Dec '18 directional PM10 plot indicated the highest PM10 concentrations originated from the E and from the S vectors, i.e. not from the direction of the ACRW plant. The annual average PM10 Mn levels remain higher than the WHO annual guideline.
0 6 0 0 Insuff. Data
Insuff. Data 0 0 0 0 1 0 Insuff.
Data Insuff. Data
Not sampled
January-19
For the past 12 months this station has remained non-compliant with respect to the maximum number of allowable exceedances of the 24h PM10 standard per annum. Over the current Feb '18 to Jan '19 review period, 6 exceedances were recorded, only 4 are allowed per annum. The Jan '19 directional PM10 plot indicated the highest PM10 concentrations originated from the NE to E vector, and to a lesser extent from the S to SSW vector. Neither of these source directions correspond to the ACRW plant. Although traces (ie significantly below the AQ stds) of CO and SO2 were occasionally recorded from the direction of
0 6 0 0 Insuff. Data
Insuff. Data 0 0 0 0 1 0 Insuff.
Data Insuff. Data
Not sampled
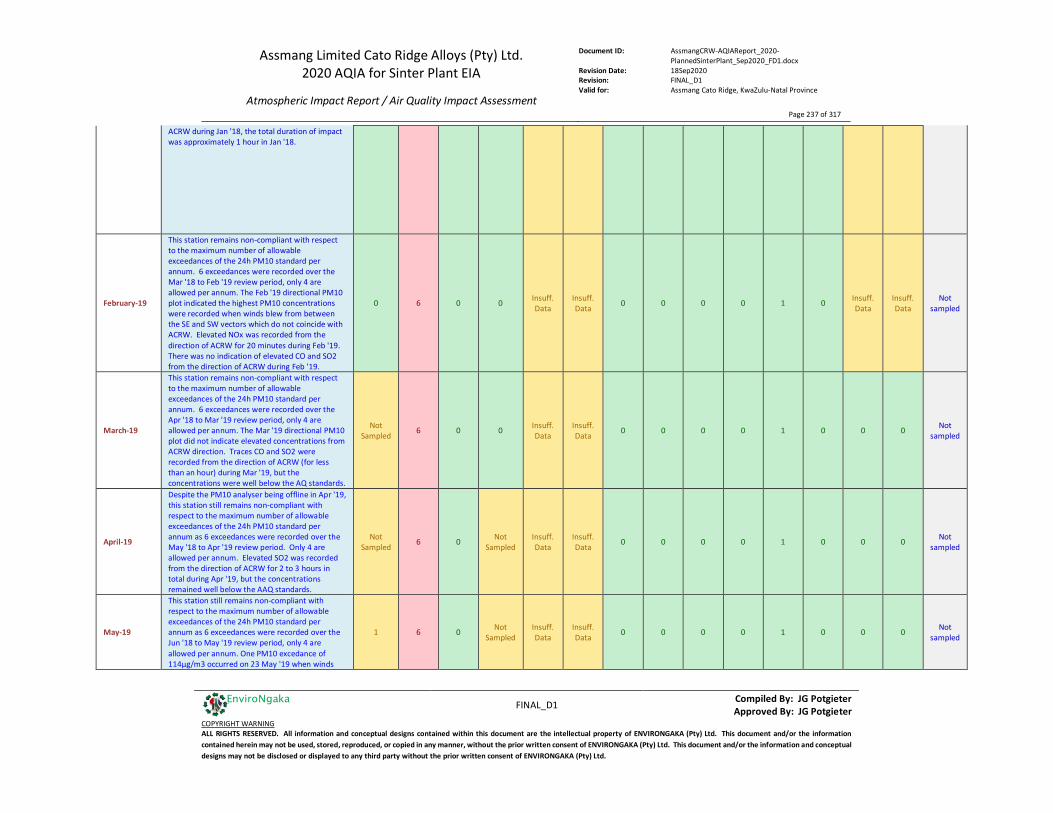
Assmang Limited Cato Ridge Alloys (Pty) Ltd. 2020 AQIA for Sinter Plant EIA
Atmospheric Impact Report / Air Quality Impact Assessment
Document ID: AssmangCRW-AQIAReport_2020-PlannedSinterPlant_Sep2020_FD1.docx
Revision Date: 18Sep2020 Revision: FINAL_D1 Valid for: Assmang Cato Ridge, KwaZulu-Natal Province
Page 237 of 317
FINAL_D1 Compiled By: JG Potgieter
Approved By: JG Potgieter COPYRIGHT WARNING ALL RIGHTS RESERVED. All information and conceptual designs contained within this document are the intellectual property of ENVIRONGAKA (Pty) Ltd. This document and/or the information contained herein may not be used, stored, reproduced, or copied in any manner, without the prior written consent of ENVIRONGAKA (Pty) Ltd. This document and/or the information and conceptual designs may not be disclosed or displayed to any third party without the prior written consent of ENVIRONGAKA (Pty) Ltd.
EnviroNgaka
ACRW during Jan '18, the total duration of impact was approximately 1 hour in Jan '18.
February-19
This station remains non-compliant with respect to the maximum number of allowable exceedances of the 24h PM10 standard per annum. 6 exceedances were recorded over the Mar '18 to Feb '19 review period, only 4 are allowed per annum. The Feb '19 directional PM10 plot indicated the highest PM10 concentrations were recorded when winds blew from between the SE and SW vectors which do not coincide with ACRW. Elevated NOx was recorded from the direction of ACRW for 20 minutes during Feb '19. There was no indication of elevated CO and SO2 from the direction of ACRW during Feb '19.
0 6 0 0 Insuff. Data
Insuff. Data 0 0 0 0 1 0 Insuff.
Data Insuff. Data
Not sampled
March-19
This station remains non-compliant with respect to the maximum number of allowable exceedances of the 24h PM10 standard per annum. 6 exceedances were recorded over the Apr '18 to Mar '19 review period, only 4 are allowed per annum. The Mar '19 directional PM10 plot did not indicate elevated concentrations from ACRW direction. Traces CO and SO2 were recorded from the direction of ACRW (for less than an hour) during Mar '19, but the concentrations were well below the AQ standards.
Not Sampled 6 0 0 Insuff.
Data Insuff. Data 0 0 0 0 1 0 0 0 Not
sampled
April-19
Despite the PM10 analyser being offline in Apr '19, this station still remains non-compliant with respect to the maximum number of allowable exceedances of the 24h PM10 standard per annum as 6 exceedances were recorded over the May '18 to Apr '19 review period. Only 4 are allowed per annum. Elevated SO2 was recorded from the direction of ACRW for 2 to 3 hours in total during Apr '19, but the concentrations remained well below the AAQ standards.
Not Sampled 6 0 Not
Sampled Insuff. Data
Insuff. Data 0 0 0 0 1 0 0 0 Not
sampled
May-19
This station still remains non-compliant with respect to the maximum number of allowable exceedances of the 24h PM10 standard per annum as 6 exceedances were recorded over the Jun '18 to May '19 review period, only 4 are allowed per annum. One PM10 excedance of 114µg/m3 occurred on 23 May '19 when winds
1 6 0 Not Sampled
Insuff. Data
Insuff. Data 0 0 0 0 1 0 0 0 Not
sampled
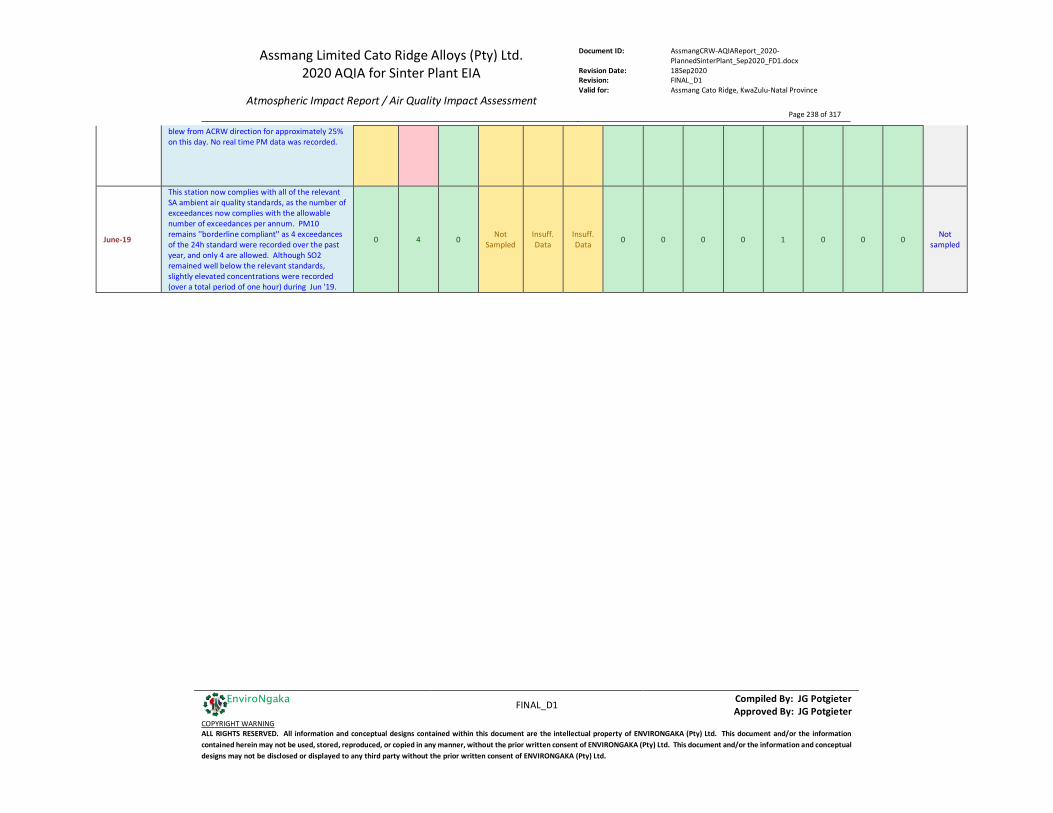
Assmang Limited Cato Ridge Alloys (Pty) Ltd. 2020 AQIA for Sinter Plant EIA
Atmospheric Impact Report / Air Quality Impact Assessment
Document ID: AssmangCRW-AQIAReport_2020-PlannedSinterPlant_Sep2020_FD1.docx
Revision Date: 18Sep2020 Revision: FINAL_D1 Valid for: Assmang Cato Ridge, KwaZulu-Natal Province
Page 238 of 317
FINAL_D1 Compiled By: JG Potgieter
Approved By: JG Potgieter COPYRIGHT WARNING ALL RIGHTS RESERVED. All information and conceptual designs contained within this document are the intellectual property of ENVIRONGAKA (Pty) Ltd. This document and/or the information contained herein may not be used, stored, reproduced, or copied in any manner, without the prior written consent of ENVIRONGAKA (Pty) Ltd. This document and/or the information and conceptual designs may not be disclosed or displayed to any third party without the prior written consent of ENVIRONGAKA (Pty) Ltd.
EnviroNgaka
blew from ACRW direction for approximately 25% on this day. No real time PM data was recorded.
June-19
This station now complies with all of the relevant SA ambient air quality standards, as the number of exceedances now complies with the allowable number of exceedances per annum. PM10 remains ''borderline compliant'' as 4 exceedances of the 24h standard were recorded over the past year, and only 4 are allowed. Although SO2 remained well below the relevant standards, slightly elevated concentrations were recorded (over a total period of one hour) during Jun '19.
0 4 0 Not Sampled
Insuff. Data
Insuff. Data 0 0 0 0 1 0 0 0 Not
sampled

Assmang Limited Cato Ridge Alloys (Pty) Ltd. 2020 AQIA for Sinter Plant EIA
Atmospheric Impact Report / Air Quality Impact Assessment
Document ID: AssmangCRW-AQIAReport_2020-PlannedSinterPlant_Sep2020_FD1.docx
Revision Date: 18Sep2020 Revision: FINAL_D1 Valid for: Assmang Cato Ridge, KwaZulu-Natal Province
Page 239 of 317
FINAL_D1 Compiled By: JG Potgieter
Approved By: JG Potgieter COPYRIGHT WARNING ALL RIGHTS RESERVED. All information and conceptual designs contained within this document are the intellectual property of ENVIRONGAKA (Pty) Ltd. This document and/or the information contained herein may not be used, stored, reproduced, or copied in any manner, without the prior written consent of ENVIRONGAKA (Pty) Ltd. This document and/or the information and conceptual designs may not be disclosed or displayed to any third party without the prior written consent of ENVIRONGAKA (Pty) Ltd.
EnviroNgaka
Table B.AAQ.S2.CA: Compliance with Ambient Air Quality Standards – Radnor AQMS – Jul2019 to Jun2020
Pollutant / Compound: PM10 PM2.5 SO2 NO2 CO O3
Applicable Averaging Period: 24 hours
24 hours Annual 24
hours 24
hours Annual 10 minute 1 hour 24
hour Annual 1 hour Annual 1 hour 8 hour 8 hour
Standard (S) or Guideline (G): S S S S S S S S S S S S S S S Historical Standard: Concentration in µg/m3 120 120 50 65 65 25 500 350 125 50 200 40 30000 10000 120
Current Standard: Concentration in µg/m3 75 75 40 40 40 20 500 350 125 50 200 40 30000 10000 120 Allowable Exceedances per annum (99th Percentile): 4 4 0 4 4 0 526 88 4 0 88 0 88 11 11
Period: Findings on Investigation of Exceedances and Scatter Plots
Month Specific
Rolling Annual Total
Rolling Annual
Month Specific
Rolling Annual Total
Rolling Annual
Rolling Annual Total
Rolling Annual Total
Rolling Annual Total
Rolling Annual
Rolling Annual Total
Rolling Annual
Rolling Annual Total
Rolling Annual Total
Rolling Annual Total
July-19
A record breaking frequency of 24h PM10 exceedances were recorded this month (Total = 9). Radnor therefore remains non-compliant with respect to 24h PM10 as 11 exceedances were recorded over the past year. July's real time wind and PM2.5 data for the 9 exceedance days did not indicate specific source direction/s for elevated PM2.5. This includes the ACRW plant which lies along the NW / NNW vector, as concentrations recorded during these winds were generally no higher than the normal / background concentrations recorded from the other wind vectors. Although elevated PM2.5 was recorded for 30mins from the direction of ACRW on 12 July, this was not one of the 9 exceedance days.
9 11 0 6 6 Insuff. Data 0 0 0 0 0 0 0 0 Not
sampled
August-19
PM10 remains non-compliant wrt the 24h standard. Although one year's PM2.5 data is not yet available, 6 exceedances of the 24h standard were recorded in Jul '19, and another (one) exceedance during Aug '19. These 7 exceedances over 2 months represents non-compliance as only 4 are allowed per annum. The Aug '19 PM2.5 scatter plot indicates the highest PM2.5 levels were most commonly recorded when winds blew from the SE quadrant which does not coincide with the ACRW plant. The Aug '19 PM2.5 di-urnal plot indicates that the highest PM2.5 levels were generally recorded between 9pm and 5pm. The PM2.5 exceedance was recorded on 25 Aug '19 which coincided with the nearby Geurnica / Metallica fire. Maximum PM2.5 levels on this day were recorded between 11h30 and 14h30.
0 11 0 1 7 Insuff. Data 0 0 0 0 0 0 0 0 Not
sampled
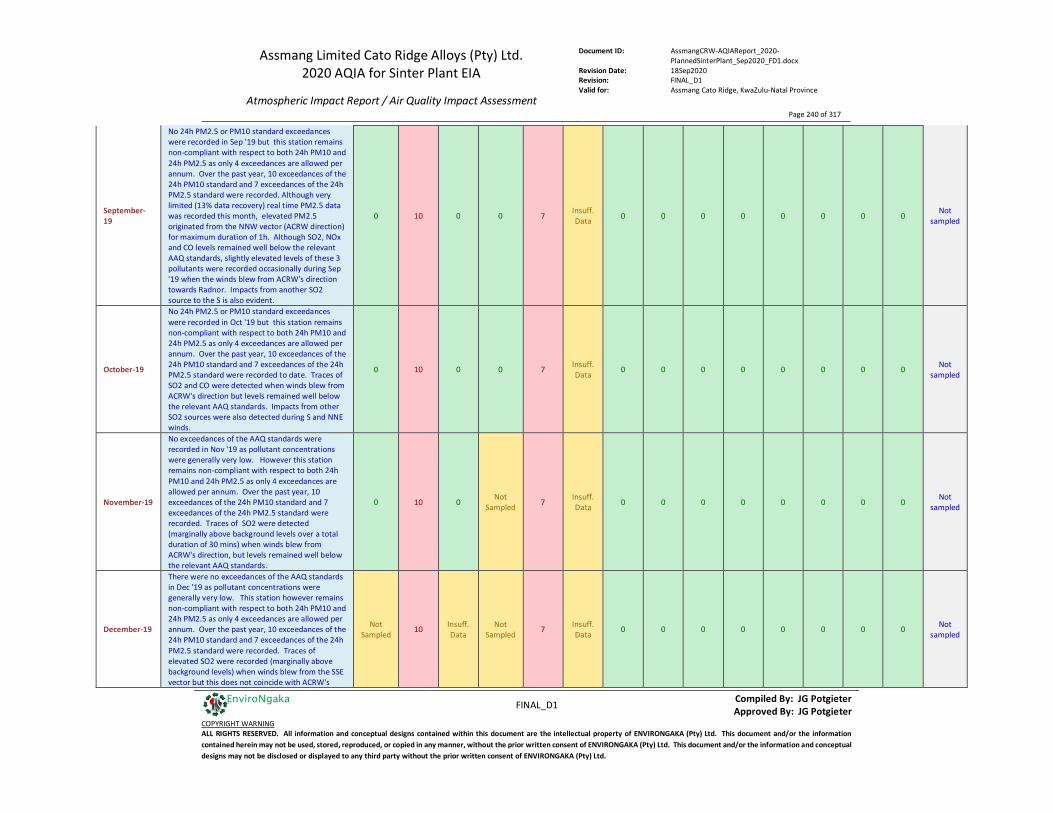
Assmang Limited Cato Ridge Alloys (Pty) Ltd. 2020 AQIA for Sinter Plant EIA
Atmospheric Impact Report / Air Quality Impact Assessment
Document ID: AssmangCRW-AQIAReport_2020-PlannedSinterPlant_Sep2020_FD1.docx
Revision Date: 18Sep2020 Revision: FINAL_D1 Valid for: Assmang Cato Ridge, KwaZulu-Natal Province
Page 240 of 317
FINAL_D1 Compiled By: JG Potgieter
Approved By: JG Potgieter COPYRIGHT WARNING ALL RIGHTS RESERVED. All information and conceptual designs contained within this document are the intellectual property of ENVIRONGAKA (Pty) Ltd. This document and/or the information contained herein may not be used, stored, reproduced, or copied in any manner, without the prior written consent of ENVIRONGAKA (Pty) Ltd. This document and/or the information and conceptual designs may not be disclosed or displayed to any third party without the prior written consent of ENVIRONGAKA (Pty) Ltd.
EnviroNgaka
September-19
No 24h PM2.5 or PM10 standard exceedances were recorded in Sep '19 but this station remains non-compliant with respect to both 24h PM10 and 24h PM2.5 as only 4 exceedances are allowed per annum. Over the past year, 10 exceedances of the 24h PM10 standard and 7 exceedances of the 24h PM2.5 standard were recorded. Although very limited (13% data recovery) real time PM2.5 data was recorded this month, elevated PM2.5 originated from the NNW vector (ACRW direction) for maximum duration of 1h. Although SO2, NOx and CO levels remained well below the relevant AAQ standards, slightly elevated levels of these 3 pollutants were recorded occasionally during Sep '19 when the winds blew from ACRW's direction towards Radnor. Impacts from another SO2 source to the S is also evident.
0 10 0 0 7 Insuff. Data 0 0 0 0 0 0 0 0 Not
sampled
October-19
No 24h PM2.5 or PM10 standard exceedances were recorded in Oct '19 but this station remains non-compliant with respect to both 24h PM10 and 24h PM2.5 as only 4 exceedances are allowed per annum. Over the past year, 10 exceedances of the 24h PM10 standard and 7 exceedances of the 24h PM2.5 standard were recorded to date. Traces of SO2 and CO were detected when winds blew from ACRW's direction but levels remained well below the relevant AAQ standards. Impacts from other SO2 sources were also detected during S and NNE winds.
0 10 0 0 7 Insuff. Data 0 0 0 0 0 0 0 0 Not
sampled
November-19
No exceedances of the AAQ standards were recorded in Nov '19 as pollutant concentrations were generally very low. However this station remains non-compliant with respect to both 24h PM10 and 24h PM2.5 as only 4 exceedances are allowed per annum. Over the past year, 10 exceedances of the 24h PM10 standard and 7 exceedances of the 24h PM2.5 standard were recorded. Traces of SO2 were detected (marginally above background levels over a total duration of 30 mins) when winds blew from ACRW's direction, but levels remained well below the relevant AAQ standards.
0 10 0 Not Sampled 7 Insuff.
Data 0 0 0 0 0 0 0 0 Not sampled
December-19
There were no exceedances of the AAQ standards in Dec '19 as pollutant concentrations were generally very low. This station however remains non-compliant with respect to both 24h PM10 and 24h PM2.5 as only 4 exceedances are allowed per annum. Over the past year, 10 exceedances of the 24h PM10 standard and 7 exceedances of the 24h PM2.5 standard were recorded. Traces of elevated SO2 were recorded (marginally above background levels) when winds blew from the SSE vector but this does not coincide with ACRW's
Not Sampled 10 Insuff.
Data Not
Sampled 7 Insuff. Data 0 0 0 0 0 0 0 0 Not
sampled
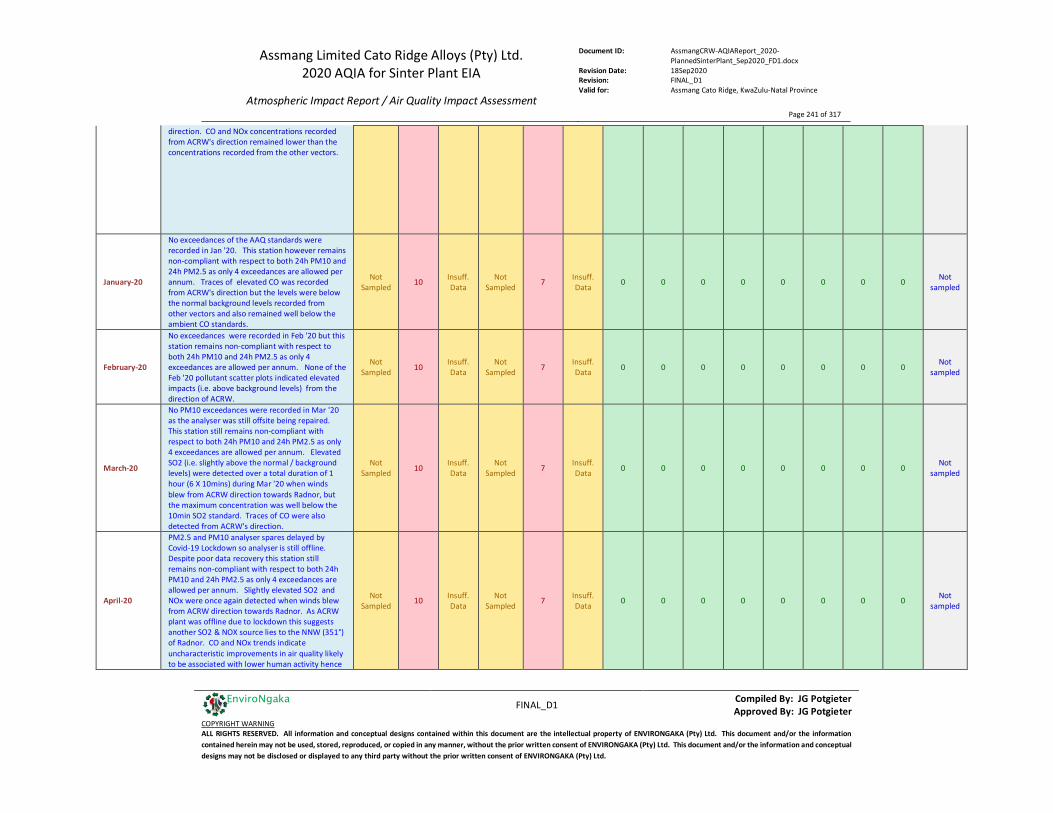
Assmang Limited Cato Ridge Alloys (Pty) Ltd. 2020 AQIA for Sinter Plant EIA
Atmospheric Impact Report / Air Quality Impact Assessment
Document ID: AssmangCRW-AQIAReport_2020-PlannedSinterPlant_Sep2020_FD1.docx
Revision Date: 18Sep2020 Revision: FINAL_D1 Valid for: Assmang Cato Ridge, KwaZulu-Natal Province
Page 241 of 317
FINAL_D1 Compiled By: JG Potgieter
Approved By: JG Potgieter COPYRIGHT WARNING ALL RIGHTS RESERVED. All information and conceptual designs contained within this document are the intellectual property of ENVIRONGAKA (Pty) Ltd. This document and/or the information contained herein may not be used, stored, reproduced, or copied in any manner, without the prior written consent of ENVIRONGAKA (Pty) Ltd. This document and/or the information and conceptual designs may not be disclosed or displayed to any third party without the prior written consent of ENVIRONGAKA (Pty) Ltd.
EnviroNgaka
direction. CO and NOx concentrations recorded from ACRW's direction remained lower than the concentrations recorded from the other vectors.
January-20
No exceedances of the AAQ standards were recorded in Jan '20. This station however remains non-compliant with respect to both 24h PM10 and 24h PM2.5 as only 4 exceedances are allowed per annum. Traces of elevated CO was recorded from ACRW's direction but the levels were below the normal background levels recorded from other vectors and also remained well below the ambient CO standards.
Not Sampled 10 Insuff.
Data Not
Sampled 7 Insuff. Data 0 0 0 0 0 0 0 0 Not
sampled
February-20
No exceedances were recorded in Feb '20 but this station remains non-compliant with respect to both 24h PM10 and 24h PM2.5 as only 4 exceedances are allowed per annum. None of the Feb '20 pollutant scatter plots indicated elevated impacts (i.e. above background levels) from the direction of ACRW.
Not Sampled 10 Insuff.
Data Not
Sampled 7 Insuff. Data 0 0 0 0 0 0 0 0 Not
sampled
March-20
No PM10 exceedances were recorded in Mar '20 as the analyser was still offsite being repaired. This station still remains non-compliant with respect to both 24h PM10 and 24h PM2.5 as only 4 exceedances are allowed per annum. Elevated SO2 (i.e. slightly above the normal / background levels) were detected over a total duration of 1 hour (6 X 10mins) during Mar '20 when winds blew from ACRW direction towards Radnor, but the maximum concentration was well below the 10min SO2 standard. Traces of CO were also detected from ACRW's direction.
Not Sampled 10 Insuff.
Data Not
Sampled 7 Insuff. Data 0 0 0 0 0 0 0 0 Not
sampled
April-20
PM2.5 and PM10 analyser spares delayed by Covid-19 Lockdown so analyser is still offline. Despite poor data recovery this station still remains non-compliant with respect to both 24h PM10 and 24h PM2.5 as only 4 exceedances are allowed per annum. Slightly elevated SO2 and NOx were once again detected when winds blew from ACRW direction towards Radnor. As ACRW plant was offline due to lockdown this suggests another SO2 & NOX source lies to the NNW (351°) of Radnor. CO and NOx trends indicate uncharacteristic improvements in air quality likely to be associated with lower human activity hence
Not Sampled 10 Insuff.
Data Not
Sampled 7 Insuff. Data 0 0 0 0 0 0 0 0 Not
sampled

Assmang Limited Cato Ridge Alloys (Pty) Ltd. 2020 AQIA for Sinter Plant EIA
Atmospheric Impact Report / Air Quality Impact Assessment
Document ID: AssmangCRW-AQIAReport_2020-PlannedSinterPlant_Sep2020_FD1.docx
Revision Date: 18Sep2020 Revision: FINAL_D1 Valid for: Assmang Cato Ridge, KwaZulu-Natal Province
Page 242 of 317
FINAL_D1 Compiled By: JG Potgieter
Approved By: JG Potgieter COPYRIGHT WARNING ALL RIGHTS RESERVED. All information and conceptual designs contained within this document are the intellectual property of ENVIRONGAKA (Pty) Ltd. This document and/or the information contained herein may not be used, stored, reproduced, or copied in any manner, without the prior written consent of ENVIRONGAKA (Pty) Ltd. This document and/or the information and conceptual designs may not be disclosed or displayed to any third party without the prior written consent of ENVIRONGAKA (Pty) Ltd.
EnviroNgaka
lower emissions since the Covid-19 Lockdown commenced on 27 Mar '20.
May-20
PM10 analyser repairs completed so online again from mid May '20. Real time / continuous PM10 sensor installed to assist with PM10 exceedance investigations. No exceedances recorded this month but PM10 and PM2.5 remains non-compliant due to the number of annual 24h standard exceedances over past year (only 4 are allowed per annum). Scatter plots show traces of SO2 and CO from direction of ACRW plant (NNW) but levels remained well below respectiove AAQ standards. April '20 data showed elevated SO2 and NOx originating from the same vector but ACRW plant was shutdown. Another emission source lying to the NNW of Radnor may therefore be responsible such as trucks idling at adjacent property entrance gate, only a few meters from the monitoring station.
0 9 Insuff. Data
Not Sampled 7 Insuff.
Data 0 0 0 0 0 0 0 0 Not sampled
June-20
2 PM10 exceedances were recorded on 25 & 26 Jun '20 during warm pre-frontal poor visibility synoptic conditions. Real time PM10 scatter plot does not indicate a specific source direction and none of the real time PM10 peaks on those days originated from the direction of ACRW. Exceedances therefore attributed to the usual increase in photochemical activity associated with relatively warm wintertime pre-frontal synoptic conditions. Station remains non-compliant with respect to the number of allowable PM10 and PM2.5 exceedances per annum. Monthly scatter plots shows PM10, CO, NOx and SO2 originating from the same NW quadrant as ACRWwhich was particularly evident overnight.
2 11 Insuff. Data
Not Sampled 7 Insuff.
Data 0 0 0 0 0 0 0 0 Not sampled

Assmang Limited Cato Ridge Alloys (Pty) Ltd. 2020 AQIA for Sinter Plant EIA
Atmospheric Impact Report / Air Quality Impact Assessment
Document ID: AssmangCRW-AQIAReport_2020-PlannedSinterPlant_Sep2020_FD1.docx
Revision Date: 18Sep2020 Revision: FINAL_D1 Valid for: Assmang Cato Ridge, KwaZulu-Natal Province
Page 243 of 317
FINAL_D1 Compiled By: JG Potgieter
Approved By: JG Potgieter COPYRIGHT WARNING ALL RIGHTS RESERVED. All information and conceptual designs contained within this document are the intellectual property of ENVIRONGAKA (Pty) Ltd. This document and/or the information contained herein may not be used, stored, reproduced, or copied in any manner, without the prior written consent of ENVIRONGAKA (Pty) Ltd. This document and/or the information and conceptual designs may not be disclosed or displayed to any third party without the prior written consent of ENVIRONGAKA (Pty) Ltd.
EnviroNgaka
B.M Comparison of Modelling Results versus Monitored Results In view of other non-Enterpise related sources which could potentially contribute to the ambient concentration of the pollutant(s) associated with this study, a full comparison of modelling versus monitored data is not possible. However, ad-hoc comparison of modelled and monitored data was done to assist with the development of the investigation. Modelling results from section 5.3 for Mn annual averages compare well with monitored results in terms of orders of magnitude.
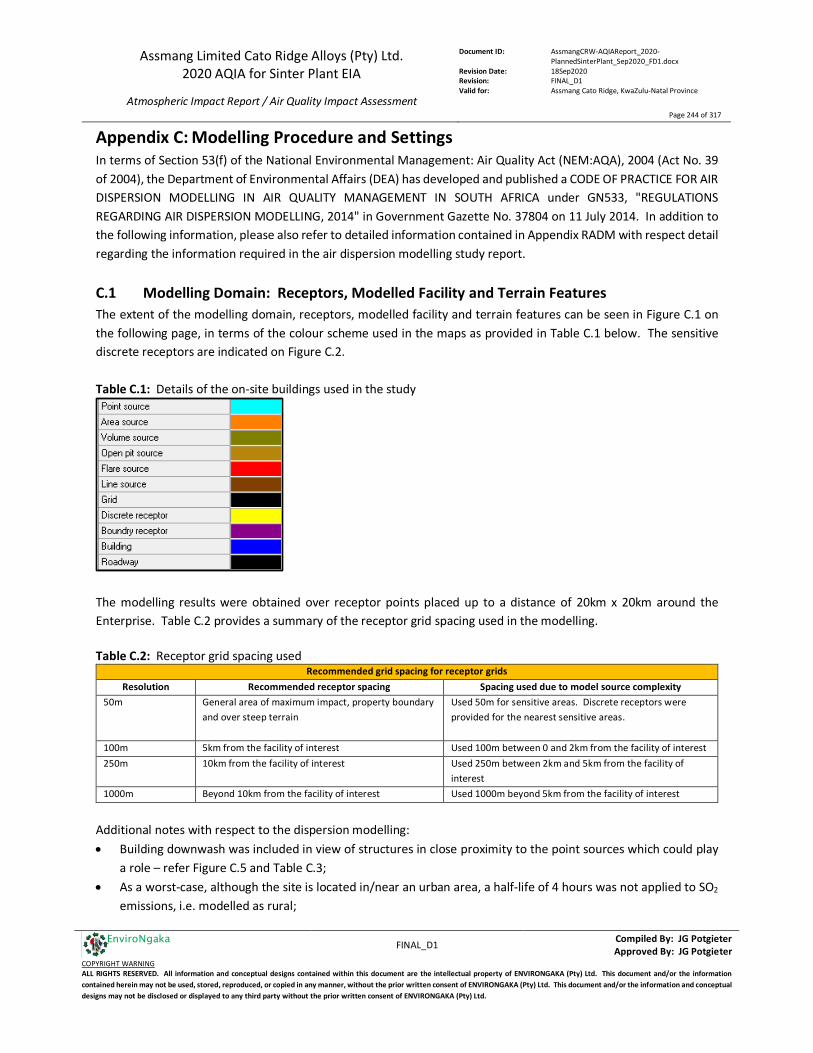
Assmang Limited Cato Ridge Alloys (Pty) Ltd. 2020 AQIA for Sinter Plant EIA
Atmospheric Impact Report / Air Quality Impact Assessment
Document ID: AssmangCRW-AQIAReport_2020-PlannedSinterPlant_Sep2020_FD1.docx
Revision Date: 18Sep2020 Revision: FINAL_D1 Valid for: Assmang Cato Ridge, KwaZulu-Natal Province
Page 244 of 317
FINAL_D1 Compiled By: JG Potgieter
Approved By: JG Potgieter COPYRIGHT WARNING ALL RIGHTS RESERVED. All information and conceptual designs contained within this document are the intellectual property of ENVIRONGAKA (Pty) Ltd. This document and/or the information contained herein may not be used, stored, reproduced, or copied in any manner, without the prior written consent of ENVIRONGAKA (Pty) Ltd. This document and/or the information and conceptual designs may not be disclosed or displayed to any third party without the prior written consent of ENVIRONGAKA (Pty) Ltd.
EnviroNgaka
Appendix C: Modelling Procedure and Settings In terms of Section 53(f) of the National Environmental Management: Air Quality Act (NEM:AQA), 2004 (Act No. 39 of 2004), the Department of Environmental Affairs (DEA) has developed and published a CODE OF PRACTICE FOR AIR DISPERSION MODELLING IN AIR QUALITY MANAGEMENT IN SOUTH AFRICA under GN533, "REGULATIONS REGARDING AIR DISPERSION MODELLING, 2014" in Government Gazette No. 37804 on 11 July 2014. In addition to the following information, please also refer to detailed information contained in Appendix RADM with respect detail regarding the information required in the air dispersion modelling study report.
C.1 Modelling Domain: Receptors, Modelled Facility and Terrain Features The extent of the modelling domain, receptors, modelled facility and terrain features can be seen in Figure C.1 on the following page, in terms of the colour scheme used in the maps as provided in Table C.1 below. The sensitive discrete receptors are indicated on Figure C.2. Table C.1: Details of the on-site buildings used in the study
The modelling results were obtained over receptor points placed up to a distance of 20km x 20km around the Enterprise. Table C.2 provides a summary of the receptor grid spacing used in the modelling. Table C.2: Receptor grid spacing used
Recommended grid spacing for receptor grids Resolution Recommended receptor spacing Spacing used due to model source complexity
50m General area of maximum impact, property boundary and over steep terrain
Used 50m for sensitive areas. Discrete receptors were provided for the nearest sensitive areas.
100m 5km from the facility of interest Used 100m between 0 and 2km from the facility of interest 250m 10km from the facility of interest Used 250m between 2km and 5km from the facility of
interest 1000m Beyond 10km from the facility of interest Used 1000m beyond 5km from the facility of interest
Additional notes with respect to the dispersion modelling: • Building downwash was included in view of structures in close proximity to the point sources which could play
a role – refer Figure C.5 and Table C.3; • As a worst-case, although the site is located in/near an urban area, a half-life of 4 hours was not applied to SO2
emissions, i.e. modelled as rural;
Assmang Limited Cato Ridge Alloys (Pty) Ltd. 2020 AQIA for Sinter Plant EIA
Atmospheric Impact Report / Air Quality Impact Assessment
Document ID: AssmangCRW-AQIAReport_2020-PlannedSinterPlant_Sep2020_FD1.docx
Revision Date: 18Sep2020 Revision: FINAL_D1 Valid for: Assmang Cato Ridge, KwaZulu-Natal Province
Page 245 of 317
FINAL_D1 Compiled By: JG Potgieter
Approved By: JG Potgieter COPYRIGHT WARNING ALL RIGHTS RESERVED. All information and conceptual designs contained within this document are the intellectual property of ENVIRONGAKA (Pty) Ltd. This document and/or the information contained herein may not be used, stored, reproduced, or copied in any manner, without the prior written consent of ENVIRONGAKA (Pty) Ltd. This document and/or the information and conceptual designs may not be disclosed or displayed to any third party without the prior written consent of ENVIRONGAKA (Pty) Ltd.
EnviroNgaka
• All NOX emissions were interpreted and modelled as NO2; • In view of this study forming part of an environmental authorisation and / or impact assessment associated with
a Listed Activity in terms of Section 21 of NEM:AQA, i.e. associated with an Atmospheric Emission Licence, deposition was not accounted for;
• Modelling was done for elevated terrain and not in terms of flat terrain; • Abnormal emissions were applicable for this investigation in view of the specific operations – abnormal
Emissions from Primary Point Sources (Stacks) when APCE is not available: when applicable, it is modelled during the most stable atmospheric condition (i.e. poorest dispersion potential), which is usually around midnight and the abnormal emissions were modelled to occur during this period;
• The hours of emission for the current and/or future sources are applied in terms of their operation, i.e. either batch, intermittent or continuous;
• Metals are modelled if the investigation warrants the modelling thereof in terms of adding additional value in terms of decision making. Hence with manganese being relevant for this Enterprise, it was also modelled;
• The impact of the secondary emissions from stockpiles, product/material handling and roads are accounted for in the ambient air monitoring data referenced in Section 5.1.1 and Appendix B, and considering the objective of each individual investigation, the merits of modelling the secondary emissions need to be considered. It is thus not always worthwhile to model the secondary emissions for each investigation, considering the resources required for complex modelling. In view of the objective of this study being to assess baseline impact, it was decided to model all the existing and/or proposed future secondary emissions in addition to the point sources;
• The locations (coordinates) and dimension (exit heights and diameters) of the proposed new stacks P30, P31 and P32 were assumed based the available information at the time of the study;
• Tapping emissions: Modelled as: o 95% captured, of which 96% abated and stacked; o 5% remaining as fugitive tapping emissions at a release height of 20m which is the estimated height
of the building; • Refer Section D.1 for further assumptions and exclusions where relevant.
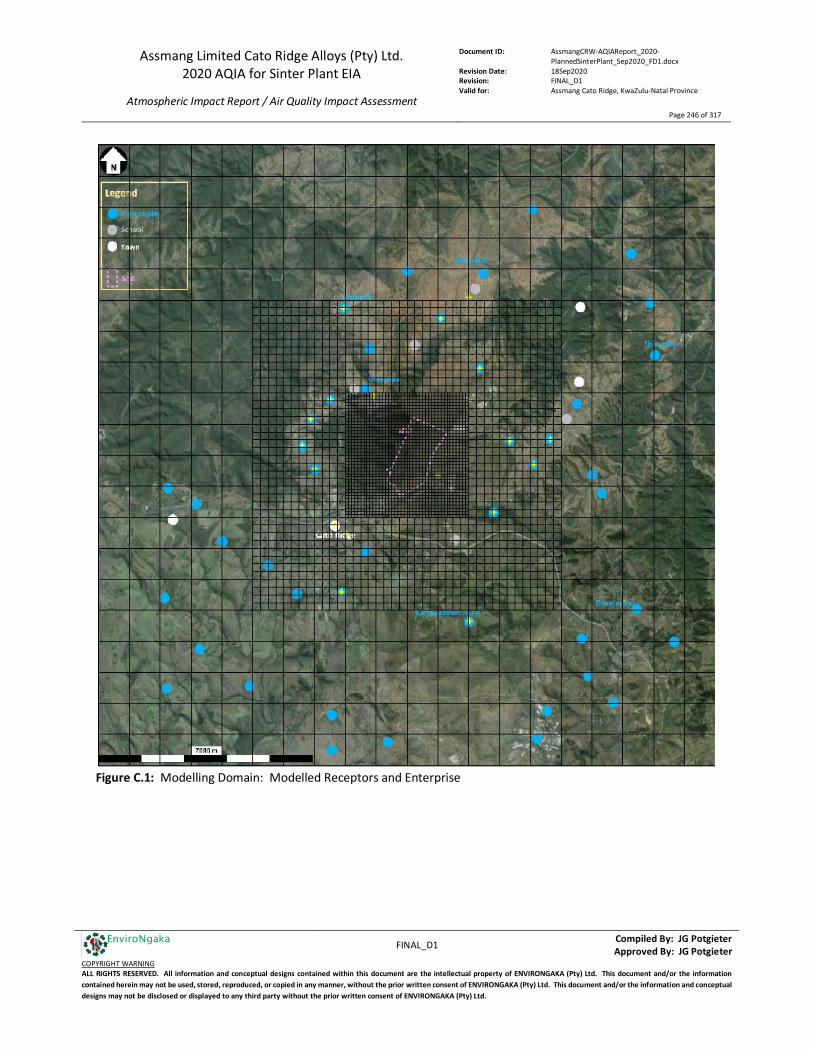
Assmang Limited Cato Ridge Alloys (Pty) Ltd. 2020 AQIA for Sinter Plant EIA
Atmospheric Impact Report / Air Quality Impact Assessment
Document ID: AssmangCRW-AQIAReport_2020-PlannedSinterPlant_Sep2020_FD1.docx
Revision Date: 18Sep2020 Revision: FINAL_D1 Valid for: Assmang Cato Ridge, KwaZulu-Natal Province
Page 246 of 317
FINAL_D1 Compiled By: JG Potgieter
Approved By: JG Potgieter COPYRIGHT WARNING ALL RIGHTS RESERVED. All information and conceptual designs contained within this document are the intellectual property of ENVIRONGAKA (Pty) Ltd. This document and/or the information contained herein may not be used, stored, reproduced, or copied in any manner, without the prior written consent of ENVIRONGAKA (Pty) Ltd. This document and/or the information and conceptual designs may not be disclosed or displayed to any third party without the prior written consent of ENVIRONGAKA (Pty) Ltd.
EnviroNgaka
Figure C.1: Modelling Domain: Modelled Receptors and Enterprise

Assmang Limited Cato Ridge Alloys (Pty) Ltd. 2020 AQIA for Sinter Plant EIA
Atmospheric Impact Report / Air Quality Impact Assessment
Document ID: AssmangCRW-AQIAReport_2020-PlannedSinterPlant_Sep2020_FD1.docx
Revision Date: 18Sep2020 Revision: FINAL_D1 Valid for: Assmang Cato Ridge, KwaZulu-Natal Province
Page 247 of 317
FINAL_D1 Compiled By: JG Potgieter
Approved By: JG Potgieter COPYRIGHT WARNING ALL RIGHTS RESERVED. All information and conceptual designs contained within this document are the intellectual property of ENVIRONGAKA (Pty) Ltd. This document and/or the information contained herein may not be used, stored, reproduced, or copied in any manner, without the prior written consent of ENVIRONGAKA (Pty) Ltd. This document and/or the information and conceptual designs may not be disclosed or displayed to any third party without the prior written consent of ENVIRONGAKA (Pty) Ltd.
EnviroNgaka
Figure C.2: Modelling Domain indicating Sensitive Discrete Receptors and Enterprise
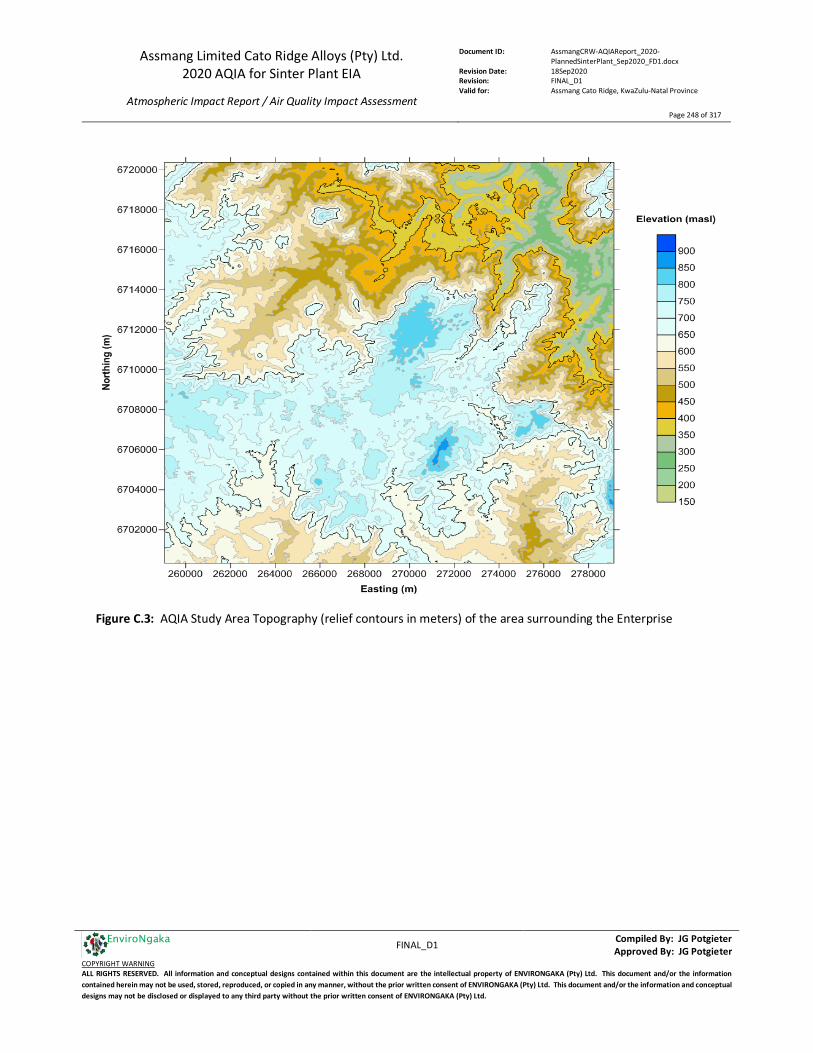
Assmang Limited Cato Ridge Alloys (Pty) Ltd. 2020 AQIA for Sinter Plant EIA
Atmospheric Impact Report / Air Quality Impact Assessment
Document ID: AssmangCRW-AQIAReport_2020-PlannedSinterPlant_Sep2020_FD1.docx
Revision Date: 18Sep2020 Revision: FINAL_D1 Valid for: Assmang Cato Ridge, KwaZulu-Natal Province
Page 248 of 317
FINAL_D1 Compiled By: JG Potgieter
Approved By: JG Potgieter COPYRIGHT WARNING ALL RIGHTS RESERVED. All information and conceptual designs contained within this document are the intellectual property of ENVIRONGAKA (Pty) Ltd. This document and/or the information contained herein may not be used, stored, reproduced, or copied in any manner, without the prior written consent of ENVIRONGAKA (Pty) Ltd. This document and/or the information and conceptual designs may not be disclosed or displayed to any third party without the prior written consent of ENVIRONGAKA (Pty) Ltd.
EnviroNgaka
Figure C.3: AQIA Study Area Topography (relief contours in meters) of the area surrounding the Enterprise
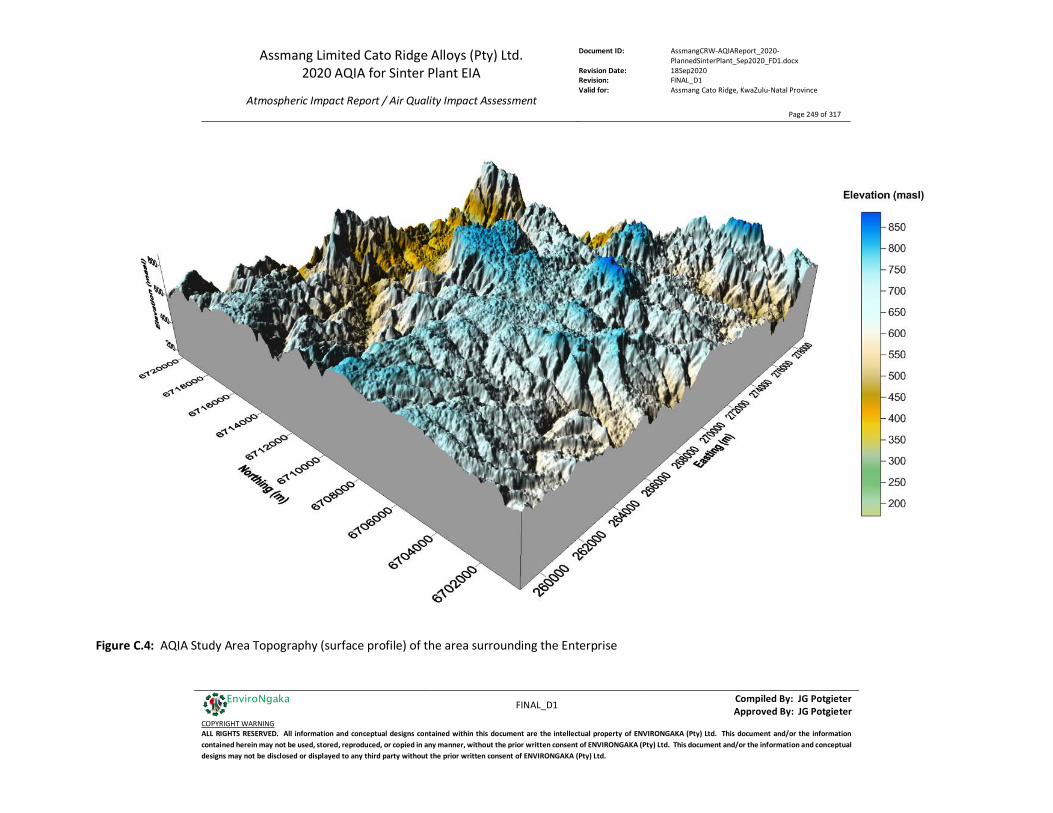
Assmang Limited Cato Ridge Alloys (Pty) Ltd. 2020 AQIA for Sinter Plant EIA
Atmospheric Impact Report / Air Quality Impact Assessment
Document ID: AssmangCRW-AQIAReport_2020-PlannedSinterPlant_Sep2020_FD1.docx
Revision Date: 18Sep2020 Revision: FINAL_D1 Valid for: Assmang Cato Ridge, KwaZulu-Natal Province
Page 249 of 317
FINAL_D1 Compiled By: JG Potgieter
Approved By: JG Potgieter COPYRIGHT WARNING ALL RIGHTS RESERVED. All information and conceptual designs contained within this document are the intellectual property of ENVIRONGAKA (Pty) Ltd. This document and/or the information contained herein may not be used, stored, reproduced, or copied in any manner, without the prior written consent of ENVIRONGAKA (Pty) Ltd. This document and/or the information and conceptual designs may not be disclosed or displayed to any third party without the prior written consent of ENVIRONGAKA (Pty) Ltd.
EnviroNgaka
Figure C.4: AQIA Study Area Topography (surface profile) of the area surrounding the Enterprise
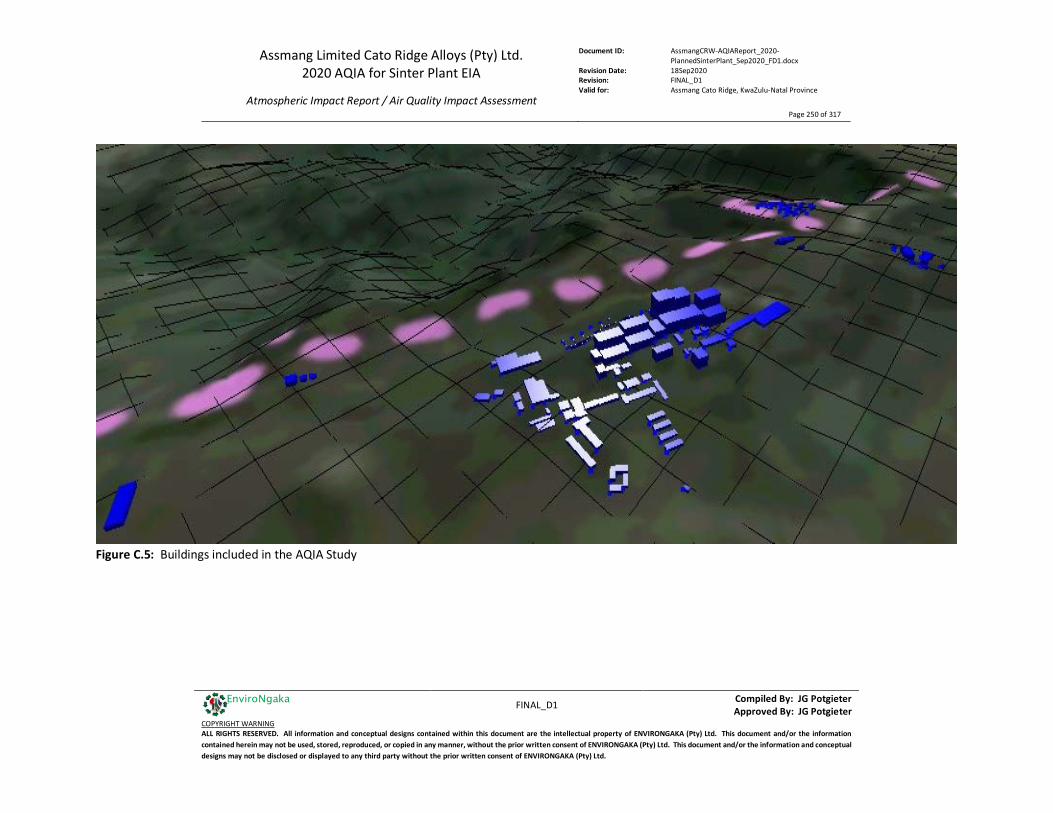
Assmang Limited Cato Ridge Alloys (Pty) Ltd. 2020 AQIA for Sinter Plant EIA
Atmospheric Impact Report / Air Quality Impact Assessment
Document ID: AssmangCRW-AQIAReport_2020-PlannedSinterPlant_Sep2020_FD1.docx
Revision Date: 18Sep2020 Revision: FINAL_D1 Valid for: Assmang Cato Ridge, KwaZulu-Natal Province
Page 250 of 317
FINAL_D1 Compiled By: JG Potgieter
Approved By: JG Potgieter COPYRIGHT WARNING ALL RIGHTS RESERVED. All information and conceptual designs contained within this document are the intellectual property of ENVIRONGAKA (Pty) Ltd. This document and/or the information contained herein may not be used, stored, reproduced, or copied in any manner, without the prior written consent of ENVIRONGAKA (Pty) Ltd. This document and/or the information and conceptual designs may not be disclosed or displayed to any third party without the prior written consent of ENVIRONGAKA (Pty) Ltd.
EnviroNgaka
Figure C.5: Buildings included in the AQIA Study
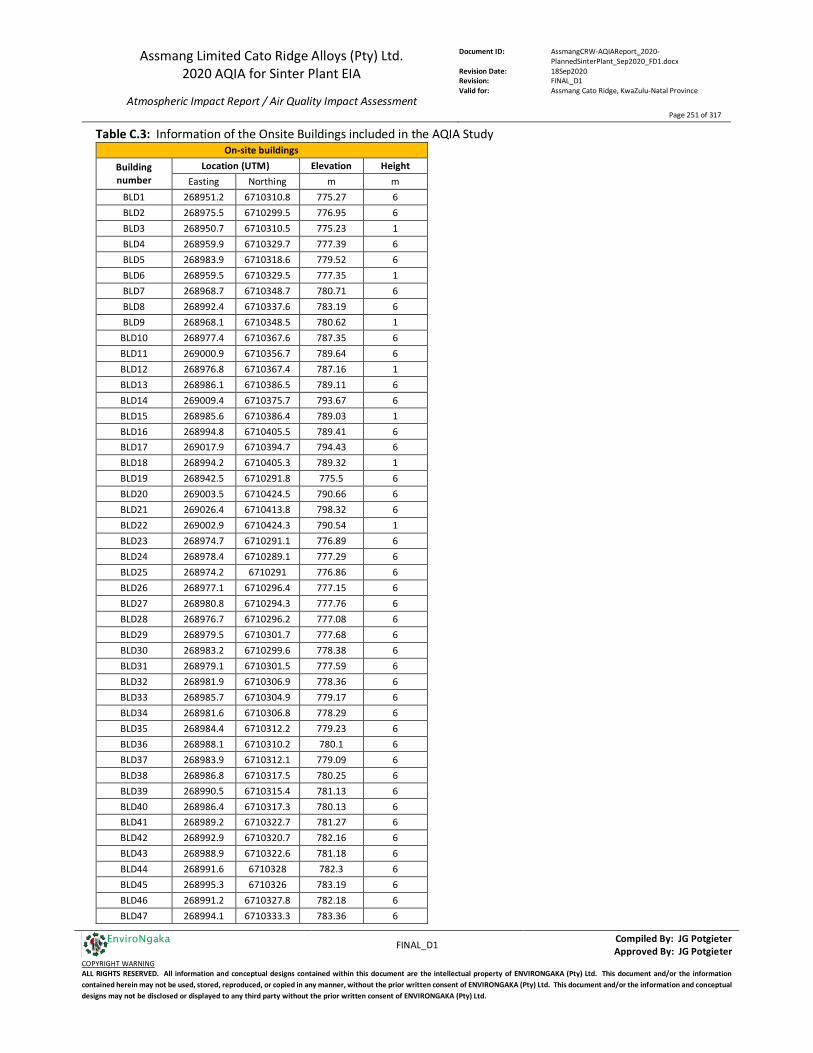
Assmang Limited Cato Ridge Alloys (Pty) Ltd. 2020 AQIA for Sinter Plant EIA
Atmospheric Impact Report / Air Quality Impact Assessment
Document ID: AssmangCRW-AQIAReport_2020-PlannedSinterPlant_Sep2020_FD1.docx
Revision Date: 18Sep2020 Revision: FINAL_D1 Valid for: Assmang Cato Ridge, KwaZulu-Natal Province
Page 251 of 317
FINAL_D1 Compiled By: JG Potgieter
Approved By: JG Potgieter COPYRIGHT WARNING ALL RIGHTS RESERVED. All information and conceptual designs contained within this document are the intellectual property of ENVIRONGAKA (Pty) Ltd. This document and/or the information contained herein may not be used, stored, reproduced, or copied in any manner, without the prior written consent of ENVIRONGAKA (Pty) Ltd. This document and/or the information and conceptual designs may not be disclosed or displayed to any third party without the prior written consent of ENVIRONGAKA (Pty) Ltd.
EnviroNgaka
Table C.3: Information of the Onsite Buildings included in the AQIA Study On-site buildings
Building number
Location (UTM) Elevation Height Easting Northing m m
BLD1 268951.2 6710310.8 775.27 6 BLD2 268975.5 6710299.5 776.95 6 BLD3 268950.7 6710310.5 775.23 1 BLD4 268959.9 6710329.7 777.39 6 BLD5 268983.9 6710318.6 779.52 6 BLD6 268959.5 6710329.5 777.35 1 BLD7 268968.7 6710348.7 780.71 6 BLD8 268992.4 6710337.6 783.19 6 BLD9 268968.1 6710348.5 780.62 1
BLD10 268977.4 6710367.6 787.35 6 BLD11 269000.9 6710356.7 789.64 6 BLD12 268976.8 6710367.4 787.16 1 BLD13 268986.1 6710386.5 789.11 6 BLD14 269009.4 6710375.7 793.67 6 BLD15 268985.6 6710386.4 789.03 1 BLD16 268994.8 6710405.5 789.41 6 BLD17 269017.9 6710394.7 794.43 6 BLD18 268994.2 6710405.3 789.32 1 BLD19 268942.5 6710291.8 775.5 6 BLD20 269003.5 6710424.5 790.66 6 BLD21 269026.4 6710413.8 798.32 6 BLD22 269002.9 6710424.3 790.54 1 BLD23 268974.7 6710291.1 776.89 6 BLD24 268978.4 6710289.1 777.29 6 BLD25 268974.2 6710291 776.86 6 BLD26 268977.1 6710296.4 777.15 6 BLD27 268980.8 6710294.3 777.76 6 BLD28 268976.7 6710296.2 777.08 6 BLD29 268979.5 6710301.7 777.68 6 BLD30 268983.2 6710299.6 778.38 6 BLD31 268979.1 6710301.5 777.59 6 BLD32 268981.9 6710306.9 778.36 6 BLD33 268985.7 6710304.9 779.17 6 BLD34 268981.6 6710306.8 778.29 6 BLD35 268984.4 6710312.2 779.23 6 BLD36 268988.1 6710310.2 780.1 6 BLD37 268983.9 6710312.1 779.09 6 BLD38 268986.8 6710317.5 780.25 6 BLD39 268990.5 6710315.4 781.13 6 BLD40 268986.4 6710317.3 780.13 6 BLD41 268989.2 6710322.7 781.27 6 BLD42 268992.9 6710320.7 782.16 6 BLD43 268988.9 6710322.6 781.18 6 BLD44 268991.6 6710328 782.3 6 BLD45 268995.3 6710326 783.19 6 BLD46 268991.2 6710327.8 782.18 6 BLD47 268994.1 6710333.3 783.36 6
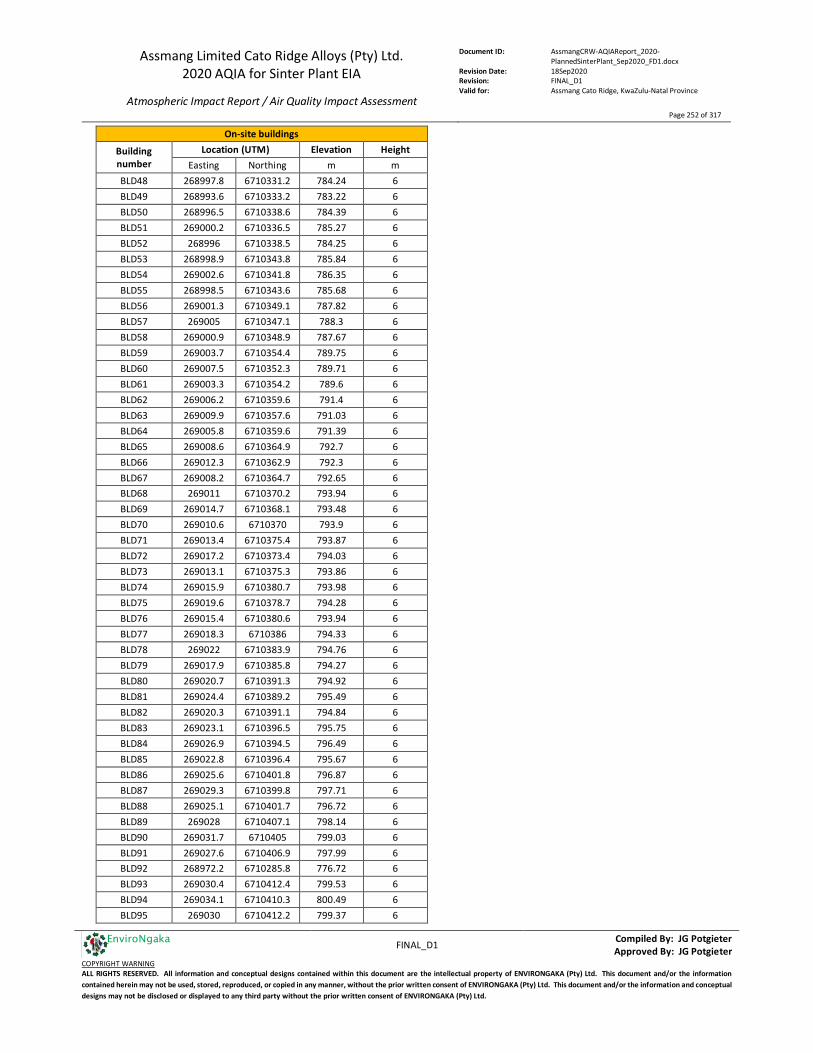
Assmang Limited Cato Ridge Alloys (Pty) Ltd. 2020 AQIA for Sinter Plant EIA
Atmospheric Impact Report / Air Quality Impact Assessment
Document ID: AssmangCRW-AQIAReport_2020-PlannedSinterPlant_Sep2020_FD1.docx
Revision Date: 18Sep2020 Revision: FINAL_D1 Valid for: Assmang Cato Ridge, KwaZulu-Natal Province
Page 252 of 317
FINAL_D1 Compiled By: JG Potgieter
Approved By: JG Potgieter COPYRIGHT WARNING ALL RIGHTS RESERVED. All information and conceptual designs contained within this document are the intellectual property of ENVIRONGAKA (Pty) Ltd. This document and/or the information contained herein may not be used, stored, reproduced, or copied in any manner, without the prior written consent of ENVIRONGAKA (Pty) Ltd. This document and/or the information and conceptual designs may not be disclosed or displayed to any third party without the prior written consent of ENVIRONGAKA (Pty) Ltd.
EnviroNgaka
On-site buildings
Building number
Location (UTM) Elevation Height Easting Northing m m
BLD48 268997.8 6710331.2 784.24 6 BLD49 268993.6 6710333.2 783.22 6 BLD50 268996.5 6710338.6 784.39 6 BLD51 269000.2 6710336.5 785.27 6 BLD52 268996 6710338.5 784.25 6 BLD53 268998.9 6710343.8 785.84 6 BLD54 269002.6 6710341.8 786.35 6 BLD55 268998.5 6710343.6 785.68 6 BLD56 269001.3 6710349.1 787.82 6 BLD57 269005 6710347.1 788.3 6 BLD58 269000.9 6710348.9 787.67 6 BLD59 269003.7 6710354.4 789.75 6 BLD60 269007.5 6710352.3 789.71 6 BLD61 269003.3 6710354.2 789.6 6 BLD62 269006.2 6710359.6 791.4 6 BLD63 269009.9 6710357.6 791.03 6 BLD64 269005.8 6710359.6 791.39 6 BLD65 269008.6 6710364.9 792.7 6 BLD66 269012.3 6710362.9 792.3 6 BLD67 269008.2 6710364.7 792.65 6 BLD68 269011 6710370.2 793.94 6 BLD69 269014.7 6710368.1 793.48 6 BLD70 269010.6 6710370 793.9 6 BLD71 269013.4 6710375.4 793.87 6 BLD72 269017.2 6710373.4 794.03 6 BLD73 269013.1 6710375.3 793.86 6 BLD74 269015.9 6710380.7 793.98 6 BLD75 269019.6 6710378.7 794.28 6 BLD76 269015.4 6710380.6 793.94 6 BLD77 269018.3 6710386 794.33 6 BLD78 269022 6710383.9 794.76 6 BLD79 269017.9 6710385.8 794.27 6 BLD80 269020.7 6710391.3 794.92 6 BLD81 269024.4 6710389.2 795.49 6 BLD82 269020.3 6710391.1 794.84 6 BLD83 269023.1 6710396.5 795.75 6 BLD84 269026.9 6710394.5 796.49 6 BLD85 269022.8 6710396.4 795.67 6 BLD86 269025.6 6710401.8 796.87 6 BLD87 269029.3 6710399.8 797.71 6 BLD88 269025.1 6710401.7 796.72 6 BLD89 269028 6710407.1 798.14 6 BLD90 269031.7 6710405 799.03 6 BLD91 269027.6 6710406.9 797.99 6 BLD92 268972.2 6710285.8 776.72 6 BLD93 269030.4 6710412.4 799.53 6 BLD94 269034.1 6710410.3 800.49 6 BLD95 269030 6710412.2 799.37 6

Assmang Limited Cato Ridge Alloys (Pty) Ltd. 2020 AQIA for Sinter Plant EIA
Atmospheric Impact Report / Air Quality Impact Assessment
Document ID: AssmangCRW-AQIAReport_2020-PlannedSinterPlant_Sep2020_FD1.docx
Revision Date: 18Sep2020 Revision: FINAL_D1 Valid for: Assmang Cato Ridge, KwaZulu-Natal Province
Page 253 of 317
FINAL_D1 Compiled By: JG Potgieter
Approved By: JG Potgieter COPYRIGHT WARNING ALL RIGHTS RESERVED. All information and conceptual designs contained within this document are the intellectual property of ENVIRONGAKA (Pty) Ltd. This document and/or the information contained herein may not be used, stored, reproduced, or copied in any manner, without the prior written consent of ENVIRONGAKA (Pty) Ltd. This document and/or the information and conceptual designs may not be disclosed or displayed to any third party without the prior written consent of ENVIRONGAKA (Pty) Ltd.
EnviroNgaka
On-site buildings
Building number
Location (UTM) Elevation Height Easting Northing m m
BLD96 269007.8 6710469.2 786.92 6 BLD97 269044.2 6710452 803.64 1 BLD98 269007.3 6710468.9 786.82 1 BLD99 269016.5 6710488.1 783.79 6
BLD100 269052.9 6710470.9 799.72 1 BLD101 269016 6710488 783.64 1 BLD102 269025.2 6710507.1 780.5 6 BLD103 269061.6 6710489.9 794.34 1 BLD104 269024.6 6710506.9 780.45 1 BLD105 269033.9 6710526.1 776.33 6 BLD106 269070.3 6710508.8 789.92 1 BLD107 269033.3 6710525.9 776.31 1 BLD108 269042.5 6710545 772.07 6 BLD109 269078.9 6710527.8 786.56 1 BLD110 269042 6710544.7 772.13 1 BLD111 268999.2 6710450.2 788.37 6 BLD112 269051.1 6710564 767.77 6 BLD113 269087.6 6710546.8 783.29 1 BLD114 269050.6 6710563.7 767.83 1 BLD115 268687.7 6709650.8 778.3 8 BLD116 268629.8 6709898.6 774.39 8 BLD117 268643.6 6709911.1 775.88 5 BLD118 268652.1 6709924.8 776.22 4 BLD119 268930.2 6710091.2 778.26 5 BLD120 268952.2 6710114.9 780.94 5 BLD121 268884.3 6710167.1 775.64 8 BLD122 268915.8 6710197 775.81 8 BLD123 268880.6 6710158.9 775.39 5 BLD124 268990.1 6710124.5 786.26 5 BLD125 269009.1 6710117.1 784.88 5 BLD126 268980.9 6710156.9 787.22 5 BLD127 268997.8 6710171.1 786.31 5 BLD128 269040 6710166.7 784.19 5 BLD129 269053.4 6710106.8 781.25 5 BLD130 269055.6 6710141.8 784.07 5 BLD131 269066.4 6710110.2 781.48 5 BLD132 269085.7 6710154.3 785.63 5 BLD133 269063.8 6710163.3 784.85 5 BLD134 269101.5 6710165.1 787.07 5 BLD135 269076 6710181.5 785.37 5 BLD136 269102.4 6710187.7 788.23 5 BLD137 269113.1 6710209.9 787.44 5 BLD138 269119.4 6710143.7 789.98 5 BLD139 269133.9 6710143.4 790.6 5 BLD140 269128.7 6710118.7 786.59 5 BLD141 269212.2 6710133.3 781.14 5 BLD142 269226.4 6710116.1 771.58 5 BLD143 269234.7 6710137 780.28 5
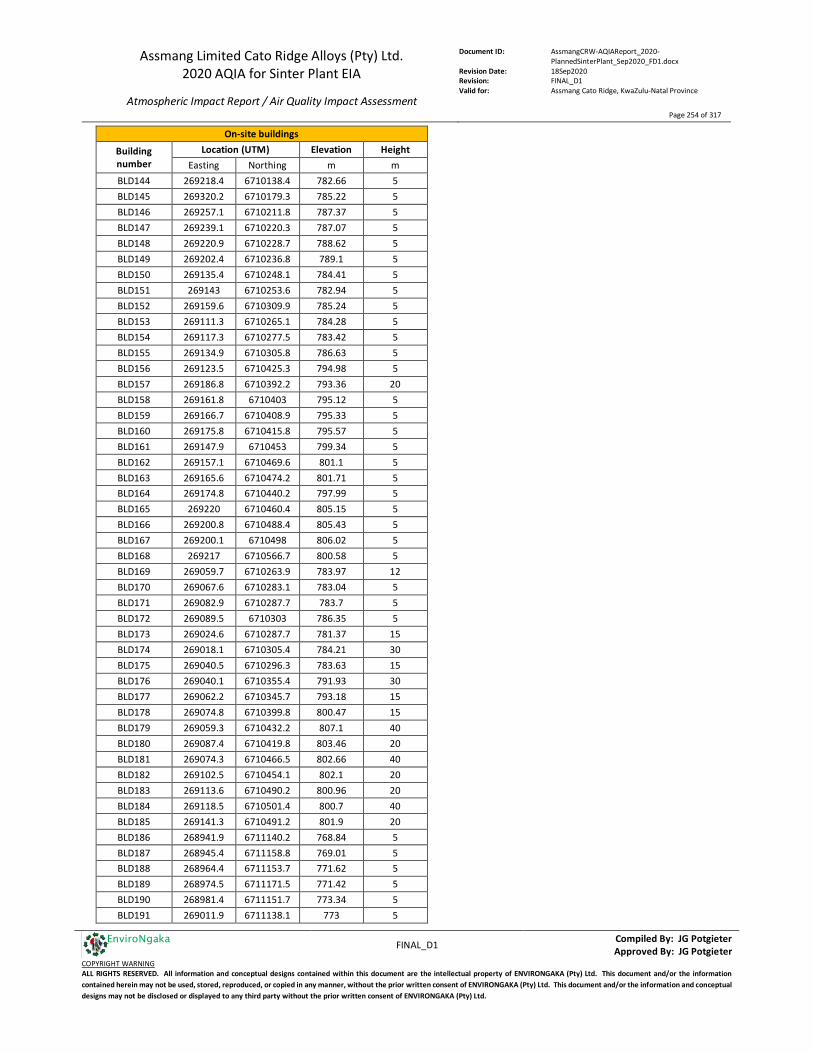
Assmang Limited Cato Ridge Alloys (Pty) Ltd. 2020 AQIA for Sinter Plant EIA
Atmospheric Impact Report / Air Quality Impact Assessment
Document ID: AssmangCRW-AQIAReport_2020-PlannedSinterPlant_Sep2020_FD1.docx
Revision Date: 18Sep2020 Revision: FINAL_D1 Valid for: Assmang Cato Ridge, KwaZulu-Natal Province
Page 254 of 317
FINAL_D1 Compiled By: JG Potgieter
Approved By: JG Potgieter COPYRIGHT WARNING ALL RIGHTS RESERVED. All information and conceptual designs contained within this document are the intellectual property of ENVIRONGAKA (Pty) Ltd. This document and/or the information contained herein may not be used, stored, reproduced, or copied in any manner, without the prior written consent of ENVIRONGAKA (Pty) Ltd. This document and/or the information and conceptual designs may not be disclosed or displayed to any third party without the prior written consent of ENVIRONGAKA (Pty) Ltd.
EnviroNgaka
On-site buildings
Building number
Location (UTM) Elevation Height Easting Northing m m
BLD144 269218.4 6710138.4 782.66 5 BLD145 269320.2 6710179.3 785.22 5 BLD146 269257.1 6710211.8 787.37 5 BLD147 269239.1 6710220.3 787.07 5 BLD148 269220.9 6710228.7 788.62 5 BLD149 269202.4 6710236.8 789.1 5 BLD150 269135.4 6710248.1 784.41 5 BLD151 269143 6710253.6 782.94 5 BLD152 269159.6 6710309.9 785.24 5 BLD153 269111.3 6710265.1 784.28 5 BLD154 269117.3 6710277.5 783.42 5 BLD155 269134.9 6710305.8 786.63 5 BLD156 269123.5 6710425.3 794.98 5 BLD157 269186.8 6710392.2 793.36 20 BLD158 269161.8 6710403 795.12 5 BLD159 269166.7 6710408.9 795.33 5 BLD160 269175.8 6710415.8 795.57 5 BLD161 269147.9 6710453 799.34 5 BLD162 269157.1 6710469.6 801.1 5 BLD163 269165.6 6710474.2 801.71 5 BLD164 269174.8 6710440.2 797.99 5 BLD165 269220 6710460.4 805.15 5 BLD166 269200.8 6710488.4 805.43 5 BLD167 269200.1 6710498 806.02 5 BLD168 269217 6710566.7 800.58 5 BLD169 269059.7 6710263.9 783.97 12 BLD170 269067.6 6710283.1 783.04 5 BLD171 269082.9 6710287.7 783.7 5 BLD172 269089.5 6710303 786.35 5 BLD173 269024.6 6710287.7 781.37 15 BLD174 269018.1 6710305.4 784.21 30 BLD175 269040.5 6710296.3 783.63 15 BLD176 269040.1 6710355.4 791.93 30 BLD177 269062.2 6710345.7 793.18 15 BLD178 269074.8 6710399.8 800.47 15 BLD179 269059.3 6710432.2 807.1 40 BLD180 269087.4 6710419.8 803.46 20 BLD181 269074.3 6710466.5 802.66 40 BLD182 269102.5 6710454.1 802.1 20 BLD183 269113.6 6710490.2 800.96 20 BLD184 269118.5 6710501.4 800.7 40 BLD185 269141.3 6710491.2 801.9 20 BLD186 268941.9 6711140.2 768.84 5 BLD187 268945.4 6711158.8 769.01 5 BLD188 268964.4 6711153.7 771.62 5 BLD189 268974.5 6711171.5 771.42 5 BLD190 268981.4 6711151.7 773.34 5 BLD191 269011.9 6711138.1 773 5

Assmang Limited Cato Ridge Alloys (Pty) Ltd. 2020 AQIA for Sinter Plant EIA
Atmospheric Impact Report / Air Quality Impact Assessment
Document ID: AssmangCRW-AQIAReport_2020-PlannedSinterPlant_Sep2020_FD1.docx
Revision Date: 18Sep2020 Revision: FINAL_D1 Valid for: Assmang Cato Ridge, KwaZulu-Natal Province
Page 255 of 317
FINAL_D1 Compiled By: JG Potgieter
Approved By: JG Potgieter COPYRIGHT WARNING ALL RIGHTS RESERVED. All information and conceptual designs contained within this document are the intellectual property of ENVIRONGAKA (Pty) Ltd. This document and/or the information contained herein may not be used, stored, reproduced, or copied in any manner, without the prior written consent of ENVIRONGAKA (Pty) Ltd. This document and/or the information and conceptual designs may not be disclosed or displayed to any third party without the prior written consent of ENVIRONGAKA (Pty) Ltd.
EnviroNgaka
On-site buildings
Building number
Location (UTM) Elevation Height Easting Northing m m
BLD192 269038.8 6711118.2 769.16 5 BLD193 268993.2 6711185.5 772.04 5 BLD194 269004.7 6711166.9 774.44 5 BLD195 269025.9 6711160.3 776.05 5 BLD196 269033.9 6711139.3 772.96 5 BLD197 269048.5 6711139.9 773.81 5 BLD198 269060.7 6711132.7 772.89 5 BLD199 269027.1 6711189.8 775.78 5 BLD200 269056.3 6711180.2 780.97 5 BLD201 269054.1 6711162.4 778.17 5 BLD202 269073.2 6711159 778.85 5 BLD203 269052.8 6711203.5 779.47 5 BLD204 269076.9 6711201.4 782.48 5 BLD205 269088.2 6711186.9 782.87 5 BLD206 269092.5 6711153.2 779.2 3 BLD207 269356.3 6711055.7 801.94 5 BLD208 269359 6711047.8 804.32 5 BLD209 269376.8 6711030.6 809.26 10 BLD210 269428.8 6711039.7 809.61 10 BLD211 269425.1 6711046.5 807.63 10 BLD212 269411.5 6710981.4 813.08 5 BLD213 269437 6710980.1 812.26 5 BLD214 269471.9 6711022.7 808.79 5 BLD215 269123.2 6710355.5 786.99 22 BLD216 269133 6710907 801.22 9 BLD217 269143 6710925 803.81 6 BLD218 269184.7 6710903.7 803.88 6 BLD219 269122.5 6710879.5 797.29 9
Assmang Limited Cato Ridge Alloys (Pty) Ltd. 2020 AQIA for Sinter Plant EIA
Atmospheric Impact Report / Air Quality Impact Assessment
Document ID: AssmangCRW-AQIAReport_2020-PlannedSinterPlant_Sep2020_FD1.docx
Revision Date: 18Sep2020 Revision: FINAL_D1 Valid for: Assmang Cato Ridge, KwaZulu-Natal Province
Page 256 of 317
FINAL_D1 Compiled By: JG Potgieter
Approved By: JG Potgieter COPYRIGHT WARNING ALL RIGHTS RESERVED. All information and conceptual designs contained within this document are the intellectual property of ENVIRONGAKA (Pty) Ltd. This document and/or the information contained herein may not be used, stored, reproduced, or copied in any manner, without the prior written consent of ENVIRONGAKA (Pty) Ltd. This document and/or the information and conceptual designs may not be disclosed or displayed to any third party without the prior written consent of ENVIRONGAKA (Pty) Ltd.
EnviroNgaka
Appendix D: Additional Emission Inventory Estimation Information Section D.1 below provides additional summary of the assumptions and calculations used for the emission inventory used in this study. Sections D.2 to D.7 thereafter cover a summary of the literature which is used for the compilation of an emission inventory for secondary/fugitive sources when relevant/applicable.
D.1 Emission Inventory Summary of Assumptions and Calculations D.1.1 Scenarios’ Key Assumptions • Secondary emissions were calculated/estimated per the methodology provided in Sections D.2 to D.7; • Secondary emissions from stockpiles, roads, loading/unloading and raw material primary transfer points were
included in the assessment and the associated emissions calculated per the parameter referenced in Section D.1.3, based on assumed parameters for:
o Diesel consumption for the various production scenarios: estimated based on other similar operations per quantities of material moved and typical other vehicle usage. Diesel consumption and or its contribution/impact could potentially be conservatively overestimated;
o Silt content of the various storage/stockpiles and material types: most applicable conservative figures used per Table D.1;
o Moisture content of the various storage/stockpiles and material types: most applicable conservative figures used per Table D.1;
• The quantities/volumes of materials used to estimate the secondary emissions were estimated and is referenced the D.0-X tables;
• Seasonal wind ratios for wind dependant emissions: Calculated per Meteorological Data; • All areas/volumes of secondary emission sources are estimations; • Mining, and milling is not applicable in this assessment; • Crushing is applicable to this assessment and referenced in Section D.1.3; • PM2.5 emissions for secondary sources (assumed 30% of PM10) and the metal content was assumed based on
expected figures from other similar operations and estimated per the expected average content for each of the defined areas;
• Assumed control efficiencies for fugitive secondary dust emission sources are referenced in Section D.1.3; • Tapping emissions are applicable for this study, and were simulated as tapping at same time/after one another
(conservative worst-case); • Tapping emissions: Duration of 10min every 2 hours per furnace; • Based on site data, it is assumed that 5% of tapping emissions remain fugitive, whilst 95% are captured and PM
abated at an estimated efficiency of 96%; • The D.0-X tables contain the emissions for each of the different sources17, which also includes associated
abnormal emission characteristics, if applicable or relevant as well as the emission concentrations and other source parameters used for this study; inclusive of fraction/percentages of PM emission to be emitted as PM10 and PM2.5 from the different defined sources.
17 Information is based on actual emission concentration ranges from historical emission sampling reports and estimations per design criteria in the absence of sampling data, unless stated otherwise;
Assmang Limited Cato Ridge Alloys (Pty) Ltd. 2020 AQIA for Sinter Plant EIA
Atmospheric Impact Report / Air Quality Impact Assessment
Document ID: AssmangCRW-AQIAReport_2020-PlannedSinterPlant_Sep2020_FD1.docx
Revision Date: 18Sep2020 Revision: FINAL_D1 Valid for: Assmang Cato Ridge, KwaZulu-Natal Province
Page 257 of 317
FINAL_D1 Compiled By: JG Potgieter
Approved By: JG Potgieter COPYRIGHT WARNING ALL RIGHTS RESERVED. All information and conceptual designs contained within this document are the intellectual property of ENVIRONGAKA (Pty) Ltd. This document and/or the information contained herein may not be used, stored, reproduced, or copied in any manner, without the prior written consent of ENVIRONGAKA (Pty) Ltd. This document and/or the information and conceptual designs may not be disclosed or displayed to any third party without the prior written consent of ENVIRONGAKA (Pty) Ltd.
EnviroNgaka
• Furnace Clean Gas stacks’ emissions were modelled at expected pre-flare volumetric rates and temperatures with CO emissions as if flared;
• Manganese (Mn) emissions are based on monitoring / sampling data and associated uncertainties apply; • Abnormal emissions were applicable for this investigation in view of the specific operations – abnormal
Emissions from Primary Point Sources (Stacks) when APCE is not available: when applicable, it is modelled during the most stable atmospheric condition (i.e. poorest dispersion potential), which is usually around midnight and the abnormal emissions were modelled to occur during this period;
• Based on site data, it was assumed that furnace raw gas abnormal emissions occur 0.025% of production time, which equates to approximately 7.2min per month per furnace, and 0.14% for the CRA (60min per month);
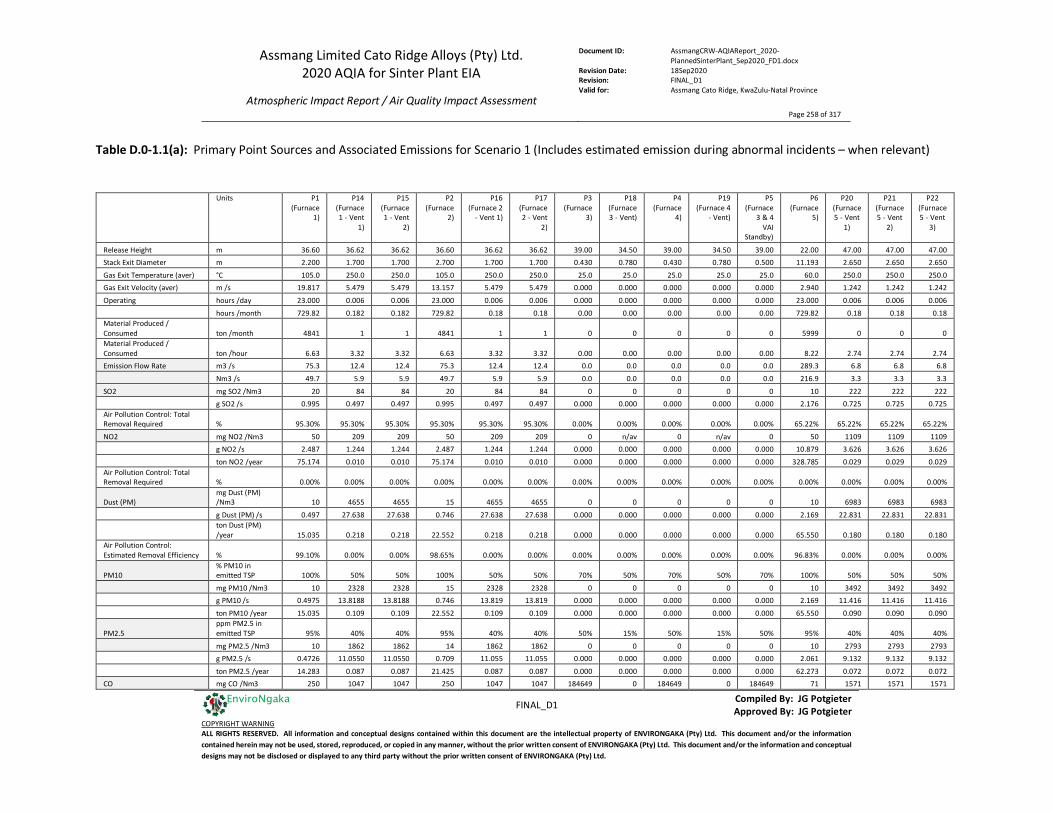
Assmang Limited Cato Ridge Alloys (Pty) Ltd. 2020 AQIA for Sinter Plant EIA
Atmospheric Impact Report / Air Quality Impact Assessment
Document ID: AssmangCRW-AQIAReport_2020-PlannedSinterPlant_Sep2020_FD1.docx
Revision Date: 18Sep2020 Revision: FINAL_D1 Valid for: Assmang Cato Ridge, KwaZulu-Natal Province
Page 258 of 317
FINAL_D1 Compiled By: JG Potgieter
Approved By: JG Potgieter COPYRIGHT WARNING ALL RIGHTS RESERVED. All information and conceptual designs contained within this document are the intellectual property of ENVIRONGAKA (Pty) Ltd. This document and/or the information contained herein may not be used, stored, reproduced, or copied in any manner, without the prior written consent of ENVIRONGAKA (Pty) Ltd. This document and/or the information and conceptual designs may not be disclosed or displayed to any third party without the prior written consent of ENVIRONGAKA (Pty) Ltd.
EnviroNgaka
Table D.0-1.1(a): Primary Point Sources and Associated Emissions for Scenario 1 (Includes estimated emission during abnormal incidents – when relevant)
Units P1 (Furnace
1)
P14 (Furnace 1 - Vent
1)
P15 (Furnace 1 - Vent
2)
P2 (Furnace
2)
P16 (Furnace 2
- Vent 1)
P17 (Furnace 2 - Vent
2)
P3 (Furnace
3)
P18 (Furnace 3 - Vent)
P4 (Furnace
4)
P19 (Furnace 4
- Vent)
P5 (Furnace
3 & 4 VAI
Standby)
P6 (Furnace
5)
P20 (Furnace 5 - Vent
1)
P21 (Furnace 5 - Vent
2)
P22 (Furnace 5 - Vent
3)
Release Height m 36.60 36.62 36.62 36.60 36.62 36.62 39.00 34.50 39.00 34.50 39.00 22.00 47.00 47.00 47.00 Stack Exit Diameter m 2.200 1.700 1.700 2.700 1.700 1.700 0.430 0.780 0.430 0.780 0.500 11.193 2.650 2.650 2.650
Gas Exit Temperature (aver) °C 105.0 250.0 250.0 105.0 250.0 250.0 25.0 25.0 25.0 25.0 25.0 60.0 250.0 250.0 250.0 Gas Exit Velocity (aver) m /s 19.817 5.479 5.479 13.157 5.479 5.479 0.000 0.000 0.000 0.000 0.000 2.940 1.242 1.242 1.242
Operating hours /day 23.000 0.006 0.006 23.000 0.006 0.006 0.000 0.000 0.000 0.000 0.000 23.000 0.006 0.006 0.006
hours /month 729.82 0.182 0.182 729.82 0.18 0.18 0.00 0.00 0.00 0.00 0.00 729.82 0.18 0.18 0.18 Material Produced / Consumed ton /month 4841 1 1 4841 1 1 0 0 0 0 0 5999 0 0 0 Material Produced / Consumed ton /hour 6.63 3.32 3.32 6.63 3.32 3.32 0.00 0.00 0.00 0.00 0.00 8.22 2.74 2.74 2.74 Emission Flow Rate m3 /s 75.3 12.4 12.4 75.3 12.4 12.4 0.0 0.0 0.0 0.0 0.0 289.3 6.8 6.8 6.8
Nm3 /s 49.7 5.9 5.9 49.7 5.9 5.9 0.0 0.0 0.0 0.0 0.0 216.9 3.3 3.3 3.3
SO2 mg SO2 /Nm3 20 84 84 20 84 84 0 0 0 0 0 10 222 222 222 g SO2 /s 0.995 0.497 0.497 0.995 0.497 0.497 0.000 0.000 0.000 0.000 0.000 2.176 0.725 0.725 0.725 Air Pollution Control: Total Removal Required % 95.30% 95.30% 95.30% 95.30% 95.30% 95.30% 0.00% 0.00% 0.00% 0.00% 0.00% 65.22% 65.22% 65.22% 65.22%
NO2 mg NO2 /Nm3 50 209 209 50 209 209 0 n/av 0 n/av 0 50 1109 1109 1109 g NO2 /s 2.487 1.244 1.244 2.487 1.244 1.244 0.000 0.000 0.000 0.000 0.000 10.879 3.626 3.626 3.626
ton NO2 /year 75.174 0.010 0.010 75.174 0.010 0.010 0.000 0.000 0.000 0.000 0.000 328.785 0.029 0.029 0.029 Air Pollution Control: Total Removal Required % 0.00% 0.00% 0.00% 0.00% 0.00% 0.00% 0.00% 0.00% 0.00% 0.00% 0.00% 0.00% 0.00% 0.00% 0.00%
Dust (PM) mg Dust (PM) /Nm3 10 4655 4655 15 4655 4655 0 0 0 0 0 10 6983 6983 6983
g Dust (PM) /s 0.497 27.638 27.638 0.746 27.638 27.638 0.000 0.000 0.000 0.000 0.000 2.169 22.831 22.831 22.831
ton Dust (PM) /year 15.035 0.218 0.218 22.552 0.218 0.218 0.000 0.000 0.000 0.000 0.000 65.550 0.180 0.180 0.180
Air Pollution Control: Estimated Removal Efficiency % 99.10% 0.00% 0.00% 98.65% 0.00% 0.00% 0.00% 0.00% 0.00% 0.00% 0.00% 96.83% 0.00% 0.00% 0.00%
PM10 % PM10 in emitted TSP 100% 50% 50% 100% 50% 50% 70% 50% 70% 50% 70% 100% 50% 50% 50%
mg PM10 /Nm3 10 2328 2328 15 2328 2328 0 0 0 0 0 10 3492 3492 3492 g PM10 /s 0.4975 13.8188 13.8188 0.746 13.819 13.819 0.000 0.000 0.000 0.000 0.000 2.169 11.416 11.416 11.416
ton PM10 /year 15.035 0.109 0.109 22.552 0.109 0.109 0.000 0.000 0.000 0.000 0.000 65.550 0.090 0.090 0.090
PM2.5 ppm PM2.5 in emitted TSP 95% 40% 40% 95% 40% 40% 50% 15% 50% 15% 50% 95% 40% 40% 40%
mg PM2.5 /Nm3 10 1862 1862 14 1862 1862 0 0 0 0 0 10 2793 2793 2793 g PM2.5 /s 0.4726 11.0550 11.0550 0.709 11.055 11.055 0.000 0.000 0.000 0.000 0.000 2.061 9.132 9.132 9.132
ton PM2.5 /year 14.283 0.087 0.087 21.425 0.087 0.087 0.000 0.000 0.000 0.000 0.000 62.273 0.072 0.072 0.072 CO mg CO /Nm3 250 1047 1047 250 1047 1047 184649 0 184649 0 184649 71 1571 1571 1571
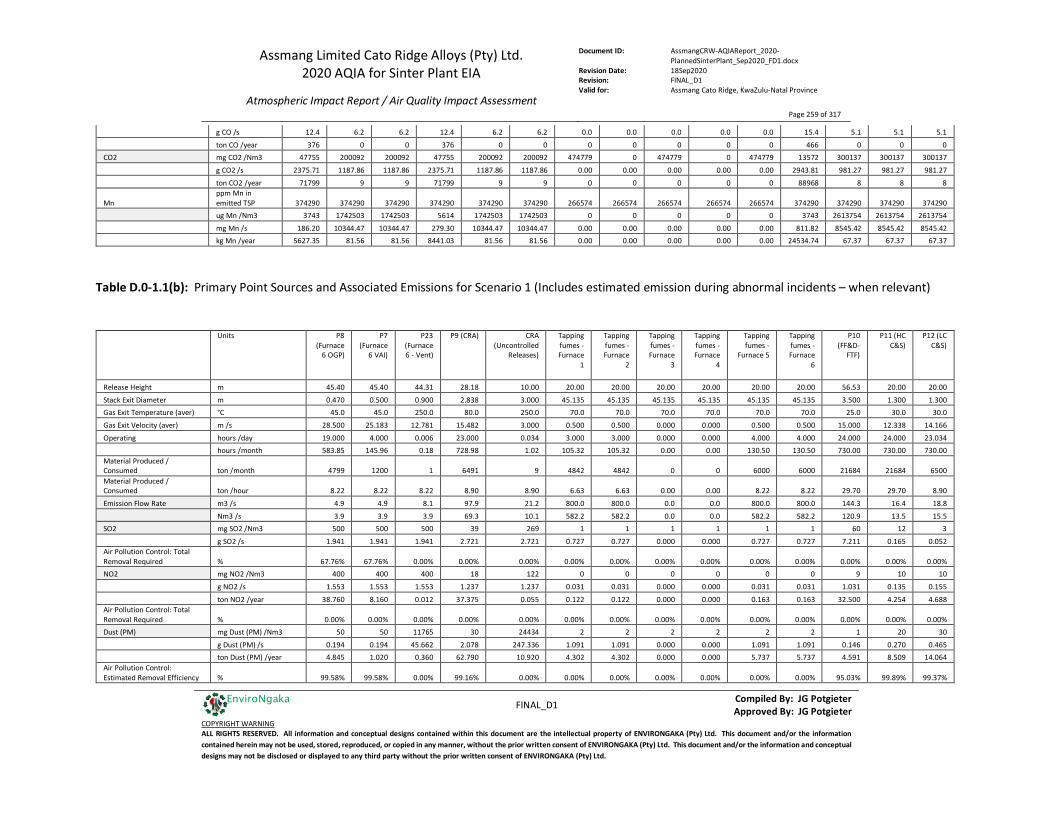
Assmang Limited Cato Ridge Alloys (Pty) Ltd. 2020 AQIA for Sinter Plant EIA
Atmospheric Impact Report / Air Quality Impact Assessment
Document ID: AssmangCRW-AQIAReport_2020-PlannedSinterPlant_Sep2020_FD1.docx
Revision Date: 18Sep2020 Revision: FINAL_D1 Valid for: Assmang Cato Ridge, KwaZulu-Natal Province
Page 259 of 317
FINAL_D1 Compiled By: JG Potgieter
Approved By: JG Potgieter COPYRIGHT WARNING ALL RIGHTS RESERVED. All information and conceptual designs contained within this document are the intellectual property of ENVIRONGAKA (Pty) Ltd. This document and/or the information contained herein may not be used, stored, reproduced, or copied in any manner, without the prior written consent of ENVIRONGAKA (Pty) Ltd. This document and/or the information and conceptual designs may not be disclosed or displayed to any third party without the prior written consent of ENVIRONGAKA (Pty) Ltd.
EnviroNgaka
g CO /s 12.4 6.2 6.2 12.4 6.2 6.2 0.0 0.0 0.0 0.0 0.0 15.4 5.1 5.1 5.1
ton CO /year 376 0 0 376 0 0 0 0 0 0 0 466 0 0 0 CO2 mg CO2 /Nm3 47755 200092 200092 47755 200092 200092 474779 0 474779 0 474779 13572 300137 300137 300137
g CO2 /s 2375.71 1187.86 1187.86 2375.71 1187.86 1187.86 0.00 0.00 0.00 0.00 0.00 2943.81 981.27 981.27 981.27
ton CO2 /year 71799 9 9 71799 9 9 0 0 0 0 0 88968 8 8 8
Mn ppm Mn in emitted TSP 374290 374290 374290 374290 374290 374290 266574 266574 266574 266574 266574 374290 374290 374290 374290
ug Mn /Nm3 3743 1742503 1742503 5614 1742503 1742503 0 0 0 0 0 3743 2613754 2613754 2613754
mg Mn /s 186.20 10344.47 10344.47 279.30 10344.47 10344.47 0.00 0.00 0.00 0.00 0.00 811.82 8545.42 8545.42 8545.42 kg Mn /year 5627.35 81.56 81.56 8441.03 81.56 81.56 0.00 0.00 0.00 0.00 0.00 24534.74 67.37 67.37 67.37
Table D.0-1.1(b): Primary Point Sources and Associated Emissions for Scenario 1 (Includes estimated emission during abnormal incidents – when relevant)
Units P8 (Furnace
6 OGP)
P7 (Furnace
6 VAI)
P23 (Furnace 6 - Vent)
P9 (CRA) CRA (Uncontrolled
Releases)
Tapping fumes - Furnace
1
Tapping fumes - Furnace
2
Tapping fumes - Furnace
3
Tapping fumes - Furnace
4
Tapping fumes -
Furnace 5
Tapping fumes - Furnace
6
P10 (FF&D-
FTF)
P11 (HC C&S)
P12 (LC C&S)
Release Height m 45.40 45.40 44.31 28.18 10.00 20.00 20.00 20.00 20.00 20.00 20.00 56.53 20.00 20.00
Stack Exit Diameter m 0.470 0.500 0.900 2.838 3.000 45.135 45.135 45.135 45.135 45.135 45.135 3.500 1.300 1.300 Gas Exit Temperature (aver) °C 45.0 45.0 250.0 80.0 250.0 70.0 70.0 70.0 70.0 70.0 70.0 25.0 30.0 30.0
Gas Exit Velocity (aver) m /s 28.500 25.183 12.781 15.482 3.000 0.500 0.500 0.000 0.000 0.500 0.500 15.000 12.338 14.166
Operating hours /day 19.000 4.000 0.006 23.000 0.034 3.000 3.000 0.000 0.000 4.000 4.000 24.000 24.000 23.034 hours /month 583.85 145.96 0.18 728.98 1.02 105.32 105.32 0.00 0.00 130.50 130.50 730.00 730.00 730.00 Material Produced / Consumed ton /month 4799 1200 1 6491 9 4842 4842 0 0 6000 6000 21684 21684 6500 Material Produced / Consumed ton /hour 8.22 8.22 8.22 8.90 8.90 6.63 6.63 0.00 0.00 8.22 8.22 29.70 29.70 8.90
Emission Flow Rate m3 /s 4.9 4.9 8.1 97.9 21.2 800.0 800.0 0.0 0.0 800.0 800.0 144.3 16.4 18.8
Nm3 /s 3.9 3.9 3.9 69.3 10.1 582.2 582.2 0.0 0.0 582.2 582.2 120.9 13.5 15.5 SO2 mg SO2 /Nm3 500 500 500 39 269 1 1 1 1 1 1 60 12 3
g SO2 /s 1.941 1.941 1.941 2.721 2.721 0.727 0.727 0.000 0.000 0.727 0.727 7.211 0.165 0.052 Air Pollution Control: Total Removal Required % 67.76% 67.76% 0.00% 0.00% 0.00% 0.00% 0.00% 0.00% 0.00% 0.00% 0.00% 0.00% 0.00% 0.00% NO2 mg NO2 /Nm3 400 400 400 18 122 0 0 0 0 0 0 9 10 10
g NO2 /s 1.553 1.553 1.553 1.237 1.237 0.031 0.031 0.000 0.000 0.031 0.031 1.031 0.135 0.155
ton NO2 /year 38.760 8.160 0.012 37.375 0.055 0.122 0.122 0.000 0.000 0.163 0.163 32.500 4.254 4.688 Air Pollution Control: Total Removal Required % 0.00% 0.00% 0.00% 0.00% 0.00% 0.00% 0.00% 0.00% 0.00% 0.00% 0.00% 0.00% 0.00% 0.00% Dust (PM) mg Dust (PM) /Nm3 50 50 11765 30 24434 2 2 2 2 2 2 1 20 30
g Dust (PM) /s 0.194 0.194 45.662 2.078 247.336 1.091 1.091 0.000 0.000 1.091 1.091 0.146 0.270 0.465 ton Dust (PM) /year 4.845 1.020 0.360 62.790 10.920 4.302 4.302 0.000 0.000 5.737 5.737 4.591 8.509 14.064 Air Pollution Control: Estimated Removal Efficiency % 99.58% 99.58% 0.00% 99.16% 0.00% 0.00% 0.00% 0.00% 0.00% 0.00% 0.00% 95.03% 99.89% 99.37%
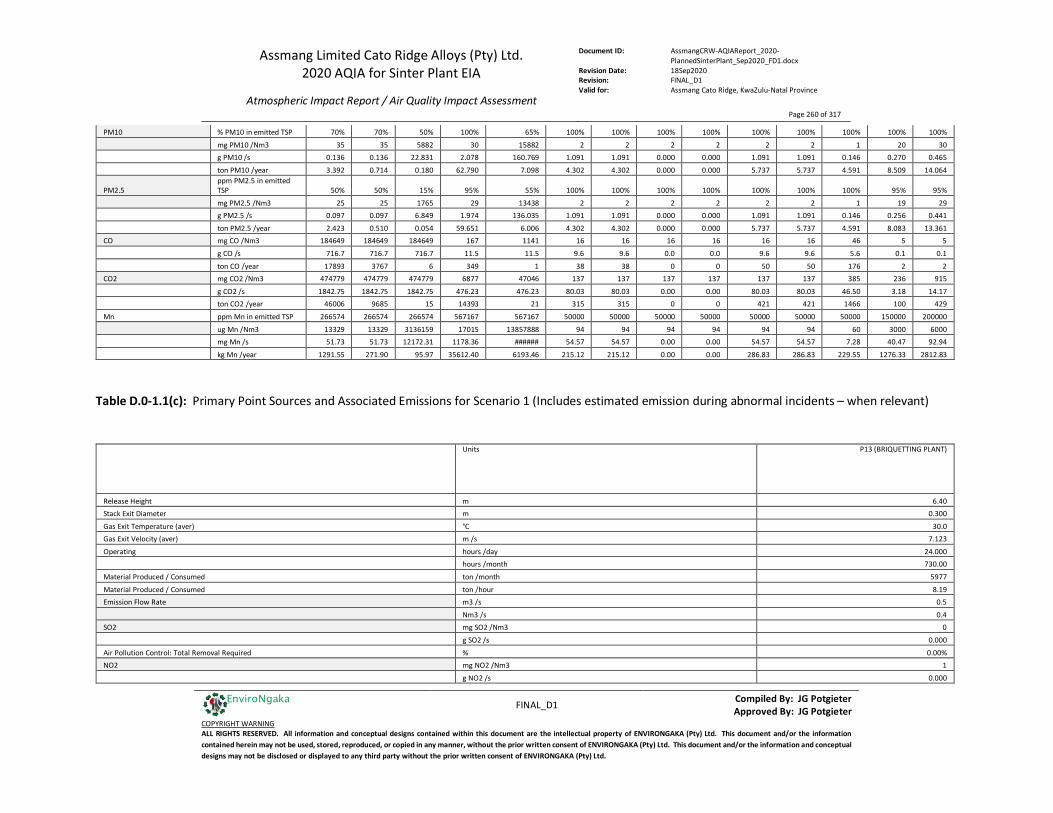
Assmang Limited Cato Ridge Alloys (Pty) Ltd. 2020 AQIA for Sinter Plant EIA
Atmospheric Impact Report / Air Quality Impact Assessment
Document ID: AssmangCRW-AQIAReport_2020-PlannedSinterPlant_Sep2020_FD1.docx
Revision Date: 18Sep2020 Revision: FINAL_D1 Valid for: Assmang Cato Ridge, KwaZulu-Natal Province
Page 260 of 317
FINAL_D1 Compiled By: JG Potgieter
Approved By: JG Potgieter COPYRIGHT WARNING ALL RIGHTS RESERVED. All information and conceptual designs contained within this document are the intellectual property of ENVIRONGAKA (Pty) Ltd. This document and/or the information contained herein may not be used, stored, reproduced, or copied in any manner, without the prior written consent of ENVIRONGAKA (Pty) Ltd. This document and/or the information and conceptual designs may not be disclosed or displayed to any third party without the prior written consent of ENVIRONGAKA (Pty) Ltd.
EnviroNgaka
PM10 % PM10 in emitted TSP 70% 70% 50% 100% 65% 100% 100% 100% 100% 100% 100% 100% 100% 100%
mg PM10 /Nm3 35 35 5882 30 15882 2 2 2 2 2 2 1 20 30 g PM10 /s 0.136 0.136 22.831 2.078 160.769 1.091 1.091 0.000 0.000 1.091 1.091 0.146 0.270 0.465
ton PM10 /year 3.392 0.714 0.180 62.790 7.098 4.302 4.302 0.000 0.000 5.737 5.737 4.591 8.509 14.064
PM2.5 ppm PM2.5 in emitted TSP 50% 50% 15% 95% 55% 100% 100% 100% 100% 100% 100% 100% 95% 95%
mg PM2.5 /Nm3 25 25 1765 29 13438 2 2 2 2 2 2 1 19 29 g PM2.5 /s 0.097 0.097 6.849 1.974 136.035 1.091 1.091 0.000 0.000 1.091 1.091 0.146 0.256 0.441
ton PM2.5 /year 2.423 0.510 0.054 59.651 6.006 4.302 4.302 0.000 0.000 5.737 5.737 4.591 8.083 13.361 CO mg CO /Nm3 184649 184649 184649 167 1141 16 16 16 16 16 16 46 5 5
g CO /s 716.7 716.7 716.7 11.5 11.5 9.6 9.6 0.0 0.0 9.6 9.6 5.6 0.1 0.1
ton CO /year 17893 3767 6 349 1 38 38 0 0 50 50 176 2 2 CO2 mg CO2 /Nm3 474779 474779 474779 6877 47046 137 137 137 137 137 137 385 236 915
g CO2 /s 1842.75 1842.75 1842.75 476.23 476.23 80.03 80.03 0.00 0.00 80.03 80.03 46.50 3.18 14.17 ton CO2 /year 46006 9685 15 14393 21 315 315 0 0 421 421 1466 100 429
Mn ppm Mn in emitted TSP 266574 266574 266574 567167 567167 50000 50000 50000 50000 50000 50000 50000 150000 200000
ug Mn /Nm3 13329 13329 3136159 17015 13857888 94 94 94 94 94 94 60 3000 6000 mg Mn /s 51.73 51.73 12172.31 1178.36 ###### 54.57 54.57 0.00 0.00 54.57 54.57 7.28 40.47 92.94
kg Mn /year 1291.55 271.90 95.97 35612.40 6193.46 215.12 215.12 0.00 0.00 286.83 286.83 229.55 1276.33 2812.83
Table D.0-1.1(c): Primary Point Sources and Associated Emissions for Scenario 1 (Includes estimated emission during abnormal incidents – when relevant)
Units P13 (BRIQUETTING PLANT)
Release Height m 6.40 Stack Exit Diameter m 0.300
Gas Exit Temperature (aver) °C 30.0 Gas Exit Velocity (aver) m /s 7.123
Operating hours /day 24.000 hours /month 730.00
Material Produced / Consumed ton /month 5977
Material Produced / Consumed ton /hour 8.19 Emission Flow Rate m3 /s 0.5
Nm3 /s 0.4 SO2 mg SO2 /Nm3 0
g SO2 /s 0.000
Air Pollution Control: Total Removal Required % 0.00% NO2 mg NO2 /Nm3 1
g NO2 /s 0.000
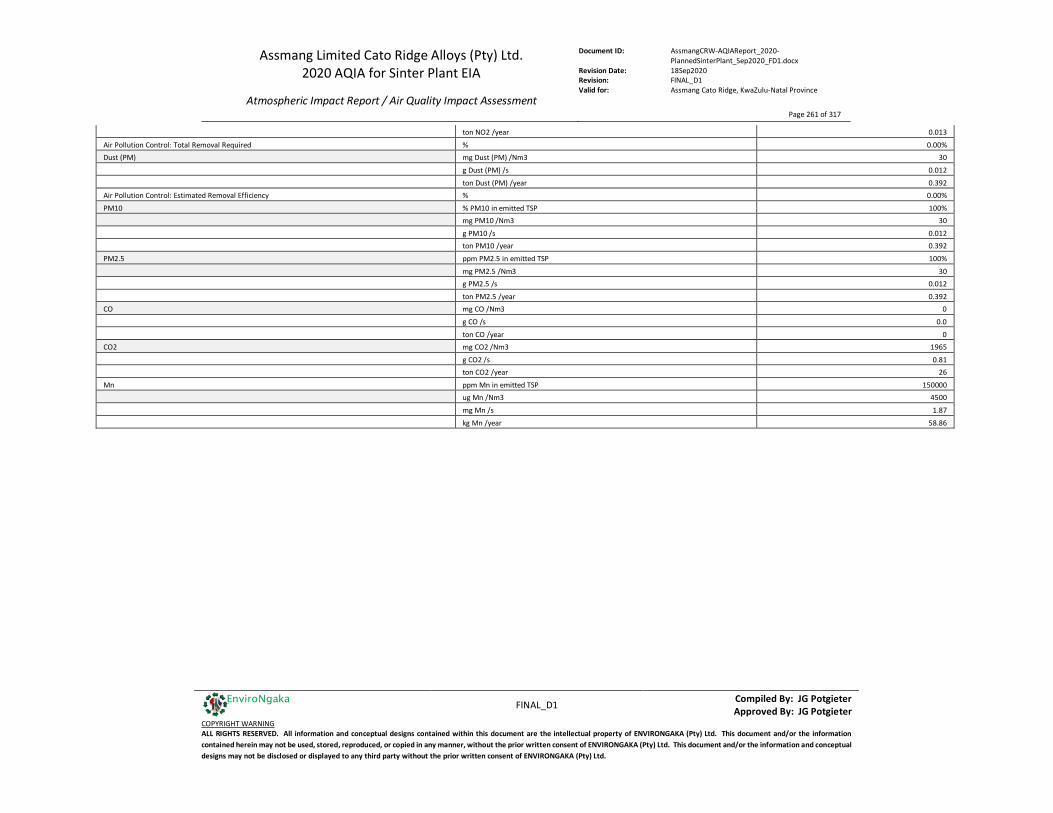
Assmang Limited Cato Ridge Alloys (Pty) Ltd. 2020 AQIA for Sinter Plant EIA
Atmospheric Impact Report / Air Quality Impact Assessment
Document ID: AssmangCRW-AQIAReport_2020-PlannedSinterPlant_Sep2020_FD1.docx
Revision Date: 18Sep2020 Revision: FINAL_D1 Valid for: Assmang Cato Ridge, KwaZulu-Natal Province
Page 261 of 317
FINAL_D1 Compiled By: JG Potgieter
Approved By: JG Potgieter COPYRIGHT WARNING ALL RIGHTS RESERVED. All information and conceptual designs contained within this document are the intellectual property of ENVIRONGAKA (Pty) Ltd. This document and/or the information contained herein may not be used, stored, reproduced, or copied in any manner, without the prior written consent of ENVIRONGAKA (Pty) Ltd. This document and/or the information and conceptual designs may not be disclosed or displayed to any third party without the prior written consent of ENVIRONGAKA (Pty) Ltd.
EnviroNgaka
ton NO2 /year 0.013
Air Pollution Control: Total Removal Required % 0.00% Dust (PM) mg Dust (PM) /Nm3 30
g Dust (PM) /s 0.012
ton Dust (PM) /year 0.392 Air Pollution Control: Estimated Removal Efficiency % 0.00%
PM10 % PM10 in emitted TSP 100% mg PM10 /Nm3 30
g PM10 /s 0.012 ton PM10 /year 0.392
PM2.5 ppm PM2.5 in emitted TSP 100%
mg PM2.5 /Nm3 30 g PM2.5 /s 0.012
ton PM2.5 /year 0.392 CO mg CO /Nm3 0
g CO /s 0.0
ton CO /year 0 CO2 mg CO2 /Nm3 1965
g CO2 /s 0.81 ton CO2 /year 26
Mn ppm Mn in emitted TSP 150000 ug Mn /Nm3 4500
mg Mn /s 1.87
kg Mn /year 58.86
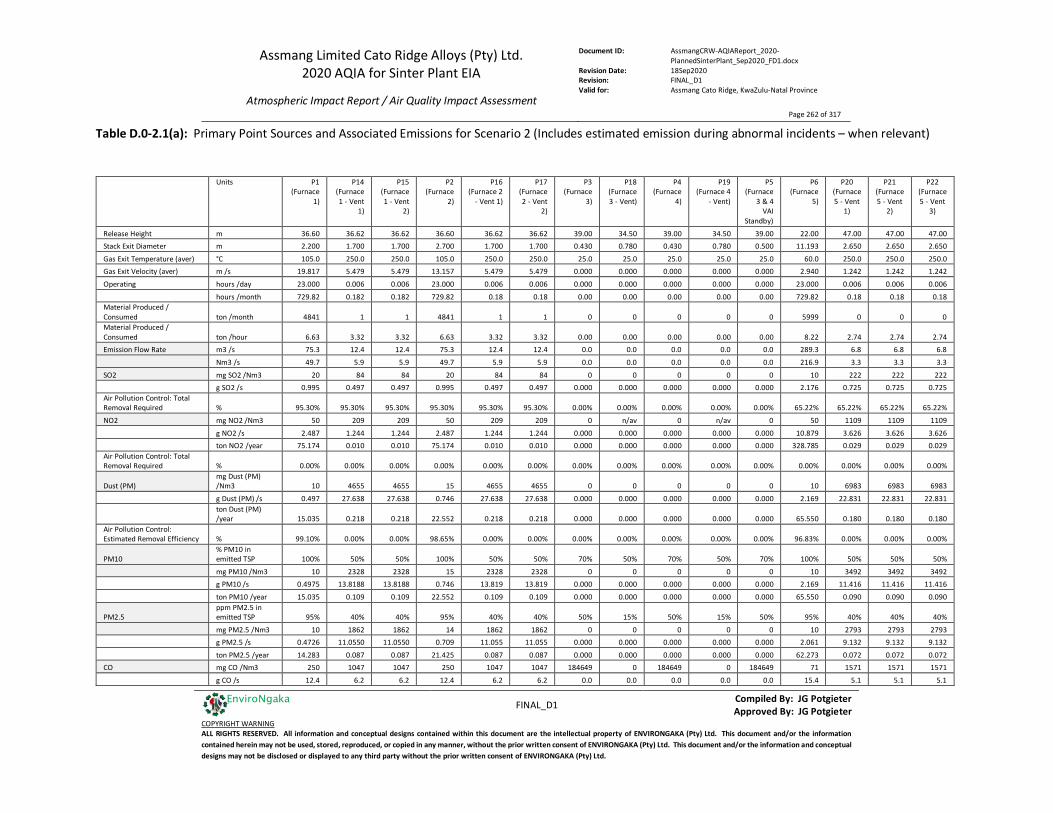
Assmang Limited Cato Ridge Alloys (Pty) Ltd. 2020 AQIA for Sinter Plant EIA
Atmospheric Impact Report / Air Quality Impact Assessment
Document ID: AssmangCRW-AQIAReport_2020-PlannedSinterPlant_Sep2020_FD1.docx
Revision Date: 18Sep2020 Revision: FINAL_D1 Valid for: Assmang Cato Ridge, KwaZulu-Natal Province
Page 262 of 317
FINAL_D1 Compiled By: JG Potgieter
Approved By: JG Potgieter COPYRIGHT WARNING ALL RIGHTS RESERVED. All information and conceptual designs contained within this document are the intellectual property of ENVIRONGAKA (Pty) Ltd. This document and/or the information contained herein may not be used, stored, reproduced, or copied in any manner, without the prior written consent of ENVIRONGAKA (Pty) Ltd. This document and/or the information and conceptual designs may not be disclosed or displayed to any third party without the prior written consent of ENVIRONGAKA (Pty) Ltd.
EnviroNgaka
Table D.0-2.1(a): Primary Point Sources and Associated Emissions for Scenario 2 (Includes estimated emission during abnormal incidents – when relevant)
Units P1 (Furnace
1)
P14 (Furnace 1 - Vent
1)
P15 (Furnace 1 - Vent
2)
P2 (Furnace
2)
P16 (Furnace 2
- Vent 1)
P17 (Furnace 2 - Vent
2)
P3 (Furnace
3)
P18 (Furnace 3 - Vent)
P4 (Furnace
4)
P19 (Furnace 4
- Vent)
P5 (Furnace
3 & 4 VAI
Standby)
P6 (Furnace
5)
P20 (Furnace 5 - Vent
1)
P21 (Furnace 5 - Vent
2)
P22 (Furnace 5 - Vent
3)
Release Height m 36.60 36.62 36.62 36.60 36.62 36.62 39.00 34.50 39.00 34.50 39.00 22.00 47.00 47.00 47.00 Stack Exit Diameter m 2.200 1.700 1.700 2.700 1.700 1.700 0.430 0.780 0.430 0.780 0.500 11.193 2.650 2.650 2.650
Gas Exit Temperature (aver) °C 105.0 250.0 250.0 105.0 250.0 250.0 25.0 25.0 25.0 25.0 25.0 60.0 250.0 250.0 250.0 Gas Exit Velocity (aver) m /s 19.817 5.479 5.479 13.157 5.479 5.479 0.000 0.000 0.000 0.000 0.000 2.940 1.242 1.242 1.242
Operating hours /day 23.000 0.006 0.006 23.000 0.006 0.006 0.000 0.000 0.000 0.000 0.000 23.000 0.006 0.006 0.006
hours /month 729.82 0.182 0.182 729.82 0.18 0.18 0.00 0.00 0.00 0.00 0.00 729.82 0.18 0.18 0.18 Material Produced / Consumed ton /month 4841 1 1 4841 1 1 0 0 0 0 0 5999 0 0 0 Material Produced / Consumed ton /hour 6.63 3.32 3.32 6.63 3.32 3.32 0.00 0.00 0.00 0.00 0.00 8.22 2.74 2.74 2.74 Emission Flow Rate m3 /s 75.3 12.4 12.4 75.3 12.4 12.4 0.0 0.0 0.0 0.0 0.0 289.3 6.8 6.8 6.8
Nm3 /s 49.7 5.9 5.9 49.7 5.9 5.9 0.0 0.0 0.0 0.0 0.0 216.9 3.3 3.3 3.3
SO2 mg SO2 /Nm3 20 84 84 20 84 84 0 0 0 0 0 10 222 222 222 g SO2 /s 0.995 0.497 0.497 0.995 0.497 0.497 0.000 0.000 0.000 0.000 0.000 2.176 0.725 0.725 0.725 Air Pollution Control: Total Removal Required % 95.30% 95.30% 95.30% 95.30% 95.30% 95.30% 0.00% 0.00% 0.00% 0.00% 0.00% 65.22% 65.22% 65.22% 65.22%
NO2 mg NO2 /Nm3 50 209 209 50 209 209 0 n/av 0 n/av 0 50 1109 1109 1109
g NO2 /s 2.487 1.244 1.244 2.487 1.244 1.244 0.000 0.000 0.000 0.000 0.000 10.879 3.626 3.626 3.626 ton NO2 /year 75.174 0.010 0.010 75.174 0.010 0.010 0.000 0.000 0.000 0.000 0.000 328.785 0.029 0.029 0.029 Air Pollution Control: Total Removal Required % 0.00% 0.00% 0.00% 0.00% 0.00% 0.00% 0.00% 0.00% 0.00% 0.00% 0.00% 0.00% 0.00% 0.00% 0.00%
Dust (PM) mg Dust (PM) /Nm3 10 4655 4655 15 4655 4655 0 0 0 0 0 10 6983 6983 6983
g Dust (PM) /s 0.497 27.638 27.638 0.746 27.638 27.638 0.000 0.000 0.000 0.000 0.000 2.169 22.831 22.831 22.831
ton Dust (PM) /year 15.035 0.218 0.218 22.552 0.218 0.218 0.000 0.000 0.000 0.000 0.000 65.550 0.180 0.180 0.180
Air Pollution Control: Estimated Removal Efficiency % 99.10% 0.00% 0.00% 98.65% 0.00% 0.00% 0.00% 0.00% 0.00% 0.00% 0.00% 96.83% 0.00% 0.00% 0.00%
PM10 % PM10 in emitted TSP 100% 50% 50% 100% 50% 50% 70% 50% 70% 50% 70% 100% 50% 50% 50%
mg PM10 /Nm3 10 2328 2328 15 2328 2328 0 0 0 0 0 10 3492 3492 3492 g PM10 /s 0.4975 13.8188 13.8188 0.746 13.819 13.819 0.000 0.000 0.000 0.000 0.000 2.169 11.416 11.416 11.416
ton PM10 /year 15.035 0.109 0.109 22.552 0.109 0.109 0.000 0.000 0.000 0.000 0.000 65.550 0.090 0.090 0.090
PM2.5 ppm PM2.5 in emitted TSP 95% 40% 40% 95% 40% 40% 50% 15% 50% 15% 50% 95% 40% 40% 40%
mg PM2.5 /Nm3 10 1862 1862 14 1862 1862 0 0 0 0 0 10 2793 2793 2793 g PM2.5 /s 0.4726 11.0550 11.0550 0.709 11.055 11.055 0.000 0.000 0.000 0.000 0.000 2.061 9.132 9.132 9.132
ton PM2.5 /year 14.283 0.087 0.087 21.425 0.087 0.087 0.000 0.000 0.000 0.000 0.000 62.273 0.072 0.072 0.072 CO mg CO /Nm3 250 1047 1047 250 1047 1047 184649 0 184649 0 184649 71 1571 1571 1571
g CO /s 12.4 6.2 6.2 12.4 6.2 6.2 0.0 0.0 0.0 0.0 0.0 15.4 5.1 5.1 5.1
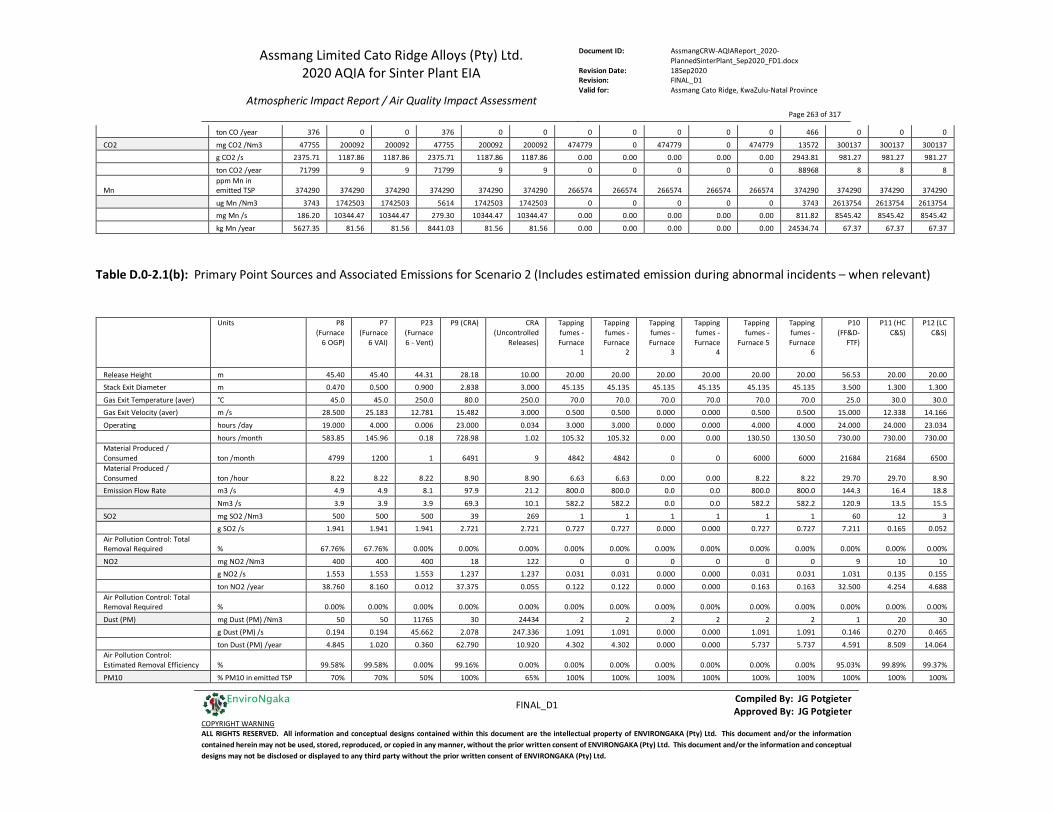
Assmang Limited Cato Ridge Alloys (Pty) Ltd. 2020 AQIA for Sinter Plant EIA
Atmospheric Impact Report / Air Quality Impact Assessment
Document ID: AssmangCRW-AQIAReport_2020-PlannedSinterPlant_Sep2020_FD1.docx
Revision Date: 18Sep2020 Revision: FINAL_D1 Valid for: Assmang Cato Ridge, KwaZulu-Natal Province
Page 263 of 317
FINAL_D1 Compiled By: JG Potgieter
Approved By: JG Potgieter COPYRIGHT WARNING ALL RIGHTS RESERVED. All information and conceptual designs contained within this document are the intellectual property of ENVIRONGAKA (Pty) Ltd. This document and/or the information contained herein may not be used, stored, reproduced, or copied in any manner, without the prior written consent of ENVIRONGAKA (Pty) Ltd. This document and/or the information and conceptual designs may not be disclosed or displayed to any third party without the prior written consent of ENVIRONGAKA (Pty) Ltd.
EnviroNgaka
ton CO /year 376 0 0 376 0 0 0 0 0 0 0 466 0 0 0
CO2 mg CO2 /Nm3 47755 200092 200092 47755 200092 200092 474779 0 474779 0 474779 13572 300137 300137 300137 g CO2 /s 2375.71 1187.86 1187.86 2375.71 1187.86 1187.86 0.00 0.00 0.00 0.00 0.00 2943.81 981.27 981.27 981.27
ton CO2 /year 71799 9 9 71799 9 9 0 0 0 0 0 88968 8 8 8
Mn ppm Mn in emitted TSP 374290 374290 374290 374290 374290 374290 266574 266574 266574 266574 266574 374290 374290 374290 374290
ug Mn /Nm3 3743 1742503 1742503 5614 1742503 1742503 0 0 0 0 0 3743 2613754 2613754 2613754 mg Mn /s 186.20 10344.47 10344.47 279.30 10344.47 10344.47 0.00 0.00 0.00 0.00 0.00 811.82 8545.42 8545.42 8545.42
kg Mn /year 5627.35 81.56 81.56 8441.03 81.56 81.56 0.00 0.00 0.00 0.00 0.00 24534.74 67.37 67.37 67.37
Table D.0-2.1(b): Primary Point Sources and Associated Emissions for Scenario 2 (Includes estimated emission during abnormal incidents – when relevant)
Units P8 (Furnace
6 OGP)
P7 (Furnace
6 VAI)
P23 (Furnace 6 - Vent)
P9 (CRA) CRA (Uncontrolled
Releases)
Tapping fumes - Furnace
1
Tapping fumes - Furnace
2
Tapping fumes - Furnace
3
Tapping fumes - Furnace
4
Tapping fumes -
Furnace 5
Tapping fumes - Furnace
6
P10 (FF&D-
FTF)
P11 (HC C&S)
P12 (LC C&S)
Release Height m 45.40 45.40 44.31 28.18 10.00 20.00 20.00 20.00 20.00 20.00 20.00 56.53 20.00 20.00 Stack Exit Diameter m 0.470 0.500 0.900 2.838 3.000 45.135 45.135 45.135 45.135 45.135 45.135 3.500 1.300 1.300
Gas Exit Temperature (aver) °C 45.0 45.0 250.0 80.0 250.0 70.0 70.0 70.0 70.0 70.0 70.0 25.0 30.0 30.0 Gas Exit Velocity (aver) m /s 28.500 25.183 12.781 15.482 3.000 0.500 0.500 0.000 0.000 0.500 0.500 15.000 12.338 14.166
Operating hours /day 19.000 4.000 0.006 23.000 0.034 3.000 3.000 0.000 0.000 4.000 4.000 24.000 24.000 23.034
hours /month 583.85 145.96 0.18 728.98 1.02 105.32 105.32 0.00 0.00 130.50 130.50 730.00 730.00 730.00 Material Produced / Consumed ton /month 4799 1200 1 6491 9 4842 4842 0 0 6000 6000 21684 21684 6500 Material Produced / Consumed ton /hour 8.22 8.22 8.22 8.90 8.90 6.63 6.63 0.00 0.00 8.22 8.22 29.70 29.70 8.90 Emission Flow Rate m3 /s 4.9 4.9 8.1 97.9 21.2 800.0 800.0 0.0 0.0 800.0 800.0 144.3 16.4 18.8
Nm3 /s 3.9 3.9 3.9 69.3 10.1 582.2 582.2 0.0 0.0 582.2 582.2 120.9 13.5 15.5
SO2 mg SO2 /Nm3 500 500 500 39 269 1 1 1 1 1 1 60 12 3 g SO2 /s 1.941 1.941 1.941 2.721 2.721 0.727 0.727 0.000 0.000 0.727 0.727 7.211 0.165 0.052 Air Pollution Control: Total Removal Required % 67.76% 67.76% 0.00% 0.00% 0.00% 0.00% 0.00% 0.00% 0.00% 0.00% 0.00% 0.00% 0.00% 0.00%
NO2 mg NO2 /Nm3 400 400 400 18 122 0 0 0 0 0 0 9 10 10 g NO2 /s 1.553 1.553 1.553 1.237 1.237 0.031 0.031 0.000 0.000 0.031 0.031 1.031 0.135 0.155
ton NO2 /year 38.760 8.160 0.012 37.375 0.055 0.122 0.122 0.000 0.000 0.163 0.163 32.500 4.254 4.688 Air Pollution Control: Total Removal Required % 0.00% 0.00% 0.00% 0.00% 0.00% 0.00% 0.00% 0.00% 0.00% 0.00% 0.00% 0.00% 0.00% 0.00%
Dust (PM) mg Dust (PM) /Nm3 50 50 11765 30 24434 2 2 2 2 2 2 1 20 30 g Dust (PM) /s 0.194 0.194 45.662 2.078 247.336 1.091 1.091 0.000 0.000 1.091 1.091 0.146 0.270 0.465
ton Dust (PM) /year 4.845 1.020 0.360 62.790 10.920 4.302 4.302 0.000 0.000 5.737 5.737 4.591 8.509 14.064 Air Pollution Control: Estimated Removal Efficiency % 99.58% 99.58% 0.00% 99.16% 0.00% 0.00% 0.00% 0.00% 0.00% 0.00% 0.00% 95.03% 99.89% 99.37%
PM10 % PM10 in emitted TSP 70% 70% 50% 100% 65% 100% 100% 100% 100% 100% 100% 100% 100% 100%
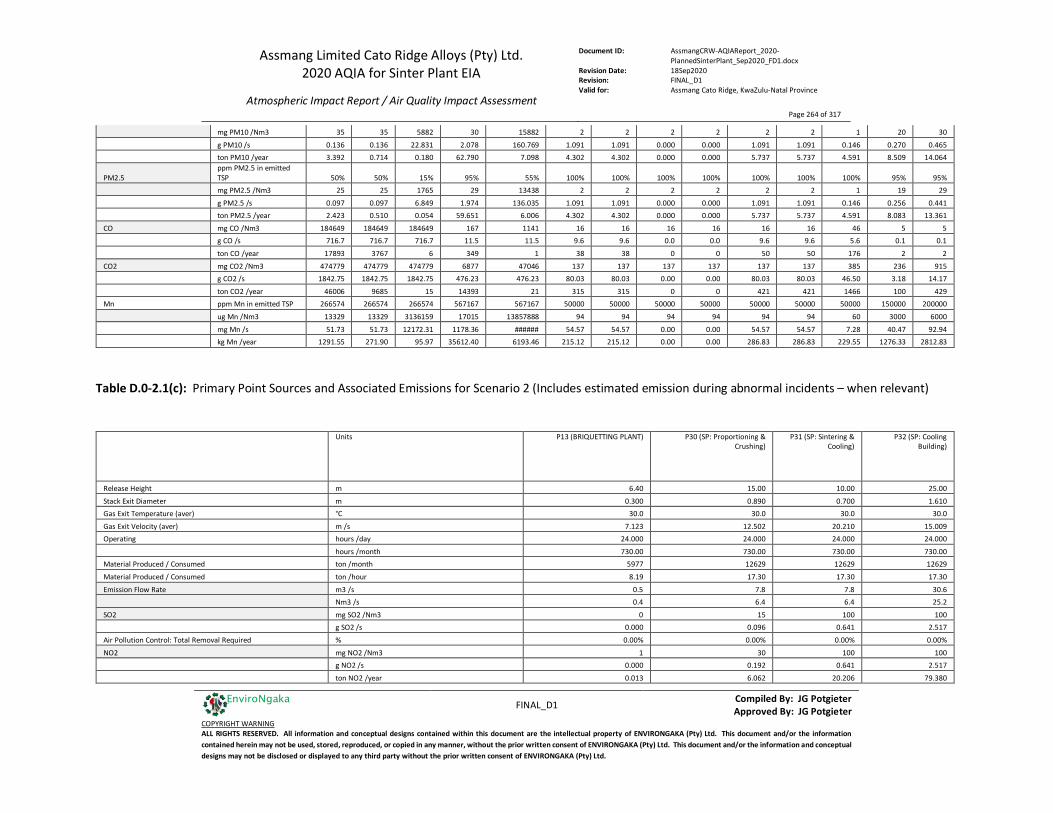
Assmang Limited Cato Ridge Alloys (Pty) Ltd. 2020 AQIA for Sinter Plant EIA
Atmospheric Impact Report / Air Quality Impact Assessment
Document ID: AssmangCRW-AQIAReport_2020-PlannedSinterPlant_Sep2020_FD1.docx
Revision Date: 18Sep2020 Revision: FINAL_D1 Valid for: Assmang Cato Ridge, KwaZulu-Natal Province
Page 264 of 317
FINAL_D1 Compiled By: JG Potgieter
Approved By: JG Potgieter COPYRIGHT WARNING ALL RIGHTS RESERVED. All information and conceptual designs contained within this document are the intellectual property of ENVIRONGAKA (Pty) Ltd. This document and/or the information contained herein may not be used, stored, reproduced, or copied in any manner, without the prior written consent of ENVIRONGAKA (Pty) Ltd. This document and/or the information and conceptual designs may not be disclosed or displayed to any third party without the prior written consent of ENVIRONGAKA (Pty) Ltd.
EnviroNgaka
mg PM10 /Nm3 35 35 5882 30 15882 2 2 2 2 2 2 1 20 30
g PM10 /s 0.136 0.136 22.831 2.078 160.769 1.091 1.091 0.000 0.000 1.091 1.091 0.146 0.270 0.465 ton PM10 /year 3.392 0.714 0.180 62.790 7.098 4.302 4.302 0.000 0.000 5.737 5.737 4.591 8.509 14.064
PM2.5 ppm PM2.5 in emitted TSP 50% 50% 15% 95% 55% 100% 100% 100% 100% 100% 100% 100% 95% 95%
mg PM2.5 /Nm3 25 25 1765 29 13438 2 2 2 2 2 2 1 19 29
g PM2.5 /s 0.097 0.097 6.849 1.974 136.035 1.091 1.091 0.000 0.000 1.091 1.091 0.146 0.256 0.441 ton PM2.5 /year 2.423 0.510 0.054 59.651 6.006 4.302 4.302 0.000 0.000 5.737 5.737 4.591 8.083 13.361
CO mg CO /Nm3 184649 184649 184649 167 1141 16 16 16 16 16 16 46 5 5 g CO /s 716.7 716.7 716.7 11.5 11.5 9.6 9.6 0.0 0.0 9.6 9.6 5.6 0.1 0.1
ton CO /year 17893 3767 6 349 1 38 38 0 0 50 50 176 2 2
CO2 mg CO2 /Nm3 474779 474779 474779 6877 47046 137 137 137 137 137 137 385 236 915 g CO2 /s 1842.75 1842.75 1842.75 476.23 476.23 80.03 80.03 0.00 0.00 80.03 80.03 46.50 3.18 14.17
ton CO2 /year 46006 9685 15 14393 21 315 315 0 0 421 421 1466 100 429 Mn ppm Mn in emitted TSP 266574 266574 266574 567167 567167 50000 50000 50000 50000 50000 50000 50000 150000 200000
ug Mn /Nm3 13329 13329 3136159 17015 13857888 94 94 94 94 94 94 60 3000 6000
mg Mn /s 51.73 51.73 12172.31 1178.36 ###### 54.57 54.57 0.00 0.00 54.57 54.57 7.28 40.47 92.94 kg Mn /year 1291.55 271.90 95.97 35612.40 6193.46 215.12 215.12 0.00 0.00 286.83 286.83 229.55 1276.33 2812.83
Table D.0-2.1(c): Primary Point Sources and Associated Emissions for Scenario 2 (Includes estimated emission during abnormal incidents – when relevant)
Units P13 (BRIQUETTING PLANT) P30 (SP: Proportioning & Crushing)
P31 (SP: Sintering & Cooling)
P32 (SP: Cooling Building)
Release Height m 6.40 15.00 10.00 25.00
Stack Exit Diameter m 0.300 0.890 0.700 1.610 Gas Exit Temperature (aver) °C 30.0 30.0 30.0 30.0
Gas Exit Velocity (aver) m /s 7.123 12.502 20.210 15.009 Operating hours /day 24.000 24.000 24.000 24.000
hours /month 730.00 730.00 730.00 730.00 Material Produced / Consumed ton /month 5977 12629 12629 12629
Material Produced / Consumed ton /hour 8.19 17.30 17.30 17.30
Emission Flow Rate m3 /s 0.5 7.8 7.8 30.6 Nm3 /s 0.4 6.4 6.4 25.2
SO2 mg SO2 /Nm3 0 15 100 100 g SO2 /s 0.000 0.096 0.641 2.517
Air Pollution Control: Total Removal Required % 0.00% 0.00% 0.00% 0.00%
NO2 mg NO2 /Nm3 1 30 100 100 g NO2 /s 0.000 0.192 0.641 2.517
ton NO2 /year 0.013 6.062 20.206 79.380
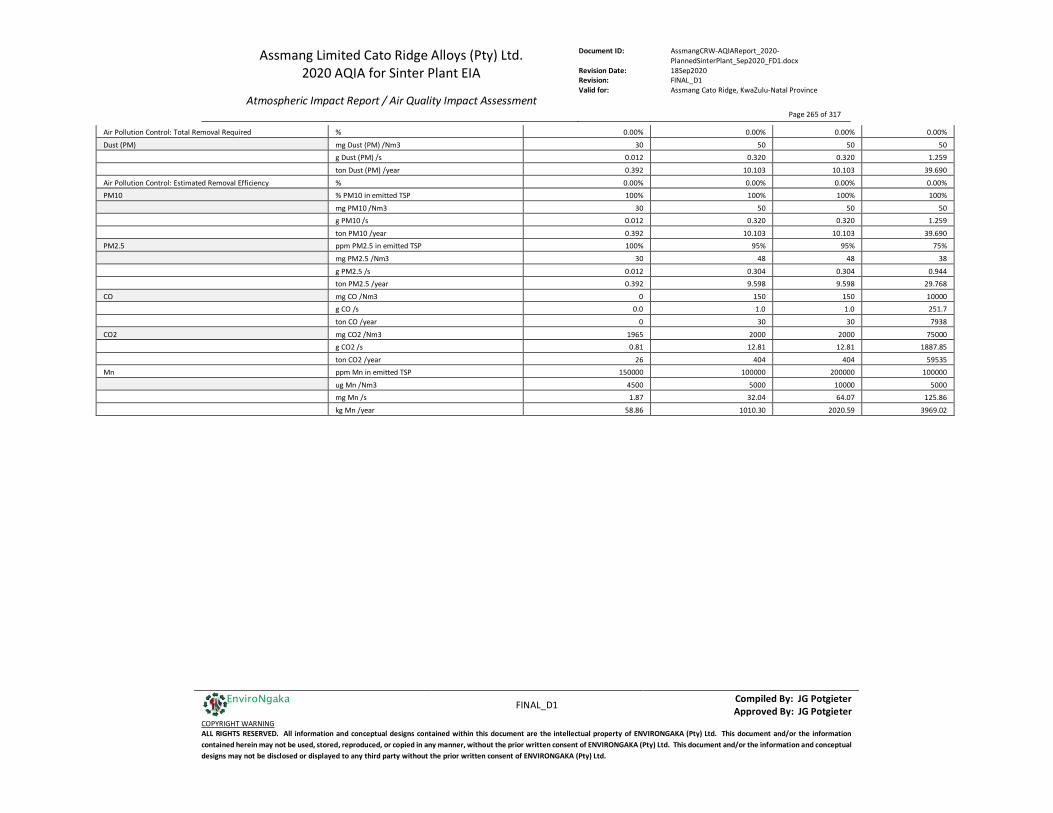
Assmang Limited Cato Ridge Alloys (Pty) Ltd. 2020 AQIA for Sinter Plant EIA
Atmospheric Impact Report / Air Quality Impact Assessment
Document ID: AssmangCRW-AQIAReport_2020-PlannedSinterPlant_Sep2020_FD1.docx
Revision Date: 18Sep2020 Revision: FINAL_D1 Valid for: Assmang Cato Ridge, KwaZulu-Natal Province
Page 265 of 317
FINAL_D1 Compiled By: JG Potgieter
Approved By: JG Potgieter COPYRIGHT WARNING ALL RIGHTS RESERVED. All information and conceptual designs contained within this document are the intellectual property of ENVIRONGAKA (Pty) Ltd. This document and/or the information contained herein may not be used, stored, reproduced, or copied in any manner, without the prior written consent of ENVIRONGAKA (Pty) Ltd. This document and/or the information and conceptual designs may not be disclosed or displayed to any third party without the prior written consent of ENVIRONGAKA (Pty) Ltd.
EnviroNgaka
Air Pollution Control: Total Removal Required % 0.00% 0.00% 0.00% 0.00%
Dust (PM) mg Dust (PM) /Nm3 30 50 50 50 g Dust (PM) /s 0.012 0.320 0.320 1.259
ton Dust (PM) /year 0.392 10.103 10.103 39.690
Air Pollution Control: Estimated Removal Efficiency % 0.00% 0.00% 0.00% 0.00% PM10 % PM10 in emitted TSP 100% 100% 100% 100%
mg PM10 /Nm3 30 50 50 50 g PM10 /s 0.012 0.320 0.320 1.259
ton PM10 /year 0.392 10.103 10.103 39.690 PM2.5 ppm PM2.5 in emitted TSP 100% 95% 95% 75%
mg PM2.5 /Nm3 30 48 48 38
g PM2.5 /s 0.012 0.304 0.304 0.944 ton PM2.5 /year 0.392 9.598 9.598 29.768
CO mg CO /Nm3 0 150 150 10000 g CO /s 0.0 1.0 1.0 251.7
ton CO /year 0 30 30 7938
CO2 mg CO2 /Nm3 1965 2000 2000 75000 g CO2 /s 0.81 12.81 12.81 1887.85
ton CO2 /year 26 404 404 59535 Mn ppm Mn in emitted TSP 150000 100000 200000 100000
ug Mn /Nm3 4500 5000 10000 5000 mg Mn /s 1.87 32.04 64.07 125.86
kg Mn /year 58.86 1010.30 2020.59 3969.02
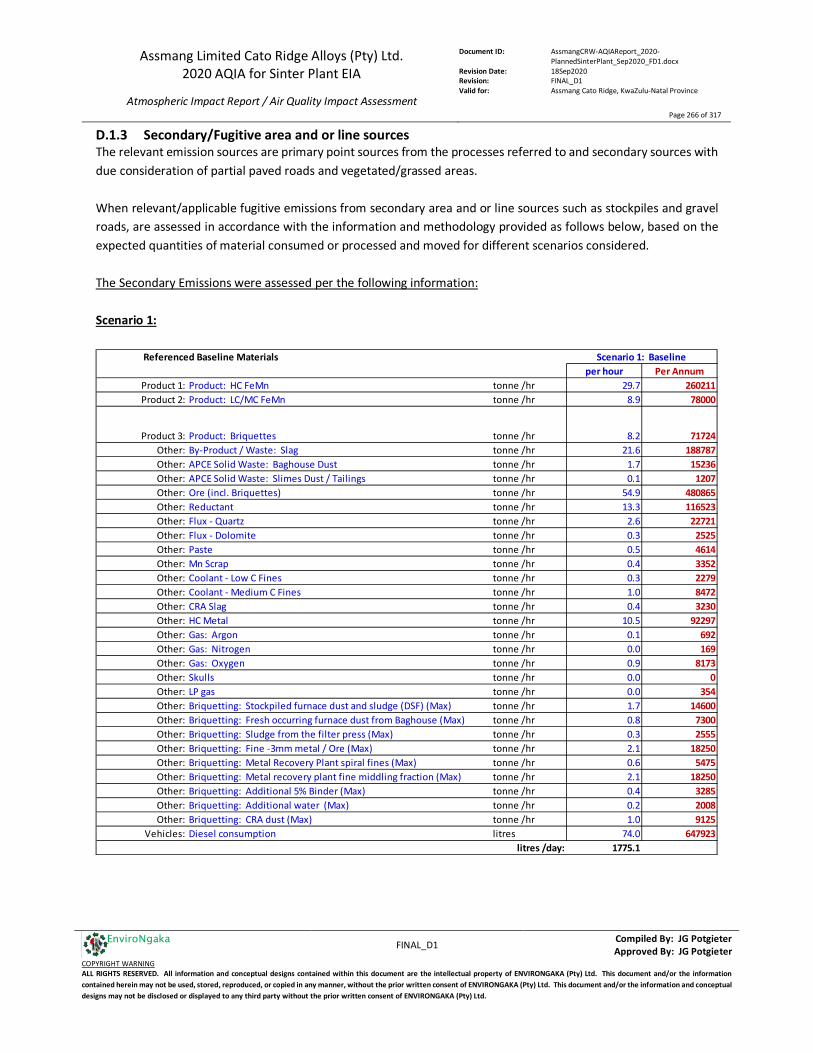
Assmang Limited Cato Ridge Alloys (Pty) Ltd. 2020 AQIA for Sinter Plant EIA
Atmospheric Impact Report / Air Quality Impact Assessment
Document ID: AssmangCRW-AQIAReport_2020-PlannedSinterPlant_Sep2020_FD1.docx
Revision Date: 18Sep2020 Revision: FINAL_D1 Valid for: Assmang Cato Ridge, KwaZulu-Natal Province
Page 266 of 317
FINAL_D1 Compiled By: JG Potgieter
Approved By: JG Potgieter COPYRIGHT WARNING ALL RIGHTS RESERVED. All information and conceptual designs contained within this document are the intellectual property of ENVIRONGAKA (Pty) Ltd. This document and/or the information contained herein may not be used, stored, reproduced, or copied in any manner, without the prior written consent of ENVIRONGAKA (Pty) Ltd. This document and/or the information and conceptual designs may not be disclosed or displayed to any third party without the prior written consent of ENVIRONGAKA (Pty) Ltd.
EnviroNgaka
D.1.3 Secondary/Fugitive area and or line sources The relevant emission sources are primary point sources from the processes referred to and secondary sources with due consideration of partial paved roads and vegetated/grassed areas. When relevant/applicable fugitive emissions from secondary area and or line sources such as stockpiles and gravel roads, are assessed in accordance with the information and methodology provided as follows below, based on the expected quantities of material consumed or processed and moved for different scenarios considered. The Secondary Emissions were assessed per the following information: Scenario 1:
Referenced Baseline Materialsper hour Per Annum
Product 1: Product: HC FeMn tonne /hr 29.7 260211Product 2: Product: LC/MC FeMn tonne /hr 8.9 78000
Product 3: Product: Briquettes tonne /hr 8.2 71724Other: By-Product / Waste: Slag tonne /hr 21.6 188787Other: APCE Solid Waste: Baghouse Dust tonne /hr 1.7 15236Other: APCE Solid Waste: Slimes Dust / Tailings tonne /hr 0.1 1207Other: Ore (incl. Briquettes) tonne /hr 54.9 480865Other: Reductant tonne /hr 13.3 116523Other: Flux - Quartz tonne /hr 2.6 22721Other: Flux - Dolomite tonne /hr 0.3 2525Other: Paste tonne /hr 0.5 4614Other: Mn Scrap tonne /hr 0.4 3352Other: Coolant - Low C Fines tonne /hr 0.3 2279Other: Coolant - Medium C Fines tonne /hr 1.0 8472Other: CRA Slag tonne /hr 0.4 3230Other: HC Metal tonne /hr 10.5 92297Other: Gas: Argon tonne /hr 0.1 692Other: Gas: Nitrogen tonne /hr 0.0 169Other: Gas: Oxygen tonne /hr 0.9 8173Other: Skulls tonne /hr 0.0 0Other: LP gas tonne /hr 0.0 354Other: Briquetting: Stockpiled furnace dust and sludge (DSF) (Max) tonne /hr 1.7 14600Other: Briquetting: Fresh occurring furnace dust from Baghouse (Max) tonne /hr 0.8 7300Other: Briquetting: Sludge from the filter press (Max) tonne /hr 0.3 2555Other: Briquetting: Fine -3mm metal / Ore (Max) tonne /hr 2.1 18250Other: Briquetting: Metal Recovery Plant spiral fines (Max) tonne /hr 0.6 5475Other: Briquetting: Metal recovery plant fine middling fraction (Max) tonne /hr 2.1 18250Other: Briquetting: Additional 5% Binder (Max) tonne /hr 0.4 3285Other: Briquetting: Additional water (Max) tonne /hr 0.2 2008Other: Briquetting: CRA dust (Max) tonne /hr 1.0 9125
Vehicles: Diesel consumption litres 74.0 647923litres /day: 1775.1
Scenario 1: Baseline
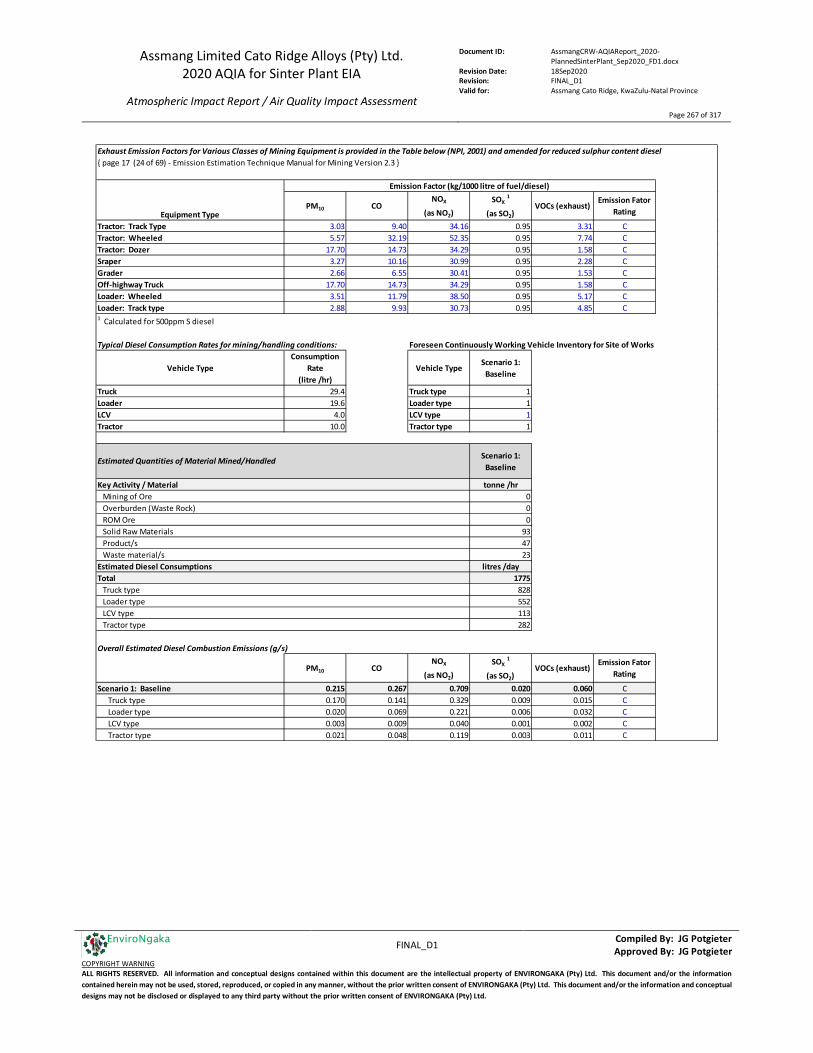
Assmang Limited Cato Ridge Alloys (Pty) Ltd. 2020 AQIA for Sinter Plant EIA
Atmospheric Impact Report / Air Quality Impact Assessment
Document ID: AssmangCRW-AQIAReport_2020-PlannedSinterPlant_Sep2020_FD1.docx
Revision Date: 18Sep2020 Revision: FINAL_D1 Valid for: Assmang Cato Ridge, KwaZulu-Natal Province
Page 267 of 317
FINAL_D1 Compiled By: JG Potgieter
Approved By: JG Potgieter COPYRIGHT WARNING ALL RIGHTS RESERVED. All information and conceptual designs contained within this document are the intellectual property of ENVIRONGAKA (Pty) Ltd. This document and/or the information contained herein may not be used, stored, reproduced, or copied in any manner, without the prior written consent of ENVIRONGAKA (Pty) Ltd. This document and/or the information and conceptual designs may not be disclosed or displayed to any third party without the prior written consent of ENVIRONGAKA (Pty) Ltd.
EnviroNgaka
PM10 CONOX
(as NO2)SOX 1
(as SO2)VOCs (exhaust)
Emission Fator Rating
Tractor: Track Type 3.03 9.40 34.16 0.95 3.31 CTractor: Wheeled 5.57 32.19 52.35 0.95 7.74 CTractor: Dozer 17.70 14.73 34.29 0.95 1.58 CSraper 3.27 10.16 30.99 0.95 2.28 CGrader 2.66 6.55 30.41 0.95 1.53 COff-highway Truck 17.70 14.73 34.29 0.95 1.58 CLoader: Wheeled 3.51 11.79 38.50 0.95 5.17 CLoader: Track type 2.88 9.93 30.73 0.95 4.85 C1 Calculated for 500ppm S diesel
Typical Diesel Consumption Rates for mining/handling conditions: Foreseen Continuously Working Vehicle Inventory for Site of Works
Vehicle TypeConsumption
Rate(litre /hr)
Vehicle TypeScenario 1:
Baseline
Truck 29.4 Truck type 1Loader 19.6 Loader type 1LCV 4.0 LCV type 1Tractor 10.0 Tractor type 1
Scenario 1: Baseline
tonne /hr000
934723
litres /day1775
828552113282
Overall Estimated Diesel Combustion Emissions (g/s)
PM10 CONOX
(as NO2)SOX 1
(as SO2)VOCs (exhaust)
Emission Fator Rating
Scenario 1: Baseline 0.215 0.267 0.709 0.020 0.060 CTruck type 0.170 0.141 0.329 0.009 0.015 CLoader type 0.020 0.069 0.221 0.006 0.032 CLCV type 0.003 0.009 0.040 0.001 0.002 CTractor type 0.021 0.048 0.119 0.003 0.011 C
{ page 17 (24 of 69) - Emission Estimation Technique Manual for Mining Version 2.3 }
Equipment Type
Emission Factor (kg/1000 litre of fuel/diesel)
Product/sWaste material/s
Exhaust Emission Factors for Various Classes of Mining Equipment is provided in the Table below (NPI, 2001) and amended for reduced sulphur content diesel
Estimated Quantities of Material Mined/Handled
Key Activity / Material
LCV typeTractor type
Estimated Diesel Consumptions
Truck typeTotal
Loader type
Overburden (Waste Rock)ROM OreSolid Raw Materials
Mining of Ore
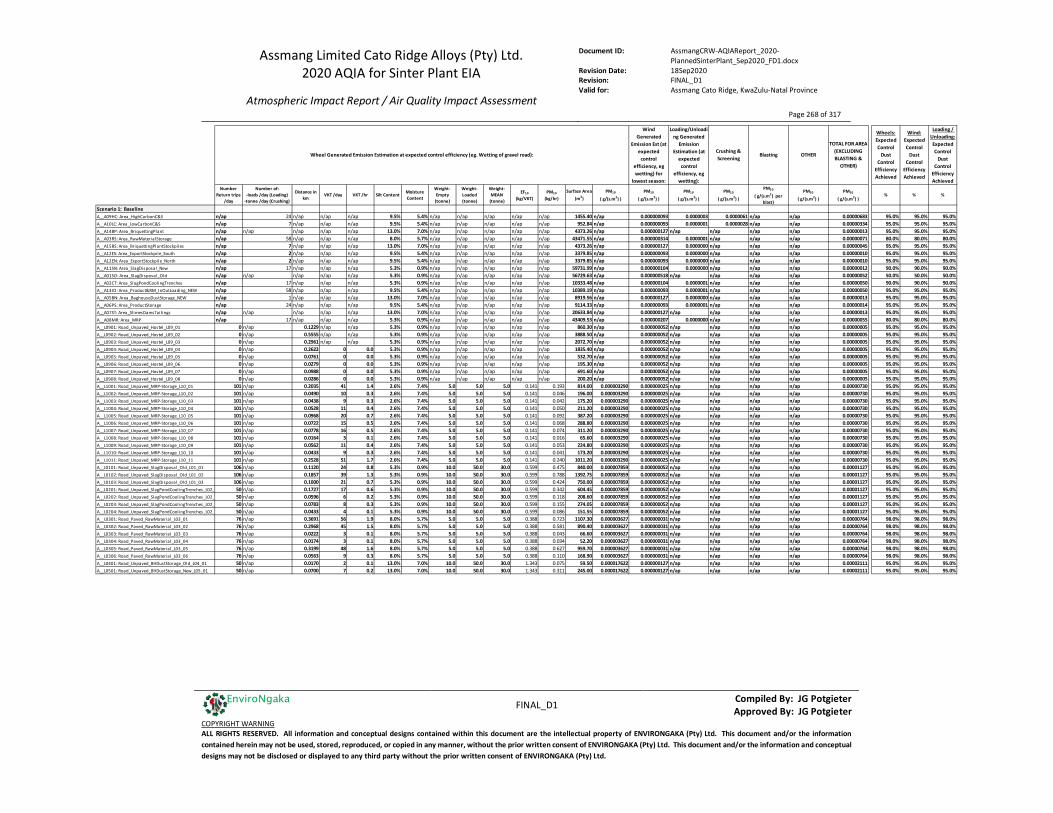
Assmang Limited Cato Ridge Alloys (Pty) Ltd. 2020 AQIA for Sinter Plant EIA
Atmospheric Impact Report / Air Quality Impact Assessment
Document ID: AssmangCRW-AQIAReport_2020-PlannedSinterPlant_Sep2020_FD1.docx
Revision Date: 18Sep2020 Revision: FINAL_D1 Valid for: Assmang Cato Ridge, KwaZulu-Natal Province
Page 268 of 317
FINAL_D1 Compiled By: JG Potgieter
Approved By: JG Potgieter COPYRIGHT WARNING ALL RIGHTS RESERVED. All information and conceptual designs contained within this document are the intellectual property of ENVIRONGAKA (Pty) Ltd. This document and/or the information contained herein may not be used, stored, reproduced, or copied in any manner, without the prior written consent of ENVIRONGAKA (Pty) Ltd. This document and/or the information and conceptual designs may not be disclosed or displayed to any third party without the prior written consent of ENVIRONGAKA (Pty) Ltd.
EnviroNgaka
Number Return trips
/day
Number of:-loads /day (Loading)
-tonne /day (Crushing)
Distance in km
VKT /day VKT /hr Silt Content Moisture Content
Weight-Empty
(tonne)
Weight-Loaded(tonne)
Weight-MEAN
(tonne)
EF10
(kg/VKT)PM10
(kg/hr)Surface Area
(m2) PM10
( g/(s.m2) )
PM10
( g/(s.m2) )
PM10
( g/(s.m2) )
PM10
( g/(s.m2) )
PM10
( g/(s.m2) per blast)
PM10
( g/(s.m2) )
PM10
( g/(s.m2) )% % %
Scenario 1: BaselineA__A09HC: Area_HighCarbonC&S n/ap 24 n/ap n/ap n/ap 9.5% 5.4% n/ap n/ap n/ap n/ap n/ap 1455.40 n/ap 0.000000093 0.0000003 0.0000061 n/ap n/ap 0.00000683 95.0% 95.0% 95.0%A__A10LC: Area_LowCarbonC&S n/ap 7 n/ap n/ap n/ap 9.5% 5.4% n/ap n/ap n/ap n/ap n/ap 952.84 n/ap 0.000000093 0.0000001 0.0000028 n/ap n/ap 0.00000334 95.0% 95.0% 95.0%A__A14BP: Area_BriquettingPlant n/ap n/ap n/ap n/ap n/ap 13.0% 7.0% n/ap n/ap n/ap n/ap n/ap 4373.26 n/ap 0.000000127 n/ap n/ap n/ap n/ap 0.00000013 95.0% 95.0% 95.0%A__A03RS: Area_RawMaterialStorage n/ap 58 n/ap n/ap n/ap 8.0% 5.7% n/ap n/ap n/ap n/ap n/ap 43471.55 n/ap 0.000000314 0.0000001 n/ap n/ap n/ap 0.00000071 80.0% 80.0% 80.0%A__A15BS: Area_BriquettingPlantStockpiles n/ap 7 n/ap n/ap n/ap 13.0% 7.0% n/ap n/ap n/ap n/ap n/ap 4373.26 n/ap 0.000000127 0.0000000 n/ap n/ap n/ap 0.00000045 95.0% 95.0% 95.0%A__A12ES: Area_ExportStockpile_South n/ap 2 n/ap n/ap n/ap 9.5% 5.4% n/ap n/ap n/ap n/ap n/ap 3379.85 n/ap 0.000000093 0.0000000 n/ap n/ap n/ap 0.00000010 95.0% 95.0% 95.0%A__A12EN: Area_ExportStockpile_North n/ap 2 n/ap n/ap n/ap 9.5% 5.4% n/ap n/ap n/ap n/ap n/ap 3379.85 n/ap 0.000000093 0.0000000 n/ap n/ap n/ap 0.00000010 95.0% 95.0% 95.0%A__A11SN: Area_SlagDisposal_New n/ap 17 n/ap n/ap n/ap 5.3% 0.9% n/ap n/ap n/ap n/ap n/ap 59731.99 n/ap 0.000000104 0.0000000 n/ap n/ap n/ap 0.00000012 90.0% 90.0% 90.0%A__A01SO: Area_SlagDisposal_Old n/ap n/ap n/ap n/ap n/ap 5.3% 0.9% n/ap n/ap n/ap n/ap n/ap 56729.63 n/ap 0.000000518 n/ap n/ap n/ap n/ap 0.00000052 50.0% 50.0% 50.0%A__A02CT: Area_SlagPondCoolingTrenches n/ap 17 n/ap n/ap n/ap 5.3% 0.9% n/ap n/ap n/ap n/ap n/ap 10333.48 n/ap 0.000000104 0.0000001 n/ap n/ap n/ap 0.00000050 90.0% 90.0% 90.0%A__A13IO: Area_Product&RM_InOutLoading_NEW n/ap 58 n/ap n/ap n/ap 9.5% 5.4% n/ap n/ap n/ap n/ap n/ap 10389.19 n/ap 0.000000093 0.0000001 n/ap n/ap n/ap 0.00000050 95.0% 95.0% 95.0%A__A05BN: Area_BaghouseDustStorage_NEW n/ap 1 n/ap n/ap n/ap 13.0% 7.0% n/ap n/ap n/ap n/ap n/ap 8919.56 n/ap 0.000000127 0.0000000 n/ap n/ap n/ap 0.00000013 95.0% 95.0% 95.0%A__A06PS: Area_ProductStorage n/ap 24 n/ap n/ap n/ap 9.5% 5.4% n/ap n/ap n/ap n/ap n/ap 9114.33 n/ap 0.000000093 0.0000001 n/ap n/ap n/ap 0.00000014 95.0% 95.0% 95.0%A__A07ST: Area_SlimesDamsTail ings n/ap n/ap n/ap n/ap n/ap 13.0% 7.0% n/ap n/ap n/ap n/ap n/ap 20633.84 n/ap 0.000000127 n/ap n/ap n/ap n/ap 0.00000013 95.0% 95.0% 95.0%A__A08MR: Area_MRP n/ap 17 n/ap n/ap n/ap 5.3% 0.9% n/ap n/ap n/ap n/ap n/ap 43409.53 n/ap 0.000000207 0.0000000 n/ap n/ap n/ap 0.00000055 80.0% 80.0% 80.0%A__L0901: Road_Unpaved_Hostel_L09_01 0 n/ap 0.1229 n/ap n/ap 5.3% 0.9% n/ap n/ap n/ap n/ap n/ap 860.30 n/ap 0.000000052 n/ap n/ap n/ap n/ap 0.00000005 95.0% 95.0% 95.0%A__L0902: Road_Unpaved_Hostel_L09_02 0 n/ap 0.5555 n/ap n/ap 5.3% 0.9% n/ap n/ap n/ap n/ap n/ap 3888.50 n/ap 0.000000052 n/ap n/ap n/ap n/ap 0.00000005 95.0% 95.0% 95.0%A__L0903: Road_Unpaved_Hostel_L09_03 0 n/ap 0.2961 n/ap n/ap 5.3% 0.9% n/ap n/ap n/ap n/ap n/ap 2072.70 n/ap 0.000000052 n/ap n/ap n/ap n/ap 0.00000005 95.0% 95.0% 95.0%A__L0904: Road_Unpaved_Hostel_L09_04 0 n/ap 0.2622 0 0.0 5.3% 0.9% n/ap n/ap n/ap n/ap n/ap 1835.40 n/ap 0.000000052 n/ap n/ap n/ap n/ap 0.00000005 95.0% 95.0% 95.0%A__L0905: Road_Unpaved_Hostel_L09_05 0 n/ap 0.0761 0 0.0 5.3% 0.9% n/ap n/ap n/ap n/ap n/ap 532.70 n/ap 0.000000052 n/ap n/ap n/ap n/ap 0.00000005 95.0% 95.0% 95.0%A__L0906: Road_Unpaved_Hostel_L09_06 0 n/ap 0.0279 0 0.0 5.3% 0.9% n/ap n/ap n/ap n/ap n/ap 195.30 n/ap 0.000000052 n/ap n/ap n/ap n/ap 0.00000005 95.0% 95.0% 95.0%A__L0907: Road_Unpaved_Hostel_L09_07 0 n/ap 0.0988 0 0.0 5.3% 0.9% n/ap n/ap n/ap n/ap n/ap 691.60 n/ap 0.000000052 n/ap n/ap n/ap n/ap 0.00000005 95.0% 95.0% 95.0%A__L0908: Road_Unpaved_Hostel_L09_08 0 n/ap 0.0286 0 0.0 5.3% 0.9% n/ap n/ap n/ap n/ap n/ap 200.20 n/ap 0.000000052 n/ap n/ap n/ap n/ap 0.00000005 95.0% 95.0% 95.0%A__L1001: Road_Unpaved_MRP-Storage_L10_01 101 n/ap 0.2035 41 1.4 2.6% 7.4% 5.0 5.0 5.0 0.141 0.193 814.00 0.000003290 0.000000025 n/ap n/ap n/ap n/ap 0.00000730 95.0% 95.0% 95.0%A__L1002: Road_Unpaved_MRP-Storage_L10_02 101 n/ap 0.0490 10 0.3 2.6% 7.4% 5.0 5.0 5.0 0.141 0.046 196.00 0.000003290 0.000000025 n/ap n/ap n/ap n/ap 0.00000730 95.0% 95.0% 95.0%A__L1003: Road_Unpaved_MRP-Storage_L10_03 101 n/ap 0.0438 9 0.3 2.6% 7.4% 5.0 5.0 5.0 0.141 0.042 175.20 0.000003290 0.000000025 n/ap n/ap n/ap n/ap 0.00000730 95.0% 95.0% 95.0%A__L1004: Road_Unpaved_MRP-Storage_L10_04 101 n/ap 0.0528 11 0.4 2.6% 7.4% 5.0 5.0 5.0 0.141 0.050 211.20 0.000003290 0.000000025 n/ap n/ap n/ap n/ap 0.00000730 95.0% 95.0% 95.0%A__L1005: Road_Unpaved_MRP-Storage_L10_05 101 n/ap 0.0968 20 0.7 2.6% 7.4% 5.0 5.0 5.0 0.141 0.092 387.20 0.000003290 0.000000025 n/ap n/ap n/ap n/ap 0.00000730 95.0% 95.0% 95.0%A__L1006: Road_Unpaved_MRP-Storage_L10_06 101 n/ap 0.0722 15 0.5 2.6% 7.4% 5.0 5.0 5.0 0.141 0.068 288.80 0.000003290 0.000000025 n/ap n/ap n/ap n/ap 0.00000730 95.0% 95.0% 95.0%A__L1007: Road_Unpaved_MRP-Storage_L10_07 101 n/ap 0.0778 16 0.5 2.6% 7.4% 5.0 5.0 5.0 0.141 0.074 311.20 0.000003290 0.000000025 n/ap n/ap n/ap n/ap 0.00000730 95.0% 95.0% 95.0%A__L1008: Road_Unpaved_MRP-Storage_L10_08 101 n/ap 0.0164 3 0.1 2.6% 7.4% 5.0 5.0 5.0 0.141 0.016 65.60 0.000003290 0.000000025 n/ap n/ap n/ap n/ap 0.00000730 95.0% 95.0% 95.0%A__L1009: Road_Unpaved_MRP-Storage_L10_09 101 n/ap 0.0562 11 0.4 2.6% 7.4% 5.0 5.0 5.0 0.141 0.053 224.80 0.000003290 0.000000025 n/ap n/ap n/ap n/ap 0.00000730 95.0% 95.0% 95.0%A__L1010: Road_Unpaved_MRP-Storage_L10_10 101 n/ap 0.0433 9 0.3 2.6% 7.4% 5.0 5.0 5.0 0.141 0.041 173.20 0.000003290 0.000000025 n/ap n/ap n/ap n/ap 0.00000730 95.0% 95.0% 95.0%A__L1011: Road_Unpaved_MRP-Storage_L10_11 101 n/ap 0.2528 51 1.7 2.6% 7.4% 5.0 5.0 5.0 0.141 0.240 1011.20 0.000003290 0.000000025 n/ap n/ap n/ap n/ap 0.00000730 95.0% 95.0% 95.0%A__L0101: Road_Unpaved_SlagDisposal_Old_L01_01 106 n/ap 0.1120 24 0.8 5.3% 0.9% 10.0 50.0 30.0 0.599 0.475 840.00 0.000007859 0.000000052 n/ap n/ap n/ap n/ap 0.00001127 95.0% 95.0% 95.0%A__L0102: Road_Unpaved_SlagDisposal_Old_L01_02 106 n/ap 0.1857 39 1.3 5.3% 0.9% 10.0 50.0 30.0 0.599 0.788 1392.75 0.000007859 0.000000052 n/ap n/ap n/ap n/ap 0.00001127 95.0% 95.0% 95.0%A__L0103: Road_Unpaved_SlagDisposal_Old_L01_03 106 n/ap 0.1000 21 0.7 5.3% 0.9% 10.0 50.0 30.0 0.599 0.424 750.00 0.000007859 0.000000052 n/ap n/ap n/ap n/ap 0.00001127 95.0% 95.0% 95.0%A__L0201: Road_Unpaved_SlagPondCoolingTrenches_L02_0 50 n/ap 0.1727 17 0.6 5.3% 0.9% 10.0 50.0 30.0 0.599 0.342 604.45 0.000007859 0.000000052 n/ap n/ap n/ap n/ap 0.00001127 95.0% 95.0% 95.0%A__L0202: Road_Unpaved_SlagPondCoolingTrenches_L02_0 50 n/ap 0.0596 6 0.2 5.3% 0.9% 10.0 50.0 30.0 0.599 0.118 208.60 0.000007859 0.000000052 n/ap n/ap n/ap n/ap 0.00001127 95.0% 95.0% 95.0%A__L0203: Road_Unpaved_SlagPondCoolingTrenches_L02_0 50 n/ap 0.0783 8 0.3 5.3% 0.9% 10.0 50.0 30.0 0.599 0.155 274.05 0.000007859 0.000000052 n/ap n/ap n/ap n/ap 0.00001127 95.0% 95.0% 95.0%A__L0204: Road_Unpaved_SlagPondCoolingTrenches_L02_0 50 n/ap 0.0433 4 0.1 5.3% 0.9% 10.0 50.0 30.0 0.599 0.086 151.55 0.000007859 0.000000052 n/ap n/ap n/ap n/ap 0.00001127 95.0% 95.0% 95.0%A__L0301: Road_Paved_RawMaterial_L03_01 76 n/ap 0.3691 56 1.9 8.0% 5.7% 5.0 5.0 5.0 0.388 0.723 1107.30 0.000003627 0.000000031 n/ap n/ap n/ap n/ap 0.00000764 98.0% 98.0% 98.0%A__L0302: Road_Paved_RawMaterial_L03_02 76 n/ap 0.2968 45 1.5 8.0% 5.7% 5.0 5.0 5.0 0.388 0.581 890.40 0.000003627 0.000000031 n/ap n/ap n/ap n/ap 0.00000764 98.0% 98.0% 98.0%A__L0303: Road_Paved_RawMaterial_L03_03 76 n/ap 0.0222 3 0.1 8.0% 5.7% 5.0 5.0 5.0 0.388 0.043 66.60 0.000003627 0.000000031 n/ap n/ap n/ap n/ap 0.00000764 98.0% 98.0% 98.0%A__L0304: Road_Paved_RawMaterial_L03_04 76 n/ap 0.0174 3 0.1 8.0% 5.7% 5.0 5.0 5.0 0.388 0.034 52.20 0.000003627 0.000000031 n/ap n/ap n/ap n/ap 0.00000764 98.0% 98.0% 98.0%A__L0305: Road_Paved_RawMaterial_L03_05 76 n/ap 0.3199 48 1.6 8.0% 5.7% 5.0 5.0 5.0 0.388 0.627 959.70 0.000003627 0.000000031 n/ap n/ap n/ap n/ap 0.00000764 98.0% 98.0% 98.0%A__L0306: Road_Paved_RawMaterial_L03_06 76 n/ap 0.0563 9 0.3 8.0% 5.7% 5.0 5.0 5.0 0.388 0.110 168.90 0.000003627 0.000000031 n/ap n/ap n/ap n/ap 0.00000764 98.0% 98.0% 98.0%A__L0401: Road_Unpaved_BHDustStorage_Old_L04_01 50 n/ap 0.0170 2 0.1 13.0% 7.0% 10.0 50.0 30.0 1.343 0.075 59.50 0.000017622 0.000000127 n/ap n/ap n/ap n/ap 0.00002111 95.0% 95.0% 95.0%A__L0501: Road_Unpaved_BHDustStorage_New_L05_01 50 n/ap 0.0700 7 0.2 13.0% 7.0% 10.0 50.0 30.0 1.343 0.311 245.00 0.000017622 0.000000127 n/ap n/ap n/ap n/ap 0.00002111 95.0% 95.0% 95.0%
Wheel Generated Emission Estimation at expected control efficiency (eg. Wetting of gravel road):
Wind Generated
Emission Est (at expected
control efficiency, eg wetting) for
lowest season:
Loading/Unloading Generated
Emission Estimation (at
expected control
efficiency, eg wetting):
Crushing & Screening
Wheels:Expected Control
Dust Control
Efficiency Achieved
Wind:Expected Control
Dust Control
Efficiency Achieved
Loading / Unloading:Expected Control
Dust Control
Efficiency Achieved
OTHERBlasting
TOTAL FOR AREA(EXCLUDING BLASTING &
OTHER)
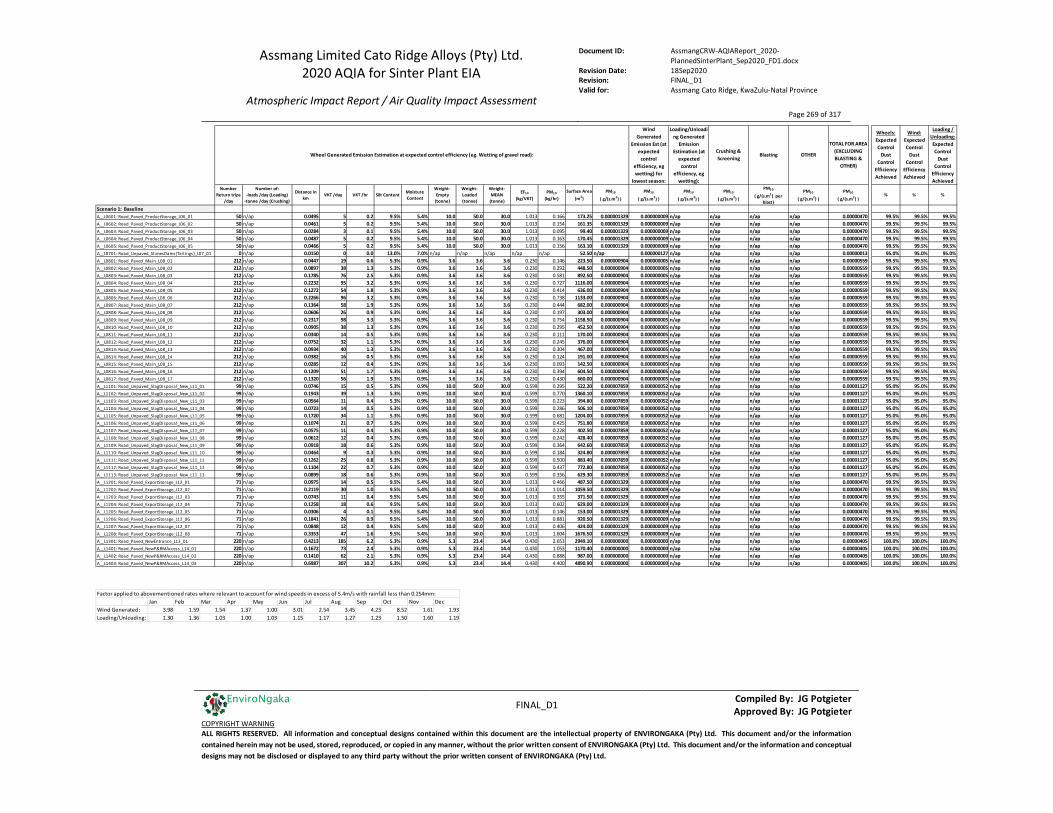
Assmang Limited Cato Ridge Alloys (Pty) Ltd. 2020 AQIA for Sinter Plant EIA
Atmospheric Impact Report / Air Quality Impact Assessment
Document ID: AssmangCRW-AQIAReport_2020-PlannedSinterPlant_Sep2020_FD1.docx
Revision Date: 18Sep2020 Revision: FINAL_D1 Valid for: Assmang Cato Ridge, KwaZulu-Natal Province
Page 269 of 317
FINAL_D1 Compiled By: JG Potgieter
Approved By: JG Potgieter COPYRIGHT WARNING ALL RIGHTS RESERVED. All information and conceptual designs contained within this document are the intellectual property of ENVIRONGAKA (Pty) Ltd. This document and/or the information contained herein may not be used, stored, reproduced, or copied in any manner, without the prior written consent of ENVIRONGAKA (Pty) Ltd. This document and/or the information and conceptual designs may not be disclosed or displayed to any third party without the prior written consent of ENVIRONGAKA (Pty) Ltd.
EnviroNgaka
Number Return trips
/day
Number of:-loads /day (Loading)
-tonne /day (Crushing)
Distance in km
VKT /day VKT /hr Silt Content Moisture Content
Weight-Empty
(tonne)
Weight-Loaded(tonne)
Weight-MEAN
(tonne)
EF10
(kg/VKT)PM10
(kg/hr)Surface Area
(m2) PM10
( g/(s.m2) )
PM10
( g/(s.m2) )
PM10
( g/(s.m2) )
PM10
( g/(s.m2) )
PM10
( g/(s.m2) per blast)
PM10
( g/(s.m2) )
PM10
( g/(s.m2) )% % %
Scenario 1: BaselineA__L0601: Road_Paved_ProductStorage_L06_01 50 n/ap 0.0495 5 0.2 9.5% 5.4% 10.0 50.0 30.0 1.013 0.166 173.25 0.000001329 0.000000009 n/ap n/ap n/ap n/ap 0.00000470 99.5% 99.5% 99.5%A__L0602: Road_Paved_ProductStorage_L06_02 50 n/ap 0.0461 5 0.2 9.5% 5.4% 10.0 50.0 30.0 1.013 0.154 161.35 0.000001329 0.000000009 n/ap n/ap n/ap n/ap 0.00000470 99.5% 99.5% 99.5%A__L0603: Road_Paved_ProductStorage_L06_03 50 n/ap 0.0284 3 0.1 9.5% 5.4% 10.0 50.0 30.0 1.013 0.095 99.40 0.000001329 0.000000009 n/ap n/ap n/ap n/ap 0.00000470 99.5% 99.5% 99.5%A__L0604: Road_Paved_ProductStorage_L06_04 50 n/ap 0.0487 5 0.2 9.5% 5.4% 10.0 50.0 30.0 1.013 0.163 170.45 0.000001329 0.000000009 n/ap n/ap n/ap n/ap 0.00000470 99.5% 99.5% 99.5%A__L0605: Road_Paved_ProductStorage_L06_05 50 n/ap 0.0466 5 0.2 9.5% 5.4% 10.0 50.0 30.0 1.013 0.156 163.10 0.000001329 0.000000009 n/ap n/ap n/ap n/ap 0.00000470 99.5% 99.5% 99.5%A__L0701: Road_Unpaved_SlimesDams(Tail ings)_L07_01 0 n/ap 0.0150 0 0.0 13.0% 7.0% n/ap n/ap n/ap n/ap n/ap 52.50 n/ap 0.000000127 n/ap n/ap n/ap n/ap 0.00000013 95.0% 95.0% 95.0%A__L0801: Road_Paved_Main_L08_01 212 n/ap 0.0447 19 0.6 5.3% 0.9% 3.6 3.6 3.6 0.230 0.146 223.50 0.000000904 0.000000005 n/ap n/ap n/ap n/ap 0.00000559 99.5% 99.5% 99.5%A__L0802: Road_Paved_Main_L08_02 212 n/ap 0.0897 38 1.3 5.3% 0.9% 3.6 3.6 3.6 0.230 0.292 448.50 0.000000904 0.000000005 n/ap n/ap n/ap n/ap 0.00000559 99.5% 99.5% 99.5%A__L0803: Road_Paved_Main_L08_03 212 n/ap 0.1785 76 2.5 5.3% 0.9% 3.6 3.6 3.6 0.230 0.581 892.50 0.000000904 0.000000005 n/ap n/ap n/ap n/ap 0.00000559 99.5% 99.5% 99.5%A__L0804: Road_Paved_Main_L08_04 212 n/ap 0.2232 95 3.2 5.3% 0.9% 3.6 3.6 3.6 0.230 0.727 1116.00 0.000000904 0.000000005 n/ap n/ap n/ap n/ap 0.00000559 99.5% 99.5% 99.5%A__L0805: Road_Paved_Main_L08_05 212 n/ap 0.1272 54 1.8 5.3% 0.9% 3.6 3.6 3.6 0.230 0.414 636.00 0.000000904 0.000000005 n/ap n/ap n/ap n/ap 0.00000559 99.5% 99.5% 99.5%A__L0806: Road_Paved_Main_L08_06 212 n/ap 0.2266 96 3.2 5.3% 0.9% 3.6 3.6 3.6 0.230 0.738 1133.00 0.000000904 0.000000005 n/ap n/ap n/ap n/ap 0.00000559 99.5% 99.5% 99.5%A__L0807: Road_Paved_Main_L08_07 212 n/ap 0.1364 58 1.9 5.3% 0.9% 3.6 3.6 3.6 0.230 0.444 682.00 0.000000904 0.000000005 n/ap n/ap n/ap n/ap 0.00000559 99.5% 99.5% 99.5%A__L0808: Road_Paved_Main_L08_08 212 n/ap 0.0606 26 0.9 5.3% 0.9% 3.6 3.6 3.6 0.230 0.197 303.00 0.000000904 0.000000005 n/ap n/ap n/ap n/ap 0.00000559 99.5% 99.5% 99.5%A__L0809: Road_Paved_Main_L08_09 212 n/ap 0.2317 98 3.3 5.3% 0.9% 3.6 3.6 3.6 0.230 0.754 1158.50 0.000000904 0.000000005 n/ap n/ap n/ap n/ap 0.00000559 99.5% 99.5% 99.5%A__L0810: Road_Paved_Main_L08_10 212 n/ap 0.0905 38 1.3 5.3% 0.9% 3.6 3.6 3.6 0.230 0.295 452.50 0.000000904 0.000000005 n/ap n/ap n/ap n/ap 0.00000559 99.5% 99.5% 99.5%A__L0811: Road_Paved_Main_L08_11 212 n/ap 0.0340 14 0.5 5.3% 0.9% 3.6 3.6 3.6 0.230 0.111 170.00 0.000000904 0.000000005 n/ap n/ap n/ap n/ap 0.00000559 99.5% 99.5% 99.5%A__L0812: Road_Paved_Main_L08_12 212 n/ap 0.0752 32 1.1 5.3% 0.9% 3.6 3.6 3.6 0.230 0.245 376.00 0.000000904 0.000000005 n/ap n/ap n/ap n/ap 0.00000559 99.5% 99.5% 99.5%A__L0813: Road_Paved_Main_L08_13 212 n/ap 0.0934 40 1.3 5.3% 0.9% 3.6 3.6 3.6 0.230 0.304 467.00 0.000000904 0.000000005 n/ap n/ap n/ap n/ap 0.00000559 99.5% 99.5% 99.5%A__L0814: Road_Paved_Main_L08_14 212 n/ap 0.0382 16 0.5 5.3% 0.9% 3.6 3.6 3.6 0.230 0.124 191.00 0.000000904 0.000000005 n/ap n/ap n/ap n/ap 0.00000559 99.5% 99.5% 99.5%A__L0815: Road_Paved_Main_L08_15 212 n/ap 0.0285 12 0.4 5.3% 0.9% 3.6 3.6 3.6 0.230 0.093 142.50 0.000000904 0.000000005 n/ap n/ap n/ap n/ap 0.00000559 99.5% 99.5% 99.5%A__L0816: Road_Paved_Main_L08_16 212 n/ap 0.1209 51 1.7 5.3% 0.9% 3.6 3.6 3.6 0.230 0.394 604.50 0.000000904 0.000000005 n/ap n/ap n/ap n/ap 0.00000559 99.5% 99.5% 99.5%A__L0817: Road_Paved_Main_L08_17 212 n/ap 0.1320 56 1.9 5.3% 0.9% 3.6 3.6 3.6 0.230 0.430 660.00 0.000000904 0.000000005 n/ap n/ap n/ap n/ap 0.00000559 99.5% 99.5% 99.5%A__L1101: Road_Unpaved_SlagDisposal_New_L11_01 99 n/ap 0.0746 15 0.5 5.3% 0.9% 10.0 50.0 30.0 0.599 0.295 522.20 0.000007859 0.000000052 n/ap n/ap n/ap n/ap 0.00001127 95.0% 95.0% 95.0%A__L1102: Road_Unpaved_SlagDisposal_New_L11_02 99 n/ap 0.1943 39 1.3 5.3% 0.9% 10.0 50.0 30.0 0.599 0.770 1360.10 0.000007859 0.000000052 n/ap n/ap n/ap n/ap 0.00001127 95.0% 95.0% 95.0%A__L1103: Road_Unpaved_SlagDisposal_New_L11_03 99 n/ap 0.0564 11 0.4 5.3% 0.9% 10.0 50.0 30.0 0.599 0.223 394.80 0.000007859 0.000000052 n/ap n/ap n/ap n/ap 0.00001127 95.0% 95.0% 95.0%A__L1104: Road_Unpaved_SlagDisposal_New_L11_04 99 n/ap 0.0723 14 0.5 5.3% 0.9% 10.0 50.0 30.0 0.599 0.286 506.10 0.000007859 0.000000052 n/ap n/ap n/ap n/ap 0.00001127 95.0% 95.0% 95.0%A__L1105: Road_Unpaved_SlagDisposal_New_L11_05 99 n/ap 0.1720 34 1.1 5.3% 0.9% 10.0 50.0 30.0 0.599 0.681 1204.00 0.000007859 0.000000052 n/ap n/ap n/ap n/ap 0.00001127 95.0% 95.0% 95.0%A__L1106: Road_Unpaved_SlagDisposal_New_L11_06 99 n/ap 0.1074 21 0.7 5.3% 0.9% 10.0 50.0 30.0 0.599 0.425 751.80 0.000007859 0.000000052 n/ap n/ap n/ap n/ap 0.00001127 95.0% 95.0% 95.0%A__L1107: Road_Unpaved_SlagDisposal_New_L11_07 99 n/ap 0.0575 11 0.4 5.3% 0.9% 10.0 50.0 30.0 0.599 0.228 402.50 0.000007859 0.000000052 n/ap n/ap n/ap n/ap 0.00001127 95.0% 95.0% 95.0%A__L1108: Road_Unpaved_SlagDisposal_New_L11_08 99 n/ap 0.0612 12 0.4 5.3% 0.9% 10.0 50.0 30.0 0.599 0.242 428.40 0.000007859 0.000000052 n/ap n/ap n/ap n/ap 0.00001127 95.0% 95.0% 95.0%A__L1109: Road_Unpaved_SlagDisposal_New_L11_09 99 n/ap 0.0918 18 0.6 5.3% 0.9% 10.0 50.0 30.0 0.599 0.364 642.60 0.000007859 0.000000052 n/ap n/ap n/ap n/ap 0.00001127 95.0% 95.0% 95.0%A__L1110: Road_Unpaved_SlagDisposal_New_L11_10 99 n/ap 0.0464 9 0.3 5.3% 0.9% 10.0 50.0 30.0 0.599 0.184 324.80 0.000007859 0.000000052 n/ap n/ap n/ap n/ap 0.00001127 95.0% 95.0% 95.0%A__L1111: Road_Unpaved_SlagDisposal_New_L11_11 99 n/ap 0.1262 25 0.8 5.3% 0.9% 10.0 50.0 30.0 0.599 0.500 883.40 0.000007859 0.000000052 n/ap n/ap n/ap n/ap 0.00001127 95.0% 95.0% 95.0%A__L1112: Road_Unpaved_SlagDisposal_New_L11_12 99 n/ap 0.1104 22 0.7 5.3% 0.9% 10.0 50.0 30.0 0.599 0.437 772.80 0.000007859 0.000000052 n/ap n/ap n/ap n/ap 0.00001127 95.0% 95.0% 95.0%A__L1113: Road_Unpaved_SlagDisposal_New_L11_13 99 n/ap 0.0899 18 0.6 5.3% 0.9% 10.0 50.0 30.0 0.599 0.356 629.30 0.000007859 0.000000052 n/ap n/ap n/ap n/ap 0.00001127 95.0% 95.0% 95.0%A__L1201: Road_Paved_ExportStorage_L12_01 71 n/ap 0.0975 14 0.5 9.5% 5.4% 10.0 50.0 30.0 1.013 0.466 487.50 0.000001329 0.000000009 n/ap n/ap n/ap n/ap 0.00000470 99.5% 99.5% 99.5%A__L1202: Road_Paved_ExportStorage_L12_02 71 n/ap 0.2119 30 1.0 9.5% 5.4% 10.0 50.0 30.0 1.013 1.014 1059.50 0.000001329 0.000000009 n/ap n/ap n/ap n/ap 0.00000470 99.5% 99.5% 99.5%A__L1203: Road_Paved_ExportStorage_L12_03 71 n/ap 0.0743 11 0.4 9.5% 5.4% 10.0 50.0 30.0 1.013 0.355 371.50 0.000001329 0.000000009 n/ap n/ap n/ap n/ap 0.00000470 99.5% 99.5% 99.5%A__L1204: Road_Paved_ExportStorage_L12_04 71 n/ap 0.1258 18 0.6 9.5% 5.4% 10.0 50.0 30.0 1.013 0.602 629.00 0.000001329 0.000000009 n/ap n/ap n/ap n/ap 0.00000470 99.5% 99.5% 99.5%A__L1205: Road_Paved_ExportStorage_L12_05 71 n/ap 0.0306 4 0.1 9.5% 5.4% 10.0 50.0 30.0 1.013 0.146 153.00 0.000001329 0.000000009 n/ap n/ap n/ap n/ap 0.00000470 99.5% 99.5% 99.5%A__L1206: Road_Paved_ExportStorage_L12_06 71 n/ap 0.1841 26 0.9 9.5% 5.4% 10.0 50.0 30.0 1.013 0.881 920.50 0.000001329 0.000000009 n/ap n/ap n/ap n/ap 0.00000470 99.5% 99.5% 99.5%A__L1207: Road_Paved_ExportStorage_L12_07 71 n/ap 0.0848 12 0.4 9.5% 5.4% 10.0 50.0 30.0 1.013 0.406 424.00 0.000001329 0.000000009 n/ap n/ap n/ap n/ap 0.00000470 99.5% 99.5% 99.5%A__L1208: Road_Paved_ExportStorage_L12_08 71 n/ap 0.3353 47 1.6 9.5% 5.4% 10.0 50.0 30.0 1.013 1.604 1676.50 0.000001329 0.000000009 n/ap n/ap n/ap n/ap 0.00000470 99.5% 99.5% 99.5%A__L1301: Road_Paved_NewEntrance_L13_01 220 n/ap 0.4213 185 6.2 5.3% 0.9% 5.3 23.4 14.4 0.430 2.653 2949.10 0.000000000 0.000000000 n/ap n/ap n/ap n/ap 0.00000405 100.0% 100.0% 100.0%A__L1401: Road_Paved_NewP&RMAccess_L14_01 220 n/ap 0.1672 73 2.4 5.3% 0.9% 5.3 23.4 14.4 0.430 1.053 1170.40 0.000000000 0.000000000 n/ap n/ap n/ap n/ap 0.00000405 100.0% 100.0% 100.0%A__L1402: Road_Paved_NewP&RMAccess_L14_02 220 n/ap 0.1410 62 2.1 5.3% 0.9% 5.3 23.4 14.4 0.430 0.888 987.00 0.000000000 0.000000000 n/ap n/ap n/ap n/ap 0.00000405 100.0% 100.0% 100.0%A__L1403: Road_Paved_NewP&RMAccess_L14_03 220 n/ap 0.6987 307 10.2 5.3% 0.9% 5.3 23.4 14.4 0.430 4.400 4890.90 0.000000000 0.000000000 n/ap n/ap n/ap n/ap 0.00000405 100.0% 100.0% 100.0%
Wheel Generated Emission Estimation at expected control efficiency (eg. Wetting of gravel road):
Wind Generated
Emission Est (at expected
control efficiency, eg wetting) for
lowest season:
Loading/Unloading Generated
Emission Estimation (at
expected control
efficiency, eg wetting):
Crushing & Screening
Wheels:Expected Control
Dust Control
Efficiency Achieved
Wind:Expected Control
Dust Control
Efficiency Achieved
Loading / Unloading:Expected Control
Dust Control
Efficiency Achieved
OTHERBlasting
TOTAL FOR AREA(EXCLUDING BLASTING &
OTHER)
Factor applied to abovementioned rates where relevant to account for wind speeds in excess of 5.4m/s with rainfall less than 0.254mm:Jan Feb Mar Apr May Jun Jul Aug Sep Oct Nov Dec
Wind Generated: 3.98 1.59 1.54 1.37 1.00 3.01 2.54 3.45 4.23 8.52 1.61 1.93Loading/Unloading: 1.30 1.36 1.03 1.00 1.03 1.15 1.17 1.27 1.23 1.50 1.60 1.19
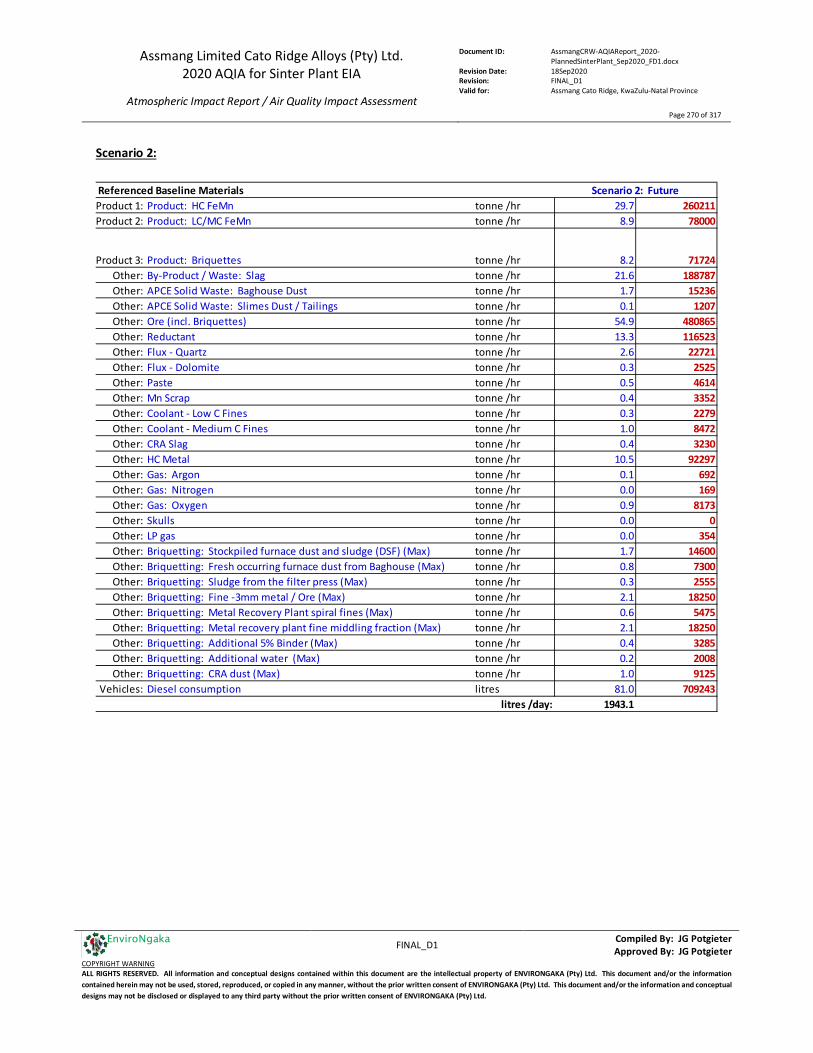
Assmang Limited Cato Ridge Alloys (Pty) Ltd. 2020 AQIA for Sinter Plant EIA
Atmospheric Impact Report / Air Quality Impact Assessment
Document ID: AssmangCRW-AQIAReport_2020-PlannedSinterPlant_Sep2020_FD1.docx
Revision Date: 18Sep2020 Revision: FINAL_D1 Valid for: Assmang Cato Ridge, KwaZulu-Natal Province
Page 270 of 317
FINAL_D1 Compiled By: JG Potgieter
Approved By: JG Potgieter COPYRIGHT WARNING ALL RIGHTS RESERVED. All information and conceptual designs contained within this document are the intellectual property of ENVIRONGAKA (Pty) Ltd. This document and/or the information contained herein may not be used, stored, reproduced, or copied in any manner, without the prior written consent of ENVIRONGAKA (Pty) Ltd. This document and/or the information and conceptual designs may not be disclosed or displayed to any third party without the prior written consent of ENVIRONGAKA (Pty) Ltd.
EnviroNgaka
Scenario 2:
Referenced Baseline MaterialsProduct 1: Product: HC FeMn tonne /hr 29.7 260211Product 2: Product: LC/MC FeMn tonne /hr 8.9 78000
Product 3: Product: Briquettes tonne /hr 8.2 71724Other: By-Product / Waste: Slag tonne /hr 21.6 188787Other: APCE Solid Waste: Baghouse Dust tonne /hr 1.7 15236Other: APCE Solid Waste: Slimes Dust / Tailings tonne /hr 0.1 1207Other: Ore (incl. Briquettes) tonne /hr 54.9 480865Other: Reductant tonne /hr 13.3 116523Other: Flux - Quartz tonne /hr 2.6 22721Other: Flux - Dolomite tonne /hr 0.3 2525Other: Paste tonne /hr 0.5 4614Other: Mn Scrap tonne /hr 0.4 3352Other: Coolant - Low C Fines tonne /hr 0.3 2279Other: Coolant - Medium C Fines tonne /hr 1.0 8472Other: CRA Slag tonne /hr 0.4 3230Other: HC Metal tonne /hr 10.5 92297Other: Gas: Argon tonne /hr 0.1 692Other: Gas: Nitrogen tonne /hr 0.0 169Other: Gas: Oxygen tonne /hr 0.9 8173Other: Skulls tonne /hr 0.0 0Other: LP gas tonne /hr 0.0 354Other: Briquetting: Stockpiled furnace dust and sludge (DSF) (Max) tonne /hr 1.7 14600Other: Briquetting: Fresh occurring furnace dust from Baghouse (Max) tonne /hr 0.8 7300Other: Briquetting: Sludge from the filter press (Max) tonne /hr 0.3 2555Other: Briquetting: Fine -3mm metal / Ore (Max) tonne /hr 2.1 18250Other: Briquetting: Metal Recovery Plant spiral fines (Max) tonne /hr 0.6 5475Other: Briquetting: Metal recovery plant fine middling fraction (Max) tonne /hr 2.1 18250Other: Briquetting: Additional 5% Binder (Max) tonne /hr 0.4 3285Other: Briquetting: Additional water (Max) tonne /hr 0.2 2008Other: Briquetting: CRA dust (Max) tonne /hr 1.0 9125
Vehicles: Diesel consumption litres 81.0 709243litres /day: 1943.1
Scenario 2: Future

Assmang Limited Cato Ridge Alloys (Pty) Ltd. 2020 AQIA for Sinter Plant EIA
Atmospheric Impact Report / Air Quality Impact Assessment
Document ID: AssmangCRW-AQIAReport_2020-PlannedSinterPlant_Sep2020_FD1.docx
Revision Date: 18Sep2020 Revision: FINAL_D1 Valid for: Assmang Cato Ridge, KwaZulu-Natal Province
Page 271 of 317
FINAL_D1 Compiled By: JG Potgieter
Approved By: JG Potgieter COPYRIGHT WARNING ALL RIGHTS RESERVED. All information and conceptual designs contained within this document are the intellectual property of ENVIRONGAKA (Pty) Ltd. This document and/or the information contained herein may not be used, stored, reproduced, or copied in any manner, without the prior written consent of ENVIRONGAKA (Pty) Ltd. This document and/or the information and conceptual designs may not be disclosed or displayed to any third party without the prior written consent of ENVIRONGAKA (Pty) Ltd.
EnviroNgaka
PM10 CONOX
(as NO2)SOX 1
(as SO2)VOCs (exhaust)
Emission Fator Rating
Tractor: Track Type 3.03 9.40 34.16 0.95 3.31 CTractor: Wheeled 5.57 32.19 52.35 0.95 7.74 CTractor: Dozer 17.70 14.73 34.29 0.95 1.58 CSraper 3.27 10.16 30.99 0.95 2.28 CGrader 2.66 6.55 30.41 0.95 1.53 COff-highway Truck 17.70 14.73 34.29 0.95 1.58 CLoader: Wheeled 3.51 11.79 38.50 0.95 5.17 CLoader: Track type 2.88 9.93 30.73 0.95 4.85 C1 Calculated for 500ppm S diesel
Typical Diesel Consumption Rates for mining/handling conditions: Foreseen Continuously Working Vehicle Inventory for Site of Works
Vehicle TypeConsumption
Rate(litre /hr)
Vehicle TypeScenario 2:
Future
Truck 29.4 Truck type 1Loader 19.6 Loader type 2LCV 4.0 LCV type 1Tractor 10.0 Tractor type 1
Scenario 2: Future
tonne /hr000
934723
litres /day1943
692922
94235
Overall Estimated Diesel Combustion Emissions (g/s)
PM10 CONOX
(as NO2)SOX 1
(as SO2)VOCs (exhaust)
Emission Fator Rating
Scenario 2: Future 0.196 0.281 0.776 0.021 0.077 CTruck type 0.142 0.118 0.274 0.008 0.013 CLoader type 0.034 0.116 0.369 0.010 0.053 CLCV type 0.003 0.007 0.033 0.001 0.002 CTractor type 0.018 0.040 0.099 0.003 0.009 C
{ page 17 (24 of 69) - Emission Estimation Technique Manual for Mining Version 2.3 }
Equipment Type
Emission Factor (kg/1000 litre of fuel/diesel)
Product/sWaste material/s
Exhaust Emission Factors for Various Classes of Mining Equipment is provided in the Table below (NPI, 2001) and amended for reduced sulphur content diesel
Estimated Quantities of Material Mined/Handled
Key Activity / Material
LCV typeTractor type
Estimated Diesel Consumptions
Truck typeTotal
Loader type
Overburden (Waste Rock)ROM OreSolid Raw Materials
Mining of Ore
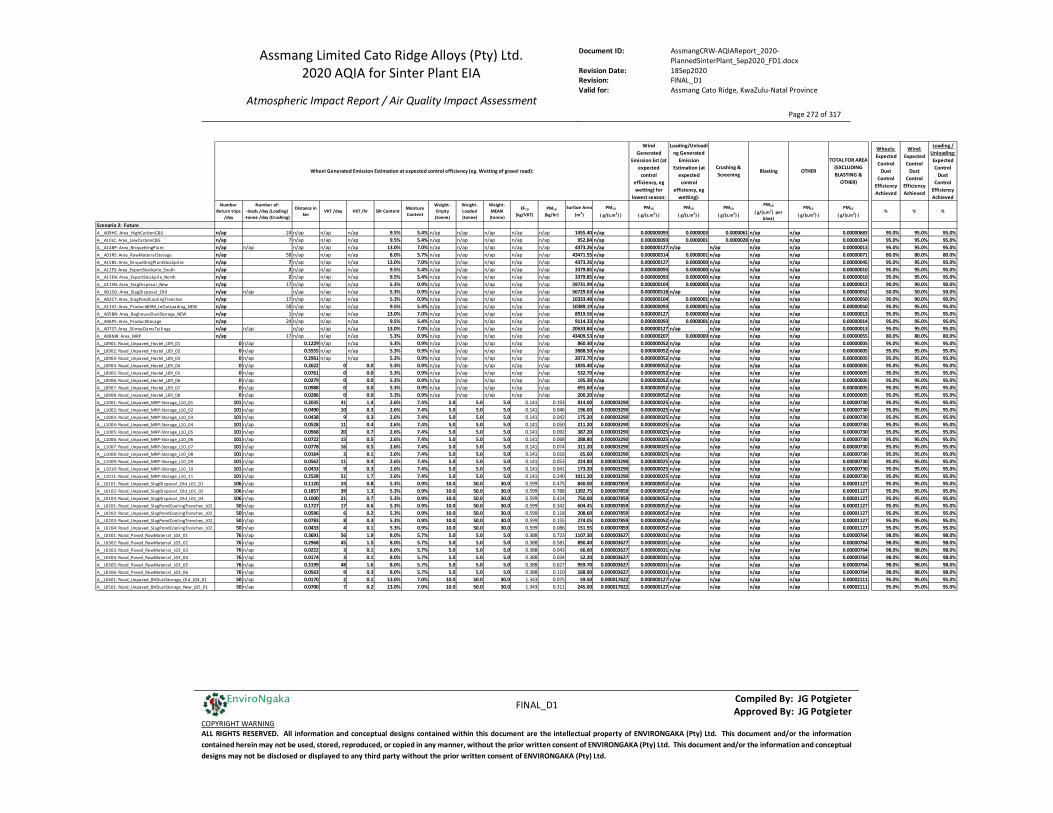
Assmang Limited Cato Ridge Alloys (Pty) Ltd. 2020 AQIA for Sinter Plant EIA
Atmospheric Impact Report / Air Quality Impact Assessment
Document ID: AssmangCRW-AQIAReport_2020-PlannedSinterPlant_Sep2020_FD1.docx
Revision Date: 18Sep2020 Revision: FINAL_D1 Valid for: Assmang Cato Ridge, KwaZulu-Natal Province
Page 272 of 317
FINAL_D1 Compiled By: JG Potgieter
Approved By: JG Potgieter COPYRIGHT WARNING ALL RIGHTS RESERVED. All information and conceptual designs contained within this document are the intellectual property of ENVIRONGAKA (Pty) Ltd. This document and/or the information contained herein may not be used, stored, reproduced, or copied in any manner, without the prior written consent of ENVIRONGAKA (Pty) Ltd. This document and/or the information and conceptual designs may not be disclosed or displayed to any third party without the prior written consent of ENVIRONGAKA (Pty) Ltd.
EnviroNgaka
Number Return trips
/day
Number of:-loads /day (Loading)
-tonne /day (Crushing)
Distance in km
VKT /day VKT /hr Silt Content Moisture Content
Weight-Empty
(tonne)
Weight-Loaded(tonne)
Weight-MEAN
(tonne)
EF10
(kg/VKT)PM10
(kg/hr)Surface Area
(m2) PM10
( g/(s.m2) )
PM10
( g/(s.m2) )
PM10
( g/(s.m2) )
PM10
( g/(s.m2) )
PM10
( g/(s.m2) per blast)
PM10
( g/(s.m2) )
PM10
( g/(s.m2) )% % %
Scenario 2: FutureA__A09HC: Area_HighCarbonC&S n/ap 24 n/ap n/ap n/ap 9.5% 5.4% n/ap n/ap n/ap n/ap n/ap 1455.40 n/ap 0.000000093 0.0000003 0.0000061 n/ap n/ap 0.00000683 95.0% 95.0% 95.0%A__A10LC: Area_LowCarbonC&S n/ap 7 n/ap n/ap n/ap 9.5% 5.4% n/ap n/ap n/ap n/ap n/ap 952.84 n/ap 0.000000093 0.0000001 0.0000028 n/ap n/ap 0.00000334 95.0% 95.0% 95.0%A__A14BP: Area_BriquettingPlant n/ap n/ap n/ap n/ap n/ap 13.0% 7.0% n/ap n/ap n/ap n/ap n/ap 4373.26 n/ap 0.000000127 n/ap n/ap n/ap n/ap 0.00000013 95.0% 95.0% 95.0%A__A03RS: Area_RawMaterialStorage n/ap 58 n/ap n/ap n/ap 8.0% 5.7% n/ap n/ap n/ap n/ap n/ap 43471.55 n/ap 0.000000314 0.0000001 n/ap n/ap n/ap 0.00000071 80.0% 80.0% 80.0%A__A15BS: Area_BriquettingPlantStockpiles n/ap 7 n/ap n/ap n/ap 13.0% 7.0% n/ap n/ap n/ap n/ap n/ap 4373.26 n/ap 0.000000127 0.0000000 n/ap n/ap n/ap 0.00000045 95.0% 95.0% 95.0%A__A12ES: Area_ExportStockpile_South n/ap 2 n/ap n/ap n/ap 9.5% 5.4% n/ap n/ap n/ap n/ap n/ap 3379.85 n/ap 0.000000093 0.0000000 n/ap n/ap n/ap 0.00000010 95.0% 95.0% 95.0%A__A12EN: Area_ExportStockpile_North n/ap 2 n/ap n/ap n/ap 9.5% 5.4% n/ap n/ap n/ap n/ap n/ap 3379.85 n/ap 0.000000093 0.0000000 n/ap n/ap n/ap 0.00000010 95.0% 95.0% 95.0%A__A11SN: Area_SlagDisposal_New n/ap 17 n/ap n/ap n/ap 5.3% 0.9% n/ap n/ap n/ap n/ap n/ap 59731.99 n/ap 0.000000104 0.0000000 n/ap n/ap n/ap 0.00000012 90.0% 90.0% 90.0%A__A01SO: Area_SlagDisposal_Old n/ap n/ap n/ap n/ap n/ap 5.3% 0.9% n/ap n/ap n/ap n/ap n/ap 56729.63 n/ap 0.000000518 n/ap n/ap n/ap n/ap 0.00000052 50.0% 50.0% 50.0%A__A02CT: Area_SlagPondCoolingTrenches n/ap 17 n/ap n/ap n/ap 5.3% 0.9% n/ap n/ap n/ap n/ap n/ap 10333.48 n/ap 0.000000104 0.0000001 n/ap n/ap n/ap 0.00000050 90.0% 90.0% 90.0%A__A13IO: Area_Product&RM_InOutLoading_NEW n/ap 58 n/ap n/ap n/ap 9.5% 5.4% n/ap n/ap n/ap n/ap n/ap 10389.19 n/ap 0.000000093 0.0000001 n/ap n/ap n/ap 0.00000050 95.0% 95.0% 95.0%A__A05BN: Area_BaghouseDustStorage_NEW n/ap 1 n/ap n/ap n/ap 13.0% 7.0% n/ap n/ap n/ap n/ap n/ap 8919.56 n/ap 0.000000127 0.0000000 n/ap n/ap n/ap 0.00000013 95.0% 95.0% 95.0%A__A06PS: Area_ProductStorage n/ap 24 n/ap n/ap n/ap 9.5% 5.4% n/ap n/ap n/ap n/ap n/ap 9114.33 n/ap 0.000000093 0.0000001 n/ap n/ap n/ap 0.00000014 95.0% 95.0% 95.0%A__A07ST: Area_SlimesDamsTail ings n/ap n/ap n/ap n/ap n/ap 13.0% 7.0% n/ap n/ap n/ap n/ap n/ap 20633.84 n/ap 0.000000127 n/ap n/ap n/ap n/ap 0.00000013 95.0% 95.0% 95.0%A__A08MR: Area_MRP n/ap 17 n/ap n/ap n/ap 5.3% 0.9% n/ap n/ap n/ap n/ap n/ap 43409.53 n/ap 0.000000207 0.0000000 n/ap n/ap n/ap 0.00000055 80.0% 80.0% 80.0%A__L0901: Road_Unpaved_Hostel_L09_01 0 n/ap 0.1229 n/ap n/ap 5.3% 0.9% n/ap n/ap n/ap n/ap n/ap 860.30 n/ap 0.000000052 n/ap n/ap n/ap n/ap 0.00000005 95.0% 95.0% 95.0%A__L0902: Road_Unpaved_Hostel_L09_02 0 n/ap 0.5555 n/ap n/ap 5.3% 0.9% n/ap n/ap n/ap n/ap n/ap 3888.50 n/ap 0.000000052 n/ap n/ap n/ap n/ap 0.00000005 95.0% 95.0% 95.0%A__L0903: Road_Unpaved_Hostel_L09_03 0 n/ap 0.2961 n/ap n/ap 5.3% 0.9% n/ap n/ap n/ap n/ap n/ap 2072.70 n/ap 0.000000052 n/ap n/ap n/ap n/ap 0.00000005 95.0% 95.0% 95.0%A__L0904: Road_Unpaved_Hostel_L09_04 0 n/ap 0.2622 0 0.0 5.3% 0.9% n/ap n/ap n/ap n/ap n/ap 1835.40 n/ap 0.000000052 n/ap n/ap n/ap n/ap 0.00000005 95.0% 95.0% 95.0%A__L0905: Road_Unpaved_Hostel_L09_05 0 n/ap 0.0761 0 0.0 5.3% 0.9% n/ap n/ap n/ap n/ap n/ap 532.70 n/ap 0.000000052 n/ap n/ap n/ap n/ap 0.00000005 95.0% 95.0% 95.0%A__L0906: Road_Unpaved_Hostel_L09_06 0 n/ap 0.0279 0 0.0 5.3% 0.9% n/ap n/ap n/ap n/ap n/ap 195.30 n/ap 0.000000052 n/ap n/ap n/ap n/ap 0.00000005 95.0% 95.0% 95.0%A__L0907: Road_Unpaved_Hostel_L09_07 0 n/ap 0.0988 0 0.0 5.3% 0.9% n/ap n/ap n/ap n/ap n/ap 691.60 n/ap 0.000000052 n/ap n/ap n/ap n/ap 0.00000005 95.0% 95.0% 95.0%A__L0908: Road_Unpaved_Hostel_L09_08 0 n/ap 0.0286 0 0.0 5.3% 0.9% n/ap n/ap n/ap n/ap n/ap 200.20 n/ap 0.000000052 n/ap n/ap n/ap n/ap 0.00000005 95.0% 95.0% 95.0%A__L1001: Road_Unpaved_MRP-Storage_L10_01 101 n/ap 0.2035 41 1.4 2.6% 7.4% 5.0 5.0 5.0 0.141 0.193 814.00 0.000003290 0.000000025 n/ap n/ap n/ap n/ap 0.00000730 95.0% 95.0% 95.0%A__L1002: Road_Unpaved_MRP-Storage_L10_02 101 n/ap 0.0490 10 0.3 2.6% 7.4% 5.0 5.0 5.0 0.141 0.046 196.00 0.000003290 0.000000025 n/ap n/ap n/ap n/ap 0.00000730 95.0% 95.0% 95.0%A__L1003: Road_Unpaved_MRP-Storage_L10_03 101 n/ap 0.0438 9 0.3 2.6% 7.4% 5.0 5.0 5.0 0.141 0.042 175.20 0.000003290 0.000000025 n/ap n/ap n/ap n/ap 0.00000730 95.0% 95.0% 95.0%A__L1004: Road_Unpaved_MRP-Storage_L10_04 101 n/ap 0.0528 11 0.4 2.6% 7.4% 5.0 5.0 5.0 0.141 0.050 211.20 0.000003290 0.000000025 n/ap n/ap n/ap n/ap 0.00000730 95.0% 95.0% 95.0%A__L1005: Road_Unpaved_MRP-Storage_L10_05 101 n/ap 0.0968 20 0.7 2.6% 7.4% 5.0 5.0 5.0 0.141 0.092 387.20 0.000003290 0.000000025 n/ap n/ap n/ap n/ap 0.00000730 95.0% 95.0% 95.0%A__L1006: Road_Unpaved_MRP-Storage_L10_06 101 n/ap 0.0722 15 0.5 2.6% 7.4% 5.0 5.0 5.0 0.141 0.068 288.80 0.000003290 0.000000025 n/ap n/ap n/ap n/ap 0.00000730 95.0% 95.0% 95.0%A__L1007: Road_Unpaved_MRP-Storage_L10_07 101 n/ap 0.0778 16 0.5 2.6% 7.4% 5.0 5.0 5.0 0.141 0.074 311.20 0.000003290 0.000000025 n/ap n/ap n/ap n/ap 0.00000730 95.0% 95.0% 95.0%A__L1008: Road_Unpaved_MRP-Storage_L10_08 101 n/ap 0.0164 3 0.1 2.6% 7.4% 5.0 5.0 5.0 0.141 0.016 65.60 0.000003290 0.000000025 n/ap n/ap n/ap n/ap 0.00000730 95.0% 95.0% 95.0%A__L1009: Road_Unpaved_MRP-Storage_L10_09 101 n/ap 0.0562 11 0.4 2.6% 7.4% 5.0 5.0 5.0 0.141 0.053 224.80 0.000003290 0.000000025 n/ap n/ap n/ap n/ap 0.00000730 95.0% 95.0% 95.0%A__L1010: Road_Unpaved_MRP-Storage_L10_10 101 n/ap 0.0433 9 0.3 2.6% 7.4% 5.0 5.0 5.0 0.141 0.041 173.20 0.000003290 0.000000025 n/ap n/ap n/ap n/ap 0.00000730 95.0% 95.0% 95.0%A__L1011: Road_Unpaved_MRP-Storage_L10_11 101 n/ap 0.2528 51 1.7 2.6% 7.4% 5.0 5.0 5.0 0.141 0.240 1011.20 0.000003290 0.000000025 n/ap n/ap n/ap n/ap 0.00000730 95.0% 95.0% 95.0%A__L0101: Road_Unpaved_SlagDisposal_Old_L01_01 106 n/ap 0.1120 24 0.8 5.3% 0.9% 10.0 50.0 30.0 0.599 0.475 840.00 0.000007859 0.000000052 n/ap n/ap n/ap n/ap 0.00001127 95.0% 95.0% 95.0%A__L0102: Road_Unpaved_SlagDisposal_Old_L01_02 106 n/ap 0.1857 39 1.3 5.3% 0.9% 10.0 50.0 30.0 0.599 0.788 1392.75 0.000007859 0.000000052 n/ap n/ap n/ap n/ap 0.00001127 95.0% 95.0% 95.0%A__L0103: Road_Unpaved_SlagDisposal_Old_L01_03 106 n/ap 0.1000 21 0.7 5.3% 0.9% 10.0 50.0 30.0 0.599 0.424 750.00 0.000007859 0.000000052 n/ap n/ap n/ap n/ap 0.00001127 95.0% 95.0% 95.0%A__L0201: Road_Unpaved_SlagPondCoolingTrenches_L02_ 50 n/ap 0.1727 17 0.6 5.3% 0.9% 10.0 50.0 30.0 0.599 0.342 604.45 0.000007859 0.000000052 n/ap n/ap n/ap n/ap 0.00001127 95.0% 95.0% 95.0%A__L0202: Road_Unpaved_SlagPondCoolingTrenches_L02_ 50 n/ap 0.0596 6 0.2 5.3% 0.9% 10.0 50.0 30.0 0.599 0.118 208.60 0.000007859 0.000000052 n/ap n/ap n/ap n/ap 0.00001127 95.0% 95.0% 95.0%A__L0203: Road_Unpaved_SlagPondCoolingTrenches_L02_ 50 n/ap 0.0783 8 0.3 5.3% 0.9% 10.0 50.0 30.0 0.599 0.155 274.05 0.000007859 0.000000052 n/ap n/ap n/ap n/ap 0.00001127 95.0% 95.0% 95.0%A__L0204: Road_Unpaved_SlagPondCoolingTrenches_L02_ 50 n/ap 0.0433 4 0.1 5.3% 0.9% 10.0 50.0 30.0 0.599 0.086 151.55 0.000007859 0.000000052 n/ap n/ap n/ap n/ap 0.00001127 95.0% 95.0% 95.0%A__L0301: Road_Paved_RawMaterial_L03_01 76 n/ap 0.3691 56 1.9 8.0% 5.7% 5.0 5.0 5.0 0.388 0.723 1107.30 0.000003627 0.000000031 n/ap n/ap n/ap n/ap 0.00000764 98.0% 98.0% 98.0%A__L0302: Road_Paved_RawMaterial_L03_02 76 n/ap 0.2968 45 1.5 8.0% 5.7% 5.0 5.0 5.0 0.388 0.581 890.40 0.000003627 0.000000031 n/ap n/ap n/ap n/ap 0.00000764 98.0% 98.0% 98.0%A__L0303: Road_Paved_RawMaterial_L03_03 76 n/ap 0.0222 3 0.1 8.0% 5.7% 5.0 5.0 5.0 0.388 0.043 66.60 0.000003627 0.000000031 n/ap n/ap n/ap n/ap 0.00000764 98.0% 98.0% 98.0%A__L0304: Road_Paved_RawMaterial_L03_04 76 n/ap 0.0174 3 0.1 8.0% 5.7% 5.0 5.0 5.0 0.388 0.034 52.20 0.000003627 0.000000031 n/ap n/ap n/ap n/ap 0.00000764 98.0% 98.0% 98.0%A__L0305: Road_Paved_RawMaterial_L03_05 76 n/ap 0.3199 48 1.6 8.0% 5.7% 5.0 5.0 5.0 0.388 0.627 959.70 0.000003627 0.000000031 n/ap n/ap n/ap n/ap 0.00000764 98.0% 98.0% 98.0%A__L0306: Road_Paved_RawMaterial_L03_06 76 n/ap 0.0563 9 0.3 8.0% 5.7% 5.0 5.0 5.0 0.388 0.110 168.90 0.000003627 0.000000031 n/ap n/ap n/ap n/ap 0.00000764 98.0% 98.0% 98.0%A__L0401: Road_Unpaved_BHDustStorage_Old_L04_01 50 n/ap 0.0170 2 0.1 13.0% 7.0% 10.0 50.0 30.0 1.343 0.075 59.50 0.000017622 0.000000127 n/ap n/ap n/ap n/ap 0.00002111 95.0% 95.0% 95.0%A__L0501: Road_Unpaved_BHDustStorage_New_L05_01 50 n/ap 0.0700 7 0.2 13.0% 7.0% 10.0 50.0 30.0 1.343 0.311 245.00 0.000017622 0.000000127 n/ap n/ap n/ap n/ap 0.00002111 95.0% 95.0% 95.0%
Wheel Generated Emission Estimation at expected control efficiency (eg. Wetting of gravel road):
Wind Generated
Emission Est (at expected
control efficiency, eg wetting) for
lowest season:
Loading/Unloading Generated
Emission Estimation (at
expected control
efficiency, eg wetting):
Crushing & Screening
Wheels:Expected Control
Dust Control
Efficiency Achieved
Wind:Expected Control
Dust Control
Efficiency Achieved
Loading / Unloading:Expected Control
Dust Control
Efficiency Achieved
OTHERBlasting
TOTAL FOR AREA(EXCLUDING BLASTING &
OTHER)

Assmang Limited Cato Ridge Alloys (Pty) Ltd. 2020 AQIA for Sinter Plant EIA
Atmospheric Impact Report / Air Quality Impact Assessment
Document ID: AssmangCRW-AQIAReport_2020-PlannedSinterPlant_Sep2020_FD1.docx
Revision Date: 18Sep2020 Revision: FINAL_D1 Valid for: Assmang Cato Ridge, KwaZulu-Natal Province
Page 273 of 317
FINAL_D1 Compiled By: JG Potgieter
Approved By: JG Potgieter COPYRIGHT WARNING ALL RIGHTS RESERVED. All information and conceptual designs contained within this document are the intellectual property of ENVIRONGAKA (Pty) Ltd. This document and/or the information contained herein may not be used, stored, reproduced, or copied in any manner, without the prior written consent of ENVIRONGAKA (Pty) Ltd. This document and/or the information and conceptual designs may not be disclosed or displayed to any third party without the prior written consent of ENVIRONGAKA (Pty) Ltd.
EnviroNgaka
Number Return trips
/day
Number of:-loads /day (Loading)
-tonne /day (Crushing)
Distance in km
VKT /day VKT /hr Silt Content Moisture Content
Weight-Empty
(tonne)
Weight-Loaded(tonne)
Weight-MEAN
(tonne)
EF10
(kg/VKT)PM10
(kg/hr)Surface Area
(m2) PM10
( g/(s.m2) )
PM10
( g/(s.m2) )
PM10
( g/(s.m2) )
PM10
( g/(s.m2) )
PM10
( g/(s.m2) per blast)
PM10
( g/(s.m2) )
PM10
( g/(s.m2) )% % %
Scenario 2: FutureA__L0601: Road_Paved_ProductStorage_L06_01 50 n/ap 0.0495 5 0.2 9.5% 5.4% 10.0 50.0 30.0 1.013 0.166 173.25 0.000001329 0.000000009 n/ap n/ap n/ap n/ap 0.00000470 99.5% 99.5% 99.5%A__L0602: Road_Paved_ProductStorage_L06_02 50 n/ap 0.0461 5 0.2 9.5% 5.4% 10.0 50.0 30.0 1.013 0.154 161.35 0.000001329 0.000000009 n/ap n/ap n/ap n/ap 0.00000470 99.5% 99.5% 99.5%A__L0603: Road_Paved_ProductStorage_L06_03 50 n/ap 0.0284 3 0.1 9.5% 5.4% 10.0 50.0 30.0 1.013 0.095 99.40 0.000001329 0.000000009 n/ap n/ap n/ap n/ap 0.00000470 99.5% 99.5% 99.5%A__L0604: Road_Paved_ProductStorage_L06_04 50 n/ap 0.0487 5 0.2 9.5% 5.4% 10.0 50.0 30.0 1.013 0.163 170.45 0.000001329 0.000000009 n/ap n/ap n/ap n/ap 0.00000470 99.5% 99.5% 99.5%A__L0605: Road_Paved_ProductStorage_L06_05 50 n/ap 0.0466 5 0.2 9.5% 5.4% 10.0 50.0 30.0 1.013 0.156 163.10 0.000001329 0.000000009 n/ap n/ap n/ap n/ap 0.00000470 99.5% 99.5% 99.5%A__L0701: Road_Unpaved_SlimesDams(Tail ings)_L07_01 0 n/ap 0.0150 0 0.0 13.0% 7.0% n/ap n/ap n/ap n/ap n/ap 52.50 n/ap 0.000000127 n/ap n/ap n/ap n/ap 0.00000013 95.0% 95.0% 95.0%A__L0801: Road_Paved_Main_L08_01 212 n/ap 0.0447 19 0.6 5.3% 0.9% 3.6 3.6 3.6 0.230 0.146 223.50 0.000000904 0.000000005 n/ap n/ap n/ap n/ap 0.00000559 99.5% 99.5% 99.5%A__L0802: Road_Paved_Main_L08_02 212 n/ap 0.0897 38 1.3 5.3% 0.9% 3.6 3.6 3.6 0.230 0.292 448.50 0.000000904 0.000000005 n/ap n/ap n/ap n/ap 0.00000559 99.5% 99.5% 99.5%A__L0803: Road_Paved_Main_L08_03 212 n/ap 0.1785 76 2.5 5.3% 0.9% 3.6 3.6 3.6 0.230 0.581 892.50 0.000000904 0.000000005 n/ap n/ap n/ap n/ap 0.00000559 99.5% 99.5% 99.5%A__L0804: Road_Paved_Main_L08_04 212 n/ap 0.2232 95 3.2 5.3% 0.9% 3.6 3.6 3.6 0.230 0.727 1116.00 0.000000904 0.000000005 n/ap n/ap n/ap n/ap 0.00000559 99.5% 99.5% 99.5%A__L0805: Road_Paved_Main_L08_05 212 n/ap 0.1272 54 1.8 5.3% 0.9% 3.6 3.6 3.6 0.230 0.414 636.00 0.000000904 0.000000005 n/ap n/ap n/ap n/ap 0.00000559 99.5% 99.5% 99.5%A__L0806: Road_Paved_Main_L08_06 212 n/ap 0.2266 96 3.2 5.3% 0.9% 3.6 3.6 3.6 0.230 0.738 1133.00 0.000000904 0.000000005 n/ap n/ap n/ap n/ap 0.00000559 99.5% 99.5% 99.5%A__L0807: Road_Paved_Main_L08_07 212 n/ap 0.1364 58 1.9 5.3% 0.9% 3.6 3.6 3.6 0.230 0.444 682.00 0.000000904 0.000000005 n/ap n/ap n/ap n/ap 0.00000559 99.5% 99.5% 99.5%A__L0808: Road_Paved_Main_L08_08 212 n/ap 0.0606 26 0.9 5.3% 0.9% 3.6 3.6 3.6 0.230 0.197 303.00 0.000000904 0.000000005 n/ap n/ap n/ap n/ap 0.00000559 99.5% 99.5% 99.5%A__L0809: Road_Paved_Main_L08_09 212 n/ap 0.2317 98 3.3 5.3% 0.9% 3.6 3.6 3.6 0.230 0.754 1158.50 0.000000904 0.000000005 n/ap n/ap n/ap n/ap 0.00000559 99.5% 99.5% 99.5%A__L0810: Road_Paved_Main_L08_10 212 n/ap 0.0905 38 1.3 5.3% 0.9% 3.6 3.6 3.6 0.230 0.295 452.50 0.000000904 0.000000005 n/ap n/ap n/ap n/ap 0.00000559 99.5% 99.5% 99.5%A__L0811: Road_Paved_Main_L08_11 212 n/ap 0.0340 14 0.5 5.3% 0.9% 3.6 3.6 3.6 0.230 0.111 170.00 0.000000904 0.000000005 n/ap n/ap n/ap n/ap 0.00000559 99.5% 99.5% 99.5%A__L0812: Road_Paved_Main_L08_12 212 n/ap 0.0752 32 1.1 5.3% 0.9% 3.6 3.6 3.6 0.230 0.245 376.00 0.000000904 0.000000005 n/ap n/ap n/ap n/ap 0.00000559 99.5% 99.5% 99.5%A__L0813: Road_Paved_Main_L08_13 212 n/ap 0.0934 40 1.3 5.3% 0.9% 3.6 3.6 3.6 0.230 0.304 467.00 0.000000904 0.000000005 n/ap n/ap n/ap n/ap 0.00000559 99.5% 99.5% 99.5%A__L0814: Road_Paved_Main_L08_14 212 n/ap 0.0382 16 0.5 5.3% 0.9% 3.6 3.6 3.6 0.230 0.124 191.00 0.000000904 0.000000005 n/ap n/ap n/ap n/ap 0.00000559 99.5% 99.5% 99.5%A__L0815: Road_Paved_Main_L08_15 212 n/ap 0.0285 12 0.4 5.3% 0.9% 3.6 3.6 3.6 0.230 0.093 142.50 0.000000904 0.000000005 n/ap n/ap n/ap n/ap 0.00000559 99.5% 99.5% 99.5%A__L0816: Road_Paved_Main_L08_16 212 n/ap 0.1209 51 1.7 5.3% 0.9% 3.6 3.6 3.6 0.230 0.394 604.50 0.000000904 0.000000005 n/ap n/ap n/ap n/ap 0.00000559 99.5% 99.5% 99.5%A__L0817: Road_Paved_Main_L08_17 212 n/ap 0.1320 56 1.9 5.3% 0.9% 3.6 3.6 3.6 0.230 0.430 660.00 0.000000904 0.000000005 n/ap n/ap n/ap n/ap 0.00000559 99.5% 99.5% 99.5%A__L1101: Road_Unpaved_SlagDisposal_New_L11_01 99 n/ap 0.0746 15 0.5 5.3% 0.9% 10.0 50.0 30.0 0.599 0.295 522.20 0.000007859 0.000000052 n/ap n/ap n/ap n/ap 0.00001127 95.0% 95.0% 95.0%A__L1102: Road_Unpaved_SlagDisposal_New_L11_02 99 n/ap 0.1943 39 1.3 5.3% 0.9% 10.0 50.0 30.0 0.599 0.770 1360.10 0.000007859 0.000000052 n/ap n/ap n/ap n/ap 0.00001127 95.0% 95.0% 95.0%A__L1103: Road_Unpaved_SlagDisposal_New_L11_03 99 n/ap 0.0564 11 0.4 5.3% 0.9% 10.0 50.0 30.0 0.599 0.223 394.80 0.000007859 0.000000052 n/ap n/ap n/ap n/ap 0.00001127 95.0% 95.0% 95.0%A__L1104: Road_Unpaved_SlagDisposal_New_L11_04 99 n/ap 0.0723 14 0.5 5.3% 0.9% 10.0 50.0 30.0 0.599 0.286 506.10 0.000007859 0.000000052 n/ap n/ap n/ap n/ap 0.00001127 95.0% 95.0% 95.0%A__L1105: Road_Unpaved_SlagDisposal_New_L11_05 99 n/ap 0.1720 34 1.1 5.3% 0.9% 10.0 50.0 30.0 0.599 0.681 1204.00 0.000007859 0.000000052 n/ap n/ap n/ap n/ap 0.00001127 95.0% 95.0% 95.0%A__L1106: Road_Unpaved_SlagDisposal_New_L11_06 99 n/ap 0.1074 21 0.7 5.3% 0.9% 10.0 50.0 30.0 0.599 0.425 751.80 0.000007859 0.000000052 n/ap n/ap n/ap n/ap 0.00001127 95.0% 95.0% 95.0%A__L1107: Road_Unpaved_SlagDisposal_New_L11_07 99 n/ap 0.0575 11 0.4 5.3% 0.9% 10.0 50.0 30.0 0.599 0.228 402.50 0.000007859 0.000000052 n/ap n/ap n/ap n/ap 0.00001127 95.0% 95.0% 95.0%A__L1108: Road_Unpaved_SlagDisposal_New_L11_08 99 n/ap 0.0612 12 0.4 5.3% 0.9% 10.0 50.0 30.0 0.599 0.242 428.40 0.000007859 0.000000052 n/ap n/ap n/ap n/ap 0.00001127 95.0% 95.0% 95.0%A__L1109: Road_Unpaved_SlagDisposal_New_L11_09 99 n/ap 0.0918 18 0.6 5.3% 0.9% 10.0 50.0 30.0 0.599 0.364 642.60 0.000007859 0.000000052 n/ap n/ap n/ap n/ap 0.00001127 95.0% 95.0% 95.0%A__L1110: Road_Unpaved_SlagDisposal_New_L11_10 99 n/ap 0.0464 9 0.3 5.3% 0.9% 10.0 50.0 30.0 0.599 0.184 324.80 0.000007859 0.000000052 n/ap n/ap n/ap n/ap 0.00001127 95.0% 95.0% 95.0%A__L1111: Road_Unpaved_SlagDisposal_New_L11_11 99 n/ap 0.1262 25 0.8 5.3% 0.9% 10.0 50.0 30.0 0.599 0.500 883.40 0.000007859 0.000000052 n/ap n/ap n/ap n/ap 0.00001127 95.0% 95.0% 95.0%A__L1112: Road_Unpaved_SlagDisposal_New_L11_12 99 n/ap 0.1104 22 0.7 5.3% 0.9% 10.0 50.0 30.0 0.599 0.437 772.80 0.000007859 0.000000052 n/ap n/ap n/ap n/ap 0.00001127 95.0% 95.0% 95.0%A__L1113: Road_Unpaved_SlagDisposal_New_L11_13 99 n/ap 0.0899 18 0.6 5.3% 0.9% 10.0 50.0 30.0 0.599 0.356 629.30 0.000007859 0.000000052 n/ap n/ap n/ap n/ap 0.00001127 95.0% 95.0% 95.0%A__L1201: Road_Paved_ExportStorage_L12_01 71 n/ap 0.0975 14 0.5 9.5% 5.4% 10.0 50.0 30.0 1.013 0.466 487.50 0.000001329 0.000000009 n/ap n/ap n/ap n/ap 0.00000470 99.5% 99.5% 99.5%A__L1202: Road_Paved_ExportStorage_L12_02 71 n/ap 0.2119 30 1.0 9.5% 5.4% 10.0 50.0 30.0 1.013 1.014 1059.50 0.000001329 0.000000009 n/ap n/ap n/ap n/ap 0.00000470 99.5% 99.5% 99.5%A__L1203: Road_Paved_ExportStorage_L12_03 71 n/ap 0.0743 11 0.4 9.5% 5.4% 10.0 50.0 30.0 1.013 0.355 371.50 0.000001329 0.000000009 n/ap n/ap n/ap n/ap 0.00000470 99.5% 99.5% 99.5%A__L1204: Road_Paved_ExportStorage_L12_04 71 n/ap 0.1258 18 0.6 9.5% 5.4% 10.0 50.0 30.0 1.013 0.602 629.00 0.000001329 0.000000009 n/ap n/ap n/ap n/ap 0.00000470 99.5% 99.5% 99.5%A__L1205: Road_Paved_ExportStorage_L12_05 71 n/ap 0.0306 4 0.1 9.5% 5.4% 10.0 50.0 30.0 1.013 0.146 153.00 0.000001329 0.000000009 n/ap n/ap n/ap n/ap 0.00000470 99.5% 99.5% 99.5%A__L1206: Road_Paved_ExportStorage_L12_06 71 n/ap 0.1841 26 0.9 9.5% 5.4% 10.0 50.0 30.0 1.013 0.881 920.50 0.000001329 0.000000009 n/ap n/ap n/ap n/ap 0.00000470 99.5% 99.5% 99.5%A__L1207: Road_Paved_ExportStorage_L12_07 71 n/ap 0.0848 12 0.4 9.5% 5.4% 10.0 50.0 30.0 1.013 0.406 424.00 0.000001329 0.000000009 n/ap n/ap n/ap n/ap 0.00000470 99.5% 99.5% 99.5%A__L1208: Road_Paved_ExportStorage_L12_08 71 n/ap 0.3353 47 1.6 9.5% 5.4% 10.0 50.0 30.0 1.013 1.604 1676.50 0.000001329 0.000000009 n/ap n/ap n/ap n/ap 0.00000470 99.5% 99.5% 99.5%A__L1301: Road_Paved_NewEntrance_L13_01 220 n/ap 0.4213 185 6.2 5.3% 0.9% 5.3 23.4 14.4 0.430 2.653 2949.10 0.000000000 0.000000000 n/ap n/ap n/ap n/ap 0.00000405 100.0% 100.0% 100.0%A__L1401: Road_Paved_NewP&RMAccess_L14_01 220 n/ap 0.1672 73 2.4 5.3% 0.9% 5.3 23.4 14.4 0.430 1.053 1170.40 0.000000000 0.000000000 n/ap n/ap n/ap n/ap 0.00000405 100.0% 100.0% 100.0%A__L1402: Road_Paved_NewP&RMAccess_L14_02 220 n/ap 0.1410 62 2.1 5.3% 0.9% 5.3 23.4 14.4 0.430 0.888 987.00 0.000000000 0.000000000 n/ap n/ap n/ap n/ap 0.00000405 100.0% 100.0% 100.0%A__L1403: Road_Paved_NewP&RMAccess_L14_03 220 n/ap 0.6987 307 10.2 5.3% 0.9% 5.3 23.4 14.4 0.430 4.400 4890.90 0.000000000 0.000000000 n/ap n/ap n/ap n/ap 0.00000405 100.0% 100.0% 100.0%2__A16SP: Area_SinterPlant_MatH 1064 10 0.1000 213 7.1 8.0% 5.7% 6.1 15.3 10.7 0.547 3.880 2205.99 0.000024432 0.000000078 0.0000001 Included n/ap n/ap 0.00003168 95.0% 95.0% 95.0%
Wheel Generated Emission Estimation at expected control efficiency (eg. Wetting of gravel road):
Wind Generated
Emission Est (at expected
control efficiency, eg wetting) for
lowest season:
Loading/Unloading Generated
Emission Estimation (at
expected control
efficiency, eg wetting):
Crushing & Screening
Wheels:Expected Control
Dust Control
Efficiency Achieved
Wind:Expected Control
Dust Control
Efficiency Achieved
Loading / Unloading:Expected Control
Dust Control
Efficiency Achieved
OTHERBlasting
TOTAL FOR AREA(EXCLUDING BLASTING &
OTHER)
Factor applied to abovementioned rates where relevant to account for wind speeds in excess of 5.4m/s with rainfall less than 0.254mm:Jan Feb Mar Apr May Jun Jul Aug Sep Oct Nov Dec
Wind Generated: 3.98 1.59 1.54 1.37 1.00 3.01 2.54 3.45 4.23 8.52 1.61 1.93Loading/Unloading: 1.30 1.36 1.03 1.00 1.03 1.15 1.17 1.27 1.23 1.50 1.60 1.19

Assmang Limited Cato Ridge Alloys (Pty) Ltd. 2020 AQIA for Sinter Plant EIA
Atmospheric Impact Report / Air Quality Impact Assessment
Document ID: AssmangCRW-AQIAReport_2020-PlannedSinterPlant_Sep2020_FD1.docx
Revision Date: 18Sep2020 Revision: FINAL_D1 Valid for: Assmang Cato Ridge, KwaZulu-Natal Province
Page 274 of 317
FINAL_D1 Compiled By: JG Potgieter
Approved By: JG Potgieter COPYRIGHT WARNING ALL RIGHTS RESERVED. All information and conceptual designs contained within this document are the intellectual property of ENVIRONGAKA (Pty) Ltd. This document and/or the information contained herein may not be used, stored, reproduced, or copied in any manner, without the prior written consent of ENVIRONGAKA (Pty) Ltd. This document and/or the information and conceptual designs may not be disclosed or displayed to any third party without the prior written consent of ENVIRONGAKA (Pty) Ltd.
EnviroNgaka
Expected Mn content in the secondary sources is referenced in Table D.0-M. Table D.0-M: Secondary sources: Expected Manganese content.
FeMn Production:
ID Description Mn
w/w%A__A09HC Area_HighCarbonC&S 70.0%A__A10LC Area_LowCarbonC&S 78.0%A__A14BP Area_BriquettingPlant 30.4%A__A03RS Area_RawMateria lStorage 30.4%A__A15BS Area_BriquettingPlantStockpi les 30.4%
ID Description Mn
w/w%A__A12ES Area_ExportStockpi le_South 75.0%A__A12EN Area_ExportStockpi le_North 70.0%
ID Description Mn
w/w%A__A11SN Area_SlagDisposa l_New 0.4%A__A01SO Area_SlagDisposa l_Old 0.4%A__A02CT Area_SlagPondCool ingTrenches 17.9%A__A13IO Area_Product&RM_InOutLoading_NEW 72.5%A__A05BN Area_BaghouseDustStorage_NEW 33.2%A__A06PS Area_ProductStorage 72.5%A__A07ST Area_Sl imesDamsTai l ings 20.2%A__A08MR Area_MRP 17.9%2__A16SP Area_SinterPlant_MatH 30.4%
ID Description Mn
w/w%A__L0901 Road_Unpaved_Hostel_L09_01 0.1%A__L0902 Road_Unpaved_Hostel_L09_02 0.1%A__L0903 Road_Unpaved_Hostel_L09_03 0.1%A__L0904 Road_Unpaved_Hostel_L09_04 0.1%A__L0905 Road_Unpaved_Hostel_L09_05 0.1%A__L0906 Road_Unpaved_Hostel_L09_06 0.1%A__L0907 Road_Unpaved_Hostel_L09_07 0.1%A__L0908 Road_Unpaved_Hostel_L09_08 0.1%A__L1001 Road_Unpaved_MRP-Storage_L10_01 17.9%A__L1002 Road_Unpaved_MRP-Storage_L10_02 17.9%A__L1003 Road_Unpaved_MRP-Storage_L10_03 17.9%A__L1004 Road_Unpaved_MRP-Storage_L10_04 17.9%A__L1005 Road_Unpaved_MRP-Storage_L10_05 17.9%A__L1006 Road_Unpaved_MRP-Storage_L10_06 17.9%A__L1007 Road_Unpaved_MRP-Storage_L10_07 17.9%A__L1008 Road_Unpaved_MRP-Storage_L10_08 17.9%A__L1009 Road_Unpaved_MRP-Storage_L10_09 17.9%A__L1010 Road_Unpaved_MRP-Storage_L10_10 17.9%A__L1011 Road_Unpaved_MRP-Storage_L10_11 17.9%A__L0101 Road_Unpaved_SlagDisposa l_Old_L01_01 0.4%A__L0102 Road_Unpaved_SlagDisposa l_Old_L01_02 0.4%A__L0103 Road_Unpaved_SlagDisposa l_Old_L01_03 0.4%A__L0201 Road_Unpaved_SlagPondCool ingTrenches_L02_01 17.9%A__L0202 Road_Unpaved_SlagPondCool ingTrenches_L02_02 17.9%A__L0203 Road_Unpaved_SlagPondCool ingTrenches_L02_03 17.9%A__L0204 Road_Unpaved_SlagPondCool ingTrenches_L02_04 17.9%A__L0301 Road_Paved_RawMateria l_L03_01 30.4%A__L0302 Road_Paved_RawMateria l_L03_02 30.4%A__L0303 Road_Paved_RawMateria l_L03_03 30.4%A__L0304 Road_Paved_RawMateria l_L03_04 30.4%A__L0305 Road_Paved_RawMateria l_L03_05 30.4%A__L0306 Road_Paved_RawMateria l_L03_06 30.4%A__L0401 Road_Unpaved_BHDustStorage_Old_L04_01 0.1%A__L0501 Road_Unpaved_BHDustStorage_New_L05_01 33.2%
ID Description Mn
w/w%A__L0601 Road_Paved_ProductStorage_L06_01 36.3%A__L0602 Road_Paved_ProductStorage_L06_02 36.3%A__L0603 Road_Paved_ProductStorage_L06_03 36.3%A__L0604 Road_Paved_ProductStorage_L06_04 36.3%A__L0605 Road_Paved_ProductStorage_L06_05 36.3%A__L0701 Road_Unpaved_Sl imesDams(Tai l ings )_L07_01 20.2%A__L0801 Road_Paved_Main_L08_01 5.1%A__L0802 Road_Paved_Main_L08_02 5.1%A__L0803 Road_Paved_Main_L08_03 5.1%A__L0804 Road_Paved_Main_L08_04 5.1%A__L0805 Road_Paved_Main_L08_05 5.1%A__L0806 Road_Paved_Main_L08_06 5.1%A__L0807 Road_Paved_Main_L08_07 5.1%A__L0808 Road_Paved_Main_L08_08 5.1%A__L0809 Road_Paved_Main_L08_09 5.1%A__L0810 Road_Paved_Main_L08_10 5.1%A__L0811 Road_Paved_Main_L08_11 5.1%A__L0812 Road_Paved_Main_L08_12 5.1%A__L0813 Road_Paved_Main_L08_13 5.1%A__L0814 Road_Paved_Main_L08_14 5.1%A__L0815 Road_Paved_Main_L08_15 5.1%A__L0816 Road_Paved_Main_L08_16 5.1%A__L0817 Road_Paved_Main_L08_17 5.1%A__L1101 Road_Unpaved_SlagDisposa l_New_L11_01 0.4%A__L1102 Road_Unpaved_SlagDisposa l_New_L11_02 0.4%A__L1103 Road_Unpaved_SlagDisposa l_New_L11_03 0.4%A__L1104 Road_Unpaved_SlagDisposa l_New_L11_04 0.4%A__L1105 Road_Unpaved_SlagDisposa l_New_L11_05 0.4%A__L1106 Road_Unpaved_SlagDisposa l_New_L11_06 0.4%A__L1107 Road_Unpaved_SlagDisposa l_New_L11_07 0.4%A__L1108 Road_Unpaved_SlagDisposa l_New_L11_08 0.4%A__L1109 Road_Unpaved_SlagDisposa l_New_L11_09 0.4%A__L1110 Road_Unpaved_SlagDisposa l_New_L11_10 0.4%A__L1111 Road_Unpaved_SlagDisposa l_New_L11_11 0.4%A__L1112 Road_Unpaved_SlagDisposa l_New_L11_12 0.4%A__L1113 Road_Unpaved_SlagDisposa l_New_L11_13 0.4%A__L1201 Road_Paved_ExportStorage_L12_01 36.3%A__L1202 Road_Paved_ExportStorage_L12_02 36.3%A__L1203 Road_Paved_ExportStorage_L12_03 36.3%A__L1204 Road_Paved_ExportStorage_L12_04 36.3%A__L1205 Road_Paved_ExportStorage_L12_05 36.3%A__L1206 Road_Paved_ExportStorage_L12_06 36.3%A__L1207 Road_Paved_ExportStorage_L12_07 36.3%A__L1208 Road_Paved_ExportStorage_L12_08 36.3%A__L1301 Road_Paved_NewEntrance_L13_01 3.1%A__L1401 Road_Paved_NewP&RMAccess_L14_01 3.1%A__L1402 Road_Paved_NewP&RMAccess_L14_02 3.1%A__L1403 Road_Paved_NewP&RMAccess_L14_03 3.1%

Assmang Limited Cato Ridge Alloys (Pty) Ltd. 2020 AQIA for Sinter Plant EIA
Atmospheric Impact Report / Air Quality Impact Assessment
Document ID: AssmangCRW-AQIAReport_2020-PlannedSinterPlant_Sep2020_FD1.docx
Revision Date: 18Sep2020 Revision: FINAL_D1 Valid for: Assmang Cato Ridge, KwaZulu-Natal Province
Page 275 of 317
FINAL_D1 Compiled By: JG Potgieter
Approved By: JG Potgieter COPYRIGHT WARNING ALL RIGHTS RESERVED. All information and conceptual designs contained within this document are the intellectual property of ENVIRONGAKA (Pty) Ltd. This document and/or the information contained herein may not be used, stored, reproduced, or copied in any manner, without the prior written consent of ENVIRONGAKA (Pty) Ltd. This document and/or the information and conceptual designs may not be disclosed or displayed to any third party without the prior written consent of ENVIRONGAKA (Pty) Ltd.
EnviroNgaka
In 2005 a report on a study conducted in Australia to review the status of, and identify and recommend ways to improve, emission estimation methodologies for fugitive (non-combustion) PM2.5, PM10, TSP and metals/metal compounds in particulate matter from mining (non-coal) and other industrial activities for the National Pollutant Inventory (NPI) reporting (Pitts, 2005), was published. In this study we used the appropriate equations for estimating fugitive dust emissions for each of the activities which have been identified. The report presents a review of the status of techniques listed in USEPA AP-42 and the USA’s Toxic Release Inventory (US TRI), as well as the Canadian National Pollutant Release Inventory (NPRI), with comparison to current NPI techniques. This section will give the equations that were used, along with the recommendations made for each of them in the document “Improvement of Fugitive Particulate Matter Emission Estimation Techniques”. Where ratings were assigned to equations, the rating system is as follows:
• A: Excellent; • B: Above average; • C: Average; • D: Below average; and • E: Poor.
D.2 Blasting Emissions from blasting activities at a site can be expected to be similar to the type of blasts at Crushed stone processing plants where the rock and crushed stone products generally are loosened by drilling holes in the rock and then blasting it (USEPA, 2004). Section 11.19.2 of AP-42, “Crushed stone processing and Pulvurised mineral processing”, says the following with regards to blasting: “Emission factor estimates for stone quarry blasting operations are not presented because of the sparsity and unreliability of available tests. While a procedure for estimating blasting emissions is presented in Section 11.9, Western Surface Coal Mining, that procedure should not be applied to stone quarries because of dissimilarities in blasting techniques, material blasted, and size of blast areas.” (USEPA, 2004) The equation for estimating particulate emissions from blasting given in Section 11.9 of AP-42 is as follows:
5.130 00022.0)/( AblastkgEF = (D.1)
with: A = Blasting area (m2) According to Pitts, there are currently no other equations available to estimate particulate emissions from blasting (Pitts, 2005). The values of PM10 emissions from blasting are then estimated at 52% of TSP emissions predicted by Equation D.1, which is based on material handing PM10/TSP ratios. Equation D.1 can therefore be used as follows for estimated PM10 emissions:
5.110 0001144.0)/( AblastkgEF = (D.2)
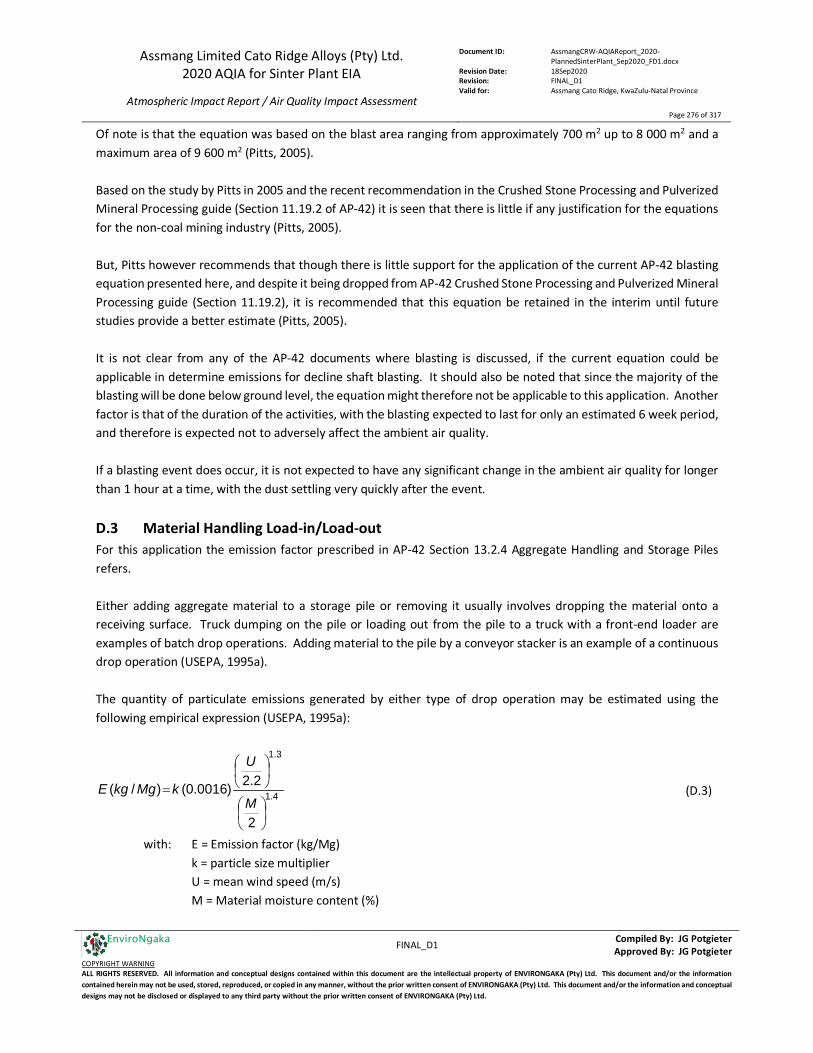
Assmang Limited Cato Ridge Alloys (Pty) Ltd. 2020 AQIA for Sinter Plant EIA
Atmospheric Impact Report / Air Quality Impact Assessment
Document ID: AssmangCRW-AQIAReport_2020-PlannedSinterPlant_Sep2020_FD1.docx
Revision Date: 18Sep2020 Revision: FINAL_D1 Valid for: Assmang Cato Ridge, KwaZulu-Natal Province
Page 276 of 317
FINAL_D1 Compiled By: JG Potgieter
Approved By: JG Potgieter COPYRIGHT WARNING ALL RIGHTS RESERVED. All information and conceptual designs contained within this document are the intellectual property of ENVIRONGAKA (Pty) Ltd. This document and/or the information contained herein may not be used, stored, reproduced, or copied in any manner, without the prior written consent of ENVIRONGAKA (Pty) Ltd. This document and/or the information and conceptual designs may not be disclosed or displayed to any third party without the prior written consent of ENVIRONGAKA (Pty) Ltd.
EnviroNgaka
Of note is that the equation was based on the blast area ranging from approximately 700 m2 up to 8 000 m2 and a maximum area of 9 600 m2 (Pitts, 2005). Based on the study by Pitts in 2005 and the recent recommendation in the Crushed Stone Processing and Pulverized Mineral Processing guide (Section 11.19.2 of AP-42) it is seen that there is little if any justification for the equations for the non-coal mining industry (Pitts, 2005). But, Pitts however recommends that though there is little support for the application of the current AP-42 blasting equation presented here, and despite it being dropped from AP-42 Crushed Stone Processing and Pulverized Mineral Processing guide (Section 11.19.2), it is recommended that this equation be retained in the interim until future studies provide a better estimate (Pitts, 2005). It is not clear from any of the AP-42 documents where blasting is discussed, if the current equation could be applicable in determine emissions for decline shaft blasting. It should also be noted that since the majority of the blasting will be done below ground level, the equation might therefore not be applicable to this application. Another factor is that of the duration of the activities, with the blasting expected to last for only an estimated 6 week period, and therefore is expected not to adversely affect the ambient air quality. If a blasting event does occur, it is not expected to have any significant change in the ambient air quality for longer than 1 hour at a time, with the dust settling very quickly after the event.
D.3 Material Handling Load-in/Load-out For this application the emission factor prescribed in AP-42 Section 13.2.4 Aggregate Handling and Storage Piles refers. Either adding aggregate material to a storage pile or removing it usually involves dropping the material onto a receiving surface. Truck dumping on the pile or loading out from the pile to a truck with a front-end loader are examples of batch drop operations. Adding material to the pile by a conveyor stacker is an example of a continuous drop operation (USEPA, 1995a). The quantity of particulate emissions generated by either type of drop operation may be estimated using the following empirical expression (USEPA, 1995a):
4.1
3.1
2
2.2)0016.0()/(
=M
U
kMgkgE (D.3)
with: E = Emission factor (kg/Mg) k = particle size multiplier U = mean wind speed (m/s) M = Material moisture content (%)

Assmang Limited Cato Ridge Alloys (Pty) Ltd. 2020 AQIA for Sinter Plant EIA
Atmospheric Impact Report / Air Quality Impact Assessment
Document ID: AssmangCRW-AQIAReport_2020-PlannedSinterPlant_Sep2020_FD1.docx
Revision Date: 18Sep2020 Revision: FINAL_D1 Valid for: Assmang Cato Ridge, KwaZulu-Natal Province
Page 277 of 317
FINAL_D1 Compiled By: JG Potgieter
Approved By: JG Potgieter COPYRIGHT WARNING ALL RIGHTS RESERVED. All information and conceptual designs contained within this document are the intellectual property of ENVIRONGAKA (Pty) Ltd. This document and/or the information contained herein may not be used, stored, reproduced, or copied in any manner, without the prior written consent of ENVIRONGAKA (Pty) Ltd. This document and/or the information and conceptual designs may not be disclosed or displayed to any third party without the prior written consent of ENVIRONGAKA (Pty) Ltd.
EnviroNgaka
Equation D.3 replaced a previous, and outdated, equation that used the silt content as well as the drop height to estimate the emissions (Pitts, 2005). The particle size multiplier used in Equation D.3 to estimate the PM10 emissions is k = 0.35. The equation can therefore be written as:
4.1
3.1
10
2
2.200056.0)/(
=M
U
MgkgEF (D.4)
Pitts reported that for application in metalliferous mines, due to the fact that there was no Australian data available for comparison, the AP-42 equation is recommended as the only available option, though it was considered that this equation may underestimate actual emissions by a factor of 5 to 10 (Pitts, 2005). D.4 Wheel generated dust from unpaved roads In October 2001, the USEPA published a new draft section 13.2.2 “Unpaved roads” for AP-42 and requested comments. This draft (Pitts, 2005):
• proposed two separate emission factor models for public and industrial roads; • incorporated speed as an input parameter for public roads to overcome the shortcoming of the previous
model which over-predicted emissions for low vehicle speeds; and • revised the watering control effectiveness discussion.
In December 2003 the USEPA finalised this revision with slight changes (Pitts, 2005). The current AP-42 equation for vehicles travelling on unpaved surfaces at industrial sites is (Quality rating is B):
45.09.0
10 7.212423.0)/(
=
WsVKTkgEF
(D.5) with: s = silt content of the road (%)
W = mean vehicle weight (ton) The equation for vehicles travelling on publicly accessible roads, dominated by light duty vehicles, is (Pitts, 2005):
CMSsVKTkgEF −
=
− 2.05.09.0
10 5.03012508.0)/( (D.6)
with: s = silt content of the road (%) S = average vehicle speed (km/hr) M = Material moisture content (%) C = emission factor for 1980’s vehicle fleet exhaust, brake wear and tyre wear equal to
(0.000133kg/VKT) The quality rating for this equation is also B.
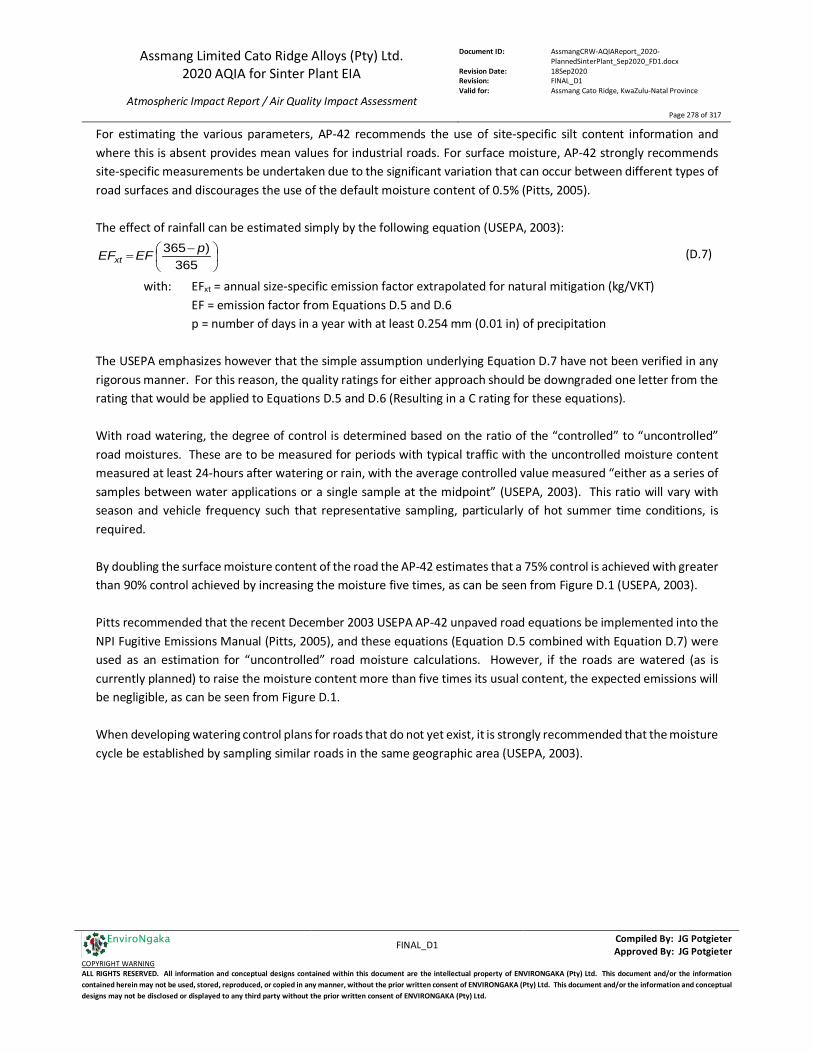
Assmang Limited Cato Ridge Alloys (Pty) Ltd. 2020 AQIA for Sinter Plant EIA
Atmospheric Impact Report / Air Quality Impact Assessment
Document ID: AssmangCRW-AQIAReport_2020-PlannedSinterPlant_Sep2020_FD1.docx
Revision Date: 18Sep2020 Revision: FINAL_D1 Valid for: Assmang Cato Ridge, KwaZulu-Natal Province
Page 278 of 317
FINAL_D1 Compiled By: JG Potgieter
Approved By: JG Potgieter COPYRIGHT WARNING ALL RIGHTS RESERVED. All information and conceptual designs contained within this document are the intellectual property of ENVIRONGAKA (Pty) Ltd. This document and/or the information contained herein may not be used, stored, reproduced, or copied in any manner, without the prior written consent of ENVIRONGAKA (Pty) Ltd. This document and/or the information and conceptual designs may not be disclosed or displayed to any third party without the prior written consent of ENVIRONGAKA (Pty) Ltd.
EnviroNgaka
For estimating the various parameters, AP-42 recommends the use of site-specific silt content information and where this is absent provides mean values for industrial roads. For surface moisture, AP-42 strongly recommends site-specific measurements be undertaken due to the significant variation that can occur between different types of road surfaces and discourages the use of the default moisture content of 0.5% (Pitts, 2005). The effect of rainfall can be estimated simply by the following equation (USEPA, 2003):
−
=365
)365 pEFEFxt (D.7)
with: EFxt = annual size-specific emission factor extrapolated for natural mitigation (kg/VKT) EF = emission factor from Equations D.5 and D.6 p = number of days in a year with at least 0.254 mm (0.01 in) of precipitation The USEPA emphasizes however that the simple assumption underlying Equation D.7 have not been verified in any rigorous manner. For this reason, the quality ratings for either approach should be downgraded one letter from the rating that would be applied to Equations D.5 and D.6 (Resulting in a C rating for these equations). With road watering, the degree of control is determined based on the ratio of the “controlled” to “uncontrolled” road moistures. These are to be measured for periods with typical traffic with the uncontrolled moisture content measured at least 24-hours after watering or rain, with the average controlled value measured “either as a series of samples between water applications or a single sample at the midpoint” (USEPA, 2003). This ratio will vary with season and vehicle frequency such that representative sampling, particularly of hot summer time conditions, is required. By doubling the surface moisture content of the road the AP-42 estimates that a 75% control is achieved with greater than 90% control achieved by increasing the moisture five times, as can be seen from Figure D.1 (USEPA, 2003). Pitts recommended that the recent December 2003 USEPA AP-42 unpaved road equations be implemented into the NPI Fugitive Emissions Manual (Pitts, 2005), and these equations (Equation D.5 combined with Equation D.7) were used as an estimation for “uncontrolled” road moisture calculations. However, if the roads are watered (as is currently planned) to raise the moisture content more than five times its usual content, the expected emissions will be negligible, as can be seen from Figure D.1. When developing watering control plans for roads that do not yet exist, it is strongly recommended that the moisture cycle be established by sampling similar roads in the same geographic area (USEPA, 2003).
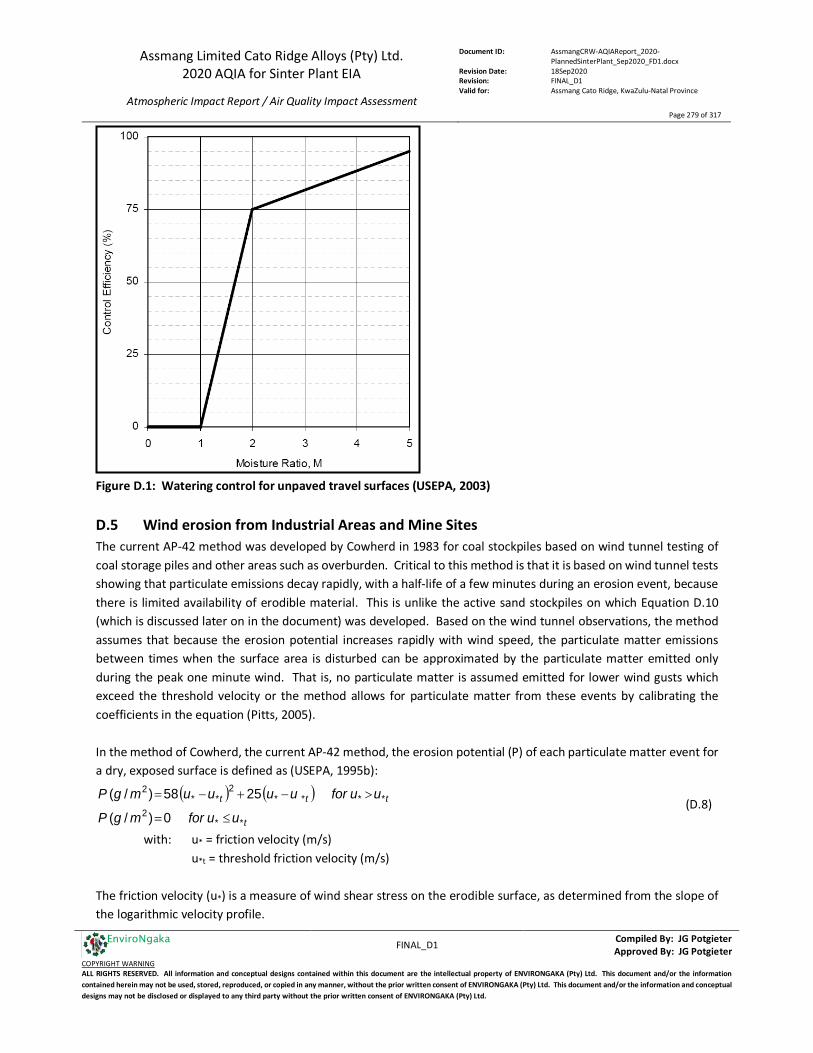
Assmang Limited Cato Ridge Alloys (Pty) Ltd. 2020 AQIA for Sinter Plant EIA
Atmospheric Impact Report / Air Quality Impact Assessment
Document ID: AssmangCRW-AQIAReport_2020-PlannedSinterPlant_Sep2020_FD1.docx
Revision Date: 18Sep2020 Revision: FINAL_D1 Valid for: Assmang Cato Ridge, KwaZulu-Natal Province
Page 279 of 317
FINAL_D1 Compiled By: JG Potgieter
Approved By: JG Potgieter COPYRIGHT WARNING ALL RIGHTS RESERVED. All information and conceptual designs contained within this document are the intellectual property of ENVIRONGAKA (Pty) Ltd. This document and/or the information contained herein may not be used, stored, reproduced, or copied in any manner, without the prior written consent of ENVIRONGAKA (Pty) Ltd. This document and/or the information and conceptual designs may not be disclosed or displayed to any third party without the prior written consent of ENVIRONGAKA (Pty) Ltd.
EnviroNgaka
Figure D.1: Watering control for unpaved travel surfaces (USEPA, 2003)
D.5 Wind erosion from Industrial Areas and Mine Sites The current AP-42 method was developed by Cowherd in 1983 for coal stockpiles based on wind tunnel testing of coal storage piles and other areas such as overburden. Critical to this method is that it is based on wind tunnel tests showing that particulate emissions decay rapidly, with a half-life of a few minutes during an erosion event, because there is limited availability of erodible material. This is unlike the active sand stockpiles on which Equation D.10 (which is discussed later on in the document) was developed. Based on the wind tunnel observations, the method assumes that because the erosion potential increases rapidly with wind speed, the particulate matter emissions between times when the surface area is disturbed can be approximated by the particulate matter emitted only during the peak one minute wind. That is, no particulate matter is assumed emitted for lower wind gusts which exceed the threshold velocity or the method allows for particulate matter from these events by calibrating the coefficients in the equation (Pitts, 2005). In the method of Cowherd, the current AP-42 method, the erosion potential (P) of each particulate matter event for a dry, exposed surface is defined as (USEPA, 1995b):
( ) ( )t
ttt
uuformgP
uuforuuuumgP
**2
****2
**2
0)/(
2558)/(
≤=
>−+−= (D.8)
with: u* = friction velocity (m/s) u*t = threshold friction velocity (m/s) The friction velocity (u*) is a measure of wind shear stress on the erodible surface, as determined from the slope of the logarithmic velocity profile.

Assmang Limited Cato Ridge Alloys (Pty) Ltd. 2020 AQIA for Sinter Plant EIA
Atmospheric Impact Report / Air Quality Impact Assessment
Document ID: AssmangCRW-AQIAReport_2020-PlannedSinterPlant_Sep2020_FD1.docx
Revision Date: 18Sep2020 Revision: FINAL_D1 Valid for: Assmang Cato Ridge, KwaZulu-Natal Province
Page 280 of 317
FINAL_D1 Compiled By: JG Potgieter
Approved By: JG Potgieter COPYRIGHT WARNING ALL RIGHTS RESERVED. All information and conceptual designs contained within this document are the intellectual property of ENVIRONGAKA (Pty) Ltd. This document and/or the information contained herein may not be used, stored, reproduced, or copied in any manner, without the prior written consent of ENVIRONGAKA (Pty) Ltd. This document and/or the information and conceptual designs may not be disclosed or displayed to any third party without the prior written consent of ENVIRONGAKA (Pty) Ltd.
EnviroNgaka
The threshold friction velocity (as cm/s) (u*t) can be estimated using an appropriate correlation. The EPA Manual recommends that the aggregate size distribution mode (in mm) should be used to determine the uncorrected threshold friction velocity (as cm/s) from Figure D.2. The correlation of Figure D.3 is then used to correct the threshold friction velocity for the presence of non-erodible elements (greater than about 1 cm). It is important to note that the correlation of Figure D.2 shows that there is significant scatter about the regression line (Anon, 2005?). The referenced document describes in detail how to further calculate the threshold friction velocity.
Figure D.2: Relation of threshold friction velocity to size distribution mode (USEPA, 1988)
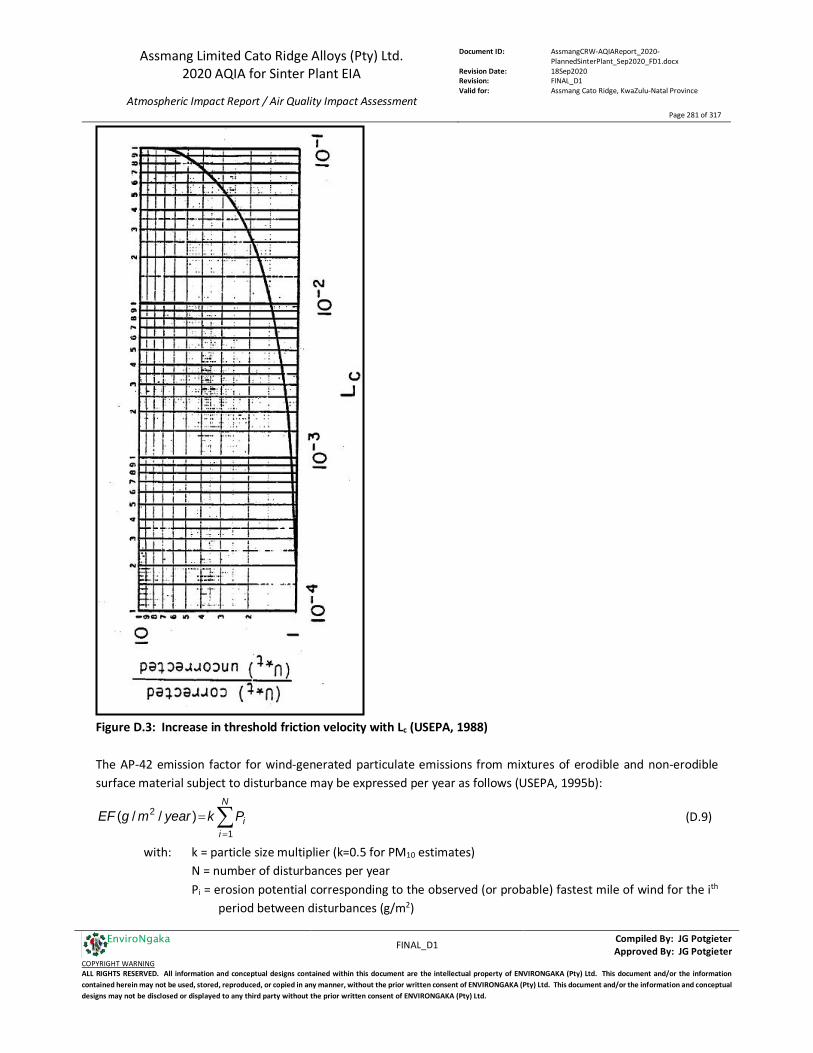
Assmang Limited Cato Ridge Alloys (Pty) Ltd. 2020 AQIA for Sinter Plant EIA
Atmospheric Impact Report / Air Quality Impact Assessment
Document ID: AssmangCRW-AQIAReport_2020-PlannedSinterPlant_Sep2020_FD1.docx
Revision Date: 18Sep2020 Revision: FINAL_D1 Valid for: Assmang Cato Ridge, KwaZulu-Natal Province
Page 281 of 317
FINAL_D1 Compiled By: JG Potgieter
Approved By: JG Potgieter COPYRIGHT WARNING ALL RIGHTS RESERVED. All information and conceptual designs contained within this document are the intellectual property of ENVIRONGAKA (Pty) Ltd. This document and/or the information contained herein may not be used, stored, reproduced, or copied in any manner, without the prior written consent of ENVIRONGAKA (Pty) Ltd. This document and/or the information and conceptual designs may not be disclosed or displayed to any third party without the prior written consent of ENVIRONGAKA (Pty) Ltd.
EnviroNgaka
Figure D.3: Increase in threshold friction velocity with Lc (USEPA, 1988) The AP-42 emission factor for wind-generated particulate emissions from mixtures of erodible and non-erodible surface material subject to disturbance may be expressed per year as follows (USEPA, 1995b):
∑=
=N
iiPkyearmgEF
1
2 )//( (D.9)
with: k = particle size multiplier (k=0.5 for PM10 estimates) N = number of disturbances per year Pi = erosion potential corresponding to the observed (or probable) fastest mile of wind for the ith
period between disturbances (g/m2)
Assmang Limited Cato Ridge Alloys (Pty) Ltd. 2020 AQIA for Sinter Plant EIA
Atmospheric Impact Report / Air Quality Impact Assessment
Document ID: AssmangCRW-AQIAReport_2020-PlannedSinterPlant_Sep2020_FD1.docx
Revision Date: 18Sep2020 Revision: FINAL_D1 Valid for: Assmang Cato Ridge, KwaZulu-Natal Province
Page 282 of 317
FINAL_D1 Compiled By: JG Potgieter
Approved By: JG Potgieter COPYRIGHT WARNING ALL RIGHTS RESERVED. All information and conceptual designs contained within this document are the intellectual property of ENVIRONGAKA (Pty) Ltd. This document and/or the information contained herein may not be used, stored, reproduced, or copied in any manner, without the prior written consent of ENVIRONGAKA (Pty) Ltd. This document and/or the information and conceptual designs may not be disclosed or displayed to any third party without the prior written consent of ENVIRONGAKA (Pty) Ltd.
EnviroNgaka
A disturbance (N) is defined as an action which results in the exposure of fresh surface material. On a storage pile, this would occur whenever aggregate material is either added to or removed from the old surface. A disturbance of an exposed area may also result from the turning of surface material to a depth exceeding the size of the largest pieces of material present (USEPA, 1988). The NPI Mining Manual suggests the use of Equation D.10, and therefore did not adopt the USEPA method current at the time as introduced in Equations D.8 and D.9 (Pitts, 2005). The current NPI emission factor equation for estimating the PM10 component of wind erosion is (NPI, 2001):
−
=
15235365
5.195.0)//(10
fpsdayhakgEF (D.10)
with: s = silt content (%) p = number of days in a year with at least 0.254 mm (0.01 in) of precipitation f = the percentage of time the unobstructed wind at the mean pile height exceeds 5.4 m/s This equation was developed to estimate wind erosion on active storage piles. It is rated C for application in the sand and gravel industry and D for other industries using the USEPA quality rating for emission factors (Pitts, 2005). It is important to note that the storage pile is active, that is either the surface is being disturbed frequently enough such that fresh material is available for wind erosion, or the surface is not depleted or crusted. Pitts found that though the current NPI equation is considered indicative only, there appears to be no ready replacement, with the existing AP-42 equation considered to be based on little data for non-coal mines and difficult to implement (e.g. estimation of threshold friction velocities) (Pitts, 2005). He recommended that the current NPI equation (Equation D.10) should be retained in the interim.
D.6 Silt and moisture content of different materials Typical silt and moisture content of materials at various industries can be seen in Table D.1 (USEPA, 1995a). Typical silt content values of surface material on industrial unpaved roads can be seen in Table D.2 (USEPA, 2003).
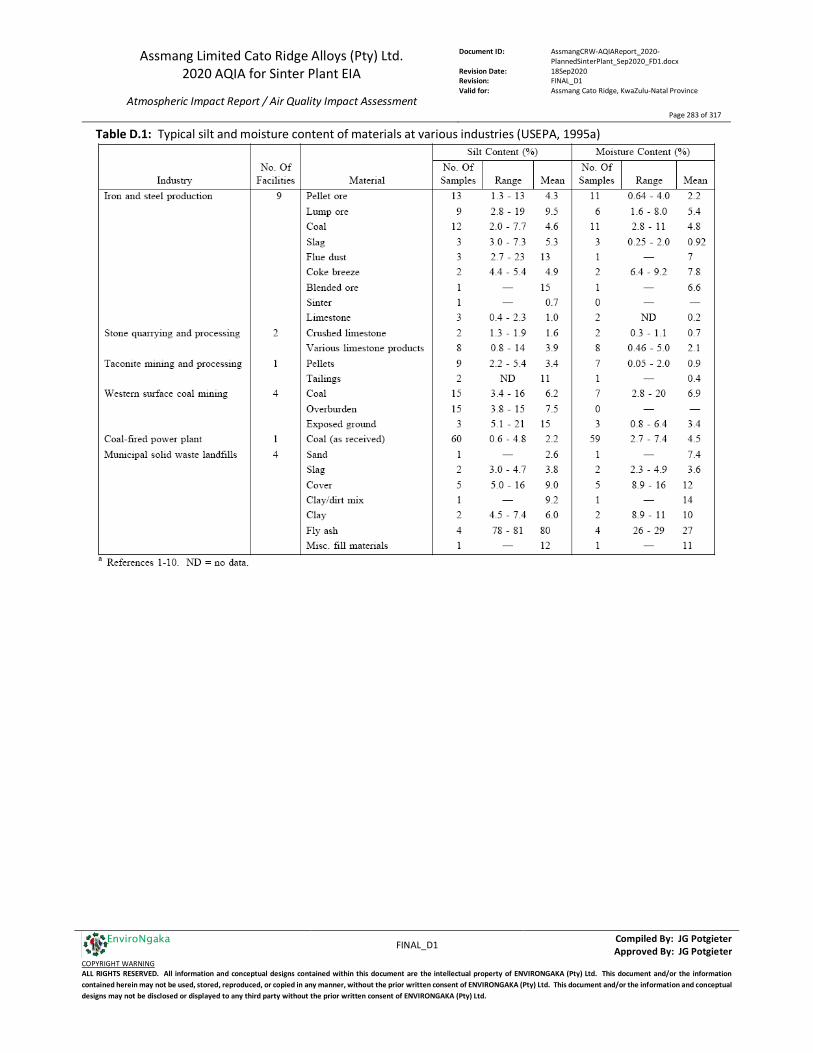
Assmang Limited Cato Ridge Alloys (Pty) Ltd. 2020 AQIA for Sinter Plant EIA
Atmospheric Impact Report / Air Quality Impact Assessment
Document ID: AssmangCRW-AQIAReport_2020-PlannedSinterPlant_Sep2020_FD1.docx
Revision Date: 18Sep2020 Revision: FINAL_D1 Valid for: Assmang Cato Ridge, KwaZulu-Natal Province
Page 283 of 317
FINAL_D1 Compiled By: JG Potgieter
Approved By: JG Potgieter COPYRIGHT WARNING ALL RIGHTS RESERVED. All information and conceptual designs contained within this document are the intellectual property of ENVIRONGAKA (Pty) Ltd. This document and/or the information contained herein may not be used, stored, reproduced, or copied in any manner, without the prior written consent of ENVIRONGAKA (Pty) Ltd. This document and/or the information and conceptual designs may not be disclosed or displayed to any third party without the prior written consent of ENVIRONGAKA (Pty) Ltd.
EnviroNgaka
Table D.1: Typical silt and moisture content of materials at various industries (USEPA, 1995a)

Assmang Limited Cato Ridge Alloys (Pty) Ltd. 2020 AQIA for Sinter Plant EIA
Atmospheric Impact Report / Air Quality Impact Assessment
Document ID: AssmangCRW-AQIAReport_2020-PlannedSinterPlant_Sep2020_FD1.docx
Revision Date: 18Sep2020 Revision: FINAL_D1 Valid for: Assmang Cato Ridge, KwaZulu-Natal Province
Page 284 of 317
FINAL_D1 Compiled By: JG Potgieter
Approved By: JG Potgieter COPYRIGHT WARNING ALL RIGHTS RESERVED. All information and conceptual designs contained within this document are the intellectual property of ENVIRONGAKA (Pty) Ltd. This document and/or the information contained herein may not be used, stored, reproduced, or copied in any manner, without the prior written consent of ENVIRONGAKA (Pty) Ltd. This document and/or the information and conceptual designs may not be disclosed or displayed to any third party without the prior written consent of ENVIRONGAKA (Pty) Ltd.
EnviroNgaka
Table D.2: Typical silt content values of surface material on industrial unpaved roads (USEPA, 2003)
D.7 Exhaust Emission Factors Exhaust Emission Factors for Various Classes of Mining Equipment can be seen in Table D.3 (NPI, 2001) Table D.3: Exhaust Emission Factors for Various Classes of Mining Equipment (NPI, 2001)
2 SO2 emission rate to be corrected in accordance with sulphur content of the fuel combusted
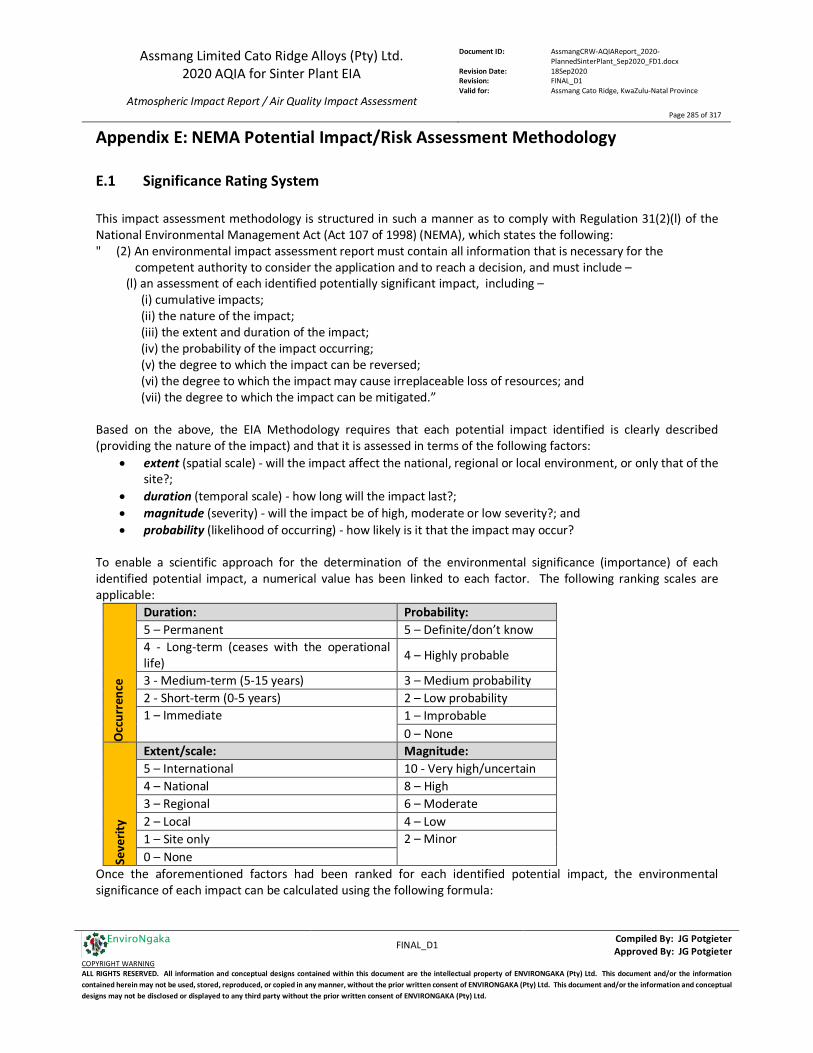
Assmang Limited Cato Ridge Alloys (Pty) Ltd. 2020 AQIA for Sinter Plant EIA
Atmospheric Impact Report / Air Quality Impact Assessment
Document ID: AssmangCRW-AQIAReport_2020-PlannedSinterPlant_Sep2020_FD1.docx
Revision Date: 18Sep2020 Revision: FINAL_D1 Valid for: Assmang Cato Ridge, KwaZulu-Natal Province
Page 285 of 317
FINAL_D1 Compiled By: JG Potgieter
Approved By: JG Potgieter COPYRIGHT WARNING ALL RIGHTS RESERVED. All information and conceptual designs contained within this document are the intellectual property of ENVIRONGAKA (Pty) Ltd. This document and/or the information contained herein may not be used, stored, reproduced, or copied in any manner, without the prior written consent of ENVIRONGAKA (Pty) Ltd. This document and/or the information and conceptual designs may not be disclosed or displayed to any third party without the prior written consent of ENVIRONGAKA (Pty) Ltd.
EnviroNgaka
Appendix E: NEMA Potential Impact/Risk Assessment Methodology
E.1 Significance Rating System This impact assessment methodology is structured in such a manner as to comply with Regulation 31(2)(l) of the National Environmental Management Act (Act 107 of 1998) (NEMA), which states the following: " (2) An environmental impact assessment report must contain all information that is necessary for the competent authority to consider the application and to reach a decision, and must include – (l) an assessment of each identified potentially significant impact, including – (i) cumulative impacts; (ii) the nature of the impact; (iii) the extent and duration of the impact; (iv) the probability of the impact occurring; (v) the degree to which the impact can be reversed; (vi) the degree to which the impact may cause irreplaceable loss of resources; and (vii) the degree to which the impact can be mitigated.” Based on the above, the EIA Methodology requires that each potential impact identified is clearly described (providing the nature of the impact) and that it is assessed in terms of the following factors:
• extent (spatial scale) - will the impact affect the national, regional or local environment, or only that of the site?;
• duration (temporal scale) - how long will the impact last?; • magnitude (severity) - will the impact be of high, moderate or low severity?; and • probability (likelihood of occurring) - how likely is it that the impact may occur?
To enable a scientific approach for the determination of the environmental significance (importance) of each identified potential impact, a numerical value has been linked to each factor. The following ranking scales are applicable:
Occ
urre
nce
Duration: Probability: 5 – Permanent 5 – Definite/don’t know 4 - Long-term (ceases with the operational life) 4 – Highly probable
3 - Medium-term (5-15 years) 3 – Medium probability 2 - Short-term (0-5 years) 2 – Low probability 1 – Immediate 1 – Improbable
0 – None
Seve
rity
Extent/scale: Magnitude: 5 – International 10 - Very high/uncertain 4 – National 8 – High 3 – Regional 6 – Moderate 2 – Local 4 – Low 1 – Site only 2 – Minor 0 – None
Once the aforementioned factors had been ranked for each identified potential impact, the environmental significance of each impact can be calculated using the following formula:
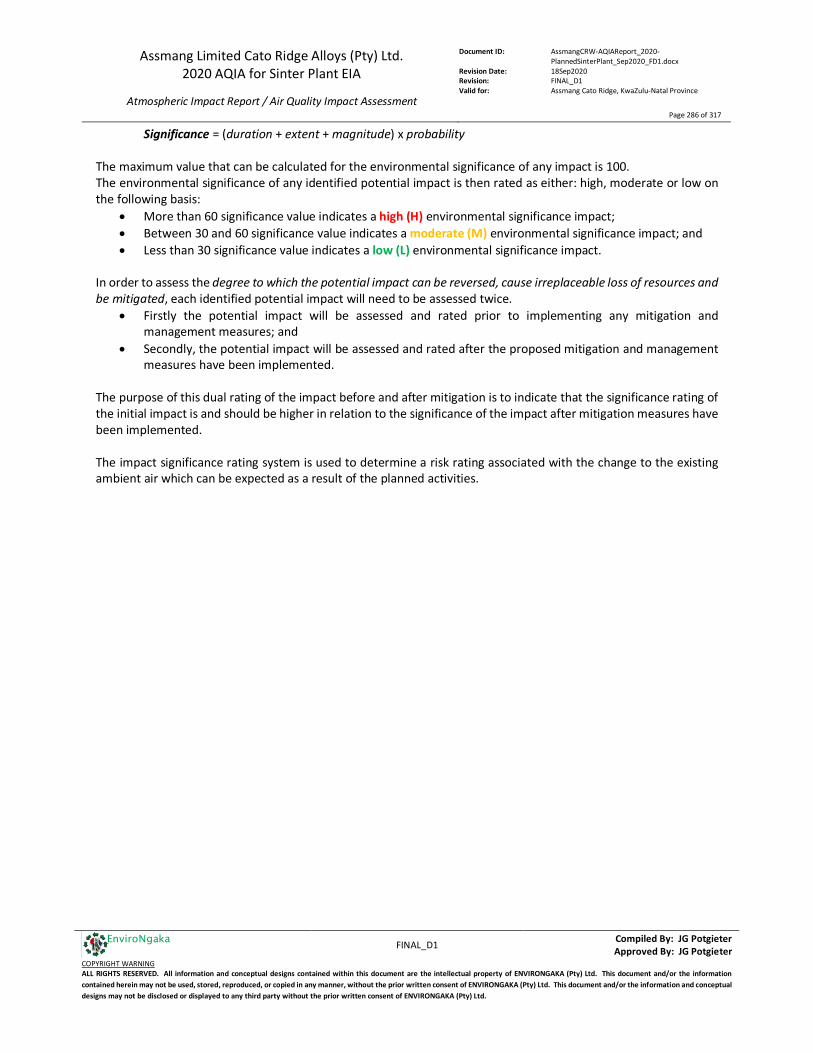
Assmang Limited Cato Ridge Alloys (Pty) Ltd. 2020 AQIA for Sinter Plant EIA
Atmospheric Impact Report / Air Quality Impact Assessment
Document ID: AssmangCRW-AQIAReport_2020-PlannedSinterPlant_Sep2020_FD1.docx
Revision Date: 18Sep2020 Revision: FINAL_D1 Valid for: Assmang Cato Ridge, KwaZulu-Natal Province
Page 286 of 317
FINAL_D1 Compiled By: JG Potgieter
Approved By: JG Potgieter COPYRIGHT WARNING ALL RIGHTS RESERVED. All information and conceptual designs contained within this document are the intellectual property of ENVIRONGAKA (Pty) Ltd. This document and/or the information contained herein may not be used, stored, reproduced, or copied in any manner, without the prior written consent of ENVIRONGAKA (Pty) Ltd. This document and/or the information and conceptual designs may not be disclosed or displayed to any third party without the prior written consent of ENVIRONGAKA (Pty) Ltd.
EnviroNgaka
Significance = (duration + extent + magnitude) x probability The maximum value that can be calculated for the environmental significance of any impact is 100. The environmental significance of any identified potential impact is then rated as either: high, moderate or low on the following basis:
• More than 60 significance value indicates a high (H) environmental significance impact; • Between 30 and 60 significance value indicates a moderate (M) environmental significance impact; and • Less than 30 significance value indicates a low (L) environmental significance impact.
In order to assess the degree to which the potential impact can be reversed, cause irreplaceable loss of resources and be mitigated, each identified potential impact will need to be assessed twice.
• Firstly the potential impact will be assessed and rated prior to implementing any mitigation and management measures; and
• Secondly, the potential impact will be assessed and rated after the proposed mitigation and management measures have been implemented.
The purpose of this dual rating of the impact before and after mitigation is to indicate that the significance rating of the initial impact is and should be higher in relation to the significance of the impact after mitigation measures have been implemented. The impact significance rating system is used to determine a risk rating associated with the change to the existing ambient air which can be expected as a result of the planned activities.

Assmang Limited Cato Ridge Alloys (Pty) Ltd. 2020 AQIA for Sinter Plant EIA
Atmospheric Impact Report / Air Quality Impact Assessment
Document ID: AssmangCRW-AQIAReport_2020-PlannedSinterPlant_Sep2020_FD1.docx
Revision Date: 18Sep2020 Revision: FINAL_D1 Valid for: Assmang Cato Ridge, KwaZulu-Natal Province
Page 287 of 317
FINAL_D1 Compiled By: JG Potgieter
Approved By: JG Potgieter COPYRIGHT WARNING ALL RIGHTS RESERVED. All information and conceptual designs contained within this document are the intellectual property of ENVIRONGAKA (Pty) Ltd. This document and/or the information contained herein may not be used, stored, reproduced, or copied in any manner, without the prior written consent of ENVIRONGAKA (Pty) Ltd. This document and/or the information and conceptual designs may not be disclosed or displayed to any third party without the prior written consent of ENVIRONGAKA (Pty) Ltd.
EnviroNgaka
E.2 Significance Rating: Project Phases Based on the information reviewed for this study and the results of the associated dispersion modelling impact assessment conducted for the different scenarios, the following impact risk ratings apply as findings from this study, specific to the current operation.
E.2.1 Significance Impact Rating: Pre-Construction Phase Not relevant for this study / not considered
E.2.2 Significance Impact Rating: Construction Phase
Nature of the impact
Significance of potential impact BEFORE mitigation
Mitigation Measures
Significance of potential impact AFTER mitigation
Monitoring Method
Prob
abili
ty
Dura
tion
Exte
nt
Mag
nitu
de
Sign
ifica
nce
Prob
abili
ty
Dura
tion
Exte
nt
Mag
nitu
de
Sign
ifica
nce
Construction Phase Fugitive dust: Increased LCV 5 2 1 4 35 Moderate - Manage site access and control
movement on site; - Practice dust suppression techniques;
4 2 3 2 28 Low DFO monitoring
Fugitive dust: Excavation work
5 4 3 10 85 High Practice dust suppression techniques;
3 4 1 4 27 Low DFO monitoring
Fugitive dust: Movement of material
5 4 3 10 85 High Practice dust suppression techniques;
3 4 1 4 27 Low DFO monitoring
Excessive quantity of noxious vehicle exhaust fumes
5 4 2 8 70 High - Manage vehicle fleet and movement of vehicles on site; - Limit the use of vehicles in poorly ventilated areas; - Where possible / practical, plan vehicle travel routes in such a manner as to allow for exhaust fumes to disperse sufficiently and not to affect air quality to the extent whereby exceedences of standards could occur; - Consider alternative options to vehicles with combustion engines;
4 4 1 2 28 Low Noxious fume monitoring to identify/establish level of compliance / non-compliance
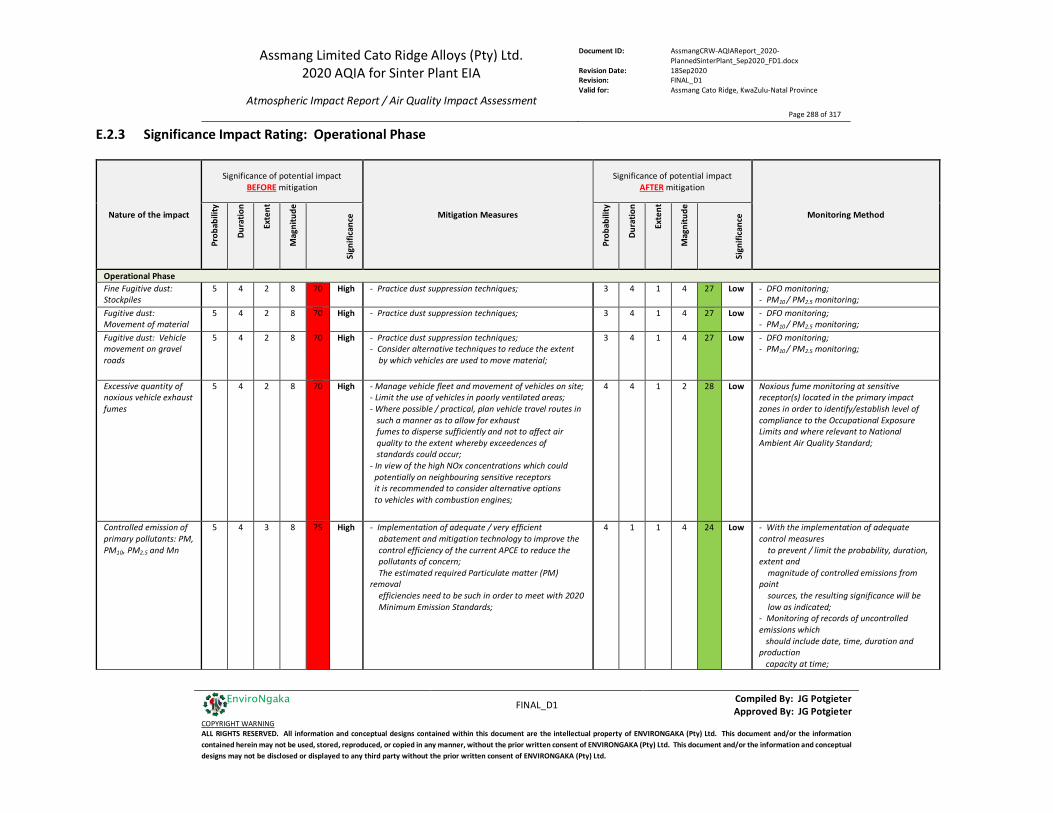
Assmang Limited Cato Ridge Alloys (Pty) Ltd. 2020 AQIA for Sinter Plant EIA
Atmospheric Impact Report / Air Quality Impact Assessment
Document ID: AssmangCRW-AQIAReport_2020-PlannedSinterPlant_Sep2020_FD1.docx
Revision Date: 18Sep2020 Revision: FINAL_D1 Valid for: Assmang Cato Ridge, KwaZulu-Natal Province
Page 288 of 317
FINAL_D1 Compiled By: JG Potgieter
Approved By: JG Potgieter COPYRIGHT WARNING ALL RIGHTS RESERVED. All information and conceptual designs contained within this document are the intellectual property of ENVIRONGAKA (Pty) Ltd. This document and/or the information contained herein may not be used, stored, reproduced, or copied in any manner, without the prior written consent of ENVIRONGAKA (Pty) Ltd. This document and/or the information and conceptual designs may not be disclosed or displayed to any third party without the prior written consent of ENVIRONGAKA (Pty) Ltd.
EnviroNgaka
E.2.3 Significance Impact Rating: Operational Phase
Nature of the impact
Significance of potential impact BEFORE mitigation
Mitigation Measures
Significance of potential impact AFTER mitigation
Monitoring Method Pr
obab
ility
Dura
tion
Exte
nt
Mag
nitu
de
Sign
ifica
nce
Prob
abili
ty
Dura
tion
Exte
nt
Mag
nitu
de
Sign
ifica
nce
Operational Phase Fine Fugitive dust: Stockpiles
5 4 2 8 70 High - Practice dust suppression techniques; 3 4 1 4 27 Low - DFO monitoring; - PM10 / PM2.5 monitoring;
Fugitive dust: Movement of material
5 4 2 8 70 High - Practice dust suppression techniques; 3 4 1 4 27 Low - DFO monitoring; - PM10 / PM2.5 monitoring;
Fugitive dust: Vehicle movement on gravel roads
5 4 2 8 70 High - Practice dust suppression techniques; - Consider alternative techniques to reduce the extent by which vehicles are used to move material;
3 4 1 4 27 Low - DFO monitoring; - PM10 / PM2.5 monitoring;
Excessive quantity of noxious vehicle exhaust fumes
5 4 2 8 70 High - Manage vehicle fleet and movement of vehicles on site; - Limit the use of vehicles in poorly ventilated areas; - Where possible / practical, plan vehicle travel routes in such a manner as to allow for exhaust fumes to disperse sufficiently and not to affect air quality to the extent whereby exceedences of standards could occur; - In view of the high NOx concentrations which could potentially on neighbouring sensitive receptors it is recommended to consider alternative options to vehicles with combustion engines;
4 4 1 2 28 Low Noxious fume monitoring at sensitive receptor(s) located in the primary impact zones in order to identify/establish level of compliance to the Occupational Exposure Limits and where relevant to National Ambient Air Quality Standard;
Controlled emission of primary pollutants: PM, PM10, PM2.5 and Mn
5 4 3 8 75 High - Implementation of adequate / very efficient abatement and mitigation technology to improve the control efficiency of the current APCE to reduce the pollutants of concern; The estimated required Particulate matter (PM) removal efficiencies need to be such in order to meet with 2020 Minimum Emission Standards;
4 1 1 4 24 Low - With the implementation of adequate control measures to prevent / limit the probability, duration, extent and magnitude of controlled emissions from point sources, the resulting significance will be low as indicated; - Monitoring of records of uncontrolled emissions which should include date, time, duration and production capacity at time;

Assmang Limited Cato Ridge Alloys (Pty) Ltd. 2020 AQIA for Sinter Plant EIA
Atmospheric Impact Report / Air Quality Impact Assessment
Document ID: AssmangCRW-AQIAReport_2020-PlannedSinterPlant_Sep2020_FD1.docx
Revision Date: 18Sep2020 Revision: FINAL_D1 Valid for: Assmang Cato Ridge, KwaZulu-Natal Province
Page 289 of 317
FINAL_D1 Compiled By: JG Potgieter
Approved By: JG Potgieter COPYRIGHT WARNING ALL RIGHTS RESERVED. All information and conceptual designs contained within this document are the intellectual property of ENVIRONGAKA (Pty) Ltd. This document and/or the information contained herein may not be used, stored, reproduced, or copied in any manner, without the prior written consent of ENVIRONGAKA (Pty) Ltd. This document and/or the information and conceptual designs may not be disclosed or displayed to any third party without the prior written consent of ENVIRONGAKA (Pty) Ltd.
EnviroNgaka
Uncontrolled emission of primary pollutants: PM, PM10, PM2.5 and Mn
5 4 3 10 85 High - Without the implementation of control measures to prevent / limit the probability, duration, extent and magnitude of uncontrolled emissions from point sources, the resulting significance will be extremely high as indicated; - Required to minimise the release of uncontrolled emissions to an absolute minimum since the impact thereof is significant; - Uncontrolled releases need to be limited with an availability/utilisation of at least 99.5%, ideally 99.8% (in terms of production time) for the abatement at the referenced efficiencies or better;
4 1 2 4 28 Low - With the implementation of control measures to prevent / limit the probability, duration, extent and magnitude of uncontrolled emissions from point sources, the resulting significance will be extremely low as indicated; - Monitoring of records of uncontrolled emissions which should include date, time, duration and production capacity at time;
E.2.4 Significance Impact Rating: Closure/Rehabilitation Phase
Nature of the impact
Significance of potential impact BEFORE mitigation
Mitigation Measures
Significance of potential impact AFTER mitigation
Monitoring Method
Prob
abili
ty
Dura
tion
Exte
nt
Mag
nitu
de
Sign
ifica
nce
Prob
abili
ty
Dura
tion
Exte
nt
Mag
nitu
de
Sign
ifica
nce
Closure/Rehabilitation Phase Fugitive dust: Increased LCV 5 2 1 4 35 Moderate - Manage site access and control
movement on site; - Practice dust suppression techniques;
4 2 3 2 28 Low DFO monitoring
Fugitive dust: Excavation work 5 4 3 10 85 High Practice dust suppression techniques; 3 4 1 4 27 Low None required Fugitive dust: Movement of material 5 4 3 10 85 High Practice dust suppression techniques; 3 4 1 4 27 Low DFO monitoring Fine Fugitive dust: Stockpiles 5 4 3 10 85 High Practice dust suppression techniques; 3 4 1 4 27 Low DFO monitoring
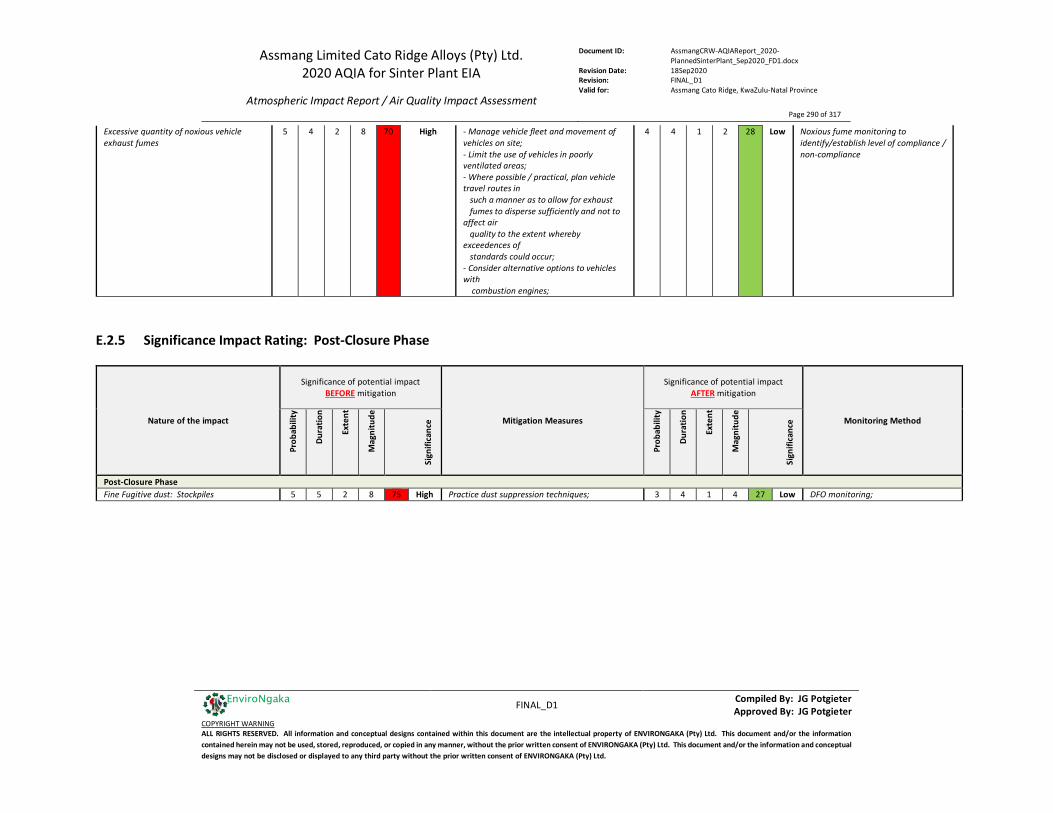
Assmang Limited Cato Ridge Alloys (Pty) Ltd. 2020 AQIA for Sinter Plant EIA
Atmospheric Impact Report / Air Quality Impact Assessment
Document ID: AssmangCRW-AQIAReport_2020-PlannedSinterPlant_Sep2020_FD1.docx
Revision Date: 18Sep2020 Revision: FINAL_D1 Valid for: Assmang Cato Ridge, KwaZulu-Natal Province
Page 290 of 317
FINAL_D1 Compiled By: JG Potgieter
Approved By: JG Potgieter COPYRIGHT WARNING ALL RIGHTS RESERVED. All information and conceptual designs contained within this document are the intellectual property of ENVIRONGAKA (Pty) Ltd. This document and/or the information contained herein may not be used, stored, reproduced, or copied in any manner, without the prior written consent of ENVIRONGAKA (Pty) Ltd. This document and/or the information and conceptual designs may not be disclosed or displayed to any third party without the prior written consent of ENVIRONGAKA (Pty) Ltd.
EnviroNgaka
Excessive quantity of noxious vehicle exhaust fumes
5 4 2 8 70 High - Manage vehicle fleet and movement of vehicles on site; - Limit the use of vehicles in poorly ventilated areas; - Where possible / practical, plan vehicle travel routes in such a manner as to allow for exhaust fumes to disperse sufficiently and not to affect air quality to the extent whereby exceedences of standards could occur; - Consider alternative options to vehicles with combustion engines;
4 4 1 2 28 Low Noxious fume monitoring to identify/establish level of compliance / non-compliance
E.2.5 Significance Impact Rating: Post-Closure Phase
Nature of the impact
Significance of potential impact BEFORE mitigation
Mitigation Measures
Significance of potential impact AFTER mitigation
Monitoring Method
Prob
abili
ty
Dura
tion
Exte
nt
Mag
nitu
de
Sign
ifica
nce
Prob
abili
ty
Dura
tion
Exte
nt
Mag
nitu
de
Sign
ifica
nce
Post-Closure Phase Fine Fugitive dust: Stockpiles 5 5 2 8 75 High Practice dust suppression techniques; 3 4 1 4 27 Low DFO monitoring;
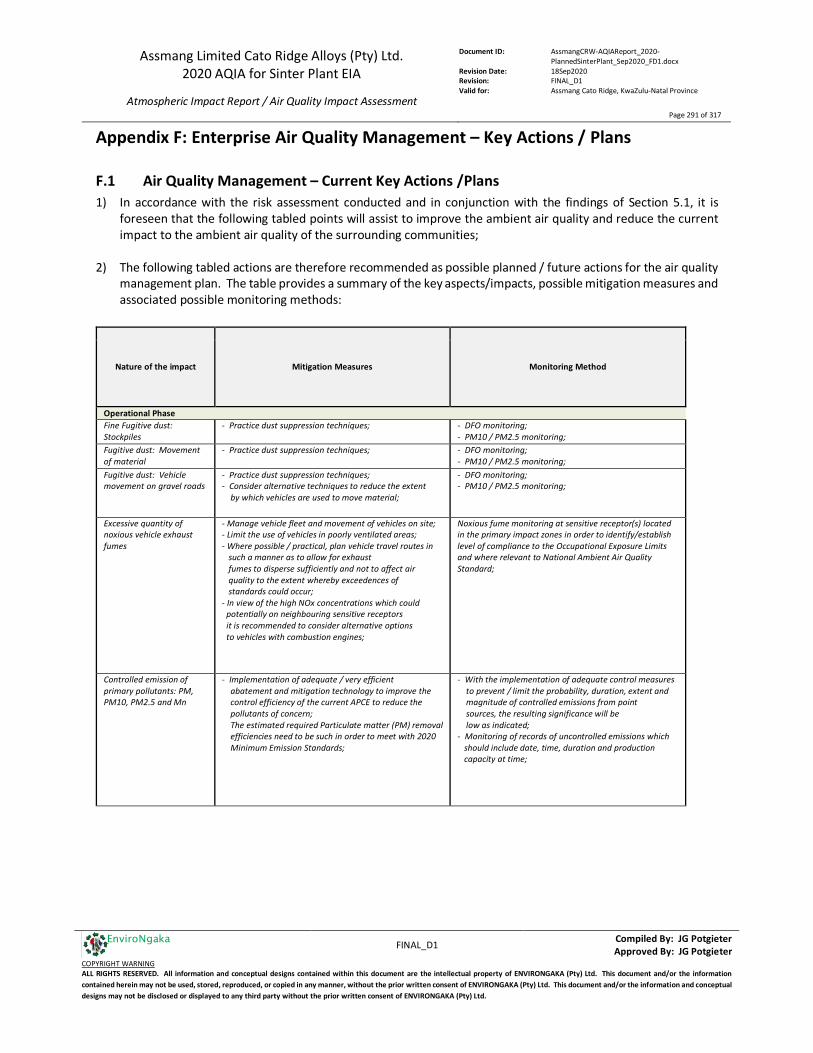
Assmang Limited Cato Ridge Alloys (Pty) Ltd. 2020 AQIA for Sinter Plant EIA
Atmospheric Impact Report / Air Quality Impact Assessment
Document ID: AssmangCRW-AQIAReport_2020-PlannedSinterPlant_Sep2020_FD1.docx
Revision Date: 18Sep2020 Revision: FINAL_D1 Valid for: Assmang Cato Ridge, KwaZulu-Natal Province
Page 291 of 317
FINAL_D1 Compiled By: JG Potgieter
Approved By: JG Potgieter COPYRIGHT WARNING ALL RIGHTS RESERVED. All information and conceptual designs contained within this document are the intellectual property of ENVIRONGAKA (Pty) Ltd. This document and/or the information contained herein may not be used, stored, reproduced, or copied in any manner, without the prior written consent of ENVIRONGAKA (Pty) Ltd. This document and/or the information and conceptual designs may not be disclosed or displayed to any third party without the prior written consent of ENVIRONGAKA (Pty) Ltd.
EnviroNgaka
Appendix F: Enterprise Air Quality Management – Key Actions / Plans
F.1 Air Quality Management – Current Key Actions /Plans 1) In accordance with the risk assessment conducted and in conjunction with the findings of Section 5.1, it is
foreseen that the following tabled points will assist to improve the ambient air quality and reduce the current impact to the ambient air quality of the surrounding communities;
2) The following tabled actions are therefore recommended as possible planned / future actions for the air quality management plan. The table provides a summary of the key aspects/impacts, possible mitigation measures and associated possible monitoring methods:
Nature of the impact Mitigation Measures Monitoring Method
Operational Phase Fine Fugitive dust: Stockpiles
- Practice dust suppression techniques; - DFO monitoring; - PM10 / PM2.5 monitoring;
Fugitive dust: Movement of material
- Practice dust suppression techniques; - DFO monitoring; - PM10 / PM2.5 monitoring;
Fugitive dust: Vehicle movement on gravel roads
- Practice dust suppression techniques; - Consider alternative techniques to reduce the extent by which vehicles are used to move material;
- DFO monitoring; - PM10 / PM2.5 monitoring;
Excessive quantity of noxious vehicle exhaust fumes
- Manage vehicle fleet and movement of vehicles on site; - Limit the use of vehicles in poorly ventilated areas; - Where possible / practical, plan vehicle travel routes in such a manner as to allow for exhaust fumes to disperse sufficiently and not to affect air quality to the extent whereby exceedences of standards could occur; - In view of the high NOx concentrations which could potentially on neighbouring sensitive receptors it is recommended to consider alternative options to vehicles with combustion engines;
Noxious fume monitoring at sensitive receptor(s) located in the primary impact zones in order to identify/establish level of compliance to the Occupational Exposure Limits and where relevant to National Ambient Air Quality Standard;
Controlled emission of primary pollutants: PM, PM10, PM2.5 and Mn
- Implementation of adequate / very efficient abatement and mitigation technology to improve the control efficiency of the current APCE to reduce the pollutants of concern; The estimated required Particulate matter (PM) removal efficiencies need to be such in order to meet with 2020 Minimum Emission Standards;
- With the implementation of adequate control measures to prevent / limit the probability, duration, extent and magnitude of controlled emissions from point sources, the resulting significance will be low as indicated; - Monitoring of records of uncontrolled emissions which should include date, time, duration and production capacity at time;

Assmang Limited Cato Ridge Alloys (Pty) Ltd. 2020 AQIA for Sinter Plant EIA
Atmospheric Impact Report / Air Quality Impact Assessment
Document ID: AssmangCRW-AQIAReport_2020-PlannedSinterPlant_Sep2020_FD1.docx
Revision Date: 18Sep2020 Revision: FINAL_D1 Valid for: Assmang Cato Ridge, KwaZulu-Natal Province
Page 292 of 317
FINAL_D1 Compiled By: JG Potgieter
Approved By: JG Potgieter COPYRIGHT WARNING ALL RIGHTS RESERVED. All information and conceptual designs contained within this document are the intellectual property of ENVIRONGAKA (Pty) Ltd. This document and/or the information contained herein may not be used, stored, reproduced, or copied in any manner, without the prior written consent of ENVIRONGAKA (Pty) Ltd. This document and/or the information and conceptual designs may not be disclosed or displayed to any third party without the prior written consent of ENVIRONGAKA (Pty) Ltd.
EnviroNgaka
Uncontrolled emission of primary pollutants: PM, PM10, PM2.5 and Mn
- Without the implementation of control measures to prevent / limit the probability, duration, extent and magnitude of uncontrolled emissions from point sources, the resulting significance will be extremely high as indicated; - Required to minimise the release of uncontrolled emissions to an absolute minimum since the impact thereof is significant; - Uncontrolled releases need to be limited with an availability/utilisation of at least 99.5%, ideally 99.8% (in terms of production time) for the abatement at the referenced efficiencies or better;
- With the implementation of control measures to prevent / limit the probability, duration, extent and magnitude of uncontrolled emissions from point sources, the resulting significance will be extremely low as indicated; - Monitoring of records of uncontrolled emissions which should include date, time, duration and production capacity at time;
F.2 Air Quality Management – Planned Key Actions/Plans Whilst ensuring that AEL limits are met, it is recommended to focus attention on:
1) Maintaining measures to minimise the release of abnormal emissions (raw gas and tapping/casting fugitives) to an absolute minimum since the impact thereof is potentially significant;
2) Maintaining the application of efficient dust abatement and suppression techniques in order to minimise overall particulate emissions;
3) Limiting vehicle movement and associated diesel consumption as far as possible;
4) Limiting fugitive emissions;
5) Aforementioned points will individually and collectively minimise emissions and impact of manganese;
Assmang Limited Cato Ridge Alloys (Pty) Ltd. 2020 AQIA for Sinter Plant EIA
Atmospheric Impact Report / Air Quality Impact Assessment
Document ID: AssmangCRW-AQIAReport_2020-PlannedSinterPlant_Sep2020_FD1.docx
Revision Date: 18Sep2020 Revision: FINAL_D1 Valid for: Assmang Cato Ridge, KwaZulu-Natal Province
Page 293 of 317
FINAL_D1 Compiled By: JG Potgieter
Approved By: JG Potgieter COPYRIGHT WARNING ALL RIGHTS RESERVED. All information and conceptual designs contained within this document are the intellectual property of ENVIRONGAKA (Pty) Ltd. This document and/or the information contained herein may not be used, stored, reproduced, or copied in any manner, without the prior written consent of ENVIRONGAKA (Pty) Ltd. This document and/or the information and conceptual designs may not be disclosed or displayed to any third party without the prior written consent of ENVIRONGAKA (Pty) Ltd.
EnviroNgaka
Appendix RADM: Regulations Regarding Air Dispersion Modelling In terms of Section 53(f) of the National Environmental Management: Air Quality Act (NEM:AQA), 2004 (Act No. 39 of 2004), the Department of Environmental Affairs (DEA) has developed and published a CODE OF PRACTICE FOR AIR DISPERSION MODELLING IN AIR QUALITY MANAGEMENT IN SOUTH AFRICA under GN533, "REGULATIONS REGARDING AIR DISPERSION MODELLING, 2014" in Government Gazette No. 37804 on 11 July 2014. The Code of Practice is prescribed as the technical Code of Practice for air dispersion modelling which provides technical standards on the application of air dispersion models as contained in Appendix A of the aforementioned regulation. The Code of Practice for air dispersion modelling is applicable: a. in the development of an air quality management plan, as contemplated in Chapter 3 of the Act; b. in the development of a priority area air quality management plan, as contemplated in Section 19 of the Act; c. in the development of an atmospheric impact report, as contemplated in Section 30 of the Act; and d. in the development of a specialist air quality impact assessment study, as contemplated in Section 37(2)(b) of
the Act; In accordance with the application of the Code of Practice to an atmospheric impact report or a specialist air quality impact assessment study, this assessment is submitted in accordance with the prescribed format of an atmospheric impact report, as published by DEA on 11 October 2013 in Government Gazette No. 36904 under GN747 as the "REGULATIONS PRESCRIBING THE FORMAT OF THE ATMOSPHERIC IMPACT REPORT" in terms of Section 53(o) read with Section 30 of the Act. In accordance with Section 7.2 of the Regulations Regarding Air Dispersion Modelling, 2014, the information required for the study and the report are provided as follows hereafter: a. Table RADM.10: Information required in the Plan of Study Report; and b. Table RADM.11: Information required in the Air Dispersion Modelling Study Report; It provides an overview of important information included as minimum requirement in the final report to enable sufficient review and decision making by the authority. Additional relevant information provided is specified as such if applicable
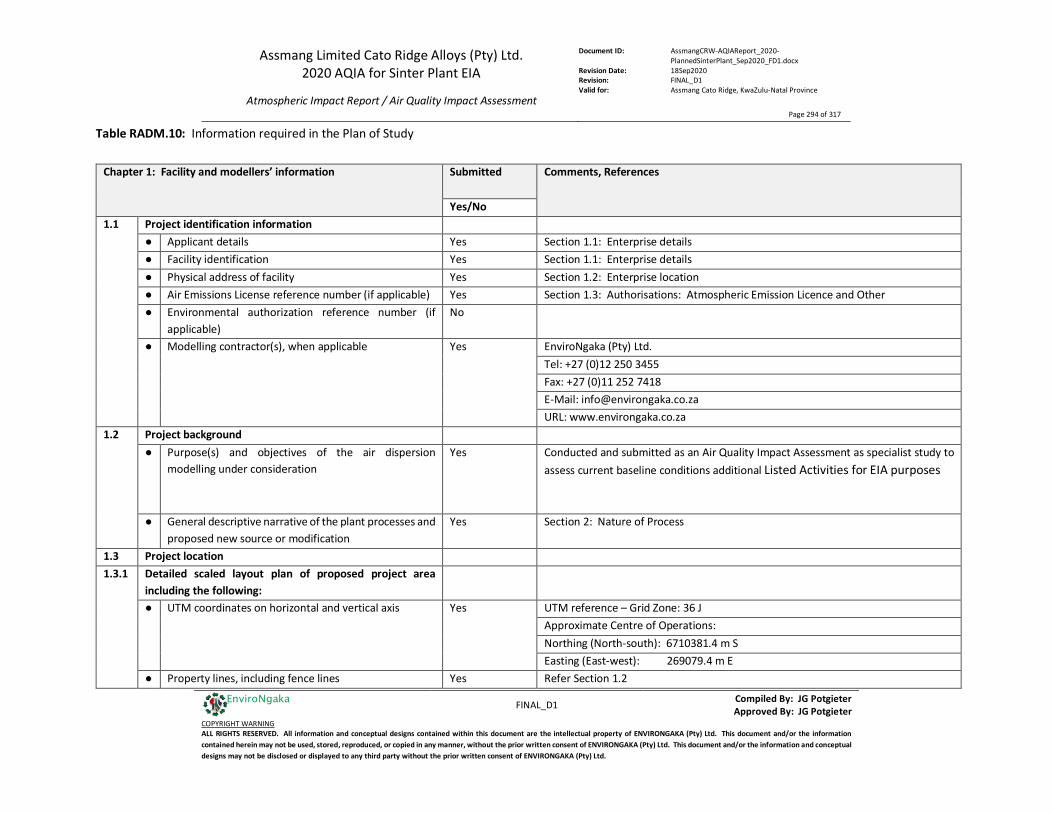
Assmang Limited Cato Ridge Alloys (Pty) Ltd. 2020 AQIA for Sinter Plant EIA
Atmospheric Impact Report / Air Quality Impact Assessment
Document ID: AssmangCRW-AQIAReport_2020-PlannedSinterPlant_Sep2020_FD1.docx
Revision Date: 18Sep2020 Revision: FINAL_D1 Valid for: Assmang Cato Ridge, KwaZulu-Natal Province
Page 294 of 317
FINAL_D1 Compiled By: JG Potgieter
Approved By: JG Potgieter COPYRIGHT WARNING ALL RIGHTS RESERVED. All information and conceptual designs contained within this document are the intellectual property of ENVIRONGAKA (Pty) Ltd. This document and/or the information contained herein may not be used, stored, reproduced, or copied in any manner, without the prior written consent of ENVIRONGAKA (Pty) Ltd. This document and/or the information and conceptual designs may not be disclosed or displayed to any third party without the prior written consent of ENVIRONGAKA (Pty) Ltd.
EnviroNgaka
Table RADM.10: Information required in the Plan of Study
Chapter 1: Facility and modellers’ information Submitted Comments, References
Yes/No 1.1 Project identification information
● Applicant details Yes Section 1.1: Enterprise details ● Facility identification Yes Section 1.1: Enterprise details ● Physical address of facility Yes Section 1.2: Enterprise location ● Air Emissions License reference number (if applicable) Yes Section 1.3: Authorisations: Atmospheric Emission Licence and Other ● Environmental authorization reference number (if
applicable) No
● Modelling contractor(s), when applicable Yes EnviroNgaka (Pty) Ltd. Tel: +27 (0)12 250 3455 Fax: +27 (0)11 252 7418 E-Mail: [email protected]
URL: www.environgaka.co.za
1.2 Project background ● Purpose(s) and objectives of the air dispersion
modelling under consideration Yes Conducted and submitted as an Air Quality Impact Assessment as specialist study to
assess current baseline conditions additional Listed Activities for EIA purposes
● General descriptive narrative of the plant processes and proposed new source or modification
Yes Section 2: Nature of Process
1.3 Project location 1.3.1 Detailed scaled layout plan of proposed project area
including the following:
● UTM coordinates on horizontal and vertical axis Yes UTM reference – Grid Zone: 36 J Approximate Centre of Operations: Northing (North-south): 6710381.4 m S Easting (East-west): 269079.4 m E
● Property lines, including fence lines Yes Refer Section 1.2
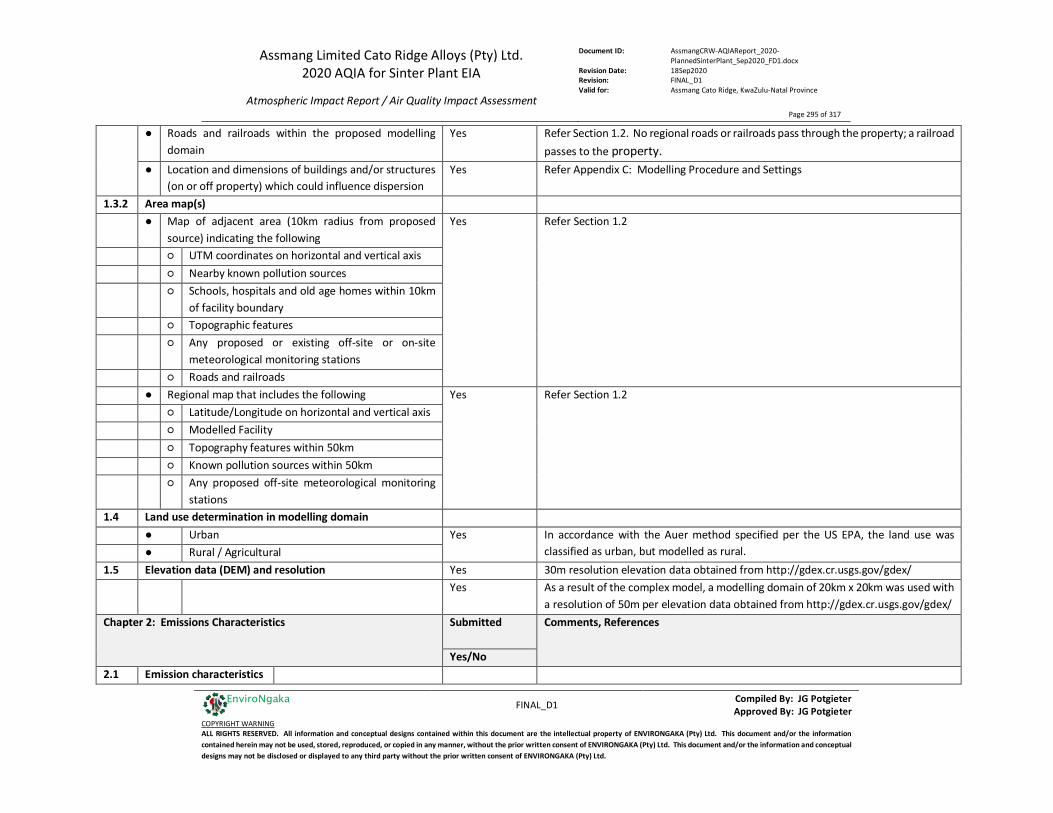
Assmang Limited Cato Ridge Alloys (Pty) Ltd. 2020 AQIA for Sinter Plant EIA
Atmospheric Impact Report / Air Quality Impact Assessment
Document ID: AssmangCRW-AQIAReport_2020-PlannedSinterPlant_Sep2020_FD1.docx
Revision Date: 18Sep2020 Revision: FINAL_D1 Valid for: Assmang Cato Ridge, KwaZulu-Natal Province
Page 295 of 317
FINAL_D1 Compiled By: JG Potgieter
Approved By: JG Potgieter COPYRIGHT WARNING ALL RIGHTS RESERVED. All information and conceptual designs contained within this document are the intellectual property of ENVIRONGAKA (Pty) Ltd. This document and/or the information contained herein may not be used, stored, reproduced, or copied in any manner, without the prior written consent of ENVIRONGAKA (Pty) Ltd. This document and/or the information and conceptual designs may not be disclosed or displayed to any third party without the prior written consent of ENVIRONGAKA (Pty) Ltd.
EnviroNgaka
● Roads and railroads within the proposed modelling domain
Yes Refer Section 1.2. No regional roads or railroads pass through the property; a railroad passes to the property.
● Location and dimensions of buildings and/or structures (on or off property) which could influence dispersion
Yes Refer Appendix C: Modelling Procedure and Settings
1.3.2 Area map(s) ● Map of adjacent area (10km radius from proposed
source) indicating the following Yes Refer Section 1.2
○ UTM coordinates on horizontal and vertical axis
○ Nearby known pollution sources
○ Schools, hospitals and old age homes within 10km of facility boundary
○ Topographic features
○ Any proposed or existing off-site or on-site
meteorological monitoring stations
○ Roads and railroads
● Regional map that includes the following Yes Refer Section 1.2
○ Latitude/Longitude on horizontal and vertical axis
○ Modelled Facility
○ Topography features within 50km
○ Known pollution sources within 50km ○ Any proposed off-site meteorological monitoring
stations 1.4 Land use determination in modelling domain ● Urban Yes In accordance with the Auer method specified per the US EPA, the land use was
classified as urban, but modelled as rural. ● Rural / Agricultural 1.5 Elevation data (DEM) and resolution Yes 30m resolution elevation data obtained from http://gdex.cr.usgs.gov/gdex/ Yes As a result of the complex model, a modelling domain of 20km x 20km was used with
a resolution of 50m per elevation data obtained from http://gdex.cr.usgs.gov/gdex/ Chapter 2: Emissions Characteristics Submitted Comments, References
Yes/No 2.1 Emission characteristics
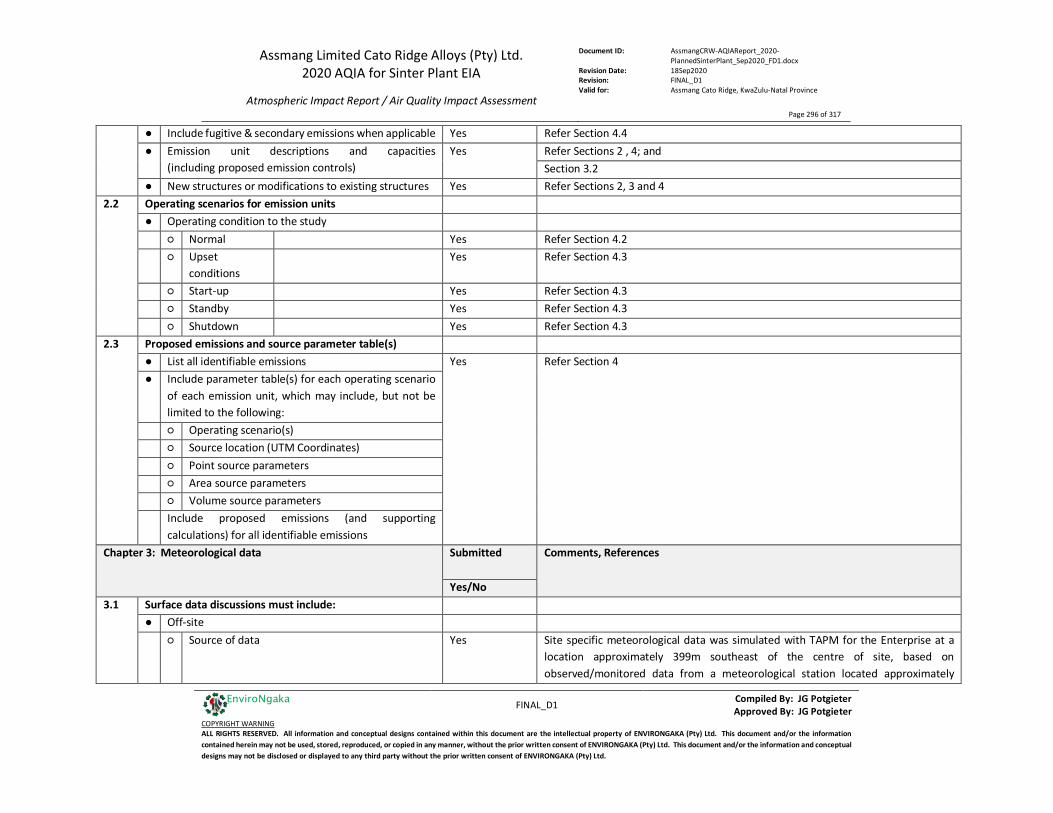
Assmang Limited Cato Ridge Alloys (Pty) Ltd. 2020 AQIA for Sinter Plant EIA
Atmospheric Impact Report / Air Quality Impact Assessment
Document ID: AssmangCRW-AQIAReport_2020-PlannedSinterPlant_Sep2020_FD1.docx
Revision Date: 18Sep2020 Revision: FINAL_D1 Valid for: Assmang Cato Ridge, KwaZulu-Natal Province
Page 296 of 317
FINAL_D1 Compiled By: JG Potgieter
Approved By: JG Potgieter COPYRIGHT WARNING ALL RIGHTS RESERVED. All information and conceptual designs contained within this document are the intellectual property of ENVIRONGAKA (Pty) Ltd. This document and/or the information contained herein may not be used, stored, reproduced, or copied in any manner, without the prior written consent of ENVIRONGAKA (Pty) Ltd. This document and/or the information and conceptual designs may not be disclosed or displayed to any third party without the prior written consent of ENVIRONGAKA (Pty) Ltd.
EnviroNgaka
● Include fugitive & secondary emissions when applicable Yes Refer Section 4.4 ● Emission unit descriptions and capacities
(including proposed emission controls) Yes Refer Sections 2 , 4; and
Section 3.2 ● New structures or modifications to existing structures Yes Refer Sections 2, 3 and 4
2.2 Operating scenarios for emission units ● Operating condition to the study
○ Normal
Yes Refer Section 4.2 ○ Upset
conditions Yes Refer Section 4.3
○ Start-up Yes Refer Section 4.3 ○ Standby Yes Refer Section 4.3
○ Shutdown Yes Refer Section 4.3 2.3 Proposed emissions and source parameter table(s)
● List all identifiable emissions Yes Refer Section 4 ● Include parameter table(s) for each operating scenario
of each emission unit, which may include, but not be limited to the following: ○ Operating scenario(s) ○ Source location (UTM Coordinates) ○ Point source parameters ○ Area source parameters ○ Volume source parameters
Include proposed emissions (and supporting calculations) for all identifiable emissions
Chapter 3: Meteorological data Submitted Comments, References
Yes/No 3.1 Surface data discussions must include:
● Off-site ○ Source of data Yes Site specific meteorological data was simulated with TAPM for the Enterprise at a
location approximately 399m southeast of the centre of site, based on observed/monitored data from a meteorological station located approximately
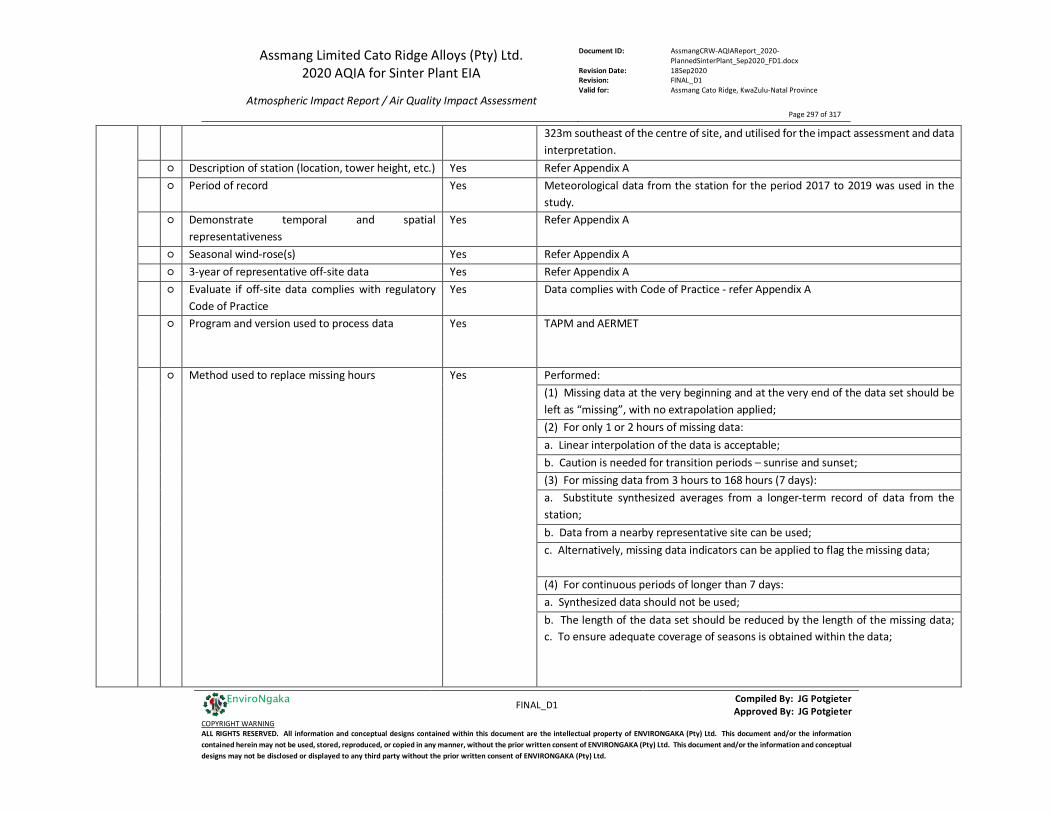
Assmang Limited Cato Ridge Alloys (Pty) Ltd. 2020 AQIA for Sinter Plant EIA
Atmospheric Impact Report / Air Quality Impact Assessment
Document ID: AssmangCRW-AQIAReport_2020-PlannedSinterPlant_Sep2020_FD1.docx
Revision Date: 18Sep2020 Revision: FINAL_D1 Valid for: Assmang Cato Ridge, KwaZulu-Natal Province
Page 297 of 317
FINAL_D1 Compiled By: JG Potgieter
Approved By: JG Potgieter COPYRIGHT WARNING ALL RIGHTS RESERVED. All information and conceptual designs contained within this document are the intellectual property of ENVIRONGAKA (Pty) Ltd. This document and/or the information contained herein may not be used, stored, reproduced, or copied in any manner, without the prior written consent of ENVIRONGAKA (Pty) Ltd. This document and/or the information and conceptual designs may not be disclosed or displayed to any third party without the prior written consent of ENVIRONGAKA (Pty) Ltd.
EnviroNgaka
323m southeast of the centre of site, and utilised for the impact assessment and data interpretation.
○ Description of station (location, tower height, etc.) Yes Refer Appendix A ○ Period of record Yes Meteorological data from the station for the period 2017 to 2019 was used in the
study. ○ Demonstrate temporal and spatial
representativeness Yes Refer Appendix A
○ Seasonal wind-rose(s) Yes Refer Appendix A ○ 3-year of representative off-site data Yes Refer Appendix A ○ Evaluate if off-site data complies with regulatory
Code of Practice Yes Data complies with Code of Practice - refer Appendix A
○ Program and version used to process data Yes TAPM and AERMET
○ Method used to replace missing hours Yes Performed:
(1) Missing data at the very beginning and at the very end of the data set should be left as “missing”, with no extrapolation applied; (2) For only 1 or 2 hours of missing data: a. Linear interpolation of the data is acceptable; b. Caution is needed for transition periods – sunrise and sunset; (3) For missing data from 3 hours to 168 hours (7 days): a. Substitute synthesized averages from a longer-term record of data from the station; b. Data from a nearby representative site can be used; c. Alternatively, missing data indicators can be applied to flag the missing data;
(4) For continuous periods of longer than 7 days: a. Synthesized data should not be used; b. The length of the data set should be reduced by the length of the missing data; c. To ensure adequate coverage of seasons is obtained within the data;
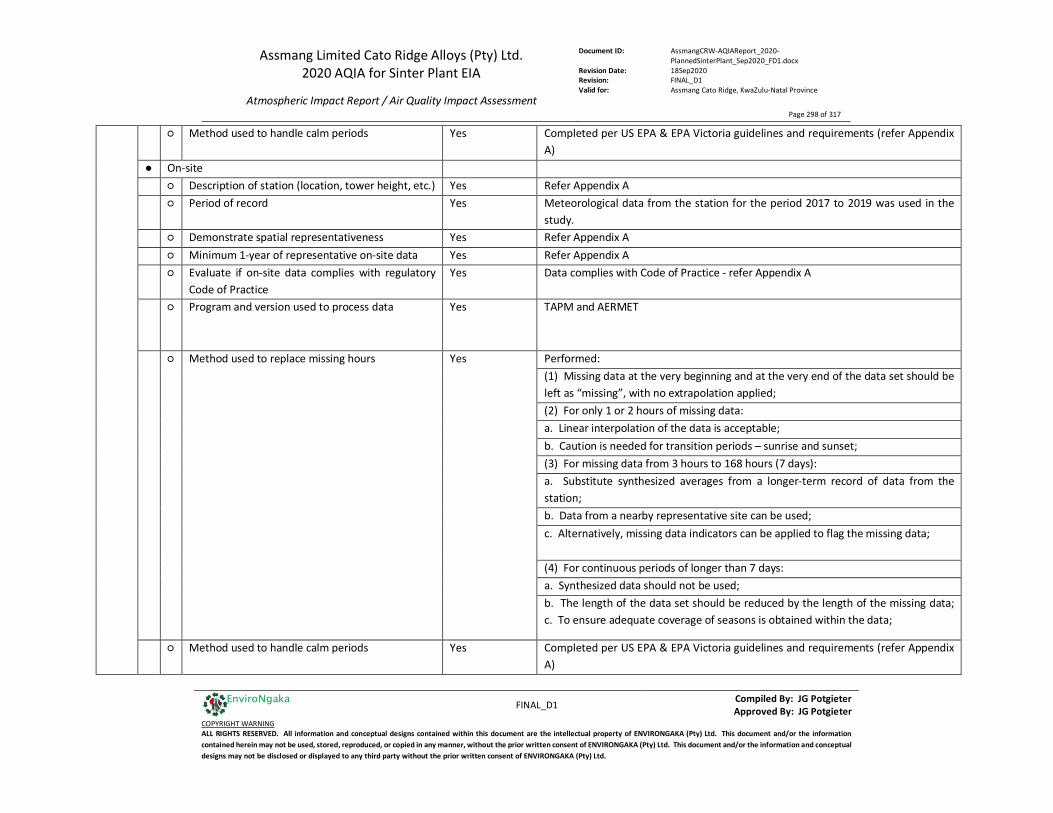
Assmang Limited Cato Ridge Alloys (Pty) Ltd. 2020 AQIA for Sinter Plant EIA
Atmospheric Impact Report / Air Quality Impact Assessment
Document ID: AssmangCRW-AQIAReport_2020-PlannedSinterPlant_Sep2020_FD1.docx
Revision Date: 18Sep2020 Revision: FINAL_D1 Valid for: Assmang Cato Ridge, KwaZulu-Natal Province
Page 298 of 317
FINAL_D1 Compiled By: JG Potgieter
Approved By: JG Potgieter COPYRIGHT WARNING ALL RIGHTS RESERVED. All information and conceptual designs contained within this document are the intellectual property of ENVIRONGAKA (Pty) Ltd. This document and/or the information contained herein may not be used, stored, reproduced, or copied in any manner, without the prior written consent of ENVIRONGAKA (Pty) Ltd. This document and/or the information and conceptual designs may not be disclosed or displayed to any third party without the prior written consent of ENVIRONGAKA (Pty) Ltd.
EnviroNgaka
○ Method used to handle calm periods Yes Completed per US EPA & EPA Victoria guidelines and requirements (refer Appendix
A) ● On-site
○ Description of station (location, tower height, etc.) Yes Refer Appendix A ○ Period of record Yes Meteorological data from the station for the period 2017 to 2019 was used in the
study. ○ Demonstrate spatial representativeness Yes Refer Appendix A ○ Minimum 1-year of representative on-site data Yes Refer Appendix A ○ Evaluate if on-site data complies with regulatory
Code of Practice Yes Data complies with Code of Practice - refer Appendix A
○ Program and version used to process data Yes TAPM and AERMET
○ Method used to replace missing hours Yes Performed:
(1) Missing data at the very beginning and at the very end of the data set should be left as “missing”, with no extrapolation applied; (2) For only 1 or 2 hours of missing data: a. Linear interpolation of the data is acceptable; b. Caution is needed for transition periods – sunrise and sunset; (3) For missing data from 3 hours to 168 hours (7 days): a. Substitute synthesized averages from a longer-term record of data from the station; b. Data from a nearby representative site can be used; c. Alternatively, missing data indicators can be applied to flag the missing data;
(4) For continuous periods of longer than 7 days: a. Synthesized data should not be used; b. The length of the data set should be reduced by the length of the missing data; c. To ensure adequate coverage of seasons is obtained within the data;
○ Method used to handle calm periods Yes Completed per US EPA & EPA Victoria guidelines and requirements (refer Appendix A)
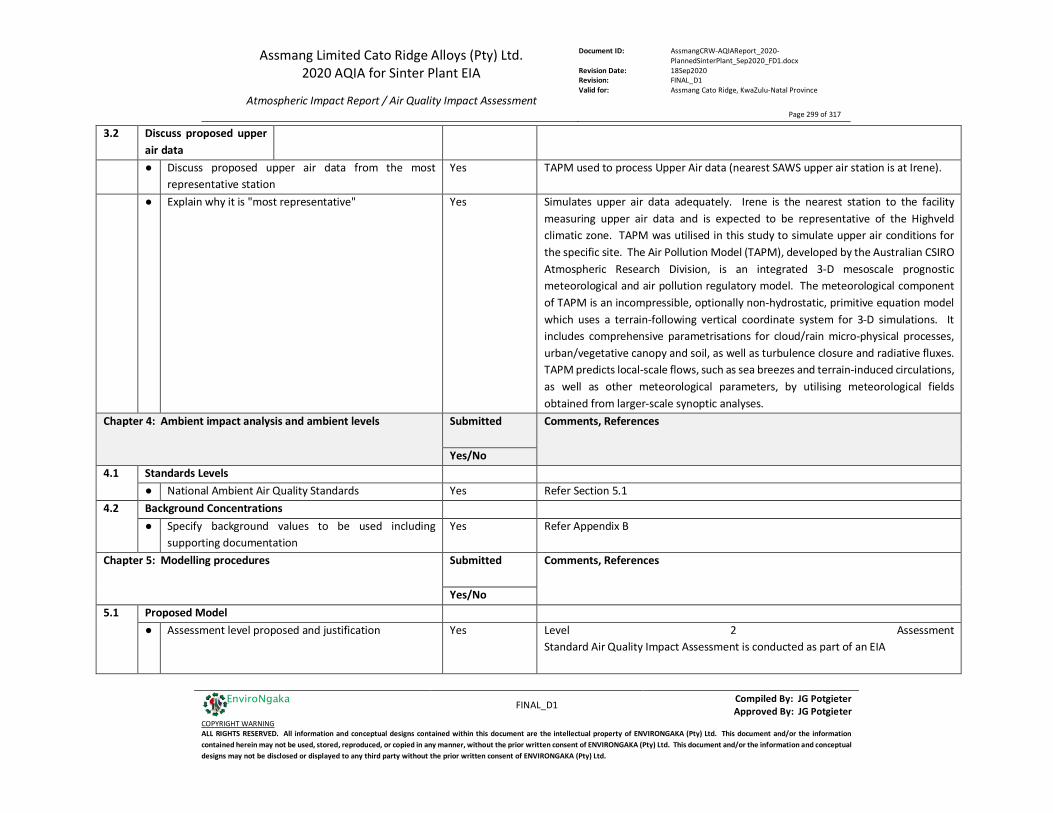
Assmang Limited Cato Ridge Alloys (Pty) Ltd. 2020 AQIA for Sinter Plant EIA
Atmospheric Impact Report / Air Quality Impact Assessment
Document ID: AssmangCRW-AQIAReport_2020-PlannedSinterPlant_Sep2020_FD1.docx
Revision Date: 18Sep2020 Revision: FINAL_D1 Valid for: Assmang Cato Ridge, KwaZulu-Natal Province
Page 299 of 317
FINAL_D1 Compiled By: JG Potgieter
Approved By: JG Potgieter COPYRIGHT WARNING ALL RIGHTS RESERVED. All information and conceptual designs contained within this document are the intellectual property of ENVIRONGAKA (Pty) Ltd. This document and/or the information contained herein may not be used, stored, reproduced, or copied in any manner, without the prior written consent of ENVIRONGAKA (Pty) Ltd. This document and/or the information and conceptual designs may not be disclosed or displayed to any third party without the prior written consent of ENVIRONGAKA (Pty) Ltd.
EnviroNgaka
3.2 Discuss proposed upper air data
● Discuss proposed upper air data from the most representative station
Yes TAPM used to process Upper Air data (nearest SAWS upper air station is at Irene).
● Explain why it is "most representative" Yes Simulates upper air data adequately. Irene is the nearest station to the facility measuring upper air data and is expected to be representative of the Highveld climatic zone. TAPM was utilised in this study to simulate upper air conditions for the specific site. The Air Pollution Model (TAPM), developed by the Australian CSIRO Atmospheric Research Division, is an integrated 3-D mesoscale prognostic meteorological and air pollution regulatory model. The meteorological component of TAPM is an incompressible, optionally non-hydrostatic, primitive equation model which uses a terrain-following vertical coordinate system for 3-D simulations. It includes comprehensive parametrisations for cloud/rain micro-physical processes, urban/vegetative canopy and soil, as well as turbulence closure and radiative fluxes. TAPM predicts local-scale flows, such as sea breezes and terrain-induced circulations, as well as other meteorological parameters, by utilising meteorological fields obtained from larger-scale synoptic analyses.
Chapter 4: Ambient impact analysis and ambient levels Submitted Comments, References
Yes/No 4.1 Standards Levels
● National Ambient Air Quality Standards Yes Refer Section 5.1 4.2 Background Concentrations
● Specify background values to be used including supporting documentation
Yes Refer Appendix B
Chapter 5: Modelling procedures Submitted Comments, References
Yes/No 5.1 Proposed Model
● Assessment level proposed and justification Yes Level 2 Assessment Standard Air Quality Impact Assessment is conducted as part of an EIA
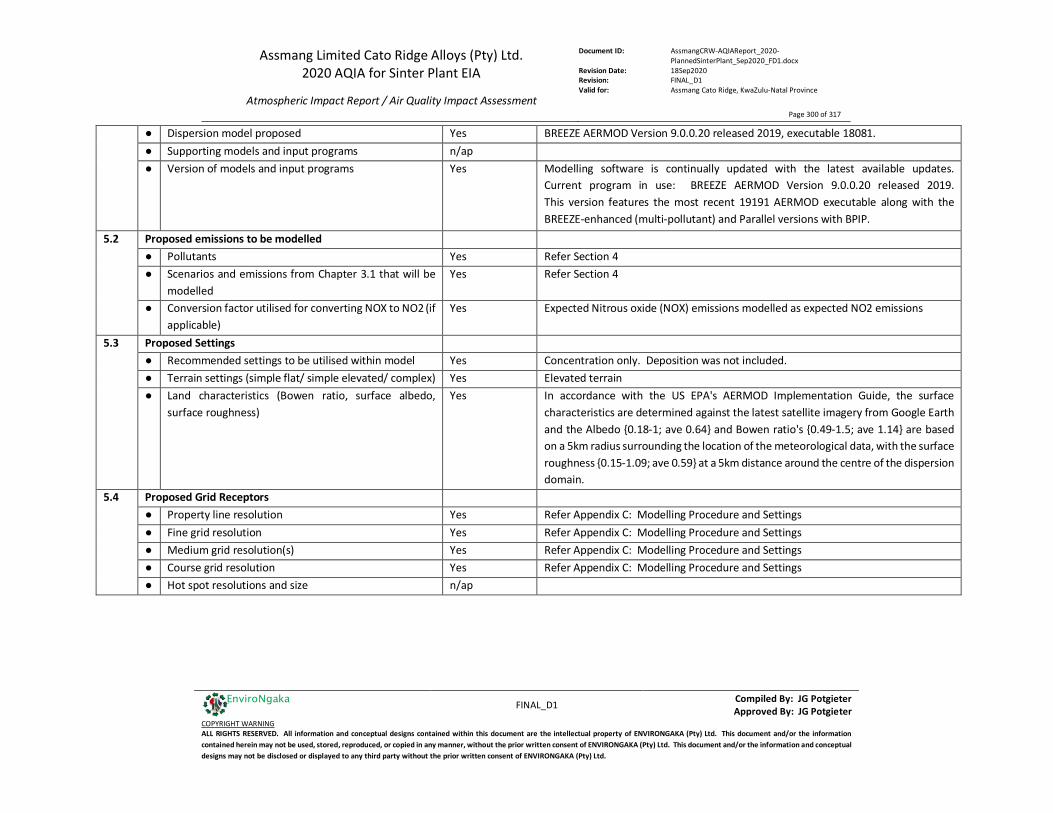
Assmang Limited Cato Ridge Alloys (Pty) Ltd. 2020 AQIA for Sinter Plant EIA
Atmospheric Impact Report / Air Quality Impact Assessment
Document ID: AssmangCRW-AQIAReport_2020-PlannedSinterPlant_Sep2020_FD1.docx
Revision Date: 18Sep2020 Revision: FINAL_D1 Valid for: Assmang Cato Ridge, KwaZulu-Natal Province
Page 300 of 317
FINAL_D1 Compiled By: JG Potgieter
Approved By: JG Potgieter COPYRIGHT WARNING ALL RIGHTS RESERVED. All information and conceptual designs contained within this document are the intellectual property of ENVIRONGAKA (Pty) Ltd. This document and/or the information contained herein may not be used, stored, reproduced, or copied in any manner, without the prior written consent of ENVIRONGAKA (Pty) Ltd. This document and/or the information and conceptual designs may not be disclosed or displayed to any third party without the prior written consent of ENVIRONGAKA (Pty) Ltd.
EnviroNgaka
● Dispersion model proposed Yes BREEZE AERMOD Version 9.0.0.20 released 2019, executable 18081. ● Supporting models and input programs n/ap ● Version of models and input programs Yes Modelling software is continually updated with the latest available updates.
Current program in use: BREEZE AERMOD Version 9.0.0.20 released 2019. This version features the most recent 19191 AERMOD executable along with the BREEZE-enhanced (multi-pollutant) and Parallel versions with BPIP.
5.2 Proposed emissions to be modelled ● Pollutants Yes Refer Section 4 ● Scenarios and emissions from Chapter 3.1 that will be
modelled Yes Refer Section 4
● Conversion factor utilised for converting NOX to NO2 (if applicable)
Yes Expected Nitrous oxide (NOX) emissions modelled as expected NO2 emissions
5.3 Proposed Settings ● Recommended settings to be utilised within model Yes Concentration only. Deposition was not included. ● Terrain settings (simple flat/ simple elevated/ complex) Yes Elevated terrain ● Land characteristics (Bowen ratio, surface albedo,
surface roughness) Yes In accordance with the US EPA's AERMOD Implementation Guide, the surface
characteristics are determined against the latest satellite imagery from Google Earth and the Albedo {0.18-1; ave 0.64} and Bowen ratio's {0.49-1.5; ave 1.14} are based on a 5km radius surrounding the location of the meteorological data, with the surface roughness {0.15-1.09; ave 0.59} at a 5km distance around the centre of the dispersion domain.
5.4 Proposed Grid Receptors ● Property line resolution Yes Refer Appendix C: Modelling Procedure and Settings ● Fine grid resolution Yes Refer Appendix C: Modelling Procedure and Settings ● Medium grid resolution(s) Yes Refer Appendix C: Modelling Procedure and Settings ● Course grid resolution Yes Refer Appendix C: Modelling Procedure and Settings ● Hot spot resolutions and size n/ap
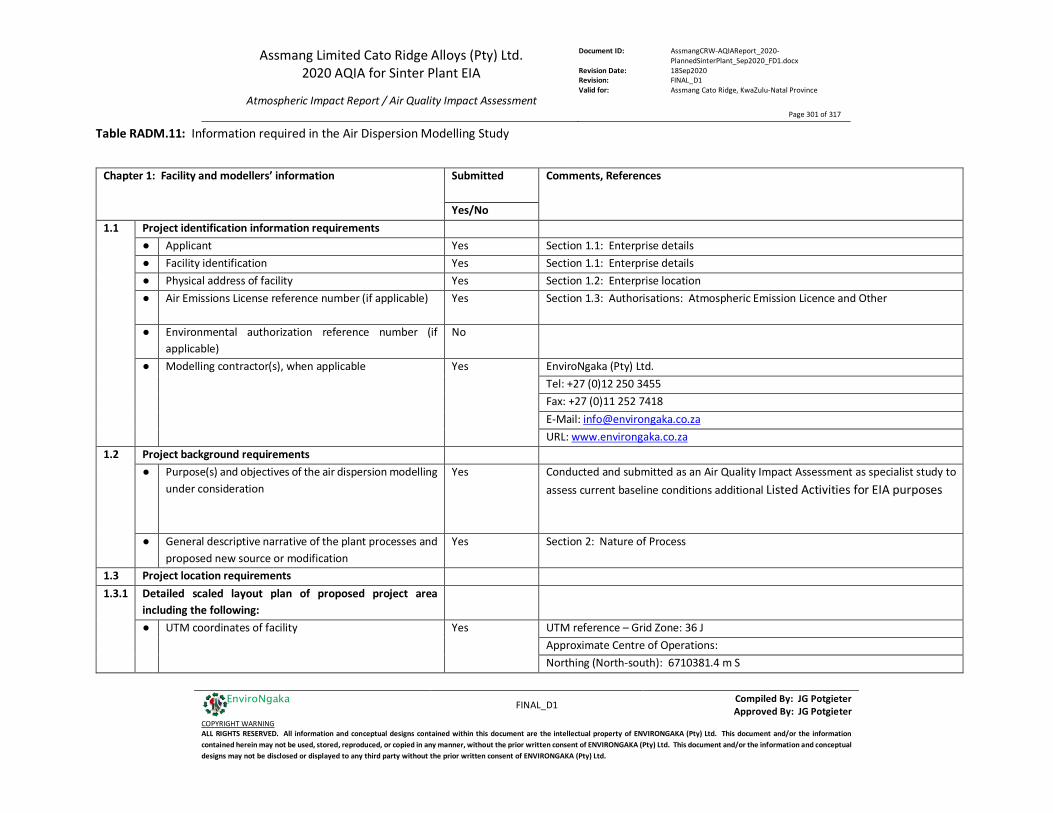
Assmang Limited Cato Ridge Alloys (Pty) Ltd. 2020 AQIA for Sinter Plant EIA
Atmospheric Impact Report / Air Quality Impact Assessment
Document ID: AssmangCRW-AQIAReport_2020-PlannedSinterPlant_Sep2020_FD1.docx
Revision Date: 18Sep2020 Revision: FINAL_D1 Valid for: Assmang Cato Ridge, KwaZulu-Natal Province
Page 301 of 317
FINAL_D1 Compiled By: JG Potgieter
Approved By: JG Potgieter COPYRIGHT WARNING ALL RIGHTS RESERVED. All information and conceptual designs contained within this document are the intellectual property of ENVIRONGAKA (Pty) Ltd. This document and/or the information contained herein may not be used, stored, reproduced, or copied in any manner, without the prior written consent of ENVIRONGAKA (Pty) Ltd. This document and/or the information and conceptual designs may not be disclosed or displayed to any third party without the prior written consent of ENVIRONGAKA (Pty) Ltd.
EnviroNgaka
Table RADM.11: Information required in the Air Dispersion Modelling Study
Chapter 1: Facility and modellers’ information Submitted Comments, References
Yes/No 1.1 Project identification information requirements
● Applicant Yes Section 1.1: Enterprise details ● Facility identification Yes Section 1.1: Enterprise details ● Physical address of facility Yes Section 1.2: Enterprise location ● Air Emissions License reference number (if applicable) Yes Section 1.3: Authorisations: Atmospheric Emission Licence and Other
● Environmental authorization reference number (if applicable)
No
● Modelling contractor(s), when applicable Yes EnviroNgaka (Pty) Ltd. Tel: +27 (0)12 250 3455 Fax: +27 (0)11 252 7418 E-Mail: [email protected]
URL: www.environgaka.co.za
1.2 Project background requirements ● Purpose(s) and objectives of the air dispersion modelling
under consideration Yes Conducted and submitted as an Air Quality Impact Assessment as specialist study to
assess current baseline conditions additional Listed Activities for EIA purposes
● General descriptive narrative of the plant processes and proposed new source or modification
Yes Section 2: Nature of Process
1.3 Project location requirements 1.3.1 Detailed scaled layout plan of proposed project area
including the following:
● UTM coordinates of facility Yes UTM reference – Grid Zone: 36 J Approximate Centre of Operations: Northing (North-south): 6710381.4 m S
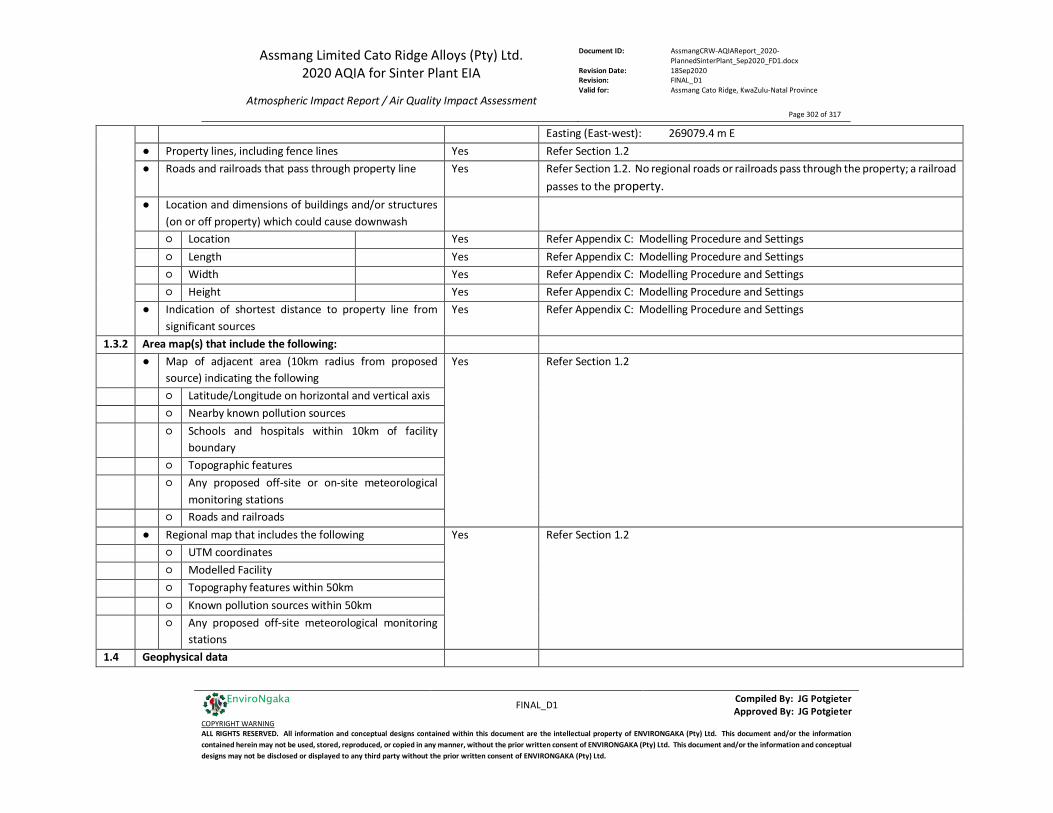
Assmang Limited Cato Ridge Alloys (Pty) Ltd. 2020 AQIA for Sinter Plant EIA
Atmospheric Impact Report / Air Quality Impact Assessment
Document ID: AssmangCRW-AQIAReport_2020-PlannedSinterPlant_Sep2020_FD1.docx
Revision Date: 18Sep2020 Revision: FINAL_D1 Valid for: Assmang Cato Ridge, KwaZulu-Natal Province
Page 302 of 317
FINAL_D1 Compiled By: JG Potgieter
Approved By: JG Potgieter COPYRIGHT WARNING ALL RIGHTS RESERVED. All information and conceptual designs contained within this document are the intellectual property of ENVIRONGAKA (Pty) Ltd. This document and/or the information contained herein may not be used, stored, reproduced, or copied in any manner, without the prior written consent of ENVIRONGAKA (Pty) Ltd. This document and/or the information and conceptual designs may not be disclosed or displayed to any third party without the prior written consent of ENVIRONGAKA (Pty) Ltd.
EnviroNgaka
Easting (East-west): 269079.4 m E ● Property lines, including fence lines Yes Refer Section 1.2 ● Roads and railroads that pass through property line Yes Refer Section 1.2. No regional roads or railroads pass through the property; a railroad
passes to the property. ● Location and dimensions of buildings and/or structures
(on or off property) which could cause downwash
○ Location Yes Refer Appendix C: Modelling Procedure and Settings ○ Length Yes Refer Appendix C: Modelling Procedure and Settings ○ Width Yes Refer Appendix C: Modelling Procedure and Settings ○ Height Yes Refer Appendix C: Modelling Procedure and Settings
● Indication of shortest distance to property line from significant sources
Yes Refer Appendix C: Modelling Procedure and Settings
1.3.2 Area map(s) that include the following: ● Map of adjacent area (10km radius from proposed
source) indicating the following Yes Refer Section 1.2
○ Latitude/Longitude on horizontal and vertical axis
○ Nearby known pollution sources
○ Schools and hospitals within 10km of facility boundary
○ Topographic features
○ Any proposed off-site or on-site meteorological
monitoring stations
○ Roads and railroads
● Regional map that includes the following Yes Refer Section 1.2
○ UTM coordinates
○ Modelled Facility
○ Topography features within 50km
○ Known pollution sources within 50km ○ Any proposed off-site meteorological monitoring
stations 1.4 Geophysical data
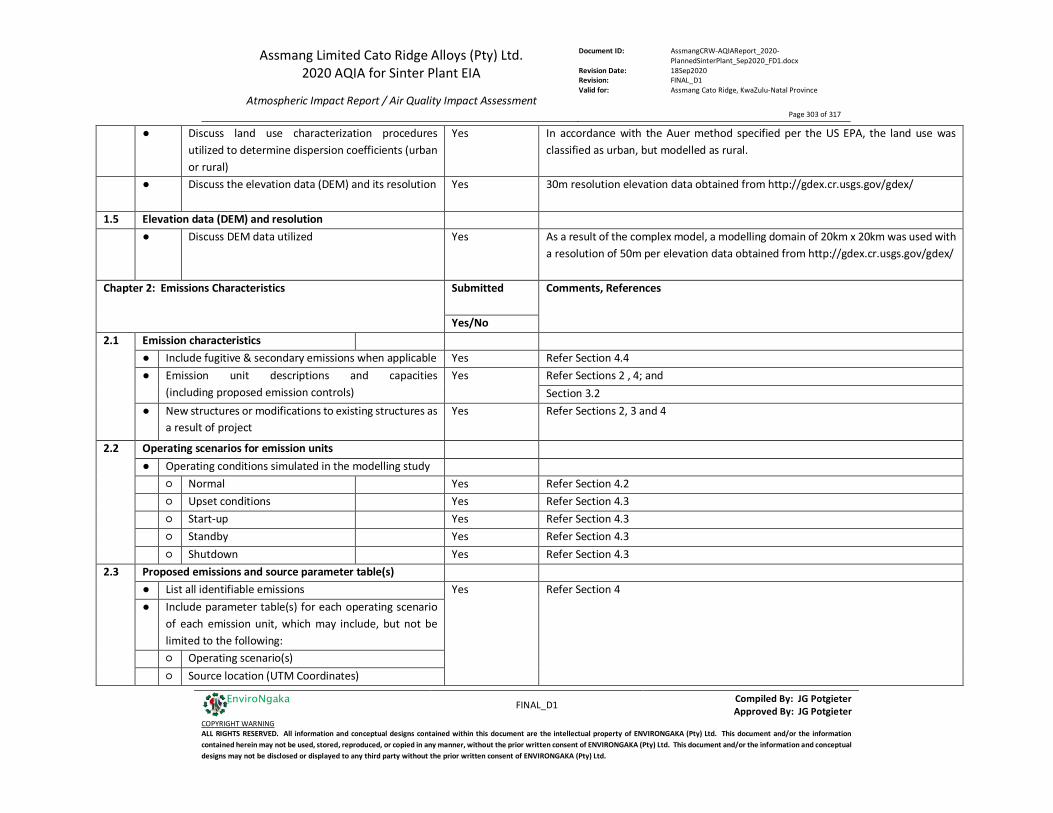
Assmang Limited Cato Ridge Alloys (Pty) Ltd. 2020 AQIA for Sinter Plant EIA
Atmospheric Impact Report / Air Quality Impact Assessment
Document ID: AssmangCRW-AQIAReport_2020-PlannedSinterPlant_Sep2020_FD1.docx
Revision Date: 18Sep2020 Revision: FINAL_D1 Valid for: Assmang Cato Ridge, KwaZulu-Natal Province
Page 303 of 317
FINAL_D1 Compiled By: JG Potgieter
Approved By: JG Potgieter COPYRIGHT WARNING ALL RIGHTS RESERVED. All information and conceptual designs contained within this document are the intellectual property of ENVIRONGAKA (Pty) Ltd. This document and/or the information contained herein may not be used, stored, reproduced, or copied in any manner, without the prior written consent of ENVIRONGAKA (Pty) Ltd. This document and/or the information and conceptual designs may not be disclosed or displayed to any third party without the prior written consent of ENVIRONGAKA (Pty) Ltd.
EnviroNgaka
● Discuss land use characterization procedures utilized to determine dispersion coefficients (urban or rural)
Yes In accordance with the Auer method specified per the US EPA, the land use was classified as urban, but modelled as rural.
● Discuss the elevation data (DEM) and its resolution Yes 30m resolution elevation data obtained from http://gdex.cr.usgs.gov/gdex/
1.5 Elevation data (DEM) and resolution ● Discuss DEM data utilized Yes As a result of the complex model, a modelling domain of 20km x 20km was used with
a resolution of 50m per elevation data obtained from http://gdex.cr.usgs.gov/gdex/
Chapter 2: Emissions Characteristics Submitted Comments, References
Yes/No 2.1 Emission characteristics
● Include fugitive & secondary emissions when applicable Yes Refer Section 4.4 ● Emission unit descriptions and capacities
(including proposed emission controls) Yes Refer Sections 2 , 4; and
Section 3.2 ● New structures or modifications to existing structures as
a result of project Yes Refer Sections 2, 3 and 4
2.2 Operating scenarios for emission units ● Operating conditions simulated in the modelling study
○ Normal Yes Refer Section 4.2 ○ Upset conditions Yes Refer Section 4.3 ○ Start-up Yes Refer Section 4.3 ○ Standby Yes Refer Section 4.3
○ Shutdown Yes Refer Section 4.3 2.3 Proposed emissions and source parameter table(s)
● List all identifiable emissions Yes Refer Section 4 ● Include parameter table(s) for each operating scenario
of each emission unit, which may include, but not be limited to the following: ○ Operating scenario(s) ○ Source location (UTM Coordinates)
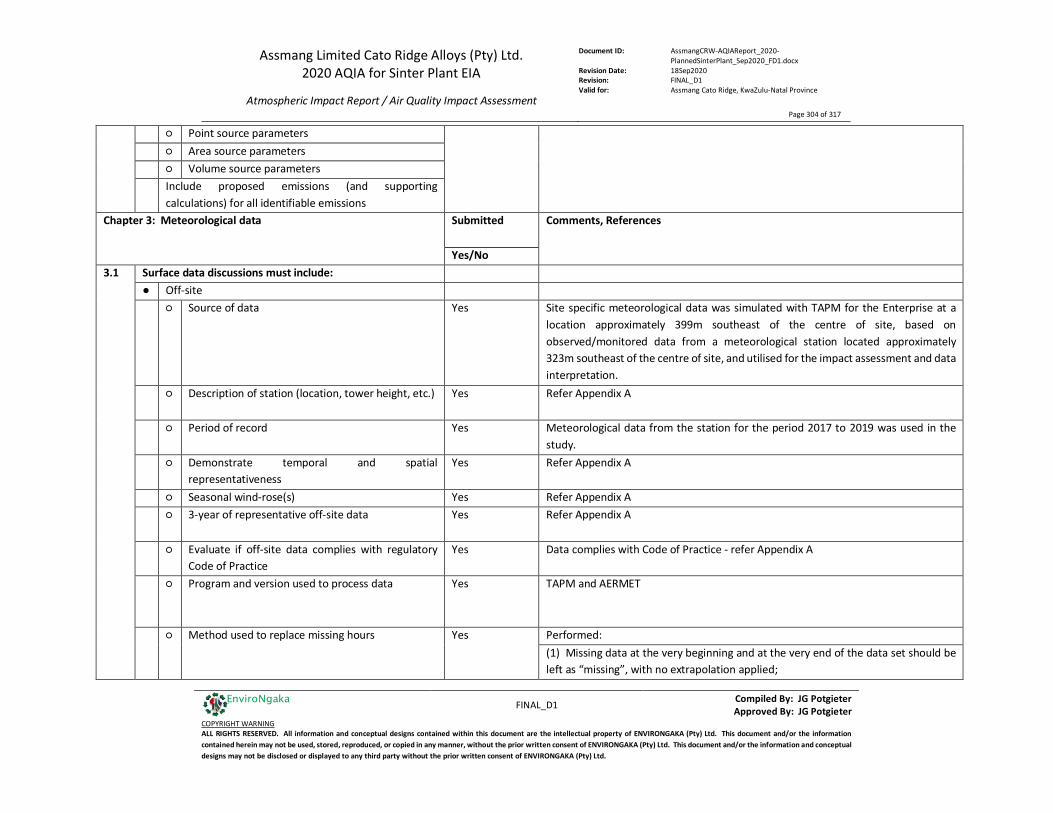
Assmang Limited Cato Ridge Alloys (Pty) Ltd. 2020 AQIA for Sinter Plant EIA
Atmospheric Impact Report / Air Quality Impact Assessment
Document ID: AssmangCRW-AQIAReport_2020-PlannedSinterPlant_Sep2020_FD1.docx
Revision Date: 18Sep2020 Revision: FINAL_D1 Valid for: Assmang Cato Ridge, KwaZulu-Natal Province
Page 304 of 317
FINAL_D1 Compiled By: JG Potgieter
Approved By: JG Potgieter COPYRIGHT WARNING ALL RIGHTS RESERVED. All information and conceptual designs contained within this document are the intellectual property of ENVIRONGAKA (Pty) Ltd. This document and/or the information contained herein may not be used, stored, reproduced, or copied in any manner, without the prior written consent of ENVIRONGAKA (Pty) Ltd. This document and/or the information and conceptual designs may not be disclosed or displayed to any third party without the prior written consent of ENVIRONGAKA (Pty) Ltd.
EnviroNgaka
○ Point source parameters ○ Area source parameters ○ Volume source parameters
Include proposed emissions (and supporting calculations) for all identifiable emissions
Chapter 3: Meteorological data Submitted Comments, References
Yes/No 3.1 Surface data discussions must include:
● Off-site ○ Source of data Yes Site specific meteorological data was simulated with TAPM for the Enterprise at a
location approximately 399m southeast of the centre of site, based on observed/monitored data from a meteorological station located approximately 323m southeast of the centre of site, and utilised for the impact assessment and data interpretation.
○ Description of station (location, tower height, etc.) Yes Refer Appendix A
○ Period of record Yes Meteorological data from the station for the period 2017 to 2019 was used in the
study. ○ Demonstrate temporal and spatial
representativeness Yes Refer Appendix A
○ Seasonal wind-rose(s) Yes Refer Appendix A ○ 3-year of representative off-site data Yes Refer Appendix A
○ Evaluate if off-site data complies with regulatory
Code of Practice Yes Data complies with Code of Practice - refer Appendix A
○ Program and version used to process data Yes TAPM and AERMET
○ Method used to replace missing hours Yes Performed:
(1) Missing data at the very beginning and at the very end of the data set should be left as “missing”, with no extrapolation applied;

Assmang Limited Cato Ridge Alloys (Pty) Ltd. 2020 AQIA for Sinter Plant EIA
Atmospheric Impact Report / Air Quality Impact Assessment
Document ID: AssmangCRW-AQIAReport_2020-PlannedSinterPlant_Sep2020_FD1.docx
Revision Date: 18Sep2020 Revision: FINAL_D1 Valid for: Assmang Cato Ridge, KwaZulu-Natal Province
Page 305 of 317
FINAL_D1 Compiled By: JG Potgieter
Approved By: JG Potgieter COPYRIGHT WARNING ALL RIGHTS RESERVED. All information and conceptual designs contained within this document are the intellectual property of ENVIRONGAKA (Pty) Ltd. This document and/or the information contained herein may not be used, stored, reproduced, or copied in any manner, without the prior written consent of ENVIRONGAKA (Pty) Ltd. This document and/or the information and conceptual designs may not be disclosed or displayed to any third party without the prior written consent of ENVIRONGAKA (Pty) Ltd.
EnviroNgaka
(2) For only 1 or 2 hours of missing data: a. Linear interpolation of the data is acceptable; b. Caution is needed for transition periods – sunrise and sunset; (3) For missing data from 3 hours to 168 hours (7 days): a. Substitute synthesized averages from a longer-term record of data from the station; b. Data from a nearby representative site can be used; c. Alternatively, missing data indicators can be applied to flag the missing data;
(4) For continuous periods of longer than 7 days: a. Synthesized data should not be used; b. The length of the data set should be reduced by the length of the missing data; c. To ensure adequate coverage of seasons is obtained within the data;
○ Method used to handle calm periods Yes Completed per US EPA & EPA Victoria guidelines and requirements (refer Appendix A)
3.1 ● On-site ○ Description of station (location, tower height, etc.) Yes Refer Appendix A ○ Period of record Yes Meteorological data from the station for the period 2017 to 2019 was used in the
study. ○ Demonstrate spatial representativeness Yes Refer Appendix A ○ Minimum 1-year of representative on-site data Yes Refer Appendix A ○ Evaluate if on-site data complies with regulatory
Code of Practice Yes Data complies with Code of Practice - refer Appendix A
○ Program and version used to process data Yes TAPM and AERMET ○ Method used to replace missing hours Yes Performed:
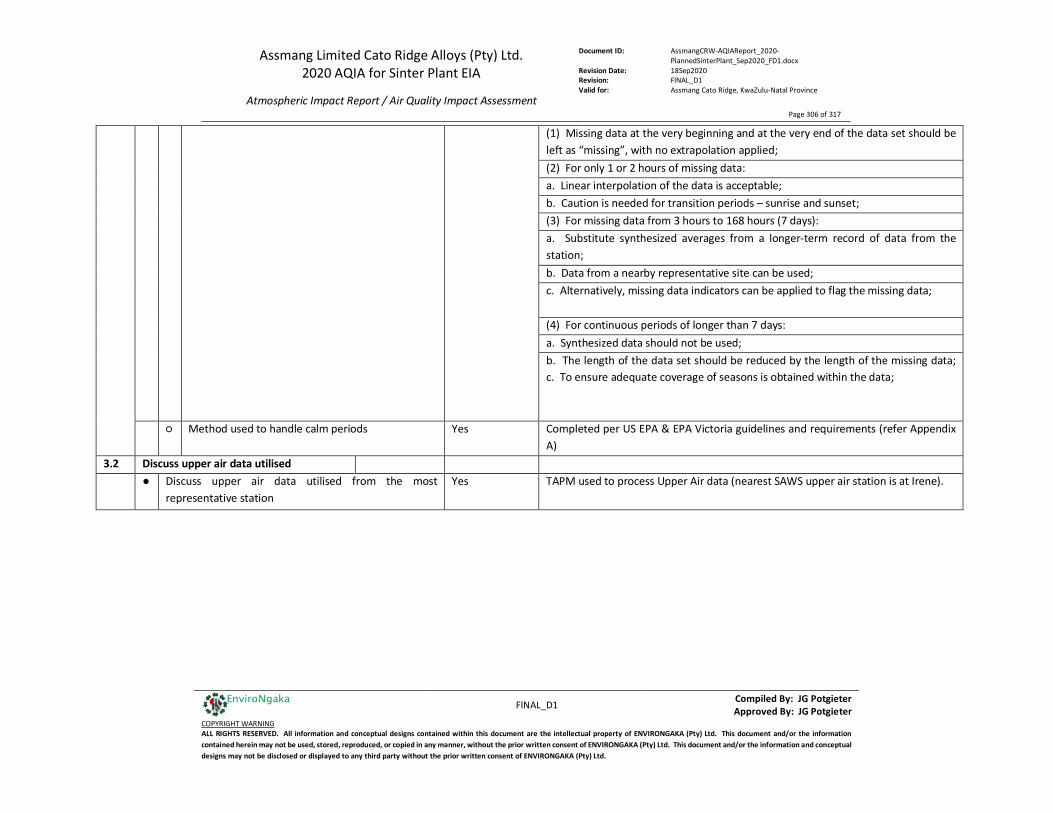
Assmang Limited Cato Ridge Alloys (Pty) Ltd. 2020 AQIA for Sinter Plant EIA
Atmospheric Impact Report / Air Quality Impact Assessment
Document ID: AssmangCRW-AQIAReport_2020-PlannedSinterPlant_Sep2020_FD1.docx
Revision Date: 18Sep2020 Revision: FINAL_D1 Valid for: Assmang Cato Ridge, KwaZulu-Natal Province
Page 306 of 317
FINAL_D1 Compiled By: JG Potgieter
Approved By: JG Potgieter COPYRIGHT WARNING ALL RIGHTS RESERVED. All information and conceptual designs contained within this document are the intellectual property of ENVIRONGAKA (Pty) Ltd. This document and/or the information contained herein may not be used, stored, reproduced, or copied in any manner, without the prior written consent of ENVIRONGAKA (Pty) Ltd. This document and/or the information and conceptual designs may not be disclosed or displayed to any third party without the prior written consent of ENVIRONGAKA (Pty) Ltd.
EnviroNgaka
(1) Missing data at the very beginning and at the very end of the data set should be left as “missing”, with no extrapolation applied; (2) For only 1 or 2 hours of missing data: a. Linear interpolation of the data is acceptable; b. Caution is needed for transition periods – sunrise and sunset; (3) For missing data from 3 hours to 168 hours (7 days): a. Substitute synthesized averages from a longer-term record of data from the station; b. Data from a nearby representative site can be used; c. Alternatively, missing data indicators can be applied to flag the missing data;
(4) For continuous periods of longer than 7 days: a. Synthesized data should not be used; b. The length of the data set should be reduced by the length of the missing data; c. To ensure adequate coverage of seasons is obtained within the data;
○ Method used to handle calm periods Yes Completed per US EPA & EPA Victoria guidelines and requirements (refer Appendix A)
3.2 Discuss upper air data utilised ● Discuss upper air data utilised from the most
representative station Yes TAPM used to process Upper Air data (nearest SAWS upper air station is at Irene).
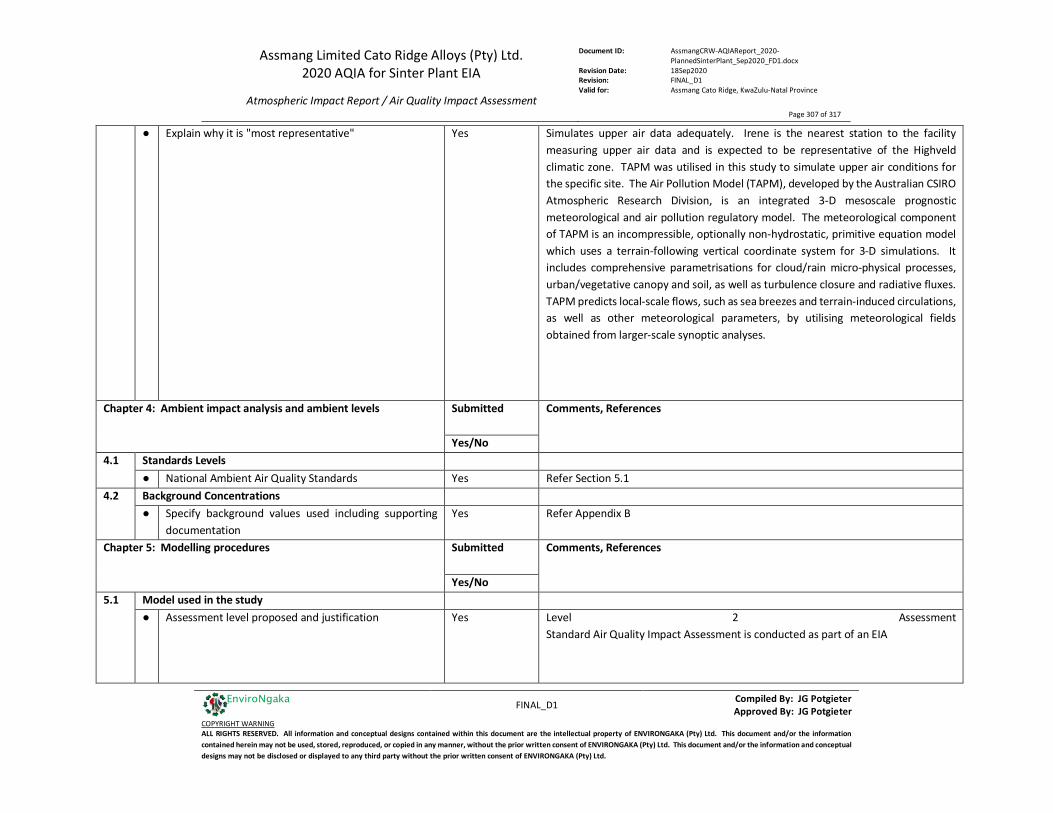
Assmang Limited Cato Ridge Alloys (Pty) Ltd. 2020 AQIA for Sinter Plant EIA
Atmospheric Impact Report / Air Quality Impact Assessment
Document ID: AssmangCRW-AQIAReport_2020-PlannedSinterPlant_Sep2020_FD1.docx
Revision Date: 18Sep2020 Revision: FINAL_D1 Valid for: Assmang Cato Ridge, KwaZulu-Natal Province
Page 307 of 317
FINAL_D1 Compiled By: JG Potgieter
Approved By: JG Potgieter COPYRIGHT WARNING ALL RIGHTS RESERVED. All information and conceptual designs contained within this document are the intellectual property of ENVIRONGAKA (Pty) Ltd. This document and/or the information contained herein may not be used, stored, reproduced, or copied in any manner, without the prior written consent of ENVIRONGAKA (Pty) Ltd. This document and/or the information and conceptual designs may not be disclosed or displayed to any third party without the prior written consent of ENVIRONGAKA (Pty) Ltd.
EnviroNgaka
● Explain why it is "most representative" Yes Simulates upper air data adequately. Irene is the nearest station to the facility measuring upper air data and is expected to be representative of the Highveld climatic zone. TAPM was utilised in this study to simulate upper air conditions for the specific site. The Air Pollution Model (TAPM), developed by the Australian CSIRO Atmospheric Research Division, is an integrated 3-D mesoscale prognostic meteorological and air pollution regulatory model. The meteorological component of TAPM is an incompressible, optionally non-hydrostatic, primitive equation model which uses a terrain-following vertical coordinate system for 3-D simulations. It includes comprehensive parametrisations for cloud/rain micro-physical processes, urban/vegetative canopy and soil, as well as turbulence closure and radiative fluxes. TAPM predicts local-scale flows, such as sea breezes and terrain-induced circulations, as well as other meteorological parameters, by utilising meteorological fields obtained from larger-scale synoptic analyses.
Chapter 4: Ambient impact analysis and ambient levels Submitted Comments, References
Yes/No 4.1 Standards Levels
● National Ambient Air Quality Standards Yes Refer Section 5.1 4.2 Background Concentrations
● Specify background values used including supporting documentation
Yes Refer Appendix B
Chapter 5: Modelling procedures Submitted Comments, References
Yes/No 5.1 Model used in the study
● Assessment level proposed and justification Yes Level 2 Assessment Standard Air Quality Impact Assessment is conducted as part of an EIA
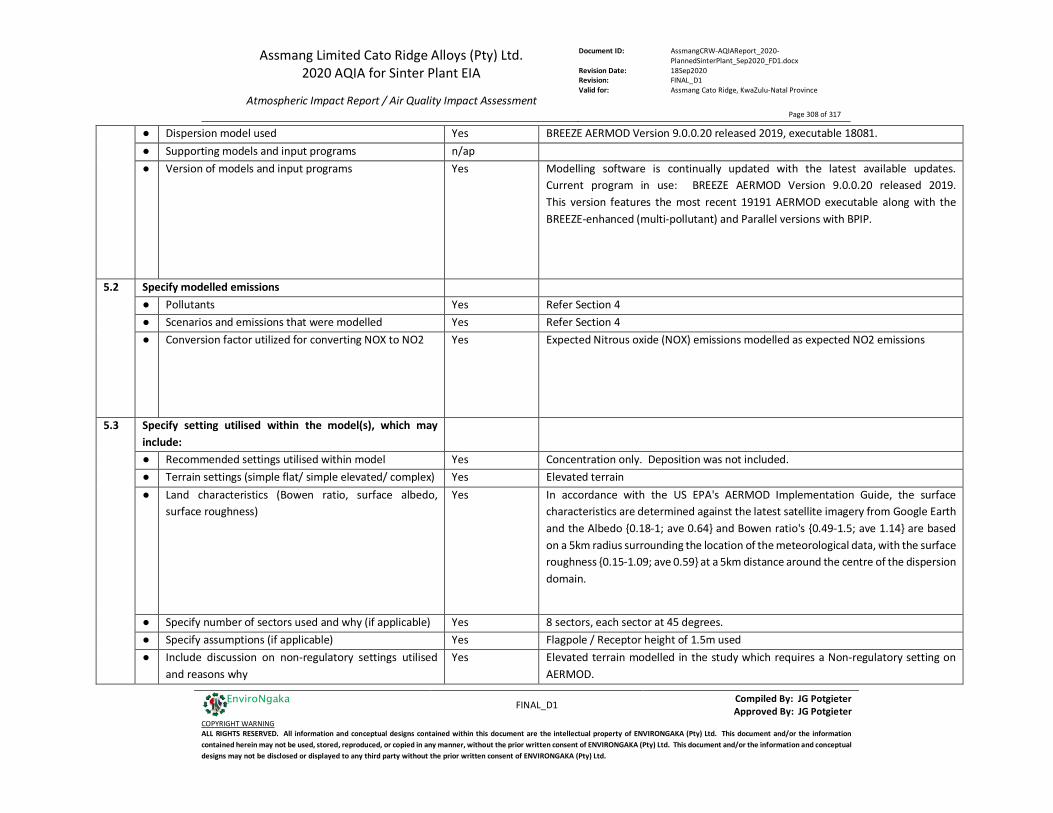
Assmang Limited Cato Ridge Alloys (Pty) Ltd. 2020 AQIA for Sinter Plant EIA
Atmospheric Impact Report / Air Quality Impact Assessment
Document ID: AssmangCRW-AQIAReport_2020-PlannedSinterPlant_Sep2020_FD1.docx
Revision Date: 18Sep2020 Revision: FINAL_D1 Valid for: Assmang Cato Ridge, KwaZulu-Natal Province
Page 308 of 317
FINAL_D1 Compiled By: JG Potgieter
Approved By: JG Potgieter COPYRIGHT WARNING ALL RIGHTS RESERVED. All information and conceptual designs contained within this document are the intellectual property of ENVIRONGAKA (Pty) Ltd. This document and/or the information contained herein may not be used, stored, reproduced, or copied in any manner, without the prior written consent of ENVIRONGAKA (Pty) Ltd. This document and/or the information and conceptual designs may not be disclosed or displayed to any third party without the prior written consent of ENVIRONGAKA (Pty) Ltd.
EnviroNgaka
● Dispersion model used Yes BREEZE AERMOD Version 9.0.0.20 released 2019, executable 18081. ● Supporting models and input programs n/ap ● Version of models and input programs Yes Modelling software is continually updated with the latest available updates.
Current program in use: BREEZE AERMOD Version 9.0.0.20 released 2019. This version features the most recent 19191 AERMOD executable along with the BREEZE-enhanced (multi-pollutant) and Parallel versions with BPIP.
5.2 Specify modelled emissions ● Pollutants Yes Refer Section 4 ● Scenarios and emissions that were modelled Yes Refer Section 4 ● Conversion factor utilized for converting NOX to NO2 Yes Expected Nitrous oxide (NOX) emissions modelled as expected NO2 emissions
5.3 Specify setting utilised within the model(s), which may include:
● Recommended settings utilised within model Yes Concentration only. Deposition was not included. ● Terrain settings (simple flat/ simple elevated/ complex) Yes Elevated terrain ● Land characteristics (Bowen ratio, surface albedo,
surface roughness) Yes In accordance with the US EPA's AERMOD Implementation Guide, the surface
characteristics are determined against the latest satellite imagery from Google Earth and the Albedo {0.18-1; ave 0.64} and Bowen ratio's {0.49-1.5; ave 1.14} are based on a 5km radius surrounding the location of the meteorological data, with the surface roughness {0.15-1.09; ave 0.59} at a 5km distance around the centre of the dispersion domain.
● Specify number of sectors used and why (if applicable) Yes 8 sectors, each sector at 45 degrees. ● Specify assumptions (if applicable) Yes Flagpole / Receptor height of 1.5m used ● Include discussion on non-regulatory settings utilised
and reasons why Yes Elevated terrain modelled in the study which requires a Non-regulatory setting on
AERMOD.

Assmang Limited Cato Ridge Alloys (Pty) Ltd. 2020 AQIA for Sinter Plant EIA
Atmospheric Impact Report / Air Quality Impact Assessment
Document ID: AssmangCRW-AQIAReport_2020-PlannedSinterPlant_Sep2020_FD1.docx
Revision Date: 18Sep2020 Revision: FINAL_D1 Valid for: Assmang Cato Ridge, KwaZulu-Natal Province
Page 309 of 317
FINAL_D1 Compiled By: JG Potgieter
Approved By: JG Potgieter COPYRIGHT WARNING ALL RIGHTS RESERVED. All information and conceptual designs contained within this document are the intellectual property of ENVIRONGAKA (Pty) Ltd. This document and/or the information contained herein may not be used, stored, reproduced, or copied in any manner, without the prior written consent of ENVIRONGAKA (Pty) Ltd. This document and/or the information and conceptual designs may not be disclosed or displayed to any third party without the prior written consent of ENVIRONGAKA (Pty) Ltd.
EnviroNgaka
5.4 Describe the receptors grids utilised within the analysis ● Property line resolution Yes Refer Appendix C: Modelling Procedure and Settings ● Fine grid resolution Yes Refer Appendix C: Modelling Procedure and Settings ● Medium grid resolution(s) Yes Refer Appendix C: Modelling Procedure and Settings ● Course grid resolution Yes Refer Appendix C: Modelling Procedure and Settings ● Hotspots and sensitive location resolutions and sizes n/ap ● Figures that show locations of receptors relative to
modelled facility and terrain features Yes Refer Appendix C: Modelling Procedure and Settings
Chapter 6: Ambient impact results documentation Submitted Comments, References
Yes/No 6 At a minimum, the Ambient Air Quality Standards results
are to be documented as follows:
6.1 Table(s) of modelling results including 1. Pollutant Yes Refer Section 5.1 2. Averaging time Yes Refer Section 5.1 3. Operating scenario Yes Refer Section 5.1 4. Maximum modelled concentration Yes Refer Section 5.1 5. Receptor location of maximum impact (coordinates) Yes Refer Section 5.1 6. Receptor elevation Yes Refer Section 5.1 7. Date of maximum impact Yes Refer Section 5.1 8. Grid resolution at maximum impact Yes Multiple cartesian grid: sources and model complexity in accordance with South
African Dispersion Modelling guidelines with sensitive receptors
9. Name of output e-file(s) where data was taken from Yes Refer data files in folder K040_2020-SinterP 6.2 Figure(s) showing source impact area including
1. UTM coordinates on horizontal and vertical axis Yes Refer Section 5.1 & Appendix C: Modelling Procedure and Settings 2. Modelled facility
○ Boundary Yes Refer Section 5.1 & Appendix C: Modelling Procedure and Settings ○ Buildings Yes Refer Section 5.1 & Appendix C: Modelling Procedure and Settings ○ Emission points Yes Refer Section 5.1 & Appendix C: Modelling Procedure and Settings

Assmang Limited Cato Ridge Alloys (Pty) Ltd. 2020 AQIA for Sinter Plant EIA
Atmospheric Impact Report / Air Quality Impact Assessment
Document ID: AssmangCRW-AQIAReport_2020-PlannedSinterPlant_Sep2020_FD1.docx
Revision Date: 18Sep2020 Revision: FINAL_D1 Valid for: Assmang Cato Ridge, KwaZulu-Natal Province
Page 310 of 317
FINAL_D1 Compiled By: JG Potgieter
Approved By: JG Potgieter COPYRIGHT WARNING ALL RIGHTS RESERVED. All information and conceptual designs contained within this document are the intellectual property of ENVIRONGAKA (Pty) Ltd. This document and/or the information contained herein may not be used, stored, reproduced, or copied in any manner, without the prior written consent of ENVIRONGAKA (Pty) Ltd. This document and/or the information and conceptual designs may not be disclosed or displayed to any third party without the prior written consent of ENVIRONGAKA (Pty) Ltd.
EnviroNgaka
3. Topography features Yes Refer Section 5.1 & Appendix C: Modelling Procedure and Settings 4. Isopleths of impact concentrations Yes Refer Section 5.1 5. Location and value of maximum impact Yes Refer Section 5.1 6. Location and value of maximum cumulative impact Yes Refer Section 5.1
Chapter 7: Ambient impact supporting documentation Submitted Comments, References
Yes/No 7.1 All warning and informational messages within modelling
output files must be explained and evaluated Yes Minor warnings / messages
7.2 Required electronic files to be submitted with report 1. Input & output files for models Yes 2. Input & output files for pre-processors Yes Input files prepared per the guidelines provided by the EPA of Victoria. Only output
files of AERMET. 3. Input & output files for post-processors Yes 4. Digital terrain files Yes 5. Plot files Yes 6. Final report Yes
7.3 Report shall include a list and description of electronic files Yes Refer Appendix RADM 7.4 Report shall include a discussion on deviations from the
modelling protocol Yes Refer Appendix RADM
Assmang Limited Cato Ridge Alloys (Pty) Ltd. 2020 AQIA for Sinter Plant EIA
Atmospheric Impact Report / Air Quality Impact Assessment
Document ID: AssmangCRW-AQIAReport_2020-PlannedSinterPlant_Sep2020_FD1.docx
Revision Date: 18Sep2020 Revision: FINAL_D1 Valid for: Assmang Cato Ridge, KwaZulu-Natal Province
Page 311 of 317
FINAL_D1 Compiled By: JG Potgieter
Approved By: JG Potgieter COPYRIGHT WARNING ALL RIGHTS RESERVED. All information and conceptual designs contained within this document are the intellectual property of ENVIRONGAKA (Pty) Ltd. This document and/or the information contained herein may not be used, stored, reproduced, or copied in any manner, without the prior written consent of ENVIRONGAKA (Pty) Ltd. This document and/or the information and conceptual designs may not be disclosed or displayed to any third party without the prior written consent of ENVIRONGAKA (Pty) Ltd.
EnviroNgaka
Appendix U: Dispersion Modelling Uncertainties In accordance with the US EPA Guideline on Air Quality Models (US EPA, 2005) it is important to acknowledge need to address uncertainties associated with dispersion modelling. In accordance with the US EPA guideline, two key types of uncertainty exist: A) Reducible uncertainty:
Resulting from uncertainties associated with the input values and with the limitations of the model in terms of its capability and calculations. More representative input data and improved model capability can hence improve reducible;
B) Inherent uncertainty: This entails the uncertainty associated with numerical models used to provide numerical representation / approximation of the atmosphere’s turbulent (stochastic) nature. Models provide estimations to concentrations which are averages obtained for several repetitions the same event. Therefore, an individual specific measure value can deviate significantly from the average value modelled, and this uncertainty may be responsible for a ± 50% deviation from the measured value;
As a result of these uncertainties the dispersion models may underestimate or overestimate predicted ground-level concentrations. The US EPA Guideline on Air Quality Models (US EPA, 2005) also states that: “Models are reasonably reliable in estimating the magnitude of highest concentrations occurring sometime, somewhere within an area. For example, errors in highest estimated concentrations of +/- 10 to 40 percent are found to be typical, i.e., certainly well within the often-quoted factor of two accuracy that has long been recognized for these models. However, estimates of concentrations that occur at a specific time and site are poorly correlated with actually observed concentrations and are much less reliable."
U.1 Minimising / Managing Reducible Uncertainties: The following points refer to actions undertaken in order to minimise reducible uncertainties and to apply a risk based conservative approach: 1. The objectives of the investigation should be considered, i.e. assessment level, extent, for comparison, etc.
1.1. With due consideration of the uncertainty of dispersion models, they are to be considered as an
approximation / prediction. The dispersion model utilised for this investigation is an acceptable dispersion model in terms of the application thereof. Confidence level: Medium
1.2. The objective of this study was to assess the expected contribution of the Enterprise with respect to baseline and/or future conditions, i.e. with the estimated contribution of the proposed additional/change to activities included. In order to achieve that, different scenarios were investigated and reported. Hence inherent model uncertainty would apply to all the scenarios and the results relative to each other, should therefore cancel out the associated uncertainty. Confidence level: High
Assmang Limited Cato Ridge Alloys (Pty) Ltd. 2020 AQIA for Sinter Plant EIA
Atmospheric Impact Report / Air Quality Impact Assessment
Document ID: AssmangCRW-AQIAReport_2020-PlannedSinterPlant_Sep2020_FD1.docx
Revision Date: 18Sep2020 Revision: FINAL_D1 Valid for: Assmang Cato Ridge, KwaZulu-Natal Province
Page 312 of 317
FINAL_D1 Compiled By: JG Potgieter
Approved By: JG Potgieter COPYRIGHT WARNING ALL RIGHTS RESERVED. All information and conceptual designs contained within this document are the intellectual property of ENVIRONGAKA (Pty) Ltd. This document and/or the information contained herein may not be used, stored, reproduced, or copied in any manner, without the prior written consent of ENVIRONGAKA (Pty) Ltd. This document and/or the information and conceptual designs may not be disclosed or displayed to any third party without the prior written consent of ENVIRONGAKA (Pty) Ltd.
EnviroNgaka
2. Representativeness/relevance of model input parameters and application thereof in the model. The use of appropriate data is one of the most important factors in modelling accuracy. 2.1. Surface Air Meteorological Data
Refer Appendix A and Appendix RADM – the surface air meteorological data is considered to be representative for this investigation; Confidence level: High;
2.2. Upper Air Meteorological Data Refer Appendix RADM – data from Irene was used and is considered to be applicable for the study area; Confidence level: Medium;
2.3. Emission Inventory Refer Appendix D – All emissions used in the simulations of the baseline scenario were based on either isokinetic measurement/sampling data from external service providers, relevant/available continuous emissions monitoring (CEM) and or conservative estimation techniques for the specific industry. The uncertainty associated with the emissions inventory needs to be accommodated in the results. Confidence level: Medium to High;
3. Understanding the model performance limitations Refer Appendix C
4. Demonstrating that the modelling process has been conducted appropriately and in line with both local DEA requirements and international practice, which includes following a conservative approach where greater uncertainty is associated such as conversion of NO to NO2, SO2 half-life, deposition, etc. Refer Appendix RADM
5. Where possible/available to reference/include validated actual ambient monitoring data which could be used to compare modelled results for the purpose of verification and or validation; i.e. the processes used to assist with the credibility of numerical models, whereas: • Verification is the process to determine that a model represents the developer’s conceptual description of
the model and its solution. • Validation is the process to determine the degree to which a model is a representation of the actual
occurrences with respect to the intended purpose/objective. With due consideration that model verification and validation cannot prove that a model is accurate and or correct with respect to all possible scenarios/eventualities, it can assist to provide assurance that it is sufficient with respect to its intended use. With due consideration of limited actual ambient monitoring data within a modelling domain for comparison with the model outputs/results, it is not always possible to conduct a comprehensive verification and validation process. Hence results are therefore scrutinized as a rule in order to make sure that they make sense in terms of the modelling domain.
For all investigations available data from relevant ambient monitoring locations are used to compare the modelled data and to identify potential other contributing sources and or over-estimation of emissions and or impact. It is endeavoured to distinctly “fingerprint” and assess the site’s contribution at these locations and or identify the site’s contribution at those monitoring locations. Agreement level: Medium –based on monitoring data of Mn available for comparison with model results.

Assmang Limited Cato Ridge Alloys (Pty) Ltd. 2020 AQIA for Sinter Plant EIA
Atmospheric Impact Report / Air Quality Impact Assessment
Document ID: AssmangCRW-AQIAReport_2020-PlannedSinterPlant_Sep2020_FD1.docx
Revision Date: 18Sep2020 Revision: FINAL_D1 Valid for: Assmang Cato Ridge, KwaZulu-Natal Province
Page 313 of 317
FINAL_D1 Compiled By: JG Potgieter
Approved By: JG Potgieter COPYRIGHT WARNING ALL RIGHTS RESERVED. All information and conceptual designs contained within this document are the intellectual property of ENVIRONGAKA (Pty) Ltd. This document and/or the information contained herein may not be used, stored, reproduced, or copied in any manner, without the prior written consent of ENVIRONGAKA (Pty) Ltd. This document and/or the information and conceptual designs may not be disclosed or displayed to any third party without the prior written consent of ENVIRONGAKA (Pty) Ltd.
EnviroNgaka
U.2 IPCC CONSISTENT GUIDANCE TO UNCERTAINTIES In accordance with guidance provided by the Intergovernmental Panel on Climate Change (IPCC) regarding a consistent and common approach in terms of the handling of uncertainties, the following points refer with respect to ascertaining the degree of certainty in findings of an assessment process: • Confidence in the validity of a finding – Qualitative Confidence Validity of Finding: it is based on the type, amount,
quality and consistency of evidence such as mechanistic understanding, theory, data, models, expert judgment) and the degree of agreement;
• Quantified measures of uncertainty in a finding expressed probabilistically: it is based on statistical analysis of observations or model results, or expert judgment;
The recommended dimensions for the validity of a finding are: “limited”, “medium” or “robust”, and the recommended dimensions for the degree of agreement are: “low”, “medium”, “high”. Generally, evidence is most robust when there are multiple, consistent independent lines of high-quality evidence. • For findings with high agreement and robust evidence, present a level of confidence or a quantified measure of
uncertainty; • For findings with high agreement or robust evidence, but not both, assign confidence or quantify uncertainty
when possible. Otherwise, assign the appropriate combination of summary terms for your evaluation of evidence and agreement (e.g., robust evidence, medium agreement);
• For findings with low agreement and limited evidence, assign summary terms for your evaluation of evidence and agreement;
• In any of these cases, the degree of certainty in findings that are conditional on other findings should be evaluated and reported separately.
Figure U.1: A depiction of evidence and agreement statements and their relationship to confidence (Confidence increases towards the top-right corner as suggested by the increasing strength of shading)
Limited Medium Robust
Agre
emen
t con
fiden
ce le
vel
→ High agreement Limited evidence
Medium agreement Limited evidence
Low agreement Limited evidence
Low agreement Robust evidence
Evidence confidence level →
Hig
hM
ediu
mLo
w
High agreement Medium evidence
High agreement Robust evidence
Medium agreement Medium evidence
Medium agreement Robust evidence
Low agreement Medium evidence
Assmang Limited Cato Ridge Alloys (Pty) Ltd. 2020 AQIA for Sinter Plant EIA
Atmospheric Impact Report / Air Quality Impact Assessment
Document ID: AssmangCRW-AQIAReport_2020-PlannedSinterPlant_Sep2020_FD1.docx
Revision Date: 18Sep2020 Revision: FINAL_D1 Valid for: Assmang Cato Ridge, KwaZulu-Natal Province
Page 314 of 317
FINAL_D1 Compiled By: JG Potgieter
Approved By: JG Potgieter COPYRIGHT WARNING ALL RIGHTS RESERVED. All information and conceptual designs contained within this document are the intellectual property of ENVIRONGAKA (Pty) Ltd. This document and/or the information contained herein may not be used, stored, reproduced, or copied in any manner, without the prior written consent of ENVIRONGAKA (Pty) Ltd. This document and/or the information and conceptual designs may not be disclosed or displayed to any third party without the prior written consent of ENVIRONGAKA (Pty) Ltd.
EnviroNgaka
A level of confidence is expressed using five qualifiers: “very low,” “low,” “medium,” “high,” and “very high.” It synthesizes the author teams’ judgments about the validity of findings as determined through evaluation of evidence and agreement. Figure U.1 depicts summary statements for evidence and agreement and their relationship to confidence.
• Flexibility exists in this relationship – for a given evidence and agreement statement, different confidence levels could be assigned, but increasing levels of evidence and degrees of agreement are correlated with increasing confidence;
• Confidence cannot necessarily be assigned for all combinations of evidence and agreement in Figure U.1; • Presentation of findings with “low” and “very low” confidence should be reserved for areas of major
concern, and the reasons for their presentation should be carefully explained; • Confidence should not be interpreted probabilistically, and it is distinct from “statistical confidence.”
Additionally, a finding that includes a probabilistic measure of uncertainty does not require explicit mention of the level of confidence associated with that finding if the level of confidence is “high” or “very high”.
Likelihood, as defined in Table U.1, provides calibrated language for describing quantified uncertainty. It can be used to express a probabilistic estimate of the occurrence of a single event or of an outcome (e.g., a climate parameter, observed trend, or projected change lying in a given range). Likelihood may be based on statistical or modelling analyses, elicitation of expert views, or other quantitative analyses. The categories defined in Table U.1 can be considered to have “fuzzy” boundaries. A statement that an outcome is “likely” means that the probability of this outcome can range from ≥66% (fuzzy boundaries implied) to 100% probability. This implies that all alternative outcomes are “unlikely” (0-33% probability). The key findings should be characterised by using calibrated uncertainty language that conveys the most information to the reader - refer Table U.1. Table U.1: Likelihood Scale
Term Likelihood of the Outcome
Virtually certain 99-100% probability
Very likely 90-100% probability
Likely 66-100% probability
About as likely as not 33 to 66% probability
Unlikely 0-33% probability
Very unlikely 0-10% probability
Exceptionally unlikely 0-1% probability
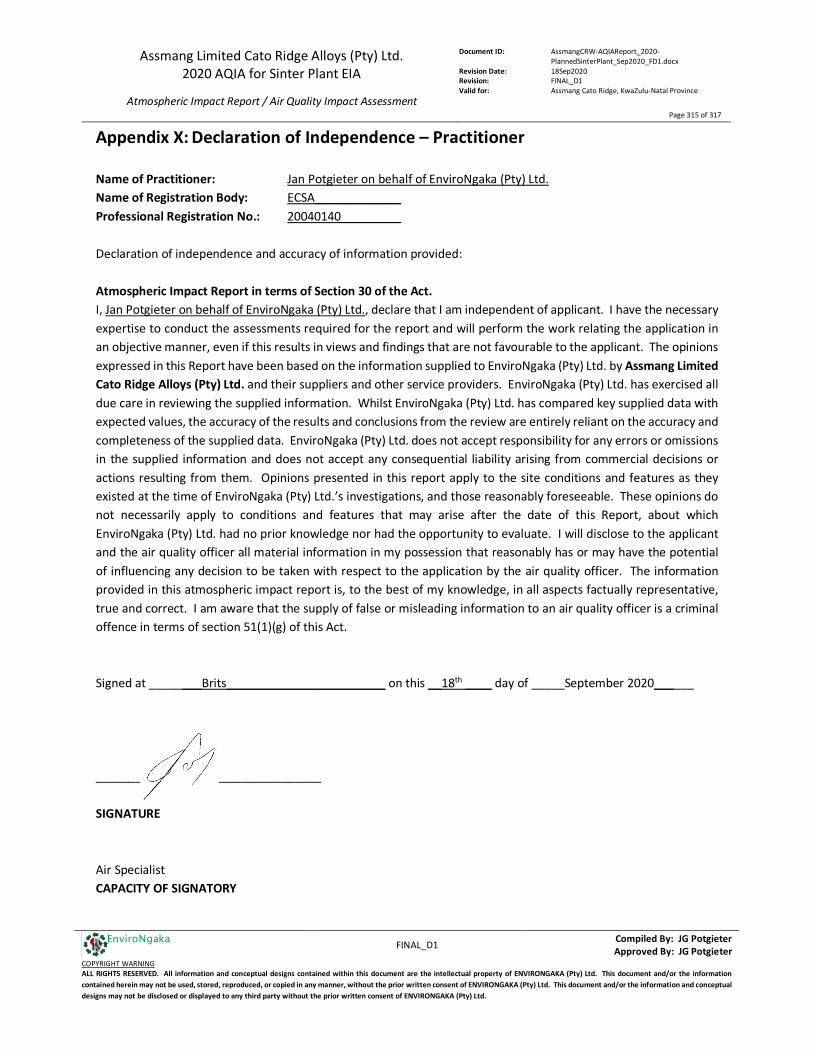
Assmang Limited Cato Ridge Alloys (Pty) Ltd. 2020 AQIA for Sinter Plant EIA
Atmospheric Impact Report / Air Quality Impact Assessment
Document ID: AssmangCRW-AQIAReport_2020-PlannedSinterPlant_Sep2020_FD1.docx
Revision Date: 18Sep2020 Revision: FINAL_D1 Valid for: Assmang Cato Ridge, KwaZulu-Natal Province
Page 315 of 317
FINAL_D1 Compiled By: JG Potgieter
Approved By: JG Potgieter COPYRIGHT WARNING ALL RIGHTS RESERVED. All information and conceptual designs contained within this document are the intellectual property of ENVIRONGAKA (Pty) Ltd. This document and/or the information contained herein may not be used, stored, reproduced, or copied in any manner, without the prior written consent of ENVIRONGAKA (Pty) Ltd. This document and/or the information and conceptual designs may not be disclosed or displayed to any third party without the prior written consent of ENVIRONGAKA (Pty) Ltd.
EnviroNgaka
Appendix X: Declaration of Independence – Practitioner Name of Practitioner: Jan Potgieter on behalf of EnviroNgaka (Pty) Ltd. Name of Registration Body: ECSA_____________ Professional Registration No.: 20040140_________ Declaration of independence and accuracy of information provided: Atmospheric Impact Report in terms of Section 30 of the Act. I, Jan Potgieter on behalf of EnviroNgaka (Pty) Ltd., declare that I am independent of applicant. I have the necessary expertise to conduct the assessments required for the report and will perform the work relating the application in an objective manner, even if this results in views and findings that are not favourable to the applicant. The opinions expressed in this Report have been based on the information supplied to EnviroNgaka (Pty) Ltd. by Assmang Limited Cato Ridge Alloys (Pty) Ltd. and their suppliers and other service providers. EnviroNgaka (Pty) Ltd. has exercised all due care in reviewing the supplied information. Whilst EnviroNgaka (Pty) Ltd. has compared key supplied data with expected values, the accuracy of the results and conclusions from the review are entirely reliant on the accuracy and completeness of the supplied data. EnviroNgaka (Pty) Ltd. does not accept responsibility for any errors or omissions in the supplied information and does not accept any consequential liability arising from commercial decisions or actions resulting from them. Opinions presented in this report apply to the site conditions and features as they existed at the time of EnviroNgaka (Pty) Ltd.’s investigations, and those reasonably foreseeable. These opinions do not necessarily apply to conditions and features that may arise after the date of this Report, about which EnviroNgaka (Pty) Ltd. had no prior knowledge nor had the opportunity to evaluate. I will disclose to the applicant and the air quality officer all material information in my possession that reasonably has or may have the potential of influencing any decision to be taken with respect to the application by the air quality officer. The information provided in this atmospheric impact report is, to the best of my knowledge, in all aspects factually representative, true and correct. I am aware that the supply of false or misleading information to an air quality officer is a criminal offence in terms of section 51(1)(g) of this Act. Signed at ________Brits________________________ on this __18th ____ day of _____September 2020______ __________________________________ SIGNATURE Air Specialist CAPACITY OF SIGNATORY
Assmang Limited Cato Ridge Alloys (Pty) Ltd. 2020 AQIA for Sinter Plant EIA
Atmospheric Impact Report / Air Quality Impact Assessment
Document ID: AssmangCRW-AQIAReport_2020-PlannedSinterPlant_Sep2020_FD1.docx
Revision Date: 18Sep2020 Revision: FINAL_D1 Valid for: Assmang Cato Ridge, KwaZulu-Natal Province
Page 316 of 317
FINAL_D1 Compiled By: JG Potgieter
Approved By: JG Potgieter COPYRIGHT WARNING ALL RIGHTS RESERVED. All information and conceptual designs contained within this document are the intellectual property of ENVIRONGAKA (Pty) Ltd. This document and/or the information contained herein may not be used, stored, reproduced, or copied in any manner, without the prior written consent of ENVIRONGAKA (Pty) Ltd. This document and/or the information and conceptual designs may not be disclosed or displayed to any third party without the prior written consent of ENVIRONGAKA (Pty) Ltd.
EnviroNgaka
Appendix Y: Curriculum Vitae of Practitioner Mr. JG Potgieter, B.Eng (Chemical) Pr.Eng (20040140)
Jan Potgieter holds a degree in Chemical Engineering from the University of the North-West and registered as a Professional Engineer since 2004. He was in the service of Kynoch Fertilizer (Pty) Ltd in Potchefstroom, South Africa for 9 years in various positions as Process Engineer, Project Manager and Process Manager. He founded EnviroNgaka in 2004 and currently holds the positions of Technical Manager and Managing Director. EnviroNgaka specialises in air pollution/air quality management related work, which includes emission monitoring, emission inventory quantification, ambient air quality monitoring and assessment of ambient air quality environmental impacts. This would include, but not limited to activities such as sampling, analysis & assessment of atmospheric emissions - to determine the risk & environmental footprint; atmospheric modelling (dispersion modelling) to assess the distribution and footprint associated to emission sources, as well as source apportionment of ambient concentrations; technical assistance to industries with respect to improvement of existing designs/or proposed control technologies to mitigate atmospheric emissions; technical & specialist assistance into EIA’s regarding expansions/modifications and new projects or facilities; specialist baseline and future ambient air quality impact assessments/studies; assistance for a range of air quality related projects; atmospheric risk assessments, regulatory/legal requirements and assessing abatement/control technology options and impacts on behalf of clients. He has over 15 years’ experience in this field, having completed and managed numerous specialist projects, as well as air quality and impact assessments. During his career Jan Potgieter served on the following committees/forums:
• SABS TC0146/SC01 Air Quality – Source Emissions Subcommittee • SABS TC0146/SC03 Air Quality – Ambient Atmospheres Subcommittee • NLA, STSA Subcommittee (Stack Testers of South Africa)
o Member of the Working Group o NAPCoF (The North West Air Pollution Control Forum)
o Service Provided to the Forum He holds the following professional registrations:
• Engineering Council of South Africa (ECSA) o Pr.Eng (20040140) (Chemical Engineering)
Assmang Limited Cato Ridge Alloys (Pty) Ltd. 2020 AQIA for Sinter Plant EIA
Atmospheric Impact Report / Air Quality Impact Assessment
Document ID: AssmangCRW-AQIAReport_2020-PlannedSinterPlant_Sep2020_FD1.docx
Revision Date: 18Sep2020 Revision: FINAL_D1 Valid for: Assmang Cato Ridge, KwaZulu-Natal Province
Page 317 of 317
FINAL_D1 Compiled By: JG Potgieter
Approved By: JG Potgieter COPYRIGHT WARNING ALL RIGHTS RESERVED. All information and conceptual designs contained within this document are the intellectual property of ENVIRONGAKA (Pty) Ltd. This document and/or the information contained herein may not be used, stored, reproduced, or copied in any manner, without the prior written consent of ENVIRONGAKA (Pty) Ltd. This document and/or the information and conceptual designs may not be disclosed or displayed to any third party without the prior written consent of ENVIRONGAKA (Pty) Ltd.
EnviroNgaka
Appendix Z: Declaration of Accuracy of Information - Applicant Name of Enterprise: _________________ Declaration of accuracy of information provided: Atmospheric Impact Report in terms of Section 30 of the Act. I, ______________________[duly authorised], declare that the information provided in this atmospheric impact report is, to the best of my knowledge, in all aspects factually true and correct. I am aware that the supply of false or misleading information to an air quality officer is a criminal offence in terms of section 51(1)(g) of this Act. Signed at _________________ on this _________ day of ________________________ _________ SIGNATURE ___________________ CAPACITY OF SIGNATORY