Consulting Study 3: - Winrock International
31
Consulng Study 3: Review of aboveground biomass esmaon techniques December 2015
-
Upload
khangminh22 -
Category
Documents
-
view
0 -
download
0
Transcript of Consulting Study 3: - Winrock International
Consulting Study 3:Review of aboveground biomass estimation techniques
December 2015

Authors
© The High Carbon Stock Science Study 2015
This work is licensed under the Creative Commons Attribution 4.0 International License. You are free to reuse, reprint, or republish the work, in whole or in part, without written permission, provided that the source is acknowledged.To view a copy of this license, please visit http://creativecommons.org/licenses/by/4.0/
This report has been independently prepared by the authors for the High Carbon Stock (HCS) Science Study. It is part of a series of consulting studies on high carbon stock, in the areas of biomass estimation, soil carbon dynamics, remote sensing and socio-eco nomics. Together, these consulting studies provide background information for the HCS Science Study’s synthesis report, but also they constitute stand-alone research that aims to shed light on this critical area of enquiry.
Katherine M Goslee, Sandra Brown, Sarah M Walker, Lara Murray and Therese Tepe
Winrock International2101 Riverfront Drive Little Rock, Arkansas 72202Tel: +1 501 280 3000 Fax: +1 501 280 3090 https://www.winrock.org/

Contents
Executive Summary 04
Section 1: Introduction 05
Section 2: Allometric Equations for Biomass Estimation 06
2.1 Overview
2.2 Common equation variables
2.3 Review of existing aboveground tree biomass equations potentially applicable to palm-oil producing countries
07
2.4 Verifying applicability of allometric equations
11
2.5 Belowground biomass estimation 13
2.6 Plantation oil palm allometric equations 14
Section 3: Forest Inventory Approach 16
3.1 Overview of approaches
3.1.1 Approach 1: Biomass density based on volume data
17
3.1.2 Approach 2: Biomass density based on stand tables
18
3.2 Available inventory data for countries of interest
20
3.2.1 National to regional scales
3.2.2 Local to timber concession scale
21
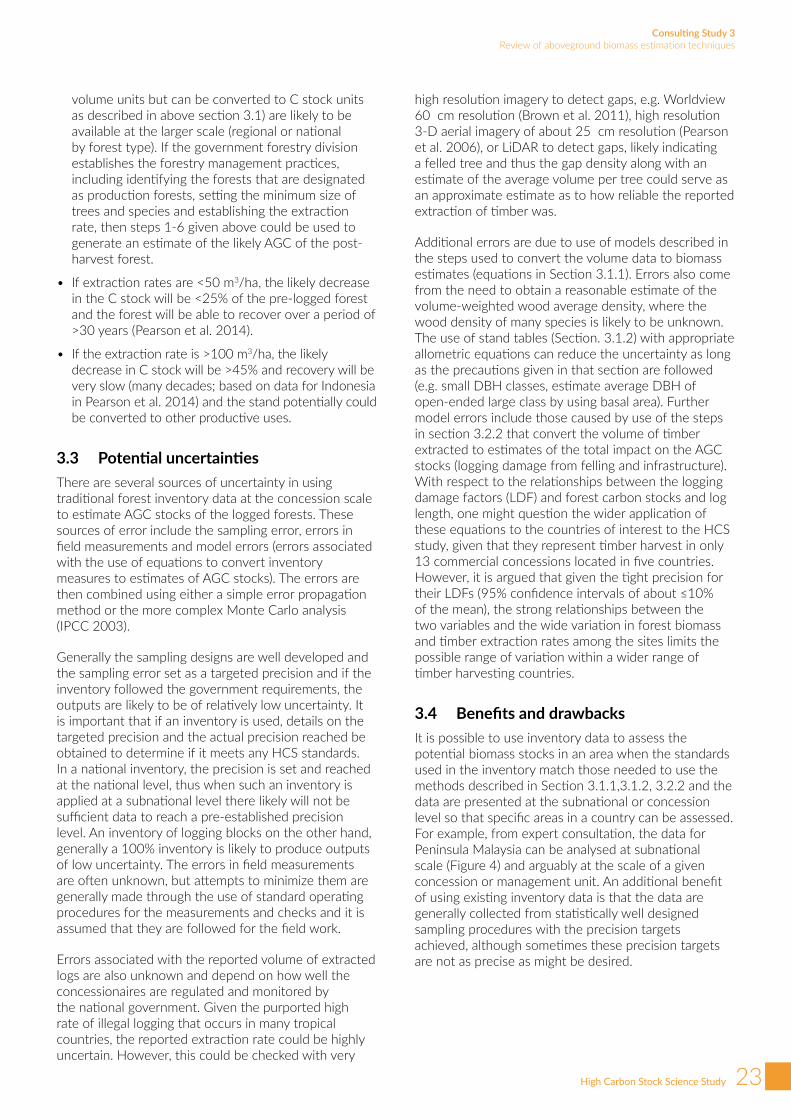
3.3 Potential uncertainties 23
3.4 Benefits and drawbacks
Section 4: Summary of Recommendations 25
References 26
Appendix: VCS allometric equation validation 30

04
Consulting Study 3Review of aboveground biomass estimation techniques
High Carbon Stock Science Study
Executive SummaryEstimating carbon dioxide emissions that result from altering forest cover relies on the quantification of the biomass stocks in various vegetation types, as well as the carbon stored in the soil (Brown, 1997). It is therefore necessary to develop reliable methods for estimating biomass stocks in forest systems. It is not possible to directly measure the mass of vegetation in a forest area without harvesting and weighing all components and thus indirect estimation methods and sampling techniques have been developed over the past decades. This report explores the use of: (1) allometric models that relate the biomass of trees with certain measureable tree morphological features (e.g. diameter and height) to indirectly quantify aboveground and belowground tree biomass estimates; and (2) the use of traditional forest inventories that provide data on the number or trees per hectare, the volume of timber and the amount of timber extracted to estimate aboveground biomass.
Live trees contain the majority of biomass in most forests and the informed selection and verification of allometric models to estimate biomass is a crucial step in developing accurate estimates of forest carbon stocks1. Allocating insufficient attention and resources to this component of a carbon stock study can lead to significant under-or-over estimations of carbon stocks and therefore undermine the integrity of the biomass assessment.
This report offers an assessment of existing allometric equations for estimating live tree carbon stocks in potential High Carbon Stock (HCS) forests in the palm oil producing countries of Cameroon, Colombia, Gabon, Liberia, Sierra Leone, Ghana, Indonesia and Malaysia. Global, regional and country-specific equations are examined. The review includes an analysis of the datasets used to develop existing models, the strength of the allometric relationships they reflect and discusses potential sources of error in biomass estimation. Among these sources of error, the most significant is model error from the use of an allometric equation (Chave et al. 2004) and therefore guidance is provided on examining the applicability of allometric equations. Approaches to verify existing allometric equations are detailed including destructive harvesting, leveraging existing databases and statistical analyses needed to determine the adequacy of chosen allometric equations.
Values for aboveground tree biomass can be used to derive estimates of belowground tree biomass using published ‘root-to-shoot’ ratios. A review of published ratios for estimating belowground tree root biomass
is also included to offer more complete guidance on generating scientifically sound estimates of total live tree biomass for potential HCS forests. Furthermore, a review of existing models and estimates for determining the biomass stocks in oil palm plantations is also provided.
Although forest inventories have typically focused on assessing the quantity and value of timber, the data collected can often be used to estimate biomass and carbon stocks of the forest tree pool, so long as they include all tree species, not just commercial species. Two approaches for using timber volume data to identify HCS forests are reviewed: (1) converting existing volume estimates to aboveground biomass stocks and (2) directly estimating biomass stocks from stand tables (tables of the number of trees in different diameter classes) and allometric equations. This section includes methods to convert inventory data to estimates of aboveground tree biomass and carbon stocks, sources of uncertainty and recommendations on the value of forest inventories in relation to the overall HCS study.
Key recommendations resulting from the report include:
1. Chave et al. (2014) is recommended for biomass estimates of tropical forests.
2. Selection of an existing allometric equation for use in estimating the biomass of a forest should be verified as appropriate for use with local data (as described in this report).
3. Mokany et al. (2006) root:shoot factors are recommended to estimate below-ground biomass at the stand level.
4. For oil palm plantations, it is appropriate to use the 2009 RSPO for the time-averaged AGB plus BGB carbon stock in such plantation (~35 t C ha-1), calculated over a 25-30 years period.
5. Forest inventories at the concession-scale that report stand and stock tables and the amount of timber harvested can be useful for reliably estimating the carbon stocks of pre- and post-harvest forests, provided they: (1) include all species (not just commercial species), (2) are based on approved government guidelines and are scientifically robust and (3) are implemented and monitored at the concession scale.
1 Biomass stocks are converted to carbon stocks using the IPCC default carbon fraction of 0.47.

05
Consulting Study 3Review of aboveground biomass estimation techniques
High Carbon Stock Science Study
Section 1: IntroductionWithin the palm oil sector there is growing interest in ensuring that plantations are not developed on areas that are critical for conservation and livelihood purposes in top and emerging oil palm producing countries. One such purpose is the reduction or avoidance of greenhouse gas emissions from land use change. To this end, the Sustainable Palm Oil Manifesto has committed to reducing conversion of high carbon stock (HCS) forests to oil palm plantations. The definition of HCS forest is evolving, but it is understood here as a natural forest that meets an established threshold of biomass carbon stocks or has the capacity to reach the threshold if allowed to regenerate naturally.
Ensuring that HCS forests are properly identified requires the development of appropriate criteria for assessing the quantity of forest carbon stocks and the potential of forests to achieve high carbon stocks.
Typically the biomass stocks of a forest area are estimated by establishing plots of known area and collecting field data of easily measurable tree parameters, such as diameter at breast height (DBH measured at 1.3 m from the ground) or above irregularities, such as buttresses. These data are then converted to biomass estimates using allometric equations. Such an approach increases sampling efficiency while minimizing damage by avoiding extensive destructive sampling. The estimation of biomass using LiDAR measurements is based on calibration of LiDAR data to ground measurements, therefore also requiring the use of allometric equations. Numerous allometric equations have been developed, using a variety of metrics and resulting in various levels of accuracy. It is critical to choose appropriate allometric equations, to minimize error in biomass estimates as much as possible. The primary goal of this study is to provide guidance on the selection of allometric models.
Forest biomass stocks can also be estimated from statistically well-designed timber inventories combined with expansion factors to account for the non-merchantable biomass. However, the extensive inventorying of biomass or volume may not be necessary for areas that can be shown to be incontrovertibly either above or below the HCS threshold using alternative data sources. Therefore, this study also explores methods for converting classic timber inventories into biomass estimates.
Within the High Carbon Stock Study, Consulting Study 1 provides a review of forest inventory methods and Consulting Study 2 synthesizes methods and data on existing biomass mapping. This report, Consulting Study 3, provides an evaluation of methods to estimate biomass and assess uncertainty. Thus we review the reliability of available allometric equations that can be used to convert forest inventory data into estimates of live biomass carbon stock and provide recommendations on choosing an appropriate equation. We then recommend appropriate data analyses for conversion from existing forest inventories into aboveground biomass estimates. Throughout, we define the likely level of uncertainty in estimates of biomass carbon stocks made using various methods, at a range of spatial scales.

06
Consulting Study 3Review of aboveground biomass estimation techniques
High Carbon Stock Science Study
Section 2: Allometric Equations forBiomass Estimation
2.1 OverviewThe quantity of carbon stored in forests is based on the biomass stocks found in various vegetation types along with the carbon stored in the soil. The potential carbon dioxide emissions that will occur through altering the vegetation present or through complete forest conversion can be estimated by calculating the biomass stocks (Brown, 1997). However, it is not possible to directly measure the mass of carbon or vegetation in a forest area without harvesting and weighing all tree and vegetation biomass and thus indirect measurement methods and sampling techniques must be used. In a forest, the majority of the biomass is stored in the trees . Here we discuss the most common indirect measurement method for estimating aboveground tree biomass, allometric equations, as well as methods to estimate belowground tree root biomass.
As with many organisms, the biomass of a tree is proportional and thus can be directly correlated, with certain morphological features of the tree. For example, the most commonly measured feature is the diameter of the trunk, which has been found to be highly correlated with the total aboveground biomass. This allometric relationship can be used as a method to estimate the tree’s aboveground biomass by measuring the morphological feature, e.g. the diameter and then applying a developed allometric equation (Brown et al. 1989, Brown 1997, Chave et al. 2005, Stas 2011).
To create an allometric equation to estimate aboveground tree dry biomass, generally a study is conducted where trees across a geographic, species and tree size range are destructively harvested to estimate their biomass. Easy-to-measure morphological features of the specific tree, such as tree height and trunk diameter at a specific height, are compared to the tree’s total dry aboveground biomass. A range of equation types and variables are examined to determine which combination creates the most accurate and unbiased predictors of dry biomass. This equation can then be used in the future to estimate the biomass of other trees without damaging them. The quantity of carbon can be estimated by converting biomass to carbon using the IPCC default carbon fraction of 0.47 (that is, one kg of biomass is equivalent to 0.47 kg of carbon).
As described in Consulting Study 1, the most common method to estimate the biomass of a forest area, is to sample specifically-known areas. The variables used in the selected allometric equation are measured on individual trees in the sampled area and the biomass of the individual trees are then estimated from the equation and summed to estimate the total biomass within the area.
2.2 Common equation variablesThere are a number of variables that are commonly used to estimate tree biomass. Most allometric equations are developed to estimate total aboveground biomass, however, some equations are created to estimate different components of the tree such as stem, branches, leaves etc. Variables commonly within equations include:
• Stem/trunk diameter at breast height (at 1.3 m aboveground; DBH)
• Stem diameter at stump height (DSH) (common for multi-stemmed trees)
• Basal area
• Total height
• Botanical identification
• Wood density
• Site quality
• Tree age (common for trees grown in plantations)
• Crown width (common for shrubs)
• Climate (environmental stress factor)
Of these variables, DBH and wood density are easiest to attain and provide the most reliable inputs (Brown 1997; Chave et al. 2005). Height is also a commonly used variable and can lead to less biased estimates of above ground biomass (Rutishauser et al. 2013, Chave et al. 2014). This is due to the fact that site differences in tree allometry are almost entirely driven by differences in height:diameter allometry (Banin et al. 2012; Feldpausch et al. 2011) and thus tree height is an important allometric factor that needs

07
Consulting Study 3Review of aboveground biomass estimation techniques
High Carbon Stock Science Study
to be considered in order to improve forest biomass estimates (Feldpausch et al. 2012). However, tree height assessment through ground-based measurement is challenging in closed-canopy tropical forests primarily due to the fact that the top of individual trees is difficult to see in dense forests. Furthermore, trunks are sometimes leaning and tree crown dimensions are large, making it difficult to decipher between adjacent trees (King & Clark 2011; Primack & Corlett 2011; Chave et al. 2014, Larjavaara & Muller-Landau 2013). As a result, existing methods to measure height using traditional trigonometry or newer approaches employing laser range finders often render height estimates with high degrees of random and systematic error and thus there is a lack of consensus as to whether height measurements collected through ground inventory should be used as a predictor of AGB in tropical forests (Larjavaara & Muller-Landau 2013).
Chave et al. (2005) showed that three equations (for dry, moist and wet forest types), including trunk diameter, wood specific gravity and total tree height already provide an accurate estimate of above-ground biomass and that including site, successional status, continent or forest type only slightly improves the quality of the fit. Chave et al. (2014) improved this allometric relationship based on more data and showed that it holds across a wide range of environmental conditions.
When height measurement is unavailable, Chave et al. (2014) developed a relationship for height based on DBH and an environmental stress factor, but recommend the use of locally derived diameter-height relationships when available. This can be done by measuring the DBH and height of a subset of trees within the area of interest, across the range of species and sizes. A relationship between diameter and height can then be developed and used within existing allometric equations.
Species-specific equations may increase accuracy, although it is not clear that this is always the case (Rutishauser et al. 2013; Fayolle et al. 2013). Relationships between diameter and tree height have been found to vary across environmental conditions, reducing importance of species type in determining accuracy of equations (Banin et al. 2012, Feldpausch et al. 2011, Fayolle et al. 2013). Including wood density allows for the incorporation of a species-specific factor into an overall equation. Similarly, including climatic factors can allow equations to address differences based on elements unique to different regions.
2.3 Review of existing aboveground tree biomass equations potentially applicable to palm-oil producing countries
Relevant literature was reviewed to identify existing allometric equations and assess their applicability for estimating carbon stocks in potential HCS forests in top palm oil producing countries (Table 1). The countries of most interest to the HCS Forest Initiative are Cameroon, Colombia, Gabon, Liberia, Sierra Leone, Ghana, Indonesia and Malaysia. There have been a number of initiatives to compile equations that have been developed, including GlobAllomeTree (Henry et al. 2013) and a UN-REDD funded initiative focused on Southeast Asia (Abd Rahman 2014). However, at this time there is no single comprehensive database that provides consistent information that has been reviewed for errors.
Table 1: Top 20 palm oil producing countries (Source: index Mundi http://www.indexmundi.com/agriculture/?commodity=palm-oil&).
Rank Country Production (1000 MT)1 Indonesia 33,000
2 Malaysia 20,500
3 Thailand 2,250
4 Colombia 1,108
5 Nigeria 930
6 Papua New Guinea 630
7 Ecuador 575
8 Ghana 495
9 Honduras 440
10 Côte d’Ivoire 400
11 Guatemala 355
12 Brazil 340
13 Costa Rica 270
14 Cameroon 270
15 DR Congo 215
16 Philippines 135
17 Mexico 83
18 Angola 58
19 Venezuela 55
20 Dominican Republic 53
Several field studies have taken place to create specific allometric equations for a specific set of species, country, region and/or forest type in palm-oil producing areas (Table 2). Palm oil producing countries of interest to the HCS Study that are not included in Table 2 did not have an equation for all species in widely cited published literature on allometric equations. In an

08
Consulting Study 3Review of aboveground biomass estimation techniques
High Carbon Stock Science Study
attempt to reduce the barrier to biomass estimation in locations where a specific study for allometric equation development has not taken place, destructive sampling data from various studies have been compiled over the years and used to develop equations applicable across the tropics. This work was initiated in the early 1980’s, such as Brown and Lugo (1982, 1984) and has continued to this day. Destructive biomass data has been continuously compiled from across the tropics and with this new data the tropic-wide equations have been successively updated over time (Table 3). Although many species-specific equations have been developed within some palm oil producing countries (e.g. Ebuy et al. 2011), our equation review focused on equations applicable to all species within a forest area.
Most of the equations listed in Tables 2 and 3 have a fairly high R-squared value, generally greater than 0.95. However, there is a substantial difference in the size of the datasets, with fewer than 150 trees for nearly all of the region- or country-specific equations, between 143 and 1,349 for the pantropical Chave 2005 equations, 4,004 trees for the pantropical Chave 2014 equations and as fewer than 35 for some older pantropical equations. The size of the dataset clearly determines the degree to which the full variability of tree size is captured and modelled. Those equations that are based on a very small dataset (<30 trees) are likely to be appropriate for monospecific forests, as long as they include samples from the full range of tree sizes, but unlikely to be too reliable for multispecies forests.
Nearly all of the equations require data on DBH, although Deans et al. (1996) provides an option for Cameroon that relies on basal area and Kenzo et al (2009) uses basal diameter in an equation for Malaysia. All of the pantropical equations provide options of using either with or without height measurements. Results from a study by Feldspauch et al (2012) show that excluding tree height overestimated total carbon stored. In the case of Chave et al. (2014), the equations without height as an input do require an environmental stress factor, which is a function of temperature seasonality, climatic water deficit and precipitation seasonality, all of which can be obtained from global datasets (see http://chave.ups-tlse.fr/pantropical_allometry.htm for data layers). Height is also an input in a number of the country or regional equations. Most of the pantropical equations, along with some regional or country equations use wood density as an input.
It is important to note the forest type for which equations were developed. Kenzo et al. (2009) found that equations that had been developed for primary tropical forests can significantly overestimate the biomass when applied to secondary tropical forests. However, Chave et al. (2014) found that their models
that were equally applicable in primary and secondary forests. When the equations include species-specific wood density as an input, biomass estimates are significantly improved, though may still yield errors, for example overestimates in the case of smaller trees (Kenzo et al 2009). In addition, it is necessary to understand the geographic areas for which equations were developed. Some equations, such as those given by Sierra et al (2007) are developed for select locations and thus may not be more widely applicable. However, even choosing an equation from an appropriate forest type does not guarantee that it is applicable. Ngomanda et al. (2014) found that the Chave et al. equation (2005) for moist forests did not fit with local data, but the equation for wet forests did, even though climatic zone does not correspond (perhaps indicating the same growth limitations are felt but not captured by the precipitation standard).
With a multitude of varying options for calculating AGB, a pan-tropical allometric equation, such as Chave et al. (2005, 2014), is extremely useful. The validity of the Chave et al (2005) equation has been confirmed in studies across Southeast Asia and Africa, areas where uncertainty in the 2005 models was thought to be due to climatic variations. Chave et al. (2014) published an improved allometric equation inclusive of a variable representative of climatic effects on tree growth.
In Indonesia, six models for Dipterocarp forests were analyzed in a study by Rutishauser et al. (2013). All were found to accurately predict above ground biomass explaining between 90 and 96% of the variation observed. Overall, they found regional models had lower performance, with greater bias (-31 – +8%) and higher Akaike Information Criterion (AIC) values (177–204), compared to generic models (bias: -2 – +2% and AIC: 57–67). The generic allometric model developed by Chave et al. (2005) including height was the best model with the highest coefficient of determination (R2 = 0.964) and the lowest residual standard error (0.309) and AIC (56.6). The model developed locally in the same region by Basuki et al. (2009) greatly underestimated individual tree biomass, resulting in very low aggregated biomass estimates at the plot level (Rutishauser et al. 2013). Brown et al. (2011) and Fayolle et al. (2013) reported similar findings for forests in East Kalimantan and Central Africa, respectively.
3 AIC is a measure of the goodness-of-fit of statistical models, addressing the tradeoff between goodness-of-fit and the complexity of models.

09
Consulting Study 3Review of aboveground biomass estimation techniques
High Carbon Stock Science Study
Table 2: Examples of Select Region/Country specific equations for areas of interest to HCS Study.
Area/ Country Equation Forest Type n R2 Tree Size Source
Central Africa, Congo Basin, Cameroon
AGB = ρ * exp (-1.183 + 1.940 × In(D) + 0.239 × (In(D))2 – 0.0285 × (In(D))3)
Lowland tropical forest (moist forests)
138 0.988 RSE= 0.188
NA Fayolle et al. 2013
Cameroon ln(AGB) = -2.1801 + 2.5634 x ln (D)
Moist tropical forest
443 0.9671 RSE=0.444
1-148 cm DBH Djomo et al. 2010
ln(AGB) = -3.2249 + 0.9885 x ln (D2 x H)
274 0.971 RSE=0.437
1-138 cm DBH
ln(AGB) = -2.4733 + 0.2893 x (ln (D))2 – 0.0372 x (ln(D))3 + 0.7415 x ln (D2 x H) + 0.2843 x ln(ρ)
274 0.9717 RSE=0.437
1-138 cm DBH
Cameroon AGB = -3.37 + (0.02483 X D2H)
Regenerating tropical forest species
14 0.99 5-120 cm DBH Deans et al. 1996
AGB = -30.87 + 0.7684 * BA
Ghana AGB = 0.30 * D2.31 Tropical Rainforest, Wet evergreen forests
42 0.93 2-180 cm DBH Henry et al. 2010
Central Africa ABG=exp (-4.0596+4.0624×ln(D)-.0228 x (ln(D))2 + 1.4307 x ln(ρ))
Evergreen rainforest mixed semi-deciduous species
101 0.944 11.8-109.4 cm DBH
Ngomanda et al. 2014
ABG=exp(-2.5680 + 0.9517 × ln(D²×H) + 1.1891 x ln(ρ))
Colombia ln(AGB) = -2.277 + 2.017ln(D) + 0.715ln(H) + 0.718ln(ρ)
Natural forests across different biogeographical regions in Colombia
631 0.954 D>10 cm Alvarez et al. 2011
ln(AGB) = -2.286 + 2.471 x ln(D)
Primary forests 140 0.979 0.5-198 cm DBH
Sierra et al. 2007
ln(AGB) = -2.232 + 2.422 x ln(D)
Secondary forests
152 0.975 0.9-40 cm DBH
Malaysia AGB = 0.0829 x D2.43 Secondary forests in Southeast Asia
107 0.96 0.1<H<23.0 m0.2<Db<31.8 cm
Kenzo et al. 2009AGB = 0.0379 x Db
2.63 135 0.99
AGB = 0.0300 x H2.49 131 0.99
AGB = 0.1525 x D0.0188 Secondary forests in Southeast Asia
30 0.99 1.0-44.1 cm DBH
Kenzo et al 2009bAGB = 0.1083 x (D2 x H)0.0138 30 0.99
AGB = 0.0558 x H0.0113 30 0.97
Indonesia, Borneo
ln(AGB) = -2.30 + 2.62 x ln(D) Primary rain forest
>4.5 cm DBH Yamakura et al. 1986 (per Kenzo et al 2009)
Indonesia, Kalimantan
ln(AGB) = -2.51 + 2.44 x ln(D) Secondary forest
Hashimoto et al. 2004 (per Kenzo et al 2009)
10
Consulting Study 3Review of aboveground biomass estimation techniques
High Carbon Stock Science Study
Area/ Country Equation Forest Type n R2 Tree Size Source
Indonesia, Seram
ln(AGB) = -1.9366 + 1.8368 x ln(D) + 0.9047 x ln(H) + 1.1645 x ln(ρ)
Old secondary limestone forests
25 0.961 RSE=0.148
10.4-41.7 cm DBH
Stas 2011
ln(AGB)_+ -1.9946 + 0.9009 x ln(D2 x H x ρ)
0.953 RSE=0.162
Indonesia, East Kalimantan
ln(AGB) = -1.201 + 2.196 x ln(D)
Lowland Dipterocarp forests
122 0.963 RSE=0.335
6-200 cm DBH Basuki et al. 2008
ln(AGB) = -1.935 + 1.981 x ln(D) + 0.541 x ln(CBH)
0.967 RSE=0.318
ln(AGB) = -0.744 + 2.188 x ln(D) + 0.832 x ln(ρ)
0.970 RSE=0.303
Indonesia, Sumatra
AGB = 0.11* ρ * D2.62 Secondary, logged over (mixed secondary forestry)
29 NA 7.6-48.1 cm DBH
Ketterings et al. 2001
AGB = 0.066D2.59
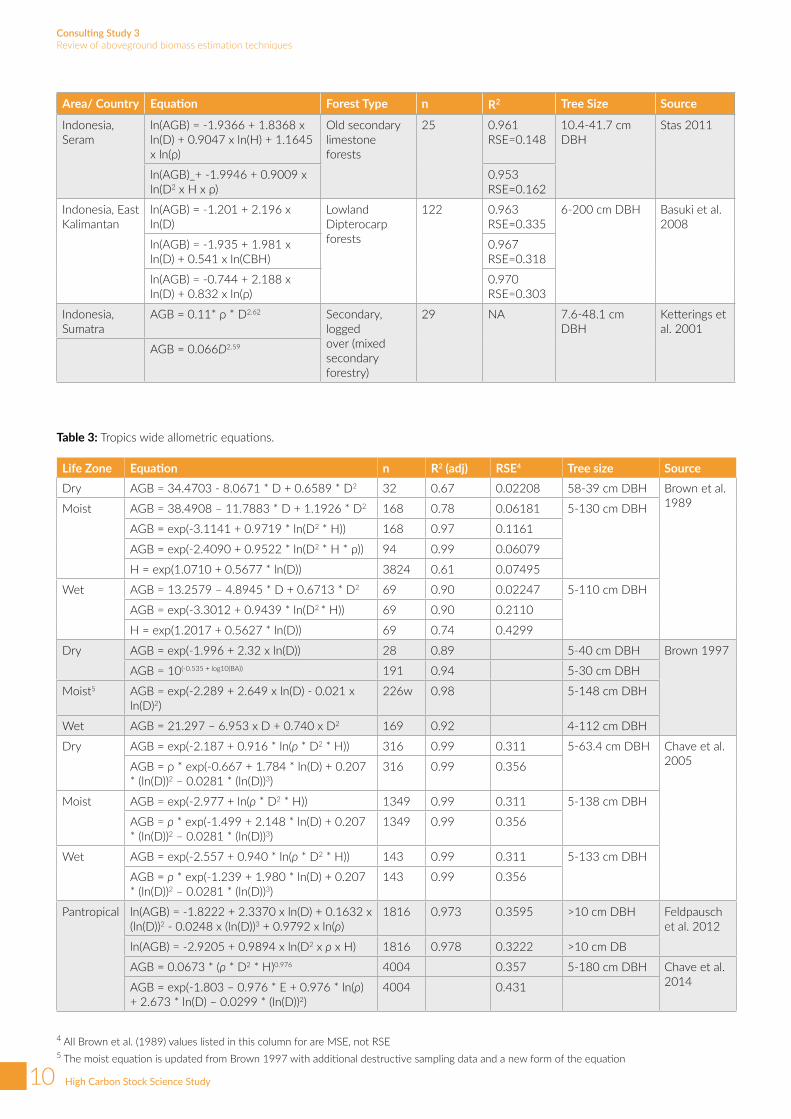
Table 3: Tropics wide allometric equations.
Life Zone Equation n R2 (adj) RSE4 Tree size SourceDry AGB = 34.4703 - 8.0671 * D + 0.6589 * D2 32 0.67 0.02208 58-39 cm DBH Brown et al.
1989Moist AGB = 38.4908 – 11.7883 * D + 1.1926 * D2 168 0.78 0.06181 5-130 cm DBH
AGB = exp(-3.1141 + 0.9719 * ln(D2 * H)) 168 0.97 0.1161
AGB = exp(-2.4090 + 0.9522 * ln(D2 * H * ρ)) 94 0.99 0.06079
H = exp(1.0710 + 0.5677 * ln(D)) 3824 0.61 0.07495
Wet AGB = 13.2579 – 4.8945 * D + 0.6713 * D2 69 0.90 0.02247 5-110 cm DBH
AGB = exp(-3.3012 + 0.9439 * ln(D2 * H)) 69 0.90 0.2110
H = exp(1.2017 + 0.5627 * ln(D)) 69 0.74 0.4299
Dry AGB = exp(-1.996 + 2.32 x ln(D)) 28 0.89 5-40 cm DBH Brown 1997
AGB = 10(-0.535 + log10(BA)) 191 0.94 5-30 cm DBH
Moist5 AGB = exp(-2.289 + 2.649 x ln(D) - 0.021 x ln(D)2)
226w 0.98 5-148 cm DBH
Wet AGB = 21.297 – 6.953 x D + 0.740 x D2 169 0.92 4-112 cm DBH
Dry AGB = exp(-2.187 + 0.916 * ln(ρ * D2 * H)) 316 0.99 0.311 5-63.4 cm DBH Chave et al. 2005AGB = ρ * exp(-0.667 + 1.784 * ln(D) + 0.207
* (ln(D))2 – 0.0281 * (ln(D))3)316 0.99 0.356
Moist AGB = exp(-2.977 + ln(ρ * D2 * H)) 1349 0.99 0.311 5-138 cm DBH
AGB = ρ * exp(-1.499 + 2.148 * ln(D) + 0.207 * (ln(D))2 – 0.0281 * (ln(D))3)
1349 0.99 0.356
Wet AGB = exp(-2.557 + 0.940 * ln(ρ * D2 * H)) 143 0.99 0.311 5-133 cm DBH
AGB = ρ * exp(-1.239 + 1.980 * ln(D) + 0.207 * (ln(D))2 – 0.0281 * (ln(D))3)
143 0.99 0.356
Pantropical ln(AGB) = -1.8222 + 2.3370 x ln(D) + 0.1632 x (ln(D))2 - 0.0248 x (ln(D))3 + 0.9792 x ln(ρ)
1816 0.973 0.3595 >10 cm DBH Feldpausch et al. 2012
ln(AGB) = -2.9205 + 0.9894 x ln(D2 x ρ x H) 1816 0.978 0.3222 >10 cm DB
AGB = 0.0673 * (ρ * D2 * H)0.976 4004 0.357 5-180 cm DBH Chave et al. 2014AGB = exp(-1.803 – 0.976 * E + 0.976 * ln(ρ)
+ 2.673 * ln(D) – 0.0299 * (ln(D))2)4004 0.431
4 All Brown et al. (1989) values listed in this column for are MSE, not RSE5 The moist equation is updated from Brown 1997 with additional destructive sampling data and a new form of the equation

11
Consulting Study 3Review of aboveground biomass estimation techniques
High Carbon Stock Science Study
We recommend the use of Chave et al. (2014) for biomass estimates of tropical forests. Where height is available or reliably attainable (from a locally specific DBH versus height relationship), the equation including height should be used. In other cases, the equations using an environmental stress factor can be used. In select cases, alternative equations may be more applicable to the forested area of interest. This could include young regenerating forests, areas of shifting cultivation mosaic, areas undergoing heavy selective cutting resulting in stunted trees and abandoned plantations. In forest areas with a dominance of lianas, palms and/or bamboo, it is recommended that equations specific to these vegetation types be used along with the Chave et al. (2014) equation for the trees. However, it is recommended that any existing allometric equation be verified as appropriate for use with local data, as described in the next section.
2.4 Verifying applicability of allometric equations
Since live trees contain the majority of biomass in most forests, the careful assessment and verification of models applied to derive estimates of live tree biomass is perhaps the most important step in forest biomass inventories. Chave et al. (2004) confirms that while there are multiple sources of error in the estimation of aboveground biomass in tropical forests (Box 1), model error from the use of an allometric equation to convert direct measurements to biomass estimates has been shown to be a significant source of error.
Furthermore, the use of LiDAR technology to assess carbon stocks remotely also requires the use of appropriate allometric models because estimates produced by LiDAR must be based on calibrated relationships with ground measurements. Therefore allocating insufficient attention and resources to ensuring the selected allometric equation is appropriate can lead to significant under-or-over estimations of carbon stocks and therefore undermine the integrity of the entire effort to estimate forest carbon stocks
The basic initial step when exploring which allometric equation to employ is developing a full understanding of the population of trees that were destructively harvested to produce the model. This includes considering:
• Range in diameter and height
• Species
• Geographic range
• Soil type, particularly if trees grew on atypical, non-zonal soil (e.g. very sandy spodosol or highly organic histosol)
• Tree density
All of these variables have a significant impact on growth behavior and aboveground biomass of a forest. Therefore, when selecting an appropriate allometric equation to use for biomass estimation it is important that the forest under study must match as much as possible the biophysical characteristics and growth conditions as the forest from which the allometric equation was developed.
If an existing allometric equation is deemed potentially appropriate, its applicability can be verified through measurement or limited destructive sampling and an additional series of statistical tests. Destructive sampling typically involves harvesting a representative sample of trees (at least five, including at least three of these to have DBH >50 cm, but preferably more) from the forest strata of interest so that the biomass can be directly measured (i.e. dry weight of sample trees). Strict protocols must be followed during the destructive harvesting process to ensure scientific integrity. Standard field and data analysis protocols are widely available (c.f. Brown 1997 and Walker et al 2014). As an initial step, an alternative approach is presented in the Appendix to indicate if the equation is systematically overestimating the likely biomass.
Alternatively, existing databases can be used to access relevant measurements for the geographic area of interest. For example, the BAAD (Biomass and Allometry Database) database provides data on woody plant measurements of at least 678 species from 176 different studies (Falster et al 2015). This database includes measurements from individual plants (rather than stand averages), direct measurements of biomass (i.e. data derived through destructive harvesting, rather than estimated using allometric equations) and offers appropriate associated metadata (location, light, management, vegetation type, etc.). As such, it may serve as a valuable resource for assessing model applicability by offering a reputable source data that can supply inputs to produce biomass estimates from the area of interest avoiding the need for destructive harvesting to validate the allometric equation in question.
It is recommended that multiple methods of statistical analysis be employed to determine the adequacy of the chosen allometric equation (Tedeschi 2006). As a first step, the biomass of the harvested trees can be plotted along with the curve of biomass against diameter as predicted by the allometric equation. The predictive accuracy can be assessed by calculating the error between the predicted biomass and the biomass from the harvested tree and by plotting the residuals (Pickard et al 2012). Ngomanda et al (2014) used three validation criteria in assessing the applicability of site-specific equations compared with pantropical equations: relative bias, relative root mean square error and the proportion of observations outside an approximate confidence interval for predictions (e.g. 95% confidence interval).

12
Consulting Study 3Review of aboveground biomass estimation techniques
High Carbon Stock Science Study
In general, if the measured biomasses of the harvested trees are evenly distributed both above and below the predicted biomass using the equation, the equation has demonstrated that it is a good predictor for tree biomass in the area of interest.
In situations where all examined biomass equations produce very biased estimates on a per tree basis during validation and there are not resources to develop a new equation, then a chosen equation can still be applied if it produces conservative estimates when compared with data from destructive sampling. For example:
• If the potential biomass equation to be applied will be used to determine if an area is above a certain carbon stock threshold, than it will be conservative
Box 1: Uncertainty of carbon stock estimatesIt is not possible to avoid errors entirely when estimating biomass based on forest inventories. It is important, however, to know how to identify sources of error and minimize them. It is also essential to report errors in studies. There are numerous sources of potential error in estimating biomass and carbon stocks. Common sources of error include:
• Sampling error – the difference between a population value and a sample estimate• Measurement error – the difference between a measured value and the true value errors in collecting data
from the plots• Model error – error due to the use of models such as allometric equations or diameter-height relationships
that estimate desired values, such as AGB, as a function of certain measureable tree dimension
All significant sources of error should be quantified using estimates. Sampling error can be estimated by calculating the standard error of the sample estimate. Measurement error can be estimated by comparing two sets of repeated measurements for a limited percentage of the sample. Model error can be estimated based on goodness-of-fit of the original model, or by validating the models used and estimating error through use of destructive sampling or conversion factors.
Estimating overall error when multiple error sources are combined can be done by either simple propagation of errors or through the use of a Monte Carlo analysis.
The following equation is used for error propagation, as recommended by IPCC:
Where: UE = percentage uncertainty of the sum of the quantities (half the 95% confidence interval divided by the total (i.e. mean) and expressed as a percentage) Un = percentage uncertainty associated with each source En = the uncertain quantity (e.g. biomass of the tree or of the stand)
The Monte Carlo approach is recommended by IPCC (2006) as an advanced alternative to simple error propagation. A Monte Carlo analysis selects random values of the data being evaluated and uses them in calculations, repeating this many times to build the overall probability of obtaining the mean outcome. It is a method for iteratively evaluating a deterministic model using sets of random numbers from a given distribution for each parameter as inputs. Using this model it is possible to substitute a range of values for any factor with uncertainty, thereby creating a stochastic model. A deterministic model yields the same result with each recalculation, while a stochastic model introduces probability and randomness so that the results are different with each recalculation. If sources of errors are uncorrelated and have a normal distribution, then simple error propagation (deterministic model) is acceptable. It is advised to use a stochastic model when the functions are complex or nonlinear, uncertainty is high, there are multiple sources of uncertainty, correlations exist between datasets, or distribution is not normal.
to use the equation if the predicted biomass per tree is consistently (>75% of trees) below the measured tree biomasses.
• If the potential biomass equation to be applied will be used to determine if an area is below a certain carbon stock threshold, than it will be conservative to use the equation if the predicted biomass per tree is consistently (>75% of trees) above the measured tree biomasses.
The estimates of carbon stocks, both at the tree and at the site level, will include a certain amount of error (Box 1). It is recommended that the error associated with the use of the allometric equation be incorporated into calculating total stand-level biomass error.

13
Consulting Study 3Review of aboveground biomass estimation techniques
High Carbon Stock Science Study
2.5 Belowground biomass estimation
As with aboveground biomass, it is not practical to measure the below ground biomass (BGB) of an area of interest directly. It is also very difficult and resource-intensive to develop specific forest type or country-specific allometric equations for root biomass due to the time and labor intensive process of excavating root structures. Instead, below-ground biomass can be estimated indirectly using available equations that reliably predict root biomass based on shoot (i.e. aboveground) biomass. A commonly applied root:shoot ratio was developed by Mokany et al. (2006; also reported in the IPCC 2006 GL) offers specific ratios based on forest type and climate zone (Table 4). These ratios are applicable when the aboveground biomass estimate (shoot) is reported at the stand level and not for individual trees. For an individual tree, Mokany et al. (2006) propose the following relationship: BGB=0.26*AGB (R2=0.78). Additional root:shoot ratios for natural forests developed through root excavation also exist (Table 5).
Table 4: Root to Shoot ratios from Mokany et al. 2006.
Vegetation Category
Shoot biomass (t/ha)
Mokany Root:Shoot ratio
IPCC Root:Shoot ratios
Tropical/subtropical moist forest/plantation
<125 0.205 0.06-0.33
>125 0.235 0.06-0.33
Tropical/subtropical dry forest/plantation
<20 0.563 0.23-0.85
>20 0.275 0.23-0.85
Tropical/subtropical moist woodland
All 0.420 -
Tropical/subtropical/temperate dry woodland
All 0.322 -
Table 5: Root to shoot ratios for tropical forests.
Geography Ratio to AG biomass
Source
Global tropical forests
0.18 Gremer & Sauerborn, 2007
Pasoh Forest Reverve, Peninsular Malaysia
0.18 Niiyama et al. 2010
Tropical forests 0.221 Luo et al. 2012
Angiosperms (global)
0.205 Reich et al. 2014
Gymnosperms (global)
0.192
The Mokany et al. root:shoot ratios are commonly applied for estimating belowground biomass in tropical forests and thus it is recommended that these ratios be applied unless a specific study has been conducted for the area of interest that has produced root estimates significantly different from those estimated using Mokany et al. (2006).
It should be noted that in forests underlain by peat, BGB is normally not estimated. Instead, the biomass contained in the roots are included in the peat carbon stocks.

14
Consulting Study 3Review of aboveground biomass estimation techniques
High Carbon Stock Science Study
Both Khalid et al. (1999) and Corley and Thinker (2003) equations have been widely cited and applied (Morel C., et al. 2011, Shashikant V.,et al. 2012). The Khalid et al. (1999) equation only requires height measurements, but is based on a study of oil palm AGB in a specific site in west Malaysia. The Corley and Thinker (2003) model is based on data from a wider geographic region, but requires more data inputs in addition to height including diameter, age, wood density, frond width and front depth. Asari et al. (2013)’s study of 60 oil palm stands in Selangor, Malaysia showed that the Khalid et al. (1999) model rendered slightly higher (47.19 tonnes ha-1) estimates of biomass than that of Corley and Thinker (2003) (40.77 tonnes ha-1). Korom, A. and Phua, M. (2014) also conducted an assessment of available allometric equations to estimate the biomass in palm oil stands and concluded the Khalid et al. (1999) equation most accurately predicted the biomass in their study sites in Sabah, Malaysia.
As an alternative approach, the long-term average biomass stocks of a palm oil plantation have been developed (Table 7). These estimates simplify the growth and stabilization of carbon stocks in palm oil
plantations by creating a time averaged value across the plantation cycle or according to age. This allows for an approach that does not necessitate intensive field data collection to supply allometric models with appropriate data. It offers an initial estimate of post-conversion long term carbon stocks. Of course, stocking density, site conditions and overall management will impact the actual biomass stocks of a particular plantation. Therefore, this approach may be appropriate if it will produce a conservative estimate of carbon stocks.
The 2009 RSPO report referenced in the table above that the time averaged carbon stock in an oil palm plantation is on the order of 35 tonnes carbon/ha, calculated over a 25-30 years period (includes both above and belowground biomass) and that it is reasonable to use this value because it represents a midpoint between highest and lowest published values for standing carbon stocks in palm oil plantations. Consulting Study 4 reassessed the RSPO analysis and concluded that the time-integrated AGB should instead be 30 t C/ha for oil palm plantations.
Table 6: Allometric equations for oil palm.
Geography Equation Measured variables N R2 SourceOil palm plantations in Malaysia
AGB= 725+197* total height Height 10 0.96 Khalid et al. (1999)
Oil palm plantations across the tropics
• Density: ƥ = 0.0076x + 0.083
• Trunk dry weight: AGBtrunk = 0.1π ƥ htotal (D/2)2
• Frond dry weight: AGBfrond = 0.102wd + 0.21
• AGB dry weight: AGBtotal = AGBtrunk + AGBfrond
• Total height•Diameter• Age• Wood density• Frond width and depth
0.93 Corley and Thinker (2003)
2.6 Plantation oil palm allometric equations
Estimating the greenhouse gas impacts of removing high carbon stock forests to establish palm oil plantations requires an understanding of the carbon stocks stored in palm oil plantations. In this section, different approaches are presented as well as a literature review of the carbon stocks in palm oil plantations.
Allometric equations have been developed for oil palm plantations (Khalid et al 1999; Corley and Thinker 2003) (Table 6). Inputs for these equations differ from those developed for natural forests, as the equations for estimating biomass in palm generally require age and/or height data rather than diameter inputs.

15
Consulting Study 3Review of aboveground biomass estimation techniques
High Carbon Stock Science Study
Table 7: Above and below ground carbon stock values for oil palm plantations.
Source Location Age (years) Aboveground C Stock Belowground C Stock Mg/ha
RSPO-published ‘Greenhouse Gas Emissions from Palm Oil Production’ (2009); based on data from Germer and Sauerborn (2007)
Indonesia (Sumatra) Time averaged 35.3 ± 11
IPCC (2006) No sources listed and no indication on geographic region
Time averaged 55
Henson (2008) Malaysia Time averaged 25 yr cycle
35.3 -
Jiwan and Saharjo (2009)
Indonesia (East Kalimantan)
25 40 -
Morel (2009) Malaysia (Sabah) Time averaged 25 yr cycle
24.2 -
Syahrinudin (2005) Indonesia 30 62.8 21.8
Khaled et al. (1999b) Malaysia - 6.12
In terms of belowground biomass estimates, Khaled et al. (1999b) and Aholoukpe et al. (2013) found that this carbon pool in oil palm plantations does not contribute significantly to the total biomass and that the majority of biomass in oil palm is concentrated in the trunk, fronds and fruits (96%). This assertion is not in agreement with Kho et al. (2015) who report that belowground biomass does contribute a relatively large share of the total biomass in oil palm, but is typically not accounted for due to the complexities in measuring its biomass. The above and belowground values developed Syahrinudin (2005) shown in the table above indicate that belowground constitutes 25 percent of the total biomass, which validates Kho et al. (2015). Therefore, selecting the combined value of 35.3 ± 11 t C/ha suggested in the RSPO report is reasonable as it includes both above and below ground biomass.

16
Consulting Study 3Review of aboveground biomass estimation techniques
High Carbon Stock Science Study
Section 3: Forest Inventory Approach3.1 Overview of approaches In locations where forest inventories have taken place, it may be possible to estimate biomass without conducting biomass sampling independently. A traditional forest inventory is used to collect data that can be analysed and assessed to estimate the value and possible uses of the resource at various scales (national, subnational, by forest type or to specific forest area). Inventories are used to provide information on the state and dynamics of forests for management planning. Such inventories are commonly used to estimate the number or trees per hectare, the volume of timber (generally selected species of value) and the potential value of the timber. Although forest inventories have typically focussed on assessing the quantity and value of timber, the data collected by such inventories can often be used to estimate biomass and carbon stocks of the forest tree pool (Brown et al. 1989). This section will describe how forest inventories of timber volume could be used to identify HCS forests, including the methods used to convert inventory data to estimates of aboveground tree biomass (AGB) and carbon stocks, sources of uncertainty and recommendations on the value of forest inventories in relation to the overall HCS study.
There are two approaches for estimating AGB from traditional forest inventories. The first approach is based on the use of existing measured volume estimates defined as volume over bark of tree bole from stump or buttress to the crown point or first main branch (VOB per ha) converted to biomass density (t/ha) using a variety of methods described in this section (Brown et al. 1989, Brown and Lugo 1992, Gillespie et al. 1992). The second approach directly estimates biomass density using biomass stand tables (tables of the number of trees in different diameter classes) or allometric equations (Brown et al. 1989; also see Section 2 above). The advantage of this second method is that it produces biomass estimates without having to make volume estimates, followed by application of expansion factors6 to account for non-inventoried tree components. The disadvantage is that a fewer number of inventories report stand tables to small diameter classes for all species. To use either of these two approaches, the inventories must include all tree species-often inventories report data for only certain commercial or potentially commercial species.
Data from national or subnational forest inventories can be useful for providing an initial estimate of biomass and where these are available it is recommended that they be examined to make sure that they are suitable. Such inventories are collected from large sample areas (subnational to national level) using a statistically planned sampling method designed to represent this entire population of interest. Thus the number of sample points from the area of interest for an HCS assessment for a particular subregion will likely be inadequate to reach uncertainty targets. Moreover, it is noted that some tropical countries have not conducted new inventories for one or two decades. Thus, dependent on the land management that has taken place, these estimates may not be applicable to current forest conditions. However, they could still be useful for national biomass assessments if the inventory data were used in combination with remote sensing data such as Radar or LiDAR that can detect the forest vegetation density (mass or volume per unit area).
Timber inventories at the concession level also exist for many areas and may also be useful for determining whether an area could be considered a HCS. Both national/subnational and forest concession specific timber inventories are often conducted with the narrow objective of estimating expected timber volumes and thus may not be appropriate for estimating total biomass. Thus the field methods and protocols used must be thoroughly reviewed. Common problems include:
• Subnational inventories may have only been conducted in forests viewed as having commercial value;
• The minimum diameter (diameter at beast height, DBH) of trees included in inventories is often greater than 10 cm and sometimes as large as 50 cm; this excludes small and even medium sized trees, which can account for a substantial proportion of forest biomass.
• The maximum diameter class in stand tables (used with allometric equations) is generally open-ended with trees greater than 80 cm DBH often lumped into one class. The actual diameter distribution of these large trees significantly affects aboveground biomass density.
6 Expansion factors (more details below) are used to convert volume estimates to biomass estimates taking into account wood density of the trees and the non-commercial components (e.g. branches, twigs, etc.)

17
Consulting Study 3Review of aboveground biomass estimation techniques
High Carbon Stock Science Study
• Not all tree species may have been inventoried. Instead only a select group, perceived to have commercial value, may have been inventoried.
• The definition of inventoried volume is not always consistent.
• Inventory reports may not include detailed sampling methods; field measurement data are not always archived and therefore are lost.
• Very little descriptive information is given about the actual condition of the forests - they are often described as primary, but diameter distributions and volumes suggest otherwise (e.g. Brown et al. 1991, 1994).
• Field measurement methods may not measure DBH to the accuracy desired for biomass estimates. For example, instead of actual DBH measurements, a diameter stick may be used to classify the tree into a DBH class or measurements may be taken only down to the nearest unit digit (e.g. 5, 10, 15, 20, 25).
Thus to use a traditional forest inventory for biomass estimation, using either approach, the inventory must meet the following criteria:
1. Be no older than 10 years (if logging has taken place in the interim, data on volumes removed must also exist)
2. The inventory data must be based on trees with a minimum DBH of ≥10 cm-inventories with minimum DBH greater than 30 cm are generally not acceptable for biomass estimation. (In HCS context, the presence of a significant number of large diameter trees could indicate high C stocks – see section 3.2.2 below).
3. All trees and species must be included.
4. If using stand tables with allometric equations, additional data are required to better estimate the average DBH of the largest open-ended diameter class.
3.1.1 Approach 1: Biomass density based on volume data
The method presented here to estimate above ground biomass is based on existing volume per ha data and is best used for secondary to mature closed forests only, growing in moist to dry climates. It should be used for closed forest only because the original database used for developing this approach was based on closed forests. The primary data needed for this approach is VOB/ha and a volume-weighted average wood density (oven dry mass per unit of green volume in t/m3).
Biomass density can be calculated from VOB/ha by first estimating the biomass of the inventoried volume and then "expanding" this value to take into account the biomass of the other aboveground components as follows:
Aboveground biomass density (t/ha) = VOB * WD * BEF
Where:
VOB = volume over bark of free bole from stump or buttress to the crown point or first main branch (m3/ha)
WD = volume-weighted average wood density (t/m3)
BEF = biomass expansion factor (ratio of aboveground oven-dry biomass of trees to
oven-dry biomass of inventoried volume, unitless)
Volume-weighted average (based on dominance of each species as measured by volume) wood density value is best used here, calculated as follows.
Where:
Vn = volume of species 1, 2, ....to the nth species
Vt = total volume
WDn = wood density of species 1, 2, .....to the nth species
In situations where sufficient wood density data do not exist to do this level of detailed calculations, it is best to estimate a weighted mean wood density based on known species, using an arithmetic mean for unknown species from e.g. Reyes et al. (1992).
BEFs have been calculated from inventory sources for many broadleaf forest types (young secondary to mature) growing in moist to seasonal moist climates representative of the tropics (Brown et al. 1989). Sufficient data were included in these inventory sources to independently calculate aboveground biomass density and biomass of the inventoried volume. The relationship between BEF and stemwood biomass (biomass of the inventoried volume BV) is shown in Figure 1. The BEFs are high (>4) at low stemwood biomass (<40 t/ha), then decrease exponentially to almost a constant value (~1.6) at high stemwood biomass (>200 t/ha). The shape of this curve makes logical sense because at very low stemwood biomass (approaching zero commercial volume) there is an absolute amount of AGB, thus dividing an absolute quantity by a very small amount tends to infinity. At the other end of the curve, as the stemwood biomass becomes very large, the mass of the bole dominates and the proportion of mass in the smaller branches etc. decreases, thus tending to a constant.

18
Consulting Study 3Review of aboveground biomass estimation techniques
High Carbon Stock Science Study
Figure 1: Relationship between Biomass Expansion Factor (BEF, unitless) and stem wood biomass (VOB*WD, t/ha) for representative tropical forests (from Brown and Lugo 1992). The data are from the forest inventory sources given in Brown et al. (1989) for forests of tropical America, tropical Asia and tropical Africa and include all trees with a minimum DBH of 10 cm.
A regression equation was fit to the data resulting in the following best fit equation with no bias in the residuals (updated from Brown 1997) (sample size = 73; R2 = 0.84):
BEF = e(3.274 – 0.525*LN(BV))
Where:
BV = stemwood biomass (biomass of VOB)
The IPCC (2006) report also provides a method for using VOB to estimate the AGB of forests-in this report it refers to the Biomass Conversion and Expansion Factor (BCEF) that is the product of the BEF and wood density. In the IPCC report no equation is provided, but instead the values of BCEF are given for a range of VOB classes. The values for tropical humid natural forests range from 9.0 (range 4-12) for a VOB of <10 m3/ha to 0.95 (range 0.7-1.1) at VOB >200 m3/ha (Table 4.5 in Vol. 4, Ch. 4 of IPCC 2006). The general pattern of BCEFs is similar to that shown in Figure 1. From a practical perspective, use of the above equation is recommended rather than the values given in the IPCC report.
Situations where the minimum DBH is ≥25-30 cm
To attempt to unify data on inventoried volume measured to a minimum diameter greater than 10 cm, volume expansion factors (VEF) were developed (Brown 1990). The VEF is defined here as the ratio of inventoried volume for all trees with a minimum diameter of 10 cm and above (VOB10) to inventoried volume for all trees with a minimum diameter of 25-30 cm and above (VOB30). The VOB30 was chosen because after 10 cm, a common minimum diameter for inventoried volumes ranges between 25-30 cm. Data from inventories that reported volumes to minimum diameters in this range were combined into one data
set to obtain sufficient number of studies for analysis. The uncertainty in extrapolating inventoried volume based on a minimum diameter of >30 cm to inventoried volume to a minimum diameter of 10 cm is likely to be large and this approach is not recommended. Estimates of the VEFs were based on a few inventories from tropical Asia and America only (no similar data were available for forests from tropical Africa). Volume expansion factors based on these inventories ranged from about 1.1 to 2.5 and they were related to the VOB30 as follows (sample size = 66, adjusted R2 = 0.65):
VEF =e(1.300 - 0.209*Ln(VOB30)) for VOB30 <250 m3/ha
VEF=1.13 for VOB30 >250 m3/ha
3.1.2 Approach 2: Biomass density based on stand tables
The approach involves estimating the biomass per average tree of each DBH class of the stand table using the recommended allometric equation, multiplying by the number of trees in the class and summing across all classes. Many inventories often report stand tables with wide and/or uneven-width classes. The most unbiased biomass density estimate is obtained when diameter classes are small, about 10 cm wide or smaller and are even-width for the whole stand table.
A key issue is the choice of the average diameter to represent the DBH class. For small DBH classes (≥10 cm), the mid-point of the class has been used (e.g. Brown et al. 1989). The quadratic-mean-diameter (QSD) of a DBH class would be a better choice, particularly for wider diameter classes (Brown et al. 1989). If basal area for each DBH class is known (often provided in inventory data), the QSD of trees in the class, or the DBH of a tree of average basal area in the class, should be used instead. To calculate the QSD, first divide the basal area of the diameter class by the number of trees in the class to find the basal area of the average tree. Then the DBH = 2 x {√(basal area/3.142)}. For example, the DBH of a tree of basal area of 707 cm2 = 2 x {√ (707/3.142)} = 30 cm.
Like with reported VOB estimates, stand tables may be incomplete, that is smaller diameter classes may be missing. To overcome the problem of incomplete stand tables, an approach has been developed for estimating the number of trees in smaller diameter classes based on number of trees in larger classes (Gillespie et al. 1992). It is recommended that the method described here be used for estimating the number of trees in one to two small classes only to complete a stand table to a minimum diameter of 10 cm. It is also emphasized that this method should only be used when no other data for biomass estimation are available.

19
Consulting Study 3Review of aboveground biomass estimation techniques
High Carbon Stock Science Study
The method is based on the concept that uneven-aged forest stands have a characteristic exponential or “inverse J-shaped” diameter distribution. These distributions have a large number of trees in the small classes and gradually decrease in numbers in medium to large classes. Full details of the theory behind the approach and of the different methods tested are given in Gillespie et al. (1992). The best method was the one that estimated the number of trees in the missing smallest class as the ratio of the number of trees in DBH class 1 (the smallest reported class) to the number in DBH class 2 (the next smallest class) times the number in DBH class 1. To use this approach, diameter classes must be of uniform width, preferably no wider than 10-15 cm and should not be used for estimating numbers of trees in more than two “missing’ classes. This method is demonstrated in the following example:
1. Assume that: the minimum diameter class is 20-30 cm and we wish to estimate the number of trees in the 10-20 cm class.
2. The number of trees in the 20-30 cm class equals 80 and the number in the 30-40 cm class equals 35.
3. The estimated number of trees in the 10-20 cm class is the number in the 20-30 cm class x (number in 20-30/number in 30-40); this equals 80 x (80/35) = 183.
As mentioned previously, a larger problem than missing small diameter classes with the use of stand tables is that in practically all inventories reviewed (includes most countries with areas of dense humid forests), the DBH in the largest open-ended class is not given-the data are typically reported as the number of trees in e.g. DBH class >100 cm. But the average DBH of trees in this class could be larger than this and it is these very large trees that contribute significant quantities of biomass at the stand level. The data in Figure 2 show that high aboveground biomass forests contain a high percentage of this biomass in large diameter trees, defined here as >70 cm DBH (see also Slik et al. 2013).
To ensure that errors are minimized when using stand tables that contains open-ended largest DBH classes, it is important that the basal area of this largest class be reported so that a better estimate of the DBH of this class can be calculated.
Figure 2: Relationship between aboveground biomass (Mg/ha or t/ha) and percent of aboveground biomass in trees with DBH >70 cm for tropical humid forests in Malaysia and Sarawak (from Brown et al. 1994) and Philippines7.
7 Data for the Philippines are from a National forest inventory done under the Philippine-German Forest Resources Inventory Project 1986-1988 (unpublished report obtained from FAO library in the early 1990s)
Percent biomass in trees of dbh >70 cm
Abo
vegr
ound
bio
mas
s (M
g/ha
)

20
Consulting Study 3Review of aboveground biomass estimation techniques
High Carbon Stock Science Study
Table 8. Summary of the state of national inventories in the counties of interest to the HCS Forest Initiative.
Country Year of most recent inventory
Standards for volume Standards for biomass Comments
Cameroon 2005 Minimum DBH ≥10 cm, volume defined as VOB in Section 3.1.1.
Biomass based on VOB and BEF in Section 3.1.1.
Gabon 1999 Minimum DBH ≥10 cm, volume defined as VOB in Section 3.1.1.
Biomass based on VOB and BCEF from FAO/IPCC guidelines (cf. section 3.1.1)
Ghana 1980 Minimum DBH ≥10 cm, volume defined with a top diameter of 5 cm (does not equal VOB in Section 3.1.1)
Biomass based on VOB and BEF in Section 3.1.1.
The VOB is not as defined in Section 3.1.1 so the use of the BEF is questionable.
Liberia 1989 Minimum DBH ≥20 cm, no other details given.
Biomass based on BEF in Section 3.1.1.
Inventory data not national; biomass based on BEF but volume data do not met the definition.
Sierra Leone None Expert guess based on minimum DBH of ≥40 cm
none Volume data not national.
Indonesia 2003 Minimum DBH ≥20 cm, no other details given. Volume reported by 10 most common species.
Biomass based on BEF method (section 3.1.1) but VOB for Indonesia is not defined the same; would have to use the VEF with the VOB.
Latest inventory is based on re-measuring 91 plots and updating the baseline inventory of 1992; BEF calculated from equation in Section 3.1.1. (as stated in report) is incorrectly used.
Malaysia 2003 (only Peninsula Malaysia)
Minimum DBH ≥10 cm, volume defined as VOB in Section 3.1.1. Volume reported by 10 most common species.
Biomass based on VOB and BCEF from FRA/IPCC guidelines (cf. section 3.1.1).
Based on 4th national forest inventory-done every 10-yr but does not include Sabah nor Sarawak, for which no data exists.
3.2 Available inventory data for countries of interest
3.2.1 National to regional scales
The countries of most interest to the HCS Forest Initiative are Cameroon, Colombia, Gabon, Liberia, Sierra Leone, Ghana, Indonesia and Malaysia. A review of the Country Reports on the FAO Forestry website for the countries of interest resulted in the following observations (Table 8):

21
Consulting Study 3Review of aboveground biomass estimation techniques
High Carbon Stock Science Study
8 Details of inventory requirements for Indonesia were provided by Art Klassen of the Tropical Forest Foundation, Indonesia; the source for Peninsular Malaysia is the Forestry Department Peninsular Malaysia 2003.
From the above table, it is clear that at the national or regional scales only Cameroon, Gabon and Peninsula Malaysia have data suitable for assessing forest carbon stocks based on inventory data. Indonesia is another candidate country with suitable inventory data but its volume would have to be unified using the VEF with the VOB. The country reports do not contain the details of the inventories but it is likely that they could be obtained from the countries of interest to identify specific areas of interest as countries do subdivide their forest area into various subunits. Inventory data for the other countries are not suitable and could not be used for assessing C stocks.
For determining the biomass at a small concession scale, such national inventories can be used as one level of assessment. However, they are inadequate for providing certainty of site level biomass. Another sampling approach would need to be supplemented to demonstrate the applicability of such data to the area of interest.
3.2.2 Local to timber concession scale
Although the availability of larger scale forest inventories is limited for many countries of interest, data at the timber concession or local scale could be useful. However this is dependent on the inventory methods and expected data accuracy.
In many tropical countries, forest areas are designated by allowable forest use, such as conservation, timber production, community managed forests and areas allowable for conversion. Areas designated for timber production area normally divided into concessions or management units and the management of these concessions for timber production will be articulated in the national forest code of practice (e.g. FAO 1999). Depending on the country, a periodic concession-wide inventory is generally required, for example, in Indonesia such an inventory is required every 10 years (to be completed by 2010)8 and in Peninsular Malaysia a national inventory of the permanent reserved forest area is done every 10 years. In both of these examples, the inventory is based on a statistical sample of the area and results include stand and stocking tables (distribution of number of trees and volume per DBH class) for all species and all trees to a minimum DBH of 10 cm.
A concession is typically divided into cutting blocks, often about 30 such blocks based on a 30-yr cutting cycle, but this will vary by country depending upon the length of the cutting cycle they allow. As part of the management plan, a pre-harvest inventory of the blocks to be harvested will generally be performed by the concessionaires following the national forest code. These pre-harvest inventories typically cover 100% of
the block. Usually the inventory requires tree species identification, location (often mapped), the number and commercial volume of all species by diameter classes and the height to first branch or defect is estimated and recorded. Volumes are calculated based on the recorded data applied to standard government-approved volume tables. And at the same time, trees for harvest are marked. Timber trees for harvest generally include few species with a minimum diameter of about 60 cm or larger (established by the government forest code). Examples of such forest code of practices are given in Forestry Department of Peninsular Malaysia (2003) and Maniatis et al. (2011) for Gabon.
From the above description, it is clear that generally the timber concession inventories will be a useful source of data for identifying HCS forests as they likely meet the criteria outlined in section 3.1 above, however the problem with open-ended largest diameter class could still be an issue. The carbon stock of a forest concession area after logging is basically the difference between the initial C stock and the amount of carbon in the timber extracted and the amount of live tree biomass converted to dead biomass during logging—this includes the carbon in the residual dead biomass of the felled tree left in the forest, the carbon in the incidental or collateral damaged trees and the carbon in the biomass of trees damaged and killed in the construction of skid trails, logging decks and road (Pearson et al. 2014).
The gross reduction in the carbon stock of the concession depends on the amount of timber extracted. For example, for a range of extraction rates of 5-34 m3/ha from 13 commercially operated concessions (based on multiple direct measurements of logging practices in five tropical countries of Bolivia, Brazil, Guyana, Indonesia and Republic of Congo) the reduction in C stock of the trees ranged from about 3-16% of the pre timber harvest stock (140-332 t C/ha) after logging (Pearson et al. 2014). If extraction rates were as high as about 100-150 m3/ha, as can be found in many forests in Sabah and Indonesia, then the reduction in C stock could be as high as about 50-70% of the pre logging stocks (based on factors given in Pearson et al. for Indonesia).
Some logging concessions have been subsequently converted to oil palm plantations and other land uses and this is likely to continue into the future. Thus, from the perspective of the HCS study, inventories of the concessions could be useful. However, these inventories nor data on volume of timber harvested are not available to the general public. Access to the concession pre-inventory and timber volume extraction data is essential and thus some type of an agreement with the concession holder would need to be developed. Here we describe the steps that could

22
Consulting Study 3Review of aboveground biomass estimation techniques
High Carbon Stock Science Study
6. Estimated AGC (can convert to units of biomass by multiplying by 2.13) of the residual stand AGCR = AGCpre – (AGCH + AGCD + AGCR)
These steps will enable an approximate estimate of the post-harvest AGC stocks in a given block (or several blocks depending upon the data archive of pre-harvest inventories) to be made. A ratio of the post-harvest to pre-harvest AGC stocks for a single or multiple blocks can be generated and potentially used to scale up to the whole concession if it all has been logged in the past, or partial concession, based on the concession-scale inventory-this would produce an estimate only of the potential post-harvest impact on AGC stocks. The estimated post-harvest AGC can be compared to the threshold value for a HCS forest and if it approaches the threshold it will indicate that further sampling may be required to reduce uncertainties.
In summary:
• Inventories at the concession level that produce the types of data as described for the above examples are very useful for estimating the AGC of residual forest stands. However, those that only report the size, species and location of the trees to be extracted are of very limited use.
• If unavailable from the concession inventory, data for the pre-harvest stocks (usually reported in
Figure 3: Relationship between the logging damage factor and aboveground biomass carbon (AGC) top and average log length, bottom (Pearson et al. 2014; modified by exclusion of belowground biomass).
be used to convert the pre- harvest inventory data and the volume of timber extracted to an estimate of the remaining carbon stock in AGB of the post-harvest forest (based on Section 3.1 and Pearson et al. 2014).
1. The pre-harvest data on forest volume and/or stand tables would be used to estimate AGB carbon (AGC) using one of the methods given above. Alternatively, if raw tree species and diameter data are available these can be used to directly calculate biomass using an allometric equation. The result from this step would be t C/ha in AGB for the pre-harvest forest [AGCpre] (convert AGB to carbon units by multiplying by 0.47, the IPCC recommended default conversion factor from biomass to carbon).
2. The volume extracted can be converted to an estimate of the AGC based on species specific or average estimate of wood density of the species harvested—the product of total volume per ha extracted and wood density, converted to units of C, is the carbon removed in the timber [AGCH].
3. An estimate of the AGB of the felled tree left in the forest (stump and top) and any incidental damage left behind is needed and generally not measured—this is referred to as the logging damage factor [LDF] (Pearson et al. 2014). An approximate estimate of this factor can be obtained from either of the following two equations (Figure 3) (based on data for 13 commercially operated concessions in six tropical countries of Belize, Bolivia, Brazil, Republic of Congo, Guyana and Congo).
If using the equation in Figure. 2 (top), then X is the AGCpre, if using the equation in Figure. 2 (bottom) then X is the average length of the extracted log (=measured height to first branch or defect minus the height of stump). It is recommended that the LDF based on log length is the more reliable estimate.
4. Multiply the volume extracted (m3/ha) by the LDF (t C in AGB/m3), to arrive at an estimate of AGC in the dead biomass left in the forest caused by felling and extracting the logs [AGCD].
5. Loss of AGC stocks occurs due to the construction of logging infrastructure such as skid trails, logging roads, or logging decks. Typically, concessionaires can harvest the commercial volume generated during road construction, thus the plans for approved infrastructure establishment must also be obtained. Most of the loss of AGC from construction of infrastructure is due to roads, e.g. for Indonesia, roads accounted for almost 70% of the total loss in carbon due to infrastructure (Pearson et al. 2014). The area of roads can be estimated from their length and average width. The product of road area and AGCpre will result in an estimate of the loss in AGCR stocks due to roads.
23
Consulting Study 3Review of aboveground biomass estimation techniques
High Carbon Stock Science Study
volume units but can be converted to C stock units as described in above section 3.1) are likely to be available at the larger scale (regional or national by forest type). If the government forestry division establishes the forestry management practices, including identifying the forests that are designated as production forests, setting the minimum size of trees and species and establishing the extraction rate, then steps 1-6 given above could be used to generate an estimate of the likely AGC of the post-harvest forest.
• If extraction rates are <50 m3/ha, the likely decrease in the C stock will be <25% of the pre-logged forest and the forest will be able to recover over a period of >30 years (Pearson et al. 2014).
• If the extraction rate is >100 m3/ha, the likely decrease in C stock will be >45% and recovery will be very slow (many decades; based on data for Indonesia in Pearson et al. 2014) and the stand potentially could be converted to other productive uses.
3.3 Potential uncertaintiesThere are several sources of uncertainty in using traditional forest inventory data at the concession scale to estimate AGC stocks of the logged forests. These sources of error include the sampling error, errors in field measurements and model errors (errors associated with the use of equations to convert inventory measures to estimates of AGC stocks). The errors are then combined using either a simple error propagation method or the more complex Monte Carlo analysis (IPCC 2003).
Generally the sampling designs are well developed and the sampling error set as a targeted precision and if the inventory followed the government requirements, the outputs are likely to be of relatively low uncertainty. It is important that if an inventory is used, details on the targeted precision and the actual precision reached be obtained to determine if it meets any HCS standards. In a national inventory, the precision is set and reached at the national level, thus when such an inventory is applied at a subnational level there likely will not be sufficient data to reach a pre-established precision level. An inventory of logging blocks on the other hand, generally a 100% inventory is likely to produce outputs of low uncertainty. The errors in field measurements are often unknown, but attempts to minimize them are generally made through the use of standard operating procedures for the measurements and checks and it is assumed that they are followed for the field work.
Errors associated with the reported volume of extracted logs are also unknown and depend on how well the concessionaires are regulated and monitored by the national government. Given the purported high rate of illegal logging that occurs in many tropical countries, the reported extraction rate could be highly uncertain. However, this could be checked with very
high resolution imagery to detect gaps, e.g. Worldview 60 cm resolution (Brown et al. 2011), high resolution 3-D aerial imagery of about 25 cm resolution (Pearson et al. 2006), or LiDAR to detect gaps, likely indicating a felled tree and thus the gap density along with an estimate of the average volume per tree could serve as an approximate estimate as to how reliable the reported extraction of timber was.
Additional errors are due to use of models described in the steps used to convert the volume data to biomass estimates (equations in Section 3.1.1). Errors also come from the need to obtain a reasonable estimate of the volume-weighted wood average density, where the wood density of many species is likely to be unknown. The use of stand tables (Section. 3.1.2) with appropriate allometric equations can reduce the uncertainty as long as the precautions given in that section are followed (e.g. small DBH classes, estimate average DBH of open-ended large class by using basal area). Further model errors include those caused by use of the steps in section 3.2.2 that convert the volume of timber extracted to estimates of the total impact on the AGC stocks (logging damage from felling and infrastructure). With respect to the relationships between the logging damage factors (LDF) and forest carbon stocks and log length, one might question the wider application of these equations to the countries of interest to the HCS study, given that they represent timber harvest in only 13 commercial concessions located in five countries. However, it is argued that given the tight precision for their LDFs (95% confidence intervals of about ≤10% of the mean), the strong relationships between the two variables and the wide variation in forest biomass and timber extraction rates among the sites limits the possible range of variation within a wider range of timber harvesting countries.
3.4 Benefits and drawbacksIt is possible to use inventory data to assess the potential biomass stocks in an area when the standards used in the inventory match those needed to use the methods described in Section 3.1.1,3.1.2, 3.2.2 and the data are presented at the subnational or concession level so that specific areas in a country can be assessed. For example, from expert consultation, the data for Peninsula Malaysia can be analysed at subnational scale (Figure 4) and arguably at the scale of a given concession or management unit. An additional benefit of using existing inventory data is that the data are generally collected from statistically well designed sampling procedures with the precision targets achieved, although sometimes these precision targets are not as precise as might be desired.

24
Consulting Study 3Review of aboveground biomass estimation techniques
High Carbon Stock Science Study
An evaluation will need to take place to compare the expected costs associated with the compilation and analysis of forest inventory data and the expected uncertainty estimates resulting from such data with the cost of initiating new field or remote sensing based analysis. However, given the multiple sources of error and the fact that some of the key error values are likely to be unknown for some countries of interest to the HCS study (e.g. the amount of timber extracted from concessions) and the probable need to conduct a more complex Monte Carlo type uncertainty analysis, the question becomes whether a detailed uncertainty analysis is needed. It is concluded that if an approved government inventory is implemented and monitored at the concession scale then the reported values on timber stocks and extraction rates would be reliable enough to use as the basis for estimating the carbon stocks using the methods described in Section 3.2 and thus are a valuable source of data for assessing whether a forest is of HCS at this scale.
Figure 4: Map of the aboveground biomass based on the national forest inventory for Peninsula Malaysia for 1982 (from Brown et al. 1994). This map was based on a digitized paper map of the forest types into ARC-INFO and the conversion of the 1982 stand and stock tables (reported by 11 forest types and six planning units) into biomass units using the approaches given in Sections 3.1.1 and 3.1.2.
It is our expert opinion that the other sources of error (based on steps described in Sections 3.1 and 3.2.2) cannot amount to more than 30-40% or so. However, these conclusions are only applicable to those forest concessions in countries that have implemented government regulations for the management of their forests, including the requirement to conduct periodic government-approved inventories of the whole concession. Additionally there must be approved standards for field measurements, 100% inventory of the annual logging blocks and reporting of the amount of timber extracted and the inventory data must be available.

25
Consulting Study 3Review of aboveground biomass estimation techniques
High Carbon Stock Science Study
Section 4: Summary of RecommendationsHere we summarize the main recommendations from our study on estimating biomass (AGB and BGB) of tropical forests:
1. We recommend the use of Chave et al. (2014) for biomass estimates of tropical forests. Where height is available or reliably attainable (from a locally specific DBH versus height relationship), the equation including height should be used. In other cases, the equations using an environmental stress factor can be used. In areas with extensive non-tree biomass – including lianas, bamboo and palms, equations specific for these vegetation types may need to be developed.
2. We recommend that the selection of an existing allometric equation for use in estimating the biomass of a forest be verified as appropriate for use with local data (as described in this report).
3. We recommend that below-ground biomass at the stand level be estimated using the Mokany et al. (also reported in IPCC 2006) root: shoot factors.
4. For oil palm plantations, we recommend the use of the 2009 RSPO for the time averaged ABG and BGB carbon stock in such plantation (~35 t C ha-1), calculated over a 25-30 years period (includes both above and belowground biomass).
5. We recommend that forest inventories at the concession-scale (particularly at the harvest block scale) that report stand and stock tables (tables of number of trees and commercial volume by size classes) and the amount of timber harvested can be very useful for reliably estimating the carbon stocks of pre- and post-harvest forests and thus are a valuable source of data for assessing whether a forest is of HCS at this scale. However these concession-scale inventories must be based on approved government guidelines and implemented and monitored at the concession scale.
a. In addition to the government approved standards for doing an inventory, the inventory data must meet the criteria presented in this report (Section 3.1).
b. When converting inventory data based on volume to AGB, it is practical and reliable to use the BEF equation presented in this report (Section 3.1).
c. To ensure that errors are minimized when using stand tables with the largest DBH class being open-ended, it is important that the basal area of this largest class also be reported so that a better estimate of the DBH of this class can be calculated.

26
Consulting Study 3Review of aboveground biomass estimation techniques
High Carbon Stock Science Study
ReferencesAholoukpè, H., B. Dubos, A. Flori, P. Deleporte, G. Amadji, L.L. Chotte, D. Blavet. 2013. Estimating aboveground biomass of oil palm: allometric equations for estimating frond biomass. Forest Ecology and Management 292: 12-129.
Abd Rahman, K., Mohamad Danial, M. S., Muhammad Faiz, K., Birigazzi, L. 2014. Inventory of volume and biomass allometric equations for Southeast Asia. FRIM, Kepong, Food & Agriculture Organization of the United Nations, Rome, Italy
Alvarez, E., Duque, A., Saldarriaga, J., Cabrera, K., de las Salas, G., del Valle, I., Lema, A., Moreno, F., Orrego, S., Rodríguez, L., 2012. Tree above-ground biomass allometries for carbon stocks estimation in the natural forests of Colombia. For. Ecol. Manag. 267, 297–308.
Brown, S. and A.E. Lugo. 1982. The storage and production of organic matter in tropical forests and their role in the global carbon cycle. Biotropica 14: 161-187.
Brown, S. and A.E. Lugo. 1984. Biomass of tropical forests: a new estimate based on forest volumes. Science 223: 1290-1293.
Brown, S., 1990. Volume expansion factors for tropical forests. Unpublished Paper, Prepared for the Forest resource Assessment-1990 Project (available from author).
Brown, S. 1997. Estimating Biomass and Biomass Change of Tropical Forests: A Primer. UN FAO Forestry Paper 134. Food and Agriculture Organization, Rome. [http://www.fao.org/docrep/w4095e/w4095e00.HTM]
Brown, S., F. M. Casarim, S.K. Grimland and T. Pearson. 2011. Carbon Impacts from Selective Logging of Forests in Berau, East Kalimantan, Indonesia. Final Report to The Nature Conservancy. Available at http://www.winrock.org/sites/default/files/publications/attachments/Winrock_FINAL_logging_report_TNC_06-9-2011.pdf
Brown S, A.J.R. Gillespie, A.E. Lugo. 1989. Biomass estimation methods for tropical forests with applications to forest inventory data. Forest Science 35: 881-902.
Brown, S., A. J. R. Gillespie and A. E. Lugo, 1991. Biomass of tropical forests of South and Southeast Asia. Canadian Journal of Forest Research 21:111-117.
Brown, S., L., Iverson and A. E. Lugo, 1994. Land use and biomass changes of forests in Peninsular Malaysia during 1972-82: use of GIS analysis. Chapter 4 in V. H. Dale (ed.), Effects of land use change on atmospheric CO2 concentrations: Southeast Asia as a case study. Springer Verlag, NY.
Brown, S. and A. E. Lugo, 1992. Aboveground biomass estimates for tropical moist forests of the Brazilian Amazon. Interciencia 17:8-18.
Calders, K., G. Newnham, A. Burt, S. Murphy, P. Raumonen, M. Herold, D. Culvenor, Vl Avitabile, M. Disney, J. Armston and M. Kaasalainen. 2014. Nondestructive estimates of above-ground biomass using terrestrial laser scanning. Methods in Ecology and Evolution.
Chave, J., R. Condit, S. Aguilar, A. Hernandez, S. Lao, R. Perez. 2004. Error propagation and scaling for tropical forest biomass estimates. Philisophical Transactions. The Royal Society London, 359: 409-420.
Chave, J., C. Andalo, S. Brown, M. A. Cairns, J. Q. Chambers, D. Eamus, H. Folster, F. Fromard, N. Higuchi, T. Kira, J.-P. Lescure, B. W. Nelson, H. Ogawa, H. Puig, B. Riera, T. Yamakura. 2005. Tree allometry and improved estimation of carbon stocks and balance in tropical forests. Oecologia 145: 87-99.
Chave, J., M. Réjou-Méchain, A. Búrques, E. Chidumayo, M.S. Colgan, W.B.C. Delitti, A. Duque, T. Eid, P.M. Rearnside, R.C. Goodman, M. Henry, A. Martínez-Yrízar, W.A. Mugasha, H.C. Muller-Landau, M. Mencuccini, B.W. Nelson, A. Ngomanda, E.M. Nogueira, E. Ortiz-Malavassi, R. Pélissier, P. Ploton, C.M. Ryan, J.G. Saldarriaga, G. Vieillendent. 2014. Improved allometric models to estimate the aboveground biomass of tropical trees. Global Change Biology 12629.
Corley, R.H.V and P.B. Tinker. “The Oil Palm.” Blackwell Science Ltd, Oxford, 2003.
Deans, J. D., Moran, J. and Grace, J., 1996. Biomass relationships for tree species in regenerating semi-deciduous tropical moist forest in Cameroon, For. Ecol. Manage., 88, 215–225.
Djomo A.N., A. Ibrahima, J. Saborowski, G. Gravenhorst. 2010. Allometric equations for biomass estimations in Cameroon and pan moist tropical equations including biomass data from Africa Forest Ecology and Management, 260, 1873-1885.

27
Consulting Study 3Review of aboveground biomass estimation techniques
High Carbon Stock Science Study
Ebuy, J, JP Lokombe, Q Ponette, D Sonwa and N Picard. 2011. Allometric equation for predicting aboveground biomass of three tree species. Journal of Tropical Forest Science 23(2): 125-132
Falster, D.S., R.A. Duursma, et al. (>90 co authors). 2015. BAAD: a Biomass and Allometry Database for Woody Plants. Ecology 96(5) 1445.
FAO 1999, Code of Practice for Forest Harvesting in Asia-Pacific; RAP Publication 1999/12, Regional Office for Asia and the Pacific, Bangkok, Thailand.
Fayolle A, J-L Doucet, J-F Gillet, N Bourland, P Lejeune. 2013. Tree allometry in Central Africa: Testing the validity of pantropical multi-species allometric equations for estimating biomass and carbon stocks. Forest Ecology and Management 305:29-37.
Feldpausch, T.R., L. Banin, et al (+50 co-authors). 2011. Height-diameter allometry of tropical forest trees. Biogeosciences 8: 1081-1106.
Feldpausch, T.R., J. Lloyd, et al (+50 co-authors). 2012. Tree height integrated into pantropical forest biomass estimates. Biogeosciences 9: 3381-3403
Forestry Department Peninsular Malaysia, 2003. Guidelines for Reduced Impact Logging in Peninsular Malaysia, Kuala Lumpur, Malaysia, 38 pp.
Gillespie, A. J. R, S. Brown and A. E. Lugo, 1992. Tropical forest biomass estimation from truncated stand tables. Forest Ecology and Management 48:69-88.
Hansen, MC, PC Potapov, R Moore, M Hancher, SA Turubanova, A Tyukavina, D Thau, SV Stehman, SJ Goetze, TR Loveland, A Kommareddy, A Egorov, L Chini, CO Justics, JRG Townshend. 2013. High-Resolution Global Maps of 21st-Century Forest Cover Change. Science 342, 850. DOI: 10.1126/science.1244693
Hashimoto, T., T. Tange, M. Masumori, H. Yagi, S. Sasaki, K. Kojima. 2004. Allometric equations for pioneer tree species and estimation of the aboveground biomass of a tropical secondary forest in East Kalimantan. Tropics 14;123–130.
HCS Approach Steering Group, Eds. 2015. The HCS Approach Toolkit, version 1.0. Kuala Lumpur: HCS Approach Steering Group. Available at http://highcarbonstock.org/the-hcs-approach-toolkit/.
Henry, M, A Besnard, WA Asante, J Eshun, S Adu-Bredu, R Valentini, M Bernoux, L Saint-André, 2010. Wood density, phytomass variations within and among trees and allometric equations in a tropical rainforest of Africa Forest Ecology and Management 260:1375–1388.
Henry, M., A. Bombelli, C. Trotta, A. Alessandrini, L. Birigazzi, G. Sola, G. Vieilledent, P. Santenoise, F. Longuetaud, R. Valentini, N. Picard, L. Saint-André. 2013. GlobAllomeTree: International Platform for Tree Allometric Equations to Support Volume, Biomass and Carbon Assessment. iForest 6(326-330). Database available at http://www.globallometree.org/.
Henson, I.E. (2008). The carbon cost of palm oil production in Malaysia. The Planter 84, (988).
IPCC 2003. Good Practice Guidance for Land Use, Land-Use Change and Forestry. Prepared by the National Greenhouse Gas Inventories Programme, J. Penman, M. Gytarsky, T. Hiraishi, T. Krug, D. Kruger, R. Pipatti, L. Buendia, K. Miwa, T. Ngara, K. Tanabe and F. WagnerI (eds). Institute for Global Environmental Strategies (IGES), Hayama, Japan.
IPCC 2006. 2006 IPCC Guidelines for National Greenhouse Gas Inventories. Volume 4 Agriculture, Forestry and Other Land Use. Prepared by the National Greenhouse Gas Inventories Programme, Eggleston H.S., Buendia L., Miwa K., Ngara T. and Tanabe K. (eds). Institute for Global Environmental Strategies (IGES), Hayama, Japan.
Jiwan, N. and B.H. Saharjo (2009). The Above Ground Carbon Stock of 25 years Oil Palm Planted in the Mineral Soil “Case Study in Tanah Grogot, East Kalimantan, Indonesia”. July 2009.
Kenzo T., T. Ichie, D. Hattori, T. Itioka, C. Handa, T. Ohkubo, J.J. Kendawang, M. Nakamura, M. Sakaguchi, N. Takahashi, M. Okamoto, A. Tanaka-Oda, K. Sakurai and I. Ninomiya. 2009. Development of allometric relationships for accurate estimation of above- and below-ground biomass in tropical secondary forests in Sarawak, Malaysia. Journal of Tropical Ecology, 25(04), pp. 371-386.
Kenzo, T., R. Furutani, D. Hattori, J. Kendawang, S. Tanaka, K. Sakurai and I. Ninomiya. 2009b. Allometric equations for accurate estimation of above-ground biomass in logged-over tropical rainforests in Sarawak, Malaysia. Journal of Forest Research, 14(6), pp. 365-372.
Ketterings, Q.M., Coe, R., van Noordwijk, M., Ambagau’, Y., Palm, C.A., 2001. Reducing uncertainty in the use of allometric biomass equations for predicting above-ground tree biomass in mixed secondary forests. For. Ecol. Manage. 146, 199–209.
Khalid H., Z.Z. Zin and Anderson, J.M. 1999. Quantification of oil palm biomass and nutrient value in a mature plantation. I, Above-ground biomass. Journal of Oil Palm research, Vol. 11, 23-32.
Kho, L., & Jepsen, M. (2015). Carbon stock of oil palm plantations and tropical forests in Malaysia: A review. Singapore Journal of Tropical Geography, 36(2), 249-266.

28
Consulting Study 3Review of aboveground biomass estimation techniques
High Carbon Stock Science Study
Larjavaara, M., Muller-Landau, H. C. 2013. Measuring tree height: a quantitative comparison of two common field methods in a moist tropical forest. Methods in Ecology and Evolution, 4: 793–801. doi: 10.1111/2041-210X.12071
Luo, Y., Wang, X., Zhang, Z., Booth, T. and Lu, Fei. 2012. Root:shoot ratios across China’s forests: Foresty type and climatic effects. Forest Ecology and Management. Vol 269, 19-25.
Maniatis, D. et al. 2011. Evaluating the potential of commercial forest inventory data to report on forest carbon stock and forest carbon stock change for REDD+ under the UNFCCC. Int. J For Res, Article ID 134526, 13 pages doi:10.1155/2011/134526.
Morel, A. (2009) Estimates of Aboveground Biomass Forest and Oil Palm Values for Sabah, Malaysia. University of Oxford, Environmental Exchange Institute, September 2009
Niiyama K, Kajimoto T, Matsuura Y, Yamashita T, Matsuo N, Yashiro Y, Ripin A, Kassim AR, Noor NS. 2010. Estimation of root biomass based on excavation of individual root systems in a primary dipterocarp forest in Pasoh Forest Reserve, Peninsular Malaysia. Journal of Tropical Ecology, 26, 271-284.
Ngomanda A., N.L.E. Obiang, J. Lebamba, Q.M Mavouroulou, H. Gomat, G.S. Mankou, J. Loumeto, D.M. Iponga, F.K. Ditsouga, R.Z. Koumba, K.H.B. Bobé, C.M. Okouyi, R. Nyangadouma, N. Lépengué, B. Mbatchi, N. Picard. 2014. Site-specific versus pantropical allometric equations: Which option to estimate the biomass of a moist central African forest? For. Ecol. Manage. 312, 1-9
Pearson, T., Brown, S., Parveen, A. and Moore, N. 2006a. Use of Aerial Digital Imagery to Measure the Impact of Selective Logging on Carbon Stocks of Tropical Forests in the Republic of Congo: Deliverable 9: Aerial imagery analysis of logging damage. Winrock International, Report submitted to USAID. Cooperative Agreement No. EEM-A-00-03-00006-00. Available at http://www.winrock.org/resources/use-aerial-digital-imagery-measure-impact-selective-logging-carbon-stocks-tropical-forest
Pearson, T.R.H., S. Brown and F.M. Casarim. 2014. Carbon emissions from tropical forest degradation caused by logging. Environmental Research Letters, 9. Available at http://iopscience.iop.org/1748-9326/9/3/034017.
Picard, N., L. Saint-André, M. Henry. 2012. Manual for building tree volume and biomass allometric equations, from field measurement to prediction. FAO, Rome, Italy and CIRAD, Montpellier, France.
Reich, P.B., Luo, Y., Bradford, J.B., Poorter, H., Peery, C.H. and Oleksyn, J. 2014. Temperature drives global patterns in forest biomass distribution in leaves, stems and roots. Proceedings of the National Academy of Sciences, 111, 13721-13726.
Reyes, G., S. Brown, J. Chapman and A.E. Lugo. 1992. Wood Densities of Tropical Tree Species. New Orleans, LA: USDA Forest Service, Southern Forest Experiment Station, Institute of Tropical Forestry. Gen. Tech. Rep. SO-88
Rutishauser, E., Noor’an, F., Laumonier, Y., Halperin, J., Rufi’ie, Hergoualc’h, K., Verchot, L., 2013. Generic allometric models including height best estimate forest biomass and carbon stocks in Indonesia. For. Ecol. Manage. 307, 219–225.
Saatchi, SS, Harris, NL, Brown, S, Lefsky, M, Mitchard, ETA, Salas, W, Zutta, BR, Buermann, W, Lewis, SL, Hagen, S, Petrova, S, White, L, Silman, M & Morel, A 2011, "Benchmark map of forest carbon stocks in tropical regions across three continents" Proceedings of the National Academy of Sciences of the United States of America - PNAS, vol 108, no. 24, pp. 9899-9904., 10.1073/pnas.1019576108
Slik, J. W. F. +61 other authors, 2013. Large trees drive forest aboveground variation in moist lowland forests across the tropics. Global Ecology and Biogeography 22: 1261–1271. doi: 10.1111/geb.12092.
Shashikant V.,et al. 2012. Estimation of aboveground biomass of oil palm trees by PALSAR. IEEE Colloquium on Humanities, Science & Engineering Research (CHUSER 2012), December 3-4 Kota Kinabalu, Sabah, Malaysia.
Sierra, C.A., J.I. del Valle, S.A. Orrego, F.H. Moreno, M.E. Harmon, M. Zapata, G.J. Colorado, M.A. Herrera, W. Lara, D.E. Restrepo, L.M. Berrouet, L.M. Loaiza, J.F. Benjumea. 2007. Total carbon stocks in a tropical forest landscape of the Porce region, Colombia. Forest Ecology and Management 243: 299-309.
Sitompul, SM and K. Hairiah. 2000. Biomass measurement of homegarden. Paper presented at the Workshop on LUCC and Greenhouse Gas Emissions Biophysical Data. Institute Pertanian Bogor, Indonesia. 16 December 2000.
Stas, S.M. 2011. Aboveground biomass and carbon stocks in a S forest in comparison with adjacent primary forest on limestone in Seram, the Moluccas, Indonesia. Msc report, Utrecht University.
Syahrinudin. 2005. The potential of oil palm and forest plantations for carbon sequestration on degraded lands in Indonesia. Ecology and Development Series No. 28, 2005.

29
Consulting Study 3Review of aboveground biomass estimation techniques
High Carbon Stock Science Study
Tedeschi, L.O., 2006. Assessment of the adequacy of mathematical models. Agr. Syst. 89 (2–3), 225–247.
Walker, SM, TRH Pearson, FM Casarim, N. Harris, S, Petrova, AM Grais, E. Swails, M. Netzer, KM Goslee and S. Brown. 2014. Standard Operating Procedures for Terrestrial Carbon Measurement. Winrock International.
Yamakura, T., A. Hagiharam S. Sukardjo, H. Ogawa. 1986. Aboveground biomass of tropical rain forest stands in Indonesian Borneo. Vegetatio 68:71–82.
Zhao, F. Q. Guo and M. Kelly. 2012. Allometric equation choice impacts LiDAR-based forest biomass estimates: A case study from the Sierra National Forest, CA. Agricultural and Forest Meteorology 165: 64-72.

30
Consulting Study 3Review of aboveground biomass estimation techniques
High Carbon Stock Science Study
AppendixVCS allometric equation validation
Extracted directly from Approved VCS Module VMD0001, version 1.0. REDD Methodological Module: Estimation of carbon stocks in the above- and belowground biomass in live tree and non-tree pools (CP-AB). Sectoral Scope 14. Available at http://www.vc-s.org/sites/v-c-s.org/files/VMD0001%20CP-AB%20Live%20biomass_0.pdf.
Allometric equations can be validated either by:
1. Limited Measurements:
• Select at least 30 trees (if validating forest type-specific equation, selection should be representative of the species composition in the project area, i.e. species representation in roughly in proportion to relative basal area). Minimum diameter of measured trees shall be 20 cm and maximum diameter shall reflect the largest trees present or potentially present in the future in the project area (and/or leakage belt)
• Measure DBH and height to a 10 cm diameter top or to the first branch.
• Calculate stem volume from measurements and multiplying by species-specific density to gain biomass of bole.
• Apply a biomass expansion factor to estimate total aboveground biomass from stem biomass. For broadleaf tropical trees this factor shall be:
- 1.38 for trees 20-40 cm
- 1.33 for trees 40-80 cm
- 1.25 for trees ≥80 cm
• Plot all the estimated biomass of all the measured trees along with the curve of biomass against diameter as predicted by the allometric equation. If the estimated biomass of the measured trees are distributed both above and below the curve (as predicted by the allometric equation) the equation may be used. The equation may also be used if the measured individuals have a biomass consistently higher than predicted by the equation. If plotting the biomass of the measured trees indicates a systematic bias to overestimation of biomass (>75% of the trees above the predicted curve) then destructive sampling must be undertaken, or another equation selected.
or
2. Destructive Sampling:
• Select at least five trees (if validating forest type-specific equation, selection should be representative of the species composition in the project area, i.e. species representation in roughly in proportion to relative basal area) at the upper end of the range of independent variable values existing in the project area
• Measure DBH and commercial height and calculate volume using the same procedures/equations used to generate commercial volumes to which BCEFs will be applied
• Fell and weigh the aboveground biomass to determine the total (wet) mass of the stem, branch, twig, leaves, etc. Extract and immediately weigh subsamples from each of the wet stem and branch components, followed by oven drying at 70 degrees C to determine dry biomass;
• Determine the total dry weight of each tree from the wet weights and the averaged ratios of wet and dry weights of the stem and branch components.
• Plot the biomass of all the harvested trees along with the curve of biomass against diameter as predicted by the allometric equation. If the biomass of the harvested trees are distributed both above and below the curve (as predicted by the allometric equation) the equation may be used. The equation may also be used if the harvested individuals have a biomass consistently higher than predicted by the equation. If plotting the biomass of the harvested trees indicates a systematic bias to overestimation of biomass (>75% of the trees below the predicted curve) then additional destructive sampling must be undertaken or another equation selected.
Details of destructive sampling measurements are given in:
Brown, S. 1997. Estimating biomass and biomass change of tropical forests: a primer. FAO Forestry Paper 134, Rome, Italy. Available at http://www.fao.org/docrep/W4095E/W4095E00.htm

www.carbonstockstudy.com