Only a matter of time - Motilal Oswal
296
4 April 2008 Only a matter of time Research Team ([email protected]) Expectations of a slowdown in the US triggered a sharp market correction in 4QFY08 This was aggravated by concerns of a possible slowdown in the domestic market, too We believe that valuations are now reasonable; risk- reward equation has turned favorable We have downgraded Sensex earnings estimates for the first time in eight quarters However, Sensex earnings growth is still healthy Downside from current levels is limited; we strongly recommend investing now Prices as of Friday, 28 March 2008 India Strategy R ESULTS P REVIEW Quarter ended March 2008
-
Upload
khangminh22 -
Category
Documents
-
view
0 -
download
0
Transcript of Only a matter of time - Motilal Oswal

4 April 2008
Only a matter of timeResearch Team ([email protected])
Expectations of aslowdown in the US
triggered a sharp marketcorrection in 4QFY08
This was aggravated byconcerns of a possible
slowdown in the domesticmarket, too
We believe that valuationsare now reasonable; risk-
reward equation hasturned favorable
We have downgradedSensex earnings estimatesfor the first time in eight
quarters
However, Sensex earningsgrowth is still healthy
Downside from currentlevels is limited; we
strongly recommendinvesting now
Prices as of Friday, 28 March 2008
India Strategy
RESULTS PREVIEW
Quarter ended March 2008
228 March 2008
ContentsIndia Strategy 3-40
1. Automobiles 41-66Amtek Auto 56Ashok Leyland 57Bajaj Auto 58Bharat Forge 59Eicher Motors 60Hero Honda 61Mahindra & Mahindra 62Maruti Suzuki India 63Swaraj Mazda 64Tata Motors 65TVS Motor 66
2. Banking 67-94Andhra Bank 75Axis Bank 76Bank of Baroda 77Bank of India 78Canara Bank 79Corporation Bank 80Federal Bank 81HDFC 82HDFC Bank 83ICICI Bank 84Indian Bank 85Indian Overseas Bank 86J&K Bank 87Karnataka Bank 88Oriental Bank 89Punjab National Bank 90State Bank 91Syndicate Bank 92Union Bank 93Vijaya Bank 94
3. Cement 95-109ACC 103Ambuja Cement 104Birla Corporation 105Grasim Industries 106India Cements 107Shree Cement 108UltraTech Cement 109
4. Engineering 110-124ABB 115Alstom Projects 116Bharat Electronics 117BHEL 118Crompton Greaves 119Cummins India 120Larsen & Toubro 121Siemens 122Suzlon Energy 123Thermax 124
5. FMCG 125-142Asian Paints 131Britannia Industries 132Colgate Palmolive 133Dabur India 134GSK Consumer 135Godrej Consumer Products 136Hindustan Unilever 137ITC 138Marico 139Nestle India 140Tata Tea 141United Spirits 142
6. Information Technology143-154HCL Technologies 147Infosys 148MphasiS 149Patni Computer 150Satyam Computer 151TCS 152Tech Mahindra 153Wipro 154
7. Infrastructure 155-169BL Kashyap 161Gammon India 162GMR Infrastructure 163Hindustan Construction 164IVRCL 165Jaiprakash Associates 166Nagarjuna Construction 167Patel Engineering 168Simplex Infrastructure 169
8. Media 170-180Deccan Chronicle 175HT Media 176Jagran Prakashan 177Sun TV Network 178TV Today 179Zee Entertainment 180
9. Metals 181-194Hindalco 187Hindustan Zinc 188Jindal Steel 189JSW Steel 190Nalco 191Sterlite Industries 192SAIL 193Tata Steel 194
10. Oil & Gas 195-217BPCL 208Cairn India 209Chennai Petroleum 210GAIL 211HPCL 212IOC 213Indraprastha Gas 214
MRPL 215ONGC 216Reliance Industries 217
11. Pharmaceuticals 218-242Aurobindo Pharma 226Aventis Pharma 227Biocon 228Cadila Healthcare 229Cipla 230Dishman Pharma 231Divi’s Laboratories 232Dr Reddy’s Labs. 233GSK Pharma 234Jubilant Organosys 235Lupin 236Nicholas Piramal 237Pfizer 238Ranbaxy Labs. 239Shasun Chemicals 240Sun Pharmaceuticals 241Wockhardt 242
12. Real Estate 243-248DLF 247Unitech 248
12. Retailing 249-255Pantaloon Retail 253Shopper's Stop 254Titan Industries 255
13. Telecom 256-264Bharti Airtel 262Idea Cellular 263Reliance Communication 264
14. Textiles 265-276Alok Industries 270Arvind Mills 271Gokaldas Exports 272Himatsingka Seide 273Raymond 274Vardhman Textiles 275Welspun India 276
15. Utilities 277-284CESC 280NTPC 281PTC India 282Reliance Energy 283Tata Power 284
16. Others 285-292Ashapura Minechem 285Blue Star 286Bombay Rayon 287Everest Kanto Cylinders 288Great Offshore 289Greaves Cotton 290TajGVK Hotels 291United Phosphorus 292
Results Preview

328 March 2008
India Strategy
Navin Agarwal ([email protected])/Rajat Rajgarhia ([email protected])
BSE Sensex: 16,371 S&P CNX: 4,942 28 March 2008
Results PreviewQUARTER ENDED MARCH 2008
Sensex has corrected 23% in 4QFY08: The Sensex corrected by 23% in 4QFY08 toclose at 15,644, reducing the total returns in FY08 to 19.7%. While this is the fifth consecutiveyear of positive returns for the markets, the sharp correction in the last couple of monthshas resulted in FY08 returns being much lower than what was anticipated till mid-January.The sharp correction came on the back of global woes – expectation of a slowdown in theUS. This was further aggravated, with concerns of a possible slowdown in the domesticeconomy emerging and hopes of an interest rate cut fading, as inflation inched up.
Rising inflation – a big worry: Since July 2006, inflation has moved up from 4.7% to~6.7% last week, well above the RBI’s target range of 5-5.5%. Inflation remains a bigworry for the Indian government. An analysis of the constituents of the wholesale priceindex (WPI) – primary articles, fuel, and manufacturing products – indicates that theupward price movement in all the three items has led to a significant jump in inflation,despite higher base effect. In fact, for the first time in the last seven years, all the threeconstituents have crossed 6%. With no base impact to help, we believe inflation is likely toremain high and taming it will require multiple measures from the government.
Earnings estimates downgraded after eight quarters: Over the last eight quarters,we have witnessed consistent upgrades to our earnings estimates. Our Sensex EPS estimatefor FY08 was upgraded from Rs810 in December 2006 to Rs846 in June 2007 to Rs883 inDecember 2007. Similarly, our Sensex EPS estimate for FY09 was revised from Rs891 inDecember 2006 to Rs955 in June 2007 to Rs1,064 in December 2007. After a series ofupgrades, we have now downgraded our Sensex EPS estimates by 5.5% to Rs834 forFY08 and by 5.8% to Rs1,002 for FY09. However, the Sensex earnings growth remainshealthy – our FY09 EPS estimate is 20.1% higher than our FY08 Sensex EPS estimate.
Valuations are now reasonable; time to start investing: The broader indices havecome off the high of 21x one-year forward earnings in the peak of December 2007. TheBSE Sensex now trades at 15.6x FY09E earnings v/s the 15-year average of 17.5x. Overthe last three years, the BSE Sensex has traded at a forward P/E of 15.7x at the end ofMarch. In the near term, the headwinds (inflation, interest rate, oil prices, etc) may becomestronger, but we see limited downside from current levels. The risk-reward equation hasturned favorable; we recommend investing now.
Sensex target of 19,000-21,000: Given the increased risks on earnings and other macroindicators, we are reducing our target Sensex P/E range to 16-18x FY09E EPS and addthe embedded value of 2,800. Our 12-month target range for the BSE Sensex is 19,000 –21,000. Our top large-cap bets are Reliance Industries, Bharti Airtel, Tata Steel, AxisBank, Hero Honda, ITC, Gail, Ranbaxy, and TCS. Amongst the mid-caps, we like LICHousing, IVRCL, Sintex, Blue Star, and Amtek Auto.

428 March 2008
India Strategy
Risk-reward equation has turned favorable
The BSE Sensex corrected by 23% in 4QFY08 to close at 15,644, reducing the totalreturns in FY08 to 19.7%. While this is the fifth consecutive year of positive returns forthe markets, the sharp correction in the last couple of months has resulted in FY08 returnsbeing much lower than what was anticipated till mid-January. The sharp correction cameon the back of global woes – expectation of a slowdown in the US. This was furtheraggravated, with concerns of a possible slowdown in the domestic economy emerging andhopes of an interest rate cut fading, as inflation inched up.
RECORD CORRECTION IN 4QFY08 LIMITING GAINS FOR FY08
Source: Motilal Oswal Securities
In our opinion, market valuations have become reasonable post the recent correction andthe risk-reward equation has turned favorable. In the near term, the headwinds (inflation,interest rate, oil prices, etc) may become stronger, but we see limited downside to marketsfrom current levels. We believe that the recent market correction has reduced severalexcesses relating to valuations, earnings optimism, primary market offerings and recordsubscription, leveraging, etc. Given our belief that the downside from current levels islimited, we strongly recommend investing now.
We expect Sensex EPS to grow 16% in FY08 to Rs834, 20.1% in FY09 to Rs1,002, and29.6% in FY10 to Rs1,299 (over half of the growth contributed by Reliance Industries).Given the increasing risks on earnings and other macro headwinds, we are reducing ourtarget Sensex P/E range to 16-18x FY09E EPS and add the embedded value of 2,800.Our 12-month target range for the BSE Sensex is 19,000 – 21,000. Our top large-cap betsare Reliance Industries, Bharti Airtel, Tata Steel, Axis Bank, Hero Honda, ITC, Gail,Ranbaxy, and TCS. Amongst the mid-caps, we like LIC Housing, IVRCL, Sintex, BlueStar, and Amtek Auto.
-50
-10
30
70
110
1980
1982
1984
1986
1988
1990
1992
1994
1996
1998
2000
2002
2004
2006
2008
0
3500
7000
10500
14000
17500Sensex Annual Return (%) - LHS Sensex - RHS
Growth for 1992 is 267% 28 years
CAGR of 20.6%
-36
-18
0
18
36
Mar
-98
Sep
-98
Mar
-99
Sep
-99
Mar
-00
Sep
-00
Mar
-01
Sep
-01
Mar
-02
Sep
-02
Mar
-03
Sep
-03
Mar
-04
Sep
-04
Mar
-05
Sep
-05
Mar
-06
Sep
-06
Mar
-07
Sep
-07
Mar
-08
Biggest quarterly loss since June 1992
Quarterly Sensex Return (%)

528 March 2008
India Strategy
Sensex has corrected 23% in 4QFY08The Indian markets witnessed a severe correction in 4QFY08, with the BSE Sensexdeclining by 23% to close at 15,644. This sharp decline lowered the FY08 Sensex returnsto 19.7% (9MFY08 returns were 55.2%). During the quarter, the Indian marketsunderperformed most global markets by a significant margin. Following thisunderperformance, the valuation gap vis-à-vis other global markets has narrowed.
COMPARISON OF INDIAN MARKETS WITH GLOBAL MARKETSINDEX EPS (RS) P/E (X) P/BV (X) ROE (%)
INDEX VALUE CY07/FY08 CY08/FY09 CY07/FY08 CY08/FY09 CY07/FY08 CY08/FY09 CY07/FY08 CY08/FY09Brazil 60,968 4,325 5,177 14.1 11.8 2.1 2.1 15.2 17.7Russia 2,054 246 234 8.3 8.8 1.9 1.7 22.2 19.7China 3,473 124 166 28.1 21.0 2.2 4.4 8.0 21.1Korea 1,704 120 143 14.2 12.0 1.5 1.7 10.3 14.2Taiwan 8,573 467 665 18.4 12.9 2.3 2.1 12.4 16.2Thailand 817 49 72 16.6 11.3 1.9 1.9 11.2 16.9US - S&P 500 1,323 66 96 20.0 13.8 2.5 2.3 12.5 16.8UK - FTSE 5,702 496 524 11.5 10.9 2.1 2.0 18.0 18.2Nikkei 12,526 880 854 14.2 14.7 NA NA 10.1 NAMalyasia 1,248 91 98 13.6 12.7 2.0 2.0 14.3 15.5Singapore 3,007 279 214 10.8 14.0 1.9 1.8 17.5 13.0Hong Kong 22,849 1,715 1,550 13.3 14.7 2.3 2.1 17.2 14.2Indonesia 2,447 145 168 16.9 14.6 2.1 3.3 12.5 22.7Philippines 2,985 247 222 12.1 13.5 2.2 2.0 18.1 15.2India - Sensex 15,644 834 1,002 18.8 15.6 3.9 3.1 21.0 19.5
Source : Bloomberg /Motilal Oswal Securities
PERFORMANCE OF MAJOR MARKETS - 4QFY08 (%) PERFORMANCE OF MAJOR MARKETS - FY08 (%)
Source : Bloomberg /Motilal Oswal Securities
-4.6
-4.8
-7.6
-18.2
-25.1
-10.2
-11.7
-11.5
0.8
-9.9
-10.3
-22.9
-22.9
Taiwan
Brazil
Thailand
US
S&P 500
South Korea
Russia
MSCI - Asia
UK
Japan
India - Nifty
India - Sensex
China
25.7
21.3
8.7
-4.4
-6.9
-9.6
-27.5
19.7
23.9
33.1
6.1
-0.7
17.3
Brazil
China
India - Nifty
Thailand
India - Sensex
South Korea
Taiwan
Russia
US
MSCI - Asia
S&P 500
UK
Japan

628 March 2008
India Strategy
FY08 was the fifth consecutive year of positive returns for Indian equities. While the BSESensex delivered returns of 19.7%, 8 of the 30 Sensex stocks delivered negative returns.The stocks that outperformed the Sensex by a significant margin were Reliance Energy,Jaiprakash Associates, L&T, and BHEL.
TREND IN SENSEX AND RETURN
Source: Motilal Oswal Securities
PERFORMANCE OF INDIVIDUAL SENSEX STOCKSCOMPANY NAME PRICE 31 MAR 08 (RS) RETURN FY08 (%) RETURN FY07 (%)Reliance Energy 1,251 152.7 -19.1Jaiprakash Assoc 227 110.3 14.5Larsen & Toubro 3,025 86.8 33.1B H E L 2,057 81.9 0.6Tata Steel 693 74.4 -16.2St Bk of India 1,599 70.7 2.6Reliance Inds. 2,265 65.5 71.8H D F C 2,384 56.8 13.8HDFC Bank 1,320 39.0 22.7ITC 206 37.2 -22.9NTPC 197 31.6 11.8Hindalco Inds. 165 26.4 -28.6Ranbaxy Labs. 439 24.4 -18.3Grasim Inds. 2,575 23.1 1.6Reliance Communication 508 21.0 36.0BSE Sensex 15,644 19.7 15.9Ambuja Cement 121 13.4 3.3DLF 647 13.4 -ACC 826 12.4 -6.1O N G C 981 11.8 0.6Hind. Unilever 229 11.4 -24.6Bharti Airtel 826 8.2 84.9Maruti Suzuki 830 1.2 -6.3Cipla 220 -6.8 -11.0ICICI Bank 770 -9.7 44.8M & M 696 -10.8 24.4Tata Motors 623 -14.3 -22.0Satyam Computer 395 -16.1 10.7Wipro 425 -23.8 0.0Infosys Tech. 1,430 -28.9 35.0TCS 811 -34.1 28.6Note: DLF Price is from the listing day Source: Motilal Oswal Securities
2016741683(12)(4)(28)34(4)16
1,000
5,000
9,000
13,000
17,000
1998 1999 2000 2001 2002 2003 2004 2005 2006 2007 2008-35
-5
25
55
85
Trend in Sensex - LHS Annual Return (%) - RHS
Annual Return
728 March 2008
India Strategy
The sharp correction has reduced several excessesA correction of over 20% in a matter of two months has reduced several excesses in themarkets. We discuss some of these, below:
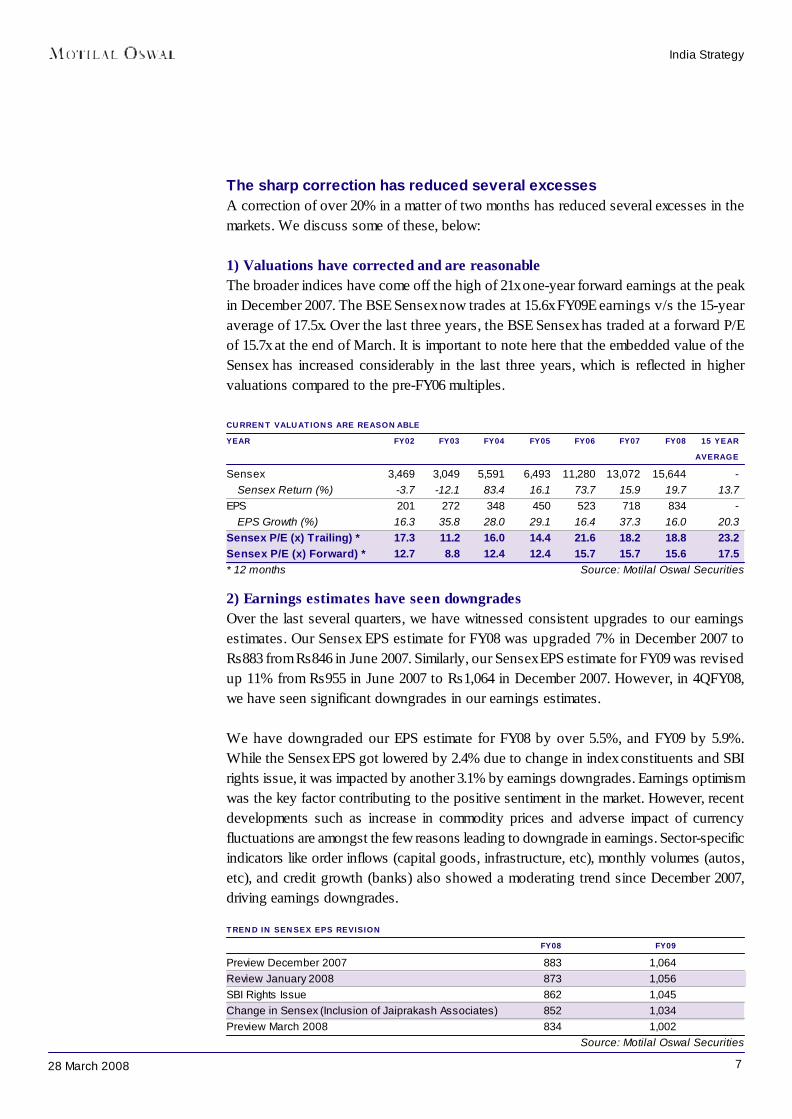
1) Valuations have corrected and are reasonableThe broader indices have come off the high of 21x one-year forward earnings at the peakin December 2007. The BSE Sensex now trades at 15.6x FY09E earnings v/s the 15-yearaverage of 17.5x. Over the last three years, the BSE Sensex has traded at a forward P/Eof 15.7x at the end of March. It is important to note here that the embedded value of theSensex has increased considerably in the last three years, which is reflected in highervaluations compared to the pre-FY06 multiples.
CURRENT VALUATIONS ARE REASONABLEYEAR FY02 FY03 FY04 FY05 FY06 FY07 FY08 15 YEAR
AVERAGESensex 3,469 3,049 5,591 6,493 11,280 13,072 15,644 -
Sensex Return (%) -3.7 -12.1 83.4 16.1 73.7 15.9 19.7 13.7EPS 201 272 348 450 523 718 834 -
EPS Growth (%) 16.3 35.8 28.0 29.1 16.4 37.3 16.0 20.3Sensex P/E (x) Trailing) * 17.3 11.2 16.0 14.4 21.6 18.2 18.8 23.2Sensex P/E (x) Forward) * 12.7 8.8 12.4 12.4 15.7 15.7 15.6 17.5* 12 months Source: Motilal Oswal Securities
2) Earnings estimates have seen downgradesOver the last several quarters, we have witnessed consistent upgrades to our earningsestimates. Our Sensex EPS estimate for FY08 was upgraded 7% in December 2007 toRs883 from Rs846 in June 2007. Similarly, our Sensex EPS estimate for FY09 was revisedup 11% from Rs955 in June 2007 to Rs1,064 in December 2007. However, in 4QFY08,we have seen significant downgrades in our earnings estimates.
We have downgraded our EPS estimate for FY08 by over 5.5%, and FY09 by 5.9%.While the Sensex EPS got lowered by 2.4% due to change in index constituents and SBIrights issue, it was impacted by another 3.1% by earnings downgrades. Earnings optimismwas the key factor contributing to the positive sentiment in the market. However, recentdevelopments such as increase in commodity prices and adverse impact of currencyfluctuations are amongst the few reasons leading to downgrade in earnings. Sector-specificindicators like order inflows (capital goods, infrastructure, etc), monthly volumes (autos,etc), and credit growth (banks) also showed a moderating trend since December 2007,driving earnings downgrades.
TREND IN SENSEX EPS REVISIONFY08 FY09
Preview December 2007 883 1,064Review January 2008 873 1,056SBI Rights Issue 862 1,045Change in Sensex (Inclusion of Jaiprakash Associates) 852 1,034Preview March 2008 834 1,002
Source: Motilal Oswal Securities

828 March 2008
India Strategy
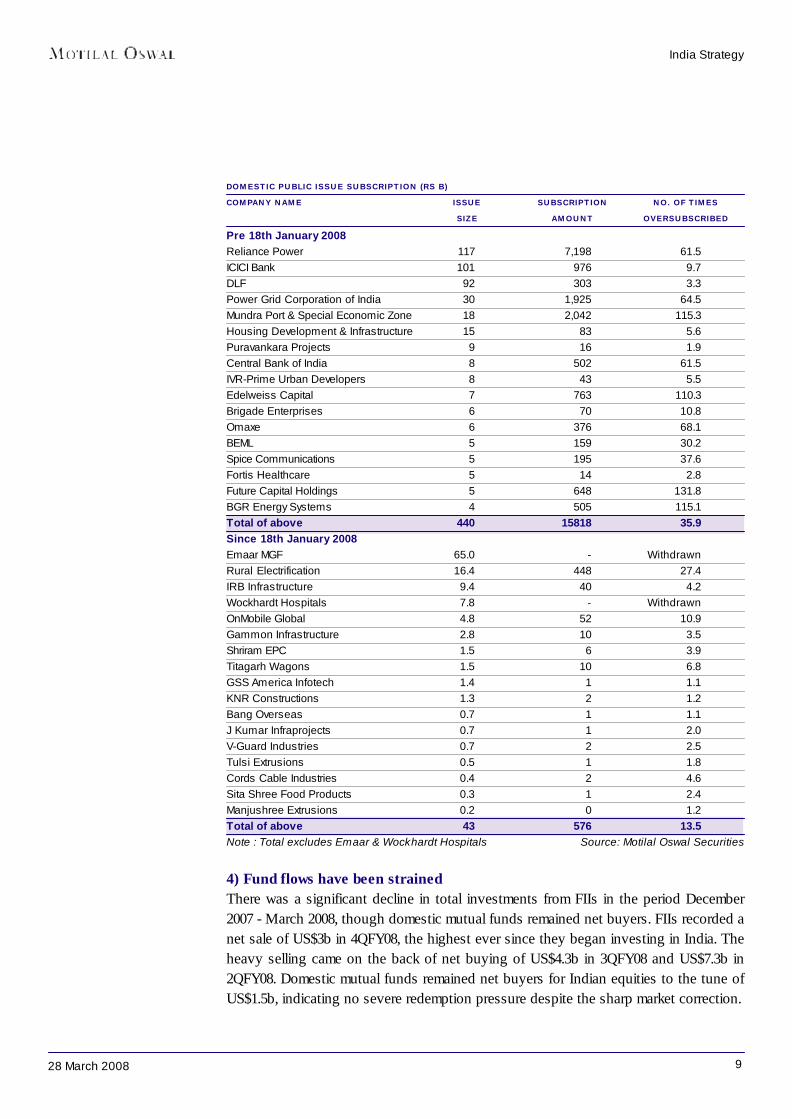
3) Primary market has almost dried upThe Indian capital market witnessed its largest primary market offerings in FY08 – Rs535bv/s the previous highest of Rs292b in FY07. Of the Rs535b, IPOs completed beforeJanuary 2008 constituted Rs494b; IPOs worth just Rs23.5b were concluded after January2008. Some of the large equity issues like Reliance Power (Rs117b), ICICI Bank (Rs100b),DLF (Rs92b), Power Grid (Rs29.8b), Idea Cellular (Rs21.2b), Rural Electrification(Rs16.4b), etc witnessed significant over subscription.
MONEY RAISED FROM CAPITAL MARKETS (RS B)
TREND IN FY08E EPS AND REVISION TREND IN FY09E EPS AND REVISION
Source: Motilal Oswal Securities
Source: Motilal Oswal Securities
As against the total equity offering of Rs535b, the total demand (based on subscriptions)stood at Rs18.4t, an average subscription of 34.3x. The Reliance Power issue wassubscribed 61x – a total demand of Rs7.2t v/s the IPO size of Rs117b. The primarymarket euphoria ended in January 2008, post which subscriptions to IPOs declinedsignificantly. Companies like Emmar MGF (proposed equity offering of Rs65b) andWockhardt Hospitals (proposed equity offering of Rs7.8b) had to call off their IPOs evenafter downward revision of the price bands. Even the rights issue of SBI just managed toscrape through. The total money raised through IPOs and QIPs post-January 2008 isRs43b v/s Rs732b during the period April 2007 - January 2008.
709733 732
780810 822
846 855883
834
650
715
780
845
910
Dec
-05
Mar
-06
June
-06
Sep
- 06
Dec
-06
Mar
-07
Jun-
07
Sep
-07
Dec
-07
Mar
-08
9
13
17
21
25
FY08 EPS (LHS)% Growth Revision in FY08 EPS - (RHS)
891
9891,007
1,064
9551,002
850
910
970
1,030
1,090
Dec-06 Mar-07 Jun-07 Sep-07 Dec-07 Mar-088
12
16
20
24
FY09 EPS % Growth Revision in FY09 EPS
0
150
300
450
600
750
Apr-Jan 08 Feb - Mar 08
QIP (Rs b) Public Issue (Rs b)
928 March 2008
India Strategy
DOMESTIC PUBLIC ISSUE SUBSCRIPTION (RS B)COMPANY NAME ISSUE SUBSCRIPTION NO. OF TIMES
SIZE AMOUNT OVERSUBSCRIBEDPre 18th January 2008Reliance Power 117 7,198 61.5ICICI Bank 101 976 9.7DLF 92 303 3.3Power Grid Corporation of India 30 1,925 64.5Mundra Port & Special Economic Zone 18 2,042 115.3Housing Development & Infrastructure 15 83 5.6Puravankara Projects 9 16 1.9Central Bank of India 8 502 61.5IVR-Prime Urban Developers 8 43 5.5Edelweiss Capital 7 763 110.3Brigade Enterprises 6 70 10.8Omaxe 6 376 68.1BEML 5 159 30.2Spice Communications 5 195 37.6Fortis Healthcare 5 14 2.8Future Capital Holdings 5 648 131.8BGR Energy Systems 4 505 115.1Total of above 440 15818 35.9Since 18th January 2008Emaar MGF 65.0 - WithdrawnRural Electrification 16.4 448 27.4IRB Infrastructure 9.4 40 4.2Wockhardt Hospitals 7.8 - WithdrawnOnMobile Global 4.8 52 10.9Gammon Infrastructure 2.8 10 3.5Shriram EPC 1.5 6 3.9Titagarh Wagons 1.5 10 6.8GSS America Infotech 1.4 1 1.1KNR Constructions 1.3 2 1.2Bang Overseas 0.7 1 1.1J Kumar Infraprojects 0.7 1 2.0V-Guard Industries 0.7 2 2.5Tulsi Extrusions 0.5 1 1.8Cords Cable Industries 0.4 2 4.6Sita Shree Food Products 0.3 1 2.4Manjushree Extrusions 0.2 0 1.2Total of above 43 576 13.5Note : Total excludes Emaar & Wockhardt Hospitals Source: Motilal Oswal Securities
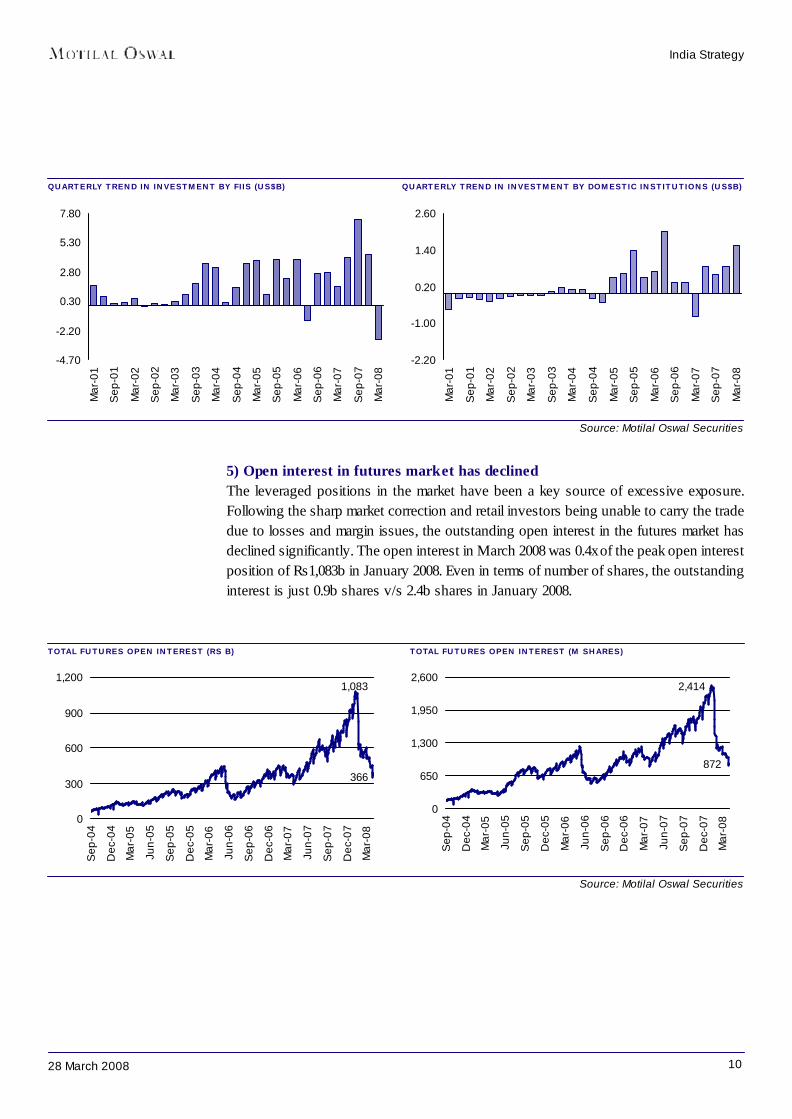
4) Fund flows have been strainedThere was a significant decline in total investments from FIIs in the period December2007 - March 2008, though domestic mutual funds remained net buyers. FIIs recorded anet sale of US$3b in 4QFY08, the highest ever since they began investing in India. Theheavy selling came on the back of net buying of US$4.3b in 3QFY08 and US$7.3b in2QFY08. Domestic mutual funds remained net buyers for Indian equities to the tune ofUS$1.5b, indicating no severe redemption pressure despite the sharp market correction.
1028 March 2008
India Strategy
QUARTERLY TREND IN INVESTMENT BY FIIS (US$B) QUARTERLY TREND IN INVESTMENT BY DOMESTIC INSTITUTIONS (US$B)
Source: Motilal Oswal Securities
5) Open interest in futures market has declinedThe leveraged positions in the market have been a key source of excessive exposure.Following the sharp market correction and retail investors being unable to carry the tradedue to losses and margin issues, the outstanding open interest in the futures market hasdeclined significantly. The open interest in March 2008 was 0.4x of the peak open interestposition of Rs1,083b in January 2008. Even in terms of number of shares, the outstandinginterest is just 0.9b shares v/s 2.4b shares in January 2008.
TOTAL FUTURES OPEN INTEREST (RS B) TOTAL FUTURES OPEN INTEREST (M SHARES)
Source: Motilal Oswal Securities
-4.70
-2.20
0.30
2.80
5.30
7.80
Mar
-01
Sep
-01
Mar
-02
Sep
-02
Mar
-03
Sep
-03
Mar
-04
Sep
-04
Mar
-05
Sep
-05
Mar
-06
Sep
-06
Mar
-07
Sep
-07
Mar
-08
366
1,083
0
300
600
900
1,200
Sep
-04
Dec
-04
Mar
-05
Jun-
05
Sep
-05
Dec
-05
Mar
-06
Jun-
06
Sep
-06
Dec
-06
Mar
-07
Jun-
07
Sep
-07
Dec
-07
Mar
-08
872
2,414
0
650
1,300
1,950
2,600
Sep
-04
Dec
-04
Mar
-05
Jun-
05
Sep
-05
Dec
-05
Mar
-06
Jun-
06
Sep
-06
Dec
-06
Mar
-07
Jun-
07
Sep
-07
Dec
-07
Mar
-08
-2.20
-1.00
0.20
1.40
2.60
Mar
-01
Sep
-01
Mar
-02
Sep
-02
Mar
-03
Sep
-03
Mar
-04
Sep
-04
Mar
-05
Sep
-05
Mar
-06
Sep
-06
Mar
-07
Sep
-07
Mar
-08
1128 March 2008
India Strategy
Few headwinds have become stronger
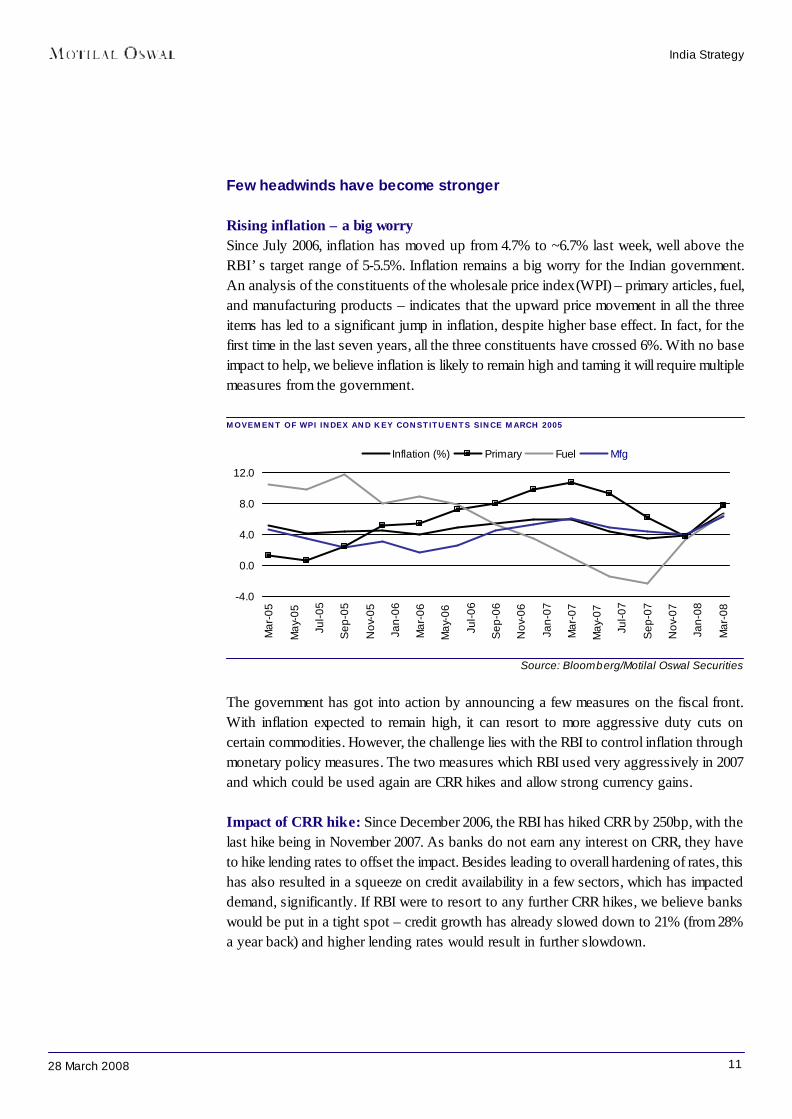
Rising inflation – a big worrySince July 2006, inflation has moved up from 4.7% to ~6.7% last week, well above theRBI’s target range of 5-5.5%. Inflation remains a big worry for the Indian government.An analysis of the constituents of the wholesale price index (WPI) – primary articles, fuel,and manufacturing products – indicates that the upward price movement in all the threeitems has led to a significant jump in inflation, despite higher base effect. In fact, for thefirst time in the last seven years, all the three constituents have crossed 6%. With no baseimpact to help, we believe inflation is likely to remain high and taming it will require multiplemeasures from the government.
MOVEMENT OF WPI INDEX AND KEY CONSTITUENTS SINCE MARCH 2005
Source: Bloomberg/Motilal Oswal Securities
The government has got into action by announcing a few measures on the fiscal front.With inflation expected to remain high, it can resort to more aggressive duty cuts oncertain commodities. However, the challenge lies with the RBI to control inflation throughmonetary policy measures. The two measures which RBI used very aggressively in 2007and which could be used again are CRR hikes and allow strong currency gains.
Impact of CRR hike: Since December 2006, the RBI has hiked CRR by 250bp, with thelast hike being in November 2007. As banks do not earn any interest on CRR, they haveto hike lending rates to offset the impact. Besides leading to overall hardening of rates, thishas also resulted in a squeeze on credit availability in a few sectors, which has impacteddemand, significantly. If RBI were to resort to any further CRR hikes, we believe bankswould be put in a tight spot – credit growth has already slowed down to 21% (from 28%a year back) and higher lending rates would result in further slowdown.
-4.0
0.0
4.0
8.0
12.0
Mar
-05
May
-05
Jul-0
5
Sep
-05
Nov
-05
Jan-
06
Mar
-06
May
-06
Jul-0
6
Sep
-06
Nov
-06
Jan-
07
Mar
-07
May
-07
Jul-0
7
Sep
-07
Nov
-07
Jan-
08
Mar
-08
Inflation (%) Primary Fuel Mfg

1228 March 2008
India Strategy
Source: RBI/Motilal Oswal Securities
Every 100bp hike in CRR increases bank lending rates by 14bp. With margins of banksalready under pressure due to higher cost of funds, any CRR hike will result in bankstightening their lending rates. We also believe that banks will be unable to pass the entireimpact, as credit growth is slowing down and banks would like to maintain an averagegrowth of 20% in FY09.
IMPACT OF CRR HIKE ON RATES (RS B)MAR-08
Deposits 30,752Other Time Liabilities 4,087Total NDTL 34,839CRR Hike (%) 1Liquidity Outflow 348Revenue Loss to Banks at 9% Yield 31Total Advances Book 22,726Increase in Yields (bp) Necessary to Recoup Revenue Loss 13.8
Source: Motilal Oswal Securities
M3 GROWTH V/S CREDIT GROWTH (%)
TREND IN CRR RATE HIKE (%)
Source: Bloomberg/Motilal Oswal Securities
7.00
6.506.256.00
5.755.50
4.75
5.255.00
7.50
4.50
5.35
6.20
7.05
7.90
Sep 04 Oct 04 Dec 06 Jan 07 Feb 07 Mar 07 Apr 07 Apr 07 Aug 07 Nov 07 14 Apr 28 Apr
15
22
29
36
43
Mar
-05
Jun-
05
Sep
-05
Dec
-05
Mar
-06
Jun-
06
Sep
-06
Dec
-06
Mar
-07
Jun-
07
Sep
-07
Dec
-07
Mar
-08
10
14
18
22
26Credit Growth (%) - LHS M3 Growth (%) - RHS

1328 March 2008
India Strategy
Source: Bloomberg/Motilal Oswal Securities
While a strong rupee can have a positive impact on inflation in the near term, it has anegative impact on corporate profits. For the Sensex companies, almost 50% of profits getnegatively impacted by rupee appreciation. This is more severe for the IT sector, whichconstitutes 11.2% of the Sensex profits.
Impact of currency gains: In 2007, the RBI allowed the Indian rupee to appreciatesignificantly to control inflation. In the first nine-months of 2007, the rupee appreciated10% vis-à-vis the US dollar, which helped to lower inflation. As the differential betweenthe benchmark rates of India widens with other global economies, higher capital flows inthe system could also lead to rupee appreciation.
INFLATION V/S RUPEE/DOLLAR RATE (RS/US$)
Source:Bloomberg/Motilal Oswal Securities
SPREAD BETWEEN 10-YEAR INDIAN AND US G-SEC YIELD IS RISING
38
41
44
47
50
Mar
-01
Sep
-01
Mar
-02
Sep
-02
Mar
-03
Sep
-03
Mar
-04
Sep
-04
Mar
-05
Sep
-05
Mar
-06
Sep
-06
Mar
-07
Sep
-07
Mar
-08
1
3
5
7
9 Rs / Dollar - LHS Inflation - RHS
8.0
14.0
5.6
3.42.5
5.0
7.5
10.0
12.5
15.0
Mar
-93
Mar
-94
Mar
-95
Mar
-96
Mar
-97
Mar
-98
Mar
-99
Mar
-00
Mar
-01
Mar
-02
Mar
-03
Mar
-04
Mar
-05
Mar
-06
Mar
-07
Mar
-08
10-Year India G-Sec Yield (%) 10 Year US G-Sec Yield (%)
Diff of 840bp
Diff of 460bp
1428 March 2008
India Strategy
Source: Motilal Oswal Securities
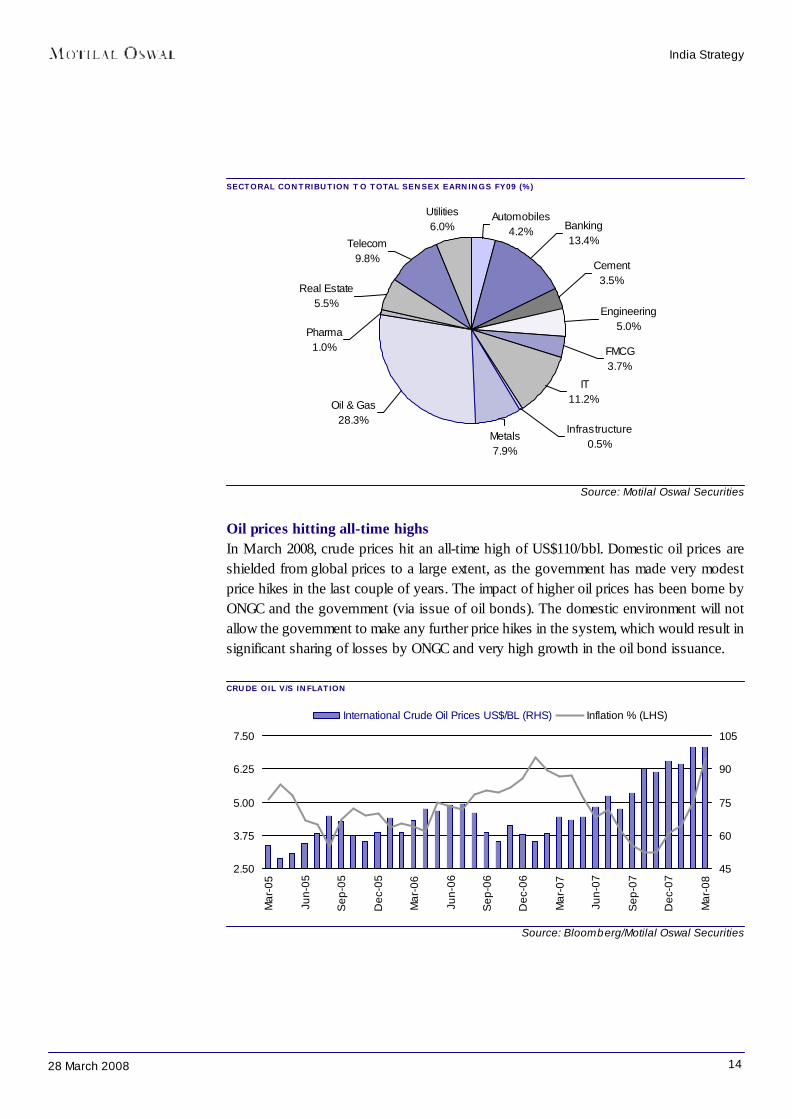
Oil prices hitting all-time highsIn March 2008, crude prices hit an all-time high of US$110/bbl. Domestic oil prices areshielded from global prices to a large extent, as the government has made very modestprice hikes in the last couple of years. The impact of higher oil prices has been borne byONGC and the government (via issue of oil bonds). The domestic environment will notallow the government to make any further price hikes in the system, which would result insignificant sharing of losses by ONGC and very high growth in the oil bond issuance.
CRUDE OIL V/S INFLATION
SECTORAL CONTRIBUTION TO TOTAL SENSEX EARNINGS FY09 (%)
Source: Bloomberg/Motilal Oswal Securities
Utilities6.0%
Telecom9.8%
Real Estate5.5%
Automobiles4.2% Banking
13.4%
Cement3.5%
Engineering5.0%
FMCG3.7%
IT11.2%
Infrastructure0.5%
Metals7.9%
Oil & Gas28.3%
Pharma1.0%
2.50
3.75
5.00
6.25
7.50
Mar
-05
Jun-
05
Sep
-05
Dec
-05
Mar
-06
Jun-
06
Sep
-06
Dec
-06
Mar
-07
Jun-
07
Sep
-07
Dec
-07
Mar
-08
45
60
75
90
105
International Crude Oil Prices US$/BL (RHS) Inflation % (LHS)
1528 March 2008
India Strategy
FUEL UNDER RECOVERIES AT DIFFERENT OIL PRICES (RSB) FY08E FY09 SCENARIOS
Oil Price - Brent US$/bbl 82 80 85 90 95 100 110 120Under recoveries Rsb 780 605 751 898 1,045 1,191 1,484 1,777
Source: Motilal Oswal Securities
DISCOUNTS TO OIL MARKETING COMPANIES BY ONGC (RSB) OIL PRICE (US$/BBL) - FY09
UPSTREAM SHARING (%) 80 85 90 95 100 110 12033.3 172 215 258 301 344 429 51540.0 206 258 309 361 412 515 61845.0 232 290 348 406 464 580 69650.0 257 322 386 451 515 644 773
Source: Motilal Oswal Securities
OIL BONDS V/S FISCAL DEFICITYEAR OIL BONDS (RS B) FISCAL DEFICIT (RS B) OIL BONDS AS A % TO FISCAL DEFICITFY06 115 1,464 7.9FY07 241 1,426 16.9FY08E 377 1,437 26.2FY09E (US$80/bbl) 321 1,333 24.1FY09E (US$100/bbl) 679 1,333 50.9
Base Case Source: Motilal Oswal Securities
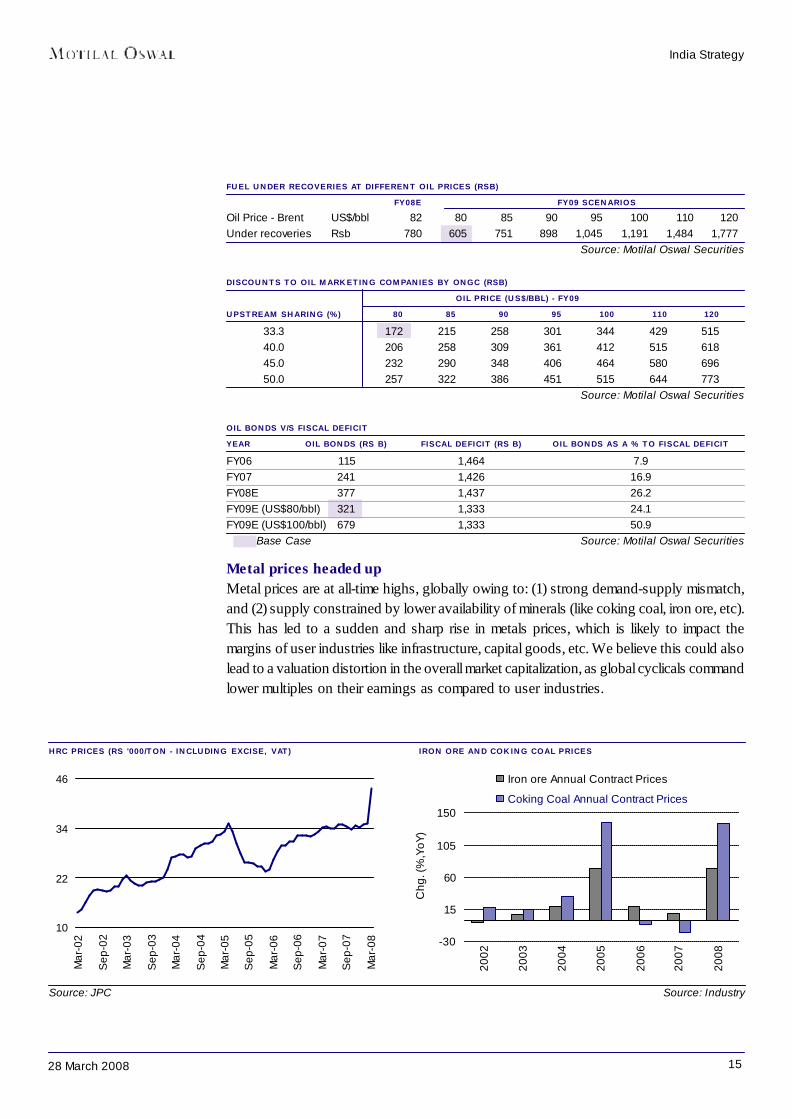
Metal prices headed upMetal prices are at all-time highs, globally owing to: (1) strong demand-supply mismatch,and (2) supply constrained by lower availability of minerals (like coking coal, iron ore, etc).This has led to a sudden and sharp rise in metals prices, which is likely to impact themargins of user industries like infrastructure, capital goods, etc. We believe this could alsolead to a valuation distortion in the overall market capitalization, as global cyclicals commandlower multiples on their earnings as compared to user industries.
HRC PRICES (RS '000/TON - INCLUDING EXCISE, VAT) IRON ORE AND COKING COAL PRICES
Source: JPC Source: Industry
10
22
34
46
Mar
-02
Sep
-02
Mar
-03
Sep
-03
Mar
-04
Sep
-04
Mar
-05
Sep
-05
Mar
-06
Sep
-06
Mar
-07
Sep
-07
Mar
-08 -30
15
60
105
150
2002
2003
2004
2005
2006
2007
2008
Chg
. (%
,YoY
)
Iron ore Annual Contract Prices
Coking Coal Annual Contract Prices
1628 March 2008
India Strategy
Since the beginning of January 2008, major metal prices have increased sharply – steelprices are up 28% for flat products and 42% for long products, aluminum prices are up 15-18%, and copper prices are up 20%, while zinc prices have remained flat. Aluminumprices are driven by rising energy costs and production disruption in China and SouthAfrica due to power shortage. News flow of supply disruption has attracted the attentionof funds, magnifying the impact on base metal prices.
Steel prices are driven by demand-supply mismatch, as production growth was restricteddue to shortage of coking coal in January - February 2008, (2) 65-71% increase in iron oreprices and 140% increase in coking coal prices (consensus estimates, annual contractsare yet to be settled). Iron ore prices have moved up sharply due to strong demand fromChina, shipping bottlenecks, and supply shortage due to high level of consolidation amongminers.
Coking coal prices moved up sharply, as the demand-supply equation has turned fromtightly balanced to deficit. This is due to repeated flooding of Australian mines, whichcontribute 62% to seaborne global trade, in January and February 2008. Also, Chinasimultaneously imposed a temporary ban on coal export after its mines were closed due tounprecedented snowfall.
1728 March 2008
India – the next trillion dollar opportunity
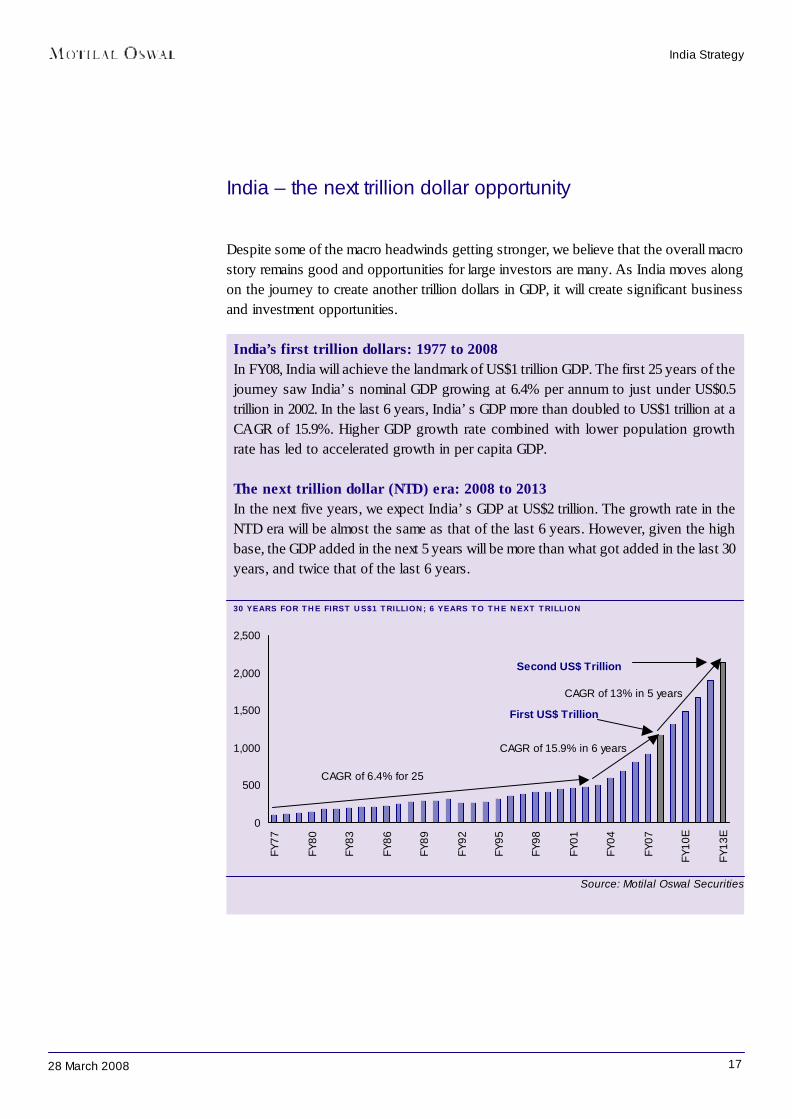
Despite some of the macro headwinds getting stronger, we believe that the overall macrostory remains good and opportunities for large investors are many. As India moves alongon the journey to create another trillion dollars in GDP, it will create significant businessand investment opportunities.
India’s first trillion dollars: 1977 to 2008In FY08, India will achieve the landmark of US$1 trillion GDP. The first 25 years of thejourney saw India’s nominal GDP growing at 6.4% per annum to just under US$0.5trillion in 2002. In the last 6 years, India’s GDP more than doubled to US$1 trillion at aCAGR of 15.9%. Higher GDP growth rate combined with lower population growthrate has led to accelerated growth in per capita GDP.
The next trillion dollar (NTD) era: 2008 to 2013In the next five years, we expect India’s GDP at US$2 trillion. The growth rate in theNTD era will be almost the same as that of the last 6 years. However, given the highbase, the GDP added in the next 5 years will be more than what got added in the last 30years, and twice that of the last 6 years.
30 YEARS FOR THE FIRST US$1 TRILLION; 6 YEARS TO THE NEXT TRILLION
India Strategy
Source: Motilal Oswal Securities
0
500
1,000
1,500
2,000
2,500
FY77
FY80
FY83
FY86
FY89
FY92
FY95
FY98
FY01
FY04
FY07
FY10
E
FY13
EFirst US$ Trillion
Second US$ Trillion
CAGR of 6.4% for 25
CAGR of 15.9% in 6 years
CAGR of 13% in 5 years

1828 March 2008
India Strategy
ACCELERATED GROWTH IN PER CAPITA GDP (US$)
Source: Motilal Oswal Securities
Recent policy measures to boost consumerismIndia is currently in the golden phase of its growth trajectory – average GDP growth in thelast four years has been 8.8%. High GDP growth has resulted in per capita GDP increasingfrom US$561 to US$1,023 in the last four years. We expect per capita GDP to increase toUS$1,572 in the next four years. We believe that US$1,000-1,200 will act as an inflexionpoint, beyond which higher proportion of income would be allocated to discretionary spending.According to F&R Research, the share of grocery in the consumer spending basket iscurrently 63%; this share is expected to decline to 53% by 2015. The government hastaken a few initiatives in the recent past, which will further boost disposable income andresult in higher allocation for consumer durables, housing, automobiles, telecom, education,entertainment, and healthcare.
Change in tax slabs to increase post tax incomeIn light of robust direct tax collections, the Finance Minister has altered personal incometax slabs to benefit individual tax payers. The threshold of exemption has been increasedfrom Rs110,000 to Rs150,000, and the tax slabs have been raised (please see table below).We estimate that for taxable income level of Rs300,000 the savings would be Rs2,000 permonth while for Rs400,000 the savings would be about Rs3,000 per month.
CHANGE IN TAX SLABOLD SLABS % NEW SLABS %Upto Rs110,000 0 Upto Rs150,000 0Rs110,000 to Rs150,000 10 Rs150,000 to Rs300,000 10Rs150,000 to Rs250,000 20 Rs300,000 to Rs500,000 20Rs250,000 and above 30 Rs500,000 and above 30
Source: Budget 2008
200
650
1,100
1,550
2,000
1990
1991
1992
1993
1994
1995
1996
1997
1998
1999
2000
2001
2002
2003
2004
2005
2006
2007
2008
E
2009
E
2010
E
2011
E
2012
E
2013
E
Per Capita GDP expected to grow to US$ 1,762 in 2013 from US$ 816 in 2007
Acceleration in Per Capita GDP from 2003
CAGR of 2.2%
CAGR of 12.1%
CAGR of 13.7%
1928 March 2008
India Strategy
Sixth Pay Commission recommendations to increase salaries by 20-25%The central government has announced the implementation of the Sixth Pay Commissionrecommendations, which would result in a 20-25% increase in the salaries of nearly 5.5mcentral government employees. In addition, more than 7m state government employees,and central and state pensioners would also witness an increase in income. As therecommendations are to be implemented with effect from January 2006, employees willget arrears of more than two years. Increase in monthly take home salary and payment ofone-time arrears bodes well for consumer demand. The Commission has also maderecommendations of soft loans for two-wheelers (Rs60k), cars (Rs360k) and housing(Rs1,500k) at 2% interest rate subsidy from state-owned banks, which would boost demandfor automobiles and real estate.
Waiver of farm loans positive for rural demandThe government has provided for waiver of farm loans worth Rs600b. The waiver wouldbe 100% for land holdings up to two hectares and 25% for others. The move wouldremove the burden of loan repayment for a large number of small and marginal farmers.It would also make them eligible for further loans from other banks. The resultant increasein credit flow to the rural economy would boost consumer demand.

2028 March 2008
India Strategy
Sensex earnings still healthy; valuations comfortable
We have downgraded our Sensex earnings estimates for the first time in eight quarters.We now estimate Sensex EPS at Rs834 for FY08 and at Rs1,002 for FY09. At theselevels, Sensex earnings remain healthy. Given the increased risks on earnings and othermacro indicators, we are reducing our target Sensex P/E range to 16-18x FY09E EPS andadd the embedded value of 2,800. Our 12-month target range for the BSE Sensex is19,000 – 21,000.
Earnings estimates – downgrades after eight quartersOver the last eight quarters, we have witnessed consistent upgrades to our earningsestimates. Our Sensex EPS estimate for FY08 was upgraded from Rs810 in December2006 to Rs846 in June 2007 to Rs883 in December 2007. Similarly, our Sensex EPSestimate for FY09 was revised from Rs891 in December 2006 to Rs955 in June 2007 toRs1,064 in December 2007.
REVISIONS IN FY08 SENSEX EPS REVISIONS IN FY09 SENSEX EPS
Source:Motilal Oswal Securities
After a series of upgrades, we have now downgraded our Sensex EPS estimates by 5.5%to Rs834 for FY08 and by 5.8% to Rs1,002 for FY09. While the Sensex EPS got loweredby 2.4% due to change in index constituents and SBI rights issue, it was impacted byanother 3.1% by earnings downgrades. The key contributors to downgrades in FY08earnings are: Metals, Real Estate, Oil & Gas, Cement, and Engineering; while sectors thathave witnessed upgrades include Banking, Autos, Pharmaceuticals, and Telecom. Thekey contributors to downgrades in FY09 earnings are: Metals, IT, Telecom, Cement andAutos; while sectors that have witnessed upgrades include Banking, and Oil & Gas.
709733 732
780810 822
846 855883
834
650
715
780
845
910
Dec
-05
Mar
-06
June
-06
Sep
- 06
Dec
-06
Mar
-07
Jun-
07
Sep
-07
Dec
-07
Mar
-08
9
13
17
21
25
FY08 EPS (LHS)% Growth Revision in FY08 EPS - (RHS)
891
955
9891,007
1,002
1,064
850
910
970
1,030
1,090
Dec-06 Mar-07 Jun-07 Sep-07 Dec-07 Mar-088
12
16
20
24
FY09 EPS % Growth Revision in FY09 EPS

2128 March 2008
India Strategy
TOP 10 UPGRADES/DOWNGRADES IN FY08 EPS (RS) PREVIEW EPS UP- PREVIEW EPS DOWN-
MAR-08 DEC-07 GRADE % MAR-08 DEC-07 GRADE %Hindalco 14.0 12.4 13.3 Tata Steel 82.8 114.7 -27.7Tata Motors 51.9 47.8 8.6 Ambuja Cements 7.1 9.6 -26.1Cipla 8.5 7.9 8.0 Reliance Energy 25.3 33.8 -25.0HDFC 87.2 84.5 3.3 Larsen & Toubro 78.9 89.0 -11.3HDFC Bank 44.6 43.7 2.1 ACC 64.0 70.0 -8.6Hind. Unilever 8.1 8.0 2.0 DLF 44.1 47.0 -6.0TCS 52.0 51.2 1.5 Wipro 22.4 23.6 -5.1ITC 8.3 8.2 1.4 BHEL 60.2 63.1 -4.7Infosys 82.7 81.6 1.3 ICICI Bank 35.5 36.5 -2.8Mahindra & Mahindra 62.8 62.1 1.1 Maruti Suzuki 66.4 68.1 -2.6
Source: Motilal Oswal Securities
Sensex earnings growth still at healthy levelsWe estimate Sensex EPS at Rs1,002 for FY09, 20.1% higher than our FY08 Sensex EPSestimate of Rs834. A significant part of this growth would be contributed by Oil & Gas,Banking, Telecom, IT, and Engineering. Company-wise, the largest contributors to theincrease in Sensex earnings would be ONGC, Reliance Industries, SBI, Tata Steel, BhartiAirtel, Reliance Communication, NTPC, and DLF. The top-10 companies account for70% of the total Sensex EPS for FY09 (v/s 61% in FY07).
‘Low/Average P/E’ sectors to drive earnings growth in FY09Sensex earnings growth in FY09 would largely be driven by ‘low/average P/E’ sectorslike Oil & Gas, Metals, IT, etc (contributing 52.1% of the growth). Even during FY10, weexpect the share of ‘lower average P/E’ sectors at 62%, which is high.
COMPOSITION OF SENSEX EARNINGS & GROWTH (FY09)
Source: Motilal Oswal Securities
0.0
8.0
16.0
24.0
32.0
Auto
Ban
king
Cem
ent
Eng
g
FMC
G IT
Infra
stru
ctur
e
Met
als
Oil
& G
as
Pha
rma
Rea
l Est
ate
Tele
com
Util
ities
0.0
6.0
12.0
18.0
24.0Contribution to total Earnings - LHS Contribution to Earnings Growth - RHS
2228 March 2008
India Strategy
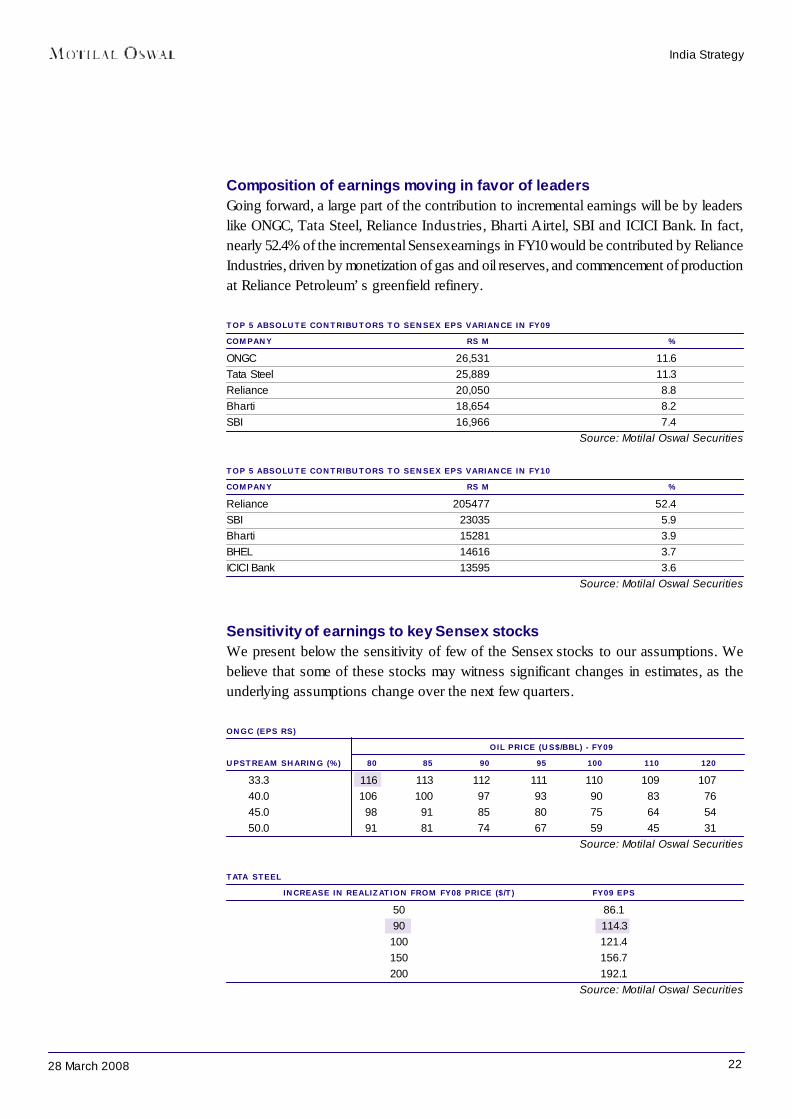
Composition of earnings moving in favor of leadersGoing forward, a large part of the contribution to incremental earnings will be by leaderslike ONGC, Tata Steel, Reliance Industries, Bharti Airtel, SBI and ICICI Bank. In fact,nearly 52.4% of the incremental Sensex earnings in FY10 would be contributed by RelianceIndustries, driven by monetization of gas and oil reserves, and commencement of productionat Reliance Petroleum’s greenfield refinery.
TOP 5 ABSOLUTE CONTRIBUTORS TO SENSEX EPS VARIANCE IN FY09COMPANY RS M %ONGC 26,531 11.6Tata Steel 25,889 11.3Reliance 20,050 8.8Bharti 18,654 8.2SBI 16,966 7.4
Source: Motilal Oswal Securities
TOP 5 ABSOLUTE CONTRIBUTORS TO SENSEX EPS VARIANCE IN FY10COMPANY RS M %Reliance 205477 52.4SBI 23035 5.9Bharti 15281 3.9BHEL 14616 3.7ICICI Bank 13595 3.6
Source: Motilal Oswal Securities
Sensitivity of earnings to key Sensex stocksWe present below the sensitivity of few of the Sensex stocks to our assumptions. Webelieve that some of these stocks may witness significant changes in estimates, as theunderlying assumptions change over the next few quarters.
ONGC (EPS RS) OIL PRICE (US$/BBL) - FY09
UPSTREAM SHARING (%) 80 85 90 95 100 110 12033.3 116 113 112 111 110 109 10740.0 106 100 97 93 90 83 7645.0 98 91 85 80 75 64 5450.0 91 81 74 67 59 45 31
Source: Motilal Oswal Securities
TATA STEELINCREASE IN REALIZATION FROM FY08 PRICE ($/T) FY09 EPS
50 86.190 114.3
100 121.4150 156.7200 192.1
Source: Motilal Oswal Securities
2328 March 2008
India Strategy
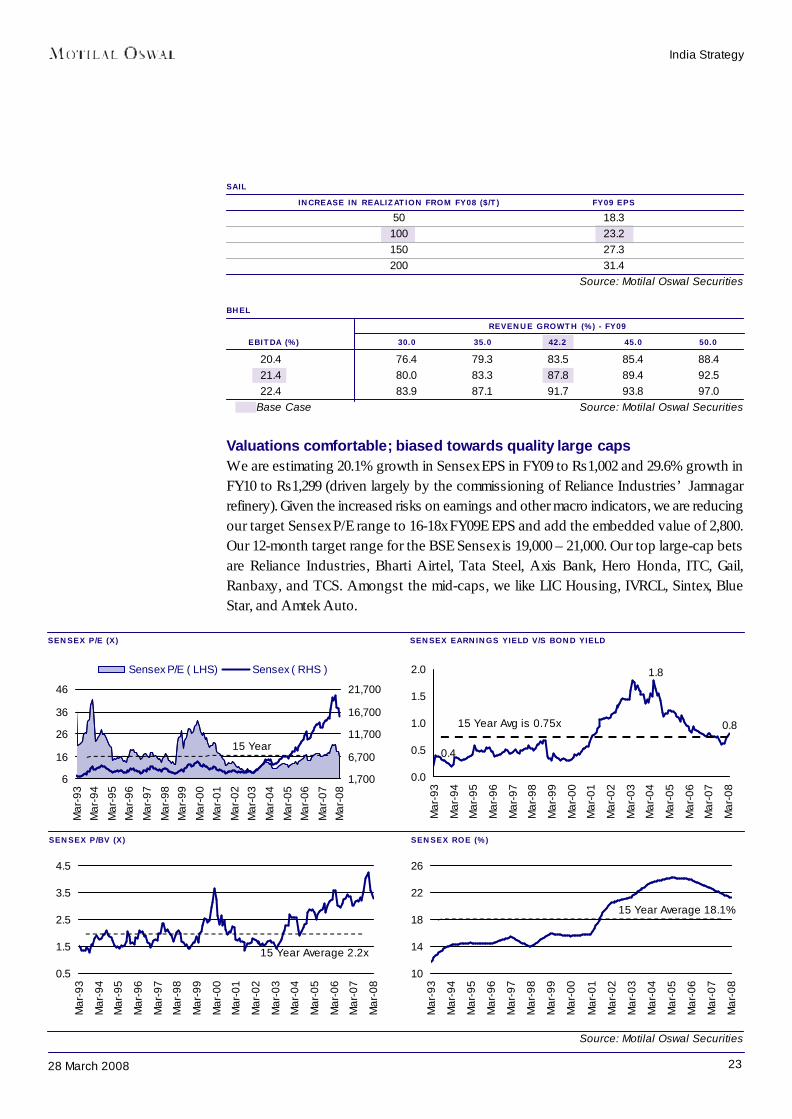
SAILINCREASE IN REALIZATION FROM FY08 ($/T) FY09 EPS
50 18.3100 23.2150 27.3200 31.4
Source: Motilal Oswal Securities
BHEL REVENUE GROWTH (%) - FY09
EBITDA (%) 30.0 35.0 42.2 45.0 50.020.4 76.4 79.3 83.5 85.4 88.421.4 80.0 83.3 87.8 89.4 92.522.4 83.9 87.1 91.7 93.8 97.0
Base Case Source: Motilal Oswal Securities
Valuations comfortable; biased towards quality large capsWe are estimating 20.1% growth in Sensex EPS in FY09 to Rs1,002 and 29.6% growth inFY10 to Rs1,299 (driven largely by the commissioning of Reliance Industries’ Jamnagarrefinery). Given the increased risks on earnings and other macro indicators, we are reducingour target Sensex P/E range to 16-18x FY09E EPS and add the embedded value of 2,800.Our 12-month target range for the BSE Sensex is 19,000 – 21,000. Our top large-cap betsare Reliance Industries, Bharti Airtel, Tata Steel, Axis Bank, Hero Honda, ITC, Gail,Ranbaxy, and TCS. Amongst the mid-caps, we like LIC Housing, IVRCL, Sintex, BlueStar, and Amtek Auto.
1,700
6,700
11,700
16,700
21,700
Mar
-08
Mar
-07
Mar
-06
Mar
-05
Mar
-04
Mar
-03
Mar
-02
Mar
-01
Mar
-00
Mar
-99
Mar
-98
Mar
-97
Mar
-96
Mar
-95
Mar
-94
Mar
-93
6
16
26
36
46
Sensex P/E ( LHS) Sensex ( RHS )
15 Year
SENSEX P/E (X) SENSEX EARNINGS YIELD V/S BOND YIELD
SENSEX P/BV (X) SENSEX ROE (%)
1.8
0.8
0.4
0.0
0.5
1.0
1.5
2.0
Mar
-93
Mar
-94
Mar
-95
Mar
-96
Mar
-97
Mar
-98
Mar
-99
Mar
-00
Mar
-01
Mar
-02
Mar
-03
Mar
-04
Mar
-05
Mar
-06
Mar
-07
Mar
-08
15 Year Avg is 0.75x
Source: Motilal Oswal Securities
10
14
18
22
26
Mar
-93
Mar
-94
Mar
-95
Mar
-96
Mar
-97
Mar
-98
Mar
-99
Mar
-00
Mar
-01
Mar
-02
Mar
-03
Mar
-04
Mar
-05
Mar
-06
Mar
-07
Mar
-08
15 Year Average 18.1%
0.5
1.5
2.5
3.5
4.5
Mar
-93
Mar
-94
Mar
-95
Mar
-96
Mar
-97
Mar
-98
Mar
-99
Mar
-00
Mar
-01
Mar
-02
Mar
-03
Mar
-04
Mar
-05
Mar
-06
Mar
-07
Mar
-08
15 Year Average 2.2x

2428 March 2008
MOST MODEL PORTFOLIOSECTOR WEIGHT / BSE-100 MOST WEIGHT RELATIVE EFFECTIVE SECTORPORTFOLIO PICKS WEIGHT TO BSE-100 STANCEBanks 19.2 18.0 -1.2 Neutral
ICICI Bank 5.5 5.0 -0.5 BuyAxis Bank 1.1 5.0 3.9 BuyPNB 0.5 4.0 3.5 BuyKotak Mahindra Bank 0.7 2.0 1.3 BuyUnion Bank 0.2 2.0 1.8 Buy
Engg./ Infrastrcuture / Real Estate 14.1 14.0 -0.1 NeutralLarsen & Toubro 5.1 5.0 -0.1 NeutralIVRCL Infra. 0.3 4.0 3.7 BuyIndiaBulls Real Estate 0.6 3.0 2.4 BuySimplex Infra. 0.0 2.0 2.0 Buy
Telecom 6.5 9.0 2.5 OverweightBharti Airtel 3.5 6.0 2.5 BuyReliance Comm 2.3 3.0 0.7 Buy
Petrochemicals 12.9 9.0 -3.9 UnderweightReliance Inds. 10.5 9.0 -1.5 Buy
FMCG 6.1 8.0 1.9 OverweightITC 3.5 4.0 0.5 BuyNestle India 0.4 2.0 1.6 BuyUnited Spirit 0.5 2.0 1.5 Buy
Metals 6.7 8.0 1.3 OverweightTata Steel 2.3 5.0 2.7 BuySAIL 0.7 3.0 2.3 Buy
Information Technology 9.0 8.0 -1.0 NeutralTCS 1.3 4.0 2.7 BuyHCL Tech. 0.4 4.0 3.6 Buy
Oil & Gas 5.5 7.0 1.5 OverweightCairn India 0.6 4.0 3.4 BuyGAIL 0.9 3.0 2.1 Buy
Auto 3.6 6.0 2.4 OverweightHero Honda 0.4 3.0 2.6 BuyMaruti Suzuki 0.8 3.0 2.2 Buy
Pharmaceuticals 3.4 5.0 1.6 OverweightRanbaxy Labs 0.7 3.0 2.3 BuyGlaxo Pharma 0.3 2.0 1.7 Buy
Cement 2.8 2.0 -0.8 UnderweightGrasim Industries 1.1 2.0 0.9 Buy
Others 9.9 6.0 -3.9 UnderweightBlue Star 0.0 2.0 2.0 BuyLIC Housing 0.0 2.0 2.0 BuySintex Inds. 0.0 2.0 2.0 Buy
Cash 0.0 0.0Total 100.0 100.0
Model Portfolio

2528 March 2008
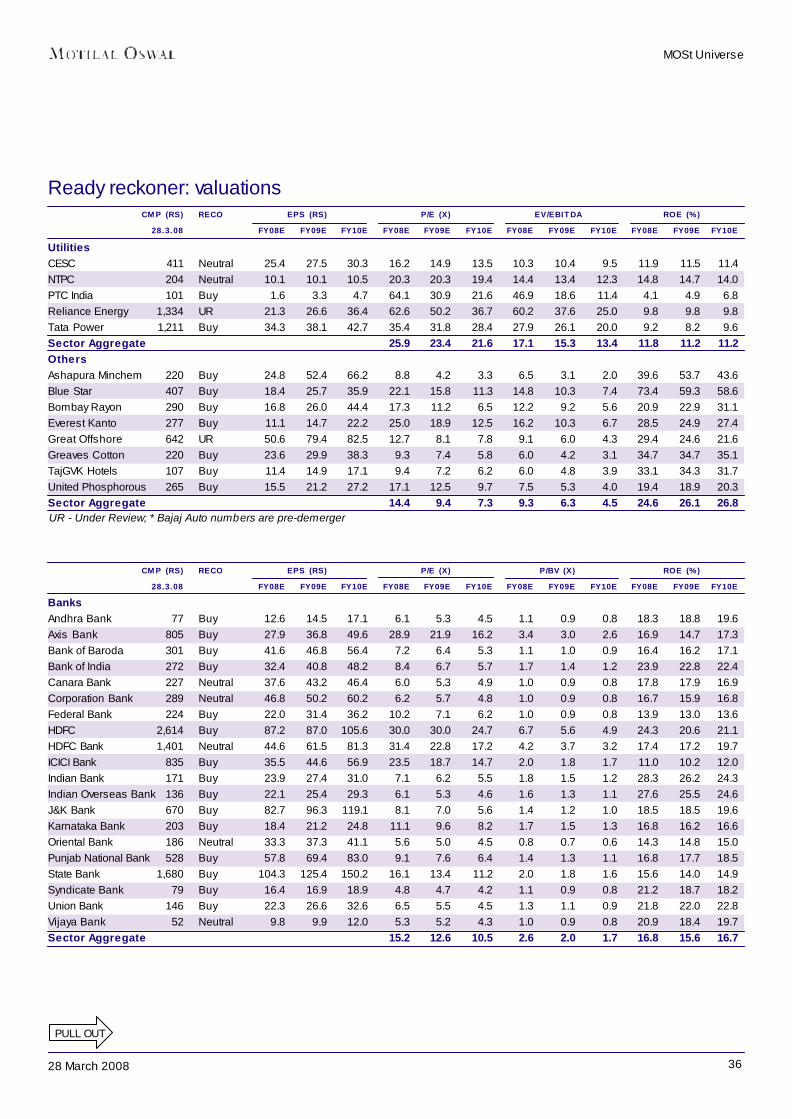
ANNUAL PERFORMANCE - MOST UNIVERSE (RS BILLION)SECTOR SALES EBITDA NET PROFITY/E MARCH FY08E FY09E FY10E CH. (%)* FY08E FY09E FY10E CH. (%)* FY08E FY09E FY10E CH. (%)*Auto (11) 986 1,135 1,299 15.1 120 134 155 11.6 78 87 100 10.7Banks (20) 691 847 1,030 22.5 537 664 814 23.6 295 355 429 20.6Cement (7) 413 473 528 14.5 135 142 144 5.4 75 79 80 6.2Engineering (10) 916 1,238 1,560 35.2 136 189 247 39.1 95 135 176 42.6FMCG (12) 536 621 714 15.9 106 125 148 17.8 77 92 111 20.5IT (8) 842 1,025 1,276 21.7 204 243 302 18.7 174 202 229 15.8Infrastructure (9) 234 324 438 38.5 35 55 81 58.2 16 23 30 45.1Media (6) 56 69 81 21.9 22 27 33 25.3 13 18 22 32.0Metals (8) 2,890 3,313 3,509 14.6 575 671 721 16.8 295 360 411 21.9Oil Gas & Petchem (10) 7,827 7,978 8,489 1.9 954 1,087 1,375 14.0 570 658 880 15.5Pharma (17) 409 475 481 16.0 81 95 113 17.1 62 69 83 12.3Real Estate (2) 184 259 340 40.7 115 150 202 30.1 92 110 149 19.5Retail (3) 95 138 184 44.1 7 11 15 43.4 3 4 7 56.7Telecom (3) 524 691 838 32.1 217 297 366 36.8 129 161 194 25.1Textiles (7) 116 140 171 20.5 17 25 30 47.9 5 9 12 74.4Utilities (5) 553 633 762 14.4 135 158 186 16.4 93 103 112 10.8Others (8) 115 157 195 36.0 23 34 44 46.3 14 21 27 53.0MOSt (146) 17,388 19,514 21,896 12.2 3,419 4,106 4,976 20.1 2,085 2,487 3,050 19.3MOSt Excl. Banks (126) 16,697 18,667 20,865 11.8 2,882 3,442 4,162 19.4 1,791 2,132 2,621 19.1MOSt Excl.Oil & Gas (136) 9,561 11,536 13,406 20.7 2,465 3,018 3,601 22.4 1,515 1,829 2,170 20.7MOST Excl. RMs (143) 12,674 14,787 17,424 16.7 3,212 3,839 4,697 19.5 1,947 2,311 2,867 18.7* Growth FY09 over FY08; For Banks : Sales = Net Interest Income, EBITDA = Operating Profits; Tata Steel figures are consolidated incl. Corus.
VALUATIONS - MOST UNIVERSESECTOR P/E EV/EBITDA P/BV ROE DIV. EARN.
(X) (X) (X) (%) YLD (%) CAGR(NO. OF COMPANIES) FY08E FY09E FY10E FY08E FY09E FY10E FY08E FY09E FY08E FY09E FY10E FY08E (FY10-08)Auto (11) 15.4 13.9 12.1 9.1 7.9 6.6 3.2 2.7 20.7 19.7 19.5 2.0 12.9Banks (20) 15.2 12.6 10.5 N.M N.M N.M 2.6 2.0 16.8 15.6 16.7 1.4 20.7Cement (7) 10.6 10.0 9.9 5.9 5.3 4.9 3.4 2.6 32.1 26.3 21.9 1.7 3.8Engineering (10) 33.8 23.7 18.2 23.0 16.7 12.8 8.7 6.8 25.7 28.8 30.1 0.9 36.2FMCG (12) 26.5 22.0 18.4 18.5 15.4 12.8 8.6 7.3 32.3 33.0 34.0 2.3 20.1IT (8) 17.2 14.8 13.1 13.4 11.0 8.5 5.2 4.1 30.1 27.8 25.5 1.4 14.6Infrastructure (9) 53.9 37.1 29.2 27.7 18.8 13.4 4.9 4.0 9.1 10.9 12.5 0.3 35.7Media (6) 25.1 19.0 15.4 15.0 11.6 9.1 4.7 3.9 18.6 20.4 20.8 0.6 27.5Metals (8) 10.8 8.9 7.8 6.2 5.1 4.6 2.3 1.9 21.2 21.0 19.7 1.3 18.0Oil Gas & Petchem (10) 13.0 11.3 8.5 8.1 7.1 5.5 2.7 2.2 20.9 19.7 21.6 1.9 24.2Pharma (17) 19.2 17.1 14.3 15.1 12.6 10.3 4.3 3.6 22.5 20.8 21.0 1.4 15.8Real Estate (2) 18.0 15.0 11.2 15.4 11.5 7.9 8.1 5.9 45.2 39.4 38.4 1.0 26.9Retail (3) 44.8 28.6 17.5 19.2 13.6 9.3 6.2 5.3 13.8 18.4 17.7 0.3 59.9Telecom (3) 22.8 18.2 15.1 14.4 11.0 8.7 6.0 4.8 26.5 26.1 25.2 0.0 22.8Textiles (7) 11.7 6.7 5.2 9.3 6.8 5.8 0.8 0.8 7.1 11.3 13.0 2.2 50.1Utilities (5) 25.9 23.4 21.6 17.1 15.3 13.4 3.1 2.6 11.8 11.2 11.2 1.3 9.7Others (8) 14.4 9.4 7.3 9.3 6.3 4.5 3.5 2.5 24.6 26.1 26.8 1.3 41.1MOSt (146) 16.8 14.1 11.5 N.M N.M N.M 3.6 2.9 21.2 20.4 21.0 1.3 20.9MOSt Excl. Banks (126) 17.1 14.4 11.7 10.8 9.0 7.3 3.8 3.1 22.2 21.5 21.9 1.3 21.0MOSt Excl.Oil & Gas (136) 18.3 15.1 12.8 N.M N.M N.M 3.9 3.1 21.4 20.7 20.7 1.2 19.7MOST Excl. RMs (143) 17.6 14.9 12.0 N.M N.M N.M 3.8 3.0 21.3 20.4 21.2 1.3 21.4N.M. - Not Meaningful Source: Motilal Oswal Securities
MOSt Universe
2628 March 2008
QUARTER-WISE SALES GROWTH (% YOY) QUARTER-WISE NET PROFIT GROWTH (% YOY)
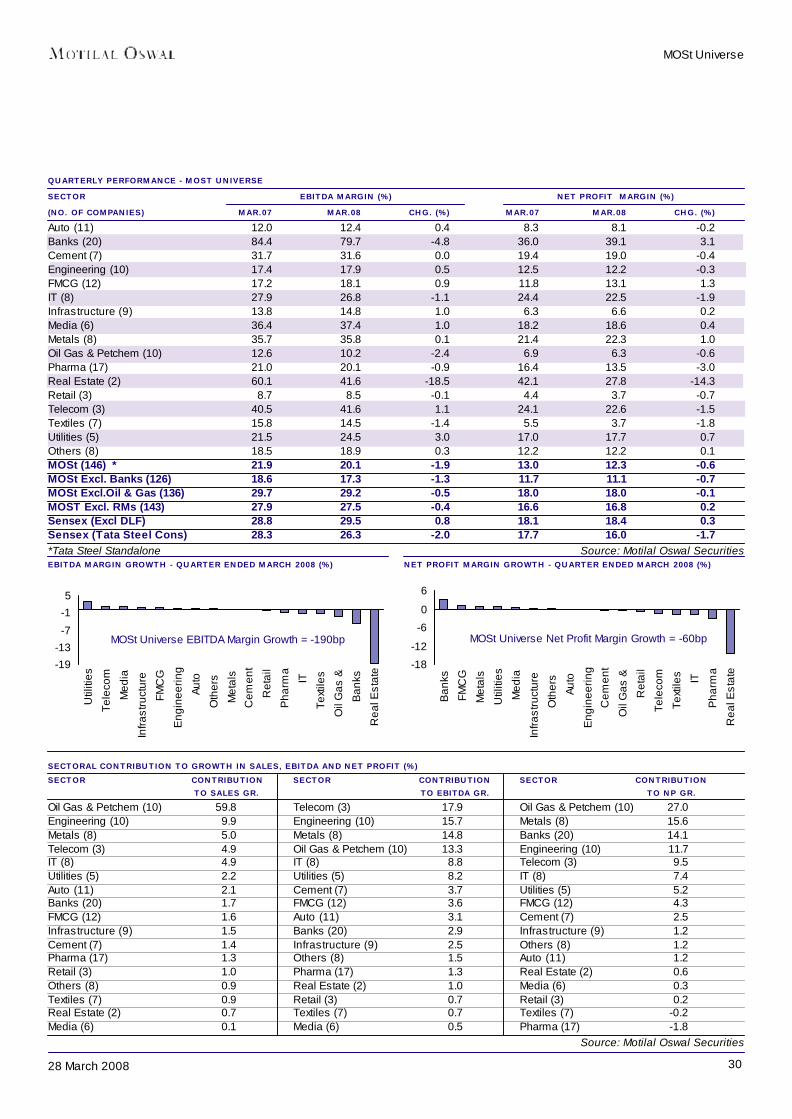
QUARTERLY PERFORMANCE - MOST UNIVERSE (RS MILLION)SECTOR SALES EBITDA NET PROFIT(NO. OF COMPANIES) MAR.07 MAR.08 CHG. (%) MAR.07 MAR.08 CHG. (%) MAR.07 MAR.08 CHG. (%)Auto (11) 259,427 276,299 6.5 31,205 34,287 9.9 21,551 22,472 4.3Banks (20) 175,866 189,951 8.0 148,469 151,324 1.9 63,264 74,260 17.4Cement (7) 84,260 96,011 13.9 26,672 30,356 13.8 16,366 18,282 11.7Engineering (10) 239,956 320,364 33.5 41,740 57,397 37.5 30,050 39,162 30.3FMCG (12) 127,333 140,646 10.5 21,938 25,481 16.2 15,050 18,393 22.2IT (8) 171,946 211,984 23.3 48,048 56,813 18.2 41,952 47,768 13.9Infrastructure (9) 60,445 73,033 20.8 8,367 10,807 29.2 3,815 4,789 25.5Media (6) 14,082 15,152 7.6 5,121 5,668 10.7 2,564 2,818 9.9Metals (8) 333,892 374,314 12.1 119,212 133,988 12.4 71,420 83,649 17.1Oil Gas & Petchem (10) 1,554,451 2,041,356 31.3 195,485 208,690 6.8 106,676 127,765 19.8Pharma (17) 95,315 105,590 10.8 20,005 21,257 6.3 15,652 14,220 -9.1Real Estate (2) 8,487 14,592 71.9 5,101 6,073 19.1 3,571 4,051 13.5Retail (3) 16,725 24,769 48.1 1,447 2,110 45.8 730 919 25.9Telecom (3) 106,386 146,478 37.7 43,123 60,951 41.3 25,682 33,132 29.0Textiles (7) 25,131 32,058 27.6 3,975 4,634 16.6 1,370 1,177 -14.1Utilities (5) 127,954 145,716 13.9 27,508 35,685 29.7 21,693 25,794 18.9Others (8) 25,372 32,866 29.5 4,701 6,202 31.9 3,086 4,021 30.3MOSt (146)* 3,427,027 4,241,179 23.8 752,117 851,723 13.2 444,489 522,672 17.6MOSt Excl. Banks (126) 3,251,161 4,051,228 24.6 603,648 700,399 16.0 381,226 448,413 17.6MOSt Excl.Oil & Gas (136) 1,872,576 2,199,822 17.5 556,632 643,033 15.5 337,814 394,907 16.9MOST Excl. RMs (143) 2,438,377 2,920,888 19.8 680,102 801,894 17.9 404,084 489,521 21.1Sensex (Excl DLF) 1,351,846 1,612,965 19.3 388,987 476,550 22.5 245,138 296,579 21.0Sensex (Tata Steel Cons) 1,376,739 1,889,211 37.2 389,631 497,448 27.7 243,732 303,216 24.4* Tata Steel Standalone; Bajaj Auto numbers are pre-demerger Source: Motilal Oswal Securities
Source: Motilal Oswal Securities
4QFY08: expect steady corporate performance
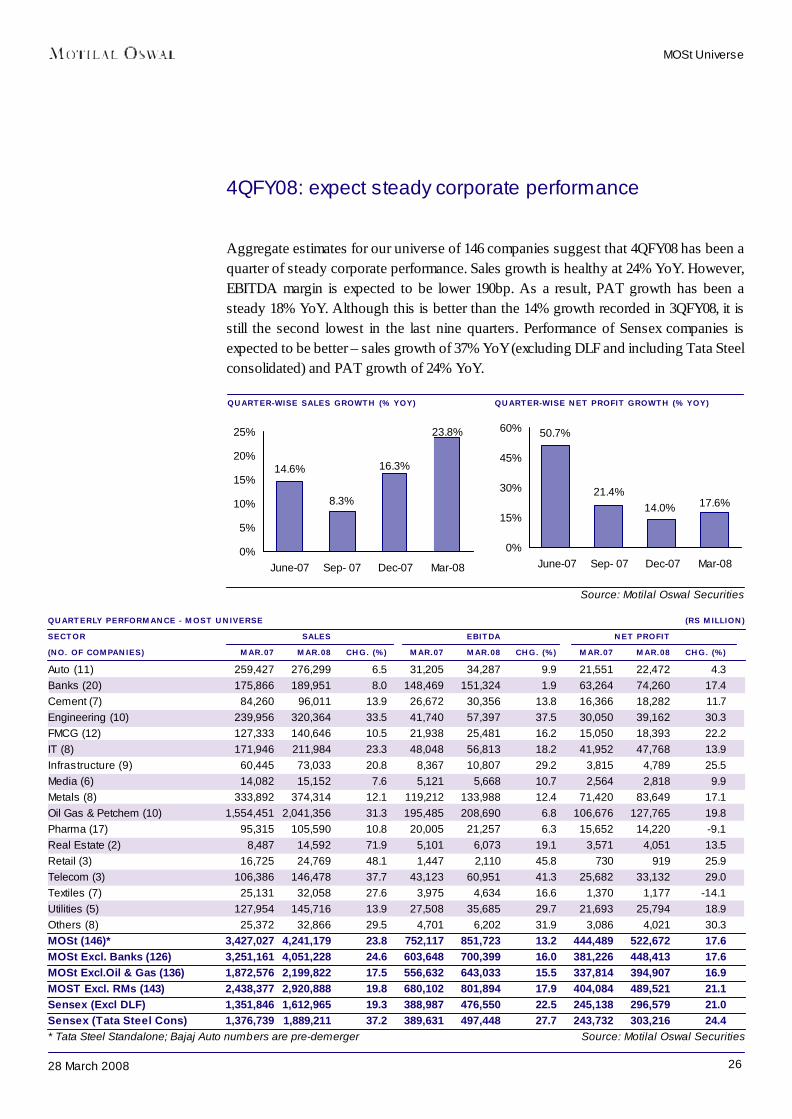
Aggregate estimates for our universe of 146 companies suggest that 4QFY08 has been aquarter of steady corporate performance. Sales growth is healthy at 24% YoY. However,EBITDA margin is expected to be lower 190bp. As a result, PAT growth has been asteady 18% YoY. Although this is better than the 14% growth recorded in 3QFY08, it isstill the second lowest in the last nine quarters. Performance of Sensex companies isexpected to be better – sales growth of 37% YoY (excluding DLF and including Tata Steelconsolidated) and PAT growth of 24% YoY.
MOSt Universe
14.6%
23.8%
16.3%
8.3%
0%
5%
10%
15%
20%
25%
June-07 Sep- 07 Dec-07 Mar-08
50.7%
21.4%17.6%14.0%
0%
15%
30%
45%
60%
June-07 Sep- 07 Dec-07 Mar-08
2728 March 2008
0
20
40
60
80
Rea
l Est
ate
Ret
ail
Tele
com
Eng
inee
ring
Oil
Gas
&P
etch
em
Oth
ers
Text
iles IT
Infra
stru
ctur
e
Cem
ent
Util
ities
Met
als
Pha
rma
FMC
G
Ban
ks
Med
ia
Auto
SECTORAL SALES GROWTH - QUARTER ENDED MARCH 2008 (%)
Source: Motilal Oswal Securities
MOSt Universe
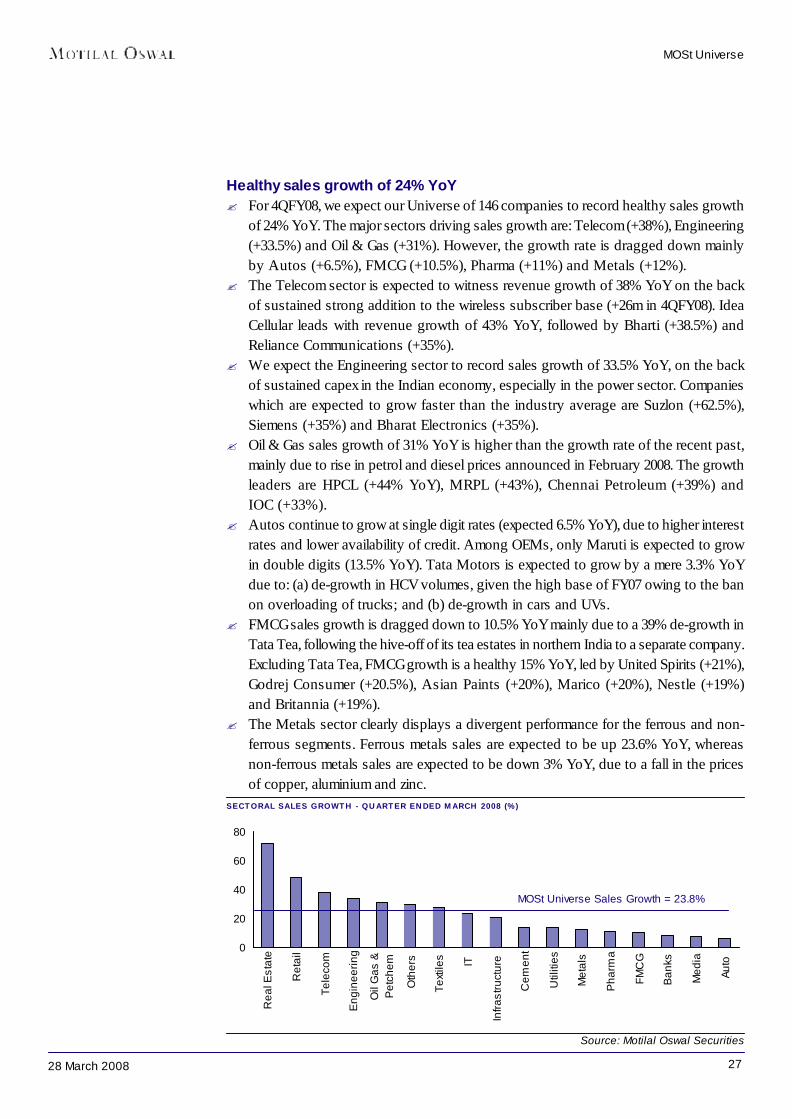
Healthy sales growth of 24% YoY? For 4QFY08, we expect our Universe of 146 companies to record healthy sales growth
of 24% YoY. The major sectors driving sales growth are: Telecom (+38%), Engineering(+33.5%) and Oil & Gas (+31%). However, the growth rate is dragged down mainlyby Autos (+6.5%), FMCG (+10.5%), Pharma (+11%) and Metals (+12%).
? The Telecom sector is expected to witness revenue growth of 38% YoY on the backof sustained strong addition to the wireless subscriber base (+26m in 4QFY08). IdeaCellular leads with revenue growth of 43% YoY, followed by Bharti (+38.5%) andReliance Communications (+35%).
? We expect the Engineering sector to record sales growth of 33.5% YoY, on the backof sustained capex in the Indian economy, especially in the power sector. Companieswhich are expected to grow faster than the industry average are Suzlon (+62.5%),Siemens (+35%) and Bharat Electronics (+35%).
? Oil & Gas sales growth of 31% YoY is higher than the growth rate of the recent past,mainly due to rise in petrol and diesel prices announced in February 2008. The growthleaders are HPCL (+44% YoY), MRPL (+43%), Chennai Petroleum (+39%) andIOC (+33%).
? Autos continue to grow at single digit rates (expected 6.5% YoY), due to higher interestrates and lower availability of credit. Among OEMs, only Maruti is expected to growin double digits (13.5% YoY). Tata Motors is expected to grow by a mere 3.3% YoYdue to: (a) de-growth in HCV volumes, given the high base of FY07 owing to the banon overloading of trucks; and (b) de-growth in cars and UVs.
? FMCG sales growth is dragged down to 10.5% YoY mainly due to a 39% de-growth inTata Tea, following the hive-off of its tea estates in northern India to a separate company.Excluding Tata Tea, FMCG growth is a healthy 15% YoY, led by United Spirits (+21%),Godrej Consumer (+20.5%), Asian Paints (+20%), Marico (+20%), Nestle (+19%)and Britannia (+19%).
? The Metals sector clearly displays a divergent performance for the ferrous and non-ferrous segments. Ferrous metals sales are expected to be up 23.6% YoY, whereasnon-ferrous metals sales are expected to be down 3% YoY, due to a fall in the pricesof copper, aluminium and zinc.
MOSt Universe Sales Growth = 23.8%
2828 March 2008
0
12
24
36
48
Ret
ail
Tele
com
Eng
inee
ring
Oth
ers
Util
ities
Infra
stru
ctur
e
Rea
l Est
ate
IT
Text
iles
FMC
G
Cem
ent
Met
als
Med
ia
Auto
Oil
Gas
&P
etch
em
Pha
rma
Ban
ks
SECTORAL EBITDA GROWTH - QUARTER ENDED MARCH 2008 (%)
Source: Motilal Oswal Securities
MOSt Universe
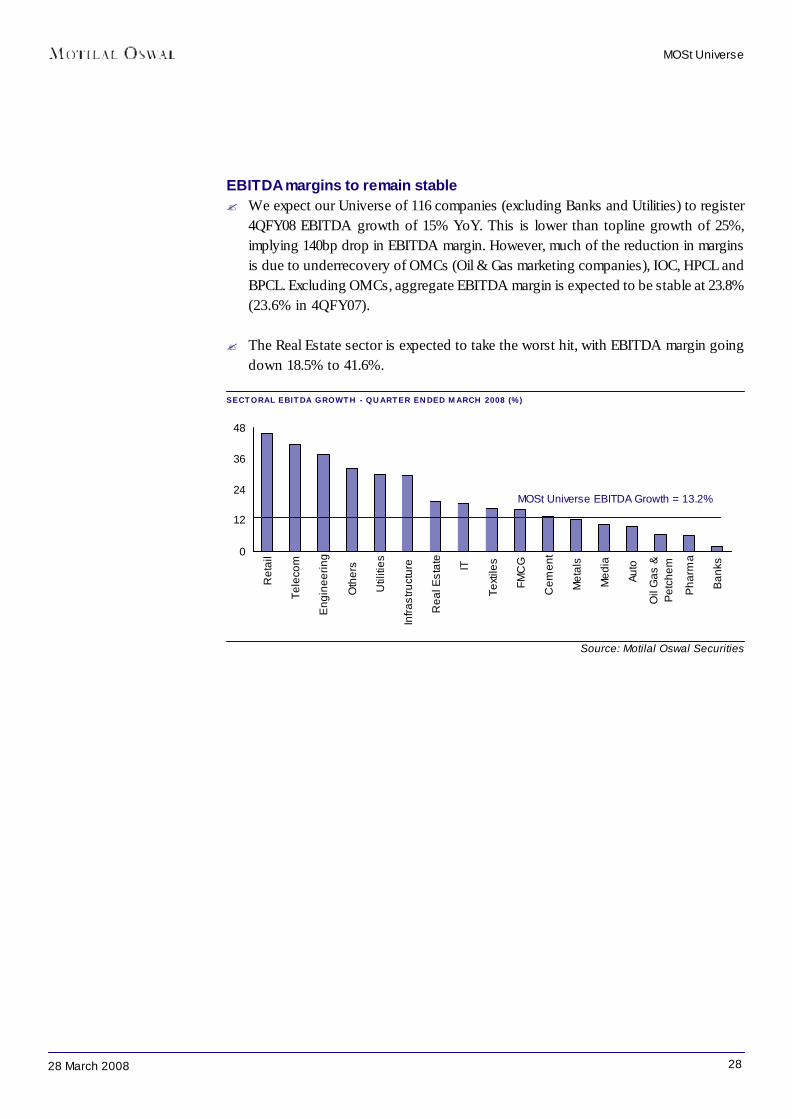
EBITDA margins to remain stable? We expect our Universe of 116 companies (excluding Banks and Utilities) to register
4QFY08 EBITDA growth of 15% YoY. This is lower than topline growth of 25%,implying 140bp drop in EBITDA margin. However, much of the reduction in marginsis due to underrecovery of OMCs (Oil & Gas marketing companies), IOC, HPCL andBPCL. Excluding OMCs, aggregate EBITDA margin is expected to be stable at 23.8%(23.6% in 4QFY07).
? The Real Estate sector is expected to take the worst hit, with EBITDA margin goingdown 18.5% to 41.6%.
MOSt Universe EBITDA Growth = 13.2%
2928 March 2008
-20
-6
8
22
36
Eng
inee
ring
Oth
ers
Tele
com
Ret
ail
Infra
stru
ctur
e
FMC
G
Oil
Gas
&P
etch
em
Util
ities
Ban
ks
Met
als IT
Rea
l Est
ate
Cem
ent
Med
ia
Auto
Pha
rma
Text
iles
SECTORAL NET PROFIT GROWTH - QUARTER ENDED MARCH 2008 (%)
Source: Motilal Oswal Securities
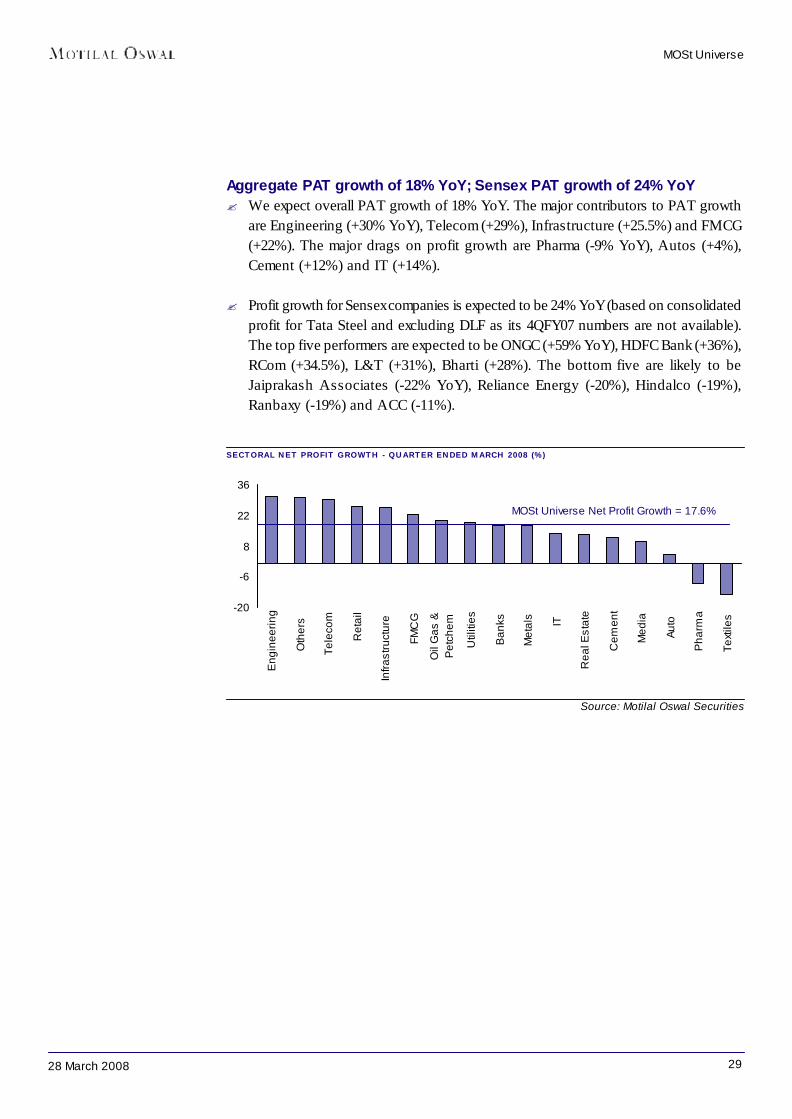
Aggregate PAT growth of 18% YoY; Sensex PAT growth of 24% YoY? We expect overall PAT growth of 18% YoY. The major contributors to PAT growth
are Engineering (+30% YoY), Telecom (+29%), Infrastructure (+25.5%) and FMCG(+22%). The major drags on profit growth are Pharma (-9% YoY), Autos (+4%),Cement (+12%) and IT (+14%).
? Profit growth for Sensex companies is expected to be 24% YoY (based on consolidatedprofit for Tata Steel and excluding DLF as its 4QFY07 numbers are not available).The top five performers are expected to be ONGC (+59% YoY), HDFC Bank (+36%),RCom (+34.5%), L&T (+31%), Bharti (+28%). The bottom five are likely to beJaiprakash Associates (-22% YoY), Reliance Energy (-20%), Hindalco (-19%),Ranbaxy (-19%) and ACC (-11%).
MOSt Universe
MOSt Universe Net Profit Growth = 17.6%
3028 March 2008
-18
-12
-6
0
6
Ban
ks
FMC
G
Met
als
Util
ities
Med
ia
Infra
stru
ctur
e
Oth
ers
Auto
Eng
inee
ring
Cem
ent
Oil
Gas
&
Ret
ail
Tele
com
Text
iles IT
Pha
rma
Rea
l Est
ate-19
-13-7
-15
Util
ities
Tele
com
Med
ia
Infra
stru
ctur
e
FMC
G
Eng
inee
ring
Auto
Oth
ers
Met
als
Cem
ent
Ret
ail
Pha
rma
IT
Text
iles
Oil
Gas
&
Ban
ks
Rea
l Est
ate
QUARTERLY PERFORMANCE - MOST UNIVERSESECTOR EBITDA MARGIN (%) NET PROFIT MARGIN (%)(NO. OF COMPANIES) MAR.07 MAR.08 CHG. (%) MAR.07 MAR.08 CHG. (%)Auto (11) 12.0 12.4 0.4 8.3 8.1 -0.2Banks (20) 84.4 79.7 -4.8 36.0 39.1 3.1Cement (7) 31.7 31.6 0.0 19.4 19.0 -0.4Engineering (10) 17.4 17.9 0.5 12.5 12.2 -0.3FMCG (12) 17.2 18.1 0.9 11.8 13.1 1.3IT (8) 27.9 26.8 -1.1 24.4 22.5 -1.9Infrastructure (9) 13.8 14.8 1.0 6.3 6.6 0.2Media (6) 36.4 37.4 1.0 18.2 18.6 0.4Metals (8) 35.7 35.8 0.1 21.4 22.3 1.0Oil Gas & Petchem (10) 12.6 10.2 -2.4 6.9 6.3 -0.6Pharma (17) 21.0 20.1 -0.9 16.4 13.5 -3.0Real Estate (2) 60.1 41.6 -18.5 42.1 27.8 -14.3Retail (3) 8.7 8.5 -0.1 4.4 3.7 -0.7Telecom (3) 40.5 41.6 1.1 24.1 22.6 -1.5Textiles (7) 15.8 14.5 -1.4 5.5 3.7 -1.8Utilities (5) 21.5 24.5 3.0 17.0 17.7 0.7Others (8) 18.5 18.9 0.3 12.2 12.2 0.1MOSt (146) * 21.9 20.1 -1.9 13.0 12.3 -0.6MOSt Excl. Banks (126) 18.6 17.3 -1.3 11.7 11.1 -0.7MOSt Excl.Oil & Gas (136) 29.7 29.2 -0.5 18.0 18.0 -0.1MOST Excl. RMs (143) 27.9 27.5 -0.4 16.6 16.8 0.2Sensex (Excl DLF) 28.8 29.5 0.8 18.1 18.4 0.3Sensex (Tata Steel Cons) 28.3 26.3 -2.0 17.7 16.0 -1.7*Tata Steel Standalone Source: Motilal Oswal Securities
SECTORAL CONTRIBUTION TO GROWTH IN SALES, EBITDA AND NET PROFIT (%)SECTOR CONTRIBUTION SECTOR CONTRIBUTION SECTOR CONTRIBUTION TO SALES GR. TO EBITDA GR. TO NP GR.Oil Gas & Petchem (10) 59.8 Telecom (3) 17.9 Oil Gas & Petchem (10) 27.0Engineering (10) 9.9 Engineering (10) 15.7 Metals (8) 15.6Metals (8) 5.0 Metals (8) 14.8 Banks (20) 14.1Telecom (3) 4.9 Oil Gas & Petchem (10) 13.3 Engineering (10) 11.7IT (8) 4.9 IT (8) 8.8 Telecom (3) 9.5Utilities (5) 2.2 Utilities (5) 8.2 IT (8) 7.4Auto (11) 2.1 Cement (7) 3.7 Utilities (5) 5.2Banks (20) 1.7 FMCG (12) 3.6 FMCG (12) 4.3FMCG (12) 1.6 Auto (11) 3.1 Cement (7) 2.5Infrastructure (9) 1.5 Banks (20) 2.9 Infrastructure (9) 1.2Cement (7) 1.4 Infrastructure (9) 2.5 Others (8) 1.2Pharma (17) 1.3 Others (8) 1.5 Auto (11) 1.2Retail (3) 1.0 Pharma (17) 1.3 Real Estate (2) 0.6Others (8) 0.9 Real Estate (2) 1.0 Media (6) 0.3Textiles (7) 0.9 Retail (3) 0.7 Retail (3) 0.2Real Estate (2) 0.7 Textiles (7) 0.7 Textiles (7) -0.2Media (6) 0.1 Media (6) 0.5 Pharma (17) -1.8
Source: Motilal Oswal Securities
EBITDA MARGIN GROWTH - QUARTER ENDED MARCH 2008 (%) NET PROFIT MARGIN GROWTH - QUARTER ENDED MARCH 2008 (%)
MOSt Universe
MOSt Universe EBITDA Margin Growth = -190bp MOSt Universe Net Profit Margin Growth = -60bp

3128 March 2008
TOP 10 BY SALES GROWTH (%)
TOP 10 BY EBITDA GROWTH (%)
TOP 10 BY NET PROFIT GROWTH (%)
WORST 10 BY SALES GROWTH (%)
WORST 10 BY EBITDA GROWTH (%)
WORST 10 BY NET PROFIT GROWTH (%)
Scoreboard (quarter ended March 2008)
Matrix: Excluding DocPharma Source: Motilal Oswal Securities
MOSt Universe
40%
55%
70%
85%
100%
Bom
bay
Ray
on
B.L
.Kas
hyap
Ray
mon
d
Uni
tech
Him
atsi
ngka
Sei
de
Axis
Ban
k
Pan
talo
onR
etai
lS
hree
Cem
ent
Suz
lon
Ene
rgy
Asha
pura
Min
chem
-44%
-33%
-22%
-11%
0%
Tata
Tea
Sun
TV
Dr R
eddy
’sLa
bsG
MR
Infra
stru
ctur
eS
yndi
cate
Ban
kH
indu
stan
Zinc
Vija
ya B
ank
TVS
Mot
or
Nal
co
Rel
ianc
eE
nerg
y
0%
75%
150%
225%
300%
Rel
ianc
eE
nerg
yS
impl
exIn
fra.
Bom
bay
Ray
onS
hasu
nC
hem
ical
s
Blu
e S
tar
Sun
Pha
rma
Pan
talo
onR
etai
lD
ishm
anP
harm
a
Ray
mon
d
TVS
Mot
or
-88%
-66%
-44%
-22%
0%
Dr R
eddy
’sLa
bs HP
CL
BP
CL
Vija
yaB
ank
Syn
dica
teB
ank
Sun
TV
Indi
an B
ank
Can
ara
Ban
k
IOC
Cor
pora
tion
Ban
k
2,791%
0%
200%
400%
600%
800%
Shr
ee C
emen
t
Tata
Tea
GM
RIn
frast
ruct
ure
Cai
rn In
dia
Arvi
nd M
ills
Hin
d.C
onst
ruct
ion
Sim
plex
Infra
.
J&K
Ban
k
GAI
L
Kar
nata
kaB
ank -88%
-66%
-44%
-22%
0%
Him
atsi
ngka
Sei
deW
elsp
unIn
dS
hopp
er's
Sto
pD
r Red
dy’s
Labs
Vard
hman
Text
iles
HP
CL
BP
CL
TVS
Mot
or
Gam
mon
Indi
aAv
entis
Pha
rma

3228 March 2008
THIS SPACE IS INTENTIONALLY LEFT BLANK
Note: In our quarterly performance tables, our four-quarter numbers may not always add up to the full-year numbers. This is because ofdifferences in classification of account heads in the company’s quarterly and annual results or because of differences in the way we
classify account heads as opposed to the company.
3328 March 2008
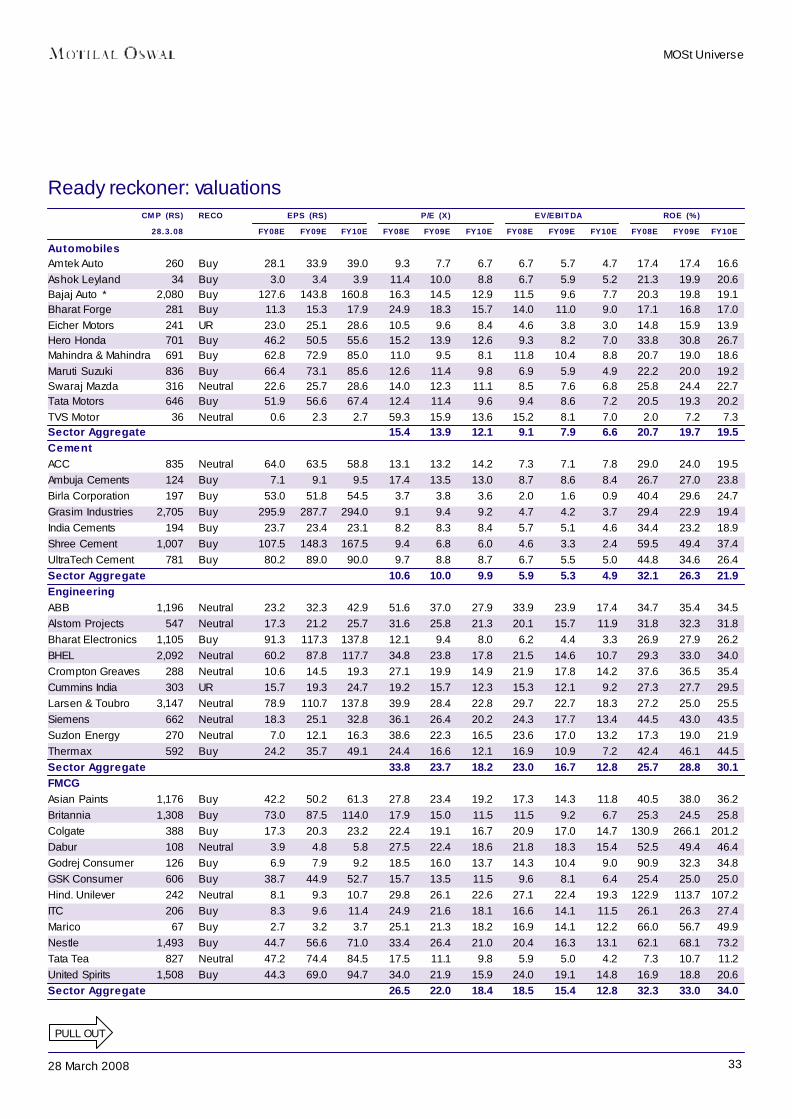
Ready reckoner: valuations
PULL OUT
CMP (RS) RECO EPS (RS) P/E (X) EV/EBITDA ROE (%)28.3.08 FY08E FY09E FY10E FY08E FY09E FY10E FY08E FY09E FY10E FY08E FY09E FY10E
AutomobilesAmtek Auto 260 Buy 28.1 33.9 39.0 9.3 7.7 6.7 6.7 5.7 4.7 17.4 17.4 16.6Ashok Leyland 34 Buy 3.0 3.4 3.9 11.4 10.0 8.8 6.7 5.9 5.2 21.3 19.9 20.6Bajaj Auto * 2,080 Buy 127.6 143.8 160.8 16.3 14.5 12.9 11.5 9.6 7.7 20.3 19.8 19.1Bharat Forge 281 Buy 11.3 15.3 17.9 24.9 18.3 15.7 14.0 11.0 9.0 17.1 16.8 17.0Eicher Motors 241 UR 23.0 25.1 28.6 10.5 9.6 8.4 4.6 3.8 3.0 14.8 15.9 13.9Hero Honda 701 Buy 46.2 50.5 55.6 15.2 13.9 12.6 9.3 8.2 7.0 33.8 30.8 26.7Mahindra & Mahindra 691 Buy 62.8 72.9 85.0 11.0 9.5 8.1 11.8 10.4 8.8 20.7 19.0 18.6Maruti Suzuki 836 Buy 66.4 73.1 85.6 12.6 11.4 9.8 6.9 5.9 4.9 22.2 20.0 19.2Swaraj Mazda 316 Neutral 22.6 25.7 28.6 14.0 12.3 11.1 8.5 7.6 6.8 25.8 24.4 22.7Tata Motors 646 Buy 51.9 56.6 67.4 12.4 11.4 9.6 9.4 8.6 7.2 20.5 19.3 20.2TVS Motor 36 Neutral 0.6 2.3 2.7 59.3 15.9 13.6 15.2 8.1 7.0 2.0 7.2 7.3Sector Aggregate 15.4 13.9 12.1 9.1 7.9 6.6 20.7 19.7 19.5CementACC 835 Neutral 64.0 63.5 58.8 13.1 13.2 14.2 7.3 7.1 7.8 29.0 24.0 19.5Ambuja Cements 124 Buy 7.1 9.1 9.5 17.4 13.5 13.0 8.7 8.6 8.4 26.7 27.0 23.8Birla Corporation 197 Buy 53.0 51.8 54.5 3.7 3.8 3.6 2.0 1.6 0.9 40.4 29.6 24.7Grasim Industries 2,705 Buy 295.9 287.7 294.0 9.1 9.4 9.2 4.7 4.2 3.7 29.4 22.9 19.4India Cements 194 Buy 23.7 23.4 23.1 8.2 8.3 8.4 5.7 5.1 4.6 34.4 23.2 18.9Shree Cement 1,007 Buy 107.5 148.3 167.5 9.4 6.8 6.0 4.6 3.3 2.4 59.5 49.4 37.4UltraTech Cement 781 Buy 80.2 89.0 90.0 9.7 8.8 8.7 6.7 5.5 5.0 44.8 34.6 26.4Sector Aggregate 10.6 10.0 9.9 5.9 5.3 4.9 32.1 26.3 21.9EngineeringABB 1,196 Neutral 23.2 32.3 42.9 51.6 37.0 27.9 33.9 23.9 17.4 34.7 35.4 34.5Alstom Projects 547 Neutral 17.3 21.2 25.7 31.6 25.8 21.3 20.1 15.7 11.9 31.8 32.3 31.8Bharat Electronics 1,105 Buy 91.3 117.3 137.8 12.1 9.4 8.0 6.2 4.4 3.3 26.9 27.9 26.2BHEL 2,092 Neutral 60.2 87.8 117.7 34.8 23.8 17.8 21.5 14.6 10.7 29.3 33.0 34.0Crompton Greaves 288 Neutral 10.6 14.5 19.3 27.1 19.9 14.9 21.9 17.8 14.2 37.6 36.5 35.4Cummins India 303 UR 15.7 19.3 24.7 19.2 15.7 12.3 15.3 12.1 9.2 27.3 27.7 29.5Larsen & Toubro 3,147 Neutral 78.9 110.7 137.8 39.9 28.4 22.8 29.7 22.7 18.3 27.2 25.0 25.5Siemens 662 Neutral 18.3 25.1 32.8 36.1 26.4 20.2 24.3 17.7 13.4 44.5 43.0 43.5Suzlon Energy 270 Neutral 7.0 12.1 16.3 38.6 22.3 16.5 23.6 17.0 13.2 17.3 19.0 21.9Thermax 592 Buy 24.2 35.7 49.1 24.4 16.6 12.1 16.9 10.9 7.2 42.4 46.1 44.5Sector Aggregate 33.8 23.7 18.2 23.0 16.7 12.8 25.7 28.8 30.1FMCGAsian Paints 1,176 Buy 42.2 50.2 61.3 27.8 23.4 19.2 17.3 14.3 11.8 40.5 38.0 36.2Britannia 1,308 Buy 73.0 87.5 114.0 17.9 15.0 11.5 11.5 9.2 6.7 25.3 24.5 25.8Colgate 388 Buy 17.3 20.3 23.2 22.4 19.1 16.7 20.9 17.0 14.7 130.9 266.1 201.2Dabur 108 Neutral 3.9 4.8 5.8 27.5 22.4 18.6 21.8 18.3 15.4 52.5 49.4 46.4Godrej Consumer 126 Buy 6.9 7.9 9.2 18.5 16.0 13.7 14.3 10.4 9.0 90.9 32.3 34.8GSK Consumer 606 Buy 38.7 44.9 52.7 15.7 13.5 11.5 9.6 8.1 6.4 25.4 25.0 25.0Hind. Unilever 242 Neutral 8.1 9.3 10.7 29.8 26.1 22.6 27.1 22.4 19.3 122.9 113.7 107.2ITC 206 Buy 8.3 9.6 11.4 24.9 21.6 18.1 16.6 14.1 11.5 26.1 26.3 27.4Marico 67 Buy 2.7 3.2 3.7 25.1 21.3 18.2 16.9 14.1 12.2 66.0 56.7 49.9Nestle 1,493 Buy 44.7 56.6 71.0 33.4 26.4 21.0 20.4 16.3 13.1 62.1 68.1 73.2Tata Tea 827 Neutral 47.2 74.4 84.5 17.5 11.1 9.8 5.9 5.0 4.2 7.3 10.7 11.2United Spirits 1,508 Buy 44.3 69.0 94.7 34.0 21.9 15.9 24.0 19.1 14.8 16.9 18.8 20.6Sector Aggregate 26.5 22.0 18.4 18.5 15.4 12.8 32.3 33.0 34.0
MOSt Universe
3428 March 2008
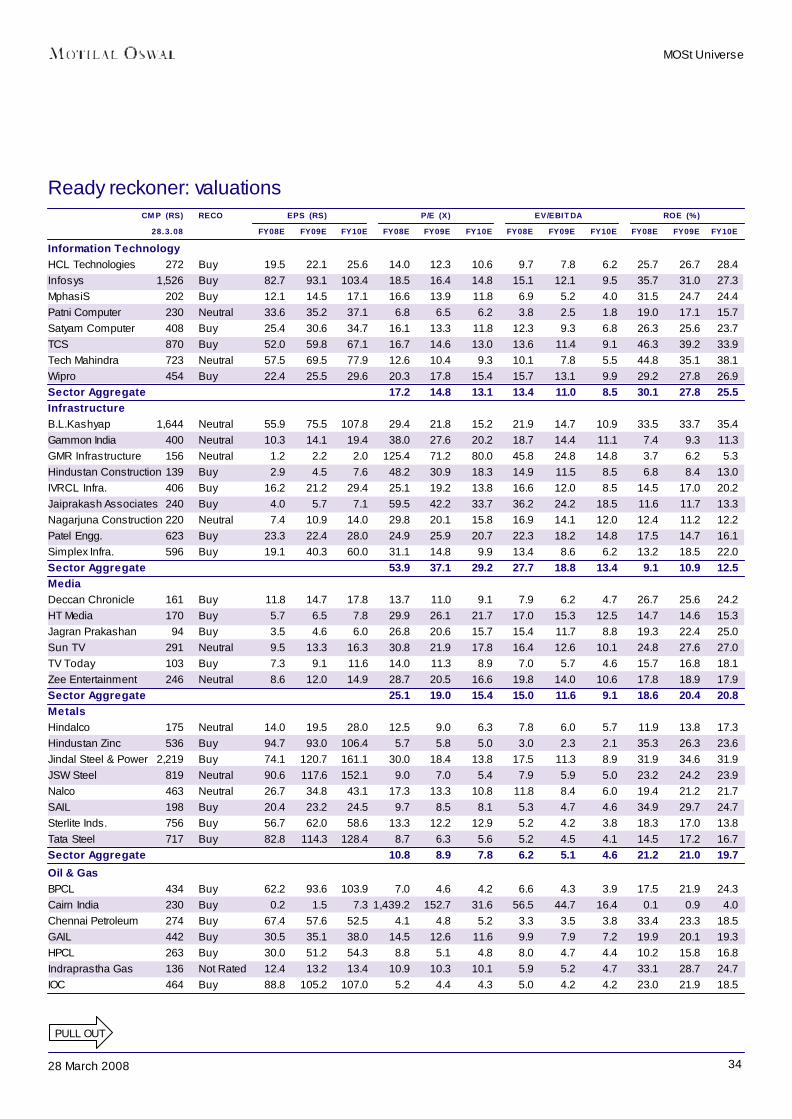
Ready reckoner: valuationsCMP (RS) RECO EPS (RS) P/E (X) EV/EBITDA ROE (%)
28.3.08 FY08E FY09E FY10E FY08E FY09E FY10E FY08E FY09E FY10E FY08E FY09E FY10EInformation TechnologyHCL Technologies 272 Buy 19.5 22.1 25.6 14.0 12.3 10.6 9.7 7.8 6.2 25.7 26.7 28.4Infosys 1,526 Buy 82.7 93.1 103.4 18.5 16.4 14.8 15.1 12.1 9.5 35.7 31.0 27.3MphasiS 202 Buy 12.1 14.5 17.1 16.6 13.9 11.8 6.9 5.2 4.0 31.5 24.7 24.4Patni Computer 230 Neutral 33.6 35.2 37.1 6.8 6.5 6.2 3.8 2.5 1.8 19.0 17.1 15.7Satyam Computer 408 Buy 25.4 30.6 34.7 16.1 13.3 11.8 12.3 9.3 6.8 26.3 25.6 23.7TCS 870 Buy 52.0 59.8 67.1 16.7 14.6 13.0 13.6 11.4 9.1 46.3 39.2 33.9Tech Mahindra 723 Neutral 57.5 69.5 77.9 12.6 10.4 9.3 10.1 7.8 5.5 44.8 35.1 38.1Wipro 454 Buy 22.4 25.5 29.6 20.3 17.8 15.4 15.7 13.1 9.9 29.2 27.8 26.9Sector Aggregate 17.2 14.8 13.1 13.4 11.0 8.5 30.1 27.8 25.5InfrastructureB.L.Kashyap 1,644 Neutral 55.9 75.5 107.8 29.4 21.8 15.2 21.9 14.7 10.9 33.5 33.7 35.4Gammon India 400 Neutral 10.3 14.1 19.4 38.0 27.6 20.2 18.7 14.4 11.1 7.4 9.3 11.3GMR Infrastructure 156 Neutral 1.2 2.2 2.0 125.4 71.2 80.0 45.8 24.8 14.8 3.7 6.2 5.3Hindustan Construction 139 Buy 2.9 4.5 7.6 48.2 30.9 18.3 14.9 11.5 8.5 6.8 8.4 13.0IVRCL Infra. 406 Buy 16.2 21.2 29.4 25.1 19.2 13.8 16.6 12.0 8.5 14.5 17.0 20.2Jaiprakash Associates 240 Buy 4.0 5.7 7.1 59.5 42.2 33.7 36.2 24.2 18.5 11.6 11.7 13.3Nagarjuna Construction 220 Neutral 7.4 10.9 14.0 29.8 20.1 15.8 16.9 14.1 12.0 12.4 11.2 12.2Patel Engg. 623 Buy 23.3 22.4 28.0 24.9 25.9 20.7 22.3 18.2 14.8 17.5 14.7 16.1Simplex Infra. 596 Buy 19.1 40.3 60.0 31.1 14.8 9.9 13.4 8.6 6.2 13.2 18.5 22.0Sector Aggregate 53.9 37.1 29.2 27.7 18.8 13.4 9.1 10.9 12.5MediaDeccan Chronicle 161 Buy 11.8 14.7 17.8 13.7 11.0 9.1 7.9 6.2 4.7 26.7 25.6 24.2HT Media 170 Buy 5.7 6.5 7.8 29.9 26.1 21.7 17.0 15.3 12.5 14.7 14.6 15.3Jagran Prakashan 94 Buy 3.5 4.6 6.0 26.8 20.6 15.7 15.4 11.7 8.8 19.3 22.4 25.0Sun TV 291 Neutral 9.5 13.3 16.3 30.8 21.9 17.8 16.4 12.6 10.1 24.8 27.6 27.0TV Today 103 Buy 7.3 9.1 11.6 14.0 11.3 8.9 7.0 5.7 4.6 15.7 16.8 18.1Zee Entertainment 246 Neutral 8.6 12.0 14.9 28.7 20.5 16.6 19.8 14.0 10.6 17.8 18.9 17.9Sector Aggregate 25.1 19.0 15.4 15.0 11.6 9.1 18.6 20.4 20.8MetalsHindalco 175 Neutral 14.0 19.5 28.0 12.5 9.0 6.3 7.8 6.0 5.7 11.9 13.8 17.3Hindustan Zinc 536 Buy 94.7 93.0 106.4 5.7 5.8 5.0 3.0 2.3 2.1 35.3 26.3 23.6Jindal Steel & Power 2,219 Buy 74.1 120.7 161.1 30.0 18.4 13.8 17.5 11.3 8.9 31.9 34.6 31.9JSW Steel 819 Neutral 90.6 117.6 152.1 9.0 7.0 5.4 7.9 5.9 5.0 23.2 24.2 23.9Nalco 463 Neutral 26.7 34.8 43.1 17.3 13.3 10.8 11.8 8.4 6.0 19.4 21.2 21.7SAIL 198 Buy 20.4 23.2 24.5 9.7 8.5 8.1 5.3 4.7 4.6 34.9 29.7 24.7Sterlite Inds. 756 Buy 56.7 62.0 58.6 13.3 12.2 12.9 5.2 4.2 3.8 18.3 17.0 13.8Tata Steel 717 Buy 82.8 114.3 128.4 8.7 6.3 5.6 5.2 4.5 4.1 14.5 17.2 16.7Sector Aggregate 10.8 8.9 7.8 6.2 5.1 4.6 21.2 21.0 19.7
Oil & GasBPCL 434 Buy 62.2 93.6 103.9 7.0 4.6 4.2 6.6 4.3 3.9 17.5 21.9 24.3Cairn India 230 Buy 0.2 1.5 7.3 1,439.2 152.7 31.6 56.5 44.7 16.4 0.1 0.9 4.0Chennai Petroleum 274 Buy 67.4 57.6 52.5 4.1 4.8 5.2 3.3 3.5 3.8 33.4 23.3 18.5GAIL 442 Buy 30.5 35.1 38.0 14.5 12.6 11.6 9.9 7.9 7.2 19.9 20.1 19.3HPCL 263 Buy 30.0 51.2 54.3 8.8 5.1 4.8 8.0 4.7 4.4 10.2 15.8 16.8Indraprastha Gas 136 Not Rated 12.4 13.2 13.4 10.9 10.3 10.1 5.9 5.2 4.7 33.1 28.7 24.7IOC 464 Buy 88.8 105.2 107.0 5.2 4.4 4.3 5.0 4.2 4.2 23.0 21.9 18.5
PULL OUT
MOSt Universe
3528 March 2008
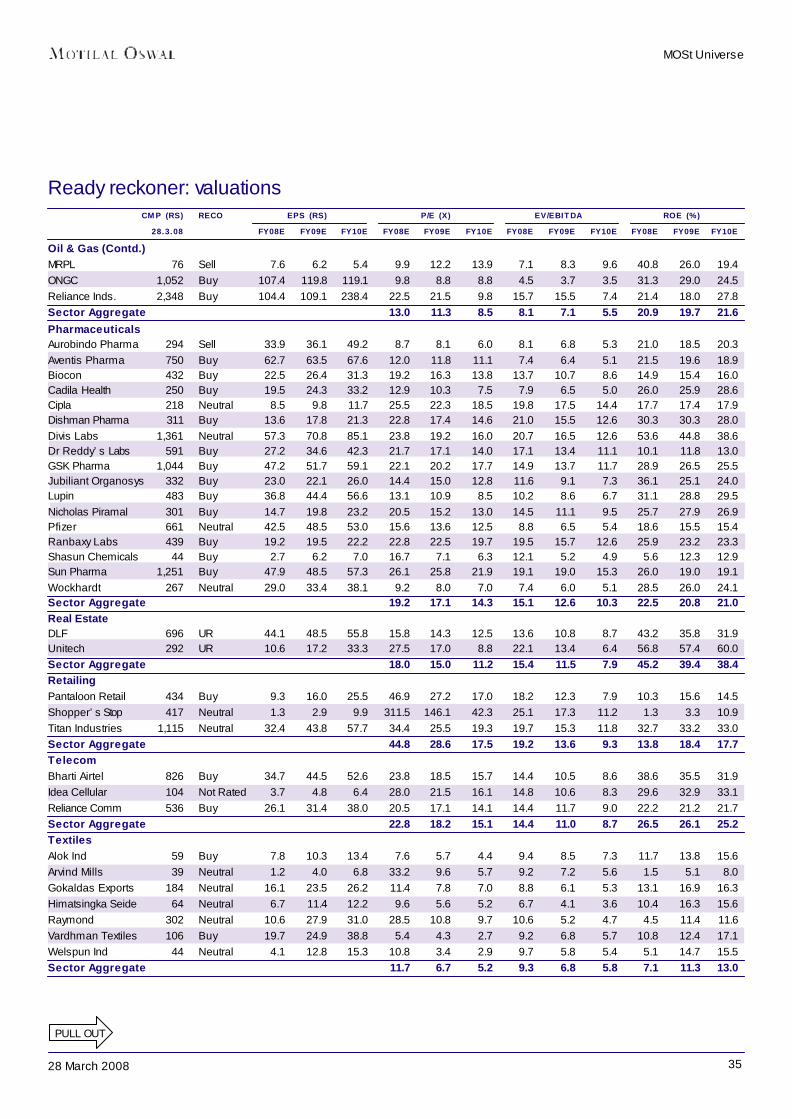
Ready reckoner: valuationsCMP (RS) RECO EPS (RS) P/E (X) EV/EBITDA ROE (%)
28.3.08 FY08E FY09E FY10E FY08E FY09E FY10E FY08E FY09E FY10E FY08E FY09E FY10EOil & Gas (Contd.)MRPL 76 Sell 7.6 6.2 5.4 9.9 12.2 13.9 7.1 8.3 9.6 40.8 26.0 19.4ONGC 1,052 Buy 107.4 119.8 119.1 9.8 8.8 8.8 4.5 3.7 3.5 31.3 29.0 24.5Reliance Inds. 2,348 Buy 104.4 109.1 238.4 22.5 21.5 9.8 15.7 15.5 7.4 21.4 18.0 27.8Sector Aggregate 13.0 11.3 8.5 8.1 7.1 5.5 20.9 19.7 21.6PharmaceuticalsAurobindo Pharma 294 Sell 33.9 36.1 49.2 8.7 8.1 6.0 8.1 6.8 5.3 21.0 18.5 20.3Aventis Pharma 750 Buy 62.7 63.5 67.6 12.0 11.8 11.1 7.4 6.4 5.1 21.5 19.6 18.9Biocon 432 Buy 22.5 26.4 31.3 19.2 16.3 13.8 13.7 10.7 8.6 14.9 15.4 16.0Cadila Health 250 Buy 19.5 24.3 33.2 12.9 10.3 7.5 7.9 6.5 5.0 26.0 25.9 28.6Cipla 218 Neutral 8.5 9.8 11.7 25.5 22.3 18.5 19.8 17.5 14.4 17.7 17.4 17.9Dishman Pharma 311 Buy 13.6 17.8 21.3 22.8 17.4 14.6 21.0 15.5 12.6 30.3 30.3 28.0Divis Labs 1,361 Neutral 57.3 70.8 85.1 23.8 19.2 16.0 20.7 16.5 12.6 53.6 44.8 38.6Dr Reddy’s Labs 591 Buy 27.2 34.6 42.3 21.7 17.1 14.0 17.1 13.4 11.1 10.1 11.8 13.0GSK Pharma 1,044 Buy 47.2 51.7 59.1 22.1 20.2 17.7 14.9 13.7 11.7 28.9 26.5 25.5Jubiliant Organosys 332 Buy 23.0 22.1 26.0 14.4 15.0 12.8 11.6 9.1 7.3 36.1 25.1 24.0Lupin 483 Buy 36.8 44.4 56.6 13.1 10.9 8.5 10.2 8.6 6.7 31.1 28.8 29.5Nicholas Piramal 301 Buy 14.7 19.8 23.2 20.5 15.2 13.0 14.5 11.1 9.5 25.7 27.9 26.9Pfizer 661 Neutral 42.5 48.5 53.0 15.6 13.6 12.5 8.8 6.5 5.4 18.6 15.5 15.4Ranbaxy Labs 439 Buy 19.2 19.5 22.2 22.8 22.5 19.7 19.5 15.7 12.6 25.9 23.2 23.3Shasun Chemicals 44 Buy 2.7 6.2 7.0 16.7 7.1 6.3 12.1 5.2 4.9 5.6 12.3 12.9Sun Pharma 1,251 Buy 47.9 48.5 57.3 26.1 25.8 21.9 19.1 19.0 15.3 26.0 19.0 19.1Wockhardt 267 Neutral 29.0 33.4 38.1 9.2 8.0 7.0 7.4 6.0 5.1 28.5 26.0 24.1Sector Aggregate 19.2 17.1 14.3 15.1 12.6 10.3 22.5 20.8 21.0Real EstateDLF 696 UR 44.1 48.5 55.8 15.8 14.3 12.5 13.6 10.8 8.7 43.2 35.8 31.9Unitech 292 UR 10.6 17.2 33.3 27.5 17.0 8.8 22.1 13.4 6.4 56.8 57.4 60.0Sector Aggregate 18.0 15.0 11.2 15.4 11.5 7.9 45.2 39.4 38.4RetailingPantaloon Retail 434 Buy 9.3 16.0 25.5 46.9 27.2 17.0 18.2 12.3 7.9 10.3 15.6 14.5Shopper’s Stop 417 Neutral 1.3 2.9 9.9 311.5 146.1 42.3 25.1 17.3 11.2 1.3 3.3 10.9Titan Industries 1,115 Neutral 32.4 43.8 57.7 34.4 25.5 19.3 19.7 15.3 11.8 32.7 33.2 33.0Sector Aggregate 44.8 28.6 17.5 19.2 13.6 9.3 13.8 18.4 17.7TelecomBharti Airtel 826 Buy 34.7 44.5 52.6 23.8 18.5 15.7 14.4 10.5 8.6 38.6 35.5 31.9Idea Cellular 104 Not Rated 3.7 4.8 6.4 28.0 21.5 16.1 14.8 10.6 8.3 29.6 32.9 33.1Reliance Comm 536 Buy 26.1 31.4 38.0 20.5 17.1 14.1 14.4 11.7 9.0 22.2 21.2 21.7Sector Aggregate 22.8 18.2 15.1 14.4 11.0 8.7 26.5 26.1 25.2TextilesAlok Ind 59 Buy 7.8 10.3 13.4 7.6 5.7 4.4 9.4 8.5 7.3 11.7 13.8 15.6Arvind Mills 39 Neutral 1.2 4.0 6.8 33.2 9.6 5.7 9.2 7.2 5.6 1.5 5.1 8.0Gokaldas Exports 184 Neutral 16.1 23.5 26.2 11.4 7.8 7.0 8.8 6.1 5.3 13.1 16.9 16.3Himatsingka Seide 64 Neutral 6.7 11.4 12.2 9.6 5.6 5.2 6.7 4.1 3.6 10.4 16.3 15.6Raymond 302 Neutral 10.6 27.9 31.0 28.5 10.8 9.7 10.6 5.2 4.7 4.5 11.4 11.6Vardhman Textiles 106 Buy 19.7 24.9 38.8 5.4 4.3 2.7 9.2 6.8 5.7 10.8 12.4 17.1Welspun Ind 44 Neutral 4.1 12.8 15.3 10.8 3.4 2.9 9.7 5.8 5.4 5.1 14.7 15.5Sector Aggregate 11.7 6.7 5.2 9.3 6.8 5.8 7.1 11.3 13.0
MOSt Universe
PULL OUT
3628 March 2008
PULL OUT
CMP (RS) RECO EPS (RS) P/E (X) P/BV (X) ROE (%)28.3.08 FY08E FY09E FY10E FY08E FY09E FY10E FY08E FY09E FY10E FY08E FY09E FY10E
BanksAndhra Bank 77 Buy 12.6 14.5 17.1 6.1 5.3 4.5 1.1 0.9 0.8 18.3 18.8 19.6Axis Bank 805 Buy 27.9 36.8 49.6 28.9 21.9 16.2 3.4 3.0 2.6 16.9 14.7 17.3Bank of Baroda 301 Buy 41.6 46.8 56.4 7.2 6.4 5.3 1.1 1.0 0.9 16.4 16.2 17.1Bank of India 272 Buy 32.4 40.8 48.2 8.4 6.7 5.7 1.7 1.4 1.2 23.9 22.8 22.4Canara Bank 227 Neutral 37.6 43.2 46.4 6.0 5.3 4.9 1.0 0.9 0.8 17.8 17.9 16.9Corporation Bank 289 Neutral 46.8 50.2 60.2 6.2 5.7 4.8 1.0 0.9 0.8 16.7 15.9 16.8Federal Bank 224 Buy 22.0 31.4 36.2 10.2 7.1 6.2 1.0 0.9 0.8 13.9 13.0 13.6HDFC 2,614 Buy 87.2 87.0 105.6 30.0 30.0 24.7 6.7 5.6 4.9 24.3 20.6 21.1HDFC Bank 1,401 Neutral 44.6 61.5 81.3 31.4 22.8 17.2 4.2 3.7 3.2 17.4 17.2 19.7ICICI Bank 835 Buy 35.5 44.6 56.9 23.5 18.7 14.7 2.0 1.8 1.7 11.0 10.2 12.0Indian Bank 171 Buy 23.9 27.4 31.0 7.1 6.2 5.5 1.8 1.5 1.2 28.3 26.2 24.3Indian Overseas Bank 136 Buy 22.1 25.4 29.3 6.1 5.3 4.6 1.6 1.3 1.1 27.6 25.5 24.6J&K Bank 670 Buy 82.7 96.3 119.1 8.1 7.0 5.6 1.4 1.2 1.0 18.5 18.5 19.6Karnataka Bank 203 Buy 18.4 21.2 24.8 11.1 9.6 8.2 1.7 1.5 1.3 16.8 16.2 16.6Oriental Bank 186 Neutral 33.3 37.3 41.1 5.6 5.0 4.5 0.8 0.7 0.6 14.3 14.8 15.0Punjab National Bank 528 Buy 57.8 69.4 83.0 9.1 7.6 6.4 1.4 1.3 1.1 16.8 17.7 18.5State Bank 1,680 Buy 104.3 125.4 150.2 16.1 13.4 11.2 2.0 1.8 1.6 15.6 14.0 14.9Syndicate Bank 79 Buy 16.4 16.9 18.9 4.8 4.7 4.2 1.1 0.9 0.8 21.2 18.7 18.2Union Bank 146 Buy 22.3 26.6 32.6 6.5 5.5 4.5 1.3 1.1 0.9 21.8 22.0 22.8Vijaya Bank 52 Neutral 9.8 9.9 12.0 5.3 5.2 4.3 1.0 0.9 0.8 20.9 18.4 19.7Sector Aggregate 15.2 12.6 10.5 2.6 2.0 1.7 16.8 15.6 16.7
Ready reckoner: valuations
MOSt Universe
CMP (RS) RECO EPS (RS) P/E (X) EV/EBITDA ROE (%)28.3.08 FY08E FY09E FY10E FY08E FY09E FY10E FY08E FY09E FY10E FY08E FY09E FY10E
UtilitiesCESC 411 Neutral 25.4 27.5 30.3 16.2 14.9 13.5 10.3 10.4 9.5 11.9 11.5 11.4NTPC 204 Neutral 10.1 10.1 10.5 20.3 20.3 19.4 14.4 13.4 12.3 14.8 14.7 14.0PTC India 101 Buy 1.6 3.3 4.7 64.1 30.9 21.6 46.9 18.6 11.4 4.1 4.9 6.8Reliance Energy 1,334 UR 21.3 26.6 36.4 62.6 50.2 36.7 60.2 37.6 25.0 9.8 9.8 9.8Tata Power 1,211 Buy 34.3 38.1 42.7 35.4 31.8 28.4 27.9 26.1 20.0 9.2 8.2 9.6Sector Aggregate 25.9 23.4 21.6 17.1 15.3 13.4 11.8 11.2 11.2OthersAshapura Minchem 220 Buy 24.8 52.4 66.2 8.8 4.2 3.3 6.5 3.1 2.0 39.6 53.7 43.6Blue Star 407 Buy 18.4 25.7 35.9 22.1 15.8 11.3 14.8 10.3 7.4 73.4 59.3 58.6Bombay Rayon 290 Buy 16.8 26.0 44.4 17.3 11.2 6.5 12.2 9.2 5.6 20.9 22.9 31.1Everest Kanto 277 Buy 11.1 14.7 22.2 25.0 18.9 12.5 16.2 10.3 6.7 28.5 24.9 27.4Great Offshore 642 UR 50.6 79.4 82.5 12.7 8.1 7.8 9.1 6.0 4.3 29.4 24.6 21.6Greaves Cotton 220 Buy 23.6 29.9 38.3 9.3 7.4 5.8 6.0 4.2 3.1 34.7 34.7 35.1TajGVK Hotels 107 Buy 11.4 14.9 17.1 9.4 7.2 6.2 6.0 4.8 3.9 33.1 34.3 31.7United Phosphorous 265 Buy 15.5 21.2 27.2 17.1 12.5 9.7 7.5 5.3 4.0 19.4 18.9 20.3Sector Aggregate 14.4 9.4 7.3 9.3 6.3 4.5 24.6 26.1 26.8UR - Under Review; * Bajaj Auto numbers are pre-demerger

3728 March 2008
Ready reckoner: quarterly performanceCMP (RS) RECO SALES EBITDA NET PROFIT
28.3.08 MAR.07 MAR.08 CHG. (%) MAR.07 MAR.08 CHG. (%) MAR.07 MAR.08 CHG. (%)AutomobilesAmtek Auto 260 Buy 10,805 12,966 20.0 1,994 2,321 16.4 1,085 1,220 12.5Ashok Leyland 34 Buy 22,910 24,697 7.8 2,596 2,650 2.1 1,692 1,548 -8.5Bajaj Auto * 2,080 Buy 23,136 23,873 3.2 3,263 3,510 7.6 3,208 3,552 10.7Bharat Forge 281 Buy 5,161 6,094 18.1 1,243 1,461 17.5 665 675 1.6Eicher Motors 241 UR 6,191 6,655 7.5 384 381 -0.6 209 209 0.2Hero Honda 701 Buy 26,396 27,589 4.5 2,767 3,760 35.9 2,030 2,538 25.0Mahindra & Mahindra 691 Buy 27,439 29,926 9.1 3,099 3,352 8.2 2,436 2,418 -0.7Maruti Suzuki 836 Buy 44,298 50,092 13.1 6,494 7,210 11.0 4,485 4,811 7.3Swaraj Mazda 316 Neutral 1,651 1,507 -8.7 119 117 -1.5 60 52 -12.6Tata Motors 646 Buy 82,242 84,978 3.3 9,147 9,347 2.2 5,592 5,392 -3.6TVS Motor 36 Neutral 9,199 7,924 -13.9 101 178 76.6 90 57 -37.4Sector Aggregate 259,427 276,299 6.5 31,205 34,287 9.9 21,551 22,472 4.3CementACC 835 Neutral 16,348 17,839 9.1 5,071 4,681 -7.7 3,286 2,937 -10.6Ambuja Cements 124 Buy 14,338 16,433 14.6 5,631 5,270 -6.4 3,826 3,587 -6.3Birla Corporation 197 Buy 4,441 4,561 2.7 1,524 1,561 2.4 1,012 1,011 -0.1Grasim Industries 2,705 Buy 24,938 27,006 8.3 6,942 8,453 21.8 4,488 5,174 15.3India Cements 194 Buy 5,758 8,256 43.4 1,906 2,973 56.0 1,398 1,607 14.9Shree Cement 1,007 Buy 3,783 6,246 65.1 1,513 2,468 63.2 40 1,164 2791.4UltraTech Cement 781 Buy 14,655 15,670 6.9 4,085 4,950 21.2 2,315 2,801 21.0Sector Aggregate 84,260 96,011 13.9 26,672 30,356 13.8 16,366 18,282 11.7EngineeringABB 1,196 Neutral 13,124 17,456 33.0 1,282 1,833 43.0 866 1,235 42.6Alstom Projects 547 Neutral 4,306 5,630 30.7 534 669 25.2 368 441 20.0Bharat Electronics 1,105 Buy 17,342 23,371 34.8 4,849 6,690 38.0 3,572 4,686 31.2BHEL 2,092 Neutral 69,197 87,499 26.4 15,872 20,210 27.3 11,506 14,649 27.3Crompton Greaves 288 Neutral 9,900 12,472 26.0 1,143 1,573 37.6 749 942 25.7Cummins India 303 UR 5,049 6,330 25.4 823 887 7.7 657 742 13.0Larsen & Toubro 3,147 Neutral 62,482 82,133 31.4 9,718 13,902 43.0 7,006 9,158 30.7Siemens 662 Neutral 21,352 28,804 34.9 1,677 2,301 37.2 1,081 1,555 43.9Suzlon Energy 270 Neutral 29,159 47,377 62.5 4,954 8,175 65.0 3,590 4,839 34.8Thermax 592 Buy 8,044 9,293 15.5 887 1,159 30.6 656 915 39.5Sector Aggregate 239,956 320,364 33.5 41,740 57,397 37.5 30,050 39,162 30.3FMCGAsian Paints 1,176 Buy 9,589 11,549 20.4 1,170 1,532 31.0 615 843 37.1Britannia 1,308 Buy 5,992 7,129 19.0 387 623 60.9 366 463 26.5Colgate 388 Buy 3,433 3,927 14.4 536 646 20.7 498 580 16.4Dabur 108 Neutral 5,307 6,245 17.7 881 1,039 18.0 780 857 9.9Godrej Consumer 126 Buy 2,424 2,921 20.5 431 464 7.6 308 360 16.9GSK Consumer 606 Buy 3,265 3,750 14.9 624 705 13.0 423 496 17.3Hind. Unilever 242 Neutral 31,843 36,250 13.8 3,620 4,278 18.2 3,339 3,797 13.7ITC 206 Buy 34,663 38,733 11.7 9,303 10,492 12.8 6,507 7,372 13.3Marico 67 Buy 3,970 4,765 20.0 412 565 37.2 309 368 19.2Nestle 1,493 Buy 8,631 10,300 19.3 1,788 2,184 22.1 1,114 1,390 24.8Tata Tea 827 Neutral 11,591 7,048 -39.2 1,933 1,646 -14.8 146 973 564.5United Spirits 1,508 Buy 6,624 8,029 21.2 853 1,307 53.2 645 894 38.7Sector Aggregate 127,333 140,646 10.5 21,938 25,481 16.2 15,050 18,393 22.2
PULL OUT
MOSt Universe
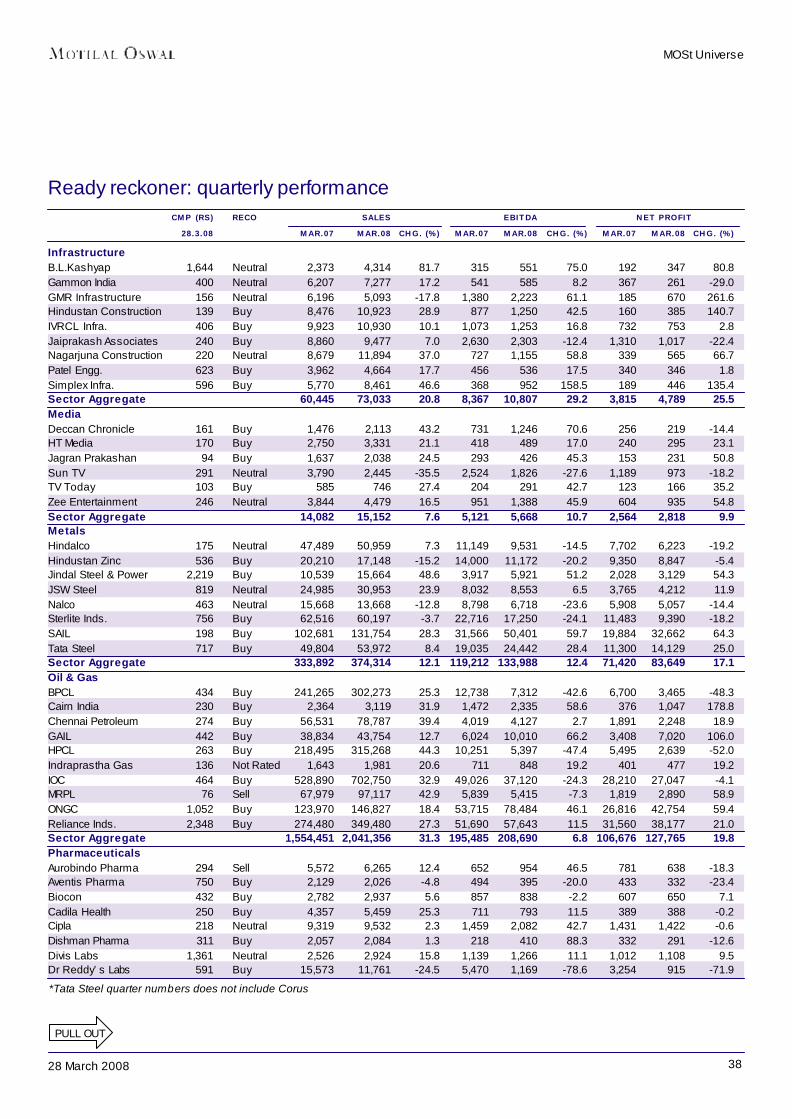
3828 March 2008
Ready reckoner: quarterly performance
InfrastructureB.L.Kashyap 1,644 Neutral 2,373 4,314 81.7 315 551 75.0 192 347 80.8Gammon India 400 Neutral 6,207 7,277 17.2 541 585 8.2 367 261 -29.0GMR Infrastructure 156 Neutral 6,196 5,093 -17.8 1,380 2,223 61.1 185 670 261.6Hindustan Construction 139 Buy 8,476 10,923 28.9 877 1,250 42.5 160 385 140.7IVRCL Infra. 406 Buy 9,923 10,930 10.1 1,073 1,253 16.8 732 753 2.8Jaiprakash Associates 240 Buy 8,860 9,477 7.0 2,630 2,303 -12.4 1,310 1,017 -22.4Nagarjuna Construction 220 Neutral 8,679 11,894 37.0 727 1,155 58.8 339 565 66.7Patel Engg. 623 Buy 3,962 4,664 17.7 456 536 17.5 340 346 1.8Simplex Infra. 596 Buy 5,770 8,461 46.6 368 952 158.5 189 446 135.4Sector Aggregate 60,445 73,033 20.8 8,367 10,807 29.2 3,815 4,789 25.5MediaDeccan Chronicle 161 Buy 1,476 2,113 43.2 731 1,246 70.6 256 219 -14.4HT Media 170 Buy 2,750 3,331 21.1 418 489 17.0 240 295 23.1Jagran Prakashan 94 Buy 1,637 2,038 24.5 293 426 45.3 153 231 50.8Sun TV 291 Neutral 3,790 2,445 -35.5 2,524 1,826 -27.6 1,189 973 -18.2TV Today 103 Buy 585 746 27.4 204 291 42.7 123 166 35.2Zee Entertainment 246 Neutral 3,844 4,479 16.5 951 1,388 45.9 604 935 54.8Sector Aggregate 14,082 15,152 7.6 5,121 5,668 10.7 2,564 2,818 9.9MetalsHindalco 175 Neutral 47,489 50,959 7.3 11,149 9,531 -14.5 7,702 6,223 -19.2Hindustan Zinc 536 Buy 20,210 17,148 -15.2 14,000 11,172 -20.2 9,350 8,847 -5.4Jindal Steel & Power 2,219 Buy 10,539 15,664 48.6 3,917 5,921 51.2 2,028 3,129 54.3JSW Steel 819 Neutral 24,985 30,953 23.9 8,032 8,553 6.5 3,765 4,212 11.9Nalco 463 Neutral 15,668 13,668 -12.8 8,798 6,718 -23.6 5,908 5,057 -14.4Sterlite Inds. 756 Buy 62,516 60,197 -3.7 22,716 17,250 -24.1 11,483 9,390 -18.2SAIL 198 Buy 102,681 131,754 28.3 31,566 50,401 59.7 19,884 32,662 64.3Tata Steel 717 Buy 49,804 53,972 8.4 19,035 24,442 28.4 11,300 14,129 25.0Sector Aggregate 333,892 374,314 12.1 119,212 133,988 12.4 71,420 83,649 17.1Oil & GasBPCL 434 Buy 241,265 302,273 25.3 12,738 7,312 -42.6 6,700 3,465 -48.3Cairn India 230 Buy 2,364 3,119 31.9 1,472 2,335 58.6 376 1,047 178.8Chennai Petroleum 274 Buy 56,531 78,787 39.4 4,019 4,127 2.7 1,891 2,248 18.9GAIL 442 Buy 38,834 43,754 12.7 6,024 10,010 66.2 3,408 7,020 106.0HPCL 263 Buy 218,495 315,268 44.3 10,251 5,397 -47.4 5,495 2,639 -52.0Indraprastha Gas 136 Not Rated 1,643 1,981 20.6 711 848 19.2 401 477 19.2IOC 464 Buy 528,890 702,750 32.9 49,026 37,120 -24.3 28,210 27,047 -4.1MRPL 76 Sell 67,979 97,117 42.9 5,839 5,415 -7.3 1,819 2,890 58.9ONGC 1,052 Buy 123,970 146,827 18.4 53,715 78,484 46.1 26,816 42,754 59.4Reliance Inds. 2,348 Buy 274,480 349,480 27.3 51,690 57,643 11.5 31,560 38,177 21.0Sector Aggregate 1,554,451 2,041,356 31.3 195,485 208,690 6.8 106,676 127,765 19.8PharmaceuticalsAurobindo Pharma 294 Sell 5,572 6,265 12.4 652 954 46.5 781 638 -18.3Aventis Pharma 750 Buy 2,129 2,026 -4.8 494 395 -20.0 433 332 -23.4Biocon 432 Buy 2,782 2,937 5.6 857 838 -2.2 607 650 7.1Cadila Health 250 Buy 4,357 5,459 25.3 711 793 11.5 389 388 -0.2Cipla 218 Neutral 9,319 9,532 2.3 1,459 2,082 42.7 1,431 1,422 -0.6Dishman Pharma 311 Buy 2,057 2,084 1.3 218 410 88.3 332 291 -12.6Divis Labs 1,361 Neutral 2,526 2,924 15.8 1,139 1,266 11.1 1,012 1,108 9.5Dr Reddy’s Labs 591 Buy 15,573 11,761 -24.5 5,470 1,169 -78.6 3,254 915 -71.9
CMP (RS) RECO SALES EBITDA NET PROFIT28.3.08 MAR.07 MAR.08 CHG. (%) MAR.07 MAR.08 CHG. (%) MAR.07 MAR.08 CHG. (%)
PULL OUT
MOSt Universe
*Tata Steel quarter numbers does not include Corus

3928 March 2008
Ready reckoner: quarterly performance
Pharmaceuticals (Contd.)GSK Pharma 1,044 Buy 4,203 4,411 4.9 1,450 1,501 3.5 1,113 1,223 9.9Jubiliant Organosys 332 Buy 4,633 6,635 43.2 797 1,251 56.9 638 796 24.8Lupin 483 Buy 5,318 7,509 41.2 776 1,250 61.1 652 854 30.8Nicholas Piramal 301 Buy 6,452 7,600 17.8 849 1,419 67.2 615 980 59.4Pfizer 661 Neutral 1,703 1,678 -1.4 408 430 5.4 324 364 12.2Ranbaxy Labs 439 Buy 15,821 17,488 10.5 1,908 2,413 26.5 1,276 1,038 -18.7Shasun Chemicals 44 Buy 2,328 2,521 8.3 114 268 135.0 121 141 16.1Sun Pharma 1,251 Buy 5,313 6,812 28.2 1,545 2,984 93.1 2,121 2,282 7.6Wockhardt 267 Neutral 5,228 7,945 52.0 1,159 1,835 58.3 552 799 44.7Sector Aggregate 95,315 105,590 10.8 20,005 21,257 6.3 15,652 14,220 -9.1Real EstateDLF 696 UR - 39,751 22,237 - 18,445 -Unitech 292 UR 8,487 14,592 71.9 5,101 6,073 19.1 3,571 4,051 13.5Sector Aggregate 8,487 14,592 71.9 5,101 6,073 19.1 3,571 4,051 13.5RetailingPantaloon Retail 434 Buy 8,610 14,250 65.5 603 1,140 89.1 187 359 91.6Shopper’s Stop 417 Neutral 2,149 2,876 33.8 152 174 14.6 67 18 -73.3Titan Industries 1,115 Neutral 5,966 7,643 28.1 693 796 14.9 475 542 14.0Sector Aggregate 16,725 24,769 48.1 1,447 2,110 45.8 730 919 25.9TelecomBharti Airtel 826 Buy 53,932 74,677 38.5 22,408 31,924 42.5 13,531 17,288 27.8Idea Cellular 104 Not Rated 13,085 18,688 42.8 4,363 6,165 41.3 1,934 2,108 9.0Reliance Comm 536 Buy 39,369 53,113 34.9 16,352 22,863 39.8 10,217 13,737 34.5Sector Aggregate 106,386 146,478 37.7 43,123 60,951 41.3 25,682 33,132 29.0TextilesAlok Ind 59 Buy 5,741 6,552 14.1 1,321 1,509 14.3 452 475 5.0Arvind Mills 39 Neutral 4,831 5,856 21.2 672 710 5.6 39 96 142.8Gokaldas Exports 184 Neutral 2,766 3,024 9.4 367 309 -15.9 181 164 -9.5Himatsingka Seide 64 Neutral 432 742 71.9 58 93 60.4 89 18 -79.8Raymond 302 Neutral 3,477 6,110 75.7 437 801 83.1 136 229 68.6Vardhman Textiles 106 Buy 5,400 6,704 24.2 768 845 10.1 369 168 -54.5Welspun Ind 44 Neutral 2,485 3,070 23.6 352 367 4.4 103 27 -73.8Sector Aggregate 25,131 32,058 27.6 3,975 4,634 16.6 1,370 1,177 -14.1UtilitiesCESC 411 Neutral 5,470 6,486 18.6 1,170 1,377 17.7 610 834 36.8NTPC 204 Neutral 88,603 102,986 16.2 23,397 29,795 27.3 18,539 22,153 19.5PTC India 101 Buy 6,025 7,219 19.8 53 73 39.5 58 61 5.0Reliance Energy 1,334 UR 16,143 14,183 -12.1 598 2,265 278.6 1,848 1,473 -20.3Tata Power 1,211 Buy 11,713 14,841 26.7 2,290 2,175 -5.0 638 1,272 99.4Sector Aggregate 127,954 145,716 13.9 27,508 35,685 29.7 21,693 25,794 18.9
CMP (RS) RECO SALES EBITDA NET PROFIT28.3.08 MAR.07 MAR.08 CHG. (%) MAR.07 MAR.08 CHG. (%) MAR.07 MAR.08 CHG. (%)
PULL OUT
MOSt Universe
UR - Under Review; * Bajaj Auto numbers are pre-demerger
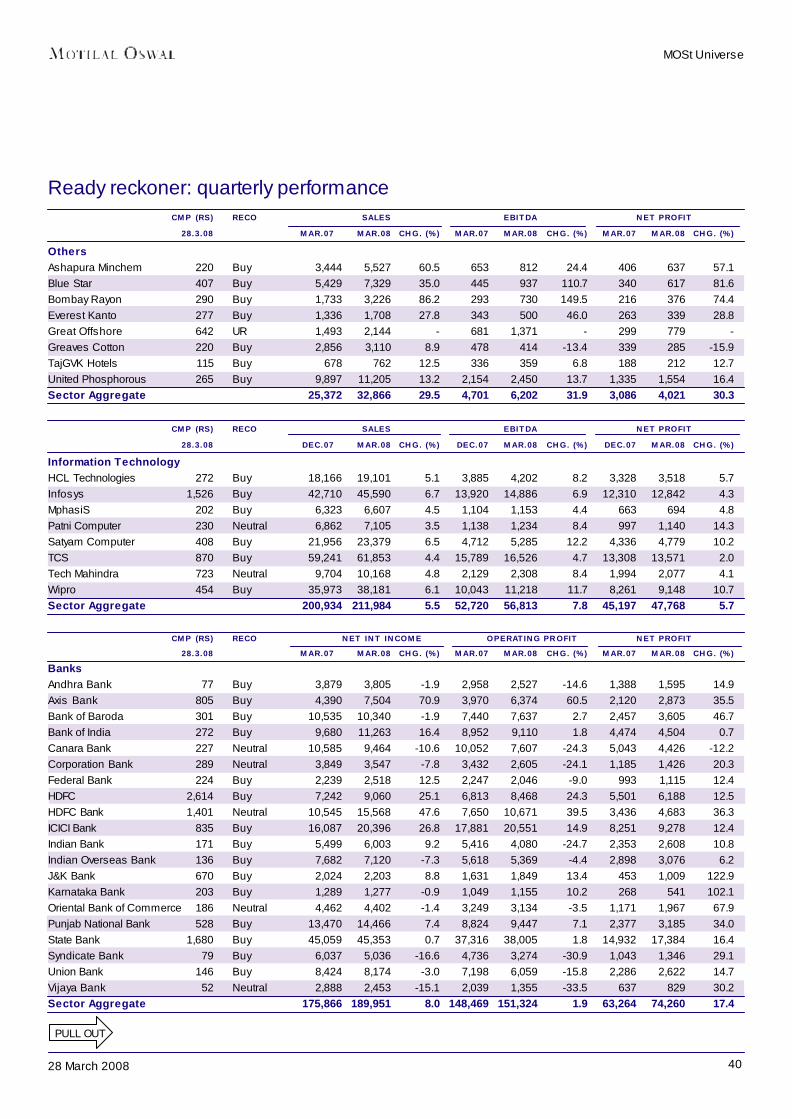
4028 March 2008
Ready reckoner: quarterly performance
MOSt Universe
PULL OUT
CMP (RS) RECO SALES EBITDA NET PROFIT28.3.08 DEC.07 MAR.08 CHG. (%) DEC.07 MAR.08 CHG. (%) DEC.07 MAR.08 CHG. (%)
Information TechnologyHCL Technologies 272 Buy 18,166 19,101 5.1 3,885 4,202 8.2 3,328 3,518 5.7Infosys 1,526 Buy 42,710 45,590 6.7 13,920 14,886 6.9 12,310 12,842 4.3MphasiS 202 Buy 6,323 6,607 4.5 1,104 1,153 4.4 663 694 4.8Patni Computer 230 Neutral 6,862 7,105 3.5 1,138 1,234 8.4 997 1,140 14.3Satyam Computer 408 Buy 21,956 23,379 6.5 4,712 5,285 12.2 4,336 4,779 10.2TCS 870 Buy 59,241 61,853 4.4 15,789 16,526 4.7 13,308 13,571 2.0Tech Mahindra 723 Neutral 9,704 10,168 4.8 2,129 2,308 8.4 1,994 2,077 4.1Wipro 454 Buy 35,973 38,181 6.1 10,043 11,218 11.7 8,261 9,148 10.7Sector Aggregate 200,934 211,984 5.5 52,720 56,813 7.8 45,197 47,768 5.7
CMP (RS) RECO NET INT INCOME OPERATING PROFIT NET PROFIT28.3.08 MAR.07 MAR.08 CHG. (%) MAR.07 MAR.08 CHG. (%) MAR.07 MAR.08 CHG. (%)
BanksAndhra Bank 77 Buy 3,879 3,805 -1.9 2,958 2,527 -14.6 1,388 1,595 14.9Axis Bank 805 Buy 4,390 7,504 70.9 3,970 6,374 60.5 2,120 2,873 35.5Bank of Baroda 301 Buy 10,535 10,340 -1.9 7,440 7,637 2.7 2,457 3,605 46.7Bank of India 272 Buy 9,680 11,263 16.4 8,952 9,110 1.8 4,474 4,504 0.7Canara Bank 227 Neutral 10,585 9,464 -10.6 10,052 7,607 -24.3 5,043 4,426 -12.2Corporation Bank 289 Neutral 3,849 3,547 -7.8 3,432 2,605 -24.1 1,185 1,426 20.3Federal Bank 224 Buy 2,239 2,518 12.5 2,247 2,046 -9.0 993 1,115 12.4HDFC 2,614 Buy 7,242 9,060 25.1 6,813 8,468 24.3 5,501 6,188 12.5HDFC Bank 1,401 Neutral 10,545 15,568 47.6 7,650 10,671 39.5 3,436 4,683 36.3ICICI Bank 835 Buy 16,087 20,396 26.8 17,881 20,551 14.9 8,251 9,278 12.4Indian Bank 171 Buy 5,499 6,003 9.2 5,416 4,080 -24.7 2,353 2,608 10.8Indian Overseas Bank 136 Buy 7,682 7,120 -7.3 5,618 5,369 -4.4 2,898 3,076 6.2J&K Bank 670 Buy 2,024 2,203 8.8 1,631 1,849 13.4 453 1,009 122.9Karnataka Bank 203 Buy 1,289 1,277 -0.9 1,049 1,155 10.2 268 541 102.1Oriental Bank of Commerce 186 Neutral 4,462 4,402 -1.4 3,249 3,134 -3.5 1,171 1,967 67.9Punjab National Bank 528 Buy 13,470 14,466 7.4 8,824 9,447 7.1 2,377 3,185 34.0State Bank 1,680 Buy 45,059 45,353 0.7 37,316 38,005 1.8 14,932 17,384 16.4Syndicate Bank 79 Buy 6,037 5,036 -16.6 4,736 3,274 -30.9 1,043 1,346 29.1Union Bank 146 Buy 8,424 8,174 -3.0 7,198 6,059 -15.8 2,286 2,622 14.7Vijaya Bank 52 Neutral 2,888 2,453 -15.1 2,039 1,355 -33.5 637 829 30.2Sector Aggregate 175,866 189,951 8.0 148,469 151,324 1.9 63,264 74,260 17.4
CMP (RS) RECO SALES EBITDA NET PROFIT28.3.08 MAR.07 MAR.08 CHG. (%) MAR.07 MAR.08 CHG. (%) MAR.07 MAR.08 CHG. (%)
OthersAshapura Minchem 220 Buy 3,444 5,527 60.5 653 812 24.4 406 637 57.1Blue Star 407 Buy 5,429 7,329 35.0 445 937 110.7 340 617 81.6Bombay Rayon 290 Buy 1,733 3,226 86.2 293 730 149.5 216 376 74.4Everest Kanto 277 Buy 1,336 1,708 27.8 343 500 46.0 263 339 28.8Great Offshore 642 UR 1,493 2,144 - 681 1,371 - 299 779 -Greaves Cotton 220 Buy 2,856 3,110 8.9 478 414 -13.4 339 285 -15.9TajGVK Hotels 115 Buy 678 762 12.5 336 359 6.8 188 212 12.7United Phosphorous 265 Buy 9,897 11,205 13.2 2,154 2,450 13.7 1,335 1,554 16.4Sector Aggregate 25,372 32,866 29.5 4,701 6,202 31.9 3,086 4,021 30.3
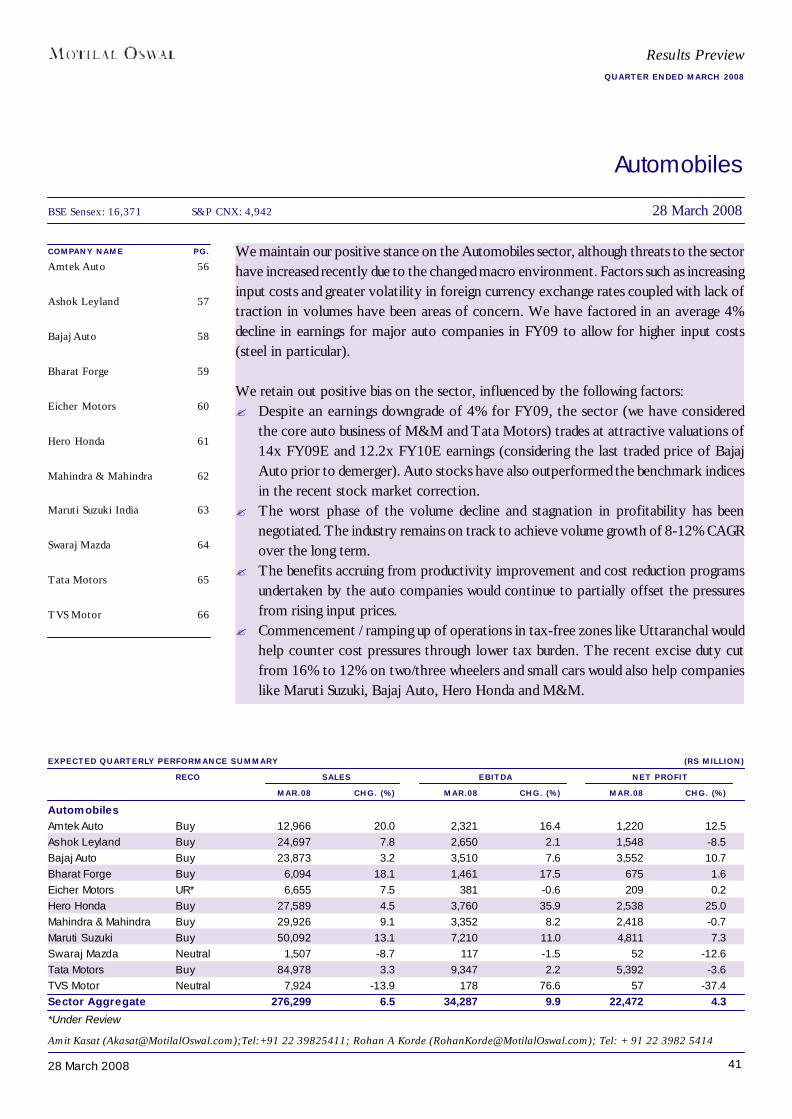
4128 March 2008
Automobiles
COMPANY NAME PG.Amtek Auto 56
Ashok Leyland 57
Bajaj Auto 58
Bharat Forge 59
Eicher Motors 60
Hero Honda 61
Mahindra & Mahindra 62
Maruti Suzuki India 63
Swaraj Mazda 64
Tata Motors 65
TVS Motor 66
EXPECTED QUARTERLY PERFORMANCE SUMMARY (RS MILLION)RECO SALES EBITDA NET PROFIT
MAR.08 CHG. (%) MAR.08 CHG. (%) MAR.08 CHG. (%)AutomobilesAmtek Auto Buy 12,966 20.0 2,321 16.4 1,220 12.5Ashok Leyland Buy 24,697 7.8 2,650 2.1 1,548 -8.5Bajaj Auto Buy 23,873 3.2 3,510 7.6 3,552 10.7Bharat Forge Buy 6,094 18.1 1,461 17.5 675 1.6Eicher Motors UR* 6,655 7.5 381 -0.6 209 0.2Hero Honda Buy 27,589 4.5 3,760 35.9 2,538 25.0Mahindra & Mahindra Buy 29,926 9.1 3,352 8.2 2,418 -0.7Maruti Suzuki Buy 50,092 13.1 7,210 11.0 4,811 7.3Swaraj Mazda Neutral 1,507 -8.7 117 -1.5 52 -12.6Tata Motors Buy 84,978 3.3 9,347 2.2 5,392 -3.6TVS Motor Neutral 7,924 -13.9 178 76.6 57 -37.4Sector Aggregate 276,299 6.5 34,287 9.9 22,472 4.3
Amit Kasat ([email protected]);Tel:+91 22 39825411; Rohan A Korde ([email protected]); Tel: + 91 22 3982 5414
BSE Sensex: 16,371 S&P CNX: 4,942 28 March 2008
Results PreviewQUARTER ENDED MARCH 2008
We maintain our positive stance on the Automobiles sector, although threats to the sectorhave increased recently due to the changed macro environment. Factors such as increasinginput costs and greater volatility in foreign currency exchange rates coupled with lack oftraction in volumes have been areas of concern. We have factored in an average 4%decline in earnings for major auto companies in FY09 to allow for higher input costs(steel in particular).
We retain out positive bias on the sector, influenced by the following factors:? Despite an earnings downgrade of 4% for FY09, the sector (we have considered
the core auto business of M&M and Tata Motors) trades at attractive valuations of14x FY09E and 12.2x FY10E earnings (considering the last traded price of BajajAuto prior to demerger). Auto stocks have also outperformed the benchmark indicesin the recent stock market correction.
? The worst phase of the volume decline and stagnation in profitability has beennegotiated. The industry remains on track to achieve volume growth of 8-12% CAGRover the long term.
? The benefits accruing from productivity improvement and cost reduction programsundertaken by the auto companies would continue to partially offset the pressuresfrom rising input prices.
? Commencement / ramping up of operations in tax-free zones like Uttaranchal wouldhelp counter cost pressures through lower tax burden. The recent excise duty cutfrom 16% to 12% on two/three wheelers and small cars would also help companieslike Maruti Suzuki, Bajaj Auto, Hero Honda and M&M.
*Under Review

4228 March 2008
Automobiles
? The exports market is yet to be fully tapped by Indian auto manufacturers; this segmentmay become a further volume growth driver for the industry.
? Recent initiatives by the Finance Minister, such as increasing the tax exemption slabsfor individuals and the recommendations of the Sixth Pay Commission (40% increasein basic salary) are positives for the sector. These moves would increase the disposableincomes in the hands of consumers, favorably impacting demand for automobiles.
Input costs are increasingPrices of aluminum, rubber and copper have inched upwards on a sequential basis in4QFY08, while zinc price has corrected, significantly.The biggest cause of concern is therapid increase in steel price in 4QFY08.
RISING INPUT COSTS (PLS PUT UNITS)
75
95
115
135
155
1QFY07 2QFY07 3QFY07 4QFY07 1QFY08 2QFY08 3QFY08 4QFY08
Steel (HRC) Copper Zinc Aluminium Rubber
Source: Bloomberg
Forex fluctuation continues to have a destabilizing effectExchange rate fluctuation has led to concerns over export revenue realization and risingcost of imported inputs, as well as the effectiveness of the hedging practices being followedby companies.? The US dollar has depreciated marginally on a YoY basis, but appreciated marginally
significantly on a QoQ basis. The QoQ change is positive for Bharat Forge and otherauto companies that have dollar-denominated export revenues.
? The UK pound has depreciated on a YoY basis, but appreciated marginally on a QoQbasis – positive for Amtek Auto.
? The euro has appreciated, which will be positive for Amtek Auto and Bharat Forge.

4328 March 2008
Automobiles
Source: xe.com
? The Japanese yen has appreciated on a YoY and QoQ basis – negative for MarutiSuzuki, Hero Honda.
HOW THE YEN HAS MOVED (RUPEES PER YEN)
Source: xe.com
Downgrading earnings estimates to factor in cost pressuresWe have downgraded our earnings estimates for FY09 and FY10 based on the followingassumptions:? 30% of raw-material cost is impacted by higher steel prices? steel prices have appreciated by 20%? auto companies will be able to sustain gains through productivity improvement and
cost reduction measures to the extent of 5% of raw material cost, annually
EXCHANGE RATE MOVEMENT (RUPEES PER UNIT OF FOREIGN CURRENCY)
30
45
60
75
90
Jun-
06
Sep
-06
Dec
-06
Mar
-07
Jun-
07
Sep
-07
Dec
-07
Mar
-08
USD - INR Euro - INR GBP - INR
0.2
0.3
0.4
0.5
Jun-
06
Sep
-06
Dec
-06
Mar
-07
Jun-
07
Sep
-07
Dec
-07
Mar
-08
JPY - INR
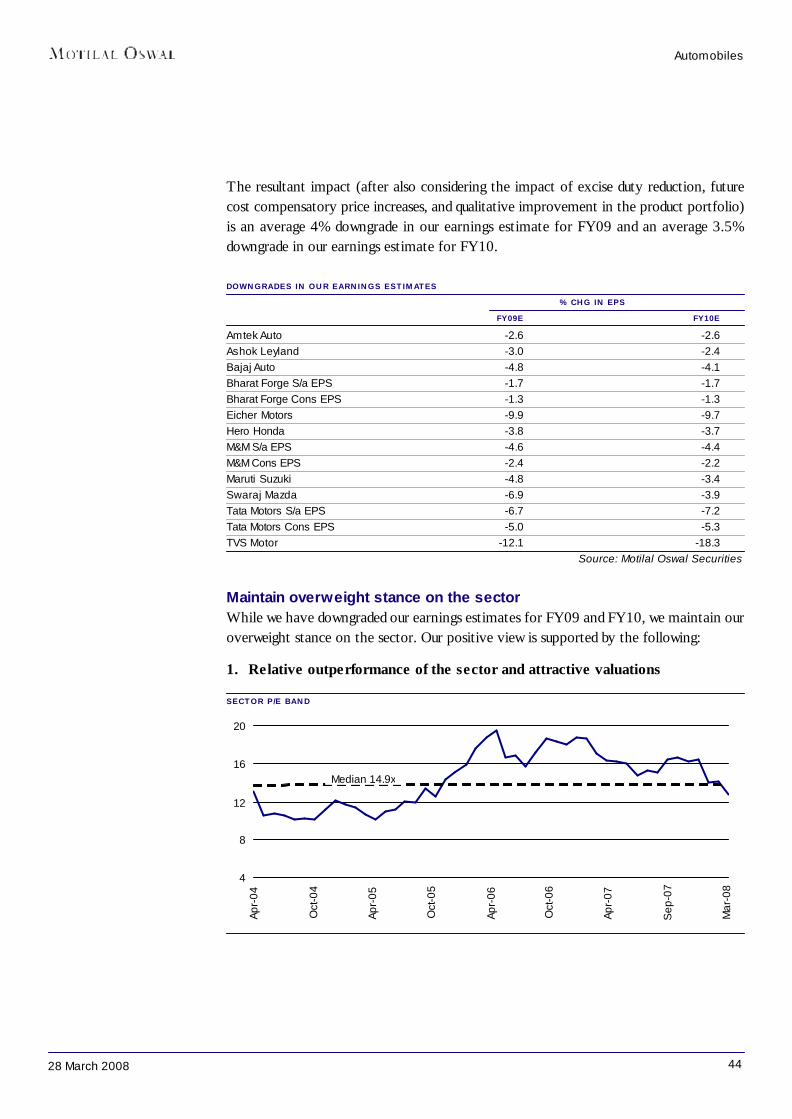
4428 March 2008
Automobiles
The resultant impact (after also considering the impact of excise duty reduction, futurecost compensatory price increases, and qualitative improvement in the product portfolio)is an average 4% downgrade in our earnings estimate for FY09 and an average 3.5%downgrade in our earnings estimate for FY10.
DOWNGRADES IN OUR EARNINGS ESTIMATES% CHG IN EPS
FY09E FY10EAmtek Auto -2.6 -2.6Ashok Leyland -3.0 -2.4Bajaj Auto -4.8 -4.1Bharat Forge S/a EPS -1.7 -1.7Bharat Forge Cons EPS -1.3 -1.3Eicher Motors -9.9 -9.7Hero Honda -3.8 -3.7M&M S/a EPS -4.6 -4.4M&M Cons EPS -2.4 -2.2Maruti Suzuki -4.8 -3.4Swaraj Mazda -6.9 -3.9Tata Motors S/a EPS -6.7 -7.2Tata Motors Cons EPS -5.0 -5.3TVS Motor -12.1 -18.3
Source: Motilal Oswal Securities
Maintain overweight stance on the sectorWhile we have downgraded our earnings estimates for FY09 and FY10, we maintain ouroverweight stance on the sector. Our positive view is supported by the following:
1. Relative outperformance of the sector and attractive valuations
SECTOR P/E BAND
4
8
12
16
20
Apr-
04
Oct
-04
Apr-
05
Oct
-05
Apr-
06
Oct
-06
Apr-
07
Sep
-07
Mar
-08
Median 14.9x

4528 March 2008
Automobiles
2. Expect long-term volume CAGR of 8-12%We expect the auto sector to register a volume CAGR of 8-12% over the long term,driven by sustenance of robust growth in passenger vehicles, likely turnaround in two-wheeler volumes, robust LCV demand driven by the hub-and-spoke transportation model,and continuing infrastructure development leading to a revival in M&HCV sales.
VOLUME TREND
Source: SIAM/Motilal Oswal Securities
3. Economies of scaleRevival in volumes will also result in economies of scale for most companies over theirexpanded capacities. Moreover, the leading companies have successfully undertaken costreduction and productivity improvement programs, which will help to partially offset thepressures from rising input prices.
4. Plants in tax-exempt regionsAuto majors like Tata Motors, Bajaj Auto, Hero Honda, Ashok Leyland, and TVS Motorshave set up their plants in the tax-exempt region of Uttaranchal. All the companies barringHero Honda (operations to commence in April 2009) have commenced their operations atthese plants. As volumes are ramped up further at these tax-exempt locations, autocompanies will be in even better positions to take further advantage of these tax benefitsoffered and thereby counter cost pressures. The recent excise duty cut from 16% to 12%on two/three wheelers and small cars will also help companies like Maruti Suzuki, BajajAuto, Hero Honda and M&M.
5. Rising exportsThe exports market is yet to be fully tapped by Indian auto manufacturers; this segmentmay become a further volume growth driver for the industry. Companies like Maruti, TataMotors, M&M, and Bajaj Auto are in a position to further increase their exports by tappingnewer destinations and increasing penetration in their existing markets.
4,000,000
8,000,000
12,000,000
16,000,000
20,000,000
FY02 FY03 FY04 FY05 FY06 FY07 FY08E FY09E FY10E FY11E FY12E
Total Auto Sales
CAGR of 15.6% over FY02-07
Volume declineof 2.7% in FY08
CAGR (%)12
10
8
5
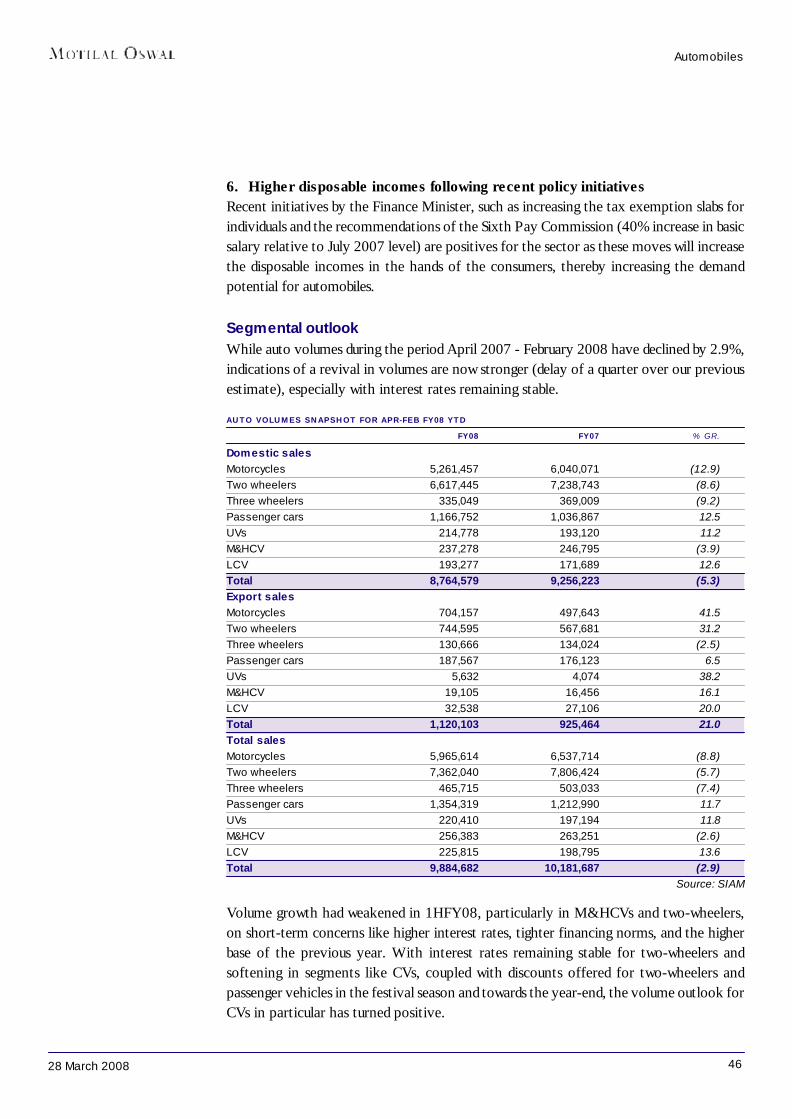
4628 March 2008
Automobiles
6. Higher disposable incomes following recent policy initiativesRecent initiatives by the Finance Minister, such as increasing the tax exemption slabs forindividuals and the recommendations of the Sixth Pay Commission (40% increase in basicsalary relative to July 2007 level) are positives for the sector as these moves will increasethe disposable incomes in the hands of the consumers, thereby increasing the demandpotential for automobiles.
Segmental outlookWhile auto volumes during the period April 2007 - February 2008 have declined by 2.9%,indications of a revival in volumes are now stronger (delay of a quarter over our previousestimate), especially with interest rates remaining stable.
AUTO VOLUMES SNAPSHOT FOR APR-FEB FY08 YTD FY08 FY07 % GR.Domestic salesMotorcycles 5,261,457 6,040,071 (12.9)Two wheelers 6,617,445 7,238,743 (8.6)Three wheelers 335,049 369,009 (9.2)Passenger cars 1,166,752 1,036,867 12.5UVs 214,778 193,120 11.2M&HCV 237,278 246,795 (3.9)LCV 193,277 171,689 12.6Total 8,764,579 9,256,223 (5.3)Export salesMotorcycles 704,157 497,643 41.5Two wheelers 744,595 567,681 31.2Three wheelers 130,666 134,024 (2.5)Passenger cars 187,567 176,123 6.5UVs 5,632 4,074 38.2M&HCV 19,105 16,456 16.1LCV 32,538 27,106 20.0Total 1,120,103 925,464 21.0Total salesMotorcycles 5,965,614 6,537,714 (8.8)Two wheelers 7,362,040 7,806,424 (5.7)Three wheelers 465,715 503,033 (7.4)Passenger cars 1,354,319 1,212,990 11.7UVs 220,410 197,194 11.8M&HCV 256,383 263,251 (2.6)LCV 225,815 198,795 13.6Total 9,884,682 10,181,687 (2.9)
Source: SIAM
Volume growth had weakened in 1HFY08, particularly in M&HCVs and two-wheelers,on short-term concerns like higher interest rates, tighter financing norms, and the higherbase of the previous year. With interest rates remaining stable for two-wheelers andsoftening in segments like CVs, coupled with discounts offered for two-wheelers andpassenger vehicles in the festival season and towards the year-end, the volume outlook forCVs in particular has turned positive.
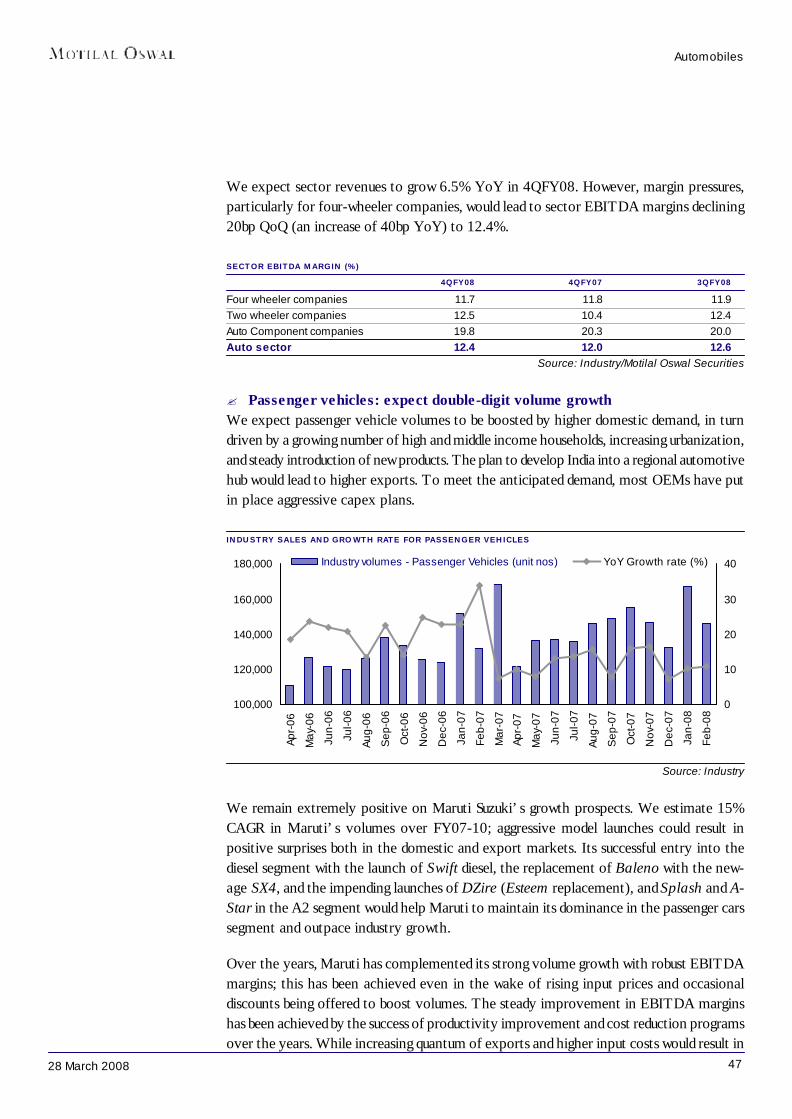
4728 March 2008
Automobiles
We expect sector revenues to grow 6.5% YoY in 4QFY08. However, margin pressures,particularly for four-wheeler companies, would lead to sector EBITDA margins declining20bp QoQ (an increase of 40bp YoY) to 12.4%.
SECTOR EBITDA MARGIN (%)4QFY08 4QFY07 3QFY08
Four wheeler companies 11.7 11.8 11.9Two wheeler companies 12.5 10.4 12.4Auto Component companies 19.8 20.3 20.0Auto sector 12.4 12.0 12.6
Source: Industry/Motilal Oswal Securities
? Passenger vehicles: expect double-digit volume growthWe expect passenger vehicle volumes to be boosted by higher domestic demand, in turndriven by a growing number of high and middle income households, increasing urbanization,and steady introduction of new products. The plan to develop India into a regional automotivehub would lead to higher exports. To meet the anticipated demand, most OEMs have putin place aggressive capex plans.
INDUSTRY SALES AND GROWTH RATE FOR PASSENGER VEHICLES
Source: Industry
We remain extremely positive on Maruti Suzuki’s growth prospects. We estimate 15%CAGR in Maruti’s volumes over FY07-10; aggressive model launches could result inpositive surprises both in the domestic and export markets. Its successful entry into thediesel segment with the launch of Swift diesel, the replacement of Baleno with the new-age SX4, and the impending launches of DZire (Esteem replacement), and Splash and A-Star in the A2 segment would help Maruti to maintain its dominance in the passenger carssegment and outpace industry growth.
Over the years, Maruti has complemented its strong volume growth with robust EBITDAmargins; this has been achieved even in the wake of rising input prices and occasionaldiscounts being offered to boost volumes. The steady improvement in EBITDA marginshas been achieved by the success of productivity improvement and cost reduction programsover the years. While increasing quantum of exports and higher input costs would result in
100,000
120,000
140,000
160,000
180,000
Apr-
06
May
-06
Jun-
06
Jul-0
6
Aug-
06
Sep
-06
Oct
-06
Nov
-06
Dec
-06
Jan-
07
Feb-
07
Mar
-07
Apr-
07
May
-07
Jun-
07
Jul-0
7
Aug-
07
Sep
-07
Oct
-07
Nov
-07
Dec
-07
Jan-
08
Feb-
080
10
20
30
40Industry volumes - Passenger Vehicles (unit nos) YoY Growth rate (%)

4828 March 2008
Automobiles
lower EBITDA margins, we expect the company to register 17% CAGR in profitabilityover FY07-10.
MARKET SHARE OF MARUTI IN PASSENGER CARS
Source: Company/Motilal Oswal Securities
Our other preferred play in the passenger vehicles segment is Mahindra & Mahindra,which has a strong presence in utility vehicles and tractors. Though new entrants havedented its market share in both the segments, the rapidly increasing market size has enabledfast growth in the company’s UV sales. M&M’s subsidiary and associate companies likeM&M Financial Services, Mahindra Gesco, Tech Mahindra, Mahindra Systech, etc. alsoadd substantially to its valuations and consolidated revenues. The expected listing ofMahindra Holidays will add further to M&M’s valuations.
MARKET SHARE OF M&M IN UTILITY VEHICLES
Source: Company/Motilal Oswal Securities
4947
5149
44
5152
5050
49
464747
45
47
51
4847
44
4142
46
42
30,000
40,000
50,000
60,000
70,000Ap
r-06
May
-06
Jun-
06
Jul-0
6
Aug-
06
Sep
-06
Oct
-06
Nov
-06
Dec
-06
Jan-
07
Feb-
07
Mar
-07
Apr-
07
May
-07
Jun-
07
Jul-0
7
Aug-
07
Sep
-07
Oct
-07
Nov
-07
Dec
-07
Jan-
08
Feb-
08
40
45
50
55
60MUL Sales (Unit Nos) -LHS Market Share (%) -RHS
46 4346
37
4448
42424443464342
32
4240
4343
40
42
35
4243
4,000
6,000
8,000
10,000
12,000
Apr-
06
May
-06
Jun-
06
Jul-0
6
Aug-
06
Sep
-06
Oct
-06
Nov
-06
Dec
-06
Jan-
07
Feb-
07
Mar
-07
Apr-
07
May
-07
Jun-
07
Jul-0
7
Aug-
07
Sep
-07
Oct
-07
Nov
-07
Dec
-07
Jan-
08
Feb-
08
0
15
30
45
60M&M Sales (Unit Nos) -LHS Market Share (%) -RHS
4928 March 2008
Automobiles
Recent developments? Tata Motors has acquired the luxury brands of Jaguar and Land Rover from Ford UK.
The formalities of the acquisitions will be completed in 1QFY09.? M&M has announced the IPO of its subsidiary, Mahindra Holidays and Resorts India.
The company is offering 10.7m equity shares and has concluded a pre-IPO sale of2.5m shares in January 2008. The proceeds of the issue would be used to financeexpansion of some of its existing resorts and to set up new projects. This move wouldresult in further value unlocking for M&M and add to its valuations.
? Maruti is investing heavily in its facilities; it will invest a further Rs90b in India over thenext 8 years (previously it had set aside a corpus of Rs90b to increase its productioncapacities). The additional outlay will be utilized to set up R&D facilities, a designfacility, regional distribution centers, and logistics support. The company had earlierannounced plans to put up an R&D facility with an investment of Rs1.75-3.5b overthe next 3-5 years.
? M&M’s board has approved the amalgamation of Mahindra Holdings & Finance (100%subsidiary) into M&M; the merger would be effective from 1 February 2008. All of itsassets and liabilities will be transferred to and recorded by M&M at book value. Thescheme of amalgamation will be implemented subject to approval of shareholders andother regulatory approvals.
THE SCHEME FOR AMALGAMATION IS AS UNDERNO. OF SHARES
Existing equity share capital of MHFL 146.6mShares of MHFL transferred to a Trust 51.3mBalance equity shares of MHFL to be extinguished 95.3mNo. of shares of M&M to be issued to the Trust in the 1:4 swap ratio 12.8mFurther dilution to existing equity capital of M&M (%) 5
Source: Company/Motilal Oswal Securities
? CV industry: demand slackensThe M&HCV industry growth has slackened during April 2007 - February 2008 on twomain counts – the high base of the previous year and increase in cost of ownership of avehicle owing to higher interest rates on financing in 1HFY08. With the interest rate onCV loans declining, the scenario has improved partially in 4QFY08. We expect a furtherimprovement in FY09. LCVs have maintained robust growth even in FY08, driven by thesuccess of the Ace.
We have a positive long-term view on the CV sector. Our view is based on structural andfundamental positives such as: strong growth in economy/industry, policy focus oninfrastructure, infrastructure development, steady vehicle replacement demand, expectationof an increase in the demand for buses from STUs and private operators, substitution ofthree-wheelers by sub-one tonners (both in passenger and goods segments), tonnageredistribution demand (due to hub-and-spoke, restriction on entry of M&HCVs in cities,rising penetration of consumer goods), under-achievement of overloading ban, and continuedstrong growth in industrial production.
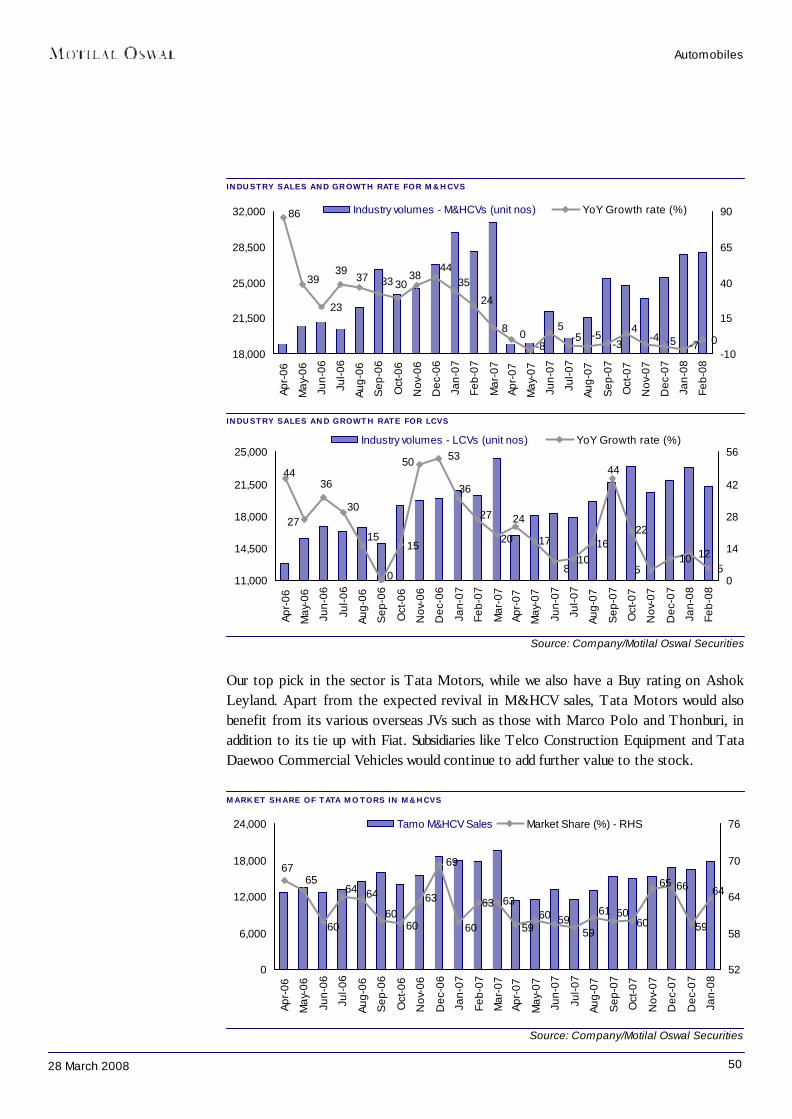
5028 March 2008
Automobiles
INDUSTRY SALES AND GROWTH RATE FOR LCVS
INDUSTRY SALES AND GROWTH RATE FOR M&HCVS
Source: Company/Motilal Oswal Securities
Our top pick in the sector is Tata Motors, while we also have a Buy rating on AshokLeyland. Apart from the expected revival in M&HCV sales, Tata Motors would alsobenefit from its various overseas JVs such as those with Marco Polo and Thonburi, inaddition to its tie up with Fiat. Subsidiaries like Telco Construction Equipment and TataDaewoo Commercial Vehicles would continue to add further value to the stock.
MARKET SHARE OF TATA MOTORS IN M&HCVS
Source: Company/Motilal Oswal Securities
23
80-7-5-4
4-3
-5-55
-80
24
3544
38303337
3939
86
18,000
21,500
25,000
28,500
32,000
Apr-
06
May
-06
Jun-
06
Jul-0
6
Aug-
06
Sep
-06
Oct
-06
Nov
-06
Dec
-06
Jan-
07
Feb-
07
Mar
-07
Apr-
07
May
-07
Jun-
07
Jul-0
7
Aug-
07
Sep
-07
Oct
-07
Nov
-07
Dec
-07
Jan-
08
Feb-
08
-10
15
40
65
90Industry volumes - M&HCVs (unit nos) YoY Growth rate (%)
64
59
6665
606061
595960
59
6363
60
69
63
6060
6464
60
6567
0
6,000
12,000
18,000
24,000
Apr-
06
May
-06
Jun-
06
Jul-0
6
Aug-
06
Sep
-06
Oct
-06
Nov
-06
Dec
-06
Jan-
07
Feb-
07
Mar
-07
Apr-
07
May
-07
Jun-
07
Jul-0
7
Aug-
07
Sep
-07
Oct
-07
Nov
-07
Dec
-07
Dec
-07
Jan-
08
52
58
64
70
76Tamo M&HCV Sales Market Share (%) - RHS
10 125
44
27
36
30
15
0
15
50 53
36
27
20
24
17
810
16
44
22
511,000
14,500
18,000
21,500
25,000
Apr-
06
May
-06
Jun-
06
Jul-0
6
Aug-
06
Sep
-06
Oct
-06
Nov
-06
Dec
-06
Jan-
07
Feb-
07
Mar
-07
Apr-
07
May
-07
Jun-
07
Jul-0
7
Aug-
07
Sep
-07
Oct
-07
Nov
-07
Dec
-07
Jan-
08
Feb-
08
0
14
28
42
56Industry volumes - LCVs (unit nos) YoY Growth rate (%)
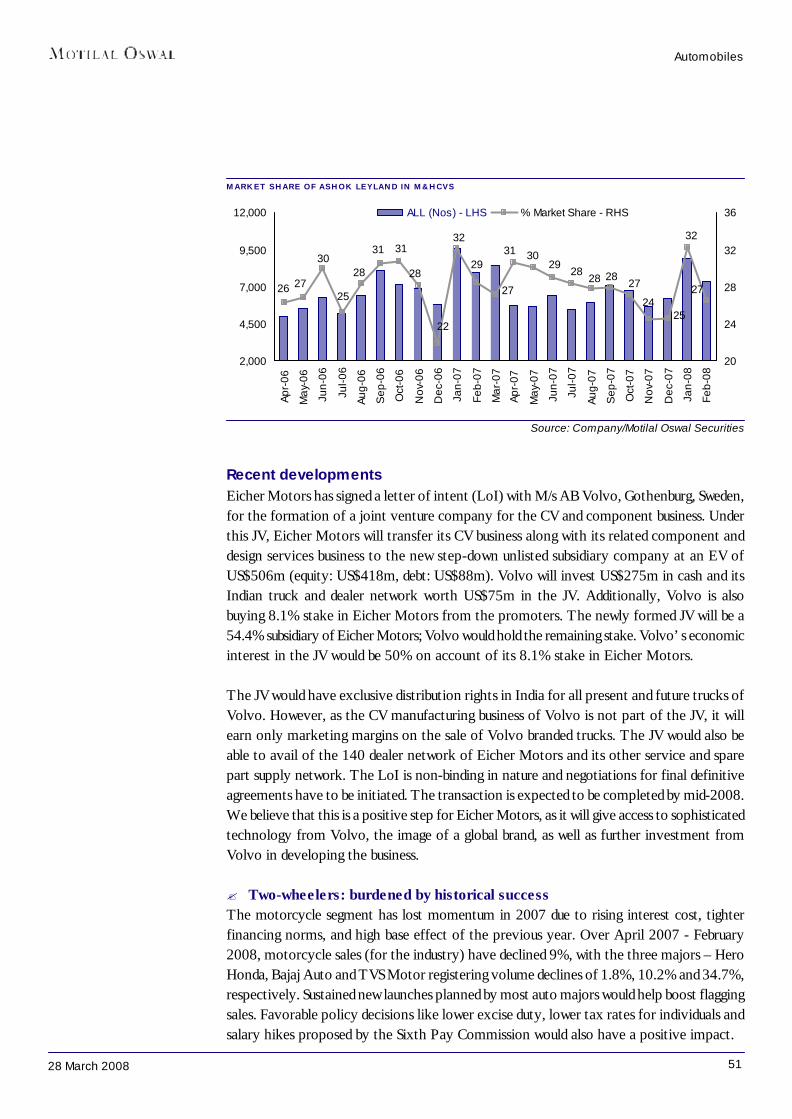
5128 March 2008
Source: Company/Motilal Oswal Securities
Recent developmentsEicher Motors has signed a letter of intent (LoI) with M/s AB Volvo, Gothenburg, Sweden,for the formation of a joint venture company for the CV and component business. Underthis JV, Eicher Motors will transfer its CV business along with its related component anddesign services business to the new step-down unlisted subsidiary company at an EV ofUS$506m (equity: US$418m, debt: US$88m). Volvo will invest US$275m in cash and itsIndian truck and dealer network worth US$75m in the JV. Additionally, Volvo is alsobuying 8.1% stake in Eicher Motors from the promoters. The newly formed JV will be a54.4% subsidiary of Eicher Motors; Volvo would hold the remaining stake. Volvo’s economicinterest in the JV would be 50% on account of its 8.1% stake in Eicher Motors.
The JV would have exclusive distribution rights in India for all present and future trucks ofVolvo. However, as the CV manufacturing business of Volvo is not part of the JV, it willearn only marketing margins on the sale of Volvo branded trucks. The JV would also beable to avail of the 140 dealer network of Eicher Motors and its other service and sparepart supply network. The LoI is non-binding in nature and negotiations for final definitiveagreements have to be initiated. The transaction is expected to be completed by mid-2008.We believe that this is a positive step for Eicher Motors, as it will give access to sophisticatedtechnology from Volvo, the image of a global brand, as well as further investment fromVolvo in developing the business.
? Two-wheelers: burdened by historical successThe motorcycle segment has lost momentum in 2007 due to rising interest cost, tighterfinancing norms, and high base effect of the previous year. Over April 2007 - February2008, motorcycle sales (for the industry) have declined 9%, with the three majors – HeroHonda, Bajaj Auto and TVS Motor registering volume declines of 1.8%, 10.2% and 34.7%,respectively. Sustained new launches planned by most auto majors would help boost flaggingsales. Favorable policy decisions like lower excise duty, lower tax rates for individuals andsalary hikes proposed by the Sixth Pay Commission would also have a positive impact.
MARKET SHARE OF ASHOK LEYLAND IN M&HCVS
Automobiles
29
2427
32
25
272828
2829
3031
27
32
22
28
3131
28
25
30
2726
2,000
4,500
7,000
9,500
12,000
Apr-
06
May
-06
Jun-
06
Jul-0
6
Aug-
06
Sep
-06
Oct
-06
Nov
-06
Dec
-06
Jan-
07
Feb-
07
Mar
-07
Apr-
07
May
-07
Jun-
07
Jul-0
7
Aug-
07
Sep
-07
Oct
-07
Nov
-07
Dec
-07
Jan-
08
Feb-
08
20
24
28
32
36ALL (Nos) - LHS % Market Share - RHS
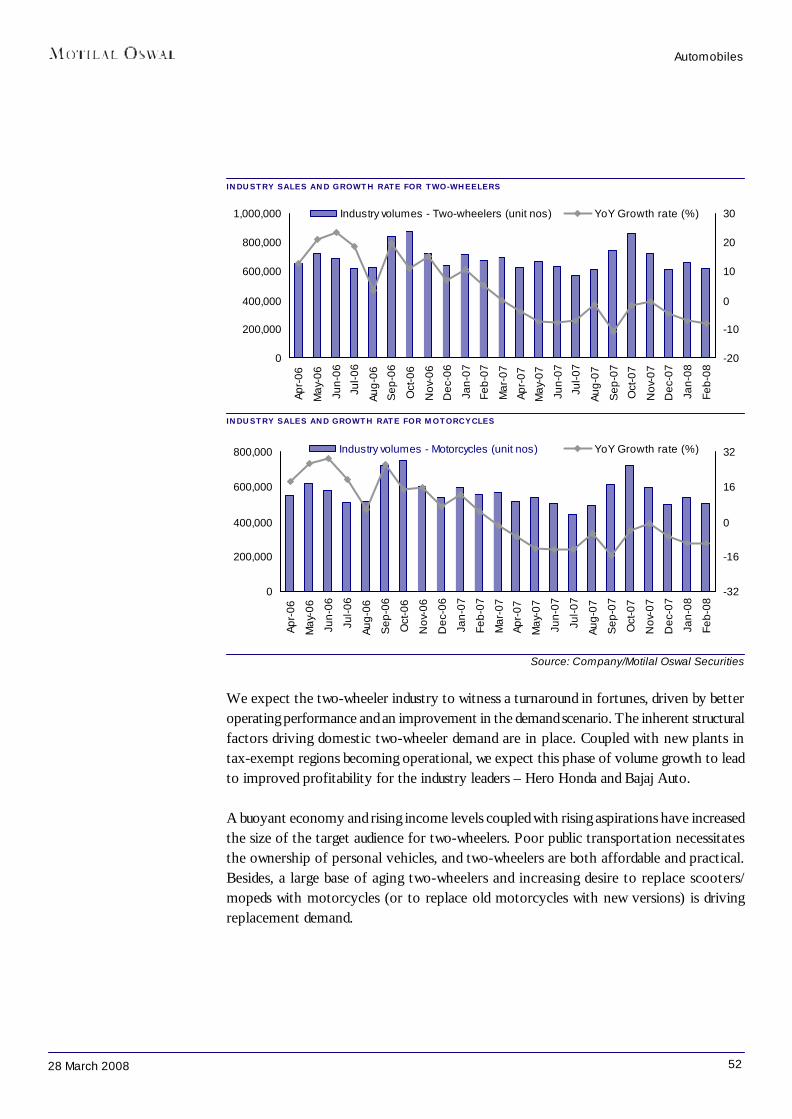
5228 March 2008
Source: Company/Motilal Oswal Securities
We expect the two-wheeler industry to witness a turnaround in fortunes, driven by betteroperating performance and an improvement in the demand scenario. The inherent structuralfactors driving domestic two-wheeler demand are in place. Coupled with new plants intax-exempt regions becoming operational, we expect this phase of volume growth to leadto improved profitability for the industry leaders – Hero Honda and Bajaj Auto.
A buoyant economy and rising income levels coupled with rising aspirations have increasedthe size of the target audience for two-wheelers. Poor public transportation necessitatesthe ownership of personal vehicles, and two-wheelers are both affordable and practical.Besides, a large base of aging two-wheelers and increasing desire to replace scooters/mopeds with motorcycles (or to replace old motorcycles with new versions) is drivingreplacement demand.
INDUSTRY SALES AND GROWTH RATE FOR TWO-WHEELERS
INDUSTRY SALES AND GROWTH RATE FOR MOTORCYCLES
Automobiles
0
200,000
400,000
600,000
800,000
1,000,000
Apr-
06
May
-06
Jun-
06
Jul-0
6
Aug-
06
Sep
-06
Oct
-06
Nov
-06
Dec
-06
Jan-
07
Feb-
07
Mar
-07
Apr-
07
May
-07
Jun-
07
Jul-0
7
Aug-
07
Sep
-07
Oct
-07
Nov
-07
Dec
-07
Jan-
08
Feb-
08
-20
-10
0
10
20
30Industry volumes - Two-wheelers (unit nos) YoY Growth rate (%)
0
200,000
400,000
600,000
800,000
Apr-
06
May
-06
Jun-
06
Jul-0
6
Aug-
06
Sep
-06
Oct
-06
Nov
-06
Dec
-06
Jan-
07
Feb-
07
Mar
-07
Apr-
07
May
-07
Jun-
07
Jul-0
7
Aug-
07
Sep
-07
Oct
-07
Nov
-07
Dec
-07
Jan-
08
Feb-
08
-32
-16
0
16
32Industry volumes - Motorcycles (unit nos) YoY Growth rate (%)
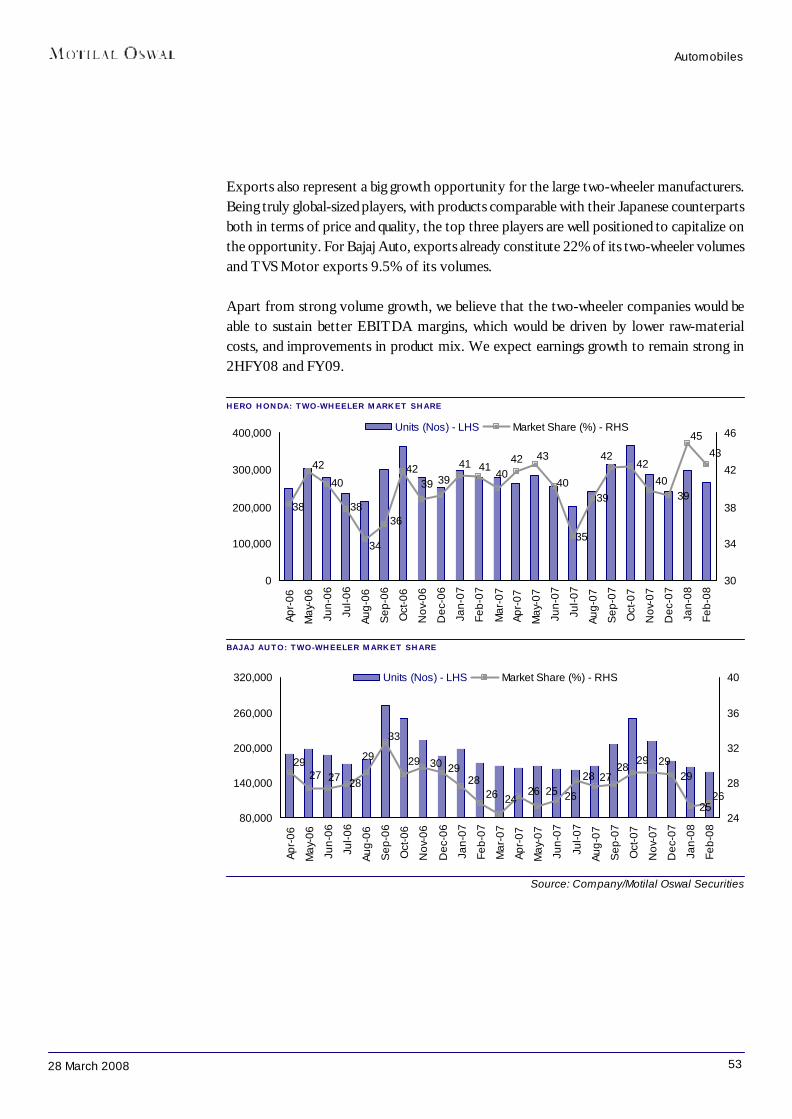
5328 March 2008
Exports also represent a big growth opportunity for the large two-wheeler manufacturers.Being truly global-sized players, with products comparable with their Japanese counterpartsboth in terms of price and quality, the top three players are well positioned to capitalize onthe opportunity. For Bajaj Auto, exports already constitute 22% of its two-wheeler volumesand TVS Motor exports 9.5% of its volumes.
Apart from strong volume growth, we believe that the two-wheeler companies would beable to sustain better EBITDA margins, which would be driven by lower raw-materialcosts, and improvements in product mix. We expect earnings growth to remain strong in2HFY08 and FY09.
HERO HONDA: TWO-WHEELER MARKET SHARE
BAJAJ AUTO: TWO-WHEELER MARKET SHARE
Source: Company/Motilal Oswal Securities
Automobiles
39
4345
40
42
38
42
40
38
34
36
4239 39
41 4140
43
40
35
39
4242
0
100,000
200,000
300,000
400,000
Apr-
06
May
-06
Jun-
06
Jul-0
6
Aug-
06
Sep
-06
Oct
-06
Nov
-06
Dec
-06
Jan-
07
Feb-
07
Mar
-07
Apr-
07
May
-07
Jun-
07
Jul-0
7
Aug-
07
Sep
-07
Oct
-07
Nov
-07
Dec
-07
Jan-
08
Feb-
08
30
34
38
42
46Units (Nos) - LHS Market Share (%) - RHS
29
2526
292928
2728
2625262426
28293029
33
29
28272729
80,000
140,000
200,000
260,000
320,000
Apr-
06
May
-06
Jun-
06
Jul-0
6
Aug-
06
Sep
-06
Oct
-06
Nov
-06
Dec
-06
Jan-
07
Feb-
07
Mar
-07
Apr-
07
May
-07
Jun-
07
Jul-0
7
Aug-
07
Sep
-07
Oct
-07
Nov
-07
Dec
-07
Jan-
08
Feb-
08
24
28
32
36
40Units (Nos) - LHS Market Share (%) - RHS
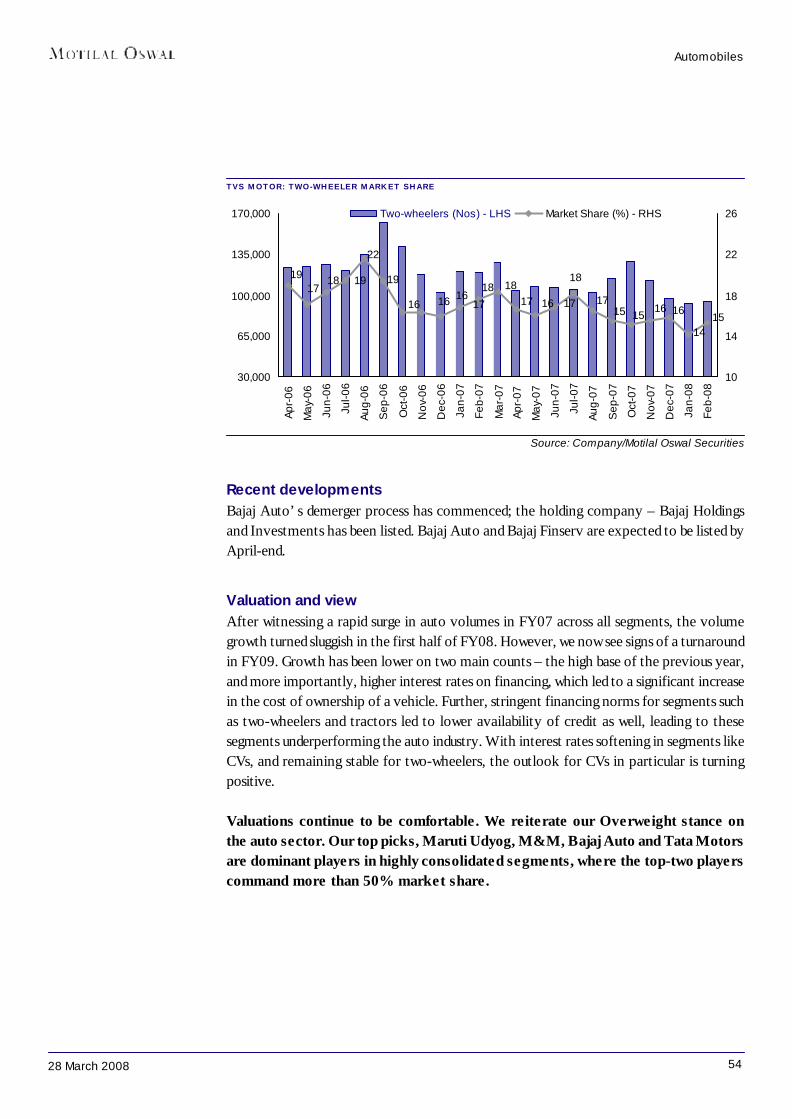
5428 March 2008
Source: Company/Motilal Oswal Securities
Recent developmentsBajaj Auto’s demerger process has commenced; the holding company – Bajaj Holdingsand Investments has been listed. Bajaj Auto and Bajaj Finserv are expected to be listed byApril-end.
Valuation and viewAfter witnessing a rapid surge in auto volumes in FY07 across all segments, the volumegrowth turned sluggish in the first half of FY08. However, we now see signs of a turnaroundin FY09. Growth has been lower on two main counts – the high base of the previous year,and more importantly, higher interest rates on financing, which led to a significant increasein the cost of ownership of a vehicle. Further, stringent financing norms for segments suchas two-wheelers and tractors led to lower availability of credit as well, leading to thesesegments underperforming the auto industry. With interest rates softening in segments likeCVs, and remaining stable for two-wheelers, the outlook for CVs in particular is turningpositive.
Valuations continue to be comfortable. We reiterate our Overweight stance onthe auto sector. Our top picks, Maruti Udyog, M&M, Bajaj Auto and Tata Motorsare dominant players in highly consolidated segments, where the top-two playerscommand more than 50% market share.
TVS MOTOR: TWO-WHEELER MARKET SHARE
Automobiles
19
1514
16161515
17
18
1716171818
17161616
19
22
1817
19
30,000
65,000
100,000
135,000
170,000
Apr-
06
May
-06
Jun-
06
Jul-0
6
Aug-
06
Sep
-06
Oct
-06
Nov
-06
Dec
-06
Jan-
07
Feb-
07
Mar
-07
Apr-
07
May
-07
Jun-
07
Jul-0
7
Aug-
07
Sep
-07
Oct
-07
Nov
-07
Dec
-07
Jan-
08
Feb-
08
10
14
18
22
26Two-wheelers (Nos) - LHS Market Share (%) - RHS
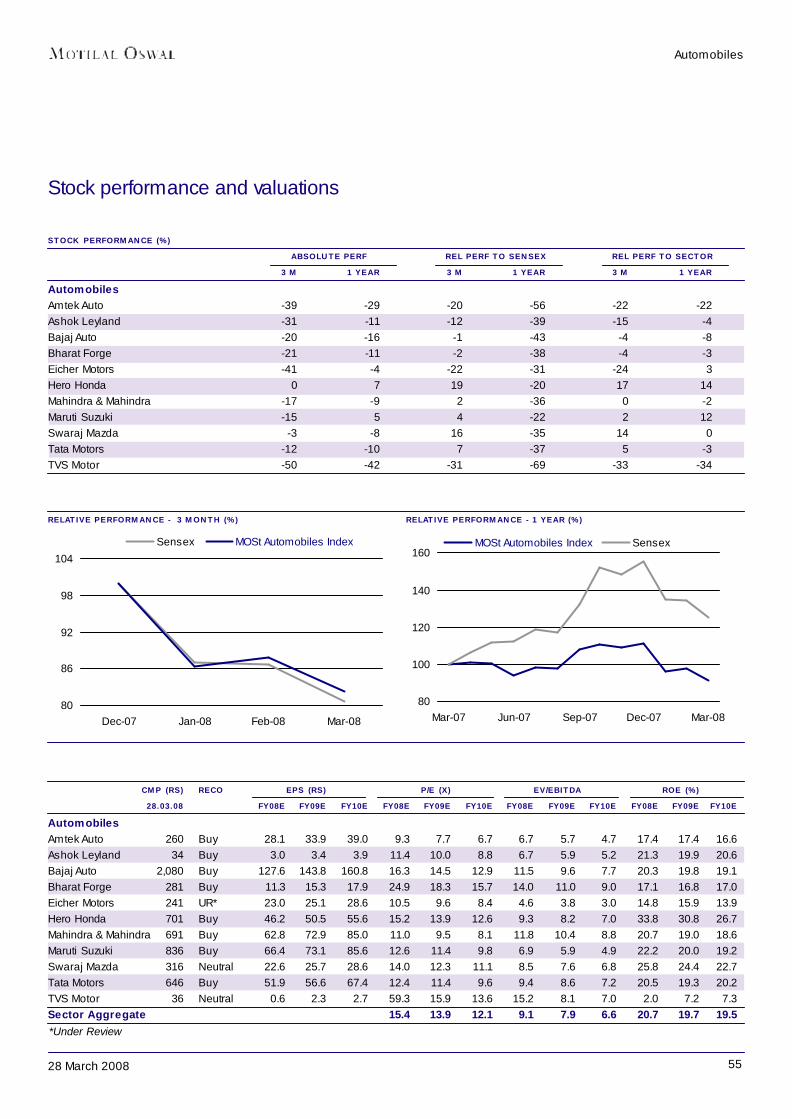
5528 March 2008
Automobiles
RELATIVE PERFORMANCE - 3 MONTH (%) RELATIVE PERFORMANCE - 1 YEAR (%)
Stock performance and valuations
STOCK PERFORMANCE (%) ABSOLUTE PERF REL PERF TO SENSEX REL PERF TO SECTOR
3 M 1 YEAR 3 M 1 YEAR 3 M 1 YEARAutomobilesAmtek Auto -39 -29 -20 -56 -22 -22Ashok Leyland -31 -11 -12 -39 -15 -4Bajaj Auto -20 -16 -1 -43 -4 -8Bharat Forge -21 -11 -2 -38 -4 -3Eicher Motors -41 -4 -22 -31 -24 3Hero Honda 0 7 19 -20 17 14Mahindra & Mahindra -17 -9 2 -36 0 -2Maruti Suzuki -15 5 4 -22 2 12Swaraj Mazda -3 -8 16 -35 14 0Tata Motors -12 -10 7 -37 5 -3TVS Motor -50 -42 -31 -69 -33 -34
CMP (RS) RECO EPS (RS) P/E (X) EV/EBITDA ROE (%)28.03.08 FY08E FY09E FY10E FY08E FY09E FY10E FY08E FY09E FY10E FY08E FY09E FY10E
AutomobilesAmtek Auto 260 Buy 28.1 33.9 39.0 9.3 7.7 6.7 6.7 5.7 4.7 17.4 17.4 16.6Ashok Leyland 34 Buy 3.0 3.4 3.9 11.4 10.0 8.8 6.7 5.9 5.2 21.3 19.9 20.6Bajaj Auto 2,080 Buy 127.6 143.8 160.8 16.3 14.5 12.9 11.5 9.6 7.7 20.3 19.8 19.1Bharat Forge 281 Buy 11.3 15.3 17.9 24.9 18.3 15.7 14.0 11.0 9.0 17.1 16.8 17.0Eicher Motors 241 UR* 23.0 25.1 28.6 10.5 9.6 8.4 4.6 3.8 3.0 14.8 15.9 13.9Hero Honda 701 Buy 46.2 50.5 55.6 15.2 13.9 12.6 9.3 8.2 7.0 33.8 30.8 26.7Mahindra & Mahindra 691 Buy 62.8 72.9 85.0 11.0 9.5 8.1 11.8 10.4 8.8 20.7 19.0 18.6Maruti Suzuki 836 Buy 66.4 73.1 85.6 12.6 11.4 9.8 6.9 5.9 4.9 22.2 20.0 19.2Swaraj Mazda 316 Neutral 22.6 25.7 28.6 14.0 12.3 11.1 8.5 7.6 6.8 25.8 24.4 22.7Tata Motors 646 Buy 51.9 56.6 67.4 12.4 11.4 9.6 9.4 8.6 7.2 20.5 19.3 20.2TVS Motor 36 Neutral 0.6 2.3 2.7 59.3 15.9 13.6 15.2 8.1 7.0 2.0 7.2 7.3Sector Aggregate 15.4 13.9 12.1 9.1 7.9 6.6 20.7 19.7 19.5
80
100
120
140
160
Mar-07 Jun-07 Sep-07 Dec-07 Mar-08
MOSt Automobiles Index Sensex
80
86
92
98
104
Dec-07 Jan-08 Feb-08 Mar-08
Sensex MOSt Automobiles Index
*Under Review
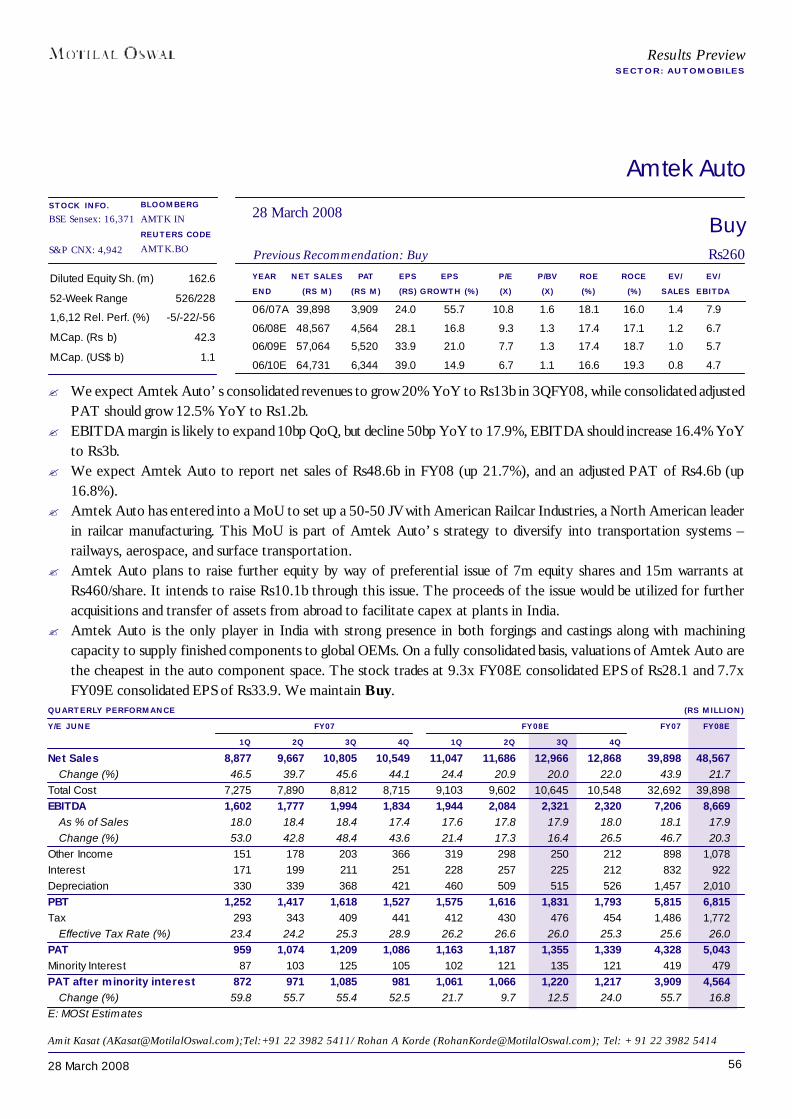
5628 March 2008
Amtek Auto
YEAR NET SALES PAT EPS EPS P/E P/BV ROE ROCE EV/ EV/END (RS M) (RS M) (RS) GROWTH (%) (X) (X) (%) (%) SALES EBITDA
06/07A 39,898 3,909 24.0 55.7 10.8 1.6 18.1 16.0 1.4 7.9
06/08E 48,567 4,564 28.1 16.8 9.3 1.3 17.4 17.1 1.2 6.7
06/09E 57,064 5,520 33.9 21.0 7.7 1.3 17.4 18.7 1.0 5.7
06/10E 64,731 6,344 39.0 14.9 6.7 1.1 16.6 19.3 0.8 4.7
Diluted Equity Sh. (m) 162.6
52-Week Range 526/228
1,6,12 Rel. Perf. (%) -5/-22/-56
M.Cap. (Rs b) 42.3
M.Cap. (US$ b) 1.1
QUARTERLY PERFORMANCE (RS MILLION)Y/E JUNE FY07 FY08E FY07 FY08E
1Q 2Q 3Q 4Q 1Q 2Q 3Q 4QNet Sales 8,877 9,667 10,805 10,549 11,047 11,686 12,966 12,868 39,898 48,567
Change (%) 46.5 39.7 45.6 44.1 24.4 20.9 20.0 22.0 43.9 21.7Total Cost 7,275 7,890 8,812 8,715 9,103 9,602 10,645 10,548 32,692 39,898EBITDA 1,602 1,777 1,994 1,834 1,944 2,084 2,321 2,320 7,206 8,669
As % of Sales 18.0 18.4 18.4 17.4 17.6 17.8 17.9 18.0 18.1 17.9Change (%) 53.0 42.8 48.4 43.6 21.4 17.3 16.4 26.5 46.7 20.3
Other Income 151 178 203 366 319 298 250 212 898 1,078Interest 171 199 211 251 228 257 225 212 832 922Depreciation 330 339 368 421 460 509 515 526 1,457 2,010PBT 1,252 1,417 1,618 1,527 1,575 1,616 1,831 1,793 5,815 6,815Tax 293 343 409 441 412 430 476 454 1,486 1,772
Effective Tax Rate (%) 23.4 24.2 25.3 28.9 26.2 26.6 26.0 25.3 25.6 26.0PAT 959 1,074 1,209 1,086 1,163 1,187 1,355 1,339 4,328 5,043Minority Interest 87 103 125 105 102 121 135 121 419 479PAT after minority interest 872 971 1,085 981 1,061 1,066 1,220 1,217 3,909 4,564
Change (%) 59.8 55.7 55.4 52.5 21.7 9.7 12.5 24.0 55.7 16.8E: MOSt Estimates
BuyPrevious Recommendation: Buy Rs260
BLOOMBERGAMTK INREUTERS CODEAMTK.BO
Amit Kasat ([email protected]);Tel:+91 22 3982 5411/ Rohan A Korde ([email protected]); Tel: + 91 22 3982 5414
Results PreviewSECTOR: AUTOMOBILES
STOCK INFO.BSE Sensex: 16,371
S&P CNX: 4,942
28 March 2008
? We expect Amtek Auto’s consolidated revenues to grow 20% YoY to Rs13b in 3QFY08, while consolidated adjustedPAT should grow 12.5% YoY to Rs1.2b.
? EBITDA margin is likely to expand 10bp QoQ, but decline 50bp YoY to 17.9%, EBITDA should increase 16.4% YoYto Rs3b.
? We expect Amtek Auto to report net sales of Rs48.6b in FY08 (up 21.7%), and an adjusted PAT of Rs4.6b (up16.8%).
? Amtek Auto has entered into a MoU to set up a 50-50 JV with American Railcar Industries, a North American leaderin railcar manufacturing. This MoU is part of Amtek Auto’s strategy to diversify into transportation systems –railways, aerospace, and surface transportation.
? Amtek Auto plans to raise further equity by way of preferential issue of 7m equity shares and 15m warrants atRs460/share. It intends to raise Rs10.1b through this issue. The proceeds of the issue would be utilized for furtheracquisitions and transfer of assets from abroad to facilitate capex at plants in India.
? Amtek Auto is the only player in India with strong presence in both forgings and castings along with machiningcapacity to supply finished components to global OEMs. On a fully consolidated basis, valuations of Amtek Auto arethe cheapest in the auto component space. The stock trades at 9.3x FY08E consolidated EPS of Rs28.1 and 7.7xFY09E consolidated EPS of Rs33.9. We maintain Buy.
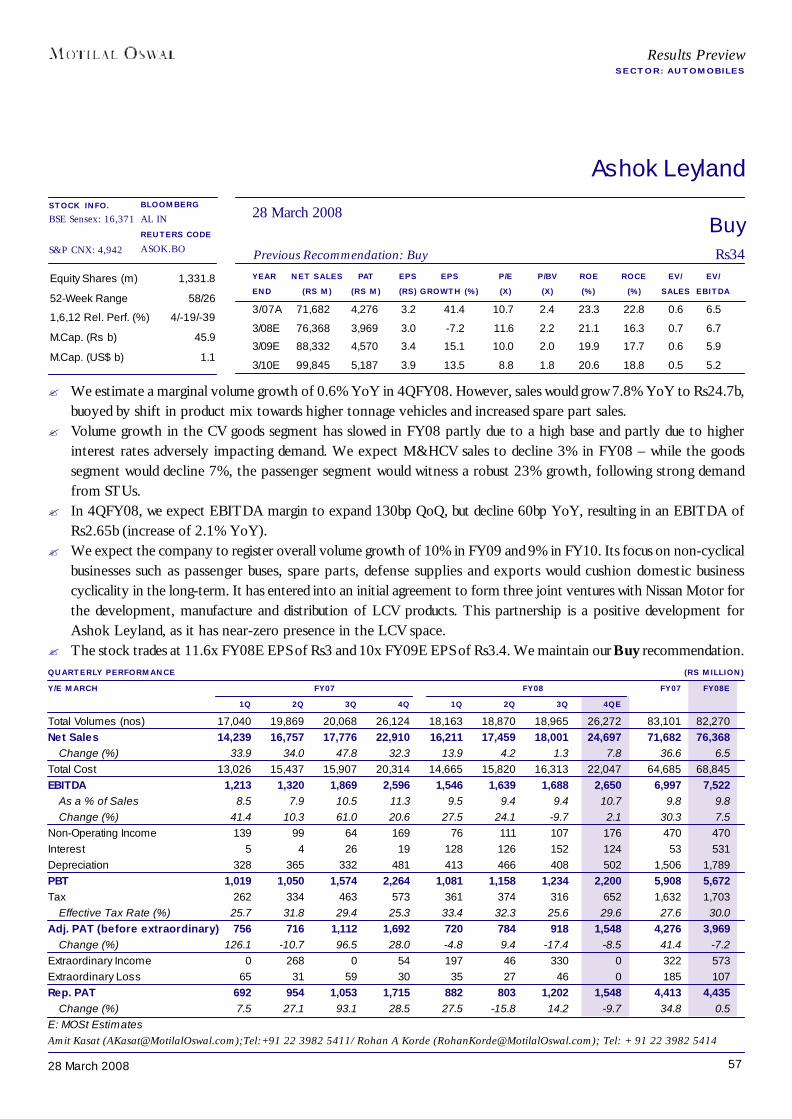
5728 March 2008
Ashok Leyland
YEAR NET SALES PAT EPS EPS P/E P/BV ROE ROCE EV/ EV/END (RS M) (RS M) (RS) GROWTH (%) (X) (X) (%) (%) SALES EBITDA
3/07A 71,682 4,276 3.2 41.4 10.7 2.4 23.3 22.8 0.6 6.5
3/08E 76,368 3,969 3.0 -7.2 11.6 2.2 21.1 16.3 0.7 6.7
3/09E 88,332 4,570 3.4 15.1 10.0 2.0 19.9 17.7 0.6 5.9
3/10E 99,845 5,187 3.9 13.5 8.8 1.8 20.6 18.8 0.5 5.2
Equity Shares (m) 1,331.8
52-Week Range 58/26
1,6,12 Rel. Perf. (%) 4/-19/-39
M.Cap. (Rs b) 45.9
M.Cap. (US$ b) 1.1
QUARTERLY PERFORMANCE (RS MILLION)Y/E MARCH FY07 FY08 FY07 FY08E
1Q 2Q 3Q 4Q 1Q 2Q 3Q 4QETotal Volumes (nos) 17,040 19,869 20,068 26,124 18,163 18,870 18,965 26,272 83,101 82,270Net Sales 14,239 16,757 17,776 22,910 16,211 17,459 18,001 24,697 71,682 76,368
Change (%) 33.9 34.0 47.8 32.3 13.9 4.2 1.3 7.8 36.6 6.5Total Cost 13,026 15,437 15,907 20,314 14,665 15,820 16,313 22,047 64,685 68,845EBITDA 1,213 1,320 1,869 2,596 1,546 1,639 1,688 2,650 6,997 7,522
As a % of Sales 8.5 7.9 10.5 11.3 9.5 9.4 9.4 10.7 9.8 9.8Change (%) 41.4 10.3 61.0 20.6 27.5 24.1 -9.7 2.1 30.3 7.5
Non-Operating Income 139 99 64 169 76 111 107 176 470 470Interest 5 4 26 19 128 126 152 124 53 531Depreciation 328 365 332 481 413 466 408 502 1,506 1,789PBT 1,019 1,050 1,574 2,264 1,081 1,158 1,234 2,200 5,908 5,672Tax 262 334 463 573 361 374 316 652 1,632 1,703
Effective Tax Rate (%) 25.7 31.8 29.4 25.3 33.4 32.3 25.6 29.6 27.6 30.0Adj. PAT (before extraordinary) 756 716 1,112 1,692 720 784 918 1,548 4,276 3,969
Change (%) 126.1 -10.7 96.5 28.0 -4.8 9.4 -17.4 -8.5 41.4 -7.2Extraordinary Income 0 268 0 54 197 46 330 0 322 573Extraordinary Loss 65 31 59 30 35 27 46 0 185 107Rep. PAT 692 954 1,053 1,715 882 803 1,202 1,548 4,413 4,435
Change (%) 7.5 27.1 93.1 28.5 27.5 -15.8 14.2 -9.7 34.8 0.5E: MOSt Estimates
BuyPrevious Recommendation: Buy Rs34
BLOOMBERGAL INREUTERS CODEASOK.BO
Amit Kasat ([email protected]);Tel:+91 22 3982 5411/ Rohan A Korde ([email protected]); Tel: + 91 22 3982 5414
Results PreviewSECTOR: AUTOMOBILES
STOCK INFO.BSE Sensex: 16,371
S&P CNX: 4,942
28 March 2008
? We estimate a marginal volume growth of 0.6% YoY in 4QFY08. However, sales would grow 7.8% YoY to Rs24.7b,buoyed by shift in product mix towards higher tonnage vehicles and increased spare part sales.
? Volume growth in the CV goods segment has slowed in FY08 partly due to a high base and partly due to higherinterest rates adversely impacting demand. We expect M&HCV sales to decline 3% in FY08 – while the goodssegment would decline 7%, the passenger segment would witness a robust 23% growth, following strong demandfrom STUs.
? In 4QFY08, we expect EBITDA margin to expand 130bp QoQ, but decline 60bp YoY, resulting in an EBITDA ofRs2.65b (increase of 2.1% YoY).
? We expect the company to register overall volume growth of 10% in FY09 and 9% in FY10. Its focus on non-cyclicalbusinesses such as passenger buses, spare parts, defense supplies and exports would cushion domestic businesscyclicality in the long-term. It has entered into an initial agreement to form three joint ventures with Nissan Motor forthe development, manufacture and distribution of LCV products. This partnership is a positive development forAshok Leyland, as it has near-zero presence in the LCV space.
? The stock trades at 11.6x FY08E EPS of Rs3 and 10x FY09E EPS of Rs3.4. We maintain our Buy recommendation.
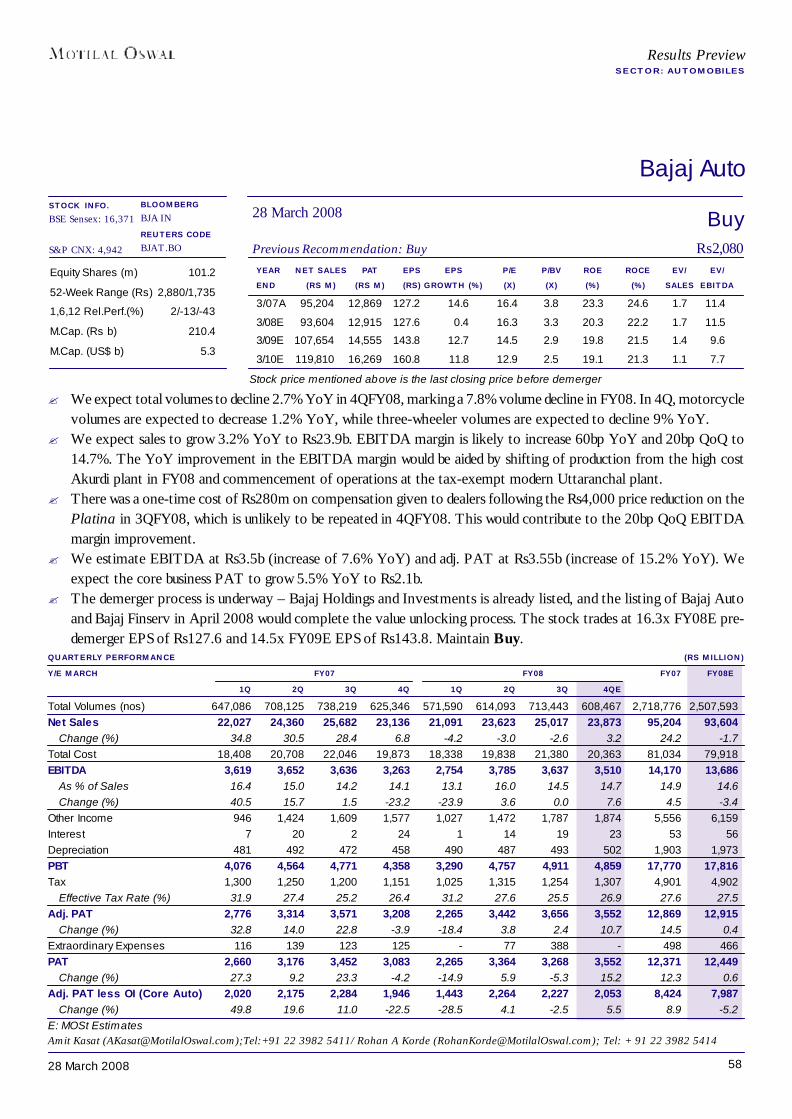
5828 March 2008
YEAR NET SALES PAT EPS EPS P/E P/BV ROE ROCE EV/ EV/END (RS M) (RS M) (RS) GROWTH (%) (X) (X) (%) (%) SALES EBITDA
3/07A 95,204 12,869 127.2 14.6 16.4 3.8 23.3 24.6 1.7 11.4
3/08E 93,604 12,915 127.6 0.4 16.3 3.3 20.3 22.2 1.7 11.5
3/09E 107,654 14,555 143.8 12.7 14.5 2.9 19.8 21.5 1.4 9.6
3/10E 119,810 16,269 160.8 11.8 12.9 2.5 19.1 21.3 1.1 7.7
Equity Shares (m) 101.2
52-Week Range (Rs) 2,880/1,735
1,6,12 Rel.Perf.(%) 2/-13/-43
M.Cap. (Rs b) 210.4
M.Cap. (US$ b) 5.3
QUARTERLY PERFORMANCE (RS MILLION)Y/E MARCH FY07 FY08 FY07 FY08E
1Q 2Q 3Q 4Q 1Q 2Q 3Q 4QETotal Volumes (nos) 647,086 708,125 738,219 625,346 571,590 614,093 713,443 608,467 2,718,776 2,507,593Net Sales 22,027 24,360 25,682 23,136 21,091 23,623 25,017 23,873 95,204 93,604
Change (%) 34.8 30.5 28.4 6.8 -4.2 -3.0 -2.6 3.2 24.2 -1.7Total Cost 18,408 20,708 22,046 19,873 18,338 19,838 21,380 20,363 81,034 79,918EBITDA 3,619 3,652 3,636 3,263 2,754 3,785 3,637 3,510 14,170 13,686
As % of Sales 16.4 15.0 14.2 14.1 13.1 16.0 14.5 14.7 14.9 14.6Change (%) 40.5 15.7 1.5 -23.2 -23.9 3.6 0.0 7.6 4.5 -3.4
Other Income 946 1,424 1,609 1,577 1,027 1,472 1,787 1,874 5,556 6,159Interest 7 20 2 24 1 14 19 23 53 56Depreciation 481 492 472 458 490 487 493 502 1,903 1,973PBT 4,076 4,564 4,771 4,358 3,290 4,757 4,911 4,859 17,770 17,816Tax 1,300 1,250 1,200 1,151 1,025 1,315 1,254 1,307 4,901 4,902
Effective Tax Rate (%) 31.9 27.4 25.2 26.4 31.2 27.6 25.5 26.9 27.6 27.5Adj. PAT 2,776 3,314 3,571 3,208 2,265 3,442 3,656 3,552 12,869 12,915
Change (%) 32.8 14.0 22.8 -3.9 -18.4 3.8 2.4 10.7 14.5 0.4Extraordinary Expenses 116 139 123 125 - 77 388 - 498 466PAT 2,660 3,176 3,452 3,083 2,265 3,364 3,268 3,552 12,371 12,449
Change (%) 27.3 9.2 23.3 -4.2 -14.9 5.9 -5.3 15.2 12.3 0.6Adj. PAT less OI (Core Auto) 2,020 2,175 2,284 1,946 1,443 2,264 2,227 2,053 8,424 7,987
Change (%) 49.8 19.6 11.0 -22.5 -28.5 4.1 -2.5 5.5 8.9 -5.2E: MOSt Estimates
BuyPrevious Recommendation: Buy Rs2,080
28 March 2008BLOOMBERGBJA IN
REUTERS CODEBJAT.BO
Results PreviewSECTOR: AUTOMOBILES
Bajaj Auto
Amit Kasat ([email protected]);Tel:+91 22 3982 5411/ Rohan A Korde ([email protected]); Tel: + 91 22 3982 5414
STOCK INFO.BSE Sensex: 16,371
S&P CNX: 4,942
? We expect total volumes to decline 2.7% YoY in 4QFY08, marking a 7.8% volume decline in FY08. In 4Q, motorcyclevolumes are expected to decrease 1.2% YoY, while three-wheeler volumes are expected to decline 9% YoY.
? We expect sales to grow 3.2% YoY to Rs23.9b. EBITDA margin is likely to increase 60bp YoY and 20bp QoQ to14.7%. The YoY improvement in the EBITDA margin would be aided by shifting of production from the high costAkurdi plant in FY08 and commencement of operations at the tax-exempt modern Uttaranchal plant.
? There was a one-time cost of Rs280m on compensation given to dealers following the Rs4,000 price reduction on thePlatina in 3QFY08, which is unlikely to be repeated in 4QFY08. This would contribute to the 20bp QoQ EBITDAmargin improvement.
? We estimate EBITDA at Rs3.5b (increase of 7.6% YoY) and adj. PAT at Rs3.55b (increase of 15.2% YoY). Weexpect the core business PAT to grow 5.5% YoY to Rs2.1b.
? The demerger process is underway – Bajaj Holdings and Investments is already listed, and the listing of Bajaj Autoand Bajaj Finserv in April 2008 would complete the value unlocking process. The stock trades at 16.3x FY08E pre-demerger EPS of Rs127.6 and 14.5x FY09E EPS of Rs143.8. Maintain Buy.
Stock price mentioned above is the last closing price before demerger
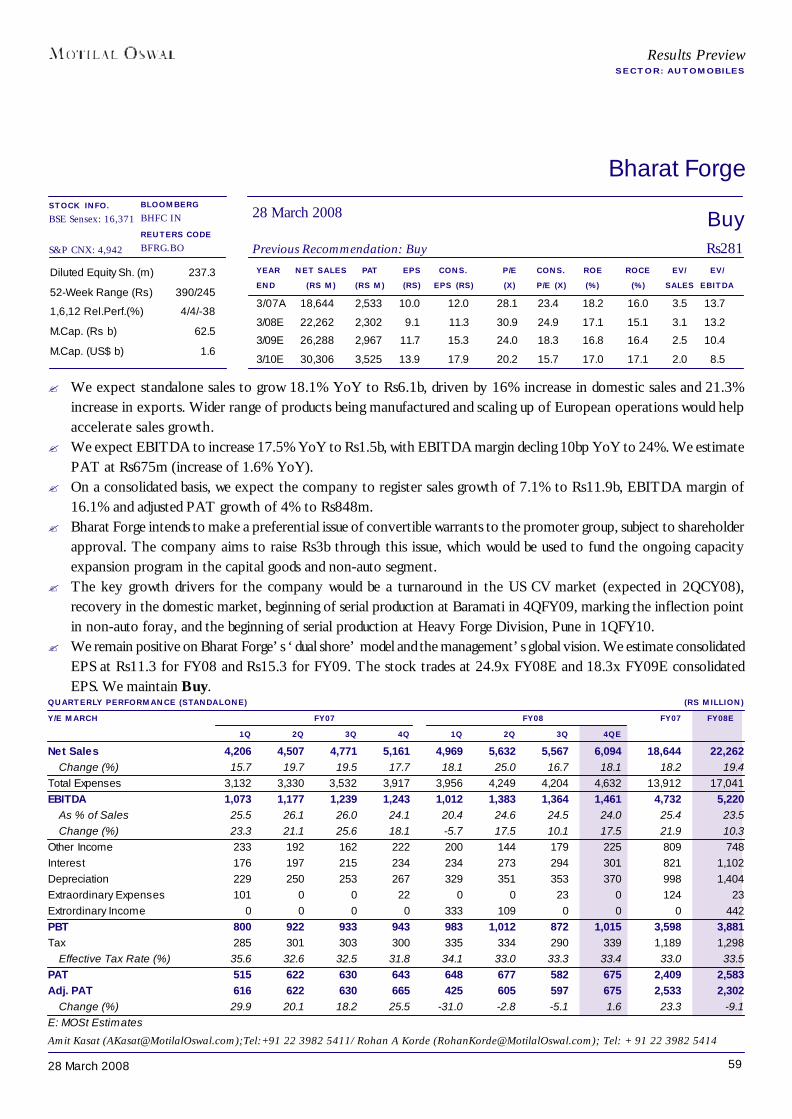
5928 March 2008
Bharat Forge
YEAR NET SALES PAT EPS CONS. P/E CONS. ROE ROCE EV/ EV/END (RS M) (RS M) (RS) EPS (RS) (X) P/E (X) (%) (%) SALES EBITDA
3/07A 18,644 2,533 10.0 12.0 28.1 23.4 18.2 16.0 3.5 13.7
3/08E 22,262 2,302 9.1 11.3 30.9 24.9 17.1 15.1 3.1 13.2
3/09E 26,288 2,967 11.7 15.3 24.0 18.3 16.8 16.4 2.5 10.4
3/10E 30,306 3,525 13.9 17.9 20.2 15.7 17.0 17.1 2.0 8.5
Diluted Equity Sh. (m) 237.3
52-Week Range (Rs) 390/245
1,6,12 Rel.Perf.(%) 4/4/-38
M.Cap. (Rs b) 62.5
M.Cap. (US$ b) 1.6
QUARTERLY PERFORMANCE (STANDALONE) (RS MILLION)Y/E MARCH FY07 FY08 FY07 FY08E
1Q 2Q 3Q 4Q 1Q 2Q 3Q 4QENet Sales 4,206 4,507 4,771 5,161 4,969 5,632 5,567 6,094 18,644 22,262
Change (%) 15.7 19.7 19.5 17.7 18.1 25.0 16.7 18.1 18.2 19.4Total Expenses 3,132 3,330 3,532 3,917 3,956 4,249 4,204 4,632 13,912 17,041EBITDA 1,073 1,177 1,239 1,243 1,012 1,383 1,364 1,461 4,732 5,220
As % of Sales 25.5 26.1 26.0 24.1 20.4 24.6 24.5 24.0 25.4 23.5Change (%) 23.3 21.1 25.6 18.1 -5.7 17.5 10.1 17.5 21.9 10.3
Other Income 233 192 162 222 200 144 179 225 809 748Interest 176 197 215 234 234 273 294 301 821 1,102Depreciation 229 250 253 267 329 351 353 370 998 1,404Extraordinary Expenses 101 0 0 22 0 0 23 0 124 23Extrordinary Income 0 0 0 0 333 109 0 0 0 442PBT 800 922 933 943 983 1,012 872 1,015 3,598 3,881Tax 285 301 303 300 335 334 290 339 1,189 1,298
Effective Tax Rate (%) 35.6 32.6 32.5 31.8 34.1 33.0 33.3 33.4 33.0 33.5PAT 515 622 630 643 648 677 582 675 2,409 2,583Adj. PAT 616 622 630 665 425 605 597 675 2,533 2,302
Change (%) 29.9 20.1 18.2 25.5 -31.0 -2.8 -5.1 1.6 23.3 -9.1E: MOSt Estimates
BuyPrevious Recommendation: Buy Rs281
28 March 2008BLOOMBERGBHFC IN
REUTERS CODEBFRG.BO
Results PreviewSECTOR: AUTOMOBILES
Amit Kasat ([email protected]);Tel:+91 22 3982 5411/ Rohan A Korde ([email protected]); Tel: + 91 22 3982 5414
STOCK INFO.BSE Sensex: 16,371
S&P CNX: 4,942
? We expect standalone sales to grow 18.1% YoY to Rs6.1b, driven by 16% increase in domestic sales and 21.3%increase in exports. Wider range of products being manufactured and scaling up of European operations would helpaccelerate sales growth.
? We expect EBITDA to increase 17.5% YoY to Rs1.5b, with EBITDA margin decling 10bp YoY to 24%. We estimatePAT at Rs675m (increase of 1.6% YoY).
? On a consolidated basis, we expect the company to register sales growth of 7.1% to Rs11.9b, EBITDA margin of16.1% and adjusted PAT growth of 4% to Rs848m.
? Bharat Forge intends to make a preferential issue of convertible warrants to the promoter group, subject to shareholderapproval. The company aims to raise Rs3b through this issue, which would be used to fund the ongoing capacityexpansion program in the capital goods and non-auto segment.
? The key growth drivers for the company would be a turnaround in the US CV market (expected in 2QCY08),recovery in the domestic market, beginning of serial production at Baramati in 4QFY09, marking the inflection pointin non-auto foray, and the beginning of serial production at Heavy Forge Division, Pune in 1QFY10.
? We remain positive on Bharat Forge’s ‘dual shore’ model and the management’s global vision. We estimate consolidatedEPS at Rs11.3 for FY08 and Rs15.3 for FY09. The stock trades at 24.9x FY08E and 18.3x FY09E consolidatedEPS. We maintain Buy.
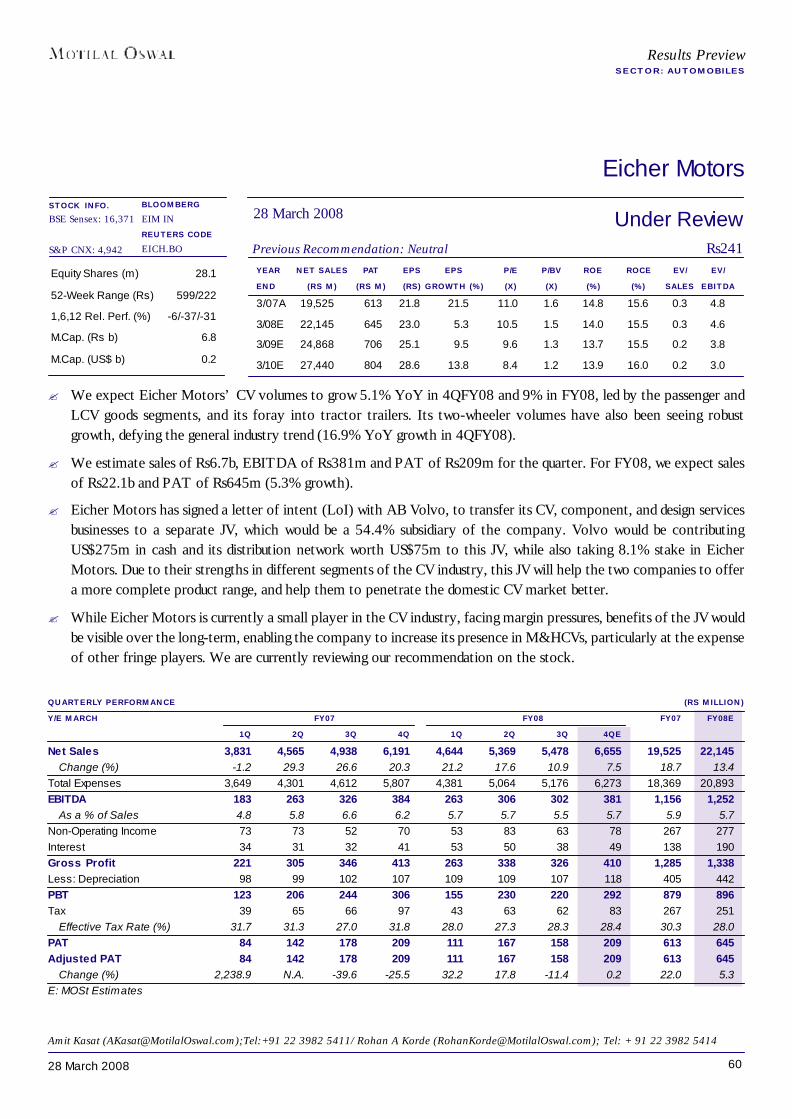
6028 March 2008
Eicher Motors
Equity Shares (m) 28.1
52-Week Range (Rs) 599/222
1,6,12 Rel. Perf. (%) -6/-37/-31
M.Cap. (Rs b) 6.8
M.Cap. (US$ b) 0.2
QUARTERLY PERFORMANCE (RS MILLION)Y/E MARCH FY07 FY08 FY07 FY08E
1Q 2Q 3Q 4Q 1Q 2Q 3Q 4QENet Sales 3,831 4,565 4,938 6,191 4,644 5,369 5,478 6,655 19,525 22,145
Change (%) -1.2 29.3 26.6 20.3 21.2 17.6 10.9 7.5 18.7 13.4Total Expenses 3,649 4,301 4,612 5,807 4,381 5,064 5,176 6,273 18,369 20,893EBITDA 183 263 326 384 263 306 302 381 1,156 1,252
As a % of Sales 4.8 5.8 6.6 6.2 5.7 5.7 5.5 5.7 5.9 5.7Non-Operating Income 73 73 52 70 53 83 63 78 267 277Interest 34 31 32 41 53 50 38 49 138 190Gross Profit 221 305 346 413 263 338 326 410 1,285 1,338Less: Depreciation 98 99 102 107 109 109 107 118 405 442PBT 123 206 244 306 155 230 220 292 879 896Tax 39 65 66 97 43 63 62 83 267 251
Effective Tax Rate (%) 31.7 31.3 27.0 31.8 28.0 27.3 28.3 28.4 30.3 28.0PAT 84 142 178 209 111 167 158 209 613 645Adjusted PAT 84 142 178 209 111 167 158 209 613 645
Change (%) 2,238.9 N.A. -39.6 -25.5 32.2 17.8 -11.4 0.2 22.0 5.3E: MOSt Estimates
Under ReviewPrevious Recommendation: Neutral Rs241
28 March 2008BLOOMBERGEIM INREUTERS CODEEICH.BO
YEAR NET SALES PAT EPS EPS P/E P/BV ROE ROCE EV/ EV/END (RS M) (RS M) (RS) GROWTH (%) (X) (X) (%) (%) SALES EBITDA3/07A 19,525 613 21.8 21.5 11.0 1.6 14.8 15.6 0.3 4.8
3/08E 22,145 645 23.0 5.3 10.5 1.5 14.0 15.5 0.3 4.6
3/09E 24,868 706 25.1 9.5 9.6 1.3 13.7 15.5 0.2 3.8
3/10E 27,440 804 28.6 13.8 8.4 1.2 13.9 16.0 0.2 3.0
Results PreviewSECTOR: AUTOMOBILES
Amit Kasat ([email protected]);Tel:+91 22 3982 5411/ Rohan A Korde ([email protected]); Tel: + 91 22 3982 5414
STOCK INFO.BSE Sensex: 16,371
S&P CNX: 4,942
? We expect Eicher Motors’ CV volumes to grow 5.1% YoY in 4QFY08 and 9% in FY08, led by the passenger andLCV goods segments, and its foray into tractor trailers. Its two-wheeler volumes have also been seeing robustgrowth, defying the general industry trend (16.9% YoY growth in 4QFY08).
? We estimate sales of Rs6.7b, EBITDA of Rs381m and PAT of Rs209m for the quarter. For FY08, we expect salesof Rs22.1b and PAT of Rs645m (5.3% growth).
? Eicher Motors has signed a letter of intent (LoI) with AB Volvo, to transfer its CV, component, and design servicesbusinesses to a separate JV, which would be a 54.4% subsidiary of the company. Volvo would be contributingUS$275m in cash and its distribution network worth US$75m to this JV, while also taking 8.1% stake in EicherMotors. Due to their strengths in different segments of the CV industry, this JV will help the two companies to offera more complete product range, and help them to penetrate the domestic CV market better.
? While Eicher Motors is currently a small player in the CV industry, facing margin pressures, benefits of the JV wouldbe visible over the long-term, enabling the company to increase its presence in M&HCVs, particularly at the expenseof other fringe players. We are currently reviewing our recommendation on the stock.
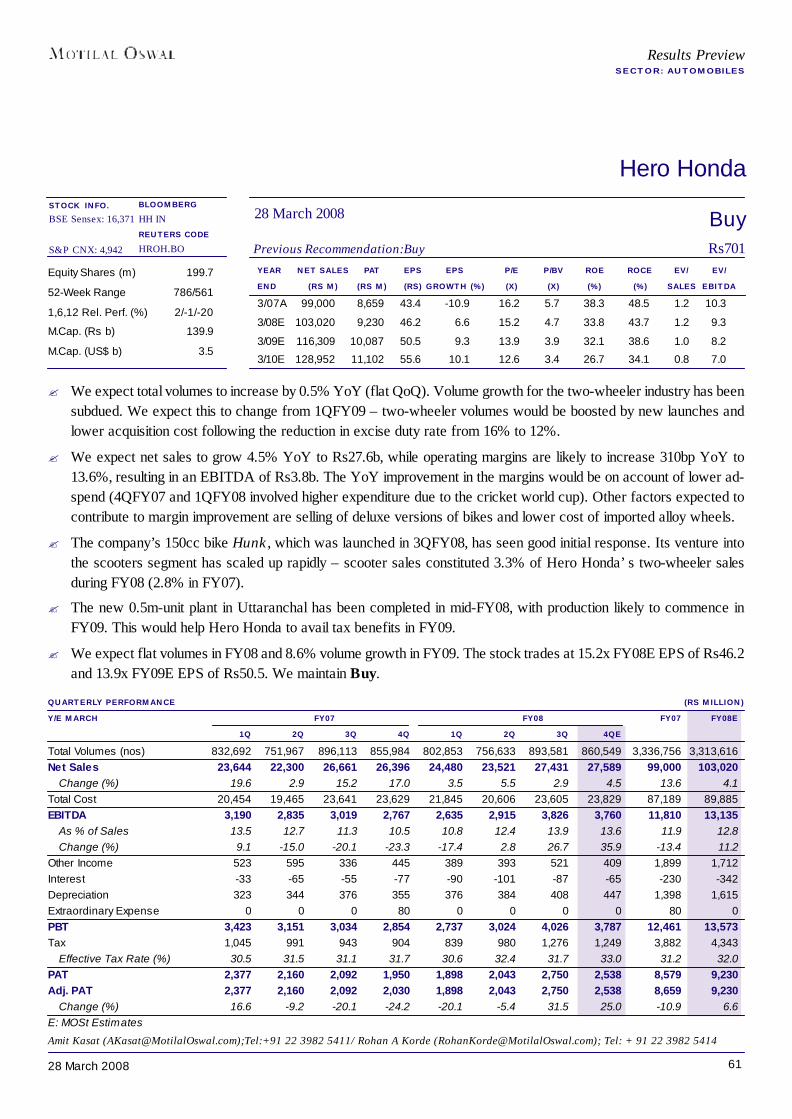
6128 March 2008
Hero Honda
YEAR NET SALES PAT EPS EPS P/E P/BV ROE ROCE EV/ EV/END (RS M) (RS M) (RS) GROWTH (%) (X) (X) (%) (%) SALES EBITDA3/07A 99,000 8,659 43.4 -10.9 16.2 5.7 38.3 48.5 1.2 10.3
3/08E 103,020 9,230 46.2 6.6 15.2 4.7 33.8 43.7 1.2 9.3
3/09E 116,309 10,087 50.5 9.3 13.9 3.9 32.1 38.6 1.0 8.2
3/10E 128,952 11,102 55.6 10.1 12.6 3.4 26.7 34.1 0.8 7.0
Equity Shares (m) 199.7
52-Week Range 786/561
1,6,12 Rel. Perf. (%) 2/-1/-20
M.Cap. (Rs b) 139.9
M.Cap. (US$ b) 3.5
QUARTERLY PERFORMANCE (RS MILLION)Y/E MARCH FY07 FY08 FY07 FY08E
1Q 2Q 3Q 4Q 1Q 2Q 3Q 4QETotal Volumes (nos) 832,692 751,967 896,113 855,984 802,853 756,633 893,581 860,549 3,336,756 3,313,616Net Sales 23,644 22,300 26,661 26,396 24,480 23,521 27,431 27,589 99,000 103,020
Change (%) 19.6 2.9 15.2 17.0 3.5 5.5 2.9 4.5 13.6 4.1Total Cost 20,454 19,465 23,641 23,629 21,845 20,606 23,605 23,829 87,189 89,885EBITDA 3,190 2,835 3,019 2,767 2,635 2,915 3,826 3,760 11,810 13,135
As % of Sales 13.5 12.7 11.3 10.5 10.8 12.4 13.9 13.6 11.9 12.8Change (%) 9.1 -15.0 -20.1 -23.3 -17.4 2.8 26.7 35.9 -13.4 11.2
Other Income 523 595 336 445 389 393 521 409 1,899 1,712Interest -33 -65 -55 -77 -90 -101 -87 -65 -230 -342Depreciation 323 344 376 355 376 384 408 447 1,398 1,615Extraordinary Expense 0 0 0 80 0 0 0 0 80 0PBT 3,423 3,151 3,034 2,854 2,737 3,024 4,026 3,787 12,461 13,573Tax 1,045 991 943 904 839 980 1,276 1,249 3,882 4,343
Effective Tax Rate (%) 30.5 31.5 31.1 31.7 30.6 32.4 31.7 33.0 31.2 32.0PAT 2,377 2,160 2,092 1,950 1,898 2,043 2,750 2,538 8,579 9,230Adj. PAT 2,377 2,160 2,092 2,030 1,898 2,043 2,750 2,538 8,659 9,230
Change (%) 16.6 -9.2 -20.1 -24.2 -20.1 -5.4 31.5 25.0 -10.9 6.6E: MOSt Estimates
BuyPrevious Recommendation:Buy Rs701
28 March 2008BLOOMBERGHH INREUTERS CODEHROH.BO
Results PreviewSECTOR: AUTOMOBILES
Amit Kasat ([email protected]);Tel:+91 22 3982 5411/ Rohan A Korde ([email protected]); Tel: + 91 22 3982 5414
STOCK INFO.BSE Sensex: 16,371
S&P CNX: 4,942
? We expect total volumes to increase by 0.5% YoY (flat QoQ). Volume growth for the two-wheeler industry has beensubdued. We expect this to change from 1QFY09 – two-wheeler volumes would be boosted by new launches andlower acquisition cost following the reduction in excise duty rate from 16% to 12%.
? We expect net sales to grow 4.5% YoY to Rs27.6b, while operating margins are likely to increase 310bp YoY to13.6%, resulting in an EBITDA of Rs3.8b. The YoY improvement in the margins would be on account of lower ad-spend (4QFY07 and 1QFY08 involved higher expenditure due to the cricket world cup). Other factors expected tocontribute to margin improvement are selling of deluxe versions of bikes and lower cost of imported alloy wheels.
? The company’s 150cc bike Hunk, which was launched in 3QFY08, has seen good initial response. Its venture intothe scooters segment has scaled up rapidly – scooter sales constituted 3.3% of Hero Honda’s two-wheeler salesduring FY08 (2.8% in FY07).
? The new 0.5m-unit plant in Uttaranchal has been completed in mid-FY08, with production likely to commence inFY09. This would help Hero Honda to avail tax benefits in FY09.
? We expect flat volumes in FY08 and 8.6% volume growth in FY09. The stock trades at 15.2x FY08E EPS of Rs46.2and 13.9x FY09E EPS of Rs50.5. We maintain Buy.

6228 March 2008
Mahindra & Mahindra
YEAR NET SALES S/A PAT ADJ.EPS CONS. P/E CONS, ROE ROCE EV/ EV/END (RS M) (RS M) (RS) EPS (RS) (X) P/E (X) (%) (%) SALES EBITDA
3/07A 99,874 9,198 35.9 55.1 19.2 12.6 25.9 22.3 1.5 12.1
3/08E 112,551 9,095 35.5 62.8 19.4 11.0 20.7 19.6 1.2 10.8
3/09E 125,368 9,449 36.9 72.9 18.7 9.5 19.0 19.3 1.0 9.5
3/10E 138,400 10,523 41.1 85.0 16.8 8.1 18.6 19.4 0.9 8.0
Diluted Eq. Shares (m) 255.9
52-Week Range 872/543
1,6,12 Rel.Perf.(%) 10/-3/-36
M.Cap. (Rs b) 176.9
M.Cap. (US$ b) 4.4
QUARTERLY PERFORMANCE (RS MILLION)Y/E MARCH FY07 FY08 FY07 FY08E
1Q 2Q 3Q 4Q 1Q 2Q 3Q 4QETotal Volumes (nos) 62,417 66,649 73,973 77,727 70,915 72,203 79,520 79,707 280,766 302,345Total Income 22,172 24,501 25,761 27,439 26,128 27,095 29,402 29,926 99,874 112,551
Change (%) 22.4 28.0 17.8 23.2 17.8 10.6 14.1 9.1 22.7 12.7Total Cost 19,660 21,209 22,664 24,340 23,357 24,170 26,087 26,574 87,874 100,188EBITDA 2,512 3,292 3,096 3,099 2,771 2,925 3,315 3,352 12,000 12,363
As % of Sales 11.3 13.4 12.0 11.3 10.6 10.8 11.3 11.2 12.0 11.0Change (%) 30.2 50.9 17.5 46.3 10.3 -11.2 7.1 8.2 35.4 3.0
Non-Operating Income 454 478 412 354 316 692 401 375 1,698 1,784Extraordinary Income 190 1,393 0 116 0 929 1,571 0 1,699 2,500Extraordinary Expense 15 0 6 192 16 19 23 0 213 58Interest -147 -155 -168 -205 -51 82 72 65 -675 169Gross Profit 3,288 5,318 3,670 3,582 3,122 4,444 5,192 3,663 15,859 16,420Less: Depreciation 463 501 522 609 571 577 590 617 2,096 2,355PBT 2,825 4,817 3,148 2,973 2,551 3,867 4,601 3,046 13,763 14,065Tax 784 952 731 613 640 1,008 550 628 3,079 2,825
Effective Tax Rate (%) 27.7 19.8 23.2 20.6 25.1 26.1 12.0 20.6 22.4 20.1PAT 2,042 3,865 2,417 2,360 1,912 2,859 4,052 2,418 10,684 11,241
Change (%) 40.6 145.9 3.5 -26.5 -6.4 -26.0 67.6 2.4 24.7 5.2Adj PAT 1,867 2,472 2,423 2,436 1,923 2,259 2,496 2,418 9,198 9,095
Change (%) 27.2 55.8 35.3 49.0 3.0 -8.6 3.0 -0.7 42.0 -1.1E: MOSt Estimates
BuyPrevious Recommendation: Buy Rs691
28 March 2008BLOOMBERGMM IN
REUTERS CODEMAHM.BO
Results PreviewSECTOR: AUTOMOBILES
Amit Kasat ([email protected]);Tel:+91 22 3982 5411/ Rohan A Korde ([email protected]); Tel: + 91 22 3982 5414
STOCK INFO.BSE Sensex: 16,371
S&P CNX: 4,942
? We expect M&M to report overall volume growth of 2.5% YoY in 4QFY08 (excluding Logan), driven by stronggrowth in UVs (+12.74% YoY). However, three-wheelers and tractors are likely to register volume declines of19.8% YoY and 5.5% YoY, respectively.
? Net sales should grow 9.1% YoY to Rs29.9b. We expect margins to decline 10bp to 11.2%, resulting in 8.2% increasein EBITDA to Rs3.4b, and an adjusted PAT of Rs2.4b – a marginal decline of 0.7% YoY.
? In FY08, we expect M&M to deliver 12.7% total income growth to Rs112.6b, while net profit is expected to declinemarginally by 1.1% to Rs9.1b.
? M&M’s board has approved the amalgamation of Mahindra Holdings & Finance (100% subsidiary) into M&M; themerger would be effective from 1 February 2008. M&M would issue 12.8m equity shares to the shareholders ofMHFL – the swap ratio would be 1 share of M&M for every 4 shares of MHFL. This would result in a 5% dilutionof M&M’s existing equity capital.
? M&M enjoys market leadership in both UVs and tractors. Given the rural bias in its product mix, we expect thecompany to benefit significantly from the government’s thrust on the development of the rural economy. The stockquotes at 11x FY08E and 9.5x FY09E consolidated earnings of Rs62.8 and Rs72.9, respectively. We maintain Buy.
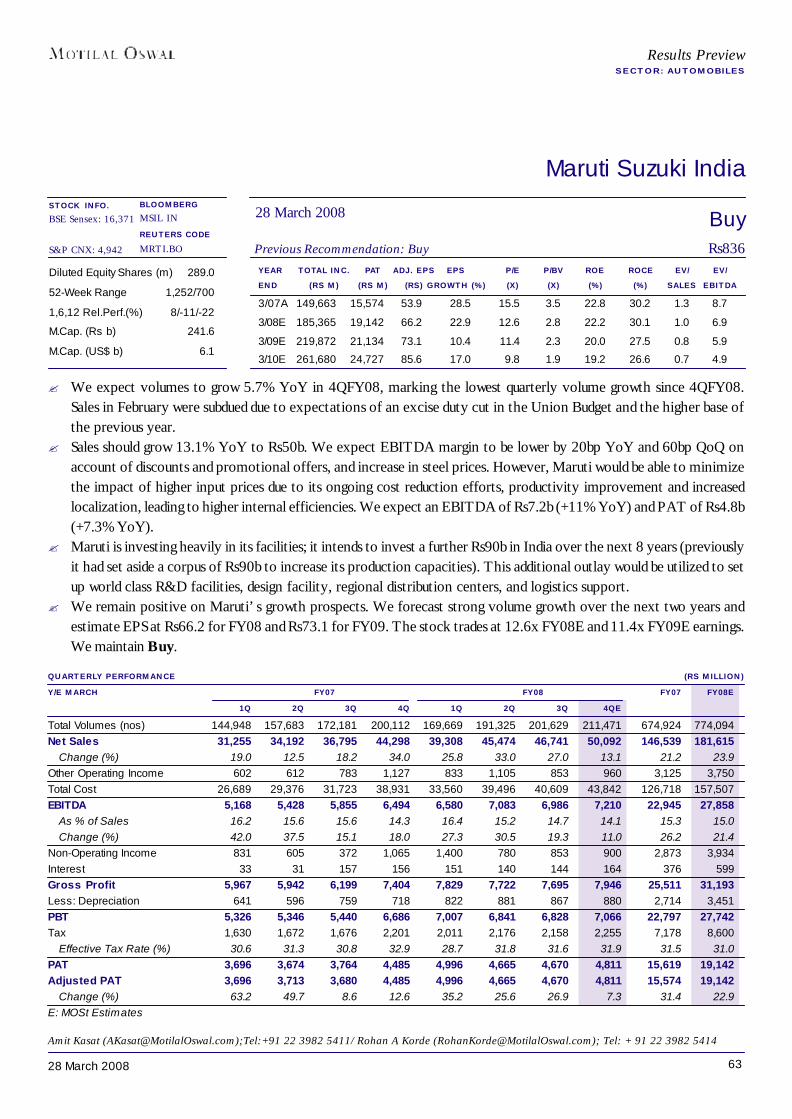
6328 March 2008
Maruti Suzuki India
YEAR TOTAL INC. PAT ADJ. EPS EPS P/E P/BV ROE ROCE EV/ EV/END (RS M) (RS M) (RS) GROWTH (%) (X) (X) (%) (%) SALES EBITDA
3/07A 149,663 15,574 53.9 28.5 15.5 3.5 22.8 30.2 1.3 8.7
3/08E 185,365 19,142 66.2 22.9 12.6 2.8 22.2 30.1 1.0 6.9
3/09E 219,872 21,134 73.1 10.4 11.4 2.3 20.0 27.5 0.8 5.9
3/10E 261,680 24,727 85.6 17.0 9.8 1.9 19.2 26.6 0.7 4.9
Diluted Equity Shares (m) 289.0
52-Week Range 1,252/700
1,6,12 Rel.Perf.(%) 8/-11/-22
M.Cap. (Rs b) 241.6
M.Cap. (US$ b) 6.1
QUARTERLY PERFORMANCE (RS MILLION)Y/E MARCH FY07 FY08 FY07 FY08E
1Q 2Q 3Q 4Q 1Q 2Q 3Q 4QETotal Volumes (nos) 144,948 157,683 172,181 200,112 169,669 191,325 201,629 211,471 674,924 774,094Net Sales 31,255 34,192 36,795 44,298 39,308 45,474 46,741 50,092 146,539 181,615
Change (%) 19.0 12.5 18.2 34.0 25.8 33.0 27.0 13.1 21.2 23.9Other Operating Income 602 612 783 1,127 833 1,105 853 960 3,125 3,750Total Cost 26,689 29,376 31,723 38,931 33,560 39,496 40,609 43,842 126,718 157,507EBITDA 5,168 5,428 5,855 6,494 6,580 7,083 6,986 7,210 22,945 27,858
As % of Sales 16.2 15.6 15.6 14.3 16.4 15.2 14.7 14.1 15.3 15.0Change (%) 42.0 37.5 15.1 18.0 27.3 30.5 19.3 11.0 26.2 21.4
Non-Operating Income 831 605 372 1,065 1,400 780 853 900 2,873 3,934Interest 33 31 157 156 151 140 144 164 376 599Gross Profit 5,967 5,942 6,199 7,404 7,829 7,722 7,695 7,946 25,511 31,193Less: Depreciation 641 596 759 718 822 881 867 880 2,714 3,451PBT 5,326 5,346 5,440 6,686 7,007 6,841 6,828 7,066 22,797 27,742Tax 1,630 1,672 1,676 2,201 2,011 2,176 2,158 2,255 7,178 8,600
Effective Tax Rate (%) 30.6 31.3 30.8 32.9 28.7 31.8 31.6 31.9 31.5 31.0PAT 3,696 3,674 3,764 4,485 4,996 4,665 4,670 4,811 15,619 19,142Adjusted PAT 3,696 3,713 3,680 4,485 4,996 4,665 4,670 4,811 15,574 19,142
Change (%) 63.2 49.7 8.6 12.6 35.2 25.6 26.9 7.3 31.4 22.9E: MOSt Estimates
BuyPrevious Recommendation: Buy Rs836
28 March 2008BLOOMBERGMSIL IN
REUTERS CODEMRTI.BO
Results PreviewSECTOR: AUTOMOBILES
Amit Kasat ([email protected]);Tel:+91 22 3982 5411/ Rohan A Korde ([email protected]); Tel: + 91 22 3982 5414
STOCK INFO.BSE Sensex: 16,371
S&P CNX: 4,942
? We expect volumes to grow 5.7% YoY in 4QFY08, marking the lowest quarterly volume growth since 4QFY08.Sales in February were subdued due to expectations of an excise duty cut in the Union Budget and the higher base ofthe previous year.
? Sales should grow 13.1% YoY to Rs50b. We expect EBITDA margin to be lower by 20bp YoY and 60bp QoQ onaccount of discounts and promotional offers, and increase in steel prices. However, Maruti would be able to minimizethe impact of higher input prices due to its ongoing cost reduction efforts, productivity improvement and increasedlocalization, leading to higher internal efficiencies. We expect an EBITDA of Rs7.2b (+11% YoY) and PAT of Rs4.8b(+7.3% YoY).
? Maruti is investing heavily in its facilities; it intends to invest a further Rs90b in India over the next 8 years (previouslyit had set aside a corpus of Rs90b to increase its production capacities). This additional outlay would be utilized to setup world class R&D facilities, design facility, regional distribution centers, and logistics support.
? We remain positive on Maruti’s growth prospects. We forecast strong volume growth over the next two years andestimate EPS at Rs66.2 for FY08 and Rs73.1 for FY09. The stock trades at 12.6x FY08E and 11.4x FY09E earnings.We maintain Buy.
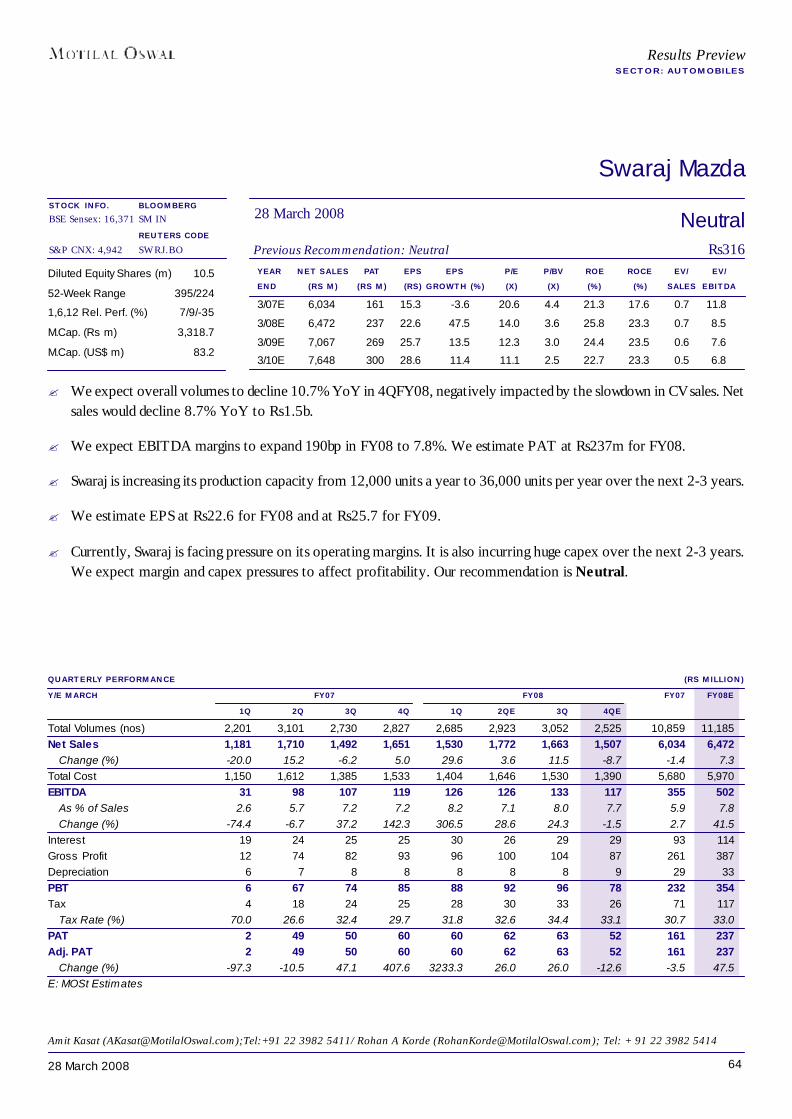
6428 March 2008
Swaraj Mazda
YEAR NET SALES PAT EPS EPS P/E P/BV ROE ROCE EV/ EV/END (RS M) (RS M) (RS) GROWTH (%) (X) (X) (%) (%) SALES EBITDA
3/07E 6,034 161 15.3 -3.6 20.6 4.4 21.3 17.6 0.7 11.8
3/08E 6,472 237 22.6 47.5 14.0 3.6 25.8 23.3 0.7 8.5
3/09E 7,067 269 25.7 13.5 12.3 3.0 24.4 23.5 0.6 7.6
3/10E 7,648 300 28.6 11.4 11.1 2.5 22.7 23.3 0.5 6.8
Diluted Equity Shares (m) 10.5
52-Week Range 395/224
1,6,12 Rel. Perf. (%) 7/9/-35
M.Cap. (Rs m) 3,318.7
M.Cap. (US$ m) 83.2
QUARTERLY PERFORMANCE (RS MILLION)Y/E MARCH FY07 FY08 FY07 FY08E
1Q 2Q 3Q 4Q 1Q 2QE 3Q 4QETotal Volumes (nos) 2,201 3,101 2,730 2,827 2,685 2,923 3,052 2,525 10,859 11,185Net Sales 1,181 1,710 1,492 1,651 1,530 1,772 1,663 1,507 6,034 6,472
Change (%) -20.0 15.2 -6.2 5.0 29.6 3.6 11.5 -8.7 -1.4 7.3Total Cost 1,150 1,612 1,385 1,533 1,404 1,646 1,530 1,390 5,680 5,970EBITDA 31 98 107 119 126 126 133 117 355 502
As % of Sales 2.6 5.7 7.2 7.2 8.2 7.1 8.0 7.7 5.9 7.8Change (%) -74.4 -6.7 37.2 142.3 306.5 28.6 24.3 -1.5 2.7 41.5
Interest 19 24 25 25 30 26 29 29 93 114Gross Profit 12 74 82 93 96 100 104 87 261 387Depreciation 6 7 8 8 8 8 8 9 29 33PBT 6 67 74 85 88 92 96 78 232 354Tax 4 18 24 25 28 30 33 26 71 117
Tax Rate (%) 70.0 26.6 32.4 29.7 31.8 32.6 34.4 33.1 30.7 33.0PAT 2 49 50 60 60 62 63 52 161 237Adj. PAT 2 49 50 60 60 62 63 52 161 237
Change (%) -97.3 -10.5 47.1 407.6 3233.3 26.0 26.0 -12.6 -3.5 47.5E: MOSt Estimates
NeutralPrevious Recommendation: Neutral Rs316
28 March 2008BLOOMBERGSM IN
REUTERS CODESWRJ.BO
Results PreviewSECTOR: AUTOMOBILES
Amit Kasat ([email protected]);Tel:+91 22 3982 5411/ Rohan A Korde ([email protected]); Tel: + 91 22 3982 5414
STOCK INFO.BSE Sensex: 16,371
S&P CNX: 4,942
? We expect overall volumes to decline 10.7% YoY in 4QFY08, negatively impacted by the slowdown in CV sales. Netsales would decline 8.7% YoY to Rs1.5b.
? We expect EBITDA margins to expand 190bp in FY08 to 7.8%. We estimate PAT at Rs237m for FY08.
? Swaraj is increasing its production capacity from 12,000 units a year to 36,000 units per year over the next 2-3 years.
? We estimate EPS at Rs22.6 for FY08 and at Rs25.7 for FY09.
? Currently, Swaraj is facing pressure on its operating margins. It is also incurring huge capex over the next 2-3 years.We expect margin and capex pressures to affect profitability. Our recommendation is Neutral.
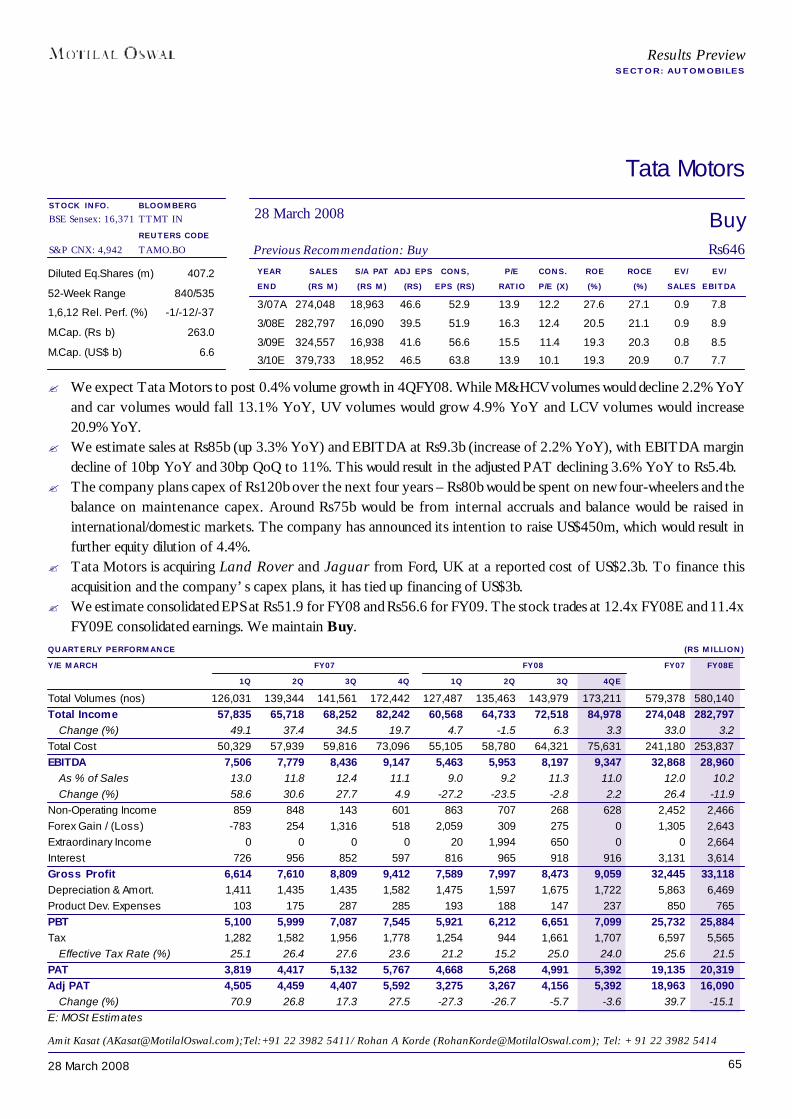
6528 March 2008
Results PreviewSECTOR: AUTOMOBILES
Tata Motors
YEAR SALES S/A PAT ADJ EPS CONS, P/E CONS. ROE ROCE EV/ EV/END (RS M) (RS M) (RS) EPS (RS) RATIO P/E (X) (%) (%) SALES EBITDA
3/07A 274,048 18,963 46.6 52.9 13.9 12.2 27.6 27.1 0.9 7.8
3/08E 282,797 16,090 39.5 51.9 16.3 12.4 20.5 21.1 0.9 8.9
3/09E 324,557 16,938 41.6 56.6 15.5 11.4 19.3 20.3 0.8 8.5
3/10E 379,733 18,952 46.5 63.8 13.9 10.1 19.3 20.9 0.7 7.7
Diluted Eq.Shares (m) 407.2
52-Week Range 840/535
1,6,12 Rel. Perf. (%) -1/-12/-37
M.Cap. (Rs b) 263.0
M.Cap. (US$ b) 6.6
QUARTERLY PERFORMANCE (RS MILLION)Y/E MARCH FY07 FY08 FY07 FY08E
1Q 2Q 3Q 4Q 1Q 2Q 3Q 4QETotal Volumes (nos) 126,031 139,344 141,561 172,442 127,487 135,463 143,979 173,211 579,378 580,140Total Income 57,835 65,718 68,252 82,242 60,568 64,733 72,518 84,978 274,048 282,797
Change (%) 49.1 37.4 34.5 19.7 4.7 -1.5 6.3 3.3 33.0 3.2Total Cost 50,329 57,939 59,816 73,096 55,105 58,780 64,321 75,631 241,180 253,837EBITDA 7,506 7,779 8,436 9,147 5,463 5,953 8,197 9,347 32,868 28,960
As % of Sales 13.0 11.8 12.4 11.1 9.0 9.2 11.3 11.0 12.0 10.2Change (%) 58.6 30.6 27.7 4.9 -27.2 -23.5 -2.8 2.2 26.4 -11.9
Non-Operating Income 859 848 143 601 863 707 268 628 2,452 2,466Forex Gain / (Loss) -783 254 1,316 518 2,059 309 275 0 1,305 2,643Extraordinary Income 0 0 0 0 20 1,994 650 0 0 2,664Interest 726 956 852 597 816 965 918 916 3,131 3,614Gross Profit 6,614 7,610 8,809 9,412 7,589 7,997 8,473 9,059 32,445 33,118Depreciation & Amort. 1,411 1,435 1,435 1,582 1,475 1,597 1,675 1,722 5,863 6,469Product Dev. Expenses 103 175 287 285 193 188 147 237 850 765PBT 5,100 5,999 7,087 7,545 5,921 6,212 6,651 7,099 25,732 25,884Tax 1,282 1,582 1,956 1,778 1,254 944 1,661 1,707 6,597 5,565
Effective Tax Rate (%) 25.1 26.4 27.6 23.6 21.2 15.2 25.0 24.0 25.6 21.5PAT 3,819 4,417 5,132 5,767 4,668 5,268 4,991 5,392 19,135 20,319Adj PAT 4,505 4,459 4,407 5,592 3,275 3,267 4,156 5,392 18,963 16,090
Change (%) 70.9 26.8 17.3 27.5 -27.3 -26.7 -5.7 -3.6 39.7 -15.1E: MOSt Estimates
BuyPrevious Recommendation: Buy Rs646
28 March 2008BLOOMBERGTTMT IN
REUTERS CODETAMO.BO
Amit Kasat ([email protected]);Tel:+91 22 3982 5411/ Rohan A Korde ([email protected]); Tel: + 91 22 3982 5414
STOCK INFO.BSE Sensex: 16,371
S&P CNX: 4,942
? We expect Tata Motors to post 0.4% volume growth in 4QFY08. While M&HCV volumes would decline 2.2% YoYand car volumes would fall 13.1% YoY, UV volumes would grow 4.9% YoY and LCV volumes would increase20.9% YoY.
? We estimate sales at Rs85b (up 3.3% YoY) and EBITDA at Rs9.3b (increase of 2.2% YoY), with EBITDA margindecline of 10bp YoY and 30bp QoQ to 11%. This would result in the adjusted PAT declining 3.6% YoY to Rs5.4b.
? The company plans capex of Rs120b over the next four years – Rs80b would be spent on new four-wheelers and thebalance on maintenance capex. Around Rs75b would be from internal accruals and balance would be raised ininternational/domestic markets. The company has announced its intention to raise US$450m, which would result infurther equity dilution of 4.4%.
? Tata Motors is acquiring Land Rover and Jaguar from Ford, UK at a reported cost of US$2.3b. To finance thisacquisition and the company’s capex plans, it has tied up financing of US$3b.
? We estimate consolidated EPS at Rs51.9 for FY08 and Rs56.6 for FY09. The stock trades at 12.4x FY08E and 11.4xFY09E consolidated earnings. We maintain Buy.
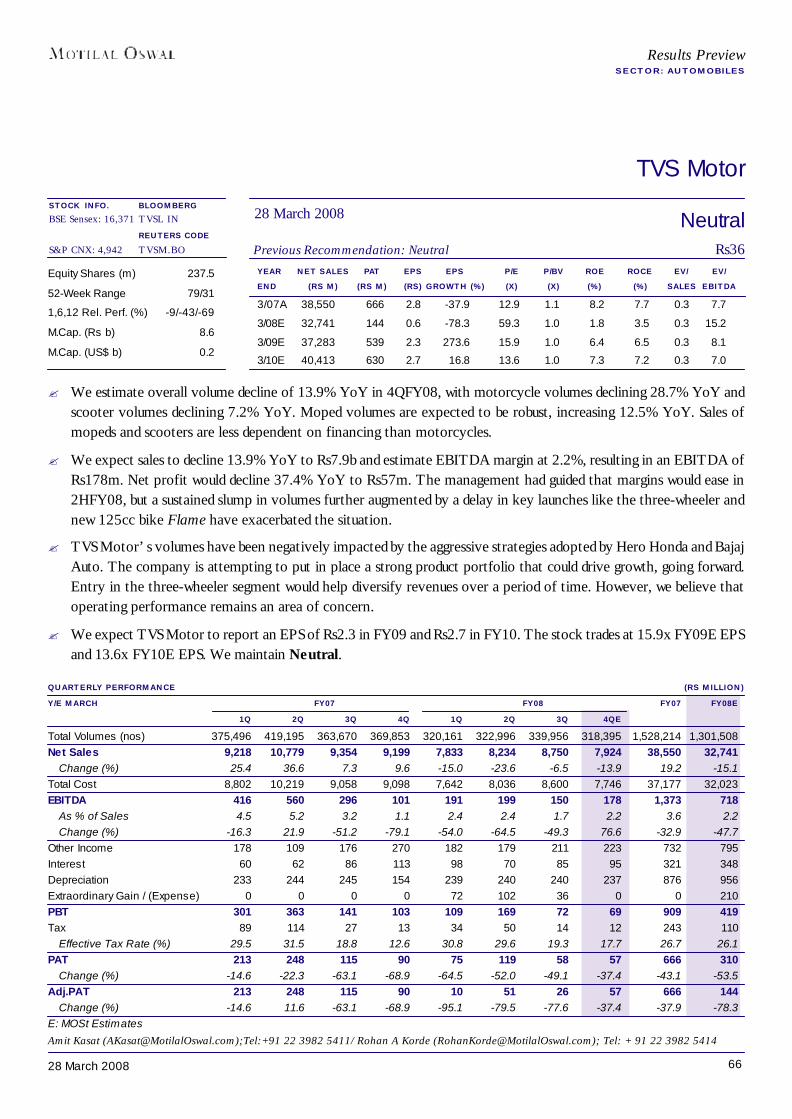
6628 March 2008
Results PreviewSECTOR: AUTOMOBILES
TVS Motor
YEAR NET SALES PAT EPS EPS P/E P/BV ROE ROCE EV/ EV/END (RS M) (RS M) (RS) GROWTH (%) (X) (X) (%) (%) SALES EBITDA
3/07A 38,550 666 2.8 -37.9 12.9 1.1 8.2 7.7 0.3 7.7
3/08E 32,741 144 0.6 -78.3 59.3 1.0 1.8 3.5 0.3 15.2
3/09E 37,283 539 2.3 273.6 15.9 1.0 6.4 6.5 0.3 8.1
3/10E 40,413 630 2.7 16.8 13.6 1.0 7.3 7.2 0.3 7.0
Equity Shares (m) 237.5
52-Week Range 79/31
1,6,12 Rel. Perf. (%) -9/-43/-69
M.Cap. (Rs b) 8.6
M.Cap. (US$ b) 0.2
QUARTERLY PERFORMANCE (RS MILLION)Y/E MARCH FY07 FY08 FY07 FY08E
1Q 2Q 3Q 4Q 1Q 2Q 3Q 4QETotal Volumes (nos) 375,496 419,195 363,670 369,853 320,161 322,996 339,956 318,395 1,528,214 1,301,508Net Sales 9,218 10,779 9,354 9,199 7,833 8,234 8,750 7,924 38,550 32,741
Change (%) 25.4 36.6 7.3 9.6 -15.0 -23.6 -6.5 -13.9 19.2 -15.1Total Cost 8,802 10,219 9,058 9,098 7,642 8,036 8,600 7,746 37,177 32,023EBITDA 416 560 296 101 191 199 150 178 1,373 718
As % of Sales 4.5 5.2 3.2 1.1 2.4 2.4 1.7 2.2 3.6 2.2Change (%) -16.3 21.9 -51.2 -79.1 -54.0 -64.5 -49.3 76.6 -32.9 -47.7
Other Income 178 109 176 270 182 179 211 223 732 795Interest 60 62 86 113 98 70 85 95 321 348Depreciation 233 244 245 154 239 240 240 237 876 956Extraordinary Gain / (Expense) 0 0 0 0 72 102 36 0 0 210PBT 301 363 141 103 109 169 72 69 909 419Tax 89 114 27 13 34 50 14 12 243 110
Effective Tax Rate (%) 29.5 31.5 18.8 12.6 30.8 29.6 19.3 17.7 26.7 26.1PAT 213 248 115 90 75 119 58 57 666 310
Change (%) -14.6 -22.3 -63.1 -68.9 -64.5 -52.0 -49.1 -37.4 -43.1 -53.5Adj.PAT 213 248 115 90 10 51 26 57 666 144
Change (%) -14.6 11.6 -63.1 -68.9 -95.1 -79.5 -77.6 -37.4 -37.9 -78.3E: MOSt Estimates
NeutralPrevious Recommendation: Neutral Rs36
28 March 2008BLOOMBERGTVSL IN
REUTERS CODETVSM.BO
Amit Kasat ([email protected]);Tel:+91 22 3982 5411/ Rohan A Korde ([email protected]); Tel: + 91 22 3982 5414
STOCK INFO.BSE Sensex: 16,371
S&P CNX: 4,942
? We estimate overall volume decline of 13.9% YoY in 4QFY08, with motorcycle volumes declining 28.7% YoY andscooter volumes declining 7.2% YoY. Moped volumes are expected to be robust, increasing 12.5% YoY. Sales ofmopeds and scooters are less dependent on financing than motorcycles.
? We expect sales to decline 13.9% YoY to Rs7.9b and estimate EBITDA margin at 2.2%, resulting in an EBITDA ofRs178m. Net profit would decline 37.4% YoY to Rs57m. The management had guided that margins would ease in2HFY08, but a sustained slump in volumes further augmented by a delay in key launches like the three-wheeler andnew 125cc bike Flame have exacerbated the situation.
? TVS Motor’s volumes have been negatively impacted by the aggressive strategies adopted by Hero Honda and BajajAuto. The company is attempting to put in place a strong product portfolio that could drive growth, going forward.Entry in the three-wheeler segment would help diversify revenues over a period of time. However, we believe thatoperating performance remains an area of concern.
? We expect TVS Motor to report an EPS of Rs2.3 in FY09 and Rs2.7 in FY10. The stock trades at 15.9x FY09E EPSand 13.6x FY10E EPS. We maintain Neutral.

6728 March 2008
Banking
COMPANY NAME PG.Andhra Bank 75
Axis Bank 76
Bank of Baroda 77
Bank of India 78
Canara Bank 79
Corporation Bank 80
HDFC 81
HDFC Bank 82
Federal Bank 83
ICICI Bank 84
Indian Bank 85
Indian Overseas Bank 86
J&K Bank 87
Karnataka Bank 88
Oriental Bank 89
Punjab National Bank 90
State Bank 91
Syndicate Bank 92
Union Bank 93
Vijaya Bank 94
EXPECTED QUARTERLY PERFORMANCE SUMMARY (RS MILLION)RECO NET INTEREST OPERATING PROFIT NET PROFIT
MAR.08 CHG. (%) MAR.08 CHG. (%) MAR.08 CHG. (%)BanksAndhra Bank Buy 3,805 -1.9 2,527 -14.6 1,595 14.9Axis Bank Buy 7,504 70.9 6,374 60.5 2,873 35.5Bank of Baroda Buy 10,340 -1.9 7,637 2.7 3,605 46.7Bank of India Buy 11,263 16.4 9,110 1.8 4,504 0.7Canara Bank Neutral 9,464 -10.6 7,607 -24.3 4,426 -12.2Corporation Bank Neutral 3,547 -7.8 2,605 -24.1 1,426 20.3Federal Bank Buy 2,518 12.5 2,046 -9.0 1,115 12.4HDFC Buy 9,060 25.1 8,468 24.3 6,188 12.5HDFC Bank Neutral 15,568 47.6 10,671 39.5 4,683 36.3ICICI Bank Buy 20,396 26.8 20,551 14.9 9,278 12.4Indian Bank Buy 6,003 9.2 4,080 -24.7 2,608 10.8Indian Overseas Bank Buy 7,120 -7.3 5,369 -4.4 3,076 6.2J&K Bank Buy 2,203 8.8 1,849 13.4 1,009 122.9Karnataka Bank Buy 1,277 -0.9 1,155 10.2 541 102.1Oriental Bank Neutral 4,402 -1.4 3,134 -3.5 1,967 67.9Punjab National Bank Buy 14,466 7.4 9,447 7.1 3,185 34.0State Bank Buy 45,353 0.7 38,005 1.8 17,384 16.4Syndicate Bank Buy 5,036 -16.6 3,274 -30.9 1,346 29.1Union Bank Buy 8,174 -3.0 6,059 -15.8 2,622 14.7Vijaya Bank Neutral 2,453 -15.1 1,355 -33.5 829 30.2Sector Aggregate 189,951 8.0 151,324 1.9 74,260 17.4
In 4QFY08 (as at 14 March 2008), non-food credit grew ~7% QoQ and ~22.5% YoY toRs22.3t. Slowing demand for housing loans and lower than anticipated credit demandfrom corporates has led to moderation in credit growth.
Deposits grew ~23% YoY and 5% QoQ to Rs30.7t on the back of higher interest ratesoffered by the banks. There was increased competitive pressure to raise deposits in1HFY08, as banks were anticipating a pick-up in credit and they also wanted to reducethe proportion of high cost bulk deposits towards the end of the year. In FY08, the C/Dratio declined marginally to 73.9% from 74.1% recorded in FY07. However, incrementalC/D ratio has been more than 100% during 4QFY08.
Lending yields have peaked for most banks and increase in yields from 3QFY08 levelswould be marginal, if any. SBI and many large banks (excluding ICICI Bank) havereduced PLR by 25-50bp during the quarter to boost credit demand. Reduction in PLRwas contrary to our expectation and given the current inflationary concerns in the economy,there is a high probability of interest rates rising. While liquidity crunch during 4QFY08has heated up interest rates in the bulk market, the severity is significantly lower comparedto last year. Downward re-pricing of these deposits in 4QFY08 would lower cost offunds for banks like ICICI Bank, Canara Bank, OBC, Andhra Bank, etc in FY09.
Manish Karwa ([email protected])/Ajinkya Dhavale ([email protected])/Alpesh Mehta ([email protected])
BSE Sensex: 16,371 S&P CNX: 4,942 28 March 2008
Results PreviewQUARTER ENDED MARCH 2008
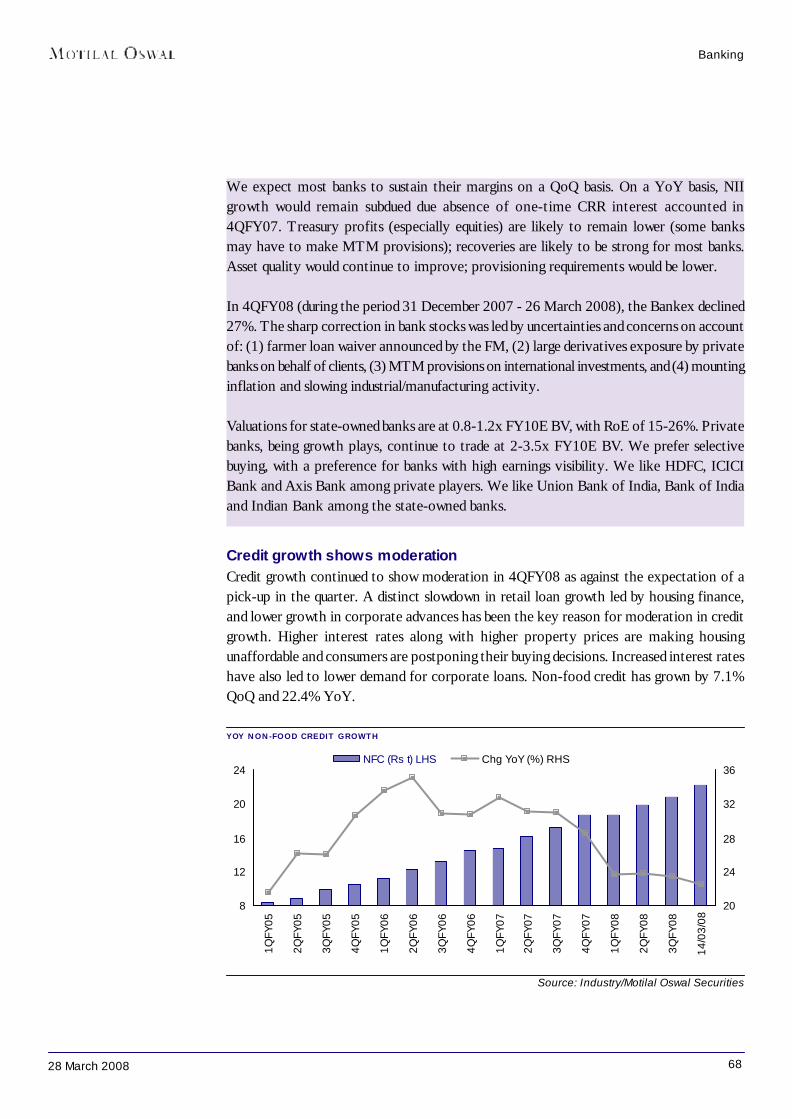
6828 March 2008
Banking
We expect most banks to sustain their margins on a QoQ basis. On a YoY basis, NIIgrowth would remain subdued due absence of one-time CRR interest accounted in4QFY07. Treasury profits (especially equities) are likely to remain lower (some banksmay have to make MTM provisions); recoveries are likely to be strong for most banks.Asset quality would continue to improve; provisioning requirements would be lower.
In 4QFY08 (during the period 31 December 2007 - 26 March 2008), the Bankex declined27%. The sharp correction in bank stocks was led by uncertainties and concerns on accountof: (1) farmer loan waiver announced by the FM, (2) large derivatives exposure by privatebanks on behalf of clients, (3) MTM provisions on international investments, and (4) mountinginflation and slowing industrial/manufacturing activity.
Valuations for state-owned banks are at 0.8-1.2x FY10E BV, with RoE of 15-26%. Privatebanks, being growth plays, continue to trade at 2-3.5x FY10E BV. We prefer selectivebuying, with a preference for banks with high earnings visibility. We like HDFC, ICICIBank and Axis Bank among private players. We like Union Bank of India, Bank of Indiaand Indian Bank among the state-owned banks.
Credit growth shows moderationCredit growth continued to show moderation in 4QFY08 as against the expectation of apick-up in the quarter. A distinct slowdown in retail loan growth led by housing finance,and lower growth in corporate advances has been the key reason for moderation in creditgrowth. Higher interest rates along with higher property prices are making housingunaffordable and consumers are postponing their buying decisions. Increased interest rateshave also led to lower demand for corporate loans. Non-food credit has grown by 7.1%QoQ and 22.4% YoY.
YOY NON-FOOD CREDIT GROWTH
Source: Industry/Motilal Oswal Securities
8
12
16
20
24
1QFY
05
2QFY
05
3QFY
05
4QFY
05
1QFY
06
2QFY
06
3QFY
06
4QFY
06
1QFY
07
2QFY
07
3QFY
07
4QFY
07
1QFY
08
2QFY
08
3QFY
08
14/0
3/08
20
24
28
32
36NFC (Rs t) LHS Chg YoY (%) RHS

6928 March 2008
Banking
We believe that lending yields have peaked for most of the banks and improvement inyields from 3QFY08 levels would be marginal, if any. SBI and many large banks (excludingICICI Bank) have reduced PLR by 25-50bp in 4QFY08 to boost credit demand. Webelieve that reduction in PLR without corresponding cut in deposit rates (especially forSBI) would maintain downward pressure on margins in 1HFY09.
Deposit growth remain higher than advances growthDeposits grew ~23% YoY and 5% QoQ to Rs30.7t on the back of higher interest ratesoffered by the banks. There was increased competitive pressure to raise deposits in4QFY08, as banks were anticipating a pick-up in credit and they also wanted to reducethe proportion of high cost bulk deposits towards the end of the year. In FY08, the C/Dratio declined marginally to 73.9% from 74.1% recorded in FY07. However, incrementalC/D ratio has been more than 100% during 4QFY08.
DEPOSITS GROWTH YOY BASIS
Source: Industry/Motilal Oswal Securities
Banks have reduced PLR too early, likely pressure on marginsSBI announced a total 50bp cut in PLR in two tranches of 25bp each in February 2008.The decision to lower lending rates was to increase credit volume during 4QFY08. SBI’smove to reduce lending rates was followed by most of the large state-owned banks likeCanara Bank, PNB, BoI and BoB. Except Axis Bank, private banks have not reducedtheir PLR so far. HDFC passed on the benefit of its lower cost of funds during 2HFY08to customers by reducing its lending rates by 25bp.
The PLR cut in February came as a negative surprise for us. With inflationary conditionsin the economy worsening, there is now a probability of interest rates actually rising. ThePLR cut would imply that sustained improvement in yields over several previous quarterswould stall or may be marginal, going forward. Since >50% of advances of state-ownedbanks are sub-PLR, we believe they would reduce the discounts to PLR to counter theeffect of decrease in PLR. Thus, we do not see yields dropping significantly.
12
18
24
30
36
1QFY
05
2QFY
05
3QFY
05
4QFY
05
1QFY
06
2QFY
06
3QFY
06
4QFY
06
1QFY
07
2QFY
07
3QFY
07
4QFY
07
1QFY
08
2QFY
08
3QFY
08
14/0
3/08
0
8
16
24
32Deposits (Rs t) LHS Chg YoY (%) RHS
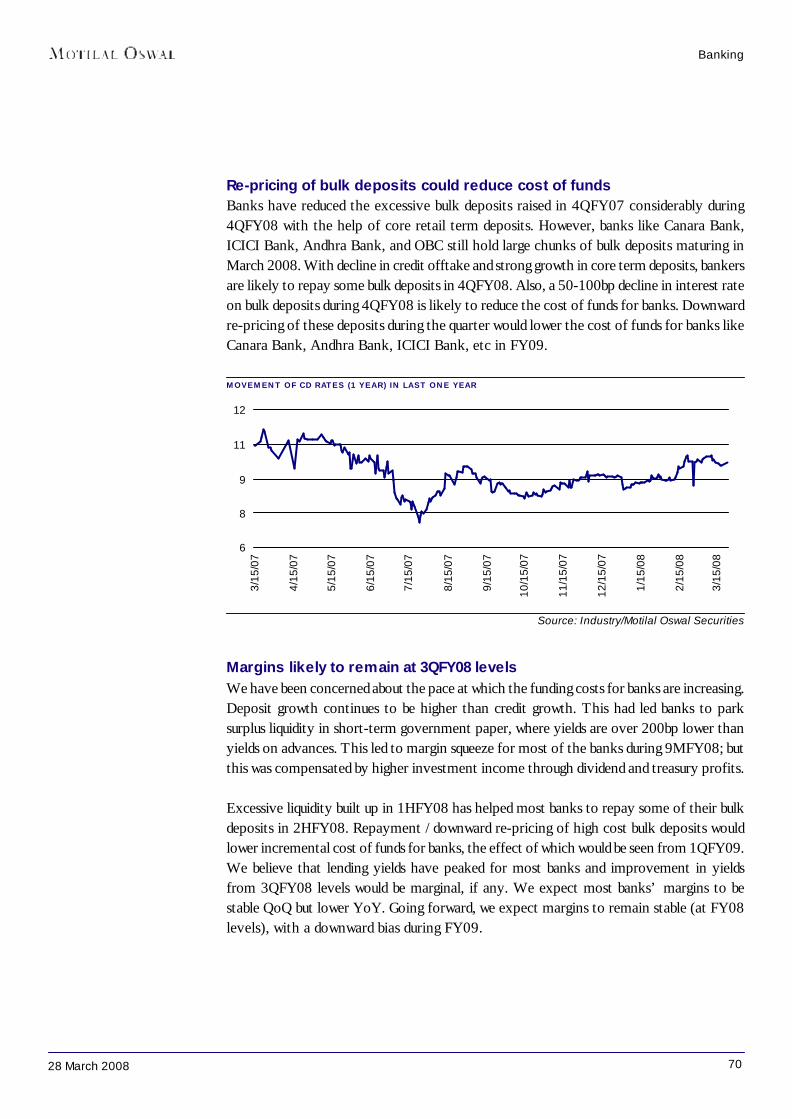
7028 March 2008
Banking
Re-pricing of bulk deposits could reduce cost of fundsBanks have reduced the excessive bulk deposits raised in 4QFY07 considerably during4QFY08 with the help of core retail term deposits. However, banks like Canara Bank,ICICI Bank, Andhra Bank, and OBC still hold large chunks of bulk deposits maturing inMarch 2008. With decline in credit offtake and strong growth in core term deposits, bankersare likely to repay some bulk deposits in 4QFY08. Also, a 50-100bp decline in interest rateon bulk deposits during 4QFY08 is likely to reduce the cost of funds for banks. Downwardre-pricing of these deposits during the quarter would lower the cost of funds for banks likeCanara Bank, Andhra Bank, ICICI Bank, etc in FY09.
MOVEMENT OF CD RATES (1 YEAR) IN LAST ONE YEAR
Source: Industry/Motilal Oswal Securities
Margins likely to remain at 3QFY08 levelsWe have been concerned about the pace at which the funding costs for banks are increasing.Deposit growth continues to be higher than credit growth. This had led banks to parksurplus liquidity in short-term government paper, where yields are over 200bp lower thanyields on advances. This led to margin squeeze for most of the banks during 9MFY08; butthis was compensated by higher investment income through dividend and treasury profits.
Excessive liquidity built up in 1HFY08 has helped most banks to repay some of their bulkdeposits in 2HFY08. Repayment / downward re-pricing of high cost bulk deposits wouldlower incremental cost of funds for banks, the effect of which would be seen from 1QFY09.We believe that lending yields have peaked for most banks and improvement in yieldsfrom 3QFY08 levels would be marginal, if any. We expect most banks’ margins to bestable QoQ but lower YoY. Going forward, we expect margins to remain stable (at FY08levels), with a downward bias during FY09.
6
8
9
11
12
3/15
/07
4/15
/07
5/15
/07
6/15
/07
7/15
/07
8/15
/07
9/15
/07
10/1
5/07
11/1
5/07
12/1
5/07
1/15
/08
2/15
/08
3/15
/08

7128 March 2008
Banking
While operating profit growth would be subdued…Sustained pressure on NIM on the back of moderating credit growth and high depositmobilization is likely to keep NII growth under pressure. In 4QFY07, banks had receivedone-time income of interest on CRR balance with RBI for 9 months; the absence of thiswould contribute to muted NII growth (YoY) during the quarter.
Most banks would show 25%+ growth in their fee-based income. Treasury income islikely to fall sequentially in 4QFY08 due to subdued equity markets. NPA recoveries areexpected to be strong for almost all state-owned banks. However, overall operating profitis likely to remain under pressure due to muted NII growth and lower treasury gains.
… net profit growth would be moderateStrong asset quality would keep NPA provisions lower (except for the new private banksand PNB). Banks (mainly private banks) had to take a hit on their profitability in 4QFY07for increased provision requirement (from 1% to 2%) for certain asset classes like creditcards, personal loans, etc. Banks like OBC and Canara Bank had taken large MTMprovisions on their investment book during 4QFY07, which would be lower in 4QFY08.We expect overall provisions to remain low for the sector. However, uncertainties persistover the quantum of provisions towards MTM losses on overseas credit derivatives, forexlosses for private banks. We have built in higher provisions for these aspects in our estimatesfor private banks. We expect net profit to show moderate growth of 15-20% for mostbanks on account of lower provision requirements. We expect HDFC Bank, Axis Bank,BoB and BoI to report strong earnings growth of 30%+ YoY during 4QFY08.
Bankex plummeted amidst uncertainties in 4QFY08In 4QFY08 (during the period 31 December 2007 - 26 March 2008), the Bankex declined27%. The sharp correction in bank stocks was led by uncertainties and concerns on accountof: (1) scheme of loan waiver for farmers announced in Budget 2008-09, (2) large derivativesexposure by private banks on behalf of clients, (3) MTM provisions on internationalinvestments, and (4) mounting inflation and slowing industrial/manufacturing activity.
1. Scheme of loan waiver for farmers announced in Budget 2008-09In the Union Budget for 2008-09, the Finance Minister announced a loan waiver schemefor small and marginal farmers, and a one-time settlement for other farmers. The lack ofclarity on the scheme (the exact definition of beneficiaries and modalities) and exaggeratedconcern over the moral hazard led to significant fall in the Bankex. The FM has sinceissued clarifications on the total relief package of Rs603b (of which Rs505b would betowards the debt waiver and Rs98b towards one-time settlement). Of the total amount,around 55% would be for cooperative banks, 35% towards SCBs and rest for RRBs. TheFM also clarified that the settlement would be done on cash basis over a period of 36months. We believe that all-cash disbursement is the key positive for these institutions.However, the front-loaded package in favor of cooperative banks and RRBs is a marginalnegative for the SCBs. Bankers do not foresee a large case of moral hazard.

7228 March 2008
Banking
2. Large derivatives exposure by private banks on behalf of clientsSome of the large corporates and SME clients had entered into exotic derivatives contractsto hedge currency risk, on the back of fast rupee appreciation during 1QFY08. They tookexposures in CHF/Yen which were relatively stable against the dollar compared to therupee. With the sharp weakening of the dollar against these currencies as well 3QFY08onwards, these exposures started turning into large losses. Based on our interaction withindustry participants, the losses on these products are likely to be as big as US$4-5b, mostof which relates to foreign banks’ clients. Private banks like Yes Bank, Kotak MahindraBank, HDFC Bank, ICICI Bank and Axis Bank were also aggressive on this front.However, 70-80% of the exposure of these banks relates to large corporate clients, whichare likely to honor their MTM loss commitment.
3. MTM provisions on international investmentsThe widening of credit spreads in international markets has resulted in a negative mark-to-market impact on credit derivatives and fixed income investment portfolios of variousbanks and overseas banking subsidiaries (while there has been no significant deteriorationin actual credit quality of the underlying investments). ICICI Bank is expected to reportRs3b of provisions, whereas Axis Bank, BoI and BoB are expected to provide Rs150m,Rs100m and Rs200m, respectively. SBI has categorically denied any MTM provisions forits international book. We believe the turmoil in global financial markets has led to MTMlosses on investment book; there is no significant deterioration in the underlying assetquality. This may lead to reversal of these provisions in future once global financial marketsstabilize and credit spreads become rational.
4. Mounting inflation and slowing industrial/manufacturing activityInflation dropped from its highs of 6.5%+ in March-April 2007 and 4.5% in June 2007 tonear 3% in December 2007 (mainly due to high base effect and non pass-through of therising crude oil prices in India). However, it shot up to 6.8%+ on 14 March 2008. Inflationis well above RBI’s comfort level of 5%. The low base effect, mounting commodityprices, and global uncertainties have increased upside risk to inflation. Rising inflation hasreduced the probability of interest rate cuts in India.
We believe that probability of CRR hike is low, considering the severe ill effects it wouldhave on already slowing economic growth. Inflation is driven by supply-side constraints(especially food articles and oil prices) and excessive demand control through increasedinterest rates would de-rail economic growth. However, RBI would like to keep a tightmonetary policy, which implies that lending yields would not soften in the medium term.

7328 March 2008
MOUNTING INFLATION
Source: Industry/Motilal Oswal Securities
G-Sec yields firm upWhile G-Sec yields remained stable in 4QFY08, they shot up >10bp in the last threetrading days, as high inflation numbers meant interest rates would remain firm. While 1-year G-Sec yield has increased by 11bp QoQ, 10-year G-Sec yield has increased by 17bp.However, 2/3-year G-Sec yields are lower by 8-9bp QoQ. We do not expect significantMTM provisions on AFS book for banks during the quarter (as was the case in 4QFY07).However, earnings of OBC, Canara Bank – (high % in AFS book) and IOB (high durationof AFS book) remain vulnerable to G-Sec yield movement.
TREND IN G-SEC YIELDS
Source: Industry/Motilal Oswal Securities
We prefer selective buyingValuations for state-owned banks are at 0.8-1.2x FY10E BV, with RoE of 15-26%. Privatebanks, being growth plays, continue to trade at 2-3.5x FY10E BV. We prefer selectivebuying, with a preference for banks with high earnings visibility. We like HDFC, ICICIBank and Axis Bank among private players. We like Union Bank of India, Bank of Indiaand Indian Bank among the state-owned banks.
190
200
210
220
230
Mar
-06
Jun-
06
Sep
-06
Dec
-06
Mar
-07
Jun-
07
Sep
-07
Dec
-07
Mar
-08
2.2
3.4
4.6
5.8
7.0Inflation Index - LHS(units) Inflation - RHS (%)
6.5
7.0
7.5
8.0
8.5
Apr-
07
May
-07
Jun-
07
Jul-0
7
Aug-
07
Sep
-07
Nov
-07
Dec
-07
Jan-
08
Feb-
08
Mar
-08
1-Year India G-Sec Yield 2-Year India G-Sec Yield 10-Year India G-Sec Yield
Banking
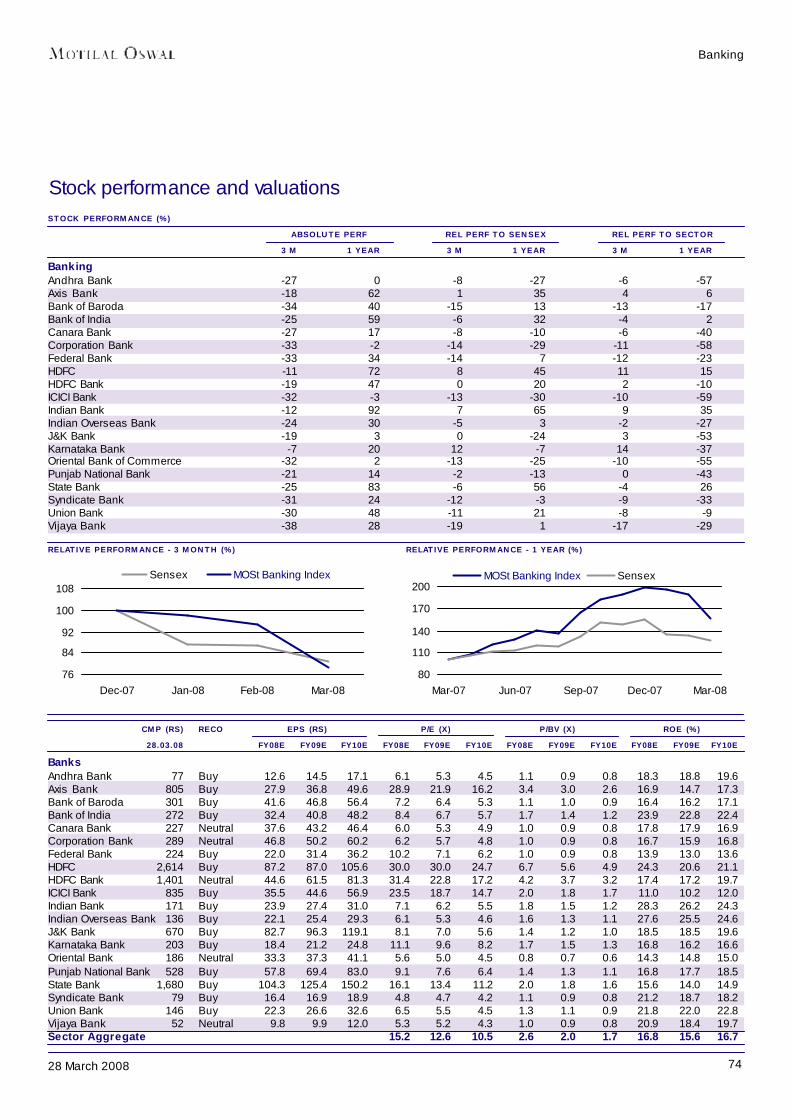
7428 March 2008
Banking
RELATIVE PERFORMANCE - 3 MONTH (%) RELATIVE PERFORMANCE - 1 YEAR (%)
Stock performance and valuationsSTOCK PERFORMANCE (%)
ABSOLUTE PERF REL PERF TO SENSEX REL PERF TO SECTOR 3 M 1 YEAR 3 M 1 YEAR 3 M 1 YEAR
BankingAndhra Bank -27 0 -8 -27 -6 -57Axis Bank -18 62 1 35 4 6Bank of Baroda -34 40 -15 13 -13 -17Bank of India -25 59 -6 32 -4 2Canara Bank -27 17 -8 -10 -6 -40Corporation Bank -33 -2 -14 -29 -11 -58Federal Bank -33 34 -14 7 -12 -23HDFC -11 72 8 45 11 15HDFC Bank -19 47 0 20 2 -10ICICI Bank -32 -3 -13 -30 -10 -59Indian Bank -12 92 7 65 9 35Indian Overseas Bank -24 30 -5 3 -2 -27J&K Bank -19 3 0 -24 3 -53Karnataka Bank -7 20 12 -7 14 -37Oriental Bank of Commerce -32 2 -13 -25 -10 -55Punjab National Bank -21 14 -2 -13 0 -43State Bank -25 83 -6 56 -4 26Syndicate Bank -31 24 -12 -3 -9 -33Union Bank -30 48 -11 21 -8 -9Vijaya Bank -38 28 -19 1 -17 -29
CMP (RS) RECO EPS (RS) P/E (X) P/BV (X) ROE (%)28.03.08 FY08E FY09E FY10E FY08E FY09E FY10E FY08E FY09E FY10E FY08E FY09E FY10E
BanksAndhra Bank 77 Buy 12.6 14.5 17.1 6.1 5.3 4.5 1.1 0.9 0.8 18.3 18.8 19.6Axis Bank 805 Buy 27.9 36.8 49.6 28.9 21.9 16.2 3.4 3.0 2.6 16.9 14.7 17.3Bank of Baroda 301 Buy 41.6 46.8 56.4 7.2 6.4 5.3 1.1 1.0 0.9 16.4 16.2 17.1Bank of India 272 Buy 32.4 40.8 48.2 8.4 6.7 5.7 1.7 1.4 1.2 23.9 22.8 22.4Canara Bank 227 Neutral 37.6 43.2 46.4 6.0 5.3 4.9 1.0 0.9 0.8 17.8 17.9 16.9Corporation Bank 289 Neutral 46.8 50.2 60.2 6.2 5.7 4.8 1.0 0.9 0.8 16.7 15.9 16.8Federal Bank 224 Buy 22.0 31.4 36.2 10.2 7.1 6.2 1.0 0.9 0.8 13.9 13.0 13.6HDFC 2,614 Buy 87.2 87.0 105.6 30.0 30.0 24.7 6.7 5.6 4.9 24.3 20.6 21.1HDFC Bank 1,401 Neutral 44.6 61.5 81.3 31.4 22.8 17.2 4.2 3.7 3.2 17.4 17.2 19.7ICICI Bank 835 Buy 35.5 44.6 56.9 23.5 18.7 14.7 2.0 1.8 1.7 11.0 10.2 12.0Indian Bank 171 Buy 23.9 27.4 31.0 7.1 6.2 5.5 1.8 1.5 1.2 28.3 26.2 24.3Indian Overseas Bank 136 Buy 22.1 25.4 29.3 6.1 5.3 4.6 1.6 1.3 1.1 27.6 25.5 24.6J&K Bank 670 Buy 82.7 96.3 119.1 8.1 7.0 5.6 1.4 1.2 1.0 18.5 18.5 19.6Karnataka Bank 203 Buy 18.4 21.2 24.8 11.1 9.6 8.2 1.7 1.5 1.3 16.8 16.2 16.6Oriental Bank 186 Neutral 33.3 37.3 41.1 5.6 5.0 4.5 0.8 0.7 0.6 14.3 14.8 15.0Punjab National Bank 528 Buy 57.8 69.4 83.0 9.1 7.6 6.4 1.4 1.3 1.1 16.8 17.7 18.5State Bank 1,680 Buy 104.3 125.4 150.2 16.1 13.4 11.2 2.0 1.8 1.6 15.6 14.0 14.9Syndicate Bank 79 Buy 16.4 16.9 18.9 4.8 4.7 4.2 1.1 0.9 0.8 21.2 18.7 18.2Union Bank 146 Buy 22.3 26.6 32.6 6.5 5.5 4.5 1.3 1.1 0.9 21.8 22.0 22.8Vijaya Bank 52 Neutral 9.8 9.9 12.0 5.3 5.2 4.3 1.0 0.9 0.8 20.9 18.4 19.7Sector Aggregate 15.2 12.6 10.5 2.6 2.0 1.7 16.8 15.6 16.7
80
110
140
170
200
Mar-07 Jun-07 Sep-07 Dec-07 Mar-08
MOSt Banking Index Sensex
76
84
92
100
108
Dec-07 Jan-08 Feb-08 Mar-08
Sensex MOSt Banking Index
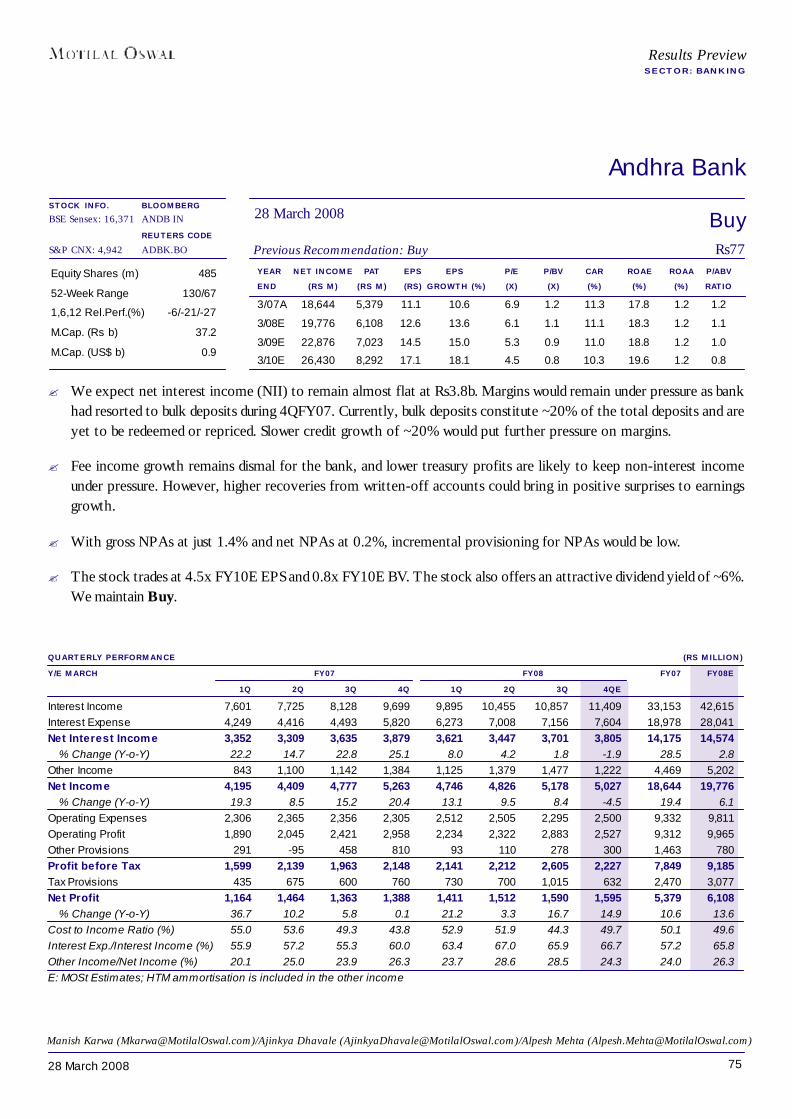
7528 March 2008
Andhra Bank
YEAR NET INCOME PAT EPS EPS P/E P/BV CAR ROAE ROAA P/ABVEND (RS M) (RS M) (RS) GROWTH (%) (X) (X) (%) (%) (%) RATIO
3/07A 18,644 5,379 11.1 10.6 6.9 1.2 11.3 17.8 1.2 1.2
3/08E 19,776 6,108 12.6 13.6 6.1 1.1 11.1 18.3 1.2 1.1
3/09E 22,876 7,023 14.5 15.0 5.3 0.9 11.0 18.8 1.2 1.0
3/10E 26,430 8,292 17.1 18.1 4.5 0.8 10.3 19.6 1.2 0.8
Equity Shares (m) 485
52-Week Range 130/67
1,6,12 Rel.Perf.(%) -6/-21/-27
M.Cap. (Rs b) 37.2
M.Cap. (US$ b) 0.9
QUARTERLY PERFORMANCE (RS MILLION)Y/E MARCH FY07 FY08 FY07 FY08E
1Q 2Q 3Q 4Q 1Q 2Q 3Q 4QEInterest Income 7,601 7,725 8,128 9,699 9,895 10,455 10,857 11,409 33,153 42,615Interest Expense 4,249 4,416 4,493 5,820 6,273 7,008 7,156 7,604 18,978 28,041Net Interest Income 3,352 3,309 3,635 3,879 3,621 3,447 3,701 3,805 14,175 14,574
% Change (Y-o-Y) 22.2 14.7 22.8 25.1 8.0 4.2 1.8 -1.9 28.5 2.8Other Income 843 1,100 1,142 1,384 1,125 1,379 1,477 1,222 4,469 5,202Net Income 4,195 4,409 4,777 5,263 4,746 4,826 5,178 5,027 18,644 19,776
% Change (Y-o-Y) 19.3 8.5 15.2 20.4 13.1 9.5 8.4 -4.5 19.4 6.1Operating Expenses 2,306 2,365 2,356 2,305 2,512 2,505 2,295 2,500 9,332 9,811Operating Profit 1,890 2,045 2,421 2,958 2,234 2,322 2,883 2,527 9,312 9,965Other Provisions 291 -95 458 810 93 110 278 300 1,463 780Profit before Tax 1,599 2,139 1,963 2,148 2,141 2,212 2,605 2,227 7,849 9,185Tax Provisions 435 675 600 760 730 700 1,015 632 2,470 3,077Net Profit 1,164 1,464 1,363 1,388 1,411 1,512 1,590 1,595 5,379 6,108
% Change (Y-o-Y) 36.7 10.2 5.8 0.1 21.2 3.3 16.7 14.9 10.6 13.6Cost to Income Ratio (%) 55.0 53.6 49.3 43.8 52.9 51.9 44.3 49.7 50.1 49.6Interest Exp./Interest Income (%) 55.9 57.2 55.3 60.0 63.4 67.0 65.9 66.7 57.2 65.8Other Income/Net Income (%) 20.1 25.0 23.9 26.3 23.7 28.6 28.5 24.3 24.0 26.3E: MOSt Estimates; HTM ammortisation is included in the other income
BuyPrevious Recommendation: Buy Rs77
28 March 2008BLOOMBERGANDB IN
REUTERS CODEADBK.BO
Results PreviewSECTOR: BANKING
STOCK INFO.BSE Sensex: 16,371
S&P CNX: 4,942
Manish Karwa ([email protected])/Ajinkya Dhavale ([email protected])/Alpesh Mehta ([email protected])
? We expect net interest income (NII) to remain almost flat at Rs3.8b. Margins would remain under pressure as bankhad resorted to bulk deposits during 4QFY07. Currently, bulk deposits constitute ~20% of the total deposits and areyet to be redeemed or repriced. Slower credit growth of ~20% would put further pressure on margins.
? Fee income growth remains dismal for the bank, and lower treasury profits are likely to keep non-interest incomeunder pressure. However, higher recoveries from written-off accounts could bring in positive surprises to earningsgrowth.
? With gross NPAs at just 1.4% and net NPAs at 0.2%, incremental provisioning for NPAs would be low.
? The stock trades at 4.5x FY10E EPS and 0.8x FY10E BV. The stock also offers an attractive dividend yield of ~6%.We maintain Buy.

7628 March 2008
Axis Bank
YEAR NET INCOME PAT EPS EPS P/E P/BV CAR ROAE ROAA P/ABVEND (RS M) (RS M) (RS) GROWTH (%) (X) (X) (%) (%) (%) RATIO
3/07A 24,784 6,590 23.4 34.5 34.4 6.7 11.6 21.0 1.1 6.9
3/08E 42,223 9,969 27.9 19.2 28.9 3.4 14.6 16.9 1.1 3.5
3/09E 56,057 13,154 36.8 31.9 21.9 3.0 12.1 14.7 1.1 3.1
3/10E 73,890 17,744 49.6 34.9 16.2 2.6 10.6 17.3 1.1 2.7
Equity Shares (m) 357.4
52-Week Range 1,291/433
1,6,12 Rel.Perf.(%) -12/11/35
M.Cap. (Rs b) 287.7
M.Cap. (US$ b) 7.2
QUARTERLY PERFORMANCE (RS MILLION)Y/E MARCH FY07 FY08 FY07 FY08E
1Q 2Q 3Q 4Q 1Q 2Q 3Q 4QEInterest Income 9,299 10,254 11,648 13,415 15,111 16,765 18,023 19,434 44,617 69,333Interest Expense 6,321 6,849 7,738 9,025 10,901 10,878 10,550 11,930 29,933 44,260Net Interest Income 2,978 3,405 3,910 4,390 4,209 5,887 7,473 7,504 14,683 25,073
Y-o-Y Growth (%) NM NM NM NM 41.3 72.9 91.1 70.9 48.2 70.8Other Income 2,245 2,048 2,797 3,011 3,682 3,829 4,879 4,760 10,101 17,150Net Income 5,223 5,453 6,708 7,401 7,892 9,716 12,352 12,263 24,784 42,223Operating Expenses 2,392 2,955 3,370 3,430 4,212 5,087 5,630 5,889 12,146 20,818Operating Profit 2,832 2,498 3,338 3,970 3,679 4,629 6,723 6,374 12,639 21,405
Y-o-Y Growth (%) NM NM NM NM 29.9 85.3 101.4 60.5 39.5 69.4Provision & Contingencies 1,008 341 515 812 1,009 1,145 2,001 2,146 2,674 6,300Profit before Tax 1,824 2,157 2,824 3,159 2,670 3,484 4,722 4,228 9,965 15,105Tax Provisions 618 738 977 1,039 921 1,206 1,654 1,355 3,375 5,136Net Profit 1,206 1,420 1,846 2,120 1,750 2,278 3,068 2,873 6,590 9,969
Y-o-Y Growth (%) 30.1 30.2 40.2 39.7 45.2 60.5 66.2 35.5 35.9 51.3Int Exp/ Int Earned (%) 68.0 66.8 66.4 67.3 72.1 64.9 58.5 61.4 67.1 63.8Other Income / Net Income (%) 43.0 37.6 41.7 40.7 46.7 39.4 39.5 38.8 40.8 40.6Cost to Income Ratio (%) 45.8 54.2 50.2 46.4 53.4 52.4 45.6 48.0 49.0 49.3E: MOSt Estimates
BuyPrevious Recommendation: Buy Rs805
28 March 2008BLOOMBERGAXSB IN
REUTERS CODEAXBK.BO
Results PreviewSECTOR: BANKING
STOCK INFO.BSE Sensex: 16,371
S&P CNX: 4,942
Manish Karwa ([email protected])/Ajinkya Dhavale ([email protected])/Alpesh Mehta ([email protected])
? We expect strong NII growth of 70% YoY in 4QFY08, on the back of ~50% loan growth, improved yield on advances,and strong growth in CASA.
? We expect NIMs to remain strong at 3.5%+ during 4QFY08; however they would remain lower than the 3.9%reported in 3QFY08. The impact of capital raising during 2QFY08 is fading away, putting pressure on cost of fundswhile improving yields on advances from 3QFY08 levels remains a challenge.
? The bank continues to be in a rapid branch expansion and manpower addition phase. Opex growth likely to remain~70% YoY.
? Another key driver of the bank’s performance has been sustained growth in its fee-based income. We expect corefee income to grow ~50% in 4QFY08. The bank’s cost-to-income ratio would remain <50%.
? We have assumed higher provisions towards MTM losses on the bank’s international investment book as well asNPAs. We expect the bank to make prudent provisions towards losses on forex and exotic derivatives contractsentered on behalf of clients.
? Earnings are likely to grow 36% YoY to Rs2.9b in 4QFY08, supported by robust growth in NII and fee income.
? The stock trades at 16.2x FY10E EPS and 2.6x FY10E BV. Maintain Buy.
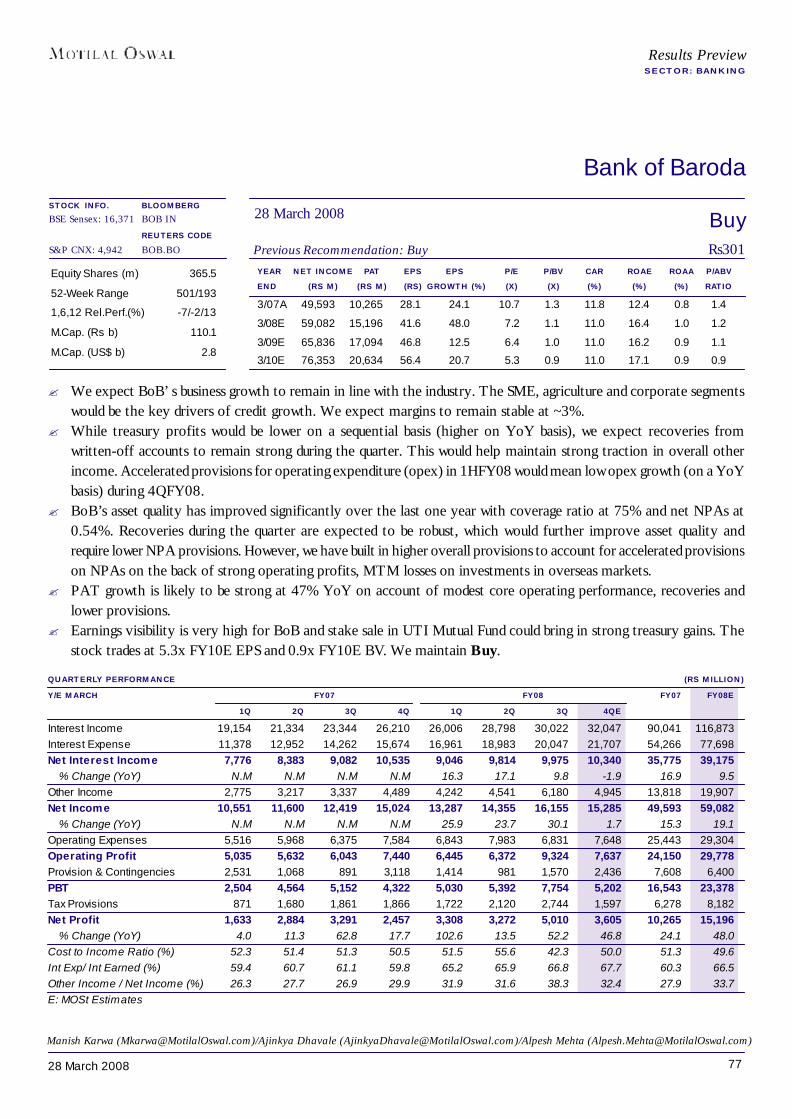
7728 March 2008
Bank of Baroda
YEAR NET INCOME PAT EPS EPS P/E P/BV CAR ROAE ROAA P/ABVEND (RS M) (RS M) (RS) GROWTH (%) (X) (X) (%) (%) (%) RATIO
3/07A 49,593 10,265 28.1 24.1 10.7 1.3 11.8 12.4 0.8 1.4
3/08E 59,082 15,196 41.6 48.0 7.2 1.1 11.0 16.4 1.0 1.2
3/09E 65,836 17,094 46.8 12.5 6.4 1.0 11.0 16.2 0.9 1.1
3/10E 76,353 20,634 56.4 20.7 5.3 0.9 11.0 17.1 0.9 0.9
Equity Shares (m) 365.5
52-Week Range 501/193
1,6,12 Rel.Perf.(%) -7/-2/13
M.Cap. (Rs b) 110.1
M.Cap. (US$ b) 2.8
QUARTERLY PERFORMANCE (RS MILLION)Y/E MARCH FY07 FY08 FY07 FY08E
1Q 2Q 3Q 4Q 1Q 2Q 3Q 4QEInterest Income 19,154 21,334 23,344 26,210 26,006 28,798 30,022 32,047 90,041 116,873Interest Expense 11,378 12,952 14,262 15,674 16,961 18,983 20,047 21,707 54,266 77,698Net Interest Income 7,776 8,383 9,082 10,535 9,046 9,814 9,975 10,340 35,775 39,175
% Change (YoY) N.M N.M N.M N.M 16.3 17.1 9.8 -1.9 16.9 9.5Other Income 2,775 3,217 3,337 4,489 4,242 4,541 6,180 4,945 13,818 19,907Net Income 10,551 11,600 12,419 15,024 13,287 14,355 16,155 15,285 49,593 59,082
% Change (YoY) N.M N.M N.M N.M 25.9 23.7 30.1 1.7 15.3 19.1Operating Expenses 5,516 5,968 6,375 7,584 6,843 7,983 6,831 7,648 25,443 29,304Operating Profit 5,035 5,632 6,043 7,440 6,445 6,372 9,324 7,637 24,150 29,778Provision & Contingencies 2,531 1,068 891 3,118 1,414 981 1,570 2,436 7,608 6,400PBT 2,504 4,564 5,152 4,322 5,030 5,392 7,754 5,202 16,543 23,378Tax Provisions 871 1,680 1,861 1,866 1,722 2,120 2,744 1,597 6,278 8,182Net Profit 1,633 2,884 3,291 2,457 3,308 3,272 5,010 3,605 10,265 15,196
% Change (YoY) 4.0 11.3 62.8 17.7 102.6 13.5 52.2 46.8 24.1 48.0Cost to Income Ratio (%) 52.3 51.4 51.3 50.5 51.5 55.6 42.3 50.0 51.3 49.6Int Exp/ Int Earned (%) 59.4 60.7 61.1 59.8 65.2 65.9 66.8 67.7 60.3 66.5Other Income / Net Income (%) 26.3 27.7 26.9 29.9 31.9 31.6 38.3 32.4 27.9 33.7E: MOSt Estimates
BuyPrevious Recommendation: Buy Rs301
28 March 2008BLOOMBERGBOB IN
REUTERS CODEBOB.BO
Results PreviewSECTOR: BANKING
STOCK INFO.BSE Sensex: 16,371
S&P CNX: 4,942
Manish Karwa ([email protected])/Ajinkya Dhavale ([email protected])/Alpesh Mehta ([email protected])
? We expect BoB’s business growth to remain in line with the industry. The SME, agriculture and corporate segmentswould be the key drivers of credit growth. We expect margins to remain stable at ~3%.
? While treasury profits would be lower on a sequential basis (higher on YoY basis), we expect recoveries fromwritten-off accounts to remain strong during the quarter. This would help maintain strong traction in overall otherincome. Accelerated provisions for operating expenditure (opex) in 1HFY08 would mean low opex growth (on a YoYbasis) during 4QFY08.
? BoB’s asset quality has improved significantly over the last one year with coverage ratio at 75% and net NPAs at0.54%. Recoveries during the quarter are expected to be robust, which would further improve asset quality andrequire lower NPA provisions. However, we have built in higher overall provisions to account for accelerated provisionson NPAs on the back of strong operating profits, MTM losses on investments in overseas markets.
? PAT growth is likely to be strong at 47% YoY on account of modest core operating performance, recoveries andlower provisions.
? Earnings visibility is very high for BoB and stake sale in UTI Mutual Fund could bring in strong treasury gains. Thestock trades at 5.3x FY10E EPS and 0.9x FY10E BV. We maintain Buy.
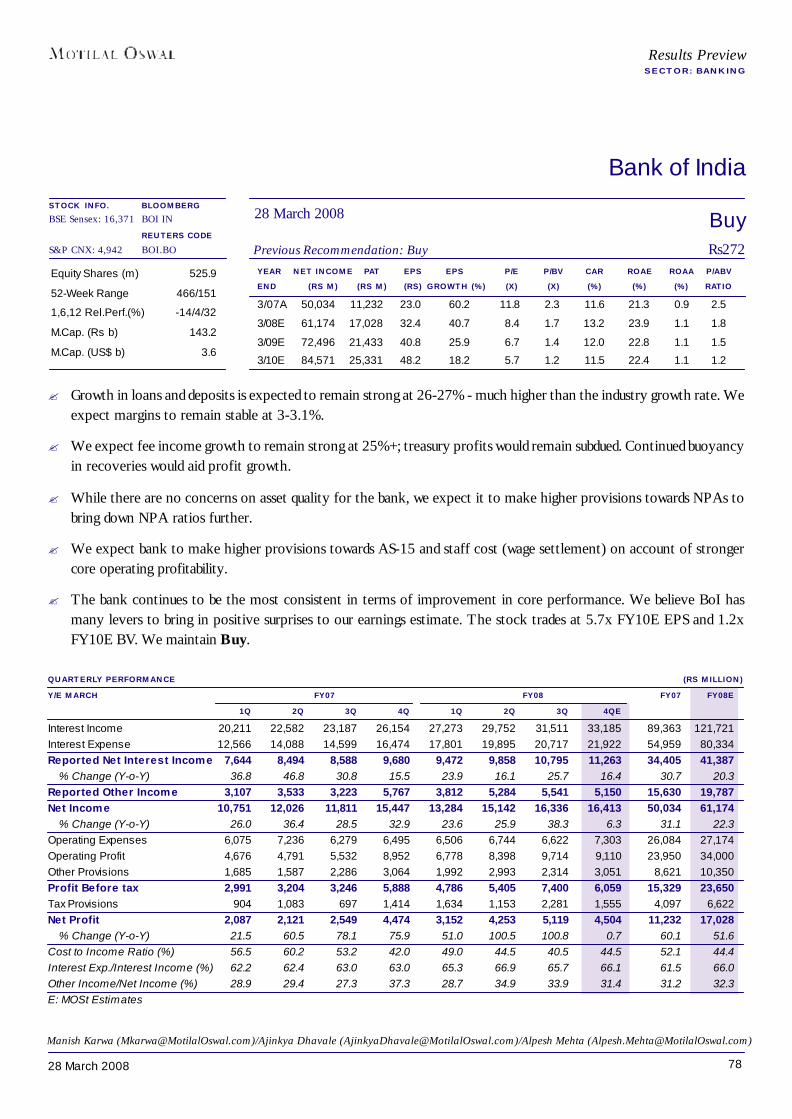
7828 March 2008
Bank of India
YEAR NET INCOME PAT EPS EPS P/E P/BV CAR ROAE ROAA P/ABVEND (RS M) (RS M) (RS) GROWTH (%) (X) (X) (%) (%) (%) RATIO
3/07A 50,034 11,232 23.0 60.2 11.8 2.3 11.6 21.3 0.9 2.5
3/08E 61,174 17,028 32.4 40.7 8.4 1.7 13.2 23.9 1.1 1.8
3/09E 72,496 21,433 40.8 25.9 6.7 1.4 12.0 22.8 1.1 1.5
3/10E 84,571 25,331 48.2 18.2 5.7 1.2 11.5 22.4 1.1 1.2
Equity Shares (m) 525.9
52-Week Range 466/151
1,6,12 Rel.Perf.(%) -14/4/32
M.Cap. (Rs b) 143.2
M.Cap. (US$ b) 3.6
QUARTERLY PERFORMANCE (RS MILLION)Y/E MARCH FY07 FY08 FY07 FY08E
1Q 2Q 3Q 4Q 1Q 2Q 3Q 4QEInterest Income 20,211 22,582 23,187 26,154 27,273 29,752 31,511 33,185 89,363 121,721Interest Expense 12,566 14,088 14,599 16,474 17,801 19,895 20,717 21,922 54,959 80,334Reported Net Interest Income 7,644 8,494 8,588 9,680 9,472 9,858 10,795 11,263 34,405 41,387
% Change (Y-o-Y) 36.8 46.8 30.8 15.5 23.9 16.1 25.7 16.4 30.7 20.3Reported Other Income 3,107 3,533 3,223 5,767 3,812 5,284 5,541 5,150 15,630 19,787Net Income 10,751 12,026 11,811 15,447 13,284 15,142 16,336 16,413 50,034 61,174
% Change (Y-o-Y) 26.0 36.4 28.5 32.9 23.6 25.9 38.3 6.3 31.1 22.3Operating Expenses 6,075 7,236 6,279 6,495 6,506 6,744 6,622 7,303 26,084 27,174Operating Profit 4,676 4,791 5,532 8,952 6,778 8,398 9,714 9,110 23,950 34,000Other Provisions 1,685 1,587 2,286 3,064 1,992 2,993 2,314 3,051 8,621 10,350Profit Before tax 2,991 3,204 3,246 5,888 4,786 5,405 7,400 6,059 15,329 23,650Tax Provisions 904 1,083 697 1,414 1,634 1,153 2,281 1,555 4,097 6,622Net Profit 2,087 2,121 2,549 4,474 3,152 4,253 5,119 4,504 11,232 17,028
% Change (Y-o-Y) 21.5 60.5 78.1 75.9 51.0 100.5 100.8 0.7 60.1 51.6Cost to Income Ratio (%) 56.5 60.2 53.2 42.0 49.0 44.5 40.5 44.5 52.1 44.4Interest Exp./Interest Income (%) 62.2 62.4 63.0 63.0 65.3 66.9 65.7 66.1 61.5 66.0Other Income/Net Income (%) 28.9 29.4 27.3 37.3 28.7 34.9 33.9 31.4 31.2 32.3E: MOSt Estimates
BuyPrevious Recommendation: Buy Rs272
28 March 2008BLOOMBERGBOI IN
REUTERS CODEBOI.BO
Results PreviewSECTOR: BANKING
STOCK INFO.BSE Sensex: 16,371
S&P CNX: 4,942
Manish Karwa ([email protected])/Ajinkya Dhavale ([email protected])/Alpesh Mehta ([email protected])
? Growth in loans and deposits is expected to remain strong at 26-27% - much higher than the industry growth rate. Weexpect margins to remain stable at 3-3.1%.
? We expect fee income growth to remain strong at 25%+; treasury profits would remain subdued. Continued buoyancyin recoveries would aid profit growth.
? While there are no concerns on asset quality for the bank, we expect it to make higher provisions towards NPAs tobring down NPA ratios further.
? We expect bank to make higher provisions towards AS-15 and staff cost (wage settlement) on account of strongercore operating profitability.
? The bank continues to be the most consistent in terms of improvement in core performance. We believe BoI hasmany levers to bring in positive surprises to our earnings estimate. The stock trades at 5.7x FY10E EPS and 1.2xFY10E BV. We maintain Buy.
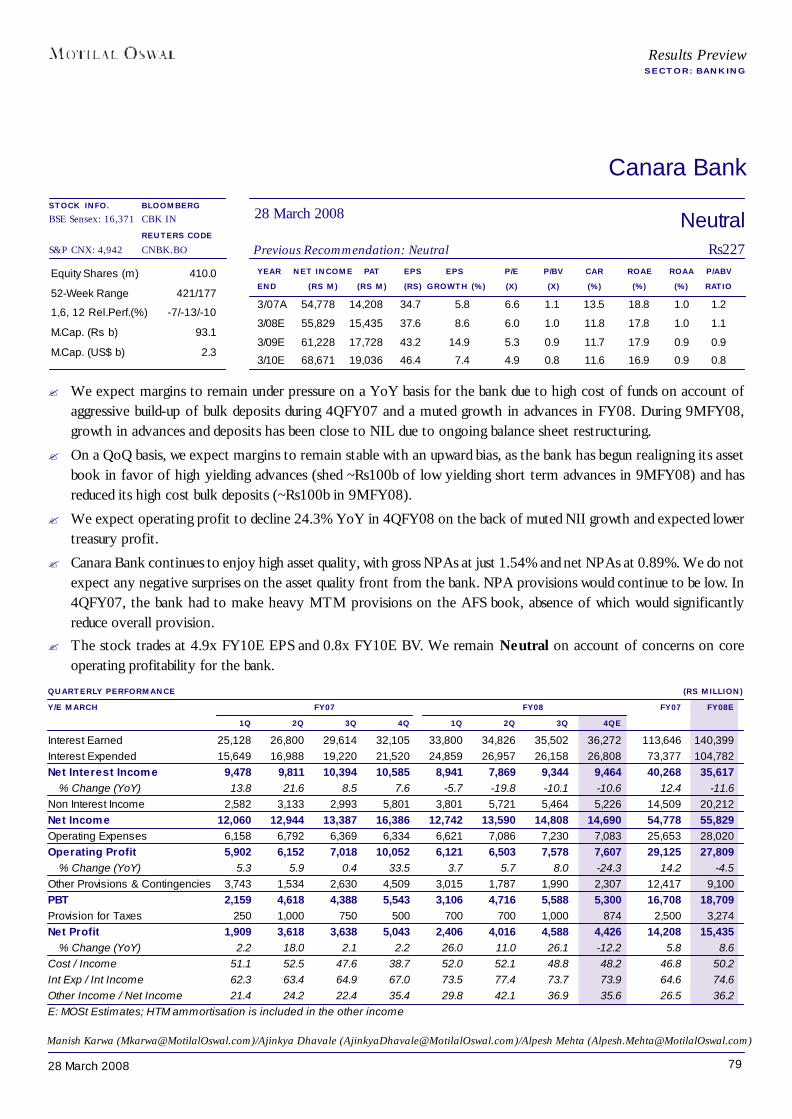
7928 March 2008
Canara Bank
YEAR NET INCOME PAT EPS EPS P/E P/BV CAR ROAE ROAA P/ABVEND (RS M) (RS M) (RS) GROWTH (%) (X) (X) (%) (%) (%) RATIO
3/07A 54,778 14,208 34.7 5.8 6.6 1.1 13.5 18.8 1.0 1.2
3/08E 55,829 15,435 37.6 8.6 6.0 1.0 11.8 17.8 1.0 1.1
3/09E 61,228 17,728 43.2 14.9 5.3 0.9 11.7 17.9 0.9 0.9
3/10E 68,671 19,036 46.4 7.4 4.9 0.8 11.6 16.9 0.9 0.8
Equity Shares (m) 410.0
52-Week Range 421/177
1,6, 12 Rel.Perf.(%) -7/-13/-10
M.Cap. (Rs b) 93.1
M.Cap. (US$ b) 2.3
QUARTERLY PERFORMANCE (RS MILLION)Y/E MARCH FY07 FY08 FY07 FY08E
1Q 2Q 3Q 4Q 1Q 2Q 3Q 4QEInterest Earned 25,128 26,800 29,614 32,105 33,800 34,826 35,502 36,272 113,646 140,399Interest Expended 15,649 16,988 19,220 21,520 24,859 26,957 26,158 26,808 73,377 104,782Net Interest Income 9,478 9,811 10,394 10,585 8,941 7,869 9,344 9,464 40,268 35,617
% Change (YoY) 13.8 21.6 8.5 7.6 -5.7 -19.8 -10.1 -10.6 12.4 -11.6Non Interest Income 2,582 3,133 2,993 5,801 3,801 5,721 5,464 5,226 14,509 20,212Net Income 12,060 12,944 13,387 16,386 12,742 13,590 14,808 14,690 54,778 55,829Operating Expenses 6,158 6,792 6,369 6,334 6,621 7,086 7,230 7,083 25,653 28,020Operating Profit 5,902 6,152 7,018 10,052 6,121 6,503 7,578 7,607 29,125 27,809
% Change (YoY) 5.3 5.9 0.4 33.5 3.7 5.7 8.0 -24.3 14.2 -4.5Other Provisions & Contingencies 3,743 1,534 2,630 4,509 3,015 1,787 1,990 2,307 12,417 9,100PBT 2,159 4,618 4,388 5,543 3,106 4,716 5,588 5,300 16,708 18,709Provision for Taxes 250 1,000 750 500 700 700 1,000 874 2,500 3,274Net Profit 1,909 3,618 3,638 5,043 2,406 4,016 4,588 4,426 14,208 15,435
% Change (YoY) 2.2 18.0 2.1 2.2 26.0 11.0 26.1 -12.2 5.8 8.6Cost / Income 51.1 52.5 47.6 38.7 52.0 52.1 48.8 48.2 46.8 50.2Int Exp / Int Income 62.3 63.4 64.9 67.0 73.5 77.4 73.7 73.9 64.6 74.6Other Income / Net Income 21.4 24.2 22.4 35.4 29.8 42.1 36.9 35.6 26.5 36.2E: MOSt Estimates; HTM ammortisation is included in the other income
NeutralPrevious Recommendation: Neutral Rs227
28 March 2008BLOOMBERGCBK IN
REUTERS CODECNBK.BO
Results PreviewSECTOR: BANKING
STOCK INFO.BSE Sensex: 16,371
S&P CNX: 4,942
Manish Karwa ([email protected])/Ajinkya Dhavale ([email protected])/Alpesh Mehta ([email protected])
? We expect margins to remain under pressure on a YoY basis for the bank due to high cost of funds on account ofaggressive build-up of bulk deposits during 4QFY07 and a muted growth in advances in FY08. During 9MFY08,growth in advances and deposits has been close to NIL due to ongoing balance sheet restructuring.
? On a QoQ basis, we expect margins to remain stable with an upward bias, as the bank has begun realigning its assetbook in favor of high yielding advances (shed ~Rs100b of low yielding short term advances in 9MFY08) and hasreduced its high cost bulk deposits (~Rs100b in 9MFY08).
? We expect operating profit to decline 24.3% YoY in 4QFY08 on the back of muted NII growth and expected lowertreasury profit.
? Canara Bank continues to enjoy high asset quality, with gross NPAs at just 1.54% and net NPAs at 0.89%. We do notexpect any negative surprises on the asset quality front from the bank. NPA provisions would continue to be low. In4QFY07, the bank had to make heavy MTM provisions on the AFS book, absence of which would significantlyreduce overall provision.
? The stock trades at 4.9x FY10E EPS and 0.8x FY10E BV. We remain Neutral on account of concerns on coreoperating profitability for the bank.
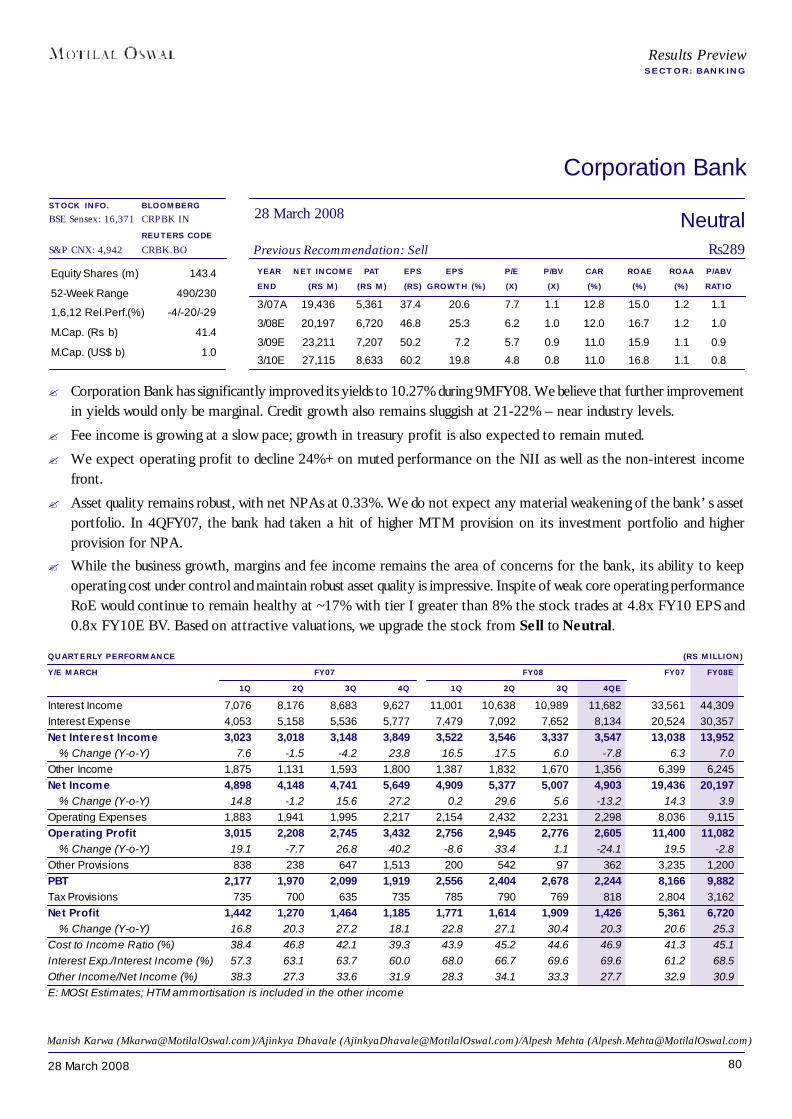
8028 March 2008
Corporation Bank
YEAR NET INCOME PAT EPS EPS P/E P/BV CAR ROAE ROAA P/ABVEND (RS M) (RS M) (RS) GROWTH (%) (X) (X) (%) (%) (%) RATIO
3/07A 19,436 5,361 37.4 20.6 7.7 1.1 12.8 15.0 1.2 1.1
3/08E 20,197 6,720 46.8 25.3 6.2 1.0 12.0 16.7 1.2 1.0
3/09E 23,211 7,207 50.2 7.2 5.7 0.9 11.0 15.9 1.1 0.9
3/10E 27,115 8,633 60.2 19.8 4.8 0.8 11.0 16.8 1.1 0.8
Equity Shares (m) 143.4
52-Week Range 490/230
1,6,12 Rel.Perf.(%) -4/-20/-29
M.Cap. (Rs b) 41.4
M.Cap. (US$ b) 1.0
QUARTERLY PERFORMANCE (RS MILLION)Y/E MARCH FY07 FY08 FY07 FY08E
1Q 2Q 3Q 4Q 1Q 2Q 3Q 4QEInterest Income 7,076 8,176 8,683 9,627 11,001 10,638 10,989 11,682 33,561 44,309Interest Expense 4,053 5,158 5,536 5,777 7,479 7,092 7,652 8,134 20,524 30,357Net Interest Income 3,023 3,018 3,148 3,849 3,522 3,546 3,337 3,547 13,038 13,952
% Change (Y-o-Y) 7.6 -1.5 -4.2 23.8 16.5 17.5 6.0 -7.8 6.3 7.0Other Income 1,875 1,131 1,593 1,800 1,387 1,832 1,670 1,356 6,399 6,245Net Income 4,898 4,148 4,741 5,649 4,909 5,377 5,007 4,903 19,436 20,197
% Change (Y-o-Y) 14.8 -1.2 15.6 27.2 0.2 29.6 5.6 -13.2 14.3 3.9Operating Expenses 1,883 1,941 1,995 2,217 2,154 2,432 2,231 2,298 8,036 9,115Operating Profit 3,015 2,208 2,745 3,432 2,756 2,945 2,776 2,605 11,400 11,082
% Change (Y-o-Y) 19.1 -7.7 26.8 40.2 -8.6 33.4 1.1 -24.1 19.5 -2.8Other Provisions 838 238 647 1,513 200 542 97 362 3,235 1,200PBT 2,177 1,970 2,099 1,919 2,556 2,404 2,678 2,244 8,166 9,882Tax Provisions 735 700 635 735 785 790 769 818 2,804 3,162Net Profit 1,442 1,270 1,464 1,185 1,771 1,614 1,909 1,426 5,361 6,720
% Change (Y-o-Y) 16.8 20.3 27.2 18.1 22.8 27.1 30.4 20.3 20.6 25.3Cost to Income Ratio (%) 38.4 46.8 42.1 39.3 43.9 45.2 44.6 46.9 41.3 45.1Interest Exp./Interest Income (%) 57.3 63.1 63.7 60.0 68.0 66.7 69.6 69.6 61.2 68.5Other Income/Net Income (%) 38.3 27.3 33.6 31.9 28.3 34.1 33.3 27.7 32.9 30.9E: MOSt Estimates; HTM ammortisation is included in the other income
NeutralPrevious Recommendation: Sell Rs289
28 March 2008BLOOMBERGCRPBK IN
REUTERS CODECRBK.BO
Results PreviewSECTOR: BANKING
STOCK INFO.BSE Sensex: 16,371
S&P CNX: 4,942
Manish Karwa ([email protected])/Ajinkya Dhavale ([email protected])/Alpesh Mehta ([email protected])
? Corporation Bank has significantly improved its yields to 10.27% during 9MFY08. We believe that further improvementin yields would only be marginal. Credit growth also remains sluggish at 21-22% – near industry levels.
? Fee income is growing at a slow pace; growth in treasury profit is also expected to remain muted.
? We expect operating profit to decline 24%+ on muted performance on the NII as well as the non-interest incomefront.
? Asset quality remains robust, with net NPAs at 0.33%. We do not expect any material weakening of the bank’s assetportfolio. In 4QFY07, the bank had taken a hit of higher MTM provision on its investment portfolio and higherprovision for NPA.
? While the business growth, margins and fee income remains the area of concerns for the bank, its ability to keepoperating cost under control and maintain robust asset quality is impressive. Inspite of weak core operating performanceRoE would continue to remain healthy at ~17% with tier I greater than 8% the stock trades at 4.8x FY10 EPS and0.8x FY10E BV. Based on attractive valuations, we upgrade the stock from Sell to Neutral.
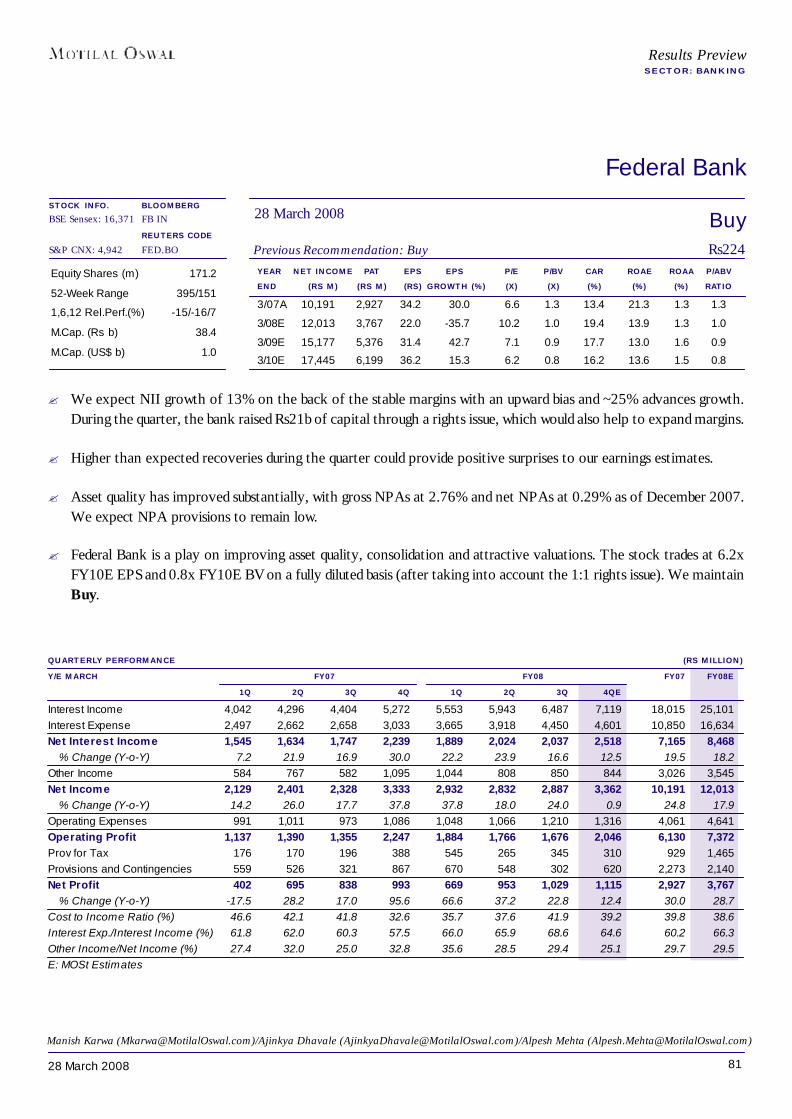
8128 March 2008
Federal Bank
YEAR NET INCOME PAT EPS EPS P/E P/BV CAR ROAE ROAA P/ABVEND (RS M) (RS M) (RS) GROWTH (%) (X) (X) (%) (%) (%) RATIO
3/07A 10,191 2,927 34.2 30.0 6.6 1.3 13.4 21.3 1.3 1.3
3/08E 12,013 3,767 22.0 -35.7 10.2 1.0 19.4 13.9 1.3 1.0
3/09E 15,177 5,376 31.4 42.7 7.1 0.9 17.7 13.0 1.6 0.9
3/10E 17,445 6,199 36.2 15.3 6.2 0.8 16.2 13.6 1.5 0.8
Equity Shares (m) 171.2
52-Week Range 395/151
1,6,12 Rel.Perf.(%) -15/-16/7
M.Cap. (Rs b) 38.4
M.Cap. (US$ b) 1.0
QUARTERLY PERFORMANCE (RS MILLION)Y/E MARCH FY07 FY08 FY07 FY08E
1Q 2Q 3Q 4Q 1Q 2Q 3Q 4QEInterest Income 4,042 4,296 4,404 5,272 5,553 5,943 6,487 7,119 18,015 25,101Interest Expense 2,497 2,662 2,658 3,033 3,665 3,918 4,450 4,601 10,850 16,634Net Interest Income 1,545 1,634 1,747 2,239 1,889 2,024 2,037 2,518 7,165 8,468
% Change (Y-o-Y) 7.2 21.9 16.9 30.0 22.2 23.9 16.6 12.5 19.5 18.2Other Income 584 767 582 1,095 1,044 808 850 844 3,026 3,545Net Income 2,129 2,401 2,328 3,333 2,932 2,832 2,887 3,362 10,191 12,013
% Change (Y-o-Y) 14.2 26.0 17.7 37.8 37.8 18.0 24.0 0.9 24.8 17.9Operating Expenses 991 1,011 973 1,086 1,048 1,066 1,210 1,316 4,061 4,641Operating Profit 1,137 1,390 1,355 2,247 1,884 1,766 1,676 2,046 6,130 7,372Prov for Tax 176 170 196 388 545 265 345 310 929 1,465Provisions and Contingencies 559 526 321 867 670 548 302 620 2,273 2,140Net Profit 402 695 838 993 669 953 1,029 1,115 2,927 3,767
% Change (Y-o-Y) -17.5 28.2 17.0 95.6 66.6 37.2 22.8 12.4 30.0 28.7Cost to Income Ratio (%) 46.6 42.1 41.8 32.6 35.7 37.6 41.9 39.2 39.8 38.6Interest Exp./Interest Income (%) 61.8 62.0 60.3 57.5 66.0 65.9 68.6 64.6 60.2 66.3Other Income/Net Income (%) 27.4 32.0 25.0 32.8 35.6 28.5 29.4 25.1 29.7 29.5E: MOSt Estimates
BuyPrevious Recommendation: Buy Rs224
28 March 2008BLOOMBERGFB IN
REUTERS CODEFED.BO
Results PreviewSECTOR: BANKING
STOCK INFO.BSE Sensex: 16,371
S&P CNX: 4,942
Manish Karwa ([email protected])/Ajinkya Dhavale ([email protected])/Alpesh Mehta ([email protected])
? We expect NII growth of 13% on the back of the stable margins with an upward bias and ~25% advances growth.During the quarter, the bank raised Rs21b of capital through a rights issue, which would also help to expand margins.
? Higher than expected recoveries during the quarter could provide positive surprises to our earnings estimates.
? Asset quality has improved substantially, with gross NPAs at 2.76% and net NPAs at 0.29% as of December 2007.We expect NPA provisions to remain low.
? Federal Bank is a play on improving asset quality, consolidation and attractive valuations. The stock trades at 6.2xFY10E EPS and 0.8x FY10E BV on a fully diluted basis (after taking into account the 1:1 rights issue). We maintainBuy.

8228 March 2008
HDFC
YEAR NET INCOME PAT EPS EPS P/E# P/BV CAR ROAE ROAA P/ABV*END (RS M) (RS M) (RS) GROWTH (%) (X) (X) (%) (%) (%) RATIO
3/07A 22,294 15,704 62.1 23.2 30.5 11.9 13.0 31.3 2.8 12.1
3/08E 30,050 24,213 87.2 40.5 21.7 6.7 16.5 24.3 2.8 6.7
3/09E 37,503 24,979 87.0 -0.3 21.8 5.6 15.0 20.6 2.8 5.5
3/10E 45,283 30,321 105.6 21.4 17.9 4.9 14.0 21.1 2.8 4.9
Equity Shares (m) 287.1
52-Week Range 3,257/1397
1,6,12 Rel.Perf.(%) 2/9/45
M.Cap. (Rs b) 750.4
M.Cap. (US$ b) 18.8
QUARTERLY PERFORMANCE (RS MILLION)Y/E MARCH FY07 FY08 FY07 FY08E
1Q 2Q 3Q 4Q 1Q 2Q 3Q 4QEIncome from Operations 12,457 14,468 14,538 17,285 18,270 18,886 21,504 22,775 58,755 81,434Other Income 28 95 39 45 34 39 44 63 208 180Reported Total Income 12,485 14,563 14,577 17,330 18,304 18,925 21,547 22,838 58,963 81,614Total Income ex invst. profits 11,975 13,382 13,896 16,454 18,044 18,912 20,513 22,338 55,705 79,807
YoY Change (%) 30.7 35.3 40.2 43.6 50.7 41.3 47.6 31.8 37.8 38.4Interest and Other Charges 8,014 9,137 9,475 10,042 12,451 12,238 13,160 13,715 36,669 51,564Other Expenses 667 686 614 474 765 823 741 654 2,442 2,984Total Expenses 8,681 9,823 10,089 10,517 13,217 13,061 13,901 14,370 39,110 54,587PBDT 3,805 4,740 4,488 6,813 5,087 5,864 7,646 8,468 19,852 27,027
YoY Change (%) 22.0 22.3 25.6 31.4 33.7 23.7 70.4 24.3 26.0 36.1Depreciation 37 39 47 52 37 40 44 79 175 200PBT Pre exceptional income 3,767 4,701 4,441 6,761 5,050 5,824 7,602 8,389 19,678 26,827Exceptional Profits 3,133 1,209 2,000 6,342Reported PBT 3,767 4,701 4,441 6,761 5,050 8,957 8,812 10,389 19,678 33,169Provision for Tax 799 1,021 886 1,261 1,322 2,493 2,323 2,818 3,974 8,956Reported PAT 2,968 3,680 3,555 5,501 3,728 6,464 6,489 7,571 15,704 24,213
YoY Change (%) 20.0 23.1 25.0 29.0 25.6 75.6 82.5 37.6 24.9 54.4PAT ex exceptional 2,968 3,680 3,555 5,501 3,728 4,310 5,626 6,188 15,704 19,852
YoY Change (%) 20.0 23.1 25.2 29.0 25.6 17.1 58.2 12.5 24.9 26.4E: MOSt Estimates
BuyPrevious Recommendation: Buy Rs2,614
28 March 2008BLOOMBERGHDFC IN
REUTERS CODEHDFC.BO
Results PreviewSECTOR: BANKING
STOCK INFO.BSE Sensex: 16,371
S&P CNX: 4,942
*Price is adjusted for value of key ventures; Book value adjusted for investment in subsidiaries
Manish Karwa ([email protected])/Ajinkya Dhavale ([email protected])/Alpesh Mehta ([email protected])
? Despite concerns relating to growth in mortgages, we expect HDFC to maintain its traditional growth of 26-27% indisbursements and 25%+ in loans.
? HDFC has cut its lending rate on existing loans by 25bp during the quarter. This cut would impact its overall yields by~5bp QoQ. We expect reported spreads to decline ~5bp QoQ to ~2.25%. However, they would continue to be aboveHDFC’s desired level of 2.1-2.2%.
? We expect a modest 24% normalized PBT growth in 4QFY08, on a higher base of 4QFY07 when HDFC enjoyed theimpact of its lending rate hikes.
? We have factored in exceptional capital gains of Rs2b from stake sale in HDFC General Insurance (26%) to Ergo.
? Adjusting for the value of its investments, the stock is available at 17.9x FY10E EPS. We are optimistic aboutHDFC’s future earnings prospects and value unlocking through its other business ventures. Maintain Buy.
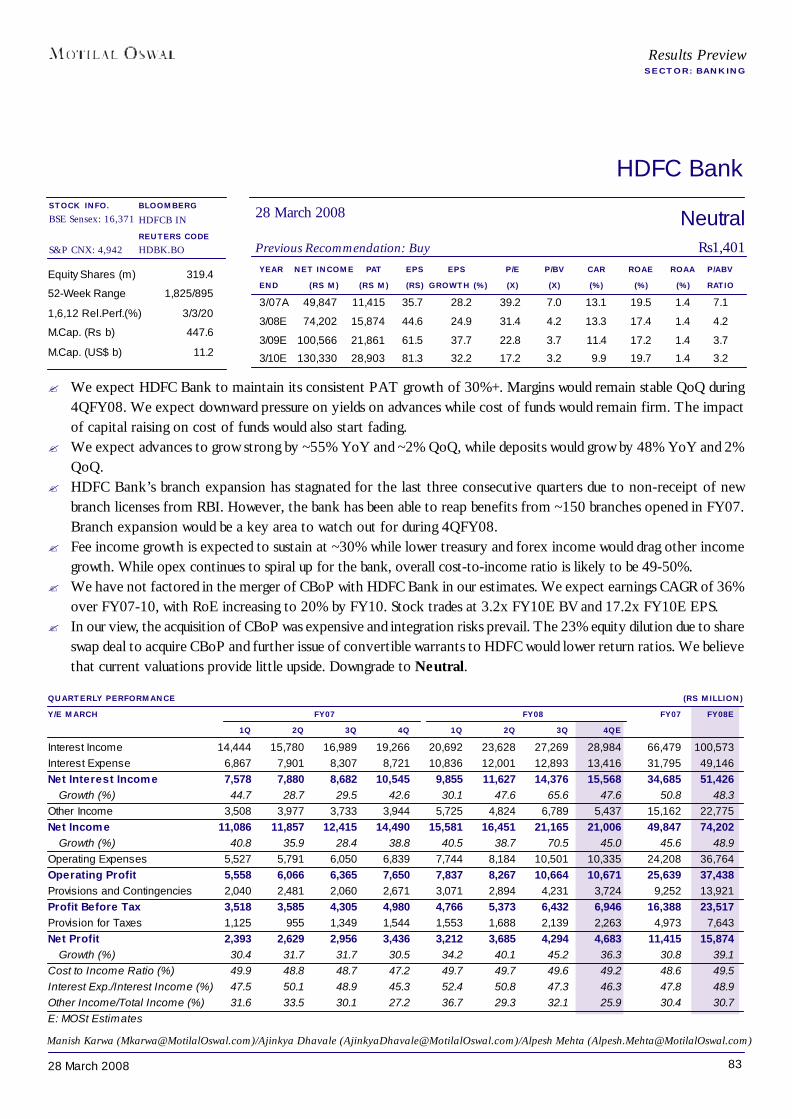
8328 March 2008
HDFC Bank
YEAR NET INCOME PAT EPS EPS P/E P/BV CAR ROAE ROAA P/ABVEND (RS M) (RS M) (RS) GROWTH (%) (X) (X) (%) (%) (%) RATIO3/07A 49,847 11,415 35.7 28.2 39.2 7.0 13.1 19.5 1.4 7.1
3/08E 74,202 15,874 44.6 24.9 31.4 4.2 13.3 17.4 1.4 4.2
3/09E 100,566 21,861 61.5 37.7 22.8 3.7 11.4 17.2 1.4 3.7
3/10E 130,330 28,903 81.3 32.2 17.2 3.2 9.9 19.7 1.4 3.2
Equity Shares (m) 319.4
52-Week Range 1,825/895
1,6,12 Rel.Perf.(%) 3/3/20
M.Cap. (Rs b) 447.6
M.Cap. (US$ b) 11.2
QUARTERLY PERFORMANCE (RS MILLION)Y/E MARCH FY07 FY08 FY07 FY08E
1Q 2Q 3Q 4Q 1Q 2Q 3Q 4QEInterest Income 14,444 15,780 16,989 19,266 20,692 23,628 27,269 28,984 66,479 100,573Interest Expense 6,867 7,901 8,307 8,721 10,836 12,001 12,893 13,416 31,795 49,146Net Interest Income 7,578 7,880 8,682 10,545 9,855 11,627 14,376 15,568 34,685 51,426
Growth (%) 44.7 28.7 29.5 42.6 30.1 47.6 65.6 47.6 50.8 48.3Other Income 3,508 3,977 3,733 3,944 5,725 4,824 6,789 5,437 15,162 22,775Net Income 11,086 11,857 12,415 14,490 15,581 16,451 21,165 21,006 49,847 74,202
Growth (%) 40.8 35.9 28.4 38.8 40.5 38.7 70.5 45.0 45.6 48.9Operating Expenses 5,527 5,791 6,050 6,839 7,744 8,184 10,501 10,335 24,208 36,764Operating Profit 5,558 6,066 6,365 7,650 7,837 8,267 10,664 10,671 25,639 37,438Provisions and Contingencies 2,040 2,481 2,060 2,671 3,071 2,894 4,231 3,724 9,252 13,921Profit Before Tax 3,518 3,585 4,305 4,980 4,766 5,373 6,432 6,946 16,388 23,517Provision for Taxes 1,125 955 1,349 1,544 1,553 1,688 2,139 2,263 4,973 7,643Net Profit 2,393 2,629 2,956 3,436 3,212 3,685 4,294 4,683 11,415 15,874
Growth (%) 30.4 31.7 31.7 30.5 34.2 40.1 45.2 36.3 30.8 39.1Cost to Income Ratio (%) 49.9 48.8 48.7 47.2 49.7 49.7 49.6 49.2 48.6 49.5Interest Exp./Interest Income (%) 47.5 50.1 48.9 45.3 52.4 50.8 47.3 46.3 47.8 48.9Other Income/Total Income (%) 31.6 33.5 30.1 27.2 36.7 29.3 32.1 25.9 30.4 30.7E: MOSt Estimates
NeutralPrevious Recommendation: Buy Rs1,401
28 March 2008BLOOMBERGHDFCB IN
REUTERS CODEHDBK.BO
Results PreviewSECTOR: BANKING
STOCK INFO.BSE Sensex: 16,371
S&P CNX: 4,942
Manish Karwa ([email protected])/Ajinkya Dhavale ([email protected])/Alpesh Mehta ([email protected])
? We expect HDFC Bank to maintain its consistent PAT growth of 30%+. Margins would remain stable QoQ during4QFY08. We expect downward pressure on yields on advances while cost of funds would remain firm. The impactof capital raising on cost of funds would also start fading.
? We expect advances to grow strong by ~55% YoY and ~2% QoQ, while deposits would grow by 48% YoY and 2%QoQ.
? HDFC Bank’s branch expansion has stagnated for the last three consecutive quarters due to non-receipt of newbranch licenses from RBI. However, the bank has been able to reap benefits from ~150 branches opened in FY07.Branch expansion would be a key area to watch out for during 4QFY08.
? Fee income growth is expected to sustain at ~30% while lower treasury and forex income would drag other incomegrowth. While opex continues to spiral up for the bank, overall cost-to-income ratio is likely to be 49-50%.
? We have not factored in the merger of CBoP with HDFC Bank in our estimates. We expect earnings CAGR of 36%over FY07-10, with RoE increasing to 20% by FY10. Stock trades at 3.2x FY10E BV and 17.2x FY10E EPS.
? In our view, the acquisition of CBoP was expensive and integration risks prevail. The 23% equity dilution due to shareswap deal to acquire CBoP and further issue of convertible warrants to HDFC would lower return ratios. We believethat current valuations provide little upside. Downgrade to Neutral.
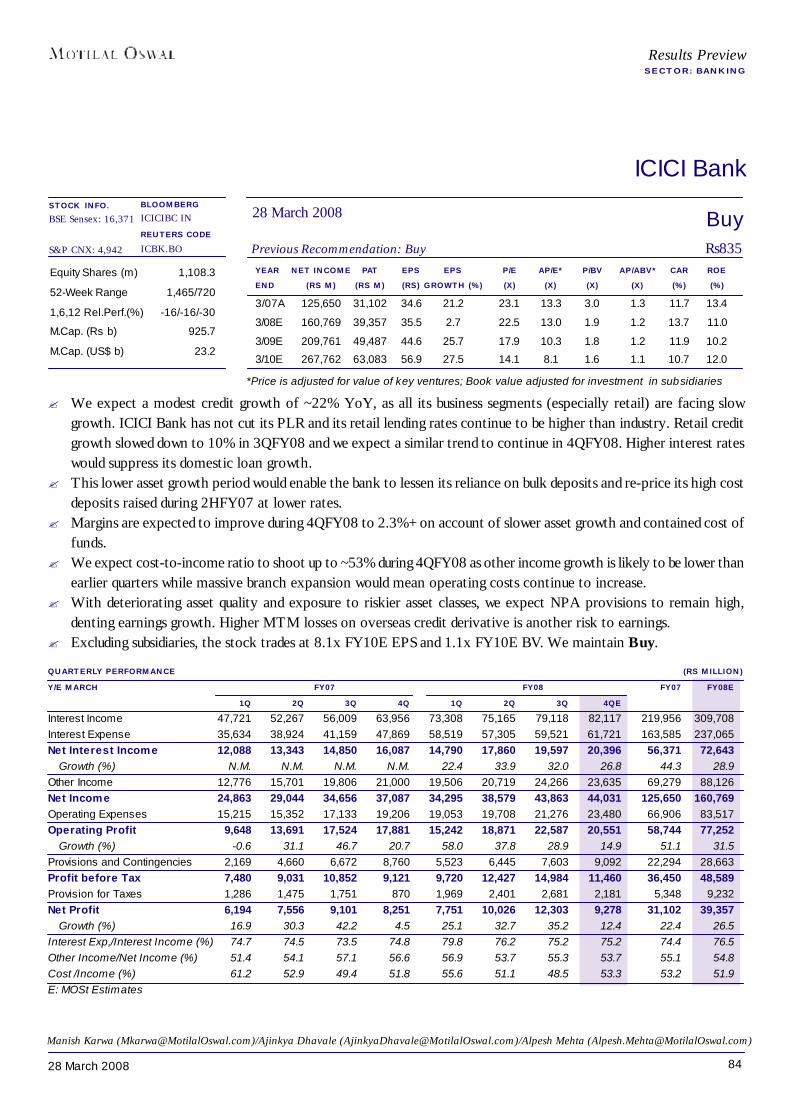
8428 March 2008
ICICI Bank
YEAR NET INCOME PAT EPS EPS P/E AP/E* P/BV AP/ABV* CAR ROEEND (RS M) (RS M) (RS) GROWTH (%) (X) (X) (X) (X) (%) (%)
3/07A 125,650 31,102 34.6 21.2 23.1 13.3 3.0 1.3 11.7 13.4
3/08E 160,769 39,357 35.5 2.7 22.5 13.0 1.9 1.2 13.7 11.0
3/09E 209,761 49,487 44.6 25.7 17.9 10.3 1.8 1.2 11.9 10.2
3/10E 267,762 63,083 56.9 27.5 14.1 8.1 1.6 1.1 10.7 12.0
Equity Shares (m) 1,108.3
52-Week Range 1,465/720
1,6,12 Rel.Perf.(%) -16/-16/-30
M.Cap. (Rs b) 925.7
M.Cap. (US$ b) 23.2
QUARTERLY PERFORMANCE (RS MILLION)Y/E MARCH FY07 FY08 FY07 FY08E
1Q 2Q 3Q 4Q 1Q 2Q 3Q 4QEInterest Income 47,721 52,267 56,009 63,956 73,308 75,165 79,118 82,117 219,956 309,708Interest Expense 35,634 38,924 41,159 47,869 58,519 57,305 59,521 61,721 163,585 237,065Net Interest Income 12,088 13,343 14,850 16,087 14,790 17,860 19,597 20,396 56,371 72,643
Growth (%) N.M. N.M. N.M. N.M. 22.4 33.9 32.0 26.8 44.3 28.9Other Income 12,776 15,701 19,806 21,000 19,506 20,719 24,266 23,635 69,279 88,126Net Income 24,863 29,044 34,656 37,087 34,295 38,579 43,863 44,031 125,650 160,769Operating Expenses 15,215 15,352 17,133 19,206 19,053 19,708 21,276 23,480 66,906 83,517Operating Profit 9,648 13,691 17,524 17,881 15,242 18,871 22,587 20,551 58,744 77,252
Growth (%) -0.6 31.1 46.7 20.7 58.0 37.8 28.9 14.9 51.1 31.5Provisions and Contingencies 2,169 4,660 6,672 8,760 5,523 6,445 7,603 9,092 22,294 28,663Profit before Tax 7,480 9,031 10,852 9,121 9,720 12,427 14,984 11,460 36,450 48,589Provision for Taxes 1,286 1,475 1,751 870 1,969 2,401 2,681 2,181 5,348 9,232Net Profit 6,194 7,556 9,101 8,251 7,751 10,026 12,303 9,278 31,102 39,357
Growth (%) 16.9 30.3 42.2 4.5 25.1 32.7 35.2 12.4 22.4 26.5Interest Exp,/Interest Income (%) 74.7 74.5 73.5 74.8 79.8 76.2 75.2 75.2 74.4 76.5Other Income/Net Income (%) 51.4 54.1 57.1 56.6 56.9 53.7 55.3 53.7 55.1 54.8Cost /Income (%) 61.2 52.9 49.4 51.8 55.6 51.1 48.5 53.3 53.2 51.9E: MOSt Estimates
BuyPrevious Recommendation: Buy Rs835
28 March 2008BLOOMBERGICICIBC IN
REUTERS CODEICBK.BO
Results PreviewSECTOR: BANKING
STOCK INFO.BSE Sensex: 16,371
S&P CNX: 4,942
Manish Karwa ([email protected])/Ajinkya Dhavale ([email protected])/Alpesh Mehta ([email protected])
? We expect a modest credit growth of ~22% YoY, as all its business segments (especially retail) are facing slowgrowth. ICICI Bank has not cut its PLR and its retail lending rates continue to be higher than industry. Retail creditgrowth slowed down to 10% in 3QFY08 and we expect a similar trend to continue in 4QFY08. Higher interest rateswould suppress its domestic loan growth.
? This lower asset growth period would enable the bank to lessen its reliance on bulk deposits and re-price its high costdeposits raised during 2HFY07 at lower rates.
? Margins are expected to improve during 4QFY08 to 2.3%+ on account of slower asset growth and contained cost offunds.
? We expect cost-to-income ratio to shoot up to ~53% during 4QFY08 as other income growth is likely to be lower thanearlier quarters while massive branch expansion would mean operating costs continue to increase.
? With deteriorating asset quality and exposure to riskier asset classes, we expect NPA provisions to remain high,denting earnings growth. Higher MTM losses on overseas credit derivative is another risk to earnings.
? Excluding subsidiaries, the stock trades at 8.1x FY10E EPS and 1.1x FY10E BV. We maintain Buy.
*Price is adjusted for value of key ventures; Book value adjusted for investment in subsidiaries

8528 March 2008
Indian Bank
YEAR NET INCOME PAT EPS EPS P/E P/BV CAR ROAE ROAA P/ABVEND (RS M) (RS M) (RS) GROWTH (%) (X) (X) (%) (%) (%) RATIO
3/07A 26,052 7,598 17.7 20.5 9.7 2.3 14.1 29.9 1.5 2.3
3/08E 30,349 10,280 23.9 35.3 7.1 1.8 12.7 28.3 1.7 1.8
3/09E 34,606 11,795 27.4 14.7 6.2 1.5 11.2 26.2 1.6 1.5
3/10E 39,260 13,342 31.0 13.1 5.5 1.2 11.3 24.3 1.6 1.2
Equity Shares (m) 429.8
52-Week Range 256/83
1,6,12 Rel.Perf.(%) -6/12/65
M.Cap. (Rs b) 73.5
M.Cap. (US$ b) 1.8
QUARTERLY PERFORMANCE (RS MILLION)Y/E MARCH FY07 FY08 FY07 FY08E
1Q 2Q 3Q 4Q 1Q 2Q 3Q 4QEInterest Income 9,336 10,102 10,545 11,965 11,824 12,330 13,754 14,613 41,948 52,520Interest Expense 5,468 5,785 6,407 6,466 7,124 7,862 8,137 8,610 24,126 31,733Net Interest Income 3,868 4,317 4,138 5,499 4,700 4,468 5,617 6,003 17,822 20,787
% Change (Y-o-Y) 13.6 20.0 12.1 24.8 21.5 3.5 35.7 9.2 18.0 16.6Other Income 1,148 1,661 1,751 3,671 1,944 2,601 3,006 2,010 8,231 9,561Net Income 5,016 5,978 5,889 9,170 6,644 7,069 8,623 8,013 26,052 30,349
% Change (Y-o-Y) 9.4 21.1 23.2 50.0 32.5 18.3 46.4 -12.6 32.0 16.5Operating Expenses 2,721 3,005 2,987 3,754 3,346 3,635 3,991 3,933 12,467 14,905Operating Profit 2,295 2,973 2,903 5,416 3,297 3,434 4,632 4,080 13,586 15,444Other Provisions 417 1,043 797 2,486 907 497 1,057 889 4,744 3,350Profit Before tax 1,878 1,930 2,105 2,930 2,390 2,937 3,575 3,191 8,842 12,094Tax Provisions 230 238 200 577 270 461 500 583 1,244 1,814Net Profit 1,648 1,692 1,905 2,353 2,120 2,476 3,075 2,608 7,598 10,280
% Change (Y-o-Y) 20.7 60.2 54.7 69.2 28.7 46.4 61.4 10.8 50.6 35.3Cost to Income Ratio (%) 54.2 50.3 50.7 40.9 50.4 51.4 46.3 49.1 47.9 49.1Interest Exp./Interest Income (%) 58.6 57.3 60.8 54.0 60.3 63.8 59.2 58.9 57.5 60.4Other Income/Net Income (%) 22.9 27.8 29.7 40.0 29.3 36.8 34.9 25.1 31.6 31.5E: MOSt Estimates
BuyPrevious Recommendation: Buy Rs171
28 March 2008BLOOMBERGINBK IN
REUTERS CODEINBA.BO
Results PreviewSECTOR: BANKING
STOCK INFO.BSE Sensex: 16,371
S&P CNX: 4,942
Manish Karwa ([email protected])/Ajinkya Dhavale ([email protected])/Alpesh Mehta ([email protected])
? Considering the bank’s comfortable liquidity position, we expect loan book growth to remain strong at >30% YoY –higher than industry growth rate. The bank continues to focus on high yielding SME, agricultural and retail advances.
? We expect margins to sustain at 3QFY08 levels, with an upward bias due to strong credit offtake and improvementin incremental C-D ratio. The proportion of bulk deposits for Indian Bank at ~8% is one of the lowest amongst thestate-owned banks.
? Strong recoveries would also drive earnings growth during the quarter.
? The bank’s higher operating profitability would enable it to make higher provisions towards AS-15 liability, NPAs andstandard assets.
? The stock trades at 5.5x FY10E EPS and 1.2x FY10E BV. Maintain Buy.
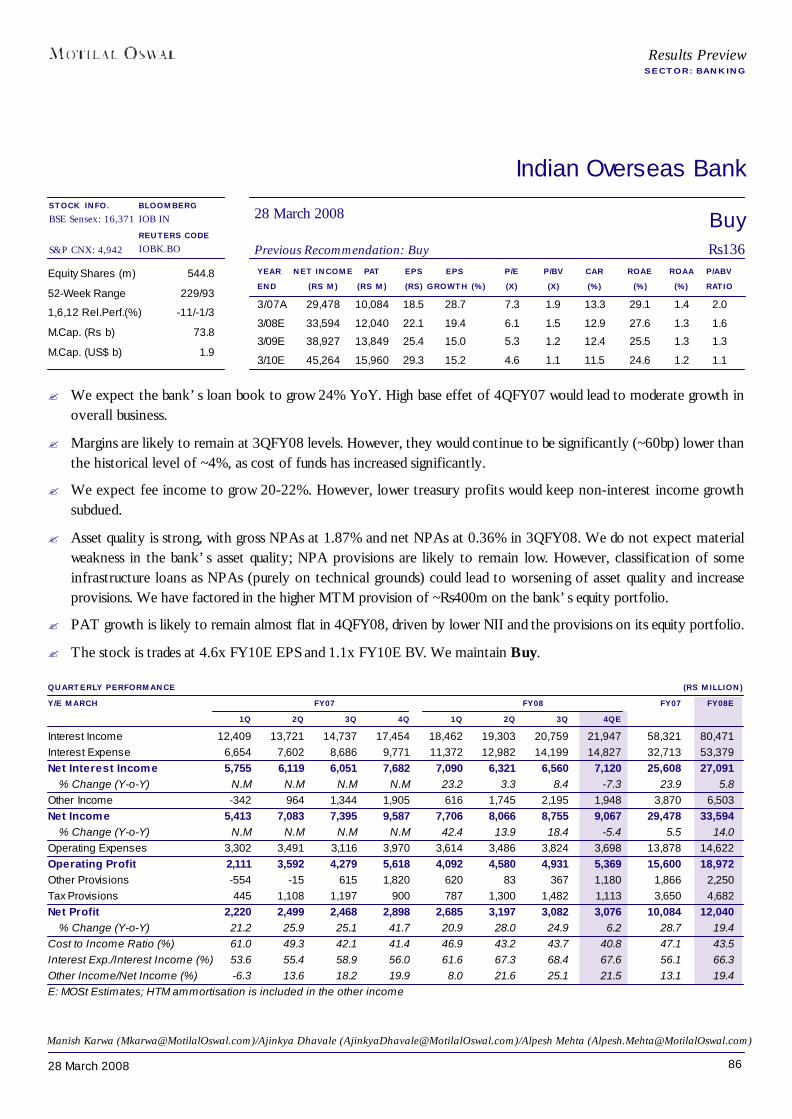
8628 March 2008
Indian Overseas Bank
YEAR NET INCOME PAT EPS EPS P/E P/BV CAR ROAE ROAA P/ABVEND (RS M) (RS M) (RS) GROWTH (%) (X) (X) (%) (%) (%) RATIO
3/07A 29,478 10,084 18.5 28.7 7.3 1.9 13.3 29.1 1.4 2.0
3/08E 33,594 12,040 22.1 19.4 6.1 1.5 12.9 27.6 1.3 1.6
3/09E 38,927 13,849 25.4 15.0 5.3 1.2 12.4 25.5 1.3 1.3
3/10E 45,264 15,960 29.3 15.2 4.6 1.1 11.5 24.6 1.2 1.1
Equity Shares (m) 544.8
52-Week Range 229/93
1,6,12 Rel.Perf.(%) -11/-1/3
M.Cap. (Rs b) 73.8
M.Cap. (US$ b) 1.9
QUARTERLY PERFORMANCE (RS MILLION)Y/E MARCH FY07 FY08 FY07 FY08E
1Q 2Q 3Q 4Q 1Q 2Q 3Q 4QEInterest Income 12,409 13,721 14,737 17,454 18,462 19,303 20,759 21,947 58,321 80,471Interest Expense 6,654 7,602 8,686 9,771 11,372 12,982 14,199 14,827 32,713 53,379Net Interest Income 5,755 6,119 6,051 7,682 7,090 6,321 6,560 7,120 25,608 27,091
% Change (Y-o-Y) N.M N.M N.M N.M 23.2 3.3 8.4 -7.3 23.9 5.8Other Income -342 964 1,344 1,905 616 1,745 2,195 1,948 3,870 6,503Net Income 5,413 7,083 7,395 9,587 7,706 8,066 8,755 9,067 29,478 33,594
% Change (Y-o-Y) N.M N.M N.M N.M 42.4 13.9 18.4 -5.4 5.5 14.0Operating Expenses 3,302 3,491 3,116 3,970 3,614 3,486 3,824 3,698 13,878 14,622Operating Profit 2,111 3,592 4,279 5,618 4,092 4,580 4,931 5,369 15,600 18,972Other Provisions -554 -15 615 1,820 620 83 367 1,180 1,866 2,250Tax Provisions 445 1,108 1,197 900 787 1,300 1,482 1,113 3,650 4,682Net Profit 2,220 2,499 2,468 2,898 2,685 3,197 3,082 3,076 10,084 12,040
% Change (Y-o-Y) 21.2 25.9 25.1 41.7 20.9 28.0 24.9 6.2 28.7 19.4Cost to Income Ratio (%) 61.0 49.3 42.1 41.4 46.9 43.2 43.7 40.8 47.1 43.5Interest Exp./Interest Income (%) 53.6 55.4 58.9 56.0 61.6 67.3 68.4 67.6 56.1 66.3Other Income/Net Income (%) -6.3 13.6 18.2 19.9 8.0 21.6 25.1 21.5 13.1 19.4E: MOSt Estimates; HTM ammortisation is included in the other income
BuyPrevious Recommendation: Buy Rs136
28 March 2008BLOOMBERGIOB IN
REUTERS CODEIOBK.BO
Results PreviewSECTOR: BANKING
STOCK INFO.BSE Sensex: 16,371
S&P CNX: 4,942
Manish Karwa ([email protected])/Ajinkya Dhavale ([email protected])/Alpesh Mehta ([email protected])
? We expect the bank’s loan book to grow 24% YoY. High base effet of 4QFY07 would lead to moderate growth inoverall business.
? Margins are likely to remain at 3QFY08 levels. However, they would continue to be significantly (~60bp) lower thanthe historical level of ~4%, as cost of funds has increased significantly.
? We expect fee income to grow 20-22%. However, lower treasury profits would keep non-interest income growthsubdued.
? Asset quality is strong, with gross NPAs at 1.87% and net NPAs at 0.36% in 3QFY08. We do not expect materialweakness in the bank’s asset quality; NPA provisions are likely to remain low. However, classification of someinfrastructure loans as NPAs (purely on technical grounds) could lead to worsening of asset quality and increaseprovisions. We have factored in the higher MTM provision of ~Rs400m on the bank’s equity portfolio.
? PAT growth is likely to remain almost flat in 4QFY08, driven by lower NII and the provisions on its equity portfolio.
? The stock is trades at 4.6x FY10E EPS and 1.1x FY10E BV. We maintain Buy.
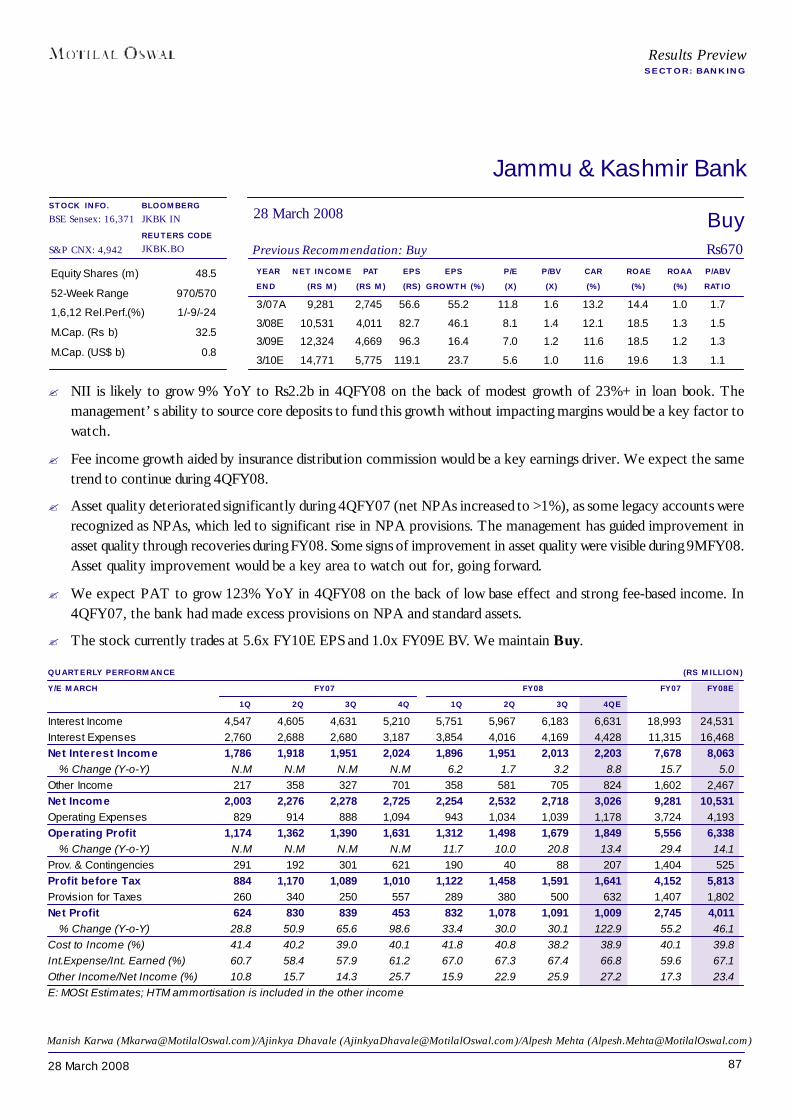
8728 March 2008
Jammu & Kashmir Bank
YEAR NET INCOME PAT EPS EPS P/E P/BV CAR ROAE ROAA P/ABVEND (RS M) (RS M) (RS) GROWTH (%) (X) (X) (%) (%) (%) RATIO
3/07A 9,281 2,745 56.6 55.2 11.8 1.6 13.2 14.4 1.0 1.7
3/08E 10,531 4,011 82.7 46.1 8.1 1.4 12.1 18.5 1.3 1.5
3/09E 12,324 4,669 96.3 16.4 7.0 1.2 11.6 18.5 1.2 1.3
3/10E 14,771 5,775 119.1 23.7 5.6 1.0 11.6 19.6 1.3 1.1
Equity Shares (m) 48.5
52-Week Range 970/570
1,6,12 Rel.Perf.(%) 1/-9/-24
M.Cap. (Rs b) 32.5
M.Cap. (US$ b) 0.8
QUARTERLY PERFORMANCE (RS MILLION)Y/E MARCH FY07 FY08 FY07 FY08E
1Q 2Q 3Q 4Q 1Q 2Q 3Q 4QEInterest Income 4,547 4,605 4,631 5,210 5,751 5,967 6,183 6,631 18,993 24,531Interest Expenses 2,760 2,688 2,680 3,187 3,854 4,016 4,169 4,428 11,315 16,468Net Interest Income 1,786 1,918 1,951 2,024 1,896 1,951 2,013 2,203 7,678 8,063
% Change (Y-o-Y) N.M N.M N.M N.M 6.2 1.7 3.2 8.8 15.7 5.0Other Income 217 358 327 701 358 581 705 824 1,602 2,467Net Income 2,003 2,276 2,278 2,725 2,254 2,532 2,718 3,026 9,281 10,531Operating Expenses 829 914 888 1,094 943 1,034 1,039 1,178 3,724 4,193Operating Profit 1,174 1,362 1,390 1,631 1,312 1,498 1,679 1,849 5,556 6,338
% Change (Y-o-Y) N.M N.M N.M N.M 11.7 10.0 20.8 13.4 29.4 14.1Prov. & Contingencies 291 192 301 621 190 40 88 207 1,404 525Profit before Tax 884 1,170 1,089 1,010 1,122 1,458 1,591 1,641 4,152 5,813Provision for Taxes 260 340 250 557 289 380 500 632 1,407 1,802Net Profit 624 830 839 453 832 1,078 1,091 1,009 2,745 4,011
% Change (Y-o-Y) 28.8 50.9 65.6 98.6 33.4 30.0 30.1 122.9 55.2 46.1Cost to Income (%) 41.4 40.2 39.0 40.1 41.8 40.8 38.2 38.9 40.1 39.8Int.Expense/Int. Earned (%) 60.7 58.4 57.9 61.2 67.0 67.3 67.4 66.8 59.6 67.1Other Income/Net Income (%) 10.8 15.7 14.3 25.7 15.9 22.9 25.9 27.2 17.3 23.4E: MOSt Estimates; HTM ammortisation is included in the other income
BuyPrevious Recommendation: Buy Rs670
28 March 2008BLOOMBERGJKBK IN
REUTERS CODEJKBK.BO
Results PreviewSECTOR: BANKING
STOCK INFO.BSE Sensex: 16,371
S&P CNX: 4,942
Manish Karwa ([email protected])/Ajinkya Dhavale ([email protected])/Alpesh Mehta ([email protected])
? NII is likely to grow 9% YoY to Rs2.2b in 4QFY08 on the back of modest growth of 23%+ in loan book. Themanagement’s ability to source core deposits to fund this growth without impacting margins would be a key factor towatch.
? Fee income growth aided by insurance distribution commission would be a key earnings driver. We expect the sametrend to continue during 4QFY08.
? Asset quality deteriorated significantly during 4QFY07 (net NPAs increased to >1%), as some legacy accounts wererecognized as NPAs, which led to significant rise in NPA provisions. The management has guided improvement inasset quality through recoveries during FY08. Some signs of improvement in asset quality were visible during 9MFY08.Asset quality improvement would be a key area to watch out for, going forward.
? We expect PAT to grow 123% YoY in 4QFY08 on the back of low base effect and strong fee-based income. In4QFY07, the bank had made excess provisions on NPA and standard assets.
? The stock currently trades at 5.6x FY10E EPS and 1.0x FY09E BV. We maintain Buy.
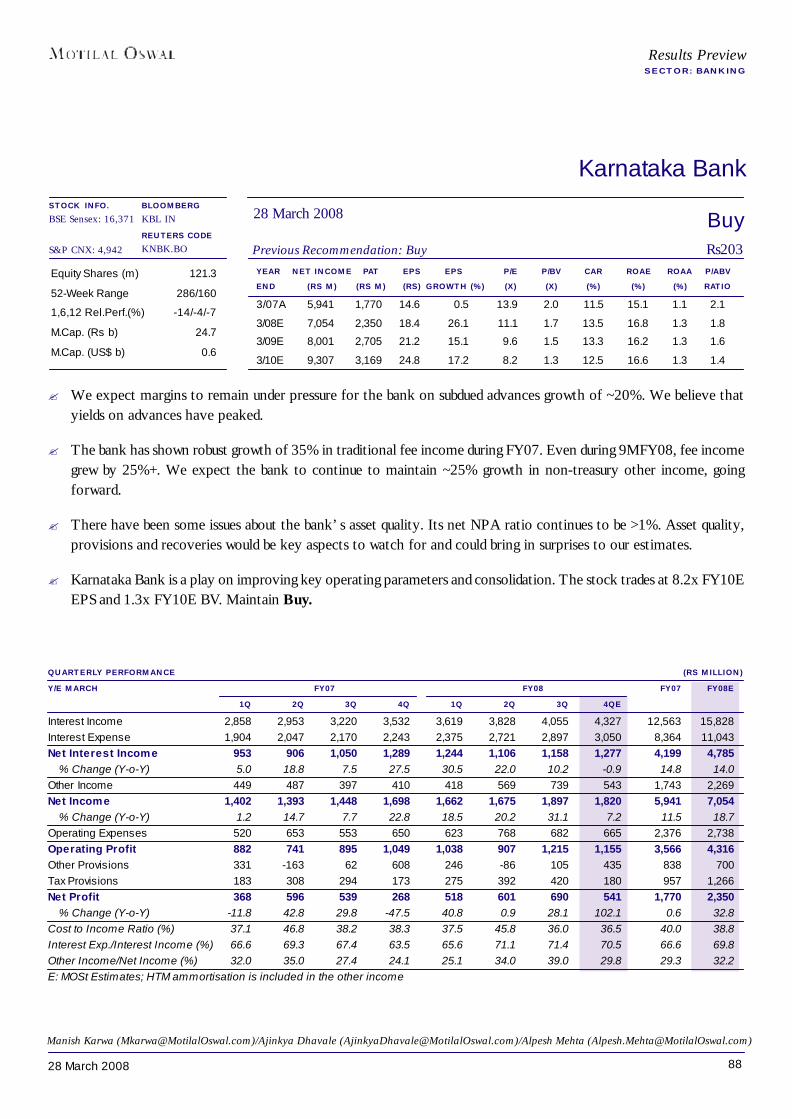
8828 March 2008
Karnataka Bank
YEAR NET INCOME PAT EPS EPS P/E P/BV CAR ROAE ROAA P/ABVEND (RS M) (RS M) (RS) GROWTH (%) (X) (X) (%) (%) (%) RATIO
3/07A 5,941 1,770 14.6 0.5 13.9 2.0 11.5 15.1 1.1 2.1
3/08E 7,054 2,350 18.4 26.1 11.1 1.7 13.5 16.8 1.3 1.8
3/09E 8,001 2,705 21.2 15.1 9.6 1.5 13.3 16.2 1.3 1.6
3/10E 9,307 3,169 24.8 17.2 8.2 1.3 12.5 16.6 1.3 1.4
Equity Shares (m) 121.3
52-Week Range 286/160
1,6,12 Rel.Perf.(%) -14/-4/-7
M.Cap. (Rs b) 24.7
M.Cap. (US$ b) 0.6
QUARTERLY PERFORMANCE (RS MILLION)Y/E MARCH FY07 FY08 FY07 FY08E
1Q 2Q 3Q 4Q 1Q 2Q 3Q 4QEInterest Income 2,858 2,953 3,220 3,532 3,619 3,828 4,055 4,327 12,563 15,828Interest Expense 1,904 2,047 2,170 2,243 2,375 2,721 2,897 3,050 8,364 11,043Net Interest Income 953 906 1,050 1,289 1,244 1,106 1,158 1,277 4,199 4,785
% Change (Y-o-Y) 5.0 18.8 7.5 27.5 30.5 22.0 10.2 -0.9 14.8 14.0Other Income 449 487 397 410 418 569 739 543 1,743 2,269Net Income 1,402 1,393 1,448 1,698 1,662 1,675 1,897 1,820 5,941 7,054
% Change (Y-o-Y) 1.2 14.7 7.7 22.8 18.5 20.2 31.1 7.2 11.5 18.7Operating Expenses 520 653 553 650 623 768 682 665 2,376 2,738Operating Profit 882 741 895 1,049 1,038 907 1,215 1,155 3,566 4,316Other Provisions 331 -163 62 608 246 -86 105 435 838 700Tax Provisions 183 308 294 173 275 392 420 180 957 1,266Net Profit 368 596 539 268 518 601 690 541 1,770 2,350
% Change (Y-o-Y) -11.8 42.8 29.8 -47.5 40.8 0.9 28.1 102.1 0.6 32.8Cost to Income Ratio (%) 37.1 46.8 38.2 38.3 37.5 45.8 36.0 36.5 40.0 38.8Interest Exp./Interest Income (%) 66.6 69.3 67.4 63.5 65.6 71.1 71.4 70.5 66.6 69.8Other Income/Net Income (%) 32.0 35.0 27.4 24.1 25.1 34.0 39.0 29.8 29.3 32.2E: MOSt Estimates; HTM ammortisation is included in the other income
BuyPrevious Recommendation: Buy Rs203
28 March 2008BLOOMBERGKBL IN
REUTERS CODEKNBK.BO
Results PreviewSECTOR: BANKING
STOCK INFO.BSE Sensex: 16,371
S&P CNX: 4,942
Manish Karwa ([email protected])/Ajinkya Dhavale ([email protected])/Alpesh Mehta ([email protected])
? We expect margins to remain under pressure for the bank on subdued advances growth of ~20%. We believe thatyields on advances have peaked.
? The bank has shown robust growth of 35% in traditional fee income during FY07. Even during 9MFY08, fee incomegrew by 25%+. We expect the bank to continue to maintain ~25% growth in non-treasury other income, goingforward.
? There have been some issues about the bank’s asset quality. Its net NPA ratio continues to be >1%. Asset quality,provisions and recoveries would be key aspects to watch for and could bring in surprises to our estimates.
? Karnataka Bank is a play on improving key operating parameters and consolidation. The stock trades at 8.2x FY10EEPS and 1.3x FY10E BV. Maintain Buy.

8928 March 2008
Oriental Bank of Commerce
YEAR NET INCOME PAT EPS EPS P/E P/BV CAR ROAE ROAA P/ABVEND (RS M) (RS M) (RS) GROWTH (%) (X) (X) (%) (%) (%) RATIO
3/07A 22,946 8,268 33.0 2.9 5.6 0.9 12.5 15.4 1.2 0.9
3/08E 22,879 8,331 33.3 0.8 5.6 0.8 12.0 14.3 1.0 0.8
3/09E 26,151 9,335 37.3 12.0 5.0 0.7 11.0 14.8 1.0 0.7
3/10E 30,042 10,309 41.1 10.4 4.5 0.6 11.0 15.0 0.9 0.7
Equity Shares (m) 250.5
52-Week Range 321/158
1,6,12 Rel. Perf.(%) -17/-18/-25
M.Cap. (Rs b) 46.5
M.Cap. (US$ b) 1.2
QUARTERLY PERFORMANCE (RS MILLION)Y/E MARCH FY07 FY08 FY07 FY08E
1Q 2Q 3Q 4Q 1Q 2Q 3Q 4QEInterest Income 11,353 12,822 13,137 14,336 15,341 16,457 17,479 17,976 51,649 67,253Interest Expense 7,244 8,695 8,924 9,874 10,910 12,462 13,456 13,575 34,736 50,402Net Interest Income 4,110 4,128 4,213 4,462 4,431 3,995 4,024 4,402 16,913 16,851
% Change (YoY) 2.0 2.1 6.7 10.7 7.8 -3.2 -4.5 -1.4 5.4 -0.4Other Income 1,687 1,579 1,330 1,437 1,462 1,425 1,674 1,467 6,033 6,028Net Income 5,797 5,707 5,543 5,899 5,893 5,420 5,697 5,868 22,946 22,879
% Change (YoY) 16.3 -1.0 6.3 5.0 1.7 -5.0 2.8 -0.5 6.3 -0.3Operating Expenses 2,287 2,566 2,476 2,650 2,642 2,698 2,730 2,734 9,979 10,804Operating Profit 3,510 3,141 3,067 3,249 3,251 2,722 2,967 3,134 12,967 12,075Provision & Contingencies 1,477 -737 81 1,616 506 -191 258 377 2,436 950PBT 2,033 3,878 2,986 1,633 2,745 2,913 2,710 2,757 10,531 11,125Tax Provisions 481 771 550 462 741 551 713 790 2,263 2,794Net Profit 1,553 3,108 2,437 1,171 2,004 2,362 1,997 1,967 8,268 8,331
% Change (YoY) 48.2 37.2 19.1 -56.2 29.1 -24.0 -18.0 67.9 2.9 0.8Cost to Income Ratio (%) 39.4 43.4 44.7 44.9 44.8 49.8 47.9 46.6 43.5 47.2Int Exp/ Int Earned (%) 63.8 59.9 67.9 68.9 71.1 75.7 77.0 75.5 67.3 74.9Other Income / Net Income (%) 29.1 29.9 24.0 24.4 24.8 26.3 29.4 25.0 26.3 26.3E: MOSt Estimates
NeutralPrevious Recommendation: Neutral Rs186
28 March 2008BLOOMBERGOBC IN
REUTERS CODEORBC.BO
Results PreviewSECTOR: BANKING
STOCK INFO.BSE Sensex: 16,371
S&P CNX: 4,942
Manish Karwa ([email protected])/Ajinkya Dhavale ([email protected])/Alpesh Mehta ([email protected])
? We expect OBC’s margins to remain stable at 3QFY08 levels, with an upward bias. In 3QFY08, the bank had shedRs45b of bulk deposits. However, the proportion of bulk deposits continues to be 25%+. Higher proportion of bulkdeposits would continue to put pressure on margins. Advances should grow in line with the industry at 23%+.
? Sustained growth in fee income, higher recoveries and controlled operating costs would help the bank to reportoperating profits similar to 4QFY07 levels.
? OBC continues to enjoy robust asset quality, with net NPAs at 0.67%. Recoveries are expected to remain strong.Moreover, the bank has a pool of Rs2.5b of specific NPA provisions made in excess of the RBI requirement.
? We expect the bank to report 68% growth in net profit due to reduced provisioning requirements as compared to4QFY07. In 4QFY07, provisions had increased substantially on account of increased regulatory requirement ofstandard asset provisions and higher MTM depreciation on investment portfolio.
? The stock is trading at 4.5x FY10E EPS and 0.6x FY10E BV. We maintain Neutral.
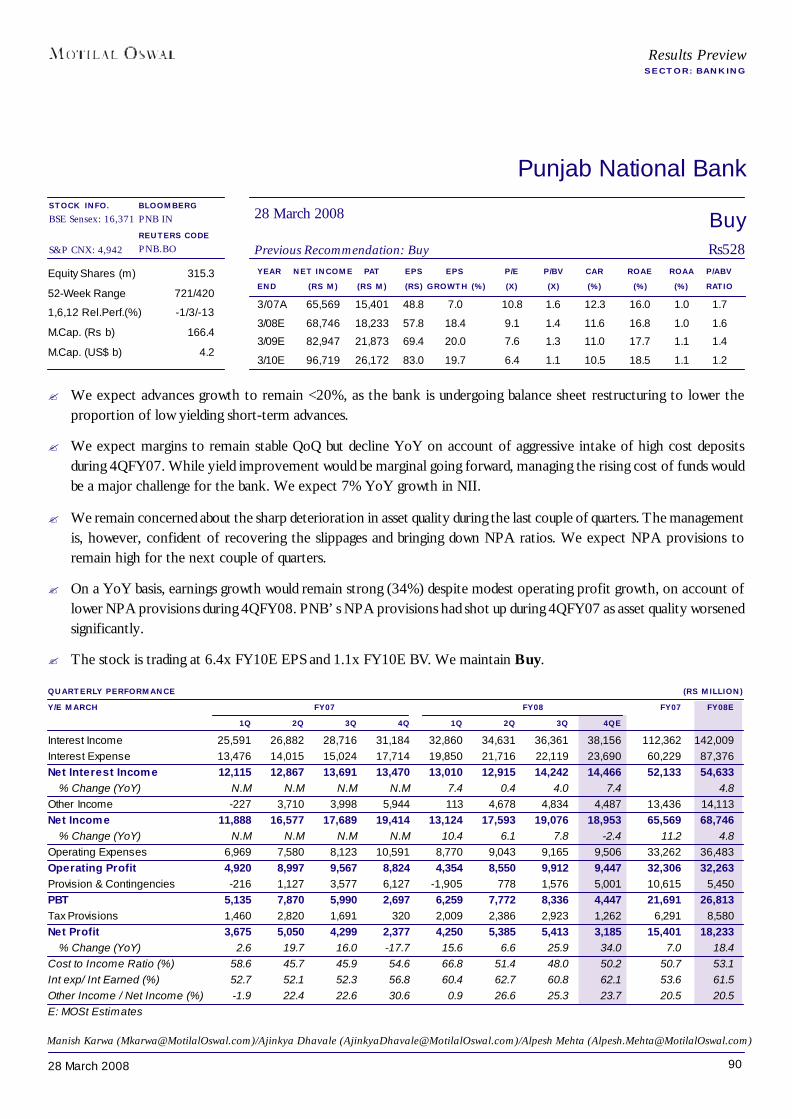
9028 March 2008
Punjab National Bank
YEAR NET INCOME PAT EPS EPS P/E P/BV CAR ROAE ROAA P/ABVEND (RS M) (RS M) (RS) GROWTH (%) (X) (X) (%) (%) (%) RATIO
3/07A 65,569 15,401 48.8 7.0 10.8 1.6 12.3 16.0 1.0 1.7
3/08E 68,746 18,233 57.8 18.4 9.1 1.4 11.6 16.8 1.0 1.6
3/09E 82,947 21,873 69.4 20.0 7.6 1.3 11.0 17.7 1.1 1.4
3/10E 96,719 26,172 83.0 19.7 6.4 1.1 10.5 18.5 1.1 1.2
Equity Shares (m) 315.3
52-Week Range 721/420
1,6,12 Rel.Perf.(%) -1/3/-13
M.Cap. (Rs b) 166.4
M.Cap. (US$ b) 4.2
QUARTERLY PERFORMANCE (RS MILLION)Y/E MARCH FY07 FY08 FY07 FY08E
1Q 2Q 3Q 4Q 1Q 2Q 3Q 4QEInterest Income 25,591 26,882 28,716 31,184 32,860 34,631 36,361 38,156 112,362 142,009Interest Expense 13,476 14,015 15,024 17,714 19,850 21,716 22,119 23,690 60,229 87,376Net Interest Income 12,115 12,867 13,691 13,470 13,010 12,915 14,242 14,466 52,133 54,633
% Change (YoY) N.M N.M N.M N.M 7.4 0.4 4.0 7.4 4.8Other Income -227 3,710 3,998 5,944 113 4,678 4,834 4,487 13,436 14,113Net Income 11,888 16,577 17,689 19,414 13,124 17,593 19,076 18,953 65,569 68,746
% Change (YoY) N.M N.M N.M N.M 10.4 6.1 7.8 -2.4 11.2 4.8Operating Expenses 6,969 7,580 8,123 10,591 8,770 9,043 9,165 9,506 33,262 36,483Operating Profit 4,920 8,997 9,567 8,824 4,354 8,550 9,912 9,447 32,306 32,263Provision & Contingencies -216 1,127 3,577 6,127 -1,905 778 1,576 5,001 10,615 5,450PBT 5,135 7,870 5,990 2,697 6,259 7,772 8,336 4,447 21,691 26,813Tax Provisions 1,460 2,820 1,691 320 2,009 2,386 2,923 1,262 6,291 8,580Net Profit 3,675 5,050 4,299 2,377 4,250 5,385 5,413 3,185 15,401 18,233
% Change (YoY) 2.6 19.7 16.0 -17.7 15.6 6.6 25.9 34.0 7.0 18.4Cost to Income Ratio (%) 58.6 45.7 45.9 54.6 66.8 51.4 48.0 50.2 50.7 53.1Int exp/ Int Earned (%) 52.7 52.1 52.3 56.8 60.4 62.7 60.8 62.1 53.6 61.5Other Income / Net Income (%) -1.9 22.4 22.6 30.6 0.9 26.6 25.3 23.7 20.5 20.5E: MOSt Estimates
BuyPrevious Recommendation: Buy Rs528
28 March 2008BLOOMBERGPNB IN
REUTERS CODEPNB.BO
Results PreviewSECTOR: BANKING
STOCK INFO.BSE Sensex: 16,371
S&P CNX: 4,942
Manish Karwa ([email protected])/Ajinkya Dhavale ([email protected])/Alpesh Mehta ([email protected])
? We expect advances growth to remain <20%, as the bank is undergoing balance sheet restructuring to lower theproportion of low yielding short-term advances.
? We expect margins to remain stable QoQ but decline YoY on account of aggressive intake of high cost depositsduring 4QFY07. While yield improvement would be marginal going forward, managing the rising cost of funds wouldbe a major challenge for the bank. We expect 7% YoY growth in NII.
? We remain concerned about the sharp deterioration in asset quality during the last couple of quarters. The managementis, however, confident of recovering the slippages and bringing down NPA ratios. We expect NPA provisions toremain high for the next couple of quarters.
? On a YoY basis, earnings growth would remain strong (34%) despite modest operating profit growth, on account oflower NPA provisions during 4QFY08. PNB’s NPA provisions had shot up during 4QFY07 as asset quality worsenedsignificantly.
? The stock is trading at 6.4x FY10E EPS and 1.1x FY10E BV. We maintain Buy.
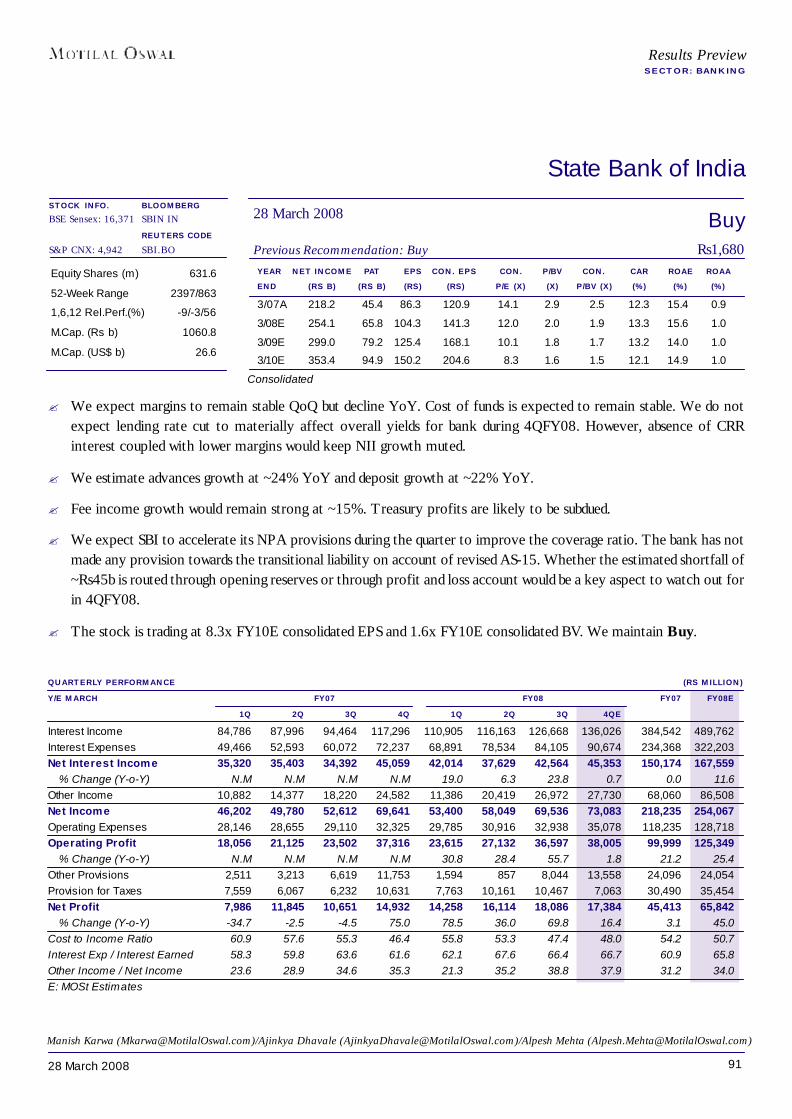
9128 March 2008
State Bank of India
YEAR NET INCOME PAT EPS CON. EPS CON. P/BV CON. CAR ROAE ROAAEND (RS B) (RS B) (RS) (RS) P/E (X) (X) P/BV (X) (%) (%) (%)
3/07A 218.2 45.4 86.3 120.9 14.1 2.9 2.5 12.3 15.4 0.9
3/08E 254.1 65.8 104.3 141.3 12.0 2.0 1.9 13.3 15.6 1.0
3/09E 299.0 79.2 125.4 168.1 10.1 1.8 1.7 13.2 14.0 1.0
3/10E 353.4 94.9 150.2 204.6 8.3 1.6 1.5 12.1 14.9 1.0
Equity Shares (m) 631.6
52-Week Range 2397/863
1,6,12 Rel.Perf.(%) -9/-3/56
M.Cap. (Rs b) 1060.8
M.Cap. (US$ b) 26.6
QUARTERLY PERFORMANCE (RS MILLION)Y/E MARCH FY07 FY08 FY07 FY08E
1Q 2Q 3Q 4Q 1Q 2Q 3Q 4QEInterest Income 84,786 87,996 94,464 117,296 110,905 116,163 126,668 136,026 384,542 489,762Interest Expenses 49,466 52,593 60,072 72,237 68,891 78,534 84,105 90,674 234,368 322,203Net Interest Income 35,320 35,403 34,392 45,059 42,014 37,629 42,564 45,353 150,174 167,559
% Change (Y-o-Y) N.M N.M N.M N.M 19.0 6.3 23.8 0.7 0.0 11.6Other Income 10,882 14,377 18,220 24,582 11,386 20,419 26,972 27,730 68,060 86,508Net Income 46,202 49,780 52,612 69,641 53,400 58,049 69,536 73,083 218,235 254,067Operating Expenses 28,146 28,655 29,110 32,325 29,785 30,916 32,938 35,078 118,235 128,718Operating Profit 18,056 21,125 23,502 37,316 23,615 27,132 36,597 38,005 99,999 125,349
% Change (Y-o-Y) N.M N.M N.M N.M 30.8 28.4 55.7 1.8 21.2 25.4Other Provisions 2,511 3,213 6,619 11,753 1,594 857 8,044 13,558 24,096 24,054Provision for Taxes 7,559 6,067 6,232 10,631 7,763 10,161 10,467 7,063 30,490 35,454Net Profit 7,986 11,845 10,651 14,932 14,258 16,114 18,086 17,384 45,413 65,842
% Change (Y-o-Y) -34.7 -2.5 -4.5 75.0 78.5 36.0 69.8 16.4 3.1 45.0Cost to Income Ratio 60.9 57.6 55.3 46.4 55.8 53.3 47.4 48.0 54.2 50.7Interest Exp / Interest Earned 58.3 59.8 63.6 61.6 62.1 67.6 66.4 66.7 60.9 65.8Other Income / Net Income 23.6 28.9 34.6 35.3 21.3 35.2 38.8 37.9 31.2 34.0E: MOSt Estimates
BuyPrevious Recommendation: Buy Rs1,680
28 March 2008BLOOMBERGSBIN IN
REUTERS CODESBI.BO
Results PreviewSECTOR: BANKING
Consolidated
STOCK INFO.BSE Sensex: 16,371
S&P CNX: 4,942
Manish Karwa ([email protected])/Ajinkya Dhavale ([email protected])/Alpesh Mehta ([email protected])
? We expect margins to remain stable QoQ but decline YoY. Cost of funds is expected to remain stable. We do notexpect lending rate cut to materially affect overall yields for bank during 4QFY08. However, absence of CRRinterest coupled with lower margins would keep NII growth muted.
? We estimate advances growth at ~24% YoY and deposit growth at ~22% YoY.
? Fee income growth would remain strong at ~15%. Treasury profits are likely to be subdued.
? We expect SBI to accelerate its NPA provisions during the quarter to improve the coverage ratio. The bank has notmade any provision towards the transitional liability on account of revised AS-15. Whether the estimated shortfall of~Rs45b is routed through opening reserves or through profit and loss account would be a key aspect to watch out forin 4QFY08.
? The stock is trading at 8.3x FY10E consolidated EPS and 1.6x FY10E consolidated BV. We maintain Buy.
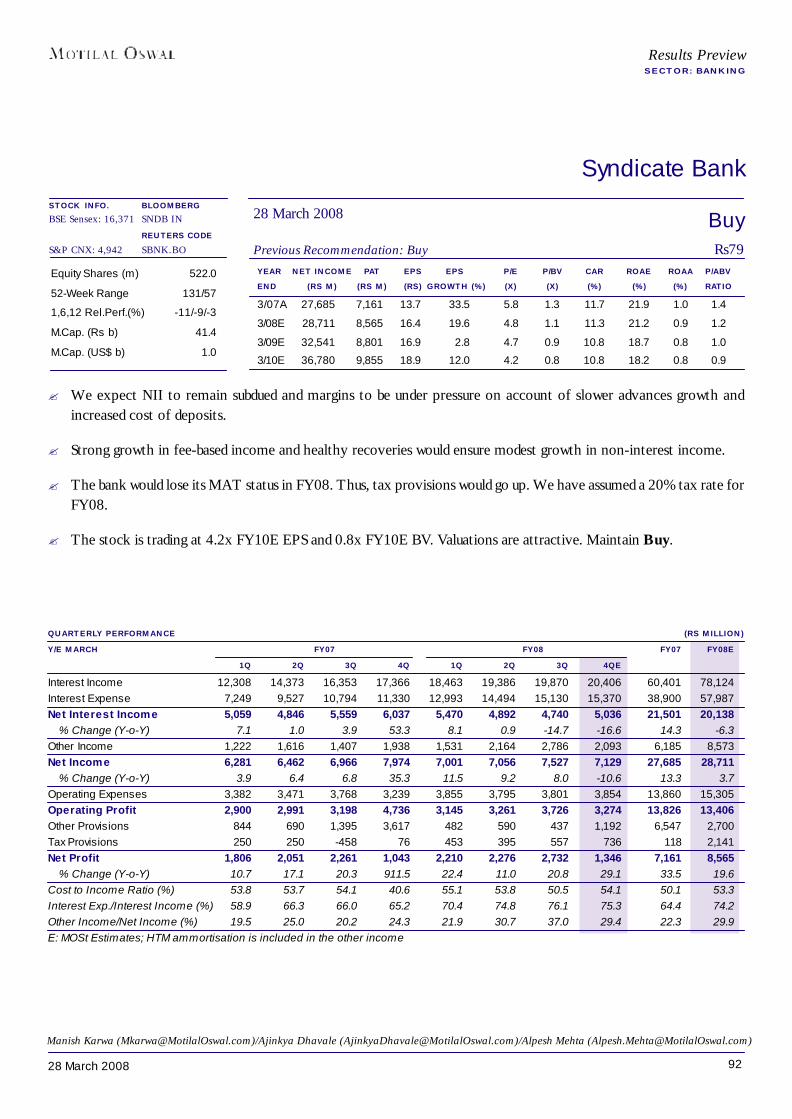
9228 March 2008
Syndicate Bank
YEAR NET INCOME PAT EPS EPS P/E P/BV CAR ROAE ROAA P/ABVEND (RS M) (RS M) (RS) GROWTH (%) (X) (X) (%) (%) (%) RATIO
3/07A 27,685 7,161 13.7 33.5 5.8 1.3 11.7 21.9 1.0 1.4
3/08E 28,711 8,565 16.4 19.6 4.8 1.1 11.3 21.2 0.9 1.2
3/09E 32,541 8,801 16.9 2.8 4.7 0.9 10.8 18.7 0.8 1.0
3/10E 36,780 9,855 18.9 12.0 4.2 0.8 10.8 18.2 0.8 0.9
Equity Shares (m) 522.0
52-Week Range 131/57
1,6,12 Rel.Perf.(%) -11/-9/-3
M.Cap. (Rs b) 41.4
M.Cap. (US$ b) 1.0
QUARTERLY PERFORMANCE (RS MILLION)Y/E MARCH FY07 FY08 FY07 FY08E
1Q 2Q 3Q 4Q 1Q 2Q 3Q 4QEInterest Income 12,308 14,373 16,353 17,366 18,463 19,386 19,870 20,406 60,401 78,124Interest Expense 7,249 9,527 10,794 11,330 12,993 14,494 15,130 15,370 38,900 57,987Net Interest Income 5,059 4,846 5,559 6,037 5,470 4,892 4,740 5,036 21,501 20,138
% Change (Y-o-Y) 7.1 1.0 3.9 53.3 8.1 0.9 -14.7 -16.6 14.3 -6.3Other Income 1,222 1,616 1,407 1,938 1,531 2,164 2,786 2,093 6,185 8,573Net Income 6,281 6,462 6,966 7,974 7,001 7,056 7,527 7,129 27,685 28,711
% Change (Y-o-Y) 3.9 6.4 6.8 35.3 11.5 9.2 8.0 -10.6 13.3 3.7Operating Expenses 3,382 3,471 3,768 3,239 3,855 3,795 3,801 3,854 13,860 15,305Operating Profit 2,900 2,991 3,198 4,736 3,145 3,261 3,726 3,274 13,826 13,406Other Provisions 844 690 1,395 3,617 482 590 437 1,192 6,547 2,700Tax Provisions 250 250 -458 76 453 395 557 736 118 2,141Net Profit 1,806 2,051 2,261 1,043 2,210 2,276 2,732 1,346 7,161 8,565
% Change (Y-o-Y) 10.7 17.1 20.3 911.5 22.4 11.0 20.8 29.1 33.5 19.6Cost to Income Ratio (%) 53.8 53.7 54.1 40.6 55.1 53.8 50.5 54.1 50.1 53.3Interest Exp./Interest Income (%) 58.9 66.3 66.0 65.2 70.4 74.8 76.1 75.3 64.4 74.2Other Income/Net Income (%) 19.5 25.0 20.2 24.3 21.9 30.7 37.0 29.4 22.3 29.9E: MOSt Estimates; HTM ammortisation is included in the other income
BuyPrevious Recommendation: Buy Rs79
28 March 2008BLOOMBERGSNDB IN
REUTERS CODESBNK.BO
Results PreviewSECTOR: BANKING
STOCK INFO.BSE Sensex: 16,371
S&P CNX: 4,942
Manish Karwa ([email protected])/Ajinkya Dhavale ([email protected])/Alpesh Mehta ([email protected])
? We expect NII to remain subdued and margins to be under pressure on account of slower advances growth andincreased cost of deposits.
? Strong growth in fee-based income and healthy recoveries would ensure modest growth in non-interest income.
? The bank would lose its MAT status in FY08. Thus, tax provisions would go up. We have assumed a 20% tax rate forFY08.
? The stock is trading at 4.2x FY10E EPS and 0.8x FY10E BV. Valuations are attractive. Maintain Buy.
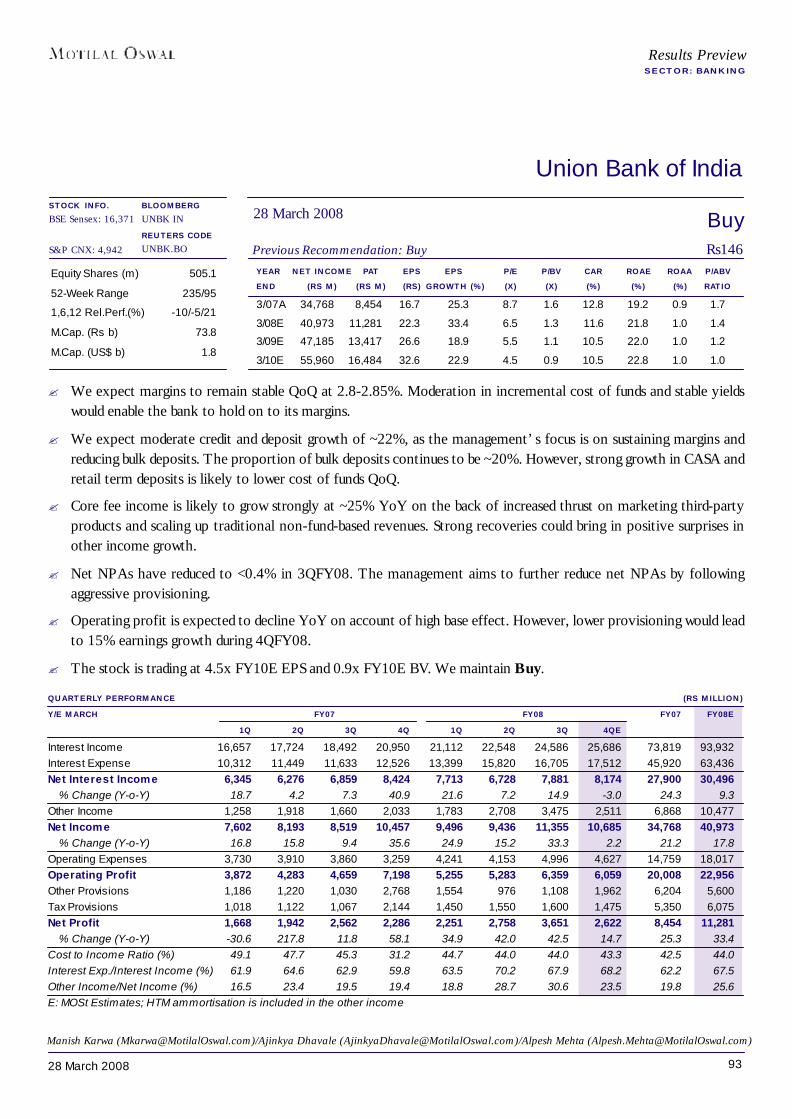
9328 March 2008
Union Bank of India
YEAR NET INCOME PAT EPS EPS P/E P/BV CAR ROAE ROAA P/ABVEND (RS M) (RS M) (RS) GROWTH (%) (X) (X) (%) (%) (%) RATIO
3/07A 34,768 8,454 16.7 25.3 8.7 1.6 12.8 19.2 0.9 1.7
3/08E 40,973 11,281 22.3 33.4 6.5 1.3 11.6 21.8 1.0 1.4
3/09E 47,185 13,417 26.6 18.9 5.5 1.1 10.5 22.0 1.0 1.2
3/10E 55,960 16,484 32.6 22.9 4.5 0.9 10.5 22.8 1.0 1.0
Equity Shares (m) 505.1
52-Week Range 235/95
1,6,12 Rel.Perf.(%) -10/-5/21
M.Cap. (Rs b) 73.8
M.Cap. (US$ b) 1.8
QUARTERLY PERFORMANCE (RS MILLION)Y/E MARCH FY07 FY08 FY07 FY08E
1Q 2Q 3Q 4Q 1Q 2Q 3Q 4QEInterest Income 16,657 17,724 18,492 20,950 21,112 22,548 24,586 25,686 73,819 93,932Interest Expense 10,312 11,449 11,633 12,526 13,399 15,820 16,705 17,512 45,920 63,436Net Interest Income 6,345 6,276 6,859 8,424 7,713 6,728 7,881 8,174 27,900 30,496
% Change (Y-o-Y) 18.7 4.2 7.3 40.9 21.6 7.2 14.9 -3.0 24.3 9.3Other Income 1,258 1,918 1,660 2,033 1,783 2,708 3,475 2,511 6,868 10,477Net Income 7,602 8,193 8,519 10,457 9,496 9,436 11,355 10,685 34,768 40,973
% Change (Y-o-Y) 16.8 15.8 9.4 35.6 24.9 15.2 33.3 2.2 21.2 17.8Operating Expenses 3,730 3,910 3,860 3,259 4,241 4,153 4,996 4,627 14,759 18,017Operating Profit 3,872 4,283 4,659 7,198 5,255 5,283 6,359 6,059 20,008 22,956Other Provisions 1,186 1,220 1,030 2,768 1,554 976 1,108 1,962 6,204 5,600Tax Provisions 1,018 1,122 1,067 2,144 1,450 1,550 1,600 1,475 5,350 6,075Net Profit 1,668 1,942 2,562 2,286 2,251 2,758 3,651 2,622 8,454 11,281
% Change (Y-o-Y) -30.6 217.8 11.8 58.1 34.9 42.0 42.5 14.7 25.3 33.4Cost to Income Ratio (%) 49.1 47.7 45.3 31.2 44.7 44.0 44.0 43.3 42.5 44.0Interest Exp./Interest Income (%) 61.9 64.6 62.9 59.8 63.5 70.2 67.9 68.2 62.2 67.5Other Income/Net Income (%) 16.5 23.4 19.5 19.4 18.8 28.7 30.6 23.5 19.8 25.6E: MOSt Estimates; HTM ammortisation is included in the other income
BuyPrevious Recommendation: Buy Rs146
28 March 2008BLOOMBERGUNBK IN
REUTERS CODEUNBK.BO
Results PreviewSECTOR: BANKING
STOCK INFO.BSE Sensex: 16,371
S&P CNX: 4,942
Manish Karwa ([email protected])/Ajinkya Dhavale ([email protected])/Alpesh Mehta ([email protected])
? We expect margins to remain stable QoQ at 2.8-2.85%. Moderation in incremental cost of funds and stable yieldswould enable the bank to hold on to its margins.
? We expect moderate credit and deposit growth of ~22%, as the management’s focus is on sustaining margins andreducing bulk deposits. The proportion of bulk deposits continues to be ~20%. However, strong growth in CASA andretail term deposits is likely to lower cost of funds QoQ.
? Core fee income is likely to grow strongly at ~25% YoY on the back of increased thrust on marketing third-partyproducts and scaling up traditional non-fund-based revenues. Strong recoveries could bring in positive surprises inother income growth.
? Net NPAs have reduced to <0.4% in 3QFY08. The management aims to further reduce net NPAs by followingaggressive provisioning.
? Operating profit is expected to decline YoY on account of high base effect. However, lower provisioning would leadto 15% earnings growth during 4QFY08.
? The stock is trading at 4.5x FY10E EPS and 0.9x FY10E BV. We maintain Buy.
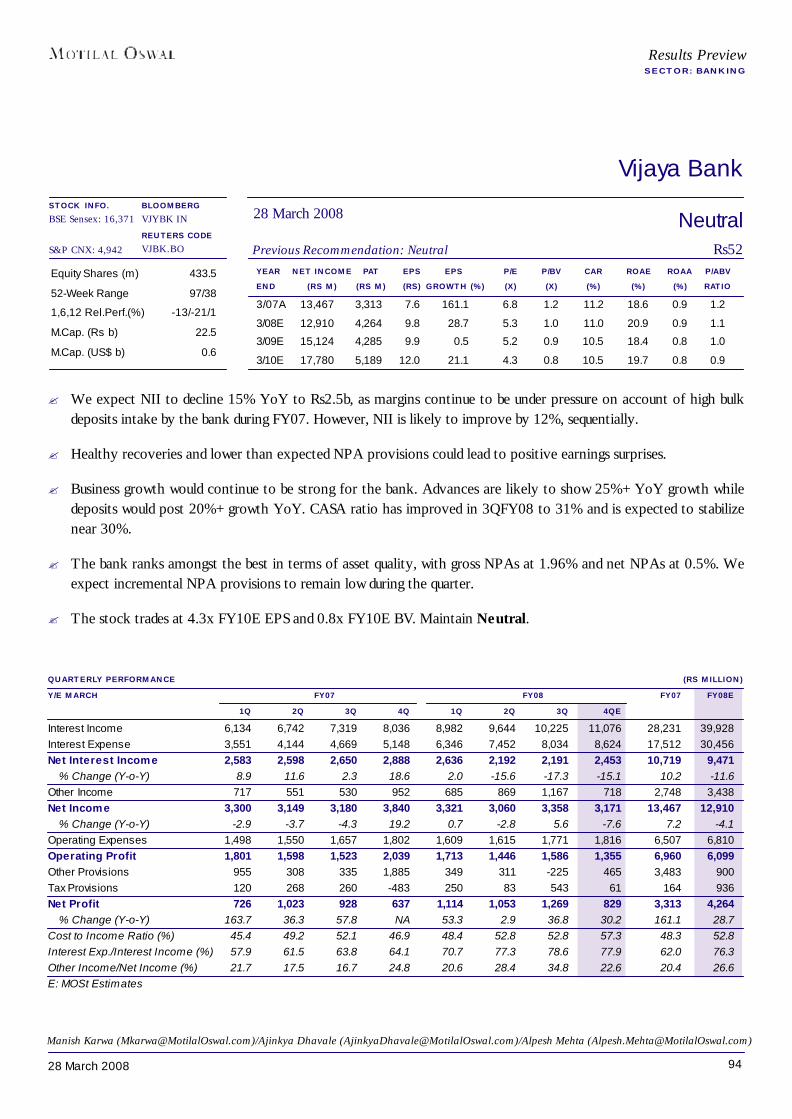
9428 March 2008
Results PreviewSECTOR: BANKING
Vijaya Bank
YEAR NET INCOME PAT EPS EPS P/E P/BV CAR ROAE ROAA P/ABVEND (RS M) (RS M) (RS) GROWTH (%) (X) (X) (%) (%) (%) RATIO
3/07A 13,467 3,313 7.6 161.1 6.8 1.2 11.2 18.6 0.9 1.2
3/08E 12,910 4,264 9.8 28.7 5.3 1.0 11.0 20.9 0.9 1.1
3/09E 15,124 4,285 9.9 0.5 5.2 0.9 10.5 18.4 0.8 1.0
3/10E 17,780 5,189 12.0 21.1 4.3 0.8 10.5 19.7 0.8 0.9
Equity Shares (m) 433.5
52-Week Range 97/38
1,6,12 Rel.Perf.(%) -13/-21/1
M.Cap. (Rs b) 22.5
M.Cap. (US$ b) 0.6
QUARTERLY PERFORMANCE (RS MILLION)Y/E MARCH FY07 FY08 FY07 FY08E
1Q 2Q 3Q 4Q 1Q 2Q 3Q 4QEInterest Income 6,134 6,742 7,319 8,036 8,982 9,644 10,225 11,076 28,231 39,928Interest Expense 3,551 4,144 4,669 5,148 6,346 7,452 8,034 8,624 17,512 30,456Net Interest Income 2,583 2,598 2,650 2,888 2,636 2,192 2,191 2,453 10,719 9,471
% Change (Y-o-Y) 8.9 11.6 2.3 18.6 2.0 -15.6 -17.3 -15.1 10.2 -11.6Other Income 717 551 530 952 685 869 1,167 718 2,748 3,438Net Income 3,300 3,149 3,180 3,840 3,321 3,060 3,358 3,171 13,467 12,910
% Change (Y-o-Y) -2.9 -3.7 -4.3 19.2 0.7 -2.8 5.6 -7.6 7.2 -4.1Operating Expenses 1,498 1,550 1,657 1,802 1,609 1,615 1,771 1,816 6,507 6,810Operating Profit 1,801 1,598 1,523 2,039 1,713 1,446 1,586 1,355 6,960 6,099Other Provisions 955 308 335 1,885 349 311 -225 465 3,483 900Tax Provisions 120 268 260 -483 250 83 543 61 164 936Net Profit 726 1,023 928 637 1,114 1,053 1,269 829 3,313 4,264
% Change (Y-o-Y) 163.7 36.3 57.8 NA 53.3 2.9 36.8 30.2 161.1 28.7Cost to Income Ratio (%) 45.4 49.2 52.1 46.9 48.4 52.8 52.8 57.3 48.3 52.8Interest Exp./Interest Income (%) 57.9 61.5 63.8 64.1 70.7 77.3 78.6 77.9 62.0 76.3Other Income/Net Income (%) 21.7 17.5 16.7 24.8 20.6 28.4 34.8 22.6 20.4 26.6E: MOSt Estimates
NeutralPrevious Recommendation: Neutral Rs52
28 March 2008BLOOMBERGVJYBK IN
REUTERS CODEVJBK.BO
STOCK INFO.BSE Sensex: 16,371
S&P CNX: 4,942
Manish Karwa ([email protected])/Ajinkya Dhavale ([email protected])/Alpesh Mehta ([email protected])
? We expect NII to decline 15% YoY to Rs2.5b, as margins continue to be under pressure on account of high bulkdeposits intake by the bank during FY07. However, NII is likely to improve by 12%, sequentially.
? Healthy recoveries and lower than expected NPA provisions could lead to positive earnings surprises.
? Business growth would continue to be strong for the bank. Advances are likely to show 25%+ YoY growth whiledeposits would post 20%+ growth YoY. CASA ratio has improved in 3QFY08 to 31% and is expected to stabilizenear 30%.
? The bank ranks amongst the best in terms of asset quality, with gross NPAs at 1.96% and net NPAs at 0.5%. Weexpect incremental NPA provisions to remain low during the quarter.
? The stock trades at 4.3x FY10E EPS and 0.8x FY10E BV. Maintain Neutral.
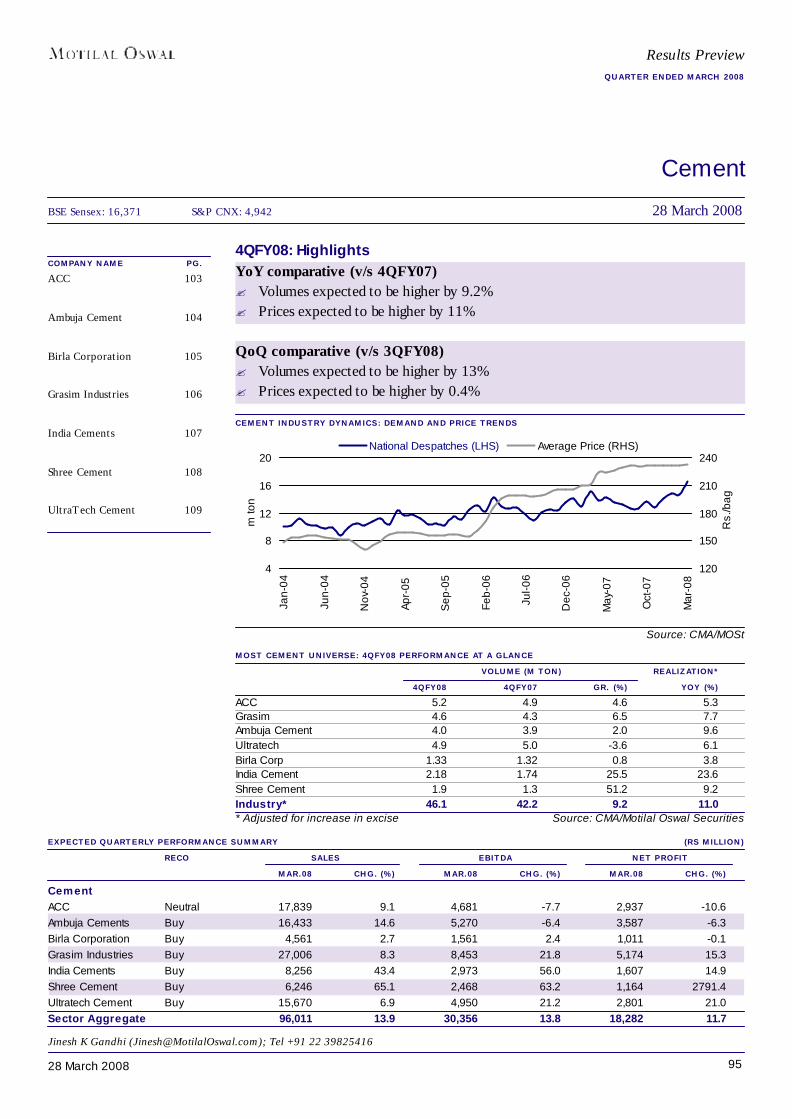
9528 March 2008
Cement
COMPANY NAME PG.ACC 103
Ambuja Cement 104
Birla Corporation 105
Grasim Industries 106
India Cements 107
Shree Cement 108
UltraTech Cement 109
EXPECTED QUARTERLY PERFORMANCE SUMMARY (RS MILLION)RECO SALES EBITDA NET PROFIT
MAR.08 CHG. (%) MAR.08 CHG. (%) MAR.08 CHG. (%)CementACC Neutral 17,839 9.1 4,681 -7.7 2,937 -10.6Ambuja Cements Buy 16,433 14.6 5,270 -6.4 3,587 -6.3Birla Corporation Buy 4,561 2.7 1,561 2.4 1,011 -0.1Grasim Industries Buy 27,006 8.3 8,453 21.8 5,174 15.3India Cements Buy 8,256 43.4 2,973 56.0 1,607 14.9Shree Cement Buy 6,246 65.1 2,468 63.2 1,164 2791.4Ultratech Cement Buy 15,670 6.9 4,950 21.2 2,801 21.0Sector Aggregate 96,011 13.9 30,356 13.8 18,282 11.7
4QFY08: HighlightsYoY comparative (v/s 4QFY07)? Volumes expected to be higher by 9.2%? Prices expected to be higher by 11%
QoQ comparative (v/s 3QFY08)? Volumes expected to be higher by 13%? Prices expected to be higher by 0.4%
CEMENT INDUSTRY DYNAMICS: DEMAND AND PRICE TRENDS
Source: CMA/MOSt
Jinesh K Gandhi ([email protected]); Tel +91 22 39825416
MOST CEMENT UNIVERSE: 4QFY08 PERFORMANCE AT A GLANCE VOLUME (M TON) REALIZATION*
4QFY08 4QFY07 GR. (%) YOY (%)ACC 5.2 4.9 4.6 5.3Grasim 4.6 4.3 6.5 7.7Ambuja Cement 4.0 3.9 2.0 9.6Ultratech 4.9 5.0 -3.6 6.1Birla Corp 1.33 1.32 0.8 3.8India Cement 2.18 1.74 25.5 23.6Shree Cement 1.9 1.3 51.2 9.2Industry* 46.1 42.2 9.2 11.0* Adjusted for increase in excise Source: CMA/Motilal Oswal Securities
BSE Sensex: 16,371 S&P CNX: 4,942 28 March 2008
Results PreviewQUARTER ENDED MARCH 2008
4
8
12
16
20
Jan-
04
Jun-
04
Nov
-04
Apr-
05
Sep
-05
Feb-
06
Jul-0
6
Dec
-06
May
-07
Oct
-07
Mar
-08
m to
n
120
150
180
210
240
Rs.
/bag
National Despatches (LHS) Average Price (RHS)
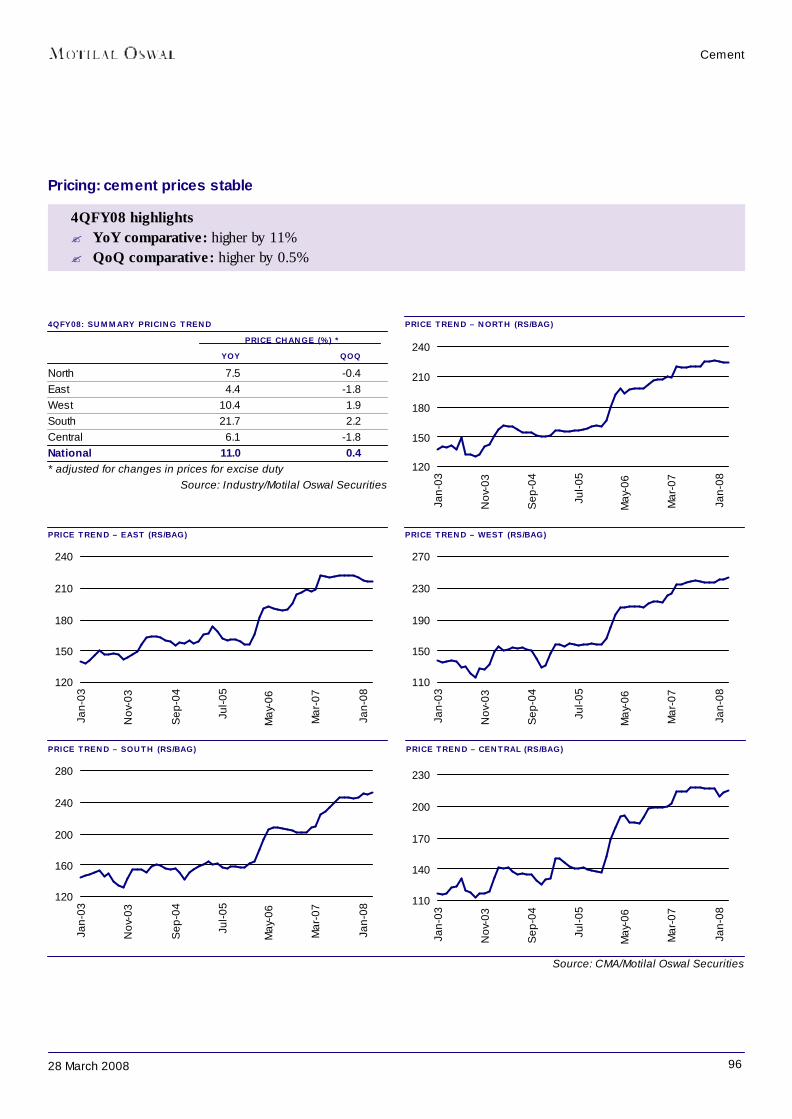
9628 March 2008
4QFY08: SUMMARY PRICING TREND PRICE CHANGE (%) *
YOY QOQNorth 7.5 -0.4East 4.4 -1.8West 10.4 1.9South 21.7 2.2Central 6.1 -1.8National 11.0 0.4* adjusted for changes in prices for excise duty
Source: Industry/Motilal Oswal Securities
PRICE TREND – NORTH (RS/BAG)
PRICE TREND – EAST (RS/BAG) PRICE TREND – WEST (RS/BAG)
PRICE TREND – SOUTH (RS/BAG) PRICE TREND – CENTRAL (RS/BAG)
Pricing: cement prices stable
4QFY08 highlights? YoY comparative: higher by 11%? QoQ comparative: higher by 0.5%
Cement
Source: CMA/Motilal Oswal Securities
120
150
180
210
240
Jan-
03
Nov
-03
Sep
-04
Jul-0
5
May
-06
Mar
-07
Jan-
08
120
150
180
210
240
Jan-
03
Nov
-03
Sep
-04
Jul-0
5
May
-06
Mar
-07
Jan-
08
110
150
190
230
270
Jan-
03
Nov
-03
Sep
-04
Jul-0
5
May
-06
Mar
-07
Jan-
08
120
160
200
240
280
Jan-
03
Nov
-03
Sep
-04
Jul-0
5
May
-06
Mar
-07
Jan-
08
110
140
170
200
230
Jan-
03
Nov
-03
Sep
-04
Jul-0
5
May
-06
Mar
-07
Jan-
08
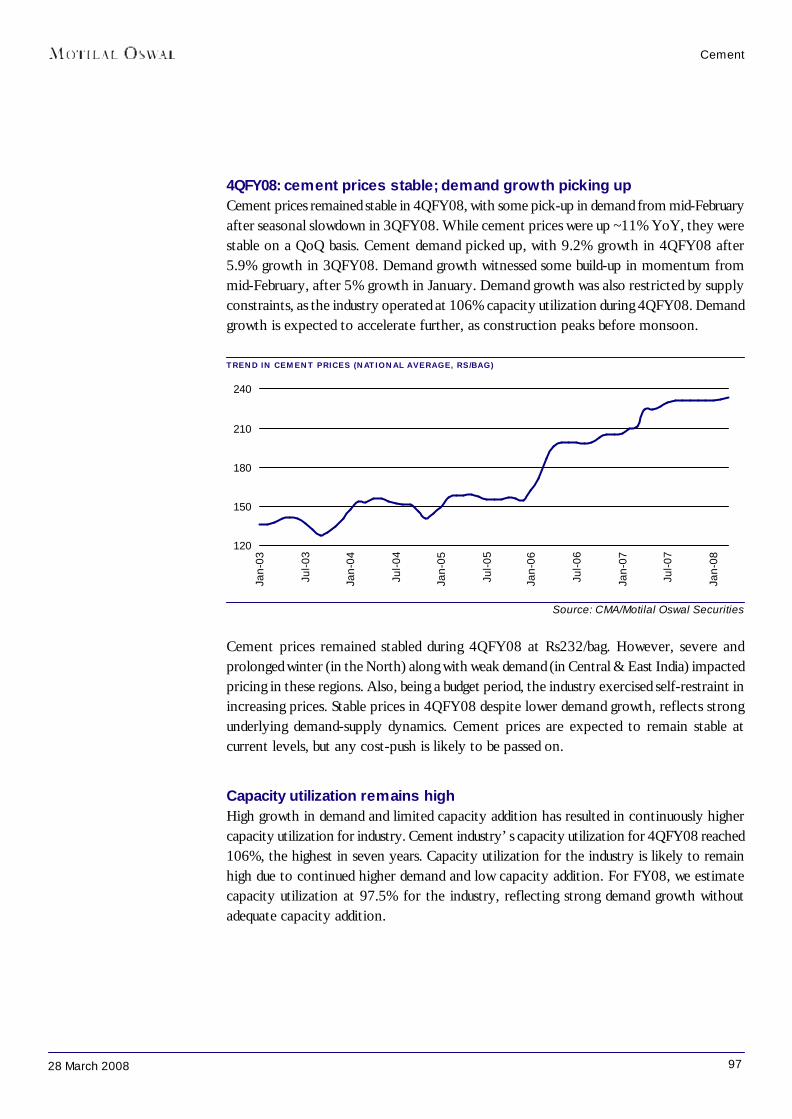
9728 March 2008
Source: CMA/Motilal Oswal Securities
Cement prices remained stabled during 4QFY08 at Rs232/bag. However, severe andprolonged winter (in the North) along with weak demand (in Central & East India) impactedpricing in these regions. Also, being a budget period, the industry exercised self-restraint inincreasing prices. Stable prices in 4QFY08 despite lower demand growth, reflects strongunderlying demand-supply dynamics. Cement prices are expected to remain stable atcurrent levels, but any cost-push is likely to be passed on.
Capacity utilization remains highHigh growth in demand and limited capacity addition has resulted in continuously highercapacity utilization for industry. Cement industry’s capacity utilization for 4QFY08 reached106%, the highest in seven years. Capacity utilization for the industry is likely to remainhigh due to continued higher demand and low capacity addition. For FY08, we estimatecapacity utilization at 97.5% for the industry, reflecting strong demand growth withoutadequate capacity addition.
4QFY08: cement prices stable; demand growth picking upCement prices remained stable in 4QFY08, with some pick-up in demand from mid-Februaryafter seasonal slowdown in 3QFY08. While cement prices were up ~11% YoY, they werestable on a QoQ basis. Cement demand picked up, with 9.2% growth in 4QFY08 after5.9% growth in 3QFY08. Demand growth witnessed some build-up in momentum frommid-February, after 5% growth in January. Demand growth was also restricted by supplyconstraints, as the industry operated at 106% capacity utilization during 4QFY08. Demandgrowth is expected to accelerate further, as construction peaks before monsoon.
TREND IN CEMENT PRICES (NATIONAL AVERAGE, RS/BAG)
Cement
120
150
180
210
240
Jan-
03
Jul-0
3
Jan-
04
Jul-0
4
Jan-
05
Jul-0
5
Jan-
06
Jul-0
6
Jan-
07
Jul-0
7
Jan-
08

9828 March 2008
Source: CMA/Motilal Oswal Securities
Supplies are stretched and expansions delayed…Supply continues to face challenges in its response to growing cement demand. This hasbeen intensified by a prolonged period of underinvestment in capacity addition. As a result,the industry is stretched in its attempt to meet stronger demand, thereby operating aboveoptimum range and leaving no further room for expanding production. The industry hasreached its peak utilization in 4QFY08 (~106%), as against optimum capacity utilization ofaround 90%. This coupled with delay in capacity additions has further aggravated thesupply situation.
… restricting demand growthLack of adequate supply has restricted demand growth over the past few quarters, asreflected in 8.3% growth in FY08. We believe that the cement demand growth could havebeen higher than reported demand growth, suggesting latent demand which remains under-serviced due to lack of adequate supply. With few new capacities expected to come overthe next six months, the supply situation is expected to ease slightly, thereby boostingdemand growth.
Expect cement prices to remain stableWith the government’s focus to contain inflation, the cement industry is expected to maintainpricing at current levels. While we do not anticipate any significant increase in cementprices from here on, we do not rule out marginal and gradual increase in prices to offsetcost push.
Cement
TREND IN CAPACITY UTILIZATION
106%104%
99%
89%88%87%
70%
80%
90%
100%
110%
Q4F
Y03
Q2F
Y04
Q4F
Y04
Q2F
Y05
Q4F
Y05
Q2F
Y06
Q4F
Y06
Q2F
Y07
Q4F
Y07
Q2F
Y08
Q4F
Y08

9928 March 2008
Source: Bloomberg
Spiraling energy cost to restrict margin expansionCoal prices, both domestic and imported, are on an uptrend. While imported coal priceshave gone up by around 15% QoQ, domestic coal prices have gone up by 10-15% from 13December 2007. Escalating coal prices would push overall cost up by Rs50-70/ton QoQ.However, this cost push is expected to be passed on to the consumer, though with a lag,resulting in stable margins. Our estimates now factor in current coal prices and any furtherincrease would put pressure on margins.
TREND IN IMPORTED COAL PRICES – CIF (US$/TON)
Cement
TREND IN INFLATION (%)
Source: Bloomberg
Budget increases excise duty for bulk segmentThe Finance Minister has increased the excise duty on bulk cement (non-retail) to higherof 14% ad-valorem or Rs400/ton from Rs400/ton earlier and on clinker to Rs450/ton fromRs350/ton. However, it has kept excise on bagged cement (with MRP printed) at existinglevel of 12.5% ad-valorem. Increase in excise duty for bulk segment would result in higherexcise of Rs5-6/bag. The bulk segment has grown to around 40% of total cement sales forthe industry, driven by favorable excise regime earlier. The new policy measure reducesscope for increase in cement prices, as any further increase in bulk cement prices wouldbe first to compensate for higher excise. However, increase in clinker excise wouldn’t
50
75
100
125
150
Dec
-05
Jan-
06
Mar
-06
Apr-
06
Jun-
06
Jul-0
6
Aug-
06
Oct
-06
Nov
-06
Jan-
07
Feb-
07
Apr-
07
May
-07
Jun-
07
Aug-
07
Sep
-07
Nov
-07
Dec
-07
Jan-
08
Mar
-08
2.2
3.4
4.6
5.8
7.0
Feb-
06
May
-06
Aug-
06
Nov
-06
Feb-
07
May
-07
Aug-
07
Nov
-07
Feb-
08
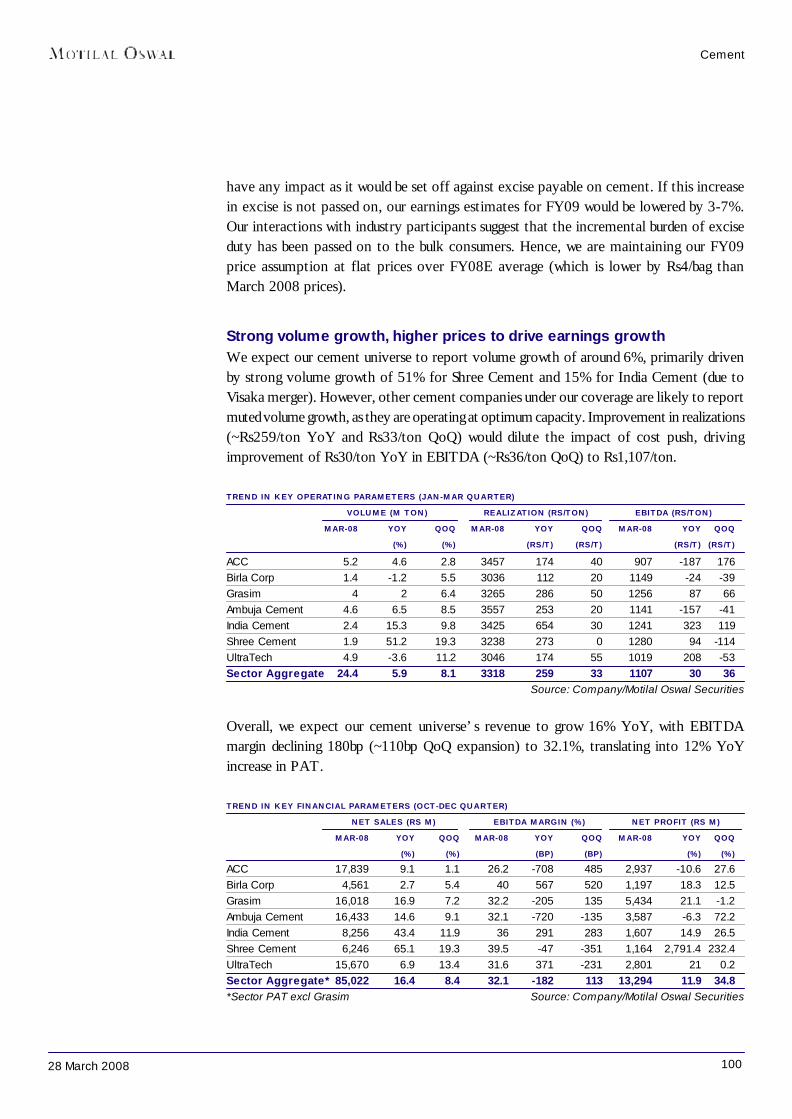
10028 March 2008
have any impact as it would be set off against excise payable on cement. If this increasein excise is not passed on, our earnings estimates for FY09 would be lowered by 3-7%.Our interactions with industry participants suggest that the incremental burden of exciseduty has been passed on to the bulk consumers. Hence, we are maintaining our FY09price assumption at flat prices over FY08E average (which is lower by Rs4/bag thanMarch 2008 prices).
Strong volume growth, higher prices to drive earnings growthWe expect our cement universe to report volume growth of around 6%, primarily drivenby strong volume growth of 51% for Shree Cement and 15% for India Cement (due toVisaka merger). However, other cement companies under our coverage are likely to reportmuted volume growth, as they are operating at optimum capacity. Improvement in realizations(~Rs259/ton YoY and Rs33/ton QoQ) would dilute the impact of cost push, drivingimprovement of Rs30/ton YoY in EBITDA (~Rs36/ton QoQ) to Rs1,107/ton.
TREND IN KEY OPERATING PARAMETERS (JAN-MAR QUARTER) VOLUME (M TON) REALIZATION (RS/TON) EBITDA (RS/TON)
MAR-08 YOY QOQ MAR-08 YOY QOQ MAR-08 YOY QOQ (%) (%) (RS/T) (RS/T) (RS/T) (RS/T)
ACC 5.2 4.6 2.8 3457 174 40 907 -187 176Birla Corp 1.4 -1.2 5.5 3036 112 20 1149 -24 -39Grasim 4 2 6.4 3265 286 50 1256 87 66Ambuja Cement 4.6 6.5 8.5 3557 253 20 1141 -157 -41India Cement 2.4 15.3 9.8 3425 654 30 1241 323 119Shree Cement 1.9 51.2 19.3 3238 273 0 1280 94 -114UltraTech 4.9 -3.6 11.2 3046 174 55 1019 208 -53Sector Aggregate 24.4 5.9 8.1 3318 259 33 1107 30 36
Source: Company/Motilal Oswal Securities
Overall, we expect our cement universe’s revenue to grow 16% YoY, with EBITDAmargin declining 180bp (~110bp QoQ expansion) to 32.1%, translating into 12% YoYincrease in PAT.
TREND IN KEY FINANCIAL PARAMETERS (OCT-DEC QUARTER) NET SALES (RS M) EBITDA MARGIN (%) NET PROFIT (RS M)
MAR-08 YOY QOQ MAR-08 YOY QOQ MAR-08 YOY QOQ (%) (%) (BP) (BP) (%) (%)
ACC 17,839 9.1 1.1 26.2 -708 485 2,937 -10.6 27.6Birla Corp 4,561 2.7 5.4 40 567 520 1,197 18.3 12.5Grasim 16,018 16.9 7.2 32.2 -205 135 5,434 21.1 -1.2Ambuja Cement 16,433 14.6 9.1 32.1 -720 -135 3,587 -6.3 72.2India Cement 8,256 43.4 11.9 36 291 283 1,607 14.9 26.5Shree Cement 6,246 65.1 19.3 39.5 -47 -351 1,164 2,791.4 232.4UltraTech 15,670 6.9 13.4 31.6 371 -231 2,801 21 0.2Sector Aggregate* 85,022 16.4 8.4 32.1 -182 113 13,294 11.9 34.8*Sector PAT excl Grasim Source: Company/Motilal Oswal Securities
Cement

10128 March 2008
Downgrading earnings estimates to factor in lower volumes, cost pushWe are downgrading our earnings estimates for FY09 and FY10 to factor in lower thanexpected volumes (due to delay in capacity additions and ramp-up), higher energy pricesand higher freight. Our estimates for imported coal prices are now re-based at currentlevel. Our estimates are based on flat prices for FY09 over FY08 (average) and Rs5/bagdecline in FY10. Our earnings estimates are lowered by 3-12% for FY08 and by 1-11%for FY09. While our estimates factor in the impact of higher energy prices, they do notfactor in the impact of any pass-through of cost push to consumers.
REVISED EPS FORECAST (RS) FY09E FY10E
REV OLD CHG (%) REV OLD CHG (%)ACC 63.5 71.5 -11.3 58.8 67.2 -12.6Ambuja Cement 9.1 10.1 -9.6 9.5 10.0 -5.2Grasim 287.7 327.6 -12.2 294.0 329.6 -10.8UltraTech 89.0 98.7 -9.8 90.0 98.2 -8.3Birla Corp 53.7 55.2 -2.8 56.4 56.8 -0.8India Cement 23.4 24.9 -5.9 23.1 24.6 -6.1Shree Cement 148.3 160.1 -7.4 167.5 178.1 -6.0
Source: Motilal Oswal Securities
Valuation and viewHigh volume growth and limited capacity addition has improved demand-supply scenariofor industry significantly. The industry is going through a cyclical upturn, which is likely tocontinue at least till 1HCY09. However, margins are expected to remain under pressurewith stable pricing and energy cost push. We prefer companies that are ahead of thecurve in adding capacity, and have strong cost saving possibilities. Amongst the large caps,Grasim remains our top pick, while we prefer Birla Corp, India Cement, Kesoram andShree Cement among mid-caps.
Cement
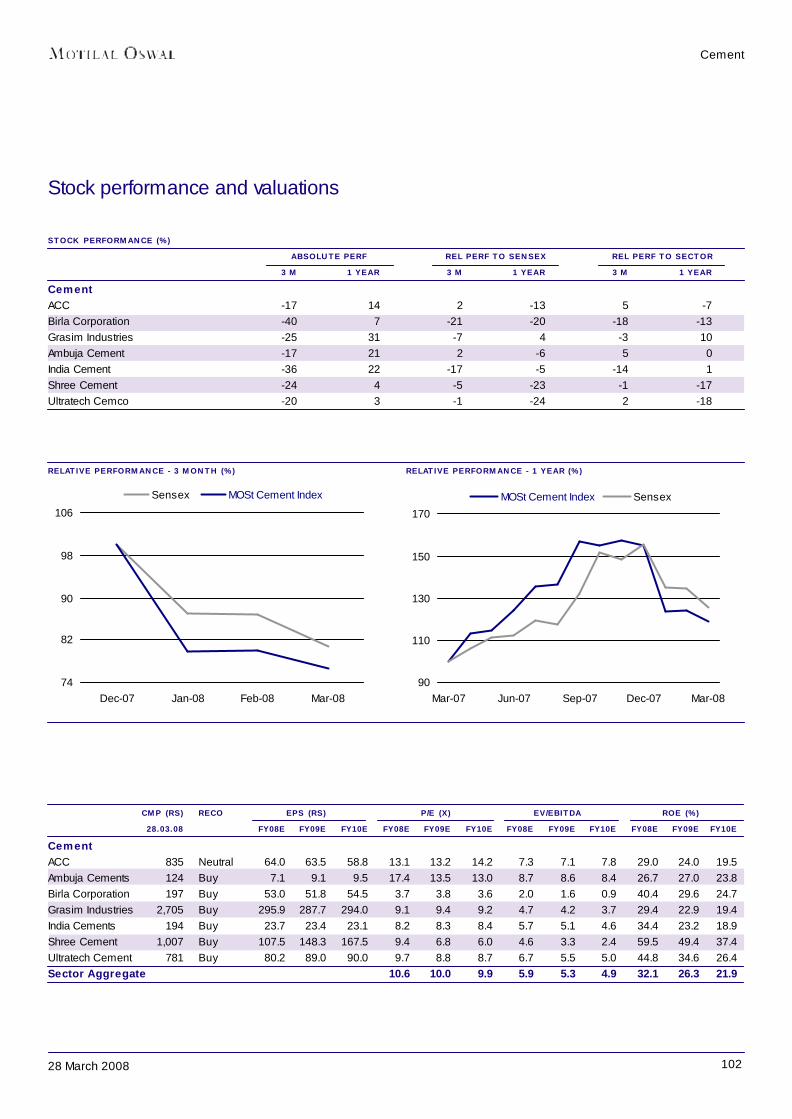
10228 March 2008
Cement
RELATIVE PERFORMANCE - 3 MONTH (%) RELATIVE PERFORMANCE - 1 YEAR (%)
Stock performance and valuations
STOCK PERFORMANCE (%) ABSOLUTE PERF REL PERF TO SENSEX REL PERF TO SECTOR
3 M 1 YEAR 3 M 1 YEAR 3 M 1 YEARCementACC -17 14 2 -13 5 -7Birla Corporation -40 7 -21 -20 -18 -13Grasim Industries -25 31 -7 4 -3 10Ambuja Cement -17 21 2 -6 5 0India Cement -36 22 -17 -5 -14 1Shree Cement -24 4 -5 -23 -1 -17Ultratech Cemco -20 3 -1 -24 2 -18
CMP (RS) RECO EPS (RS) P/E (X) EV/EBITDA ROE (%)28.03.08 FY08E FY09E FY10E FY08E FY09E FY10E FY08E FY09E FY10E FY08E FY09E FY10E
CementACC 835 Neutral 64.0 63.5 58.8 13.1 13.2 14.2 7.3 7.1 7.8 29.0 24.0 19.5Ambuja Cements 124 Buy 7.1 9.1 9.5 17.4 13.5 13.0 8.7 8.6 8.4 26.7 27.0 23.8Birla Corporation 197 Buy 53.0 51.8 54.5 3.7 3.8 3.6 2.0 1.6 0.9 40.4 29.6 24.7Grasim Industries 2,705 Buy 295.9 287.7 294.0 9.1 9.4 9.2 4.7 4.2 3.7 29.4 22.9 19.4India Cements 194 Buy 23.7 23.4 23.1 8.2 8.3 8.4 5.7 5.1 4.6 34.4 23.2 18.9Shree Cement 1,007 Buy 107.5 148.3 167.5 9.4 6.8 6.0 4.6 3.3 2.4 59.5 49.4 37.4Ultratech Cement 781 Buy 80.2 89.0 90.0 9.7 8.8 8.7 6.7 5.5 5.0 44.8 34.6 26.4Sector Aggregate 10.6 10.0 9.9 5.9 5.3 4.9 32.1 26.3 21.9
74
82
90
98
106
Dec-07 Jan-08 Feb-08 Mar-08
Sensex MOSt Cement Index
90
110
130
150
170
Mar-07 Jun-07 Sep-07 Dec-07 Mar-08
MOSt Cement Index Sensex
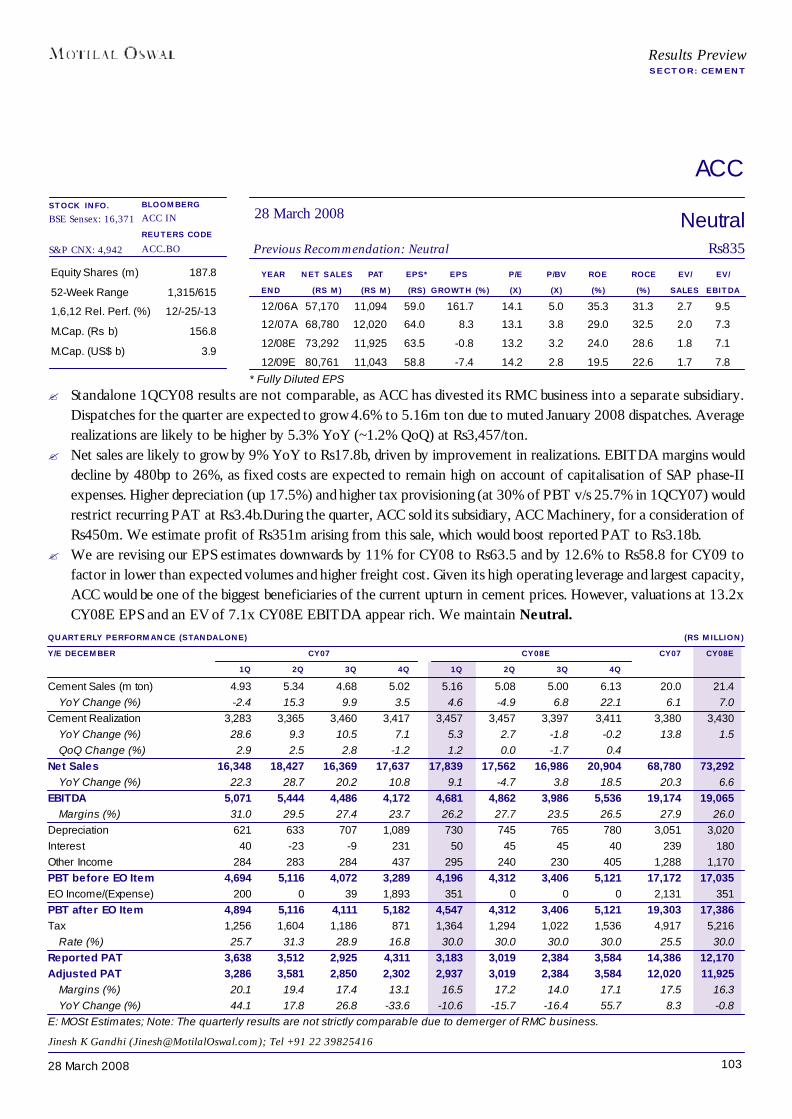
10328 March 2008
ACC
YEAR NET SALES PAT EPS* EPS P/E P/BV ROE ROCE EV/ EV/END (RS M) (RS M) (RS) GROWTH (%) (X) (X) (%) (%) SALES EBITDA12/06A 57,170 11,094 59.0 161.7 14.1 5.0 35.3 31.3 2.7 9.5
12/07A 68,780 12,020 64.0 8.3 13.1 3.8 29.0 32.5 2.0 7.3
12/08E 73,292 11,925 63.5 -0.8 13.2 3.2 24.0 28.6 1.8 7.1
12/09E 80,761 11,043 58.8 -7.4 14.2 2.8 19.5 22.6 1.7 7.8
Equity Shares (m) 187.8
52-Week Range 1,315/615
1,6,12 Rel. Perf. (%) 12/-25/-13
M.Cap. (Rs b) 156.8
M.Cap. (US$ b) 3.9
QUARTERLY PERFORMANCE (STANDALONE) (RS MILLION)Y/E DECEMBER CY07 CY08E CY07 CY08E
1Q 2Q 3Q 4Q 1Q 2Q 3Q 4QCement Sales (m ton) 4.93 5.34 4.68 5.02 5.16 5.08 5.00 6.13 20.0 21.4
YoY Change (%) -2.4 15.3 9.9 3.5 4.6 -4.9 6.8 22.1 6.1 7.0Cement Realization 3,283 3,365 3,460 3,417 3,457 3,457 3,397 3,411 3,380 3,430
YoY Change (%) 28.6 9.3 10.5 7.1 5.3 2.7 -1.8 -0.2 13.8 1.5QoQ Change (%) 2.9 2.5 2.8 -1.2 1.2 0.0 -1.7 0.4
Net Sales 16,348 18,427 16,369 17,637 17,839 17,562 16,986 20,904 68,780 73,292YoY Change (%) 22.3 28.7 20.2 10.8 9.1 -4.7 3.8 18.5 20.3 6.6
EBITDA 5,071 5,444 4,486 4,172 4,681 4,862 3,986 5,536 19,174 19,065Margins (%) 31.0 29.5 27.4 23.7 26.2 27.7 23.5 26.5 27.9 26.0
Depreciation 621 633 707 1,089 730 745 765 780 3,051 3,020Interest 40 -23 -9 231 50 45 45 40 239 180Other Income 284 283 284 437 295 240 230 405 1,288 1,170PBT before EO Item 4,694 5,116 4,072 3,289 4,196 4,312 3,406 5,121 17,172 17,035EO Income/(Expense) 200 0 39 1,893 351 0 0 0 2,131 351PBT after EO Item 4,894 5,116 4,111 5,182 4,547 4,312 3,406 5,121 19,303 17,386Tax 1,256 1,604 1,186 871 1,364 1,294 1,022 1,536 4,917 5,216
Rate (%) 25.7 31.3 28.9 16.8 30.0 30.0 30.0 30.0 25.5 30.0Reported PAT 3,638 3,512 2,925 4,311 3,183 3,019 2,384 3,584 14,386 12,170Adjusted PAT 3,286 3,581 2,850 2,302 2,937 3,019 2,384 3,584 12,020 11,925
Margins (%) 20.1 19.4 17.4 13.1 16.5 17.2 14.0 17.1 17.5 16.3YoY Change (%) 44.1 17.8 26.8 -33.6 -10.6 -15.7 -16.4 55.7 8.3 -0.8
E: MOSt Estimates; Note: The quarterly results are not strictly comparable due to demerger of RMC business.
NeutralPrevious Recommendation: Neutral Rs835
28 March 2008BLOOMBERGACC IN
REUTERS CODEACC.BO
Jinesh K Gandhi ([email protected]); Tel +91 22 39825416
* Fully Diluted EPS
Results PreviewSECTOR: CEMENT
STOCK INFO.BSE Sensex: 16,371
S&P CNX: 4,942
? Standalone 1QCY08 results are not comparable, as ACC has divested its RMC business into a separate subsidiary.Dispatches for the quarter are expected to grow 4.6% to 5.16m ton due to muted January 2008 dispatches. Averagerealizations are likely to be higher by 5.3% YoY (~1.2% QoQ) at Rs3,457/ton.
? Net sales are likely to grow by 9% YoY to Rs17.8b, driven by improvement in realizations. EBITDA margins woulddecline by 480bp to 26%, as fixed costs are expected to remain high on account of capitalisation of SAP phase-IIexpenses. Higher depreciation (up 17.5%) and higher tax provisioning (at 30% of PBT v/s 25.7% in 1QCY07) wouldrestrict recurring PAT at Rs3.4b.During the quarter, ACC sold its subsidiary, ACC Machinery, for a consideration ofRs450m. We estimate profit of Rs351m arising from this sale, which would boost reported PAT to Rs3.18b.
? We are revising our EPS estimates downwards by 11% for CY08 to Rs63.5 and by 12.6% to Rs58.8 for CY09 tofactor in lower than expected volumes and higher freight cost. Given its high operating leverage and largest capacity,ACC would be one of the biggest beneficiaries of the current upturn in cement prices. However, valuations at 13.2xCY08E EPS and an EV of 7.1x CY08E EBITDA appear rich. We maintain Neutral.

10428 March 2008
Ambuja Cement
YEAR NET SALES PAT EPS EPS P/E P/BV ROE ROCE EV/ EV/END (RS M) (RS M) (RS) GROWTH (%) (X) (X) (%) (%) SALES EBITDA
12/06A 48,479 13,401 8.8 114.7 14.0 5.4 47.4 43.3 3.6 9.8
12/07E 57,048 10,814 7.1 -19.5 17.4 4.1 26.7 41.6 3.1 8.7
12/08E 63,540 13,909 9.1 28.6 13.5 3.3 27.0 33.6 2.7 8.6
12/09E 75,117 14,470 9.5 4.0 13.0 2.9 23.8 30.3 2.4 8.4
Equity Shares (m) 1,520.7
52-Week Range 161/100
1,6,12 Rel. Perf. (%) 10/-9/-6
M.Cap. (Rs b) 188.0
M.Cap. (US$ b) 4.7
QUARTERLY PERFORMANCE (STANDALONE) (RS MILLION)Y/E DECEMBER CY07 CY08E CY07 CY08E
1Q 2Q 3Q 4Q 1Q 2Q 3Q 4QSales Volume (m ton) 4.34 4.39 3.77 4.26 4.62 4.70 4.05 4.63 16.76 18.00
YoY Change (%) 3.8 1.7 3.0 3.4 6.5 7.1 7.4 8.7 133.3 83.3Realization (Rs/ton) 3,304 3,336 3,448 3,537 3,557 3,557 3,497 3,505 3,404 3,530
YoY Change (%) 28.6 9.6 11.6 9.6 7.7 6.6 1.4 -0.9 76.5 99.6QoQ Change (%) 2.4 1.0 3.4 2.6 0.6 0.0 -1.7 0.2 66.3 18.7
Net Sales 14,338 14,644 12,999 15,067 16,433 16,717 14,162 16,228 57,048 63,540YoY Change (%) 33.5 11.5 14.9 13.4 14.6 14.2 8.9 7.7 312.1 266.2
EBITDA 5,631 5,453 4,332 5,036 5,270 5,468 4,237 5,029 20,451 20,004Margins (%) 39.3 37.2 33.3 33.4 32.1 32.7 29.9 31.0 35.8 31.5
Depreciation 598 583 584 598 605 620 630 676 2,363 2,531Interest 18 -211 -156 1,108 135 125 120 120 759 500Other Income 257 487 184 1,008 350 600 300 700 1,935 1,950PBT before EO Item 5,271 5,567 4,088 4,338 4,880 5,323 3,787 4,933 19,265 18,923Extraordinary Inc/(Exp) 2,408 5,747 -270 -26 0 3,032 0 0 7,859 3,032PBT after EO Exp/(Inc) 7,679 11,314 3,818 4,313 4,880 8,355 3,787 4,933 27,124 21,955Tax 1,772 2,537 893 4,231 1,293 1,782 1,004 1,307 9,433 5,386
Rate (%) 23.1 22.4 23.4 98.1 26.5 21.3 26.5 26.5 34.8 24.5Reported Profit 5,907 8,778 2,924 82 3,587 6,573 2,784 3,626 17,691 16,569Adj PAT 3,826 4,036 3,133 2,083 3,587 3,912 2,784 3,626 10,814 13,919YoY Change (%) 42.6 23.2 19.7 -38.3 -6.3 -3.1 -11.2 74.1 60.4 479.3
E: MOSt Estimates
BuyPrevious Recommendation: Buy Rs124
28 March 2008BLOOMBERGACEM IN
REUTERS CODEGACM.BO
Jinesh K Gandhi ([email protected]); Tel +91 22 39825416
Results PreviewSECTOR: CEMENT
STOCK INFO.BSE Sensex: 16,371
S&P CNX: 4,942
? We estimate Ambuja Cement’s 1QCY08 sales at Rs16.4b, up ~14.6% YoY. Dispatches are likely to grow ~6.5%YoY to 4.62m ton whereas average realizations would be Rs3,557/ton (up ~7.7% YoY and 0.6% QoQ). Ambuja’svolume growth has been restricted due to capacity constraint.
? EBITDA margins are likely to decline by 720bp YoY to 32.1%, impacted by spiraling imported coal prices. EBITDAat Rs5.27b (~6% decline) would translate into PAT decline of 6% to Rs3.6b.
? The company is witnessing capacity constraint, as its new capacities are expected to come in only 1QCY09 onwards.However, Ambuja intends to grow volumes by buying clinker and grinding it at its recently commissioned grindingunits. While this strategy would add to growth, it could be margin dilutive.
? We are revising our EPS estimates downwards by 9.6% to Rs9.1 for CY08 and by 5.2% to Rs9.5 for CY09, due toincrease in coal prices (domestic as well as imported) and lower than expected volumes. Being a pure play oncement, with the ability to grow volumes faster and more efficiently, valuations at 13.5x CY08E earnings and an EVof 8.6x CY08E EBITDA appear reasonable.
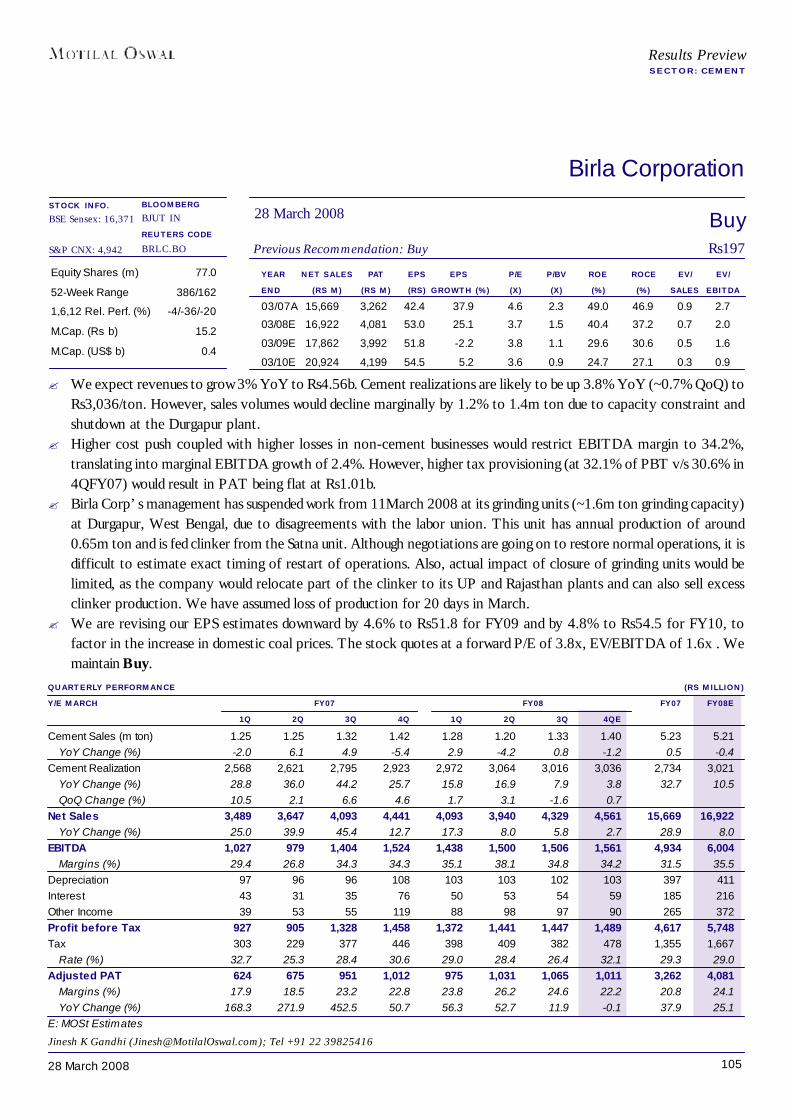
10528 March 2008
Birla Corporation
YEAR NET SALES PAT EPS EPS P/E P/BV ROE ROCE EV/ EV/END (RS M) (RS M) (RS) GROWTH (%) (X) (X) (%) (%) SALES EBITDA03/07A 15,669 3,262 42.4 37.9 4.6 2.3 49.0 46.9 0.9 2.7
03/08E 16,922 4,081 53.0 25.1 3.7 1.5 40.4 37.2 0.7 2.0
03/09E 17,862 3,992 51.8 -2.2 3.8 1.1 29.6 30.6 0.5 1.6
03/10E 20,924 4,199 54.5 5.2 3.6 0.9 24.7 27.1 0.3 0.9
Equity Shares (m) 77.0
52-Week Range 386/162
1,6,12 Rel. Perf. (%) -4/-36/-20
M.Cap. (Rs b) 15.2
M.Cap. (US$ b) 0.4
QUARTERLY PERFORMANCE (RS MILLION)Y/E MARCH FY07 FY08 FY07 FY08E
1Q 2Q 3Q 4Q 1Q 2Q 3Q 4QECement Sales (m ton) 1.25 1.25 1.32 1.42 1.28 1.20 1.33 1.40 5.23 5.21
YoY Change (%) -2.0 6.1 4.9 -5.4 2.9 -4.2 0.8 -1.2 0.5 -0.4Cement Realization 2,568 2,621 2,795 2,923 2,972 3,064 3,016 3,036 2,734 3,021
YoY Change (%) 28.8 36.0 44.2 25.7 15.8 16.9 7.9 3.8 32.7 10.5QoQ Change (%) 10.5 2.1 6.6 4.6 1.7 3.1 -1.6 0.7
Net Sales 3,489 3,647 4,093 4,441 4,093 3,940 4,329 4,561 15,669 16,922YoY Change (%) 25.0 39.9 45.4 12.7 17.3 8.0 5.8 2.7 28.9 8.0
EBITDA 1,027 979 1,404 1,524 1,438 1,500 1,506 1,561 4,934 6,004Margins (%) 29.4 26.8 34.3 34.3 35.1 38.1 34.8 34.2 31.5 35.5
Depreciation 97 96 96 108 103 103 102 103 397 411Interest 43 31 35 76 50 53 54 59 185 216Other Income 39 53 55 119 88 98 97 90 265 372Profit before Tax 927 905 1,328 1,458 1,372 1,441 1,447 1,489 4,617 5,748Tax 303 229 377 446 398 409 382 478 1,355 1,667
Rate (%) 32.7 25.3 28.4 30.6 29.0 28.4 26.4 32.1 29.3 29.0Adjusted PAT 624 675 951 1,012 975 1,031 1,065 1,011 3,262 4,081
Margins (%) 17.9 18.5 23.2 22.8 23.8 26.2 24.6 22.2 20.8 24.1YoY Change (%) 168.3 271.9 452.5 50.7 56.3 52.7 11.9 -0.1 37.9 25.1
E: MOSt Estimates
BuyPrevious Recommendation: Buy Rs197
28 March 2008BLOOMBERGBJUT IN
REUTERS CODEBRLC.BO
Jinesh K Gandhi ([email protected]); Tel +91 22 39825416
Results PreviewSECTOR: CEMENT
STOCK INFO.BSE Sensex: 16,371
S&P CNX: 4,942
? We expect revenues to grow 3% YoY to Rs4.56b. Cement realizations are likely to be up 3.8% YoY (~0.7% QoQ) toRs3,036/ton. However, sales volumes would decline marginally by 1.2% to 1.4m ton due to capacity constraint andshutdown at the Durgapur plant.
? Higher cost push coupled with higher losses in non-cement businesses would restrict EBITDA margin to 34.2%,translating into marginal EBITDA growth of 2.4%. However, higher tax provisioning (at 32.1% of PBT v/s 30.6% in4QFY07) would result in PAT being flat at Rs1.01b.
? Birla Corp’s management has suspended work from 11March 2008 at its grinding units (~1.6m ton grinding capacity)at Durgapur, West Bengal, due to disagreements with the labor union. This unit has annual production of around0.65m ton and is fed clinker from the Satna unit. Although negotiations are going on to restore normal operations, it isdifficult to estimate exact timing of restart of operations. Also, actual impact of closure of grinding units would belimited, as the company would relocate part of the clinker to its UP and Rajasthan plants and can also sell excessclinker production. We have assumed loss of production for 20 days in March.
? We are revising our EPS estimates downward by 4.6% to Rs51.8 for FY09 and by 4.8% to Rs54.5 for FY10, tofactor in the increase in domestic coal prices. The stock quotes at a forward P/E of 3.8x, EV/EBITDA of 1.6x . Wemaintain Buy.
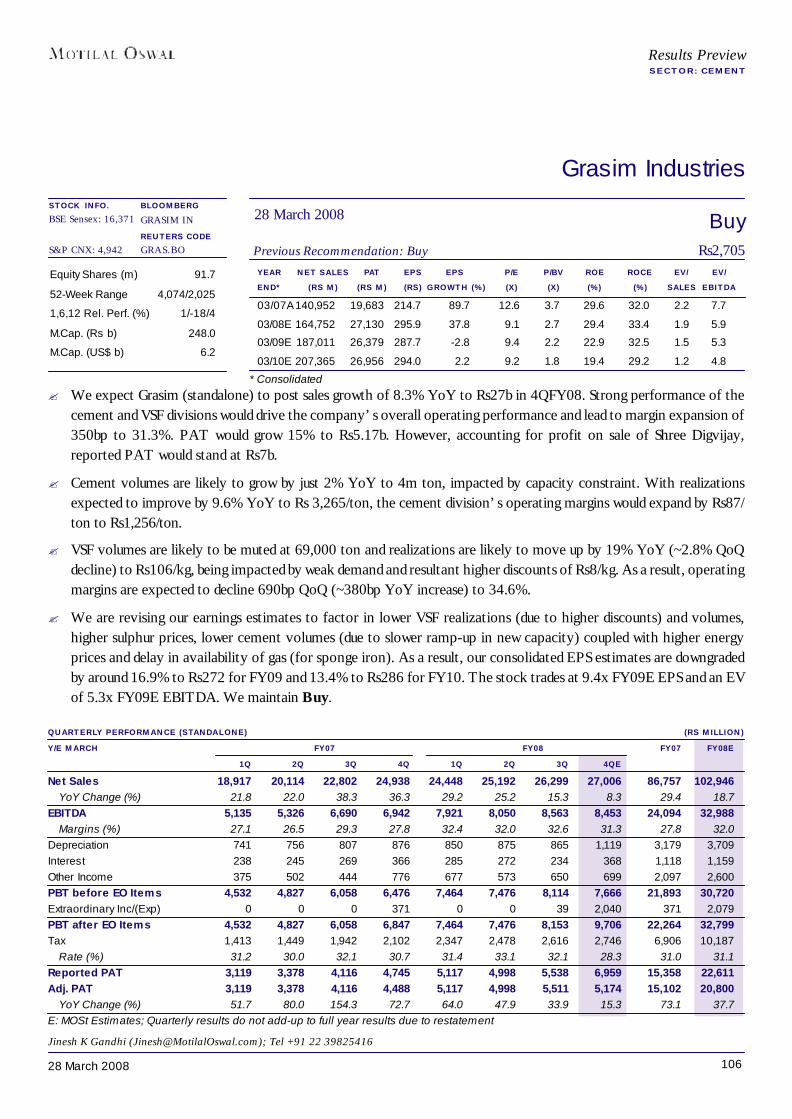
10628 March 2008
Grasim Industries
YEAR NET SALES PAT EPS EPS P/E P/BV ROE ROCE EV/ EV/END* (RS M) (RS M) (RS) GROWTH (%) (X) (X) (%) (%) SALES EBITDA
03/07A 140,952 19,683 214.7 89.7 12.6 3.7 29.6 32.0 2.2 7.7
03/08E 164,752 27,130 295.9 37.8 9.1 2.7 29.4 33.4 1.9 5.9
03/09E 187,011 26,379 287.7 -2.8 9.4 2.2 22.9 32.5 1.5 5.3
03/10E 207,365 26,956 294.0 2.2 9.2 1.8 19.4 29.2 1.2 4.8
Equity Shares (m) 91.7
52-Week Range 4,074/2,025
1,6,12 Rel. Perf. (%) 1/-18/4
M.Cap. (Rs b) 248.0
M.Cap. (US$ b) 6.2
QUARTERLY PERFORMANCE (STANDALONE) (RS MILLION)Y/E MARCH FY07 FY08 FY07 FY08E
1Q 2Q 3Q 4Q 1Q 2Q 3Q 4QENet Sales 18,917 20,114 22,802 24,938 24,448 25,192 26,299 27,006 86,757 102,946
YoY Change (%) 21.8 22.0 38.3 36.3 29.2 25.2 15.3 8.3 29.4 18.7EBITDA 5,135 5,326 6,690 6,942 7,921 8,050 8,563 8,453 24,094 32,988
Margins (%) 27.1 26.5 29.3 27.8 32.4 32.0 32.6 31.3 27.8 32.0Depreciation 741 756 807 876 850 875 865 1,119 3,179 3,709Interest 238 245 269 366 285 272 234 368 1,118 1,159Other Income 375 502 444 776 677 573 650 699 2,097 2,600PBT before EO Items 4,532 4,827 6,058 6,476 7,464 7,476 8,114 7,666 21,893 30,720Extraordinary Inc/(Exp) 0 0 0 371 0 0 39 2,040 371 2,079PBT after EO Items 4,532 4,827 6,058 6,847 7,464 7,476 8,153 9,706 22,264 32,799Tax 1,413 1,449 1,942 2,102 2,347 2,478 2,616 2,746 6,906 10,187
Rate (%) 31.2 30.0 32.1 30.7 31.4 33.1 32.1 28.3 31.0 31.1Reported PAT 3,119 3,378 4,116 4,745 5,117 4,998 5,538 6,959 15,358 22,611Adj. PAT 3,119 3,378 4,116 4,488 5,117 4,998 5,511 5,174 15,102 20,800
YoY Change (%) 51.7 80.0 154.3 72.7 64.0 47.9 33.9 15.3 73.1 37.7E: MOSt Estimates; Quarterly results do not add-up to full year results due to restatement
BuyPrevious Recommendation: Buy Rs2,705
28 March 2008BLOOMBERGGRASIM IN
REUTERS CODEGRAS.BO
Jinesh K Gandhi ([email protected]); Tel +91 22 39825416
* Consolidated
Results PreviewSECTOR: CEMENT
STOCK INFO.BSE Sensex: 16,371
S&P CNX: 4,942
? We expect Grasim (standalone) to post sales growth of 8.3% YoY to Rs27b in 4QFY08. Strong performance of thecement and VSF divisions would drive the company’s overall operating performance and lead to margin expansion of350bp to 31.3%. PAT would grow 15% to Rs5.17b. However, accounting for profit on sale of Shree Digvijay,reported PAT would stand at Rs7b.
? Cement volumes are likely to grow by just 2% YoY to 4m ton, impacted by capacity constraint. With realizationsexpected to improve by 9.6% YoY to Rs 3,265/ton, the cement division’s operating margins would expand by Rs87/ton to Rs1,256/ton.
? VSF volumes are likely to be muted at 69,000 ton and realizations are likely to move up by 19% YoY (~2.8% QoQdecline) to Rs106/kg, being impacted by weak demand and resultant higher discounts of Rs8/kg. As a result, operatingmargins are expected to decline 690bp QoQ (~380bp YoY increase) to 34.6%.
? We are revising our earnings estimates to factor in lower VSF realizations (due to higher discounts) and volumes,higher sulphur prices, lower cement volumes (due to slower ramp-up in new capacity) coupled with higher energyprices and delay in availability of gas (for sponge iron). As a result, our consolidated EPS estimates are downgradedby around 16.9% to Rs272 for FY09 and 13.4% to Rs286 for FY10. The stock trades at 9.4x FY09E EPS and an EVof 5.3x FY09E EBITDA. We maintain Buy.
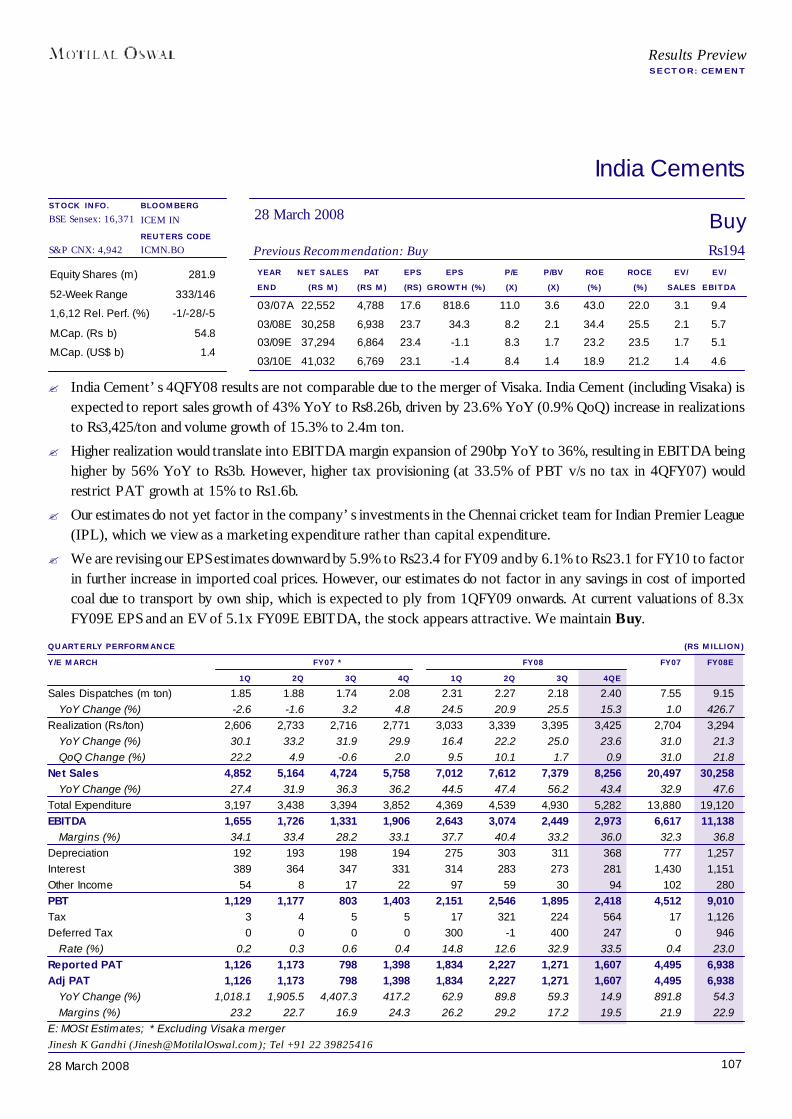
10728 March 2008
India Cements
YEAR NET SALES PAT EPS EPS P/E P/BV ROE ROCE EV/ EV/END (RS M) (RS M) (RS) GROWTH (%) (X) (X) (%) (%) SALES EBITDA
03/07A 22,552 4,788 17.6 818.6 11.0 3.6 43.0 22.0 3.1 9.4
03/08E 30,258 6,938 23.7 34.3 8.2 2.1 34.4 25.5 2.1 5.7
03/09E 37,294 6,864 23.4 -1.1 8.3 1.7 23.2 23.5 1.7 5.1
03/10E 41,032 6,769 23.1 -1.4 8.4 1.4 18.9 21.2 1.4 4.6
Equity Shares (m) 281.9
52-Week Range 333/146
1,6,12 Rel. Perf. (%) -1/-28/-5
M.Cap. (Rs b) 54.8
M.Cap. (US$ b) 1.4
QUARTERLY PERFORMANCE (RS MILLION)Y/E MARCH FY07 * FY08 FY07 FY08E
1Q 2Q 3Q 4Q 1Q 2Q 3Q 4QESales Dispatches (m ton) 1.85 1.88 1.74 2.08 2.31 2.27 2.18 2.40 7.55 9.15
YoY Change (%) -2.6 -1.6 3.2 4.8 24.5 20.9 25.5 15.3 1.0 426.7Realization (Rs/ton) 2,606 2,733 2,716 2,771 3,033 3,339 3,395 3,425 2,704 3,294
YoY Change (%) 30.1 33.2 31.9 29.9 16.4 22.2 25.0 23.6 31.0 21.3QoQ Change (%) 22.2 4.9 -0.6 2.0 9.5 10.1 1.7 0.9 31.0 21.8
Net Sales 4,852 5,164 4,724 5,758 7,012 7,612 7,379 8,256 20,497 30,258YoY Change (%) 27.4 31.9 36.3 36.2 44.5 47.4 56.2 43.4 32.9 47.6
Total Expenditure 3,197 3,438 3,394 3,852 4,369 4,539 4,930 5,282 13,880 19,120EBITDA 1,655 1,726 1,331 1,906 2,643 3,074 2,449 2,973 6,617 11,138
Margins (%) 34.1 33.4 28.2 33.1 37.7 40.4 33.2 36.0 32.3 36.8Depreciation 192 193 198 194 275 303 311 368 777 1,257Interest 389 364 347 331 314 283 273 281 1,430 1,151Other Income 54 8 17 22 97 59 30 94 102 280PBT 1,129 1,177 803 1,403 2,151 2,546 1,895 2,418 4,512 9,010Tax 3 4 5 5 17 321 224 564 17 1,126Deferred Tax 0 0 0 0 300 -1 400 247 0 946
Rate (%) 0.2 0.3 0.6 0.4 14.8 12.6 32.9 33.5 0.4 23.0Reported PAT 1,126 1,173 798 1,398 1,834 2,227 1,271 1,607 4,495 6,938Adj PAT 1,126 1,173 798 1,398 1,834 2,227 1,271 1,607 4,495 6,938
YoY Change (%) 1,018.1 1,905.5 4,407.3 417.2 62.9 89.8 59.3 14.9 891.8 54.3Margins (%) 23.2 22.7 16.9 24.3 26.2 29.2 17.2 19.5 21.9 22.9
E: MOSt Estimates; * Excluding Visaka merger
BuyPrevious Recommendation: Buy Rs194
28 March 2008BLOOMBERGICEM IN
REUTERS CODEICMN.BO
Results PreviewSECTOR: CEMENT
Jinesh K Gandhi ([email protected]); Tel +91 22 39825416
STOCK INFO.BSE Sensex: 16,371
S&P CNX: 4,942
? India Cement’s 4QFY08 results are not comparable due to the merger of Visaka. India Cement (including Visaka) isexpected to report sales growth of 43% YoY to Rs8.26b, driven by 23.6% YoY (0.9% QoQ) increase in realizationsto Rs3,425/ton and volume growth of 15.3% to 2.4m ton.
? Higher realization would translate into EBITDA margin expansion of 290bp YoY to 36%, resulting in EBITDA beinghigher by 56% YoY to Rs3b. However, higher tax provisioning (at 33.5% of PBT v/s no tax in 4QFY07) wouldrestrict PAT growth at 15% to Rs1.6b.
? Our estimates do not yet factor in the company’s investments in the Chennai cricket team for Indian Premier League(IPL), which we view as a marketing expenditure rather than capital expenditure.
? We are revising our EPS estimates downward by 5.9% to Rs23.4 for FY09 and by 6.1% to Rs23.1 for FY10 to factorin further increase in imported coal prices. However, our estimates do not factor in any savings in cost of importedcoal due to transport by own ship, which is expected to ply from 1QFY09 onwards. At current valuations of 8.3xFY09E EPS and an EV of 5.1x FY09E EBITDA, the stock appears attractive. We maintain Buy.
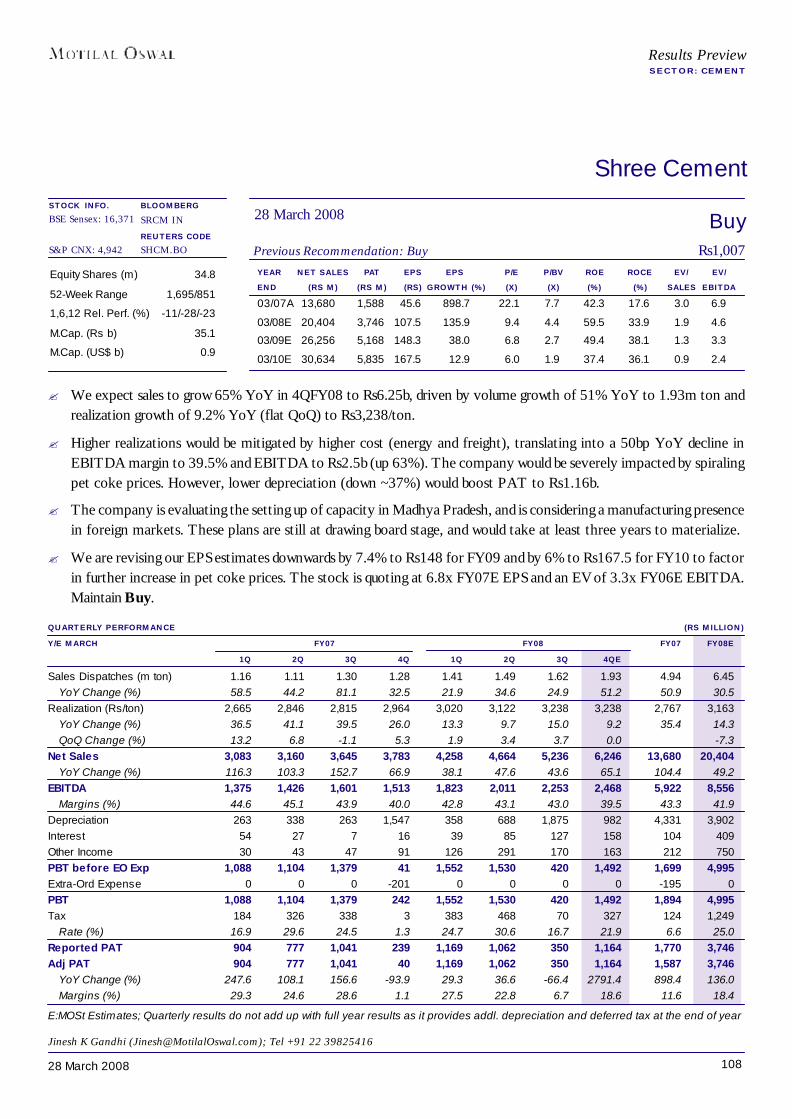
10828 March 2008
Shree Cement
YEAR NET SALES PAT EPS EPS P/E P/BV ROE ROCE EV/ EV/END (RS M) (RS M) (RS) GROWTH (%) (X) (X) (%) (%) SALES EBITDA03/07A 13,680 1,588 45.6 898.7 22.1 7.7 42.3 17.6 3.0 6.9
03/08E 20,404 3,746 107.5 135.9 9.4 4.4 59.5 33.9 1.9 4.6
03/09E 26,256 5,168 148.3 38.0 6.8 2.7 49.4 38.1 1.3 3.3
03/10E 30,634 5,835 167.5 12.9 6.0 1.9 37.4 36.1 0.9 2.4
Equity Shares (m) 34.8
52-Week Range 1,695/851
1,6,12 Rel. Perf. (%) -11/-28/-23
M.Cap. (Rs b) 35.1
M.Cap. (US$ b) 0.9
BuyPrevious Recommendation: Buy Rs1,007
28 March 2008BLOOMBERGSRCM IN
REUTERS CODESHCM.BO
Jinesh K Gandhi ([email protected]); Tel +91 22 39825416
QUARTERLY PERFORMANCE (RS MILLION)Y/E MARCH FY07 FY08 FY07 FY08E
1Q 2Q 3Q 4Q 1Q 2Q 3Q 4QESales Dispatches (m ton) 1.16 1.11 1.30 1.28 1.41 1.49 1.62 1.93 4.94 6.45
YoY Change (%) 58.5 44.2 81.1 32.5 21.9 34.6 24.9 51.2 50.9 30.5Realization (Rs/ton) 2,665 2,846 2,815 2,964 3,020 3,122 3,238 3,238 2,767 3,163
YoY Change (%) 36.5 41.1 39.5 26.0 13.3 9.7 15.0 9.2 35.4 14.3QoQ Change (%) 13.2 6.8 -1.1 5.3 1.9 3.4 3.7 0.0 -7.3
Net Sales 3,083 3,160 3,645 3,783 4,258 4,664 5,236 6,246 13,680 20,404YoY Change (%) 116.3 103.3 152.7 66.9 38.1 47.6 43.6 65.1 104.4 49.2
EBITDA 1,375 1,426 1,601 1,513 1,823 2,011 2,253 2,468 5,922 8,556Margins (%) 44.6 45.1 43.9 40.0 42.8 43.1 43.0 39.5 43.3 41.9
Depreciation 263 338 263 1,547 358 688 1,875 982 4,331 3,902Interest 54 27 7 16 39 85 127 158 104 409Other Income 30 43 47 91 126 291 170 163 212 750PBT before EO Exp 1,088 1,104 1,379 41 1,552 1,530 420 1,492 1,699 4,995Extra-Ord Expense 0 0 0 -201 0 0 0 0 -195 0PBT 1,088 1,104 1,379 242 1,552 1,530 420 1,492 1,894 4,995Tax 184 326 338 3 383 468 70 327 124 1,249
Rate (%) 16.9 29.6 24.5 1.3 24.7 30.6 16.7 21.9 6.6 25.0Reported PAT 904 777 1,041 239 1,169 1,062 350 1,164 1,770 3,746Adj PAT 904 777 1,041 40 1,169 1,062 350 1,164 1,587 3,746
YoY Change (%) 247.6 108.1 156.6 -93.9 29.3 36.6 -66.4 2791.4 898.4 136.0Margins (%) 29.3 24.6 28.6 1.1 27.5 22.8 6.7 18.6 11.6 18.4
E:MOSt Estimates; Quarterly results do not add up with full year results as it provides addl. depreciation and deferred tax at the end of year
Results PreviewSECTOR: CEMENT
STOCK INFO.BSE Sensex: 16,371
S&P CNX: 4,942
? We expect sales to grow 65% YoY in 4QFY08 to Rs6.25b, driven by volume growth of 51% YoY to 1.93m ton andrealization growth of 9.2% YoY (flat QoQ) to Rs3,238/ton.
? Higher realizations would be mitigated by higher cost (energy and freight), translating into a 50bp YoY decline inEBITDA margin to 39.5% and EBITDA to Rs2.5b (up 63%). The company would be severely impacted by spiralingpet coke prices. However, lower depreciation (down ~37%) would boost PAT to Rs1.16b.
? The company is evaluating the setting up of capacity in Madhya Pradesh, and is considering a manufacturing presencein foreign markets. These plans are still at drawing board stage, and would take at least three years to materialize.
? We are revising our EPS estimates downwards by 7.4% to Rs148 for FY09 and by 6% to Rs167.5 for FY10 to factorin further increase in pet coke prices. The stock is quoting at 6.8x FY07E EPS and an EV of 3.3x FY06E EBITDA.Maintain Buy.
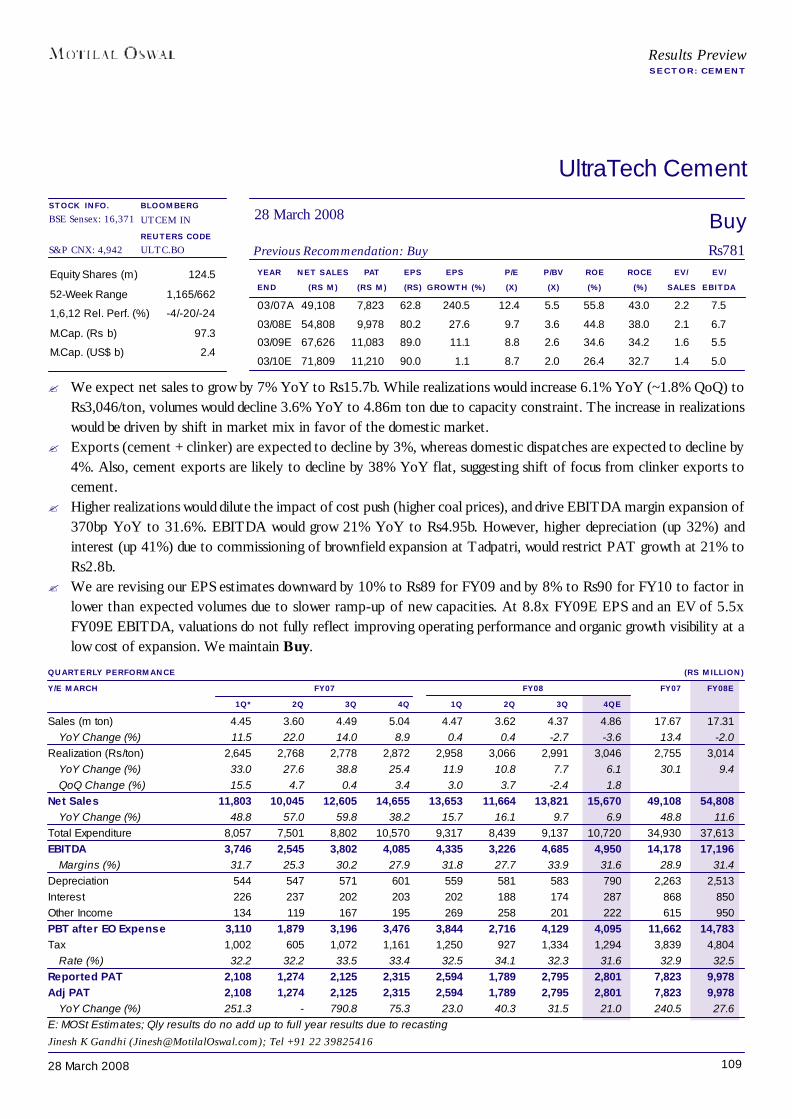
10928 March 2008
Results PreviewSECTOR: CEMENT
UltraTech Cement
YEAR NET SALES PAT EPS EPS P/E P/BV ROE ROCE EV/ EV/END (RS M) (RS M) (RS) GROWTH (%) (X) (X) (%) (%) SALES EBITDA
03/07A 49,108 7,823 62.8 240.5 12.4 5.5 55.8 43.0 2.2 7.5
03/08E 54,808 9,978 80.2 27.6 9.7 3.6 44.8 38.0 2.1 6.7
03/09E 67,626 11,083 89.0 11.1 8.8 2.6 34.6 34.2 1.6 5.5
03/10E 71,809 11,210 90.0 1.1 8.7 2.0 26.4 32.7 1.4 5.0
Equity Shares (m) 124.5
52-Week Range 1,165/662
1,6,12 Rel. Perf. (%) -4/-20/-24
M.Cap. (Rs b) 97.3
M.Cap. (US$ b) 2.4
QUARTERLY PERFORMANCE (RS MILLION)Y/E MARCH FY07 FY08 FY07 FY08E
1Q* 2Q 3Q 4Q 1Q 2Q 3Q 4QESales (m ton) 4.45 3.60 4.49 5.04 4.47 3.62 4.37 4.86 17.67 17.31
YoY Change (%) 11.5 22.0 14.0 8.9 0.4 0.4 -2.7 -3.6 13.4 -2.0Realization (Rs/ton) 2,645 2,768 2,778 2,872 2,958 3,066 2,991 3,046 2,755 3,014
YoY Change (%) 33.0 27.6 38.8 25.4 11.9 10.8 7.7 6.1 30.1 9.4QoQ Change (%) 15.5 4.7 0.4 3.4 3.0 3.7 -2.4 1.8
Net Sales 11,803 10,045 12,605 14,655 13,653 11,664 13,821 15,670 49,108 54,808YoY Change (%) 48.8 57.0 59.8 38.2 15.7 16.1 9.7 6.9 48.8 11.6
Total Expenditure 8,057 7,501 8,802 10,570 9,317 8,439 9,137 10,720 34,930 37,613EBITDA 3,746 2,545 3,802 4,085 4,335 3,226 4,685 4,950 14,178 17,196
Margins (%) 31.7 25.3 30.2 27.9 31.8 27.7 33.9 31.6 28.9 31.4Depreciation 544 547 571 601 559 581 583 790 2,263 2,513Interest 226 237 202 203 202 188 174 287 868 850Other Income 134 119 167 195 269 258 201 222 615 950PBT after EO Expense 3,110 1,879 3,196 3,476 3,844 2,716 4,129 4,095 11,662 14,783Tax 1,002 605 1,072 1,161 1,250 927 1,334 1,294 3,839 4,804
Rate (%) 32.2 32.2 33.5 33.4 32.5 34.1 32.3 31.6 32.9 32.5Reported PAT 2,108 1,274 2,125 2,315 2,594 1,789 2,795 2,801 7,823 9,978Adj PAT 2,108 1,274 2,125 2,315 2,594 1,789 2,795 2,801 7,823 9,978
YoY Change (%) 251.3 - 790.8 75.3 23.0 40.3 31.5 21.0 240.5 27.6E: MOSt Estimates; Qly results do no add up to full year results due to recasting
BuyPrevious Recommendation: Buy Rs781
28 March 2008BLOOMBERGUTCEM IN
REUTERS CODEULTC.BO
Jinesh K Gandhi ([email protected]); Tel +91 22 39825416
STOCK INFO.BSE Sensex: 16,371
S&P CNX: 4,942
? We expect net sales to grow by 7% YoY to Rs15.7b. While realizations would increase 6.1% YoY (~1.8% QoQ) toRs3,046/ton, volumes would decline 3.6% YoY to 4.86m ton due to capacity constraint. The increase in realizationswould be driven by shift in market mix in favor of the domestic market.
? Exports (cement + clinker) are expected to decline by 3%, whereas domestic dispatches are expected to decline by4%. Also, cement exports are likely to decline by 38% YoY flat, suggesting shift of focus from clinker exports tocement.
? Higher realizations would dilute the impact of cost push (higher coal prices), and drive EBITDA margin expansion of370bp YoY to 31.6%. EBITDA would grow 21% YoY to Rs4.95b. However, higher depreciation (up 32%) andinterest (up 41%) due to commissioning of brownfield expansion at Tadpatri, would restrict PAT growth at 21% toRs2.8b.
? We are revising our EPS estimates downward by 10% to Rs89 for FY09 and by 8% to Rs90 for FY10 to factor inlower than expected volumes due to slower ramp-up of new capacities. At 8.8x FY09E EPS and an EV of 5.5xFY09E EBITDA, valuations do not fully reflect improving operating performance and organic growth visibility at alow cost of expansion. We maintain Buy.

11028 March 2008
Engineering
COMPANY NAME PG.ABB 115
Alstom Projects 116
Bharat Electronics 117
BHEL 118
Crompton Greaves 119
Cummins India 120
Larsen & Toubro 121
Siemens 122
Suzlon Energy 123
Thermax 124
EXPECTED QUARTERLY PERFORMANCE SUMMARY (RS MILLION)RECO SALES EBITDA NET PROFIT
MAR.08 CHG. (%) MAR.08 CHG. (%) MAR.08 CHG. (%)EngineeringABB Neutral 17,456 33.0 1,833 43.0 1,235 42.6Alstom Projects Neutral 5,630 30.7 669 25.2 441 20.0Bharat Electronics Buy 23,371 34.8 6,690 38.0 4,686 31.2BHEL Neutral 87,499 26.4 20,210 27.3 14,649 27.3Crompton Greaves Neutral 12,472 26.0 1,573 37.6 942 25.7Cummins India UR* 6,330 25.4 887 7.7 742 13.0Larsen & Toubro Neutral 82,133 31.4 13,902 43.0 9,158 30.7Siemens Neutral 28,804 34.9 2,301 37.2 1,555 43.9Suzlon Energy Neutral 47,377 62.5 8,175 65.0 4,839 34.8Thermax Buy 9,293 15.5 1,159 30.6 915 39.5Sector Aggregate 320,364 33.5 57,397 37.5 39,162 30.3
IIP growth for January 2008: an aberration?The Index of Industrial Production (IIP) grew by a modest 5.3% YoY in January 2008;the Capital Goods Index grew just 2.1% YoY. The cumulative growth in IIP for theperiod April 2007 – January 2008 was 8.7% YoY. The key surprise has been theperformance of the Capital Goods Index, which has witnessed a sharp fall from 24.3%YoY growth in November 2007 to 2.1% in January 2008. We believe that this could bean aberration, as the order books for most of the capital goods companies continue towitness strong growth momentum. Justification for such numbers, in our opinion, couldbe increased imports, impact of higher interest rates on industrial capex, and unevenproject commissioning, as the index is based on project commissioning.
CAPITAL GOODS INDEX (% CHG YOY)
Satyam Agarwal ([email protected])Tel: +91 22 3982 5410/ Shridatta Bhandwaldar ([email protected])
BSE Sensex: 16,371 S&P CNX: 4,942 28 March 2008
Results PreviewQUARTER ENDED MARCH 2008
Source: CMIE
*Under Review
26.2
30.8
16.6
10.9
18.1
6.5
16.6
2.1
24.3
12.3
23.1
16.3
29.4
20.9 20.9
22.4
18.0
9.5
18.3
21.621.4
19.6
0
8
16
24
32
Apr-06 Jul-06 Oct-06 Jan-07 Apr-07 Jul-07 Oct-07 Jan-08
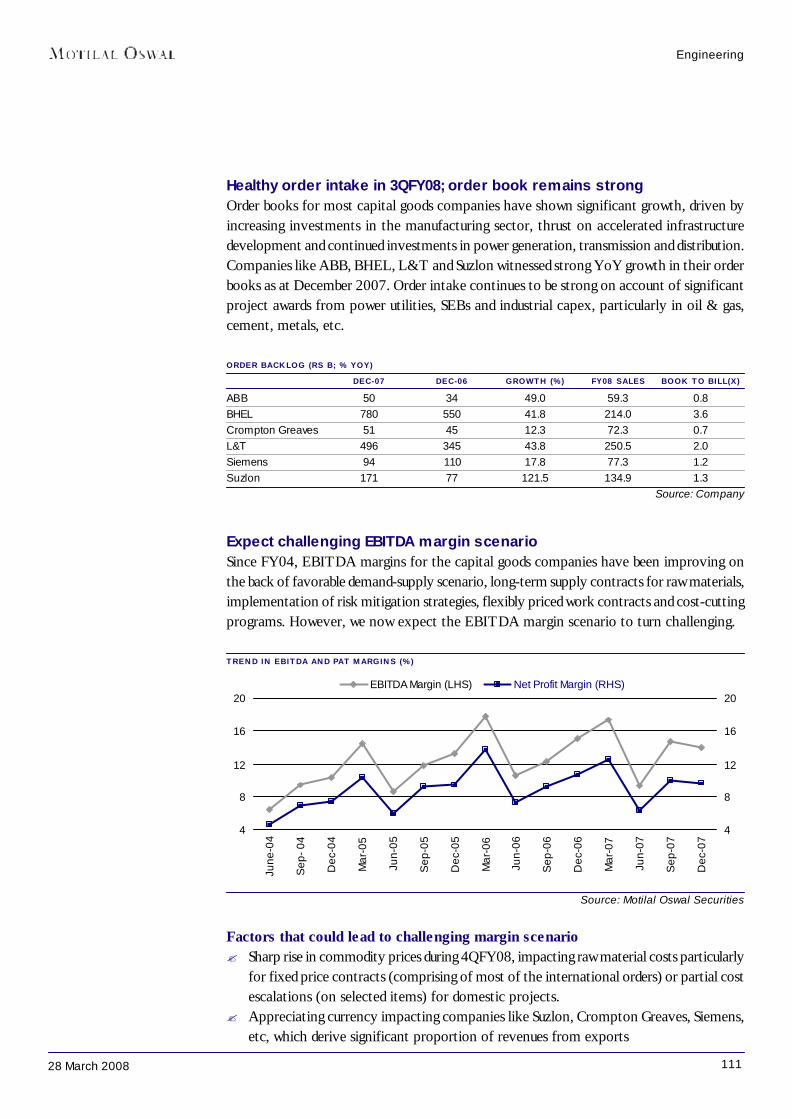
11128 March 2008
Engineering
Healthy order intake in 3QFY08; order book remains strongOrder books for most capital goods companies have shown significant growth, driven byincreasing investments in the manufacturing sector, thrust on accelerated infrastructuredevelopment and continued investments in power generation, transmission and distribution.Companies like ABB, BHEL, L&T and Suzlon witnessed strong YoY growth in their orderbooks as at December 2007. Order intake continues to be strong on account of significantproject awards from power utilities, SEBs and industrial capex, particularly in oil & gas,cement, metals, etc.
ORDER BACKLOG (RS B; % YOY)DEC-07 DEC-06 GROWTH (%) FY08 SALES BOOK TO BILL(X)
ABB 50 34 49.0 59.3 0.8BHEL 780 550 41.8 214.0 3.6Crompton Greaves 51 45 12.3 72.3 0.7L&T 496 345 43.8 250.5 2.0Siemens 94 110 17.8 77.3 1.2Suzlon 171 77 121.5 134.9 1.3
Source: Company
Expect challenging EBITDA margin scenarioSince FY04, EBITDA margins for the capital goods companies have been improving onthe back of favorable demand-supply scenario, long-term supply contracts for raw materials,implementation of risk mitigation strategies, flexibly priced work contracts and cost-cuttingprograms. However, we now expect the EBITDA margin scenario to turn challenging.
TREND IN EBITDA AND PAT MARGINS (%)
Source: Motilal Oswal Securities
Factors that could lead to challenging margin scenario? Sharp rise in commodity prices during 4QFY08, impacting raw material costs particularly
for fixed price contracts (comprising of most of the international orders) or partial costescalations (on selected items) for domestic projects.
? Appreciating currency impacting companies like Suzlon, Crompton Greaves, Siemens,etc, which derive significant proportion of revenues from exports
4
8
12
16
20
June
-04
Sep
- 04
Dec
-04
Mar
-05
Jun-
05
Sep
-05
Dec
-05
Mar
-06
Jun-
06
Sep
-06
Dec
-06
Mar
-07
Jun-
07
Sep
-07
Dec
-07
4
8
12
16
20EBITDA Margin (LHS) Net Profit Margin (RHS)

11228 March 2008
Engineering
Key factors to watch for: commodity prices, forex exposure, one-off items? Suzlon’s EBITDA for 3QFY08 were impacted due to: (1) provision of Rs190m towards
replacement of rotor blades in the US; (2) Rs150m on account of customs duty leviedby the US on import of Nacelles; and (3) Rs140m on account of site restorationexpenses in Maharashtra. Tax liability for 3QFY08 was higher by Rs480m due to taxpaid on non deductibility of hedging related expenses in Denmark (Rs280m) and reversalof deferred tax asset in USA (Rs200m). Also, it is derives almost 65% of its revenuefrom the international market, whereby it is exposed to currency risk and also thenature of international (fixed price) contracts.
? L&T International FZE (100% subsidiary of L&T) has incurred loss of ~Rs2b oncommodity hedging, largely on zinc (price decline of 27% during 9MFY08) and othermetals, which had witnessed sharp volatility in the interim. The risk managementpractice adopted by the company mandates ‘stop loss’ for derivative positions, whichhave got triggered due to the sharp price volatility of underlying metals. The losses dueto hedging are partly offset through spot market purchases of the specified commoditiesduring that period in the standalone financials.
EXPORTS (AS % OF REVENUES)ABB 10.0BHEL 10.0Crompton Greaves* ~50L&T 18.0Siemens 32.0Suzlon 65
Source: Industry
Commodity prices have increased significantlyMajor raw materials used by the capital goods industry – steel, copper, etc – have witnessedsharp price increases since December 2007. This could adversely impact margins of capitalgoods companies, which have larger exposure to fixed price contracts (largely exportorders, impacting companies like Siemens, Suzlon, Crompton Greaves, etc) or to contractsallowing only partial cost escalations.
STEEL PRICES – CIS EXPORT, BLACK SEA (US$/TON)
Source: Bloomberg
200
450
700
950
1,200
Jun-
04
Oct
-04
Feb-
05
Jun-
05
Oct
-05
Feb-
06
Jun-
06
Oct
-06
Feb-
07
Jun-
07
Oct
-07
Feb-
08
Billet price HRC CRC
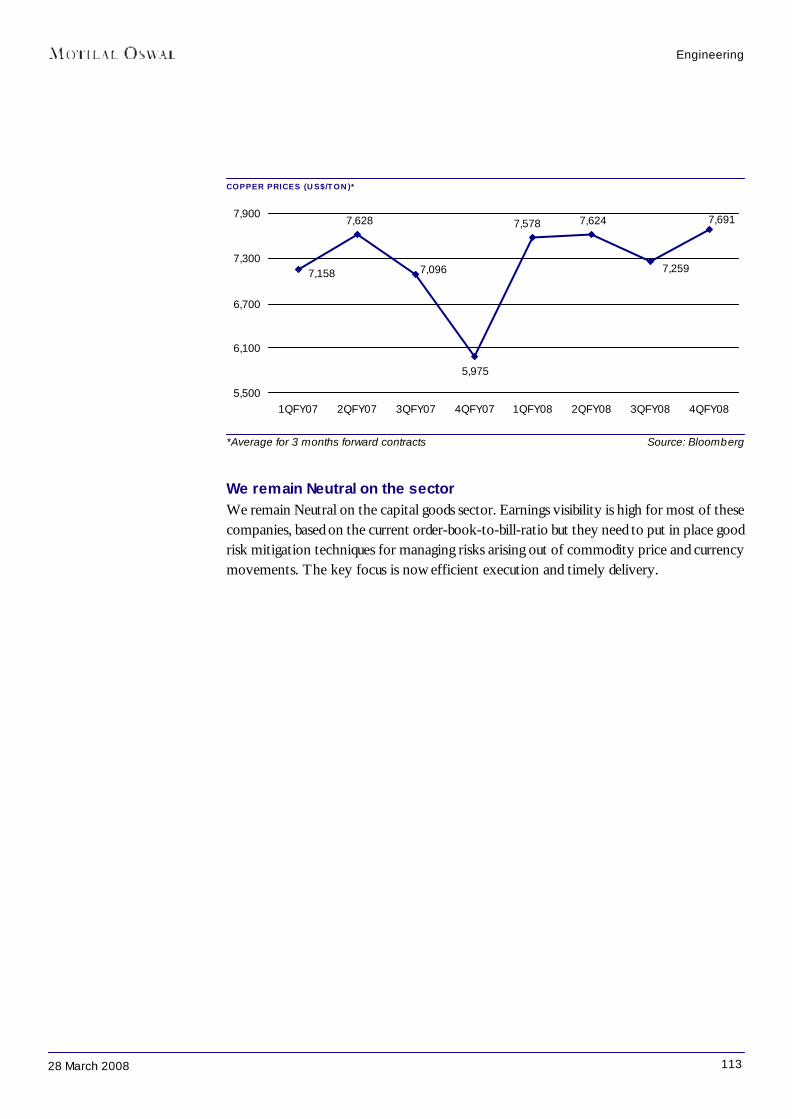
11328 March 2008
*Average for 3 months forward contracts Source: Bloomberg
We remain Neutral on the sectorWe remain Neutral on the capital goods sector. Earnings visibility is high for most of thesecompanies, based on the current order-book-to-bill-ratio but they need to put in place goodrisk mitigation techniques for managing risks arising out of commodity price and currencymovements. The key focus is now efficient execution and timely delivery.
COPPER PRICES (US$/TON)*
7,691
7,259
7,6247,578
5,975
7,0967,158
7,628
5,500
6,100
6,700
7,300
7,900
1QFY07 2QFY07 3QFY07 4QFY07 1QFY08 2QFY08 3QFY08 4QFY08
Engineering

11428 March 2008
Engineering
RELATIVE PERFORMANCE - 3 MONTH (%) RELATIVE PERFORMANCE - 1 YEAR (%)
Stock performance and valuations
STOCK PERFORMANCE (%) ABSOLUTE PERF REL PERF TO SENSEX REL PERF TO SECTOR
3 M 1 YEAR 3 M 1 YEAR 3 M 1 YEAREngineeringABB -20 68 -1 41 5 2Alstom Projects -45 39 -26 12 -20 -26Bharat Electron -47 -26 -28 -53 -23 -92BHEL -19 83 0 56 6 18Crompton Greaves -27 51 -8 23 -2 -15Cummins India -26 16 -7 -11 -1 -50Larsen & Toubro -24 101 -5 74 1 35Siemens -30 22 -11 -5 -5 -43Suzlon Energy -29 40 -10 13 -4 -26Thermax -29 62 -10 35 -4 -4
COMPARATIVE VALUATIONCMP (RS) RECO EPS (RS) P/E (X) EV/EBITDA ROE (%)28.03.08 FY08E FY09E FY10E FY08E FY09E FY10E FY08E FY09E FY10E FY08E FY09E FY10E
EngineeringABB 1,196 Neutral 23.2 32.3 42.9 51.6 37.0 27.9 33.9 23.9 17.4 34.7 35.4 34.5Alstom Projects 547 Neutral 17.3 21.2 25.7 31.6 25.8 21.3 20.1 15.7 11.9 31.8 32.3 31.8Bharat Electronics 1,105 Buy 91.3 117.3 137.8 12.1 9.4 8.0 6.2 4.4 3.3 26.9 27.9 26.2BHEL 2,092 Neutral 60.2 87.8 117.7 34.8 23.8 17.8 21.5 14.6 10.7 29.3 33.0 34.0Crompton Greaves 288 Neutral 10.6 14.5 19.3 27.1 19.9 14.9 21.9 17.8 14.2 37.6 36.5 35.4Cummins India 303 UR* 15.7 19.3 24.7 19.2 15.7 12.3 15.3 12.1 9.2 27.3 27.7 29.5Larsen & Toubro 3,147 Neutral 78.9 110.7 137.8 39.9 28.4 22.8 29.7 22.7 18.3 27.2 25.0 25.5Siemens 662 Neutral 18.3 25.1 32.8 36.1 26.4 20.2 24.3 17.7 13.4 44.5 43.0 43.5Suzlon Energy 270 Neutral 7.0 12.1 16.3 38.6 22.3 16.5 23.6 17.0 13.2 17.3 19.0 21.9Thermax 592 Buy 24.2 35.7 49.1 24.4 16.6 12.1 16.9 10.9 7.2 42.4 46.1 44.5Sector Aggregate 33.8 23.7 18.2 23.0 16.7 12.8 25.7 28.8 30.1
80
115
150
185
220
Mar-07 Jun-07 Sep-07 Dec-07 Mar-08
MOSt Engineering Index Sensex
70
78
86
94
102
Dec-07 Jan-08 Feb-08 Mar-08
Sensex MOSt Engineering Index
*Under Review
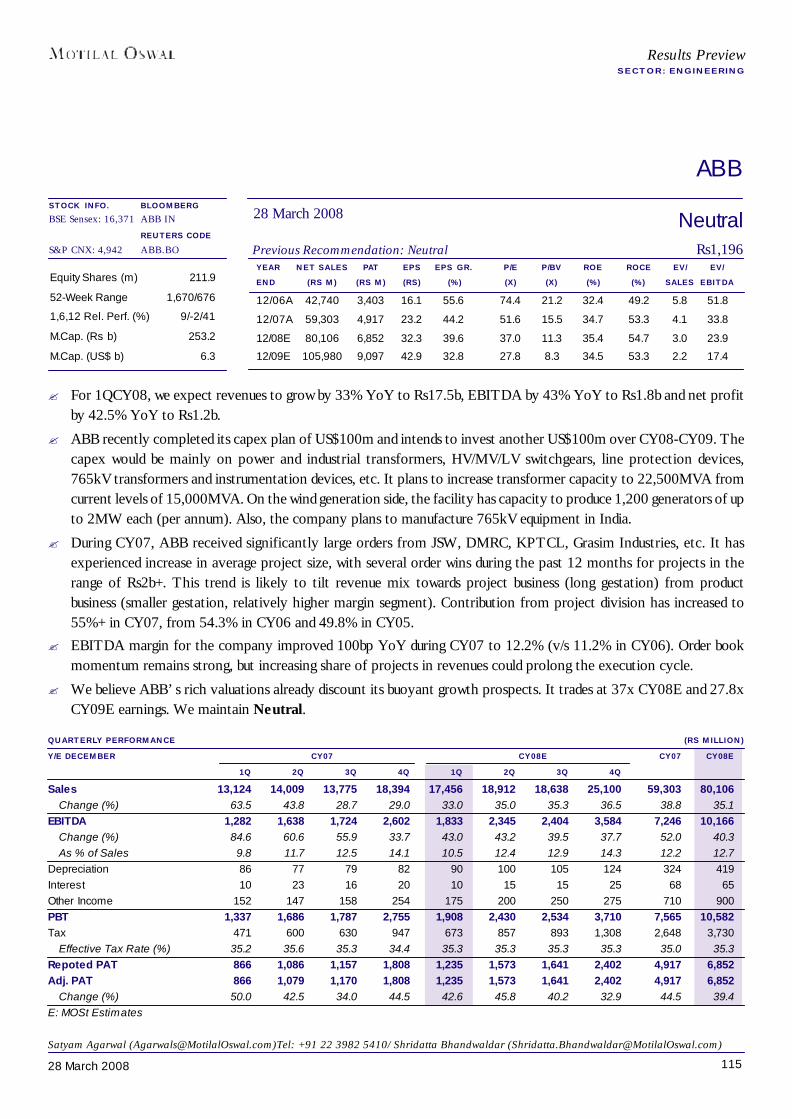
11528 March 2008
ABB
YEAR NET SALES PAT EPS EPS GR. P/E P/BV ROE ROCE EV/ EV/END (RS M) (RS M) (RS) (%) (X) (X) (%) (%) SALES EBITDA
12/06A 42,740 3,403 16.1 55.6 74.4 21.2 32.4 49.2 5.8 51.8
12/07A 59,303 4,917 23.2 44.2 51.6 15.5 34.7 53.3 4.1 33.8
12/08E 80,106 6,852 32.3 39.6 37.0 11.3 35.4 54.7 3.0 23.9
12/09E 105,980 9,097 42.9 32.8 27.8 8.3 34.5 53.3 2.2 17.4
Equity Shares (m) 211.9
52-Week Range 1,670/676
1,6,12 Rel. Perf. (%) 9/-2/41
M.Cap. (Rs b) 253.2
M.Cap. (US$ b) 6.3
QUARTERLY PERFORMANCE (RS MILLION)Y/E DECEMBER CY07 CY08E CY07 CY08E
1Q 2Q 3Q 4Q 1Q 2Q 3Q 4QSales 13,124 14,009 13,775 18,394 17,456 18,912 18,638 25,100 59,303 80,106
Change (%) 63.5 43.8 28.7 29.0 33.0 35.0 35.3 36.5 38.8 35.1EBITDA 1,282 1,638 1,724 2,602 1,833 2,345 2,404 3,584 7,246 10,166
Change (%) 84.6 60.6 55.9 33.7 43.0 43.2 39.5 37.7 52.0 40.3As % of Sales 9.8 11.7 12.5 14.1 10.5 12.4 12.9 14.3 12.2 12.7
Depreciation 86 77 79 82 90 100 105 124 324 419Interest 10 23 16 20 10 15 15 25 68 65Other Income 152 147 158 254 175 200 250 275 710 900PBT 1,337 1,686 1,787 2,755 1,908 2,430 2,534 3,710 7,565 10,582Tax 471 600 630 947 673 857 893 1,308 2,648 3,730
Effective Tax Rate (%) 35.2 35.6 35.3 34.4 35.3 35.3 35.3 35.3 35.0 35.3Repoted PAT 866 1,086 1,157 1,808 1,235 1,573 1,641 2,402 4,917 6,852Adj. PAT 866 1,079 1,170 1,808 1,235 1,573 1,641 2,402 4,917 6,852
Change (%) 50.0 42.5 34.0 44.5 42.6 45.8 40.2 32.9 44.5 39.4E: MOSt Estimates
NeutralPrevious Recommendation: Neutral Rs1,196
28 March 2008BLOOMBERGABB IN
REUTERS CODEABB.BO
Results PreviewSECTOR: ENGINEERING
STOCK INFO.BSE Sensex: 16,371
S&P CNX: 4,942
Satyam Agarwal ([email protected])Tel: +91 22 3982 5410/ Shridatta Bhandwaldar ([email protected])
? For 1QCY08, we expect revenues to grow by 33% YoY to Rs17.5b, EBITDA by 43% YoY to Rs1.8b and net profitby 42.5% YoY to Rs1.2b.
? ABB recently completed its capex plan of US$100m and intends to invest another US$100m over CY08-CY09. Thecapex would be mainly on power and industrial transformers, HV/MV/LV switchgears, line protection devices,765kV transformers and instrumentation devices, etc. It plans to increase transformer capacity to 22,500MVA fromcurrent levels of 15,000MVA. On the wind generation side, the facility has capacity to produce 1,200 generators of upto 2MW each (per annum). Also, the company plans to manufacture 765kV equipment in India.
? During CY07, ABB received significantly large orders from JSW, DMRC, KPTCL, Grasim Industries, etc. It hasexperienced increase in average project size, with several order wins during the past 12 months for projects in therange of Rs2b+. This trend is likely to tilt revenue mix towards project business (long gestation) from productbusiness (smaller gestation, relatively higher margin segment). Contribution from project division has increased to55%+ in CY07, from 54.3% in CY06 and 49.8% in CY05.
? EBITDA margin for the company improved 100bp YoY during CY07 to 12.2% (v/s 11.2% in CY06). Order bookmomentum remains strong, but increasing share of projects in revenues could prolong the execution cycle.
? We believe ABB’s rich valuations already discount its buoyant growth prospects. It trades at 37x CY08E and 27.8xCY09E earnings. We maintain Neutral.
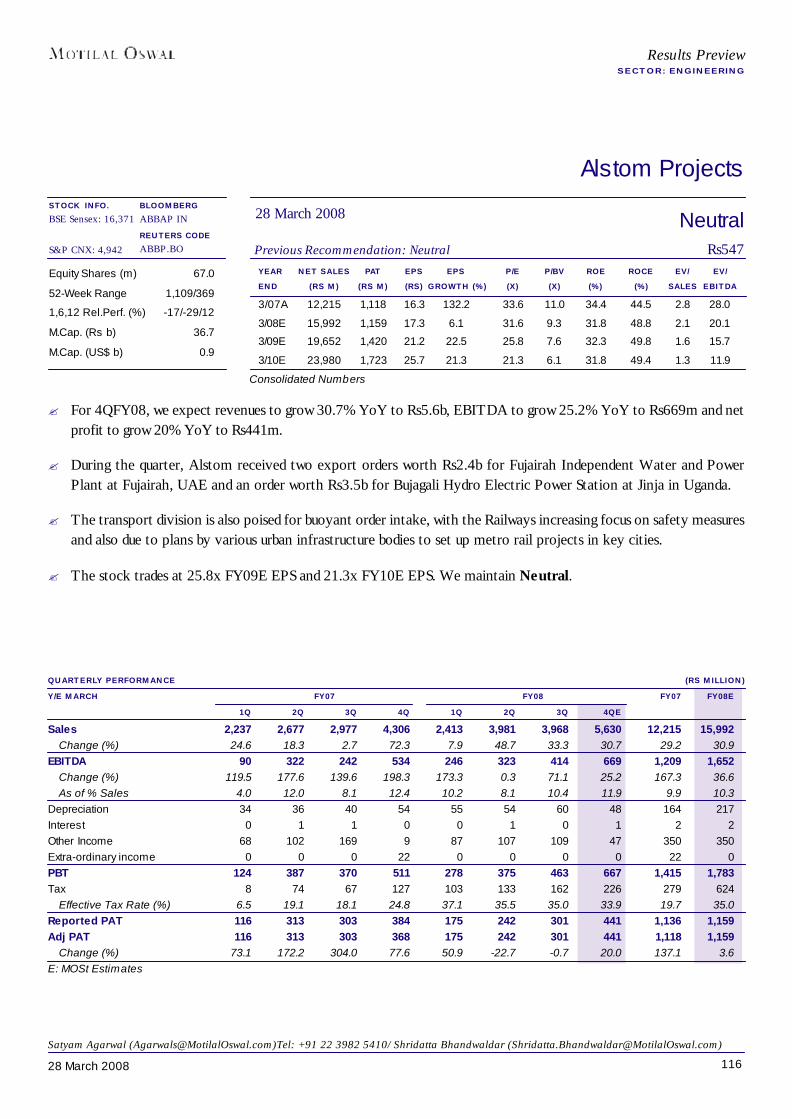
11628 March 2008
Alstom Projects
YEAR NET SALES PAT EPS EPS P/E P/BV ROE ROCE EV/ EV/END (RS M) (RS M) (RS) GROWTH (%) (X) (X) (%) (%) SALES EBITDA
3/07A 12,215 1,118 16.3 132.2 33.6 11.0 34.4 44.5 2.8 28.0
3/08E 15,992 1,159 17.3 6.1 31.6 9.3 31.8 48.8 2.1 20.1
3/09E 19,652 1,420 21.2 22.5 25.8 7.6 32.3 49.8 1.6 15.7
3/10E 23,980 1,723 25.7 21.3 21.3 6.1 31.8 49.4 1.3 11.9
Equity Shares (m) 67.0
52-Week Range 1,109/369
1,6,12 Rel.Perf. (%) -17/-29/12
M.Cap. (Rs b) 36.7
M.Cap. (US$ b) 0.9
NeutralPrevious Recommendation: Neutral Rs547
28 March 2008BLOOMBERGABBAP IN
REUTERS CODEABBP.BO
QUARTERLY PERFORMANCE (RS MILLION)Y/E MARCH FY07 FY08 FY07 FY08E
1Q 2Q 3Q 4Q 1Q 2Q 3Q 4QESales 2,237 2,677 2,977 4,306 2,413 3,981 3,968 5,630 12,215 15,992
Change (%) 24.6 18.3 2.7 72.3 7.9 48.7 33.3 30.7 29.2 30.9EBITDA 90 322 242 534 246 323 414 669 1,209 1,652
Change (%) 119.5 177.6 139.6 198.3 173.3 0.3 71.1 25.2 167.3 36.6As of % Sales 4.0 12.0 8.1 12.4 10.2 8.1 10.4 11.9 9.9 10.3
Depreciation 34 36 40 54 55 54 60 48 164 217Interest 0 1 1 0 0 1 0 1 2 2Other Income 68 102 169 9 87 107 109 47 350 350Extra-ordinary income 0 0 0 22 0 0 0 0 22 0PBT 124 387 370 511 278 375 463 667 1,415 1,783Tax 8 74 67 127 103 133 162 226 279 624
Effective Tax Rate (%) 6.5 19.1 18.1 24.8 37.1 35.5 35.0 33.9 19.7 35.0Reported PAT 116 313 303 384 175 242 301 441 1,136 1,159Adj PAT 116 313 303 368 175 242 301 441 1,118 1,159
Change (%) 73.1 172.2 304.0 77.6 50.9 -22.7 -0.7 20.0 137.1 3.6E: MOSt Estimates
Results PreviewSECTOR: ENGINEERING
Consolidated Numbers
STOCK INFO.BSE Sensex: 16,371
S&P CNX: 4,942
Satyam Agarwal ([email protected])Tel: +91 22 3982 5410/ Shridatta Bhandwaldar ([email protected])
? For 4QFY08, we expect revenues to grow 30.7% YoY to Rs5.6b, EBITDA to grow 25.2% YoY to Rs669m and netprofit to grow 20% YoY to Rs441m.
? During the quarter, Alstom received two export orders worth Rs2.4b for Fujairah Independent Water and PowerPlant at Fujairah, UAE and an order worth Rs3.5b for Bujagali Hydro Electric Power Station at Jinja in Uganda.
? The transport division is also poised for buoyant order intake, with the Railways increasing focus on safety measuresand also due to plans by various urban infrastructure bodies to set up metro rail projects in key cities.
? The stock trades at 25.8x FY09E EPS and 21.3x FY10E EPS. We maintain Neutral.

11728 March 2008
Bharat Electronics
YEAR NET SALES PAT EPS EPS P/E P/BV ROE ROCE EV/ EV/END (RS M) (RS M) (RS) GROWTH (%) (X) (X) (%) (%) SALES EBITDA
3/07A 39,002 7,139 89.8 23.2 12.3 3.4 32.9 32.9 1.7 6.2
3/08E 41,206 7,307 91.3 1.7 12.1 2.8 26.9 26.9 1.6 6.2
3/09E 51,058 9,388 117.3 28.5 9.4 2.3 27.9 27.9 1.1 4.4
3/10E 58,717 11,022 137.8 17.4 8.0 1.8 26.2 26.2 1.1 4.4
Equity Shares (m) 80.0
52-Week Range 2,180/1102
1,6,12 Rel. Perf. (%) 10/-24/12
M.Cap. (Rs b) 88.4
M.Cap. (US$ b) 2.2
QUARTERLY PERFORMANCE (RS MILLION)Y/E MARCH FY07 FY08 FY07 FY08E
1Q 2Q 3Q 4Q 1Q 2Q 3Q 4QESales 4,831 8,343 8,638 17,342 4,044 7,089 6,622 23,371 38,943 41,127
Change (%) 0.8 0.7 27.5 10.1 -16.3 -15.0 -23.3 34.8 9.4 5.6EBITDA 721 1,865 1,976 4,849 -46 1,534 1,269 6,690 9,411 9,446
Change (%) -4.0 -9.1 36.6 16.2 -106.4 -17.8 -35.8 38.0 11.7 0.4As of % Sales 14.9 22.4 22.9 28.0 -1.1 21.6 19.2 28.6 24.2 23.0
Depreciation 208 198 205 252 211 221 234 248 863 914Interest 3 1 2 0 1 0 0 1 5 3Other Income 384 508 407 574 656 497 647 416 1,874 2,217PBT 894 2,175 2,177 5,171 398 1,809 1,681 6,857 10,416 10,745Tax 291 692 696 1,599 135 581 552 2,171 3,278 3,439
Effective Tax Rate (%) 32.6 31.8 31.9 30.9 33.9 32.1 32.8 31.7 31.5 32.0Reported PAT 603 1,483 1,482 3,572 263 1,228 1,130 4,686 7,139 7,307
Change (%) 6.5 1.1 52.7 27.2 -56.4 -17.2 -23.8 31.2 22.8 2.4Adj PAT 603 1,483 1,482 3,572 263 1,228 1,130 4,686 7,139 7,307E: MOSt Estimates
BuyPrevious Recommendation: Buy Rs1,105
28 March 2008BLOOMBERGBHE IN
REUTERS CODEBAJE.BO
Results PreviewSECTOR: ENGINEERING
STOCK INFO.BSE Sensex: 16,371
S&P CNX: 4,942
Satyam Agarwal ([email protected])Tel: +91 22 3982 5410/ Shridatta Bhandwaldar ([email protected])
? For 4QFY08, we expect Bharat Electronics to report revenues of Rs23.4b, up 34.8% YoY, EBITDA of Rs6.7b, up38% YoY, and net profit of Rs4.7b, up 31.2% YoY.
? BEL has guided revenues of US$1b in FY08 and US$2b by FY12. Order backlog as of March 2007 stood at Rs90b(up 36% YoY) and order intake for FY07 was at Rs63b (up 64% YoY).
? BEL has signed MoUs with (1) Lockheed Martin to explore business opportunities for co-production of domesticaerospace and defense electronics needs, (2) Elbit Systems Electro Optics ELOP Ltd, Israel, for setting up a JV fordevelopment, production and marketing of Thermal Imaging Cameras and Forward Looking Infra Red (FLIRs) forthe Indian and global markets, and (3) Northrop Grumman Corp to explore business opportunities for co-productionin current and future aerospace and defense needs of India and international markets of Northrop Grummans.
? Though these are currently enabling MoUs, we believe BEL would be able to leverage its competitive positioningwith the JV partners over a longer period due to the offset clause.
? We expect the company to post earnings CAGR of 15% over FY07-10. The stock quotes at a 9.4x FY09E EPS and8x FY10E EPS. We maintain Buy.
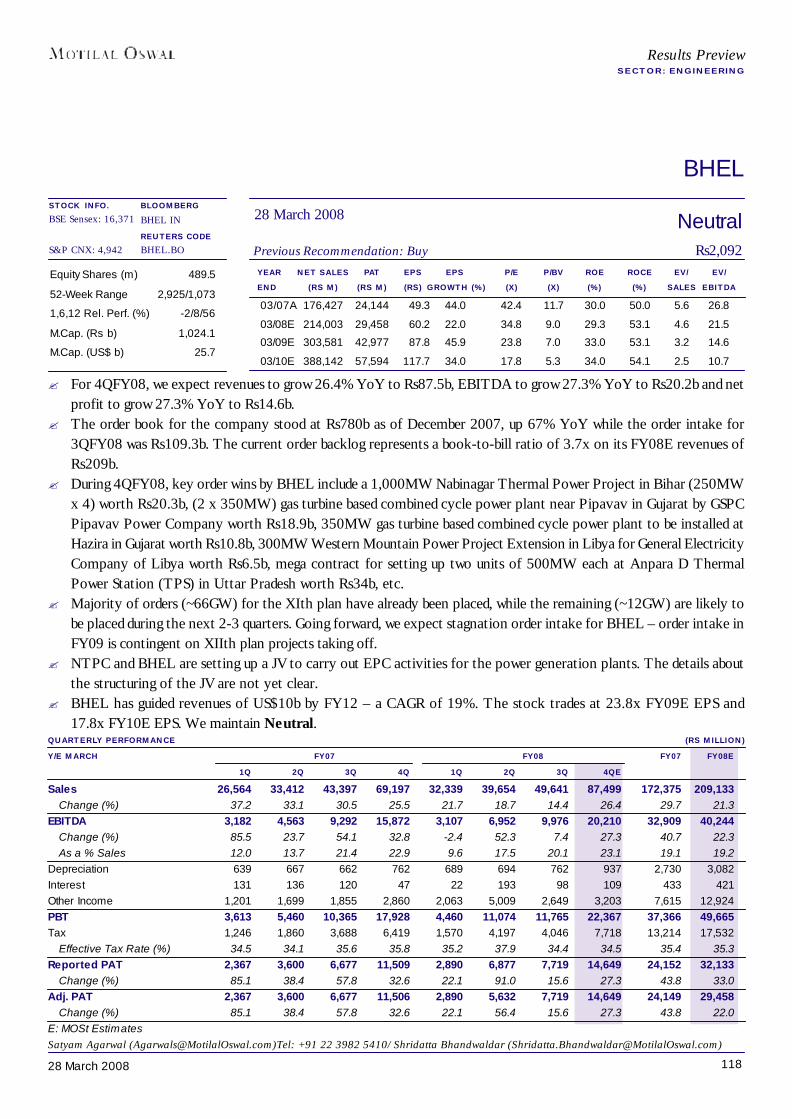
11828 March 2008
BHEL
YEAR NET SALES PAT EPS EPS P/E P/BV ROE ROCE EV/ EV/END (RS M) (RS M) (RS) GROWTH (%) (X) (X) (%) (%) SALES EBITDA
03/07A 176,427 24,144 49.3 44.0 42.4 11.7 30.0 50.0 5.6 26.8
03/08E 214,003 29,458 60.2 22.0 34.8 9.0 29.3 53.1 4.6 21.5
03/09E 303,581 42,977 87.8 45.9 23.8 7.0 33.0 53.1 3.2 14.6
03/10E 388,142 57,594 117.7 34.0 17.8 5.3 34.0 54.1 2.5 10.7
Equity Shares (m) 489.5
52-Week Range 2,925/1,073
1,6,12 Rel. Perf. (%) -2/8/56
M.Cap. (Rs b) 1,024.1
M.Cap. (US$ b) 25.7
QUARTERLY PERFORMANCE (RS MILLION)Y/E MARCH FY07 FY08 FY07 FY08E
1Q 2Q 3Q 4Q 1Q 2Q 3Q 4QESales 26,564 33,412 43,397 69,197 32,339 39,654 49,641 87,499 172,375 209,133
Change (%) 37.2 33.1 30.5 25.5 21.7 18.7 14.4 26.4 29.7 21.3EBITDA 3,182 4,563 9,292 15,872 3,107 6,952 9,976 20,210 32,909 40,244
Change (%) 85.5 23.7 54.1 32.8 -2.4 52.3 7.4 27.3 40.7 22.3As a % Sales 12.0 13.7 21.4 22.9 9.6 17.5 20.1 23.1 19.1 19.2
Depreciation 639 667 662 762 689 694 762 937 2,730 3,082Interest 131 136 120 47 22 193 98 109 433 421Other Income 1,201 1,699 1,855 2,860 2,063 5,009 2,649 3,203 7,615 12,924PBT 3,613 5,460 10,365 17,928 4,460 11,074 11,765 22,367 37,366 49,665Tax 1,246 1,860 3,688 6,419 1,570 4,197 4,046 7,718 13,214 17,532
Effective Tax Rate (%) 34.5 34.1 35.6 35.8 35.2 37.9 34.4 34.5 35.4 35.3Reported PAT 2,367 3,600 6,677 11,509 2,890 6,877 7,719 14,649 24,152 32,133
Change (%) 85.1 38.4 57.8 32.6 22.1 91.0 15.6 27.3 43.8 33.0Adj. PAT 2,367 3,600 6,677 11,506 2,890 5,632 7,719 14,649 24,149 29,458
Change (%) 85.1 38.4 57.8 32.6 22.1 56.4 15.6 27.3 43.8 22.0E: MOSt Estimates
NeutralPrevious Recommendation: Buy Rs2,092
28 March 2008BLOOMBERGBHEL IN
REUTERS CODEBHEL.BO
Results PreviewSECTOR: ENGINEERING
STOCK INFO.BSE Sensex: 16,371
S&P CNX: 4,942
Satyam Agarwal ([email protected])Tel: +91 22 3982 5410/ Shridatta Bhandwaldar ([email protected])
? For 4QFY08, we expect revenues to grow 26.4% YoY to Rs87.5b, EBITDA to grow 27.3% YoY to Rs20.2b and netprofit to grow 27.3% YoY to Rs14.6b.
? The order book for the company stood at Rs780b as of December 2007, up 67% YoY while the order intake for3QFY08 was Rs109.3b. The current order backlog represents a book-to-bill ratio of 3.7x on its FY08E revenues ofRs209b.
? During 4QFY08, key order wins by BHEL include a 1,000MW Nabinagar Thermal Power Project in Bihar (250MWx 4) worth Rs20.3b, (2 x 350MW) gas turbine based combined cycle power plant near Pipavav in Gujarat by GSPCPipavav Power Company worth Rs18.9b, 350MW gas turbine based combined cycle power plant to be installed atHazira in Gujarat worth Rs10.8b, 300MW Western Mountain Power Project Extension in Libya for General ElectricityCompany of Libya worth Rs6.5b, mega contract for setting up two units of 500MW each at Anpara D ThermalPower Station (TPS) in Uttar Pradesh worth Rs34b, etc.
? Majority of orders (~66GW) for the XIth plan have already been placed, while the remaining (~12GW) are likely tobe placed during the next 2-3 quarters. Going forward, we expect stagnation order intake for BHEL – order intake inFY09 is contingent on XIIth plan projects taking off.
? NTPC and BHEL are setting up a JV to carry out EPC activities for the power generation plants. The details aboutthe structuring of the JV are not yet clear.
? BHEL has guided revenues of US$10b by FY12 – a CAGR of 19%. The stock trades at 23.8x FY09E EPS and17.8x FY10E EPS. We maintain Neutral.

11928 March 2008
Crompton Greaves
YEAR NET SALES PAT* EPS* EPS GR. P/E P/BV ROE ROCE EV/ EV/END (RS M) (RS M) (RS) (%) (X) (X) (%) (%) SALES EBITDA
3/07A 33,676 2,417 6.6 0.6 43.7 16.0 32.6 38.6 3.2 31.2
3/08E 39,634 3,887 10.6 60.8 27.2 12.0 37.6 45.8 2.7 21.9
3/09E 47,319 5,298 14.5 36.3 19.9 9.2 36.5 44.6 2.2 17.8
3/10E 57,238 7,076 19.3 33.6 14.9 7.1 35.4 46.0 1.8 14.3
Equity Shares (m) 366.6
52-Week Range 454/183
1,6,12 Rel. Perf. (%) -4/-8/23
M.Cap. (Rs b) 105.6
M.Cap. (US$ b) 2.6
NeutralPrevious Recommendation: Neutral Rs288
28 March 2008BLOOMBERGCRG IN
REUTERS CODECROM.BO
QUARTERLY PERFORMANCE (STANDALONE) (RS MILLION)Y/E MARCH FY07 FY08 FY07 FY08E
1Q 2Q 3Q 4Q 1Q 2Q 3Q 4QESales 7,406 8,240 8,130 9,900 8,961 9,050 9,152 12,472 33,676 39,634
Change (%) 42.5 48.6 25.5 24.0 21.0 9.8 12.6 26.0 33.6 17.7EBITDA 722 736 818 1,143 1,045 1,068 1,160 1,573 3,418 4,846
Change (%) 58.7 39.1 38.5 52.0 44.8 45.2 41.8 37.6 46.9 41.8As of % Sales (Adj) 9.7 8.9 10.1 11.5 11.7 11.8 12.7 12.6 10.2 12.2
Depreciation 100 81 100 113 105 113 115 122 394 455Interest 53 72 78 101 66 60 72 85 304 282Other Income 49 94 72 133 126 185 144 129 349 584PBT 618 677 713 1,063 1,000 1,080 1,117 1,495 3,070 4,693Tax 254 270 258 363 313 339 438 553 1,146 1,642
Effective Tax Rate (%) 41.1 39.9 36.3 34.2 31.2 31.4 39.2 37.0 37.3 35.0Reported PAT 364 407 454 699 688 742 679 942 1,924 3,050Adj PAT 364 387 454 749 638 642 679 942 1,954 2,900
Change (%) 16.4 18.9 -17.0 0.1 75.3 65.9 49.5 25.7 1.0 48.4E: MOSt Estimates
* Consolidated; pre-exceptionals
Results PreviewSECTOR: ENGINEERING
STOCK INFO.BSE Sensex: 16,371
S&P CNX: 4,942
Satyam Agarwal ([email protected])Tel: +91 22 3982 5410/ Shridatta Bhandwaldar ([email protected])
? For 4QFY08, we expect Crompton to report standalone revenues of Rs12.5b, up 26% YoY, EBITDA of Rs1.6b, up37.6% YoY, and net profit of Rs942m, up 25.7% YoY. As of December 2007, the company’s standalone order bookstood at Rs21.7b, up 2.8% YoY, and the order book for Pauwels and Ganz put together stands at Rs30.3b, up24.8%YoY.
? The management has guided 20-22% revenue growth during FY09. Power and Industrial segments are expected togrow ~20% during FY08; in FY09, growth in the Industrial segment is likely to decline to 15%. Exports and internationalbusiness are expected to grow at ~20% for FY08 and FY09. The company expects standalone EBITDA margins toimprove to ~12% in FY08 (v/s 10.2% in FY07). The tax rate would increase to the full corporate tax level by FY10.Due to demand slowdown in the US and Europe, the power business could be adversely impacted.
? Through its 100% subsidiary, CG International BV, Netherlands, the company has acquired its JV partner’s 40%voting share capital in PT Pauwels Trafo Asia, Indonesia, for US$10.7m.
? We expect Crompton to report consolidated revenues of Rs72.3b in FY08 (up 20.6% YoY) and Rs86.8b in FY09 (up20% YoY). The stock trades at 27.2x FY08E EPS and 19.9x FY09E EPS. We maintain Neutral.
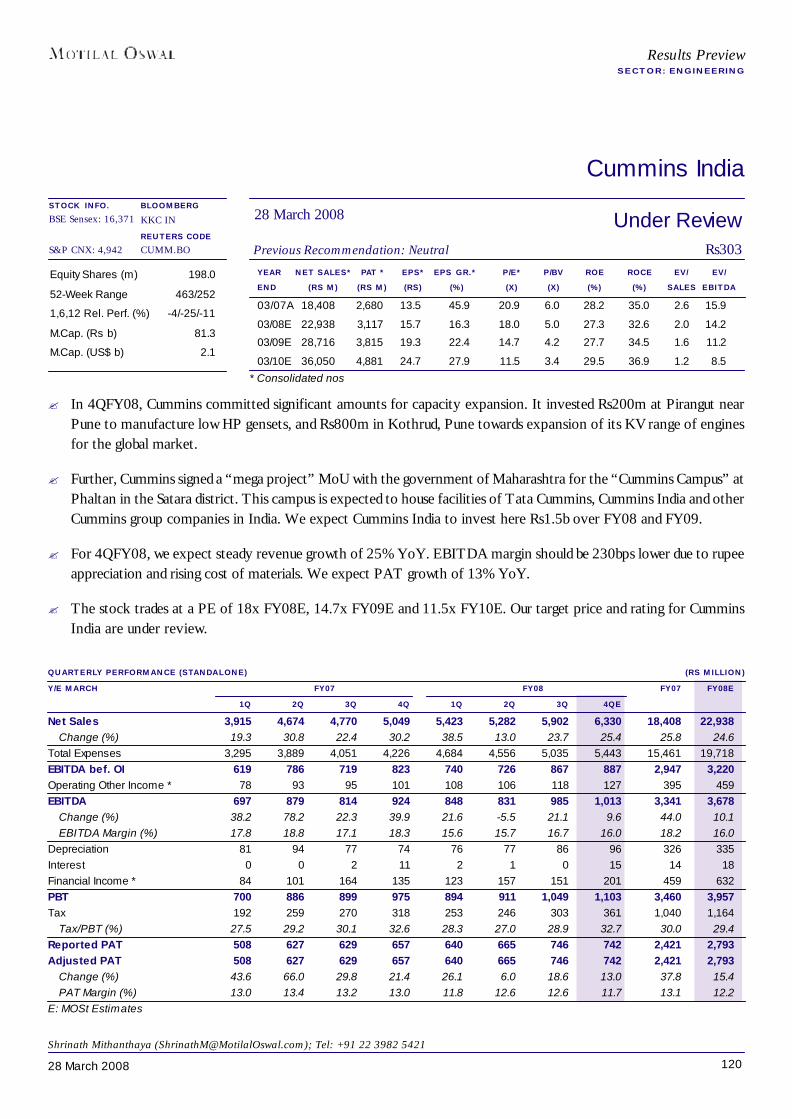
12028 March 2008
Cummins India
YEAR NET SALES* PAT * EPS* EPS GR.* P/E* P/BV ROE ROCE EV/ EV/END (RS M) (RS M) (RS) (%) (X) (X) (%) (%) SALES EBITDA
03/07A 18,408 2,680 13.5 45.9 20.9 6.0 28.2 35.0 2.6 15.9
03/08E 22,938 3,117 15.7 16.3 18.0 5.0 27.3 32.6 2.0 14.2
03/09E 28,716 3,815 19.3 22.4 14.7 4.2 27.7 34.5 1.6 11.2
03/10E 36,050 4,881 24.7 27.9 11.5 3.4 29.5 36.9 1.2 8.5
Equity Shares (m) 198.0
52-Week Range 463/252
1,6,12 Rel. Perf. (%) -4/-25/-11
M.Cap. (Rs b) 81.3
M.Cap. (US$ b) 2.1
QUARTERLY PERFORMANCE (STANDALONE) (RS MILLION)Y/E MARCH FY07 FY08 FY07 FY08E
1Q 2Q 3Q 4Q 1Q 2Q 3Q 4QENet Sales 3,915 4,674 4,770 5,049 5,423 5,282 5,902 6,330 18,408 22,938
Change (%) 19.3 30.8 22.4 30.2 38.5 13.0 23.7 25.4 25.8 24.6Total Expenses 3,295 3,889 4,051 4,226 4,684 4,556 5,035 5,443 15,461 19,718EBITDA bef. OI 619 786 719 823 740 726 867 887 2,947 3,220Operating Other Income * 78 93 95 101 108 106 118 127 395 459EBITDA 697 879 814 924 848 831 985 1,013 3,341 3,678
Change (%) 38.2 78.2 22.3 39.9 21.6 -5.5 21.1 9.6 44.0 10.1EBITDA Margin (%) 17.8 18.8 17.1 18.3 15.6 15.7 16.7 16.0 18.2 16.0
Depreciation 81 94 77 74 76 77 86 96 326 335Interest 0 0 2 11 2 1 0 15 14 18Financial Income * 84 101 164 135 123 157 151 201 459 632PBT 700 886 899 975 894 911 1,049 1,103 3,460 3,957Tax 192 259 270 318 253 246 303 361 1,040 1,164
Tax/PBT (%) 27.5 29.2 30.1 32.6 28.3 27.0 28.9 32.7 30.0 29.4Reported PAT 508 627 629 657 640 665 746 742 2,421 2,793Adjusted PAT 508 627 629 657 640 665 746 742 2,421 2,793
Change (%) 43.6 66.0 29.8 21.4 26.1 6.0 18.6 13.0 37.8 15.4PAT Margin (%) 13.0 13.4 13.2 13.0 11.8 12.6 12.6 11.7 13.1 12.2
E: MOSt Estimates
BLOOMBERGKKC IN
REUTERS CODECUMM.BO
* Consolidated nos
Under ReviewPrevious Recommendation: Neutral Rs303
28 March 2008
Results PreviewSECTOR: ENGINEERING
Shrinath Mithanthaya ([email protected]); Tel: +91 22 3982 5421
STOCK INFO.BSE Sensex: 16,371
S&P CNX: 4,942
? In 4QFY08, Cummins committed significant amounts for capacity expansion. It invested Rs200m at Pirangut nearPune to manufacture low HP gensets, and Rs800m in Kothrud, Pune towards expansion of its KV range of enginesfor the global market.
? Further, Cummins signed a “mega project” MoU with the government of Maharashtra for the “Cummins Campus” atPhaltan in the Satara district. This campus is expected to house facilities of Tata Cummins, Cummins India and otherCummins group companies in India. We expect Cummins India to invest here Rs1.5b over FY08 and FY09.
? For 4QFY08, we expect steady revenue growth of 25% YoY. EBITDA margin should be 230bps lower due to rupeeappreciation and rising cost of materials. We expect PAT growth of 13% YoY.
? The stock trades at a PE of 18x FY08E, 14.7x FY09E and 11.5x FY10E. Our target price and rating for CumminsIndia are under review.
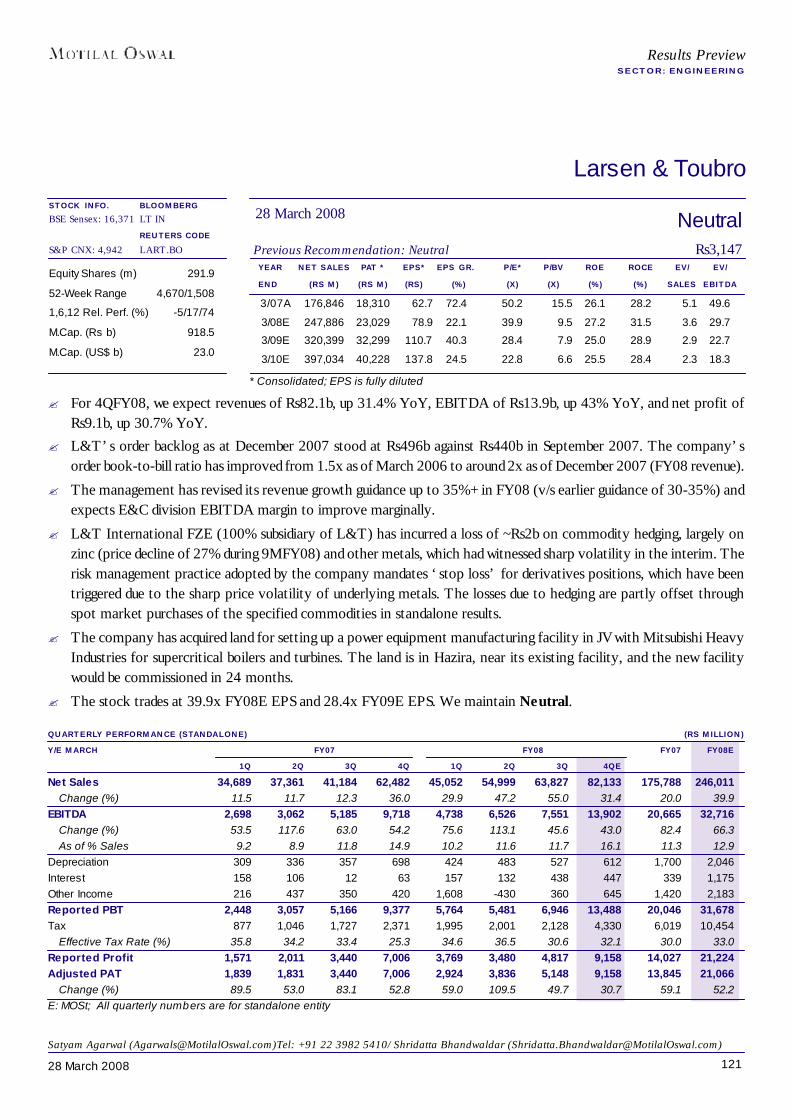
12128 March 2008
BLOOMBERGLT IN
REUTERS CODELART.BO
Larsen & Toubro
YEAR NET SALES PAT * EPS* EPS GR. P/E* P/BV ROE ROCE EV/ EV/END (RS M) (RS M) (RS) (%) (X) (X) (%) (%) SALES EBITDA
3/07A 176,846 18,310 62.7 72.4 50.2 15.5 26.1 28.2 5.1 49.6
3/08E 247,886 23,029 78.9 22.1 39.9 9.5 27.2 31.5 3.6 29.7
3/09E 320,399 32,299 110.7 40.3 28.4 7.9 25.0 28.9 2.9 22.7
3/10E 397,034 40,228 137.8 24.5 22.8 6.6 25.5 28.4 2.3 18.3
Equity Shares (m) 291.9
52-Week Range 4,670/1,508
1,6,12 Rel. Perf. (%) -5/17/74
M.Cap. (Rs b) 918.5
M.Cap. (US$ b) 23.0
QUARTERLY PERFORMANCE (STANDALONE) (RS MILLION)Y/E MARCH FY07 FY08 FY07 FY08E
1Q 2Q 3Q 4Q 1Q 2Q 3Q 4QENet Sales 34,689 37,361 41,184 62,482 45,052 54,999 63,827 82,133 175,788 246,011
Change (%) 11.5 11.7 12.3 36.0 29.9 47.2 55.0 31.4 20.0 39.9EBITDA 2,698 3,062 5,185 9,718 4,738 6,526 7,551 13,902 20,665 32,716
Change (%) 53.5 117.6 63.0 54.2 75.6 113.1 45.6 43.0 82.4 66.3As of % Sales 9.2 8.9 11.8 14.9 10.2 11.6 11.7 16.1 11.3 12.9
Depreciation 309 336 357 698 424 483 527 612 1,700 2,046Interest 158 106 12 63 157 132 438 447 339 1,175Other Income 216 437 350 420 1,608 -430 360 645 1,420 2,183Reported PBT 2,448 3,057 5,166 9,377 5,764 5,481 6,946 13,488 20,046 31,678Tax 877 1,046 1,727 2,371 1,995 2,001 2,128 4,330 6,019 10,454
Effective Tax Rate (%) 35.8 34.2 33.4 25.3 34.6 36.5 30.6 32.1 30.0 33.0Reported Profit 1,571 2,011 3,440 7,006 3,769 3,480 4,817 9,158 14,027 21,224Adjusted PAT 1,839 1,831 3,440 7,006 2,924 3,836 5,148 9,158 13,845 21,066
Change (%) 89.5 53.0 83.1 52.8 59.0 109.5 49.7 30.7 59.1 52.2E: MOSt; All quarterly numbers are for standalone entity
* Consolidated; EPS is fully diluted
NeutralPrevious Recommendation: Neutral Rs3,147
28 March 2008STOCK INFO.BSE Sensex: 16,371
S&P CNX: 4,942
Satyam Agarwal ([email protected])Tel: +91 22 3982 5410/ Shridatta Bhandwaldar ([email protected])
? For 4QFY08, we expect revenues of Rs82.1b, up 31.4% YoY, EBITDA of Rs13.9b, up 43% YoY, and net profit ofRs9.1b, up 30.7% YoY.
? L&T’s order backlog as at December 2007 stood at Rs496b against Rs440b in September 2007. The company’sorder book-to-bill ratio has improved from 1.5x as of March 2006 to around 2x as of December 2007 (FY08 revenue).
? The management has revised its revenue growth guidance up to 35%+ in FY08 (v/s earlier guidance of 30-35%) andexpects E&C division EBITDA margin to improve marginally.
? L&T International FZE (100% subsidiary of L&T) has incurred a loss of ~Rs2b on commodity hedging, largely onzinc (price decline of 27% during 9MFY08) and other metals, which had witnessed sharp volatility in the interim. Therisk management practice adopted by the company mandates ‘stop loss’ for derivatives positions, which have beentriggered due to the sharp price volatility of underlying metals. The losses due to hedging are partly offset throughspot market purchases of the specified commodities in standalone results.
? The company has acquired land for setting up a power equipment manufacturing facility in JV with Mitsubishi HeavyIndustries for supercritical boilers and turbines. The land is in Hazira, near its existing facility, and the new facilitywould be commissioned in 24 months.
? The stock trades at 39.9x FY08E EPS and 28.4x FY09E EPS. We maintain Neutral.
Results PreviewSECTOR: ENGINEERING

12228 March 2008
BLOOMBERGSIEM IN
REUTERS CODESIEM.BO
Siemens
YEAR NET SALES PAT EPS EPS GR. P/E P/BV ROE ROCE EV/ EV/END (RS M) (RS M) (RS) (%) (X) (X) (%) (%) SALES EBITDA
9/07A 77,660 4,671 13.9 30.0 47.8 7.0 40.1 69.1 1.4 14.4
9/08E 103,294 6,183 18.3 32.4 36.1 5.4 44.5 66.6 1.0 11.8
9/09E 137,500 8,463 25.1 36.9 26.4 4.3 43.0 64.8 0.7 8.5
Equity Shares (m) 337.2
52-Week Range 1,125/510
1,6,12 Rel. Perf. (%) -15/3/-5
M.Cap. (Rs b) 223.2
M.Cap. (US$ b) 5.6
QUARTERLY PERFORMANCE (STANDALONE) (RS MILLION)Y/E SEPTEMBER FY07 FY08 FY07 FY08E
1Q 2Q 3Q 4Q 1Q 2Q 3QE 4QETotal Revenues 16,331 21,352 17,902 22,055 19,195 28,804 25,031 30,264 77,660 103,294
Change (%) 89.9 88.4 71.1 47.1 17.5 34.9 39.8 37.2 71.1 33.0EBITDA 1,234 1,677 910 3,575 1,548 2,301 1,529 3,505 7,415 8,883
Change (%) 56.1 38.2 14.8 187.3 25.4 37.2 68.1 -2.0 85.2 19.8As % of Revenues 7.6 7.9 5.1 16.2 8.1 8.0 6.1 11.6 9.5 8.6
Adjusted EBIDTA 1,234 1,677 910 2,495 1,548 2,301 1,529 3,505 6,335 8,883As % of Revenues 7.6 7.9 5.1 11.3 8.1 8.0 6.1 11.6 8.2 8.6
Depreciation 103 109 121 160 151 125 150 165 492 591Interest Income 126 105 123 90 131 100 125 94 443 450Other Income 152 57 295 370 16 45 250 176 593 486Extra-ordinary Items 0 0 259 524 1,246 0 0 0 783 1,246PBT 1,409 1,730 1,207 4,399 2,789 2,321 1,754 3,610 8,742 10,474Tax 426 650 389 1,313 819 766 579 1,293 2,777 3,456
Effective Tax Rate (%) 30.2 37.5 32.2 29.8 29.4 33.0 33.0 35.8 31.8 33.0Reported PAT 984 1,081 818 3,086 1,970 1,555 1,175 2,317 5,965 7,018Adjusted PAT 984 1,081 642 1,960 1,090 1,555 1,175 2,317 4,671 6,183
Change (%) 78.4 -8.3 13.6 43.4 10.8 43.9 83.1 18.2 27.6 32.4E: MOSt Estimates; Nos are for standalone entity
NeutralPrevious Recommendation: Neutral Rs662
28 March 2008
Results PreviewSECTOR: ENGINEERING
STOCK INFO.BSE Sensex: 16,371
S&P CNX: 4,942
Satyam Agarwal ([email protected])Tel: +91 22 3982 5410/ Shridatta Bhandwaldar ([email protected])
? For 2QFY08, we expect Siemens to report revenues of Rs28.8b (up 34.9% YoY), EBITDA of Rs2.3b (up 37.2%YoY), and net profit of Rs1.5b (up 43.9% YoY).
? Siemens has set a target to double its revenues over the next three years, driven by growth in product and projectbusiness. The order book for the company as of December 2007 stood at Rs93.7b (v/s Rs110b in December 2006),and order book to bill ratio now stands at 0.9x.
? During FY07, the company spent Rs4.5b on new factory additions and upgradation of existing manufacturing facilities.Its new large transformer capacity at Kalwa became operational during FY07. Currently, total manufacturing capacityfor transformers stands at 15,000 MVA per year.
? Siemens AG launched an extensive review of major projects in 2QCY08, and the results so far indicate an impact of€900m on earnings in 2QCY08, largely on account of: (a) Power Generation Equipment: large number of turnkeyprojects that had accumulated since 2004 have had an adverse effect and new exposure is attributed to structuralchallenges in suppliers market and delays in recruiting experienced project engineers; (b) Mobility Division: delays inawarding of major projects; (c) Siemens IT Solutions and Services: new risks arose in UK projects, including amongothers a customer’s cancellation of a major order.
? We expect Siemens to report a standalone net profit of Rs6.2b during FY08 and Rs8.5b during FY09. The stocktrades at 36x FY08E and 26.4x FY09E EPS. We maintain Neutral.
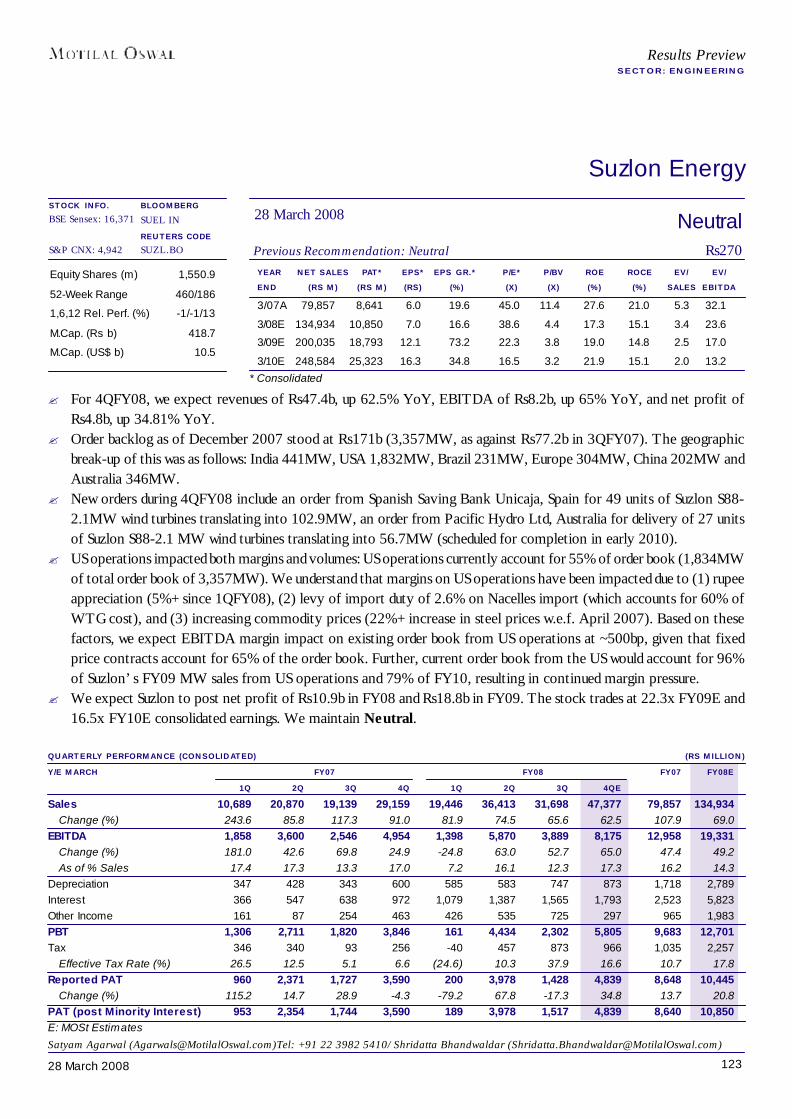
12328 March 2008
Results PreviewSECTOR: ENGINEERING
Suzlon Energy
YEAR NET SALES PAT* EPS* EPS GR.* P/E* P/BV ROE ROCE EV/ EV/END (RS M) (RS M) (RS) (%) (X) (X) (%) (%) SALES EBITDA
3/07A 79,857 8,641 6.0 19.6 45.0 11.4 27.6 21.0 5.3 32.1
3/08E 134,934 10,850 7.0 16.6 38.6 4.4 17.3 15.1 3.4 23.6
3/09E 200,035 18,793 12.1 73.2 22.3 3.8 19.0 14.8 2.5 17.0
3/10E 248,584 25,323 16.3 34.8 16.5 3.2 21.9 15.1 2.0 13.2
Equity Shares (m) 1,550.9
52-Week Range 460/186
1,6,12 Rel. Perf. (%) -1/-1/13
M.Cap. (Rs b) 418.7
M.Cap. (US$ b) 10.5
QUARTERLY PERFORMANCE (CONSOLIDATED) (RS MILLION)Y/E MARCH FY07 FY08 FY07 FY08E
1Q 2Q 3Q 4Q 1Q 2Q 3Q 4QESales 10,689 20,870 19,139 29,159 19,446 36,413 31,698 47,377 79,857 134,934
Change (%) 243.6 85.8 117.3 91.0 81.9 74.5 65.6 62.5 107.9 69.0EBITDA 1,858 3,600 2,546 4,954 1,398 5,870 3,889 8,175 12,958 19,331
Change (%) 181.0 42.6 69.8 24.9 -24.8 63.0 52.7 65.0 47.4 49.2As of % Sales 17.4 17.3 13.3 17.0 7.2 16.1 12.3 17.3 16.2 14.3
Depreciation 347 428 343 600 585 583 747 873 1,718 2,789Interest 366 547 638 972 1,079 1,387 1,565 1,793 2,523 5,823Other Income 161 87 254 463 426 535 725 297 965 1,983PBT 1,306 2,711 1,820 3,846 161 4,434 2,302 5,805 9,683 12,701Tax 346 340 93 256 -40 457 873 966 1,035 2,257
Effective Tax Rate (%) 26.5 12.5 5.1 6.6 (24.6) 10.3 37.9 16.6 10.7 17.8Reported PAT 960 2,371 1,727 3,590 200 3,978 1,428 4,839 8,648 10,445
Change (%) 115.2 14.7 28.9 -4.3 -79.2 67.8 -17.3 34.8 13.7 20.8PAT (post Minority Interest) 953 2,354 1,744 3,590 189 3,978 1,517 4,839 8,640 10,850E: MOSt Estimates
NeutralPrevious Recommendation: Neutral Rs270
28 March 2008BLOOMBERGSUEL IN
REUTERS CODESUZL.BO
* Consolidated
STOCK INFO.BSE Sensex: 16,371
S&P CNX: 4,942
Satyam Agarwal ([email protected])Tel: +91 22 3982 5410/ Shridatta Bhandwaldar ([email protected])
? For 4QFY08, we expect revenues of Rs47.4b, up 62.5% YoY, EBITDA of Rs8.2b, up 65% YoY, and net profit ofRs4.8b, up 34.81% YoY.
? Order backlog as of December 2007 stood at Rs171b (3,357MW, as against Rs77.2b in 3QFY07). The geographicbreak-up of this was as follows: India 441MW, USA 1,832MW, Brazil 231MW, Europe 304MW, China 202MW andAustralia 346MW.
? New orders during 4QFY08 include an order from Spanish Saving Bank Unicaja, Spain for 49 units of Suzlon S88-2.1MW wind turbines translating into 102.9MW, an order from Pacific Hydro Ltd, Australia for delivery of 27 unitsof Suzlon S88-2.1 MW wind turbines translating into 56.7MW (scheduled for completion in early 2010).
? US operations impacted both margins and volumes: US operations currently account for 55% of order book (1,834MWof total order book of 3,357MW). We understand that margins on US operations have been impacted due to (1) rupeeappreciation (5%+ since 1QFY08), (2) levy of import duty of 2.6% on Nacelles import (which accounts for 60% ofWTG cost), and (3) increasing commodity prices (22%+ increase in steel prices w.e.f. April 2007). Based on thesefactors, we expect EBITDA margin impact on existing order book from US operations at ~500bp, given that fixedprice contracts account for 65% of the order book. Further, current order book from the US would account for 96%of Suzlon’s FY09 MW sales from US operations and 79% of FY10, resulting in continued margin pressure.
? We expect Suzlon to post net profit of Rs10.9b in FY08 and Rs18.8b in FY09. The stock trades at 22.3x FY09E and16.5x FY10E consolidated earnings. We maintain Neutral.
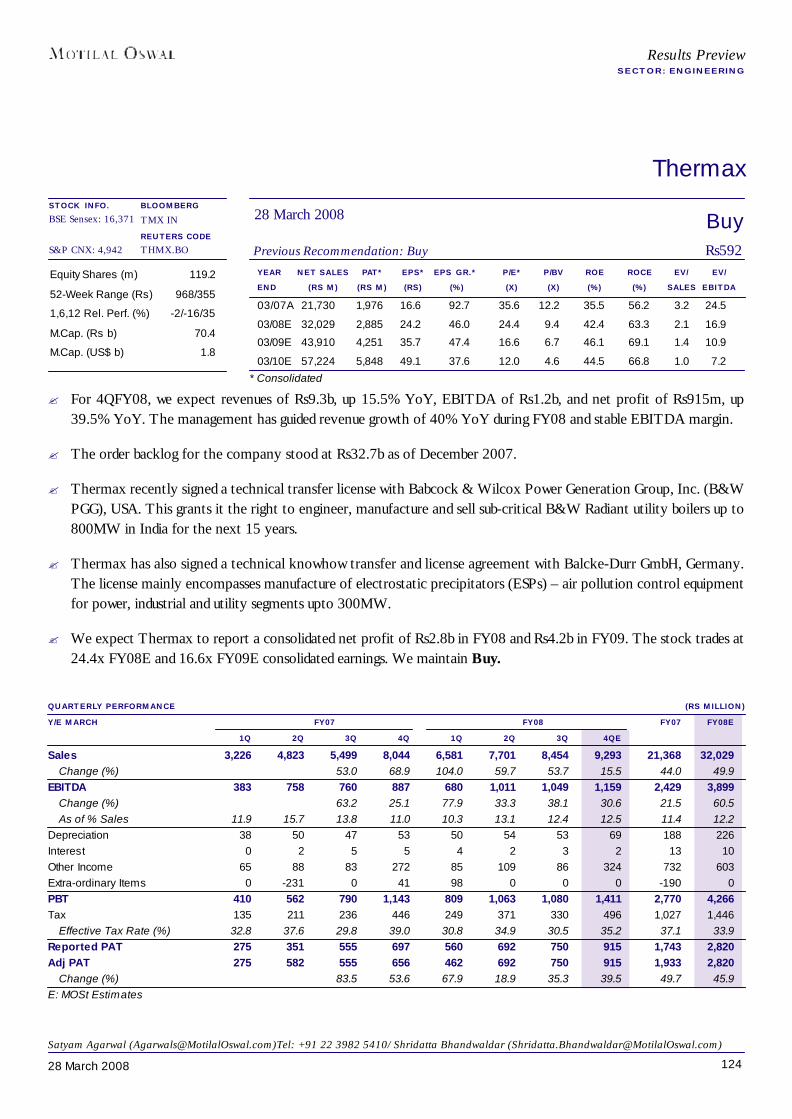
12428 March 2008
Results PreviewSECTOR: ENGINEERING
Thermax
YEAR NET SALES PAT* EPS* EPS GR.* P/E* P/BV ROE ROCE EV/ EV/END (RS M) (RS M) (RS) (%) (X) (X) (%) (%) SALES EBITDA
03/07A 21,730 1,976 16.6 92.7 35.6 12.2 35.5 56.2 3.2 24.5
03/08E 32,029 2,885 24.2 46.0 24.4 9.4 42.4 63.3 2.1 16.9
03/09E 43,910 4,251 35.7 47.4 16.6 6.7 46.1 69.1 1.4 10.9
03/10E 57,224 5,848 49.1 37.6 12.0 4.6 44.5 66.8 1.0 7.2
Equity Shares (m) 119.2
52-Week Range (Rs) 968/355
1,6,12 Rel. Perf. (%) -2/-16/35
M.Cap. (Rs b) 70.4
M.Cap. (US$ b) 1.8
QUARTERLY PERFORMANCE (RS MILLION)Y/E MARCH FY07 FY08 FY07 FY08E
1Q 2Q 3Q 4Q 1Q 2Q 3Q 4QESales 3,226 4,823 5,499 8,044 6,581 7,701 8,454 9,293 21,368 32,029
Change (%) 53.0 68.9 104.0 59.7 53.7 15.5 44.0 49.9EBITDA 383 758 760 887 680 1,011 1,049 1,159 2,429 3,899
Change (%) 63.2 25.1 77.9 33.3 38.1 30.6 21.5 60.5As of % Sales 11.9 15.7 13.8 11.0 10.3 13.1 12.4 12.5 11.4 12.2
Depreciation 38 50 47 53 50 54 53 69 188 226Interest 0 2 5 5 4 2 3 2 13 10Other Income 65 88 83 272 85 109 86 324 732 603Extra-ordinary Items 0 -231 0 41 98 0 0 0 -190 0PBT 410 562 790 1,143 809 1,063 1,080 1,411 2,770 4,266Tax 135 211 236 446 249 371 330 496 1,027 1,446
Effective Tax Rate (%) 32.8 37.6 29.8 39.0 30.8 34.9 30.5 35.2 37.1 33.9Reported PAT 275 351 555 697 560 692 750 915 1,743 2,820Adj PAT 275 582 555 656 462 692 750 915 1,933 2,820
Change (%) 83.5 53.6 67.9 18.9 35.3 39.5 49.7 45.9E: MOSt Estimates
BuyPrevious Recommendation: Buy Rs592
28 March 2008BLOOMBERGTMX IN
REUTERS CODETHMX.BO
* Consolidated
STOCK INFO.BSE Sensex: 16,371
S&P CNX: 4,942
Satyam Agarwal ([email protected])Tel: +91 22 3982 5410/ Shridatta Bhandwaldar ([email protected])
? For 4QFY08, we expect revenues of Rs9.3b, up 15.5% YoY, EBITDA of Rs1.2b, and net profit of Rs915m, up39.5% YoY. The management has guided revenue growth of 40% YoY during FY08 and stable EBITDA margin.
? The order backlog for the company stood at Rs32.7b as of December 2007.
? Thermax recently signed a technical transfer license with Babcock & Wilcox Power Generation Group, Inc. (B&WPGG), USA. This grants it the right to engineer, manufacture and sell sub-critical B&W Radiant utility boilers up to800MW in India for the next 15 years.
? Thermax has also signed a technical knowhow transfer and license agreement with Balcke-Durr GmbH, Germany.The license mainly encompasses manufacture of electrostatic precipitators (ESPs) – air pollution control equipmentfor power, industrial and utility segments upto 300MW.
? We expect Thermax to report a consolidated net profit of Rs2.8b in FY08 and Rs4.2b in FY09. The stock trades at24.4x FY08E and 16.6x FY09E consolidated earnings. We maintain Buy.
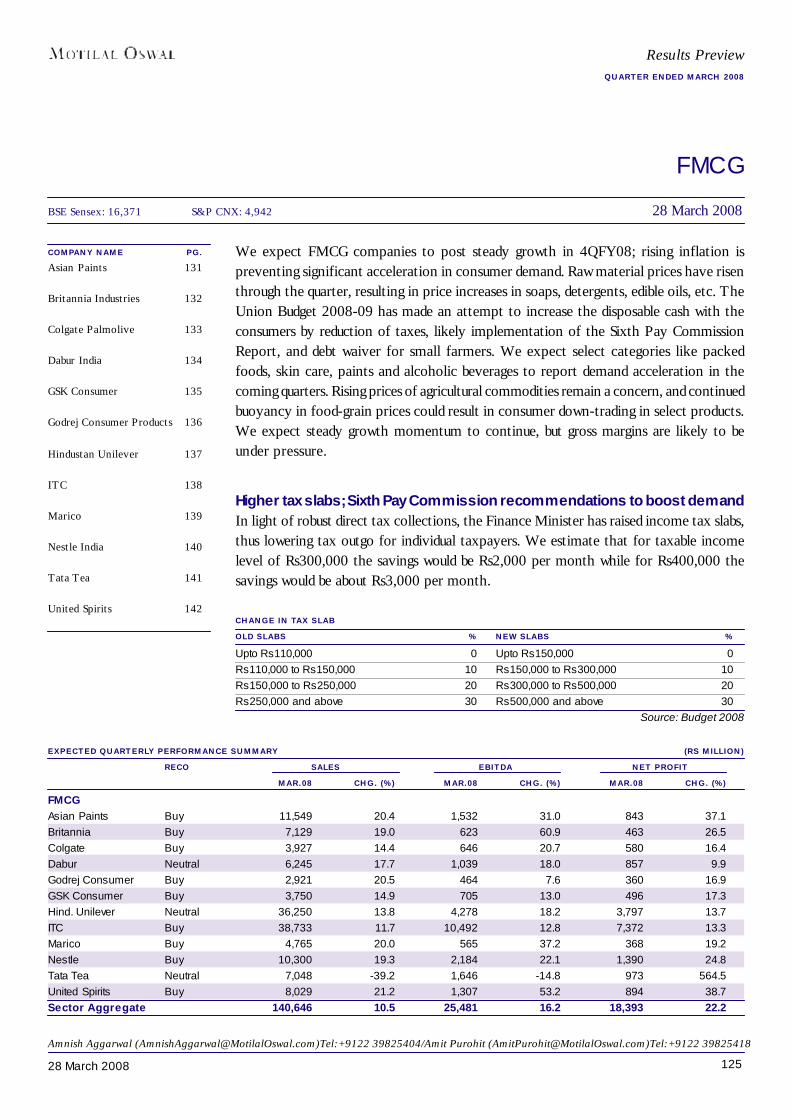
12528 March 2008
FMCG
COMPANY NAME PG.Asian Paints 131
Britannia Industries 132
Colgate Palmolive 133
Dabur India 134
GSK Consumer 135
Godrej Consumer Products 136
Hindustan Unilever 137
ITC 138
Marico 139
Nestle India 140
Tata Tea 141
United Spirits 142
EXPECTED QUARTERLY PERFORMANCE SUMMARY (RS MILLION)RECO SALES EBITDA NET PROFIT
MAR.08 CHG. (%) MAR.08 CHG. (%) MAR.08 CHG. (%)FMCGAsian Paints Buy 11,549 20.4 1,532 31.0 843 37.1Britannia Buy 7,129 19.0 623 60.9 463 26.5Colgate Buy 3,927 14.4 646 20.7 580 16.4Dabur Neutral 6,245 17.7 1,039 18.0 857 9.9Godrej Consumer Buy 2,921 20.5 464 7.6 360 16.9GSK Consumer Buy 3,750 14.9 705 13.0 496 17.3Hind. Unilever Neutral 36,250 13.8 4,278 18.2 3,797 13.7ITC Buy 38,733 11.7 10,492 12.8 7,372 13.3Marico Buy 4,765 20.0 565 37.2 368 19.2Nestle Buy 10,300 19.3 2,184 22.1 1,390 24.8Tata Tea Neutral 7,048 -39.2 1,646 -14.8 973 564.5United Spirits Buy 8,029 21.2 1,307 53.2 894 38.7Sector Aggregate 140,646 10.5 25,481 16.2 18,393 22.2
We expect FMCG companies to post steady growth in 4QFY08; rising inflation ispreventing significant acceleration in consumer demand. Raw material prices have risenthrough the quarter, resulting in price increases in soaps, detergents, edible oils, etc. TheUnion Budget 2008-09 has made an attempt to increase the disposable cash with theconsumers by reduction of taxes, likely implementation of the Sixth Pay CommissionReport, and debt waiver for small farmers. We expect select categories like packedfoods, skin care, paints and alcoholic beverages to report demand acceleration in thecoming quarters. Rising prices of agricultural commodities remain a concern, and continuedbuoyancy in food-grain prices could result in consumer down-trading in select products.We expect steady growth momentum to continue, but gross margins are likely to beunder pressure.
Higher tax slabs; Sixth Pay Commission recommendations to boost demandIn light of robust direct tax collections, the Finance Minister has raised income tax slabs,thus lowering tax outgo for individual taxpayers. We estimate that for taxable incomelevel of Rs300,000 the savings would be Rs2,000 per month while for Rs400,000 thesavings would be about Rs3,000 per month.
CHANGE IN TAX SLABOLD SLABS % NEW SLABS %Upto Rs110,000 0 Upto Rs150,000 0Rs110,000 to Rs150,000 10 Rs150,000 to Rs300,000 10Rs150,000 to Rs250,000 20 Rs300,000 to Rs500,000 20Rs250,000 and above 30 Rs500,000 and above 30
Source: Budget 2008
Amnish Aggarwal ([email protected])Tel:+9122 39825404/Amit Purohit ([email protected])Tel:+9122 39825418
BSE Sensex: 16,371 S&P CNX: 4,942 28 March 2008
Results PreviewQUARTER ENDED MARCH 2008
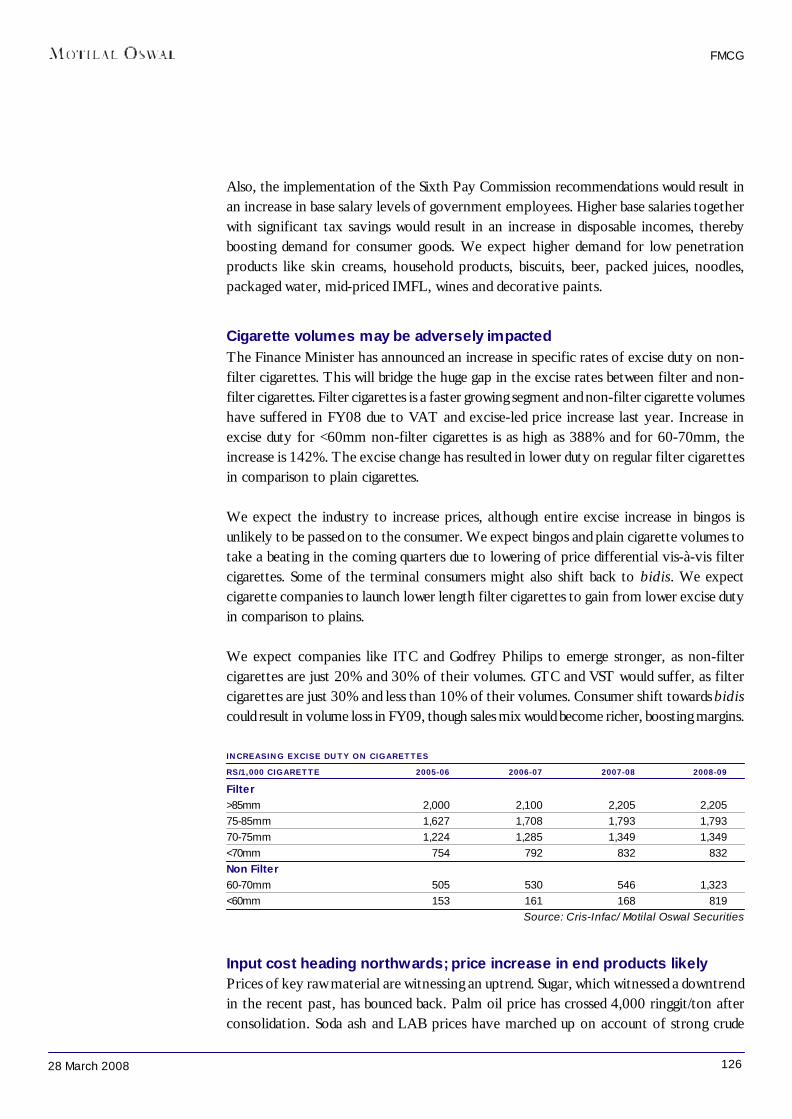
12628 March 2008
FMCG
Also, the implementation of the Sixth Pay Commission recommendations would result inan increase in base salary levels of government employees. Higher base salaries togetherwith significant tax savings would result in an increase in disposable incomes, therebyboosting demand for consumer goods. We expect higher demand for low penetrationproducts like skin creams, household products, biscuits, beer, packed juices, noodles,packaged water, mid-priced IMFL, wines and decorative paints.
Cigarette volumes may be adversely impactedThe Finance Minister has announced an increase in specific rates of excise duty on non-filter cigarettes. This will bridge the huge gap in the excise rates between filter and non-filter cigarettes. Filter cigarettes is a faster growing segment and non-filter cigarette volumeshave suffered in FY08 due to VAT and excise-led price increase last year. Increase inexcise duty for <60mm non-filter cigarettes is as high as 388% and for 60-70mm, theincrease is 142%. The excise change has resulted in lower duty on regular filter cigarettesin comparison to plain cigarettes.
We expect the industry to increase prices, although entire excise increase in bingos isunlikely to be passed on to the consumer. We expect bingos and plain cigarette volumes totake a beating in the coming quarters due to lowering of price differential vis-à-vis filtercigarettes. Some of the terminal consumers might also shift back to bidis. We expectcigarette companies to launch lower length filter cigarettes to gain from lower excise dutyin comparison to plains.
We expect companies like ITC and Godfrey Philips to emerge stronger, as non-filtercigarettes are just 20% and 30% of their volumes. GTC and VST would suffer, as filtercigarettes are just 30% and less than 10% of their volumes. Consumer shift towards bidiscould result in volume loss in FY09, though sales mix would become richer, boosting margins.
INCREASING EXCISE DUTY ON CIGARETTESRS/1,000 CIGARETTE 2005-06 2006-07 2007-08 2008-09Filter>85mm 2,000 2,100 2,205 2,20575-85mm 1,627 1,708 1,793 1,79370-75mm 1,224 1,285 1,349 1,349<70mm 754 792 832 832Non Filter60-70mm 505 530 546 1,323<60mm 153 161 168 819
Source: Cris-Infac/ Motilal Oswal Securities
Input cost heading northwards; price increase in end products likelyPrices of key raw material are witnessing an uptrend. Sugar, which witnessed a downtrendin the recent past, has bounced back. Palm oil price has crossed 4,000 ringgit/ton afterconsolidation. Soda ash and LAB prices have marched up on account of strong crude
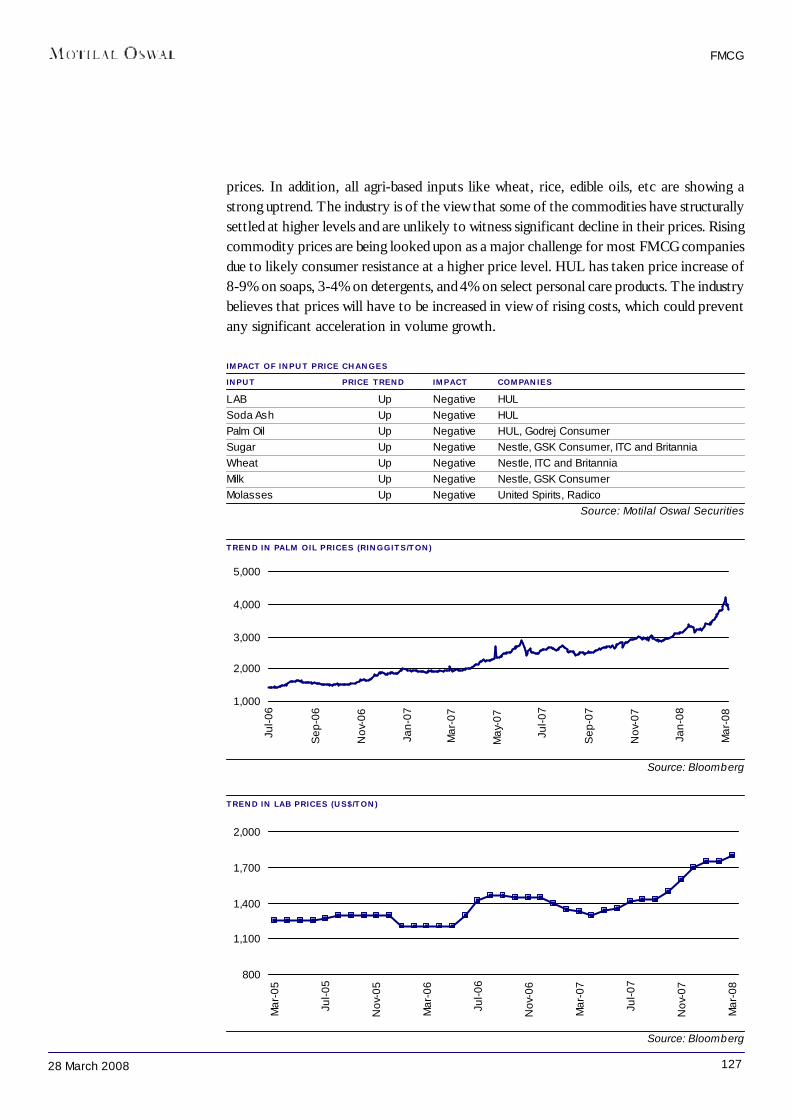
12728 March 2008
FMCG
prices. In addition, all agri-based inputs like wheat, rice, edible oils, etc are showing astrong uptrend. The industry is of the view that some of the commodities have structurallysettled at higher levels and are unlikely to witness significant decline in their prices. Risingcommodity prices are being looked upon as a major challenge for most FMCG companiesdue to likely consumer resistance at a higher price level. HUL has taken price increase of8-9% on soaps, 3-4% on detergents, and 4% on select personal care products. The industrybelieves that prices will have to be increased in view of rising costs, which could preventany significant acceleration in volume growth.
IMPACT OF INPUT PRICE CHANGES INPUT PRICE TREND IMPACT COMPANIESLAB Up Negative HULSoda Ash Up Negative HULPalm Oil Up Negative HUL, Godrej ConsumerSugar Up Negative Nestle, GSK Consumer, ITC and BritanniaWheat Up Negative Nestle, ITC and BritanniaMilk Up Negative Nestle, GSK ConsumerMolasses Up Negative United Spirits, Radico
Source: Motilal Oswal Securities
TREND IN PALM OIL PRICES (RINGGITS/TON)
Source: Bloomberg
TREND IN LAB PRICES (US$/TON)
1,000
2,000
3,000
4,000
5,000
Jul-0
6
Sep
-06
Nov
-06
Jan-
07
Mar
-07
May
-07
Jul-0
7
Sep
-07
Nov
-07
Jan-
08
Mar
-08
Source: Bloomberg
800
1,100
1,400
1,700
2,000
Mar
-05
Jul-0
5
Nov
-05
Mar
-06
Jul-0
6
Nov
-06
Mar
-07
Jul-0
7
Nov
-07
Mar
-08

12828 March 2008
FMCG
SUGAR PRICE TREND (RS/QUINTAL)
Source: Cris-Infac/ Motilal Oswal Securities
Competition intensifies across all categoriesRising disposable income and buoyant consumer confidence is resulting in rising growthrates for premium products, although at a low base. The trend is clearly visible in processedfoods, skin care, hair care and liquor, where the key drivers have been a young workingpopulation, influence of media and modern trade. To tap this opportunity, FMCG majorsare adding new products in their portfolio.
This is evident from the fact that HUL, which did not add any new product categoryduring the last few years, is turning aggressive in new product launches. It plans to completethe national rollout of its water purifier (Pure IT) by the end of CY08. The company haslaunched the Ponds (Skincare) and Dove (Hair care) products in the premium end.HUL has also unveiled Kissan Amaze Brainfood nutritional products targeted at the 6-14age-group.
Nestle has launched Nescafe Mild Coffee and Cerevita breakfast cereals. Marico hasunveiled Parachute Advanced Starz range of hair care products for 3-10 year-old children.ITC has launched five new variants in its premium soap brand Vivel Di Wills, shower gelsand conditioners.
COMPANY CATEGORY BRAND VARIANTNestle Coffee Nescafe Mild
Breakfast Cereals Cerevita Wheat, Corn and Mixed FruitDabur Health Supplements Chyawan Junior Malted Drink
Household Products Dazzle Household and Kitchen CleanerSkin Care Gulabari Rose Skin cream and Lotion
Marico Hair Care Parachute Advanced Starz Shampoo, Hair oil and Cream for kidsEdible Oil Saffola Functional food Cholesterol & Diabetes Management
United Spirits Premium IMFL W&M, Isle of Jura Scotch WhiskyITC Personal Wash Vivel Di Wills Soap in 2 variants
Fiama Di Wills Shower gel in 3 variantsVivel Soap in 4 variantsFiama Di Wills Polishing drops hair conditioner
HUL Food Products Kissan Amaze Brainfood Milk Mix, Bites and BarsSource: Motilal Oswal Securities
1,400
1,550
1,700
1,850
2,000
Mar
-05
May
-05
Jul-0
5
Sep
-05
Nov
-05
Jan-
06
Mar
-06
May
-06
Jul-0
6
Sep
-06
Nov
-06
Jan-
07
Mar
-07
May
-07
Jul-0
7
Sep
-07
Nov
-07
Jan-
08
12928 March 2008
We expect new product launches to intensify competition across segments and productcategories. This will put pressure on incumbents to launch new variants and increasespends on advertising and brand building. Rising competitive intensity in a highly inflationaryenvironment will prevent any sharp increase in profit margins.
Focus on specific categories and stocksWe expect steady growth for the FMCG sector in 4QFY08. Gross margins would beunder pressure for companies having dependence on crude and agri-based raw materials.We expect premium-end personal care products, household products, processed foodsand alcoholic beverages to report acceleration in volume growth. We prefer companieswith strong presence in processed foods, alcoholic beverages and paints. United Spirits,ITC, Nestle and Colgate are our top picks.
FMCG
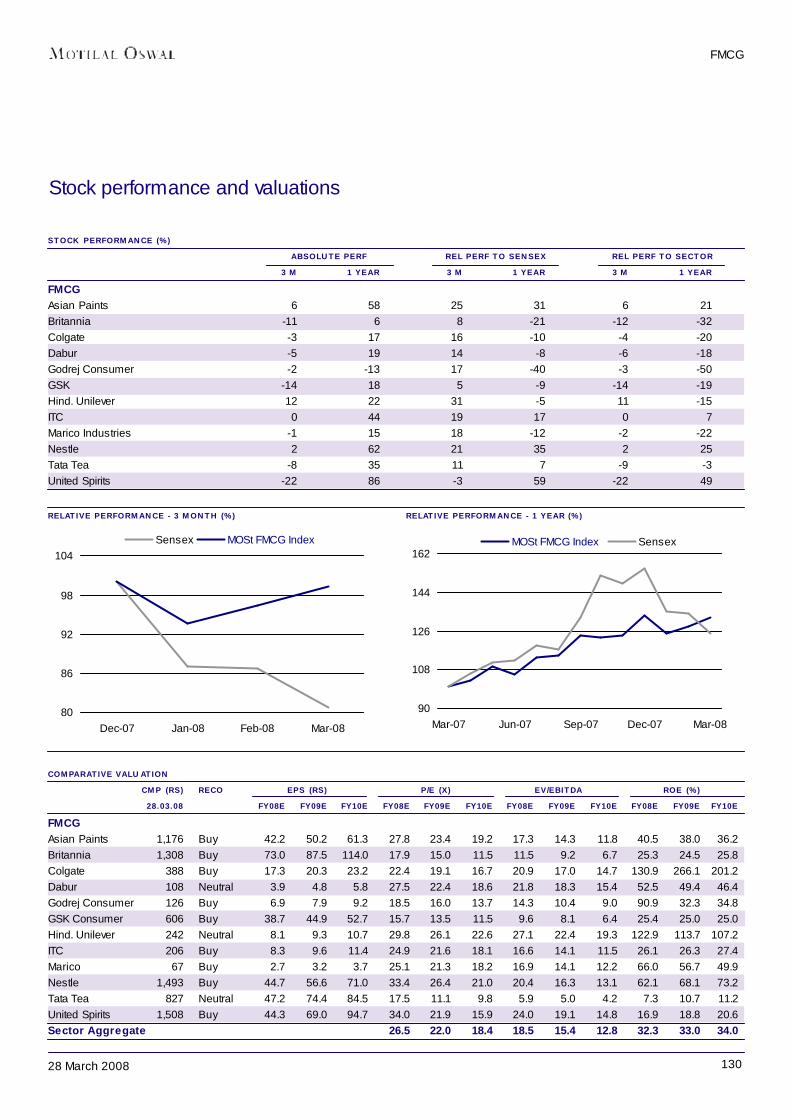
13028 March 2008
RELATIVE PERFORMANCE - 3 MONTH (%) RELATIVE PERFORMANCE - 1 YEAR (%)
Stock performance and valuations
STOCK PERFORMANCE (%) ABSOLUTE PERF REL PERF TO SENSEX REL PERF TO SECTOR
3 M 1 YEAR 3 M 1 YEAR 3 M 1 YEARFMCGAsian Paints 6 58 25 31 6 21Britannia -11 6 8 -21 -12 -32Colgate -3 17 16 -10 -4 -20Dabur -5 19 14 -8 -6 -18Godrej Consumer -2 -13 17 -40 -3 -50GSK -14 18 5 -9 -14 -19Hind. Unilever 12 22 31 -5 11 -15ITC 0 44 19 17 0 7Marico Industries -1 15 18 -12 -2 -22Nestle 2 62 21 35 2 25Tata Tea -8 35 11 7 -9 -3United Spirits -22 86 -3 59 -22 49
FMCG
COMPARATIVE VALUATIONCMP (RS) RECO EPS (RS) P/E (X) EV/EBITDA ROE (%)28.03.08 FY08E FY09E FY10E FY08E FY09E FY10E FY08E FY09E FY10E FY08E FY09E FY10E
FMCGAsian Paints 1,176 Buy 42.2 50.2 61.3 27.8 23.4 19.2 17.3 14.3 11.8 40.5 38.0 36.2Britannia 1,308 Buy 73.0 87.5 114.0 17.9 15.0 11.5 11.5 9.2 6.7 25.3 24.5 25.8Colgate 388 Buy 17.3 20.3 23.2 22.4 19.1 16.7 20.9 17.0 14.7 130.9 266.1 201.2Dabur 108 Neutral 3.9 4.8 5.8 27.5 22.4 18.6 21.8 18.3 15.4 52.5 49.4 46.4Godrej Consumer 126 Buy 6.9 7.9 9.2 18.5 16.0 13.7 14.3 10.4 9.0 90.9 32.3 34.8GSK Consumer 606 Buy 38.7 44.9 52.7 15.7 13.5 11.5 9.6 8.1 6.4 25.4 25.0 25.0Hind. Unilever 242 Neutral 8.1 9.3 10.7 29.8 26.1 22.6 27.1 22.4 19.3 122.9 113.7 107.2ITC 206 Buy 8.3 9.6 11.4 24.9 21.6 18.1 16.6 14.1 11.5 26.1 26.3 27.4Marico 67 Buy 2.7 3.2 3.7 25.1 21.3 18.2 16.9 14.1 12.2 66.0 56.7 49.9Nestle 1,493 Buy 44.7 56.6 71.0 33.4 26.4 21.0 20.4 16.3 13.1 62.1 68.1 73.2Tata Tea 827 Neutral 47.2 74.4 84.5 17.5 11.1 9.8 5.9 5.0 4.2 7.3 10.7 11.2United Spirits 1,508 Buy 44.3 69.0 94.7 34.0 21.9 15.9 24.0 19.1 14.8 16.9 18.8 20.6Sector Aggregate 26.5 22.0 18.4 18.5 15.4 12.8 32.3 33.0 34.0
80
86
92
98
104
Dec-07 Jan-08 Feb-08 Mar-08
Sensex MOSt FMCG Index
90
108
126
144
162
Mar-07 Jun-07 Sep-07 Dec-07 Mar-08
MOSt FMCG Index Sensex
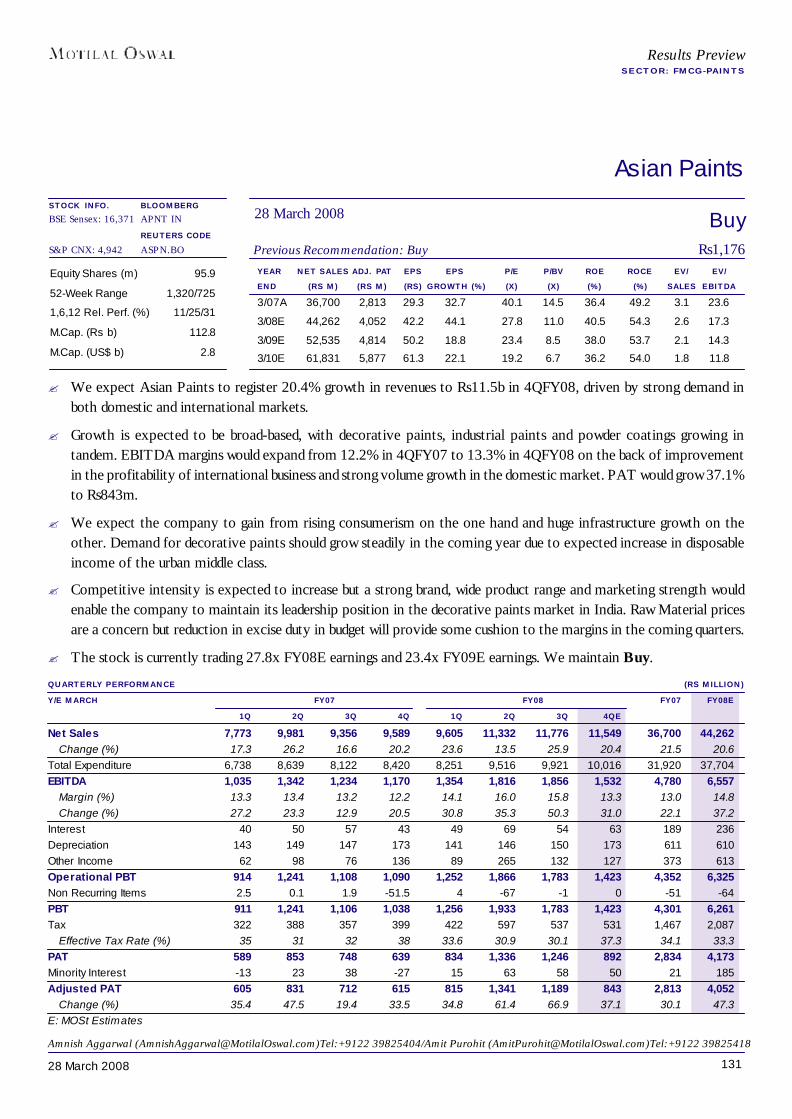
13128 March 2008
Results PreviewSECTOR: FMCG-PAINTS
Asian Paints
YEAR NET SALES ADJ. PAT EPS EPS P/E P/BV ROE ROCE EV/ EV/END (RS M) (RS M) (RS) GROWTH (%) (X) (X) (%) (%) SALES EBITDA3/07A 36,700 2,813 29.3 32.7 40.1 14.5 36.4 49.2 3.1 23.6
3/08E 44,262 4,052 42.2 44.1 27.8 11.0 40.5 54.3 2.6 17.3
3/09E 52,535 4,814 50.2 18.8 23.4 8.5 38.0 53.7 2.1 14.3
3/10E 61,831 5,877 61.3 22.1 19.2 6.7 36.2 54.0 1.8 11.8
Equity Shares (m) 95.9
52-Week Range 1,320/725
1,6,12 Rel. Perf. (%) 11/25/31
M.Cap. (Rs b) 112.8
M.Cap. (US$ b) 2.8
BuyPrevious Recommendation: Buy Rs1,176
28 March 2008BLOOMBERGAPNT IN
REUTERS CODEASPN.BO
QUARTERLY PERFORMANCE (RS MILLION)Y/E MARCH FY07 FY08 FY07 FY08E
1Q 2Q 3Q 4Q 1Q 2Q 3Q 4QENet Sales 7,773 9,981 9,356 9,589 9,605 11,332 11,776 11,549 36,700 44,262
Change (%) 17.3 26.2 16.6 20.2 23.6 13.5 25.9 20.4 21.5 20.6Total Expenditure 6,738 8,639 8,122 8,420 8,251 9,516 9,921 10,016 31,920 37,704EBITDA 1,035 1,342 1,234 1,170 1,354 1,816 1,856 1,532 4,780 6,557
Margin (%) 13.3 13.4 13.2 12.2 14.1 16.0 15.8 13.3 13.0 14.8Change (%) 27.2 23.3 12.9 20.5 30.8 35.3 50.3 31.0 22.1 37.2
Interest 40 50 57 43 49 69 54 63 189 236Depreciation 143 149 147 173 141 146 150 173 611 610Other Income 62 98 76 136 89 265 132 127 373 613Operational PBT 914 1,241 1,108 1,090 1,252 1,866 1,783 1,423 4,352 6,325Non Recurring Items 2.5 0.1 1.9 -51.5 4 -67 -1 0 -51 -64PBT 911 1,241 1,106 1,038 1,256 1,933 1,783 1,423 4,301 6,261Tax 322 388 357 399 422 597 537 531 1,467 2,087
Effective Tax Rate (%) 35 31 32 38 33.6 30.9 30.1 37.3 34.1 33.3PAT 589 853 748 639 834 1,336 1,246 892 2,834 4,173Minority Interest -13 23 38 -27 15 63 58 50 21 185Adjusted PAT 605 831 712 615 815 1,341 1,189 843 2,813 4,052
Change (%) 35.4 47.5 19.4 33.5 34.8 61.4 66.9 37.1 30.1 47.3E: MOSt Estimates
Amnish Aggarwal ([email protected])Tel:+9122 39825404/Amit Purohit ([email protected])Tel:+9122 39825418
STOCK INFO.BSE Sensex: 16,371
S&P CNX: 4,942
? We expect Asian Paints to register 20.4% growth in revenues to Rs11.5b in 4QFY08, driven by strong demand inboth domestic and international markets.
? Growth is expected to be broad-based, with decorative paints, industrial paints and powder coatings growing intandem. EBITDA margins would expand from 12.2% in 4QFY07 to 13.3% in 4QFY08 on the back of improvementin the profitability of international business and strong volume growth in the domestic market. PAT would grow 37.1%to Rs843m.
? We expect the company to gain from rising consumerism on the one hand and huge infrastructure growth on theother. Demand for decorative paints should grow steadily in the coming year due to expected increase in disposableincome of the urban middle class.
? Competitive intensity is expected to increase but a strong brand, wide product range and marketing strength wouldenable the company to maintain its leadership position in the decorative paints market in India. Raw Material pricesare a concern but reduction in excise duty in budget will provide some cushion to the margins in the coming quarters.
? The stock is currently trading 27.8x FY08E earnings and 23.4x FY09E earnings. We maintain Buy.
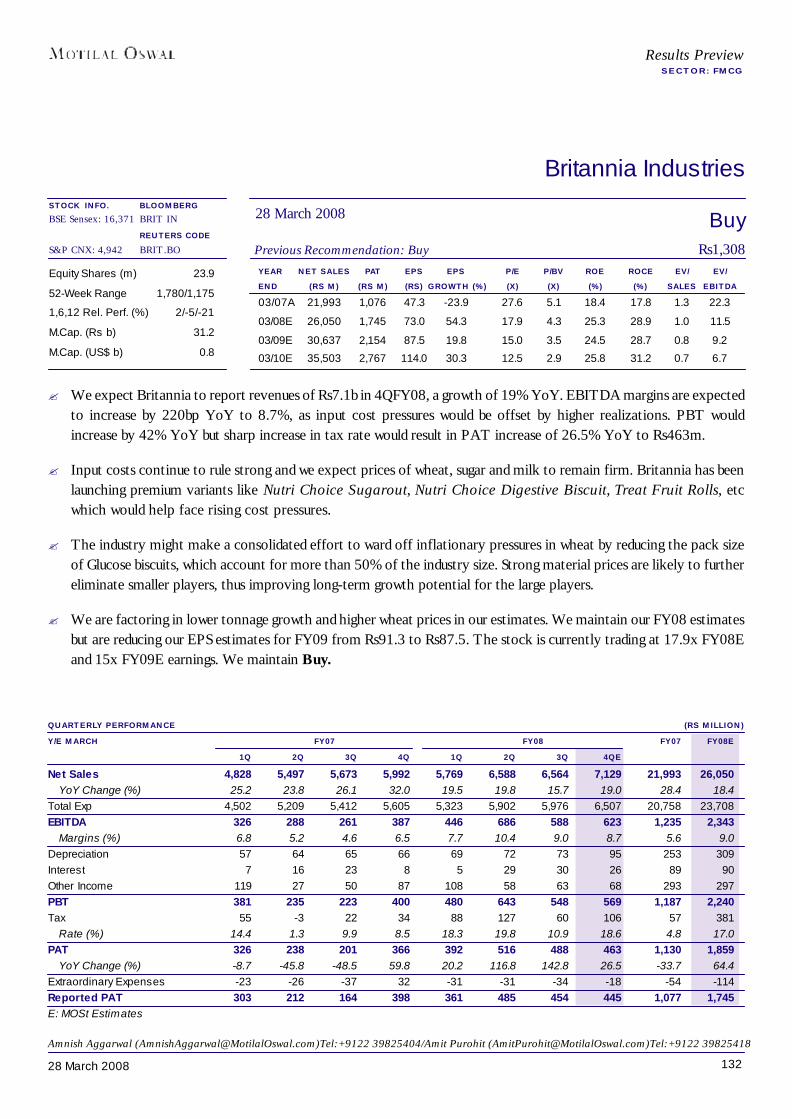
13228 March 2008
BuyPrevious Recommendation: Buy Rs1,308
BLOOMBERGBRIT IN
REUTERS CODEBRIT.BO
Britannia Industries
28 March 2008
YEAR NET SALES PAT EPS EPS P/E P/BV ROE ROCE EV/ EV/END (RS M) (RS M) (RS) GROWTH (%) (X) (X) (%) (%) SALES EBITDA03/07A 21,993 1,076 47.3 -23.9 27.6 5.1 18.4 17.8 1.3 22.3
03/08E 26,050 1,745 73.0 54.3 17.9 4.3 25.3 28.9 1.0 11.5
03/09E 30,637 2,154 87.5 19.8 15.0 3.5 24.5 28.7 0.8 9.2
03/10E 35,503 2,767 114.0 30.3 12.5 2.9 25.8 31.2 0.7 6.7
Equity Shares (m) 23.9
52-Week Range 1,780/1,175
1,6,12 Rel. Perf. (%) 2/-5/-21
M.Cap. (Rs b) 31.2
M.Cap. (US$ b) 0.8
QUARTERLY PERFORMANCE (RS MILLION)Y/E MARCH FY07 FY08 FY07 FY08E
1Q 2Q 3Q 4Q 1Q 2Q 3Q 4QENet Sales 4,828 5,497 5,673 5,992 5,769 6,588 6,564 7,129 21,993 26,050
YoY Change (%) 25.2 23.8 26.1 32.0 19.5 19.8 15.7 19.0 28.4 18.4Total Exp 4,502 5,209 5,412 5,605 5,323 5,902 5,976 6,507 20,758 23,708EBITDA 326 288 261 387 446 686 588 623 1,235 2,343
Margins (%) 6.8 5.2 4.6 6.5 7.7 10.4 9.0 8.7 5.6 9.0Depreciation 57 64 65 66 69 72 73 95 253 309Interest 7 16 23 8 5 29 30 26 89 90Other Income 119 27 50 87 108 58 63 68 293 297PBT 381 235 223 400 480 643 548 569 1,187 2,240Tax 55 -3 22 34 88 127 60 106 57 381
Rate (%) 14.4 1.3 9.9 8.5 18.3 19.8 10.9 18.6 4.8 17.0PAT 326 238 201 366 392 516 488 463 1,130 1,859
YoY Change (%) -8.7 -45.8 -48.5 59.8 20.2 116.8 142.8 26.5 -33.7 64.4Extraordinary Expenses -23 -26 -37 32 -31 -31 -34 -18 -54 -114Reported PAT 303 212 164 398 361 485 454 445 1,077 1,745E: MOSt Estimates
Results PreviewSECTOR: FMCG
Amnish Aggarwal ([email protected])Tel:+9122 39825404/Amit Purohit ([email protected])Tel:+9122 39825418
STOCK INFO.BSE Sensex: 16,371
S&P CNX: 4,942
? We expect Britannia to report revenues of Rs7.1b in 4QFY08, a growth of 19% YoY. EBITDA margins are expectedto increase by 220bp YoY to 8.7%, as input cost pressures would be offset by higher realizations. PBT wouldincrease by 42% YoY but sharp increase in tax rate would result in PAT increase of 26.5% YoY to Rs463m.
? Input costs continue to rule strong and we expect prices of wheat, sugar and milk to remain firm. Britannia has beenlaunching premium variants like Nutri Choice Sugarout, Nutri Choice Digestive Biscuit, Treat Fruit Rolls, etcwhich would help face rising cost pressures.
? The industry might make a consolidated effort to ward off inflationary pressures in wheat by reducing the pack sizeof Glucose biscuits, which account for more than 50% of the industry size. Strong material prices are likely to furthereliminate smaller players, thus improving long-term growth potential for the large players.
? We are factoring in lower tonnage growth and higher wheat prices in our estimates. We maintain our FY08 estimatesbut are reducing our EPS estimates for FY09 from Rs91.3 to Rs87.5. The stock is currently trading at 17.9x FY08Eand 15x FY09E earnings. We maintain Buy.
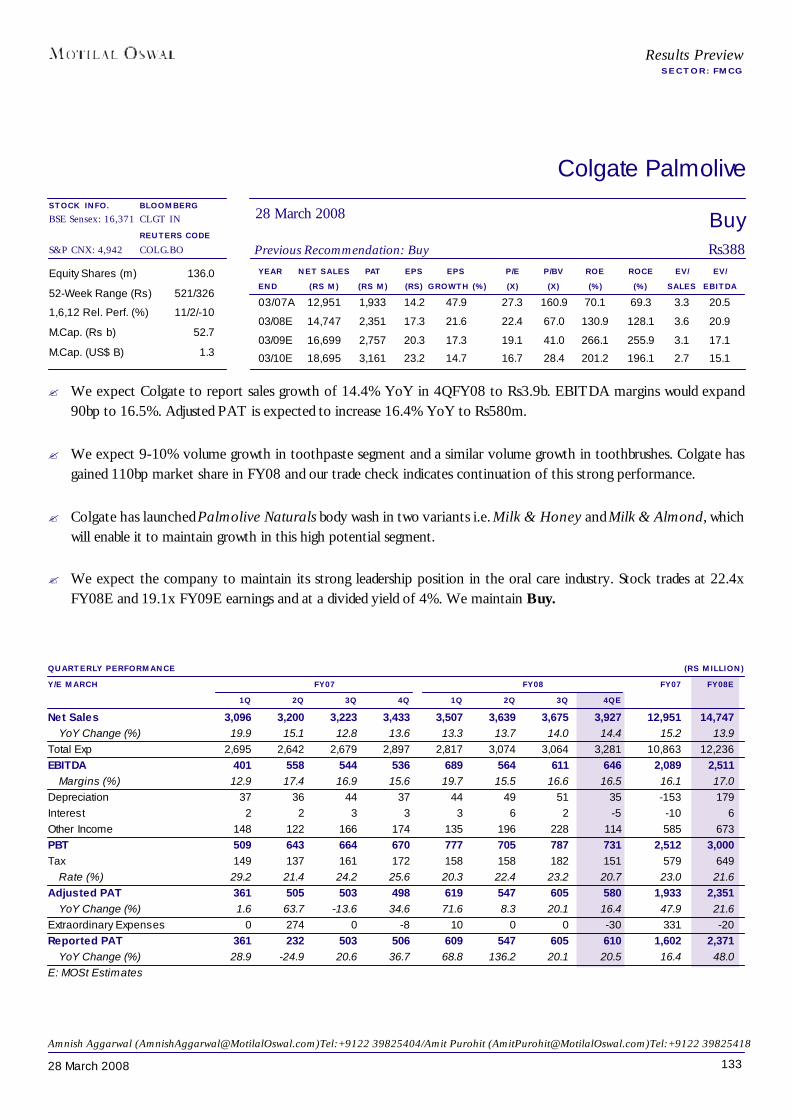
13328 March 2008
BuyPrevious Recommendation: Buy Rs388
BLOOMBERGCLGT IN
REUTERS CODECOLG.BO
Colgate Palmolive
28 March 2008
YEAR NET SALES PAT EPS EPS P/E P/BV ROE ROCE EV/ EV/END (RS M) (RS M) (RS) GROWTH (%) (X) (X) (%) (%) SALES EBITDA03/07A 12,951 1,933 14.2 47.9 27.3 160.9 70.1 69.3 3.3 20.5
03/08E 14,747 2,351 17.3 21.6 22.4 67.0 130.9 128.1 3.6 20.9
03/09E 16,699 2,757 20.3 17.3 19.1 41.0 266.1 255.9 3.1 17.1
03/10E 18,695 3,161 23.2 14.7 16.7 28.4 201.2 196.1 2.7 15.1
Equity Shares (m) 136.0
52-Week Range (Rs) 521/326
1,6,12 Rel. Perf. (%) 11/2/-10
M.Cap. (Rs b) 52.7
M.Cap. (US$ B) 1.3
QUARTERLY PERFORMANCE (RS MILLION)Y/E MARCH FY07 FY08 FY07 FY08E
1Q 2Q 3Q 4Q 1Q 2Q 3Q 4QENet Sales 3,096 3,200 3,223 3,433 3,507 3,639 3,675 3,927 12,951 14,747
YoY Change (%) 19.9 15.1 12.8 13.6 13.3 13.7 14.0 14.4 15.2 13.9Total Exp 2,695 2,642 2,679 2,897 2,817 3,074 3,064 3,281 10,863 12,236EBITDA 401 558 544 536 689 564 611 646 2,089 2,511
Margins (%) 12.9 17.4 16.9 15.6 19.7 15.5 16.6 16.5 16.1 17.0Depreciation 37 36 44 37 44 49 51 35 -153 179Interest 2 2 3 3 3 6 2 -5 -10 6Other Income 148 122 166 174 135 196 228 114 585 673PBT 509 643 664 670 777 705 787 731 2,512 3,000Tax 149 137 161 172 158 158 182 151 579 649
Rate (%) 29.2 21.4 24.2 25.6 20.3 22.4 23.2 20.7 23.0 21.6Adjusted PAT 361 505 503 498 619 547 605 580 1,933 2,351
YoY Change (%) 1.6 63.7 -13.6 34.6 71.6 8.3 20.1 16.4 47.9 21.6Extraordinary Expenses 0 274 0 -8 10 0 0 -30 331 -20Reported PAT 361 232 503 506 609 547 605 610 1,602 2,371
YoY Change (%) 28.9 -24.9 20.6 36.7 68.8 136.2 20.1 20.5 16.4 48.0E: MOSt Estimates
Results PreviewSECTOR: FMCG
Amnish Aggarwal ([email protected])Tel:+9122 39825404/Amit Purohit ([email protected])Tel:+9122 39825418
STOCK INFO.BSE Sensex: 16,371
S&P CNX: 4,942
? We expect Colgate to report sales growth of 14.4% YoY in 4QFY08 to Rs3.9b. EBITDA margins would expand90bp to 16.5%. Adjusted PAT is expected to increase 16.4% YoY to Rs580m.
? We expect 9-10% volume growth in toothpaste segment and a similar volume growth in toothbrushes. Colgate hasgained 110bp market share in FY08 and our trade check indicates continuation of this strong performance.
? Colgate has launched Palmolive Naturals body wash in two variants i.e. Milk & Honey and Milk & Almond, whichwill enable it to maintain growth in this high potential segment.
? We expect the company to maintain its strong leadership position in the oral care industry. Stock trades at 22.4xFY08E and 19.1x FY09E earnings and at a divided yield of 4%. We maintain Buy.

13428 March 2008
NeutralPrevious Recommendation: Neutral Rs108
BLOOMBERGDABUR IN
REUTERS CODEDABU.BO
Dabur India
28 March 2008
YEAR NET SALES PAT EPS EPS P/E P/BV ROE ROCE EV/ EV/END (RS M) (RS M) (RS) GROWTH (%) (X) (X) (%) (%) SALES EBITDA03/07A 20,431 2,782 3.2 23.9 33.3 19.4 58.0 51.4 4.6 26.6
03/08E 23,790 3,361 3.9 21.2 27.5 14.5 52.5 57.4 3.8 21.8
03/09E 27,194 4,146 4.8 22.6 22.4 11.1 49.4 53.6 3.3 18.3
03/10E 30,835 4,995 5.8 20.5 18.6 8.7 46.4 50.9 2.8 15.4
Equity Shares (m) 862.9
52-Week Range 134/72
1,6,12 Rel. Perf. (%) 18/7/-8
M.Cap. (Rs b) 92.9
M.Cap. (US$ b) 2.3
QUARTERLY PERFORMANCE (RS MILLION)Y/E MARCH FY07 FY08 FY07 FY08E
1Q 2Q 3Q 4Q 1Q 2Q 3Q 4QENet Sales 3,917 5,544 5,664 5,307 4,791 6,258 6,497 6,245 20,431 23,790
YoY Change (%) 18.6 5.4 10.6 22.3 12.9 14.7 17.7 18.6 16.4Total Exp 4,116 4,571 4,660 4,426 3,999 5,098 5,334 5,206 16,934 19,636EBITDA 639 973 1,004 881 792 1,160 1,163 1,039 3,497 4,154
Margins (%) 16.3 17.6 17.7 16.6 16.5 18.5 17.9 16.6 17.1 17.5Depreciation 97 106 115 90 102 98 105 152 408 456Interest 41 55 31 28 47 42 44 14 154 147Other Income 53 62 33 71 77 76 49 83 219 285PBT 554 874 891 835 721 1,096 1,064 956 3,155 3,837Tax 80 123 115 54 100 139 139 98 373 476
Rate (%) 14.5 14.1 12.9 6.5 13.9 12.7 13.0 10.3 11.8 12.4PAT 474 751 776 780 621 958 925 857 2,782 3,361
YoY Change (%) 37.5 19.7 17.3 23.3 31.1 27.5 19.2 9.9 23.9 20.8Minority Interest -9 6 -17 11 -1 -8 -20 10 -9 -20Extraordinary Inc/(Exp) 0 41 0 0 0 0 0 0 40 0Reported PAT 482 787 793 769 622 966 945 848 2,830 3,381E: MOSt Estimates
Results PreviewSECTOR: FMCG
Amnish Aggarwal ([email protected])Tel:+9122 39825404/Amit Purohit ([email protected])Tel:+9122 39825418
STOCK INFO.BSE Sensex: 16,371
S&P CNX: 4,942
? We expect Dabur to report sales of Rs6.2b in 4QFY08, a growth of 17.7% YoY. EBITDA margins would remain flaton a YoY basis due to increasing raw material prices. Pre-tax profit would increase by 14.5% while adjusted PATbefore minority interest is likely to be Rs857m – up 9.9% YoY due to higher tax rate of 10.3%.
? Volume growth is likely to remain steady across segments. Growth would be mainly volume-driven, as the companyhas not taken any price increase in 4QFY08. The company expects urban demand to remain strong while anyacceleration in rural demand is still doubtful.
? Dabur has launched Chyawan Junior, Gulabari Hydrating Rose cream & lotion, Vatika Black shampoo andDazzle range of household cleaners, which have received good consumer response.
? H&B Stores (Dabur’s 100% retail subsidiary) has launched its first Health & Beauty store under the brand, New-Uin Rajouri Garden in Delhi. The stores would provide top of the line personal care and wellness products. We expectthe venture to accelerate topline growth although it is likely to break even only in the fourth year. Our estimates do notfactor in the impact of retail operations.
? We believe that wide product range and strong market shares in niche segments makes Dabur one of the best playsin the FMCG space. The stock is currently trading at 27.5x FY08E and 22.4x FY09E earnings without consideringthe impact of retail operations, which factor in the high growth prospects. We maintain Neutral.

13528 March 2008
BuyPrevious Recommendation: Buy Rs606
BLOOMBERGSKB IN
REUTERS CODEGLSM.BO
GlaxoSmithKline Consumer
28 March 2008
YEAR NET SALES PAT EPS EPS P/E P/BV ROE ROCE EV/ EV/END (RS M) (RS M) (RS) GROWTH (%) (X) (X) (%) (%) SALES EBITDA
12/06A 11,079 1,269 30.2 18.4 20.1 4.7 23.4 35.7 2.1 12.4
12/07A 12,778 1,627 38.7 28.2 15.7 4.0 25.4 39.0 1.7 9.6
12/08E 14,470 1,887 44.9 16.0 13.5 3.4 25.0 38.1 1.4 8.0
12/09E 15,654 2,217 52.7 17.5 11.5 2.9 25.0 38.0 1.2 6.4
Equity Shares (m) 42.1
52-Week Range (Rs) 742/489
1,6,12 Rel. Perf. (%) 7/0/-9
M.Cap. (Rs b) 25.5
M.Cap. (US$ b) 0.6
QUARTERLY PERFORMANCE (RS MILLION)Y/E DECEMBER CY07 CY08E CY07 CY08E
1Q 2Q 3Q 4Q 1Q 2Q 3Q 4QNet Sales 3,265 3,156 3,516 2,841 3,750 3,650 3,975 3,095 12,778 14,470
YoY Change (%) 17.9 17.8 16.6 7.3 14.9 15.7 13.1 8.9 14.9 13.2Total Exp 2,641 2,571 2,839 2,484 3,045 2,986 3,220 2,712 10,535 11,962EBITDA 624 585 677 357 705 664 755 383 2,243 2,508
Margins (%) 19.1 18.5 19.3 12.6 18.8 18.2 19.0 12.4 17.6 17.3Depreciation 108 109 111 108 110 110 115 112 435 447Interest 11 11 12 12 8 8 10 9 45 35Other Income 139 166 209 175 165 200 245 206 689 816PBT 644 631 763 412 752 746 875 468 2,452 2,842Tax 221 208 258 137 256 250 293 156 825 955
Rate (%) 34.3 33.0 33.8 33.3 34.0 33.5 33.5 33.3 33.7 33.6PAT 423 423 505 275 496 496 582 313 1,627 1,887
YoY Change (%) 22.8 36.8 39.4 9.1 17.3 17.3 15.3 13.7 28.4 16.0E: MOSt Estimates
Results PreviewSECTOR: FMCG
Amnish Aggarwal ([email protected])Tel:+9122 39825404/Amit Purohit ([email protected])Tel:+9122 39825418
STOCK INFO.BSE Sensex: 16,371
S&P CNX: 4,942
? We expect GSK Consumer to register sales of Rs3.8b in 1QCY08 against Rs3.3b in 1QCY07, a growth of 14.9%YoY. Volume growth is expected to be 7-8%. GSK's EBITDA margins at 18.8% are likely to decline by 30bp. Margindecline despite 4% price increase in January due to rising prices of milk, malt and wheat. GSK is likely to report PATof Rs496m in 1QCY08 against Rs423m in 1QCY07, a growth of 17.3% YoY.
? We expect competitive intensity to increase due to the launch of Chyawan Junior by Dabur and increased focus ofNestle on this product category. HUL has entered the milk-based drinks category, with the launch of Kissan AmazeBrainfood which is priced at 25% premium to Horlicks. GSK has launched Women Horlicks and is undertaking anaggressive campaign in this niche segment. Entry of new formats and players would expand the category. We expectHorlicks to maintain market leadership in this category, although growing at above industry average rates could be achallenge.
? The stock is currently trading at 13.5x CY08E and 11.5x CY09E earnings. Launch of new products and liberaldividend policy could re-rate the stock significantly. We maintain Buy.
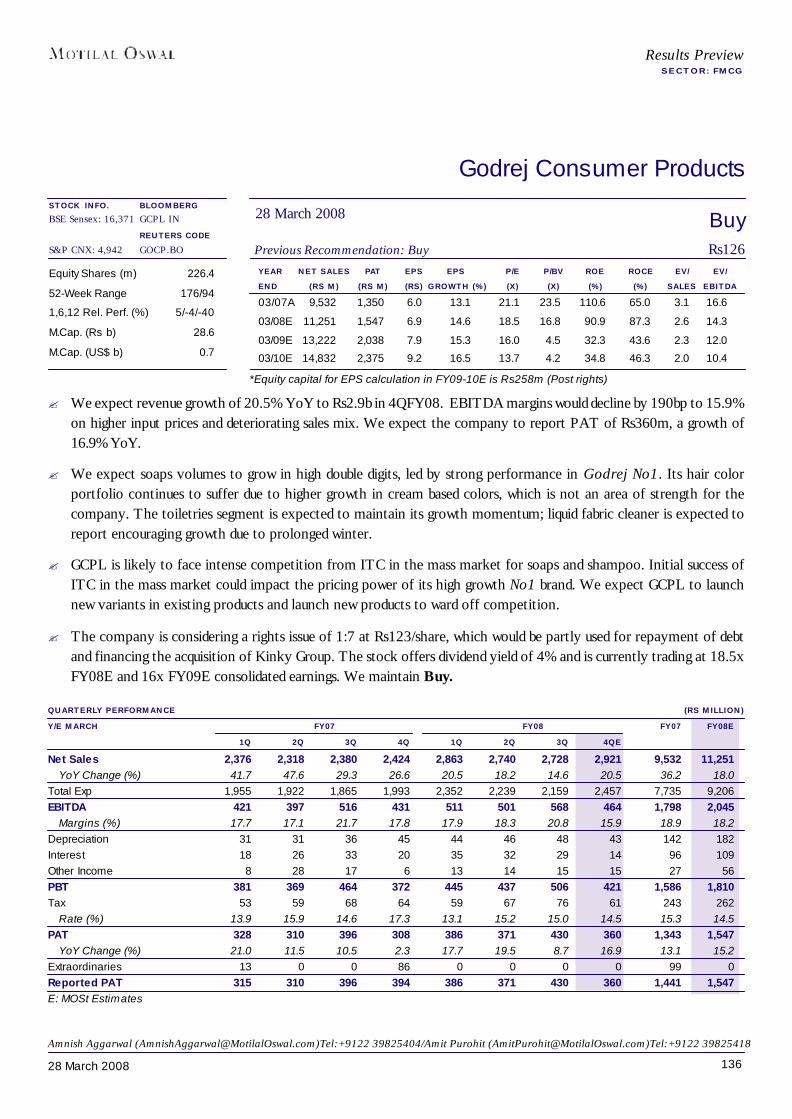
13628 March 2008
BuyPrevious Recommendation: Buy Rs126
BLOOMBERGGCPL IN
REUTERS CODEGOCP.BO
Godrej Consumer Products
28 March 2008
YEAR NET SALES PAT EPS EPS P/E P/BV ROE ROCE EV/ EV/END (RS M) (RS M) (RS) GROWTH (%) (X) (X) (%) (%) SALES EBITDA03/07A 9,532 1,350 6.0 13.1 21.1 23.5 110.6 65.0 3.1 16.6
03/08E 11,251 1,547 6.9 14.6 18.5 16.8 90.9 87.3 2.6 14.3
03/09E 13,222 2,038 7.9 15.3 16.0 4.5 32.3 43.6 2.3 12.0
03/10E 14,832 2,375 9.2 16.5 13.7 4.2 34.8 46.3 2.0 10.4
Equity Shares (m) 226.4
52-Week Range 176/94
1,6,12 Rel. Perf. (%) 5/-4/-40
M.Cap. (Rs b) 28.6
M.Cap. (US$ b) 0.7
QUARTERLY PERFORMANCE (RS MILLION)Y/E MARCH FY07 FY08 FY07 FY08E
1Q 2Q 3Q 4Q 1Q 2Q 3Q 4QENet Sales 2,376 2,318 2,380 2,424 2,863 2,740 2,728 2,921 9,532 11,251
YoY Change (%) 41.7 47.6 29.3 26.6 20.5 18.2 14.6 20.5 36.2 18.0Total Exp 1,955 1,922 1,865 1,993 2,352 2,239 2,159 2,457 7,735 9,206EBITDA 421 397 516 431 511 501 568 464 1,798 2,045
Margins (%) 17.7 17.1 21.7 17.8 17.9 18.3 20.8 15.9 18.9 18.2Depreciation 31 31 36 45 44 46 48 43 142 182Interest 18 26 33 20 35 32 29 14 96 109Other Income 8 28 17 6 13 14 15 15 27 56PBT 381 369 464 372 445 437 506 421 1,586 1,810Tax 53 59 68 64 59 67 76 61 243 262
Rate (%) 13.9 15.9 14.6 17.3 13.1 15.2 15.0 14.5 15.3 14.5PAT 328 310 396 308 386 371 430 360 1,343 1,547
YoY Change (%) 21.0 11.5 10.5 2.3 17.7 19.5 8.7 16.9 13.1 15.2Extraordinaries 13 0 0 86 0 0 0 0 99 0Reported PAT 315 310 396 394 386 371 430 360 1,441 1,547E: MOSt Estimates
Results PreviewSECTOR: FMCG
Amnish Aggarwal ([email protected])Tel:+9122 39825404/Amit Purohit ([email protected])Tel:+9122 39825418
STOCK INFO.BSE Sensex: 16,371
S&P CNX: 4,942
? We expect revenue growth of 20.5% YoY to Rs2.9b in 4QFY08. EBITDA margins would decline by 190bp to 15.9%on higher input prices and deteriorating sales mix. We expect the company to report PAT of Rs360m, a growth of16.9% YoY.
? We expect soaps volumes to grow in high double digits, led by strong performance in Godrej No1. Its hair colorportfolio continues to suffer due to higher growth in cream based colors, which is not an area of strength for thecompany. The toiletries segment is expected to maintain its growth momentum; liquid fabric cleaner is expected toreport encouraging growth due to prolonged winter.
? GCPL is likely to face intense competition from ITC in the mass market for soaps and shampoo. Initial success ofITC in the mass market could impact the pricing power of its high growth No1 brand. We expect GCPL to launchnew variants in existing products and launch new products to ward off competition.
? The company is considering a rights issue of 1:7 at Rs123/share, which would be partly used for repayment of debtand financing the acquisition of Kinky Group. The stock offers dividend yield of 4% and is currently trading at 18.5xFY08E and 16x FY09E consolidated earnings. We maintain Buy.
*Equity capital for EPS calculation in FY09-10E is Rs258m (Post rights)
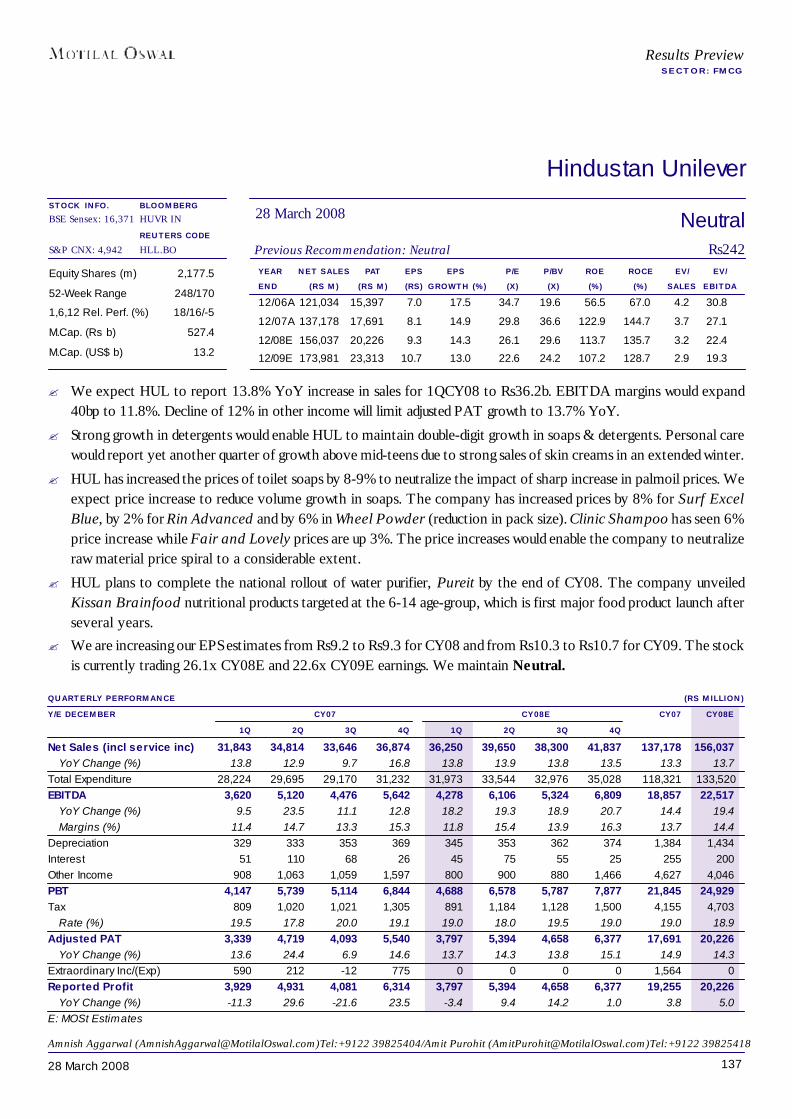
13728 March 2008
NeutralPrevious Recommendation: Neutral Rs242
BLOOMBERGHUVR IN
REUTERS CODEHLL.BO
Hindustan Unilever
28 March 2008
YEAR NET SALES PAT EPS EPS P/E P/BV ROE ROCE EV/ EV/END (RS M) (RS M) (RS) GROWTH (%) (X) (X) (%) (%) SALES EBITDA12/06A 121,034 15,397 7.0 17.5 34.7 19.6 56.5 67.0 4.2 30.8
12/07A 137,178 17,691 8.1 14.9 29.8 36.6 122.9 144.7 3.7 27.1
12/08E 156,037 20,226 9.3 14.3 26.1 29.6 113.7 135.7 3.2 22.4
12/09E 173,981 23,313 10.7 13.0 22.6 24.2 107.2 128.7 2.9 19.3
Equity Shares (m) 2,177.5
52-Week Range 248/170
1,6,12 Rel. Perf. (%) 18/16/-5
M.Cap. (Rs b) 527.4
M.Cap. (US$ b) 13.2
QUARTERLY PERFORMANCE (RS MILLION)Y/E DECEMBER CY07 CY08E CY07 CY08E
1Q 2Q 3Q 4Q 1Q 2Q 3Q 4QNet Sales (incl service inc) 31,843 34,814 33,646 36,874 36,250 39,650 38,300 41,837 137,178 156,037
YoY Change (%) 13.8 12.9 9.7 16.8 13.8 13.9 13.8 13.5 13.3 13.7Total Expenditure 28,224 29,695 29,170 31,232 31,973 33,544 32,976 35,028 118,321 133,520EBITDA 3,620 5,120 4,476 5,642 4,278 6,106 5,324 6,809 18,857 22,517
YoY Change (%) 9.5 23.5 11.1 12.8 18.2 19.3 18.9 20.7 14.4 19.4Margins (%) 11.4 14.7 13.3 15.3 11.8 15.4 13.9 16.3 13.7 14.4
Depreciation 329 333 353 369 345 353 362 374 1,384 1,434Interest 51 110 68 26 45 75 55 25 255 200Other Income 908 1,063 1,059 1,597 800 900 880 1,466 4,627 4,046PBT 4,147 5,739 5,114 6,844 4,688 6,578 5,787 7,877 21,845 24,929Tax 809 1,020 1,021 1,305 891 1,184 1,128 1,500 4,155 4,703
Rate (%) 19.5 17.8 20.0 19.1 19.0 18.0 19.5 19.0 19.0 18.9Adjusted PAT 3,339 4,719 4,093 5,540 3,797 5,394 4,658 6,377 17,691 20,226
YoY Change (%) 13.6 24.4 6.9 14.6 13.7 14.3 13.8 15.1 14.9 14.3Extraordinary Inc/(Exp) 590 212 -12 775 0 0 0 0 1,564 0Reported Profit 3,929 4,931 4,081 6,314 3,797 5,394 4,658 6,377 19,255 20,226
YoY Change (%) -11.3 29.6 -21.6 23.5 -3.4 9.4 14.2 1.0 3.8 5.0E: MOSt Estimates
Results PreviewSECTOR: FMCG
Amnish Aggarwal ([email protected])Tel:+9122 39825404/Amit Purohit ([email protected])Tel:+9122 39825418
STOCK INFO.BSE Sensex: 16,371
S&P CNX: 4,942
? We expect HUL to report 13.8% YoY increase in sales for 1QCY08 to Rs36.2b. EBITDA margins would expand40bp to 11.8%. Decline of 12% in other income will limit adjusted PAT growth to 13.7% YoY.
? Strong growth in detergents would enable HUL to maintain double-digit growth in soaps & detergents. Personal carewould report yet another quarter of growth above mid-teens due to strong sales of skin creams in an extended winter.
? HUL has increased the prices of toilet soaps by 8-9% to neutralize the impact of sharp increase in palmoil prices. Weexpect price increase to reduce volume growth in soaps. The company has increased prices by 8% for Surf ExcelBlue, by 2% for Rin Advanced and by 6% in Wheel Powder (reduction in pack size). Clinic Shampoo has seen 6%price increase while Fair and Lovely prices are up 3%. The price increases would enable the company to neutralizeraw material price spiral to a considerable extent.
? HUL plans to complete the national rollout of water purifier, Pureit by the end of CY08. The company unveiledKissan Brainfood nutritional products targeted at the 6-14 age-group, which is first major food product launch afterseveral years.
? We are increasing our EPS estimates from Rs9.2 to Rs9.3 for CY08 and from Rs10.3 to Rs10.7 for CY09. The stockis currently trading 26.1x CY08E and 22.6x CY09E earnings. We maintain Neutral.
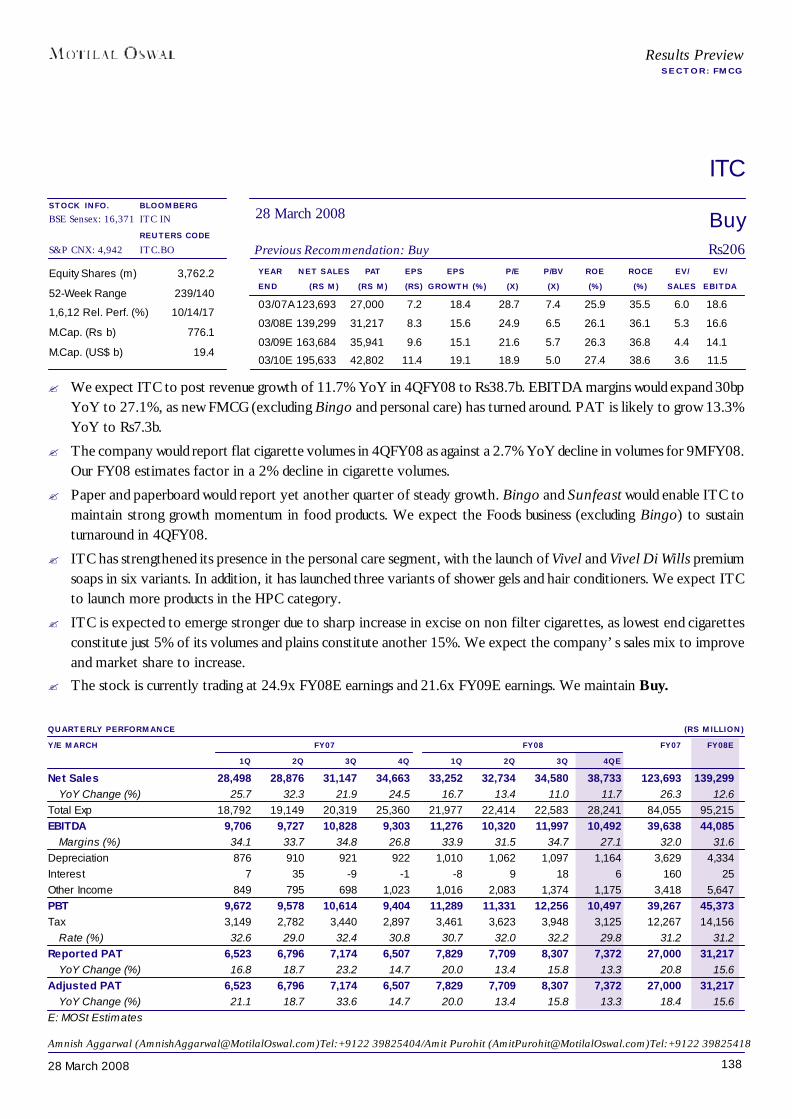
13828 March 2008
BuyPrevious Recommendation: Buy Rs206
BLOOMBERGITC IN
REUTERS CODEITC.BO
ITC
28 March 2008
YEAR NET SALES PAT EPS EPS P/E P/BV ROE ROCE EV/ EV/END (RS M) (RS M) (RS) GROWTH (%) (X) (X) (%) (%) SALES EBITDA
03/07A 123,693 27,000 7.2 18.4 28.7 7.4 25.9 35.5 6.0 18.6
03/08E 139,299 31,217 8.3 15.6 24.9 6.5 26.1 36.1 5.3 16.6
03/09E 163,684 35,941 9.6 15.1 21.6 5.7 26.3 36.8 4.4 14.1
03/10E 195,633 42,802 11.4 19.1 18.9 5.0 27.4 38.6 3.6 11.5
Equity Shares (m) 3,762.2
52-Week Range 239/140
1,6,12 Rel. Perf. (%) 10/14/17
M.Cap. (Rs b) 776.1
M.Cap. (US$ b) 19.4
QUARTERLY PERFORMANCE (RS MILLION)Y/E MARCH FY07 FY08 FY07 FY08E
1Q 2Q 3Q 4Q 1Q 2Q 3Q 4QENet Sales 28,498 28,876 31,147 34,663 33,252 32,734 34,580 38,733 123,693 139,299
YoY Change (%) 25.7 32.3 21.9 24.5 16.7 13.4 11.0 11.7 26.3 12.6Total Exp 18,792 19,149 20,319 25,360 21,977 22,414 22,583 28,241 84,055 95,215EBITDA 9,706 9,727 10,828 9,303 11,276 10,320 11,997 10,492 39,638 44,085
Margins (%) 34.1 33.7 34.8 26.8 33.9 31.5 34.7 27.1 32.0 31.6Depreciation 876 910 921 922 1,010 1,062 1,097 1,164 3,629 4,334Interest 7 35 -9 -1 -8 9 18 6 160 25Other Income 849 795 698 1,023 1,016 2,083 1,374 1,175 3,418 5,647PBT 9,672 9,578 10,614 9,404 11,289 11,331 12,256 10,497 39,267 45,373Tax 3,149 2,782 3,440 2,897 3,461 3,623 3,948 3,125 12,267 14,156
Rate (%) 32.6 29.0 32.4 30.8 30.7 32.0 32.2 29.8 31.2 31.2Reported PAT 6,523 6,796 7,174 6,507 7,829 7,709 8,307 7,372 27,000 31,217
YoY Change (%) 16.8 18.7 23.2 14.7 20.0 13.4 15.8 13.3 20.8 15.6Adjusted PAT 6,523 6,796 7,174 6,507 7,829 7,709 8,307 7,372 27,000 31,217
YoY Change (%) 21.1 18.7 33.6 14.7 20.0 13.4 15.8 13.3 18.4 15.6E: MOSt Estimates
Results PreviewSECTOR: FMCG
Amnish Aggarwal ([email protected])Tel:+9122 39825404/Amit Purohit ([email protected])Tel:+9122 39825418
STOCK INFO.BSE Sensex: 16,371
S&P CNX: 4,942
? We expect ITC to post revenue growth of 11.7% YoY in 4QFY08 to Rs38.7b. EBITDA margins would expand 30bpYoY to 27.1%, as new FMCG (excluding Bingo and personal care) has turned around. PAT is likely to grow 13.3%YoY to Rs7.3b.
? The company would report flat cigarette volumes in 4QFY08 as against a 2.7% YoY decline in volumes for 9MFY08.Our FY08 estimates factor in a 2% decline in cigarette volumes.
? Paper and paperboard would report yet another quarter of steady growth. Bingo and Sunfeast would enable ITC tomaintain strong growth momentum in food products. We expect the Foods business (excluding Bingo) to sustainturnaround in 4QFY08.
? ITC has strengthened its presence in the personal care segment, with the launch of Vivel and Vivel Di Wills premiumsoaps in six variants. In addition, it has launched three variants of shower gels and hair conditioners. We expect ITCto launch more products in the HPC category.
? ITC is expected to emerge stronger due to sharp increase in excise on non filter cigarettes, as lowest end cigarettesconstitute just 5% of its volumes and plains constitute another 15%. We expect the company’s sales mix to improveand market share to increase.
? The stock is currently trading at 24.9x FY08E earnings and 21.6x FY09E earnings. We maintain Buy.
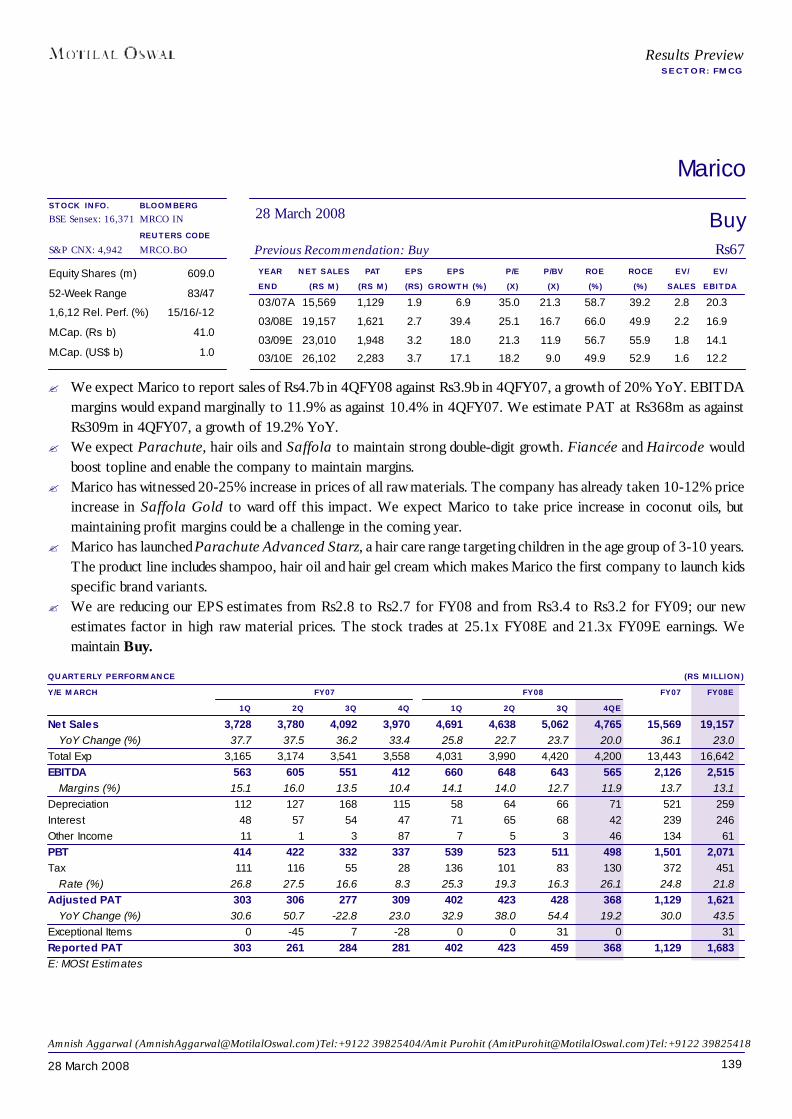
13928 March 2008
BuyPrevious Recommendation: Buy Rs67
BLOOMBERGMRCO IN
REUTERS CODEMRCO.BO
Marico
28 March 2008
YEAR NET SALES PAT EPS EPS P/E P/BV ROE ROCE EV/ EV/END (RS M) (RS M) (RS) GROWTH (%) (X) (X) (%) (%) SALES EBITDA03/07A 15,569 1,129 1.9 6.9 35.0 21.3 58.7 39.2 2.8 20.3
03/08E 19,157 1,621 2.7 39.4 25.1 16.7 66.0 49.9 2.2 16.9
03/09E 23,010 1,948 3.2 18.0 21.3 11.9 56.7 55.9 1.8 14.1
03/10E 26,102 2,283 3.7 17.1 18.2 9.0 49.9 52.9 1.6 12.2
Equity Shares (m) 609.0
52-Week Range 83/47
1,6,12 Rel. Perf. (%) 15/16/-12
M.Cap. (Rs b) 41.0
M.Cap. (US$ b) 1.0
QUARTERLY PERFORMANCE (RS MILLION)Y/E MARCH FY07 FY08 FY07 FY08E
1Q 2Q 3Q 4Q 1Q 2Q 3Q 4QENet Sales 3,728 3,780 4,092 3,970 4,691 4,638 5,062 4,765 15,569 19,157
YoY Change (%) 37.7 37.5 36.2 33.4 25.8 22.7 23.7 20.0 36.1 23.0Total Exp 3,165 3,174 3,541 3,558 4,031 3,990 4,420 4,200 13,443 16,642EBITDA 563 605 551 412 660 648 643 565 2,126 2,515
Margins (%) 15.1 16.0 13.5 10.4 14.1 14.0 12.7 11.9 13.7 13.1Depreciation 112 127 168 115 58 64 66 71 521 259Interest 48 57 54 47 71 65 68 42 239 246Other Income 11 1 3 87 7 5 3 46 134 61PBT 414 422 332 337 539 523 511 498 1,501 2,071Tax 111 116 55 28 136 101 83 130 372 451
Rate (%) 26.8 27.5 16.6 8.3 25.3 19.3 16.3 26.1 24.8 21.8Adjusted PAT 303 306 277 309 402 423 428 368 1,129 1,621
YoY Change (%) 30.6 50.7 -22.8 23.0 32.9 38.0 54.4 19.2 30.0 43.5Exceptional Items 0 -45 7 -28 0 0 31 0 31Reported PAT 303 261 284 281 402 423 459 368 1,129 1,683E: MOSt Estimates
Results PreviewSECTOR: FMCG
Amnish Aggarwal ([email protected])Tel:+9122 39825404/Amit Purohit ([email protected])Tel:+9122 39825418
STOCK INFO.BSE Sensex: 16,371
S&P CNX: 4,942
? We expect Marico to report sales of Rs4.7b in 4QFY08 against Rs3.9b in 4QFY07, a growth of 20% YoY. EBITDAmargins would expand marginally to 11.9% as against 10.4% in 4QFY07. We estimate PAT at Rs368m as againstRs309m in 4QFY07, a growth of 19.2% YoY.
? We expect Parachute, hair oils and Saffola to maintain strong double-digit growth. Fiancée and Haircode wouldboost topline and enable the company to maintain margins.
? Marico has witnessed 20-25% increase in prices of all raw materials. The company has already taken 10-12% priceincrease in Saffola Gold to ward off this impact. We expect Marico to take price increase in coconut oils, butmaintaining profit margins could be a challenge in the coming year.
? Marico has launched Parachute Advanced Starz, a hair care range targeting children in the age group of 3-10 years.The product line includes shampoo, hair oil and hair gel cream which makes Marico the first company to launch kidsspecific brand variants.
? We are reducing our EPS estimates from Rs2.8 to Rs2.7 for FY08 and from Rs3.4 to Rs3.2 for FY09; our newestimates factor in high raw material prices. The stock trades at 25.1x FY08E and 21.3x FY09E earnings. Wemaintain Buy.
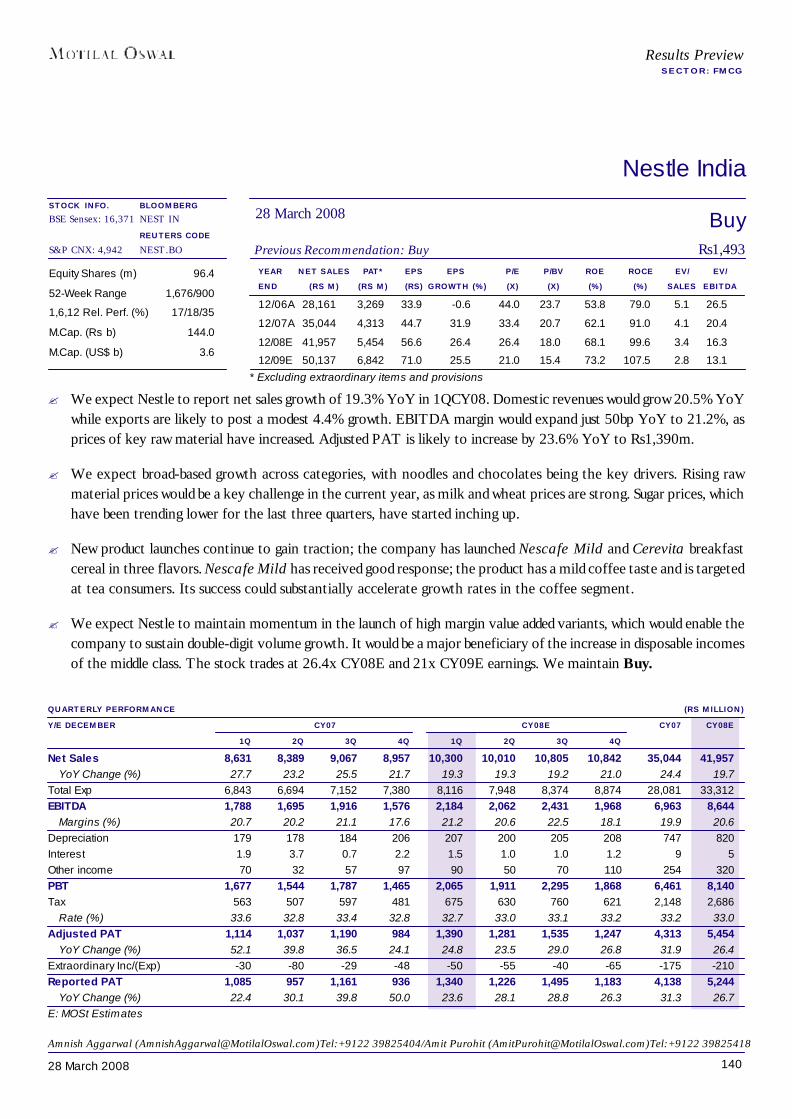
14028 March 2008
BuyPrevious Recommendation: Buy Rs1,493
BLOOMBERGNEST IN
REUTERS CODENEST.BO
Nestle India
28 March 2008
YEAR NET SALES PAT* EPS EPS P/E P/BV ROE ROCE EV/ EV/END (RS M) (RS M) (RS) GROWTH (%) (X) (X) (%) (%) SALES EBITDA
12/06A 28,161 3,269 33.9 -0.6 44.0 23.7 53.8 79.0 5.1 26.5
12/07A 35,044 4,313 44.7 31.9 33.4 20.7 62.1 91.0 4.1 20.4
12/08E 41,957 5,454 56.6 26.4 26.4 18.0 68.1 99.6 3.4 16.3
12/09E 50,137 6,842 71.0 25.5 21.0 15.4 73.2 107.5 2.8 13.1
Equity Shares (m) 96.4
52-Week Range 1,676/900
1,6,12 Rel. Perf. (%) 17/18/35
M.Cap. (Rs b) 144.0
M.Cap. (US$ b) 3.6
QUARTERLY PERFORMANCE (RS MILLION)Y/E DECEMBER CY07 CY08E CY07 CY08E
1Q 2Q 3Q 4Q 1Q 2Q 3Q 4QNet Sales 8,631 8,389 9,067 8,957 10,300 10,010 10,805 10,842 35,044 41,957
YoY Change (%) 27.7 23.2 25.5 21.7 19.3 19.3 19.2 21.0 24.4 19.7Total Exp 6,843 6,694 7,152 7,380 8,116 7,948 8,374 8,874 28,081 33,312EBITDA 1,788 1,695 1,916 1,576 2,184 2,062 2,431 1,968 6,963 8,644
Margins (%) 20.7 20.2 21.1 17.6 21.2 20.6 22.5 18.1 19.9 20.6Depreciation 179 178 184 206 207 200 205 208 747 820Interest 1.9 3.7 0.7 2.2 1.5 1.0 1.0 1.2 9 5Other income 70 32 57 97 90 50 70 110 254 320PBT 1,677 1,544 1,787 1,465 2,065 1,911 2,295 1,868 6,461 8,140Tax 563 507 597 481 675 630 760 621 2,148 2,686
Rate (%) 33.6 32.8 33.4 32.8 32.7 33.0 33.1 33.2 33.2 33.0Adjusted PAT 1,114 1,037 1,190 984 1,390 1,281 1,535 1,247 4,313 5,454
YoY Change (%) 52.1 39.8 36.5 24.1 24.8 23.5 29.0 26.8 31.9 26.4Extraordinary Inc/(Exp) -30 -80 -29 -48 -50 -55 -40 -65 -175 -210Reported PAT 1,085 957 1,161 936 1,340 1,226 1,495 1,183 4,138 5,244
YoY Change (%) 22.4 30.1 39.8 50.0 23.6 28.1 28.8 26.3 31.3 26.7E: MOSt Estimates
* Excluding extraordinary items and provisions
Results PreviewSECTOR: FMCG
Amnish Aggarwal ([email protected])Tel:+9122 39825404/Amit Purohit ([email protected])Tel:+9122 39825418
STOCK INFO.BSE Sensex: 16,371
S&P CNX: 4,942
? We expect Nestle to report net sales growth of 19.3% YoY in 1QCY08. Domestic revenues would grow 20.5% YoYwhile exports are likely to post a modest 4.4% growth. EBITDA margin would expand just 50bp YoY to 21.2%, asprices of key raw material have increased. Adjusted PAT is likely to increase by 23.6% YoY to Rs1,390m.
? We expect broad-based growth across categories, with noodles and chocolates being the key drivers. Rising rawmaterial prices would be a key challenge in the current year, as milk and wheat prices are strong. Sugar prices, whichhave been trending lower for the last three quarters, have started inching up.
? New product launches continue to gain traction; the company has launched Nescafe Mild and Cerevita breakfastcereal in three flavors. Nescafe Mild has received good response; the product has a mild coffee taste and is targetedat tea consumers. Its success could substantially accelerate growth rates in the coffee segment.
? We expect Nestle to maintain momentum in the launch of high margin value added variants, which would enable thecompany to sustain double-digit volume growth. It would be a major beneficiary of the increase in disposable incomesof the middle class. The stock trades at 26.4x CY08E and 21x CY09E earnings. We maintain Buy.
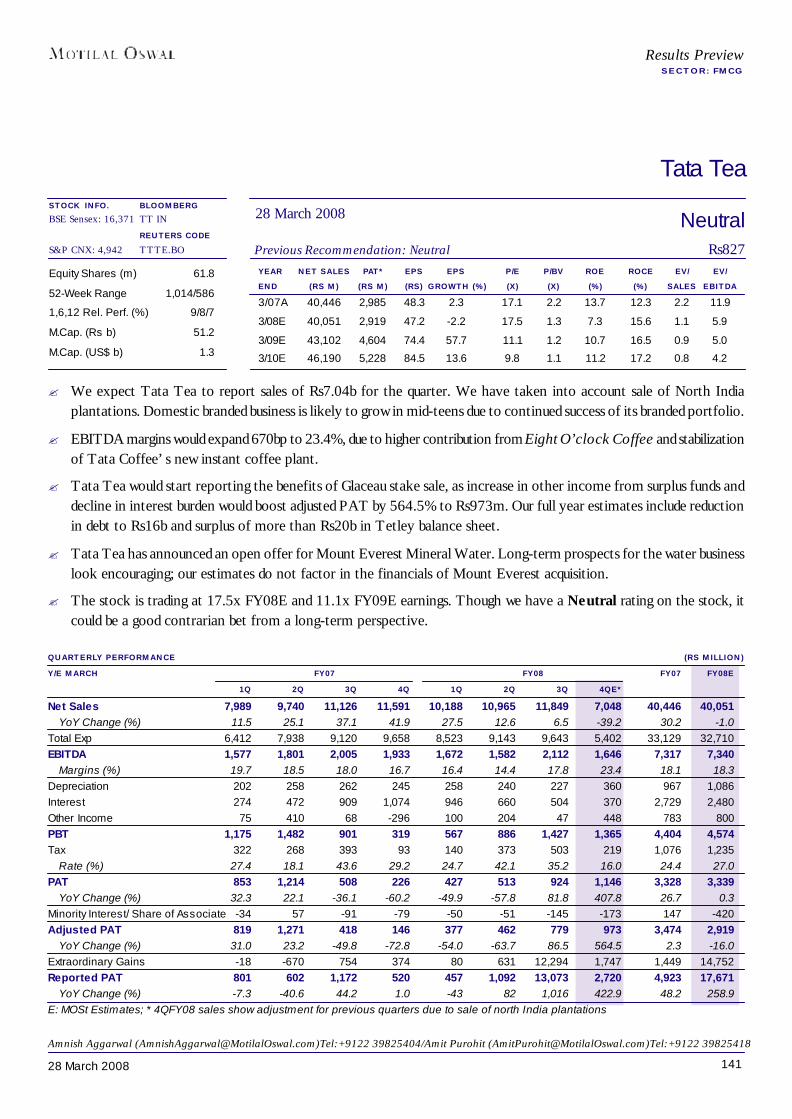
14128 March 2008
NeutralPrevious Recommendation: Neutral Rs827
Results PreviewSECTOR: FMCG
BLOOMBERGTT IN
REUTERS CODETTTE.BO
Tata Tea
28 March 2008
YEAR NET SALES PAT* EPS EPS P/E P/BV ROE ROCE EV/ EV/END (RS M) (RS M) (RS) GROWTH (%) (X) (X) (%) (%) SALES EBITDA3/07A 40,446 2,985 48.3 2.3 17.1 2.2 13.7 12.3 2.2 11.9
3/08E 40,051 2,919 47.2 -2.2 17.5 1.3 7.3 15.6 1.1 5.9
3/09E 43,102 4,604 74.4 57.7 11.1 1.2 10.7 16.5 0.9 5.0
3/10E 46,190 5,228 84.5 13.6 9.8 1.1 11.2 17.2 0.8 4.2
Equity Shares (m) 61.8
52-Week Range 1,014/586
1,6,12 Rel. Perf. (%) 9/8/7
M.Cap. (Rs b) 51.2
M.Cap. (US$ b) 1.3
QUARTERLY PERFORMANCE (RS MILLION)Y/E MARCH FY07 FY08 FY07 FY08E
1Q 2Q 3Q 4Q 1Q 2Q 3Q 4QE*Net Sales 7,989 9,740 11,126 11,591 10,188 10,965 11,849 7,048 40,446 40,051
YoY Change (%) 11.5 25.1 37.1 41.9 27.5 12.6 6.5 -39.2 30.2 -1.0Total Exp 6,412 7,938 9,120 9,658 8,523 9,143 9,643 5,402 33,129 32,710EBITDA 1,577 1,801 2,005 1,933 1,672 1,582 2,112 1,646 7,317 7,340
Margins (%) 19.7 18.5 18.0 16.7 16.4 14.4 17.8 23.4 18.1 18.3Depreciation 202 258 262 245 258 240 227 360 967 1,086Interest 274 472 909 1,074 946 660 504 370 2,729 2,480Other Income 75 410 68 -296 100 204 47 448 783 800PBT 1,175 1,482 901 319 567 886 1,427 1,365 4,404 4,574Tax 322 268 393 93 140 373 503 219 1,076 1,235
Rate (%) 27.4 18.1 43.6 29.2 24.7 42.1 35.2 16.0 24.4 27.0PAT 853 1,214 508 226 427 513 924 1,146 3,328 3,339
YoY Change (%) 32.3 22.1 -36.1 -60.2 -49.9 -57.8 81.8 407.8 26.7 0.3Minority Interest/ Share of Associate -34 57 -91 -79 -50 -51 -145 -173 147 -420Adjusted PAT 819 1,271 418 146 377 462 779 973 3,474 2,919
YoY Change (%) 31.0 23.2 -49.8 -72.8 -54.0 -63.7 86.5 564.5 2.3 -16.0Extraordinary Gains -18 -670 754 374 80 631 12,294 1,747 1,449 14,752Reported PAT 801 602 1,172 520 457 1,092 13,073 2,720 4,923 17,671
YoY Change (%) -7.3 -40.6 44.2 1.0 -43 82 1,016 422.9 48.2 258.9E: MOSt Estimates; * 4QFY08 sales show adjustment for previous quarters due to sale of north India plantations
Amnish Aggarwal ([email protected])Tel:+9122 39825404/Amit Purohit ([email protected])Tel:+9122 39825418
STOCK INFO.BSE Sensex: 16,371
S&P CNX: 4,942
? We expect Tata Tea to report sales of Rs7.04b for the quarter. We have taken into account sale of North Indiaplantations. Domestic branded business is likely to grow in mid-teens due to continued success of its branded portfolio.
? EBITDA margins would expand 670bp to 23.4%, due to higher contribution from Eight O’clock Coffee and stabilizationof Tata Coffee’s new instant coffee plant.
? Tata Tea would start reporting the benefits of Glaceau stake sale, as increase in other income from surplus funds anddecline in interest burden would boost adjusted PAT by 564.5% to Rs973m. Our full year estimates include reductionin debt to Rs16b and surplus of more than Rs20b in Tetley balance sheet.
? Tata Tea has announced an open offer for Mount Everest Mineral Water. Long-term prospects for the water businesslook encouraging; our estimates do not factor in the financials of Mount Everest acquisition.
? The stock is trading at 17.5x FY08E and 11.1x FY09E earnings. Though we have a Neutral rating on the stock, itcould be a good contrarian bet from a long-term perspective.
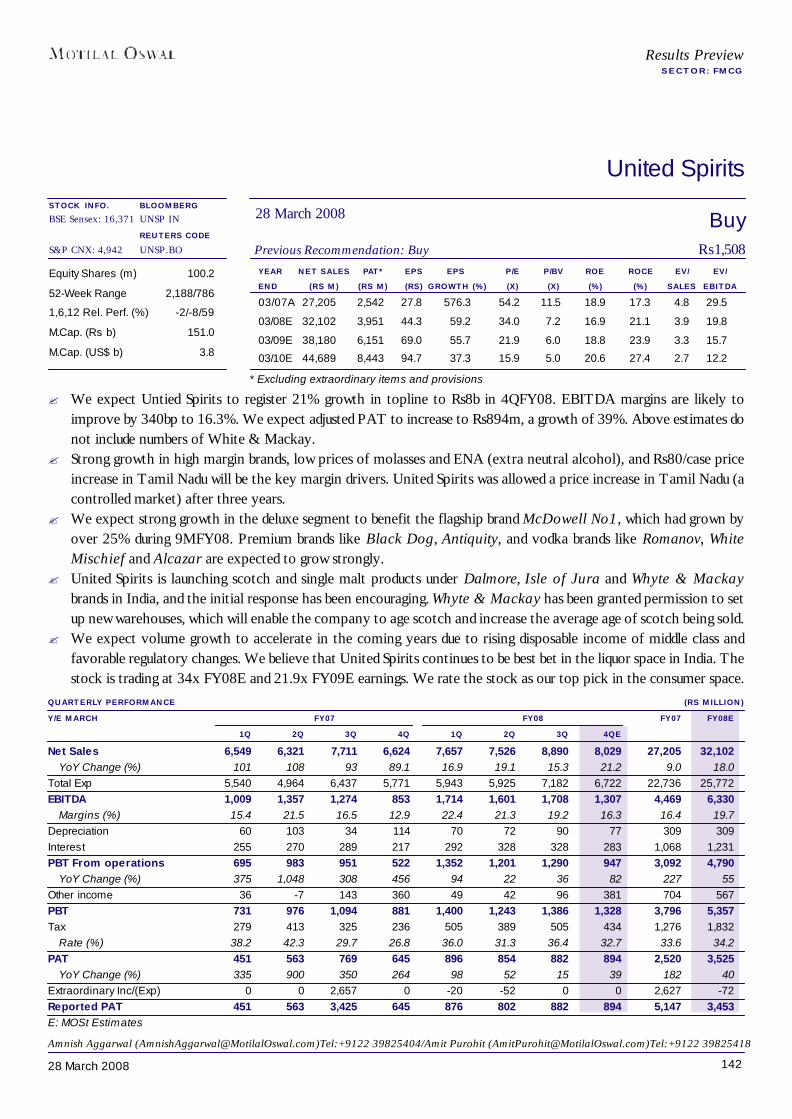
14228 March 2008
BuyPrevious Recommendation: Buy Rs1,508
Results PreviewSECTOR: FMCG
BLOOMBERGUNSP IN
REUTERS CODEUNSP.BO
United Spirits
28 March 2008
YEAR NET SALES PAT* EPS EPS P/E P/BV ROE ROCE EV/ EV/END (RS M) (RS M) (RS) GROWTH (%) (X) (X) (%) (%) SALES EBITDA03/07A 27,205 2,542 27.8 576.3 54.2 11.5 18.9 17.3 4.8 29.5
03/08E 32,102 3,951 44.3 59.2 34.0 7.2 16.9 21.1 3.9 19.8
03/09E 38,180 6,151 69.0 55.7 21.9 6.0 18.8 23.9 3.3 15.7
03/10E 44,689 8,443 94.7 37.3 15.9 5.0 20.6 27.4 2.7 12.2
Equity Shares (m) 100.2
52-Week Range 2,188/786
1,6,12 Rel. Perf. (%) -2/-8/59
M.Cap. (Rs b) 151.0
M.Cap. (US$ b) 3.8
* Excluding extraordinary items and provisions
Amnish Aggarwal ([email protected])Tel:+9122 39825404/Amit Purohit ([email protected])Tel:+9122 39825418
QUARTERLY PERFORMANCE (RS MILLION)Y/E MARCH FY07 FY08 FY07 FY08E
1Q 2Q 3Q 4Q 1Q 2Q 3Q 4QENet Sales 6,549 6,321 7,711 6,624 7,657 7,526 8,890 8,029 27,205 32,102
YoY Change (%) 101 108 93 89.1 16.9 19.1 15.3 21.2 9.0 18.0Total Exp 5,540 4,964 6,437 5,771 5,943 5,925 7,182 6,722 22,736 25,772EBITDA 1,009 1,357 1,274 853 1,714 1,601 1,708 1,307 4,469 6,330
Margins (%) 15.4 21.5 16.5 12.9 22.4 21.3 19.2 16.3 16.4 19.7Depreciation 60 103 34 114 70 72 90 77 309 309Interest 255 270 289 217 292 328 328 283 1,068 1,231PBT From operations 695 983 951 522 1,352 1,201 1,290 947 3,092 4,790
YoY Change (%) 375 1,048 308 456 94 22 36 82 227 55Other income 36 -7 143 360 49 42 96 381 704 567PBT 731 976 1,094 881 1,400 1,243 1,386 1,328 3,796 5,357Tax 279 413 325 236 505 389 505 434 1,276 1,832
Rate (%) 38.2 42.3 29.7 26.8 36.0 31.3 36.4 32.7 33.6 34.2PAT 451 563 769 645 896 854 882 894 2,520 3,525
YoY Change (%) 335 900 350 264 98 52 15 39 182 40Extraordinary Inc/(Exp) 0 0 2,657 0 -20 -52 0 0 2,627 -72Reported PAT 451 563 3,425 645 876 802 882 894 5,147 3,453E: MOSt Estimates
STOCK INFO.BSE Sensex: 16,371
S&P CNX: 4,942
? We expect Untied Spirits to register 21% growth in topline to Rs8b in 4QFY08. EBITDA margins are likely toimprove by 340bp to 16.3%. We expect adjusted PAT to increase to Rs894m, a growth of 39%. Above estimates donot include numbers of White & Mackay.
? Strong growth in high margin brands, low prices of molasses and ENA (extra neutral alcohol), and Rs80/case priceincrease in Tamil Nadu will be the key margin drivers. United Spirits was allowed a price increase in Tamil Nadu (acontrolled market) after three years.
? We expect strong growth in the deluxe segment to benefit the flagship brand McDowell No1, which had grown byover 25% during 9MFY08. Premium brands like Black Dog, Antiquity, and vodka brands like Romanov, WhiteMischief and Alcazar are expected to grow strongly.
? United Spirits is launching scotch and single malt products under Dalmore, Isle of Jura and Whyte & Mackaybrands in India, and the initial response has been encouraging. Whyte & Mackay has been granted permission to setup new warehouses, which will enable the company to age scotch and increase the average age of scotch being sold.
? We expect volume growth to accelerate in the coming years due to rising disposable income of middle class andfavorable regulatory changes. We believe that United Spirits continues to be best bet in the liquor space in India. Thestock is trading at 34x FY08E and 21.9x FY09E earnings. We rate the stock as our top pick in the consumer space.

14328 March 2008
Information Technology
COMPANY NAME PG.HCL Technologies 147
Infosys 148
MphasiS 149
Patni Computer 150
Satyam Computer 151
TCS 152
Tech Mahindra 153
Wipro 154
EXPECTED QUARTERLY PERFORMANCE SUMMARY (RS MILLION)RECO SALES EBITDA NET PROFIT
MAR.08 CHG. (%) MAR.08 CHG. (%) MAR.08 CHG. (%)Information TechnologyHCL Technologies Buy 19,101 5.1 4,202 8.2 3,518 5.7Infosys Buy 45,590 6.7 14,886 6.9 12,842 4.3MphasiS Buy 6,607 4.5 1,153 4.4 694 4.8Patni Computer Neutral 7,105 3.5 1,234 8.4 1,140 14.3Satyam Computer Buy 23,379 6.5 5,285 12.2 4,779 10.2TCS Buy 61,853 4.4 16,526 4.7 13,571 2.0Tech Mahindra Neutral 10,168 4.8 2,308 8.4 2,077 4.1Wipro Buy 38,181 6.1 11,218 11.7 9,148 10.7Sector Aggregate 211,984 5.5 56,813 7.8 47,768 5.7
Vikas Jadhav ([email protected]); Tel: +91 22 3982 5585
The current scenario: The United States (US) is in the midst of one of its worstfinancial crises arising out of sub prime lending and bad mortgages. The relentless pricefall in the overheated housing markets in the recent past has aggravated the credit crisis.Major financial institutions such as Merrill Lynch, Citigroup, UBS, Morgan Stanley, HSBC,BOA, DB and others have taken write offs of over US$150b. We have already seen fallof the fifth largest Investment banking firm in the US viz Bear Stearns. With negativenews still flowing in from the US credit markets and the extent of woes still uncertain, itseems there is still some time before one sees light at the end of tunnel. Further, theimpact on insurance companies and some European banks is yet unknown. Under thesecircumstances the US economy is already slowing down, with recession being only amatter of time. There’s no question that as America’s huge and hungry consumptionmachine starts to splutter, other economies around the world will suffer, including emergingeconomies like China and India.
On the eve of the closure of FY08 closure, never had there been (post the dot-combubble bust and 9/11 events dating back about 8 years in year 2001) a bigger questionmark on (business) demand for the Indian IT/BPO industry, than is perceived today onaccount of uncertainty looming around in the US financial markets. Managements of thefrontline IT companies like TCS, Infosys, Wipro etc. are still non-committal on businessoutlook for the next fiscal. Even the customers, particularly BFSIs are non-committal onIT spend, as they are not able to assess the impact of the credit crisis on their businessesgoing forward. This has put IT spends for CY08 in state of flux. The authorities on theirpart have been supportive — indicated by the Federal Reserve (Fed) having taken sixinterest cuts in six months, bringing rates down to 2.25% from 5.5%. Further the Fed
BSE Sensex: 16,371 S&P CNX: 4,942 28 March 2008
Results PreviewQUARTER ENDED MARCH 2008
14428 March 2008
Information Technology
also had announced a US$200b loan program that allowed the biggest US banks to borrowtreasury securities and post mortgage-backed securities as collateral hoping to avoid asystemic meltdown in financial markets. The Federal Reserve had approved a US$30bcredit line to engineer the bail out and takeover of Bear Stearns.
What to expect in FY09: Ever since the last recession (i.e. 3 quarters of continuousdeclining GDP growth – this happened in Sep-01) in the US in CY01, until now, the IndianIT/BPO industry’s exports has witnessed an impressive CAGR growth of 34%, taking itssize from US$4b to around US$40b in FY 2008 (est). The total IT/BPO services industryincluding the domestic business would be US$50b by FY08, employing close to 1.6 millionpeople and contributing close to 5.2% to India’s GDP. NASSCOM believes Indian IT/BPO is on track to reach the US$60b in exports and US$73-75b in overall software andservices revenues, by 2010, implying export growth of 22.47% for next two years.
For FY09 we believe that IT companies would have back ended growth. We are assumingonly 2-3 quarters of negative growth for the US economy including the March 2008 quarterand hence the IT spends would be impacted in H1FY09. After factoring the impact ofmarginal negative growth in a few BFSI clients, a flat pricing scenario and a moderatewage hike, we expect the frontline IT companies like TCS, Infosys, Satyam, HCL andWipro to register muted growth in FY09 ranging from higher teens to higher twenties inUS$ terms. Infosys had posted muted growth for two quarters post the US being hit by arecession the previous time, emphasizing a lag effect of this condition on IT spends.
Companies such as Infosys and TCS have grown by 35%+ in US$ terms in FY08. In thelight of uncertainty in IT spend and continuing woes in US credit markets we reckonInfosys to guide between 18% to 21% revenue growth in US$ terms. The growth isexpected to be driven via the European geography and ex BFSI verticals. Upon a turnaroundin US credit crisis expected post H1FY09, companies could witness back ended growth.During FY09 companies will be under immense pricing pressure across geographies, moreso from the worst-affected BFSI clients. We have assumed around 2% rupee appreciation(last financial year rupee appreciated ~10%) from an average Rs40 in FY08. With the USalone contributing over 60% of the business for Indian IT/BPO industry the impact isimminent; it only remains to be seen how severe the recession in the US could be.
In spite of slowdown in businesses, nondiscretionary spend (which is typically between60-70% of IT companies business), would continue to increase given urgency for costrationalization in biting business conditions. Also to maintain global competitiveness the UScompanies would have to stay put with their discretionary spend, which could get impactedin the short term. Further most frontline companies now have 30% business coming fromEurope, for example in the last quarter, TCS has less that 50% revenue contribution fromUS. In tough times we could see IT intensity (IT spend as % to business) going down orbeing flat with a shift towards offshoring.

14528 March 2008
Information Technology
FY09 will witness reduction of margins depending on the worsening of sub prime crisis.Indian IT companies will have to come out of their comfort zones for holding margins andtake short term risks for long term sustainability and growth. For this IT companies wouldneed to transform yet again and move up the value chain and thrive on innovation andbusiness solutions, coupled with cost arbitrages, productivity gains and pricing pressures.
What is reassuring at this stage for Indian IT companies?1. A fair fourth quarter guidance from some frontline companies like Satyam, Infosys
and Wipro in midst of US slowing down2. Cognizant giving a good 38% revenue growth guidance for CY08 in mid-February
2008 and reassuring Accenture results in March last week3. No significant stall in hiring plans by frontline companies4. No profit or revenue guidance warning coming from any of Indian IT companies5. A slowing US economy though would envisage cuts in IT budgets, could be a blessing
in disguise for offshore companies as it would focus on cost savings. Globally India isthe only country equipped to provide skill, scale, quality, pace and cost rationalization inone go.
6. Wage hikes are expected to be moderate in current year due to business slowingdown and budgetary tax concession in salary for FY09
7. The offshoring story remains intact with frontline Indian IT companies already at thetop end of the value chain competing with global players like IBM, Accenture, EDS,CSC, HP etc.
8. Analysts from IDC, Gartner, Forrester have indicated growth in IT spend globallyalbeit slower in CY08a. Gartner predicts that the IT spending is expected to grow by 3.3 percent in FY2008
when compared with 2007 levelsb. IDC predicted in February that worldwide IT market would grow of 5% this year,
down from last year’s pace of 6 %. Global IT spending is projected to reachUS$1.38t (including hardware) this year CY08, up from just over US$1.3t in 2007
c. Forrester Research has revised its earlier forecast for a 4.6% increase in USpurchase of IT goods and services down to a more modest 2.8%. The researchfirm says it is based on the updated numbers of newly available economic datathat points toward a slight recession in the United States and will impact IT spendingfor more than half of this year.
Sector valuations: Valuations of Indian IT companies have already discounted a mild /soft US slowdown / recession and hence would have limited downside unless a severerecessionary condition develops (this could only be estimated after a few months), in sucha scenario one could see a significant fall in revenues and growth impacting profitability ofthe Indian IT/BPO companies severely. We recommend holding investments in frontlineIT companies viz. TCS, Infosys, HCL Technologies, Satyam Computers and Wipro, whichhave transformational capabilities which is the need of the hour. We expect fair returns inthe long run and post clarity on uncertainties in IT spending.

14628 March 2008
RELATIVE PERFORMANCE - 3 MONTH (%) RELATIVE PERFORMANCE - 1 YEAR (%)
Stock performance and valuations
STOCK PERFORMANCE (%) ABSOLUTE PERF REL PERF TO SENSEX REL PERF TO SECTOR
3 M 1 YEAR 3 M 1 YEAR 3 M 1 YEARInformation TechnologyHCL Technologies -17 -5 2 -33 0 17Infosys -15 -23 4 -50 2 -1MphasiS -33 -27 -14 -54 -16 -5Patni Computer -30 -38 -12 -65 -13 -16Satyam Computer -9 -10 10 -37 8 12TCS -19 -28 0 -55 -2 -5Tech Mahindra -37 -49 -18 -76 -20 -27Wipro -14 -19 5 -46 3 3
COMPARATIVE VALUATIONCMP (RS) RECO EPS (RS) P/E (X) EV/EBITDA ROE (%)28.03.08 FY08E FY09E FY10E FY08E FY09E FY10E FY08E FY09E FY10E FY08E FY09E FY10E
Information TechnologyHCL Technologies 272 Buy 19.5 22.1 25.6 14.0 12.3 10.6 9.7 7.8 6.2 25.7 26.7 28.4Infosys 1,526 Buy 82.7 93.1 103.4 18.5 16.4 14.8 15.1 12.1 9.5 35.7 31.0 27.3MphasiS 202 Buy 12.1 14.5 17.1 16.6 13.9 11.8 6.9 5.2 4.0 31.5 24.7 24.4Patni Computer 230 Neutral 33.6 35.2 37.1 6.8 6.5 6.2 3.8 2.5 1.8 19.0 17.1 15.7Satyam Computer 408 Buy 25.4 30.6 34.7 16.1 13.3 11.8 12.3 9.3 6.8 26.3 25.6 23.7TCS 870 Buy 52.0 59.8 67.1 16.7 14.6 13.0 13.6 11.4 9.1 46.3 39.2 33.9Tech Mahindra 723 Neutral 57.5 69.5 77.9 12.6 10.4 9.3 10.1 7.8 5.5 44.8 35.1 38.1Wipro 454 Buy 22.4 25.5 29.6 20.3 17.8 15.4 15.7 13.1 9.9 29.2 27.8 26.9Sector Aggregate 17.2 14.8 13.1 13.4 11.0 8.5 30.1 27.8 25.5
Information Technology
74
98
122
146
170
Mar-07 Jun-07 Sep-07 Dec-07 Mar-08
MOSt IT Index Sensex
78
84
90
96
102
Dec-07 Jan-08 Feb-08 Mar-08
Sensex MOSt IT Index
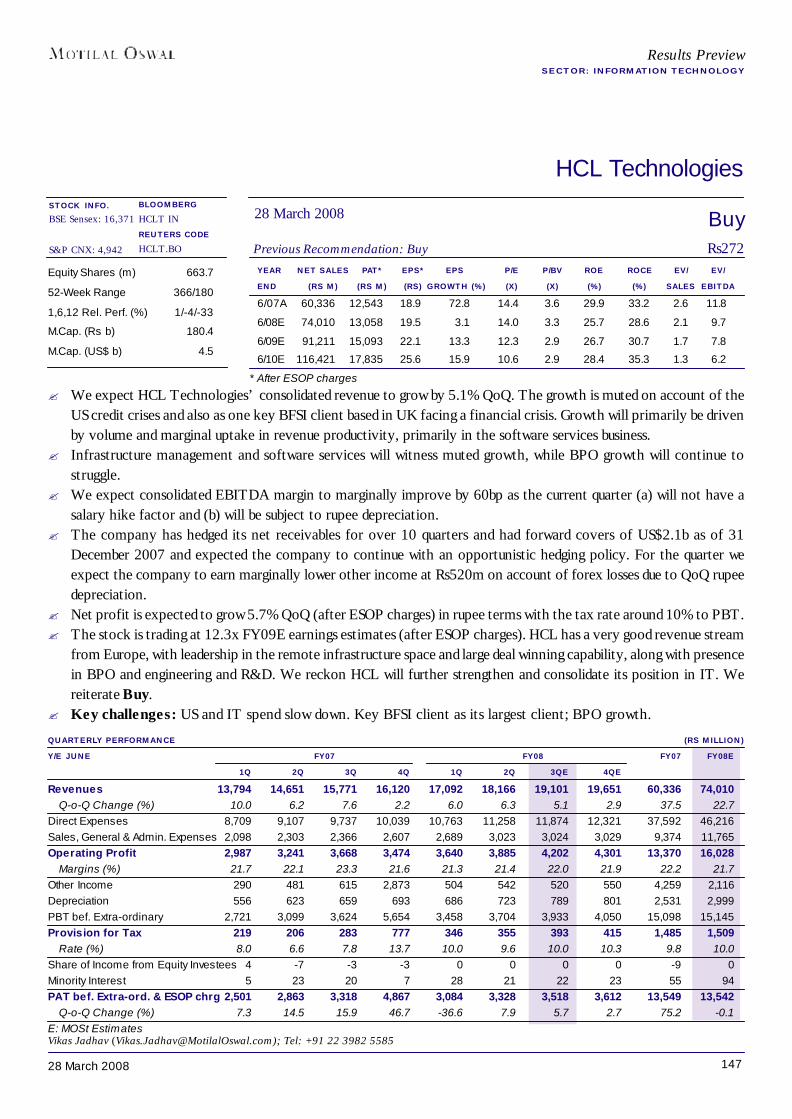
14728 March 2008
HCL Technologies
YEAR NET SALES PAT* EPS* EPS P/E P/BV ROE ROCE EV/ EV/END (RS M) (RS M) (RS) GROWTH (%) (X) (X) (%) (%) SALES EBITDA6/07A 60,336 12,543 18.9 72.8 14.4 3.6 29.9 33.2 2.6 11.8
6/08E 74,010 13,058 19.5 3.1 14.0 3.3 25.7 28.6 2.1 9.7
6/09E 91,211 15,093 22.1 13.3 12.3 2.9 26.7 30.7 1.7 7.8
6/10E 116,421 17,835 25.6 15.9 10.6 2.9 28.4 35.3 1.3 6.2
Equity Shares (m) 663.7
52-Week Range 366/180
1,6,12 Rel. Perf. (%) 1/-4/-33
M.Cap. (Rs b) 180.4
M.Cap. (US$ b) 4.5
QUARTERLY PERFORMANCE (RS MILLION)Y/E JUNE FY07 FY08 FY07 FY08E
1Q 2Q 3Q 4Q 1Q 2Q 3QE 4QERevenues 13,794 14,651 15,771 16,120 17,092 18,166 19,101 19,651 60,336 74,010
Q-o-Q Change (%) 10.0 6.2 7.6 2.2 6.0 6.3 5.1 2.9 37.5 22.7Direct Expenses 8,709 9,107 9,737 10,039 10,763 11,258 11,874 12,321 37,592 46,216Sales, General & Admin. Expenses 2,098 2,303 2,366 2,607 2,689 3,023 3,024 3,029 9,374 11,765Operating Profit 2,987 3,241 3,668 3,474 3,640 3,885 4,202 4,301 13,370 16,028
Margins (%) 21.7 22.1 23.3 21.6 21.3 21.4 22.0 21.9 22.2 21.7Other Income 290 481 615 2,873 504 542 520 550 4,259 2,116Depreciation 556 623 659 693 686 723 789 801 2,531 2,999PBT bef. Extra-ordinary 2,721 3,099 3,624 5,654 3,458 3,704 3,933 4,050 15,098 15,145Provision for Tax 219 206 283 777 346 355 393 415 1,485 1,509
Rate (%) 8.0 6.6 7.8 13.7 10.0 9.6 10.0 10.3 9.8 10.0Share of Income from Equity Investees 4 -7 -3 -3 0 0 0 0 -9 0Minority Interest 5 23 20 7 28 21 22 23 55 94PAT bef. Extra-ord. & ESOP chrg 2,501 2,863 3,318 4,867 3,084 3,328 3,518 3,612 13,549 13,542
Q-o-Q Change (%) 7.3 14.5 15.9 46.7 -36.6 7.9 5.7 2.7 75.2 -0.1E: MOSt Estimates
BuyPrevious Recommendation: Buy Rs272
28 March 2008BLOOMBERGHCLT INREUTERS CODEHCLT.BO
Results PreviewSECTOR: INFORMATION TECHNOLOGY
Vikas Jadhav ([email protected]); Tel: +91 22 3982 5585
* After ESOP charges
STOCK INFO.BSE Sensex: 16,371
S&P CNX: 4,942
? We expect HCL Technologies’ consolidated revenue to grow by 5.1% QoQ. The growth is muted on account of theUS credit crises and also as one key BFSI client based in UK facing a financial crisis. Growth will primarily be drivenby volume and marginal uptake in revenue productivity, primarily in the software services business.
? Infrastructure management and software services will witness muted growth, while BPO growth will continue tostruggle.
? We expect consolidated EBITDA margin to marginally improve by 60bp as the current quarter (a) will not have asalary hike factor and (b) will be subject to rupee depreciation.
? The company has hedged its net receivables for over 10 quarters and had forward covers of US$2.1b as of 31December 2007 and expected the company to continue with an opportunistic hedging policy. For the quarter weexpect the company to earn marginally lower other income at Rs520m on account of forex losses due to QoQ rupeedepreciation.
? Net profit is expected to grow 5.7% QoQ (after ESOP charges) in rupee terms with the tax rate around 10% to PBT.? The stock is trading at 12.3x FY09E earnings estimates (after ESOP charges). HCL has a very good revenue stream
from Europe, with leadership in the remote infrastructure space and large deal winning capability, along with presencein BPO and engineering and R&D. We reckon HCL will further strengthen and consolidate its position in IT. Wereiterate Buy.
? Key challenges: US and IT spend slow down. Key BFSI client as its largest client; BPO growth.
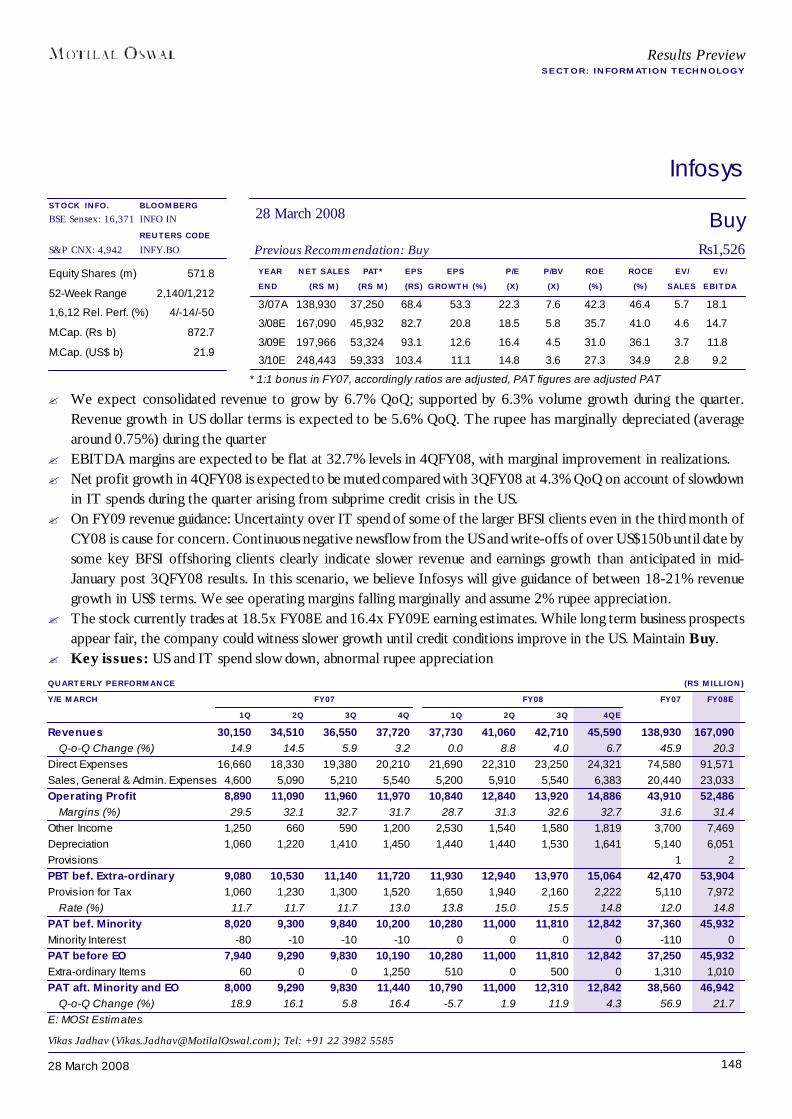
14828 March 2008
Infosys
YEAR NET SALES PAT* EPS EPS P/E P/BV ROE ROCE EV/ EV/END (RS M) (RS M) (RS) GROWTH (%) (X) (X) (%) (%) SALES EBITDA
3/07A 138,930 37,250 68.4 53.3 22.3 7.6 42.3 46.4 5.7 18.1
3/08E 167,090 45,932 82.7 20.8 18.5 5.8 35.7 41.0 4.6 14.7
3/09E 197,966 53,324 93.1 12.6 16.4 4.5 31.0 36.1 3.7 11.8
3/10E 248,443 59,333 103.4 11.1 14.8 3.6 27.3 34.9 2.8 9.2
Equity Shares (m) 571.8
52-Week Range 2,140/1,212
1,6,12 Rel. Perf. (%) 4/-14/-50
M.Cap. (Rs b) 872.7
M.Cap. (US$ b) 21.9
QUARTERLY PERFORMANCE (RS MILLION)Y/E MARCH FY07 FY08 FY07 FY08E
1Q 2Q 3Q 4Q 1Q 2Q 3Q 4QERevenues 30,150 34,510 36,550 37,720 37,730 41,060 42,710 45,590 138,930 167,090
Q-o-Q Change (%) 14.9 14.5 5.9 3.2 0.0 8.8 4.0 6.7 45.9 20.3Direct Expenses 16,660 18,330 19,380 20,210 21,690 22,310 23,250 24,321 74,580 91,571Sales, General & Admin. Expenses 4,600 5,090 5,210 5,540 5,200 5,910 5,540 6,383 20,440 23,033Operating Profit 8,890 11,090 11,960 11,970 10,840 12,840 13,920 14,886 43,910 52,486
Margins (%) 29.5 32.1 32.7 31.7 28.7 31.3 32.6 32.7 31.6 31.4Other Income 1,250 660 590 1,200 2,530 1,540 1,580 1,819 3,700 7,469Depreciation 1,060 1,220 1,410 1,450 1,440 1,440 1,530 1,641 5,140 6,051Provisions 1 2PBT bef. Extra-ordinary 9,080 10,530 11,140 11,720 11,930 12,940 13,970 15,064 42,470 53,904Provision for Tax 1,060 1,230 1,300 1,520 1,650 1,940 2,160 2,222 5,110 7,972
Rate (%) 11.7 11.7 11.7 13.0 13.8 15.0 15.5 14.8 12.0 14.8PAT bef. Minority 8,020 9,300 9,840 10,200 10,280 11,000 11,810 12,842 37,360 45,932Minority Interest -80 -10 -10 -10 0 0 0 0 -110 0PAT before EO 7,940 9,290 9,830 10,190 10,280 11,000 11,810 12,842 37,250 45,932Extra-ordinary Items 60 0 0 1,250 510 0 500 0 1,310 1,010PAT aft. Minority and EO 8,000 9,290 9,830 11,440 10,790 11,000 12,310 12,842 38,560 46,942
Q-o-Q Change (%) 18.9 16.1 5.8 16.4 -5.7 1.9 11.9 4.3 56.9 21.7E: MOSt Estimates
BuyPrevious Recommendation: Buy Rs1,526
28 March 2008BLOOMBERGINFO IN
REUTERS CODEINFY.BO
Results PreviewSECTOR: INFORMATION TECHNOLOGY
Vikas Jadhav ([email protected]); Tel: +91 22 3982 5585
* 1:1 bonus in FY07, accordingly ratios are adjusted, PAT figures are adjusted PAT
STOCK INFO.BSE Sensex: 16,371
S&P CNX: 4,942
? We expect consolidated revenue to grow by 6.7% QoQ; supported by 6.3% volume growth during the quarter.Revenue growth in US dollar terms is expected to be 5.6% QoQ. The rupee has marginally depreciated (averagearound 0.75%) during the quarter
? EBITDA margins are expected to be flat at 32.7% levels in 4QFY08, with marginal improvement in realizations.? Net profit growth in 4QFY08 is expected to be muted compared with 3QFY08 at 4.3% QoQ on account of slowdown
in IT spends during the quarter arising from subprime credit crisis in the US.? On FY09 revenue guidance: Uncertainty over IT spend of some of the larger BFSI clients even in the third month of
CY08 is cause for concern. Continuous negative newsflow from the US and write-offs of over US$150b until date bysome key BFSI offshoring clients clearly indicate slower revenue and earnings growth than anticipated in mid-January post 3QFY08 results. In this scenario, we believe Infosys will give guidance of between 18-21% revenuegrowth in US$ terms. We see operating margins falling marginally and assume 2% rupee appreciation.
? The stock currently trades at 18.5x FY08E and 16.4x FY09E earning estimates. While long term business prospectsappear fair, the company could witness slower growth until credit conditions improve in the US. Maintain Buy.
? Key issues: US and IT spend slow down, abnormal rupee appreciation
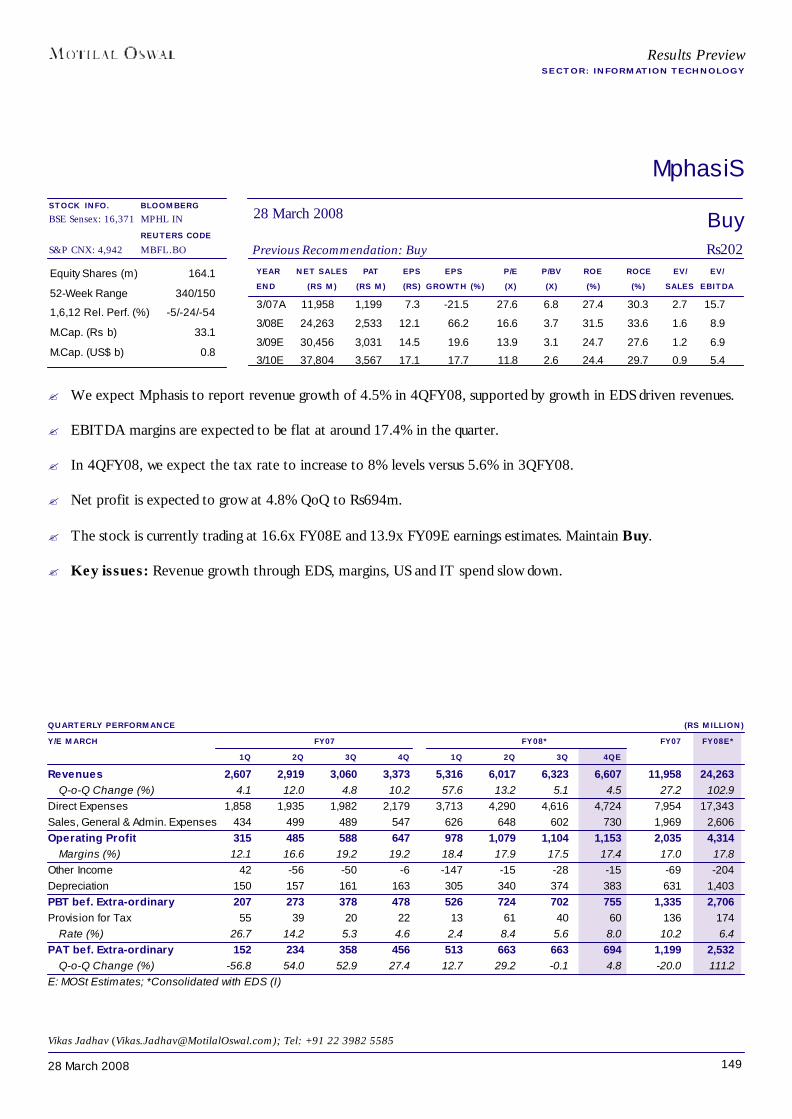
14928 March 2008
MphasiS
YEAR NET SALES PAT EPS EPS P/E P/BV ROE ROCE EV/ EV/END (RS M) (RS M) (RS) GROWTH (%) (X) (X) (%) (%) SALES EBITDA
3/07A 11,958 1,199 7.3 -21.5 27.6 6.8 27.4 30.3 2.7 15.7
3/08E 24,263 2,533 12.1 66.2 16.6 3.7 31.5 33.6 1.6 8.9
3/09E 30,456 3,031 14.5 19.6 13.9 3.1 24.7 27.6 1.2 6.9
3/10E 37,804 3,567 17.1 17.7 11.8 2.6 24.4 29.7 0.9 5.4
Equity Shares (m) 164.1
52-Week Range 340/150
1,6,12 Rel. Perf. (%) -5/-24/-54
M.Cap. (Rs b) 33.1
M.Cap. (US$ b) 0.8
QUARTERLY PERFORMANCE (RS MILLION)Y/E MARCH FY07 FY08* FY07 FY08E*
1Q 2Q 3Q 4Q 1Q 2Q 3Q 4QERevenues 2,607 2,919 3,060 3,373 5,316 6,017 6,323 6,607 11,958 24,263
Q-o-Q Change (%) 4.1 12.0 4.8 10.2 57.6 13.2 5.1 4.5 27.2 102.9Direct Expenses 1,858 1,935 1,982 2,179 3,713 4,290 4,616 4,724 7,954 17,343Sales, General & Admin. Expenses 434 499 489 547 626 648 602 730 1,969 2,606Operating Profit 315 485 588 647 978 1,079 1,104 1,153 2,035 4,314
Margins (%) 12.1 16.6 19.2 19.2 18.4 17.9 17.5 17.4 17.0 17.8Other Income 42 -56 -50 -6 -147 -15 -28 -15 -69 -204Depreciation 150 157 161 163 305 340 374 383 631 1,403PBT bef. Extra-ordinary 207 273 378 478 526 724 702 755 1,335 2,706Provision for Tax 55 39 20 22 13 61 40 60 136 174
Rate (%) 26.7 14.2 5.3 4.6 2.4 8.4 5.6 8.0 10.2 6.4PAT bef. Extra-ordinary 152 234 358 456 513 663 663 694 1,199 2,532
Q-o-Q Change (%) -56.8 54.0 52.9 27.4 12.7 29.2 -0.1 4.8 -20.0 111.2E: MOSt Estimates; *Consolidated with EDS (I)
BuyPrevious Recommendation: Buy Rs202
28 March 2008BLOOMBERGMPHL IN
REUTERS CODEMBFL.BO
Results PreviewSECTOR: INFORMATION TECHNOLOGY
Vikas Jadhav ([email protected]); Tel: +91 22 3982 5585
STOCK INFO.BSE Sensex: 16,371
S&P CNX: 4,942
? We expect Mphasis to report revenue growth of 4.5% in 4QFY08, supported by growth in EDS driven revenues.
? EBITDA margins are expected to be flat at around 17.4% in the quarter.
? In 4QFY08, we expect the tax rate to increase to 8% levels versus 5.6% in 3QFY08.
? Net profit is expected to grow at 4.8% QoQ to Rs694m.
? The stock is currently trading at 16.6x FY08E and 13.9x FY09E earnings estimates. Maintain Buy.
? Key issues: Revenue growth through EDS, margins, US and IT spend slow down.
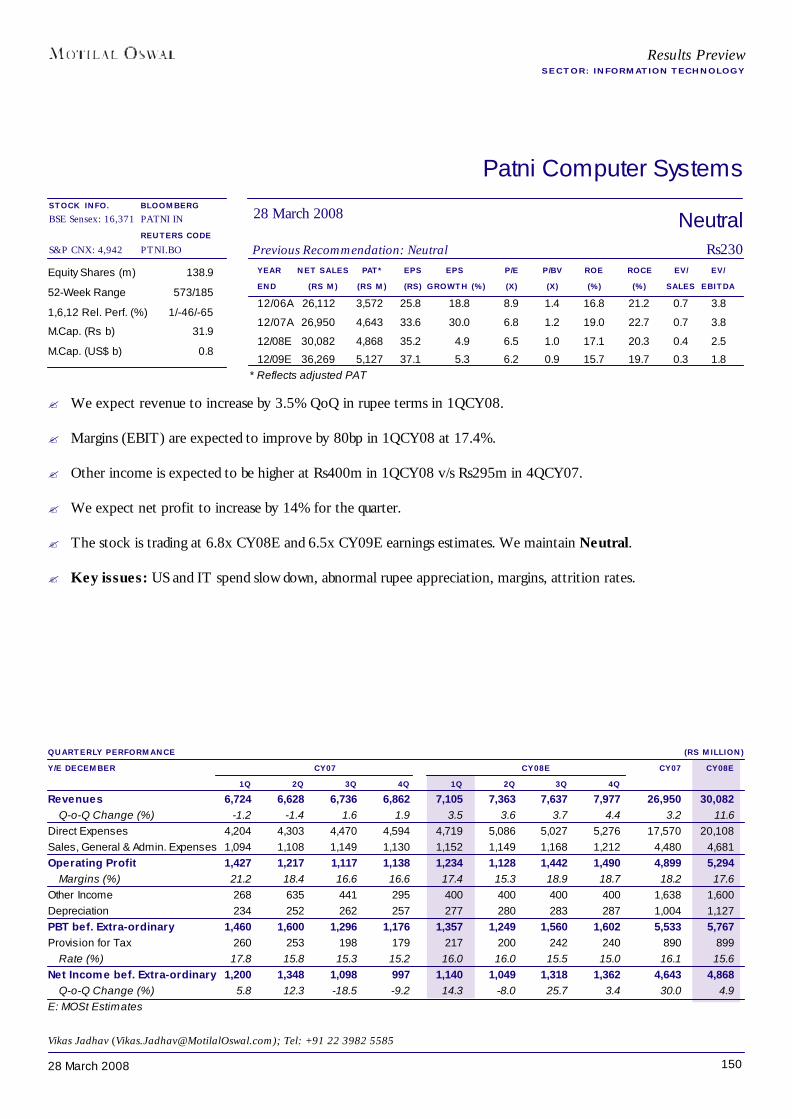
15028 March 2008
Patni Computer Systems
NeutralPrevious Recommendation: Neutral Rs230
28 March 2008BLOOMBERGPATNI IN
REUTERS CODEPTNI.BO
Equity Shares (m) 138.9
52-Week Range 573/185
1,6,12 Rel. Perf. (%) 1/-46/-65
M.Cap. (Rs b) 31.9
M.Cap. (US$ b) 0.8
QUARTERLY PERFORMANCE (RS MILLION)Y/E DECEMBER CY07 CY08E CY07 CY08E
1Q 2Q 3Q 4Q 1Q 2Q 3Q 4QRevenues 6,724 6,628 6,736 6,862 7,105 7,363 7,637 7,977 26,950 30,082
Q-o-Q Change (%) -1.2 -1.4 1.6 1.9 3.5 3.6 3.7 4.4 3.2 11.6Direct Expenses 4,204 4,303 4,470 4,594 4,719 5,086 5,027 5,276 17,570 20,108Sales, General & Admin. Expenses 1,094 1,108 1,149 1,130 1,152 1,149 1,168 1,212 4,480 4,681Operating Profit 1,427 1,217 1,117 1,138 1,234 1,128 1,442 1,490 4,899 5,294
Margins (%) 21.2 18.4 16.6 16.6 17.4 15.3 18.9 18.7 18.2 17.6Other Income 268 635 441 295 400 400 400 400 1,638 1,600Depreciation 234 252 262 257 277 280 283 287 1,004 1,127PBT bef. Extra-ordinary 1,460 1,600 1,296 1,176 1,357 1,249 1,560 1,602 5,533 5,767Provision for Tax 260 253 198 179 217 200 242 240 890 899
Rate (%) 17.8 15.8 15.3 15.2 16.0 16.0 15.5 15.0 16.1 15.6Net Income bef. Extra-ordinary 1,200 1,348 1,098 997 1,140 1,049 1,318 1,362 4,643 4,868
Q-o-Q Change (%) 5.8 12.3 -18.5 -9.2 14.3 -8.0 25.7 3.4 30.0 4.9E: MOSt Estimates
YEAR NET SALES PAT* EPS EPS P/E P/BV ROE ROCE EV/ EV/END (RS M) (RS M) (RS) GROWTH (%) (X) (X) (%) (%) SALES EBITDA12/06A 26,112 3,572 25.8 18.8 8.9 1.4 16.8 21.2 0.7 3.8
12/07A 26,950 4,643 33.6 30.0 6.8 1.2 19.0 22.7 0.7 3.8
12/08E 30,082 4,868 35.2 4.9 6.5 1.0 17.1 20.3 0.4 2.5
12/09E 36,269 5,127 37.1 5.3 6.2 0.9 15.7 19.7 0.3 1.8
Results PreviewSECTOR: INFORMATION TECHNOLOGY
Vikas Jadhav ([email protected]); Tel: +91 22 3982 5585
* Reflects adjusted PAT
STOCK INFO.BSE Sensex: 16,371
S&P CNX: 4,942
? We expect revenue to increase by 3.5% QoQ in rupee terms in 1QCY08.
? Margins (EBIT) are expected to improve by 80bp in 1QCY08 at 17.4%.
? Other income is expected to be higher at Rs400m in 1QCY08 v/s Rs295m in 4QCY07.
? We expect net profit to increase by 14% for the quarter.
? The stock is trading at 6.8x CY08E and 6.5x CY09E earnings estimates. We maintain Neutral.
? Key issues: US and IT spend slow down, abnormal rupee appreciation, margins, attrition rates.

15128 March 2008
Satyam Computer
YEAR NET SALES PAT* EPS EPS P/E P/BV ROE ROCE EV/ EV/END (RS M) (RS M) (RS) GROWTH (%) (X) (X) (%) (%) SALES EBITDA
3/07A 64,851 14,047 21.5 41.7 19.0 4.6 27.9 30.3 3.6 15.3
3/08E 83,954 16,989 25.4 18.4 16.1 3.8 26.3 29.9 2.7 12.3
3/09E 106,731 20,601 30.6 20.5 13.3 3.1 25.6 30.0 2.0 9.3
3/10E 136,725 23,600 34.7 13.5 11.8 2.5 23.7 31.0 1.4 6.8
Equity Shares (m) 669.1
52-Week Range 522/305
1,6,12 Rel. Perf. (%) -0/-3/-37
M.Cap. (Rs b) 273.3
M.Cap. (US$ b) 6.8
QUARTERLY PERFORMANCE (RS MILLION)Y/E MARCH FY07 FY08 FY07 FY08E
1Q 2Q 3Q 4Q 1Q 2Q 3Q 4QERevenues 14,429 16,019 16,611 17,792 18,302 20,317 21,956 23,379 64,851 83,954
Q-o-Q Change (%) 9.8 11.0 3.7 7.1 2.9 11.0 8.1 6.5 35.3 29.5Direct Expenses 8,316 9,827 9,674 10,763 11,062 13,028 13,806 14,423 38,579 52,319Sales, General & Admin. Expenses 2,563 2,567 2,838 2,927 3,137 3,263 3,437 3,670 10,894 13,508Operating Profit 3,550 3,625 4,100 4,102 4,103 4,027 4,712 5,285 15,377 18,127
Margins (%) 24.6 22.6 24.7 23.1 22.4 19.8 21.5 22.6 23.7 21.6Other Income 745 282 102 704 632 1,105 705 706 1,833 3,148Depreciation 362 375 394 354 387 391 423 456 1,484 1,656Interest 26 27 32 74 33 42 81 47 159 203PBT bef. Extra-ordinary 3,908 3,505 3,776 4,378 4,315 4,700 4,913 5,488 15,566 19,416Provision for Tax 368 307 403 442 532 609 576 710 1,520 2,427
Rate (%) 9.4 8.8 10.7 10.1 12.3 13.0 11.7 12.9 9.8 12.5Minority Interest -1 0 0 0 0 0 0 0 -1 0PAT bef. Extra-ordinary 3,541 3,198 3,372 3,936 3,783 4,091 4,336 4,779 14,047 16,989
Q-o-Q Change (%) 24.4 -9.7 5.4 16.7 -3.9 8.1 6.0 10.2 43.0 20.9E: MOSt Estimates
BuyPrevious Recommendation: Buy Rs408
28 March 2008BLOOMBERGSCS IN
REUTERS CODESATY.BO
Results PreviewSECTOR: INFORMATION TECHNOLOGY
Vikas Jadhav ([email protected]); Tel: +91 22 3982 5585
* PAT figures reflects adjusted PAT
STOCK INFO.BSE Sensex: 16,371
S&P CNX: 4,942
? We expect Satyam to report consolidated revenue growth of 6.5% QoQ in 4QFY08. In dollar terms, we expectconsolidated revenue growth of 5.9% QoQ in 4QFY08.
? EBITDA margins are expected to improve by 100bp in 4QFY08, on the back of higher volume growth and betterrevenue realisation.
? Net profit is expected to grow by 10.2% in the quarter on the back of improved revenue growth.
? The stock is currently trading at 16.1x FY08E and 13.3x FY09E earnings estimates. We continue to be impressedwith Satyam’s execution in terms of reduction in attrition rates and diversification into other service offerings such asengineering services and infrastructure management. This measure has improved its earnings visibility significantly.We maintain Buy.
? Key issues: US and IT spend slowdown, abnormal rupee appreciation, BPO business.
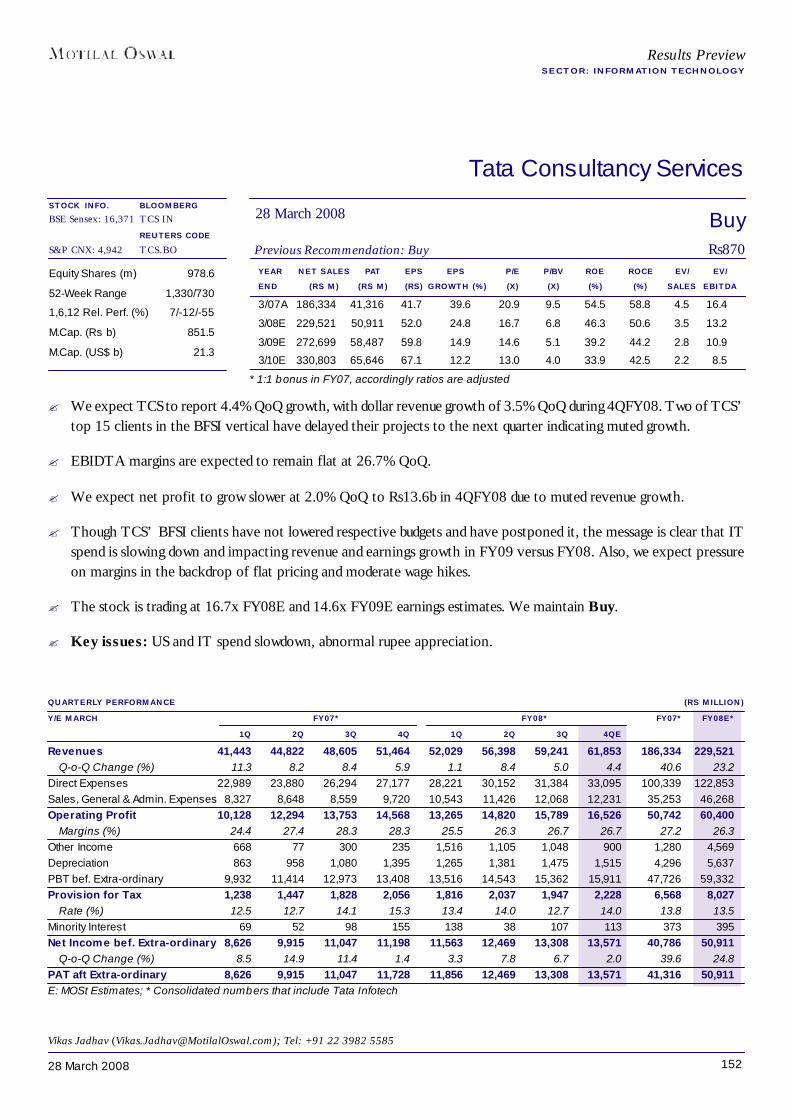
15228 March 2008
Tata Consultancy Services
YEAR NET SALES PAT EPS EPS P/E P/BV ROE ROCE EV/ EV/END (RS M) (RS M) (RS) GROWTH (%) (X) (X) (%) (%) SALES EBITDA
3/07A 186,334 41,316 41.7 39.6 20.9 9.5 54.5 58.8 4.5 16.4
3/08E 229,521 50,911 52.0 24.8 16.7 6.8 46.3 50.6 3.5 13.2
3/09E 272,699 58,487 59.8 14.9 14.6 5.1 39.2 44.2 2.8 10.9
3/10E 330,803 65,646 67.1 12.2 13.0 4.0 33.9 42.5 2.2 8.5
Equity Shares (m) 978.6
52-Week Range 1,330/730
1,6,12 Rel. Perf. (%) 7/-12/-55
M.Cap. (Rs b) 851.5
M.Cap. (US$ b) 21.3
QUARTERLY PERFORMANCE (RS MILLION)Y/E MARCH FY07* FY08* FY07* FY08E*
1Q 2Q 3Q 4Q 1Q 2Q 3Q 4QERevenues 41,443 44,822 48,605 51,464 52,029 56,398 59,241 61,853 186,334 229,521
Q-o-Q Change (%) 11.3 8.2 8.4 5.9 1.1 8.4 5.0 4.4 40.6 23.2Direct Expenses 22,989 23,880 26,294 27,177 28,221 30,152 31,384 33,095 100,339 122,853Sales, General & Admin. Expenses 8,327 8,648 8,559 9,720 10,543 11,426 12,068 12,231 35,253 46,268Operating Profit 10,128 12,294 13,753 14,568 13,265 14,820 15,789 16,526 50,742 60,400
Margins (%) 24.4 27.4 28.3 28.3 25.5 26.3 26.7 26.7 27.2 26.3Other Income 668 77 300 235 1,516 1,105 1,048 900 1,280 4,569Depreciation 863 958 1,080 1,395 1,265 1,381 1,475 1,515 4,296 5,637PBT bef. Extra-ordinary 9,932 11,414 12,973 13,408 13,516 14,543 15,362 15,911 47,726 59,332Provision for Tax 1,238 1,447 1,828 2,056 1,816 2,037 1,947 2,228 6,568 8,027
Rate (%) 12.5 12.7 14.1 15.3 13.4 14.0 12.7 14.0 13.8 13.5Minority Interest 69 52 98 155 138 38 107 113 373 395Net Income bef. Extra-ordinary 8,626 9,915 11,047 11,198 11,563 12,469 13,308 13,571 40,786 50,911
Q-o-Q Change (%) 8.5 14.9 11.4 1.4 3.3 7.8 6.7 2.0 39.6 24.8PAT aft Extra-ordinary 8,626 9,915 11,047 11,728 11,856 12,469 13,308 13,571 41,316 50,911E: MOSt Estimates; * Consolidated numbers that include Tata Infotech
BuyPrevious Recommendation: Buy Rs870
28 March 2008BLOOMBERGTCS IN
REUTERS CODETCS.BO
Results PreviewSECTOR: INFORMATION TECHNOLOGY
Vikas Jadhav ([email protected]); Tel: +91 22 3982 5585
* 1:1 bonus in FY07, accordingly ratios are adjusted
STOCK INFO.BSE Sensex: 16,371
S&P CNX: 4,942
? We expect TCS to report 4.4% QoQ growth, with dollar revenue growth of 3.5% QoQ during 4QFY08. Two of TCS’top 15 clients in the BFSI vertical have delayed their projects to the next quarter indicating muted growth.
? EBIDTA margins are expected to remain flat at 26.7% QoQ.
? We expect net profit to grow slower at 2.0% QoQ to Rs13.6b in 4QFY08 due to muted revenue growth.
? Though TCS’ BFSI clients have not lowered respective budgets and have postponed it, the message is clear that ITspend is slowing down and impacting revenue and earnings growth in FY09 versus FY08. Also, we expect pressureon margins in the backdrop of flat pricing and moderate wage hikes.
? The stock is trading at 16.7x FY08E and 14.6x FY09E earnings estimates. We maintain Buy.
? Key issues: US and IT spend slowdown, abnormal rupee appreciation.
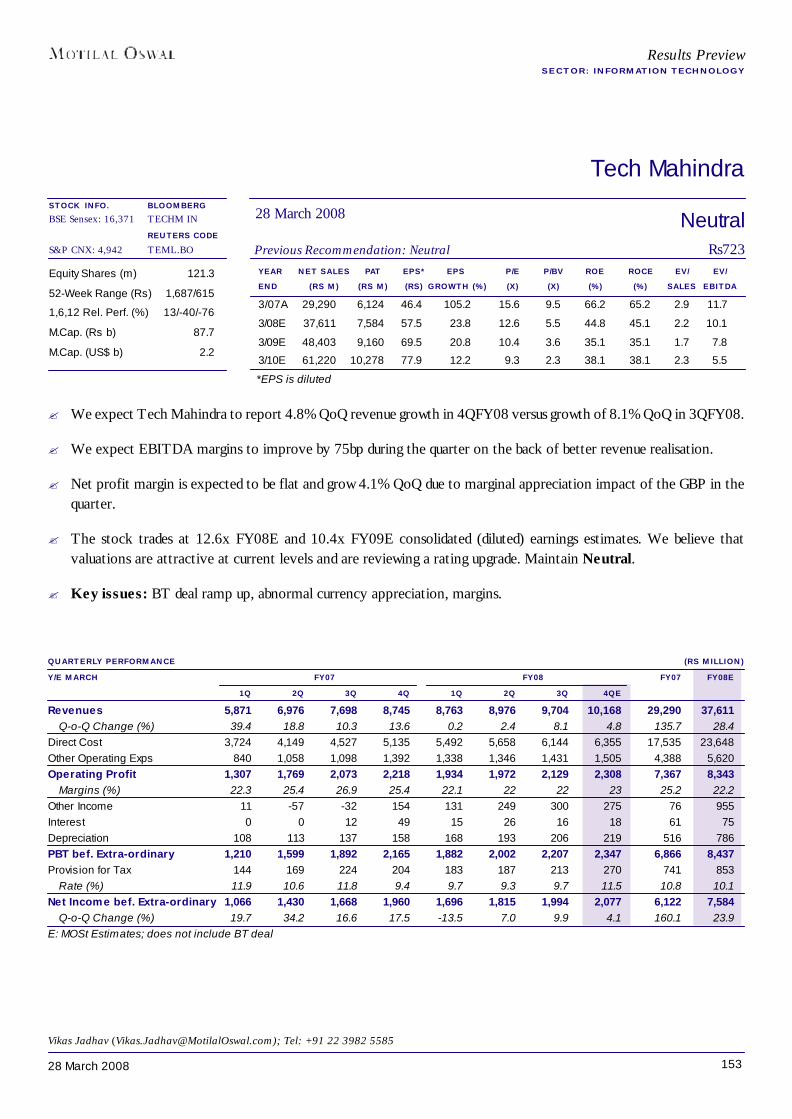
15328 March 2008
Tech Mahindra
YEAR NET SALES PAT EPS* EPS P/E P/BV ROE ROCE EV/ EV/END (RS M) (RS M) (RS) GROWTH (%) (X) (X) (%) (%) SALES EBITDA
3/07A 29,290 6,124 46.4 105.2 15.6 9.5 66.2 65.2 2.9 11.7
3/08E 37,611 7,584 57.5 23.8 12.6 5.5 44.8 45.1 2.2 10.1
3/09E 48,403 9,160 69.5 20.8 10.4 3.6 35.1 35.1 1.7 7.8
3/10E 61,220 10,278 77.9 12.2 9.3 2.3 38.1 38.1 2.3 5.5
Equity Shares (m) 121.3
52-Week Range (Rs) 1,687/615
1,6,12 Rel. Perf. (%) 13/-40/-76
M.Cap. (Rs b) 87.7
M.Cap. (US$ b) 2.2
QUARTERLY PERFORMANCE (RS MILLION)Y/E MARCH FY07 FY08 FY07 FY08E
1Q 2Q 3Q 4Q 1Q 2Q 3Q 4QERevenues 5,871 6,976 7,698 8,745 8,763 8,976 9,704 10,168 29,290 37,611
Q-o-Q Change (%) 39.4 18.8 10.3 13.6 0.2 2.4 8.1 4.8 135.7 28.4Direct Cost 3,724 4,149 4,527 5,135 5,492 5,658 6,144 6,355 17,535 23,648Other Operating Exps 840 1,058 1,098 1,392 1,338 1,346 1,431 1,505 4,388 5,620Operating Profit 1,307 1,769 2,073 2,218 1,934 1,972 2,129 2,308 7,367 8,343
Margins (%) 22.3 25.4 26.9 25.4 22.1 22 22 23 25.2 22.2Other Income 11 -57 -32 154 131 249 300 275 76 955Interest 0 0 12 49 15 26 16 18 61 75Depreciation 108 113 137 158 168 193 206 219 516 786PBT bef. Extra-ordinary 1,210 1,599 1,892 2,165 1,882 2,002 2,207 2,347 6,866 8,437Provision for Tax 144 169 224 204 183 187 213 270 741 853
Rate (%) 11.9 10.6 11.8 9.4 9.7 9.3 9.7 11.5 10.8 10.1Net Income bef. Extra-ordinary 1,066 1,430 1,668 1,960 1,696 1,815 1,994 2,077 6,122 7,584
Q-o-Q Change (%) 19.7 34.2 16.6 17.5 -13.5 7.0 9.9 4.1 160.1 23.9E: MOSt Estimates; does not include BT deal
NeutralPrevious Recommendation: Neutral Rs723
28 March 2008BLOOMBERGTECHM IN
REUTERS CODETEML.BO
Results PreviewSECTOR: INFORMATION TECHNOLOGY
*EPS is diluted
Vikas Jadhav ([email protected]); Tel: +91 22 3982 5585
STOCK INFO.BSE Sensex: 16,371
S&P CNX: 4,942
? We expect Tech Mahindra to report 4.8% QoQ revenue growth in 4QFY08 versus growth of 8.1% QoQ in 3QFY08.
? We expect EBITDA margins to improve by 75bp during the quarter on the back of better revenue realisation.
? Net profit margin is expected to be flat and grow 4.1% QoQ due to marginal appreciation impact of the GBP in thequarter.
? The stock trades at 12.6x FY08E and 10.4x FY09E consolidated (diluted) earnings estimates. We believe thatvaluations are attractive at current levels and are reviewing a rating upgrade. Maintain Neutral.
? Key issues: BT deal ramp up, abnormal currency appreciation, margins.
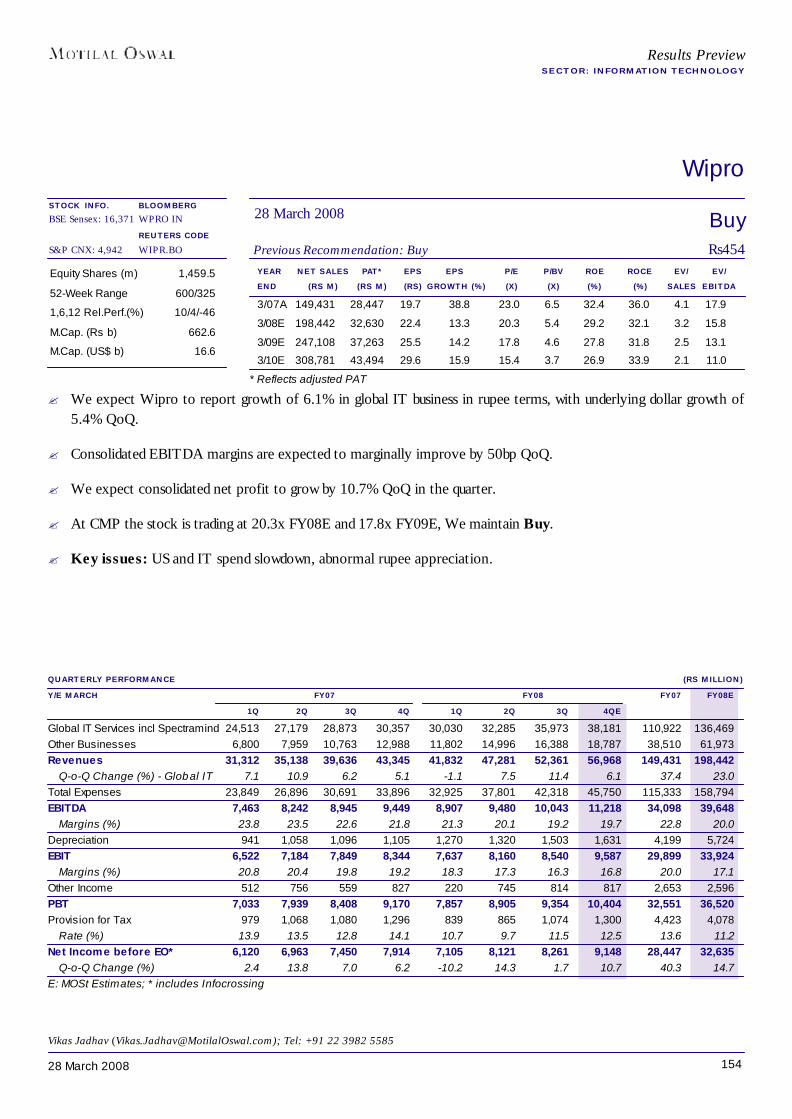
15428 March 2008
Wipro
YEAR NET SALES PAT* EPS EPS P/E P/BV ROE ROCE EV/ EV/END (RS M) (RS M) (RS) GROWTH (%) (X) (X) (%) (%) SALES EBITDA
3/07A 149,431 28,447 19.7 38.8 23.0 6.5 32.4 36.0 4.1 17.9
3/08E 198,442 32,630 22.4 13.3 20.3 5.4 29.2 32.1 3.2 15.8
3/09E 247,108 37,263 25.5 14.2 17.8 4.6 27.8 31.8 2.5 13.1
3/10E 308,781 43,494 29.6 15.9 15.4 3.7 26.9 33.9 2.1 11.0
Equity Shares (m) 1,459.5
52-Week Range 600/325
1,6,12 Rel.Perf.(%) 10/4/-46
M.Cap. (Rs b) 662.6
M.Cap. (US$ b) 16.6
QUARTERLY PERFORMANCE (RS MILLION)Y/E MARCH FY07 FY08 FY07 FY08E
1Q 2Q 3Q 4Q 1Q 2Q 3Q 4QEGlobal IT Services incl Spectramind 24,513 27,179 28,873 30,357 30,030 32,285 35,973 38,181 110,922 136,469Other Businesses 6,800 7,959 10,763 12,988 11,802 14,996 16,388 18,787 38,510 61,973Revenues 31,312 35,138 39,636 43,345 41,832 47,281 52,361 56,968 149,431 198,442
Q-o-Q Change (%) - Global IT 7.1 10.9 6.2 5.1 -1.1 7.5 11.4 6.1 37.4 23.0Total Expenses 23,849 26,896 30,691 33,896 32,925 37,801 42,318 45,750 115,333 158,794EBITDA 7,463 8,242 8,945 9,449 8,907 9,480 10,043 11,218 34,098 39,648
Margins (%) 23.8 23.5 22.6 21.8 21.3 20.1 19.2 19.7 22.8 20.0Depreciation 941 1,058 1,096 1,105 1,270 1,320 1,503 1,631 4,199 5,724EBIT 6,522 7,184 7,849 8,344 7,637 8,160 8,540 9,587 29,899 33,924
Margins (%) 20.8 20.4 19.8 19.2 18.3 17.3 16.3 16.8 20.0 17.1Other Income 512 756 559 827 220 745 814 817 2,653 2,596PBT 7,033 7,939 8,408 9,170 7,857 8,905 9,354 10,404 32,551 36,520Provision for Tax 979 1,068 1,080 1,296 839 865 1,074 1,300 4,423 4,078
Rate (%) 13.9 13.5 12.8 14.1 10.7 9.7 11.5 12.5 13.6 11.2Net Income before EO* 6,120 6,963 7,450 7,914 7,105 8,121 8,261 9,148 28,447 32,635
Q-o-Q Change (%) 2.4 13.8 7.0 6.2 -10.2 14.3 1.7 10.7 40.3 14.7E: MOSt Estimates; * includes Infocrossing
BuyPrevious Recommendation: Buy Rs454
28 March 2008BLOOMBERGWPRO IN
REUTERS CODEWIPR.BO
Results PreviewSECTOR: INFORMATION TECHNOLOGY
Vikas Jadhav ([email protected]); Tel: +91 22 3982 5585
* Reflects adjusted PAT
STOCK INFO.BSE Sensex: 16,371
S&P CNX: 4,942
? We expect Wipro to report growth of 6.1% in global IT business in rupee terms, with underlying dollar growth of5.4% QoQ.
? Consolidated EBITDA margins are expected to marginally improve by 50bp QoQ.
? We expect consolidated net profit to grow by 10.7% QoQ in the quarter.
? At CMP the stock is trading at 20.3x FY08E and 17.8x FY09E, We maintain Buy.
? Key issues: US and IT spend slowdown, abnormal rupee appreciation.

15528 March 2008
Infrastructure
COMPANY NAME PG.BL Kashyap 161
Gammon India 162
GMR Infrastructure 163
Hindustan Construction 164
IVRCL 165
Jaiprakash Associates 166
Nagarjuna Construction 167
Patel Engineering 168
Simplex Infrastructure 169
EXPECTED QUARTERLY PERFORMANCE SUMMARY (RS MILLION)RECO SALES EBITDA NET PROFIT
MAR.08 CHG. (%) MAR.08 CHG. (%) MAR.08 CHG. (%)InfrastructureB.L.Kashyap Neutral 4,314 81.7 551 75.0 347 80.8Gammon India Neutral 7,277 17.2 585 8.2 261 -29.0GMR Infrastructure Neutral 5,093 -17.8 2,223 61.1 670 261.6Hindustan Construction Buy 10,923 28.9 1,250 42.5 385 140.7IVRCL Infra. Buy 10,930 10.1 1,253 16.8 753 2.8Jaiprakash Associates Buy 9,477 7.0 2,303 -12.4 1,017 -22.4Nagarjuna Construction Neutral 11,894 37.0 1,155 58.8 565 66.7Patel Engg. Buy 4,664 17.7 536 17.5 346 1.8Simplex Infra. Buy 8,461 46.6 952 158.5 446 135.4Sector Aggregate 73,033 20.8 10,807 29.2 4,789 25.5
During 4QFY08, we expect infrastructure companies in our universe to report revenuegrowth of 20.8% YoY, EBITDA growth of 29.2% YoY, and net profit growth of 25.5%YoY. EBITDA margins would expand 110bp from 9.6% in 4QFY07 to 10.7%. Thoughthe order intake has been moderate (except for IVRCL and Simplex), order book to billratio remains comfortable at ~3.3x FY08E revenues. The key challenge is of fasterexecution, as the order intake in the medium term would is expected to remain healthy,given the proposed investment of US$494b during the 11th five-year plan.
TREND IN ORDER BOOK (RS M)1QFY07 2QFY07 3QFY07 4QFY07 1QFY08 2QFY08 3QFY08 YOY (%)
Gammon 74,000 80,000 75,000 75,000 80,000 78,000 75,000 0.0HCC 91,430 98,170 96,040 93,120 93,810 96,020 90,530 -5.7IVRCL 66,866 66,372 72,200 81,000 95,000 96,000 110,000 52.4L&T 286,520 306,760 357,100 368,820 368,820 440,290 496,000 38.9NCC 62,700 66,917 70,250 73,020 77,710 90,040 97,500 38.8Patel 43,000 50,000 47,651 50,000 50,000 54,000 55,000 15.4Simplex Infra. 45,900 52,000 54,880 53,200 70,000 70,770 89,000 62.2%
Source: Companies
TREND IN REVENUE GROWTH (% YOY)1QFY07 2QFY07 3QFY07 4QFY07 1QFY08 2QFY08 3QFY08 YOY (%)
Gammon 5,539 4,830 4,607 6,207 6,495 4,699 5,227 13.5HCC 5,806 4,257 5,407 8,476 7,306 5,487 7,530 39.3IVRCL 4,266 3,644 5,223 9,923 6,773 6,885 9,749 86.6L&T 34,689 37,361 41,184 62,482 45,052 54,999 63,827 55.0NCC 6,517 6,517 6,998 8,679 7,622 6,772 7,795 11.4Patel 2,900 1,979 2,184 3,962 3,301 2,358 2,622 20.1Simplex Infra. 3,520 3,563 4,257 5,770 5,818 5,711 7,040 65.4
Source: Companies
Satyam Agarwal ([email protected])Tel: +91 22 3982 5410/ Shridatta Bhandwaldar ([email protected])
BSE Sensex: 16,371 S&P CNX: 4,942 28 March 2008
Results PreviewQUARTER ENDED MARCH 2008

15628 March 2008
Infrastructure
*Excluding L&T Source: Companies
Comfortable order backlog positionThe order book for the construction companies under our coverage as of December 2007was up 24.3% YoY, indicating moderation in terms of project award. The order intakeduring FY07 witnessed a mere 15% YoY growth as against 142% YoY increase duringFY05 and 69% YoY increase during FY06. Growth during FY05 and FY06 was driven byincreased spending by NHAI and Andhra Pradesh government on irrigation projects.
TREND IN BOOK TO BILL RATIO (X)FY04 FY05 FY06 FY07 DEC-07*
Gammon 2.7 4.3 3.8 4.1 3.1Hind. Const. 3.8 3.6 4.9 3.9 2.9IVRCL 2.1 3.7 4.1 3.0 3.2Nagarjuna Const 2.0 3.0 2.9 2.5 2.9Simplex Projects 5.5 4.5 3.4 3.0 3.3Patel Engineering 4.6 5.2 4.9 4.6 3.3(*) Calculated on FY08E sales Source: Motilal Oswal Securities
BOOK TO BILL RATIO (X)
REVENUE (RS M) AND EBITDA (%) TREND*
Source: Companies
10.6
11.410.79.9
9.4
11.9
9.68.3
0
15,000
30,000
45,000
60,000
1QFY
07
2QFY
07
3QFY
07
4QFY
07
1QFY
08
2QFY
08
3QFY
08
4QFY
08
0
4
8
12
16Revenue(LHS) EBITDA(%)
3.1
3.3 3.3 3.3
3.93.9
2.0
2.5
3.0
3.5
4.0
FY05 FY06 FY07 FY08 FY09 FY10
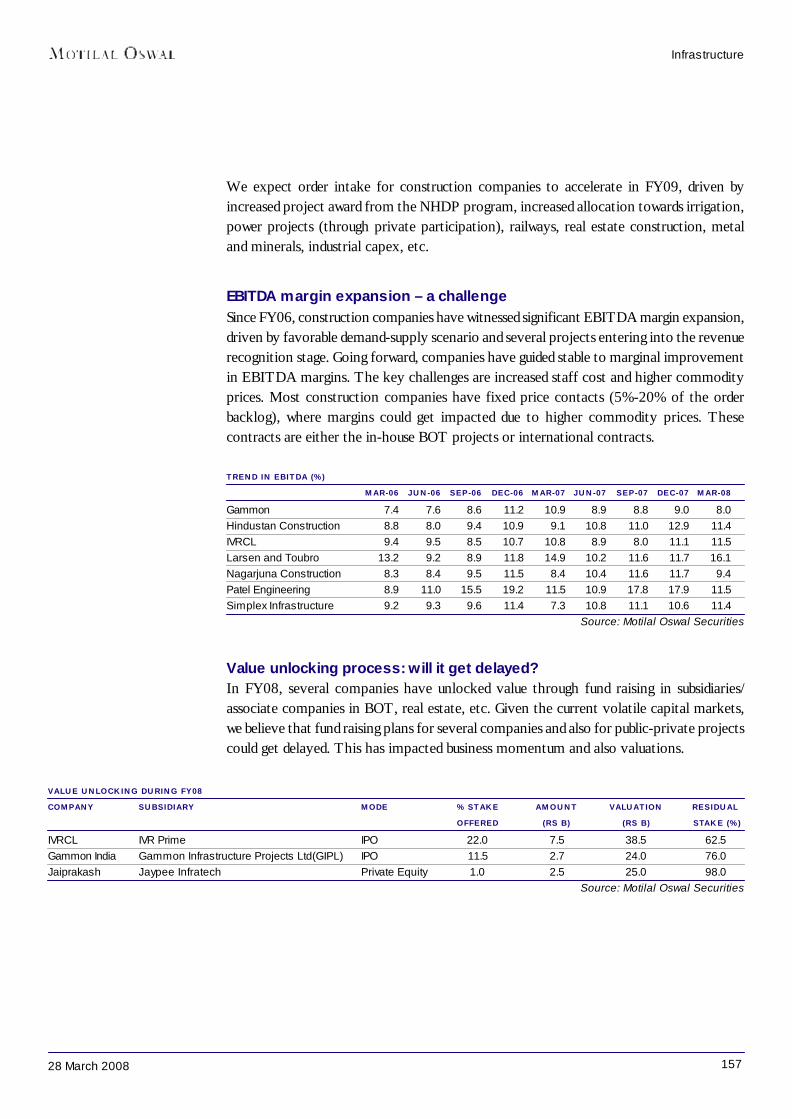
15728 March 2008
Infrastructure
We expect order intake for construction companies to accelerate in FY09, driven byincreased project award from the NHDP program, increased allocation towards irrigation,power projects (through private participation), railways, real estate construction, metaland minerals, industrial capex, etc.
EBITDA margin expansion – a challengeSince FY06, construction companies have witnessed significant EBITDA margin expansion,driven by favorable demand-supply scenario and several projects entering into the revenuerecognition stage. Going forward, companies have guided stable to marginal improvementin EBITDA margins. The key challenges are increased staff cost and higher commodityprices. Most construction companies have fixed price contacts (5%-20% of the orderbacklog), where margins could get impacted due to higher commodity prices. Thesecontracts are either the in-house BOT projects or international contracts.
TREND IN EBITDA (%)MAR-06 JUN-06 SEP-06 DEC-06 MAR-07 JUN-07 SEP-07 DEC-07 MAR-08
Gammon 7.4 7.6 8.6 11.2 10.9 8.9 8.8 9.0 8.0Hindustan Construction 8.8 8.0 9.4 10.9 9.1 10.8 11.0 12.9 11.4IVRCL 9.4 9.5 8.5 10.7 10.8 8.9 8.0 11.1 11.5Larsen and Toubro 13.2 9.2 8.9 11.8 14.9 10.2 11.6 11.7 16.1Nagarjuna Construction 8.3 8.4 9.5 11.5 8.4 10.4 11.6 11.7 9.4Patel Engineering 8.9 11.0 15.5 19.2 11.5 10.9 17.8 17.9 11.5Simplex Infrastructure 9.2 9.3 9.6 11.4 7.3 10.8 11.1 10.6 11.4
Source: Motilal Oswal Securities
Value unlocking process: will it get delayed?In FY08, several companies have unlocked value through fund raising in subsidiaries/associate companies in BOT, real estate, etc. Given the current volatile capital markets,we believe that fund raising plans for several companies and also for public-private projectscould get delayed. This has impacted business momentum and also valuations.
VALUE UNLOCKING DURING FY08COMPANY SUBSIDIARY MODE % STAKE AMOUNT VALUATION RESIDUAL
OFFERED (RS B) (RS B) STAKE (%)IVRCL IVR Prime IPO 22.0 7.5 38.5 62.5Gammon India Gammon Infrastructure Projects Ltd(GIPL) IPO 11.5 2.7 24.0 76.0Jaiprakash Jaypee Infratech Private Equity 1.0 2.5 25.0 98.0
Source: Motilal Oswal Securities

15828 March 2008
Plans for value unlocking, which could possibly get delayed? Lavasa Corp (63% subsidiary of HCC) has successfully completed the launch of
Phase-1 at Lavasa, which comprises 300 units at an average realization of Rs2,950/sft. The company is contemplating private equity funding, and media reports indicatethat it is in talks with various strategic and financial partners.
? L&T has stated that IPO plans for L&T Infotech (100% subsidiary) have been delayed;it had earlier intended to bring out the IPO in CY08.
? Patel Engineering has a land bank of 1,000 acres, spread across Hyderabad, Mumbai,Bangalore and Maharashtra (Karjat, Panvel, etc) and development rights for theproperties have been transferred to Patel Realty India (100% subsidiary). The companyis looking for funding at the SPV level for certain projects.
? Nagarjuna Construction has consolidated its real estate initiatives under NCC UrbanInfrastructure (80% subsidiary) and has a land bank of 530 acres, of which 267 acresis being developed currently (development area of 13.4m sft). It also has a BOTsubsidiary, NCC Infrastructure Projects Limited, with a portfolio of seven BOT projects(including Machillipatnam Sea Port Project). The company has fund raising plans inboth the subsidiaries over the next two years, through either an IPO or PE.
Factors to watch out for? Uncertain capital markets could impact business momentum for infrastructure
companies: Accelerated investments through public private partnerships (PPPs) forphysical infrastructure require vibrant capital markets, which encourage value unlockingfor existing assets and enable easy financing of new projects. The current volatility incapital markets could result in postponement of investments by potential investors.This would delay plans for several companies in segments like BOT, real estate, etc.Also, companies in the construction space need to augment their net worth periodicallyto bid for large projects, and thus require robust capital markets.
? Run-up to central elections could lead to political uncertainty: During FY09, inthe run-up towards central elections, several project awards could get delayed. Also,elections result in uncertainty, as new governments tend to re-look at the existingregulatory framework, ongoing projects, etc; thus leading to delays in project awards.
? Continued higher interest rates: Falling interest rates can create additional incentivefor the private players, by improving returns in PPP projects. At the same time, thisalso helps on the demand side, as more projects become financially viable, improvingthe demand scenario for construction companies. Continued high interest rates couldpotentially postpone some projects.
? EBITDA margin expansion – a challenge: Since FY06, construction companieshave witnessed significant improvement in EBITDA margins, driven by favorabledemand-supply scenario. Going forward, key challenges are increased staff cost andhigher commodity prices. Most construction companies have fixed price contacts (5-20% of order backlog), where margins could get impacted due to higher input cost.
Infrastructure
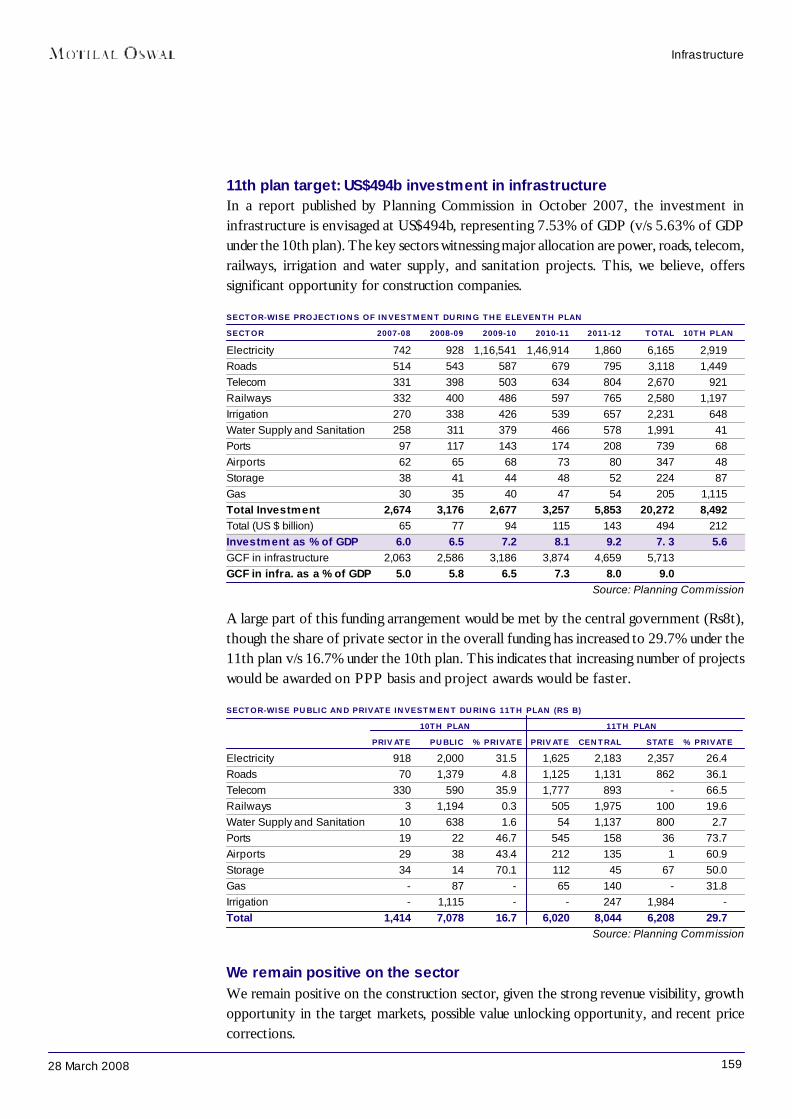
15928 March 2008
11th plan target: US$494b investment in infrastructureIn a report published by Planning Commission in October 2007, the investment ininfrastructure is envisaged at US$494b, representing 7.53% of GDP (v/s 5.63% of GDPunder the 10th plan). The key sectors witnessing major allocation are power, roads, telecom,railways, irrigation and water supply, and sanitation projects. This, we believe, offerssignificant opportunity for construction companies.
SECTOR-WISE PROJECTIONS OF INVESTMENT DURING THE ELEVENTH PLANSECTOR 2007-08 2008-09 2009-10 2010-11 2011-12 TOTAL 10TH PLANElectricity 742 928 1,16,541 1,46,914 1,860 6,165 2,919Roads 514 543 587 679 795 3,118 1,449Telecom 331 398 503 634 804 2,670 921Railways 332 400 486 597 765 2,580 1,197Irrigation 270 338 426 539 657 2,231 648Water Supply and Sanitation 258 311 379 466 578 1,991 41Ports 97 117 143 174 208 739 68Airports 62 65 68 73 80 347 48Storage 38 41 44 48 52 224 87Gas 30 35 40 47 54 205 1,115Total Investment 2,674 3,176 2,677 3,257 5,853 20,272 8,492Total (US $ billion) 65 77 94 115 143 494 212Investment as % of GDP 6.0 6.5 7.2 8.1 9.2 7. 3 5.6GCF in infrastructure 2,063 2,586 3,186 3,874 4,659 5,713GCF in infra. as a % of GDP 5.0 5.8 6.5 7.3 8.0 9.0
Source: Planning Commission
A large part of this funding arrangement would be met by the central government (Rs8t),though the share of private sector in the overall funding has increased to 29.7% under the11th plan v/s 16.7% under the 10th plan. This indicates that increasing number of projectswould be awarded on PPP basis and project awards would be faster.
SECTOR-WISE PUBLIC AND PRIVATE INVESTMENT DURING 11TH PLAN (RS B)10TH PLAN 11TH PLAN
PRIVATE PUBLIC % PRIVATE PRIVATE CENTRAL STATE % PRIVATEElectricity 918 2,000 31.5 1,625 2,183 2,357 26.4Roads 70 1,379 4.8 1,125 1,131 862 36.1Telecom 330 590 35.9 1,777 893 - 66.5Railways 3 1,194 0.3 505 1,975 100 19.6Water Supply and Sanitation 10 638 1.6 54 1,137 800 2.7Ports 19 22 46.7 545 158 36 73.7Airports 29 38 43.4 212 135 1 60.9Storage 34 14 70.1 112 45 67 50.0Gas - 87 - 65 140 - 31.8Irrigation - 1,115 - - 247 1,984 -Total 1,414 7,078 16.7 6,020 8,044 6,208 29.7
Source: Planning Commission
We remain positive on the sectorWe remain positive on the construction sector, given the strong revenue visibility, growthopportunity in the target markets, possible value unlocking opportunity, and recent pricecorrections.
Infrastructure
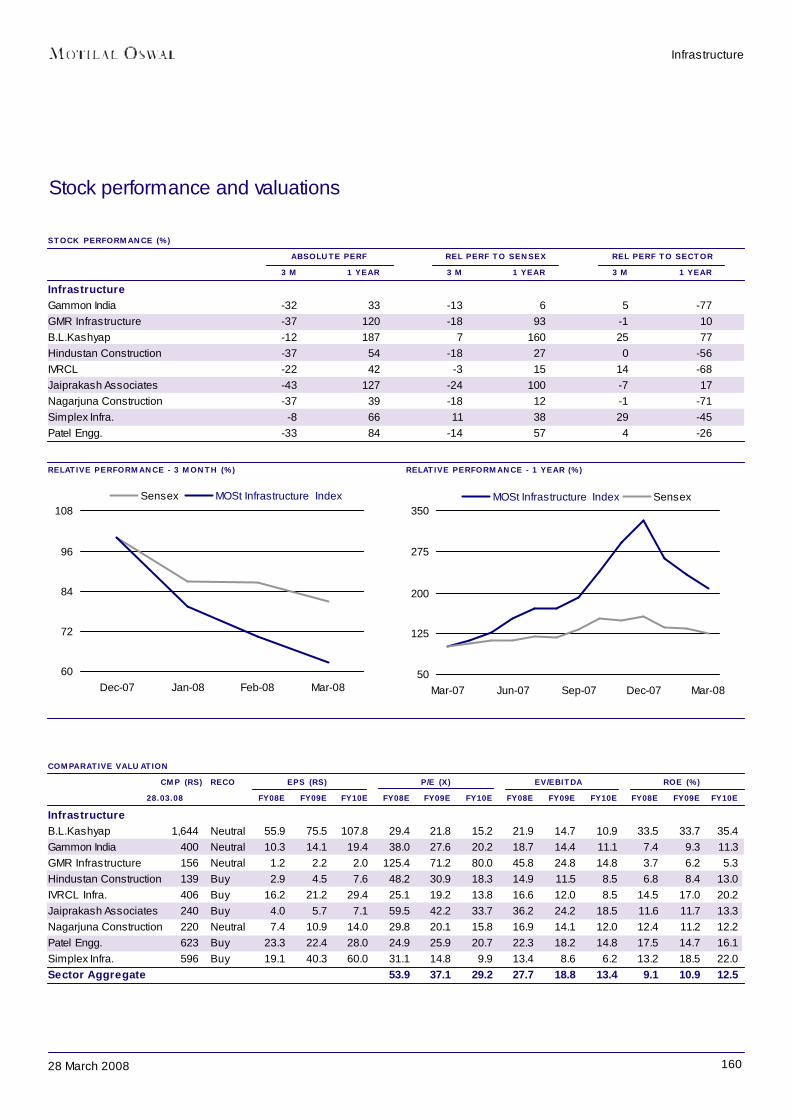
16028 March 2008
Infrastructure
RELATIVE PERFORMANCE - 3 MONTH (%) RELATIVE PERFORMANCE - 1 YEAR (%)
Stock performance and valuations
STOCK PERFORMANCE (%) ABSOLUTE PERF REL PERF TO SENSEX REL PERF TO SECTOR
3 M 1 YEAR 3 M 1 YEAR 3 M 1 YEARInfrastructureGammon India -32 33 -13 6 5 -77GMR Infrastructure -37 120 -18 93 -1 10B.L.Kashyap -12 187 7 160 25 77Hindustan Construction -37 54 -18 27 0 -56IVRCL -22 42 -3 15 14 -68Jaiprakash Associates -43 127 -24 100 -7 17Nagarjuna Construction -37 39 -18 12 -1 -71Simplex Infra. -8 66 11 38 29 -45Patel Engg. -33 84 -14 57 4 -26
COMPARATIVE VALUATIONCMP (RS) RECO EPS (RS) P/E (X) EV/EBITDA ROE (%)
28.03.08 FY08E FY09E FY10E FY08E FY09E FY10E FY08E FY09E FY10E FY08E FY09E FY10EInfrastructureB.L.Kashyap 1,644 Neutral 55.9 75.5 107.8 29.4 21.8 15.2 21.9 14.7 10.9 33.5 33.7 35.4Gammon India 400 Neutral 10.3 14.1 19.4 38.0 27.6 20.2 18.7 14.4 11.1 7.4 9.3 11.3GMR Infrastructure 156 Neutral 1.2 2.2 2.0 125.4 71.2 80.0 45.8 24.8 14.8 3.7 6.2 5.3Hindustan Construction 139 Buy 2.9 4.5 7.6 48.2 30.9 18.3 14.9 11.5 8.5 6.8 8.4 13.0IVRCL Infra. 406 Buy 16.2 21.2 29.4 25.1 19.2 13.8 16.6 12.0 8.5 14.5 17.0 20.2Jaiprakash Associates 240 Buy 4.0 5.7 7.1 59.5 42.2 33.7 36.2 24.2 18.5 11.6 11.7 13.3Nagarjuna Construction 220 Neutral 7.4 10.9 14.0 29.8 20.1 15.8 16.9 14.1 12.0 12.4 11.2 12.2Patel Engg. 623 Buy 23.3 22.4 28.0 24.9 25.9 20.7 22.3 18.2 14.8 17.5 14.7 16.1Simplex Infra. 596 Buy 19.1 40.3 60.0 31.1 14.8 9.9 13.4 8.6 6.2 13.2 18.5 22.0Sector Aggregate 53.9 37.1 29.2 27.7 18.8 13.4 9.1 10.9 12.5
60
72
84
96
108
Dec-07 Jan-08 Feb-08 Mar-08
Sensex MOSt Infrastructure Index
50
125
200
275
350
Mar-07 Jun-07 Sep-07 Dec-07 Mar-08
MOSt Infrastructure Index Sensex
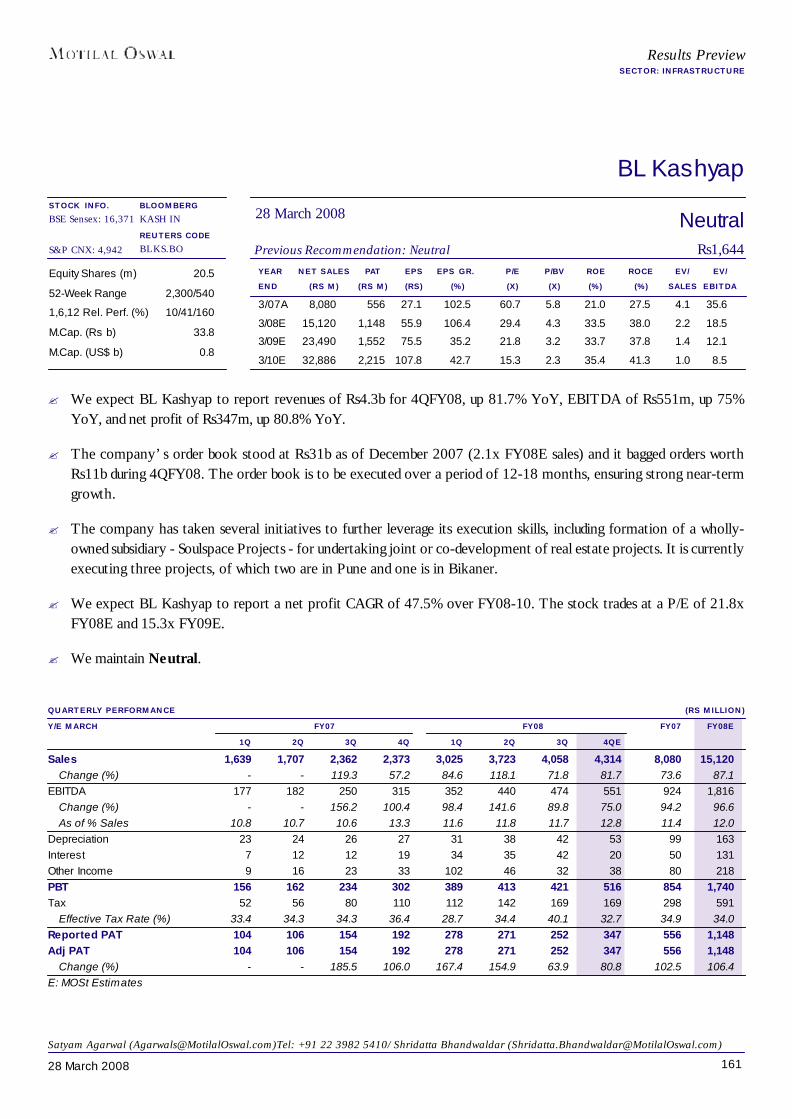
16128 March 2008
BL Kashyap
YEAR NET SALES PAT EPS EPS GR. P/E P/BV ROE ROCE EV/ EV/END (RS M) (RS M) (RS) (%) (X) (X) (%) (%) SALES EBITDA
3/07A 8,080 556 27.1 102.5 60.7 5.8 21.0 27.5 4.1 35.6
3/08E 15,120 1,148 55.9 106.4 29.4 4.3 33.5 38.0 2.2 18.5
3/09E 23,490 1,552 75.5 35.2 21.8 3.2 33.7 37.8 1.4 12.1
3/10E 32,886 2,215 107.8 42.7 15.3 2.3 35.4 41.3 1.0 8.5
Equity Shares (m) 20.5
52-Week Range 2,300/540
1,6,12 Rel. Perf. (%) 10/41/160
M.Cap. (Rs b) 33.8
M.Cap. (US$ b) 0.8
NeutralPrevious Recommendation: Neutral Rs1,644
28 March 2008BLOOMBERGKASH IN
REUTERS CODEBLKS.BO
Results PreviewSECTOR: INFRASTRUCTURE
Satyam Agarwal ([email protected])Tel: +91 22 3982 5410/ Shridatta Bhandwaldar ([email protected])
QUARTERLY PERFORMANCE (RS MILLION)Y/E MARCH FY07 FY08 FY07 FY08E
1Q 2Q 3Q 4Q 1Q 2Q 3Q 4QESales 1,639 1,707 2,362 2,373 3,025 3,723 4,058 4,314 8,080 15,120
Change (%) - - 119.3 57.2 84.6 118.1 71.8 81.7 73.6 87.1EBITDA 177 182 250 315 352 440 474 551 924 1,816
Change (%) - - 156.2 100.4 98.4 141.6 89.8 75.0 94.2 96.6As of % Sales 10.8 10.7 10.6 13.3 11.6 11.8 11.7 12.8 11.4 12.0
Depreciation 23 24 26 27 31 38 42 53 99 163Interest 7 12 12 19 34 35 42 20 50 131Other Income 9 16 23 33 102 46 32 38 80 218PBT 156 162 234 302 389 413 421 516 854 1,740Tax 52 56 80 110 112 142 169 169 298 591
Effective Tax Rate (%) 33.4 34.3 34.3 36.4 28.7 34.4 40.1 32.7 34.9 34.0Reported PAT 104 106 154 192 278 271 252 347 556 1,148Adj PAT 104 106 154 192 278 271 252 347 556 1,148
Change (%) - - 185.5 106.0 167.4 154.9 63.9 80.8 102.5 106.4E: MOSt Estimates
STOCK INFO.BSE Sensex: 16,371
S&P CNX: 4,942
? We expect BL Kashyap to report revenues of Rs4.3b for 4QFY08, up 81.7% YoY, EBITDA of Rs551m, up 75%YoY, and net profit of Rs347m, up 80.8% YoY.
? The company’s order book stood at Rs31b as of December 2007 (2.1x FY08E sales) and it bagged orders worthRs11b during 4QFY08. The order book is to be executed over a period of 12-18 months, ensuring strong near-termgrowth.
? The company has taken several initiatives to further leverage its execution skills, including formation of a wholly-owned subsidiary - Soulspace Projects - for undertaking joint or co-development of real estate projects. It is currentlyexecuting three projects, of which two are in Pune and one is in Bikaner.
? We expect BL Kashyap to report a net profit CAGR of 47.5% over FY08-10. The stock trades at a P/E of 21.8xFY08E and 15.3x FY09E.
? We maintain Neutral.

16228 March 2008
Gammon India
YEAR NET SALES PAT EPS EPS GR. P/E P/BV ROE ROCE EV/ EV/END (RS M) (RS M) (RS) (%) (X) (X) (%) (%) SALES EBITDA
3/07A 18,647 957 10.8 12.5 36.9 3.1 8.3 11.6 2.0 20.2
3/08E 22,526 910 10.3 -4.9 38.8 2.9 7.4 9.6 1.7 19.1
3/09E 30,634 1,251 14.1 37.6 28.2 2.6 9.3 11.8 1.3 14.6
3/10E 39,644 1,714 19.4 36.9 20.6 2.3 11.3 14.1 1.1 11.3
Equity Shares (m) 86.7
52-Week Range 845/280
1,6,12 Rel. Perf. (%) -13/-9/6
M.Cap. (Rs b) 34.7
M.Cap. (US$ b) 0.9
NeutralPrevious Recommendation: Neutral Rs400
28 March 2008BLOOMBERGGMON IN
REUTERS CODEGAMM.BO
Results PreviewSECTOR: INFRASTRUCTURE
Satyam Agarwal ([email protected])Tel: +91 22 3982 5410/ Shridatta Bhandwaldar ([email protected])
STOCK INFO.BSE Sensex: 16,371
S&P CNX: 4,942
QUARTERLY PERFORMANCE (RS MILLION)Y/E MARCH FY07 FY08 FY07 FY08E
1Q 2Q 3Q 4Q 1Q 2Q 3Q 4QESales 5,539 4,830 4,607 6,207 6,495 4,699 5,227 7,277 20,912 23,697
Change (%) 93.5 67.1 37.5 30.2 17.3 -2.7 13.5 17.2 25.4 13.3EBITDA 317 418 515 541 577 412 472 585 1,722 2,046
Change (%) -6.9 -6.6 6.0 53.2 82.1 -1.3 -8.4 8.2 -10.9 18.9As of % Sales 5.7 8.6 11.2 8.7 8.9 8.8 9.0 8.0 8.2 8.6
Depreciation 83 103 102 91 108 113 114 116 352 452Interest 52 18 53 13 35 38 48 63 136 185Other Income 3 1 7 118 11 8 0 5 197 23Extra-ordinary income 27 0 0 0 0 0 0 0 27 0PBT 211 297 366 556 444 269 309 410 1,458 1,432Tax 25 36 50 875 159 97 118 149 1,030 523
Effective Tax Rate (%) 11.9 12.0 13.7 157.4 35.7 36.2 38.0 36.4 70.7 36.5Reported PAT 186 262 316 -319 285 171 192 261 427 910Adj PAT 122 197 242 367 271 171 192 261 946 895
Change (%) -20.8 -20.6 15.5 34.1 122.2 -12.8 -20.6 -29.0 -8.1 -5.3E: MOSt Estimates; * including sales from JV's
? For 4QFY08, we expect Gammon to report revenues of Rs7.3b, up 17.2% YoY, EBITDA of Rs585m, up 8.2% YoY,and net profit of Rs261m, down 29% YoY.
? Gammon Infrastructure Project Limited (GIPL), a 76.15% subsidiary, has successfully completed its IPO, by offering16.5m shares at Rs167/share, raising Rs2.7b. At the issue price of Rs167/share, GIPL has been valued at Rs24b.Post issue, the holding structure would be: Gammon India – 76.15%, Och Ziff – 7.9%, Promoters – 4.4%, and Public– 11.5%.
? GIPL currently has a portfolio of 15 BOT projects, comprising of 6 road and bridge projects, 2 port projects, 4 O&Mprojects (own BOT road), and 3 power projects. Besides, the company has been declared L1 bidder or has receivedLOI for (1) Bedi Port Project in Gujarat, (2) 264 MW hydro power project in Himachal Pradesh and 60MW TidongHydro Project, and (3) Adityapur SEZ Project.
? The company has tied up with Siemens Transportation for design, commissioning and operation of airport-city rail linkfor a 30-year period in an expression of interest invited by Delhi Metro Rail Corporation.
? Order backlog as of December 2007 stood at Rs75b, representing 3.1x FY08E revenue.
? The stock trades at a reported P/E of 28.2x FY09E and 20.6x FY10E. We maintain Neutral.
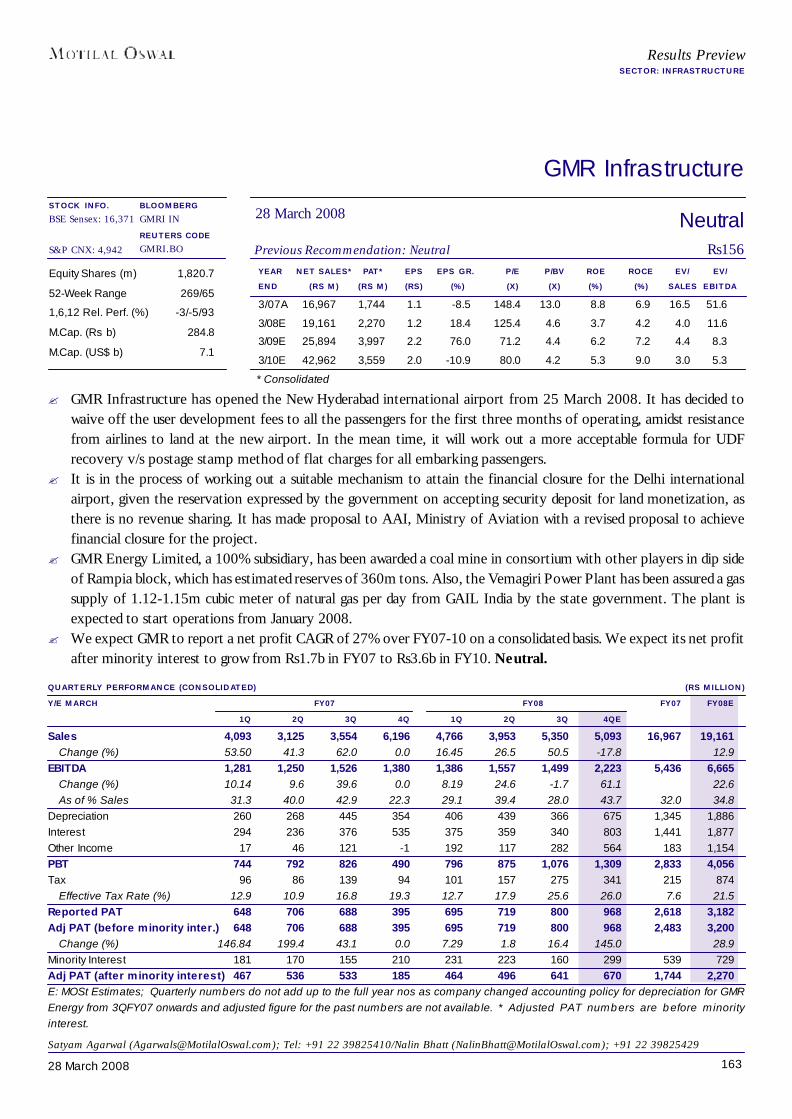
16328 March 2008
GMR Infrastructure
YEAR NET SALES* PAT* EPS EPS GR. P/E P/BV ROE ROCE EV/ EV/END (RS M) (RS M) (RS) (%) (X) (X) (%) (%) SALES EBITDA
3/07A 16,967 1,744 1.1 -8.5 148.4 13.0 8.8 6.9 16.5 51.6
3/08E 19,161 2,270 1.2 18.4 125.4 4.6 3.7 4.2 4.0 11.6
3/09E 25,894 3,997 2.2 76.0 71.2 4.4 6.2 7.2 4.4 8.3
3/10E 42,962 3,559 2.0 -10.9 80.0 4.2 5.3 9.0 3.0 5.3
Equity Shares (m) 1,820.7
52-Week Range 269/65
1,6,12 Rel. Perf. (%) -3/-5/93
M.Cap. (Rs b) 284.8
M.Cap. (US$ b) 7.1
NeutralPrevious Recommendation: Neutral Rs156
28 March 2008BLOOMBERGGMRI IN
REUTERS CODEGMRI.BO
Results PreviewSECTOR: INFRASTRUCTURE
Satyam Agarwal ([email protected]); Tel: +91 22 39825410/Nalin Bhatt ([email protected]); +91 22 39825429
* Consolidated
STOCK INFO.BSE Sensex: 16,371
S&P CNX: 4,942
QUARTERLY PERFORMANCE (CONSOLIDATED) (RS MILLION)Y/E MARCH FY07 FY08 FY07 FY08E
1Q 2Q 3Q 4Q 1Q 2Q 3Q 4QESales 4,093 3,125 3,554 6,196 4,766 3,953 5,350 5,093 16,967 19,161
Change (%) 53.50 41.3 62.0 0.0 16.45 26.5 50.5 -17.8 12.9EBITDA 1,281 1,250 1,526 1,380 1,386 1,557 1,499 2,223 5,436 6,665
Change (%) 10.14 9.6 39.6 0.0 8.19 24.6 -1.7 61.1 22.6As of % Sales 31.3 40.0 42.9 22.3 29.1 39.4 28.0 43.7 32.0 34.8
Depreciation 260 268 445 354 406 439 366 675 1,345 1,886Interest 294 236 376 535 375 359 340 803 1,441 1,877Other Income 17 46 121 -1 192 117 282 564 183 1,154PBT 744 792 826 490 796 875 1,076 1,309 2,833 4,056Tax 96 86 139 94 101 157 275 341 215 874
Effective Tax Rate (%) 12.9 10.9 16.8 19.3 12.7 17.9 25.6 26.0 7.6 21.5Reported PAT 648 706 688 395 695 719 800 968 2,618 3,182Adj PAT (before minority inter.) 648 706 688 395 695 719 800 968 2,483 3,200
Change (%) 146.84 199.4 43.1 0.0 7.29 1.8 16.4 145.0 28.9Minority Interest 181 170 155 210 231 223 160 299 539 729Adj PAT (after minority interest) 467 536 533 185 464 496 641 670 1,744 2,270E: MOSt Estimates; Quarterly numbers do not add up to the full year nos as company changed accounting policy for depreciation for GMREnergy from 3QFY07 onwards and adjusted figure for the past numbers are not available. * Adjusted PAT numbers are before minorityinterest.
? GMR Infrastructure has opened the New Hyderabad international airport from 25 March 2008. It has decided towaive off the user development fees to all the passengers for the first three months of operating, amidst resistancefrom airlines to land at the new airport. In the mean time, it will work out a more acceptable formula for UDFrecovery v/s postage stamp method of flat charges for all embarking passengers.
? It is in the process of working out a suitable mechanism to attain the financial closure for the Delhi internationalairport, given the reservation expressed by the government on accepting security deposit for land monetization, asthere is no revenue sharing. It has made proposal to AAI, Ministry of Aviation with a revised proposal to achievefinancial closure for the project.
? GMR Energy Limited, a 100% subsidiary, has been awarded a coal mine in consortium with other players in dip sideof Rampia block, which has estimated reserves of 360m tons. Also, the Vemagiri Power Plant has been assured a gassupply of 1.12-1.15m cubic meter of natural gas per day from GAIL India by the state government. The plant isexpected to start operations from January 2008.
? We expect GMR to report a net profit CAGR of 27% over FY07-10 on a consolidated basis. We expect its net profitafter minority interest to grow from Rs1.7b in FY07 to Rs3.6b in FY10. Neutral.

16428 March 2008
Hindustan Construction
YEAR NET SALES PAT EPS EPS GR. P/E P/BV ROE ROCE EV/ EV/END (RS M) (RS M) (RS) (%) (X) (X) (%) (%) SALES EBITDA
3/07A 23,576 595 2.1 -35.3 65.2 3.9 6.1 6.6 2.1 22.8
3/08E 31,245 793 2.9 35.7 48.1 2.7 6.8 10.9 1.7 14.9
3/09E 40,850 1,239 4.5 56.2 30.8 2.5 8.4 11.3 1.4 11.5
3/10E 53,650 2,086 7.6 68.4 18.3 2.3 13.0 14.3 1.0 8.5
Equity Shares (m) 274.3
52-Week Range 279/83
1,6,12 Rel. Perf. (%) -8/7/27
M.Cap. (Rs b) 38.1
M.Cap. (US$ b) 1.0
BuyPrevious Recommendation: Buy Rs139
28 March 2008BLOOMBERGHCC IN
REUTERS CODEHCNS.BO
QUARTERLY PERFORMANCE (RS MILLION)Y/E MARCH FY07 FY08 FY07 FY08E
1Q 2Q 3Q 4Q 1Q 2Q 3Q 4QEGross Sales 5,806 4,257 5,407 8,476 7,306 5,487 7,530 10,923 23,945 31,245
Change (%) 25.9 40.9 18.6 10.3 25.8 28.9 39.3 28.9 20.5 30.5EBITDA 461 395 664 877 791 602 968 1,250 2,396 3,611
Change (%) 12.8 53.3 36.6 29.9 71.5 52.4 45.9 42.5 31.0 50.7As of % Sales (Adj) 7.9 9.3 11.1 9.1 10.8 11.0 12.9 11.4 9.3 11.6
Depreciation 161 186 206 244 228 226 233 236 797 923Interest 74 158 175 212 322 342 408 420 620 1,491Other Income 62 10 2 125 315 106 54 -74 199 401PBT 288 61 284 546 556 140 381 520 1,179 1,597Tax 36 19 65 266 206 23 130 183 386 543
Effective Tax Rate (%) 12.6 31.5 22.8 48.7 37.1 16.5 34.2 35.3 32.8 34.0Reported PAT 251 42 220 280 350 117 251 337 793 1,054Adj PAT 201 42 144 160 150 34 216 385 547 793
Change (%) -11.2 45.3 -36.5 -62.4 -25.5 -19.5 50.3 140.7 -33.1 45.0E: MOSt Estimates
Results PreviewSECTOR: INFRASTRUCTURE
Satyam Agarwal ([email protected]); Tel: +91 22 39825410/Nalin Bhatt ([email protected]); +91 22 39825429
STOCK INFO.BSE Sensex: 16,371
S&P CNX: 4,942
? For 4QFY08, we expect HCC to report revenue of Rs10.9b, up 28.9% YoY, EBITDA of Rs1.2b, and net profit ofRs385m, up 140.7% YoY.
? HCC’s order backlog at the end of December 2007 was Rs90.5b (2.9x FY08E revenue) and it had L1 projects worthRs40b. As of December 2007, the share of power sector in order backlog was 33%.
? Lavasa Corp (63% subsidiary of HCC) has successfully completed the launch of Phase 1 at Lavasa comprising of300 units at an average realization of Rs2,950/sft+.
? The state cabinet has approved part of the cost escalations (increased cost from changes in project scope and design)of Rs1.6b, v/s claims of Rs2.3b for Bandra-Worli Sea Link. As per the revised timeframe, the project will be completedby December 2008 (4 lanes).
? Construction work on Vikroli IT Park has already commenced (developable area of 1.95m sft) and it plans to offeroffices for fit-out by December 2008 and for occupation by March 2009. The revenue booking from the projectwould start from 1QFY09.
? During FY07-09E, we expect HCC to report a revenue CAGR of 32% and a net profit CAGR of 44.2%. The stocktrades at a P/E of 30.8x FY09E and 18.3x FY10E.
? We recommend Buy.
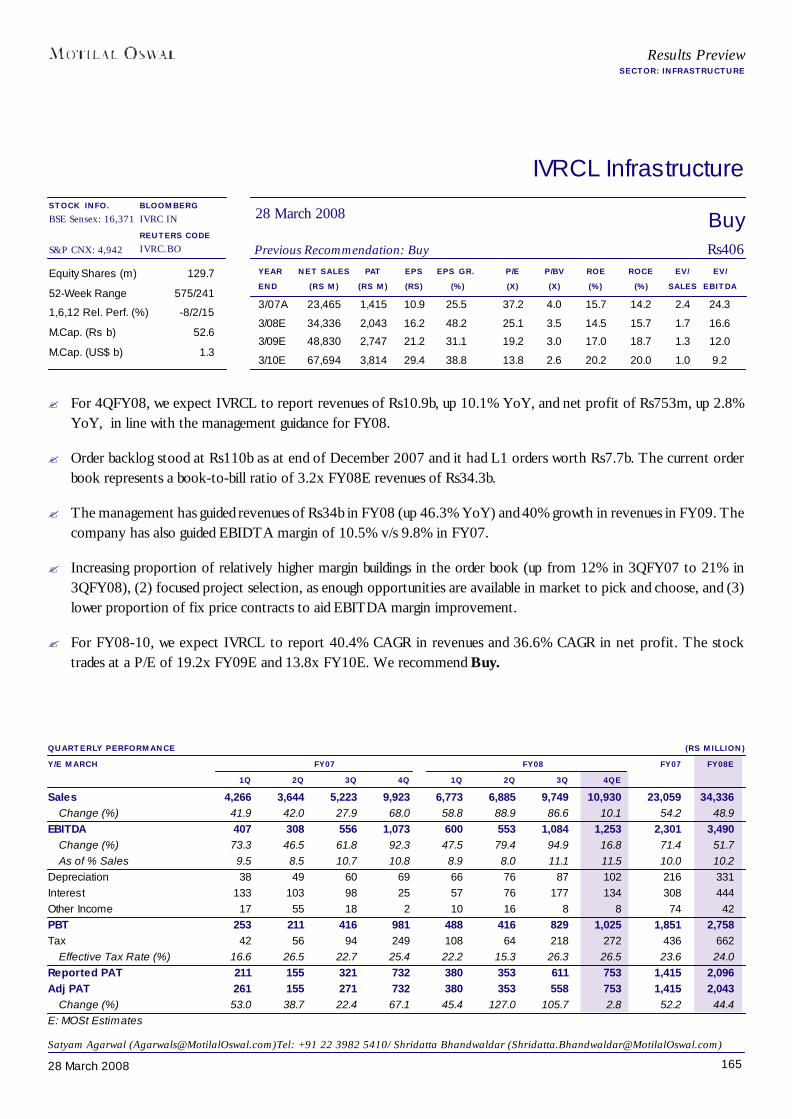
16528 March 2008
IVRCL Infrastructure
YEAR NET SALES PAT EPS EPS GR. P/E P/BV ROE ROCE EV/ EV/END (RS M) (RS M) (RS) (%) (X) (X) (%) (%) SALES EBITDA
3/07A 23,465 1,415 10.9 25.5 37.2 4.0 15.7 14.2 2.4 24.3
3/08E 34,336 2,043 16.2 48.2 25.1 3.5 14.5 15.7 1.7 16.6
3/09E 48,830 2,747 21.2 31.1 19.2 3.0 17.0 18.7 1.3 12.0
3/10E 67,694 3,814 29.4 38.8 13.8 2.6 20.2 20.0 1.0 9.2
Equity Shares (m) 129.7
52-Week Range 575/241
1,6,12 Rel. Perf. (%) -8/2/15
M.Cap. (Rs b) 52.6
M.Cap. (US$ b) 1.3
BuyPrevious Recommendation: Buy Rs406
28 March 2008BLOOMBERGIVRC IN
REUTERS CODEIVRC.BO
QUARTERLY PERFORMANCE (RS MILLION)Y/E MARCH FY07 FY08 FY07 FY08E
1Q 2Q 3Q 4Q 1Q 2Q 3Q 4QESales 4,266 3,644 5,223 9,923 6,773 6,885 9,749 10,930 23,059 34,336
Change (%) 41.9 42.0 27.9 68.0 58.8 88.9 86.6 10.1 54.2 48.9EBITDA 407 308 556 1,073 600 553 1,084 1,253 2,301 3,490
Change (%) 73.3 46.5 61.8 92.3 47.5 79.4 94.9 16.8 71.4 51.7As of % Sales 9.5 8.5 10.7 10.8 8.9 8.0 11.1 11.5 10.0 10.2
Depreciation 38 49 60 69 66 76 87 102 216 331Interest 133 103 98 25 57 76 177 134 308 444Other Income 17 55 18 2 10 16 8 8 74 42PBT 253 211 416 981 488 416 829 1,025 1,851 2,758Tax 42 56 94 249 108 64 218 272 436 662
Effective Tax Rate (%) 16.6 26.5 22.7 25.4 22.2 15.3 26.3 26.5 23.6 24.0Reported PAT 211 155 321 732 380 353 611 753 1,415 2,096Adj PAT 261 155 271 732 380 353 558 753 1,415 2,043
Change (%) 53.0 38.7 22.4 67.1 45.4 127.0 105.7 2.8 52.2 44.4E: MOSt Estimates
Results PreviewSECTOR: INFRASTRUCTURE
Satyam Agarwal ([email protected])Tel: +91 22 3982 5410/ Shridatta Bhandwaldar ([email protected])
STOCK INFO.BSE Sensex: 16,371
S&P CNX: 4,942
? For 4QFY08, we expect IVRCL to report revenues of Rs10.9b, up 10.1% YoY, and net profit of Rs753m, up 2.8%YoY, in line with the management guidance for FY08.
? Order backlog stood at Rs110b as at end of December 2007 and it had L1 orders worth Rs7.7b. The current orderbook represents a book-to-bill ratio of 3.2x FY08E revenues of Rs34.3b.
? The management has guided revenues of Rs34b in FY08 (up 46.3% YoY) and 40% growth in revenues in FY09. Thecompany has also guided EBIDTA margin of 10.5% v/s 9.8% in FY07.
? Increasing proportion of relatively higher margin buildings in the order book (up from 12% in 3QFY07 to 21% in3QFY08), (2) focused project selection, as enough opportunities are available in market to pick and choose, and (3)lower proportion of fix price contracts to aid EBITDA margin improvement.
? For FY08-10, we expect IVRCL to report 40.4% CAGR in revenues and 36.6% CAGR in net profit. The stocktrades at a P/E of 19.2x FY09E and 13.8x FY10E. We recommend Buy.
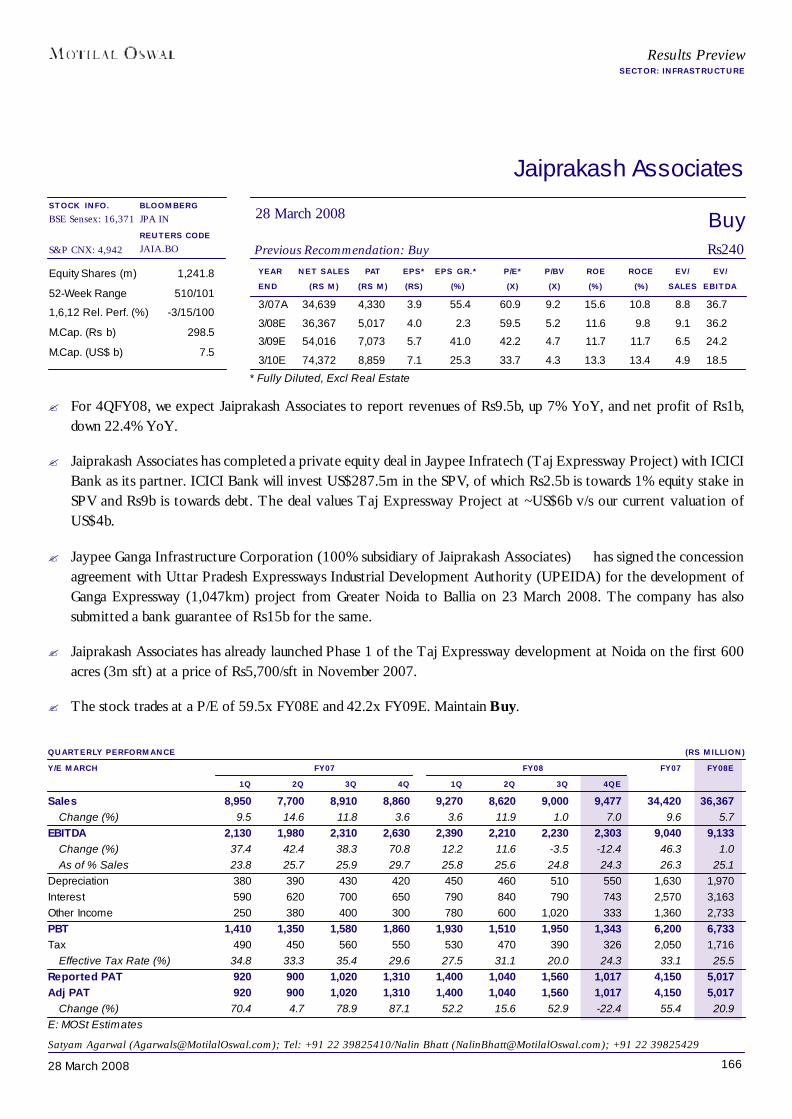
16628 March 2008
Jaiprakash Associates
YEAR NET SALES PAT EPS* EPS GR.* P/E* P/BV ROE ROCE EV/ EV/END (RS M) (RS M) (RS) (%) (X) (X) (%) (%) SALES EBITDA
3/07A 34,639 4,330 3.9 55.4 60.9 9.2 15.6 10.8 8.8 36.7
3/08E 36,367 5,017 4.0 2.3 59.5 5.2 11.6 9.8 9.1 36.2
3/09E 54,016 7,073 5.7 41.0 42.2 4.7 11.7 11.7 6.5 24.2
3/10E 74,372 8,859 7.1 25.3 33.7 4.3 13.3 13.4 4.9 18.5
Equity Shares (m) 1,241.8
52-Week Range 510/101
1,6,12 Rel. Perf. (%) -3/15/100
M.Cap. (Rs b) 298.5
M.Cap. (US$ b) 7.5
BuyPrevious Recommendation: Buy Rs240
28 March 2008BLOOMBERGJPA IN
REUTERS CODEJAIA.BO
QUARTERLY PERFORMANCE (RS MILLION)Y/E MARCH FY07 FY08 FY07 FY08E
1Q 2Q 3Q 4Q 1Q 2Q 3Q 4QESales 8,950 7,700 8,910 8,860 9,270 8,620 9,000 9,477 34,420 36,367
Change (%) 9.5 14.6 11.8 3.6 3.6 11.9 1.0 7.0 9.6 5.7EBITDA 2,130 1,980 2,310 2,630 2,390 2,210 2,230 2,303 9,040 9,133
Change (%) 37.4 42.4 38.3 70.8 12.2 11.6 -3.5 -12.4 46.3 1.0As of % Sales 23.8 25.7 25.9 29.7 25.8 25.6 24.8 24.3 26.3 25.1
Depreciation 380 390 430 420 450 460 510 550 1,630 1,970Interest 590 620 700 650 790 840 790 743 2,570 3,163Other Income 250 380 400 300 780 600 1,020 333 1,360 2,733PBT 1,410 1,350 1,580 1,860 1,930 1,510 1,950 1,343 6,200 6,733Tax 490 450 560 550 530 470 390 326 2,050 1,716
Effective Tax Rate (%) 34.8 33.3 35.4 29.6 27.5 31.1 20.0 24.3 33.1 25.5Reported PAT 920 900 1,020 1,310 1,400 1,040 1,560 1,017 4,150 5,017Adj PAT 920 900 1,020 1,310 1,400 1,040 1,560 1,017 4,150 5,017
Change (%) 70.4 4.7 78.9 87.1 52.2 15.6 52.9 -22.4 55.4 20.9E: MOSt Estimates
Results PreviewSECTOR: INFRASTRUCTURE
* Fully Diluted, Excl Real Estate
Satyam Agarwal ([email protected]); Tel: +91 22 39825410/Nalin Bhatt ([email protected]); +91 22 39825429
STOCK INFO.BSE Sensex: 16,371
S&P CNX: 4,942
? For 4QFY08, we expect Jaiprakash Associates to report revenues of Rs9.5b, up 7% YoY, and net profit of Rs1b,down 22.4% YoY.
? Jaiprakash Associates has completed a private equity deal in Jaypee Infratech (Taj Expressway Project) with ICICIBank as its partner. ICICI Bank will invest US$287.5m in the SPV, of which Rs2.5b is towards 1% equity stake inSPV and Rs9b is towards debt. The deal values Taj Expressway Project at ~US$6b v/s our current valuation ofUS$4b.
? Jaypee Ganga Infrastructure Corporation (100% subsidiary of Jaiprakash Associates) has signed the concessionagreement with Uttar Pradesh Expressways Industrial Development Authority (UPEIDA) for the development ofGanga Expressway (1,047km) project from Greater Noida to Ballia on 23 March 2008. The company has alsosubmitted a bank guarantee of Rs15b for the same.
? Jaiprakash Associates has already launched Phase 1 of the Taj Expressway development at Noida on the first 600acres (3m sft) at a price of Rs5,700/sft in November 2007.
? The stock trades at a P/E of 59.5x FY08E and 42.2x FY09E. Maintain Buy.

16728 March 2008
Nagarjuna Construction
YEAR NET SALES PAT EPS EPS P/E P/BV ROE ROCE EV/ EV/END (RS M) (RS M) (RS) GROWTH (%) (X) (X) (%) (%) SALES EBITDA
3/07A 28,711 1,335 6.4 26.1 34.4 4.4 13.5 14.9 1.9 20.3
3/08E 34,083 1,658 7.2 12.0 30.7 3.1 12.4 12.9 1.7 16.3
3/09E 41,758 2,037 8.8 22.9 25.0 2.6 11.2 12.7 1.5 13.7
3/10E 52,515 2,565 11.1 25.9 19.8 2.4 12.2 13.3 1.3 11.7
Equity Shares (m) 240.3
52-Week Range 373/220
1,6,12 Rel. Perf. (%) -8/-9/12
M.Cap. (Rs b) 52.9
M.Cap. (US$ b) 1.3
NeutralPrevious Recommendation: Neutral Rs220
28 March 2008BLOOMBERGNJCC IN
REUTERS CODENGCN.BO
QUARTERLY PERFORMANCE (RS MILLION)Y/E MARCH FY07 FY08 FY07 FY08E
1Q 2Q 3Q 4Q 1Q 2Q 3Q 4QESales 6,517 6,517 6,998 8,679 7,622 6,772 7,795 11,894 28,711 34,083
Change (%) 81.4 77.0 48.1 35.5 16.9 3.9 11.4 37.0 56.0 18.7EBITDA 550 618 802 727 794 848 862 1,155 2,697 3,659
Change (%) 97.8 63.0 75.5 36.9 44.3 37.3 7.5 58.8 64.4 35.6As of % Sales 8.4 9.5 11.5 8.4 10.4 12.5 11.1 9.7 9.4 10.7
Depreciation 58 69 76 96 104 117 123 128 299 472Interest 57 96 185 166 145 233 167 206 504 751Other Income 8 10 5 270 4 4 11 12 292 31PBT 443 462 546 735 548 502 583 834 2,186 2,467Tax 59 69 97 443 187 165 187 270 667 809
Effective Tax Rate (%) 13.3 14.9 17.8 60.2 34.2 32.9 32.1 32.3 30.5 32.8Reported PAT 384 393 449 293 360 337 396 565 1,519 1,658Adj PAT 326 334 359 339 360 337 396 565 1,358 1,658
Change (%) 70.3 59.9 33.9 -3.1 10.4 0.6 10.5 66.7 30.7 22.1E: MOSt Estimates
Results PreviewSECTOR: INFRASTRUCTURE
Satyam Agarwal ([email protected])Tel: +91 22 3982 5410/ Shridatta Bhandwaldar ([email protected])
STOCK INFO.BSE Sensex: 16,371
S&P CNX: 4,942
? For 4QFY08, we expect NCC to report revenue of Rs11.9b, up 37%YoY, and net profit of Rs565m, up 66.7% YoY.
? As of end-December 2007, NCC’s order book stood at Rs97.5b, 2.9x its FY08E revenues of Rs34b. Order bookcomposition: roads 17.4%, buildings 22.6%, water 17%, irrigation/HEP 9%, electricals 6%, power 1%, oil/gas 3%,metals 11% and international 13%.
? NCC consortium (NCC’s stake 25%) comprising of Maytas (26%), Port Operator Company (11%) and SREI Finance(38%) has received the Letter of Intent from the government for Machilipatnam port project in Andhra Pradesh. Theproject location has been firmed at Machillipatnam town itself (rather than earlier location ~30km away from city)and the additional construction cost is estimated at Rs3.35-3.5b.The management expects to sign the developmentagreement for the project shortly. Financial closure would be achieved by December 2008 and the operations arelikely to begin in 2011.The project entails 8,000 acres of land to be provided to the consortium by the government on99-year lease for development of SEZ.
? The stock trades at a P/E of 25x FY09E and 19.8x FY10E. Neutral.
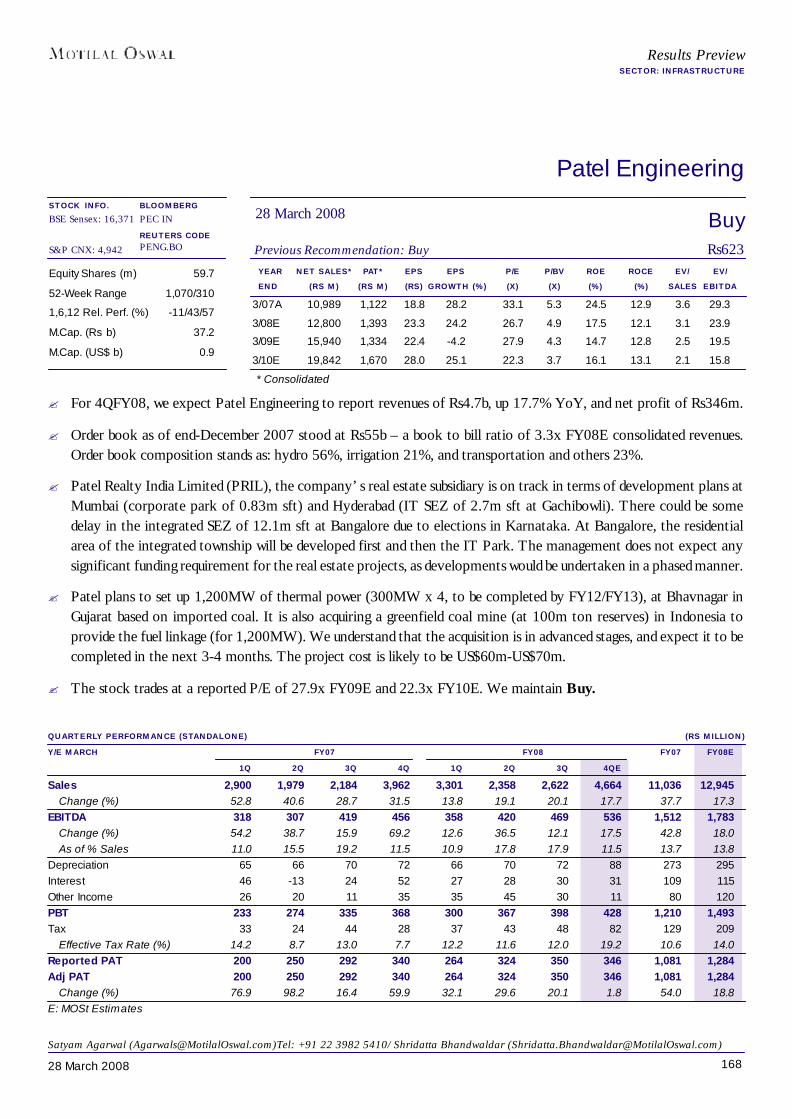
16828 March 2008
Patel Engineering
YEAR NET SALES* PAT* EPS EPS P/E P/BV ROE ROCE EV/ EV/END (RS M) (RS M) (RS) GROWTH (%) (X) (X) (%) (%) SALES EBITDA
3/07A 10,989 1,122 18.8 28.2 33.1 5.3 24.5 12.9 3.6 29.3
3/08E 12,800 1,393 23.3 24.2 26.7 4.9 17.5 12.1 3.1 23.9
3/09E 15,940 1,334 22.4 -4.2 27.9 4.3 14.7 12.8 2.5 19.5
3/10E 19,842 1,670 28.0 25.1 22.3 3.7 16.1 13.1 2.1 15.8
Equity Shares (m) 59.7
52-Week Range 1,070/310
1,6,12 Rel. Perf. (%) -11/43/57
M.Cap. (Rs b) 37.2
M.Cap. (US$ b) 0.9
BuyPrevious Recommendation: Buy Rs623
28 March 2008BLOOMBERGPEC IN
REUTERS CODEPENG.BO
QUARTERLY PERFORMANCE (STANDALONE) (RS MILLION)Y/E MARCH FY07 FY08 FY07 FY08E
1Q 2Q 3Q 4Q 1Q 2Q 3Q 4QESales 2,900 1,979 2,184 3,962 3,301 2,358 2,622 4,664 11,036 12,945
Change (%) 52.8 40.6 28.7 31.5 13.8 19.1 20.1 17.7 37.7 17.3EBITDA 318 307 419 456 358 420 469 536 1,512 1,783
Change (%) 54.2 38.7 15.9 69.2 12.6 36.5 12.1 17.5 42.8 18.0As of % Sales 11.0 15.5 19.2 11.5 10.9 17.8 17.9 11.5 13.7 13.8
Depreciation 65 66 70 72 66 70 72 88 273 295Interest 46 -13 24 52 27 28 30 31 109 115Other Income 26 20 11 35 35 45 30 11 80 120PBT 233 274 335 368 300 367 398 428 1,210 1,493Tax 33 24 44 28 37 43 48 82 129 209
Effective Tax Rate (%) 14.2 8.7 13.0 7.7 12.2 11.6 12.0 19.2 10.6 14.0Reported PAT 200 250 292 340 264 324 350 346 1,081 1,284Adj PAT 200 250 292 340 264 324 350 346 1,081 1,284
Change (%) 76.9 98.2 16.4 59.9 32.1 29.6 20.1 1.8 54.0 18.8E: MOSt Estimates
Results PreviewSECTOR: INFRASTRUCTURE
Satyam Agarwal ([email protected])Tel: +91 22 3982 5410/ Shridatta Bhandwaldar ([email protected])
* Consolidated
STOCK INFO.BSE Sensex: 16,371
S&P CNX: 4,942
? For 4QFY08, we expect Patel Engineering to report revenues of Rs4.7b, up 17.7% YoY, and net profit of Rs346m.
? Order book as of end-December 2007 stood at Rs55b – a book to bill ratio of 3.3x FY08E consolidated revenues.Order book composition stands as: hydro 56%, irrigation 21%, and transportation and others 23%.
? Patel Realty India Limited (PRIL), the company’s real estate subsidiary is on track in terms of development plans atMumbai (corporate park of 0.83m sft) and Hyderabad (IT SEZ of 2.7m sft at Gachibowli). There could be somedelay in the integrated SEZ of 12.1m sft at Bangalore due to elections in Karnataka. At Bangalore, the residentialarea of the integrated township will be developed first and then the IT Park. The management does not expect anysignificant funding requirement for the real estate projects, as developments would be undertaken in a phased manner.
? Patel plans to set up 1,200MW of thermal power (300MW x 4, to be completed by FY12/FY13), at Bhavnagar inGujarat based on imported coal. It is also acquiring a greenfield coal mine (at 100m ton reserves) in Indonesia toprovide the fuel linkage (for 1,200MW). We understand that the acquisition is in advanced stages, and expect it to becompleted in the next 3-4 months. The project cost is likely to be US$60m-US$70m.
? The stock trades at a reported P/E of 27.9x FY09E and 22.3x FY10E. We maintain Buy.

16928 March 2008
Simplex Infrastructure
YEAR NET SALES* PAT* EPS EPS P/E P/BV ROE ROCE EV/ EV/END (RS M) (RS M) (RS) GROWTH (%) (X) (X) (%) (%) SALES EBITDA
3/07A 17,110 537 12.5 28.9 47.8 9.3 19.5 15.9 1.6 19.2
3/08E 27,030 1,052 19.1 53.5 31.1 4.1 13.2 18.5 1.0 9.5
3/09E 41,106 2,216 40.3 110.6 14.8 2.7 18.5 22.2 0.7 6.2
3/10E 53,438 3,296 60.0 48.7 9.9 2.2 22.0 25.7 0.6 4.5
Equity Shares (m) 55.0
52-Week Range 774/315
1,6,12 Rel. Perf. (%) 4/46/38
M.Cap. (Rs b) 32.7
M.Cap. (US$ b) 0.8
BuyPrevious Recommendation: Buy Rs596
28 March 2008BLOOMBERGSINF IN
REUTERS CODESINF.BO
QUARTERLY PERFORMANCE (STANDALONE) (RS MILLION)Y/E MARCH FY07 FY08 FY07 FY08E
1Q 2Q 3Q 4Q 1Q 2Q 3Q 4QENet Income 3,520 3,563 4,257 5,770 5,818 5,711 7,040 8,461 17,110 27,030
Change % 13.1 29.8 13.6 45.6 65.3 60.3 65.4 46.6 26.1 58.0Total Expenses 3,203 3,232 3,804 5,402 5,236 5,139 6,334 7,509 15,642 24,219EBITDA 317 331 452 368 582 572 705 952 1,468 2,811
Change % 22.4 39.0 67.2 10.3 83.9 73.0 55.9 158.5 33.3 91.5As % of sales 9.3 9.6 11.4 7.3 10.8 11.1 10.6 11.4 9.2 11.0
Other Income 11 12 33 50 44 63 41 9 106 157Interest 121 148 160 202 247 251 296 141 632 934Depreciation 86 94 104 (44) 127 142 167 175 240 612PBT 121 100 221 261 252 242 283 644 702 1,422
As % of sales 3.4 2.8 5.2 4.5 4.3 4.2 4.0 7.6 4.1 5.3Change % (22.3) (2.1) 57.5 35.9 109.1 143.0 28.4 147.1 19.2 102.6
Tax 16 29 48 71 56 52 63 198 164 370Tax/PBT 13.5 29.1 21.7 27.3 22.2 21.5 22.3 30.8 23.4 26.0PAT 104 71 173 189 196 190 220 446 537 1,052Adjusted PAT 104 71 173 189 196 190 220 446 537 1,052
As % of sales 3.0 2.0 4.1 3.3 3.4 3.3 3.1 5.3 3.1 3.9Change % (10.3) (21.2) 57.2 78.2 88.1 169.1 27.4 135.4 27.3 95.9
E: MOSt Estimates
Results PreviewSECTOR: INFRASTRUCTURE
Satyam Agarwal ([email protected])Tel: +91 22 3982 5410/ Shridatta Bhandwaldar ([email protected])
* Consolidated
STOCK INFO.BSE Sensex: 16,371
S&P CNX: 4,942
? For 4QFY08, we expect Simplex to report revenue of Rs8.5b, up 46.6% YoY, and net profit of Rs446m, up 135%YoY.
? Order backlog stood at Rs89b as at the end of December 2007. The current order book represents a book-to-bill ratioof 3.1x FY08E revenue of Rs27b. Order book is represented by orders from government - 35%, private sector - 35%and foreign orders - 35%. The current order book is executable over the next 2.5 years. The average order size hasmoved beyond Rs1b for the company and could increase further, going forward.
? The company has acquired the ability to execute about Rs2.5b worth of orders per month. It plans to take it toRs3.5b/month in FY09, thus improving project execution.
? Key orders received during 4QFY08: Ritz Carlton Hotel, Bangalore, cement plant, sewerage system and thermalpower plant (Rs6,530m), 6 flyovers on Seeb Corniche Road in Muscat in Sultanate of Oman (Rs3,020m), 10.7 kmviaduct on the Versova - Andheri - Ghatkopar elevated corridor (Rs4,060m) and Qatalum Thermal Power Plant inQatar (Rs2,870m).
? For FY08-10, we expect IVRCL to report 40.6% CAGR in revenue and 77% CAGR in net profit. The stock tradesat a P/E of 14.8x FY09E and 9.9x FY10E. We recommend Buy.

17028 March 2008
The media sector witnessed a great deal of action with launch of 9X and NDTV Imaginechannels, new radio policy recommendations by TRAI and huge investors interest.Competitive intensity is increasing in all segments of the media industry, as most playersare in the process of diversifying their revenue streams. Advertising revenues continue topost sustained growth of 20-22% as rising consumer demand is necessitating an increasein spend across segments. TV broadcasting subscription revenues picked up in 3QFY08due to exponential growth in the DTH subscriber base; addressability in cable can perk upsubscription revenue growth further. FICCI-PricewaterhouseCoopers 2008 report on theIndian media industry expects the entertainment and media (E&M) industry to grow by18% CAGR for the next five years. We maintain our positive view on the print mediaindustry with Deccan Chronicle Holdings (DCHL) as our top pick. We maintain aNeutral stance on the TV broadcasting industry with a Neutral rating on Sun TV and ZeeEntertainment Enterprise.
Entry of 9X and NDTV Imagine likely to result in fragmentationTelevision industry continues to attract new players on the back of sustained growth inadvertisement revenue and positive outlook on subscription revenue driven by digitizationof distribution network. During the quarter NDTV launched a GEC channel NDTV Imagine.In just first two months from its launch the channel has already made a huge impact in theGEC genre. The channel has a GRP of 90 which is higher than Sony. UTV World movieshas emerged as the third most watched movie channel trailing only HBO and Star Movies.9XM has emerged as most watched music channel in just 7 weeks from launch. Morechannels are expected to hit this space from the stable of Network 18 Group, RelianceEntertainment and Bag Films. This is likely to result in fragmentation of viewership ratings.Fragmentation of viewership will put a cap to the ad rates being charged on various channelsand genres.
Media
COMPANY NAME PG.Deccan Chronicle 175
H T Media 176
Jagran Prakashan 177
Sun TV Network 178
TV Today 179
Zee Entertainment 180
BSE Sensex: 16,371 S&P CNX: 4,942 28 March 2008
Results PreviewQUARTER ENDED MARCH 2008
Amnish Aggarwal ([email protected]) Tel: +91 22 39825404/Amit Purohit ([email protected]); Tel: 39825418
EXPECTED QUARTERLY PERFORMANCE SUMMARY (RS MILLION)RECO SALES EBITDA NET PROFIT
MAR.08 CHG. (%) MAR.08 CHG. (%) MAR.08 CHG. (%)MediaDeccan Chronicle Buy 2,113 43.2 1,246 70.6 219 -14.4HT Media Buy 3,331 21.1 489 17.0 295 23.1Jagran Prakashan Buy 2,038 24.5 426 45.3 231 50.8Sun TV Neutral 2,445 -35.5 1,826 -27.6 973 -18.2TV Today Buy 746 27.4 291 42.7 166 35.2Zee Entertainment Neutral 4,479 16.5 1,388 45.9 935 54.8Sector Aggregate 15,152 7.6 5,668 10.7 2,818 9.9
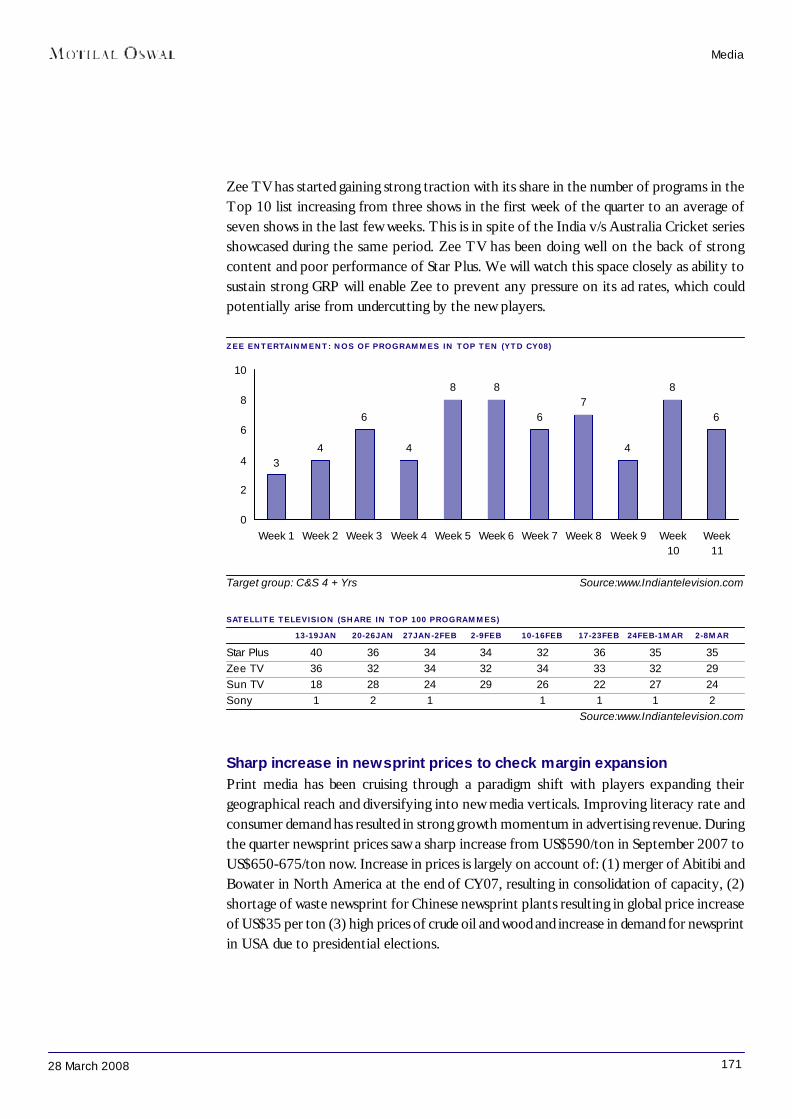
17128 March 2008
Zee TV has started gaining strong traction with its share in the number of programs in theTop 10 list increasing from three shows in the first week of the quarter to an average ofseven shows in the last few weeks. This is in spite of the India v/s Australia Cricket seriesshowcased during the same period. Zee TV has been doing well on the back of strongcontent and poor performance of Star Plus. We will watch this space closely as ability tosustain strong GRP will enable Zee to prevent any pressure on its ad rates, which couldpotentially arise from undercutting by the new players.
ZEE ENTERTAINMENT: NOS OF PROGRAMMES IN TOP TEN (YTD CY08)
Media
Target group: C&S 4 + Yrs Source:www.Indiantelevision.com
SATELLITE TELEVISION (SHARE IN TOP 100 PROGRAMMES)13-19JAN 20-26JAN 27JAN-2FEB 2-9FEB 10-16FEB 17-23FEB 24FEB-1MAR 2-8MAR
Star Plus 40 36 34 34 32 36 35 35Zee TV 36 32 34 32 34 33 32 29Sun TV 18 28 24 29 26 22 27 24Sony 1 2 1 1 1 1 2
Source:www.Indiantelevision.com
Sharp increase in newsprint prices to check margin expansionPrint media has been cruising through a paradigm shift with players expanding theirgeographical reach and diversifying into new media verticals. Improving literacy rate andconsumer demand has resulted in strong growth momentum in advertising revenue. Duringthe quarter newsprint prices saw a sharp increase from US$590/ton in September 2007 toUS$650-675/ton now. Increase in prices is largely on account of: (1) merger of Abitibi andBowater in North America at the end of CY07, resulting in consolidation of capacity, (2)shortage of waste newsprint for Chinese newsprint plants resulting in global price increaseof US$35 per ton (3) high prices of crude oil and wood and increase in demand for newsprintin USA due to presidential elections.
34
6
4
8 8
67
4
8
6
0
2
4
6
8
10
Week 1 Week 2 Week 3 Week 4 Week 5 Week 6 Week 7 Week 8 Week 9 Week10
Week11

17228 March 2008
The domestic market for newsprint is very tight currently and it is difficult to sourcevolumes. Firm newsprint prices will impact the profitability all the three print mediacompanies. HT Media will face the maximum pressure as it has plans to expand geographicalreach of Hindustan (Hindi daily) and Mint (Business daily). HT Media’s circulation of itsMumbai edition and Mint is mostly subscription based, which will impair the ability of thecompany to pass on any cost increases to consumers. Jagran Prakashan will also have animmediate impact as it maintains newsprint inventory of just 10-15 days for domesticallysourced material. Near term newsprint price outlook remains strong; the prices couldcorrect after CY08 post the impact of US elections, the Olympics and commissioning ofnew capacities in China.
NEWSPRINT PRICES TO REMAIN FIRM (US$/TON)
450
500
550
600
650
Apr-
06
Jun-
06
Aug-
06
Oct
-06
Dec
-06
Feb-
07
Apr-
07
Jun-
07
Aug-
07
Oct
-07
Dec
-07
Feb-
08
Media
Source: Company/Motilal Oswal Securities
Direct-to-homeThe DTH subscriber base, which stood at 2.2m in 2006-07, is likely to touch the 5m markby March 2008 on the back of upsurge in subscriber base additions. Existing players suchas Tata Sky and Dish TV continued to offer attractive schemes to woo customers. Theforthcoming months will see the launch of services by both Reliance and Bharti. Weexpect the resultant competition to accelerate industry growth rates significantly. We expectthe DTH subscriber base to post CAGR of 54% to 26m by FY12.
During the quarter, Dish TV India cancelled its Rs2.5b preferential allotment of equityshares and warrants to Indivision Partners due to low valuations. The company has plansto raise Rs16b (debt:equity at 40:60) to fund its expansion plans over the next 2-3 years.However, the company indicated that it has lined up adequate funds for the coming 6-9months.
17328 March 2008
RadioThe radio industry is growing at a fast clip in the current year on the base of over 70%jump in revenues last year. Rising popularity of FM radio and increasing usage options inout-of-home devices like cars and mobiles is aiding this growth. From the level of Rs6.2bin 2007, industry is expected to grow to Rs18b by 2012. Deregulation in the radio industryhas been the turning point for the sector. TRAI has proposed a new radio policy, whichwould go a long way to boost growth prospects of the industry. Some the keyrecommendations by TRAI are:1. Geographical basis of private FM radio bidding to be changed from city to district.2. Multiple channels allowed to be operated by a FM broadcaster in a district3. Cap on maximum number of channels by an operator removed4. Broadcasting of news and current affairs by FM radio stations5. Increase in the FDI and FII cap
We believe that multiple frequencies and entry of private players into news and currentaffairs programs can open up new revenue streams, pushing growth rates to higher-than-estimated levels.
We maintain our positive view on the print media industry with DCHL as our top pick. Wemaintain a Neutral stance on the TV broadcasting industry with a Neutral rating on SunTV and Zee Entertainment Enterprise.
Media
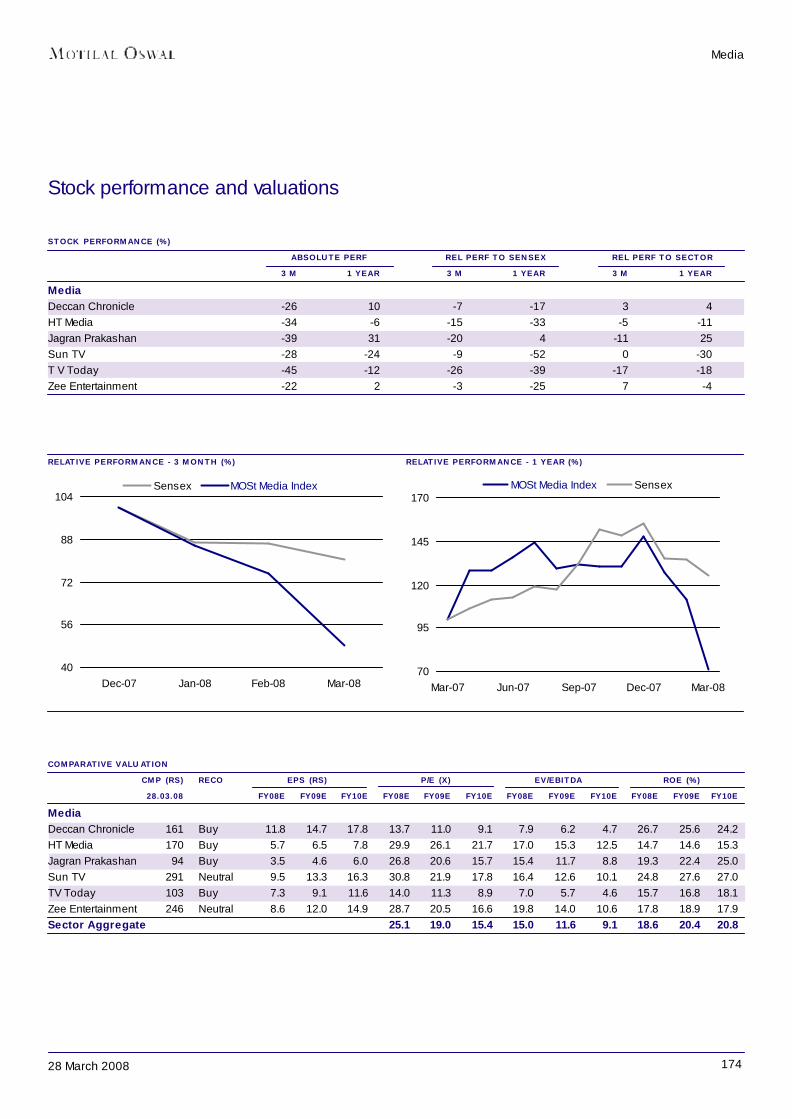
17428 March 2008
RELATIVE PERFORMANCE - 3 MONTH (%) RELATIVE PERFORMANCE - 1 YEAR (%)
Stock performance and valuations
STOCK PERFORMANCE (%) ABSOLUTE PERF REL PERF TO SENSEX REL PERF TO SECTOR
3 M 1 YEAR 3 M 1 YEAR 3 M 1 YEARMediaDeccan Chronicle -26 10 -7 -17 3 4HT Media -34 -6 -15 -33 -5 -11Jagran Prakashan -39 31 -20 4 -11 25Sun TV -28 -24 -9 -52 0 -30T V Today -45 -12 -26 -39 -17 -18Zee Entertainment -22 2 -3 -25 7 -4
COMPARATIVE VALUATIONCMP (RS) RECO EPS (RS) P/E (X) EV/EBITDA ROE (%)28.03.08 FY08E FY09E FY10E FY08E FY09E FY10E FY08E FY09E FY10E FY08E FY09E FY10E
MediaDeccan Chronicle 161 Buy 11.8 14.7 17.8 13.7 11.0 9.1 7.9 6.2 4.7 26.7 25.6 24.2HT Media 170 Buy 5.7 6.5 7.8 29.9 26.1 21.7 17.0 15.3 12.5 14.7 14.6 15.3Jagran Prakashan 94 Buy 3.5 4.6 6.0 26.8 20.6 15.7 15.4 11.7 8.8 19.3 22.4 25.0Sun TV 291 Neutral 9.5 13.3 16.3 30.8 21.9 17.8 16.4 12.6 10.1 24.8 27.6 27.0TV Today 103 Buy 7.3 9.1 11.6 14.0 11.3 8.9 7.0 5.7 4.6 15.7 16.8 18.1Zee Entertainment 246 Neutral 8.6 12.0 14.9 28.7 20.5 16.6 19.8 14.0 10.6 17.8 18.9 17.9Sector Aggregate 25.1 19.0 15.4 15.0 11.6 9.1 18.6 20.4 20.8
70
95
120
145
170
Mar-07 Jun-07 Sep-07 Dec-07 Mar-08
MOSt Media Index Sensex
40
56
72
88
104
Dec-07 Jan-08 Feb-08 Mar-08
Sensex MOSt Media Index
Media
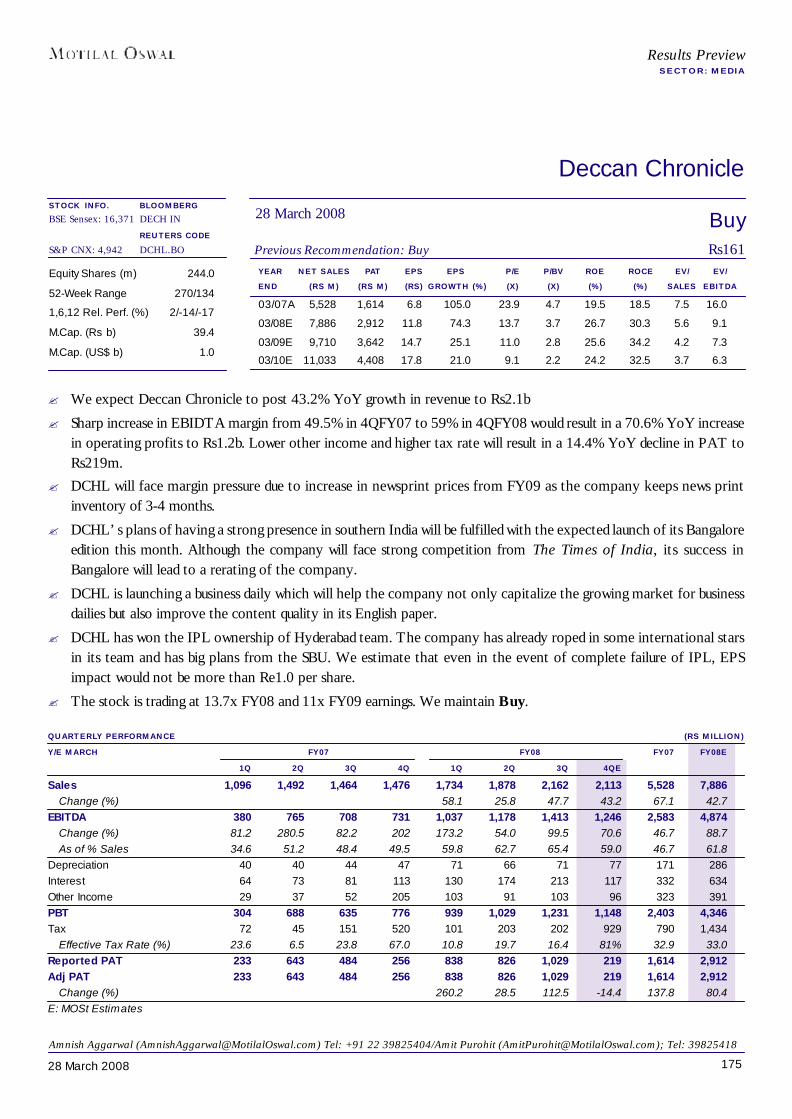
17528 March 2008
Results PreviewSECTOR: MEDIA
Deccan Chronicle
YEAR NET SALES PAT EPS EPS P/E P/BV ROE ROCE EV/ EV/END (RS M) (RS M) (RS) GROWTH (%) (X) (X) (%) (%) SALES EBITDA
03/07A 5,528 1,614 6.8 105.0 23.9 4.7 19.5 18.5 7.5 16.0
03/08E 7,886 2,912 11.8 74.3 13.7 3.7 26.7 30.3 5.6 9.1
03/09E 9,710 3,642 14.7 25.1 11.0 2.8 25.6 34.2 4.2 7.3
03/10E 11,033 4,408 17.8 21.0 9.1 2.2 24.2 32.5 3.7 6.3
Equity Shares (m) 244.0
52-Week Range 270/134
1,6,12 Rel. Perf. (%) 2/-14/-17
M.Cap. (Rs b) 39.4
M.Cap. (US$ b) 1.0
QUARTERLY PERFORMANCE (RS MILLION)Y/E MARCH FY07 FY08 FY07 FY08E
1Q 2Q 3Q 4Q 1Q 2Q 3Q 4QESales 1,096 1,492 1,464 1,476 1,734 1,878 2,162 2,113 5,528 7,886
Change (%) 58.1 25.8 47.7 43.2 67.1 42.7EBITDA 380 765 708 731 1,037 1,178 1,413 1,246 2,583 4,874
Change (%) 81.2 280.5 82.2 202 173.2 54.0 99.5 70.6 46.7 88.7As of % Sales 34.6 51.2 48.4 49.5 59.8 62.7 65.4 59.0 46.7 61.8
Depreciation 40 40 44 47 71 66 71 77 171 286Interest 64 73 81 113 130 174 213 117 332 634Other Income 29 37 52 205 103 91 103 96 323 391PBT 304 688 635 776 939 1,029 1,231 1,148 2,403 4,346Tax 72 45 151 520 101 203 202 929 790 1,434
Effective Tax Rate (%) 23.6 6.5 23.8 67.0 10.8 19.7 16.4 81% 32.9 33.0Reported PAT 233 643 484 256 838 826 1,029 219 1,614 2,912Adj PAT 233 643 484 256 838 826 1,029 219 1,614 2,912
Change (%) 260.2 28.5 112.5 -14.4 137.8 80.4E: MOSt Estimates
BuyPrevious Recommendation: Buy Rs161
28 March 2008BLOOMBERGDECH IN
REUTERS CODEDCHL.BO
Amnish Aggarwal ([email protected]) Tel: +91 22 39825404/Amit Purohit ([email protected]); Tel: 39825418
STOCK INFO.BSE Sensex: 16,371
S&P CNX: 4,942
? We expect Deccan Chronicle to post 43.2% YoY growth in revenue to Rs2.1b
? Sharp increase in EBIDTA margin from 49.5% in 4QFY07 to 59% in 4QFY08 would result in a 70.6% YoY increasein operating profits to Rs1.2b. Lower other income and higher tax rate will result in a 14.4% YoY decline in PAT toRs219m.
? DCHL will face margin pressure due to increase in newsprint prices from FY09 as the company keeps news printinventory of 3-4 months.
? DCHL’s plans of having a strong presence in southern India will be fulfilled with the expected launch of its Bangaloreedition this month. Although the company will face strong competition from The Times of India, its success inBangalore will lead to a rerating of the company.
? DCHL is launching a business daily which will help the company not only capitalize the growing market for businessdailies but also improve the content quality in its English paper.
? DCHL has won the IPL ownership of Hyderabad team. The company has already roped in some international starsin its team and has big plans from the SBU. We estimate that even in the event of complete failure of IPL, EPSimpact would not be more than Re1.0 per share.
? The stock is trading at 13.7x FY08 and 11x FY09 earnings. We maintain Buy.

17628 March 2008
Results PreviewSECTOR: MEDIA
H T Media
YEAR NET SALES PAT EPS EPS P/E P/BV ROE ROCE EV/ EV/END (RS M) (RS M) (RS) GROWTH (%) (X) (X) (%) (%) SALES EBITDA
03/07A 10,393 1,156 4.9 91.7 34.4 5.1 14.7 15.1 3.5 19.2
03/08E 12,135 1,330 5.7 15.3 29.9 4.4 14.7 15.4 2.9 16.2
03/09E 14,264 1,521 6.5 14.3 26.1 3.8 14.6 14.8 2.5 14.6
03/10E 16,663 1,828 7.8 20.2 21.7 3.3 15.3 15.7 2.1 11.9
Equity Shares (m) 234.2
52-Week Range 266/128
1,6,12 Rel. Perf. (%) -5/-16/-33
M.Cap. (Rs b) 39.7
M.Cap. (US$ b) 1.0
QUARTERLY PERFORMANCE (RS MILLION)Y/E MARCH FY07 FY08 FY07 FY08E
1Q 2Q 3Q 4Q 1Q 2Q 3Q 4QESales 2,391 2,499 2,752 2,750 2,733 2,877 3,194 3,331 10,393 12,135
Change (%) 14.3 15.1 16.1 21.1 0.3 16.8EBITDA 519 477 491 418 556 558 592 489 1,905 2,195
Change (%) 7.1 17.0 20.7 17.0 15.2As of % Sales 21.7 19.1 17.8 15.2 20.3 19.4 18.5 14.7 18.3 18.1
Depreciation 96 96 98 107 106 110 114 105 397 435Interest 34 38 36 35 42 44 45 43 143 173Other Income 87 76 149 91 103 18 87 105 403 313Extra-ordinary income -3 0 0 0 0 0 0 0 -3 0PBT 474 419 506 367 511 422 521 446 1,765 1,900Tax 167 150 170 127 169 97 153 151 614 570
Effective Tax Rate (%) 35.3 35.7 33.6 34.7 33.1 23.0 29.3 33.9 34.8 30.0Reported PAT 306 269 336 240 342 325 369 295 1,151 1,330Adj PAT 309 269 336 240 342 325 369 295 1,153 1,330
Change (%) 10.6 20.7 9.8 23.1 15.3E: MOSt Estimates
BuyPrevious Recommendation: Buy Rs170
28 March 2008BLOOMBERGHTML IN
REUTERS CODEHTML.BO
Amnish Aggarwal ([email protected]) Tel: +91 22 39825404/Amit Purohit ([email protected]); Tel: 39825418
STOCK INFO.BSE Sensex: 16,371
S&P CNX: 4,942
? We expect HT Media to post 21.1% increase in revenue to Rs3.3b.
? EBIDTA margin is expected to decline from 15.2% in 4QFY07 to 14.7% in 4QFY08. The decline is largely onaccount of expanding the geographical presence of Mint, launch of Hindustan in UP markets and continuing lossesin Mumbai.
? HT Media will start feeling the impact of increase in newsprint prices from this quarter itself as it currently has lowinventory (normal level is 2 months). Moreover ability of HT Media to pass on the cost increase is very low inMumbai as most of the circulation is subscription based.
? HT Delhi continues to be the largest contributor to the company’s total revenue. We do not rule out some priceincrease in Delhi after an understanding with TOI. Hindustan and Mint edition launches might be delayed due to arise in material costs.
? The company will start reporting the numbers of Hindustan separately from 1QFY09. We expect Mint and HTMumbai to remain in an investment mode for next 2-3 years.
? The stock is trading at 29.9x FY08 and 26.1x FY09 earnings. We maintain a Buy.
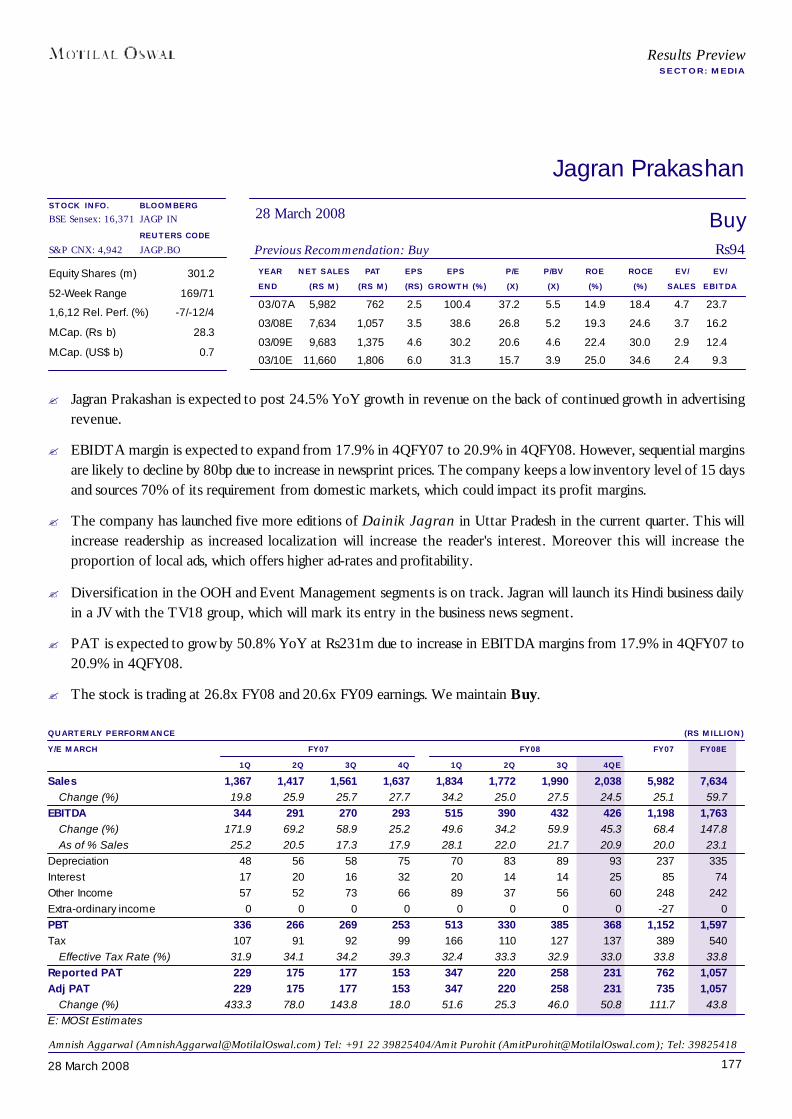
17728 March 2008
Results PreviewSECTOR: MEDIA
Jagran Prakashan
YEAR NET SALES PAT EPS EPS P/E P/BV ROE ROCE EV/ EV/END (RS M) (RS M) (RS) GROWTH (%) (X) (X) (%) (%) SALES EBITDA
03/07A 5,982 762 2.5 100.4 37.2 5.5 14.9 18.4 4.7 23.7
03/08E 7,634 1,057 3.5 38.6 26.8 5.2 19.3 24.6 3.7 16.2
03/09E 9,683 1,375 4.6 30.2 20.6 4.6 22.4 30.0 2.9 12.4
03/10E 11,660 1,806 6.0 31.3 15.7 3.9 25.0 34.6 2.4 9.3
Equity Shares (m) 301.2
52-Week Range 169/71
1,6,12 Rel. Perf. (%) -7/-12/4
M.Cap. (Rs b) 28.3
M.Cap. (US$ b) 0.7
QUARTERLY PERFORMANCE (RS MILLION)Y/E MARCH FY07 FY08 FY07 FY08E
1Q 2Q 3Q 4Q 1Q 2Q 3Q 4QESales 1,367 1,417 1,561 1,637 1,834 1,772 1,990 2,038 5,982 7,634
Change (%) 19.8 25.9 25.7 27.7 34.2 25.0 27.5 24.5 25.1 59.7EBITDA 344 291 270 293 515 390 432 426 1,198 1,763
Change (%) 171.9 69.2 58.9 25.2 49.6 34.2 59.9 45.3 68.4 147.8As of % Sales 25.2 20.5 17.3 17.9 28.1 22.0 21.7 20.9 20.0 23.1
Depreciation 48 56 58 75 70 83 89 93 237 335Interest 17 20 16 32 20 14 14 25 85 74Other Income 57 52 73 66 89 37 56 60 248 242Extra-ordinary income 0 0 0 0 0 0 0 0 -27 0PBT 336 266 269 253 513 330 385 368 1,152 1,597Tax 107 91 92 99 166 110 127 137 389 540
Effective Tax Rate (%) 31.9 34.1 34.2 39.3 32.4 33.3 32.9 33.0 33.8 33.8Reported PAT 229 175 177 153 347 220 258 231 762 1,057Adj PAT 229 175 177 153 347 220 258 231 735 1,057
Change (%) 433.3 78.0 143.8 18.0 51.6 25.3 46.0 50.8 111.7 43.8E: MOSt Estimates
BuyPrevious Recommendation: Buy Rs94
28 March 2008BLOOMBERGJAGP IN
REUTERS CODEJAGP.BO
Amnish Aggarwal ([email protected]) Tel: +91 22 39825404/Amit Purohit ([email protected]); Tel: 39825418
STOCK INFO.BSE Sensex: 16,371
S&P CNX: 4,942
? Jagran Prakashan is expected to post 24.5% YoY growth in revenue on the back of continued growth in advertisingrevenue.
? EBIDTA margin is expected to expand from 17.9% in 4QFY07 to 20.9% in 4QFY08. However, sequential marginsare likely to decline by 80bp due to increase in newsprint prices. The company keeps a low inventory level of 15 daysand sources 70% of its requirement from domestic markets, which could impact its profit margins.
? The company has launched five more editions of Dainik Jagran in Uttar Pradesh in the current quarter. This willincrease readership as increased localization will increase the reader's interest. Moreover this will increase theproportion of local ads, which offers higher ad-rates and profitability.
? Diversification in the OOH and Event Management segments is on track. Jagran will launch its Hindi business dailyin a JV with the TV18 group, which will mark its entry in the business news segment.
? PAT is expected to grow by 50.8% YoY at Rs231m due to increase in EBITDA margins from 17.9% in 4QFY07 to20.9% in 4QFY08.
? The stock is trading at 26.8x FY08 and 20.6x FY09 earnings. We maintain Buy.

17828 March 2008
Results PreviewSECTOR: MEDIA
Sun TV Network
YEAR NET SALES PAT EPS EPS P/E P/BV ROE ROCE EV/ EV/END (RS M) (RS M) (RS) GROWTH (%) (X) (X) (%) (%) SALES EBITDA
3/07A 6,788 2,688 6.8 29.9 42.7 7.6 22.1 41.0 16.1 22.6
3/08E 8,609 3,728 9.5 38.7 30.8 6.2 24.8 44.1 12.3 16.4
3/09E 10,665 5,243 13.3 40.7 21.9 6.2 27.6 44.5 9.6 12.6
3/10E 12,719 6,434 16.3 22.7 17.8 4.9 27.0 43.4 7.7 10.1
Equity Shares (m) 394
52-Week Range 458/260
1,6,12 Rel. Perf. (%) 2/-8/-52
M.Cap. (Rs b) 114.7
M.Cap. (US$ b) 2.9
QUARTERLY PERFORMANCE (RS MILLION)Y/E MARCH FY07 FY08 FY07 FY08E
1Q 2Q 3Q 4Q 1Q 2Q 3Q 4QESales 894 945 1,140 3,790 2,023 1,945 2,178 2,445 6,770 8,591
Change (%) 126.3 105.8 91.0 -35.5 26.9EBITDA 693 715 884 2,524 1,529 1,398 1,710 1,826 4,818 6,464
Change (%) 120.8 95.5 93.5 -27.6 34.2As of % Sales 77.5 75.7 77.5 66.6 75.6 71.9 78.5 74.7 71.2 75.2
Depreciation 127 110 90 864 243 248 262 471 1,193 1,225Interest 11 2 2 15 5 15 25 21 31 65Other Income 96 114 110 174 149 143 142 100 495 534PBT 651 717 902 1,819 1,431 1,278 1,565 1,435 4,089 5,709Tax 228 238 305 630 500 477 542 462 1,401 1,981
Effective Tax Rate (%) 35.1 33.1 33.8 34.6 34.9 37.3 34.6 32.2 34.3 34.7Reported PAT 422 480 598 1,189 931 802 1,023 973 2,688 3,728Adj PAT 422 480 598 1,189 931 802 1,023 973 2,688 3,728
Change (%) 120.4 67.1 71.2 -18.2 38.7E: MOSt Estimates; Note: 4QFY08 nos not comparable on a YoY basis, as 4QFY07 results includes Udaya TV and Gemini TV full year nos
NeutralPrevious Recommendation: Neutral Rs291
28 March 2008BLOOMBERGSUNTV IN
REUTERS CODESUTV.BO
Amnish Aggarwal ([email protected]) Tel: +91 22 39825404/Amit Purohit ([email protected]); Tel: 39825418
STOCK INFO.BSE Sensex: 16,371
S&P CNX: 4,942
? We expect the company to post revenue of Rs2.4b up 12.3% QoQ, EBITDA of Rs1.8b and of PAT of Rs973m for4QFY08.
? Sun TV continues to remain an undisputed leader in southern India with presence across all the four states. Its TamilKids channel Chutti TV has been big hit and the company now plans to extend this same to other languages, whichwill further strengthen its position in the Kids genre.
? We expect competitive intensity to increase due to expansion plans of players like Kalaignar and Raj TV in Tamillanguage. Zee News is gaining ground in Kannada and Telgu GEC space in the non-film based programmes. Thecompany has plans to relaunch its Tamil GEC channel in six months.
? The company is in the process of becoming a strong player in the FM radio space. It currently has 27 stations underoperation; the remaining 14 are to be launched by year-end. We expect Sun TV network to be a major beneficiaryfrom phase three of radio policy, due to groups synergy in other news based mediums like television and print.
? The stock is trading at 30.8x FY08 and 21.9x FY09 earnings. We maintain Neutral.

17928 March 2008
Results PreviewSECTOR: MEDIA
TV Today
YEAR NET SALES PAT* EPS EPS P/E P/BV ROE ROCE EV/ EV/END (RS M) (RS M) (RS) GROWTH (%) (X) (X) (%) (%) SALES EBITDA
3/07A 1,889 312 5.4 12.3 19.2 2.3 12.2 18.4 2.5 9.0
3/08E 2,419 466 7.3 36.5 14.0 2.2 15.7 23.6 2.1 6.8
3/09E 2,755 578 9.1 24.1 11.3 1.9 16.8 25.3 1.7 5.3
3/10E 3,174 734 11.6 26.9 8.9 1.6 18.1 27.3 1.3 3.8
Equity Shares (m) 58.0
52-Week Range 200/88
1,6,12 Rel. Perf. (%) -14/-23/-39
M.Cap. (Rs b) 6.0
M.Cap. (US$ b) 0.1
QUARTERLY PERFORMANCE (RS MILLION)Y/E MARCH FY07 FY08 FY07 FY08E
1Q 2Q 3Q 4Q 1Q 2Q 3Q 4QESales 351 381 571 585 515 464 694 746 1,889 2,419
Change (%) 3.1 21.2 26.2 20.0 46.7 21.8 21.4 27.4 18.4 28.1EBITDA 38 61 216 204 119 78 244 291 518 732
Change (%) -66.6 7.1 33.3 8.1 214.3 29.6 13.1 42.7 -0.5 2.9As of % Sales 10.8 15.9 37.7 34.8 23.1 16.9 35.1 39.0 27.4 30.3
Depreciation 39 45 43 43 39 40 40 52 170 171Interest 0 0 0 0 0 0 0 1 1 1Other Income 25 37 46 27 42 44 54 18 135 157Extra-ordinary income 0 0 0 0 0 0 0 0 0 0PBT 24 53 218 188 121 82 257 257 482 717Tax 9 20 77 66 41 29 90 92 170 251
Effective Tax Rate (%) 37.3 37.6 35.3 34.8 33.7 34.7 35.1 33.0 35.3 35.0Reported PAT 15 33 141 123 80 54 167 166 312 466Adj PAT 15 33 141 123 80 54 167 166 312 466
Change (%) -65.5 -66.7 93.8 -5.7 439.9 63.7 18.6 35.2 12.3 49.5E: MOSt Estimates
BuyPrevious Recommendation: Buy Rs103
28 March 2008BLOOMBERGTVTN IN
REUTERS CODETVTO.BO
Amnish Aggarwal ([email protected]) Tel: +91 22 39825404/Amit Purohit ([email protected]); Tel: 39825418
STOCK INFO.BSE Sensex: 16,371
S&P CNX: 4,942
* Excluding extraordinary items and provisions
? We expect the company to post revenue of Rs746m, up 27.4% YoY on the back consistent growth in advertisingrevenue.
? Aaj Tak is an undisputed leader in the Hindi news genre in spite of increased competition in this genre. Revamp ofHeadlines Today has resulted in an increase in market share from 7% in FY05 to 10% in FY07.
? New initiatives like merger of Radio Today and conversion into a pay channel will pay off in the long term. TV Todayis awaiting the Ministry of Information and Broadcasting’s clearance to go ahead with the merger.
? We believe TV Today is a low risk investment, with potential re-rating triggers. The stock is trading at 14x FY08 and11.3x FY09 earnings. We maintain Buy.
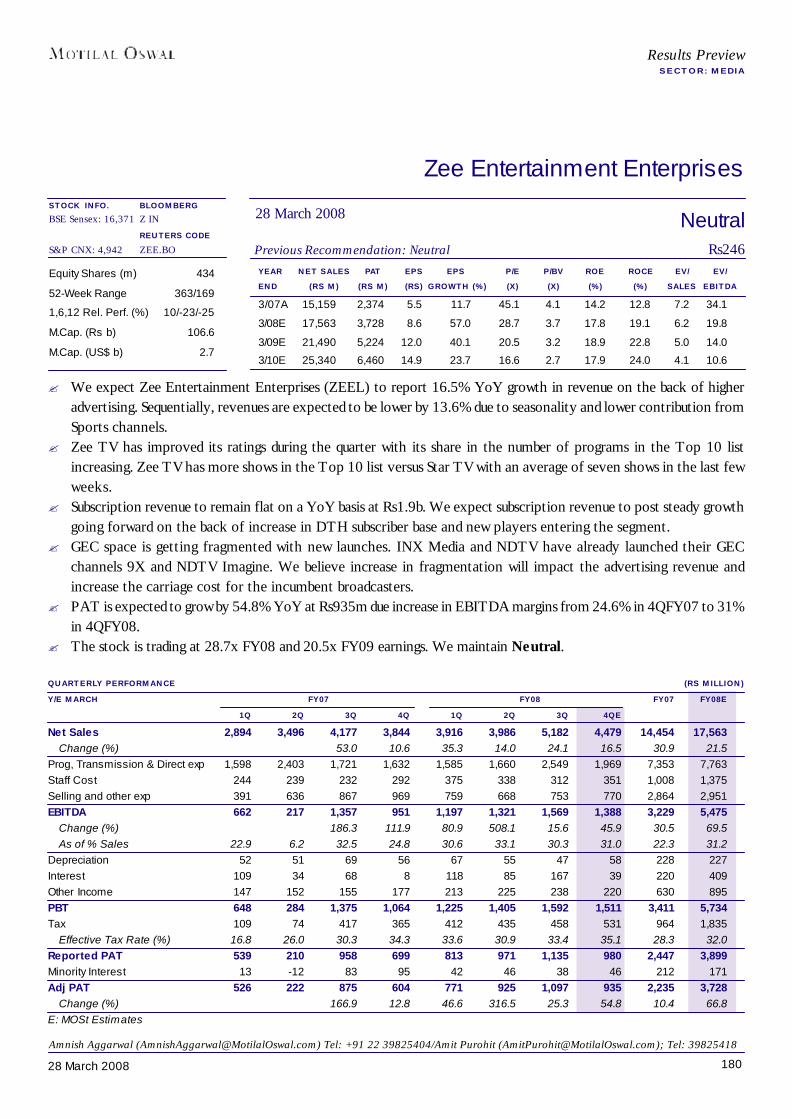
18028 March 2008
Results PreviewSECTOR: MEDIA
Zee Entertainment Enterprises
YEAR NET SALES PAT EPS EPS P/E P/BV ROE ROCE EV/ EV/END (RS M) (RS M) (RS) GROWTH (%) (X) (X) (%) (%) SALES EBITDA
3/07A 15,159 2,374 5.5 11.7 45.1 4.1 14.2 12.8 7.2 34.1
3/08E 17,563 3,728 8.6 57.0 28.7 3.7 17.8 19.1 6.2 19.8
3/09E 21,490 5,224 12.0 40.1 20.5 3.2 18.9 22.8 5.0 14.0
3/10E 25,340 6,460 14.9 23.7 16.6 2.7 17.9 24.0 4.1 10.6
Equity Shares (m) 434
52-Week Range 363/169
1,6,12 Rel. Perf. (%) 10/-23/-25
M.Cap. (Rs b) 106.6
M.Cap. (US$ b) 2.7
QUARTERLY PERFORMANCE (RS MILLION)Y/E MARCH FY07 FY08 FY07 FY08E
1Q 2Q 3Q 4Q 1Q 2Q 3Q 4QENet Sales 2,894 3,496 4,177 3,844 3,916 3,986 5,182 4,479 14,454 17,563
Change (%) 53.0 10.6 35.3 14.0 24.1 16.5 30.9 21.5Prog, Transmission & Direct exp 1,598 2,403 1,721 1,632 1,585 1,660 2,549 1,969 7,353 7,763Staff Cost 244 239 232 292 375 338 312 351 1,008 1,375Selling and other exp 391 636 867 969 759 668 753 770 2,864 2,951EBITDA 662 217 1,357 951 1,197 1,321 1,569 1,388 3,229 5,475
Change (%) 186.3 111.9 80.9 508.1 15.6 45.9 30.5 69.5As of % Sales 22.9 6.2 32.5 24.8 30.6 33.1 30.3 31.0 22.3 31.2
Depreciation 52 51 69 56 67 55 47 58 228 227Interest 109 34 68 8 118 85 167 39 220 409Other Income 147 152 155 177 213 225 238 220 630 895PBT 648 284 1,375 1,064 1,225 1,405 1,592 1,511 3,411 5,734Tax 109 74 417 365 412 435 458 531 964 1,835
Effective Tax Rate (%) 16.8 26.0 30.3 34.3 33.6 30.9 33.4 35.1 28.3 32.0Reported PAT 539 210 958 699 813 971 1,135 980 2,447 3,899Minority Interest 13 -12 83 95 42 46 38 46 212 171Adj PAT 526 222 875 604 771 925 1,097 935 2,235 3,728
Change (%) 166.9 12.8 46.6 316.5 25.3 54.8 10.4 66.8E: MOSt Estimates
NeutralPrevious Recommendation: Neutral Rs246
28 March 2008BLOOMBERGZ IN
REUTERS CODEZEE.BO
Amnish Aggarwal ([email protected]) Tel: +91 22 39825404/Amit Purohit ([email protected]); Tel: 39825418
STOCK INFO.BSE Sensex: 16,371
S&P CNX: 4,942
? We expect Zee Entertainment Enterprises (ZEEL) to report 16.5% YoY growth in revenue on the back of higheradvertising. Sequentially, revenues are expected to be lower by 13.6% due to seasonality and lower contribution fromSports channels.
? Zee TV has improved its ratings during the quarter with its share in the number of programs in the Top 10 listincreasing. Zee TV has more shows in the Top 10 list versus Star TV with an average of seven shows in the last fewweeks.
? Subscription revenue to remain flat on a YoY basis at Rs1.9b. We expect subscription revenue to post steady growthgoing forward on the back of increase in DTH subscriber base and new players entering the segment.
? GEC space is getting fragmented with new launches. INX Media and NDTV have already launched their GECchannels 9X and NDTV Imagine. We believe increase in fragmentation will impact the advertising revenue andincrease the carriage cost for the incumbent broadcasters.
? PAT is expected to grow by 54.8% YoY at Rs935m due increase in EBITDA margins from 24.6% in 4QFY07 to 31%in 4QFY08.
? The stock is trading at 28.7x FY08 and 20.5x FY09 earnings. We maintain Neutral.
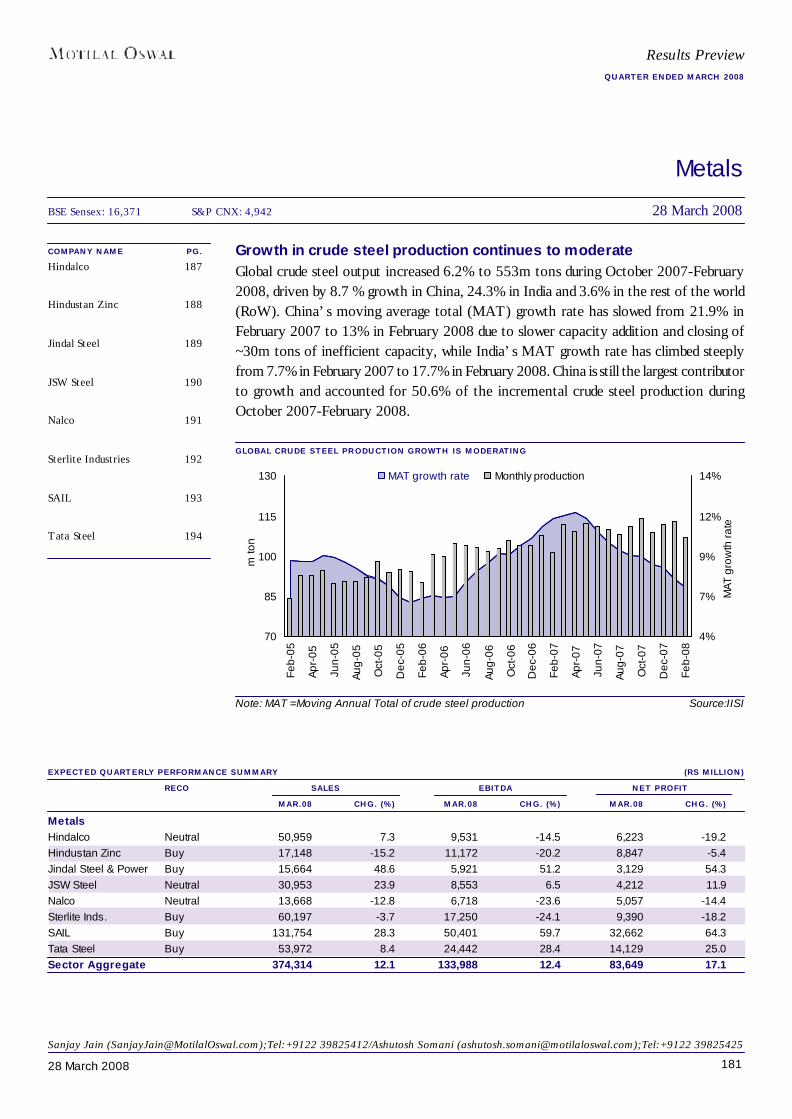
18128 March 2008
Metals
COMPANY NAME PG.Hindalco 187
Hindustan Zinc 188
Jindal Steel 189
JSW Steel 190
Nalco 191
Sterlite Industries 192
SAIL 193
Tata Steel 194
EXPECTED QUARTERLY PERFORMANCE SUMMARY (RS MILLION)RECO SALES EBITDA NET PROFIT
MAR.08 CHG. (%) MAR.08 CHG. (%) MAR.08 CHG. (%)MetalsHindalco Neutral 50,959 7.3 9,531 -14.5 6,223 -19.2Hindustan Zinc Buy 17,148 -15.2 11,172 -20.2 8,847 -5.4Jindal Steel & Power Buy 15,664 48.6 5,921 51.2 3,129 54.3JSW Steel Neutral 30,953 23.9 8,553 6.5 4,212 11.9Nalco Neutral 13,668 -12.8 6,718 -23.6 5,057 -14.4Sterlite Inds. Buy 60,197 -3.7 17,250 -24.1 9,390 -18.2SAIL Buy 131,754 28.3 50,401 59.7 32,662 64.3Tata Steel Buy 53,972 8.4 24,442 28.4 14,129 25.0Sector Aggregate 374,314 12.1 133,988 12.4 83,649 17.1
Growth in crude steel production continues to moderateGlobal crude steel output increased 6.2% to 553m tons during October 2007-February2008, driven by 8.7 % growth in China, 24.3% in India and 3.6% in the rest of the world(RoW). China’s moving average total (MAT) growth rate has slowed from 21.9% inFebruary 2007 to 13% in February 2008 due to slower capacity addition and closing of~30m tons of inefficient capacity, while India’s MAT growth rate has climbed steeplyfrom 7.7% in February 2007 to 17.7% in February 2008. China is still the largest contributorto growth and accounted for 50.6% of the incremental crude steel production duringOctober 2007-February 2008.
GLOBAL CRUDE STEEL PRODUCTION GROWTH IS MODERATING
Note: MAT =Moving Annual Total of crude steel production Source:IISI
BSE Sensex: 16,371 S&P CNX: 4,942 28 March 2008
Sanjay Jain ([email protected]);Tel:+9122 39825412/Ashutosh Somani ([email protected]);Tel:+9122 39825425
Results PreviewQUARTER ENDED MARCH 2008
70
85
100
115
130
Feb-
05
Apr-
05
Jun-
05
Aug-
05
Oct
-05
Dec
-05
Feb-
06
Apr-
06
Jun-
06
Aug-
06
Oct
-06
Dec
-06
Feb-
07
Apr-
07
Jun-
07
Aug-
07
Oct
-07
Dec
-07
Feb-
08
m to
n
4%
7%
9%
12%
14%
MAT
gro
wth
rate
MAT growth rate Monthly production

18228 March 2008
Source: IISI
Metallics shortage worldwide is driving iron ore prices northwardIron ore prices have been up sharply in the last six months in the spot market. Driving ironore prices upward are: (1) continued strong demand from the largest consumer of iron orei.e. China, which constitutes ~45 % of the total global trade; (2) high ocean freight due toshortage of ships and port congestion; (3) limited supply growth in the international marketdue to infrastructure bottlenecks and consolidation of miners; and (4) supply of substitutei.e. steel scrap has been limited as scrap collection in main scrap generating developedcountries has peaked.
IRON ORE ANNUAL BENCHMARK CONTRACT PRICES 5X IN 5 YEARS
Metals
CHINA’S CRUDE STEEL PRODUCTION GROWTH DECLINING SHARPLY
Source: Industry
Sesa Goa is a play on iron ore prices, while SAIL, Jindal Steel & Power benefit when steelprices are pushed up due to rising iron ore costs.
-60
0
60
120
180
1990
1991
1992
1993
1994
1995
1996
1997
1998
1999
2000
2001
2002
2003
2004
2005
2006
2007
2008
Change (%, YoY) lumps (US ¢/dmtu) Fines (US ¢/dmtu)
10
20
30
40
50
Feb-
05
Apr-
05
Jun-
05
Aug-
05
Oct
-05
Dec
-05
Feb-
06
Apr-
06
Jun-
06
Aug-
06
Oct
-06
Dec
-06
Feb-
07
Apr-
07
Jun-
07
Aug-
07
Oct
-07
Dec
-07
Feb-
08
m to
n
10%
15%
20%
25%
30%
MAT
gro
wth
rate
MAT growth rate Monthly production
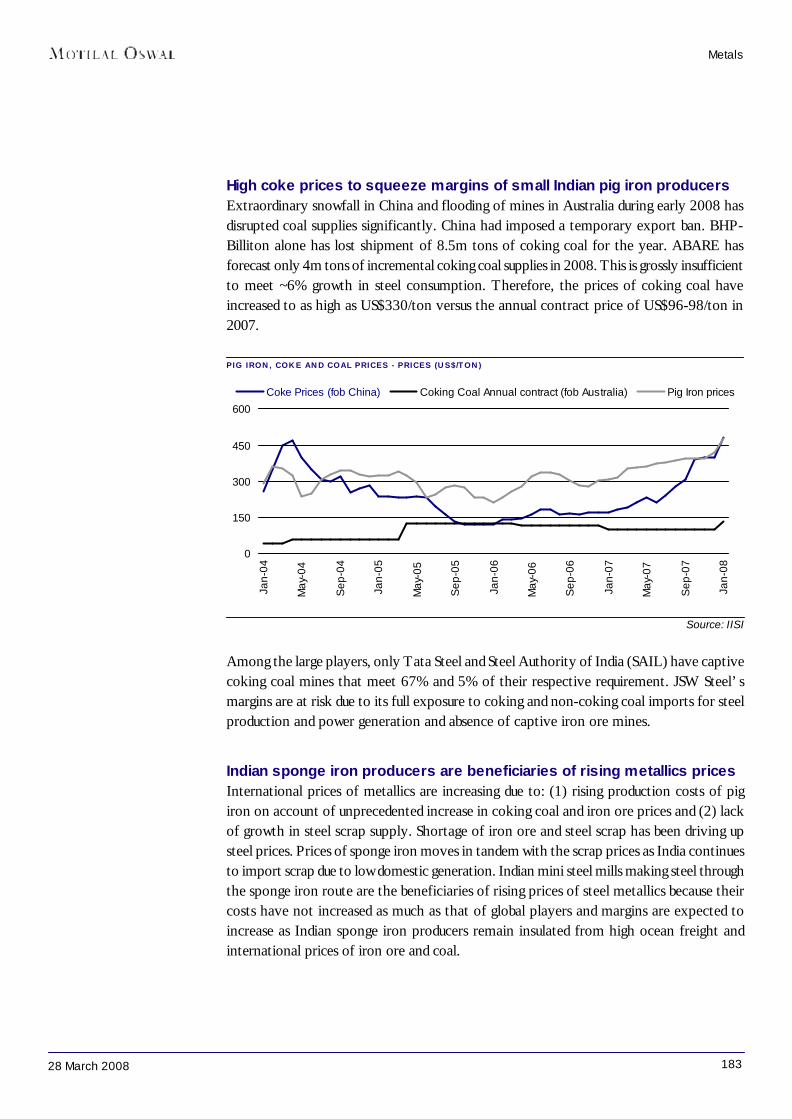
18328 March 2008
Metals
High coke prices to squeeze margins of small Indian pig iron producersExtraordinary snowfall in China and flooding of mines in Australia during early 2008 hasdisrupted coal supplies significantly. China had imposed a temporary export ban. BHP-Billiton alone has lost shipment of 8.5m tons of coking coal for the year. ABARE hasforecast only 4m tons of incremental coking coal supplies in 2008. This is grossly insufficientto meet ~6% growth in steel consumption. Therefore, the prices of coking coal haveincreased to as high as US$330/ton versus the annual contract price of US$96-98/ton in2007.
PIG IRON, COKE AND COAL PRICES - PRICES (US$/TON)
Source: IISI
Among the large players, only Tata Steel and Steel Authority of India (SAIL) have captivecoking coal mines that meet 67% and 5% of their respective requirement. JSW Steel’smargins are at risk due to its full exposure to coking and non-coking coal imports for steelproduction and power generation and absence of captive iron ore mines.
Indian sponge iron producers are beneficiaries of rising metallics pricesInternational prices of metallics are increasing due to: (1) rising production costs of pigiron on account of unprecedented increase in coking coal and iron ore prices and (2) lackof growth in steel scrap supply. Shortage of iron ore and steel scrap has been driving upsteel prices. Prices of sponge iron moves in tandem with the scrap prices as India continuesto import scrap due to low domestic generation. Indian mini steel mills making steel throughthe sponge iron route are the beneficiaries of rising prices of steel metallics because theircosts have not increased as much as that of global players and margins are expected toincrease as Indian sponge iron producers remain insulated from high ocean freight andinternational prices of iron ore and coal.
0
150
300
450
600
Jan-
04
May
-04
Sep
-04
Jan-
05
May
-05
Sep
-05
Jan-
06
May
-06
Sep
-06
Jan-
07
May
-07
Sep
-07
Jan-
08
Coke Prices (fob China) Coking Coal Annual contract (fob Australia) Pig Iron prices
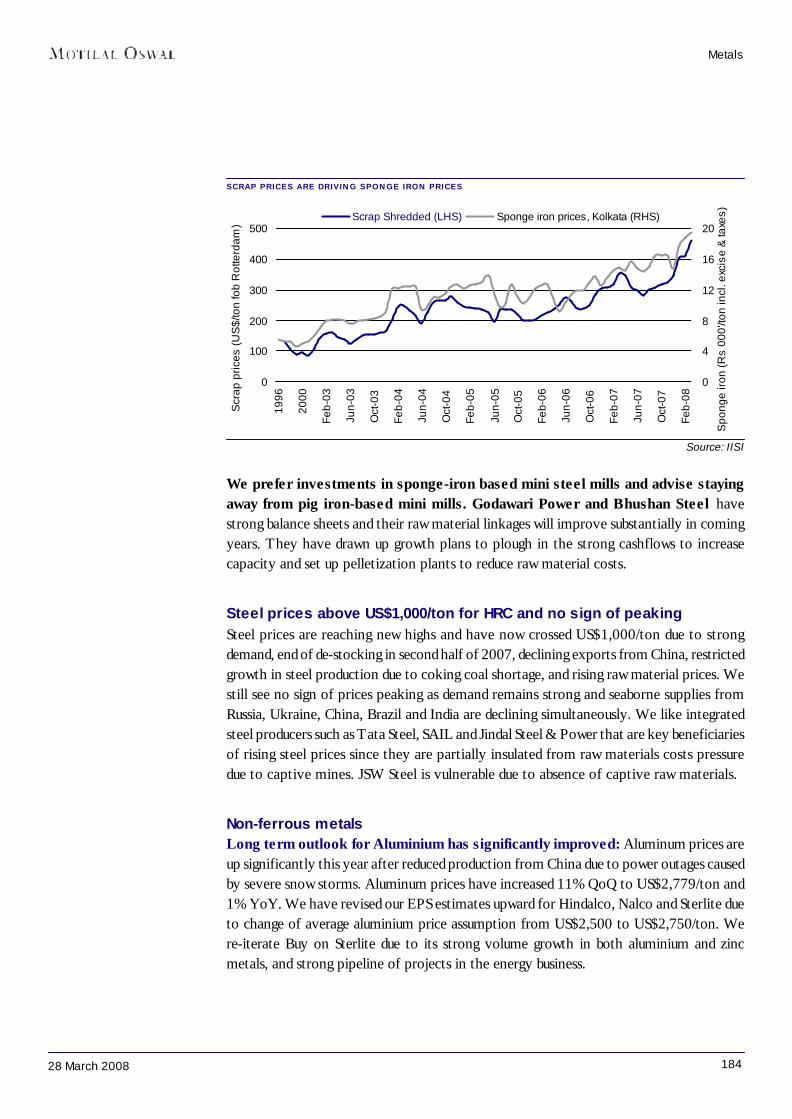
18428 March 2008
SCRAP PRICES ARE DRIVING SPONGE IRON PRICES
Metals
Source: IISI
We prefer investments in sponge-iron based mini steel mills and advise stayingaway from pig iron-based mini mills. Godawari Power and Bhushan Steel havestrong balance sheets and their raw material linkages will improve substantially in comingyears. They have drawn up growth plans to plough in the strong cashflows to increasecapacity and set up pelletization plants to reduce raw material costs.
Steel prices above US$1,000/ton for HRC and no sign of peakingSteel prices are reaching new highs and have now crossed US$1,000/ton due to strongdemand, end of de-stocking in second half of 2007, declining exports from China, restrictedgrowth in steel production due to coking coal shortage, and rising raw material prices. Westill see no sign of prices peaking as demand remains strong and seaborne supplies fromRussia, Ukraine, China, Brazil and India are declining simultaneously. We like integratedsteel producers such as Tata Steel, SAIL and Jindal Steel & Power that are key beneficiariesof rising steel prices since they are partially insulated from raw materials costs pressuredue to captive mines. JSW Steel is vulnerable due to absence of captive raw materials.
Non-ferrous metalsLong term outlook for Aluminium has significantly improved: Aluminum prices areup significantly this year after reduced production from China due to power outages causedby severe snow storms. Aluminum prices have increased 11% QoQ to US$2,779/ton and1% YoY. We have revised our EPS estimates upward for Hindalco, Nalco and Sterlite dueto change of average aluminium price assumption from US$2,500 to US$2,750/ton. Were-iterate Buy on Sterlite due to its strong volume growth in both aluminium and zincmetals, and strong pipeline of projects in the energy business.
0
100
200
300
400
500
1996
2000
Feb-
03
Jun-
03
Oct
-03
Feb-
04
Jun-
04
Oct
-04
Feb-
05
Jun-
05
Oct
-05
Feb-
06
Jun-
06
Oct
-06
Feb-
07
Jun-
07
Oct
-07
Feb-
08
0
4
8
12
16
20Scrap Shredded (LHS) Sponge iron prices, Kolkata (RHS)
Scr
ap p
rices
(US
$/to
n fo
b R
otte
rdam
)
Spo
nge
iron
(Rs
000'
/ton
incl
. exc
ise
& ta
xes)

18528 March 2008
Metals
GLOBAL INVENTORIES AND PRICES OF ALUMINUM
Source: IAI and LME
AVERAGE METAL PRICES ON LME (US$/TON)QUARTER ZINC ALUMINIUN COPPER LEAD ALUMINA
AVG. QOQ % YOY % AVG. QOQ % YOY % AVG. QOQ % YOY % AVG. QOQ % YOY % AVG. QOQ % YOY %4QFY08 2,460 -8 -29 2,779 11 1 7,741 7 30 2,900 -10 66 391 14 213QFY08 2,664 -17 -36 2,500 -4 -8 7,259 -5 2 3,232 4 104 343 -1 432QFY08 3,221 -12 -4 2,610 -7 3 7,624 1 0 3,094 42 159 347 -4 21QFY08 3,679 7 14 2,802 2 4 7,578 27 6 2,184 25 95 360 12 -384QFY07 3,441 -17 52 2,748 1 12 5,975 -16 23 1,751 10 43 322 34 -473QFY07 4,142 23 152 2,726 8 32 7,096 -7 72 1,587 33 57 240 -29 -552QFY07 3,359 4 155 2,531 -6 37 7,628 7 115 1,194 7 37 340 -42 -211QFY07 3,239 43 152 2,684 10 50 7,158 47 123 1,119 -9 18 583 -4 344QFY06 2,267 38 71 2,447 18 29 4,862 18 55 1,224 21 31 607 15 463QFY06 1,642 25 45 2,071 12 14 4,130 17 39 1,011 16 9 530 23 322QFY06 1,316 2 32 1,849 3 8 3,544 10 27 869 -8 0 432 0 291QFY06 1,287 -3 23 1,795 -5 6 3,213 3 19 949 1 22 434 5 -54QFY05 1,327 17 22 1,891 4 13 3,127 5 16 937 1 15 415 3 -13QFY05 1,131 13 20 1,818 6 19 2,975 7 45 927 6 47 401 19 292QFY05 998 -4 19 1,718 2 21 2,788 3 58 872 12 71 336 -27 181QFY05 1,043 -4 32 1,690 1 22 2,698 0 63 777 -5 68 450 9 62
Source: Bloomberg & Motilaloswal Research
4
6
8
10
12
Aug-
95
Aug-
97
Aug-
99
Aug-
01
Aug-
03
Aug-
05
Aug-
07
1,000
1,500
2,000
2,500
3,000
LME
spo
t pric
es (
US
$/to
n)
Global Inventories Price
Glo
bal I
nven
torie
s (w
eeks
of p
rodu
ctio
n)
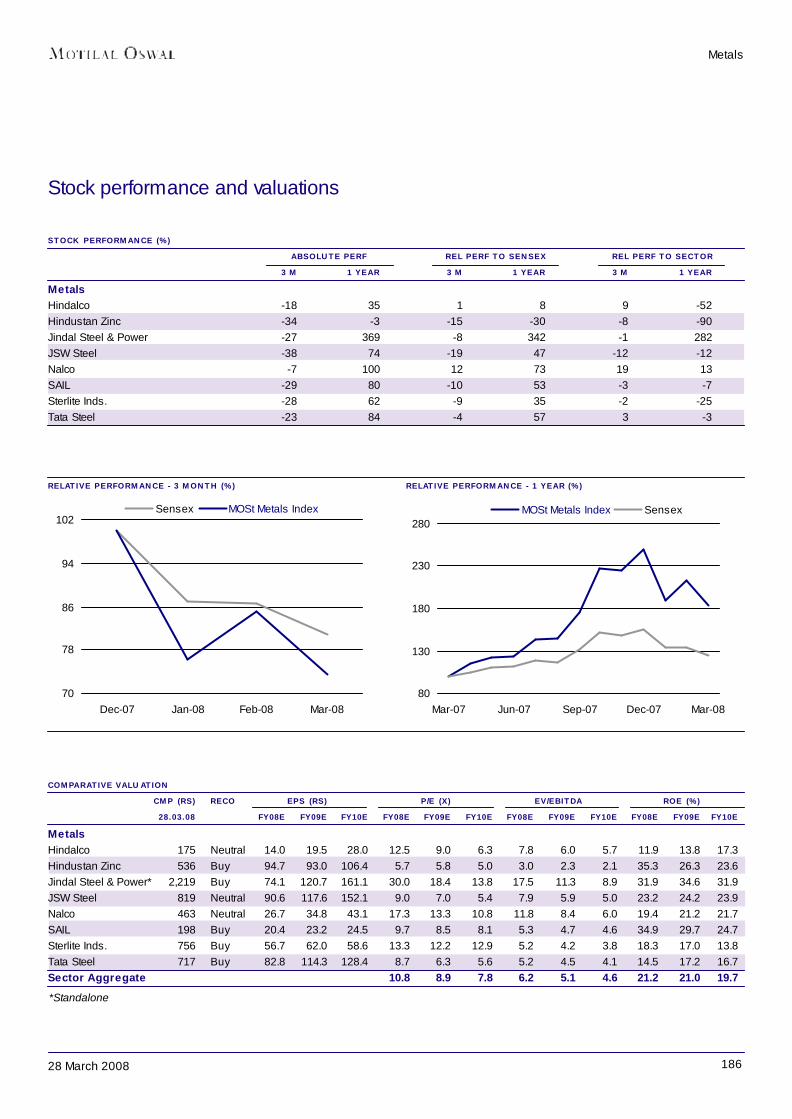
18628 March 2008
RELATIVE PERFORMANCE - 3 MONTH (%) RELATIVE PERFORMANCE - 1 YEAR (%)
Stock performance and valuations
STOCK PERFORMANCE (%) ABSOLUTE PERF REL PERF TO SENSEX REL PERF TO SECTOR
3 M 1 YEAR 3 M 1 YEAR 3 M 1 YEARMetalsHindalco -18 35 1 8 9 -52Hindustan Zinc -34 -3 -15 -30 -8 -90Jindal Steel & Power -27 369 -8 342 -1 282JSW Steel -38 74 -19 47 -12 -12Nalco -7 100 12 73 19 13SAIL -29 80 -10 53 -3 -7Sterlite Inds. -28 62 -9 35 -2 -25Tata Steel -23 84 -4 57 3 -3
Metals
COMPARATIVE VALUATIONCMP (RS) RECO EPS (RS) P/E (X) EV/EBITDA ROE (%)28.03.08 FY08E FY09E FY10E FY08E FY09E FY10E FY08E FY09E FY10E FY08E FY09E FY10E
MetalsHindalco 175 Neutral 14.0 19.5 28.0 12.5 9.0 6.3 7.8 6.0 5.7 11.9 13.8 17.3Hindustan Zinc 536 Buy 94.7 93.0 106.4 5.7 5.8 5.0 3.0 2.3 2.1 35.3 26.3 23.6Jindal Steel & Power* 2,219 Buy 74.1 120.7 161.1 30.0 18.4 13.8 17.5 11.3 8.9 31.9 34.6 31.9JSW Steel 819 Neutral 90.6 117.6 152.1 9.0 7.0 5.4 7.9 5.9 5.0 23.2 24.2 23.9Nalco 463 Neutral 26.7 34.8 43.1 17.3 13.3 10.8 11.8 8.4 6.0 19.4 21.2 21.7SAIL 198 Buy 20.4 23.2 24.5 9.7 8.5 8.1 5.3 4.7 4.6 34.9 29.7 24.7Sterlite Inds. 756 Buy 56.7 62.0 58.6 13.3 12.2 12.9 5.2 4.2 3.8 18.3 17.0 13.8Tata Steel 717 Buy 82.8 114.3 128.4 8.7 6.3 5.6 5.2 4.5 4.1 14.5 17.2 16.7Sector Aggregate 10.8 8.9 7.8 6.2 5.1 4.6 21.2 21.0 19.7
70
78
86
94
102
Dec-07 Jan-08 Feb-08 Mar-08
Sensex MOSt Metals Index
80
130
180
230
280
Mar-07 Jun-07 Sep-07 Dec-07 Mar-08
MOSt Metals Index Sensex
*Standalone
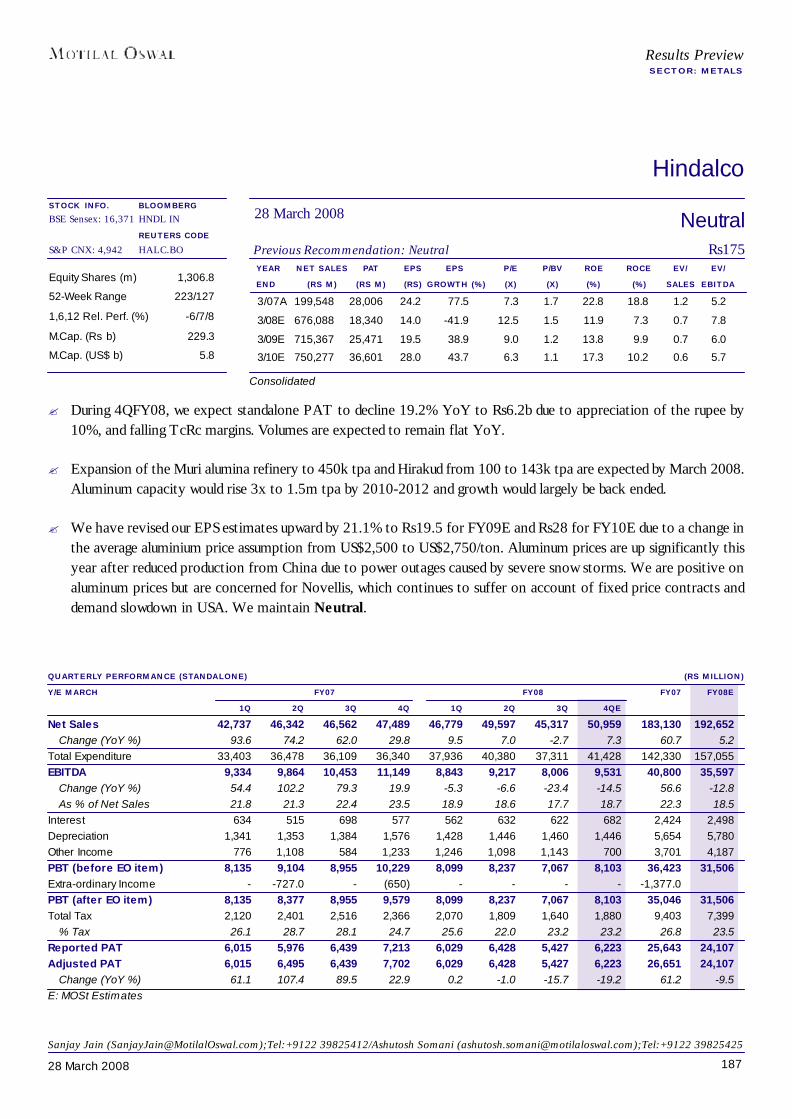
18728 March 2008
Hindalco
YEAR NET SALES PAT EPS EPS P/E P/BV ROE ROCE EV/ EV/END (RS M) (RS M) (RS) GROWTH (%) (X) (X) (%) (%) SALES EBITDA3/07A 199,548 28,006 24.2 77.5 7.3 1.7 22.8 18.8 1.2 5.2
3/08E 676,088 18,340 14.0 -41.9 12.5 1.5 11.9 7.3 0.7 7.8
3/09E 715,367 25,471 19.5 38.9 9.0 1.2 13.8 9.9 0.7 6.0
3/10E 750,277 36,601 28.0 43.7 6.3 1.1 17.3 10.2 0.6 5.7
Equity Shares (m) 1,306.8
52-Week Range 223/127
1,6,12 Rel. Perf. (%) -6/7/8
M.Cap. (Rs b) 229.3
M.Cap. (US$ b) 5.8
QUARTERLY PERFORMANCE (STANDALONE) (RS MILLION)Y/E MARCH FY07 FY08 FY07 FY08E
1Q 2Q 3Q 4Q 1Q 2Q 3Q 4QENet Sales 42,737 46,342 46,562 47,489 46,779 49,597 45,317 50,959 183,130 192,652
Change (YoY %) 93.6 74.2 62.0 29.8 9.5 7.0 -2.7 7.3 60.7 5.2Total Expenditure 33,403 36,478 36,109 36,340 37,936 40,380 37,311 41,428 142,330 157,055EBITDA 9,334 9,864 10,453 11,149 8,843 9,217 8,006 9,531 40,800 35,597
Change (YoY %) 54.4 102.2 79.3 19.9 -5.3 -6.6 -23.4 -14.5 56.6 -12.8As % of Net Sales 21.8 21.3 22.4 23.5 18.9 18.6 17.7 18.7 22.3 18.5
Interest 634 515 698 577 562 632 622 682 2,424 2,498Depreciation 1,341 1,353 1,384 1,576 1,428 1,446 1,460 1,446 5,654 5,780Other Income 776 1,108 584 1,233 1,246 1,098 1,143 700 3,701 4,187PBT (before EO item) 8,135 9,104 8,955 10,229 8,099 8,237 7,067 8,103 36,423 31,506Extra-ordinary Income - -727.0 - (650) - - - - -1,377.0PBT (after EO item) 8,135 8,377 8,955 9,579 8,099 8,237 7,067 8,103 35,046 31,506Total Tax 2,120 2,401 2,516 2,366 2,070 1,809 1,640 1,880 9,403 7,399
% Tax 26.1 28.7 28.1 24.7 25.6 22.0 23.2 23.2 26.8 23.5Reported PAT 6,015 5,976 6,439 7,213 6,029 6,428 5,427 6,223 25,643 24,107Adjusted PAT 6,015 6,495 6,439 7,702 6,029 6,428 5,427 6,223 26,651 24,107
Change (YoY %) 61.1 107.4 89.5 22.9 0.2 -1.0 -15.7 -19.2 61.2 -9.5E: MOSt Estimates
NeutralPrevious Recommendation: Neutral Rs175
28 March 2008BLOOMBERGHNDL IN
REUTERS CODEHALC.BO
Consolidated
Results PreviewSECTOR: METALS
Sanjay Jain ([email protected]);Tel:+9122 39825412/Ashutosh Somani ([email protected]);Tel:+9122 39825425
STOCK INFO.BSE Sensex: 16,371
S&P CNX: 4,942
? During 4QFY08, we expect standalone PAT to decline 19.2% YoY to Rs6.2b due to appreciation of the rupee by10%, and falling TcRc margins. Volumes are expected to remain flat YoY.
? Expansion of the Muri alumina refinery to 450k tpa and Hirakud from 100 to 143k tpa are expected by March 2008.Aluminum capacity would rise 3x to 1.5m tpa by 2010-2012 and growth would largely be back ended.
? We have revised our EPS estimates upward by 21.1% to Rs19.5 for FY09E and Rs28 for FY10E due to a change inthe average aluminium price assumption from US$2,500 to US$2,750/ton. Aluminum prices are up significantly thisyear after reduced production from China due to power outages caused by severe snow storms. We are positive onaluminum prices but are concerned for Novellis, which continues to suffer on account of fixed price contracts anddemand slowdown in USA. We maintain Neutral.
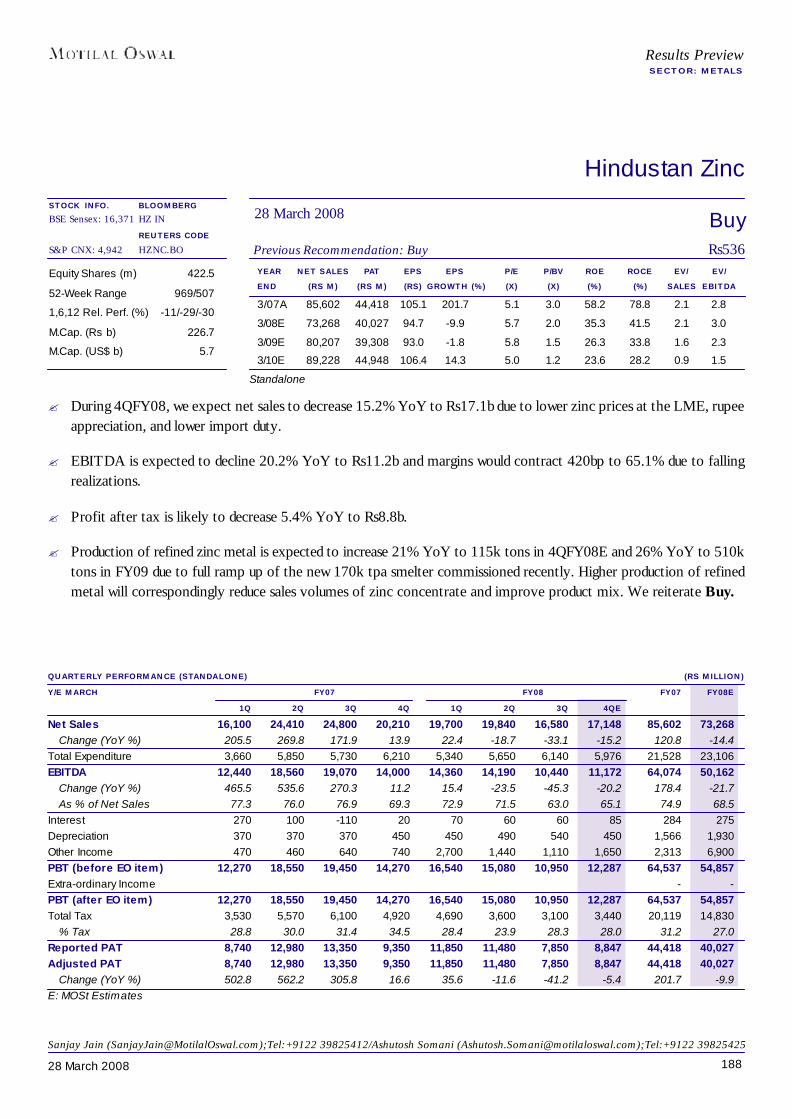
18828 March 2008
Hindustan Zinc
YEAR NET SALES PAT EPS EPS P/E P/BV ROE ROCE EV/ EV/END (RS M) (RS M) (RS) GROWTH (%) (X) (X) (%) (%) SALES EBITDA
3/07A 85,602 44,418 105.1 201.7 5.1 3.0 58.2 78.8 2.1 2.8
3/08E 73,268 40,027 94.7 -9.9 5.7 2.0 35.3 41.5 2.1 3.0
3/09E 80,207 39,308 93.0 -1.8 5.8 1.5 26.3 33.8 1.6 2.3
3/10E 89,228 44,948 106.4 14.3 5.0 1.2 23.6 28.2 0.9 1.5
Equity Shares (m) 422.5
52-Week Range 969/507
1,6,12 Rel. Perf. (%) -11/-29/-30
M.Cap. (Rs b) 226.7
M.Cap. (US$ b) 5.7
QUARTERLY PERFORMANCE (STANDALONE) (RS MILLION)Y/E MARCH FY07 FY08 FY07 FY08E
1Q 2Q 3Q 4Q 1Q 2Q 3Q 4QENet Sales 16,100 24,410 24,800 20,210 19,700 19,840 16,580 17,148 85,602 73,268
Change (YoY %) 205.5 269.8 171.9 13.9 22.4 -18.7 -33.1 -15.2 120.8 -14.4Total Expenditure 3,660 5,850 5,730 6,210 5,340 5,650 6,140 5,976 21,528 23,106EBITDA 12,440 18,560 19,070 14,000 14,360 14,190 10,440 11,172 64,074 50,162
Change (YoY %) 465.5 535.6 270.3 11.2 15.4 -23.5 -45.3 -20.2 178.4 -21.7As % of Net Sales 77.3 76.0 76.9 69.3 72.9 71.5 63.0 65.1 74.9 68.5
Interest 270 100 -110 20 70 60 60 85 284 275Depreciation 370 370 370 450 450 490 540 450 1,566 1,930Other Income 470 460 640 740 2,700 1,440 1,110 1,650 2,313 6,900PBT (before EO item) 12,270 18,550 19,450 14,270 16,540 15,080 10,950 12,287 64,537 54,857Extra-ordinary Income - -PBT (after EO item) 12,270 18,550 19,450 14,270 16,540 15,080 10,950 12,287 64,537 54,857Total Tax 3,530 5,570 6,100 4,920 4,690 3,600 3,100 3,440 20,119 14,830
% Tax 28.8 30.0 31.4 34.5 28.4 23.9 28.3 28.0 31.2 27.0Reported PAT 8,740 12,980 13,350 9,350 11,850 11,480 7,850 8,847 44,418 40,027Adjusted PAT 8,740 12,980 13,350 9,350 11,850 11,480 7,850 8,847 44,418 40,027
Change (YoY %) 502.8 562.2 305.8 16.6 35.6 -11.6 -41.2 -5.4 201.7 -9.9E: MOSt Estimates
BuyPrevious Recommendation: Buy Rs536
28 March 2008BLOOMBERGHZ IN
REUTERS CODEHZNC.BO
Results PreviewSECTOR: METALS
Sanjay Jain ([email protected]);Tel:+9122 39825412/Ashutosh Somani ([email protected]);Tel:+9122 39825425
STOCK INFO.BSE Sensex: 16,371
S&P CNX: 4,942
Standalone
? During 4QFY08, we expect net sales to decrease 15.2% YoY to Rs17.1b due to lower zinc prices at the LME, rupeeappreciation, and lower import duty.
? EBITDA is expected to decline 20.2% YoY to Rs11.2b and margins would contract 420bp to 65.1% due to fallingrealizations.
? Profit after tax is likely to decrease 5.4% YoY to Rs8.8b.
? Production of refined zinc metal is expected to increase 21% YoY to 115k tons in 4QFY08E and 26% YoY to 510ktons in FY09 due to full ramp up of the new 170k tpa smelter commissioned recently. Higher production of refinedmetal will correspondingly reduce sales volumes of zinc concentrate and improve product mix. We reiterate Buy.
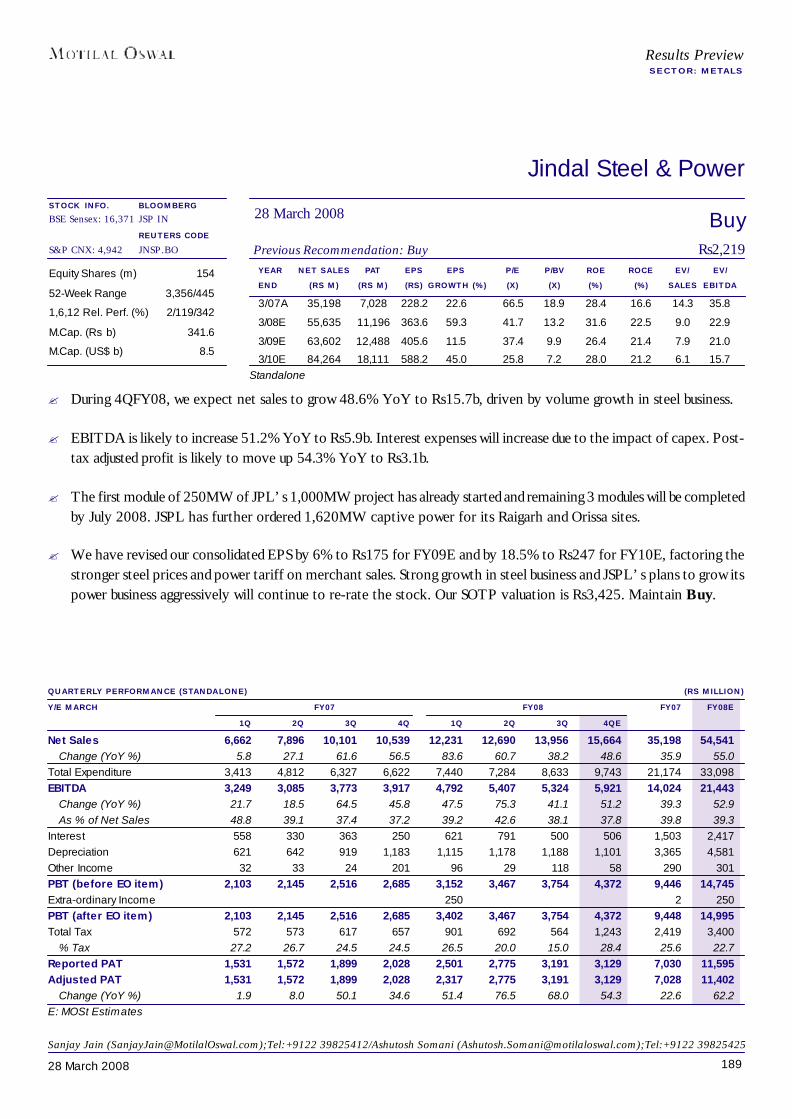
18928 March 2008
Jindal Steel & Power
YEAR NET SALES PAT EPS EPS P/E P/BV ROE ROCE EV/ EV/END (RS M) (RS M) (RS) GROWTH (%) (X) (X) (%) (%) SALES EBITDA
3/07A 35,198 7,028 228.2 22.6 66.5 18.9 28.4 16.6 14.3 35.8
3/08E 55,635 11,196 363.6 59.3 41.7 13.2 31.6 22.5 9.0 22.9
3/09E 63,602 12,488 405.6 11.5 37.4 9.9 26.4 21.4 7.9 21.0
3/10E 84,264 18,111 588.2 45.0 25.8 7.2 28.0 21.2 6.1 15.7
Equity Shares (m) 154
52-Week Range 3,356/445
1,6,12 Rel. Perf. (%) 2/119/342
M.Cap. (Rs b) 341.6
M.Cap. (US$ b) 8.5
BuyPrevious Recommendation: Buy Rs2,219
28 March 2008BLOOMBERGJSP IN
REUTERS CODEJNSP.BO
QUARTERLY PERFORMANCE (STANDALONE) (RS MILLION)Y/E MARCH FY07 FY08 FY07 FY08E
1Q 2Q 3Q 4Q 1Q 2Q 3Q 4QENet Sales 6,662 7,896 10,101 10,539 12,231 12,690 13,956 15,664 35,198 54,541
Change (YoY %) 5.8 27.1 61.6 56.5 83.6 60.7 38.2 48.6 35.9 55.0Total Expenditure 3,413 4,812 6,327 6,622 7,440 7,284 8,633 9,743 21,174 33,098EBITDA 3,249 3,085 3,773 3,917 4,792 5,407 5,324 5,921 14,024 21,443
Change (YoY %) 21.7 18.5 64.5 45.8 47.5 75.3 41.1 51.2 39.3 52.9As % of Net Sales 48.8 39.1 37.4 37.2 39.2 42.6 38.1 37.8 39.8 39.3
Interest 558 330 363 250 621 791 500 506 1,503 2,417Depreciation 621 642 919 1,183 1,115 1,178 1,188 1,101 3,365 4,581Other Income 32 33 24 201 96 29 118 58 290 301PBT (before EO item) 2,103 2,145 2,516 2,685 3,152 3,467 3,754 4,372 9,446 14,745Extra-ordinary Income 250 2 250PBT (after EO item) 2,103 2,145 2,516 2,685 3,402 3,467 3,754 4,372 9,448 14,995Total Tax 572 573 617 657 901 692 564 1,243 2,419 3,400
% Tax 27.2 26.7 24.5 24.5 26.5 20.0 15.0 28.4 25.6 22.7Reported PAT 1,531 1,572 1,899 2,028 2,501 2,775 3,191 3,129 7,030 11,595Adjusted PAT 1,531 1,572 1,899 2,028 2,317 2,775 3,191 3,129 7,028 11,402
Change (YoY %) 1.9 8.0 50.1 34.6 51.4 76.5 68.0 54.3 22.6 62.2E: MOSt Estimates
Results PreviewSECTOR: METALS
Sanjay Jain ([email protected]);Tel:+9122 39825412/Ashutosh Somani ([email protected]);Tel:+9122 39825425
STOCK INFO.BSE Sensex: 16,371
S&P CNX: 4,942
Standalone
? During 4QFY08, we expect net sales to grow 48.6% YoY to Rs15.7b, driven by volume growth in steel business.
? EBITDA is likely to increase 51.2% YoY to Rs5.9b. Interest expenses will increase due to the impact of capex. Post-tax adjusted profit is likely to move up 54.3% YoY to Rs3.1b.
? The first module of 250MW of JPL’s 1,000MW project has already started and remaining 3 modules will be completedby July 2008. JSPL has further ordered 1,620MW captive power for its Raigarh and Orissa sites.
? We have revised our consolidated EPS by 6% to Rs175 for FY09E and by 18.5% to Rs247 for FY10E, factoring thestronger steel prices and power tariff on merchant sales. Strong growth in steel business and JSPL’s plans to grow itspower business aggressively will continue to re-rate the stock. Our SOTP valuation is Rs3,425. Maintain Buy.

19028 March 2008
JSW Steel
YEAR NET SALES PAT EPS EPS P/E P/BV ROE ROCE EV/ EV/END (RS M) (RS M) (RS) GROWTH (%) (X) (X) (%) (%) SALES EBITDA
3/07A 85,944 12,340 71.7 90.5 11.4 2.6 23.0 21.0 2.0 6.5
3/08E 113,229 15,588 90.6 26.3 9.0 2.1 23.2 14.6 2.0 7.2
3/09E 188,995 20,247 117.7 29.9 7.0 1.7 24.2 14.9 1.5 5.7
3/10E 240,980 28,248 152.1 29.2 5.4 1.3 23.9 16.2 1.3 5.0
Equity Shares (m) 200.8
52-Week Range 1,390/461
1,6,12 Rel. Perf. (%) -16/2/47
M.Cap. (Rs b) 164.5
M.Cap. (US$ b) 4.1
NeutralPrevious Recommendation: Neutral Rs819
28 March 2008BLOOMBERGJSTL IN
REUTERS CODEJSTL.BO
QUARTERLY PERFORMANCE (STANDALONE) (RS MILLION)Y/E MARCH FY07 FY08 FY07 FY08E
1Q 2Q 3Q 4Q 1Q 2Q 3Q 4QESales (tons) 543,000 656,000 688,000 784,000 635,000 730,000 775,000 835,000 2,672,759 2,975,000
Change (YoY %) 21.5 15.7 33.1 33.0 16.9 11.3 12.6 6.5 26.2 11.3Realisation (Rs per ton) 28,902 33,454 33,452 31,869 34,500 32,644 33,072 37,069 32,042 34,394
Change (YoY %) -16.1 23.1 13.9 18.6 19.4 -2.4 -1.1 16.3 9.8 7.3Net Sales 15,694 21,946 23,015 24,985 21,907 23,830 25,631 30,953 85,640 102,321
Change (YoY %) 2.0 42.5 51.6 57.8 39.6 8.6 11.4 23.9 38.6 19.5Total Expenditure 11,136 14,983 15,318 16,954 14,428 17,046 18,712 22,400 58,390 72,585EBITDA 4,558 6,963 7,697 8,032 7,479 6,784 6,919 8,553 27,250 29,736
Change (YoY %) -6.9 86.2 83.4 100.2 64.1 -2.6 -10.1 6.5 -40.2 9.1As % of Net Sales 29.0 31.7 33.4 32.1 34.1 28.5 27.0 27.6 31.8 29.1
EBITDA (Rs per ton) 8,394 10,614 11,188 10,245 11,778 9,293 8,928 10,243 10,196 9,995Interest 887 967 1,107 1,016 860 681 953 1,100 3,978 3,593Depreciation 1,025 1,164 1,295 1,498 1,322 1,354 1,698 1,686 4,982 6,060Other Income 16 84 64 245 215 1,247 351 650 409 2,462PBT (before EO Item) 2,662 4,915 5,360 5,762 5,512 5,996 4,620 6,417 18,699 22,545EO Items 0 0 0 447 620 1,111 0 0 447 1,731PBT (after EO Item) 2,662 4,915 5,360 6,209 6,132 7,107 4,620 6,417 19,146 24,276Total Tax 959 1,452 1,738 2,077 1,854 1,995 1,338 2,135 6,226 7,322
% Tax 36.0 29.5 32.4 33.4 30.2 28.1 29.0 33.3 32.5 30.2Reported PAT 1,703 3,463 3,622 4,133 4,278 5,112 3,282 4,282 12,920 16,954Preference Dividend 70 70 70 70 70 70 70 70 279 279Adjusted PAT 1,633 3,393 3,552 3,765 3,775 4,243 3,212 4,212 12,339 15,466
Change (YoY %) -18.5 219.2 146.6 143.5 131.2 25.1 -9.6 11.9 -63.2 25.3E: MOSt Estimates
Results PreviewSECTOR: METALS
Consolidated
Sanjay Jain ([email protected]);Tel:+9122 39825412/Ashutosh Somani ([email protected]);Tel:+9122 39825425
STOCK INFO.BSE Sensex: 16,371
S&P CNX: 4,942
? We expect net sales to grow 23.9% YoY to Rs30.9b. We expect volume growth of 6.5% YoY while realizationswould grow 16.3% YoY.
? EBITDA is likely to grow 6.5% YoY to Rs8.6b. Margins would decline 450bp YoY to 27.6% due to mounting rawmaterial cost pressures. PAT should grow 11.9% YoY to Rs4.2b.
? We have revised our earnings estimate downward by 7% to Rs117.6 for FY09 after factoring in higher steel pricesand increased coal and iron ore costs. Maintain Neutral.
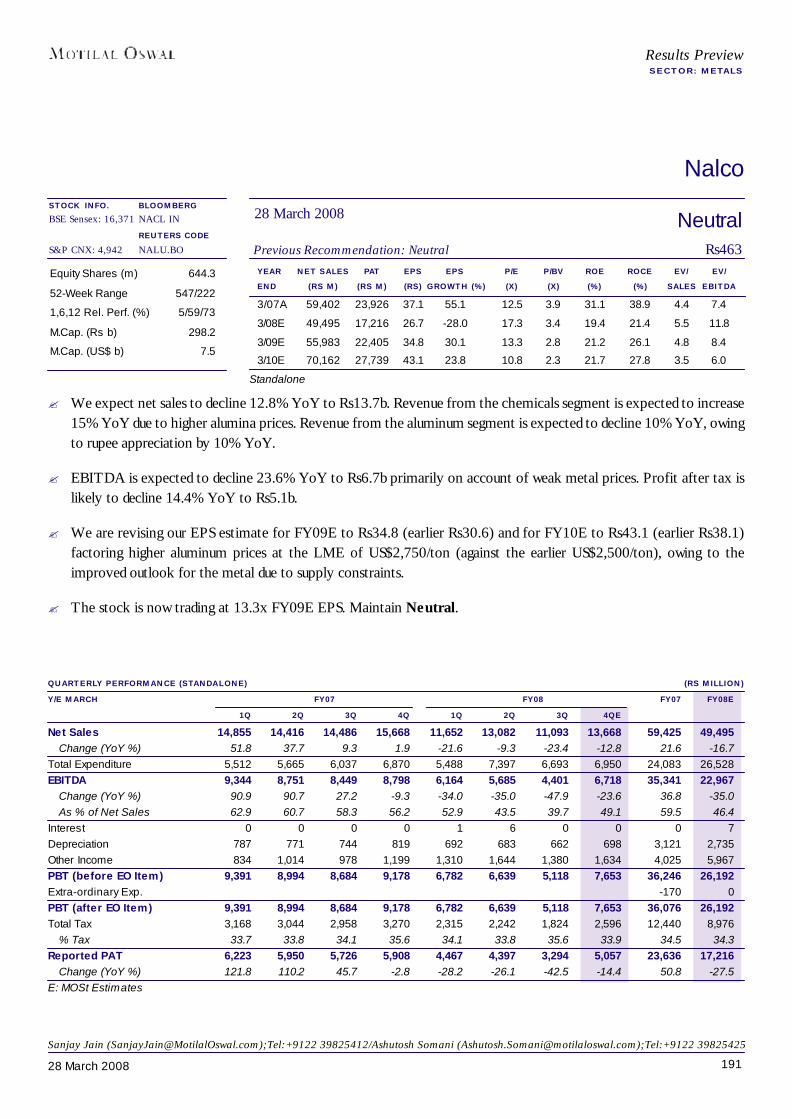
19128 March 2008
Nalco
YEAR NET SALES PAT EPS EPS P/E P/BV ROE ROCE EV/ EV/END (RS M) (RS M) (RS) GROWTH (%) (X) (X) (%) (%) SALES EBITDA
3/07A 59,402 23,926 37.1 55.1 12.5 3.9 31.1 38.9 4.4 7.4
3/08E 49,495 17,216 26.7 -28.0 17.3 3.4 19.4 21.4 5.5 11.8
3/09E 55,983 22,405 34.8 30.1 13.3 2.8 21.2 26.1 4.8 8.4
3/10E 70,162 27,739 43.1 23.8 10.8 2.3 21.7 27.8 3.5 6.0
Equity Shares (m) 644.3
52-Week Range 547/222
1,6,12 Rel. Perf. (%) 5/59/73
M.Cap. (Rs b) 298.2
M.Cap. (US$ b) 7.5
QUARTERLY PERFORMANCE (STANDALONE) (RS MILLION)Y/E MARCH FY07 FY08 FY07 FY08E
1Q 2Q 3Q 4Q 1Q 2Q 3Q 4QENet Sales 14,855 14,416 14,486 15,668 11,652 13,082 11,093 13,668 59,425 49,495
Change (YoY %) 51.8 37.7 9.3 1.9 -21.6 -9.3 -23.4 -12.8 21.6 -16.7Total Expenditure 5,512 5,665 6,037 6,870 5,488 7,397 6,693 6,950 24,083 26,528EBITDA 9,344 8,751 8,449 8,798 6,164 5,685 4,401 6,718 35,341 22,967
Change (YoY %) 90.9 90.7 27.2 -9.3 -34.0 -35.0 -47.9 -23.6 36.8 -35.0As % of Net Sales 62.9 60.7 58.3 56.2 52.9 43.5 39.7 49.1 59.5 46.4
Interest 0 0 0 0 1 6 0 0 0 7Depreciation 787 771 744 819 692 683 662 698 3,121 2,735Other Income 834 1,014 978 1,199 1,310 1,644 1,380 1,634 4,025 5,967PBT (before EO Item) 9,391 8,994 8,684 9,178 6,782 6,639 5,118 7,653 36,246 26,192Extra-ordinary Exp. -170 0PBT (after EO Item) 9,391 8,994 8,684 9,178 6,782 6,639 5,118 7,653 36,076 26,192Total Tax 3,168 3,044 2,958 3,270 2,315 2,242 1,824 2,596 12,440 8,976
% Tax 33.7 33.8 34.1 35.6 34.1 33.8 35.6 33.9 34.5 34.3Reported PAT 6,223 5,950 5,726 5,908 4,467 4,397 3,294 5,057 23,636 17,216
Change (YoY %) 121.8 110.2 45.7 -2.8 -28.2 -26.1 -42.5 -14.4 50.8 -27.5E: MOSt Estimates
NeutralPrevious Recommendation: Neutral Rs463
28 March 2008BLOOMBERGNACL IN
REUTERS CODENALU.BO
Results PreviewSECTOR: METALS
Sanjay Jain ([email protected]);Tel:+9122 39825412/Ashutosh Somani ([email protected]);Tel:+9122 39825425
STOCK INFO.BSE Sensex: 16,371
S&P CNX: 4,942
Standalone
? We expect net sales to decline 12.8% YoY to Rs13.7b. Revenue from the chemicals segment is expected to increase15% YoY due to higher alumina prices. Revenue from the aluminum segment is expected to decline 10% YoY, owingto rupee appreciation by 10% YoY.
? EBITDA is expected to decline 23.6% YoY to Rs6.7b primarily on account of weak metal prices. Profit after tax islikely to decline 14.4% YoY to Rs5.1b.
? We are revising our EPS estimate for FY09E to Rs34.8 (earlier Rs30.6) and for FY10E to Rs43.1 (earlier Rs38.1)factoring higher aluminum prices at the LME of US$2,750/ton (against the earlier US$2,500/ton), owing to theimproved outlook for the metal due to supply constraints.
? The stock is now trading at 13.3x FY09E EPS. Maintain Neutral.

19228 March 2008
Sterlite Industries
YEAR NET SALES PAT EPS EPS P/E P/BV ROE ROCE EV/ EV/END (RS M) (RS M) (RS) GROWTH (%) (X) (X) (%) (%) SALES EBITDA
3/07A 243,868 45,005 80.6 34 9.4 4.3 45.8 48.7 1.7 4.4
3/08E 239,592 40,198 56.7 -30 13.3 2.4 18.3 21.7 1.6 5.2
3/09E 264,662 43,970 62.0 9 12.2 2.1 17.0 20.2 1.3 4.2
3/10E 277,561 41,558 58.6 -5 12.9 1.8 13.8 16.4 1.0 3.5
Equity Shares (m) 708.7
52-Week Range 1,140/415
1,6,12 Rel. Perf. (%) -3/6/35
M.Cap. (Rs b) 535.9
M.Cap. (US$ b) 13.6
QUARTERLY PERFORMANCE (CONSOLIDATED) (RS MILLION)Y/E MARCH FY07 FY08 FY07 FY08E
1Q 2Q 3Q 4Q 1Q 2Q 3Q 4QENet Sales 46,030 67,180 68,143 62,516 61,391 65,671 52,332 60,197 243,868 239,592
Change (YoY %) 146.3 153.8 94.1 22.6 33.4 -2.2 -23.2 -3.7 86.1 -1.8Total Expenditure 27,531 41,434 40,515 39,799 39,830 46,013 36,616 42,947 149,280 165,406EBITDA 18,499 25,746 27,628 22,716 21,561 19,658 15,717 17,250 94,589 74,186
Change (YoY %) 379.1 392.4 215.7 19.3 16.6 -23.6 -43.1 -24.1 156.5 -21.6As % of Net Sales 40.2 38.3 40.5 36.3 35.1 29.9 30.0 28.7 38.8 31.0
Interest 898 1,163 856 874 955 643 681 300 3,791 2,578Depreciation 1,834 1,871 1,888 2,446 2,031 2,046 2,142 1,941 8,039 8,160Other Income 1,355 1,112 1,864 2,485 3,501 3,233 3,009 3,377 6,817 13,120PBT (before XO item) 17,122 23,825 26,749 21,881 22,076 20,202 15,904 18,387 89,576 76,569Extra-ordinary Exp. (122) (1,362) (25) (63) - - - - (1,572) -PBT (after XO item) 17,000 22,463 26,724 21,818 22,076 20,202 15,904 18,387 88,004 76,569Total Tax 4,790 6,862 7,763 4,702 5,247 4,465 4,138 4,317 24,118 18,166
% Tax 28.2 30.6 29.0 21.5 23.8 22.1 26.0 23.5 27.4 23.7Reported PAT 12,209 15,600 18,960 17,117 16,829 15,737 11,766 14,070 63,887 58,402Minority interest 3,419 4,890 6,030 5,683 5,400 4,911 3,213 4,680 20,023 18,204Adjusted PAT 8,878 11,656 12,948 11,483 11,429 10,826 8,553 9,390 45,005 40,198
Change (YoY %) 435.7 348.2 226.3 41.0 28.7 -7.1 -33.9 -18.2 168.5 -10.7E: MOSt Estimates
BuyPrevious Recommendation: Buy Rs756
28 March 2008BLOOMBERGSTLT IN
REUTERS CODESTRL.BO
Results PreviewSECTOR: METALS
Consolidated
Sanjay Jain ([email protected]);Tel:+9122 39825412/Ashutosh Somani ([email protected]);Tel:+9122 39825425
STOCK INFO.BSE Sensex: 16,371
S&P CNX: 4,942
? We expect net sales to decline 3.7% YoY to Rs60.2b, due to fall in zinc prices at the LME, rupee appreciation, andfalling TcRc margins in the copper business.
? EBITDA is expected to decline 24% YoY and the margin would contract 760bp to 28.7%.
? Profit after tax is likely to decrease 18.2% YoY to Rs9.4b.
? The stock trades at an EV of 4.2x FY09E EBITDA. We have revised our EPS estimates upward marginally by 3.3%for FY09E and 3.5% for FY10E due to the change in aluminum price assumption to US$2750/ton (earlier US$2500/ton). Maintain Buy.

19328 March 2008
Steel Authority of India
YEAR NET SALES PAT EPS EPS P/E P/BV ROE ROCE EV/ EV/END (RS M) (RS M) (RS) GROWTH (%) (X) (X) (%) (%) SALES EBITDA
3/07A 343,331 62,135 15.0 54.5 13.1 4.7 36.2 42.7 2.2 8.1
3/08E 399,117 84,264 20.4 35.6 9.7 3.4 34.9 45.5 1.7 5.3
3/09E 467,569 95,874 23.2 13.8 8.5 2.5 29.7 39.6 1.4 4.7
3/10E 490,948 101,309 24.5 5.7 8.1 2.0 24.7 33.8 1.4 4.6
Equity Shares (m) 4,130.4
52-Week Range 293/106
1,6,12 Rel. Perf. (%) -14/1/53
M.Cap. (Rs b) 816
M.Cap. (US$ b) 20.5
QUARTERLY PERFORMANCE (STANDALONE) (RS MILLION)Y/E MARCH FY07 FY08 FY07 FY08E
1Q 2Q 3Q 4Q 1Q 2Q 3Q 4QESales (m tons) 2.47 2.95 3.01 3.45 2.53 3.00 3.01 3.80 11.88 12.34
Change (YoY %) 31.0 5.1 8.6 -10.3 2.4 1.8 -0.1 10.1 5.1 3.9Realization (Rs per ton) 27,766 28,976 28,325 29,763 31,777 30,545 31,672 34,672 28,788 32,343
Change (YoY %) -7.2 12.5 24.1 24.2 14.4 5.4 11.8 16.5 13.0 12.4Net Sales 68,583 85,391 85,371 102,681 80,395 91,635 95,333 131,754 342,025 399,117
Change (%) 21.6 18.3 34.8 11.4 17.2 7.3 11.7 28.3 18.8 16.7EBITDA 17,803 23,333 26,226 31,566 23,829 26,293 29,834 50,401 98,928 130,356
Change (YoY %) -10.8 18.9 91.1 108.2 33.8 12.7 13.8 59.7 44.5 31.8As % of Net Sales 26.0 27.3 30.7 30.7 29.6 28.7 31.3 38.3 28.9 32.7
EBITDA per ton 7,208 7,918 8,701 9,149 9,418 8,764 9,912 13,263 8,327 10,564Interest 937 924 906 555 796 594 598 800 3,321 2,788Depreciation 2,959 3,035 3,299 2,822 3,012 3,012 3,160 3,682 12,115 12,866Other Income 1,513 2,261 2,231 2,388 3,069 3,043 3,143 3,494 8,392 12,750PBT (before EO Inc.) 15,421 21,635 24,252 30,577 23,090 25,730 29,219 49,414 91,884 127,452EO Income(exp) 5,582 -1,910 -1,330 2,342PBT (after EO Inc.) 21,002 21,635 22,342 29,247 23,090 25,730 29,219 49,414 94,226 127,452Total Tax 7,138 7,207 7,630 10,228 7,839 8,726 9,873 16,751 32,203 43,188
% Tax 34.0 33.3 34.2 35.0 33.9 33.9 33.8 33.9 34.2 33.9Reported PAT 13,864 14,428 14,712 19,019 15,251 17,004 19,347 32,662 62,023 84,264Adjusted PAT 10,179 14,428 15,969 19,884 15,251 17,004 19,347 32,662 60,481 84,264
Change (YoY %) -9.6 28.0 133.3 80.2 49.8 17.9 21.1 64.3 50.7 39.3E: MOSt Estimates; Quarterly results don’t add up with full year results due to restating of past quarter results.
BuyPrevious Recommendation: Buy Rs198
28 March 2008BLOOMBERGSAIL IN
REUTERS CODESAIL.BO
Results PreviewSECTOR: METALS
Sanjay Jain ([email protected]);Tel:+9122 39825412/Ashutosh Somani ([email protected]);Tel:+9122 39825425
STOCK INFO.BSE Sensex: 16,371
S&P CNX: 4,942
Standalone? We expect net sales to grow 28.3% YoY to Rs131.8b driven by 16.5% growth in average realization and 10.1%
growth in sales volume.
? EBITDA margin is likely to expand 760bp YoY to 38.3%, driven largely by strong growth in volumes and higherrealizations.
? Post-tax adjusted profit is likely to increase 64.3% YoY to Rs32.7b.
? SAIL remains insulated from iron ore prices due to its captive mines. We expect re-rating of the stock to continue dueto its US$12b capex plan, with full iron ore security, which would expand margins, improve product mix, and deliverstrong volume growth in the next 3-5 years. Maintain Buy.

19428 March 2008
Results PreviewSECTOR: METALS
Tata Steel
YEAR NET SALES PAT EPS EPS P/E P/BV ROE ROCE EV/ EV/END (RS M) (RS M) (RS) GROWTH (%) (X) (X) (%) (%) SALES EBITDA
3/07A 251,197 42,786 70.2 3.1 10.2 2.8 27.9 31.8 1.6 5.6
3/08E 1,284,994 68,131 82.8 18.0 8.7 1.3 14.5 15.3 0.7 5.2
3/09E 1,464,866 94,020 114.3 38.0 6.3 1.1 17.2 17.4 0.6 4.5
3/10E 1,492,812 105,617 128.4 12.3 5.6 0.9 16.7 17.2 0.6 4.1
Equity Shares (m) 822.4
52-Week Range 970/352
1,6,12 Rel. Perf. (%) -5/1/57
M.Cap. (Rs b) 589.4
M.Cap. (US$ b) 14.6
QUARTERLY PERFORMANCE (STANDALONE) (RS MILLION)Y/E MARCH FY07 FY08 FY07 FY08E
1Q 2Q 3Q 4Q 1Q 2Q 3Q 4QEStandalone FinancialsSales (000 tons) 1,115 1,184 1,234 1,261 1,041 1,218 1,244 1,280 4,794 4,783
Change (YoY %) 27.4 0.4 11.5 0.4 -6.6 2.9 0.7 1.5 8.5 -0.2Realisation (Rs per ton) 31,133 31,656 32,236 35,135 36,665 35,280 35,201 37,200 32,599 36,075
Change (YoY %) -10.1 6.0 8.5 21.8 17.8 11.4 9.2 5.9 6.9 10.7Net Sales 39,159 41,858 44,700 49,804 41,976 47,851 49,739 53,972 175,520 193,538
Change (YoY %) 13.0 8.3 21.4 20.6 7.2 14.3 11.3 8.4 15.9 10.3EBITDA 15,813 17,048 17,836 19,035 16,992 20,254 20,966 24,442 69,733 82,655
Change (YoY %) -0.4 3.2 28.2 46.3 7.5 18.8 17.5 28.4 17.6 18.5(% of Net Sales) 40.4 40.7 39.9 38.2 40.5 42.3 42.2 45.3 39.7 42.7
EBITDA(Rs/tss) 12,871 13,236 13,398 13,977 15,204 15,220 15,023 17,311 13,387 16,126Interest 293 478 520 448 800 2,022 3,627 1,524 1,739 7,972Depreciation 1,951 1,957 1,991 2,294 2,112 2,050 2,092 2,240 8,193 8,495Other Income 779 1,772 987 798 1,461 943 670 798 4,337 3,872PBT (after EO Inc.) 14,164 15,943 15,820 16,690 19,025 17,466 15,747 21,118 62,617 73,356Total Tax 4,630 4,928 5,183 5,655 6,804 5,558 5,061 7,225 20,395 24,648
% Tax 32.7 30.9 32.8 33.9 35.8 31.8 32.1 34.2 32.6 33.6Reported PAT 9,534 11,015 10,638 11,035 12,221 11,908 10,686 13,893 42,222 48,708Adjusted PAT 9,658 11,321 10,969 11,300 9,983 11,676 10,802 14,129 43,247 46,520
Change (YoY %) 2.3 6.3 41.9 48.6 3.4 3.1 -1.5 25.0 22.1 7.6Consolidated FinancialsNet Sales 57,641 60,083 59,712 74,697 311,542 324,249 318,985 330,217 251,197 1,284,994EBITDA 17,414 18,504 18,905 19,679 49,043 47,227 39,428 45,340 74,502 181,039Adjusted PAT 10,318 11,696 10,872 9,894 20,406 18,412 13,350 20,766 42,782 68,131E: MOSt Estimates; tss=ton of steel sales; Exchange rate assumed GBP=1.98 USD, USD=40.4 INR
BuyPrevious Recommendation: Buy Rs717
28 March 2008BLOOMBERGTATA IN
REUTERS CODETISC.BO
Consolidated
Sanjay Jain ([email protected]);Tel:+9122 39825412/Ashutosh Somani ([email protected]);Tel:+9122 39825425
STOCK INFO.BSE Sensex: 16,371
S&P CNX: 4,942
? We expect standalone net sales to increase 8.4% YoY to Rs54b, driven by 5.9% YoY growth in realizations and 1.5%YoY growth in volumes.
? We expect consolidated EPS to grow at a CAGR of 22.3% during FY07-10, driven by overall volume growth in India.? Expansion to 6.8m tpa at Jamshedpur is expected by June 2008 and will deliver 20% volume growth in FY09 for
Indian operations. Number of price increases since January 2008 will result in expansion of margins as cost increaseswill be few due to iron ore and coking coal integration. Corus too has announced several price hikes to cover increasein costs and the performance improvement program is expected to deliver a benefit of GBP300m in CY08. Lowerinterest due to repaying of bridge loan through the proceeds of rights issue will drive bottomline.
? The stock trades at an EV of 4.5x FY09E EBITDA – at a substantial discount to Indian peers. We reiterate Buy.
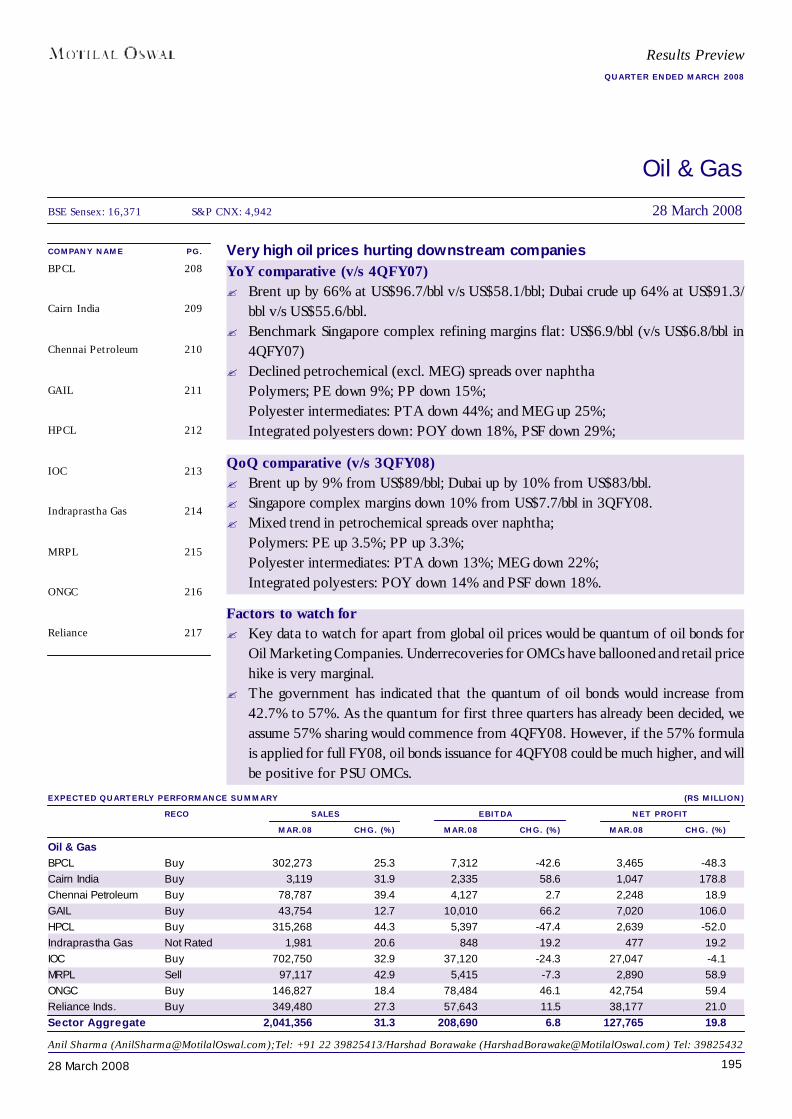
19528 March 2008
Oil & Gas
COMPANY NAME PG.BPCL 208
Cairn India 209
Chennai Petroleum 210
GAIL 211
HPCL 212
IOC 213
Indraprastha Gas 214
MRPL 215
ONGC 216
Reliance 217
EXPECTED QUARTERLY PERFORMANCE SUMMARY (RS MILLION)RECO SALES EBITDA NET PROFIT
MAR.08 CHG. (%) MAR.08 CHG. (%) MAR.08 CHG. (%)Oil & GasBPCL Buy 302,273 25.3 7,312 -42.6 3,465 -48.3Cairn India Buy 3,119 31.9 2,335 58.6 1,047 178.8Chennai Petroleum Buy 78,787 39.4 4,127 2.7 2,248 18.9GAIL Buy 43,754 12.7 10,010 66.2 7,020 106.0HPCL Buy 315,268 44.3 5,397 -47.4 2,639 -52.0Indraprastha Gas Not Rated 1,981 20.6 848 19.2 477 19.2IOC Buy 702,750 32.9 37,120 -24.3 27,047 -4.1MRPL Sell 97,117 42.9 5,415 -7.3 2,890 58.9ONGC Buy 146,827 18.4 78,484 46.1 42,754 59.4Reliance Inds. Buy 349,480 27.3 57,643 11.5 38,177 21.0Sector Aggregate 2,041,356 31.3 208,690 6.8 127,765 19.8
Anil Sharma ([email protected]);Tel: +91 22 39825413/Harshad Borawake ([email protected]) Tel: 39825432
BSE Sensex: 16,371 S&P CNX: 4,942 28 March 2008
Results PreviewQUARTER ENDED MARCH 2008
Very high oil prices hurting downstream companiesYoY comparative (v/s 4QFY07)? Brent up by 66% at US$96.7/bbl v/s US$58.1/bbl; Dubai crude up 64% at US$91.3/
bbl v/s US$55.6/bbl.? Benchmark Singapore complex refining margins flat: US$6.9/bbl (v/s US$6.8/bbl in
4QFY07)? Declined petrochemical (excl. MEG) spreads over naphtha
Polymers; PE down 9%; PP down 15%;Polyester intermediates: PTA down 44%; and MEG up 25%;Integrated polyesters down: POY down 18%, PSF down 29%;
QoQ comparative (v/s 3QFY08)? Brent up by 9% from US$89/bbl; Dubai up by 10% from US$83/bbl.? Singapore complex margins down 10% from US$7.7/bbl in 3QFY08.? Mixed trend in petrochemical spreads over naphtha;
Polymers: PE up 3.5%; PP up 3.3%;Polyester intermediates: PTA down 13%; MEG down 22%;Integrated polyesters: POY down 14% and PSF down 18%.
Factors to watch for? Key data to watch for apart from global oil prices would be quantum of oil bonds for
Oil Marketing Companies. Underrecoveries for OMCs have ballooned and retail pricehike is very marginal.
? The government has indicated that the quantum of oil bonds would increase from42.7% to 57%. As the quantum for first three quarters has already been decided, weassume 57% sharing would commence from 4QFY08. However, if the 57% formulais applied for full FY08, oil bonds issuance for 4QFY08 could be much higher, and willbe positive for PSU OMCs.
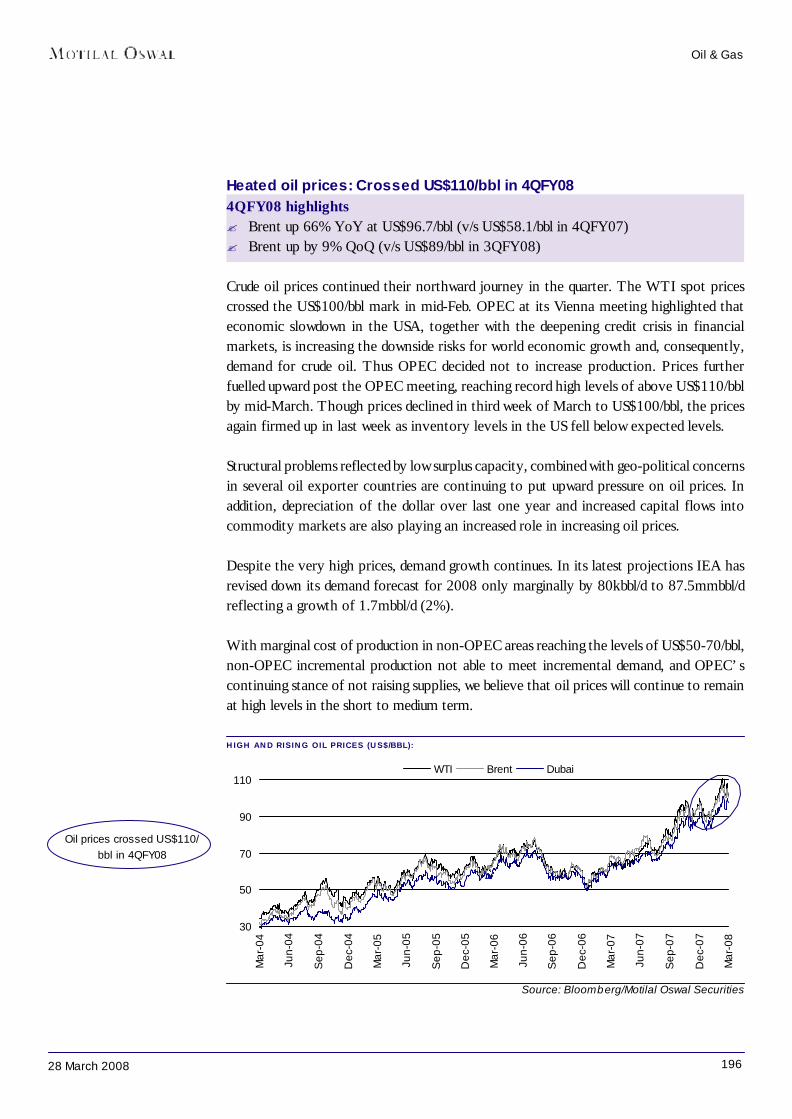
19628 March 2008
Heated oil prices: Crossed US$110/bbl in 4QFY084QFY08 highlights? Brent up 66% YoY at US$96.7/bbl (v/s US$58.1/bbl in 4QFY07)? Brent up by 9% QoQ (v/s US$89/bbl in 3QFY08)
Crude oil prices continued their northward journey in the quarter. The WTI spot pricescrossed the US$100/bbl mark in mid-Feb. OPEC at its Vienna meeting highlighted thateconomic slowdown in the USA, together with the deepening credit crisis in financialmarkets, is increasing the downside risks for world economic growth and, consequently,demand for crude oil. Thus OPEC decided not to increase production. Prices furtherfuelled upward post the OPEC meeting, reaching record high levels of above US$110/bblby mid-March. Though prices declined in third week of March to US$100/bbl, the pricesagain firmed up in last week as inventory levels in the US fell below expected levels.
Structural problems reflected by low surplus capacity, combined with geo-political concernsin several oil exporter countries are continuing to put upward pressure on oil prices. Inaddition, depreciation of the dollar over last one year and increased capital flows intocommodity markets are also playing an increased role in increasing oil prices.
Despite the very high prices, demand growth continues. In its latest projections IEA hasrevised down its demand forecast for 2008 only marginally by 80kbbl/d to 87.5mmbbl/dreflecting a growth of 1.7mbbl/d (2%).
With marginal cost of production in non-OPEC areas reaching the levels of US$50-70/bbl,non-OPEC incremental production not able to meet incremental demand, and OPEC’scontinuing stance of not raising supplies, we believe that oil prices will continue to remainat high levels in the short to medium term.
HIGH AND RISING OIL PRICES (US$/BBL):
Oil & Gas
Oil prices crossed US$110/bbl in 4QFY08
Source: Bloomberg/Motilal Oswal Securities
30
50
70
90
110
Mar
-04
Jun-
04
Sep
-04
Dec
-04
Mar
-05
Jun-
05
Sep
-05
Dec
-05
Mar
-06
Jun-
06
Sep
-06
Dec
-06
Mar
-07
Jun-
07
Sep
-07
Dec
-07
Mar
-08
WTI Brent Dubai

19728 March 2008
Source: Bloomberg/Motilal Oswal Securities
WTI-Maya (Sweet –Sour) spreads continued their uptrend since July 2007WTI-Maya spreads, which saw their recent lows in June 2007, have continued their upwardtrend. The spread at US$16.8/bbl were up 12% QoQ (from US$15/bbl in 3QFY08) andup 28% YoY (US$13.1/bbl in 4QFY07).
WTI - MAYA DIFFERENTIAL (US$/BBL)
Oil & Gas
Light – Heavy differentials firmed upWith rising oil prices, the light-heavy oil differential also firmed up during 4QFY08. ArabLight Heavy differential at US$6.3/bbl was up 24% QoQ (US$5.1 in 3QFY08) and 16%YoY (US$5.5/bbl in 4QFY07). With expected commissioning of nearly 1.2 to 1.5mmbbl/day of refining capacity over next 6-8 months, most of which is skewed toward processingheavies and sour (including RPL’s refinery) we would expect some moderation in differentialin forthcoming quarters.
ARAB LIGHT – HEAVY DIFFERENTIALS (US$/BBL)
Light heavy differentialsincreased during the
quarter; though slightlydeclined towards end
Source: Bloomberg/Motilal Oswal Securities
0
2
4
6
8
Apr-
01
Aug-
01
Dec
-01
Apr-
02
Aug-
02
Dec
-02
Apr-
03
Aug-
03
Dec
-03
Apr-
04
Aug-
04
Dec
-04
Apr-
05
Aug-
05
Dec
-05
Apr-
06
Aug-
06
Dec
-06
Apr-
07
Aug-
07
Dec
-07
10
35
60
85
110Diff. (LHS, $/bbl) Arab Light (RHS, $/bbl) Arab Heavy (RHS, $/bbl)
0
6
12
18
24
Apr-
01
Aug-
01
Dec
-01
Apr-
02
Aug-
02
Dec
-02
Apr-
03
Aug-
03
Dec
-03
Apr-
04
Aug-
04
Dec
-04
Apr-
05
Aug-
05
Dec
-05
Apr-
06
Aug-
06
Dec
-06
Apr-
07
Aug-
07
Dec
-07
-10
20
50
80
110WTI-Maya (LHS) WTI Maya Crude US
Mar
-08
Mar
-08
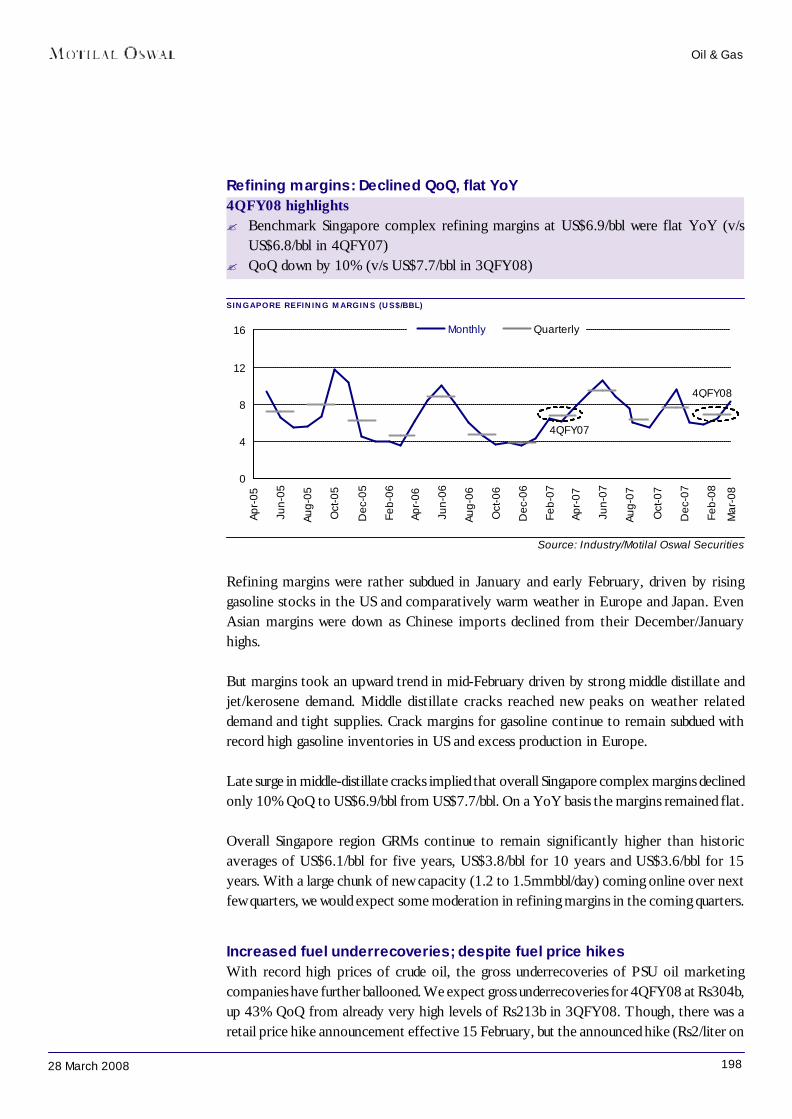
19828 March 2008
Refining margins: Declined QoQ, flat YoY4QFY08 highlights? Benchmark Singapore complex refining margins at US$6.9/bbl were flat YoY (v/s
US$6.8/bbl in 4QFY07)? QoQ down by 10% (v/s US$7.7/bbl in 3QFY08)
SINGAPORE REFINING MARGINS (US$/BBL)
Oil & Gas
Source: Industry/Motilal Oswal Securities
Refining margins were rather subdued in January and early February, driven by risinggasoline stocks in the US and comparatively warm weather in Europe and Japan. EvenAsian margins were down as Chinese imports declined from their December/Januaryhighs.
But margins took an upward trend in mid-February driven by strong middle distillate andjet/kerosene demand. Middle distillate cracks reached new peaks on weather relateddemand and tight supplies. Crack margins for gasoline continue to remain subdued withrecord high gasoline inventories in US and excess production in Europe.
Late surge in middle-distillate cracks implied that overall Singapore complex margins declinedonly 10% QoQ to US$6.9/bbl from US$7.7/bbl. On a YoY basis the margins remained flat.
Overall Singapore region GRMs continue to remain significantly higher than historicaverages of US$6.1/bbl for five years, US$3.8/bbl for 10 years and US$3.6/bbl for 15years. With a large chunk of new capacity (1.2 to 1.5mmbbl/day) coming online over nextfew quarters, we would expect some moderation in refining margins in the coming quarters.
Increased fuel underrecoveries; despite fuel price hikesWith record high prices of crude oil, the gross underrecoveries of PSU oil marketingcompanies have further ballooned. We expect gross underrecoveries for 4QFY08 at Rs304b,up 43% QoQ from already very high levels of Rs213b in 3QFY08. Though, there was aretail price hike announcement effective 15 February, but the announced hike (Rs2/liter on
0
4
8
12
16
Apr-
05
Jun-
05
Aug-
05
Oct
-05
Dec
-05
Feb-
06
Apr-
06
Jun-
06
Aug-
06
Oct
-06
Dec
-06
Feb-
07
Apr-
07
Jun-
07
Aug-
07
Oct
-07
Dec
-07
Feb-
08
Monthly Quarterly
4QFY07
4QFY08
Mar
-08
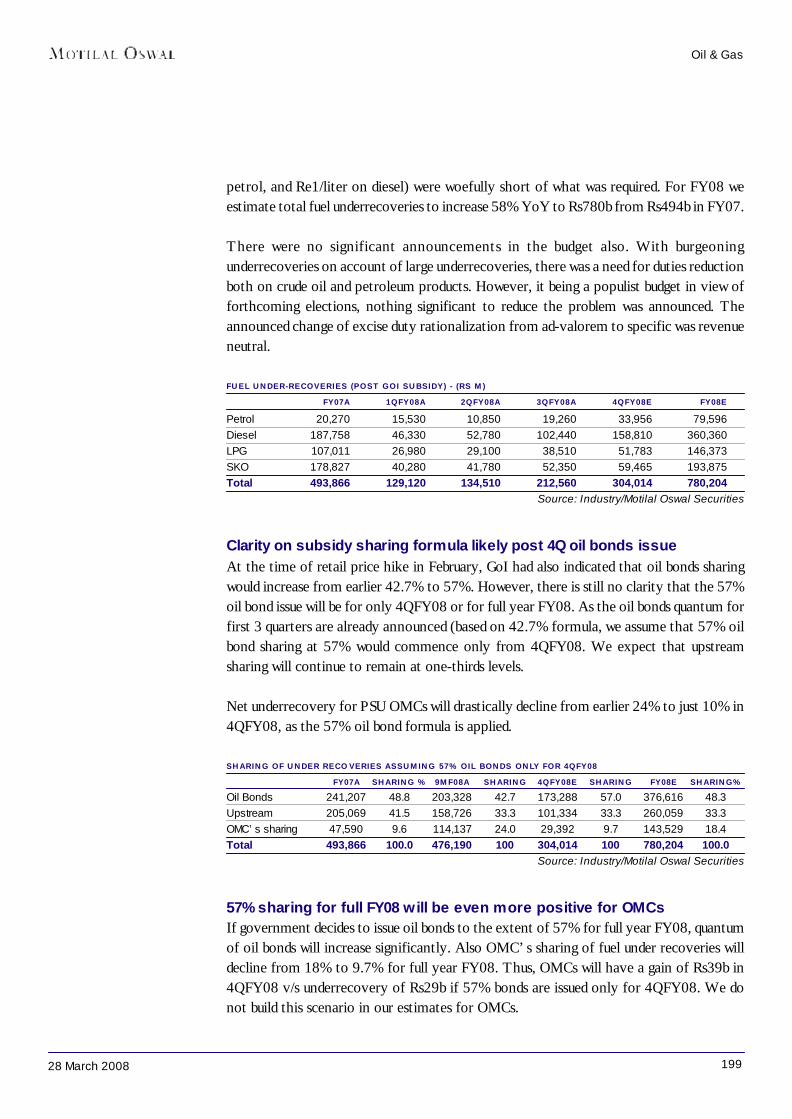
19928 March 2008
Oil & Gas
petrol, and Re1/liter on diesel) were woefully short of what was required. For FY08 weestimate total fuel underrecoveries to increase 58% YoY to Rs780b from Rs494b in FY07.
There were no significant announcements in the budget also. With burgeoningunderrecoveries on account of large underrecoveries, there was a need for duties reductionboth on crude oil and petroleum products. However, it being a populist budget in view offorthcoming elections, nothing significant to reduce the problem was announced. Theannounced change of excise duty rationalization from ad-valorem to specific was revenueneutral.
FUEL UNDER-RECOVERIES (POST GOI SUBSIDY) - (RS M)FY07A 1QFY08A 2QFY08A 3QFY08A 4QFY08E FY08E
Petrol 20,270 15,530 10,850 19,260 33,956 79,596Diesel 187,758 46,330 52,780 102,440 158,810 360,360LPG 107,011 26,980 29,100 38,510 51,783 146,373SKO 178,827 40,280 41,780 52,350 59,465 193,875Total 493,866 129,120 134,510 212,560 304,014 780,204
Source: Industry/Motilal Oswal Securities
Clarity on subsidy sharing formula likely post 4Q oil bonds issueAt the time of retail price hike in February, GoI had also indicated that oil bonds sharingwould increase from earlier 42.7% to 57%. However, there is still no clarity that the 57%oil bond issue will be for only 4QFY08 or for full year FY08. As the oil bonds quantum forfirst 3 quarters are already announced (based on 42.7% formula, we assume that 57% oilbond sharing at 57% would commence only from 4QFY08. We expect that upstreamsharing will continue to remain at one-thirds levels.
Net underrecovery for PSU OMCs will drastically decline from earlier 24% to just 10% in4QFY08, as the 57% oil bond formula is applied.
SHARING OF UNDER RECOVERIES ASSUMING 57% OIL BONDS ONLY FOR 4QFY08FY07A SHARING % 9MF08A SHARING 4QFY08E SHARING FY08E SHARING%
Oil Bonds 241,207 48.8 203,328 42.7 173,288 57.0 376,616 48.3Upstream 205,069 41.5 158,726 33.3 101,334 33.3 260,059 33.3OMC’s sharing 47,590 9.6 114,137 24.0 29,392 9.7 143,529 18.4Total 493,866 100.0 476,190 100 304,014 100 780,204 100.0
Source: Industry/Motilal Oswal Securities
57% sharing for full FY08 will be even more positive for OMCsIf government decides to issue oil bonds to the extent of 57% for full year FY08, quantumof oil bonds will increase significantly. Also OMC’s sharing of fuel under recoveries willdecline from 18% to 9.7% for full year FY08. Thus, OMCs will have a gain of Rs39b in4QFY08 v/s underrecovery of Rs29b if 57% bonds are issued only for 4QFY08. We donot build this scenario in our estimates for OMCs.

20028 March 2008
SHARING ASSUMING 57% OIL BONDS FOR FULL YEAR FY08 (RS M)FY07 SHARING % 1QFY08 2QFY08 3QFY08 4QFY08E FY08E SHARING%
Oil Bonds 241,207 48.8 0 112,564 90,764 241,388 444,716 57.0Upstream 205,069 41.5 43,040 44,831 70,855 101,334 260,059 33.3OMC’s sharing 47,590 9.6 86,081 -22,885 50,941 -38,708 75,429 9.7Total 493,866 100.0 129,120 134,510 212,560 304,014 780,204 100.0
Source: Industry/Motilal Oswal Securities
Higher oil bonds sharing to benefit OMCsOMCs’ combined average quarterly net underrecoveries for the first three quarters wereat Rs38b. Despite the 43% higher gross underrecoveries in 4Q, we estimate OMCs’ totalnet underrecoveries for 4Q will be much lower at Rs29b. However, for full year FY08OMCs burden will triple at Rs144b from Rs48b in FY07.
NET UNDER-RECOVERIES OF OMCS (RS M)YOY CHANGE
FY07 1QFY08 2QFY08 3QFY08 4QFY08E FY08 RS M (%)IOC 27,539 48,097 -12,694 28,214 16,054 79,672 52,133 189.3BPCL 10,355 19,614 -5,108 12,044 7,149 33,700 23,345 225.4HPCL 9,696 18,369 -5,084 10,687 6,189 30,161 20,465 211.1Total 47,590 86,080 -22,885 50,946 29,392 143,533 95,943 201.6
Source: Industry/Motilal Oswal Securities
Lower increase in upstream discounts vis a vis overall under recoveriesDespite 58% increase in overall under recoveries we estimate upstream sharing to increaseonly by 27% from Rs205b in FY07 to Rs260b, primarily due to higher sharing of 42% byupstream companies in FY07.
SHARING BY UPSTREAM COMPANIES (RS M)YOY CHANGE
FY07A 1QFY08 2QFY08 3QFY08 4QFY08E FY08 RS M (%)ONGC 170,252 36,490 37,990 60,800 87,996 223,276 53,024 31.1OIL 19,938 3,830 4,241 6,380 8,839 23,290 3,353 16.8GAIL 14,880 2,720 2,600 3,675 4,499 13,494 -1,386 -9.3Total 205,069 43,040 44,831 70,855 101,334 260,060 54,991 26.8
Source: Industry/Motilal Oswal Securities
Oil & Gas
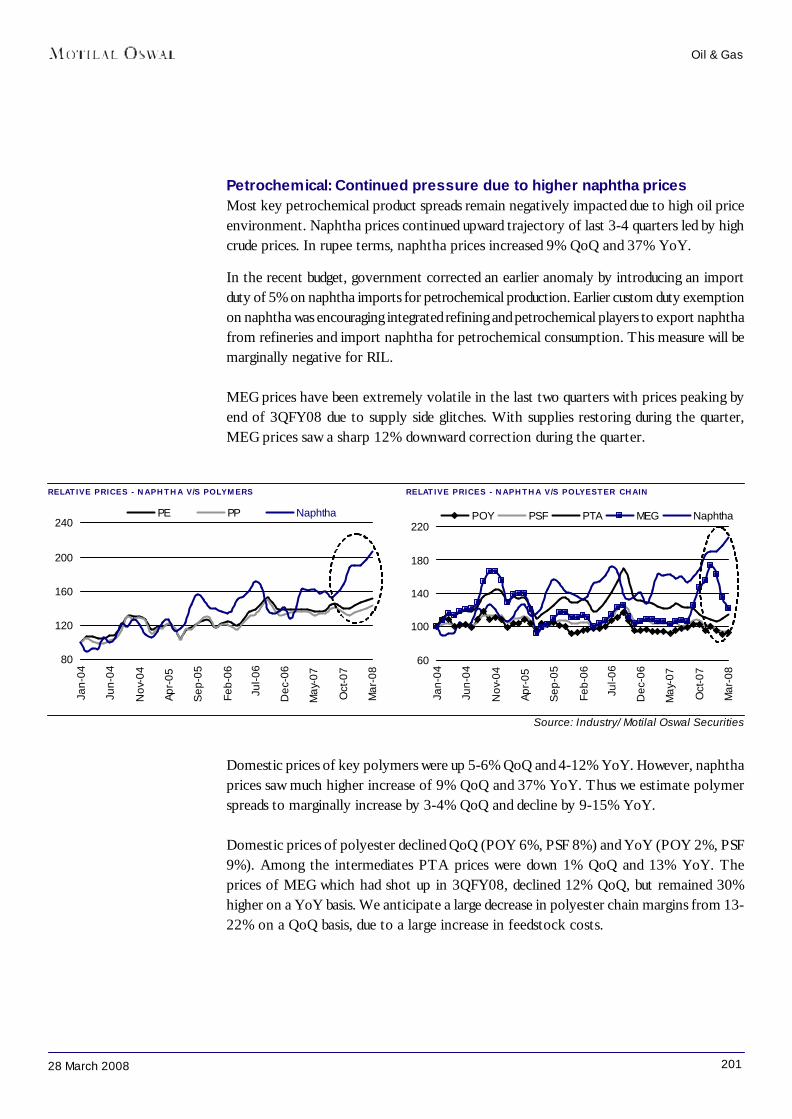
20128 March 2008
Domestic prices of key polymers were up 5-6% QoQ and 4-12% YoY. However, naphthaprices saw much higher increase of 9% QoQ and 37% YoY. Thus we estimate polymerspreads to marginally increase by 3-4% QoQ and decline by 9-15% YoY.
Domestic prices of polyester declined QoQ (POY 6%, PSF 8%) and YoY (POY 2%, PSF9%). Among the intermediates PTA prices were down 1% QoQ and 13% YoY. Theprices of MEG which had shot up in 3QFY08, declined 12% QoQ, but remained 30%higher on a YoY basis. We anticipate a large decrease in polyester chain margins from 13-22% on a QoQ basis, due to a large increase in feedstock costs.
Oil & Gas
RELATIVE PRICES - NAPHTHA V/S POLYMERS RELATIVE PRICES - NAPHTHA V/S POLYESTER CHAIN
Source: Industry/ Motilal Oswal Securities
Petrochemical: Continued pressure due to higher naphtha pricesMost key petrochemical product spreads remain negatively impacted due to high oil priceenvironment. Naphtha prices continued upward trajectory of last 3-4 quarters led by highcrude prices. In rupee terms, naphtha prices increased 9% QoQ and 37% YoY.
In the recent budget, government corrected an earlier anomaly by introducing an importduty of 5% on naphtha imports for petrochemical production. Earlier custom duty exemptionon naphtha was encouraging integrated refining and petrochemical players to export naphthafrom refineries and import naphtha for petrochemical consumption. This measure will bemarginally negative for RIL.
MEG prices have been extremely volatile in the last two quarters with prices peaking byend of 3QFY08 due to supply side glitches. With supplies restoring during the quarter,MEG prices saw a sharp 12% downward correction during the quarter.
80
120
160
200
240
Jan-
04
Jun-
04
Nov
-04
Apr-
05
Sep
-05
Feb-
06
Jul-0
6
Dec
-06
May
-07
Oct
-07
Mar
-08
PE PP Naphtha
60
100
140
180
220
Jan-
04
Jun-
04
Nov
-04
Apr-
05
Sep
-05
Feb-
06
Jul-0
6
Dec
-06
May
-07
Oct
-07
Mar
-08
POY PSF PTA MEG Naphtha
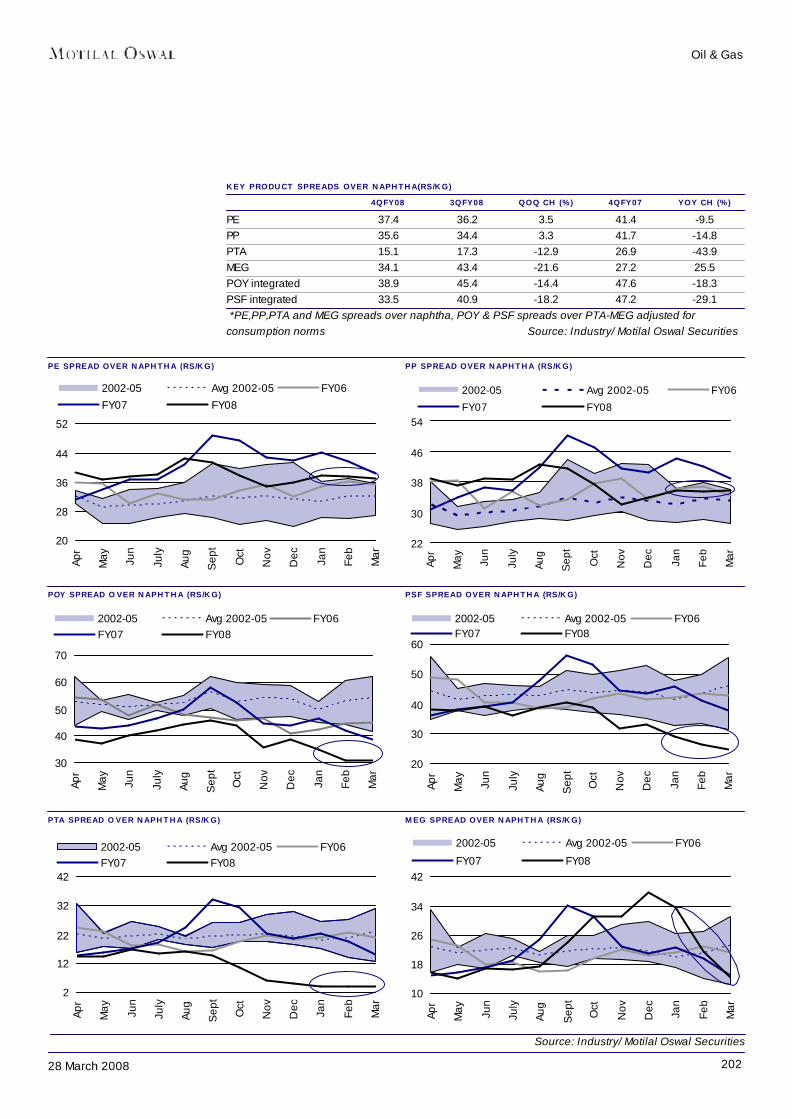
20228 March 2008
Oil & Gas
PE SPREAD OVER NAPHTHA (RS/KG) PP SPREAD OVER NAPHTHA (RS/KG)
POY SPREAD OVER NAPHTHA (RS/KG) PSF SPREAD OVER NAPHTHA (RS/KG)
PTA SPREAD OVER NAPHTHA (RS/KG) MEG SPREAD OVER NAPHTHA (RS/KG)
Source: Industry/ Motilal Oswal Securities
20
28
36
44
52
Apr
May Ju
n
July
Aug
Sep
t
Oct
Nov
Dec Ja
n
Feb
Mar
2002-05 Avg 2002-05 FY06FY07 FY08
22
30
38
46
54Ap
r
May Ju
n
July
Aug
Sep
t
Oct
Nov
Dec Ja
n
Feb
Mar
2002-05 Avg 2002-05 FY06
FY07 FY08
30
40
50
60
70
Apr
May Ju
n
July
Aug
Sep
t
Oct
Nov
Dec Ja
n
Feb
Mar
2002-05 Avg 2002-05 FY06FY07 FY08
20
30
40
50
60
Apr
May Ju
n
July
Aug
Sep
t
Oct
Nov
Dec Ja
n
Feb
Mar
2002-05 Avg 2002-05 FY06FY07 FY08
2
12
22
32
42
Apr
May Ju
n
July
Aug
Sep
t
Oct
Nov
Dec Ja
n
Feb
Mar
2002-05 Avg 2002-05 FY06FY07 FY08
10
18
26
34
42
Apr
May Ju
n
July
Aug
Sep
t
Oct
Nov
Dec Ja
n
Feb
Mar
2002-05 Avg 2002-05 FY06
FY07 FY08
KEY PRODUCT SPREADS OVER NAPHTHA(RS/KG)4QFY08 3QFY08 QOQ CH (%) 4QFY07 YOY CH (%)
PE 37.4 36.2 3.5 41.4 -9.5PP 35.6 34.4 3.3 41.7 -14.8PTA 15.1 17.3 -12.9 26.9 -43.9MEG 34.1 43.4 -21.6 27.2 25.5POY integrated 38.9 45.4 -14.4 47.6 -18.3PSF integrated 33.5 40.9 -18.2 47.2 -29.1 *PE,PP,PTA and MEG spreads over naphtha, POY & PSF spreads over PTA-MEG adjusted forconsumption norms Source: Industry/ Motilal Oswal Securities

20328 March 2008
Valuation and viewGAIL and Cairn India are our top picks in the oil and gas space. We also remain verypositive on RIL and ONGC in view of large E&P upside potential. With likely 57% oilbonds issued to oil marketing companies, we expect net underrecoveries to declinesignificantly in FY09. This would lead to a large increase in reported earnings makingvaluation even more attractive in the range of 4-5x P/E FY09E.
Gail: Transmission volumes to grow by 60%; maintain BuyGAIL’s transmission volumes are expected to increase significantly going forward as itwould be one of the key beneficiaries of several large-scale gas finds in India in recentyears. We expect GAIL’s transmission volumes to grow by 60% to 136mmscmd by FY10from 85mmscmd currently.
We believe there is little threat of further reduction in tariffs for GAIL. Its transmissiontariffs for most of its network were reduced over last two years. As GAIL is ramping upinvestments significantly to upgrade and expand its network, we do not expect any furthertariff cuts in the near term.
GAIL’s petrochemical capacity has increased by 32% post commissioning of 100kta HDPEexpansion in 4QFY08. While we remain bearish on the polymer cycle and expect pricesto decline from 2HFY09, volume growth will remain strong.
GAIL already operates the city gas distribution network in several key cities via nine JVsand plans to add a further 130 cities over the next 6-7years. It has stakes in 29 E&Pblocks in India and overseas, and has encountered hydrocarbon finds in five of its blocks.We believe significant value could accrue to GAIL from these businesses, going forward.
We believe that GAIL offers value at current valuations of 9x PE FY09 (adjusting forvalue of E&P and investments). We maintain Buy.
Cairn India: Maintain BuyRajasthan field development is on schedule and the company has already awarded all themajor contracts for the pipeline and for civil and consolidated construction works. Weexpect production to begin in July 2009 with a peak plateau rate of 180kbpd.
We believe that final approval from the government allowing inclusion of evacuation pipeline,as part of Field Development Plan will come soon. Empowered Committee of Secretaries(ECS) has also cleared the proposal, after earlier clearance by Law Ministry. Some delaysin announcement could have been due to the Rajasthan government expressing concernover its losing CST revenue if the delivery point is shifted out of state. Cairn has alreadysubmitted the expert opinion that Rajasthan government’s revenue will not be affectedand also ECS has directed the Ministry of Petroleum to ensure that the Rajasthangovernment’s revenues are not impacted. We believe this issue will be resolved soon,paving way for the issue of notification approving pipeline inclusion in FDP.
Oil & Gas
20428 March 2008
Cairn recently announced a US$625m preferential issue to Petronas and Oriental GlobalTamarind. We believe this development though 6% equity dilutive is a positive developmentas:? a large strategic partner like Petronas is showing further commitment; and? the issue proceeds will ensure adequate funds availability for development of Rajasthan
as capex is likely to escalate because of increase of scope and all-round cost increasesin the business.
We believe Cairn’s valuation has significant potential upside from:1) Rajasthan block a) upside from current area under development, b) adding new
development area into development phase, c) development of smaller fields and2) Other exploration assets: Cairn also has large exploration acreage of about 94,800sq
km in 12 other blocks, including five as operator. The most promising of these isONGC operated (Cairn 10%) deep-water block KG-DWN-98/2.
Maintain Buy on ONGCONGC is adopting multi-pronged efforts to sustain and increase its production and reserves.We expect its total production to increase at a significantly higher rate than its historicalaverages owing to its IOR/EOR initiatives, marginal field developments, joint ventures,and increasing contribution from ONGC Videsh.
ONGC has increased its capital expenditure to boost exploration and production activities.The benefits of increased capex are already visible in improved reserve accretion andproduction.
ONGC has more than 50% of NELP acreage and we believe this will provide long termgrowth for the company. Initial success has already been seen in the KG block – thecountry’s first ultra-deep water discovery. With increased efforts towards E&P, we expectthe company to report more oil and gas finds going forward.
The tariff commission had revised the producer price of ONGC from Rs3,200 to Rs3,600/MSCM in 1QFY08. Adjusted for WPI increase, the current producer price works out toRs3,710/MSCM, a rise of 16%. Implementation of the revised pricing had been considerablydelayed. Early implementation of revised pricing will be positive for ONGC.
The concern remains on high upstream discounts and lack of clarity on the subsidy sharingmechanism going forward.
Reliance Industries: Maintain BuyWe believe that E&P is the new growth engine in RIL’s successful strategy of backwardintegration. RIL is the largest exploration acreage holder in the private sector in India. Ithad its world-scale gas find in 2002, and since then has nearly 40 discoveries. In our view,as its KG-D6 gas comes on line later this year, E&P will soon become the key growth
Oil & Gas
20528 March 2008
driver. Apart from KG-D6, RIL has a large inventory of high potential blocks, in several ofwhich it has reported exploration success. There remains large potential upside from theseblocks, which is not quantifiable at this juncture.
In the medium to longer term, we expect refining margins to remain high, as the globaldemand for refined products is robust and not enough capacity is coming on line. However,in the shorter term we would expect some moderation in margins in the coming quarter asa large chunk of capacity (1.2-1.5mmbbls/day including RPL) gets commissioned overcoming quarters. Margins in petrochemicals business have declined in recent quarters,primarily due to rise in Naphtha prices and no commensurate increase in product prices.With oil prices continuing to remain very high, we would expect high naphtha prices also tocontinue, putting pressure on overall petrochemical margins.
We believe that organized retailing in India offers a huge growth opportunity and RILwould be able to make the most of this opportunity. Its deep pockets would help sustain arelatively long gestation involved in building a pan-India retailing giant.
Approval of the gas pricing formula is a key positive. Near term upside could come from:(1) marketing tie-ups with potential gas buyers, (2) the updates on actual progress on KG-D6 field development and pipeline, (3) update on progress of RPL refinery completion,and (4) progress on the retail front.
Maintain Buy on oil marketing companies – BPCL, HPCL and IOCWith record high prices of crude oil, the gross underrecoveries of oil marketing companieshave further ballooned. With not much in the recent budget in terms of reduction in duties,and very marginal price hikes during the quarter, we expect high gross underrecoveries tocontinue.
However, the silver lining for PSU OMCs could come in the form of higher sharing of oilbonds by the Government of India. At the time of retail price hike in February, GoI has alsoindicated that oil bonds sharing would increase from earlier 42.7% to 57%. There remainsno clarity on whether the oil bonds issuance would be effective from 4QFY08 (we assumethis) or for the full year FY08. However, for FY09 we believe the 57% formula will apply,leading to large reduction in net underrecoveries borne by OMCs from earlier 24% to just10% of total gross underrecoveries.
Higher oil bonds for FY09, leads to a significant increase in our earnings estimates forPSU OMC. Our EPS estimates are revised upward by 53% for BPCL, 104% for HPCL,and 74% for IOC. The large revision in our earnings estimates would mean that valuationfor PSU OMCs have become even more attractive. On PE multiples for FY09E, BPCLtrades at 4.6x, HPCL at 5.1x, and IOCL at 4.4x. On EV/EBITDA multiples for FY09E,BPCL trades at 4.3x, HPCL at 4.7x, and IOCL at 4.2x. On P/book value the stock continuesto trade in the band of 0.8 to 1x for FY09.
Oil & Gas

20628 March 2008
On business fundamentals, refining margins continue to remain strong and are expected toremain so in the short to medium term. OMCs are also implementing several upgradationprojects for their capacity, which will enable them to: (1) produce higher share of middledistillates, (2) produce Euro-III/IV compliant fuels and (3) to process larger share of sour/heavy crudes. Completion of these projects, in time and within schedules, will be marginaccretive in our view.
We maintain Buy on PSU OMCs on attractive valuations and continuing strong refiningfundamentals. However, concerns remain on the large and non-transparent underrecoverysharing mechanism
We maintain Buy on Chennai PetroChennai Petroleum (CPCL) has been reporting a premium over Singapore benchmark inrecent quarters, reversing the earlier trend of discounts. Apart from some inventory gains,we believe this is also because of increasing share of middle and light distillates. Weexpect CPCL to report premium of ~US$0.5/bbl to 3QFY10, beyond which premiumswould further increase by US$1-1.5/bbl, as its Rs19b auto fuel upgradation projects startcoming on line.
CPCL is also increasing capacity of its one crude unit from 3mmtpa to 4mmtpa, which willincrease refining capacity by 9.5% to 11.5mmtpa (likely by May 2009). Post-completion,we expect refining throughput to increase by 7% in FY10.
We recently upgraded our rating on CPCL from Neutral to Buy. Post-recent correctionin overall markets, CPCL's valuations have become very attractive. On PE basis CPCLtrades at 4.8x FY09E and on EV/EBITDA basis it trades at 3.5x FY09E. Valuations alsolook attractive compared with its peer MRPL (which like CPCL does not have muchsubsidy concern) which trades at 12.2x FY09 PE and 8.3x FY09 EV/EBITDA.
MRPL: Despite recent large correction in stock price and continued strong refiningfundamentals we believe MRPL’s valuations continue to remain stretched compared withpeers. We maintain Sell.
Indraprastha Gas (IGL): We also present estimates of Indraprastha Gas (IGL) in thispreview compendium. We currently do not have a rating on the stock.
Oil & Gas
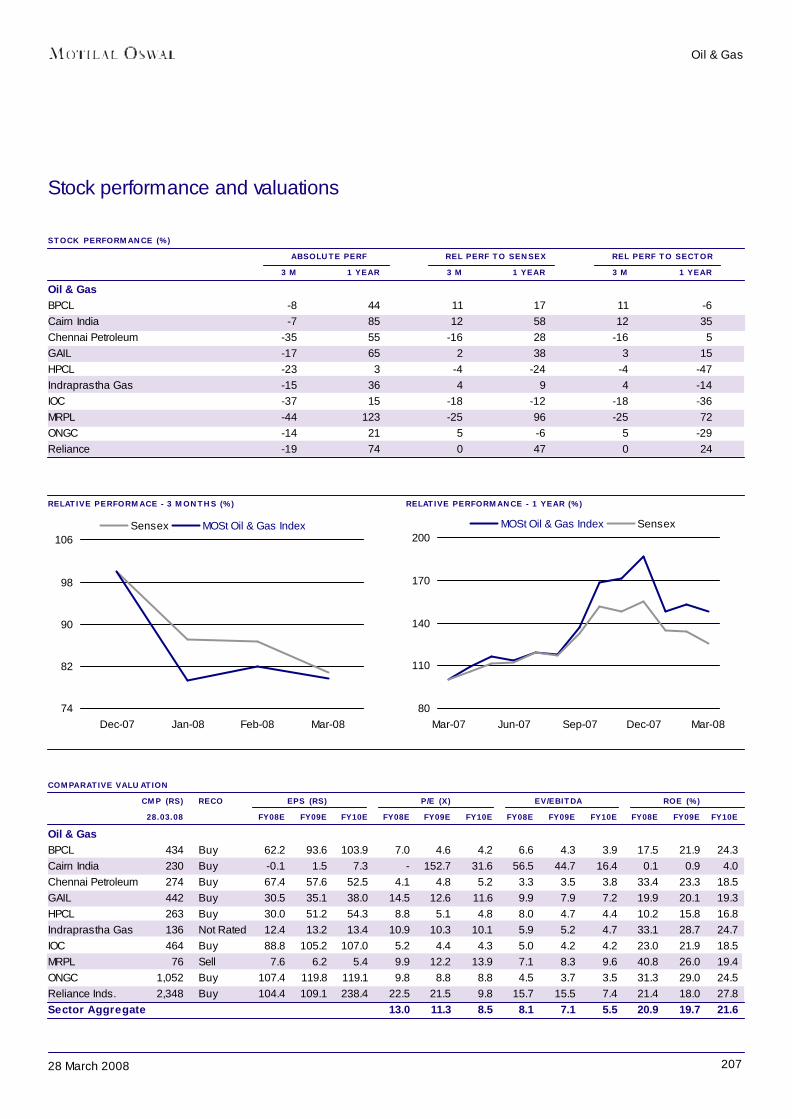
20728 March 2008
Oil & Gas
STOCK PERFORMANCE (%) ABSOLUTE PERF REL PERF TO SENSEX REL PERF TO SECTOR
3 M 1 YEAR 3 M 1 YEAR 3 M 1 YEAROil & GasBPCL -8 44 11 17 11 -6Cairn India -7 85 12 58 12 35Chennai Petroleum -35 55 -16 28 -16 5GAIL -17 65 2 38 3 15HPCL -23 3 -4 -24 -4 -47Indraprastha Gas -15 36 4 9 4 -14IOC -37 15 -18 -12 -18 -36MRPL -44 123 -25 96 -25 72ONGC -14 21 5 -6 5 -29Reliance -19 74 0 47 0 24
RELATIVE PERFORMACE - 3 MONTHS (%) RELATIVE PERFORMANCE - 1 YEAR (%)
Stock performance and valuations
COMPARATIVE VALUATIONCMP (RS) RECO EPS (RS) P/E (X) EV/EBITDA ROE (%)28.03.08 FY08E FY09E FY10E FY08E FY09E FY10E FY08E FY09E FY10E FY08E FY09E FY10E
Oil & GasBPCL 434 Buy 62.2 93.6 103.9 7.0 4.6 4.2 6.6 4.3 3.9 17.5 21.9 24.3Cairn India 230 Buy -0.1 1.5 7.3 - 152.7 31.6 56.5 44.7 16.4 0.1 0.9 4.0Chennai Petroleum 274 Buy 67.4 57.6 52.5 4.1 4.8 5.2 3.3 3.5 3.8 33.4 23.3 18.5GAIL 442 Buy 30.5 35.1 38.0 14.5 12.6 11.6 9.9 7.9 7.2 19.9 20.1 19.3HPCL 263 Buy 30.0 51.2 54.3 8.8 5.1 4.8 8.0 4.7 4.4 10.2 15.8 16.8Indraprastha Gas 136 Not Rated 12.4 13.2 13.4 10.9 10.3 10.1 5.9 5.2 4.7 33.1 28.7 24.7IOC 464 Buy 88.8 105.2 107.0 5.2 4.4 4.3 5.0 4.2 4.2 23.0 21.9 18.5MRPL 76 Sell 7.6 6.2 5.4 9.9 12.2 13.9 7.1 8.3 9.6 40.8 26.0 19.4ONGC 1,052 Buy 107.4 119.8 119.1 9.8 8.8 8.8 4.5 3.7 3.5 31.3 29.0 24.5Reliance Inds. 2,348 Buy 104.4 109.1 238.4 22.5 21.5 9.8 15.7 15.5 7.4 21.4 18.0 27.8Sector Aggregate 13.0 11.3 8.5 8.1 7.1 5.5 20.9 19.7 21.6
80
110
140
170
200
Mar-07 Jun-07 Sep-07 Dec-07 Mar-08
MOSt Oil & Gas Index Sensex
74
82
90
98
106
Dec-07 Jan-08 Feb-08 Mar-08
Sensex MOSt Oil & Gas Index
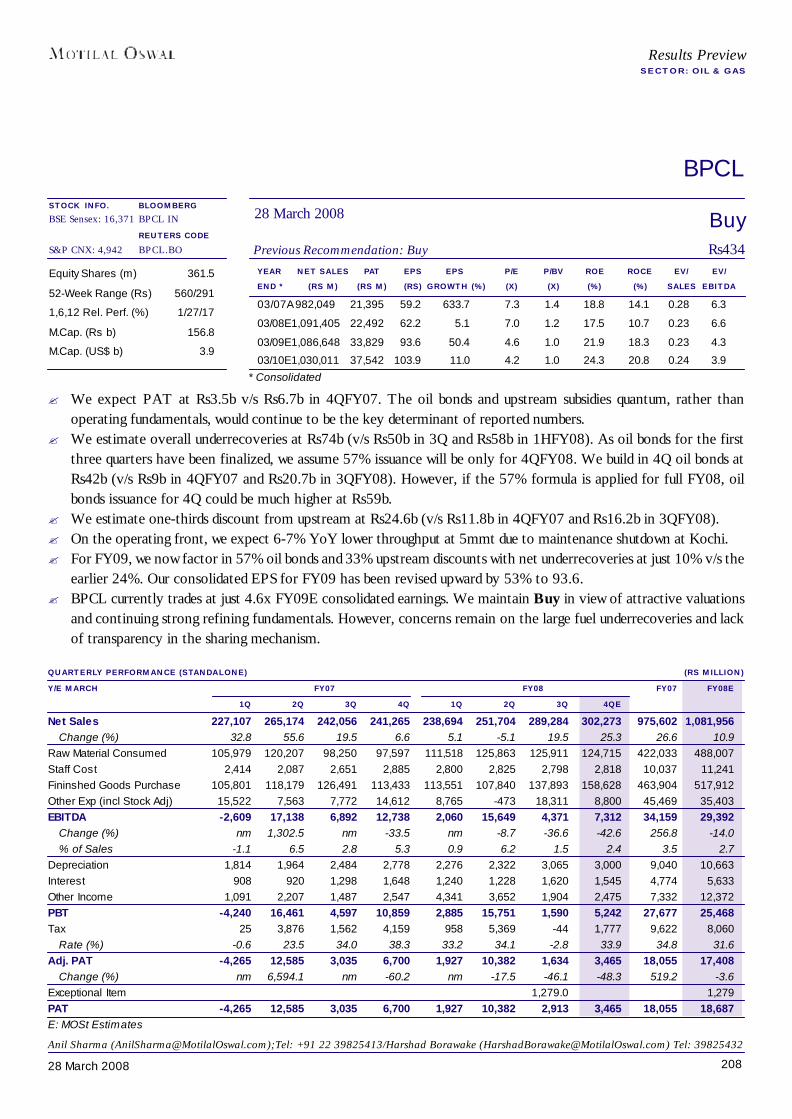
20828 March 2008
BPCL
YEAR NET SALES PAT EPS EPS P/E P/BV ROE ROCE EV/ EV/END * (RS M) (RS M) (RS) GROWTH (%) (X) (X) (%) (%) SALES EBITDA
03/07A 982,049 21,395 59.2 633.7 7.3 1.4 18.8 14.1 0.28 6.3
03/08E1,091,405 22,492 62.2 5.1 7.0 1.2 17.5 10.7 0.23 6.6
03/09E1,086,648 33,829 93.6 50.4 4.6 1.0 21.9 18.3 0.23 4.3
03/10E1,030,011 37,542 103.9 11.0 4.2 1.0 24.3 20.8 0.24 3.9
Equity Shares (m) 361.5
52-Week Range (Rs) 560/291
1,6,12 Rel. Perf. (%) 1/27/17
M.Cap. (Rs b) 156.8
M.Cap. (US$ b) 3.9
QUARTERLY PERFORMANCE (STANDALONE) (RS MILLION)Y/E MARCH FY07 FY08 FY07 FY08E
1Q 2Q 3Q 4Q 1Q 2Q 3Q 4QENet Sales 227,107 265,174 242,056 241,265 238,694 251,704 289,284 302,273 975,602 1,081,956
Change (%) 32.8 55.6 19.5 6.6 5.1 -5.1 19.5 25.3 26.6 10.9Raw Material Consumed 105,979 120,207 98,250 97,597 111,518 125,863 125,911 124,715 422,033 488,007Staff Cost 2,414 2,087 2,651 2,885 2,800 2,825 2,798 2,818 10,037 11,241Fininshed Goods Purchase 105,801 118,179 126,491 113,433 113,551 107,840 137,893 158,628 463,904 517,912Other Exp (incl Stock Adj) 15,522 7,563 7,772 14,612 8,765 -473 18,311 8,800 45,469 35,403EBITDA -2,609 17,138 6,892 12,738 2,060 15,649 4,371 7,312 34,159 29,392
Change (%) nm 1,302.5 nm -33.5 nm -8.7 -36.6 -42.6 256.8 -14.0% of Sales -1.1 6.5 2.8 5.3 0.9 6.2 1.5 2.4 3.5 2.7
Depreciation 1,814 1,964 2,484 2,778 2,276 2,322 3,065 3,000 9,040 10,663Interest 908 920 1,298 1,648 1,240 1,228 1,620 1,545 4,774 5,633Other Income 1,091 2,207 1,487 2,547 4,341 3,652 1,904 2,475 7,332 12,372PBT -4,240 16,461 4,597 10,859 2,885 15,751 1,590 5,242 27,677 25,468Tax 25 3,876 1,562 4,159 958 5,369 -44 1,777 9,622 8,060
Rate (%) -0.6 23.5 34.0 38.3 33.2 34.1 -2.8 33.9 34.8 31.6Adj. PAT -4,265 12,585 3,035 6,700 1,927 10,382 1,634 3,465 18,055 17,408
Change (%) nm 6,594.1 nm -60.2 nm -17.5 -46.1 -48.3 519.2 -3.6Exceptional Item 1,279.0 1,279PAT -4,265 12,585 3,035 6,700 1,927 10,382 2,913 3,465 18,055 18,687E: MOSt Estimates
BuyPrevious Recommendation: Buy Rs434
28 March 2008BLOOMBERGBPCL IN
REUTERS CODEBPCL.BO
* Consolidated
Results PreviewSECTOR: OIL & GAS
Anil Sharma ([email protected]);Tel: +91 22 39825413/Harshad Borawake ([email protected]) Tel: 39825432
STOCK INFO.BSE Sensex: 16,371
S&P CNX: 4,942
? We expect PAT at Rs3.5b v/s Rs6.7b in 4QFY07. The oil bonds and upstream subsidies quantum, rather thanoperating fundamentals, would continue to be the key determinant of reported numbers.
? We estimate overall underrecoveries at Rs74b (v/s Rs50b in 3Q and Rs58b in 1HFY08). As oil bonds for the firstthree quarters have been finalized, we assume 57% issuance will be only for 4QFY08. We build in 4Q oil bonds atRs42b (v/s Rs9b in 4QFY07 and Rs20.7b in 3QFY08). However, if the 57% formula is applied for full FY08, oilbonds issuance for 4Q could be much higher at Rs59b.
? We estimate one-thirds discount from upstream at Rs24.6b (v/s Rs11.8b in 4QFY07 and Rs16.2b in 3QFY08).? On the operating front, we expect 6-7% YoY lower throughput at 5mmt due to maintenance shutdown at Kochi.? For FY09, we now factor in 57% oil bonds and 33% upstream discounts with net underrecoveries at just 10% v/s the
earlier 24%. Our consolidated EPS for FY09 has been revised upward by 53% to 93.6.? BPCL currently trades at just 4.6x FY09E consolidated earnings. We maintain Buy in view of attractive valuations
and continuing strong refining fundamentals. However, concerns remain on the large fuel underrecoveries and lackof transparency in the sharing mechanism.

20928 March 2008
Cairn India
YEAR NET SALES PAT EPS EPS P/E P/BV ROE ROCE EV/ EV/END (RS M) (RS M) (RS) GROWTH (%) (X) (X) (%) (%) SALES EBITDA
12/07A 10,123 -245 -0.1 - - 1.4 0.1 1.3 39.8 56.5
12/08E 11,954 2,679 1.5 - 152.7 1.4 0.9 1.5 34.6 47.7
12/09E 28,409 12,958 7.3 383.6 31.6 1.3 4.0 5.2 14.9 17.5
12/10E 71,064 44,360 24.9 242.3 9.2 1.2 13.0 15.0 5.7 6.3
Equity Shares (m) 1,778.4
52-Week Range 269/121
1,6,12 Rel. Perf. (%) 11/32/58
M.Cap. (Rs b) 409.2
M.Cap. (US$ b) 10.3
QUARTERLY PERFORMANCE (RS MILLION)Y/E DECEMBER CY07 CY08 CY07 CY08E
1Q 2Q 3Q 4Q 1QE 2QE 3QE 4QENet Sales 2,364 2,433 2,658 2,667 3,119 3,028 2,921 2,886 10,123 11,954
Change (%) 31.9 24.5 9.9 10.0 18.1Inc/Dec in Stock 95 -157 0 -51 0 0 0 0 -112Staff Cost 309 288 238 423 255 267 281 295 1,257 1,098Operating Expenses 488 407 555 856 529 531 555 560 2,305 2,174EBITDA 1,472 1,895 1,865 1,439 2,335 2,230 2,085 2,031 6,672 8,682
% of Net Sales 62.3 77.9 70.2 54.0 74.9 73.6 71.4 70.4 65.9 72.6% Change 58.6 17.7 11.8 8.5 30.1
Depreciation & Exploration write-off1,002 1,145 1,233 1,210 1,270 1,305 1,345 1,366 4,589 5,286Interest 2 8 1 17 50 150 250 263 27 713Other Income (Net) 362 351 343 268 360 365 380 385 1,324 1,490Forex Fluctuations -138 -1,406 -300 -276 245 0 0 0 -2,120 245PBT 692 -312 674 205 1,620 1,140 870 788 1,259 4,418Tax 317 402 442 344 573 475 363 328 1,505 1,739
Rate* (%) 38.2 36.8 45.3 71.6 41.7 41.7 41.7 41.7 44.5 39.4PAT 376 -714 232 -139 1,047 665 508 460 -245 2,680E: MOSt Estimates; * Excluding forex fluctuations
BuyPrevious Recommendation: Buy Rs230
28 March 2008BLOOMBERGCAIR IN
REUTERS CODECAIL.BO
Results PreviewSECTOR: OIL & GAS
Anil Sharma ([email protected]);Tel: +91 22 39825413/Harshad Borawake ([email protected]) Tel: 39825432
STOCK INFO.BSE Sensex: 16,371
S&P CNX: 4,942
? We estimate net sales of Rs3.1b v/s (Rs2.4b in 1QCY07, and Rs2.7b in 4Q), driven by higher oil prices thoughmoderated by lower overall production. Our expected net profit is Rs1b (v/s Rs376m in 1QCY07 and loss of Rs139min 4Q).
? We expect gross oil and gas production at 70kboepd (v/s 75kboepd in 1Q and 65kboepd in 4QCY07). We estimatethat production at Ravva would return to normal levels post the work on two work-over wells in 4Q; however the gasproduction at Cambay continues to remain lower.
? Cairn’s net working interest production is estimated at 17.5kboepd (down 12% YoY and up 7% QoQ). Averagerealization at US$78/boe (v/s US$42.3 in 1QCY07 and US$71.1/boe in 4QCY07) are expected to increase significantlyby 85% YoY and 10% QoQ, driven by higher oil price.
? We would expect Cairn to report about Rs 240m of forex currency gain (against reported loss of Rs138m in 1Q andRs276m in 4Q) on its balanced forex reserves.
? Cairn has awarded all the major contracts for Rajasthan field development and pipeline is progressing as planned andon schedule. We expect production from Rajasthan block to commence in July 2009 with a peak plateau rate of180kbpd.
? Cairn currently trades at 9.2x CY10E earnings. We maintain Buy.

21028 March 2008
Chennai Petroleum Corporation
YEAR NET SALES PAT EPS EPS P/E P/BV ROE ROCE EV/ EV/END (RS M) (RS M) (RS) GROWTH (%) (X) (X) (%) (%) SALES EBITDA
03/07A 246,533 5,653 37.9 16.1 7.2 1.5 23.0 20.1 0.3 5.2
03/08E 277,176 10,038 67.4 77.6 4.1 1.2 33.4 32.4 0.2 3.3
03/09E 270,935 8,585 57.6 -14.5 4.8 1.0 23.3 25.7 0.2 3.5
03/10E 268,361 7,824 52.5 -8.9 5.2 0.9 18.5 21.9 0.2 3.8
Equity Shares (m) 149.0
52-Week Range 490/173
1,6,12 Rel. Perf. (%) -1/3/28
M.Cap. (Rs b) 40.8
M.Cap. (US$ b) 1.0
QUARTERLY PERFORMANCE (RS MILLION)Y/E MARCH FY07 FY08 FY07 FY08E
1Q 2Q 3Q 4Q 1Q 2Q 3Q 4QENet Sales 64,656 66,527 58,819 56,531 62,966 62,816 72,606 78,787 246,533 277,176
Change (%) 38.7 21.6 7.5 2.9 -2.6 -5.6 23.4 39.4 16.8 12.4Raw Materials (incl Stock Adj) 57,820 62,432 56,095 51,253 55,767 57,210 66,870 73,214 227,600 253,061Employee Costs 245 353 302 607 303 384 290 330 1,506 1,307Other Exp 1,803 1,362 1,204 652 982 934 1,335 1,116 5,020 4,368EBITDA 4,789 2,381 1,218 4,019 5,914 4,288 4,112 4,127 12,407 18,440
% of Sales 7.4 3.6 2.1 7.1 9.4 6.8 5.7 5.2 5.0 6.7% Change 10.8 (39.1) (7.2) 194.3 23.5 80.1 237.5 2.7 13.7 48.6
Depreciation 586 586 586 662 637 616 603 621 2,419 2,477Interest 426 468 412 577 460 561 409 450 1,883 1,880Other Income 69 146 152 338 83 386 421 350 705 1,240PBT 3,845 1,473 373 3,118 4,900 3,497 3,521 3,406 8,809 15,323Tax 1,300 500 129 1,227 1,668 1,194 1,264 1,158 3,156 5,285
Rate (%) 33.8 34.0 34.6 39.4 34.0 34.2 35.9 34.0 35.8 34.5PAT 2,546 973 243 1,891 3,232 2,303 2,256 2,248 5,653 10,038
Change (%) 8.8 -50.5 14.4 434.3 26.9 136.8 826.6 18.9 16.1 77.6E: MOSt Estimates
BuyPrevious Recommendation: Neutral Rs274
28 March 2008BLOOMBERGMRL IN
REUTERS CODECHPC.BO
Results PreviewSECTOR: OIL & GAS
Anil Sharma ([email protected]);Tel: +91 22 39825413/Harshad Borawake ([email protected]) Tel: 39825432
STOCK INFO.BSE Sensex: 16,371
S&P CNX: 4,942
? We expect CPCL’s net profit at Rs2.2b v/s Rs1.9b in 4QFY07 and Rs2.3b in 3QFY08.
? We estimate reported GRM at US$7.4/bbl (v/s US$6.4/bbl in 4QFY07 and US$8.75/pbl in 3QFY08) indicating apremium of US$0.5/bbl to Singapore benchmark GRM of US$6.9/bbl for 4Q.
? We expect CPCL to report premium of ~US$0.5/bbl over the Singapore benchmark until its fuel upgradation projectcomes online (expected in 3QFY10); beyond which we expect premiums to expand further by US$1-1.5/bbl.
? 15% YoY gains in GRM will be moderated by 10% appreciation of rupee.
? We expect refinery throughput at 2.5mmt (v/s 2.67mmt in 4QFY07 and 2.27mmt in 3QFY08), due to ongoingmaintenance work at PYIII fields.
? Post-recent correction in overall markets, CPCL’s valuations have become very attractive. On a PE basis CPCLtrades at 4.8x FY09E and 5.2x FY10E. On EV/EBITDA basis it trades at 3.5x FY09E and 3.8x FY10E. We maintainBuy.

21128 March 2008
GAIL (India)
YEAR NET SALES PAT EPS EPS P/E P/BV ROE ROCE EV/ EV/END (RS M) (RS M) (RS) GROWTH (%) (X) (X) (%) (%) SALES EBITDA
03/07A 160,472 20,468 24.2 -11.4 18.3 3.3 20.9 21.1 2.2 12.0
03/08E 174,483 25,811 30.5 26.1 14.5 2.9 19.9 24.4 2.1 9.9
03/09E 243,721 29,660 35.1 14.9 12.6 2.5 20.1 25.9 1.5 7.9
03/10E 302,966 32,101 38.0 8.2 11.6 2.2 19.3 25.1 1.2 7.2
Equity Shares (m) 845.7
52-Week Range 555/257
1,6,12 Rel. Perf. (%) 12/22/38
M.Cap. (Rs b) 373.9
M.Cap. (US$ b) 9.4
QUARTERLY PERFORMANCE (RS MILLION)Y/E MARCH FY07 FY08 FY07 FY08E
1Q 2Q 3Q 4Q 1Q 2Q 3Q 4QENet Sales 40,784 37,070 43,784 38,834 42,457 45,289 42,983 43,754 160,472 174,483
Change (%) 24.1 2.9 12.0 6.1 4.1 22.2 -1.8 12.7 11.0 8.7Finished Gds Purchase 24,720 22,130 24,072 23,368 23,529 25,398 24,190 24,940 94,290 98,056Raw Materials Cons 4,342 4,224 4,759 4,527 4,314 4,503 4,725 5,119 17,851 18,661Employee Costs 551 907 649 816 688 824 985 867 2,923 3,364Other Exp (incl Stock Adj) 1,755 3,919 5,662 4,099 3,540 5,782 4,360 2,818 15,435 16,499EBITDA 9,416 5,891 8,641 6,024 10,387 8,783 8,723 10,010 29,973 37,903
% of Net Sales 23.1 15.9 19.7 15.5 24.5 19.4 20.3 22.9 18.7 21.7% Change -0.7 -37.0 -5.2 -14.5 10.3 49.1 0.9 66.2 -14.3 26.5
Depreciation 1,408 1,436 1,439 1,471 1,407 1,492 1,387 1,500 5,754 5,786Interest 288 291 271 221 204 201 196 200 1,071 800Other Income 801 1,674 1,846 1,129 913 1,806 1,848 1,864 5,450 6,430PBT 8,521 5,838 8,778 5,461 9,689 8,897 8,989 10,174 28,598 37,748Tax 2,600 1,354 2,124 2,053 2,837 3,171 2,775 3,154 8,130 11,937
Rate (%) 30.5 23.2 24.2 37.6 29.3 35.6 30.9 31.0 28.4 31.6PAT 5,921 4,484 6,655 3,408 6,852 5,725 6,214 7,020 20,468 25,811
Change (%) 22.5 -42.1 3.5 -16.7 15.7 27.7 -6.6 106.0 -11.4 26.1Extraord.: Tax Prov. Write Back 3,399 0 0 0 0 3,399Reported PAT 5,921 4,484 6,655 6,807 6,852 5,725 6,214 7,020 23,867 25,811E: MOSt Estimates
BuyPrevious Recommendation: Buy Rs442
28 March 2008BLOOMBERGGAIL IN
REUTERS CODEGAIL.BO
Results PreviewSECTOR: OIL & GAS
Anil Sharma ([email protected]);Tel: +91 22 39825413/Harshad Borawake ([email protected]) Tel: 39825432
STOCK INFO.BSE Sensex: 16,371
S&P CNX: 4,942
? We expect PAT of Rs7b v/s Rs6.2b in 3QFY08 and adjusted net profit of Rs3.4b in 4QFY07. GAIL’s reported profitof Rs6.8b in 4QFY07 included tax provision writeback of Rs3.4b.
? YoY increase in profits is primarily due to 5% higher transmission and production volumes, ~8% higher petchem andLPG prices and Rs0.5b decline in subsidy burden at Rs4.5b.
? While on a QoQ basis increase in profit is primarily due to 30% higher petchem production at 105kt (v/s 81kt in3QFY08), and 14% higher LPG production. GAIL’s production volumes in 3Q were affected due to a three-weekshutdown as well as lower gas availability. Petchem volumes are also expected to increase post commissioning of100kta expansion in 4QFY08.
? Transmission volumes are expected to decline marginally at 84mmscmd v/s 85.3mmscmd, due to shutdown at MumbaiHigh, though moderated by increased availability of PMT gas to GAIL during the quarter.
? We remain very positive on GAIL, as we expect transmission volumes to increase by ~60% over the next two years.GAIL’s existing and large plans for city gas distribution and E&P will provide added upsides. The stock currentlytrades at 12.6x FY09E earnings. We maintain Buy.
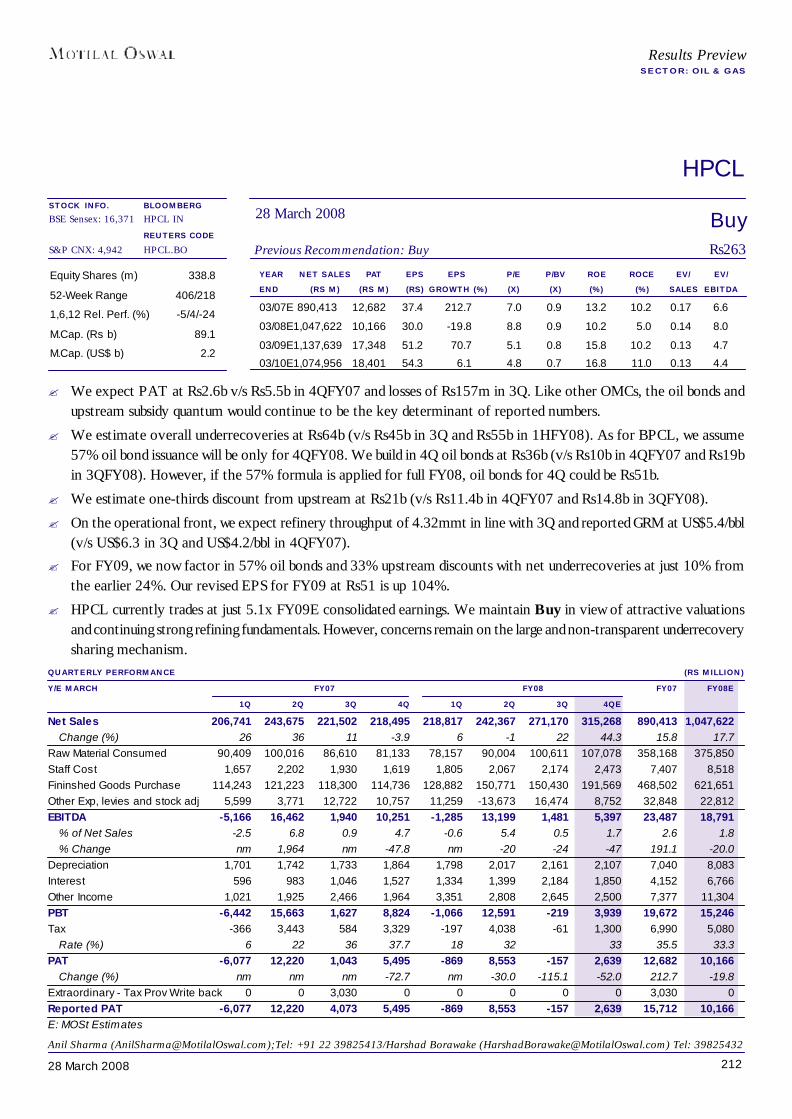
21228 March 2008
HPCL
YEAR NET SALES PAT EPS EPS P/E P/BV ROE ROCE EV/ EV/END (RS M) (RS M) (RS) GROWTH (%) (X) (X) (%) (%) SALES EBITDA
03/07E 890,413 12,682 37.4 212.7 7.0 0.9 13.2 10.2 0.17 6.6
03/08E1,047,622 10,166 30.0 -19.8 8.8 0.9 10.2 5.0 0.14 8.0
03/09E1,137,639 17,348 51.2 70.7 5.1 0.8 15.8 10.2 0.13 4.7
03/10E1,074,956 18,401 54.3 6.1 4.8 0.7 16.8 11.0 0.13 4.4
Equity Shares (m) 338.8
52-Week Range 406/218
1,6,12 Rel. Perf. (%) -5/4/-24
M.Cap. (Rs b) 89.1
M.Cap. (US$ b) 2.2
QUARTERLY PERFORMANCE (RS MILLION)Y/E MARCH FY07 FY08 FY07 FY08E
1Q 2Q 3Q 4Q 1Q 2Q 3Q 4QENet Sales 206,741 243,675 221,502 218,495 218,817 242,367 271,170 315,268 890,413 1,047,622
Change (%) 26 36 11 -3.9 6 -1 22 44.3 15.8 17.7Raw Material Consumed 90,409 100,016 86,610 81,133 78,157 90,004 100,611 107,078 358,168 375,850Staff Cost 1,657 2,202 1,930 1,619 1,805 2,067 2,174 2,473 7,407 8,518Fininshed Goods Purchase 114,243 121,223 118,300 114,736 128,882 150,771 150,430 191,569 468,502 621,651Other Exp, levies and stock adj 5,599 3,771 12,722 10,757 11,259 -13,673 16,474 8,752 32,848 22,812EBITDA -5,166 16,462 1,940 10,251 -1,285 13,199 1,481 5,397 23,487 18,791
% of Net Sales -2.5 6.8 0.9 4.7 -0.6 5.4 0.5 1.7 2.6 1.8% Change nm 1,964 nm -47.8 nm -20 -24 -47 191.1 -20.0
Depreciation 1,701 1,742 1,733 1,864 1,798 2,017 2,161 2,107 7,040 8,083Interest 596 983 1,046 1,527 1,334 1,399 2,184 1,850 4,152 6,766Other Income 1,021 1,925 2,466 1,964 3,351 2,808 2,645 2,500 7,377 11,304PBT -6,442 15,663 1,627 8,824 -1,066 12,591 -219 3,939 19,672 15,246Tax -366 3,443 584 3,329 -197 4,038 -61 1,300 6,990 5,080
Rate (%) 6 22 36 37.7 18 32 33 35.5 33.3PAT -6,077 12,220 1,043 5,495 -869 8,553 -157 2,639 12,682 10,166
Change (%) nm nm nm -72.7 nm -30.0 -115.1 -52.0 212.7 -19.8Extraordinary - Tax Prov Write back 0 0 3,030 0 0 0 0 0 3,030 0Reported PAT -6,077 12,220 4,073 5,495 -869 8,553 -157 2,639 15,712 10,166E: MOSt Estimates
BuyPrevious Recommendation: Buy Rs263
28 March 2008BLOOMBERGHPCL IN
REUTERS CODEHPCL.BO
Results PreviewSECTOR: OIL & GAS
Anil Sharma ([email protected]);Tel: +91 22 39825413/Harshad Borawake ([email protected]) Tel: 39825432
STOCK INFO.BSE Sensex: 16,371
S&P CNX: 4,942
? We expect PAT at Rs2.6b v/s Rs5.5b in 4QFY07 and losses of Rs157m in 3Q. Like other OMCs, the oil bonds andupstream subsidy quantum would continue to be the key determinant of reported numbers.
? We estimate overall underrecoveries at Rs64b (v/s Rs45b in 3Q and Rs55b in 1HFY08). As for BPCL, we assume57% oil bond issuance will be only for 4QFY08. We build in 4Q oil bonds at Rs36b (v/s Rs10b in 4QFY07 and Rs19bin 3QFY08). However, if the 57% formula is applied for full FY08, oil bonds for 4Q could be Rs51b.
? We estimate one-thirds discount from upstream at Rs21b (v/s Rs11.4b in 4QFY07 and Rs14.8b in 3QFY08).
? On the operational front, we expect refinery throughput of 4.32mmt in line with 3Q and reported GRM at US$5.4/bbl(v/s US$6.3 in 3Q and US$4.2/bbl in 4QFY07).
? For FY09, we now factor in 57% oil bonds and 33% upstream discounts with net underrecoveries at just 10% fromthe earlier 24%. Our revised EPS for FY09 at Rs51 is up 104%.
? HPCL currently trades at just 5.1x FY09E consolidated earnings. We maintain Buy in view of attractive valuationsand continuing strong refining fundamentals. However, concerns remain on the large and non-transparent underrecoverysharing mechanism.

21328 March 2008
Indian Oil Corporation
YEAR NET SALES PAT EPS EPS P/E P/BV ROE ROCE EV/ EV/END (RS M) (RS M) (RS) GROWTH (%) (X) (X) (%) (%) SALES EBITDA03/07A1,999,308 59,887 50.2 18.9 9.2 1.5 16.4 12.6 0.4 6.4
03/08E 2,575,058 105,911 88.8 76.9 5.2 1.2 23.1 15.7 0.3 5.0
03/09E 2,502,280 125,481 105.2 18.5 4.4 1.0 21.9 16.8 0.3 4.2
03/10E 2,367,161 127,569 107.0 1.7 4.3 0.8 18.5 15.1 0.3 4.2
Equity Shares (m) 1,192.4
52-Week Range (Rs) 810/355
1,6,12 Rel. Perf. (%) -7/4/-12
M.Cap. (Rs b) 552.7
M.Cap. (US$ b) 13.8
BuyPrevious Recommendation: Buy Rs464
28 March 2008BLOOMBERGIOC IN
REUTERS CODEIOC.BO
*Consolidated
Results PreviewSECTOR: OIL & GAS
Anil Sharma ([email protected]);Tel: +91 22 39825413/Harshad Borawake ([email protected]) Tel: 39825432
STOCK INFO.BSE Sensex: 16,371
S&P CNX: 4,942
QUARTERLY PERFORMANCE (STANDALONE) (RS MILLION)Y/E MARCH FY07 FY08 FY07 FY08E
1Q 2Q 3Q 4Q 1Q 2Q 3Q 4QENet Sales 484,996 578,305 556,472 528,890 528,620 561,487 640,585 702,750 2,148,663 2,433,443
Change (%) 25.5 44.3 25.6 4.4 9.0 -2.9 15.1 32.9 23.7 13.3Raw Material Consumed 200,627 250,034 234,099 200,839 230,738 224,399 262,522 307,055 885,598 1,024,715Staff Cost 5,232 6,548 5,388 9,041 6,838 7,502 6,954 7,330 26,209 28,625Fininshed Goods Purchase 264,627 273,744 263,690 238,226 253,246 269,770 301,254 323,405 1,040,288 1,147,675Other Exp (incl Stock Adj) 27,392 8,994 28,090 31,759 23,611 8,603 40,180 27,839 96,235 100,233EBITDA -12,882 38,985 25,205 49,026 14,187 51,213 29,675 37,120 100,333 132,194
% of Net Sales -2.7 6.7 4.5 9.3 2.7 9.1 4.6 5.3 4.7 5.4% Change -370.2 157.5 1,309.0 -6.0 nm 31.4 17.7 -24.3 35.8 31.8
Depreciation 5,894 6,688 6,597 6,723 6,748 6,765 6,663 6,882 25,903 27,057Interest 3,385 3,760 3,963 3,947 3,374 3,335 3,880 3,600 15,055 14,189Other Income 3,201 6,066 7,910 9,243 16,911 12,783 13,463 12,000 26,419 55,156PBT -18,960 34,602 22,555 47,598 20,975 53,895 32,595 38,638 85,795 146,104Tax 60 5,767 4,641 19,388 6,291 15,718 11,689 11,592 29,855 45,289
Rate (%) -0.3 16.7 20.6 40.7 30.0 29.2 35.9 30.0 34.8 31.0PAT -19,020 28,836 17,914 28,210 14,684 38,178 20,907 27,047 55,940 100,815
Change (%) nm 203.9 nm -21.0 nm 32.4 16.7 -4.1 25.5 80.2Extraordinary Items 32,238 0 0 -13,183 0.0 0.0 0 0.0 19,055 0PAT incl extra-ordinaries 13,218 28,836 17,914 15,027 14,684 38,178 20,907 27,047 74,995 100,815E: MOSt Estimates
? We expect PAT at Rs27b v/s Rs28.2b in 4QFY07 and Rs21b in 3Q. Like other OMCs, the oil bonds and upstreamsubsidy quantum would continue to be the key determinant of reported numbers.
? We estimate overall underrecoveries at Rs166b (v/s Rs121b in 3Q and Rs154b in 1HFY08). Like other OMCs, weassume 57% oil bond issuance will be only for 4QFY08. We build in 4Q oil bonds at Rs95b (v/s Rs42b in 4QFY07 andRs51b in 3QFY08). However, if the 57% formula is applied for full FY08, oil bonds for 4Q could be Rs132b.
? We estimate one-thirds discount from upstream at Rs55b (v/s Rs34b in 4QFY07 and Rs40b in 3QFY08).? On the operational front, we expect refinery throughput of 12.5mmt (up 6% YoY and 4% QoQ) and GRM at US$8.9/
bbl (v/s US$10.4/bbl in 3Q and US$5.7/bbl in 4QFY07).? For FY09, we now factor in 57% oil bonds and 33% upstream discounts with net underrecoveries at just 10% from
earlier 24%. Our revised EPS for FY09 at Rs105 is up 74%.? IOC currently trades at just 4.4x FY09E consolidated earnings. We maintain Buy in view of attractive valuations and
continuing strong refining fundamentals. However, concerns remain on the large and non-transparent underrecoverysharing mechanism.

21428 March 2008
Indraprastha Gas
YEAR NET SALES PAT EPS EPS P/E P/BV ROE ROCE EV/ EV/END (RS M) (RS M) (RS) GROWTH (%) (X) (X) (%) (%) SALES EBITDA03/07E 6,141 1,380 9.9 29.7 13.8 4.1 32.6 44.8 3.0 7.3
03/08E 7,167 1,740 12.4 26.2 10.9 3.3 33.1 46.5 2.5 5.9
03/09E 8,552 1,851 13.2 6.3 10.3 2.7 28.7 41.2 2.0 5.2
03/10E 10,070 1,879 13.4 1.5 10.1 2.3 24.7 35.6 1.6 4.7
Equity Shares (m) 140.0
52-Week Range 183/89
1,6,12 Rel. Perf. (%) -1/10/9
M.Cap. (Rs b) 19.0
M.Cap. (US$ b) 0.5
QUARTERLY PERFORMANCE (RS MILLION)Y/E MARCH FY07 FY08 FY07 FY08E
1Q 2Q 3Q 4Q 1Q 2Q 3Q 4QENet Sales 1,358 1,542 1,599 1,643 1,618 1,741 1,827 1,981 6,141 7,167
Change (%) 19.1 15.0 16.7 21.1 19.1 12.9 14.3 20.6 17.9 16.7Raw Material Consumed 586 675 721 696 693 746 780 846 2,677 3,065Staff Cost 31 36 36 38 36 35 40 41 141 152Other Exp (incl Stock Adj) 199 186 188 198 202 211 227 246 771 884EBITDA 541 645 654 711 687 750 780 848 2,552 3,065
% of Net Sales 39.9 41.9 40.9 43.3 42.5 43.1 42.7 42.8 41.6 42.8% Change 23.8 20.1 12.4 22.5 27.0 16.2 19.4 19.2 19.4 20.1
Depreciation 150 150 150 149 156 158 161 171 598 645Interest 0 0 0 0 0 0 0 0 0 0Other Income 22 23 24 34 40 47 58 45 102 190PBT 413 518 528 596 571 639 678 722 2,056 2,611Tax 137 170 173 196 187 211 227 245 676 870
Rate (%) 33.1 32.9 32.8 32.8 32.8 33.0 33.6 33.9 32.9 33.0PAT 276 348 355 401 384 429 450 477 1,380 1,740
Change (%) 36.5 28.7 21.0 34.6 39.0 23.2 26.9 19.2 29.7 26.2E: MOSt Estimates
Not RatedRs136
28 March 2008BLOOMBERGIGL IN
REUTERS CODEIGAS.BO
Results PreviewSECTOR: OIL & GAS
Anil Sharma ([email protected]);Tel: +91 22 39825413/Harshad Borawake ([email protected]) Tel: 39825432
STOCK INFO.BSE Sensex: 16,371
S&P CNX: 4,942
? We expect reported PAT at Rs477m (v/s Rs401m in 4QFY07 and Rs450m in 3QFY08) driven by volume growth.
? We expect EBITDA margin at 42.8% (similar to 3QFY08) and 43.3% in 4QFY07.
? IGL currently operates 156 CNG stations and the volumes at its current stations continue to grow at 12-13%, led byregulatory as well as discretionary conversion of vehicles to CNG.
? We expect CNG volumes to grow 6% QoQ to 138.6mmscm and PNG volumes to grow by significantly higher rateof 23% to 13.1mmscm.
? Medium term growth for IGL is expected to come from expansion of its network in Delhi region as well as in newareas such as Greater Noida, Ghaziabad, Panipat and Sonipat and from addition of a new bus fleet (~2,000-2,500 newbuses) for the Commonwealth Games.
? IGL is currently trading at 10.3X FY09E. We have no rating on the stock.

21528 March 2008
MRPL
YEAR NET SALES PAT EPS EPS P/E P/BV ROE ROCE EV/ EV/END (RS M) (RS M) (RS) GROWTH (%) (X) (X) (%) (%) SALES EBITDA03/07A 286,331 5,255 3.0 41.4 25.2 4.8 20.4 20.0 0.5 10.3
03/08E 329,295 13,359 7.6 154.2 9.9 3.5 40.8 26.4 0.5 7.1
03/09E 316,669 10,859 6.2 -18.7 12.2 2.9 26.0 18.0 0.5 8.3
03/10E 296,006 9,503 5.4 -12.5 13.9 2.5 19.4 13.0 0.6 9.6
Equity Shares (m) 1,752.6
52-Week Range 149/32
1,6,12 Rel. Perf. (%) -3/9/96
M.Cap. (Rs b) 132.4
M.Cap. (US$ b) 3.3
QUARTERLY PERFORMANCE (RS MILLION)Y/E MARCH FY07 FY08 FY07 FY08E
1Q 2Q 3Q 4Q 1Q 2Q 3Q 4QENet Sales 64,698 80,522 73,133 67,979 74,391 76,404 81,383 97,117 286,331 329,295
Change (%) 16 30 8 6.4 15 -5 11 43 14.7 15.0Raw Material Cons. (incl. inv chg) 57,412 77,504 68,785 59,388 66,664 70,467 73,777 89,344 263,089 300,252Staff Cost 126 148 131 143 143 354 253 220 548 970Other Expenditure 2,055 1,453 1,480 2,610 1,400 1,084 1,872 2,138 7,598 6,494EBITDA 5,104 1,417 2,737 5,839 6,186 4,499 5,480 5,415 15,097 21,579
% of Net Sales 7.9 1.8 3.7 8.6 8.3 5.9 6.7 5.6 5.3 6.6% Change 12 -64 72 1,140.7 21 217 100 -7 42.6 42.9
Depreciation 854 872 888 934 938 947 948 982 3,549 3,814Interest 579 588 511 468 398 358 362 361 2,145 1,478Other Income 83 182 841 380 1,333 386 308 300 1,487 2,327PBT 3,755 139 2,179 4,817 6,183 3,580 4,479 4,372 10,889 18,614Tax 1,596 46 994 2,998 2,498 785 1,534 1,482 5,634 6,300MAT Credit entitlement adjusted 0 -523 -522 0 -1,044
Rate (%) 43 33 46 62.2 40 7 23 34 51.7 28.2PAT 2,159 93 1,185 1,819 3,686 3,317 3,466 2,890 5,255 13,359
Change (%) 0 -94 512 nm 70.7 3,470.9 192.6 58.9 41.4 154.2Adj. PAT 2,159 93 1,185 1,819 3,686 2,795 2,944 2,890 5,255 12,315E: MOSt Estimates
SellPrevious Recommendation: Sell Rs76
28 March 2008BLOOMBERGMRPL IN
REUTERS CODEMRPL.BO
Results PreviewSECTOR: OIL & GAS
Anil Sharma ([email protected]);Tel: +91 22 39825413/Harshad Borawake ([email protected]) Tel: 39825432
STOCK INFO.BSE Sensex: 16,371
S&P CNX: 4,942
? We expect reported EBITDA at Rs5.4b (Rs5.8b in 4QFY07 and Rs5.5b in 3QFY08) down 7% YoY and 1% QoQ.
? Reported PAT estimate at Rs2.9b (Rs1.8b in 4QFY07) is up 59% YoY and down 2% QoQ.
? Though we expect lower EBITDA on a YoY basis, we estimate MRPL to report higher net profit at Rs2.9b v/sRs1.8b in 4QFY07, primarily because MRPL had paid higher tax in 4QFY07. (effective tax rate of 62% in 4QFY07)
? Unlike last two quarters we do not expect any MAT credit reversal in this quarter as we understand MRPL hasexhausted all its available MAT credit of ~Rs1b.
? On the operational front we expect throughput to remain flat on a YoY basis at 3.22mmt. We expect reported GRMat US$7.4/bbl (v/s US$6.8 for 4QFY07 and US$7.7/bbl for 3QFY08).
? MRPL trades at PE of 12.2x and EV/EBITDA of 8.3x on FY09E. Despite recent large correction and continuedstrong refining fundamentals we believe MRPL’s valuations continue to remain stretched compared with peers. Wemaintain Sell.
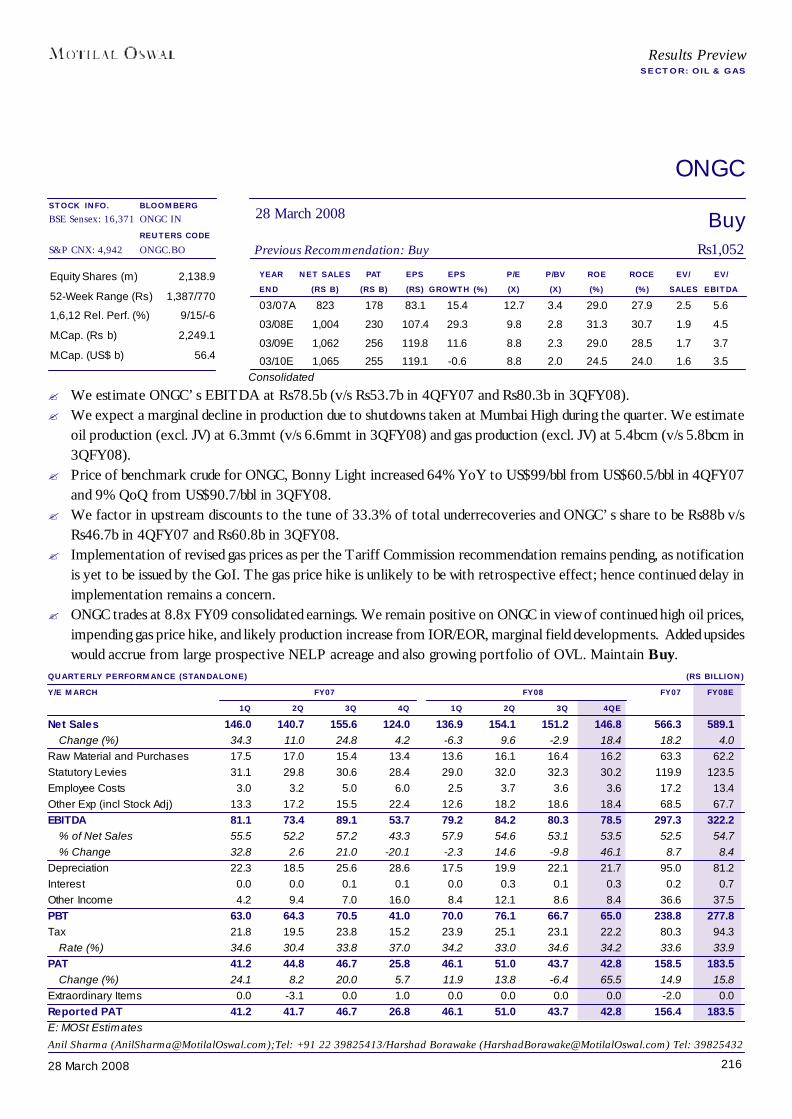
21628 March 2008
ONGC
YEAR NET SALES PAT EPS EPS P/E P/BV ROE ROCE EV/ EV/END (RS B) (RS B) (RS) GROWTH (%) (X) (X) (%) (%) SALES EBITDA03/07A 823 178 83.1 15.4 12.7 3.4 29.0 27.9 2.5 5.6
03/08E 1,004 230 107.4 29.3 9.8 2.8 31.3 30.7 1.9 4.5
03/09E 1,062 256 119.8 11.6 8.8 2.3 29.0 28.5 1.7 3.7
03/10E 1,065 255 119.1 -0.6 8.8 2.0 24.5 24.0 1.6 3.5
Equity Shares (m) 2,138.9
52-Week Range (Rs) 1,387/770
1,6,12 Rel. Perf. (%) 9/15/-6
M.Cap. (Rs b) 2,249.1
M.Cap. (US$ b) 56.4
QUARTERLY PERFORMANCE (STANDALONE) (RS BILLION)Y/E MARCH FY07 FY08 FY07 FY08E
1Q 2Q 3Q 4Q 1Q 2Q 3Q 4QENet Sales 146.0 140.7 155.6 124.0 136.9 154.1 151.2 146.8 566.3 589.1
Change (%) 34.3 11.0 24.8 4.2 -6.3 9.6 -2.9 18.4 18.2 4.0Raw Material and Purchases 17.5 17.0 15.4 13.4 13.6 16.1 16.4 16.2 63.3 62.2Statutory Levies 31.1 29.8 30.6 28.4 29.0 32.0 32.3 30.2 119.9 123.5Employee Costs 3.0 3.2 5.0 6.0 2.5 3.7 3.6 3.6 17.2 13.4Other Exp (incl Stock Adj) 13.3 17.2 15.5 22.4 12.6 18.2 18.6 18.4 68.5 67.7EBITDA 81.1 73.4 89.1 53.7 79.2 84.2 80.3 78.5 297.3 322.2
% of Net Sales 55.5 52.2 57.2 43.3 57.9 54.6 53.1 53.5 52.5 54.7% Change 32.8 2.6 21.0 -20.1 -2.3 14.6 -9.8 46.1 8.7 8.4
Depreciation 22.3 18.5 25.6 28.6 17.5 19.9 22.1 21.7 95.0 81.2Interest 0.0 0.0 0.1 0.1 0.0 0.3 0.1 0.3 0.2 0.7Other Income 4.2 9.4 7.0 16.0 8.4 12.1 8.6 8.4 36.6 37.5PBT 63.0 64.3 70.5 41.0 70.0 76.1 66.7 65.0 238.8 277.8Tax 21.8 19.5 23.8 15.2 23.9 25.1 23.1 22.2 80.3 94.3
Rate (%) 34.6 30.4 33.8 37.0 34.2 33.0 34.6 34.2 33.6 33.9PAT 41.2 44.8 46.7 25.8 46.1 51.0 43.7 42.8 158.5 183.5
Change (%) 24.1 8.2 20.0 5.7 11.9 13.8 -6.4 65.5 14.9 15.8Extraordinary Items 0.0 -3.1 0.0 1.0 0.0 0.0 0.0 0.0 -2.0 0.0Reported PAT 41.2 41.7 46.7 26.8 46.1 51.0 43.7 42.8 156.4 183.5E: MOSt Estimates
BuyPrevious Recommendation: Buy Rs1,052
28 March 2008BLOOMBERGONGC IN
REUTERS CODEONGC.BO
Consolidated
Results PreviewSECTOR: OIL & GAS
Anil Sharma ([email protected]);Tel: +91 22 39825413/Harshad Borawake ([email protected]) Tel: 39825432
STOCK INFO.BSE Sensex: 16,371
S&P CNX: 4,942
? We estimate ONGC’s EBITDA at Rs78.5b (v/s Rs53.7b in 4QFY07 and Rs80.3b in 3QFY08).? We expect a marginal decline in production due to shutdowns taken at Mumbai High during the quarter. We estimate
oil production (excl. JV) at 6.3mmt (v/s 6.6mmt in 3QFY08) and gas production (excl. JV) at 5.4bcm (v/s 5.8bcm in3QFY08).
? Price of benchmark crude for ONGC, Bonny Light increased 64% YoY to US$99/bbl from US$60.5/bbl in 4QFY07and 9% QoQ from US$90.7/bbl in 3QFY08.
? We factor in upstream discounts to the tune of 33.3% of total underrecoveries and ONGC’s share to be Rs88b v/sRs46.7b in 4QFY07 and Rs60.8b in 3QFY08.
? Implementation of revised gas prices as per the Tariff Commission recommendation remains pending, as notificationis yet to be issued by the GoI. The gas price hike is unlikely to be with retrospective effect; hence continued delay inimplementation remains a concern.
? ONGC trades at 8.8x FY09 consolidated earnings. We remain positive on ONGC in view of continued high oil prices,impending gas price hike, and likely production increase from IOR/EOR, marginal field developments. Added upsideswould accrue from large prospective NELP acreage and also growing portfolio of OVL. Maintain Buy.
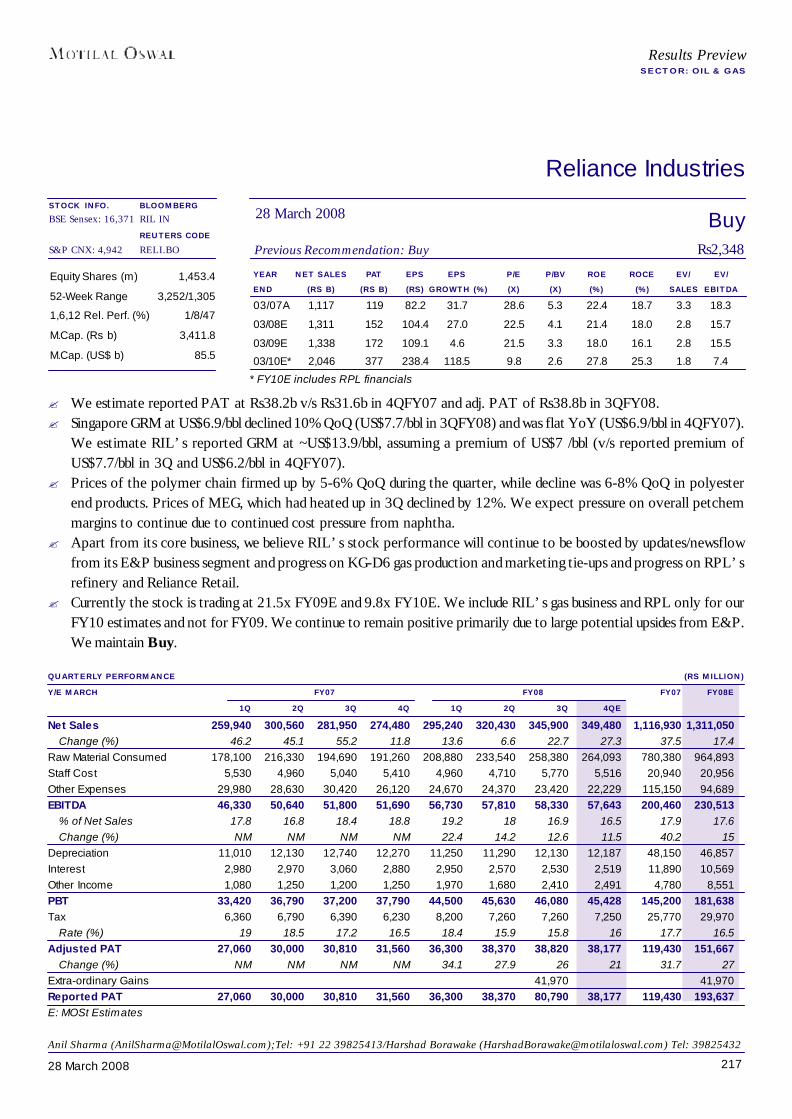
21728 March 2008
Results PreviewSECTOR: OIL & GAS
Reliance Industries
YEAR NET SALES PAT EPS EPS P/E P/BV ROE ROCE EV/ EV/END (RS B) (RS B) (RS) GROWTH (%) (X) (X) (%) (%) SALES EBITDA03/07A 1,117 119 82.2 31.7 28.6 5.3 22.4 18.7 3.3 18.3
03/08E 1,311 152 104.4 27.0 22.5 4.1 21.4 18.0 2.8 15.7
03/09E 1,338 172 109.1 4.6 21.5 3.3 18.0 16.1 2.8 15.5
03/10E* 2,046 377 238.4 118.5 9.8 2.6 27.8 25.3 1.8 7.4
Equity Shares (m) 1,453.4
52-Week Range 3,252/1,305
1,6,12 Rel. Perf. (%) 1/8/47
M.Cap. (Rs b) 3,411.8
M.Cap. (US$ b) 85.5
QUARTERLY PERFORMANCE (RS MILLION)Y/E MARCH FY07 FY08 FY07 FY08E
1Q 2Q 3Q 4Q 1Q 2Q 3Q 4QENet Sales 259,940 300,560 281,950 274,480 295,240 320,430 345,900 349,480 1,116,930 1,311,050
Change (%) 46.2 45.1 55.2 11.8 13.6 6.6 22.7 27.3 37.5 17.4Raw Material Consumed 178,100 216,330 194,690 191,260 208,880 233,540 258,380 264,093 780,380 964,893Staff Cost 5,530 4,960 5,040 5,410 4,960 4,710 5,770 5,516 20,940 20,956Other Expenses 29,980 28,630 30,420 26,120 24,670 24,370 23,420 22,229 115,150 94,689EBITDA 46,330 50,640 51,800 51,690 56,730 57,810 58,330 57,643 200,460 230,513
% of Net Sales 17.8 16.8 18.4 18.8 19.2 18 16.9 16.5 17.9 17.6Change (%) NM NM NM NM 22.4 14.2 12.6 11.5 40.2 15
Depreciation 11,010 12,130 12,740 12,270 11,250 11,290 12,130 12,187 48,150 46,857Interest 2,980 2,970 3,060 2,880 2,950 2,570 2,530 2,519 11,890 10,569Other Income 1,080 1,250 1,200 1,250 1,970 1,680 2,410 2,491 4,780 8,551PBT 33,420 36,790 37,200 37,790 44,500 45,630 46,080 45,428 145,200 181,638Tax 6,360 6,790 6,390 6,230 8,200 7,260 7,260 7,250 25,770 29,970
Rate (%) 19 18.5 17.2 16.5 18.4 15.9 15.8 16 17.7 16.5Adjusted PAT 27,060 30,000 30,810 31,560 36,300 38,370 38,820 38,177 119,430 151,667
Change (%) NM NM NM NM 34.1 27.9 26 21 31.7 27Extra-ordinary Gains 41,970 41,970Reported PAT 27,060 30,000 30,810 31,560 36,300 38,370 80,790 38,177 119,430 193,637E: MOSt Estimates
BuyPrevious Recommendation: Buy Rs2,348
28 March 2008BLOOMBERGRIL IN
REUTERS CODERELI.BO
Anil Sharma ([email protected]);Tel: +91 22 39825413/Harshad Borawake ([email protected]) Tel: 39825432
* FY10E includes RPL financials
STOCK INFO.BSE Sensex: 16,371
S&P CNX: 4,942
? We estimate reported PAT at Rs38.2b v/s Rs31.6b in 4QFY07 and adj. PAT of Rs38.8b in 3QFY08.? Singapore GRM at US$6.9/bbl declined 10% QoQ (US$7.7/bbl in 3QFY08) and was flat YoY (US$6.9/bbl in 4QFY07).
We estimate RIL’s reported GRM at ~US$13.9/bbl, assuming a premium of US$7 /bbl (v/s reported premium ofUS$7.7/bbl in 3Q and US$6.2/bbl in 4QFY07).
? Prices of the polymer chain firmed up by 5-6% QoQ during the quarter, while decline was 6-8% QoQ in polyesterend products. Prices of MEG, which had heated up in 3Q declined by 12%. We expect pressure on overall petchemmargins to continue due to continued cost pressure from naphtha.
? Apart from its core business, we believe RIL’s stock performance will continue to be boosted by updates/newsflowfrom its E&P business segment and progress on KG-D6 gas production and marketing tie-ups and progress on RPL’srefinery and Reliance Retail.
? Currently the stock is trading at 21.5x FY09E and 9.8x FY10E. We include RIL’s gas business and RPL only for ourFY10 estimates and not for FY09. We continue to remain positive primarily due to large potential upsides from E&P.We maintain Buy.
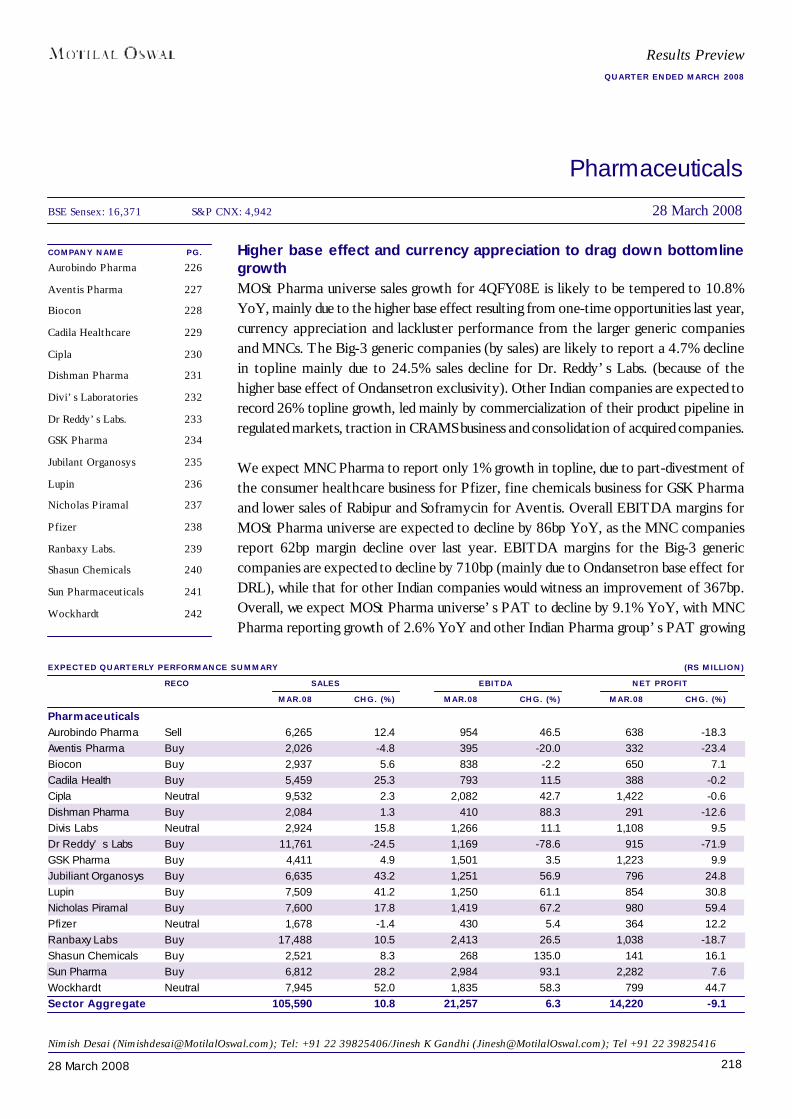
21828 March 2008
Pharmaceuticals
COMPANY NAME PG.Aurobindo Pharma 226
Aventis Pharma 227
Biocon 228
Cadila Healthcare 229
Cipla 230
Dishman Pharma 231
Divi’s Laboratories 232
Dr Reddy’s Labs. 233
GSK Pharma 234
Jubilant Organosys 235
Lupin 236
Nicholas Piramal 237
Pfizer 238
Ranbaxy Labs. 239
Shasun Chemicals 240
Sun Pharmaceuticals 241
Wockhardt 242
EXPECTED QUARTERLY PERFORMANCE SUMMARY (RS MILLION)RECO SALES EBITDA NET PROFIT
MAR.08 CHG. (%) MAR.08 CHG. (%) MAR.08 CHG. (%)PharmaceuticalsAurobindo Pharma Sell 6,265 12.4 954 46.5 638 -18.3Aventis Pharma Buy 2,026 -4.8 395 -20.0 332 -23.4Biocon Buy 2,937 5.6 838 -2.2 650 7.1Cadila Health Buy 5,459 25.3 793 11.5 388 -0.2Cipla Neutral 9,532 2.3 2,082 42.7 1,422 -0.6Dishman Pharma Buy 2,084 1.3 410 88.3 291 -12.6Divis Labs Neutral 2,924 15.8 1,266 11.1 1,108 9.5Dr Reddy’ s Labs Buy 11,761 -24.5 1,169 -78.6 915 -71.9GSK Pharma Buy 4,411 4.9 1,501 3.5 1,223 9.9Jubiliant Organosys Buy 6,635 43.2 1,251 56.9 796 24.8Lupin Buy 7,509 41.2 1,250 61.1 854 30.8Nicholas Piramal Buy 7,600 17.8 1,419 67.2 980 59.4Pfizer Neutral 1,678 -1.4 430 5.4 364 12.2Ranbaxy Labs Buy 17,488 10.5 2,413 26.5 1,038 -18.7Shasun Chemicals Buy 2,521 8.3 268 135.0 141 16.1Sun Pharma Buy 6,812 28.2 2,984 93.1 2,282 7.6Wockhardt Neutral 7,945 52.0 1,835 58.3 799 44.7Sector Aggregate 105,590 10.8 21,257 6.3 14,220 -9.1
Higher base effect and currency appreciation to drag down bottomlinegrowthMOSt Pharma universe sales growth for 4QFY08E is likely to be tempered to 10.8%YoY, mainly due to the higher base effect resulting from one-time opportunities last year,currency appreciation and lackluster performance from the larger generic companiesand MNCs. The Big-3 generic companies (by sales) are likely to report a 4.7% declinein topline mainly due to 24.5% sales decline for Dr. Reddy’s Labs. (because of thehigher base effect of Ondansetron exclusivity). Other Indian companies are expected torecord 26% topline growth, led mainly by commercialization of their product pipeline inregulated markets, traction in CRAMS business and consolidation of acquired companies.
We expect MNC Pharma to report only 1% growth in topline, due to part-divestment ofthe consumer healthcare business for Pfizer, fine chemicals business for GSK Pharmaand lower sales of Rabipur and Soframycin for Aventis. Overall EBITDA margins forMOSt Pharma universe are expected to decline by 86bp YoY, as the MNC companiesreport 62bp margin decline over last year. EBITDA margins for the Big-3 genericcompanies are expected to decline by 710bp (mainly due to Ondansetron base effect forDRL), while that for other Indian companies would witness an improvement of 367bp.Overall, we expect MOSt Pharma universe’s PAT to decline by 9.1% YoY, with MNCPharma reporting growth of 2.6% YoY and other Indian Pharma group’s PAT growing
Nimish Desai ([email protected]); Tel: +91 22 39825406/Jinesh K Gandhi ([email protected]); Tel +91 22 39825416
BSE Sensex: 16,371 S&P CNX: 4,942 28 March 2008
Results PreviewQUARTER ENDED MARCH 2008
21928 March 2008
by 14.1%. The Big-3 generic companies are expected to record 43% PAT de-growthmainly due to a 72% decline in PAT for DRL and a 18.7% decline for Ranbaxy (due tolower forex gains). PAT for Sun Pharma will be partly boosted due to shared exclusivityfor Oxcarbazepine while that for NPIL will be boosted by savings on NCE research.Topline performance of MNCs is likely to be impacted by company-specific factors —divestment of fine chemicals business for GSK and part-divestment of consumer healthcarebusiness for Pfizer.
Patent expiries to drive generics growth in regulated marketsWe expect US$45b-US$50b worth of products to go off-patent in the US alone by 2010.At an average of 97% price discount, this is likely to result in a potential market worthUS$1.5b for generics players over the next three years. Western Europe will witnesspatent expiries worth about US$6b in the same period. Many countries (for e.g. Japan)are likely to encourage generics to reduce their healthcare costs. All this will ensure thatgeneric volumes continue to expand further.
US generic prices already at 97-99% discount, further declines insignificantPrices for patent-expired products in the US are already at 97-99% discount to theinnovator’s price. While we do not expect any significant improvement in the competitivelandscape in the short-to-medium term, we believe that further price declines may not bevery significant. Price deflation commenced in CY04 and we are already into the fourthyear of successive price decline.
Low penetration to drive double-digit growth in many European marketsWe believe that the generic penetration in several European markets is extremely low.Barring Germany and the UK, generic penetration in most of the regulated markets inEurope (France, Spain, Italy, Belgium) is in single digits. Japan, the second largestpharmaceutical market, also has a generic penetration of merely 5%. This implies that asmore drugs go off-patent in these markets and as respective governments enact favorablelegislation, generic penetration in these markets is likely to improve significantly. The largerIndian generic players have already entered these markets (either via the inorganic routeor via partnerships), which should augur well for these companies in the long term.
RoW markets offer an attractive opportunity with higher marginsThe size of the semi-regulated markets is expected to increase from US$40b in 2005 toUS$50b-US$60b by 2009. The opportunity spans more than 150 markets through LatinAmerica, Asia, Eastern Europe and Australia. The current market share of Indian companiesis merely about 6%, implying that there is substantial room for growth. Secondly, most ofthese markets are branded generic markets, thus, resulting in better margins comparedwith the US generic market (GPM of about 60-70% compared with about 40-50% for theUS). Indian generic companies have already established a reasonable presence in someof these markets (like Russia, Latam) while they are in the process of strengthening theirpresence in some of the other markets (like China, Australia, New Zealand).
Pharmaceuticals
22028 March 2008
Pharmaceuticals
Cost structures are being re-aligned/de-riskedTo counter the pricing pressure in regulated markets, Indian generic companies haveembarked on a cost control cum de-risking drive. Costs are being reduced by focusing onconducting in-house bioequivalence studies; controlling SG&A costs and adopting apragmatic approach towards patent challenges (leading to out-of-court settlements thuscapping litigation costs and leading to confirmed upsides from the patent challenges).Ranbaxy is a typical example of this approach. Dr. Reddy’s Labs has de-risked its fixedcosts by resorting to external funding and partnering with private equity investors. SunPharma and Nicholas Piramal have de-merged their NCE/NDDS research. Ranbaxy hasalso proposed a de-risking of its NCE research through a de-merger of its research unit.
Consolidation to gain further steam ahead, risks of extended payback remainIntense price competition in the traditional generic market of the US and UK has forcedmost generic players to expand geographically and also focus on backward integration.This has led to a big consolidation wave in the global generic industry with large playerssuch as Teva and Sandoz successfully polarizing the market in their favor (via big ticketacquisitions). While acquisitions are imperative to gain scale, we believe that currentvaluations for generic assets are extremely demanding implying that inorganic growth forIndian players is likely to come at the cost of extended paybacks of about 8-10 years.
Which generic models will succeed?In our opinion, the winning business model will include a combination of:1. Vertical integration2. Low cost of manufacture3. Geographically diversified presence4. Wide product basket with pragmatic mix of FTF/niche and normal products5. Strong balance sheet
The table below indicates the status of Indian players vis-à-vis each of the above parameters:PARAMETER PRE-REQUISITE STATUS OF INDIAN PLAYERSVertical Integration Complete integration from Most Indian players are vertically
manufacturing of inter- integratedmediates to formulations
Manufacturing locations Access to low-cost Most Indian players have a strongmanufacturing base like India manufacturing base in India
Geographical Diversification Right mix of regulated and Ranbaxy & Cipla have a fairlysemi-regulated markets diversified geographical portfolio
Product Basket Wide product basket The top four generic Indian playersincluding various dosage have large product baskets. Otherforms with some niche Indian companies in the process ofproducts & FTFs widening their portfolios
Financial Health Strong balance sheet to Amongst the leading players only Sunmanage litigation risks, Pharma has the balance sheet strengthacquisitions etc. to fund large acquisitions without
significantly diluting equity capitalSource: Motilal Oswal Securities
22128 March 2008
US pricing pressure, costly acquisitions – already discounted in currentvaluationsWhile valuations for Ranbaxy and Dr Reddy’s reflect extreme pessimism led by intensegenerics, pricing pressure and expensive acquisitions made by these companies, that forSun Pharma reflect the consistency of performance over the past seven years and theconservative stance of its management.
Sensitivity to US revenues likely to reduce in future for Ranbaxy and DRLWe believe that markets are currently discounting the 97-99% price erosion in the USgeneric markets despite the fact that the sensitivity to US generic revenues is likely todecline (particularly for Ranbaxy and DRL) in the coming years as initiatives in othermarkets (which enjoy better margins) start contributing to revenues and profits.
Outsourcing opportunity gaining tractionMore MNCs are visiting India for CRAMS tie-ups. We believe that India offers a uniquecombination of skilled labor (at low costs), international regulatory compliance, IPRprotection, presence across CRAMS value chain and good quality. Most of the CRAMSplayers are expecting a ramp-up in their contract manufacturing revenues.
Large pharmaceutical companies like Pfizer, Merck (USA), AstraZeneca etc., haveundertaken a restructuring of their manufacturing operations and are likely to focus onoutsourcing to reduce costs. We believe that India could be a significant beneficiary of theincreased outsourcing.
Indian CRAMS players are also looking at acquisitionsMost of the Indian CRAMS players are looking at acquisitions to acquire more customerrelationships and contracts as well as get access to critical technologies. Nicholas Piramalhas already announced two acquisitions (Avecia and Pfizer’s UK unit at Morpeth) whileShasun has acquired Rhodia’s custom manufacturing unit in the UK. Dishman Pharmahas acquired Carbogen-AMCIS in Switzerland while Jubilant Organosys has acquiredHollister in the US.
Most of the acquired companies were divested by their existing owners (mostly largepharmaceutical/chemicals companies) as a part of their strategy of divesting non-coreassets. It is pertinent to note that most of these companies had invested significant resourcessome years ago to establish their presence in the CRAMS space. Failure/withdrawal ofsome large molecules, intense generic competition and low R&D productivity (at thecustomer’s end) has adversely impacted most CRAMS players in Europe and USA overthe past three years. This coupled with high fixed costs forced the owners to divest theseassets, which have been purchased by Indian CRAMS players at very reasonable valuations(0.5-1x sales).
Pharmaceuticals

22228 March 2008
Topline growth is imperative for turnaround of acquired CRAMS companiesAlthough, Indian CRAMS players have acquired these assets at very reasonable valuations(0.5-1x sales), high fixed costs mandate that a turnaround is not feasible without toplinegrowth. It is also important to note that most of these CRAMS assets were divested postrestructuring (by their existing owners) implying that; there may not be very significantroom to cut costs further. Hence the challenge for Indian companies which acquire suchplayers, will be to grow the topline by getting more manufacturing contracts.
Significant appreciation of the INR could have an adverse impactThe INR has appreciated significantly against the US$ since March 2007. Being an export-oriented business model, currency appreciation is likely to have an adverse impact on thegeneric and the CRAMS players. We believe that the current valuations of these playershave already discounted this significant currency appreciation. It has also been factoredinto our earnings estimates for these companies. Our estimates also take into account afurther gradual appreciation of the INR v/s the US$ for the next three years. However,any significant appreciation will have an adverse impact on operational performance ofsome of these companies with high net exposure to the US$. These include Ranbaxy,Shasun, Dishman Pharma, Aurobindo and Cipla. Sun Pharma, Cadila Healthcare, MNCPharma, and Nicholas Piramal will not be significantly impacted as they have lower netexposure to the US$. However, if the INR were to appreciate against the Euro and theGBP, it will impact companies like Nicholas Piramal, Shasun and Wockhardt due to theirexposure to the European markets. We note that the INR has, in fact, depreciated againstthe US$ in the past few weeks.
New Pharma Policy: Uncertainty continuesThe outlook on the New Pharmaceutical Policy continues to be uncertain as the governmentis yet to announce the final policy. We believe that there are still differences between thegovernment and the pharmaceutical industry which need to be worked out. Major differencesconcern the span and extent of price control on pharmaceutical products. Media reportssuggest that the government is not fully satisfied with the price cuts implemented by thepharmaceutical industry in the generic-generics segment.
The new policy proposes to significantly increase the span of control by bringing in additional354 drugs under price control. This could severely impact profitability of the domesticformulations business. Industry has taken strong objection to the proposed policy and webelieve that the policy is unlikely to be implemented in the current form. Given strongopposition from industry, the government has formed a Group of Ministers (GoM), whichwould give final recommendations to the government regarding the new pharmaceuticalpolicy. However, the uncertainty related to this will remain until the government finallynotifies the new pharmaceutical policy.
Pharmaceuticals
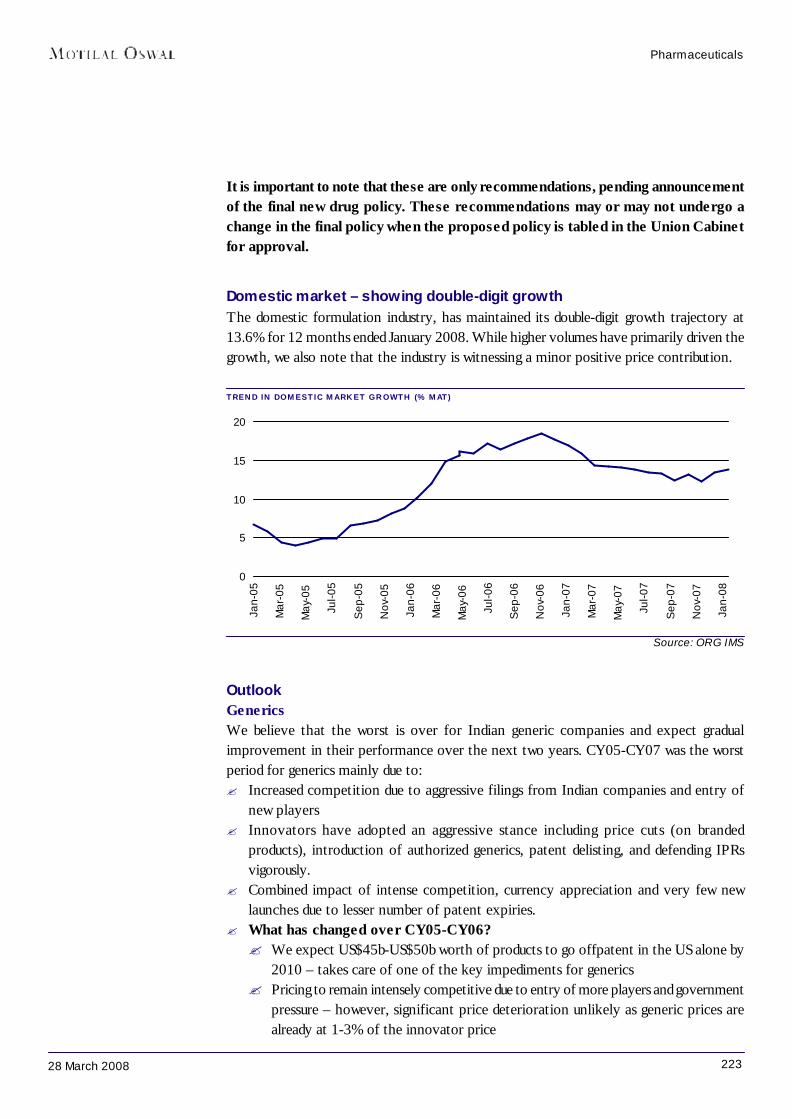
22328 March 2008
It is important to note that these are only recommendations, pending announcementof the final new drug policy. These recommendations may or may not undergo achange in the final policy when the proposed policy is tabled in the Union Cabinetfor approval.
Domestic market – showing double-digit growthThe domestic formulation industry, has maintained its double-digit growth trajectory at13.6% for 12 months ended January 2008. While higher volumes have primarily driven thegrowth, we also note that the industry is witnessing a minor positive price contribution.
TREND IN DOMESTIC MARKET GROWTH (% MAT)
Pharmaceuticals
Source: ORG IMS
OutlookGenericsWe believe that the worst is over for Indian generic companies and expect gradualimprovement in their performance over the next two years. CY05-CY07 was the worstperiod for generics mainly due to:? Increased competition due to aggressive filings from Indian companies and entry of
new players? Innovators have adopted an aggressive stance including price cuts (on branded
products), introduction of authorized generics, patent delisting, and defending IPRsvigorously.
? Combined impact of intense competition, currency appreciation and very few newlaunches due to lesser number of patent expiries.
? What has changed over CY05-CY06?? We expect US$45b-US$50b worth of products to go offpatent in the US alone by
2010 – takes care of one of the key impediments for generics? Pricing to remain intensely competitive due to entry of more players and government
pressure – however, significant price deterioration unlikely as generic prices arealready at 1-3% of the innovator price
0
5
10
15
20
Jan-
05
Mar
-05
May
-05
Jul-0
5
Sep
-05
Nov
-05
Jan-
06
Mar
-06
May
-06
Jul-0
6
Sep
-06
Nov
-06
Jan-
07
Mar
-07
May
-07
Jul-0
7
Sep
-07
Nov
-07
Jan-
08

22428 March 2008
? Expect more consolidation as generics gain scale and expand geographical reach? Indian generic companies have initiated cost-cutting measures (including R&D
hive-off)? Generics and innovators adopting a more pragmatic stance on patent litigations
leading to settlements and resulting in monetization of the Para-IV pipeline forsome of these companies (especially Ranbaxy, Sun Pharma and DRL).
? Governments worldwide trying to reduce healthcare costs – expect regulation toremain favorable
Our top picks in the generic space are Ranbaxy, Sun Pharma and Lupin.
MNC PharmaWe remain favorably inclined towards MNC Pharma stocks in the long term. In our view,the current risk-reward equation is stacked in favor of MNC stocks. Leading PharmaMNCs are geared to gain from the opportunities arising in the stronger patent regime post2005. We remain bullish on the long-term prospects of these companies. The potentialupside from product patents would create ‘option value’ in these stocks over the longerterm. It should be noted that some of the patented products may be launched by the parentthrough the 100% subsidiary route. However, we believe that most of the mass-marketproducts (which need a large field force for promotion) are likely to be launched throughthe listed entities. GSK Pharma remains our top pick amongst the MNCs.
CRAMSWe also believe that the Indian contract-manufacturing segment will see strong double-digit secular growth (given India’s advantages) with the financial impact visible from FY09onwards. Piramal Healthcare remains our top pick amongst the CRAMS players.
Pharmaceuticals
TREND IN GROWTH / PROFITABILITY OF DIFFERENT SEGMENTS OF THE INDUSTRY (JANUARY-MARCH QUARTER)INQUIRE PHARMA UNIVERSE YOY GROWTH (%) EBITDA MARGIN (%) NET PROFIT MARGIN (%)AGGREGATES SALES EBITDA ADJ PAT MAR-08 MAR-07 CHG (BPS) MAR-08 MAR-07 CHG (BPS)MNC Pharma (Aventis, GSK Pharma, Pfizer) 1.0 -1.1 2.6 28.7 29.3 -62 23.6 23.3 36Indian Big-3 (Cipla, DRL, Ranbaxy) ** -4.7 -35.9 -43.4 14.6 21.7 -710 8.7 14.6 -594Other Indian Pharma 26.0 50.5 14.1 22.6 18.9 367 15.2 16.8 -159Sector Aggregate 10.8 6.3 -9.1 20.1 21.0 -86 13.5 16.4 -295** Ranked according to revenues Source: Motilal Oswal Securities
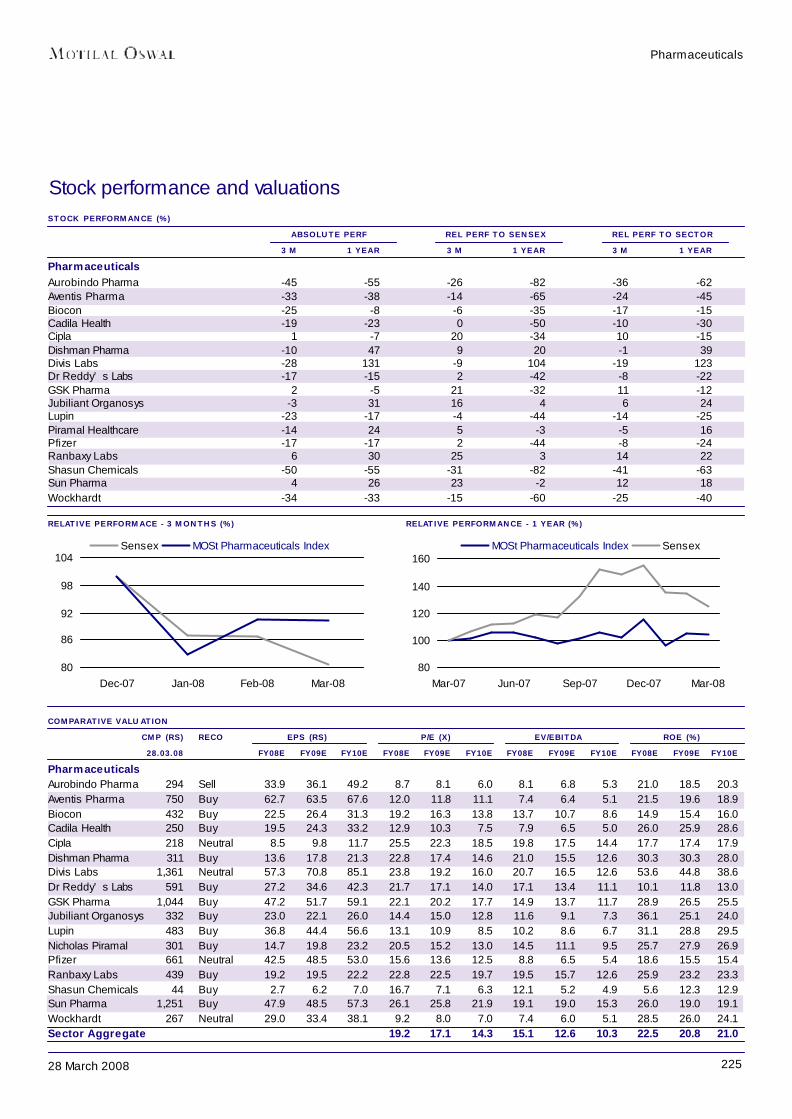
22528 March 2008
RELATIVE PERFORMACE - 3 MONTHS (%) RELATIVE PERFORMANCE - 1 YEAR (%)
Stock performance and valuationsSTOCK PERFORMANCE (%)
ABSOLUTE PERF REL PERF TO SENSEX REL PERF TO SECTOR 3 M 1 YEAR 3 M 1 YEAR 3 M 1 YEAR
PharmaceuticalsAurobindo Pharma -45 -55 -26 -82 -36 -62Aventis Pharma -33 -38 -14 -65 -24 -45Biocon -25 -8 -6 -35 -17 -15Cadila Health -19 -23 0 -50 -10 -30Cipla 1 -7 20 -34 10 -15Dishman Pharma -10 47 9 20 -1 39Divis Labs -28 131 -9 104 -19 123Dr Reddy’ s Labs -17 -15 2 -42 -8 -22GSK Pharma 2 -5 21 -32 11 -12Jubiliant Organosys -3 31 16 4 6 24Lupin -23 -17 -4 -44 -14 -25Piramal Healthcare -14 24 5 -3 -5 16Pfizer -17 -17 2 -44 -8 -24Ranbaxy Labs 6 30 25 3 14 22Shasun Chemicals -50 -55 -31 -82 -41 -63Sun Pharma 4 26 23 -2 12 18Wockhardt -34 -33 -15 -60 -25 -40
Pharmaceuticals
COMPARATIVE VALUATIONCMP (RS) RECO EPS (RS) P/E (X) EV/EBITDA ROE (%)28.03.08 FY08E FY09E FY10E FY08E FY09E FY10E FY08E FY09E FY10E FY08E FY09E FY10E
PharmaceuticalsAurobindo Pharma 294 Sell 33.9 36.1 49.2 8.7 8.1 6.0 8.1 6.8 5.3 21.0 18.5 20.3Aventis Pharma 750 Buy 62.7 63.5 67.6 12.0 11.8 11.1 7.4 6.4 5.1 21.5 19.6 18.9Biocon 432 Buy 22.5 26.4 31.3 19.2 16.3 13.8 13.7 10.7 8.6 14.9 15.4 16.0Cadila Health 250 Buy 19.5 24.3 33.2 12.9 10.3 7.5 7.9 6.5 5.0 26.0 25.9 28.6Cipla 218 Neutral 8.5 9.8 11.7 25.5 22.3 18.5 19.8 17.5 14.4 17.7 17.4 17.9Dishman Pharma 311 Buy 13.6 17.8 21.3 22.8 17.4 14.6 21.0 15.5 12.6 30.3 30.3 28.0Divis Labs 1,361 Neutral 57.3 70.8 85.1 23.8 19.2 16.0 20.7 16.5 12.6 53.6 44.8 38.6Dr Reddy’ s Labs 591 Buy 27.2 34.6 42.3 21.7 17.1 14.0 17.1 13.4 11.1 10.1 11.8 13.0GSK Pharma 1,044 Buy 47.2 51.7 59.1 22.1 20.2 17.7 14.9 13.7 11.7 28.9 26.5 25.5Jubiliant Organosys 332 Buy 23.0 22.1 26.0 14.4 15.0 12.8 11.6 9.1 7.3 36.1 25.1 24.0Lupin 483 Buy 36.8 44.4 56.6 13.1 10.9 8.5 10.2 8.6 6.7 31.1 28.8 29.5Nicholas Piramal 301 Buy 14.7 19.8 23.2 20.5 15.2 13.0 14.5 11.1 9.5 25.7 27.9 26.9Pfizer 661 Neutral 42.5 48.5 53.0 15.6 13.6 12.5 8.8 6.5 5.4 18.6 15.5 15.4Ranbaxy Labs 439 Buy 19.2 19.5 22.2 22.8 22.5 19.7 19.5 15.7 12.6 25.9 23.2 23.3Shasun Chemicals 44 Buy 2.7 6.2 7.0 16.7 7.1 6.3 12.1 5.2 4.9 5.6 12.3 12.9Sun Pharma 1,251 Buy 47.9 48.5 57.3 26.1 25.8 21.9 19.1 19.0 15.3 26.0 19.0 19.1Wockhardt 267 Neutral 29.0 33.4 38.1 9.2 8.0 7.0 7.4 6.0 5.1 28.5 26.0 24.1Sector Aggregate 19.2 17.1 14.3 15.1 12.6 10.3 22.5 20.8 21.0
80
100
120
140
160
Mar-07 Jun-07 Sep-07 Dec-07 Mar-08
MOSt Pharmaceuticals Index Sensex
80
86
92
98
104
Dec-07 Jan-08 Feb-08 Mar-08
Sensex MOSt Pharmaceuticals Index
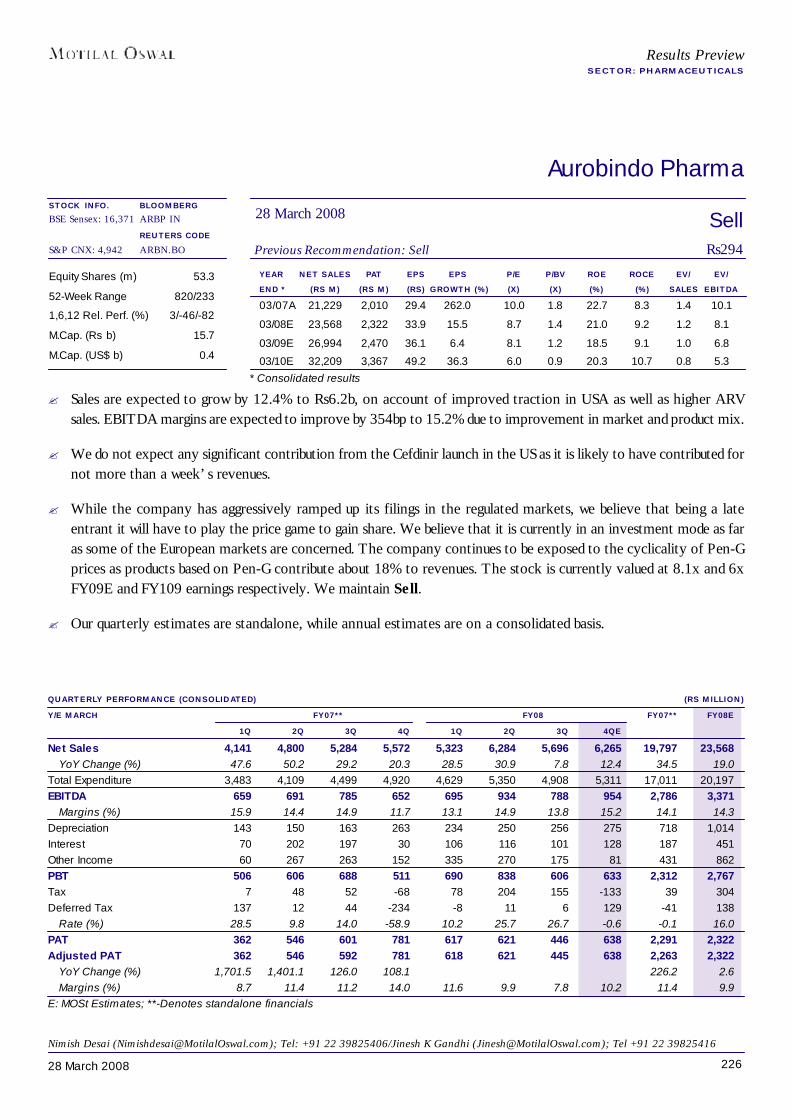
22628 March 2008
Aurobindo Pharma
YEAR NET SALES PAT EPS EPS P/E P/BV ROE ROCE EV/ EV/END * (RS M) (RS M) (RS) GROWTH (%) (X) (X) (%) (%) SALES EBITDA03/07A 21,229 2,010 29.4 262.0 10.0 1.8 22.7 8.3 1.4 10.1
03/08E 23,568 2,322 33.9 15.5 8.7 1.4 21.0 9.2 1.2 8.1
03/09E 26,994 2,470 36.1 6.4 8.1 1.2 18.5 9.1 1.0 6.8
03/10E 32,209 3,367 49.2 36.3 6.0 0.9 20.3 10.7 0.8 5.3
Equity Shares (m) 53.3
52-Week Range 820/233
1,6,12 Rel. Perf. (%) 3/-46/-82
M.Cap. (Rs b) 15.7
M.Cap. (US$ b) 0.4
QUARTERLY PERFORMANCE (CONSOLIDATED) (RS MILLION)Y/E MARCH FY07** FY08 FY07** FY08E
1Q 2Q 3Q 4Q 1Q 2Q 3Q 4QENet Sales 4,141 4,800 5,284 5,572 5,323 6,284 5,696 6,265 19,797 23,568
YoY Change (%) 47.6 50.2 29.2 20.3 28.5 30.9 7.8 12.4 34.5 19.0Total Expenditure 3,483 4,109 4,499 4,920 4,629 5,350 4,908 5,311 17,011 20,197EBITDA 659 691 785 652 695 934 788 954 2,786 3,371
Margins (%) 15.9 14.4 14.9 11.7 13.1 14.9 13.8 15.2 14.1 14.3Depreciation 143 150 163 263 234 250 256 275 718 1,014Interest 70 202 197 30 106 116 101 128 187 451Other Income 60 267 263 152 335 270 175 81 431 862PBT 506 606 688 511 690 838 606 633 2,312 2,767Tax 7 48 52 -68 78 204 155 -133 39 304Deferred Tax 137 12 44 -234 -8 11 6 129 -41 138
Rate (%) 28.5 9.8 14.0 -58.9 10.2 25.7 26.7 -0.6 -0.1 16.0PAT 362 546 601 781 617 621 446 638 2,291 2,322Adjusted PAT 362 546 592 781 618 621 445 638 2,263 2,322
YoY Change (%) 1,701.5 1,401.1 126.0 108.1 226.2 2.6Margins (%) 8.7 11.4 11.2 14.0 11.6 9.9 7.8 10.2 11.4 9.9
E: MOSt Estimates; **-Denotes standalone financials
SellPrevious Recommendation: Sell Rs294
28 March 2008BLOOMBERGARBP IN
REUTERS CODEARBN.BO
* Consolidated results
Nimish Desai ([email protected]); Tel: +91 22 39825406/Jinesh K Gandhi ([email protected]); Tel +91 22 39825416
Results PreviewSECTOR: PHARMACEUTICALS
STOCK INFO.BSE Sensex: 16,371
S&P CNX: 4,942
? Sales are expected to grow by 12.4% to Rs6.2b, on account of improved traction in USA as well as higher ARVsales. EBITDA margins are expected to improve by 354bp to 15.2% due to improvement in market and product mix.
? We do not expect any significant contribution from the Cefdinir launch in the US as it is likely to have contributed fornot more than a week’s revenues.
? While the company has aggressively ramped up its filings in the regulated markets, we believe that being a lateentrant it will have to play the price game to gain share. We believe that it is currently in an investment mode as faras some of the European markets are concerned. The company continues to be exposed to the cyclicality of Pen-Gprices as products based on Pen-G contribute about 18% to revenues. The stock is currently valued at 8.1x and 6xFY09E and FY109 earnings respectively. We maintain Sell.
? Our quarterly estimates are standalone, while annual estimates are on a consolidated basis.
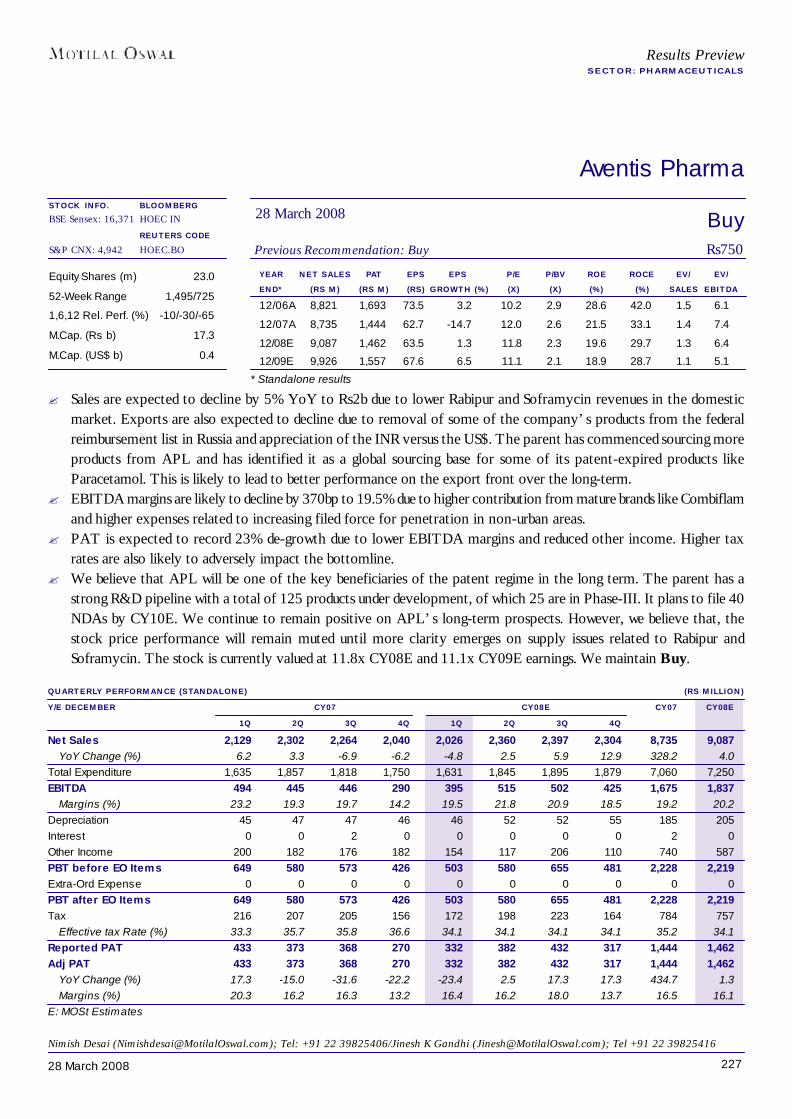
22728 March 2008
Aventis Pharma
YEAR NET SALES PAT EPS EPS P/E P/BV ROE ROCE EV/ EV/END* (RS M) (RS M) (RS) GROWTH (%) (X) (X) (%) (%) SALES EBITDA12/06A 8,821 1,693 73.5 3.2 10.2 2.9 28.6 42.0 1.5 6.1
12/07A 8,735 1,444 62.7 -14.7 12.0 2.6 21.5 33.1 1.4 7.4
12/08E 9,087 1,462 63.5 1.3 11.8 2.3 19.6 29.7 1.3 6.4
12/09E 9,926 1,557 67.6 6.5 11.1 2.1 18.9 28.7 1.1 5.1
Equity Shares (m) 23.0
52-Week Range 1,495/725
1,6,12 Rel. Perf. (%) -10/-30/-65
M.Cap. (Rs b) 17.3
M.Cap. (US$ b) 0.4
QUARTERLY PERFORMANCE (STANDALONE) (RS MILLION)Y/E DECEMBER CY07 CY08E CY07 CY08E
1Q 2Q 3Q 4Q 1Q 2Q 3Q 4QNet Sales 2,129 2,302 2,264 2,040 2,026 2,360 2,397 2,304 8,735 9,087
YoY Change (%) 6.2 3.3 -6.9 -6.2 -4.8 2.5 5.9 12.9 328.2 4.0Total Expenditure 1,635 1,857 1,818 1,750 1,631 1,845 1,895 1,879 7,060 7,250EBITDA 494 445 446 290 395 515 502 425 1,675 1,837
Margins (%) 23.2 19.3 19.7 14.2 19.5 21.8 20.9 18.5 19.2 20.2Depreciation 45 47 47 46 46 52 52 55 185 205Interest 0 0 2 0 0 0 0 0 2 0Other Income 200 182 176 182 154 117 206 110 740 587PBT before EO Items 649 580 573 426 503 580 655 481 2,228 2,219Extra-Ord Expense 0 0 0 0 0 0 0 0 0 0PBT after EO Items 649 580 573 426 503 580 655 481 2,228 2,219Tax 216 207 205 156 172 198 223 164 784 757
Effective tax Rate (%) 33.3 35.7 35.8 36.6 34.1 34.1 34.1 34.1 35.2 34.1Reported PAT 433 373 368 270 332 382 432 317 1,444 1,462Adj PAT 433 373 368 270 332 382 432 317 1,444 1,462
YoY Change (%) 17.3 -15.0 -31.6 -22.2 -23.4 2.5 17.3 17.3 434.7 1.3Margins (%) 20.3 16.2 16.3 13.2 16.4 16.2 18.0 13.7 16.5 16.1
E: MOSt Estimates
BuyPrevious Recommendation: Buy Rs750
28 March 2008BLOOMBERGHOEC IN
REUTERS CODEHOEC.BO
* Standalone results
Results PreviewSECTOR: PHARMACEUTICALS
Nimish Desai ([email protected]); Tel: +91 22 39825406/Jinesh K Gandhi ([email protected]); Tel +91 22 39825416
STOCK INFO.BSE Sensex: 16,371
S&P CNX: 4,942
? Sales are expected to decline by 5% YoY to Rs2b due to lower Rabipur and Soframycin revenues in the domesticmarket. Exports are also expected to decline due to removal of some of the company’s products from the federalreimbursement list in Russia and appreciation of the INR versus the US$. The parent has commenced sourcing moreproducts from APL and has identified it as a global sourcing base for some of its patent-expired products likeParacetamol. This is likely to lead to better performance on the export front over the long-term.
? EBITDA margins are likely to decline by 370bp to 19.5% due to higher contribution from mature brands like Combiflamand higher expenses related to increasing filed force for penetration in non-urban areas.
? PAT is expected to record 23% de-growth due to lower EBITDA margins and reduced other income. Higher taxrates are also likely to adversely impact the bottomline.
? We believe that APL will be one of the key beneficiaries of the patent regime in the long term. The parent has astrong R&D pipeline with a total of 125 products under development, of which 25 are in Phase-III. It plans to file 40NDAs by CY10E. We continue to remain positive on APL’s long-term prospects. However, we believe that, thestock price performance will remain muted until more clarity emerges on supply issues related to Rabipur andSoframycin. The stock is currently valued at 11.8x CY08E and 11.1x CY09E earnings. We maintain Buy.

22828 March 2008
Biocon
BuyPrevious Recommendation: Buy Rs432
28 March 2008BLOOMBERGBIOS IN
REUTERS CODEBION.BO
YEAR NET SALES PAT EPS EPS P/E P/BV ROE ROCE EV/ EV/END (RS M) (RS M) (RS) GROWTH (%) (X) (X) (%) (%) SALES EBITDA03/07A 9,863 2,002 20.0 15.1 21.6 4.0 18.7 17.0 4.5 15.5
03/08E 10,807 2,250 22.5 12.4 19.2 2.9 14.9 14.2 3.8 13.7
03/09E 17,917 2,645 26.4 17.5 16.3 2.5 15.4 16.1 2.4 10.7
03/10E 21,178 3,127 31.3 18.3 13.8 2.2 16.0 16.4 1.9 8.6
Equity Shares (m) 100.0
52-Week Range 663/345
1,6,12 Rel. Perf. (%) 4/-4/-35
M.Cap. (Rs b) 43.2
M.Cap. (US$ b) 1.1
QUARTERLY PERFORMANCE (CONSOLIDATED) (RS MILLION)Y/E MARCH FY07 FY08 FY07 FY08E
1Q 2Q 3Q 4Q 1Q 2Q 3Q 4QENet Sales 2,120 2,490 2,470 2,782 2,710 2,790 2,370 2,937 9,862 10,807
YoY Change (%) 21.9 24.2 24.0 29.8 27.8 12.0 -4.0 5.6 25.1 9.6Total Expenditure 1,577 1,831 1,693 1,925 1,945 1,985 1,779 2,099 7,022 7,809EBITDA 544 659 777 857 765 805 591 838 2,840 2,998
Margins (%) 25.6 26.5 31.5 30.8 28.2 28.8 24.9 28.5 28.8 27.7Depreciation 109.7 177.5 182.8 195.3 216.4 233.6 240.0 253.0 665.3 943.0Interest 16.7 21.6 21.6 34.5 27.5 26.7 25.8 27.5 94.5 107.5Other Income 13.6 8.6 2.8 11.9 9.9 19.2 210.9 106.9 31.9 346.9PBT 431 469 576 639 531 564 536 665 2,112 2,295Tax 42 22 36 65 15 38 18 44 165 114
Rate (%) 9.8 4.8 6.2 10.2 2.8 6.7 3.3 6.7 7.8 5.0Minority Interest -5 -7 -20 -33 -14 -14 -12 -30 -63 -70PAT 394 453 560 607 530 540 530 650 2,010 2,250
YoY Change (%) 1.8 4.1 27.7 26.9 34.5 19.0 -5.3 7.1 15.5 12.0Margins (%) 18.6 18.2 22.7 21.8 19.6 19.3 22.4 22.1 20.4 20.8
E: MOSt Estimates
Results PreviewSECTOR: PHARMACEUTICALS
Nimish Desai ([email protected]); Tel: +91 22 39825406/Jinesh K Gandhi ([email protected]); Tel +91 22 39825416
STOCK INFO.BSE Sensex: 16,371
S&P CNX: 4,942
? Biocon’s 4QFY08 sales are expected to grow by only 5.6% YoY to Rs2.9b mainly due to divestment of the enzymebusiness and lower growth in the contract research business.
? EBITDA margins are likely to reduce by 227bp (to 28.5%) due to higher R&D and promotional spend as well ascurrency appreciation.
? Higher depreciation (up by 30% YoY) on account of commencement of new facility, is likely to restrict PAT growthto 7% at Rs650m.
? Biocon has divested its enzymes business to Novozymes for US$115m. Since the sale is effective from 3QFY08, ourestimates take into account the revenue impact of this divestment.
? While some of Biocon’s initiatives appear promising, their visibility is poor. Biocon is currently valued at 16.3x FY09Eand 13.8x FY10E earnings. Launch of bio-generics in regulated markets remains the key long-term trigger; however,clarity on the regulatory pathway is still awaited from the US FDA. In the interim, Biocon’s initiatives in the Insulinspace are likely to be key growth drivers. Another re-rating trigger is the proposed listing of its contract researchbusiness over the next 12 months. We maintain Buy.

22928 March 2008
Cadila Healthcare
BuyPrevious Recommendation: Buy Rs250
28 March 2008BLOOMBERGCDH IN
REUTERS CODECADI.BO
YEAR NET SALES PAT EPS EPS P/E P/BV ROE ROCE EV/ EV/END* (RS M) (RS M) (RS) GROWTH (%) (X) (X) (%) (%) SALES EBITDA03/07A 18,288 2,343 18.7 43.5 13.4 3.6 29.9 24.1 1.9 9.9
03/08E 23,072 2,503 19.5 4.3 12.9 3.0 25.4 21.0 1.5 8.3
03/09E 27,048 3,052 24.3 24.9 10.3 2.4 25.9 19.7 1.3 6.9
03/10E 31,713 4,172 33.2 36.7 7.5 1.9 28.6 22.7 1.1 5.3
Equity Shares (m) 125.6
52-Week Range 412/203
1,6,12 Rel. Perf. (%) -7/-14/-50
M.Cap. (Rs b) 31.5
M.Cap. (US$ b) 0.8
QUARTERLY PERFORMANCE (CONSOLIDATED) (RS MILLION)Y/E MARCH FY07 FY08 FY07 FY08E
1Q 2Q 3Q 4Q 1Q 2Q 3Q 4QENet Revenues 4,458 4,748 4,724 4,357 5,722 6,097 5,794 5,459 18,288 23,072
YoY Change (%) 19.5 27.3 27.8 25.9 28.4 28.4 22.7 25.3 23.2 26.2Total Expenditure 3,560 3,658 3,901 3,646 4,610 4,780 4,759 4,667 14,767 18,816EBITDA 898 1,090 823 711 1,112 1,317 1,035 793 3,521 4,257
Margins (%) 20.1 23.0 17.4 16.3 19.4 21.6 17.9 14.5 19.3 18.4Depreciation 197 213 212 200 239 235 270 279 823 1,023Interest 69 54 49 52 73 127 66 75 223 341Other Income 49 3 0 15 94 0 2 4 264 100PBT before EO Income 681 826 562 474 894 955 701 443 2,739 2,993EO Exp/(Inc) 0 0 -196 0 0 24 45 0 0 69PBT after EO Income 681 826 758 474 894 931 656 443 2,739 2,924Tax 76 100 98 50 121 114 177 27 324 439
Rate (%) 11.2 12.1 12.9 10.5 13.5 12.2 27.0 6.0 11.8 15.0Minority Int/Adj on Consol 21 21 1 35 34 16 -37 28 77 41Reported PAT 584 705 659 389 739 801 516 388 2,338 2,444Adj PAT 584 705 488 389 739 822 549 388 2,338 2,503
YoY Change (%) 47.2 38.8 18.4 13.0 26.5 16.6 12.4 -0.2 40.7 7.0Margins (%) 13.1 14.8 10.3 8.9 12.9 13.5 9.5 7.1 12.8 10.8
E: MOSt Estimates; Quarterly numbers don’t add up to full year numbers due to restatement
Results PreviewSECTOR: PHARMACEUTICALS
Nimish Desai ([email protected]); Tel: +91 22 39825406/Jinesh K Gandhi ([email protected]); Tel +91 22 39825416
STOCK INFO.BSE Sensex: 16,371
S&P CNX: 4,942
? Cadila’s 4QFY08 revenue is expected to grow by 25.3% to Rs5.5b, driven by 40% growth in formulation exports and33% growth in domestic business (on a low base).
? EBITDA margins are expected to decline by 180bp to 14.5%, mainly due to reduced sourcing of Pantoprazoleintermediates by Nycomed (a high-margin product). This coupled with higher interest cost (up by 44%) and increaseddepreciation (up 40%) is likely to result in flat PAT growth.
? Teva and Sun Pharma have recently launched their generic versions of Protonix (Pantoprazole) in the US thusadversely impacting Nycomed’s revenues. Cadila management has, in the past, indicated that this is likely to adverselyimpact the bottomline by about Rs170-200m on an annualized basis.
? Cadila is currently valued at 10.3x FY09E and 7.5x FY10E consolidated earnings. Higher growth in the internationalbusiness, turnaround in French operations and commencement of supplies to Hospira coupled with a de-riskedbusiness model should augur well for the company. We maintain Buy.
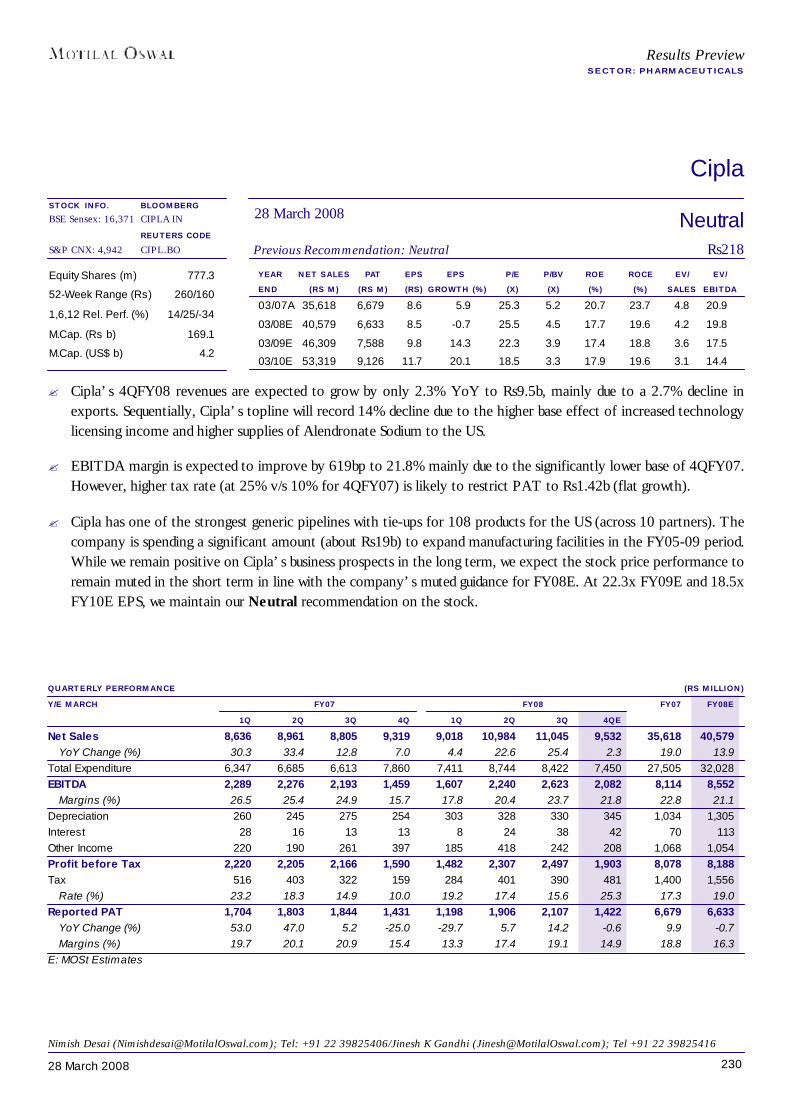
23028 March 2008
Cipla
YEAR NET SALES PAT EPS EPS P/E P/BV ROE ROCE EV/ EV/END (RS M) (RS M) (RS) GROWTH (%) (X) (X) (%) (%) SALES EBITDA03/07A 35,618 6,679 8.6 5.9 25.3 5.2 20.7 23.7 4.8 20.9
03/08E 40,579 6,633 8.5 -0.7 25.5 4.5 17.7 19.6 4.2 19.8
03/09E 46,309 7,588 9.8 14.3 22.3 3.9 17.4 18.8 3.6 17.5
03/10E 53,319 9,126 11.7 20.1 18.5 3.3 17.9 19.6 3.1 14.4
Equity Shares (m) 777.3
52-Week Range (Rs) 260/160
1,6,12 Rel. Perf. (%) 14/25/-34
M.Cap. (Rs b) 169.1
M.Cap. (US$ b) 4.2
QUARTERLY PERFORMANCE (RS MILLION)Y/E MARCH FY07 FY08 FY07 FY08E
1Q 2Q 3Q 4Q 1Q 2Q 3Q 4QENet Sales 8,636 8,961 8,805 9,319 9,018 10,984 11,045 9,532 35,618 40,579
YoY Change (%) 30.3 33.4 12.8 7.0 4.4 22.6 25.4 2.3 19.0 13.9Total Expenditure 6,347 6,685 6,613 7,860 7,411 8,744 8,422 7,450 27,505 32,028EBITDA 2,289 2,276 2,193 1,459 1,607 2,240 2,623 2,082 8,114 8,552
Margins (%) 26.5 25.4 24.9 15.7 17.8 20.4 23.7 21.8 22.8 21.1Depreciation 260 245 275 254 303 328 330 345 1,034 1,305Interest 28 16 13 13 8 24 38 42 70 113Other Income 220 190 261 397 185 418 242 208 1,068 1,054Profit before Tax 2,220 2,205 2,166 1,590 1,482 2,307 2,497 1,903 8,078 8,188Tax 516 403 322 159 284 401 390 481 1,400 1,556
Rate (%) 23.2 18.3 14.9 10.0 19.2 17.4 15.6 25.3 17.3 19.0Reported PAT 1,704 1,803 1,844 1,431 1,198 1,906 2,107 1,422 6,679 6,633
YoY Change (%) 53.0 47.0 5.2 -25.0 -29.7 5.7 14.2 -0.6 9.9 -0.7Margins (%) 19.7 20.1 20.9 15.4 13.3 17.4 19.1 14.9 18.8 16.3
E: MOSt Estimates
NeutralPrevious Recommendation: Neutral Rs218
28 March 2008BLOOMBERGCIPLA IN
REUTERS CODECIPL.BO
Results PreviewSECTOR: PHARMACEUTICALS
Nimish Desai ([email protected]); Tel: +91 22 39825406/Jinesh K Gandhi ([email protected]); Tel +91 22 39825416
STOCK INFO.BSE Sensex: 16,371
S&P CNX: 4,942
? Cipla’s 4QFY08 revenues are expected to grow by only 2.3% YoY to Rs9.5b, mainly due to a 2.7% decline inexports. Sequentially, Cipla’s topline will record 14% decline due to the higher base effect of increased technologylicensing income and higher supplies of Alendronate Sodium to the US.
? EBITDA margin is expected to improve by 619bp to 21.8% mainly due to the significantly lower base of 4QFY07.However, higher tax rate (at 25% v/s 10% for 4QFY07) is likely to restrict PAT to Rs1.42b (flat growth).
? Cipla has one of the strongest generic pipelines with tie-ups for 108 products for the US (across 10 partners). Thecompany is spending a significant amount (about Rs19b) to expand manufacturing facilities in the FY05-09 period.While we remain positive on Cipla’s business prospects in the long term, we expect the stock price performance toremain muted in the short term in line with the company’s muted guidance for FY08E. At 22.3x FY09E and 18.5xFY10E EPS, we maintain our Neutral recommendation on the stock.
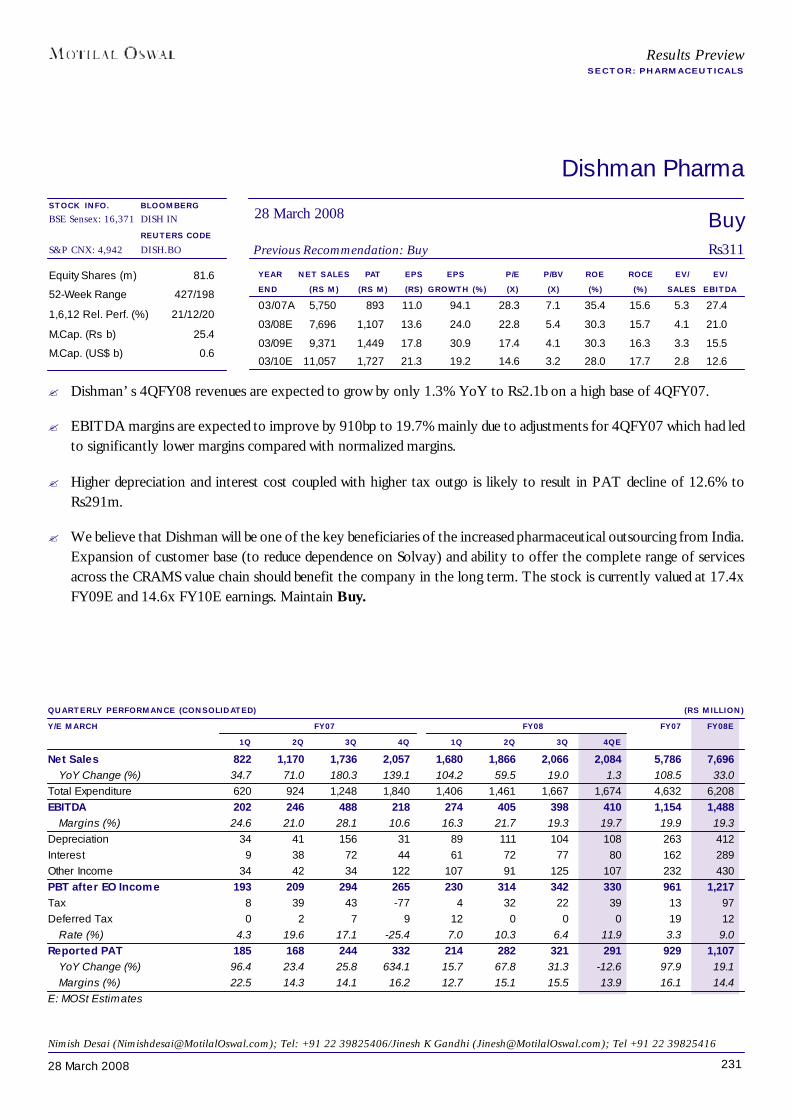
23128 March 2008
Dishman Pharma
YEAR NET SALES PAT EPS EPS P/E P/BV ROE ROCE EV/ EV/END (RS M) (RS M) (RS) GROWTH (%) (X) (X) (%) (%) SALES EBITDA03/07A 5,750 893 11.0 94.1 28.3 7.1 35.4 15.6 5.3 27.4
03/08E 7,696 1,107 13.6 24.0 22.8 5.4 30.3 15.7 4.1 21.0
03/09E 9,371 1,449 17.8 30.9 17.4 4.1 30.3 16.3 3.3 15.5
03/10E 11,057 1,727 21.3 19.2 14.6 3.2 28.0 17.7 2.8 12.6
Equity Shares (m) 81.6
52-Week Range 427/198
1,6,12 Rel. Perf. (%) 21/12/20
M.Cap. (Rs b) 25.4
M.Cap. (US$ b) 0.6
QUARTERLY PERFORMANCE (CONSOLIDATED) (RS MILLION)Y/E MARCH FY07 FY08 FY07 FY08E
1Q 2Q 3Q 4Q 1Q 2Q 3Q 4QENet Sales 822 1,170 1,736 2,057 1,680 1,866 2,066 2,084 5,786 7,696
YoY Change (%) 34.7 71.0 180.3 139.1 104.2 59.5 19.0 1.3 108.5 33.0Total Expenditure 620 924 1,248 1,840 1,406 1,461 1,667 1,674 4,632 6,208EBITDA 202 246 488 218 274 405 398 410 1,154 1,488
Margins (%) 24.6 21.0 28.1 10.6 16.3 21.7 19.3 19.7 19.9 19.3Depreciation 34 41 156 31 89 111 104 108 263 412Interest 9 38 72 44 61 72 77 80 162 289Other Income 34 42 34 122 107 91 125 107 232 430PBT after EO Income 193 209 294 265 230 314 342 330 961 1,217Tax 8 39 43 -77 4 32 22 39 13 97Deferred Tax 0 2 7 9 12 0 0 0 19 12
Rate (%) 4.3 19.6 17.1 -25.4 7.0 10.3 6.4 11.9 3.3 9.0Reported PAT 185 168 244 332 214 282 321 291 929 1,107
YoY Change (%) 96.4 23.4 25.8 634.1 15.7 67.8 31.3 -12.6 97.9 19.1Margins (%) 22.5 14.3 14.1 16.2 12.7 15.1 15.5 13.9 16.1 14.4
E: MOSt Estimates
BuyPrevious Recommendation: Buy Rs311
28 March 2008BLOOMBERGDISH IN
REUTERS CODEDISH.BO
Results PreviewSECTOR: PHARMACEUTICALS
Nimish Desai ([email protected]); Tel: +91 22 39825406/Jinesh K Gandhi ([email protected]); Tel +91 22 39825416
STOCK INFO.BSE Sensex: 16,371
S&P CNX: 4,942
? Dishman’s 4QFY08 revenues are expected to grow by only 1.3% YoY to Rs2.1b on a high base of 4QFY07.
? EBITDA margins are expected to improve by 910bp to 19.7% mainly due to adjustments for 4QFY07 which had ledto significantly lower margins compared with normalized margins.
? Higher depreciation and interest cost coupled with higher tax outgo is likely to result in PAT decline of 12.6% toRs291m.
? We believe that Dishman will be one of the key beneficiaries of the increased pharmaceutical outsourcing from India.Expansion of customer base (to reduce dependence on Solvay) and ability to offer the complete range of servicesacross the CRAMS value chain should benefit the company in the long term. The stock is currently valued at 17.4xFY09E and 14.6x FY10E earnings. Maintain Buy.
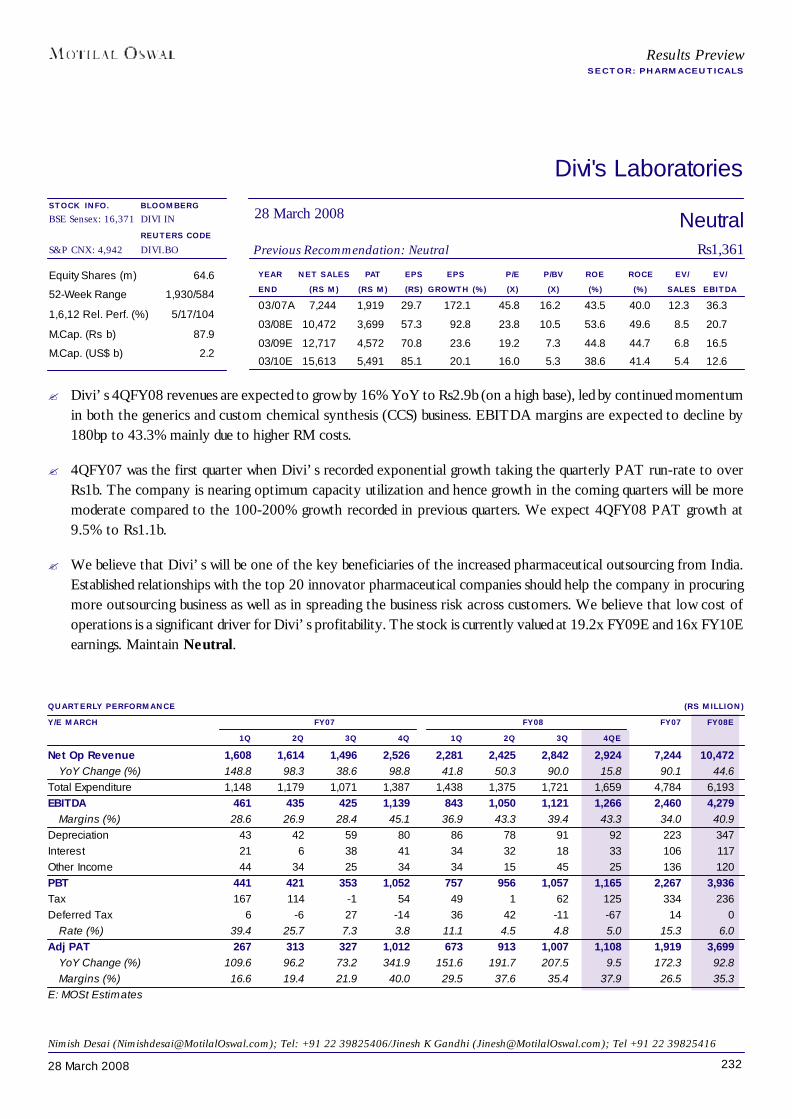
23228 March 2008
Divi's Laboratories
YEAR NET SALES PAT EPS EPS P/E P/BV ROE ROCE EV/ EV/END (RS M) (RS M) (RS) GROWTH (%) (X) (X) (%) (%) SALES EBITDA03/07A 7,244 1,919 29.7 172.1 45.8 16.2 43.5 40.0 12.3 36.3
03/08E 10,472 3,699 57.3 92.8 23.8 10.5 53.6 49.6 8.5 20.7
03/09E 12,717 4,572 70.8 23.6 19.2 7.3 44.8 44.7 6.8 16.5
03/10E 15,613 5,491 85.1 20.1 16.0 5.3 38.6 41.4 5.4 12.6
Equity Shares (m) 64.6
52-Week Range 1,930/584
1,6,12 Rel. Perf. (%) 5/17/104
M.Cap. (Rs b) 87.9
M.Cap. (US$ b) 2.2
QUARTERLY PERFORMANCE (RS MILLION)Y/E MARCH FY07 FY08 FY07 FY08E
1Q 2Q 3Q 4Q 1Q 2Q 3Q 4QENet Op Revenue 1,608 1,614 1,496 2,526 2,281 2,425 2,842 2,924 7,244 10,472
YoY Change (%) 148.8 98.3 38.6 98.8 41.8 50.3 90.0 15.8 90.1 44.6Total Expenditure 1,148 1,179 1,071 1,387 1,438 1,375 1,721 1,659 4,784 6,193EBITDA 461 435 425 1,139 843 1,050 1,121 1,266 2,460 4,279
Margins (%) 28.6 26.9 28.4 45.1 36.9 43.3 39.4 43.3 34.0 40.9Depreciation 43 42 59 80 86 78 91 92 223 347Interest 21 6 38 41 34 32 18 33 106 117Other Income 44 34 25 34 34 15 45 25 136 120PBT 441 421 353 1,052 757 956 1,057 1,165 2,267 3,936Tax 167 114 -1 54 49 1 62 125 334 236Deferred Tax 6 -6 27 -14 36 42 -11 -67 14 0
Rate (%) 39.4 25.7 7.3 3.8 11.1 4.5 4.8 5.0 15.3 6.0Adj PAT 267 313 327 1,012 673 913 1,007 1,108 1,919 3,699
YoY Change (%) 109.6 96.2 73.2 341.9 151.6 191.7 207.5 9.5 172.3 92.8Margins (%) 16.6 19.4 21.9 40.0 29.5 37.6 35.4 37.9 26.5 35.3
E: MOSt Estimates
NeutralPrevious Recommendation: Neutral Rs1,361
28 March 2008BLOOMBERGDIVI IN
REUTERS CODEDIVI.BO
Results PreviewSECTOR: PHARMACEUTICALS
Nimish Desai ([email protected]); Tel: +91 22 39825406/Jinesh K Gandhi ([email protected]); Tel +91 22 39825416
STOCK INFO.BSE Sensex: 16,371
S&P CNX: 4,942
? Divi’s 4QFY08 revenues are expected to grow by 16% YoY to Rs2.9b (on a high base), led by continued momentumin both the generics and custom chemical synthesis (CCS) business. EBITDA margins are expected to decline by180bp to 43.3% mainly due to higher RM costs.
? 4QFY07 was the first quarter when Divi’s recorded exponential growth taking the quarterly PAT run-rate to overRs1b. The company is nearing optimum capacity utilization and hence growth in the coming quarters will be moremoderate compared to the 100-200% growth recorded in previous quarters. We expect 4QFY08 PAT growth at9.5% to Rs1.1b.
? We believe that Divi’s will be one of the key beneficiaries of the increased pharmaceutical outsourcing from India.Established relationships with the top 20 innovator pharmaceutical companies should help the company in procuringmore outsourcing business as well as in spreading the business risk across customers. We believe that low cost ofoperations is a significant driver for Divi’s profitability. The stock is currently valued at 19.2x FY09E and 16x FY10Eearnings. Maintain Neutral.

23328 March 2008
Dr Reddy's Laboratories
YEAR NET SALES PAT EPS EPS P/E P/BV ROE ROCE EV/ EV/END (RS M) (RS M) (RS) GROWTH (%) (X) (X) (%) (%) SALES EBITDA03/07A 65,095 9,323 55.5 521.1 10.6 2.4 22.4 14.3 1.6 7.3
03/08E 48,769 4,569 27.2 -51.0 21.7 2.2 10.1 4.4 2.2 17.1
03/09E 54,815 5,809 34.6 27.1 17.1 2.0 11.8 8.8 1.9 13.4
03/10E 61,352 7,095 42.3 22.1 14.0 1.8 13.0 10.0 1.6 11.1
Equity Shares (m) 167.9
52-Week Range (Rs) 760/501
1,6,12 Rel. Perf. (%) 12/-4/-42
M.Cap. (Rs b) 99.2
M.Cap. (US$ b) 2.5
GLOBAL QUARTERLY PERFORMANCE (US GAAP) (RS MILLION)Y/E MARCH FY07 FY08 FY07 FY08E
1Q 2Q 3Q 4Q 1Q 2Q 3Q 4QEGross Sales 14,049 20,039 15,434 15,573 12,018 12,669 12,321 11,761 65,095 48,769
YoY Change (%) 151.3 247.1 161.7 124.7 -14.5 -36.8 -20.2 -24.5 168.2 -25.1EBITDA 2,210 4,220 2,464 5,470 2,132 1,461 1,383 1,169 14,361 6,145
Margins (%) 15.7 21.1 16.0 35.1 17.7 11.5 11.2 9.9 22.1 12.6Depreciation & Amortization 388 402 330 2,221 351 410 2,740 360 3,341 3,861Interest 0 0 0 0 0 0 0 0 0 0Other Income -216 -287 -281 264 231 372 129 96 -520 828Profit before Tax 1,606 3,531 1,853 3,513 2,012 1,423 -1,228 905 10,500 3,112Tax 208 737 -27 260 181 -1,248 -380 -10 1,177 -1,457
Rate (%) 13.0 20.9 -1.5 7.4 9.0 -87.7 30.9 -1.1 11.2 -46.8Reported PAT 1,398 2,794 1,880 3,253 1,831 2,671 -848 915 9,323 4,569Minority Interest 0 -4 0 -1 3 1 3 0 -4 7EO (Exp)/Inc 42 0 0 0 0 0 0 0 42 0Adjusted PAT 1,356 2,798 1,880 3,254 1,828 2,670 -851 915 9,285 4,562
YoY Change (%) 255.0 215.4 407.6 - 34.8 -4.6 -145.3 -71.9 576.6 -50.9Margins (%) 9.7 14.0 12.2 20.9 15.2 21.1 -6.9 7.8 14.3 9.4
E: MOSt Estimates
BuyPrevious Recommendation: Buy Rs591
28 March 2008BLOOMBERGDR IN
REUTERS CODEREDY.BO
Results PreviewSECTOR: PHARMACEUTICALS
Nimish Desai ([email protected]); Tel: +91 22 39825406/Jinesh K Gandhi ([email protected]); Tel +91 22 39825416
STOCK INFO.BSE Sensex: 16,371
S&P CNX: 4,942
? Dr Reddy’s 4QFY08 sales are expected to decline by 24.5% YoY to Rs11.7b, mainly due to absence of one-timeOndansetron exclusivity revenues (which contributed about Rs2.7b to 4QFY07 sales). Excluding this one-time impactrevenues are expected to record 8.6% de-growth, mainly due to pressure on German operations, seasonal slowdownin Russian and Indian formulation businesses and currency appreciation.
? Overall gross margins are expected at 48.8% for the quarter, tempered down by the pressure on German operations.EBITDA margins are also likely to be under pressure at 10%. A tax writeback is likely to partly compensate for thisdecline resulting in 44% decline in core PAT (excluding impact of Ondansetron for 4QFY07).
? DRL is currently valued at 17.1x FY09E and 14x FY10E earnings (excl FTF upsides). We believe that stock priceperformance may remain muted until the company is able to demonstrate a significant improvement in its Germanoperations. We maintain Buy.

23428 March 2008
GlaxoSmithKline Pharmaceuticals
YEAR NET SALES PAT EPS EPS P/E P/BV ROE ROCE EV/ EV/END (RS M) (RS M) (RS) GROWTH (%) (X) (X) (%) (%) SALES EBITDA12/06A 15,384 3,617 42.7 18.1 24.5 7.4 30.3 46.4 5.0 16.1
12/07A 15,703 3,997 47.2 10.5 22.1 6.4 28.9 44.0 4.7 14.9
12/08E 16,488 4,375 51.7 9.5 20.2 5.4 26.5 40.0 4.3 13.7
12/09E 18,467 5,003 59.1 14.3 17.7 4.5 25.5 38.6 3.7 11.7
Equity Shares (m) 84.7
52-Week Range (Rs) 1,340/800
1,6,12 Rel. Perf. (%) 7/-1/-32
M.Cap. (Rs b) 88.5
M.Cap. (US$ b) 2.2
QUARTERLY PERFORMANCE (RS MILLION)Y/E DECEMBER CY07 CY08E CY07 CY08E
1Q 2Q 3Q 4Q 1Q 2Q 3Q 4QNet Sales 4,203 3,915 4,193 3,392 4,411 4,122 4,287 3,669 15,703 16,488
YoY Change (%) -1.2 -3.1 5.6 8.8 4.9 5.3 2.2 8.1 2.1 5.0Total Expenditure 2,753 2,692 2,826 2,460 2,910 2,867 2,932 2,546 10,731 11,254EBITDA 1,450 1,223 1,366 932 1,501 1,255 1,355 1,123 4,972 5,234
Margins (%) 34.5 31.2 32.6 27.5 34.0 30.5 31.6 30.6 31.7 31.7Depreciation 37 37 38 50 35 36 36 48 162 156Other Income 272 312 339 379 388 388 388 388 1,301 1,551PBT before EO Expense 1,686 1,498 1,667 1,261 1,853 1,607 1,707 1,462 6,112 6,629Tax 563 502 555 374 630 546 580 497 1,993 2,254Deferred Tax 10 32 22 59 0 0 0 0 122 0
Rate (%) 34.0 35.6 34.6 34.3 34.0 34.0 34.0 34.0 34.6 34.0Adjusted PAT 1,113 964 1,091 829 1,223 1,061 1,126 965 3,997 4,375
YoY Change (%) 7.6 5.9 10.1 21.6 9.9 10.0 3.2 16.5 10.5 9.5Margins (%) 26.5 24.6 26.0 24.4 27.7 25.7 26.3 26.3 25.5 26.5
Extra-Ord Expense 0 0 -1,399 20 0 0 0 0 -1,379 0Reported PAT 1,113 964 2,490 809 1,223 1,061 1,126 965 5,377 4,375E: MOSt Estimates
BuyPrevious Recommendation: Buy Rs1,044
28 March 2008BLOOMBERGGLXO IN
REUTERS CODEGLAX.BO
Results PreviewSECTOR: PHARMACEUTICALS
Nimish Desai ([email protected]); Tel: +91 22 39825406/Jinesh K Gandhi ([email protected]); Tel +91 22 39825416
STOCK INFO.BSE Sensex: 16,371
S&P CNX: 4,942
? GSK Pharma’s 1QCY08 net sales are expected to grow by only 4% to Rs4.4b, due to the recent divestment of finechemicals business. On a like-to-like basis, we believe that topline growth will be about 7-8% with Priority Productsportfolio growing in line with average industry growth of 13-14%.
? PAT is expected to record 10% growth to Rs1.2b partly boosted by a 43% jump in other income.
? GSK is focused on strengthening its presence in the lifestyle disease segment of CVS, CNS, diabetes etc., by in-licensing products and evaluating brand acquisitions in the domestic market.
? GSK Pharma is one of the best plays on the IPR regime with planned launches of 9 patented/exclusive products inCY08-09 period. Our estimates for CY08E take into account the additional marketing and promotional expenditurelinked to launch of patented products and the divestment of fine chemicals division. Valuations at 20.2x CY08E and17.7x CY09E earnings do not fully reflect the strong parentage, cash-rich operations and the ‘option value’ createdfrom product patent regime in the long term. Maintain Buy.
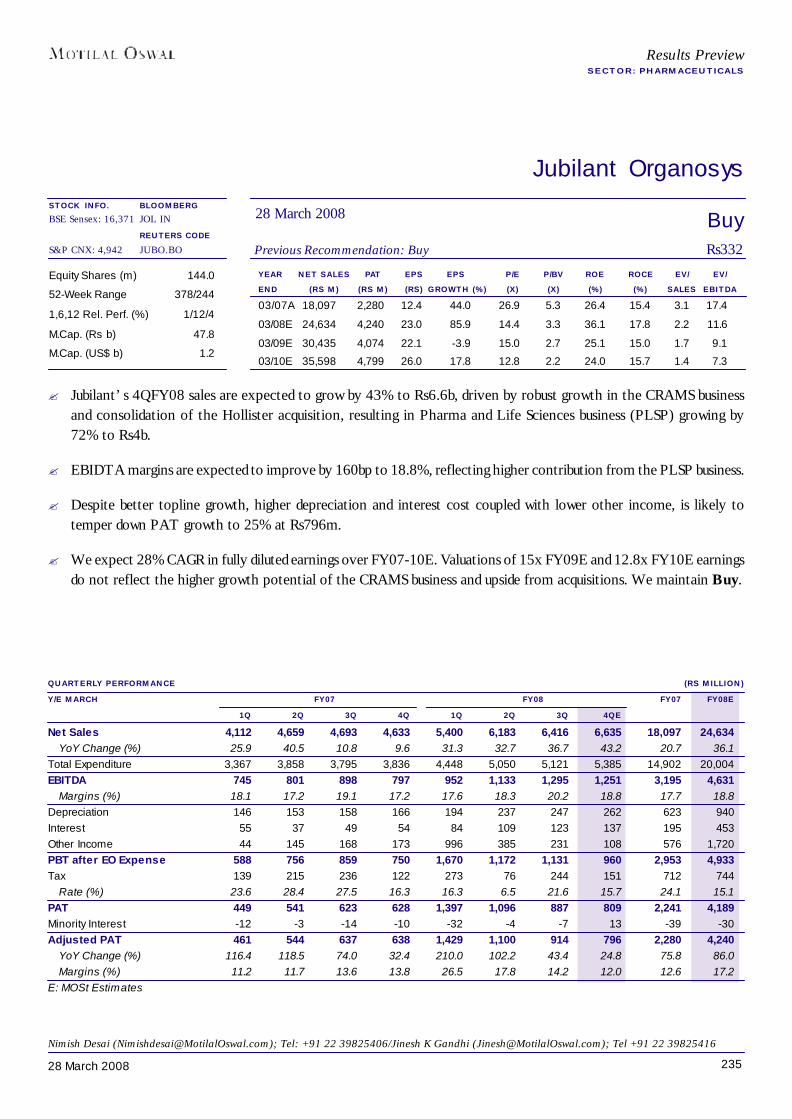
23528 March 2008
Jubilant Organosys
BuyPrevious Recommendation: Buy Rs332
28 March 2008BLOOMBERGJOL IN
REUTERS CODEJUBO.BO
QUARTERLY PERFORMANCE (RS MILLION)Y/E MARCH FY07 FY08 FY07 FY08E
1Q 2Q 3Q 4Q 1Q 2Q 3Q 4QENet Sales 4,112 4,659 4,693 4,633 5,400 6,183 6,416 6,635 18,097 24,634
YoY Change (%) 25.9 40.5 10.8 9.6 31.3 32.7 36.7 43.2 20.7 36.1Total Expenditure 3,367 3,858 3,795 3,836 4,448 5,050 5,121 5,385 14,902 20,004EBITDA 745 801 898 797 952 1,133 1,295 1,251 3,195 4,631
Margins (%) 18.1 17.2 19.1 17.2 17.6 18.3 20.2 18.8 17.7 18.8Depreciation 146 153 158 166 194 237 247 262 623 940Interest 55 37 49 54 84 109 123 137 195 453Other Income 44 145 168 173 996 385 231 108 576 1,720PBT after EO Expense 588 756 859 750 1,670 1,172 1,131 960 2,953 4,933Tax 139 215 236 122 273 76 244 151 712 744
Rate (%) 23.6 28.4 27.5 16.3 16.3 6.5 21.6 15.7 24.1 15.1PAT 449 541 623 628 1,397 1,096 887 809 2,241 4,189Minority Interest -12 -3 -14 -10 -32 -4 -7 13 -39 -30Adjusted PAT 461 544 637 638 1,429 1,100 914 796 2,280 4,240
YoY Change (%) 116.4 118.5 74.0 32.4 210.0 102.2 43.4 24.8 75.8 86.0Margins (%) 11.2 11.7 13.6 13.8 26.5 17.8 14.2 12.0 12.6 17.2
E: MOSt Estimates
YEAR NET SALES PAT EPS EPS P/E P/BV ROE ROCE EV/ EV/END (RS M) (RS M) (RS) GROWTH (%) (X) (X) (%) (%) SALES EBITDA03/07A 18,097 2,280 12.4 44.0 26.9 5.3 26.4 15.4 3.1 17.4
03/08E 24,634 4,240 23.0 85.9 14.4 3.3 36.1 17.8 2.2 11.6
03/09E 30,435 4,074 22.1 -3.9 15.0 2.7 25.1 15.0 1.7 9.1
03/10E 35,598 4,799 26.0 17.8 12.8 2.2 24.0 15.7 1.4 7.3
Equity Shares (m) 144.0
52-Week Range 378/244
1,6,12 Rel. Perf. (%) 1/12/4
M.Cap. (Rs b) 47.8
M.Cap. (US$ b) 1.2
Results PreviewSECTOR: PHARMACEUTICALS
Nimish Desai ([email protected]); Tel: +91 22 39825406/Jinesh K Gandhi ([email protected]); Tel +91 22 39825416
STOCK INFO.BSE Sensex: 16,371
S&P CNX: 4,942
? Jubilant’s 4QFY08 sales are expected to grow by 43% to Rs6.6b, driven by robust growth in the CRAMS businessand consolidation of the Hollister acquisition, resulting in Pharma and Life Sciences business (PLSP) growing by72% to Rs4b.
? EBIDTA margins are expected to improve by 160bp to 18.8%, reflecting higher contribution from the PLSP business.
? Despite better topline growth, higher depreciation and interest cost coupled with lower other income, is likely totemper down PAT growth to 25% at Rs796m.
? We expect 28% CAGR in fully diluted earnings over FY07-10E. Valuations of 15x FY09E and 12.8x FY10E earningsdo not reflect the higher growth potential of the CRAMS business and upside from acquisitions. We maintain Buy.
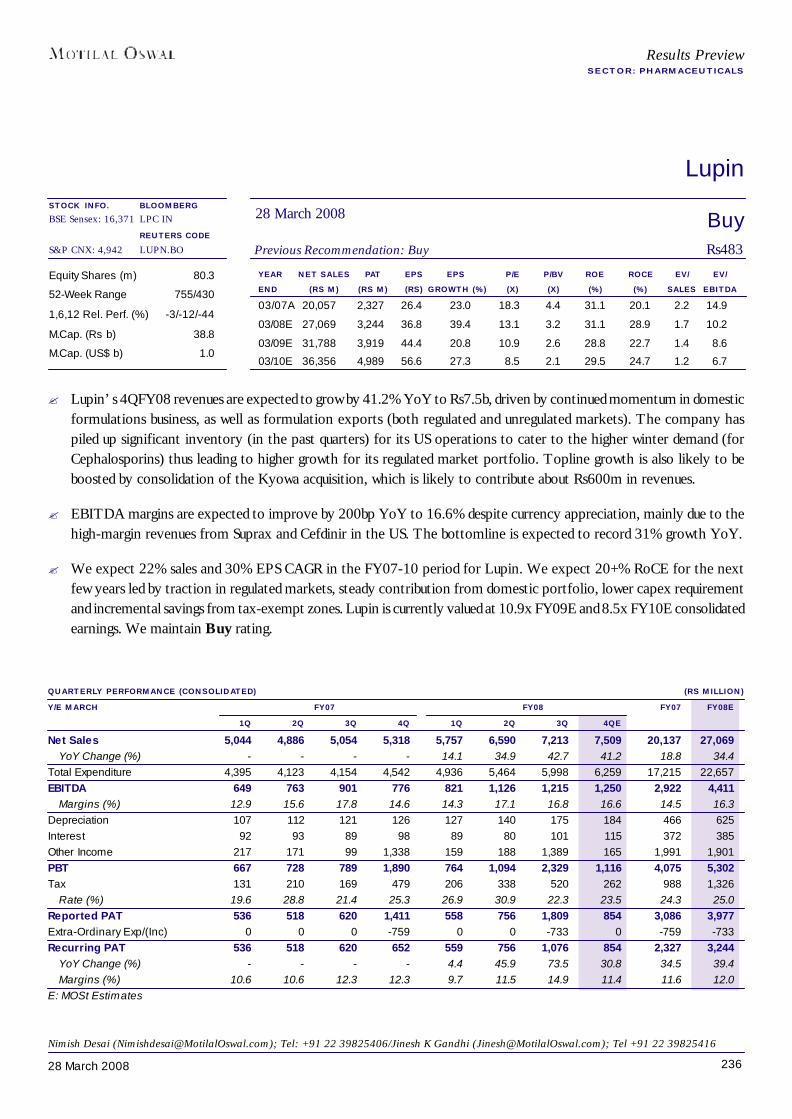
23628 March 2008
Lupin
BuyPrevious Recommendation: Buy Rs483
28 March 2008BLOOMBERGLPC IN
REUTERS CODELUPN.BO
QUARTERLY PERFORMANCE (CONSOLIDATED) (RS MILLION)Y/E MARCH FY07 FY08 FY07 FY08E
1Q 2Q 3Q 4Q 1Q 2Q 3Q 4QENet Sales 5,044 4,886 5,054 5,318 5,757 6,590 7,213 7,509 20,137 27,069
YoY Change (%) - - - - 14.1 34.9 42.7 41.2 18.8 34.4Total Expenditure 4,395 4,123 4,154 4,542 4,936 5,464 5,998 6,259 17,215 22,657EBITDA 649 763 901 776 821 1,126 1,215 1,250 2,922 4,411
Margins (%) 12.9 15.6 17.8 14.6 14.3 17.1 16.8 16.6 14.5 16.3Depreciation 107 112 121 126 127 140 175 184 466 625Interest 92 93 89 98 89 80 101 115 372 385Other Income 217 171 99 1,338 159 188 1,389 165 1,991 1,901PBT 667 728 789 1,890 764 1,094 2,329 1,116 4,075 5,302Tax 131 210 169 479 206 338 520 262 988 1,326
Rate (%) 19.6 28.8 21.4 25.3 26.9 30.9 22.3 23.5 24.3 25.0Reported PAT 536 518 620 1,411 558 756 1,809 854 3,086 3,977Extra-Ordinary Exp/(Inc) 0 0 0 -759 0 0 -733 0 -759 -733Recurring PAT 536 518 620 652 559 756 1,076 854 2,327 3,244
YoY Change (%) - - - - 4.4 45.9 73.5 30.8 34.5 39.4Margins (%) 10.6 10.6 12.3 12.3 9.7 11.5 14.9 11.4 11.6 12.0
E: MOSt Estimates
YEAR NET SALES PAT EPS EPS P/E P/BV ROE ROCE EV/ EV/END (RS M) (RS M) (RS) GROWTH (%) (X) (X) (%) (%) SALES EBITDA03/07A 20,057 2,327 26.4 23.0 18.3 4.4 31.1 20.1 2.2 14.9
03/08E 27,069 3,244 36.8 39.4 13.1 3.2 31.1 28.9 1.7 10.2
03/09E 31,788 3,919 44.4 20.8 10.9 2.6 28.8 22.7 1.4 8.6
03/10E 36,356 4,989 56.6 27.3 8.5 2.1 29.5 24.7 1.2 6.7
Equity Shares (m) 80.3
52-Week Range 755/430
1,6,12 Rel. Perf. (%) -3/-12/-44
M.Cap. (Rs b) 38.8
M.Cap. (US$ b) 1.0
Results PreviewSECTOR: PHARMACEUTICALS
Nimish Desai ([email protected]); Tel: +91 22 39825406/Jinesh K Gandhi ([email protected]); Tel +91 22 39825416
STOCK INFO.BSE Sensex: 16,371
S&P CNX: 4,942
? Lupin’s 4QFY08 revenues are expected to grow by 41.2% YoY to Rs7.5b, driven by continued momentum in domesticformulations business, as well as formulation exports (both regulated and unregulated markets). The company haspiled up significant inventory (in the past quarters) for its US operations to cater to the higher winter demand (forCephalosporins) thus leading to higher growth for its regulated market portfolio. Topline growth is also likely to beboosted by consolidation of the Kyowa acquisition, which is likely to contribute about Rs600m in revenues.
? EBITDA margins are expected to improve by 200bp YoY to 16.6% despite currency appreciation, mainly due to thehigh-margin revenues from Suprax and Cefdinir in the US. The bottomline is expected to record 31% growth YoY.
? We expect 22% sales and 30% EPS CAGR in the FY07-10 period for Lupin. We expect 20+% RoCE for the nextfew years led by traction in regulated markets, steady contribution from domestic portfolio, lower capex requirementand incremental savings from tax-exempt zones. Lupin is currently valued at 10.9x FY09E and 8.5x FY10E consolidatedearnings. We maintain Buy rating.

23728 March 2008
Nicholas Piramal
BuyPrevious Recommendation: Buy Rs301
28 March 2008BLOOMBERGNP IN
REUTERS CODENICH.BO
QUARTERLY PERFORMANCE (RS MILLION)Y/E MARCH FY07 FY08 FY07 FY08E
1Q 2Q 3Q 4Q 1Q 2Q 3Q 4QENet Sales 5,226 6,547 6,495 6,452 6,081 7,566 7,323 7,600 24,719 28,570
YoY Change (%) 31.2 79.3 61.3 52.9 16.4 15.6 12.8 17.8 55.0 15.6Total Expenditure 4,348 5,409 5,525 5,603 5,240 6,317 6,112 6,181 20,885 23,849EBITDA 877 1,138 971 849 841 1,249 1,212 1,419 3,835 4,720
Margins (%) 16.8 17.4 14.9 13.2 13.8 16.5 16.5 18.7 15.5 16.5Depreciation 228 244 222 158 249 263 269 333 818 1,114Interest 46 76 88 96 111 111 122 115 305 459Other Income 0 2 2 54 20 80 40 84 58 224PBT before EO Expense 604 820 663 649 500 955 861 1,055 2,770 3,371Extra-Ord Expense 0 -76 -2 12 3 27 56 0 43 86PBT after EO Expense 604 896 665 638 497 928 805 1,055 2,727 3,285Tax 13 172 59 -2 18 127 79 77 231 302Deferred Tax 51 9 51 36 45 -47 0 -4 158 -6
Rate (%) 10.7 20.2 16.5 5.3 12.7 8.6 9.8 7.0 14.3 9.0PAT 539 715 556 604 434 848 726 981 2,338 2,989Less: Minority Interest 1 0 0 0 0 0 -1 1 1 0Reported PAT 539 715 556 604 434 848 728 980 2,337 2,989Adj PAT 539 654 554 615 437 872 778 980 2,374 3,068
YoY Change (%) 11.9 22.8 129.9 318.8 -18.8 33.3 40.5 59.4 87.0 29.2E: MOSt Estimates; Quarterly numbers don’t add up to full year numbers due to restatement
YEAR NET SALES PAT EPS EPS P/E P/BV ROE ROCE EV/ EV/END (RS M) (RS M) (RS) GROWTH (%) (X) (X) (%) (%) SALES EBITDA03/07A 24,202 2,319 11.0 85.4 27.4 6.0 23.1 19.8 2.8 20.7
03/08E 28,570 3,068 14.7 33.8 20.5 4.7 25.7 20.3 2.4 14.5
03/09E 31,704 4,134 19.8 34.8 15.2 3.9 27.9 23.3 2.1 11.1
03/10E 34,259 4,841 23.2 17.1 13.0 3.2 26.9 24.0 1.9 9.5
Equity Shares (m) 209.0
52-Week Range 383/231
1,6,12 Rel. Perf. (%) 15/12/-3
M.Cap. (Rs b) 62.9
M.Cap. (US$ b) 1.6
Results PreviewSECTOR: PHARMACEUTICALS
Nimish Desai ([email protected]); Tel: +91 22 39825406/Jinesh K Gandhi ([email protected]); Tel +91 22 39825416
STOCK INFO.BSE Sensex: 16,371
S&P CNX: 4,942
? NPIL is expected to report revenue growth of 17.8% to Rs7.6b in 4QFY08, driven mainly by higher growth inCRAMS supplies from India.
? EBITDA margins are expected to expand by 550bp YoY to 18.7% driven by higher traction in India-based CRAMSrevenues as well as savings in R&D cost (as NCE research operations have been de-merged). This will be the firstquarter post the NCE de-merger and is likely to witness part-benefits of the cost savings linked to demerger. Fullimpact of this saving will be reflected from 1QFY09 onwards.
? Higher depreciation and interest costs are likely to partly temper the impact of EBITDA margin expansion, resultingin PAT growth of 59% at Rs980m. Our estimates do not take into account the expected large one-timerestructuring charges, which the company is likely to record in the current quarter.
? Increasing visibility in CRAMS, turnaround at Avecia, margin expansion from restructuring of UK operations andhigher growth in the domestic portfolio, would serve as catalysts for the stock. Valuations at 15.2x FY09E and 13xFY10E do not fully reflect these triggers. Maintain Buy.

23828 March 2008
Pfizer
YEAR NET SALES PAT EPS EPS P/E P/BV ROE ROCE EV/ EV/END (RS M) (RS M) (RS) GROWTH (%) (X) (X) (%) (%) SALES EBITDA11/06A 6,859 1,210 40.5 46.3 16.3 4.5 27.5 43.6 2.4 10.1
11/07A 6,939 1,267 42.5 4.8 15.6 2.9 18.6 29.0 2.0 8.8
11/08E 6,907 1,447 48.5 14.2 13.6 2.1 15.5 23.9 1.6 6.5
11/09E 7,598 1,583 53.0 9.3 12.5 1.9 15.4 23.5 1.4 5.4
Equity Shares (m) 29.8
52-Week Range 893/580
1,6,12 Rel. Perf. (%) 8/-2/-44
M.Cap. (Rs b) 19.72
M.Cap. (US$ b) 0.5
QUARTERLY PERFORMANCE (RS MILLION)Y/E NOVEMBER FY07 FY08E FY07 FY08E
1Q 2Q 3Q 4Q 1Q 2Q 3Q 4QNet Revenues 1,603 1,703 1,800 1,834 1,544 1,678 1,828 1,856 6,939 6,907
YoY Change (%) 4.4 -1.5 -3.0 3.9 -3.6 -1.4 1.6 1.2 1.2 -0.5Total Expenditure 1,176 1,295 1,327 1,586 1,166 1,248 1,290 1,486 5,383 5,189EBITDA 427 408 474 248 379 430 538 371 1,556 1,718
Margins (%) 26.6 24.0 26.3 13.5 24.5 25.6 29.4 20.0 22.4 24.9Depreciation 27 30 23 15 22 33 35 48 96 139Interest 0 0 0 0 0 0 0 0 0 0Other Income 67 118 130 163 140 160 150 184 478 634PBT before EO Items 467 496 580 395 497 557 653 507 1,938 2,213EO Expense/(Income) 26 -2,711 96 26 -2,099 20 20 -12 -2,563 -2,071PBT after EO items 441 3,207 484 369 2,596 537 633 518 4,501 4,284Tax 158 629 176 149 667 186 220 33 1,112 1,107Deferred Tax 0 0 0 0 0 0 0 89 0 89
Rate (%) 35.9 19.6 36.3 40.2 25.7 34.7 34.7 23.5 24.7 27.9Reported PAT 283 2,578 308 221 1,929 350 413 396 3,389 3,089
YoY Change (%) 14.1 618.2 9.8 29.7 582.3 -86.4 34.0 79.5 220.6 -8.9PAT adj. for Excep Items 305 324 379 259 325 364 427 331 1,267 1,447
YoY Change (%) 5.2 11.6 17.2 13.2 6.4 12.2 12.7 28.1 4.8 14.2Margins (%) 19.0 19.1 21.1 14.1 21.0 21.7 23.4 17.9 18.3 21.0
E: MOSt Estimates; FY08 estimates adjusted for consumer healthcare divestment. Historic numbers include consumer healthcare
NeutralPrevious Recommendation: Neutral Rs661
28 March 2008BLOOMBERGPFIZ IN
REUTERS CODEPFIZ.BO
Results PreviewSECTOR: PHARMACEUTICALS
Nimish Desai ([email protected]); Tel: +91 22 39825406/Jinesh K Gandhi ([email protected]); Tel +91 22 39825416
STOCK INFO.BSE Sensex: 16,371
S&P CNX: 4,942
? Pfizer’s revenues for 2QFY08 (year end November 2008) are expected to de-grow by 1.4% to Rs1.7b, reflectingpart divestment of the consumer healthcare brands and sale/discontinuation of certain products like Protinex, Abdecand Pyridium.
? Pfizer recently announced the long-pending divestment of its consumer business to J&J. The company has sold theexclusive licenses relating to some of its consumer brands (Benadryl, Caladryl, Benylin and Listerine) and certainrelated assets for a total consideration of Rs2.14b. It has retained one of the key brands - Gelusil with revenues ofabout Rs500m - within the company. The consumer business generates annualized sales of about Rs1.1b with thedivested brands contributing about Rs0.5-0.6b.
? While valuations at 13.6x FY08E and 12.5x FY09E (after adjusting for a divestment of the Consumer Healthcaredivision in FY08E) do not adequately reflect Pfizer’s business fundamentals, uncertainty still exists on the existenceof the parent’s 100% subsidiary and potential launch of patented products through this company. We maintain Neutralrating.

23928 March 2008
Ranbaxy Laboratories
Equity Shares (m) 372.7
52-Week Range (Rs) 490/300
1,6,12 Rel. Perf. (%) 7/6/3
M.Cap. (Rs b) 163.6
M.Cap. (US$ b) 4.1
QUARTERLY PERFORMANCE (RS MILLION)Y/E DECEMBER CY07 CY08E CY07 CY08E
1Q 2Q 3Q 4Q 1Q 2Q 3Q 4QNet Income 15,821 16,853 17,746 19,007 17,488 17,924 19,323 20,822 69,427 75,557
YoY Change (%) 22.4 15.7 10.3 7.0 10.5 6.4 8.9 9.6 13.2 8.8EBITDA 1,908 2,265 2,847 2,961 2,413 2,599 3,285 3,661 9,981 11,958
Margins (%) 12.1 13.4 16.0 15.6 13.8 14.5 17.0 17.6 14.4 15.8Depreciation 557 565 613 493 630 658 712 740 2,228 2,740Interest 313 351 394 385 418 418 387 325 1,443 1,547Other Income 604 2,051 543 196 -22 1,902 80 178 3,394 2,138PBT before EO Expense 1,642 3,400 2,383 2,279 1,344 3,426 2,265 2,774 9,704 9,809Extra-Ord Expense 0 0 -223 -44 0 0 0 0 -267 0PBT after EO Expense 1,642 3,400 2,606 2,323 1,344 3,426 2,265 2,774 9,971 9,809Tax 355 738 516 461 296 754 453 459 2,070 1,962
Rate (%) 21.6 21.7 19.8 19.8 22.0 22.0 20.0 16.6 20.8 20.0Reported PAT 1,287 2,662 2,090 1,862 1,048 2,672 1,812 2,315 7,901 7,847Minority Interest 11 27 0 0 10 11 10 9 38 40Adj PAT after Minority Int. 1,276 2,635 1,911 1,818 1,038 2,662 1,802 2,306 7,651 7,807
YoY Change (%) 78.7 117.6 21.7 -0.8 -18.7 1.0 -5.7 26.8 49.9 2.0Margins (%) 8.1 15.6 10.8 9.6 5.9 14.8 9.3 11.1 11.0 10.3
E: MOSt Estimates
BuyPrevious Recommendation: Buy Rs439
28 March 2008BLOOMBERGRBXY IN
REUTERS CODERANB.BO
YEAR NET SALES PAT EPS EPS P/E P/BV ROE ROCE EV/ EV/END* (RS M) (RS M) (RS) GROWTH (%) (X) (X) (%) (%) SALES EBITDA12/06A 61,377 5,103 12.8 135.8 34.4 6.4 19.8 11.4 3.3 22.7
12/07A 69,427 7,689 19.2 50.7 22.8 5.5 25.9 11.2 2.8 19.5
12/08E* 75,557 7,807 19.5 1.5 22.5 4.9 23.2 12.3 2.5 15.7
12/09E* 87,794 8,893 22.2 13.9 19.7 4.3 23.3 14.7 2.1 12.6
Results PreviewSECTOR: PHARMACEUTICALS
Nimish Desai ([email protected]); Tel: +91 22 39825406/Jinesh K Gandhi ([email protected]); Tel +91 22 39825416
* Excludes upsides from FTF products
STOCK INFO.BSE Sensex: 16,371
S&P CNX: 4,942
? Ranbaxy is expected to report 10.5% YoY growth in revenues to Rs17.4b in 1QCY08 mainly impacted by currencyappreciation. In fact, in US$-terms, revenues are expected to grow by 21% driven primarily by higher growth insemi-regulated markets and a recovery in the US portfolio (led by new launches).
? EBIDTA margins are expected to improve by 170bp to 13.8% due to higher traction in semi-regulated markets,which enjoy higher margins and forward cover gains.
? Higher interest cost (up 33%) coupled with lower other income (mainly due to translation losses on FCCB) is likelyto result in PAT de-growth of 18.7% to Rs1b for the quarter.
? We believe that the worst is over for Ranbaxy and expect a gradual improvement in performance. Ranbaxy’s currentstock price is not factoring-in the potential leverage arising out of a strong product pipeline, the profitable growth fromsemi-regulated markets, value unlocking from its Para-IV pipeline and the incremental upsides from a potential de-merger of NCE/NDDS research (incremental EPS of Rs1.5/share). Ranbaxy is currently valued at 22.5x CY08Eand 19.7x CY09E earnings (excluding patent challenge upsides). An appreciating currency and possibility of expensiveacquisitions remain key risks. Our estimates do not include upsides from FTF opportunities. Reiterate Buy.
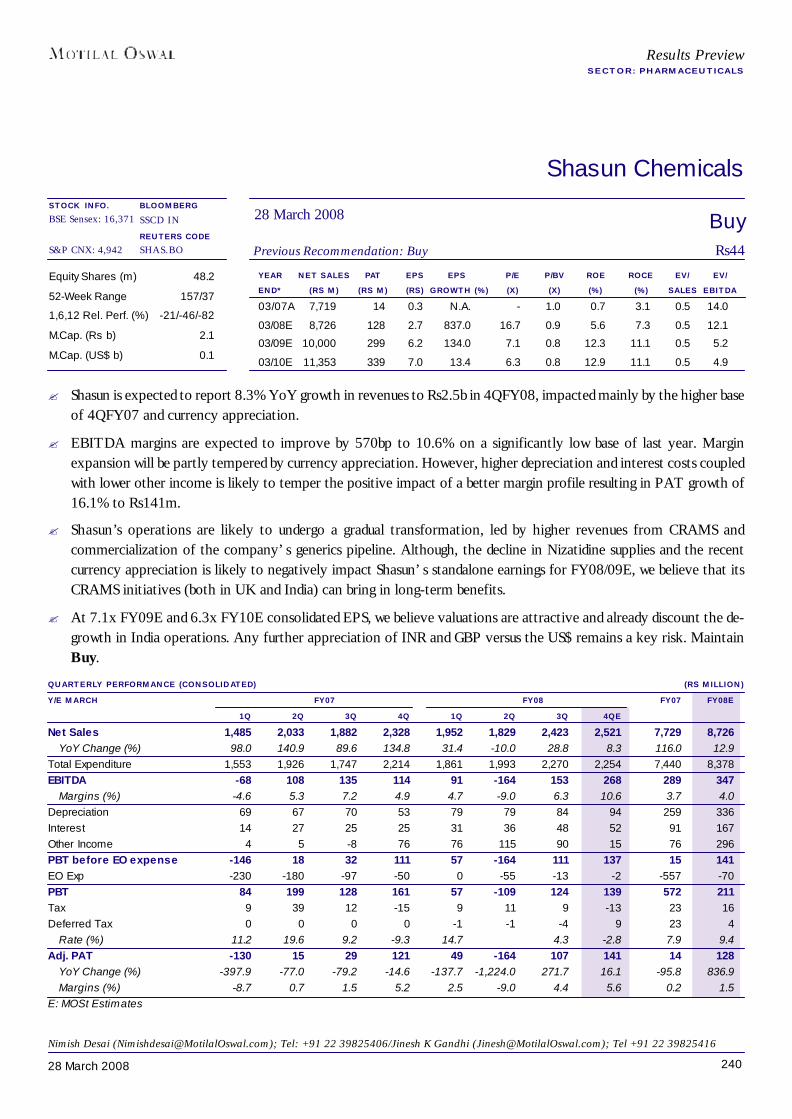
24028 March 2008
Shasun Chemicals
YEAR NET SALES PAT EPS EPS P/E P/BV ROE ROCE EV/ EV/END* (RS M) (RS M) (RS) GROWTH (%) (X) (X) (%) (%) SALES EBITDA03/07A 7,719 14 0.3 N.A. - 1.0 0.7 3.1 0.5 14.0
03/08E 8,726 128 2.7 837.0 16.7 0.9 5.6 7.3 0.5 12.1
03/09E 10,000 299 6.2 134.0 7.1 0.8 12.3 11.1 0.5 5.2
03/10E 11,353 339 7.0 13.4 6.3 0.8 12.9 11.1 0.5 4.9
Equity Shares (m) 48.2
52-Week Range 157/37
1,6,12 Rel. Perf. (%) -21/-46/-82
M.Cap. (Rs b) 2.1
M.Cap. (US$ b) 0.1
QUARTERLY PERFORMANCE (CONSOLIDATED) (RS MILLION)Y/E MARCH FY07 FY08 FY07 FY08E
1Q 2Q 3Q 4Q 1Q 2Q 3Q 4QENet Sales 1,485 2,033 1,882 2,328 1,952 1,829 2,423 2,521 7,729 8,726
YoY Change (%) 98.0 140.9 89.6 134.8 31.4 -10.0 28.8 8.3 116.0 12.9Total Expenditure 1,553 1,926 1,747 2,214 1,861 1,993 2,270 2,254 7,440 8,378EBITDA -68 108 135 114 91 -164 153 268 289 347
Margins (%) -4.6 5.3 7.2 4.9 4.7 -9.0 6.3 10.6 3.7 4.0Depreciation 69 67 70 53 79 79 84 94 259 336Interest 14 27 25 25 31 36 48 52 91 167Other Income 4 5 -8 76 76 115 90 15 76 296PBT before EO expense -146 18 32 111 57 -164 111 137 15 141EO Exp -230 -180 -97 -50 0 -55 -13 -2 -557 -70PBT 84 199 128 161 57 -109 124 139 572 211Tax 9 39 12 -15 9 11 9 -13 23 16Deferred Tax 0 0 0 0 -1 -1 -4 9 23 4
Rate (%) 11.2 19.6 9.2 -9.3 14.7 4.3 -2.8 7.9 9.4Adj. PAT -130 15 29 121 49 -164 107 141 14 128
YoY Change (%) -397.9 -77.0 -79.2 -14.6 -137.7 -1,224.0 271.7 16.1 -95.8 836.9Margins (%) -8.7 0.7 1.5 5.2 2.5 -9.0 4.4 5.6 0.2 1.5
E: MOSt Estimates
BuyPrevious Recommendation: Buy Rs44
28 March 2008BLOOMBERGSSCD IN
REUTERS CODESHAS.BO
Results PreviewSECTOR: PHARMACEUTICALS
Nimish Desai ([email protected]); Tel: +91 22 39825406/Jinesh K Gandhi ([email protected]); Tel +91 22 39825416
STOCK INFO.BSE Sensex: 16,371
S&P CNX: 4,942
? Shasun is expected to report 8.3% YoY growth in revenues to Rs2.5b in 4QFY08, impacted mainly by the higher baseof 4QFY07 and currency appreciation.
? EBITDA margins are expected to improve by 570bp to 10.6% on a significantly low base of last year. Marginexpansion will be partly tempered by currency appreciation. However, higher depreciation and interest costs coupledwith lower other income is likely to temper the positive impact of a better margin profile resulting in PAT growth of16.1% to Rs141m.
? Shasun’s operations are likely to undergo a gradual transformation, led by higher revenues from CRAMS andcommercialization of the company’s generics pipeline. Although, the decline in Nizatidine supplies and the recentcurrency appreciation is likely to negatively impact Shasun’s standalone earnings for FY08/09E, we believe that itsCRAMS initiatives (both in UK and India) can bring in long-term benefits.
? At 7.1x FY09E and 6.3x FY10E consolidated EPS, we believe valuations are attractive and already discount the de-growth in India operations. Any further appreciation of INR and GBP versus the US$ remains a key risk. MaintainBuy.

24128 March 2008
Sun Pharmaceuticals Industries
YEAR NET SALES PAT EPS EPS P/E P/BV ROE ROCE EV/ EV/END (RS M) (RS M) (RS) GROWTH (%) (X) (X) (%) (%) SALES EBITDA03/07A 20,792 7,842 37.9 36.8 33.0 8.7 35.9 22.7 11.4 35.2
03/08E 27,333 9,923 47.9 26.5 26.1 5.3 26.0 24.8 7.7 19.1
03/09E 30,743 10,055 48.5 1.3 25.8 4.5 19.0 20.1 6.7 19.0
03/10E 36,704 11,858 57.3 17.9 21.9 3.9 19.1 20.2 5.3 15.3
Equity Shares (m) 193.4
52-Week Range 1,352/886
1,6,12 Rel. Perf. (%) 8/35/-2
M.Cap. (Rs b) 242.0
M.Cap. (US$ b) 6.1
QUARTERLY PERFORMANCE (CONSOLIDATED) (RS MILLION)Y/E MARCH FY07 FY08 FY07 FY08E
1Q 2Q 3Q 4Q 1Q 2Q 3Q 4QENet Revenues 4,987 5,239 5,263 5,313 6,153 6,465 7,902 6,812 20,792 27,333
YoY Change (%) 31.8 27.4 24.2 33.5 23.4 23.4 50.1 28.2 30.4 31.5EBITDA 1,811 1,708 1,733 1,545 2,148 2,409 3,547 2,984 6,798 11,088
Margins (%) 36.3 32.6 32.9 29.1 34.9 37.3 44.9 43.8 32.7 40.6Depreciation 202 204 212 201 226 230 245 259 818 959Net Other Income 274 402 636 942 606 111 179 -187 2,253 709PBT 1,883 1,906 2,157 2,286 2,528 2,290 3,481 2,538 8,233 10,837Tax 2 -22 -29 -18 98 1 116 56 -67 271
Rate (%) 0.1 -1.1 -1.3 -0.8 3.9 0.0 3.3 2.2 -0.8 2.5Profit after Tax 1,882 1,928 2,186 2,304 2,430 2,289 3,365 2,482 8,300 10,566Share of Minority Partner 115 64 198 183 158 104 181 200 559 643Adj Net Profit 1,767 1,864 1,989 2,121 2,272 2,185 3,184 2,282 7,741 9,923
YoY Change (%) 29.9 26.1 35.8 48.4 28.6 17.2 60.1 7.6 35.0 28.2Margins (%) 35.4 35.6 37.8 39.9 36.9 33.8 40.3 33.5 37.2 36.3
E: MOSt Estimates; Quaterly results have been recasted and hence do not tally with full year results
BuyPrevious Recommendation: Buy Rs1,251
28 March 2008BLOOMBERGSUNP IN
REUTERS CODESUN.BO
Results PreviewSECTOR: PHARMACEUTICALS
Nimish Desai ([email protected]); Tel: +91 22 39825406/Jinesh K Gandhi ([email protected]); Tel +91 22 39825416
STOCK INFO.BSE Sensex: 16,371
S&P CNX: 4,942
? Sun’s 4QFY08 revenues are expected to grow by 28% YoY to Rs6.8b, driven by 36% YoY growth in internationalsales and 18.4% growth in domestic sales.
? EBITDA margins are expected to improve by 1470bp to 43.8% due to lower material and R&D expenses (due to de-merger of NCE research) and Oxcarbazepine sales in the US, which currently enjoy the benefit of limited competition.However, lower other income and higher tax outgo (tax rate of 2.2% of PBT v/s tax writeback for 3QFY07) is likelyto temper down PAT growth to 7.6% to Rs2.2b.
? Our estimates do not include upsides from the January 2008 launch of generic Protonix (Pantoprazole)under shared exclusivity with Teva. Since Teva had launched its version much before SPIL’s launch, we believethat the latter will take time to ramp-up market share and hence we expect the company to record only US$10-15min sales from this exclusivity-based product in 4QFY08.
? SPIL’s ability to sustain high growth rates at superior margins even on a high base is a clear positive. With thedomestic business progressing well and increasing traction on the US front (both in Caraco and from India), thepossibility of a rapid scale-up over the next couple of years is high. While valuations at 25.8x FY09E and 21.9xFY10E EPS (excl. Taro acquisition) appear rich, they do not fully factor in ramp-up in the US and the expected valueunlocking by leveraging acquired companies (Taro, Able Labs & Valeant). Stock performance in the short term mayremain muted until further clarity on the Taro acquisition emerges. Maintain Buy.

24228 March 2008
Results PreviewSECTOR: PHARMACEUTICALS
Wockhardt
YEAR NET SALES PAT EPS EPS P/E P/BV ROE ROCE EV/ EV/END (RS M) (RS M) (RS) GROWTH (%) (X) (X) (%) (%) SALES EBITDA12/06A 17,290 2,558 21.4 -0.5 12.5 2.7 27.2 15.0 2.3 9.8
12/07E 26,531 3,459 29.0 35.3 9.2 2.1 28.5 16.9 1.8 7.4
12/08E 33,892 3,984 33.4 15.2 8.0 1.7 26.0 17.2 1.4 6.0
12/09E 38,067 4,550 38.1 14.2 7.0 1.4 24.1 17.1 1.1 5.1
Equity Shares (m) 109.4
52-Week Range 448/245
1,6,12 Rel. Perf. (%) -12/-31/-60
M.Cap. (Rs b) 29.2
M.Cap. (US$ b) 0.7
QUARTERLY PERFORMANCE (CONSOLIDATED ) (RS MILLION)Y/E DECEMBER CY07 CY08E CY07 CY08E
1Q 2Q 3Q 4Q 1Q 2Q 3Q 4QEGross Sales 5,228 6,303 7,381 7,620 7,945 7,855 8,993 9,099 26,531 33,892
YoY Change (%) 48.7 52.7 68.6 44.7 52.0 24.6 21.8 19.4 53.4 27.7Total Expenditure 4,069 4,781 5,572 5,719 6,110 6,090 6,840 7,058 20,141 26,098EBITDA 1,159 1,522 1,809 1,901 1,835 1,765 2,153 2,041 6,390 7,794
Margins (%) 22.2 24.1 24.5 24.9 23.1 22.5 23.9 22.4 24.1 23.0Depreciation 181 172 196 236 260 280 285 287 785 1,112Interest 129 85 268 492 435 300 300 168 974 1,203Other Income 22 25 26 37 30 25 30 51 110 136PBT before EO Items 871 1,290 1,371 1,210 1,170 1,210 1,598 1,636 4,741 5,614EO Income 0 0 0 0 0 0 0 0 0 0PBT after EO Items 871 1,290 1,371 1,210 1,170 1,210 1,598 1,636 4,741 5,614Tax 208 266 288 155 260 226 360 333 917 1,179
Rate (%) 23.9 20.6 21.0 12.8 22.2 18.7 22.5 20.4 19.3 21.0Reported PAT 663 1,024 1,083 1,055 910 984 1,238 1,303 3,824 4,435R&D Capitalized 180 170 180 118 180 170 180 270 648 800Adjusted PAT 552 870 972 997 799 880 1,127 1,152 3,459 3,984
YoY Change (%) 1.8 37.2 53.0 29.2 44.7 1.2 15.9 15.5 35.2 15.2Margins (%) 10.6 13.8 13.2 13.1 10.1 11.2 12.5 12.7 13.0 11.8
E: MOSt Estimates; Quarterly numbers don’t add up to annual numbers due to re-classification
NeutralPrevious Recommendation: Neutral Rs267
28 March 2008BLOOMBERGWOCK IN
REUTERS CODEWCKH.BO
Nimish Desai ([email protected]); Tel: +91 22 39825406/Jinesh K Gandhi ([email protected]); Tel +91 22 39825416
STOCK INFO.BSE Sensex: 16,371
S&P CNX: 4,942
? Wockhardt’s 1QCY08 revenues are expected to grow by 52% YoY to Rs7.9b, driven by higher growth in domesticbusiness and consolidation of Negma acquisition.
? EBITDA margins are expected to improve by 110bp to 23.1% on a low base of 1QCY07. While the company hascommenced capitalizing a part of its R&D expenses beginning 3QCY06, we continue to expense R&D costs fully.Higher interest costs (linked to acquisitions) will restrict adjusted PAT growth to 45% YoY at Rs799m. Reported PATgrowth is expected to be higher due to R&D capitalization.
? We believe that Wockhardt still has to display the ability to fully leverage its assets (particularly the biotech facilities)and scale up substantially in regulated markets, for a further re-rating in its valuation multiples. While valuations at 8xCY08E and 7x CY09E fully diluted earnings appear cheap, they do not take into account the proposed US$200m ofequity dilution (28% of current market capitalization). Maintain Neutral.
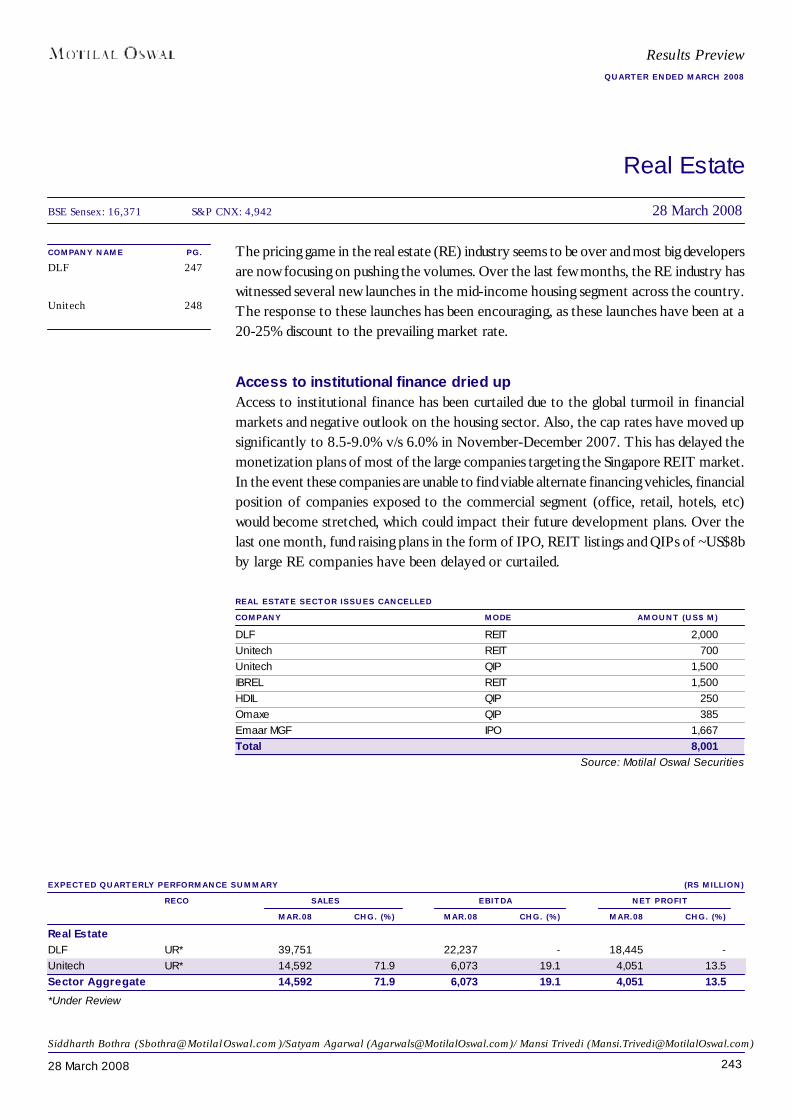
24328 March 2008
Real Estate
Siddharth Bothra ([email protected])/Satyam Agarwal ([email protected])/ Mansi Trivedi ([email protected])
BSE Sensex: 16,371 S&P CNX: 4,942 28 March 2008
Results PreviewQUARTER ENDED MARCH 2008
EXPECTED QUARTERLY PERFORMANCE SUMMARY (RS MILLION)RECO SALES EBITDA NET PROFIT
MAR.08 CHG. (%) MAR.08 CHG. (%) MAR.08 CHG. (%)Real EstateDLF UR* 39,751 22,237 - 18,445 -Unitech UR* 14,592 71.9 6,073 19.1 4,051 13.5Sector Aggregate 14,592 71.9 6,073 19.1 4,051 13.5
The pricing game in the real estate (RE) industry seems to be over and most big developersare now focusing on pushing the volumes. Over the last few months, the RE industry haswitnessed several new launches in the mid-income housing segment across the country.The response to these launches has been encouraging, as these launches have been at a20-25% discount to the prevailing market rate.
Access to institutional finance dried upAccess to institutional finance has been curtailed due to the global turmoil in financialmarkets and negative outlook on the housing sector. Also, the cap rates have moved upsignificantly to 8.5-9.0% v/s 6.0% in November-December 2007. This has delayed themonetization plans of most of the large companies targeting the Singapore REIT market.In the event these companies are unable to find viable alternate financing vehicles, financialposition of companies exposed to the commercial segment (office, retail, hotels, etc)would become stretched, which could impact their future development plans. Over thelast one month, fund raising plans in the form of IPO, REIT listings and QIPs of ~US$8bby large RE companies have been delayed or curtailed.
REAL ESTATE SECTOR ISSUES CANCELLEDCOMPANY MODE AMOUNT (US$ M)DLF REIT 2,000Unitech REIT 700Unitech QIP 1,500IBREL REIT 1,500HDIL QIP 250Omaxe QIP 385Emaar MGF IPO 1,667Total 8,001
Source: Motilal Oswal Securities
COMPANY NAME PG.DLF 247
Unitech 248
*Under Review

24428 March 2008
Possible price correction in RE pricesThe festival period of November-February 2008 (comprising Dassera, Diwali, Christmas,and marriage season) was supposed to be the acid test for the RE industry, as developershave been holding on to prices for almost a year now, even though the transactions havedried up considerably. Our feedback suggests that demand pick up during the last fewmonths has not met the expectations of developers in several markets. Hence developers,who are now desperate for a pick up in volumes to meet their inventory pile up, couldresort to moderation of RE prices in the near term. This could negatively impact all REplayers, especially those who have higher exposure to the middle income residential segment.
Wave towards mid-housingOver the last few months, large real estate (RE) players have launched projects classifiedas affordable housing, mid-income housing or low-income housing. They have pricedproperties under these projects at 20-25% discount to the prices prevailing in the surroundingareas, and have received encouraging response from the market. We believe that thistrend is more than just product re-classification and signals price corrections in the REmarket. Considering the current slowdown in volumes and stringent financing norms, wealso expect the proportion of plots in the development plans of RE players to increase, asplots offer the advantage of early monetization.
Sufficient demand, but at lower pricesDLF started the trend in 3QFY08 by launching mid-income housing projects across severalcities such as Chennai, Gurgaon and Kolkata. Unitech followed by launching its mid-income housing in Greater Noida, where the marketing is directly done by the companyand not through brokers or any other channels.
MID-INCOME RESIDENTIAL LAUNCHES BY MAJOR RE PLAYERSLOCATION PROJECT TOTAL SOLD SOLD SOFT OFFICIAL BASE RATE
UNITS UNITS (%) LAUNCH LAUNCH (RS/SF)DLFKolkata New Town Heights 798 748 93.7 26th Nov 07 18th Jan-08 3,275
Rs2,500/sfKochi DLF Riverside 176 96 55.0 - - 3,495Chennai DLF Garden City, OMR 3,500 2,800 80.0 8-18th Jan Feb-08 3,400
Rs2,700/sfGurgaon New Town Heights, 1,000 1,000 100.0 - Feb-08 2,350
Sector 90, Nr ManesarUnitechGreater Noida Greater Noida - - - March 08 - 2,700
Rs2,700/sfPuravankaraChennai Purva Windemere 2,092 300 14.3 14th Jan 08 Apr-08 3,050
Palikarni nr Vellachari Rs2,790/sfSource: Industry/Motilal Oswal Securities
Mid-income housing –catalyst to boost thedampened volumes in
RE sector
~550 units sold in two days
Sold out within hoursof launch
Real Estate

24528 March 2008
Both DLF and Unitech’s mid-income residential projects have received good response.DLF’s mid-income housing project consisting of 1,000 apartments in Gurgaon was fullysold within hours of its launch and the next 1,000 apartments are expected to be launchedsoon. DLF’s project in Kolkata also received a good response with Phase I, consisting of550 units, being sold in just two days time. Almost ~94% of Phase II of this project hasbeen sold.
DLF also made an aggressive entry in Chennai by launching apartments at rates ~20%lower than rates quoted by competitors in the same region and its project is ~80% sold.We believe other developers would also launch similar products going forward, mainly onaccount of the huge demand potential in the mid-income housing segment.
Expect greater focus on plotsMost of the real estate companies have majority of their residential plans focused onapartments, which enjoy very high realizations, and very little exposure to plots. However,considering the current slowdown in the RE industry, we believe RE players may shiftfocus from apartments to plot developments, as they offer early monetization. However,as plots do not attract lucrative returns like FSI development, the NAVs for RE companiesare expected to plummet with change in development plans skewed towards plots.
PLOTS AS % OF TOTAL RESIDENTIAL (MSF)COMPANY TOTAL RESIDENTIAL PLOTS PLOTS AS % OF
DEVELOPMENT PLANS TOTAL RESIDENTIALDLF 492.0 110.0 * 22.4Unitech 519.5 34.5 6.6Sobha 106.0 26.0 24.5Parsvnath 112.0 29.0 25.9Omaxe 122.8 32.1 26.2Puravankara 113.0 0.0 0.0Ansal Property 111.0 77.0 69.4Emaar MGF 435.0 135.0 31.0Total 1,933.3 447.6 23.2* as per July 2007 presentation Source: Company/Motilal Oswal Securities
Real Estate
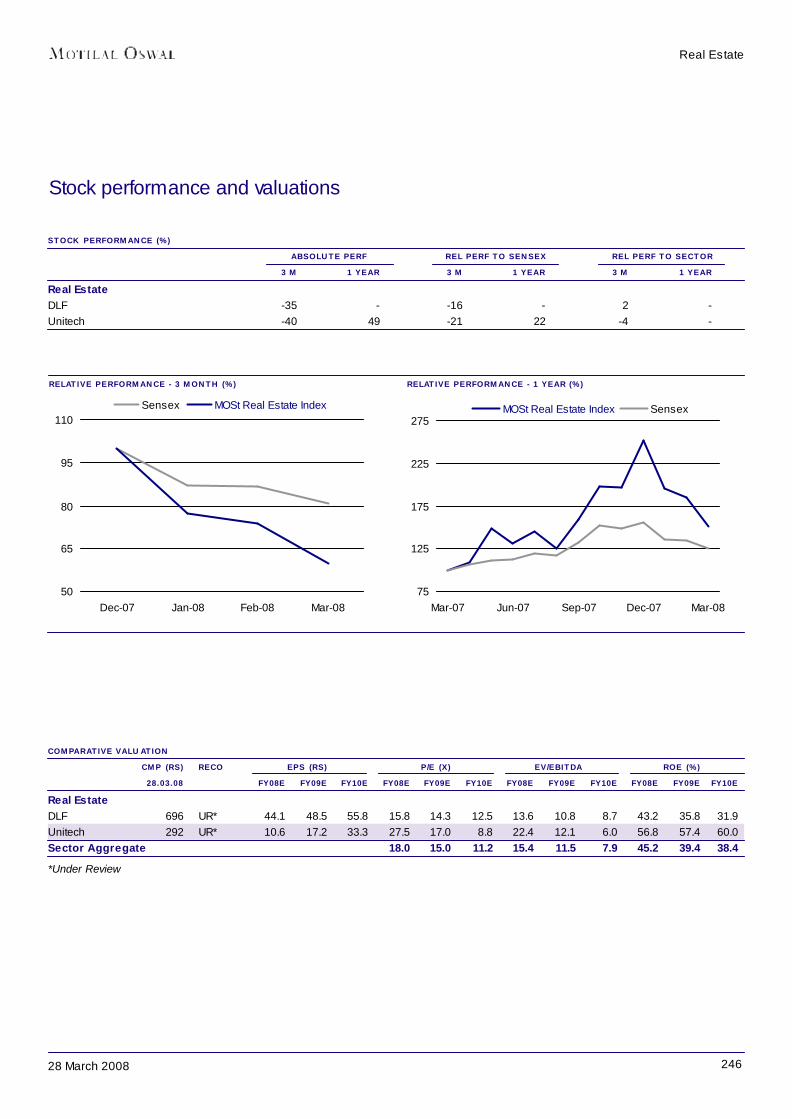
24628 March 2008
RELATIVE PERFORMANCE - 3 MONTH (%) RELATIVE PERFORMANCE - 1 YEAR (%)
Stock performance and valuations
STOCK PERFORMANCE (%) ABSOLUTE PERF REL PERF TO SENSEX REL PERF TO SECTOR
3 M 1 YEAR 3 M 1 YEAR 3 M 1 YEARReal EstateDLF -35 - -16 - 2 -Unitech -40 49 -21 22 -4 -
75
125
175
225
275
Mar-07 Jun-07 Sep-07 Dec-07 Mar-08
MOSt Real Estate Index Sensex
50
65
80
95
110
Dec-07 Jan-08 Feb-08 Mar-08
Sensex MOSt Real Estate Index
Real Estate
COMPARATIVE VALUATIONCMP (RS) RECO EPS (RS) P/E (X) EV/EBITDA ROE (%)28.03.08 FY08E FY09E FY10E FY08E FY09E FY10E FY08E FY09E FY10E FY08E FY09E FY10E
Real EstateDLF 696 UR* 44.1 48.5 55.8 15.8 14.3 12.5 13.6 10.8 8.7 43.2 35.8 31.9Unitech 292 UR* 10.6 17.2 33.3 27.5 17.0 8.8 22.4 12.1 6.0 56.8 57.4 60.0Sector Aggregate 18.0 15.0 11.2 15.4 11.5 7.9 45.2 39.4 38.4
*Under Review

24728 March 2008
Results PreviewSECTOR: REAL ESTATE
DLF
YEAR NET SALES PAT EPS* EPS P/E* P/BV ROE ROCE EV/ EV/END (RS M) (RS M) (RS) GROWTH (%) (X) (X) (%) (%) SALES EBITDA3/07A 26,344 19,366 12.7 56.2 54.7 26.8 49.0 30.0 32.5 45.4
3/08E 138,972 75,259 44.1 247.4 15.8 6.8 43.2 45.9 9.0 13.6
3/09E 185,769 82,736 48.5 9.9 14.3 5.1 35.8 38.7 6.4 10.8
3/10E 195,252 95,087 55.8 14.9 12.5 4.0 31.9 39.3 5.7 8.7
Equity Shares (m) 1,704.8
52-Week Range 1,225/506
1,6,12 Rel. Perf. (%) -5/-3/-
M.Cap. (Rs b) 1,186.0
M.Cap. (US$ b) 29.7
Under ReviewPrevious Recommendation: Buy Rs696
28 March 2008BLOOMBERGDLFU IN
REUTERS CODEDLF.BO
Siddharth Bothra ([email protected])/Satyam Agarwal ([email protected])/ Mansi Trivedi ([email protected])
STOCK INFO.BSE Sensex: 16,371
S&P CNX: 4,942
QUARTERLY PERFORMANCE (RS MILLION)Y/E MARCH FY08 FY07 FY08E
1Q 2Q 3Q 4QESales 30,738 32,499 35,984 39,751 26,344 138,972
Change (%) 427.5Total Expenditure 8,699 9,863 10,970 17,514 11,477 47,046Cost of land/construction 7,263 8,326 9,512 15,964 6,394 41,065Staff Cost 526 606 609 639 1,051 2,380Others 909 930 850 911 4,032 3,600EBITDA 22,039 22,637 25,014 22,237 14,866 91,926
As % of Sales 71.7 69.7 69.5 55.94 56.4 66.1Depreciation 166 110 148 193 578 616Interest 1,077 36 788 935 3,076 2,837Other Income 472 993 528 438 14,190 2,431PBT 21,268 23,484 24,606 21,547 25,402 90,905Tax 6,024 3301 3,218 3,102 6,036 15,645
Effective Tax Rate (%) 28.3 14.1 13.1 14.40 23.8 17.2Reported PAT 15,244 20,182 21,389 18,445 19,366 75,259Minority Interest 4.3Adj. PAT 15,244 20,182 21,450 18,445 19366 75,259E: MOSt Estimates; Comparable quarterly numbers are not available, as 1QFY08 is the first quarter post listing
? We expect DLF to report a robust performance in 4QFY08 with revenue of Rs39.8b and net profit of Rs18.4b (noYoY comparison available). We estimate EBITDA margin to reduce 1,357bp at 56%, mainly owing to change in itsproduct offering (mid-income housing).
? During 4QFY08, DLF successfully launched mid-income residential apartments, ranging from Rs4.5m to Rs7.5m/unit, in Kolkata, Kochi, Chennai and Gurgaon. The company has successfully sold ~4,700 units during 4QFY08 atthese locations.
? New projects are expected to be launched in Chandigarh, Hyderabad, Bangalore, Kochi, Jaipur and Lucknow overthe next few quarters.
? We estimate DLF’s revenue to increase from Rs26.3b in FY07 to Rs195.3b in FY10, a CAGR of 94.5% and netprofit to increase from Rs19.4b in FY07 to Rs95.1b in FY10, a CAGR of 69.8%.
? Our FY10 NAV for DLF is Rs624/share. The residential vertical accounts for ~36% of GAV, commercial ~28% ofGAV and retail ~25% of GAV.

24828 March 2008
Results PreviewSECTOR: REAL ESTATE
Unitech
YEAR NET SALES PAT EPS EPS P/E P/BV ROE ROCE EV/ EV/END (RS M) (RS M) (RS) GROWTH (%) (X) (X) (%) (%) SALES EBITDA3/07A 32,883 13,055 8.1 1,846.7 36.2 11.9 65.7 46.5 15.8 25.9
3/08E 44,804 17,052 10.6 31.6 27.5 15.6 56.8 28.1 11.7 22.4
3/09E 72,894 27,582 17.2 62.0 17.0 9.7 57.4 41.3 6.5 12.1
3/10E 144,288 53,640 33.3 93.8 8.8 5.3 60.0 64.8 3.1 6.0
Equity Shares (m) 1,623.4
52-Week Range 547/165
1,6,12 Rel. Perf. (%) -14/0/22
M.Cap. (Rs b) 473.5
M.Cap. (US$ b) 11.9
Under ReviewPrevious Recommendation: Buy Rs292
28 March 2008BLOOMBERGUT IN
REUTERS CODEUNTE.BO
Siddharth Bothra ([email protected])/Satyam Agarwal ([email protected])/ Mansi Trivedi ([email protected])
STOCK INFO.BSE Sensex: 16,371
S&P CNX: 4,942
QUARTERLY PERFORMANCE (RS MILLION)Y/E MARCH FY08 FY07 FY08E
1Q 2Q 3Q 4QESales 8,656 10,135 11,421 14,592 33,183 44,804
Change (%) 223.3 135.4 13.9 71.9 114.6 35.0Total Expenditure 3,651 5,064 4,077 8,519 12,865 21,311EBITDA 5,005 5,071 7,344 6,073 20,318 23,492
Change (%) 558.6 259.5 5.7 19.1As of % Sales 57.8 50.0 64.3 41.6 61.2 52.4
Depreciation 32 30 55 60 80 176Interest 601 790 980 1,021 3,020 3,391Other Income 341 508 230 385 700 1,463PBT 4,714 4,759 6,539 5,377 17,919 21,389Tax 1,044 660 1,307 1,326 4,864 4,336
Effective Tax Rate (%) 22.1 13.9 20.0 24.7 27.1 20.3Reported PAT 3,670 4,099 5,232 4,051 13,055 17,052Adj PAT 3,670 4,099 5,232 4,051 13,055 17,052
Change (%) 396.0 296.3 15.7 13.5 206.7 31.6E: MOSt Estimates;*Standalone, # Consolidated
? We expect Unitech to report revenue of Rs14.6b (up 72% YoY) and net profit of Rs4.1b (up 13.5% YoY) in4QFY08. We expect EBITDA margin at 41.6% in 4QFY08, 2,270bp lower than 64.3% in 3QFY08.
? During 4QFY08, Unitech announced its new land bank and development plans. Its land bank has increased from14,638 acres to 18,512 acres between September 2006 to January 2008 and its share has increased from 10,585acres to 13,763 acres over the same period. Unitech’s saleable area has increased from 472msf in September 2006to 690.3msf in January 2008 with increased focus on commercial offices and IT park development.
? Unitech has formed a JV christened Shivalik Ventures for its foray in the Mumbai RE market with two local Mumbaidevelopers - Rohan Group and Shivalik Ventures. While Unitech’s investment is ~Rs8b for its 50% stake in the JV,the other partners have transferred their land holdings as their consideration for their 50% stake in the JV.
? Unitech has shifted its focus towards affordable homes segment and launched projects starting at Rs3.5m/unit(1,200sf @Rs2,700/sf) in Greater Noida.
? Unitech has put its US$1.2b QIP on hold owing to the volatility in stock markets. This QIP was mainly to increase itsnet worth in order to qualify for project tenders floated by the government.
? We estimate Unitech’s revenues to increase from Rs32.9b in FY07 to Rs144.3b in FY10, a CAGR of 63.7% and netprofit to increase from Rs13b in FY07 to Rs53.6b in FY10, a CAGR of 60.2%. Our FY10E NAV for Unitech isRs315. The residential vertical accounts for ~39% of GAV, commercial ~27% of GAV and retail ~17% of GAV.

24928 March 2008
Retailing
COMPANY NAME PG.Pantaloon Retail 253
Shopper’s Stop 254
Titan Industries 255
EXPECTED QUARTERLY PERFORMANCE SUMMARY (RS MILLION)RECO SALES EBITDA NET PROFIT
MAR.08 CHG. (%) MAR.08 CHG. (%) MAR.08 CHG. (%)RetailingPantaloon Retail Buy 14,250 65.5 1,140 89.1 359 91.6Shopper’s Stop Neutral 2,876 33.8 174 14.6 18 -73.3Titan Industries Neutral 7,643 28.1 796 14.9 542 14.0Sector Aggregate 24,769 48.1 2,110 45.8 919 25.9
Organized retail is getting increasing acceptance by the consumers but opposition fromsmall retailers has intensified. The scale is delicately balanced with small retailers on oneside and farming community on the other; particularly as we are approaching generalelections in coming 9-12 months. Rising lease rentals, service tax, power tariff andmanpower costs are adding to the woes of the retailers. We foresee early phase ofconsolidation in the retail sector as large groups try to achieve critical scale. Specialtyformats are attracting heightened interest from both local and global players due tobetter brand recall. Long-term prospects for the sector remain bright, although shortterm cost pressures and other challenges remain. We maintain Pantaloon Retail as ourtop pick.
Income tax concessions to boost demandTax concessions given during Budget 2008 will lead to increase in disposable income.This augurs well for the organized retail as time spent by consumers inside malls hasbeen steadily increasing. Increase in time spent coupled with higher disposable incomecan convert a window shopper into a consumer. The increase in disposable income willincrease sales of general merchandise, clothing and other specialty segments like watches,furniture and fixture, footwear, books, music and durables. We don’t foresee much of animpact on the food and grocery segment where the overall sales increase might beconfined to upgrading and increased sales volume in processed foods.
CHANGE IN TAX SLAB (RS IN LAC)OLD SLABS % NEW SLABS %Rs110,000 to Rs150,000 10 Rs150,000 to Rs300,000 10Rs150,000 to Rs250,000 20 Rs300,000 to Rs500,000 20Rs250,000 and above 30 Rs500,000 and above 30
Source: Budget 2008
Amnish Aggarwal ([email protected])Tel:+9122 39825404/Amit Purohit ([email protected])Tel:+9122 39825418
BSE Sensex: 16,371 S&P CNX: 4,942 28 March 2008
Results PreviewQUARTER ENDED MARCH 2008
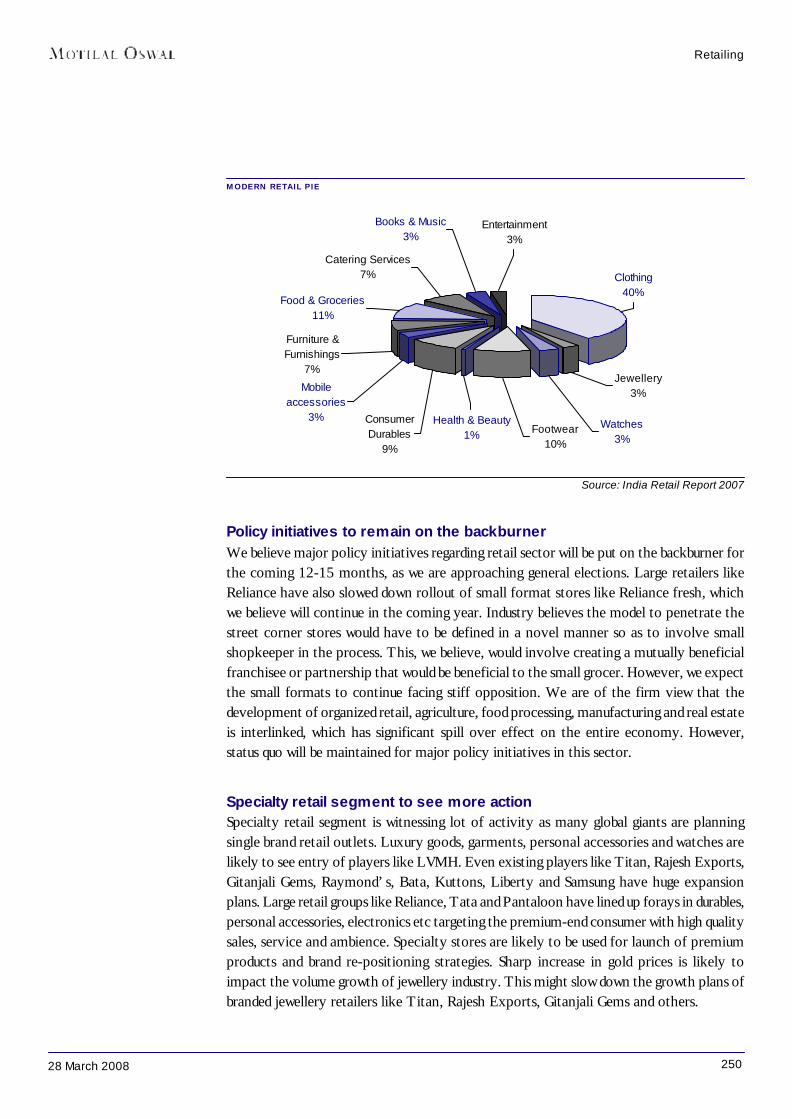
25028 March 2008
Source: India Retail Report 2007
Policy initiatives to remain on the backburnerWe believe major policy initiatives regarding retail sector will be put on the backburner forthe coming 12-15 months, as we are approaching general elections. Large retailers likeReliance have also slowed down rollout of small format stores like Reliance fresh, whichwe believe will continue in the coming year. Industry believes the model to penetrate thestreet corner stores would have to be defined in a novel manner so as to involve smallshopkeeper in the process. This, we believe, would involve creating a mutually beneficialfranchisee or partnership that would be beneficial to the small grocer. However, we expectthe small formats to continue facing stiff opposition. We are of the firm view that thedevelopment of organized retail, agriculture, food processing, manufacturing and real estateis interlinked, which has significant spill over effect on the entire economy. However,status quo will be maintained for major policy initiatives in this sector.
Specialty retail segment to see more actionSpecialty retail segment is witnessing lot of activity as many global giants are planningsingle brand retail outlets. Luxury goods, garments, personal accessories and watches arelikely to see entry of players like LVMH. Even existing players like Titan, Rajesh Exports,Gitanjali Gems, Raymond’s, Bata, Kuttons, Liberty and Samsung have huge expansionplans. Large retail groups like Reliance, Tata and Pantaloon have lined up forays in durables,personal accessories, electronics etc targeting the premium-end consumer with high qualitysales, service and ambience. Specialty stores are likely to be used for launch of premiumproducts and brand re-positioning strategies. Sharp increase in gold prices is likely toimpact the volume growth of jewellery industry. This might slow down the growth plans ofbranded jewellery retailers like Titan, Rajesh Exports, Gitanjali Gems and others.
Retailing
MODERN RETAIL PIE
Jewellery3%
Clothing40%
Footwear10%
Consumer Durables
9%
Watches3%
Mobile accessories
3%
Food & Groceries11%
Furniture & Furnishings
7%
Entertainment3%
Catering Services 7%
Books & Music3%
Health & Beauty 1%
25128 March 2008
Rising operating costs amid lack of pricing powerThe retail sector is reeling under all round cost escalation due to a combination of risinglease rentals, manpower, and power costs. Severe competition impairs the ability of theseplayers to increase gross margins. Real estate costs have been the major cost push factordue to:? 35-40% increase in lease rentals? Imposition of service tax on lease rentals; full set off is not available? Deposit costs for obtaining the lease has increased from an average of three months
of rentals to six months of rentals.? There is a delay of 9-12 months in getting the properties, even as other resource costs
like manpower, logistics etc start impacting.
Leading retailers have slowed down fresh booking of properties and some of the realestate developers are revising their plans to set up malls in their upcoming properties. Theindustry expects 9-12 months of delay in getting the properties. However, the lease rentalsare expected to come down in the coming 18-24 months.
Valuation and viewWe believe the existing retailers will continue to grow topline and attract footfalls due tolow penetration although same store sales growth will be lower. EBIDTA margin is unlikelyto expand due to rising lease rentals and manpower costs. We expect specialty stores toflourish due to committed customers and strong brand recall. We believe that scale ofoperations and cost control initiatives would be a key to survival in the long term. Weexpect the sector to enjoy premium valuations due to huge growth potential. We maintaina cautiously positive view on the sector with Pantaloon Retail as our top pick.
Retailing
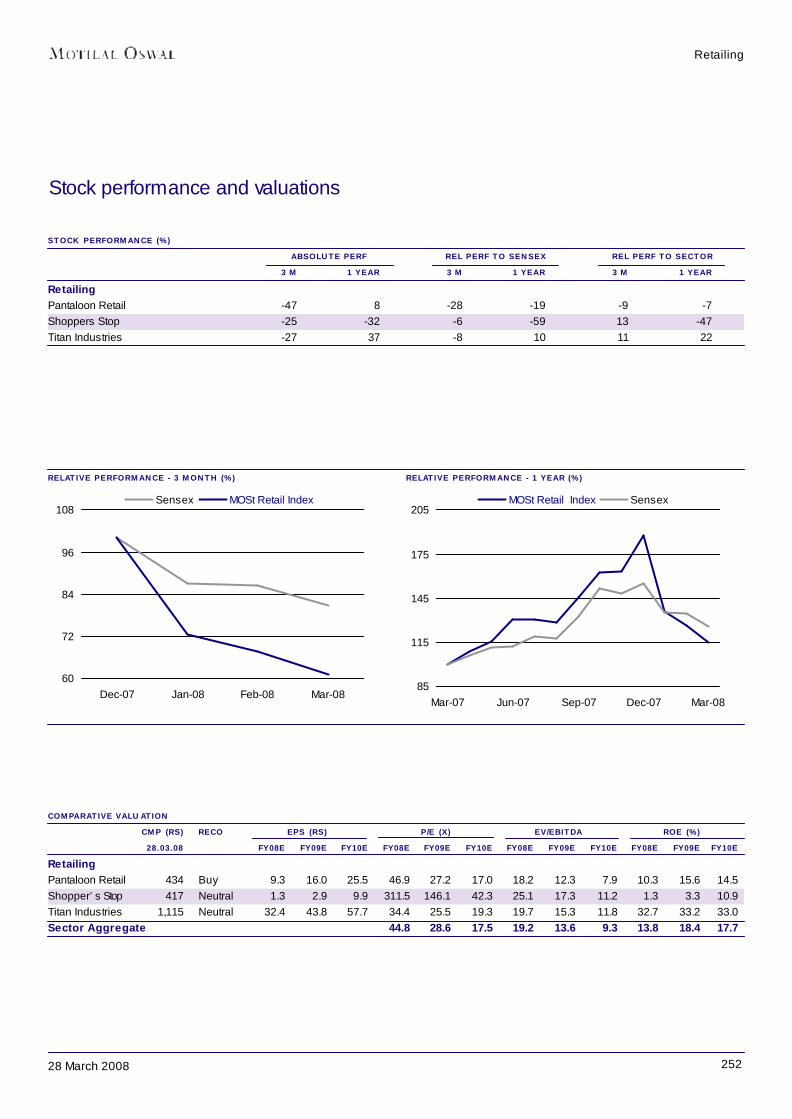
25228 March 2008
Retailing
RELATIVE PERFORMANCE - 3 MONTH (%) RELATIVE PERFORMANCE - 1 YEAR (%)
Stock performance and valuations
STOCK PERFORMANCE (%) ABSOLUTE PERF REL PERF TO SENSEX REL PERF TO SECTOR
3 M 1 YEAR 3 M 1 YEAR 3 M 1 YEARRetailingPantaloon Retail -47 8 -28 -19 -9 -7Shoppers Stop -25 -32 -6 -59 13 -47Titan Industries -27 37 -8 10 11 22
COMPARATIVE VALUATIONCMP (RS) RECO EPS (RS) P/E (X) EV/EBITDA ROE (%)28.03.08 FY08E FY09E FY10E FY08E FY09E FY10E FY08E FY09E FY10E FY08E FY09E FY10E
RetailingPantaloon Retail 434 Buy 9.3 16.0 25.5 46.9 27.2 17.0 18.2 12.3 7.9 10.3 15.6 14.5Shopper’s Stop 417 Neutral 1.3 2.9 9.9 311.5 146.1 42.3 25.1 17.3 11.2 1.3 3.3 10.9Titan Industries 1,115 Neutral 32.4 43.8 57.7 34.4 25.5 19.3 19.7 15.3 11.8 32.7 33.2 33.0Sector Aggregate 44.8 28.6 17.5 19.2 13.6 9.3 13.8 18.4 17.7
85
115
145
175
205
Mar-07 Jun-07 Sep-07 Dec-07 Mar-08
MOSt Retail Index Sensex
60
72
84
96
108
Dec-07 Jan-08 Feb-08 Mar-08
Sensex MOSt Retail Index

25328 March 2008
BuyPrevious Recommendation: Buy Rs434
Results PreviewSECTOR: RETAILING
BLOOMBERGPF IN
REUTERS CODEPART.BO
Pantaloon Retail
28 March 2008
YEAR NET SALES PAT EPS EPS P/E P/BV ROE ROCE EV/ EV/END (RS M) (RS M) (RS) GROWTH (%) (X) (X) (%) (%) SALES EBITDA
06/07A 32,367 611 4.2 -11.2 104.4 5.8 5.6 7.4 2.3 34.5
06/08E 55,156 1,360 9.3 122.7 46.9 4.8 10.3 10.4 1.4 18.2
06/09E 83,873 2,408 16.0 72.3 27.2 4.2 15.6 13.9 1.0 12.3
06/10E 116,089 4,358 25.5 59.7 17.0 2.5 14.5 16.0 0.7 7.9
Equity Shares (m) 151.0
52-Week Range (Rs) 875/365
1,6,12 Rel. Perf. (%) -8/-14/-19
M.Cap. (Rs b) 65.6
M.Cap. (US$ b) 1.6
QUARTERLY PERFORMANCE (RS MILLION)Y/E JUNE FY07 FY08 FY07 FY08E
1Q 2Q 3Q 4Q 1Q 2Q 3QE 4QENet Sales 6,034 7,527 8,610 10,196 10,864 12,268 14,250 17,774 32,367 55,156
YoY Change (%) 65.4 59.5 89.1 77.3 80.1 63.0 65.5 74.3 73.3 70.4Total Exp 5,618 6,957 8,008 9,629 9,908 11,171 13,110 16,587 30,211 50,777EBITDA 415 570 603 568 956 1,096 1,140 1,187 2,156 4,379
Margins (%) 6.9 7.6 7.0 5.6 8.8 8.9 8.0 6.7 6.7 7.9Depreciation 67 82 93 126 153 204 185 189 369 731Interest 125 207 229 337 352 418 420 430 898 1,619Other Income 17 5 9 0 7 13 8 4 32 32PBT 241 286 290 105 459 487 543 572 921 2,061Tax 79 94 103 36 162 171 185 183 311 701
Rate (%) 32.7 33.0 35.5 34.0 35.3 35.1 34.0 32.0 33.7 34.0Adjusted PAT 162 191 187 69 297 317 359 388 611 1,360
YoY Change (%) 19.6 3.1 15.3 -56.2 82.9 65.3 91.6 460.2 -3.0 122.8Exceptional Income 224 249 0 117 0 0 0 0 589 0Reported PAT 386 440 187 187 297 317 359 388 1,200 1,360E: MOSt Estimates
Amnish Aggarwal ([email protected])Tel:+9122 39825404/Amit Purohit ([email protected])Tel:+9122 39825418
STOCK INFO.BSE Sensex: 16,371
S&P CNX: 4,942
? Pantaloon’s revenues are expected to grow 65.5% YoY in 3QFY08 to Rs14.3b, driven by value retailing.
? EBITDA margin is expected to expand 100bp to 8.0% while PAT is expected at Rs359m, up 91.6%.
? Pantaloon is expected to end the year with 11msf of retail space by June 2008. The company targets to increase theretail space to 16msf by FY09 and 24msf by FY10. The total capex plan spread over three years stands at US$1.5b(US$500m internal accruals; US$700m debt; US$300m equity)
? Pantaloon is focusing on building brands by increasing its private label in its hypermarket. The company plans to haveits private label in food, electronics, apparel and cosmetics. It has identified three brands for sale in other multibandstores. These include Dreamline for home products, John Miller for shirts and Buffalo for jeans.
? Pantaloon Retail is expected to take a one-time hit of US$20m in valuation of closing stock. The company is likely toprovide the same in 4QFY08 results as an exceptional one time write-off.
? The stock is currently trading at 46.9x FY08E EPS and 27.2x FY09E EPS. We maintain Buy.
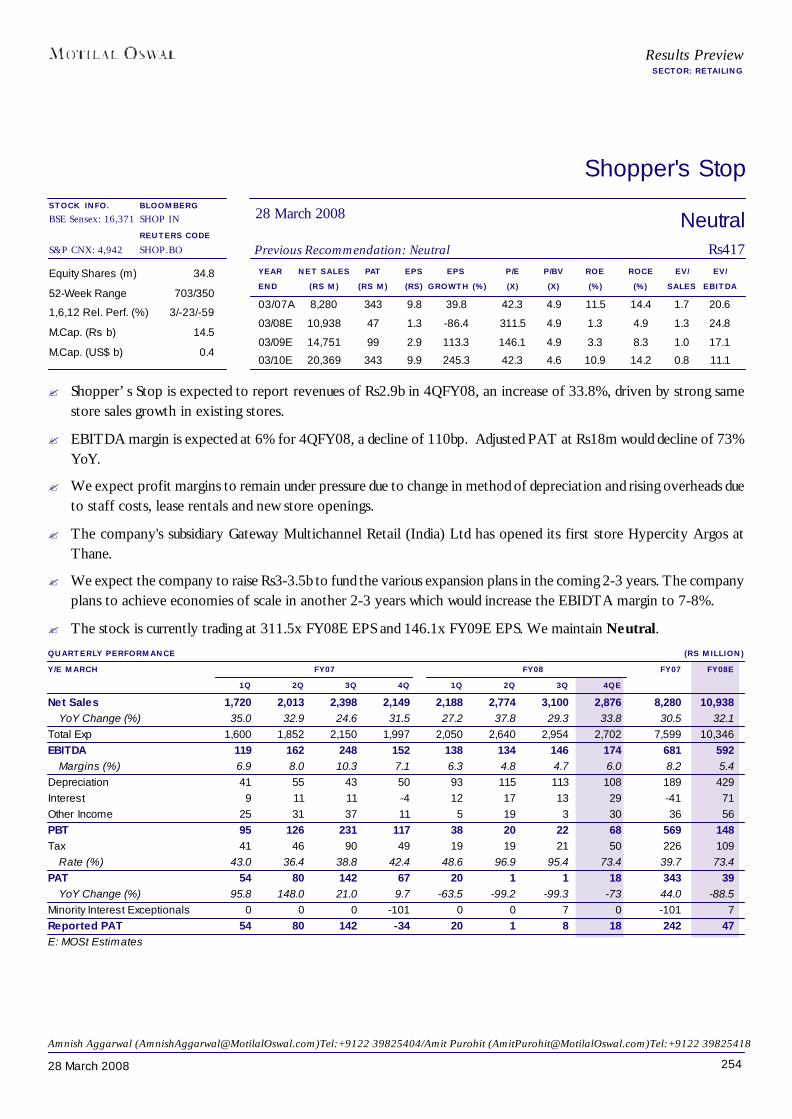
25428 March 2008
NeutralPrevious Recommendation: Neutral Rs417
Results PreviewSECTOR: RETAILING
BLOOMBERGSHOP IN
REUTERS CODESHOP.BO
Shopper's Stop
28 March 2008
YEAR NET SALES PAT EPS EPS P/E P/BV ROE ROCE EV/ EV/END (RS M) (RS M) (RS) GROWTH (%) (X) (X) (%) (%) SALES EBITDA
03/07A 8,280 343 9.8 39.8 42.3 4.9 11.5 14.4 1.7 20.6
03/08E 10,938 47 1.3 -86.4 311.5 4.9 1.3 4.9 1.3 24.8
03/09E 14,751 99 2.9 113.3 146.1 4.9 3.3 8.3 1.0 17.1
03/10E 20,369 343 9.9 245.3 42.3 4.6 10.9 14.2 0.8 11.1
Equity Shares (m) 34.8
52-Week Range 703/350
1,6,12 Rel. Perf. (%) 3/-23/-59
M.Cap. (Rs b) 14.5
M.Cap. (US$ b) 0.4
QUARTERLY PERFORMANCE (RS MILLION)Y/E MARCH FY07 FY08 FY07 FY08E
1Q 2Q 3Q 4Q 1Q 2Q 3Q 4QENet Sales 1,720 2,013 2,398 2,149 2,188 2,774 3,100 2,876 8,280 10,938
YoY Change (%) 35.0 32.9 24.6 31.5 27.2 37.8 29.3 33.8 30.5 32.1Total Exp 1,600 1,852 2,150 1,997 2,050 2,640 2,954 2,702 7,599 10,346EBITDA 119 162 248 152 138 134 146 174 681 592
Margins (%) 6.9 8.0 10.3 7.1 6.3 4.8 4.7 6.0 8.2 5.4Depreciation 41 55 43 50 93 115 113 108 189 429Interest 9 11 11 -4 12 17 13 29 -41 71Other Income 25 31 37 11 5 19 3 30 36 56PBT 95 126 231 117 38 20 22 68 569 148Tax 41 46 90 49 19 19 21 50 226 109
Rate (%) 43.0 36.4 38.8 42.4 48.6 96.9 95.4 73.4 39.7 73.4PAT 54 80 142 67 20 1 1 18 343 39
YoY Change (%) 95.8 148.0 21.0 9.7 -63.5 -99.2 -99.3 -73 44.0 -88.5Minority Interest Exceptionals 0 0 0 -101 0 0 7 0 -101 7Reported PAT 54 80 142 -34 20 1 8 18 242 47E: MOSt Estimates
Amnish Aggarwal ([email protected])Tel:+9122 39825404/Amit Purohit ([email protected])Tel:+9122 39825418
STOCK INFO.BSE Sensex: 16,371
S&P CNX: 4,942
? Shopper’s Stop is expected to report revenues of Rs2.9b in 4QFY08, an increase of 33.8%, driven by strong samestore sales growth in existing stores.
? EBITDA margin is expected at 6% for 4QFY08, a decline of 110bp. Adjusted PAT at Rs18m would decline of 73%YoY.
? We expect profit margins to remain under pressure due to change in method of depreciation and rising overheads dueto staff costs, lease rentals and new store openings.
? The company's subsidiary Gateway Multichannel Retail (India) Ltd has opened its first store Hypercity Argos atThane.
? We expect the company to raise Rs3-3.5b to fund the various expansion plans in the coming 2-3 years. The companyplans to achieve economies of scale in another 2-3 years which would increase the EBIDTA margin to 7-8%.
? The stock is currently trading at 311.5x FY08E EPS and 146.1x FY09E EPS. We maintain Neutral.
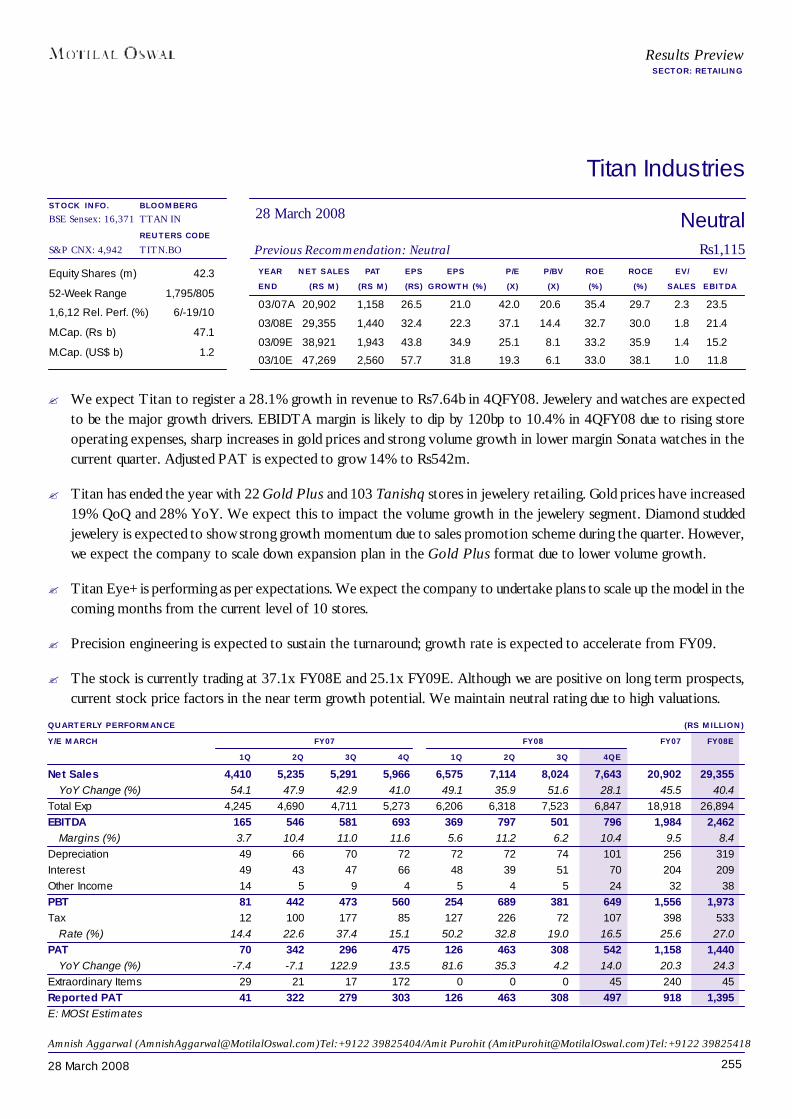
25528 March 2008
NeutralPrevious Recommendation: Neutral Rs1,115
Results PreviewSECTOR: RETAILING
BLOOMBERGTTAN IN
REUTERS CODETITN.BO
Titan Industries
28 March 2008
YEAR NET SALES PAT EPS EPS P/E P/BV ROE ROCE EV/ EV/END (RS M) (RS M) (RS) GROWTH (%) (X) (X) (%) (%) SALES EBITDA
03/07A 20,902 1,158 26.5 21.0 42.0 20.6 35.4 29.7 2.3 23.5
03/08E 29,355 1,440 32.4 22.3 37.1 14.4 32.7 30.0 1.8 21.4
03/09E 38,921 1,943 43.8 34.9 25.1 8.1 33.2 35.9 1.4 15.2
03/10E 47,269 2,560 57.7 31.8 19.3 6.1 33.0 38.1 1.0 11.8
Equity Shares (m) 42.3
52-Week Range 1,795/805
1,6,12 Rel. Perf. (%) 6/-19/10
M.Cap. (Rs b) 47.1
M.Cap. (US$ b) 1.2
QUARTERLY PERFORMANCE (RS MILLION)Y/E MARCH FY07 FY08 FY07 FY08E
1Q 2Q 3Q 4Q 1Q 2Q 3Q 4QENet Sales 4,410 5,235 5,291 5,966 6,575 7,114 8,024 7,643 20,902 29,355
YoY Change (%) 54.1 47.9 42.9 41.0 49.1 35.9 51.6 28.1 45.5 40.4Total Exp 4,245 4,690 4,711 5,273 6,206 6,318 7,523 6,847 18,918 26,894EBITDA 165 546 581 693 369 797 501 796 1,984 2,462
Margins (%) 3.7 10.4 11.0 11.6 5.6 11.2 6.2 10.4 9.5 8.4Depreciation 49 66 70 72 72 72 74 101 256 319Interest 49 43 47 66 48 39 51 70 204 209Other Income 14 5 9 4 5 4 5 24 32 38PBT 81 442 473 560 254 689 381 649 1,556 1,973Tax 12 100 177 85 127 226 72 107 398 533
Rate (%) 14.4 22.6 37.4 15.1 50.2 32.8 19.0 16.5 25.6 27.0PAT 70 342 296 475 126 463 308 542 1,158 1,440
YoY Change (%) -7.4 -7.1 122.9 13.5 81.6 35.3 4.2 14.0 20.3 24.3Extraordinary Items 29 21 17 172 0 0 0 45 240 45Reported PAT 41 322 279 303 126 463 308 497 918 1,395E: MOSt Estimates
Amnish Aggarwal ([email protected])Tel:+9122 39825404/Amit Purohit ([email protected])Tel:+9122 39825418
STOCK INFO.BSE Sensex: 16,371
S&P CNX: 4,942
? We expect Titan to register a 28.1% growth in revenue to Rs7.64b in 4QFY08. Jewelery and watches are expectedto be the major growth drivers. EBIDTA margin is likely to dip by 120bp to 10.4% in 4QFY08 due to rising storeoperating expenses, sharp increases in gold prices and strong volume growth in lower margin Sonata watches in thecurrent quarter. Adjusted PAT is expected to grow 14% to Rs542m.
? Titan has ended the year with 22 Gold Plus and 103 Tanishq stores in jewelery retailing. Gold prices have increased19% QoQ and 28% YoY. We expect this to impact the volume growth in the jewelery segment. Diamond studdedjewelery is expected to show strong growth momentum due to sales promotion scheme during the quarter. However,we expect the company to scale down expansion plan in the Gold Plus format due to lower volume growth.
? Titan Eye+ is performing as per expectations. We expect the company to undertake plans to scale up the model in thecoming months from the current level of 10 stores.
? Precision engineering is expected to sustain the turnaround; growth rate is expected to accelerate from FY09.
? The stock is currently trading at 37.1x FY08E and 25.1x FY09E. Although we are positive on long term prospects,current stock price factors in the near term growth potential. We maintain neutral rating due to high valuations.

25628 March 2008
Telecom
COMPANY NAME PG.Bharti Airtel 262
Idea Cellular 263
Reliance Communication 264
EXPECTED QUARTERLY PERFORMANCE SUMMARY (RS MILLION)RECO SALES EBITDA NET PROFIT
MAR.08 CHG. (%) MAR.08 CHG. (%) MAR.08 CHG. (%)TelecomBharti Airtel Buy 74,677 38.5 31,924 42.5 17,288 27.8Idea Cellular Not Rated 18,688 42.8 6,165 41.3 2,108 9.0Reliance Comm Buy 53,113 34.9 22,863 39.8 13,737 34.5Sector Aggregate 146,478 37.7 60,951 41.3 33,132 29.0
We expect robust 4QFY08 operating performance from the listed telecom majors -Bharti, RCOM, and Idea - with EBITDA growth of ~8-9% QoQ and ~40-42% YoY.However earnings are likely to be dragged by higher finance costs (forex losses due toRe depreciation v/s US$; increased net debt). We expect flat earnings for Bharti andRCOM while Idea’s net profit is likely to decline ~11% QoQ.
We expect wireless EBITDA margins to remain stable QoQ. Scope for an upward tickin EBITDA margins appears limited given selective tariff cuts undertaken by thecompanies. However, positive demand elasticity is likely to expand MOU and restrictARPU decline to ~3-4% QoQ.
The momentum in subscriber net additions continued to be strong during 4QFY08. Industryis expected to add ~26m subscribers in 4QFY08 v/s 24.2m subscribers in 3QFY08.Sustained subscriber momentum would support ~12-13% quarterly average subscribergrowth for Bharti, RCOM, and Idea.
WIRELESS SUBSCRIBER ADDITIONS
BSE Sensex: 16,371 S&P CNX: 4,942 28 March 2008
Results PreviewQUARTER ENDED MARCH 2008
Shobhit Khare ([email protected]); Tel: +91 22 3982 5428
120
160
200
240
280
Jan-
07
Feb-
07
Mar
-07
Apr-
07
May
-07
Jun-
07
Jul-0
7
Aug-
07
Sep
-07
Oct
-07
Nov
-07
Dec
-07
Jan-
08
Feb-
08
2
4
6
8
10Indian Wireless Subscribers - mn (LHS) Monthly Net Additions -mn (RHS)
Source: Industry/Motilal Oswal Securities
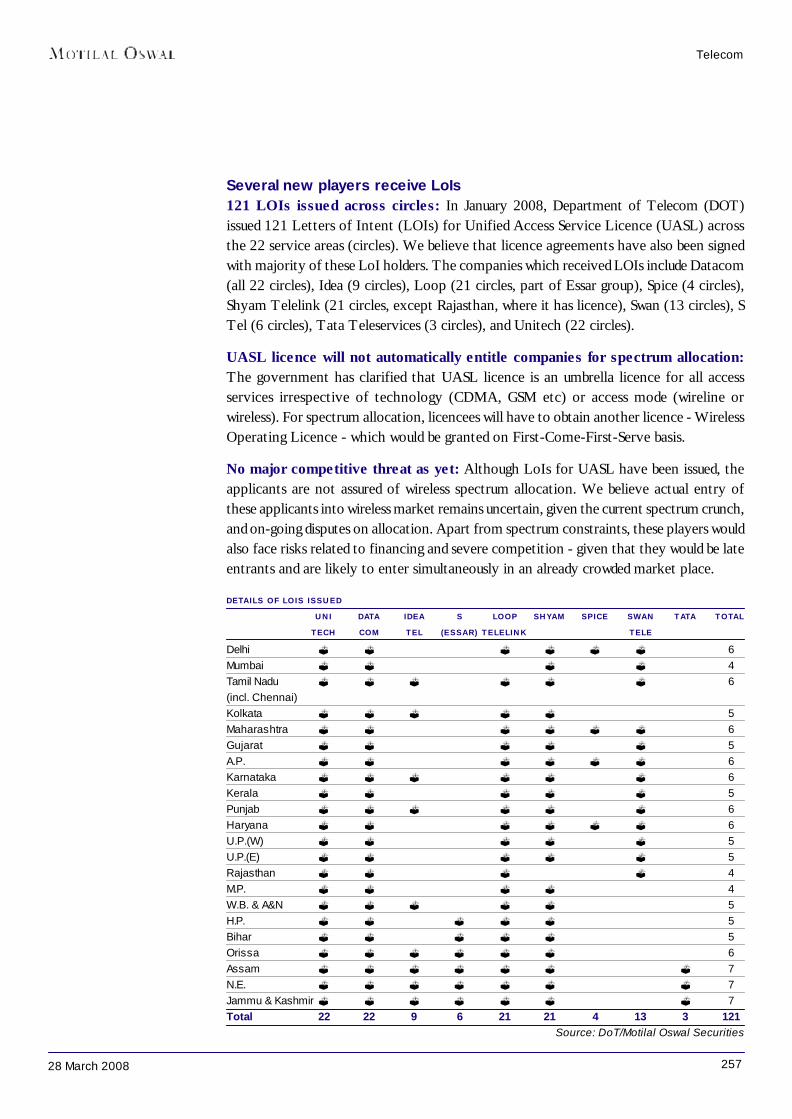
25728 March 2008
Telecom
Several new players receive LoIs121 LOIs issued across circles: In January 2008, Department of Telecom (DOT)issued 121 Letters of Intent (LOIs) for Unified Access Service Licence (UASL) acrossthe 22 service areas (circles). We believe that licence agreements have also been signedwith majority of these LoI holders. The companies which received LOIs include Datacom(all 22 circles), Idea (9 circles), Loop (21 circles, part of Essar group), Spice (4 circles),Shyam Telelink (21 circles, except Rajasthan, where it has licence), Swan (13 circles), STel (6 circles), Tata Teleservices (3 circles), and Unitech (22 circles).
UASL licence will not automatically entitle companies for spectrum allocation:The government has clarified that UASL licence is an umbrella licence for all accessservices irrespective of technology (CDMA, GSM etc) or access mode (wireline orwireless). For spectrum allocation, licencees will have to obtain another licence - WirelessOperating Licence - which would be granted on First-Come-First-Serve basis.
No major competitive threat as yet: Although LoIs for UASL have been issued, theapplicants are not assured of wireless spectrum allocation. We believe actual entry ofthese applicants into wireless market remains uncertain, given the current spectrum crunch,and on-going disputes on allocation. Apart from spectrum constraints, these players wouldalso face risks related to financing and severe competition - given that they would be lateentrants and are likely to enter simultaneously in an already crowded market place.
DETAILS OF LOIS ISSUEDUNI DATA IDEA S LOOP SHYAM SPICE SWAN TATA TOTAL
TECH COM TEL (ESSAR) TELELINK TELEDelhi ? ? ? ? ? ? 6Mumbai ? ? ? ? 4Tamil Nadu ? ? ? ? ? ? 6(incl. Chennai)Kolkata ? ? ? ? ? 5Maharashtra ? ? ? ? ? ? 6Gujarat ? ? ? ? ? 5A.P. ? ? ? ? ? ? 6Karnataka ? ? ? ? ? ? 6Kerala ? ? ? ? ? 5Punjab ? ? ? ? ? ? 6Haryana ? ? ? ? ? ? 6U.P.(W) ? ? ? ? ? 5U.P.(E) ? ? ? ? ? 5Rajasthan ? ? ? ? 4M.P. ? ? ? ? 4W.B. & A&N ? ? ? ? ? 5H.P. ? ? ? ? ? 5Bihar ? ? ? ? ? 5Orissa ? ? ? ? ? ? 6Assam ? ? ? ? ? ? ? 7N.E. ? ? ? ? ? ? ? 7Jammu & Kashmir ? ? ? ? ? ? ? 7Total 22 22 9 6 21 21 4 13 3 121
Source: DoT/Motilal Oswal Securities
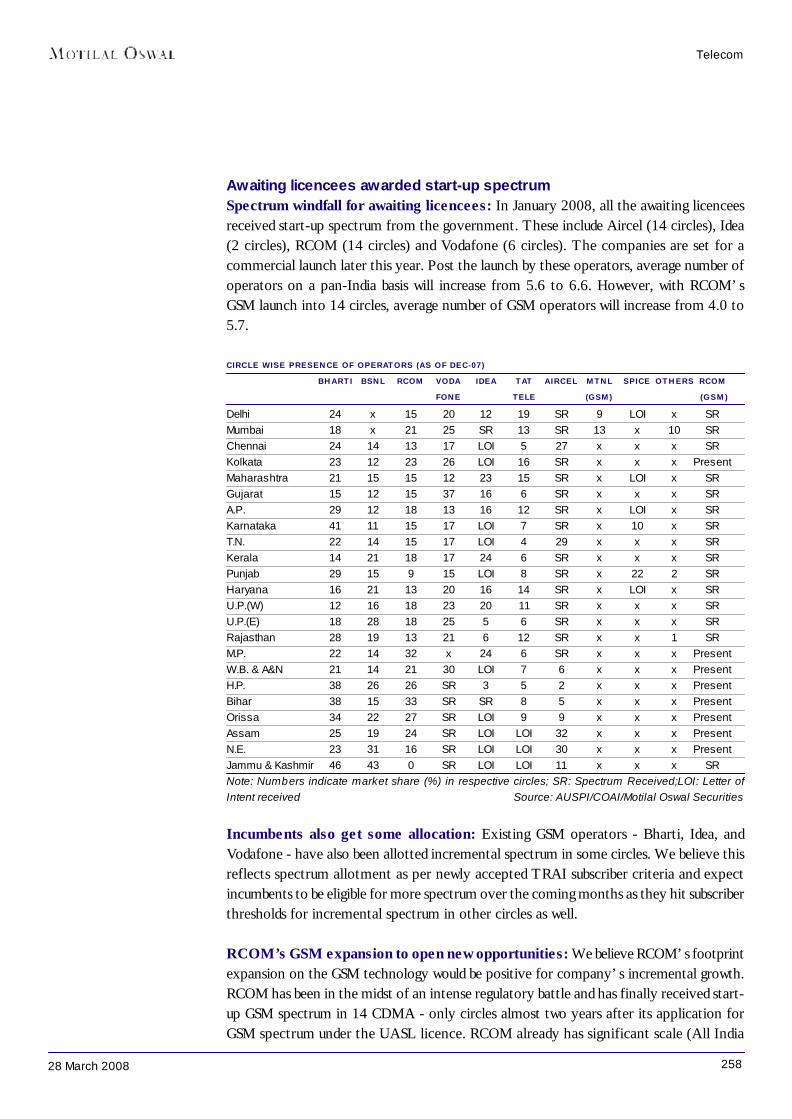
25828 March 2008
Telecom
Awaiting licencees awarded start-up spectrumSpectrum windfall for awaiting licencees: In January 2008, all the awaiting licenceesreceived start-up spectrum from the government. These include Aircel (14 circles), Idea(2 circles), RCOM (14 circles) and Vodafone (6 circles). The companies are set for acommercial launch later this year. Post the launch by these operators, average number ofoperators on a pan-India basis will increase from 5.6 to 6.6. However, with RCOM’sGSM launch into 14 circles, average number of GSM operators will increase from 4.0 to5.7.
CIRCLE WISE PRESENCE OF OPERATORS (AS OF DEC-07)BHARTI BSNL RCOM VODA IDEA TAT AIRCEL MTNL SPICE OTHERS RCOM
FONE TELE (GSM) (GSM)Delhi 24 x 15 20 12 19 SR 9 LOI x SRMumbai 18 x 21 25 SR 13 SR 13 x 10 SRChennai 24 14 13 17 LOI 5 27 x x x SRKolkata 23 12 23 26 LOI 16 SR x x x PresentMaharashtra 21 15 15 12 23 15 SR x LOI x SRGujarat 15 12 15 37 16 6 SR x x x SRA.P. 29 12 18 13 16 12 SR x LOI x SRKarnataka 41 11 15 17 LOI 7 SR x 10 x SRT.N. 22 14 15 17 LOI 4 29 x x x SRKerala 14 21 18 17 24 6 SR x x x SRPunjab 29 15 9 15 LOI 8 SR x 22 2 SRHaryana 16 21 13 20 16 14 SR x LOI x SRU.P.(W) 12 16 18 23 20 11 SR x x x SRU.P.(E) 18 28 18 25 5 6 SR x x x SRRajasthan 28 19 13 21 6 12 SR x x 1 SRM.P. 22 14 32 x 24 6 SR x x x PresentW.B. & A&N 21 14 21 30 LOI 7 6 x x x PresentH.P. 38 26 26 SR 3 5 2 x x x PresentBihar 38 15 33 SR SR 8 5 x x x PresentOrissa 34 22 27 SR LOI 9 9 x x x PresentAssam 25 19 24 SR LOI LOI 32 x x x PresentN.E. 23 31 16 SR LOI LOI 30 x x x PresentJammu & Kashmir 46 43 0 SR LOI LOI 11 x x x SRNote: Numbers indicate market share (%) in respective circles; SR: Spectrum Received;LOI: Letter ofIntent received Source: AUSPI/COAI/Motilal Oswal Securities
Incumbents also get some allocation: Existing GSM operators - Bharti, Idea, andVodafone - have also been allotted incremental spectrum in some circles. We believe thisreflects spectrum allotment as per newly accepted TRAI subscriber criteria and expectincumbents to be eligible for more spectrum over the coming months as they hit subscriberthresholds for incremental spectrum in other circles as well.
RCOM’s GSM expansion to open new opportunities: We believe RCOM’s footprintexpansion on the GSM technology would be positive for company’s incremental growth.RCOM has been in the midst of an intense regulatory battle and has finally received start-up GSM spectrum in 14 CDMA - only circles almost two years after its application forGSM spectrum under the UASL licence. RCOM already has significant scale (All India
25928 March 2008
subscriber share of 17.8%), a pan-India distribution network, and is currently deployinghuge capex in passive infrastructure to increase its tower base to ~40,000. We believe theGSM scale-up will provide RCOM an opportunity to target floating GSM subscriber base(given significant GSM churn), and further deepen its distribution (advantage of sellingSIMs v/s handsets for new connections). RCOM has indicated a timeline of around oneyear from the date of spectrum allocation for its commercial launch. Key challenges forRCOM would be to maintain a dual network and limit cannibalization of its CDMA users.
Aircel to become a pan-India GSM operator, Idea’s footprint expands to 13 circles:Aircel would now be able to scale-up its GSM footprint from current 8 circles to pan-India(22 circles). Idea Cellular would now have presence in 13 circles and is expected tolaunch operations in Mumbai and Bihar over the next 6-9 months.
Tata Teleservices gets in-principle nod for GSM: CDMA operator Tata Teleserviceshas also been given an in-principle approval for allotment of start-up GSM spectrum. Weexpect Tata Tele to receive spectrum before others (who have received LoIs) in thequeue, as precedent has already been set by allocation to RCOM.
Other aspirants could be in for a long wait: The government recently issued as manyas 121 LoIs for UASL across circles to nine applicants. If these players receive start-upspectrum, the number of operators could increase further by 4-7 in each circle.
Development had been widely expected; its back-to-basics for now: We believethat start-up spectrum allocation to awaiting licencees was widely expected by the marketand has put to rest the long-drawn uncertainty over this key issue. Although competitiveintensity in the market is set to increase, we note that all these rollouts would be done byexisting operators either for their footprint expansion (Idea, Vodafone, Aircel) or alternatetechnology strategy (for RCOM). We believe that chances of new players entering intothe sector in the short to medium term are currently low due to significant regulatory,market, and execution challenges. We now expect the focus to head back towards coreoperations as spectrum row has settled for the interim.
Competitive intensity set to riseWith the entry of 1-3 GSM operators in all circles (except West Bengal) over the next oneyear, the competitive intensity in the GSM space is set to rise. The new entrants will notonly eye incremental subscribers but also target existing subscribers of incumbents (currenthigh churn rate of ~4% per month in GSM provides enough opportunity). The competitioncould further increase once Mobile Number Portability (MNP) is introduced. The telecomregulator TRAI is currently working on detailed guidelines for MNP implementation. Weexpect MNP to be introduced in a phased manner starting from metros in H2CY08.
Telecom
26028 March 2008
Valuation and viewMomentum in subscriber additions continues to be strong, primarily driven by highercoverage and attractive tariffs. We expect strong near-term earnings momentum to shieldagainst concerns on the regulatory front. We believe that ongoing value-unlocking initiatives,good response from new projects like DTH/IPTV/retail broadband, and news flow oninternational expansion/industry consolidation could be positive triggers while adverseregulatory environment and increase in competitive activity pose key risks. Valuations at~10.5-12x FY09E EV/EBITDA and ~8.5-10x FY10E EV/EBITDA are attractive.
Telecom
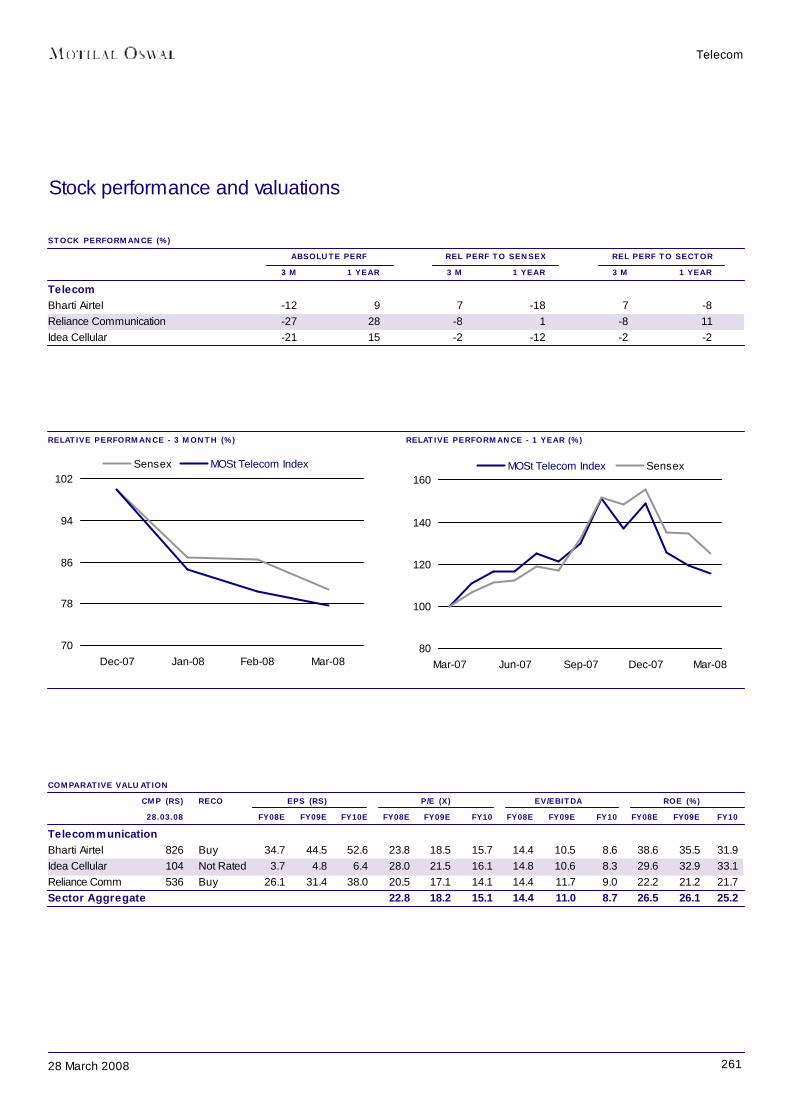
26128 March 2008
RELATIVE PERFORMANCE - 3 MONTH (%) RELATIVE PERFORMANCE - 1 YEAR (%)
Stock performance and valuations
STOCK PERFORMANCE (%) ABSOLUTE PERF REL PERF TO SENSEX REL PERF TO SECTOR
3 M 1 YEAR 3 M 1 YEAR 3 M 1 YEARTelecomBharti Airtel -12 9 7 -18 7 -8Reliance Communication -27 28 -8 1 -8 11Idea Cellular -21 15 -2 -12 -2 -2
COMPARATIVE VALUATIONCMP (RS) RECO EPS (RS) P/E (X) EV/EBITDA ROE (%)28.03.08 FY08E FY09E FY10E FY08E FY09E FY10 FY08E FY09E FY10 FY08E FY09E FY10
TelecommunicationBharti Airtel 826 Buy 34.7 44.5 52.6 23.8 18.5 15.7 14.4 10.5 8.6 38.6 35.5 31.9Idea Cellular 104 Not Rated 3.7 4.8 6.4 28.0 21.5 16.1 14.8 10.6 8.3 29.6 32.9 33.1Reliance Comm 536 Buy 26.1 31.4 38.0 20.5 17.1 14.1 14.4 11.7 9.0 22.2 21.2 21.7Sector Aggregate 22.8 18.2 15.1 14.4 11.0 8.7 26.5 26.1 25.2
Telecom
80
100
120
140
160
Mar-07 Jun-07 Sep-07 Dec-07 Mar-08
MOSt Telecom Index Sensex
70
78
86
94
102
Dec-07 Jan-08 Feb-08 Mar-08
Sensex MOSt Telecom Index

26228 March 2008
Results PreviewSECTOR: TELECOM
Bharti Airtel
YEAR NET SALES PAT EPS EPS P/E P/BV ROE ROCE EV/ EV/END (RS M) (RS M) (RS) GROWTH (%) (X) (X) (%) (%) SALES EBITDA
3/07A 185,196 42,572 22.5 88.0 36.8 11.4 37.0 26.6 8.7 21.6
3/08E 266,736 65,768 34.7 54.5 23.8 7.7 38.6 29.2 6.1 14.3
3/09E 345,126 84,422 44.5 28.4 18.5 5.7 35.5 29.1 4.6 10.4
3/10E 408,976 99,703 52.6 18.1 15.7 4.4 31.9 27.5 3.9 8.7
Equity Shares (m) 1,896
52-Week Range (Rs) 1,149/700
1,6,12 Rel. Perf. (%) 6/-7/-18
M.Cap. (Rs b) 1,565.1
M.Cap. (US$ b) 39.2
QUARTERLY PERFORMANCE (CONSOLIDATED) (RS MILLION)Y/E MARCH FY07 FY08 FY07 FY08E
1Q 2Q 3Q 4Q 1Q 2Q 3Q 4QEGross Revenue 38,564 43,571 49,129 53,932 59,046 63,374 69,639 74,677 185,196 266,736
YoY Growth (%) 53.2 60.8 62.4 58.1 53.1 45.4 41.7 38.5 58.8 44.0QoQ Growth (%) 13.0 13.0 12.8 9.8 9.5 7.3 9.9 7.2
Net Revenue 31,952 36,381 40,887 44,597 49,975 54,057 59,215 74,677 153,817 237,924Total Operating Expenses 16,931 19,356 20,832 22,189 25,509 26,960 29,581 42,753 79,309 124,805EBITDA 15,021 17,025 20,055 22,408 24,466 27,097 29,634 31,924 74,508 113,119
Margin (%) 39.0 39.1 40.8 41.5 41.4 42.8 42.6 42.7 40.2 42.4Net Finance Costs 1,691 587 -1,318 477 -1,752 1,126 810 1,423 1,438 1,607Cash Profit from Operations 13,330 16,438 21,373 21,931 26,218 25,971 28,824 30,501 73,070 111,512Depreciation & Amortisation 4,972 5,926 7,072 7,239 8,120 9,062 10,377 11,069 25,208 38,628Profit before Tax 8,599 10,782 14,412 15,068 18,901 17,472 19,033 19,862 48,861 75,264Income Tax Expense / (Income) 952 1,378 2,139 1,353 3,594 1,135 1,564 2,383 5,822 8,676P/L to Minority Shareholders 96 66 122 184 191 197 244 190 468 822Reported Net Profit / (Loss) 7,551 9,338 12,151 13,531 15,116 16,139 17,224 17,288 42,571 64,420
QoQ Growth (%) 10.7 23.7 30.1 11.4 11.7 6.8 6.7 0.4 88.5 51.3E: MOSt Estimates; Financials as per US GAAP
BuyPrevious Recommendation: Buy Rs826
28 March 2008BLOOMBERGBHARTI IN
REUTERS CODEBRTI.BO
STOCK INFO.BSE Sensex: 16,371
S&P CNX: 4,942
Shobhit Khare ([email protected]); Tel: +91 22 3982 5428
? We expect revenue to grow 38% YoY and 7% QoQ, driven by healthy mobile subscriber additions.
? EBITDA margin is expected to expand 20 basis points QoQ to 42.7 % on the back of modest margin accretions inB&T and long-distance segments. We expect an overall EBITDA growth of 42% YoY and 8% QoQ.
? Mobility revenues are expected to grow 8% QoQ, implying an ARPU decline of ~4% to Rs343. EBITDA margin formobile telephony business is expected to remain stable.
? Net profit is expected to grow 31% YoY and 0.4% QoQ to Rs17.6b. QoQ earnings growth will remain subdued dueto higher finance cost from likely derivative and exchange fluctuation losses on rupee depreciation against the USdollar. We have factored in a Rs0.5b derivative loss due to forex fluctuation in 4QFY08. There was a gain of 24m in3QFY08.
? Bharti is expected to report results for its tower subsidiary Bharti Infratel separately in Q4FY08 numbers. The resultsof Indus Towers (42% stake) will not be consolidated but will likely be accounted as profit/loss from associate.
? The stock is currently trading at 10.4x FY09E EV/EBITDA and 18.5x FY09E earnings. We expect Bharti to maintainits leadership in the mobility markets, while continuing to invest aggressively. Maintain Buy.

26328 March 2008
Results PreviewSECTOR: TELECOM
Idea Cellular
YEAR NET SALES PAT EPS EPS P/E P/BV ROE ROCE EV/ EV/END (RS M) (RS M) (RS) GROWTH (%) (X) (X) (%) (%) SALES EBITDA
3/07A 43,664 5,032 2.2 137.6 46.6 7.0 25.2 11.7 6.8 20.4
3/08E 66,164 9,762 3.7 66.7 28.0 8.4 29.6 13.5 4.9 14.8
3/09E 89,710 12,713 4.8 30.0 21.5 6.1 32.9 15.3 3.8 10.6
3/10E 112,175 16,990 6.4 33.6 16.1 4.8 33.1 17.2 3.0 8.3
Equity Shares (m) 2,635.4
52-Week Range (Rs) 161/89
1,6,12 Rel. Perf. (%) 0/-12/-12
M.Cap. (Rs b) 273.4
M.Cap. (US$ b) 6.9
Not RatedRs104
28 March 2008BLOOMBERGIDEA IN
REUTERS CODEIDEA.BO
QUARTERLY PERFORMANCE (CONSOLIDATED) (RS MILLION)Y/E MARCH FY07 FY08 FY07 FY08E
1Q 2Q 3Q 4Q 1Q 2Q 3Q 4QEGross Revenue 9,002 10,096 11,482 13,085 14,773 15,622 17,081 18,688 43,664 66,164
YoY Growth (%) 64.1 54.7 48.8 42.8 47.2 51.5QoQ Growth (%) 12.1 13.7 14.0 12.9 5.7 9.3 9.4
Total Operating Expenses 5,982 6,548 7,776 8,722 9,645 10,515 11,407 12,523 29,028 44,094EBITDA 3,020 3,548 3,706 4,363 5,128 5,107 5,674 6,165 14,636 22,070
QoQ Growth (%) 17.5 4.4 17.7 17.5 -0.4 11.1 8.6Margin (%) 33.5 35.1 32.3 33.3 34.7 32.7 33.2 33.0 33.5 33.4
Net Finance Costs 721 790 806 975 143 641 782 1,217 3,292 2,783Cash Profit from Operations 2,299 2,758 2,900 3,388 4,985 4,466 4,892 4,947 11,344 19,287Non-Operating Income 20 51 68 326 3 21 22 19 465 65Depreciation & Amortisation 1,456 1,700 1,800 1,761 1,887 2,007 2,277 2,515 6,718 8,686Profit before Tax 863 1,108 1,168 1,953 3,101 2,480 2,637 2,451 5,091 10,665Income Tax Expense / (Income) 4 6 31 19 16 277 268 343 60 904Adjusted Net Profit / (Loss) 859 1,102 1,137 1,934 3,085 2,203 2,369 2,108 5,032 9,762
QoQ Growth (%) 28.2 3.2 70.1 59.5 -28.6 7.5 -11.0E: MOSt Estimates
STOCK INFO.BSE Sensex: 16,371
S&P CNX: 4,942
Shobhit Khare ([email protected]); Tel: +91 22 3982 5428
? We expect revenue to grow 43% YoY and 9% QoQ, driven by sustained subscriber additions.
? We expect ARPU decline of ~3% in 4QFY08. MOU is expected to exhibit elasticity driven by tariff cuts taken duringthe quarter.
? EBITDA margin is likely to decline ~20bp to 33%, led by likely margin pressure in 8 established circles on continuedhigher network costs while EBITDA losses in the 3 newly-launched circles are expected to climb down further.
? Net profit is expected to remain muted with an expected growth of 9% YoY and a decline of 11% QoQ. WhileEBITDA growth would remain robust at ~41% YoY and 9% QoQ, continued aggressive network rollout would resultin higher depreciation cost (+43% YoY and 10% QoQ).
? Finance cost is also likely to increase sharply by 56% QoQ led by 1) higher net debt on continued aggressive capexand ~Rs7b outlay as licence fee for 9 circles 2) lower treasury income on further utilization of IPO funds and likelyforex losses due to rupee depreciation against the US dollar.
? The stock is currently trading at 10.6x FY09E EV/EBITDA and 21.5x FY09E earnings. We currentlydo not haverating on the stock.
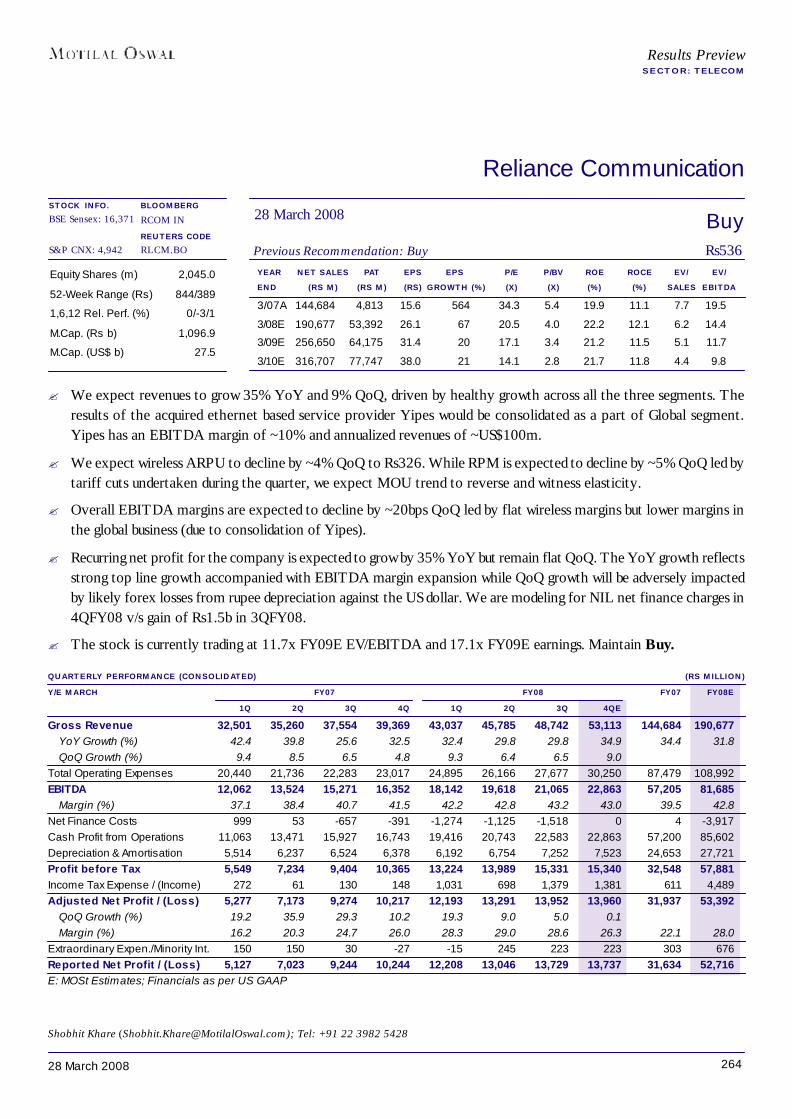
26428 March 2008
Results PreviewSECTOR: TELECOM
Reliance Communication
YEAR NET SALES PAT EPS EPS P/E P/BV ROE ROCE EV/ EV/END (RS M) (RS M) (RS) GROWTH (%) (X) (X) (%) (%) SALES EBITDA
3/07A 144,684 4,813 15.6 564 34.3 5.4 19.9 11.1 7.7 19.5
3/08E 190,677 53,392 26.1 67 20.5 4.0 22.2 12.1 6.2 14.4
3/09E 256,650 64,175 31.4 20 17.1 3.4 21.2 11.5 5.1 11.7
3/10E 316,707 77,747 38.0 21 14.1 2.8 21.7 11.8 4.4 9.8
Equity Shares (m) 2,045.0
52-Week Range (Rs) 844/389
1,6,12 Rel. Perf. (%) 0/-3/1
M.Cap. (Rs b) 1,096.9
M.Cap. (US$ b) 27.5
BuyPrevious Recommendation: Buy Rs536
28 March 2008BLOOMBERGRCOM IN
REUTERS CODERLCM.BO
QUARTERLY PERFORMANCE (CONSOLIDATED) (RS MILLION)Y/E MARCH FY07 FY08 FY07 FY08E
1Q 2Q 3Q 4Q 1Q 2Q 3Q 4QEGross Revenue 32,501 35,260 37,554 39,369 43,037 45,785 48,742 53,113 144,684 190,677
YoY Growth (%) 42.4 39.8 25.6 32.5 32.4 29.8 29.8 34.9 34.4 31.8QoQ Growth (%) 9.4 8.5 6.5 4.8 9.3 6.4 6.5 9.0
Total Operating Expenses 20,440 21,736 22,283 23,017 24,895 26,166 27,677 30,250 87,479 108,992EBITDA 12,062 13,524 15,271 16,352 18,142 19,618 21,065 22,863 57,205 81,685
Margin (%) 37.1 38.4 40.7 41.5 42.2 42.8 43.2 43.0 39.5 42.8Net Finance Costs 999 53 -657 -391 -1,274 -1,125 -1,518 0 4 -3,917Cash Profit from Operations 11,063 13,471 15,927 16,743 19,416 20,743 22,583 22,863 57,200 85,602Depreciation & Amortisation 5,514 6,237 6,524 6,378 6,192 6,754 7,252 7,523 24,653 27,721Profit before Tax 5,549 7,234 9,404 10,365 13,224 13,989 15,331 15,340 32,548 57,881Income Tax Expense / (Income) 272 61 130 148 1,031 698 1,379 1,381 611 4,489Adjusted Net Profit / (Loss) 5,277 7,173 9,274 10,217 12,193 13,291 13,952 13,960 31,937 53,392
QoQ Growth (%) 19.2 35.9 29.3 10.2 19.3 9.0 5.0 0.1Margin (%) 16.2 20.3 24.7 26.0 28.3 29.0 28.6 26.3 22.1 28.0
Extraordinary Expen./Minority Int. 150 150 30 -27 -15 245 223 223 303 676Reported Net Profit / (Loss) 5,127 7,023 9,244 10,244 12,208 13,046 13,729 13,737 31,634 52,716E: MOSt Estimates; Financials as per US GAAP
STOCK INFO.BSE Sensex: 16,371
S&P CNX: 4,942
Shobhit Khare ([email protected]); Tel: +91 22 3982 5428
? We expect revenues to grow 35% YoY and 9% QoQ, driven by healthy growth across all the three segments. Theresults of the acquired ethernet based service provider Yipes would be consolidated as a part of Global segment.Yipes has an EBITDA margin of ~10% and annualized revenues of ~US$100m.
? We expect wireless ARPU to decline by ~4% QoQ to Rs326. While RPM is expected to decline by ~5% QoQ led bytariff cuts undertaken during the quarter, we expect MOU trend to reverse and witness elasticity.
? Overall EBITDA margins are expected to decline by ~20bps QoQ led by flat wireless margins but lower margins inthe global business (due to consolidation of Yipes).
? Recurring net profit for the company is expected to grow by 35% YoY but remain flat QoQ. The YoY growth reflectsstrong top line growth accompanied with EBITDA margin expansion while QoQ growth will be adversely impactedby likely forex losses from rupee depreciation against the US dollar. We are modeling for NIL net finance charges in4QFY08 v/s gain of Rs1.5b in 3QFY08.
? The stock is currently trading at 11.7x FY09E EV/EBITDA and 17.1x FY09E earnings. Maintain Buy.

26528 March 2008
Textiles
COMPANY NAME PG.Alok Industries 270
Arvind Mills 271
Gokaldas Exports 272
Himatsingka Seide 273
Raymond 274
Vardhman Textiles 275
Welspun India 276
EXPECTED QUARTERLY PERFORMANCE SUMMARY (RS MILLION)RECO SALES EBITDA NET PROFIT
MAR.08 CHG. (%) MAR.08 CHG. (%) MAR.08 CHG. (%)TextilesAlok Ind Buy 6,552 14.1 1,509 14.3 475 5.0Arvind Mills Neutral 5,856 21.2 710 5.6 96 142.8Gokaldas Exports Neutral 3,024 9.4 309 -15.9 164 -9.5Himatsingka Seide Neutral 742 71.9 93 60.4 18 -79.8Raymond Neutral 6,110 75.7 801 83.1 229 68.6Vardhman Textiles Buy 6,704 24.2 845 10.1 168 -54.5Welspun Ind Neutral 3,070 23.6 367 4.4 27 -73.8Sector Aggregate 32,058 27.6 4,634 16.6 1,177 -14.1
Siddharth Bothra ([email protected]); Tel: +91 22 39825407
Indian textiles continue to reel under pressureThe Indian textile industry continues to reel under pressure from rising rupee and highercotton prices. The sector growth, which had slowed down to 7% in FY07 from 25% inFY06, is expected to fall further in FY08. During 1QFY08, Indian textile exports weredown 3.3% YoY. The worst hit export segment has been the Readymade Garments(RMG), which accounts for almost 43% of the total exports from India.
INDIAN TEXTILE EXPORTS BREAK-UP (US$ B)FY05 FY06 FY07 FY07 SHARE (%)
RMG 6.0 8.0 8.1 43.1Cotton Textiles 3.5 4.6 5.5 29.3Woolen Textiles 0.4 0.5 0.4 2.4Man made Textiles 2.1 2.0 2.4 12.6Silk 0.6 0.7 0.7 3.7Handicrafts 1.0 1.3 1.3 6.7Coir Manufacturers 0.1 0.1 0.2 0.8Jute Goods 0.3 0.3 0.3 1.4Grand Total 14.0 17.5 18.7 100.0
% Change 25.0 7.0Source: DGCIS Kolkata
Textile companies striving to remain competitiveIndian textile companies have been taking steps to cope with the rising rupee and remaincompetitive in the exports markets: (1) Shifting focus to European countries, (2) increasingfocus on innovations, (3) accepting orders only in euros, and (4) sourcing raw materialand machineries from US, etc.
BSE Sensex: 16,371 S&P CNX: 4,942 28 March 2008
Results PreviewQUARTER ENDED MARCH 2008

26628 March 2008
Textiles
Surge in Chinese exports to EU seen in 1HCY08We expect garment exports from China to EU to surge due to lifting of quotas on textileexports (key categories) in CY08. However, under the WTO rules, EU retains the right toreimpose quotas on Chinese exports until the end of 2008. Hence, a surge in Chineseexports could lead to reimposition of quotas on China till December 2008.
Removal of trade restrictions on China poses threat for Indian textilesWe believe the removal of quota restrictions on China would be particularly negative forIndia (as compared to competitors such as Pakistan, Bangladesh and Sri Lanka) due tothe sharp appreciation of the Indian rupee against the US dollar. Though there is a possibilityof reimposition of quotas on China for a year by mid-CY08 (in case of any major upsurgein Chinese textile exports to EU), this would only be a temporary reprieve for the Indiantextile industry, as the US quota on Chinese exports would be lifted from CY09, whichwould again exert severe price pressure on the Indian textile industry.
RESTRICTION ON CHINA BY EU-25: GROWTH RATES IN KEY CATEGORIES (%)CY05 CY06 CY07
Jersey and Pullovers 8 10 10Men’s and Boy’s Bottomwear 8 10 10Women and Girl’s Shirt/Blouses 8 10 10T-Shirts and Vests 10 10 10Women’s and Girl’s Dresses 10 10 10
Source: Industry/CRISIL Research
RESTRICTION ON CHINA BY USA: GROWTH RATES IN KEY CATEGORIES (%)2006 2007 2008
Growth Rate Cap
Men’ and Boys’ Cotton Knit Shirts 10 12.5 15Men’ and Boys’ MMF Knit Shirts 10 12.5 15Women’ and Girls’ Cotton Knit Shirts/Blouses 10 12.5 15Women’ and Girls’ MMF Knit Shirts/Blouses 10 12.5 15Men’s and Boys’ Cotton Woven Shirts 10 12.5 15Men’s and Boys’ MMF Woven Shirts 10 12.5 15Men’s and Boys’ Cotton Bottom-wear 10 12.5 15Women’s and Girls’ Cotton Bottom-wear 10 12.5 15Cotton Bras 10 12.5 15MMF Bras 10 12.5 15Cotton Underwear 10 12.5 15MMF Underwear 10 12.5 15Sweaters 10 12.5 15
Source: Industry/CRISIL Research

26728 March 2008
Textiles
Trade shift to developing countries slower than anticipatedWorld textile trade was expected to shift from the artificially protected developed countriesto the low-cost developing countries in the post quota era. Though the initial trade data inthe post-quota period confirms the above prognosis, the pace of trade shift has beensubstantially slower than anticipated due to: (1) tariff differentials, (2) preferentialagreements, (3) reimposition of quotas on China by the US and EU, and (4) transition timerequired by large buyers. Going forward, though tariff differentials and preferentialagreements may continue to be a deterrent to growth, we expect trade shifts to accelerateas a result of aggressive outsourcing ramp-up by global retailers from key sourcing countriessuch as India.
Textile players shift focus from exports to domestic marketsA clear trend seems to be emerging in the domestic textile industry, wherein players areshifting their focus from the export market to the domestic market. This shift in strategyhas been driven by two key factors. Firstly, the export market has become less attractivedue to the appreciating rupee, raw material and labor cost-push and the relative competitiveadvantage enjoyed by neighboring countries. Secondly, domestic market has becomeextremely attractive, on the back of rising per capita income and emergence of organizedretail. This has resulted in large companies such as Arvind, Raymond, Alok etc trying toforward integrate into branding and retail.
Domestic RMG market to emerge as a big opportunityCRISIL estimates RMG market to grow at a CAGR of 14.4%, over FY06-FY11, toUS$50.4b in FY11 from around US$25.8b in FY06. CRISIL estimates the domestic RMGmarket to grow at a CAGR of 12.6% to US$32b in FY11 from around US$17.7b in FY06.This growth will primarily be led by increasing income levels and a shift in consumptionpattern from tailored to readymade garments. We believe with the consolidation of retailindustry in India, the domestic RMG market would present a big opportunity for the Indiangarment manufacturers.
785
1420356
814
0
600
1,200
1,800
2,400
FY06 FY11
Domestic Sales Exports
CAGR 12.6%
CAGR 18%
Total CAGR 14.4%
RMG MARKET: AN OUTLOOK (RS B)
Source: CRISIL

26828 March 2008
Textiles
ValuationsMost of the textile companies have expanded and modernized their capacities to reachcritical size. Consequently, due to their modern plans and global capacities, they have alsomanaged to attract large international institutional buyers with whom they now haveestablished strategic relationships. This has allowed them to move their business frombeing a transitional-based model to a strategic vendor-based relationship model. At thesame time, their financials are extremely healthy, as they have resorted to substantialwithdrawals from the subsidized TUF scheme. Further, there is no immediate concern oflarge dilutions, as most companies have already completed a substantial portion of theircapex plans. We maintain our Neutral rating on Arvind, Gokaldas, Welspun, Raymondand Himatsingka Seide. We remain bullish on Vardhman Textiles and Alok Textiles.
Indian Readymade Garment Industry(Rs1,141b)
DomesticRs785b
Exports(Rs356b)
Men’sRs325b(42%)
Women’sRs270b(34%)
KidsRs190b(24%)
USARs139b(39%)
EURs179b(50%)
OthersRs38b(11%)
OVERVIEW OF INDIAN RMG MARKET
Source: CRISIL
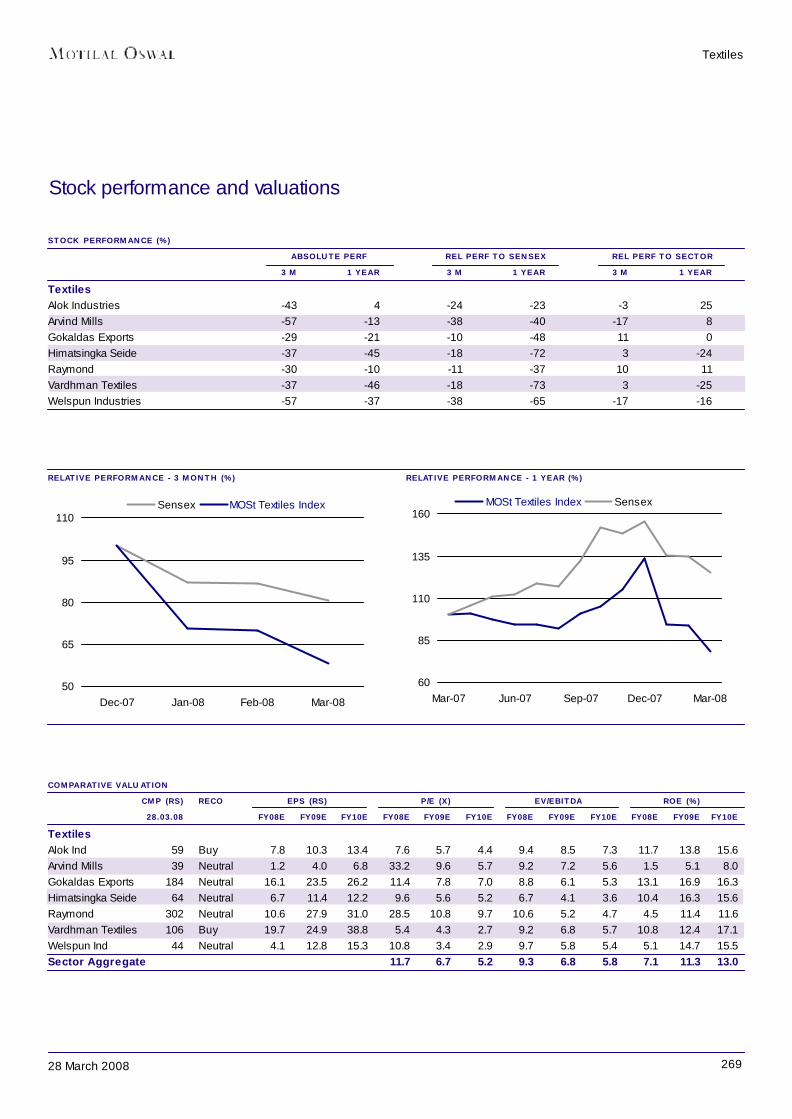
26928 March 2008
Textiles
RELATIVE PERFORMANCE - 3 MONTH (%) RELATIVE PERFORMANCE - 1 YEAR (%)
Stock performance and valuations
STOCK PERFORMANCE (%) ABSOLUTE PERF REL PERF TO SENSEX REL PERF TO SECTOR
3 M 1 YEAR 3 M 1 YEAR 3 M 1 YEARTextilesAlok Industries -43 4 -24 -23 -3 25Arvind Mills -57 -13 -38 -40 -17 8Gokaldas Exports -29 -21 -10 -48 11 0Himatsingka Seide -37 -45 -18 -72 3 -24Raymond -30 -10 -11 -37 10 11Vardhman Textiles -37 -46 -18 -73 3 -25Welspun Industries -57 -37 -38 -65 -17 -16
COMPARATIVE VALUATIONCMP (RS) RECO EPS (RS) P/E (X) EV/EBITDA ROE (%)28.03.08 FY08E FY09E FY10E FY08E FY09E FY10E FY08E FY09E FY10E FY08E FY09E FY10E
TextilesAlok Ind 59 Buy 7.8 10.3 13.4 7.6 5.7 4.4 9.4 8.5 7.3 11.7 13.8 15.6Arvind Mills 39 Neutral 1.2 4.0 6.8 33.2 9.6 5.7 9.2 7.2 5.6 1.5 5.1 8.0Gokaldas Exports 184 Neutral 16.1 23.5 26.2 11.4 7.8 7.0 8.8 6.1 5.3 13.1 16.9 16.3Himatsingka Seide 64 Neutral 6.7 11.4 12.2 9.6 5.6 5.2 6.7 4.1 3.6 10.4 16.3 15.6Raymond 302 Neutral 10.6 27.9 31.0 28.5 10.8 9.7 10.6 5.2 4.7 4.5 11.4 11.6Vardhman Textiles 106 Buy 19.7 24.9 38.8 5.4 4.3 2.7 9.2 6.8 5.7 10.8 12.4 17.1Welspun Ind 44 Neutral 4.1 12.8 15.3 10.8 3.4 2.9 9.7 5.8 5.4 5.1 14.7 15.5Sector Aggregate 11.7 6.7 5.2 9.3 6.8 5.8 7.1 11.3 13.0
50
65
80
95
110
Dec-07 Jan-08 Feb-08 Mar-08
Sensex MOSt Textiles Index
60
85
110
135
160
Mar-07 Jun-07 Sep-07 Dec-07 Mar-08
MOSt Textiles Index Sensex

27028 March 2008
Alok Industries
YEAR NET SALES PAT EPS* EPS P/E P/BV ROE ROCE EV/ EV/END (RS M) (RS M) (RS) GROWTH (%) (X) (X) (%) (%) SALES EBITDA
3/07A 18,290 1,419 8.3 32.7 7.1 1.0 17.1 6.6 1.9 8.5
3/08E 20,897 1,548 7.8 9.1 7.7 0.9 11.7 6.6 2.2 9.1
3/09E 27,334 2,049 10.3 32.4 7.0 0.8 13.8 7.3 2.1 8.9
3/10E 35,220 2,678 13.4 30.7 4.4 0.7 15.6 8.4 1.7 7.3
Equity Shares 199.1
52-Week Range 108/49
1,6,12 Rel.Per. (%) -10/-12/-23
M.Cap (Rs. b) 11.7
M.Cap (US$ b) 0.3
QUARTERLY PERFORMANCE (RS MILLION)Y/E MARCH FY07 FY08 FY07 FY08E
1Q 2Q 3Q 4Q 1Q 2Q 3Q 4QESales 3,579 4,172 4,799 5,741 4,189 4,648 5,508 6,552 18,290 20,897
Change (%) 19.6 20.8 31.0 40.8 17.1 11.4 14.8 14.1 28.9 14.2Total Expenditure 2,772 3,204 3,726 4,420 3,173 3,562 4,160 5,043 14,123 15,939EBITDA 806 968 1,073 1,321 1,016 1,086 1,348 1,509 4,168 4,958
Change (%) 37.1 36.7 32.5 50.8 26.0 12.3 25.6 14.3 40.7 19.0As % of Sales 22.5 23.2 22.4 23.0 24.2 23.4 24.5 23.0 22.8 23.7
Depreciation 246 280 325 354 358 364 434 444 1,205 1,599Interest 170 213 242 269 270 283 295 466 893 1,314Other Income -4 -16 32 19 2 139 89 36 32 265Non Recurring Expense 0 0 0 334 396 0 0 0 334 396PBT 386 459 539 1,051 785 579 707 635 2,435 2,705Tax 117 132 168 265 235 149 219 160 682 762
Effective Tax Rate (%) 28.2 28.9 31.2 25.2 30.0 29.0 32.5 25.2 28.0 33.0Repoted PAT 269 326 371 787 550 430 488 475 1,753 1,943
Change (%) 31.0 28.1 25.7 139.4 104.3 31.8 31.7 -39.6 61.8 10.8Adj. PAT 269 326 371 452 285 430 488 475 1,419 1,548
Change (%) 31.0 28.1 25.7 30.4 5.9 31.8 31.7 5.0 30.9 9.1E: MOSt Estimates
BuyPrevious Recommendation: Neutral Rs59
28 March 2008BLOOMBERGALOK IN
REUTERS CODEALOK.BO
Siddharth Bothra ([email protected]); Tel: +91 22 39825407
*Fully Diluted EPS
Results PreviewSECTOR: TEXTILES
STOCK INFO.BSE Sensex: 16,371
S&P CNX: 4,942
? For 4QFY08, we expect Alok to post revenue of Rs6.5b, up 14.1% YoY, aided by higher capacities across all textilesegments. We expect value added sales to increase from 21% of total sales in FY07 to 36% of total sales in FY09.
? EBITDA margin is likely to be 23%, led by higher sales from value added segments.
? In FY08, Alok announced several new initiatives, which include foray into real estate business and increased focus onthe retail business.
? The management has drawn up restructuring plans, which include creating dedicated verticals for the textile andretail businesses.
? The company has ambitious expansion plans for its domestic retail business, which entails introducing internationalbrands in India and opening ~500 H&A retail outlets over the next three years. Post restructuring, we expect Alok toemerge as a large retail play.
? Alok is trading at attractive valuations of 7.6x FY08E EPS of Rs9.3 and 5.7x FY09E EPS of Rs10.3. We believe thereal estate vertical could lead to value creation of ~Rs36/share.We maintain Buy.

27128 March 2008
Arvind Mills
YEAR NET SALES PAT EPS EPS P/E P/BV ROE ROCE EV/ EV/END (RS M) (RS M) (RS) GROWTH (%) (X) (X) (%) (%) SALES EBITDA
3/07A 18,449 1,196 0.8 -6.0 46.1 0.5 1.1 8.2 1.4 8.6
3/08E 21,965 244 1.2 38.9 33.2 0.5 1.5 4.6 1.2 9.2
3/09E 25,243 845 4.0 246.0 9.6 0.5 5.1 7.1 1.0 7.2
3/10E 31,985 1,421 6.8 68.1 5.7 0.4 8.0 9.3 0.8 5.6
Equity Shares (m) 209.4
52-Week Range (Rs) 94/34
1,6,12 Rel.Per. (%) -16/-32/-40
M.Cap (Rs b) 8.1
M.Cap (US$ b) 0.2
QUARTERLY PERFORMANCE (RS MILLION)Y/E MARCH FY07 FY08 FY07 FY08E
1Q 2Q 3Q 4Q 1Q 2Q 3Q 4QESales 4,208 4,931 4,479 4,831 5,103 5,637 5,368 5,856 18,449 21,965
Change (%) 0.1 15.2 14.8 35.0 21.3 14.3 19.9 21.2 15.6 19.1Total Expenditure 3,376 4,094 3,769 4,159 4,382 4,854 4,750 5,146 15,398 19,131EBITDA 832 837 710 672 721 783 619 710 3,051 2,834
Change (%) -27.6 -21.2 -22.7 -22.1 -13.3 -6.4 -12.8 5.6 -23.6 -7.1As % of Sales 19.8 17.0 15.8 13.9 14.1 13.9 11.5 12.1 16.5 12.9
Depreciation 404 380 347 302 355 351 352 365 1,434 1,423Interest 373 407 399 407 438 337 268 279 1,579 1,322Other Income 53 2 27 81 52 17 73 34 163 175Non Recurring Expense -56 0 1,068 15 83 0 -8 0 1,020 75PBT 52 51 1,058 58 63 112 63 100 1,220 338Tax 6 4 10 4 5 7 6 4 24 19
Effective Tax Rate (%) 11.3 8.0 1.0 7.2 5.0 5.0 5.0 4.0 2.0 5.6Reported PAT 46 47 1,048 54 58 105 57 96 1,196 319Adj. PAT 103 47 -20 39 -24 105 65 96 176 170
Change (%) -77.2 -87.3 -108.5 -81.6 -123.9 121.5 427.8 142.8 -86.2 -3.4E: MOSt Estimates, * Restated Quarterly Numbers
NeutralPrevious Recommendation: Neutral Rs39
28 March 2008BLOOMBERGARVND IN
REUTERS CODEARMI.BO
Siddharth Bothra ([email protected]); Tel: +91 22 39825407
Results PreviewSECTOR: TEXTILES
STOCK INFO.BSE Sensex: 16,371
S&P CNX: 4,942
? For 4QFY08, we expect Arvind to record revenue growth of 21.2% YoY to Rs5.8b, primarily driven by highergarment sales. However, 4QFY08 results are not comparable on a YoY basis, as the result for the quarter underconsideration includes revenues from the merged Arvind Brands.
? EBITDA margin is likely to decline 180bp YoY to 12.1% v/s 13.9% in 4QFY07. EBITDA margin is likely to continueto be under pressure due to increasing raw material prices and rising energy costs.
? During 4QFY08, the denim scenario improved in the international markets. However, the domestic market continuesto be plagued by a huge overcapacity situation. We do not expect domestic demand-supply equilibrium in the denimsector to emerge in the near-to-medium term. Hence, we expect pressure on denim margins.
? We expect Arvind to record brand/retail sales of Rs3.8b in FY08 (~180 stores in FY08; to increase to ~250 by FY09).It owns brands such as Newport, Excalibur, Flying Machine, Ruf and Tuf, reatil hypermarket chain ‘Megamart’ andhas perpetual licensee agreement with international apparel brands such as Arrow, Tommy Hilfiger, Diesel, Polo andCherokee.
? Arvind is currently working on restructuring plans, which could include relocating a part of its commodity gradedenim capacity to other countries and increasing its focus on branded apparel and garment manufacturing.
? The stock is trading at 33.2x FY08E and 9.6x FY09E earnings. We maintain Neutral.

27228 March 2008
Gokaldas Exports
YEAR NET SALES PAT EPS EPS P/E P/BV ROE ROCE EV/ EV/END (RS M) (RS M) (RS) GROWTH (%) (X) (X) (%) (%) SALES EBITDA
3/07A 10,344 703 17.7 15.6 9.0 1.6 18.9 15.7 0.8 7.0
3/08E 11,704 554 16.1 -21.1 11.4 1.4 13.1 10.1 0.7 8.8
3/09E 12,957 809 23.5 46.0 7.8 1.2 16.9 14.7 0.7 6.1
3/10E 14,378 900 26.2 11.2 7.0 1.1 16.3 15.2 0.6 5.3
Equity Shares (m) 34.4
52-Week Range (Rs) 299/160
1,6,12 Rel.Per. (%) -12/-21/-48
M.Cap (Rs. b) 6.3
M.Cap (US$ b) 0.2
NeutralPrevious Recommendation: Buy Rs184
28 March 2008BLOOMBERGGOKL IN
REUTERS CODEGOKL.BO
Results PreviewSECTOR: TEXTILES
Siddharth Bothra ([email protected]); Tel: +91 22 39825407
QUARTERLY PERFORMANCE (RS MILLION)Y/E MARCH FY07 FY08 FY07 FY08E
1Q 2Q 3Q 4Q 1Q 2Q 3Q 4QESales 2,216 2,810 2,553 2,766 2,619 2,499 2,811 3,024 10,344 10,954
Change (%) 23.8 13.7 16.4 15.7 18.2 -11.1 10.1 9.4 17.0 5.9Total Expenditure 1,991 2,494 2,263 2,398 2,410 2,274 2,558 2,715 9,146 9,957EBITDA 225 316 290 367 209 225 253 309 1,198 997
Change (%) 26 19 21 33 -7 -29 -13 -16 25 -16.8As % of Sales 10.2 11.2 11.4 13.3 8.0 9.0 9.0 10.2 11.6 9.1
Depreciation 52 60 68 70 72 75 84 88 250 319Interest 46 54 55 65 71 73 82 51 220 277Other Income 22 16 12 1 51 43 105 16 51 215PBT 150 218 179 234 116 120 193 186 780 616Tax 14 10 1 52 11 8 21 22 77 62
Effective Tax Rate (%) 9.7 4.4 10.2 22.4 8.0 9.0 9.0 11.8 9.9 10.0Repoted PAT 135 208 178 181 105 113 172 164 703 554
Change (%) 16.3 12.4 13.4 20.6 -22.1 -45.9 -3.6 -9.5 15.4 -21.1
E: MOSt Estimates
STOCK INFO.BSE Sensex: 16,371
S&P CNX: 4,942
? We expect revenue to increase 9.4% YoY in 4QFY08 to Rs3b, primarily aided by rise in volumes. Revenue growthwould have been higher but for the sharp rupee appreciation by 9-11%. Almost 92% of Gokaldas revenues arederived from exports.
? We expect EBITDA margin to decline 306bp YoY to 10.2% as a result of the sharp rupee appreciation against the USdollar.
? We expect PAT to decline 9.5% YoY to Rs164m v/s Rs181m in 4QFY07.
? During 2QFY08, the promoters of Gokaldas sold 50.1% stake in the company to Balckstone FP Capital Partners(Mauritius) at a price of Rs275/sh. Post this transaction, Blackstone would further make an open offer for another20% of the equity capital from existing shareholders, implying a total investment of US$165m.
? We expect the company to register revenue CAGR of 11.4% and profit CAGR of 8.6% over FY07-FY10. The stockis trading at 11.4x FY08E and 7.8x FY09E earnings. We maintain Neutral.
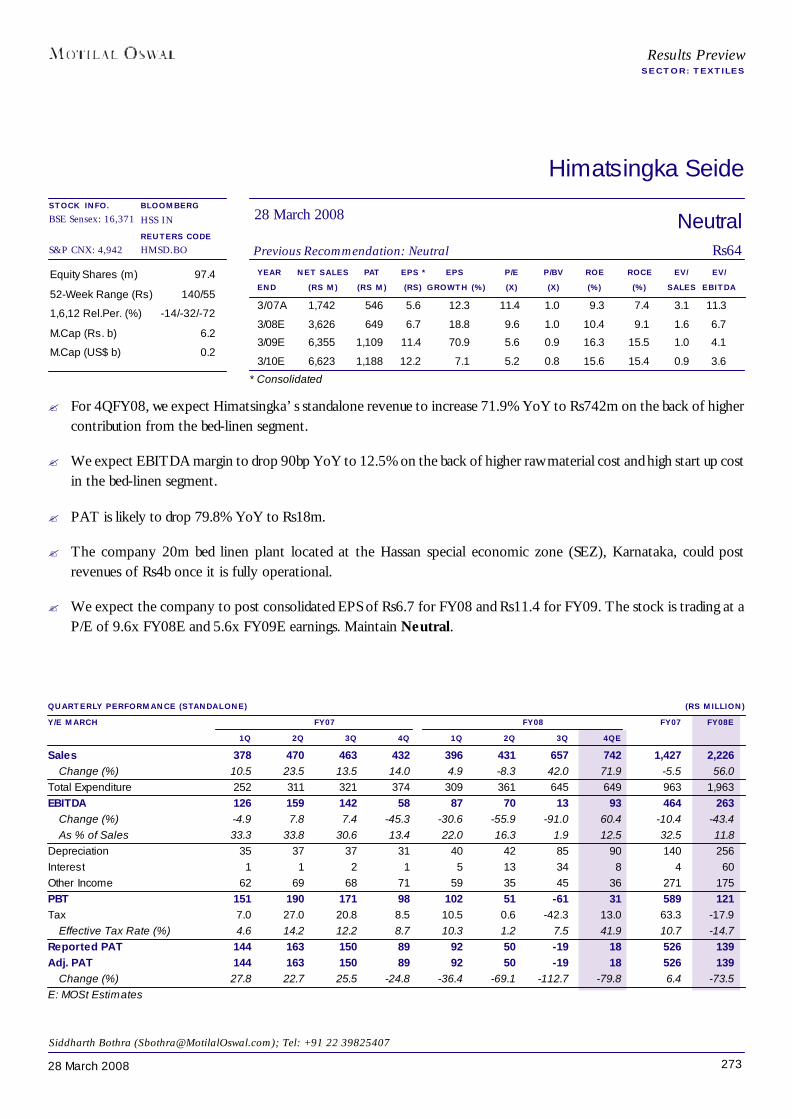
27328 March 2008
Himatsingka Seide
YEAR NET SALES PAT EPS * EPS P/E P/BV ROE ROCE EV/ EV/END (RS M) (RS M) (RS) GROWTH (%) (X) (X) (%) (%) SALES EBITDA
3/07A 1,742 546 5.6 12.3 11.4 1.0 9.3 7.4 3.1 11.3
3/08E 3,626 649 6.7 18.8 9.6 1.0 10.4 9.1 1.6 6.7
3/09E 6,355 1,109 11.4 70.9 5.6 0.9 16.3 15.5 1.0 4.1
3/10E 6,623 1,188 12.2 7.1 5.2 0.8 15.6 15.4 0.9 3.6
Equity Shares (m) 97.4
52-Week Range (Rs) 140/55
1,6,12 Rel.Per. (%) -14/-32/-72
M.Cap (Rs. b) 6.2
M.Cap (US$ b) 0.2
NeutralPrevious Recommendation: Neutral Rs64
28 March 2008BLOOMBERGHSS IN
REUTERS CODEHMSD.BO
Siddharth Bothra ([email protected]); Tel: +91 22 39825407
QUARTERLY PERFORMANCE (STANDALONE) (RS MILLION)Y/E MARCH FY07 FY08 FY07 FY08E
1Q 2Q 3Q 4Q 1Q 2Q 3Q 4QESales 378 470 463 432 396 431 657 742 1,427 2,226
Change (%) 10.5 23.5 13.5 14.0 4.9 -8.3 42.0 71.9 -5.5 56.0Total Expenditure 252 311 321 374 309 361 645 649 963 1,963EBITDA 126 159 142 58 87 70 13 93 464 263
Change (%) -4.9 7.8 7.4 -45.3 -30.6 -55.9 -91.0 60.4 -10.4 -43.4As % of Sales 33.3 33.8 30.6 13.4 22.0 16.3 1.9 12.5 32.5 11.8
Depreciation 35 37 37 31 40 42 85 90 140 256Interest 1 1 2 1 5 13 34 8 4 60Other Income 62 69 68 71 59 35 45 36 271 175PBT 151 190 171 98 102 51 -61 31 589 121Tax 7.0 27.0 20.8 8.5 10.5 0.6 -42.3 13.0 63.3 -17.9
Effective Tax Rate (%) 4.6 14.2 12.2 8.7 10.3 1.2 7.5 41.9 10.7 -14.7Reported PAT 144 163 150 89 92 50 -19 18 526 139Adj. PAT 144 163 150 89 92 50 -19 18 526 139
Change (%) 27.8 22.7 25.5 -24.8 -36.4 -69.1 -112.7 -79.8 6.4 -73.5E: MOSt Estimates
* Consolidated
Results PreviewSECTOR: TEXTILES
STOCK INFO.BSE Sensex: 16,371
S&P CNX: 4,942
? For 4QFY08, we expect Himatsingka’s standalone revenue to increase 71.9% YoY to Rs742m on the back of highercontribution from the bed-linen segment.
? We expect EBITDA margin to drop 90bp YoY to 12.5% on the back of higher raw material cost and high start up costin the bed-linen segment.
? PAT is likely to drop 79.8% YoY to Rs18m.
? The company 20m bed linen plant located at the Hassan special economic zone (SEZ), Karnataka, could postrevenues of Rs4b once it is fully operational.
? We expect the company to post consolidated EPS of Rs6.7 for FY08 and Rs11.4 for FY09. The stock is trading at aP/E of 9.6x FY08E and 5.6x FY09E earnings. Maintain Neutral.
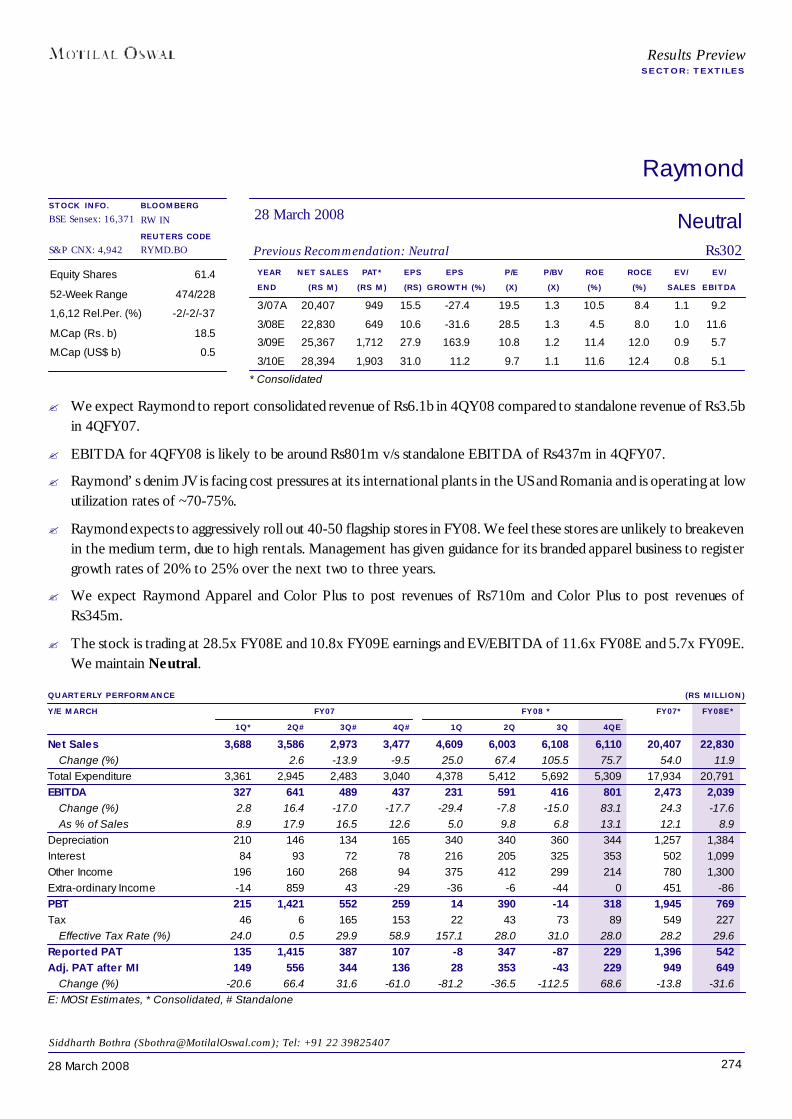
27428 March 2008
Raymond
YEAR NET SALES PAT* EPS EPS P/E P/BV ROE ROCE EV/ EV/END (RS M) (RS M) (RS) GROWTH (%) (X) (X) (%) (%) SALES EBITDA
3/07A 20,407 949 15.5 -27.4 19.5 1.3 10.5 8.4 1.1 9.2
3/08E 22,830 649 10.6 -31.6 28.5 1.3 4.5 8.0 1.0 11.6
3/09E 25,367 1,712 27.9 163.9 10.8 1.2 11.4 12.0 0.9 5.7
3/10E 28,394 1,903 31.0 11.2 9.7 1.1 11.6 12.4 0.8 5.1
Equity Shares 61.4
52-Week Range 474/228
1,6,12 Rel.Per. (%) -2/-2/-37
M.Cap (Rs. b) 18.5
M.Cap (US$ b) 0.5
NeutralPrevious Recommendation: Neutral Rs302
28 March 2008BLOOMBERGRW IN
REUTERS CODERYMD.BO
Siddharth Bothra ([email protected]); Tel: +91 22 39825407
QUARTERLY PERFORMANCE (RS MILLION)Y/E MARCH FY07 FY08 * FY07* FY08E*
1Q* 2Q# 3Q# 4Q# 1Q 2Q 3Q 4QENet Sales 3,688 3,586 2,973 3,477 4,609 6,003 6,108 6,110 20,407 22,830
Change (%) 2.6 -13.9 -9.5 25.0 67.4 105.5 75.7 54.0 11.9Total Expenditure 3,361 2,945 2,483 3,040 4,378 5,412 5,692 5,309 17,934 20,791EBITDA 327 641 489 437 231 591 416 801 2,473 2,039
Change (%) 2.8 16.4 -17.0 -17.7 -29.4 -7.8 -15.0 83.1 24.3 -17.6As % of Sales 8.9 17.9 16.5 12.6 5.0 9.8 6.8 13.1 12.1 8.9
Depreciation 210 146 134 165 340 340 360 344 1,257 1,384Interest 84 93 72 78 216 205 325 353 502 1,099Other Income 196 160 268 94 375 412 299 214 780 1,300Extra-ordinary Income -14 859 43 -29 -36 -6 -44 0 451 -86PBT 215 1,421 552 259 14 390 -14 318 1,945 769Tax 46 6 165 153 22 43 73 89 549 227
Effective Tax Rate (%) 24.0 0.5 29.9 58.9 157.1 28.0 31.0 28.0 28.2 29.6Reported PAT 135 1,415 387 107 -8 347 -87 229 1,396 542Adj. PAT after MI 149 556 344 136 28 353 -43 229 949 649
Change (%) -20.6 66.4 31.6 -61.0 -81.2 -36.5 -112.5 68.6 -13.8 -31.6E: MOSt Estimates, * Consolidated, # Standalone
Results PreviewSECTOR: TEXTILES
* Consolidated
STOCK INFO.BSE Sensex: 16,371
S&P CNX: 4,942
? We expect Raymond to report consolidated revenue of Rs6.1b in 4QY08 compared to standalone revenue of Rs3.5bin 4QFY07.
? EBITDA for 4QFY08 is likely to be around Rs801m v/s standalone EBITDA of Rs437m in 4QFY07.
? Raymond’s denim JV is facing cost pressures at its international plants in the US and Romania and is operating at lowutilization rates of ~70-75%.
? Raymond expects to aggressively roll out 40-50 flagship stores in FY08. We feel these stores are unlikely to breakevenin the medium term, due to high rentals. Management has given guidance for its branded apparel business to registergrowth rates of 20% to 25% over the next two to three years.
? We expect Raymond Apparel and Color Plus to post revenues of Rs710m and Color Plus to post revenues ofRs345m.
? The stock is trading at 28.5x FY08E and 10.8x FY09E earnings and EV/EBITDA of 11.6x FY08E and 5.7x FY09E.We maintain Neutral.

27528 March 2008
Vardhman Textiles
YEAR NET SALES PAT EPS EPS P/E P/BV ROE ROCE EV/ EV/END (RS M) (RS M) (RS) GROWTH (%) (X) (X) (%) (%) SALES EBITDA
3/07A 20,876 1,717 26.8 -12.5 4.0 0.6 16.6 9.3 1.0 6.1
3/08E 23,759 1,259 19.7 -26.7 6.3 0.7 10.8 6.1 1.4 9.3
3/09E 29,817 1,592 24.9 26.5 5.2 0.6 12.4 7.5 1.2 7.1
3/10E 41,147 2,487 38.8 56.2 2.7 0.4 17.1 9.4 0.9 5.7
Equity Shares (m) 64.1
52-Week Range (Rs) 209/91
1,6,12 Rel.Per. (%) -5/-23/-73
M.Cap (Rs. b) 6.8
M.Cap (US$ b) 0.2
BuyPrevious Recommendation: Buy Rs106
28 March 2008BLOOMBERGVTEX IN
REUTERS CODEMHSP.BO
Siddharth Bothra ([email protected]); Tel: +91 22 39825407
QUARTERLY PERFORMANCE (RS MILLION)Y/E MARCH FY07 FY08 FY07 FY08E
1Q 2Q 3Q 4Q 1Q 2Q 3Q 4QESales 4,755 5,283 5,438 5,400 5,276 5,661 6,119 6,704 20,876 23,759
Change (%) 12.7 15.0 6.1 9.1 10.9 7.1 12.5 24.2 10.5 13.8Total Expenditure 133 4,366 4,470 4,632 4,380 4,778 5,218 5,859 17,388 20,235EBITDA 836 917 968 768 896 883 901 845 3,488 3,524
Change (%) 6.8 7.5 1.0 -8.2 7.2 -3.7 -7.0 10.1 1.7 1.0As % of Sales 17.6 17.4 17.8 14.2 17.0 15.6 14.7 12.6 16.7 14.8
Depreciation 286 301 290 317 346 354 375 401 1,194 1,477Interest 110 99 87 81 165 131 125 214 377 635Other Income 62 37 77 129 66 116 94 24 340 300Extra-ordinary Income 0 35 0 1 0 0 0 0 35 0PBT 501 590 668 500 451 514 494 254 2,292 1,712Tax 126 132 152 131 134 140 94 86 541 454
Effective Tax Rate (%) 25.2 22.4 22.8 26.2 23.7 25.1 24.2 33.9 23.6 26.5Reported PAT 375 458 516 369 317 374 401 168 1,752 1,259Adj. PAT 375 423 516 369 317 374 401 168 1,717 1,259
Change (%) 29.4 5.9 0.5 -24.9 -15.5 -11.6 -22.2 -54.5 1.4 -26.7E: MOSt Estimates
Results PreviewSECTOR: TEXTILES
Vardhman Textiles has issued a bonus of 1:2
STOCK INFO.BSE Sensex: 16,371
S&P CNX: 4,942
? For 4QFY08, Vardhman is likely to report revenue growth of 24.2% YoY to Rs6.7b. We expect EBITDA margin todecline 161bp to 12.6% v/s 14.2% in 4QFY07, as a result of higher cotton prices.
? Adjusted PAT is likely to register 54.5% YoY decline to Rs168m v/s Rs369m in 4QFY07, as a result of higherdepreciation and interest cost.
? VTL is currently implementing an ambitious Rs16b capex plan, which would double its fabric capacity and increasespinning capacity by nearly 50%.
? We are lowering our PAT estimates for FY09 by 11.2% to Rs1.6b, due to margin pressure from higher fuel cost, rawmaterial pressure and sharp appreciation in the rupee.
? We expect Vardhman Textiles’ sales and earnings to witness CAGR of 25.3% and 13.1% respectively over FY07-FY10E.
? The stock is trading at 6.3x FY08E and 5.2x FY09E earnings. We maintain Buy.
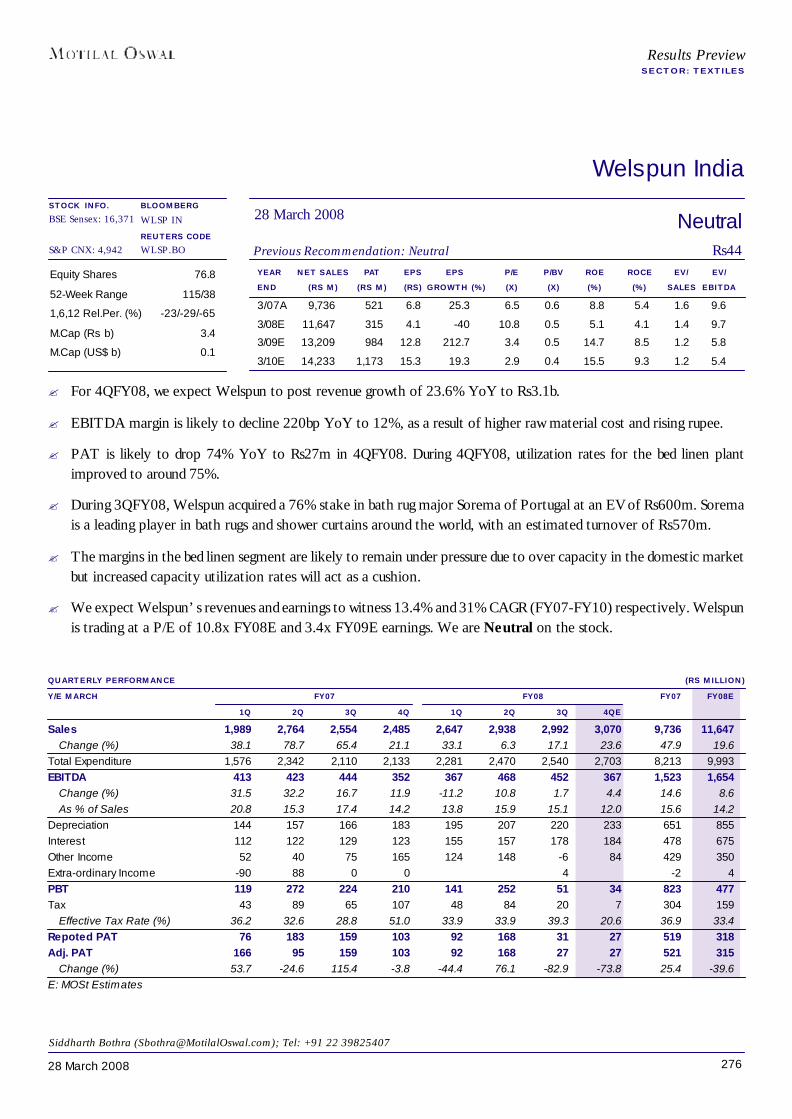
27628 March 2008
Results PreviewSECTOR: TEXTILES
Welspun India
YEAR NET SALES PAT EPS EPS P/E P/BV ROE ROCE EV/ EV/END (RS M) (RS M) (RS) GROWTH (%) (X) (X) (%) (%) SALES EBITDA
3/07A 9,736 521 6.8 25.3 6.5 0.6 8.8 5.4 1.6 9.6
3/08E 11,647 315 4.1 -40 10.8 0.5 5.1 4.1 1.4 9.7
3/09E 13,209 984 12.8 212.7 3.4 0.5 14.7 8.5 1.2 5.8
3/10E 14,233 1,173 15.3 19.3 2.9 0.4 15.5 9.3 1.2 5.4
Equity Shares 76.8
52-Week Range 115/38
1,6,12 Rel.Per. (%) -23/-29/-65
M.Cap (Rs b) 3.4
M.Cap (US$ b) 0.1
NeutralPrevious Recommendation: Neutral Rs44
28 March 2008BLOOMBERGWLSP IN
REUTERS CODEWLSP.BO
Siddharth Bothra ([email protected]); Tel: +91 22 39825407
QUARTERLY PERFORMANCE (RS MILLION)Y/E MARCH FY07 FY08 FY07 FY08E
1Q 2Q 3Q 4Q 1Q 2Q 3Q 4QESales 1,989 2,764 2,554 2,485 2,647 2,938 2,992 3,070 9,736 11,647
Change (%) 38.1 78.7 65.4 21.1 33.1 6.3 17.1 23.6 47.9 19.6Total Expenditure 1,576 2,342 2,110 2,133 2,281 2,470 2,540 2,703 8,213 9,993EBITDA 413 423 444 352 367 468 452 367 1,523 1,654
Change (%) 31.5 32.2 16.7 11.9 -11.2 10.8 1.7 4.4 14.6 8.6As % of Sales 20.8 15.3 17.4 14.2 13.8 15.9 15.1 12.0 15.6 14.2
Depreciation 144 157 166 183 195 207 220 233 651 855Interest 112 122 129 123 155 157 178 184 478 675Other Income 52 40 75 165 124 148 -6 84 429 350Extra-ordinary Income -90 88 0 0 4 -2 4PBT 119 272 224 210 141 252 51 34 823 477Tax 43 89 65 107 48 84 20 7 304 159
Effective Tax Rate (%) 36.2 32.6 28.8 51.0 33.9 33.9 39.3 20.6 36.9 33.4Repoted PAT 76 183 159 103 92 168 31 27 519 318Adj. PAT 166 95 159 103 92 168 27 27 521 315
Change (%) 53.7 -24.6 115.4 -3.8 -44.4 76.1 -82.9 -73.8 25.4 -39.6E: MOSt Estimates
STOCK INFO.BSE Sensex: 16,371
S&P CNX: 4,942
? For 4QFY08, we expect Welspun to post revenue growth of 23.6% YoY to Rs3.1b.
? EBITDA margin is likely to decline 220bp YoY to 12%, as a result of higher raw material cost and rising rupee.
? PAT is likely to drop 74% YoY to Rs27m in 4QFY08. During 4QFY08, utilization rates for the bed linen plantimproved to around 75%.
? During 3QFY08, Welspun acquired a 76% stake in bath rug major Sorema of Portugal at an EV of Rs600m. Soremais a leading player in bath rugs and shower curtains around the world, with an estimated turnover of Rs570m.
? The margins in the bed linen segment are likely to remain under pressure due to over capacity in the domestic marketbut increased capacity utilization rates will act as a cushion.
? We expect Welspun’s revenues and earnings to witness 13.4% and 31% CAGR (FY07-FY10) respectively. Welspunis trading at a P/E of 10.8x FY08E and 3.4x FY09E earnings. We are Neutral on the stock.
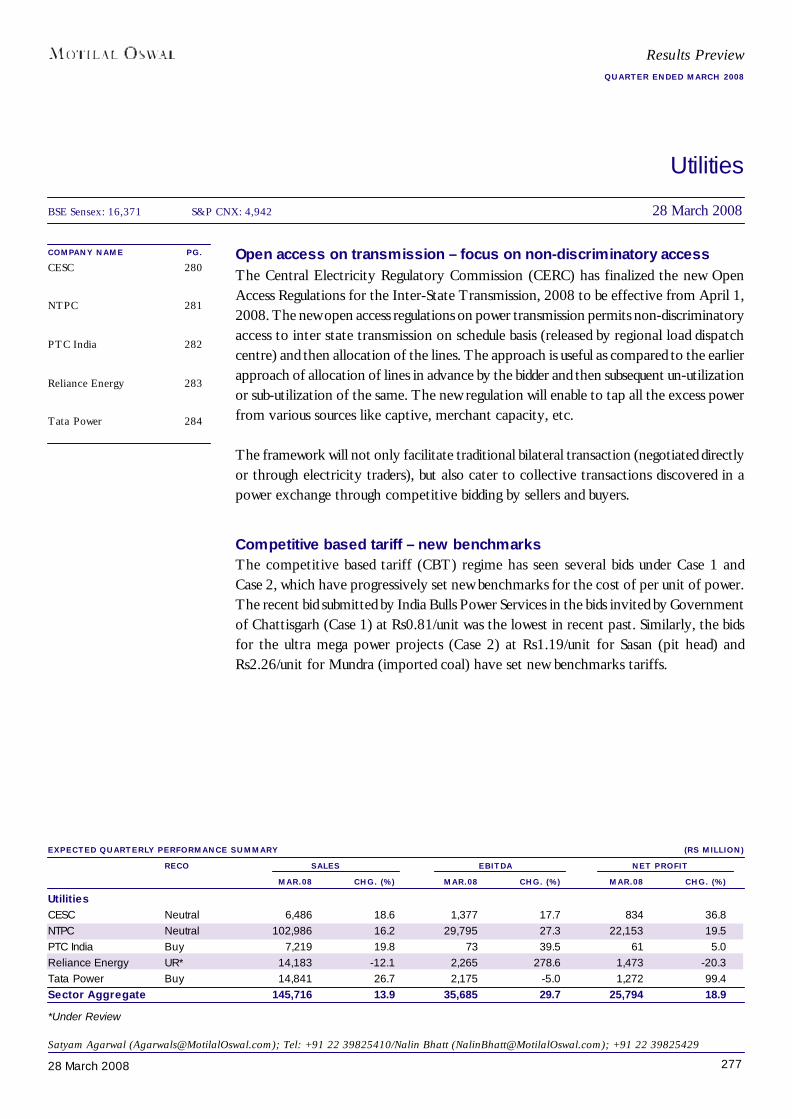
27728 March 2008
Utilities
COMPANY NAME PG.CESC 280
NTPC 281
PTC India 282
Reliance Energy 283
Tata Power 284
EXPECTED QUARTERLY PERFORMANCE SUMMARY (RS MILLION)RECO SALES EBITDA NET PROFIT
MAR.08 CHG. (%) MAR.08 CHG. (%) MAR.08 CHG. (%)UtilitiesCESC Neutral 6,486 18.6 1,377 17.7 834 36.8NTPC Neutral 102,986 16.2 29,795 27.3 22,153 19.5PTC India Buy 7,219 19.8 73 39.5 61 5.0Reliance Energy UR* 14,183 -12.1 2,265 278.6 1,473 -20.3Tata Power Buy 14,841 26.7 2,175 -5.0 1,272 99.4Sector Aggregate 145,716 13.9 35,685 29.7 25,794 18.9
Satyam Agarwal ([email protected]); Tel: +91 22 39825410/Nalin Bhatt ([email protected]); +91 22 39825429
Open access on transmission – focus on non-discriminatory accessThe Central Electricity Regulatory Commission (CERC) has finalized the new OpenAccess Regulations for the Inter-State Transmission, 2008 to be effective from April 1,2008. The new open access regulations on power transmission permits non-discriminatoryaccess to inter state transmission on schedule basis (released by regional load dispatchcentre) and then allocation of the lines. The approach is useful as compared to the earlierapproach of allocation of lines in advance by the bidder and then subsequent un-utilizationor sub-utilization of the same. The new regulation will enable to tap all the excess powerfrom various sources like captive, merchant capacity, etc.
The framework will not only facilitate traditional bilateral transaction (negotiated directlyor through electricity traders), but also cater to collective transactions discovered in apower exchange through competitive bidding by sellers and buyers.
Competitive based tariff – new benchmarksThe competitive based tariff (CBT) regime has seen several bids under Case 1 andCase 2, which have progressively set new benchmarks for the cost of per unit of power.The recent bid submitted by India Bulls Power Services in the bids invited by Governmentof Chattisgarh (Case 1) at Rs0.81/unit was the lowest in recent past. Similarly, the bidsfor the ultra mega power projects (Case 2) at Rs1.19/unit for Sasan (pit head) andRs2.26/unit for Mundra (imported coal) have set new benchmarks tariffs.
BSE Sensex: 16,371 S&P CNX: 4,942 28 March 2008
Results PreviewQUARTER ENDED MARCH 2008
*Under Review

27828 March 2008
Utilities
LIST OF PROJECTS AWARDED THROUGH CBTSTATE BIDDERS CAPACITY (MW) BID (RS/UNIT)Projects under Case 1 biddingHaryana Lanco Power 390 2.35Madhya Pradesh Lanco Power 600 2.32Projects under Case 2 biddingJhajjar, Haryana China Light and Power 1,320 2.996Chhattisgarh India Bulls Power Services 1,600 0.81*Sasan, UMPP Reliance Power 4,000 1.19Mundra, UMPP Tata Power 4,000 2.26Krishnapatnam, UMPP Reliance Power 4,000 2.37*65% of power at Rs0.81/unit to State govt, 35% merchant; coal mine of 350m ton allotted, coal salespermitted in initial 4 years Source: MoP/Motilal Oswal Securities
Extention of Rajiv Gandhi Grameen Vidyutikaran YojanaThe Rajiv Gandhi Grameen Vidyutikaran Yojana (RGGVY) scheme has been extendedfor the Eleventh Plan with capital subsidy of Rs280b currently (v/s the total estimatedexpenditure of Rs418b). This shows the commitment of the government towards the ruralelectrification projects. Rural Electrification Corporation (REC) has been specified as thenodal agency for the scheme. According to the scheme, 90% capital subsidy would beprovided towards overall cost of the projects under the scheme (excluding state or locallevies, to be borne by State/State Utility) while the balance 10% of the project cost wouldbe contributed by states through own resources/loan from financial institution.
The scheme will benefit companies like Power Grid Corporation of India, which arefunctional entities for execution of the scheme. PGCIL will receive 8-9% of the projectcost as charges for implementing the scheme.
Section 80-IA benefit not extended; reduction in indirect dutiesThe Union Budget 2008-09 did not extend deadline for claiming Sec80IA deadline forpower generation projects commissioned post FY10. Thus, a significant capacity in theEleventh Plan, which is likely to be commissioned post FY10, will not be entitled to the taxbenefit. The budget, however, recommended reduction in customs and excise duty forpower projects, which will marginally lower the project cost. The customs duty on projectimport is reduced from 7.5% to 5.0%, while additional CVD of 4% is levied for selectpower project equipment. In addition, 4% additional customs duty exemption on powergeneration, transmission and distribution equipment has been withdrawn, which is a positivefor the local power equipment companies.
Valuation and viewFor 4QFY08, we expect utilities to report a steady performance in terms of revenues andprofitability. The pace of reforms, achievement of the target capacity addition and attractingprivate sector investments in generation and privatization of distribution represent keychallenges for the Indian power sector. However, the reforms are on track, albeit at aslower rate, which is reflected in UMPP projects, various initiatives by the government toensure the fuel linkages, etc. We remain positive on the sector.
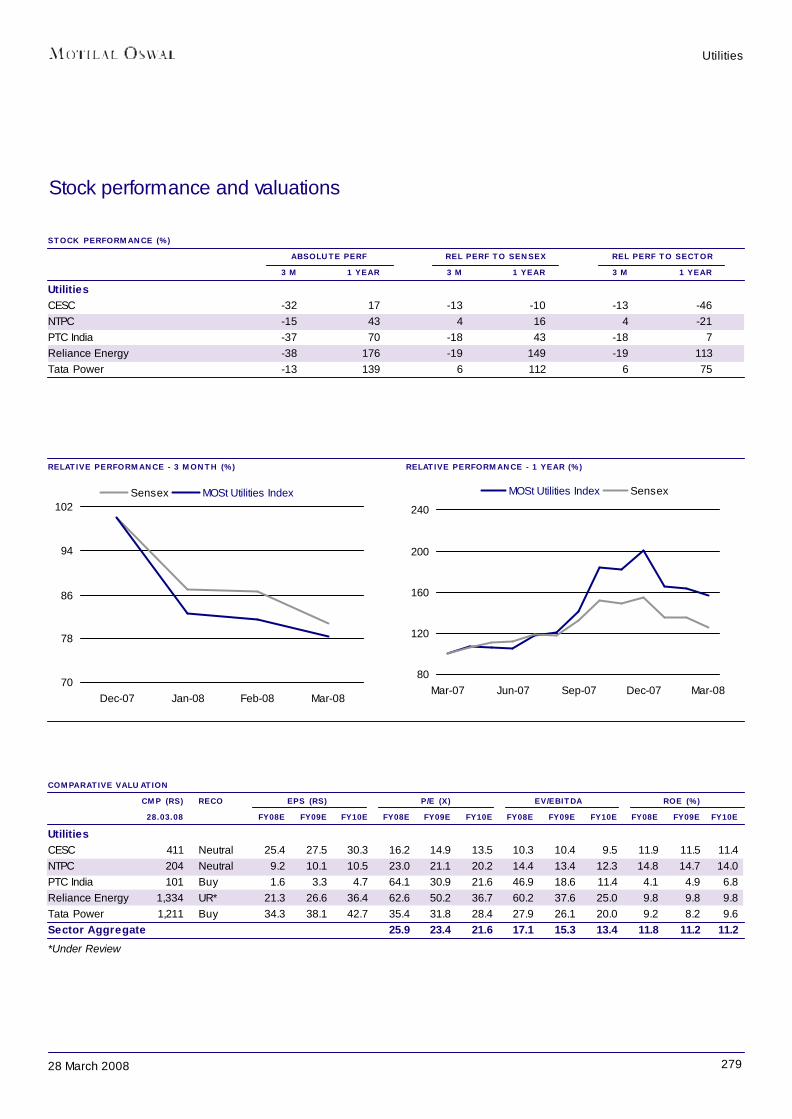
27928 March 2008
Utilities
RELATIVE PERFORMANCE - 3 MONTH (%) RELATIVE PERFORMANCE - 1 YEAR (%)
Stock performance and valuations
STOCK PERFORMANCE (%) ABSOLUTE PERF REL PERF TO SENSEX REL PERF TO SECTOR
3 M 1 YEAR 3 M 1 YEAR 3 M 1 YEARUtilitiesCESC -32 17 -13 -10 -13 -46NTPC -15 43 4 16 4 -21PTC India -37 70 -18 43 -18 7Reliance Energy -38 176 -19 149 -19 113Tata Power -13 139 6 112 6 75
COMPARATIVE VALUATIONCMP (RS) RECO EPS (RS) P/E (X) EV/EBITDA ROE (%)28.03.08 FY08E FY09E FY10E FY08E FY09E FY10E FY08E FY09E FY10E FY08E FY09E FY10E
UtilitiesCESC 411 Neutral 25.4 27.5 30.3 16.2 14.9 13.5 10.3 10.4 9.5 11.9 11.5 11.4NTPC 204 Neutral 9.2 10.1 10.5 23.0 21.1 20.2 14.4 13.4 12.3 14.8 14.7 14.0PTC India 101 Buy 1.6 3.3 4.7 64.1 30.9 21.6 46.9 18.6 11.4 4.1 4.9 6.8Reliance Energy 1,334 UR* 21.3 26.6 36.4 62.6 50.2 36.7 60.2 37.6 25.0 9.8 9.8 9.8Tata Power 1,211 Buy 34.3 38.1 42.7 35.4 31.8 28.4 27.9 26.1 20.0 9.2 8.2 9.6Sector Aggregate 25.9 23.4 21.6 17.1 15.3 13.4 11.8 11.2 11.2
80
120
160
200
240
Mar-07 Jun-07 Sep-07 Dec-07 Mar-08
MOSt Utilities Index Sensex
70
78
86
94
102
Dec-07 Jan-08 Feb-08 Mar-08
Sensex MOSt Utilities Index
*Under Review
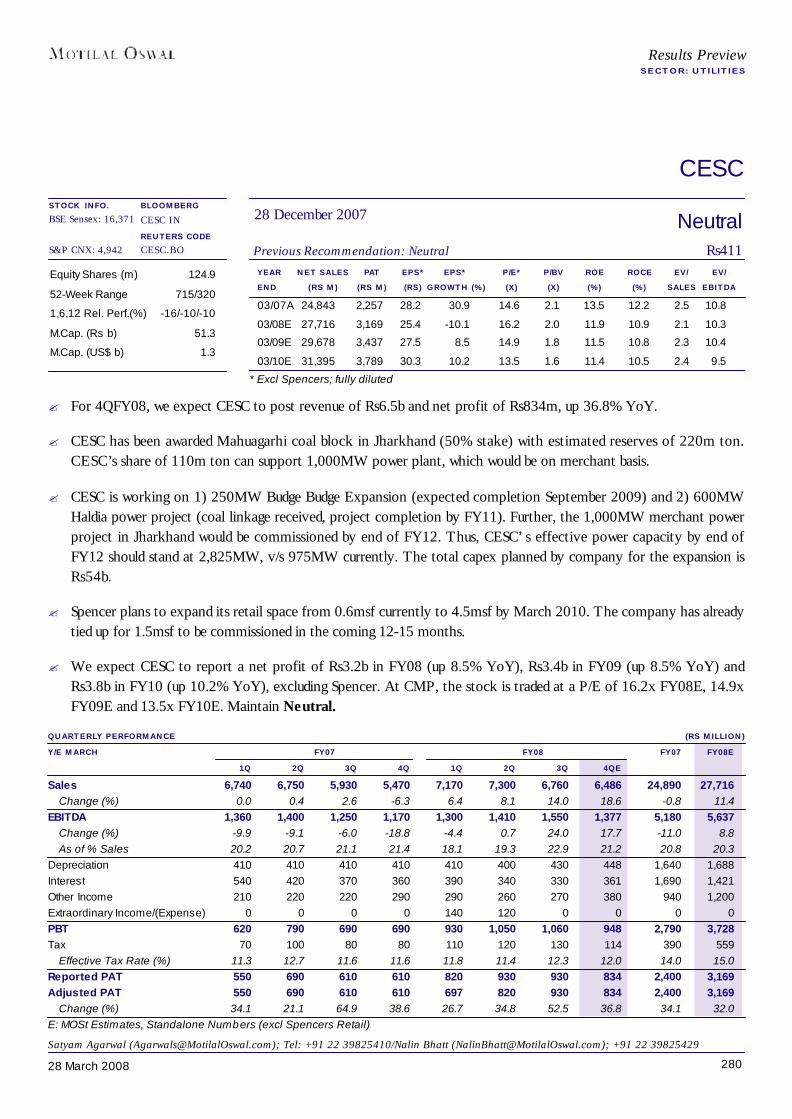
28028 March 2008
CESC
YEAR NET SALES PAT EPS* EPS* P/E* P/BV ROE ROCE EV/ EV/END (RS M) (RS M) (RS) GROWTH (%) (X) (X) (%) (%) SALES EBITDA
03/07A 24,843 2,257 28.2 30.9 14.6 2.1 13.5 12.2 2.5 10.8
03/08E 27,716 3,169 25.4 -10.1 16.2 2.0 11.9 10.9 2.1 10.3
03/09E 29,678 3,437 27.5 8.5 14.9 1.8 11.5 10.8 2.3 10.4
03/10E 31,395 3,789 30.3 10.2 13.5 1.6 11.4 10.5 2.4 9.5
Equity Shares (m) 124.9
52-Week Range 715/320
1,6,12 Rel. Perf.(%) -16/-10/-10
M.Cap. (Rs b) 51.3
M.Cap. (US$ b) 1.3
QUARTERLY PERFORMANCE (RS MILLION)Y/E MARCH FY07 FY08 FY07 FY08E
1Q 2Q 3Q 4Q 1Q 2Q 3Q 4QESales 6,740 6,750 5,930 5,470 7,170 7,300 6,760 6,486 24,890 27,716
Change (%) 0.0 0.4 2.6 -6.3 6.4 8.1 14.0 18.6 -0.8 11.4EBITDA 1,360 1,400 1,250 1,170 1,300 1,410 1,550 1,377 5,180 5,637
Change (%) -9.9 -9.1 -6.0 -18.8 -4.4 0.7 24.0 17.7 -11.0 8.8As of % Sales 20.2 20.7 21.1 21.4 18.1 19.3 22.9 21.2 20.8 20.3
Depreciation 410 410 410 410 410 400 430 448 1,640 1,688Interest 540 420 370 360 390 340 330 361 1,690 1,421Other Income 210 220 220 290 290 260 270 380 940 1,200Extraordinary Income/(Expense) 0 0 0 0 140 120 0 0 0 0PBT 620 790 690 690 930 1,050 1,060 948 2,790 3,728Tax 70 100 80 80 110 120 130 114 390 559
Effective Tax Rate (%) 11.3 12.7 11.6 11.6 11.8 11.4 12.3 12.0 14.0 15.0Reported PAT 550 690 610 610 820 930 930 834 2,400 3,169Adjusted PAT 550 690 610 610 697 820 930 834 2,400 3,169
Change (%) 34.1 21.1 64.9 38.6 26.7 34.8 52.5 36.8 34.1 32.0E: MOSt Estimates, Standalone Numbers (excl Spencers Retail)
NeutralPrevious Recommendation: Neutral Rs411
28 December 2007BLOOMBERGCESC IN
REUTERS CODECESC.BO
* Excl Spencers; fully diluted
Results PreviewSECTOR: UTILITIES
Satyam Agarwal ([email protected]); Tel: +91 22 39825410/Nalin Bhatt ([email protected]); +91 22 39825429
STOCK INFO.BSE Sensex: 16,371
S&P CNX: 4,942
? For 4QFY08, we expect CESC to post revenue of Rs6.5b and net profit of Rs834m, up 36.8% YoY.
? CESC has been awarded Mahuagarhi coal block in Jharkhand (50% stake) with estimated reserves of 220m ton.CESC’s share of 110m ton can support 1,000MW power plant, which would be on merchant basis.
? CESC is working on 1) 250MW Budge Budge Expansion (expected completion September 2009) and 2) 600MWHaldia power project (coal linkage received, project completion by FY11). Further, the 1,000MW merchant powerproject in Jharkhand would be commissioned by end of FY12. Thus, CESC’s effective power capacity by end ofFY12 should stand at 2,825MW, v/s 975MW currently. The total capex planned by company for the expansion isRs54b.
? Spencer plans to expand its retail space from 0.6msf currently to 4.5msf by March 2010. The company has alreadytied up for 1.5msf to be commissioned in the coming 12-15 months.
? We expect CESC to report a net profit of Rs3.2b in FY08 (up 8.5% YoY), Rs3.4b in FY09 (up 8.5% YoY) andRs3.8b in FY10 (up 10.2% YoY), excluding Spencer. At CMP, the stock is traded at a P/E of 16.2x FY08E, 14.9xFY09E and 13.5x FY10E. Maintain Neutral.

28128 March 2008
National Thermal Power Corporation
YEAR NET SALES PAT* EPS* EPS P/E P/BV ROE ROCE EV/ EV/END* (RS M) (RS M) (RS) GROWTH (%) (X) (X) (%) (%) SALES EBITDA
03/07A 326,317 65,681 8.0 23.6 26.6 3.6 13.9 21.2 5.2 14.5
03/08E 366,160 75,968 9.2 16.8 23.0 3.2 14.8 22.8 4.7 12.9
03/09E 418,646 83,042 10.1 9.3 21.1 3.0 14.7 21.3 4.4 12.1
03/10E 481,744 86,608 10.5 4.3 20.2 2.7 14.0 19.7 4.0 11.0
Equity Shares (m) 8,245.5
52-Week Range 291/141
1,6,12 Rel. Perf. (%) 8/11/16
M.Cap. (Rs b) 1,684
M.Cap. (US$ b) 42.2
QUARTERLY PERFORMANCE (RS MILLION)Y/E MARCH FY07 FY08 FY07 FY08E
1Q 2Q 3Q 4Q 1Q 2Q 3Q 4QESales 71,536 68,138 81,468 88,603 89,697 80,169 93,308 102,986 326,317 366,160
Change (%) 18.1 15.0 18.6 21.5 25.4 17.7 14.5 16.2 24.8 18.2EBITDA 19,960 18,408 22,595 23,397 26,945 27,490 29,691 29,795 100,932 113,921
Change (%) 29.4 41.9 24.2 33.1 35.0 49.3 31.4 27.3 57.3 12.9As of % Sales 27.9 27.0 27.7 26.4 30.0 34.3 31.8 28.9 30.9 31.1
Depreciation 4,755 4,780 5,138 6,081 4,914 5,134 5,266 5,484 20,754 20,798Interest 5,238 4,630 2,807 5,919 278 4,964 4,665 5,349 18,594 15,256Other Income 6,369 6,505 7,752 6,864 7,181 7,323 7,624 7,829 27,490 29,957PBT 16,336 15,503 22,402 18,261 28,934 24,715 27,384 26,790 89,074 107,823Tax 808 764 1,369 914 5,235 5,460 9,585 4,638 20,427 24,918
Effective Tax Rate (%) 4.9 4.9 6.1 5.0 18.1 22.1 35.0 17.3 22.9 23.1Reported PAT 15,528 14,739 21,033 17,347 23,699 19,255 17,799 22,153 68,647 82,906Adj.PAT (Pre Exceptional) 15,318 14,410 17,415 18,539 17,648 16,269 19,898 22,153 65,681 75,968
Change (%) 25.4 24.8 37.4 18.4 15.2 12.9 14.3 19.5 23.6 15.7E: MOSt Estimates
NeutralPrevious Recommendation: Neutral Rs204
28 March 2008BLOOMBERGNTPC IN
REUTERS CODENTPC.BO
* Pre Exceptional Earnings; FY05 reported Net Profit Rs58.1b
Results PreviewSECTOR: UTILITIES
Satyam Agarwal ([email protected]); Tel: +91 22 39825410/Nalin Bhatt ([email protected]); +91 22 39825429
STOCK INFO.BSE Sensex: 16,371
S&P CNX: 4,942
? We expect NTPC to report revenue of Rs103b, up 16.2% YoY, and net profit of Rs22.2b, up 19.5% YoY, in 4QFY08.
? The power capacity as of December 2007 stood at 26,850MW (excluding JV capacity of 1,054MW), up from26,350MW in March 2007. For the Eleventh Plan, NTPC plans to add 22,600MW and of this, capacity underconstruction stands at ~17,000MW. The company expects to issue the main plant award for the balance 5,600MW byMarch 2008.
? The expected ramp up for the targeted capacity of 22,600MW in the Eleventh plan: FY08- 2,740 MW, FY09-2,580MW, FY10- 3,000MW, FY11 – 5,960MW and FY12 – 8,310MW. The management has indicated that expectedcapacity addition during FY08 will be 2,740MW (Kahalgaon 500MW, Sipat 1,000MW, Dabhol 740MW and Bhilai JV250MW) During FY09, capacity addition is expected at 2,580MW (Sipat 1,320MW, Barh 660MW and Koldam hydropower 600MW).
? NTPC has recently signed a JV agreement (50:50) with Bihar State Electricity Board to set up a 1,980MW powerplant and with Uttar Pradesh Rajya Vidyut Utpadan Nigam to set up a 660MW power plant in UP (at Meja district inAllahabad).
? We expect NTPC to report net profit of Rs76b in FY08, Rs83.1b in FY09 and Rs86.6b in FY10. At CMP, NTPCquotes at a P/E of 23x FY08E, 21x FY09E and 20x FY10E. Maintain Neutral.
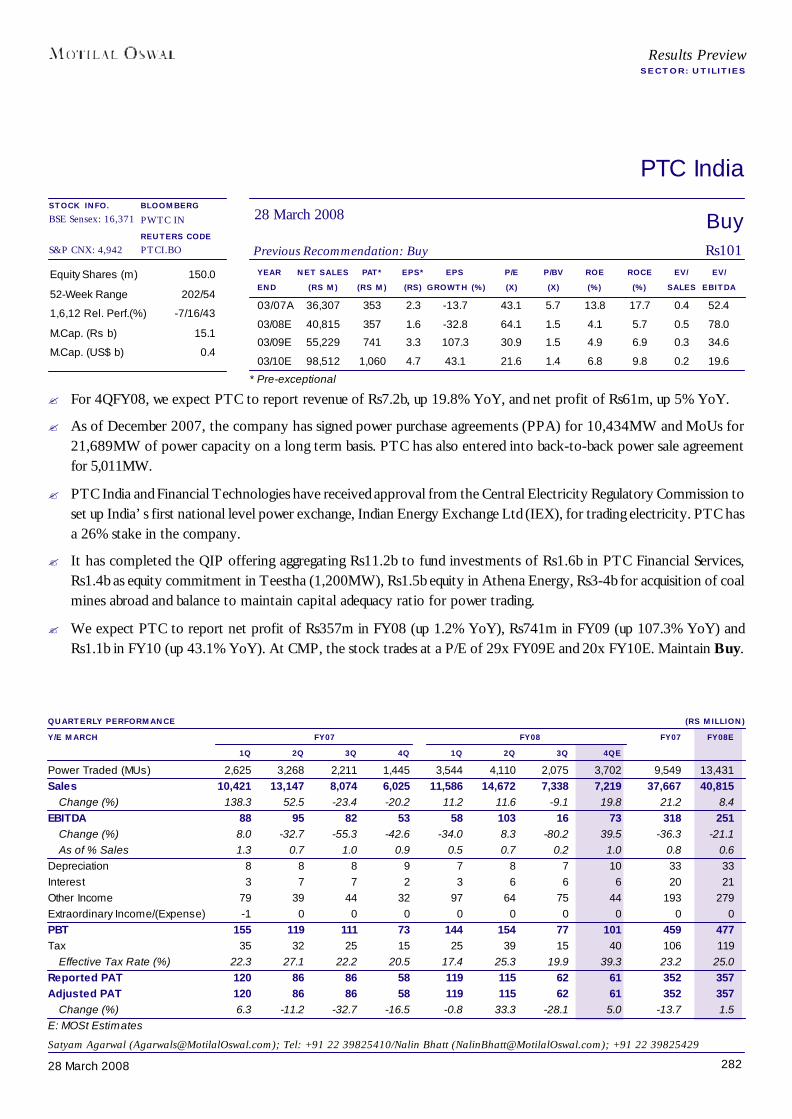
28228 March 2008
PTC India
YEAR NET SALES PAT* EPS* EPS P/E P/BV ROE ROCE EV/ EV/END (RS M) (RS M) (RS) GROWTH (%) (X) (X) (%) (%) SALES EBITDA
03/07A 36,307 353 2.3 -13.7 43.1 5.7 13.8 17.7 0.4 52.4
03/08E 40,815 357 1.6 -32.8 64.1 1.5 4.1 5.7 0.5 78.0
03/09E 55,229 741 3.3 107.3 30.9 1.5 4.9 6.9 0.3 34.6
03/10E 98,512 1,060 4.7 43.1 21.6 1.4 6.8 9.8 0.2 19.6
Equity Shares (m) 150.0
52-Week Range 202/54
1,6,12 Rel. Perf.(%) -7/16/43
M.Cap. (Rs b) 15.1
M.Cap. (US$ b) 0.4
QUARTERLY PERFORMANCE (RS MILLION)Y/E MARCH FY07 FY08 FY07 FY08E
1Q 2Q 3Q 4Q 1Q 2Q 3Q 4QEPower Traded (MUs) 2,625 3,268 2,211 1,445 3,544 4,110 2,075 3,702 9,549 13,431Sales 10,421 13,147 8,074 6,025 11,586 14,672 7,338 7,219 37,667 40,815
Change (%) 138.3 52.5 -23.4 -20.2 11.2 11.6 -9.1 19.8 21.2 8.4EBITDA 88 95 82 53 58 103 16 73 318 251
Change (%) 8.0 -32.7 -55.3 -42.6 -34.0 8.3 -80.2 39.5 -36.3 -21.1As of % Sales 1.3 0.7 1.0 0.9 0.5 0.7 0.2 1.0 0.8 0.6
Depreciation 8 8 8 9 7 8 7 10 33 33Interest 3 7 7 2 3 6 6 6 20 21Other Income 79 39 44 32 97 64 75 44 193 279Extraordinary Income/(Expense) -1 0 0 0 0 0 0 0 0 0PBT 155 119 111 73 144 154 77 101 459 477Tax 35 32 25 15 25 39 15 40 106 119
Effective Tax Rate (%) 22.3 27.1 22.2 20.5 17.4 25.3 19.9 39.3 23.2 25.0Reported PAT 120 86 86 58 119 115 62 61 352 357Adjusted PAT 120 86 86 58 119 115 62 61 352 357
Change (%) 6.3 -11.2 -32.7 -16.5 -0.8 33.3 -28.1 5.0 -13.7 1.5E: MOSt Estimates
BuyPrevious Recommendation: Buy Rs101
28 March 2008BLOOMBERGPWTC IN
REUTERS CODEPTCI.BO
* Pre-exceptional
Results PreviewSECTOR: UTILITIES
Satyam Agarwal ([email protected]); Tel: +91 22 39825410/Nalin Bhatt ([email protected]); +91 22 39825429
STOCK INFO.BSE Sensex: 16,371
S&P CNX: 4,942
? For 4QFY08, we expect PTC to report revenue of Rs7.2b, up 19.8% YoY, and net profit of Rs61m, up 5% YoY.
? As of December 2007, the company has signed power purchase agreements (PPA) for 10,434MW and MoUs for21,689MW of power capacity on a long term basis. PTC has also entered into back-to-back power sale agreementfor 5,011MW.
? PTC India and Financial Technologies have received approval from the Central Electricity Regulatory Commission toset up India’s first national level power exchange, Indian Energy Exchange Ltd (IEX), for trading electricity. PTC hasa 26% stake in the company.
? It has completed the QIP offering aggregating Rs11.2b to fund investments of Rs1.6b in PTC Financial Services,Rs1.4b as equity commitment in Teestha (1,200MW), Rs1.5b equity in Athena Energy, Rs3-4b for acquisition of coalmines abroad and balance to maintain capital adequacy ratio for power trading.
? We expect PTC to report net profit of Rs357m in FY08 (up 1.2% YoY), Rs741m in FY09 (up 107.3% YoY) andRs1.1b in FY10 (up 43.1% YoY). At CMP, the stock trades at a P/E of 29x FY09E and 20x FY10E. Maintain Buy.

28328 March 2008
Reliance Energy
YEAR NET SALES PAT EPS* EPS P/E* P/BV ROE ROCE EV/ EV/END (RS M) (RS M) (RS) GROWTH (%) (X) (X) (%) (%) SALES EBITDA
3/07A 56,930 8,015 28.7 3.5 46.5 3.5 10.2 8.7 5.6 66.8
3/08E 60,896 5,947 21.3 -25.8 62.6 3.7 9.8 9.2 5.1 60.2
3/09E 69,196 7,423 26.6 24.8 50.2 2.1 9.8 9.2 4.0 37.6
3/10E 85,021 10,163 36.4 36.9 36.7 2.0 9.8 9.2 2.7 25.0
Equity Shares (m) 279.4
52-Week Range 2632/465
1,6,12 Rel. Perf. (%) -9/16/149
M.Cap. (Rs b) 372.6
M.Cap. (US$ b) 9.3
QUARTERLY PERFORMANCE (RS MILLION)Y/E MARCH FY07 FY08 FY07 FY08E
1Q 2Q 3Q 4Q 1Q 2Q 3Q 4QESales 11,549 14,076 15,337 16,143 16,240 15,417 15,055 14,183 56,930 60,896
Change (%) 21.6 35.0 55.2 55.5 40.6 9.5 -1.8 -12.1 41.6 7.0EBITDA 1,334 1,775 827 598 376 1,813 741 2,265 4,804 5,195
Change (%) -17.4 -12.8 -53.9 -68.5 -71.8 2.1 -10.4 278.6 -34.5 8.1As of % Sales 11.6 12.6 5.4 3.7 2.3 11.8 4.9 16.0 8.4 8.5
Depreciation 619 635 612 535 581 556 566 573 2,401 2,276Interest 459 671 551 823 693 854 854 905 2,503 3,306Other Income 1,711 1,761 2,867 2,754 3,599 2,582 3,479 1,058 8,823 10,718PBT 1,967 2,230 2,531 1,994 2,701 2,985 2,800 1,845 8,724 10,331Tax (incl contingencies) 201 366 522 -380 485 484 -216 372 709 1,126
Effective Tax Rate (%) 10.2 16.4 20.6 -19.1 18.0 16.2 -7.7 20.2 8.1 10.9Reported PAT 1,766 1,864 2,009 2,374 2,216 2,501 3,016 1,473 8,015 9,205PAT (Pre Exceptionals) 1,666 1,864 2,009 1,848 1,341 1,599 1,505 1,473 7,388 5,947
Change (%) 12.7 16.8 22.0 40.1 -19.5 -14.2 -25.1 -20.3 23.2 -19.5E: MOSt Estimates; Quarterly numbers are on standalone basis
Under ReviewPrevious Recommendation: Buy Rs1,334
28 March 2008BLOOMBERGRELE IN
REUTERS CODERLEN.BO
Results PreviewSECTOR: UTILITIES
* Consolidated, Fully Diluted
Satyam Agarwal ([email protected]); Tel: +91 22 39825410/Nalin Bhatt ([email protected]); +91 22 39825429
STOCK INFO.BSE Sensex: 16,371
S&P CNX: 4,942
? For 4QFY08, we expect Reliance Energy to report revenue of Rs14.2b, down 12.1% YoY, and a net profit of Rs1.5b,down 20.3%YoY.
? Reliance Energy Board has approved share buy-back (up to 25% of the existing paid-up capital) of up to Rs20b(US$500m), in two phases at maximum price of Rs2,000/sh. The first tranche of buy back up to Rs8b will beeffective immediately while second tranche of Rs12b will be subject to approval of shareholders.
? Reliance Energy in consortium with Hyundai Engineering (Korea) has emerged as a successful bidder for MumbaiTrans-harbor sea-link project to be developed at a cost of US$1.5b. The project involves construction of six lane dualcarriageway linking Nhava to Sewri covering 25km.
? The order backlog for the EPC division stood at Rs83b (v/s Rs17.1b as of December 2006), which is expected to goup further with the booking of EPC orders for the project under execution by Reliance Power (48% stake).
? Reliance energy’s EPC division will provide turnkey services for the proposed 28,200 MW of capacity planned byReliance power (45% stake).
? We believe the stock is largely a play on the future growth opportunities rather than on existing assured returnbusinesses.
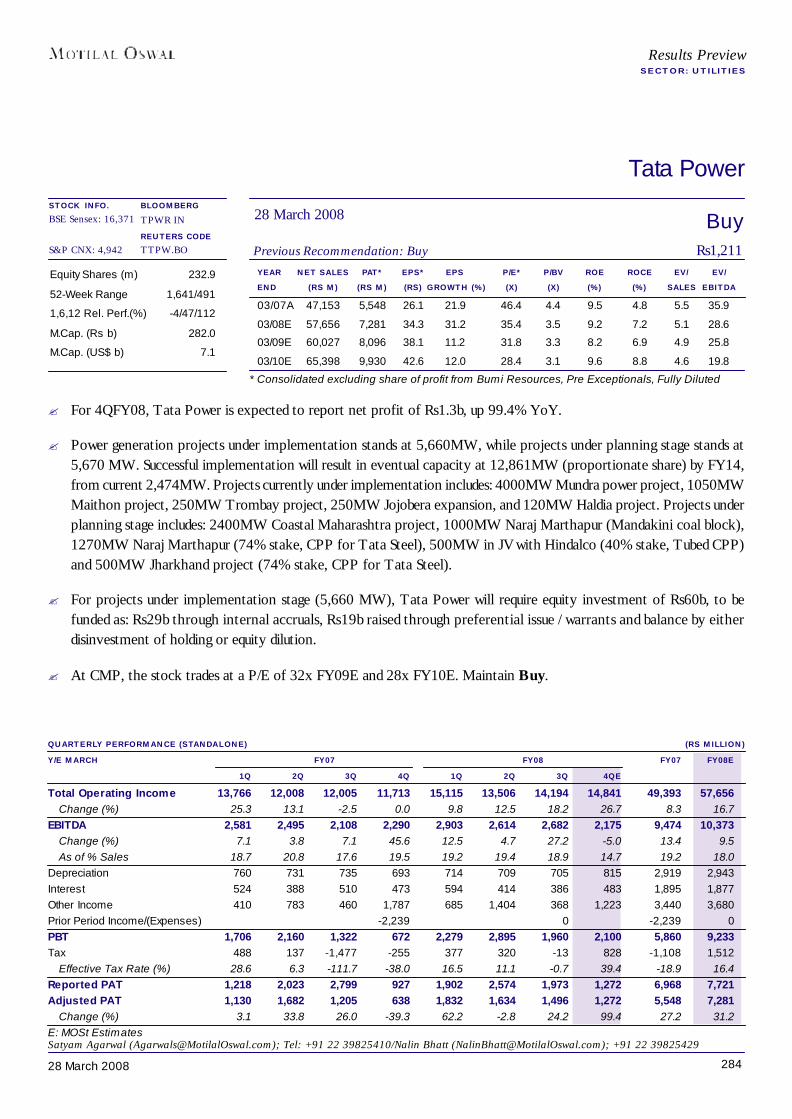
28428 March 2008
Results PreviewSECTOR: UTILITIES
Tata Power
YEAR NET SALES PAT* EPS* EPS P/E* P/BV ROE ROCE EV/ EV/END (RS M) (RS M) (RS) GROWTH (%) (X) (X) (%) (%) SALES EBITDA
03/07A 47,153 5,548 26.1 21.9 46.4 4.4 9.5 4.8 5.5 35.9
03/08E 57,656 7,281 34.3 31.2 35.4 3.5 9.2 7.2 5.1 28.6
03/09E 60,027 8,096 38.1 11.2 31.8 3.3 8.2 6.9 4.9 25.8
03/10E 65,398 9,930 42.6 12.0 28.4 3.1 9.6 8.8 4.6 19.8
Equity Shares (m) 232.9
52-Week Range 1,641/491
1,6,12 Rel. Perf.(%) -4/47/112
M.Cap. (Rs b) 282.0
M.Cap. (US$ b) 7.1
BuyPrevious Recommendation: Buy Rs1,211
28 March 2008BLOOMBERGTPWR IN
REUTERS CODETTPW.BO
QUARTERLY PERFORMANCE (STANDALONE) (RS MILLION)Y/E MARCH FY07 FY08 FY07 FY08E
1Q 2Q 3Q 4Q 1Q 2Q 3Q 4QETotal Operating Income 13,766 12,008 12,005 11,713 15,115 13,506 14,194 14,841 49,393 57,656
Change (%) 25.3 13.1 -2.5 0.0 9.8 12.5 18.2 26.7 8.3 16.7EBITDA 2,581 2,495 2,108 2,290 2,903 2,614 2,682 2,175 9,474 10,373
Change (%) 7.1 3.8 7.1 45.6 12.5 4.7 27.2 -5.0 13.4 9.5As of % Sales 18.7 20.8 17.6 19.5 19.2 19.4 18.9 14.7 19.2 18.0
Depreciation 760 731 735 693 714 709 705 815 2,919 2,943Interest 524 388 510 473 594 414 386 483 1,895 1,877Other Income 410 783 460 1,787 685 1,404 368 1,223 3,440 3,680Prior Period Income/(Expenses) -2,239 0 -2,239 0PBT 1,706 2,160 1,322 672 2,279 2,895 1,960 2,100 5,860 9,233Tax 488 137 -1,477 -255 377 320 -13 828 -1,108 1,512
Effective Tax Rate (%) 28.6 6.3 -111.7 -38.0 16.5 11.1 -0.7 39.4 -18.9 16.4Reported PAT 1,218 2,023 2,799 927 1,902 2,574 1,973 1,272 6,968 7,721Adjusted PAT 1,130 1,682 1,205 638 1,832 1,634 1,496 1,272 5,548 7,281
Change (%) 3.1 33.8 26.0 -39.3 62.2 -2.8 24.2 99.4 27.2 31.2E: MOSt Estimates
* Consolidated excluding share of profit from Bumi Resources, Pre Exceptionals, Fully Diluted
Satyam Agarwal ([email protected]); Tel: +91 22 39825410/Nalin Bhatt ([email protected]); +91 22 39825429
STOCK INFO.BSE Sensex: 16,371
S&P CNX: 4,942
? For 4QFY08, Tata Power is expected to report net profit of Rs1.3b, up 99.4% YoY.
? Power generation projects under implementation stands at 5,660MW, while projects under planning stage stands at5,670 MW. Successful implementation will result in eventual capacity at 12,861MW (proportionate share) by FY14,from current 2,474MW. Projects currently under implementation includes: 4000MW Mundra power project, 1050MWMaithon project, 250MW Trombay project, 250MW Jojobera expansion, and 120MW Haldia project. Projects underplanning stage includes: 2400MW Coastal Maharashtra project, 1000MW Naraj Marthapur (Mandakini coal block),1270MW Naraj Marthapur (74% stake, CPP for Tata Steel), 500MW in JV with Hindalco (40% stake, Tubed CPP)and 500MW Jharkhand project (74% stake, CPP for Tata Steel).
? For projects under implementation stage (5,660 MW), Tata Power will require equity investment of Rs60b, to befunded as: Rs29b through internal accruals, Rs19b raised through preferential issue / warrants and balance by eitherdisinvestment of holding or equity dilution.
? At CMP, the stock trades at a P/E of 32x FY09E and 28x FY10E. Maintain Buy.

28528 March 2008
Results PreviewSECTOR: MINING AND MINERALS
Ashapura Minechem
YEAR NET SALES PAT EPS EPS P/E P/BV ROE ROCE EV/ EV/END (RS M) (RS M) (RS) GROWTH (%) (X) (X) (%) (%) SALES EBITDA
03/07A 12,724 1,302 16.6 37.0 13.2 4.2 47.4 45.4 1.4 9.2
03/08E 18,370 1,960 24.8 49.3 8.8 3.0 39.6 44.7 0.9 6.5
03/09E 32,378 4,137 52.4 111.0 4.2 1.8 53.7 66.7 0.5 3.1
03/10E 38,358 5,225 66.2 26.3 3.3 1.2 43.6 54.3 0.3 2.0
Equity shares (m) 78.9
52-Week Range 445/105
1, 6, 12 Rel. Perf. (%) -12/1/82
M. Cap. (Rs b) 17.3
M. Cap. (US$ b) 0.4
BuyPrevious Recommendation: Neutral Rs220
28 March 2008BLOOMBERGASMN IN
REUTERS CODEASHM.BO
QUARTERLY PERFORMANCE (CONSOLIDATED) (RS MILLION)Y/E MARCH FY07 FY08 FY07 FY08E
1Q 2Q 3Q 4Q 1Q 2Q 3Q 4QENet Income 4,614 2,510 2,157 3,444 4,270 4,459 4,115 5,527 12,724 18,370
Change (%) 89.0 37.3 20.9 38.3 -7.5 77.6 90.8 60.5 48.9 44.4Total Expenses 4,123 2,186 1,621 2,791 3,688 3,753 3,588 4,715 10,721 15,744EBITDA 491 324 537 653 581 706 527 812 2,004 2,626
Change (%) 97.7 17.8 44.1 84.8 18.4 118.1 -1.8 24.4 60.5 31.1EBITDA Margin (%) 10.6 12.9 24.9 18.9 13.6 15.8 12.8 14.7 15.7 14.3
Depreciation 16 17 17 23 21 12 18 48 73 99Interest 31 22 31 31 32 37 35 44 115 147Other Income 2 5 15 25 9 19 45 17 46 90PBT 446 290 503 623 538 676 519 738 1,862 2,470Tax 98 75 168 207 154 142 77 103 549 476
Tax/PBT (%) 22.0 26.0 33.5 33.2 28.6 20.0 16.0 14.0 29.5 19.3Prior period items 0 0 0 -7 -2 0 -16 0 -7 -18Share from associate 0 0 0 -3 -4 -5 -10 4 -3 -15Minority interest 0 0 0 0 0 0 0 -1 -1 -1Consolidated PAT 348 214 334 406 378 530 415 637 1,302 1,960Adjusted PAT 348 214 334 406 378 530 415 637 1,302 1,960
Change (%) 108.8 19.5 46.2 87.6 8.5 147.3 24.2 57.1 66.2 50.6PAT Margin (%) 7.5 8.5 15.5 11.8 8.8 11.9 10.1 11.5 10.2 10.7
E: MOSt Estimates
Shrinath Mithanthaya ([email protected]); Tel: +91 22 3982 5421
STOCK INFO.BSE Sensex: 16,371
S&P CNX: 4,942
? Ashapura continues to benefit from buoyant demand for bauxite from alumina refineries in coastal China. FY09 willsee full impact of higher bauxite volumes and prices, and contribution from other projects including kaolin, barites,mineral processing complex at Antwerp, etc.
? We expect 4QFY08 sales at Rs5.5b, up 61% YoY. The key driver will be bauxite volumes, which we expect at 2.2mtonnes.
? We have lowered our assumption for bauxite contribution to US$9 per tonne for FY08E (US$10 earlier), to factor inpenalties for higher moisture content. We expect 4QFY08 EBITDA of Rs812m, up 24% YoY. Tax rate will be lowdue to EOU status for bauxite processing units. So, PAT growth should be strong at 57% to Rs637m.
? We have also lowered our FY09E bauxite contribution to US$12 per tonne (US$13 earlier). As a result, we havedowngraded our FY09E PAT 7% to Rs4.14b.
? The stock trades at an attractive PE of 4.2x and EV/EBITDA of 3.3x FY09E. Our SOTP target price of Rs316offers 44% upside from current levels. Buy.
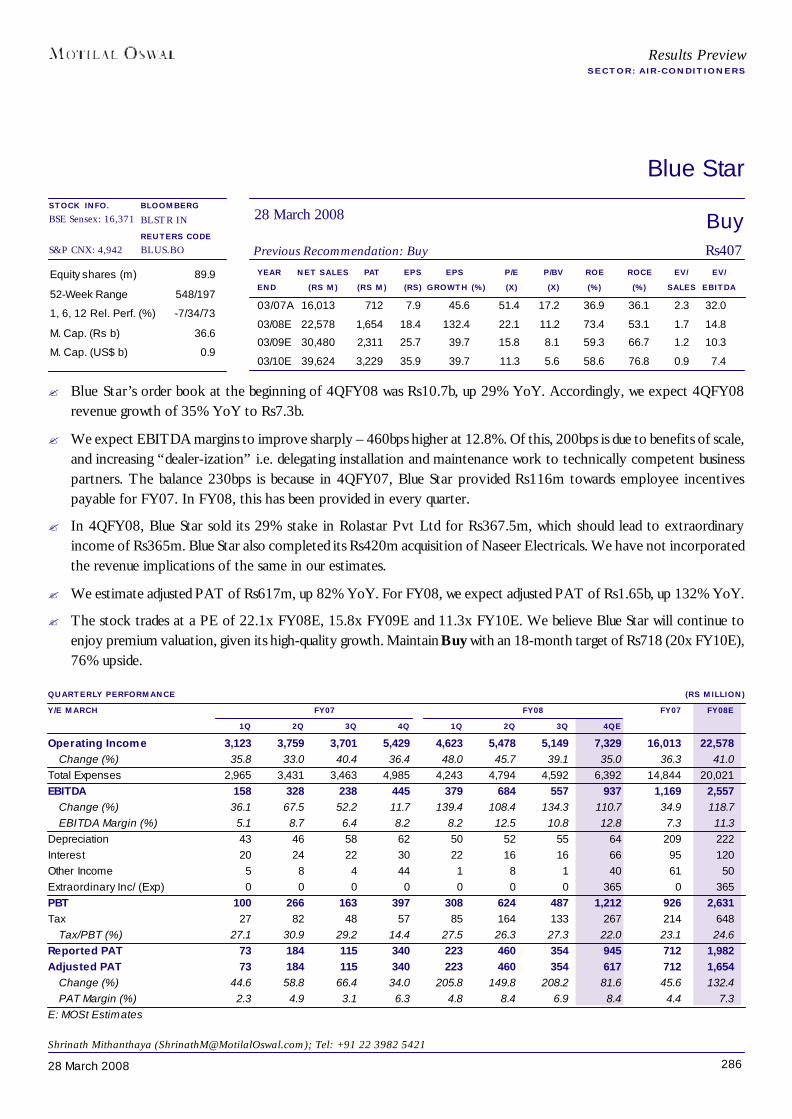
28628 March 2008
Results PreviewSECTOR: AIR-CONDITIONERS
Blue Star
YEAR NET SALES PAT EPS EPS P/E P/BV ROE ROCE EV/ EV/END (RS M) (RS M) (RS) GROWTH (%) (X) (X) (%) (%) SALES EBITDA
03/07A 16,013 712 7.9 45.6 51.4 17.2 36.9 36.1 2.3 32.0
03/08E 22,578 1,654 18.4 132.4 22.1 11.2 73.4 53.1 1.7 14.8
03/09E 30,480 2,311 25.7 39.7 15.8 8.1 59.3 66.7 1.2 10.3
03/10E 39,624 3,229 35.9 39.7 11.3 5.6 58.6 76.8 0.9 7.4
Equity shares (m) 89.9
52-Week Range 548/197
1, 6, 12 Rel. Perf. (%) -7/34/73
M. Cap. (Rs b) 36.6
M. Cap. (US$ b) 0.9
BuyPrevious Recommendation: Buy Rs407
28 March 2008BLOOMBERGBLSTR IN
REUTERS CODEBLUS.BO
QUARTERLY PERFORMANCE (RS MILLION)Y/E MARCH FY07 FY08 FY07 FY08E
1Q 2Q 3Q 4Q 1Q 2Q 3Q 4QEOperating Income 3,123 3,759 3,701 5,429 4,623 5,478 5,149 7,329 16,013 22,578
Change (%) 35.8 33.0 40.4 36.4 48.0 45.7 39.1 35.0 36.3 41.0Total Expenses 2,965 3,431 3,463 4,985 4,243 4,794 4,592 6,392 14,844 20,021EBITDA 158 328 238 445 379 684 557 937 1,169 2,557
Change (%) 36.1 67.5 52.2 11.7 139.4 108.4 134.3 110.7 34.9 118.7EBITDA Margin (%) 5.1 8.7 6.4 8.2 8.2 12.5 10.8 12.8 7.3 11.3
Depreciation 43 46 58 62 50 52 55 64 209 222Interest 20 24 22 30 22 16 16 66 95 120Other Income 5 8 4 44 1 8 1 40 61 50Extraordinary Inc/ (Exp) 0 0 0 0 0 0 0 365 0 365PBT 100 266 163 397 308 624 487 1,212 926 2,631Tax 27 82 48 57 85 164 133 267 214 648
Tax/PBT (%) 27.1 30.9 29.2 14.4 27.5 26.3 27.3 22.0 23.1 24.6Reported PAT 73 184 115 340 223 460 354 945 712 1,982Adjusted PAT 73 184 115 340 223 460 354 617 712 1,654
Change (%) 44.6 58.8 66.4 34.0 205.8 149.8 208.2 81.6 45.6 132.4PAT Margin (%) 2.3 4.9 3.1 6.3 4.8 8.4 6.9 8.4 4.4 7.3
E: MOSt Estimates
Shrinath Mithanthaya ([email protected]); Tel: +91 22 3982 5421
STOCK INFO.BSE Sensex: 16,371
S&P CNX: 4,942
? Blue Star’s order book at the beginning of 4QFY08 was Rs10.7b, up 29% YoY. Accordingly, we expect 4QFY08revenue growth of 35% YoY to Rs7.3b.
? We expect EBITDA margins to improve sharply – 460bps higher at 12.8%. Of this, 200bps is due to benefits of scale,and increasing “dealer-ization” i.e. delegating installation and maintenance work to technically competent businesspartners. The balance 230bps is because in 4QFY07, Blue Star provided Rs116m towards employee incentivespayable for FY07. In FY08, this has been provided in every quarter.
? In 4QFY08, Blue Star sold its 29% stake in Rolastar Pvt Ltd for Rs367.5m, which should lead to extraordinaryincome of Rs365m. Blue Star also completed its Rs420m acquisition of Naseer Electricals. We have not incorporatedthe revenue implications of the same in our estimates.
? We estimate adjusted PAT of Rs617m, up 82% YoY. For FY08, we expect adjusted PAT of Rs1.65b, up 132% YoY.
? The stock trades at a PE of 22.1x FY08E, 15.8x FY09E and 11.3x FY10E. We believe Blue Star will continue toenjoy premium valuation, given its high-quality growth. Maintain Buy with an 18-month target of Rs718 (20x FY10E),76% upside.
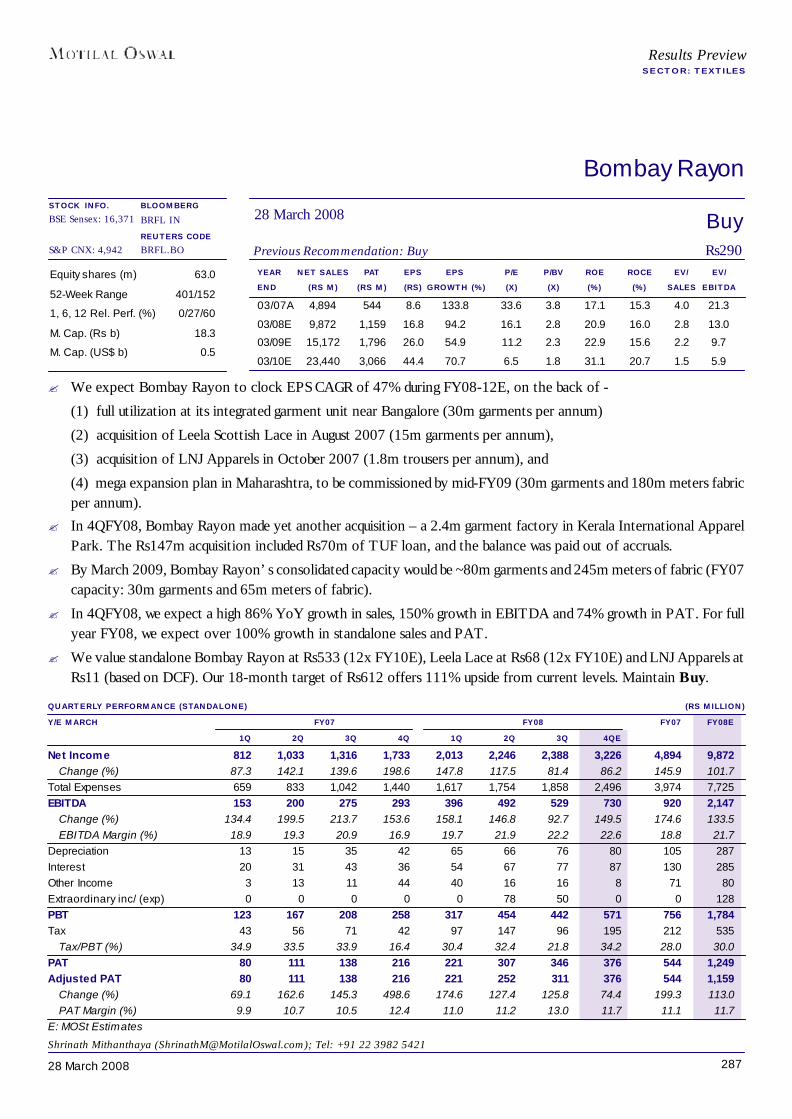
28728 March 2008
Results PreviewSECTOR: TEXTILES
Bombay Rayon
YEAR NET SALES PAT EPS EPS P/E P/BV ROE ROCE EV/ EV/END (RS M) (RS M) (RS) GROWTH (%) (X) (X) (%) (%) SALES EBITDA
03/07A 4,894 544 8.6 133.8 33.6 3.8 17.1 15.3 4.0 21.3
03/08E 9,872 1,159 16.8 94.2 16.1 2.8 20.9 16.0 2.8 13.0
03/09E 15,172 1,796 26.0 54.9 11.2 2.3 22.9 15.6 2.2 9.7
03/10E 23,440 3,066 44.4 70.7 6.5 1.8 31.1 20.7 1.5 5.9
Equity shares (m) 63.0
52-Week Range 401/152
1, 6, 12 Rel. Perf. (%) 0/27/60
M. Cap. (Rs b) 18.3
M. Cap. (US$ b) 0.5
BuyPrevious Recommendation: Buy Rs290
28 March 2008BLOOMBERGBRFL IN
REUTERS CODEBRFL.BO
QUARTERLY PERFORMANCE (STANDALONE) (RS MILLION)Y/E MARCH FY07 FY08 FY07 FY08E
1Q 2Q 3Q 4Q 1Q 2Q 3Q 4QENet Income 812 1,033 1,316 1,733 2,013 2,246 2,388 3,226 4,894 9,872
Change (%) 87.3 142.1 139.6 198.6 147.8 117.5 81.4 86.2 145.9 101.7Total Expenses 659 833 1,042 1,440 1,617 1,754 1,858 2,496 3,974 7,725EBITDA 153 200 275 293 396 492 529 730 920 2,147
Change (%) 134.4 199.5 213.7 153.6 158.1 146.8 92.7 149.5 174.6 133.5EBITDA Margin (%) 18.9 19.3 20.9 16.9 19.7 21.9 22.2 22.6 18.8 21.7
Depreciation 13 15 35 42 65 66 76 80 105 287Interest 20 31 43 36 54 67 77 87 130 285Other Income 3 13 11 44 40 16 16 8 71 80Extraordinary inc/ (exp) 0 0 0 0 0 78 50 0 0 128PBT 123 167 208 258 317 454 442 571 756 1,784Tax 43 56 71 42 97 147 96 195 212 535
Tax/PBT (%) 34.9 33.5 33.9 16.4 30.4 32.4 21.8 34.2 28.0 30.0PAT 80 111 138 216 221 307 346 376 544 1,249Adjusted PAT 80 111 138 216 221 252 311 376 544 1,159
Change (%) 69.1 162.6 145.3 498.6 174.6 127.4 125.8 74.4 199.3 113.0PAT Margin (%) 9.9 10.7 10.5 12.4 11.0 11.2 13.0 11.7 11.1 11.7
E: MOSt Estimates
Shrinath Mithanthaya ([email protected]); Tel: +91 22 3982 5421
STOCK INFO.BSE Sensex: 16,371
S&P CNX: 4,942
? We expect Bombay Rayon to clock EPS CAGR of 47% during FY08-12E, on the back of -
(1) full utilization at its integrated garment unit near Bangalore (30m garments per annum)
(2) acquisition of Leela Scottish Lace in August 2007 (15m garments per annum),
(3) acquisition of LNJ Apparels in October 2007 (1.8m trousers per annum), and
(4) mega expansion plan in Maharashtra, to be commissioned by mid-FY09 (30m garments and 180m meters fabricper annum).
? In 4QFY08, Bombay Rayon made yet another acquisition – a 2.4m garment factory in Kerala International ApparelPark. The Rs147m acquisition included Rs70m of TUF loan, and the balance was paid out of accruals.
? By March 2009, Bombay Rayon’s consolidated capacity would be ~80m garments and 245m meters of fabric (FY07capacity: 30m garments and 65m meters of fabric).
? In 4QFY08, we expect a high 86% YoY growth in sales, 150% growth in EBITDA and 74% growth in PAT. For fullyear FY08, we expect over 100% growth in standalone sales and PAT.
? We value standalone Bombay Rayon at Rs533 (12x FY10E), Leela Lace at Rs68 (12x FY10E) and LNJ Apparels atRs11 (based on DCF). Our 18-month target of Rs612 offers 111% upside from current levels. Maintain Buy.
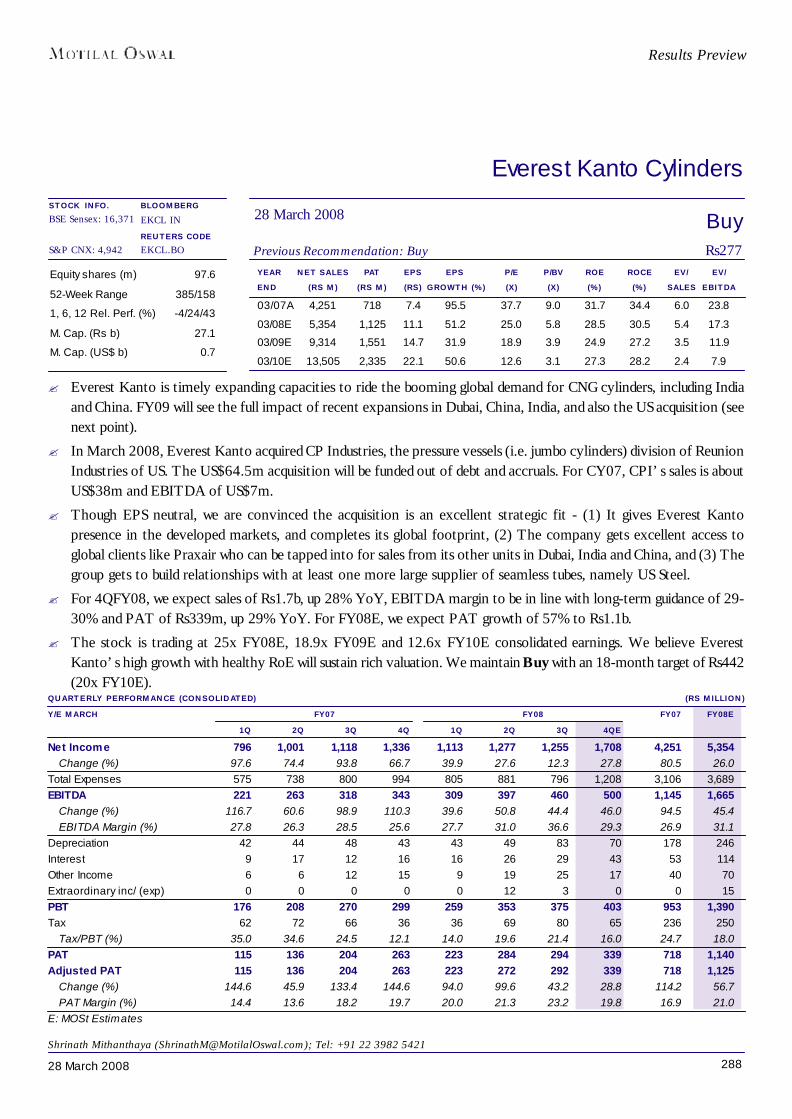
28828 March 2008
Results Preview
Everest Kanto Cylinders
YEAR NET SALES PAT EPS EPS P/E P/BV ROE ROCE EV/ EV/END (RS M) (RS M) (RS) GROWTH (%) (X) (X) (%) (%) SALES EBITDA
03/07A 4,251 718 7.4 95.5 37.7 9.0 31.7 34.4 6.0 23.8
03/08E 5,354 1,125 11.1 51.2 25.0 5.8 28.5 30.5 5.4 17.3
03/09E 9,314 1,551 14.7 31.9 18.9 3.9 24.9 27.2 3.5 11.9
03/10E 13,505 2,335 22.1 50.6 12.6 3.1 27.3 28.2 2.4 7.9
Equity shares (m) 97.6
52-Week Range 385/158
1, 6, 12 Rel. Perf. (%) -4/24/43
M. Cap. (Rs b) 27.1
M. Cap. (US$ b) 0.7
BuyPrevious Recommendation: Buy Rs277
28 March 2008BLOOMBERGEKCL IN
REUTERS CODEEKCL.BO
QUARTERLY PERFORMANCE (CONSOLIDATED) (RS MILLION)Y/E MARCH FY07 FY08 FY07 FY08E
1Q 2Q 3Q 4Q 1Q 2Q 3Q 4QENet Income 796 1,001 1,118 1,336 1,113 1,277 1,255 1,708 4,251 5,354
Change (%) 97.6 74.4 93.8 66.7 39.9 27.6 12.3 27.8 80.5 26.0Total Expenses 575 738 800 994 805 881 796 1,208 3,106 3,689EBITDA 221 263 318 343 309 397 460 500 1,145 1,665
Change (%) 116.7 60.6 98.9 110.3 39.6 50.8 44.4 46.0 94.5 45.4EBITDA Margin (%) 27.8 26.3 28.5 25.6 27.7 31.0 36.6 29.3 26.9 31.1
Depreciation 42 44 48 43 43 49 83 70 178 246Interest 9 17 12 16 16 26 29 43 53 114Other Income 6 6 12 15 9 19 25 17 40 70Extraordinary inc/ (exp) 0 0 0 0 0 12 3 0 0 15PBT 176 208 270 299 259 353 375 403 953 1,390Tax 62 72 66 36 36 69 80 65 236 250
Tax/PBT (%) 35.0 34.6 24.5 12.1 14.0 19.6 21.4 16.0 24.7 18.0PAT 115 136 204 263 223 284 294 339 718 1,140Adjusted PAT 115 136 204 263 223 272 292 339 718 1,125
Change (%) 144.6 45.9 133.4 144.6 94.0 99.6 43.2 28.8 114.2 56.7PAT Margin (%) 14.4 13.6 18.2 19.7 20.0 21.3 23.2 19.8 16.9 21.0
E: MOSt Estimates
Shrinath Mithanthaya ([email protected]); Tel: +91 22 3982 5421
STOCK INFO.BSE Sensex: 16,371
S&P CNX: 4,942
? Everest Kanto is timely expanding capacities to ride the booming global demand for CNG cylinders, including Indiaand China. FY09 will see the full impact of recent expansions in Dubai, China, India, and also the US acquisition (seenext point).
? In March 2008, Everest Kanto acquired CP Industries, the pressure vessels (i.e. jumbo cylinders) division of ReunionIndustries of US. The US$64.5m acquisition will be funded out of debt and accruals. For CY07, CPI’s sales is aboutUS$38m and EBITDA of US$7m.
? Though EPS neutral, we are convinced the acquisition is an excellent strategic fit - (1) It gives Everest Kantopresence in the developed markets, and completes its global footprint, (2) The company gets excellent access toglobal clients like Praxair who can be tapped into for sales from its other units in Dubai, India and China, and (3) Thegroup gets to build relationships with at least one more large supplier of seamless tubes, namely US Steel.
? For 4QFY08, we expect sales of Rs1.7b, up 28% YoY, EBITDA margin to be in line with long-term guidance of 29-30% and PAT of Rs339m, up 29% YoY. For FY08E, we expect PAT growth of 57% to Rs1.1b.
? The stock is trading at 25x FY08E, 18.9x FY09E and 12.6x FY10E consolidated earnings. We believe EverestKanto’s high growth with healthy RoE will sustain rich valuation. We maintain Buy with an 18-month target of Rs442(20x FY10E).

28928 March 2008
Results PreviewSECTOR: OIL DRILLING & ALLIED SERVICES
Great Offshore
YEAR NET SALES PAT EPS EPS P/E P/BV ROE ROCE EV/ EV/END (RS M) (RS M) (RS) GROWTH (%) (X) (X) (%) (%) SALES EBITDA
03/07A 5,822 1,452 38.1 49.6 16.8 4.0 23.5 14.1 5.4 11.9
03/08E 7,198 1,930 50.6 32.9 12.7 3.1 29.4 11.7 4.6 9.1
03/09E 8,345 3,313 79.4 56.9 8.1 2.0 24.6 14.8 3.9 6.5
03/10E 10,604 3,441 82.5 3.9 7.8 1.7 21.6 16.1 2.7 4.7
Equity Shares (m) 38.1
52-Week Range 1,150/550
1, 6 Rel. Perf. (%) -15/-16/-14
M. Cap. (Rs b) 24.5
M. Cap. (US$ b) 0.6
Under ReviewPrevious Recommendation: Under Review Rs642
28 March 2008BLOOMBERGGOFF IN
REUTERS CODEGOFS.BO
QUARTERLY PERFORMANCE (RS MILLION)Y/E MARCH FY07 * FY08 # FY07# FY08E
1Q 2Q 3Q 4Q 1Q 2Q 3Q 4QEOperating Income 1,122 1,271 1,483 1,493 1,450 1,523 2,080 2,144 5,822 7,198
Change (%) N.A. N.A. N.A. N.A. N.A. N.A. N.A. N.A. 49.9 23.6Total Expenses 543 646 761 812 1,090 921 792 773 3,194 3,576EBITDA 579 624 722 681 360 602 1,288 1,371 2,628 3,621
Change (%) N.A. N.A. N.A. N.A. N.A. N.A. N.A. N.A. 62.5 37.8EBITDA Margin (%) 51.6 49.1 48.7 45.6 24.8 39.5 61.9 64.0 45.1 50.3
Depreciation 137 147 193 220 236 231 263 307 709 1,038Interest 58 73 95 133 136 145 211 161 361 653Other Income 36 9 6 27 83 90 58 69 79 300Extraordinary Inc/ (Exp) 0 0 0 0 207 83 18 0 0 309PBT 421 414 439 354 277 399 890 972 1,638 2,539Tax 70 26 64 54 -4 23 89 105 186 213
Tax/PBT (%) 16.6 6.3 14.5 15.4 -1.6 5.8 10.0 10.8 11.3 8.4Reported PAT 351 388 375 299 282 376 801 867 1,452 2,326Adjusted PAT 351 388 375 299 74 293 783 779 1,452 1,930
Change (%) N.A. N.A. N.A. N.A. N.A. N.A. N.A. N.A. 49.6 32.9PAT Margin (%) 31.3 30.5 25.3 20.0 5.1 19.2 37.6 36.3 24.9 26.8
E: MOSt Estimates; * Standalone; # Consolidated
Shrinath Mithanthaya ([email protected]); Tel: +91 22 3982 5421
STOCK INFO.BSE Sensex: 16,371
S&P CNX: 4,942
? We expect 4QFY08 for Great Offshore to be the best quarter in terms of reported PAT. However, adjusted PATwould be dragged down due to Rs88m preference dividend and dividend tax on 10% preference shares worth Rs1.5bissued to Exim Bank in October 2007.
? In 4QFY08, Great Offshore made three asset-related announcements – (1) acquisition of a flat cargo carrier (namedMalaviya Thirty-Three) for US$14m, (2) Sale of an AHTSV (Malaviya Nine) for an undisclosed amount, and (3)Proposed acquisition of an overseas firm which has two ultra deep-water, semi-submersible rigs under constructionworth US$1.4b. This deal is under due diligence, and the full details are not yet made public.
? For FY08, we expect Great Offshore to report consolidated revenue of Rs7.2b, up 24%, and adjusted PAT of Rs1.9b,up 36%. Our current FY09 and FY10 estimates will need to be revised to incorporate the proposed mega acquisition.
? The stock trades at a PE of 12.7x FY08E. Considering the recent sharp drop in stock price, the company also plansto consider buyback of shares worth Rs552m at a price not exceeding Rs750. However, our target price and ratingremains under review, as we believe the acquisition will have a major impact on earnings and the balance sheet.

29028 March 2008
Results PreviewSECTOR: ENGINES
Greaves Cotton
YEAR NET SALES PAT EPS EPS P/E P/BV ROE ROCE EV/ EV/END (RS M) (RS M) (RS) GROWTH (%) (X) (X) (%) (%) SALES EBITDA
06/07A 10,867 1,216 24.9 63.3 8.8 3.6 48.0 47.7 0.8 6.3
06/08E 12,550 1,153 23.6 -5.2 9.3 2.9 34.7 40.3 0.7 6.0
06/09E 16,184 1,459 29.9 26.6 7.4 2.3 34.7 48.5 0.5 4.2
06/10E 19,653 1,869 38.3 28.1 5.8 1.8 35.1 48.6 0.4 3.1
Equity shares (m) 48.8
52-Week Range 466/173
1, 6, 12 Rel. Perf. (%) -9/-25/-57
M. Cap. (Rs b) 10.8
M. Cap. (US$ b) 0.3
BuyPrevious Recommendation: Buy Rs220
28 March 2008BLOOMBERGGRV IN
REUTERS CODEGRVL.BO
QUARTERLY PERFORMANCE (STANDALONE) (RS MILLION)Y/E JUNE FY07 FY08 FY07# FY08E#
1Q 2Q 3Q 4Q 1Q 2Q 3QE 4QENet Sales* 2,488 2,835 2,856 2,482 2,723 3,001 3,110 3,232 10,867 12,550
Change (%) 30.9 36.6 35.0 10.7 9.5 5.9 8.9 30.2 30.2 15.5Total Expenses 2,093 2,361 2,377 2,208 2,374 2,571 2,695 2,815 9,237 10,875EBITDA 395 474 478 273 350 429 414 417 1,630 1,675
Change (%) 33.5 39.8 54.0 -14.9 -11.5 -9.4 -13.4 52.5 22.1 2.8EBITDA Margin (%) 15.9 16.7 16.8 11.0 12.8 14.3 13.3 12.9 15.0 13.3
Depreciation 37 39 42 42 50 51 60 67 176 239Interest 32 51 41 32 55 49 53 38 187 200Other Income 21 28 26 58 25 21 42 75 174 168PBT 348 412 421 257 270 350 344 387 1,440 1,404Tax 102 114 82 -84 32 56 59 105 224 251
Tax/PBT (%) 29.4 27.6 19.5 -32.6 11.8 15.9 17.0 27.2 15.6 17.9Reported PAT 246 298 339 341 238 295 285 282 1,216 1,153Adjusted PAT 246 298 339 341 238 295 285 282 1,216 1,153
Change (%) 66.4 66.3 59.3 53.1 -3.1 -1.2 -15.9 -17.2 63.3 -5.2PAT Margin (%) 9.9 10.5 11.9 13.7 8.7 9.8 9.2 8.7 11.2 9.2
E: MOSt Estimates; * - net of estimated excise; # Consolidated
Shrinath Mithanthaya ([email protected]); Tel: +91 22 3982 5421
STOCK INFO.BSE Sensex: 16,371
S&P CNX: 4,942
? In 3QFY08, we expect engine sales to be down 9% YoY due to – (1) 6% degrowth in three-wheelers on account ofhigher interest rates and cannibalization by Tata Ace, and (2) 14% degrowth in non-auto engines sales due to high-base effect of defence orders in 3QFY07.
? Engine sales de-growth should be offset by high 75% YoY growth in infrastructure equipment, leading to total salesgrowth of 9% YoY to Rs3.1b.
? Given high operating leverage in the slowing auto engines business, we expect EBITDA margin to drop 350bps YoYto 13.3%. Expected PAT is Rs285m, down 16% YoY. The fall in PAT is lower than fall in the 19% fall in PBT due toMAT credit of Rs40m.
? Greaves has lined up new range of engines and infrastructure equipment. We expect the full benefit of this to be feltfrom 4QFY08.
? The stock is currently trading at 7.4x FY09E EPS of Rs29.9. We maintain Buy with a target of Rs359 (12x FY09E).

29128 March 2008
Results PreviewSECTOR: HOTELS
TajGVK Hotels
YEAR NET SALES PAT EPS EPS P/E P/BV ROE ROCE EV/ EV/END (RS M) (RS M) (RS) GROWTH (%) (X) (X) (%) (%) SALES EBITDA
03/07A 2,429 644 10.3 39.7 10.4 3.5 37.3 41.2 3.0 6.2
03/08E 2,623 715 11.4 11.1 9.4 2.8 33.1 38.4 2.8 5.9
03/09E 3,295 933 14.9 30.5 7.2 2.2 34.3 40.0 2.3 4.7
03/10E 3,821 1,074 17.1 15.1 6.2 1.8 31.7 37.9 1.9 3.8
Equity shares (m) 62.7
52-Week Range 205/100
1, 6, 12 Rel. Perf. (%) -12/-19/-67
M. Cap. (Rs b) 6.7
M. Cap. (US$ b) 0.2
BuyPrevious Recommendation: Buy Rs107
28 March 2008BLOOMBERGTAJG IN
REUTERS CODETAJG.BO
QUARTERLY PERFORMANCE (STANDALONE) (RS MILLION)Y/E MARCH FY07 FY08 FY07 FY08E
1Q 2Q 3Q 4Q 1Q 2Q 3QE 4QENet Sales 610 566 579 678 565 591 705 762 2,429 2,623
Change (%) 74.0 67.8 38.0 30.3 -7.3 4.5 21.6 12.5 28.7 8.0Total Expenses 326 300 311 342 306 315 377 403 1,291 1,401EBITDA 284 266 269 336 259 277 328 359 1,139 1,222
Change (%) 85.0 49.5 36.9 -8.7 4.0 21.9 6.8 35.2 7.3EBITDA Margin (%) 46.6 47.0 46.4 49.6 45.9 46.8 46.5 47.1 46.9 46.6
Depreciation 39 33 32 28 30 27 29 28 112 114Interest 12 12 10 7 7 7 7 6 31 27Other Income 0 3 2 7 7 3 4 5 13 18PBT 233 224 229 308 229 246 295 329 1,008 1,099Tax 80 76 78 120 78 86 103 117 364 384
Tax/PBT (%) 34.3 33.8 33.9 39.0 34.1 34.9 34.9 35.5 36.1 34.9Reported PAT 153 148 152 188 151 160 192 212 644 715Adjusted PAT 153 148 152 188 151 160 192 212 644 715
Change (%) 115.2 98.4 60.7 34.5 -1.4 8.1 26.7 12.7 39.7 11.1PAT Margin (%) 25.1 26.1 26.2 27.8 26.7 27.1 27.3 27.8 26.5 27.3
E: MOSt Estimates
Mcenro Samdani ([email protected]);Tel: +9122 3982 5423/ Shrinath Mithanthaya ([email protected])
STOCK INFO.BSE Sensex: 16,371
S&P CNX: 4,942
? TajGVK Hotels is the hotels market leader in Hyderabad. It operates three 5-star hotels in Hyderabad with 526rooms out of 1,400 rooms in the city. It also operates one 5-star hotel in Chandigarh with 152 rooms out of 325 roomsin the city.
? We have lowered our FY08 PAT estimates by 2.7% to Rs715m due to delay in the Chennai hotel (expected tocommence in 1QFY09 vs 4QFY08 earlier). Our FY09 estimate remains unchanged. We have lowered our FY10PAT estimate by 6.4% to Rs1.07b, due to delay in Begumpet (Hyderabad) hotel, and change in the Amritsar planfrom leased hotel to owned hotel, leading to a delay here as well.
? The demand in Hyderabad and Chandigarh continues to be healthy and hotel room supply still remains low. In4QFY08, we expect TajGVK to post combined ARR of Rs8,800 and OR of 83%. EBITDA margin is expected todecrease mainly on account of higher growth rate in F&B revenue than growth in room revenue.
? The stock trades at a PE of 7.2x FY09E and 6.2x FY10E. We lowered our target price from Rs250 to Rs228[average of (16x FY09-Rs238, DCF-Rs228 and EV/Room-Rs219)]. We maintain Buy, with an upside of 113%.
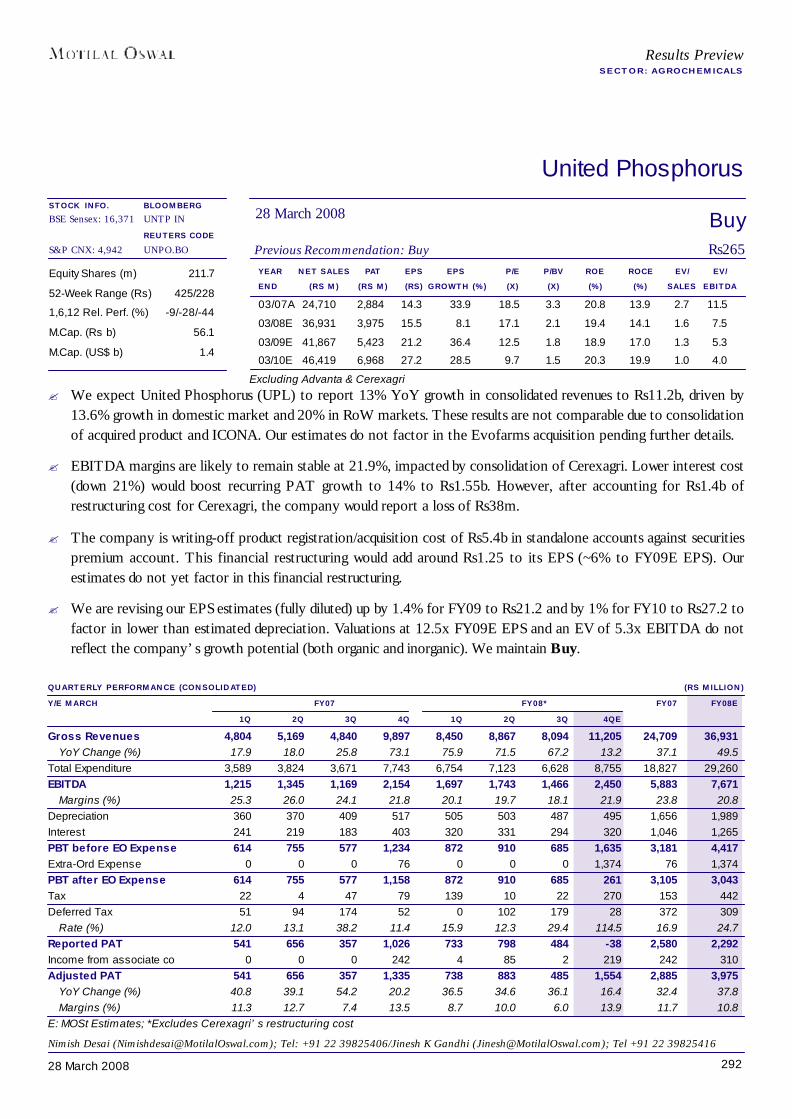
29228 March 2008
Results PreviewSECTOR: AGROCHEMICALS
United Phosphorus
YEAR NET SALES PAT EPS EPS P/E P/BV ROE ROCE EV/ EV/END (RS M) (RS M) (RS) GROWTH (%) (X) (X) (%) (%) SALES EBITDA
03/07A 24,710 2,884 14.3 33.9 18.5 3.3 20.8 13.9 2.7 11.5
03/08E 36,931 3,975 15.5 8.1 17.1 2.1 19.4 14.1 1.6 7.5
03/09E 41,867 5,423 21.2 36.4 12.5 1.8 18.9 17.0 1.3 5.3
03/10E 46,419 6,968 27.2 28.5 9.7 1.5 20.3 19.9 1.0 4.0
Equity Shares (m) 211.7
52-Week Range (Rs) 425/228
1,6,12 Rel. Perf. (%) -9/-28/-44
M.Cap. (Rs b) 56.1
M.Cap. (US$ b) 1.4
QUARTERLY PERFORMANCE (CONSOLIDATED) (RS MILLION)Y/E MARCH FY07 FY08* FY07 FY08E
1Q 2Q 3Q 4Q 1Q 2Q 3Q 4QEGross Revenues 4,804 5,169 4,840 9,897 8,450 8,867 8,094 11,205 24,709 36,931
YoY Change (%) 17.9 18.0 25.8 73.1 75.9 71.5 67.2 13.2 37.1 49.5Total Expenditure 3,589 3,824 3,671 7,743 6,754 7,123 6,628 8,755 18,827 29,260EBITDA 1,215 1,345 1,169 2,154 1,697 1,743 1,466 2,450 5,883 7,671
Margins (%) 25.3 26.0 24.1 21.8 20.1 19.7 18.1 21.9 23.8 20.8Depreciation 360 370 409 517 505 503 487 495 1,656 1,989Interest 241 219 183 403 320 331 294 320 1,046 1,265PBT before EO Expense 614 755 577 1,234 872 910 685 1,635 3,181 4,417Extra-Ord Expense 0 0 0 76 0 0 0 1,374 76 1,374PBT after EO Expense 614 755 577 1,158 872 910 685 261 3,105 3,043Tax 22 4 47 79 139 10 22 270 153 442Deferred Tax 51 94 174 52 0 102 179 28 372 309
Rate (%) 12.0 13.1 38.2 11.4 15.9 12.3 29.4 114.5 16.9 24.7Reported PAT 541 656 357 1,026 733 798 484 -38 2,580 2,292Income from associate co 0 0 0 242 4 85 2 219 242 310Adjusted PAT 541 656 357 1,335 738 883 485 1,554 2,885 3,975
YoY Change (%) 40.8 39.1 54.2 20.2 36.5 34.6 36.1 16.4 32.4 37.8Margins (%) 11.3 12.7 7.4 13.5 8.7 10.0 6.0 13.9 11.7 10.8
E: MOSt Estimates; *Excludes Cerexagri’s restructuring cost
BuyPrevious Recommendation: Buy Rs265
28 March 2008BLOOMBERGUNTP IN
REUTERS CODEUNPO.BO
Nimish Desai ([email protected]); Tel: +91 22 39825406/Jinesh K Gandhi ([email protected]); Tel +91 22 39825416
Excluding Advanta & Cerexagri
STOCK INFO.BSE Sensex: 16,371
S&P CNX: 4,942
? We expect United Phosphorus (UPL) to report 13% YoY growth in consolidated revenues to Rs11.2b, driven by13.6% growth in domestic market and 20% in RoW markets. These results are not comparable due to consolidationof acquired product and ICONA. Our estimates do not factor in the Evofarms acquisition pending further details.
? EBITDA margins are likely to remain stable at 21.9%, impacted by consolidation of Cerexagri. Lower interest cost(down 21%) would boost recurring PAT growth to 14% to Rs1.55b. However, after accounting for Rs1.4b ofrestructuring cost for Cerexagri, the company would report a loss of Rs38m.
? The company is writing-off product registration/acquisition cost of Rs5.4b in standalone accounts against securitiespremium account. This financial restructuring would add around Rs1.25 to its EPS (~6% to FY09E EPS). Ourestimates do not yet factor in this financial restructuring.
? We are revising our EPS estimates (fully diluted) up by 1.4% for FY09 to Rs21.2 and by 1% for FY10 to Rs27.2 tofactor in lower than estimated depreciation. Valuations at 12.5x FY09E EPS and an EV of 5.3x EBITDA do notreflect the company’s growth potential (both organic and inorganic). We maintain Buy.

29328 March 2008
N O T E S

29428 March 2008
N O T E S

29528 March 2008
N O T E S
29628 March 2008
This report is for the personal information of the authorized recipient and does not construe to be any investment, legal or taxation advice to you. Motilal OswalSecurities Limited (hereinafter referred as MOSt) is not soliciting any action based upon it. This report is not for public distribution and has been furnished to you solelyfor your information and should not be reproduced or redistributed to any other person in any form.
The report is based upon information that we consider reliable, but we do not represent that it is accurate or complete, and it should not be relied upon such. MOSt orany of its affiliates or employees shall not be in any way responsible for any loss or damage that may arise to any person from any inadvertent error in the informationcontained in this report. MOSt or any of its affiliates or employees do not provide, at any time, any express or implied warranty of any kind, regarding any matterpertaining to this report, including without limitation the implied warranties of merchantability, fitness for a particular purpose, and non-infringement. The recipients ofthis report should rely on their own investigations.
MOSt and/or its affiliates and/or employees may have interests/ positions, financial or otherwise in the securities mentioned in this report. To enhance transparency,MOSt has incorporated a Disclosure of Interest Statement in this document. This should, however, not be treated as endorsement of the views expressed in the report.
Disclosure of Interest Statement
The MOSt group and its Directors own shares in the following companies covered in this report: Aventis Pharma, Bharat Electronics, Bharti Airtel, Birla Corporation,GSK Pharma, Hero Honda, IOC, Marico, Pfizer, Ranbaxy Labs., Siemens, State Bank, Tata Motors and Tata Steel.
MOSt has broking relationships with a few of the companies covered in this report.
MOSt is engaged in providing investment-banking services in the following companies covered in this report: Great Offshore
This information is subject to change without any prior notice. MOSt reserves the right to make modifications and alternations to this statement as may be requiredfrom time to time. Nevertheless, MOSt is committed to providing independent and transparent recommendations to its clients, and would be happy to provideinformation in response to specific client queries.
For more copies or other information, contactInstitutional: Navin Agarwal. Retail: Manish Shah
Phone: (91-22) 39825500 Fax: (91-22) 22885038. E-mail: [email protected]
Motilal Oswal Securities Ltd, 3rd Floor, Hoechst House, Nariman Point, Mumbai 400 021
Results Preview


![08_08_12.html.ppt [Read-Only]](https://static.fdokumen.com/doc/165x107/633217ef5696ca4473030eca/080812htmlppt-read-only.jpg)


![Tiernan Humphrys.ppt [Read-Only]](https://static.fdokumen.com/doc/165x107/631e0aba5ff22fc7450683ec/tiernan-humphrysppt-read-only.jpg)


![Bles.ppt [Read-Only]](https://static.fdokumen.com/doc/165x107/633bffc7197a6737f10ceddf/blesppt-read-only.jpg)
![sequential.ppt [Read-Only]](https://static.fdokumen.com/doc/165x107/6319ca5fc51d6b41aa04902b/sequentialppt-read-only.jpg)