Alpha Strategist | 'Winter Harvest' - Motilal Oswal Private Wealth
68
WINNING PORTFOLIOS ‘Winter Harvest’ ISSUE 96 100 COUNTDOWN BEGINS FOR th POWERED BY KNOWLEDGE DECEMBER 2020
-
Upload
khangminh22 -
Category
Documents
-
view
1 -
download
0
Transcript of Alpha Strategist | 'Winter Harvest' - Motilal Oswal Private Wealth

WINNING PORTFOLIOS
‘Winter Harvest’
ISSUE 96
100
COUNTDOWN
BEGINS FOR
th
POWERED BY KNOWLEDGE
DECEMBER 2020

This document is not valid without disclosure; refer the last page for the disclosure
DECEMBER 2020 | ISSUE 96 2
Alpha Strategist | ‘Winter Harvest’
Contents
Executive Summary………………………………………………………………........................................….…......03
Long Term Investing............…................................................................................................04-05
Section I………………………………………………………………......................................................………..07-15
(Market through Graphs, Portfolio Commentary, Investment Grid, Our Recommendations,
Temperature Gauge, Risk Return Matrix)
Section II…………………………………………………….......................................................………………...17-25
(Advisory Approach, 4C Framework For Equity Funds, Fixed Income Manager Selection Framework,
Hind-sight Investing, Decoding Investment Style, Investment Charter, Sample Investment Charter,
Estate Planning)
Section III…………………………………………………….........................................................…….……….27-41
(Macro Economy, Equities, Fixed Income, Gold)
Section VI…………………………………………………….........................................................…….……….43-65
(DELPHI, Me-Gold, Managed Strategies - PMS, Managed Strategies - MF, Investment Charter
Template)
DECEMBER 2020 | ISSUE 96 3
Executive Summary
Alpha Strategist | ‘Winter Harvest’
The Q2FY20 domestic earnings season saw a bumper with majority of“Winter Harvest”
companies beating estimates. Nifty50 PAT is at an all-time high of INR 1,042 bn. Cost
optimization during the lockdown phase has been one of the main reasons for the growth in
profits apart from demand recovery. Managements across sectors are talking about
continued recovery in the upcoming quarter due to the festive season and pent up demand.
BFSI sector has delivered strong earnings with large private banks indicating lower than
expected stress on their loan books. Healthcare sector has also delivered double digit returns in
this quarter. After many years, analysts are finally considering a positive upgrade in Nifty 50 earnings.
Earnings growth over the last few years has remained subdued on account of structural reforms such as GST, IBC &
RERA. The Corporate Tax cut announced last year has been followed up with recent reforms such as the Essential
Commodities Act to boost farm income, and Production linked incentives (PLI) for various sectors to boost domestic
manufacturing. With Corporate India deleveraging its balance sheet by a considerable extent over the last few years,
and with Financial system (particularly PSU Banks) already at high provision coverage, Corporate Profit-to-GDP ratio
in India should start inching upwards steadily from its current decadal lows over the next few quarters.
Hence, while our Temperature Gauge Index for equities indicates that Large Cap valuations are in expensive zone,
earnings recovery going forward will likely provide cushion for valuations. The broader market still offers a lot of
attractive investment opportunities. We continue to maintain bias towards Multicap and select Mid & Small cap
strategies. For incremental allocation to equities, we suggest investments to be staggered over a period of 3-6
months.
Positive news flow regarding the success rate of vaccines as well as various countries approving the same for
administration has brought back hope of faster recovery of global economy. Safe haven assets like USD and Gold are
seeing a drop in demand, signifying that investors are moving back to investing in risk assets. Strong rally in global
equity indices, high yield debt and commodities has been witnessed in November.
RBI also maintained its accommodative stance while emphasising the importance of economic growth over inflation.
Relaxation of the prevailing inflation targeting mechanism is also being discussed with the Govt. This indicates an
extended period of low yields. Hence in Fixed Income, we suggest following a barbell portfolio approach i.e. having
core allocation to high quality accrual oriented funds with short maturities (2-4 years), complemented by tactical
investments in select credit funds, high yield NCDs, bonds & MLDs. Gold should continue to remain part of portfolio
allocation, predominantly as a hedge against heightened volatility.
While most of CY2020 was dominated by disruption & turbulence in financial markets, we are ending the year with a
fundamental recovery across risk assets. This is as appropriate a time as ever to revisit your investment charter &
asset allocation and ensure that portfolios are positioned as per your financial goals.
Happy Investing!
Ashish Shanker
(Head, Investments – Private Wealth Management)

It is common knowledge that investments, when given time to grow, have a much higher chance of reaching their full
potential. One of the most successful and well known investors, Peter Lynch, once mentioned “You get recessions, you
have stock market declines, if you don't understand that's going to happen, then you're not ready, you won't do well in
the markets”. Even though these scenarios mentioned are known to investors, why are they not able to ride through the
cycle? The problem arises when personal capital is invested, as it is simple human nature to notice every small
turbulence that depletes one's capital. Initially an investor may be able to comprehend the situation, but when the bear
market last months or even years, portfolio profits and even capital begin to erode. This is when for most investors,
patience begins to wear thin and fear sets in. In such a mindset, investors end up making impulsive decisions that are
solely based on emotions without realizing that they are doing themselves more harm than good. Therefore we believe
that the key ingredient to healthy investment portfolios is to have a long term vision.
The most common question that then arises is: how long is long term? When it comes to computation of tax on capital
gains, long term is considered as a holding period of one year for equities and a period of three years for debt
instruments. However, from an investment perspective one year is considered as a very short period of time since
volatility can be very high and the investor could suffer losses. The fundamental reason for investing for a long period of
time is to deal with volatility, which can never be predicted. This is why many successful managers strongly believe in
the philosophy of 'Time in the market' as opposed to 'Timing the Market'. In hindsight, even if the entry point might
have been wrong, positive returns can still be made by patiently holding onto the investments and benefitting from the
subsequent rally. Some managers even try to improve their returns by increasing their investments in periods which are
negative or low return phases.
To understand the truth behind these statements, we conducted a small study that tracked the journey of the Nifty 50
Index and two actively managed funds in the last 25 years. We assumed 25 separate investments in each of the funds at
the start of every calendar year. The study yielded some very fascinating discoveries of the equity markets.
Long Term Investing
DECEMBER 2020 | ISSUE 96 4
Alpha Strategist | ‘Winter Harvest’
Disclaimer: Past performance may or may not be sustained in future,
*2020 returns are as of 3 t0 h Nov
No of obs 26 25 24 23 22 21 20 19 18 17 16 15 14 13 12 11 10 9 8 7 6 5 4 3 2 1
% of Posi�ve
obs69% 64% 83% 87% 95% 100% 95% 95% 100% 100% 100% 100% 100% 100% 100% 100% 100% 100% 100% 100% 100% 100% 100% 100% 100% 100%
No of
Posi�ve obs18 16 20 20 21 21 19 18 18 17 16 15 14 13 12 11 10 9 8 7 6 5 4 3 2 1
Ni�y 50
Years Yr 1 Yr 2 Yr 3 Yr 4 Yr 5 Yr 6 Yr 7 Yr 8 Yr 9 Yr 10 Yr 11 Yr 12 Yr 13 Yr 14 Yr 15 Yr 16 Yr 17 Yr 18 Yr 19 Yr 20 Yr 21 Yr 22 Yr 23 Yr 24 Yr 25 Yr 26*
1995 -23% -13% -3% -7% 5% 1% -2% -1% 5% 6% 8% 11% 14% 7% 10% 11% 8% 9% 9% 10% 9% 9% 10% 10% 10% 10%
1996 -1% 9% -1% 13% 7% 3% 3% 10% 10% 12% 14% 17% 10% 13% 14% 11% 12% 11% 12% 11% 11% 12% 11% 11% 11%
1997 20% -1% 18% 9% 3% 3% 11% 11% 14% 16% 19% 10% 14% 15% 12% 12% 12% 13% 12% 12% 12% 12% 12% 12%
1998 -18% 17% 5% 0% 0% 10% 10% 13% 16% 19% 10% 14% 14% 11% 12% 12% 13% 12% 11% 12% 12% 12% 11%
1999 67% 20% 6% 5% 16% 15% 18% 21% 24% 13% 17% 18% 14% 15% 14% 15% 14% 13% 14% 13% 13% 13%
2000 -15% -15% -10% 6% 7% 11% 15% 19% 8% 13% 14% 10% 11% 11% 12% 11% 11% 12% 11% 11% 11%
2001 -16% -7% 14% 13% 18% 21% 25% 11% 17% 17% 13% 14% 13% 14% 13% 12% 13% 13% 13% 12%
2002 3% 33% 25% 28% 30% 34% 16% 22% 22% 16% 17% 16% 17% 15% 15% 15% 15% 15% 14%
2003 72% 38% 37% 38% 41% 18% 25% 24% 17% 18% 17% 18% 16% 15% 16% 15% 15% 15%
2004 11% 23% 28% 34% 9% 18% 18% 12% 14% 13% 14% 13% 12% 13% 12% 12% 12%
2005 36% 38% 43% 9% 20% 20% 12% 14% 13% 15% 13% 12% 13% 13% 12% 12%
2006 40% 47% 1% 16% 17% 8% 11% 10% 13% 11% 10% 12% 11% 11% 11%
2007 55% -14% 9% 12% 3% 7% 7% 10% 8% 8% 9% 9% 9% 9%
2008 -52% -8% 0% -7% -1% 0% 4% 3% 3% 6% 5% 6% 6%
2009 76% 44% 16% 19% 16% 19% 15% 14% 15% 14% 14% 13%
2010 18% -6% 4% 5% 10% 7% 7% 9% 9% 9% 9%
2011 -25% -2% 1% 8% 5% 5% 8% 7% 8% 8%
2012 28% 17% 21% 14% 12% 15% 13% 13% 12%
2013 7% 18% 10% 9% 12% 11% 11% 10%
2014 31% 12% 9% 14% 11% 12% 11%
2015 -4% -1% 8% 7% 8% 8%
2016 3% 15% 11% 11% 10%
2017 29% 15% 14% 12%
2018 3% 7% 7%
2019 12% 9%
2020* 7%

DECEMBER 2020 | ISSUE 96 5
Alpha Strategist | ‘Winter Harvest’
In general, we noticed that negative or low return periods were perpetually followed by medium to high return periods.
This observation is a simple explanation for understanding that equity returns are nonlinear and tend to be bunched in
few years. Another important finding was that approximately 66.67% of the time one year absolute returns were
positive. In the case of active funds, there were some further motivating discoveries. In spite of having a poor entry
point and suffering negative returns in the first year, the active fund managers were successfully able to produce
positive annualized returns on a 5 year period and double digit returns on a 10 year period. The conclusion that we can
derive from this analysis is that compounding has a much larger effect on our investment returns than we realize and
that we should not get easily spooked by negative returns as they will fade with time.
When looking at these several data points, the bear markets appear to be like minor speed bumps in a consistent rally,
but this is a view in hindsight. When investors are in the thick of the fall, an atmosphere of doom gets created in the mind
and it becomes very hard go against the primary instinct of selling. For example, when the Nifty 50 Index crashed 52% in
CY08 only the very few investors who were able to hold their nerves and brave the storm benefitted from the 71% rally
in CY09. As Warren Buffet puts it, “The stock market is a device for transferring money from the impatient to the
patient”.
Disclaimer: Past performance may or may not be sustained in future,
*2020 returns are as of 3 t0 h Nov
Disclaimer: Past performance may or may not be sustained in future, *2020 returns are as of 3 t0 h Nov
HDFC Equity
Years Yr 1 Yr 2 Yr 3 Yr 4 Yr 5 Yr 6 Yr 7 Yr 8 Yr 9 Yr 10 Yr 11 Yr 12 Yr 13 Yr 14 Yr 15 Yr 16 Yr 17 Yr 18 Yr 19 Yr 20 Yr 21 Yr 22 Yr 23 Yr 24 Yr 25 Yr 26
1995 -29% -26% -13% -2% 19% 11% 9% 11% 20% 21% 24% 25% 27% 19% 23% 24% 20% 21% 20% 21% 20% 19% 20% 19% 18% 17%
1996 -23% -3% 9% 35% 22% 17% 18% 28% 28% 31% 32% 33% 24% 28% 28% 24% 24% 23% 25% 23% 22% 23% 22% 21% 20%
1997 23% 30% 63% 36% 27% 27% 38% 37% 39% 39% 40% 29% 33% 33% 28% 28% 27% 28% 26% 25% 26% 24% 23% 22%
1998 38% 88% 41% 29% 28% 41% 39% 41% 41% 42% 29% 34% 34% 28% 29% 27% 28% 26% 25% 26% 24% 23% 22%
1999 156% 43% 26% 25% 41% 39% 42% 41% 42% 28% 34% 34% 28% 28% 26% 28% 26% 25% 25% 24% 23% 21%
2000 -20% -12% -1% 22% 23% 29% 30% 32% 19% 26% 26% 20% 21% 20% 22% 20% 19% 20% 19% 18% 17%
2001 -3% 10% 40% 37% 41% 41% 42% 25% 32% 32% 25% 26% 24% 26% 23% 22% 23% 22% 21% 19%
2002 24% 68% 53% 55% 51% 52% 30% 37% 36% 28% 29% 26% 28% 26% 24% 25% 23% 22% 21%
2003 126% 70% 67% 59% 58% 30% 39% 38% 29% 29% 27% 29% 26% 24% 25% 23% 22% 20%
2004 28% 44% 41% 44% 17% 28% 29% 20% 21% 19% 22% 20% 19% 20% 18% 17% 16%
2005 63% 49% 50% 14% 29% 29% 19% 21% 19% 22% 19% 18% 19% 18% 17% 15%
2006 36% 44% 2% 21% 23% 13% 16% 14% 18% 15% 15% 16% 15% 14% 13%
2007 54% -12% 17% 20% 9% 12% 11% 16% 13% 13% 15% 13% 13% 11%
2008 -50% 2% 10% -1% 6% 5% 11% 9% 9% 11% 10% 10% 9%
2009 106% 63% 25% 27% 22% 27% 22% 20% 22% 19% 18% 16%
2010 29% -3% 8% 7% 15% 12% 11% 14% 12% 11% 10%
2011 -27% -1% 1% 12% 8% 8% 12% 10% 9% 8%
2012 34% 18% 29% 19% 17% 20% 16% 15% 13%
2013 4% 26% 15% 13% 17% 14% 13% 11%
2014 54% 21% 16% 21% 16% 14% 12%
2015 -5% 1% 12% 8% 8% 6%
2016 7% 21% 12% 11% 8%
2017 37% 15% 12% 8%
2018 -4% -2% 0%
2019 7% 2%
2020* -3%
No of obs 26 25 24 23 22 21 20 19 18 17 16 15 14 13 12 11 10 9 8 7 6 5 4 3 2 1
No of Posi�ve obs 17 17 22 21 22 21 20 19 18 17 16 15 14 13 12 11 10 9 8 7 6 5 4 3 2 1
% of Posi�ve obs 65% 68% 92% 91% 100% 100% 100% 100% 100% 100% 100% 100% 100% 100% 100% 100% 100% 100% 100% 100% 100% 100% 100% 100% 100% 100%
Outperformace to Ni�y 15 19 20 21 20 20 20 19 18 17 16 15 14 13 12 11 10 9 8 7 6 5 4 3 2 1
% Outperformace to
Ni�y58% 76% 83% 91% 91% 95% 100% 100% 100% 100% 100% 100% 100% 100% 100% 100% 100% 100% 100% 100% 100% 100% 100% 100% 100% 100%
Franklin Equity
Years Yr 1 Yr 2 Yr 3 Yr 4 Yr 5 Yr 6 Yr 7 Yr 8 Yr 9 Yr 10 Yr 11 Yr 12 Yr 13 Yr 14 Yr 15 Yr 16 Yr 17 Yr 18 Yr 19 Yr 20 Yr 21 Yr 22 Yr 23 Yr 24 Yr 25 Yr 26
1995 -23% -19% -10% 1% 26% 14% 11% 12% 20% 21% 23% 25% 27% 19% 22% 22% 19% 20% 19% 21% 20% 19% 20% 19% 18% 18%
1996 -16% -2% 10% 42% 23% 18% 18% 27% 27% 29% 30% 32% 23% 26% 26% 23% 23% 22% 24% 23% 22% 22% 21% 20% 19%
1997 13% 26% 70% 35% 26% 25% 34% 33% 35% 36% 38% 27% 30% 29% 26% 26% 25% 26% 25% 24% 24% 23% 22% 21%
1998 39% 108% 43% 29% 27% 38% 36% 38% 39% 40% 28% 32% 31% 27% 27% 25% 27% 26% 24% 25% 23% 22% 22%
1999 209% 45% 26% 24% 38% 36% 37% 39% 41% 27% 31% 30% 26% 26% 24% 26% 25% 24% 24% 22% 21% 21%
2000 -32% -20% -8% 12% 15% 20% 24% 27% 15% 20% 20% 17% 18% 17% 19% 18% 17% 18% 17% 16% 16%
2001 -5% 6% 33% 31% 34% 37% 39% 23% 28% 27% 22% 23% 22% 24% 22% 21% 22% 20% 19% 19%
2002 19% 57% 47% 47% 47% 49% 28% 33% 31% 26% 26% 24% 26% 25% 23% 24% 22% 21% 20%
2003 107% 62% 57% 55% 55% 29% 35% 33% 26% 27% 25% 27% 25% 24% 24% 22% 21% 20%
2004 27% 37% 41% 44% 18% 26% 25% 19% 20% 18% 21% 20% 19% 20% 18% 17% 16%
2005 48% 48% 51% 16% 25% 24% 17% 19% 18% 21% 19% 18% 19% 17% 16% 16%
2006 49% 52% 7% 20% 20% 13% 15% 14% 18% 17% 16% 17% 15% 14% 14%
2007 55% -10% 12% 14% 7% 11% 10% 15% 14% 13% 14% 13% 12% 12%
2008 -48% -5% 3% -2% 3% 4% 10% 9% 9% 11% 9% 9% 9%
2009 73% 44% 20% 23% 19% 25% 22% 19% 21% 18% 16% 16%
2010 19% 0% 9% 8% 17% 15% 13% 15% 13% 12% 12%
2011 -16% 5% 5% 16% 14% 12% 15% 12% 11% 11%
2012 31% 18% 29% 23% 19% 21% 17% 15% 14%
2013 6% 29% 20% 16% 19% 15% 13% 12%
2014 57% 28% 20% 22% 17% 14% 13%
2015 4% 5% 13% 8% 7% 7%
2016 5% 17% 9% 8% 8%
2017 31% 12% 9% 9%
2018 -4% -1% 2%
2019 3% 6%
2020* 9%
No of obs 26 25 24 23 22 21 20 19 18 17 16 15 14 13 12 11 10 9 8 7 6 5 4 3 2 1
No of Posi�ve obs 19 17 22 22 22 21 20 19 18 17 16 15 14 13 12 11 10 9 8 7 6 5 4 3 2 1
% of Posi�ve obs 73% 68% 92% 96% 100% 100% 100% 100% 100% 100% 100% 100% 100% 100% 100% 100% 100% 100% 100% 100% 100% 100% 100% 100% 100% 100%
Outperformace to
Ni�y19 18 20 21 20 20 20 19 18 17 16 15 14 13 12 11 10 9 8 7 6 5 4 3 2 1
% Outperformace
to Ni�y73% 72% 83% 91% 91% 95% 100% 100% 100% 100% 100% 100% 100% 100% 100% 100% 100% 100% 100% 100% 100% 100% 100% 100% 100% 100%

This document is not valid without disclosure; refer the last page for the disclosure
DECEMBER 2020 | ISSUE 96 6
Alpha Strategist | ‘Winter Harvest’
Section I
Market through Graphs .......................................................................................07
Portfolios Commentary........................................................................................08
Investment Grid ...................................................................................................10
Our Recommendations........................................................................................11
Temperature Gauge.............................................................................................13
Risk Return Matrix ..............................................................................................15

DECEMBER 2020 | ISSUE 96 7
Alpha Strategist | ‘Winter Harvest’
Market through Graphs
Summary
Equity
Fixed Income High quality accrual funds with Short Term MaturityPositive on accrual strategies
Me-Gold, Sovereign Gold Bonds, Gold ETF/FoFPositive Positive
Recommended Strategies
Gold
Biased towards Multicap strategies
in MF/PMS/AIF platformsNeutral Positive
Fixed IncomeRBI kept policy rates unchanged; Continues with the 'Accommodative
Stance'
Source: Bloomberg, MOPWM Research
• RBI has reiterated to maintain accommodative stance
while keeping the policy rates unchanged
• RBI's primary focus still remains economic recovery
while being cognizant of inflation dynamics
• The central bank has taken several monetary and
regulatory measures to alleviate the challenges faced
by various stakeholders of the financial system
• Real GDP contracted for the second consecutive
quarter by 7.5% YoY, slightly better than market
expectation of 8.2% YoY
• This is the first time ever when india's quarterly growth
numbers has contracted consecutively
• Fall in both private and government consumption is
one of the major reasons for the GDP contraction
India's GDP contracts further leading to technical depression
Source: CSO
EquitiesQ2FY21 earnings beat estimates
• Q2FY21 earnings season has been a great one till now
with big beats on estimates and improved
management commentaries
• The earnings beat and consequent earnings upgrade
could be attributed to sharp demand recovery and cost
optimization
• Nifty 50 EPS of FY21 has been upgraded by 9% to INR
497 and EPS of FY22 has been upgraded by 3.9% to INR
677
Source: MOSL, MOPWM Research
Economy
5.91
4.00
7.61
1.0
2.0
3.0
4.0
5.0
6.0
7.0
8.0
9.0
10.0
11.0
12.0
De
c-1
2
Ap
r-1
3
Jul-
13
Oct-
13
Jan
-14
Ap
r-1
4
Jul-
14
Oct-
14
Jan
-15
Ap
r-1
5
Jul-
15
Oct-
15
Jan
-16
Ap
r-1
6
Jul-
16
Oct-
16
Jan
-17
Ap
r-1
7
Au
g-1
7
No
v-1
7
Fe
b-1
8
Ma
y-1
8
Au
g-1
8
No
v-1
8
Fe
b-1
9
Ma
y-1
9
Au
g-1
9
No
v-1
9
Fe
b-2
0
Ma
y-2
0
Au
g-2
0
No
v-2
0
10 Yr Gsec (Yield %) Repo Rate (%) CPI (%)
-7
17
-40
-30
-20
-10
0
10
20
30
Q1FY19 Q2FY19 Q3FY19 Q4FY19 Q1FY20 Q2FY20 Q3FY20 Q4FY20 Q1FY21 Q2FY21
Ni�y Sales growth (% YoY) Ni�y PAT growth (% YoY)
5.20 5.20 2.80
-13.10-9.30
-1.00 -1.50 -2.00
-16.80
-2.90
1.90 1.70
-0.20
5.50 3.40
-1.70 -1.30
2.50
0.50 1.30
4.40 4.10 3.10
-23.90
-7.50
-25.00
-21.00
-17.00
-13.00
-9.00
-5.00
-1.00
3.00
-35.0
-30.0
-25.0
-20.0
-15.0
-10.0
-5.0
0.0
5.0
10.0
Q2FY20 Q3FY20 Q4FY20 Q1FY21 Q2FY21
Consump�on GCF Net Exports Discrepancy GDP (% YoY)

Tactical changes and strategies
� February 14, 2013 – Reduced allocation to Gold by 25% and increased to Dynamic Bond Funds based on discussion
in the Investment Committee meeting
� April 1, 2013 – Reduced further allocation to Gold by 25% and increased to Dynamic Bond Funds based on discussion
in the Investment Committee meeting
� May 17, 2013 – Exited Gilt Fund’s and moved to Short-term Funds (40%), Income Funds (40%) and Dynamic Bond
Funds (20%) based on the note released - “Yields came tumbling after…to plummet further”
� July 29, 2013 – Exited Income Funds and other long duration investments and invested the redemption proceeds in
Ultra Short-term Funds based on the note released – “Ride the Tide”
� September 20, 2013 – Cash allocation brought back to its strategic weight and invested the balance allocation into gilt
funds based on the note released – “The Gilt Edge”
� September 27, 2013 – Switched 15% of equity allocation to Information Technology (IT) sector funds from large cap and
multi cap funds, based on the note released – “Information Technology – In a position on strength”
� September 30, 2013 – Reduced 10% of equity allocation and switched to ultra short term funds based on the note
released – “The Bear-nanke Hug – Underweight Equities
� November 20, 2013 – Switched 50% of Short-term Funds allocation to Gilt Funds, to increase duration of the
portfolio, based on the note released – “Time to Rebuild Duration – A Déjà vu”
� November 25, 2013 – Deployed Cash in Nifty ETFs, based on the note released – “Equity Markets – An Update”
� December 3, 2013 – Switched all cash positions to gilt funds, to further increase duration of the portfolio
� May 5, 2014 – Reduced allocation to Gilts and moved to Ultra Short term Funds to create liquidity in the portfolio
� May 23, 2014 – Switched allocation from IT Sector Funds and Nifty ETFs to Infrastructure Funds and Small cap Funds
respectively, based on the note released – “Good Times Ahead!”
� September 6, 2014 – Switched allocation from Cash to Gilt funds, to increase the duration of the portfolio based on the
note “Way Ahead for Duration”.
� September 28, 2015 – Switched allocation from Small & Midcap funds to Large Cap funds, on the back of relatively
higher valuations of midcaps as compared to large cap.
� September 24, 2015 – On the fundamental front, demand side continues to be supportive for gold. We have thereby revised out
short term outlook on gold from underweight to neutral stance.
� February 29 , 2016 – Reduced Gilt exposure and allocated the proceeds towards Gold, on the back of better risk reward scenario
for gold & bond yields coming below it long term average
� April 22, 2016 – Switched allocation from Duration strategies to Accrual strategies, based on the note released – “Time to Shift
Gears”
� May 31, 2018 – In Fixed Income, we reiterate our stance on accrual strategy, however, given the current valuations, tactical
allocation to dynamic bond funds can be considered by investors who can withstand interest rate volatility
� May 31, 2018 – Increase allocation towards value oriented multi-cap strategies
� Novemmmended arbitrage fund with minimum 6 months investment horizon; put a hold on long duration accrual strategiesber
30, 2018 – Focus on multi cap and staggered investment to mid & small cap strategies; shift to high quality AAA rated high accrual
debt funds
� January 31,2019 – We favor a combination of multi cap strategies within Equity MFs and selected high conviction portfolios
within the PMS/AIF platform, we recommend high quality accrual funds for incremental investment in fixed income; we have
changed our stance to positive for gold in long term
� June 30, 2019 - We favour a combination of Multi cap and Mid & Small cap strategies in MF/PMS/AIF platforms, we change our
stance on gold to neutral in long term and maintain neutral stance in short term
� July 31,2019 - Increased allocation to high quality “AAA” accrual strategies to benefit from the corporate bond spreads
As on Oct 31, 2019
DECEMBER 2020 | ISSUE 96 8
Alpha Strategist | ‘Winter Harvest’
Portfolios Commentary

DECEMBER 2020 | ISSUE 96 9
Alpha Strategist | ‘Winter Harvest’
Investment CommitteeCommittee MembersVirendra Somwanshi –Managing Director & CEO, Private Wealth Management
Ashish Shanker – Head, Investments
Gautam Duggad – Head of Research, Institutional Equities, MOSL
Kishore Narne – Head, Commodities & Currency
Nikhil Gupta – Economist, MOSL
Nitin Shanbhag – Head, Investment Products
Products & Advisory Team, Private Wealth Management
External Speakers: Mr. Vinith Sambre, Head of Equity and Mr. Saurabh Bhatia , Head of Fixed Income in DSP Mutual Fund Ltd
Tactical changes and strategies
� August 31,2019 - Increase allocation to Equity in a staggered manner for the next six months; we have changed our stance to
positive for gold in long term
� September 26,2019 – For incremental investment in equities we revise our stance to invest in lump sum from staggered
� March, 2020 – For incremental investment in equities we revise our stance to staggered investment over the next 6 -12 months
� April, 2020 – Biased towards Largecap & Multicap strategies in MF/PMS/AIF platforms for incremental Equity Investment
� May, 2020 - Recommended arbitrage fund with minimum 6 months investment horizon; put a hold on long duration accrual
strategies
� June, 2020 - For incremental investment in equities we revise our stance to staggered investment over the next 3 - 6 months biased
towards Multicap strategies in MF/PMS/AIF platforms
� July, 2020 – For incremental allocation in equity, we recommend to increase allocation by investing 50% immediately and the
balance in a staggered manner in Multicap strategies (MFs, PMS, AIF) over the next 3-6 months
� October 13, 2020 – For incremental allocation in equity, we recommend to increase allocation in a staggered manner in Multicap
strategies(MFs, PMS, AIF) over the next 3-6months; fixed income allocation can be complemented by tactical investments in
select credit oriented funds, high yield NCDs, bonds & MLDs
� November 2020 - To enhance the overall portfolio yield, investors with medium to high risk profile can consider 15 – 20%
allocation of the overall fixed income portfolio to select MLDs, NCDS and credit oriented strategies

DECEMBER 2020 | ISSUE 96 10
Investment GridAlpha Strategist | ‘Winter Harvest’
MOTILAL OSWAL PRIVATE WEALTH MANAGEMENT (MOPWM) - INVESTMENT GRID DECEMBER, 2020
Asset Class Holding Period Theme Strategy
Equity
Outperformance to Nifty
Sectors agnostic of Market cap and style
High conviction Mid & Small Cap strategies
Large Cap
Multi-Cap
Mid & Small Cap
3 Years & above
<6 months
6 months-
1 year
Fixed Income
Alternates
Liquid
Ultra Short Term/ Arbitrage
Overnight/Liquid
3 years+
High quality accrual strategies
--
Ultra Short Term Fund
Roll Down strategy
Arbitrage
Banking and PSU
Short Term
Corporate Bond
Roll Down strategy
Venture CapitalInvest in high growth consumer tech and consumer
offline brandsOrios Select Fund>7 years
Managed Solutions
Axis Midcap, HDFC Midcap, HDFC Small Cap, Invesco Small Cap, KotakEmerging Equity, Kotak SmallCap, MO F30, MO Nifty Midcap 150, MO NiftySmallcap250,SundaramMidCap, Invesco RISE PMS, MO IOP PMS, MO IOP2PMS,Renaissance Mid Cap PMS, Unifi Blend PMS, Unifi Insider Shadow
ABSL Frontline Equity, ABSL Focused Equity, Axis Bluechip, HDFC Top 100,ICICI Pru Nifty Next 50 Index Fund, Mirae Asset Large Cap Fund, MO F25,MO Bank Index, MO NIFTY 50, MO NEXT NIFTY 50, SBI Bluechip, UTI NiftyIndex FundMOValuePMS,MOMulticap AIF,AvendusERF-IIAIF,AxisPRIMEFactorsIAIF
ABSL Equity, Axis ESG Fund, Axis Focused 25, DSP Quant Fund, HDFCEquity, HDFC Capital Builder Value Fund, ICICI Pru India Opportunities,ICICI Pru Multicap, Invesco India Contra, Kotak Equity Opportunities,Kotak Standard Multicap, L&T India Value, MO F35, MO Nifty 500, MOLarge & Midcap Fund,
Alchemy High Growth PMS, ASK Indian Entrepreneur PMS, ASK SelectPMS, ASK Vision, Invesco DAWN PMS, MO BOP, MO NTDOP PMS, MOBusiness Advantage Fund-II, Marcellus Kings of Capital, Renaissance IndiaNext PMS, Renaissance Opportunities PMS, Unifi BCAD
Hedge against volatility> 3 Years Me-Gold, Sovereign Gold Bonds, Kotak Gold ETF, Kotak Gold Fund
Generate alpha through active management of long and shortpositions
>1 year Long – Short fund Avendus Absolute Return Fund (PMS/AIF)
ICICI Liquid, ICICI Overnight, IDFC Cash, HDFC Liquid, HDFC Overnight,
SBI Overnight
HDFC Ultra Short Term, IDFC Ultra Short Term
IDFC Corporate Bond
ABSL Arbitrage, ICICI Prudential Equity Arbitrage, IDFC Arbitrage,
Kotak Equity Arbitrage, Mirae Asset Arbitrage
Axis Banking and PSU, IDFC Banking and PSU, ICICI Banking and PSU,
Kotak Banking and PSU
IDFC Bond- Short Term Plan
ICICI Prudential Corporate Bond, HDFC Corporate Bond
Axis Dynamic Bond Fund, Bharat Bond ETF/FOF, Kotak Floating Rate Fund,
L&T Triple Ace Bond Fund, Nippon India Nivesh Lakhsya Fund
High Yield strategies / CAT II AIFNorthern Arc Income Builder Fund Series IICredit oriented schemes
Market Linked Debentures (MLD) Fixed Coupon oriented MLD

DECEMBER 2020 | ISSUE 96 11
Alpha Strategist | ‘Winter Harvest’
Our RecommendationsFixed Income Mutual Funds
ICICI Pru Short Term Fund(G)
IDFC Bond Fund - Short Term Plan-Reg
Category Average
Crisil Short Term Bond Fund Index
20,927
13,210
--
--
18,606
13,802
19,780
10,286
--
--
6,336
6,513
800
--
--
Short Term Income Fund
Axis Banking & PSU Debt Fund-Reg
ICICI Pru Banking & PSU Debt Fund
IDFC Banking & PSU Debt Fund-Reg
Kotak Banking and PSU Debt Fund
Category Average
Crisil Composite Bond Fund Index
Banking & PSU Debt Funds
HDFC Credit Risk Debt Fund
ICICI Pru Credit Risk Fund
IDFC Credit Risk Fund-Reg
Category Average
Crisil Composite Bond Fund Index
Credit Risk Fund
11.5
8.9
9.5
2.7
9.0
11.3
10.4
12.1
10.8
3.4
16.9
13.3
12.0
14.3
3.4
10.8
9.2
10.0
5.0
9.1
9.2
9.9
10.2
9.1
4.9
15.7
12.2
9.7
10.5
4.9
10.6
9.6
8.0
10.4
9.5
9.5
10.8
10.4
9.7
12.1
10.3
9.7
7.4
0.7
12.1
8.5
8.5
6.1
8.8
9.3
8.1
9.7
9.2
8.7
9.3
8.0
8.5
6.9
1.6
9.3
8.6
8.2
6.7
8.6
8.7
8.7
8.7
8.9
8.4
9.3
8.5
8.4
--
4.1
9.3
11.2
11.5
--
11.5
12.5
11.0
13.3
12.1
--
13.8
10.5
10.8
10.2
--
13.8
3.8
4.2
--
4.6
5.4
3.6
4.2
4.2
--
1.1
3.1
5.1
3.1
--
1.1
7.7
7.9
--
8.2
8.8
7.5
8.9
8.4
--
8.5
7.0
7.8
6.7
--
8.5
8.7
8.5
--
8.5
9.3
9.2
9.7
9.2
--
9.3
9.2
8.6
6.9
--
9.3
6.9
6.6
--
7.1
7.1
6.7
6.3
7.1
--
6.8
6.1
7.3
6.1
--
6.8
7.7
7.4
--
7.7
8.2
7.8
7.7
8.0
--
7.8
7.5
7.8
6.5
--
7.8
2.4
1.7
--
--
1.7
3.3
2.1
2.9
--
--
2.1
2.1
2.8
--
--
5.1
4.5
--
--
4.3
5.1
4.7
5.3
--
--
8.6
7.9
7.2
--
--
84.1
100.0
--
--
100.0
81.9
100.0
89.5
--
--
39.9
30.8
58.9
--
--
15.9
--
--
--
--
18.1
--
10.5
--
--
60.1
69.2
41.1
--
--
–
--
--
--
--
--
--
--
--
--
--
--
--
--
--
Scheme NameAUM
(in Rs. Cr.)3 Month 6 Month 1 Year 5 Years
Mod Dur
(Years)
Gross
YTM(%)
Sov, AAA&
CashUnrated
1 Year Rolling Return
Min MinMax Max
3 Year Rolling Return AA+
& below3 Years
Mean Mean
Aditya Birla SL Corp Bond Fund
Axis Dynamic Bond Fund-Reg
HDFC Corp Bond Fund
ICICI Pru Corp Bond Fund
IDFC Corp Bond Fund-Reg
L&T Triple Ace Bond Fund-Reg
Nippon India Nivesh Lakshya Fund
Kotak Floating Rate Fund-Reg
BHARAT Bond ETF - April 2025
BHARAT Bond ETF - April 2030
BHARAT Bond ETF - April 2031
Category Average
Crisil Composite Bond Fund Index
23,395
1,184
23,494
18,906
19,345
5,624
1,623
3,269
6,138
11,174
7,612
--
--
Corporate Bond Fund
12.3
15.0
12.7
10.9
12.6
13.9
11.9
13.9
13.9
16.5
18.2
10.6
3.4
11.6
10.6
11.1
10.3
11.7
9.2
7.0
13.5
--
12.1
--
7.7
4.9
11.8
12.6
11.5
10.5
11.7
12.3
12.9
11.4
--
--
--
8.7
12.1
9.3
9.7
9.3
8.7
8.6
10.0
--
--
--
--
--
7.8
9.3
9.1
9.2
9.1
8.6
--
8.8
--
--
--
--
--
7.9
9.3
12.1
14.3
12.3
11.5
11.8
16.3
22.8
11.4
--
--
--
--
13.8
4.8
1.2
4.0
4.7
4.2
-0.6
9.2
7.4
--
--
--
--
1.1
8.5
8.2
8.5
8.0
7.7
8.6
15.8
9.5
--
--
--
--
8.5
9.3
9.7
9.3
8.7
8.6
10.0
--
--
--
--
--
--
9.3
7.5
6.2
7.4
7.2
6.6
5.3
--
--
--
--
--
--
6.8
8.1
7.6
8.1
7.8
7.6
7.0
--
--
--
--
--
--
7.8
2.7
6.2
3.3
2.9
2.8
5.6
11.3
2.8
3.7
6.4
7.2
--
--
5.2
6.4
5.2
4.9
5.1
6.3
6.6
5.3
5.5
6.6
6.6
--
--
96.7
100.0
100.0
100.0
100.0
100.0
100.0
87.9
100.0
100.0
100.0
--
--
3.3
--
--
--
--
--
--
12.1
--
--
--
--
--
—
—
—
—
—
—
—
—
—
—
—
—
—
Portfolio as on 30th November 2020* Annulized ^Less than 1 year period from date of recommendation; Returns less than or equal to 1 year are annulized return & more than 1 year period calculated by CAGR Data as on 31st Oct., 2020;

DECEMBER 2020 | ISSUE 96 12
Alpha Strategist | ‘Winter Harvest’
Portfolio as on 30th November 2020
Arbitrage Fund
Aditya Birla SL Arbitrage Fund
ICICI Pru Equity-Arbitrage Fund
IDFC Arbitrage Fund-Reg
Invesco India Arbitrage Fund
Kotak Equity Arbitrage Fund
Mirae Asset Arbitrage Fund-Reg
Category Average
Crisil Liquid Fund Index
3,683
9,673
7,098
477
15,289
241
--
--
Scheme NameAUM
(in Rs. Cr.) 1 Month 3 Month 6 Month 3 YearsMod Dur
(Years)Gross
YTM(%)
Sov, AAA&
CashUnrated
3 Month Rolling Return
Min MinMax Max
1 Year Rolling Return AA+
& below1 Years
Mean Mean
Liquid/Overnight Fund
34,021
64,687
13,934
40,247
9,208
10,190
26,077
11,580
—
—
15,216
5,034
—
—
1.4
1.9
2.0
1.4
1.9
2.1
1.3
0.3
2.7
3.6
3.4
2.9
3.4
3.5
2.8
1.0
2.3
2.5
2.5
2.5
2.7
--
2.1
2.0
4.0
4.2
3.7
4.1
4.2
--
3.7
4.8
5.5
5.5
5.5
5.4
5.6
--
5.2
6.4
2.0
2.0
1.9
1.8
2.0
1.0
--
1.9
0.3
0.1
0.2
0.4
0.3
0.6
--
1.0
1.4
1.4
1.4
1.4
1.4
0.8
--
1.6
6.7
6.7
7.0
6.5
6.9
--
--
7.7
4.0
4.2
3.8
4.2
4.2
--
--
5.0
5.9
5.9
5.9
5.8
6.0
--
--
6.8
66.1
66.4
66.6
66.9
67.6
67.9
--
--
3.1
3.1
2.6
3.2
2.6
3.1
3.1
2.7
3.5
0.3
4.6
3.8
4.8
0.3
3.2
3.2
2.8
3.2
2.9
3.1
3.2
2.9
3.4
1.0
5.0
3.9
4.8
1.0
3.4
3.2
2.9
3.4
2.9
3.2
3.3
2.9
3.4
2.0
5.6
4.3
5.3
2.0
4.5
4.3
3.4
4.5
3.4
4.2
4.4
3.4
4.3
4.8
6.6
5.8
6.0
4.8
6.2
6.0
5.0
6.2
0.0
6.0
6.2
5.1
5.9
6.4
--
--
6.7
6.4
1.9
1.9
1.6
1.9
1.6
1.8
1.9
1.6
--
1.9
2.4
2.3
--
1.9
0.8
0.8
0.7
0.8
0.7
0.8
0.8
0.7
--
1.0
1.3
0.9
--
1.0
1.6
1.5
1.3
1.5
1.1
1.5
1.6
1.3
--
1.6
1.8
1.8
--
1.6
7.5
7.4
6.3
7.5
5.8
7.4
7.6
6.3
--
7.7
8.6
8.7
--
7.7
4.5
4.3
3.4
4.5
3.4
4.2
4.4
3.5
--
5.0
6.6
5.8
--
5.0
6.7
6.5
5.5
6.6
4.6
6.5
6.7
5.5
--
6.8
7.5
7.6
--
6.8
0.1
0.1
0.0
0.1
0.0
0.1
0.1
--
--
--
0.4
0.3
--
--
3.4
3.0
3.0
3.0
3.1
3.2
3.2
3.1
--
--
3.7
3.4
--
--
100.0
100.0
100.0
100.0
100.0
100.0
100.0
100.0
--
--
100.0
100.0
--
--
—
—
—
—
—
—
—
—
—
—
—
—
—
—
—
—
—
—
—
—
—
—
—
—
—
—
—
—
–
23.6
22.3
5.5
--
--
--
--
—
—
—
—
—
—
—
—
24.5
3.0
4.5
-46.4
25.7
-44.5
--
--
9.4
7.0
6.6
74.0
6.7
76.6
--
--
Scheme NameAUM
(in Rs. Cr.) 1 Month 3 Month 6 Month 3 Years Equity DebtFutures/Option Cash
3 Month Rolling Return
Min MinMax Max
1 Year Rolling ReturnOthers1 Years
Mean Mean
Aditya Birla SL Liquid Fund
HDFC Liquid Fund
HDFC Overnight Fund
ICICI Pru Liquid Fund
ICICI Pru Overnight Fund
IDFC Cash Fund-Reg
Nippon India Liquid Fund
SBI Overnight Fund-Reg
Category Average
Crisil Liquid Fund Index
Ultra Short Term Fund
HDFC Ultra Short Term Fund-Reg
IDFC Ultra Short Term Fund-Reg
Category Average
Crisil Liquid Fund Index
Scheme NameAUM
(in Rs. Cr.)3 Month 6 Month 1 Year 5 Years
Mod Dur
(Years)
Gross
YTM(%)
Sov, AAA&
CashUnrated
1 Year Rolling Return
Min MinMax Max
3 Year Rolling Return AA+
& below3 Years
Mean Mean
Low Duration
ICICI Pru Savings Fund
Category Average
Crisil Composite Bond Fund Index
23,677
--
--
8.1
6.5
3.4
8.8
11.0
4.9
8.4
6.0
12.1
8.1
5.1
9.3
8.1
.16
9.3
9.2
--
13.8
6.3
--
1.1
7.8
--
8.5
8.5
--
9.3
7.4
--
6.8
7.9
--
7.8
0.9
--
--
4.4
--
--
88.8
--
--
11.2
--
--
—
—
—
Fixed Income Mutual Funds

DECEMBER 2020 | ISSUE 96 13
Temperature Gauge
Alpha Strategist | ‘Winter Harvest’
129
60
70
80
90
100
110
120
130
140
Temperature Gauge Index
-7%
13%
33%
53%> 10% CAGR Between 0-10% CAGR < 0%Nifty – 3 Year Forward Return
Cheap Zone Fair Zone Expensive Zone
We are cognizant of the fact that investments are tuned to meet your objectives and thus calling for a suitable asset mix
basis your investment objective. However the challenge always remains to accurately estimate when the market is
cheap or expensive. In order to arrive at the decision of preferring equity over debt or vice versa, we believe earning
yield to bond yield is an excellent parameter to consider. This ratio indicates the perceived risk differential between
equity and bonds.
Historically whenever earnings yield and bond yield spreads are above 0.8, equities are considered to be undervalued.
The earning yield to bond yield parameter along with our in-house indicator of market valuations named as MOVI – The
Motilal Oswal Valuation Index enables us to arrive at a well-researched and thought through asset class outlook. MOVI
is basically an index which is calculated based on the Price to Earnings (PE), Price to Book Value (PB) and Dividend Yield
(DY) on the components of Nifty 50. By means of an algorithm the weighted average PE, PB and DY of the components of
Nifty 50, one arrives at index. A higher level on the MOVI means markets are expensive and hence one should reduce
equity exposure and vice versa.
With the above mentioned input variables, we have crafted a unique model coined as which helpTemperature Gauge
in making investment choices across asset classes.
This qualitative and quantitative process would enable us to construct “winning portfolios” for our clients. In line with
our philosophy of providing better insights to you, we hope you find the same informative.
Source: Capital Line, Internal Research, Data as of 1st Dec’20
Index indicates that prevailing valua�ons are above long term average

DECEMBER 2020 | ISSUE 96 14
Alpha Strategist | ‘Winter Harvest’
Source: Capital Line, Internal Research, Data as of 1-Dec’20; *Total nos. of observa�on is 4,647
W h e n ev e r Te m p e r a t u r e
Gauge Index has been at the
levels of 125-130, the forward
returns shows a low
probability of high single digit
CAGR returns
Nifty 50 3 Yr Return CAGR% Times in
CAGR range
Index in RangeNo. of
Observations*Min Max Average
% Times
Positive6% to 10% >=10%
65 70 26 17% 58% 26% 100% 0% 100%
70 75 91 14% 58% 31% 100% 0% 100%
75 80 54 18% 56% 38% 100% 0% 100%
80 85 158 15% 51% 39% 100% 0% 100%
85 90 190 12% 45% 35% 100% 0% 100%
90 95 241 10% 49% 28% 100% 0% 100%
95 100 582 2% 48% 21% 100% 6% 93%
100 105 554 1% 44% 15% 100% 20% 75%
105 110 586 -4% 33% 11% 98% 28% 57%
110 115 864 -6% 28% 7% 89% 44% 17%
115 120 819 -7% 13% 5% 93% 28% 16%
120 125 387 -4% 10% 4% 87% 29% 0%
125 130 47 -1% 6% 2% 78% 0% 0%
130 135 38 -2% 3% 0% 66% 0% 0%
135 140 10 -3% 0% -2% 0% 0% 0%
� Below grid is based on Temperature Gauge Index
No Action Reduce Reduce
Invest Stay Invested Stay Invested
Invest Invest Stay Invested
Expensive
Fair
Cheap
Underweight Neutral Overweight
Strategic
Allocation
Valuation
100% Staggered
(Current Scenario)
50% Staggered
50% Lump sum
100% Lump sum
Equity Allocation & Deployment Grid
3 Yr Forward Returns Of Nifty At Different Levels Of TemperatureGauge Index

DECEMBER 2020 | ISSUE 96 15
Alpha Strategist | ‘Winter Harvest’
Risk Return Matrix
Risk Return profile helps to determine one’s asset allocation frame work. The next logical step is to look at the different
investment strategies that would enable one to eventually achieve their financial goals.
From the above chart we can conclude that in debt, a high quality accrual startegy would have lower volatility as
compared to a dynamic startegy while generating similar average return over a 1 year holding period
While in equity, a large cap strategy has historically exhibited relatively lower volatility and generated lower return as
compared to the small cap strategy.
Thereby, one has to carefully examine if a particular investment strategy is aligned with their risk appetite before making
an investment decision.
Strategies considered for the analysis:
Large cap fund category:ABSL frontline, ABSL focused equity, SBI bluechip, Motilal Value PMS & Motilal Oswal focused 25
Multi cap fund category: ABSL equity, ASK IEP PMS, ASK Select PMS, Motilal NTDOP PMS, DHFL Deep Value PMS, Franklin
India equity, Franklin focused equity, I-Pru multi cap, Invesco contra, L&T value & Kotak standard multicap
Mid cap category: Franklin prima, HDFC midcap opps, Motilal IOP PMS, Kotak emerging equities, Sundaram midcap &
Motilal focused 30
Small cap category: Franklin smaller cos, DSP small Cap & HDFC small cap
High quality accrual: ABSL Corp Bond, Axis Banking PSU, BNP Corp bond, ICICI Short term bond fund, IDFC Banking & PSU
& IDFC bond fund –ST, ICICI Banking and PSU, Kotak Banking and PSU
Credit risk: BOI AXA credit risk, Franklin India ST income, ICICI credit risk, L&T resurgent, Reliance credit risk & Reliance
strategic debt fund
Dynamic: IDFC Dynamic, SBI Dynamic, UTI Dynamic & ABSL Dynamic
Long/Short: Performance of Ambit Alpha fund from 31 May 2013 – 30 Sep 2016, Liquid return assumed from 1st Oct 16-
29th Feb 17 and performance of Avendus Absolute Return Fund from 31st Mar 2017 onwards
Data used from December 2009, Source: Ace MF
*Every category consists of fund equally wieghted
Risk Return matrix of various investment strategies
Multi Cap
Average
Max
Min
8.0%
11.9%
2.7%
6.7%
12.1%
-13.1%
8.1%
17.3%
0.1%
10.5%
16.5%
1.8%
14.4%
86.9%
-23.1%
18.4%
112.3%
-25.6%
19.9%
123.6%
-28.4%
21.1%
145.9%
-36.3%
Credit Risk Dynamic Mid Cap Small CapHigh Quality
AccrualLarge CapLong Short
1 -Year
Rolling Return
Large Cap
Multi CapMidcap
Small cap
ST &
AccrualCredit
Dynamic
Long short
0.0%
5.0%
10.0%
15.0%
20.0%
25.0%
30.0%
0.0% 5.0% 10.0% 15.0% 20.0% 25.0% 30.0% 35.0% 40.0%
Av
era
ge
1-
ye
ar
roll
ing
pe
rio
d
Standard Deviation (monthly data)
Large Cap Multi Cap Midcap Small cap ST & Accrual Credit Dynamic Long short

Section II
Advisory Approach ..............................................................................................17
4C Framework For Equity Managers .....................................................................18
Fixed Income Manager Selection Framework ........................................................19
Hind-sight Investing.............................................................................................21
Decoding Investment Style ...................................................................................22
Investment Charter .............................................................................................23
Sample Investment Charter .................................................................................24
Estate Planning ...................................................................................................25
This document is not valid without disclosure; refer the last page for the disclosure
DECEMBER 2020 | ISSUE 96 16
Alpha Strategist | ‘Winter Harvest’

True portfolio of clients and asset allocation is best determined through Financial Planning strategy. If not, the clients
can follow a model portfolio approach. Following steps are followed for Model Portfolio construction:
1) Investors are classified according to their risk profile viz. Aggressive, Moderately Aggressive, Balanced, Moderately
Conservative and Conservative.
2) Asset Allocation is done at two levels:
(a) Static – Based on the risk profile, asset allocation is defined at a broad level:
DECEMBER 2020 | ISSUE 96 17
Advisory Approach
Our Methodology
Since different clients have different risk return preferences, based on our comprehensive risk profiling process we have
categorized the clients broadly into 5 categories viz. Conservative (Debt only) Aggressive + (High conviction), Balanced, ,
Aggressive + (PMS/AIF only), Aggressive + (MF only).
Advisory Process
We follow a robust Advisory Process to generate “Alpha” in the client’s portfolio. The entire approach is governed by a
stringent risk management framework.
View on asset
classes
Asset Allocation
Alpha
Investment
Committee
Product Selection
across asset classes
Manager Alpha
Product & Advisory
CommitteePortfolio
Construction
Financial Strategy
Alpha Strategist | ‘Winter Harvest’
Conservative (Debt only)
Balanced
Aggressive + (High conviction)
Aggressive + (PMS/AIF only)
Aggressive + (MF only)
0
40
100
100
100
80
50
0
0
0
0
10
0
0
0
20
0
0
0
0
Equity (%) Debt (%) Gold (%)Cash (UST /
Liquid) (%)Asset Class / RiskProfile
(b) Dynamic – Asset Allocation based on the market conditions

DECEMBER 2020 | ISSUE 96 18
4C Framework For Equity Managers
The 4C Manager Selection Process
Evaluating Manager Expertise
Alpha Strategist | ‘Winter Harvest’
DECEMBER 2020 | ISSUE 96 19
Fixed Income Manager Selection Framework
Alpha Strategist | ‘Winter Harvest’
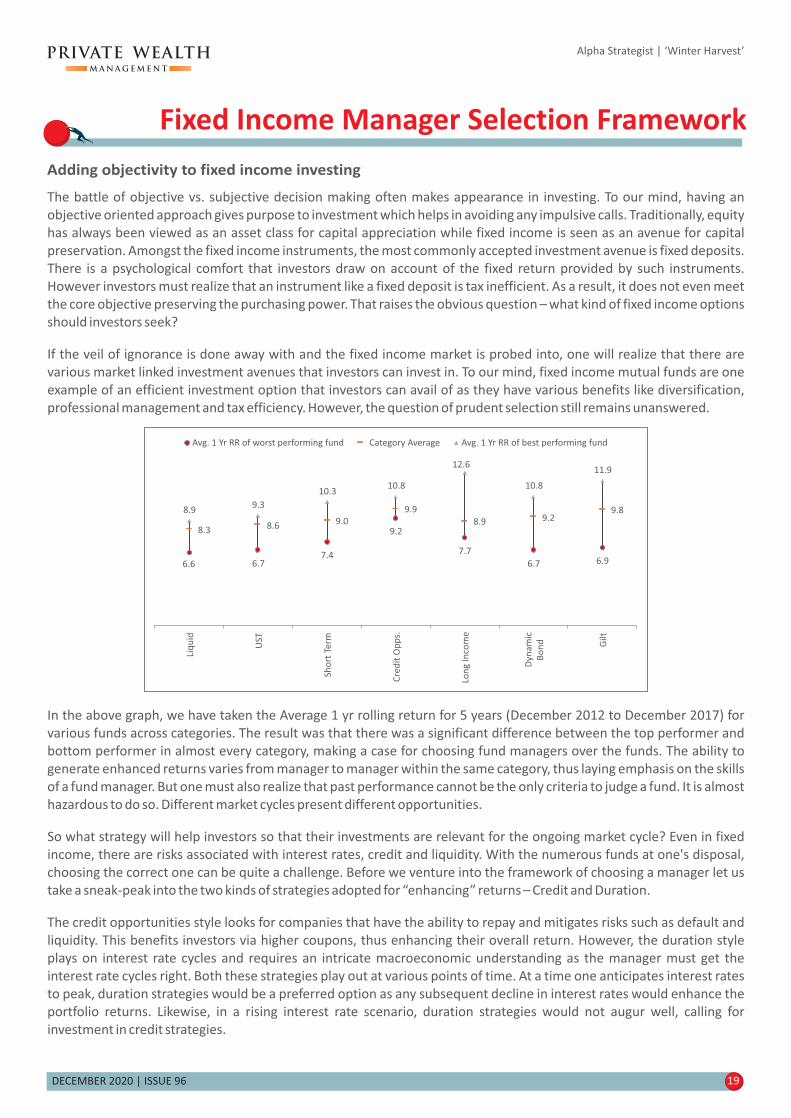
In the above graph, we have taken the Average 1 yr rolling return for 5 years (December 2012 to December 2017) for
various funds across categories. The result was that there was a significant difference between the top performer and
bottom performer in almost every category, making a case for choosing fund managers over the funds. The ability to
generate enhanced returns varies from manager to manager within the same category, thus laying emphasis on the skills
of a fund manager. But one must also realize that past performance cannot be the only criteria to judge a fund. It is almost
hazardous to do so. Different market cycles present different opportunities.
So what strategy will help investors so that their investments are relevant for the ongoing market cycle? Even in fixed
income, there are risks associated with interest rates, credit and liquidity. With the numerous funds at one's disposal,
choosing the correct one can be quite a challenge. Before we venture into the framework of choosing a manager let us
take a sneak-peak into the two kinds of strategies adopted for “enhancing” returns – Credit and Duration.
The credit opportunities style looks for companies that have the ability to repay and mitigates risks such as default and
liquidity. This benefits investors via higher coupons, thus enhancing their overall return. However, the duration style
plays on interest rate cycles and requires an intricate macroeconomic understanding as the manager must get the
interest rate cycles right. Both these strategies play out at various points of time. At a time one anticipates interest rates
to peak, duration strategies would be a preferred option as any subsequent decline in interest rates would enhance the
portfolio returns. Likewise, in a rising interest rate scenario, duration strategies would not augur well, calling for
investment in credit strategies.
Adding objectivity to fixed income investing
The battle of objective vs. subjective decision making often makes appearance in investing. To our mind, having an
objective oriented approach gives purpose to investment which helps in avoiding any impulsive calls. Traditionally, equity
has always been viewed as an asset class for capital appreciation while fixed income is seen as an avenue for capital
preservation. Amongst the fixed income instruments, the most commonly accepted investment avenue is fixed deposits.
There is a psychological comfort that investors draw on account of the fixed return provided by such instruments.
However investors must realize that an instrument like a fixed deposit is tax inefficient. As a result, it does not even meet
the core objective preserving the purchasing power. That raises the obvious question – what kind of fixed income options
should investors seek?
If the veil of ignorance is done away with and the fixed income market is probed into, one will realize that there are
various market linked investment avenues that investors can invest in. To our mind, fixed income mutual funds are one
example of an efficient investment option that investors can avail of as they have various benefits like diversification,
professional management and tax efficiency. However, the question of prudent selection still remains unanswered.
Liq
uid
UST
Sho
rt T
erm
Cre
dit
Op
ps.
Lon
g I
nco
me
Dyn
am
ic
Bo
nd Gilt
6.6 6.77.4
9.2
7.7
6.7 6.9
8.3 8.6 9.0
9.9
8.9 9.29.88.9
9.3
10.310.8 10.8
11.912.6
Avg. 1 Yr RR of worst performing fund Category Average Avg. 1 Yr RR of best performing fund

DECEMBER 2020 | ISSUE 96 20
Alpha Strategist | ‘Winter Harvest’
Just like a fast bowler cannot bowl spin and vice versa, a manager cannot mimic both approaches simultaneously. A
manager must be clear on his stance and having experienced two to three market cycles will be of huge significance.
To our mind, good performance is an outcome of a robust process. Hence, one needs to be cognizant of the latter at the
time of evaluation. This thought process has given birth to our . By evaluating the“4C framework of manager selection”
pilot rather than just the plane, each would enable us to unmask the different hues of investment process from the“C”
performance which is the ultimate outcome.
This framework implies a paradigm shift from the industry norm of ranking funds only on the basis of past performance.
This qualitative and quantitative process would enable us to construct for our clients. In line with“winning portfolios”
our philosophy of providing better insights to you, we hope you find the same informative.

21
Hind-sight Investing
We are well aware of the disclaimer “past performance is no guarantee of future results”. Despite this the most common
method of investing in mutual funds remains by looking at the past performance. It’s quite intuitive to assume that
something that was a good investment in the recent past is still a good investment.
However, it’s not that simple. Our study shows that there is a limited probability of getting investment decisions right
which are solely based on historical data. Let us illustrate this with some examples of the recent past.
The below table comprises of last 17 years of data which to our mind is comprehensive. Funds were ranked based solely
on performance for pre-defined time buckets. As you can see, in the 1 year bucket 36% of the funds continued to be top
performers and 64% could not retain their position. Similarly, in the 3 year bucket 68% of the funds could not retain their
position.
If we translate the above numbers in terms of probability, your chance of selecting a top performing fund basis past
performance is lesser than winning a coin toss!
Just like we don't drive a car looking at the rear view mirror, investment decisions too should not be based on mere past
performance. In fact to our mind one needs to go beyond the norm of return based analysis to arrive at investment
decisions.
As the age old adage goes “bet on the jockey, not the horse”, the same holds true for investment wherein you lay your bet
on the manager and not the fund. So how does one go about it? In line with our philosophy of empowering you, we take
this opportunity to provide you an understanding of our “manager selection methodology”.
(Methodology notes: Date range period 2000-2017, calendar year returns, all open-ended equity schemes, AUM cut off
250cr as on 31st Dec 2017)
Review period: 2000 - 2017
Investments in top performing funds based on 1 – 3 yr track record
Top funds basis
1 yr performance
Rank after1 year
Q1 - 36%
Q2 - 24%
Q3 - 20%
Q4 – 20%
Rank after3 year
Q1 - 33% Q1 - 32%
Top funds basis
1 yr performance
Top funds basis
3 yr performance
Q2 - 34%
Q3 - 16%
Q4 – 17%
Q2 - 33%
Q3 - 18%
Q4 – 17%
Rank after3 year
The top 25% of the funds on basis of performance are assigned Q1, next 25% are assigned Q2 and so on.
DECEMBER 2020 | ISSUE 96
Alpha Strategist | ‘Winter Harvest’

DECEMBER 2020 | ISSUE 96 22
Decoding Investment Style
Past performance is just the tip of the iceberg - A consistent and a transparent portfolio management approach
contributes to the sustainable long term returns
As investors and advisors, we tend to get swayed by the recent past performance while making our investment
decisions and overlook the underlying philosophy and process which would contribute towards the future returns.
Moreover, history suggests that the process for selecting funds only on the basis of past performance may not be a full
proof procedure in the future. Thus, we believe that in generating sustainable long term performance, skill plays a
major role rather than luck and to assess the skills of a fund manager, it becomes pertinent to understand the
consistency in their fund management approach.
Like any sportsman who demonstrates their styles in different terrains, we are of the view that every manager has a
different style and approach for stock picking and portfolio construction. Through our detailed due diligence process,
we aim to understand the capabilities, consistency and experience of the Fund manager and substantiate their
investment style with their past and current investments.
Through our analysis and research, we have devised a which basically states that an investment style‘Fund Stylometer’
oscillates between two extremes of investing i.e. and while the other blendedMean reversion Earnings Momentum
styles of investment like and lies in between the two extremes. When a manager sticks toValue, Blended Growth
picking stocks which are out of favor or below their average valuations and expect these stocks to revert back, then
these managers are demonstrating a mean reversion investment style. For example, ICICI Fund Managers are known for
their value style of investing. On the other hand, if the manager foresees a sustainable growth in the earnings of a
company and is ready to pay a premium for the stock, then the fund manager belongs to growth style of investing. For
example, Motilal Oswal Fund Managers believe in ‘QGLP’ and exhibit earnings momentum investment style.
In an investment world where more choices may lead to more confusion, it is important to understand the style of the
Fund Manager rather than the standalone performance of the funds. Also, since different managers exhibit their
strengths in different market conditions, it is viable to construct a portfolio with appropriate combination of
investment styles which in turn would minimize duplication and over diversification.
To put into the perspective of quantifiable numbers, we have exhibited the styles of the managers through portfolio
attributes (P/E, P/B and RoE) over a period of three years, as shown in the bubble chart. The bubble chart aims to show
the relative positioning of each fund with respect to their investment style with the peers and benchmark. For
example, a fund with relatively low P/B and low P/E would represent a mean reversion style of investing, while a fund
with relatively high P/B, high P/E and higher RoE would represent earnings momentum style. Except for a few funds,
most of the funds represent a blended investment style which is a mix of value and growth style
Alpha Strategist | ‘Winter Harvest’
Mean
Reversion
Value Blended Growth Earnings
Momentum
Note: Over a period of 3 years, X Axis represents monthly average of P/B , Y Axis represents monthly average of P/E ,
Size of the bubble represents monthly average of RoE
Positioning of Multi Cap Funds (Sample)
Period: Nov 2017 - Oct 2020
12.8
10.1
19.8
16.9
15.6
15.7 22.013.3
18.8
13.4
10.8
15.0
17.0
19.0
21.0
23.0
25.0
27.0
29.0
31.0
33.0
35.0
37.0
39.0
41.0
43.0
45.0
47.0
1.0 2.0 3.0 4.0 5.0 6.0 7.0 8.0 9.0 10.0 11.0
3 yrs Average P/B
L&T Value Franklin Focused Equity Axis Focused 25 Kotak Standard Multicap
Invesco India Contra ICICI Multicap MOSt Multicap 35 Franklin Equity
Birla Equity HDFC Equity ICICI Pru India Opp NIFTY 500
Bubble size
High P/B
High P/E
Low P/E
Low P/B
3 y
rs A
ve
rag
e P
/E

Investment Charter
Alpha Strategist | ‘Winter Harvest’
DECEMBER 2020 | ISSUE 96 23
Define & Review
Investment
Objectives
Design Investment
Charter In Line
With Objectives
Analyze Existing
Portfolio
Implement
Portfolio Changes
Ongoing
Monitoring &
Evaluation
Define
Investment
Objective
• Example: Portfolio designed to provide stability and protection from loss. Primary goal iscapital preservation with moderate growth
• Define any liquidity or cash flow requirements from the portfolio
Risk Tolerance• Degree of risk you are willing to undertake to achieve investment objectives
• Understanding that portfolio returns and portfolio risk are positively correlated
Investment
Horizon
• Defining investment horizon, consistent with risk tolerance and return expectations
• The longer the investment tenure, the greater likelihood of achieving investment
objectives
Return
Expectations
• Return expectations has to be viewed in conjunction with risk undertaken, and the
investment horizon
• Ensuring return maximization, for a given level of risk
• Optimizing returns through tax efficiency & legal mechanisms
Investment Charter – Purpose & Objectives
Portfolio Process

DECEMBER 2020 | ISSUE 96 24
Sample Investment Charter
Alpha Strategist | ‘Winter Harvest’
General Information & Client Profile
Investment Horizon
Particulars Details
Liquidity Requirements
Cash Flow Requirements
Restricted Investments
Performance Benchmarking
Portfolio Review
Portfolio Characteristics
1Return expectations for portfolio since inception for active and closed holdings. There is no guarantee that the performance will be achieved.
2Average age of portfolio holding – Including Closed Holdings
Investment Charter – Asset Allocation Guidelines
Asset Allocation
Equity (Mutual Funds, Direct Equity, AIFs) –Fixed Income ( –Mutual Funds, Structures, AIFs, Direct Debt)Alternatives (Real Estate, Private Equity, Long Short Funds) –Liquid Assets (Liquid, Ultra Short-Term, and Arbitrage Funds)
–
ReturnExpectations
1
Investment TimeHorizon
2
8% to 10% Pre Tax
3 Years to 5 Years
Mandate Criteria Portfolio Compliance
Equity – 3.7%
Fixed Income – 85.3%
Liquid Assets – 11.0%
8.2%
2.4 Years
Portfolio designed to provide stability and protection from loss. Primary goal is capitalpreservation with moderate growth
5% of the portfolio to be available for redemptions within 2 working days80% of the portfolio to be available for redemptions within 7 working days
Fixed Income – CRISIL Short Term IndexLiquid Assets – CRISIL Liquid Fund Index
No cashflows required from portfolio
No exposure to a single issuer real estate NCD
3 to 5 Years
Review of Guidelines Guidelines to be reviewed every quarter and / or at the discretion of client / financial advisor
Monthly Basis – Portfolio AdvisorQuarterly Basis – Head of Investment AdvisoryAnnual Basis – CEO
Investment Charter – Exposure Guidelines
Market Cap Limits
Interest Rate Risk
Mandate Criteria Portfolio Compliance
Green indicates compliance, meaning it is matching the criteria, while non-compliance, meaning it is not matching the criteriaRed indicates
Credit Quality
Mutual Funds &
Managed Accounts
Other Instruments
Large Cap (Top 100 Companies) –
Mid Cap (101 to 250th Company) –
Small Cap (251st Company Onwards) –
Modified Duration –
AAA and Above –
AA & Above –
A & Below –
Single AMC –
Single Scheme –
Single Instrument-
Large Cap – 48.2%
Mid Cap – 23.2%
Small Cap – 28.6%
60.2%
80.3%
19.8%
Proprietary Products Own AMC/ Self-Managed Funds/ Structures/ Debt - AMC 1 – 12.1%
Fund House A – 19.2%
Fund B – 13.7%
Issuer 1 – 8.4%
Instrument 1 – 8.4%
Mod Duration – 1.85
Closed EndedInvestments
Maximum allocation to closed ended investments – 14%

Estate Planning
Alpha Strategist | ‘Winter Harvest’
25DECEMBER 2020 | ISSUE 96
No Will Will Private Family Trust
Assets distributed on
demise
Succession law will apply As per the wish of the
deceased
As per the Trust Deed
Legal formalities for
asset transfer post
demise of a person
Legal heirs will have to
get succession / legal
heir certificate from
court
Probate / Letter of
Administration to be
obtained from the
competent authority
No legal formalities required
Time taken for legal
formalities to be
completed
High Medium NA
Flexibility and Control No control or flexibility
as the default succession
will apply
Some level of control to
the point that you
choose your
beneficiaries and the
quantum of assets
distributed to them.
However the end use of
those assets cannot be
controlled
High level of control to the
point that even post life time
the end use of the assets can
be controlled through a Trust
Structure
Confidentiality Cannot maintain
confidentiality
As probate records are
open to public cannot
maintain confidentiality
as no probate formalities are
required the confidentiality is
maintained
Control Does not allow for
control of end use,
monitoring etc
Does not allow for
control of end use,
monitoring etc
Provides for distribution and
monitoring
Coverage Only existing individuals
can originate
Only existing individuals
can originate
Present & future Individuals
can originate
Identity NA Not a separate entity It is a separate entity
Contestability High Medium Low
Incapacity management Not possible Not Possible Possible
Broad differentiation between Will and Private Family Trust

This document is not valid without disclosure; refer the last page for the disclosure
DECEMBER 2020 | ISSUE 96 26
Alpha Strategist | ‘Winter Harvest’
Section III
Macro Economy...................................................................................................27
Equities...............................................................................................................33
Fixed Income.......................................................................................................38
Gold....................................................................................................................41

The systematic liquidityhad fallen to a low of INR3.2tn in Sep'20 whichhas come back to INR6.3tn in Nov'20; therehas been growth incredit disbursements byb a n k s u n d e r t h eEmergency Credit LineGuarantee Scheme butbanks have been veryselective in selectingcredit portfolios
Macro Economy
Alpha Strategist | ‘Winter Harvest’
Emerging Economies - Snapshot
Major Economies - Snapshot
GDP YoY
Inflation rate
10yr Gsec
Policy rate
-2.90%
1.20%
0.94%
0.25%
-5.80%
-0.40%
0.03%
-0.10%
-3.80%
0.70%
1.04%
0.10%
-4.00%
-0.30%
-0.56%
0.00%
-3.90%
0.20%
-0.34%
0.00%
-9.60%
0.70%
0.30%
0.10%
-4.40%
-0.30%
0.00%
0.00%
US Japan Australia Germany FranceUnited
KingdomEuro Area
GDP YoY
Inflation rate
10yr Gsec
Policy rate
-7.50%
7.61%
5.93%
4.00%
-3.90%
3.92%
7.00%
2.00%
-8.60%
4.09%
5.45%
4.25%
-1.10%
0.60%
1.65%
0.50%
4.90%
0.50%
3.30%
3.85%
-3.60%
4.40%
5.82%
4.25%
India
-3.49%
1.59%
6.24%
3.75%
Indonesia Brazil Mexico South Korea RussiaChina
DECEMBER 2020 | ISSUE 96 27
Source: BNP Paribas MF
*Only central government expenditure has been considered
The increasing inflationis not due majorly due tolack of demand uptickbut more due to supplyside constraints; MPChas revised the CPIprojection for Q3FY21and Q4FY21 to 6.8% and5.8% respectively
Manufactur ing PMIIndex is finally above thecontraction mark whichindicates revival inmanufacturing thoughthere has been a slightcontraction in Nov'20,mostly due to festiveholidays
Dec-19 Mar-20 Jun-20 Jul-20 Aug-20 Sep-20 Oct-20 Nov-20
CPI (% YoY)
Core CPI (% YoY)
IIP (% YoY)
Manufacturing (% YoY)
Mining (% YoY)
Electricty (% YoY)
Capital goods production (%YoY)
Export Growth (% YoY)
Import Growth (% YoY)
PMI Manufacturing Index (% YoY)
PMI Services Index (% YoY)
Auto Sales(% YoY)
Petrol consumption (%YoY)
Diesel consumption (%YoY)
M3(%YoY)
Currency in circulation(%YoY)
Credit to deposit ratio (%YoY)
Government expenditure (%YoY)*
Indirect tax (%YoY)
-9.1
-13.3
56.3
53.7
12.0
22.2
72.4
7.4
3.7
-0.3
5.4
-1.2
-0.1
-18.0
-1.8
-8.8
52.7
53.3
-13.1
3.2
-0.1
10.4
11.9
76.2
32.3
4.2
5.9
4.1
-16.7
-20.6
0.0
-6.8
-38.3
-1.6
0.1
55.3
55.5
-45.0
-16.4
-24.2
8.9
14.5
76.4
75.0
3.8
6.1
5.3
-16.6
-17.1
-19.8
-10
-36.9
-12.4
-47.6
47.2
33.7
-45.5
-13.5
-15.4
12.3
20.6
73.6
45.7
-3.21
6.7
5.7
-10.4
-11.1
-13
-2.5
-22.8
-10.2
-28.4
46.0
33.7
-25.5
-10.4
-19.5
13.2
22.2
72.6
5.6
14.1
6.7
5.8
-8.0
-8.6
-9.8
-1.8
-15.4
-12.7
-26.0
52.0
41.8
-1.3
-7.5
-20.7
12.6
23.2
72.0
-15.2
-1.6
7.3
5.7
0.2
-0.6
1.4
4.9
-3.3
6.0
-19.6
56.8
49.8
7.2
3.3
-6.0
12.2
22.7
72.0
-26.0
12.0
7.6
5.8
-5.1
-11.5
58.9
54.1
10.5
4.5
7.4
11.6
20.3
72.3
9.5
49.1
Macro indicators

Alpha Strategist | ‘Winter Harvest’
DECEMBER 2020 | ISSUE 96 28
Global Economy
US Fed continues to keep the interest rate low
The US Federal Reserve in its November FOMC have decided that the economy is yet to
recover from the COVID-19 impact and hence are determined to keep the borrowing costs
lower. There has been quite a significant improvement since the onset of the lockdown in
March, but many high frequency indicators are still showing weak pick-up, mostly due to
renewed sporadic lockdown led by the sudden rise in new cases. The Fed is in support of
another fiscal stimulus to give further ammunition to the reviving economy.
Another major thing which has got discussed in the Nov'20 FOMC meeting is the notion for
changes in the bond-buying program. The Fed has signaled that it would most likely buy
more longer-term bonds to further lower interest rates on debt like mortgages. Nothing has
been confirmed as yet by the Fed but market is expecting that they might give more details
about the same in the upcoming Dec'20 FOMC.
As everyone is eyeing
another round of fiscal
stimulus from the new
government, analysts feel
that Fed might have to
step in for an aggravated
bond buying program if
f i n a n c i a l c o n d i t i o n s
continue to deteriorate
Japan's economy exits recession
After having a fall in the Q2 GDP (-8.3% QoQ), Japan's economy rebounded as industries
started opening up and has delivered a GDP growth of 5.3% QoQ, slightly higher than the
expectation of 5.0% QoQ. The economic growth has been driven by increasing exports and
consumption. Another major reason for such a jump has been due to the low base effect (-
0.7% QoQ).
With the rising cases of COVID-19 virus once again in the island nation, the new Japanese
government has planned for a fresh stimulus package of YEN 73.6tn (USD 708bn). Of this
amount, fiscal spending would be to the tune of YEN 40tn (USD 384bn). The package is likely
to consist of subsidies and incentives to provoke organizations to increase green
investments and increase digitization.
Economists are expecting
BOJ to aid the government
fiscal stimulus package by
boosting its monetary
stimulus program to ease
corporate borrowings
US Fed interest rates remain steady at 0.25% since Mar'20
Source: Bloomberg
Japan's GDP Growth QoQ
Source: Bloomberg
0
0.4
0.8
1.2
1.6
2
Nov-19 Jan-20 Mar-20 May-20 Jul-20 Sep-20 Nov-20
US Fed rates
- 8.3
5.3
-10
-8
-6
-4
-2
0
2
4
6
Q1 Q2 Q3 Q4 Q1 Q2 Q3 Q4 Q1 Q2 Q3
2018 2019 2020
Japan GDP Growth QoQ (%)

DECEMBER 2020 | ISSUE 96 29
Alpha Strategist | ‘Winter Harvest’
Negative yielding bonds at an all time high
With major nations in the western hemisphere, especially EU and USA, are reeling under
the second wave of increasing COVID-19 cases, there has been again a flight to safety by
investors by investing in negative yielding bonds. The corpus of these bonds has reached a
new height in Nov'20 to more than USD 17tn. This accumulates to almost 26% of the
investment-grade debt. These levels were last seen around 15 months back in Aug'19.
Due to fresh issuances across the globe, the total percentage of negative yielding bonds
remain lower the 30% of total investment which happened last year. Most of these negative
yielding investments have been denominated in either Yen or Euro, but the confusion
regarding the new fiscal package to be announced by the newly formed Democratic
Government in the USA is also driving down the yields of US Treasury bonds.
Analysts were surprised by
the inflow in these bonds
given other safe haven
assets like Gold and USD
are seeing an outflow the
same time
0.2 -0.1 -0.2 0.4 0.40.4
0.7 0.9
-11.7
-0.63.8 2.9 2.3
-11.6
-6.8
5.6 5.7 5.44.8 4.5
-5
-3
-1
1
3
5
7
-25.0
-20.0
-15.0
-10.0
-5.0
0.0
5.0
10.0
Q2FY19 Q3FY19 Q4FY19 Q1FY20 Q2FY20
Agriculture Industry Service GVA(% YoY)
4.40 4.10 3.10
-23.90
-7.50
-25.00
-21.00
-17.00
-13.00
-9.00
-5.00
-1.00
3.00
-35.0
-30.0
-25.0
-20.0
-15.0
-10.0
-5.0
0.0
5.0
10.0
Q2FY20 Q3FY20 Q4FY20 Q1FY21 Q2FY21
Consump�on GCF Net Exports Discrepancy GDP (% YoY)
Indian Economy
Second quarter GDP contracts further leading to technical recession
Real GDP of India fell by 7.5% YoY in Q2FY21, the second consecutive contraction quarterly
for the first time since 1996 when quarterly recording of GDP data started. But the
contraction was better than market expectations of 8.2% YoY. One of the major
contributors of the GDP contraction is the fall in consumption, both on a personal level as
well as government level, which has shown little recovery since last quarter.
On the other hand, investments have made a speedy recovery from a massive fall of ~17%
YoY last quarter to ~-3% YoY. As imports have contracted heavily compared to exports in this
quarter, net exports remain positive even though there has been a slight fall in its
contribution since the previous quarter. Real GVA growth also continued the trend and has
fallen 7% YoY in Q2FY21. Services sector seems to be the main reason for the fall as
industrial sector recorded a meagre fall of 0.6% YoY.
G i v e n t h e t r e n d ,
economists feel that the
Indian economy has
been pushed back by
almost two years and is
not expected to start
growing again before
2021
…..along with GVA growth rateGDP growth rate falls again….
Source: : CSO, Bloomberg
Negative yielding bond corpus
Source: Bloomberg
6.00
8.00
10.00
12.00
14.00
16.00
18.00
20.00Corpus of -ve yielding bonds (USD mn)

DECEMBER 2020 | ISSUE 96 30
Alpha Strategist | ‘Winter Harvest’
……keeping INR depreciation in checkForex reserves on a continuous rise……
Source: RBI
GST collections cross INR 1tn for two consecutive months
The Good and Services Tax collection once again crossed INR 1tn in the month of Nov'20.
The collection has been similar to that of Oct'20 to the tune of ~INR 1.05tn. The states which
recorded double digit growth in GST collections over last year were Andhra Pradesh,
Gujarat, Jharkhand and Tamil Nadu.
All components of GST- Central GST (INR 0.19tn), State GST (INR 0.25tn) and Integrated GST
(INR 0.52tn) were marginally higher in Oct'20 than in Nov'20. The cess collected this month,
which is used to compensate states for GST implementation, has been higher this month.
Cumulatively, INR 6.6bn has been collected as GST in these 8 months, which is barely ~48%
of the budgeted estimate.
Economists feel that
though the festive season
GST collection has been
e n c o u r a g i n g , d a t a
regarding demand post
then has been weak and
they remain cautious to
see whether the trend of
higher GST collection
continues
Indian Foreign reserves keep beating their own records
Indian forex reserves kept up to it northward trend and surged to an all-time high of ~USD
575bn in the month of Nov'20. It has gone up by ~INR 15bn since Oct'20 and ~INR 98bn
(~22%) since the onset of the pandemic in Mar'20. The main component of forex reserves,
FCA, rose up by ~USD 16bn to USD 533.1bn. The value of the country's gold reserves
contracted marginally to USD36.02bn. The drawing rights with IMF increased to USD 1.5bn
while the reserve position increased to USD 4.7bn.
The surge can be contributed to increasing FDI despite COVID-19 challenges. Also FPI
investments have been quite strong in this financial year. Apart from these the fall in import
bill due to falling crude oil prices, falling gold and other imports on account of COVID-19 also
attributed to the increasing reserves. The rising reserves also helped the INR remain stable
in such turbulent times and arrested currency depreciation, despite weak macros.
The increasing forex
reserves provided a good
12 months import cover to
the country which acts as a
great support to the
economy during such
tough times
Revival in GST collections….
Source: MoF
1052 1049
200
300
400
500
600
700
800
900
1000
1100
1200
Nov-19 Jan-20 Mar-20 May-20 Jul-20 Sep-20 Nov-20
GST collec�ons (INR Bn) Average
57.0
62.0
67.0
72.0
77.0
82.0
No
v-1
8
Jan
-19
Ma
r-1
9
May
-19
Jul-
19
Sep
-19
No
v-1
9
Jan
-20
Ma
r-2
0
May
-20
Jul-
20
Sep
-20
No
v-2
0
USD-INR
451.3459.9
471.3481.3 477.8
481.1493.6
505.6
534.5 542.0542.1
560.6575.3
Nov-19 Jan-20 Mar-20 May-20 Jul-20 Sep-20 Nov-20
Foreign exchange reserves ($ bn)

DECEMBER 2020 | ISSUE 96 31
Alpha Strategist | ‘Winter Harvest’
The index of industrial production finally entered the growth phase after a long period of
contraction. It grew minutely by 0.2% YoY in Sep'20 after five months of de-growth. IIP
growth in Sep'20 was led by growth in all major components except manufacturing. With
gradual relaxations in restrictions across different phases of unlocking, manufacturing
activities are seeing relative improvements since the onset of the lockdown.
Among the three key sectors,
• Manufacturing output saw a minor contraction of 0.6% YoY in Sep, compared to a
contraction of 8.6% YoY in Aug
• Mining output grew by 1.4% YoY in Sep, compared to a contraction of 9.8% YoY in aug
• Electricity generation grew by 4.9% YoY in Sep, compared to a contraction of 1.8% YoY in
Aug
The IIP in H1FY21 has shrunk by almost 21% compared to a growth of 1.1% in the same
period last year.
Industrial production registers growth
Even though a lot of
industries have still not
resumed working amidst
stages of unlocking, the
pick-up in manufacturing
and services sector is
guiding the movement of
IIP in the right direction
………with rising WPI as wellCPI inflation remains elevated…….
Source: : CSO
Retail inflation maintains the northward trend
Consumer price index continued to remain above the upper level of the RBI tolerance band
to reach 7.6% YoY in Oct'20, the highest in 77 months. The higher numbers are mostly due
to more than normal rainfall in many states, leading to delay in harvesting of onions, which
is a staple food item in Indian diet.
The basic break-up of inflation are given below:
• Rural inflation went up to 7.7% YoY, whereas urban inflation also increased to 7.4% YoY
• Food and beverages inflation was up by 11.1% YoY, vegetable inflation remained high at
22.5% YoY, whereas meat and fish inflation was at 18.7% YoY
• Fuel inflation was up by 2.3% YoY
• Core inflation remained stable at 5.5% YoY
Wholesale Price Index also clocked an eight month high of 1.5%. The wide gap between
retail and the wholesale inflation is mainly due to the difference in weightages of certain
items. Manufacturing holds a huge weightage (64%) in WPI, which is slowly recovering
from the pandemic impact. Food and beverages hold a small weightage in wholesale
inflation, but it is one of the major components of retail inflation (46%).
Economists are of the
opinion that the prolonged
p e r i o d o f i n f l a t i o n
remaining above RBI's
tolerance level will rule
out any opportunity of any
further rate cuts by them
-4.0
-2.0
0.0
2.0
4.0
6.0
8.0
Oct-18 Jan-19 Apr-19 Jul-19 Oct-19 Jan-20 Apr-20 Jul-20 Oct-20
WPI (%YoY)
0.0
2.0
4.0
6.0
8.0
Oct
-18
Jan
-19
Ap
r-1
9
Jul-
19
Oct
-19
Jan
-20
Ap
r-2
0
Jul-
20
Oct
-20
CPI (% YoY)

DECEMBER 2020 | ISSUE 96 32
Alpha Strategist | ‘Winter Harvest’
India's exports declined again at 9.1% YoY in Nov'20 to USD 23.4bn, mainly led by
contraction in the export of petroleum product. Gems and jewellery export on the other
hand grew by 4% YoY. Imports continued declining but a slower pace of 13.3% YoY to USD
33.4bn in Nov'20, mainly due to falling oil and gold imports.
Due to this fall in imports and exports, india had a trade deficit of USD 10.0bn in Nov'20.
Exports in these seven months of FY21 fell 17.9% to USD 173.6bn whereas imports in the
same period fell by 33.6% to USD 215.7bn. Overall, India's foreign trade is still very weak
compared to pre-COVID or year ago levels. The current data, besides indicating uncertainty
of the situation, also poses a risk to India's external trade in the coming days.
Trade deficit narrows as exports turn positive
Imports are liekly to rise in
the coming months with
the impending marriage
season, along with the
potential of a rise in rural
demand after the kharif
harvest
.…due to mining and electricity generationIIP registers a growth…..
Source: CSO, MOSL
-70.0%
-60.0%
-50.0%
-40.0%
-30.0%
-20.0%
-10.0%
0.0%
10.0%
20.0% IIP (%YoY)
-80.0%
-70.0%
-60.0%
-50.0%
-40.0%
-30.0%
-20.0%
-10.0%
0.0%
10.0%
20.0%
Sep
-19
Oct
-19
No
v-1
9
De
c-1
9
Jan
-20
Feb
-20
Ma
r-2
0
Ap
r-2
0
May
-20
Jun
-20
Jul-
20
Au
g-2
0
Sep
-20
(% YoY) Manufacturing Electricity Mining
….amidst fall in both exports and importsTrade deficit rises slowly……
Source: MOC, MOSL
-25
0
25
50
Oct
-18
Dec
-18
Feb
-19
Ap
r-19
Jun
-19
Au
g-19
Oct
-19
Dec
-19
Feb
-20
Ap
r-20
Jun
-20
Au
g-20
Oct
-20
Exports Imports Trade Balance
-70
-60
-50
-40
-30
-20
-10
0
10
20
30
40
Oct
-18
De
c-1
8
Feb
-19
Ap
r-1
9
Jun
-19
Au
g-1
9
Oct
-19
De
c-1
9
Feb
-20
Ap
r-2
0
Jun
-20
Au
g-2
0
Oct
-20
Exports (YoY %) Imports (YoY %)

DECEMBER 2020 | ISSUE 96
Equities
Alpha Strategist | ‘Winter Harvest’
33
Markets are upbeat
On the back of positive developments on Covid-19 vaccine, normalization of economic
activity supported by pent-up and festive demand and a better than expected 2QFY21
results helped Nifty touch its all-time high levels in the month of November. The 2QFY21
results turned out to be the highest beat over expectations in the last 26 quarters. The
economic recovery seems to be largely on track with better trends in high-frequency data
points - GST collections, Manufacturing PMI, rail freight, power demand, and IIP.
FII continued their interest in Indian markets with record inflow of 8.3bn dollars in the
month of November. FIIs flow was partly driven by MSCI rebalance wherein India’s weight
increased from 8.1% to 8.7%, while DII’s continued to remain net sellers including Domestic
MFs led by net outflows.
Global markets also cheered the signs of progress in Covid-19 vaccine development,
renewed hopes of a US stimulus package and formal approval to US President-elect Joe
Biden to begin his transition to White house.
Key benchmark indices
Nifty, Nifty Mid cap and
Nifty Small cap posted
returns of 11.4%/15.5%/
13.0% in the month of
November.
FII inflows at highest levels, while DII sustained highest net outflows
Equity market in India witnessed a significant dichotomy in November as the DII's logged
the highest outflow of funds at $5.9 billion, although FII's purchase touched an all-time high
for any month ever. FII's have been one of the biggest reasons for the recent rally in the
Indian equity markets.
Benchmark Performance on a calendar year basis as on September 2020:
Source: Bloomberg; Data as on 30-Nov-2020
NIFTY
NIFTY Midcap 100
NIFTY Smallcap 100
CY1 9 CY18
12.02%
-4.32%
-9.53%
CY17
28.65%
47.26%
57.30%
3.15%
-15.42%
-29.08%
CY16
3.01%
7.13%
2.26%
CY15
-4.06%
6.46%
7.21%
CY14
31.39%
55.91%
54.95%
CY13
6.76%
-5.10%
-8.28%
CY12
27.70%
39.16%
36.81%
6.58%
15.28%
12.66%
CYTD 20Index FTYD 20
50.84%
68.45%
82.86%
Source: Bloomberg
Performance of key benchmark Indices for Nov'20
Source: Bloomberg
-1.7-6.4
-23.2
14.7
-2.8
7.5 7.52.8
-1.2
3.5
11.4
5.3
-6.8
-30.3
15.4
-1.7
10.8
5.27.8
1.8 0.5
15.5
6.7
-8.8
-36.7
13.4
-1.8
15.3
8.611.5
4.2
-0.1
13.0
Jan-20 Feb-20 Mar-20 Apr-20 May-20 Jun-20 Jul-20 Aug-20 Sep-20 Oct-20 Nov-20
Nifty 50 (%) CNX Mid Cap (%) CNX Small Cap (%)
-0.7
-8.6
-13.5
10.8
4.62.5
4.76.5
-3.6 -3.1
12.7
-4.7 -5.3
-15.6
9.0
0.6
7.08.4
2.1
-1.8
2.0
9.2
Jan-20 Feb-20 Mar-20 Apr-20 May-20 Jun-20 Jul-20 Aug-20 Sep-20 Oct-20 Nov-20
MSCI World Indices MSCI Emerging Indices

DECEMBER 2020 | ISSUE 96 34
Alpha Strategist | ‘Winter Harvest’
- 0.8
- 8.4
0.0 -0.1-1.3 -1.5
1.40.4
1.7 2.51.2
6.1
2.7
8.3
0.3
2.4
7.5
1.50.3 0.0
-2.4
-5.9
-10.0
-8.0
-6.0
-4.0
-2.0
0.0
2.0
4.0
6.0
8.0
10.0
Jan
-20
Feb
-20
Ma
r-2
0
Ap
r-2
0
May
-20
Jun
-20
Jul-
20
Au
g-2
0
Sep
-20
Oct
-20
No
v-2
0
Monthly Institutional Flows (USD Bn)
FII DII
For CYTD20 net FII inflows has been $15.1bn
There have been a string of reforms in the last few years including GST, RERA, IBC, etc. It has
been observed that previous periods of reforms have coincided with phases of low earnings
growth, followed by periods of much higher earnings growth
FII's and DII's net flows in the month of Nov'20 (in $ Bn)
Source: NSDL, MOFSL
02
05
01
0403
06
07
Reduction in FDI Limit
Restriction Across Many Sectors
Like construction, Multi brand
Retail, Railways, E-Commerce
etc
Production linked
Incentives
GOI is working on offering
production linked incentives
for up to five sectors to boost
domestic manufacturing
Essential Commodities Act
GOI approved amendments to the Act
and that will allow farmers to sell their
crop to anyone, helping Indian
farmers and transforming the
agriculture sector.
Corporate Tax Cut
Tax rate for domestic companies lowered
to 22% (vs. 30% earlier) taking down the
effective corporate tax rate to 25% (vs. 35%
earlier)
One of the lowest tax rates in world for
manufacturing companies set up post Oct
1, 2019
Implementation of GST
The Goods and Services Tax
went into effect nationwide on
July 1, creating India's first-
ever national market and
replacing most state and
federal taxes
IBC, 2016
Made it Quicker and Easier
for companies to go through
bankruptcy
RERA,2016
Aims at protecting the
home Purchasers from
the malpractices of
unfair builders and also
boosts the real estate
investment
Structural Reforms to Accelerate India's Growth
One of the major reasons for DII outflows has been profit booking by investors driven by
recent rally in equity markets and deluge of retail investors entering stock trading, skipping
the conventional route of using mutual funds which could be seen in Non Institution as % of
average daily cash volumes being higher since the beginning of pandemic in March.
5
54
64
54
30
42
54
66
78Monthly Avg. Cash Volume (INR b) Non Institution % to Cash Volume (RHS)
Jan
-18
Fe
b-1
8
Ma
r-1
8
Ap
r-1
8
Ma
y-1
8
Jun
-18
Jul-
18
Au
g-1
8
Se
p-1
8
Oct-
18
No
v-1
8
De
c-1
8
Jan
-19
Fe
b-1
9
Ma
r-1
9
Ap
r-1
9
Ma
y-1
9
Jun
-19
Jul-
19
Au
g-1
9
Se
p-1
9
Oct-
19
No
v-1
9
De
c-1
9
Jan
-20
Fe
b-2
0
Ma
r-2
0
Ap
r-2
0
Ma
y-2
0
Jun
-20
Jul-
20
Au
g-2
0
Se
p-2
0
Oct-
20
No
v-2
0
42
6
38
0
35
4
34
0
35
2
31
2
33
1
36
8
41
7
38
7
33
5
32
5
31
6
34
5
41
0
36
6
38
5
34
4
34
9
36
3
40
3
40
3
44
6
34
6
37
4
42
6
51
8
52
8
56
1
66
4
62
1
65
5
58
8
55
1
70
4

DECEMBER 2020 | ISSUE 96 35
Alpha Strategist | ‘Winter Harvest’
Nifty PAT (INR b)
74
8
67
0
68
8
76
7
77
5
69
8
72
4
78
8
72
3
78
9
83
8
83
8
80
0
88
4
90
5
99
3
84
5
89
1
99
1
80
6
58
2
1,0
42
Jun
e-1
5
Se
p-1
5
De
c-1
5
Ma
r-1
6
Jun
e-1
6
Se
p-1
6
De
c-1
6
Ma
r-1
7
Jun
e-1
7
Se
p-1
7
De
c-1
7
Ma
r-1
8
Jun
e-1
8
Se
p-1
8
De
c-1
8
Ma
r-1
9
Jun
e-1
9
Se
p-1
9
De
c-1
9
Ma
r-2
0
Jun
e-2
0
Se
p-2
0
Q2FY21 Corporate earnings review: Demand recovery and cost cuts drivebig profit beat
In Q2FY21 results, one of the key and defining features of this performance was the better-
than-expected focus on cost mitigation measures, apart from demand recovery and a
healthy tailwind from gross margin expansion
Nifty-50 PAT at All Time High in 2QFY21; BFSI % Contribution to Nifty Increases YoY
16 18 16 22 25
52 47 4448 43
34 35 3936 34
-2
1 2
-5 -2
Sep-16 Sep-17 Sep-18 Sep-19 Sep-20
Nifty Profit Pool Analysis BFSI Consumer +IT+Autos+Retail+Pharma Oil& Gas +Metals+Cement+Telecom Others
Source: MOSL
Nifty EPS expected to remain flattish YoY in FY21, after many years, there has been a
material upgrade in Nifty EPS estimates from our Inst. Equity desk Nifty EPS has been
revised up by 9% to INR497 (prior: INR456) for FY21E and by3.9% to INR677 (prior: INR651)
for FY22E.
Key Sectoral Insights:
Banks: Most managements indicated an encouraging asset quality outlook, led by a sharp
improvement in collection trends and low restructuring guidance. Large Private Banks
posted a collection efficiency between 95% and 97%. However, it is lower for PSU banks
Metals: The metal sector, which got de-rated on deteriorating macros earlier due to the
trade war and later due to the impact of COVID-19, has got re-rated again on higher steel
and base metals prices.
Automobiles: 2W retail sales during Diwali were below expectations. Therefore, OEMs
remained cautious on demand sustainability and kept inventory in check. We expect
PVs/Tractors to grow on a low inventory and order book. However, we expect demand
momentum to normalize in a seasonally weak Dec'20.
Cement: We expect strong cement demand to continue for the rest of the year. Pricing is
expected to stay higher on strong demand and seasonal pick-up in construction activity.
Technology: The IT sector has seen multiple earnings upgrades owing to better-than-
expected recovery, along with a jump in operating margins. We expect spends to remain a
critical enabler for enterprises to transform in preparation for the new normal.

-0.8%
3.3%
-5.6%
-27.6%
13.7%
-1.4%
10.2%
5.4%
6.6%
0.3%
1.4%
13.5%
13.0%
60.0%
1.0%
7.1%
-6.5%
-29.9%
15.5%
-1.9%
13.7%
5.2%
10.1%
3.7%
0.1%
13.3%
23.2%
75.6%
6.6%
-9.0%
-13.2%
-30.7%
18.1%
0.9%
5.9%
8.5%
12.9%
-6.0%
-1.2%
24.5%
-2.0%
78.9%
Dec-19
Jan-20
Feb-20
Mar-20
Apr-20
May-20
Jun-20
Jul-20
Aug-20
Sep-20
Oct-20
Nov-20
CYTD
FYTD
1.1%
-1.3%
-6.0%
-23.1%
14.4%
-3.8%
7.7%
7.7%
2.7%
-1.5%
4.1%
11.4%
7.0%
49.8%
Date SensexBSE Mid
Cap
BSE Small
Cap
3.4%
2.5%
-4.8%
-15.0%
11.7%
1.0%
4.8%
16.8%
-1.5%
5.9%
4.9%
3.2%
29.2%
55.7%
ITRealty
-2.7%
2.1%
-5.8%
-6.5%
5.0%
1.2%
3.3%
1.7%
-0.8%
-2.6%
-1.2%
7.4%
2.8%
14.3%
FMCG
5.3%
10.8%
-15.9%
-36.3%
7.1%
-2.7%
12.0%
-0.4%
11.6%
-4.9%
7.9%
14.3%
-9.6%
52.3%
Note: Performance in absolute terms
0.0%
5.6%
0.4%
-17.9%
16.7%
11.2%
3.5%
-2.3%
-3.8%
-15.7%
3.0%
8.7%
3.9%
19.3%
-2.7%
-5.6%
-9.4%
-20.6%
20.4%
-1.9%
7.0%
4.0%
-0.7%
-6.4%
-0.9%
9.3%
-10.1%
32.2%
Oil & Gas
2.1%
-1.8%
-14.3%
-31.0%
24.2%
5.6%
8.4%
8.0%
7.3%
1.1%
-2.0%
14.9%
8.9%
87.3%
Auto
-1.7%
-5.6%
-10.5%
-24.2%
7.3%
-6.0%
8.5%
0.7%
4.6%
-11.8%
0.4%
16.2%
-23.9%
18.7%
Power
0.1%
-1.4%
-9.6%
-19.7%
8.2%
-0.6%
6.3%
-2.3%
8.5%
-1.0%
4.6%
15.6%
3.8%
45.1%
1.3%
-3.8%
-5.3%
-34.0%
12.1%
-10.5%
9.7%
1.3%
9.6%
-9.7%
12.5%
23.7%
-7.6%
53.7%
Bank
-2.5%
3.1%
-11.8%
-28.7%
11.0%
1.2%
4.3%
-1.0%
7.9%
0.7%
2.4%
20.2%
0.5%
55.0%
Capital
GoodsMetal PSU
DECEMBER 2020 | ISSUE 96 36
Alpha Strategist | ‘Winter Harvest’
The Nifty's 12-month
trailing P/E of 26.7x is at
a 34% premium to its
long-period average of
19.8x. At 3.1x, its 12-
month trailing P/B is also
above its historical
average of 2.8x
Valuations:Nifty 50 Trailing P/E (x) - Long term average
Source: MOSL Source: MOSL
Nifty 50 Trailing P/B (x) - Long term average
Breadth positive in Nov'20 - All sectors delivered positive returns
In Nov'20, BSE Small-cap/mid-cap outperformed BSE large-cap index by 2%. Amongsectors, Metals (+25%), Banks (+24%) and Capital Goods (+20%) were the top performers.The metals sector has seen a strong improvement in profitability on the back of higher steeland base metals prices (+30% QoQ). CY20YTD, the BSE Sensex is up 7.0%. Healthcare(+51%) and Technology (+29%) were top positive performers.
Sectoral performance For Nov'20
Source: : MOSL
Nifty sales decline by 7% YoY (in line with est. – 7%) Nifty PAT increases 17% YoY (v/s est. -5%)
75 84 71 75 73 78 92
131
169184
236
281251 247
315348
369406 415
397426
454483
465497
677
FY97
FY98
FY99
FY00
FY01
FY02
FY03
FY04
FY05
FY06
FY07
FY08
FY09
FY10
FY11
FY12
FY13
FY14
FY15
FY16
FY17
FY18
FY19
FY20
FY21
E
FY22
E
Nifty EPS (INR)
FY97-20: 8.3% CAGR
FY97-03: 3.5% CAGR
The Cost of Reforms!
FY03-08: 25% CAGR FY08-14: 6.3% CAGR
FY20-22E: 20% CAGR
FY14-20: 3.0% CAGR
15
24 2522
107
-2 -2-5
-30
-7
Q4F
Y18
Q1F
Y19
Q2F
Y19
Q3F
Y19
Q4F
Y19
Q1F
Y20
Q2F
Y20
Q3F
Y20
Q4F
Y20
Q1F
Y21
Q2F
Y21
611 12
8
18
61
9
-19
-31
17
Q4
FY1
8
Q1
FY1
9
Q2
FY1
9
Q3
FY1
9
Q4
FY1
9
Q1
FY2
0
Q2
FY2
0
Q3
FY2
0
Q4
FY2
0
Q1
FY2
1
Q2
FY2
1
3.3
1.5
2.3
3.0
3.8
No
v-1
0
No
v-1
1
No
v-1
2
No
v-1
3
No
v-1
4
No
v-1
5
No
v-1
6
No
v-1
7
No
v-1
8
No
v-1
9
No
v-2
0
10 Year Avg: 2.8x20.1
9
13
17
21
25
29
No
v-1
0
No
v-1
1
No
v-1
2
No
v-1
3
No
v-1
4
No
v-1
5
No
v-1
6
No
v-1
7
No
v-1
8
No
v-1
9
No
v-2
0
10 Year Avg: 19.8x
26.7
3.1
0.6%
4.5%
0.0%
-26.0%
6.0%
-7.6%
7.2%
5.6%
6.0%
6.7%
-0.8%
12.3%
8.1%
39.7%
Consumer
DurablesTelecom
-1.3%
3.9%
-3.4%
-9.9%
26.2%
2.0%
3.9%
12.4%
0.6%
7.7%
-2.7%
5.5%
51.3%
67.3%
Health
Care

DECEMBER 2020 | ISSUE 96 37
Alpha Strategist | ‘Winter Harvest’
Market cap to GDP Ratio:
Market cap-to-GDP ratio has been volatile as it moved from 79% in FY19 to 56% (FY20 GDP)
in Mar'20 to 91% now (FY21E GDP) – above its long-term average of 75%.
The lowest in the last two decades was 42% in FY04. However, the number of listed and
traded companies back then were much lower vis-à-vis today. The ratio hit a peak of 149%
in Dec'07 during the 2003-08 Bull Run.
Risk -reward situation in favor of Multi cap strategies:Domestic Equities – CY20 vs. Since Beginning CY18
Mid & Small caps have
outperformed Large Caps
in CYTD20
Source: MOPWM, Data as on 30th November 2020
From the levels seen at
beginning CY18, Small cap
index has still a lot of catch-
up to be done
Considering the room available for run up in mid and small cap category compared to largecap, we believe Multicap strategies provide a favorable risk-reward situation where theportfolio would have stability from large caps and potential alpha generation from mid andsmall cap as and when the earnings recovery happens in the broader market.
Outlook: Demand recovery and cost optimization key themes; Incremental upside to be function of earnings
The market scaled record highs in Nov’20 on the back of strong FII inflows, good corporate earnings season, and earlytrends from the festive season, which suggests that the demand recovery continues. The visibility of earnings growthhas improved on the back of improving operating leverage and reducing debt levels across the corporate sector. A bigdriver of Nifty earnings growth is going to be BFSI sector due to mean reversion of provisions made by banks andimproving profitability. Multiple reforms have been introduced by government to further aid the economic recovery.
The sector rotation in past few months indicates towards a broader based recovery in process. Initially, themes whichwere resilient and robust to the pandemic did very well, currently Cyclicals are doing well over the last few months.Recovery across small and midcaps has also been very strong, though they continue to be cheaper compared to theirlarger counterparts on a PB, ROE (bottom of the cycle) basis. Hence, we recommend to invest in a staggered manner inMulticap strategies (MFs, PMS, AIF) over the next 3-6 months.
4252
82 83
103
55
9588
7164 68
81
6979 83 79
58
91
Market Cap to GDP RatioNo. of traded
companies was
just 2,640 in
2004 v/s 3,861
in Mar’20
GFC: Peak of 149% in Dec’07
Average of 75% for the period
Lowest
since
the GFC
124%
93%
72%
0%
20%
40%
60%
80%
100%
120%
140%
(Jan'18 - Nov'20)Nifty 50 Nifty Midcap 100 Nifty Smallcap 100
106%
115%112%
50%
60%
70%
80%
90%
100%
110%
120%
(Jan'20- Nov'20)Nifty 50 Nifty Midcap 100 Nifty Smallcap 100

DECEMBER 2020 | ISSUE 96 38
Alpha Strategist | ‘Winter Harvest’
Fixed Income
As per market consensus, in the latest Monetary Policy Committee (MPC) Meeting, the
Central bank kept policy rates unchanged. However, there was reiteration that
accommodative stance may continue as long as necessary to revive growth on a durable
basis while ensuring that inflation remains within the target going forward.
MPC expects real GDP growth in FY2021 to be at -7.5% (earlier -9.5%), +0.1% in 3QFY21,
+0.7% in 4QFY21. The MPC projects headline CPI inflation at 6.8% for 3QFY21, 5.8% for
4QFY21.
Though inflation has turned adverse, but it is mainly driven by supply chain bottle necks and
food prices. Since inflation is not yet driven by monetary factors and, hence, surplus
liquidity is unlikely to interfere with monetary policy objectives.
While being cognizant of medium term inflation target, the Central Bank's primary focus
still remains economic recovery. Hence, reversal of monetary easing does not seem to be an
urgency. Further reduction in policy rates, if any, would be contingent on growth inflation
dynamics.
We expect RBI to remain proactive to alleviate the economic and liquidity challenges, both
through conventional and unconventional modes. These measures have aided in easing
credit and term spreads, though the latter is still at elevated levels
RBI kept policy rates unchanged; Continues with the 'Accommodative Stance'
G-Sec & Corporate Bond Yields across the maturity curve have substantially eased and havebecome steep post RBI intervention when compared to levels seen during onset ofCovid-19.
Surplus liquidity in the banking system has led to sharper rally in shorter end of the curve.Yields at longer end of the curve has remained volatile due to potential fiscal expansion,supply issues, foreign outflows, crude and currency movement.
Impact on Yields across the credit & maturity curve
System liquidity bounced back to ~INR 5.5 Trillion
Source: Bloomberg
Source: Bloomberg
Policy Rates remain unchanged; Reiteration of Accommodative Stance; Spike in Inflation due to Food Prices & Supply
Bottlenecks;
5.91
4.00
7.61
1.02.03.04.05.06.07.08.09.0
10.011.012.0
De
c-1
2Fe
b-1
3A
pr-
13
Jun
-13
Au
g-1
3O
ct-
13
De
c-1
3Fe
b-1
4A
pr-
14
Jun
-14
Au
g-1
4O
ct-
14
De
c-1
4Fe
b-1
5A
pr-
15
Jun
-15
Au
g-1
5S
ep
-15
No
v-1
5Ja
n-1
6M
ar-
16
Ma
y-1
6Ju
l-1
6S
ep
-16
No
v-1
6Ja
n-1
7M
ar-
17
Ma
y-1
7Ju
l-1
7S
ep
-17
No
v-1
7Ja
n-1
8M
ar-
18
Ma
y-1
8Ju
n-1
8A
ug
-18
Oct-
18
De
c-1
8Fe
b-1
9A
pr-
19
Jun
-19
Au
g-1
9O
ct-
19
De
c-1
9Fe
b-2
0A
pr-
20
Jun
-20
Au
g-2
0O
ct-
20
No
v-2
0
10 Yr Gsec (Yield %) Repo Rate (%) CPI (%)
(2,00,000)
(1,00,000)
-
1,00,000
2,00,000
3,00,000
4,00,000
5,00,000
6,00,000
7,00,000 Core System Liquidity
FII Ou�lows
RBI Forex Interven�ons
OMO Purchase,
Opera�on Twist, LTRO, TLTRO
RBI Forex Interven�ons,
Refinancing tools
Sep-
18
Nov-
18
Jan-
19
Mar
-19
May
-19
Jul-1
9
Sep-
19
Nov-
19
Jan-
20
Mar
-20
May
-20
Jul-2
0
Sep-
20
Nov-
20
Rs.
Crs

Alpha Strategist | ‘Winter Harvest’
39DECEMBER 2020 | ISSUE 96
Source: Bloomberg
CURRENT YIELD CURVE
(3 20)0 NOV
Outlook
RBI has reiterated to maintain accommodative stance while keeping the policy rates unchanged. The central bank has
taken several monetary and regulatory measures to alleviate the challenges faced by various stakeholders of the
financial system. Though RBI is cognizant about fiscal worries, its primary focus still remains economic recovery while
being cognizant of inflation dynamics. RBI has reiterated in many forms that it is committed to ensure comfortable
liquidity, financial stability and mitigating growth risks.
From market point of view, the policy rates are at decadal lows, liquidity is sufficient in the system and yield curve is
steep. Yields, especially in the shorter end of the curve may remain subdued. At the longer end of the curve, factors like
potential fiscal expansion, supply issues, foreign outflows, geo-political tensions, crude and currency movement may
keep the yields volatile. However, RBI is taking bold steps in a right direction to keep the yields at the longer end of the
curve in check.
Primary activity has gradually picked up across the rating spectrum over the last fewmonths. Credit spreads have started normalizing, especially in AAA segment. Goingforward, combination of Policymakers' efforts and benign liquidity may lead to moremoderation in term and credit spreads.
1Y 2Y 3Y 5Y 10Y
G-Sec 3.33 3.92 4.35 5.08 5.91
AAA 3.89 4.20 4.71 5.55 6.51
AA 4.77 5.09 5.56 6.28 7.31
A 6.62 6.83 7.39 8.12 8.78
3.333.92
4.35
5.08
5.91
3.894.20
4.71
5.55
6.51
4.775.09
5.56
6.28
7.31
6.62 6.837.39
8.12
8.78
Source: Bloomberg
Effect on G-Sec Yield Curve (Eased by 35 – 200 bps)
Source: Bloomberg
Effect on AAA Yield Curve (Eased by 100 – 250 bps)
Source: Bloomberg
Effect on AA Yield Curve (Eased by 90 – 210 bps) Effect on A Yield Curve (Eased by 100 – 170 bps)
Source: Bloomberg
Onset of Covid (20 Mar)
Last Month (Oct 20)
Current Month (Nov 20)
1Y 2Y 3Y 5Y 10Y
5.34 5.54 5.75 6.34 6.26
3.47 4.19 4.40 5.17 5.88
3.33 3.92 4.35 5.08 5.91
5.34 5.545.75
6.34 6.26
3.47
4.194.40
5.17
5.88
3.33
3.92
4.35
5.08
5.91
MOVEMENT OF
G-SEC CURVE
ACROSS MATURITIES
Onset of Covid (20 Mar)
Last Month (Oct 20)
Current Month (Nov 20)
1Y 2Y 3Y 5Y 10Y
6.37 6.74 6.87 7.20 7.58
3.93 4.41 4.72 5.63 6.61
3.89 4.20 4.71 5.55 6.51
6.37
6.74 6.877.20
7.58
3.93
4.41
4.72
5.63
6.61
3.89
4.20
4.71
5.55
6.51
MOVEMENT OF
AAA CURVE
ACROSS MATURITIES
Onset of Covid (20 Mar)
Last Month (Oct 20)
Current Month (Nov 20)
1Y 2Y 3Y 5Y 10Y
6.89 7.30 7.53 7.75 8.25
4.79 5.28 5.62 6.40 7.40
4.77 5.09 5.56 6.28 7.31
6.897.30
7.537.75
8.25
4.795.28
5.62
6.40
7.40
4.77
5.095.56
6.28
7.31
MOVEMENT OF
AA CURVE
ACROSS MATURITIES
Onset of Covid (20 Mar)
Last Month (Oct 20)
Current Month (Nov 20)
1Y 2Y 3Y 5Y 10Y
8.34 8.34 8.71 9.22 9.74
6.70 7.06 7.54 8.19 8.86
6.62 6.83 7.39 8.12 8.78
8.348.34
8.71
9.22
9.74
6.70
7.06
7.54
8.19
8.86
6.62
6.83
7.39
8.12
8.78MOVEMENT OF
A CURVE
ACROSS MATURITIES

DECEMBER 2020 | ISSUE 96 40
Alpha Strategist | ‘Winter Harvest’
Given the current fixed income market scenario wherein abundant liquidity and some degree of uncertainty prevails,
we recommend core allocation should be biased towards high quality short to medium term (2 – 5 years maturity)
strategies with minimum investment horizon of 3 years
To enhance the overall portfolio yield, investors with medium to high risk profile can consider 15 – 20% allocation of
the overall fixed income portfolio to select MLDs, NCDS and credit oriented strategies.
For liquidity management or temporary parking, 10% - 20% of the fixed income portfolio can be allocated to Arbitrage
(minimum 6 months)/UST (minimum 3 months)/Liquid (less than 3 months) strategies which can be deployed in a
staggered manner when opportunities arise.

DECEMBER 2020 | ISSUE 96 41
Gold
Alpha Strategist | ‘Winter Harvest’
Gold prices retreated by almost 6% in November, posting its worst month since 2016. The fall in price has been on back of
rising optimism over the Covid-19 vaccine, more clarity on the US Presidential election, rising yields and better than
expected economic data. Market sentiments were also hit when the Covid relief bill which was in headlines for so many
months, was later sidelined. With the renewed wave of corona virus cases globally the panic was high in the market,
although many pharma companies came out with their reports justifying the effectiveness of their antidote hence
increasing optimism in the market and boosting the appeal for the riskier assets.
US Presidential election 2020 is still not over, even after the vote counting and having a clear winner i.e. Joe Biden, it is still
a nail biting game for market which can take a turn at any point of time. All hopes are now on the Electoral College's
stance, President Trump has himself commented that if Electoral College votes for Biden he will accept defeat. On other
hand, Covid relief bill is still a big factor which the market is waiting for, although now the quantum of the bill and the
sectors it aims to support will be very important to lookout for.
More than 50 million cases of corona virus have been reported globally and still rising at a very significant pace. Many
countries have re-imposed lockdown restrictions in their respective countries. Worsening COVID situation is driving the
uncertainty and somewhat counter intuitively working against gold as investors were seen to book profit as sit on cash i.e.
dollar as the preferred safe haven. Apart from the profit booking witnessed in the gold prices, rapid updates regarding
the development of Covid vaccine is also weighing on the metal. As market was just getting out the Presidential election
mood, big pharma companies like Pfzier, Moderna etc. came out with their report showing the effectiveness of their
vaccine. With this they also approached FDA for approval, which if they get vaccine will start rolling out in the market by
the end of this month. Yes, there are still questions on the criteria's of the vaccine although; we will get more clarity in the
FDA meet scheduled on Dec.10th.
Speech from major central bank governors was in focus in the previous month. Governors of major central banker were
quite active in keeping the market up to date with the current scenario. They continued to show concerns regarding the
impact of the pandemic and maintained their accommodative stance although which supported the metal at lower
levels In recent past, amidst a selloff in the metal, we have witnessed a significant outflow from the ETF which has had a
strong impact on the overall sentiment in the market although strong fundamentals has still created a solid floor for the
metal making every fall an opportunity to accumulate more. Economic numbers released from the US have been better
than estimates thereby weighing on precious metals.
Outlook
December will be very important as it is the end of the year and there have been some significant developments on the
Covid-19 vaccine front, hence getting clarity on the same will be the primary focus for the market. With all other
factors, trade tensions and other geopolitical tensions are still a worry for the market. Hence, apart from economic
data points, the spread and impact of coronavirus, central bank policy statements, development in Covid vaccine and
status of the next leader of the US will also be very important to watch for. Keeping all the variables in mind, gold could
trade sideways with negative bias from a short term perspective. We continue to maintain our bullish stance on gold
with our targets of $2,450 by the end of 2021 on COMEX, and �65,000-68,000/10gms on the domestic front.
Gold prices kept contracting
Source: Bloomberg, MCX
Shift to neutral stance for Short term
Source: Bloomberg, MCX
1300
1400
1500
1600
1700
1800
1900
2000
2100
GOLD Spot ($/Oz)
30000
35000
40000
45000
50000
55000
60000
MCX Gold Spot (INR)

This document is not valid without disclosure; refer the last page for the disclosure
DECEMBER 2020 | ISSUE 96 42
Alpha Strategist | ‘Winter Harvest’
Section IV
DELPHI....................................................................................................................43
Me-Gold.................................................................................................................46
Managed Strategies - PMS .....................................................................................47
Managed Strategies - MF .......................................................................................54
Investment Charter Template .................................................................................65

DECEMBER 2020 | ISSUE 96 43
Alpha Strategist | ‘Winter Harvest’
DELPHI
ASAP - Simple Equal-Weight Portfolio…
Exhibit Low Correlation to Each Other
Correlation Equity - INDEquity –
USA (INR)Gold (INR) Debt Cash
1.00
0.25 1.00
- 0.01 0.03 1.00
0.10 -0.06 -0.07 1.00
Equity- IND
Equity –USA (INR)
Gold (INR)
Debt
Cash - 0.03 0.02 -0.07 0.30 1.00
Period of Analysis is from 1990 to 30th Nov’20. Indices used: Equity is represented by Sensex from 1990 to 2002 and Nifty 50 from 2002 onwards Debt is represented by SBI 1-yr FD rates
from 1990 to 2002 and CRISIL Composite bond Index from 2002 onwardsLiquid/Cash is represented by SBI 3-month FD rates from 1990 to 2002 and CRISIL Liquid fund Index from 2002
onwards Gold is represented by gold spot price in INR terms, Equity US is represented by S&P 500 in INR terms
Average: Source: AceMF; Bloomberg. Disclaimer :Past Performance is no guarantee of future Results
Cash 7.2% 0.6% 0.0%
Equity – IND 13.5% 28.0% -55.1%
CAGRStandard
Deviation
Maximum
DrawdownAsset Class
Equity–US (INR) 13.0% 15.0% -45.9%
Gold - INR 10.1% 15.8% -25.3%
Debt 8.7% 2.6% -6.3%
Understanding Asset Class CharacteristicsINR 100 invested in 1990 would have become x �mes in 2020
Note: CAGR Represents Compounded Annual Growth Rate; SD is calculated
based on monthly returns
44x
13x
9x
19x
Jan/
1990
Jan/
1991
Jan/
1992
Dec/
1992
Dec/
1993
Nov/
1994
Nov/
1995
Oct/1
996
Oct/1
997
Sep/
1998
Sep/
1999
Aug/
2000
Aug/
2001
Jul/2
002
Jul/2
003
Jul/2
004
Jun/
2005
Jun/
2006
May
/200
7
May
/200
8
Apr/2
009
Apr/2
010
Mar
/201
1
Mar
/201
2
Feb/
2013
Feb/
2014
Jan/
2015
Jan/
2016
Dec/
2016
Dec/
2017
Nov/
2018
Nov/
2019
Nov/
2020
Period of Analysis is from 1990 to 30th Nov’20. Indices used: Equity IND is represented by Sensex from 1990 to 2002 and Nifty 50 from 2002 onwards Debt is represented
by SBI 1-yr FD rates from 1990 to 2002 and CRISIL Composite bond Index from 2002 onwardsLiquid/Cash is represented by SBI 3-month FD rates from 1990 to 2002 and
CRISIL Liquid fund Index from 2002 onwards Gold is represented by gold spot price in INR terms and Equity US is Represented by S&P500 in INR Average: Source: AceMF;
Bloomberg. Disclaimer: Past Performance is no guarantee of future Results
51x
1990 1991 1992 1993 1994 1995 1996 1997 1998 1999 2000 2001 2002 2003 2004 2005
Equity-INDEquity-INDEquity-INDEquity-INDEquity-IND Equity-US Equity-US Equity-US Equity-US Equity-IND Debt Debt Gold Equity-INDEquity-INDEquity-IND
34.4% 82.1% 37.0% 27.9% 17.4% 50.4% 22.6% 43.3% 37.3% 63.8% 9.0% 8.5% 24.1% 71.9% 10.7% 36.3%
ASAP Equity-US Equity-US Gold Debt Gold Debt Equity-IND Debt Equity-US Cash Cash Debt ASAP ASAP Gold
10.4% 79.8% 17.3% 27.1% 13.0% 13.3% 12.0% 18.6% 10.5% 22.5% 5.6% 6.4% 12.7% 27.1% 6.7% 22.2%
Debt ASAP ASAP ASAP Cash Debt Cash ASAP ASAP ASAP Gold Gold Cash Equity-US Cash ASAP
9.0% 42.2% 16.7% 18.8% 7.0% 13.0% 9.4% 13.2% 9.2% 20.7% 1.3% 5.9% 6.4% 20.2% 4.0% 14.5%
Cash Gold Cash Equity-US ASAP ASAP ASAP Debt Gold Debt ASAP ASAP ASAP Gold Equity-US Equity-US
8.0% 31.3% 12.1% 16.5% 6.6% 12.9% 8.0% 11.0% 8.1% 9.0% -1.7% -1.4% 4.4% 13.5% 3.8% 6.8%
Gold Debt Debt Debt Equity-US Cash Equity-IND Cash Cash Cash Equity-US Equity-US Equity-IND Debt Gold Debt
2.3% 9.0% 11.0% 12.0% -1.9% 8.8% -0.8% 7.0% 6.5% 5.7% -3.7% -10.1% 2.7% 8.1% 0.5% 4.8%
Equity-US Cash Gold Cash Gold Equity-IND Gold Gold Equity-IND Gold Equity-INDEquity-IND Equity-US Cash Debt Cash
-1.5% 9.0% 6.3% 10.3% -2.3% -20.8% -3.2% -14.0% -16.5% 2.4% -20.6% -17.9% -23.8% 4.6% -0.3% 4.6%
2006 2007 2008 2009 2010 2011 2012 2013^ 2014 2015 2016 2017 2018 2019 2020*
Equity-IND Equity-IND Gold Equity-IND Gold Gold Equity-IND Equity-US Equity-IND Debt Debt Equity-IND Cash Equity-US Gold
39.8% 54.8% 31.0% 75.8% 24.5% 30.7% 27.7% 45.6% 31.4% 8.6% 12.9% 28.6% 7.6% 31.9% 21.4%
Gold Gold Debt ASAP Equity-IND Equity-US Equity-US ASAP Debt Cash Equity-US ASAP Gold Gold Equity-US
21.0% 16.6% 9.1% 29.4% 17.9% 18.7% 17.5% 12.2% 14.3% 8.2% 12.5% 12.4% 7.5% 21.0% 16.2%
ASAP ASAP Cash Gold ASAP ASAP ASAP Cash ASAP Equity-US Gold Equity-US Debt ASAP ASAP
15.4% 14.0% 8.4% 18.6% 11.6% 8.3% 15.3% 9.0% 14.2% 4.2% 11.0% 12.3% 5.9% 16.6% 14.1%
Equity-US Cash ASAP Equity-US Equity-US Cash Gold Equity-IND Equity-US ASAP ASAP Gold ASAP Equity-IND Debt
11.7% 7.5% -7.6% 17.7% 8.4% 8.2% 11.0% 6.8% 13.6% 3.1% 9.9% 6.8% 3.8% 12.0% 11.8%
Cash Debt Equity-US Cash Cash Debt Debt Debt Cash Equity-IND Cash Cash Equity-IND Debt Equity-IND
6.0% 6.9% -23.8% 4.9% 5.1% 6.9% 9.4% 3.8% 9.2% -4.1% 7.5% 6.7% 3.2% 10.7% 6.6%
Debt Equity-US Equity-IND Debt Debt Equity-IND Cash Gold Gold Gold Equity-IND Debt Equity-US Cash Cash
4.0% -7.8% -51.8% 3.5% 5.0% -24.6% 8.5% -19.4% 0.5% -6.0% 3.0% 4.7% 2.4% 6.9% 4.3%
^ For ASAP: Model Portfolios are used from 2012 onwards; ASAP - Alpha Strategist Advantage Portfolio*CAGR is for period 1990 to 30th Nov 2020. Equity-IND is represented by Sensex from 1990 to 2002 and Nifty 50 from 2002 onwards; Debt is represented by SBI 1 -yr FD rates from 1990 to 2002 and CRISIL Composite bond Index from 2002 onwards;
Cash is represented by SBI 3-month FD rates from 1990 to 2002 and CRISIL Liquid fund Index from 2002 onwards; Gold is represented by gold spot price in INR terms. Equity-US is represented by S&P 500 in INR terms; Source: AceMF; BloombergNote: ASAP Portfolio (Equity Sensex 1990-2002,Nifty200-2012 and MF Model Portfolio 2013 onwards; Debt: SBI 1 yr 1990-2002; CRISIL Composite 2002-2012, Debt only Model Portfolio 2013 onwards; Cash- SBI 3 month
deposit 1900-2002; HDFC liquid (g)- REG 2002-2012;HEFC Liquid (G)- Direct 2013 onwards; Gold – Gold sport Price (INR 1990-2008;Nippon Gold Bees 2008 onwards; S&P 500 in INR 1990 onwards

DECEMBER 2020 | ISSUE 96 44
Alpha Strategist | ‘Winter Harvest’
DELPHI
…Ensuring a Smoother Journey Over 3 Years
5
Period of Analysis 1990 to 30th Nov 2020. Equity-IND is represented by Sensex from 1990 to 2002 and Nifty 50 from 2002 onwards; Debt is represented by SBI 1-yr FD
rates from 1990 to 2002 and CRISIL Composite bond Index from 2002 onwards; Cash is represented by SBI 3-month FD rates from 1990 to 2002 and CRISIL Liquid fund
Index from 2002 onwards; Gold is represented by gold spot price in INR terms. Equity-US is represented by S&P 500 in INR terms; Source: AceMF; Bloomberg
Note: ASAP Portfolio (Equity Sensex 1990-2002,Nifty200-2012 and MF Model Portfolio 2013 onwards; Debt: SBI 1yr 1990-2002; CRISIL Composite 2002-2012, Debt only
Model Portfolio 2013 onwards; Cash- SBI 3 month deposit 1900-2002; HDFC liquid (g)- REG 2002-2012;HEFC Liquid (G)- Direct 2013 onwards; Gold – Gold sport Price
(INR 1990-2008;Nippon Gold Bees 2008 onwards; S&P 500 in INR 1990 onwardsSource: MOPWM, Bloomberg, ACEMF Disclaimer :Past Performance is no guarantee of
future Results
Note: For ASAP, Model Portfolios are used from 2012 onwards; ASAP - Alpha Strategist Advantage Portfolio
-20%
-10%
0%
10%
20%
30%
40%
50%
60%
De
c-9
2
No
v-9
3
Oct
-94
Sep
-95
Au
g-9
6
Jun
-97
May
-98
Ap
r-9
9
Mar
-00
Jan
-01
De
c-0
1
No
v-0
2
Oct
-03
Sep
-04
Jul-
05
Jun
-06
May
-07
Ap
r-0
8
Mar
-09
Jan
-10
De
c-1
0
No
v-1
1
Oct
-12
Au
g-1
3
Jul-
14
Jun
-15
May
-16
Mar
-17
Feb
-18
Jan
-19
De
c-1
9
No
v-2
0
3 Yr Rolling Returns- ASAP vs. Other Asset Classes
Equity -IND Equity -US Debt Cash Gold ASAP
ASAP – The Big Picture!
6
Asset Class Equity-IND Equity-US Debt Cash Gold ASAP
CAGR from 1990 to 2020* 13.5% 13.0% 8.7% 7.2% 10.1% 11.9%
Standard Deviation 28.0% 15.0% 2.6% 0.6% 15.8% 8.2%
Maximum Drawdown -55.1% -45.9% -6.3% 0.0% -25.3% -11.4%
Maximum Returns - 3Y 59.6% 41.1% 12.7% 10.6% 32.6% 27.1%
Minimum Returns - 3Y -15.7% -14.9% 2.4% 4.4% -8.7% 0.1%
Average Returns - 3Y 12.5% 13.0% 8.5% 7.2% 9.9% 11.3%
Positive Observations (%) - 3Y 83.9% 81.0% 100.0% 100.0% 84.5% 100.0%
Returns Distribution
(3Y Rolling Returns)
% Observations
Equity-IND Equity-US Debt Cash Gold ASAP
-20% to -10% 3.3% 4.8% 0% 0% 0% 0%
-10% to 0% 12.8% 14.3% 0% 0% 15.5%
0% to 6% 22.0% 10.1% 16.1% 21.7% 23.5% 10.7%
6% to 10% 15.5% 8.9% 53.9% 72.6% 13.4% 25.6%
10% to 20% 22.3% 32.4% 30.1% 5.7% 28.3% 58.0%
20% to 30% 8.6% 15.8% 0% 0% 18.5% 5.7%
Above 30% 15.5% 13.7% 0% 0% 0.9%
*CAGR is for period 1990 to 30th Nov 2020. Equity-IND is represented by Sensex from 1990 to 2002 and Nifty 50 from 2002 onwards; Debt is represented by SBI 1-yr FD
rates from 1990 to 2002 and CRISIL Composite bond Index from 2002 onwards; Cash is represented by SBI 3-month FD rates from 1990 to 2002 and CRISIL Liquid fund
Index from 2002 onwards; Gold is represented by gold spot price in INR terms. Equity-US is represented by S&P 500 in INR terms; Source: AceMF; Bloomberg
Note: ASAP Portfolio (Equity Sensex 1990-2002,Nifty200-2012 and MF Model Portfolio 2013 onwards; Debt: SBI 1 yr 1990-2002; CRISIL Composite 2002-2012, Debt only
Model Portfolio 2013 onwards; Cash- SBI 3 month deposit 1900-2002; HDFC liquid (g)- REG 2002-2012;HEFC Liquid (G)- Direct 2013 onwards; Gold – Gold sport Price
(INR 1990-2008;Nippon Gold Bees 2008 onwards; S&P 500 in INR 1990 onwards Disclaimer :Past Performance is no guarantee of future Results
ASAP - Alpha Strategist Advantage Portfolio

DECEMBER 2020 | ISSUE 96 45
Alpha Strategist | ‘Winter Harvest’
DELPHI
Data up to 30th Nov 2020. Source: AceMF; Bloomberg, MOPWM Disclaimer :Past Performance is no guarantee of future Results
^ For ASAP: Model Portfolios are used from 2012 onwards; ASAP - Alpha Strategist Advantage Portfolio
*Nifty is represented by Sensex from 1990 to 2002 and Nifty 50 from 2002 onwards.
Note: ASAP Portfolio (Equity Sensex 1990-2002,Nifty200-2012 and MF Model Portfolio 2013 onwards; Debt: SBI 1 yr 1990-2002; CRISIL Composite 2002-2012, Debt only Model
Portfolio 2013 onwards; Cash- SBI 3 month deposit 1900-2002; HDFC liquid (g)- REG 2002-2012;HEFC Liquid (G)- Direct 2013 onwards; Gold – Gold sport Price (INR 1990-
2008;Nippon Gold Bees 2008 onwards; S&P 500 in INR 1990onwards.
Performance as on 30/11/2020 Absolute CAGR(%)
Strategy 3M 6M 1Y 2Y 3Y 5Y 7Y 10Y
ASAP 2.7% 12.4% 15.6% 14.9% 11.7% 11.2% 10.5% 11.1%
Nifty 50* 13.9% 35.4% 7.6% 9.2% 8.2% 10.3% 11.2% 8.3%
S&P 500 - INR 4.0% 16.4% 18.9% 18.1% 16.2% 14.1% 13.2% 17.3%
Gold - INR -9.2% 0.5% 25.2% 24.4% 16.9% 13.1% 7.7% 7.5%
Crisil Composite 3.5% 4.9% 12.0% 12.2% 9.3% 9.3% 9.9% 8.9%
Crisil Liquid 0.9% 2.0% 4.8% 5.9% 6.4% 6.7% 7.3% 7.7%
ASAP – Time Window Performance
Conservative – Time Window Performance
Data up to 30th Nov’2020; Rolling Returns Period of Analysis is Oct’12 toNov’20
Source: AceMF; Bloomberg, ACEMF, MOPWM Disclaimer :Past Performance is no guarantee of futureResults
Conservative consist of MOPWM Debt Model Portfolio
Performance as on 30/11/2020 Absolute CAGR(%)
Strategy 3M 6M 1Y 2Y 3Y 5Y 7Y
Conservative 3.1% 5.3% 11.2% 11.1% 8.9% 8.9% 9.6%
Crisil Composite 3.5% 4.9% 12.0% 12.2% 9.3% 9.3% 9.9%
Crisil Liquid 0.9% 2.0% 4.8% 5.9% 6.4% 6.7% 7.3%
9.09% 9.08%8.81% 8.80%
9.11% 9.14%
8.85% 8.86%
7.69% 7.70% 7.63% 7.62%
1Y 2Y 3Y 5Y
Average Rolling Returns
Conservative CRISIL Composite CRISIL Liquid
4C – Time Window Performance
Average Rolling Returns 4c Nifty 500 TRI
14.5% 14.4%13.6% 13.6%
12.4% 12.3% 11.9% 12.0%
1Y 2Y 3Y 5Y
Data up to 30th Nov’2020; Rolling Returns Period of Analysis is Oct’12 to Nov’20
Source: AceMF; Bloomberg, MOPWM Disclaimer :Past Performance is no guarantee of future Results
4C Advantage Portfolio consist of MOPWM MF Model Portfolio
Performance as on 30/11/2020 Absolute CAGR(%)
Strategy 3M 6M 1Y 2Y 3Y 5Y 7Y
4C 9.1% 30.1% 5.8% 9.9% 5.2% 10.0% 14.9%
Nifty 500 TRI 14.6% 37.8% 10.4% 9.7% 6.6% 11.2% 13.6%

Me-Gold
DECEMBER 2020 | ISSUE 96 46
Alpha Strategist | ‘Winter Harvest’
PurityWith 999.9 purity
Liquidity24 X 7 Live
SavingsDirect debit equity ledger
Or monthly Purchase
SafetySpecially Vaulted by
MMTC - PAMP
Me – Gold
Salient Features
Store it for
Free
Gift /
Transfer
Gold
Savings
Plan
999.9
24Kt
Real Time
Price
Buy any
Quantity
Get a Coin
at HomeSell it Back
Exchange
for
Jewellery
Why Me - Gold
� Access : Customer can buy
highest quality Gold of 999.9 at
doorstep
� Flexibility: No minimum entry
size, lock in or fixed payments
� Convenience: Can redeem gold
for coins (1gm+), for cash, and
directly with gold at jewelers
� Transparency: No hidden costs,
pricing based on live gold price
� Security: vault with full
insurance cover and security
Comparative analysis of our product
Me-Gold JewellerSBI GoldScheme
Gold ETFSovereignGold Bond
No Fixed Tenure
Competitive
Rates
High Liquidity
No Risk of theft
No Risk of Purity
No Management
Fee
Returns match
Actual Gold
Minimum Ticket � 500.00 1gm (�3000+) 1gm (�3000+) 1gm (�3000+) 2gm (�6000+)
�
�
�
�
�
�
�
� �
� �
�
�
� �
�
�
�
�
��
�
�
�
�
�
�
�
� � �
�
�
�
�

Managed Strategies - PMS
Alpha Strategist | ‘Winter Harvest’
DECEMBER 2020 | ISSUE 96 47
*PE PB for Indices are from NSE - * Returns on 3 t 20200 h Nov
**Rolling Returns on a monthly basis : 1 Year time period – 16 - 20, 3 Year time period - 14 - 20Nov Nov Nov Nov
Name of the Fund
Category
Fund Manager
Inception Date
AUM (in Rs cr)
Investment Style
Number of Stocks
Returns* (%)
1 Months
3 Months
6 Months
1 Year
3 Year
5 Year
Since Inception
Risk Measures
Standard Dev.
Beta
Positive Observations
Average Return
Minimum Return
Maximum Return
Positive Observations
Average Return
Minimum Return
Maximum Return
Valuations
PE
PB
ROE
Max Financial 11.78 HDFC Bank 13.61 HDFC Bank 11.21 Kotak Mah. Bank 12.91 HDFC Bank 7.86
ICICI Bank 9.87 Avenue Super. 12.98 Reliance Industr 11.17 Voltas 11.78 Reliance Industr 7.83
HDFC Life Insur. 8.88 ICICI Bank 7.40 H D F C 7.23 ICICI Bank 5.89 H D F C 5.07
HDFC Bank 8.55 Reliance Inds. 7.27 Infosys 7.21 Max Financial 5.25 Infosys 5.06
Dr Reddy's Labs 5.49 Hind. Unilever 6.41 ICICI Bank 5.84 Eicher Motors 5.20 ICICI Bank 4.10
Bharti Airtel 4.56 Dr Reddy's Labs 6.39 TCS 5.04 Ipca Labs. 5.18 TCS 3.53
Tube Investments 4.25 Nestle India 5.91 Kotak Mah. Bank 5.00 L&T Technology 4.44 Kotak Mah. Bank 3.50
Maruti Suzuki 3.71 Titan Company 5.20 Hind. Unilever 3.42 Page Industries 4.15 Hind. Unilever 2.40
Hind. Unilever 3.38 Bajaj Finserv 5.07 ITC 3.03 Gland Pharma 4.09 ITC 2.12
SBI Cards 3.26 H D F C 4.66 Axis Bank 2.67 Tech Mahindra 3.98 Axis Bank 1.87
Others 36.26 Others 25.11 Others 38.18 Others 37.14 Others 56.66
BFSI 33.73 FMCG 21.23 BFSI 39.28 BFSI 22.52 BFSI 33.58
Insurance 20.67 BFSI 21.01 IT 15.75 Consumer Durables 11.78 Consumer Goods 13.48
Pharma & Health. 11.80 Retail 12.98 Oil & Gas 12.94 Auto & Auto Anc 10.77 IT 12.49
Auto & Auto Anc 7.96 FMCG 12.32 Consumer Goods 11.17 Pharma & Health. 10.77 Oil & Gas 10.29
FMCG 5.36 Oil & Gas 7.27 Auto & Auto Anc. 5.58 Technology 8.41 Pharma & Health. 5.46
Concentration( %)
Top 5
Top 10
Large Cap
Mid Cap
Small Cap
Wt. Avg Market Cap (in
Rs Cr)
0.00 0.00 0.00 3.71 5.65
1,98,516 4,31,741 4,65,956 1,16,580 3,36,301
66.43 74.90 100.00 62.49 80.47
30.34 0.00 0.00 32.80 13.42
63.74 74.89 61.82 62.86 43.34
Market Capitalisation (%)
44.58 47.67 42.66 41.02 29.92
Top 10 Stocks
Top 5 Sectors
3.96 4.60 2.89 4.37 2.81
12.96 10.82 8.96 13.31 5.32
Portfolio Composition(%)
30.57 42.50 32.28 32.84 52.92
-19.51 -2.89 -2.14 -4.99 -4.35
26.68 17.53 15.60 22.23 15.38
91.67
4.45 10.76 8.69 10.22 8.31
3 Year Rolling Return**(%)
58.33 88.57 94.44 80.56
-3.67 -18.52 -26.32 -25.57 -27.88
13.58 47.58 28.81 42.13 35.91
66.67
5.57 5.45 6.17 2.67 4.15
1 Year Rolling Return**(%)
94.44 54.29 75.00 52.78
22.54 19.33 20.82 21.81 21.38
1.04 0.78 1.00 0.97 1.00
19.68 -- 14.91 --
5.46 8.23 3.07 5.39
8.22 10.31 11.44 9.89
30.05 35.37 38.89 37.03
1.02 7.57 5.22 9.23
11.00 11.39 11.91 11.87
11.87 13.89 15.35 14.37
25 na 50 26 500
1923 82 7688
Growth Growth Blended Earnings Momentum Blended
Shrey Loonkar, SushmitPatodia
Amit Nadekar Index Manish Sonthalia Index
25-Mar-03 21-Dec-06 05-Dec-07
Motilal Oswal Value PMS Alchemy Leaders Nifty 50 Motilal Oswal NTDOP PMS Nifty 500
Large Cap Large Cap Large Cap Multi Cap Multicap
10.5
-0.4
7.5
17.9
-8.8
8.9
8.1

Alpha Strategist | ‘Winter Harvest’
DECEMBER 2020 | ISSUE 96 48
*PE PB for Indices are from NSE - * Returns on 3 t 20200 h Nov
**Rolling Returns on a monthly basis : 1 Year time period – 16 - 20, 3 Year time period - 14 - 20Nov Nov Nov Nov
Name of the Fund
Category
Fund Manager
Inception Date
AUM (in Rs cr)
Investment Style
Number of Stocks
Returns* (%)
1 Months
3 Months
6 Months
1 Year
3 Year
5 Year
Since Inception
Risk Measures
Standard Dev.
Beta
Positive Observations
Average Return
Minimum Return
Maximum Return
Positive Observations
Average Return
Minimum Return
Maximum Return
Valuations
PE
PB
ROE
Bajaj Fin. 9.09 Bajaj Fin. 8.88 Bajaj Fin. 7.47 Divi's Lab. 6.43 HDFC Bank 7.86
Divi's Lab. 7.33 Bajaj Finserv 7.30 Bajaj Finserv 7.15 Bajaj Fin. 5.71 Reliance Industr 7.83
Bajaj Finserv 6.44 Divi's Lab. 6.73 Divi's Lab. 6.42 Reliance Inds. 5.58 H D F C 5.07
HDFC Bank 6.17 P I Inds. 5.99 MAS FINANC SER 5.66 AU Small Finance 5.46 Infosys 5.06
P I Inds. 6.03 Cholaman.Inv.&Fn 5.54 HDFC Bank 5.52 Aarti Inds. 5.31 ICICI Bank 4.10
Reliance Inds. 4.80 Kotak Mah. Bank 5.52 Aarti Inds. 5.41 HDFC Bank 5.17 TCS 3.53
Asian Paints 4.60 AU Small Finance 4.61 AU Small Finance 5.17 Bajaj Finserv 5.16 Kotak Mah. Bank 3.50
Aarti Inds. 4.51 Reliance Inds. 4.46 SRF 5.13 MAS FINANC SER 5.02 Hind. Unilever 2.40
HDFC Life Insur. 4.50 TCS 4.37 Reliance Inds. 4.87 Infosys 4.94 ITC 2.12
Dabur India 4.06 Aarti Inds. 4.14 Infosys 4.49 Abbott India 4.94 Axis Bank 1.87
Others 42.48 Others 42.46 Others 42.72 Others 46.28 Others 56.66
BFSI 32.86 BFSI 31.85 BFSI 23.82 BFSI 35.18 BFSI 33.58
FMCG 22.52 Chemicals 12.92 Insurance 15.79 FMCG 16.40 Consumer Goods 13.48
Chemicals 10.54 FMCG 11.46 FMCG 14.54 Pharma & Health. 11.37 IT 12.49
Pharma & Health. 10.12 Pharma & Health. 10.56 Pharma & Health. 10.89 Chemicals 9.91 Oil & Gas 10.29
Oil & Gas 4.80 Diversified / Misc. 7.60 Chemicals 9.35 Oil & Gas 5.58 Pharma & Health. 5.46
Concentration( %)
Top 5
Top 10
Large Cap
Mid Cap
Small Cap
Wt. Avg Market Cap (inRs Cr)
0.00 0.00 5.66 32.42 5.65
2,44,321 2,06,432 1,87,148 2,06,892 3,36,301
84.40 70.08 80.09 51.43 80.47
14.49 28.04 13.84 15.58 13.42
57.52 57.54 57.28 53.72 43.34
Market Capitalisation (%)
35.06 34.43 32.22 28.49 29.92
Top 10 Stocks
Top 5 Sectors
6.94 6.78 6.46 7.14 2.81
13.76 14.08 16.20 15.56 5.32
50.45 48.17 39.86 45.89 52.92
-0.49 1.38 - -4.35
18.42 17.86 - 15.38
91.67
9.29 11.54 - 8.31
94.44 100.00 -
-15.60 -18.53 - - -27.88
38.66 37.18 - - 35.91
66.67
5.46 8.30 - - 4.15
55.56 80.56 - -
21.48 22.38 21.38
0.89 0.96 1.00
16.05 18.16 8.22 8.82 --
5.40 9.99 -- -- 5.39
11.23 14.34 -- -- 9.89
16.46 14.37
31.44 41.54 30.75 32.65 37.03
7.92 14.35 8.52 8.83 9.23
500
13.35 15.08 14.05 13.92 11.87
3838 13251 188 338
Earnings Momentum Earnings Momentum Earnings Momentum Earnings Momentum Blended
Nifty 500
Multi Cap Multi Cap Multicap Multi Cap Multicap
Prateek Agarwal Prateek Agarwal Prateek Agarwal Prateek Agarwal Index
1 Year Rolling Return**(%)
3 Year Rolling Return**(%)
Portfolio Composition(%)
ASK Select PMS ASK IEP PMS ASK India Vision ASK 2025 AIF
04-Jan-10 25-Jan-10 20-Nov-19 31-Aug-18
22 21 21 22
15.36 20.00 16.19

Alpha Strategist | ‘Winter Harvest’
DECEMBER 2020 | ISSUE 96 49
*PE PB for Indices are from NSE - * Returns on 3 t 20200 h Nov
**Rolling Returns on a monthly basis : 1 Year time period – 16 - 20, 3 Year time period - 14 - 20Nov Nov Nov Nov
Name of the Fund
Category
Fund Manager
Inception Date
AUM (in Rs cr)
Investment Style
Number of Stocks
Returns* (%)
1 Months
3 Months
6 Months
1 Year
3 Year
5 Year
Since Inception
Risk Measures
Standard Dev.
Beta
Positive Observations
Average Return
Minimum Return
Maximum Return
Positive Observations
Average Return
Minimum Return
Maximum Return
Valuations
PE
PB
ROE
Max Financial 11.57 Asian Paints 12.00 Aditya Bir. Fas. 9.90 Axis Bank 13.19 HDFC Bank 7.86
HDFC Bank 11.48 HDFC Bank 10.00 Tata Motors 8.98 ICICI Bank 10.45 Reliance Industr 7.83
Kotak Mah. Bank 11.30 Bajaj Fin. 9.50 Info Edg.(India) 8.36 St Bk of India 8.83 H D F C 5.07
ICICI Bank 10.35 Page Industries 9.00 ICICI Bank 7.87 Gateway Distr. 8.05 Infosys 5.06
TCS 9.90 Pidilite Inds. 8.30 St Bk of India 6.53 Tata Motors 7.32 ICICI Bank 4.10
HDFC Life Insur. 7.03 Kotak Mah. Bank 8.00 HDFC Bank 6.45 Indian Hotels 6.88 TCS 3.53
Bata India 6.88 Nestle India 7.20 Kotak Mah. Bank 6.44 Sanghvi Movers 5.81 Kotak Mah. Bank 3.50
L & T Infotech 6.28 HDFC Life Insur. 7.00 Axis Bank 6.25 Aditya Bir. Fas. 4.99 Hind. Unilever 2.40
Eicher Motors 5.85 Dr Lal Pathlabs 7.00 Indian Hotels 5.94 Kalpataru Power 4.97 ITC 2.12
Hind. Unilever 5.08 Berger Paints 6.00 Kalpataru Power 5.72 Mahindra Holiday 4.66 Axis Bank 1.87
Others 14.28 Others 16.00 Others 27.56 Others 24.85 Others 56.66
BFSI 33.12 BFSI 27.50 BFSI 33.54 BFSI 32.47 BFSI 33.58
Insurance 18.60 FMCG 25.20 Retail 9.90 Capital Goods 18.63 Consumer Goods 13.48
IT - Software 9.90 Pharma & Health. 16.00 FMCG 9.76 Hotels 11.54 IT 12.49
FMCG 9.10 Retail 15.00 Auto & Auto Anc 8.98 Auto & Auto Anc 9.16 Oil & Gas 10.29
Retail 6.88 Chemicals 8.30 Diversified / Misc. 8.36 Shipping, Logistics & Transportation 8.05 Pharma & Health. 5.46
Concentration( %)
Top 5
Top 10
Large Cap
Mid Cap
Small Cap
Wt. Avg Market Cap (in
Rs Cr)
4.45 78.00 5.72 34.24 5.65
3,27,278 2,07,247 1,87,744 94,016 3,36,301
67.80 15.00 69.80 43.01 80.47
21.16 6.00 15.84 17.73 13.42
85.72 84.00 72.44 75.15 43.34
Market Capitalisation (%)
54.60 48.80 41.64 47.84 29.92
Top 10 Stocks
Top 5 Sectors
5.82 11.00 2.48 1.51 2.81
12.65 16.92 6.70 4.43 5.32
Portfolio Composition(%)
46.05 65.01 37.02 34.19 52.92
- - - - -4.35
- - - - 15.38
91.67
- - - - 8.31
- - - -
3 Year Rolling Return**(%)
- - - - -27.88
- - - - 35.91
66.67
- - - - 4.15
- - - -
21.38
1.00
8.13 25.98 6.07 -6.63 --
-- -- -- -- 5.39
-- -- -- -- 9.89
16.85 14.37
36.46 32.71 47.30 49.16 37.03
12.23 25.82 5.41 -8.43 9.23
500
14.01 12.00 16.76 19.59 11.87
983 2418 38 17
Earnings Momentum Earnings Momentum Blended Towards Growth Blended Towards Growth Blended
Nifty 500
Multi Cap Multi Cap Multi Cap Multi Cap Multicap
Manish Sonthalia Saurabh Mukherjea Pankaj Murarka Pankaj Murarka Index
1 Year Rolling Return**(%)
Motilal Oswal BOP PMS Marcellus CC PMS Renaissance Opportunities PMS Renaissance India Next PMS
16-Jan-18 01-Dec-18 01-Dec-17 19-Apr-18
15 13 14 17
18.71 20.39 15.78

DECEMBER 2020 | ISSUE 96 50
Alpha Strategist | ‘Winter Harvest’
*PE PB for Indices are from NSE - * Returns on 3 t 20200 h Nov
**Rolling Returns on a monthly basis : 1 Year time period – 16 - 20, 3 Year time period - 14 - 20Nov Nov Nov Nov
Name of the Fund
Category
Fund Manager
Inception Date
AUM (in Rs cr)
Investment Style
Number of Stocks
Returns* (%)
1 Months
3 Months
6 Months
1 Year
3 Year
5 Year
Since Inception
Risk Measures
Standard Dev.
Beta
Positive Observations
Average Return
Minimum Return
Maximum Return
Positive Observations
Average Return
Minimum Return
Maximum Return
Valuations
PE
PB
ROE
ICICI Bank 9.08 HDFC Bank 8.43 Syngene Intl. 7.76 Escorts 7.70 HDFC Bank 7.86
Infosys 7.70 Reliance Inds. 7.88 Aurobindo Pharma 7.33 Kaveri Seed Co. 7.50 Reliance Industr 7.83
Reliance Inds. 7.01 Bharti Airtel 5.39 Indian Energy Ex 7.09 Aurobindo Pharma 6.80 H D F C 5.07
Axis Bank 6.09 Ratnamani Metals 5.28 Escorts 6.82 Coromandel Inter 6.50 Infosys 5.06
Tech Mahindra 6.09 ITC 5.17 Indiamart Inter. 6.59 Syngene Intl. 6.20 ICICI Bank 4.10
UltraTech Cem. 5.24 Birla Corpn. 5.15 Coromandel Inter 6.11 Indian Energy Ex 5.80 TCS 3.53
Bharti Airtel 4.48 AIA Engg. 4.75 SRF 5.36 SRF 4.70 Kotak Mah. Bank 3.50
Timken India 4.01 UTI AMC 4.64 Kaveri Seed Co. 5.23 Radico Khaitan 4.30 Hind. Unilever 2.40
United Spirits 3.93 Apollo Hospitals 4.28 Chambal Fert. 5.02 Chambal Fert. 4.00 ITC 2.12
Cipla 3.92 Petronet LNG 4.22 Redington India 4.43 Guj.St.Petronet 3.90 Axis Bank 1.87
Others 42.47 Others 44.81 Others 38.26 Others 42.60 Others 56.66
BFSI 18.42 BFSI 13.44 Diversified / Misc. 18.91 Capital Goods 14.50 BFSI 33.58
Technology 13.78 Oil & Gas 12.09 Pharma & Health. 15.09 Pharma & Health. 13.00 Consumer Goods 13.48
Oil & Gas 10.11 Pharma & Health. 11.68 Chemicals 11.13 Diversified / Misc. 11.20 IT 12.49
Pharma & Health. 7.67 Capital Goods 10.03 Auto & Auto Anc 9.04 Chemicals 10.50 Oil & Gas 10.29
Auto & Auto Anc 7.17 FMCG 8.20 Capital Goods 8.49 Auto & Auto Anc 8.40 Pharma & Health. 5.46
Concentration( %)
Top 5
Top 10
Large Cap
Mid Cap
Small Cap
Wt. Avg Market Cap (in
Rs Cr)2,25,606 2,52,791 17,033 22,142 3,36,301
13.17 13.13 29.01 39.30 13.42
9.90 25.74 46.44 40.10 5.65
68.29 41.52 21.29 14.30 80.47
35.95 32.15 35.59 14.30 29.92
57.53 55.19 61.74 39.30 43.34
Top 5 Sectors
Top 10 Stocks
2.98 3.42 2.87 2.55 2.81
9.94 11.77 15.80 14.37 5.32
29.96 29.09 18.15 17.75 52.92
- - - -4.35
- - - 15.38
- - - 35.91
91.67
- - - 8.31
- - -
- - - 4.15
- - - -27.88
0.94 1.00
- - - 66.67
25.11 21.38
-0.20 -- 5.39
-- -- -- -- 9.89
-0.78 10.55 9.50 -0.98 --
15.84 14.37
29.43 41.91 39.90 40.41 37.03
0.77 24.45 23.00 21.78 9.23
29 500
7.90 8.17 11.30 11.86 11.87
18-Dec-17
394 701 1500.00
Value Value Blended Towards Value Blended Towards Value Blended
Kenneth Andrade Index
Invesco DAWN Invesco RISE PMS Old Bridge All Cap OBCM Vantage Equity Nifty 500
Multi Cap Mid & Small Cap Multi Cap Multi Cap Multicap
1 Year Rolling Return**(%)
3 Year Rolling Return**(%)
Market Capitalisation (%)
Portfolio Composition(%)
Amit Nigam Amit Nigam Kenneth Andrade
28-Aug-17 18-Apr-16 30-Aug-16
24 19 23
9.04 14.16 14.70
-0.23 0.35

DECEMBER 2020 | ISSUE 96 51
Alpha Strategist | ‘Winter Harvest’
*PE PB for Indices are from NSE - * Returns on 3 t 20200 h Nov
**Rolling Returns on a monthly basis : 1 Year time period – 16 - 20, 3 Year time period - 14 - 20Nov Nov Nov Nov
Name of the Fund
Category
Fund Manager
Inception Date
AUM (in Rs cr)
Investment Style
Number of Stocks
Returns* (%)
1 Months
3 Months
6 Months
1 Year
3 Year
5 Year
Since Inception
Risk Measures
Standard Dev.
Beta
Positive Observations
Average Return
Minimum Return
Maximum Return
Positive Observations
Average Return
Minimum Return
Maximum Return
Valuations
PE
PB
ROE
Syngene Intl. 8.81 Suven Pharma 11.45 ICICI Sec 10.00 Suven Life Scie. 12.00 Apollo Hospitals 2.68
Aditya Bir. Fas. 8.22 Axis Bank 11.36 Tech Mahindra 10.00 Garware Tech. 12.00 Shriram Trans. 2.39
Info Edg.(India) 7.58 J B Chem & Pharm 9.88 Axis Bank 5.00 J B Chem & Pharm 11.00 Jubilant Food. 2.28
Alembic Pharma 6.62 Garware Tech. 9.24 Sheela Foam 5.00 ICICI Sec 7.00 Voltas 2.23
DCB Bank 6.21 Petronet LNG 9.02 TCI Express 5.00 Tech Mahindra 7.00 P I Industries 2.11
M & M Fin. Serv. 6.06 ICICI Securities 8.59 Crompton Gr. Con 5.00 Crompton Gr. Con 6.00 Zee Entertainmen 2.09
Kalpataru Power 5.79 Crompton Gr. Con 5.74 Mayur Uniquoters 5.00 Axis Bank 6.00 MRF 1.92
Federal Bank 5.68 Tech Mahindra 5.25 K E C Intl. 5.00 ICICI Bank 5.00 Trent 1.92
Natco Pharma 5.00 The Anup Enginee 4.86 I D F C 5.00 Petronet LNG 5.00 AU Small Finance 1.87
Indian Hotels 5.00 Sanofi India 4.30 SBI Life Insuran 5.00 K E C Intl. 5.00 Cholaman.Inv.&Fn 1.82
Others 35.03 Others 20.31 Others 40.00 Others 24.00 Others 78.69
BFSI 25.56 Pharma & Health. 25.63 BFSI 15.00 Pharma & Health. 27.00 BFSI 24.30
Pharma & Health. 20.43 BFSI 19.95 Technology 10.00 BFSI 18.00 Consumer Goods 14.87
Diversified / Misc. 12.25 Oil & Gas 9.24 Consumer Durables 5.00 Textiles & Apparels 16.00 Auto & Auto Anc. 10.63
FMCG 8.35 Capital Goods 9.02 Textiles & Apparels 5.00 Consumer Durables 10.00 Pharma & Health. 7.45
Retail 8.22 Chemicals 3.78 Capital Goods 5.00 Technology 10.00 Industrials 6.55
Concentration( %)
Top 5
Top 10
Large Cap
Mid Cap
Small Cap
Wt. Avg Market Cap (in
Rs Cr)18,033 37,519 25,685 42,781 22,126
53.00 18.63 15.00 13.00 95.37
27.23 48.59 35.00 58.00 2.73
15.93 25.63 15.00 23.00 1.92
Market Capitalisation (%)
37.44 50.95 35.00 49.00 11.69
64.97 79.69 60.00 76.00 21.31
Top 5 Sectors
Top 10 Stocks
2.52 3.72 3.82 3.92 2.25
8.53 15.05 11.92 12.87 4.99
29.50 24.74 32.06 30.43 45.01
- - - -12.04
- - - 18.76
77.78
- - - 6.16
- - -
- - - -36.16
- - - 47.26
38.89
- - - -1.65
- - -
26.96
1.00
2.90 16.84 4.89 25.26 --
-- -- -- -- -0.30
-- -- -- -- 8.26
14.88 18.18
54.00 57.17 0.28 61.86 48.54
13.09 59.00 18.36 53.68 14.48
100
15.45 10.84 5.29 10.65 15.52
49.93 1743.00 859.00 118.00
Blended Towards Growth Value Value Value Blended
Nifty Free Float Mid Cap 100
Mid & Small Cap Mid & Small Cap Multicap Mid & Small Cap Multicap
Pankaj Murarka Sarath K Reddy Sarath K Reddy Sarath K Reddy Index
1 Year Rolling Return**(%)
3 Year Rolling Return**(%)
Portfolio Composition(%)
Renaissance Midcap PMS Unifi Blended PMS Unifi BCAD PMS Unifi Blend AIF
01-Nov-17 30-May-17 01-Apr-18 14-Feb-19
21 13 21 15
16.98 13.09 19.46

DECEMBER 2020 | ISSUE 96 52
Alpha Strategist | ‘Winter Harvest’
*PE PB for Indices are from NSE - * Returns on 3 t 20200 h Nov
**Rolling Returns on a monthly basis : 1 Year time period – 16 - 20, 3 Year time period - 14 - 20Nov Nov Nov Nov
Name of the Fund
Category
Fund Manager
Inception Date
AUM (in Rs cr)
Investment Style
Number of Stocks
Returns* (%)
1 Months
3 Months
6 Months
1 Year
3 Year
5 Year
Since Inception
Risk Measures
Standard Dev.
Beta
Positive Observations
Average Return
Minimum Return
Maximum Return
Positive Observations
Average Return
Minimum Return
Maximum Return
Valuations
PE
PB
ROE
Kajaria Ceramics 9.44 L & T Infotech 11.43 Max Financial 10.65 Solara Active 8.57 Laurus Labs 4.30
Alkem Lab 7.89 Cholaman.Inv.&Fn 9.87 APL Apollo 8.44 Granules India 8.45 Dixon Technolog. 3.07
ITC 6.93 Ipca Labs. 9.12 Muthoot Finance 8.35 Laurus Labs 6.11 Multi Comm. Exc. 3.06
Mahanagar Gas 6.63 Central Dep. Ser 7.48 Alkem Lab 6.32 RBL Bank 5.66 Indian Energy Ex 2.43
Can Fin Homes 6.61 Bajaj Electrical 6.91 MAS FINANC SER 6.13 M & M Fin. Serv. 4.94 Deepak Nitrite 2.37
TTK Prestige 6.47 Kajaria Ceramics 6.04 Ajanta Pharma 5.67 Security & Intel 4.74 Persistent Sys 2.21
ICICI Sec 6.42 Godrej Agrovet 5.93 Team Lease Serv. 5.42 CCL Products 4.17 Granules India 2.13
ICICI Bank 5.94 ICICI Sec 4.79 Polycab India 5.10 Mahindra Logis. 4.00 I D F C 2.09
Birla Corpn. 5.88 JK Lakshmi Cem. 4.77 Dixon Technolog. 5.01 Kajaria Ceramics 3.59 P & G Health Ltd 2.04
Blue Star 5.75 Avanti Feeds 4.53 Amber Enterp. 4.18 L&T Fin.Holdings 3.56 Tata Elxsi 2.02
Others 32.03 Others 29.12 Others 34.73 Others 46.22 Others 74.28
Consumer Durables 25.37 BFSI 25.17 BFSI 29.19 Pharma & Health. 26.03 BFSI 16.84
BFSI 22.82 Consumer Durables 12.95 Technology 14.98 BFSI 18.53 Pharma & Health. 15.38
Pharma & Health. 12.25 Technology 12.64 Pharma & Health. 11.99 Chemicals 8.55 Consumer Goods 12.82
FMCG 8.09 Pharma & Health. 9.12 Consumer Durables 10.11 Auto & Auto Anc 5.92 IT 11.87
Oil & Gas 6.63 Diversified / Misc. 8.30 Metals & Mining 8.44 Technology 5.79 CONSTRUCTION 8.39
Concentration( %)
Top 5
Top 10
Large Cap
Mid Cap
Small Cap
Wt. Avg Market Cap (in
Rs Cr)50,575 17,380 17,104 19,749 7,423
36.39 42.53 36.77 29.02 3.68
31.74 44.33 42.30 63.34 95.99
28.09 11.43 17.96 3.55 0.29
Market Capitalisation(%)
37.51 44.81 39.88 33.73 15.23
67.97 70.88 65.27 53.78 25.72
Top 10 Stocks
Top 5 Sectors
3.92 3.92 4.13 2.05 3.27
14.44 13.04 16.51 8.11 8.20
27.11 30.04 24.99 25.31 39.88
-17.52 - - -19.86
21.17 - - 19.42
58.33
2.92 - - 1.95
58.33 - -
-35.42 - - -46.65
44.45 - - 57.30
25.00 - - 30.56
-7.42 - - -7.60
29.34 32.56
7.38 -0.91 -5.72 -3.41 --
0.87 1.00
-8.26 -- -- -6.98 -8.96
5.35 -- -- -- 3.45
20.64 17.62
41.55 55.47 55.55 76.42 64.22
3.49 22.71 21.87 25.16 13.04
100
10.77 10.50 7.09 12.60 12.96
2121 473 482 184
Earnings Momentum Earnings Momentum Earnings Momentum Value Blended
Index
Motilal Oswal IOP PMS Motilal Oswal IOP V2 PMS MO Emergence AIF Ashmore India Opportunities AIF Nifty Small Cap
Mid & Small Cap Mid & Small Cap Mid & Small cap Mid & Small Cap Small Cap
3 Year Rolling Return**(%)
Portfolio Composition(%)
1 Year Rolling Return**(%)
Manish Sonthalia Manish Sonthalia Rakesh Tarway Ashwini Agarwal, Rashmi Talwar
15-Feb-10 05-Feb-18 10-Jan-18 28-Apr-17
21 21 17 26
12.18 16.73 13.95

DECEMBER 2020 | ISSUE 96 53
Alpha Strategist | ‘Winter Harvest’
*PE PB for Indices are from NSE - * Returns on 3 t 20200 h Nov
**Rolling Returns on a monthly basis : 1 Year time period – 16 - 20, 3 Year time period - 14 - 20Nov Nov Nov Nov
Name of the Fund
Category
Fund Manager
Inception Date
AUM (in Rs cr)
Investment Style
Number of Stocks
Returns* (%)
1 Months
3 Months
6 Months
1 Year
3 Year
5 Year
Since Inception
Risk Measures
Standard Dev.
Beta
Positive Observations
Average Return
Minimum Return
Maximum Return
Positive Observations
Average Return
Minimum Return
Maximum Return
Valuations
PE
PB
ROE
Escorts 7.77 Voltas 17.03 Divi's Lab. 7.93 HDFC Bank 6.41 HDFC Bank 7.86
SRF 7.04 Colgate-Palm. 10.79 Bajaj Fin. 5.76 Avenue Super. 5.88 Reliance Industr 7.83
Jindal Steel 6.52 ICICI Sec 9.31 Tata Elxsi 5.39 Kotak Mah. Bank 5.61 H D F C 5.07
UPL 6.17 Gland Pharma 9.25 Reliance Inds. 4.96 Divi's Lab. 5.23 Infosys 5.06
Ramkrishna Forg. 6.05 Sun Pharma.Inds. 8.81 United Spirits 4.83 Ipca Labs. 4.98 ICICI Bank 4.10
AIA Engg. 6.00 Kotak Mah. Bank 8.46 Tata Consumer 4.27 ICICI Bank 4.83 TCS 3.53
Aurobindo Pharma 5.94 HDFC Life Insur. 8.40 Hind. Unilever 4.02 Reliance Inds. 4.82 Kotak Mah. Bank 3.50
Redington India 5.07 TCS 7.35 ICICI Bank 3.76 Hind. Unilever 4.74 Hind. Unilever 2.40
GE Shipping Co 4.96 Quess Corp 7.34 HDFC Bank 3.62 H D F C 4.70 ITC 2.12
Nelcast 4.90 Kajaria Ceramics 3.66 Dr Reddy's Labs 3.59 Dr Reddy's Labs 4.65 Axis Bank 1.87
Others 39.58 Others 9.60 Others 51.87 Others 48.15 Others 56.66
Auto & Auto Anc 18.72 Consumer Durables 22.46 BFSI 13.15 BFSI 31.77 BFSI 33.58
Textiles & Apparels 10.43 Pharma & Health. 20.08 FMCG 13.12 FMCG 16.15 Consumer Goods 13.48
Chemicals 10.30 BFSI 17.77 Pharma & Health. 11.52 Pharma & Health. 14.86 IT 12.49
Metals & Mining 6.52 FMCG 14.31 Technology 5.39 IT - Software 7.76 Oil & Gas 10.29
Capital Goods 6.00 Insurance 8.40 Oil & Gas 4.96 Retail 5.88 Pharma & Health. 5.46
Concentration( %)
Top 5
Top 10
Large Cap
Mid Cap
Small Cap
Wt. Avg Market Cap
(in Rs Cr)16,893 1,54,212 3,24,443 2,54,356 3,36,301
31.66 32.02 0.00 16.67 13.42
33.17 9.11 5.39 8.63 5.65
12.11 56.58 42.74 71.74 80.47
33.55 55.19 28.87 28.11 29.92
60.42 90.40 44.54 51.85 43.34
Market Capitalisation(%)
Top 10 Stocks
Top 5 Sectors
Portfolio Composition(%)
1.68 5.86 4.98 5.31 2.81
9.41 16.05 11.21 12.64 5.32
17.85 36.50 44.43 41.99 52.92
-- -7.30 -4.35
-- 18.75 15.38
91.67
-- 9.45 8.31
3 Year Rolling Return**(%)
-- 80.00
-- -31.37 -27.88
-- 46.21 35.91
66.67
-- 0.76 4.15
1 Year Rolling Return**(%)
-- 51.43
-- 22.39 21.38
-- 0.97 1.00
11.80 0.57 18.11 20.49 --
3.00 -3.36 -0.74 -5.16 5.39
-- -- 7.01 5.20 9.89
36.60 37.81 24.75 20.69 37.03
34.40 -1.04 -13.23 -12.51 9.23
7.80 8.19 -0.16 10.40 11.87
8.10 12.27 10.43 4.83 14.37
335 2684 1881
Blended Towords Value Earnings Momentum Growth Blended Towords Growth Blended
30-Aug-16 01-Mar-17 19-Dec-08 08-May-02
NA 14 NA NA 500
Nifty 500
Mid & Small Cap Multi Cap Multicap Multi Cap Multicap
Kenneth Andrade Manish Sonthalia Hiren Ved Amit Nadekar Index
OLD Bridge Thematic PMS MO AIF Alchemy High Growth Alchemy High Growth PMS

*PE PB for Indices are from NSE - * Returns on 3 t 20200 h Nov
**Rolling Returns on a monthly basis : 1 Year time period – 16 - 20, 3 Year time period - 14 - 20Nov Nov Nov Nov
DECEMBER 2020 | ISSUE 96 54
Alpha Strategist | ‘Winter Harvest’
Managed Strategies - MF
Scheme Name
Category
Fund Manager
Inception Date
Latest AUM (In INR Crs)
Investment Style
No of Stock
Returns* (%)
1M
3M
6M
1 Yr
3 Yr
5 Yr
Since Inception
Risk Measures
Standard Dev
Beta
Postive
Mean
Max
Min
Postive
Mean
Max
Min
Valuations
PE
PB
ROE
HDFC Bank 9.22 HDFC Bank 8.65 HDFC Bank 8.76 HDFC Bank 11.21
ICICI Bank 8.27 ICICI Bank 7.96 ICICI Bank 7.74 Reliance Industr 11.17
Infosys 7.98 Infosys 7.79 Infosys 6.73 H D F C 7.23
Bharti Airtel 5.01 Reliance Industr 5.91 St Bk of India 5.55 Infosys 7.21
Bajaj Finance 4.06 Bharti Airtel 4.44 ITC 4.77 ICICI Bank 5.84
UltraTech Cem. 3.84 H D F C 3.44 Reliance Industr 4.62 TCS 5.04
H D F C 3.60 Kotak Mah. Bank 3.02 H D F C 4.29 Kotak Mah. Bank 5.00
Reliance Industr 3.36 Axis Bank 2.81 Axis Bank 4.07 Hind. Unilever 3.42
HCL Technologies 3.34 Hind. Unilever 2.58 Larsen & Toubro 4.05 ITC 3.03
Kotak Mah. Bank 3.31 HCL Technologies 2.45 NTPC 3.52 Axis Bank 2.67
Others 48.01 Others 50.96 Others 45.90 Others 38.18
Bank 23.97 Bank 25.43 Bank 26.52 BFSI 39.28
IT 13.26 IT 12.91 IT 12.04 IT 15.75
Finance 7.66 Finance 8.21 Crude Oil 9.61 Oil & Gas 12.94
Healthcare 7.35 FMCG 8.09 Finance 8.69 Consumer Goods 11.17
FMCG 6.15 Crude Oil 7.88 Power 7.41 Auto & Auto Anc. 5.58
Concentration(%)
Top 5
Top10
Market Capitalisation
LargeCap (%)
MidCap (%)
SmallCap (%)
Debt/Other (%)
Wt. Avg Market Cap (in
Rs Cr)
7.89 2.53 2.20 --
2,89,786 3,13,246 3,03,013 4,65,956
9.98 9.85 6.36 --
0.00 0.96 0.00 --
51.99 49.04 54.10 61.82
82.12 86.67 91.44 100.00
Top 5 Sectors
34.53 34.75 33.56 42.66
12.84 11.60 12.32 8.96
Top 10 Stocks
Portfolio Composition(%)
29.46 25.27 14.65 32.28
3.78 2.93 1.80 2.89
13.98 14.35 19.16 17.20
-3.59 -5.10 -11.23 -0.82
3 Year Rolling Return** (%)
91.67 86.11 80.56 97.22
7.83 7.43 8.22 10.20
30.94 30.58 31.97 30.46
-22.96 -27.21 -44.07 -25.02
1 Year Rolling Return** (%)
63.89 61.11 63.89 75.00
3.56 2.34 1.79 7.06
21.02 21.55 35.05 21.61
0.95 0.98 1.50 1.00
9.74 9.19 8.19 11.73
13.44 19.19 18.40 --
7.85 6.28 -2.30 8.72
5.53 4.62 2.52 9.61
12.71 13.26 10.87 14.17
31.89 33.71 29.70 36.21
29 64 51 50
10.65 11.90 13.16 11.44
4429 18746 17566
Blended Towards Growth Blended Towards Growth Blended Towards Growth Blended
Mahesh Patil Mahesh PatilPrashant Jain,Anand
LaddhaIndex
24-Oct-05 30-Aug-02 03-Sep-96
Aditya Birla SL Focused
Equity Fund(G)
Aditya Birla SL Frontline
Equity Fund(G)HDFC Top 100 Fund(G) NIFTY 50 - TRI
Large Cap Large Cap Large Cap Large Cap

DECEMBER 2020 | ISSUE 96 55
Alpha Strategist | ‘Winter Harvest’
*PE PB for Indices are from NSE - * Returns on 3 t 20200 h Nov
**Rolling Returns on a monthly basis : 1 Year time period – 16 - 20, 3 Year time period - 14 - 20Nov Nov Nov Nov
Scheme Name
Category
Fund Manager
Inception Date
Latest AUM (In INR Crs)
Investment Style
No of Stock
Returns* (%)
1M
3M
6M
1 Yr
3 Yr
5 Yr
Since Inception
Risk Measures
Standard Dev
Beta
Postive
Mean
Max
Min
Postive
Mean
Max
Min
Valuations
PE
PB
ROE
HDFC Bank 10.94 HDFC Bank 11.27 Adani Green 5.27 HDFC Bank 11.21
Bajaj Finance 10.38 ICICI Bank 5.89 Avenue Super. 4.04 Reliance Industr 11.17
Infosys 8.58 Infosys 4.35 Info Edg.(India) 3.87 H D F C 7.23
Kotak Mah. Bank 7.63 HCL Technologies 4.34 Tata Consumer 3.84 Infosys 7.21
TCS 6.52 Divi's Lab. 4.05 ICICI Lombard 3.75 ICICI Bank 5.84
Reliance Industr 5.69 H D F C 3.97 Dabur India 3.35 TCS 5.04
ICICI Bank 5.30 Reliance Industr 3.64 Godrej Consumer 3.14 Kotak Mah. Bank 5.00
Avenue Super. 4.97 ITC 3.57 Bandhan Bank 2.94 Hind. Unilever 3.42
Hind. Unilever 3.31 Larsen & Toubro 3.41 Aurobindo Pharma 2.90 ITC 3.03
Nestle India 3.28 Shree Cement 2.93 Pidilite Inds. 2.79 Axis Bank 2.67
Others 33.41 Others 52.58 Others 64.10 Others 38.18
Bank 23.87 Bank 24.46 FMCG 16.14 BFSI 39.28
IT 16.53 Auto & Auto Anc. 11.72 Healthcare 14.78 IT 15.75
Finance 13.22 IT 9.49 Finance 7.72 Oil & Gas 12.94
Healthcare 7.41 Finance 7.26 Power 6.50 Consumer Goods 11.17
FMCG 7.03 Healthcare 7.21 IT 6.31 Auto & Auto Anc. 5.58
Concentration(%)
Top 5
Top10
Market Capitalisation
LargeCap (%)
MidCap (%)
SmallCap (%)
Debt/Other (%)
Wt. Avg Market Cap (in
Rs Cr)
4.18 3.70 0.27 --
4,18,822 2,70,100 60,728 4,65,956
0.00 10.26 4.03 0.00
0.00 0.89 0.00 0.00
66.59 47.42 35.90 61.82
95.82 85.15 95.69 100.00
Top 5 Sectors
44.04 29.90 20.78 42.66
12.99 12.03 10.72 8.96
Top 10 Stocks
Portfolio Composition(%)
41.67 26.71 31.85 32.28
5.41 3.21 3.42 2.89
20.36 13.81 18.52 17.20
6.76 -3.95 -5.54 -0.82
3 Year Rolling Return** (%)
100.00 91.67 77.78 97.22
12.46 7.77 8.44 10.20
38.03 30.23 45.67 30.46
-9.06 -24.12 -25.34 -25.02
1 Year Rolling Return** (%)
86.11 61.11 50.00 75.00
11.83 3.51 0.99 7.06
17.44 21.85 21.13 21.61
0.76 0.99 1.00 1.00
13.33 9.81 9.35 11.73
12.30 10.66 9.89 --
12.05 9.11 5.78 8.72
13.10 6.12 0.57 9.61
15.33 15.59 12.93 14.17
30.79 35.26 25.88 36.21
28 54 50 50
10.89 14.00 10.96 11.44
20480 24880 893
Growth Blended Towards Growth Value Blended
Shreyash Devalkar Sohini Andani Kayzad Eghlim Index
05-Jan-10 20-Jan-06 25-Jun-10
Axis Bluechip Fund-Reg(G)
SBI BlueChip Fund-Reg(G) ICICI Pru Nifty Next 50Index Fund(G)
NIFTY 50 - TRI
Large Cap Large Cap Large Cap Large Cap

Alpha Strategist | ‘Winter Harvest’
56DECEMBER 2020 | ISSUE 96
*PE PB for Indices are from NSE - * Returns on 3 t 20200 h Nov
**Rolling Returns on a monthly basis : 1 Year time period – 16 - 20, 3 Year time period - 14 - 20Nov Nov Nov Nov
Scheme Name
Category
Fund Manager
Inception Date
Latest AUM (In INR Crs)
Investment Style
No of Stock
Returns* (%)
1M
3M
6M
1 Yr
3 Yr
5 Yr
Since Inception
Risk Measures
Standard Dev
Beta
Postive
Mean
Max
Min
Postive
Mean
Max
Min
Valuations
PE
PB
ROE
HDFC Bank 11.23 HDFC Bank 10.56 HDFC Bank 7.48 HDFC Bank 11.20 HDFC Bank 11.21
Reliance Industr 9.00 H D F C 9.82 H D F C 7.44 Reliance Industr 11.16 Reliance Industr 11.17
Infosys 8.34 Kotak Mah. Bank 9.63 Bajaj Finance 6.51 H D F C 7.23 H D F C 7.23
ICICI Bank 7.46 TCS 7.10 Bajaj Finserv 5.17 Infosys 7.21 Infosys 7.21
Axis Bank 4.01 ICICI Bank 6.13 HDFC Life Insur. 3.99 ICICI Bank 5.84 ICICI Bank 5.84
TCS 3.79 Infosys 6.02 Infosys 2.99 TCS 5.04 TCS 5.04
Bharti Airtel 3.68 HDFC Life Insur. 5.74 TCS 2.90 Kotak Mah. Bank 5.00 Kotak Mah. Bank 5.00
Hind. Unilever 3.38 P I Industries 4.81 Tech Mahindra 2.76 Hind. Unilever 3.41 Hind. Unilever 3.42
St Bk of India 2.85 P & G Health Ltd 4.77 HCL Technologies 2.60 ITC 3.03 ITC 3.03
Larsen & Toubro 2.77 Container Corpn. 3.91 Voltas 2.53 Axis Bank 2.67 Axis Bank 2.67
Others 43.48 Others 31.52 Others 55.63 Others 38.22 Others 38.18
Bank 25.84 Bank 26.31 Finance 20.83 Bank 27.25 BFSI 39.28
IT 13.63 IT 13.12 IT 14.84 IT 15.74 IT 15.75
Crude Oil 11.53 Healthcare 11.28 FMCG 12.09 Crude Oil 12.59 Oil & Gas 12.94
FMCG 9.79 Finance 9.82 Auto & Auto Anc. 8.57 Finance 10.50 Consumer Goods 11.17
Healthcare 7.68 Insurance 8.03 Insurance 8.29 FMCG 8.35 Auto & Auto Anc. 5.58
Concentration(%)
Top 5
Top10
Market Capitalisation
LargeCap (%)
MidCap (%)
SmallCap (%)
Debt/Other (%)
Wt. Avg Market Cap (in
Rs Cr)3,88,388 3,37,486 2,17,204 4,65,618 4,65,956
0.88 6.29 0.00 0.00 --
1.65 2.26 0.13 0.06 --
85.90 82.46 85.12 99.94 100.00
11.58 8.99 14.76 0.00 --
56.52 68.48 44.37 61.78 61.82
Top 10 Stocks
Top 5 Sectors
40.04 43.23 30.58 42.64 42.66
Portfolio Composition(%)
3.14 5.01 5.59 2.94 2.89
12.03 12.82 15.80 11.11 8.96
26.13 39.07 35.37 26.48 32.28
19.43 14.02 -- 16.70 17.20
-0.89 -0.18 -- -1.19 -0.82
97.22 97.22 -- 97.22 97.22
11.48 8.79 -- 9.79 10.20
-24.11 -13.56 -- -25.41 -25.02
3 Year Rolling Return** (%)
6.37 5.91 -- 6.68 7.06
38.58 32.15 -- 29.86 30.46
1 Year Rolling Return** (%)
75.00 63.89 -- 75.00 75.00
21.17 20.98 -- 21.67 21.61
0.97 0.93 -- 1.00 1.00
12.41 11.31 -- 11.30 11.73
14.85 13.95 17.78 10.90 --
6.80 12.81 19.27 8.11 8.72
7.21 8.74 -- 9.20 9.61
11.47 16.54 16.87 14.10 14.17
34.51 31.84 36.92 36.04 36.21
53 24 45 50 50
9.86 10.98 12.52 11.42 11.44
20797 1477 501
Blended Towards Value Earnings Growth Blended Blended Blended
Gaurav Misra,Harshad
Borawake
Siddharth Bothra,Abhiroop
Mukherjee
Anil Ghelani,Diipesh
ShahSharwan Kumar Goyal Index
09-Apr-08 13-May-13 10-Jun-19 28-Mar-00
Mirae Asset Large Cap
Fund-Reg(G)
Motilal Oswal Focused 25 Fund-
Reg(G)DSP Quant Fund-Reg(G)
UTI Nifty Index Fund-
Reg(G)NIFTY 50 - TRI
Large Cap Large Cap Thematic Large Cap Large Cap

DECEMBER 2020 | ISSUE 96 57
Alpha Strategist | ‘Winter Harvest’
*PE PB for Indices are from NSE - * Returns on 3 t 20200 h Nov
**Rolling Returns on a monthly basis : 1 Year time period – 16 - 20, 3 Year time period - 14 - 20Nov Nov Nov Nov
Scheme Name
Category
Fund Manager
Inception Date
Latest AUM (In INR Crs)
Investment Style
No of Stock
Returns* (%)
1M
3M
6M
1 Yr
3 Yr
5 Yr
Since Inception
Risk Measures
Standard Dev
Beta
Postive
Mean
Max
Min
Postive
Mean
Max
Min
Valuations
PE
PB
ROE
ICICI Bank 8.81 Bajaj Finance 10.33 St Bk of India 9.73 NTPC 10.05 HDFC Bank 7.86
HDFC Bank 8.64 TCS 8.45 ICICI Bank 9.01 Bharti Airtel 9.52 Reliance Industr 7.83
Infosys 6.52 Kotak Mah. Bank 8.18 Infosys 7.53 Hindalco Inds. 8.70 H D F C 5.07
Dr Reddy's Labs 5.74 HDFC Bank 7.39 Larsen & Toubro 5.67 O N G C 6.30 Infosys 5.06
Bharti Airtel 4.98 Reliance Industr 6.63 ITC 5.12 Sun Pharma.Inds. 6.12 ICICI Bank 4.10
Kotak Mah. Bank 3.32 H D F C 5.82 NTPC 4.45 Tata Power Co. 5.94 TCS 3.53
HCL Technologies 3.31 Avenue Super. 5.65 Coal India 4.40 GAIL (India) 3.93 Kotak Mah. Bank 3.50
Sun Pharma.Inds. 3.04 Maruti Suzuki 5.38 Power Grid Corpn 4.22 Power Grid Corpn 3.78 Hind. Unilever 2.40
ICICI Lombard 2.95 Info Edg.(India) 5.34 Axis Bank 4.00 Coal India 3.68 ITC 2.12
Reliance Industr 2.36 Divi's Lab. 4.99 Power Fin.Corpn. 3.34 Tata Chemicals 3.53 Axis Bank 1.87
Others 50.32 Others 31.84 Others 42.54 Others 38.47 Others 56.66
Bank 23.93 IT 18.60 Bank 25.78 Power 21.70 BFSI 33.58
Healthcare 14.68 Finance 17.80 Power 10.25 Crude Oil 12.86 Consumer Goods 13.48
IT 10.58 Bank 15.85 IT 9.64 Non - Ferrous Metals 10.78 IT 12.49
Auto & Auto Anc. 6.03 Auto & Auto Anc. 8.80 Healthcare 7.77 Telecom 9.52 Oil & Gas 10.29
Finance 5.29 Chemicals 7.66 Finance 7.16 Healthcare 6.93 Pharma & Health. 5.46
Concentration(%)
Top 5
Top10
Market Capitalisation
LargeCap (%)
MidCap (%)
SmallCap (%)
Debt/Other (%)
Wt. Avg Market Cap (in
Rs Cr)2,29,792 3,76,926 1,86,393 83,751 3,36,301
6.22 0.00 4.57 7.41 5.65
2.56 5.55 2.98 5.72 --
67.56 89.53 82.62 70.62 80.47
23.66 4.92 9.83 16.25 13.42
49.68 68.16 57.46 61.53 43.34
Top 10 Stocks
Top 5 Sectors
34.69 40.99 37.06 40.68 29.92
9.30 12.20 12.08 8.51 5.32
32.96 47.56 12.27 12.69 52.92
3.07 5.80 1.48 1.08 2.81
Portfolio Composition(%)
-4.92 3.40 -5.58 -- -3.14
9.40 13.10 8.06 -- 9.55
17.95 19.60 19.50 -- 16.88
3 Year Rolling Return** (%)
86.11 100.00 80.56 -- 94.44
33.51 45.15 36.86 -- 37.65
-26.32 -13.69 -32.81 -- -26.62
55.56 75.00 55.56 -- 69.44
2.85 9.35 1.47 -- 4.84
1.05 0.96 1.03 -- 1.00
1 Year Rolling Return** (%)
23.43 22.15 23.93 -- 22.28
11.81 14.78 7.50 -- 11.23
21.94 15.84 17.49 1.65 --
9.33 13.08 -2.96 -1.15 10.36
5.45 10.69 0.92 -- 6.64
15.91 18.12 10.82 6.18 14.64
37.43 37.90 30.68 23.33 37.84
63 20 46 34 500
12.93 13.57 14.45 15.71 11.94
12109 13359 20546
Blended Towards Growth Blended towards Growth Value Value Blended
Anil Shah Jinesh GopaniPrashant Jain,Anand
Laddha
Sankaran Naren,Roshan
ChutkeyIndex
14-Sep-98 05-Jul-12 02-Jan-95 15-Jan-19
Aditya Birla SL Equity
Fund(G)
Axis Focused 25 Fund-
Reg(G)HDFC Equity Fund(G) ICICI Pru India Opp Fund(G) NIFTY 500 - TRI
Multi Cap Multi Cap Multi Cap Multi Cap Multicap

DECEMBER 2020 | ISSUE 96 58
Alpha Strategist | ‘Winter Harvest’
*PE PB for Indices are from NSE - * Returns on 3 t 20200 h Nov
**Rolling Returns on a monthly basis : 1 Year time period – 16 - 20, 3 Year time period - 14 - 20Nov Nov Nov Nov
Scheme Name
Category
Fund Manager
Inception Date
Latest AUM (In INR Crs)
Investment Style
No of Stock
Returns* (%)
1M
3M
6M
1 Yr
3 Yr
5 Yr
Since Inception
Risk Measures
Standard Dev
Beta
Postive
Mean
Max
Min
Postive
Mean
Max
Min
Valuations
PE
PB
ROE
HDFC Bank 7.26 HDFC Bank 10.03 Infosys 5.80 Reliance Industr 8.03 HDFC Bank 7.86
ICICI Bank 6.48 ICICI Bank 8.14 Reliance Industr 5.66 HDFC Bank 6.35 Reliance Industr 7.83
Bharti Airtel 6.09 Infosys 7.39 TCS 5.52 ICICI Bank 6.35 H D F C 5.07
Infosys 3.80 Reliance Industr 6.39 HDFC Bank 4.46 Infosys 6.27 Infosys 5.06
Reliance Industr 3.57 Bharti Airtel 5.19 ICICI Bank 3.80 TCS 5.58 ICICI Bank 4.10
NTPC 3.49 Axis Bank 3.97 SRF 3.65 UltraTech Cem. 4.48 TCS 3.53
Motherson Sumi 3.19 Larsen & Toubro 3.31 Coromandel Inter 3.56 Axis Bank 3.63 Kotak Mah. Bank 3.50
TVS Motor Co. 2.91 HCL Technologies 2.59 Dr Reddy's Labs 3.04 Hind. Unilever 3.43 Hind. Unilever 2.40
St Bk of India 2.72 Sun Pharma.Inds. 2.47 Jindal Steel 2.91 Larsen & Toubro 3.36 ITC 2.12
Sun Pharma.Inds. 2.51 United Spirits 2.45 Hind. Unilever 2.72 SRF 3.01 Axis Bank 1.87
Others 58.00 Others 48.07 Others 58.90 Others 49.52 Others 56.66
Bank 21.21 Financial Services 25.12 Bank 12.05 Bank 22.10 BFSI 33.58
IT 11.11 Oil & Gas 15.67 IT 11.32 IT 11.85 Consumer Goods 13.48
Auto & Auto Anc. 9.71 IT 14.00 Const Materials 8.55 Const Materials 9.03 IT 12.49
FMCG 7.39 Auto & Auto Anc. 8.81 FMCG 7.90 Crude Oil 8.99 Oil & Gas 10.29
Healthcare 7.17 Pharma 6.45 Capital Goods 6.66 FMCG 8.85 Pharma & Health. 5.46
Concentration(%)
Top 5
Top10
Market Capitalisation
LargeCap (%)
MidCap (%)
SmallCap (%)
Debt/Other (%)
Wt. Avg Market Cap (in
Rs Cr)2,12,144 2,65,893 2,48,160 3,26,810 3,36,301
11.94 8.69 4.81 1.13 5.65
4.97 3.90 2.44 1.08 --
63.59 68.73 51.94 78.14 80.47
19.50 18.69 40.81 19.65 13.42
42.00 51.93 41.10 50.48 43.34
Top 10 Stocks
Top 5 Sectors
27.19 37.14 25.23 32.58 29.92
9.05 11.72 12.98 11.79 5.32
24.29 25.94 29.63 30.12 52.92
2.20 3.04 3.85 3.55 2.81
Portfolio Composition(%)
-6.84 -1.31 -2.23 -2.05 -3.14
8.04 11.76 9.39 10.39 9.55
16.21 19.05 16.63 17.79 16.88
-30.31 -25.22 -21.12 -23.87 -26.62
83.33 97.22 94.44 94.44 94.44
3 Year Rolling Return** (%)
2.00 7.07 4.95 4.98 4.84
28.01 45.63 34.87 34.31 37.65
0.95 1.00 0.93 0.94 1.00
66.67 72.22 66.67 63.89 69.44
1 Year Rolling Return** (%)
21.16 22.57 21.14 21.18 22.28
8.28 12.50 11.93 11.52 11.23
13.93 13.40 17.77 13.03 --
2.12 13.66 12.64 6.10 10.36
3.68 6.94 7.00 6.49 6.64
12.13 12.10 15.19 13.86 14.64
31.04 33.32 33.84 31.77 37.84
83 48 49 49 500
13.26 11.65 11.52 11.11 11.94
5847 5609 4365
Value Value Blended towards Growth Blended towards Growth Blended
Sankaran Naren,Rajat
Chandak
Taher Badshah,Dhimant
KothariHarsha Upadhyaya Harsha Upadhyaya Index
01-Oct-94 12-Apr-07 10-Sep-04 17-Sep-09
ICICI Pru Multicap Fund(G)Invesco India Contra
Fund(G)Kotak Equity Opp Fund(G)
Kotak Standard Multicap
Fund(G)NIFTY 500 - TRI
Multi Cap Multi Cap Multi Cap Multi Cap Multicap

DECEMBER 2020 | ISSUE 96 59
Alpha Strategist | ‘Winter Harvest’
*PE PB for Indices are from NSE - * Returns on 3 t 20200 h Nov
**Rolling Returns on a monthly basis : 1 Year time period – 16 - 20, 3 Year time period - 14 - 20Nov Nov Nov Nov
Scheme Name
Category
Fund Manager
Inception Date
Latest AUM (In INR Crs)
Investment Style
No of Stock
Returns* (%)
1M
3M
6M
1 Yr
3 Yr
5 Yr
Since Inception
Risk Measures
Standard Dev
Beta
Postive
Mean
Max
Min
Postive
Mean
Max
Min
Valuations
PE
PB
ROE
HDFC Bank 8.03 HDFC Bank 9.29 HDFC Bank 10.00 Bajaj Finance 11.38 HDFC Bank 7.86
ICICI Bank 7.74 HDFC Life Insur. 8.12 Infosys 8.59 Kotak Mah. Bank 9.32 Reliance Industr 7.83
Max Financial 6.14 Infosys 5.60 ICICI Bank 8.49 HDFC Bank 8.21 H D F C 5.07
Jubilant Food. 4.68 Vaibhav Global 5.59 Bharti Airtel 4.73 Avenue Super. 7.77 Infosys 5.06
Torrent Pharma. 4.61 Maruti Suzuki 5.37 Axis Bank 3.84 TCS 7.41 ICICI Bank 4.10
Bharti Airtel 4.39 H D F C 5.17 HCL Technologies 2.61 Info Edg.(India) 5.96 TCS 3.53
Dr Lal Pathlabs 4.29 AU Small Finance 4.85 NTPC 2.41 Nestle India 4.22 Kotak Mah. Bank 3.50
Axis Bank 4.25 Eicher Motors 4.62 Maruti Suzuki 2.03 H D F C 4.05 Hind. Unilever 2.40
United Breweries 3.74 TCS 3.86 Cipla 1.79 Hind. Unilever 4.05 ITC 2.12
Cholaman.Inv.&Fn 3.53 Reliance Industr 3.76 Larsen & Toubro 1.79 HDFC Life Insur. 4.02 Axis Bank 1.87
Others 48.61 Others 43.77 Others 53.72 Others 33.60 Others 56.66
Bank 20.01 Bank 17.86 Bank 25.18 Others 24.63 BFSI 33.58
Finance 15.50 Finance 15.21 IT 14.28 Bank 17.53 Consumer Goods 13.48
Healthcare 11.48 Auto & Auto Anc. 13.42 Healthcare 7.90 IT 17.19 IT 12.49
FMCG 10.25 Insurance 11.81 Auto & Auto Anc. 6.71 Finance 15.43 Oil & Gas 10.29
Consumer Durables 6.01 IT 10.99 Telecom 4.73 FMCG 8.27 Pharma & Health. 5.46
Concentration(%)
Top 5
Top10
Market Capitalisation
LargeCap (%)
MidCap (%)
SmallCap (%)
Debt/Other (%)
Wt. Avg Market Cap (in
Rs Cr)1,90,687 2,96,496 2,23,849 2,79,864 3,36,301
8.18 5.59 11.13 0.00 5.65
0.80 5.31 4.30 0.53 --
54.97 77.50 73.12 70.73 80.47
36.06 11.60 11.45 3.47 13.42
51.39 56.23 46.28 66.40 43.34
Top 10 Stocks
Top 5 Sectors
31.20 33.96 35.65 44.09 29.92
11.94 15.37 11.51 14.98 5.32
36.16 36.00 26.40 41.88 52.92
4.32 5.53 3.04 6.27 2.81
Portfolio Composition(%)
-- -5.06 -7.55 -- -3.14
-- 9.62 8.40 -- 9.55
-- 21.14 17.60 -- 16.88
-- -24.99 -35.15 -- -26.62
-- 77.78 83.33 -- 94.44
3 Year Rolling Return** (%)
-- 2.07 1.33 -- 4.84
-- 43.05 42.31 -- 37.65
-- 0.96 1.05 -- 1.00
-- 52.78 50.00 -- 69.44
1 Year Rolling Return** (%)
-- 22.13 23.06 -- 22.28
-- 10.14 8.07 -- 11.23
10.78 17.05 13.51 25.60 --
6.29 5.47 4.83 -- 10.36
-- 2.50 0.81 -- 6.64
15.24 12.37 13.12 16.30 14.64
32.48 32.46 35.95 32.49 37.84
28 29 66 15 500
12.38 9.81 10.11 13.15 11.94
538 11791 4171
Earnings Growth Earnings Growth Value Blended towards Growth Blended
Aditya Khemani,Abhiroop
Mukherjee
Akash Singhania,Abhiroop
Mukherjee
Amit Ganatra,Anand
Laddha
Jinesh Gopani,Hitesh
DasIndex
17-Oct-19 28-Apr-14 01-Feb-94 12-Feb-20
Motilal Oswal Large &
Midcap Fund-Reg(G)
Motilal Oswal Multicap 35
Fund-Reg(G)
HDFC Capital Builder
Value Fund(G)
Axis ESG Equity Fund-
Reg(G)NIFTY 500 - TRI
Multi Cap Multi Cap Multi Cap Thematic Multicap

DECEMBER 2020 | ISSUE 96 60
Alpha Strategist | ‘Winter Harvest’
DECEMBER 2020 | ISSUE 96 60
*PE PB for Indices are from NSE - * Returns on 3 t 20200 h Nov
**Rolling Returns on a monthly basis : 1 Year time period – 16 - 20, 3 Year time period - 14 - 20Nov Nov Nov Nov
Scheme Name
Category
Fund Manager
Inception Date
Latest AUM (In INR Crs)
Investment Style
No of Stock
Returns* (%)
1M
3M
6M
1 Yr
3 Yr
5 Yr
Since Inception
Risk Measures
Standard Dev
Beta
Postive
Mean
Max
Min
Postive
Mean
Max
Min
Valuations
PE
PB
ROE
Balkrishna Inds 5.57 Supreme Inds. 5.90 Max Financial 9.44 Cholaman.Inv.&Fn 4.90 Apollo Hospitals 2.68
Cholaman.Inv.&Fn 5.25 Coromandel Inter 4.10 Endurance Tech. 6.06 P I Industries 4.37 Shriram Trans. 2.39
Aarti Industries 3.94 The Ramco Cement 4.10 P I Industries 5.86 Voltas 3.95 Jubilant Food. 2.28
Ipca Labs. 3.34 P I Industries 3.56 Bajaj Finance 5.08 Ipca Labs. 3.79 Voltas 2.23
Sundram Fasten. 3.15 Schaeffler India 2.89 Tube Investments 4.61 HDFC Bank 3.48 P I Industries 2.11
Voltas 3.10 Sheela Foam 2.80 Crompton Gr. Con 4.45 Bajaj Finance 3.42 Zee Entertainmen 2.09
Bharat Electron 2.80 Kajaria Ceramics 2.60 Ipca Labs. 4.43 City Union Bank 3.21 MRF 1.92
Atul 2.69 Thermax 2.50 Coromandel Inter 4.41 Astral Poly Tech 3.10 Trent 1.92
Max Financial 2.60 Cadila Health. 2.25 Metropolis Healt 4.38 Tata Consumer 2.91 AU Small Finance 1.87
City Union Bank 2.54 Atul 2.22 Abbott India 4.26 Trent 2.89 Cholaman.Inv.&Fn 1.82
Others 65.04 Others 67.08 Others 47.03 Others 63.97 Others 78.69
Finance 13.10 Auto & Auto Anc. 14.26 Finance 21.23 Healthcare 12.28 BFSI 24.30
Auto & Auto Anc. 13.08 Chemicals 11.74 Healthcare 14.53 Finance 10.70 Consumer Goods 14.87
Healthcare 10.96 Constr Materials 9.63 Chemicals 13.99 Bank 10.29 Auto & Auto Anc. 10.63
Chemicals 9.64 Healthcare 8.58 Auto & Auto Anc. 10.67 Retailing 9.48 Pharma & Health. 7.45
Consumer Durables 8.95 Bank 7.30 Consumer Durables 10.44 Consumer Durables 9.26 Industrials 6.55
Concentration(%)
Top 5
Top10
Market Capitalisation
LargeCap (%)
MidCap (%)
SmallCap (%)
Debt/Other (%)
Wt. Avg Market Cap (in
Rs Cr)20,737 26,805 45,518 77,693 22,126
16.96 17.87 5.76 1.41 2.73
5.61 1.38 4.78 4.00 --
9.18 12.90 17.34 23.69 1.92
68.25 67.84 72.12 70.90 95.37
34.96 32.92 52.97 36.03 21.31
Top 10 Stocks
Top 5 Sectors
21.24 20.56 31.05 20.49 11.69
10.30 11.76 13.56 14.31 4.99
26.84 31.06 48.67 38.79 45.01
2.76 3.65 6.60 5.55 2.25
Portfolio Composition(%)
-7.81 -5.61 -7.42 5.40 -11.10
8.15 9.23 4.76 11.90 6.90
18.62 19.61 17.02 18.28 20.27
83.33 88.89 77.78 100.00 77.78
41.66 43.00 30.78 41.99 49.28
-30.67 -24.08 -24.20 -10.60 -35.06
3 Year Rolling Return** (%)
52.78 58.33 50.00 86.11 41.67
0.77 3.32 -0.09 11.61 -1.20
0.89 0.86 0.84 0.66 1.00
25.51 24.90 25.39 19.62 28.29
1 Year Rolling Return** (%)
10.48 12.33 6.96 13.73 9.45
14.56 12.01 16.48 17.31 --
16.20 17.45 5.87 20.11 15.56
2.57 5.21 1.60 12.79 0.65
15.11 17.92 14.70 16.18 18.44
44.30 44.55 40.59 34.55 49.26
70 68 29 52 100
13.83 13.51 11.41 11.43 15.64
24215 8654 1786
Blended towards Value Blended towards Growth Earnings Growth Earnings Growth Blended
Chirag Setalvad,Anand
LaddhaPankaj Tibrewal
Niket Shah,Abhiroop
MukherjeeShreyash Devalkar Index
05-Jul-07 03-Apr-07 24-Feb-14 18-Feb-11
HDFC Mid-Cap OpportunitiesFund(G)
Kotak Emerging EquityFund(G)
Motilal Oswal Midcap 30Fund-Reg(G)
Axis Midcap Fund-Reg(G) Nifty Midcap 100 - TRI
Mid Cap Mid Cap Mid Cap Mid Cap Mid Cap

61
Alpha Strategist | ‘Winter Harvest’
*PE PB for Indices are from NSE - * Returns on 3 t 20200 h Nov
**Rolling Returns on a monthly basis : 1 Year time period – 16 - 20, 3 Year time period - 14 - 20Nov Nov Nov Nov
Scheme Name
Category
Fund Manager
Inception Date
Latest AUM (In INR Crs)
Investment Style
No of Stock
Returns* (%)
1M
3M
6M
1 Yr
3 Yr
5 Yr
Since Inception
Risk Measures
Standard Dev
Beta
Postive
Mean
Max
Min
Postive
Mean
Max
Min
Valuations
PE
PB
ROE
Atul 4.72 Firstsour.Solu. 4.54 Sheela Foam 3.78 Cera Sanitary. 4.53 Laurus Labs 4.30
Ipca Labs. 4.71 Bajaj Electrical 4.29 Supreme Inds. 3.67 V-Mart Retail 3.87 Dixon Technolog. 3.07
Tube Investments 3.64 Persistent Sys 3.65 Century Plyboard 3.60 V I P Inds. 3.63 Multi Comm. Exc. 3.06
Ratnamani Metals 3.59 Aurobindo Pharma 3.63 Ratnamani Metals 3.57 K E C Intl. 3.58 Indian Energy Ex 2.43
Manappuram Fin. 3.16 Sonata Software 3.26 J K Cements 3.34 Rallis India 3.18 Deepak Nitrite 2.37
APL Apollo Tubes 3.03 P & G Health Ltd 3.07 Dixon Technolog. 3.30 Orient Electric 3.10 Persistent Sys 2.21
Nilkamal Ltd 2.97 Chambal Fert. 3.00 Hawkins Cookers 2.88 Timken India 3.06 Granules India 2.13
Chambal Fert. 2.69 Aster DM Health. 2.73 Galaxy Surfact. 2.80 C D S L 3.00 I D F C 2.09
Welspun India 2.60 Atul 2.70 Persistent Sys 2.76 TCI Express 2.97 P & G Health Ltd 2.04
Suprajit Engg. 2.52 Finolex Inds. 2.48 Blue Star 2.75 Team Lease Serv. 2.61 Tata Elxsi 2.02
Others 66.36 Others 66.65 Others 67.56 Others 66.47 Others 74.28
Auto & Auto Anc. 15.73 IT 14.36 Consumer Durables 11.34 Consumer Goods 27.42 BFSI 16.84
Chemicals 13.55 Healthcare 13.85 Const Materials 11.28 Construction 15.93 Pharma & Health. 15.38
Healthcare 9.68 Auto & Auto Anc. 10.23 FMCG 10.85 Financial Services 9.89 Consumer Goods 12.82
Textile 7.78 Chemicals 9.96 Auto & Auto Anc. 10.01 Ind Manufacturing 9.72 IT 11.87
Const Materials 7.26 Infrastructure 6.81 Chemicals 8.92 Auto & Auto Anc. 7.57 Construction 8.39
Concentration(%)
Top 5
Top10
Market Capitalisation
LargeCap (%)
MidCap (%)
SmallCap (%)
Debt/Other (%)
Wt. Avg Market Cap (in
Rs Cr)7,478 7,925 15,116 7,928 7,423
73.81 77.20 68.00 72.23 95.99
5.60 6.95 4.43 8.45 --
0.00 4.60 3.64 0.00 0.29
20.59 11.26 23.93 19.32 3.68
33.64 33.35 32.44 33.53 25.72
Top 10 Stocks
Top 5 Sectors
19.83 19.37 17.96 18.79 15.23
12.73 10.01 10.26 11.57 8.20
21.46 20.50 36.27 30.23 39.88
2.73 2.05 3.72 3.50 3.27
Portfolio Composition(%)
-12.29 -8.22 -8.95 -- -18.71
5.38 11.11 6.96 -- 2.49
24.67 23.97 18.96 -- 21.02
69.44 77.78 86.11 -- 61.11
42.77 60.75 44.02 -- 58.73
-30.48 -41.77 -27.09 -- -45.30
3 Year Rolling Return** (%)
44.44 36.11 55.56 -- 33.33
-2.10 1.43 1.27 -- -7.35
0.83 0.79 0.81 -- 1.00
28.23 27.13 27.86 -- 32.44
1 Year Rolling Return** (%)
9.40 9.68 11.64 -- 4.68
15.21 12.13 15.14 10.94 --
29.43 9.99 28.33 16.64 14.25
0.24 -1.06 4.80 -- -7.71
16.75 13.73 21.86 12.21 17.89
57.26 52.47 62.61 38.35 65.05
67 73 59 44 100
10.68 13.00 14.08 11.70 13.12
5791 9323 2154
Earnings Growth Blended towards Value Blended towards Growth Blended towards Growth Blended
Vinit Sambre,Jay KothariChirag Setalvad,Anand
LaddhaPankaj Tibrewal
Taher Badshah,Pranav
GokhaleIndex
20-Jun-07 10-Apr-08 24-Feb-05 30-Oct-18
DSP Small Cap Fund-Reg(G)HDFC Small Cap Fund-
Reg(G)Kotak Small Cap Fund(G)
Invesco India Smallcap Fund-
Reg(G)Nifty Smallcap 100 - TRI
Small Cap Funds Small Cap Funds Small Cap Small Cap Funds Small Cap
DECEMBER 2020 | ISSUE 96

Alpha Strategist | ‘Winter Harvest’
DECEMBER 2020 | ISSUE 96 62
*PE PB for Indices are from NSE - * Returns on 3 t 20200 h Nov
**Rolling Returns on a monthly basis : 1 Year time period – 16 - 20, 3 Year time period - 14 - 20Nov Nov Nov Nov
Scheme Name CRISIL Hybrid 35+65 - AggressiveIndex
Category
Fund Manager --
Inception Date --
Latest AUM (In INR Crs)
Investment Style --
No of Stock
Returns* (%)
1M 7.76
3M 8.63
6M 24.86
1 Yr 12.65
3 Yr 9.19
5 Yr 11.40
Since Inception --
Risk Measures
Standard Dev 15.28
Beta 1.00
Postive 54.05
Mean 7.81
Max 20.61
Min -14.87
Postive 70.27
Mean 9.98
Max 13.97
Min 1.16
Valuations
PE --
PB --
ROE --
HDFC Bank 6.77 HDFC Bank 10.24 NTPC 8.01
Infosys 5.49 ICICI Bank 7.64 Bharti Airtel 7.94
ICICI Bank 3.66 H D F C 6.45 ICICI Bank 7.54
Reliance Industr 3.56 Infosys 5.77 O N G C 4.29
Kotak Mah. Bank 3.08 Reliance Industr 4.27 ITC 4.14
UltraTech Cem. 2.66 Aurobindo Pharma 3.72 Hindalco Inds. 3.88
H D F C 2.64 Larsen & Toubro 3.68 Vedanta 3.81
Axis Bank 2.01 ITC 3.02 Sun Pharma.Inds. 3.54
Whirlpool India 1.80 Axis Bank 2.63 Infosys 2.96
Cholaman.Inv.&Fn 1.76 St Bk of India 2.22 I O C L 2.23
Others 66.55 Others 50.36 Others 51.66
Bank 20.33 Bank 29.36 Bank 20.57
IT 12.85 Finance 16.51 Power 12.38
Finance 11.17 Infrastructure 6.68 Non - Ferrous Metals 9.27
Healthcare 9.38 IT 6.43 Telecom 7.94
Power 4.98 G-Sec 6.40 Crude Oil 7.08
Concentration(%)
Top 5 --
Top10 --
Market Capitalisation
LargeCap (%) --
MidCap (%) --
SmallCap (%) --
Debt/Other (%) --
Wt. Avg Market Cap (in
Rs Cr)--
22.93 26.00 26.88
2,15,874 2,49,732 1,07,556
21.73 6.61 6.58
3.99 6.66 5.87
33.45 49.64 48.34
51.36 60.73 60.67
11.48 11.19 9.08
Top 10 Stocks
Top 5 Sectors
22.57 34.37 31.92
43.09 26.71 18.11
4.95 2.99 1.65
12.31 15.36 15.05
-5.66 -4.77 -2.48
77.78 83.33 94.44
6.08 5.42 8.53
25.91 35.09 24.78
-24.64 -22.03 -21.18
50.00 52.78 63.89
0.44 0.98 3.00
2.42 1.54 3.24
17.83 18.16 17.26
0.00 0.00 0.00
7.78 6.08 8.87
Aditya Birla SL Equity Hybrid'95 Fund(G)
HDFC Hybrid EquityFund(G)
ICICI Pru Equity & DebtFund(G)
Balanced Balanced Balanced
62 40 67
7995 17168 16331
Blended towards Growth Blended towards Value Value
1 Year Rolling Return** (%)
3 Year Rolling Return** (%)
Portfolio Composition(%)
Satyabrata Mohanty,DhavalShah
Chirag Setalvad,AnandLaddha
Sankaran Naren,ManishBanthia
10-Feb-95 20-Apr-05 03-Nov-99
10.14 10.58 12.06
13.95 11.01 6.64
31.44 28.93 19.07
18.58 12.01 13.36
6.50 7.32 1.54

DECEMBER 2020 | ISSUE 96 63
Notes
Alpha Strategist | ‘Winter Harvest’

DECEMBER 2020 | ISSUE 96 64
Notes
Alpha Strategist | ‘Winter Harvest’

DECEMBER 2020 | ISSUE 96 65
Investment Charter Template
Alpha Strategist | ‘Winter Harvest’
General Information & Client Profile
Investment Horizon
Particulars Details
Liquidity Requirements
Cash Flow Requirements
Restricted Investments
Performance Benchmarking
Portfolio Review
Review of Guidelines
Portfolio Characteristics
1Return expectations for portfolio since inception for active and closed holdings. There is no guarantee that the performance will be achieved.
2Average age of portfolio holding – Including Closed Holdings
Investment Charter – Exposure Guidelines
Market Cap Limits
Interest Rate Risk
Mandate Criteria Portfolio Compliance
Investment Charter – Asset Allocation Guidelines
Asset Allocation
Equity (Mutual Funds, Direct Equity, AIFs) –
Fixed Income ( –Mutual Funds, Structures, AIFs, Direct Debt)
Alternatives (Real Estate, Private Equity, Long Short Funds) –
Liquid Assets (Liquid, Ultra Short-Term, and Arbitrage Funds)
–
ReturnExpectations
1
Investment TimeHorizon
2
Mandate Criteria Portfolio Compliance
Credit Quality
Mutual Funds &
Managed Accounts
Closed Ended
Investments
Other Instruments
Proprietary Products
Large Cap (Top 100 Companies) –
Mid Cap (101 to 250th Company) –
Small Cap (251st Company Onwards) –
Modified Duration –
AAA and Above –
AA & Above –
A & Below –
Single AMC –
Single Scheme –
Maximum allocation to closed ended investments –
Single Issuer -
Single Instrument-
Own AMC/ Self-Managed Funds/ Structures/ Debt -

Inte
ntion
ally l
eft b
lank

DECEMBER 2020 | ISSUE 96 66
Motilal Oswal Wealth Management Limited
CIN: U67110MH2002PLC135075
Registered Office Address: Motilal Oswal Tower, Rahimtullah Sayani Road,
Opposite Parel ST Depot, Prabhadevi, Mumbai 400 025
Tel No.: 022 7193 4200/63; Website: www.motilaloswalpwm.com
Registration details: SEBI PMS Regn No: INP000004409; AMFI Regn No: ARN87554
Please read disclosure document as issued by company from time to time.
Ashish Shanker
MD, CEO
91 22+ 7198 5549
Nitin Shanbhag
Head - Investment Products
+91 22 7199 2328
The information, data or analysis does not constitute investment advice or as an offer or solicitation of an offer to purchase or subscribe for any investment or a recommendation and is meantfor your personal information only and suggests a proposition which does not guarantee any returns. Motilal Oswal Wealth Management Ltd (hereinafter referred as MOWML) or any of itsaffiliates is not soliciting any action based upon it. This information, including the data, or analysis provided herein is neither intended to aid in decision making for legal, financial or otherconsulting questions, nor should it be the basis of any investment or other decisions. The historical performance presented in this document is not indicative of and should not be construed asbeing indicative of or otherwise used as a proxy for future or specific investments. The relevant product offering documents should be read for further details. MOWML does not takeresponsibility for authentication of any data or information which has been furnished by you, the entity offering the product, or any other third party which furnishes the data or information.The above mentioned assets are not necessarily maintained or kept in custody of MOWML. The information contained in this statement are updated as and when received as a result of whichthere may be differences between the details contained herein and those reflected in the records of the respective entities or that of yours. In the event where information sent through anyelectronic Media (including but not limited to Net Banking or e-mail) or print do not tally, for whatever reason, with the records available with the entity offering the product or the third partymaintaining such information in each of the foregoing cases, the information with the entity offering the product or third party maintaining such information shall be considered as final. Thebenchmarking shown in document above is a result of the choice of benchmark MOWML uses for the various products. It is possible that some investments offered by the third parties haveother benchmarks and their actual relative under- or out-performance is different from that provided in the statement. The recipient should seek appropriate professional advice includingtax advice before dealing with any realized or unrealized gain / loss reflecting in this statement. The above data, information or analysis is shared at the request of the recipient and is meant forinformation purpose only and is not an official confirmation of any transactions mentioned in the document above. Service related complaints may be acceptable for rectification ofinaccurate data. You should notify us immediately and in any case within 15 days of receipt of this document date if you notice any error or discrepancy in the information furnished above,failing which it would be deemed to have been accepted by you. MOWML reserves the right to rectify discrepancies in this document, at any point of time. The sharing of information inrelation to one’s assets may not be secure and you are required to completely understand the risk associated with sharing such information. The information being shared with MOWML canpose risk of information being stolen and or used by unauthorized persons who do not have the rights to access such information. MOWML or any of its group companies, its employees, andagents cannot be held liable for unauthorized use of such information. Our sales professionals or other employees may provide oral or written views to you that reflect their personal opinionswhich may be contrary to the opinions expressed herein. You should carefully consider whether any information shared herein and investment products mentioned herein are appropriate inview of your investment experience, objectives, financial resources, relevant circumstances & risk appetite. All recipients of this Information should conduct their own investigation andanalysis and should check the accuracy, reliability and completeness of the Information .This Information is distributed upon the express understanding that no part of the information hereincontained has been independently verified. Further, no representation or warranty expressed or implied is made nor is any responsibility of any kind accepted with respect to thecompleteness or accuracy of any information as may be contained herein. Also no representation or warranty expressed or implied is made that such information remains unchanged in anyrespect as of any date or dates after those stated herein with respect to any matter concerning any statement made herein above. In no event will MOWML and their officers, directors,personnel, employees or its affiliates and group company be liable for any damages, losses or liabilities including without limitation, direct or indirect, special, incidental, consequentialdamages, losses or liabilities, in connection with your use of the information mentioned in this document or your reliance on or use or inability to use the information contained in thisdocument, even if you advise us of the possibility of such damages, losses or expenses. The contents of this document do not have any contractual value. The information contained in thisdocument is confidential in nature and you are receiving all such information on the express condition of confidentiality. If you are not the intended recipient, you must not disclose or use theinformation in this document in any way whatsoever. If you received it in error, please inform us immediately by return e-mail and delete the document with no intention of its being retrievedby you. We do not guarantee the integrity of any e-mails or attached files and are not responsible for any changes made to them. This report and information therein is not directed orintended for distribution to, or use by, any person or entity who is a citizen or resident of or located in any locality, state, country or other jurisdiction, where such distribution, publication,availability or use would be contrary to law, regulation or which would subject MOWML and affiliates to any registration or licensing requirement within such jurisdiction. The informationcontained herein is strictly confidential and meant solely for the selected recipient and may not be altered in any way, transmitted to, copied or distributed, in part or in whole, to any otherperson or to the media or reproduced in any form, without prior written consent of MOWML.MOWML in the course of conduct of its business activity may have financial, business or otherinterest in other entities including the subject mentioned herein, however MOWML encourages independence in preparing this information and strives to minimize conflict in preparation ofthe above information. MOWML does not have material conflict of interest at the time of publication of this information. While every effort has been made to ensure that the informationprovided herein is accurate, timely, secure and error-free, MOWML, their directors, promoters, employees, agents and assigns shall not in any way be responsible for any loss or damagesarising in any contract, tort or otherwise from the use or inability to use this information and its contents. Any material downloaded or otherwise obtained through the use of the website oremail is at your own discretion and risk and you will be solely responsible for any damage that may occur to your computer systems and data as a result of download of such material. Anyinformation sent from MOWML to an e-mail account or other electronic receiving communication systems/ servers, is at your risk and if the same is lost, incorrectly received, or sent to theincorrect e-mail or are accessible to third parties, MOWML is not and cannot be responsible or made liable for such transmission.
“© 2013 CRISIL Limited. All Rights Reserved.
“CRISIL Indices are the sole property of CRISIL Limited (CRISIL). CRISIL Indices shall not be copied, retransmitted or redistributed in any manner for any commercial
use. CRISIL has taken due care and caution in computation of the Indices, based on the data obtained from sources, which it considers reliable. However, CRISIL does
not guarantee the accuracy, adequacy or completeness of the Indices and is not responsible for any errors or for the results obtained from the use of the Indices.
CRISIL especially states that it has no financial liability whatsoever to the Licensee / users of CRISIL Indices.”
Safe Harbor
Alpha Strategist | ‘Winter Harvest’

Motilal Oswal Tower, 6th Floor, Junction of Gokhale & Sayani Road, Prabhadevi, Mumbai - 400 025.
Ahmedabad | Bangalore | Chennai | Hyderabad | Kolkata | Mumbai | New Delhi | Pune
Email: [email protected]