Bajaj Electricals - Motilal Oswal
14
5 November 2015 2QFY16 Results Update | Sector: Consumer Bajaj Electricals Atul Mehra ([email protected]); +91 22 3982 5417 Niket Shah ([email protected]); +91 22 3982 5426 BSE SENSEX S&P CNX CMP: INR241 TP: INR280 (+16%) Buy 26,304 7,955 Bloomberg BJE IN Equity Shares (m) 100.0 M.Cap.(INR b)/(USD b) 24.1/0.4 52-Week Range (INR) 310 / 191 1, 6, 12 Rel. Per (%) -1/5/-10 Avg Val (INRm) 93 Free float (%) 36.4 Financials & Valuation (INR Billion) Y/E Mar 2015 2016E 2017E Sales 42.6 47.6 54.6 EBITDA 0.9 2.6 3.4 NP -0.1 1.1 1.6 EPS (INR) -1.4 10.5 15.4 EPS Gr. (%) NM NM 47.1 BV/Sh.(INR) 68.2 75.8 88.0 RoE (%) -2.0 14.6 18.8 RoCE (%) 7.9 23.0 27.9 P/E (x) NM 23.0 15.6 P/BV (x) 3.5 3.2 2.7 Estimate change 13% TP change 13% Rating change Revenue in line; margin misses estimate, led by consumer durables segment Revenue in line; EBITDA miss: BJE reported revenue of INR11.3b (est. of INR11b) compared with INR10.3b in 2QFY15, marking a 9.5% growth YoY. Lighting business grew 16.8% YoY to INR2.6b; consumer durables de-grew 4% to INR4.4b while E&P business grew 23% YoY to INR4.2b. EBITDA stood at INR461m (est. of INR690m) as against INR98m in 2QFY15. EBITDA margin for 2QFY16 stood at 4.1% (est. of 6.3%) against 1% in 2QFY15. Lighting division margin came in at 6.1% (v/s 2.8% in 2QFY15), consumer durables margin at 2.6% (v/s 6% in 2QFY15) and E&P margin at 4.1% (v/s -8.3% in 2QFY15). PAT for 2QFY16 stood at INR113m (est. of INR266m) compared with a loss of INR142m in 2QFY15. E&P margin down 170bp QoQ, led by provisioning for doubtful receivables: During 2Q, BJE provided INR150m toward provisions for doubtful receivables while parallelly it also accounted for write-back of INR70m for receivables recovered—providing a net charge of INR80m (190bp) in 2Q. While management commentary suggests that the provision is only technical in nature due to ageing of receivables beyond one year, we see the provisioning as a negative surprise as the management earlier guided that there will not be incremental provisions for doubtful receivables. Management guided for FY16 E&P margin at 6%, implying 8% margin in 2HFY16. With an order book of INR32b (2x book-to-bill) in E&P, we expect 24% revenue growth and 5.5% margin in E&P for FY16. Consumer durables facing issues due to transition in distribution structure: Given the implementation of replenishment-based distribution structure in the consumer business, management highlighted that primary sales for the consumer division have been impacted—even though secondary sales growth is steady. With transition likely in FY16, we expect muted revenue growth (2%) in FY16 (margin at 5.7%) and a meaningful growth recovery only in FY17 (15% growth in FY17). Valuation and view: Lower growth and margin in consumer division along with a negative surprise on provisioning requirement lead us to cut our FY16/FY17 EPS estimates by 19%/13%. We expect revenue to post a CAGR of 13% over FY15-17. We expect a 420bp EBITDA margin expansion over FY15-17. Maintain Buy with a revised target price of INR280 (18x FY17E EPS of INR15.4). Investors are advised to refer through disclosures made at the end of the Research Report. Motilal Oswal research is available on www.motilaloswal.com/Institutional-Equities, Bloomberg, Thomson Reuters, Factset and S&P Capital.
-
Upload
khangminh22 -
Category
Documents
-
view
6 -
download
0
Transcript of Bajaj Electricals - Motilal Oswal

5 November 2015
2QFY16 Results Update | Sector: Consumer
Bajaj Electricals
Atul Mehra ([email protected]); +91 22 3982 5417 Niket Shah ([email protected]); +91 22 3982 5426
BSE SENSEX S&P CNX CMP: INR241 TP: INR280 (+16%) Buy 26,304 7,955 Bloomberg BJE IN
Equity Shares (m) 100.0 M.Cap.(INR b)/(USD b) 24.1/0.4 52-Week Range (INR) 310 / 191 1, 6, 12 Rel. Per (%) -1/5/-10 Avg Val (INRm) 93 Free float (%) 36.4
Financials & Valuation (INR Billion) Y/E Mar 2015 2016E 2017E
Sales 42.6 47.6 54.6 EBITDA 0.9 2.6 3.4 NP -0.1 1.1 1.6
EPS (INR) -1.4 10.5 15.4 EPS Gr. (%) NM NM 47.1 BV/Sh.(INR) 68.2 75.8 88.0
RoE (%) -2.0 14.6 18.8 RoCE (%) 7.9 23.0 27.9 P/E (x) NM 23.0 15.6
P/BV (x) 3.5 3.2 2.7
Estimate change 13%
TP change 13%
Rating change
Revenue in line; margin misses estimate, led by consumer durables segment Revenue in line; EBITDA miss: BJE reported revenue of INR11.3b (est. of INR11b)
compared with INR10.3b in 2QFY15, marking a 9.5% growth YoY. Lighting business grew 16.8% YoY to INR2.6b; consumer durables de-grew 4% to INR4.4b while E&P business grew 23% YoY to INR4.2b. EBITDA stood at INR461m (est. of INR690m) as against INR98m in 2QFY15. EBITDA margin for 2QFY16 stood at 4.1% (est. of 6.3%) against 1% in 2QFY15. Lighting division margin came in at 6.1% (v/s 2.8% in 2QFY15), consumer durables margin at 2.6% (v/s 6% in 2QFY15) and E&P margin at 4.1% (v/s -8.3% in 2QFY15). PAT for 2QFY16 stood at INR113m (est. of INR266m) compared with a loss of INR142m in 2QFY15.
E&P margin down 170bp QoQ, led by provisioning for doubtful receivables: During 2Q, BJE provided INR150m toward provisions for doubtful receivables while parallelly it also accounted for write-back of INR70m for receivables recovered—providing a net charge of INR80m (190bp) in 2Q. While management commentary suggests that the provision is only technical in nature due to ageing of receivables beyond one year, we see the provisioning as a negative surprise as the management earlier guided that there will not be incremental provisions for doubtful receivables. Management guided for FY16 E&P margin at 6%, implying 8% margin in 2HFY16. With an order book of INR32b (2x book-to-bill) in E&P, we expect 24% revenue growth and 5.5% margin in E&P for FY16.
Consumer durables facing issues due to transition in distribution structure: Given the implementation of replenishment-based distribution structure in the consumer business, management highlighted that primary sales for the consumer division have been impacted—even though secondary sales growth is steady. With transition likely in FY16, we expect muted revenue growth (2%) in FY16 (margin at 5.7%) and a meaningful growth recovery only in FY17 (15% growth in FY17).
Valuation and view: Lower growth and margin in consumer division along with a negative surprise on provisioning requirement lead us to cut our FY16/FY17 EPS estimates by 19%/13%. We expect revenue to post a CAGR of 13% over FY15-17. We expect a 420bp EBITDA margin expansion over FY15-17. Maintain Buy with a revised target price of INR280 (18x FY17E EPS of INR15.4).
Investors are advised to refer through disclosures made at the end of the Research Report. Motilal Oswal research is available on www.motilaloswal.com/Institutional-Equities, Bloomberg, Thomson Reuters, Factset and S&P Capital.

5 November 2015 2
Bajaj Electricals
Revenues in line; EBITDA miss BJE reported revenue of INR11.3b (est. of INR11b) compared with INR10.3b in
2QFY15, marking a 9.5% growth YoY. Lighting business grew 16.8% YoY to INR2.6b, while consumer durables de-grew
4% to INR4.4b. E&P business grew 23% YoY to INR4.2b. EBITDA stood at INR461m (est. of INR690m) as against INR98m in 2QFY15.
EBITDA margin for 2QFY16 stood at 4.1% (est. of 6.3%) against 1% in 2QFY15. Lighting division margin came in at 6.1% (v/s 2.8% in 2QFY15), consumer
durables margin at 2.6% (v/s 6% in 2QFY15) and E&P margin at 4.1% (v/s -8.3%in 2QFY15).
Tax rate stood at 39% as against 30% in 2QFY15. PAT for 2QFY16 stood atINR113m (est. of INR266m) compared with a loss of INR142m in 2QFY15.
Exhibit 1: Revenue trend
Source: Company, MOSL
Exhibit 2: EBITDA and EBITDA margin trend
Source: Company, MOSL
Exhibit 3: PAT trend
Source: Company, MOSL
6,666
7,341 8,734
11,137
7,890
9,602
10,274 12,709
8,876 10,295 10,293
13,117
10,091 11,277
22.5
4.7 10.0
5.1
18.4
30.8
17.6 14.1 12.5
7.2
0.2 3.2
13.7 9.5
1QFY
13
2QFY
13
3QFY
13
4QFY
13
1QFY
14
2QFY
14
3QFY
14
4QFY
14
1QFY
15
2QFY
15
3QFY
15
4QFY
15
1QFY
16
2QFY
16
Revenues (INR m) Growth (YoY) %
202 -16
577
54
368
98
-351 774 602 461
2.6 -0.2
5.6
0.4
4.2
1.0
-3.4
5.9 6.0
4.1
1QFY
14
2QFY
14
3QFY
14
4QFY
14
1QFY
15
2QFY
15
3QFY
15
4QFY
15
1QFY
16
2QFY
16
EBITDA (INR m) EBITDA Margin (%)
7
-154
200
-107
56
-142 -523469 203
113
0.1 (1.6) 1.9 (0.8)
0.6 (1.4) (5.1)
3.6
2.0 1.0
1QFY
14
2QFY
14
3QFY
14
4QFY
14
1QFY
15
2QFY
15
3QFY
15
4QFY
15
1QFY
16
2QFY
16
PAT (INR m) PAT Margin (%)

5 November 2015 3
Bajaj Electricals
Lighting and Luminaries posts 17% growth YoY Lighting and Luminaries business revenues grew by 16.8% YoY to INR2.6b. EBIT for Lighting and Luminaries division stood at INR160m, with margins at
6.1% as against 2.8% in 2QFY15. Management guided for revenues of INR11b for lighting in FY16 with margins at
~7%. BJE has orders worth INR1.2b to supply LED lamps to Energy Efficiency Services
Ltd. providing strong growth visibility for FY16. During 1HFY16, revenuesamounting to INR300m were booked from the same.
We expect revenues of INR10.4b, implying growth of 16% YoY.
Exhibit 4: Lighting division revenue trend
Source: Company, MOSL
Exhibit 5: Lighting division EBIT margin trend
Source: Company, MOSL
Exhibit 6: RoCE trend
Source: Company, MOSL
1,525 2,018 2,216 2,847 1,574 2,509 2,472
2,975
1,686 2,260 2,318 2,719 2,029 2,638
19.7
6.6 10.7 14.9
3.2
24.4
11.6 4.5 7.2
(10.0) (6.2) (8.6)
20.3 16.8
1QFY
13
2QFY
13
3QFY
13
4QFY
13
1QFY
14
2QFY
14
3QFY
14
4QFY
14
1QFY
15
2QFY
15
3QFY
15
4QFY
15
1QFY
16
2QFY
16
Revenues (INR m) Growth (YoY) %
74 130 156 224 77 191 129 89 25
64 107 117 85 160
4.8 6.5 7.0
7.9
4.9
7.6
5.2
3.0 1.5
2.8 4.6 4.3 4.2
6.1
1QFY
13
2QFY
13
3QFY
13
4QFY
13
1QFY
14
2QFY
14
3QFY
14
4QFY
14
1QFY
15
2QFY
15
3QFY
15
4QFY
15
1QFY
16
2QFY
16
EBIT (INR m) EBIT Margin (%)
627 538 604 732
911
668 323 402 796
557
351 497 1,037 344
47
97 104 122
34 115
159
88
13
46 122
94
33
186
1QFY
13
2QFY
13
3QFY
13
4QFY
13
1QFY
14
2QFY
14
3QFY
14
4QFY
14
1QFY
15
2QFY
15
3QFY
15
4QFY
15
1QFY
16
2QFY
16
Capital Employed (INR m) RoCE (%)

5 November 2015 4
Bajaj Electricals
Consumer Durables business de-grows 4%, margins contract 340bp YoY Consumer Durable (CD) revenue de-grew by 3.9% YoY to INR4.5b. Margins for the division stood at 2.6% as against 6% in 2QFY15. Fans posted a growth of 2.7%, Morphy Richards de-grew 2.4% and appliances
de-grew 6.8% in 2QFY16. Management guided for revenues of INR21b in consumer durables with margins
close to ~6% (reduced from an earlier guidance of 8%). Management is seeing good response for its products like premium fans, newly
introduced mini induction cook-tops, gas stoves, mixers and steam iron. Of the total 1HFY16 sales in consumer durable category amounting to INR9.2b,
water heater consisted of INR850m, dryers consisted of INR600m, mixers ofINR1060m and fans of INR3050m.
Given implementation of replenishment-based distribution structure in theconsumer business, management highlighted that primary sales for consumerdivision have been impacted even through secondary sales growth is steady.
With transition likely in FY16, we expect muted revenue growth at 2% in FY16(margins at 5.7%) and a meaningful growth recovery only in FY17 (15% growthin FY17).
Exhibit 7: Consumer durables revenue trend
Source: Company, MOSL
Exhibit 8: Consumer durable EBIT trend
Source: Company, MOSL
3,908 3,988 5,046 5,436 4,321 4,539 5,192 5,330
5,046 4,657 5,072 5,462 4,758
4,475
29
17 22 22
11 14
3
(2)
17
3 (2)
2 (6) (4)
1QFY
13
2QFY
13
3QFY
13
4QFY
13
1QFY
14
2QFY
14
3QFY
14
4QFY
14
1QFY
15
2QFY
15
3QFY
15
4QFY
15
1QFY
16
2QFY
16
Revenues (INR m) Growth (YoY) %
328 369 609 438 403 386 500 191 346 278 342 375 302
117 8.4 9.3
12.1
8.0 9.3
8.5 9.6
3.6
6.9 6.0 6.7 6.9 6.3
2.6
1QFY
13
2QFY
13
3QFY
13
4QFY
13
1QFY
14
2QFY
14
3QFY
14
4QFY
14
1QFY
15
2QFY
15
3QFY
15
4QFY
15
1QFY
16
2QFY
16
EBIT (INR m) EBIT Margin (%)

5 November 2015 5
Bajaj Electricals
Exhibit 9: Consumer durable capital employed trend
Source: Company, MOSL
Exhibit 10: Bajaj Electricals has a huge mass market product portfolio
Segment Sub-Segment
Mkt Size (INR m)
Organized (%)
Mkt Share (%) Description Competition
Lighting
Lighting 50,000 65% 8% GLS lamps, fluorescent tube lights, compact fluorescent lamps, domestic luminaries, ballasts & starters, LED torches
Philips, Crompton, Surya, Havells, etc
Luminaries 25,000 65% 5%
Industrial, commercial, decorative, street light, floodlight, LED, lighting electronics, lighting control, HID Lamps: Mercury & sodium vapor lamps, halogen lamps, metal halide & fluorescent lamps
Phillips, Crompton, Wipro, Thorn
Consumer Durables
Fans 35,000 65% 17%
Ceiling, table, pedestal & wall mounted fans, personal fans, Bajaj-Disney children’s fans, Industrial exhaust fans, commercial air industrial fans, circulators, cooler kits and pumps
Crompton, Usha, Orient, Khaitan, Polar, Havells
Appliances 68,000 70% 20%
Mixers grinders, juicers, food processors, water heaters, air coolers, iron, (OTG), room heaters, toasters & S/W makers, hand blenders, water filters microwave ovens gas stove purifiers & filters, ovens, stoves, electric kettles, coffee/tea makers
Philips, Kenstar, Usha, Maharaja, Preeti, Prestige, Kenwood
Source: Company, MOSL
Exhibit 11: Bajaj has a strong retail network
Source: Company, MOSL
Exhibit 12: Bajaj leads the distribution game… Channel Bajaj Electricals Havells TTK Prestige
Retail Network 4,00,000 > 1,00,000 25,000
EBOs 103 'Bajaj World' Stores 210 'Havells Galaxy' Stores 500 'Prestige Smart Kitchen' Stores
Source: Company, MOSL
804
1,577
759
1,359
1,770
1,321
884 717 700 706 742 708
1,211 827
40.9 23.4
80.3
32.2
91.1 116.9
226.3
106.2
197.9 157.7
184.6 212.2
99.8 56.7
1QFY
13
2QFY
13
3QFY
13
4QFY
13
1QFY
14
2QFY
14
3QFY
14
4QFY
14
1QFY
15
2QFY
15
3QFY
15
4QFY
15
1QFY
16
Capital Employed (INR m) RoCE (%)
45,000 86,000
400,000
Appliances Fans Lighting
Retail Network
5 November 2015 6
Bajaj Electricals
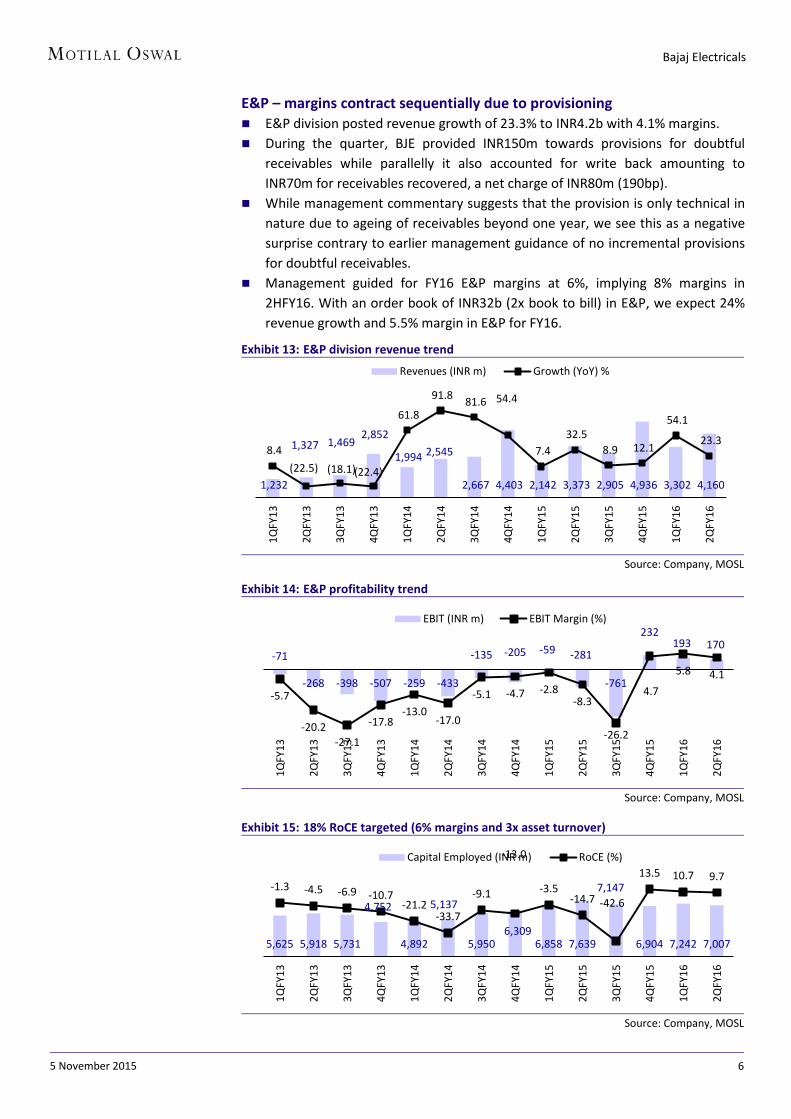
E&P – margins contract sequentially due to provisioning E&P division posted revenue growth of 23.3% to INR4.2b with 4.1% margins. During the quarter, BJE provided INR150m towards provisions for doubtful
receivables while parallelly it also accounted for write back amounting toINR70m for receivables recovered, a net charge of INR80m (190bp).
While management commentary suggests that the provision is only technical innature due to ageing of receivables beyond one year, we see this as a negativesurprise contrary to earlier management guidance of no incremental provisionsfor doubtful receivables.
Management guided for FY16 E&P margins at 6%, implying 8% margins in2HFY16. With an order book of INR32b (2x book to bill) in E&P, we expect 24%revenue growth and 5.5% margin in E&P for FY16.
Exhibit 13: E&P division revenue trend
Source: Company, MOSL
Exhibit 14: E&P profitability trend
Source: Company, MOSL
Exhibit 15: 18% RoCE targeted (6% margins and 3x asset turnover)
Source: Company, MOSL
1,232
1,327 1,469 2,852
1,994 2,545
2,667 4,403 2,142 3,373 2,905 4,936 3,302 4,160
8.4 (22.5) (18.1) (22.4)
61.8
91.8 81.6 54.4
7.4 32.5
8.9 12.1
54.1
23.3
1QFY
13
2QFY
13
3QFY
13
4QFY
13
1QFY
14
2QFY
14
3QFY
14
4QFY
14
1QFY
15
2QFY
15
3QFY
15
4QFY
15
1QFY
16
2QFY
16
Revenues (INR m) Growth (YoY) %
-71
-268 -398 -507 -259 -433
-135 -205 -59 -281
-761
232 193 170
-5.7
-20.2-27.1
-17.8-13.0
-17.0
-5.1 -4.7 -2.8-8.3
-26.2
4.7
5.8 4.1
1QFY
13
2QFY
13
3QFY
13
4QFY
13
1QFY
14
2QFY
14
3QFY
14
4QFY
14
1QFY
15
2QFY
15
3QFY
15
4QFY
15
1QFY
16
2QFY
16
EBIT (INR m) EBIT Margin (%)
5,625 5,918 5,731
4,752
4,892
5,137
5,950 6,309
6,858 7,639
7,147
6,904 7,242 7,007
-1.3 -4.5 -6.9 -10.7-21.2
-33.7
-9.1
-13.0
-3.5-14.7 -42.6
13.5 10.7 9.7
1QFY
13
2QFY
13
3QFY
13
4QFY
13
1QFY
14
2QFY
14
3QFY
14
4QFY
14
1QFY
15
2QFY
15
3QFY
15
4QFY
15
1QFY
16
2QFY
16
Capital Employed (INR m) RoCE (%)

5 November 2015 7
Bajaj Electricals
Valuation and view We value BJE at a multiple of 18x FY17E EPS, (10% discount to Havell’s FY17 PE multiple of 20x), which we believe is justified considering:
Leader in small appliances with 15% market shareBajaj is the only brand apart from Havells that has a pan-India recall. BJE has a hugeproduct portfolio in the Appliances and Lighting segments, spanning over 2,000SKUs. The combined market size for BJE’s consumer-facing segments is pegged atover INR178b, with BJE’s revenues and market share standing at INR26b and 15.2%,respectively. We believe BJE’s strategy of having a presence across products gives ita great degree of clout amongst consumers as well as the distribution channel,which has helped it to grow and sustain its market leadership. It has a widedistribution reach, with over 4,100 dealers and a 400k strong retail network forLighting, 86k dealers for Fans and 45k dealers for Appliances across India.Manufacturing is entirely outsourced to 80 different vendors across India, leavingthe management free to focus on innovation, brand building and distribution.
E&P business set for strong turnaround in FY16BJE has taken a number of steps in FY15 to revive the performance of the E&Pdivision. Unlike earlier, the division now reports to the central finance team,resulting in more prudent supervision. The top management has been revamped,with industry veteran, Mr. Rakesh Markhedkar replacing internally-groomed Mr.Lalit Mehta as Business Head. The new management has implemented a strictproject monitoring process, which has ensured better timeliness in execution.Albeit, taken longer than as expected earlier, we expect the E&P business to post astrong turnaround in FY16, with revenues growing at a CAGR of 22% over FY15-17and EBIT margin expanding to +5%.
Asset-light business model – manufacturing outsourced to 80 vendorsBJE has an asset-light business model. 95% of the Consumer and Lighting products itmarkets are outsourced. BJE has strong long-term relationships with ~80 vendors,who have been supplying to the company over the last 15-20 years. With this assetlight business model, BJE’s Consumer facing Appliances and Lighting businessesenjoy RoCE of ~128% and 80% respectively.
Exhibit 16: 15 year PE band
Source: Company, MOSL
Exhibit 17: 15 year PB band
Source: Company, MOSL
We value the stock at 18x FY17E EPS and arrive at a target price of INR280 – 16% upside. Maintain Buy rating.
18.4
10.1
23.7
13.0
0
8
16
24
32
40
Oct
-00
Dec
-01
Feb-
03
Apr-0
4
Jun-
05
Aug-
06
Sep-
07
Nov
-08
Jan-
10
Mar
-11
May
-12
Jun-
13
Aug-
14
Oct
-15
P/E (x) 15 Yrs Avg(x)5 Yrs Avg(x) 10 Yrs Avg(x)
Negative Earnings
Cycle 3.0
1.9
3.1
2.7
0.0
1.0
2.0
3.0
4.0
5.0
6.0
Oct
-00
Dec
-01
Feb-
03
Apr-0
4
Jun-
05
Aug-
06
Sep-
07
Nov
-08
Jan-
10
Mar
-11
May
-…
Jun-
13
Aug-
14
Oct
-15
P/B (x) 15 Yrs Avg(x)5 Yrs Avg(x) 10 Yrs Avg(x)

5 November 2015 8
Bajaj Electricals
Story in charts
Exhibit 18: Revenue Contribution (%)
Source: MOSL, Company
Exhibit 19: Segment Profitability for FY15 (%)
Source: MOSL, Company
Exhibit 20: E&P segment a drag on overall profitability
Source: MOSL, Company
Exhibit 21: Management changes to ensure turnaround
Source: MOSL, Company
Exhibit 22: Earnings to expand
Source: MOSL, Company
Exhibit 23: Bajaj Electricals reports strong capital efficiency
Source: MOSL, Company
Lighting, 25
Consumer Durables, 50
Engineering &
Projects, 20
128%
80%
-26%
Consumer Durables Lighting E&P
Segment RoCE (%)
3.2
(18.1)
(9.0) (6.5)
5.5 5.0
FY12 FY13 FY14 FY15 FY16E FY17E
E&P Margins (%)
265
(1,243)
(1,032)
(869)
911 994
3.2%
-18.1%
-9.0%
-6.5%
5.5% 5.0%
FY12 FY13 FY14 FY15 FY16E FY17E
E&P EBIT (INR m) Margin
1,179
512
(53)
(140)
1,056
1,554
FY12 FY13 FY14 FY15 FY16E FY17E
PAT (INR m)
29
13
7 8
23 28
FY12 FY13 FY14 FY15 FY16E FY17E
RoCE (%)

5 November 2015 9
Bajaj Electricals
Key assumptions
Exhibit 24: Key assumptions Particulars FY10 FY11 FY12 FY13 FY14 FY15 FY16E FY17E
Segment revenue growth
Lighting 9.7 17.8 21.2 12.5 10.8 -5.7 16.0 5.0 Consumer Durables 26.7 33.8 17.5 22.5 5.7 4.2 2.0 15.0 Engineering & Projects 41.1 12.9 0.0 -17.3 67.3 16.1 24.0 20.0 Total 26.2 23.0 13.0 9.3 19.0 5.7 11.9 14.5 Segment EBIT Margins (%)
Lighting 6.2 5.9 7.8 6.8 5.1 3.5 5.7 5.5 Consumer Durables 13.0 11.5 10.1 9.5 7.6 6.6 4.8 7 Engineering & Projects 10.7 8.9 3.2 -18.1 -9.0 -6.5 5.5 5.0 Total 10.6 9.4 7.7 3.2 2.3 1.8 5.2 6.0 Segment Revenue Mix (%)
Lighting 24.0 23.0 24.7 25.4 23.6 21.1 21.9 20.1 Consumer Durables 42.8 46.6 48.4 54.2 48.2 47.5 43.3 43.5 Engineering & Projects 33.1 30.3 26.8 20.3 28.6 31.4 34.8 36.4 Total 100 100 100 100 100 100 100 100 Segment EBIT Mix (%)
Lighting 14.1 14.3 25.0 53.6 51.7 40.2 23.8 18.5 Consumer Durables 52.2 56.9 63.6 160.2 157.6 172.7 39.7 21.0 Engineering & Projects 33.4 28.7 11.1 -114.2 -109.9 -111.9 36.5 30.5 Total 100 100 100 100 100 100 100 100
Source: Company, MOSL

5 November 2015 10
Bajaj Electricals
Financials and valuations
Standalone - Income Statement (INR Million) Y/E March (Rs mn) FY11 FY12 FY13 FY14 FY15 FY16E FY17E Net Sales 27,414 30,990 33,876 40,298 42,581 47,629 54,558 Change (%) 23.0 13.0 9.3 19.0 5.7 11.9 14.5 EBITDA 2,549 2,372 1,108 818 890 2,620 3,437 Margin (%) 9.3 7.7 3.3 2.0 2.1 5.5 6.3 Depreciation 108 125 145 247 290 330 366 EBIT 2,441 2,246 963 571 599 2,289 3,071 Int. and Finance Charges 367 630 690 783 1,051 944 984 Other Income - Rec. 161 144 169 153 243 255 268 PBT bef. EO Exp. 2,235 1,760 443 -60 -208 1,600 2,354 EO Expense/(Income) 50 0 -247 0 0 0 0 PBT after EO Exp. 2,185 1,760 690 -60 -208 1,600 2,354 Current Tax 763 580 238 168 -69 544 800 Deferred Tax -15 1 -60 -174 0 0 0 Tax Rate (%) 34.2 33.0 25.8 11.0 32.9 34.0 34.0 Reported PAT 1,438 1,179 512 -53 -140 1,056 1,554 PAT Adj for EO items 1,471 1,179 329 -53 -140 1,056 1,554 Change (%) 22.5 -19.8 -72.1 -116.2 163.3 NM 47.1 Margin (%) 5.4 3.8 1.0 -0.1 -0.3 2.2 2.8
Standalone - Balance Sheet (INR Million) Y/E March (Rs mn) FY11 FY12 FY13 FY14 FY15 FY16E FY17E Equity Share Capital 198 199 200 200 202 202 202 Total Reserves 5,913 6,799 7,087 6,896 6,668 7,442 8,665 Preference Capital 0 0 0 0 0 0 0 Net Worth 6,111 6,999 7,286 7,096 6,870 7,643 8,867 Deferred Liabilities -20 -19 -79 -253 0 0 0 Total Loans 1,170 2,091 1,659 3,484 3,869 3,769 3,669 Capital Employed 7,261 9,070 8,866 10,327 10,739 11,412 12,536
Gross Block 2,302 2,721 3,260 3,723 4,329 4,829 5,329 Less: Accum. Deprn. 769 881 996 1,231 1,521 1,851 2,217 Net Fixed Assets 1,533 1,840 2,264 2,492 2,808 2,978 3,112 Capital WIP 0 30 59 26 0 0 0 Total Investments 366 441 298 673 594 594 594
Curr. Assets, Loans&Adv. 15,739 17,191 18,874 23,482 24,895 27,088 30,820 Inventory 2,946 3,552 4,212 4,467 4,746 4,966 5,640 Account Receivables 9,112 9,220 9,379 12,427 12,896 14,354 16,442 Cash and Bank Balance 486 536 501 544 377 135 65 Loans and Advances 3,195 3,882 4,781 6,045 6,876 7,633 8,673 Curr. Liability & Prov. 10,377 10,432 12,628 16,346 17,558 19,248 21,990 Account Payables 4,220 3,717 4,505 5,466 11,747 12,642 14,355 Other Current Liabilities 5,426 5,918 7,341 9,956 4,617 5,239 6,001 Provisions 731 797 782 925 1,194 1,367 1,633 Net Current Assets 5,362 6,759 6,246 7,136 7,337 7,840 8,830 Appl. of Funds 7,261 9,070 8,866 10,327 10,739 11,412 12,536

5 November 2015 11
Bajaj Electricals
Financials and valuations
Ratios Y/E March FY11 FY12 FY13 FY14 FY15 FY16E FY17E Basic (INR) EPS 14.9 11.8 3.3 -0.5 -1.4 10.5 15.4 Cash EPS 16.0 13.1 4.7 1.9 1.5 13.8 19.1 BV/Share 61.8 70.2 73.0 71.0 68.2 75.9 88.0 DPS 2.8 2.8 2.0 1.5 1.5 2.4 2.8 Payout (%) 22.4 27.5 45.6 -330.5 -126.5 26.8 21.2 Valuation (x) P/E -453.3 -173.5 23.0 15.6 Cash P/E 123.8 161.2 17.5 12.6 P/BV 3.4 3.5 3.2 2.7 EV/Sales 0.7 0.6 0.6 0.5 EV/EBITDA 33.0 31.0 10.6 8.0 Dividend Yield (%) 0.6 0.6 1.0 1.2 Return Ratios (%) RoE 26.6 18.0 4.6 -0.7 -2.0 14.6 18.8 RoCE 37.9 29.2 12.6 7.4 7.9 23.0 27.9 Working Capital Ratios Asset Turnover (x) 3.8 3.4 3.8 3.9 4.0 4.2 4.4 Inventory (Days) 39.2 41.8 45.4 40.5 40.7 38.1 37.7 Debtor (Days) 120 108 100 112 110 109 109 Leverage Ratio (x) Current Ratio 1.5 1.6 1.5 1.4 1.4 1.4 1.4 Debt/Equity 0.2 0.3 0.2 0.5 0.6 0.5 0.4 Standalone - Cash Flow Statement (INR Million) Y/E March (Rs mn) FY11 FY12 FY13 FY14 FY15 FY16E FY17E NP / (Loss) Before Tax and EO Items 2,186 1,760 690 -60 -208 1,600 2,354 Depreciation 108 125 145 247 290 330 366 Interest & Finance Charges 368 607 671 728 808 689 717 Direct Taxes Paid 806 600 398 302 -69 544 800 (Inc)/Dec in WC -773 -1,278 171 -1,294 121 -745 -1,060 CF from Operations 1,082 614 1,279 -679 1,079 1,330 1,577 Others 42 143 144 614 0 0 0 CF from Operating incl EO 1,124 756 1,422 -65 1,079 1,330 1,577 (inc)/dec in FA -215 -660 -392 -500 -581 -500 -500 Free Cash Flow 909 97 1,030 -565 498 830 1,077 (Pur)/Sale of Investments 0 -75 -70 -376 0 0 0 Others -74 59 461 135 243 255 268 CF from Investments -290 -676 -2 -741 -338 -245 -232 (Inc)/Dec in Debt -411 840 -500 1,789 318 -100 -100 Interest Paid -315 -567 -660 -688 -1,049 -944 -984 Dividend Paid -235 -278 -279 -234 -177 -283 -330 CF from Fin. Activity -961 -5 -1,439 867 -908 -1,327 -1,415 Inc/Dec of Cash -127 75 -18 62 -167 -242 -70 Add: Beginning Balance 612 461 519 483 544 377 135 Closing Balance 486 536 501 544 377 135 66
5 November 2015 12
Bajaj Electricals
Corporate profile: Bajaj Electricals
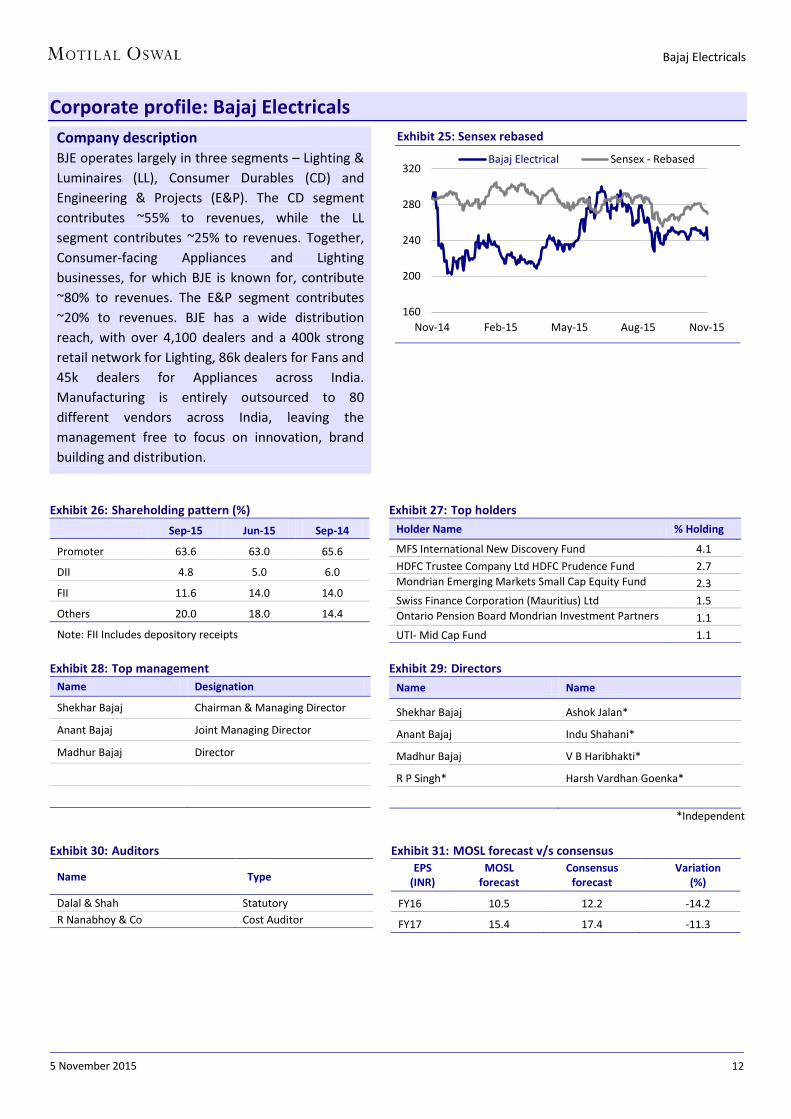
Exhibit 26: Shareholding pattern (%) Sep-15 Jun-15 Sep-14
Promoter 63.6 63.0 65.6
DII 4.8 5.0 6.0
FII 11.6 14.0 14.0
Others 20.0 18.0 14.4
Note: FII Includes depository receipts
Exhibit 27: Top holders Holder Name % Holding
MFS International New Discovery Fund 4.1 HDFC Trustee Company Ltd HDFC Prudence Fund 2.7 Mondrian Emerging Markets Small Cap Equity Fund
2.3
Swiss Finance Corporation (Mauritius) Ltd 1.5 Ontario Pension Board Mondrian Investment Partners
1.1
UTI- Mid Cap Fund 1.1
Exhibit 28: Top management Name Designation
Shekhar Bajaj Chairman & Managing Director
Anant Bajaj Joint Managing Director
Madhur Bajaj Director
Exhibit 29: Directors Name Name
Shekhar Bajaj Ashok Jalan*
Anant Bajaj Indu Shahani*
Madhur Bajaj V B Haribhakti*
R P Singh* Harsh Vardhan Goenka*
*Independent
Exhibit 30: Auditors
Name Type
Dalal & Shah Statutory R Nanabhoy & Co Cost Auditor
Exhibit 31: MOSL forecast v/s consensus EPS
(INR) MOSL
forecast Consensus
forecast Variation
(%)
FY16 10.5 12.2 -14.2
FY17 15.4 17.4 -11.3
Company description BJE operates largely in three segments – Lighting & Luminaires (LL), Consumer Durables (CD) and Engineering & Projects (E&P). The CD segment contributes ~55% to revenues, while the LL segment contributes ~25% to revenues. Together, Consumer-facing Appliances and Lighting businesses, for which BJE is known for, contribute ~80% to revenues. The E&P segment contributes ~20% to revenues. BJE has a wide distribution reach, with over 4,100 dealers and a 400k strong retail network for Lighting, 86k dealers for Fans and 45k dealers for Appliances across India. Manufacturing is entirely outsourced to 80 different vendors across India, leaving the management free to focus on innovation, brand building and distribution.
Exhibit 25: Sensex rebased
160
200
240
280
320
Nov-14 Feb-15 May-15 Aug-15 Nov-15
Bajaj Electrical Sensex - Rebased

5 November 2015 13
Bajaj Electricals
N O T E S

5 November 2015 14
Bajaj Electricals
Disclosures This document has been prepared by Motilal Oswal Securities Limited (hereinafter referred to as Most) to provide information about the company(ies) and/sector(s), if any, covered in the report and may be distributed by it and/or its affiliated company(ies). This report is for personal information of the selected recipient/s and does not construe to be any investment, legal or taxation advice to you. This research report does not constitute an offer, invitation or inducement to invest in securities or other investments and Motilal Oswal Securities Limited (hereinafter referred as MOSt) is not soliciting any action based upon it. This report is not for public distribution and has been furnished to you solely for your general information and should not be reproduced or redistributed to any other person in any form. This report does not constitute a personal recommendation or take into account the particular investment objectives, financial situations, or needs of individual clients. Before acting on any advice or recommendation in this material, investors should consider whether it is suitable for their particular circumstances and, if necessary, seek professional advice. The price and value of the investments referred to in this material and the income from them may go down as well as up, and investors may realize losses on any investments. Past performance is not a guide for future performance, future returns are not guaranteed and a loss of original capital may occur.
MOSt and its affiliates are a full-service, integrated investment banking, investment management, brokerage and financing group. We and our affiliates have investment banking and other business relationships with a some companies covered by our Research Department. Our research professionals may provide input into our investment banking and other business selection processes. Investors should assume that MOSt and/or its affiliates are seeking or will seek investment banking or other business from the company or companies that are the subject of this material and that the research professionals who were involved in preparing this material may educate investors on investments in such business. The research professionals responsible for the preparation of this document may interact with trading desk personnel, sales personnel and other parties for the purpose of gathering, applying and interpreting information. Our research professionals are paid on the profitability of MOSt which may include earnings from investment banking and other business.
MOSt generally prohibits its analysts, persons reporting to analysts, and members of their households from maintaining a financial interest in the securities or derivatives of any companies that the analysts cover. Additionally, MOSt generally prohibits its analysts and persons reporting to analysts from serving as an officer, director, or advisory board member of any companies that the analysts cover. Our salespeople, traders, and other professionals or affiliates may provide oral or written market commentary or trading strategies to our clients that reflect opinions that are contrary to the opinions expressed herein, and our proprietary trading and investing businesses may make investment decisions that are inconsistent with the recommendations expressed herein. In reviewing these materials, you should be aware that any or all of the foregoing among other things, may give rise to real or potential conflicts of interest. MOSt and its affiliated company(ies), their directors and employees and their relatives may; (a) from time to time, have a long or short position in, act as principal in, and buy or sell the securities or derivatives thereof of companies mentioned herein. (b) be engaged in any other transaction involving such securities and earn brokerage or other compensation or act as a market maker in the financial instruments of the company(ies) discussed herein or act as an advisor or lender/borrower to such company(ies) or may have any other potential conflict of interests with respect to any recommendation and other related information and opinions.; however the same shall have no bearing whatsoever on the specific recommendations made by the analyst(s), as the recommendations made by the analyst(s) are completely independent of the views of the affiliates of MOSt even though there might exist an inherent conflict of interest in some of the stocks mentioned in the research report Reports based on technical and derivative analysis center on studying charts company's price movement, outstanding positions and trading volume, as opposed to focusing on a company's fundamentals and, as such, may not match with a report on a company's fundamental analysis. In addition MOST has different business segments / Divisions with independent research separated by Chinese walls catering to different set of customers having various objectives, risk profiles, investment horizon, etc, and therefore may at times have different contrary views on stocks sectors and markets.
Unauthorized disclosure, use, dissemination or copying (either whole or partial) of this information, is prohibited. The person accessing this information specifically agrees to exempt MOSt or any of its affiliates or employees from, any and all responsibility/liability arising from such misuse and agrees not to hold MOSt or any of its affiliates or employees responsible for any such misuse and further agrees to hold MOSt or any of its affiliates or employees free and harmless from all losses, costs, damages, expenses that may be suffered by the person accessing this information due to any errors and delays. The information contained herein is based on publicly available data or other sources believed to be reliable. Any statements contained in this report attributed to a third party represent MOSt’s interpretation of the data, information and/or opinions provided by that third party either publicly or through a subscription service, and such use and interpretation have not been reviewed by the third party. This Report is not intended to be a complete statement or summary of the securities, markets or developments referred to in the document. While we would endeavor to update the information herein on reasonable basis, MOSt and/or its affiliates are under no obligation to update the information. Also there may be regulatory, compliance, or other reasons that may prevent MOSt and/or its affiliates from doing so. MOSt or any of its affiliates or employees shall not be in any way responsible and liable for any loss or damage that may arise to any person from any inadvertent error in the information contained in this report. MOSt or any of its affiliates or employees do not provide, at any time, any express or implied warranty of any kind, regarding any matter pertaining to this report, including without limitation the implied warranties of merchantability, fitness for a particular purpose, and non-infringement. The recipients of this report should rely on their own investigations.
This report is intended for distribution to institutional investors. Recipients who are not institutional investors should seek advice of their independent financial advisor prior to taking any investment decision based on this report or for any necessary explanation of its contents.
Most and it’s associates may have managed or co-managed public offering of securities, may have received compensation for investment banking or merchant banking or brokerage services, may have received any compensation for products or services other than investment banking or merchant banking or brokerage services from the subject company in the past 12 months. Most and it’s associates have not received any compensation or other benefits from the subject company or third party in connection with the research report. Subject Company may have been a client of Most or its associates during twelve months preceding the date of distribution of the research report
MOSt and/or its affiliates and/or employees may have interests/positions, financial or otherwise of over 1 % at the end of the month immediately preceding the date of publication of the research in the securities mentioned in this report. To enhance transparency, MOSt has incorporated a Disclosure of Interest Statement in this document. This should, however, not be treated as endorsement of the views expressed in the report.
Motilal Oswal Securities Limited is registered as a Research Analyst under SEBI (Research Analyst) Regulations, 2014. SEBI Reg. No. INH000000412
There are no material disciplinary action that been taken by any regulatory authority impacting equity research analysis activities
Analyst Certification The views expressed in this research report accurately reflect the personal views of the analyst(s) about the subject securities or issues, and no part of the compensation of the research analyst(s) was, is, or will be directly or indirectly related to the specific recommendations and views expressed by research analyst(s) in this report. The research analysts, strategists, or research associates principally responsible for preparation of MOSt research receive compensation based upon various factors, including quality of research, investor client feedback, stock picking, competitive factors and firm revenues
Disclosure of Interest Statement BAJAJ ELECTRICALS Analyst ownership of the stock No Served as an officer, director or employee No A graph of daily closing prices of securities is available at www.nseindia.com and http://economictimes.indiatimes.com/markets/stocks/stock-quotes
Regional Disclosures (outside India) This report is not directed or intended for distribution to or use by any person or entity resident in a state, country or any jurisdiction, where such distribution, publication, availability or use would be contrary to law, regulation or which would subject MOSt & its group companies to registration or licensing requirements within such jurisdictions.
For U.S. Motilal Oswal Securities Limited (MOSL) is not a registered broker - dealer under the U.S. Securities Exchange Act of 1934, as amended (the"1934 act") and under applicable state laws in the United States. In addition MOSL is not a registered investment adviser under the U.S. Investment Advisers Act of 1940, as amended (the "Advisers Act" and together with the 1934 Act, the "Acts), and under applicable state laws in the United States. Accordingly, in the absence of specific exemption under the Acts, any brokerage and investment services provided by MOSL, including the products and services described herein are not available to or intended for U.S. persons.
This report is intended for distribution only to "Major Institutional Investors" as defined by Rule 15a-6(b)(4) of the Exchange Act and interpretations thereof by SEC (henceforth referred to as "major institutional investors"). This document must not be acted on or relied on by persons who are not major institutional investors. Any investment or investment activity to which this document relates is only available to major institutional investors and will be engaged in only with major institutional investors. In reliance on the exemption from registration provided by Rule 15a-6 of the U.S. Securities Exchange Act of 1934, as amended (the "Exchange Act") and interpretations thereof by the U.S. Securities and Exchange Commission ("SEC") in order to conduct business with Institutional Investors based in the U.S., MOSL has entered into a chaperoning agreement with a U.S. registered broker-dealer, Motilal Oswal Securities International Private Limited. ("MOSIPL"). Any business interaction pursuant to this report will have to be executed within the provisions of this chaperoning agreement.
The Research Analysts contributing to the report may not be registered /qualified as research analyst with FINRA. Such research analyst may not be associated persons of the U.S. registered broker-dealer, MOSIPL, and therefore, may not be subject to NASD rule 2711 and NYSE Rule 472 restrictions on communication with a subject company, public appearances and trading securities held by a research analyst account.
For Hong Kong: This report is distributed in Hong Kong by Motilal Oswal capital Markets (Hong Kong) Private Limited, a licensed corporation (CE AYY-301) licensed and regulated by the Hong Kong Securities and Futures Commission (SFC) pursuant to the Securities and Futures Ordinance (Chapter 571 of the Laws of Hong Kong) “SFO”. As per SEBI (Research Analyst Regulations) 2014 Motilal Oswal Securities (SEBI Reg No. INH000000412) has an agreement with Motilal Oswal capital Markets (Hong Kong) Private Limited for distribution of research report in Kong Kong. This report is intended for distribution only to “Professional Investors” as defined in Part I of Schedule 1 to SFO. Any investment or investment activity to which this document relates is only available to professional investor and will be engaged only with professional investors.”
Nothing here is an offer or solicitation of these securities, products and services in any jurisdiction where their offer or sale is not qualified or exempt from registration. The Indian Analyst(s) who compile this report is/are not located in Hong Kong & are not conducting Research Analysis in Hong Kong. For Singapore Motilal Oswal Capital Markets Singapore Pte Limited is acting as an exempt financial advisor under section 23(1)(f) of the Financial Advisers Act(FAA) read with regulation 17(1)(d) of the Financial Advisors Regulations and is a subsidiary of Motilal Oswal Securities Limited in India. This research is distributed in Singapore by Motilal Oswal Capital Markets Singapore Pte Limited and it is only directed in Singapore to accredited investors, as defined in the Financial Advisers Regulations and the Securities and Futures Act (Chapter 289), as amended from time to time. In respect of any matter arising from or in connection with the research you could contact the following representatives of Motilal Oswal Capital Markets Singapore Pte Limited:
Kadambari Balachandran Email : [email protected] Contact : (+65) 68189233 / 65249115 Office Address : 21 (Suite 31),16 Collyer Quay,Singapore 04931
Motilal Oswal Securities Ltd
Motilal Oswal Tower, Level 9, Sayani Road, Prabhadevi, Mumbai 400 025 Phone: +91 22 3982 5500 E-mail: [email protected]