An Option Valuation Approach
29
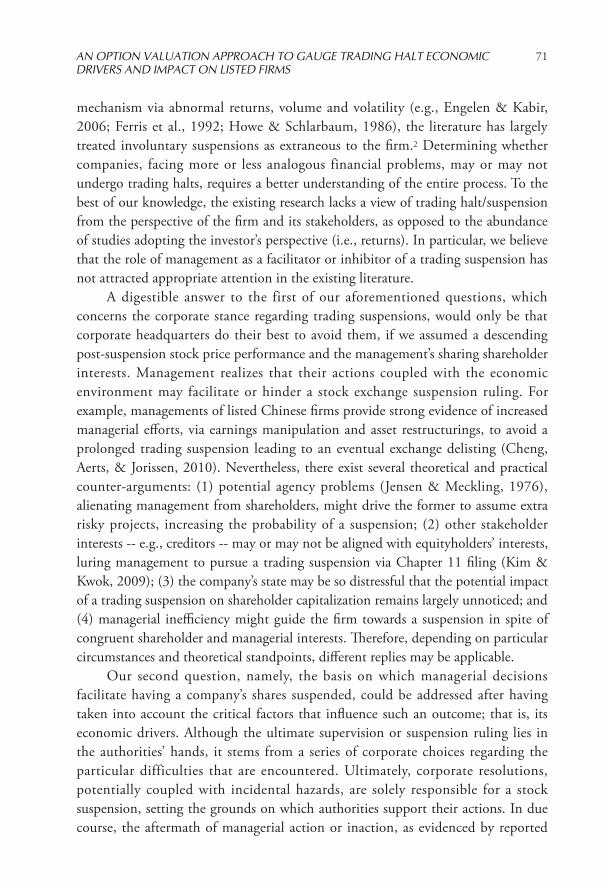
Heriot-Watt University Research Gateway Heriot-Watt University An option valuation approach to gauge trading halt economic drivers and impact on listed firms Konstantaras, Konstantinos; Siriopoulos, Costas Published in: Advances in Financial Planning & Forecasting Publication date: 2012 Link to publication Citation for pulished version (APA): Konstantaras, K., & Siriopoulos, C. (2012). An option valuation approach to gauge trading halt economic drivers and impact on listed firms. Advances in Financial Planning & Forecasting, 5, 69-96. General rights Copyright and moral rights for the publications made accessible in the public portal are retained by the authors and/or other copyright owners and it is a condition of accessing publications that users recognise and abide by the legal requirements associated with these rights. • Users may download and print one copy of any publication from the public portal for the purpose of private study or research. • You may not further distribute the material or use it for any profit-making activity or commercial gain • You may freely distribute the URL identifying the publication in the public portal
Transcript of An Option Valuation Approach
Heriot-Watt University Research Gateway
Heriot-Watt University
An option valuation approach to gauge trading halt economic drivers and impact onlisted firmsKonstantaras, Konstantinos; Siriopoulos, Costas
Published in:Advances in Financial Planning & Forecasting
Publication date:2012
Link to publication
Citation for pulished version (APA):Konstantaras, K., & Siriopoulos, C. (2012). An option valuation approach to gauge trading halt economic driversand impact on listed firms. Advances in Financial Planning & Forecasting, 5, 69-96.
General rightsCopyright and moral rights for the publications made accessible in the public portal are retained by the authors and/or other copyright ownersand it is a condition of accessing publications that users recognise and abide by the legal requirements associated with these rights.
• Users may download and print one copy of any publication from the public portal for the purpose of private study or research. • You may not further distribute the material or use it for any profit-making activity or commercial gain • You may freely distribute the URL identifying the publication in the public portal

Advances in Financial Planning and ForecastingVolume 5(2012), pp.69-96
©Center for PBBEFR and Airiti Press Inc.
AN OPTION VALUATION APPROACH TO GAUGE TRADING HALT ECONOMIC DRIVERS AND IMPACT ON LISTED FIRMSKonstantinos KonstantarasDepartment of Financial and Management Engineering, University of Aegean, GreeceCostas SiriopoulosDepartment of Business Administration, University of Patras, Greece
ABSTRACT
The main purpose of this paper is to estimate the economic factors that drive companies to institute the supervision or suspension of stock exchange-driven trading. To do this, we emphasize the analysis from the shareholder’s and creditor’s perspectives. Following an option-theoretical formulation, we explain why a bad news-related trading suspension should affect the most shareholders experiencing a lower financial burden and the least those experiencing the opposite. In contrast, creditors face a greater impact on their debt holdings if they have extended credit to the heavier debt-ridden category. In the middle, the situation is characterized by negative gamma for creditors and long gamma for shareholders, which leads to an asymmetric risk exposure. Empirical results confirm that management adheres to our theoretical classification. It uncovers alternative economic drivers influencing the probability of a supervision or suspension, depending on the membership of each of our identified classes. Variables explaining such an exchange’s ruling include the degree of economic distress, managerial inefficiency, company size, and the condition of the macroeconomic environment.
Keywords: Supervision, Suspension, Trading Halt, Option, Distress

Konstantaras and Siriopoulos70
I. INTRODUCTION
Around the world, trading halts, suspensions or supervisions are widespread measures, based on regulator -- “mandatory” -- or issuer -- “voluntary” -- initiatives, undertaken by international stock exchanges to enable the smooth dissemination of salient corporate news. Suspension enforcement procedures and their duration vary between exchanges.1 Additionally, the typical causes for such a decision may vary across markets. For example, in the U.S., the Securities and Exchange Commission (SEC) may impose a trading suspension on a New York Stock Exchange (NYSE) traded stock based on their belief that the public requires protection from questionable corporate action or inaction, whereas stock exchange-driven trading halts last for a shorter term (Ferris, Kumar, & Wolfe, 1992). In other markets, such as in Hong Kong, issuers may voluntarily request a halt, typically because of forthcoming neutral or positive news such as takeovers, private placements or privatizations (Wu, 1998), whereas involuntary trading suspensions have their roots in mostly unfavorable news.
Holding shares of companies liable to suffer a trading suspension, especially when expectations are for forthcoming bad news, may command an additional premium, implying negative shareholder returns (Ferris et al., 1992); moreover, expectations for an impending volume reduction might require an increased liquidity premium from investors (Eleswarapu, 1997). Such pieces of bad news may result from the failure to comply with various reporting and disclosure requirements or a questionable financial or operating corporate condition, and this news may portray financial distress (Howe & Schlarbaum, 1986). In addition, it has been established that stock supervision and trading disruptions are more common in shares of firms in financial distress (Ro, Zavgren, & Hsieh, 1992), which burdens their shareholders with an additional onus. Shares of financially distressed companies suffer from huge reductions in stock prices, as the probability of an associated delisting increase (Yen & Li, 2010). In this study, we focus on the basis of distinction between companies that suffer a bad news-related stock supervision, suspension or halting versus those that do not, based on the former’s association with significant underperformance (Engelen & Kabir, 2006; Ferris et al.; Howe & Schlarbaum). Voluntary halts, suspensions or supervisions which are company-initiated and reflect mostly good or neutral news (Wu, 1998) will not be studied hereto.
Regarding the negative expected trading performance following a halt, several questions might arise: first, do companies take adequate measures to avoid such an authority’s decision, and second, what is the root cause of such an outcome? Although the existing literature has focused on trading suspensions by analyzing the resulting stock performance and the efficiency of its information diffusion
AN OPTION VALUATION APPROACH TO GAUGE TRADING HALT ECONOMIC DRIVERS AND IMPACT ON LISTED FIRMS
71
mechanism via abnormal returns, volume and volatility (e.g., Engelen & Kabir, 2006; Ferris et al., 1992; Howe & Schlarbaum, 1986), the literature has largely treated involuntary suspensions as extraneous to the firm.2 Determining whether companies, facing more or less analogous financial problems, may or may not undergo trading halts, requires a better understanding of the entire process. To the best of our knowledge, the existing research lacks a view of trading halt/suspension from the perspective of the firm and its stakeholders, as opposed to the abundance of studies adopting the investor’s perspective (i.e., returns). In particular, we believe that the role of management as a facilitator or inhibitor of a trading suspension has not attracted appropriate attention in the existing literature.
A digestible answer to the first of our aforementioned questions, which concerns the corporate stance regarding trading suspensions, would only be that corporate headquarters do their best to avoid them, if we assumed a descending post-suspension stock price performance and the management’s sharing shareholder interests. Management realizes that their actions coupled with the economic environment may facilitate or hinder a stock exchange suspension ruling. For example, managements of listed Chinese firms provide strong evidence of increased managerial efforts, via earnings manipulation and asset restructurings, to avoid a prolonged trading suspension leading to an eventual exchange delisting (Cheng, Aerts, & Jorissen, 2010). Nevertheless, there exist several theoretical and practical counter-arguments: (1) potential agency problems (Jensen & Meckling, 1976), alienating management from shareholders, might drive the former to assume extra risky projects, increasing the probability of a suspension; (2) other stakeholder interests -- e.g., creditors -- may or may not be aligned with equityholders’ interests, luring management to pursue a trading suspension via Chapter 11 filing (Kim & Kwok, 2009); (3) the company’s state may be so distressful that the potential impact of a trading suspension on shareholder capitalization remains largely unnoticed; and (4) managerial inefficiency might guide the firm towards a suspension in spite of congruent shareholder and managerial interests. Therefore, depending on particular circumstances and theoretical standpoints, different replies may be applicable.
Our second question, namely, the basis on which managerial decisions facilitate having a company’s shares suspended, could be addressed after having taken into account the critical factors that influence such an outcome; that is, its economic drivers. Although the ultimate supervision or suspension ruling lies in the authorities’ hands, it stems from a series of corporate choices regarding the particular difficulties that are encountered. Ultimately, corporate resolutions, potentially coupled with incidental hazards, are solely responsible for a stock suspension, setting the grounds on which authorities support their actions. In due course, the aftermath of managerial action or inaction, as evidenced by reported

Konstantaras and Siriopoulos72
corporate performance, facilitates or stalls stock exchange’s suspension decisions. Overall, management influences corporate reports, which in turn may induce an exchange authority decision to suspend company shares, which in turn affects corporate valuation, which impinges on managerial well being and their decisions. An overview of our suggested framework of interactions between parties involved and suspension decisions is depicted in Figure 1.
In this figure a full arrow indicates direct influence and interrupted arrow stands for indirect influence. Rectangles represent decision making entities, ellipses represent variables affected and diamonds symbolize decisions.
In this study, we differentiate between highly, medium and lightly distressed companies (as measured by their ratio of Financial Expenses [FE] over Earnings Before Interest Tax Depreciation & Amortization [EBITDA]), expecting different economic drivers for each category. The theoretical reasoning behind this distinction is based on the typical option-theoretical framework for debt-ridden corporate valuation (Merton, 1974) and the fact that a decision to suspend or halt stock trading bears a negative marginal impact on its capitalization.3 Therefore, by examining the behavior of the implied option’s delta (which measures the sensitivity of an option to marginal asset value changes) and gamma (which measures delta’s sensitivity from the equityholder and creditor’s perspectives), the theoretical underpinning of our categorization is better understood. Higher shareholder delta values, applicable to companies facing a lower debt burden (low debt over
Figure 1. Lines of influence between managerial decisions, corporate performance, corporate valuation and mandatory trading suspensions.

AN OPTION VALUATION APPROACH TO GAUGE TRADING HALT ECONOMIC DRIVERS AND IMPACT ON LISTED FIRMS
73
valuation), imply a greater impact of suspension’s on valuation, whereas lower delta, suitable for heavily debt-laden firms, entails a minimal suspension effect. Corporate creditors face an opposite situation, witnessing maximal sensitivity to asset valuation changes (delta) at lower valuations and minimal sensitivity at higher valuations. In the middle, around where debt equals the asset valuation ratio, delta’s sensitivity (gamma) is maximized for both creditors and equityholders, albeit with opposite signs (negative gamma for creditors and positive for equityholders). Therefore, the increased delta risk from the creditor side (short gamma) and inferior for the shareholders (long gamma) entail another source of potential conflict between the creditor’s interests and the equityholder’s interests.
We would also expect alternative economic drivers to influence the expected outcome for each of our identified categories, for example in the asymmetric delta risk position in the middle and at the extremes of asset valuation, where divergence between creditor delta and equityholder delta is the highest. Previous empirical findings regarding choices of individual financial distress outcomes seem to support our conflict of interest distinction: shareholders of more economically distressed firms (carrying a heavier debt burden) prefer filing for Chapter 11 (Chatterjee, Dhillon, & Ramírez, 1996; Kim & Kwok, 2009) whereas those with a lesser load but managers with increased shareholdings prefer Chapter 11 to a private debt workout, despite creditors’ opposite preference (Kim & Kwok).
Therefore, according to our theoretical formulation, we may conclude that managers are liable to align with one or another interested party, based on the degree of interest divergence among corporate stakeholders. The conditions of minimal or maximal delta should not raise difficulties in gauging either shareholder or creditor preferences: for low levels of financial distress, bankers do not care too much for suspension effects, as their short put delta approaches zero; this is in contrast to equityholders, whose delta is maximal and who strive to avoid the negative impact of suspension on their assets. For high financial distress, shareholders do not care for the minimal impact of delta’s tending to zero affecting their holdings in the event of a suspension; creditors do care even for the slightest change in a company’s asset valuation, as their short put delta approaches its maximum value of one. Finally, in the middle, asymmetric risk managing an opposite-sign, large gamma position may also raise conflicts.
The trading environment of the Athens Stock Exchange (ASE) offers a unique setting to test our hypothesized framework, as it not only provides us with the classic cases of trading halts and suspensions but also with its so-called “supervision” doctrine, under which shares of identified troubled companies maintain trading through a small number of daily “Dutch” auctions. This mechanism allows bad news to gradually disseminate via infrequent yet existent trading over periods that

Konstantaras and Siriopoulos74
usually last for several months. Throughout this supervision period, information gets slowly digested, and troublesome listed firms get earmarked. Trading halts/suspensions take the place of supervision in more severe cases, such as bankruptcy filings, which reflect even graver corporate events.
By gauging individual economic drivers for each of our distinctive theoretical classes, we find that lack of growth indicates higher economic distress and increases the probability of a bad news supervision/suspension for companies with very low and very high debt burdens. A harsher macroeconomic environment has been found to influence the probability of not financially distressed firms to suffer supervision or suspension. A history of restrained corporate performance, pointing to managerial inefficiency, has also been found to increase the chances that a company that is not financially distressed will be suspended/supervised. Finally, a lower size seems to drive firms with lower debt burdens under supervision or suspension. Our identified economic drivers also reflect that, for those instances where a supervision/suspension bears the higher delta impact for shareholders and creditors, namely, for heavily and lightly distressed firms, economic distress is the most influential factor; in contrast, for companies facing maximum gamma risk divergence, managerial inefficiency plays the most influential role, portraying, lasting underperformance coupled with inability to efficiently handle creditor-shareholder conflicts.
The rest of our paper discusses trading supervision and suspension rules on the ASE, summarizes our analytical framework, portrays our econometric model, describes our sample, presents our results and finally provides our conclusions.
II. TRADING SUPERVISION AND SUSPENSION AT THE ASE
The ASE, in line with most international exchanges, imposes trading illiquidity to listed firms failing to meet serious listing requirements or that have questionable operating performance. This pause of regular share trading serves to provide sufficient time to market participants in order to fully comprehend adverse corporate news and the resulting ramifications for share prices. Since 1998, the ASE, in addition to using measures commonly assumed internationally (such as suspensions or delisting), may also employ a unique mechanism in the form of three auctions that do not prohibit the exchange of shares but subdue the trading frequency. According to existing ASE regulations (Athens Stock Exchange [ASE], 2008), a company’s stock may be set under the so-called supervision regime if
(1) It has negative equity;(2) Its losses exceed 30% of its equity without its having officially announced a
rights issue;

AN OPTION VALUATION APPROACH TO GAUGE TRADING HALT ECONOMIC DRIVERS AND IMPACT ON LISTED FIRMS
75
(3) It exhibits severe short-term debt overhang;(4) It has officially filed for bankruptcy protection (Articles 44, 45 and 46 of
Law 1982/1990);(5) There have been facts or announcements casting serious doubt on whether
it can continue to relentlessly operate.From the investor’s point of view, stock supervision on the ASE means
disrupted and infrequent (three auctions per day) auction-based trading, coupled with a closer follow-up of a company’s economic performance by the regulatory authorities.
More severe measures available to the ASEs and Greek Capital Markets Committees, according to Article 17 of Law 3371/2005, include the decision to suspend its trading or to delist a company’s shares. Both render investor holdings entirely illiquid for an indefinite period of time. Only a small fraction of problematic listed companies ends up in a fully fledged suspension, which invariably coincides with filing for bankruptcy or corporate liquidation.
As may be clearly understood from the ASE’s rules, firms exhibiting subdued retained earnings, indicating a history of weak performance (hence, persistent managerial inefficiency) may be closer to a supervision ruling under (1) and (2) above. Moreover, negative earnings increase the probability that a listed firm is set under supervision because of rule (3) above.
III. ANALYTICAL FRAMEWORK
The decision to set the trading of listed shares under suspension can be met throughout the world under various stock exchange rulings. Examples of markets studied internationally (regarding their trading halts characteristics) include National Association of Securities Dealers Automated Quotations (NASDAQ) (Christie, Corwin, & Harris, 2002; Ferris et al., 1992; Howe & Schlarbaum, 1986), Brussels (Engelen & Kabir, 2006), Lisbon (Duque & Fazenda, 2003), Honk Kong (Wu, 1998), Montreal and Toronto (Kryzanowski, 1979), to list only a few. The purpose of such an action is to ensure that market participants have ample time to absorb new pieces of significant corporate developments, which might otherwise create information asymmetry among its participants. The majority of international exchanges allow a relatively quick reinstatement of trading once such asymmetry is deemed to have disappeared. Longer-term suspensions mostly occur internationally in the graver cases of inadequate financial statements, possible manipulation or forthcoming bankruptcy, referred to as “bad news” in our study.
The negative stock-return impact of a trading suspension due to bad company-related news has been established in a series of empirical studies, including all of the

Konstantaras and Siriopoulos76
references in our previous paragraph. The theoretical underpinning of involuntary halt’s negative performance may be attributed either to investors realizing that their holdings are going to suffer reduced liquidity, to investors asking for an additional liquidity premium (Sanger & Peterson, 1990), or to the adverse informational content of the forthcoming news (Ferris et al., 1992).
The existing literature generally treats the event of a trading suspension as external to the firm, neglecting any corporate policies leading to it under the supposition that it is an involuntary process expressing an exchange’s beliefs rather than managerial signals (Sanger & Peterson, 1990). Nonetheless, an extensive amount of research has been devoted to the disappearance of stocks (in the form of delistings via bankruptcy, liquidation or acquisition) from the stock exchanges and the fundamental corporate factors behind them, treating them by no means as involuntary (Dahiya & Klapper, 2007). With our current research, we aim to bridge this discrepancy, estimating economic drivers behind trading halts and supervision events and treating them as factors driving the outcomes, irrespective of their root cause, which may be exchange, firm or event driven.
The impact a trading suspension usually bears on the traded shares, be it short or longer term, does not last long. From previous event studies, it has been shown that negative abnormal returns emanating from a bad-news suspension rarely lasts longer than the announcement day, portraying market efficiency; moreover, they only exert a marginal influence on stock returns. For instance, Wu (1998) reported significant abnormal returns on the suspension day of -4.08% in Honk Kong, whereas Duque and Fazenda (2003) posted -5.05% in the Portuguese stock exchange, both for bad news-related suspensions. Therefore, it is safe to assume that only a marginal impact is withstood by existing company creditors and shareholders.
Taking this into account, the way such an event may influence equity and debt holdings may be estimated by its marginal effect on company valuation. An estimate of this may be calculated on the basis of the option-theoretical model of corporate debt, set out by Black and Scholes (1973) and refined by Merton (1974). According to these authors, shareholder claims may be estimated as call options on a firm’s assets with a strike price equal to its debt’s nominal amount and with an effective life equal to the time-to-maturity of the debt. Notwithstanding the limitations of the aforementioned models, it provides a helpful way to understand the positions of the major firm’s stakeholders, namely, its creditors and shareholders.
For reasons of completeness we briefly review the salient theoretical underpinnings of Merton’s (1974) model. According to this formulation, corporate assets (A) consist of equity (E) and debt (D); asset prices follow a geometric Brownian motion:

AN OPTION VALUATION APPROACH TO GAUGE TRADING HALT ECONOMIC DRIVERS AND IMPACT ON LISTED FIRMS
77
dA = μ Α dt + σ Α dZ, dZ is assumed to be a Wiener process.Hence, equity is formally derived asE = max(0, A − D).Alternatively, the equity is derived based on the risk-neutral probability
measure EQ as follows,
(1)
In essence, the value of a firm’s equity is the maximum between the excess of the total value of the firm’s assets over its debt and zero, or, in option terms, a call option on whatever assets are left after the company has fully repaid its debtholders at maturity T; Debt is assumed to consist of a single zero-coupon, non-callable bond of face value F and term T, with the economy’s risk-free rate being rf.
The solution provided by Black and Scholes (1973) for the call value of equity is given by
E = AN (d1) − Fe−rfT N (d2),4 (2)
In a completely analogous manner, using put-call parity, they obtain for the put
(3)
and the value of corporate debt is derived as the difference between the safe bond, represented by the present value promised to creditors, minus the value of the aforementioned put, which has been granted to the firm’s shareholders:
(4)
In our problem formulation, we need to estimate the marginal impact of an empirically evidenced, instantaneous drop in equity price (and thus on the company’s valuation) of a trading suspension, which is assumed to negatively influence it. As may be derived from the previous equity and debt valuation relationships, equityholders and creditors will not be affected in the same way. The sensitivity of an option’s price to its impact on company valuation is commonly referred to as its “delta” (Δ). In order to estimate the price sensitivity of the equityholder’s call option, we calculate the first partial derivative of Expression (2) as follows:
Konstantaras and Siriopoulos78
(5)
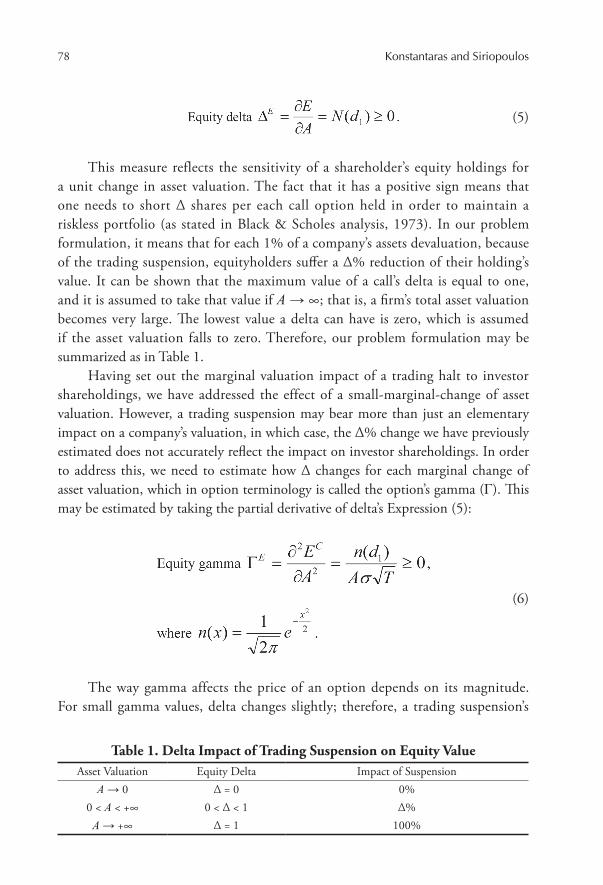
This measure reflects the sensitivity of a shareholder’s equity holdings for a unit change in asset valuation. The fact that it has a positive sign means that one needs to short Δ shares per each call option held in order to maintain a riskless portfolio (as stated in Black & Scholes analysis, 1973). In our problem formulation, it means that for each 1% of a company’s assets devaluation, because of the trading suspension, equityholders suffer a Δ% reduction of their holding’s value. It can be shown that the maximum value of a call’s delta is equal to one, and it is assumed to take that value if A → ∞; that is, a firm’s total asset valuation becomes very large. The lowest value a delta can have is zero, which is assumed if the asset valuation falls to zero. Therefore, our problem formulation may be summarized as in Table 1.
Having set out the marginal valuation impact of a trading halt to investor shareholdings, we have addressed the effect of a small-marginal-change of asset valuation. However, a trading suspension may bear more than just an elementary impact on a company’s valuation, in which case, the Δ% change we have previously estimated does not accurately reflect the impact on investor shareholdings. In order to address this, we need to estimate how Δ changes for each marginal change of asset valuation, which in option terminology is called the option’s gamma (Γ). This may be estimated by taking the partial derivative of delta’s Expression (5):
(6)
The way gamma affects the price of an option depends on its magnitude. For small gamma values, delta changes slightly; therefore, a trading suspension’s
Table 1. Delta Impact of Trading Suspension on Equity ValueAsset Valuation Equity Delta Impact of Suspension
A → 0 Δ = 0 0%0 < Α < +∞ 0 < Δ < 1 Δ%A → +∞ Δ = 1 100%
AN OPTION VALUATION APPROACH TO GAUGE TRADING HALT ECONOMIC DRIVERS AND IMPACT ON LISTED FIRMS
79
marginal impact is adequately reflected by the value of its delta. For large gamma values, delta is highly sensitive to asset valuation and thus does not by itself accurately reflect the impact of a marginal devaluation.
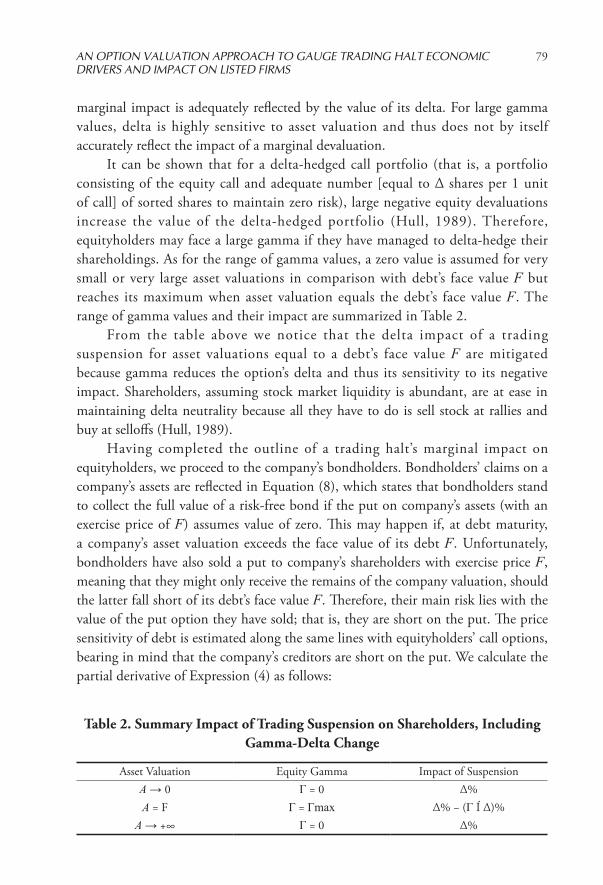
It can be shown that for a delta-hedged call portfolio (that is, a portfolio consisting of the equity call and adequate number [equal to Δ shares per 1 unit of call] of sorted shares to maintain zero risk), large negative equity devaluations increase the value of the delta-hedged portfolio (Hull, 1989). Therefore, equityholders may face a large gamma if they have managed to delta-hedge their shareholdings. As for the range of gamma values, a zero value is assumed for very small or very large asset valuations in comparison with debt’s face value F but reaches its maximum when asset valuation equals the debt’s face value F. The range of gamma values and their impact are summarized in Table 2.
From the table above we notice that the delta impact of a trading suspension for asset valuations equal to a debt’s face value F are mitigated because gamma reduces the option’s delta and thus its sensitivity to its negative impact. Shareholders, assuming stock market liquidity is abundant, are at ease in maintaining delta neutrality because all they have to do is sell stock at rallies and buy at selloffs (Hull, 1989).
Having completed the outline of a trading halt’s marginal impact on equityholders, we proceed to the company’s bondholders. Bondholders’ claims on a company’s assets are reflected in Equation (8), which states that bondholders stand to collect the full value of a risk-free bond if the put on company’s assets (with an exercise price of F) assumes value of zero. This may happen if, at debt maturity, a company’s asset valuation exceeds the face value of its debt F. Unfortunately, bondholders have also sold a put to company’s shareholders with exercise price F, meaning that they might only receive the remains of the company valuation, should the latter fall short of its debt’s face value F. Therefore, their main risk lies with the value of the put option they have sold; that is, they are short on the put. The price sensitivity of debt is estimated along the same lines with equityholders’ call options, bearing in mind that the company’s creditors are short on the put. We calculate the partial derivative of Expression (4) as follows:
Table 2. Summary Impact of Trading Suspension on Shareholders, Including Gamma-Delta Change
Asset Valuation Equity Gamma Impact of SuspensionA → 0 Γ = 0 Δ%Α = F Γ = Γmax Δ% − (Γ Í Δ)%
A → +∞ Γ = 0 Δ%

Konstantaras and Siriopoulos80
(7)
As a result, we see that the creditor’s price sensitivity of their holdings ΔC is positive (N(d1) < 1) and that it assumes its maximum value of 1.0 when the asset valuation equals zero. It also tends to zero for very large asset valuations. The range of possible creditor deltas is summarized in Table 3.
Therefore, the theoretical debt-option framework leads us to presume that a lower valuation of the firm’s assets leads to the greater expected impact of a trading suspension on a creditor’s holdings. For very large asset valuations, debtholders do not care about the effects of any trading suspensions, as their option delta approaches zero (they will still be receiving their full debt value, irrespective of asset valuation).
Larger amounts of asset devaluation are expected to bear an additional effect estimated by the change in delta due to its sensitivity to asset valuation. Along the same lines, we may estimate it for creditors by taking the partial derivative of Equation (7):
(8)
In the case of debt, we see that its price sensitivity to marginal asset devaluations depicts a negative gamma, meaning that for large asset-price reductions, its delta increases, magnifying its downward revaluation. In option terminology, this unhelpful behavior of short gamma positions is referred to as “delta risk” and has historically been a reason for severe trading losses of large short put positions (as in the infamous failure of Long Term Capital Management). The intricacy of managing a short gamma position relates to the difficulty of selling shares in a depressed market and buying them at a rally, rendering delta hedging uncertain.
The creditor position’s gamma is minimized at the same value at which it was previously maximized for equityholders, i.e., for A = F. Along the same lines, for very small and very large asset valuations it goes to zero. Its full range of values is depicted in Table 4.
Table 3. Delta Impact of Trading Suspension on Debt ValueAsset Valuation Debt Delta Impact of Suspension
A → 0 Δ = 1 100%0 < Α < +∞ 0 < Δ < 1 Δ%
A → +∞ Δ = 0 0%

AN OPTION VALUATION APPROACH TO GAUGE TRADING HALT ECONOMIC DRIVERS AND IMPACT ON LISTED FIRMS
81
Therefore, a creditor’s delta risk is maximized whenever the asset valuation assumes the same value with the face value of its debt - equity equals zero. Moreover, debt suffers maximal trading suspension sensitivity at relatively low asset valuations.
To sum up our conclusions regarding the option-based formulation of our trading suspension impact estimation problem, we may draw the following general results for equityholders:
Eq/hold. (1) For very low asset valuations, shareholders are relatively indifferent toward a forthcoming trading suspension, as it bears a minimal impact on their holdings - delta approaches zero;
Eq/hold. (2) For very high asset valuations, equityholders are most worried about a possible trading halt, as its potential impact on their holdings is maximal -- delta approaches one;
Eq/hold. (3) For intermediate asset valuations that are close or equal to the debt’s face value F, shareholdings are affected by a factor of a Δ% per-unit devaluation. Nevertheless, the positive gamma impact on an equityholder’s equity repricing is beneficial, as it reduces the delta sensitivity of their holdings.
On the other hand, creditors face an alternative trading suspension impact on their holdings:
Cred. (1) For very low asset valuations, creditors suffer from larger reductions in their holdings, witnessing the maximum impact of suspension -- delta approaches one -;
Cred. (2) For very high asset valuations, creditors are relatively indifferent towards a forthcoming trading suspension, as it only has a minimal effect on their debt value -- delta approaches zero;
Cred. (3) For intermediate asset valuations that are close or equal to debt’s face value F, creditors face the maximum delta risk from their negative gamma position, coupled with an intermediate Δ% value reduction.
As a result of the above, it has been made apparent that for very low asset valuations vs. debt obligation, creditors care a lot and equityholders care a little,
Table 4. Summary Impact of Trading Suspension on Creditor Holdings, Including gamma-delta Change.
Asset Valuation Creditor Gamma Impact of SuspensionA → 0 Γ = 0 Δ%Α = F Γ = max Δ% + (Γ Í Δ)%
A → +∞ Γ = 0 Δ%
Konstantaras and Siriopoulos82
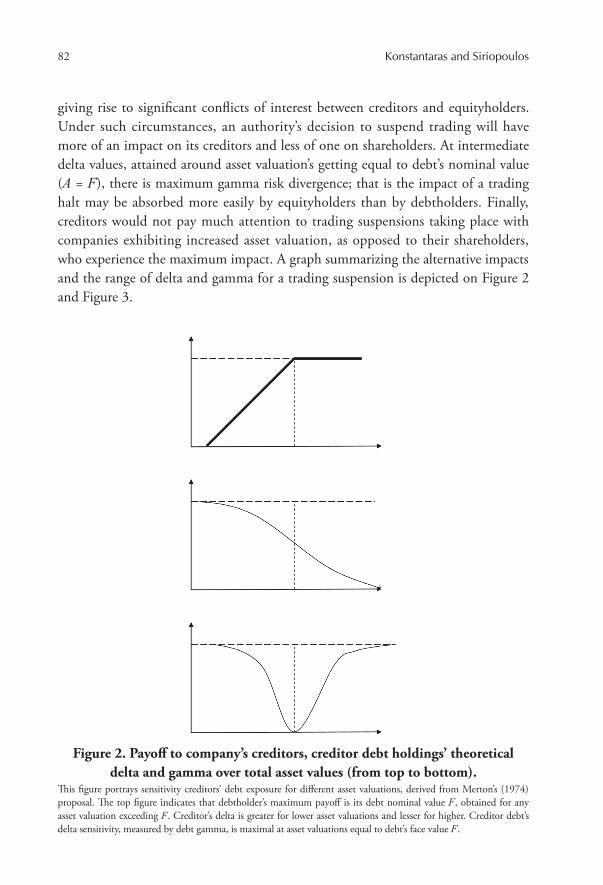
giving rise to significant conflicts of interest between creditors and equityholders. Under such circumstances, an authority’s decision to suspend trading will have more of an impact on its creditors and less of one on shareholders. At intermediate delta values, attained around asset valuation’s getting equal to debt’s nominal value (A = F), there is maximum gamma risk divergence; that is the impact of a trading halt may be absorbed more easily by equityholders than by debtholders. Finally, creditors would not pay much attention to trading suspensions taking place with companies exhibiting increased asset valuation, as opposed to their shareholders, who experience the maximum impact. A graph summarizing the alternative impacts and the range of delta and gamma for a trading suspension is depicted on Figure 2 and Figure 3.
Figure 2. Payoff to company’s creditors, creditor debt holdings’ theoretical delta and gamma over total asset values (from top to bottom).
This figure portrays sensitivity creditors’ debt exposure for different asset valuations, derived from Merton’s (1974) proposal. The top figure indicates that debtholder’s maximum payoff is its debt nominal value F, obtained for any asset valuation exceeding F. Creditor’s delta is greater for lower asset valuations and lesser for higher. Creditor debt’s delta sensitivity, measured by debt gamma, is maximal at asset valuations equal to debt’s face value F.

AN OPTION VALUATION APPROACH TO GAUGE TRADING HALT ECONOMIC DRIVERS AND IMPACT ON LISTED FIRMS
83
We should note here that a common problem arising in equivalent studies concerns the determination of asset valuation, which is more or less not directly observable. Therefore, we could only indirectly estimate asset valuation via proxy variables that are assumed to reflect it. In our study, we treat the ratio of a company’s FE to its adjusted EBITDA as such a proxy.
In our study we have selected exchange suspension or supervision decisions that relate to bad news, referring to a more or less distressed corporate condition expected to bear negative performance ramifications. The prime indicator for economic distress is earnings contraction (John, Lang, & Netter, 1992) or asset shrinkage. Business failure is associated with increased debt burden over total assets internationally (Chen, Marshall, Zhang, & Ganesh, 2006). We use reduced
Figure 3. Payoff to company’s shareholders, equity theoretical delta and gamma over total asset values (from top to bottom).
This figure portrays sensitivity of theoretical equity exposure to a listed firm for different asset valuations, derived from Merton’s (1974) proposal. The top figure indicates that equityholder’s payoff gets positive for asset valuations exceeding debt’s nominal value F. Equity delta is greater for higher asset valuations and smaller for lower. Equity’s delta sensitivity, measured by gamma, is maximal at asset valuations equal to debt’s face value F.

Konstantaras and Siriopoulos84
total assets as a measure of the reduction of growth, indicating economic distress. Financially distressed companies are typically referred to as those exhibiting an inability to meet its FE (e.g., Asquith, Asquith, & Scharfstein, 1994) or depicting negative earnings (John et al.). We use the latter as an indicator of severe financial distress.
In our theoretical representation, we measured the marginal impact on company’s valuation that a trading suspension may have, and we found that depending on firm’s overall financial soundness, there exist three distinctive classes. Approximating financial distress by FE over EBITDA, we distinguish firms into three equivalent categories: (1) firms with negative EBITDA, implying severe financial distress, (2) firms with low FE over EBITDA, portraying a sounder financial position and (3) the situation in the middle, reflected by relatively higher FE and lower valuation.
Our principle hypotheses based on the above analysis relate to1. The differential impact of a trading supervision/suspension,
depending on alternative debt burdens, ranging for low, medium to high FE/EBITDA ratios, reflecting high, medium and low debt over asset valuation, respectively. Should our theoretical distinction be valid, we would expect alternative economic drivers to play a significant role for companies under very high, medium and very low debt loads. This would be justified by the existence of a varied frequency of trading suspension occurrence but also from a difference in corporate and/or environmental characteristics that facilitate its incidence.
2. The frequency of Suspension cases under alternative managerial interests. The fact that the two extremes of the FE/EBITDA range bear -- with their maximum delta -- considerable effects on either shareholders or creditors implies that the effect of a trading halt stands to bear a significant repercussion to a company’s stakeholders. Managers acting in the interest of each of the latter would make an effort to resist such an occurrence according to their vested interests. We should then expect managers acting in the interest of shareholders to avoid suspensions when their impact is highest; that is, at low debt burdens. In contrast, should they act in the interest of creditors, they would avoid suspension in conditions of severe financial distress; that is, at significantly low corporate valuation.
3. The adverse result of economic coupled with financial distress. For companies in financial distress, their long-term viability very much relies on the degree of growth opportunities they have at their disposal (Kahl, 2002). Therefore, we should expect that for firms already in financial distress, should signs of economic distress and business failure materialize the
AN OPTION VALUATION APPROACH TO GAUGE TRADING HALT ECONOMIC DRIVERS AND IMPACT ON LISTED FIRMS
85
probability of default increases (Turetsky & McEwen, 2001) and, hence, get under the exchange’s supervision/suspension screen.
Thus, we hypothesize that
Hypothesis 1: The economic drivers of the probability that a listed firm will undergo trading suspension will differ between the lower, middle and the higher degrees of distress (proxied by FE/EBITDA).
Hypothesis 2: Whenever the effects of trading supervision/suspension are greater for company’s shareholders -- higher delta values at high asset valuations -- managers acting in their interest would avoid supervision/suspension. In contrast, managers acting in the interest of creditors would avoid such incidents at low asset valuations.
Hypothesis 3: In a negative EBITDA range, indicating imminent financial distress, the arrival of economic distress is expected to facilitate occurrence of trading halts.
IV. ECONOMETRIC MODELING
In order to test our hypotheses, we employ a logit regression analysis, which conveniently estimates the probability that a firm undergoes a trading halt or suspension. Our dependent variable assumes a value of one if the stock exchange decides within a particular year to suspend or halt the trading of company’s shares, based on the explicit bad news, which was previously analyzed.5 The financial ratios we employ in order to determine the probability of such an event are based on the following determinants.
Managerial efficiency: Managerial efficiency is gauged by employing the scaled6 retained earnings ratio (RET), assuming that inefficient management hampering corporate performance may be evidenced by a lower historical level of retained earnings. In addition, the same indicator pertains to ASE’s supervision/suspension-specific rules, as we have analyzed above.
Macroeconomic environment: due to external shocks in the economy, a company may face insurmountable obstacles, facilitating a trading suspension. Evidence of a Year on Year interest rate reduction (INT_DIF), usually taken up as a measure to stimulate lingering economies, will serve as an indicator of macroeconomic gravity.
Performance: a lower degree of cash generation over a firm’s total assets (ROA: return on assets, measured as EBITDA over total assets) indicates a higher
Konstantaras and Siriopoulos86
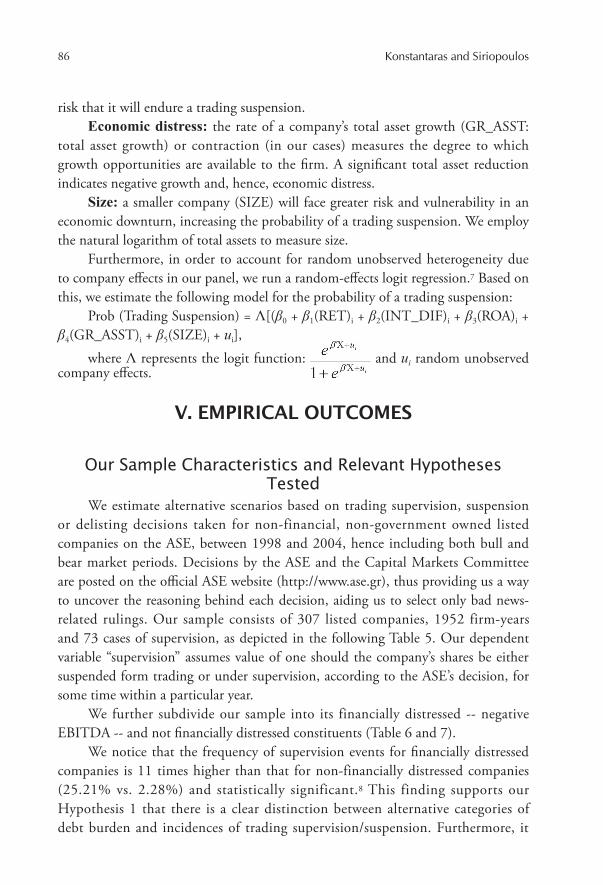
risk that it will endure a trading suspension. Economic distress: the rate of a company’s total asset growth (GR_ASST:
total asset growth) or contraction (in our cases) measures the degree to which growth opportunities are available to the firm. A significant total asset reduction indicates negative growth and, hence, economic distress.
Size: a smaller company (SIZE) will face greater risk and vulnerability in an economic downturn, increasing the probability of a trading suspension. We employ the natural logarithm of total assets to measure size.
Furthermore, in order to account for random unobserved heterogeneity due to company effects in our panel, we run a random-effects logit regression.7 Based on this, we estimate the following model for the probability of a trading suspension:
Prob (Trading Suspension) = Λ[(β0 + β1(RET)i + β2(INT_DIF)i + β3(ROA)i + β4(GR_ASST)i + β5(SIZE)i + ui],
where Λ represents the logit function: and ui random unobserved company effects.
V. EMPIRICAL OUTCOMES
Our Sample Characteristics and Relevant Hypotheses Tested
We estimate alternative scenarios based on trading supervision, suspension or delisting decisions taken for non-financial, non-government owned listed companies on the ASE, between 1998 and 2004, hence including both bull and bear market periods. Decisions by the ASE and the Capital Markets Committee are posted on the official ASE website (http://www.ase.gr), thus providing us a way to uncover the reasoning behind each decision, aiding us to select only bad news-related rulings. Our sample consists of 307 listed companies, 1952 firm-years and 73 cases of supervision, as depicted in the following Table 5. Our dependent variable “supervision” assumes value of one should the company’s shares be either suspended form trading or under supervision, according to the ASE’s decision, for some time within a particular year.
We further subdivide our sample into its financially distressed -- negative EBITDA -- and not financially distressed constituents (Table 6 and 7).
We notice that the frequency of supervision events for financially distressed companies is 11 times higher than that for non-financially distressed companies (25.21% vs. 2.28%) and statistically significant.8 This finding supports our Hypothesis 1 that there is a clear distinction between alternative categories of debt burden and incidences of trading supervision/suspension. Furthermore, it

AN OPTION VALUATION APPROACH TO GAUGE TRADING HALT ECONOMIC DRIVERS AND IMPACT ON LISTED FIRMS
87
supports our Hypothesis 2 that managers are acting on behalf of shareholders,9 as the incidence of such exchange rulings is relatively scarce when the impact on shareholder holdings is maximal; that is, for the non-financially distressed subsample. To support our argument further, we subdivide the latter into its two 50% subsamples, according to their FE over EBITDA ratio, portraying lower and higher debt burdens. Therefore, we come up with two subsamples of the median FE/EBITDA (equal to 0.123), each consisting of 916 and 917 firm-years respectively, for higher and lower debt loads. Within these equally populated subsamples, 18 supervision cases are categorized as lower FE/EBITDA, and 25 are placed in the upper range.10 Our higher FE/EBITDA group reflects a medium debt burden; therefore, situations close to the intermediate deltas analyzed previously (valuation equal to debt’s nominal value). The lower FE/EBITDA group includes companies portraying the lighter debt load in our sample. Running a non-parametric Mann-Whitney test both subsamples portray significantly different supervision/suspension incidence rate compared to the financially distressed sample (1.96% for the low, 2.73% for the medium versus 25.21% for the
Table 5. Distribution of Supervision/Suspension Outcomes: Full Sample
SupervisionYear
1998 1999 2000 2001 2002 2003 2004 Total0 287 291 293 275 263 247 223 1,879 1 2 4 4 10 7 26 20 73 Total 289 295 297 285 270 273 243 1,952
Table 6. Distribution of Supervision/Suspension Outcomes: Financially Distressed
SupervisionYear
1998 1999 2000 2001 2002 2003 2004 Total0 13 7 9 12 23 11 14 89 1 0 2 2 3 5 9 9 30 Total 13 9 11 15 28 20 23 119
Table 7. Distribution of Supervision/Suspension Outcomes: Non-financially Distressed
SupervisionYear
1998 1999 2000 2001 2002 2003 2004 Total0 274 284 284 263 240 236 209 1,790 1 2 2 2 7 2 17 11 43 Total 276 286 286 270 242 253 220 1,833

Konstantaras and Siriopoulos88
distressed). Our finding ratifies that managerial actions are congruent with shareholders’: the impact of a trading suspension is minimal -- from a delta point of view -- in the financially distressed firms, hence management, in line with shareholders, does not care much for its negative valuation impact; for the less distressed firms, management strives to reduce the incidence of exchange’s suspension rulings, in tandem with shareholder interests which strive to avoid the great reduction in valuation caused by a maximal position delta. Hence, our Hypothesis 2 positing scarcer incidences of supervision/suspension whenever its valuation impact is greater has been confirmed, given the alignment of interest between shareholders and managers in our sample.
Logit Regression ResultsThe results from running panel logit regression, using Stata 911 to estimate
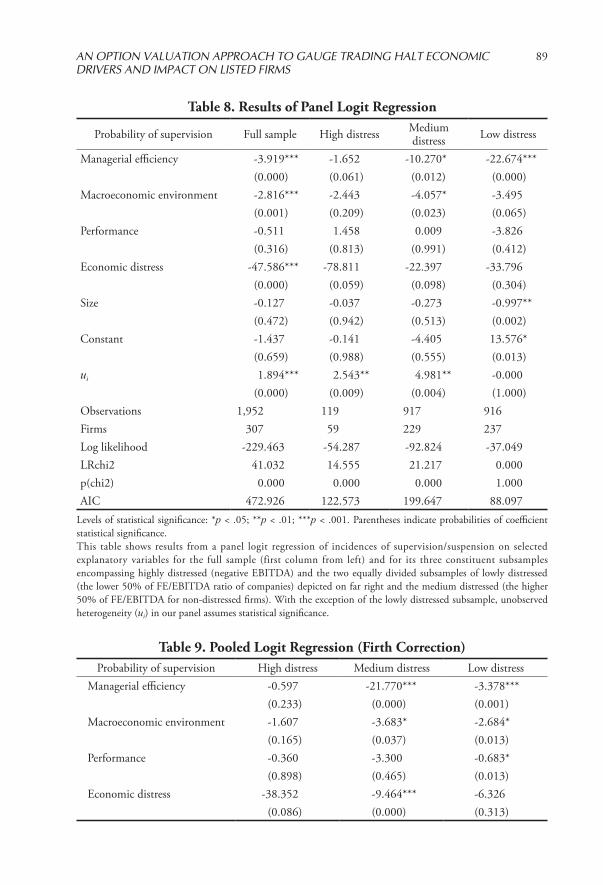
the probability of supervision/suspension for our sample, indicate that all of our identified covariates, except for ROA, play a statistically significant role, albeit on different samples (Table 8). Our Hypothesis 1, which concerns differences in economic drivers among different subsamples, seems, at first glance, to hold. Company-specific heterogeneity (ui) also seems to play an influential role, albeit in different subsamples.
A problem we face with our estimated results is the degree of inflation exhibited in our estimated beta coefficients. This, coupled with overblown standard errors, casts serious doubt regarding Wald-based significance tests and points towards a potential problem of quasi-separation, as Heinze and Schemper (2002) have pointed out. This may be a result of our data structure (zero frequency of supervision in 1998) or due to its sparseness. Having run into this difficulty, we employed a logistic regression technique proposed by Heinze and Schemper that was originally developed by Firth (1993); employing this logistic regression formulation overcomes the previous problem,12 though it applies to pooled data applications. Treating our data as pooled, we run a series of logit regressions13 for each of our subsamples (Table 9).
Moreover, we do not rely on the Wald-reported significance of coefficients but rather employ a series of likelihood ratio tests for each of them, based on the methodology proposed by Heinze and Schemper (2002). Based on this, the significance of coefficients for each subsample is summarized in Table 10.
Results obtained from Table 10, coupled with our first estimates portrayed in Table 8 allow us to draw the conclusion that alternative economic drivers play an important role for each of our identified subsamples, confirming our Hypothesis 1.
Looking at our highly distressed subsample, we observe that when economic distress (evidenced by negative total assets growth) hits companies already in
AN OPTION VALUATION APPROACH TO GAUGE TRADING HALT ECONOMIC DRIVERS AND IMPACT ON LISTED FIRMS
89
Table 8. Results of Panel Logit Regression
Probability of supervision Full sample High distress Mediumdistress Low distress
Managerial efficiency -3.919*** -1.652 -10.270* -22.674***(0.000) (0.061) (0.012) (0.000)
Macroeconomic environment -2.816*** -2.443 -4.057* -3.495(0.001) (0.209) (0.023) (0.065)
Performance -0.511 1.458 0.009 -3.826(0.316) (0.813) (0.991) (0.412)
Economic distress -47.586*** -78.811 -22.397 -33.796(0.000) (0.059) (0.098) (0.304)
Size -0.127 -0.037 -0.273 -0.997**(0.472) (0.942) (0.513) (0.002)
Constant -1.437 -0.141 -4.405 13.576*(0.659) (0.988) (0.555) (0.013)
ui 1.894*** 2.543** 4.981** -0.000(0.000) (0.009) (0.004) (1.000)
Observations 1,952 119 917 916Firms 307 59 229 237Log likelihood -229.463 -54.287 -92.824 -37.049LRchi2 41.032 14.555 21.217 0.000p(chi2) 0.000 0.000 0.000 1.000AIC 472.926 122.573 199.647 88.097
Levels of statistical significance: *p < .05; **p < .01; ***p < .001. Parentheses indicate probabilities of coefficient statistical significance. This table shows results from a panel logit regression of incidences of supervision/suspension on selected explanatory variables for the full sample (first column from left) and for its three constituent subsamples encompassing highly distressed (negative EBITDA) and the two equally divided subsamples of lowly distressed (the lower 50% of FE/EBITDA ratio of companies) depicted on far right and the medium distressed (the higher 50% of FE/EBITDA for non-distressed firms). With the exception of the lowly distressed subsample, unobserved heterogeneity (ui) in our panel assumes statistical significance.
Table 9. Pooled Logit Regression (Firth Correction)Probability of supervision High distress Medium distress Low distress
Managerial efficiency -0.597 -21.770*** -3.378***(0.233) (0.000) (0.001)
Macroeconomic environment -1.607 -3.683* -2.684*(0.165) (0.037) (0.013)
Performance -0.360 -3.300 -0.683* (0.898) (0.465) (0.013)
Economic distress -38.352 -9.464*** -6.326 (0.086) (0.000) (0.313)

Konstantaras and Siriopoulos90
severe financial distress, trading supervision/suspension becomes more probable, confirming our Hypothesis 3. Remembering that according to our theoretical formulation, delta would be maximal for creditors but minimal for investors, we may infer that the former should be carefully monitoring their debtors and become quickly alerted at the earlier signs of economic distress.14 An increased probability of having a company’s stock under suspension may have a significant effect on their
Table 9. Pooled Logit Regression (Firth Correction) (continued)Probability of supervision High distress Medium distress Low distress
Size -0.099 -0.966** -0.236 (0.693) (0.002) (0.232)
Constant 1.321 12.272* 0.294 (0.762) (0.021) (0.932)
Observations 119 917 916 Log likelihood -62.260 -39.523 -101.433 AIC 136.521 91.047 214.867
Levels of statistical significance: *p < .05; **p < .01; ***p < .001. Parentheses indicate probabilities of coefficient statistical significance.This table shows results from a pooled logit regression employing a correction proposed by Frith (1993) of incidences of supervision/suspension on selected explanatory variables for the three constituent subsamples of highly distressed (negative EBITDA) -- constituting the first column on the left -- and the two equally divided subsamples of lowly distressed (the lower 50% of FE/EBITDA ratio of companies) depicted on far right and the medium distressed (the higher 50% of FE/EBITDA for non-distressed firms).
Table 10. Pooled Logit Regression (Frith Correction) Likelihood Ratio Based Significance
Probability of supervision High distress Mediumdistress Low distress
Managerial efficiency LR chi2(1) = 1.50 14.58 55.67Prob > chi2 = 0.221 0.000*** 0.000***
Macroeconomicenvironment
LR chi2(1) = 1.90 5.73 4.23
Prob > chi2 = 0.168 0.017* 0.040*Performance LR chi2(1) = 0.02 3.30 0.59
Prob > chi2 = 0.898 0.069 0.444Economic distress LR chi2(1) = 4.24 1.37 14.57
Prob > chi2 = 0.039* 0.243 0.000***Size LR chi2(1) = 0.16 1.48 10.93
Prob > chi2 = 0.693 0.224 0.001**Levels of statistical significance: *p < .05; **p < .01; ***p < .001. This table portrays Likelihood ratio-based statistical significance for estimated coefficients in the logit regression previously employed with Frith’s (1993) correction. The highly distressed, lowly distressed and medium distressed subsamples correspond exactly to the analysis performed in Table 9.

AN OPTION VALUATION APPROACH TO GAUGE TRADING HALT ECONOMIC DRIVERS AND IMPACT ON LISTED FIRMS
91
debt valuation.In the case of the less distressed companies, the incidence of trading
supervision/suspension affects their equityholders to a greater extent, leaving creditors indifferent. The fact that economic distress, managerial inefficiency, a small company size and an adverse macroeconomic environment influence the probability leads to the proposal that there are many indicators influencing exchange authorities’ decisions. This multiplicity of driving factors implies two phenomena: first, that authorities have more degrees of freedom to impose such a fearful, from an equityholder point of view, measure, rendering its avoidance a hazardous exercise on behalf of the management; secondly, that apart from the drivers relating to past performance and the macroeconomic environment, aggressive managerial actions realizing growth opportunities might alleviate the probability of a stock supervision or suspension, even by assuming increased risks.
Negative historical performance, evidenced by subdued retained earnings, influences the probability the company’s stock gets under supervision/suspension under both the less and the medium distressed firms. This financial indicator may assume a twofold interpretation: It either denotes proximity to breaching ASE’s rules for negative equity or significant losses, or it reflects chronic managerial incompetence. Either way, it affects all companies in our non-distressed subsamples, coupled with macroeconomic difficulties. Both factors relate to corporate weaknesses without a quick fix from incumbent management unless a shakeout takes place. We find them to be the sole economic drivers in our medium-distressed subsample, indicating that in this case supervision/suspension decisions are, to a degree, dependent on factors exogenous to corporate policies of management in place. Moreover, the fact that there exists an increased influence on creditors’ and shareholders’ holdings stemming from the exchange’s decision, based on their intermediate delta and maximum gamma value, may drive creditors to monitor their debtor’s condition even more closely.
VI. CONCLUSIONS
In order to estimate the economic drivers behind a bad news-related trading supervision or suspension, we have developed a theoretical option-based model to gauge its impact. This theory implies reduced liquidity and negative stock performance imposed by stock exchange authorities. Our theoretical model, which interprets Merton’s (1974) option valuation, predicts that trading suspensions should influence the most shareholders of companies with a relatively low debt
Konstantaras and Siriopoulos92
burden, i.e., higher FE coverage. Under such circumstances, the effect of a supervision/suspension is the maximum for its shareholders and the minimum for its creditors. The effect depends on several economic factors, which provides ample degrees of freedom to the authorities. Among them, macroeconomic hardships and historical underperformance may not be easily turned around. In contrast, managerial decisions to increase investments and uncover growth opportunities may reduce the probability of such an unfortunate development for equityholders.
Firms in the higher echelon of FE/EBITDA (i.e., those with the least FE coverage), according to our theoretical interpretation, undergo trading suspensions with the least marginal impact on its shareholders but the most marginal impact on its creditors. Managers looking after their equityholders should not care too much about such an exchange’s decision, although creditors would suffer from its maximal delta impact on their debt holdings. Incidence of economic distress, on top of existing financial distress, seems to positively influence the probability of such a development. Creditors should be extra careful to avoid the augmented effect of such an event to their debt holdings. That the probability of supervision/suspension is several times higher than in the other classes of companies supports that our theoretical categorization accurately reflects reality for our sample of manager-owner led firms.
Finally, for companies in the midrange of FE coverage, shareholders and creditors are expected to equally suffer from trading suspensions. However, the latter must also cope with a difficultly manageable negative gamma position. Our sample confirms that managerial inefficiency, coupled with macroeconomic distress, is playing a significant role in increasing the probability of a trading supervision/suspension. Finally, we employed a panel logit model to account for unobserved heterogeneity but resorted to models correcting for data sparseness and quasi separation to come up with robust results.
We believe that the implications of our research are twofold: to increase creditor and shareholder awareness regarding the implications of an exchange-driven supervision/suspension for their holdings and to uncover the economic drivers that influence the probability of its occurrence.
ACKNOWLEDGEMENTS
We would like to express our gratitude for their valuable contribution and remarks participants in the BRMC-QASS 2010 conference in Brunel University/UK. In addition we would like to thank participants in EEFS 2009 conference in Warsaw/Poland and Prof. Dr. Florian Heiss of Johannes Gutenberg-Universität Mainz for their assistance in an earlier version of this research. Helpful comments
AN OPTION VALUATION APPROACH TO GAUGE TRADING HALT ECONOMIC DRIVERS AND IMPACT ON LISTED FIRMS
93
and suggestions which have been received by two anonymous referees are gratefully acknowledged.
NOTES
1 Kryzanowski (1979) has reported trading suspensions lasting for 15 weeks in his sample of Canadian stock exchanges, and Howe and Schlarbaum’s (1986) sample of SEC-ordered suspensions shows cases lasting for 12 weeks on average. In contrast, Engelen and Kabir (2006) study Brussels’ stock exchange suspensions, which are found to last 2:25 hours on average.
2 Numerous studies have studied the economic drivers behind the complete disappearance from the exchanges, in the form of delistings or acquisitions (e.g., Dahiya & Klapper, 2007).
3 Assuming semi-strong market efficiency, the stock exchange authorities’ decision to suspend or halt shares should be instantaneously reflected in stock prices; Wu (1998) reports a -4.08% mean excess return during the suspension day in the Honk Kong market and semi-strong efficiency, whereas Duque and Fazenda (2003) report a -5.05% mean excess return on suspension day in the Portuguese market and a lack of semi-strong efficiency.
4 For variables mentioned, formulas and formal derivations readers are advised to refer to the original papers of Black and Scholes (1973) and Merton (1974) or textbooks on options such as Hull (1989).
5 We do not include other supervision or suspension decisions, e.g., because of an acquisition announcement.
6 Scaled by its total asset replacement cost, estimated according to a proposal by Perfect and Wiles (1996).
7 Kim and Kwok (2009) have run a pooled logit regression to estimate the effects of certain economic variables on the probability that a firm will file for Chapter 11, albeit only for financially distressed companies.
8 A non-parametric Mann-Whitney test for equality of Supervision occurrences showed z = -12.735 rejecting at 99.99% confidence equality of occurrences between financially and non-financially distressed companies.
9 Listed companies on the ASE portray a significant percentage of historically family/manager-owned firms (44% of listed firms), which have than 39% of their interest in the hands of their managers (Kapopoulos & Lazaretou, 2007).
10 In tests of the two subsamples on a t-test and Mann-Whitney non-parametric basis, no statistically significant difference exists.
11 StataCorp. (2005). Stata Statistical Software: Release 9. College Station. College Station, TX: StataCorp LP.

Konstantaras and Siriopoulos94
12 Firth (1993) proposed a modified score equation related to penalized log likelihood and likelihood functions of logit estimation problems. Likewise, the log-likelihood is penalized with one half of the logarithm of the determinant of the information matrix. He showed that the small bias of maximum likelihood estimates is removed as a result.
13 For this purpose, we used the Stata user-written command FIRTHLOGIT, developed by Coveney (2008).
14 Kahl (2002) also posits that creditors monitor the economic viability of their debtors and modify accordingly their decision to proceed or not with the liquidation of the distressed company.
REFERENCES
Athens Stock Exchange. (2008). Rules and regulations. Retrieved January 12, 2010, from http://www.ase.gr/content/gr/announcements/Files/ATHEX%20Rulebook%202008%20V_teliko%2025072008.pdf
Asquith, P., Gertner, R., & Scharfstein, D. (1994). Anatomy of financial distress: An examination of junk bond issuers. Quarterly Journal of Economics, 109, 625-658.
Black, F., & Scholes, M. (1973). The pricing of options and corporate liabilities. The Journal of Political Economy, 81, 637-654.
Chen, J., Marshall, B. R., Zhang, J., & Ganesh, S. (2006). Financial distress prediction in China. Review of Pacific Basin Financial Markets and Policies, 9, 317-336.
Cheng, P., Aerts, W., & Jorissen, A. (2010). Earnings management, asset restructuring, and the threat of exchange delisting in an earnings-based regulatory regime. Corporate Governance: An International Review, 18, 438-456. Retrieved September 14, 2010, from http://dx.doi.org/10.1111/j.1467-8683.2009.00780.x
Chatterjee, S., Dhillon, U. S., & Ramírez, G. G. (1996), Resolution of financial distress: Debt restructurings via Chapter 11, prepackaged bankruptcies, and workouts. Financial Management, 25, 5-18.
Christie, W. G., Corwin, S. A., & Harris, J. H. (2002). NASDAQ trading halts: The impact of market mechanisms on prices, trading activity, and execution costs. The Journal of Finance, 57, 1443-1478.
Coveney, J. (2008). FIRTHLOGIT: Stata module to calculate bias reduction in logistic regression. Statistical Software Components, Boston College Department of Economics. Retrieved February 25, 2010, from http://fmwww.bc.edu/repec/bocode/f/firthlogit.ado
AN OPTION VALUATION APPROACH TO GAUGE TRADING HALT ECONOMIC DRIVERS AND IMPACT ON LISTED FIRMS
95
Dahiya, S., & Klapper, L. (2007). Who survives? A cross-country comparison. Journal of Financial Stability, 3, 261-278.
Duque, J., & Fazenda, A. R. (2003). Evaluating market supervision through an overiview of trading halts in the Portuguese stock market. Journal of Financial Regulation and Compliance, 11, 349-376.
Eleswarapu, V. R. (1997). Cost of transacting and expected returns in the NASDAQ market. The Journal of Finance, 52, 2113-2127.
Engelen, P.-J., & Kabir, R. (2006). Empirical evidence on the role of trading suspensions in disseminating new information to the capital market. Journal of Business Finance and Accounting, 33, 1142-1167.
Ferris, S. P., Kumar, R., & Wolfe, G. A. (1992). The effect of SEC-ordered suspensions on returns, volatility, and trading volume. Financial Review, 27, 1-34.
Firth, D. (1993). Bias reduction of maximum likelihood estimates. Biometrika, 80, 27-38.
Heinze, G., & Schemper, M. (2002). A solution to the problem of separation in logistic regression. Statistics in Medicine, 21, 2409-2419.
Howe, J. S., & Schlarbaum, G. G. (1986). SEC trading suspensions: Empirical evidence. The Journal of Financial and Quantitative Analysis, 21, 323-333.
Hull, J. (1989). Options, futures and other derivative securities. Englewood Cliffs, NJ: Prentice Hall.
Perfect, S. B., & Wiles, K. W. (1994). Alternative constructions of Tobin’s q: An empirical comparison. Journal of Empirical Finance, 1, 313-341.
Jensen, M. C., & Meckling, W. H. (1976). Theory of the firm: Managerial behavior, agency costs and ownership structure. Journal of Financial Economics, 3, 305-360.
John, K., Lang, L. H. P., & Netter, J. (1992). The voluntary restructuring of large firms in response to performance decline. The Journal of Finance, 47, 891-917.
Kahl, M. (2002). Economic distress, financial distress, and dynamic liquidation. The Journal of Finance, 57, 135-168.
Kapopoulos, P., & Lazaretou, S. (2007). Corporate ownership structure and firm performance: Evidence from Greek firms. Corporate Governance: An International Review, 15, 144-158.
Kim, D.-K., & Kwok, C. (2009). The influence of managerial incentives on the resolution of financial distress. Review of Quantitative Finance and Accounting, 32, 61-83.
Kryzanowski, L. (1979). The efficacy of trading suspensions: A regulatory action

Konstantaras and Siriopoulos96
to prevent the exploitation of monopoly information. The Journal of Finance, 34, 1187-1200.
Merton, R. C. (1974). On the pricing of corporate debt: The risk structure of interest rates. The Journal of Finance, 29, 449-470.
Ro, B. T., Zavgren, C. V., & Hsieh, S. J. (1992). The effect of bankruptcy on systematic risk of common stock: an empirical assessment. Journal of Business Finance and Accounting, 19, 309-328.
Sanger, G. C., & Peterson, J. D. (1990). An empirical analysis of common stock delistings. Journal of Financial and Quantitative Analysis, 25, 261-272.
Turetsky, H. F., & McEwen, R. A. (2001). An empirical investigation of firm longevity: A model of the ex ante predictors of financial distress. Review of Quantitative Finance and Accounting, 16, 323-343.
Wu, L. (1998). Market reactions to the Honk Kong trading suspensions: Mandatory versus voluntary. Journal of Business Finance and Accounting, 25, 419-437.
Yen, G., & Li, J.-F. (2010). Financial distress announcements, transaction mode change, and aggregate shareholder wealth: Empirical evidence from TAIEX-listed companies. Review of Pacific Basin Financial Markets and Policies, 13, 19-43.