VALUATION REPORT - FPTS
23
VALUATION REPORT Cuong Vu Nguyen Equity Analyst Email: [email protected] Tel.: (+84) 24 3773 9058 – Ext.: 4309 Closing Price (Jul 23, 2019) Target Price Upside 67,000 74,100 +10.53% Recommendation HOLD TRA and VNINDEX Price Movement Trading Information (as of July 23, 2019) Current Price (VND) 67,000 52-week High (VND per share) 94,200 52-week Low (VND per share) 65,500 Shares Issued 41,453,673 Shares Outstanding 41,450,540 30-day Average Volume (share/day) 2,137 Market Cap. (billion VND) 2,777.40 Trailing EPS (VND per share) 4,216.12 Trailing P/E 15.89x Company General Information Name Traphaco Joint Stock Company Address No. 75, Yen Ninh St., Quan Thanh, Ba Dinh Dist., Ha Noi Main Business Manufacturing and distributing pharmaceutical products Competitive Advantage Ability to self-supply WHO-GACP quality herbal ingredients Major Weakness Inefficient cost management LOW HERBAL PRODUCT SALES GROWTH GENERIC DRUG MARKET EXPANSION INTENTION Using the Discounted Cash Flow Models and Relative Valuation Method, we valued HSX listed TRA – Traphaco Joint Stock Company. The target price of one TRA share was determined at 74,100 VND, 10.53% higher compared to its closing price on July 23 rd , 2019. We recommend a HOLD position for TRA stocks. Investors may consider to buy TRA stocks when its price drops to 61,700 VND per share, equivalent to an expected return of 20%. INVESTING PROSPECTS 1. Traditional and herbal products: Notable brand recognition contributes to TRA’s 11.53% of domestic herbal product market share (approximately 76% of TRA’s manufacturing revenues). The Nielsen Corporation evaluated TRA as the strongest brand among all herbal pharmaceutical manufacturers in Vietnam. TRA’s “Boganic” and “Hoat huyet duong nao” have the highest recognition rate compared to other products with similar uses. 88.4% herbal ingredients used are certified with WHO- GACP standard, helping TRA bid in the highest tier for herbal and traditional products in the Ethical Drug (ETC) channel starting October 2019. Circular No.15/2019/TT-BYT re-classifies the bidding tiers for herbal and traditional products based on the quality of herbal ingredients, allowing TRA and 13 other herbal medicine manufacturers to leave the competition against 70 lower quality manufacturers in the old tier to enter bidding in the new tier for herbal and traditional products in the ETC channel. 2. Generic and patented drugs: Revenue growth is positive for major generic drugs including “Methorphan”, “Quimoxi”, “Ofloxacin” and “Tobramycin” (account for 7.8% of revenues) due to increasing demand for cough/respiratory and eye care medicines in Vietnam. Euromonitor estimated domestic average sales growth to reach 5.6-7.8% yoy for cough/respiratory medicines and 11-11.2% yoy for eye care products from 2019 to 2023. -25% 25% 75% 125% 175% 225% VNINDEX TRA PHARMACEUTICAL INDUSTRY July 23 rd , 2019 TRAPHACO JOINT STOCK COMPANY (HSX: TRA)
-
Upload
khangminh22 -
Category
Documents
-
view
0 -
download
0
Transcript of VALUATION REPORT - FPTS

VALUATION REPORT
Cuong Vu Nguyen
Equity Analyst
Email: [email protected]
Tel.: (+84) 24 3773 9058 – Ext.: 4309
Closing Price (Jul 23, 2019)
Target Price
Upside
67,000
74,100
+10.53%
Recommendation
HOLD
TRA and VNINDEX Price Movement
Trading Information (as of July 23, 2019)
Current Price (VND) 67,000
52-week High (VND per share) 94,200
52-week Low (VND per share) 65,500
Shares Issued 41,453,673
Shares Outstanding 41,450,540
30-day Average Volume (share/day) 2,137
Market Cap. (billion VND) 2,777.40
Trailing EPS (VND per share) 4,216.12
Trailing P/E 15.89x
Company General Information
Name Traphaco Joint Stock Company
Address No. 75, Yen Ninh St., Quan
Thanh, Ba Dinh Dist., Ha Noi
Main
Business
Manufacturing and distributing
pharmaceutical products
Competitive
Advantage
Ability to self-supply WHO-GACP
quality herbal ingredients
Major
Weakness Inefficient cost management
LOW HERBAL PRODUCT SALES GROWTH
GENERIC DRUG MARKET EXPANSION INTENTION
Using the Discounted Cash Flow Models and Relative Valuation
Method, we valued HSX listed TRA – Traphaco Joint Stock
Company. The target price of one TRA share was determined at
74,100 VND, 10.53% higher compared to its closing price on July
23rd, 2019.
We recommend a HOLD position for TRA stocks. Investors may
consider to buy TRA stocks when its price drops to 61,700 VND per
share, equivalent to an expected return of 20%.
INVESTING PROSPECTS
1. Traditional and herbal products:
Notable brand recognition contributes to TRA’s 11.53% of
domestic herbal product market share (approximately
76% of TRA’s manufacturing revenues). The Nielsen
Corporation evaluated TRA as the strongest brand among all
herbal pharmaceutical manufacturers in Vietnam. TRA’s
“Boganic” and “Hoat huyet duong nao” have the highest
recognition rate compared to other products with similar uses.
88.4% herbal ingredients used are certified with WHO-
GACP standard, helping TRA bid in the highest tier for
herbal and traditional products in the Ethical Drug (ETC)
channel starting October 2019. Circular No.15/2019/TT-BYT
re-classifies the bidding tiers for herbal and traditional products
based on the quality of herbal ingredients, allowing TRA and
13 other herbal medicine manufacturers to leave the
competition against 70 lower quality manufacturers in the old
tier to enter bidding in the new tier for herbal and traditional
products in the ETC channel.
2. Generic and patented drugs:
Revenue growth is positive for major generic drugs
including “Methorphan”, “Quimoxi”, “Ofloxacin” and
“Tobramycin” (account for 7.8% of revenues) due to
increasing demand for cough/respiratory and eye care
medicines in Vietnam. Euromonitor estimated domestic
average sales growth to reach 5.6-7.8% yoy for
cough/respiratory medicines and 11-11.2% yoy for eye care
products from 2019 to 2023.
-25%
25%
75%
125%
175%
225%VNINDEXTRA
PHARMACEUTICAL INDUSTRY July 23rd, 2019
TRAPHACO JOINT STOCK COMPANY (HSX: TRA)

Bloomberg – FPTS <GO> | 2
HSX: TRA
www.fpts.com.vn
List of Shareholders (as of July 23, 2019)
State Capital Investment
Corporation (SCIC) 35.67%
Magbi Fund Ltd. (Mirae Asset) 25.00%
Super Delta Pte. Ltd. (Daewoong
Pharmaceutical Co., Ltd.) 15.12%
Domestic Shareholders 13.02%
International Shareholders 6.48%
Board of Directors 4.71%
INVESTING RISKS
Ineffecient expense management: additional expenses
incurred for new distribution centers has not helped boost
sales. Opening 8 new distribution centers in two recent years
has led to higher SG&A expenses; however, TRA’s net income
still fell by 32.89% yoy and net income margin dropped to
9.72% in 2018.
Limited control over API quality and price (58% of
ingredient costs) due to complete dependence on
imported sources. Major components of TRA’s leading
generic and patented drugs including “Methorphan”, “Quimoxi”,
“Tobramycin” and “Moxifloxacin” (7.8% of net revenues) are
imported from only a few suppliers in India and China.
Tight Liquidity: TRA stocks are low-volume because three
large shareholders’ ownership accounts for about 75% of
TRA’s equity, in which SCIC is the biggest shareholder with
35.67% of TRA ownership.
ONGOING ISSUE
TRA’s ability to enter new higher bidding tiers (according
to Circular No.15/2019/TT-BYT which takes effect from
October 2019) for generic and patented drugs in the
Ethical Drug channel largely depends on TRA’s progress
of acquiring the EU-GMP standard for its generic and
patented drug production lines. The upgrading process for
the production lines at TRA’s Hung Yen Generic Drug Factory
will take up an estimated amount of 225 billion VND
(approximately US$10 million) for the EU-GMP to be achieved
by 2022. The result of this upgrade will have significant impacts
on TRA’s plan to expand its generic and patented drug
manufacturing scale and sales in the ETC channel.

Bloomberg – FPTS <GO> | 3
HSX: TRA
www.fpts.com.vn
COMPANY OVERVIEW
General Background
Traphaco Joint Stock Company was formerly the serum and medical fluid manufacturing department of Railway
Medical Center.
Between 1993 and 1999, the manufacturing department was split from the Center to become a capitalized firm
whose 45% equity was state-owned.
In 2008, Traphaco Joint Stock Company was officially listed on Ho Chi Minh Stock Exchange (HSX) with the
ticker “TRA”.
From 2008-2018, TRA gradually increased its authorized capital to 415 billion VND with its equity sources.
Major Shareholders Information as of July 23, 2019
TRA has a concentrated shareholders’ structure as three largest shareholders own approximately 75% of the
company’s equity. State Capital Investment Corporation (SCIC) owns 35.67% of TRA’s equity and remains the
biggest shareholder. SCIC does not have any plans to divest from TRA and still holds the right of veto at TRA.
Magbi Fund Ltd. and Super Delta Pte. are two entities representing Mirae Asset Financial Group and Daewoong
Pharmaceutical Co. Ltd., respectively. These two strategic partners of TRA own approximately 40% of the
company’s equity. Mirae Asset announced that it would help TRA invest in R&D activities for new pharmaceutical
products. On the other hand, being a well-known pharmaceutical manufacturer from South Korea, Daewoong
Pharmaceutical has committed to support TRA with its technological advance and has transferred 8 different
manufacturing technologies to TRA since March 2019.
Despite having years of experience at TRA, the company’s Board of Directors and its management team own only
about 5% of the equity. Because of the three above shareholders’ large ownership, TRA’s current management
team might face the threat of being replaced.
35.67%
25.00%
15.12%
13.02%
6.48%4.71%
State Capital Investment Corporation (SCIC)
Magbi Fund Ltd. (Mirae Asset)
Super Delta Pte. Ltd. (Daewoong Pharmaceutical Co., Ltd.)
Other Domestic Shareholders
Other International Shareholders
Board of Directors

Bloomberg – FPTS <GO> | 4
HSX: TRA
www.fpts.com.vn
Revenue Structure in 2018
Revenue Structure by Products and Services
Revenue Structure by Distribution Channels
Source(s): Traphaco
TRA’s herbal and traditional product sales contribute to more than 60% of the company’s net revenues while generic
drug sales account for about 20% of TRA’s net revenues.
Beside manufacturing sales, TRA’s revenues are also generated from its distributing activities, importing and
entrusted importing services. Distributing activity sales account for nearly 13% of TRA’s net revenues, which are
carried out by one of TRA’s subsidiaries known as Dak Lak Pharmaceutical and Medical Equipment Joint Stock
Company. This firm distributes pharmaceutical products for both domestic and international partners such as Ipca
Laboratories Ltd., RPG Lifescienes Ltd., Abbvie Inc., Egis Pharmaceutical Pte. Ltd., Tipharco, Savipharm, Stada,
Agimexpharm, etc. mostly in the two provinces of Dak Lak and Dak Nong to both of the Over-the-Counter channel
(64% of the subsidiary’s net revenues) and the Ethical Drug channel (36% of the subsidiary’s net revenues).
The importing and entrusted importing services add about 5% to TRA’s net revenues and include:
Importing antipyretic and personal plasters from Kobayashi Pharmaceutical Co., Ltd. (Japan) and dietary
supplements such as multivitamins, fish oil, Glucosamin, Coenzyme Q10, etc. from Natural Factors Nutritional
Products Inc. (Canada) and Westland – Pure Nutrition Ltd. (New Zealand) and re-selling in the OTC market.
Entrusted importing: acting as an intermediary which purchases XO Milk Powder from Namyang Dairy Products
Co., Ltd. (South Korea) and re-distributes to Nam Duong Joint Stock Company.
TRA’s sales from the OTC market take up more than 90% of TRA’s net revenues while those from the ETC market
only account for a modest amount of 9.06% of TRA’s net revenues.
Leading Products
Product Percentage
of Sales Description
Herb
al P
roducts
Boganic 22.50% Traditional hepatic medicine, clinically tested by National Cancer Hospital,
accounts for about 20% of all domestic hepatic medicine sales.
Hoat huyet duong
nao/ Cebraton 25.28%
Traditional cerebral blood circulating enhancement, accounts for roughly
10% of sales of medicines with similar uses in Vietnam.
Tottri 5.56% Traditional hemorrhoid medicine, pharmacological effect proved by Hanoi
University of Pharmacy, takes up 25% of medicines with similar use sales.
Generic D
rugs
Methorphan 5.56% Generic cough/respiratory suppressant, growth rate reached 22% yoy
between 2012 and 2018.
Eye Drops 2.22%
Including 3 eye antibiotics “Quimoxi”, “Ofloxacin” and “Tobramycin”,
manufactured with advanced “BFS” technology, sales reached 40 billion
VND after the first year of being introduced.
Source(s): Traphaco, IMS Health IV/2018
62.20%19.64%
12.74%
5.42%
Herbal Products
Generic Drugs
Subsidiary's DistributingServices
Entrusted Importing 90.94%
9.06%
Over-the-CounterChannel (OTC)
Ethical Drug Channel(ETC)

Bloomberg – FPTS <GO> | 5
HSX: TRA
www.fpts.com.vn
OPERATING ANALYSIS
TRA’S VALUE CHAIN
Herbal Products
Herbal Ingredients
Self-supply: 12.6%
of ingredient cost
Domestic sources:
29.4% of ingredient cost
Hoang Liet Factory &
Hung Yen High-Technology Factory
Capsules, Tablets,
etc.
Others: Syrups,
Granules
Generic Drugs
Active Pharmaceutical Ingredients (API)
Imported from: China, Switzerland, Germany,
India, etc.; account for 58% of ingredient cost
Hung Yen Generic Drug Factory
Capsules, Tablets, etc.
Liquid: Eye
drops, Nasal
drops
Others:
Granules,
Ointments
Inb
ou
nd
Lo
gis
tic
s
Op
era
tio
ns
Ou
tbo
un
d
Lo
gis
tic
s
Distribution Methods
Over-the-Counter Channel (OTC): 90.94% of net revenues
Ethical Drug Channel (ETC): 9.06% of net revenues
INBOUND LOGISTICS
I. Herbal Ingredients: Self-Supply Sources Give TRA Stable Advantages
Domestic Manufacturers with
WHO-GACP Certified Ingredients
(as of April 2019)
Source(s): Traditional Medicine Administration
88.4% of all herbal ingredients used by TRA annually are certified with
WHO-GACP standard. These ingredients are TRA’s 5 most intensively
used herbs and plants, including Artichoke (Cynarae Scolymi), Dinh Lang
(Polyscias Fruticosa), Rau Dang Dat (Glini Oppositifolius), Che Day
(Ampelopsis Cantoniensis) and Bim Bim Biec (Pharbitidis), which are
grown and collected mainly in the provinces of Lao Cai, Hoa Binh, Phu
Tho, Nam Dinh and Phu Yen. The agricultural areas used for these 5 herbs
and plants have increased from only 4 ha in 1998 to more than 36,300 ha
in 2019, which gives TRA about 2,900 tons of herbal ingredients annually
and makes TRA the pharmaceutical company with the most amount of
self-grown herbal ingredients and the largest WHO-GACP certified
growing areas in Vietnam.
All of TRA’s WHO-GACP certified herbal ingredients are grown on 675
local farmers’ agricultural land. These farmers and TRA have partnership
agreements which allow TRA to train the farmers with WHO-GACP
standard. On the other hand, the farmers’ profit from growing TRA’s
ingredients would be 3 to 5 times higher compared to what they would earn
from growing other traditional crops. Between 2016 and 2018, there were
175 additional local families participating in this program, helping TRA
expand the growing areas. In general, TRA’s partnership with trained local
farmers is a stable method to self-supply its high quality herbal ingredients.
Furthermore, being able to self-supply WHO-GACP quality herbal ingredients gives TRA a good reputation in the
domestic herbal product market. Currently, 80% to 85% of all herbal ingredients in Vietnam are repordly imported
from China without being regulated; among which there are a significant amount of low quality herbal leftovers and
poisoned herbs. As a result, having WHO-GACP certified herbal ingredients gives TRA, together with about 16.25%
of all domestic firms, a competitive advantage against the rest of the herbal product manufacturing firms.
0
5000
10000
15000
20000
25000
30000
35000
40000
0
1
2
3
4
5
6
TR
AD
uo
c lie
u V
NN
am
Du
oc
Hon
g D
ai V
iet
Lad
op
ha
rO
PC
So
lavin
aT
ue L
inh
Th
ien
Duo
cF
usi
Ngo
c M
inh
Duo
c K
hoa
KH
CN
Don
g A
Number of Herbs
Growing Area in ha (right)

Bloomberg – FPTS <GO> | 6
HSX: TRA
www.fpts.com.vn
II. Active Pharmaceutical Ingredients (API): Complete Dependence on Imported Sources Gives TRA No
Control over API Price Fluctuations
Estimated TRA’s Imported
API Value
Source(s): Traphaco, Drug
Administration of Vietnam, FPTS
Research
TRA’s API costs account for about 58% of all TRA’s ingredient expenses. All API
are imported as there is no stable supplier in Vietnam, among which we estimated
the API value imported from China takes up 44.09% of TRA’s imported API value.
Certain API for TRA’s leading products depend on sole suppliers, including:
Ingredients for “Moxifloxacin” and “Tobramycin” depend on one supplier in
China.
Ingredients for “Methorphan” depends solely on one supplier in India.
API imported from China may cause a price fluctuation risk: China Food and
Drug Administration (CFDA) and Chinese Ministry of Ecology and Environment
(MEP) increased control over API’s quality waste treatment standards, forcing
hundreds of Chinese API manufacturers to close. The remaining API factories
have had to pay extra “waste treatment” tax since 2018. If TRA could not find
better alternative sources of API, we estimated that TRA’s ingredient costs for
generic drugs would increase with a CAGR of 6.23% in the next 5 years
(assuming TRA would not develop any new generic drugs).
OPERATIONS
Since November 2017, TRA has moved all generic and patented drug manufacturing operations from its Hoang Liet
Factory to the new Hung Yen Generic Drug Factory (manufacturing process description). As a result, TRA now
owns 4 different factories, each of which has its own purpose as follows:
Factory Traphaco Sapa Hoang Liet Hung Yen
High-Technology
Hung Yen
Generic Drug
Invested
Capital 25 billion VND 25 billion VND 114 billion VND 477 billion VND
Product Herbal Ingredients Herbal Products Herbal Products Generic Drugs
Manufacturing
Quality
WHO-GACP
WHO-GMP WHO-GMP WHO-GMP WHO-GMP
Source(s): Traphaco
I. Herbal Medicines: WHO-GMP Manufacturing Quality Does Not Gives TRA Any Competitive Advantages
Herbal medicines in Vietnam are manufactured using two main methods, the manual method and the automated
one. The manual way is used by hundreds of unregistered herbal manufacturers, especially when they extract and
concentrate the herbs and plants. Without a stable and standardized level of pressure and temperature, manual
herbal extracts usually lose their active substances, thus, lose their effects.
For WHO-GMP certified manufacturers, the herbal medicine manufacturing process is automated from the
extracting step to the packaging step. The automated method requires herbal ingredients to be cleansed and
pasteurized before being extracted in a vacuum environment with calculated temperature so that the active
substances would be preserved. In addition, final herbal products are always examined closely with high technology
to make sure the medicine quality complies with WHO-GMP standard.
Despite possessing WHO-GMP certified herbal production lines, TRA does not have any manufacturing competitive
advantages in the herbal product segment because approximately 70 other herbal manufacturers own similar WHO-
GMP quality technology in Vietnam.
44.09%
15.05%
13.98%
11.83%
15.05%
China Germany
Switzerland India
Others

Bloomberg – FPTS <GO> | 7
HSX: TRA
www.fpts.com.vn
II. Generic Drugs: Investments in New Factory Have Not Boosted Sales Because of Manufacturing Quality
TRA has invested significantly in the production lines at its new Hung Yen Generic Drug Factory to enhance the
generic drug manufacturing capacity and quality.
BFS Technology (Blow-Fill-Seal) minimizes human’s direct interactions with the manufacturing process to
ensure complete sterilization.
Electricity consumption of the new advanced production lines is 50% less compared to that of the old ones,
saving TRA 2.2 billion VND annually.
However, TRA’s Hung Yen Generic Druc Factory has not helped boost sales because of the following reasons.
Revenue from ETC Channel and ROE
between 2017-2018
Source(s): Traphaco
Generic drug quality is directly related to the bidding tiers in the ETC
channel to which each drug belongs. As a new pharmaceutical bill which
re-classifies the requirements for each bidding tier was introduced in
February 2018 but took 17 months to be passed, TRA safely chose to
postpone its EU-GMP upgrading activities for the Hung Yen Generic
Drug Factory. In July 2019, as the bill officially became Circular
No.15/2019/TT-BYT, TRA has estimated that it would spend an extra
amount of 225 billion VND to complete the EU-GMP upgrade for the
generic drug production lines in 2022 so that TRA could place its
products in higher bidding tiers.
The above circumstance also explains why TRA’s generic drugs have
been competing in the lower generic drug tiers in the ETC channel
against cheaper products. As a result, revenues from the ETC channel
dropped by 27.4% and TRA’s ROE was reduced from 24.4% in 2017 to
15.7% in 2018. In general, investments in Hung Yen Generic Drug
Factory production lines have not effectively helped TRA achieved its
ultimate goal of bidding in higher generic drug tiers.
OUTBOUND LOGISTICS
I. Distribution Structure
1. Over-the-counter (OTC) channel remains TRA’s major distribution method
TRA’s OTC and ETC Revenue Structure
Source(s): Traphaco
TRA’s OTC Market Shares
Source(s): Fitch Solutions, Traphaco
Being the main distribution method, TRA’s OTC channel generates 91% of the firm’s net revenues, ranked the 2nd
largest among domestic pharmaceutical manufacturers, and accounts for 5.31% of the pharmaceutical OTC market
share in Vietnam.
Herbal product sales account for about 73% of TRA’s OTC revenues while generic drug sales add another 27%.
24%
16%
0%
5%
10%
15%
20%
25%
30%
000
050
100
150
200
250
2017 2018
bill
ion V
ND
ETC Revenue ROE (right)
0
500
1000
1500
2000
2500
2014 2015 2016 2017 2018
bill
ion
VN
D TRA'sETC Sales
TRA'sOTCSales
0%
2%
4%
6%
8%
0
500
1000
1500
2000
2014 2015 2016 2017 2018
bill
ion
VN
D TRA's OTCSales
TRA's OTCMarketShares

Bloomberg – FPTS <GO> | 8
HSX: TRA
www.fpts.com.vn
a. TRA’s good brand recognition helps maintaining large herbal product market share
TRA’s OTC Herbal Product Market Shares
TRA’s herbal product sales generate about 52% of the
company’s net revenues and account for 18.5% of all domestic
herbal product sales.
Being able to build a strong brand for its leading herbal
products is an important factor helping TRA maintain its
sales in the OTC market. The Nielsen Corporation evaluated
TRA as the strongest pharmaceutical brand among other
researched pharmaceutical brands in Vietnam with the highest
recognition rate of 6.2 for domestic consumers and 7.3 for
domestic pharmacies (out of 10). TRA’s leading herbal products
including “Boganic” (22.5% of net revenues) and “Hoat huyet
duong nao – Cebraton” (25.3% of net revenues) both achieved a
recognition rate of above 95%, the highest among other products
with similar uses.
b. Generic drugs in the OTC market does not have a competitive advantage
TRA’s OTC generic drug sales generate about 19% of the firm’s net revenues, equivalent to 1.17% of total domestic
generic drug sales. TRA’s generic products do not possess any differences compared to other competitors as:
Prescribed drugs tend to have weak brand recognitions because the Ministry of Health limits their marketing
forms to only being directly introduced to specialists and being advertised on health magazines.
WHO-GMP standard is similar across most generic drug manufacturers.
Full dependence on imported ingredients removes most differences on ingredient costs.
2. Having difficulty competing against cheaper brands, TRA’s ETC sales outlook is dependent on the new
circular
TRA’s ETC Market Shares
Source(s): Traphaco, Fitch Solutions
TRA’s herbal product sales generate 94.7% of the
company’s ETC revenues and its generic drug sales
generate about 5.3%.
Between 2014 and 2018, TRA’s ETC sales dropped by
64.7%, from 462 billion VND to 163 billion VND, which
reduced TRA’s ETC market share from 0.78% to
0.16%. The main reason for such performance was the
bidding policy which prioritizes lower priced products
(bidding procedure description). As TRA’s main priority
was product quality, it was difficult for the company to
compete against lower priced peers. Meanwhile, the
number of domestic manufacturers in the same bidding
tier with TRA has increased from 123 firms in 2013 to
175 firms in 2019.
However, Circular 15/2019/TT-BYT (passed in July
2019, effective from October 2019) will create
significant impacts on TRA’s ETC future.
18.49%
TRA's OTC Herbal Product Sales
Domestic OTC Herbal Product Sales
00%
00%
00%
00%
00%
01%
01%
01%
01%
01%
0
50
100
150
200
250
300
350
400
450
500
2014 2015 2016 2017 2018
bill
ion
VN
D
TRA's ETC Sales TRA's ETC Market Shares

Bloomberg – FPTS <GO> | 9
HSX: TRA
www.fpts.com.vn
a. TRA’s herbal product sales in ETC channel will benefit from Circular No.15/2019/TT-BYT for its WHO-
GACP quality herbal ingredients
Major Domestic Manufacturers’ Market Shares of
Herbal Product Sales
TRA’s herbal product sales in the ETC channel contribute
to about 10.3% of the company’s net revenues, which
equals to about 4% of total domestic herbal product sales.
Currently bidding in Tier 1 until October 2019 when the new
circular takes effect, TRA does not possess any price
advantages due to the large number of about 70
manufacturers in Tier 1.
Circular No.11/2016/TT-BYT (exp. Oct. 2019) Circular No.15/2019/TT-BYT (effective Oct. 2019)
Tier 1 WHO-GMP manufacturing quality
Tier 1 WHO-GACP certified herbal ingredients,
WHO-GMP manufacturing quality
Tier 2 Non WHO-GMP manufacturing
quality Tier 2 WHO-GMP manufacturing quality
Tier 3 Non WHO-GMP manufacturing quality
From October 2019, Circular No.15/2019/TT-BYT which re-classifies the bidding tiers for herbal products in the ETC
market will take effect. Products without WHO-GACP certified ingredients will be taken down to Tier 2 and 3, which
would help reduce TRA’s competitors. Being able to self-supply WHO-GACP certified ingredients, TRA will be
among the 13 herbal product manufacturers qualified to bid in the highest herbal product tier starting October 2019.
b. TRA’s generic drug sales outlook in the ETC market remains uncertain due to its non EU-GMP quality
TRA is currently bidding its generic products in Tier 3 for drugs manufactured with WHO-GMP quality. As TRA’s
products are not competitive in terms of price, its generic drug sales only reached a modest amount of 10.4 billion
VND in 2018, equal to 0.58% of TRA’s net revenues and 0.01% of total domestic generic drug sales. TRA’s generic
drug sales depends significantly on whether the firm can upgrade its EU-GMP manufacturing quality to comply with
the new circular’s requirements for Tier 1 & 2.
Compared to the existing Circular No.11/2016/TT-BYT (detail), the new Circular No.15/2019/TT-BYT (detail)
contains the following major changes:
New Tier 1 requires generic products to be manufactured with EU-GMP qualified production lines and certified
by Stringent Regulatory Authorities (SRA) (complete list).
EU-GMP qualified products which are not certified by the SRA and PIC/s-GMP qualified products certified by
both PIC/s and ICH members will be moved to the future Tier 2 from the current Tier 1. PIC/s-GMP qualified
products certified by non-ICH members will also be moved to the lower tiers from the current Tier 2.
GMP certified drugs will be divided into 3 main tiers: Tier 3 includes bioequivalent (BE) drugs certified by
Vietnam Pharmaceutical Regulatory Authorities, Tier 4 includes domestic WHO-GMP manufactured drugs, and
Tier 5 includes WHO-GMP certified drugs which do not satisfy the first 4 tiers’ requirements.
In order to bid in Tier 1 and 2 and to comply with the new circular’s requirements, TRA is investing 225 billion VND
in its Hung Yen Generic Drug Factory. As TRA is currently bidding in the existing Tier 3 and does not have a price
advantage, TRA’s generic drug sales performance in the ETC market is anticipated to be modest within the next
two years.
0%2%4%6%8%
10%

Bloomberg – FPTS <GO> | 10
HSX: TRA
www.fpts.com.vn
II. Geographic Performance
TRA’s Revenue Structure by Geography
Source(s): Traphaco
Northern regions of Vietnam remain TRA’s major market,
which account for almost 60% of the firm’s net revenues. The
reason behind TRA’s success in the North is that TRA has been
operating and strengthening its brand for Northern consumers for
about 25 years.
TRA is having difficulty expanding its business to the South
of Vietnam. Despite having opening three more distribution
centers in the South in 2018 and increasing the number of sales
representatives, TRA’s revenues from the Southern regions has
decreased by 4.32% compared to those in 2017. Between 2015
and 2018, its total revenues from the Southern regions dropped
by 17.68%. One of the main reasons behind the firm’s
unsuccessful performance in the South is TRA’s inability to
partner with pharmacy chains such as Pharmacity, Phano,
Medicare, Guardian, and Sapharco, etc. This pharmacy chain
model became familiar with consumers in the South since 2007;
however, it was not introduced to the North until 2018.
58.40%19.92%
21.69% North
Central
South

Bloomberg – FPTS <GO> | 11
HSX: TRA
www.fpts.com.vn
FINANCIAL ANALYSIS
I. Slow Revenue Growth Due to OTC Channel Sales Policies and ETC Channel Price Competition
TRA’s Revenue Growth between 2014 and 2018
*The adjusting entry for TRA’s OTC sales in the period of 2017-2018 records the trade discounts and
entrusted import sales to ensure consistency with TRA’s accounting entry during 2014-2016.
TRA’s revenue growth has been modest since 2016 because of the following major reasons:
Revenue growth from TRA’s OTC channel has been slowing down due to TRA’s strict sales policies which have
weakened their OTC pharmacy customers’ motivation. Specifically, TRA has tightened its receivable collecting
duration and requires its pharmacy customers to achieve a sales growth of 20% for TRA products in order to
receive bonuses. As a result, these uncompetitive policies have restricted TRA from expanding its customer
network which has remained unchanged at approximately 27,000 pharmacies between 2017 and 2018.
Revenue growth from TRA’s ETC channel dropped by 27.4% mainly because of a rising competition in the ETC
market. The quantity of bidders in the same bidding tier with TRA has increased from 123 firms in 2013 to 175
firms in 2019 while the advantage belongs to lower priced brands because of the price-based bidding policy.
For a firm that has invested intensely in quality like TRA, it is difficult to bid effectively against cheaper products.
II. Increasing SG&A Expenses Show Slight Improvements
TRA’s Costs for Labor and Trade Discounts
Source(s): Traphaco
TRA’s profit margin was relatively high at 51.97%; however, its net income margin was significantly low at 9.72%. The
major reason for the this issue came from the incurred commission expenses and labor costs for 8 new distribution
centers which TRA has opened in 2 recent years (complete list). As a result, SG&A expense margin has taken up a
larger proportion from 32.34% in 2016 to 39.37% in 2018, causing a net income reduction of 32.89% for TRA between
2017 and 2018.
However, TRA ‘s SG&A expense management has shown signs of improvements in the 1st Quarter of 2019. By cutting
labor costs and commission expenses for its pharmaceutical representatives, TRA’s net income margin has increased
from 9.72% to 12.4%.
-1.88%
19.58%
1.23%3.31%
-3.80%
-5%
0%
5%
10%
15%
20%
25%
0
500
1000
1500
2000
2500
2014 2015 2016 2017 2018
bill
ion
VN
D
OTC Sales Adjusting Entry* TRA's OTC Sales TRA's ETC Sales Sales Growth
16.32%17.64%
22.61%20.80%
12.57%
29.96%32.34%
38.37% 39.37%
31.91%
10.32% 11.42%13.92%
9.72%12.40%
0%
5%
10%
15%
20%
25%
30%
35%
40%
45%
2015 2016 2017 2018 Q1/2019
(Labor Costs + Discounts) /Sales
SG&A Expenses /Sales
Net Profit Margin
Bloomberg – FPTS <GO> | 12
HSX: TRA
www.fpts.com.vn
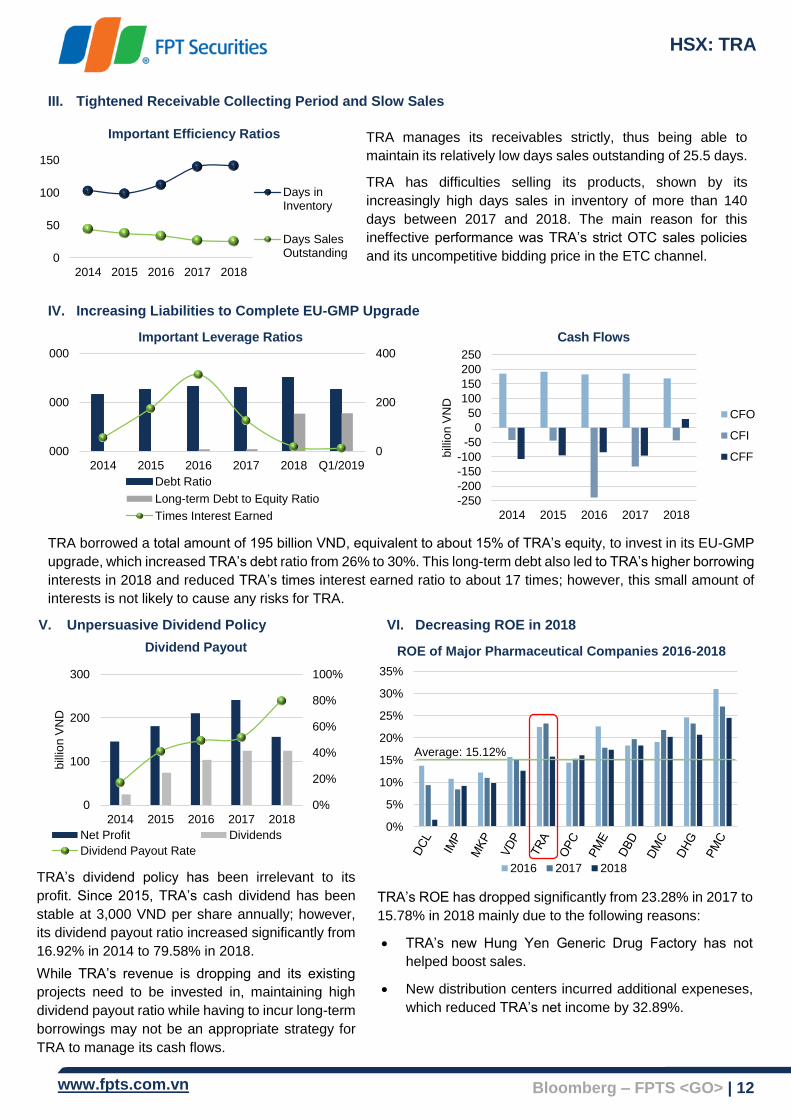
III. Tightened Receivable Collecting Period and Slow Sales
Important Efficiency Ratios
TRA manages its receivables strictly, thus being able to
maintain its relatively low days sales outstanding of 25.5 days.
TRA has difficulties selling its products, shown by its
increasingly high days sales in inventory of more than 140
days between 2017 and 2018. The main reason for this
ineffective performance was TRA’s strict OTC sales policies
and its uncompetitive bidding price in the ETC channel.
IV. Increasing Liabilities to Complete EU-GMP Upgrade
Important Leverage Ratios
Cash Flows
TRA borrowed a total amount of 195 billion VND, equivalent to about 15% of TRA’s equity, to invest in its EU-GMP
upgrade, which increased TRA’s debt ratio from 26% to 30%. This long-term debt also led to TRA’s higher borrowing
interests in 2018 and reduced TRA’s times interest earned ratio to about 17 times; however, this small amount of
interests is not likely to cause any risks for TRA.
V. Unpersuasive Dividend Policy
Dividend Payout
TRA’s dividend policy has been irrelevant to its
profit. Since 2015, TRA’s cash dividend has been
stable at 3,000 VND per share annually; however,
its dividend payout ratio increased significantly from
16.92% in 2014 to 79.58% in 2018.
While TRA’s revenue is dropping and its existing
projects need to be invested in, maintaining high
dividend payout ratio while having to incur long-term
borrowings may not be an appropriate strategy for
TRA to manage its cash flows.
VI. Decreasing ROE in 2018
ROE of Major Pharmaceutical Companies 2016-2018
TRA’s ROE has dropped significantly from 23.28% in 2017 to
15.78% in 2018 mainly due to the following reasons:
TRA’s new Hung Yen Generic Drug Factory has not
helped boost sales.
New distribution centers incurred additional expeneses,
which reduced TRA’s net income by 32.89%.
0
50
100
150
2014 2015 2016 2017 2018
Days inInventory
Days SalesOutstanding
0
200
400
000
000
000
2014 2015 2016 2017 2018 Q1/2019
Debt Ratio
Long-term Debt to Equity Ratio
Times Interest Earned
-250
-200
-150
-100
-50
0
50
100
150
200
250
2014 2015 2016 2017 2018
bill
ion
VN
D
CFO
CFI
CFF
0%
20%
40%
60%
80%
100%
0
100
200
300
2014 2015 2016 2017 2018
bill
ion
VN
D
Net Profit Dividends
Dividend Payout Rate
0%
5%
10%
15%
20%
25%
30%
35%
2016 2017 2018
Average: 15.12%

Bloomberg – FPTS <GO> | 13
HSX: TRA
www.fpts.com.vn
OUTLOOK FOR VIETNAM’S PHARMACEUTICAL INDUSTRY AND TRAPHACO
OUTLOOK FOR VIETNAM’S PHARMACEUTICAL INDUSTRY
I. ETC Sales Growth Surges to Take Over OTC Market Share Due to Regulatory Factors
Vietnam OTC and ETC Pharmaceutical
Sector Growth Forecast
Source(s): Fitch Solutions
ETC revenue scale accounts for 74.81% of total Vietnam pharmaceutical
market share and is predicted to continue to grow at a rate of 11.0% yoy
due to regulatory changes:
Health insurance ownership rate has increased from 28% in
2005 to 90% in 2019. The Government has been promoting for the
national health insurance with various approaches including
financially supporting for the poor and increasing charges for non-
covered services.
The number of hospitals is increasing as the new ones would
receive 0% tax benefits from the tax cuts policy in the first 4 years
after opening.
Domestically manufactured generic drug sales tend to surge at
a rate of 12% yoy due to supportive policies. Specifically, the
Ministry of Health supports generic replacements for patented drugs
whose copyrights expire (Pharmaceutical Law 105/2016/QH13) and
expands the number of generic drugs prioritized for domestic
bidders (Circular 03/2019/TT-BYT).
OTC sales are forecasted to grow slower at 9.4% yoy due to prescribed drug sales in the OTC market will be
controlled more closely in the next few years with the following policies:
The number of non-prescribed active substances allowed in OTC drugs was reduced to 243 substances
(Circular 07/2017/TT-BYT).
Antibiotics sold without prescriptions accounts for about 90% of all antibiotic sales in Vietnam, which
will be restricted as an approach to control the antibiotic resistance (AR) situation (Decision 4041/QD-BYT).
II. Demands for Pharmaceutical Products Increase as a Result of an Increasing and Aging Population
Vietnam’s Population Forecast
Source(s): Danso.org
Vietnam Average Pharmaceutical Product Expenses Forecast
Source(s): International Journal of Environmental Research & Public Health
The Vietnamese population is estimated to increase at 15% yoy in the next 30 years to reach 112.78 million people in
2050. The number of over-65-year-old people is expected to triple, causing the average age to rise from 33 to 42 years.
An increasing population with a speedy aging rate is likely to boost demands for healthcare and pharmaceutical product
sales in Vietnam. As a result, average expenses for pharmaceutical drugs for a Vietnamese is forecasted to hike at a
CAGR of 14.2% between 2018 and 2028.
0
50,000
100,000
150,000
200,000
250,000
bill
ion
VN
D
Domestic ETC SalesDomestic OTC Sales
0
10
20
30
40
50
0
20
40
60
80
100
120
ave
rag
e a
ge
mill
ion
pe
op
le
Population Average Age (right)
0
50
100
150
200
250
300
US
D/p
ers
on

Bloomberg – FPTS <GO> | 14
HSX: TRA
www.fpts.com.vn
OUTLOOK FOR TRAPHACO
I. TRA’s Herbal Product Sales Will Grow at a Slow Pace
TRA’s Leading Herbal Product Sales
Source(s): Traphaco
TRA’s herbal product sales account for 62.2% of the firm’s net revenues. Three of TRA’s leading products including
“Boganic”, “Hoat huyet duong nao – Cebraton” and “Tottri” contribute to 53.34% of its net revenues.
“Hoat huyet duong nao – Cebraton” sales, which account for 25.28% TRA’s net revenues, was slightly reduced
by 2.78% in 2018 because TRA’s growing area could not provide a sufficient amount of Dinh Lang (Polyscias
Fruticosa). However, as TRA announced the firm was able to fix the issue to meet the required quantity of Dinh
Lang to satisfy an increasing demand for its target market of middle aged and elderly customers, “Hoat huyet
duong nao – Cebraton” sales are expected to grow again at a low rate of 4.8% yoy.
“Tottri” sales only add to 5.56% of TRA’s net revenues but have grown at a high CAGR of 44.8% between 2013
and 2018. “Tottri” sales are likely to maintain its positive growth because of the high hemorrhoids rate in
Vietnam. Specifically, the Vietnam Society of Proctology estimated that about 55% of Vietnamese were
diagnosed with hemorrhoids while only about 0.7% of those have used TRA’s “Tottri”.
Major Tradition Hepatic Medicine Costs
Source(s): FPTS Research
“Boganic” sales, which account for 22.50% of TRA’s net
revenues, decreased due to its rough price competition
against products with similar uses. Because of the abundant
avaliability of Artichoke (Cynarae Scolymi) in Vietnam, there
are currently more than 40 different suppliers for Artichoke-
based products similar to “Boganic” with various prices. Due
to this competitive market, “Boganic” sales growth is likely to
remain low in the coming years.
0
500
1000
1500
2014 2015 2016 2017 2018
bill
ion
VN
D
Boganic Hoat huyet duong nao Tottri Total Herbal Product Sales
0 5000 10000 15000 20000
Tue Linh
Nhat Nhat
Traphaco's "Boganic"
Bao Nguyen
Hau Giang Naturenz
OPC Liverbil
Nam Duoc Hamega
Ladophar Bavega
VND/day

Bloomberg – FPTS <GO> | 15
HSX: TRA
www.fpts.com.vn
II. Generic Drugs: Long-term Growth Depends on EU-GMP Production Line Certification
TRA’s Leading Generic Drug Sales in 2018
Source(s): Traphaco
TRA’s generic drug sales account for 19.64% of its net revenues. Its leading product sales, including sales of cough
suppressant “Methorphan” and three eye drops “Quimoxi”, “Ofloxacin” and “Tobramycin”, contribute to 7.78% of
TRA’s net revenues. These leading products have a positive growing tendency due to the following reasons:
Vietnam’s Air Polution Indices Compared to
WHO-Recommended Levels
Substances
in the Air
Times Exceeded WHO-
Recommended Levels
CO 1.7 times
NO2 2.9 times
Suspended
Solid Particles
(e.g.: lead)
43-60 times
PM10 & PM2.5 4-5 times
Source(s): WHO
“Methorphan”, belonging to the cough/respiratory drug group,
grew at a rate of 22% yoy between 2012 and 2018 due to the
high rate of respiratory diseases of 16.61% among Vietnam’s
population. Most respiratory diseases in Vietnam are caused
by air pollution in which the amount of Fine Particulate Matter
(PM 2.5) has surged from 2-3 times higher in 2015 to 4-5
times higher in 2018 compared to WHO’s recommended
amount of 10 μg/m3. In addition, the smoking rate in Vietnam
remained relatively high at 22.5%. As a result, cough
suppressant and other respiratory medicine consumption rate
is expected to increase at 7.8% yoy in Vietnam (Euromonitor).
“Quimoxi”, “Ofloxacin” and “Tobramycin” are three types of non-betalactam antibiotic eye drops manufactured
with the new BFS technology since 2017. These eye drop sales have reached approximately 40 billion VND
after the first year of being introduced, contributing to about 2.22% of TRA’s net revenues, and are likely to
keep growing at a positive rate between 2019 and 2023. Euromonitor International estimated an average growth
rate of 11% yoy for eyecare products in Vietnam as a result of rising cases of eye infections caused by air
polution. Furthermore, TRA’s eye drops’ ingredients are among the substances prioritized for domestic firms to
bid in the ETC channel (Circular No. 03/2019/TT-BYT).
Other generic products, such as Dibetallic and Levigatus (anti itching and dermatitis cream and ointment),
Azithromycin (a class of Macrolide antibiotics), Stilux (Rotundine based sedative), Amorvita (multivitamins),
Antot (Amino Acid and Choline-based eating and nutrient absorbing stimulator) and T-B mouthwash, contribute
to about 60.3% of TRA’s generic product sales. These generic products are not likely to have positive growth
rates in the OTC channel due to being restrictedly marketed and sharing similar manufacturing quality
compared to other products with the same uses. In the ETC channel, assuming that TRA will be able to
complete its EU-GMP upgrade for the generic drug production lines and comply with other standards in the
new Circular No. 15/2019/TT-BYT so that the firm can start bidding in Tier 1 and 2 from 2022, we estimate
these generic drug sales growth to reach a rate of 8% to 10% yoy.

Bloomberg – FPTS <GO> | 16
HSX: TRA
www.fpts.com.vn
OPERATING ACTIVITY FORECAST
Based on the above analysis on TRA’s operating activities and financial situations, we forecasted TRA’s operating
results in the period of 2019-2026 as follows:
Net Revenue and Gross Profit Projection for TRA in the Period of 2019-2026
Cost of Goods Sold and SG&A Expense Projection for TRA in the Period of 2019-2026
Forecasted revenues, costs of goods sold, and SG&A expenses were based on the following assumptions:
TRA’s herbal product sales would grow at a CARG of 2.95% between 2018 and 2026, reducing TRA’s herbal
sales percentage from 76% to 70% of the firm’s total manufacturing sales. Major growth for herbal product
sales would be driven by TRA’s leading products “Hoat huyet duong nao – Cebraton” (CAGR of 3.8%) and
“Tottri” (CAGR of 3.54%). We assumed that TRA would not develop any new leading herbal products and that
TRA’s current herbal products, gradually becoming saturated, would grow proportionally with certain disease
rates and the aging population tendency in Vietnam.
TRA’s generic drug sales would grow at a CAGR of 6.53% during the period of 2018-2026, increasing TRA’s
generic drug sales percentage from 24% to approximately 30% of the firm’s total manufacturing sales in 2026.
We assumed that TRA’s generic product sales would not grow significantly until after its Hung Yen Generic
Drug Factory production lines would have been certified for EU-GMP standard which would allow TRA to bid
in Tier 1 and 2 in the ETC channel in 2022.
Active Pharmaceutical Ingredients (API) imported from China would surge, causing TRA’s costs of goods sold
to simultaneously increase.
SG&A expenses would continue to increase; however, would gradually be more effectively managed and would
fluctuate between 23%-27% for selling expenses and be stable at 12.5% for administrative expenses.
49%
50%
51%
52%
53%
54%
55%
.0
500.0
1000.0
1500.0
2000.0
2500.0
2018 2019(f) 2020(f) 2021(f) 2022(f) 2023(f) 2024(f) 2025(f) 2026(f)
bill
ion
VN
D
Net Revenues Gross Profit Margin (right)
.0
200.0
400.0
600.0
800.0
1000.0
1200.0
2018 2019(f) 2020(f) 2021(f) 2022(f) 2023(f) 2024(f) 2025(f) 2026(f)
bill
ion
VN
D
Cost of Goods Sold Selling Expenses Administration Expenses

Bloomberg – FPTS <GO> | 17
HSX: TRA
www.fpts.com.vn
VALUATION SUMMARY
We valued TRA’s operating activities using the discounted cash flow method and the relative approach with
weighting factors of 90% and 10%, respectively. TRA’s stock intrinsic value was determined at 74,100 VND per
stock, 10.53% higher compared to its closing price on July 23rd 2019. Therefore, we recommend a HOLD position
for TRA’s stocks for medium-term and long-term investment horizon.
Valuation Method Result Proportion
1 Discounted Cash Flow (DCF) 90%
Free Cash Flow to Equity (FCFE) 76,700
Free Cash Flow to Firm (FCFF) 75,100
2 Relative Valuation 10%
Relative P/E 57,500
Target Price (VND/share) 74,100
Discounted Cash Flow Assumptions
Assumption Value Assumption Value
WACC in 2018 12.63% Equity risk premium 9.97%
Cost of debt in 2018 10.00% Beta 0.69
Cost of equity in 2018 13.50% Long-term growth rate 1.50%
Risk-free rate (20-year T-bond coupon) 5.60% Forecasted horizon 8 yrs
DISCOUNTED CASH FLOW VALUATION RESULT
Free Cash Flow to Firm (FCFF) Summary Value
Sum of FCFF present value 3,294,734,655,697
(+) Cash 26,052,936,805
(-) Short-term and long-term liabilities 206,902,575,931
Equity value 3,113,885,016,571
Number of shares outstanding 41,453,673
Intrinsic Value (VND per share) 75,100
Free Cash Flow to Equity (FCFE) Summary Value
Sum of FCFE present value 3,178,538,880,246
Intrinsic Value (VND per share) 76,700
RELATIVE VALUATION RESULT
Traphaco was compared to a few major domestic pharmaceutical manufacturers (as of July 23rd 2019):
Firm Ticker Market Cap.
(bil. VND)
EV (bil.
VND)
NI (bil.
VND) P/E
Imexpharm Pharmaceutical JSC. IMP 2.35 2.16 0.14 16.93x
Pymepharco JSC. PME 3.60 3.24 0.31 11.61x
Domesco Medical Import & Export JSC. DMC 2.43 2.37 0.23 10.63x
Binh Dinh Pharmaceutical & Medical Equipment JSC. DBD 2.25 2.25 0.16 13.79x
OPC Pharmaceutical JSC. OPC 1.30 1.38 0.10 12.92x
Average 13.63x
Traphaco JSC. TRA 2.78 2.89 0.18 15.89x

Bloomberg – FPTS <GO> | 18
HSX: TRA
www.fpts.com.vn
FINANCIAL STATEMENT SUMMARY
Income Statement
(billion VND)
2018 2019E 2020F 2021F
Revenues 1,798.3 1,860.2 1,925.5 1,983.4
- COGS 863.7 907.4 918.0 929.7
Gross profit 934.7 952.9 1,007.5 1,053.7
- Selling expenses 485.5 442.8 472.6 533.9
- Admin. expenses 222.5 233.3 241.4 248.7
Operating profit 226.7 276.8 293.4 271.1
Fin. activity P/L 2.3 (9.0) (4.2) (6.0)
Other profit/loss (0.6) (0.07) 0.9 0.2
EBIT 228.4 267.8 290.1 265.2
- Interests 12.2 15.2 13.0 11.5
EBT 216.2 252.5 277.1 254.9
- Corporate income
tax
41.4 50.8 54.3 49.5
Profit after tax 174.8 201.7 222.8 204.2
EPS (VND) 3,352 4,404 4,898 4,448
Cash Flow
Statement
2018 2019E 2020F 2021F
Beginning balance 160.9 316.1 430.7 520.7
Profit after tax 216.2 182.6 203.0 184.4
+ Depreciation 79.4 71.2 77.9 92.9
+ Adjustments 0.2 0 0 0
+ Changes in
working capital
(49.8) 25.6 (34.1) 29.1
Cash from
operations
168.7 310.3 259.2 316.5
+ Fixed assets
liquidation
0 0 0 0
+ Investments 0.5 0 0 0
+ Others (43.7) (9.3) (11.0) (204.7)
Cash from
investing
(43.2) (9.3) (11.0) (204.7)
+ Dividend
payments
(140.1) (140.1) (140.1) (140.1)
+ Capital changes 169.8 0 0 0
+ S-T debt changes 0 0.8 0.8 0.8
+ L-T debt changes 0 (37.4) (19.4) (18.9)
+ Others 0 0 0 0
Cash from
financing
29.7 (186.4) (158.8) (158.3)
Net cash changes 155.2 114.5 89.5 (46.4)
Ending balance 316.1 430.7 520.1 473.7
Balance Sheet 2018 2019E 2020F 2021F
Assets
+ Cash and cash
equivalent
316.1 430.7 520.1 473.7
+ S-T investments 9.4 9.5 9.2 9.4
+ Receivables 153.6 179.0 169.8 188.8
+ Inventories 337.5 333.2 364.3 340.3
+ Other S-T assets 42.8 26.6 30.6 36.3
Current assets 859.4 979.1 1,094.0 1,048.5
+ Fixed assets 937.2 946.6 957.6 1,162.2
+ Acc. depreciation (331.7) (402.1) (479.1) (571.2)
+ Net book value 605.5 544.5 478.4 591.0
+ L-T investments 0.5 0.5 0.5 0.5
+ Other L-T assets 110.6 109.8 108.9 108.1
+ Construction in
progress
13.9 13.9 13.9 13.9
Long-term assets 730.5 680.6 601.7 713.4
Total assets 1,589.9 1,647.7 1,695.7 1,761.9
Liabilities & Equity
+ Payables 90.5 127.4 101.7 116.9
+ S-T borrowings 36.5 37.3 38.0 38.8
+ Other S-T
borrowings
4.3 3.8 3.9 3.3
Current liabilities 312.2 359.2 347.9 372.2
+ L-T borrowings 170.4 133.0 113.6 94.6
Long-term liabilities 170.4 133.0 113.6 94.6
Total liabilities 482.7 492.2 461.5 466.9
+ Authorized capital 414.5 414.5 414.5 414.5
+ Retained earnings 95.8 116.3 157.2 180.1
Equity 1,106.1 1,154.3 1,233.0 1,293.9
Non-controlling
interests
86.5 105.6 125.4 145.2
Total liabilities and
equity
1,589.9 1,647.7 1,695.7 1,761.9
Efficiency Ratios 2018 2019E 2020F 2021F
Days sales outstanding 25.47 25.47 25.47 25.47
Days in inventory 142.47 132.99 138.76 139.41
Accounts payable days 44.04 44.04 44.04 44.04
Cash conversion cycle 123.91 117.42 121.20 120.84
COGS/Inventories 2.56 2.72 2.52 2.73
Asset turnover 1.16 1.15 1.15 1.15

Bloomberg – FPTS <GO> | 19
HSX: TRA
www.fpts.com.vn
Profitability Ratios 2018 2019E 2020F 2021F
Gross profit margin 52.0% 51.2% 52.3% 53.1%
Net profit margin 9.7% 10.8% 11.6% 10.3%
ROE 14.0% 17.8% 18.7% 16.2%
ROA 10.1% 12.5% 13.3% 11.8%
Operating profit
margin
12.7% 14.4% 15.1% 13.4%
Profit after tax/EBT 80.8% 79.9% 80.4% 80.5%
EBT/EBIT 94.7% 94.3% 95.5% 95.7%
Liquidity & Leverage 2018 2019E 2020F 2021F
Current ratio 5.09 4.59 4.87 4.73
Quick asset ratio 1.67 1.80 2.10 1.90
Cash ratio 1.04 1.23 1.52 1.30
Debt ratio 0.13 0.10 0.09 0.08
Debt to equity ratio 0.19 0.15 0.12 0.10
S-T debt to equity ratio 0.03 0.03 0.03 0.03
L-T debt to equity ratio 0.15 0.12 0.09 0.07
Equity multiplier 1.39 1.43 1.40 1.37
Interest coverage 18.72 17.61 22.30 23.02

Bloomberg – FPTS <GO> | 20
HSX: TRA
www.fpts.com.vn
APPENDICES
I. TRA’s Manufacturing Process (back to Operation Analysis)
1. Herbal Products
a. Ingredient Preparation
WHO-GACP qualified herbal ingredients are prepared and extracted at TRA’s Traphaco Sapa Factory with three
WHO-GMP certified production lines, a spray dryer system and a cleanroom system.
b. Manufacturing Process
Herbal products are manufactured at TRA’s Hoang Liet Factory and Hung Yen High-Technology Factory with its
advanced soft capsule production lines (100% capacity), hard capsule production lines (40% capacity) and other
production lines (50-70% capacity), which consist of 36 different types of machines.
2. Generic Drugs
a. Ingredient Preparation
All of TRA’s active pharmaceutical ingredients (API) in crytalized forms with stabilized pharmacological structures
and effects are imported. Most API only need to be blended with excipients before pharmaceutically formed.
b. Manufacturing Process
TRA’s generic drugs are manufactured at Hung Yen Generic Drug Factory with five production lines in three
production plants. Its tablet production line can reach a capacity of 900 million tablets per year. TRA’ eye drop
production line is equipped with BFS Technology (Blow-Fill-Seal) which maximizes sterilization in a completely
closed process and minimizes the manufacturing duration to 13 seconds per product.
Fresh Ingredients
(3,000 tons/yr)Dried Ingredients
Herbal concentrate
Nano-sized herbal particles
(120 tons/yr)
Collecting, preparing,
drying
Heat-pumped drying
Cleansing with high-pressure
water
Vacuum extracting
Concentrating and
evaporating
Vacuum drying
Nano-sized herbal particles
Capsule and tablet forms: gel & powder capsules, sugar-coated and film-coated tablets, etc.
Other forms: syrups and granules.
Blending Pharmaceutically formed Packaging Storing
Crystalized API
Capsule and tablet forms: gel capsules, powder capsules, film-coated tablets
Liquid forms: eye drops, nasal drops, cough syrups
Other forms: ointments and granules
Blending Pharmaceutically formed Packaging Storing
Solvent added: 960 ethanol
Excipients added: solvents, gelatin, etc.
Excipients added: solvents, gelatin, etc.

Bloomberg – FPTS <GO> | 21
HSX: TRA
www.fpts.com.vn
II. Bidding Procedure in the ETC Channel (back to TRA’s ETC Sector Analysis)
Steps Details
Classification Drugs are classified into different tiers based on manufacturing quality
Technical Rating (30%) Quality: 70%, Packaging: 30% of technical points. If the total points are less
than 80%, the bidding product is disqualified
Financial Rating (70%) The lower the bidding price, the higher the financial points
Total=30%Technical+70%Financial Bidders with the highest points will have their capacity for supplying tested
Capacity for Supplying Bidding packages will be divided into smaller packages if bidders’s capacity
cannot satisfy required quantity
Source(s): National Medicine Trading Center
III. Existing generic drug tiers according to Circular No.11/2016/TT-BYT (expired Oct. 2019) (back to TRA’s
ETC Sector Analysis)
Tier Descriptions of Generic Drugs
1 Manufactured with EU-GMP or PIC/s-GMP production lines and certified by ICH members or Australia.
2 Manufactured with EU-GMP or PIC/s-GMP production lines and not certified by ICH members nor
Australia.
3 Manufactured with WHO-GMP and certified by the Vietnamese Ministry of Health.
4 Bioequivalent drugs certified by the Vietnamese Ministry of Health.
5 Other drugs which do not meet the above requirements.
Source(s): Vietnamese Ministry of Health
IV. New generic drug tiers according to Circular No.15/2019/TT-BYT (effective October 2019) (back to TRA’s
ETC Sector Analysis)
Tier Descriptions of Generic Drugs
1 Manufactured with EU-GMP or equivalent production lines and certified by certain Stringent Regulatory
Authorities (SRA).
2 Manufactured with EU-GMP and not certified by SRA or with PIC/s-GMP and certified by Reference
Regulatory Authorities which, at the same time, have to be PIC/s and ICH members.
3 Manufactured with GMP quality and bioequivalently certified by the Vietnamese Regulatory Authority.
4 Manufactured in Vietnam with WHO-GMP and certified by the Vietnamese Regulatory Authority.
5 Manufactured with WHO-GMP and do not meet the above requirements.
Source(s): Vietnamese Ministry of Health
V. List of Stringent Regulatory Authorities (SRA) qualified to certify drugs in Tier 1 (back to TRA’s ETC
Sector Analysis)
1. European Medicines Agency (EMA)
2. U.S. Food and Drug Administration (US FDA)
3. (Japanese) Pharmaceuticals and Medical Devices Agency (PMDA)
4. Medicines and Healthcare Products Regulatory Agency (MHRA)
5. The Swiss Agency for Therapeutic Products (Swissmedic)
6. Health Canada
7. (Australian) Therapeutic Goods Administration (TGA)
8. Icelandic Medicines Agency (IMA)
9. Liechtenstein – Austrian Federal Office for Safety in Health Care (BASG)
10. The Norwegian Medicines Agency (NoMA)
Source(s): Vietnam Regulatory Affairs Society

Bloomberg – FPTS <GO> | 22
HSX: TRA
www.fpts.com.vn
VI. Traphaco’s Distribution Centers (back to SG&A
Expense Analysis)
- Yen Bai - Thai Nguyen - Vinh Phuc - Phu Tho - Bac Giang - Quang Ninh - Hai Duong - Hai Phong - Hung Yen - Nam Dinh - Thanh Hoa - Nghe An - Thua Thien Hue - Da Nang - Quang Ngai - Binh Dinh - Gia Lai - Khanh Hoa - Binh Thuan - Dong Nai - Binh Duong - Ho Chi Minh City - Long An - Tien Giang - Can Tho - Vinh Long - Kien Giang - Vung Tau
Source(s): Traphaco
VII. Fine Particulate Matter (PM 2.5)
Distribution Map in Vietnam
Source(s): Yale University Data
VIII. List of Important Terms
Term Description
Herbal Products
Produced from natural sources, including herbs, plants and animals. In this context, “herbal
products” can be understood as both herbal medicines and herbal health supplements as they
share similar sources of ingredients.
Patented &
Generic Drugs
Manufactured from crystalized active pharmaceutical ingredients (API) which could be
synthesized from natural sources but have to be in pure forms.
Over-the-
Counter (OTC)
In Vietnam, due to loose regulations, the term “OTC” can be understood as a distribution
channel via which pharmaceutical products are sold at pharmacies.
Ethical Drugs
(ETC)
In Vietnam, due to loose regulations, the term “ETC” can be understood as a distribution
channel via which pharmaceutical products are bid in different tiers to be sold at hospitals and
clinics.
WHO-GACP Guidelines on good agricultural and collection practices developed by WHO.
WHO-GMP Guidelines on good manufacturing practice developed by WHO.
PIC/s-GMP Guidelines on good manufacturing practice developed and certified by Pharmaceutical
Inspection Co-operation Scheme (PIC/s) members.
ICH International Council for Harmonization of Technical Requirements for Pharmaceuticals for
Human Use.
EU-GMP Guidelines on good manufacturing practice developed by the European Medicines Agency to
satisfy European Union level of quality, one of the strictest manufacturing standard in the world.
Bioequivalence The condition in which different formulations of the same drug are equally absorbed when taken
into the body.
Source(s): FPTS Research
Bloomberg – FPTS <GO> | 23
HSX: TRA
www.fpts.com.vn
Disclaimer
All of information and analysis in this report made by FPTS based on reliable, public and legal sources. Except for information about
FPTS, we do not guarantee about the accuracy and completeness of these information.
Investors who use this report need to note that all of judgements in this report are only subjective opinions of FPTS. Investors have
to take responsibility about their decisions when using this report.
FPTS might make investment decisions based on information in this report or others and do not have any claim on legal perspective
of given information.
By the time of publishing the report, FPTS holds 59 shares of TRA and the analyst does not hold any share of the subject company.
This report many not be copied, reproduced, published or redistributed for any purpose without written permission of an
authorized representative of FPTS. Please cite sources when quoting. Information related to stocks and industries could
be viewed at https://ezsearch.fpts.com.vn or will be provided upon official request.
© Copyright by FPT Securities 2010
FPT Securities Joint Stock Company
Head Office
No. 52 Lac Long Quan, Buoi Ward,
Tay Ho District, Hanoi, Vietnam.
Tel: (84.24) 3 773 7070 / 271 7171
Fax: (84.24) 3 773 9058
FPT Securities Joint Stock Company
Ho Chi Minh City Office
3rd Floor, Ben Thanh Times Square
Building, 136-138 Le Thi Hong Gam,
District 1, Ho Chi Minh City, Vietnam.
Tel: (84.28) 6 290 8686
Fax: (84.28) 6 291 0607
FPT Securities Joint Stock Company
Da Nang Office
No. 100 Quang Trung, Thach Thang
Ward, Hai Chau District, Da Nang,
Vietnam.
Tel: (84.236) 3553 666
Fax: (84.236) 3553 888