Sample Valuation Report
31
Business Enterprise, LLC 49 Wisteria Way Atlanta, Georgia 30265 Valuation Date: March 25, 2020 Advisor: Michael Togneri Managing Partner Sample Valuation Report
-
Upload
khangminh22 -
Category
Documents
-
view
4 -
download
0
Transcript of Sample Valuation Report

Business Enterprise, LLC
49 Wisteria Way
Atlanta, Georgia 30265
Valuation Date: March 25, 2020
Advisor:
Michael Togneri
Managing Partner
Sample Valuation Report

About Your Valuation Report 2
About Business Valuation 3
Neri Capital Partners Methodology 5
Your Valuation 6
Financial Summary 7
Key Performance Indicator Overview 9
KPI Details 12
Value Map 25
About Neri Capital Partners 26
Next Steps 27
Supporting Documents 29
Contact Information 31
Contents
Page 2 of 31

This dynamically driven and customized report was
generated to provide the business owner with general
estimates of fair market value and liquidation value
under relevant transaction conditions assumed for the
profiled business, at a fair price and in real-time. The
results presented will provide the reader with estimates
which reflect both the "sale of assets" and "the sale of
equity" (on a going concern basis) as well as estimates
which reflect the so- called "enterprise value" of the
subject company. For more specific information about
business valuation, please see our About Business
Valuation on page 4.
In analyzing your business, we have generated four
distinct and useful estimates of value in addition to as
many as 30 performance related metrics:
Key Performance Indicators
The metrics known as Key Performance lndicators (KPls)
were calculated based on the analysis of company-specific
data which you input to various industry-specific averages
linked to millions of other businesses. These KPls are useful
measures of the overall financial and operational health
and growth of your business and they should be checked
regularly in order to identify meaningful trends or "red
flags" which require corrective action. These same
measures are commonly utilized by business coaches,
financial professionals and potential business acquirers in a
variety of real-world settings.
Throughout this valuation, the following color system is
used to denote business performance:
Value
Outperforming
Industry
Average
Underperforming
About Your Valuation Report
Page 3 of 31
KPI’s are an excellent management tool to improve the performance of your Business.

In understanding and interpreting the "value" of a business,
it is important to recognize that there are many different
"types" and "levels" of value. The most common scenario
involves the estimation of "fair market value on a going
concern basis" for the entire company, e.g. a 100% interest
in the subject equity or assets/enterprise.
When valuing the entire company (100% control interest),
it is necessary to distinguish between the value of "assets"
(asset deal) and the value of "equity" (stock deal). In
practice, owner-operated businesses are either sold on an
"asset sale basis" or on an "equity sale basis" with the
purchase agreement reflecting the unique aspects of each
scenario.
A variety of factors will determine the chosen mode of sale,
with buyer and seller negotiating price and an array of other
"terms and conditions" including the type of sale.
The majority of small private firms are sold as asset sales while the majority of middle- market transactions involve the sale of equity.
The "asset sale" value will always differ from the "stock sale"
value due to the specific group of assets and liabilities that
are included or excluded in each format.
In determining which estimations of value are of most
relevance to the business owner, the reason behind the
valuation will typically address this question. Business
Advisors hired to assist buyers and owners most
commonly value businesses under the "asset sale"
scenario through multiples of discretionary earnings while
valuations for divorce or estate taxes will be based primarily
on the "equity sale" scenario.
About Business Valuation
(International Glossary of Business Valuation Terms)
Page 4 of 31

The general differences between the asset and equity
transaction structure is:
Asset Sale (Asset Value)
Includes ONLY inventory/supplies, fixed assets and all
intangible assets. Excludes all liquid financial assets and all
liabilities. Buyer operates from newly formed legal entity.
Equity Sale (Equity Value)
Includes the assets listed above PLUS liquid financial assets
LESS all liabilities (ST/LT). Involves the full transfer of the
legal entity including all account balances and current tax
attributes.
Naturally, the "value" associated with these two distinct
transactions can be substantially different. In practical
terms:
In the "real-world", there are many variations on these
basic structures, e.g. an asset sale might include accounts
receivable or an equity sale might exclude long term debt,
etc. The values provided in this report are stated in terms
of the baseline case as defined above. They are both "fair
market value on a going concern basis" estimates, but one
reflects the asset sale and one reflects the equity sale.
Enterprise Value
In middle-market transactions, it is also helpful to
distinguish between "equity value" and "enterprise value".
Enterprise value reflects the firm's value as a functioning
entity, and it is helpful in that it facilitates the comparison
of companies with varying levels of debt.
Which Business Value Conclusion is Most Important?
The answer to this question depends chiefly upon
the purpose for the valuation engagement. If you are
negotiating the sale/purchase of a business via an asset
sale, then it is the asset value which is most relevant. If
you are filing an estate/gift tax return, it is the equity value
which is most important. When evaluating middle-market
companies for M&A purposes, both equity and enterprise
value will be useful. If your business is rapidly deteriorating
and you are contemplating a reorganization, then
liquidation value may be of most relevance.
About Business Valuation (continued)
Page 5 of 31

While this valuation was generated considering as many
company-, industry- and location-specific details as
available, the value presented in this report is an automated
estimation of the Fair Market Value of the business and its
assets and liabilities. Some events and circumstances that
might impact the overall valuation of a specific business
may not be considered for the purpose of this report.
Valuation methods from the income, market and asset
approach have been utilized to reach the valuation results
for the subject company. The opinion of value given in this
report is based on information provided by the user and
other sources. This information you input is assumed to be
accurate and complete. However, Neri Capital has not
audited or attempted to confirm this information for
accuracy or completeness. It's important to note that the
estimates presented herein are not "final numbers".
Instead, we are providing general estimates. As a result,
the overall valuation should be considered a frame of
reference and not an official appraisal.
Essentially, our focus is to try to provide a proprietary but
real-world oriented valuation approach for small, midsize
and emerging businesses. In doing so, we include methods
from the following valuation approaches utilized by
professional business appraisers today:
Neri Capital’s Methodology
Page 6 of 31

Business Enterprise, LLC Industry: 22111 - Electric Power Generation
Equity Value (Latest Valuation)
$5,004,214
This fair market value conclusion is the value of the
company available to its owners or shareholders and
incorporates all of the assets included in the "asset
value" plus the firm's liquid financial assets (cash, A/R,
deposits, etc.) and minus its liabilities (ST and LT).
Valuation History
Your Valuation
$5,488,446
Enterprise Value
$5,424,702
-$457,805
USD
Page 7 of 31

2019
Income Assets Liabilities
Revenue
$95,362
$175,470
Officer Compensation
$369,591
$412,788
Inventory
$9,762
$513,567
$575,483
$44,347
$199
Other Current Assets
$197,536
$334,310
$124,129
N/A
$310
$0
$0
Financial Summary
Page 8 of 31

2019 2018 2017
Revenue $5,269,090 $3,620,103 $7,148,383
Pretax Income $175,470 $126,950 $3,028,370
Officer Compensation $369,591 $269,560 $1,006,090
Interest Expense $44,347 $38,746 $64,402
Non-Cash Expenses $199 $156,182 $228,305
One-Time Expenses $310 $2,044 $4,435
One-Time Revenues $0 $0 $0
Cash
$279,124
$264,515
$17,138
Accounts Receivable $412,788 $600,747 $276,499
Inventory $9,762 $97,161 $0
Other Current Assets $197,536 $45,002 $35,791
Fixed Assets $334,310 $95,566 $393,457
Intangible Assets $0 $0 $0
Liabilities Accounts Payable $95,362 $158,378 $31,075
Other Short-Term Liabilities $513,567 $299,048 $116,719
Bank Loans $575,483 $599,376 $622,344
Other Long-Term Liabilities $124,129 $124,179 $124,179
Contingent Liabilities N/A $0 N/A
Financial Summary (Yearly)
Page 9 of 31

In order to better understand your company’s operations, we have calculated a variety of Key Performance Indicators
(KPIs) for your review and comparison to industry benchmarks. In terms of valuation outcomes for your firm, key
factors include size, profitability and growth.
The next three pages provide an Overview of KPIs; the subsequent group of pages go into further detail about
individual Indicators.
Cash Flow-to-Revenue 11%
Cash-to-Revenue 5%
Receivables (Conversion) 36
Inventory-to-Revenue 0%
Fixed Assets-to-Revenue 6%
Total Debt-to-Revenue 25%
KPI Overview
USD
Page 10 of 31

This chart shows you Pre-tax Income in comparison to some key financial items.
Receivables-to-Income (Pre-Tax) 289%
Inventory-to-Income (Pre-Tax) 6%
Fixed Assets-to-Income (Pre-Tax) 191%
Total Debt-to-Income (Pre-Tax) 746%
KPI Overview (continued)
USD
Page 11 of 31

With this chart, you can get an indication of the growth trends of the important drivers of the valuation of your business.
Growth Trends of Drivers of Valuation
KPI Overview (continued)
USD
Page 12 of 31

Return on Equity (ROE) Over Time What does it mean?
Compares profitability to the equity value of a company.
Indication of the strength of the business model.
Under- Industry Out-
Performing Average Performing
This is the amount of net income generated as a percentage
of shareholder’s equity. Return on Equity (ROE) measures
a company’s profitability by depicting how much profit
a company generates with money shareholders have
invested.
Why should it matter?
ROE is a universal and very useful measure to compare
a company’s profitability to that of its peers in the same
industry. High growth companies tend to have a high ROE.
Give me an example
If an E-Commerce company has a ROE of 0.48 this means
it generated 48 cents in net income for every $1 the
shareholder had invested.
KPIs: Return on Equity (ROE)
Perc
enta
ge
Year %
2019 -234% ●
2018 -163% ●
2017 -1,767% ●
Page 13 of 31

Increases over time could signal difficulty in collecting from
customers.
The time period shows the number of days it takes a
company to collect its accounts receivables.
Why should it matter?
Days Under- Performing
Industry Average Out-
Performing A lower time period indicates that a company relies mainly
on cash or is efficient in imparting credit and collecting its
debts. On the other hand, a higher time period could mean
some inefficiency in collecting the account receivables and
require a review of the current credit and collections
policies of the company. The quicker receivables are
collected, the sooner cash is available to meet other
business needs (thereby reducing the need to borrow
funds).
Give me an example
If a lumber wholesaler has a receivables conversion of
24 days, it means it takes 24 days on average to collect
its account receivables. If the firm's credit terms are "net
30 days”, this would be considered a positive result.
Rati
o
Year
2019 36
●
2018 52 ●
2017 15
●
Page 14 of 31

Inventory Turnover Over Time
How long it takes to sell inventory on hand.
What does it mean?
This activity or "turnover" ratio addresses how efficiently
goods are sold by calculating how many times a company’s
inventory is sold and replaced in a given time period.
Under- Performing
Industry Average Out-
Performing Why should it matter?
A lower ratio could mean poor sales and excessive inventory,
possibly due to pricing policies. A higher ratio may indicate
a too narrow selection of product and possibly lost sales.
Companies selling perishable goods have a very high
inventory turnover. Keeping inventory balances to a
minimum will reduce costs but may reduce sales volume.
Give me an example
If a soda manufacturer had an inventory turnover of 5.7,
this means it sold all its average inventory 5.7 times each
year.
KPIs: Inventory Turnover
Rati
o
Year Ratio
2019 539.755 ●
2018 37.259 ●
2017 N/A
Page 15 of 31

Fixed Assets Turnover Over Time
Shows how productive a company’s assets are.
What does it mean?
This activity ratio shows the company’s ability to generate
net sales from their investments in fixed assets.
Year Ratio
Under-
Performing
Industry Average
Out-
Performing
Why should it matter?
A higher ratio shows productive fixed asset investment. This
ratio is more vital and useful to the manufacturing industry.
Give me an example
If a manufacturing company had a fixed asset turnover of
3.8, this means the company generated sales worth $3.8 for
every $1 of investment in fixed assets
KPIs: Fixed Assets Turnover
Rati
o
2019 15.761 ●
2018 37.881 ●
2017 18.168 ●
Page 16 of 31
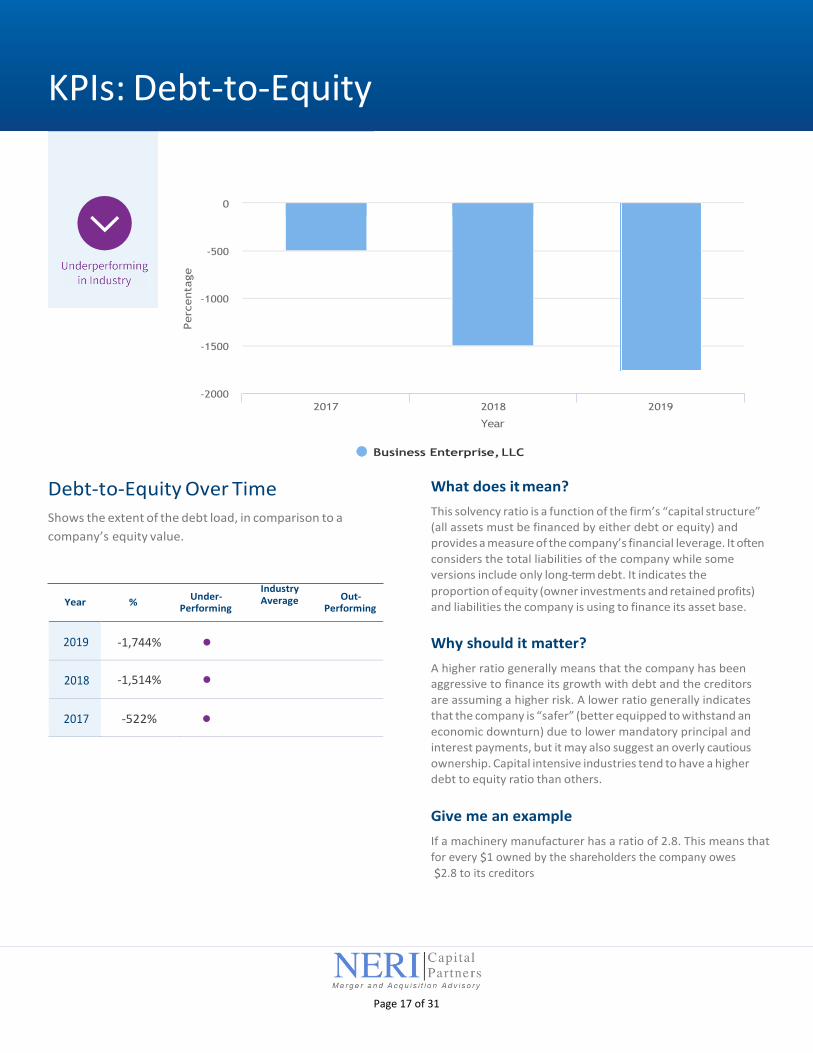
KPIs: Debt-to-Equity
Debt-to-Equity Over Time What does it mean?
Shows the extent of the debt load, in comparison to a
company’s equity value.
This solvency ratio is a function of the firm’s “capital structure”
(all assets must be financed by either debt or equity) and
provides a measure of the company’s financial leverage. It often
considers the total liabilities of the company while some
versions include only long-term debt. It indicates the
Under- Performing
Industry Average Out-
Performing
proportion of equity (owner investments and retained profits)
and liabilities the company is using to finance its asset base.
Why should it matter?
A higher ratio generally means that the company has been
aggressive to finance its growth with debt and the creditors
are assuming a higher risk. A lower ratio generally indicates
that the company is “safer” (better equipped to withstand an
economic downturn) due to lower mandatory principal and
interest payments, but it may also suggest an overly cautious
ownership. Capital intensive industries tend to have a higher
debt to equity ratio than others.
Give me an example
If a machinery manufacturer has a ratio of 2.8. This means that
for every $1 owned by the shareholders the company owes
$2.8 to its creditors
Perc
enta
ge
Year %
2019 -1,744% ●
2018 -1,514% ●
2017 -522% ●
Page 17 of 31

Shows how much cushion a company has in paying
its interest expenses.
Also referred to as “times interest earned”, this solvency
ratio is equal to earnings before interest and taxes (EBIT)
divided by interest expense and it is used to determine
the ease by which your company can pay interest on
Under- Performing
Industry Average Out-
Performing
outstanding debt obligations.
Why should it matter?
A lower ratio may cast doubt on the company’s ability to
meet ongoing principal and interest burdens. The higher
the ratio, the easier it is for the firm to repay its current debt
and take on additional debt if necessary. Bankers, creditors
and even investors often calculate and analyze this ratio to
gauge the firm's solvency position. Similar to most ratios,
averages will differ by industry.
Give me an example
If a software company has an interest coverage ratio over 2
times, this suggests that it could meet its interest payments
two times over and may qualify for additional debt.
KPIs: Interest Coverage
Rati
o
Year Ratio
2019 4.957 ●
2018 4.276 ●
2017 48.023 ●
Page 18 of 31

Cash-to-Debt Over Time
Shows the ability to pay off existing debts.
What does it mean?
This solvency ratio compares a company’s operating cash
balance to its total debt. This ratio provides an indication of
the company’s ability to cover total debt (ST and LT) with its
Under- Performing
Industry Average Out-
Performing
operating cash holdings.
Why should it matter?
A higher percentage ratio indicates that the company is
better equipped to carry and service its total debt. A high
ratio may also indicate “excess cash” or “excess net working
capital” which could be returned to the shareholders
or invested into new equipment or other avenues for
expansion. A low ratio could signal future difficulties
in servicing debt or even meeting payroll or vendor
obligations.
Give me an example
If a furniture store has a ratio of 74% this means that for
every $1 of debt, it has 74 cents in liquid holdings which
could be used to service this debt.
KPIs: Cash-to-Debt
Perc
enta
ge
Year %
2019 21%
●
2018 22%
●
2017 2% ●
Page 19 of 31

Income-to-Revenue Over Time
A rising percentage will often lead to a higher valuation.
What does it mean?
This “pretax” profitability ratio known as “return on sales”
indicates the relative profit margin of the company for each
dollar of sales.
Under- Performing
Industry Average Out-
Performing Why should it matter?
Similar to the return on equity ratio, a higher percentage
ratio indicates a higher rate of relative profitability. Unlike
the return on equity ratio, this measure is “pretax” in nature
and is not affected by the actual tax burden. Higher gross
profits and lower operating expenses coupled with higher
revenues will bolster this important metric, which can be
compared both over time and against the industry peer
group.
Give me an example
If a convenience store has a percentage ratio of 17%, this
means that for every $1 of revenue it has a pretax income of
17 cents.
KPIs: Income-to-Revenue (Pre-Tax)
Perc
enta
ge
Year %
2019 3% ●
2018 4% ●
2017 42%
●
Page 20 of 31

Cash Flow-to-Revenue Over Time
A rising percentage will often lead to a higher valuation.
What does it mean?
This multi-purpose ratio is an indicator of the firm’s ability
to convert sales revenue into spendable cash for the
ownership. Often this is a key measure when analyzing
Under- Performing
Industry Average Out-
Performing
a company’s ability to grow without the assistance of
outside capital.
Why should it matter?
A higher percentage ratio indicates that company can
turn a higher amount of revenues into cash flow.
Give me an example
If a winery has a percentage ratio of 11%, it means for every
$1 of revenue it is generating around 11 cents in
discretionary cash flow.
KPIs: Cash Flow-to-Revenue
Perc
enta
ge
Year %
2019 11% ●
2018 16% ●
2017 61%
●
Page 21 of 31

Receivables-to-Income Over Time
Under- Industry Out-
Performing Average Performing
What does it mean?
This measure provides an indication of the amount of credit
being granted to the customer base relative to ongoing
profits.
Why should it matter?
If the receivables are greater than pretax profit, the
importance of establishing and maintaining an effective
and efficient credit, billing and collections process is
heightened.
Give me an example
A company with $100K in receivables and $100K in pretax
profit must collect all receivables to maintain the firm’s
profit margin.
KPIs: Receivables-to-Income (Pre-Tax)
Perc
enta
ge
Year Ratio
2019 289%
●
2018 399% ●
2017 9%
●
Page 22 of 31

Inventory-to-Income Over Time
Under- Industry Out-
Performing Average Performing
What does it mean?
This ratio illustrates the relative importance of inventory
holdings (typically carried at lower of cost or market) to
company profitability.
Why should it matter?
For retail and manufacturing firms, inventory is one of the
factors that you can control to improve your small business
profitability. The way that inventory is sourced
and managed can impact the different profit levels of your
income statement. Ignorance of how to use inventory to
your advantage prevents you from maximizing operational
efficiency.
Give me an example
Over time, the goal might be to decrease this ratio, e.g.
generate higher pretax profit with lower average inventory
holdings.
Year Ratio
2019 6%
●
2018 77% ●
2017 N/A
Page 23 of 31
KPIs: Income to Inventory over time

Fixed Assets-to-Income Over Time
Under- Industry Out-
Performing Average Performing
What does it mean?
This ratio provides insight into the firm's profitability
relative to its stock of fixed assets (furniture, fixtures and
equipment/vehicles.
Why should it matter?
All other things equal, the firm seeks higher pretax profits
for each dollar invested into fixed assets. As this ratio
declines, the company is generating higher profits per dollar
of capital expenditures.
Give me an example
A ratio greater than one suggests that more money has
been invested into capital assets than profits have been
generated. This and other ratios should be reviewed “over
time” and against industry norms.
KPIs: Fixed Assets-to-Income (Pre-Tax)
Perc
enta
ge
Year Ratio
2019 191% ●
2018 75% ●
2017 13% ●
Page 24 of 31

Total Debt-to-Income Over Time
Under- Industry Out-
Performing Average Performing
What does it mean?
This measure shows the relationship between total
company obligations at any point in time (short- and
long-term debt) and ongoing profit performance.
Why should it matter?
Firms with high debts relative to pretax profits are often
riskier than those with lower total debts. At the same
time, some companies rely on the use of debt to grow and
enhance profit margins (when the return on investment of
borrowed funds is greater than the cost of borrowing). From
a valuation perspective, firms with lower debts and higher
pretax profits will be worth more than those with higher
debts and lower profits (all other things equal).
Give me an example
If total debts are $100K and total pretax profits are $50K, it
would take two years to pay off debts out of ongoing profits.
KPIs: Total Debt-to-Income (Pre-Tax)
Perc
enta
ge
Year %
2019 746% ●
2018 930% ●
2017 30% ●
Page 25 of 31

Exponential Business Value
Businesses of all types and sizes get business valuations because they are interested in discovering what their most valuable
asset is worth. Taking this first step is a critical one, but only the first. Having “discovered” the business value, the next steps
towards proactively managing value involve monitoring and optimizing the value of your company.
< $ 500K $ 500K- $ 2MM $ 2MM- $ 10MM $ 10MM+
Our goal is to help entrepreneurs “climb the valuation
mountain” illustrated above to the highest level possible by
internalizing certain key valuation and operational concepts
associated with discovering, monitoring and optimizing
business value. Every business will go through stages of
development and hopefully growth, and we want to help in
this process. Once the basics of business valuation are
understood, the path towards enhancing value will become
clearer and more “real” in the eyes of the owner.
One central theme that is as simple as it is important
concerns the so-called “size effect” or “size premium”.
Based on Neri Capital’s extensive research, we have found
that companies with higher revenues and earnings are
worth more than their smaller counterparts. The above
graph is for illustrative purposes only, but generally,
achieving valuation growth is possible due to the dual
impact of higher earnings, e.g., higher earnings will directly
increase value at any multiple, and higher earnings will
alone lead to a higher valuation multiple.
LEVEL 1
Value Map
Page 26 of 31

Democratizing Business Valuation Knowledge
Neri Capital urges entrepreneurs and business leaders
to discover, monitor and optimize the value of their
organization. It's arguably the single most important
question about a commercial entity: What’s it worth?
About Neri Capital
Discover Optimize
Page 27 of 31
With over 33 million completed valuations, you can have
confidence in the market values discussed in this report.
The business valuation tool and system were conceived and
developed by a leading financial institution and improved upon
by leaders in the accounting, finance, private equity, venture
capital and technology market sectors.
With over 50 patents pending or granted, the algorithmic
engine valuation system is continually provided up-to-date
data from 24 sources that include anonymized IRS data, GF
business data, Cortera, Biz Comps, Equifax, and Business
Valuation Resource (VBR).
Democratizing Big Data makes Neri Capital’s Valuations Market Accurate

Where are you in your journey?
We trust that you found your Business Valuation Report to be an informative resource. The aim of this report is to provide
guidance for growing companies as they evolve and take steps to elevate their performance results.
No matter where you may be today, this Report
can probably help you get closer to your vision:
If you're in the early stages of your company's life,
perhaps you need to expand your capabilities and
reach via marketing, intellectual property advisory,
benefits and tax consulting.
If your business is established and nearing a turning
point, maybe you seek legal representation,
strategic partners and/or growth funding.
If the company is already a substantial success with a
critical mass of business, we can help you formulate
and/or pursue a smart exit strategy.
Next Steps
Page 28 of 40
Regardless of the stage of your
business, Neri Capital has very
experienced advisors that provide
privately held and family owned
businesses the following services:
Strategic consulting / Planning
Debt – Equity Raises
Buy-Side Advisory
Sell-Side Advisory
Businesses Search Services
Exit Planning
Neri Capital Partners founded in 2006 provides Investment Banking
and Merger and Acquisition Services in North America. To date our
firm has completed over 500 business valuations and closed over
140 Sell-side and Buy-side Business transactions.

Supporting Documents – Income Statements
Page 29 of 31
Attached will be detailed profit and loss
statements for three years
Page 30 of 31
Supporting Documents – Balance Sheets
Attached will be detailed Balance
Sheets for the last three years
for the last three years

Michael Togneri Managing Partner
Phone: (770) 328-3999
Email: mtogneri@ne
Contact Information
Page 31 of 31