SAMPLE REPORT FOR ILLUSTRATION ONLY
57
Transcript of SAMPLE REPORT FOR ILLUSTRATION ONLY

W W W . E U R O M O N I T O R . C O M SAMPLE REPORT FOR ILLUSTRATION ONLY
© E u r o m o n i t o r I n t e r n a t i o n a l
LIST OF CONTENTS AND TABLES
Biscuits in Argentina - Category analysis ....................................................................................... 1 Headlines ........................................................................................................................................ 1 Trends ............................................................................................................................................. 1 Competitive Landscape .................................................................................................................. 2 Prospects ........................................................................................................................................ 2 Category Data ................................................................................................................................. 3
Table 1 Sales of Biscuits by Category: Volume 2006-2011 ....................................... 3 Table 2 Sales of Biscuits by Category: Value 2006-2011 .......................................... 3 Table 3 Sales of Biscuits by Category: % Volume Growth 2006-2011 ...................... 4 Table 4 Sales of Biscuits by Category: % Value Growth 2006-2011 ......................... 4 Table 5 Biscuits Company Shares 2006-2010 ........................................................... 4 Table 6 Biscuits Brand Shares 2007-2010 ................................................................. 5 Table 7 Sales of Biscuits by Distribution Format: % Analysis 2006-2011 .................. 6 Table 8 Forecast Sales of Biscuits by Category: Volume 2011-2016 ........................ 6 Table 9 Forecast Sales of Biscuits by Category: Value 2011-2016 ........................... 6 Table 10 Forecast Sales of Biscuits by Category: % Volume Growth 2011-2016 ....... 7 Table 11 Forecast Sales of Biscuits by Category: % Value Growth 2011-2016 .......... 7
Biscuits in Argentina - Company Profiles ....................................................................................... 8 Arcor Saic in Packaged Food (argentina)....................................................................................... 8
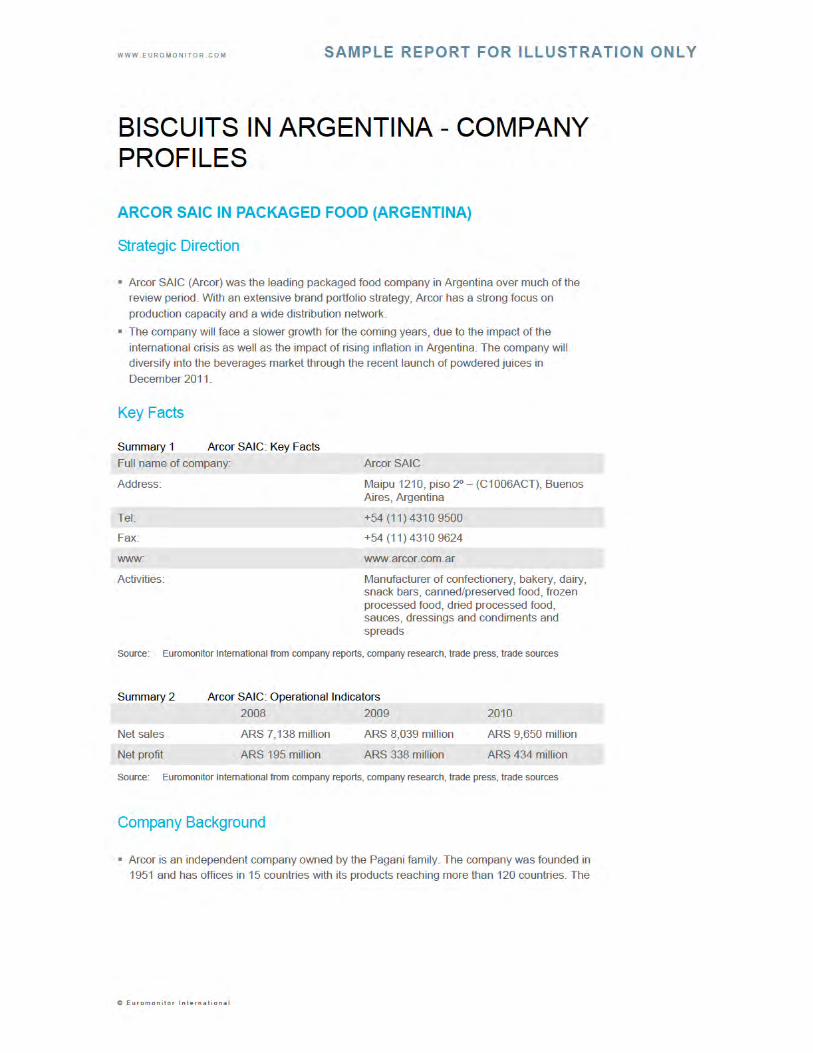
Strategic Direction ....................................................................................................................... 8 Key Facts..................................................................................................................................... 8
Summary 1 Arcor SAIC: Key Facts ................................................................................... 8 Summary 2 Arcor SAIC: Operational Indicators ................................................................ 8
Company Background ................................................................................................................. 8 Production ................................................................................................................................... 9
Summary 3 Arcor SAIC: Production Statistics 2009 ....................................................... 10
Competitive Positioning ............................................................................................................. 10 Summary 4 Arcor SAIC: Competitive Position 2010 ....................................................... 11
Packaged Food in Argentina - Industry Overview ........................................................................ 12 Executive Summary ...................................................................................................................... 12
Rising Demand Drives Growth .................................................................................................. 12 Fresh Meat Consumption Declines, Impacting the Argentinian Diet ........................................ 12 Inflation Threatens Levels of Consumption of Packaged Food................................................ 12 Strong Pressure To Discount Driven by Supermarkets/hypermarkets .................................... 12 Slower Growth Projected for 2012 ............................................................................................ 12
Key Trends and Developments .................................................................................................... 13 Economic Expansion Driven by Strong Consumer Spending .................................................. 13 Argentinian Diet Changes As Fresh Meat Consumption Declines ........................................... 13 Dynamic Packaged Food Industry Grows Despite Inflation ..................................................... 14 Healthier and More Nutritious Products Prosper Across Packaged Food ............................... 15
Foodservice – Key Trends and Developments ............................................................................ 16 Headlines................................................................................................................................... 16 Trends ....................................................................................................................................... 17 Competitive Landscape ............................................................................................................. 17

W W W . E U R O M O N I T O R . C O M SAMPLE REPORT FOR ILLUSTRATION ONLY
© E u r o m o n i t o r I n t e r n a t i o n a l
Prospects................................................................................................................................... 18 Category Data ........................................................................................................................... 18
Table 12 Foodservice Sales of Packaged Food by Category: Volume 2006-2011 ............................................................................................................. 18
Table 13 Foodservice Sales of Packaged Food by Category: % Volume Growth 2006-2011 .................................................................................................... 19
Table 14 Forecast Foodservice Sales of Packaged Food by Category: Volume
2011-2016 .................................................................................................... 20 Table 15 Forecast Foodservice Sales of Packaged Food by Category: %
Volume Growth 2011-2016 .......................................................................... 20
Impulse and Indulgence Products – Key Trends and Developments .......................................... 21 Headlines................................................................................................................................... 21 Trends ....................................................................................................................................... 21 Competitive Landscape ............................................................................................................. 22 Prospects................................................................................................................................... 23 Category Data ........................................................................................................................... 23
Table 16 Sales of Impulse and Indulgence Products by Category: Volume 2006-2011 .................................................................................................... 23
Table 17 Sales of Impulse and Indulgence Products by Category: Value 2006-2011 ............................................................................................................. 24
Table 18 Sales of Impulse and Indulgence Products by Category: % Volume Growth 2006-2011 ....................................................................................... 24
Table 19 Sales of Impulse and Indulgence Products by Category: % Value Growth 2006-2011 ....................................................................................... 24
Table 20 Company Shares of Impulse and Indulgence Products 2006-2010............ 25 Table 21 Brand Shares of Impulse and Indulgence Products 2007-2010 ................. 25 Table 22 Forecast Sales of Impulse and Indulgence Products by Category:
Volume 2011-2016 ....................................................................................... 26 Table 23 Forecast Sales of Impulse and Indulgence Products by Category:
Value 2011-2016 .......................................................................................... 27 Table 24 Forecast Sales of Impulse and Indulgence Products by Category: %
Volume Growth 2011-2016 .......................................................................... 27 Table 25 Forecast Sales of Impulse and Indulgence Products by Category: %
Value Growth 2011-2016 ............................................................................. 27
Nutrition/staples – Key Trends and Developments ...................................................................... 28 Headlines................................................................................................................................... 28 Trends ....................................................................................................................................... 28 Competitive Landscape ............................................................................................................. 29 Prospects................................................................................................................................... 29 Category Data ........................................................................................................................... 30
Table 26 Sales of Nutrition/Staples by Category: Volume 2006-2011 ....................... 30 Table 27 Sales of Nutrition/Staples by Category: Value 2006-2011 .......................... 30 Table 28 Sales of Nutrition/Staples by Category: % Volume Growth 2006-2011 ...... 31 Table 29 Sales of Nutrition/Staples by Category: % Value Growth 2006-2011 ......... 31 Table 30 Company Shares of Nutrition/Staples 2006-2010 ....................................... 32 Table 31 Brand Shares of Nutrition/Staples 2007-2010 ............................................. 32 Table 32 Forecast Sales of Nutrition/Staples by Category: Volume 2011-2016 ........ 33 Table 33 Forecast Sales of Nutrition/Staples by Category: Value 2011-2016 ........... 34

W W W . E U R O M O N I T O R . C O M SAMPLE REPORT FOR ILLUSTRATION ONLY
© E u r o m o n i t o r I n t e r n a t i o n a l
Table 34 Forecast Sales of Nutrition/Staples by Category: % Volume Growth 2011-2016 .................................................................................................... 34
Table 35 Forecast Sales of Nutrition/Staples by Category: % Value Growth 2011-2016 .................................................................................................... 34
Meal Solutions – Key Trends and Developments ........................................................................ 35 Headlines................................................................................................................................... 35 Trends ....................................................................................................................................... 35 Competitive Landscape ............................................................................................................. 36 Prospects................................................................................................................................... 37 Category Data ........................................................................................................................... 37
Table 36 Sales of Meal Solutions by Category: Volume 2006-2011 .......................... 37 Table 37 Sales of Meal Solutions by Category: Value 2006-2011 ............................. 38 Table 38 Sales of Meal Solutions by Category: % Volume Growth 2006-2011 ......... 38 Table 39 Sales of Meal Solutions by Category: % Value Growth 2006-2011 ............ 38 Table 40 Company Shares of Meal Solutions 2006-2010 .......................................... 39 Table 41 Brand Shares of Meal Solutions 2007-2010 ................................................ 39 Table 42 Forecast Sales of Meal Solutions by Category: Volume 2011-2016........... 40 Table 43 Forecast Sales of Meal Solutions by Category: Value 2011-2016 .............. 40 Table 44 Forecast Sales of Meal Solutions by Category: % Volume Growth
2011-2016 .................................................................................................... 41 Table 45 Forecast Sales of Meal Solutions by Category: % Value Growth 2011-
2016 ............................................................................................................. 41
Market Data ................................................................................................................................... 41 Table 46 Sales of Packaged Food by Category: Volume 2006-2011 ........................ 42 Table 47 Sales of Packaged Food by Category: Value 2006-2011 ........................... 42 Table 48 Sales of Packaged Food by Category: % Volume Growth 2006-2011 ....... 43 Table 49 Sales of Packaged Food by Category: % Value Growth 2006-2011 .......... 44 Table 50 GBO Shares of Packaged Food 2006-2010 ................................................ 44 Table 51 NBO Shares of Packaged Food 2006-2010 ................................................ 45 Table 52 NBO Brand Shares of Packaged Food 2007-2010 ..................................... 46 Table 53 Penetration of Private Label by Category 2006-2011 ................................. 47 Table 54 Sales of Packaged Food by Distribution Format: % Analysis 2006-
2011 ............................................................................................................. 47 Table 55 Sales of Packaged Food by Category and Distribution Format: %
Analysis 2011 ............................................................................................... 48 Table 56 Forecast Sales of Packaged Food by Category: Volume 2011-2016 ......... 49 Table 57 Forecast Sales of Packaged Food by Category: Value 2011-2016 ............ 50 Table 58 Forecast Sales of Packaged Food by Category: % Volume Growth
2011-2016 .................................................................................................... 51 Table 59 Forecast Sales of Packaged Food by Category: % Value Growth
2011-2016 .................................................................................................... 51
Definitions...................................................................................................................................... 52 Summary 5 Research Sources ........................................................................................ 52

W W W . E U R O M O N I T O R . C O M SAMPLE REPORT FOR ILLUSTRATION ONLY
© E u r o m o n i t o r I n t e r n a t i o n a l
BISCUITS IN ARGENTINA - CATEGORY ANALYSIS
HEADLINES
Current value sales of biscuits retail expected to increase by 25% to reach ARS6.4 billion in 2011
Argentina leads per capita consumption of biscuits in the Americas
Cookies set to record fastest current value growth of 33% to reach ARS108 million
Biscuits unit prices set to show average growth of 21% in 2011
Bagley Argentina leads sales with 48% value share in 2010
Constant value sales of biscuits expected to grow at a 3% CAGR over the forecast period
TRENDS
According to Euromonitor International figures, Argentinean biscuit consumption, at 10.1kg
per capita per year, is the highest in the Americas and one of the highest in the world. This is because in Argentina, biscuits are a part of the daily diet, and are considered as food rather than as snacks to be eaten between meals, as they are in Europe. Additionally, crackers are eaten both at lunch and dinner, and at breakfast and tea.
Constant value sales of biscuits are expected to increase by 13% in 2011, below the 14%
review period constant value CAGR. However, the comparability of the figures is jeopardised by the huge gap between the official inflation rate used to calculate constant currency growth rates and the observed inflation for the period 2007-2011. The official inflation rate is
considered to be an underestimation by all private actors (companies, consultancy firms, universities) operating in the country.
Using observed inflation rates according to private estimates, biscuits constant retail value sales are set to increase by 6% constant value growth in 2011, similar to a 6% average for the 2006-2011 period. This constant growth rate is due to the sustained growth of all categories,
except plain biscuits, which is a very mature market with a volume growth of under 1%.
Cookies are set to see the fastest current value growth of 33% to reach ARS108 million in 2011. This growth is due to a volume sales increase of 6% from a small base, supported by the growth of the Pepitos brand, owned by Kraft Foods Argentina.
Biscuits unit prices have shown an increase of 21% on average in 2011. Although the wheat price was stable during 2011 because it is state regulated, an increase in flour prices, due to insufficient offer, and an average salary increase of 35% caused the price increase.
Savoury biscuits and crackers are set to record current value growth of 26% and volume growth of 5% in 2011. This growth is explained by a substitution of artisanal bread for biscuits
in all daytime consumption.
Consumers continue looking for more indulgent products with original flavours or healthier functional products, even if at a slightly premium price. Some companies are now even offering products that satisfy both criteria.
W W W . E U R O M O N I T O R . C O M SAMPLE REPORT FOR ILLUSTRATION ONLY
© E u r o m o n i t o r I n t e r n a t i o n a l
COMPETITIVE LANDSCAPE
Bagley Argentina led sales with a 48% value share in 2010, followed by Kraft Foods Argentina
with 30%. The main reason for Bagley’s leadership is its distribution network, which takes advantage of Arcor’s network reaching kioskos and grocery retailers all around the country. The company leads in every segment with the exception of chocolate-coated biscuits and cookies, both of which were led by Kraft Foods.
PROSPECTS
Content removed from sample
Content removed from sample
W W W . E U R O M O N I T O R . C O M SAMPLE REPORT FOR ILLUSTRATION ONLY
© E u r o m o n i t o r I n t e r n a t i o n a l
CATEGORY DATA
Table 1 Sales of Biscuits by Category: Volume 2006-2011
'000 tonnes 2006 2007 2008 2009 2010 2011 Savoury Biscuits and Crackers Sweet Biscuits - Chocolate Coated Biscuits -- Cookies - Filled Biscuits - Plain Biscuits - Sandwich Biscuits Biscuits
Source: Euromonitor International from official statistics, trade associations, trade press, company research, store checks, trade interviews, trade sources
Table 2 Sales of Biscuits by Category: Value 2006-2011
Content removed from sample
Data removed from sample

W W W . E U R O M O N I T O R . C O M SAMPLE REPORT FOR ILLUSTRATION ONLY
© E u r o m o n i t o r I n t e r n a t i o n a l
Peso million 2006 2007 2008 2009 2010 2011 Savoury Biscuits and Crackers Sweet Biscuits - Chocolate Coated Biscuits -- Cookies - Filled Biscuits - Plain Biscuits - Sandwich Biscuits Biscuits
Source: Euromonitor International from official statistics, trade associations, trade press, company research, store checks, trade interviews, trade sources
Table 3 Sales of Biscuits by Category: % Volume Growth 2006-2011
% volume growth 2010/11 2006-11 CAGR 2006/11 Total Savoury Biscuits and Crackers Sweet Biscuits - Chocolate Coated Biscuits -- Cookies - Filled Biscuits - Plain Biscuits - Sandwich Biscuits Biscuits
Source: Euromonitor International from official statistics, trade associations, trade press, company research, store checks, trade interviews, trade sources
Table 4 Sales of Biscuits by Category: % Value Growth 2006-2011
% current value growth 2010/11 2006-11 CAGR 2006/11 Total Savoury Biscuits and Crackers Sweet Biscuits - Chocolate Coated Biscuits -- Cookies - Filled Biscuits - Plain Biscuits - Sandwich Biscuits Biscuits
Source: Euromonitor International from official statistics, trade associations, trade press, company research, store checks, trade interviews, trade sources
Table 5 Biscuits Company Shares 2006-2010
% retail value rsp Company 2006 2007 2008 2009 2010
Data removed from sample
Data removed from sample
Data removed from sample
Data removed from sample

W W W . E U R O M O N I T O R . C O M SAMPLE REPORT FOR ILLUSTRATION ONLY
© E u r o m o n i t o r I n t e r n a t i o n a l
Total 100.0 100.0 100.0 100.0 100.0
Source: Euromonitor International from official statistics, trade associations, trade press, company research, store checks, trade interviews, trade sources
Table 6 Biscuits Brand Shares 2007-2010
% retail value rsp Brand Company 2007 2008 2009 2010
Total 100.0 100.0 100.0 100.0
Source: Euromonitor International from official statistics, trade associations, trade press, company research, store checks, trade interviews, trade sources
Data removed from sample
Data removed from sample

W W W . E U R O M O N I T O R . C O M SAMPLE REPORT FOR ILLUSTRATION ONLY
© E u r o m o n i t o r I n t e r n a t i o n a l
Table 7 Sales of Biscuits by Distribution Format: % Analysis 2006-2011
% retail value rsp 2006 2007 2008 2009 2010 2011 Store-Based Retailing - Grocery Retailers - - Supermarkets/ Hypermarkets - - Discounters - - Small Grocery Retailers - - - Convenience Stores - - - Independent Small Grocers - - - Forecourt Retailers - - Other Grocery Retailers - Non-Grocery Retailers - - Health and Beauty Retailers - - Other Non-Grocery Retailers Non-Store Retailing - Vending - Homeshopping - Internet Retailing - Direct Selling Total 100.0 100.0 100.0 100.0 100.0 100.0
Source: Euromonitor International from official statistics, trade associations, trade press, company research, store checks, trade interviews, trade sources
Table 8 Forecast Sales of Biscuits by Category: Volume 2011-2016
'000 tonnes 2011 2012 2013 2014 2015 2016 Savoury Biscuits and Crackers Sweet Biscuits - Chocolate Coated Biscuits -- Cookies - Filled Biscuits - Plain Biscuits - Sandwich Biscuits Biscuits
Source: Euromonitor International from trade associations, trade press, company research, trade interviews, trade sources
Table 9 Forecast Sales of Biscuits by Category: Value 2011-2016
Peso million 2011 2012 2013 2014 2015 2016 Savoury Biscuits and , , , , , , Crackers
Data removed from sample
Data removed from sample
Data removed from sample

W W W . E U R O M O N I T O R . C O M SAMPLE REPORT FOR ILLUSTRATION ONLY
© E u r o m o n i t o r I n t e r n a t i o n a l
Sweet Biscuits - Chocolate Coated Biscuits -- Cookies - Filled Biscuits - Plain Biscuits - Sandwich Biscuits Biscuits , , , , , ,
Source: Euromonitor International from trade associations, trade press, company research, trade interviews, trade sources
Table 10 Forecast Sales of Biscuits by Category: % Volume Growth 2011-2016
% volume growth 2015/16 2011-16 CAGR 2011/16 Total Savoury Biscuits and Crackers Sweet Biscuits - Chocolate Coated Biscuits -- Cookies - Filled Biscuits - Plain Biscuits - Sandwich Biscuits Biscuits 2.9 3. 18.1
Source: Euromonitor International from trade associations, trade press, company research, trade interviews, trade sources
Table 11 Forecast Sales of Biscuits by Category: % Value Growth 2011-2016
% constant value growth 2011-16 CAGR 2011/16 TOTAL Savoury Biscuits and Crackers Sweet Biscuits - Chocolate Coated Biscuits -- Cookies - Filled Biscuits - Plain Biscuits - Sandwich Biscuits Biscuits
Source: Euromonitor International from trade associations, trade press, company research, trade interviews, trade sources
Data removed from sample
Data removed from sample
Data removed from sample
W W W . E U R O M O N I T O R . C O M SAMPLE REPORT FOR ILLUSTRATION ONLY
© E u r o m o n i t o r I n t e r n a t i o n a l
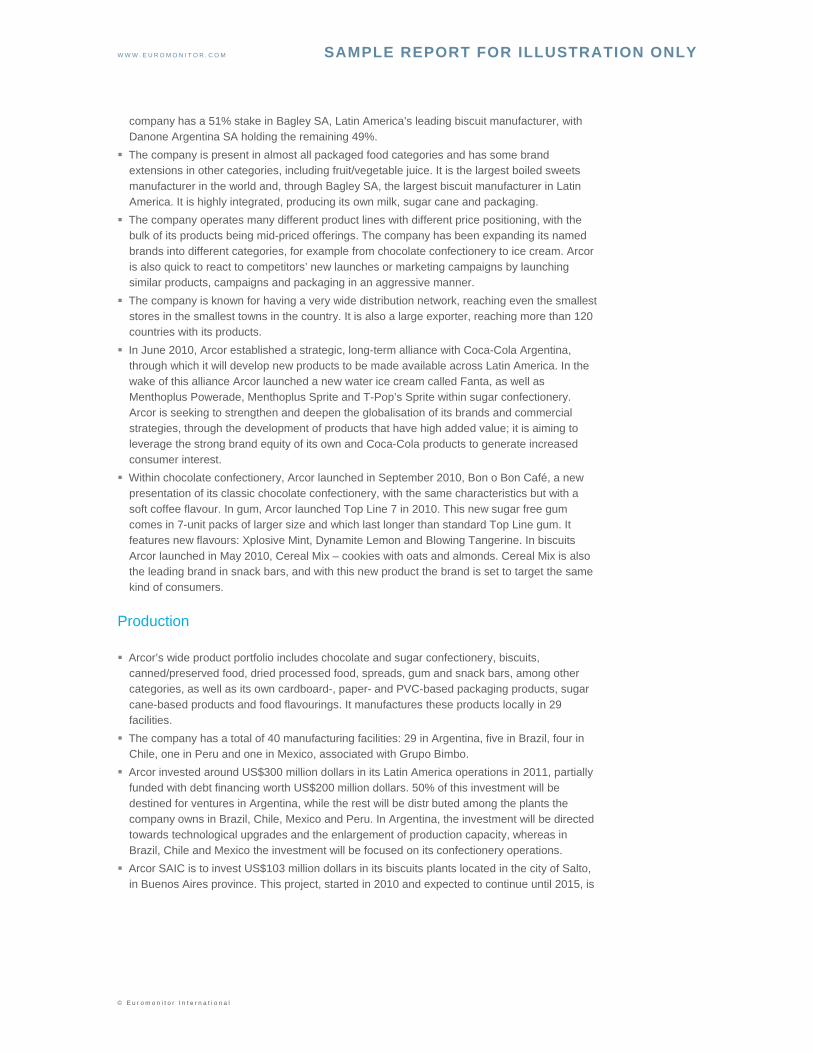
company has a 51% stake in Bagley SA, Latin America’s leading biscuit manufacturer, with Danone Argentina SA holding the remaining 49%.
The company is present in almost all packaged food categories and has some brand extensions in other categories, including fruit/vegetable juice. It is the largest boiled sweets
manufacturer in the world and, through Bagley SA, the largest biscuit manufacturer in Latin America. It is highly integrated, producing its own milk, sugar cane and packaging.
The company operates many different product lines with different price positioning, with the bulk of its products being mid-priced offerings. The company has been expanding its named brands into different categories, for example from chocolate confectionery to ice cream. Arcor is also quick to react to competitors’ new launches or marketing campaigns by launching similar products, campaigns and packaging in an aggressive manner.
The company is known for having a very wide distribution network, reaching even the smallest stores in the smallest towns in the country. It is also a large exporter, reaching more than 120 countries with its products.
In June 2010, Arcor established a strategic, long-term alliance with Coca-Cola Argentina, through which it will develop new products to be made available across Latin America. In the wake of this alliance Arcor launched a new water ice cream called Fanta, as well as Menthoplus Powerade, Menthoplus Sprite and T-Pop’s Sprite within sugar confectionery. Arcor is seeking to strengthen and deepen the globalisation of its brands and commercial strategies, through the development of products that have high added value; it is aiming to leverage the strong brand equity of its own and Coca-Cola products to generate increased consumer interest.
Within chocolate confectionery, Arcor launched in September 2010, Bon o Bon Café, a new presentation of its classic chocolate confectionery, with the same characteristics but with a
soft coffee flavour. In gum, Arcor launched Top Line 7 in 2010. This new sugar free gum comes in 7-unit packs of larger size and which last longer than standard Top Line gum. It features new flavours: Xplosive Mint, Dynamite Lemon and Blowing Tangerine. In biscuits
Arcor launched in May 2010, Cereal Mix – cookies with oats and almonds. Cereal Mix is also the leading brand in snack bars, and with this new product the brand is set to target the same kind of consumers.
Production
Arcor’s wide product portfolio includes chocolate and sugar confectionery, biscuits, canned/preserved food, dried processed food, spreads, gum and snack bars, among other categories, as well as its own cardboard-, paper- and PVC-based packaging products, sugar
cane-based products and food flavourings. It manufactures these products locally in 29 facilities.
The company has a total of 40 manufacturing facilities: 29 in Argentina, five in Brazil, four in Chile, one in Peru and one in Mexico, associated with Grupo Bimbo.
Arcor invested around US$300 million dollars in its Latin America operations in 2011, partially funded with debt financing worth US$200 million dollars. 50% of this investment will be destined for ventures in Argentina, while the rest will be distr buted among the plants the company owns in Brazil, Chile, Mexico and Peru. In Argentina, the investment will be directed towards technological upgrades and the enlargement of production capacity, whereas in Brazil, Chile and Mexico the investment will be focused on its confectionery operations.
Arcor SAIC is to invest US$103 million dollars in its biscuits plants located in the city of Salto, in Buenos Aires province. This project, started in 2010 and expected to continue until 2015, is


W W W . E U R O M O N I T O R . C O M SAMPLE REPORT FOR ILLUSTRATION ONLY
© E u r o m o n i t o r I n t e r n a t i o n a l
PACKAGED FOOD IN ARGENTINA - INDUSTRY OVERVIEW
EXECUTIVE SUMMARY
Rising Demand Drives Growth Consumption continues to be a key driver of Argentina’s economic growth. The economy is
seeing strong development in 2011, on the back of a solid performance in production,
consumption and exports. The strong rebound in output has boosted the packaged food industry; in general consumers are also exhibiting an enthusiastic appetite for consumption.
Fresh Meat Consumption Declines, Impacting the Argentinian Diet In 2011, fresh red meat has seen heavy price increases, exceeding the rate of inflation.
According to Cámara de la Industria y Comercio de Carnes y Derivados de la República, Argentinians’ consumption of fresh meat plunged by 26%, from annual per capita consumption of 70.3kg in 2009 to 52.3kg in 2011. According to the Instituto de Promoción de Carne Vacuna Argentina (Organisation for the Promotion of Red Meat), poultry prices also increased by up to 60% in 2011.Both trends left a gap to be filled by alternative packaged food products such as pasta and frozen processed food.
Inflation Threatens Levels of Consumption of Packaged Food Double-digit inflation has become a key weakness for the Argentinian economy, eroding
company profitability in 2011. Official data shows consumer prices rose 11% in the 12 months through to September 2011, however unofficial forecasts indicate that real inflation is at least twice that rate. Operating costs have become a major issue due to the rise in labour and fixed
costs, which are putting a serious strain on the profitability of small and medium-sized food producers. At the same time inflation has started to erode the purchasing power of lower-income groups, limiting their expenditure on packaged food.
Strong Pressure To Discount Driven by Supermarkets/hypermarkets Sales through supermarkets/hypermarkets continue to drive revenues in the overall packaged
food industry in Argentina. However, rising prices force consumers to be more selective and smarter in their purchases. Banks, brand operators and retailers have started to work together to offer various promotions to stimulate demand and build consumer loyalty. Major banks started this trend after the local financial crisis in 2001-2002. Carrefour (Carrefour SA), Wal-Mart (Wal-Mart de Argentina SA), Jumbo (Cencosud SA) and Coto (Coto CICSA), the leading supermarkets/hypermarkets operators, reinforced their strategies after the slowdown in 2009 and because of increasing inflationary pressures.
Slower Growth Projected for 2012 A difficult macroeconomic climate, alongside the deterioration in international financial
conditions, has started to affect consumer expectations; lowering consumption growth during Q3 in 2011.The consumer mood has also been dampened by rising inflation. If the unofficial
inflation estimates are correct, expectations of high inflation will erode consumer purchasing power, undermining spending potential and reducing potential profits for businesses. Therefore

W W W . E U R O M O N I T O R . C O M SAMPLE REPORT FOR ILLUSTRATION ONLY
© E u r o m o n i t o r I n t e r n a t i o n a l
packaged food consumption is projected to see a slowdown in its growth in constant value terms in 2012.
KEY TRENDS AND DEVELOPMENTS
Economic Expansion Driven by Strong Consumer Spending
Current impact
Outlook
Future impact
Argentinian Diet Changes As Fresh Meat Consumption Declines
Content removed from sample
Content removed from sample
Content removed from sample
Content removed from sample
Content removed from sample
W W W . E U R O M O N I T O R . C O M SAMPLE REPORT FOR ILLUSTRATION ONLY
© E u r o m o n i t o r I n t e r n a t i o n a l
Current Impact
Outlook
Future Impact
Dynamic Packaged Food Industry Grows Despite Inflation
Content removed from sample
Content removed from sample
Content removed from sample
Content removed from sample
Content removed from sample

W W W . E U R O M O N I T O R . C O M SAMPLE REPORT FOR ILLUSTRATION ONLY
© E u r o m o n i t o r I n t e r n a t i o n a l
Current impact
Outlook
Future impact
Healthier and More Nutritious Products Prosper Across Packaged Food
Current Impact
Content removed from sample
Content removed from sample
Content removed from sample
Content removed from sample
Content removed from sample

W W W . E U R O M O N I T O R . C O M SAMPLE REPORT FOR ILLUSTRATION ONLY
© E u r o m o n i t o r I n t e r n a t i o n a l
Outlook
Future Impact
FOODSERVICE – KEY TRENDS AND DEVELOPMENTS
Headlines
Content removed from sample
Content removed from sample
Content removed from sample
Content removed from sample

W W W . E U R O M O N I T O R . C O M SAMPLE REPORT FOR ILLUSTRATION ONLY
© E u r o m o n i t o r I n t e r n a t i o n a l
Trends
Competitive Landscape
Content removed from sample
Content removed from sample
Content removed from sample

W W W . E U R O M O N I T O R . C O M SAMPLE REPORT FOR ILLUSTRATION ONLY
© E u r o m o n i t o r I n t e r n a t i o n a l
Prospects
Category Data
Table 51 Foodservice Sales of Packaged Food by Category: Volume 2006-2011
2006 2007 2008 2009 2010 2011 Baby Food (Not calculable) Bakery ( tonnes) Canned/Preserved Food ( tonnes) Chilled Processed Food ( tonnes) Confectionery ( tonnes) Dairy (Not calculable) Dried Processed Food ( tonnes)
Content removed from sample
Content removed from sample
Data removed from sample

W W W . E U R O M O N I T O R . C O M SAMPLE REPORT FOR ILLUSTRATION ONLY
© E u r o m o n i t o r I n t e r n a t i o n a l
Frozen Processed Food ( tonnes) Ice Cream ('000 litres) Meal Replacement ( tonnes) Noodles ( tonnes) Oils and Fats ( tonnes) Pasta ( tonnes) Ready Meals ( tonnes) Sauces, Dressings and Condiments ( tonnes) Snack Bars ( tonnes) Soup ( tonnes) Spreads ( tonnes) Sweet and Savoury Snacks ( tonnes) Impulse and Indulgence Products (Not calculable) Nutrition/Staples (Not calculable) Meal Solutions ( tonnes) Packaged Food (Not calculable)
Source: Euromonitor International from official statistics, trade associations, trade press, company research, store checks, trade interviews, trade sources
Table 52 Foodservice Sales of Packaged Food by Category: % Volume Growth 2006-
2011
2010/11 2006-11 CAGR 2006/11 Total Baby Food (Not calculable) Bakery (% volume growth) Canned/Preserved Food (% volume growth) Chilled Processed Food (% volume growth) Confectionery (% volume growth) Dairy (Not calculable) Dried Processed Food (% volume growth) Frozen Processed Food (% volume growth) Ice Cream (% volume growth) Meal Replacement (% volume growth) Noodles (% volume growth) Oils and Fats (% volume growth) Pasta (% volume growth) Ready Meals (% volume growth) Sauces, Dressings and Condiments (% volume growth) Snack Bars (% volume growth) Soup (% volume growth) Spreads (% volume growth) Sweet and Savoury Snacks (% volume growth) Impulse and Indulgence Products (Not calculable) Nutrition/Staples (Not calculable) Meal Solutions (% volume growth) Packaged Food (Not calculable)
Source: Euromonitor International from official statistics, trade associations, trade press, company research, store checks, trade interviews, trade sources
Data removed from sample
Data removed from sample
W W W . E U R O M O N I T O R . C O M SAMPLE REPORT FOR ILLUSTRATION ONLY
© E u r o m o n i t o r I n t e r n a t i o n a l
Table 53 Forecast Foodservice Sales of Packaged Food by Category: Volume 2011-2016
2011 2012 2013 2014 2015 2016 Baby Food (Not calculable) Bakery ( tonnes) Canned/Preserved Food ( tonnes) Chilled Processed Food ( tonnes) Confectionery ( tonnes) Dairy (Not calculable) Dried Processed Food ( tonnes) Frozen Processed Food ( tonnes) Ice Cream ('000 litres) Meal Replacement ( tonnes) Noodles ( tonnes) Oils and Fats ( tonnes) Pasta ( tonnes) Ready Meals ( tonnes) Sauces, Dressings and Condiments ( tonnes) Snack Bars ( tonnes) Soup ( tonnes) Spreads ( tonnes) Sweet and Savoury Snacks ( tonnes) Impulse and Indulgence Products (Not calculable) Nutrition/Staples (Not calculable) Meal Solutions ( tonnes) Packaged Food (Not calculable)
Source: Euromonitor International from trade associations, trade press, company research, trade interviews, trade sources
Table 54 Forecast Foodservice Sales of Packaged Food by Category: % Volume Growth 2011-2016
2015/16 2011-16 CAGR 2011/16 Total Baby Food (Not calculable) Bakery (% volume growth) Canned/Preserved Food (% volume growth) Chilled Processed Food (% volume growth) Confectionery (% volume growth) Dairy (Not calculable) Dried Processed Food (% volume growth) Frozen Processed Food (% volume growth) Ice Cream (% volume growth)
Data removed from sample
Data removed from sample
W W W . E U R O M O N I T O R . C O M SAMPLE REPORT FOR ILLUSTRATION ONLY
© E u r o m o n i t o r I n t e r n a t i o n a l
Meal Replacement (% volume growth) Noodles (% volume growth) Oils and Fats (% volume growth) Pasta (% volume growth) Ready Meals (% volume growth) Sauces, Dressings and Condiments (% volume growth) Snack Bars (% volume growth) Soup (% volume growth) Spreads (% volume growth) Sweet and Savoury Snacks (% volume growth) Impulse and Indulgence Products (Not calculable) Nutrition/Staples (Not calculable) Meal Solutions (% volume growth) Packaged Food (Not calculable)
Source: Euromonitor International from trade associations, trade press, company research, trade interviews, trade sources
IMPULSE AND INDULGENCE PRODUCTS – KEY TRENDS AND DEVELOPMENTS
Headlines
Trends
Content removed from sample
Content removed from sample
Data removed from sample

W W W . E U R O M O N I T O R . C O M SAMPLE REPORT FOR ILLUSTRATION ONLY
© E u r o m o n i t o r I n t e r n a t i o n a l
Competitive Landscape
Content removed from sample
Content removed from sample

W W W . E U R O M O N I T O R . C O M SAMPLE REPORT FOR ILLUSTRATION ONLY
© E u r o m o n i t o r I n t e r n a t i o n a l
Prospects
Category Data
Table 55 Sales of Impulse and Indulgence Products by Category: Volume 2006-2011
2006 2007 2008 2009 2010 2011 Confectionery ('000 tonnes) Pastries ('000 tonnes) Cakes ('000 tonnes) Biscuits ('000 tonnes) Ice Cream (million litres) Sweet and Savoury Snacks ('000 tonnes)
Content removed from sample
Content removed from sample
Data removed from sample
W W W . E U R O M O N I T O R . C O M SAMPLE REPORT FOR ILLUSTRATION ONLY
© E u r o m o n i t o r I n t e r n a t i o n a l
Snack Bars ('000 tonnes) Impulse and Indulgence Products (Not calculable)
Source: Euromonitor International from official statistics, trade associations, trade press, company research, store checks, trade interviews, trade sources
Table 56 Sales of Impulse and Indulgence Products by Category: Value 2006-2011
Peso million 2006 2007 2008 2009 2010 2011 Confectionery Pastries Cakes Biscuits Ice Cream Sweet and Savoury Snacks Snack Bars Impulse and Indulgence Products
Source: Euromonitor International from official statistics, trade associations, trade press, company research, store checks, trade interviews, trade sources
Table 57 Sales of Impulse and Indulgence Products by Category: % Volume Growth 2006-2011
% volume growth 2010/11 2006-11 CAGR 2006/11 Total Confectionery Pastries Cakes Biscuits Ice Cream Sweet and Savoury Snacks Snack Bars Impulse and Indulgence Products
Source: Euromonitor International from official statistics, trade associations, trade press, company research, store checks, trade interviews, trade sources
Table 58 Sales of Impulse and Indulgence Products by Category: % Value Growth 2006-2011
% current value growth 2010/11 2006-11 CAGR 2006/11 Total Confectionery Pastries Cakes Biscuits Ice Cream Sweet and Savoury Snacks Snack Bars Impulse and Indulgence Products
Data removed from sample
Data removed from sample
Data removed from sample
Data removed from sample
W W W . E U R O M O N I T O R . C O M SAMPLE REPORT FOR ILLUSTRATION ONLY
© E u r o m o n i t o r I n t e r n a t i o n a l
Source: Euromonitor International from official statistics, trade associations, trade press, company research, store checks, trade interviews, trade sources
Table 59 Company Shares of Impulse and Indulgence Products 2006-2010
% retail value rsp Company 2006 2007 2008 2009 2010
Total 100.0 100.0 100.0 100.0 100.0
Source: Euromonitor International from official statistics, trade associations, trade press, company research, store checks, trade interviews, trade sources
Table 60 Brand Shares of Impulse and Indulgence Products 2007-2010
% retail value rsp Brand Company 2007 2008 2009 2010
Data removed from sample
Data removed from sample
W W W . E U R O M O N I T O R . C O M SAMPLE REPORT FOR ILLUSTRATION ONLY
© E u r o m o n i t o r I n t e r n a t i o n a l
Total 100.0 100.0 100.0 100.0
Source: Euromonitor International from official statistics, trade associations, trade press, company research, store checks, trade interviews, trade sources
Table 61 Forecast Sales of Impulse and Indulgence Products by Category: Volume 2011-2016
2011 2012 2013 2014 2015 2016 Confectionery ('000 tonnes) Pastries ('000 tonnes) Cakes ('000 tonnes) Biscuits ('000 tonnes) Ice Cream (million litres) Sweet and Savoury Snacks ('000 tonnes) Snack Bars ('000 tonnes) Impulse and Indulgence Products (Not calculable)
Source: Euromonitor International from trade associations, trade press, company research, trade interviews, trade sources
Data removed from sample
Data removed from sample
W W W . E U R O M O N I T O R . C O M SAMPLE REPORT FOR ILLUSTRATION ONLY
© E u r o m o n i t o r I n t e r n a t i o n a l
Table 62 Forecast Sales of Impulse and Indulgence Products by Category: Value 2011-
2016
Peso million 2011 2012 2013 2014 2015 2016 Confectionery Pastries Cakes Biscuits Ice Cream Sweet and Savoury Snacks Snack Bars Impulse and Indulgence Products
Source: Euromonitor International from trade associations, trade press, company research, trade interviews, trade sources
Table 63 Forecast Sales of Impulse and Indulgence Products by Category: % Volume Growth 2011-2016
% volume growth 2015/16 2011-16 CAGR 2011/16 Total Confectionery Pastries Cakes Biscuits Ice Cream Sweet and Savoury Snacks Snack Bars Impulse and Indulgence Products
Source: Euromonitor International from trade associations, trade press, company research, trade interviews, trade sources
Table 64 Forecast Sales of Impulse and Indulgence Products by Category: % Value
Growth 2011-2016
% constant value growth 2011-16 CAGR 2011/16 TOTAL Confectionery Pastries Cakes Biscuits Ice Cream Sweet and Savoury Snacks Snack Bars Impulse and Indulgence Products
Source: Euromonitor International from trade associations, trade press, company research, trade interviews, trade sources
Data removed from sample
Data removed from sample
Data removed from sample

W W W . E U R O M O N I T O R . C O M SAMPLE REPORT FOR ILLUSTRATION ONLY
© E u r o m o n i t o r I n t e r n a t i o n a l
NUTRITION/STAPLES – KEY TRENDS AND DEVELOPMENTS
Headlines
Trends
Content removed from sample
Content removed from sample
W W W . E U R O M O N I T O R . C O M SAMPLE REPORT FOR ILLUSTRATION ONLY
© E u r o m o n i t o r I n t e r n a t i o n a l
Competitive Landscape
Prospects
Content removed from sample
Content removed from sample
W W W . E U R O M O N I T O R . C O M SAMPLE REPORT FOR ILLUSTRATION ONLY
© E u r o m o n i t o r I n t e r n a t i o n a l
Category Data
Table 65 Sales of Nutrition/Staples by Category: Volume 2006-2011
2006 2007 2008 2009 2010 2011 Bread ('000 tonnes) Breakfast Cereals ('000 tonnes) Dairy (Not calculable) Meal Replacement Products ('000 tonnes) Oils and Fats ('000 tonnes) Baby Food (Not calculable) Spreads ('000 tonnes) Pasta ('000 tonnes) Noodles ('000 tonnes) Rice ('000 tonnes) Nutrition/Staples (Not calculable)
Source: Euromonitor International from official statistics, trade associations, trade press, company research, store checks, trade interviews, trade sources
Table 66 Sales of Nutrition/Staples by Category: Value 2006-2011
Content removed from sample
Data removed from sample
W W W . E U R O M O N I T O R . C O M SAMPLE REPORT FOR ILLUSTRATION ONLY
© E u r o m o n i t o r I n t e r n a t i o n a l
Peso million 2006 2007 2008 2009 2010 2011 Bread Breakfast Cereals Dairy Meal Replacement Products Oils and Fats Baby Food Spreads Pasta Noodles Rice Nutrition/Staples
Source: Euromonitor International from official statistics, trade associations, trade press, company research, store checks, trade interviews, trade sources
Table 67 Sales of Nutrition/Staples by Category: % Volume Growth 2006-2011
2010/11 2006-11 CAGR 2006/11 Total Bread (% volume growth) Breakfast Cereals (% volume growth) Dairy (Not calculable) Meal Replacement Products (% volume growth) Oils and Fats (% volume growth) Baby Food (Not calculable) Spreads (% volume growth) Pasta (% volume growth) Noodles (% volume growth) Rice (% volume growth) Nutrition/Staples (Not calculable)
Source: Euromonitor International from official statistics, trade associations, trade press, company research, store checks, trade interviews, trade sources
Table 68 Sales of Nutrition/Staples by Category: % Value Growth 2006-2011
% current value growth 2010/11 2006-11 CAGR 2006/11 Total Bread Breakfast Cereals Dairy Meal Replacement Products Oils and Fats Baby Food Spreads Pasta Noodles Rice Nutrition/Staples
Source: Euromonitor International from official statistics, trade associations, trade press, company research, store checks, trade interviews, trade sources
Data removed from sample
Data removed from sample
Data removed from sample
W W W . E U R O M O N I T O R . C O M SAMPLE REPORT FOR ILLUSTRATION ONLY
© E u r o m o n i t o r I n t e r n a t i o n a l
Table 69 Company Shares of Nutrition/Staples 2006-2010
% retail value rsp Company 2006 2007 2008 2009 2010
Total 100.0 100.0 100.0 100.0 100.0
Source: Euromonitor International from official statistics, trade associations, trade press, company research, store checks, trade interviews, trade sources
Table 70 Brand Shares of Nutrition/Staples 2007-2010
% retail value rsp Brand Company 2007 2008 2009 2010
Unidas Ltda
Data removed from sample
Data removed from sample
W W W . E U R O M O N I T O R . C O M SAMPLE REPORT FOR ILLUSTRATION ONLY
© E u r o m o n i t o r I n t e r n a t i o n a l
Total 100.0 100.0 100.0 100.0
Source: Euromonitor International from official statistics, trade associations, trade press, company research, store checks, trade interviews, trade sources
Table 71 Forecast Sales of Nutrition/Staples by Category: Volume 2011-2016
2011 2012 2013 2014 2015 2016 Bread ('000 tonnes) Breakfast Cereals ('000 tonnes) Dairy (Not calculable) Meal Replacement Products ('000 tonnes) Oils and Fats ('000 tonnes) Baby Food (Not calculable) Spreads ('000 tonnes) Pasta ('000 tonnes) Noodles ('000 tonnes) Rice ('000 tonnes) Nutrition/Staples (Not calculable)
Data removed from sample
Data removed from sample
W W W . E U R O M O N I T O R . C O M SAMPLE REPORT FOR ILLUSTRATION ONLY
© E u r o m o n i t o r I n t e r n a t i o n a l
Source: Euromonitor International from trade associations, trade press, company research, trade interviews, trade sources
Table 72 Forecast Sales of Nutrition/Staples by Category: Value 2011-2016
Peso million 2011 2012 2013 2014 2015 2016 Bread Breakfast Cereals Dairy Meal Replacement Products Oils and Fats Baby Food Spreads Pasta Noodles Rice Nutrition/Staples
Source: Euromonitor International from trade associations, trade press, company research, trade interviews, trade sources
Table 73 Forecast Sales of Nutrition/Staples by Category: % Volume Growth 2011-2016
2015/16 2011-16 CAGR 2011/16 Total Bread (% volume growth) Breakfast Cereals (% volume growth) Dairy (Not calculable) Meal Replacement Products (% volume growth) Oils and Fats (% volume growth) Baby Food (Not calculable) Spreads (% volume growth) Pasta (% volume growth) Noodles (% volume growth) Rice (% volume growth) Nutrition/Staples (Not calculable)
Source: Euromonitor International from trade associations, trade press, company research, trade interviews, trade sources
Table 74 Forecast Sales of Nutrition/Staples by Category: % Value Growth 2011-2016
% constant value growth 2011-16 CAGR 2011/16 TOTAL Bread Breakfast Cereals Dairy Meal Replacement Products Oils and Fats Baby Food Spreads Pasta Noodles
Data removed from sample
Data removed from sample
Data removed from sample

W W W . E U R O M O N I T O R . C O M SAMPLE REPORT FOR ILLUSTRATION ONLY
© E u r o m o n i t o r I n t e r n a t i o n a l
Rice Nutrition/Staples
Source: Euromonitor International from trade associations, trade press, company research, trade interviews, trade sources
MEAL SOLUTIONS – KEY TRENDS AND DEVELOPMENTS
Headlines
Trends
Content removed from sample
Content removed from sample
Data removed from sample
W W W . E U R O M O N I T O R . C O M SAMPLE REPORT FOR ILLUSTRATION ONLY
© E u r o m o n i t o r I n t e r n a t i o n a l
Competitive Landscape
Content removed from sample
Content removed from sample

W W W . E U R O M O N I T O R . C O M SAMPLE REPORT FOR ILLUSTRATION ONLY
© E u r o m o n i t o r I n t e r n a t i o n a l
Prospects
Category Data
Table 75 Sales of Meal Solutions by Category: Volume 2006-2011
'000 tonnes 2006 2007 2008 2009 2010 2011 Ready Meals Canned/Preserved Food Frozen Processed Food Dessert Mixes
Content removed from sample
Content removed from sample
Data removed from sample
W W W . E U R O M O N I T O R . C O M SAMPLE REPORT FOR ILLUSTRATION ONLY
© E u r o m o n i t o r I n t e r n a t i o n a l
Dinner Mixes Chilled Processed Food Sauces, Dressings and Condiments Soup Meal Solutions
Source: Euromonitor International from official statistics, trade associations, trade press, company research, store checks, trade interviews, trade sources
Table 76 Sales of Meal Solutions by Category: Value 2006-2011
Peso million 2006 2007 2008 2009 2010 2011 Ready Meals Canned/Preserved Food Frozen Processed Food Dessert Mixes Dinner Mixes Chilled Processed Food Sauces, Dressings and Condiments Soup Meal Solutions
Source: Euromonitor International from official statistics, trade associations, trade press, company research, store checks, trade interviews, trade sources
Table 77 Sales of Meal Solutions by Category: % Volume Growth 2006-2011
% volume growth 2010/11 2006-11 CAGR 2006/11 Total Ready Meals Canned/Preserved Food Frozen Processed Food Dessert Mixes Dinner Mixes Chilled Processed Food Sauces, Dressings and Condiments Soup Meal Solutions
Source: Euromonitor International from official statistics, trade associations, trade press, company research, store checks, trade interviews, trade sources
Table 78 Sales of Meal Solutions by Category: % Value Growth 2006-2011
% current value growth 2010/11 2006-11 CAGR 2006/11 Total Ready Meals Canned/Preserved Food Frozen Processed Food Dessert Mixes Dinner Mixes Chilled Processed Food
Data removed from sample
Data removed from sample
Data removed from sample
Data removed from sample
W W W . E U R O M O N I T O R . C O M SAMPLE REPORT FOR ILLUSTRATION ONLY
© E u r o m o n i t o r I n t e r n a t i o n a l
Sauces, Dressings and Condiments Soup Meal Solutions
Source: Euromonitor International from official statistics, trade associations, trade press, company research, store checks, trade interviews, trade sources
Table 79 Company Shares of Meal Solutions 2006-2010
% retail value rsp Company 2006 2007 2008 2009 2010
Total 100.0 100.0 100.0 100.0 100.0
Source: Euromonitor International from official statistics, trade associations, trade press, company research, store checks, trade interviews, trade sources
Table 80 Brand Shares of Meal Solutions 2007-2010
% retail value rsp Brand Company 2007 2008 2009 2010
Data removed from sample
Data removed from sample

W W W . E U R O M O N I T O R . C O M SAMPLE REPORT FOR ILLUSTRATION ONLY
© E u r o m o n i t o r I n t e r n a t i o n a l
Total 100.0 100.0 100.0 100.0
Source: Euromonitor International from official statistics, trade associations, trade press, company research, store checks, trade interviews, trade sources
Table 81 Forecast Sales of Meal Solutions by Category: Volume 2011-2016
'000 tonnes 2011 2012 2013 2014 2015 2016 Ready Meals Canned/Preserved Food Frozen Processed Food Dessert Mixes Dinner Mixes Chilled Processed Food Sauces, Dressings and Condiments Soup Meal Solutions
Source: Euromonitor International from trade associations, trade press, company research, trade interviews, trade sources
Table 82 Forecast Sales of Meal Solutions by Category: Value 2011-2016
Data removed from sample
Data removed from sample

W W W . E U R O M O N I T O R . C O M SAMPLE REPORT FOR ILLUSTRATION ONLY
© E u r o m o n i t o r I n t e r n a t i o n a l
Peso million 2011 2012 2013 2014 2015 2016 Ready Meals Canned/Preserved Food Frozen Processed Food Dessert Mixes Dinner Mixes Chilled Processed Food Sauces, Dressings and Condiments Soup Meal Solutions
Source: Euromonitor International from trade associations, trade press, company research, trade interviews, trade sources
Table 83 Forecast Sales of Meal Solutions by Category: % Volume Growth 2011-2016
% volume growth 2015/16 2011-16 CAGR 2011/16 Total Ready Meals Canned/Preserved Food Frozen Processed Food Dessert Mixes Dinner Mixes Chilled Processed Food Sauces, Dressings and Condiments Soup Meal Solutions
Source: Euromonitor International from trade associations, trade press, company research, trade interviews, trade sources
Table 84 Forecast Sales of Meal Solutions by Category: % Value Growth 2011-2016
% constant value growth 2011-16 CAGR 2011/16 TOTAL Ready Meals Canned/Preserved Food Frozen Processed Food Dessert Mixes Dinner Mixes Chilled Processed Food Sauces, Dressings and Condiments Soup Meal Solutions
Source: Euromonitor International from trade associations, trade press, company research, trade interviews, trade sources
MARKET DATA
Data removed from sample
Data removed from sample
Data removed from sample

W W W . E U R O M O N I T O R . C O M SAMPLE REPORT FOR ILLUSTRATION ONLY
© E u r o m o n i t o r I n t e r n a t i o n a l
Table 85 Sales of Packaged Food by Category: Volume 2006-2011
2006 2007 2008 2009 2010 2011 Baby Food (Not calculable) Bakery ('000 tonnes) Canned/Preserved Food ('000 tonnes) Chilled Processed Food ('000 tonnes) Confectionery ('000 tonnes) Dairy (Not calculable) Dried Processed Food ('000 tonnes) Frozen Processed Food ('000 tonnes) Ice Cream (million litres) Meal Replacement ('000 tonnes) Noodles ('000 tonnes) Oils and Fats ('000 tonnes) Pasta ('000 tonnes) Ready Meals ('000 tonnes) Sauces, Dressings and Condiments ('000 tonnes) Snack Bars ('000 tonnes) Soup ('000 tonnes) Spreads ('000 tonnes) Sweet and Savoury Snacks ('000 tonnes) Impulse and Indulgence Products (Not calculable) Nutrition/Staples (Not calculable) Meal Solutions ('000 tonnes) Packaged Food (Not calculable)
Source: Euromonitor International from official statistics, trade associations, trade press, company research, store checks, trade interviews, trade sources
Notes: Sum of sectors does not equal total packaged food because of double counting (eg canned soup is included in soups and canned foods)
Volume sales cannot be consolidated due to different unit measurements (eg confectionery in tonnes and ice cream in litres)
Table 86 Sales of Packaged Food by Category: Value 2006-2011
Peso million 2006 2007 2008 2009 2010 2011 Baby Food Bakery Canned/Preserved Food Chilled Processed Food Confectionery
Data removed from sample
Data removed from sample
W W W . E U R O M O N I T O R . C O M SAMPLE REPORT FOR ILLUSTRATION ONLY
© E u r o m o n i t o r I n t e r n a t i o n a l
Dairy Dried Processed Food Frozen Processed Food Ice Cream Meal Replacement Noodles Oils and Fats Pasta Ready Meals Sauces, Dressings and Condiments Snack Bars Soup Spreads Sweet and Savoury Snacks Impulse and Indulgence Products Nutrition/Staples Meal Solutions Packaged Food
Source: Euromonitor International from official statistics, trade associations, trade press, company research, store checks, trade interviews, trade sources
Notes: Sum of sectors does not equal total packaged food because of double counting (eg canned soup is included in soups and canned foods)
Table 87 Sales of Packaged Food by Category: % Volume Growth 2006-2011
2010/11 2006-11 CAGR 2006/11 Total Baby Food (Not calculable) Bakery (% volume growth) Canned/Preserved Food (% volume growth) Chilled Processed Food (% volume growth) Confectionery (% volume growth) Dairy (Not calculable) Dried Processed Food (% volume growth) Frozen Processed Food (% volume growth) Ice Cream (% volume growth) Meal Replacement (% volume growth) Noodles (% volume growth) Oils and Fats (% volume growth) Pasta (% volume growth) Ready Meals (% volume growth) Sauces, Dressings and Condiments (% volume growth) Snack Bars (% volume growth) Soup (% volume growth) Spreads (% volume growth) Sweet and Savoury Snacks (% volume growth) Impulse and Indulgence Products (Not calculable) Nutrition/Staples (Not calculable) Meal Solutions (% volume growth) Packaged Food (Not calculable)
Source: Euromonitor International from official statistics, trade associations, trade press, company research, store checks, trade interviews, trade sources
Notes: Sum of sectors does not equal total packaged food because of double counting (eg canned soup is included in soups and canned foods)
Data removed from sample
Data removed from sample

W W W . E U R O M O N I T O R . C O M SAMPLE REPORT FOR ILLUSTRATION ONLY
© E u r o m o n i t o r I n t e r n a t i o n a l
Volume sales cannot be consolidated due to different unit measurements (eg confectionery in tonnes and ice cream in litres)
Table 88 Sales of Packaged Food by Category: % Value Growth 2006-2011
% current value growth 2010/11 2006-11 CAGR 2006/11 Total Baby Food Bakery Canned/Preserved Food Chilled Processed Food Confectionery Dairy Dried Processed Food Frozen Processed Food Ice Cream Meal Replacement Noodles Oils and Fats Pasta Ready Meals Sauces, Dressings and Condiments Snack Bars Soup Spreads Sweet and Savoury Snacks Impulse and Indulgence Products Nutrition/Staples Meal Solutions Packaged Food
Source: Euromonitor International from official statistics, trade associations, trade press, company research, store checks, trade interviews, trade sources
Notes: Sum of sectors does not equal total packaged food because of double counting (eg canned soup is included in soups and canned foods)
Table 89 GBO Shares of Packaged Food 2006-2010
% retail value rsp Company 2006 2007 2008 2009 2010
Data removed from sample
Data removed from sample

W W W . E U R O M O N I T O R . C O M SAMPLE REPORT FOR ILLUSTRATION ONLY
© E u r o m o n i t o r I n t e r n a t i o n a l
Total 100.0 100.0 100.0 100.0 100.0
Source: Euromonitor International from official statistics, trade associations, trade press, company research, store checks, trade interviews, trade sources
Table 90 NBO Shares of Packaged Food 2006-2010
% retail value rsp Company 2006 2007 2008 2009 2010
Data removed from sample
Data removed from sample

W W W . E U R O M O N I T O R . C O M SAMPLE REPORT FOR ILLUSTRATION ONLY
© E u r o m o n i t o r I n t e r n a t i o n a l
Total 100.0 100.0 100.0 100.0 100.0
Source: Euromonitor International from official statistics, trade associations, trade press, company research, store checks, trade interviews, trade sources
Table 91 NBO Brand Shares of Packaged Food 2007-2010
% retail value rsp Brand Company 2007 2008 2009 2010
Data removed from sample
Data removed from sample
W W W . E U R O M O N I T O R . C O M SAMPLE REPORT FOR ILLUSTRATION ONLY
© E u r o m o n i t o r I n t e r n a t i o n a l
Total 100.0 100.0 100.0 100.0
Source: Euromonitor International from official statistics, trade associations, trade press, company research, store checks, trade interviews, trade sources
Table 92 Penetration of Private Label by Category 2006-2011
% retail value rsp 2006 2007 2008 2009 2010 2011 Bakery Canned/Preserved Food Chilled Processed Food Dairy Dried Processed Food Frozen Processed Food Ice Cream Impulse and Indulgence Products Meal Solutions Nutrition/Staples Oils and Fats Packaged Food Pasta Ready Meals Sauces, Dressings and Condiments Snack Bars Spreads Sweet and Savoury Snacks
Source: Euromonitor International from official statistics, trade associations, trade press, company research, store checks, trade interviews, trade sources
Table 93 Sales of Packaged Food by Distribution Format: % Analysis 2006-2011
% retail value rsp 2006 2007 2008 2009 2010 2011 Store-Based Retailing - Grocery Retailers - - Supermarkets/ Hypermarkets - - Discounters - - Small Grocery Retailers - - - Convenience Stores - - - Independent Small Grocers - - - Forecourt Retailers - - Other Grocery Retailers - Non-Grocery Retailers - - Health and Beauty Retailers - - Other Non-Grocery Retailers
Data removed from sample
Data removed from sample
Data removed from sample

W W W . E U R O M O N I T O R . C O M SAMPLE REPORT FOR ILLUSTRATION ONLY
© E u r o m o n i t o r I n t e r n a t i o n a l
Non-Store Retailing - Vending - Homeshopping - Internet Retailing - Direct Selling Total 100.0 100.0 100.0 100.0 100.0 100.0
Source: Euromonitor International from official statistics, trade associations, trade press, company research, store checks, trade interviews, trade sources
Table 94 Sales of Packaged Food by Category and Distr bution Format: % Analysis 2011
% retail value rsp BF B CPF CHP C D Store-Based Retailing Grocery Retailers Supermarkets/Hypermarkets Discounters Small Grocery Retailers Convenience Stores Independent Small Grocers Forecourt Retailers Confectionery specialists Other Grocery Retailers Non-Grocery Retailers Health and Beauty Retailers Other Non-Grocery Retailers Non-Store Retailing Vending Homeshopping Internet Retailing Direct Selling Total 100.0 100.0 100.0 100.0 100.0 100.0 DPF FPF IC MR NOO OF Store-Based Retailing Grocery Retailers Supermarkets/Hypermarkets Discounters Small Grocery Retailers Convenience Stores Independent Small Grocers Forecourt Retailers Confectionery specialists Other Grocery Retailers Non-Grocery Retailers Health and Beauty Retailers Other Non-Grocery Retailers Non-Store Retailing Vending Homeshopping Internet Retailing Direct Selling
Data removed from sample
Data removed from sample
Data removed from sample

W W W . E U R O M O N I T O R . C O M SAMPLE REPORT FOR ILLUSTRATION ONLY
© E u r o m o n i t o r I n t e r n a t i o n a l
Total 100.0 100.0 100.0 100.0 100.0 100.0 P RM SDC SB SOU SPR Store-Based Retailing Grocery Retailers Supermarkets/Hypermarkets Discounters Small Grocery Retailers Convenience Stores Independent Small Grocers Forecourt Retailers Confectionery specialists Other Grocery Retailers Non-Grocery Retailers Health and Beauty Retailers Other Non-Grocery Retailers Non-Store Retailing Vending Homeshopping Internet Retailing Direct Selling Total 100.0 100.0 100.0 100.0 100.0 100.0 SSS Store-Based Retailing Grocery Retailers Supermarkets/Hypermarkets Discounters Small Grocery Retailers Convenience Stores Independent Small Grocers Forecourt Retailers Confectionery specialists Other Grocery Retailers Non-Grocery Retailers Health and Beauty Retailers Other Non-Grocery Retailers Non-Store Retailing Vending Homeshopping Internet Retailing Direct Selling Total 100.0
Source: Euromonitor International from official statistics, trade associations, trade press, company research, store checks, trade interviews, trade sources
Key: BF = baby food; B = bakery; CPF = canned/preserved food; CHP = chilled processed food; C = confectionery; D = dairy; DPF = dried processed food; FPF = frozen processed food; IC = ice cream; MR = meal replacement; NOO = noodles; OF = oils and fats; P = pasta; RM = ready meals; SDC = sauces, dressings and condiments; SB = snack bars; SOU = soup; SPR = spreads; SSS = sweet and savoury snacks
Table 95 Forecast Sales of Packaged Food by Category: Volume 2011-2016
2011 2012 2013 2014 2015 2016
Data removed from sample
Data removed from sample
W W W . E U R O M O N I T O R . C O M SAMPLE REPORT FOR ILLUSTRATION ONLY
© E u r o m o n i t o r I n t e r n a t i o n a l
Baby Food (Not calculable) Bakery ('000 tonnes) Canned/Preserved Food ('000 tonnes) Chilled Processed Food ('000 tonnes) Confectionery ('000 tonnes) Dairy (Not calculable) Dried Processed Food ('000 tonnes) Frozen Processed Food ('000 tonnes) Ice Cream (million litres) Meal Replacement ('000 tonnes) Noodles ('000 tonnes) Oils and Fats ('000 tonnes) Pasta ('000 tonnes) Ready Meals ('000 tonnes) Sauces, Dressings and Condiments ('000 tonnes) Snack Bars ('000 tonnes) Soup ('000 tonnes) Spreads ('000 tonnes) Sweet and Savoury Snacks ('000 tonnes) Impulse and Indulgence Products (Not calculable) Nutrition/Staples (Not calculable) Meal Solutions ('000 tonnes) Packaged Food (Not calculable)
Source: Euromonitor International from trade associations, trade press, company research, trade interviews, trade sources
Table 96 Forecast Sales of Packaged Food by Category: Value 2011-2016
Peso million 2011 2012 2013 2014 2015 2016 Baby Food Bakery Canned/Preserved Food Chilled Processed Food Confectionery Dairy Dried Processed Food Frozen Processed Food Ice Cream Meal Replacement Noodles Oils and Fats
Data removed from sample
Data removed from sample

W W W . E U R O M O N I T O R . C O M SAMPLE REPORT FOR ILLUSTRATION ONLY
© E u r o m o n i t o r I n t e r n a t i o n a l
Pasta Ready Meals Sauces, Dressings and Condiments Snack Bars Soup Spreads Sweet and Savoury Snacks Impulse and Indulgence Products Nutrition/Staples Meal Solutions Packaged Food
Source: Euromonitor International from trade associations, trade press, company research, trade interviews, trade sources
Table 97 Forecast Sales of Packaged Food by Category: % Volume Growth 2011-2016
2015/16 2011-16 CAGR 2011/16 Total Baby Food (Not calculable) Bakery (% volume growth) Canned/Preserved Food (% volume growth) Chilled Processed Food (% volume growth) Confectionery (% volume growth) Dairy (Not calculable) Dried Processed Food (% volume growth) Frozen Processed Food (% volume growth) Ice Cream (% volume growth) Meal Replacement (% volume growth) Noodles (% volume growth) Oils and Fats (% volume growth) Pasta (% volume growth) Ready Meals (% volume growth) Sauces, Dressings and Condiments (% volume growth) Snack Bars (% volume growth) Soup (% volume growth) Spreads (% volume growth) Sweet and Savoury Snacks (% volume growth) Impulse and Indulgence Products (Not calculable) Nutrition/Staples (Not calculable) Meal Solutions (% volume growth) Packaged Food (Not calculable)
Source: Euromonitor International from trade associations, trade press, company research, trade interviews, trade sources
Table 98 Forecast Sales of Packaged Food by Category: % Value Growth 2011-2016
% constant value growth 2011-16 CAGR 2011/16 TOTAL Baby Food Bakery Canned/Preserved Food
Data removed from sample
Data removed from sample
Data removed from sample

![Bles.ppt [Read-Only]](https://static.fdokumen.com/doc/165x107/633bffc7197a6737f10ceddf/blesppt-read-only.jpg)