Coastline change detection on Tehama City using Remote Sensing and cloud computing
7
ISSN 2348-1196 (print) International Journal of Computer Science and Information Technology Research ISSN 2348-120X (online) Vol. 2, Issue 3, pp: (499-505), Month: July - September 2014, Available at: www.researchpublish.com Page | 499 Research Publish Journals Coastline Change Detection on Tehama City Using Remote Sensing and Cloud Computing 1 Shaima AL-GABLI, 2 Osman Hegazy 1,2 Department of Information System, Faculty of computers and Information, Cairo University, Yemen Abstract: Change detection is the measure of the distinct data framework and thematic change information that can guide to more tangible insights into underlying process involving land cover and land use changes than the information obtained from continuous change. This research demonstrates how remote sensing techniques can be integrated into monitoring process, allowing the regulatory monitoring coastline to do so more efficiently and help avoid or minimize the adverse effects .The first aim of this study is to test change detection by Discriminate change detection technique on Hodida city –Yemen coastline. Second to test cloud computing benefits on change detection study. Cloud computing is not magic tool to solve all problems, cloud computing Improvement in geo information software will allow easily implement and hence monitoring spatial data with low cost although it is under research. This study investigates the coastline changes in Hodeida, Yemen between 1972 till 2010; using Land sat TM/ETM+images. As they notice erosion of cost and sedimentation in some area. This will need to integrate GIS with remote sensing and could compute server (Apollo). This study has been done after a lot of complaints from area citizens; some area has erosion and reason for that immigration from their home. We used arc gis 10.2, erdas Imagine 2014, erdas Apollo server and Google earth. . Keywords: Cloud computing, Discriminate Change Function, Image Difference, Apollo. I. INTRODUCTION Land use Land Cover (LULC) change has become a topic of tremendous interest within the human dimensions of the Environmental change research community (Meyer W.B.,Turner B.L). Consequently, quantifying and understanding the extent and spatial distribution of LULC is a crucial importance to the study of Environmental change at various scales (Ojima D.S., Kalvin K.A.,and Turner B.L). Moreover this type of analysis provides a valuable tool to increase the efficiency of land use and land cover, and to diminish the negative environmental and societal impacts related to LULC (Daniel et al., 2002; Lu et al., 2004; Berberoglu and Akin, 2009; Tahir et al., 2013). Application of remotely sensed data made possible to study the changes in land cover in less time, at low cost and with better accuracy. Remote sensing technology and Geographic Information System (GIS) and could computing (Qihao, 2013) provide efficient methods for analysis of land use issues and tools for land use planning and modelling. Analysis of satellite data in conjunction with drainage, litho logy, and land use land cover collateral data facilitates effective evaluation of geo morphological conditions and status of degraded landforms. This data set is the core of the Geographic Information System (GIS) that provides an excellent means of spatial data analysis and interpretation6. It also provides a powerful mechanism, not only to monitor degraded lands and environmental changes, but also permits analysis of information of other environmental variables (S.Tamilenthi1, J. Punithavathi1, R. Baskaran1 and K. ChandraMohan). In this present study, an investigation has been carried out in coastline in Hodeida to detect sedimentation and erosion of cost line. Many researches in agriculture has been made but not in cost line. studying the beach stretching from Hodeida towards the south to the city of Tehama and a length of 862 km and to identify the characteristics of the geological , environmental and topographic that characterize , where the focus was on sites erosion and flooding and sedimentation and the situation morphological and compositional and human activity , and that using the information derived from the visual space and aerial photographs captured the dates and different years beginning in 1972 Mss. - 1989TM - 2010 ETM and determine the extent of the change in the form of tape beach through the accounts of digital visuals used by the technology of remote sensing and geographic information systems for different periods of time
-
Upload
independent -
Category
Documents
-
view
3 -
download
0
Transcript of Coastline change detection on Tehama City using Remote Sensing and cloud computing
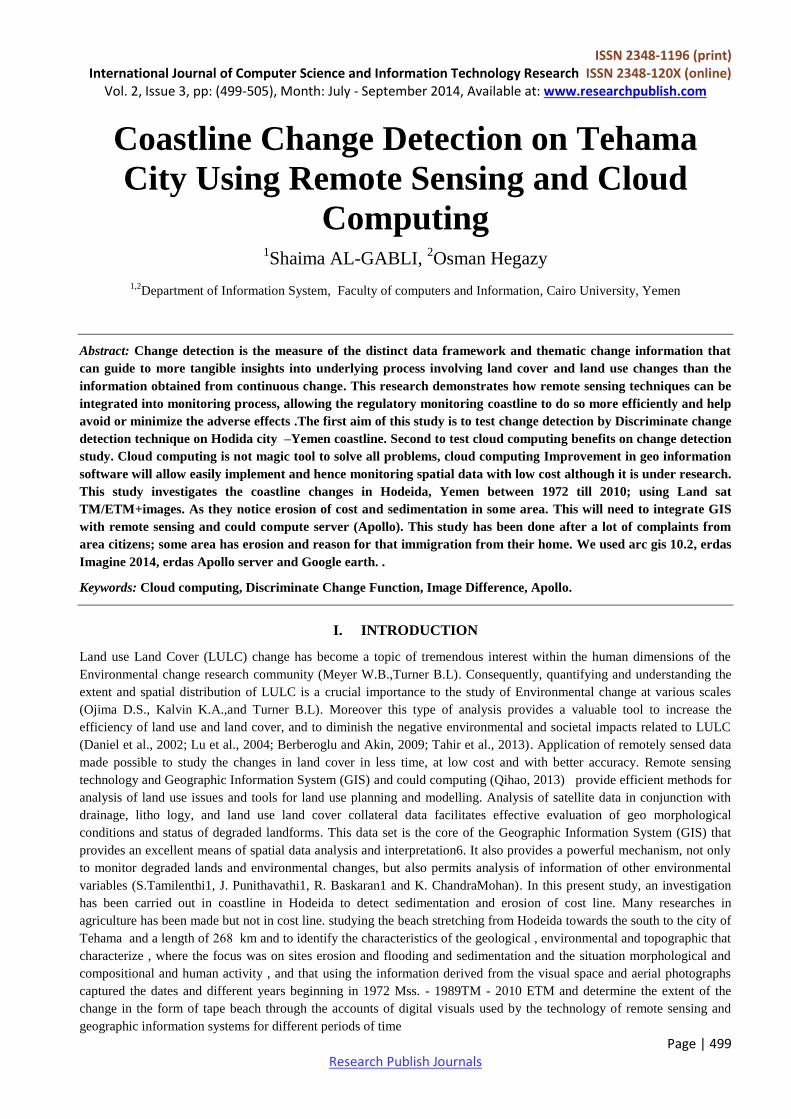
ISSN 2348-1196 (print) International Journal of Computer Science and Information Technology Research ISSN 2348-120X (online)
Vol. 2, Issue 3, pp: (499-505), Month: July - September 2014, Available at: www.researchpublish.com
Page | 499 Research Publish Journals
Coastline Change Detection on Tehama
City Using Remote Sensing and Cloud
Computing 1Shaima AL-GABLI,
2Osman Hegazy
1,2Department of Information System, Faculty of computers and Information, Cairo University, Yemen
Abstract: Change detection is the measure of the distinct data framework and thematic change information that
can guide to more tangible insights into underlying process involving land cover and land use changes than the
information obtained from continuous change. This research demonstrates how remote sensing techniques can be
integrated into monitoring process, allowing the regulatory monitoring coastline to do so more efficiently and help
avoid or minimize the adverse effects .The first aim of this study is to test change detection by Discriminate change
detection technique on Hodida city –Yemen coastline. Second to test cloud computing benefits on change detection
study. Cloud computing is not magic tool to solve all problems, cloud computing Improvement in geo information
software will allow easily implement and hence monitoring spatial data with low cost although it is under research.
This study investigates the coastline changes in Hodeida, Yemen between 1972 till 2010; using Land sat
TM/ETM+images. As they notice erosion of cost and sedimentation in some area. This will need to integrate GIS
with remote sensing and could compute server (Apollo). This study has been done after a lot of complaints from
area citizens; some area has erosion and reason for that immigration from their home. We used arc gis 10.2, erdas
Imagine 2014, erdas Apollo server and Google earth. .
Keywords: Cloud computing, Discriminate Change Function, Image Difference, Apollo.
I. INTRODUCTION
Land use Land Cover (LULC) change has become a topic of tremendous interest within the human dimensions of the
Environmental change research community (Meyer W.B.,Turner B.L). Consequently, quantifying and understanding the
extent and spatial distribution of LULC is a crucial importance to the study of Environmental change at various scales
(Ojima D.S., Kalvin K.A.,and Turner B.L). Moreover this type of analysis provides a valuable tool to increase the
efficiency of land use and land cover, and to diminish the negative environmental and societal impacts related to LULC
(Daniel et al., 2002; Lu et al., 2004; Berberoglu and Akin, 2009; Tahir et al., 2013). Application of remotely sensed data
made possible to study the changes in land cover in less time, at low cost and with better accuracy. Remote sensing
technology and Geographic Information System (GIS) and could computing (Qihao, 2013) provide efficient methods for
analysis of land use issues and tools for land use planning and modelling. Analysis of satellite data in conjunction with
drainage, litho logy, and land use land cover collateral data facilitates effective evaluation of geo morphological
conditions and status of degraded landforms. This data set is the core of the Geographic Information System (GIS) that
provides an excellent means of spatial data analysis and interpretation6. It also provides a powerful mechanism, not only
to monitor degraded lands and environmental changes, but also permits analysis of information of other environmental
variables (S.Tamilenthi1, J. Punithavathi1, R. Baskaran1 and K. ChandraMohan). In this present study, an investigation
has been carried out in coastline in Hodeida to detect sedimentation and erosion of cost line. Many researches in
agriculture has been made but not in cost line. studying the beach stretching from Hodeida towards the south to the city of
Tehama and a length of 862 km and to identify the characteristics of the geological , environmental and topographic that
characterize , where the focus was on sites erosion and flooding and sedimentation and the situation morphological and
compositional and human activity , and that using the information derived from the visual space and aerial photographs
captured the dates and different years beginning in 1972 Mss. - 1989TM - 2010 ETM and determine the extent of the
change in the form of tape beach through the accounts of digital visuals used by the technology of remote sensing and
geographic information systems for different periods of time
ISSN 2348-1196 (print) International Journal of Computer Science and Information Technology Research ISSN 2348-120X (online)
Vol. 2, Issue 3, pp: (499-505), Month: July - September 2014, Available at: www.researchpublish.com
Page | 500 Research Publish Journals
II. MATERIALS AND METHODS
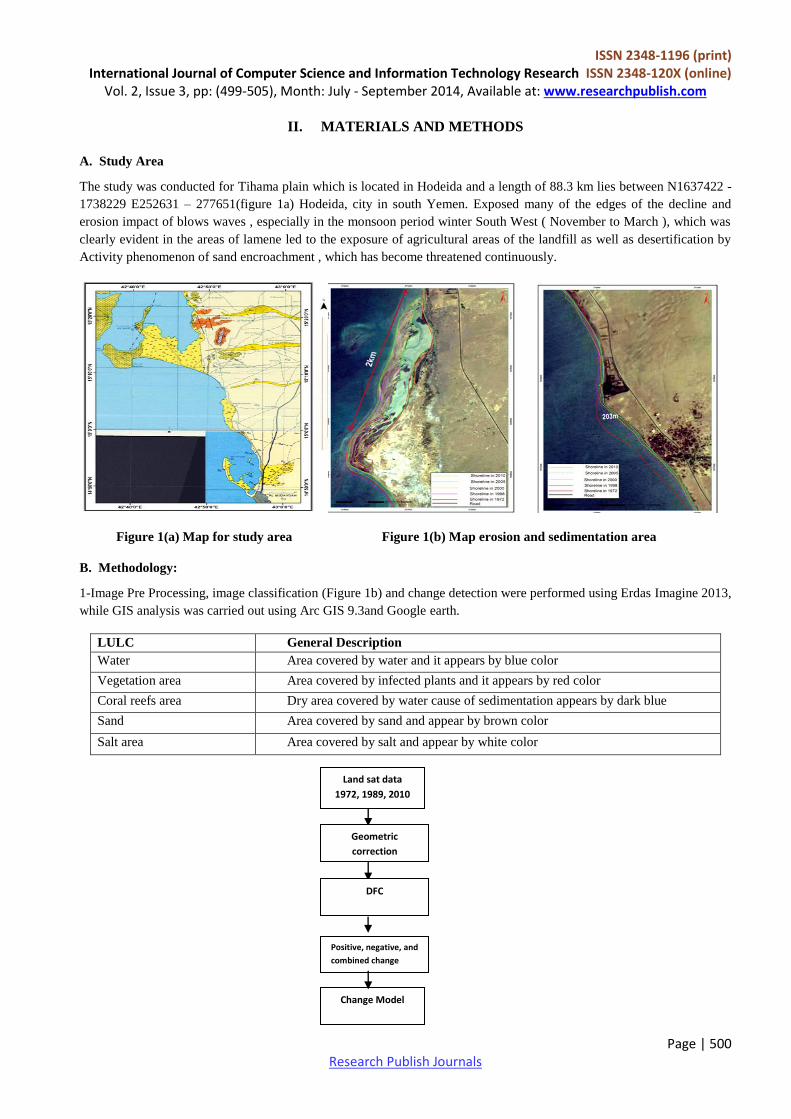
A. Study Area
The study was conducted for Tihama plain which is located in Hodeida and a length of 88.3 km lies between N1637422 -
1738229 E252631 – 277651(figure 1a) Hodeida, city in south Yemen. Exposed many of the edges of the decline and
erosion impact of blows waves , especially in the monsoon period winter South West ( November to March ), which was
clearly evident in the areas of lamene led to the exposure of agricultural areas of the landfill as well as desertification by
Activity phenomenon of sand encroachment , which has become threatened continuously.
Figure 1(a) Map for study area Figure 1(b) Map erosion and sedimentation area
B. Methodology:
1-Image Pre Processing, image classification (Figure 1b) and change detection were performed using Erdas Imagine 2013,
while GIS analysis was carried out using Arc GIS 9.3and Google earth.
LULC General Description
Water Area covered by water and it appears by blue color
Vegetation area Area covered by infected plants and it appears by red color
Coral reefs area Dry area covered by water cause of sedimentation appears by dark blue
Sand Area covered by sand and appear by brown color
Salt area Area covered by salt and appear by white color
Land sat data
1972, 1989, 2010
Geometric
correction
DFC
Positive, negative, and
combined change
Change Model
ISSN 2348-1196 (print) International Journal of Computer Science and Information Technology Research ISSN 2348-120X (online)
Vol. 2, Issue 3, pp: (499-505), Month: July - September 2014, Available at: www.researchpublish.com
Page | 501 Research Publish Journals
Discriminate Function Change Detection
Discriminate Function Change Detection is used to compute the probability of change per pixel from two images that
depict the same area at different points in time (Wu et al., 2006; Mengistu and Salami, 2007; Reis, 2008). The process
performs an unsupervised classification on the Input before Image and uses that and discriminate function analysis to
compute a probability of change between the Input after Image to generate any of the Output files. The output images
generated are composed of single band continuous data with pixel values in the range from 0.0 to 1.0. These values
represent the probability that the pixel has changed in a significant way. The algorithm’s conceptual procedure includes
determination of which image is to be the base image, i.e. which image will we find change against. This algorithm is
image-order variant meaning that it will yield different results depending on which image (before or after) is the base.
After that an unsupervised classification on base image is to be performed into a reasonable number of spectral classes (64
– 128 classes) and use this thematic image as a zonal mask to extract a set of multivariate signatures (mean vector, M and
covariance matrix, Cov) from the other image notated as change image. For each pixel in Change image compute the
Mahalanobis Distance (MD) using the signature corresponding to the class to which it is affiliated from the previous
step’s zonal operation using the formula. The MD metric can be converted to a Probability using a Chi square lookup
table. The Probability metric for each pixel is written to an output image.
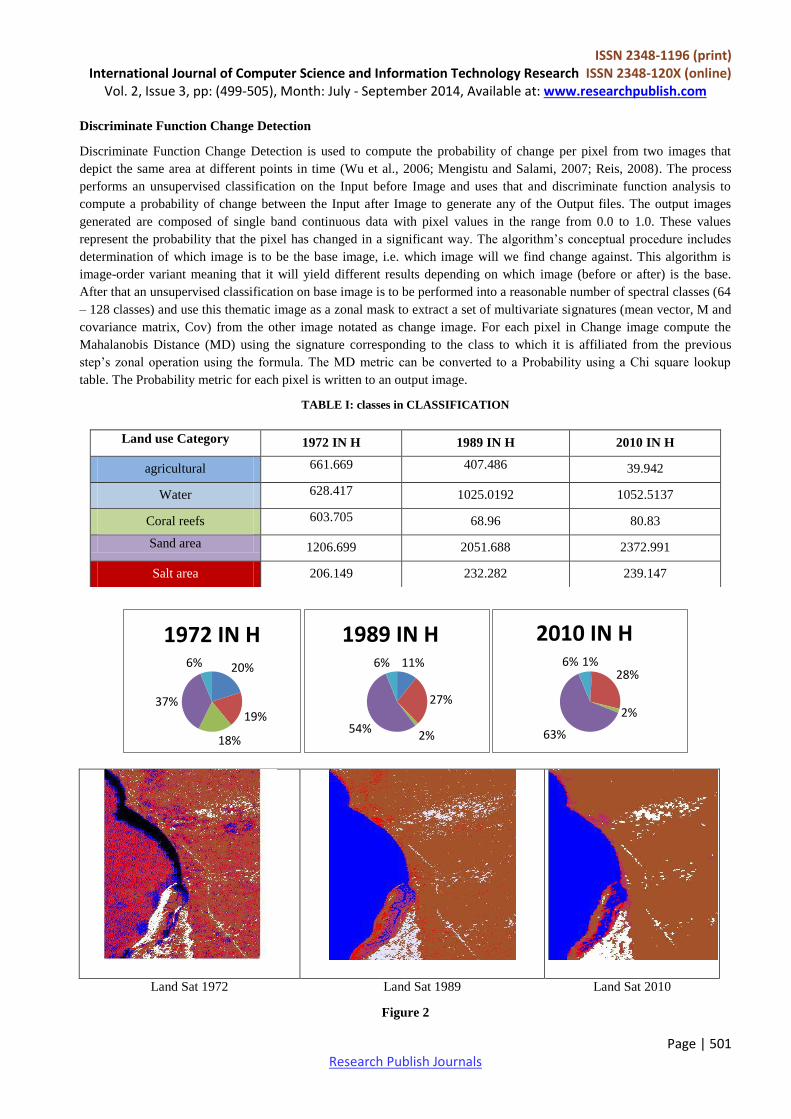
TABLE I: classes in CLASSIFICATION
Figure 2
20%
19%
18%
37%
6%
1972 IN H 11%
27%
2% 54%
6%
1989 IN H 1%
28%
2%
63%
6%
2010 IN H
Land use Category 1972 IN H 1989 IN H 2010 IN H
agricultural 661.669 407.486 39.942
Water 628.417 1025.0192 1052.5137
Coral reefs 603.705 68.96 80.83
Sand area 1206.699 2051.688 2372.991
Salt area 206.149 232.282 239.147
Land Sat 1972 Land Sat 1989 Land Sat 2010
ISSN 2348-1196 (print) International Journal of Computer Science and Information Technology Research ISSN 2348-120X (online)
Vol. 2, Issue 3, pp: (499-505), Month: July - September 2014, Available at: www.researchpublish.com
Page | 502 Research Publish Journals
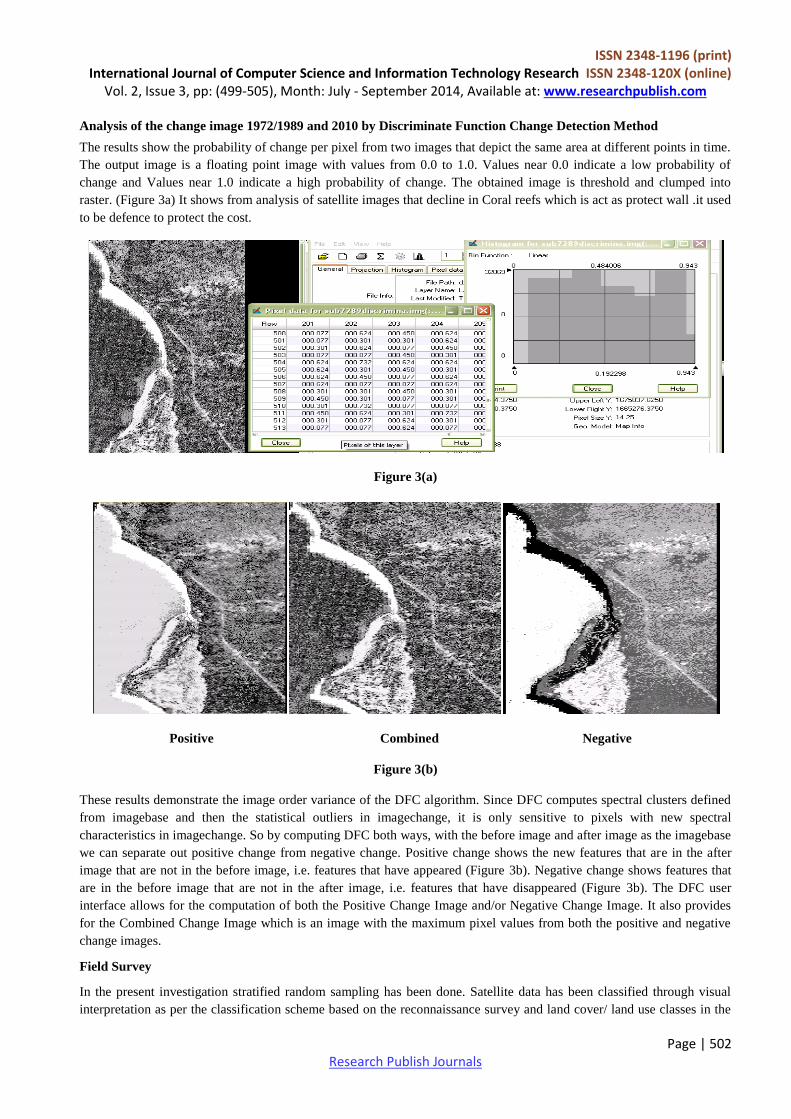
Analysis of the change image 1972/1989 and 2010 by Discriminate Function Change Detection Method
The results show the probability of change per pixel from two images that depict the same area at different points in time.
The output image is a floating point image with values from 0.0 to 1.0. Values near 0.0 indicate a low probability of
change and Values near 1.0 indicate a high probability of change. The obtained image is threshold and clumped into
raster. (Figure 3a) It shows from analysis of satellite images that decline in Coral reefs which is act as protect wall .it used
to be defence to protect the cost.
Figure 3(a)
Positive Combined Negative
Figure 3(b)
These results demonstrate the image order variance of the DFC algorithm. Since DFC computes spectral clusters defined
from imagebase and then the statistical outliers in imagechange, it is only sensitive to pixels with new spectral
characteristics in imagechange. So by computing DFC both ways, with the before image and after image as the imagebase
we can separate out positive change from negative change. Positive change shows the new features that are in the after
image that are not in the before image, i.e. features that have appeared (Figure 3b). Negative change shows features that
are in the before image that are not in the after image, i.e. features that have disappeared (Figure 3b). The DFC user
interface allows for the computation of both the Positive Change Image and/or Negative Change Image. It also provides
for the Combined Change Image which is an image with the maximum pixel values from both the positive and negative
change images.
Field Survey
In the present investigation stratified random sampling has been done. Satellite data has been classified through visual
interpretation as per the classification scheme based on the reconnaissance survey and land cover/ land use classes in the
ISSN 2348-1196 (print) International Journal of Computer Science and Information Technology Research ISSN 2348-120X (online)
Vol. 2, Issue 3, pp: (499-505), Month: July - September 2014, Available at: www.researchpublish.com
Page | 503 Research Publish Journals
area. Sampling was done on homogeneous units. Samples plots were laid along the gradient and reference to North
direction has been provided
Classification Accuracy Assessment
Each of the land use and land cover map was compared to the reference data to assess the accuracy of the classification.
The reference data was prepared by considering random sample points, the field knowledge and Google earth. During the
field visits a hand held GPS (Global Positioning System) is used to identify the exact position of the place under
consideration with Latitude and Longitude and its type by visual observation. The ground truth data so obtained was used
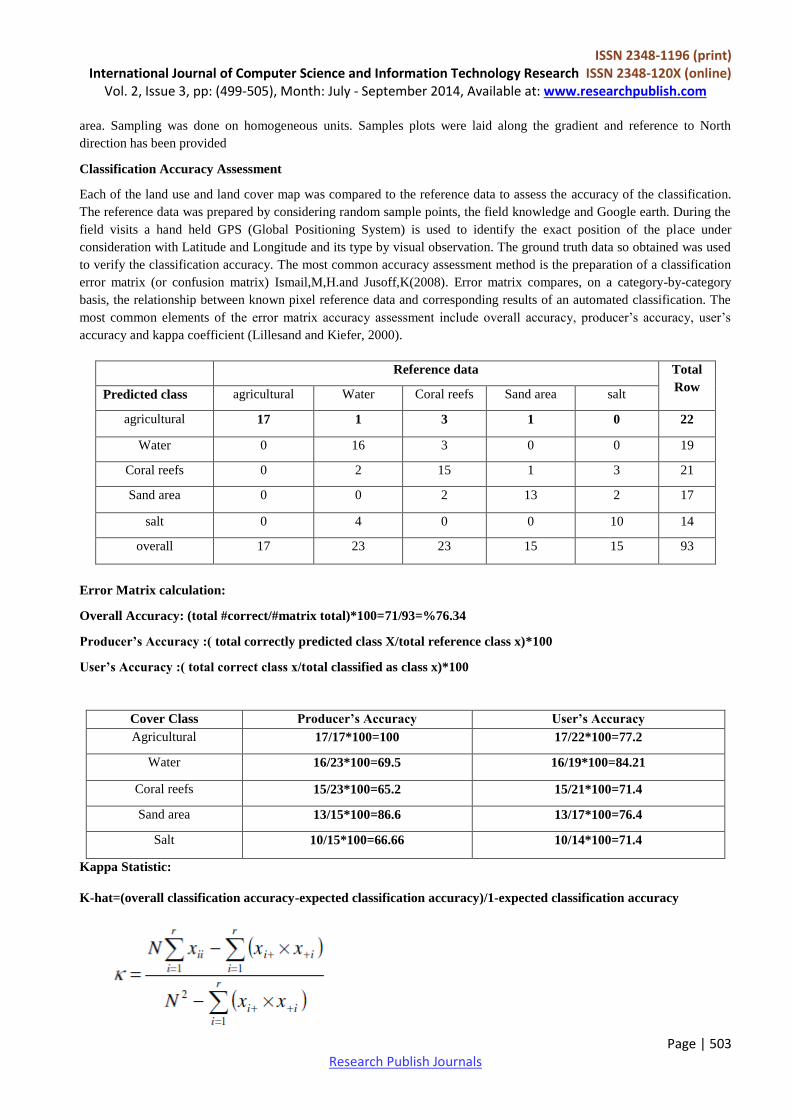
to verify the classification accuracy. The most common accuracy assessment method is the preparation of a classification
error matrix (or confusion matrix) Ismail,M,H.and Jusoff,K(2008). Error matrix compares, on a category-by-category
basis, the relationship between known pixel reference data and corresponding results of an automated classification. The
most common elements of the error matrix accuracy assessment include overall accuracy, producer’s accuracy, user’s
accuracy and kappa coefficient (Lillesand and Kiefer, 2000).
Reference data Total
Row Predicted class agricultural Water Coral reefs Sand area salt
agricultural 17 1 3 1 0 22
Water 0 16 3 0 0 19
Coral reefs 0 2 15 1 3 21
Sand area 0 0 2 13 2 17
salt 0 4 0 0 10 14
overall 17 23 23 15 15 93
Error Matrix calculation:
Overall Accuracy: (total #correct/#matrix total)*100=71/93=%76.34
Producer’s Accuracy :( total correctly predicted class X/total reference class x)*100
User’s Accuracy :( total correct class x/total classified as class x)*100
Cover Class Producer’s Accuracy User’s Accuracy
Agricultural 17/17*100=100 17/22*100=77.2
Water 16/23*100=69.5 16/19*100=84.21
Coral reefs 15/23*100=65.2 15/21*100=71.4
Sand area 13/15*100=86.6 13/17*100=76.4
Salt 10/15*100=66.66 10/14*100=71.4
Kappa Statistic:
K-hat=(overall classification accuracy-expected classification accuracy)/1-expected classification accuracy
ISSN 2348-1196 (print) International Journal of Computer Science and Information Technology Research ISSN 2348-120X (online)
Vol. 2, Issue 3, pp: (499-505), Month: July - September 2014, Available at: www.researchpublish.com
Page | 504 Research Publish Journals
Where N is the total number of sites in the matrix, r is the number of rows in the matrix, xii is the number in row i and
column i, x+i is the total for row i, and xi+ is the total for column I (Jensen1996) Result showed that an overall accuracy
from 30 reference data was 83.5 % (kappa value 0.7502459), which was considered acceptable or good for optical data.
III. RESULT
Overall changes in the cost line have shown increased in water area and sand by 58% that because of Coral reefs
decreased and human careless. Such development is guided or often times constricted by various environmentally
sensitive or protected areas. The study has revealed that satellite data has the unique capability to detect the changes in
land use quickly. From the analysis it is found that the satellite data is very useful and effective for getting the results of
temporal changes. With this effective data it is found that the agriculture land is decreasing at the rate of increasing the
erosion and sedimentation in most agriculture area.
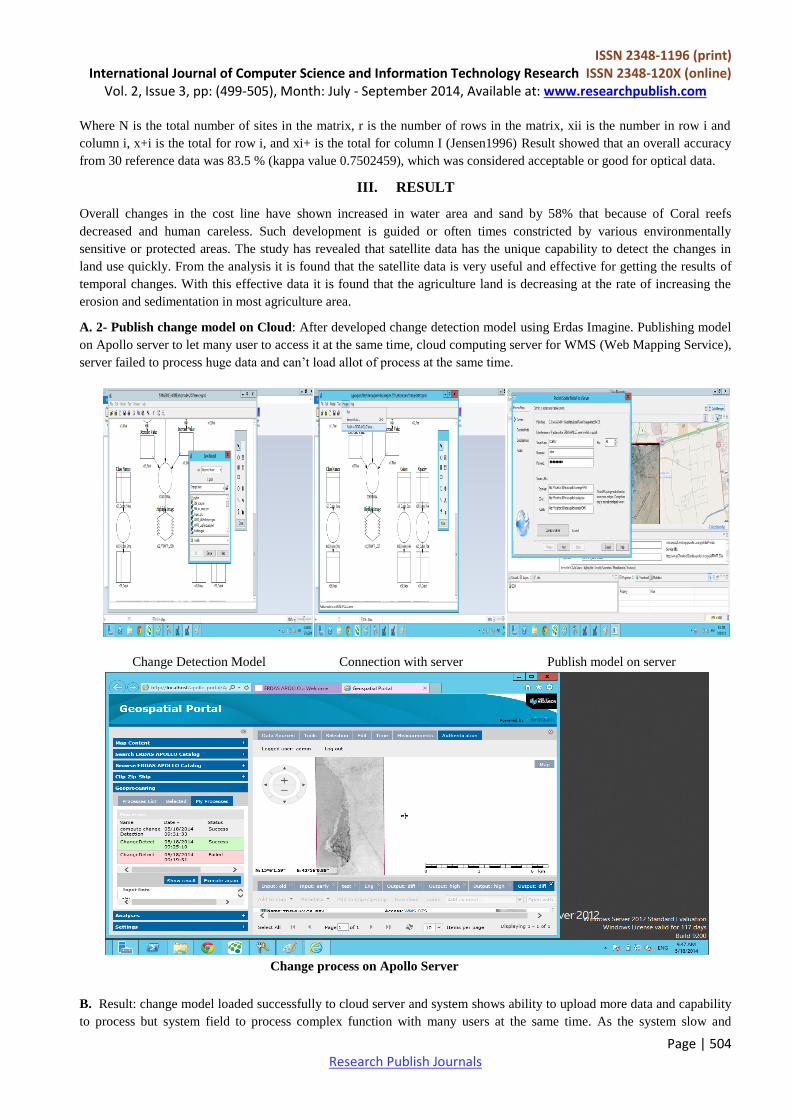
A. 2- Publish change model on Cloud: After developed change detection model using Erdas Imagine. Publishing model
on Apollo server to let many user to access it at the same time, cloud computing server for WMS (Web Mapping Service),
server failed to process huge data and can’t load allot of process at the same time.
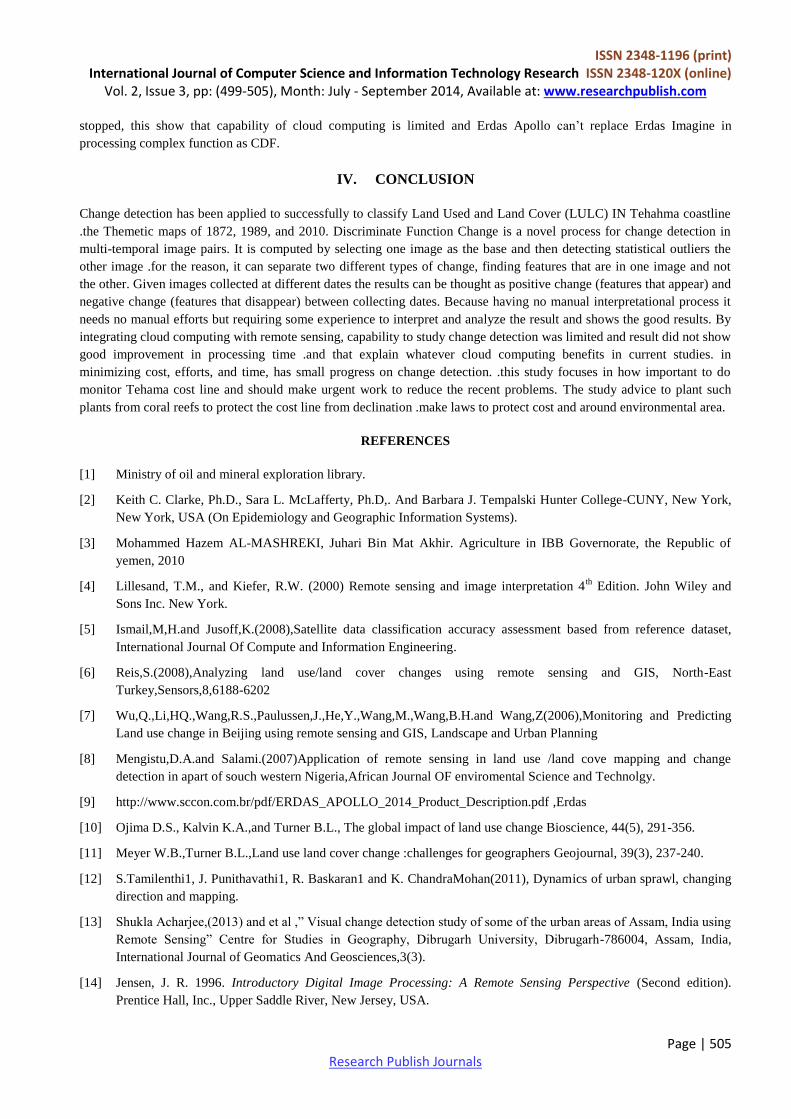
Change Detection Model Connection with server Publish model on server
Change process on Apollo Server
B. Result: change model loaded successfully to cloud server and system shows ability to upload more data and capability
to process but system field to process complex function with many users at the same time. As the system slow and
ISSN 2348-1196 (print) International Journal of Computer Science and Information Technology Research ISSN 2348-120X (online)
Vol. 2, Issue 3, pp: (499-505), Month: July - September 2014, Available at: www.researchpublish.com
Page | 505 Research Publish Journals
stopped, this show that capability of cloud computing is limited and Erdas Apollo can’t replace Erdas Imagine in
processing complex function as CDF.
IV. CONCLUSION
Change detection has been applied to successfully to classify Land Used and Land Cover (LULC) IN Tehahma coastline
.the Themetic maps of 1872, 1989, and 2010. Discriminate Function Change is a novel process for change detection in
multi-temporal image pairs. It is computed by selecting one image as the base and then detecting statistical outliers the
other image .for the reason, it can separate two different types of change, finding features that are in one image and not
the other. Given images collected at different dates the results can be thought as positive change (features that appear) and
negative change (features that disappear) between collecting dates. Because having no manual interpretational process it
needs no manual efforts but requiring some experience to interpret and analyze the result and shows the good results. By
integrating cloud computing with remote sensing, capability to study change detection was limited and result did not show
good improvement in processing time .and that explain whatever cloud computing benefits in current studies. in
minimizing cost, efforts, and time, has small progress on change detection. .this study focuses in how important to do
monitor Tehama cost line and should make urgent work to reduce the recent problems. The study advice to plant such
plants from coral reefs to protect the cost line from declination .make laws to protect cost and around environmental area.
REFERENCES
[1] Ministry of oil and mineral exploration library.
[2] Keith C. Clarke, Ph.D., Sara L. McLafferty, Ph.D,. And Barbara J. Tempalski Hunter College-CUNY, New York,
New York, USA (On Epidemiology and Geographic Information Systems).
[3] Mohammed Hazem AL-MASHREKI, Juhari Bin Mat Akhir. Agriculture in IBB Governorate, the Republic of
yemen, 2010
[4] Lillesand, T.M., and Kiefer, R.W. (2000) Remote sensing and image interpretation 4th
Edition. John Wiley and
Sons Inc. New York.
[5] Ismail,M,H.and Jusoff,K.(2008),Satellite data classification accuracy assessment based from reference dataset,
International Journal Of Compute and Information Engineering.
[6] Reis,S.(2008),Analyzing land use/land cover changes using remote sensing and GIS, North-East
Turkey,Sensors,8,6188-6202
[7] Wu,Q.,Li,HQ.,Wang,R.S.,Paulussen,J.,He,Y.,Wang,M.,Wang,B.H.and Wang,Z(2006),Monitoring and Predicting
Land use change in Beijing using remote sensing and GIS, Landscape and Urban Planning
[8] Mengistu,D.A.and Salami.(2007)Application of remote sensing in land use /land cove mapping and change
detection in apart of souch western Nigeria,African Journal OF enviromental Science and Technolgy.
[9] http://www.sccon.com.br/pdf/ERDAS_APOLLO_2014_Product_Description.pdf ,Erdas
[10] Ojima D.S., Kalvin K.A.,and Turner B.L., The global impact of land use change Bioscience, 44(5), 291-356.
[11] Meyer W.B.,Turner B.L.,Land use land cover change :challenges for geographers Geojournal, 39(3), 237-240.
[12] S.Tamilenthi1, J. Punithavathi1, R. Baskaran1 and K. ChandraMohan(2011), Dynamics of urban sprawl, changing
direction and mapping.
[13] Shukla Acharjee,(2013) and et al ,” Visual change detection study of some of the urban areas of Assam, India using
Remote Sensing” Centre for Studies in Geography, Dibrugarh University, Dibrugarh-786004, Assam, India,
International Journal of Geomatics And Geosciences,3(3).
[14] Jensen, J. R. 1996. Introductory Digital Image Processing: A Remote Sensing Perspective (Second edition).
Prentice Hall, Inc., Upper Saddle River, New Jersey, USA.