Remote sensing, in situ monitoring and planktonic toxin ...
245
Remote sensing, in situ monitoring and planktonic toxin vectors of harmful algal events in the optically complex waters of the Galician rias (NW Spain) Memoria presentada por Evangelos Spyrakos: Licenciado en Ciencias del Mar (University of Aegean, Greece, 2005) MSc en Integrated Coastal Zone Management (University of Aegean, Greece, 2007) MSc en Física Aplicada (Universidad de Vigo, España, 2009) para optar al grado de Doctor por la Universidad de Vigo Dirigida por: Dr. Jesús M. Torres Palenzuela: Laboratorio de Teledetección y SIG Física Aplicada Universidad de Vigo Dra. África González Fernández: Área de Inmunologia Universidad de Vigo Dr. Cástor Guisande: Departamento de Ecologia y Biologia animal Universidad de Vigo & FAO Roma Vigo, October 2011
-
Upload
khangminh22 -
Category
Documents
-
view
4 -
download
0
Transcript of Remote sensing, in situ monitoring and planktonic toxin ...
Remote sensing, in situ monitoring and planktonic toxin
vectors of harmful algal events in the optically complex
waters of the Galician rias (NW Spain)
Memoria presentada por Evangelos Spyrakos:
Licenciado en Ciencias del Mar (University of Aegean, Greece, 2005) MSc en Integrated Coastal Zone Management (University of Aegean, Greece, 2007)
MSc en Física Aplicada (Universidad de Vigo, España, 2009)
para optar al grado de Doctor por la Universidad de Vigo
Dirigida por:
Dr. Jesús M. Torres Palenzuela: Laboratorio de Teledetección y SIG
Física Aplicada Universidad de Vigo
Dra. África González Fernández: Área de Inmunologia Universidad de Vigo
Dr. Cástor Guisande: Departamento de Ecologia y Biologia animal
Universidad de Vigo & FAO Roma
Vigo, October 2011

El Dr. Jesús M. Torres Palenzuela, profesor titular del departamento de Física Aplicada de la Faultad de Ciencias de la Universidad de Vigo, la Dra África González Fernández, Directora del Centro de Investigaciones Biomédicas y Catedrática de Inmunología de la Universidad de Vigo y el Dr. Cástor Guisande González, Catedrático de Ecología de la Universidad de Vigo, INFORMAN: Que la presente memoria, titulada ¨Remote sensing, in situ monitoring and planktonic toxin
vectors of harmful algal events in the optically complex waters of the Galician rias (NW
Spain)¨, presentada por D. Evangelos Spyrakos para optar al grado de Doctor por la
Universidad de Vigo, ha sido realizada bajo su dirección y reúne los requisitos necesarios
para ser defendida ante el tribunal calificador. Por tanto, autorizan su presentación ante el
Consejo de Departamento y la Comisión de Doctorado.
Y para que conste a los efectos oportunos, firman en la presente certificación
En Vigo a 25 de Octubre 2011
Dr. Jesús M. Torres Palenzuela Dra. África González Fernández Dr. Cástor Guisande González

This PhD project was supported by European Commission's Marie Curie Actions
through a grant within the project 20501 ECOsystem approach to Sustainable Management
of the Marine Environment and its living Resources (ECOSUMMER). MERIS data were
obtained through EUROPEAN SPACE AGENCY/ENVISAT project AO-623. A part of the
chlorophyll data base was provided by the Technological Institute for the Control of the
Marine Environment of Galicia.

i
Content
Summary ............................................................................................................................... iii
Summary in spanish .............................................................................................................. vi
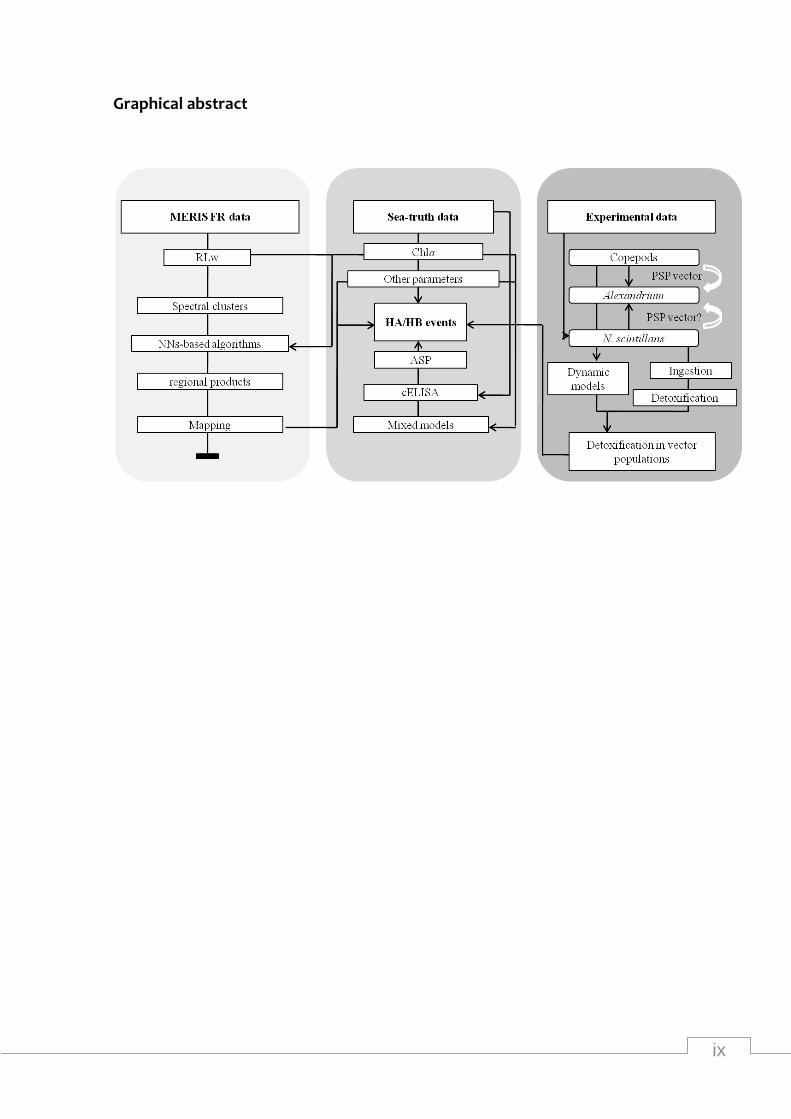
Graphical abstract ................................................................................................................ ix
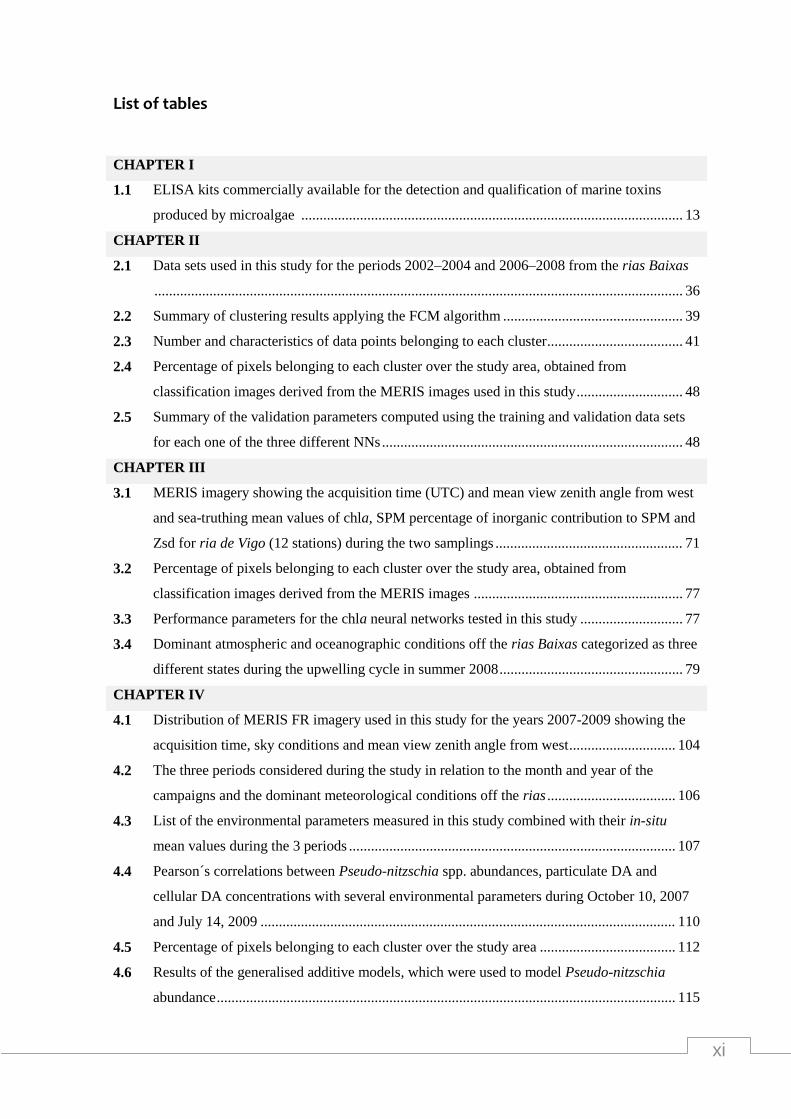
List of tables ........................................................................................................................... xi
List of figures ....................................................................................................................... xiii
List of abbreviations ............................................................................................................ xv
Acknowledgments .............................................................................................................. xvii
Dissemination of and development from work performed for this thesis ...................... xix
Thesis outline .......................................................................................................................... 1
CHAPTER I ▐
5
Overall introduction
9 1.1 Satellite remote sensing of coastal
optically complex waters
12 1.2 ELISA for DA detection 14 1.3 Harmful algae interactions with marine
planktonic grazers
15
17
1.4 Study area: Galician rias
1.5 Motivations and thesis objectives
21 1.6 References
Development of regionally specific
chlorophyll a algorithms of optically complex
waters for MERIS full resolution data
CHAPTER II ▐
29
Abstract 31
2.1 Introduction 32
2.2 Material and methods 34
2.3 Results 44
2.4 Discussion 52
2.5 References 57
CHAPTER III ▐
63
Application of a regionally specific
chlorophyll a algorithm for MERIS full
resolution data during an upwelling cycle
65 Abstract
66 3.1 Introduction
68 3.2 Material and methods
74 3.3 Results & Discussion
88 3.4 References
Remote sensing, in situ monitoring and
environmental perspectives of toxic Pseudo-
nitzschia events in the surface waters of two
Galician rias
CHAPTER IV ▐
95
Abstract 97
4.1 Introduction 98
ii
4.2 Material and methods 100
4.3 Results 106
4.4 Discussion 116
4.5 References 122
CHAPTER V ▐
129
Ingestion rates of the heterotrophic
dinoflagellate Noctiluca scintillans fed on the
toxic dinoflagellate Alexandrium minutum
(Halim)
131 Abstract
132 5.1 Introduction
133 5.2 Material and methods
137 5.3 Results
141 5.4 Discussion
144 5.5 References
Modelling PST transfer and accumulation in
two planktonic grazers
CHAPTER VI ▐
149
Abstract 151
6.1 Introduction 152
6.2 Methods 154
6.3 Results 163
6.4 Discussion 171
6.5 References 174
CHAPTER VII
181 General discussion & further considerations
183
184
186
187
188
189
7.1 Development of regional specific chla
algorithms from MERIS FR data for optically
complex waters
7.2 Remote sensing chla mapping during an
upwelling cycle
7.3 Harmful Pseudo-nitzschia spp. events in
the surface waters of two Galician rias
7.4 Planktonic grazing on a PST-producer
dinoflagellate
7.5 General discussion to all chapters
7.6 References
Conclusions ........................................................................................................................ 191
Annex I ............................................................................................................................... 195
Annex II............................................................................................................................... 211
iii
Summary
Transient increases of phytoplankton abundance, referred to as blooms, are a
common and recurrent phenomenon in many coastal areas around the world including the
upwelling estuarine systems of the Galician rias (embayments in North-West Spain). Harmful
algal events due to toxic phytoplankton species and/or high-biomass blooms pose an
increasing threat to aquaculture and fishing industries, ecosystem health and diversity and
have possible implications to human health and activities. A multidisciplinary approach was
followed in this PhD thesis in order to detect and study harmful algal events and their
driving forces in the waters of the Galician rias and explore the possible toxin planktonic
vectors and the fate of the toxins in the marine system.
A set of neural network-based chlorophyll a (chla) algorithms for Medium
Resolution Imaging Spectrometer (MERIS) full resolution (FR) data using in situ data sets
and fuzzy clustering techniques was developed specifically for the optically complex waters
(defined as Case 2 waters) of the Galician rias. Three clusters were determined, which
represent the different structures found in the data base. Three different neural networks
(NNs) were developed: one including the whole data set, and two others using only data
points belonging to one of the clusters. The fitting results were fairly good and proved the
capability of the tools to predict chla concentrations in the study area. The best prediction
was given by the NN trained with high-quality data using the most abundant cluster data
set. The NNs developed in this study detected accurately the peaks of chla, in both training
and validation sets, outperforming the algorithms that are routinely used for MERIS data in
Case 2 waters. As a continuation, this thesis takes advantage of these regionally specific
algorithms and the characteristics of MERIS in order to deliver more accurate and detailed
chla maps of optically complex coastal waters during an upwelling cycle and harmful algal
events. The main changes in chla concentration and distribution were clearly captured in
the images. There was a significant variation in the timing and the extent of the maximum
chla areas. The maps confirmed that the spatial structure of the phytoplankton distribution
in the rias Baixas is complex and it is affected by the surface currents and winds on the
adjacent continental shelf. Relatively high biomass “patches” were mapped in detail inside
the rias.
During the sampling campaigns (2007-2009) that were carried out in the study area,
toxigenic events due to Pseudo-nitzshia spp. and high abundances of the harmful
dinoflagellate red Noctiluca scintillans were recorded.
iv
A combined analysis of satellite imagery data, measurements of biotic and abiotic
parameters and mixed effects modelling was used to study Pseudo-nitzschia blooms in the
surface waters of two of the rias. Domoic acid (DA) concentrations from natural Pseudo-
nitzshia populations in the Galician rias were for the first time, to our knowledge, measured
in the study area (below detection limits-2.5 μg L-1). Two DA outbreaks were recorded in the
area. P. australis was the dominant Pseudo-nitzschia species during the blooms. The
application of a regional algorithm in combination with the characteristics of MERIS FR
allowed for accurate mapping of chla and the detection of small, high in chla and Pseudo-
nitzschia spp. “patches” in the rias. The optimal model for the Pseudo-nitzschia spp.
abundance and DA concentration suggested the significant effect of some macronutrients
as well as other abiotic and biotic parameters, approximating in that way the potential
environmental causes and effects of the harmful Pseudo-nitzschia spp. blooms in the area.
In the case of N. scintillans, speciments of this species were collected from the rias
and were established in laboratory cultures. This species was fed with the toxic (Paralytic
Shellfish Poisoning or PSP) dinoflagellate Alexandrium minutum in order to evaluate its
ingestion and clearance rates and test for toxin accumulated in the individuals. N. scintillans
actively fed on A. minutum showing no satiated feeding. No detectable amounts of toxins in
the individuals revealed from the High Performance Liquid Chromatography (HPLC) toxin
analysis. In order to calculate detoxification rates of N. scintillans a new experiment this
time performed using a different strain and species of Alexandrium, A. catenatum which
was characterised by higher levels of toxin content. N. scintillans showed relatively high
detoxification rates (-0.17 pg toxin ind-1 h-1). Using the results of these two experiments in
combination to previously published data, dynamic models were developed in order to
study the PST transfer and accumulation in two planktonic organisms, namely the copepod
Acartia clausi and and the heterotrophic dinoflagellate N. scintillans.
This thesis shows the capability of NN models to predict chlorophyll concentrations
on the Galician coast from MERIS images following the widespread understanding of the
need for regionally specific models. According to the recorded in situ data, the model
presented here is an improvement on other previously used techniques, and made it
possible to obtain reliable chlorophyll maps using almost every image. These maps were
used to study the evolution of local oceanographic processes, which in turn were related to
the development of algal blooms in the area. The present study allows more detailed
examination of the chla distribution and detection of high biomass areas in the Galician rias
and the adjacent area and should be an integral part of the monitoring programs.
Moreover, the results of this study deduce that toxic events due to DA should be an
v
important concern and therefore DA in natural phytoplankton populations should be
measured routinely in order to assess the potential of a DA outbreak. This is the first report
about grazing rates of N. scintillans on Alexandrium cells. In addition, Noctiluca may inflict
grazing pressure on the growth of PST species in the field, and could therefore play an
important role as a regulator against PST-producing phytoplankton. The dynamic model
showed that ingestion of toxic dinoflagellates by different types of planktonic organisms
may be important for the dynamics of the toxins in the food web. However, both organisms
illustrated a rapid (50 h) reduction of ingested toxin suggesting inefficiency to transfer
toxins through predation in the food web.
vi
Resumen
Los incrementos en la abundancia de fitoplancton, conocidos como floraciones
algales, son un fenómeno común y periódico en muchas zonas costeras de todo el mundo,
incluyendo las Rías Gallegas, sistemas estuáricos localizados al noroeste de España en una
zona de afloramiento marino. Algunas de estas floraciones algales están consideradas
como nocivas y suponen una amenaza creciente para la acuicultura, la industria pesquera, la
diversidad del ecosistema y a menudo tienen posibles implicaciones en la salud humana y
en sus actividades.
En esta tesis se ha seguido un enfoque multidisciplinar para detectar y estudiar los
eventos de algas nocivas y sus posibles causas en las aguas de las Rías Gallegas y explorar
posibles vectores de biotoxinas en el sistema marino. Se han utilizado para este trabajo los
datos procedentes del sensor Medium Resolution Imaging Spectrometer (MERIS) del
programa Environmental Satellite (ENVISAT) dentro del proyecto AO-623, datos de clorofila
procedentes del programa de monitorización de la calidad de las aguas llevado a cabo por
el Instituto Tecnológico para o control do medio mariño de Galicia (INTECMAR), asi como
datos obtenidos por la Universidad de Vigo dentro del programa de Marie Curie
ECOSUMMER realizado en los años 2007 hasta 2009 en las Rías Baixas Gallegas. Para estas
aguas ópticamente complejas (aguas de Caso 2), fue desarrollado específicamente un
conjunto de algoritmos de índice de clorofila a para datos de MERIS FR basados en la
utilización de redes neuronales artificiales (RNA), técnicas de fuzzy clustering y datos in-situ.
Se determinaron tres categorías de reflectancias en los datos procedentes del sensor
MERIS, las cuales representan diferentes estructuras. Se desarrollaron tres algoritmos: uno
que utiliza todo el conjunto de datos, y otros dos que incluyen puntos pertenecientes a
cada una de las categorías citadas. Los parámetros estadísticos entre la concentración de
clorofila calculada mediante el modelo desarrollado en este estudio y la estimada a partir de
muestra del campo fueron bastante buenos y demostraron la capacidad de estas
herramientas para predecir las concentraciones de clorofila a en el área de estudio. La
mejor predicción se obtuvo con la RNA entrenada con datos de alta calidad mediante el
conjunto de datos del clúster más abundante. El algoritmo desarrollado en este estudio
detecta con alta precisión los valores máximos de clorofila tanto en el conjunto de
entrenamiento como en el de validación, superando los algoritmos para datos MERIS que
rutinariamente utiliza la ESA (Agencia Europea del Espacio) en aguas de caso 2.
vii
A continuación, esta tesis utiliza estos algoritmos desarrollados específicamente
para las aguas de las Rías Gallegas junto a las características radiométricas y espaciales del
sensor MERIS para producir mapas de clorofila más precisos y detallados durante un ciclo
de afloramiento con eventos de floraciones algales. Los principales cambios en la
distribución y concentración de clorofila a fueron claramente detectados en los mapas de
clorofila obtenidos a partir de las imágenes de MERIS. Hubo una variación significativa en la
distribución en el tiempo y en la extensión de las zonas de máximos índices de clorofila
detectados. Los mapas confirman que la estructura espacial de la distribución de
fitoplancton en las Rías Baixas es compleja y que se ve afectada por las corrientes
superficiales y los vientos de la plataforma continental. Dentro de las Rías fueron
detectadas agregaciones de alta biomasa de fitoplancton (“patches”) utilizando los datos
del sensor de color de la ESA.
Durante las campañas en el área de estudio (2007-2009), realizadas por la
Universidad de Vigo, se registraron eventos toxigénicos debidos a la diatomea Pseudo-
nitzschia spp. y también elevadas abundancias del dinoflagelado Noctiluca scintillans en su
forma roja.
Se utilizaron datos derivados de imágenes de satélite, medidas de parámetros
bióticos y abióticos en la columna de agua y modelos de efectos mixtos para estudiar las
floraciones de Pseudo-nitzschia en las aguas superficiales de dos Rías Gallegas (Vigo y
Pontevedra). En estas campañas fueron medidas por primera vez concentraciones de ácido
domoico (AD) de poblaciones naturales de Pseudo-nitzschia en el área de estudio (0-2.5 μg
L-1). Se registraron en la zona dos eventos de elevada concentración de AD, siento la P.
australis la especie dominante durante la floración. La aplicación de un algoritmo regional
en combinación con las características de MERIS FR permitió obtener mapas de clorofila a
de alta precisión y detectar pequeñas zonas de alta concentración superficial de clorofila a
en presencia de altas concentraciones de Pseudo-nitzschia spp. en las Rías. Los modelos
óptimos de efecto mixto (GAMM) diseñados para predicir las abundancias de Pseudo-
nitzschia y de GLMM para la concentración de AD utilizados en este trabajo, incluyen el
efecto significativo de algunos macronutrientes, así como otros parámetros abióticos y
bióticos. De esta manera se podrían explicar las potenciales causas ambientales y conocer
los efectos perjudiciales de las floraciones nocivas de Pseudo-nitzschia spp. en la zona.
En el caso de N. scintillans, fueron recolectados ejemplares de esta especie en la Ría
de Vigo y posteriormente cultivados en laboratorio. Finalmente, este cultivo fue alimentado
con la microalga Alexandrium minutum, productora de la toxina paralizante (Paralytic
Shellfish Poisoning o PSP) para evaluar sus tasas de ingestión y para testar la toxina
viii
acumulada en los individuos. N. scintillans se alimentó activamente de A. minutum durante
el periodo evaluado con tasas de ingestión máximas de 0.3 μg C ind-1 día-1. Los análisis de los
perfiles cromatográficos de N. scintillans expuesto a A. minutum revelaron que esta especie
no acumuló las toxinas paralizantes en su citoplasma. Para calcular las tasas de
detoxificación de PST de N. scintillans se realizó un nuevo experimento utilizando esta vez
una cepa de A. catenatum que se caracteriza por niveles más altos de contenido de toxina.
En este caso se observaron tasas relativamente altas de detoxificación (-0.17 pg toxina ind-1
h-1). Estos resultados junto con datos previamente publicados, se utilizaron para el
desarrollo de modelos dinámicos con el objetivo de estudiar la transferencia y la
acumulación de PST en dos vectores planctónicos.
En conclusión, esta tesis muestra la capacidad de las RNA para predecir las
concentraciones de clorofila en la costa gallega a partir de imágenes de MERIS mostrando
la necesidad de utilizar modelos específicos para cada región. Comparando nuestros
resultados con datos de clorofila a tomados in situ, se observa que el modelo desarrollado
representa una mejora con respecto a otras técnicas utilizadas anteriormente, y ha
permitido obtener mapas precisos de clorofila a partir de las imágenes utilizadas. Estos
mapas fueron utilizados para estudiar la evolución de los procesos oceanográficos en el
área, que a su vez están relacionados con el desarrollo de floraciones de algas. Los
resultados permiten estudiar de forma más detallada la distribución de clorofila a y la
detección de áreas de alta biomasa en las Rías Gallegas y en la plataforma adyacente. Este
tipo de técnicas y modelos desarrollados específicamente para el estudio de la clorofila en
estas aguas, han mostrado ser una herramienta de gran utilidad en la detección y
seguimiento de la dinámica de proliferaciones algales pudiendo ser integrados en los
programas de monitoreo de fitoplancton. Los resultados de los niveles de AD en las aguas
de las Rías indican que la presencia de esta toxina debería determinanse no solo en bivalvos
sino también en poblaciones naturales de fitoplancton. Debería medirse de manera
rutinaria para evaluar el potencial toxico de un evento de floración algal de Pseudo-nitzschia
spp. En esta tesis de doctorado se ha documentado por primera vez el consumo de
dinoflagelados tóxicos en condiciones de laboratorio por parte de N. scintillans. Además, se
deduce de este trabajo, que la especie Noctiluca podría desempeñar un papel importante
controlando el fitoplacton que produce toxinas del tipo PST. El modelo dinámico
desarrollado, mostró que la ingestión de dinoflagelados tóxicos por diferentes tipos de
organismos planctónicos, puede ser importante para el destino de las toxinas en la cadena
trófica.
ix
Graphical abstract

x
xi
List of tables
CHAPTER I
1.1 ELISA kits commercially available for the detection and qualification of marine toxins
produced by microalgae ........................................................................................................ 13
CHAPTER II
2.1
2.2
2.3
2.4
2.5
Data sets used in this study for the periods 2002–2004 and 2006–2008 from the rias Baixas
................................................................................................................................................ 36
Summary of clustering results applying the FCM algorithm ................................................. 39
Number and characteristics of data points belonging to each cluster ..................................... 41
Percentage of pixels belonging to each cluster over the study area, obtained from
classification images derived from the MERIS images used in this study ............................. 48
Summary of the validation parameters computed using the training and validation data sets
for each one of the three different NNs .................................................................................. 48
CHAPTER III
3.1
3.2
3.3
3.4
MERIS imagery showing the acquisition time (UTC) and mean view zenith angle from west
and sea-truthing mean values of chla, SPM percentage of inorganic contribution to SPM and
Zsd for ria de Vigo (12 stations) during the two samplings ................................................... 71
Percentage of pixels belonging to each cluster over the study area, obtained from
classification images derived from the MERIS images ......................................................... 77
Performance parameters for the chla neural networks tested in this study ............................ 77
Dominant atmospheric and oceanographic conditions off the rias Baixas categorized as three
different states during the upwelling cycle in summer 2008 .................................................. 79
CHAPTER IV
4.1
4.2
4.3
4.4
4.5
4.6
Distribution of MERIS FR imagery used in this study for the years 2007-2009 showing the
acquisition time, sky conditions and mean view zenith angle from west ............................. 104
The three periods considered during the study in relation to the month and year of the
campaigns and the dominant meteorological conditions off the rias ................................... 106
List of the environmental parameters measured in this study combined with their in-situ
mean values during the 3 periods ......................................................................................... 107
Pearson´s correlations between Pseudo-nitzschia spp. abundances, particulate DA and
cellular DA concentrations with several environmental parameters during October 10, 2007
and July 14, 2009 ................................................................................................................. 110
Percentage of pixels belonging to each cluster over the study area ..................................... 112
Results of the generalised additive models, which were used to model Pseudo-nitzschia
abundance ............................................................................................................................. 115
xii
4.7
Results of the generalised linear model that shows the effect of selected abiotic and biotic
parameters on particulate domoic acid ................................................................................. 116
CHAPTER V
5.1
5.2
5.3
Cell parameters for Alexandrium minutum measured during the experiment ...................... 134
Specific toxin composition of gonyautoxins as a percentage, total toxin per cell and total cell
toxicity of Alexandrium minutum and Noctiluca scintillans during the experimental period
.............................................................................................................................................. 137
Mann-Whitney tests were carried out with ingestion rate as the dependent variable and
Alexandrium minutum abundance as a factor ....................................................................... 141
CHAPTER VI
6.1
6.2
6.3
6.4
6.5
6.6
6.7
Model parameters for nutrient uptake, population growth and toxin synthesis dynamics of
Alexandrium ......................................................................................................................... 155
Model parameters for vector population growth, toxin assimilation and detoxification for
Noctiluca scintillans and Acartia clausi ............................................................................... 156
Model parameters tested for model output sensitivity ......................................................... 161
Cell parameters for Alexandrium catenella and Prorocentrum micans measured during the
experiment ............................................................................................................................ 162
Specific toxin composition of gonyautoxins as a percentage, total toxin per cell and total cell
toxicity of Alexandrium catenella during the experiment .................................................... 163
Coefficient of variation and standard deviation from the sensitivity analysis results for
Noctiluca scintillans and Acartia clausi model with modified initial values of the
parameters ............................................................................................................................ 165
First order sensitivity indices showing the contribution and ranking of parameters to the
overall incertainty of the models output ............................................................................... 169
xiii
List of figures
CHAPTER I
1.1
1.2
1.3
1.4
Schematic for the general approach followed in this study and aspects highlighted in the
introduction ..................................................................................................................................... 9
Principal constituents in oceanic and coastal waters .............................................................. 11
Triangular diagram showing the main water optical classes .................................................. 12
Map of the study area ............................................................................................................. 16
CHAPTER II
2.1
2.2
2.3
2.4
2.5
2.6
2.7
2.8
2.9
2.10
2.11
2.12
Map of the study area and location of sampling stations ....................................................... 35
In situ chla distribution in the 4 rias ....................................................................................... 36
MERIS FR imagery set .......................................................................................................... 37
Basic architecture of the MLP network .................................................................................. 42
Mean MERIS reflectance spectra for each cluster obtained using the 3-class FCM algorithm
................................................................................................................................................ 45
RGB composite of a MERIS FR over the study area ............................................................. 46
Classification of a MERIS image and chla concentration map from the study area
(17/11/2003) ........................................................................................................................... 47
Classification of a MERIS image (15/06/2004) from the study area ..................................... 47
Linear relationship between predicted and observed concentrations of chla, considering only
the data points included in the validation set, for the three different neural networks ........... 49
Observed and predicted chla concentrations for each data point in the training and validation
sets and for the three networks ............................................................................................... 50
Scatter plots of in situ chla concentrations for MERIS C2R Processor and NNRB#3 .......... 51
Average in situ chla concentrations for all sites calculated by the NNRB#3 and C2R in the
study area for different days ................................................................................................... 52
CHAPTER III
3.1
3.2
3.3
3.4
3.5
3.6
3.7
3.8
Map of the study area and location of sampling stations ......................................................... 69
Cha fluorescence vertical profiles in ria de vigo on july 09 2008 and july 22 2008 ................ 75
Regression analysis between tsm and chla ............................................................................... 76
Classification of MERIS images from the study area .............................................................. 78
Daily upwelling index, surface currents and daily average of SST off the rias Baixas during
July 2008 .................................................................................................................................. 80
Maps of MODIS SST from the study area during July 2008 ................................................... 82
Maps of MERIS chla from the study area during July 2008 .................................................... 83
RGB MERIS FR composite image over the study area (22/07/2008) .................................... 87
xiv
CHAPTER IV
4.1
4.2
4.3
4.4
4.5
4.6
Map of the study area and location of sampling stations ..................................................... 100
Daily upwelling index off the rias Baixas for the years 2007-2009 .................................... 106
Scanning electron micrographs of Pseudo-nitzschia species ............................................... 108
Distribution of pDA during the two DA outbreaks recorded in the surface waters of ria de
Vigo on October 19, 2007 and July 14, 2009 ....................................................................... 111
Maps of MERIS chla from rias Baixas and adjasted coastal waters .................................... 114
GAMM smoothing curve for Pseudo-nitzschia spp. abundance .......................................... 115
CHAPTER V
5.1
5.2
5.3
Noctiluca scintillans with ingested Alexandrium minutum cells .......................................... 138
Noctiluca scintillans survival rates as a function of Alexandrium minutum abundance for the
4-day incubation period ........................................................................................................ 139
Ingestion and clearance rates of Noctiluca scintillans as a function of Alexandrium minutum
abundance for the 4-day incubation period ingestion and clearance rates ........................... 140
CHAPTER VI
6.1
6.2
6.3
6.4
6.5
6.6
6.7
6.8
Conceptual schematic representation of the dynamic model ............................................... 155
Toxicity retained in Noctiluca scintillans as function of the elapsed starvation time .......... 164
Sensitivity analysis results showing the mean and percentiles of simulated PST accumulated
in Noctiluca scintillans population from: 200 simulations with randomly modified initial
values of phosphorus concentration, non-toxic food concentration, Alexandrium abundance
and Noctiluca abundance and 800 simulations using all the above parameters ................... 166
Sensitivity analysis results showing the mean and percentiles of simulated PST accumulated
in Acartia clausi population from: 200 simulations with randomly modified initial values of
phosphorus concentration, non-toxic food concentration, Alexandrium abundance and
Acartia abundance and 800 simulations using all the above parameters ............................. 167
Contribution of each parameter to the variability of Noctiluca model output as indicated by
Sobol' index (SI) ................................................................................................................... 168
Contribution of each parameter to the variability of Acartia model output as indicated by
Sobol' index (SI) ................................................................................................................... 168
Scatter plot matrix of all pair combinations of “stock” dynamic variables for Noctiluca. Note
that all units in the graph refer to log-transformed values. ................................................... 170
Scatter plot matrix of all pair combinations of “stock”dynamic variables for Acartia. Note
that all units in the graph refer to log-transformed values. ................................................... 170
xv
List of abbreviations and acronyms
The following table describes the significance of various abbreviations and
acronyms used throughout the thesis.
Abs antibodies
ABTS 2,2'-azino-bis(3-ethylbenzothiazoline-6-sulphonic acid)
AC Acartia clausi
AOPs apparent optical properties
ASP amnesic shellfish poisoning
cDA cellular domoic acid
C2R case-2-regional
cELISA competitive enzyme-linked immunosorbent assay
CASI compact airborne spectographic imager
CDOM coloured dissolved organic material
chla chlorophyll a
CZCS coastal zone color scanner
DA domoic acid
DAB 3,3' Diaminobenzidine tetrahydrochloride
DOC dissolved organic carbon
DSP diarrhetic shellfish poisoning
ELISA enzyme-linked immunosorbent assay
ENACW eastern north Atlantic central water
ESA European space agency
FCM fuzzy c-mean
FR full resolution
GAMM generalized additive mixed models
GLMM generalized linear mixed models
GTX gonyautoxin
HA harmful algae
HAB harmful algal bloom
HB high biomass
HPLC high performance liquid chromatography
IOPs inherent optical properties
ISM inorganic suspended matter
xvi
l2
LM
level 2
light microscopy
MERIS medium resolution imaging spectrometer
MLP multilayer perceptron
MODIS moderate resolution imaging spectroradiometer
NASA-GSFC national aeronautics and space administration Goddard space flight center
NS Noctiluca scintillans
NSP neurotoxic shellfish poisoning
OC4v4 ocean color 4 version 4
OM organic matter
pDA particulate domoic acid
POC particulate organic carbon
PON particulate organic nitrogen
PSP paralytic shellfish poisoning
PST paralytic shellfish toxin
RLw water leaving radiance reflectance
SeaWiFS sea-viewing wide-field-view sensor
SEM scanning electron microscopy
SPM suspended particulate matter
SST sea surface temperature
STXeq saxitoxin equivalents
TMB 3,3',5,5'-Tetramethylbenzidine
TOA top of atmosphere
TSM total suspended material
WIB western Iberian Peninsula
xvii
Acknowledgments
This thesis would not have been possible without the guidance and support of many
generous and knowledgeable people. First I offer my sincerest gratitude to my main
supervisor Jesus M. Torres Palenzuela for all his continuous support, guidance and
encouragement. You are not only my academic supervisor but also a real mentor and a
friend. One simply could not wish for a better and more helpful supervisor. I equally wish to
express my profound thanks to my supervisors África González Fernández and Cástor
Guisande for their generous and endless advice and encouragement. They were always
available for me to consult on my thesis and I needed to frequently.
It would not have been possible to write this doctoral thesis without the help and
support of the colleagues and friends from the three laboratories I worked in the University
of Vigo. Beginning with the Laboratory of Remote Sensing and GIS I am particularly thankful
to Luis González Vilas for his collaboration in the Chapters II and III, where he added his
insightfulness and his advanced computational skills and for the free tickets he was always
supplied me for the Celta matches. Also to my other colleagues from this lab: Angela,
Marta, Nina, Yolanda, Carmen, Nerea, Leo and Miguel thank you for all the endless help (in
the lab or/and in the field) I received over the last four years and for the coffee/lunch break
discussions. I am also grateful to two Professors from the Applied Physics department: José
Luis Legido Soto for being always there to help me when I had crucial administrative
questions or problems and Gabriel Rosón Porto for inviting me to the campaigns in
Pontevedra and for providing valuable references and information about the dynamics of
the rias. I am most grateful to my Patagonian φίλος Maximo Frangópoulos and Aldo
Barreiro of the Zooplankton Laboratory for teaching so much about phytoplankton ecology
and biology, for their guidance (even during the last year(s) they lived abroad) throughout
the this thesis and for their contribution (writing, revising, analysing data and planning
experiments) in Chapters V and VI. I feel really fortunate to work with them and I will never
forget their support and the good times we had in the lab. I also wish to acknowledge the
wonderful assistance and support given to me by Alberto Acuña in the preparation of the
sampling campaigns, on-board and after with the analysis of the samples. Your help was
essential. I wish to express my profound thanks to the other members of this lab Isa and
Alba. Similarly, I appreciate and acknowledge Daniel Pérez for welcoming me to the
University, helping me with the sampling campaigns, spending an unbelievable amount of
hours in the lab making me familiar with the immunological methods and for always being
xviii
there every time I needed scientific advice. Ευχαριστώ Daniel. Special thanks to Elina Garet
with whom I analysed all my seawater samples for domoic acid with ELISA and to my other
colleagues from the Immunology Lab: Andréa, Belén, Silvia, Rosana, Tamara, Mercedes,
Leonardo, Jose Faro, Juan, Bernardo and my spear fishing-squash buddy Cristian.
I am grateful to Eric Desmond Barton of the Instituto Investigaciones Marinas for
spending his valuable time on my drafts of Chapter III and for ceaselessly providing me with
feedback and discussion. I also wish to acknowledge Ronald Doerffer (GKSS Center) and
Malte Elbraechter (Alfred Wegener Institute) for the advice in my first years of the PhD,
which was critical for me to accomplish this dissertation. I thank Graham Pierce from the
University of Aberdeen for organising high quality training courses where I found answers
in many scientific questions and for persistently asking about my progress. Javier Pérez
Marrero (Instituto Canario de Ciencias Marinas) and the rest of the participants in BLOOM
2008 campaign in Argentina, thank you for extending my knowledge on operational
oceanography and ocean colour techniques and I am sorry I have not included any of this
campaign data in the thesis. I will forever be thankful to my former academic and research
supervisors from the University of Aegean Drosos Koutsoubas and Athanasios
Evagelopoulos. They were the reason why I decided to pursue a career in research, their
enthusiasm and love for lecturing is contagious.
A thesis cannot be produced without substantial financial support and I would like
to thank the European Commission's Marie Curie Actions (project 20501 ECOsystem
approach to Sustainable Management of the Marine Environment and its living Resources
[ECOSUMMER]) for providing the grant which gave me the financial capacity to devote
more than two years to this research and to carry out the extensive field and lab work.
MERIS data were obtained through EUROPEAN SPACE AGENCY/ENVISAT project AO-623. I
would like to thank the Technological Institute for the Control of the Marine Environment
of Galicia, for providing me with chlorophyll data.
I deeply appreciate my multinational group of friends Mateus, Marcelo, Pepe,
Consuelo, Fiona, Sabine, Sara, Rebeca, Sonia, Ruth, Carlos, Lisa, Jose who made my life in
Vigo easier, fun and enjoyable.
To Adeline, for all the help in the manuscript correction and for the patience during
the last years: A grá, go raibh míle maith agat.
Πϊνω απ’όλα θα όθελα να ευχαριςτόςω τουσ γονεύσ μου Τούλα και Κώστα και
τον αδερφό μου Γιάννη που με ςτόριξαν όςο κανϋνασ ϊλλοσ ηθικϊ, οικονομικϊ και
ψυχολογικϊ ςε όλα τα ςτϊδια των ςπουδών και τησ παρούςασ διατριβόσ την οπούα και
τουσ αφιερώνω.
xix
Dissemination of and development from work performed for this thesis
Much of the research carried out in this thesis has been published/submitted (or is in
preparation to be submitted) in appropriate peer-reviewed international journals.
1. Spyrakos, E., González Vilas, L., Torres Palenzuela, J., & Barton E., D. (2011). Remote
sensing chlorophyll a of optically waters (rías Baixas, NW Spain): Application of a
regionally specific chlorophyll a algorithm for MERIS full resolution data during an
upwelling cycle. Remote Sensing of Environment 115(10), 2471-2485.
2. González Vilas, L., Spyrakos, E., & Torres Palenzuela, J. (2011). Neural network
estimation of chlorophyll a from MERIS full resolution data for the coastal waters of
Galician rias (NW Spain). Remote Sensing of Environment 115 (2), 524-535.
3. Frangópulos, M., Spyrakos E.1, & Guisande, C. (2011). Ingestion rates of the
heterotrophic dinoflagellate Noctiluca scintillans fed on the toxic dinoflagellate
Alexandrium minutum (Halim). Harmful Algae 10, 304-309.
4. Spyrakos, E., Frangópulos, M., Barreiro, A., & Guisande, C. Modelling PST transfer and
accumulation in two planktonic grazers.
5. Spyrakos, E., Garet E., González-Fernández Á., & Torres Palenzuela, J. Remote sensing,
in situ monitoring and environmental perspectives of toxic Pseudo-nitzschia events in
the surface waters of two Galician rias (NW Spain). Submitted to Harmful Algae (HARAL-
S-00284).
The work has also been published and provisionally accepted to be published as book
chapters in edited reviewed books.
1. Lorenzo-Abalde, S. Calvo, J. Spyrakos, E., & González-Fernández, Á. (2011). Immunology
applied in marine sciences (In Spanish). In Methods and techniques in marine research
(pp. 209-222).
2. Spyrakos, E., González Vilas, L., & Torres Palenzuela, J. Remote sensing of coastal
optically complex waters. In Y. Chemin (Ed), Remote Sensing. ISBN 979-953-307-541-8.
Part of the results of this thesis has been advertised on the European Space Agency´s
web page.
1 Shared authorship
xx
1. Chlorophyll a estimation in coastal waters from MERIS data. http://eopi.esa.int/esa/esa.
The work has also been presented at national and international conferences and
published in their proceeding books:
1. E. Spyrakos, L. González Vilas, J. Torres Palenzuela & E. D. Barton: Application of
regionally specific chla algorithms from MERIS FR data during an upwelling cycle (In
Spanish). XIV Congreso de la Asociación Española de Teledetección, Mieres, España, 21-
23 Septiembre 2011. (ORAL)
2. E. Spyrakos, L. González Vilas, J. Torres Palenzuela & N. Yarovenko: Chlorophyll a
mapping of optically complex coastal waters using regionally specific neural network-
based algorithms for MERIS full resolution data. 5th Workshop on Remote Sensing of
the Coastal Zone, Prague, Czech Republic, 1-3 June 2011. (ORAL)
3. E. Spyrakos, L. González Vilas, J. Torres Palenzuela & E. Barton: Development and
application during an upwelling cycle of neural network-based chlorophyll a algorithms
from MERIS full-resolution data for optically complex waters. 14th International
Conference on Harmful Algae, Creta, Greece, 1-5 November 2010. (POSTER)
4. E. Spyrakos, M. Frangópulos & C. Guisande: Rapid reduction of the PST content in the
heterotrophic dinoflagellate Noctiluca scintillans fed on a toxic dinoflagellate. 14th
International Conference on Harmful Algae, Creta, Greece, 1-5 November 2010.
(POSTER)
5. M. Frangópulos, E. Spyrakos & C. Guisande: Ingestion rates of the heterotrophic
dinoflagellate Noctiluca scintillans fed on the toxic dinoflagellate Alexandrium minutum
(Halim). 14th International Conference on Harmful Algae, Creta, Greece, 1-5 November
2010. (POSTER)
6. J. Torres Palenzuela, L. González Vilas & E. Spyrakos: Artificial Neural Network model
for predicting Pseudo-nitzschia spp. abundance in the Galician Rias (NW Spain). 14th
International Conference on Harmful Algae, Creta, Greece, 1-5 November 2010.
(POSTER)
7. M. Frangópulos, E. Spyrakos, S. Moraga & C. Guisande: Ingestion rates of Noctiluca fed
with the toxic microalgae Alexandrium minutum (In Spanish). XXX Congreso de Ciencias
del mar. Concepción, Chile, 19-22 October 2010. (POSTER)
8. E. Spyrakos, L. González Vilas, J. Torres Palenzuela & E. Barton: Development and
application of Neural network-based chlorophyll a algorithms from MERIS FR data for
optically complex waters. From the Sea-bed to the Cloud-tops, Remote Sensing and
xxi
photogrammetry society annual conference with Irish Earth Observation Symposium,
Cork, Ireland, 1-3 September 2010. (ORAL)
9. E. Spyrakos, L. González Vilas, D. Pérez, M. Frangópulos, C. Guisande, A. González
Fernández & J. Torres Palenzuela: Harmful algal events in the Galician rias (NW Spain).
Marine EcoSystems and Sustainability Conference, University of Aberdeen, Scotland,
U.K. 9-11 December 2009. (ORAL)
10. J. Torres Palenzuela, L. González Vilas, E. Spyrakos, M. Darriba Estévez & N. Yarovenko:
Applications of neural network technology and remote sensing in Oceanography.
Marine EcoSystems and Sustainability Conference, University of Aberdeen, Scotland,
U.K. 9-11 December 2009. (ORAL)
11. J. Torres Palenzuela, L. González Vilas & E. Spyrakos: Determination of chla index for
Case II waters in the Galician coast using MERIS FR (in Spanish). XIII Congresso de la
Asociación Española de Teledetección, Calatayud, 23-26 September 2009. (ORAL)
12. E. Spyrakos, L. González Vilas & J. Torres Palenzuela. Development and validation of
chlorophyll a algorithms for MERIS full-resolution data in Rias Baixas coastal waters
(NW Spain. Second International Symposium of Marine Sciences, Vigo, 27-30 Abril 2009.
(ORAL)
13. E. Spyrakos, J. Torres Palenzuela, D. Pérez, M. Darriba Estévez & C. Guisande: In situ
and remotely sensed measurements of optical properties in coastal waters (ria of Vigo,
Spain. Second International Symposium of Marine Sciences, Vigo, 27-30 Abril 2009.
(POSTER)
14. E. Spyrakos, M. Frangópulos & C. Guisande: Ingestion rates of the heterotrophic
dinoflagellate Noctiluca scintillans fed on the toxic dinoflagellate Alexandrium minutum
(In Spanish). X Reunion Iberica, Fitoplancon Tóxico y Biotoxinas. Lisboa, Portugal, 12-15
May 2009. (ORAL)
15. L. González Vilas, J. Torres Palenzuela, M. Darriba Estévez & E. Spyrakos. Prediction of
Pseudo-nitzschia spp. events in the Galician rias (In Spanish). X Reunion Iberica,
Fitoplancon Tóxico y Biotoxinas. Lisboa, Portugal, 12-15 May 2009. (ORAL)
16. E. Garet, E. Spyrakos, J. Torres Palenzuela & Á. González-Fernández: Determination of
Domoic Acid in the waters of Rias de Vigo (In Spanish). X Reunion Iberica, Fitoplancon
Tóxico y Biotoxinas. Lisboa, Portugal, 12-15 May 2009. (ORAL)
17. E. Spyrakos & J. Torres Palenzuela: Study of harmful algal events in the ria of Vigo (NW
Spain) using geographical information systems and remote sensing techniques. Fourth
International Symposium in GIS/Spatial Analyses in Fishery and Aquatic Sciences, Rio de
Janeiro, Brazil, 25-29 August 2008. (POSTER)
xxii
18. E. Spyrakos, D. Pérez, Á. Mosquera Giménez, A. Acuña, C. Guisande, A. González
Fernández & J. Torres Palenzuela. Combination of different techniques and methods for
the study of water quality and detection of harmful algal events in Ría of Vigo (NW
Spain). Eastern boundary upwelling systems, integrative and comparative approaches,
Las Palmas, Grand Canaria, Spain, 2-6 June 2008. (POSTER)

Thesis outline
1
Thesis outline

2
3
Thesis outline
Thesis outline
The dissertation has been written as a series of chapters and its structure is
described below. Excluding the overall introduction and general conclusion all chapters
have been adapted from papers that have been published, submitted to a journal or are in
preparation. The publication details of these papers including their current status, the co-
authors and the journals are given above.
Chapter I provides a general introduction to all the chapters regarding the status,
effects and detection of harmful algal blooms, ocean colour techniques in coastal aquatic
systems, immunological methods and their use in toxin detection and the role of planktonic
grazers as toxin vectors and regulators of harmful algal events. In addition, the chapter
gives a description of the study area.
Chapter II describes the development of regionally specific model for chla
estimation from MERIS data, using in-situ data, neural networks and fuzzy c-mean clustering
techniques. It also compares the results with other models that are routinely used.
Chapter III takes advantage of the regionally specific algorithms and the
characteristics of MERIS in order to deliver more accurate, detailed chla maps of optically
complex coastal waters during an upwelling cycle. This application is demonstrated using
the example of a phase of intense upwelling in July 2008. The potential to map the spatial
extent of algae blooms caused by coastal upwelling has also been tested.
Chapter IV deals with the Pseudo-nitzschia spp. blooms in the study area by using a
combined analysis of satellite imagery data, measurements of biotic and abiotic parameters
and mixed effects modelling. The domoic acid concentration in the seawater was
determined for the first time in the Galician rias. The synoptic view of the spatial
distribution on horizontal scales of the blooms were obtained by applying regionally
specific algorithms to MERIS data and the utility of these tools for the monitoring of
Pseudo-nitzschia was examined.
Chapter V comprises the results of a laboratory experiment in order to evaluate the
ingestion and clearance rates of the heterotrophic dinoflagellate Noctiluca scintillans fed on
the toxic microalgae Alexandrium minutum for the first time to our knowledge.
Chapter VI is motivated by the results of Chapter V and intents to study and
compare PST transfer and accumulation of two different potential PST planktonic vectors
that show different grazing and reproductive behaviour and their role as PST vectors. In
order to perform this comparison, a model of toxin accumulation in vector population was

4
Thesis outline
constructed. The planktonic vectors selected were the heterotrophic dinoflagellate N.
scintillans and the copepod Acartia clausi.

Chapter I. Overall introduction
5
Overall Introduction
1.1 Satellite remote sensing of coastal optically complex waters
1.2 ELISA for DA detection 1.3 Harmful algae interactions with marine planktonic grazers
1.4 Study area: Galician rias
1.5 Motivations and thesis objectives
1.6 References
CHAPTER I

6
7
Chapter I. Overall introduction
Transient proliferations of autotrophic algae and some heterotrophic protists,
referred to collectively as blooms are increasingly frequent in coastal areas around the
world (Sellner et al., 2003; Cullen, 2008). Some of these blooms are perceived as harmful
or/and threatening for the human health and activities and are associated with adverse
effects on marine ecosystems. The term harmful algal blooms (HABs) is used (since 1974: 1st
International conference of blooms of toxic dinoflagellates) to describe these events,
which skims over the fact that some phytoplankton species can have harmful effects in
relatively low abundances.
Anthropogenic actions like nutrient overloading of the coastal waters (Ríos et al.,
1995; Glibert et al., 2005), reduction of grazers (Rothschild et al., 1994), human-caused
climate change (Patz et al., 2005) and improved monitoring methods have been addressed
as possible factors for the escalation of this natural phenomenon. In 1993 Hallegraeff
mentioned the apparent global increase in harmful algal events characterising them as a
truly global epidemic with little in common. The last part reflects the deviation observed in
HABs in terms of harmfulness, bloom-forming organisms and dynamics.
Typically the list of harmful species includes two groups of causative organisms,
namely the toxin producers and the high biomass producers, with potentially toxic species
forming dense blooms also existing (Masó & Garcés, 2006). In terms of species number,
conservative estimations mention around 300 species out of 4000-6000 as causative for
harmful algal events under specific circumstances. Even less and in their majority
dinoflagellates are potentially marine toxins producers. Biotoxins produced by algae
species are often grouped according to the various intoxication syndromes they cause or
their chemical properties (hydrophilic and lipophilic) (see Table 1.1 in this Chapter and
Anderson et al., 1993). The best known cases are paralytic shellfish poisoning (PSP),
diarrhetic shellfish poisoning (DSP), amnesic shellfish poisoning (ASP) and ciguatera fish
poisoning (CFP). The harmful effects of high biomass algal events are described in detail in
Zingone and Enevoldsen (2000).
The global increase of harmful algal events in magnitude and frequency
documented the last decades accompanied in some cases with extensive economic and
ecological impacts has motivated advancing detection and monitoring efforts (Smayda,
1990; Hoagland et al., 2002; Sellner et al., 2003). In their review Hallegraeff et al. (2003)
addressed the substantial efforts that have been provided in order to understand and
monitor these events. Historically, harmful algal events detection relied on direct time-
consuming observation by light microscopy of the material (live or preserved) and ship
campaigns which in the most of the cases are characterised by restricted synopticity and
8
Chapter I. Overall introduction
high cost (with the exception of ship-of-opportunity programs). Therefore, there is an
increasing scientific and public interest for cost-effective, less time-consuming quantitative
methods for the detection of the harmful algal events and their spatio-temporal variations
(Vrieling & Anderson, 1996; Subramaniam et al., 2002; Carvahlo et al., 2010). Several
approaches based on morphological/optical properties (Gower & Borstad; 1981; Carder &
Steward, 1985; Brown & Yoder, 1994; Sieracki et al., 1998; Subramaniam et al., 1999;
Robbins et al., 2006) or using previously developed biomedical methods (Peperzak et al.,
2000) have been developed recently for the detection of potentially harmful species.
However, it is generally accepted that HABs monitoring programs cannot be fully based on
indirect detections of the bloom-forming organisms and must be completed with direct
observations.
Summarising, increasing attention has been paid for the development of tools and
methods for different aspects of harmful algal events and their toxins sush as the
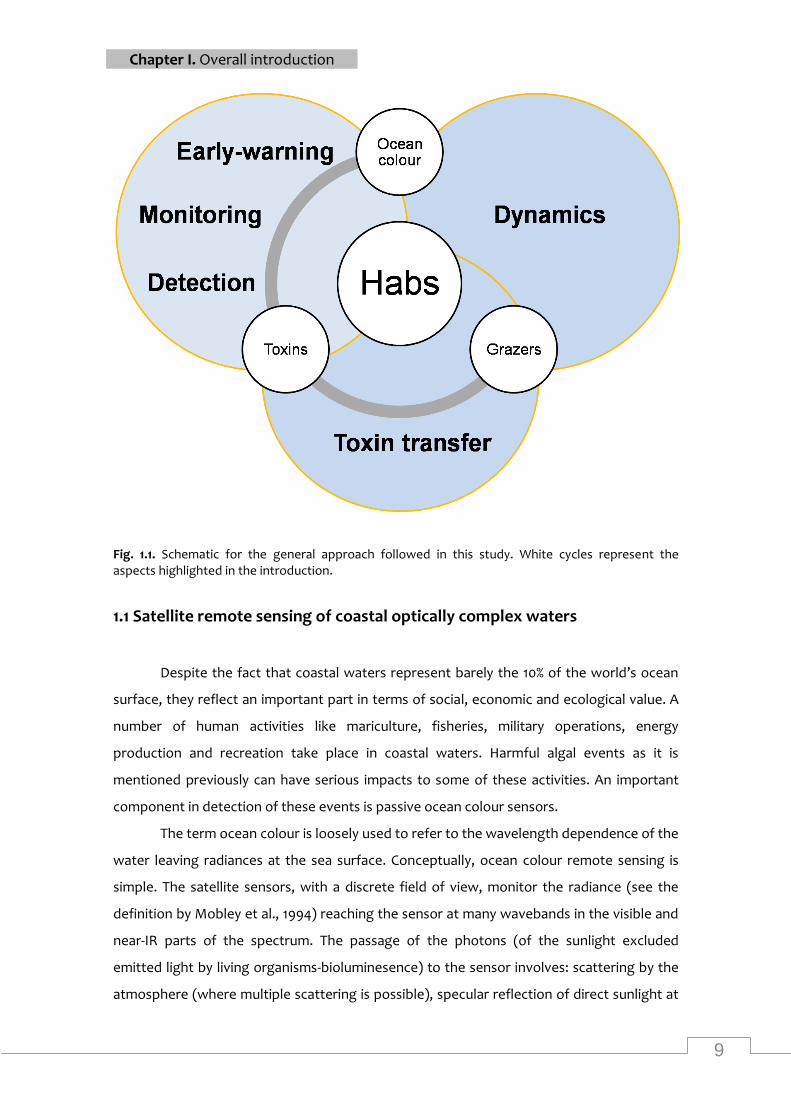
detection, monitoring, early-warning and dynamics (Fig. 1.1). The need for integration of
these tools and methods for the study of the harmful algal events is very important from a
scientific and management point of view. In this PhD thesis I present an integrated use of
technologies, data sets and models (Fig. 1.1) that could aid and improve the effectiveness of
monitoring and management programs for harmful algal events.
One tool with considerable potential for the detection and monitoring of harmful
algal events is optical remote sensing and especially reflectance-based techniques (ocean
colour). Section 1.1 provides an overview of satellite remote sensing of coastal areas
introducing the Chapters II and III. As continuation, the section 1.2 deals with another
technique used in this study for the rapid quantitative analysis of marine biotoxins.
Detection of harmful algal events in the seawater is critical to understanding this
phenomenon and in turn essential for their prediction and control. Referring to the control
of harmful algal events it is suggested, mainly after the report of Watras et al., 1985, that
planktonic grazers such as protists and zooplankton can put high pressure at harmful
species during blooms and can possible be linked to their prevention. Moreover, the
feeding interactions between harmful algal species and grazers may determine the fate of
the toxin in the food-wed. Section 1.3 gives a general introduction to the Chapters V and VI
which cope with feeding experiments and dynamic models for toxin transfer and
accumulation in planktonic grazers.
9
Chapter I. Overall introduction
Fig. 1.1. Schematic for the general approach followed in this study. White cycles represent the aspects highlighted in the introduction.
1.1 Satellite remote sensing of coastal optically complex waters
Despite the fact that coastal waters represent barely the 10% of the world’s ocean
surface, they reflect an important part in terms of social, economic and ecological value. A
number of human activities like mariculture, fisheries, military operations, energy
production and recreation take place in coastal waters. Harmful algal events as it is
mentioned previously can have serious impacts to some of these activities. An important
component in detection of these events is passive ocean colour sensors.
The term ocean colour is loosely used to refer to the wavelength dependence of the
water leaving radiances at the sea surface. Conceptually, ocean colour remote sensing is
simple. The satellite sensors, with a discrete field of view, monitor the radiance (see the
definition by Mobley et al., 1994) reaching the sensor at many wavebands in the visible and
near-IR parts of the spectrum. The passage of the photons (of the sunlight excluded
emitted light by living organisms-bioluminesence) to the sensor involves: scattering by the
atmosphere (where multiple scattering is possible), specular reflection of direct sunlight at
10
Chapter I. Overall introduction
the sea surface, in the case of shallow waters reflection by the sea-bottom and finally
upwelling from the sea surface after back-scattering in water. The last one is the useful
signal in ocean colour studies, and it can be attenuated by absorption and scattering of the
atmosphere in its way to and from the sea. This signal can be interpreted and provide
information about marine constituents such as phytoplankton biomass.
Among ocean-colour derived data, chlorophyll a (chla) concentration is the most
used product since it provides a good estimation of phytoplankton biomass and is common
to almost all taxonomic groups (Jeffrey et al., 1997). The phytoplankton community
responds rapidly to environmental changes (EC, 2000), which can cause visible changes in
chlorophyll in the surface waters.
The estimation of chla concentration in the oceans from the first dedicated ocean
colour scanner (CZCS) that launched in 1978 and operated until 1986 provided useful
information on the global distribution of chla but the quality of the data was limited
(Robinson, 2004). The Sea-viewing Wide-Field-view Sensor (SeaWiFS), Moderate Resolution
Imaging Spectroradiometer (MODIS) and the most recent Medium Resolution Imaging
Spectrometer (MERIS) that succeeded CZCS are using more and narrower spectral bands
and finer spatial resolution. MERIS provides data with a 300 m on-ground resolution in nadir
(Full Resolution) and has a spectral resolution of fifteen bands from visible to near infra red,
supporting one of the mission objectives for delicate coastal zone monitoring (Doerffer et
al., 1999).
Traditionally, chla is estimated using empirical algorithms based on the ratio
between the radiance of blue and green light reflected by the sea. For the retrieval of chla
from ocean colour sensors various empirical spectral-ratio algorithms (Evans & Gordon,
1994; Muller-Karger et al., 1990; Aiken et al., 1995; McClain et al., 2004; O´ Reilly et al., 2000;
Brown et al., 2008) and semi-analytical models (Garder & Steward, 1985; Garder et al., 1999)
were developed. These algorithms are accurately applicable in oceanic waters, where
phytoplankton and material of biological origin are the principal agents responsible for the
variation in the optical properties. These are known as Case 1 waters according to the
classification proposed by Morel and Prieur in 1977. In contrast, in coastal waters influenced
by river discharges, coloured dissolved organic material (CDOM) and suspended sediments
are also present and their concentrations vary independently from those of phytoplankton
(Case 2 waters).
11
Chapter I. Overall introduction
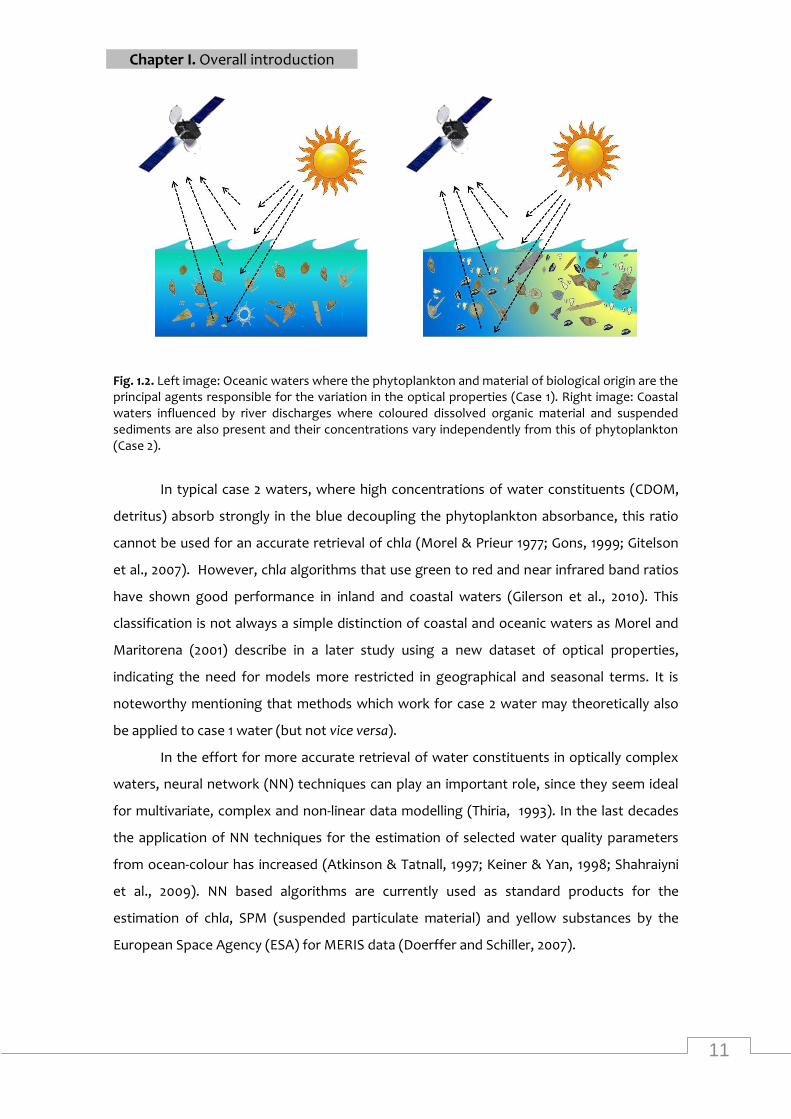
Fig. 1.2. Left image: Oceanic waters where the phytoplankton and material of biological origin are the principal agents responsible for the variation in the optical properties (Case 1). Right image: Coastal waters influenced by river discharges where coloured dissolved organic material and suspended sediments are also present and their concentrations vary independently from this of phytoplankton (Case 2).
In typical case 2 waters, where high concentrations of water constituents (CDOM,
detritus) absorb strongly in the blue decoupling the phytoplankton absorbance, this ratio
cannot be used for an accurate retrieval of chla (Morel & Prieur 1977; Gons, 1999; Gitelson
et al., 2007). However, chla algorithms that use green to red and near infrared band ratios
have shown good performance in inland and coastal waters (Gilerson et al., 2010). This
classification is not always a simple distinction of coastal and oceanic waters as Morel and
Maritorena (2001) describe in a later study using a new dataset of optical properties,
indicating the need for models more restricted in geographical and seasonal terms. It is
noteworthy mentioning that methods which work for case 2 water may theoretically also
be applied to case 1 water (but not vice versa).
In the effort for more accurate retrieval of water constituents in optically complex
waters, neural network (NN) techniques can play an important role, since they seem ideal
for multivariate, complex and non-linear data modelling (Thiria, 1993). In the last decades
the application of NN techniques for the estimation of selected water quality parameters
from ocean-colour has increased (Atkinson & Tatnall, 1997; Keiner & Yan, 1998; Shahraiyni
et al., 2009). NN based algorithms are currently used as standard products for the
estimation of chla, SPM (suspended particulate material) and yellow substances by the
European Space Agency (ESA) for MERIS data (Doerffer and Schiller, 2007).
12
Chapter I. Overall introduction
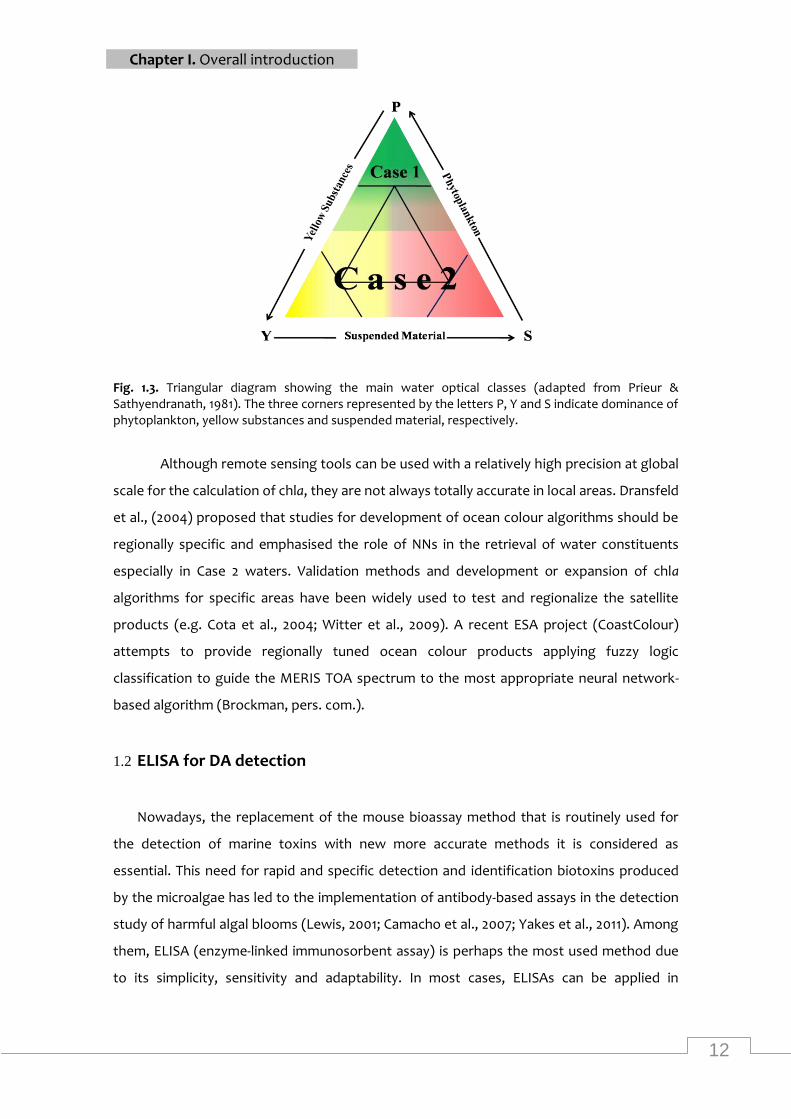
Fig. 1.3. Triangular diagram showing the main water optical classes (adapted from Prieur & Sathyendranath, 1981). The three corners represented by the letters P, Y and S indicate dominance of phytoplankton, yellow substances and suspended material, respectively.
Although remote sensing tools can be used with a relatively high precision at global
scale for the calculation of chla, they are not always totally accurate in local areas. Dransfeld
et al., (2004) proposed that studies for development of ocean colour algorithms should be
regionally specific and emphasised the role of NNs in the retrieval of water constituents
especially in Case 2 waters. Validation methods and development or expansion of chla
algorithms for specific areas have been widely used to test and regionalize the satellite
products (e.g. Cota et al., 2004; Witter et al., 2009). A recent ESA project (CoastColour)
attempts to provide regionally tuned ocean colour products applying fuzzy logic
classification to guide the MERIS TOA spectrum to the most appropriate neural network-
based algorithm (Brockman, pers. com.).
1.2 ELISA for DA detection
Nowadays, the replacement of the mouse bioassay method that is routinely used for
the detection of marine toxins with new more accurate methods it is considered as
essential. This need for rapid and specific detection and identification biotoxins produced
by the microalgae has led to the implementation of antibody-based assays in the detection
study of harmful algal blooms (Lewis, 2001; Camacho et al., 2007; Yakes et al., 2011). Among
them, ELISA (enzyme-linked immunosorbent assay) is perhaps the most used method due
to its simplicity, sensitivity and adaptability. In most cases, ELISAs can be applied in
13
Chapter I. Overall introduction
different samples, including seawater samples or biological extracts (e.g. shellfish and body
fluids) (Naar et al., 2002; Kirkpatrick et al., 2004; Samdal et al., 2005).
There are different types of ELISA (competitive, sandwich, direct and indirect) that are
performed using plastic microplates, antigens, and antibodies (Abs) marked with an
enzyme (such as horseradish peroxidase or alkaline phosphatase) that will react with a
colourless or chromogenic substrate (examples: ABTS, TMB, DAB), producing a coloured
product. The signal reading is completed in a spectrophotometer equipped with a filter
system that allows the simultaneous reading of all the wells of the plate at a given
wavelength. In general, ELISA techniques are very sensitive, detecting
picograms/nanograms of a substance in a sample. Several ELISAs for detection and
qualification of marine phytotoxins are now available commercially (Table 1.1).
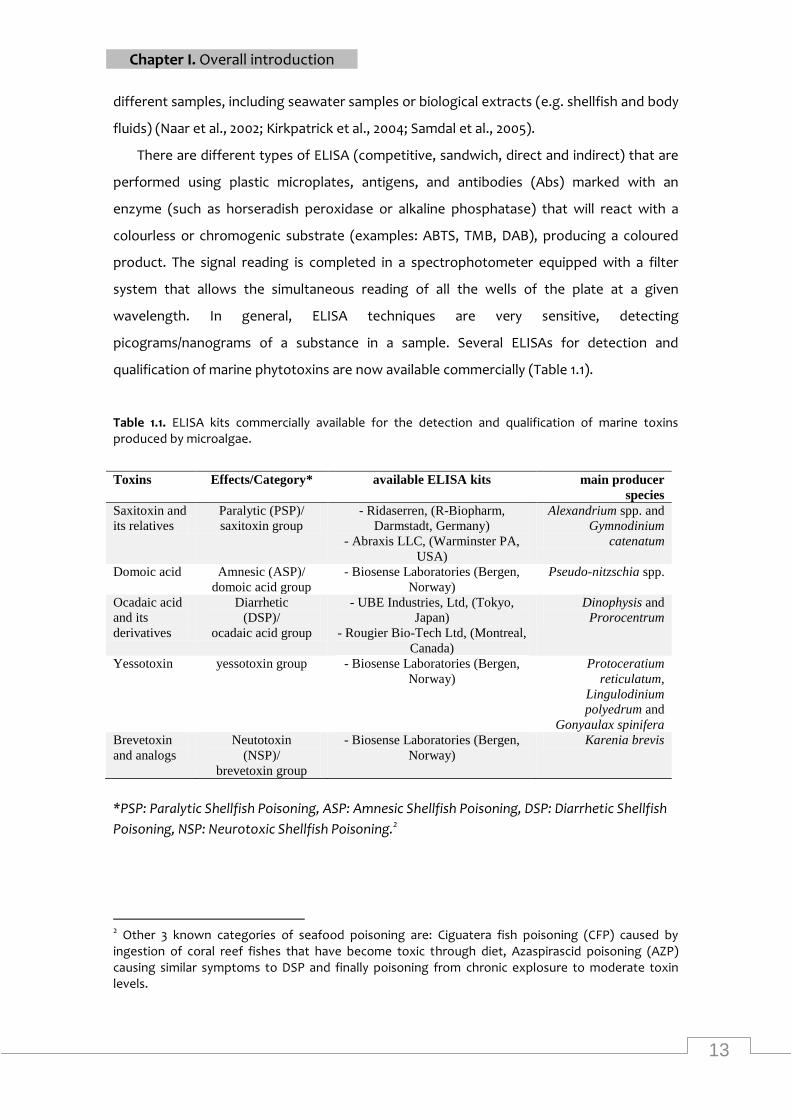
Table 1.1. ELISA kits commercially available for the detection and qualification of marine toxins produced by microalgae.
Toxins Effects/Category* available ELISA kits main producer
species
Saxitoxin and
its relatives
Paralytic (PSP)/
saxitoxin group
- Ridaserren, (R-Biopharm,
Darmstadt, Germany)
- Abraxis LLC, (Warminster PA,
USA)
Alexandrium spp. and
Gymnodinium
catenatum
Domoic acid Amnesic (ASP)/
domoic acid group
- Biosense Laboratories (Bergen,
Norway)
Pseudo-nitzschia spp.
Ocadaic acid
and its
derivatives
Diarrhetic
(DSP)/
ocadaic acid group
- UBE Industries, Ltd, (Tokyo,
Japan)
- Rougier Bio-Tech Ltd, (Montreal,
Canada)
Dinophysis and
Prorocentrum
Yessotoxin yessotoxin group - Biosense Laboratories (Bergen,
Norway)
Protoceratium
reticulatum,
Lingulodinium
polyedrum and
Gonyaulax spinifera
Brevetoxin
and analogs
Neutotoxin
(NSP)/
brevetoxin group
- Biosense Laboratories (Bergen,
Norway)
Karenia brevis
*PSP: Paralytic Shellfish Poisoning, ASP: Amnesic Shellfish Poisoning, DSP: Diarrhetic Shellfish
Poisoning, NSP: Neurotoxic Shellfish Poisoning.2
2 Other 3 known categories of seafood poisoning are: Ciguatera fish poisoning (CFP) caused by ingestion of coral reef fishes that have become toxic through diet, Azaspirascid poisoning (AZP) causing similar symptoms to DSP and finally poisoning from chronic explosure to moderate toxin levels.
14
Chapter I. Overall introduction
This thesis deals with an ELISA kit for domoic acid (DA) detection. This technique has
been recently validated as an official method (Association of Official Analytical Chemists-
AOAC, 2006), alternative to mouse bioassay. However, it is clearly mentioned that in the
case of challenged results, high performance liquid chromatography (HPLC) should be used
as the reference method. DA, a naturally occurring but rare non-protein amino acid, is a
neurotoxin produced mainly by several species of the marine diatom Pseudo-nitzschia. In
mild cases, symptoms after the consumption of toxic seafood may include vomiting,
diarrhea, abdominal cramps, headache and dizziness and normally disappear within few
days. In sterner cases, the victim may experience difficulty breathing, confusion, loss of
short-term memory and even coma and death (Wang, 2008). In comparison with HPLC
detection methods, ELISA is more sensitive with detection limits normally in the picogram
range (Garet et al., 2010). In addition, ELISA for DA detection appears to be specific for DA
while cross-reactivity with kainic acid, glutamate or glutamic acid is not significant.
Nevertheless, Burns et al., 2007 noticed significant sensitivity of cELISA to kainic acid
warning for overestimation of DA when kainic acid is present.
1.3 Harmful algae interactions with marine planktonic grazers
Planktonic grazers have a central role in marine pelagic systems as mediators of
energy to higher trophic levels and as regulators of phytoplankton biomass (Lessard, 1991;
Strom & Morello, 1998; Sherr & Sherr, 2007). In the case of harmful algal events the
interactions between the toxic species and the planktonic organisms feeding on them are
considered important, but also complex, unclear and situation-specific. Several studies (e.g.
Irogoien et al., 2005) address grazing as the main reason of harmful algae mortality in
natural bloom episodes, while others have suggested that reduced grazing pressure can be
an essential factor for monospecific blooms formation (Fiedler, 1982 ; Uye & Takamatsu,
1990). The role of planktonic grazing on harmful species may be important not only to
determine the occurrence of a harmful algal event and its dynamics but also for the
distribution of the toxins in the marine food web (Smayda, 1992). A number of laboratory
studies have shown a variety of responses of planktonic grazers feeding on bloom-forming
and/or toxic algae species ranging from no effect to mortality (for a review see Turner &
Tester, 1997). When they are fed with toxic algae species, planktonic grazers may retain,
eliminate or even transform toxins. In this sense, ingestion of toxic species by different
types of planktonic organisms may be significant for the fate of the toxins in the food web,
since a variety of planktonic vectors such as protists and zooplankton may be involved in
15
Chapter I. Overall introduction
the transfer of toxins (White 1981; Teegarden et al., 2003; Jiang et al., 2007). In theory, all
the consumers in the marine environment can eventually convert to toxin vectors.
Although many field studies and laboratory experiments deal with grazing
interactions between zooplankton and especially copepods and toxin-producer algae
species, very few have included protists (ciliates and heterotrophic dinoflagellates).
Heterotrophic protists compose a major component of the planktonic communities with
very different feeding strategies and behaviour patterns and can be found at high
concentrations during harmful algal events suggesting considerable effects on the bloom
dynamics. All of the above give prominence to the need for detailed studies of toxin
transfer and retention in systems which include harmful algae, protists and zooplankton.
1.4 Study area: Galician rias
The Galician rias are V-like embayments along the northern boundary of the NW
Africa upwelling system formed by sunken river valleys flooded by the sea, whose
ecosystems are strongly influenced by oceanic conditions on the adjacent continental shelf.
The rias Baixas constitute the southern part of the Galician rias (Fig. 1). They are formed by
four large coastal embayments, from north to south: Muros y Noya, Arousa, Pontevedra and
Vigo, all oriented in a SW–NE direction, and characterized by strong tides. Surface area
covers approximately 600 km2 and water depths range from 5 to 60 m. The ria de Vigo is the
longest of the rias whereas the ria de Arousa is the widest. Rias vary in width from 1-3 km in
their inner part to 8-12 km in their external part (Vilas et al., 2005). The main freshwater
inputs in the rias are by rivers located in innermost part of the rias.
In these highly primary productive upwelling estuarine systems (Fraga, 1981; Torres
& Barton, 2007) transient increases of phytoplankton abundance, referred to as blooms,
are a frequent phenomenon occurring mainly between early spring and late autumn (Fraga
et al., 1988; Varela, 1992, Figueiras & Ríos, 1993). Phytoplanktonic blooms or ‘‘red tides’’ as
they were formally called, were mentioned for the first time in the Galician rias in 1918 by
Sobrino (Varela, 1992). Sporadically, some phytoplankton blooms in the Galician rias are
perceived as harmful with direct and indirect impacts to the mussel production that
constitute an important economic activity in the area. Harmful algal events in the area are a
well documented phenomenon. Several studies since the 1950s referred to them and in
general to phytoplankton ecology particularizing favourable conditions to the development
of HABs, their origin, dynamic, distribution and toxicity levels (Margalef, 1956; Tilstone et
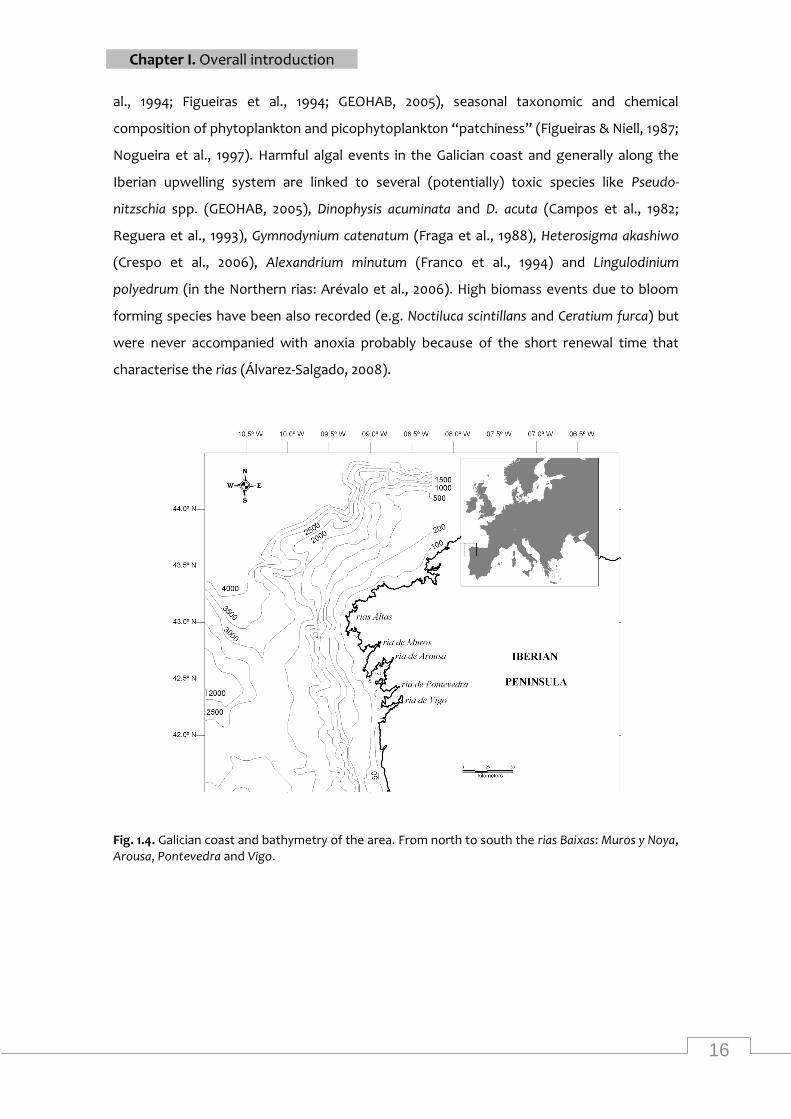
16
Chapter I. Overall introduction
al., 1994; Figueiras et al., 1994; GEOHAB, 2005), seasonal taxonomic and chemical
composition of phytoplankton and picophytoplankton “patchiness” (Figueiras & Niell, 1987;
Nogueira et al., 1997). Harmful algal events in the Galician coast and generally along the
Iberian upwelling system are linked to several (potentially) toxic species like Pseudo-
nitzschia spp. (GEOHAB, 2005), Dinophysis acuminata and D. acuta (Campos et al., 1982;
Reguera et al., 1993), Gymnodynium catenatum (Fraga et al., 1988), Heterosigma akashiwo
(Crespo et al., 2006), Alexandrium minutum (Franco et al., 1994) and Lingulodinium
polyedrum (in the Northern rias: Arévalo et al., 2006). High biomass events due to bloom
forming species have been also recorded (e.g. Noctiluca scintillans and Ceratium furca) but
were never accompanied with anoxia probably because of the short renewal time that
characterise the rias (Álvarez-Salgado, 2008).
Fig. 1.4. Galician coast and bathymetry of the area. From north to south the rias Baixas: Muros y Noya, Arousa, Pontevedra and Vigo.

Chapter I. Overall introduction-Motivations and objectives
17
Motivations and thesis
objectives

18
19
Chapter I. Overall introduction-Motivations and objectives
1.5 Motivations and thesis objectives
The present PhD thesis aims to advance or/and test the potential of remote sensing
and immunological methods for the detection of harmful algal events in the Galician rias
and the adjacent area and improve our understanding of some planktonic organisms as
toxin vectors and HA regulators.
Following the widespread understanding that universally applicable water
constituent retrieval algorithms from ocean colour sensors are currently not feasible, the
research was shifted to regionally specific implementations of powerful inversion methods.
Given the considerable interest for accurate chlorophyll a mapping in the optically
complex waters of the study area deriving from the economic and social importance of the
extensive mariculture activities and high frequency of harmful algal events.
Recognising the need for rapid detection of even small quantities of toxins
produced by algae species in the seawater and for understanding of the relationships
between the toxic species abundance, toxin production and the characteristics of the
environment.
Recalling that the role of heterotrophic dinoflagellates can be of major importance
in the fate of algal toxins in the trophic food web but is still insufficiently studied.
Considering that planktonic vectors with different grazing and reproductive
behaviour can play a different role as regulators of the marine toxins in the planktonic
community.
This dissertation will address the following objectives:
Objective 1. To develop and validate neural network-based chla algorithms for
MERIS FR data, which would be specific for the optically complex coastal waters of the
Galician rias.
Objective 2. To apply these algorithms in a short series of MERIS (FR) images
delivered during an upwelling cycle in order to obtain maps of chla.
Objective 3. To test the potential of these algorithms to map the spatial extent of
possible algal blooms caused by coastal upwelling.
Objective 4. To measure for the first time in the study area the domoic acid (DA)
concentrations in natural populations.
20
Chapter I. Overall introduction-Motivations and objectives
Objective 5. To determine the environmental factors that might be responsible for
the Peudo-nitzschia events and the production of DA.
Objective 6. To assess the utility of MERIS and regional algorithms for the
monitoring of Pseudo-nitzschia.
Objective 7. To examine whether the frequently found in the area heterotrophic
dinoflagellate N. scintillans could actively feed on a PST-producing dinoflagellate and assess
if it can eventually act as a PST vector.
Objective 8. To study and compare PST transfer and accumulation of two different
potential PST planktonic vectors that show different grazing and reproductive behaviour
and their role as PST vectors in the planktonic community using dynamic models.
21
Chapter I. Overall introduction
1.6 References
Aiken, J., Moore, G. F., Trees, C. C., Hooker, S. B., & Clark, D. K. (1995). The SeaWiFS CZCS type
pigment algorithm. In S. B. Hooker, & E. R. Firestone (Eds.). NASA technical memorandum,
104566. SeaWiFS Technical Report Series, vol. 104529. (pp. 104561-104532).
Álvarez-Salgado, X. A., Labarta, U., Fernández-Reiriz, M. J., Figueiras, F. G., Rosón, R.,
Piedracoba, S., Filgueira, R., & Cabanas, J. M. (2008). Renewal time and the impact of harmful
algal blooms on the extensive mussel raft culture of the Iberian coastal upwelling system (SW
Europe). Harmful Algae, 7, 849-855.
Anderson, D. M., Galloway, S. B., & Joseph, J. D. (1993). Marine Biotoxins and Harmful Algae: A
National Plan. Woods Hole Oceanographic Institution-Technical Report.
Arévalo, F., Pazos, Y., Correa, J., Salgado, C., Moroño, A., Pan, B., & Franco, J. (2006). First report
of yessotoxins in mussels of the Galician Rias during a bloom of Lingulodinium polyedrum Stein
(Dodge). In K. Henshilwood, B. Deegan, T. McMahon, C. Cusak, S. Keaveney, J. O. Silke, M.
Cinneide, D. Lyons & P. Hess (Eds.), 5th International Conference on Molluscan Shellfish Safety
(pp. 184–189). Galway, Ireland.
Atkinson, P. M., & Tatnall, A. R. L. (1997). Introduction Neural networks in remote sensing.
International Journal of Remote Sensing, 18, 699-709.
Brown, C. A., Huot, Y., Werdell, P. J., Gentili, B., & Claustre, H. (2008). The origin and global
distribution of second order variability in satellite ocean color and its applications to algorithm
development. Remote Sensing of Environment, 112, 4186-4203.
Brown, C. W., & Yoder, J. A. (1994). Coccolithophorid blooms in the global ocean. Journal of
Geophysical Research, 99, 7467-7482.
Burns, J. M., Schock, T. B., Hsia, M. H., Moeller, P. D., & Ferry, J. L. (2007). Photostability of kainic
acid in seawater. Journal of Agricultural and Food Chemistry, 55, 9951-9955.
Camacho, F. G., Gallardo Rodríguez, J., Sánchez Mirón, A., Cerón García, M. C., Belarbi, E. H.,
Chisti, Y., & Molina Grima, E. (2007). Biotechnological significance of toxic marine
dinoflagellates. Biotechnology Advences, 25, 176-194.
Campos, M. J., Fraga, S., Mariño, J., & Sánchez, J. (1982). Red tide monitoring programme in NW
Spain. Report of 1977-1981. In, International Council for the Exploration of the Sea (p. 8). Denmark
Carder, K., & Steward, R. G. (1985). A remote-sensing reflectance model of a red-tide
dinoflagellate off west Florida. Limnology and Oceanography, 30, 286-298.
Carder, K. L., Chen, F. R., Lee, Z. P., Hawes, S. K., & Kamykowski, D. (1999). Semianalytic
moderate-resolution imaging spectrometer algorithm for chlorophyll a concentration and
absorption with bio-optical domains based on nitrate-depletion temperatures. Journal of
22
Chapter I. Overall introduction
Geophysical Research, 104, 5403-5421.
Carder, K. L., & Steward, R. G. (1985). A remote-sensing reflectance model of a red-tide
dinoflagellate off west Florida. Limnology and Oceanography, 30, 286-298.
Carvalho, G. A., Minnett, P. J., Fleming, L. E., Banzon, V. F., & Baringer, W. (2010). Satellite
remote sensing of harmful algal blooms: A new multi-algorithm method for detecting the
Florida Red Tide (Karenia brevis). Harmful Algae, 9, 440-448.
Cembella, A. D., Doucette, G. J., & Garthwaite, I. (2003). In vitro assays for phycotoxins. In G. M.
Hallegraeff, D. M. Anderson & A. D. Cembella (Eds.), Manual on harmful marine microalgae. Paris:
IOC-UNESCO.
Cota, G. F., Wang, J., & Comiso, J. C. (2004). Transformation of global satellite chlorophyll
retrievals with a regionally tuned algorithm. Remote Sensing of Environment, 90, 373-377.
Crespo, B. G., Figueiras, F. G., Porras, P., & Teixeira, I. G. (2006). Downwelling and dominance of
autochthonous dinoflagellates in the NW Iberian margin: the example of the Ria de Vigo.
Harmful Algae, 5, 770-781.
Cullen, J. J. (2008). Observations and prediction of harmful algal blooms. In M. Babin, C. S.
Roesler & J. J. Cullen (Eds.), Real-time Coastal Observing Systems for Marine Ecosystem Dynamics
and Harmful Algal Blooms: Theory, Instrumentation and Modelling (pp. 1-41). Paris: UNESCO.
Doerffer, R., & Schiller, H. (2007). The MERIS Case 2 water algorithm. International Journal of
Remote Sensing, 28, 517-535.
Doerffer, R., Sorensen, K., & Aiken, J. (1999). MERIS potential for coastal zone application.
International Journal of Remote Sensing, 20, 1809-1818.
Dransfeld, S., Tatnall, A. R., Robinson, I. S., & Mobley, C. D. (2004). A comparison of Multi-layer
multilinear regression algorithms for the inversion of synthetic ocean colour spectra.
International Journal of Remote Sensing, 25, 4829-4834.
EC (2000). Directive 2000/60/EC of the European Parliament and of the Council of 23 October
2000 establishing a framework for Community action in the field of water policy. Official Journal
L 327, 22/12/2000: 2001-2073.
Evans, R. H., & Gordon, H. R. (1994). Coastal zone color scanner system calibration: a
retrospective examination. Journal of Geophysical Research, 99, 7293-7307.
Fiedler, P. (1982). Zooplankton avoidance and reduced grazing responses to Gymnodinium
splendens (Dinophyceae). Limnology and Oceanography, 27, 961–965.
Figueiras, F. G., Jones, K. J., Mosquera, A. M., Alvarez-Salgado, X. A., Edwards, E., & MacDougall,
N. (1994). Red tide assemblage formation in an estuarine upwelling ecosystem: Ria de Vigo.
Journal of Plankton Research, 16, 857-878.
23
Chapter I. Overall introduction
Figueiras, F. G., & Niell, F. X. (1987). Composición del fitoplankton de la ría de Pontevedra (NO de
España). Investigacion Pesquera, 51, 371-409.
Figueiras, F. G., & Ríos, A. F. (1993). Phytoplankton succession, red tides and the hydrographic
regime in the Rías Bajas of Galicia. In T. J. Smayda & Y. Shimizu (Eds.), Toxic Blooms in the Sea
(pp. 239-244). New York: Elsevier.
Fraga, F. (1981). Upwelling off the Galician coast North West Spain. In E. Suess & J. Thiede (Eds.),
Coastal upwelling (pp. 176-182). New York: Plenum Publishing Corp.
Fraga, S., Anderson, D. M., Bravo, I., Reguera, B., Steidinger, K. A., & Yentsch, C. M. (1988).
Influence of upwelling relaxation on dinoflagellates and shellfish toxicity in Ria de Vigo, Spain.
Estuarine Coastal Shelf Science, 27, 349-361.
Franco, J., Fernández, P., & Reguera, B. (1994). Toxin profiles of natural populations and
cultures of Alexandrium minutum Halim from Galician (Spain) coastal waters, Journal of Applied
Phycology, 6, 275-279.
Garet, E., González-Fernández, Á., Lago, J., Vieites, J., Cabado, A., & . . J. Agric and Food
Chemistry (2010). Comparative evaluation of Enzyme-linked Immunoassay and reference
methods for the detection of shellfish hydrophilic toxins in several presentations of seafood.
Journal of Agricultural and Food Chemistry, 58, 1410-1415.
Garthwaite, I., Ross, K. M., Miles, C. O., Hansen, R. P., Foster, D., Wilkins, A. L., & et al (1998).
Polyclonal antibodies to domoic acid, and their use in immunoassays for domoic acid in sea
water and shellfish. Journal of Natural Toxins, 6, 93-104.
GEOHAB (2005). Global Ecology and Oceanography of Harmful Algal Blooms. In G. Pitcher, T.
Moita, V. Trainer, R. Kudela, F. G. Figueiras & T. Probyn (Eds.), GEOHAB Core Research Project:
HABs in Upwelling Systems (p. 82). Paris and Baltimore: IOC and SCOR.
Gilbert, P. M., Anderson, D. M., Gentien, P., Granéli, E., & Sellner, K. G. (2005). The global,
complex phenomena of harmful algal blooms. Oceanography, 18, 131-141.
Gilerson, A. A., Gitelson, A. A., Zhou, J., Gurlin, D., Moses, W. J., Ioannou, I., & al., e. (2010).
Algorithms for remote estimation of chlorophyll-a in coastal and inland waters using red and
near-infrared bands. Optical Express, 18, 24109-24125.
Gitelson, A. A., Schalles, J. F., & Hladik, C. M. (2007). Remote chlorophyll-a retrieval in turbid,
productive estuaries: Chesapeake Bay case study. Remote Sensing of Environmental Science and
Technology, 109, 464-472.
Gons, H. (1999). Optical teledetection of chlorophyll a in turbid inland waters Environmental
Science and Technology, 33, 1127-1132.
Gower, J. F. R., & Borstad, G. A. (1981). Use of the in vivo fluorescence line at 685nm for remote
sensing of surface chlorophyll a. In J. F. R. Gower (Ed.), Oceanography From Space (pp. 329-338).
24
Chapter I. Overall introduction
New York: Plenum Press.
Hallegraeff, G. M. (1993). A review of harmful algal blooms and their apparent global increase.
Phycologia, 32, 79-99.
Hallegraeff, G. M., Anderson, D. M., & Cembella, A. D. (Eds.) (2003). Manual on harmful marine
algae. Paris: UNESCO Publishing.
Hoagland, P., Anderson, D. M., Kaoru, Y., & White, A. W. (2002). The economic effects of
harmful algal blooms in the United States: estimates, assessment issues, and information needs.
Estuaries, 25, 819-837.
Irigoien, X., Flynn, K. J., & Harris, R. P. (2005). Phytoplankton blooms: a ‘loophole’ in
microzooplankton grazing impact? Journal of Plankton Research, 27, 313-321.
Jeffrey, S. W., Mantoura, R. F. C., & Wright, S. W. (Eds.) (1997). Phytoplankton Pigments in
Oceanography: Guidelines to Modern Methods. Paris: Unesco.
Jianga, T.-J., Wang, D.-Z., Niua, T., & Xua, Y.-X. (2007). Trophic transfer of paralytic shellfish
toxins from the cladoceran (Moina mongolica) to larvae of the fish (Sciaenops ocellatus).
Toxicon, 50, 639-645.
Keiner, L. E., & Yan, X. H. (1998). A neural network model for estimating sea surface chlorophyll
and sediments from thematic mapper imagery. Remote Sensing of Environmental Science and
Technology, 66, 153-165.
Kirkpatricka, B., Flemingb, L., Squicciarinib, D., Backerc, L., Clarkd, R., Abrahamb, W., Bensone,
J., Chenge, Y., Johnsond, D., Piercea, R., Zaiasb, J., Bossartb, G., & Badenf, D. (2004). Literature
review of Florida red tide: implications for human health effects. Harmful Algae, 3, 99-115.
Lessard, E. J. (1991). The trophic role of heterotrophic dinoflagellates in diverse marine
environments. Marine Microbial Food Webs, 5, 49-58.
Lewis, R. J. (2001). The changing face of ciguatera. Toxicon, 39, 97-106.
Margalef, R. (1956). Estructura y dinámica de la “purga de mar” en Ría de Vigo. Investigacion
Pesquera, 5, 113-134.
Masó, M., & Garcés, E. (2006). Harmful microalgae blooms (HAB): problematic and conditions
that induce them. Marine Pollution Bulletin, 53, 620-630.
McClain, C. R., Feldman, G. C., & Hooker, S. B. (2004). An overview of the SeaWiFS project and
strategies for producing a climate research quality global ocean biooptical time series. Deep-Sea
Research II, 51, 6-42.
Mobley, C. D. (Ed.) (1994). Light and Water: Radiative Transfer in Natural Waters San Diego: CA:
Academic.
25
Chapter I. Overall introduction
Morel, A., & Maritorena, S. (2001). Bio-optical properties of oceanic waters: a reappraisal.
Journal of Geophysical Research, 106, 7163-7180.
Morel, A., & Prieur, L. (1977). Analysis of variations in ocean color. Limnology and Oceanography,
22, 709-722.
Muller-Karger, F. E., McClain, C. R., Sambrotto, R. N., & Ray, G. C. (1990). A comparison of ship
and coastal zone color scanner mapped distribution of phytoplankton in the southeastern
Bering Sea. Journal of Geophysical Research, 95, 483-499.
Naar, J., Bourdelais, A., Tomas, C., Kubanek, J., Whitney, P. L., Flewelling, L., Steidinger, K.,
Lancaster, J., & Baden, D. G. (2002). A competitive ELISA to detect brevetoxins from Karenia
brevis (formerly Gymnodinium breve) in seawater, shellfish, and mammalian body fluid.
Environmental Health Perspectives, 110, 179-185.
Nogueira, E., Perez, F. F., & Ríos, A. F. (1997). Seasonal patterns and long-term trends in an
estuarine upwelling ecosystem (Ria de Vigo, NW Spain). Estuarine Coastal and Shelf Science, 44,
185-300.
O'Reily, J. E., Maritorena, S., Siegel, D. A., O'Brien, M. C., Toole, D., Mitcell, B. G., & al., e. (2000).
Ocean color chlorophyll a algorithms foe SeaWiFS, OC2 and OC4. Version 4. NASA technical
memorandum 2000-206892. In S. B. Hooker & E. R. Firestone (Eds.) (p. 49)
Patz, J. A., Campbell-Lendrum, D., Holloway, T., & Foley, J. A. (2005). Impact of regional climate
change on human health. Nature, 438, 310-317.
Peperzak, L., Vrieling, E. G., Sandee, B., & Rutten, T. (2000). Immuno flow cytometry in marine
phytoplankton research. Scientia Marina, 64, 165-181.
Reguera, B., Mariño, J., Campos, M. J., Bravo, I., Fraga, S., Carbonell, A., In:, (Eds.), & , p. (1993).
Trends in the occurrence of Dinophysis spp. in Galician waters. In T. J. Smayda & Y. Shimizu
(Eds.), Toxic Phytoplankton Blooms in the Sea (pp. 559-564). Amsterdam: Elsevier Science
Publishers.
Ríos, A. F., Fraga, F., Figueiras, F. G., & Pérez, F. F. (1995). New and regenerated production in
relation to the proliferations of diatoms and dinoflagellates in natural conditions. In P. Lassus, G.
Arzul, E. Erard, P. Gentien & C. Marcaillou (Eds.), Harmful marine algal blooms (pp. 663-668).
Paris: Lavoisier.
Robbins, I. C., Kirkpatrick, G. J., Blackwell, S. M., Hillier, J., Knight, C. A., & Moline, M. A. (2006).
Improved monitoring of HABs using autonomous underwater vehicles (AUV). Harmful Algae, 5,
749-761.
Robinson, I. S. (Ed.) (2004). Measuring the Oceans from Space: The Principles and Methods of
Satellite Oceanography. Berlin: Springer-Praxis.
26
Chapter I. Overall introduction
Rothschild, B. J., Ault, J. S., Goulletquer, P., & Heral, M. (1994). The decline of the Chesapeake
Bay oyster population: A century of habitat destruction and overfishing. Marine ecology progress
series, 111, 29-39.
Samdal, I. A., Aasen, J. A. B., Briggs, L. R., Dahl, E., & Miles, C. O. (2005). Comparison of ELISA
and LC-MS analyses for yessotoxins in blue mussels (Mytilus edulis). Toxicon, 46, 7-15.
Sellner, K. G., Doucette, G. J., & Kirkpatrick, G. (2003). Harmful algal blooms: Causes, impacts
and detection. Journal of Industrial Microbiology and Biotechnology, 30, 383-406.
Shahraiyni, H. T., Shouraki, S. B., Fell, F., Schaale, M., Fischer, J., Tavakoli, A., & al., e. (2009).
Application of an active learning method to the retrieval of pigment from spectral remote
sensing reflectance data. International Journal of Remote Sensing, 30, 1045-1065.
Sherr, E. B., & Sherr, B. F. (2007). Heterotrophic dinoflagellates: a significant component of
microzooplankton biomass and major grazers of diatoms in the sea. Marine ecology progress
series, 352, 187-197.
Sieracki, C. K., Sieracki, M. E., & Yentsch, C. S. (1998). An imaging-in-flow system for automated
analysis of marine microplankton. Marine ecology progress series, 168, 285-296.
Smayda, T. J. (1990). Novel and nuisance phytoplankton blooms in the sea: evidence for a global
epidemic. In E. Graneli, B. Sundstrom, L. Edler & D. M. Anderson (Eds.), Toxic marine
phytoplankton (pp. 29-40). New York: Elsevier.
Smayda, T. J. (1992). Global epidemics of noxious phytoplankton blooms and food chain
consequences in large ecosystems. In K. Sherman, L. M. Alexander & B. D. Gold (Eds.), Food
Chains, Models and Management of Large Marine Ecosystems (pp. 275-307). San Francisco:
Westview Press.
Strom, S. L., & Morello, T. A. (1998). Comparative growth rates and yields of ciliates and
heterotrophic dinoflagellates. Journal of Plankton Research, 20, 571-584.
Subramaniam, A., Brown, C. W., Hood, R. R., Carpenter, E. J., & Capone, D. G. (2002). Detecting
Trichodesmium blooms in SeaWiFS imagery. Deep-Sea Research, 49, 107-121.
Subramaniam, A., Carpenter, E. J., & Falkowski, P. G. (1999). Bio-optical properties of the marine
diazotrophic cyanobacteria Trichodesmium spp.: II. A reflectance model for remote sensing.
Limnology and Oceanography, 44, 618-627.
Teegarden, G. J., Cembella, A. D., & Carissa, L. C. ( 2003). Phycotoxin accumulation in
zooplankton feeding on Alexandrium fundyense -vector or sink? Journal of Plankton Research,
25, 429-443.
Thiria, S., Mejia, C., Badran, F., & Crepon, M. (1993). A neural network approach for
modellingnonlinear transfer functions: Application forwind retrieval fromspaceborne
scatterometer data. Journal of Geophysical Research, 98(12), 22827-22841.
27
Chapter I. Overall introduction
Tilstone, G. H., Figueiras, F. G., & Fraga, F. (1994). Upwelling-downwelling sequences in the
generation of red tides in a coastal upwelling system. Marine ecology progress series, 112, 241-253.
Torres, R., & Barton, E. D. (2007). Onset of the Iberian upwelling along the Galician coast.
Continental Shelf Research, 27, 1759-1778.
Turner, J. T., & Tester, P. A. (1997). Toxic marine phytoplankton, zooplankton grazers, and
pelagic food webs. Limnology and Oceanography, 42, 1203-1214.
Uye S., & Takamatsu, K. (1990). Feeding interactions between planktonic copepods and red-
tide flagellates from Japanese coastal waters. Marine ecology progress series, 59, 97–107.
Varela, M. (1992). Upwelling and phytoplankton ecology in Galician (NW Spain) rías and shelf
waters. Boletín del Instituto Español de Oceanografía, 8, 57-74.
Vilas, F., Bernabeu, A., & Méndez, G. (2005). Sediment distribution pattern in the Rías Baixas
(NW Spain): main facies and hydrodynamic dependence. Journal of Marine Systems, 54, 261-276.
Vrieling, E. G., & Anderson, D. M. (1996). Immunofluorescence in phytoplankton research:
applications and potential. Journal of Phycology, 32, 1-16.
Wang, D.-Z. (2008). Neurotoxins from Marine Dinoflagellates: A Brief Review. Marine Drugs, 6,
349-371.
Watras, C. J., Garcon, V. C., Olson, R. J., Chisholm, S. W., & Anderson, D. M. (1985). The effect of
zooplankton grazing on estuarine blooms of the toxic dinoflagellate Gonyaulax tamarensis.
Journal of Plankton Research, 7, 891-908.
White, A. W. (1981). Marine zooplankton can accumulate and retain dinoflagellate toxins and
cause fish kills. Limnology and Oceanography, 26, 103-109.
Witter, D. L., Ortiz, J. D., Palm, S., Heath, R. T., & Budd, J. W. (2009). Assessing the application of
SeaWiFS ocean color algorithms to Lake Erie. Journal of Great Lakes Research, 35, 361-370.
Yakes, B. J., DeGrasse, S. L., Poli, M., & Deeds, J. R. (2011 ). Antibody characterization and
immunoassays for palytoxin using an SPR biosensor. Analytical and Bioanalytical Chemistry, 400,
2865-2869.
Zingone, A., & Enevoldsen, H. O. (2000). The diversity of harmful algal blooms: a challenge for
science and management. Ocean and Coastal Management, 43, 725-748.

28
Chapter II. Development of MERIS regionally specific chla algorithms
29
Development of regionally specific chlorophyll a algorithms of optically complex waters for MERIS FR data
Abstract
2.1 Introduction
2.2 Material and methods
2.3 Results
2.4 Discussion
2.5 References
CHAPTER II

30
31
Chapter II. Development of MERIS regionally specific chla algorithms
Abstract
In typical Case 2 waters, accurate remote sensing retrieval of chlorophyll a (chla) is
still a challenging task. In this study, focusing on the Galician rias (ΝW Spain), algorithms
based on neural network (NN) techniques were developed for the retrieval of chla
concentration in optically complex waters, using Medium Resolution Imaging Spectrometer
(MERIS) data. There is considerable interest in the accurate estimation of chla for the
Galician rias, because of the economic and social importance of the extensive culture of
mussels, and the high frequency of harmful algal events. Fifteen MERIS full resolution (FR)
cloud-free images paired with in situ chla data (for 2002–2004 and 2006–2008) were used
for the development and validation of the NN. The scope of NN was established from the
clusters obtained using fuzzy c-mean (FCM) clustering techniques applied to the satellite-
derived data. Three different NNs were developed: one including the whole data set, and
two others using only points belonging to one of the clusters. The input data for these
latter two NNs was chosen depending on the quality level, defined on the basis of quality
flags given to each data set. The fitting results were fairly good and proved the capability of
the tool to predict chla concentrations in the study area. The best prediction was given for
the NN trained with high-quality data using the most abundant cluster data set. The
performance parameters in the validation set of this NN were R2 = 0.86, mean percentage
error (MPE) = − 0.14, root mean square error (RMSE) = 0.75 mg m− 3, and relative
RMSE = 66%. The NN developed in this study detected accurately the peaks of chla, in both
training and validation sets. The performance of the Case-2-Regional (C2R) algorithm,
routinely used for MERIS data, was also tested and compared with our best performing NN
and the sea-truthing data. Results showed that this NN outperformed the C2R, giving much
higher R2 and lower RMSE values. This study showed that the combination of in situ data
and NN technology improved the retrieval of chla in Case 2 waters, and could be used to
obtain more accurate chla maps. A local-based algorithm for the chla retrieval from an
ocean colour sensor with the characteristics of MERIS would be a great support in the
quantitative monitoring and study of harmful algal events in the coastal waters of the rias
Baixas. The limitations and possible improvements of the developed chla algorithms are
also discussed.
32
Chapter II. Development of MERIS regionally specific chla algorithms
2.1 Introduction
Chlorophyll a (chla) is an integrative bioindicator of aquatic ecosystems, as it is
common to almost all photosynthetic organisms, and its concentration is widely used for
estimating phytoplankton biomass in water quality and ecological studies. The chla
concentration is one of the earliest and most commonly used satellite ocean colour
products (Robinson, 2004). From the first dedicated ocean colour scanner (CZCS) to the
currently operated sensors such as SeaWiFS, MODIS and MERIS, various algorithms have
been developed and tested for the retrieval of chla concentration from an ocean colour
spectrum.
Empirical algorithms, based on the ratio between the blue and green light reflected
by the sea or combinations of more spectral bands, are widely used to establish statistical
relationships between ocean colour data (normalized water-leaving radiance or remote
sensing reflectance) and in situ chla (e.g. Gordon & Morel, 1983; Kishino et al., 1998; O'Reilly
et al., 1998). Current standard chla ocean colour derived products are based on empirical
algorithms, such as the OC4v4 for SeaWiFS and the OC3M for MODIS (O'Reilly et al., 2000).
These algorithms have provided valuable data about the temporal and spatial distribution
of chla in Case 1 waters, which according to Morel and Prieur (1977) are dominated by
phytoplankton cells. As in typical Case 2 waters, high concentrations of water constituents
(coloured dissolved organic matter or CDOM, detritus) absorb strongly in the blue
wavelength region, decoupling phytoplankton absorbance, this ratio cannot be used for an
accurate retrieval of chla (Morel & Prieur 1977).
Semi-analytical models constitute another approach for estimating chla from ocean
colour sensors. These models relate the apparent optical properties (AOPs) to the inherent
optical properties (IOPs) of the water (Carder et al., 1999; Maritonema et al., 2002). In Case
2 waters, the semi-analytical algorithms for the retrieval of chla are based on the properties
of the reflectance peak near 700 nm (e.g. Gitelson & Kondratyev, 1991: Gons et al., 2002;
Dall'Olmo et al., 2005; Gitelson et al., 2007; Gitelson et al., 2008). Most of these algorithms
are available with SeaWiFS, MODIS and MERIS for the retrieval of chla concentration in Case
2 waters. An already existing algorithm for Case 2 waters (Gons, 1999) was adapted to
MERIS satellite imagery by Gons et al. (2002) using in situ data from inland waters in
Netherlands, which covered a chla concentration range between 3 and 185 mg m− 3.
The algorithm currently used for chla, as a standard product for Case 2 waters, by
the European Space Agency (ESA) is the MERIS Case-2-Regional Processor (C2R) (Doerffer
33
Chapter II. Development of MERIS regionally specific chla algorithms
& Schiller, 2007; Doerffer & Schiller, 2008). This algorithm takes advantage of the combined
neural network (NN) technique to determine IOPs (absorption of pigments, yellow
substance and scattering of all particles). The NN used is mainly based on North Sea
measurements and is trained with simulated bidirectional water-leaving radiance
reflectances (from 9 MERIS bands between 412 and 708 nm). In their review, Atkinson and
Tatnall (1997) showed the variety of NN applications in remote sensing and their
advantages over typical statistical approaches. Neural networks allow the application of
complex bidirectional radiative transfer models (Thiria et al., 1993), and have been
successfully used, not only for retrieving the concentrations of constituents of coastal and
inland waters, but also for improving the satellite-derived products by minimizing the error
of atmospheric correction (e.g. Keiner & Yan, 1998; Keiner & Brown, 1999; Zhang et al.,
2003; Schiller & Doerffer, 1999; Dzwonkowski & Yan, 2005; Doerffer & Schiller, 2007;
Doerffer & Schiller, 2008).
As spectral reflectance data, acquired from MERIS images for Case 2 waters, are
affected by the concentration of different optically active constituents, the development of
a single chla algorithm in this type of waters might cause unfeasible results, if data from a
normal situation are mixed with data from a specific situation, such as for example
sediment-dominated waters after a storm period. Ideally, the best strategy would probably
be the development of a different chla algorithm for each water type. The difficulty stems
from using only the derived MERIS reflectance spectra to characterize and identify different
water types because the concentrations of the different water constituents are not known
a priori. Several authors (Moore et al., 2001; Moore et al., 2009; Cococcioni et al., 2004;
Ressom et al., 2006) have proposed the application of the fuzzy c-mean (FCM) cluster
algorithm (Bezdek, 1981) to remote sensing reflectance data, to be able to determine
clusters that could be associated to different water types.
There is considerable interest in the accurate estimation of chla for the Galician rias,
because of the economic and social importance of the extensive culture of mussels, and the
high frequency of harmful algal events (GEOHAB, 2005). As part of a routine monitoring
programme, the Technological Institute for the control of the marine environment of
Galicia (INTECMAR) has organized sampling on a weekly basis at 41 stations in the Galicia
rias where, among other water quality parameters, the concentration of chla is recorded.
Although an ocean colour sensor with the characteristics of MERIS is considered to be
adequate for coastal remote sensing, the number of studies using MERIS data in the
Galician rias is very limited (Torres-Palenzuela et al., 2005a; Torres-Palenzuela et al., 2005b).
These are, to our knowledge, the only applications of ocean colour remote sensing in the
34
Chapter II. Development of MERIS regionally specific chla algorithms
Galician rias. In the Western Iberian Peninsula (WIB), data delivered by ocean colour
sensors, such as CZCS, SeaWiFS and MODIS, have been used in previous studies (McClain et
al., 1986; Bode et al., 2003; Ribeiro et al., 2005; Oliveira et al., 2009). However, because of
limited spatial resolution and failure of the retrieval algorithms, these studies focused
particularly on the ocean shelf.
The main aim of this study was to develop and validate neural network-based chla
algorithms for MERIS FR data, which would be specific for the optically complex coastal
waters of the Galician rias, using in situ data sets and fuzzy techniques. The FCM algorithm
was first applied to MERIS reflectance spectra to develop cluster-specific NNs with a scope
predefined by FCM. The performance of the neural network-based chla algorithm is
discussed in comparison to that of other algorithms routinely used for MERIS data, which
are still untested in Galician coastal waters.
2.2 Material and methods
2.2.1 Study area
The rias Baixas are located in the northwest part of the Iberian Peninsula (Fig. 2.1),
along the northern boundary of the NW Africa upwelling system. The rias Baixas are formed
by four large coastal embayments from north to south: Muros y Noya, Arousa, Pontevedra
and Vigo all with strong tides and oriented in a SW–NE direction. Initial study in the ria de
Vigo during summer showed that Secchi disk depth ranges from 2 to 12 m. Maximum
concentrations of chla occur in the area primarily in spring and summer (Nogueira et al.,
1997), during the upwelling period that normally lasts from April to October (Tilstone et al.,
1994).
2.2.2 In situ data set
Two data sets of chla concentration were used in this study (Table 2.1). One data set
consisted of analytical measurements of chla concentration provided by INTECMAR from
the monitoring programme established in the study area (Fig. 2.1). It contains
spectrofluorometrically determined chla concentrations from the surface to a depth of 5 m,
for the years 2002–2006.
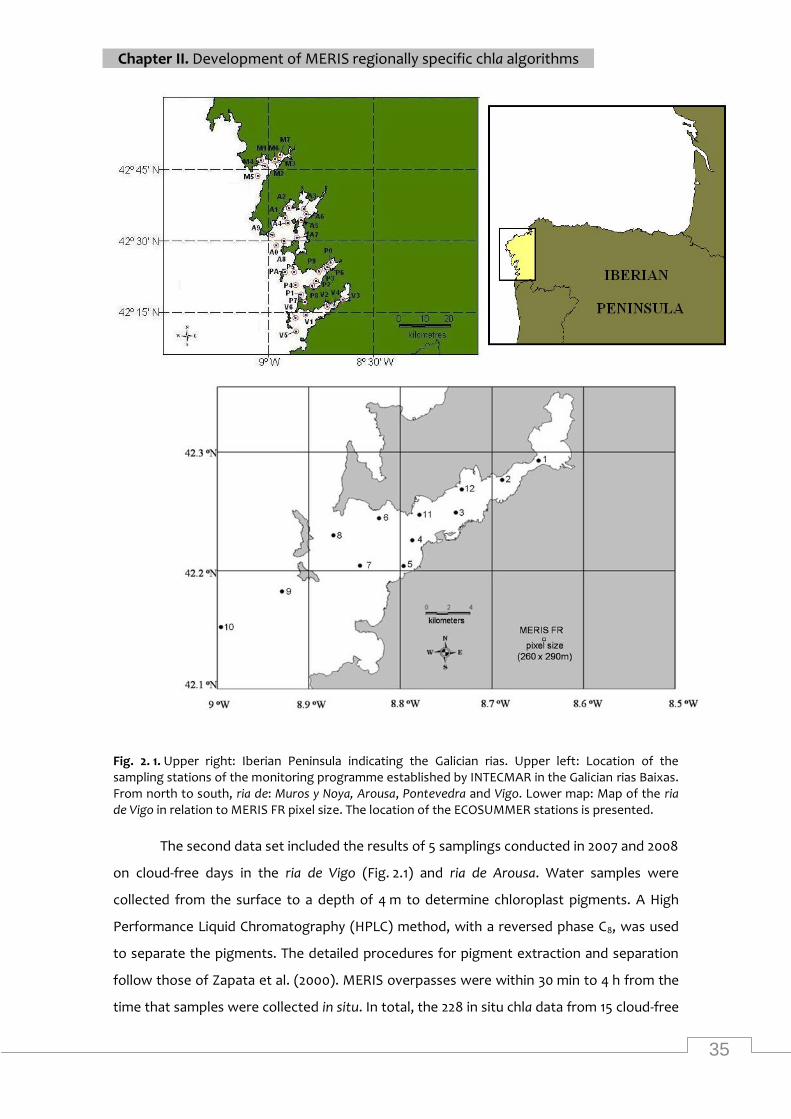
35
Chapter II. Development of MERIS regionally specific chla algorithms
Fig. 2. 1. Upper right: Iberian Peninsula indicating the Galician rias. Upper left: Location of the sampling stations of the monitoring programme established by INTECMAR in the Galician rias Baixas. From north to south, ria de: Muros y Noya, Arousa, Pontevedra and Vigo. Lower map: Map of the ria de Vigo in relation to MERIS FR pixel size. The location of the ECOSUMMER stations is presented.
The second data set included the results of 5 samplings conducted in 2007 and 2008
on cloud-free days in the ria de Vigo (Fig. 2.1) and ria de Arousa. Water samples were
collected from the surface to a depth of 4 m to determine chloroplast pigments. A High
Performance Liquid Chromatography (HPLC) method, with a reversed phase C8, was used
to separate the pigments. The detailed procedures for pigment extraction and separation
follow those of Zapata et al. (2000). MERIS overpasses were within 30 min to 4 h from the
time that samples were collected in situ. In total, the 228 in situ chla data from 15 cloud-free
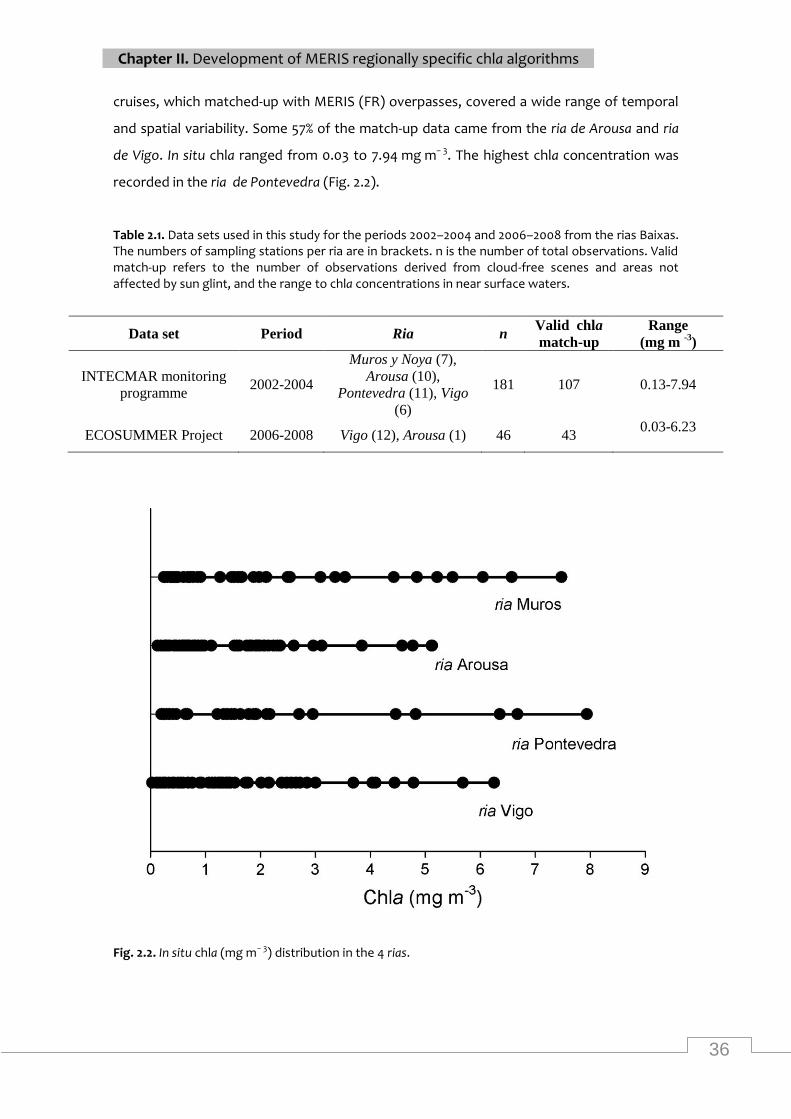
36
Chapter II. Development of MERIS regionally specific chla algorithms
cruises, which matched-up with MERIS (FR) overpasses, covered a wide range of temporal
and spatial variability. Some 57% of the match-up data came from the ria de Arousa and ria
de Vigo. In situ chla ranged from 0.03 to 7.94 mg m− 3. The highest chla concentration was
recorded in the ria de Pontevedra (Fig. 2.2).
Table 2.1. Data sets used in this study for the periods 2002–2004 and 2006–2008 from the rias Baixas. The numbers of sampling stations per ria are in brackets. n is the number of total observations. Valid match-up refers to the number of observations derived from cloud-free scenes and areas not affected by sun glint, and the range to chla concentrations in near surface waters.
Data set Period Ria n Valid chla
match-up
Range
(mg m -3
)
INTECMAR monitoring
programme 2002-2004
Muros y Noya (7),
Arousa (10),
Pontevedra (11), Vigo
(6)
181 107 0.13-7.94
ECOSUMMER Project 2006-2008 Vigo (12), Arousa (1) 46 43 0.03-6.23
Fig. 2.2. In situ chla (mg m− 3) distribution in the 4 rias.
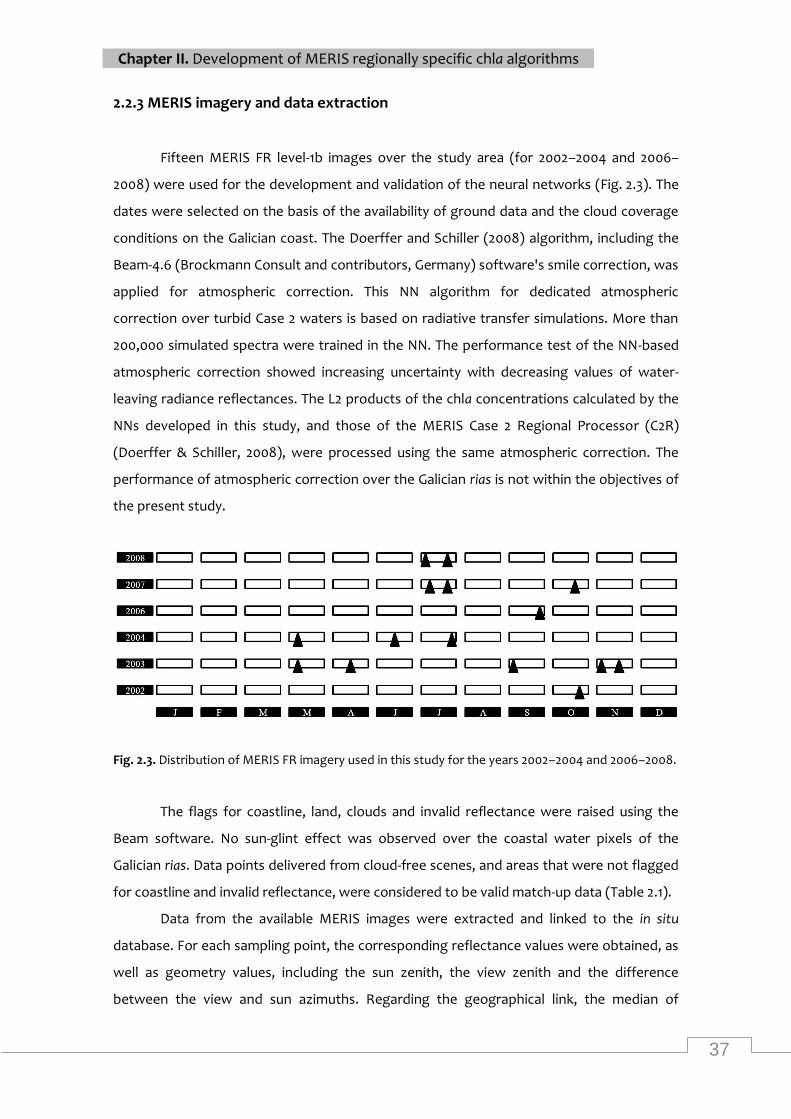
37
Chapter II. Development of MERIS regionally specific chla algorithms
2.2.3 MERIS imagery and data extraction
Fifteen MERIS FR level-1b images over the study area (for 2002–2004 and 2006–
2008) were used for the development and validation of the neural networks (Fig. 2.3). The
dates were selected on the basis of the availability of ground data and the cloud coverage
conditions on the Galician coast. The Doerffer and Schiller (2008) algorithm, including the
Beam-4.6 (Brockmann Consult and contributors, Germany) software's smile correction, was
applied for atmospheric correction. This NN algorithm for dedicated atmospheric
correction over turbid Case 2 waters is based on radiative transfer simulations. More than
200,000 simulated spectra were trained in the NN. The performance test of the NN-based
atmospheric correction showed increasing uncertainty with decreasing values of water-
leaving radiance reflectances. The L2 products of the chla concentrations calculated by the
NNs developed in this study, and those of the MERIS Case 2 Regional Processor (C2R)
(Doerffer & Schiller, 2008), were processed using the same atmospheric correction. The
performance of atmospheric correction over the Galician rias is not within the objectives of
the present study.
Fig. 2.3. Distribution of MERIS FR imagery used in this study for the years 2002–2004 and 2006–2008.
The flags for coastline, land, clouds and invalid reflectance were raised using the
Beam software. No sun-glint effect was observed over the coastal water pixels of the
Galician rias. Data points delivered from cloud-free scenes, and areas that were not flagged
for coastline and invalid reflectance, were considered to be valid match-up data (Table 2.1).
Data from the available MERIS images were extracted and linked to the in situ
database. For each sampling point, the corresponding reflectance values were obtained, as
well as geometry values, including the sun zenith, the view zenith and the difference
between the view and sun azimuths. Regarding the geographical link, the median of
38
Chapter II. Development of MERIS regionally specific chla algorithms
9 pixels was computed (approximately 0.8 km2 surface area) around the pixel containing
the exact geographical location of the sampling point. It was considered that a median of
9 pixels was able to reduce MERIS instrument noise and was, therefore, used as a data
quality criterion. Some previously masked pixels were not taken into account in the
computation of the median, because they belonged to land or were suspected of being
affected by low clouds or fog. Moreover, using the median instead of the mean reduced the
effect of possible mixed and non-masked pixels, with extremely high or low values. For
each sampling point, the number of pixels included in the median computation was also
extracted as a quality flag, ranging from 9 (highest quality) to 1 (lowest quality). Low quality
values indicate that the sampling station is located in the proximity of the coast or cloudy or
foggy areas, so that the reflectance values could be affected. The neural models were
developed by selecting the input points based on two different quality levels, to evaluate
the effect of the quality flags on the performance of the model. In addition to reflectance
and geometry values, chla concentrations derived from other algorithms were also
extracted using the same methodology (9-pixel median).
2.2.4 Fuzzy c-means (FCM) clustering
FCM algorithms were applied to MERIS data to determine the number of spectral
clusters in the data set. Cluster-specific NNs were then developed for the retrieval of chla.
From the output data of the FCM application, it is possible to represent different optical
water types, as the analysis is based on reflectances. However, the limited sea-truth
information about water constituents (total suspended material (TSM) and CDOM) and
reflectances prevented us from categorizing the FCM results as different optical water
types. Yet, in this study, FCM were principally used for providing the scope of the
developed NNs.
The FCM technique divides a data set into a specified number of clusters, but unlike
other hard or non-fuzzy clustering algorithms, a given data point (reflectance spectrum)
can belong to more than one class with a membership degree (between 0 and 1), specified
by a membership function defined for each cluster. The FCM algorithm is intended to
minimize an objective function (Moore et al., 2009). Hence, clusters are selected so that the
distance between the data points and the cluster centres is minimized, adjusting the cluster
centres iteratively until the previously established optimization criteria are met, which could
be the maximum number of iterations or the minimum change residual.
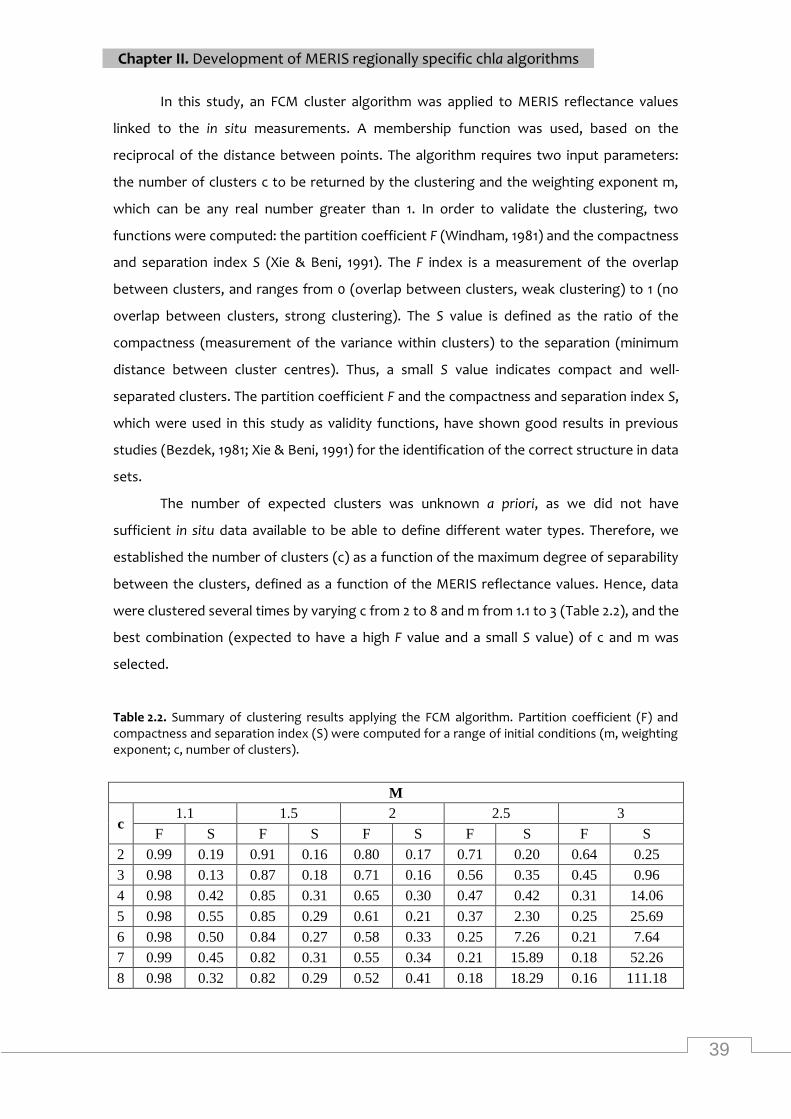
39
Chapter II. Development of MERIS regionally specific chla algorithms
In this study, an FCM cluster algorithm was applied to MERIS reflectance values
linked to the in situ measurements. A membership function was used, based on the
reciprocal of the distance between points. The algorithm requires two input parameters:
the number of clusters c to be returned by the clustering and the weighting exponent m,
which can be any real number greater than 1. In order to validate the clustering, two
functions were computed: the partition coefficient F (Windham, 1981) and the compactness
and separation index S (Xie & Beni, 1991). The F index is a measurement of the overlap
between clusters, and ranges from 0 (overlap between clusters, weak clustering) to 1 (no
overlap between clusters, strong clustering). The S value is defined as the ratio of the
compactness (measurement of the variance within clusters) to the separation (minimum
distance between cluster centres). Thus, a small S value indicates compact and well-
separated clusters. The partition coefficient F and the compactness and separation index S,
which were used in this study as validity functions, have shown good results in previous
studies (Bezdek, 1981; Xie & Beni, 1991) for the identification of the correct structure in data
sets.
The number of expected clusters was unknown a priori, as we did not have
sufficient in situ data available to be able to define different water types. Therefore, we
established the number of clusters (c) as a function of the maximum degree of separability
between the clusters, defined as a function of the MERIS reflectance values. Hence, data
were clustered several times by varying c from 2 to 8 and m from 1.1 to 3 (Table 2.2), and the
best combination (expected to have a high F value and a small S value) of c and m was
selected.
Table 2.2. Summary of clustering results applying the FCM algorithm. Partition coefficient (F) and compactness and separation index (S) were computed for a range of initial conditions (m, weighting exponent; c, number of clusters).
M
c 1.1 1.5 2 2.5 3
F S F S F S F S F S
2 0.99 0.19 0.91 0.16 0.80 0.17 0.71 0.20 0.64 0.25
3 0.98 0.13 0.87 0.18 0.71 0.16 0.56 0.35 0.45 0.96
4 0.98 0.42 0.85 0.31 0.65 0.30 0.47 0.42 0.31 14.06
5 0.98 0.55 0.85 0.29 0.61 0.21 0.37 2.30 0.25 25.69
6 0.98 0.50 0.84 0.27 0.58 0.33 0.25 7.26 0.21 7.64
7 0.99 0.45 0.82 0.31 0.55 0.34 0.21 15.89 0.18 52.26
8 0.98 0.32 0.82 0.29 0.52 0.41 0.18 18.29 0.16 111.18
40
Chapter II. Development of MERIS regionally specific chla algorithms
Once the best FCM algorithm was defined, each data point in the data set was
assigned to the cluster with the highest value for the associated membership function. The
mean reflectance spectrum and the statistics associated to the available in situ data were
calculated in an attempt to examine the possible differences of the water constituents in
the identified clusters.
Classification images were also obtained for the MERIS images involved in the
analysis using the same FCM algorithm. In these images, each sea pixel was assigned to the
cluster with the highest value in its corresponding membership function. Using these
images, the percentage of pixels belonging to each cluster over the study area was
computed.
2.2.5 Multilayer perceptron (MLP)
A multilayer perceptron (MLP) artificial neural network (NN) was implemented for
the retrieval of chla concentration from MERIS images over the study area. In addition to
the preliminary NN using the entire data set, the idea was to develop a different NN for
each cluster derived by applying the FCM algorithm, so that results could be merged to
obtain chlorophyll maps. In practice, only one of the clusters provided a representative and
sufficiently large data set to be able to develop an artificial NN.
An MLP is a feedforward NN that has been widely used in environmental sciences,
because of its ability to approximate a set of input data to the corresponding output data.
Unlike other statistical approaches, MLP does not make assumptions about data
distribution and it can model multivariate, complex and nonlinear data (Cheng &
Titterington, 1994). An MLP consists of a set of nonlinear computational elements, named
neurons or nodes, arranged in multiple layers that are interconnected in a feedforward
way, so that each neuron of a layer is only connected to the nodes of the immediately next
layer, but has no connections to neurons in the previous layers. Each connection is defined
by a set of weight values (Leondes, 1998; Raudys, 2001).
A typical MLP structure includes an input layer, one or more hidden layers and an
output layer. The input layer only distributes the input signals into the network, without
processing them. However, the neurons in the hidden layers and in the output layer
transform their input signal by an activation function.
Once the MLP architecture is designed, the relationship between the input and the
desired output is ultimately dependent on the weight values associated to each connection.
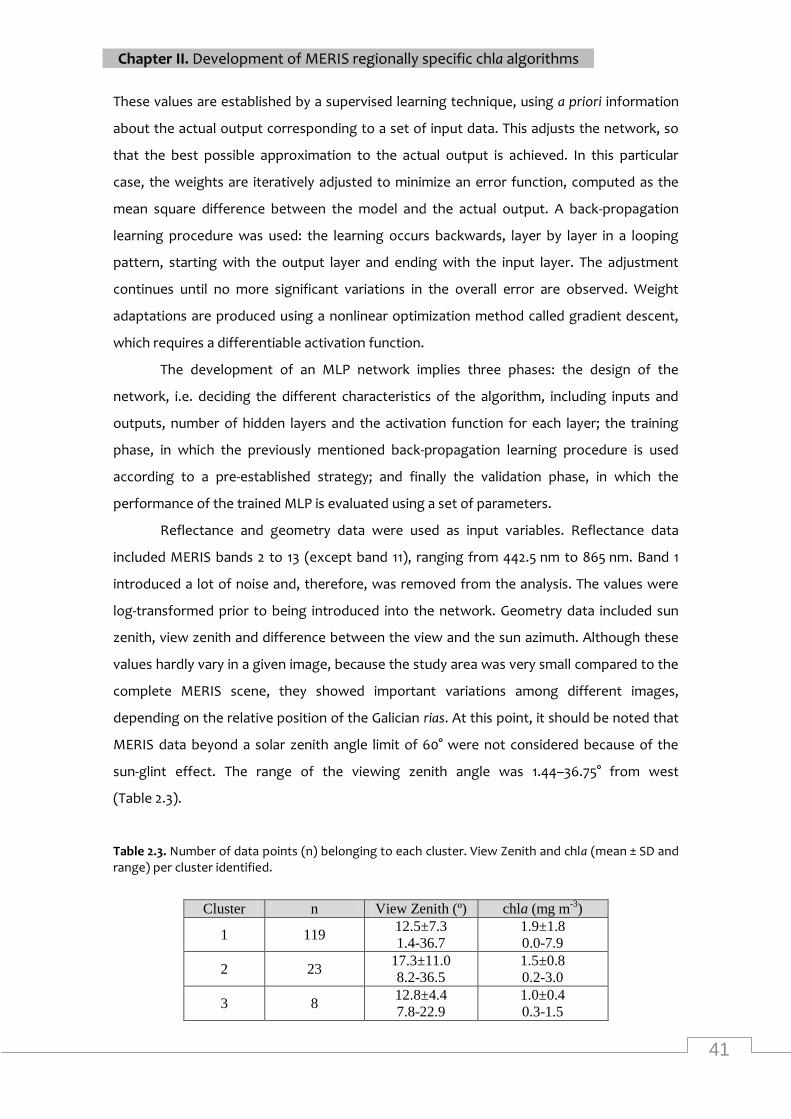
41
Chapter II. Development of MERIS regionally specific chla algorithms
These values are established by a supervised learning technique, using a priori information
about the actual output corresponding to a set of input data. This adjusts the network, so
that the best possible approximation to the actual output is achieved. In this particular
case, the weights are iteratively adjusted to minimize an error function, computed as the
mean square difference between the model and the actual output. A back-propagation
learning procedure was used: the learning occurs backwards, layer by layer in a looping
pattern, starting with the output layer and ending with the input layer. The adjustment
continues until no more significant variations in the overall error are observed. Weight
adaptations are produced using a nonlinear optimization method called gradient descent,
which requires a differentiable activation function.
The development of an MLP network implies three phases: the design of the
network, i.e. deciding the different characteristics of the algorithm, including inputs and
outputs, number of hidden layers and the activation function for each layer; the training
phase, in which the previously mentioned back-propagation learning procedure is used
according to a pre-established strategy; and finally the validation phase, in which the
performance of the trained MLP is evaluated using a set of parameters.
Reflectance and geometry data were used as input variables. Reflectance data
included MERIS bands 2 to 13 (except band 11), ranging from 442.5 nm to 865 nm. Band 1
introduced a lot of noise and, therefore, was removed from the analysis. The values were
log-transformed prior to being introduced into the network. Geometry data included sun
zenith, view zenith and difference between the view and the sun azimuth. Although these
values hardly vary in a given image, because the study area was very small compared to the
complete MERIS scene, they showed important variations among different images,
depending on the relative position of the Galician rias. At this point, it should be noted that
MERIS data beyond a solar zenith angle limit of 60° were not considered because of the
sun-glint effect. The range of the viewing zenith angle was 1.44–36.75° from west
(Table 2.3).
Table 2.3. Number of data points (n) belonging to each cluster. View Zenith and chla (mean ± SD and range) per cluster identified.
Cluster n View Zenith (º) chla (mg m-3
)
1 119 12.5±7.3
1.4-36.7
1.9±1.8
0.0-7.9
2 23 17.3±11.0
8.2-36.5
1.5±0.8
0.2-3.0
3 8 12.8±4.4
7.8-22.9
1.0±0.4
0.3-1.5
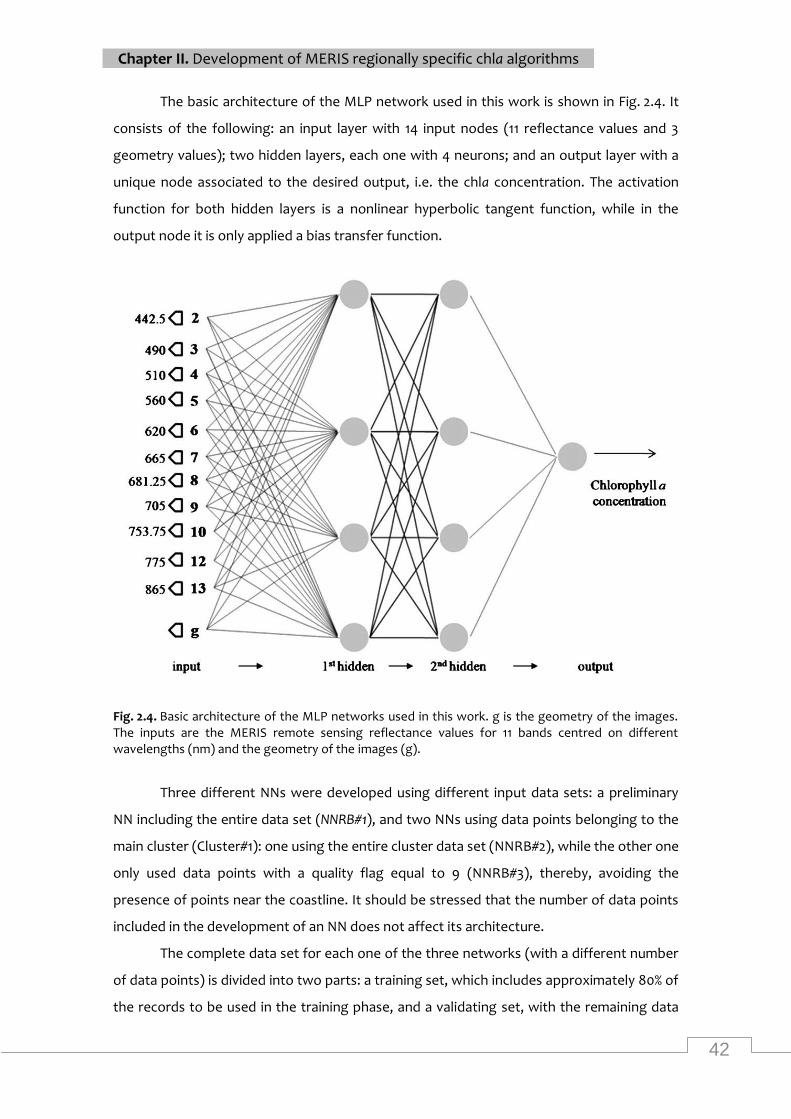
42
Chapter II. Development of MERIS regionally specific chla algorithms
The basic architecture of the MLP network used in this work is shown in Fig. 2.4. It
consists of the following: an input layer with 14 input nodes (11 reflectance values and 3
geometry values); two hidden layers, each one with 4 neurons; and an output layer with a
unique node associated to the desired output, i.e. the chla concentration. The activation
function for both hidden layers is a nonlinear hyperbolic tangent function, while in the
output node it is only applied a bias transfer function.
Fig. 2.4. Basic architecture of the MLP networks used in this work. g is the geometry of the images. The inputs are the MERIS remote sensing reflectance values for 11 bands centred on different wavelengths (nm) and the geometry of the images (g).
Three different NNs were developed using different input data sets: a preliminary
NN including the entire data set (NNRB#1), and two NNs using data points belonging to the
main cluster (Cluster#1): one using the entire cluster data set (NNRB#2), while the other one
only used data points with a quality flag equal to 9 (NNRB#3), thereby, avoiding the
presence of points near the coastline. It should be stressed that the number of data points
included in the development of an NN does not affect its architecture.
The complete data set for each one of the three networks (with a different number
of data points) is divided into two parts: a training set, which includes approximately 80% of
the records to be used in the training phase, and a validating set, with the remaining data
43
Chapter II. Development of MERIS regionally specific chla algorithms
points necessary for validating the algorithm. Both subsets must be random and significant
for the whole data set. Therefore, they were created including data points from all the
images and covering the entire range of variation of the chla concentration.
In the training phase, a leave-one-out cross-validation was applied to each training
set to improve the performance of the neural models. Cross-validation is a standard
method for assessing the predictive accuracy of a model in a test sample. Leave-one-out
cross-validation is the best method, when the training set is too small to be able to split it
into significantly sized training and test samples (Fukunaga, 1990). The network is trained N
times (N being the number of elements of the training set), and each time one element is
retained for testing and, therefore, omitted from the training procedure involving the
remaining N−1 elements. Each data point is thereby used exactly once as a test sample.
2.2.6 Performance measurements
For the validation phase, the model fitting was evaluated according to a set of
parameters, which compared the observed chla concentration (ChlO) and the obtained one
using the algorithm (ChlM). These performance measurements were obtained using the
training or/and the validation data sets. The computed parameters were the following:
- Coefficient of determination (R2) between ChlO and ChlM;
- Mean prediction error (MPE) between ChlO and ChlM. MPE is defined as:
where PEi = ChlOi − ChlMi is the prediction error and N is the number of data points;
-Variance of the prediction errors (VAR):
- Root mean square error (RMSE) between ChlO and ChlM:
44
Chapter II. Development of MERIS regionally specific chla algorithms
- Relative RMSE:
R2 is a measurement of the correlation between the observed and the predicted
data sets. MPE made it possible to find out if a model tends to underestimate (high positive
values) or overestimate (high negative values) the observed chla concentrations. RMSE and
relative RMSE were used in this work as measurements of absolute error (in mg m− 3) and
relative error respectively, while VAR was used to quantify error variability.
Our results correspond to neural networks selected following a two-step
procedure. In the first stage, the optimal configuration of the network was selected. The
NN model was first trained and validated using the Cluster#1 high-quality (quality flag equal
to 9) data and by varying the input parameters, such as number of hidden layers or
activation functions, to choose the ideal design according to the validation criteria. The
ones selected were those with high R2, MPE near zero and small relative RMSE, RMSE and
VAR, when computed using both the training and the validation set. Overfitting could have
been produced, if only the training set had been used to validate the model. The same
configuration was applied to the other two input data sets (complete data set and
complete Cluster#1 data set). The second step tackles how the fitting result of a neuronal
model can vary between different runs, even though it is trained using the same data, as it
is dependent on the initial value of the weights. Therefore, each one of the three models
was trained N times using leave-one-out cross-validation and, each time, a different data
point was used as the first test sample. Once each one of the NNs was trained, fitting
parameters were computed using both the training and the validation sets, and the best
neural model was selected as in the previous step. Hence, the results shown in this study
are those obtained using the best NN for each case.
2.3 Results
2.3.1 FCM
Table 2.2 shows the results of applying the FCM algorithm to the MERIS reflectance
values associated to in situ data, varying the number of clusters c and the weighting
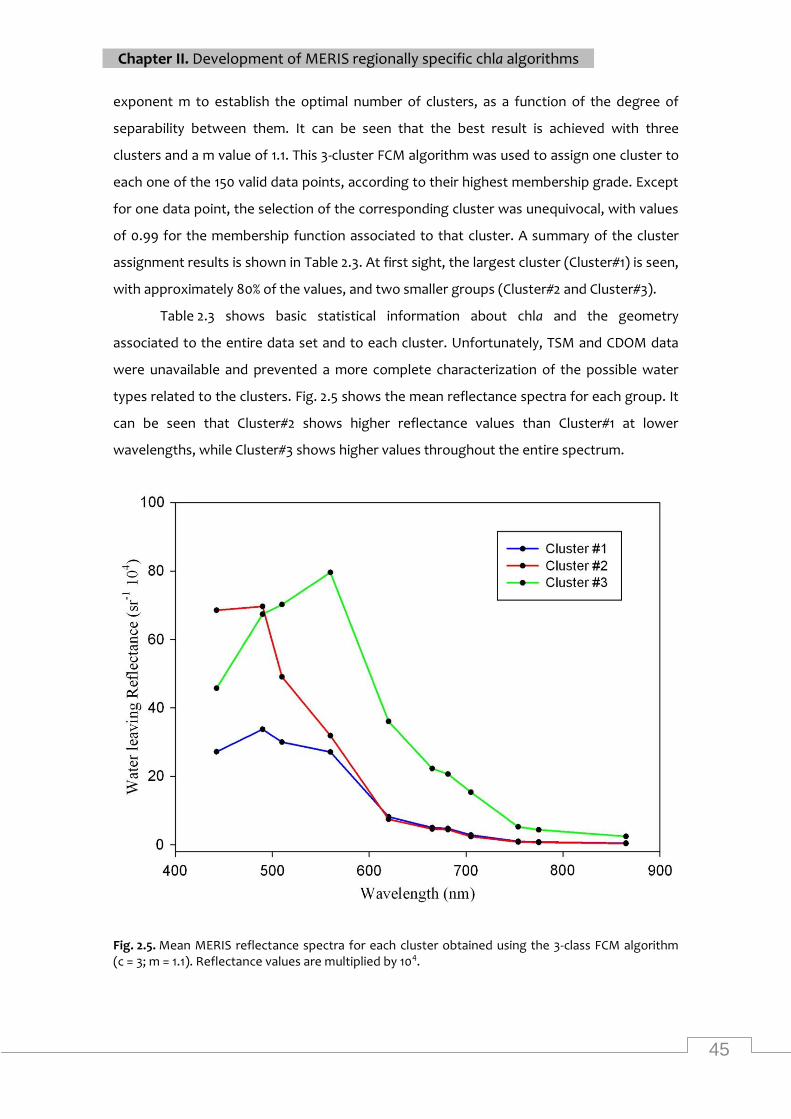
45
Chapter II. Development of MERIS regionally specific chla algorithms
exponent m to establish the optimal number of clusters, as a function of the degree of
separability between them. It can be seen that the best result is achieved with three
clusters and a m value of 1.1. This 3-cluster FCM algorithm was used to assign one cluster to
each one of the 150 valid data points, according to their highest membership grade. Except
for one data point, the selection of the corresponding cluster was unequivocal, with values
of 0.99 for the membership function associated to that cluster. A summary of the cluster
assignment results is shown in Table 2.3. At first sight, the largest cluster (Cluster#1) is seen,
with approximately 80% of the values, and two smaller groups (Cluster#2 and Cluster#3).
Table 2.3 shows basic statistical information about chla and the geometry
associated to the entire data set and to each cluster. Unfortunately, TSM and CDOM data
were unavailable and prevented a more complete characterization of the possible water
types related to the clusters. Fig. 2.5 shows the mean reflectance spectra for each group. It
can be seen that Cluster#2 shows higher reflectance values than Cluster#1 at lower
wavelengths, while Cluster#3 shows higher values throughout the entire spectrum.
Fig. 2.5. Mean MERIS reflectance spectra for each cluster obtained using the 3-class FCM algorithm (c = 3; m = 1.1). Reflectance values are multiplied by 104.
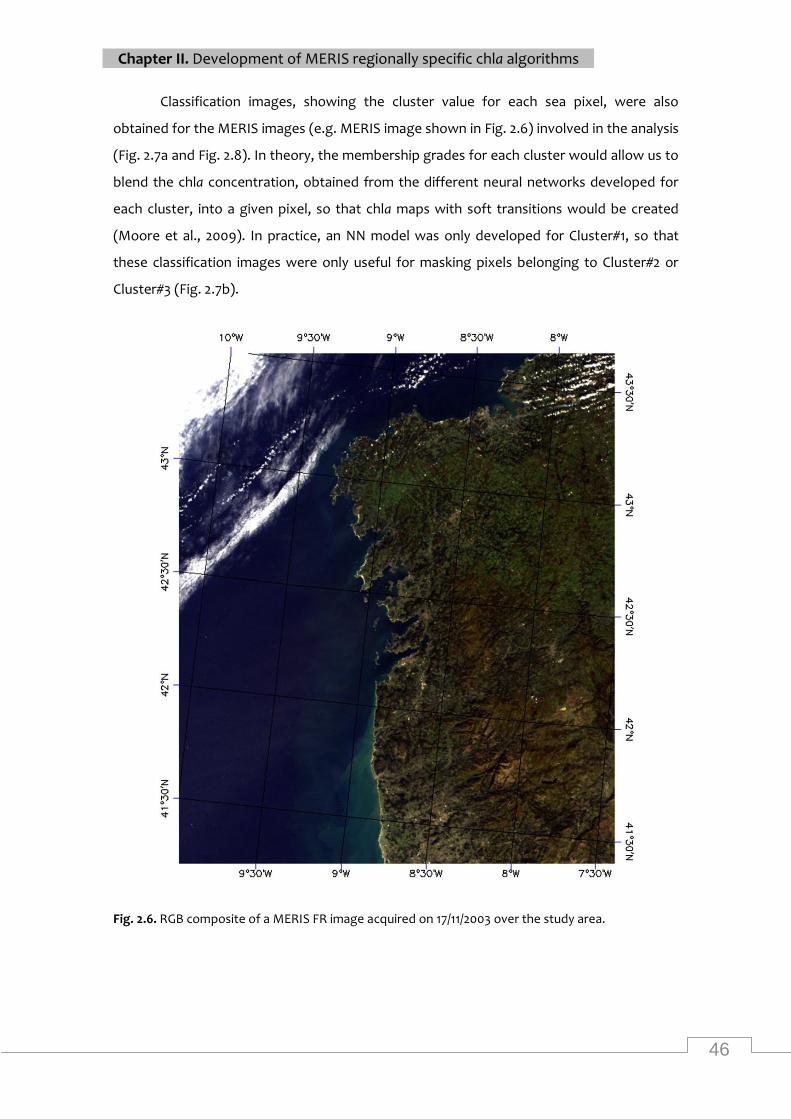
46
Chapter II. Development of MERIS regionally specific chla algorithms
Classification images, showing the cluster value for each sea pixel, were also
obtained for the MERIS images (e.g. MERIS image shown in Fig. 2.6) involved in the analysis
(Fig. 2.7a and Fig. 2.8). In theory, the membership grades for each cluster would allow us to
blend the chla concentration, obtained from the different neural networks developed for
each cluster, into a given pixel, so that chla maps with soft transitions would be created
(Moore et al., 2009). In practice, an NN model was only developed for Cluster#1, so that
these classification images were only useful for masking pixels belonging to Cluster#2 or
Cluster#3 (Fig. 2.7b).
Fig. 2.6. RGB composite of a MERIS FR image acquired on 17/11/2003 over the study area.
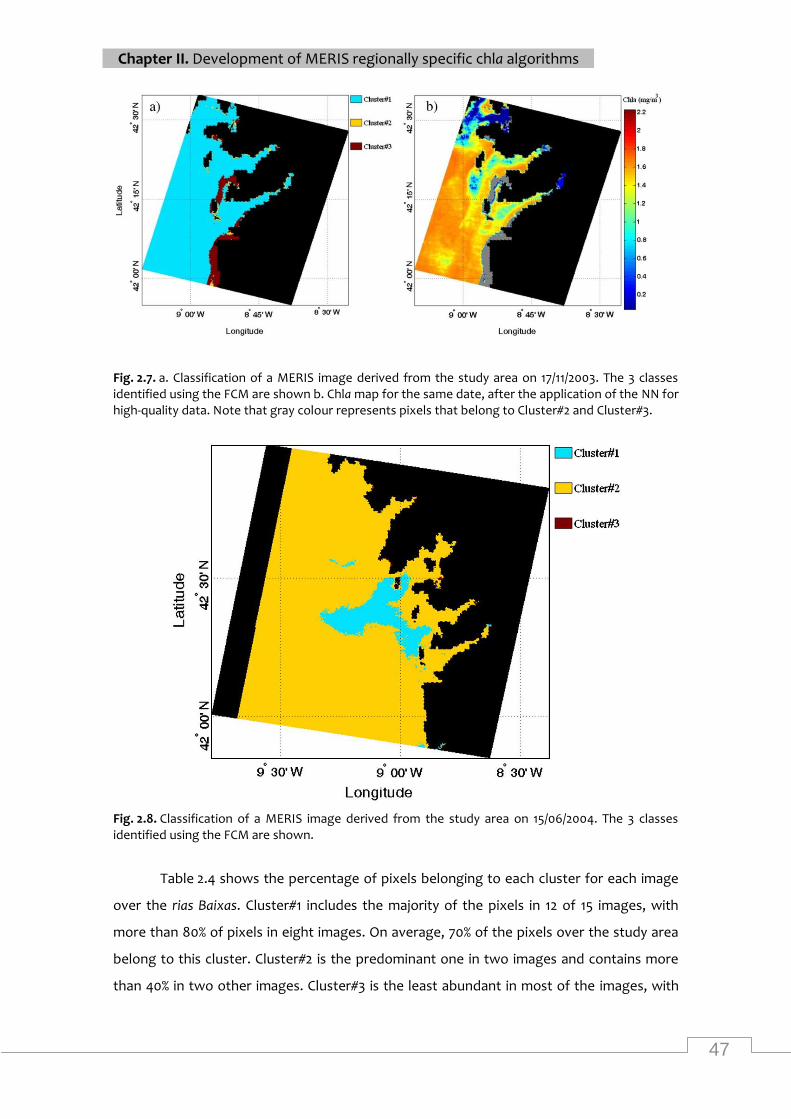
47
Chapter II. Development of MERIS regionally specific chla algorithms
Fig. 2.7. a. Classification of a MERIS image derived from the study area on 17/11/2003. The 3 classes identified using the FCM are shown b. Chla map for the same date, after the application of the NN for high-quality data. Note that gray colour represents pixels that belong to Cluster#2 and Cluster#3.
Fig. 2.8. Classification of a MERIS image derived from the study area on 15/06/2004. The 3 classes identified using the FCM are shown.
Table 2.4 shows the percentage of pixels belonging to each cluster for each image
over the rias Baixas. Cluster#1 includes the majority of the pixels in 12 of 15 images, with
more than 80% of pixels in eight images. On average, 70% of the pixels over the study area
belong to this cluster. Cluster#2 is the predominant one in two images and contains more
than 40% in two other images. Cluster#3 is the least abundant in most of the images, with
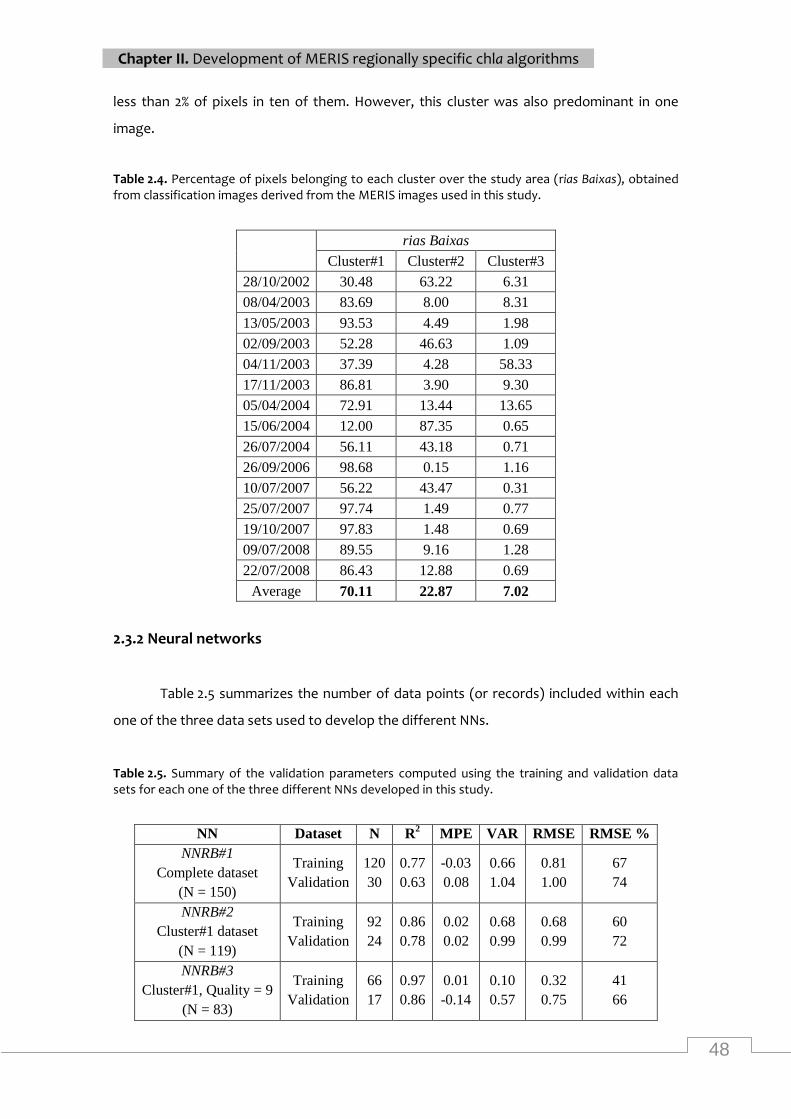
48
Chapter II. Development of MERIS regionally specific chla algorithms
less than 2% of pixels in ten of them. However, this cluster was also predominant in one
image.
Table 2.4. Percentage of pixels belonging to each cluster over the study area (rias Baixas), obtained from classification images derived from the MERIS images used in this study.
rias Baixas
Cluster#1 Cluster#2 Cluster#3
28/10/2002 30.48 63.22 6.31
08/04/2003 83.69 8.00 8.31
13/05/2003 93.53 4.49 1.98
02/09/2003 52.28 46.63 1.09
04/11/2003 37.39 4.28 58.33
17/11/2003 86.81 3.90 9.30
05/04/2004 72.91 13.44 13.65
15/06/2004 12.00 87.35 0.65
26/07/2004 56.11 43.18 0.71
26/09/2006 98.68 0.15 1.16
10/07/2007 56.22 43.47 0.31
25/07/2007 97.74 1.49 0.77
19/10/2007 97.83 1.48 0.69
09/07/2008 89.55 9.16 1.28
22/07/2008 86.43 12.88 0.69
Average 70.11 22.87 7.02
2.3.2 Neural networks
Table 2.5 summarizes the number of data points (or records) included within each
one of the three data sets used to develop the different NNs.
Table 2.5. Summary of the validation parameters computed using the training and validation data sets for each one of the three different NNs developed in this study.
NN Dataset N R2 MPE VAR RMSE RMSE %
NNRB#1
Complete dataset
(N = 150)
Training
Validation
120
30
0.77
0.63
-0.03
0.08
0.66
1.04
0.81
1.00
67
74
NNRB#2
Cluster#1 dataset
(N = 119)
Training
Validation
92
24
0.86
0.78
0.02
0.02
0.68
0.99
0.68
0.99
60
72
NNRB#3
Cluster#1, Quality = 9
(N = 83)
Training
Validation
66
17
0.97
0.86
0.01
-0.14
0.10
0.57
0.32
0.75
41
66
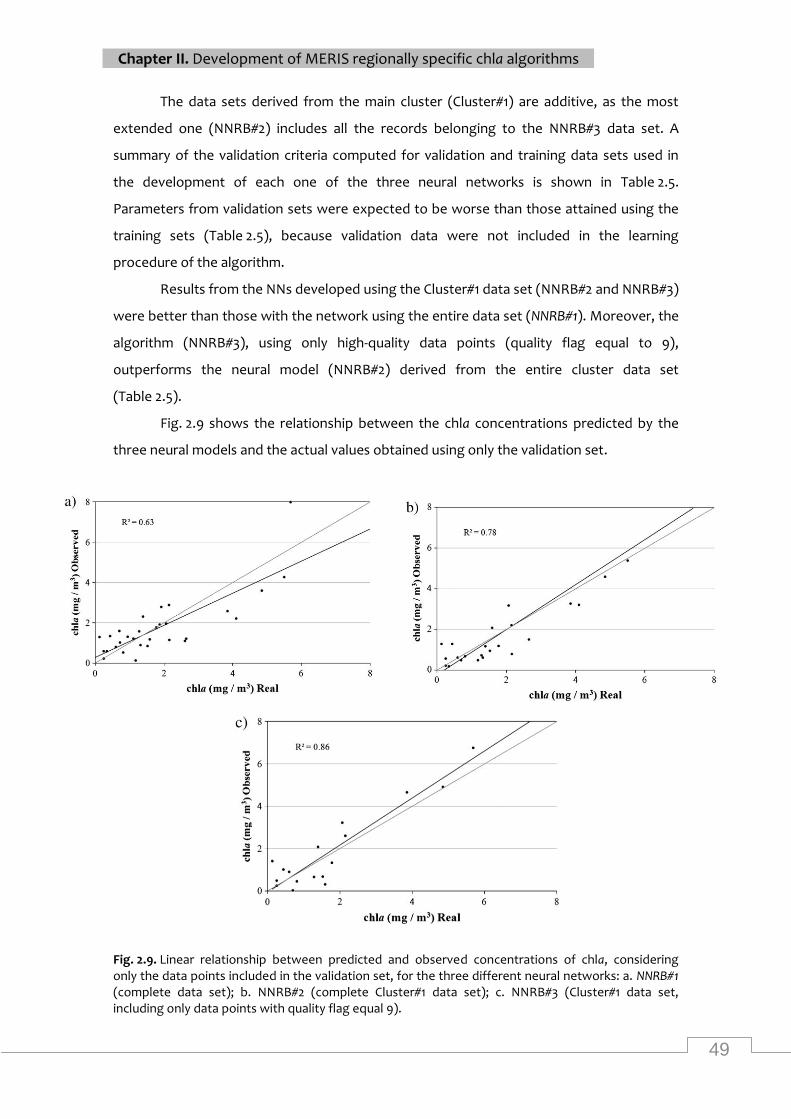
49
Chapter II. Development of MERIS regionally specific chla algorithms
The data sets derived from the main cluster (Cluster#1) are additive, as the most
extended one (NNRB#2) includes all the records belonging to the NNRB#3 data set. A
summary of the validation criteria computed for validation and training data sets used in
the development of each one of the three neural networks is shown in Table 2.5.
Parameters from validation sets were expected to be worse than those attained using the
training sets (Table 2.5), because validation data were not included in the learning
procedure of the algorithm.
Results from the NNs developed using the Cluster#1 data set (NNRB#2 and NNRB#3)
were better than those with the network using the entire data set (NNRB#1). Moreover, the
algorithm (NNRB#3), using only high-quality data points (quality flag equal to 9),
outperforms the neural model (NNRB#2) derived from the entire cluster data set
(Table 2.5).
Fig. 2.9 shows the relationship between the chla concentrations predicted by the
three neural models and the actual values obtained using only the validation set.
Fig. 2.9. Linear relationship between predicted and observed concentrations of chla, considering only the data points included in the validation set, for the three different neural networks: a. NNRB#1 (complete data set); b. NNRB#2 (complete Cluster#1 data set); c. NNRB#3 (Cluster#1 data set, including only data points with quality flag equal 9).
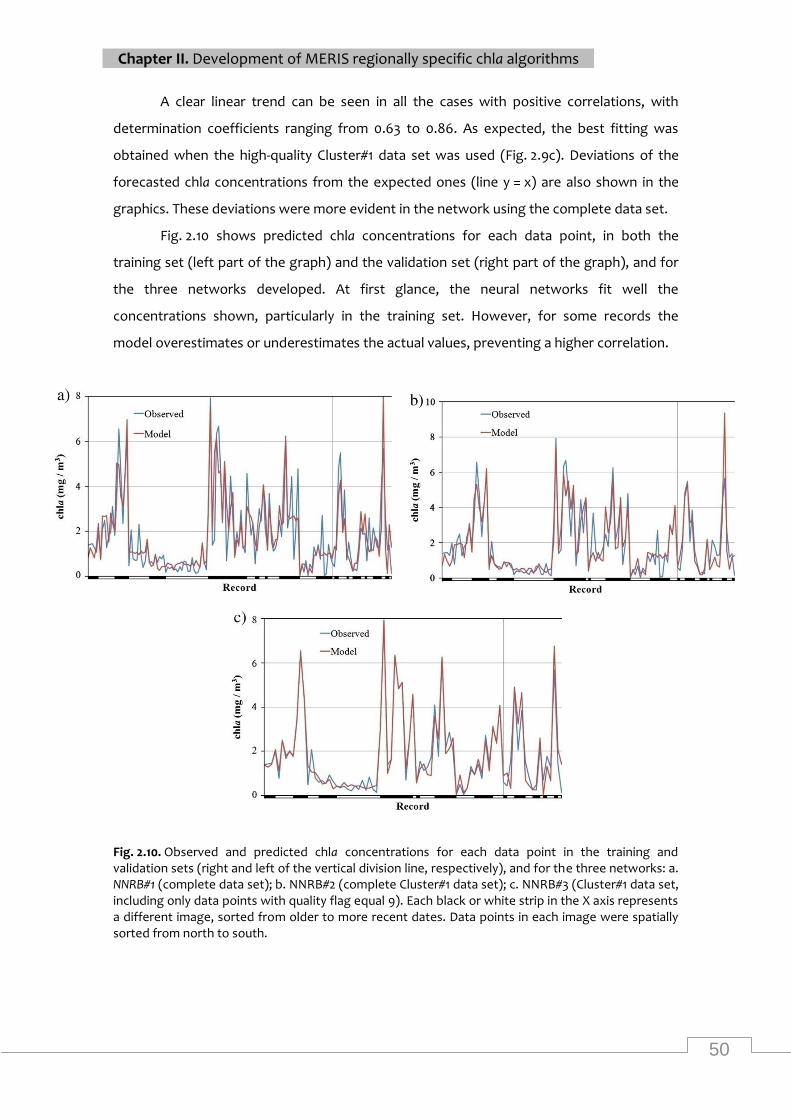
50
Chapter II. Development of MERIS regionally specific chla algorithms
A clear linear trend can be seen in all the cases with positive correlations, with
determination coefficients ranging from 0.63 to 0.86. As expected, the best fitting was
obtained when the high-quality Cluster#1 data set was used (Fig. 2.9c). Deviations of the
forecasted chla concentrations from the expected ones (line y = x) are also shown in the
graphics. These deviations were more evident in the network using the complete data set.
Fig. 2.10 shows predicted chla concentrations for each data point, in both the
training set (left part of the graph) and the validation set (right part of the graph), and for
the three networks developed. At first glance, the neural networks fit well the
concentrations shown, particularly in the training set. However, for some records the
model overestimates or underestimates the actual values, preventing a higher correlation.
Fig. 2.10. Observed and predicted chla concentrations for each data point in the training and validation sets (right and left of the vertical division line, respectively), and for the three networks: a. NNRB#1 (complete data set); b. NNRB#2 (complete Cluster#1 data set); c. NNRB#3 (Cluster#1 data set, including only data points with quality flag equal 9). Each black or white strip in the X axis represents a different image, sorted from older to more recent dates. Data points in each image were spatially sorted from north to south.
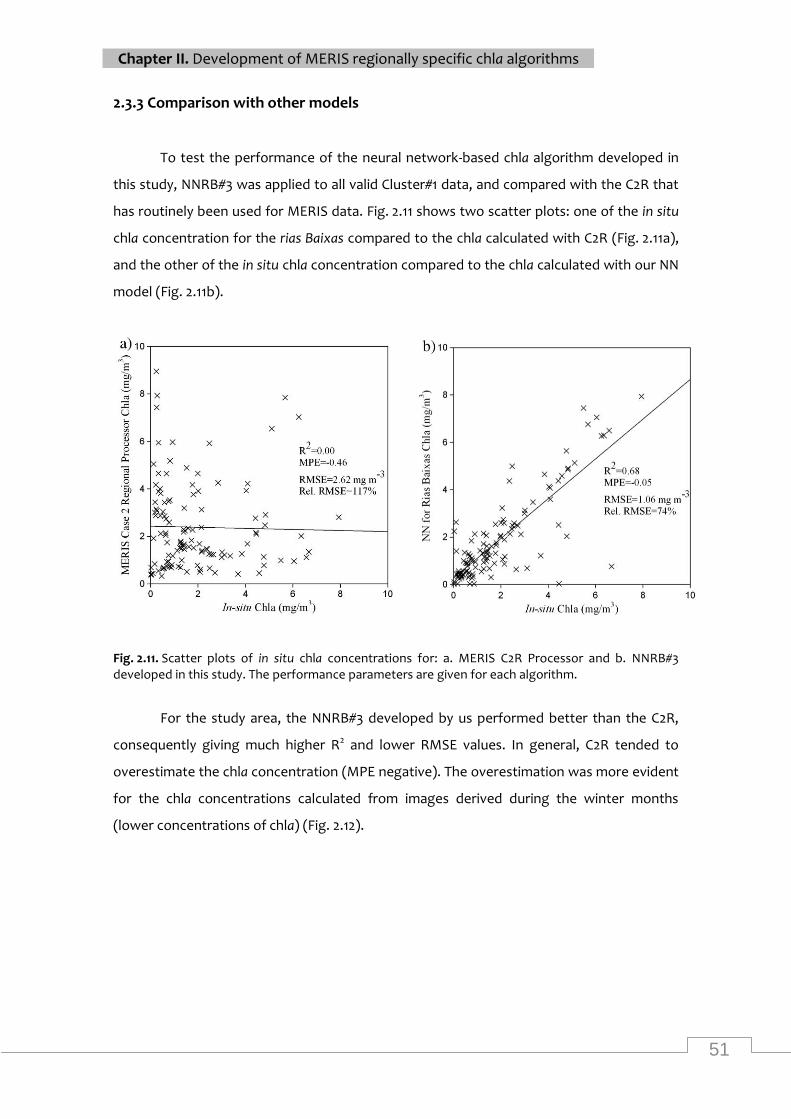
51
Chapter II. Development of MERIS regionally specific chla algorithms
2.3.3 Comparison with other models
To test the performance of the neural network-based chla algorithm developed in
this study, NNRB#3 was applied to all valid Cluster#1 data, and compared with the C2R that
has routinely been used for MERIS data. Fig. 2.11 shows two scatter plots: one of the in situ
chla concentration for the rias Baixas compared to the chla calculated with C2R (Fig. 2.11a),
and the other of the in situ chla concentration compared to the chla calculated with our NN
model (Fig. 2.11b).
Fig. 2.11. Scatter plots of in situ chla concentrations for: a. MERIS C2R Processor and b. NNRB#3 developed in this study. The performance parameters are given for each algorithm.
For the study area, the NNRB#3 developed by us performed better than the C2R,
consequently giving much higher R2 and lower RMSE values. In general, C2R tended to
overestimate the chla concentration (MPE negative). The overestimation was more evident
for the chla concentrations calculated from images derived during the winter months
(lower concentrations of chla) (Fig. 2.12).
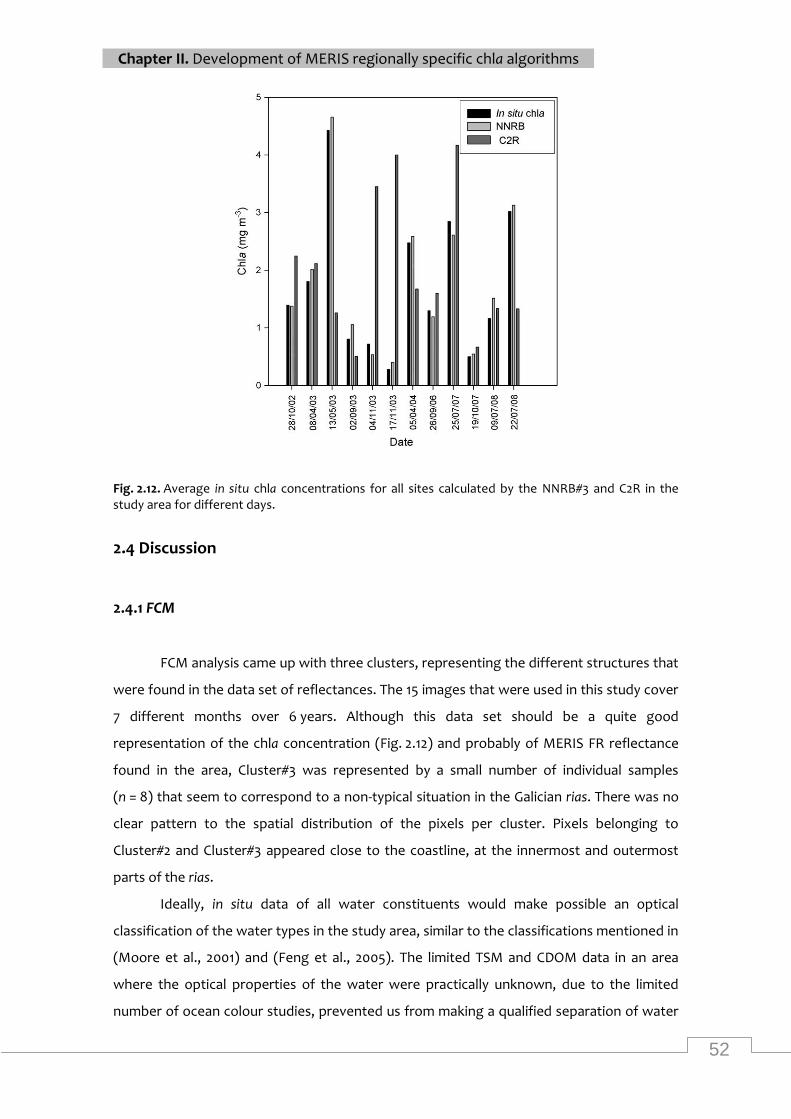
52
Chapter II. Development of MERIS regionally specific chla algorithms
Fig. 2.12. Average in situ chla concentrations for all sites calculated by the NNRB#3 and C2R in the study area for different days.
2.4 Discussion
2.4.1 FCM
FCM analysis came up with three clusters, representing the different structures that
were found in the data set of reflectances. The 15 images that were used in this study cover
7 different months over 6 years. Although this data set should be a quite good
representation of the chla concentration (Fig. 2.12) and probably of MERIS FR reflectance
found in the area, Cluster#3 was represented by a small number of individual samples
(n = 8) that seem to correspond to a non-typical situation in the Galician rias. There was no
clear pattern to the spatial distribution of the pixels per cluster. Pixels belonging to
Cluster#2 and Cluster#3 appeared close to the coastline, at the innermost and outermost
parts of the rias.
Ideally, in situ data of all water constituents would make possible an optical
classification of the water types in the study area, similar to the classifications mentioned in
(Moore et al., 2001) and (Feng et al., 2005). The limited TSM and CDOM data in an area
where the optical properties of the water were practically unknown, due to the limited
number of ocean colour studies, prevented us from making a qualified separation of water
53
Chapter II. Development of MERIS regionally specific chla algorithms
types. However, some simple observations on the different clusters could be made,
assuming accurate atmospheric correction. Cluster#1 pixels contained a wider range of chla
concentrations (0.0–7.9 mg m− 3). For the bands located between 620 and 865 nm, the
reflectance spectra coincided for Clusters#1 and #2. For Cluster#2 pixels, water-leaving
reflectance was high in blue (0.007 sr− 1) and decreased with increasing wavelength,
probably indicating blue waters (Froidefond et al., 2002), while these same pixels were
characterized by chla concentrations ranging from 0.2 to 3.0 mg m− 3. Cluster#3 pixels
showed a broad peak in the reflectance spectrum (Fig. 2.5) at 510 and 560 nm. Chlorophyll
concentration was low in Cluster#3 (range of chla: 0.3–1.5 mg m− 3). Spectral reflectance of
Cluster#3 appeared to be higher in the longer wavelengths, when compared to that for
Cluster#1 and Cluster#2. The higher reflectance values at bands 7–9, observed for the
Cluster#3 data, may be related to atmospheric aerosol features. Five samples of very low
chla concentration, classified in Cluster#3, came from a single image, but from two different
rias on November 17 2003, after a strong storm period.
The advantage of this classification is that the output includes three clusters of
overlapped chla ranges, which can provide the images that reveal the areas where the NN
developed for chla retrieval can be best applied to obtain the most reliable results.
Moreover, these results can be used as a basis for future studies of ocean colour in the
study area, for the collection of in situ water constituents and for the study of particle size
and composition in specific clusters of reflectances.
There were no discernable differences in geometry between the three clusters,
while the degree of mixing was very high. Indeed, the presence of pixels belonging to the
three classes in a single image is quite remarkable, with only small variations in the
geometry values (Fig. 2.7).
The best FCM (c = 3; m = 1.1) algorithm returned three clusters and most of the
points in the data set belonged to Cluster#1. It was the only cluster suitable for the
development of the neural model because, in addition to its size, it covered the entire range
of chla (from 0.03 to 7.94 mg m− 3) seen in the whole data set, and it was the most frequent
cluster in the classification images, appearing in all the MERIS images used in this study.
Chlorophyll mapping with NN models developed using only Cluster#1 required the
masking of pixels belonging to other clusters. Indeed, mapping might have been impractical
if Cluster#2 and Cluster#3 pixels had been predominant over the study area. However, their
presence did not prevent continuous chlorophyll mapping over large areas, because the
predominance of Cluster#1, observed in the data set, was also reflected in the images.
Hence, the classification images showed that Cluster#1 pixels were the most abundant over
54
Chapter II. Development of MERIS regionally specific chla algorithms
the rias Baixas area, in twelve of the fifteen images (Table 2.4). Chla mapping of the four rias
Baixas was achievable in eight images, while in another six images complete mapping of at
least one of the rias was feasible. The remaining image (June 15 2004) was more
problematic (Fig. 2.8), although the mapping of a small part in the ria de Arousa was also
possible.
Fig. 2.7b shows a chla map of the study area (November 17 2003) calculated by the
NNs. Chla concentration appears to be higher in adjacent coastal areas than in the rias
Baixas. The observed pattern of chla spatial distribution may be the result of a winter
upwelling event that is unusual, but has been recorded and described in the area in
previous studies (Álvarez et al., 2003; Prego et al., 2007).
2.4.2 Neural networks
The NN trained with the complete data set (NNRB#1) produced well-correlated
results (R2 = 0.77 in the training set; R2 = 0.63 in the validation set). However, although this
model performs well with low-medium chlorophyll values, it does not work properly with
values greater than 4 mg m− 3, which show a mean absolute prediction error greater than
1 mg m− 3. In addition, it does not detect some peaks of high or low chlorophyll (Fig. 2.10a).
If the validation set is considered overall, the model tends to slightly underestimate
chlorophyll values (MPE = 0.08), with a higher percentage of data points appearing below
the identity line (Fig. 2.9a). The main drawback of this NN is that data points with similar in
situ chlorophyll values were underestimated or overestimated depending on the cluster
associated to them. This effect is clearly seen in Fig. 2.9a, for two records with in situ values
of around 5.5 mg m− 3. Therefore, this chlorophyll-mapping model might produce unreliable
results, despite the good fitting results.
The fitting results, using the neural networks trained with the Cluster#1 data set,
were quite good and demonstrated the capability of the tool to predict chla concentrations
in the study area. The best results were achieved with NNRB#3, which was developed using
only high-quality data points. This model detected the peaks of high chla concentration
(Fig. 2.10c) in both the training and validation sets. The negative MPE value (MPE = − 0.14)
and a higher percentage of data points over the identity line (Fig. 2.9c) are indicative of a
slight overestimation of the chla concentrations, when only the validation set is considered,
preventing a better fitting in comparison with the training set. The deviation seen for the
expected values (identity line) is greater at high chla concentrations, but this could be due
to the small number of data points with chla peaks in the validation set, which prevents
55
Chapter II. Development of MERIS regionally specific chla algorithms
making a better adjustment. If the training data set is analysed, in addition to the high
correlation (R2 = 0.97) the error parameters are small (Rel. RMSE = 41; RMSE = 0.32;
VAR = 0.10), when compared to other models. This is because around 85% of the data points
show absolute prediction errors (PE) that are lower than 0.5 mg m− 3, while the
overestimation effect observed in the validation set is hardly noticeable (MPE = 0.01).
The results of the network trained using the complete Cluster#1 data set (NNRB#2)
were worse than those obtained only using the high-quality data points (NNRB#3). The
inclusion of pixels with a quality level below nine implies that each one of such pixels is next
to at least one invalid pixel (classified as land, cloud or fog) and, therefore, its reflectance
value could be affected in some way. In the most common case of pixels near the coastline,
there could be a bottom effect on reflectance or the presence of macroalgae and adjacency
effects could also affect reflectance. However, this is difficult to evaluate, because it does
not merely depend upon depth, but also on tidal height, illumination conditions and the
type of bottom. To sum up, there is no reliable way to find out whether or not a reflectance
value is affected and, therefore, it is not known if an error is being introduced. Data of in
situ reflectance may solve this problem.
Despite the uncertainty, NNRB#2 showed correlations greater than 0.75 and an
RMSE value lower than 1 mg m− 3 for both the training and the validation sets. However, this
model presented some problems when compared to NNRB#3: it did not detect some peaks
of chlorophyll values greater than 6 mg m− 3 (Fig. 2.10b), and it also overestimated a record
in the validation set, by giving it a value of 9.4 mg m− 3 (Fig. 2.9 and Fig. 2.10) that was larger
than the maximum concentration found in the in situ data set. In general, excluding this
record, the NNRB#2 model tended to slightly underestimate chlorophyll values (MPE = 0.2
for the training and validation sets), as in seen in Fig. 2.9b, where most of the points appear
below the identity line.
2.4.3 Comparison with other models
Even if there are ongoing efforts for the validation of the C2R algorithm, previously
conducted validation studies have shown good results, especially for the North Sea (Peters,
2006), which is the relevant area of the data set for the development of this algorithm.
Furthermore, in inland waters results showed reasonably good correlation between the
MERIS algal and in situ chla concentrations (Alikas & Reinart, 2008; Odermatt et al., 2010). In
our study, the C2R showed a nonlinear relationship with the in situ data. This may be due to
the relatively low concentrations (mainly < 3 mg m− 3) of chla in the study area. The scope of
56
Chapter II. Development of MERIS regionally specific chla algorithms
the C2R algorithm covers a much wider range of chla. Regional characteristics of the study
area, such as upwelling and the numerous small rivers that introduce water into the ria, can
lead to a temporal and spatial change of the phytoplankton abundance and composition, as
well as changes of the optical properties of the water. However, C2R performed much
better for the period 2006–2008.
57
Chapter II. Development of MERIS regionally specific chla algorithms
2.5 References
Alikas, K., & Reinart, A. (2008). Validation of the MERIS products on the large European lakes:
Peipsi, Vänern and Vättern. Hydrobiologia, 599, 161−168.
Álvarez, I., deCastro, M., Prego, R., & Gómez-Gesteira, M. (2003). hydrographic characterization
of a winter-upwelling event in the Ria of Pontevedra (NW Spain). Estuarine Coastal and Shelf
Science, 56, 869−876.
Atkinson, P. M., & Tatnall, A. R. (1997). Introduction neural networks in remote sensing.
International Journal of Remote Sensing, 18, 699−709.
Bezdek, J. C. (1981). Pattern recognition with fuzzy objective function algorithms. New York:
Plenum.
Bode, A., Carrera, P., & Lens, S. (2003). The pelagic foodweb in the upwelling ecosystem of
Galicia (NW Spain) during spring: Natural abundance of stable carbon and nitrogen isotopes.
ICES Journal of Marine Sciences, 60, 11−22.
Carder, K. L., Chen, F. R., Lee, Z. P., Hawes, S. K., & Kamykowski, D. (1999). Semianalytic
moderate-resolution imaging spectrometer algorithm for chlorophyll a concentration and
absorption with bio-optical domains based on nitrate-depletion temperatures. Journal of
Geophysical Research, 104, 5403−5421.
Cheng, B., & Titterington, D. M. (1994). Neural networks: A review from a statistical perspective.
Statistical Science, 9, 2−54.
Cococcioni, M., Corsini, G., Lazzerini, B., & Marcelloni, F. (2004). Approaching the ocean color
problem using fuzzy rules. IEEE Transactions on Systems, Man and Cybernetics—Part B:
Cybernetics, 34(3), 1360−1373.
Dall'Olmo, G., Gitelson, A. A., Rundquist, D. C., Leavitt, B., Barrow, T., & Holz, J. C. (2005).
Assessing the potential of SeaWiFS and MODIS for estimating chlorophyll concentration in
turbid productive waters using red and near-infrared bands. Remote Sensing of Environment, 96,
176−187.
58
Chapter II. Development of MERIS regionally specific chla algorithms
Doerffer, R., & Schiller, H. (2007). The MERIS Case 2 water algorithm. International Journal of
Remote Sensing, 28, 517−535.
Doerffer, R., & Schiller, H. (2008). MERIS regional coastal and lake case 2 water project—
Atmospheric correction ATBD. GKSS Research Center 21502 Geestacht, Germany. Version 1.0, 18
May 2008.
Dzwonkowski, B., & Yan, X. H. (2005). Development and application of a neural network based
ocean colour algorithm in coastal waters. International Journal of Remote Sensing, 26, 1175−1200.
Feng,H., Campbell, J.W., Dowell,M.D. &Moore, T. S. (2005).Modeling spectral reflectance of
optically complex waters using bio-optical measurements from Tokyo Bay. Remote Sensing of
Environment, 99, 232−243.
Froidefond, J. M., Gardel, L., Guiral, D., Parra, M., & Ternon, J. F. (2002). Spectral remote sensing
reflectances of coastal waters in French Guiana under the Amazon influence. Remote sensing of
Environment, 80, 225−232.
Fukunaga, K. (1990). Introduction to statistical pattern recognition, 2nd ed. San Diego, CA:
Academic Press.
GEOHAB (2005). Global ecology and oceanography of harmful algal blooms. Paris and Baltimore:
IOC and SCOR.
Gitelson, A. A., Schalles, J. F., & Hladik, C. M. (2007). Remote chlorophyll-a retrieval in turbid,
productive estuaries: Chesapeake Bay case study. Remote Sensing of Environment, 109, 464−472.
Gitelson, A. A., Dall'Olmo, G., Moses, W., Rundquist, D. C., Barrow, T., Fisher, T. R., Gurlin, D.,
&Holz, J. (2008). A simple semi-analytical model for remote estimation of chlorophyll-a in turbid
waters: Validation. Remote Sensing of Environment, 112, 947−951.
Gitelson, A. A., & Kondratyev, K. Y. (1991). Optical models of mesotrophic and eutrophic water
bodies. International Journal of Remote Sensing, 12, 373−385.
Gons,H. (1999). Optical teledetection of chlorophyll a inturbid inland waters. Environmental
Science & Technology, 33, 1127−1132.
59
Chapter II. Development of MERIS regionally specific chla algorithms
Gons, H. J., Rijkeboer, M., & Ruddick, K. G. (2002). A chlorophyll-retrieval algorithm for satellite
imagery (medium resolution imaging spectrometer) of inland and coastal waters. Journal of
Plankton Research, 24, 947−951.
Gordon, H. R., & Morel, A. Y. (1983). Remote assessment of ocean colour for interpretation of
satellite visible imagery: A review. New York: Springer Verlag.
Keiner, L. E., & Brown, C. W. (1999). Estimating oceanic chlorophyll concentrations with neural
networks. International Journal of Remote Sensing, 20, 189−194.
Keiner, L., & Yan, X. H. (1998). The use of a neural network in estimating surface chlorophyll and
sediments from Thematic Mapper imagery. Remote Sensing of the Environment, 66, 153−165.
Kishino, M., Ishimaru, T., Furuya, K., Oishi, T., & Kawasaki, K. (1998). In-water algorithm for
ADEOS/OCTS. Journal of Oceanography, 54, 431−436.
Leondes, C. T. (1998). Neural network systems techniques and applications. New York: Academic
Press.
Maritonema, S., Siegel, D. A., & Peterson, A. R. (2002). Optimization of a semianalytical ocean
color model for global-scale applications. Applied Optics, 41, 2705−2714.
McClain, C. R., Chao, S. -Y., Atkinson, L. P., Blanton, J. O., & Castillejo, F. (1986). Winddriven
upwelling in the vicinity of Cape Finisterre, Spain. Journal of Geophysical Research, 91,
8470−8486.
Moore, T. S., Campbell, J. W., & Dowell, M. D. (2009). A class-based approach to characterizing
and mapping the uncertainty of the MODIS ocean chlorophyll product. Remote Sensing of
Environment, 113, 2424−2430.
Moore, T. S., Campbell, J. W., & Feng, H. (2001). A fuzzy logic classification scheme for selecting
blending ocean color algorithms. IEEE Transactions on Geoscience and Remote Sensing, 39,
1764−1776.
Morel, A., & Prieur, L. (1977). Analysis of variations in ocean color. Limnology and Oceanography,
22, 709−722.
60
Chapter II. Development of MERIS regionally specific chla algorithms
Nogueira, E., Pérez, F. F., & Ríos, A. F. (1997). Seasonal patterns and long-term trends in an
estuarine upwelling ecosystem (Ría de Vigo, NW Spain). Estuarine, Coastal and Shelf Science, 44,
285−300.
Odermatt, D., Giardino, C., & Heege, T. (2010). Chlorophyll retrieval with MERIS Case-2-Regional
in perialpine lakes. Remote Sensing of Environment, 114, 607−617.
Oliveira, P., Nolasco, R., Dubert, J., Moita, T., & Peliz, A. (2009). Surface temperature,
chlorophyll and advection patterns during a summer upwelling event off central Portugal.
Continental Shelf Research, 29, 759−774.
O'Reilly, J. E., Maritorena, S., Mitchell, G., Siegel, D. A., Carder, K. L., Garver, S. A., Kahru, M., &
McClain, C. (1998). Ocean color chlorophyll algorithms for SeaWiFS. Journal of Geophysical
Research, 103, 24937−24953.
O'Reilly, J. E., Maritorena, S., O'Brien, M. C., Siegel, D. A., Toole, D., Menzies, D., et al. (2000).
Ocean color chlorophyll a algorithms for SeaWiFS, OC2 and OC4: Version 4. In S. B. Hooker &
E.R. Firestone (Eds.), NASA technical memorandum 2000-206892, Vol. 11 49pp.
Peters, S. Water Product Validation Case II waters. Validation at the North Sea. In, Second
Working Meeting on MERIS and AATSR Calibration and Geophysical Validation CD SP-615.
Frascati, Italy.
Prego, R., Guzmán-Zuñiga, D., Varela, M., deCastro, M., & Gómez-Gesteira, M. (2007).
Consequences of winter upwelling events on biogeochemical and phytoplankton patterns in a
western Galician ria (NW Iberian Peninsula). Estuarine Coastal and Shelf Science, 73, 409−422.
Raudys, S. (2001). Statistics and neural classifiers. An integrated approach to design. London:
Springer.
Ressom, H. W., Turner, K., & Musavi, M. (2006). Estimation of ocean water chlorophyll-a
concentration using fuzzy c-means clustering artificial neural networks. International Joint
Conference on Neural Networks (pp. 4118−4125). Vancouver, Canada: IEEE.
61
Chapter II. Development of MERIS regionally specific chla algorithms
Ribeiro, A., Peliz, A., & Santos, A. M. P. (2005). A study of the response of chl-a biomass to a
winter upwelling event off western Iberia using SeaWiFS and in situ data. Journal of Marine
Systems, 53, 87−107.
Robinson, I. (2004). Measuring the oceans from space: The principles and methods of satellite
oceanography. Chichester, UK: Spinger.
Schiller, H., & Doerffer, R. (1999). Neural network for emulation of an inverse model operational
derivation of Case II water properties from MERIS data. International Journal of Remote Sensing,
30, 1735−1746.
Thiria, S., Mejia, C., Badran, F., & Crepon, M. (1993). A neural network approach for modelling
nonlinear transfer functions: Application for wind retrieval from spaceborne scatterometer
data. Journal of Geophysical Research, 98(12), 22827−22841.
Tilstone, G. H., Figueiras, F. G., & Fraga, F. (1994). Upwelling–downwelling sequences in the
generation of red tides in a coastal upwelling system. Marine Ecology Progress Series, 112,
241−253.
Torres-Palenzuela, J. M., Vilas-González, L., & Mosqura-Giménez, Á. (2005a). Correlation between
MERIS and in-situ data for study of Pseudo-nitzschia spp. toxic blooms in Galician coastal area (pp.
497−507). Rotterdam: Millpress.
Torres-Palenzuela, J. M., Vilas-González, L., & Mosqura-Giménez, Á. (2005b). Detection of
Pseudo-nitzschia spp. toxic blooms using MERIS images on the Galician coast (pp. 1915−1919). :
European Space Agency (Special Publication).
Windham, M. (1981). Cluster validity for fuzzy clustering algorithms. Fuzzy Sets and Systems, 5,
177−185.
Xie, X., & Beni, G. (1991). A validity measure for fuzzy clustering. IEEE Transactions on Pattern
Analysis and Machine Intelligence, 13, 841−847.
Zapata, M., Rodríguez, F., & Garrido, J. L. (2000). Separation of chlorophylls and carotenoids
from marine phytoplankton: A new HPLC method using a reversed phase C8 column and
pyridine-containing mobile phases. Marine Ecology Progress Series, 195, 29−45.

62
Chapter II. Development of MERIS regionally specific chla algorithms
Zhang, T., Fell, F., Liu, Z. -S., Preusker, R., Fisher, J., & He, M. -X. (2003). Evaluating the
performance of artificial neural network techniques for pigment retrieval from ocean color in
Case I. Journal of Geophysical Research, 108, 3286−3298.
Chapter III. Chla mapping during an upwelling event
63
Application of a regionally specific
chlorophyll a algorithm for MERIS
FR data during an upwelling cycle
Abstract
3.1 Introduction
3.2 Material and methods
3.3 Results & Discussion
3.4 References
CHAPTER III

64
65
Chapter III. Chla mapping during an upwelling event
Abstract
This study takes advantage of a regionally specific algorithm and the characteristics
of Medium Resolution Imaging Spectrometer (MERIS) in order to deliver more accurate,
detailed chlorophyll a (chla) maps of optically complex coastal waters during an upwelling
cycle. MERIS full resolution chla concentrations and in situ data were obtained on the
Galician (NW Spain) shelf and in three adjacent rias (embayments), sites of extensive
mussel culture that experience frequent harmful algal events. Regionally focused
algorithms (Regional neural network for rias Baixas or NNRB) for the retrieval of chla in the
Galician rias optically complex waters were tested in comparison to sea-truth data. The one
that showed the best performance was applied to a series of six MERIS (FR) images during
a summer upwelling cycle to test its performance. The best performance parameters were
given for the NN trained with high-quality data using the most abundant cluster found in
the rias after the application of fuzzy c-mean clustering techniques (FCM). July 2008 was
characterized by three periods of different meteorological and oceanographic states. The
main changes in chla concentration and distribution were clearly captured in the images.
After a period of strong upwelling favourable winds a high biomass algal event was
recorded in the study area. However, MERIS missed the high chlorophyll upwelled water
that was detected below surface in the ria de Vigo by the chla profiles, proving the necessity
of in situ observations. Relatively high biomass “patches” were mapped in detail inside the
rias. There was a significant variation in the timing and the extent of the maximum chla
areas. The maps confirmed that the complex spatial structure of the phytoplankton
distribution in the rias Baixas is affected by the surface currents and winds on the adjacent
continental shelf. This study showed that a regionally specific algorithm for an ocean colour
sensor with the characteristics of MERIS in combination with in situ data can be of great
help in chla monitoring, detection and study of high biomass algal events in an area
affected by coastal upwelling such as the rias Baixas.
66
Chapter III. Chla mapping during an upwelling event
3.1 Introduction
Although remote sensing tools can be used with a relatively high precision at global
scale for the calculation of chlorophyll a (chla), they are not always totally accurate in local
areas (Cota et al., 2004; Ruddick et al., 2008) and highly dynamic systems such upwelling
regimes. Eastern boundary upwelling systems cover a small percentage of the ocean
surface, but account more than 20% of the global fish catch.
In these high productive systems harmful algal events due to toxic phytoplankton
species and/or high-biomass blooms pose an increasing threat for aquaculture and fishing
industries, ecosystem health and diversity and have possible implications for human health
and activities (Trainer et al., 2010). Harmful algal events in eastern boundary upwelling
systems have been closely associated with the wind properties (Bates et al., 1998; Pitcher et
al., 1998) and have become a focal point of numerous studies (e.g. Kudela et al., 2005;
Pitcher & Nelson, 2006; Fewcett et al., 2007). For example, in their review on harmful algal
events in upwelling systems, Pitcher et al. (2010) noticed that variations in wind-stress
fluctuations and buoyancy inputs in upwelling systems are controlling factors of the bloom
timing and pointed out the role of inner-shelf dynamics on the spatial distribution of the
bloom.
Upwelling waters are characterized by considerable variability in the vertical
distribution of phytoplankton (Brown & Hutchings, 1987) and in their optical properties
(Morel & Prieur, 1977). Optically active water constituents such as SPM which are brought
into the surface because of the strong mixing and vertical advection that takes place during
upwelling events may vary independently of the surface chla, as they do in typically shallow
estuarine case II waters.
In typical case II waters the traditional satellite-derived chla models (empirical:
Muller-Karger et al., 1990; Evans & Gordon, 1994; Aiken et al., 1995; O´ Reilly et al., 2000;
McClain et al., 2004; Brown et al., 2008 and semi-analytical: Carder & Steward, 1985; Carder
et al., 1999) based on the ratio between the radiance of blue and green light reflected by
the surface waters cannot be used for an accurate retrieval of chla (Morel & Prieur 1977;
Gons, 1999; Gitelson et al., 2007). However, chla algorithms that use green to red and near
infrared band ratios have shown good performance in inland and coastal waters (Gilerson
et al., 2010). In the effort for more accurate retrieval of water constituents in optically
complex waters, neural network (NN) techniques can play an important role, since they
seem ideal for multivariate, complex and non-linear data modeling (Thiria et al., 1993).
67
Chapter III. Chla mapping during an upwelling event
Dransfeld et al., (2004) emphasised the role of NNs in the retrieval of water constituents
especially in Case 2 waters. In recent decades the application of neural network (NN)
techniques for the estimation of selected water quality parameters from ocean-colour has
increased (Atkinson & Tatnall, 1997; Keiner & Yan, 1998; Dzwonkowski & Yan, 2005; Zhang
et al., 2003; Shahraiyni et al., 2009). NN based algorithms are currently used as standard
products for the estimation of chla, suspended particulate matter (SPM) and yellow
substances by the European Space Agency (ESA) for Medium Resolution Imaging
Spectrometer (MERIS) data (Doerffer & Schiller, 2007, 2008).
The Galician rias are V-like embayments along the northwest part of the Iberian
Peninsula formed by sunken river valleys flooded by the sea, whose ecosystems are
strongly influenced by oceanic conditions on the adjacent continental shelf. Interest in
developing an accurate estimation of chla in these rias is considerable, mainly because of
the economic and social importance of the extensive culture of mussels (Rodríguez
Rodríguez et al., 2011), and the frequent occurrence of harmful algal events (GEOHAB,
2005).
Although MERIS is an ocean colour sensor with characteristics considered suitable
for chla monitoring and detection of HABs in coastal areas (Doerffer et al., 1999), to our
knowledge the studies using MERIS data in the Galician rias are limited to those of Torres
Palenzuela et al. (2005a; b), Spyrakos et al., (2010) and González Vilas et al. (2011). The latter
authors developed a chla algorithm based on NNs and classification techniques from MERIS
full resolution data for rias Baixas coastal waters. Previous ocean colour studies by satellite
sensors (CZCS, SeaWiFS, MODIS) during active upwelling in the Iberian system (McClain et
al., 1986; Peliz & Fiuza, 1999; Joint et al., 2002; Bode et al., 2003; Ribeiro et al., 2005; Oliveira
et al., 2009a, Oliveira et al., 2009b) played an important role in the identification of chla
patterns and study of harmful algal blooms and primary production but were restricted to
the ocean shelf because of insufficient spatial resolution. Another problem that affected
many of these previous satellite remote sensing studies in the area was the failure of the
algorithms used to provide reliable chla data during upwelling favourable conditions
especially in the areas closest to the coast.
In the present chapter a set of neural network-based chla algorithms previously
developed for the Galician rias waters (within the rias and for coastal waters on the
continental shelf) are applied for the first time in a short series of MERIS (FR) images
delivered during an upwelling cycle in order to obtain maps of chla. This study tests the
potential of the algorithms to map the spatial extent of possible algal blooms caused by
coastal upwelling. Also, the temporal and spatial distribution of the chla patterns, captured
68
Chapter III. Chla mapping during an upwelling event
in the MERIS images using the local adapted algorithm, are discussed in relation to the
meteorological and oceanographic conditions in the area. Finally, the performance of the
neural network-based chla algorithm is compared to in situ measurements.
3.2 Methods and data
3.2.1 Study area
The rias Baixas constitute the southern part of the Galician rias (Fig. 3.1). This study
focuses on three rias (Arousa, Pontevedra and Vigo), each connected to the open sea
through two entrances, to the north and south of the islands located at the external part of
each ria.
In these highly primary productive upwelling estuarine systems (Fraga, 1981, Torres
& Barton, 2007; Spyrakos et al., in press) transient increases of phytoplankton abundance,
referred to as blooms, are a frequent phenomenon occurring mainly between early spring
and late fall (Fraga et al., 1988; Varela, 1992, Figueiras & Ríos, 1993). Sporadically, some
phytoplankton blooms in the Galician rias are perceived as harmful with direct and indirect
impacts to the mussel production that constitute an important economic activity in the
area. Harmful algal events in the Galician rias are a well documented phenomenon
(Margalef, 1956; Figueiras & Niell, 1987; Figueiras & Ríos, 1993; Tilstone et al., 1994; Figueiras
et al., 1994; Nogueira et al., 1997; Tilstone et al., 2003; GEOHAB, 2005). Harmful events due
to the Paralytic shellfish toxin (PST) producer Gymnodinium catenatum have been
occasionally (1976: Estrada et al., 1984; 1985: Laiño, 1991; 2005: Bravo et al., 2010a; b) or/and
annually (1985-1995: Pazos et al., 2006) recorded in the Galician rias. It is generally
considered (Fraga et al., 1990; Figueiras et al., 1996) that advection of warmer waters from
the shelf into the rias at the end of the upwelling season coincides with the highest
abundances of G. catenatum. Pazos et al. (2006) observed a northward progression of G.
catenatum along the Iberian Peninsula starting on the Portuguese coast, suggesting this
could provide an early notice of G. catenatum events in the Galician rias.
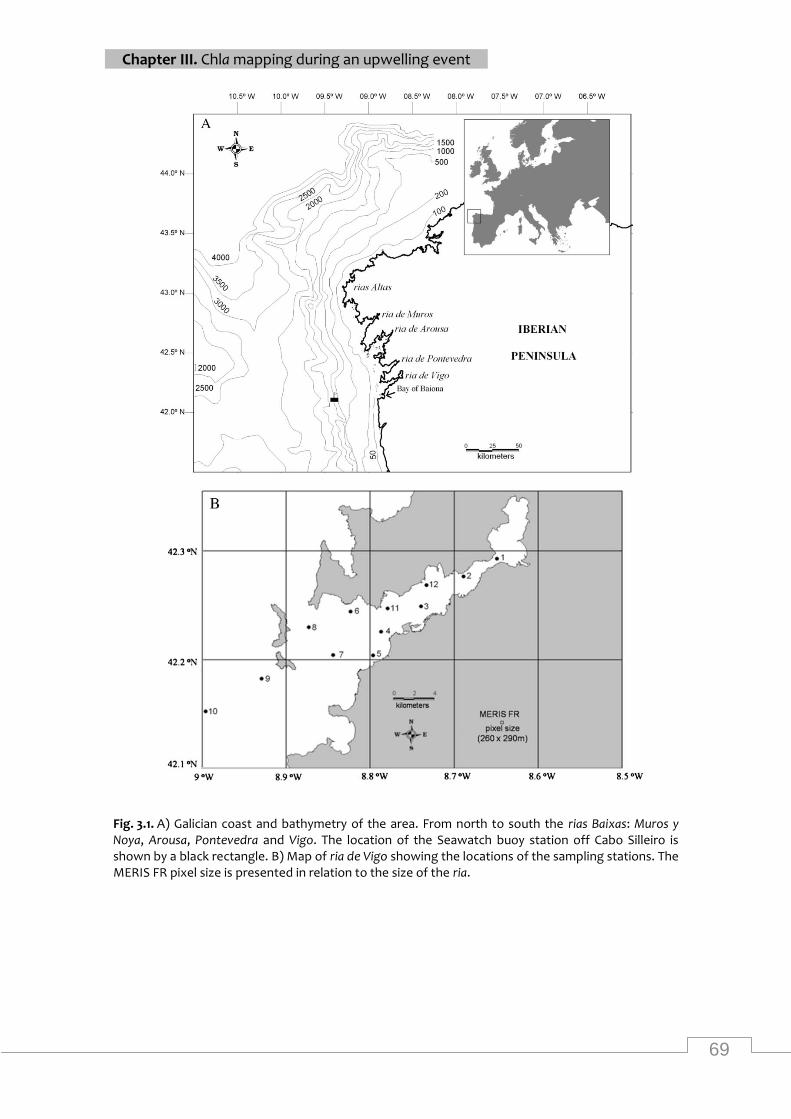
69
Chapter III. Chla mapping during an upwelling event
Fig. 3.1. A) Galician coast and bathymetry of the area. From north to south the rias Baixas: Muros y Noya, Arousa, Pontevedra and Vigo. The location of the Seawatch buoy station off Cabo Silleiro is shown by a black rectangle. B) Map of ria de Vigo showing the locations of the sampling stations. The MERIS FR pixel size is presented in relation to the size of the ria.
70
Chapter III. Chla mapping during an upwelling event
3.2.2 Sampling regime
Two samplings were conducted in 2008 in the ria de Vigo. Twelve fixed stations
were visited on cloud-free days (July 9 and 22). The sampling transect was extended from
the open sea towards the inner part of the ria. Satellite data from MERIS (FR) were
available for the same days. The depth of the sites, where samples were collected, ranged
from 5 m inside the ria to 100 m outside. Triplicate water samples from surface to 3 m were
collected at each station (Fig. 3.1B) from a sampler (3524 cm3) for the determination of chla
and SPM.
3.2.3 In situ measurements
In situ chla fluorescence profile was monitored by a Turner designs CYCLOPS-7
submersible fluorometer. Profiles of water temperature were provided by a portable meter
(HI 9829, Hanna instruments). The depth of the euphotic zone was established with a
Secchi disk. For the High Performance Liquid Chromatography (HPLC) chla determination,
water samples (100-200mL) were filtered through a 9mm diameter Whatman GF/F filters
and stored at -80oC for 2 weeks, and 95% methanol was used as extraction solvent for the
pigments. In this study only chla concentration data are presented, calculated as the sum of
chlorophyllide a, chlorophyll a epimer, chlorophyll a allomer and divinyl chlorophyll a. An
HPLC method using a reversed phase C8 was applied for the separation of the pigments.
Details of pigment extraction and separation are provided in Zapata et al. (2000).
SPM was evaluated in terms of SPM concentration and percent weight of organic
matter (%OM). Pre-combusted (450 oC for 24 h), pre-washed in 500 mL of MilliQ, 47mm
Whatman GF/F filters were used. These filters were then dried at 65 oC to a constant weight.
Particles were collected by filtering a standard volume (1000mL) of seawater samples and
then rinsed with 50mL MilliQ in order to remove salts and dissolved organic matter. For the
determination of SPM the filters were dried at 65oC till no weight changes were observed.
The filters were then re-combusted at 450 ºC for 5 h in order to obtain the inorganic
suspended matter (ISM). The percent weight of organic matter (%OM) was determined by
subtracting the ISM from the SPM. All the filters were weighted on a Precisa 262 SMA-FR
microbalance (10-5 g precision).
71
Chapter III. Chla mapping during an upwelling event
Table 3.1. MERIS imagery showing the acquisition time (UTC) and mean view zenith angle from west. Sea-truthing mean values (± S.D.) of chlorophyll a (chla), suspended particulate matter (SPM), percentage of inorganic contribution to SPM and Secchi disk depth (Zsd) for ria de Vigo (12 stations) during the two samplings.
Chla (mg m-3
) 0.74±0.80 0.97±0.82
SPM (mg L-1
) 1.85±0.30 2.01±0.65
inorganic matter (%) 48.17±6.21 48.20±7.70
Zsd (m) 7.65±3.30 4.45±1.66
MERIS FR July 03 2008 July 09 2008 July 16 2008 July 19 2008 July 22 2008 July 29 2008
Acquisition time (UTC) 10:59 11:10 10:50 10:56 11:02 10:42
View zenith angle (º) 13.5 13.0 20.7 15.3 11.7 20.7
3.2.4 Oceanographic and meteorological data
Oceanographic and meteorological data off the rias Baixas were provided by the
Spanish Port System (www.puertos.es). More specifically, wind speed (W) and direction,
current data and water temperature were observed at a Seawatch buoy station located off
Cape Silleiro (42° 7.8′N, 9° 23.4′W) (Fig. 3.1). This meteorological station was selected as
fairly representative of the study area (Herrera et al., 2005). Daily upwelling index (IW) was
estimated from wind by Bakun's (1973) method:
IW = - y/( W·f)= - 1000· a·CD·W·Wy/( W·f) m3/(s·km) (1)
where y is the alongshore component of wind stress N·m-2, W is the density of seawater
(1025 kg·m-3), f is the Coriolis parameter (9.9·10-5 s-1 at 42º latitude, a is the density of air (1.2
kg·m-3 at 15ºC), CD is an empirical dimensionless drag coefficient (1.4·10-3 according to Hidy,
1972) and W and Wy are the average daily modulus and northward component of the wind.
Moderate Resolution Imaging Spectroradiometer (MODIS-Aqua) sea surface
temperature (SST) daily level 2 data for July 2008 were downloaded from the website of
the National Aeronautics and Space Administration Goddard Space Flight Center (NASA-
GSFC) (http://oceancolor.gsfc.nasa.gov/). The 1 × 1 km resolution MODIS data were
processed using MATLAB software to derive projected SST maps of the study area. The
study area for the SST maps was expanded to 42-43o N and 9.3-8.3o W. The MODIS imagery
contains 6 images for the dates that MERIS data were available.
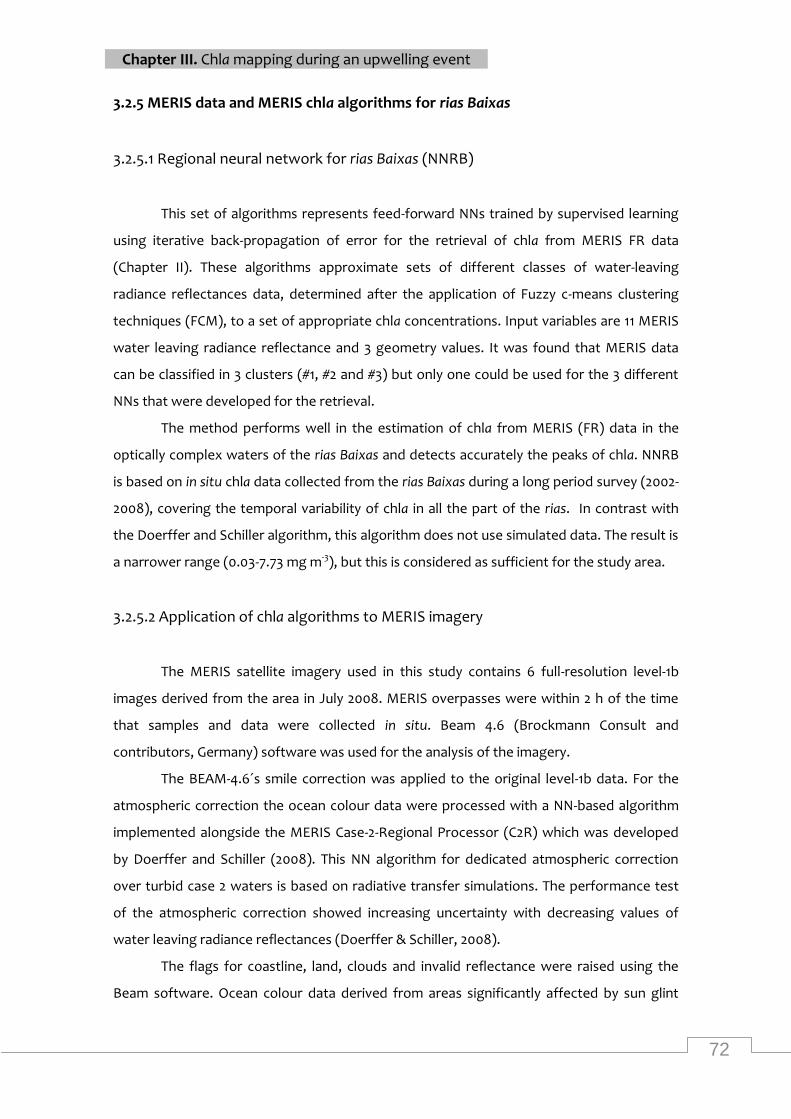
72
Chapter III. Chla mapping during an upwelling event
3.2.5 MERIS data and MERIS chla algorithms for rias Baixas
3.2.5.1 Regional neural network for rias Baixas (NNRB)
This set of algorithms represents feed-forward NNs trained by supervised learning
using iterative back-propagation of error for the retrieval of chla from MERIS FR data
(Chapter II). These algorithms approximate sets of different classes of water-leaving
radiance reflectances data, determined after the application of Fuzzy c-means clustering
techniques (FCM), to a set of appropriate chla concentrations. Input variables are 11 MERIS
water leaving radiance reflectance and 3 geometry values. It was found that MERIS data
can be classified in 3 clusters (#1, #2 and #3) but only one could be used for the 3 different
NNs that were developed for the retrieval.
The method performs well in the estimation of chla from MERIS (FR) data in the
optically complex waters of the rias Baixas and detects accurately the peaks of chla. NNRB
is based on in situ chla data collected from the rias Baixas during a long period survey (2002-
2008), covering the temporal variability of chla in all the part of the rias. In contrast with
the Doerffer and Schiller algorithm, this algorithm does not use simulated data. The result is
a narrower range (0.03-7.73 mg m-3), but this is considered as sufficient for the study area.
3.2.5.2 Application of chla algorithms to MERIS imagery
The MERIS satellite imagery used in this study contains 6 full-resolution level-1b
images derived from the area in July 2008. MERIS overpasses were within 2 h of the time
that samples and data were collected in situ. Beam 4.6 (Brockmann Consult and
contributors, Germany) software was used for the analysis of the imagery.
The BEAM-4.6´s smile correction was applied to the original level-1b data. For the
atmospheric correction the ocean colour data were processed with a NN-based algorithm
implemented alongside the MERIS Case-2-Regional Processor (C2R) which was developed
by Doerffer and Schiller (2008). This NN algorithm for dedicated atmospheric correction
over turbid case 2 waters is based on radiative transfer simulations. The performance test
of the atmospheric correction showed increasing uncertainty with decreasing values of
water leaving radiance reflectances (Doerffer & Schiller, 2008).
The flags for coastline, land, clouds and invalid reflectance were raised using the
Beam software. Ocean colour data derived from areas significantly affected by sun glint
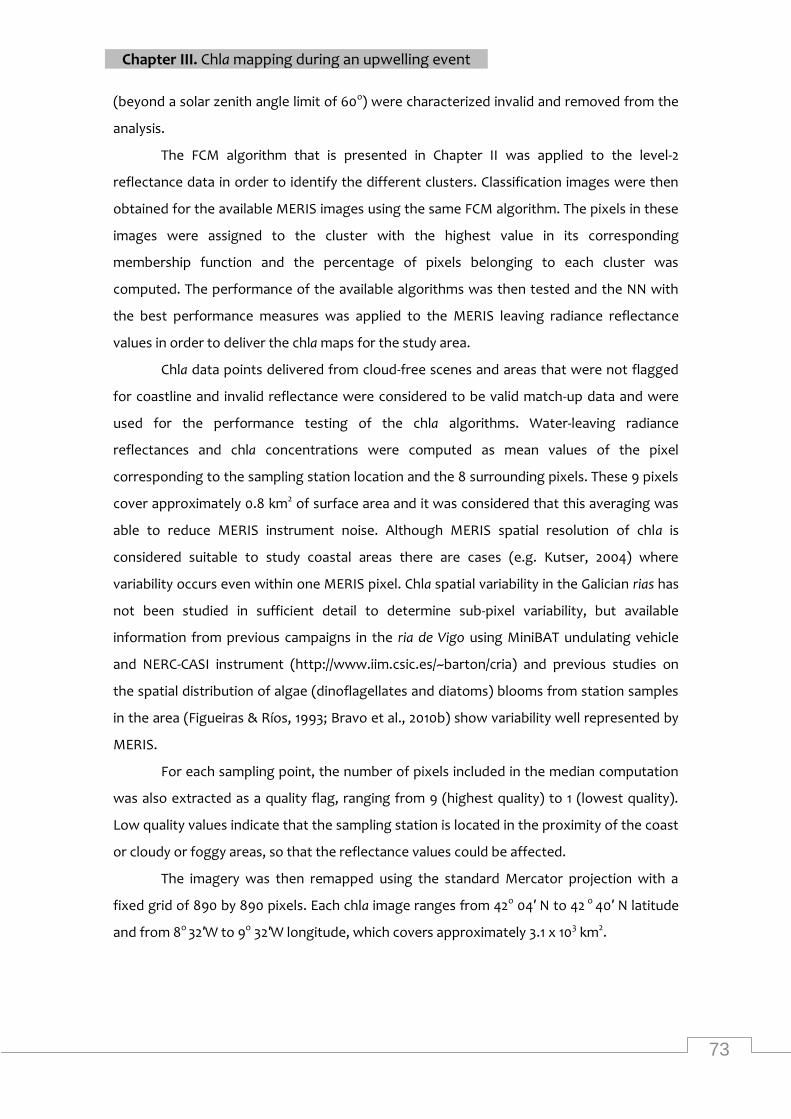
73
Chapter III. Chla mapping during an upwelling event
(beyond a solar zenith angle limit of 60o) were characterized invalid and removed from the
analysis.
The FCM algorithm that is presented in Chapter II was applied to the level-2
reflectance data in order to identify the different clusters. Classification images were then
obtained for the available MERIS images using the same FCM algorithm. The pixels in these
images were assigned to the cluster with the highest value in its corresponding
membership function and the percentage of pixels belonging to each cluster was
computed. The performance of the available algorithms was then tested and the NN with
the best performance measures was applied to the MERIS leaving radiance reflectance
values in order to deliver the chla maps for the study area.
Chla data points delivered from cloud-free scenes and areas that were not flagged
for coastline and invalid reflectance were considered to be valid match-up data and were
used for the performance testing of the chla algorithms. Water-leaving radiance
reflectances and chla concentrations were computed as mean values of the pixel
corresponding to the sampling station location and the 8 surrounding pixels. These 9 pixels
cover approximately 0.8 km2 of surface area and it was considered that this averaging was
able to reduce MERIS instrument noise. Although MERIS spatial resolution of chla is
considered suitable to study coastal areas there are cases (e.g. Kutser, 2004) where
variability occurs even within one MERIS pixel. Chla spatial variability in the Galician rias has
not been studied in sufficient detail to determine sub-pixel variability, but available
information from previous campaigns in the ria de Vigo using MiniBAT undulating vehicle
and NERC-CASI instrument (http://www.iim.csic.es/~barton/cria) and previous studies on
the spatial distribution of algae (dinoflagellates and diatoms) blooms from station samples
in the area (Figueiras & Ríos, 1993; Bravo et al., 2010b) show variability well represented by
MERIS.
For each sampling point, the number of pixels included in the median computation
was also extracted as a quality flag, ranging from 9 (highest quality) to 1 (lowest quality).
Low quality values indicate that the sampling station is located in the proximity of the coast
or cloudy or foggy areas, so that the reflectance values could be affected.
The imagery was then remapped using the standard Mercator projection with a
fixed grid of 890 by 890 pixels. Each chla image ranges from 42o 04′ N to 42 o 40′ N latitude
and from 8o 32′W to 9o 32′W longitude, which covers approximately 3.1 x 10³ km2.
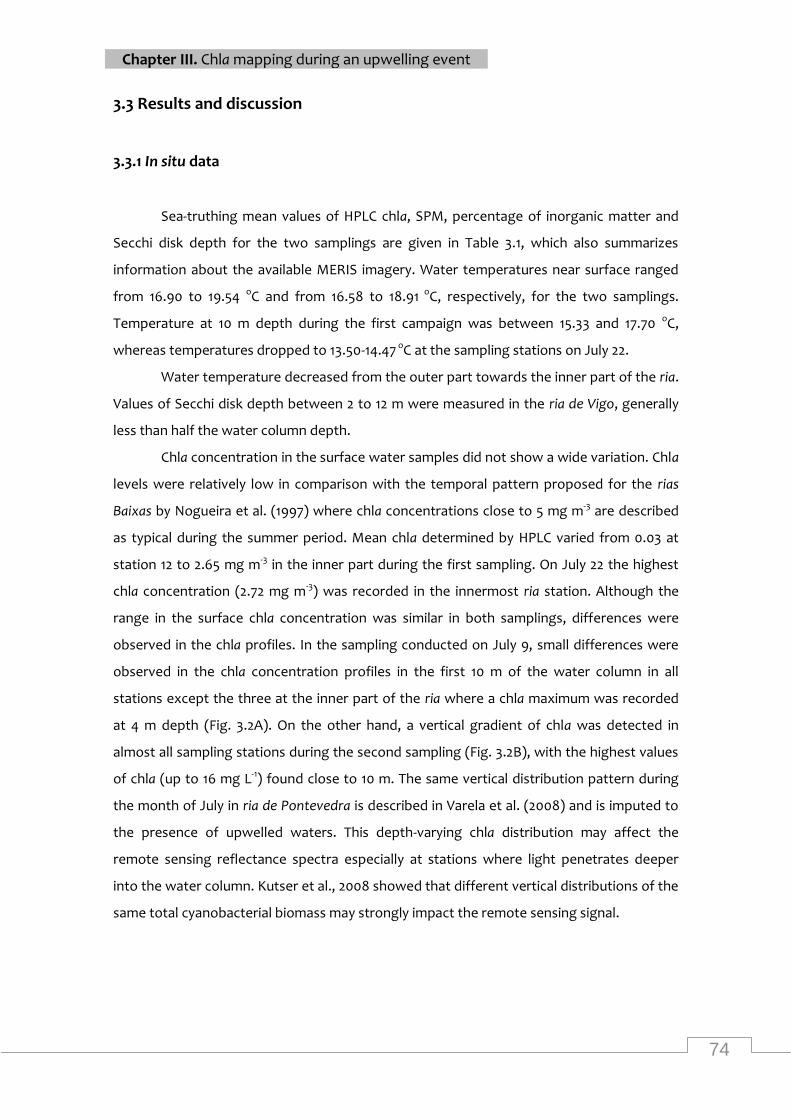
74
Chapter III. Chla mapping during an upwelling event
3.3 Results and discussion
3.3.1 In situ data
Sea-truthing mean values of HPLC chla, SPM, percentage of inorganic matter and
Secchi disk depth for the two samplings are given in Table 3.1, which also summarizes
information about the available MERIS imagery. Water temperatures near surface ranged
from 16.90 to 19.54 oC and from 16.58 to 18.91 oC, respectively, for the two samplings.
Temperature at 10 m depth during the first campaign was between 15.33 and 17.70 oC,
whereas temperatures dropped to 13.50-14.47 oC at the sampling stations on July 22.
Water temperature decreased from the outer part towards the inner part of the ria.
Values of Secchi disk depth between 2 to 12 m were measured in the ria de Vigo, generally
less than half the water column depth.
Chla concentration in the surface water samples did not show a wide variation. Chla
levels were relatively low in comparison with the temporal pattern proposed for the rias
Baixas by Nogueira et al. (1997) where chla concentrations close to 5 mg m-3 are described
as typical during the summer period. Mean chla determined by HPLC varied from 0.03 at
station 12 to 2.65 mg m-3 in the inner part during the first sampling. On July 22 the highest
chla concentration (2.72 mg m-3) was recorded in the innermost ria station. Although the
range in the surface chla concentration was similar in both samplings, differences were
observed in the chla profiles. In the sampling conducted on July 9, small differences were
observed in the chla concentration profiles in the first 10 m of the water column in all
stations except the three at the inner part of the ria where a chla maximum was recorded
at 4 m depth (Fig. 3.2A). On the other hand, a vertical gradient of chla was detected in
almost all sampling stations during the second sampling (Fig. 3.2B), with the highest values
of chla (up to 16 mg L-1) found close to 10 m. The same vertical distribution pattern during
the month of July in ria de Pontevedra is described in Varela et al. (2008) and is imputed to
the presence of upwelled waters. This depth-varying chla distribution may affect the
remote sensing reflectance spectra especially at stations where light penetrates deeper
into the water column. Kutser et al., 2008 showed that different vertical distributions of the
same total cyanobacterial biomass may strongly impact the remote sensing signal.
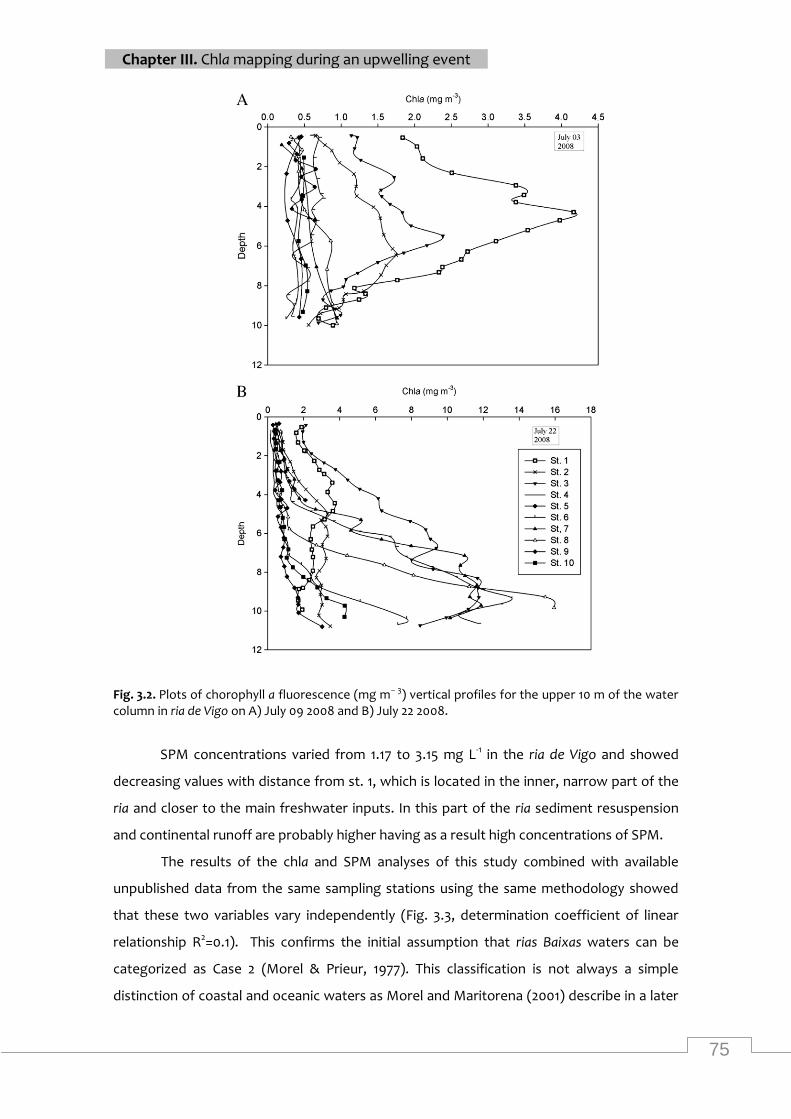
75
Chapter III. Chla mapping during an upwelling event
Fig. 3.2. Plots of chorophyll a fluorescence (mg m− 3) vertical profiles for the upper 10 m of the water column in ria de Vigo on A) July 09 2008 and B) July 22 2008.
SPM concentrations varied from 1.17 to 3.15 mg L-1 in the ria de Vigo and showed
decreasing values with distance from st. 1, which is located in the inner, narrow part of the
ria and closer to the main freshwater inputs. In this part of the ria sediment resuspension
and continental runoff are probably higher having as a result high concentrations of SPM.
The results of the chla and SPM analyses of this study combined with available
unpublished data from the same sampling stations using the same methodology showed
that these two variables vary independently (Fig. 3.3, determination coefficient of linear
relationship R2=0.1). This confirms the initial assumption that rias Baixas waters can be
categorized as Case 2 (Morel & Prieur, 1977). This classification is not always a simple
distinction of coastal and oceanic waters as Morel and Maritorena (2001) describe in a later
76
Chapter III. Chla mapping during an upwelling event
study using a new dataset of optical properties, indicating the need for models more
restricted in geographical and seasonal terms.
Fig. 3.3. Regression analysis between Total Suspended Material (TSM, also termed Suspended
Particulate Matter) and chla concentrations. (y = 1.76 + 0.13x, R2 = 0.1 and sample size N = 41).
3.3.2 Classification results and comparison of MERIS chla algorithms with in situ
data
Classification images, showing the cluster value for each sea pixel, were obtained
for the MERIS images involved in the analysis (Fig. 3.4). In theory, the membership grades
for each cluster would allow us to blend the chla concentration, obtained from the different
neural networks developed for each cluster, into a given pixel, so that chla maps with soft
transitions would be created (Moore et al., 2009). In practice, the NNRB model was only
developed for Cluster#1, so that these classification images presented here were only useful
for detecting the zones where Cluster#1 is the dominant cluster and therefore the areas
where NNRB can be best applied to obtain more reliable results. Figure 3.4 shows that
Cluster#1 is dominant in almost all the images in the rias Baixas and the adjacent area. Table
3.2 shows the percentage of pixels belonging to each cluster for each image over the rias
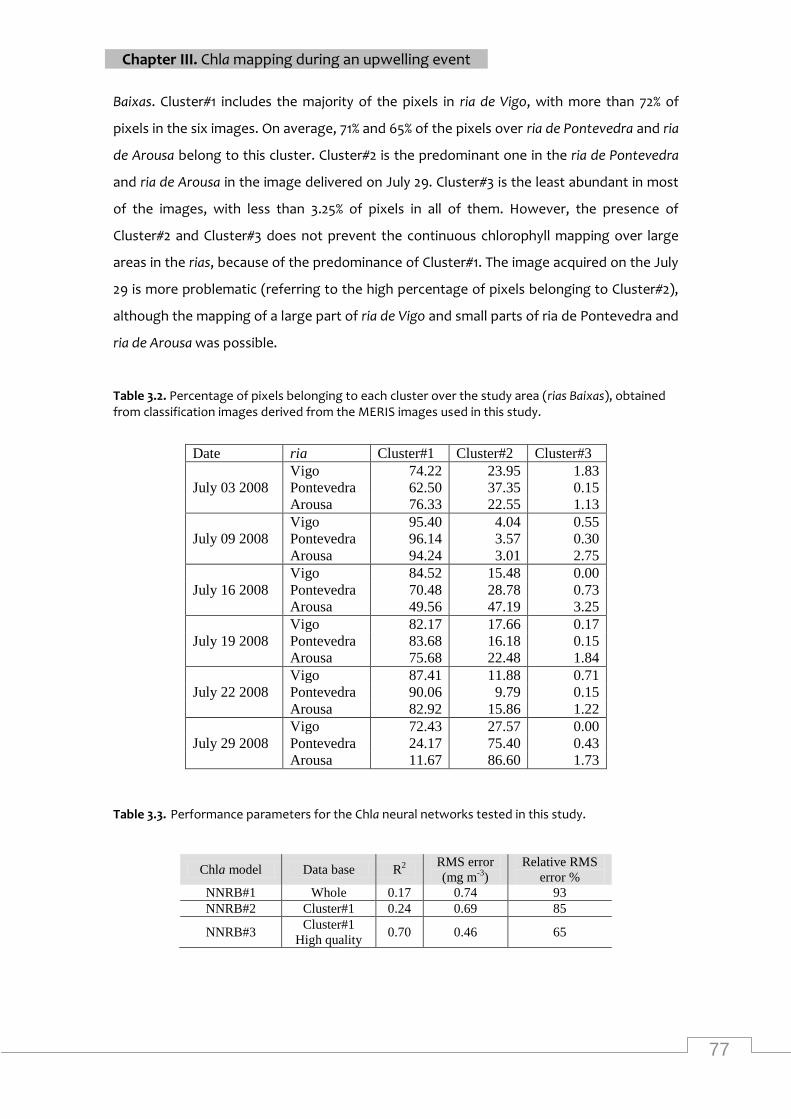
77
Chapter III. Chla mapping during an upwelling event
Baixas. Cluster#1 includes the majority of the pixels in ria de Vigo, with more than 72% of
pixels in the six images. On average, 71% and 65% of the pixels over ria de Pontevedra and ria
de Arousa belong to this cluster. Cluster#2 is the predominant one in the ria de Pontevedra
and ria de Arousa in the image delivered on July 29. Cluster#3 is the least abundant in most
of the images, with less than 3.25% of pixels in all of them. However, the presence of
Cluster#2 and Cluster#3 does not prevent the continuous chlorophyll mapping over large
areas in the rias, because of the predominance of Cluster#1. The image acquired on the July
29 is more problematic (referring to the high percentage of pixels belonging to Cluster#2),
although the mapping of a large part of ria de Vigo and small parts of ria de Pontevedra and
ria de Arousa was possible.
Table 3.2. Percentage of pixels belonging to each cluster over the study area (rias Baixas), obtained from classification images derived from the MERIS images used in this study.
Date ria Cluster#1 Cluster#2 Cluster#3
Vigo 74.22 23.95 1.83
July 03 2008 Pontevedra 62.50 37.35 0.15
Arousa 76.33 22.55 1.13
Vigo 95.40 4.04 0.55
July 09 2008 Pontevedra 96.14 3.57 0.30
Arousa 94.24 3.01 2.75
Vigo 84.52 15.48 0.00
July 16 2008 Pontevedra 70.48 28.78 0.73
Arousa 49.56 47.19 3.25
Vigo 82.17 17.66 0.17
July 19 2008 Pontevedra 83.68 16.18 0.15
Arousa 75.68 22.48 1.84
Vigo 87.41 11.88 0.71
July 22 2008 Pontevedra 90.06 9.79 0.15
Arousa 82.92 15.86 1.22
Vigo 72.43 27.57 0.00
July 29 2008 Pontevedra 24.17 75.40 0.43
Arousa 11.67 86.60 1.73
Table 3.3. Performance parameters for the Chla neural networks tested in this study.
Chla model Data base R2
RMS error
(mg m-3
)
Relative RMS
error %
NNRB#1 Whole 0.17 0.74 93
NNRB#2 Cluster#1 0.24 0.69 85
NNRB#3 Cluster#1
High quality 0.70 0.46 65
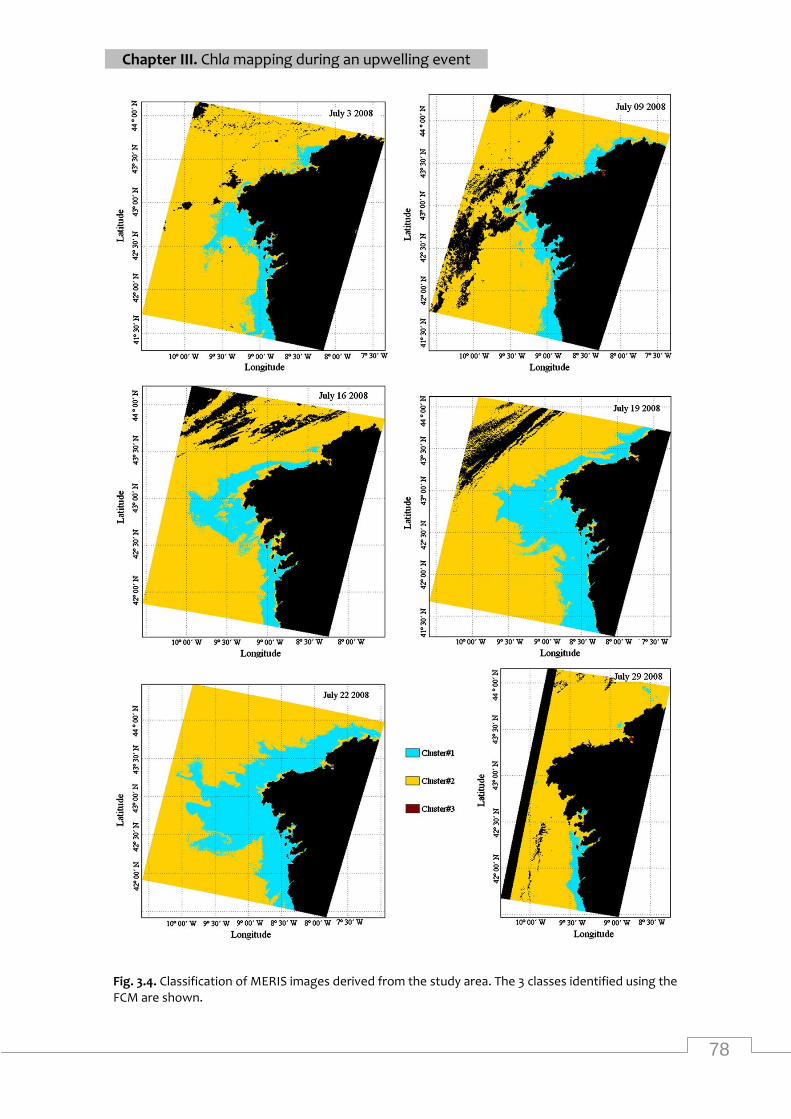
78
Chapter III. Chla mapping during an upwelling event
Fig. 3.4. Classification of MERIS images derived from the study area. The 3 classes identified using the FCM are shown.
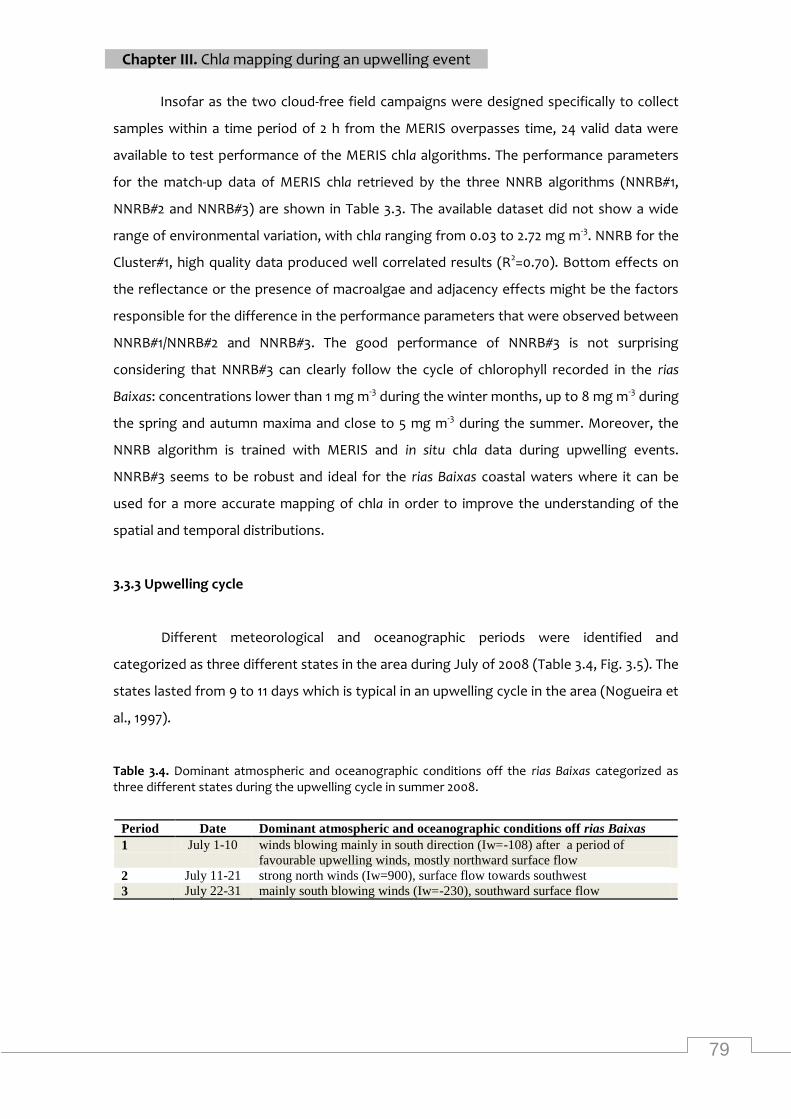
79
Chapter III. Chla mapping during an upwelling event
Insofar as the two cloud-free field campaigns were designed specifically to collect
samples within a time period of 2 h from the MERIS overpasses time, 24 valid data were
available to test performance of the MERIS chla algorithms. The performance parameters
for the match-up data of MERIS chla retrieved by the three NNRB algorithms (NNRB#1,
NNRB#2 and NNRB#3) are shown in Table 3.3. The available dataset did not show a wide
range of environmental variation, with chla ranging from 0.03 to 2.72 mg m-3. NNRB for the
Cluster#1, high quality data produced well correlated results (R2=0.70). Bottom effects on
the reflectance or the presence of macroalgae and adjacency effects might be the factors
responsible for the difference in the performance parameters that were observed between
NNRB#1/NNRB#2 and NNRB#3. The good performance of NNRB#3 is not surprising
considering that NNRB#3 can clearly follow the cycle of chlorophyll recorded in the rias
Baixas: concentrations lower than 1 mg m-3 during the winter months, up to 8 mg m-3 during
the spring and autumn maxima and close to 5 mg m-3 during the summer. Moreover, the
NNRB algorithm is trained with MERIS and in situ chla data during upwelling events.
NNRB#3 seems to be robust and ideal for the rias Baixas coastal waters where it can be
used for a more accurate mapping of chla in order to improve the understanding of the
spatial and temporal distributions.
3.3.3 Upwelling cycle
Different meteorological and oceanographic periods were identified and
categorized as three different states in the area during July of 2008 (Table 3.4, Fig. 3.5). The
states lasted from 9 to 11 days which is typical in an upwelling cycle in the area (Nogueira et
al., 1997).
Table 3.4. Dominant atmospheric and oceanographic conditions off the rias Baixas categorized as three different states during the upwelling cycle in summer 2008.
Period Date Dominant atmospheric and oceanographic conditions off rias Baixas
1 July 1-10 winds blowing mainly in south direction (Iw=-108) after a period of
favourable upwelling winds, mostly northward surface flow
2 July 11-21 strong north winds (Iw=900), surface flow towards southwest
3 July 22-31 mainly south blowing winds (Iw=-230), southward surface flow
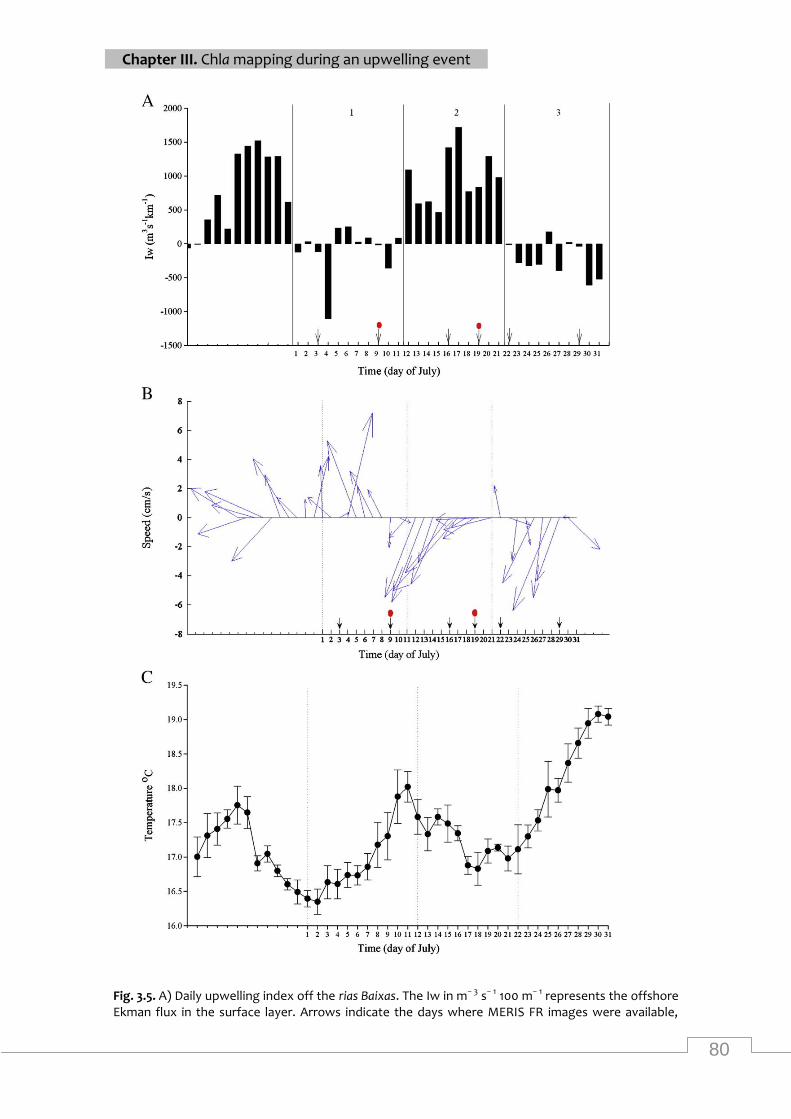
80
Chapter III. Chla mapping during an upwelling event
Fig. 3.5. A) Daily upwelling index off the rias Baixas. The Iw in m− 3 s− 1 100 m− 1 represents the offshore Ekman flux in the surface layer. Arrows indicate the days where MERIS FR images were available,
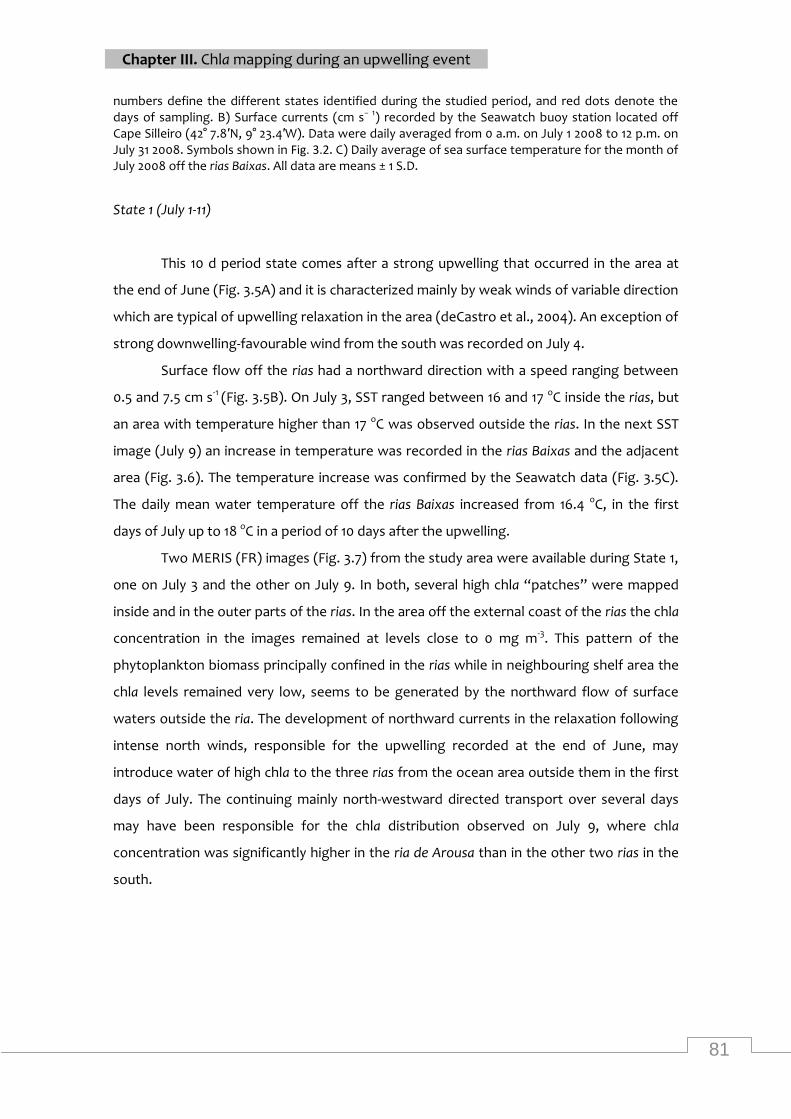
81
Chapter III. Chla mapping during an upwelling event
numbers define the different states identified during the studied period, and red dots denote the days of sampling. B) Surface currents (cm s− 1) recorded by the Seawatch buoy station located off Cape Silleiro (42° 7.8′N, 9° 23.4′W). Data were daily averaged from 0 a.m. on July 1 2008 to 12 p.m. on July 31 2008. Symbols shown in Fig. 3.2. C) Daily average of sea surface temperature for the month of July 2008 off the rias Baixas. All data are means ± 1 S.D.
State 1 (July 1-11)
This 10 d period state comes after a strong upwelling that occurred in the area at
the end of June (Fig. 3.5A) and it is characterized mainly by weak winds of variable direction
which are typical of upwelling relaxation in the area (deCastro et al., 2004). An exception of
strong downwelling-favourable wind from the south was recorded on July 4.
Surface flow off the rias had a northward direction with a speed ranging between
0.5 and 7.5 cm s-1 (Fig. 3.5B). On July 3, SST ranged between 16 and 17 oC inside the rias, but
an area with temperature higher than 17 oC was observed outside the rias. In the next SST
image (July 9) an increase in temperature was recorded in the rias Baixas and the adjacent
area (Fig. 3.6). The temperature increase was confirmed by the Seawatch data (Fig. 3.5C).
The daily mean water temperature off the rias Baixas increased from 16.4 oC, in the first
days of July up to 18 oC in a period of 10 days after the upwelling.
Two MERIS (FR) images (Fig. 3.7) from the study area were available during State 1,
one on July 3 and the other on July 9. In both, several high chla “patches” were mapped
inside and in the outer parts of the rias. In the area off the external coast of the rias the chla
concentration in the images remained at levels close to 0 mg m-3. This pattern of the
phytoplankton biomass principally confined in the rias while in neighbouring shelf area the
chla levels remained very low, seems to be generated by the northward flow of surface
waters outside the ria. The development of northward currents in the relaxation following
intense north winds, responsible for the upwelling recorded at the end of June, may
introduce water of high chla to the three rias from the ocean area outside them in the first
days of July. The continuing mainly north-westward directed transport over several days
may have been responsible for the chla distribution observed on July 9, where chla
concentration was significantly higher in the ria de Arousa than in the other two rias in the
south.
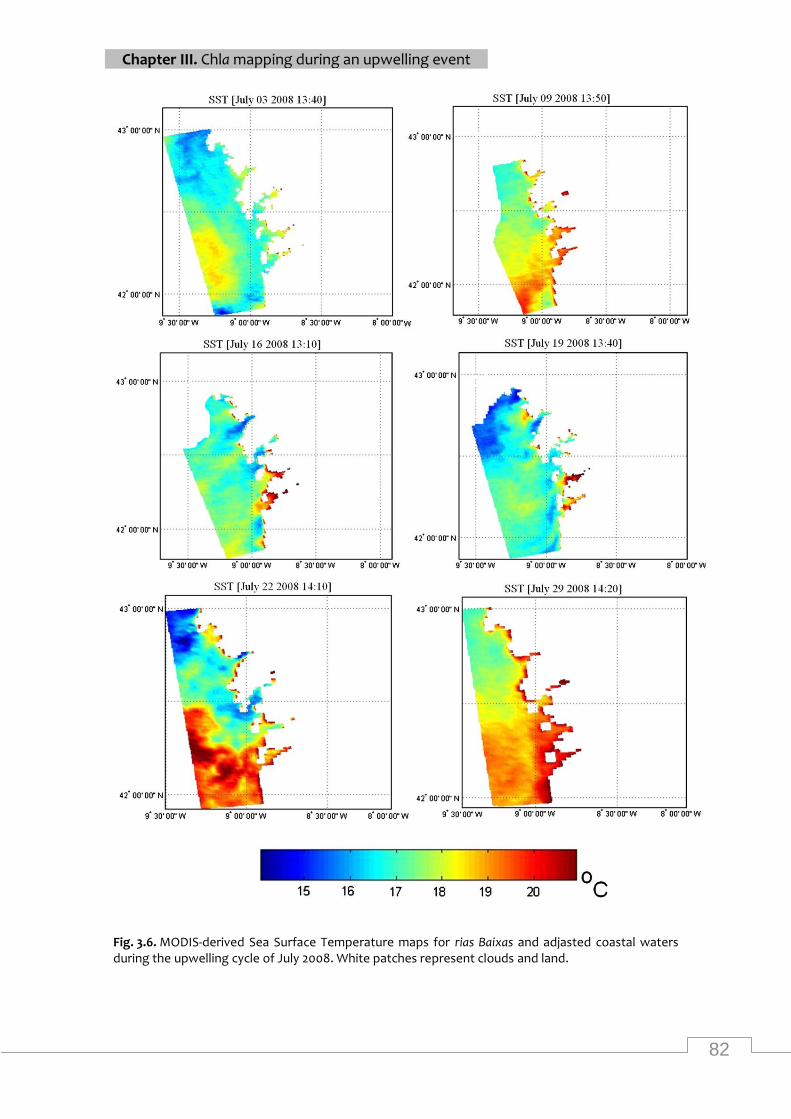
82
Chapter III. Chla mapping during an upwelling event
Fig. 3.6. MODIS-derived Sea Surface Temperature maps for rias Baixas and adjasted coastal waters during the upwelling cycle of July 2008. White patches represent clouds and land.
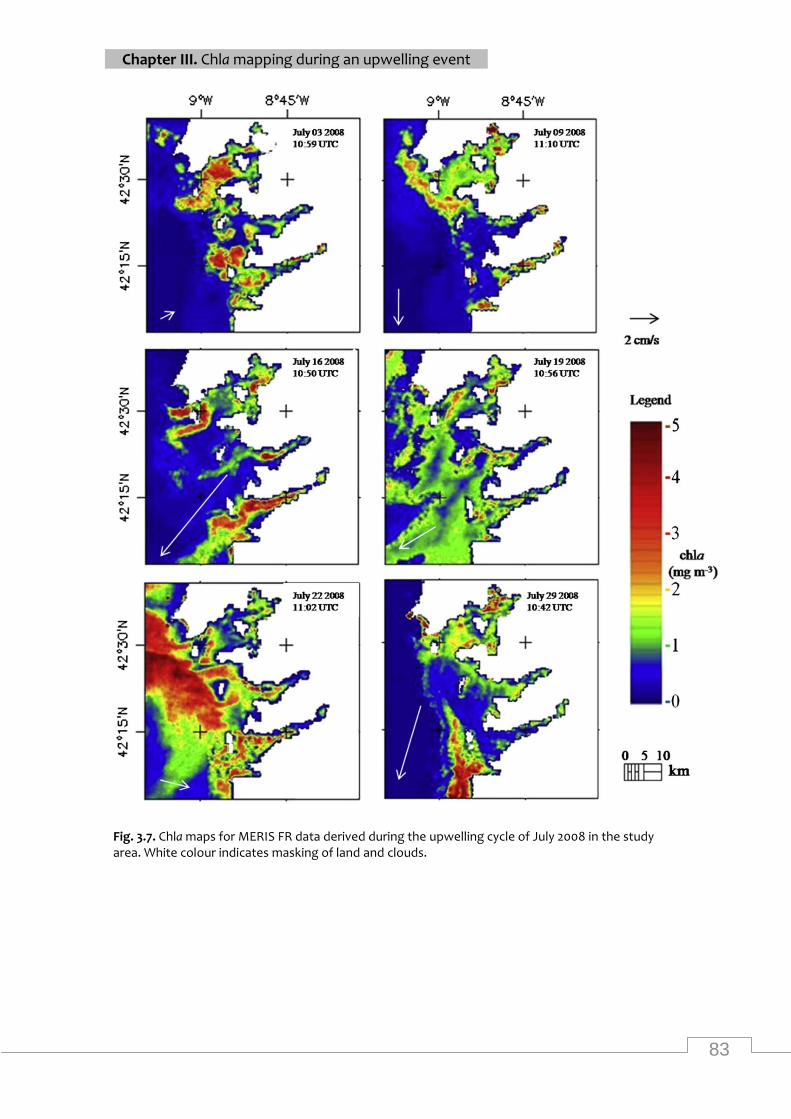
83
Chapter III. Chla mapping during an upwelling event
Fig. 3.7. Chla maps for MERIS FR data derived during the upwelling cycle of July 2008 in the study area. White colour indicates masking of land and clouds.
84
Chapter III. Chla mapping during an upwelling event
Different patterns of the higher chla areas in the rias were mapped during State 1.
On July 3, areas of high chla concentrations were mapped in the ria de Arousa (3-4.5 mg m-3)
and close to the mouths of the three rias (higher than 2 mg m-3). On July 9, chla
concentrations greater than 2 mg m-3 were mapped mainly in the middle and inner parts of
the ria de Vigo and in the outer part of the ria de Arousa.
In the image obtained on July 3, areas of high chla concentrations were observed in
the outer part of the three rias, whereas chla decreased towards the inner part of the rias.
Varela et al. (2008) reported that this gradient is common in the ria de Pontevedra during
the upwelling period when the meteorological forcing is the main factor responsible for the
circulation of the ria.
Six days after the first available image, the gradient of chla in the rias described
above was observed only in the ria de Arousa. On the contrary, Vigo and Pontevedra were
characterized by a chla gradient where concentration increased toward inshore. In the ria
de Pontevedra areas of higher chla were recorded at the innermost part and close to the
northern mouth of the ria. In the rest of the ria de Pontevedra chla concentration was close
to 0 mg m-3. In the inner part of ria de Vigo, MERIS chla varied between 2 and 3 mg m-3.
MERIS data delivered from areas like the most interior, shallow part of the rias normally
considered as suspicious because the high abundance of macroalgae increases the chla
signal (Gons, 1999) were here characterized as reliable, since they were confirmed by in situ
data. Moreover, water transparency in the 20 m station (St. 1) as determined by the Sechhi
disk measurements during the first campaign was 2 meters, decreasing the effect of the
bathymetry. This part of the rias can be firmly considered as estuary and during nutrient
enrichment from river flows, high concentrations of chla have been recorded (Evans &
Prego, 2003). In this case the observed relatively high concentrations of chla at the inner
part of the two southern rias may be the result of the mixture of estuarine water with
Eastern North Atlantic Central Water (ENACW) combined with high residence times. The
different offshore-inshore gradient of ria de Arousa seems to be formed by material
transferred to the north from the rias de Vigo and Arousa due to the northward surface
currents. Differences in topography and local winds should also be considered as possible
factors for the observed differences. Ria de Arousa is considered to be the most productive
of the rias Baixas (Bode & Varela, 1998). In the classification of Vidal-Romaní (1984) ria de
Arousa is categorized as open bay, while ria de Pontevedra and ria de Vigo as fjord-like.
Though fjords have deep quiescent interiors, only intermittently renewed, and a shallow sill
at the entrance, while the rias are shallow and have a 2 layer circulation that reverses
between up and downwelling.
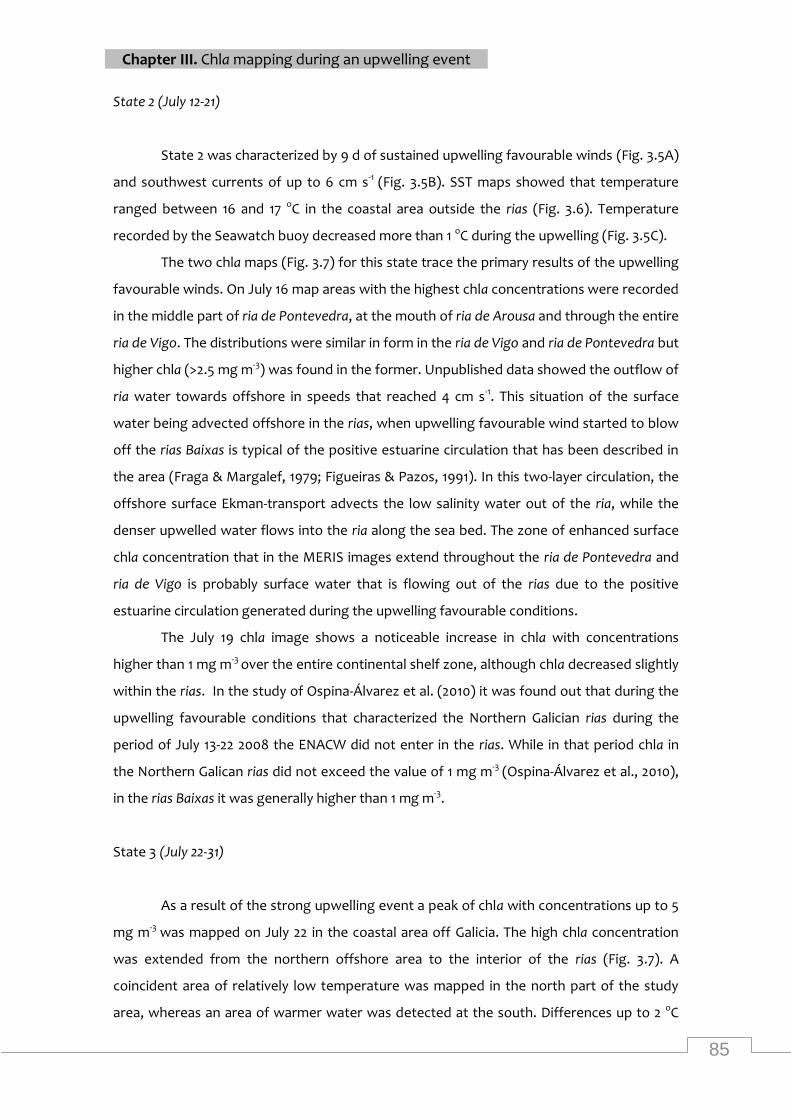
85
Chapter III. Chla mapping during an upwelling event
State 2 (July 12-21)
State 2 was characterized by 9 d of sustained upwelling favourable winds (Fig. 3.5A)
and southwest currents of up to 6 cm s-1 (Fig. 3.5B). SST maps showed that temperature
ranged between 16 and 17 oC in the coastal area outside the rias (Fig. 3.6). Temperature
recorded by the Seawatch buoy decreased more than 1 oC during the upwelling (Fig. 3.5C).
The two chla maps (Fig. 3.7) for this state trace the primary results of the upwelling
favourable winds. On July 16 map areas with the highest chla concentrations were recorded
in the middle part of ria de Pontevedra, at the mouth of ria de Arousa and through the entire
ria de Vigo. The distributions were similar in form in the ria de Vigo and ria de Pontevedra but
higher chla (>2.5 mg m-3) was found in the former. Unpublished data showed the outflow of
ria water towards offshore in speeds that reached 4 cm s-1. This situation of the surface
water being advected offshore in the rias, when upwelling favourable wind started to blow
off the rias Baixas is typical of the positive estuarine circulation that has been described in
the area (Fraga & Margalef, 1979; Figueiras & Pazos, 1991). In this two-layer circulation, the
offshore surface Ekman-transport advects the low salinity water out of the ria, while the
denser upwelled water flows into the ria along the sea bed. The zone of enhanced surface
chla concentration that in the MERIS images extend throughout the ria de Pontevedra and
ria de Vigo is probably surface water that is flowing out of the rias due to the positive
estuarine circulation generated during the upwelling favourable conditions.
The July 19 chla image shows a noticeable increase in chla with concentrations
higher than 1 mg m-3 over the entire continental shelf zone, although chla decreased slightly
within the rias. In the study of Ospina-Álvarez et al. (2010) it was found out that during the
upwelling favourable conditions that characterized the Northern Galician rias during the
period of July 13-22 2008 the ENACW did not enter in the rias. While in that period chla in
the Northern Galican rias did not exceed the value of 1 mg m-3 (Ospina-Álvarez et al., 2010),
in the rias Baixas it was generally higher than 1 mg m-3.
State 3 (July 22-31)
As a result of the strong upwelling event a peak of chla with concentrations up to 5
mg m-3 was mapped on July 22 in the coastal area off Galicia. The high chla concentration
was extended from the northern offshore area to the interior of the rias (Fig. 3.7). A
coincident area of relatively low temperature was mapped in the north part of the study
area, whereas an area of warmer water was detected at the south. Differences up to 2 oC
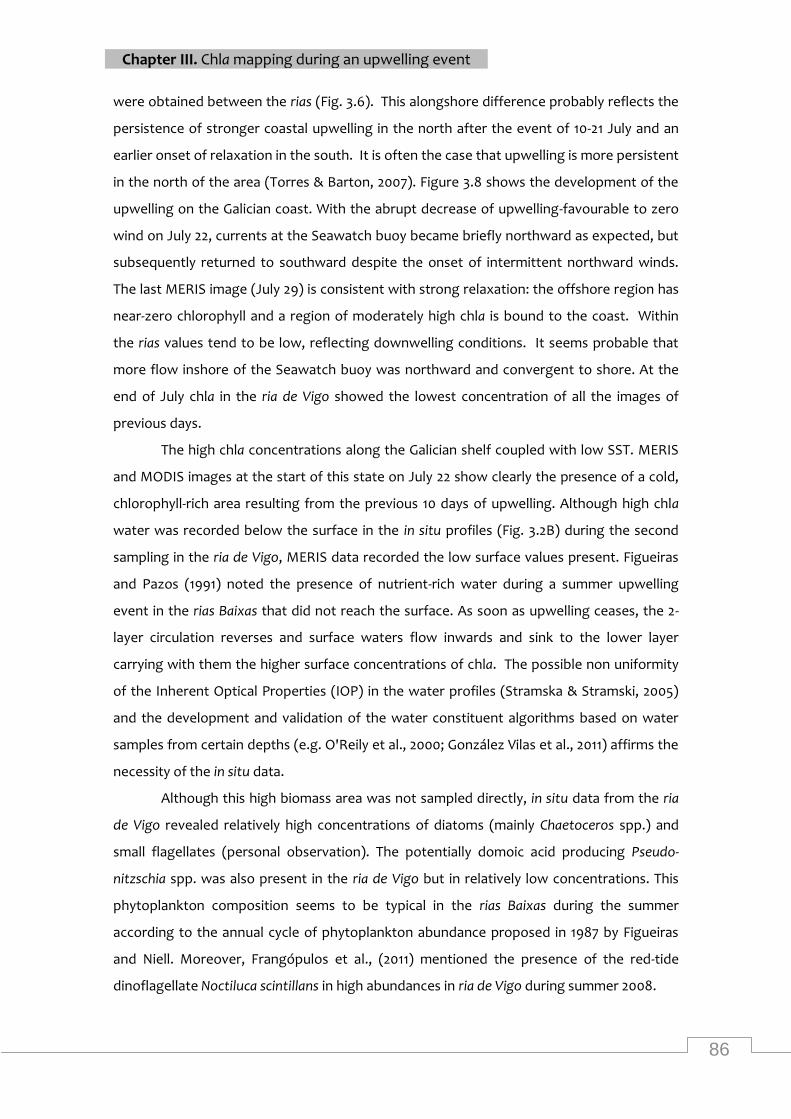
86
Chapter III. Chla mapping during an upwelling event
were obtained between the rias (Fig. 3.6). This alongshore difference probably reflects the
persistence of stronger coastal upwelling in the north after the event of 10-21 July and an
earlier onset of relaxation in the south. It is often the case that upwelling is more persistent
in the north of the area (Torres & Barton, 2007). Figure 3.8 shows the development of the
upwelling on the Galician coast. With the abrupt decrease of upwelling-favourable to zero
wind on July 22, currents at the Seawatch buoy became briefly northward as expected, but
subsequently returned to southward despite the onset of intermittent northward winds.
The last MERIS image (July 29) is consistent with strong relaxation: the offshore region has
near-zero chlorophyll and a region of moderately high chla is bound to the coast. Within
the rias values tend to be low, reflecting downwelling conditions. It seems probable that
more flow inshore of the Seawatch buoy was northward and convergent to shore. At the
end of July chla in the ria de Vigo showed the lowest concentration of all the images of
previous days.
The high chla concentrations along the Galician shelf coupled with low SST. MERIS
and MODIS images at the start of this state on July 22 show clearly the presence of a cold,
chlorophyll-rich area resulting from the previous 10 days of upwelling. Although high chla
water was recorded below the surface in the in situ profiles (Fig. 3.2B) during the second
sampling in the ria de Vigo, MERIS data recorded the low surface values present. Figueiras
and Pazos (1991) noted the presence of nutrient-rich water during a summer upwelling
event in the rias Baixas that did not reach the surface. As soon as upwelling ceases, the 2-
layer circulation reverses and surface waters flow inwards and sink to the lower layer
carrying with them the higher surface concentrations of chla. The possible non uniformity
of the Inherent Optical Properties (IOP) in the water profiles (Stramska & Stramski, 2005)
and the development and validation of the water constituent algorithms based on water
samples from certain depths (e.g. O'Reily et al., 2000; González Vilas et al., 2011) affirms the
necessity of the in situ data.
Although this high biomass area was not sampled directly, in situ data from the ria
de Vigo revealed relatively high concentrations of diatoms (mainly Chaetoceros spp.) and
small flagellates (personal observation). The potentially domoic acid producing Pseudo-
nitzschia spp. was also present in the ria de Vigo but in relatively low concentrations. This
phytoplankton composition seems to be typical in the rias Baixas during the summer
according to the annual cycle of phytoplankton abundance proposed in 1987 by Figueiras
and Niell. Moreover, Frangópulos et al., (2011) mentioned the presence of the red-tide
dinoflagellate Noctiluca scintillans in high abundances in ria de Vigo during summer 2008.
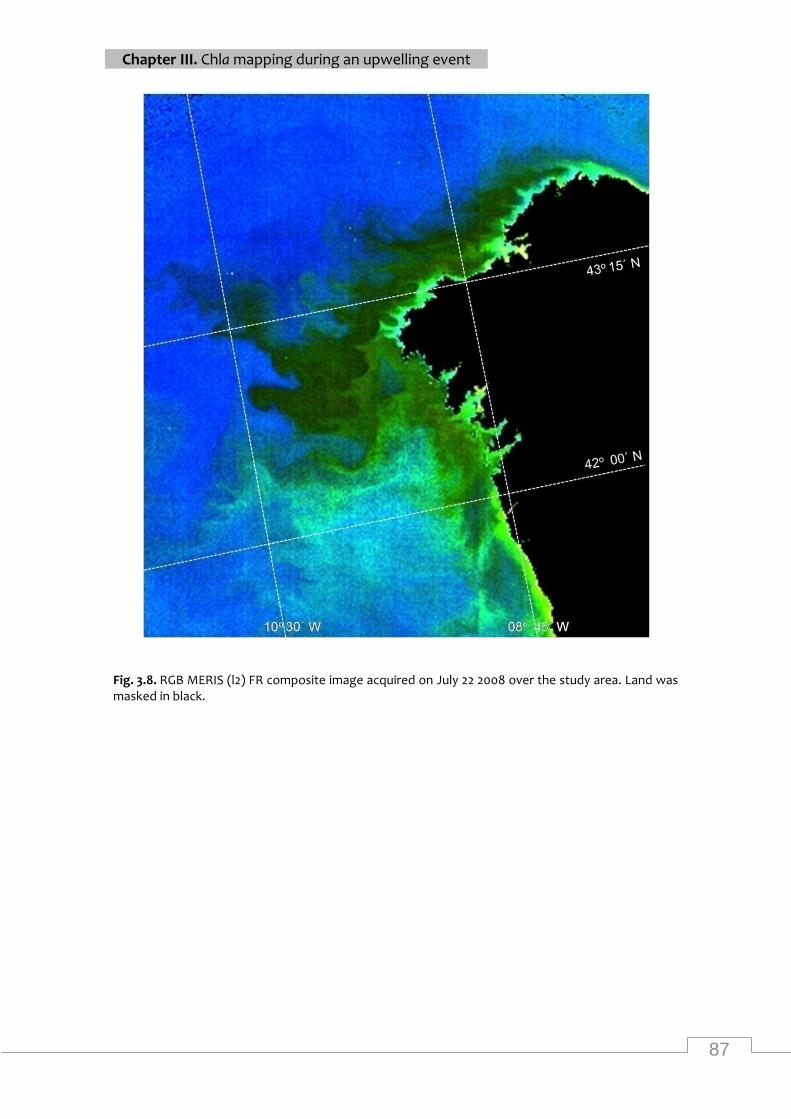
87
Chapter III. Chla mapping during an upwelling event
Fig. 3.8. RGB MERIS (l2) FR composite image acquired on July 22 2008 over the study area. Land was masked in black.
88
Chapter III. Chla mapping during an upwelling event
3.4 References
Aiken, J., Moore, G. F., Trees, C. C., Hooker, S. B., & Clark, D. K. (1995). The SeaWiFS CZCS-type
pigment algorithm. In S. B. Hooker, & E. R. Firestone (Eds.), NASA technical memorandum,
104566. SeaWiFS Technical Report Series, vol. 29 (pp. 1-32).
Atkinson, P. M., & Tatnall, A. R. L. (1997). Introduction Neural networks in remote sensing.
International Journal of Remote Sensing, 18, 699-709.
Bakun, A. (1973). Coastal upwelling indices, west coast of North America 1946-71. In NOAA
Technical Report NMFS-SSRF 671 (pp. 1-103). Seattle: US Dept. Commerce.
Bates, S. S., Garrison, D. L., & Horner, R. A. (1998). Bloom dynamics and physiology of domoic-
acid producing Pseudo-nitzschia species. In D. M. Anderson, A. D. Cembella & G. M. Hallegraeff
(Eds.), Physiological ecology of harmful algal blooms (pp.267-292). Heidelberg, Germany:
Springer-Vergal.
Bode, A., Carrera, P., & Lens, S. (2003). The pelagic foodweb in the upwelling ecosystem of
Galicia (NW Spain) during spring: natural abundance of stable carbon and nitrogen isotopes.
ICES Journal of Marine Sciences, 60, 11-22.
Bode, A., & Varela, M. (1998). Primary production and phytoplankton in three Galician Rias Altas
(NW Spain): seasonal and spatial variability. Scientia Marina, 62(4), 319-330.
Bravo, I., Figueroa, R. I., Garcés, E., Fraga, S., & Massanet, A. (2010a). The intricacies of
dinoflagellate pellicle cysts: The example of Alexandrium minutum cysts from a bloom-recurrent
area (Bay of Baiona, NW Spain). Deep Sea Research Part II: Topical Studies in Oceanography, 57,
166-174.
Bravo, I., Fraga S., Figueroa R. I., Pazos Y., Massanet A., & Ramilo I. (2010b). Bloom dynamics and
life cycle strategies of two toxic dinoflagellates in a coastal upwelling system (NW Iberian
Peninsula). Deep-Sea Research Part II: Topical Studies in Oceanography, 57, 222–234.
Brown, C. A., Huot, Y., Werdell, P. J., Gentili, B., & Claustre, H. (2008). The origin and global
distribution of second order variability in satellite ocean color and its applications to algorithm
development. Remote Sensing of Environment, 112, 4186-4203.
Brown, C., & Hutchings, L. (1987). The development and decline of phytoplankton blooms in the
Benguela upwelling system. 1. Drogue movements, hydrography and bloom development.
South African Journal of Marine Science, 5, 171-193.
Carder, K. L., Chen, F. R., Lee, Z. P., Hawes, S. K., & Kamykowski, D. (1999). Semianalytic
moderate-resolution imaging spectrometer algorithm for chlorophyll a concentration and
absorption with bio-optical domains based on nitrate-depletion temperatures. Journal of
Geophysical Research, 104, 5403-5421.
89
Chapter III. Chla mapping during an upwelling event
Carder, K. L., & Steward, R. G. (1985). A remote-sensing reflectance model of a red-tide
dinoflagellate off west Florida. Limnology and Oceanography, 30, 286-298.
Cota, G. F., Wang, J., & Comiso, J. C. (2004). Transformation of global satellite chlorophyll
retrievals with a regionally tuned algorithm. Remote Sensing of Environment, 90, 373-377.
deCastro, M., Gómez-Gesteira, M., Alvarez, I., & Prego, R. (2004). Negative estuarine circulation
in the Ria of Pontevedra (NW Spain). Estuarine, Coastal and Shelf Science, 60, 301–312.
Doerffer, R., & Schiller, H. (2007). The MERIS Case 2 water algorithm. International Journal of
Remote Sensing, 28, 517-535.
Doerffer, R., & Schiller, H. (2008). MERIS regional coastal and lake case 2 water project -
Atmoshperic correction ATBD. In: GKSS Research Center 21502 Geestacht. Germany. Version 1.0,
18 May 2008.
Doerffer, R. Sorensen, K., & Aiken, J. (1999). MERIS potential for coastal zone application,
International Journal of Remote Sensing, 20(9), 1809–1818.
Dransfeld, S., Tatnall, A. R., Robinson, I. S., & Mobley, C. D. (2004). A comparison of Multi-layer
multilinear regression algorithms for the inversion of synthetic ocean colour spectra.
International Journal of Remote Sensing, 25(21), 4829-4834.
Dzwonkowski, B., & Yan, X. -H. (2005). Development and application of a neural network based
ocean colour algorithm in coastal waters. International Journal of Remote Sensing, 26, 1175-1200.
Evans, R. H., & Gordon, H. R. (1994). Coastal zone color scanner system calibration: A
retrospective examination. Journal of Geophysical Research, 99, 7293-7307.
Evans, G., & Prego, R. (2003). Rias, estuaries and incised valleys: is a ria an estuary? Marine
Geology, 196, 171-175.
Fawcett, A., Pitcher, G. C., Bernard, S., Cembella, A. D., & Kudela, R. M. (2007). Contrasting wind
patterns and toxigenic phytoplankton in the southern Benguela upwelling system. Marine
Ecology Progress Series, 348, 19–31.
Figueiras, F. G., Gómez, E., Nogueira, E., & Villarino, M. L. (1996). Selection of Gymnodinium
catenatum under downwelling conditions in the Ría de Vigo. In T. Yasumoto, Y. Oshima & Y.
Fukuyo (Eds.), Harmful and toxic algal bloom (pp. 215–218). Paris, France: IOC/ Unesco.
Figueiras, F. G., Jones, K. J., Mosquera, A. M., Alvarez-Salgado, X. A., Edwards, E., & MacDougall,
N. (1994). Red tide assemblage formation in an estuarine upwelling ecosystem: Ria de Vigo.
Journal of Plankton Research, 16, 857-878.
Figueiras, F. G., & Niell, F. X. (1987). Composición del fitoplankton de la ría de Pontevedra (NO de
España). Investigación Pesquera, 51, 371-409.
90
Chapter III. Chla mapping during an upwelling event
Figueiras, F., & Pazos, Y. (1991). Microplankton assemblanges in three Rías Baixas (Vigo, Arosa
and Muros, Spain) with a subsurface chlorophyll maximum: their reletionships to hydrography.
Marine Ecology Progress Series, 76, 219-233.
Figueiras, F. G., & Ríos, A. F. (1993). Phytoplankton succession, red tides and the hydrographic
regime in the Rías Bajas of Galicia. In T. J. Smayda & Y. Shimizu (Eds.), Toxic Blooms in the Sea
(pp. 239-244). New York: Elsevier.
Fraga, F. (1981). Upwelling off the Galician coast North West Spain. In E. Suess & J. Thiede (Eds.),
Coastal upwelling (pp. 176-182). New York: Plenum Publishing Corp.
Fraga, S., Anderson, D. M., Bravo, I., Reguera, B., Steidinger, K. A., & Yentsch, C. M. (1988).
Influence of upwelling relaxation on dinoflagellates and shelfish toxicity in Ria de Vigo, Spain.
Estuarine Coastal Shelf Science, 27, 349-361.
Fraga, F., & Margalef, R. (1979). Las Rias Gallegas. In Estudio y explotacion del mar en Galicia
(pp. 101-122), University of Santiago (Ed.).
Fraga, S., Reguera B., & Bravo, I. (1990). Gymnodinium catenatum bloom formation in the
Spanish rías. In Graneli E., B. Sundstrom, L. Edler & D. M. Anderson (Eds.), Toxic marine
phytoplankton (pp. 149-154). New York: Elsevier.
Frangópulos, M., Spyrakos, E., & Guisande, C. (2011). Ingestion and clearance rates of the red
Noctiluca scintillans fed on the toxic dinoflagellate Alexandrium minutum (Halim). Harmful Algae,
10, 304-309.
GEOHAB (2005). Global Ecology and oceanography of Harmful Algal Blooms (GEOHAB). In G.
Pitcher, T. Moita, V. Trainer, R. Kudela, F. G. Figueiras & T. Probyn (Eds.), GEOHAB Core Research
Project: HABs in Upwelling Systems (p. 82). Paris and Baltimore: IOC and SCOR.
Gilerson, A. A., Gitelson, A. A., Zhou, J., Gurlin, D., Moses, W. J., Ioannou, I., & Ahmed S. A.
(2010). Algorithms for remote estimation of chlorophyll-a in coastal and inland waters using red
and near-infrared bands. Optical Express, 18, 24109–24125.
Gitelson, A. A., Schalles, J. F., & Hladik, C. M. (2007). Remote chlorophyll-a retrieval in turbid,
productive estuaries: Chesapeake Bay case study. Remote Sensing of Environment, 109, 464-472.
González Vilas, L., Spyrakos, E., & Torres Palenzuela, J. M. (2011). Neural network estimation of
chlorophyll a from MERIS full resolution data for the coastal waters of Galician rias (NW Spain).
Remote Sensing of Environment, 115, 524-535.
Gons, H. (1999). Optical Teledetection of Chlorophyll a in turbid inland waters. Environmental
Science & Technology, 33, 1127-1132.
Herrera, J. L., Piedracoba, S., Varela, R. A., & Roson, G. (2005). Statial analysis of the wind field
on the western coast of Galicia (NW Spain) from in situ measurements. Continental Shelf
Research, 25, 1728-1748.
91
Chapter III. Chla mapping during an upwelling event
Joint, I., Groom, S., Wollast, R., Chou, L., Tilstone, G., Figueiras, F., Loijens, M., & Smyth, T.
(2002). The response of phytoplankton production to periodic upwelling and relaxation events
at the Iberian shelf break: estimates by 14C method and by satellite remote sensing. Journal of
Marine Systems, 32, 219-238.
Keiner, L. E., & Yan, X. H. (1998). A neural network model for estimating sea surface chlorophyll
and sediments from thematic mapper imagery. Remote Sensing of the Environment, 66, 153-165.
Kudela, R., Pitcher, G., Probyn, T., Figueiras, F., Moita, T., & Trainer V. (2005). Harmful Algal
Blooms in coastal upwelling systems. Oceanography, 18, 184-197.
Kutser, T. (2004). Quantitative detection of chlorophyll in cyanobacterial blooms by satellite
remote sensing. Limnology and Oceanography, 49, 2179–2189.
Kutser T., Metsamaa L., & Dekker A. G. (2008). Influence of the vertical distribution of
cyanobacteria in the water column on the remote sensing signal. Estuarine Coastal and Shelf
Science, 78, 649-654.
Laiño, C. C. (1991). Gymnodinium catenatum toxins from mussels (mytilus galloprovincialis).
Environmental Technology, 12, 33-40.
Margalef, R. (1956). Estructura y dinámica de la ´´purga de mar´´ en Ría de Vigo. Investigacion
Pesquera, 5, 113-134.
McClain, C. R., Feldman, G. C., & Hooker, S. B. (2004). An overview of the SeaWiFS project and
strategies for producing a climate research quality global ocean bio-optical time series. Deep-Sea
Research II, 51, 6-42.
McClain, C. R., Chao, S. -Y., Atkinson, L. P., Blanton, J. O., & Castillejo, F. (1986). Wind-driven
upwelling in the vicinity of Cape Finisterre, Spain. Journal of Geophysical Research, 91, 8470-8486.
Moore, T. S., Campbell, J. W., & Dowell, M. D. (2009). A class-based approach to characterizing
and mapping the uncertainty of the MODIS ocean chlorophyll product. Remote Sensing of
Environment, 113, 2424−2430.
Morel, A., & Maritorena, S. (2001). Bio-optical properties of oceanic waters: A reappraisal.
Journal of Geophysical Research, 106, 7163-7180.
Morel, A., & Prieur, L. (1977). Analysis of variations in ocean color. Limnology and Oceanography,
22, 709-722.
Muller-Karger, F. E., McClain, C. R., Sambrotto, R. N., & Ray, G. C. (1990). A comparison of ship
and coastal zone color scanner mapped distribution of phytoplankton in the southeastern
Bering Sea. Journal of Geophysical Research, 95, 483-499.
Nogueira, E., Perez, F. F., & Ríos, A. F. (1997). Seasonal patterns and long-term trends in an
estuarine upwelling ecosystem (Ria de Vigo, NW Spain). Estuarine Coastal and Shelf Science, 44,
92
Chapter III. Chla mapping during an upwelling event
185-300.
Oliveira, P., Moita, T., Silva, A., Monteiro, I., & Palma, A. (2009a). Summer diatoms and
dinoflagellate blooms in Lisbon Bay from 2002 to 2005: Pre-conditions inferred from wind and
satellite data. Progress in Oceanography, 83, 270-277.
Oliveira, P., Nolasco, R., Dubert, J., Moita, T., & Peliz, A. (2009b). Surface temperature,
chlorophyll and advection patterns during a summer upwelling event off central Portugal.
Continental Shelf Research, 29, 759-774.
O'Reily, J. E., Maritorena, S., Siegel, D. A., O'Brien, M. C., Toole, D., & Mitcell, B. G. et al. (2000).
Ocean color chlorophyll a algorithms foe SeaWiFS, OC2 and OC4. Version 4. In: S. B. Hooker &
E.R. Firestone (Eds.), NASA technical memorandum 2000-206892, Vol. 11, 49 pp.
Ospina-Álvarez, N., Prego, R., Álvarez, I., deCastro, M., Álvarez-Ossorio, M. T., Pazos, Y., Campos,
M. J., Bernárdez, P., Garcia-Soto, C., Gómez-Gesteira, M., & Varela, M. (2010). Oceanographic
patterns during a summer upwelling-downwelling event in the Northern Galician Rias:
Comparison with the whole Ria system (NW of Iberian Peninsula). Continental Shelf Research, 30,
1362-1372.
Pazos, Y., Moroño, A., Triñanes, J., Doval, M., Montero, P., Vilarinho, M. G., & Moita, M. T.
(2006). Early detection and intensive monitoring during an unusual toxic bloom of Gymnodinium
catenatum advected into the Galician Rías (NW Spain). Proceedings of 2006 International
Conference on Harmful Algae, September 4–8. Copenhagen, Denmark.
Peliz, A., & Fiuza, A. (1999). Temporal and spatial variability of CZCS-delivered phytoplankton
concentrations off the western Iberian Peninsula. International Journal of Remote Sensing, 20,
1363-1407.
Ribeiro, A., Peliz, A., & Santos, A. M. P. (2005). A study of the response of chla-biomass to a
winter upwelling event off western Iberia using SeaWiFS and in situ data. Journal of Marine
Systems, 53, 87-107.
Pitcher, G. C., Boyd, A. J., Horstman, D. A., & Mitchell-Innes, B. A. (1998). Subsurface
dinoflagellate populations, frontal blooms and the formation of red tide in the southern
Benguela upwelling system. Marine Ecology Progress Series, 172, 243-264.
Pitcher, G. C., Figueiras, F. G., Hickey, B. M., & Moita, M. T. (2010). The physical oceanography of
upwelling systems and the development of harmful algal blooms. Progress in Oceanography, 85,
5–32.
Pitcher G. C., & Nelson G. (2006) Characteristics of the surface boundary layer important to the
development of red tide on the southern Namaqua shelf of the Benguela upwelling system.
Limnology and Oceanography, 51, 2660–2674.
Rodríguez Rodríguez, G., Villasante, S., & García-Negro, M. (2011). Are red tides affecting
economically the commercialization of the Galician (NW Spain) mussel farming? Marine Policy,
93
Chapter III. Chla mapping during an upwelling event
35, 252-257.
Ruddick, K., Lacroix, G., Lancelot, C., Nechad, B., Park., Y., Peters, S., & Van Mol., B. (2008).
Optical remote sensing of the North Sea. In V. Barale & M. Gade (Eds.), Remote Sensing of the
European Seas (pp. 79-90). New York: Springer-Verlag.
Shahraiyni, H. T., Shouraki, S. B., Fell, F., Schaale, M., Fischer, J., Tavakoli, A., Preusker, R.,
Tajrishy, M., Vatandoust, M., & Khodaparast, H. (2009). Application of an active learning method
to the retrieval of pigment from spectral remote sensing reflectance data. International Journal
of Remote Sensing, 30, 1045-1065.
Spyrakos, E., González Vilas, L., & Torres Palenzuela, J. (2010). Development and application of
neural network-based chlorophyll-a algorithms from MERIS full-resolution data for optically
complex waters. Proceedings of Remote sensing and photogrammetry society annual conference
with Irish earth observation symposium, Septermber 1-3. Cork, Ireland.
Spyrakos, E., Santos-Diniz, T. C., Martinez-Iglesias G., Torres-Palenzuela, J. M, & Pierce, G. J. (in
press). Spatiotemporal patterns of marine mammal distribution in coastal waters of Galicia, NW
Spain. Hydrobiologia.
Stramska, M., & Stramski, D. (2005). Effects of a nonuniform vertical profile of chlorophyll
concentration on remote-sensing reflectance of the ocean. Applied Optics, 44, 1735-1747.
Thiria, S., Mejia, C., Badran, F., & Crepon, M. (1993). A neural network approach for modelling
nonlinear transfer functions: Application for wind retrieval from spaceborne scatterometer
data. Journal of Geophysical Research, 98(12), 22827−22841.
Tilstone, G. H., Figueiras, F. G., & Fraga, F. (1994). Upwelling-downwelling sequences in the
generation of red tides in a coastal upwelling system. Marine Ecology Progress Series, 112, 241-253.
Tilstone, G. H., Figueiras, F. G., Lorenzo, L. M., & Arbones, B. (2003). Phytoplankton composition,
phytosynthesis and primery production during different hydrographic conditions at the
Northwest Iberian upwelling system. Marine Ecology Progress Series, 252, 89-104.
Torres, R., & Barton, E. D. (2007). Onset of the Iberian upwelling along the Galician coast.
Continental Shelf Research, 27, 1759-1778.
Torres-Palenzuela, J. M., Vilas-González, L., & Mosqura-Giménez, Á. (2005a). Correlation
between MERIS and in-situ data for study of Pseudo-nitzschia spp. toxic blooms in Galician
coastal area. (pp. 497-507). Rotterdam: Millpress.
Torres-Palenzuela, J. M., Vilas-González, L., & Mosqura-Giménez, Á. (2005b). Detection of
Pseudo-nitzschia spp. toxic blooms using MERIS images on the Galician coast (pp. 1915-1919).:
European Space Agency (Special Publication).
Trainer, V. L., Pitcher, G. C., Reguera, B., & Smayda, T. J. (2010). The distribution and impacts of
harmful algal bloom species in eastern boundary upwelling systems. Progress in Oceanography,
94
Chapter III. Chla mapping during an upwelling event
85, 33-52.
Varela, M. (1992). Upwelling and phytoplankton ecology in Galician (NW Spain) rías and shelf
waters. Boletín del Instituto Español de Oceanografía, 8, 57-74.
Varela, M., Prego, R., & Pazos, Y. (2008). Spatial and temporal variability of phytoplankton
biomass, primary production and community structure in the Pontevedra Ria (NW Iberian
Peninsula): oceanographic periods and possible response to environmental changes. Marine
Biology, 154, 483-499.
Vidal-Romaní, J. R. (1984). A orixe das rias galegas: Estado da censtión (1886-1983). Cuardenos
da Área de Ciencias Mariñas, Seminario de Estudos Galegos. Vol. 1. Ediciós do Castro. A Coruña,
Spain.
Vilas, F., Bernabeu, A., & Méndez, G. (2005). Sediment distribution pattern in the Rías Baixas
(NW Spain): main facies and hydrodynamic dependence. Journal of Marine Systems, 54, 261–276.
Zapata, M., Rodríguez, F., & Garrido, J. L. (2000). Separation of chlorophylls and carotenoids
from marine phytoplankton: A new HPLC method using a reversed phase C8 column and
pyridine-containing mobile phases. Marine Ecology Progress Series, 195, 29-45.
Zhang, T., Fell, F., Liu, Z. -S., Preusker, R., Fischer, J., & He, M. -X. (2003). Evaluating the
performance of artificial neural network techniques for pigment retrieval from ocean color in
Case I waters. Journal of Geophysical Research, 108, 3286-3298.
Chapter IV. Toxic Pseudo-nitzschia spp. events
95
Remote sensing, in situ monitoring and environmental perspectives of toxic Pseudo-nitzschia events in the surface waters of two Galician rias
Abstract
4.1 Introduction
4.2 Material and methods
4.3 Results
4.4 Discussion
4.5 References
CHAPTER IV

96
97
Chapter IV. Toxic Pseudo-nitzschia spp. events
Abstract
In this chapter, a combined analysis of satellite imagery data, measurements of
biotic and abiotic parameters and mixed effects modelling was used to study Pseudo-
nitzschia blooms in the optically complex surface waters of two Galician (NW Spain) rias
(embayments), sites of extensive mussel culture. This included the measurement of domoic
acid (DA) concentrations in natural microalgae populations for the first time, as far as we
know, in the area and the determination of Pseudo-nitzschia abundances along with several
environmental parameters during the years 2007-2009. A regionally/cluster-specific
chlorophyll a (chla) algorithm for Medium Resolution Imaging Spectrometer (MERIS) was
applied to a series of images where in-situ data were available. Three periods were
considered which were linked with the dominant meteorological conditions off the rias. The
first toxic event was recorded on autumn 2007 and was associated with moderate Pseudo-
nitzschia (abundances) and high particulate DA (pDA) (2.5 μg L-1) concentrations. Similar
pDA levels to ours have been measured in the surface waters from other coastal upwelling
areas around the world. A second, but lower in toxin concentration DA outbreak, was
recorded during summer 2009. P. australis seems to be the main source of DA in the study
area. The application of a regional algorithm in combination with the characteristics of
MERIS FR allowed for accurate mapping of chla and the detection of high in chla and
Pseudo-nitzschia spp. “patches” in the rias. The optimal model for the Pseudo-nitzschia spp.
abundance and DA concentration suggested the significant effect of some macronutrients
as well as other abiotic and biotic parameters, approximating in that way the potential
environmental causes and effects of the harmful Pseudo-nitzschia spp. blooms in the area.
The results of this study deduced that toxic events due to DA should be an important
concern and therefore DA in the seawater should be measured routinely in order to assess
the potential of a DA outbreak. Moreover, MERIS FR data and regionally specific algorithms
showed that they can provide valuable information about the blooms and should be an
integral part of the monitoring programs.
98
Chapter IV. Toxic Pseudo-nitzschia spp. events
4.1 Introduction
Pseudo-nitzschia Peragallo is a chain-forming diatom genus widespread in all oceans
of the world. A number of these diatom species are known as potential producers of a
neurotoxic amino acid, domoic acid (DA), which when accumulated via trophic transfer in
the food-wed can have deleterious (domoic amnesic syndrome, DAP) and even fatal effects
to several marine organisms and less frequently to humans. Pseudo-nitzschia is the only
diatom among 27 dinoflagellate and 1 raphidophyte species that is listed as responsible for
harmful algal events in upwelling regions. Besides this, it has been associated with
upwelling events in the California Current System (Bates et al., 1998; Adams et al., 2000;
Trainer et al., 2002; Marchetti et al., 2004; Kudela et al., 2004, 2005; Anderson et al., 2006)
and in the Iberian System (Figueiras & Rios, 1993; Moroño et al., 2000; Mouriño et al. 2010).
Understanding the relationships between the abundance of this diatom, DA
outbreaks and the characteristics of the environment will provide valuable information on
the variable(s) that might determine their growth, distribution and DA production, which
can then be used to predict harmful incidents. Several authors (Smith et al., 1990; Parsons
et al., 2002; Kudela 2004; GEOHAB 2005; Klein et al., 2010) have related these blooms with
changes in their nutrient physiology and therefore with upwelling events and
eutrophication. On the west coast of USA, an area where Pseudo-nitzschia is a common
harmful bloom former, AD outbreaks caused by P. australis have been associated with
upwelling events and elevated but in declining stage nutrients (Horner et al., 1997).
Several laboratory experiments studies (Bates et al., 1991; Pan et al., 1996;
Maldonado et al., 2002; Fehling et al., 2004; Wells et al., 2005) have addressed the silicic
acid and/or phosphorus, iron, copper limitations as significant factors for the toxin
production of Pseudo-nitzschia species. Although the relationship between DA production
and the nutritional status appears to be complex in natural populations since they are often
composed of several species (Trainer et al., 2000, 2009), it seems that the silicic acid supply
plays an important role (Kudela et al., 2004; Marchetti et al., 2004; Anderson et al., 2006).
More specifically, for P. australis, Anderson et al. (2006) suggested that ratio values of
Si(OH)4:NO3- below 2 are found to be linked to DA production from this species. Recently
Trainer et al. (2009) showed that iron limitation and not macronutrient stress is more
essential for the DA production in natural populations.
Harmful algal events due to the diatoms of the genus Pseudo-nitzschia are
considered as a reoccurring phenomenon along the northern boundary of the Iberian–
99
Chapter IV. Toxic Pseudo-nitzschia spp. events
Canary current upwelling system. These blooms have become a focal point of numerous
studies since the first time they were recorded in the autumn of 1994 (Miguez et al., 1996)
and are occasionally related with short-time DA outbreaks which mainly occure at a late
stage of the bloom (Trainer et al., 2010). Although several species of Pseudo-nitzschia have
been recorded in the Galician coastal embayments referred to as rias (NW Spain), only P.
australis is known to produce DA (Fraga et al., 1998). Toxigenic events due to blooms of P.
australis in this area have been recorded to follow PSP (Paralytic Shellfish Poisoning)
outbreaks (Reguera et al., 2003) in thermohaline stratified water masses at the early
upwelling period (March-June).
There is considerable interest in the study of Pseudo-nitzschia and the detection of
DA in the Galician rias due to the economic and social importance of the extensive culture
of mussels in this region and human health concerns (GEOHAB, 2005; Rodríguez Rodríguez
et al., 2011). As part of a routine monitoring programme, the Technological Institute for the
control of the marine environment of Galicia (INTECMAR) has organized sampling on a
weekly basis in the Galician rias where, among other water parameters, the Pseudo-nitzschia
spp. abundance and the biotoxins in mussels and other molluscs are recorded. DA
detection in this area has been studied mainly on shellfish extracts (Arévalo et al., 1998;
Garet et al., 2010) and on Pseudo-nitzschia cultures (Fraga et al., 1998; Maneiro et al., 2005).
However, no information is available, to our knowledge, on the particulate DA
concentrations (pDA) in seawater.
In these coastal embayements transient increases of Pseudo-nitzschia spp. often
exceed abundances of 106 cells L-1 dominating the phytoplankton community. High
concentrations of these potentially toxic species have been observed within high biomass
phytoplankton “patches” (Marić et al., 2011) which can raise problems to field monitoring
programs. An important component for detecting these high biomass blooms is the passive
ocean colour sensors. Medium Resolution Imaging Spectrometer (MERIS) that succeeded
the first satellite ocean colour sensor CZCS is using more and narrower spectral bands and
finer spatial resolution. MERIS provides data with a 300 m on-ground resolution in nadir
(Full Resolution) and has a spectral resolution of fifteen bands from visible to near infrared,
supporting one of the mission objectives for a delicate coastal zone monitoring (Doerffer et
al., 1999). MERIS data has been recently used on the Galician coast for the development of
regionally specific chlorophyll a algorithms (González Vilas et al., 2011) and to map the
spatial extent of high biomass algae events during an upwelling cycle (Spyrakos et al., 2011).
Our approach in this study is an integration of multidisciplinary observations in the
surface waters of two Galician rias in order to: 1) measure for the first time the pDA
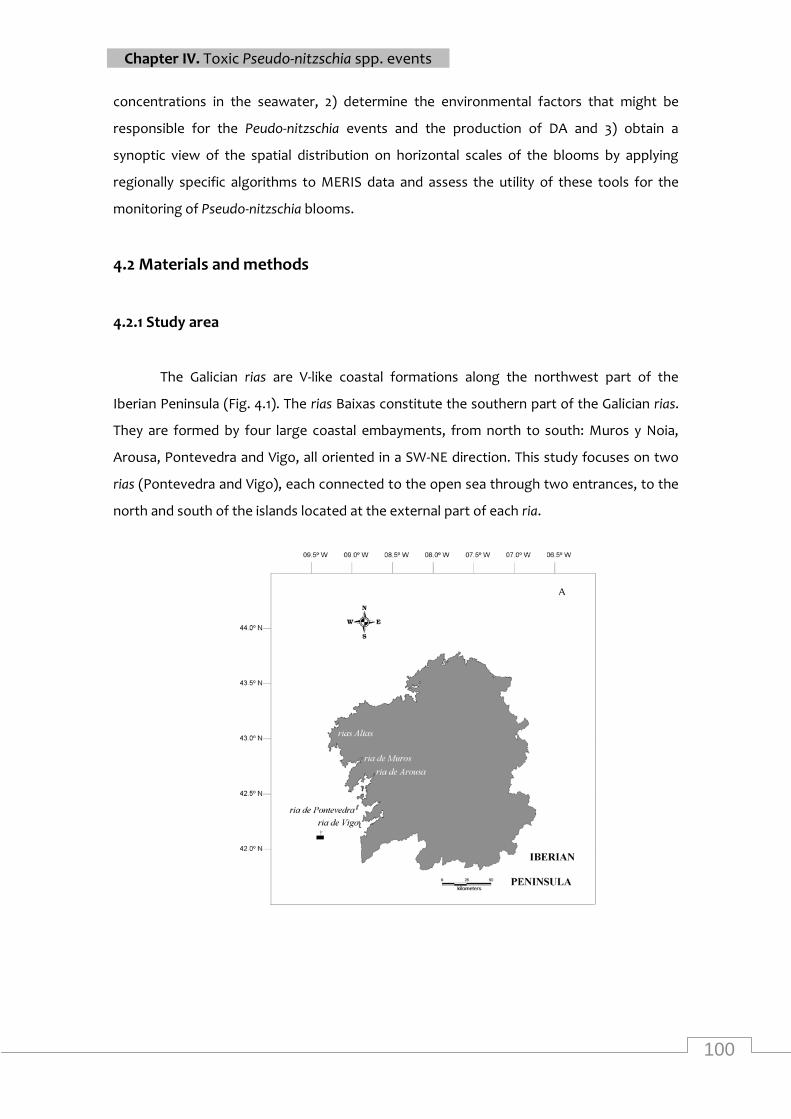
100
Chapter IV. Toxic Pseudo-nitzschia spp. events
concentrations in the seawater, 2) determine the environmental factors that might be
responsible for the Peudo-nitzschia events and the production of DA and 3) obtain a
synoptic view of the spatial distribution on horizontal scales of the blooms by applying
regionally specific algorithms to MERIS data and assess the utility of these tools for the
monitoring of Pseudo-nitzschia blooms.
4.2 Materials and methods
4.2.1 Study area
The Galician rias are V-like coastal formations along the northwest part of the
Iberian Peninsula (Fig. 4.1). The rias Baixas constitute the southern part of the Galician rias.
They are formed by four large coastal embayments, from north to south: Muros y Noia,
Arousa, Pontevedra and Vigo, all oriented in a SW-NE direction. This study focuses on two
rias (Pontevedra and Vigo), each connected to the open sea through two entrances, to the
north and south of the islands located at the external part of each ria.
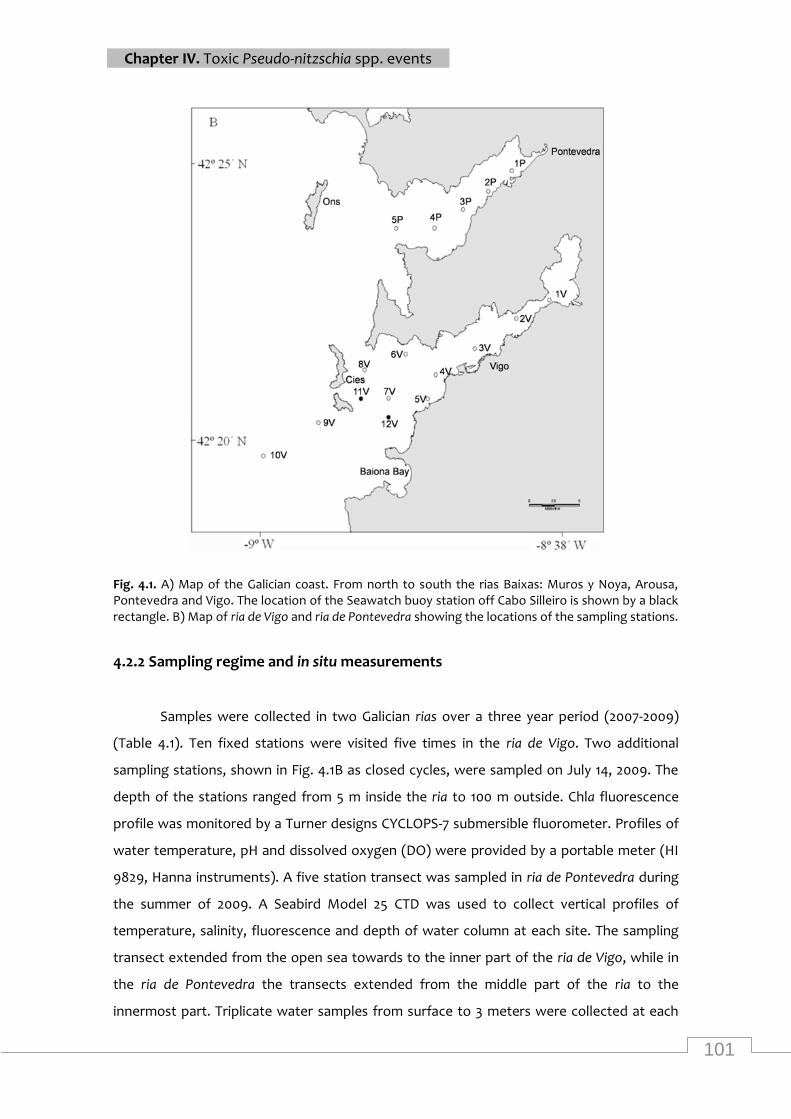
101
Chapter IV. Toxic Pseudo-nitzschia spp. events
Fig. 4.1. A) Map of the Galician coast. From north to south the rias Baixas: Muros y Noya, Arousa, Pontevedra and Vigo. The location of the Seawatch buoy station off Cabo Silleiro is shown by a black rectangle. B) Map of ria de Vigo and ria de Pontevedra showing the locations of the sampling stations.
4.2.2 Sampling regime and in situ measurements
Samples were collected in two Galician rias over a three year period (2007-2009)
(Table 4.1). Ten fixed stations were visited five times in the ria de Vigo. Two additional
sampling stations, shown in Fig. 4.1B as closed cycles, were sampled on July 14, 2009. The
depth of the stations ranged from 5 m inside the ria to 100 m outside. Chla fluorescence
profile was monitored by a Turner designs CYCLOPS-7 submersible fluorometer. Profiles of
water temperature, pH and dissolved oxygen (DO) were provided by a portable meter (HI
9829, Hanna instruments). A five station transect was sampled in ria de Pontevedra during
the summer of 2009. A Seabird Model 25 CTD was used to collect vertical profiles of
temperature, salinity, fluorescence and depth of water column at each site. The sampling
transect extended from the open sea towards to the inner part of the ria de Vigo, while in
the ria de Pontevedra the transects extended from the middle part of the ria to the
innermost part. Triplicate water samples from surface to 3 meters were collected at each
102
Chapter IV. Toxic Pseudo-nitzschia spp. events
station from a sampler (3524 cm3) for further analysis. The depth of the euphotic zone was
established with a Secchi disk.
High performance liquid chromatography (HPLC): For the HPLC chla determination,
water samples (100-200mL) were filtered through 9 mm diameter Whatman GF/F filters and
stored at -80oC for two weeks. 95% methanol was used as extraction solvent for the
pigments. In this study only chla concentration data are presented, calculated as the sum of
chlorophyllide a, chlorophyll a epimer, chlorophyll a allomer and divinyl chlorophyll a. An
HPLC method using a reversed phase C8 was applied for the separation of the pigments.
Details of pigment extraction and separation are provided in Zapata et al. (2000).
Suspended particulate material (SPM): SPM was evaluated in terms of SPM
concentration and percent weight of organic material (%OM). Pre-combusted (450 oC for 24
h), pre-washed in 500 mL of MilliQ, 47mm Whatman GF/F filters were used. These filters
were then dried at 65 oC to a constant weight. Particles were collected by filtering a
standard volume (1000mL) of seawater samples and then rinsed with 50mL MilliQ in order
to remove salts and dissolved organic material. For the determination of SPM the filters
were dried at 65oC till no weight changes were observed. The filters were then re-
combusted at 450 ºC for 5 h in order to obtain the inorganic suspended material (ISM). The
percent weight of organic material (%OM) was determined by subtracting the ISM from the
SPM. All the filters were weighted on a Precisa 262 SMA-FR microbalance (10-5 g precision).
Nutrients and dissolved organic carbon (DOC): Water samples were filtered through
47mm Whatman GF/F filters and the filtered water stored in -40oC for further analysis of
DOM and dissolved inorganic micronutrients (nitrate, nitrite, phosphorus, silicate and
ammonia). All nutrients and DOC were analysed with a Technicon AAII auto-analyser.
Particulate organic carbon and nitrogen (POC, PON): POC and PON content were
determined from seawater samples (100-200mL) filtered through pre-combusted 9mm
diameter Whatman GF/F filters and then stored at -80oC. The filters were then dried at 70°C
and combusted in a Fisons EA-1108 CHN analyzer. Sulfanilamide was used as the standard.
Pseudo-nitzschia spp. light microscopy (LM) counting: 250mL of seawater from the
first series of the samples collected in the stations were fixed with buffered formaldehyde
at a final concentration of 1% and stored under dark and cool conditions. An appropriate
aliquot (10, 50mL) depending on the phytoplankton cells, inorganic suspended material and
detritus density, was settled in a counting chamber. Total abundances of Pseudo-nitzschia
spp. were enumerated using an inverted light microscope at 250x and 400x magnification
(Utermöhl, 1958). Pseudo-nitzschia species were separated into P. delicatissima and P.
seriata complexes depending on their valve width (Tomas, 1997).
103
Chapter IV. Toxic Pseudo-nitzschia spp. events
Pseudo-nitzschia species identification: Phytoplankton samples for Pseudo-nitzschia
species identification were collected in the upper 10 meters of each station during the
campaigns by vertical net tows with 20 μm mesh-size plankton net. Samples were placed in
dark and fixed with paraformaldeyde (to a final concentration of 1%). Scanning electron
microscopy (SEM) was performed on select samples (depending on the presence or not of
Pseudo-nitzschia in the counting chambers) to identify individual Pseudo-nitzschia cells.
Removal of the organic matter from the samples involved treatment with hydrogen
hyperoxide and incubation at 90oC.
Particulate DA (pDA) analysis: Particulate DA analysis was performed to triplicate
sub-samples derived from the first series of the seawater samples collected in the stations
shown in Fig. 1. The DA remained on Whatman GF/F 9 mm filters after the filtration of 200
mL seawater was quantified by ASP cELISA (Biosense Laboratories, Bergen Norway). A
protocol described in Fehling et al., (2004) was followed for the preparation of the
seawater samples and the assay procedure. A Multiskan EX (LabSystems) microplate
spectrophotometer with a 450 nm filter was used to read the absorbance of the samples.
The detection limit for the ELISA assay was 1pg DA mL-1 and for for the analysis of pDA in
the seawater was 0.005 ng DA L-1. Cellular DA (cDA) concentration was calculated by
normalizing the pDA concentration to the abundance of Pseudo-nitzschia spp. cells found in
the preserved samples.
Meteorological buoys: Meteorological data off the rias Baixas were provided by the
Spanish Port System (www.puertos.es). Wind speed (W) and direction were observed at a
Seawatch buoy station located off Cape Silleiro (42° 7.8′N, 9° 23.4′W). This meteorological
station was selected as fairly representative of the study area (Herrera et al., 2005). Daily
upwelling index (IW) was estimated from wind by Bakun's (1973) method:
IW = - y/( W·f)= - 1000· a·CD·W·Wy/( W·f) m3/(s·km)
where a is the density of air (1.2 kg·m-3 at 15ºC), CD is an empirical dimensionless drag
coefficient (1.4·10-3 according to Hidy, 1972), f is the Coriolis parameter (9.9·10-5 s-1 at 42º
latitude), W is the density of seawater (1025 kg·m-3), and W and Wy are the average daily
module and northerly component of the wind.
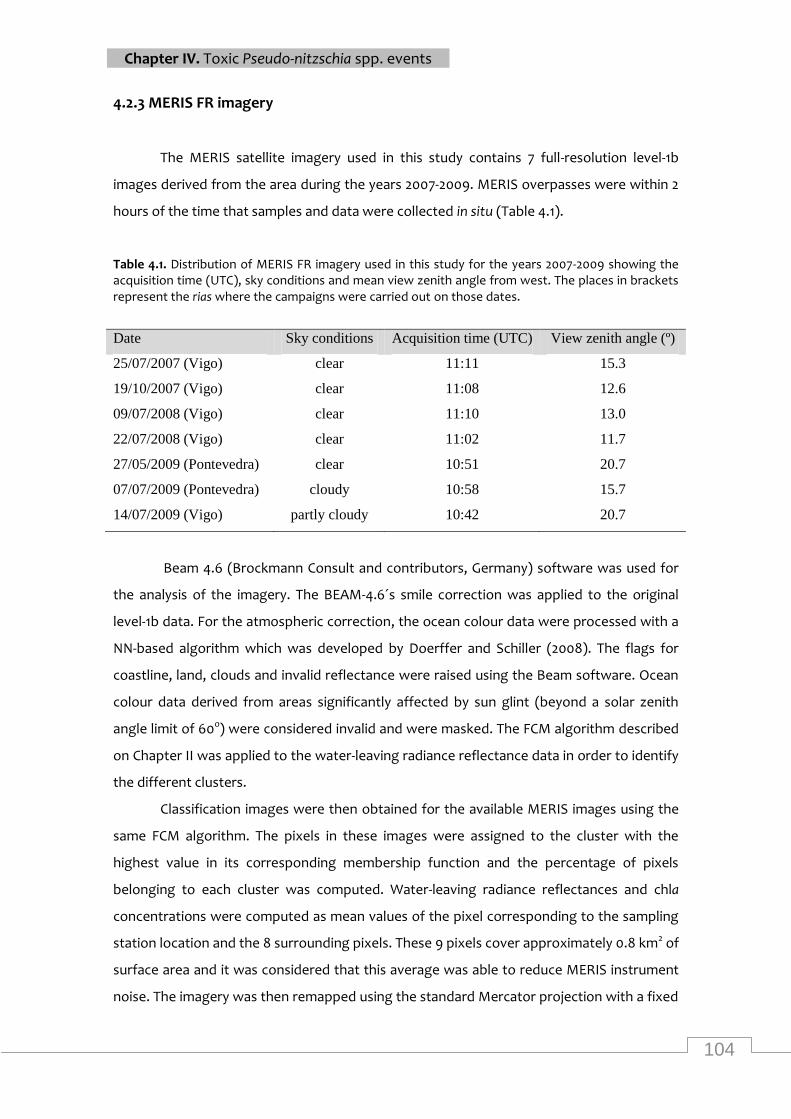
104
Chapter IV. Toxic Pseudo-nitzschia spp. events
4.2.3 MERIS FR imagery
The MERIS satellite imagery used in this study contains 7 full-resolution level-1b
images derived from the area during the years 2007-2009. MERIS overpasses were within 2
hours of the time that samples and data were collected in situ (Table 4.1).
Table 4.1. Distribution of MERIS FR imagery used in this study for the years 2007-2009 showing the acquisition time (UTC), sky conditions and mean view zenith angle from west. The places in brackets represent the rias where the campaigns were carried out on those dates.
Date Sky conditions Acquisition time (UTC) View zenith angle (º)
25/07/2007 (Vigo) clear 11:11 15.3
19/10/2007 (Vigo) clear 11:08 12.6
09/07/2008 (Vigo) clear 11:10 13.0
22/07/2008 (Vigo) clear 11:02 11.7
27/05/2009 (Pontevedra) clear 10:51 20.7
07/07/2009 (Pontevedra) cloudy 10:58 15.7
14/07/2009 (Vigo) partly cloudy 10:42 20.7
Beam 4.6 (Brockmann Consult and contributors, Germany) software was used for
the analysis of the imagery. The BEAM-4.6´s smile correction was applied to the original
level-1b data. For the atmospheric correction, the ocean colour data were processed with a
NN-based algorithm which was developed by Doerffer and Schiller (2008). The flags for
coastline, land, clouds and invalid reflectance were raised using the Beam software. Ocean
colour data derived from areas significantly affected by sun glint (beyond a solar zenith
angle limit of 60o) were considered invalid and were masked. The FCM algorithm described
on Chapter II was applied to the water-leaving radiance reflectance data in order to identify
the different clusters.
Classification images were then obtained for the available MERIS images using the
same FCM algorithm. The pixels in these images were assigned to the cluster with the
highest value in its corresponding membership function and the percentage of pixels
belonging to each cluster was computed. Water-leaving radiance reflectances and chla
concentrations were computed as mean values of the pixel corresponding to the sampling
station location and the 8 surrounding pixels. These 9 pixels cover approximately 0.8 km2 of
surface area and it was considered that this average was able to reduce MERIS instrument
noise. The imagery was then remapped using the standard Mercator projection with a fixed
105
Chapter IV. Toxic Pseudo-nitzschia spp. events
grid of 890 by 890 pixels. Each image ranges from 42o 04' N to 42 o 40' N latitude and from
8o 32'W to 9o 32'W longitude, which covers approximately 3.1 x 10³ km2.
4.2.4 Statistical modelling approach
The poor relationships between Pseudo-nitzschia abundance and pDA concentration
in our data set showed that a model based only on the abundance is not always sufficient
for the prediction of toxigenic events in the area. Therefore, two separate models were
developed in this study, which associate Pseudo-nitzschia abundance and pDA
concentration with selected environmental parameters. Data exploration showed that
there are considerable differences of Pseudo-nitzschia spp. density and pDA values between
the stations and the different months, indicating that these two factors have to be included
in the models. The abundance data was analysed using generalized additive mixed models
(GAMMs) as implemented by the mgcv (Wood, 2000) library in R (version 2.9.1, R
development CoreTeam). GAMMs use additive non-parametric functions by smoothing
splines to model covariate effects, while allow correlations between the variables explicitly
by adding random effects to the additive predictor and are applicable to nested data
structures (Lin & Zhang, 1999). Poisson and negative binomial distributions were used for
the model fitting of the Pseudo-nitzschia count data. However, the negative binomial model
did not converge. A linear function was considered and generalised linear mixed model
(GLMM: Zuur et al., 2009) was applied to the DA concentration data. Gaussian distribution
was used for DA data. A square root transformation was applied to the Pseudo-nitzschia
abundances and DA concentrations data. From the list of available variables (Table 4.3) Zd,
N, NO22-, TSIM, Temp, Si(OH)4/PO4
3- were dropped due to collinearity observed when the
variation inflation factors through the corvif-function in the AED library were calculated
(Zuur, 2009). DOC and pH were also removed from the statistical analysis due to inefficient
number of measurements. All the other variables were considered as predictors. The
optimization of the model was based on finding first the optimal random structure
followed by selection of the optimal fixed structure. Both models included each station as a
random effect. The final models were selected stepwise on the basis of the AIC (Akaike
Information Criterion) and individual significance of explanatory variables. The F test was
used to compare the nested models (see Zuur et al., 2007). We used R (R Development
Core Team, 2007) for the analyses.
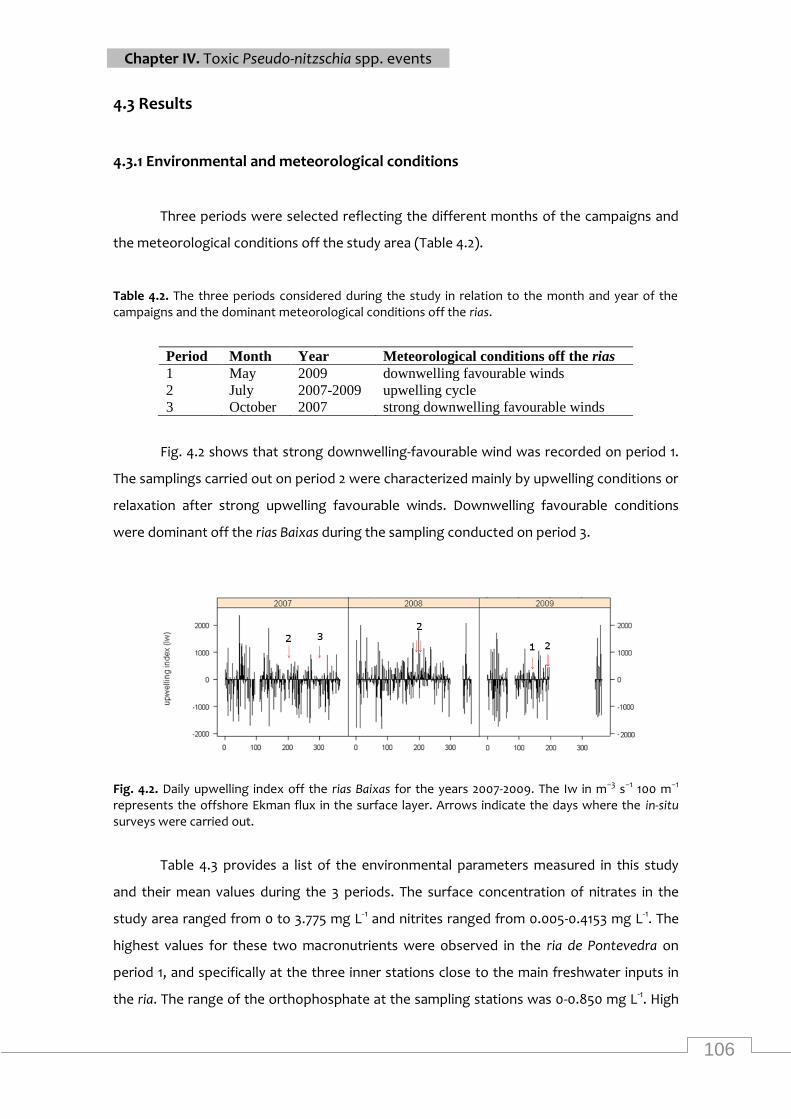
106
Chapter IV. Toxic Pseudo-nitzschia spp. events
4.3 Results
4.3.1 Environmental and meteorological conditions
Three periods were selected reflecting the different months of the campaigns and
the meteorological conditions off the study area (Table 4.2).
Table 4.2. The three periods considered during the study in relation to the month and year of the campaigns and the dominant meteorological conditions off the rias.
Period Month Year Meteorological conditions off the rias
1 May 2009 downwelling favourable winds
2 July 2007-2009 upwelling cycle
3 October 2007 strong downwelling favourable winds
Fig. 4.2 shows that strong downwelling-favourable wind was recorded on period 1.
The samplings carried out on period 2 were characterized mainly by upwelling conditions or
relaxation after strong upwelling favourable winds. Downwelling favourable conditions
were dominant off the rias Baixas during the sampling conducted on period 3.
Fig. 4.2. Daily upwelling index off the rias Baixas for the years 2007-2009. The Iw in m−3 s−1 100 m−1 represents the offshore Ekman flux in the surface layer. Arrows indicate the days where the in-situ surveys were carried out.
Table 4.3 provides a list of the environmental parameters measured in this study
and their mean values during the 3 periods. The surface concentration of nitrates in the
study area ranged from 0 to 3.775 mg L-1 and nitrites ranged from 0.005-0.4153 mg L-1. The
highest values for these two macronutrients were observed in the ria de Pontevedra on
period 1, and specifically at the three inner stations close to the main freshwater inputs in
the ria. The range of the orthophosphate at the sampling stations was 0-0.850 mg L-1. High
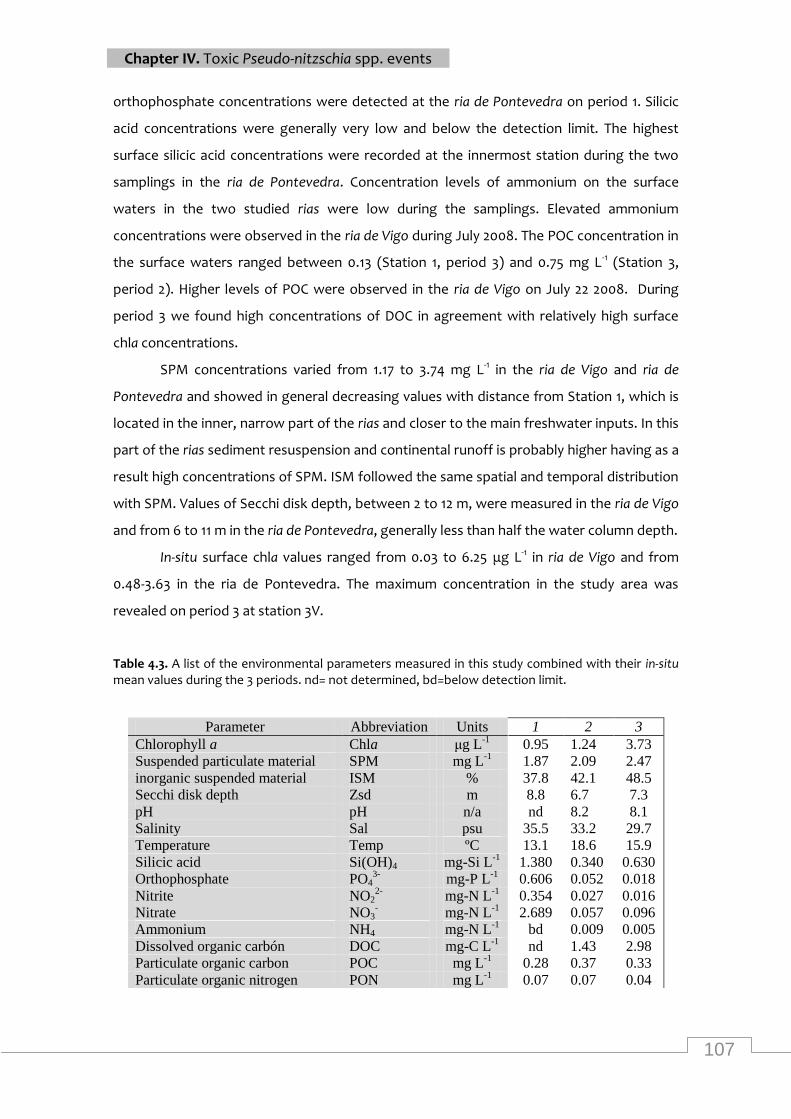
107
Chapter IV. Toxic Pseudo-nitzschia spp. events
orthophosphate concentrations were detected at the ria de Pontevedra on period 1. Silicic
acid concentrations were generally very low and below the detection limit. The highest
surface silicic acid concentrations were recorded at the innermost station during the two
samplings in the ria de Pontevedra. Concentration levels of ammonium on the surface
waters in the two studied rias were low during the samplings. Elevated ammonium
concentrations were observed in the ria de Vigo during July 2008. The POC concentration in
the surface waters ranged between 0.13 (Station 1, period 3) and 0.75 mg L-1 (Station 3,
period 2). Higher levels of POC were observed in the ria de Vigo on July 22 2008. During
period 3 we found high concentrations of DOC in agreement with relatively high surface
chla concentrations.
SPM concentrations varied from 1.17 to 3.74 mg L-1 in the ria de Vigo and ria de
Pontevedra and showed in general decreasing values with distance from Station 1, which is
located in the inner, narrow part of the rias and closer to the main freshwater inputs. In this
part of the rias sediment resuspension and continental runoff is probably higher having as a
result high concentrations of SPM. ISM followed the same spatial and temporal distribution
with SPM. Values of Secchi disk depth, between 2 to 12 m, were measured in the ria de Vigo
and from 6 to 11 m in the ria de Pontevedra, generally less than half the water column depth.
In-situ surface chla values ranged from 0.03 to 6.25 μg L-1 in ria de Vigo and from
0.48-3.63 in the ria de Pontevedra. The maximum concentration in the study area was
revealed on period 3 at station 3V.
Table 4.3. A list of the environmental parameters measured in this study combined with their in-situ mean values during the 3 periods. nd= not determined, bd=below detection limit.
Parameter Abbreviation Units 1 2 3
Chlorophyll a Chla μg L-1
0.95 1.24 3.73
Suspended particulate material SPM mg L-1
1.87 2.09 2.47
inorganic suspended material ISM % 37.8 42.1 48.5
Secchi disk depth Zsd m 8.8 6.7 7.3
pH pH n/a nd 8.2 8.1
Salinity Sal psu 35.5 33.2 29.7
Temperature Temp ºC 13.1 18.6 15.9
Silicic acid Si(OH)4 mg-Si L-1
1.380 0.340 0.630
Orthophosphate PO43-
mg-P L-1
0.606 0.052 0.018
Nitrite NO22-
mg-N L-1
0.354 0.027 0.016
Nitrate NO3- mg-N L
-1 2.689 0.057 0.096
Ammonium NH4 mg-N L-1
bd 0.009 0.005
Dissolved organic carbón DOC mg-C L-1
nd 1.43 2.98
Particulate organic carbon POC mg L-1
0.28 0.37 0.33
Particulate organic nitrogen PON mg L-1
0.07 0.07 0.04
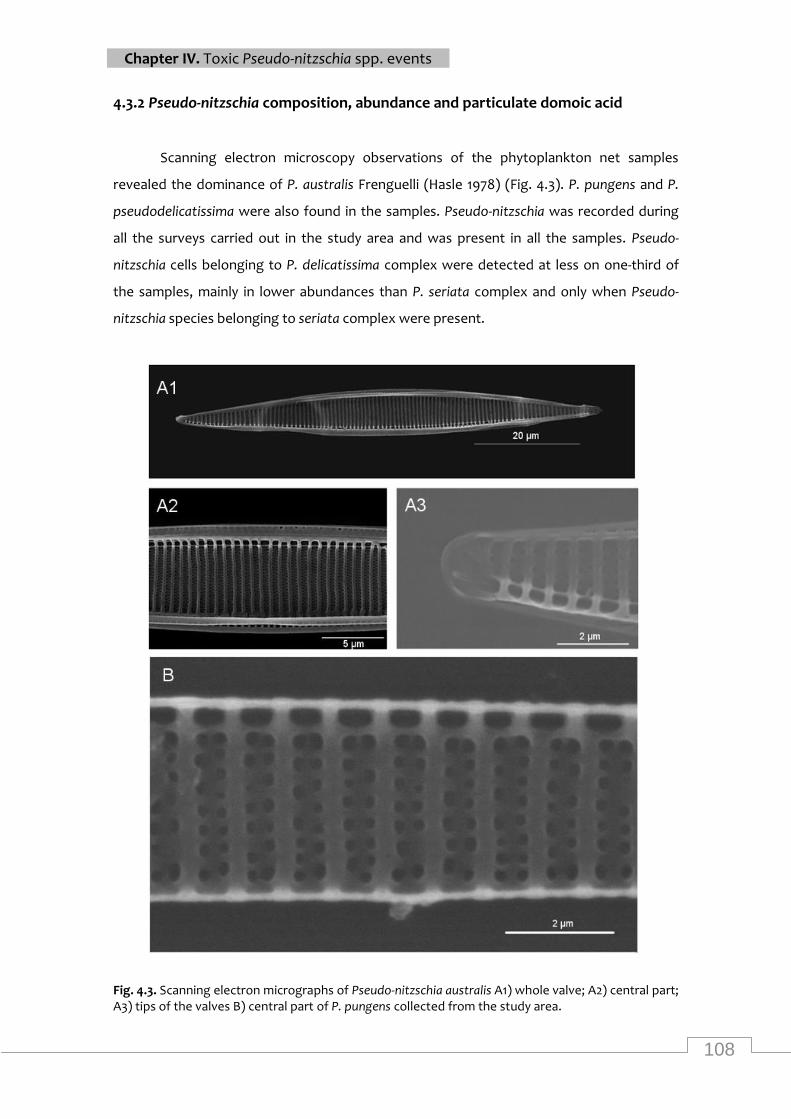
108
Chapter IV. Toxic Pseudo-nitzschia spp. events
4.3.2 Pseudo-nitzschia composition, abundance and particulate domoic acid
Scanning electron microscopy observations of the phytoplankton net samples
revealed the dominance of P. australis Frenguelli (Hasle 1978) (Fig. 4.3). P. pungens and P.
pseudodelicatissima were also found in the samples. Pseudo-nitzschia was recorded during
all the surveys carried out in the study area and was present in all the samples. Pseudo-
nitzschia cells belonging to P. delicatissima complex were detected at less on one-third of
the samples, mainly in lower abundances than P. seriata complex and only when Pseudo-
nitzschia species belonging to seriata complex were present.
Fig. 4.3. Scanning electron micrographs of Pseudo-nitzschia australis A1) whole valve; A2) central part; A3) tips of the valves B) central part of P. pungens collected from the study area.
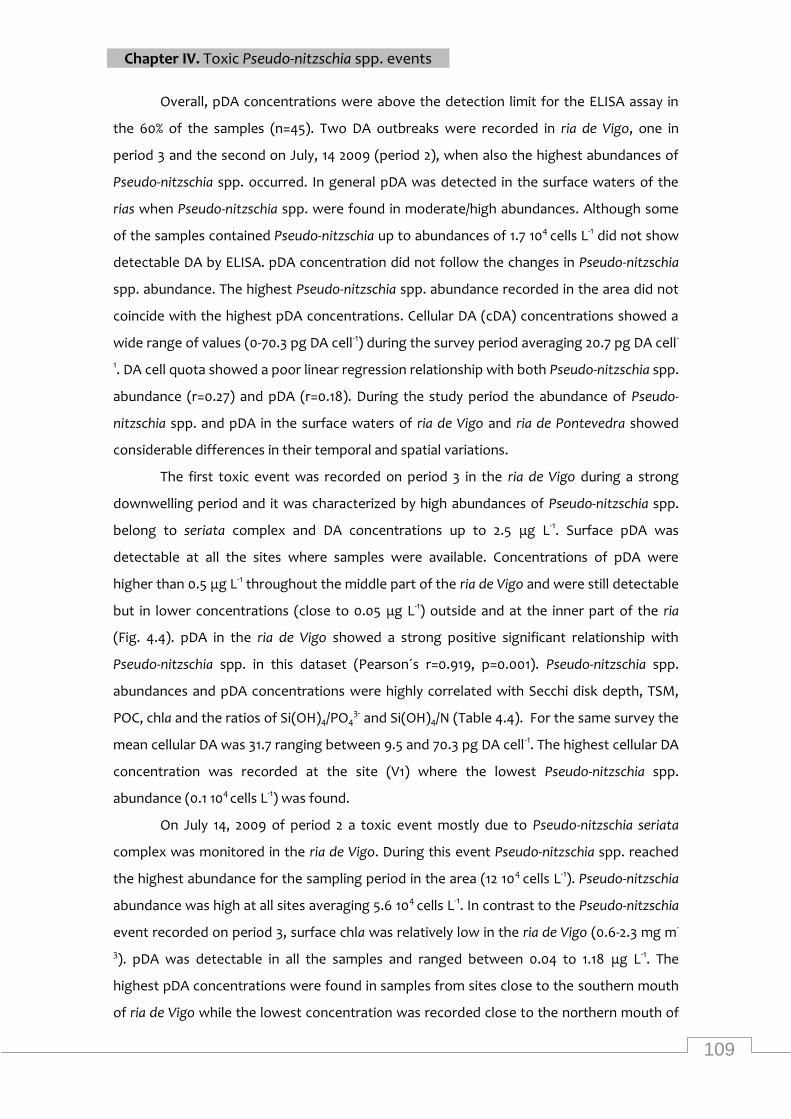
109
Chapter IV. Toxic Pseudo-nitzschia spp. events
Overall, pDA concentrations were above the detection limit for the ELISA assay in
the 60% of the samples (n=45). Two DA outbreaks were recorded in ria de Vigo, one in
period 3 and the second on July, 14 2009 (period 2), when also the highest abundances of
Pseudo-nitzschia spp. occurred. In general pDA was detected in the surface waters of the
rias when Pseudo-nitzschia spp. were found in moderate/high abundances. Although some
of the samples contained Pseudo-nitzschia up to abundances of 1.7 104 cells L-1 did not show
detectable DA by ELISA. pDA concentration did not follow the changes in Pseudo-nitzschia
spp. abundance. The highest Pseudo-nitzschia spp. abundance recorded in the area did not
coincide with the highest pDA concentrations. Cellular DA (cDA) concentrations showed a
wide range of values (0-70.3 pg DA cell-1) during the survey period averaging 20.7 pg DA cell-
1. DA cell quota showed a poor linear regression relationship with both Pseudo-nitzschia spp.
abundance (r=0.27) and pDA (r=0.18). During the study period the abundance of Pseudo-
nitzschia spp. and pDA in the surface waters of ria de Vigo and ria de Pontevedra showed
considerable differences in their temporal and spatial variations.
The first toxic event was recorded on period 3 in the ria de Vigo during a strong
downwelling period and it was characterized by high abundances of Pseudo-nitzschia spp.
belong to seriata complex and DA concentrations up to 2.5 μg L-1. Surface pDA was
detectable at all the sites where samples were available. Concentrations of pDA were
higher than 0.5 μg L-1 throughout the middle part of the ria de Vigo and were still detectable
but in lower concentrations (close to 0.05 μg L-1) outside and at the inner part of the ria
(Fig. 4.4). pDA in the ria de Vigo showed a strong positive significant relationship with
Pseudo-nitzschia spp. in this dataset (Pearson´s r=0.919, p=0.001). Pseudo-nitzschia spp.
abundances and pDA concentrations were highly correlated with Secchi disk depth, TSM,
POC, chla and the ratios of Si(OH)4/PO43- and Si(OH)4/N (Table 4.4). For the same survey the
mean cellular DA was 31.7 ranging between 9.5 and 70.3 pg DA cell-1. The highest cellular DA
concentration was recorded at the site (V1) where the lowest Pseudo-nitzschia spp.
abundance (0.1 104 cells L-1) was found.
On July 14, 2009 of period 2 a toxic event mostly due to Pseudo-nitzschia seriata
complex was monitored in the ria de Vigo. During this event Pseudo-nitzschia spp. reached
the highest abundance for the sampling period in the area (12 104 cells L-1). Pseudo-nitzschia
abundance was high at all sites averaging 5.6 104 cells L-1. In contrast to the Pseudo-nitzschia
event recorded on period 3, surface chla was relatively low in the ria de Vigo (0.6-2.3 mg m-
3). pDA was detectable in all the samples and ranged between 0.04 to 1.18 μg L-1. The
highest pDA concentrations were found in samples from sites close to the southern mouth
of ria de Vigo while the lowest concentration was recorded close to the northern mouth of
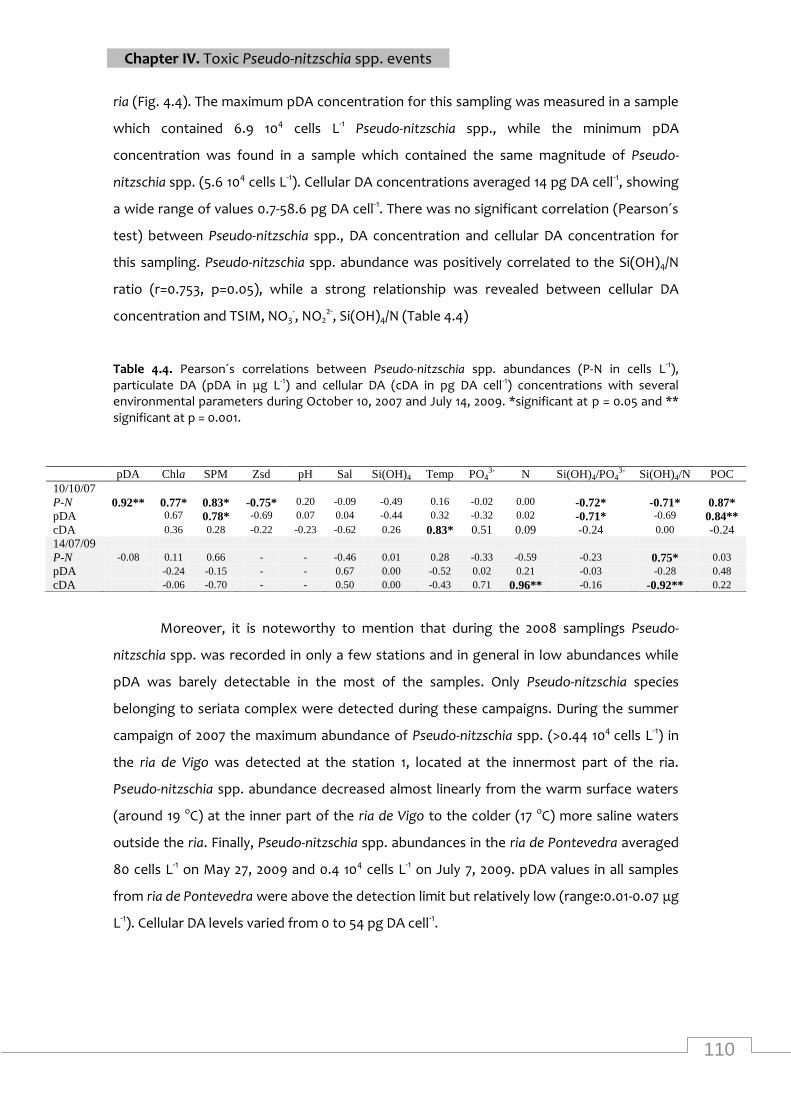
110
Chapter IV. Toxic Pseudo-nitzschia spp. events
ria (Fig. 4.4). The maximum pDA concentration for this sampling was measured in a sample
which contained 6.9 104 cells L-1 Pseudo-nitzschia spp., while the minimum pDA
concentration was found in a sample which contained the same magnitude of Pseudo-
nitzschia spp. (5.6 104 cells L-1). Cellular DA concentrations averaged 14 pg DA cell-1, showing
a wide range of values 0.7-58.6 pg DA cell-1. There was no significant correlation (Pearson´s
test) between Pseudo-nitzschia spp., DA concentration and cellular DA concentration for
this sampling. Pseudo-nitzschia spp. abundance was positively correlated to the Si(OH)4/N
ratio (r=0.753, p=0.05), while a strong relationship was revealed between cellular DA
concentration and TSIM, NO3-, NO2
2-, Si(OH)4/N (Table 4.4)
Table 4.4. Pearson´s correlations between Pseudo-nitzschia spp. abundances (P-N in cells L-1), particulate DA (pDA in μg L-1) and cellular DA (cDA in pg DA cell-1) concentrations with several environmental parameters during October 10, 2007 and July 14, 2009. *significant at p = 0.05 and ** significant at p = 0.001.
Moreover, it is noteworthy to mention that during the 2008 samplings Pseudo-
nitzschia spp. was recorded in only a few stations and in general in low abundances while
pDA was barely detectable in the most of the samples. Only Pseudo-nitzschia species
belonging to seriata complex were detected during these campaigns. During the summer
campaign of 2007 the maximum abundance of Pseudo-nitzschia spp. (>0.44 104 cells L-1) in
the ria de Vigo was detected at the station 1, located at the innermost part of the ria.
Pseudo-nitzschia spp. abundance decreased almost linearly from the warm surface waters
(around 19 oC) at the inner part of the ria de Vigo to the colder (17 oC) more saline waters
outside the ria. Finally, Pseudo-nitzschia spp. abundances in the ria de Pontevedra averaged
80 cells L-1 on May 27, 2009 and 0.4 104 cells L-1 on July 7, 2009. pDA values in all samples
from ria de Pontevedra were above the detection limit but relatively low (range:0.01-0.07 μg
L-1). Cellular DA levels varied from 0 to 54 pg DA cell-1.
pDA Chla SPM Zsd pH Sal Si(OH)4 Temp PO43- N Si(OH)4/PO4
3- Si(OH)4/N POC
10/10/07
P-N 0.92** 0.77* 0.83* -0.75* 0.20 -0.09 -0.49 0.16 -0.02 0.00 -0.72* -0.71* 0.87*
pDA 0.67 0.78* -0.69 0.07 0.04 -0.44 0.32 -0.32 0.02 -0.71* -0.69 0.84**
cDA 0.36 0.28 -0.22 -0.23 -0.62 0.26 0.83* 0.51 0.09 -0.24 0.00 -0.24
14/07/09
P-N -0.08 0.11 0.66 - - -0.46 0.01 0.28 -0.33 -0.59 -0.23 0.75* 0.03
pDA -0.24 -0.15 - - 0.67 0.00 -0.52 0.02 0.21 -0.03 -0.28 0.48
cDA -0.06 -0.70 - - 0.50 0.00 -0.43 0.71 0.96** -0.16 -0.92** 0.22
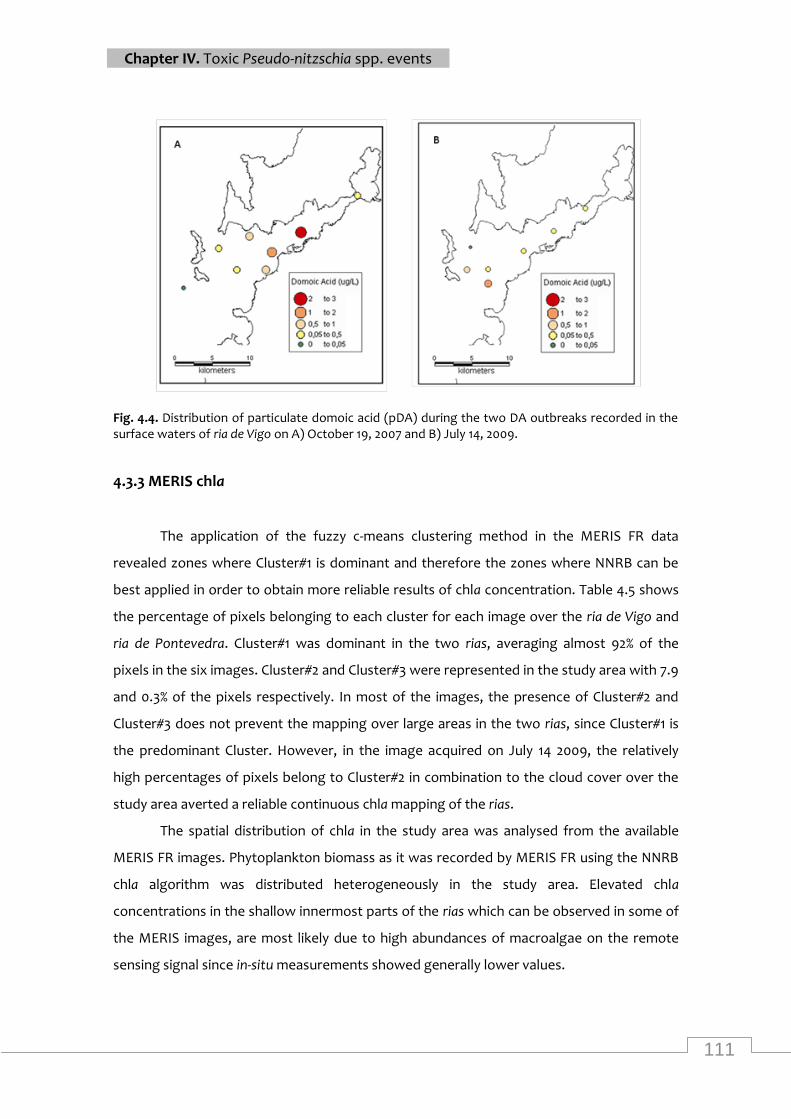
111
Chapter IV. Toxic Pseudo-nitzschia spp. events
Fig. 4.4. Distribution of particulate domoic acid (pDA) during the two DA outbreaks recorded in the surface waters of ria de Vigo on A) October 19, 2007 and B) July 14, 2009.
4.3.3 MERIS chla
The application of the fuzzy c-means clustering method in the MERIS FR data
revealed zones where Cluster#1 is dominant and therefore the zones where NNRB can be
best applied in order to obtain more reliable results of chla concentration. Table 4.5 shows
the percentage of pixels belonging to each cluster for each image over the ria de Vigo and
ria de Pontevedra. Cluster#1 was dominant in the two rias, averaging almost 92% of the
pixels in the six images. Cluster#2 and Cluster#3 were represented in the study area with 7.9
and 0.3% of the pixels respectively. In most of the images, the presence of Cluster#2 and
Cluster#3 does not prevent the mapping over large areas in the two rias, since Cluster#1 is
the predominant Cluster. However, in the image acquired on July 14 2009, the relatively
high percentages of pixels belong to Cluster#2 in combination to the cloud cover over the
study area averted a reliable continuous chla mapping of the rias.
The spatial distribution of chla in the study area was analysed from the available
MERIS FR images. Phytoplankton biomass as it was recorded by MERIS FR using the NNRB
chla algorithm was distributed heterogeneously in the study area. Elevated chla
concentrations in the shallow innermost parts of the rias which can be observed in some of
the MERIS images, are most likely due to high abundances of macroalgae on the remote
sensing signal since in-situ measurements showed generally lower values.
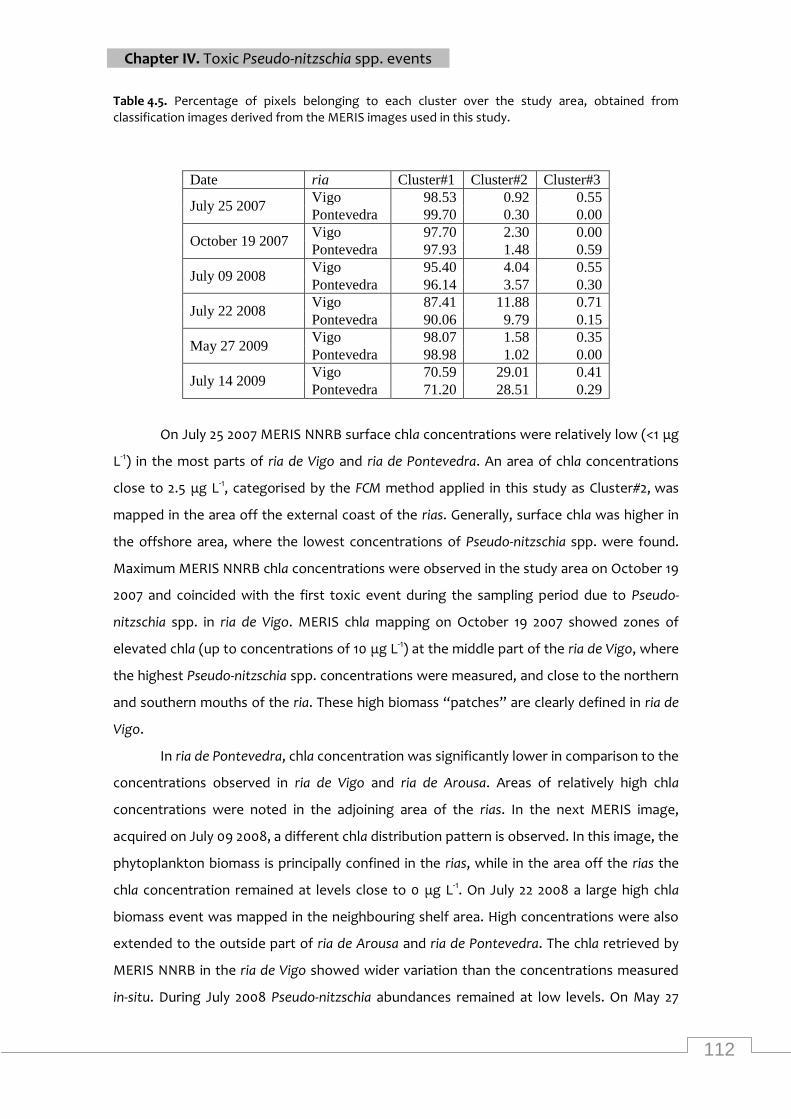
112
Chapter IV. Toxic Pseudo-nitzschia spp. events
Table 4.5. Percentage of pixels belonging to each cluster over the study area, obtained from classification images derived from the MERIS images used in this study.
Date ria Cluster#1 Cluster#2 Cluster#3
July 25 2007 Vigo 98.53 0.92 0.55
Pontevedra 99.70 0.30 0.00
October 19 2007 Vigo 97.70 2.30 0.00
Pontevedra 97.93 1.48 0.59
July 09 2008 Vigo 95.40 4.04 0.55
Pontevedra 96.14 3.57 0.30
July 22 2008 Vigo 87.41 11.88 0.71
Pontevedra 90.06 9.79 0.15
May 27 2009 Vigo 98.07 1.58 0.35
Pontevedra 98.98 1.02 0.00
July 14 2009 Vigo 70.59 29.01 0.41
Pontevedra 71.20 28.51 0.29
On July 25 2007 MERIS NNRB surface chla concentrations were relatively low (<1 μg
L-1) in the most parts of ria de Vigo and ria de Pontevedra. An area of chla concentrations
close to 2.5 μg L-1, categorised by the FCM method applied in this study as Cluster#2, was
mapped in the area off the external coast of the rias. Generally, surface chla was higher in
the offshore area, where the lowest concentrations of Pseudo-nitzschia spp. were found.
Maximum MERIS NNRB chla concentrations were observed in the study area on October 19
2007 and coincided with the first toxic event during the sampling period due to Pseudo-
nitzschia spp. in ria de Vigo. MERIS chla mapping on October 19 2007 showed zones of
elevated chla (up to concentrations of 10 μg L-1) at the middle part of the ria de Vigo, where
the highest Pseudo-nitzschia spp. concentrations were measured, and close to the northern
and southern mouths of the ria. These high biomass “patches” are clearly defined in ria de
Vigo.
In ria de Pontevedra, chla concentration was significantly lower in comparison to the
concentrations observed in ria de Vigo and ria de Arousa. Areas of relatively high chla
concentrations were noted in the adjoining area of the rias. In the next MERIS image,
acquired on July 09 2008, a different chla distribution pattern is observed. In this image, the
phytoplankton biomass is principally confined in the rias, while in the area off the rias the
chla concentration remained at levels close to 0 μg L-1. On July 22 2008 a large high chla
biomass event was mapped in the neighbouring shelf area. High concentrations were also
extended to the outside part of ria de Arousa and ria de Pontevedra. The chla retrieved by
MERIS NNRB in the ria de Vigo showed wider variation than the concentrations measured
in-situ. During July 2008 Pseudo-nitzschia abundances remained at low levels. On May 27
113
Chapter IV. Toxic Pseudo-nitzschia spp. events
2009 concentrations of chla lower than 1 μg L-1 were mainly noted in the three rias. NNRB
estimates were well above this value off the rias. Due to cloud cover and relatively large
areas of Cluster#2 pixels in the rias only data from selected areas like the outer part of the
ria de Pontevedra and ria de Arousa can be reliable. There surface chla levels were close to
or lower than 1 μg L-1.
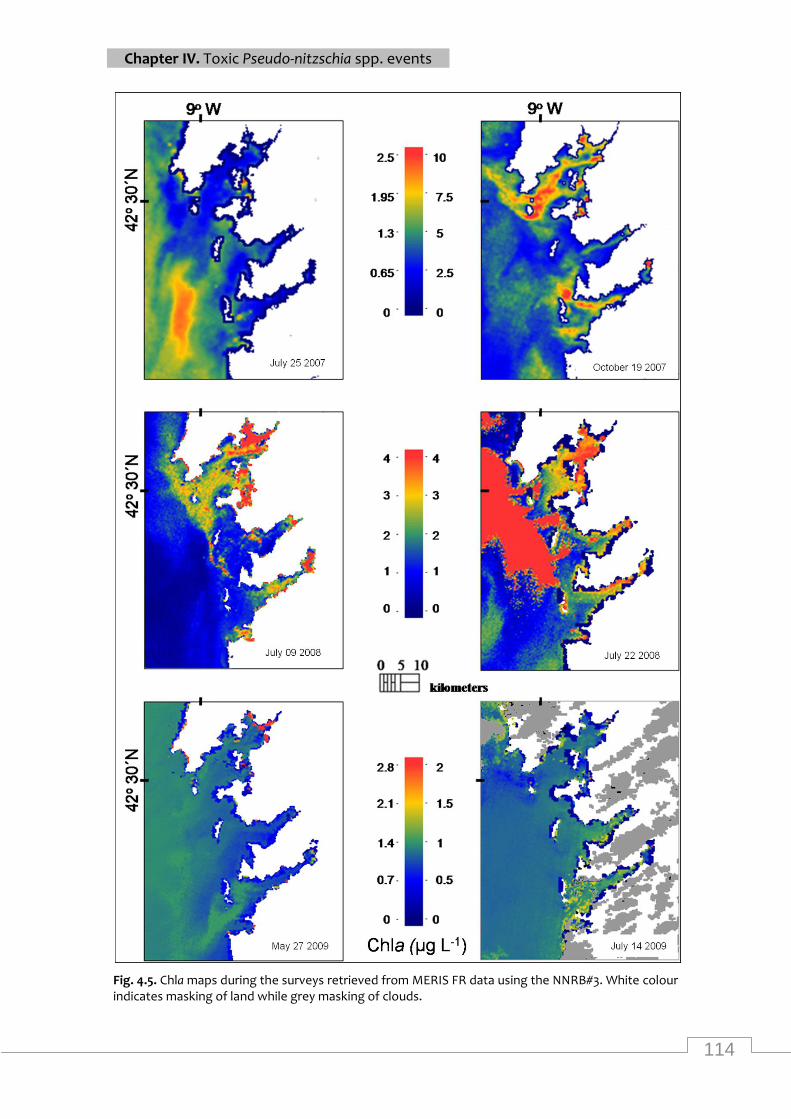
114
Chapter IV. Toxic Pseudo-nitzschia spp. events
Fig. 4.5. Chla maps during the surveys retrieved from MERIS FR data using the NNRB#3. White colour indicates masking of land while grey masking of clouds.
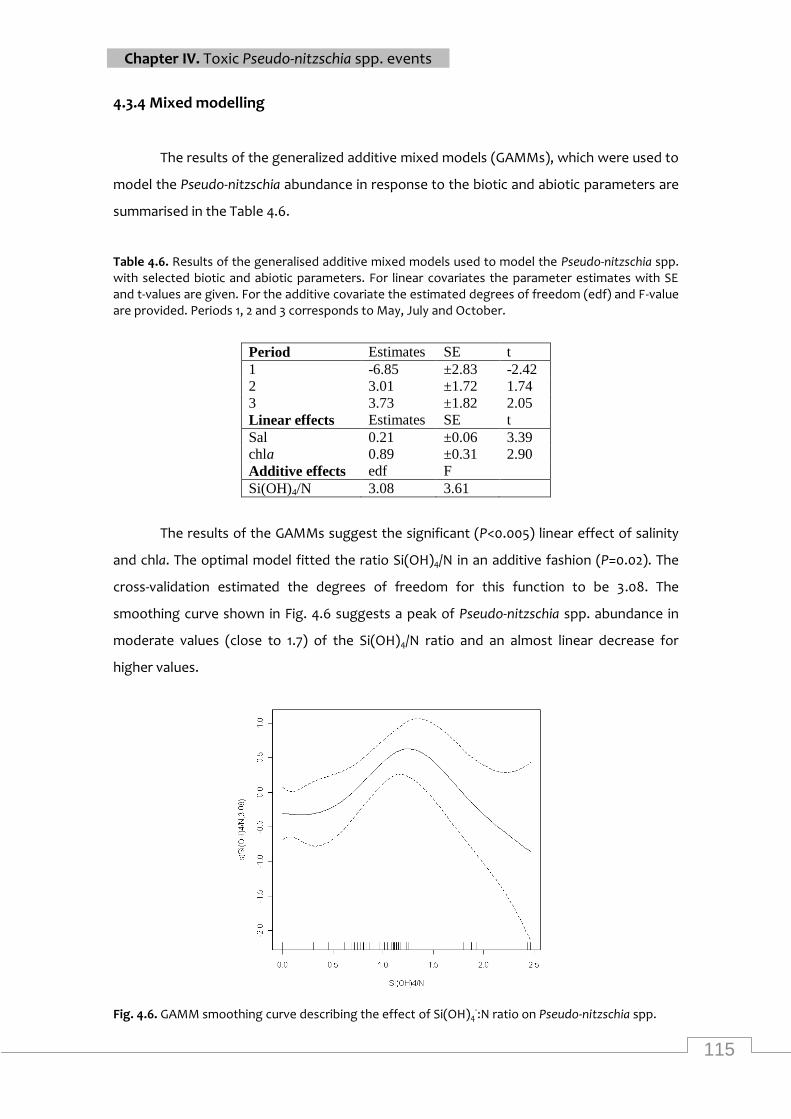
115
Chapter IV. Toxic Pseudo-nitzschia spp. events
4.3.4 Mixed modelling
The results of the generalized additive mixed models (GAMMs), which were used to
model the Pseudo-nitzschia abundance in response to the biotic and abiotic parameters are
summarised in the Table 4.6.
Table 4.6. Results of the generalised additive mixed models used to model the Pseudo-nitzschia spp. with selected biotic and abiotic parameters. For linear covariates the parameter estimates with SE and t-values are given. For the additive covariate the estimated degrees of freedom (edf) and F-value are provided. Periods 1, 2 and 3 corresponds to May, July and October.
Period Estimates SE t
1 -6.85 ±2.83 -2.42
2 3.01 ±1.72 1.74
3 3.73 ±1.82 2.05
Linear effects Estimates SE t
Sal 0.21 ±0.06 3.39
chla 0.89 ±0.31 2.90
Additive effects edf F
Si(OH)4/N 3.08 3.61
The results of the GAMMs suggest the significant (P<0.005) linear effect of salinity
and chla. The optimal model fitted the ratio Si(OH)4/N in an additive fashion (P=0.02). The
cross-validation estimated the degrees of freedom for this function to be 3.08. The
smoothing curve shown in Fig. 4.6 suggests a peak of Pseudo-nitzschia spp. abundance in
moderate values (close to 1.7) of the Si(OH)4/N ratio and an almost linear decrease for
higher values.
Fig. 4.6. GAMM smoothing curve describing the effect of Si(OH)4-:N ratio on Pseudo-nitzschia spp.
116
Chapter IV. Toxic Pseudo-nitzschia spp. events
From all the explanatory variables which were tested to model the DA
concentration, the final GLMM model included the statistically significant effect of POC
(P=0.02), NO3- (P=0.03), PO4
3- (P=0.004) and Si(OH)4/N (P=0.02). Parameters estimates with
SE and t-values for the linear covariates are given in the Table 4.7. Examination of the
residuals did not indicate patterns.
Table 4.7. Results of the best generalised linear mixed model that shows the effect of selected abiotic and biotic parameters on particulate domoic acid (pDA) in our database. Station was included as random effect. Parameter estimates with SE and t-values are given. Periods are the same as in table 4.
Period Estimates SE t
1 -0.12 0.29 0.42
2 0.09 0.23 0.39
3 0.79 0.26 3.07
Parameters Estimates SE t
POC 0.70 0.29 2.42
NO3- -0.38 0.17 -2.23
PO43-
0.69 0.22 3.15
Si(OH)4/N -0.18 0.07 -2.51
4.4 Discussion
4.4.1 Pseudo-nitzschia abundance and species
Pseudo-nitzschia spp. were revealed to be a common component of the
phytoplankton assemblages during the summer period in the study area, because they
were recorded in samples from all summer surveys. Concomitantly, in their review on HABs
in upwelling areas Trainer et al. (2010) reached to a similar conclusion that Pseudo-nitzschia
spp. are present in the Galician rias mainly during late spring-summer. Moreover, we
recorded an autumn-time high abundance event in the ria de Vigo. The Pseudo-nitzschia
assemblages during our study contained mostly Pseudo-nitzschia species belong to the
seriata complex. Pseudo-nitzschia species belonging to the delicatissima complex were also
present in some samples and always along with Pseudo-nitzschia seriata complex species. P.
australis was identified as the dominant species in the net samples examined by electron
microscopy. However, field samples from the two rias contained P. delicatissima and P.
pungens cells. The latter species has been found to consist an important part of the
phytoplankton in the ria de Pontevedra during late winter and summer
upwelling/downwelling conditions (Prego et al., 2007). Previous studies show that Pseudo-
117
Chapter IV. Toxic Pseudo-nitzschia spp. events
nitzschia assemblages in the Galician rias may also include other species like P.
pseudodelicatissima, P. fraudulenta, P. multiseries, P. subpacifica and P. cuspidata (Miguez et
al., 1996; Fraga et al., 1997).
4.4.2 Domoic acid
As far as we know, the present study is the first to provide DA concentrations from
natural phytoplankton populations in the Galician rias. DA has been previously reported
only in shellfish extracts and Pseudo-nitzschia cultures (Arévalo et al., 1998) using HPLC-UV.
From our results, P. australis seems to be the main source of DA in the study area. This
appears to be the most likely situation since P. australis is concurrently the only known DA-
producer (Fraga et al., 1997). Moreover, intoxications by DA in Galician mussels have been
linked to dominant abundances of P. australis (Miguez et al., 1996). The results of this
survey show that relatively high Pseudo-nitzschia spp. abundances and DA concentrations
can be distributed throughout the surface waters of ria de Vigo.
Overall, pDA was detected in more than half of the samples obtained during the
surveys (2007-2009) and relatively high values of pDA and cDA were found. In our data,
particulate domoic acid (pDA) ranged from below detection limits to 2.5 μg L-1. Similar pDA
levels have been measured in the surface waters in other coastal upwelling areas around
the world which have experienced DA outbreaks and where P. australis was the dominant
Pseudo-nitzschia species during the blooms (Busse et al., 2006; Schnetzer et al., 2007;
Garcia-Mentoza et al., 2009). For example, the same magnitude of Pseudo-nitzschia (7 104
cells L-1) abundance that gave us the maximum pDA concentration (2.5 μg L-1) were
detected in San Diego (USA) and the pDA levels reached at 2.3 μg L-1 (Busse et al., 2006).
Cellular DA in field samples varied between 0 and 70.3 pg DA cell-1. We are not aware of
other measurements of cellular DA content in field populations from the Iberian upwelling
system. Several studies along the West coast of USA have recorded analogous ranges of
cellular DA during harmful events mainly due to P. australis (7-75 pg DA cell-1: Scholin et al.,
2000; 0.1-78: Trainer et al., 2000; 5-43 pg DA cell-1: Busse et al., 2006; 0-117 pg DA cell-1:
Schnetzer et al., 2007).
118
Chapter IV. Toxic Pseudo-nitzschia spp. events
4.4.3 Pseudo-nitzschia spp. harmful events in the study area
In our study, the first toxic event in the ria de Vigo was recorded on October, 19
2007. It was characterized by high pDA concentrations due to moderate abundances of
Pseudo-nitzschia. It is worth mentioning that high Pseudo-nitzschia spp. abundances have
been previously observed in the Galician rias during autumn causing the closure of the
mussel harvesting (Moroño, 2000). A second DA episode due to Pseudo-nitzschia spp. was
recorded in the ria de Vigo on July 14 2009 but showed lower DA concentrations. However,
for the years 2007 and 2009 the Technological Institute for the control of the marine
environment of Galicia (INTECMAR) announced that there was not any Pseudo-nitzschia
spp. bloom recorded in the Galician rias associated with mussel intoxication
(www.intecmar.org; Moroño & Pazos., 2009). In parallel, in their detailed annual report,
relatively high Pseudo-nitzschia spp. abundances were shown during mid-October (October
15 and October 22 2007), reaching in some stations values of 2 105 cells L-1. Combining our
results with the INTECMAR database, it can be considered that the high abundances of
Pseudo-nitzschia spp. remained in the ria de Vigo for a maximum of 2 weeks during October.
On July 2009 the closures on the mussel production in the ria de Vigo were associated to
the presence of DSP (Diarrhetic Shellfish Poisoning). On the same year, Pazos and Moroño
(2010) referred very high abundances of P. australis on May in the ria de Vigo and
Pontevedra during a week. Mussel and oyster harvesting closures due to ASP were not
reported during the same periods even if the DA levels in the surface waters were relatively
high. This suggests that these bivalves were not contaminated probably due to the short-
term duration of the harmful events, to the coastal dynamics and to the affinity and
depuration rates of mussels. Spyrakos et al. (2011) describe great changes on
phytoplankton biomass in the Rias Baixas within 3 days. According to Blanco et al. (2002b)
DA events measured as accumulated toxin in the local mussels have been shown to be
characterized by short duration. More specifically, Pazos et al. (2003) mention DA
intoxication in mussels at the end of Pseudo-nitzchia blooms, which normally last for one or
two weeks. Nonetheless, these short-term DA outbreaks, if they are recurrent, can pose a
significant threat to the harvesting of species that show slow DA depuration rates like
scallops (Blanco et al., 2002a; Mauriz & Blanco, 2010). The results of this study deduce that
toxic events due to DA in the Galician rias can be a recurrent phenomenon, be associated
with moderate Pseudo-nitzchia abundances and should be an important concern. Even if in
the Galician rias it has never been reported serious illness or fatalities caused by ASP, DA
levels such the ones detected here have the potential for significant impacts on the
119
Chapter IV. Toxic Pseudo-nitzschia spp. events
ecosystem and human health security and therefore DA in the seawater and not only in
bivalves should be measured routinely in order to assess the potential of a DA outbreak.
4.4.4 Environmental conditions associated with Pseudo-nitzschia spp. abundance
and DA concentration
Coastal upwelling and nutrients availability at the end of the blooms have been
suggested as possible factors implicated in the appearance of toxic Pseudo-nitzschia spp.
events in the Galician rias (Pazos et al., 2003; Trainer et al., 2010). However, the
environmental conditions related to the DA occurrence and distribution in the area is poorly
defined. This study attempts to link environmental properties with the Pseudo-nitzschia spp.
abundances and DA concentrations in order to proximate potential environmental causes
and effects of the regional Pseudo-nitzschia spp. blooms. Therefore, several parameters
(Table 4.3) were determined during the surveys.
The results of the GAMMs for Pseudo-nitzschia spp. revealed the significant linear
effect of salinity. The preference of Pseudo-nitzschia spp. for higher values of salinity found
in our data set confirms previous observations on Pseudo-nitzschia spp. in coastal waters of
Galicia. For example Torres Palenzuela et al. 2010 analysing time series of Pseudo-nitzschia
spp. abundance between the years 1999-2000 concluded that Pseudo-nitzschia spp. blooms
were recorded mainly in high salinity values (>35). Salinity has been suggested as an
important regulator of specific Pseudo-nitzschia species or Pseudo-nitzschia spp. abundance
in other observational studies around the world (e.g. Baltic Sea: Caroppo et al., 2005 and
West Coast of USA: Trainer et al, 2000). Besides salinity, Trainer et al. 2000 and 2002 have
associated high Pseudo-nitzschia abundances with low temperature values and therefore
upwelling events. Palma et al. (2010) in the study on the Pseudo-nitzschia spp. modelling on
the central Iberian coast found a four days delay between the upwelling and the presence
of Pseudo-nitzschia but no direct relation of SST (Sea Surface Temperature) with the
intensity of the upwelling. Our surveys were conducted mainly after or during the
downwelling events off the rias Baixas. Annual data would probably model better the
effect of temperature on the Pseudo-nitzschia abundance. Nevertheless, the two surveys
during an upwelling cycle on July 2008 were accompanied with a small decrease on the
seawater surface temperature in the ria de Vigo (see Figure 3.6 in Chapter III) but not with
high Pseudo-nitzschia abundances. In parallel, after the strong upwelling on July 2008 (July
19), very high values of chla were found a 10m depth, which were missed by the surface
120
Chapter IV. Toxic Pseudo-nitzschia spp. events
sampling. The toxic Pseudo-nitzschia spp. event described here during the autumn survey
on 2007, took place during a downwelling event and after a transition from strong
downwelling at the end of September to strong upwelling the first week of October. In the
ria de Vigo it has been described that diatoms are removed from the surface and bottoms
layers during strong downwelling in the first half of October and after being accumulated
there at the beginning of the downwelling at the end of September (Crespo et al., 2006).
Unpublished data (available only for this survey) of the total phytoplankton revealed that
autrotrophic flagellates dominate (in terms of total abundance) at the station 1V,
cryptophycea at the station 2V, diatoms at the stations 3V-8V and dinoflagellates at stations
9V-10V. Pseudo-nitzschia spp. accounted from 4% (Station 4V and Station8V) to 32% (1V) of
the total diatom abundance. Taken together the results of our study and data published by
INTECMAR it is suggested that diatoms and therefore Pseudo-nitzschia spp. can remain and
bloom in the ria de Vigo for several weeks after the strong downwelling at the end of
September.
The final GAMM fitted to the Pseudo-nitzschia spp. abundance includes the linear
effect of chla. This probably reflects a dominance or co-dominance of Pseudo-nitzschia spp.
in the phytoplankton community. Trainer et al. (2000) and Kudela et al. (2005) and more
recently Trainer et al. (2009) pointed out that there is higher probability for Pseudo-nitzschia
spp. blooms when chla concentration is high. The trend recognised during the sampling
period for higher Pseudo-nitzschia spp. abundances along chla concentrations can be
valuable in the remote sensing detection of high biomass areas in the Galician rias where
these potentially harmful species could be found in high abundances. In this study chla is
retrieved from MERIS FR data using a regional algorithm previously developed. A part of
the chla data from the surveys described here has been used for the development of this
regional neural network-based algorithm, which has been shown to permit accurate
mapping of chla of the rias (Spyrakos et al., 2011). In our MERIS imagery set, Cluster#1 was
dominant in the three rias and the adjacent area allowing reliable chla mapping over the
area. The autumn-time DA event was exemplified by high chla concentrations. The highest
Pseudo-nitzschia spp. abundances (3 to 6 104 cells L-1) were found in a relatively small area in
the ria de Vigo where elevated surface chla biomass (> 6 mg m-3) was mapped from the
MERIS data. These small areas of high chla accompanied with moderate abundances of
toxic Pseudo-nitzschia spp. can easily missed by conventional monitoring techniques. The
MERIS FR and MODIS (not shown here) images from the extended area of the Iberian
Peninsula show very high chla concentrations coupled with colder waters along the
Portuguese and Galician coast indicating a general high biomass event.
121
Chapter IV. Toxic Pseudo-nitzschia spp. events
According to GAMM results Pseudo-nitzschia spp. abundance increases till a
maximum value at moderate values of the ratio of Si(OH)4 to N (mainly NO3-), followed by a
sharp decline at higher values. This may suggest that lower, but not the lowest, ratio values
favour higher Pseudo-nitzschia spp. abundances and partly supports the consideration that
low Si(OH)4/N errands the growth of several Pseudo-nitzschia species (Pan et al., 1996b;
Anderson et al., 2006; Marchetti et al., 2004). Otherwise, these results may reflect the
decline of Si(OH)4 due to high Pseudo-nitzschia spp. abundances. Although the final GAMM
model for Pseudo-nitzschia abundance showed the statistically significant effect of the
explanatory variables: salinity, chla and Si(OH)4/N, these results are limited by the relatively
small number of observations, the no species-specific nature of Pseudo-nitzschia abundance
data and the lack of micronutrients data, which have shown to play an important role on
the Pseudo-nitzschia growth and DA production.
The GLMM identified POC and macronutrients as significant factors influencing pDA
concentration. The enhancement of higher pDA concentrations by low Si(OH)4/N observed
in our data are consistent with the results reported in Anderson et al. (2006) in the Santa
Barbara Channel, California and in other field studies in which DA seems to be associated
with Si-limitation (e.g. Marchetti et al., 2004). In addition, our results associate PO43- and
NO3- concentrations with pDA in the surface seawater. DA production by several Pseudo-
nitzschia species in relation to the availability of these two macronutrients has been studied
in several laboratory experiments since it is considered that they can play an important role
in the DA production (Bates et al., 1991; Pan et al., 1996a, 1996b; Fehling et al., 2004). In
some of these studies PO43--limitation and N-sufficiency (since DA is an amino-acid) have
been pointed out as driving factors for DA production. However, this is in contradiction
with our results where moderate-high pDA values were found in relatively high PO43- and
low NO3- concentrations. Notably, the fact that our results associate high pDA values with
high POC concentrations, implicates rich in pDA POC in the surface waters.
122
Chapter IV. Toxic Pseudo-nitzschia spp. events
4.5 References
Adams, N. G., Lesoing, M., & Trainer, V. L. (2000). Environmental conditions associated with
domoic acid in razor clams on the Washington coast. Journal of Shellfish Research, 19, 1007-1015.
Anderson, C. R., Brzezinski, M. A., Washburn, L., & Kudela, R. (2006). Circulation and
environmental conditions during a toxigenic Pseudo-nitzschia australis bloom in the Santa
Barbara Channel, California. Marine Ecology Progress Series 327, 119-133.
Arévalo, F. F., Bermúdez, M., & Salgado, C. (1998). ASP toxicity in scallops: individual variability
and tissue distribution. In B. Reguera, B. Blanco, M. L. Fernández & T. Wyatt (Eds.), Harmful
Microalgae (pp. 499-502). Santiago de Compostela: Xunta de Galicia and the IOC of UNESCO.
Bakun, A. (1973). Coastal upwelling indices, west coast of North America 1946–71. In, NOAA
Technical Report NMFS-SSRF 671 (pp. 1-103). Seattle.
Bates, S. S., Defreitas, A. S. W., Milley, J. E., Pocklington, R., Quilliam, M. A., Smith, J. C., &
Worms, J. (1991). Controls on domoic acid production by the diatom Nitzschia-pungens f.
multiseries in culture—nutrients and irradiance. Canadian Journal of Fisheries and Aquatic
Sciences, 48, 1136-1144.
Bates, S. S., Garrison, D. L., & Horner, R. A. (1998). Bloom dynamics and physiology of domoic-
acid-producing Pseudo-nitzschia species. In D. M. Anderson, A. D. Cembella & G. M. Hallegraeff
(Eds.), Physiological ecology of harmful algal blooms. Heidelberg: Springer-Verlag.
Blanco, J., Acosta, C. P., de la Puente, M. B., & Salgado C. (2002a). Depuration and anatomical
distribution of the amnesic shellfish poisoning (ASP) toxin domoic acid in the king scallop Pecten
maximus. Aquatic Toxicology, 60, 111-121.
Blanco, J., De La Puente, M. B., Arevalo, F., Salgado, C., & Morono, A. (2002b). Depuration of
mussels (Mytilus galloprovincialis) contaminated with domoic acid. Aquatic Living Resources,
15(1), 53-60.
Busse, L., Venrick, E., Antrobus, R., Miller, P., Vigilant, V., Silver, M., Mengelt, C., Mydlarz, L., &.
Prezelin, B. (2006). Domoic acid in phytoplankton and fish in San Diego, CA, USA. Harmful Algae,
5, 91–101.
Caroppo, C., Congestri, R., Bracchini, L., & Albertano, P. (2005). On the presence of Pseudo-nitzschia calliantha Lundholm, Moestrup et Hasle and Pseudo-nitzschia delicatissima (Cleve) Heiden in the Southern Adriatic Sea (Mediterranean Sea, Italy). Journal of Plankton Research, 277, 63–774.
Crespo, B.G., Figueiras, F. G., Porras, P., & Teixeira, I. G. (2006). Downwelling and dominance of
autochthonous dinoflagellates in the NW Iberian margin: the example of the Ría de Vigo.
Harmful Algae, 5, 770-781.
Cziela, C. (1999). The transport and distribution of the toxic diatom Pseudo-nitzschia spp. in the
123
Chapter IV. Toxic Pseudo-nitzschia spp. events
Coos Bay estuary and the adjacent shelf.
Doerffer, R., & Schiller, H. (2008). MERIS regional coastal and lake case 2 water project—
Atmoshperic correction ATBD, Germany: GKSS Research Center 21502 Geestacht, Version 1.0, 18
May 2008.
Doerffer, R., Sorensen, K., & Aiken, J., 20(9), 1809–1818. (1999). MERIS potential for coastal zone
application. International Journal of Remote Sensing, 20, 1809-1818.
Fehling, J., Davidson, K., Bolch, C. J., & Bates, N. R. (2004). Growth and domoic acid production
by Pseudo-nitzschia seriata (Bacillariophyceae) under phosphate and silicate limitation. Journal
of Phycology, 674-683.
Figueiras, F. G., & Rios, A. F. (1993). Phytoplankton succession, red tides and the hydrographic
regime in the Rías Bajas of Galicia. In T. J. Smayda & Y. Shimizu (Eds.), Toxic Phytoplankton
Blooms in the Sea. Amsterdam: Elsevier.
Fraga, S., Ivarez, M. J., Miguez, A., Fernbndez, M. L., Costas, E., & Lopez-Rodas, V. (1997).
Pseudo-nitzschia species isolated from Galician waters. Proccedings of VIII International
Conference on Harmful Algae. June 25-28, Vigo, Spain.
Fraga, S., Alvarez, M. J., Míguez, A., Fernández, M. L., Costas, E., & Lopez-Rodas, V. (1998).
Pseudo-nitzschia species isolated from galician waters: toxicity, DNA content and lectin binding
assay. In B. Reguera, B. Blanco, M. L. Fernández & T. Wyatt (Eds.), Harmful Algae: Xunta de
Galicia and Inter¬governmental Commission of UNESCO.
Garcia-Mendoza, E., Rivas, D., Olivos-Ortiz, A., Almazan-Becerril, A., Castaneda-Vega, C., & Pena-
Manjarrez, J. L. (2009). A toxic Pseudo-nitzschia bloom in Todos Santos Bay, northwestern Baja
California, Mexico. Harmful Algae, 8, 493–503.
Garet, E., González-Fernández, Á., Lago, J., Vieites, J., & Cabado, A. (2010). Comparative
evaluation of Enzyme-linked Immunoassay and reference methods for the detection of shellfish
hydrophilic toxins in several presentations of seafood. Journal of Agricultural and Food
Chemistry, 20, 1410-1415.
GEOHAB (2005). Global Ecology and Oceanography of Harmful Algal Blooms, GEOHAB Core
Research Project: HABs in Upwelling Systems. In P. Pitcher, Moita, T., Trainer, V.L., Kudela, R.,
Figueiras, P., Probyn, T. (Ed.) (p. 82). Paris and Baltimore.
González Vilas, L., Spyrakos, E., & Torres Palenzuela, J. M. (2011). Neural network estimation of
chlorophyll a from MERIS full resolution data for the coastal waters of Galician rias (NW Spain).
Remote Sensing of Environment, 115, 524-535.
Herrera, J. L., Piedracoba, S., Varela, R. A., & Roson, G. (2005). Statial analysis of the wind field
on the western coast of Galicia (NW Spain) from in situ measurements. Continental Shelf
Research, 25, 1728-1748.
124
Chapter IV. Toxic Pseudo-nitzschia spp. events
Hidy, G. M. (1972). A view of recent air–sea interaction research. Bulletin of American
Meteorological Society, 53, 1083-1102.
Horner, R. A., Garrison, D. L., & Plumley, F. G. (1997). Harmful algal blooms and red tide
problems on the US west coast. Limnology & Oceanography, 42, 1076-1088.
Klein, C., Claquin, P., Bouchart, V., Le Roy, B., & Véron, B. (2010). Dynamics of Pseudo-nitzschia
spp. and domoic acid production in a macrotidal ecosystem of the Eastern English Channel
(Normandy, France). Harmful Algae, 9, 218-226.
Kudela, R., Cochlan, W., & Roberts, A. (2004). Spatial and temporal patterns of Pseudo-nitzschia species in central California related to regional oceanography. In K. A. Steidenger, J. H. Landsberg, J.H., Tomas, C.R., Vargo, G.A. (Eds.), Harmful Algae 2002. Florida Fish and Wildlife Conservation Commission, Florida Institute of Oceanography, and Intergovernmental Oceanographic Commission of UNESCO, St. Petersburg, Florida, pp. 347–349.
Kudela, R., Pitcher, G., Probyn, T., Figueiras, F., Moita, T., & Trainer, V. L. (2005). Harmful algal
blooms in coastal upwelling systems. Oceanography, 18, 185-197.
Landsberg, G. H, Tomas, C. R., & Vargo, G.A. (Eds.), Harmful Algae 2002 (pp. 347–349). St.
Petersburg, Florida: Florida Fish and Wildlife Conservation Commission, Florida Institute of
Oceanography, and Intergovernmental Oceanographic Commission of UNESCO.
Lin, X., & Zhang, D. (1999). Inference in generalized additive mixed models using smoothing
splines. Journal of the Royal Statistical Society, 61, 381-400.
Maldonado, M. T., Hughes, M. P., Rue, E. L., & Wells, M. C. (2002). The effect of Fe and Cu on
growth and domoic acid production by Pseudo-nitzschia multiseries and Pseudo-nitzschia
australis. Limnology & Oceanography, 47, 515-526.
Maneiro, I., Iglesias, P., Guisande, C., Riveiro, I., Barreiro, A., Zervoudaki, S., & Granéli, E. (2005).
Fate of domoic acid ingested by the copepod Acartia clausi. Marine Biology, 148, 123-130.
Marchetti, A., Trainer, V. L., & Harrison, P. J. (2004). Environmental conditions and
phytoplankton dynamics associated with Pseudo-nitzschia abundance and domoic acid in the
Juan de Fuca eddy. Marine Ecology Progress Series, 281, 1-12.
Marić, M., Ljubešić, Z., Godrijan, J., Viličić, D., Ujević, I., & Precali, R. (2011). Blooms of the
potentially toxic diatom Pseudo-nitzschia calliantha Lundholm, Moestrup & Hasle in coastal
waters of the northern Adriatic Sea (Croatia) Estuarine, Coastal and Shelf Science, 1-9.
Mauriz, A., & Blanco, J. (2010). Distribution and linkage of domoic acid (amnesic shellfish
poisoning toxins) in subcellular fractions of the digestive gland of the scallop Pecten maximus.
Toxicon, 55, 606-611.
Miguez Á., L., F. M., & S., F. (1996). First detection of domoic acid in Galicia (NW Spain). In T.
Yasumoto, Y. Oshima & Y. Fukuyo (Eds.), Harmful and Toxic Algal Blooms (pp. 143-145). Paris,
France: IOC of UNESCO.
125
Chapter IV. Toxic Pseudo-nitzschia spp. events
Moroño, A., & Pazos, Y. (2009). Floraciónes algales nocivas y condiciones oceanográficas en las
rias gallegas durante los años 2007 y 2008. In Proceedings of X Reunion Iberica, Fitoplancon
Tóxico y Biotoxinas. Lisboa, Portugal, 12-15 May 2009.
Moroño, A., Pazos, Y., & Maneiro, J. (2000). Evolución del fitoplancton tóxico y condiciones
oceanográficas asociadas en los años 97–98 en las Rías Gallegas. In, VI Reunión Ibérica sobre
Fitoplancton Tóxico y Biotoxinas (pp. 59-66). Sevilla: Junta de Andalucía.
Mouriño, H., Silva, A., Barão, M., I., & Moita, M., T. (2010). Can Pseudo-nitzschia blooms be
modeled by coastal upwelling in Lisbon Bay? Harmful Algae, 9, 294-303.
Pan, Y, Subba Rao, D. V., &Mann, K. H. (1996a). Changes in domoic acid production and cellular
chemical composition of the toxigenic diatom Pseudo-nitzschia multiseries under phosphate
limitation. Journal of Phycology, 32, 371–381.
Pan, Y. L., Rao, D. V. S., Mann, K. H., Brown, R. G., & Pocklington, R. (1996b). Effects of silicate
limitation on production of domoic acid, a neurotoxin, by the diatom Pseudo-nitzschia
multiseries. 1. Batch culture studies. Marine Ecology Progress Series, 131, 225-233.
Parsons, M. L., Dortch, Q., & Turner, R. E. (2002). Sedimentological evidence of an increase in
Pseudo-nitzschia (Bacillariophyceae) abundance in response to coastal eutrophication.
Limnology & Oceanography, 47, 551-558.
Pazos, Y., & Moroño, A. (2011). Monitoración de condiciones oceanograficas y fitoplankton en
las zonas de producción de moluscos de Galicia (2007-2010). In Proceedings of XI Reunion Iberica,
Fitoplancon Tóxico y Biotoxinas. Bilbao, Junio 2009.
Pitcher, G. C., G., F. F., Hickey, B. M., & Moita, M. T. (2010). The physical oceanography of
upwelling systems and the development of harmful algal blooms. Progress in Oceanography 85,
5-32.
Prego, R., Guzmán-Zuñiga, D., Varela, M., & deCastro M (2007) Consequences of winter upwelling events on biogeochemical and phytoplankton patterns in a western Galician ria (NW Iberian peninsula). Estuarine, Coastal and Shelf Science, 73, 409–422. R Development Core Team, 2009. R: A Language and Environment for Statistical Computing, Vienna. <www.R-project.org>.
Reguera, B., Garcés, E., Bravo, I., Pazos, Y., Ramilo, I., & González, G. (2003). Cell cycle patterns
and estimates of in situ division rates of dinoflagellates of the genus Dinophysis by a postmitotic
index. Marine Ecology Progress Series 249, 117-131.
Rodríguez Rodriguez, G., Villasante, S., & García-Negro, M. (2011). Are red tides affecting
economically the commercialization of the Galician (NW Spain) mussel farming? Marine Policy,
35, 252-257.
Smith, J. C., Cormier, R., Worms, J., Bird, C. J., Quilliam, M. A., Pocklington, R., Angus, R., &
Hanic, L. (1990). Toxic blooms of the domoic acid containing diatom Nitzschia pungens in the
126
Chapter IV. Toxic Pseudo-nitzschia spp. events
Cardigan River, Prince Edward Island. In E. Graneli, B. Sundstrom, L. Edler & D. M. Anderson
(Eds.), Toxic Marine Phytoplankton (pp. 227–232). New York.
Schnetzer, A., Miller, O., Schaffner, R., Stauffer, B., Jones, B., Weisberg, S., DiGiacomo, P.,
Berelson, W., & Caron, D. (2007). Blooms of Pseudo-nitzschia and domoic acid in the San Pedro
Channel and Los Angeles harbor areas of the Southern California Bight, 2003–2004. Harmful
Algae, 6, 372–387.
Scholin, C., Gulland, F., Doucette, G., Benson, S., Busman, M., Chavez, F., Cordaro, J., Delong, E.,
Vogelaere, A., Harvey, J., Haulena, M., Lefebvre, K., Lipscomb, T., et al., (2000). Mortality of sea
lions along the central California coast linked to a toxic diatom bloom. Nature, 403, 80–84.
Spyrakos, E., González Vilas, L., Torres Palenzuela, J. M., & Barton, E. D. (2011). Remote sensing
chlorophyll a of optically complex waters (rias Baixas, NW Spain): Application of a regionally
specific chlorophyll a algorithm for MERIS full resolution data during an upwelling cycle. Remote
Sensing of Environment, 115, 2471-2485.
Tomas, C. R. (1997). Identifying Marine phytoplankton. California, USA: Academic press.
Torres Palenzuela, J., González Vilas, L., & Spyrakos, E. (2010). Artificial Neural Network model
for predicting Pseudo-nitzschia spp. abundance in the Galician Rias (NW Spain). In proceeding of
14th International Conference on Harmful Algae, May 2010, Creta, Greece.
Trainer, V. L., Bill, B. D., Stehr, C. M., Wekell, J. C., Moeller, P., Busman, M., & Woodruff, D.
(2000). Domoic acid production near California coastal upwelling zones, June 1998. Limnology &
Oceanography, 45, 1818-1833.
Trainer, V. L., Hickey, B. M., & Horner, R. A. (2002). Biological and physical dynamics of domoic
acid production off the Washington coast. Limnology & Oceanography 47, 1438-1446.
Trainer, V. L., MacFadyen, A., & Moore, S. K. (2009). Variability of Pseudo-nitzschia and domoic
acid in the Juan de Fuca eddy region and its adjacent shelves. Limnology & Oceanography, 54,
289-308.
Trainer, V. L., Pitcher, G. C., Reguera, B., & Smayda, T. J. (2010). The distribution and impacts of
harmful algal bloom species in eastern boundary upwelling systems. Progress in Oceanography,
85, 33-52.
Utermöhl, H. (1958). Zur vervollkommnung der quantitativen phytoplankton-methodik.
Mitteilung Internationale Vereinigung Theoretische unde Amgewandte Limnologie, 9, 1-38.
Vilas, F., Bernabeu, A., & Méndez, G. (2005). Sediment distribution pattern in the Rías Baixas
(NW Spain): main facies and hydrodynamic dependence. Journal of Marine Systems, 54, 261-276.
Wells, M. L., Trick, C. G., Cochlan, W. P., Hughes, M. P., & Trainer, V. L. (2005). Domoic acid: The
synergy of iron, copper, and the toxicity of diatoms. Limnology & Oceanography 50, 1908-1917.

127
Chapter IV. Toxic Pseudo-nitzschia spp. events
Wood, S. N. (2000). Modelling and smoothing parameter estimation with multiple quadratic
penalties. Journal of the Royal Statistical Society, 62, 413-428.
Zapata, M., Rodríguez, F., & Garrido, J. L. (2000). Separation of chlorophylls and carotenoids
from marine phytoplankton: A new HPLC method using a reversed phase C8 column and
pyridine-containing mobile phases. Marine Ecology Progress Series, 195, 29-45.
Zuur, A., Ieno, E., & Smith, G. (2007). Analysing ecological data. New York, USA: Springer.
Zuur, A., Ieno, E., Walker, N., Saveliev A., & Smith, G. (2009). Mixed effects models and extensions
in ecology with R. New York, USA: Springer.

128
Chapter V. N.scintillans PST vector?
129
Ingestion and clearance rates of the red Noctiluca scintillans fed on the toxic dinoflagellate Alexandrium minutum (Halim)
Abstract
5.1 Introduction
5.2 Material and methods
5.3 Results
5.4 Discussion
5.5 References
CHAPTER V

130
131
Chapter V. N.scintillans PST vector?
Abstract
In this study, we evaluated the ingestion and clearance rates of the heterotrophic
dinoflagellate Noctiluca scintillans (Macartney) fed on the toxic microalgae Alexandrium
minutum Halim in laboratory cultures. Specimens of the red form of N. scintillans were
collected in the ria de Vigo and kept in culture. The results showed that N. scintillans actively
fed on A. minutum, with maximum ingestion rates of 0.37 μg C ind−1 day−1, showing that
there was non-satiated feeding by N. scintillans on A. minutum. The mean cellular toxin
content of A. minutum in the stock culture ranged from 2.57 to 3.44 fmol cell−1. The HPLC
analyses of the extracts from N. scintillans fed with 4 different abundances of A. minutum
revealed no detectable amounts of toxin. This suggested that although N. scintillans was
able to ingest a toxic dinoflagellate such as A. minutum into its vacuoles, the ingested toxin
was bioconverted or excreted by Noctiluca. Our findings support the theory that Noctiluca
may inflict grazing pressure on the growth of Paralytic Shellfish Toxin (PST) species in the
field, and could therefore play an important role as a regulator against PST-producing
phytoplankton. This is the first report about grazing rates of N. scintillans on Alexandrium
cells.
132
Chapter V. N.scintillans PST vector?
5.1 Introduction
Heterotrophic dinoflagellates are common members of the plankton and play an
important role in the marine pelagic systems as regulators of phytoplankton biomass
(Lessard, 1991; Strom & Morello, 1998; Jeong, 1999; Sherr & Sherr, 2007). One of the most
common organisms in this group is Noctiluca scintillans (Ehrenberg) Macartney. N. scintillans
is a large non-photosynthetic dinoflagellate with worldwide distribution which dominates
some communities of plankton grazers and occasionally causes spectacular and striking red
tides in several coastal regions of the world (Fung & Trott, 1973; Schaumann et al., 1988;
Huang & Qi, 1997; Elbrächter & Qi, 1998; Dela-Cruz et al., 2002; Fonda-Umani et al., 2004;
Fukuda & Endoh, 2006).
N. scintillans appears in the water column in two distinctive morphotypes: the
tropical or green form, which contains endosymbiotic algae (Sweeney, 1976; Hansen et al.,
2004; Furuya et al., 2006) and the strictly heterotrophic or red form that inhabits more
temperate waters (Kiørboe & Titelman, 1998). One of the most noteworthy characteristics
of N. scintillans is its highly omnivorous feeding behavior. It consumes a wide range of prey
such as phytoplankton cells (Nakamura, 1998a; Dela-Cruz et al., 2002; Hansen et al., 2004),
copepods eggs (Kimor, 1979; Daan, 1987; Quevedo et al., 1999), copepod nauplii (Dela-Cruz
et al., 2002), fish eggs (Enomoto, 1956; Hattori, 1962), fecal pellets (Kiørboe, 2003), marine
snow (Shanks & Walters, 1996) and bacteria (Kirchner et al., 1996). The main factors that
control the population growth of N. scintillans are water temperature, salinity,
phytoplankton biomass and natural nutrient enrichment processes (Uhling & Sahling, 1990;
Lee & Hirayama, 1992a; Buskey, 1995; Huang & Qi, 1997; Dela-Cruz et al., 2002; Dela-Cruz et
al., 2003).
Although N. scintillans does not produce toxins, it is categorized as harmful algae
due to the high levels of ammonium accumulated inside the cells and oxygen depletion
which occurs during the decay of high abundance events (Smayda, 1997). Several cases of
mass mortalities in caged fish and shrimp farms due to ammonium release by N. scintillans
have been reported (Okaishi & Nishio, 1976; Suvapepun, 1989; Naqvi et al., 1998; Montani et
al., 1998). More recently, Kirchner et al. (2001) and Seibold et al. (2001) pointed out that
Noctiluca cells may contain a large number of endocytic bacteria, which could be involved in
the production of harmful substances.
It is assumed that diatoms are generally the phytoplankton group most preferred
by N. scintillans as food items, both in field populations and in cultures (Buskey, 1995;
133
Chapter V. N.scintillans PST vector?
Kirchner et al., 1996; Jeong & Shim, 1996; Kiørboe & Titelman, 1998; Nakamura, 1998b;
Tiselius & Kiørboe, 1998). Hanslik (1987) reported that the diatom Skeletonema costatum is
a high value prey item, when compared to a dinoflagellate like Scrippsiella trochoidea.
Phytoplankton species such as Heterocapsa inlandica, Tetraselmis tetrathelle, and
Gymnodinium nagasakiense, have been tested as food items of N. scintillans. Takayama
(1977) showed that N. scintillans fed on H. inlandica increased in density up to 200× in 3
weeks, while Lee and Hirayama (1992b) showed no differences in clearance rates between
T. tetrathelle and G. nagasakiense. Although there is no clear trend in terms of diet, it seems
that the relationship between N. scintillans and its potential prey may be species-specific.
Few laboratory studies have addressed the interaction of Noctiluca with toxic
phytoplankton. Hinz et al. (2001) used toxic and non-toxic strains of Alexandrium fundyense
and Alexandrium tamarense to feed Noctiluca, but their study only assessed possible
ingestion by crab larvae, and they did not determine grazing rates or possible toxic effects.
Hansen et al. (2004) and Azanza et al. (2010) fed green N. scintillans with the dinoflagellate
Pyrodinium bahamense var. compressum, a tropical PST producer. Results showed that N.
scintillans ingested P. bahamense var. compressum, but at relatively low rates. In general, it
seems that heterotrophic dinoflagellates exhibit low ingestion rates compared to other
groups of predators (e.g. ciliates, see Strom & Morello, 1998).
In field studies, predation by N. scintillans on toxic dinoflagellate species, such as
Dinophysis caudata and D. acuta (Escalera et al., 2007) and Gymnodinum catenatun (Alonso-
Rodríguez et al., 2005) has been recorded, with the prey being ingested into the vacuoles of
the cell. Although there are no available quantitative data on the removal rates of toxin-
producing phytoplankton species by N. scintillans, it is generally considered that N.
scintillans could act as a regulator of the dynamics of harmful algal events.
The aim of this study was to examine whether N. scintillans could actively feed on a
PST-producing dinoflagellate. Also, to assess if N. scintillans can eventually act as a PST
vector, individuals were tested for the presence of toxin accumulated in their cells.
5.2 Materials and methods
5.2.1 Noctiluca scintillans collection
Specimens of the red N. scintillans were collected by vertically integrated tows, at
39 m depth, close to a field station located in the ria de Vigo, Spain (42°13.3′N, 8°47.7′W), an
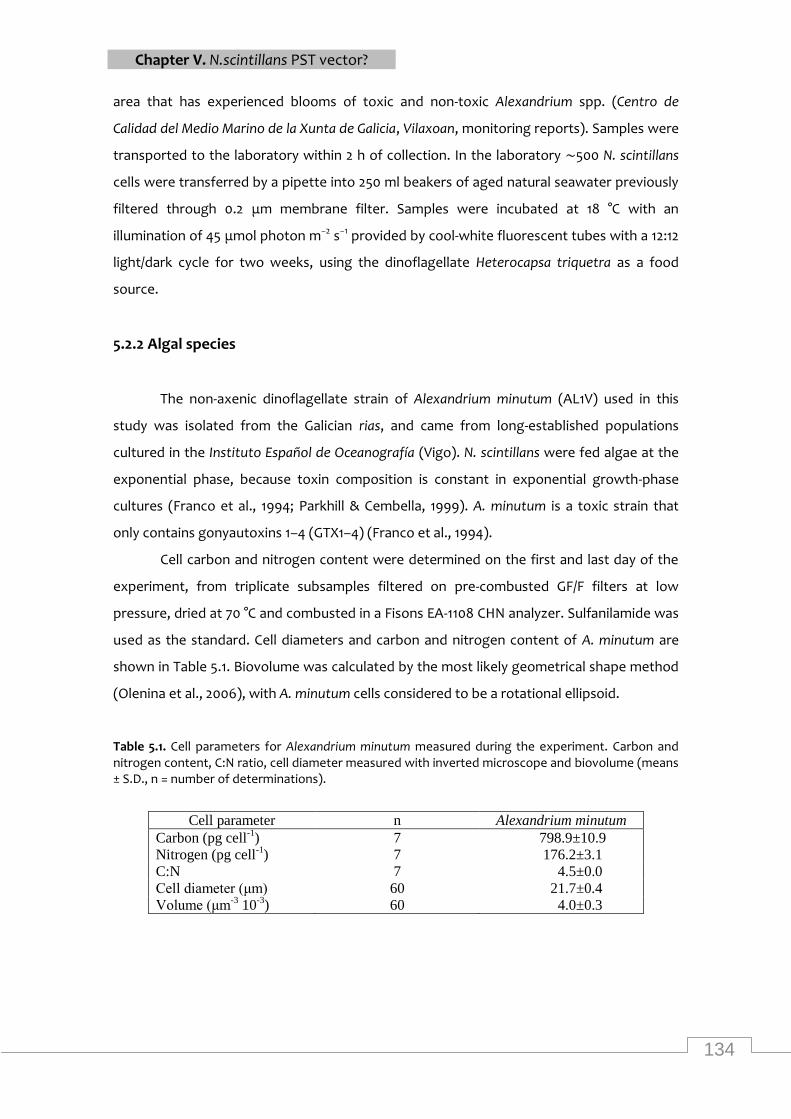
134
Chapter V. N.scintillans PST vector?
area that has experienced blooms of toxic and non-toxic Alexandrium spp. (Centro de
Calidad del Medio Marino de la Xunta de Galicia, Vilaxoan, monitoring reports). Samples were
transported to the laboratory within 2 h of collection. In the laboratory ∼500 N. scintillans
cells were transferred by a pipette into 250 ml beakers of aged natural seawater previously
filtered through 0.2 μm membrane filter. Samples were incubated at 18 °C with an
illumination of 45 μmol photon m−2 s−1 provided by cool-white fluorescent tubes with a 12:12
light/dark cycle for two weeks, using the dinoflagellate Heterocapsa triquetra as a food
source.
5.2.2 Algal species
The non-axenic dinoflagellate strain of Alexandrium minutum (AL1V) used in this
study was isolated from the Galician rias, and came from long-established populations
cultured in the Instituto Español de Oceanografía (Vigo). N. scintillans were fed algae at the
exponential phase, because toxin composition is constant in exponential growth-phase
cultures (Franco et al., 1994; Parkhill & Cembella, 1999). A. minutum is a toxic strain that
only contains gonyautoxins 1–4 (GTX1–4) (Franco et al., 1994).
Cell carbon and nitrogen content were determined on the first and last day of the
experiment, from triplicate subsamples filtered on pre-combusted GF/F filters at low
pressure, dried at 70 °C and combusted in a Fisons EA-1108 CHN analyzer. Sulfanilamide was
used as the standard. Cell diameters and carbon and nitrogen content of A. minutum are
shown in Table 5.1. Biovolume was calculated by the most likely geometrical shape method
(Olenina et al., 2006), with A. minutum cells considered to be a rotational ellipsoid.
Table 5.1. Cell parameters for Alexandrium minutum measured during the experiment. Carbon and nitrogen content, C:N ratio, cell diameter measured with inverted microscope and biovolume (means ± S.D., n = number of determinations).
Cell parameter n Alexandrium minutum
Carbon (pg cell-1
) 7 798.9±10.9
Nitrogen (pg cell-1
) 7 176.2±3.1
C:N 7 4.5±0.0
Cell diameter (μm) 60 21.7±0.4
Volume (μm-3
10-3
) 60 4.0±0.3
135
Chapter V. N.scintillans PST vector?
5.2.3 Experimental design
Noctiluca cells were starved for 72 h in 250 ml beakers containing filtered seawater.
Fifteen individuals in the trophon stage were then pipetted out into each of twenty-four 40
ml beakers which contained experimental food concentrations. Four concentrations of A.
minutum, ranging from 50 to 400 cell ml−1 (low: 50; moderate: 100, 200; high: 400) were
prepared with six replicate samples per concentration. Only individuals with active tentacle
movement were used.
The culture medium was prepared with aged natural seawater (salinity 33.6 ‰),
filtered through GF/F Whatman filters and autoclaved. N. scintillans cells were kept
throughout the experiment at 18 °C under two different conditions: twelve replicates (3 for
each experimental food concentration) in 12:12 h light/dark cycle (condition 1) and twelve
more in completely dark conditions (condition 2), with the same experimental food
concentrations as condition 1. Each day, N. scintillans cells were isolated and pipetted to a
new beaker with A. minutum suspensions at the experimental concentration. Mortality in N.
scintillans was lower than 6% day−1 in all experimental food concentrations. Cell abundance
of A. minutum, toxin content per cell, clearance rates (the volume of water swept clear of
A. minutum cells) and ingestion rates were all estimated on a daily basis for the different
experimental food concentrations.
5.2.4 Grazing estimation
All the replicates (15 individuals per 40 ml beaker) were used to estimate the
ingestion rates of the red N. scintillans fed on A. minutum at each experimental food
concentration. Initial beakers without N. scintillans were prepared simultaneously. Initial
and subsequent, subsamples were immediately preserved using 4% formaldehyde for cell
counting. Grazing experiments were run for 24 h at the temperature and light conditions
described above. The mortality of N. scintillans was checked everyday after 24 h incubation
using a steromicroscope. A. minutum subsamples were preserved with 4% formaldehyde for
cell counting. Abundances of A. minutum were determined by quadruplicate counting of 1
ml of sample with a Sedgewick-Rafter chamber using an inverted microscope. Frost's (1972)
equations were used to calculate clearance and ingestion rates.
136
Chapter V. N.scintillans PST vector?
5.2.5 Toxin analysis
To estimate the cell toxin content of A. minutum, algal cells were collected on pre-
combusted 13 mm GF/F Whatman filters and stored at −30 °C in ultracentrifuge plastic tubes
and lyophilized; 300 μl of 0.05 M acetic acid was added to the lyophilized material, and the
sample was homogenized using a pipette tip adapted to fit the shape of the vial. The
sample was shaken then frozen twice. Finally, the extract was centrifuged twice at 9000
rpm for 5 min, after which 200 μl of the supernatant was carefully collected with a Hamilton
syringe, and stored at −30 °C. For analysis of PST content in N. scintillans, on the last day of
the experiment a minimum of 15 and a maximum of 25 individuals from each experimental
food concentration were transferred to filtered seawater then to distilled water and
collected with a known volume (≤1 ml). Samples of N. scintillans were stored at −30 °C in
ultracentrifuge plastic tubes and lyophilized; 100 μl of acetic acid (0.05 M) was added to the
lyophilized material which was then processed as for A. minutum samples.
Analysis of the Paralytic Shellfish Poisoning (PSP) toxins (by high-performance liquid
chromatography (HPLC) with fluorescence detection) was carried out following a
modification of the method of Oshima et al. (1989), described by Franco and Fernández
(1993). Chromatographic profiles of A. minutum cells were determined by quadruplicate
injections of 35 μl of extracts (diluted with 0.05 M acetic acid, as necessary).
Chromatographic profiles of N. scintillans were determined by injection of 35 μl of the
extracts. Toxins from the National Research Council of Canada (Halifax) were used as toxin
standards. The toxicity of A. minutum in saxitoxin equivalents (STXeq) was calculated from
the HPLC chromatograms. The toxin concentrations were multiplied by a toxin-specific
conversion factor to yield toxicity. The specific toxicity conversion factors of the individual
toxins were adopted from Oshima (1995), based upon empirical mouse bioassay data
determined using purified standards, and assuming the conversion factor of 1 mouse unit
(MU) = 0.23 μg STXeq for the ddy mouse strains: 567.6 (GTX1), 205.2 (GTX2), 364.3 (GTX3)
and 414.7 (GTX4).
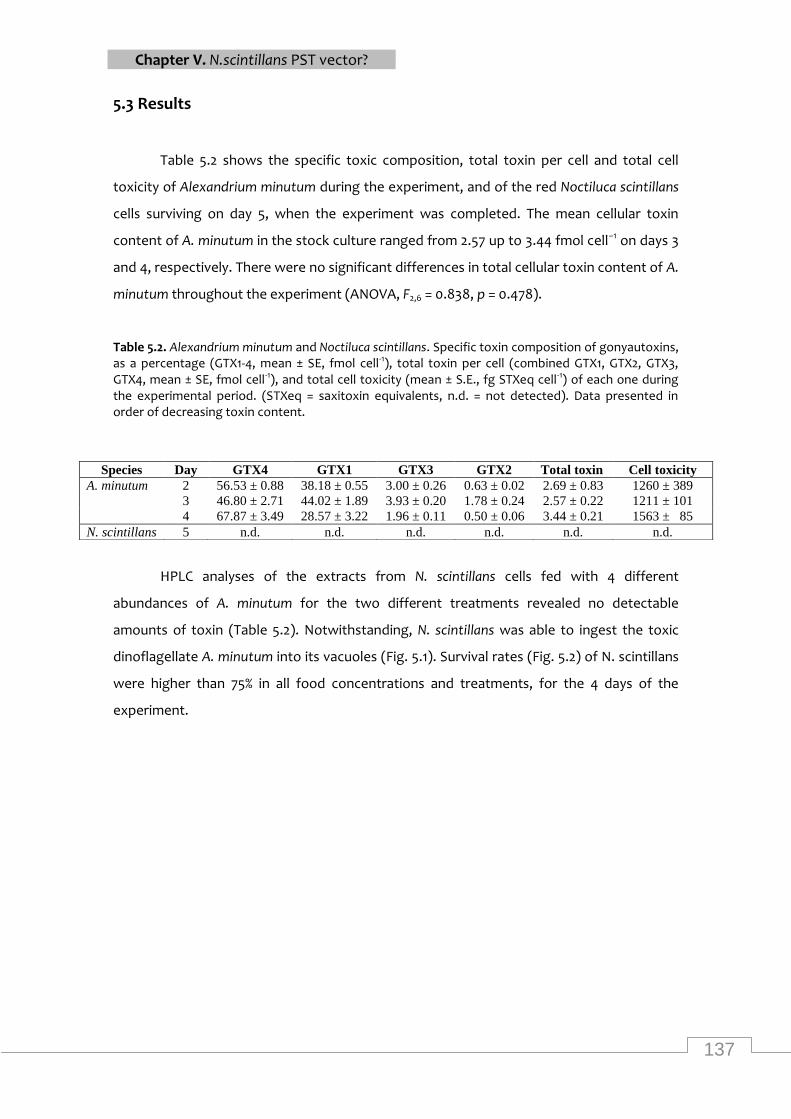
137
Chapter V. N.scintillans PST vector?
5.3 Results
Table 5.2 shows the specific toxic composition, total toxin per cell and total cell
toxicity of Alexandrium minutum during the experiment, and of the red Noctiluca scintillans
cells surviving on day 5, when the experiment was completed. The mean cellular toxin
content of A. minutum in the stock culture ranged from 2.57 up to 3.44 fmol cell−1 on days 3
and 4, respectively. There were no significant differences in total cellular toxin content of A.
minutum throughout the experiment (ANOVA, F2,6 = 0.838, p = 0.478).
Table 5.2. Alexandrium minutum and Noctiluca scintillans. Specific toxin composition of gonyautoxins, as a percentage (GTX1-4, mean ± SE, fmol cell-1), total toxin per cell (combined GTX1, GTX2, GTX3, GTX4, mean ± SE, fmol cell-1), and total cell toxicity (mean ± S.E., fg STXeq cell-1) of each one during the experimental period. (STXeq = saxitoxin equivalents, n.d. = not detected). Data presented in order of decreasing toxin content.
HPLC analyses of the extracts from N. scintillans cells fed with 4 different
abundances of A. minutum for the two different treatments revealed no detectable
amounts of toxin (Table 5.2). Notwithstanding, N. scintillans was able to ingest the toxic
dinoflagellate A. minutum into its vacuoles (Fig. 5.1). Survival rates (Fig. 5.2) of N. scintillans
were higher than 75% in all food concentrations and treatments, for the 4 days of the
experiment.
Species Day GTX4 GTX1 GTX3 GTX2 Total toxin Cell toxicity
A. minutum 2 56.53 ± 0.88 38.18 ± 0.55 3.00 ± 0.26 0.63 ± 0.02 2.69 ± 0.83 1260 ± 389
3 46.80 ± 2.71 44.02 ± 1.89 3.93 ± 0.20 1.78 ± 0.24 2.57 ± 0.22 1211 ± 101
4 67.87 ± 3.49 28.57 ± 3.22 1.96 ± 0.11 0.50 ± 0.06 3.44 ± 0.21 1563 ± 85
N. scintillans 5 n.d. n.d. n.d. n.d. n.d. n.d.
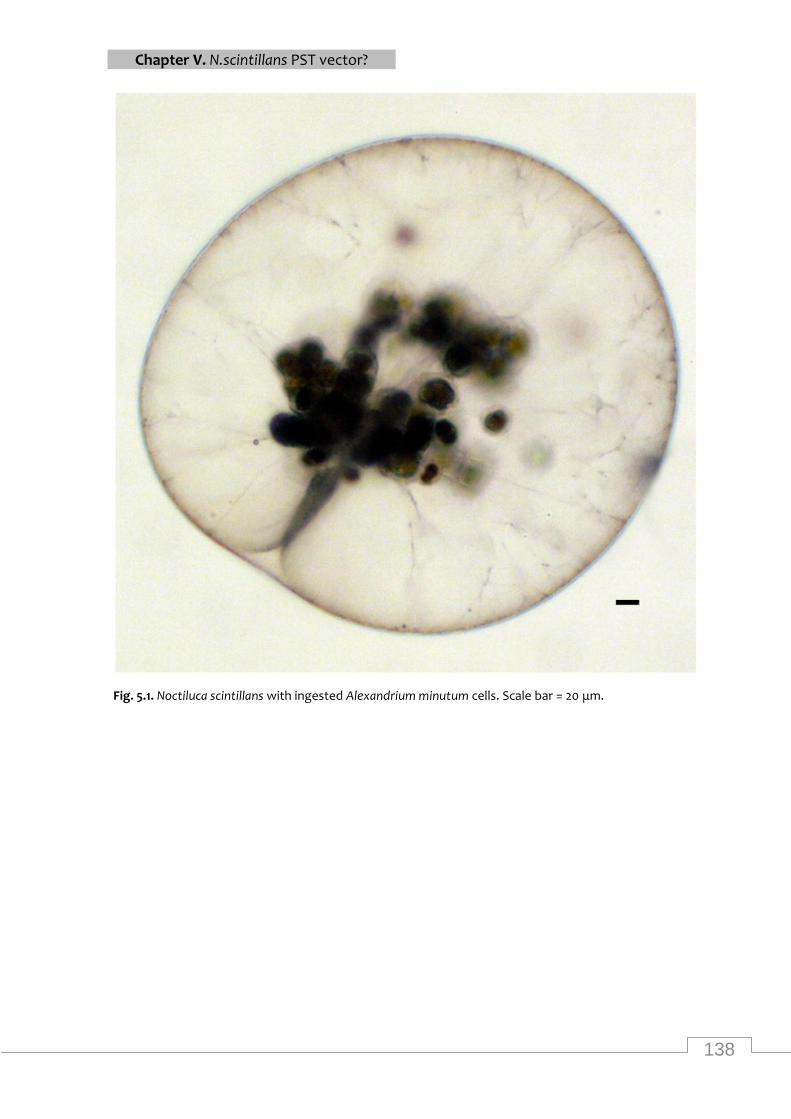
138
Chapter V. N.scintillans PST vector?
Fig. 5.1. Noctiluca scintillans with ingested Alexandrium minutum cells. Scale bar = 20 μm.
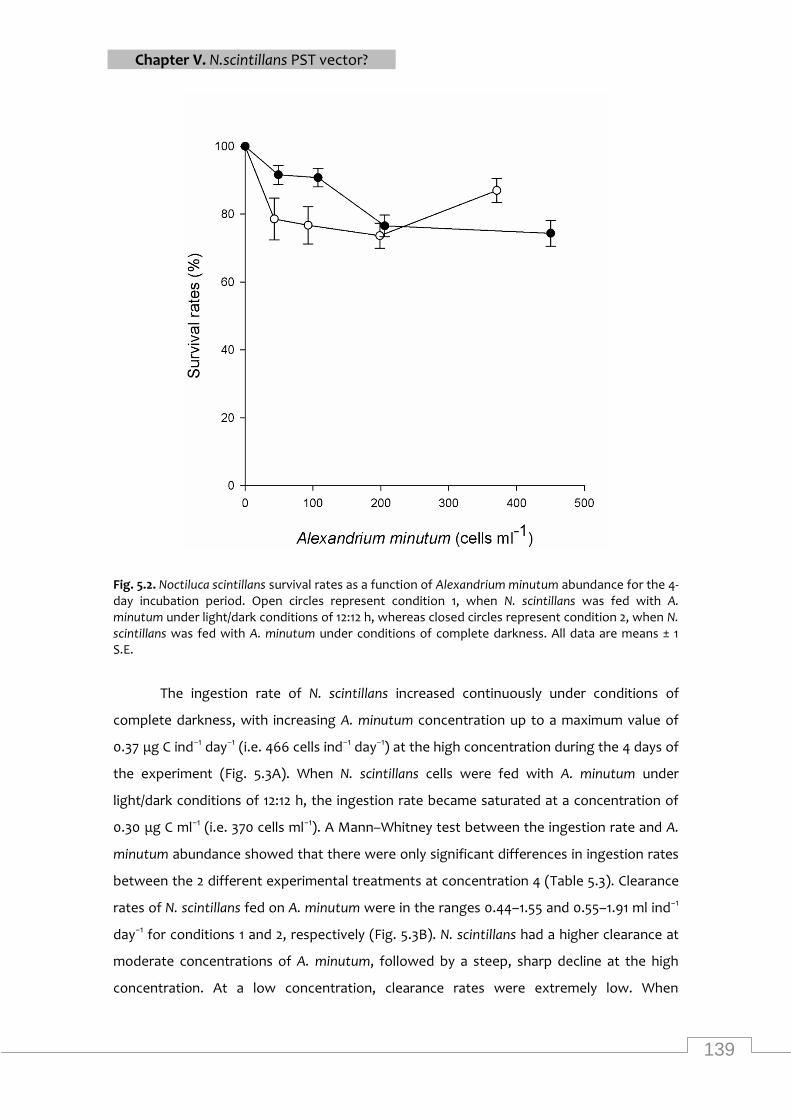
139
Chapter V. N.scintillans PST vector?
Fig. 5.2. Noctiluca scintillans survival rates as a function of Alexandrium minutum abundance for the 4-day incubation period. Open circles represent condition 1, when N. scintillans was fed with A. minutum under light/dark conditions of 12:12 h, whereas closed circles represent condition 2, when N. scintillans was fed with A. minutum under conditions of complete darkness. All data are means ± 1 S.E.
The ingestion rate of N. scintillans increased continuously under conditions of
complete darkness, with increasing A. minutum concentration up to a maximum value of
0.37 μg C ind−1 day−1 (i.e. 466 cells ind−1 day−1) at the high concentration during the 4 days of
the experiment (Fig. 5.3A). When N. scintillans cells were fed with A. minutum under
light/dark conditions of 12:12 h, the ingestion rate became saturated at a concentration of
0.30 μg C ml−1 (i.e. 370 cells ml−1). A Mann–Whitney test between the ingestion rate and A.
minutum abundance showed that there were only significant differences in ingestion rates
between the 2 different experimental treatments at concentration 4 (Table 5.3). Clearance
rates of N. scintillans fed on A. minutum were in the ranges 0.44–1.55 and 0.55–1.91 ml ind−1
day−1 for conditions 1 and 2, respectively (Fig. 5.3B). N. scintillans had a higher clearance at
moderate concentrations of A. minutum, followed by a steep, sharp decline at the high
concentration. At a low concentration, clearance rates were extremely low. When
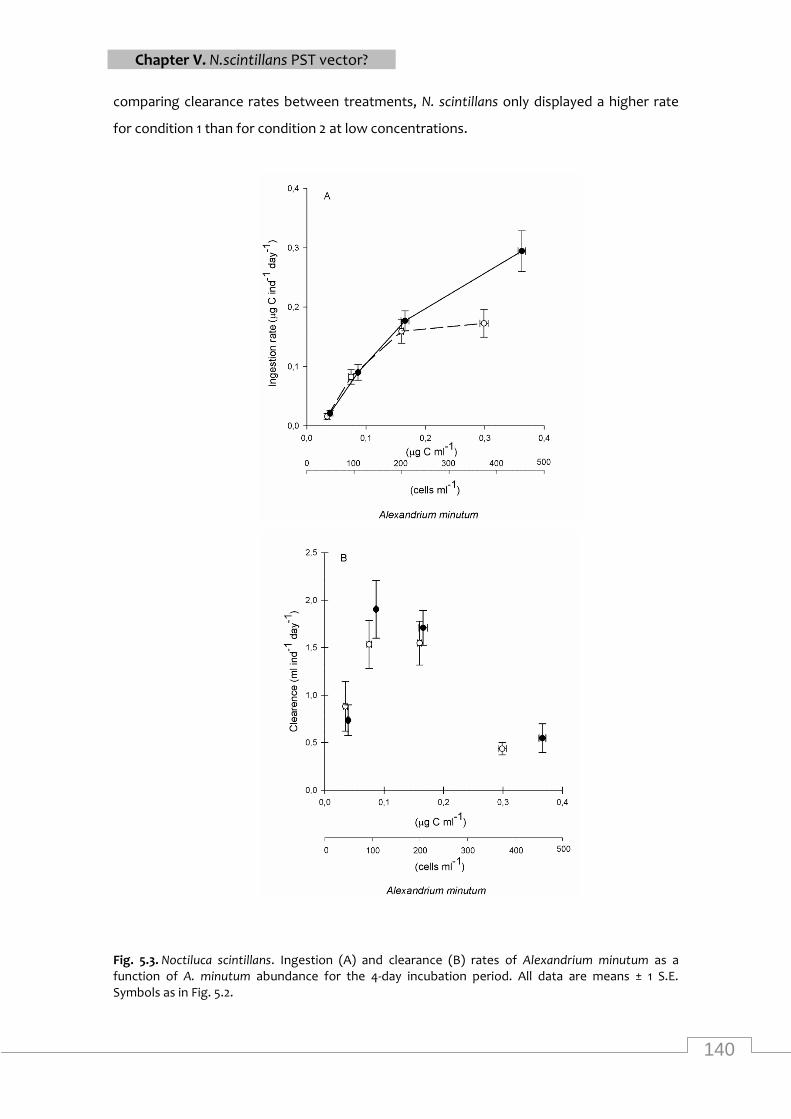
140
Chapter V. N.scintillans PST vector?
comparing clearance rates between treatments, N. scintillans only displayed a higher rate
for condition 1 than for condition 2 at low concentrations.
Fig. 5.3. Noctiluca scintillans. Ingestion (A) and clearance (B) rates of Alexandrium minutum as a function of A. minutum abundance for the 4-day incubation period. All data are means ± 1 S.E. Symbols as in Fig. 5.2.
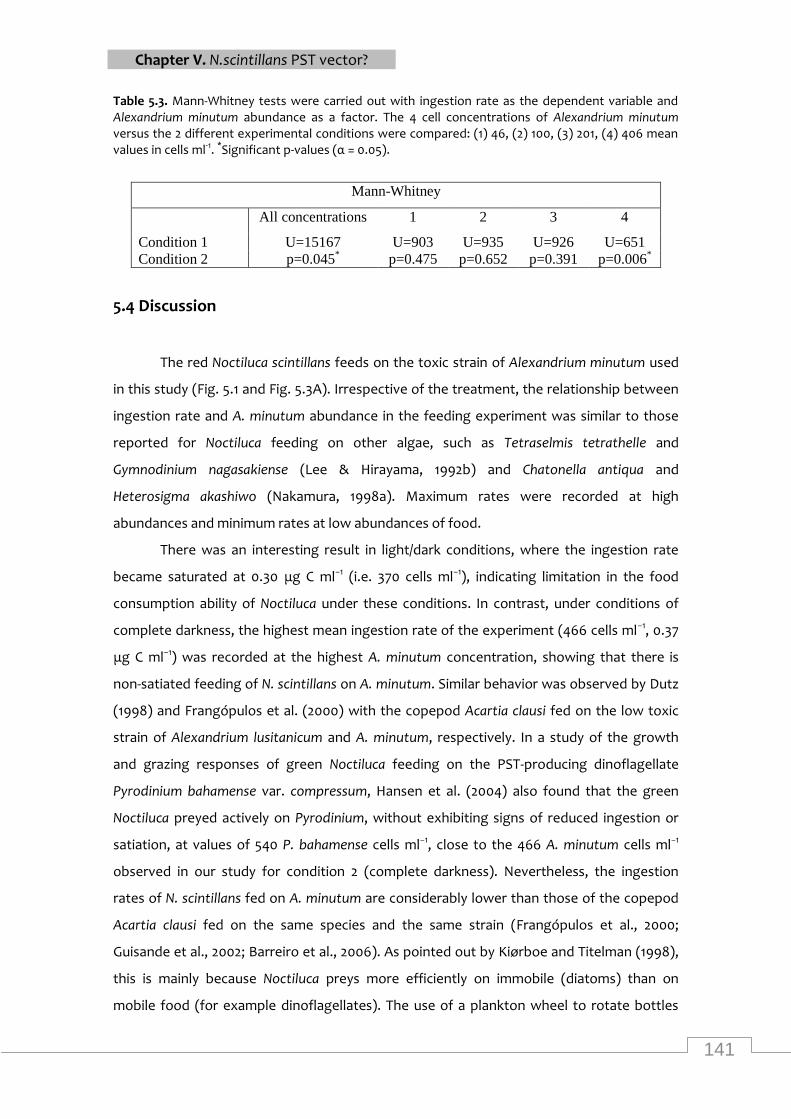
141
Chapter V. N.scintillans PST vector?
Table 5.3. Mann-Whitney tests were carried out with ingestion rate as the dependent variable and Alexandrium minutum abundance as a factor. The 4 cell concentrations of Alexandrium minutum versus the 2 different experimental conditions were compared: (1) 46, (2) 100, (3) 201, (4) 406 mean values in cells ml-1. *Significant p-values (α = 0.05).
Mann-Whitney
All concentrations 1 2 3 4
Condition 1 U=15167
p=0.045*
U=903
p=0.475
U=935
p=0.652
U=926
p=0.391
U=651
p=0.006*
Condition 2
5.4 Discussion
The red Noctiluca scintillans feeds on the toxic strain of Alexandrium minutum used
in this study (Fig. 5.1 and Fig. 5.3A). Irrespective of the treatment, the relationship between
ingestion rate and A. minutum abundance in the feeding experiment was similar to those
reported for Noctiluca feeding on other algae, such as Tetraselmis tetrathelle and
Gymnodinium nagasakiense (Lee & Hirayama, 1992b) and Chatonella antiqua and
Heterosigma akashiwo (Nakamura, 1998a). Maximum rates were recorded at high
abundances and minimum rates at low abundances of food.
There was an interesting result in light/dark conditions, where the ingestion rate
became saturated at 0.30 μg C ml−1 (i.e. 370 cells ml−1), indicating limitation in the food
consumption ability of Noctiluca under these conditions. In contrast, under conditions of
complete darkness, the highest mean ingestion rate of the experiment (466 cells ml−1, 0.37
μg C ml−1) was recorded at the highest A. minutum concentration, showing that there is
non-satiated feeding of N. scintillans on A. minutum. Similar behavior was observed by Dutz
(1998) and Frangópulos et al. (2000) with the copepod Acartia clausi fed on the low toxic
strain of Alexandrium lusitanicum and A. minutum, respectively. In a study of the growth
and grazing responses of green Noctiluca feeding on the PST-producing dinoflagellate
Pyrodinium bahamense var. compressum, Hansen et al. (2004) also found that the green
Noctiluca preyed actively on Pyrodinium, without exhibiting signs of reduced ingestion or
satiation, at values of 540 P. bahamense cells ml−1, close to the 466 A. minutum cells ml−1
observed in our study for condition 2 (complete darkness). Nevertheless, the ingestion
rates of N. scintillans fed on A. minutum are considerably lower than those of the copepod
Acartia clausi fed on the same species and the same strain (Frangópulos et al., 2000;
Guisande et al., 2002; Barreiro et al., 2006). As pointed out by Kiørboe and Titelman (1998),
this is mainly because Noctiluca preys more efficiently on immobile (diatoms) than on
mobile food (for example dinoflagellates). The use of a plankton wheel to rotate bottles
142
Chapter V. N.scintillans PST vector?
instead of a static culture, as suggested by Buskey (1995), would keep the phytoplankton
more disperse and could possibly have improved the contact rate of Noctiluca with its food.
Even so, our findings support the likelihood that the red Noctiluca is capable of limiting the
growth of PST species in the field, and may play an important role as a regulator against
PST-producing phytoplankton.
The clearance rates of the red N. scintillans fed on A. minutum are directly related to
food concentration, and showed a trend of decreased clearance as the prey concentration
increased, which is similar to that seen by Lee and Hirayama (1992b) in feeding experiments
with T. tetrathelle, and by Hansen et al. (2004) with P. bahamense. In our case, the clearance
rate curve began to decline when the food concentration increased over 0.1 μg C ml−1 (or
130 cells ml−1), which is very similar to the densities reported by Hansen et al. (2004) for the
green Noctiluca. Depending upon the cell concentration of A. minutum, N. scintillans was
able to remove A. minutum cells with a clearance rate of 0.44–1.55 and of 0.55–1.91 ml ind−1
day−1 for treatments 1 and 2, respectively. These are higher values than those previously
reported: 0.48 ml ind−l day−1 (Lee & Hirayama, 1992b), 0.10–0.35 ml ind−1 day−1 (Nakamura,
1998b) and 0.06 ml ind−1 day−1 (Hansen et al., 2004). As indicated in Fig. 5.2, survival rates of
N. scintillans were always higher than 75% in all food concentrations and treatments for the
4 days of the experiment. The cell loss that did occur was attributed to manipulation, as
each day N. scintillans cells were isolated and pipetted to a new beaker with new food
suspensions. The mortality observed was therefore not related to consumption of toxic
algae or other variables such as cannibalistic feeding behavior, which has previously been
detected in N. scintillans (Lirdwitayaprasit, 2002) and in other heterotrophic dinoflagellates
(Jeong & Latz, 1994; Latz & Jeong, 1996). Consequently, in our study there was no evidence
that the toxicity of A. minutum has an inhibitory effect on the growth and feeding activities
of N. scintillans.
The growth rates of Noctiluca were not evaluated in our study, but during the
experimental phase it was noted that they were very low. This was probably because the
experimental food concentrations used were not sufficiently high, and the growth rate of
this form of Noctiluca depends very much on the concentration, size and quality of the food
item (Lee & Hirayama, 1992a; Buskey, 1995; Kiørboe & Titelman, 1998; Nakamura, 1998a;
Nakamura, 1998b). Moreover, with light intensity values identical to ours, but using green
Noctiluca which metabolism is different to the red Noctiluca used in this experiment,
Hansen et al. (2004) recorded growth rates of 0.058 day−1, indicating that intermediate or
low growth rate values are typically obtained using dinoflagellates or poor food quality
species as prey. It is probable that as a mobile prey, A. minutum is not the most suitable
143
Chapter V. N.scintillans PST vector?
prey for Noctiluca. However, as Noctiluca is a voracious non-selective feeder that shows no
evidence of food preference (Uhling & Sahling, 1990), dinoflagellates constitute an
alternative food item that should be considered as a food source for Noctiluca.
The strain of A. minutum used in this study is at the low end of the toxicity range
observed for species of the genus Alexandrium (Chang et al., 1997). In both conditions,
HPLC analyses of the extracts from N. scintillans cells fed with A. minutum revealed no
detectable amounts of toxin (see Table 5.2). Noctiluca was still, however, able to ingest A.
minutum as shown in Fig. 5.1 and Fig. 5.3, indicating that Noctiluca bioconverted or excreted
the ingested toxins rather than bioaccumulating them. Recently Azanza et al. (2010) found
similar results studying the effects of the green Noctiluca fed on the PST-producing
dinoflagellate P. bahamense. These authors found that when Noctiluca is exposed to similar
concentrations to those used in our study (the authors’ setups 1:500 and 5:1000 are
equivalent to our 200 and 400 A. minutum ml−1), the predators did not contain any toxins, or
they were not present in detectable amounts, indicating the capacity of Noctiluca to
bioconvert and/or excrete the saxitoxins. The differences between the results of the two
studies could be because the toxin analyses of Azanza et al. (2010) were undertaken with
the culture, whereas ours were directly measured on a Noctiluca extract. Although Hansen
et al. (2004) also found grazing pressure of the green Noctiluca on Pyrodinium, toxic
concentrations were not measured. From our photographic evidence (Fig. 5.1), we believe
that Noctiluca is capable of accumulating PST in its vacuoles, perhaps at lower rates, but
detoxification/excretion processes could occur rapidly after feeding, as has been seen for
the ciliate Favella taraikaensis feeding on Alexandrium tamarense (Kamiyama & Suzuki,
2006).
Future work and further assays with a higher toxicity strain are necessary to clarify
this process and to achieve a better understanding of the ecological role of N. scintillans in
the planktonic community and also further research should include the use of plankton
wheels since cells may accumulate on the side of the container and/or one part of the
predator organism thus affecting the quality of the experiment.
144
Chapter V. N.scintillans PST vector?
5.4 References
Alonso-Rodríguez, R., Ochoa, J. L., & Uribe-Alcocer, M. (2005). Grazing of heterotrophic
dinoflagellate Noctiluca scintillans (Mcartey) Kofoid on Gymnodinium catenatum Graham. Revista
Latina de Microbiologia, 47(1-2), 6-10.
Azanza, R. V., Cruz, L. J., Cariño, F. A., Blanco, A. G., & Butardo, V. M. (2010). Paralytic shellfish
toxin concentration and cell density changes in Pyrodinium bahamense-Noctiluca scinitllans
feedings experiments. Toxicon, 55, 1017-1023.
Barreiro, A., Guisande, C., Frangópulos, M., González-Fernández, A., Muñoz, S., Pérez, D.,
Magadán, S., Manerio, I., Riveiro, I., & Iglesias, P. (2006). Feeding strategies on the copepod
Acartia clausi, on single and mixed diets of toxic and non-toxic strains of the dinoflagellate
Alexandrium minutum. Marine Ecology Progress Series, 316, 115-125.
Buskey, E. J. (1995). Growth and bioluminescence of Noctiluca scintillans on varying algal diets.
Journal of Plankton Research, 17, 29-40.
Chang, F. H., Anderson, D. M., Kulis, D. M., & Till, D. G. (1997). Toxin production of Alexandrium
minutum (Dinophyceae) from the Bay of Plenty, New Zealand. Toxicon 35, 393–409.
Daan, R. (1987). Impact of egg predation by Noctiluca miliaris on the summer development of
copepod populations in the southern North Sea. Marine Ecology Progress Series, 37, 9-17.
Dela-Cruz, J., Ajani, P., Lee, R., Pritchard, T., & Suthers, I. (2002). Temporal abundance patterns
of the red tide dinoflagellate Noctiluca scintillans along the southeast coast of Australia. Marine
Ecology Progress Series, 236, 75-88.
Dela-Cruz, J., Middleton, J. H., & Suthers, I. M. (2003). Population growth and transport of the
red tide dinoflagellate, Noctiluca scintillans, in the coastal waters off Sydney Australia, using cell
diameter as a tracer. Limnology & Oceanography, 48(2), 656-674.
Dutz, J. (1998). Repression of fecundity in the neritic copepod Acartia clausi exposed to the toxic
dinoflagellate Alexandrium lusitanicum: relationship between feeding and egg production.
Marine Ecology Progress Series, 175, 97–107.
Elbrächeter, M., & Qi, Y. Z., (1998). Aspects of Noctiluca (Dinophyceae) populations dynamics. In
D. M Anderson, A. D. Cembella & G. M. Hallegraeff (Eds.), Physiological ecology of harmful algal
blooms. NATO ASI Series, Vol G41: Ecol. Sciences, Springer-Verlag, Berlin, pp. 315-335.
Enomoto, Y. (1956). On the occurrence on Noctiluca scintillans (Macartney) in the waters
adjacent to the west coast of Kyushu, with special reference to the possible damage caused to
the fish eggs by that plankton. Bulletin of the Japanese Society for the Science of Fish, 22, 82-88.
Escalera, L., Pazos, Y., Moroño, A., & Reguera, B. (2007). Noctiluca scintillans may act as a vector
of toxigenic microalgae. Harmful algae, 6, 317-320.
145
Chapter V. N.scintillans PST vector?
Fonda-Umani, S., Beran, A., Parlato, S., Virgilio, D., Zollet, T., De Olazabal, A., Lazzarini, B., &
Cabrini, M. (2004). Noctiluca scintillans Macartney in the Northern Adriatic Sea: long-teerm
dynamics, relationships with temperature and eutrophication, and role in the food web. Journal
of Plankton Research, 26(5), 545-561.
Franco, J. M., & Fernández, P. (1993). Separation of PSP toxins by reversed phase high
performance liquid chromatography, with postcolumn reaction and fluorimetric detection.
Chromatographia, 35, 613–620.
Franco, J. M., Fernández, P., & Reguera, B. (1994). Toxin profiles of natural populations and
cultures of Alexandrium minutum Halim from Galician (Spain) coastal waters. Journal of Applied
Phycology, 6, 275-279.
Frangópulos, M., Guisande, C., Maneiro, I., Riveiro, I., & Franco, J. (2000). Short-term and long-
term effects of the toxic dinoflagellate Alexandrium minutum on the copepod Acartia clausi.
Marine Ecology Progress Series, 203, 161-169.
Frost, B. W. (1972). Effects of size and concentration of food particles on the feeding behaviour
of the marine planktonic copepod Calanus pacificus. Limnology & Oceanography, 40, 476-482.
Fukuda, Y., & Endoh, H. (2006). New details from the complete life cycle of the red-tide
dinoflagellate Noctiluca scintillans (Ehrenberg) McCartney. European Journal of Protistology, 42,
209-219.
Fung, Y. C., & Trott, L. B. (1973). The occurrence of Noctiluca scintillans (Macartey) induced red
tide in Hong Kong. Limnology & Oceanography, 18, 472-476.
Furuya, K., Saito, H., Sriwoon, R., Omura, T., Furio, E.E., Borja, V.M., & Lirdwitayaprasit, T. (2006).
Vegetative growth of Noctiluca scintillans containing the endosymbiont Pedinomonas noctilucae.
African Journal of Marine Science, 28(2), 305-308.
Guisande, C., Frangópulos, M., Carontenuto, Y., Maneiro, I., Riveiro, I., & Vergara, A. R. (2002).
Fate of paralytic shellfish poisoning toxins ingested by the copepod Acartia clausi. Marine
Ecology Progress Series, 240, 105-115.
Hansen, P. J., Miranda, L., & Azanza, R. V. (2004). Green Noctiluca scintillans: a dinoflagellate
with its own green house. Marine Ecology Progress Series, 275, 79-87.
Hanslik, M. (1987). Nahrungsaufnahme und nahrungsverwertung beim meeresleuchttierchen
Noctiluca miliaris. Diss. Univ. Bonn, 1-92.
Hattori, S. (1962). Predatory activity of Noctiluca on anchovy eggs. Bulletin of the Japan Sea
Regional Fisheries Research Laboratory, 9, 211-220.
Hinz, S., Sulkin, S., Strom, S., & Testermann, J. (2001). Discrimination in ingestion of protistan
prey by larval crabs. Marine Ecology Progress Series, 222, 155-162.
146
Chapter V. N.scintillans PST vector?
Huang, C., & Qi, Y. (1997). The abundance cycle and influence factors on red tide phenomena of
Noctiluca scintillans (Dinophyceae) in Dapeng Bay, the South China Sea. Journal of Plankton
Research, 19, 303-318.
Jeong, H. J. (1999). The ecological role of heterotrophic dinoflagellates in marine planktonic
community. Journal of Eukaryotic Microbiology, 46(4), 390-396.
Jeong, H. J., & Latz, M. I. (1994). Growth and grazing rates of the heterotrophic dinoflagellate
Protoperidinium spp. on red tide dinoflagellates. Marine Ecology Progress Series, 106, 173-185.
Jeong, H. J., & Shim, J. H. (1996). The interactions between red-tide dinoflagellate Gymnodinium
sanguineum and microzooplanktonic grazers. In: T., Yasumoto, Y., Oshima & Fukuyo, Y. (Eds.),
Harmful and Toxic Algal Blooms, 7th toxic phytoplankton conference. Sendai, Japan,
Intergovernmental Oceanographic Commission of UNESCO, pp. 377-380.
Kamiyama, T., & Suzuki, T., 2006. Lack of accumulation of paralytic shellfish poisoning (PSP)
toxins in the tintinnid ciliate Favella taraikaensis feeding on the toxic dinoflagellate Alexandrium
tamarense. Limnology & Oceanography, 317, 57-65.
Kimor,, B. (1979). Predation by Noctiluca miliaris Souriray on Acartia tonsa Dana eggs in the
inshore waters of southern California. Limnology & Oceanography, 24, 568-572.
Kiørboe, T. (2003). High turnover rates of copepods fecal pellets due to Noctiluca scintillans
grazing. Marine Ecology Progress Series, 258, 181-188.
Kiørboe, T., & Titelman, J. (1998). Feeding, preys election and prey encounter mechanisms in the
heterotrophic dinoflagellate Noctiluca scintillans. Journal of Plankton Research, 20, 1615-1636.
Kirchner, M., Sahling, G., Uhlig, G., Gunkel, W., & Klings, K. W. (1996). Does the red tide forming
dinoflagellate Noctiluca scintillans feed on bacteria? Sarsia, 81, 45-55.
Kirchner, M., Wichels, A., Seibold, A., Sahling, G., Schütt, C. (2001). New and potentially toxic
isolates from Noctiluca scintillans (Dinoflagellata). In: G. Hallegraeff, (Ed.), Proceedings on
Harmful Algae, 9th International Conference on Harmful Algae Blooms, Tasmania 2000,
Intergovernmental Oceanographic Commission of UNESCO, pp. 379-382.
Latz, M. I., & Jeong, H. J. (1996). Effect of red tide dinoflagellate diet and cannibalism on the
bioluminescence of the heterotrophic dinoflagellates Protoperidinium spp. Marine Ecology
Progress Series, 132, 275-285.
Lee, J. K., & Hirayama, K. (1992a). Effects of salinity, food level and temperatura on the
population growth of Noctiluca scintillans (Macartney). Bull. Fac. Fish. Nagasaki Univ., 71, 163-168.
Lee, J. K., & Hirayama, K., (1992b). The food removal rate by Noctiluca scintillans feeding on
Tetraselmis tetrathelle and Gymnodinium nagasakiense. Bull. Fac. Fish. Nagasaki Univ., 71, 169-175.
147
Chapter V. N.scintillans PST vector?
Lessard, E. J. (1991). The trophic role of heterotrophic dinoflagellates in diverse marine
environments. Marine Microbial Food Webs, 5, 49-58.
Lirdwitayaprasit, T. (2002). Culture of green Noctiluca under laboratory conditions: I. Feeding
behavior and sexual reproduction. Proceedings of the Fifth IOC/WESTPAC International Science
Symposium.
Montani, S., Pithakpol, S., & Tada, K. (1998). Nutrient regeneration in coastal seas by Noctiluca
scintillans, a red tide-causing dinoflagellate. Journal of Marine Biotechnology, 6, 224-228.
Nakamura, Y. (1998a). Growth and grazing of a large heterotrophic dinoflagellate, Noctiluca
scintillans, in laboratory studies. Journal of Plankton Research, 20, 1711-1720.
Nakamura, Y. (1998b). Biomass, feeding and production of Noctiluca scintillans in the Seto Island
Sea, Japan. Journal of Plankton Research, 20, 2213-2222.
Naqvi, S. W., George, M. D., Narvekar, P. V., Jayakumar, D. A., & 9 more (1998). Severe fish
mortality associated with “red tide” observed in the sea off Cochin. Current Science, 75(6), 543-
544.
Olenina, I., Hajdu, S., Andersson, A., Edler, L., Wasmund, N., Busch, S., Göbel, J., Gromisz, S.,
Huseby, S., Huttunen, M., Jaanus, A., Kokkonen, P., Ledaine, I., & Niemkiewicz, E. (2006).
Biovolumes and size-classes of phytoplankton in the Baltic Sea. Baltic Sea Environment
Proceedings No.106, 144 pp.
Okaishi, T., & Nishio, Y. (1976). Identification of ammonia as the toxic principle of red tide of
Noctiluca miliaris. Bulletin of the Plankton Society of Japan, 23, 25-30.
Oshima, Y., Sugino, K., Yasumoto, T. (1989). Latest advances in HPLC analysis of paralytic
shellfish toxins. In: S. Natori, K. Hashimoto & Y. Ueno (Eds.), Mycotoxins and phycotoxins.
Elsevier, Amsterdam, pp. 319–326.
Oshima, Y. (1995). Post-column derivatization HPLC methods for paralytic shell fish poisons. In:
G. M. Hallegraeff, D. M. Anderson, A. D. Cembella, (Eds.), Manual on harmful marine microalgae.
IOC (Intergovtl. Oceanogr. Comm.), Manuals and guides, No. 33, UNESCO, Rome, pp. 81–94.
Parkhill, J. P. & Cembella, A. D. (1999). Effects of salinity, light and inorganic nitrogen on growth
and toxigenicity of the marine dinoflagellate Alexandrium tamarense from northeastern Canada.
Journal of Plankton Research, 21, 939-955.
Quevedo, M., González-Quiros, R., & Anadon, R. (1999). Evidence of heavy predation by
Noctiluca scintillans on Acartia clausi (Copepoda) eggs off the central Cantabrian coast (NW
Spain). Oceanologica Acta, 22, 127-131.
Schaumann, K., Gerdes, D., & Hesse, K. J. (1988). Hydrographic and biological characteristics of a
Noctiluca scintillans red tide in the German Bight, 1984. Meeresforschung, 32, 71-91.
148
Chapter V. N.scintillans PST vector?
Seibold, A., Wichels, A., & Schütt, C. (2001). Diversity of endocytic bacteria in the dinoflagellate Noctiluca scintillans. Aquatic Microbial Ecology, 25, 229-235.
Shanks, A., & Walters, K. (1996). Feeding by the heterotrophic dinoflagellates (Noctiluca
scintillans) in marine snow. Limnology & Oceanography, 41, 177-181.
Sherr, E. B., & Sherr, B. F. (2007). Heterotrophic dinoflagellates: a significant component of
microzooplankton biomass and major grazers of diatoms in the sea. Marine Ecology Progress
Series, 352, 187-197.
Smayda,T. J. (1997). What is a bloom? A commentary. Limnology & Oceanography, 42(5), 1132-
1136.
Strom, S.L., & Morello, T. A. (1998). Comparative growth rates and yields of ciliates and
heterotrophic dinoflagellates. Journal of Plankton Research, 20(3), 571-584.
Suvapepun, S., (1989). Occurrences of red tides in the Gulf of Thailand. In: T. Okaichi & T.
Nemoto (Eds.), Red tide: Biology, Environmental Science and Toxicology, Elsevier, New York, pp.
41-44.
Sweeney, B. M., (1976). Perinomonas noctilucae (Prasinophyceae), the flagellate symbiotic in
Noctiluca (Dinophyceae) in Southeast Asia. Journal of Phycology, 7, 53-58.
Takayama, H., (1977). Culture of Noctiluca scintillans (Macartney). Bulletin of the Plankton Society
of Japan, 24(2), 83-86.
Tiselius, P., & Kiørboe, T. (1998). Colonization of diatom aggregates by the dinoflagellate
Noctiluca scintillans. Limnology & Oceanography, 43(1), 154-159.
Uhling. G. & Sahling, G. (1990). Long-term studies on Noctiluca scintillans in the German Bight
population dynamics and red tide phenomena 1968-1988. Netherlands Journal of Sea Research,
25(1/2), 101-112.
Chapter VI. PST transfer and accumulation in two planktonic grazers
149
Modelling PST transfer and
accumulation in two planktonic
grazers
Abstract
6.1 Introduction
6.2 Methods
6.3 Results
6.4 Discussion
6.5 References
CHAPTER VI

150
151
Chapter VI. PST transfer and accumulation in two planktonic grazers
Abstract
A model was developed in this chapter in order to study and compare the PST
transfer and accumulation of two different potential PST planktonic vectors, namely the
heterotrophic dinoflagellate in its red form Noctiluca scintillans and the copepod Acartia
clausi, and their role as PST vectors in the planktonic community. Different factors that
influence the toxin transfer such as toxin synthesis, grazing on toxic and non-toxic food and
population size of PST producers and vectors were considered in the model. Moreover, a
laboratory experiment was conducted in order to calculate the detoxification rates of
Noctiluca fed on Alexandrium catenella. According to the model results, the two grazers
showed a significant difference mainly in the timing of the PST accumulation. Noctiluca
exhibited a rapid response to the grazing of Alexandrium with high initial toxin
accumulation, followed by a reduction to zero concentration of toxins in a period of almost
two days. In contrast Acartia showed a considerable delay in comparison to Noctiluca to
accumulate the same amount of toxin in the population. This delay is linked to the slower
reproduction rates that characterise the copepod. The range of the initial values used for
the sensitivity analysis of the model is representative of the coastal environment of a
Galician ria (embayment located at the NW of Iberian Peninsula), where the two grazers
and Alexandrium may co-exist. The model for Acartia showed less sensitivity to these key
parameters probably due to the time delay in accumulation of important amount of toxins.
Both grazers showed a rapid (50 h) reduction of ingested toxin suggesting inefficiency to
transfer toxins through predation in the food web.
152
Chapter VI. PST transfer and accumulation in two planktonic grazers
6.1 Introduction
Paralytic shellfish toxins (PSTs), a class of potent neurotoxin produced among other
microalgae by a number of Alexandrium species and strains when are accumulated via
trophic transfer in the food-wed can cause a neurological affliction to humans known as
Paralytic shellfish poisoning (PSP). The transfer of PSP toxins to higher trophic levels may
involve a variety of planktonic vectors (e.g. mesozooplankton: White 1981; Turner & Tester
1997; Turner et al. 2000a; Hamasaki et al., 2003; Teegarden et al., 2003; Jiang et al., 2007,
tintinids: Turner et al., 2005; heterotrophic dinoflagellates: Sampayo, 1998; Matsuyama et
al., 1999). The role of mesozooplankton and especially of copepods in the toxin dynamics
has received more attention than any other type of planktonic grazer and has become a
focal point of numerous studies (e.g. Robineau et al. 1991; Turriff et al., 1995; Teegarden &
Cembella 1996; Frangópulos et al., 2000). More specific, certain copepod species have
shown in several laboratory experiments and field studies the ability to accumulate toxin by
grazing on PST-producing dinoflagellates (White 1981; Boyer et al., 1985; Turriff et al., 1995;
Teegarden & Cembella 1996; Turner et al. 2000b), serving as potential vectors for PST
transfer to their predators. Toxin accumulation is not the only process observed in
copepods preying on toxic dinoflagellates.
Several authors have demonstrated that copepods may retain, eliminate or even
transform PSP toxins when are fed on Alexandrium (Shimizu, 1978; Guisande et al., 2002;
Hamasaki et al., 2003; Dam & Hasey, 2011). However, PST may also have toxic effects on
copepods, causing mortality (Bagoien et al., 1996), behavioural changes (Sykes & Huntley
1987) or reduction of ingestion/filtering rates and egg hatching (Dutz 1998; Frangópulos et
al., 2000; Barreiro et al., 2006).
In contrast, few studies deal with the grazing interactions between protists (ciliates
and heterotrophic dinoflagellates) and toxic dinoflagellates. Protists as well as
mesozooplankton are common members of the plankton and play an important role in the
marine pelagic systems, as regulators of phytoplankton biomass (Lessard, 1991; Strom &
Morello, 1998; Sherr & Sherr, 2007). Based on observations of natural plankton populations,
several authors showed that ciliates and heterotrophic dinoflagellates (Watras et al., 1985;
Calbet et al., 2003; Duccete et al., 2005; Turner, 2010) can be found at high concentrations
during Alexandrium bloom events suggesting considerable effects on the bloom dynamics.
Certain marine protists have been reported to actively feed on toxic Alexandrium species
(Kamiyama & Suzuki, 2006; Kamiyama et al., 2006; Frangópulos et al., 2011) and grow in
153
Chapter VI. PST transfer and accumulation in two planktonic grazers
relatively good rates at low Alexandrium abundances independently of their cellular PST
quota (Hansen et al., 1992; Kamiyama et al., 2005). However, there are several cases of no
evident ingestion of Alexandrium by protozoan grazers. At high Alexandrium densities,
Hansen (1989, 1992) noted toxic effects on the swimming bahaviour of a ciliate tintinid
followed by swelling and lysis of the cell, which was considered to occur due to PST
exudates. In a later study, Tillman & John (2002) suggested a currently unknown toxic
substance as responsible for the toxic effects of Alexandrium on different protists. In one of
the few studies on the fate of PST in protists previously fed with toxic dinoflagellates,
Kamiyama and Suzuki (2006) showed rapid detoxification in the ciliate Favella taraikaensis.
More recently, Frangópulos et al. (2011) reported that although Noctiluca scintillans was
able to ingest low toxicity A. minutum into its vacuoles, no accumulated toxin was detected
suggesting rapid detoxification/excretion after feeding. These findings show that certain
protist grazers like N. scintillans may be important as a regulator of PST in the planktonic
community by preventing its transfer or accumulation in the food web.
The heterotrophic dinoflagellate N. scintillans and the calanoid copepod Acartia
clausi can dominate (occasionally and for prolonged periods, respectively) some
communities of plankton grazers in several coastal regions of the world (Cataletto et al.,
1995; Elbrächter & Qi, 1998; Fukuda & Endoh, 2006). Nevertheless, Quevedo et al., (1999)
showed that these two potential planktonic PST vectors may co-exist in relatively high
densities and noted out predation by N. scintillans on A. clausi eggs. N. scintillans is the most
studied organism among Noctilucales, an order which contains several aberrant species of
dinoflagellates. Occasionally, this large omnivorous, non-photosynthetic dinoflagellate
forms, mainly by accumulation of buoyant cells, pronounced and striking red tides. In field
studies, predation by N. scintillans has been recorded against toxic dinoflagellate species,
such as Dinophysis caudata and D. acuta (Escalera et al., 2007) and Gymnodinum catenatun
(Alonso-Rodríguez et al., 2005). Even if there are evidences that N. scintillans could play a
significant role in the dynamics of harmful algal events by toxin removal from the web,
there are no available data of detoxification rates. Detoxification process has been
observed also in Acartia clausi. Guisande et al., 2002 demonstrated toxin accumulation and
relatively high detoxification rates of the copepod A. clausi after ingesting A. minutum,
suggesting different fate of toxins which may be significant for higher trophic level
organisms. Using different Alexandrium species as food items, Dutz (1998) and Frangópulos
et al. (2000) showed negative effects on the gross growth-efficiency of A. clausi. The later
authors mentioned reduced egg hatching and naupliar production with increasing toxin
accumulation in the A. clausi.
154
Chapter VI. PST transfer and accumulation in two planktonic grazers
It is generally considered that planktonic grazers can have a central ecological role
in harmful blooms dynamics acting as potential toxin vectors to their predators. Ingestion
of toxic dinoflagellates by different types of planktonic organisms may be important for the
fate of the toxins in the food web. In the present work, our aim is to study and compare
PST transfer and accumulation of two different potential PST planktonic vectors that show
different grazing and reproductive behaviour and their role as PST vectors in the planktonic
community. In order to perform this comparison, a model of toxin accumulation in vector
population was constructed. This model accounts for the influence of different factors in
toxin transfer: toxin synthesis, grazing on toxic and non-toxic food, and population size of
PST producers and vectors. The planktonic vectors selected were the heterotrophic
dinoflagellate N. scintillans and the copepod A. clausi.
6.2 Methods
6.2.1 The model
General description of the model. Dynamic models for Noctiluca scintillans and
Acartia clausi were developed in order to study the link between population dynamics and
PST transfer and accumulation in vectors. Our models describe the changes in phosphorus
quota, Alexandrium and vector population, toxin content in Alexandrium and toxin in vector
population. A simplified schematic diagram of the model is presented in Fig. 6.1. Model
parameterisation was based on published information (Frangópulos et al., 2002; Guisande
et al., 2002; John & Flynn 2002; Barreiro et al 2006; Kiørboe & Titelman 1998) and new data
from laboratory experiments, which are described in detail below. All published and
unpublished data from the authors of this paper were based on experiments carried out in
similar laboratory conditions (aged natural seawater of 33.6 salinity, 12:12 cycle of light:dark
and temperature range of 15-18 ºC). A summary of all the parameters used in this model is
also given in tables 6.1 and 6.2.
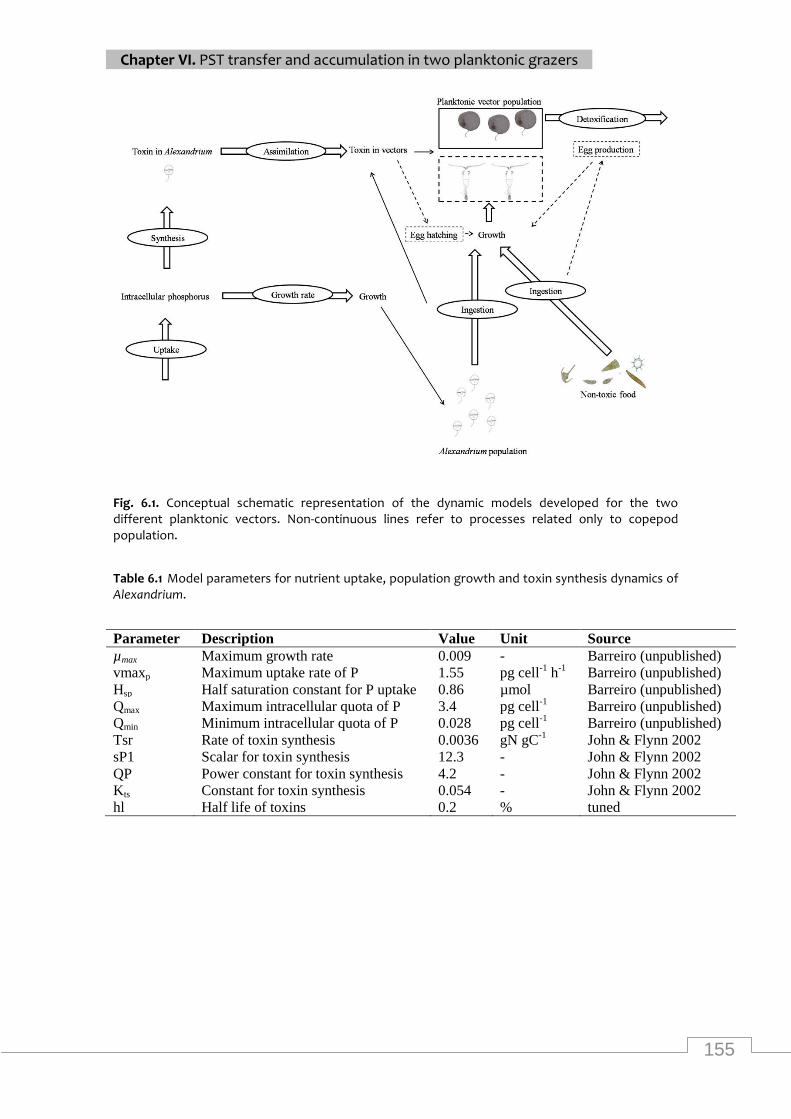
155
Chapter VI. PST transfer and accumulation in two planktonic grazers
Fig. 6.1. Conceptual schematic representation of the dynamic models developed for the two different planktonic vectors. Non-continuous lines refer to processes related only to copepod population.
Table 6.1 Model parameters for nutrient uptake, population growth and toxin synthesis dynamics of Alexandrium.
Parameter Description Value Unit Source
µmax Maximum growth rate 0.009 - Barreiro (unpublished)
vmaxp Maximum uptake rate of P 1.55 pg cell-1
h-1
Barreiro (unpublished)
Hsp Half saturation constant for P uptake 0.86 µmol Barreiro (unpublished)
Qmax Maximum intracellular quota of P 3.4 pg cell-1
Barreiro (unpublished)
Qmin Minimum intracellular quota of P 0.028 pg cell-1
Barreiro (unpublished)
Tsr Rate of toxin synthesis 0.0036 gN gC-1
John & Flynn 2002
sP1 Scalar for toxin synthesis 12.3 - John & Flynn 2002
QP Power constant for toxin synthesis 4.2 - John & Flynn 2002
Kts Constant for toxin synthesis 0.054 - John & Flynn 2002
hl Half life of toxins 0.2 % tuned
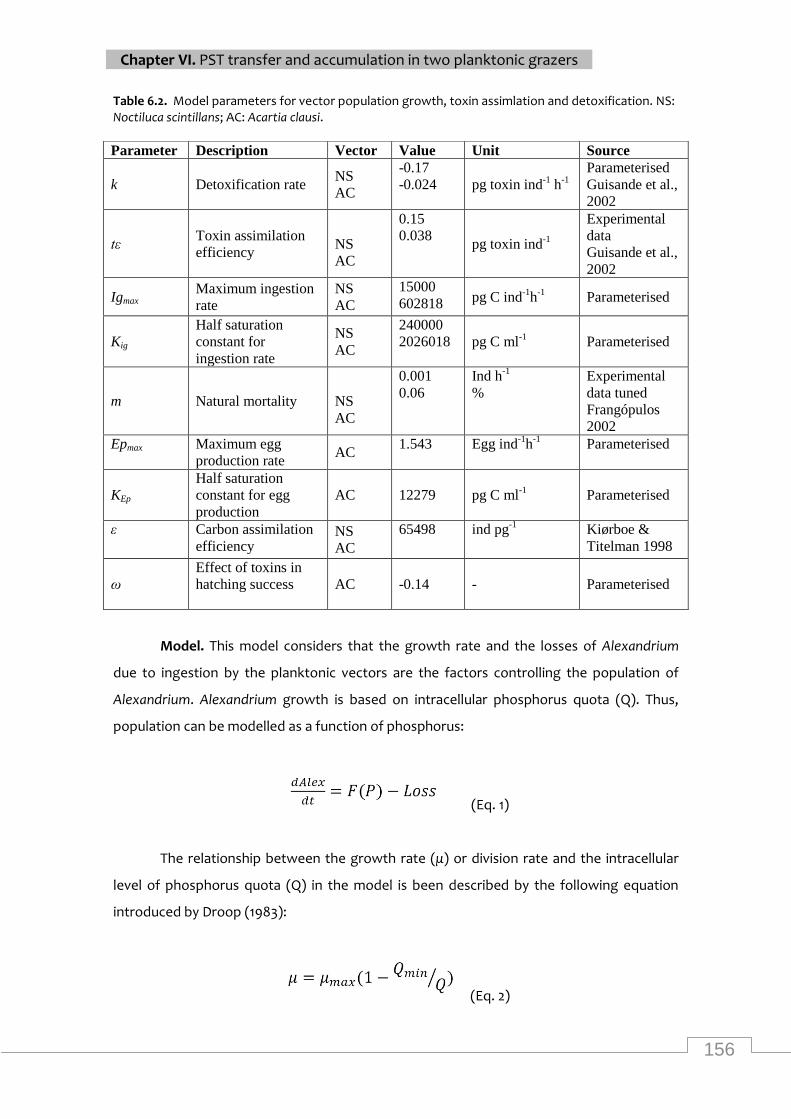
156
Chapter VI. PST transfer and accumulation in two planktonic grazers
Table 6.2. Model parameters for vector population growth, toxin assimlation and detoxification. NS: Noctiluca scintillans; AC: Acartia clausi.
Model. This model considers that the growth rate and the losses of Alexandrium
due to ingestion by the planktonic vectors are the factors controlling the population of
Alexandrium. Alexandrium growth is based on intracellular phosphorus quota (Q). Thus,
population can be modelled as a function of phosphorus:
(Eq. 1)
The relationship between the growth rate (μ) or division rate and the intracellular
level of phosphorus quota (Q) in the model is been described by the following equation
introduced by Droop (1983):
(Eq. 2)
Parameter Description Vector Value Unit Source
k Detoxification rate NS
AC
-0.17
-0.024 pg toxin ind-1
h-1
Parameterised
Guisande et al.,
2002
tε Toxin assimilation
efficiency
NS
AC
0.15
0.038 pg toxin ind
-1
Experimental
data
Guisande et al.,
2002
Igmax Maximum ingestion
rate
NS
AC
15000
602818 pg C ind-1
h-1
Parameterised
Kig
Half saturation
constant for
ingestion rate
NS
AC
240000
2026018 pg C ml-1
Parameterised
m Natural mortality
NS
AC
0.001
0.06
Ind h-1
%
Experimental
data tuned
Frangópulos
2002
Epmax Maximum egg
production rate AC
1.543 Egg ind-1
h-1
Parameterised
KEp
Half saturation
constant for egg
production
AC 12279 pg C ml-1
Parameterised
ε Carbon assimilation
efficiency NS
AC
65498 ind pg-1
Kiørboe &
Titelman 1998
ω
Effect of toxins in
hatching success AC -0.14 - Parameterised
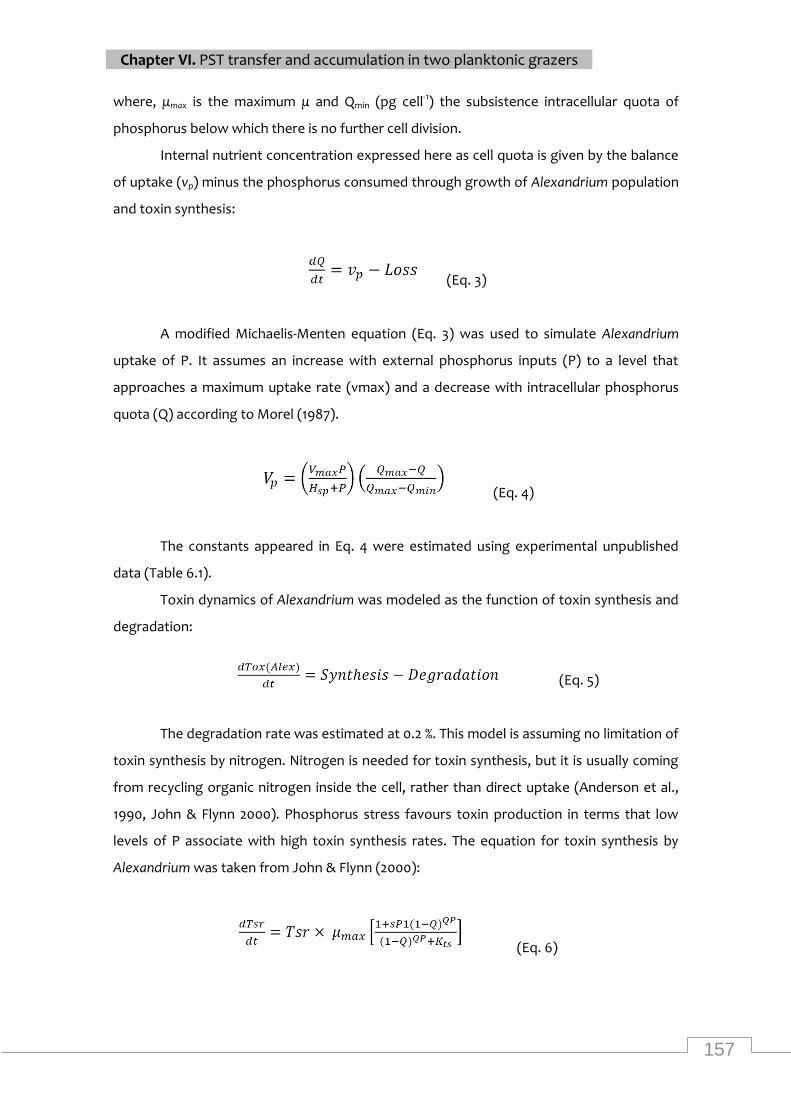
157
Chapter VI. PST transfer and accumulation in two planktonic grazers
where, μmax is the maximum μ and Qmin (pg cell-1) the subsistence intracellular quota of
phosphorus below which there is no further cell division.
Internal nutrient concentration expressed here as cell quota is given by the balance
of uptake (vp) minus the phosphorus consumed through growth of Alexandrium population
and toxin synthesis:
(Eq. 3)
A modified Michaelis-Menten equation (Eq. 3) was used to simulate Alexandrium
uptake of P. It assumes an increase with external phosphorus inputs (P) to a level that
approaches a maximum uptake rate (vmax) and a decrease with intracellular phosphorus
quota (Q) according to Morel (1987).
(Eq. 4)
The constants appeared in Eq. 4 were estimated using experimental unpublished
data (Table 6.1).
Toxin dynamics of Alexandrium was modeled as the function of toxin synthesis and
degradation:
(Eq. 5)
The degradation rate was estimated at 0.2 %. This model is assuming no limitation of
toxin synthesis by nitrogen. Nitrogen is needed for toxin synthesis, but it is usually coming
from recycling organic nitrogen inside the cell, rather than direct uptake (Anderson et al.,
1990, John & Flynn 2000). Phosphorus stress favours toxin production in terms that low
levels of P associate with high toxin synthesis rates. The equation for toxin synthesis by
Alexandrium was taken from John & Flynn (2000):
(Eq. 6)
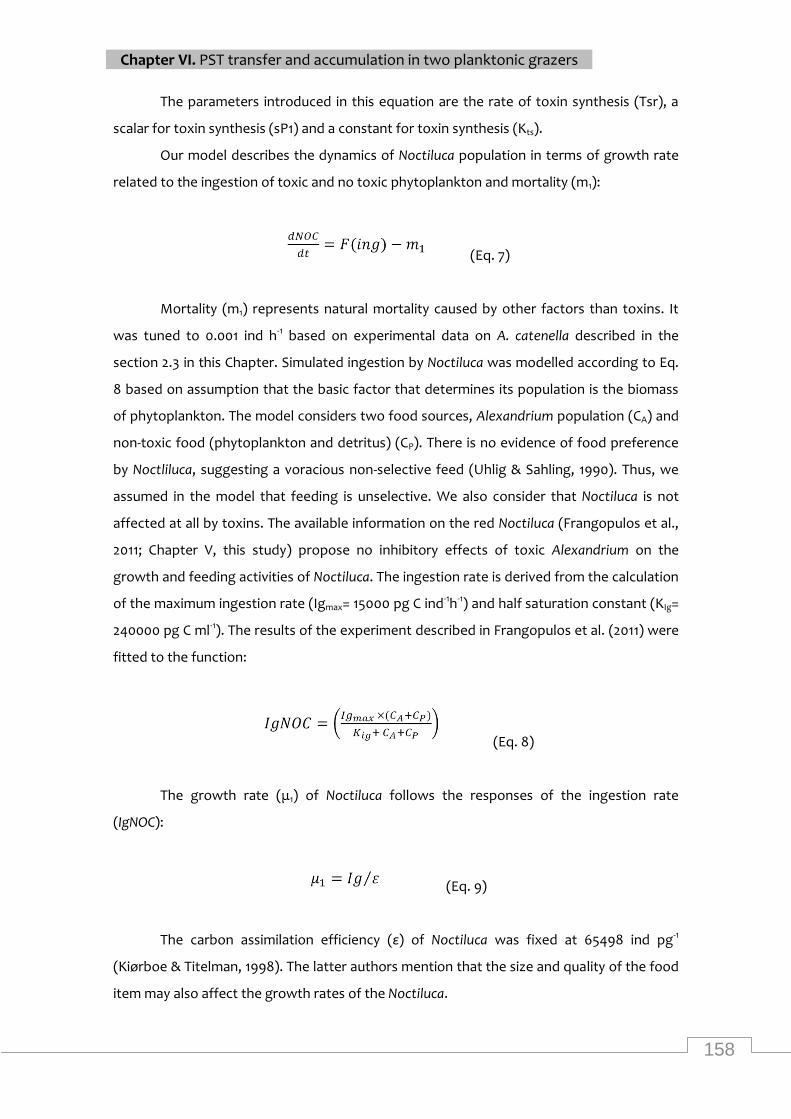
158
Chapter VI. PST transfer and accumulation in two planktonic grazers
The parameters introduced in this equation are the rate of toxin synthesis (Tsr), a
scalar for toxin synthesis (sP1) and a constant for toxin synthesis (Kts).
Our model describes the dynamics of Noctiluca population in terms of growth rate
related to the ingestion of toxic and no toxic phytoplankton and mortality (m1):
(Eq. 7)
Mortality (m1) represents natural mortality caused by other factors than toxins. It
was tuned to 0.001 ind h-1 based on experimental data on A. catenella described in the
section 2.3 in this Chapter. Simulated ingestion by Noctiluca was modelled according to Eq.
8 based on assumption that the basic factor that determines its population is the biomass
of phytoplankton. The model considers two food sources, Alexandrium population (CA) and
non-toxic food (phytoplankton and detritus) (CP). There is no evidence of food preference
by Noctliluca, suggesting a voracious non-selective feed (Uhlig & Sahling, 1990). Thus, we
assumed in the model that feeding is unselective. We also consider that Noctiluca is not
affected at all by toxins. The available information on the red Noctiluca (Frangopulos et al.,
2011; Chapter V, this study) propose no inhibitory effects of toxic Alexandrium on the
growth and feeding activities of Noctiluca. The ingestion rate is derived from the calculation
of the maximum ingestion rate (Igmax= 15000 pg C ind-1h-1) and half saturation constant (KIg=
240000 pg C ml-1). The results of the experiment described in Frangopulos et al. (2011) were
fitted to the function:
(Eq. 8)
The growth rate (μ1) of Noctiluca follows the responses of the ingestion rate
(IgNOC):
(Eq. 9)
The carbon assimilation efficiency (ε) of Noctiluca was fixed at 65498 ind pg-1
(Kiørboe & Titelman, 1998). The latter authors mention that the size and quality of the food
item may also affect the growth rates of the Noctiluca.
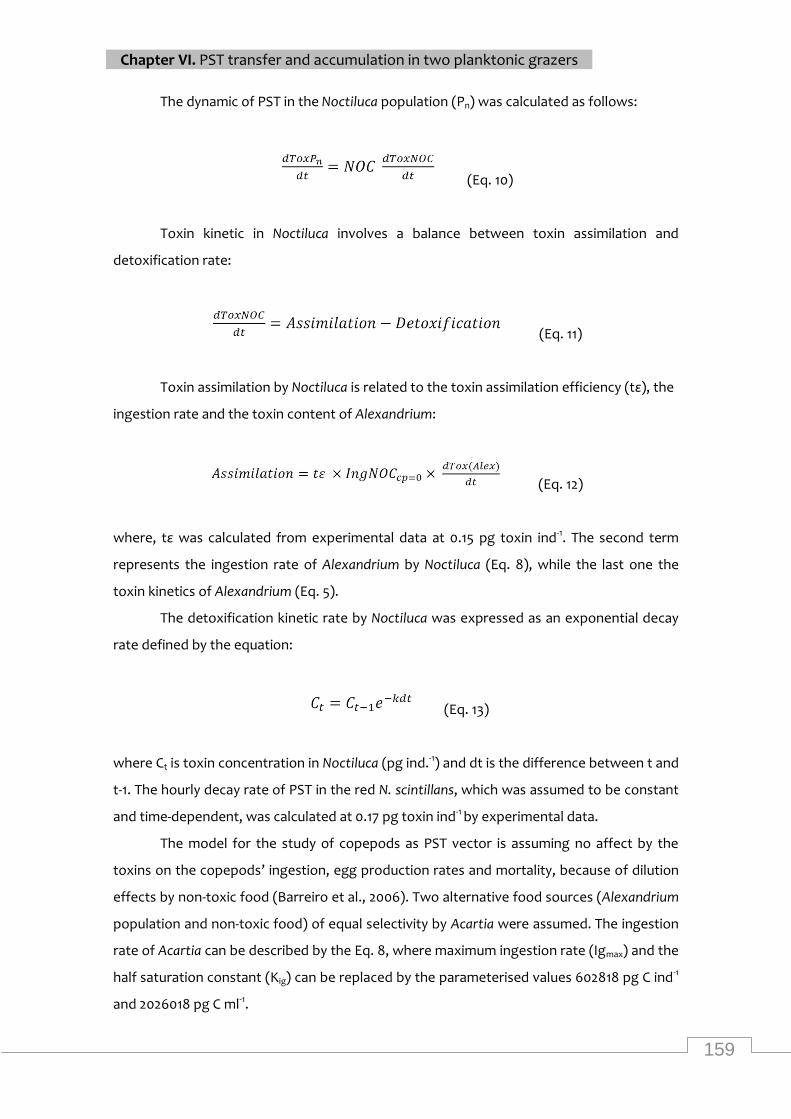
159
Chapter VI. PST transfer and accumulation in two planktonic grazers
The dynamic of PST in the Noctiluca population (Pn) was calculated as follows:
(Eq. 10)
Toxin kinetic in Noctiluca involves a balance between toxin assimilation and
detoxification rate:
(Eq. 11)
Toxin assimilation by Noctiluca is related to the toxin assimilation efficiency (tε), the
ingestion rate and the toxin content of Alexandrium:
(Eq. 12)
where, tε was calculated from experimental data at 0.15 pg toxin ind-1. The second term
represents the ingestion rate of Alexandrium by Noctiluca (Eq. 8), while the last one the
toxin kinetics of Alexandrium (Eq. 5).
The detoxification kinetic rate by Noctiluca was expressed as an exponential decay
rate defined by the equation:
(Eq. 13)
where Ct is toxin concentration in Noctiluca (pg ind.-1) and dt is the difference between t and
t-1. The hourly decay rate of PST in the red N. scintillans, which was assumed to be constant
and time-dependent, was calculated at 0.17 pg toxin ind-1 by experimental data.
The model for the study of copepods as PST vector is assuming no affect by the
toxins on the copepods’ ingestion, egg production rates and mortality, because of dilution
effects by non-toxic food (Barreiro et al., 2006). Two alternative food sources (Alexandrium
population and non-toxic food) of equal selectivity by Acartia were assumed. The ingestion
rate of Acartia can be described by the Eq. 8, where maximum ingestion rate (Igmax) and the
half saturation constant (Kig) can be replaced by the parameterised values 602818 pg C ind-1
and 2026018 pg C ml-1.
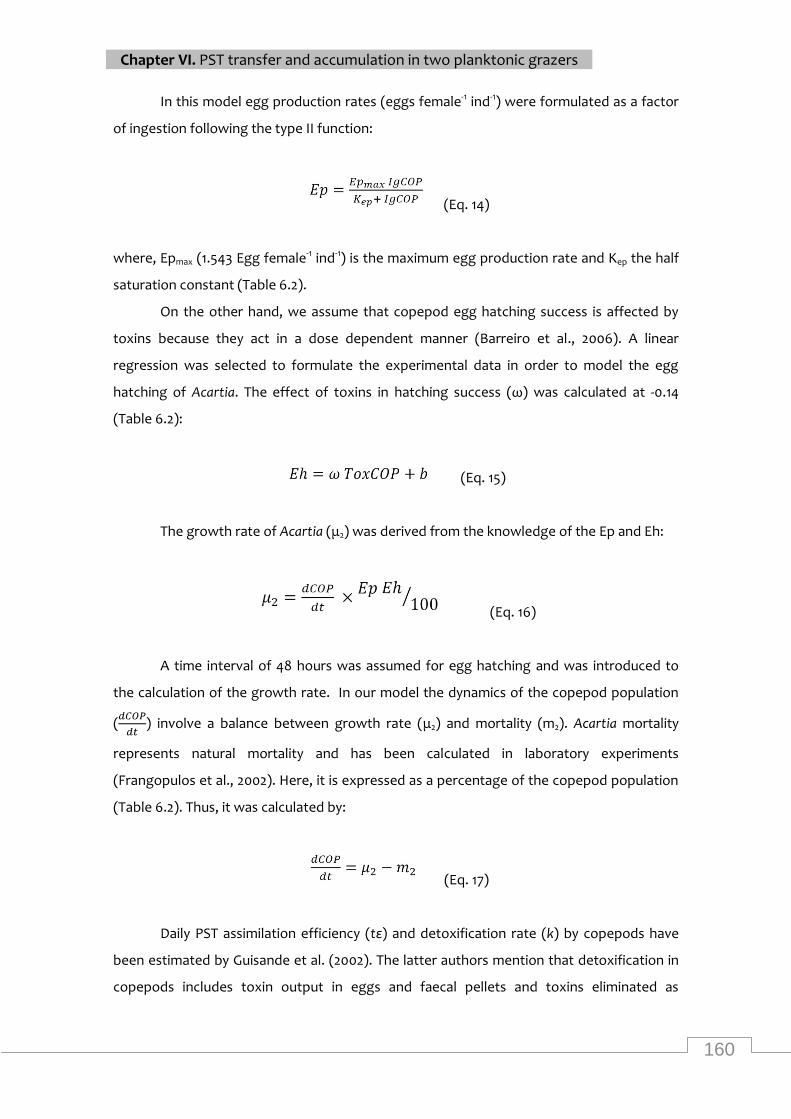
160
Chapter VI. PST transfer and accumulation in two planktonic grazers
In this model egg production rates (eggs female-1 ind-1) were formulated as a factor
of ingestion following the type II function:
(Eq. 14)
where, Epmax (1.543 Egg female-1 ind-1) is the maximum egg production rate and Kep the half
saturation constant (Table 6.2).
On the other hand, we assume that copepod egg hatching success is affected by
toxins because they act in a dose dependent manner (Barreiro et al., 2006). A linear
regression was selected to formulate the experimental data in order to model the egg
hatching of Acartia. The effect of toxins in hatching success (ω) was calculated at -0.14
(Table 6.2):
(Eq. 15)
The growth rate of Acartia (μ2) was derived from the knowledge of the Ep and Eh:
(Eq. 16)
A time interval of 48 hours was assumed for egg hatching and was introduced to
the calculation of the growth rate. In our model the dynamics of the copepod population
( ) involve a balance between growth rate (μ2) and mortality (m2). Acartia mortality
represents natural mortality and has been calculated in laboratory experiments
(Frangopulos et al., 2002). Here, it is expressed as a percentage of the copepod population
(Table 6.2). Thus, it was calculated by:
(Eq. 17)
Daily PST assimilation efficiency (tε) and detoxification rate (k) by copepods have
been estimated by Guisande et al. (2002). The latter authors mention that detoxification in
copepods includes toxin output in eggs and faecal pellets and toxins eliminated as
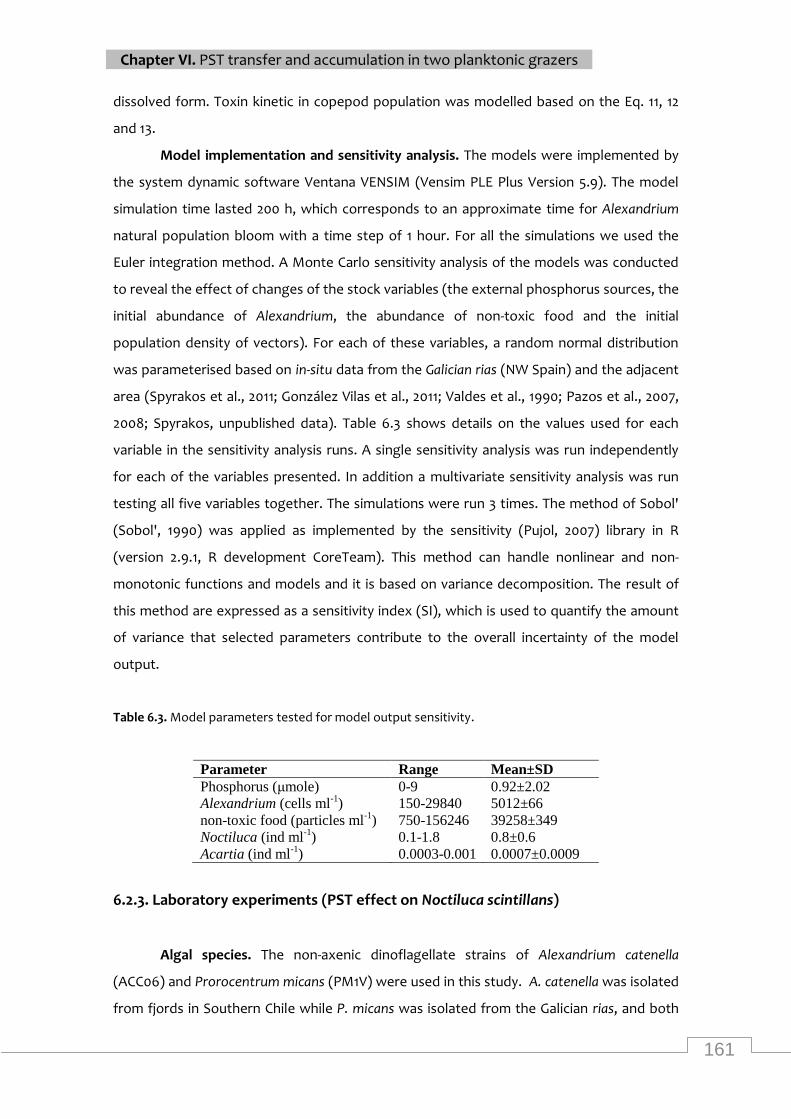
161
Chapter VI. PST transfer and accumulation in two planktonic grazers
dissolved form. Toxin kinetic in copepod population was modelled based on the Eq. 11, 12
and 13.
Model implementation and sensitivity analysis. The models were implemented by
the system dynamic software Ventana VENSIM (Vensim PLE Plus Version 5.9). The model
simulation time lasted 200 h, which corresponds to an approximate time for Alexandrium
natural population bloom with a time step of 1 hour. For all the simulations we used the
Euler integration method. A Monte Carlo sensitivity analysis of the models was conducted
to reveal the effect of changes of the stock variables (the external phosphorus sources, the
initial abundance of Alexandrium, the abundance of non-toxic food and the initial
population density of vectors). For each of these variables, a random normal distribution
was parameterised based on in-situ data from the Galician rias (NW Spain) and the adjacent
area (Spyrakos et al., 2011; González Vilas et al., 2011; Valdes et al., 1990; Pazos et al., 2007,
2008; Spyrakos, unpublished data). Table 6.3 shows details on the values used for each
variable in the sensitivity analysis runs. A single sensitivity analysis was run independently
for each of the variables presented. In addition a multivariate sensitivity analysis was run
testing all five variables together. The simulations were run 3 times. The method of Sobol'
(Sobol', 1990) was applied as implemented by the sensitivity (Pujol, 2007) library in R
(version 2.9.1, R development CoreTeam). This method can handle nonlinear and non-
monotonic functions and models and it is based on variance decomposition. The result of
this method are expressed as a sensitivity index (SI), which is used to quantify the amount
of variance that selected parameters contribute to the overall incertainty of the model
output.
Table 6.3. Model parameters tested for model output sensitivity.
Parameter Range Mean±SD
Phosphorus (μmole) 0-9 0.92±2.02
Alexandrium (cells ml-1
) 150-29840 5012±66
non-toxic food (particles ml-1
) 750-156246 39258±349
Noctiluca (ind ml-1
) 0.1-1.8 0.8±0.6
Acartia (ind ml-1
) 0.0003-0.001 0.0007±0.0009
6.2.3. Laboratory experiments (PST effect on Noctiluca scintillans)
Algal species. The non-axenic dinoflagellate strains of Alexandrium catenella
(ACC06) and Prorocentrum micans (PM1V) were used in this study. A. catenella was isolated
from fjords in Southern Chile while P. micans was isolated from the Galician rias, and both
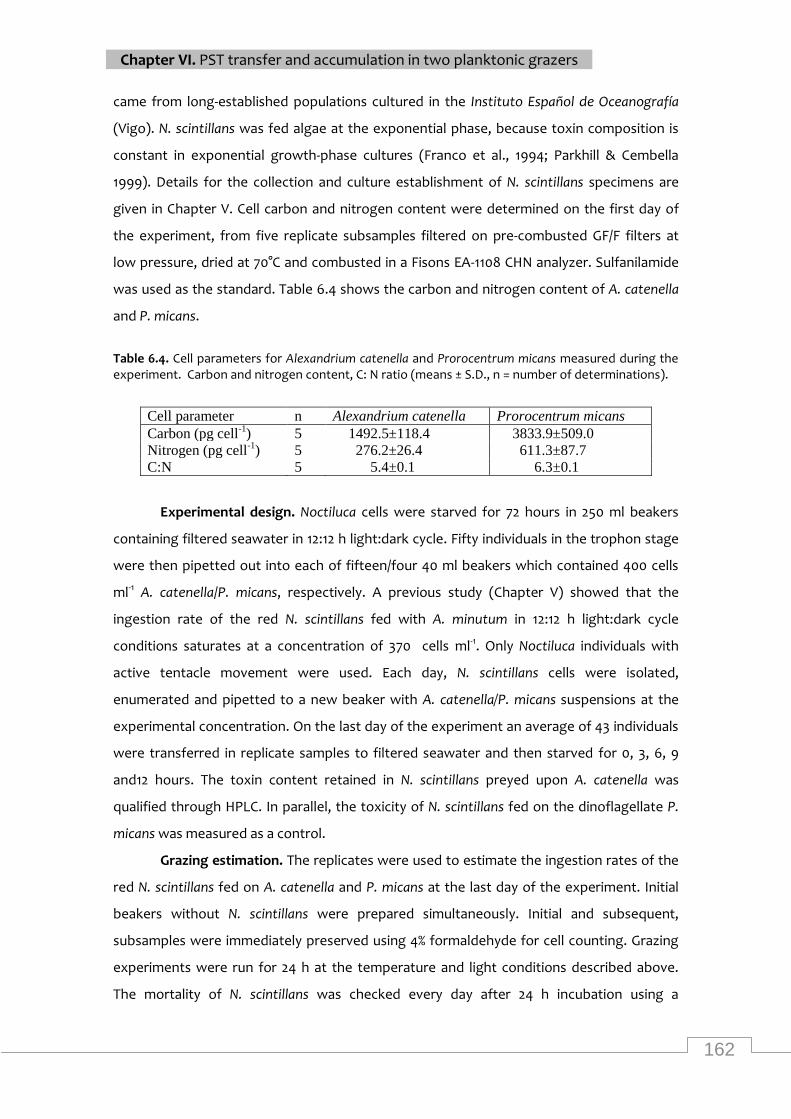
162
Chapter VI. PST transfer and accumulation in two planktonic grazers
came from long-established populations cultured in the Instituto Español de Oceanografía
(Vigo). N. scintillans was fed algae at the exponential phase, because toxin composition is
constant in exponential growth-phase cultures (Franco et al., 1994; Parkhill & Cembella
1999). Details for the collection and culture establishment of N. scintillans specimens are
given in Chapter V. Cell carbon and nitrogen content were determined on the first day of
the experiment, from five replicate subsamples filtered on pre-combusted GF/F filters at
low pressure, dried at 70°C and combusted in a Fisons EA-1108 CHN analyzer. Sulfanilamide
was used as the standard. Table 6.4 shows the carbon and nitrogen content of A. catenella
and P. micans.
Table 6.4. Cell parameters for Alexandrium catenella and Prorocentrum micans measured during the experiment. Carbon and nitrogen content, C: N ratio (means ± S.D., n = number of determinations).
Cell parameter n Alexandrium catenella Prorocentrum micans
Carbon (pg cell-1
) 5 1492.5±118.4 3833.9±509.0
Nitrogen (pg cell-1
) 5 276.2±26.4 611.3±87.7
C:N 5 5.4±0.1 6.3±0.1
Experimental design. Noctiluca cells were starved for 72 hours in 250 ml beakers
containing filtered seawater in 12:12 h light:dark cycle. Fifty individuals in the trophon stage
were then pipetted out into each of fifteen/four 40 ml beakers which contained 400 cells
ml-1 A. catenella/P. micans, respectively. A previous study (Chapter V) showed that the
ingestion rate of the red N. scintillans fed with A. minutum in 12:12 h light:dark cycle
conditions saturates at a concentration of 370 cells ml-1. Only Noctiluca individuals with
active tentacle movement were used. Each day, N. scintillans cells were isolated,
enumerated and pipetted to a new beaker with A. catenella/P. micans suspensions at the
experimental concentration. On the last day of the experiment an average of 43 individuals
were transferred in replicate samples to filtered seawater and then starved for 0, 3, 6, 9
and12 hours. The toxin content retained in N. scintillans preyed upon A. catenella was
qualified through HPLC. In parallel, the toxicity of N. scintillans fed on the dinoflagellate P.
micans was measured as a control.
Grazing estimation. The replicates were used to estimate the ingestion rates of the
red N. scintillans fed on A. catenella and P. micans at the last day of the experiment. Initial
beakers without N. scintillans were prepared simultaneously. Initial and subsequent,
subsamples were immediately preserved using 4% formaldehyde for cell counting. Grazing
experiments were run for 24 h at the temperature and light conditions described above.
The mortality of N. scintillans was checked every day after 24 h incubation using a
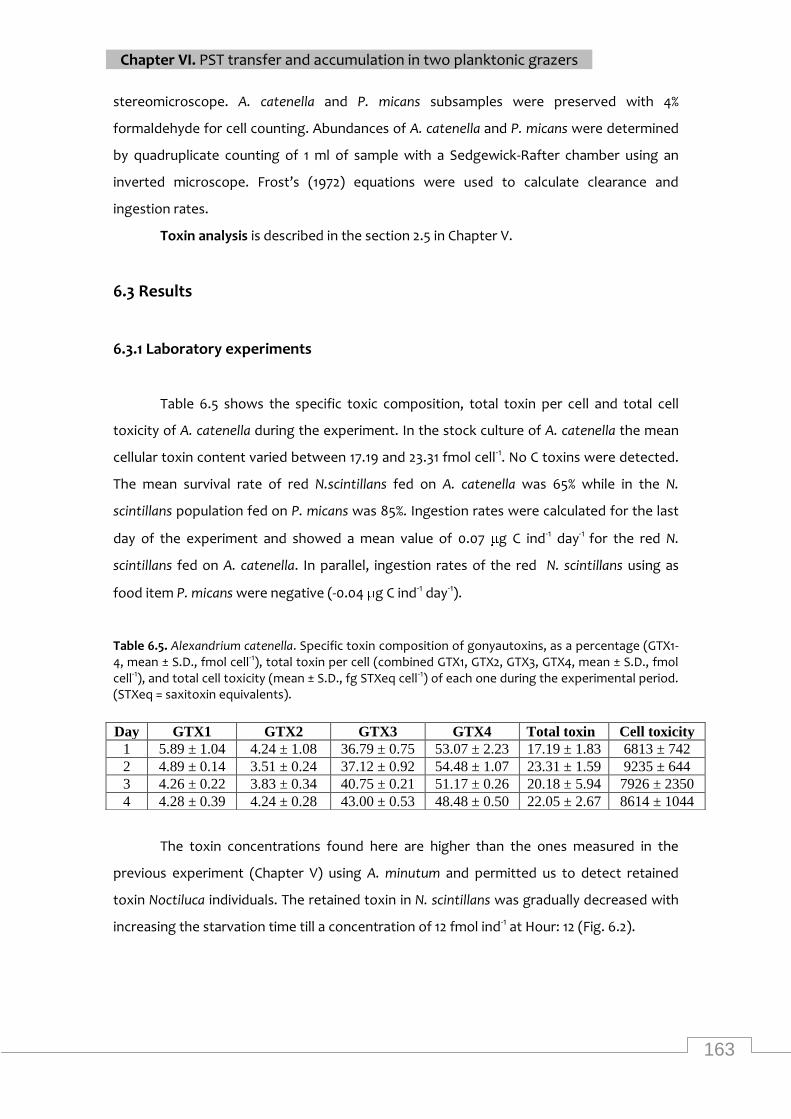
163
Chapter VI. PST transfer and accumulation in two planktonic grazers
stereomicroscope. A. catenella and P. micans subsamples were preserved with 4%
formaldehyde for cell counting. Abundances of A. catenella and P. micans were determined
by quadruplicate counting of 1 ml of sample with a Sedgewick-Rafter chamber using an
inverted microscope. Frost’s (1972) equations were used to calculate clearance and
ingestion rates.
Toxin analysis is described in the section 2.5 in Chapter V.
6.3 Results
6.3.1 Laboratory experiments
Table 6.5 shows the specific toxic composition, total toxin per cell and total cell
toxicity of A. catenella during the experiment. In the stock culture of A. catenella the mean
cellular toxin content varied between 17.19 and 23.31 fmol cell-1. No C toxins were detected.
The mean survival rate of red N.scintillans fed on A. catenella was 65% while in the N.
scintillans population fed on P. micans was 85%. Ingestion rates were calculated for the last
day of the experiment and showed a mean value of 0.07 g C ind-1 day-1 for the red N.
scintillans fed on A. catenella. In parallel, ingestion rates of the red N. scintillans using as
food item P. micans were negative (-0.04 g C ind-1 day-1).
Table 6.5. Alexandrium catenella. Specific toxin composition of gonyautoxins, as a percentage (GTX1-4, mean ± S.D., fmol cell-1), total toxin per cell (combined GTX1, GTX2, GTX3, GTX4, mean ± S.D., fmol cell-1), and total cell toxicity (mean ± S.D., fg STXeq cell-1) of each one during the experimental period. (STXeq = saxitoxin equivalents).
The toxin concentrations found here are higher than the ones measured in the
previous experiment (Chapter V) using A. minutum and permitted us to detect retained
toxin Noctiluca individuals. The retained toxin in N. scintillans was gradually decreased with
increasing the starvation time till a concentration of 12 fmol ind-1 at Hour: 12 (Fig. 6.2).
Day GTX1 GTX2 GTX3 GTX4 Total toxin Cell toxicity
1 5.89 ± 1.04 4.24 ± 1.08 36.79 ± 0.75 53.07 ± 2.23 17.19 ± 1.83 6813 ± 742
2 4.89 ± 0.14 3.51 ± 0.24 37.12 ± 0.92 54.48 ± 1.07 23.31 ± 1.59 9235 ± 644
3 4.26 ± 0.22 3.83 ± 0.34 40.75 ± 0.21 51.17 ± 0.26 20.18 ± 5.94 7926 ± 2350
4 4.28 ± 0.39 4.24 ± 0.28 43.00 ± 0.53 48.48 ± 0.50 22.05 ± 2.67 8614 ± 1044
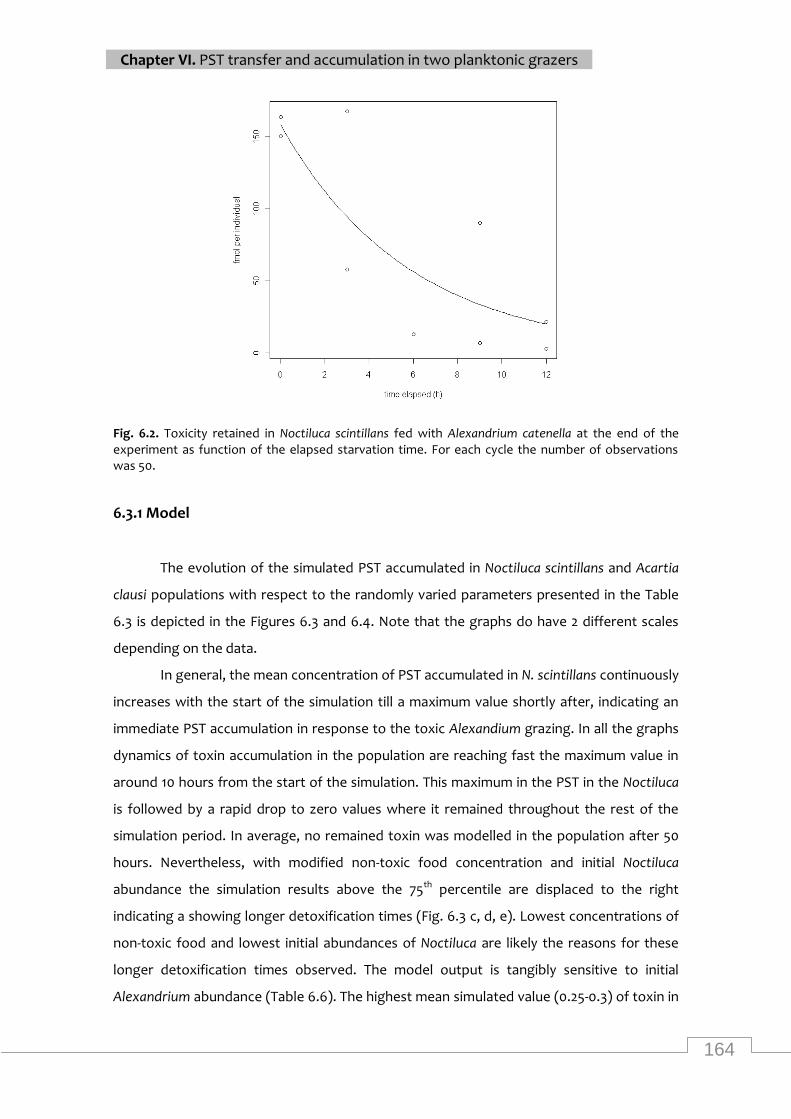
164
Chapter VI. PST transfer and accumulation in two planktonic grazers
Fig. 6.2. Toxicity retained in Noctiluca scintillans fed with Alexandrium catenella at the end of the experiment as function of the elapsed starvation time. For each cycle the number of observations was 50.
6.3.1 Model
The evolution of the simulated PST accumulated in Noctiluca scintillans and Acartia
clausi populations with respect to the randomly varied parameters presented in the Table
6.3 is depicted in the Figures 6.3 and 6.4. Note that the graphs do have 2 different scales
depending on the data.
In general, the mean concentration of PST accumulated in N. scintillans continuously
increases with the start of the simulation till a maximum value shortly after, indicating an
immediate PST accumulation in response to the toxic Alexandium grazing. In all the graphs
dynamics of toxin accumulation in the population are reaching fast the maximum value in
around 10 hours from the start of the simulation. This maximum in the PST in the Noctiluca
is followed by a rapid drop to zero values where it remained throughout the rest of the
simulation period. In average, no remained toxin was modelled in the population after 50
hours. Nevertheless, with modified non-toxic food concentration and initial Noctiluca
abundance the simulation results above the 75th percentile are displaced to the right
indicating a showing longer detoxification times (Fig. 6.3 c, d, e). Lowest concentrations of
non-toxic food and lowest initial abundances of Noctiluca are likely the reasons for these
longer detoxification times observed. The model output is tangibly sensitive to initial
Alexandrium abundance (Table 6.6). The highest mean simulated value (0.25-0.3) of toxin in
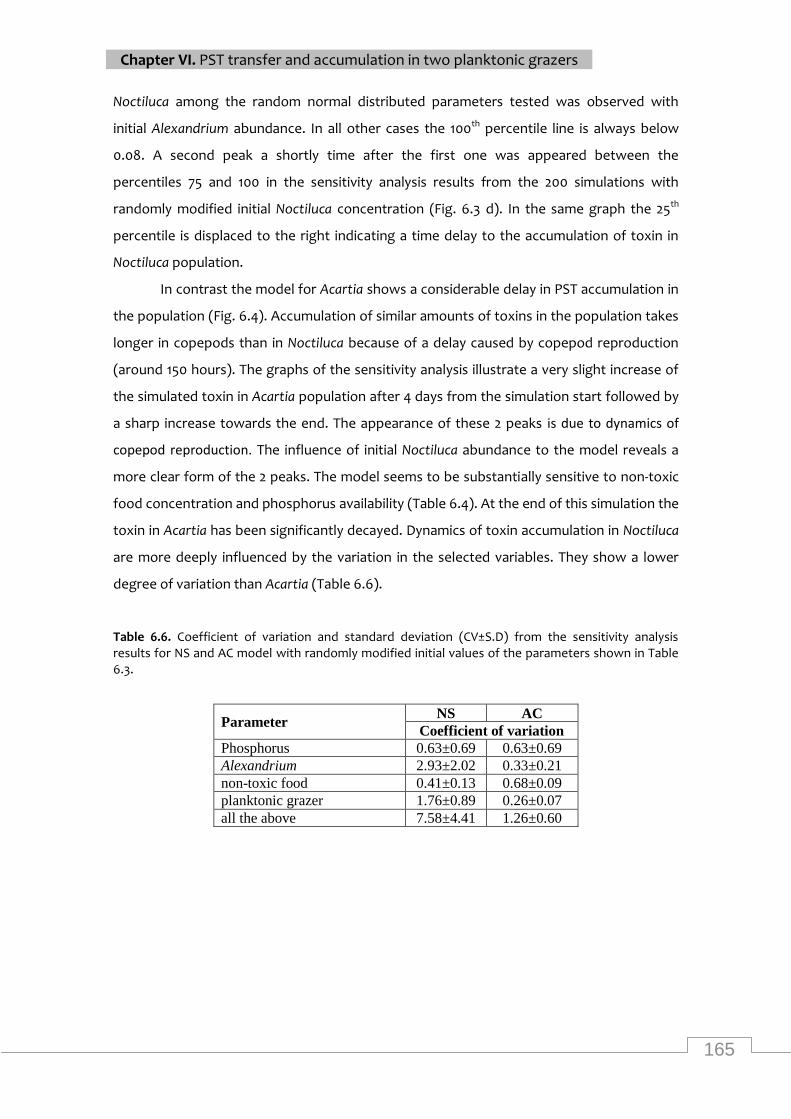
165
Chapter VI. PST transfer and accumulation in two planktonic grazers
Noctiluca among the random normal distributed parameters tested was observed with
initial Alexandrium abundance. In all other cases the 100th percentile line is always below
0.08. A second peak a shortly time after the first one was appeared between the
percentiles 75 and 100 in the sensitivity analysis results from the 200 simulations with
randomly modified initial Noctiluca concentration (Fig. 6.3 d). In the same graph the 25th
percentile is displaced to the right indicating a time delay to the accumulation of toxin in
Noctiluca population.
In contrast the model for Acartia shows a considerable delay in PST accumulation in
the population (Fig. 6.4). Accumulation of similar amounts of toxins in the population takes
longer in copepods than in Noctiluca because of a delay caused by copepod reproduction
(around 150 hours). The graphs of the sensitivity analysis illustrate a very slight increase of
the simulated toxin in Acartia population after 4 days from the simulation start followed by
a sharp increase towards the end. The appearance of these 2 peaks is due to dynamics of
copepod reproduction. The influence of initial Noctiluca abundance to the model reveals a
more clear form of the 2 peaks. The model seems to be substantially sensitive to non-toxic
food concentration and phosphorus availability (Table 6.4). At the end of this simulation the
toxin in Acartia has been significantly decayed. Dynamics of toxin accumulation in Noctiluca
are more deeply influenced by the variation in the selected variables. They show a lower
degree of variation than Acartia (Table 6.6).
Table 6.6. Coefficient of variation and standard deviation (CV±S.D) from the sensitivity analysis results for NS and AC model with randomly modified initial values of the parameters shown in Table 6.3.
Parameter NS AC
Coefficient of variation
Phosphorus 0.63±0.69 0.63±0.69
Alexandrium 2.93±2.02 0.33±0.21
non-toxic food 0.41±0.13 0.68±0.09
planktonic grazer 1.76±0.89 0.26±0.07
all the above 7.58±4.41 1.26±0.60
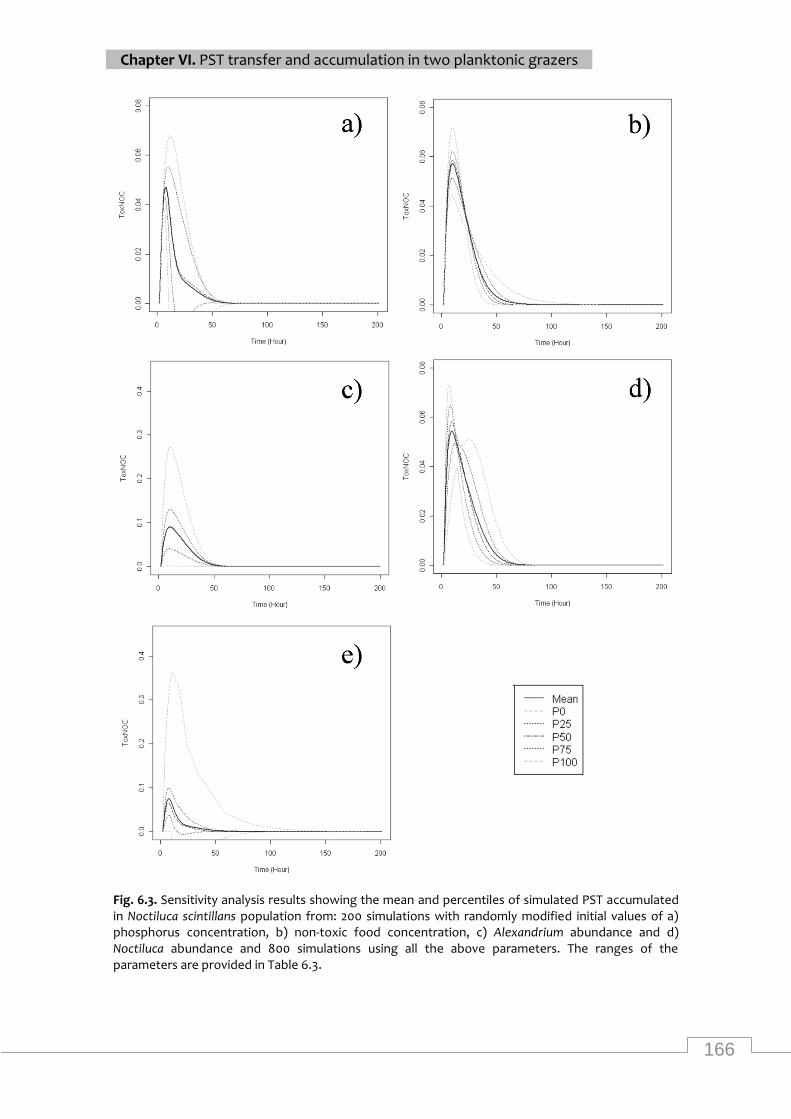
166
Chapter VI. PST transfer and accumulation in two planktonic grazers
Fig. 6.3. Sensitivity analysis results showing the mean and percentiles of simulated PST accumulated in Noctiluca scintillans population from: 200 simulations with randomly modified initial values of a) phosphorus concentration, b) non-toxic food concentration, c) Alexandrium abundance and d) Noctiluca abundance and 800 simulations using all the above parameters. The ranges of the parameters are provided in Table 6.3.
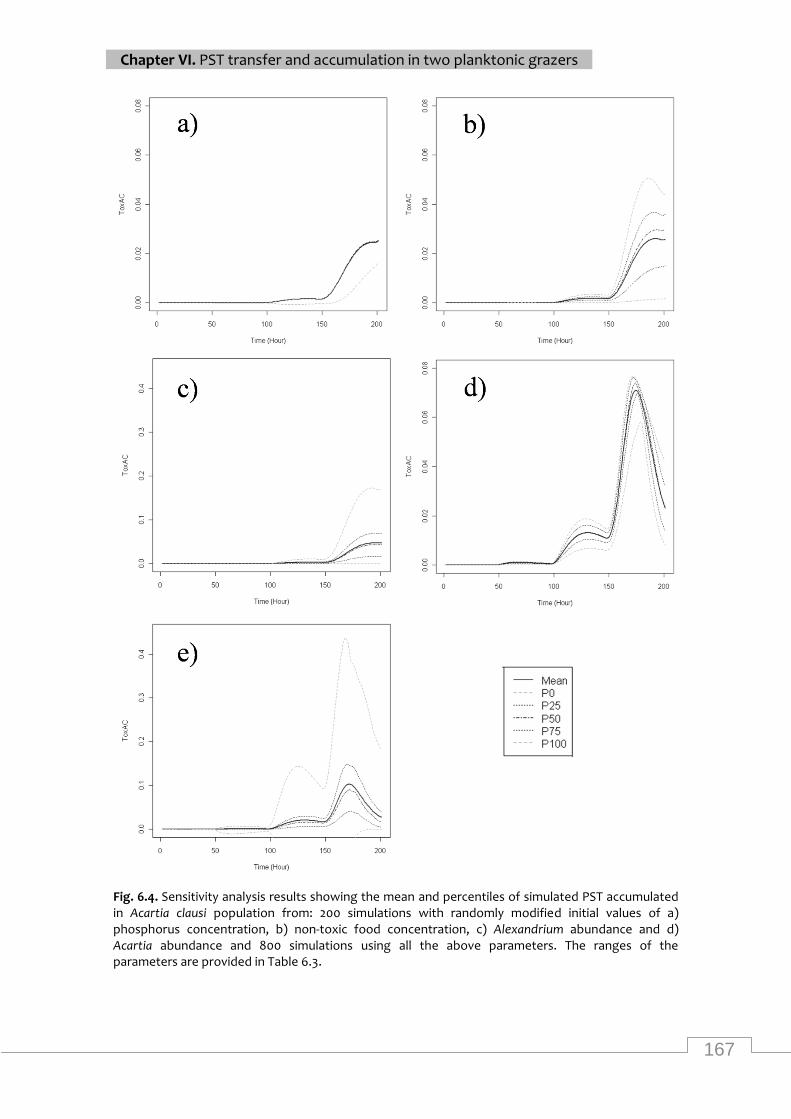
167
Chapter VI. PST transfer and accumulation in two planktonic grazers
Fig. 6.4. Sensitivity analysis results showing the mean and percentiles of simulated PST accumulated in Acartia clausi population from: 200 simulations with randomly modified initial values of a) phosphorus concentration, b) non-toxic food concentration, c) Alexandrium abundance and d) Acartia abundance and 800 simulations using all the above parameters. The ranges of the parameters are provided in Table 6.3.
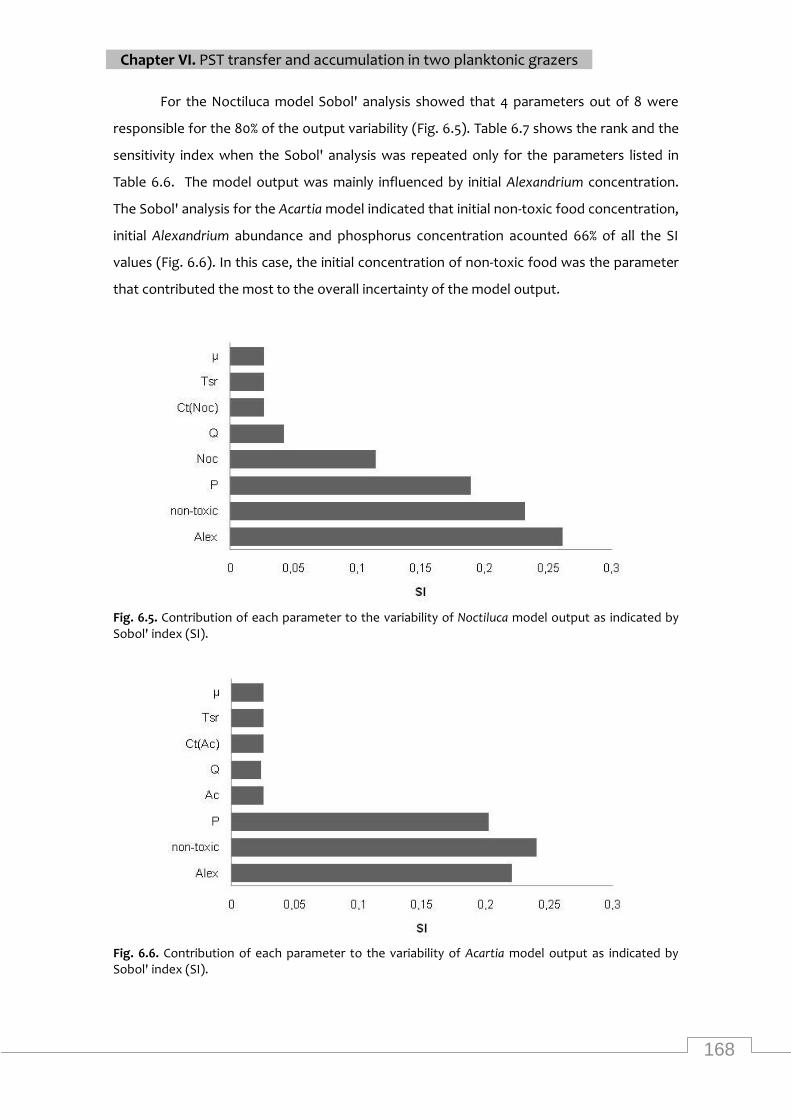
168
Chapter VI. PST transfer and accumulation in two planktonic grazers
For the Noctiluca model Sobol' analysis showed that 4 parameters out of 8 were
responsible for the 80% of the output variability (Fig. 6.5). Table 6.7 shows the rank and the
sensitivity index when the Sobol' analysis was repeated only for the parameters listed in
Table 6.6. The model output was mainly influenced by initial Alexandrium concentration.
The Sobol' analysis for the Acartia model indicated that initial non-toxic food concentration,
initial Alexandrium abundance and phosphorus concentration acounted 66% of all the SI
values (Fig. 6.6). In this case, the initial concentration of non-toxic food was the parameter
that contributed the most to the overall incertainty of the model output.
Fig. 6.5. Contribution of each parameter to the variability of Noctiluca model output as indicated by Sobol' index (SI).
Fig. 6.6. Contribution of each parameter to the variability of Acartia model output as indicated by Sobol' index (SI).
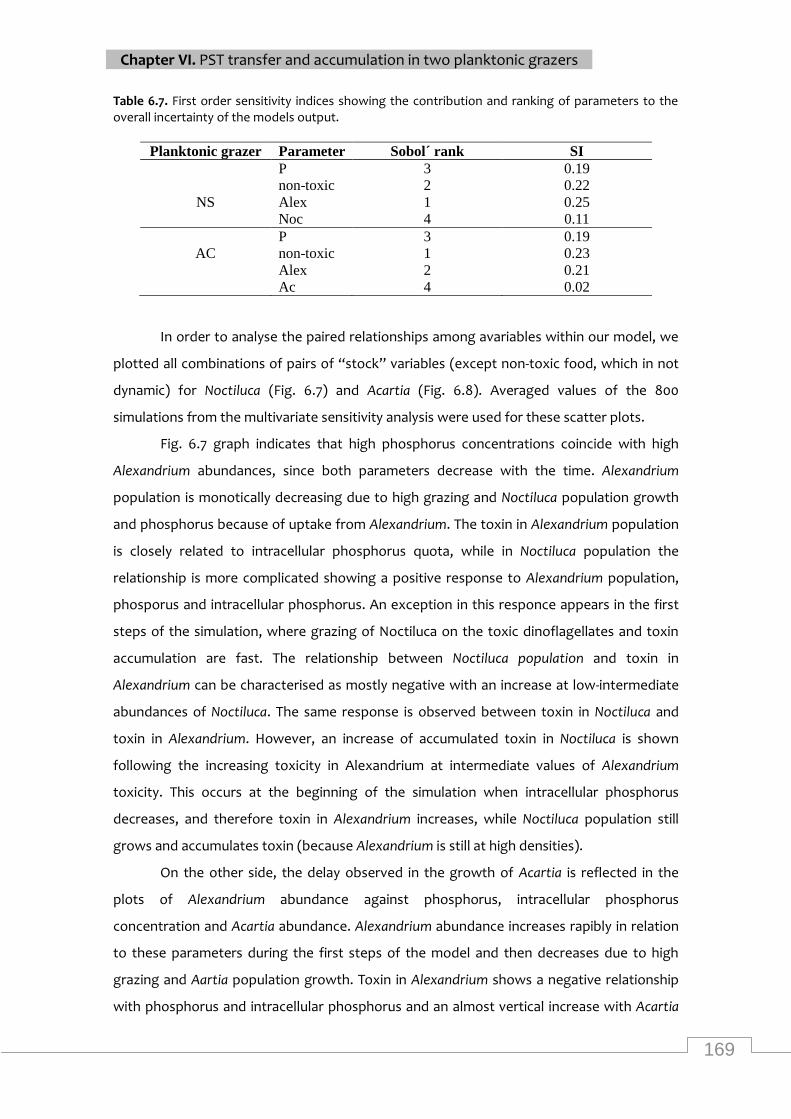
169
Chapter VI. PST transfer and accumulation in two planktonic grazers
Table 6.7. First order sensitivity indices showing the contribution and ranking of parameters to the overall incertainty of the models output.
Planktonic grazer Parameter Sobol´ rank SI
P 3 0.19
non-toxic 2 0.22
NS Alex 1 0.25
Noc 4 0.11
P 3 0.19
AC non-toxic 1 0.23
Alex 2 0.21
Ac 4 0.02
In order to analyse the paired relationships among avariables within our model, we
plotted all combinations of pairs of “stock” variables (except non-toxic food, which in not
dynamic) for Noctiluca (Fig. 6.7) and Acartia (Fig. 6.8). Averaged values of the 800
simulations from the multivariate sensitivity analysis were used for these scatter plots.
Fig. 6.7 graph indicates that high phosphorus concentrations coincide with high
Alexandrium abundances, since both parameters decrease with the time. Alexandrium
population is monotically decreasing due to high grazing and Noctiluca population growth
and phosphorus because of uptake from Alexandrium. The toxin in Alexandrium population
is closely related to intracellular phosphorus quota, while in Noctiluca population the
relationship is more complicated showing a positive response to Alexandrium population,
phosporus and intracellular phosphorus. An exception in this responce appears in the first
steps of the simulation, where grazing of Noctiluca on the toxic dinoflagellates and toxin
accumulation are fast. The relationship between Noctiluca population and toxin in
Alexandrium can be characterised as mostly negative with an increase at low-intermediate
abundances of Noctiluca. The same response is observed between toxin in Noctiluca and
toxin in Alexandrium. However, an increase of accumulated toxin in Noctiluca is shown
following the increasing toxicity in Alexandrium at intermediate values of Alexandrium
toxicity. This occurs at the beginning of the simulation when intracellular phosphorus
decreases, and therefore toxin in Alexandrium increases, while Noctiluca population still
grows and accumulates toxin (because Alexandrium is still at high densities).
On the other side, the delay observed in the growth of Acartia is reflected in the
plots of Alexandrium abundance against phosphorus, intracellular phosphorus
concentration and Acartia abundance. Alexandrium abundance increases rapibly in relation
to these parameters during the first steps of the model and then decreases due to high
grazing and Aartia population growth. Toxin in Alexandrium shows a negative relationship
with phosphorus and intracellular phosphorus and an almost vertical increase with Acartia
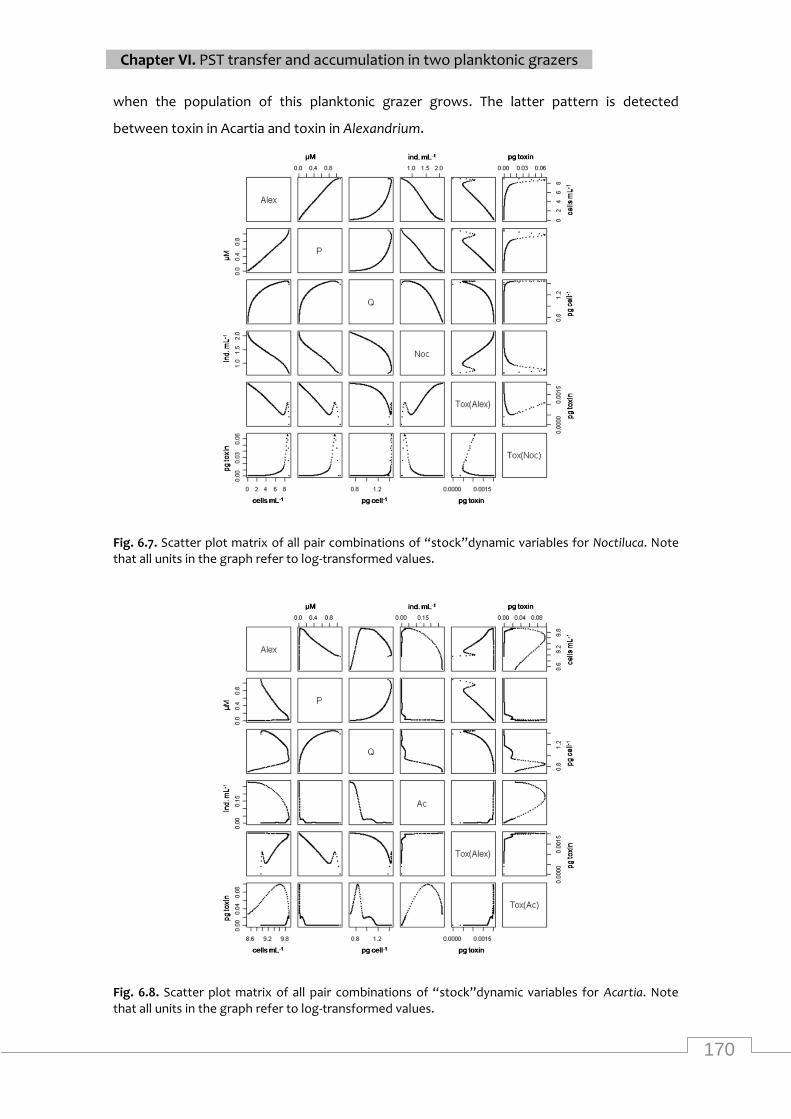
170
Chapter VI. PST transfer and accumulation in two planktonic grazers
when the population of this planktonic grazer grows. The latter pattern is detected
between toxin in Acartia and toxin in Alexandrium.
Fig. 6.7. Scatter plot matrix of all pair combinations of “stock”dynamic variables for Noctiluca. Note that all units in the graph refer to log-transformed values.
Fig. 6.8. Scatter plot matrix of all pair combinations of “stock”dynamic variables for Acartia. Note that all units in the graph refer to log-transformed values.
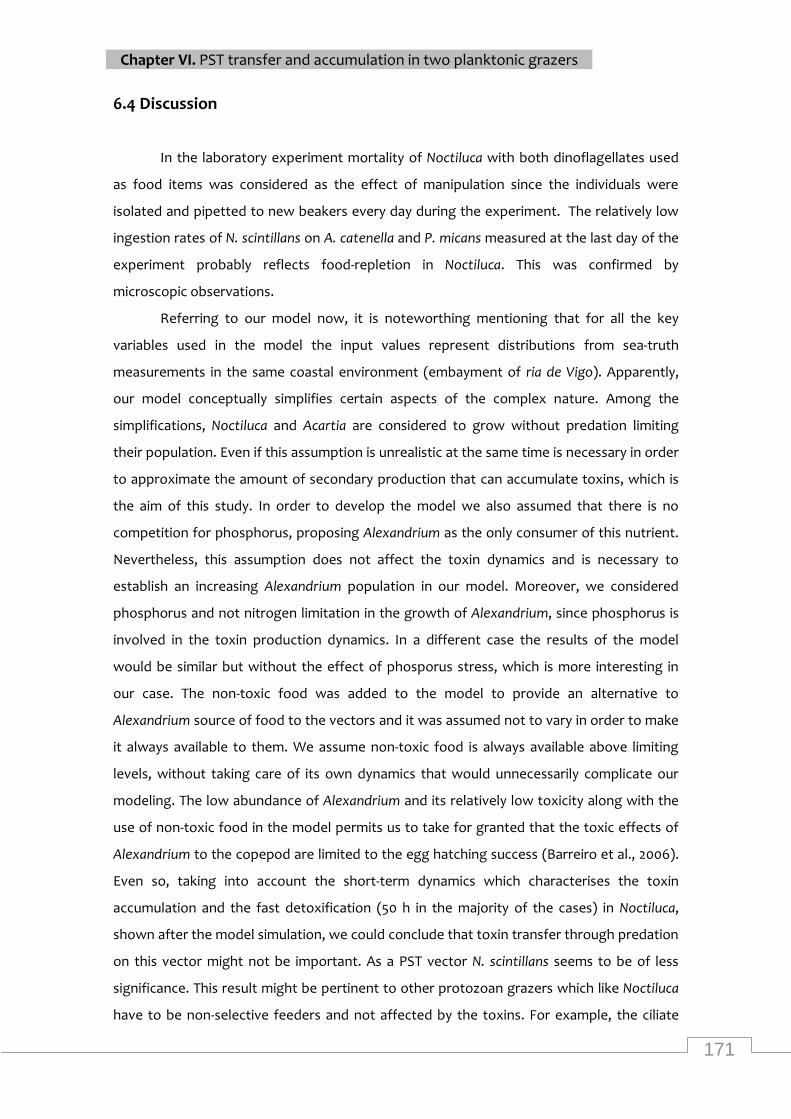
171
Chapter VI. PST transfer and accumulation in two planktonic grazers
6.4 Discussion
In the laboratory experiment mortality of Noctiluca with both dinoflagellates used
as food items was considered as the effect of manipulation since the individuals were
isolated and pipetted to new beakers every day during the experiment. The relatively low
ingestion rates of N. scintillans on A. catenella and P. micans measured at the last day of the
experiment probably reflects food-repletion in Noctiluca. This was confirmed by
microscopic observations.
Referring to our model now, it is noteworthing mentioning that for all the key
variables used in the model the input values represent distributions from sea-truth
measurements in the same coastal environment (embayment of ria de Vigo). Apparently,
our model conceptually simplifies certain aspects of the complex nature. Among the
simplifications, Noctiluca and Acartia are considered to grow without predation limiting
their population. Even if this assumption is unrealistic at the same time is necessary in order
to approximate the amount of secondary production that can accumulate toxins, which is
the aim of this study. In order to develop the model we also assumed that there is no
competition for phosphorus, proposing Alexandrium as the only consumer of this nutrient.
Nevertheless, this assumption does not affect the toxin dynamics and is necessary to
establish an increasing Alexandrium population in our model. Moreover, we considered
phosphorus and not nitrogen limitation in the growth of Alexandrium, since phosphorus is
involved in the toxin production dynamics. In a different case the results of the model
would be similar but without the effect of phosporus stress, which is more interesting in
our case. The non-toxic food was added to the model to provide an alternative to
Alexandrium source of food to the vectors and it was assumed not to vary in order to make
it always available to them. We assume non-toxic food is always available above limiting
levels, without taking care of its own dynamics that would unnecessarily complicate our
modeling. The low abundance of Alexandrium and its relatively low toxicity along with the
use of non-toxic food in the model permits us to take for granted that the toxic effects of
Alexandrium to the copepod are limited to the egg hatching success (Barreiro et al., 2006).
Even so, taking into account the short-term dynamics which characterises the toxin
accumulation and the fast detoxification (50 h in the majority of the cases) in Noctiluca,
shown after the model simulation, we could conclude that toxin transfer through predation
on this vector might not be important. As a PST vector N. scintillans seems to be of less
significance. This result might be pertinent to other protozoan grazers which like Noctiluca
have to be non-selective feeders and not affected by the toxins. For example, the ciliate
172
Chapter VI. PST transfer and accumulation in two planktonic grazers
Favella taraikaensis has shown actively grazing on A. tamarense in laboratory conditions
without toxic effects (Kamiyama et al., 2005).
On the other hand, the copepod dynamic model results show that population
requires more time to accumulate comparable to Noctiluca amounts of toxin. Because of
this delay, high predation on copepods during an Alexandrium toxic event, would probaply
result less or even no toxin accumulation in these organisms. Simulated accumulation and
detoxification in Acartia appear to be comparable to those of Noctiluca. Total detoxification
from the beginning of accumulation peak lasts 50 h, resticting in that way the availability of
this vector for toxin transfer to higher trophic levels. This could be of great importance in
the area of Galician coast, where Acartia is the most abundant mesozooplankton in all
seasons (Valdes et al., 1990). The results of the model developed here could be possibly
generalized for other calanoid copepods found in the area and other coastal environments,
which are also characterised by omnivorous feeding, similar size and high egg production.
In any case, variations in grazing rates and preferences and toxic effects must be
considered.
The slower reproduction rates in copepods have as effect the delayed (100-150 h)
noticeable increase in toxin accumulation in comparison to Noctiluca and thus the different
behaviour of these two planktonic grazers as PST vectors. This finding is considerable
because it shows that in the case of co-existence of these two planktonic grazers
(confirmed by unpublished data for the summer period in the Galician rias and recorded in
other regions: e. g. Quevedo et al., 1999). The presence of two abundant organisms of the
plankton community with high accumulated amount of toxin in marine environment at
different times from the start of the toxic event might increases the risk for toxin transfer
through predation.
The range of the input data for the model parameters controls whether or not a
factor will have a strong influence in the dynamics of the toxin accumulation. Using a widely
changed range of input values, as for example lower phosphorus concentrations or higher
amount of toxin in Alexandrium, which can be found in another coastal ecosystem the
obtained model results would be different. An important feature of the toxin dynamics for
the heterotrophic dinoflagellate is that the key variable explaining the total amount of toxin
that could be accumulated is the initial abundance of Alexandrium (cv=2.93±2.02, CI=0.25),
as it was expected. The time delay observed in the simulated PST toxin accumulated in a
copepod population probably conceals the variation of the initial concentration of this toxic
dinoflagellate. Generally, this seems to be the case for the lower sensibility that the model
for Acartia showed for the tested parameters. Nevertheless, the non-important effect of
173
Chapter VI. PST transfer and accumulation in two planktonic grazers
initial Acartia abundance on toxin dynamics is possibly linked to the relatively low variation
of values included in the sensitivity analysis that correspond to the abundances found in the
Galician coast. Noctiluca, on the other side, shows a wider distribution in the initial values
used in the model, ranging from total absent to bloom-forming abundances. In natural
assemblages, Noctiluca blooms appear to create pink “patches” and slicks with significant
deviation of the abundance (Huang & Qi, 1997). Moreover, in their review on heterotrophic
dinoflagellates Jeong et al. (2010) mention that protozoan grazers are typically 100 to
10000 timess more abundant than copepods. For the copepod studied in this paper, the
initial concentration of the non-toxic food seems to be an important parameter involved in
the toxin dynamics (cv=0.68±0.09, SI=0.23). The presence of alternative to the toxic has
been demonstrated to effect by dilution (Barreiro et al., 2006).
Conclusively, the model predicts very fast detoxification in both the planktonic
organisms suggesting that these vectors of PST are inefficient. However, simulated toxin
accumulation in the vetors reached at certain moments comparatively high amounts.
Several explanations have been proposed for this reduction of the ingested toxin in
copepods such as excresion (Guisande et al., 2002), metabolic degradation or regurgitation
(Teegarden et al., 2003). Detoxification or excretion processes have been also suspected in
Noctiluca (Frangópulos et al., 2011) and ciliates (Kamiyama & Suzuki, 2006). The latter
authors mention potential negative effects in several organisms due to concentrated
dissolved toxin.
174
Chapter VI. PST transfer and accumulation in two planktonic grazers
6.5 References
Alonso-Rodríguez, R. Ochoa, J. L., Uribe-Alcocer, M. Blanco A. G., & Butardo, V. M. (2005).
Grazing of heterotrophic dinoflagellate Noctiluca scintillans (Macartney) Kofoid on Gymnodinium
catenatum Graham. Revista Latinoamericana de Microbiología, 47(1–2), 6–10.
Anderson, D. M., Kulis, D. M., Sullivan, J. J., Hall, S., & Lee, C. (1990) Dynamics and physiology of
saxitoxin production by the dinoflagellates Alexandrium spp. Marine Biology, 104, 511–524.
Barreiro, A., Guisande, C., Frangópulos, M., Gónzalez- Fernández. A., Muñoz, S., Pérez, D.,
Magadán, S., Maneiro, I., Riveiro, I., & Iglesias, P. (2006) Feeding strategies of the copepod
Acartia clausi on single and mixed diet of toxic and non-toxic strains of the dinoflagellate
Alexandrium minutum. Marine Ecology Progress Series, 316, 115-125.
Bagoien, E., Miranda, A., Reguera, B., & Franco J. M. (1996). Effects of two paralytic shellfish
toxin producing dinoflagellates on the pelagic hapacticoid copepod Euterpina acutifrons. Marine
Biology, 126, 361–369.
Boyer, G. L., Sullivan, J. J., LeBlanc, M., & Andersen, R. J. (1985). Assimilation of PSP toxins by
the copepod Tigriopus californicus from dietary Protogonyaulax catanella. In: D. M. Anderson, A.
W. White & D. G. Baden (Eds). Toxic Dinoflagellates. (pp 407-412). New York: Elsevier.
Calbet, A. , Vaqué, D., Felipe, J., Vila, M., Sala, M. M., Alcaraz, M., & Estrada, M. (2003). Relative
grazing impact of microzooplankton and mesozooplankton on a bloom of the toxic
dinoflagellate Alexandrium minutum. 259, 303-309.
Carreto, J., Carignan, M., & Montoya, N. (2001). Comparative studies on mycosporine-like amino
acids, paralytic shellfish toxins and pigment profiles of the toxic dinoflagellates Alexandrium
tamarense, A. catenella and A. minutum. Marine Ecology Progress Series, 223, 49-60.
Cataletto, B., Feoli, E., Fonda Umani, S., & Cheng-Yong S. (1995). Eleven years of time-series
analysis on the net-zooplankton community in the Gulf of Trieste. Journal of Marine Science, 52,
669–678.
Dam, H., G. & Haley S., T. (2011). Comparative dynamics of paralytic shellfish toxins (PST) in a
tolerant and susceptible population of the copepod Acartia hudsonica. Harmful Algae, 10, 245-
253.
Droop, M. R. (1983). 25 years of algal growth kinetics. A personal view. Botanica Marina, 26, 99-
112.
Doucette, G. J., Turner, J. T., Powell, C. L., Keafer, B. A., & Anderson, D. M. (2005). ECOHAB-Gulf
of Maine. Trophic accumulation of PSP toxins in zooplankton during Alexandrium blooms in
Casco Bay, Gulf of Maine, April–June, 1998. I. Toxin levels in Alexandrium and zooplankton size
fractions. Deep-Sea Research Part II, 52 (19-21), 2764–2783.
175
Chapter VI. PST transfer and accumulation in two planktonic grazers
Dutz, J. (1998). Repression of fecundity in the neritic copepod Acartia clausi exposed to the
toxic dinoflagellate Alexandrium lusitanicum: relationship between feeding and egg production.
Marine Ecology Progress Series, 175, 97–107.
Elbrächter, M. & Qi, Y. Z. (1998). Aspects of Noctiluca (Dinophyceae) populations dynamics, In:
D. M. Anderson, A. D. Cembella & G. M. Hallegraeff (Eds). Physiological Ecology of Harmful Algal
Blooms. NATO ASI Series. (pp 315-335). Berlin: Springer-Verlag.
Escalera, L., Pazos, Y., Moroño A., & Reguera, B. (2007). Noctiluca scintillans may act as a vector
of toxigenic microalgae. Harmful Algae, 6, 317–320.
Franco, J. M., Fernández, P., & Reguera, B. (1994). Toxin profiles of natural populations and
cultures of Alexandrium minutum Halim from Galician (Spain) coastal waters. Journal of Applied
Phycology, 6, 275-279.
Frangópulos, M., Guisande, C., Maneiro, I., Riveiro, I., & Franco, J. (2000). Short-term and long-
term effects of the toxic dinoflagellate Alexandrium minutum on the copepod Acartia clausi.
Marine Ecology Progress Series, 203, 161–169.
Frangópulos, M., Spyrakos, E., & Guisande, C. (2011). Ingestion and clearance rates of the red
Noctiluca scintillans fed on the toxic dinoflagellate Alexandrium minutum (Halim), Harmful Algae,
10, 304–309.
Frost, B. W. (1972). Effects of size and concentration of food particles on the feeding behaviour
of the marine planktonic copepod Calanus pacificus. Limnology & Oceanography, 40, 476-482.
Fukuda, Y. &Endoh, H. (2006). New details from the complete life cycle of the red-tide
dinoflagellate Noctiluca scintillans (Ehrenberg) Macartney. European Journal of Protistology, 42,
209–219.
González Vilas, L., Spyrakos, E., & Torres Palenzuela, J. (2011). Neural network estimation of
chlorophyll a from MERIS full resolution data for the coastal waters of Galician rias (NW Spain).
Remote Sensing of Environment 115 (2), 524-535.
Guisande, C., Frangópulos, M., Carotenuto, Y., Maneiro, I. Riveiro I., & Vergara, A. R. (2002). Fate
of paralytic shellfish poisoning toxins ingested by the copepod Acartia clausi. Marine Ecology
Progress Series, 240, 105–115.
Hamasaki, K., Takahashi, T., & Uye, S. (2003). Accumulation of paralytic shellfish poisoning
toxins in planktonic copepods during a bloom of the toxic dinoflagellate Alexandrium tamarense
in Hiroshima Bay, western Japan. Marine Biology, 143, 981–988.
Hansen, P. J. (1989). The red tide dinoflagellate Alexandrium tamarense: effects on behaviour
and growth of a tintinnid ciliate. Marine Ecology Progress Series, 53, 105-116.
176
Chapter VI. PST transfer and accumulation in two planktonic grazers
Hansen, P. J., Cembella, A. D., & Moestrup, Ø. (1992). The marine dinoflagellate Alexandrium
ostenfeldii: paralytic shellfish toxin concentration, composition, and toxicity to a tintinnid ciliate.
Journal of Phycology, 28, 597–603.
Huang, C., & Qi, Y. (1997). The abundance cycle and influence factors on red tide phenomena of
Noctiluca scintillans (Dinophyceae) in Dapeng Bay, the South China Sea. Journal of Plankton
Research, 19, 303-318.
Jiang, T. H., Wang, D. Z., Niu, T., & Xu, Y. X. (2007). Trophic transfer of paralytic shellfish toxins
from the cladoceran (Moina mongolica) to larvae of the fish (Sciaenops ocellatus). Toxicon, 50(5),
639-645.
Kamiyama, T., & Suzuki, T. (2006). Lack of accumulation of paralytic shellfish poisoning (PSP)
toxins in the tintinnid ciliate Favella taraikaensis feeding on the toxic dinoflagellate Alexandrium
tamarense. Marine Ecology Progress Series, 317, 57-65.
Kamiyama, T., Suzuki, T., & Okumura, Y. (2006). Feeding of the tintinnid ciliate Favella
taraikaensis on the toxic dinoflagellate Alexandrium tamarense and the fate of prey toxins.
African Journal of Marine Science, 28(2), 343-346.
Kamiyama, T., Tsujino, M., Matsuyama, Y., & Uchida, T. (2005). Growth and grazing rates of the
tintinnid ciliate Favella taraikaensis on the toxic dinoflagellate Alexandrium tamarense. Marine
Biology, 147, 989–997.
Kim, C.-J. Kim, C.-H., & Sako, Y. (2005). Paralytic shellfish poisoning toxin analysis of the genus
Alexandrium (Dinophyceae) occurring in Korean coastal waters. Fisheries Science, 71, 1-11.
Kiørboe, T., & Titelman, J. (1998). Feeding, preys election and prey encounter mechanisms in the
heterotrophic dinoflagellate Noctiluca scintillans. Journal of Plankton Research, 20, 1615-1636.
Lessard, E. J. (1991). The trophic role of heterotrophic dinoflagellates in diverse marine
environments. Marine Microbial Food Webs, 5, 49–58.
Matsuyama, Y., Miyamoto, M., & Kotani, Y. (1999). Grazing impact of the heterotrophic
dinoflagellate Polykrikos kofoidii on a bloom of Gymnodinium catenatum. Aquatic Microbial
Ecology, 17, 91–98.
Morel, F. M. (1987). Kinetics of nutrient uptake and growth in phytoplankton. Journal of
Phycology, 23, 137-150.
Parkhill, J. P., & Cembella, A. D. (1999). Effects of salinity, light and inorganic nitrogen on growth
and toxigenicity of the marine dinoflagellate Alexandrium tamarense from northeastern Canada.
Journal of Plankton Research, 21, 939-955.
Pazos, Y., Moroño, A., & Doval, M. (2007). Anuario oceoanográfico de Galicia 2007. X. Romarís &
L. González (Eds). Galicia: Trisquel Ediciones.
177
Chapter VI. PST transfer and accumulation in two planktonic grazers
Pazos, Y., Moroño, A., & Doval, M. (2007). Anuario oceoanográfico de Galicia 2007. X. Romarís &
L. González (Eds). Galicia: Trisquel Ediciones.
Pujol, G. (2007). Sensitivity: sensitivity analysis, R package version 1.3-0.
Quevedo, M., González-Quiros, R., & Anadon, R. (1999). Evidence of heavy predation by
Noctiluca scintillans on Acartia clausi (Copepoda) eggs off the central Cantabrian coast (NW
Spain). Oceanologica Acta, 22, 127–131.
R Development Core Team, 2009. R: A Language and Environment for Statistical Computing, Vienna. <www.R-project.org>.
Robineau, B., Gagne, J. A., Fortier, L., & Cembella, A. D. (1991) Potential impact of a toxic
dinoflagellate (Alexandrium excavatum) bloom on survival of fish and crustacean larvae. Marine
Biology, 108, 293–301.
Sampayo, M. A. (1998). Polykrikos kofoidii Chatton predation on Gymnodinium catenatum
Graham and its effects. In: B. Reguera, J. Blanco, M. L. Fernandez & T. Wyatt T (Eds). Harmfull
algae. (pp 182-183). Santiago de Compostella: Xunta de Galicia and Intergovernmental
Oceanographic Commision of UNESCO.
Sherr, E. B., & Sherr, B. F., 2007. Heterotrophic dinoflagellates: a significant component of
microzooplankton biomass and major grazers of diatoms in the sea. Marine Ecology Progress
Series, 352, 187–197.
Shimizu Y. (1978). Dinoflagellate toxins. In: P.J. Scheuer, (Ed). Marine Natural Products, Chemical
and Biological Perspectives. (pp. 1–42). New York: Academic Press.
Sobol’, I. M. (1990). On sensitivity estimation for nonlinear mathematical models.
Matematicheskoe Modelirovanie, 112-118.
Spyrakos, E., González Vilas, L., Torres Palenzuela, J., & Barton E., D. (2011). Remote sensing
chlorophyll a of optically waters (rías Baixas, NW Spain): Application of a regionally specific
chlorophyll a algorithm for MERIS full resolution data during an upwelling cycle. Remote Sensing
of Environment 115(10), 2471-2485.
Strom, S. L., Morello T. A. (1998). Comparative growth rates and yields of ciliates and
heterotrophic dinoflagellates. Journal of Plankton Research, 20(3), 571-584.
Sykes, P. F., & Huntley, M. E. (1987). Acute physiological reactions of Calanus pacificus to
selected dinoflagellates: direct observations. Marine Biology, 94, 19-24.
Teegarden, G. J., & Cembella, A. (1996). Grazing of toxic dinoflagellates, Alexandrium spp., by
adult copepods of coastal Maine: implications for the fate of paralytic shellfish toxins in marine
food webs. Journal of Experimental Marine Biology and Ecology, 196, 145–176.
178
Chapter VI. PST transfer and accumulation in two planktonic grazers
Teegarden, G. J., Cembella, A. D., Capuano, C. L., Barron, S. H., Durbin, E. G. (2003). Phycotoxin
accumulation in zooplankton feeding on Alexandrium fundyense–vector or sink? Journal of
Plankton Research, 25, 429-443.
Tillmann, U. & John, U. (2002). Toxic effects of Alexandrium spp. on heterotrophic
dinoflagellates: an allelochemical defence mechanism independent of PSP toxins, Marine
Ecology Progress Series, 230, 47–58.
Turner, J. T. (2006). Harmful algae interactions with marine planktonic grazers. In: E. Granéli & J.
T. Turner (Eds.), Ecology of harmful algae. (pp. 259-270). Berlin: Springer-Verlag.
Turner, J. (2010). Zooplankton community grazing impact on a bloom of Alexandrium fundyense
in the Gulf of Maine. Harmful Algae, 9(6), 578-589.
Turner, J. T., Doucette, G. J., Keafer, B. A., & Anderson, D. M. (2005). ECOHAB–Gulf of Maine.
Trophic accumulation of PSP toxins in zooplankton during Alexandrium blooms in Casco Bay,
Gulf of Maine, April–June 1998. II. Zooplankton abundance and size-fractionated community
composition. Deep-Sea Research II, 52 (19-21), 2784-2800.
Turner, J. T., Doucette G. T., Powell C. L., Kulis D. M., Keafer, B. A., & Anderson, D. M. (2000).
Accumulation of red tide toxins in larger size fractions of zooplankton assemblages from
Massachusetts Bay, USA. Marine Ecology Progress Series, 203, 95–107
Turner, J. T., Powell, C. L., Kulis, D. M., Keafer, B. A., Anderson, D. M., & Doucette, G. J. (2000)
Accumulation of PSP toxins in zooplankton assemblages in the Gulf of Maine. In: D. Anderson
(Ed.), Symposium on Harmful Marine Algae in the US. Marine Biological Laboratory, Woods Hole
MA.
Turner, J. T., & Tester, P. A. (1997). Toxic marine phytoplankton, zooplankton grazers, and
pelagic food webs, Limnology and Oceanography, 42, 1203–1214.
Turriff, N., Runge, J. A., & Cembella, A.D. (1995) Toxin accumulation and feeding behaviour of
the planktonic copepod Calanus finmarchicus exposed to the red-tide dinoflagellate Alexandrium
excavatum. Marine Biology, 123, 55–64.
Uhling, G., & Sahling, G. (1990). Long-term studies on Noctiluca scintillans in the German Bight
population dynamics and red tide phenomena 1968–1988. Netherlands Journal of Sea
Research, 25(1/2), 101-112.
Valdés, L., Roman, M. R., Alvarez-Ossorio, M. T., Gauzens, A. L., & Miranda, A. (1990).
Zooplankton composition and distribution off the coast of Galicia, Spain. Journal of Plankton
Research, 12, 629-643.
Watras, C. J., Carcon, V. C., Olson. R. J., Chisholm, S. W, & Anderson, D. M. (1985). The effect of
zooplankton grazing on estuarine blooms of the toxic dinoflagellate Gonyaulax tamarensis.
Journal of Plankton Research, 7, 891–908.

179
Chapter VI. PST transfer and accumulation in two planktonic grazers
White, A.W. (1981). Marine zooplankton can accumulate and retain dinoflagellate toxins and
cause fish kills, Limnology and Oceanography, 26, 103–109.

180

Chapter VII. General discussion & further considerations
181
General discussion & further considerations
7.1 Development of regional specific chla algorithms from MERIS FR data for optically
complex waters
7.2 Remote sensing chla mapping during an upwelling cycle
7.3Harmful Pseudo-nitzschia spp. events in the surface waters of two Galician rias
7.4 Planktonic grazing on a PST-producer dinoflagellate
7.5 General discussion to all chapters
7.6 References
CHAPTER VII

182
183
Chapter VII. General discussion & further considerations
7.1 Development of regional specific chlorophyll a algorithms from MERIS
full-resolution data for optically complex waters
The results of this study show the capability of neural network models to predict
chlorophyll a (chla) concentrations on the Galician coast from MERIS (Medium Resolution
Imaging Spectrometer) images following the widespread understanding of the need for
regionally specific models. According to the recorded in situ data, our model is an
improvement on other previously used techniques, and made it possible to obtain reliable
chlorophyll maps using almost every image. These maps can be used to study the evolution
of local oceanographic processes, which in turn could be related to the development of
algal blooms in the area. The direct relationship between these blooms and chlorophyll
concentration can also be analysed. In the 150 match-up points obtained over 6 years, we
hope that we have been able to incorporate a sufficiently wide range of the other factors
responsible for the variation in the MERIS reflectance spectra in the area. The NNRB#3
developed in this study covers the range of the temporal variations of chla concentration
that have been recorded in the Rias Baixas. Nogueira et al. (1997) suggested a temporal
pattern of chla for the Rias Baixas. According to this pattern, chla concentration is lower
than 1 mg m− 3 during the winter months and rises (up to 8 mg m− 3) during the spring and
autumn maxima. Although higher concentrations have been recorded during algal blooms,
in general, chla concentration is close to 5 mg m− 3 during the summer. As an analytical tool,
the main limitations of NNRB#3 are that it requires good MERIS images (free of cloud and
without sun glint) and, also, the masking of Clusters#2 and #3. In addition, total suspended
material (TSM) and coloured dissolved organic matter (CDOM) data would certainly
improve the neural networks (NNs). Further research should include a more thorough
analysis of the water types in the area, including CDOM and TSM data, to provide better
discrimination. Despite these potential problems, NNRB#3 was able to successfully identify
a significant relationship between reflectances and chla in the Galician rias. All NN-based
algorithms for the retrieval of water constituents have an operational range defined by the
optical characteristics of the waters for which they are trained. In our study, the scope of
NNRB#3 (the algorithm proposed here as adequate for chla mapping) is defined by the
fuzzy c-mean (FCM) results and the chla concentrations (0.03–7.94 mg m− 3). Moreover, if
sufficient points were available, it may be possible to develop a neural model for Clusters#2
and #3, or to improve the Cluster#1 model by adding new data. Chlorophyll maps would,
thereby, become more complete by blending different algorithms for different water types.
184
Chapter VII. General discussion & further considerations
7.2 Remote sensing chlorophyll a mapping during an upwelling cycle
Three different states of meteorological and oceanographic periods were identified
in the area during July 2008. Surface currents and winds off the rias Baixas affected the
distribution of chla in the rias Baixas. At the beginning of July (State 1) the variable and
weak wind together with the resulting northward surface currents limited the high chla
concentrations to the rias so that only low chla values were found in the offshore area.
Differences in the topography of the rias, effects of local winds and transport by currents
between the rias seem to be the main factors for the observed differences in the gradients
of chla along the rias between ria de Arousa and the two southern rias (Vigo and
Pontevedra). MERIS images obtained during State 2 showed the first response of chla
distribution due to the strong favourable winds that were blowing in the area. With the
development of strong upwelling, the circulation in the rias is reinforced in the estuarine
sense so that chla increases rapidly there. After a period of six days of continued upwelling,
chla concentrations higher than 1 mg m-3 were observed in all the area mapped according to
MERIS data. State 3 commences with the appearance of a high biomass algal event
coincident with the area of low SST (Sea Surface Temperature) as the culmination of the
preceding, extended upwelling. The weak northward winds that characterized this state
permitted downwelling that transferred chla rich water toward the rias. The upwelled
water was recorded in the chla profiles below the surface in the ria de Vigo but was missed
by the MERIS. The continuing downwelling circulation resulted in a decay of the bloom and
a subduction of surface waters in the rias compatible with the decrease of chla observed in
the last MERIS image. Although MERIS has a repeated interval of 3 days, cloud cover
prevented acquisition of all possible images. Nevertheless, the 6 images obtained in July
2008 captured the main changes in chla concentration and distribution during the three
periods of different meteorological and oceanographic states.
The application of FCM revealed the areas where the NNRB for chla retrieval can be
best applied to obtain the most reliable results. Even if NNRB#1 and #2 did not give reliable
results, NNRB#3 showed good performance indices and seems suitable for chla
determination in the area. The chla concentrations observed in this study fall into the scope
of the NNRB algorithms proposed in Chapter 2. According to the data recorded in situ, our
models perform better than the C2R (Case-2 Regional) algorithm proving the necessity for
regionally specific models.
185
Chapter VII. General discussion & further considerations
The present study allows more detailed examination of the chla distribution and
detection of high biomass “patches” in the Galician rias and the adjacent area during a
summer upwelling cycle due to the finer spatial resolution and precise atmospheric
correction offered by MERIS. The application of an algorithm specially developed for the
study area provides more accurate mapping of chla, which has resulted, for the first time to
our knowledge, surface chla mapping of the interior of the rias Baixas.
There was a significant variation in the timing and the extent of the chla peak areas.
The maps confirmed that the complex spatial structure of the phytoplankton distribution in
the rias Baixas is affected by the surface currents and winds on the adjacent continental
shelf. Field studies have limited spatial coverage and temporal frequency. Some of these
areas of high chla levels and the dynamic changes in chla distribution that are apparent in
satellite images can be missed by in situ monitoring. High chla levels in the rias due to the
increase in the concentration of harmful phytoplankton species have been recorded in the
past especially in summer (GEOHAB, 2005). Moreover, some potentially toxic species such
as Pseudo-nitzschia spp., which form blooms in the study area and in other upwelling
systems, can be found in high concentrations within these high biomass phytoplankton
“patches”.
The approach followed in this study can be particularly useful in the case of blooms
of Gymnodynium catenatum. The progression of G. catenatum blooms from the Portuguese
coast to the Galician rias can be tracked by MERIS and current data, providing useful
advanced information, of importance to the local mussel industry. It is worth mentioning
that a harmful algal event due to G. catenatum caused the closure of the shellfishery in the
Galician rias from October 2005 till February 2006 (Caballero Miguez et al., 2009).
An example of a localized feature is that constantly high surface chla was observed
in the Bay of Baiona, located in the southern mouth of ria de Vigo. This bay is characterized
as a zone where harmful algal events due to species like Alexandrium minutum are a
frequent and recurrent phenomenon (Bravo et al., 2010). It is worth noting that for the area
seaward of the rias all the algorithms used in this study came up with very similar values and
patterns for chla. Overall, this study showed that the synergy of two space borne sensors
(MERIS, MODIS) in combination with in situ data can be of great help in the monitoring,
detection and study of high biomass algal events in an coastal upwelling areas.
186
Chapter VII. General discussion & further considerations
7.3 Harmful Pseudo-nitzshia events in the surface waters of two Galician rias
Domoic acid (DA) was measured for the first time in seawater samples from the
Galician rias and revealed the presence of high levels in several cases. P. australis seems to
be the main source of DA in the area which agrees with previous findings (Miguez et al.,
1996; Fraga et al., 1998). The actual method for public health protection from DA
intoxication involves the monitoring of molluscs from the rias using mouse bioassay. The
European Union´s official limit for DA is 20 mg/kg of edible part of the shellfish, while
European Food Safety authority (EFSA) has recently proposed the value 4.5 as regulatory
limit (EFSA 2009:1181). On the other hand there are no official limits, at the time of writing
this thesis, for DA concentration in the seawater and calculation or even estimation of DA
concentration in the seawater from shellfish tissue data is extremely difficult mainly due to
different depuration times. Pseudo-nitzschia spp. blooms have recurrently appeared in the
study area and as this study shows even in moderate abundances it can be accompanied by
high pDA concentrations. Despite the fact that no serious illnesses caused by ASP (Amnesic
Shellfish Poisoning) have been reported in the area, DA levels such as the ones detected
here could have the potential for significant impacts on the ecosystem and human health
(e.g by chronic explosure to moderate toxin levels as it is mentioned by Thessen & Stoecker
in 2008) and therefore should be regularly monitored. Furthermore, the DA content in
some potential vectors that can be consumed by humans and in other marine animals, has
not been studied in the Galician rias.
Ocean colour techniques can be helpful in tracking potentially harmful events due
to this diatom species and guide monitoring programs. Satellite data can be even more
useful following the approach of this PhD study with near real-time fine resolution imagery
and regionally/cluster-specific algorithms for the retrieval of chla and in-situ data.
The optimal models for the Pseudo-nitzschia spp. abundance and DA concentration
suggested the significant effect of some macronutrients as well as other abiotic and biotic
parameters, approximating in that way the potential environmental causes and effects of
the harmful Pseudo-nitzschia spp. blooms in the area. However, these models might be
improved with the addition of some parameters previously identified in other studies as
important (urea: Kudela et al. 2008; iron and copper: Rue & Bruland 2001, Wells et al. 2005).
The preliminary results (Torres et al., 2010) of models developed framework of this project
(but not presented here) applying mixed modelling and neural networks in time-series of
187
Chapter VII. General discussion & further considerations
Pseudo-nitzschia abundance have shown a great potential for an operational forecast of this
diatom blooms in the area but still need some improvement.
7.4 Planktonic grazing on a PST-producer dinoflagellate
First of all, this study showed that the red form of the heterotrophic dinoflagellate
Noctiluca scintillans can actively ingest toxic Alexandrium minutum in laboratory conditions.
These two species can co-occur in the Galician rias as well as in other coastal areas around
the world. N. scintillans fed on A. minutum with no obvious toxic effects and with noticeably
lower ingestion rates than those observed in some copepods. However, this omnivorous
planktonic organinism can be found in very high abundances in coastal waters and seems
that it may have a significant grazing impact on prey population and could contribute to the
cessation of toxic blooms due to Alexandrium. The results of the first experiment were not
conclusively about the toxin accumulated in Noctiluca, probably because of the low toxin
content of Alexandrium cells. In a second experiment using this time a more toxic strain of
Alexandrium, Noctiluca revealed relatively high removal rates. This study examined the
dynamics of the toxin accumulated in two different planktonic organisms: N. scintillans and
the copepod Acartia. We found that both copepod and heterotrophic dinoflagellate seem
to be inefficient but not ineffective vectors of PSP (Paralytic Shellfish Poisoning). These
planktonic organisms show fast detoxification rates but relatively high amounts of
accumulated toxin and thus can be hardly characterised as PSP vectors. These results are
quite different from those published for bivalve shellfish (e.g. Brikelj et al., 1991). Mussels,
clams and scallops have shown high efficiency in PSP toxins accumulation while the
decontamination process can take several weeks.
An important feature of the model is that the range of the initial concentrations of
the key parameters responds to values found in the Galician rias. In this area Noctiluca has
been found in very high abundances during the end of the summer, while A. clausi is the
dominant mesozooplankton organism throuout the year. A. minutum is also present in
moderate abundances. Thus, these results could be important for the study of toxin
dynamics in this coastal system. In a next step we will consider the joined influence of the
two planktonic organisms in the toxin dynamics.
188
Chapter VII. General discussion & further considerations
7.5 General discussion to all chapters
Galician coast, one of the most intensive areas of mussel production in the world,
suffers from a frequent occurrence of a variety of harmful algal events. Coastal
embayments like rias are physically complex systems and pose a challenge for the
detection, monitoring and forecast of harmful algal events. The high temporal and spatial
variability in biogeochemical processes that characterises these systems leads often to
patchy distribution of harmful algal events in terms of time and space.
MERIS FR data are an impotant source of synoptic observations which are focused
among other to the study of harmful algal blooms in coastal areas since it offers the
necessary spatial resolution and sensor sensibility. For remote sensing applications of
harmful algal events studies the accurate estimation of the concentration of chla is
essential. Here a new algorithm concept that makes use of neural network tehnology and
takes account different spectral properties to derive chla concentrations is presented.
Given specific assumptions this study made successfull the use of ocean colour imagery for
the estimation of a key property of harmful algal blooms such as chla in this optically
complex and dynamic system.
Moreover, management of the ecosystem requires a rapid and sensible way for
toxin detection and a greater understanding of the planktonic grazers’ role as regulators of
toxic species and their importance as vectors in the marine food-web. Our results were the
first reports, as far as we know, of DA concentrations in natural Pseudo-nitzschia spp.
populations in the study area and of accumulation of PST in the dinoflagellate red N.
scintillans. Given the fast reduction of accumulated toxin, it seems that N. scintillans and the
copepod Acartia are not an important link in the transfer of PST in the Galician rias.
Conclusively, this PhD thesis shows the benefits of an integrated use of in-situ data,
satellite data and models in the monitoring, detection, prediction and management of
harmful algal events in the Galician rias. The next step will integrate in-situ data, satellite
products and model results into really operational, user-relevant information on harmful
algal events in the area.
189
Chapter VII. General discussion & further considerations
7.6 References
Bravo, I., Fraga S., Figueroa R. I., Pazos Y., Massanet A., & Ramilo I. (2010b). Bloom dynamics and
life cycle strategies of two toxic dinoflagellates in a coastal upwelling system (NW Iberian
Peninsula). Deep-Sea Research Part II: Topical Studies in Oceanography, 57, 222–234.
Bricelj, V. M., Lee, J. H. and Cembella, A. D. (1991) Influence of dinoflagellate cell toxicity on uptake
and loss of paralytic shellfish toxins in the northern quahog Mercenaria mercenaria. Marine Ecology
Progress Series, 74, 33–46.
Caballero Miguez, G., Garza Gil, M. D., & Varela Lafuente, M. M. (2009). The institutional
foundations of economic performance of mussel production: the Spanish case of the Galician
floating raft culture. Marine Policy, 33, 288–296.
Fraga, S., Alvarez, M. J., Miguez, A., Fernandez, M. L., Costas, E., & Lopez-Rodas, V. (1998).
Pseudonitzschia species isolated from Galician waters: toxicity, DNA content and lectin binding
assay. In B. Reguera, J. Blanco, M. L. Fernadez & T. Wyatt (Eds.). Harmful algae. Xunta de Galicia
and IOC of UNESCO.
GEOHAB (2005). Global Ecology and Oceanography of Harmful Algal Blooms. In G. Pitcher, T.
Moita, V. Trainer, R. Kudela, F. G. Figueiras & T. Probyn (Eds.), GEOHAB Core Research Project:
HABs in Upwelling Systems (p. 82). Paris and Baltimore: IOC and SCOR.
Kudela, R., Banas, N., Barth, J., Frame, E., Jay, D., Largier, J., Lessard, E., Peterson, T., & Van der
Woude, A. (2008). New insights into the controls and mechanisms of plankton productivity in
coastal upwelling waters of the northern California Current System. Oceanography, 21, 40–54.
Miguez Á., L., F. M., & S., F. (1996). First detection of domoic acid in Galicia (NW Spain). In T.
Yasumoto, Y. Oshima & Y. Fukuyo (Eds.), Harmful and Toxic Algal Blooms (pp. 143-145). Paris,
France: IOC of UNESCO.
Nogueira, E., Perez, F. F., & Ríos, A. F. (1997). Seasonal patterns and long-term trends in an
estuarine upwelling ecosystem (Ria de Vigo, NW Spain). Estuarine Coastal and Shelf Science, 44,
185-300.
Rue, E., & Bruland. (2001).Domoic acid binds iron and copper: A possible role for the toxin
produced by the marine diatom Pseudonitzschia. Marine Chemistry, 76, 127–134.
Thessen, A. E., & Stoecker D. K. (2008). D istribution, abundance and domoic acid analysis of the
toxic diatom genus Pseudo-nitzschia from the Chesapeake Bay. Estuaries and Coasts, 31, 664-672.
Wells, M. L., Trick, C. G., Cochlan, W. P., Hughes M. P., & Trainer, V. L. (2005). Domoic acid: The
synergy of iron, copper, and the toxicity of diatoms. Limnology and Oceanography, 50,1908-1917.
Torres Palenzuela, J., González Vilas, L., & Spyrakos, E. (2010). Artificial Neural Network model
for predicting Pseudo-nitzschia spp. abundance in the Galician Rias (NW Spain). In proceeding of
14th International Conference on Harmful Algae, May 2010, Creta, Greece.

190
Conclusions
191
Conclusions

192
193
Conclusions
Conclusions
The main results of this thesis can be summarised as follow:
1. A set of chla algorithms was developed from MERIS FR data specifically for the
optically complex waters of the Galician rias and the adjacent area. These
algorithms performed better than C2R, which is routinely used for MERIS images in
Case 2 waters. The algorithm proposed here as adequate for chla mapping is the
NNRB#3. Its scope is defined by the FCM results and the chla concentrations (0.03–
7.94 mg m−3). The application of FCM reveals the areas where the NNRB for chla
retrieval can be best applied to obtain the most reliable results.
2. The application of an algorithm specially developed for the study area provided for
the first time, to our knowledge, surface chla mapping of the rias Baixas. As an
analytical tool, the main limitations of this approach are that it requires good MERIS
images (free of cloud and without sun glint) and, also, the masking of Clusters#2
and #3.
3. Three different states of meteorological and oceanographic periods were identified
in the area during the July of 2008. There was a significant variation in the timing
and the extent of the chla peak areas. The maps confirmed that the complex spatial
structure of the phytoplankton distribution in the rias Baixas is affected by the
surface currents and winds on the adjacent continental shelf.
4. The present study allows more detailed examination of the chla distribution and
detection of high biomass “patches” in the area during a summer upwelling cycle
due to the finer spatial resolution and precise atmospheric correction offered by
MERIS and the application of the local specific algorithms. This can be of great help
in the chla monitoring in any coastal upwelling area providing high-quality near real-
time cha maps and showing possible and actual harmful algal events.
5. pDA was measured for the first time, as far as we know, in seawater samples in the
Galician rias and revealed the presence of high levels in several cases. P. australis
seems to be the main source of DA.
6. The results of this study deduce that toxic events due to DA should be an important
concern and therefore DA in the seawater should be measured routinely in order to
assess the potential of a DA outbreak. Moreover, MERIS FR data and regionally
specific algorithms showed that they can provide valuable information about these
blooms and should be an integral part of the monitoring programs.
194
Conclusions
7. The optimal model for the Pseudo-nitzschia spp. abundance and DA concentration
suggested the significant effect of some macronutrients as well as other abiotic and
biotic parameters, approximating in that way the potential environmental causes
and effects of the harmful Pseudo-nitzschia spp. blooms in the area.
8. This is the first study providing evidence for ingestion of the PST microalgae
Alexandrium by the red form of the heterotrophic dinoflagellate Noctiluca
scintillans. Differences in light/dark conditions revealed different responses in food
consumption. These findings support the assumption that the red Noctiluca is
capable of limiting the growth of PST species in the field, and may play an important
role as a regulator against PST-producing phytoplankton.
9. The dynamic model predicts very fast detoxification and relatively high toxin
accumulation in both Noctiluca and Acartia suggesting that these planktonic
organisms are inefficient but perhaps not ineffective PST vectors.
10. The present PhD improves our understanding of harmful algal events in the study
area, moves forward remote sensing techniques for their detection and contributes
to the limited knowledge on aspects of toxin pathways in the food web. The
principal results of this multidisciplinary approach can be used to aid and improve
the effectiveness of monitoring and management programs.

ANNEX I
195
ANNEX I

196
197
ANNEX I
Resumen del Capítulo II
Desarrollo de algoritmos de índice de clorofila específicos para aguas de Caso 2 en
la costa gallega a partir de datos de MERIS FR
Las técnicas de teledetección permiten estimar la productividad del océano
mediante la obtención de la concentración de clorofila, la cual a su vez está asociada con la
abundancia de fitoplancton. Con este objetivo se utilizan sensores de color que operan en
el rango visible del espectro, consiguiéndose muy buenos resultados a escala global y en
océano abierto. Sin embargo, la exactitud es menor en áreas costeras con aguas de caso 2
más complejas en su composición y afectadas por fenómenos locales. Hay un interés
considerable en la estimación precisa de la clorofila a de las Rías Gallegas, debido a la
importancia económica y social del cultivo extensivo de mejillón, y la alta frecuencia de
eventos de algas nocivas. En este trabajo se han desarrollado algoritmos para la obtención
de mapas de clorofila para el área costera de Galicia a partir de imágenes del sensor
ENVISAT MERIS (Medium Resolution Imaging Spectrometer) de alta resolución (FR). Los
algoritmos se basan en la utilización de redes neuronales (RN) del tipo perceptrón
multicapa (MLP) que han sido entrenadas y validadas utilizando medidas de campo
obtenidas entre los años 2002 y 2008. Estos modelos se aplican a un conjunto de datos
(Clusters) definidos mediante técnicas de agrupamiento (FCM) aplicadas anteriormente a
los datos obtenidos por satélite. Se desarrollaron tres diferentes RN: una que incluye el
conjunto de datos, y otras dos con sólo los puntos que pertenecen a una de las categorías
(Clusters). Los buenos resultados obtenidos demuestran el gran potencial del sensor MERIS
para obtener mapas de clorofila en el interior de las Rías Gallegas. La mejor predicción fue
dada por la RN entrenada con datos de alta calidad mediante el conjunto de datos de la
categoría (Cluster) más abundante. Los parámetros estadísticos en el conjunto de
validación de esta RN fueron R2 = 0,86, MPE= − 0.14, RMSE= 0,75 mg m−3 y RMSE relativa =
66%. La RN desarrollada en este estudio detecta con precisión los altos valores de clorofila,
en los conjuntos de entrenamiento y validación. Los resultados mostraron que este
algoritmo superó el C2R (Case-2 Regional Processor), dando mayor valor de R2 y valores
RMSE inferiores. Este estudio demostró que la combinación de datos in situ y tecnología de
RN permite obtener mapas de clorofila más precisos. Un algoritmo de índice de clorofila
específico para la zona, obtenido a partir de los datos de un sensor de color del océano con
las características de MERIS, sería un gran apoyo en el seguimiento y estudio de eventos de

198
ANNEX I
algas nocivas. También se describen las limitaciones y posibles mejoras de los algoritmos
desarrollados.
199
ANNEX I
Resumen del Capítulo III
Aplicación de algoritmos, a partir de imágenes MERIS FR, de índice de clorofila
específicos para la costa gallega durante un ciclo de afloramiento
Este estudio utiliza algoritmos regionalmente específicos y las características de
Medium Resolution Imaging Spectrometer (MERIS) para obtener mapas de clorofila en el
área costera de Galicia (aguas caso 2), con una precisión mayor que la obtenida por otros
algoritmos ya existentes. Los algoritmos empleados se basan en la utilización de redes
neuronales y técnicas de “fuzzy clustering” utilizando datos in-situ. El algoritmo que mostró
la mejor eficacia fue aplicado en una serie de seis imágenes MERIS (FR) durante un ciclo de
afloramiento que se observó en el área en Julio de 2008. Los cambios principales en la
concentración y distribución de clorofila a fueron captados claramente en las imágenes. Los
mapas confirmaron que la estructura espacial de la distribución de fitoplancton en el área
de estudio puede ser compleja. Las corrientes oceánicas y los vientos de superficie
afectaron a la distribución de clorofila en las Rias Baixas. Este estudio mostró que un
algoritmo regionalmente específico para un sensor de color de océano con las
características de MERIS, en combinación con datos in situ, puede ser de gran ayuda en la
comprensión de la dinámica marina en el interior de las Rías y en concreto en la distribución
de biomasa algal durante un ciclo de afloramiento.
Introducción
Entre los productos derivados de los sensores del color del océano, la
concentración de clorofila a es el más utilizado ya que permite estimar de forma precisa la
biomasa de fitoplancton, ya que este pigmento es común a casi todos los grupos
taxonómicos. Además, las poblaciones de fitoplancton responden rápidamente a los
cambios ambientales provocando variaciones en su concentración.
Se han desarrollado varios algoritmos empíricos, como el tradicional cociente entre
las bandas azul y verde, así como diferentes modelos semi-analíticos para la estimación de
la clorofila a partir de sensores de color. Sin embargo, con este tipo de modelos o
algoritmos no se obtiene una estimación precisa para aguas costeras de Caso 2, con altas
concentraciones de otros componentes como detritus o sustancias amarillas, los cuales
absorben la radiación en la banda azul.
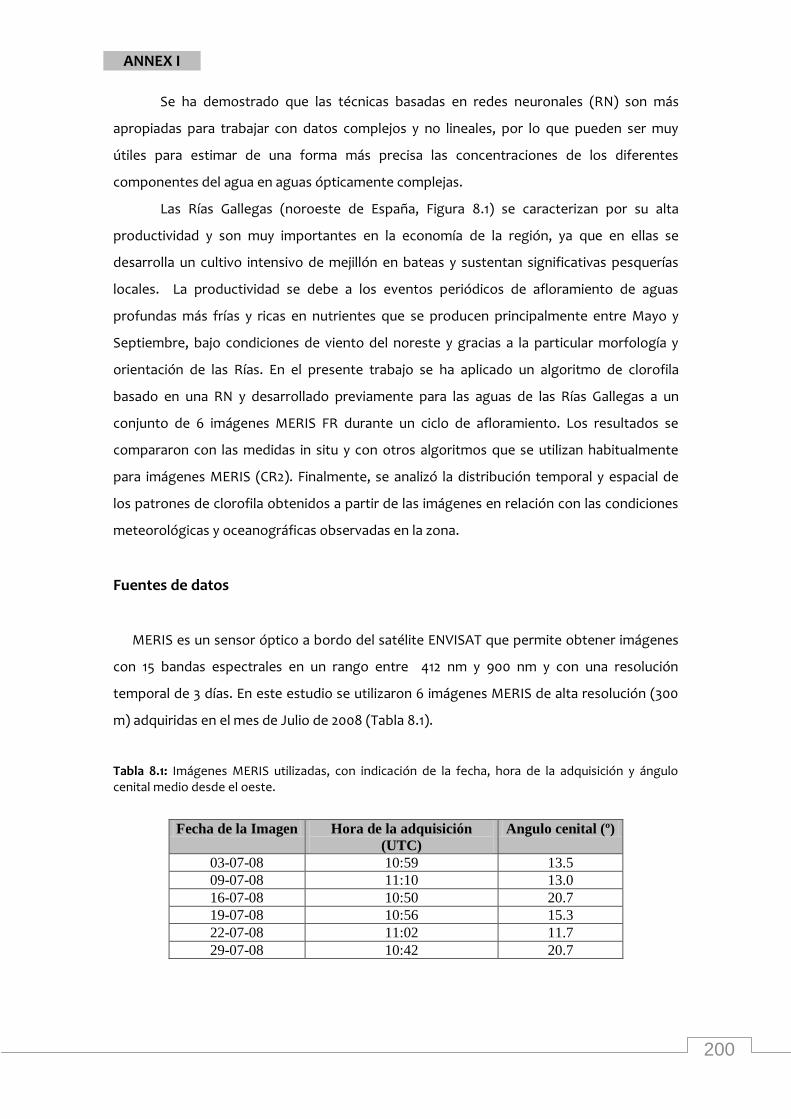
200
ANNEX I
Se ha demostrado que las técnicas basadas en redes neuronales (RN) son más
apropiadas para trabajar con datos complejos y no lineales, por lo que pueden ser muy
útiles para estimar de una forma más precisa las concentraciones de los diferentes
componentes del agua en aguas ópticamente complejas.
Las Rías Gallegas (noroeste de España, Figura 8.1) se caracterizan por su alta
productividad y son muy importantes en la economía de la región, ya que en ellas se
desarrolla un cultivo intensivo de mejillón en bateas y sustentan significativas pesquerías
locales. La productividad se debe a los eventos periódicos de afloramiento de aguas
profundas más frías y ricas en nutrientes que se producen principalmente entre Mayo y
Septiembre, bajo condiciones de viento del noreste y gracias a la particular morfología y
orientación de las Rías. En el presente trabajo se ha aplicado un algoritmo de clorofila
basado en una RN y desarrollado previamente para las aguas de las Rías Gallegas a un
conjunto de 6 imágenes MERIS FR durante un ciclo de afloramiento. Los resultados se
compararon con las medidas in situ y con otros algoritmos que se utilizan habitualmente
para imágenes MERIS (CR2). Finalmente, se analizó la distribución temporal y espacial de
los patrones de clorofila obtenidos a partir de las imágenes en relación con las condiciones
meteorológicas y oceanográficas observadas en la zona.
Fuentes de datos
MERIS es un sensor óptico a bordo del satélite ENVISAT que permite obtener imágenes
con 15 bandas espectrales en un rango entre 412 nm y 900 nm y con una resolución
temporal de 3 días. En este estudio se utilizaron 6 imágenes MERIS de alta resolución (300
m) adquiridas en el mes de Julio de 2008 (Tabla 8.1).
Tabla 8.1: Imágenes MERIS utilizadas, con indicación de la fecha, hora de la adquisición y ángulo cenital medio desde el oeste.
Fecha de la Imagen Hora de la adquisición
(UTC)
Angulo cenital (º)
03-07-08 10:59 13.5
09-07-08 11:10 13.0
16-07-08 10:50 20.7
19-07-08 10:56 15.3
22-07-08 11:02 11.7
29-07-08 10:42 20.7
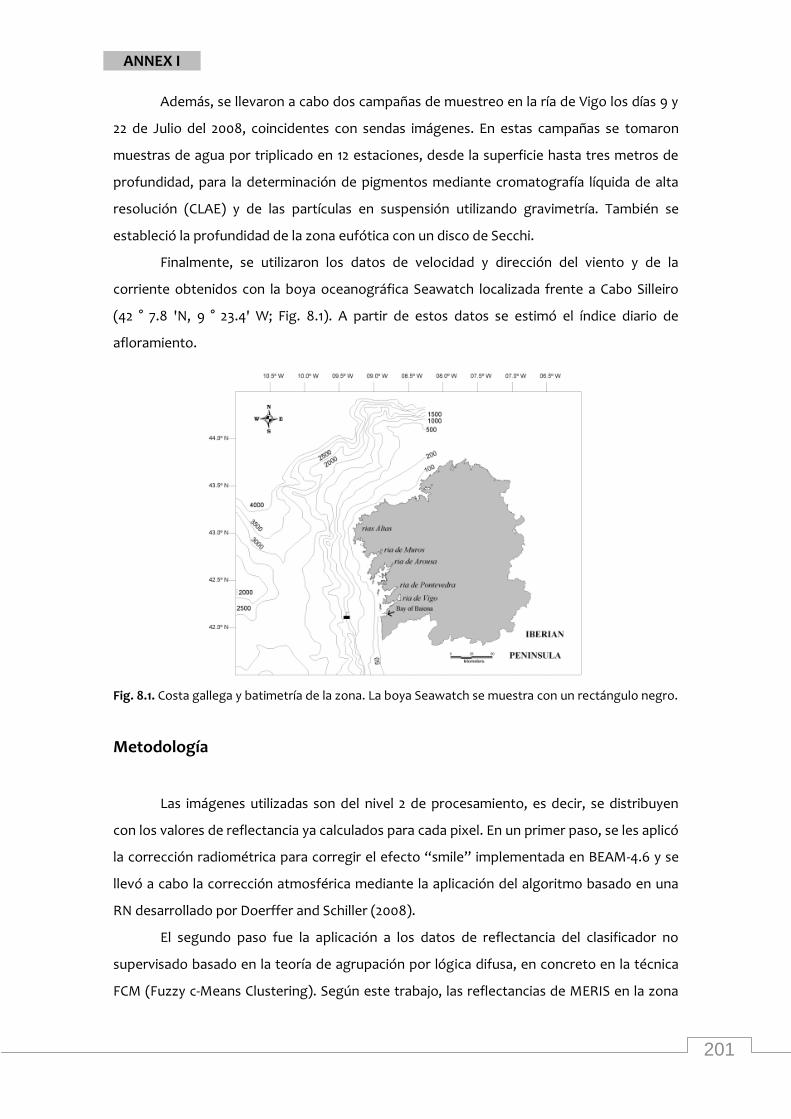
201
ANNEX I
Además, se llevaron a cabo dos campañas de muestreo en la ría de Vigo los días 9 y
22 de Julio del 2008, coincidentes con sendas imágenes. En estas campañas se tomaron
muestras de agua por triplicado en 12 estaciones, desde la superficie hasta tres metros de
profundidad, para la determinación de pigmentos mediante cromatografía líquida de alta
resolución (CLAE) y de las partículas en suspensión utilizando gravimetría. También se
estableció la profundidad de la zona eufótica con un disco de Secchi.
Finalmente, se utilizaron los datos de velocidad y dirección del viento y de la
corriente obtenidos con la boya oceanográfica Seawatch localizada frente a Cabo Silleiro
(42 ° 7.8 'N, 9 ° 23.4' W; Fig. 8.1). A partir de estos datos se estimó el índice diario de
afloramiento.
Fig. 8.1. Costa gallega y batimetría de la zona. La boya Seawatch se muestra con un rectángulo negro.
Metodología
Las imágenes utilizadas son del nivel 2 de procesamiento, es decir, se distribuyen
con los valores de reflectancia ya calculados para cada pixel. En un primer paso, se les aplicó
la corrección radiométrica para corregir el efecto “smile” implementada en BEAM-4.6 y se
llevó a cabo la corrección atmosférica mediante la aplicación del algoritmo basado en una
RN desarrollado por Doerffer and Schiller (2008).
El segundo paso fue la aplicación a los datos de reflectancia del clasificador no
supervisado basado en la teoría de agrupación por lógica difusa, en concreto en la técnica
FCM (Fuzzy c-Means Clustering). Según este trabajo, las reflectancias de MERIS en la zona
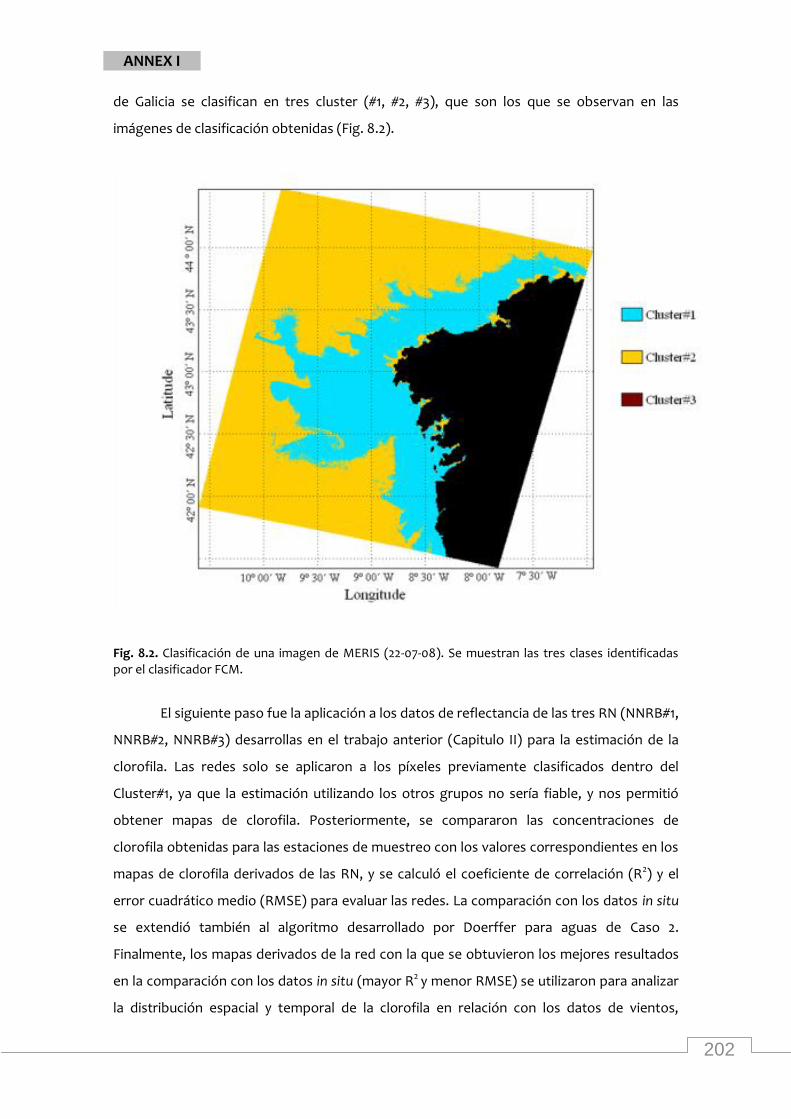
202
ANNEX I
de Galicia se clasifican en tres cluster (#1, #2, #3), que son los que se observan en las
imágenes de clasificación obtenidas (Fig. 8.2).
Fig. 8.2. Clasificación de una imagen de MERIS (22-07-08). Se muestran las tres clases identificadas por el clasificador FCM.
El siguiente paso fue la aplicación a los datos de reflectancia de las tres RN (NNRB#1,
NNRB#2, NNRB#3) desarrollas en el trabajo anterior (Capitulo II) para la estimación de la
clorofila. Las redes solo se aplicaron a los píxeles previamente clasificados dentro del
Cluster#1, ya que la estimación utilizando los otros grupos no sería fiable, y nos permitió
obtener mapas de clorofila. Posteriormente, se compararon las concentraciones de
clorofila obtenidas para las estaciones de muestreo con los valores correspondientes en los
mapas de clorofila derivados de las RN, y se calculó el coeficiente de correlación (R2) y el
error cuadrático medio (RMSE) para evaluar las redes. La comparación con los datos in situ
se extendió también al algoritmo desarrollado por Doerffer para aguas de Caso 2.
Finalmente, los mapas derivados de la red con la que se obtuvieron los mejores resultados
en la comparación con los datos in situ (mayor R2 y menor RMSE) se utilizaron para analizar
la distribución espacial y temporal de la clorofila en relación con los datos de vientos,
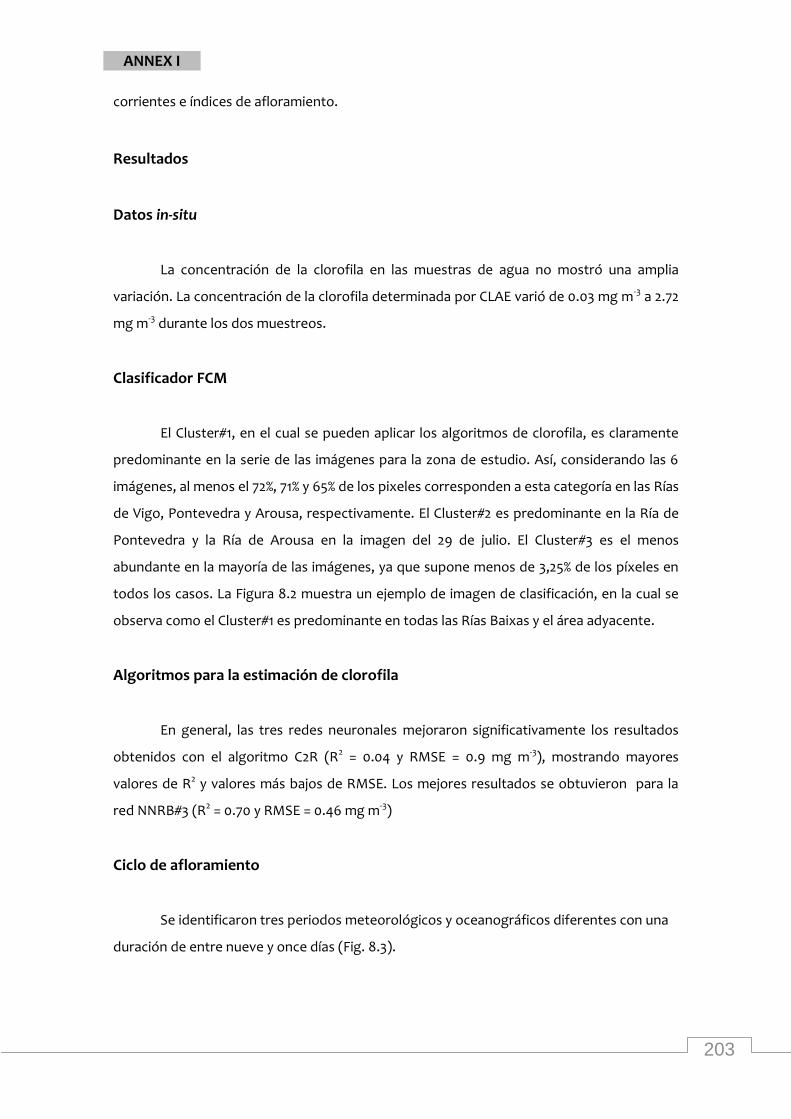
203
ANNEX I
corrientes e índices de afloramiento.
Resultados
Datos in-situ
La concentración de la clorofila en las muestras de agua no mostró una amplia
variación. La concentración de la clorofila determinada por CLAE varió de 0.03 mg m-3 a 2.72
mg m-3 durante los dos muestreos.
Clasificador FCM
El Cluster#1, en el cual se pueden aplicar los algoritmos de clorofila, es claramente
predominante en la serie de las imágenes para la zona de estudio. Así, considerando las 6
imágenes, al menos el 72%, 71% y 65% de los pixeles corresponden a esta categoría en las Rías
de Vigo, Pontevedra y Arousa, respectivamente. El Cluster#2 es predominante en la Ría de
Pontevedra y la Ría de Arousa en la imagen del 29 de julio. El Cluster#3 es el menos
abundante en la mayoría de las imágenes, ya que supone menos de 3,25% de los píxeles en
todos los casos. La Figura 8.2 muestra un ejemplo de imagen de clasificación, en la cual se
observa como el Cluster#1 es predominante en todas las Rías Baixas y el área adyacente.
Algoritmos para la estimación de clorofila
En general, las tres redes neuronales mejoraron significativamente los resultados
obtenidos con el algoritmo C2R (R2 = 0.04 y RMSE = 0.9 mg m-3), mostrando mayores
valores de R2 y valores más bajos de RMSE. Los mejores resultados se obtuvieron para la
red NNRB#3 (R2 = 0.70 y RMSE = 0.46 mg m-3)
Ciclo de afloramiento
Se identificaron tres periodos meteorológicos y oceanográficos diferentes con una
duración de entre nueve y once días (Fig. 8.3).
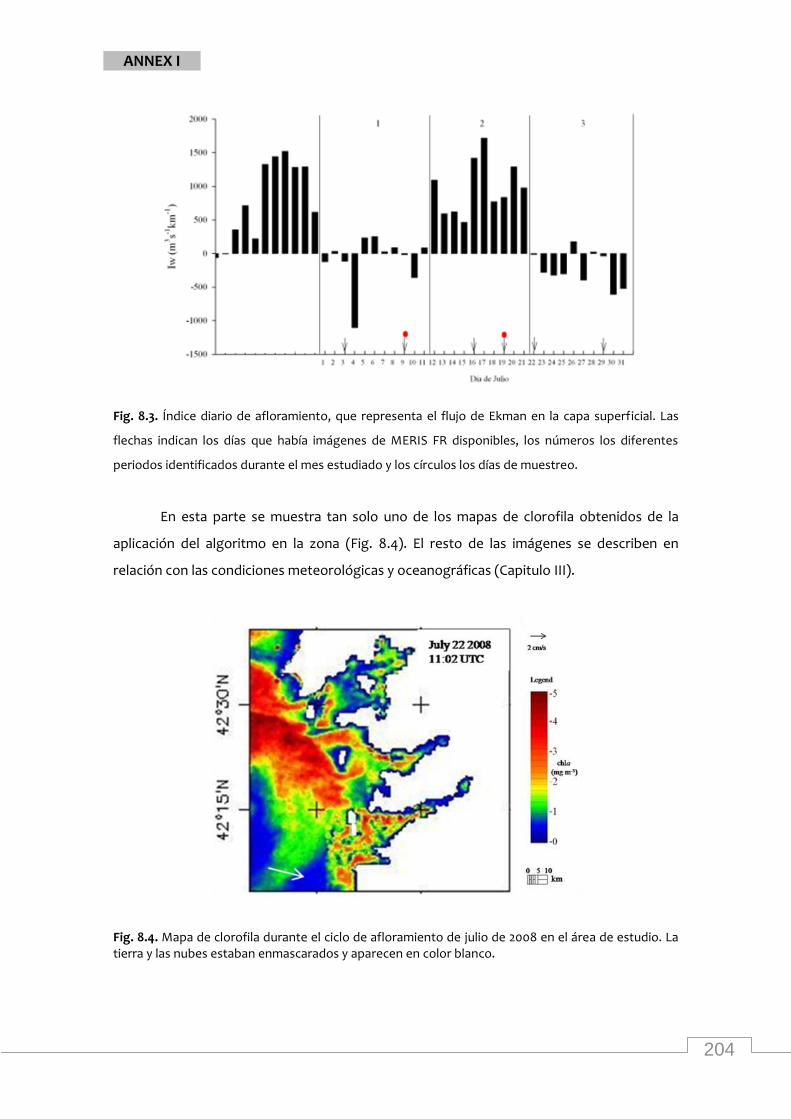
204
ANNEX I
Fig. 8.3. Índice diario de afloramiento, que representa el flujo de Ekman en la capa superficial. Las
flechas indican los días que había imágenes de MERIS FR disponibles, los números los diferentes
periodos identificados durante el mes estudiado y los círculos los días de muestreo.
En esta parte se muestra tan solo uno de los mapas de clorofila obtenidos de la
aplicación del algoritmo en la zona (Fig. 8.4). El resto de las imágenes se describen en
relación con las condiciones meteorológicas y oceanográficas (Capitulo III).
Fig. 8.4. Mapa de clorofila durante el ciclo de afloramiento de julio de 2008 en el área de estudio. La tierra y las nubes estaban enmascarados y aparecen en color blanco.
205
ANNEX I
A principios de Julio (periodo 1), los vientos y las corrientes superficiales causan una
acumulación elevada de clorofila en el interior de las Rías. Durante el segundo período, las
imágenes MERIS mostraron los primeros efectos, en la distribución de clorofila, de los
fuertes vientos favorables para el afloramiento que soplaban en la zona. Con el desarrollo
de fuertes corrientes, la clorofila aumentó rápidamente, y después de un período de seis
días de afloramiento continuo, se observaron concentraciones de clorofila superiores a 1
mg m-3 en toda el área a través de los datos de MERIS. El periodo 3 comienza con la
aparición de un evento de elevada biomasa de algas (Fig. 8.4) que coincide con el final de
un fuerte afloramiento. Los vientos del norte débiles al inicio de este período, permiten que
el agua con alta concentración de clorofila se transfiera hacia las Rías. El hundimiento
continuo que caracterizó a este período tuvo como resultado la dispersión de las altas
cantidades de clorofila y el hundimiento de las aguas superficiales en las Rías, lo cual
coincide con la disminución de la clorofila superficial observada en la última imagen de
MERIS.
Conclusiones
El presente estudio demostró que las imágenes MERIS de alta resolución son una
herramienta muy potente para el análisis detallado de la distribución de la clorofila en las
Rías de Galicia y en la plataforma adyacente durante un ciclo de afloramiento. La aplicación
de un algoritmo especialmente desarrollado para el área de estudio nos permite obtener
mapas precisos de clorofila con una resolución nunca antes lograda para esta zona. Los
mapas muestran que la estructura espacial de la distribución del fitoplancton en el área de
estudio puede ser compleja. Algunas de estas áreas de alta concentración de clorofila que
se pueden identificar en las imágenes de satélite podrían incluso no ser detectadas por los
programas de monitorización in situ.
206
ANNEX I
Resumen del Capítulo IV
Teledetección, monitoreo in situ y perspectivas ambientales de eventos tóxicos de
Pseudo-nitzschia en las aguas superficiales de dos Rías Gallegas (noroeste de
España)
En este capítulo se aborde un análisis que combina datos de imágenes de satélite,
medidas in situ de parámetros bióticos y abióticos y modelos estadísticos para estudiar las
floraciones de Pseudo-nitzschia en las aguas superficiales de dos Rías gallegas (Vigo y
Pontevedra). Este análisis incluye también la determinación de las concentraciones de ácido
domoico (AD) en las poblaciones naturales realizadas por primera vez en la zona y la
determinación de las abundancias de Pseudo-nitzschia junto con varios parámetros
ambientales durante los años 2007-2009. Un algoritmo de índice de clorofila a a partir de
datos de MERIS (Medium Resolution Imaging Spectrometer) FR fue aplicado a una serie de
imágenes. Se consideraron tres períodos relacionados con las condiciones meteorológicas
dominantes. El primer evento tóxico fue obtenido en el otoño de 2007 y se caracterizó por
moderadas abundancias de Pseudo-nitzschia spp. y concentraciones altas de AD (2,5 mg L-1).
Un segundo episodio de menor toxicidad de AD fue registrado durante el verano de 2009.
P. australis parece ser la principal fuente de AD en el área de estudio. La aplicación de un
algoritmo regional en combinación con las características de MERIS FR permitió obtener de
forma precisa concentraciones de clorofila a y detectar pequeñas areas de alta
concentración de clorofila y elevada abundancia de Pseudo-nitzschia spp. Los modelos
óptimos de efecto mixto (GAMM) para las abundancias de Pseudo-nitzschia y de GLMM para
la concentración de AD incluyen el efecto significativo de algunos macronutrientes, así
como otros parámetros abióticos y bióticos. El uso de estos modelos podrían ayudar a
conocer las causas medioambientales y los efectos perjudiciales en el desarrollo de las
floraciones nocivas de Pseudo-nitzschia spp. en la zona.
207
ANNEX I
Resumen del Capítulo V
Tasas de ingestión del dinoflagelado heterótrofo Noctiluca scintillans sobre la
microalga tóxica Alexandrium minutum
Se evaluaron las tasas de ingestión del dinoflagelado heterótrofo Noctiluca scintillans
(McCartney) sobre la microalga tóxica Alexandrium minutum Halim en cultivos de
laboratorio. Ejemplares de N. scintillans fueron recolectados en la Ría de Vigo y
posteriormente mantenidos en cultivo. Se prepararon 4 concentraciones experimentales de
A. minutum (entre 50 y 400 células ml-1) y se seleccionaron 360 individuos de N. scintillans
que fueron transferidos a botes de 40 ml que contenían alimento. Las cepas fueron
cultivadas durante 5 días y separadas en dos grupos: con ciclo luz-oscuridad 12:12h y sin luz.
Al término del experimento se evaluaron las tasas de ingestión diarias, la toxicidad en A.
minutum y en N. scintillans (mediante cromatografía líquida). Los resultados muestran que
en ambos grupos N. scintillans se alimentó activamente de A. minutum, durante el periodo
evaluado, a tasas de ingestión máximas de 0.3 μg C individuo-1 día-1, valor en el cual se
alcanza la saturación, manteniéndose la presión de consumo a través del tiempo. La
toxicidad en A. minutum estuvo dentro del rango normal detectado para esta especie, con
un valor medio de 2.90 fmol célula-1. Los análisis de los perfiles cromatográficos de los
individuos de N. scintillans expuestos a A. minutum revelaron que la especie no acumuló las
toxinas paralizantes en su citoplasma, lo que sugiere que la toxina sería metabolizada o
bien liberada. Estos datos son los primeros realizados sobre el consumo de dinoflagelados
tóxicos en condiciones de laboratorio por parte de N. scintillans.
208
ANNEX I
Resumen del Capítulo VI
Modelización de transferencia y acumulación de PST en dos consumidores planctónicos
En este capitulo se desarrolló un modelo con el objectivo de estudiar y comparar la
transferencia y la acumulación de PST en dos diferentes potenciales vectores planctónicos
de PST. El dinoflagelado heterótrofo en su forma roja Noctiluca scintillans y el copépodo
Acartia clausi fueron los organismos planctónicos que se seleccionaron para este estudio.
También se investigó la importancia de estos dos organismos como vectores de PST en la
comunidad planctónica. Diferentes factores que influyen en la tranferencia de toxinas
fueron considerados en el modelo, como la síntesis de las toxinas, la ingestión de alimento
tóxico y no tóxico y el tamaño de la población tanto en los vectores como en los
productores de toxina. Por otra parte, se llevó a cabo un experimento de laboratorio para
calcular las tasas de detoxificación en individuos de Noctiluca alimentados con A. catenella.
Los resultados del modelo mostraron diferencias en los tiempos que se aparecieron los
picos de acumulación de PST en los dos organismos. Noctiluca presenta una respuesta
rápida a la ingestión de Alexandrium que se caracteriza con una alta acumulación inicial de
toxina, seguida por una reducción a cero en un período de casi dos días. Por el contrario,
Acartia mostró un considerable retraso para acumular los mismos niveles de PST en la
población observados en Noctiluca. Este retraso está ralacionado con las tasas de
reproducción más lentas que caracterizan al copépodo. El rango de valores iniciales
utilizados para el análisis de sensibilidad del modelo es representantivo del medio costero
de una Ría Gallega, donde los dos consumidores y el dinoflagelado Alexandrium pueden
coexistir. Los resultados del modelo revelaron menor sensibilidad de Acartia para los
parámetros más importantes, probablemente debido al retraso en la acumulación de
toxinas. Ambos organismos mostraron una reducción rápida (50 h) de la toxina ingerida,
sugiriendo que no son muy eficaces en la tranferencia de toxinas a través la cadena trofica
marina.
209
ANNEX I
Conclusiones
1. Un conjunto de algoritmos para la estimación de la clorofila a partir de datos del
sensor MERIS FR se desarrolló específicamente para las aguas ópticamente
complejas de las Rías de Galicia y el área adyacente. Estos algoritmos superaron el
C2R, que se utiliza habitualmente para imágenes MERIS en aguas de Caso 2. El
algoritmo adecuado propuesto en esta tesis para la estimación de clorofila a es el
NNRB # 3. Su ámbito de aplicación viene definido por los resultados de la FCM y las
concentraciones de clorofila a (0.03–7.94 mg m−3). La aplicación de la FCM muestra
las áreas donde puede aplicarse mejor el NNRB para obtener los resultados más
fiables.
2. La aplicación de un algoritmo especialmente desarrollado para el área de estudio
nos permite obtener mapas precisos de clorofila con una resolución nunca antes
lograda para esta zona. Las principales limitaciones de esta metodología son en
primer lugar, que se requieren buenas imágenes MERIS (libres de nubes y sin
reflección solar en la zona de estudio) y por otro lado también se necesita
enmascarar las categorías #2 y # 3.
3. Se identificaron tres periodos de diferentes condiciones meteorológicas y
oceanográficas en la zona durante Julio de 2008. Hubo una variación significativa en
el tiempo y la extensión de las áreas de alta concentración de clorofila. El presente
estudio demostró que las imágenes MERIS de alta resolución son una herramienta
muy potente para el análisis detallado de la distribución de la clorofila en las Rías de
Galicia y en la plataforma adyacente durante un ciclo de afloramiento.
4. Los mapas muestran que la estructura espacial de la distribución del fitoplancton en
el área de estudio puede ser compleja. Algunas de estas áreas de alta concentración
de clorofila que se pueden identificar en las imágenes de satélite podrían incluso no
ser detectadas por los programas de monitorización in situ.
5. La concentración de ácido domoico (AD) se midió por primera vez en muestras de
agua de mar de las Rías Gallegas y además se ha detectado la presencia de esta
toxina en altos niveles en varios casos. P. australis parece ser la principal fuente de
DA.
6. Los resultados de este estudio sugieren que los eventos tóxicos debidos a AD
deberían ser un motivo de preocupaión importante y por lo tanto, el AD debería
medirse. Por otra parte, los datos de MERIS FR y los algoritmos específicos
210
ANNEX I
mostraron que pueden suministrar información valiosa de casos de floraciones
algales y deberían ser parte integrante de los programas de monitoreo.
7. El modelo óptimo para la abundancia de Pseudo-nitzschia spp. y para la
concentración DA sugirió el efecto significativo de algunos macronutrientes, así
como otros parámetros bióticos y abióticos, aproximando de ese modo las posibles
causas ambientales y los efectos de las floraciones perjudiciales de Pseudo-nitzschia
spp. en el área.
8. Se presentan los primeros datos sobre el consumo de dinoflagelados tóxicos en
condiciones de laboratorio por parte de N. scintillans. Las tasas de ingestión
máximas fueron obtenidas con altas abundancias de alimentos. Las diferencias en
las condiciones de luz y oscuridad muestran diferentes respuestas en el consumo de
alimentos. Estos resultados soportan la hipótesis que Noctiluca es capaz de limitar
el crecimiento de especies productoras de PST en el campo y pueden tener un papel
importante como regulador de fitoplancton toxico.
9. El modelo dinámico predice una detoxificación muy rápida y una acumulación de
toxinas relativamente alta en Noctiluca y Acartia. Estos resultatos muestran que los
dos organismos planctónicos pueden ser ineficientes, pero quizás no ineficaces
como vectores de PST.
10. La presente tesis doctoral ha mejorado nuestra comprensión sobre los eventos de
algas nocivas en las aguas interiores de las Rias Gallegas y ha mejorado la
metodología preexistente, basada en técnicas de teledetección, para el estudio de
índices de clorofila superficial y su relación con la dinámica oceanográfica de la zona
de estudio. Los principales resultados de este enfoque multidisciplinar pueden ser
de gran interés y utilidad en los programas de monitorización relacionados con
episodios de floraciones algales nocivas/tóxicas.

ANNEX II
211
ANNEX II

212
213
ANNEX II
Técnicas de inmunodetección y en concreto ELISAs aplicadas al campo
marino
El uso de anticuerpos (Acs) en técnicas de detección aplicadas al campo marino
permite identificar de forma específica organismos o moléculas de interés. Entre las
técnicas más empleadas se encuentran:
1) Enzyme Linked InmunoSorbent Assay (ELISA)
2) Inmunofluorescencia (IF)
3) Western Blot (WB).
La descripción de estos métodos, con ejemplos de aplicaciones concretas, es el
objeto del presente capítulo. La técnica más conocida y extendida, debido principalmente a
su simplicidad, es el ELISA. Permite detectar y/o determinar la concentración de una
molécula (o antígeno) con alta sensibilidad. Se inmoviliza el antígeno a detectar o los Acs
específicos sobre el fondo de un pocillo de plástico, y, posteriormente se lleva a cabo la
detección con Acs unidos a enzimas, mediante una reacción colorimétrica. Esta técnica
puede aplicarse en la identificación de especies, para evitar fraudes, para detectar
sustancias tóxicas o prohibidas, etc.
La immunofluorescencia usa Acs unidos a fluorocromos y suele aplicarse para la
detección de organismos enteros. Muestras de agua de mar conteniendo larvas de
moluscos y dinoflagelados pueden ser visualizadas bajo microscopio de fluorescencia o
confocal, o de forma automática, con un citómetro de flujo.
El Western blot consiste en la identificación de una proteína concreta en una
muestra compleja, tras una separación electroforética en gel de poliacrilamida y posterior
transferencia a membrana. El revelado con anticuerpos específicos conjugados a enzimas
permitirá identificar la proteína de interés en la membrana. Esta técnica permite
diagnosticar enfermedades y adulteraciones en productos marinos, localizar una proteína
en un tejido, identificar y/o diferenciar especies marinas, etc.
Las técnicas de inmunodetección pueden ser utilizadas con éxito para identificar
especies sin necesidad de conocimientos taxonómicos previos, incluso en productos
procesados, cocidos o subproductos que carecen de caracteres morfológicos.
214
ANNEX II
ELISA
La necesidad de identificar o detectar de forma rápida y específica diversos
compuestos ha llevado a que las técnicas de inmunodetección utilizando Acs se estén
aplicando en muchos campos científicos. De todas ellas, el ELISA es quizás el método más
empleado debido a su sencillez, sensibilidad y versatilidad. Mediante esta técnica se están
llevando a cabo controles de procedencia de muchos productos, con el fin de evitar el
fraude o la comercialización de especies protegidas que, una vez procesadas, no pueden ser
identificadas morfológicamente.
Descripción del método
Hay distintos tipos de ELISAs (competitivo, sándwich, directo e indirecto) que se
realizan utilizando microplacas de plástico, antígenos y Acs marcados con una enzima
(como la peroxidasa de rábano picante o fosfatasa alcalina) que reaccionará con un
sustrato incoloro o cromógeno (ejemplos: ABTS, TMB, DAB) produciendo un producto
coloreado (Figura 1). La lectura de la señal se realiza en un espectrofotómetro equipado con
un sistema de filtros que permite la lectura simultánea de todos los pocillos de la placa a
una longitud de onda determinada. En los últimos años, se han desarrollado técnicas
semejantes al ELISA, de mayor sensibilidad, utilizando agentes quimioluminiscentes o
fluorescentes, así como el marcaje del ligando o antígeno en vez del anticuerpo
(EnzimoInmunoAnálisis o EIA). Las técnicas de ELISA son muy sensibles, detectando entre
picogramos-nanogramos de sustancia en una muestra.
1) ELISA directo: los pocillos se recubren con la solución donde se encuentra el antígeno a
detectar, y a continuación, la placa se incuba con Acs específicos frente a dicho antígeno,
conjugados a una enzima. Tras lavar para eliminar aquellos anticuerpos no unidos, se lleva a
cabo la reacción colorimétrica. La coloración que aparece es proporcional a la cantidad de
antígeno presente en la muestra.
2) ELISA indirecto: Al igual que en el caso anterior, los pocillos se recubren con el antígeno,
pero primero se incuban con Acs primarios no marcados específicos frente al antígeno, y, a
continuación, después de lavados, la placa se incuba con Acs secundarios frente a los
primarios, conjugados a una enzima. Presenta mayor sensibilidad que el ensayo directo, ya
215
ANNEX II
que a cada Ac primario se le pueden unir varios Acs secundarios, amplificando la señal. Este
ensayo es útil para la cuantificación de Acs en una muestra.
3) ELISA tipo "sándwich": esta variante utiliza dos tipos de Acs, ambos específicos frente al
antígeno. Los pocillos se recubren con Acs primarios específicos. Tras bloquear y lavar la
placa, se incuba con la muestra donde se encuentra el antígeno a detectar, y, tras sucesivos
lavados, se incuba con Acs conjugados a enzimas dirigidos frente a un epítope diferente del
antígeno. Esta variante presenta gran especificidad y es muy útil para la detección y
cuantificación de moléculas grandes.
4) ELISA competitivo. Es el más sensible y versátil. En este caso, antígeno o anticuerpo se
adhieren al plástico y va a existir una competencia por aquellos que estén en solución,
marcados o no con enzima. Como ejemplo, los pocillos de la placa se recubren con
antígenos conocidos conjugados a proteínas inertes. Posteriormente se añade una mezcla
de muestra problema + una cantidad conocida y limitante de anticuerpo específico marcado
con enzima. En el proceso de lavado se retiran aquellos anticuerpos que reconocen al
antígeno en forma soluble y por tanto la señal detectada en el pocillo será inversamente
proporcional a la cantidad de antígeno presente en la muestra. Es una técnica muy útil para
la detección y cuantificación de moléculas pequeñas.
En todos los tipos de ELISA es necesario incluir controles, tanto negativos (muestra
donde la sustancia a detectar está ausente), como positivos (muestra con cantidades
conocidas de la sustancia a detectar). Para que el ensayo sea cuantitativo deben incluirse
diluciones seriadas de una muestra con concentración conocida, para realizar una curva
estándar donde interpolar los datos de las muestras. Para evitar uniones inespecíficas se
requiere el bloqueo de las placas con una proteína inerte como albúmina sérica bovina o
caseína.
Entre cada paso, la placa se lava con una solución tamponada salina que contenga una baja
concentración de un detergente suave (ej. PBS 0.001% Tween), para eliminar todas las
moléculas no unidas de modo específico.
Utilización
El uso de la técnica de ELISA en el campo marino es muy amplio. Se ha empleado en
programas de monitorización de calidad del agua para la detección de diferentes
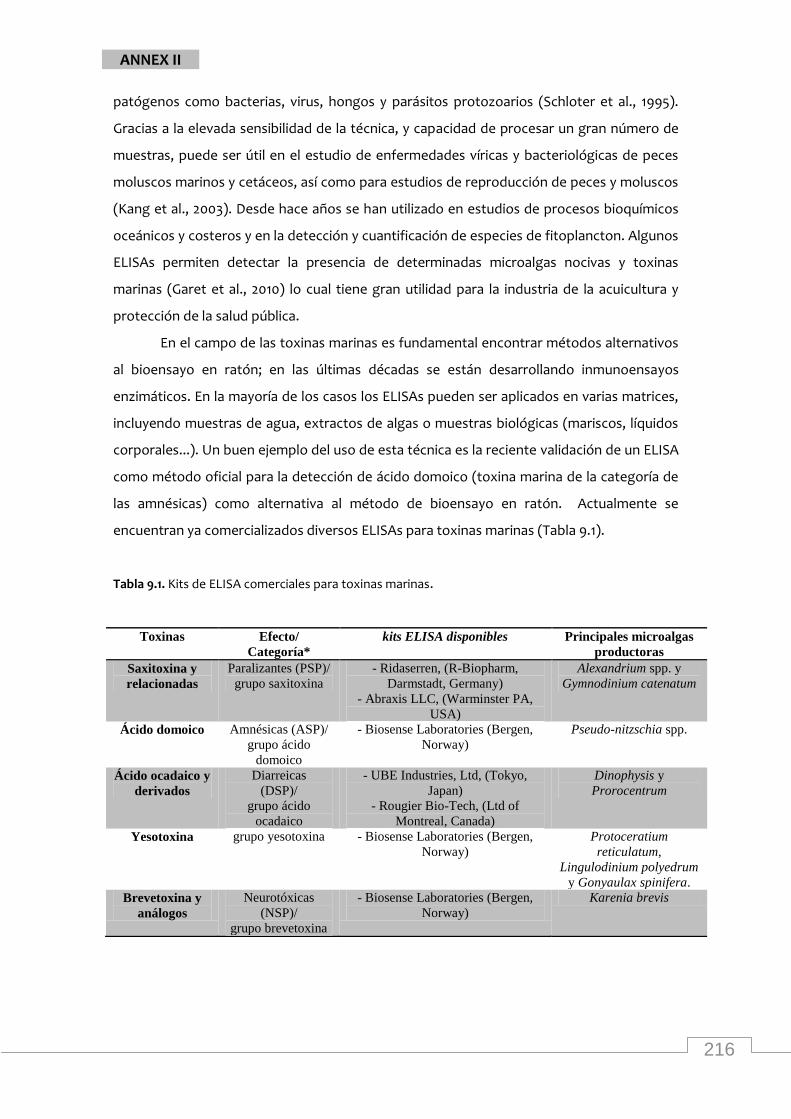
216
ANNEX II
patógenos como bacterias, virus, hongos y parásitos protozoarios (Schloter et al., 1995).
Gracias a la elevada sensibilidad de la técnica, y capacidad de procesar un gran número de
muestras, puede ser útil en el estudio de enfermedades víricas y bacteriológicas de peces
moluscos marinos y cetáceos, así como para estudios de reproducción de peces y moluscos
(Kang et al., 2003). Desde hace años se han utilizado en estudios de procesos bioquímicos
oceánicos y costeros y en la detección y cuantificación de especies de fitoplancton. Algunos
ELISAs permiten detectar la presencia de determinadas microalgas nocivas y toxinas
marinas (Garet et al., 2010) lo cual tiene gran utilidad para la industria de la acuicultura y
protección de la salud pública.
En el campo de las toxinas marinas es fundamental encontrar métodos alternativos
al bioensayo en ratón; en las últimas décadas se están desarrollando inmunoensayos
enzimáticos. En la mayoría de los casos los ELISAs pueden ser aplicados en varias matrices,
incluyendo muestras de agua, extractos de algas o muestras biológicas (mariscos, líquidos
corporales...). Un buen ejemplo del uso de esta técnica es la reciente validación de un ELISA
como método oficial para la detección de ácido domoico (toxina marina de la categoría de
las amnésicas) como alternativa al método de bioensayo en ratón. Actualmente se
encuentran ya comercializados diversos ELISAs para toxinas marinas (Tabla 9.1).
Tabla 9.1. Kits de ELISA comerciales para toxinas marinas.
Toxinas Efecto/
Categoría*
kits ELISA disponibles Principales microalgas
productoras
Saxitoxina y
relacionadas
Paralizantes (PSP)/
grupo saxitoxina
- Ridaserren, (R-Biopharm,
Darmstadt, Germany)
- Abraxis LLC, (Warminster PA,
USA)
Alexandrium spp. y
Gymnodinium catenatum
Ácido domoico Amnésicas (ASP)/
grupo ácido
domoico
- Biosense Laboratories (Bergen,
Norway)
Pseudo-nitzschia spp.
Ácido ocadaico y
derivados
Diarreicas
(DSP)/
grupo ácido
ocadaico
- UBE Industries, Ltd, (Tokyo,
Japan)
- Rougier Bio-Tech, (Ltd of
Montreal, Canada)
Dinophysis y
Prorocentrum
Yesotoxina grupo yesotoxina - Biosense Laboratories (Bergen,
Norway)
Protoceratium
reticulatum,
Lingulodinium polyedrum
y Gonyaulax spinifera.
Brevetoxina y
análogos
Neurotóxicas
(NSP)/
grupo brevetoxina
- Biosense Laboratories (Bergen,
Norway)
Karenia brevis
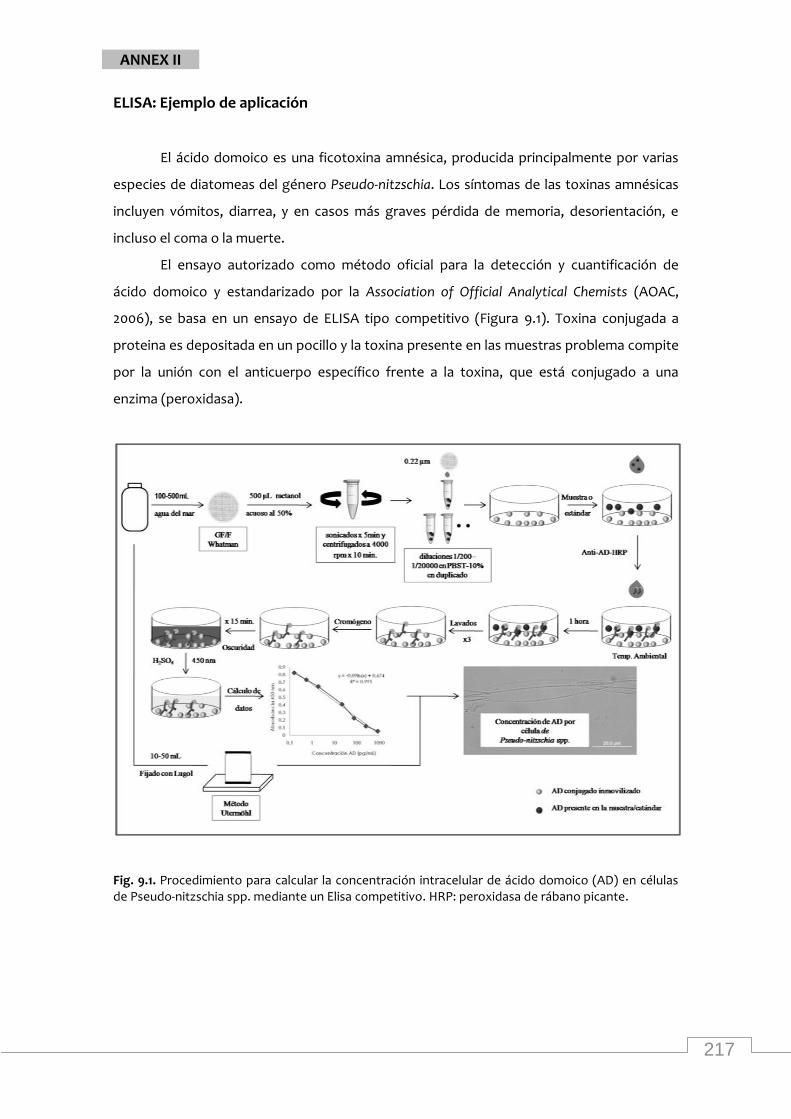
217
ANNEX II
ELISA: Ejemplo de aplicación
El ácido domoico es una ficotoxina amnésica, producida principalmente por varias
especies de diatomeas del género Pseudo-nitzschia. Los síntomas de las toxinas amnésicas
incluyen vómitos, diarrea, y en casos más graves pérdida de memoria, desorientación, e
incluso el coma o la muerte.
El ensayo autorizado como método oficial para la detección y cuantificación de
ácido domoico y estandarizado por la Association of Official Analytical Chemists (AOAC,
2006), se basa en un ensayo de ELISA tipo competitivo (Figura 9.1). Toxina conjugada a
proteina es depositada en un pocillo y la toxina presente en las muestras problema compite
por la unión con el anticuerpo específico frente a la toxina, que está conjugado a una
enzima (peroxidasa).
Fig. 9.1. Procedimiento para calcular la concentración intracelular de ácido domoico (AD) en células de Pseudo-nitzschia spp. mediante un Elisa competitivo. HRP: peroxidasa de rábano picante.