The Structure of the Planktonic Food-Web in the St. Lawrence Great Lakes

MARINE ECOLOGY PROGRESS SERIESMar Ecol Prog Ser
Vol. 351: 1–13, 2007doi: 10.3354/meps07298
Published December 6
INTRODUCTION
Pulses of nutrients cause great changes in coastalplanktonic assemblages. Nutrient enrichment gener-ally stimulates primary production, increasing the bio-mass of phytoplankton (so called ‘bottom-up’ control).In turn, feeding rates of grazers increase, stimulatingsecondary and, potentially, higher-order production(Ware & Thomson 2005, Olsen et al. 2006). Experimen-tal research in enclosed water masses, particularlylacustrine systems, has also consistently demonstratedthat abundances of phytoplankton increase whenzooplanktivores are abundant (reviewed by Brett& Goldman 1996). This process may occur becausegrazing by planktivores reduces abundances of her-
© Inter-Research 2007 · www.int-res.com*Email: [email protected]
FEATURE ARTICLE
Jellyfish modify the response of planktonicassemblages to nutrient pulses
Kylie A. Pitt1,*, Michael J. Kingsford2, David Rissik3, Klaus Koop4
1Australian Rivers Institute (Coast and Estuaries) and Griffith School of Environment, Gold Coast Campus, Griffith University, Queensland 4222, Australia
2School of Marine and Tropical Biology, James Cook University, Townsville, Queensland 4810, Australia3Freshwater and Marine Sciences, Queensland Environmental Protection Agency, 80 Meiers Road, Indooroopilly,
Queensland 4068, Australia4New South Wales Department of Environment and Climate Change, PO Box A290, Sydney South, New South Wales 1232, Australia
ABSTRACT: The short-term effects of pulses of nutrientsand jellyfish Catostylus mosaicus on planktonic assem-blages were investigated in field-based experiments using3 m3 mesocosms. Experiments ran for 5 d and wererepeated in autumn and spring at Lake Illawarra, a coastallagoon in New South Wales, Australia. Experiments con-sisted of 2 orthogonal treatments, addition/non-additionof nutrients and presence/absence of jellyfish, and weredesigned to determine how bottom-up (i.e. addition ofnutrients) and top-down (i.e. predation by jellyfish) pro-cesses influence planktonic assemblages, both indepen-dently and in combination. During both experiments, nutri-ents stimulated primary production and caused changes inphytoplankton assemblages. Nutrients also stimulated pro-duction of large tintinnids, suggesting that bottom-up pro-cesses may influence 2 trophic levels. Mesozooplanktonwere consistently depleted in mesocosms containing jelly-fish. Jellyfish also caused changes in microzooplanktonassemblages, indicating that top-down processes also cas-cade to at least 2 trophic levels. In mesocosms to which bothnutrients and jellyfish were added during spring, concen-trations of the red-tide forming, heterotrophic dinoflagel-late Noctiluca scintillans were 20 times greater than inmesocosms to which nutrients were added alone. We hy-pothesize that addition of nutrients stimulated productionof centric diatoms, the main prey of N. scintillans, but that abloom of N. scintillans only formed when jellyfish were alsopresent because jellyfish grazed on populations of herbivo-rous mesozooplankton (particularly the calanoid copepodGladioferens), which generally out-competed N. scintillansfor diatom prey. These data provide the first empiricalevidence linking jellyfish to the formation of red tides.
KEY WORDS: Red tides · Trophic cascades · Catostylusmosaicus · Noctiluca scintillans
Resale or republication not permitted without written consent of the publisher
Jellyfish blooms that occur in eutrophic waters may increasethe prevalence of red tides.
Photo: M. J. Kingsford
OPENPEN ACCESSCCESS
Mar Ecol Prog Ser 351: 1–13, 2007
bivorous zooplankton, which, in turn, reduces grazingpressure on phytoplankton (i.e. top-down control) andbecause zooplanktivores recycle nutrients directly tophytoplankton (Vanni & Findlay 1990). If periods ofnutrient enrichment coincide with periods whenplanktivores are abundant (i.e. if top-down and bot-tom-up processes coincide), responses of planktonicassemblages may differ from those observed wheneither top-down or bottom-up processes occur inde-pendently.
Gelatinous zooplankton are the dominant plankti-vores in many coastal systems and are renowned forforming episodic and spectacular population blooms.There is now compelling evidence that the biomass ofjellyfish has increased in many parts of the world (Mills2001, Purcell 2005, Link & Ford 2006, Lynam et al.2006). Gelatinous zooplankton typically prey on meso-zooplankton and can initiate changes in planktonicassemblages that cascade to lower trophic levels(Olsson et al. 1992, Granéli & Turner 2002, Stibor et al.2004). Coastal regions are also susceptible to episodicinputs of nutrients, which are often delivered from thesurrounding catchments in large pulses following peri-ods of heavy rain. Changes in planktonic assemblagesassociated with nutrient enrichment are likely to bevery different if pulses of nutrients are delivered attimes when predatory jellyfish are abundant.
The large scyphozoan jellyfish Catostylus mosaicusregularly forms blooms in the estuaries and coastallagoons of eastern and northern Australia. Averageabundances during blooms may exceed 2 medusae m–3
(Pitt & Kingsford 2000), but in localised patches,concentrations of small medusae may exceed 100smedusae m–3 (K. A. Pitt pers. obs). Many of the estuar-ies where C. mosaicus occurs are also under increasinganthropogenic pressure from urbanization and agri-cultural development and often receive pulses of nutri-ents following periods of heavy rain (Gillanders &Kingsford 2002). The objective of our experiments wasto determine how pulses of nutrients and the presenceof C. mosaicus influence planktonic assemblages ina coastal lagoon. Manipulative experiments, usingmesocosms, were done over 4 to 5 d to emulate pulseevents of nutrients and to measure short-term re-sponses of the planktonic assemblage. Although meso-cosm experiments can suffer from artefacts (e.g. Chenet al. 1997), they provide a useful tool for undertakingmanipulative experiments in pelagic systems. Experi-ments were repeated twice, once in autumn andonce in spring, to account for temporal changes inplanktonic assemblages. Specifically we wanted todetermine (1) the independent influences of nutrientpulses and C. mosaicus on planktonic assemblagesand (2) the influence of the combined effects of nutri-ent enrichment and medusae.
MATERIALS AND METHODS
The experiments were done at Lake Illawarra, ashallow (average depth 1.9 m), eutrophic, intermit-tently open/closed coastal lagoon on the south coastof New South Wales, Australia (150°50’S, 34°30’E).The average rainfall in the catchment is approxi-mately 1100 to 1600 mm yr–1 and significant rainfallevents (>50 mm) occur 3 to 4 times yr–1 (O’Donnell etal. 2004). Winter is typically the driest period. Theexperiments ran from 11 to 15 May and 12 to 16 Sep-tember 2001. Longer experiments were not feasible asCatostylus mosaicus is a large medusa (>150 mm belldiameter [BD]) and would deplete stocks of zooplank-ton in the mesocosms over periods exceeding a fewdays. Experiments were done using 12 mesocosmsthat were suspended from individual floating plat-forms placed 10 to 15 m apart and secured using ananchor. Mesocosms consisted of white sailcloth bagsthat had been lined with transparent plastic bags. Thebags extended 2 m below the water line, were ap-proximately 1.2 m2 and contained approximately 3 m3
of water. The tops of the bags extended 1 m above thewater’s surface to prevent any exchange of waterbetween the mesocosms and lagoon. Water thatcontained natural assemblages of phytoplankton andzooplankton was pumped into the bags from the sur-rounding lagoon from a depth of 1 m and at a rate of250 l min–1. There was little tidal movement in LakeIllawarra, so assemblages remained consistent duringthe preparation of the experiment.
The experiment consisted of 2 orthogonal factors(addition/non-addition of nutrients and presence/absence of jellyfish). Thus, there were 4 treatments:(1) a control, (2) jellyfish, (3) nutrients and (4) nutrients+ jellyfish. Three mesocosms were randomly assignedto each treatment. Control mesocosms, to which nei-ther jellyfish nor nutrients were added, contained onlylagoon water with natural assemblages of phytoplank-ton and zooplankton. Two Catostylus mosaicus (May:142 ± 3 mm BD; September: 136 ± 3 mm BD) weregently hand-dipped from the lake and added to eachmesocosm in the jellyfish treatment. In the nutrienttreatment, ammonia (NH3), nitrate and nitrite (NOx)and phosphate (PO4) were added to elevate the con-centrations of nutrients in the mesocosms from back-ground concentrations (NH3 and NOx 2 to 5 µg l–1;PO4 70 µg l–1) to levels similar to the upper limits of thenutrient concentrations observed in the lagoon (NH3:70.6 ± 2.7 µg l–1; NOx 71.0 ± 30 µg l–1; PO4 117.3 ±8.6 µg l–1; New South Wales Department of Environ-ment and Climate Change unpubl. data). Both nutri-ents and jellyfish were added in the nutrients + jelly-fish treatment. All jellyfish actively swam about themesocosms throughout the experiments.
2

Pitt et al.: Nutrient and jellyfish impacts on plankton
Physical variables. Water quality parameters weresampled twice daily using a Yeo-kal 611 water qualityprobe at a depth of 1 m inside the mesocosms, andadditional samples were periodically taken at the samedepth from the surrounding lagoon. Nutrient concen-trations were determined from 20 ml subsamples ofwater that were extracted from each mesocosm using asampling tube. The tube had a diameter of 50 mm andheld a volume of approximately 2 l. The tube wasslowly inserted to just above the bottom of the meso-cosm, the end of the tube was sealed and an integratedsample of the water column was extracted. Sampleswere filtered through 0.45 µm filters and frozen. Nutri-ent concentrations were determined using the Ameri-can Public Health Association (APHA) Method 4500modified for NOx, NH3 and PO4. The Practical Quanti-tation Limits were 0.07, 0.14 and 0.03 respectively.
Chlorophyll a.. Chlorophyll a (chl a) samples werecollected each afternoon (5 d in the May experimentand 4 d in the September experiment). Duplicate 2 lsamples of water were collected using the samplingtube and vacuum-filtered through acetate filters. Thenthe filter papers were frozen and stored in darkness.Chl a concentrations were determined fluorometricallyfollowing the methods of Strickland & Parsons (1972).
Microplankton. Microplankton was sampled 3 timesfrom each mesocosm during each experiment (0, 24and 96 h after the May experiment commenced and6, 36 and 96 h after the September experiment com-menced). Duplicate samples of microplankton werecollected from each mesocosm on each occasion usingthe sampling tube. Two litres of water were filteredthrough a 35 µm nylon mesh sieve and the planktonwas fixed in 4% buffered formalin. In the laboratory,phytoplankton were enumerated using a Lund Cell(Lund et al. 1958) and microzooplankton using aSedgewick-Rafter cell. We used 1 ml for microzoo-plankton and 0.5 ml for phytoplankton, and multiplefields of view were observed until between 50 and 100organisms had been identified and counted. Two sub-samples were enumerated for each phytoplankton andmicrozooplankton sample (minimal additional preci-sion was gained for additional subsamples). Concen-trations were expressed as numbers l–1 and the aver-ages of the 2 subsamples were used for analyses.
Mesozooplankton. Mesozooplankton were sampledat the end of each experiment using a 50 cm diameterplankton net. A 250 µm mesh net was used during Mayand a 100 µm mesh net during September. The netswere lowered to the bottom of each mesocosm andhauled vertically. It was not possible to take additionalsamples during the experiment without causing serialdepletion of the experimental populations. A smallermesh size was used in September to increase the sizerange of mesozooplankton sampled. Due to differences
in mesh sizes, direct comparisons in mesozooplanktonassemblages between May and September were notattempted. Zooplankton were preserved in 4% bufferedformalin. In the laboratory, zooplankton were enumer-ated in 2 subsamples (2 to 3 ml) in a Bogorov tray.Averages of the 2 subsamples were used in analyses.
Data analyses. Differences in assemblages of phyto-plankton, microzooplankton and mesozooplanktonwere displayed graphically using multidimensionalscaling (MDS) plots based on Bray-Curtis similaritymeasures (Bray & Curtis 1957), and hypotheses aboutdifferences among treatments were tested using ana-lyses of similarities (ANOSIMs) (Clarke & Greene1988). For phytoplankton and microzooplankton assem-blages, separate 1-way ANOSIMs were used to assesspossible differences in assemblages among jellyfishand nutrient treatments for each time sampled. Wheredifferences in assemblages were detected betweentreatments, or if there was a strong trend for assem-blages to differ, even if not significant at α = 0.05,similarity of percentages (SIMPER) tests were used todetermine which species contributed the most to thedissimilarity between treatments.
Differences in [chl a] and selected phytoplankton andmicrozooplankton taxa were analysed using repeatedmeasures analyses of variance (ANOVA). The treat-ments were addition/non-addition of nutrients, pres-ence/absence of jellyfish (both fixed, orthogonal factors)and mesocosms (a random factor, nested within nutrientsand jellyfish). Time was the repeated measure. De-pendency among times was tested and found to be non-significant. Homogeneity of variances was tested priorto doing ANOVAs using a Cochran’s test. Attemptswere made to stabilise heterogeneous variances usingln(x +1) transformations, but if variances could not bestabilised, untransformed data were analysed and α wasreduced to 0.01 to reduce the risk of Type I error (Under-wood 1997). When significant differences were detected,post-hoc planned contrasts were used to identify wherethe differences occurred. Differences in concentrationsof mesozooplankton (which were sampled at the end ofthe experiments only) between nutrient and jellyfishtreatments were analysed using 2-way ANOVAs, and ifsignificant interactions were observed, post-hoc Student-Newman-Keuls (SNK) tests were used to determinewhich treatments differed.
RESULTS
Physical variables
The water temperature and salinity in the meso-cosms varied from 15.9 to 16.9°C and 29.6 to 30.5 psuduring May and 15.6 to 17.3°C and 28.4 to 28.8 psu
3

Mar Ecol Prog Ser 351: 1–13, 2007
during September. Temperatures and salinities did notvary among treatments and remained similar to thesurrounding lagoon. During both experiments, con-centrations of NH3 and NOx in mesocosms enrichedwith nutrients decreased from 70.6 ± 2.7 and 71.0 ±3.0 µg l–1, respectively, to control levels (2 to 5 µg l–1 forboth nutrients) within 20 to 48 h after the experimentscommenced. In contrast, concentrations of PO4 de-creased slowly from 117.3 ± 8.6 to 80.1 ± 5.3 µg l–1, andat the end of the experiments these were still elevatedrelative to control mesocosms (40.3 ± 5.5 µg l–1). Nutri-ent concentrations in control mesocosms remainedstable throughout the experiments.
Chlorophyll a
Nutrients and jellyfish had significant effects on[chl a] during both the May and September experi-ments (Table 1). Post-hoc contrasts showed that duringMay, [chl a] was elevated in mesocosms containingnutrients and those containing jellyfish at all timesexcept for the first time sampled (Fig. 1). A similar pat-tern was observed during September, although [chl a]was already more concentrated in mesocosms contain-ing nutrients at the first time sampled (6 h after theexperiment commenced; Fig. 1).
Phytoplankton
In May no differences were detected in the assem-blages of phytoplankton present among jellyfish treat-ments at any time, but phytoplankton assemblages didvary between nutrient treatments at 96 h (Fig. 2A,Table 2). The phytoplankton that contributed the most
4
Table 1. Results of repeated measure ANOVAs of [chl a] dur-ing the May and September 2001 experiments. N: nutrients,J: jellyfish, M: mesocosm, T: time, NS: not significant, MS:
mean square
Variable df May September
MS p MS p
N 1 6143.930 <0.01 32235.950 <0.01J 1 476.84 <0.01 1196.68 <0.05N × J 1 6.53 <0.60 96.98 <0.53M (N, J) 8 21.94 <0.01 229.82 <0.01T 2 271.31 <0.01 2430.22 <0.01T × N 2 386.92 <0.01 1669.01 <0.01T × J 2 37.92 <0.01 183.73 <0.02T × N × J 2 4.063 <0.15 7.92 <0.91T × M (N, J) 16 2.144 <0.01 43.18 <0.01Error 24 0.947 16.44
Transformation Nil NilCochran’s C 0.13, NS 0.63, p < 0.01α 0.05 0.01
Ch
loro
ph
yll (
µg
l–1)
Nutrients not added
Nutrients added
Jellyfish absent
Jellyfish present
B
Hours elapsed
A70
60
50
40
30
20
10
0
70
60
50
40
30
20
10
0
70
60
50
40
30
20
10
0
70
60
50
40
30
20
10
0
C D
0 24 48 72 96 0 24 48 72 96
24 48 72 96 24 48 72 96
Fig. 1. Temporal variation in mean (±SE) concentrations ofchl a between (A) nutrient and (B) jellyfish treatments dur-ing May and (C) nutrient and (D) jellyfish treatments during
September
Table 2. Results of analyses of similarity (ANOSIM) amongtreatments for phytoplankton, microzooplankton and net-plankton assemblages for the May and September 2001 ex-periments. N: nutrients, J: jellyfish. For phytoplankton andmicrozooplankton assemblages separate analyses were done
for each run. 462 permutations used in all cases
Phyto- Microzoo- Mesozoo-plankton plankton plankton
Global R p Global R p Global R p
May0 h J –0.002 0.36 –0.119 0.91
N –0.074 0.77 –0.072 0.68
24 h J 0.054 0.25 0.146 0.10N –0.065 0.64 –0.107 0.88
96 h J –0.109 0.84 0.528 0.01 0.211 0.022N 0.628 0.02 0.080 0.23 –0.109 0.929
September6 h J –0.141 0.96 –0.059 0.71
N 0.102 0.14 –0.041 0.29
36 h J –0.039 0.51 0.013 0.36N 0.204 0.08 –0.007 0.37
96 h J 0.061 0.23 0.211 0.05 0.617 0.004N 0.122 0.12 0.424 <0.01< –0.017 0.450

Pitt et al.: Nutrient and jellyfish impacts on plankton
to the dissimilarity between nutrient treatments at theend of the experiment were the centric diatoms of theorder Biddulphiales, including Chaetoceros sp. (subor-der Biddulphiineae; 30.1%), members of the suborderCoscinodiscineae (25.4%, dominated by Skeletonemacostatum and Thalassiosira rotula), and Ceratulina sp.
(suborder Biddulphiineae; 8.2%). The pennate diatomNitzschia closterium (order Bacillariales) contributed7.0% to the dissimilarity between nutrient treatments.
Nutrients had a large influence on concentrations ofthe diatoms Nitzschia closterium, Thalassiosira rotulaand Ceratulina sp. (T × N interaction, Table 3) and, in
5
Stress = 0.1 Stress: 0.07
BA
= Nutrients = Nutrients + Jellyfish= Control = Jellyfish
Fig. 2. MDS plots of variation in assemblages of phytoplankton among treatments and runs during (A) May and (B) September. Symbols for May: white = 0 h, grey = 24 h, black = 96 h; for September: white = 6 h, grey = 36 h, black = 96 h
Table 3. Results of repeated measures ANOVAs for selected phytoplankton taxa sampled during May and September 2001. N: nutrients, J: jellyfish, M: mesocosm, T: time, NS: not significant, MS: mean square
May df Nitzschia Thalassiosira Ceratulina Chaetoceros Skeletonemaclosterium rotula sp. sp. costatum
Variable MS × 108 p MS × 108 p MS p MS × 1010 p MS p
N 1 78.21 <0.01< 109.150 0.12 0.42 0.90 6.65 0.57 1.05 0.48J 1 1.22 0.61 42.06 0.32 1.07 0.84 4.54 0.64 0.25 0.72N × J 1 0.06 0.91 3.71 0.76 0.01 0.98 2.49 0.73 0.10 0.82M (N, J) 8 4.34 0.12 36.78 <0.01< 24.390 0.04 19.23 0.03 1.79 0.01T 2 42.58 <0.01< 93.61 <0.01< 3.33 0.55 47.49 0.01 5.08 <0.01 <T × N 2 49.63 <0.01< 63.54 <0.01< 37.110 <0.01< 3.42 0.60 0.57 0.29T × J 2 3.09 0.43 0.43 0.94 4.49 0.45 7.71 0.34 0.06 0.86T × N × J 2 0.02 0.99 1.42 0.82 2.61 0.63 1.57 0.79 0.40 0.41T × M (N, J) 16 3.43 0.11 7.44 <0.01< 5.39 0.75 6.57 0.34 0.42 0.08Error 24 1.97 2.52 7.47 5.47 0.22Transformation Nil Nil Ln Nil LnCochran’s C 0.16, NS 0.50, p < 0.01 0.21, NS 0.28 NS 0.19 NSα 0.05 0.01 0.05 0.05 0.05
September df Nitzschia Skeletonema Pseudo-nitzschia Chaetocerosclosterium costatum seriata sp.
Variable MS × 108 p MS × 1011 p MS × 109 p MS p
N 1 17.81 0.01 21.14 0.10 279.8000 0.05 5.55 0.02J 1 0.34 0.62 1.16 0.67 7.36 0.72 0.10 0.70N × J 1 0.79 0.45 3.28 0.48 0.08 0.97 0.34 0.48M (N, J) 8 12.45 <0.010 5.98 <0.010 52.620 <0.010 0.61 0.01T 2 77.60 <0.010 52.16 <0.010 80.030 0.02 3.65 <0.010T × N 2 5.35 <0.010 9.84 0.11 26.200 0.23 0.74 0.23T × J 2 0.87 0.77 5.24 0.29 1.86 0.89 0.44 0.41T × N × J 2 0.33 0.63 1.27 0.73 2.33 0.87 1.06 0.14T × M (N, J) 16 0.69 <0.010 3.92 <0.010 16.430 <0.010 0.46 0.14Error 24 0.14 0.54 1.46 0.29Transformation Nil Nil Nil lnCochran’s C 0.19, NS 0.27, NS 0.14, NS 0.23, NSα 0.05 0.05 0.05 0.05

Mar Ecol Prog Ser 351: 1–13, 2007
all cases, by 96 h these diatoms were 2 to 4 times moreabundant in the mesocosms with nutrients than thosewithout (Fig. 3). Other species of diatoms (Chaetocerossp. and Skeletonema costatum) did not respond toeither jellyfish or nutrients, but concentrations haddecreased in all treatments by 96 h. Concentrations ofCeratulina sp., Chaetoceros sp. and S. costatum variedamong mesocosms within each treatment, while T.rotula also varied among mesocosms, but the pattern ofvariation among mesocosms varied among times(Table 3).
In September, assemblages of phytoplankton did notvary between jellyfish treatments at any time (Fig. 2B,Table 2). There was a strong indication that nutrientsmay have caused changes in phytoplankton assem-blages by 36 and 96 h (p = 0.08 and 0.12 respectively),but this result was not statistically significant (Table 2).SIMPER indicated that the species that may havecontributed towards the dissimilarity between nutrienttreatments were the pennate diatom Pseudo-nitzschiaseriata (30.8%), centric diatoms of the order Coscin-odiscineae (27.9%, dominated by Skeletonema costa-tum), Chaetoceros sp. (9.1%) and Nitzschia closterium(6.3%).
Nitzschia closterium also responded to nutrientsduring September, with elevated concentrations innutrient treatments at both 36 and 96 h (Table 3,Fig. 3D). Although non-significant, Skeletonema costa-
tum showed a strong trend to be more concentrated inthe mesocosms containing nutrients at 36 h, but by theend of the experiment, concentrations had decreasedand were similar to those in mesocosms without nutri-ents (Fig. 3E). In contrast, Chaetoceros sp. and Pseudo-nitzschia seriata also responded to nutrients and weremore concentrated in nutrient treatments throughoutthe experiment. Concentrations of N. closterium, S.costatum and P. seriata varied among mesocosms, butpatterns of variation were not consistent through time(Table 3). Concentrations of Chaetoceros sp. variedamong mesocosms within treatments (Table 3).
Microzooplankton
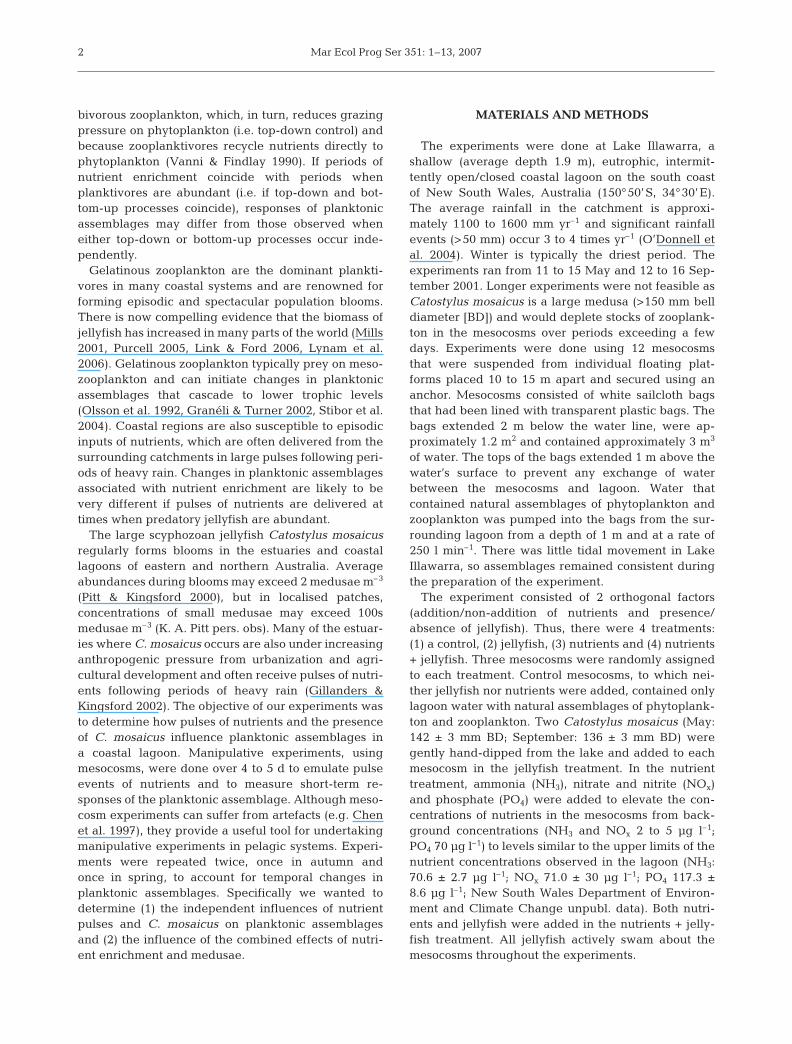
In May, nutrients had no detectable influence onassemblages of microzooplankton, but microzooplank-ton communities differed between jellyfish treatmentsat the end of the experiment (Fig. 4A, Table 2). Smoothlarge (80 to 120 µm) tintinnids (24.1%), small (<80 µm)armoured dinoflagellates (20.5%), rough small (<80 µm)tintinnids (13.6%) and large (80 to 130 µm) armoureddinoflagellates (12.8%) contributed the most to the dis-similarity between jellyfish treatments.
Concentrations of calanoid copepod nauplii had de-creased in mesocosms containing jellyfish at the end ofthe experiment (Table 4, Fig. 5A). There was also a
6
Num
ber
(x 1
03 ) l
–1C CeratulinaA Nitzschia closterium B Thalassiosira rotula
100
80
60
40
20
0
100
80
60
40
20
0
120
100
80
60
40
20
0
Hours elapsed
E Skeletonema costatum
10 30 50 70 90 11010 30 50 70 90 110
Hours elapsed10 30 50 70 90 11010 30 50 70 90 11010 30 50 70 90 110
2000
1600
1200
800
400
0
30
24
18
12
6
0
D Nitzschia closterium
Sep
tem
ber
May
Nutrients not added
Nutrients added
Fig. 3. Temporal variation in themean (±SE) concentrations of (A)Nitzschia closterium, (B) Thalassio-sira rotula and (C) Ceratulina sp. be-tween nutrient treatments duringMay and of (D) Nitzschia closteriumand (E) Skeletonema costatum dur-
ing September

Pitt et al.: Nutrient and jellyfish impacts on plankton
strong, but non-significant trend for large armoureddinoflagellates to be more abundant in treatments con-taining jellyfish (Table 4, Fig. 5B). After 96 h, smoothlarge tintinnids were most abundant in mesocosmscontaining only nutrients and were also abundant incontrol mesocosms but remained in small concen-trations in mesocosms containing jellyfish (Table 4,
Fig. 5C). Jellyfish had no influence on concentrationsof small armoured dinoflagellates or small roughtintinnids (Table 4). With the exception of calanoidcopepod nauplii, all microzooplankton varied amongmesocosms, but patterns of variation of small armoureddinoflagellates and small rough tintinnids among meso-cosms varied through time (Table 4).
7
Table 4. Repeated measure ANOVAs for selected microzooplankton taxa sampled during May and September 2001. N: nutrients, J: jellyfish, M: mesocosm, T: time, NS: not significant, MS: mean square
May df Small armoured Copepod Large armoured Large smooth Small roughdinoflagellates nauplii dinoflagellates tintinnids tintinnids
Variable MS × 106 p MS p MS × 105 p MS × 106 p MS × 106 p
N 1 0.69 0.82 7.35 0.54 72.34 0.42 1.51 0.30 0.84 0.75J 1 27.46 0.18 406.13 <0.01 408.99 0.08 22.80 <0.01 0.63 0.78N × J 1 3.31 0.62 10.89 0.46 0.96 0.93 1.27 0.34 0.08 0.92M (N, J) 8 12.38 <0.01 17.82 0.13 100.06 <0.01 1.22 <0.01 7.47 <0.01T 2 6.66 0.47 184.34 <0.01 41.63 0.08 19.71 <0.01 51.17 <0.01T × N 2 2.52 0.74 18.69 0.19 22.06 0.24 1.51 <0.01 1.68 0.65T × J 2 15.70 0.19 54.76 0.02 48.15 0.06 23.25 <0.01 0.53 0.87T × N × J 2 0.004 0.99 18.25 0.19 7.02 0.62 1.34 0.01 0.18 0.95T × M (N, J) 16 8.36 0.02 9.97 0.63 14.08 0.06 0.23 0.13 3.83 0.01Error 24 3.39 11.81 7.09 0.14 1.41Transformation Nil Nil Nil Nil NilCochran’s C 0.18, NS 0.22, NS 0.23, NS 0.40, p < 0.01 0.21, NSα 0.05 0.05 0.05 0.01 0.05
September df Small armoured Small naked Copepod Rough large Largedinoflagellates dinoflagellates nauplii tintinnids ciliates
Variable MS × 106 p MS p MS × 105 p MS × 106 p MS × 106 p
N 1 19.82 0.08 127.41 0.03 0.05 0.90 6.72 0.36 0.002 0.98J 1 0.63 0.71 0.158 0.93 20.87 0.03 2.98 0.54 0.16 0.84N × J 1 1.19 0.61 15.99 0.37 0.44 0.71 13.63 0.21 0.76 0.65M (N, J) 8 4.14 <0.01 17.49 <0.01 2.97 <0.01 7.17 <0.01 3.48 <0.01T 2 78.21 <0.01 225.38 <0.01 6.94 <0.01 14.80 <0.01 4.61 0.04T × N 2 1.65 <0.01 125.24 <0.01 0.31 0.46 4.76 0.06 2.33 0.17T × J 2 0.97 0.56 8.32 0.26 2.42 0.01 1.51 0.37 0.92 0.48T × N × J 2 0.002 0.99 8.54 0.26 0.20 0.61 7.62 0.02 1.18 0.39T × M (N, J) 16 0.16 <0.01 5.68 <0.01 0.38 0.14 1.42 0.06 1.18 <0.01Error 24 0.04 1.92 0.24 0.71 0.12Transformation Nil Nil Ln Ln LnCochran’s C 0.31, p < 0.05 0.24, NS 0.13, NS 0.21, NS 0.25, NSα 0.01 0.05 0.05 0.05 0.05
Stress: 0.09
Stress: 0.14BA
= Nutrients = Nutrients + Jellyfish= Control = Jellyfish
Fig. 4. MDS plots of variation in assemblages of microzooplankton among treatments and runs during (A) May and (B) Sep-tember. Symbols for May: white = 0 h, grey = 24 h, black = 96 h; for September: white = 6 h, grey = 36 h, black = 96 h
Mar Ecol Prog Ser 351: 1–13, 2007
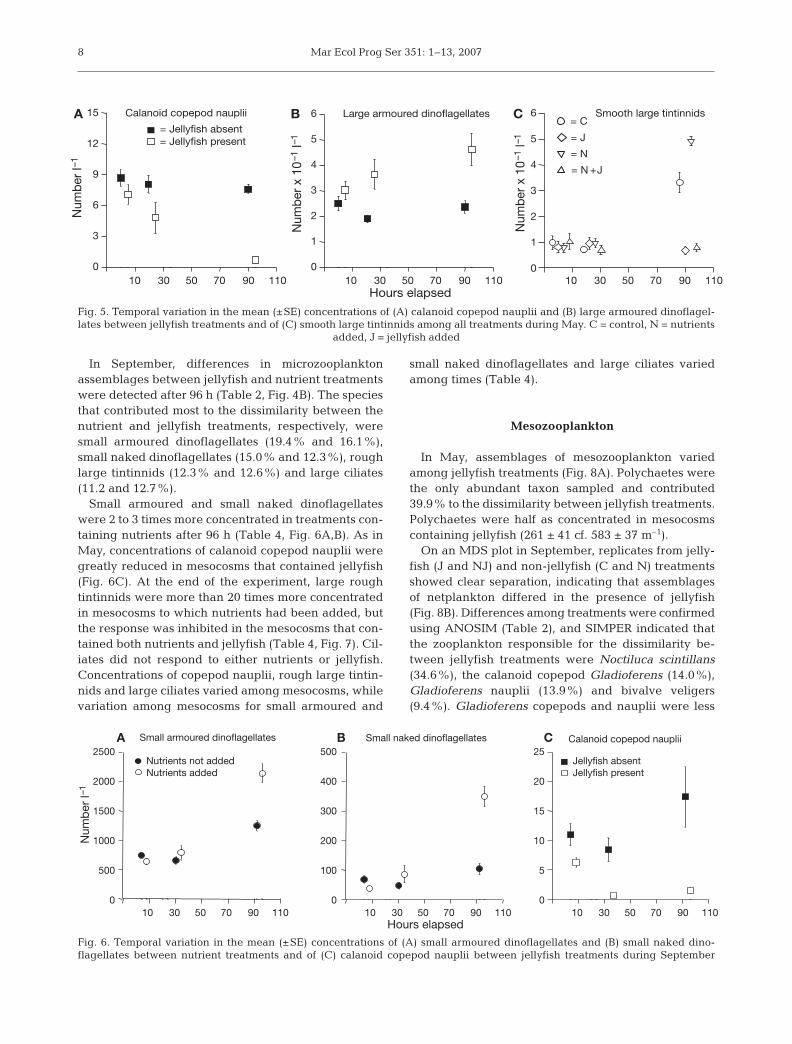
In September, differences in microzooplanktonassemblages between jellyfish and nutrient treatmentswere detected after 96 h (Table 2, Fig. 4B). The speciesthat contributed most to the dissimilarity between thenutrient and jellyfish treatments, respectively, weresmall armoured dinoflagellates (19.4% and 16.1%),small naked dinoflagellates (15.0% and 12.3%), roughlarge tintinnids (12.3% and 12.6%) and large ciliates(11.2 and 12.7%).
Small armoured and small naked dinoflagellateswere 2 to 3 times more concentrated in treatments con-taining nutrients after 96 h (Table 4, Fig. 6A,B). As inMay, concentrations of calanoid copepod nauplii weregreatly reduced in mesocosms that contained jellyfish(Fig. 6C). At the end of the experiment, large roughtintinnids were more than 20 times more concentratedin mesocosms to which nutrients had been added, butthe response was inhibited in the mesocosms that con-tained both nutrients and jellyfish (Table 4, Fig. 7). Cil-iates did not respond to either nutrients or jellyfish.Concentrations of copepod nauplii, rough large tintin-nids and large ciliates varied among mesocosms, whilevariation among mesocosms for small armoured and
small naked dinoflagellates and large ciliates variedamong times (Table 4).
Mesozooplankton
In May, assemblages of mesozooplankton variedamong jellyfish treatments (Fig. 8A). Polychaetes werethe only abundant taxon sampled and contributed39.9% to the dissimilarity between jellyfish treatments.Polychaetes were half as concentrated in mesocosmscontaining jellyfish (261 ± 41 cf. 583 ± 37 m–1).
On an MDS plot in September, replicates from jelly-fish (J and NJ) and non-jellyfish (C and N) treatmentsshowed clear separation, indicating that assemblagesof netplankton differed in the presence of jellyfish(Fig. 8B). Differences among treatments were confirmedusing ANOSIM (Table 2), and SIMPER indicated thatthe zooplankton responsible for the dissimilarity be-tween jellyfish treatments were Noctiluca scintillans(34.6%), the calanoid copepod Gladioferens (14.0%),Gladioferens nauplii (13.9%) and bivalve veligers(9.4%). Gladioferens copepods and nauplii were less
8
Num
ber
l–1
Num
ber
x 10
–1 l–
1
Num
ber
x 10
–1 l–
1
6
5
4
3
2
1
0
6
5
4
3
2
1
010 30 50 70 90 110
Hours elapsed10 30 50 70 90 11010 30 50 70 90 110
15
12
9
6
3
0
Calanoid copepod nauplii Large armoured dinoflagellates Smooth large tintinnids
= N +J
= Jellyfish absent= Jellyfish present
= N
= J
= CA B C
Fig. 5. Temporal variation in the mean (±SE) concentrations of (A) calanoid copepod nauplii and (B) large armoured dinoflagel-lates between jellyfish treatments and of (C) smooth large tintinnids among all treatments during May. C = control, N = nutrients
added, J = jellyfish added
Small naked dinoflagellatesSmall armoured dinoflagellates Calanoid copepod nauplii
Nutrients not addedNutrients added
A B C
Jellyfish absentJellyfish present
Num
ber
l–1
25
20
15
10
5
0
500
400
300
200
100
0
2500
2000
1500
1000
500
0
Hours elapsed10 30 50 70 90 110 10 30 50 70 90 11010 30 50 70 90 110
Fig. 6. Temporal variation in the mean (±SE) concentrations of (A) small armoured dinoflagellates and (B) small naked dino-flagellates between nutrient treatments and of (C) calanoid copepod nauplii between jellyfish treatments during September

Pitt et al.: Nutrient and jellyfish impacts on plankton
abundant in treatments containing jellyfish and,although non-significant, a similar trend was observedfor bivalve veligers (Table 5, Fig. 9). There was asignificant interaction between jellyfish and nutrientsfor N. scintillans (Table 5), and post-hoc SNK tests re-vealed that concentrations were substantially elevated
in the mesocosms that contained both nutrients andjellyfish compared to those that contained nutrientsalone (Fig. 10). There was also a strong, but non-signif-icant, trend for concentrations to be elevated in treat-ments containing nutrients and jellyfish compared tothose that only contained jellyfish.
DISCUSSION
Nutrients and jellyfish initiated very different re-sponses in the planktonic assemblages. Combiningnutrients and jellyfish, however, initiated some uniquechanges not apparent when treatments were appliedindividually. Nutrients caused a rapid increase in[chl a] during both May and September, indicating anoverall increase in primary production. There was evi-dence that nutrients influenced trophic levels higherthan primary producers in both experiments, but re-sults were limited to smooth large tintinnids in Mayand rough large tintinnids and small armored andsmall naked dinoflagellates in September. Tintinnidsare predominantly phytophagous (Stoecker et al. 1981,Verity 1985) and the increased concentrations ob-served in the nutrient treatment are likely to be adirect result of increased phytoplankton availability.
9
Stress: 0.08
N
NN J
JJ
NJ
NJ
NJ
C
C
Stress: 0.07
C
CC J
J
J
N
N
N
NJ
NJ
NJ
A B
Num
ber l
–1
Hours elapsed200
500
400
300
200
100
0
40 60 80 100 120
= N +J
= N
= J
= C
Fig. 7. Temporal variation in the mean (±SE) concentrations ofrough large tintinnids (number l–1) among treatments duringSeptember. C = control, N = nutrients added, J = jellyfish added
Fig. 8. MDS plots of variation in assemblages of mesozooplankton among treatments at the end of the (A) May and (B) September experiments. C = control, N = nutrients added, J = jellyfish added, NJ = nutrients and jellyfish added
Table 5. Results of 2-way ANOVAs examining variation in concentrations of selected mesozooplankton among Nutrient and Jellyfish treatments during May and September 2001. N: nutrients, J: jellyfish, NS: not significant, MS: mean square
Variable df May SeptemberPolychaetes Gladioferens Gladioferens nauplii Bivalve larvae Noctiluca scintillans
MS × 103 p MS × 106 p MS × 106 p MS × 103 p MS p
N 1 13.96 0.22 2.03 0.26 1.50 0.45 16.16 0.93 0.12 0.82J 1 315.07 <0.01 3.25 0.01 3.36 0.01 7011.43 0.10 24.14 0.01N × J 1 0.44 0.82 1.65 0.31 0.61 0.63 0.11 0.99 13.90 0.04Error 8 7.84 1.38 2.40 2008.16 2.27Transformation Nil Nil Nil Nil LnCochran’s C 0.59, NS 0.75, NS 0.54, NS 0.60, NS 0.48, NS

Mar Ecol Prog Ser 351: 1–13, 2007
Dinoflagellates, however, may be autotrophic, mixo-trophic or heterotrophic and the functional groupsused may have comprised species of varying trophicmodes. Their increase in concentration may have beena direct response to nutrient enrichment, a response toincreased availability of prey or due to a combinationof both processes. Since the response of dinoflagellateswas much slower than that of phytoplankton, parti-cularly during September, their increase most likelyreflected increased food supply rather than a simpleresponse to nutrient enrichment. Mesozooplankton didnot respond to increases in nutrients, which probablyreflects their longer turnover times, and longer experi-ments may be needed to determine if bottom-upresponses cascade to higher trophic levels.
Jellyfish had a considerable impact on the mesozoo-plankton community, with concentrations of all of themost abundant taxa decreasing in mesocosms exposed
to jellyfish. Catostylus mosaicus captures a range ofmesozooplankton, but most notably copepods, molluscveligers and polychaetes (Browne & Kingsford 2005,Peach & Pitt 2005), and most of these groups decreasedsubstantially in treatments containing jellyfish. Jelly-fish also caused changes in the assemblages of micro-zooplankton during both the May and Septemberexperiments. During May, concentrations of largearmoured dinoflagellates increased in the presence ofjellyfish. Most likely, this represented a top-down pro-cess because grazing by C. mosaicus on mesozoo-plankton may have reduced the grazing pressure ofmesozooplankton on the dinoflagellates. This resultcontrasts with that of Sommer et al. (2004), however,who observed that armoured dinoflagellates were notpreyed on by mesozooplankton in a mesocosm study.The mesozooplankton in their study was dominated bycopepods, and while copepods were also numericallydominant in our study, it is possible that the otherabundant mesozooplankton, such as polychaetes ormollusc veligers, may have preyed on the armoureddinoflagellates. Such trophic cascades are consistentwith those previously observed in ctenophore–cope-pod–ciliate food webs (Granéli & Turner 2002).
In both experiments, [chl a] was elevated by approx-imately 25% in treatments containing jellyfish, sug-gesting that jellyfish may stimulate primary produc-tion. The rapidity of the response, which was apparentwithin 24 to 36 h, however, indicates that it is unlikelyto have resulted from a top-down process because in atrophic cascade changes in primary production shouldlag behind those in zooplankton assemblages. Jellyfishalso had no discernable effects on assemblages ofphytoplankton during either experiment, indicatingthat top-down processes may not cascade to the levelof primary producers. Catostylus mosaicus excretesammonium at a rate of 1 to 1.5 mg kg–1 (wet weight) h–1
(Pitt et al. 2005). During the early stages of the experi-ments, the ammonium excreted would have resultedfrom feeding done prior to the jellyfish being added tothe mesocosms, rather than a recycling of nitrogenwithin the mesocosms. Mesocosms containing jellyfish,therefore, also effectively had an addition of nutrients.Based on the size of the medusae used in the study,their weight would have equated to approximately1 kg each (Pitt & Kingsford 2003). If we conservativelyestimate that the first 10 h of excretion representsnitrogen obtained from feeding prior to placement inthe mesocosms, then the amount of additional ammo-nium excreted by the 2 medusae in each mesocosmwould be approximately 8.5 µg l–1. This value repre-sents approximately 10% of the ammonia that wasadded to the nutrient treatments and may account forthe rapid increase in [chl a] seen in the jellyfish treat-ments. Because jellyfish had no detectable influence
10
Bivalve veligers
Gladioferensnauplii
Gladioferens+J–J
40
30
20
10
0+J–J +J–J
Num
ber
(x 1
02 )
m–3
Fig. 9. Mean (±SE) concentrations of Gladioferens, Gladio-ferens nauplii and bivalve veligers in the absence (–J) and
presence (+J) of jellyfish during September
TreatmentC J N N +J
8
6
4
2
0
Num
ber
(x 1
04 )
m–3
Fig. 10. Mean (±SE) concentrations of Noctiluca scintillans(number m–3) among treatments during September. C =
controls, N = nutrients added, J = jellyfish added

Pitt et al.: Nutrient and jellyfish impacts on plankton
on phytoplankton assemblages, however, the addi-tional nutrients in the jellyfish treatments had minimalinfluence on community structure, and were thereforeunlikely to have confounded interpretations of ourresults.
The major objective of this research was to identifyinteractive effects of jellyfish and nutrients. Interac-tions were observed for 3 groups—smooth large tin-tinnids in May, and rough large tintinnids and theheterotrophic dinoflagellate, Noctiluca scintillans inSeptember. Although the smooth and rough largetintinnids increased substantially in the mesocosms towhich only nutrients were added, their production wasinhibited in mesocosms that contained both nutrientsand jellyfish. Jellyfish generally appear to capturefew tintinnids (Stoecker et al. 1987, Larson 1991). Cato-stylus mosaicus does capture tintinnids, but tintinnidshave been observed on the oral arms of less than halfthe medusae sampled at a given time, suggesting thatit does not prey intensively on them (Browne & Kings-ford 2005). Towards the end of the experiment, how-ever, food may have been limited and so grazing by C.mosaicus may have inhibited the increase in tintinnidsseen in the mesocosms treated with nutrients only.
Evidence of synergism between nutrients and jelly-fish was found for 1 species only; the red-tide forming,heterotrophic dinoflagellate Noctiluca scintillans. N.scintillans has a global distribution, and during springand summer may form blooms in the coastal watersand estuaries of New South Wales (NSW), includingLake Illawarra (Dela-Cruz et al. 2002, 2003). In thecoastal waters adjacent to Lake Illawarra, upwelling ofnutrient-rich slope water is thought to promote produc-tion of diatoms preyed on by N. scintillans, stimulatingproduction of the dinoflagellate (Dela-Cruz et al.2002). In the current study, however, nutrients alonehad no effect on concentrations of N. scintillans, eventhough production of diatoms on which N. scintillans isknown to prey (e.g. Chaetoceros sp.) was enhanced bythe addition of nutrients. When both nutrients andjellyfish were added to the mesocosms, however, con-centrations of N. scintillans were, on average, morethan 20 times greater than the mesocosms to whichnutrients had been added alone.
Noctiluca scintillans grazes on a range of prey, in-cluding phytoplankton, protists and the eggs of cope-pods (reviewed by Elbrächter & Qi 1998). In the coastalwaters of NSW, however, the dominant food of N. scin-tillans is centric diatoms (Dela-Cruz et al. 2002). In thecurrent study, the calanoid copepod Gladioferens andbivalve veligers were the most abundant mesozoo-plankton in the mesocosms without jellyfish. In culture,Gladioferens feeds efficiently on diatoms such asChaetoceros (Payne & Rippingale 2000). If prey waslimiting, therefore, Gladioferens, may have competed
directly with N. scintillans for diatom prey. N. scintil-lans, however, probably competes poorly with othermesozooplankton because it is a largely immobile,interception predator and its clearance rates are lessthan those of similar sized zooplankton (Hansen et al.1997, Kiørboe & Titelman 1998). More mobile meso-zooplankton, such as copepods, are likely to havemuch greater encounter rates and rapidly depletephytoplankton when resources are limiting. Conse-quently, although the addition of nutrients to meso-cosms may have stimulated primary production andincreased the availability of food for N. scintillans, thecompetition exerted by co-occurring mesozooplankton(in particular Gladioferens) in the absence of jellyfishmay have limited production of N. scintillans.
Catostylus mosaicus is a voracious predator of meso-zooplankton and, with the exception of Noctiluca scin-tillans, it effectively removed most mesozooplanktonfrom the mesocosms, including the copepod andnaupliar stages of Gladioferens. Jellyfish, however,feed selectively on different types of zooplankton (e.g.Fancett 1988), possibly due to variations in the mor-phology of their nematocysts (Purcell & Mills 1988).While N. scintillans has been recorded on the oral armsof C. mosaicus (Browne & Kingsford 2005, Peach & Pitt2005), it is generally considered to be a poor source ofprey due to its low carbon (Kiørboe & Titelman 1998)and high ammonia (Okaichi & Nishio 1976) content. N.scintillans may not, therefore, be the preferred sourceof prey of C. mosaicus, and the large concentrations ofN. scintillans that remained in the mesocosms contain-ing jellyfish at the end of the experiment indicate thatC. mosaicus did not graze intensively on this species.For N. scintillans to achieve growth rates conduciveto forming red tides, its prey must be concentrated(Kiørboe & Titelman 1998). The greatest growth of N.scintillans occurred, therefore, only when both nutri-ents and jellyfish were present, since the nutrientsstimulated rapid growth of diatoms which N. scintil-lans was able to graze on in the absence of substantialcompetition from other herbivorous mesozooplankton.
Gelatinous zooplankton have been previously linkedto blooms of plankton, but data have been correlativeand it is difficult, therefore, to attribute causation(Schneider & Behrends 1998, Fock & Greve 2002, Oguzet al. 2001). For example, modeling of trophic interac-tions in the Black Sea indicates that phytoplanktonblooms are especially pronounced when gelatinouspredators are abundant (Oguz et al. 2001). Analysis ofthe Helgoland Roads time series in the North Sea alsoindicated an inverse correlation between Noctilucascintillans and the ctenophore Pleurobrachia pileus,hydromedusae, chaetognaths and copepods, all ofwhich were thought to prey on N. scintillans (Fock &Greve 2002). The food web model generated by Fock &
11
Mar Ecol Prog Ser 351: 1–13, 2007
Greve (2002) indicates that scyphozoan jellyfish andthe ctenophore Beroe prey on P. pileus and copepods,but not on N. scintillans, suggesting that if scypho-zoans were present, their predation on P. pileus andcopepods may reduce the predation pressure of thectenophore and copepods on N. scintillans, potentiallyenabling it to form blooms. Blooms of N. scintillansoccur predominantly in spring and summer (Elbrächter& Qi 1998), which coincides with the major period ofpopulation growth of many medusae (Möller 1980,Brewer 1989). Our study provides the first empiricalevidence linking gelatinous zooplankton to the devel-opment of red tides.
The biomass of gelatinous zooplankton has increasedin many parts of the world (Mills 2001, Purcell 2005). Insome cases this has resulted from the introduction ofinvasive species (Shiganova 1998, Graham et al. 2003),but increases in abundances of native species havealso occurred (e.g. Brodeur et al. 1999, Link & Ford2006, Lynam et al. 2006). Eutrophication of coastalwaters has also increased dramatically over the pastcentury (Clarke et al. 2006) and is likely to continue toincrease as populations grow and land is cleared foragricultural and urban development. There is anincreasing likelihood, therefore, that jellyfish bloomswill coincide with periods of nutrient enrichment,potentially leading to the formation of more red tides.
Acknowledgements. We thank J. Browne for her tireless workin the field and laboratory and M. Arthur for his generousassistance with statistical analyses. We are also grateful forthe assistance provided by D. Annese, G. Coade, E. Ho Shon,T. Ingleton, J. Potts and P. Scanes. The manuscript wasimproved by comments from J. Dela-Cruz and 4 anonymousreviewers. The research was funded by an AustralianResearch Council Strategic Partnerships with Industry—Research and Training grant (C00107240) to M.J.K, K.A.P,K.K. and D.R. and was conducted in accordance with institu-tional, national and international guidelines concerning theuse of animals in research and/or the sampling of endangeredspecies.
LITERATURE CITED
Bray JR, Curtis JT (1957) An ordination of the upland forestcommunities of Southern Wisconsin. Ecol Monogr 27:325–349
Brett MT, Goldman CR (1996) A meta-analysis of the freshwa-ter trophic cascade. Proc Natl Acad Sci USA 93:7723–7726
Brewer RH (1989) The annual pattern of feeding, growth, andsexual reproduction in Cyanea (Cnidaria: Scyphozoa) inthe Niantic River Estuary, Connecticut. Biol Bull 176:272–281
Brodeur RD, Mills CE, Overland JE, Walters GE, SchumacherJD (1999) Substantial increase in gelatinous zooplanktonin the Bering Sea, with possible links to climate change.Fish Oceanogr 8:296–306
Browne JG, Kingsford MJ (2005) A commensal relationshipbetween the scyphozoan medusa Catostylus mosaicus and
the copepod Paramacrochiron maximum. Mar Biol 146:1157–1168
Chen CC, Petersen JE, Kemp WM (1997) Spatial and tempo-ral scaling of periphyton growth on walls of estuarinemesocosms. Mar Ecol Prog Ser 155:1–15
Clarke KR, Greene RH (1988) Statistical design and analysisfor a ‘biological effects’ study. Mar Ecol Prog Ser 46:213–226
Clarke AL, Weckström K, Conley DJ, Anderson NJ and others(2006) Long-term trends in eutrophication and nutrientsin the coastal zone. Limnol Oceanogr 51:385–397
Dela-Cruz J, Ajani P, Lee R, Pritchard T, Suthers I (2002) Tem-poral abundance patterns of the red tide dinoflagellateNoctiluca scintillans along the southeast coast of Aus-tralia. Mar Ecol Prog Ser 236:75–88
Dela-Cruz J, Middleton JH, Suthers IM (2003) Populationgrowth and transport of the red tide dinoflagellate, Nocti-luca scintillans, in the coastal waters off Sydney Australia,using cell diameter as a tracer. Limnol Oceanogr 48:656–674
Elbrächter M, Qi YZ (1998) Aspects of Noctiluca (Dinophy-ceae) population dynamics, p. 315-335. In: Anderson DM,Cembella AD, Hallengraeff GM (eds) Physiological eco-logy of harmful algal blooms. Springer-Verlag, Berlin
Fancett MS (1988) Diet and prey selectivity of scypho-medusae from Port Phillip Bay, Australia. Mar Biol 98:503–509
Fock HO, Greve W (2002) Analysis and interpretation of re-current spatio-temporal patterns in zooplankton dynamics:a case study on Noctiluca scintillans (Dinophyceae) in theGerman Bight (North Sea). Mar Biol 140:59–73
Gillanders BM, Kingsford MJ (2002) Impact of changes inflow of freshwater on estuarine and open coastal habitatsand the associated organisms. Oceanogr Mar Biol AnnRev 40:233–309
Graham WM, Martin DL, Felder DL, Asper VL, Perry HM(2003) Ecological and economic implications of a tropicaljellyfish invader in the Gulf of Mexico. Biol Invasions 5:53–69
Granéli E, Turner JT (2002) Top-down regulation in cteno-phore–copepod–ciliate–diatom–phytoflagellate communi-ties in coastal waters: a mesocosm study. Mar Ecol ProgSer 239:57–68
Hansen PJ, Bjørnsen PK, Hansen BW (1997) Zooplanktongrazing and growth: Scaling within the 2-2,000 µm bodysize range. Limnol Oceanogr 42:687–704
Kiørboe T, Titelman J (1998) Feeding, prey selection and preyencounter mechanisms in the heterotrophic dinoflagellateNoctiluca scintillans. J Plankton Res 20:1615–1636
Larson RJ (1991) Diet, prey selection and daily ration of Sto-molophus meleagris, a filter-feeding scyphomedusa fromthe NE Gulf of Mexico. Estuar Coast Shelf Sci 32:511–525
Link JS, Ford MD (2006) Widespread and persistent increaseof Ctenophora in the continental shelf ecosystem off NEUSA. Mar Ecol Prog Ser 320:153–159
Lund JW, Kipling C, Le Cren ED (1958) An inverted micro-scope method of estimating algal numbers and the sta-tistical basis of estimations by counting. Hydrobiol 11:143–170
Lynam CP, Gibbons MJ, Bjørn EA, Sparks CAJ, HeywoodBG, Brierley AS (2006) Jellyfish overtake fish in a heavilyfished ecosystem. Curr Biol 16:R492–R493
Mills CE (2001) Jellyfish blooms: are populations increasingglobally in response to changing ocean conditions?Hydrobiol 451:55–68
Möller H (1980) Population dynamics of Aurelia aurita me-dusae in Kiel Bight, Germany (FRG). Mar Biol 60:123–128
12

Pitt et al.: Nutrient and jellyfish impacts on plankton
O’Donnell M, Yassini I, Taylor EJ, Morrison RJ (2004) Waterquality in the Lake Illawarra catchment. Wetlands (Aus-tralia) 21:237–252
Oguz T, Ducklow HW, Purcell JE, Malanotte-Rizzoli P (2001)Modeling the response of top-down control exerted bygelatinous carnivores on the Black Sea pelagic food web.J Geophys Res 106:4543–4564
Okaichi T, Nishio S (1976) Identification of ammonia as thetoxic principle of red tide of Noctiluca milaris. Bull Plank-ton Soc Jpn 23:75–80
Olsen Y, Augusti S, Duarte CM, Gasol JM and others (2006)Planktonic food web response to nutrients.Limnol Oceanogr51:489–503
Olsson P, Graneli E, Carlsson P, Abreu P (1992) Structuring ofa postspring phytoplankton community by manipulationof trophic interactions. J Exp Mar Biol Ecol 158:249–266
Payne MF, Rippingale RJ (2000) Evaluation of diets for cultureof the calanoid copepod Gladioferens imparipes. Aqua-culture 187:85–96
Peach MB, Pitt KA (2005) Morphology of the nematocysts ofthe medusae of two scyphozoans Catostylus mosaicus andPhyllorhiza punctata (Rhizostomeae): implications forcapture of prey. Invertebr Biol 124:98–108
Pitt KA, Kingsford MJ (2000) Geographic separation of stocks ofthe edible jellyfish Catostylus mosaicus (Rhizostomeae) inNew South Wales, Australia. Mar Ecol Prog Ser 196:143–155
Pitt KA, Kingsford MJ (2003) Temporal variation in the virginbiomass of the edible jellyfish, Catostylus mosaicus(Scyphozoa, Rhizostomeae). Fish Res 63:303–313
Pitt KA, Koop K, Rissik D (2005) Contrasting contributions toinorganic nutrient recycling by the co-occurring jelly-fishes, Catostylus mosaicus and Phyllorhiza punctata (Scy-phozoa, Rhizostomeae). J Exp Mar Biol Ecol 315:71–86
Purcell JE (2005) Climate effects on formation of jellyfish andctenophore blooms: a review. J Mar Biol Assoc UK 85:461–476
Purcell JE, Mills CS (1988) The correlation between nemato-cyst types and diet in pelagic hydrozoa. In: Hessinger DA,Lenhoff HM (eds) The biology of nematocysts. AcademicPress, San Diego, CA p 463–483
Schneider G, Behrends G (1998) Top-down control in a neriticplankton system by Aurelia aurita medusae—a summary.Ophelia 48:71–82
Shiganova TA (1998) Invasion of the Black Sea by thectenophore Mnemiopsis leidyi and recent changes inpelagic community structure. Fish Oceanogr 7:305–310
Sommer U, Hansen T, Stibor H, Vadstein O (2004) Persistenceof phytoplankton responses to different Si:N ratios undermesozooplankton grazing pressure: a mesocosm studywith NE Atlantic plankton. Mar Ecol Prog Ser 278:67–75
Stibor H, Vadstein O, Diehl S, Gelzleichter A and others(2004) Copepods act as a switch between alternativetrophic cascades in marine pelagic food webs. Ecol Lett7:321–328
Stoecker D, Guillard RRL, Kavee RM (1981) Selective Preda-tion by Favella ehrenbergii (Tintinnia) on and amongdinoflagellates. Biol Bull 160:136–145
Stoecker DK, Michaels AE, Davis LH (1987) Grazing by thejellyfish, Aurelia aurita, on microzooplankton. J PlanktonRes 9:901–915
Strickland JD, Parsons TR (1972) A practical handbook of seawater analysis. Fish Res Bd Canada Bull 167:311
Underwood AJ (1997) Experiments in ecology: their logicaldesign and interpretation using analysis of variance. Cam-bridge University Press, Cambridge
Vanni MJ, Findlay DL (1990) Trophic cascades and phyto-plankton community structure. Ecology 71:921–937
Verity PG (1985) Grazing, respiration, excretion, and growthrates of tintinnids. Limnol Oceanogr 30:1268–1282
Ware DM, Thomson RE (2005) Bottom-up ecosystem trophicdynamics determine fish production in the northeast. PacSci 308:1280–1285
13
Editorial responsibility: Otto Kinne (Editor-in-Chief),Oldendorf/Luhe, Germany
Submitted: July 5, 2007; Accepted: October 23, 2007Proofs received from author(s): November 26, 2007
Copyright © 2022 FDOKUMEN