Benthic and Planktonic Microalgal Community Structure and ...
Journal of Plankton Research Vol.20 no.5 pp.887-900, 1998
The use of biomass spectra and allometric relations to estimaterespiration of planktonic communities
Jose M.Blanco1, Renato A.Quifiones2, Francisco Guerrero1-3 and JaimeRodriguez1
1Departamento de Ecologia, Universidad de Malaga, Facultad de Ciencias, 29071-Malaga, Spain and 2Departamento de Oceanografia, Universidad de Conception,Casilla 2407, Concepcidn, Chile3Present address: Departamento de Ecologia, Universidad de Jaen, Facultad deCiencias Experimentales, 23071-Jaen, Spain
Abstract In this paper we compared two different approaches to estimate plankton energy consump-tion: (i) combination of the observed biomass-size spectrum and empirical allometric relationshipsbetween respiration and body size, and (ii) the experimental measurement of ETS (electronic transfersystem) activity. The first approach was carried out through both discrete and continuous models.Results indicated a good agreement between predicted and observed metabolism in both a freshwaterand an oceanic plankton assemblage from bacteria to zooplankton. The discrete integration of thespectrum accounts better for changing systems than continuous integration, which is more appropri-ate for theoretical approaches to studying the metabolism of the community. The combination ofbiomass spectrum slopes and allometric exponents was critical in metabolism sensitivity to sizestructure: flatter biomass slopes (as found in microbial assemblages) allow for greater variations inthis size range to the total metabolism contribution of the planktonic community. For future studies,the fast progression in technical discrimination and measurement of particles makes this approach apromising tool for the analysis of energy budgets in planktonic ecosystems.
Introduction
The biomass spectrum approach has proven to be very useful in the study of thestructure of pelagic oceanic communities (Sheldon et al., 1972; Platt and Denman,1978; Rodriguez and Mullin, 1986a). The open, oligotrophic ocean is especiallyappropriate to applications of this macroscopic approach due to its comparativelyconstant structure. Highly variable ecosystems also show global properties intheir organization which can be addressed by studying their biomass spectrumstructure and dynamics (Sprules and Munawar, 1986; Rodriguez et al., 1987;Echevarrfa et al., 1990; Gasol et al., 1991).
However, there have been few attempts to apply size-spectrum analysis todescribing the metabolic characteristics of ecosystems with predictable results.On the basis of empirical relationships found between the size of organisms andtheir metabolic characteristics (Peters, 1983; Calder, 1984), Platt et al. (1984)theoretically estimated the respiration of the planktonic community in theCentral Gyre of the North Pacific Ocean, whose size structure had been previ-ously described by Beers et al. (1982), There were no experimental, simultaneousmeasurements of respiration, so the empirical test of their theoretical predictionshad to be carried out by using literature data taken from Williams (1981). Gaedke(1993) also obtained an estimation of metabolism from the size structure of theplanktonic community in Lake Constance and tested it against size-productiondata. Nevertheless, the test was only possible in relative units since production
© Oxford University Press 887
by guest on August 9, 2015
http://plankt.oxfordjournals.org/D
ownloaded from
J.M.Blanco et al.
and metabolism are not directly comparable as they account for processes thatvary in different ways across the size spectrum.
To what degree can ecosystem fluxes—such as respiration—be deduced frombiomass spectra? The answer is not immediate. Quinones et al. (1994) consideredthe uncertainty in the allometric approach to the study of fluxes in the pelagiccommunities. According to this study, there would be three principal sources ofuncertainty: (i) methodological, statistical and conceptual problems in construct-ing the fundamental allometric scaling equations (e.g. Seim and Saether, 1983;Smith, 1984; McNab, 1988; Blanco et al., 1994); (ii) the wide range of sizes andtypes of organisms used for allometric analysis of their metabolic properties and,therefore, the use of 'average' coefficients that may result in considerable devia-tions (Lampert, 1984; Calder, 1987); and (iii) the fact that it is in the narrow range<100 urn ESD (equivalent spherical diameter) where most of the communitymetabolism lies (Platt et al., 1984; Blanco, 1993).
In this work we study the relationship between global community metabolism(a flux variable) and biomass spectrum (a stock variable). This differs fromprevious analyses such as those from Platt etal. (1984) and Gaedke (1993) by theuse of simultaneous measurements of metabolism and biomass size distribution.The data come from studies carried out in two very different aquatic systems: afreshwater reservoir in Southern Spain and the North Atlantic shelf waters(Quinones, 1992). In both cases, simultaneous data sets of respiration and sizestructure of planktonic communities were obtained through similar methods,covering a size range from bacteria to zooplankton. If a relationship betweenbiomass size distribution and total community metabolism can be proven, the useof biomass spectra could be a valuable tool for studying energy budgets in plank-tonic communities.
Method
The size spectrum
The size spectrum is the main tool used in this work. The theoretical models (Plattand Denman, 1978) and empirical observations on the biomass distribution ofliving organisms suggest that there is a simple relationship between biomass andsize of planktonic organisms in the open ocean (Platt et al., 1984; Rodriguez andMullin, 1986), as well as in freshwater ecosystems (Sprules and Munawar, 1986;Rodriguez et al., 1990; Ahrens and Peters, 1991; Gaedke, 1992). When the organ-isms have been grouped in size classes (by mesh filtration, counting and measur-ing, etc.), the size structure can be represented in a histogram plot (similar toFigure 1) where each rectangle area expresses the biomass B corresponding toeach size class. As the amplitude of size intervals Aw becomes narrower, theheights of the rectangles are approaching the derivative of the biomass distri-bution, which is called p\ the normalized biomass (Platt and Denman, 1978) sinceit can be approximated to P(w) = B(w, w + Aw)/Aw. If the size classes are geomet-rical of base 2 (i.e. lower limit, w, = 2') then Aw, = w, and, hence B(wh w, + j)/Aw,= B{yvh w, + i)/w(- = N{\Vi), where N is the abundance of organisms in the respectivesize class. This allows estimation of p by knowing N in octave classes. Nevertheless,
888
by guest on August 9, 2015
http://plankt.oxfordjournals.org/D
ownloaded from
Biomass spectra and community respiration
aucCO
•o3
2.o
10
8
6
4
2
0
log N = 7.744 - 0.823 log wt r2 = 0.878
p < 0.001 S.E. slope = 0.077
§ a § s - ~
individual size (um^
8!
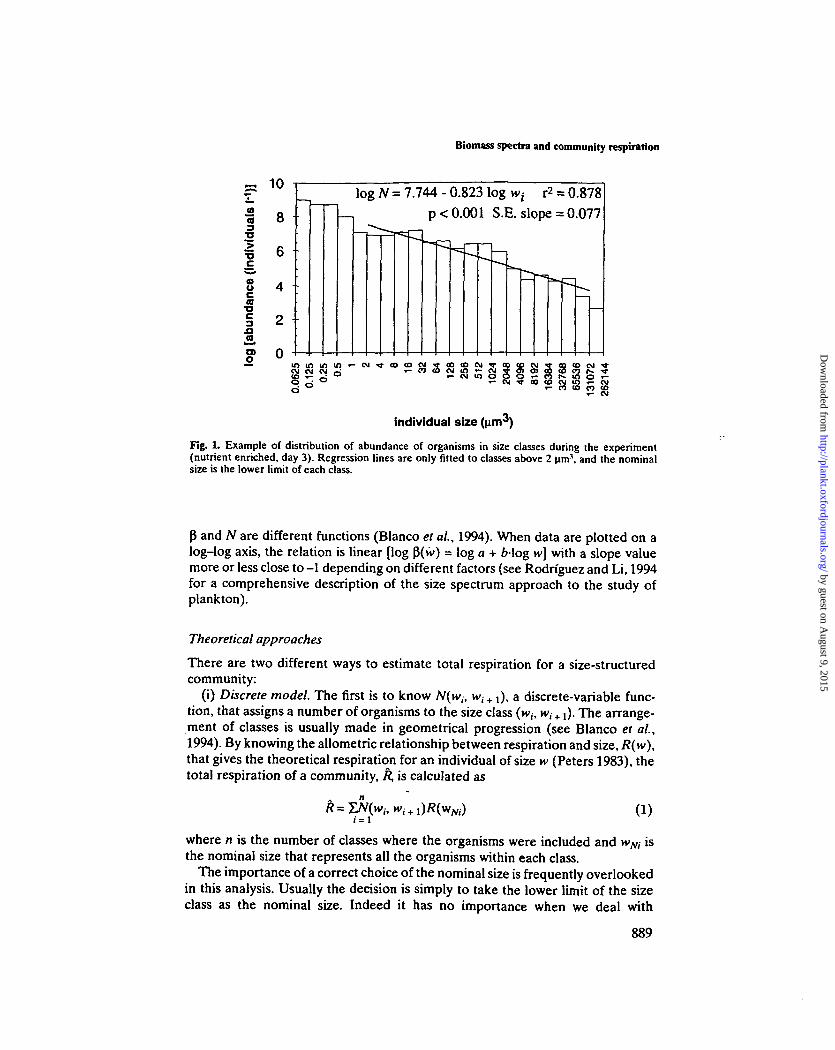
Fig. 1. Example of distribution of abundance of organisms in size classes during the experiment(nutrient enriched, day 3). Regression lines are only fitted to classes above 2 urn-1, and the nominalsize is the lower limit of each class.
P and N are different functions (Blanco et al., 1994). When data are plotted on alog-log axis, the relation is linear [log P(»v) = log a + blog w] with a slope valuemore or less close to -1 depending on different factors (see Rodriguez and Li, 1994for a comprehensive description of the size spectrum approach to the study ofplankton).
Theoretical approaches
There are two different ways to estimate total respiration for a size-structuredcommunity:
(i) Discrete model. The first is to know N(wh w, + {), a discrete-variable func-tion, that assigns a number of organisms to the size class (w,, w, + {). The arrange-ment of classes is usually made in geometrical progression (see Blanco et al.,1994). By knowing the allometric relationship between respiration and size, R(w),that gives the theoretical respiration for an individual of size w (Peters 1983), thetotal respiration of a community, R, is calculated as
(1)i= 1
where n is the number of classes where the organisms were included and wNi isthe nominal size that represents all the organisms within each class.
The importance of a correct choice of the nominal size is frequently overlookedin this analysis. Usually the decision is simply to take the lower limit of the sizeclass as the nominal size. Indeed it has no importance when we deal with
889
by guest on August 9, 2015
http://plankt.oxfordjournals.org/D
ownloaded from
J.M.Blanco el aL
metabolism (or any other global property) in arbitrary units (Gaedke, 1993) butBlanco et al. (1994) have demonstrated that the final result depends strongly onthe form of wNi (there are differences of up to 50% of the total estimation) andproposed the following to calculate the optimum nominal size for a particular sizeclass:
where w, is the lower limit of size class, c is the ratio of the geometrical increas-ing of classes (e.g. 2 for an octave arrangement as in Sheldon et al., 1972) and bis the slope of normalized biomass spectrum. Gaedke (1993) followed thismethod to obtain different R for autotrophic and heterotrophic organisms, totalmetabolism being the sum of both.
(ii) Continuous model. Platt etal. (1984) proposed a continuous function of theform
)p(w)dw (3)
where p is the function of density of biomass and p is the size-specific respiration[i.e. R(w)/w]. For size-specific respiration, the form p(w) = mw1 is accepted, wherem is a proportionality coefficient that relates the units in which respiration andsize are expressed and s is a scaling coefficient derived empirically from the allo-metric relationship between respiration and size (Hemmingsen, 1960; Peters,1983). Therefore, following equation (3), the respiration of organisms whose sizesrange from w0 to w, is
Units and equations
The units of w must be the same in P and p to allow for their combination. This isparticularly critical in plankton studies, where body size, biomass, and respirationare measured in a broad diversity of units. For instance, respiration is measuredas biovolume (Caron et aL, 1985), wet mass (Gaudy and Boucher, 1983), dry mass(Ikeda, 1970) or carbon units (Ross, 1982). Differences such as these will affectthe value of R in two ways: (i) a proportional deviation, when differences in unitsare isometric [e.g. the relationship provided by Wiebe etal. (1975) for conversionof zooplankton volume into carbon units, C = 8% V\, and (ii) a more complicateddeviation, when differences are allometric [e.g. conversion of phytoplankton cellvolume (UJTI3) into carbon (pg), log C = 0.866 log V - 0.460 given by Strathmann(1967)]. There are some attempts to eliminate these sources of discrepancy(Moloney and Field, 1989) but they always require subjective rules stronglydependent on the data source. Instead of increasing this degree of variability inthe conversion of units by giving our own ones, we used the most general equa-tion (see below) and we assessed the sensitivity of the final result.
We used biovolume (um3 I"1) to express biomass, oxygen consumption
890
by guest on August 9, 2015
http://plankt.oxfordjournals.org/D
ownloaded from
Biomass spectra and community respiration
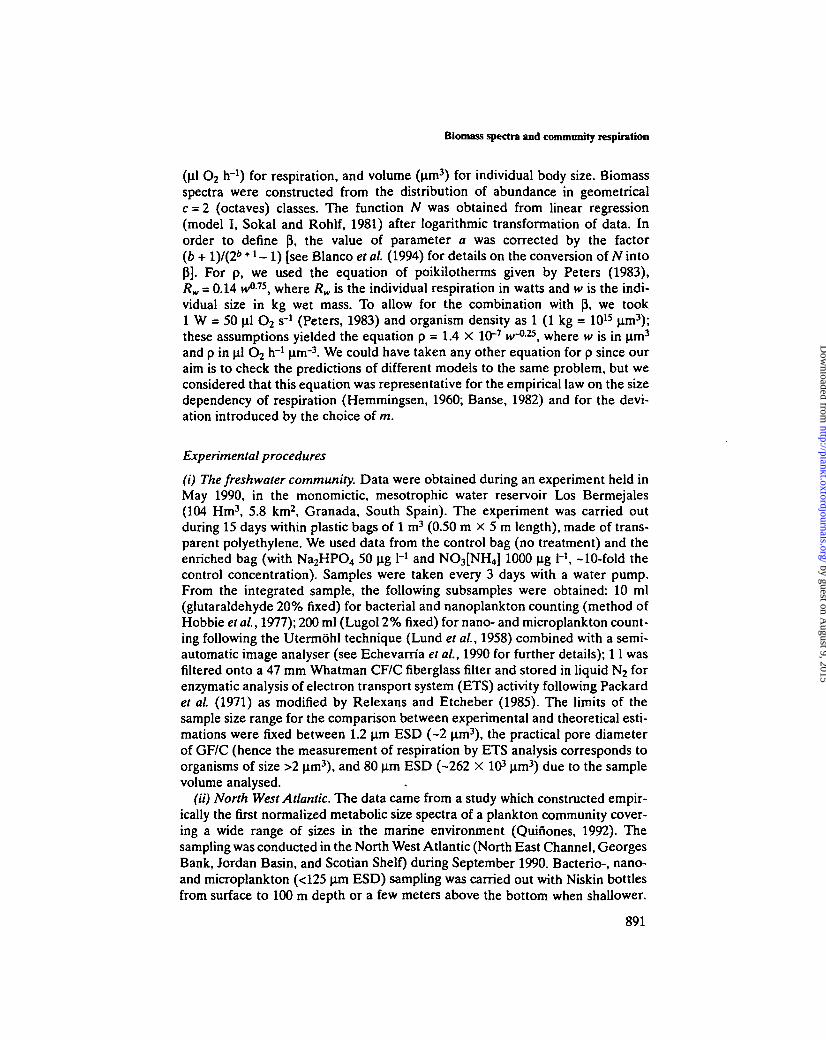
(ul O2 h"1) for respiration, and volume (um3) for individual body size. Biomassspectra were constructed from the distribution of abundance in geometricalc = 2 (octaves) classes. The function N was obtained from linear regression(model I, Sokal and Rohlf, 1981) after logarithmic transformation of data. Inorder to define p\ the value of parameter a was corrected by the factor(b + l)/(26 +1 - 1 ) [see Blanco et al. (1994) for details on the conversion of N intoP]. For p, we used the equation of poikilotherms given by Peters (1983),i?w = 0.14 w015, where Rw is the individual respiration in watts and w is the indi-vidual size in kg wet mass. To allow for the combination with p\ we took1 W = 50 ul O2 s-
1 (Peters, 1983) and organism density as 1 (1 kg = 1015 urn3);these assumptions yielded the equation p = 1.4 X 10~7 w0-25, where w is in um3
and p in ul O2 h"1 |im~3. We could have taken any other equation for p since ouraim is to check the predictions of different models to the same problem, but weconsidered that this equation was representative for the empirical law on the sizedependency of respiration (Hemmingsen, 1960; Banse, 1982) and for the devi-ation introduced by the choice of m.
Experimental procedures
(i) The freshwater community. Data were obtained during an experiment held inMay 1990, in the monomictic, mesotrophic water reservoir Los Bermejales(104 Hm3, 5.8 km2, Granada, South Spain). The experiment was carried outduring 15 days within plastic bags of 1 m3 (0.50 m X 5 m length), made of trans-parent polyethylene. We used data from the control bag (no treatment) and theenriched bag (with Na2HPO4 50 ug I"1 and NO3[NH4) 1000 \ig H, -10-fold thecontrol concentration). Samples were taken every 3 days with a water pump.From the integrated sample, the following subsamples were obtained: 10 ml(glutaraldehyde 20% fixed) for bacterial and nanoplankton counting (method ofHobbie et al., 1977); 200 ml (Lugol 2% fixed) for nano- and microplankton count-ing following the Utermohl technique (Lund et al., 1958) combined with a semi-automatic image analyser (see Echevarria et al, 1990 for further details); 11 wasfiltered onto a 47 mm Whatman CF/C fiberglass filter and stored in liquid N2 forenzymatic analysis of electron transport system (ETS) activity following Packardet al. (1971) as modified by Relexans and Etcheber (1985). The limits of thesample size range for the comparison between experimental and theoretical esti-mations were fixed between 1.2 um ESD (-2 urn3), the practical pore diameterof GF/C (hence the measurement of respiration by ETS analysis corresponds toorganisms of size >2 um3), and 80 um ESD (-262 x 103 um3) due to the samplevolume analysed.
(//) North West Atlantic. The data came from a study which constructed empir-ically the first normalized metabolic size spectra of a plankton community cover-ing a wide range of sizes in the marine environment (Quinones, 1992). Thesampling was conducted in the North West Atlantic (North East Channel, GeorgesBank, Jordan Basin, and Scotian Shelf) during September 1990. Bacterio-, nano-and microplankton (<125 um ESD) sampling was carried out with Niskin bottlesfrom surface to 100 m depth or a few meters above the bottom when shallower.
891
by guest on August 9, 2015
http://plankt.oxfordjournals.org/D
ownloaded from

JJVLBlanco el at
Then, by mixing proportionally the samples taken from different depths, an inte-grated sample of the water column was obtained. The integrated sample was size-fractionated immediately by gentle reverse filtration through Nytex planktonnetting. Zooplankton sampling was carried out through vertical tows with Bongonets (mesh size 64 |im). The maximum depth chosen for the vertical tow wasusually -200 m or a few meters above the bottom when shallower. Bacterialbiomass was estimated using the DAPI technique according to Porter and Feig(1980) and counted under an epifluorescence microscope. Bacterial biovolumeswere estimated using image analysis from picture projections. Nano- and micro-plankton biomass was estimated using a combination of the Utermohl techniqueand image analysis. Zooplankton size-fractions were weighed in order to estimatetheir biomass and carbon content using a CHN elemental analyser. The upperlimit of significant sampled size of zooplankton was 8 mm. The activity of the respi-ratory ETS of the nano- and microplankton was determined according to Packardand Williams (1981), which is basically the same method as used in the freshwatercase, except for the volume of enzymatic extract and reactive used. The zooplank-ton ETS activity was determined using the method of Owens and King (1975), atechnique which is based on the same procedure but with different pH to favorthe zooplanktonic enzymes. A complete description of the methods used inobtaining this data set can be found in Quinones (1992).
Results
Figure 1 is an example of the size distribution of organism abundance (TV) in thefreshwater ecosystem and the corresponding continuous ((3) function. The fittingof P is limited to the range over 2 um3 (1.2 urn ESD) as explained in Method. Theparameters of f$ and the corresponding ETS activities obtained during the fresh-water experiment appear in Table I. Observations corresponding to oceanicwaters are in Table II. The P function had the same slope N but a different valueof intercept, since it was corrected following Blanco et al. (1994). In all cases, the
Table I. Function of density of biomass. f5(n>) = a tv*, and ETS activity obtained at the freshwaterreservoir. Units of a are (fim3)"* H, so p is in I"1
Day
Control0369
1215
2.91 X 10⁷ W0™2.83 x 10⁷ HrO.»o1.27 X 107 HT-O™
6.61 x 10* w-0680
1.21 x 10⁷ w°™9.22 X 10⁶ w°m
Nutrient enriched0369
1215
3.28 x 10⁷ HH>*"7.52xlO7Hr<«2-i5.65 X 107 w-°TO
6.60 x 10⁷ w07"2.17 X 10⁷ »^>««1.58 X 10⁷ w~°<™
0.8960.8640.8370.8180.8410.786
0.9090.8780.8710.8640.8380.859
SE slope
0.0640.0850.0780.0830.0810.091
0.0590.0770.0710.0760.0730.064
ETS(ulO2h-' l- ' )
27.4026.0515.7021.558.706.65
32.9080.4084.60
145.2086.9071.40
892
by guest on August 9, 2015
http://plankt.oxfordjournals.org/D
ownloaded from
Biomass spectra and community respiration
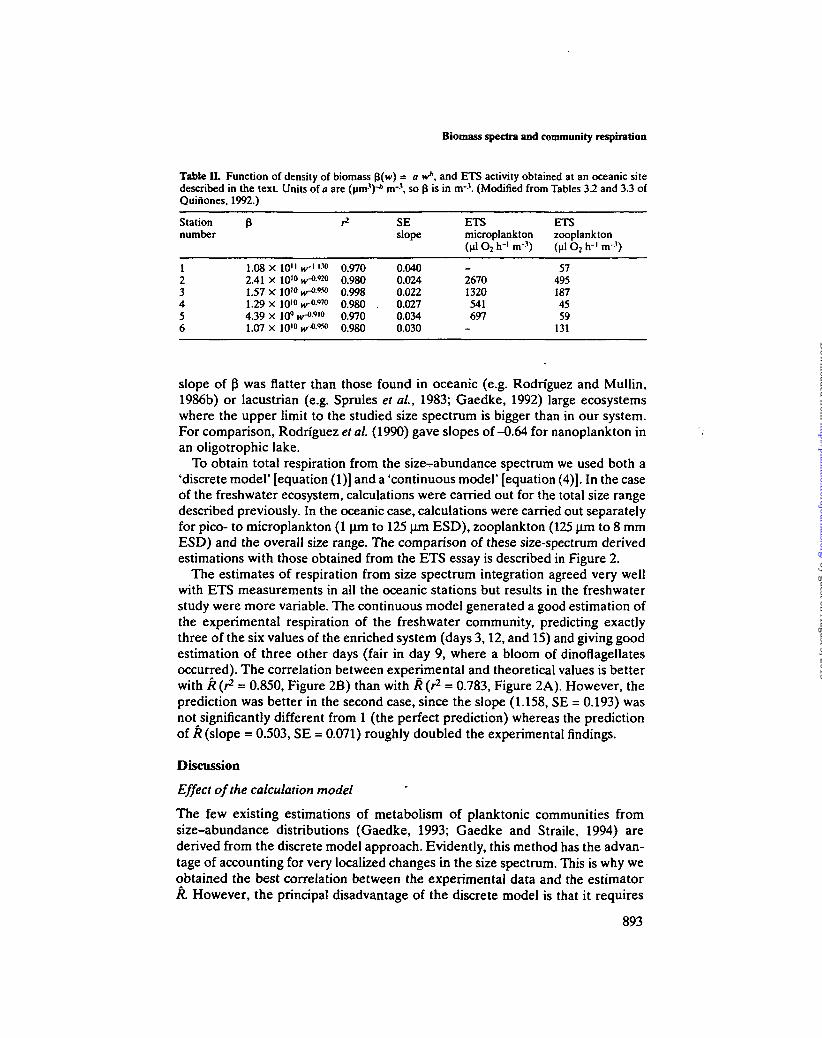
Table II. Function of density of biomass $(w) = a w*, and ETS activity obtained at an oceanic sitedescribed in the text. Units of a are (urn-1)-* n r \ so f$ is in n r \ (Modified from Tables 3.2 and 3.3 ofQuiiiones, 1992.)
Stationnumber
123456
1.08 x 10" nr"'M2 41 X 10"* HT-O-9201 57 X 101** iykW*1.29 x 10¹⁰ iv"0-970
4.39 x 10q »v-o.9io1 07 x 10'" H^- 9 ^
0.9700.9800.9980.980 .0.9700.980
SEslope
0.0400.0240.0220.0270.0340.030
ETSmicroplankton(Ml O2 h"' m-1)
_26701320541697
-
ETSzooplankton(Ml O2 h"1 m-1)
574951874559
131
slope of P was flatter than those found in oceanic (e.g. Rodriguez and Mullin,1986b) or lacustrian (e.g. Sprules et ai, 1983; Gaedke, 1992) large ecosystemswhere the upper limit to the studied size spectrum is bigger than in our system.For comparison, Rodriguez etal. (1990) gave slopes of-0.64 for nanoplankton inan oligotrophic lake.
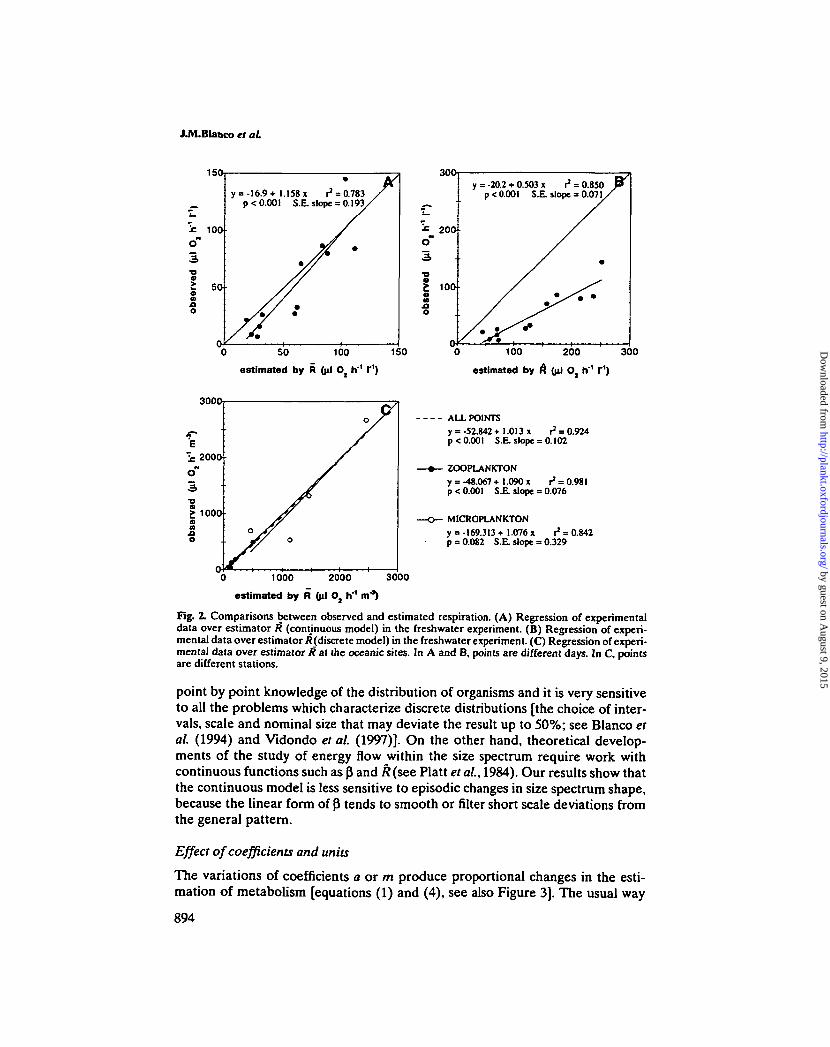
To obtain total respiration from the size^abundance spectrum we used both a'discrete model' [equation (1)] and a 'continuous model' [equation (4)]. In the caseof the freshwater ecosystem, calculations were carried out for the total size rangedescribed previously. In the oceanic case, calculations were carried out separatelyfor pice- to microplankton (1 urn to 125 urn ESD), zooplankton (125 urn to 8 mmESD) and the overall size range. The comparison of these size-spectrum derivedestimations with those obtained from the ETS essay is described in Figure 2.
The estimates of respiration from size spectrum integration agreed very wellwith ETS measurements in all the oceanic stations but results in the freshwaterstudy were more variable. The continuous model generated a good estimation ofthe experimental respiration of the freshwater community, predicting exactlythree of the six values of the enriched system (days 3,12, and 15) and giving goodestimation of three other days (fair in day 9, where a bloom of dinoflagellatesoccurred). The correlation between experimental and theoretical values is betterwith R (r2 = 0.850, Figure 2B) than with R (r2 = 0.783, Figure 2A). However, theprediction was better in the second case, since the slope (1.158, SE = 0.193) wasnot significantly different from 1 (the perfect prediction) whereas the predictionof R (slope = 0.503, SE = 0.071) roughly doubled the experimental findings.
Discussion
Effect of the calculation model
The few existing estimations of metabolism of planktonic communities fromsize-abundance distributions (Gaedke, 1993; Gaedke and Straile, 1994) arederived from the discrete model approach. Evidently, this method has the advan-tage of accounting for very localized changes in the size spectrum. This is why weobtained the best correlation between the experimental data and the estimatorR. However, the principal disadvantage of the discrete model is that it requires
893
by guest on August 9, 2015
http://plankt.oxfordjournals.org/D
ownloaded from
J.M.Blanco et at
150
100
o"
•o
9
Oao
5 0
y = -16.9+ 1.158 x ^ = 0.783p < 0.001 S.E. slope = 0.193/
300
200
t 100CDno
y = -20.2 + 0.503 x r1 = 0.850p < 0.001 S.E. slope = 0.071,
"0 50 100 150
estimated by R Oil O2 h ' r1)
"0 100 200 300
estimated by A Oil O, h 1 r1)
300O
ALL POINTSy = -52.842+1.013 x 1̂ = 0.924p < 0.001 S.E. slope = 0.102
ZOOPLANKTONy =-48.067+1.090 x r* = 0.981p < 0.001 S.E. slope = 0.076
MICROPLANKTON
y =-169.313+1.076 x ^ = 0.842p = 0.082 S.E. slope = 0.329
1000 2000 3000
estimated by R (ill O, h"1 mJ)
Fig. 2. Comparisons between observed and estimated respiration. (A) Regression of experimentaldata over estimator /? (continuous model) in the freshwater experiment. (B) Regression of experi-mental data over estimator /{(discrete model) in the freshwater experiment. (C) Regression of experi-mental data over estimator R at the oceanic sites. In A and B, points are different days. In C, pointsare different stations.
point by point knowledge of the distribution of organisms and it is very sensitiveto all the problems which characterize discrete distributions [the choice of inter-vals, scale and nominal size that may deviate the result up to 50%; see Blanco etal. (1994) and Vidondo et al. (1997)]. On the other hand, theoretical develop-ments of the study of energy flow within the size spectrum require work withcontinuous functions such as p and k(see Platt et al, 1984). Our results show thatthe continuous model is less sensitive to episodic changes in size spectrum shape,because the linear form of P tends to smooth or filter short scale deviations fromthe general pattern.
Effect of coefficients and units
The variations of coefficients a or m produce proportional changes in the esti-mation of metabolism [equations (1) and (4), see also Figure 3]. The usual way
894
by guest on August 9, 2015
http://plankt.oxfordjournals.org/D
ownloaded from

Biomass spectra and community respiration
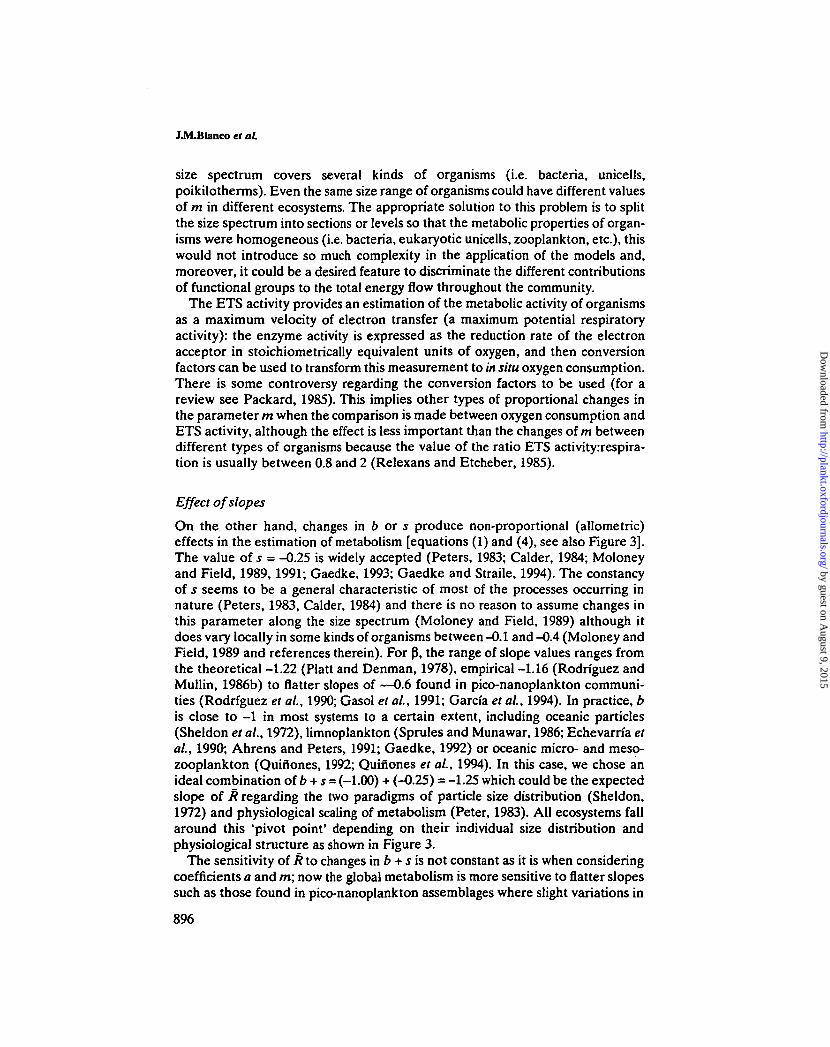
Fig. 3. Sensitivity analysis of estimated respiration R in arbitary units (a.u.) to changes in parametersof biomass spectrum and weight-specific respiration. Slope parameters (b, s) and coefficientparameters (a, m) are grouped since their effect following equation (4). Grey areas represent thecombination of slopes in Sheldon-Peters case (the most general) and in nano-microplankton case (thisstudy).
to construct p by taking the lower limits of sizes classes as nominal size (e.g.Sprules et al., 1983; Echevarria et al, 1990; Gaedke, 1992) tends to underestimatethe coefficient a and hence the estimated respiration. This problem was solved bydetermining the nominal size such as the integral of (3 and was the total biomasswithin each class (see Method).
A more difficult problem to be solved, affecting both the continuous model andthe discrete model, is the wide range of variation of m, a parameter that resultsfrom many conversions of units. These conversions are necessary to summarizedata for regression analysis (Moloney and Field, 1989) or to check with the usedunits of P (as in this work). For instance, the original Peters' value of m = 0.14 Wkg"075 for poikilotherms (R in watts, w in kg) can be transformed in order tocompare it with Gaedke's and Moloney's works (R in pg C day1, w in pg C) toyield m « 46 pg C0-25 day1, -3-fold the value that Moloney and Field (1989) givefor particle feeders of plankton (14 pg C0-25) and ~20-fold the values they use forbacteria and phytoplankton (1.7-2 pg C0-25 day1) that are fairly close to Peters'value for unicells (0.018 W kg"075 = 6 pg C0-25 day1). The selection of an adequatevalue of m is the problem to solve. The parameter m should be different when the
895
by guest on August 9, 2015
http://plankt.oxfordjournals.org/D
ownloaded from
J.M.Blanco el aL
size spectrum covers several kinds of organisms (i.e. bacteria, unicells,poikilotherms). Even the same size range of organisms could have different valuesof m in different ecosystems. The appropriate solution to this problem is to splitthe size spectrum into sections or levels so that the metabolic properties of organ-isms were homogeneous (i.e. bacteria, eukaryotic unicells, zooplankton, etc.), thiswould not introduce so much complexity in the application of the models and,moreover, it could be a desired feature to discriminate the different contributionsof functional groups to the total energy flow throughout the community.
The ETS activity provides an estimation of the metabolic activity of organismsas a maximum velocity of electron transfer (a maximum potential respiratoryactivity): the enzyme activity is expressed as the reduction rate of the electronacceptor in stoichiometrically equivalent units of oxygen, and then conversionfactors can be used to transform this measurement to in situ oxygen consumption.There is some controversy regarding the conversion factors to be used (for areview see Packard, 1985). This implies other types of proportional changes inthe parameter m when the comparison is made between oxygen consumption andETS activity, although the effect is less important than the changes of m betweendifferent types of organisms because the value of the ratio ETS activityrrespira-tion is usually between 0.8 and 2 (Relexans and Etcheber, 1985).
Effect of slopes
On the other hand, changes in b or s produce non-proportional (allometric)effects in the estimation of metabolism [equations (1) and (4), see also Figure 3].The value of s = -0.25 is widely accepted (Peters, 1983; Calder, 1984; Moloneyand Field, 1989,1991; Gaedke, 1993; Gaedke and Straile, 1994). The constancyof s seems to be a general characteristic of most of the processes occurring innature (Peters, 1983, Calder, 1984) and there is no reason to assume changes inthis parameter along the size spectrum (Moloney and Field, 1989) although itdoes vary locally in some kinds of organisms between-0.1 and -0.4 (Moloney andField, 1989 and references therein). For p\ the range of slope values ranges fromthe theoretical -1.22 (Platt and Denman, 1978), empirical -1.16 (Rodriguez andMullin, 1986b) to flatter slopes of —0.6 found in pico-nanoplankton communi-ties (Rodriguez et aL, 1990; Gasol et aL, 1991; Garcia et aL, 1994). In practice, bis close to -1 in most systems to a certain extent, including oceanic particles(Sheldon et aL, 1972), limnoplankton (Sprules and Munawar, 1986; Echevarria etaL, 1990; Ahrens and Peters, 1991; Gaedke, 1992) or oceanic micro- and meso-zooplankton (Quinones, 1992; Quinones et aL, 1994). In this case, we chose anideal combination of b + s = (-1.00) + (-0.25) = -1.25 which could be the expectedslope of R regarding the two paradigms of particle size distribution (Sheldon,1972) and physiological scaling of metabolism (Peter, 1983). All ecosystems fallaround this 'pivot point' depending on their individual size distribution andphysiological structure as shown in Figure 3.
The sensitivity of R to changes in b + s is not constant as it is when consideringcoefficients a and m; now the global metabolism is more sensitive to flatter slopessuch as those found in pico-nanoplankton assemblages where slight variations in
896
by guest on August 9, 2015
http://plankt.oxfordjournals.org/D
ownloaded from

Biomass spectra and community respiration
slopes produce great changes in the estimated respiration (Figure 3). This meansthat the global metabolism of a community with a flat slope (b + s) can changefaster than another with a steeper slope. In this sense, bacterial assemblagesusually show lower metabolism rates than those predicted by allometric rules(Strayer, 1988; Joint, 1991; Gaedke and Straile, 1994). We suggest the possibilitythat, in the same manner that m decreases one order of magnitude fromhomeotherms to poikilotherms and one order again to unicells (4.1 -» 0.14 —>0.018; Peters, 1983) picoplankton could have lower values of m than the valueswe usually assume. However, pico-nanoplankton communities have the highestpotential to modify their global metabolism—and hence the flow of energythrough them—since their size distribution is flatter than that for the corre-sponding bigger organisms, which are attained to a steeper, low efficiency trans-fer, slope of global metabolism.
This implies that the constancy of s releases the sensitivity of the totalcommunity metabolism on the slope of biomass spectrum, which characterizesnot only the flow of energy through the size axis (Platt and Silvert, 1981) but alsothe differential contribution of organization levels (bacteria, unicells, poikilo-therms) to the potential variations in that flow.
Scope of the method
The models introduced here can be applied to any system that could be properly(continuous, smooth) represented by a size spectrum. The results will be moreaccurate as this premise is fulfilled. The analysis of the size structure of planktonhas not been previously considered as an alternative method to estimatecommunity respiration, except in terms of comparison (Platt et al, 1984). Thissize-spectrum approach offers insights in relation to thermodynamic or evolu-tionary ecological questions, or in the study of the physical-biological couplingin aquatic ecosystem dynamics. As an example, thanks to a combination of flowcytometry and digital image analysis we can now describe quickly the completeautotrophic size-abundance spectrum. The flow cytometry section of the spec-trum can be obtained on board, during the normal development of an oceano-graphic cruise.
Moreover, the combination of size spectra and allometry permits a reasonableestimation of community respiration, and offers some advantages over the ETSmeasurements or other measurements of bulk properties, such as: (i) to assess themetabolic contribution of any given size range to total metabolism. This is impor-tant in the analysis of microbial communities whose ETS activity is more difficultto study because of the filtering limitations for size fractionation and the amountof biomass necessary to carry out the ETS assay; and (ii) to use different allo-metric equations for autotrophic and heterotrophic assemblages that can bedistinguished through automated analyses (i.e. flow cytometry, epifluorescencedigital image analysis). This would yield information about the relative import-ance of functional groups, information which cannot be derived from ETS orother respiration methods that use bulk properties (such as chlorophyll) insteadof individual particle properties.
897
by guest on August 9, 2015
http://plankt.oxfordjournals.org/D
ownloaded from

J.M.Blanco et aL
Acknowledgements
This study was financed by the Spanish CICYT, Projects MAR90-0339 andAMB93-0614-CO2-01. Also, J.M.B. was supported by a contract with theUniversity of Malaga ('Reincorporacidn de Doctores y Tecnologos')- We thankall the GIRTPM (Marine Pelagic Trophic Webs Investigation Group) membersfor their contribution in Bermejales sampling, and Dr W.Silvert and an anony-mous referee for their helpful comments.
ReferencesAhrensAI-A. and Peters,R.H. (1991) Patterns and limitations in limnoplankton size spectra. Can. J.
Fish. Aquat. Sci., 48,1967-1978.Banse.K. (1982) Mass-scaled rates of respiration and intrinsic growth in very small invertebrates. Mar.
EcoL Prog. Ser., 9,281-297.BeersJ.R., Reid,F.M.H. and Stewart.G.L. (1982) Seasonal abundance of the microplankton popu-
lation in the North Pacific Central Gyre. Deep-Sea Res., 29,217-245.BlancoJ.M. (1993) Estructuras y modelos din£micos dependientes del tamano: anaiisis de espectros
de respiraci6n y producci6n en comunidades planct6nicas. PhD Thesis, University of Malaga,Spain.
BlancoJ.M., Echevarria,F. and Garcia.C. (1994) Dealing with size-spectra: Some conceptual andmathematical problems. In Rodriguez,!, and Li.W.K.W. (eds). The Size Structure and Metabolismof the Pelagic Ecosystem. Sci. Mar., 58, pp. 17-29.
Calder.W.A. (1984) Size, Function and Life History. Harvard University Press, Boston.Calder.W.A. (1987) Scaling energetics of homothermic variates: an operational allometry. Annu. Rev.
Physioi, 49,107-120.CaronJ).A., GoldmanJ.C, Andersen.O.K. and Dennett.M.R. (1985) Nutrient cycling in a microfla-
gellate food chain: II. Population dynamics and carbon cycling. Mar. Ecol. Prog. Ser, 24,243-254.EchevarriaJF., Carrillo.P., JimCnezf., Sanchez-Castillo.P., Cruz-Pizarro,L. and Rodriguez,!. (1990)
The size-abundance distribution and taxonomic composition of plankton in an oligotrophic, highmountain lake (La Caldera, Sierra Nevada, Spain). / Plankton Res., 12, 415--*22.
Gaedke.U. (1992) The size distribution of plankton biomass in a large lake and its seasonal variabil-ity. LimnoL Oceanogr., 37,1202-1220.
Gaedke.U. (1993) Ecosystem analysis based on biomass size distributions: A case study of a planktoncommunity in a large lake. LimnoL Oceanogr., 38, 112-127.
Gaedke.U. and Straile.D. (1994) Seasonal changes of trophic transfer efficiencies in a plankton foodweb derived from biomass size distributions and network analysis. Ecol. Model., 75/76, 435-445.
Garcia.C.M. et al. (1994) The size structure and functional composition of ultraplankton andnanoplankton at a frontal station in the Alboran Sea. In RodriguezJ. and. Li.W.K.W (eds). TheSize Structure and Metabolism of the Pelagic Ecosystem. Sci. Mar., 58, pp. 43-52.
GasolJ.M., Guerrero.R. and Pedrds-Ali6,C. (1991) Seasonal variations in size structure and procary-otic dominance in sulfurous Lake Ciso. LimnoL Oceanogr., 36,860-872.
Gaudy ,R. and Boucher J. (1983) Relation between respiration, excretion (ammonia and inorganicphosphorous) and activity of amylase and trypsin in different species of pelagic copepods from anIndian Ocean equatorial area. Mar. BioL, 75, 37-45.
Hemmingsen A M - (1960) Energy metabolism as related to body size and respiratory surfaces, andits evolution. Reports of the Steno Memorial Hospital and Nordinsk Insulin Laboratorium, 9,6-110.
HobbieJ.E., Daley.RJ. and Jasper,S. (1977) Use of Nuclepore filters for counting bacteria by fluor-escence microscopy. AppL Environ. Microbiol:, 33,1225-1228.
Ikeda.T. (1970) Relationship between respiration rate and body size in marine plankton animals as afunction of the temperature of habitat. BulL Fac Fish. Hokkaido Univ., 21,91-112.
JointJ.R. (1991) The allometric determination of pelagic production rates. / Plankton Res., 13,69-81.Lampert.W. (1984) The measurements of respiration. In DowningJ.A. and Rigler,F.H. (eds), A
Manual on Methods for the Assessment of Secondary Productivity in Fresh Waters. Blackwell,Oxford, pp. 413-468.
Lund J.W.G., Kipling.C. and LeCren.E.D. (1958) The inverted microscope method of estimating algalnumbers and the statistical basis of estimations by counting. Hydrobiologia, 11,143-170.
898
by guest on August 9, 2015
http://plankt.oxfordjournals.org/D
ownloaded from

Biomass spectra and community respiration
McNab.B.K. (1988) Complications inherent in scaling the basal rate of metabolism in mammals. Q.Rev. Biol., 63,25-54.
Moloney.C.L. and FieldJ.G. (1989) General allometric equations for rates of nutrient uptake,ingestion, and respiration in plankton organisms. LimnoL Oceanogr., 34,1290-1299.
Moloney.C.L. and FieldJ.G. (1991) The size-based dynamics of plankton food webs. I. A simulationmodel of carbon and nitrogen flows. J. Plankton Res., 13,1003-1038.
Owens,T.G. and KingJvD. (1975) The measurement of respiratory electron-transport-system activityin marine zooplankton. Mar. Biol., 30,27-36.
Packard.T.T. (1985) Measurement of electron transport activity of microplankton. In Jannasch.H.W.and WilliamsJ'J.LeB. (eds). Advances in Aquatic Microbiology (3). Academic Press, London, pp.207-261
Packard.T.T. and Williams,PJ.LeB. (1981) Rates of respiratory oxygen consumption and electrontransport in sea surface seawater from the Northwest Atlantic. Oceanol. Ada, 4,351-358.
Packard.T.T., Healy.M.L. and Richards,F.A. (1971) Vertical distribution of the activity of the respir-atory electron transport system in marine plankton. LimnoL Oceanogr., 16, 60-70.
Peters.R.H. (1983) The Ecological Implications of Body Size. Cambridge University Press, Cambridge.Platt.T., and Denman.K. (1978) The structure of pelagic marine ecosystems. Rapp. P.-V. Reun. Cons.
Int. Explor. Mer, 173, 60-65.Platt.T. and Silvert.W. (1981) Ecology, physiology, allometry and dimensionality./. Theor. Biol., 93,
855-860.Platt.T., Lewis,M. and Geider.R. (1984) Thermodynamics of the pelagic ecosystem: Elementary
closure conditions for biological production in the open ocean. In Flows of Energy and Material inMarine Ecosystem. NATO Conf. Ser. 4, Mar. Sci. V. 13. Plenum Press, pp. 49-84.
Porter.K.G. and Feig.Y.S. (1980) The use of DAPI for identifying and counting aquatic microflora.LimnoL Oceanogr., 25,943-948.
Quinones.R.A. (1992) Size distribution of planktonic biomass and metabolic activity in the pelagicsystem. PhD Thesis, University of Dalhousie, Canada.
Quinones.R.A. (1994) A comment on the use of allometry in the study of pelagic ecosystem processes.In RodriguezJ. and Li.W.K.W. (eds). The Size Structure and Metabolism of the Pelagic Ecosystem.Sci. Mar., 58, pp. 11-16.
Quinones,R.A., BlancoJ.M., Echevarria,F., Fema'ndez-Puelles.M.L., GilabertJ., Rodriguez,V. andValdls.L. (1994) Metabolic size spectra at a frontal station in the Albora'n Sea,. In Rodriguez,!, andLi.W.K.W. (eds). The Size Structure and Metabolism of the Pelagic Ecosystem. Sci. Mar. 58, pp.17-29.
RelexansJ.C. and Etcheber,H. (1985) La mesure de l'activite des systemes transporteurs d'electrons(ETS): Methodologie. Application au domaine estuarien. Oceanics, 11,443-459.
Rodriguez,!, and Mullin,M.M. (1986) Relation between biomass and body weight of plankton in asteady state oceanic ecosystem. LimnoL Oceanogr., 31, 361-370.
Rodriguez,!, Jime'nez.F., Bautista,B. and Rodriguez.V. (1987) Planktonic biomass spectra dynamicsduring a winter production pulse in Mediterranean coastal waters. / Plankton Res., 9,1183-1194.
Rodriguez,!., Echevarn'a^F. and Jime'nez-Gdmez.F. (1990) Physiological and ecological scalings ofbody size in an oligotrophic, high mountain lake (La Caldera, Sierra Nevada, Spain). / PlanktonRes., 12,593-599.
Rodriguez,!, and Li.W.K.W. (1994) The Size Structure and Metabolism of the Pelagic Ecosystem.Scientia Marina, Barcelona.
Ross.R.M. (1982) Energetics of Euphausia pacifica. 1. Effects of body carbon and nitrogen andtemperature on measured and predicted production. Mar. Biol., 68,1-13.
Seim,E. and Saether.B.E. (1983) On rethinking allometry: which regression model to use? / Theor.Biol., 104,161-168.
Sheldon,R.W., Prakash^A. and Sutcliffe.W.H. (1972) The size distribution of particles in the ocean.LimnoL Oceanogr., 17,327-340.
Smith,R.J. (1984) Allometric scaling in comparative biology: problems of concept and method. Am.J. Physiol., 246,152-160.
Sokal.R.R. and Rohlf^J. (1981) Biometry. Freeman.Sprules.W.G., CasselmanJ.M. and Shuter,BJ- (1983) Size distribution of pelagic particles in lakes.
Can. J. Fish. Aquat. Sci., 40,1761-1769.Sprules.W.G. and Munawar.M. (1986) Plankton size spectra in relation to ecosystem productivity,
size, and perturbation. Can. J. Fish. Aquat Sci., 43,1789-1794.Strathmann,R.R. (1967) Estimating the organic carbon content of phytoplankton from cell volume
or plasma volume. LimnoL Oceanogr., 12,411-418.StrayerX>. (1988) On the limits to secondary production. LimnoL Oceanogr., 33,1217-1220.
899
by guest on August 9, 2015
http://plankt.oxfordjournals.org/D
ownloaded from

JJVLBIanco el aL
Vidondo3-, Praire.Y.T., BlancoJ.M. and Duarte.C.M. (1997) Some aspects of the analysis of sizespectra in aquatic ecology. Limnol. Oceanogr., 42,184-192.
Wiebe,P.H., Boyd,S. and CoxJ.L. (1975) Relationships between zooplankton displacement volume,wet weight, dry weight and carbon. Fish. Bull., 73,777-786.
Williams J»J. (1981) Incorporation of microheterotrophic processes into the classical paradigm of theplanktonic food web. Kieler Meeresforsch., 5 ,1 .
Received on June 6, 1997; accepted on December 11, 1997
900
by guest on August 9, 2015
http://plankt.oxfordjournals.org/D
ownloaded from
Copyright © 2022 FDOKUMEN