Cellular Respiration and Fermentation
99
LECTURE PRESENTATIONS For CAMPBELL BIOLOGY, NINTH EDITION Jane B. Reece, Lisa A. Urry, Michael L. Cain, Steven A. Wasserman, Peter V. Minorsky, Robert B. Jackson © 2011 Pearson Education, Inc. Lectures by Erin Barley Kathleen Fitzpatrick Cellular Respiration and Fermentation Chapter 9
-
Upload
khangminh22 -
Category
Documents
-
view
2 -
download
0
Transcript of Cellular Respiration and Fermentation

LECTURE PRESENTATIONS
For CAMPBELL BIOLOGY, NINTH EDITION Jane B. Reece, Lisa A. Urry, Michael L. Cain, Steven A. Wasserman, Peter V. Minorsky, Robert B. Jackson
© 2011 Pearson Education, Inc.
Lectures by
Erin Barley
Kathleen Fitzpatrick
Cellular Respiration and
Fermentation
Chapter 9

Overview: Life Is Work
• Living cells require energy from outside
sources
• Some animals, such as the chimpanzee, obtain
energy by eating plants, and some animals
feed on other organisms that eat plants
© 2011 Pearson Education, Inc.

Figure 9.1

• Energy flows into an ecosystem as sunlight
and leaves as heat
• Photosynthesis generates O2 and organic
molecules, which are used in cellular
respiration
• Cells use chemical energy stored in organic
molecules to regenerate ATP, which powers
work
© 2011 Pearson Education, Inc.

Figure 9.2
Light energy
ECOSYSTEM
Photosynthesis in chloroplasts
Cellular respiration in mitochondria
CO2 H2O O2 Organic
molecules
ATP powers most cellular work
ATP
Heat energy

Concept 9.1: Catabolic pathways yield
energy by oxidizing organic fuels
• Several processes are central to cellular
respiration and related pathways
© 2011 Pearson Education, Inc.

Catabolic Pathways and Production of ATP
• The breakdown of organic molecules is exergonic
• Fermentation is a partial degradation of sugars that occurs without O2
• Aerobic respiration consumes organic molecules and O2 and yields ATP
• Anaerobic respiration is similar to aerobic respiration but consumes compounds other than O2
© 2011 Pearson Education, Inc.

• Cellular respiration includes both aerobic and
anaerobic respiration but is often used to refer to
aerobic respiration
• Although carbohydrates, fats, and proteins are all
consumed as fuel, it is helpful to trace cellular
respiration with the sugar glucose
C6H12O6 + 6 O2 6 CO2 + 6 H2O + Energy (ATP + heat)
© 2011 Pearson Education, Inc.

Redox Reactions: Oxidation and Reduction
• The transfer of electrons during chemical
reactions releases energy stored in organic
molecules
• This released energy is ultimately used to
synthesize ATP
© 2011 Pearson Education, Inc.

The Principle of Redox
• Chemical reactions that transfer electrons
between reactants are called oxidation-reduction
reactions, or redox reactions
• In oxidation, a substance loses electrons, or is oxidized
• In reduction, a substance gains electrons, or is
reduced (the amount of positive charge is
reduced)
© 2011 Pearson Education, Inc.

Figure 9.UN01
becomes oxidized
(loses electron)
becomes reduced
(gains electron)

Figure 9.UN02
becomes oxidized
becomes reduced

• The electron donor is called the reducing agent
• The electron receptor is called the oxidizing agent
• Some redox reactions do not transfer electrons but change the electron sharing in covalent bonds
• An example is the reaction between methane and O2
© 2011 Pearson Education, Inc.

Figure 9.3
Reactants Products
Energy
Water Carbon dioxide Methane (reducing
agent)
Oxygen (oxidizing
agent)
becomes oxidized
becomes reduced

Oxidation of Organic Fuel Molecules During
Cellular Respiration
• During cellular respiration, the fuel (such as
glucose) is oxidized, and O2 is reduced
© 2011 Pearson Education, Inc.

Figure 9.UN03
becomes oxidized
becomes reduced
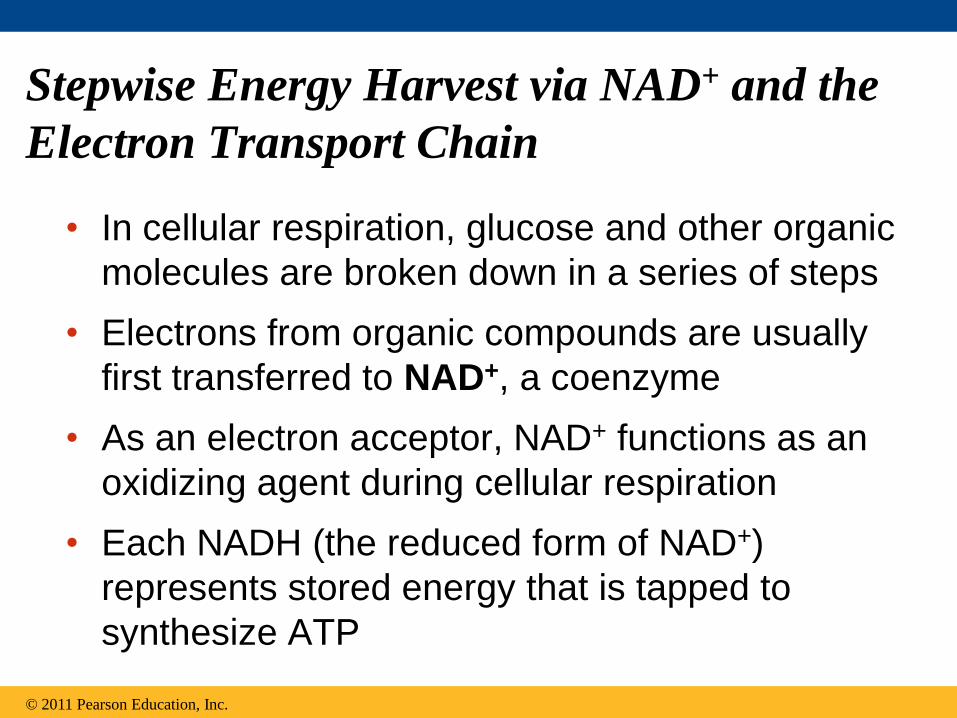
Stepwise Energy Harvest via NAD+ and the
Electron Transport Chain
• In cellular respiration, glucose and other organic
molecules are broken down in a series of steps
• Electrons from organic compounds are usually
first transferred to NAD+, a coenzyme
• As an electron acceptor, NAD+ functions as an
oxidizing agent during cellular respiration
• Each NADH (the reduced form of NAD+)
represents stored energy that is tapped to
synthesize ATP
© 2011 Pearson Education, Inc.

Figure 9.4
Nicotinamide (oxidized form)
NAD
(from food)
Dehydrogenase
Reduction of NAD
Oxidation of NADH
Nicotinamide (reduced form)
NADH

Figure 9.UN04
Dehydrogenase

• NADH passes the electrons to the electron
transport chain
• Unlike an uncontrolled reaction, the electron
transport chain passes electrons in a series of
steps instead of one explosive reaction
• O2 pulls electrons down the chain in an energy-
yielding tumble
• The energy yielded is used to regenerate ATP
© 2011 Pearson Education, Inc.

Figure 9.5
(a) Uncontrolled reaction (b) Cellular respiration
Explosive release of
heat and light energy
Controlled release of energy for
synthesis of ATP
Fre
e e
nerg
y, G
Fre
e e
ne
rgy,
G
H2 1/2 O2 2 H 1/2 O2
1/2 O2
H2O H2O
2 H+ 2 e
2 e
2 H+
ATP
ATP
ATP
(from food via NADH)

The Stages of Cellular Respiration:
A Preview
• Harvesting of energy from glucose has three
stages
– Glycolysis (breaks down glucose into two
molecules of pyruvate)
– The citric acid cycle (completes the
breakdown of glucose)
– Oxidative phosphorylation (accounts for
most of the ATP synthesis)
© 2011 Pearson Education, Inc.

Figure 9.UN05
Glycolysis (color-coded teal throughout the chapter) 1.
Pyruvate oxidation and the citric acid cycle
(color-coded salmon)
2.
Oxidative phosphorylation: electron transport and
chemiosmosis (color-coded violet)
3.

Figure 9.6-1
Electrons
carried
via NADH
Glycolysis
Glucose Pyruvate
CYTOSOL MITOCHONDRION
ATP
Substrate-level
phosphorylation

Figure 9.6-2
Electrons
carried
via NADH
Electrons carried
via NADH and
FADH2
Citric
acid
cycle
Pyruvate
oxidation
Acetyl CoA
Glycolysis
Glucose Pyruvate
CYTOSOL MITOCHONDRION
ATP ATP
Substrate-level
phosphorylation Substrate-level
phosphorylation

Figure 9.6-3
Electrons
carried
via NADH
Electrons carried
via NADH and
FADH2
Citric
acid
cycle
Pyruvate
oxidation
Acetyl CoA
Glycolysis
Glucose Pyruvate
Oxidative
phosphorylation:
electron transport
and
chemiosmosis
CYTOSOL MITOCHONDRION
ATP ATP ATP
Substrate-level
phosphorylation Substrate-level
phosphorylation
Oxidative
phosphorylation

• The process that generates most of the ATP is
called oxidative phosphorylation because it is
powered by redox reactions
© 2011 Pearson Education, Inc.

© 2011 Pearson Education, Inc.
BioFlix: Cellular Respiration

• Oxidative phosphorylation accounts for almost
90% of the ATP generated by cellular
respiration
• A smaller amount of ATP is formed in glycolysis
and the citric acid cycle by substrate-level
phosphorylation
• For each molecule of glucose degraded to CO2
and water by respiration, the cell makes up to
32 molecules of ATP
© 2011 Pearson Education, Inc.

Figure 9.7
Substrate
Product
ADP
P
ATP
Enzyme Enzyme

Concept 9.2: Glycolysis harvests chemical
energy by oxidizing glucose to pyruvate
• Glycolysis (“splitting of sugar”) breaks down
glucose into two molecules of pyruvate
• Glycolysis occurs in the cytoplasm and has two
major phases
– Energy investment phase
– Energy payoff phase
• Glycolysis occurs whether or not O2 is present
© 2011 Pearson Education, Inc.

Figure 9.8
Energy Investment Phase
Glucose
2 ADP 2 P
4 ADP 4 P
Energy Payoff Phase
2 NAD+ 4 e 4 H+
2 Pyruvate 2 H2O
2 ATP used
4 ATP formed
2 NADH 2 H+
Net Glucose 2 Pyruvate 2 H2O
2 ATP
2 NADH 2 H+ 2 NAD+ 4 e 4 H+
4 ATP formed 2 ATP used

Figure 9.9-1
Glycolysis: Energy Investment Phase
ATP Glucose Glucose 6-phosphate
ADP
Hexokinase
1

Figure 9.9-2
Glycolysis: Energy Investment Phase
ATP Glucose Glucose 6-phosphate Fructose 6-phosphate
ADP
Hexokinase Phosphogluco-
isomerase
1 2

Figure 9.9-3
Glycolysis: Energy Investment Phase
ATP ATP Glucose Glucose 6-phosphate Fructose 6-phosphate Fructose 1,6-bisphosphate
ADP ADP
Hexokinase Phosphogluco-
isomerase Phospho-
fructokinase
1 2 3

Figure 9.9-4
Glycolysis: Energy Investment Phase
ATP ATP Glucose Glucose 6-phosphate Fructose 6-phosphate Fructose 1,6-bisphosphate
Dihydroxyacetone phosphate
Glyceraldehyde 3-phosphate
To step 6
ADP ADP
Hexokinase Phosphogluco-
isomerase Phospho-
fructokinase
Aldolase
Isomerase
1 2 3 4
5

Figure 9.9-5
Glycolysis: Energy Payoff Phase
2 NADH
2 NAD + 2 H
2 P i
1,3-Bisphospho- glycerate 6
Triose
phosphate
dehydrogenase

Figure 9.9-6
Glycolysis: Energy Payoff Phase
2 ATP 2 NADH
2 NAD + 2 H
2 P i
2 ADP
1,3-Bisphospho- glycerate
3-Phospho- glycerate
2
Phospho-
glycerokinase
6 7
Triose
phosphate
dehydrogenase

Figure 9.9-7
Glycolysis: Energy Payoff Phase
2 ATP 2 NADH
2 NAD + 2 H
2 P i
2 ADP
1,3-Bisphospho- glycerate
3-Phospho- glycerate
2-Phospho- glycerate
2 2
Phospho-
glycerokinase
Phospho-
glyceromutase
6 7 8
Triose
phosphate
dehydrogenase

Figure 9.9-8
Glycolysis: Energy Payoff Phase
2 ATP 2 NADH
2 NAD + 2 H
2 P i
2 ADP
1,3-Bisphospho- glycerate
3-Phospho- glycerate
2-Phospho- glycerate
Phosphoenol- pyruvate (PEP)
2 2 2
2 H2O
Phospho-
glycerokinase
Phospho-
glyceromutase
Enolase
6 7 8
9
Triose
phosphate
dehydrogenase

Figure 9.9-9
Glycolysis: Energy Payoff Phase
2 ATP 2 ATP
2 NADH
2 NAD + 2 H
2 P i
2 ADP
1,3-Bisphospho- glycerate
3-Phospho- glycerate
2-Phospho- glycerate
Phosphoenol- pyruvate (PEP)
Pyruvate
2 ADP 2 2 2
2 H2O
Phospho-
glycerokinase
Phospho-
glyceromutase
Enolase Pyruvate
kinase
6 7 8
9 10
Triose
phosphate
dehydrogenase

Figure 9.9a
Glycolysis: Energy Investment Phase
ATP Glucose Glucose 6-phosphate
ADP
Hexokinase
1
Fructose 6-phosphate
Phosphogluco-
isomerase
2

Figure 9.9b
Glycolysis: Energy Investment Phase
ATP Fructose 6-phosphate
ADP
3
Fructose 1,6-bisphosphate
Phospho-
fructokinase
4
5
Aldolase
Dihydroxyacetone phosphate
Glyceraldehyde 3-phosphate
To step 6
Isomerase

Figure 9.9c
Glycolysis: Energy Payoff Phase
2 NADH 2 ATP
2 ADP 2
2
2 NAD + 2 H
2 P i
3-Phospho-
glycerate 1,3-Bisphospho-
glycerate
Triose
phosphate
dehydrogenase
Phospho-
glycerokinase
6 7

Figure 9.9d
Glycolysis: Energy Payoff Phase
2 ATP
2 ADP 2 2 2 2
2 H2O
Pyruvate Phosphoenol-
pyruvate (PEP) 2-Phospho-
glycerate
3-Phospho-
glycerate 8
9 10
Phospho-
glyceromutase Enolase Pyruvate
kinase

Concept 9.3: After pyruvate is oxidized, the
citric acid cycle completes the energy-
yielding oxidation of organic molecules
• In the presence of O2, pyruvate enters the
mitochondrion (in eukaryotic cells) where the
oxidation of glucose is completed
© 2011 Pearson Education, Inc.

Oxidation of Pyruvate to Acetyl CoA
• Before the citric acid cycle can begin, pyruvate
must be converted to acetyl Coenzyme A
(acetyl CoA), which links glycolysis to the citric
acid cycle
• This step is carried out by a multienzyme
complex that catalyses three reactions
© 2011 Pearson Education, Inc.

Figure 9.10
Pyruvate
Transport protein
CYTOSOL
MITOCHONDRION
CO2 Coenzyme A
NAD + H NADH Acetyl CoA
1
2
3

• The citric acid cycle, also called the Krebs
cycle, completes the break down of pyruvate
to CO2
• The cycle oxidizes organic fuel derived from
pyruvate, generating 1 ATP, 3 NADH, and 1
FADH2 per turn
© 2011 Pearson Education, Inc.
The Citric Acid Cycle

Figure 9.11
Pyruvate
NAD
NADH
+ H Acetyl CoA
CO2
CoA
CoA
CoA
2 CO2
ADP + P i
FADH2
FAD
ATP
3 NADH
3 NAD
Citric
acid
cycle
+ 3 H
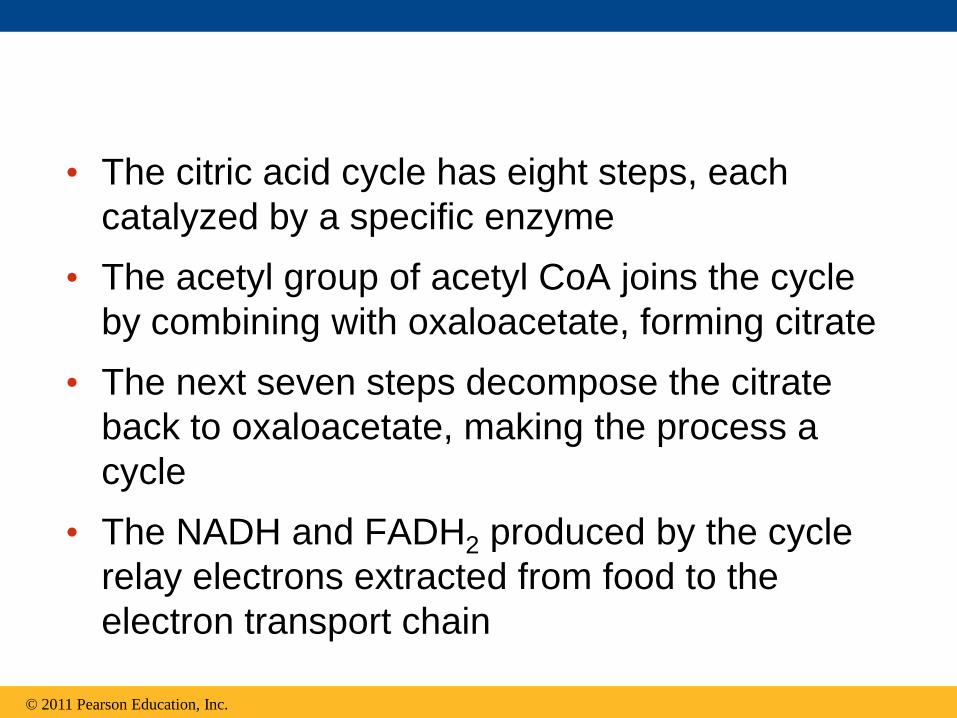
• The citric acid cycle has eight steps, each
catalyzed by a specific enzyme
• The acetyl group of acetyl CoA joins the cycle
by combining with oxaloacetate, forming citrate
• The next seven steps decompose the citrate
back to oxaloacetate, making the process a
cycle
• The NADH and FADH2 produced by the cycle
relay electrons extracted from food to the
electron transport chain
© 2011 Pearson Education, Inc.

Figure 9.12-1
1
Acetyl CoA
Citrate
Citric
acid
cycle
CoA-SH
Oxaloacetate

Figure 9.12-2
1
Acetyl CoA
Citrate Isocitrate
Citric
acid
cycle
H2O
2
CoA-SH
Oxaloacetate

Figure 9.12-3
1
Acetyl CoA
Citrate Isocitrate
-Ketoglutarate
Citric
acid
cycle
NADH
+ H
NAD
H2O
3
2
CoA-SH
CO2
Oxaloacetate

Figure 9.12-4
1
Acetyl CoA
Citrate Isocitrate
-Ketoglutarate
Succinyl
CoA
Citric
acid
cycle
NADH
NADH
+ H
+ H
NAD
NAD
H2O
3
2
4
CoA-SH
CO2
CoA-SH
CO2
Oxaloacetate

Figure 9.12-5
1
Acetyl CoA
Citrate Isocitrate
-Ketoglutarate
Succinyl
CoA
Succinate
Citric
acid
cycle
NADH
NADH
ATP
+ H
+ H
NAD
NAD
H2O
ADP
GTP GDP
P i
3
2
4
5
CoA-SH
CO2
CoA-SH
CoA-SH
CO2
Oxaloacetate

Figure 9.12-6
1
Acetyl CoA
Citrate Isocitrate
-Ketoglutarate
Succinyl
CoA
Succinate
Fumarate
Citric
acid
cycle
NADH
NADH
FADH2
ATP
+ H
+ H
NAD
NAD
H2O
ADP
GTP GDP
P i
FAD
3
2
4
5
6
CoA-SH
CO2
CoA-SH
CoA-SH
CO2
Oxaloacetate

Figure 9.12-7
1
Acetyl CoA
Citrate Isocitrate
-Ketoglutarate
Succinyl
CoA
Succinate
Fumarate
Malate
Citric
acid
cycle
NADH
NADH
FADH2
ATP
+ H
+ H
NAD
NAD
H2O
H2O
ADP
GTP GDP
P i
FAD
3
2
4
5
6
7
CoA-SH
CO2
CoA-SH
CoA-SH
CO2
Oxaloacetate

Figure 9.12-8
NADH
1
Acetyl CoA
Citrate Isocitrate
-Ketoglutarate
Succinyl
CoA
Succinate
Fumarate
Malate
Citric
acid
cycle
NAD
NADH
NADH
FADH2
ATP
+ H
+ H
+ H
NAD
NAD
H2O
H2O
ADP
GTP GDP
P i
FAD
3
2
4
5
6
7
8
CoA-SH
CO2
CoA-SH
CoA-SH
CO2
Oxaloacetate

Figure 9.12a
Acetyl CoA
Oxaloacetate
Citrate Isocitrate
H2O
CoA-SH
1
2

Figure 9.12b
Isocitrate
-Ketoglutarate
Succinyl
CoA
NADH
NADH
NAD
NAD
+ H
CoA-SH
CO2
CO2
3
4
+ H

Figure 9.12c
Fumarate
FADH2
CoA-SH 6
Succinate
Succinyl
CoA
FAD
ADP
GTP GDP
P i
ATP
5

Figure 9.12d
Oxaloacetate 8
Malate
Fumarate
H2O
NADH
NAD
+ H
7
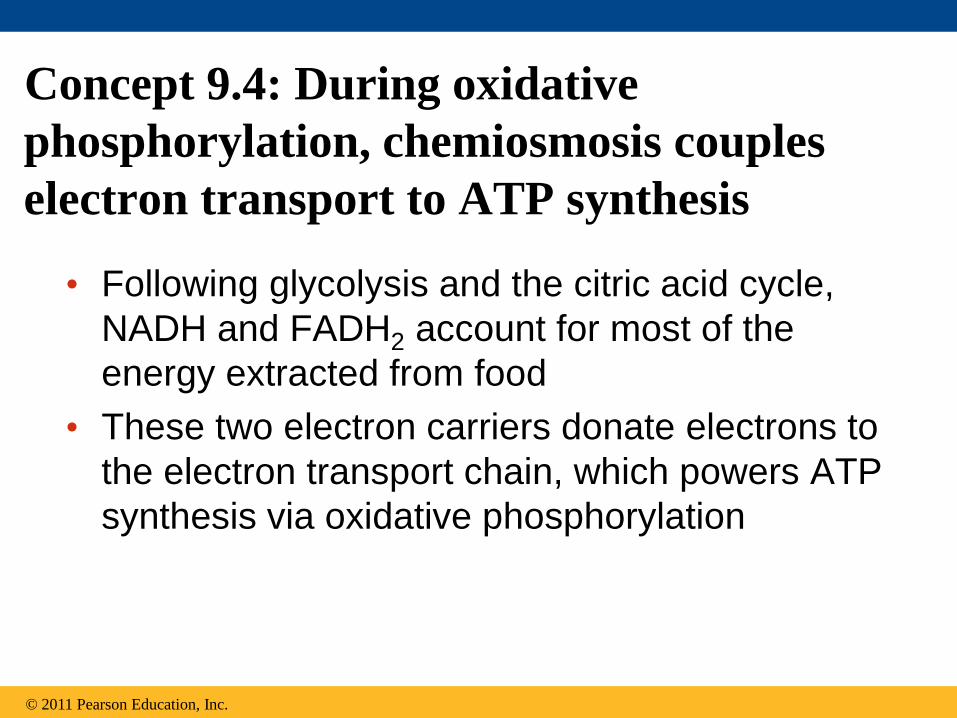
Concept 9.4: During oxidative
phosphorylation, chemiosmosis couples
electron transport to ATP synthesis
• Following glycolysis and the citric acid cycle,
NADH and FADH2 account for most of the
energy extracted from food
• These two electron carriers donate electrons to
the electron transport chain, which powers ATP
synthesis via oxidative phosphorylation
© 2011 Pearson Education, Inc.

The Pathway of Electron Transport
• The electron transport chain is in the inner
membrane (cristae) of the mitochondrion
• Most of the chain’s components are proteins,
which exist in multiprotein complexes
• The carriers alternate reduced and oxidized
states as they accept and donate electrons
• Electrons drop in free energy as they go down
the chain and are finally passed to O2, forming
H2O
© 2011 Pearson Education, Inc.

Figure 9.13
NADH
FADH2
2 H + 1/2 O2
2 e
2 e
2 e
H2O
NAD
Multiprotein
complexes
(originally from
NADH or FADH2)
I II
III
IV
50
40
30
20
10
0
Fre
e e
ne
rgy (
G)
rela
tive
to
O2 (
kc
al/
mo
l)
FMN
FeS FeS
FAD
Q
Cyt b
Cyt c1
Cyt c
Cyt a
Cyt a3
FeS

• Electrons are transferred from NADH or FADH2
to the electron transport chain
• Electrons are passed through a number of
proteins including cytochromes (each with an
iron atom) to O2
• The electron transport chain generates no ATP
directly
• It breaks the large free-energy drop from food
to O2 into smaller steps that release energy in
manageable amounts
© 2011 Pearson Education, Inc.

Chemiosmosis: The Energy-Coupling
Mechanism
• Electron transfer in the electron transport chain
causes proteins to pump H+ from the
mitochondrial matrix to the intermembrane space
• H+ then moves back across the membrane,
passing through the proton, ATP synthase
• ATP synthase uses the exergonic flow of H+ to
drive phosphorylation of ATP
• This is an example of chemiosmosis, the use of
energy in a H+ gradient to drive cellular work
© 2011 Pearson Education, Inc.

Figure 9.14
INTERMEMBRANE SPACE
Rotor
Stator H
Internal
rod
Catalytic
knob
ADP
+
P i ATP
MITOCHONDRIAL MATRIX

Figure 9.15
Protein complex of electron carriers
(carrying electrons from food)
Electron transport chain
Oxidative phosphorylation
Chemiosmosis
ATP synth- ase
I
II
III
IV Q
Cyt c
FAD FADH2
NADH ADP P i NAD
H
2 H + 1/2O2
H
H H
2 1
H
H2O
ATP
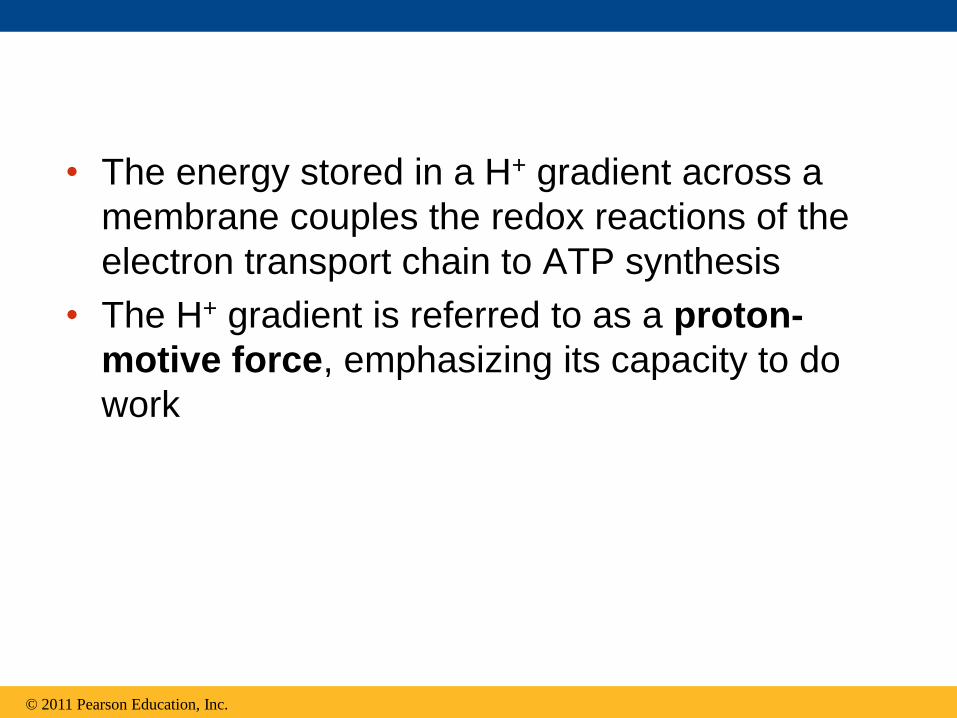
• The energy stored in a H+ gradient across a
membrane couples the redox reactions of the
electron transport chain to ATP synthesis
• The H+ gradient is referred to as a proton-
motive force, emphasizing its capacity to do
work
© 2011 Pearson Education, Inc.

An Accounting of ATP Production by
Cellular Respiration
• During cellular respiration, most energy flows
in this sequence:
glucose NADH electron transport chain
proton-motive force ATP
• About 34% of the energy in a glucose molecule
is transferred to ATP during cellular respiration,
making about 32 ATP
• There are several reasons why the number of
ATP is not known exactly
© 2011 Pearson Education, Inc.
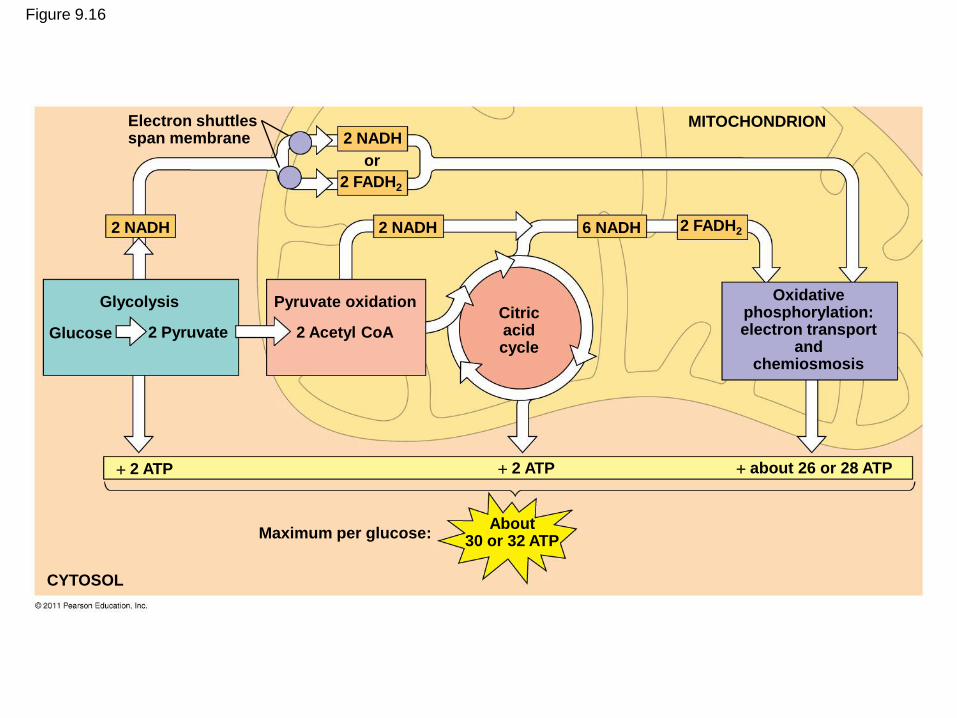
Figure 9.16
Electron shuttles span membrane
MITOCHONDRION 2 NADH
2 NADH 2 NADH 6 NADH
2 FADH2
2 FADH2
or
2 ATP 2 ATP about 26 or 28 ATP
Glycolysis
Glucose 2 Pyruvate
Pyruvate oxidation
2 Acetyl CoA
Citric acid cycle
Oxidative phosphorylation: electron transport
and chemiosmosis
CYTOSOL
Maximum per glucose: About
30 or 32 ATP

Concept 9.5: Fermentation and anaerobic
respiration enable cells to produce ATP
without the use of oxygen
• Most cellular respiration requires O2 to produce
ATP
• Without O2, the electron transport chain will
cease to operate
• In that case, glycolysis couples with
fermentation or anaerobic respiration to
produce ATP
© 2011 Pearson Education, Inc.

• Anaerobic respiration uses an electron
transport chain with a final electron acceptor
other than O2, for example sulfate
• Fermentation uses substrate-level
phosphorylation instead of an electron
transport chain to generate ATP
© 2011 Pearson Education, Inc.

Types of Fermentation
• Fermentation consists of glycolysis plus
reactions that regenerate NAD+, which can be
reused by glycolysis
• Two common types are alcohol fermentation
and lactic acid fermentation
© 2011 Pearson Education, Inc.

• In alcohol fermentation, pyruvate is converted
to ethanol in two steps, with the first releasing
CO2
• Alcohol fermentation by yeast is used in
brewing, winemaking, and baking
© 2011 Pearson Education, Inc.

© 2011 Pearson Education, Inc.
Animation: Fermentation Overview Right-click slide / select “Play”
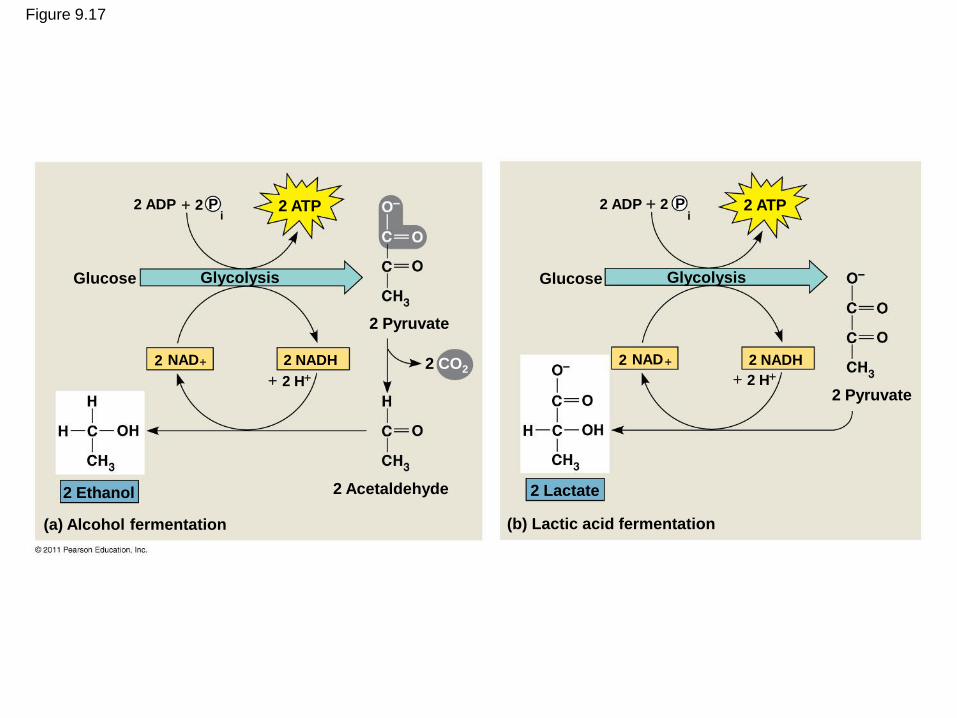
Figure 9.17
2 ADP 2 ATP
Glucose Glycolysis
2 Pyruvate
2 CO2 2
2 NADH
2 Ethanol 2 Acetaldehyde
(a) Alcohol fermentation (b) Lactic acid fermentation
2 Lactate
2 Pyruvate
2 NADH
Glucose Glycolysis
2 ATP 2 ADP 2 P i
NAD
2 H
2 P i
2 NAD 2 H

2 ADP 2 P i 2 ATP
Glucose Glycolysis
2 Pyruvate
2 CO2 2 NAD
2 NADH
2 Ethanol 2 Acetaldehyde
(a) Alcohol fermentation
2 H
Figure 9.17a

• In lactic acid fermentation, pyruvate is reduced
to NADH, forming lactate as an end product,
with no release of CO2
• Lactic acid fermentation by some fungi and
bacteria is used to make cheese and yogurt
• Human muscle cells use lactic acid
fermentation to generate ATP when O2 is
scarce
© 2011 Pearson Education, Inc.

(b) Lactic acid fermentation
2 Lactate
2 Pyruvate
2 NADH
Glucose Glycolysis
2 ADP 2 P i 2 ATP
2 NAD
2 H
Figure 9.17b
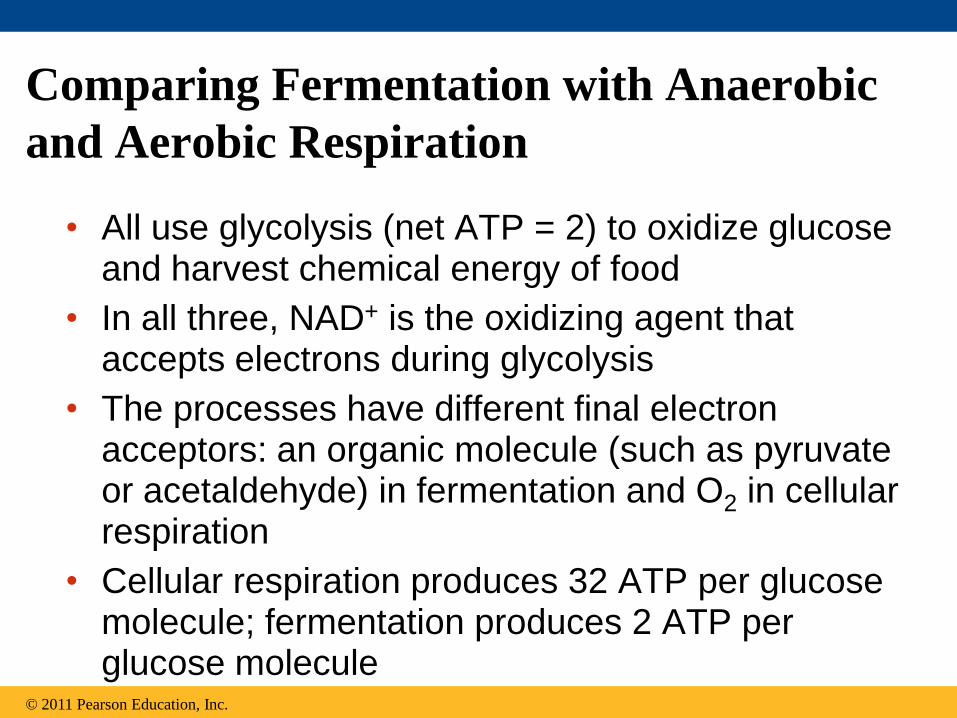
Comparing Fermentation with Anaerobic
and Aerobic Respiration
• All use glycolysis (net ATP = 2) to oxidize glucose and harvest chemical energy of food
• In all three, NAD+ is the oxidizing agent that accepts electrons during glycolysis
• The processes have different final electron acceptors: an organic molecule (such as pyruvate or acetaldehyde) in fermentation and O2 in cellular respiration
• Cellular respiration produces 32 ATP per glucose molecule; fermentation produces 2 ATP per glucose molecule
© 2011 Pearson Education, Inc.

• Obligate anaerobes carry out fermentation or
anaerobic respiration and cannot survive in the
presence of O2
• Yeast and many bacteria are facultative
anaerobes, meaning that they can survive
using either fermentation or cellular respiration
• In a facultative anaerobe, pyruvate is a fork in
the metabolic road that leads to two alternative
catabolic routes
© 2011 Pearson Education, Inc.

Figure 9.18
Glucose
CYTOSOL Glycolysis
Pyruvate
No O2 present:
Fermentation
O2 present:
Aerobic cellular
respiration
Ethanol,
lactate, or
other products
Acetyl CoA
MITOCHONDRION
Citric
acid
cycle

The Evolutionary Significance of Glycolysis
• Ancient prokaryotes are thought to have used
glycolysis long before there was oxygen in the
atmosphere
• Very little O2 was available in the atmosphere
until about 2.7 billion years ago, so early
prokaryotes likely used only glycolysis to
generate ATP
• Glycolysis is a very ancient process
© 2011 Pearson Education, Inc.

Concept 9.6: Glycolysis and the citric acid
cycle connect to many other metabolic
pathways
• Gycolysis and the citric acid cycle are major
intersections to various catabolic and anabolic
pathways
© 2011 Pearson Education, Inc.

The Versatility of Catabolism
• Catabolic pathways funnel electrons from many
kinds of organic molecules into cellular
respiration
• Glycolysis accepts a wide range of
carbohydrates
• Proteins must be digested to amino acids;
amino groups can feed glycolysis or the citric
acid cycle
© 2011 Pearson Education, Inc.

• Fats are digested to glycerol (used in
glycolysis) and fatty acids (used in generating
acetyl CoA)
• Fatty acids are broken down by beta oxidation
and yield acetyl CoA
• An oxidized gram of fat produces more than
twice as much ATP as an oxidized gram of
carbohydrate
© 2011 Pearson Education, Inc.

Figure 9.19
Carbohydrates Proteins
Fatty
acids
Amino
acids
Sugars
Fats
Glycerol
Glycolysis
Glucose
Glyceraldehyde 3- P
NH3 Pyruvate
Acetyl CoA
Citric
acid
cycle
Oxidative
phosphorylation

Biosynthesis (Anabolic Pathways)
• The body uses small molecules to build other
substances
• These small molecules may come directly
from food, from glycolysis, or from the citric
acid cycle
© 2011 Pearson Education, Inc.
Regulation of Cellular Respiration via
Feedback Mechanisms
• Feedback inhibition is the most common
mechanism for control
• If ATP concentration begins to drop,
respiration speeds up; when there is plenty
of ATP, respiration slows down
• Control of catabolism is based mainly on
regulating the activity of enzymes at
strategic points in the catabolic pathway
© 2011 Pearson Education, Inc.

Figure 9.20
Phosphofructokinase
Glucose
Glycolysis AMP
Stimulates
Fructose 6-phosphate
Fructose 1,6-bisphosphate
Pyruvate
Inhibits Inhibits
ATP Citrate
Citric
acid
cycle
Oxidative
phosphorylation
Acetyl CoA

Figure 9.UN06
Inputs Outputs
Glucose
Glycolysis
2 Pyruvate 2 ATP 2 NADH

Figure 9.UN07
Inputs Outputs
2 Pyruvate 2 Acetyl CoA
2 Oxaloacetate Citric
acid
cycle
2
2 6
8 ATP NADH
FADH2 CO2

Figure 9.UN08
Protein complex
of electron
carriers
(carrying electrons from food)
INTERMEMBRANE
SPACE
MITOCHONDRIAL MATRIX
H
H H
2 H + 1/2 O2 H2O
NAD
FADH2 FAD
Q
NADH
I
II
III
IV
Cyt c

Figure 9.UN09
INTER-
MEMBRANE
SPACE
H ADP + P i
MITO-
CHONDRIAL
MATRIX
ATP
synthase
H
ATP

Figure 9.UN10
Time
pH
dif
fere
nce
acro
ss m
em
bra
ne

Figure 9.UN11