Expedited CO2 respiration in people with Miltenberger ... - Nature
Upload
independentCategory
view
0download
0
Calcium-induced contraction of sarcomeres changes theregulation of mitochondrial respiration in permeabilizedcardiac cellsTiia Anmann1, Margus Eimre2, Andrey V. Kuznetsov3,4, Tatiana Andrienko3, Tuuli Kaambre1,Peeter Sikk1, Evelin Seppet2, Toomas Tiivel1,2, Marko Vendelin3,5, Enn Seppet1 and Valdur A. Saks1,3
1 Laboratory of Bioenergetics, National Institute of Chemical Physics and Biophysics, Tallinn, Estonia
2 Department of Pathophysiology, University of Tartu, Estonia
3 Laboratory of Fundamental and Applied Bioenergetics, INSERM E0221, Joseph Fourier University, Grenoble, France
4 Department of General and Transplant Surgery, Innsbruck Medical University, Austria
5 Institute of Cybernetics, Tallinn, Estonia
Calcium ions play a central role in the excitation-
contraction coupling in muscle cells [1,2] and partici-
pate in regulating the activities of multiple enzymes
and metabolic systems, including mitochondrial Krebs
cycle dehydrogenases, in many types of cells [2–6]. The
presence of sophisticated Ca-transport systems in mito-
chondria allows these organelles to control the calcium
cycle in the cytoplasmic space [7–15] and the lifetime
of the cell, as overload of mitochondria with calcium
results in opening of the mitochondrial permeability
transition pore, which eventually leads to cell death
[11–15]. It has also been proposed that, owing to the
simultaneous activation of the contractile system and
mitochondrial enzymes by calcium, the ATP produc-
tion is matched to its demand in cells (‘parallel activa-
tion’ mechanism) [16–20]. However, both experimental
and theoretical studies with detailed mathematical
modelling of the calcium effects on the mitochondria
showed that calcium can induce, by stimulation of the
steps of Krebs cycle, only twofold changes in the rate
Keywords
adenine nucleotides; calcium; cardio-
myocytes; intracellular energetic units,
mitochondria
Correspondence
V. A. Saks, Laboratory of Bioenergetics,
Joseph Fourier University, 2280, Rue de la
Piscine, BP53X – 38041, Grenoble Cedex 9,
France
Fax: +33 4 76514218
Tel: +33 4 76635627
E-mail: [email protected]
(Received 15 March 2005, revised 21 April
2005, accepted 22 April 2005)
doi:10.1111/j.1742-4658.2005.04734.x
The relationships between cardiac cell structure and the regulation of
mitochondrial respiration were studied by applying fluorescent confocal
microscopy and analysing the kinetics of mitochondrial ADP-stimulated
respiration, during calcium-induced contraction in permeabilized cardiomyo-
cytes and myocardial fibers, and in their ‘ghost’ preparations (after selective
myosin extraction). Up to 3 lm free calcium, in the presence of ATP,
induced strong contraction of permeabilized cardiomyocytes with intact
sarcomeres, accompanied by alterations in mitochondrial arrangement and
a significant decrease in the apparent Km for exogenous ADP and ATP in
the kinetics of mitochondrial respiration. The Vmax of respiration showed
a moderate (50%) increase, with an optimum at 0.4 lm free calcium and a
decrease at higher calcium concentrations. At high free-calcium concentra-
tions, the direct flux of ADP from ATPases to mitochondria was dimi-
nished compared to that at low calcium levels. All of these effects were
unrelated either to mitochondrial calcium overload or to mitochondrial
permeability transition and were not observed in ‘ghost’ preparations after
the selective extraction of myosin. Our results suggest that the structural
changes transmitted from contractile apparatus to mitochondria modify
localized restrictions of the diffusion of adenine nucleotides and thus may
actively participate in the regulation of mitochondrial function, in addition
to the metabolic signalling via the creatine kinase system.
Abbreviations
FCCP, carbonyl cyanide-p-trifluoromethoxy phenylhydrazone; ICEU, intracellular energetic unit; LDH, lactate dehydrogenase; PK, pyruvate
kinase; TMRE, tetramethylrhodamine ethyl ester.
FEBS Journal 272 (2005) 3145–3161 ª 2005 FEBS 3145

of mitochondrial oxidative phosphorylation [21–23].
The magnitude of these direct effects of calcium on
mitochondrial respiration is too small to explain the
variations of the respiration rate in the heart cells
in vivo: in the perfused working rat heart, the respir-
ation rate can be enhanced by more than an order
of magnitude (indeed, by a factor of 20) during work-
load changes under conditions of metabolic stability
[24–27]. Under physiological conditions in vivo, cardiac
work and respiration are linearly related [24] and both
are governed by the classical Frank–Starling mechan-
ism [28]. The Frank–Starling mechanism is based on
the length-dependent activation of sarcomere: stretch-
ing of myofibrils by increasing left ventricle filling
increases the force of contraction, work performance
and respiration as a result of increased sensitivity of
the thin filaments to calcium [24,28,29]. This results in
an increase in the number of active crossbridges, with-
out any significant changes in the cytoplasmic calcium
transients [30–32].
To explain the observed discrepancies (by a factor
of � 10) between the direct effects of calcium on the
respiration of mitochondria and changes in the rates
of oxygen consumption in vivo under physiological
conditions of alteration of workloads, in addition to
the effects of calcium, the metabolic channelling of the
endogenous ADP by the organized energy transfer and
signalling networks (the creatine kinase, adenylate kin-
ase and glycolytic systems) has been proposed as a
major signal for regulating mitochondrial respiration
in cardiac cells [25]. In myocytes, mitochondria are
arranged in a crystal-like tissue specific pattern [33],
and in oxidative muscle cells, mitochondria form func-
tional complexes with adjacent sarcoplasmic reticulum
and myofibrils, the intracellular energetic units
(ICEUs) [34–41]. In these units, the channelling of
ADP by energy transfer networks overcomes local
restrictions of intracellular diffusion of adenine nucleo-
tides [34,39,40] and explains both the linear relation-
ship between workload and respiration and the
phenomenon of metabolic stability [25]. Recently, we
have found, in a preliminary study, that structural
changes, caused by the calcium-induced contraction of
sarcomeres in permeabilized cardiac fibers, significantly
modify the kinetic parameters of mitochondrial respi-
ration regulation by exogenous ADP [35]. Very similar
data have been reported for rainbow trout muscle cells
[36]. In the current study, the structure–function rela-
tionships in cardiac cells have been studied further
with the aim of detailed quantitative analysis of the
structural and functional alterations induced by chan-
ging free calcium concentrations, both in permeabilized
cardiomyocytes and in myocardial fibers. The results
show specific sarcomere–mitochondrial structural and
functional links as a result of specific cell organization,
and are consistent with the theory of a major role of
the metabolic signalling mechanisms in the regulation
of mitochondrial respiration.
Results
As could be expected, in the control experiments with
isolated and permeabilized cardiomyocytes, neither
ATP nor calcium (free calcium concentration 1–3 lm)added alone changed the size of the cardiomyocytes,
showing an absence of contraction and of any of their
nonspecific effects, as well as an absence of intracellu-
lar ATP, endogenous substrates and residual ADP in
the permeabilized cardiomyocytes (results not shown).
However, when ATP (2 mm), or the respiratory sub-
strates glutamate or malate and ADP, were present in
the medium, the addition of calcium (at a concentra-
tion of 1 lm) resulted in a very strong contraction of
cardiomyocytes, and the length of cardiomyocytes was
decreased by � 50% (Fig. 1). This strong contraction
of the cells, without subsequent relaxation, is termed
‘hypercontraction’ in this article. These changes of cell
size were clearly caused by the sarcomere contraction
as, after the extraction of myosin, the shape of the
cells remained unaltered following the addition of ATP
and calcium, or of mitochondrial substrates, ADP and
calcium (Fig. 2). In these experiments, the concentra-
tion-dependent increase in the fluorescence intensity
of the mitochondrial calcium sensitive probe, Rhod-2
(Fig. 2), clearly indicates significant accumulation of
calcium in the mitochondrial matrix.
It is known that the accumulation of calcium in
mitochondria can lead to the opening of the permea-
bility transition pore, associated with mitochondrial
swelling and rupture of the outer mitochondrial mem-
brane [9–15]. Therefore, we used several different
methods to test pore opening under the conditions of
our experiments. Figure 3A shows that the addition of
ADP activated the respiration of permeabilized fibers
in the presence of 3 lm free calcium, and that the
addition of exogenous cytochrome c did not change
the respiration rate. This means that endogenous cyto-
chrome c always stayed in mitochondria and exogen-
ous cytochrome c had no access to the intermembrane
space, indicating that the outer mitochondrial mem-
brane was intact [42]. Monitoring of the membrane
potential in isolated heart mitochondria by measuring
the uptake of Rhodamine 123 (Fig. 3B) shows that the
single addition of 3 lm free calcium did not change the
membrane potential, but the membrane potential
collapsed after the addition of an uncoupler, carbonyl
Contraction and respiration T. Anmann et al.
3146 FEBS Journal 272 (2005) 3145–3161 ª 2005 FEBS

cyanide-p-trifluoromethoxy phenylhydrazone (FCCP).
However, when the mitochondria were titrated with
increasing concentrations of calcium for longer than
40 min, the membrane potential started to decrease after
a concentration of 3 lm calcium was reach (Fig. 3C).
This is caused by the accumulation of calcium, over
time, from the Ca-EGTA buffer in medium into the mito-
chondrial matrix. As the duration of our experiments
was usually less than 40 min, it is unlikely that the
mitochondrial permeability transition pore was open.
Analysis of the confocal images of the permeabilized
cardiomyocytes and fibers with intact sarcomeres
(Figs 4 and 5) shows that hypercontraction completely
disorganized the localization of mitochondria within
these cells. Here we used the quantitative method of
image analysis of confocal micrographs, recently devel-
oped in our laboratories [33], to analyse the changes in
the arrangement of mitochondria observed in skinned
muscles fixed at both ends (i.e. in isometric condi-
tions). In control solution (containing 0.1 lm free
Fig. 2. Absence of contraction in ‘ghost’ cardiomyocytes after the addition up to 3 lM free calcium in the presence of ATP (1 mM) and glu-
tamate (5 mM). (A) Control ‘ghost’ cardiomyocytes preloaded with 5 lM Rhod-2. (B) Cardiomyocytes after the addition of 1 lM free calcium.
(C) Cardiomyocytes after the addition of 3 lM free calcium. A significant increase in the fluorescence intensity of Rhod-2 clearly shows an
elevated calcium concentration in the mitochondrial matrix of ‘ghost’ cardiomyocytes, in particular after the addition of 3 lM free calcium.
Fig. 1. Contraction of permeabilized cardio-
myocyte induced by calcium (1 lM exter-
nally added free Ca2+) in the presence of
ATP (1 mM). Mitochondrial localization was
imaged using confocal microscopy from
autofluorescence of mitochondrial flavopro-
teins, as described in the Experimental
procedures. Changes in the shape of one
cardiomyocyte (induced by calcium in the
presence of ATP), resulting in its hyper-
contraction, is shown over time.
T. Anmann et al. Contraction and respiration
FEBS Journal 272 (2005) 3145–3161 ª 2005 FEBS 3147

calcium and no ATP) the mitochondria exhibited a
regular distribution (Fig. 4A,B), and Fig. 4C shows
that the distances between mitochondrial centers taken
from image in Fig. 4B were smallest in the direction
transversal to the fiber, whereas the largest distances
were observed in a diagonal direction (angle 45�). Thedistribution can be presented in a radial plot, where
the average distance between mitochondrial centers is
related to the direction between mitochondria. In this
plot, the distances between the centers are given by the
distances from the reference point (coordinates 0,0)
plotted in the direction corresponding to each sector
(Fig. 4D). From inspection of the radial plot
(Fig. 4D), it is clear that the mitochondrial centers
were not distributed randomly, but arranged according
to a strictly regular pattern.
The situation was entirely different if fibers with
intact sarcomeres were incubated in the presence of
ATP and elevated free calcium (3 lm) (Fig. 5). If the
fiber is fixed by its ends, the elevated calcium leads to
a disorganization of mitochondrial arrangement in the
demonstrated case. Indeed, this is evident from the dis-
tribution function (Fig. 5B): the distribution function
is almost the same, regardless of the direction. In the
radial plot (Fig. 5D), the centres tended to align along
a circle, which is the expected situation if the random
distribution of mitochondria takes place. The average
distances are increased, in this case, if compared to the
control (compare Fig. 4D and Fig. 5D).
Notably, the arrangement of mitochondria in the
cells was changed by high calcium concentrations also
in isolated and permeabilized cardiomyocytes (data not
shown). As cardiomyocytes are nonfixed cells, hyper-
contraction resulted in a decrease of the length of
fibers, and the mitochondria were pressed together
between hypercontracted myofibrils [35].
In the permeabilized cardiac fibers with intact sar-
comeres, in which an increase in the calcium concen-
tration induced hypercontraction and disorganization
of the regular intracellular mitochondrial arrangement,
calcium induced changes in the kinetics of regulation
of the respiration rate (Fig. 6). This concerned mostly
the changes in the apparent affinities for the exogenous
adenine nucleotides: a very strong decrease in the val-
ues of apparent Km, both for exogenous ADP and for
ATP, and much smaller changes in the Vmax of respir-
ation (Fig. 6A,B). Similar changes were observed in
Fig. 3. (A) Cytochrome c test of permeabilized cardiac fibers dem-
onstrates the intactness of the outer mitochondrial membrane.
ADP was added to a final concentration of 2 mM, and cytochrome
c was added to a final concentration of 8 lM. (B) Stability of the
mitochondrial inner membrane potential at 3 lM free Ca2+. The
fluorescence intensity of Rhodamine 123 (0.25 lM) in 2 mL of
gently stirred solution B (0.1 lM free Ca2+) containing 5 mM gluta-
mate and 2 mM malate as mitochondrial substrates and 2 mgÆmL)1
of BSA. Isolated rat heart mitochondria were added to a final pro-
tein concentration of 0.2 mgÆmL)1. (C) Changes of the mitochond-
rial inner membrane potential after a gradual increase of free
calcium from 0.1 to 3 lM. Arrows show the final concentration of
free calcium in the system.
Contraction and respiration T. Anmann et al.
3148 FEBS Journal 272 (2005) 3145–3161 ª 2005 FEBS

Dis
trib
utio
n fu
nctio
n 1
0.8
0.6
0.4
0.2
00 1 2 3 4 5
Distance, µm
0°45°90°
3
2
1
0
–1
–2
–3–3 –2 –1 0 1 2 3
50%25%
75%
X, µm
Y,µm
C D
A B
Fig. 4. Quantitative analysis of the regular
arrangement of mitochondria in cardiac cells
preloaded with tetramethylrhodamine ethyl
ester (TMRE) (50 nM). Representative
confocal image of cardiac muscle fiber (A).
Centers of mitochondria were marked with
small black boxes, as shown in (B). On the
basis of this image, distribution function
(subplot C) and radial plot (subplot D) were
found. In subplot C, the distribution func-
tions of distance between the centers of
neighboring mitochondria along the fiber
(direction 90�), in cross-fiber direction (0�),and in the diagonal direction (45�) are shown.
In subplot D, the distance that encloses
25%, 50%, and 75% of neighboring mitoch-
ondrial centers is shown in the radial plot. In
this plot, the distance between mitochond-
rial centers is given through the distance
from the reference point (coordinates 0,0)
and the direction is taken equal to the
middle of the corresponding sector. Sector
borders are indicated by dashed lines.
Dis
trib
utio
n fu
nctio
n 1
0.8
0.6
0.4
0.2
00 1 2 3 4 5
Distance, µm
0°45°
90°
3
2
1
0
–1
–2
–3–3 –2 –1 0 1 2 3
50%25%
75%
X, µm
Y, µ
m
C D
A B
Fig. 5. Quantitative analysis of mitochondrial
arrangement after treatment with calcium.
Fibers were preloaded with tetramethylrhod-
amine ethyl ester (TMRE), as described in
the legend to Fig. 4, and fixed at both ends
in a flexiperm chamber. Mitochondrial arran-
gement was analyzed after the addition of
3 lM free calcium and incubation for 5 min
at room temperature. (A) Representative
confocal image of cardiac muscle fiber. (B)
Centers of mitochondria were marked with
small black boxes. On the basis of this
image, distribution function (subplot C) and
radial plot (subplot D) were found. Note that
the distances between mitochondrial
centres are independent from direction. This
is clear from inspecting the distribution
function (subplot C) which is similar in all
directions. Some increase of the intermito-
chondrial distances is also seen.
T. Anmann et al. Contraction and respiration
FEBS Journal 272 (2005) 3145–3161 ª 2005 FEBS 3149

experiments in which the inhibitor of the mitochond-
rial calcium uniporter, Ruthenium Red, was used to
avoid any accumulation of calcium in the mitochon-
dria and a possible contribution of the PTP opening
into the kinetics of the respiration regulation (results
not shown). The apparent Km for exogenous ADP
decreases by an order of magnitude, from 320 ±
20 lm to 17 ± 3 lm, with an elevation of the free cal-
cium concentration up to 4 lm (Fig. 6B). At the same
time, the Vmax values for respiration only showed a
tendency to increase, with a maximum at 0.4 lmCa2+, and then to decrease (Fig. 6A). Similarly,
the apparent Km for ATP decreased from
286 ± 49 lm to 54 ± 3 lm (Fig. 6B). The Vmax value
was always lower than that with ADP and only
minimally changed with alteration in the free calcium
concentration.
On the contrary, no changes in the values of the
apparent Km for exogenous ADP were found in perme-
abilized ghost cardiac fibers after the extraction of
myosin, when contraction of sarcomere structures was
made impossible (Fig. 2). There was only a slight ten-
dency for a decrease of the apparent Km value, which
was not statistically significant Fig. 6D. Similarly,
there was only a tendency of a decrease in the Vmax
for the respiration with exogenous ADP in ghost fibers
at calcium concentrations higher than 2 lm (Fig. 6C).
Remarkably, the apparent Km for exogenous ATP in
the regulation of respiration changed in a manner simi-
lar to that for ADP (Fig. 6B). Addition of exogenous
ATP activates intracellular ATPases (the kinetics of
this activation is described below) and endogenous
ADP production that, in turn, activates respiration. It
has been observed before [37–39] and is shown in
Fig. 6B that in the regulation of respiration, the appar-
ent Km for exogenous ATP is the same as that for exo-
genous ADP. In both cases it depends, in very similar
manner, on the calcium concentration (Fig. 6B). In the
case of ghost fibers, both are practically independent
of the free calcium concentration (Fig. 6D). This com-
parison shows very clearly that the observed decrease
in the apparent Km for exogenous adenine nucleotides
in the regulation of respiration of permeabilized fibers
with intact sarcomeres is related to the changes
induced by their contraction. These results show also
that the direct effects of changes of free calcium on
mitochondrial respiration cardiac cells in situ are not
significant.
An interesting observation is described in Fig. 7. It
has been described in multiple studies that the appar-
ent Km for exogenous ADP in the regulation of
mitochondrial respiration in skinned fibers can be
effectively decreased by short-term proteolytic treat-
ment [43]. Figure 7 shows the result of the experiments
in which the skinned cardiac fibers were incubated
with different concentrations of trypsin, at 4 �C, in
solution B containing 0.1 or 3 lm free calcium and
ATP, and then the apparent Km values were deter-
mined under standard conditions – in the oxygraphic
medium containing 0.1 lm free calcium. It is clearly
seen in Fig. 7 that structural changes induced by sarco-
mere contraction decreased the rate of the proteolytic
3,5
A B
C D
2,5
1,5
0,5
3
2
1
0 0
100
200
300
400
Km
, µM
0
100
200
300
400
Km
, µM
0 1 2 3 4Ca2+, µM
0 1 2 3 4Ca2+, µM
0 1 2 3 4Ca2+, µM
0 1 2 3 4Ca2+, µM
VO
2 m
ax, n
mol
O2*
mg-1
(ww
)*m
in-1
3,5
2,5
1,5
0,5
3
2
1
0VO
2 m
ax, n
mol
O2*
mg-1
(ww
)*m
in-1
SF, ADPSF, ATP
GF, ADPGF, ATP
GF, ADPGF, ATP
SF, ADPSF, ATP
Fig. 6. The effect of free calcium on the
regulation of respiration in skinned (A, B)
and ‘ghost’ (C, D) fibers by exogenous ADP
and ATP. The left panel shows the effect of
free calcium on the maximal respiration
rates and the right panel shows the effect
of free calcium on the values of apparent
Km of respiration. Maximal respiration rates
were reached at 2.0 and 1.5 mM exogen-
ously added ADP and ATP, respectively. The
apparent Km and the maximal rates of
respiration are shown as means and SD of
the data from different experiments and at
different concentrations of free calcium.
Curves in all graphs are illustrative and show
the tendency of the effect of free calcium in
skinned and ghost fibers. The number of
independent experiments used to calculate
mean values and SD in all groups, was 3–6.
See the text for further details.
Contraction and respiration T. Anmann et al.
3150 FEBS Journal 272 (2005) 3145–3161 ª 2005 FEBS

degradation of proteins that participate in the regular
arrangement of mitochondria and contribute in mecha-
nisms resulting in a high apparent Km for exogenous
ADP, possibly being responsible for the restriction of
ADP diffusion within fibers and across the outer mito-
chondrial membrane [34,40].
Relating to the results described in Fig. 7 are data
showing that the effect of the free calcium on the
apparent Km for exogenous ADP is reversible (Fig. 8).
When cardiomyocytes or fibers incubated in the med-
ium with 3 lm free calcium were placed again into the
solution containing 0.1 lm free calcium, the apparent
Km for exogenous ADP increased again up to 300 lm(Fig. 8D). Figure 8A–C shows that this occurred in
parallel with a significant recovery of the initial shape
of permeabilized cardiomyocytes.
Figure 9 shows the results of studies in which the
fluxes of endogenous ADP in the permeabilized cells
were measured continuously by using a spectrophoto-
metric method with the coupled enzyme system
consisting of the pyruvate kinase (PK), phospho-
enolpyruvate and lactate dehydrogenase (LDH) [37,39].
In the absence of mitochondrial substrates, the total
MgATPase activity of permeabilized fibers (flux of
ADP out of fibers; upper curves in Fig. 9A–C)
increased with the addition of calcium, and the reac-
tion was characterized by a very high apparent Km (of
between 1 and 2 mm) for ATP. Similar parameters of
the total MgATPase reactions, Km ¼ 1.60 ± 0.49 mm,
were found by HPLC (results not shown), under
conditions when they were uncoupled from the mitoch-
ondrial respiration. If, then, the mitochondrial sub-
strates glutamate and malate were added to activate
respiration, the flux of ADP out of fibers (as measured
by using the coupled enzyme assay) was strongly
decreased, and, vice versa, the addition of atractyloside
restored the ADP production rate (as detected by
using the PK ⁄LDH assay) to the levels seen without
the respiratory substrates (Fig. 9A). Thus, the differ-
ence between the ATPase activities before and after
the addition of respiratory substrate gave the flux of
endogenous ADP channelled from MgATPases directly
into mitochondria (Fig. 9A). It can be seen that this
channelled flux was highest at resting levels of cytoso-
lic free calcium (0.1 lm) (Fig. 9B). Hypercontraction
of sarcomeres caused by increasing the calcium con-
centration up to 2 lm significantly decreased the flux
available to mitochondria; owing to disorganization
of the cellular structure, more ADP produced by
ATPases could diffuse to and be captured by the
PK+phosphoenolpyruvate system.
Among the results reported in this work, the
decrease in the Vmax of respiration with an increase in
the free calcium concentration (Fig. 6A) is of interest,
and may be explained by an inhibitory effect of
increased calcium concentration in the mitochondrial
matrix on the ATP synthase, as reported by Holmu-
hamedov et al. [44]. To check this possibility, we
repeated the kinetic experiments at 2 lm free calcium
in the presence of 40 mm Na+, which reversed the
inhibitory effect on the ATP synthase by activating the
Ca2+ ⁄Na+ exchange mechanism in the experiments
of Holmuhamedov et al. [44]. The results shown in
Fig. 10 demonstrate that the contraction-induced
decrease of Vmax is not reversed by 40 mm Na+, nei-
ther in the case of exogenous ADP nor of exogenous
ATP. Thus, a decrease in the Vmax of respiration in
skinned cardiac fibers is caused by hypercontraction
but not by the direct effect of calcium on mitochond-
rial respiration. This is in concordance also with an
insignificant decrease of Vmax in ghost fibers during
elevation of the free calcium concentration in the
medium (Fig. 6C).
The experiments described above were carried out
under experimental conditions that are far from normal
physiological conditions. The first of the nonphysio-
logical conditions is the absence of a contraction–
relaxation cycle and of muscular work performance,
which results in the rapid production of ADP in the
myofibrillar actomyosin reaction. The second is the
absence of creatine required to activate the creatine kin-
ase–phosphocreatine energy transfer pathway. In many
earlier publications, the strong stimulatory effect of
Fig. 7. Change in sensitivity of the skinned fibers, when in a hyper-
contracted state, to treatment with trypsin. The treatment was per-
formed with increasing trypsin concentrations at a low (0.1 lM, d)
and high (3.0 lM, m) calcium concentration in solution B in the
presence of respiratory substrates, glutamate (5 mM) and malate
(2 mM), but not supplemented by BSA, at 4 �C. Higher trypsin con-
centrations are required for a decrease in the Km value for endo-
genous ADP at a high calcium concentration.
T. Anmann et al. Contraction and respiration
FEBS Journal 272 (2005) 3145–3161 ª 2005 FEBS 3151

creatine on respiration in skinned fibers, by decreasing
the apparent Km for exogenous ADP, has been des-
cribed [37,39]. Figure 11 shows that a very strong stimu-
latory effect of creatine is observed when exogenous
ATP is used. In the presence of creatine, the apparent
Km for ATP was decreased from � 280 lm to � 130 lmat a free calcium concentration of 0.1 lm, and the Vmax
was strongly increased as a result of ADP production in
the local coupled creatine kinase reactions, including
mitochondrial creatine kinase [38–40]. Increase of the
free calcium concentration to 2 lm resulted in some
decrease of the Vmax, but its value stayed higher in the
presence of creatine than in the presence of ATP alone
(Fig. 11). Under these conditions, the apparent Km for
ADP remained low because of the presence of both cal-
cium and creatine. Thus, under physiological conditions
mitochondrial respiration is under the control of the
creatine kinase system, and this control may be modified
by an increase in the free calcium concentration.
Discussion
The results of this study show that in permeabilized
cardiac cells, a significant shortening of sarcomeres –
hypercontraction – caused by excess free calcium
results in a reversible alteration of the regular arrange-
ment of mitochondria in the cells, in the changes in
the kinetics of regulation of mitochondrial respiration
by exogenous ADP and ATP, and in the direct
channelling of endogenous ADP and ATP between
A B
C
D
Fig. 8. Reversibility of the calcium-induced
contraction of permeabilized cardiomyo-
cytes. (A) Cells were incubated and mitoch-
ondrial flavoproteins were imaged at 0.1 lM
free calcium. (B) The hypercontraction
shown was induced by increasing the free
calcium concentration to 1.0 lM in the pres-
ence of 2 mM ATP and 10 mM glutamate.
(C) Cardiomyocytes were then transferred
back into solution B that contained 0.1 lM
calcium but no ATP and respiratory sub-
strates. (D) Reversibility of the effects of
calcium-induced contraction of cardiomyo-
cytes on the kinetics of regulation of mito-
chondrial respiration by exogenous ADP.
The kinetics of respiratory regulation was
measured in solution B containing the
respiratory substrates and 3 lM free cal-
cium, then fibers were washed twice (7 min
each wash) in solution B containing 0.1 lM
calcium, and the kinetics were measured
again in the presence of 0.1 lM calcium
(return to this calcium concentration is
shown by 0.1*). The average data for three
separate experiments (±SD) are shown.
Contraction and respiration T. Anmann et al.
3152 FEBS Journal 272 (2005) 3145–3161 ª 2005 FEBS
ATPases and mitochondria (channelling meaning the
use of ADP or ATP produced without their release
into the medium). Thus, this study demonstrates
strong structure–function relationships between ATP-
producing and ATP-consuming systems [37–40] and
localized restrictions of the intracellular diffusion of
ADP and ATP related to the precise structural organ-
ization of the cell [34,40].
There is abundant information on the effects of
calcium on mitochondria, including its effects on mito-
chondrial respiration, obtained in studies carried out
on isolated mitochondria during the last three decades;
these important investigations date back to the work
by Lehninger et al. [3,45,46] and later work to those
by Hansford, Denton, McCormack and others [4–10].
These studies have recently been extended to in vivo
conditions by using confocal imaging and recombinant
protein targeting technology [10–16,47–49]. The con-
Fig. 9. Kinetics of ADP production in dependence of [ATP] in conditions of the absence (continuous line) and presence (with 10 mM gluta-
mate and 2 mM malate, dashed line) of oxidative phosphorylation in skinned cardiac fibers. Solution B was supplemented with 5 mM phos-
phoenolpyruvate, 0.24 mM NADH, a large excess of pyruvate kinase (PK) (20 IU mL)1) and lactate dehydrogenase (LDH) (20 IUÆmL)1), and
different [Ca2+] (nominally 0, 0.1 and 2 lM) at 25 �C. The curves are produced from data representing the mean values of groups (n ¼ 2–8).
*P < 0.05 compared to the parameter value in the absence of oxidative phosphorylation. (A) ADP production rates without free [Ca2+], Km
for ATP without (1.53 ± 0.16 mM) and with (0.79 ± 0.03 mM*) respiratory substrates, respectively. Glut+Mal represents the effect of respir-
atory substrates 10 mM glutamate and 2 mM malate, respectively, and Atr the effect of atractyloside (98 lM). (B) ADP production rates with
0.1 lM free Ca2+, Km without (2.33 ± 0.41 mM) and with (1.15 ± 0.26 mM*) respiratory substrates. (C) ADP production rates with 2 lM free
Ca2+, Km without (1.88 ± 0.32 mM) and with (2.68 ± 0.71 mM) respiratory substrates. To obtain the Km and Vmax values for each individual
measurement the data were fitted to a Michaelis–Menten relationship, and then average values and standard errors were calculated.
1,2
1
0,8
0,6
0,4
0,2
00 200 400 600 800
µM
VO
2, n
mol
O2*
mg-1
(WW
)*m
in-1
1000 1200 1400 1600
ADP, -Na+
ADP, +Na+
ATP, -Na+
ATP, +Na+
Fig. 10. The kinetics of regulation of respiration in permeabilized
cardiac fibers by exogenous ADP and ATP and the effect of Na-
acetate. Stimulation of mitochondrial respiration at 2 lM free Ca2+
by exogenous ADP (circles) and ATP (squares) in the absence
(white symbols) and presence of 40 mM Na+ (black symbols) is
shown. The change in the value of maximal respiration rate was
not significant. The number of experiments was 4–8.
SF, 0.1 µM Ca2+,+Cr
SF, 2.0 µM Ca2+,+Cr
SF, 0.1 µM Ca2+
SF, 2.0 µM Ca2+
0 200 400 600 800 1000ATP, µM
3
2
1
0
0,5
1,5
2,5
VO
2, n
mol
O2*
mg-
1 (w
w)*
min
-1
Fig. 11. The effect of creatine on the kinetics of respiration of
skinned fibers by exogenous ATP at 0.1 and 2.0 lM free calcium.
At the 0.1 lM calcium concentration, and in the presence of creat-
ine, the Vmax value increased from 1.48 ± 0.15, in the absence of
creatine, to 2.76 ± 0.10, and decreased at 2.0 lM calcium down to
1.64 ± 0.12, but remained still higher than in with 0.1 lM calcium.
The apparent Km decreased from 275 ± 78 lM to 132 ± 25 lM in
the presence of creatine at 0.1 lM calcium and to 108 ± 26 lM at
2.0 lM calcium.
T. Anmann et al. Contraction and respiration
FEBS Journal 272 (2005) 3145–3161 ª 2005 FEBS 3153

clusion from all these studies is that mitochondria par-
ticipate, by rapid uptake and release of calcium, in the
regulation of localized cellular calcium metabolism and
calcium transients in the cytoplasm, and that calcium
controls cell life and death under pathological condi-
tions by controlling the opening of the mitochondrial
permeability transition pore [9–15]. The results of com-
prehensive and excellent biochemical studies have
sometimes also led to the conclusion that calcium may
regulate the main function of mitochondria – respir-
ation and ATP production in oxidative phosphoryla-
tion – in parallel with the activation of contraction
(‘parallel activation’ mechanism) [6,7,16,19–22]. While
in some types of cells with very low energy fluxes the
activation of ATP synthesis by calcium may be suffi-
cient to satisfy the increased energy demand [16–18],
this enthusiasm in extrapolation of important informa-
tion of Ca–mitochondrial interactions to support the
hypothesis of ‘parallel’ activation of respiration and
contraction by calcium may not be justified in the case
of cardiac muscle cells. Indeed, direct experimental
studies carried out by Territo et al. [21,22], on isolated
heart mitochondria, showed that calcium increases the
respiration rate in the state 3 by a factor of 2–2.5, and
the respiration rate is remarkably high already at a cal-
cium concentration of zero. This experimental result
was confirmed by Cortassa et al., from calculations
obtained by using an integrated model of cardiac mito-
chondrial energy metabolism and calcium dynamics
[23]. Under physiological conditions, the regulation of
contraction and related energy fluxes in the heart is
governed by the classical Frank–Starling mechanism,
according to which the cardiac work and oxygen con-
sumption may be increased by a factor of 15–20 by
increasing the diastolic filling of the left ventricle
[24,28,29]. Under these conditions no changes in the
cytoplasmic calcium transients have been found [30–
32]. The cellular explanation of the Frank–Starling
mechanism is based on the length-dependent activation
of myofilaments as a result of the increased sensitivity
of the thin filaments to calcium at a greater sarcomere
length [30–32,50–52]. This results in changes in the
number of active crossbridges within sarcomeres at a
constant concentration of intracellular free calcium,
and consequently in the alteration of force develop-
ment, MgATP consumption, and MgADP and Pi pro-
duction. Apparently, this initiates an effective feedback
metabolic regulation of respiration via energy transfer
networks [25]. The results of this study are in favour
of the latter physiological mechanism. Indeed, in the
presence of an excess of exogenous ADP when this
substrate is available at a high concentration, in the
case of the ‘parallel activation’ mechanism, the max-
imal respiration rates should be dependent only upon
calcium concentration both in permeabilized cardiac
fibers with intact sarcomeres and in ghost fibers, and
one should expect a strong increase in the respiration
rate with an increase in the calcium concentration.
However, as shown in Fig. 6, there is only a slight
increase of Vmax (by some 40%), with the optimum
free calcium concentration of 0.4 lm, in permeabilized
fibers, and a subsequent decrease in Vmax at higher cal-
cium concentrations, and these modest changes in
Vmax are completely eliminated in ghost fibers, from
which most of the myosin ATPase is depleted. Similar
observations have been made previously [35,36].
Clearly, calcium ions are unable to stimulate oxidative
phosphorylation without involvement of extramito-
chondrial ATPases. Under conditions of hypercont-
raction, in the absence of relaxation and force
development, the contraction cycle is probably slowed
down and the related actomyosin MgATPase activity
decreased, thus decreasing the direct supply of ADP to
mitochondria.
This conclusion is also consistent with the results of
Khuchua et al., who have shown that there is no direct
significant activation of mitochondrial respiration by
Ca2+ ions in muscle cells in situ [53] but the effects of
changes in free calcium concentration rather result
from indirect effects of the Ca2+ stimulation of acto-
myosin crossbridge cycling that provides ADP to acti-
vate respiration [53].
This study shows also that unitary organization of
intracellular energy metabolism into ICEUs confers
the effective regulative mechanisms of ATPases to car-
diac cells. This is evident from comparison of the
ATPase vs. [ATP] relationships in isolated myofibrils
and skinned fibers: whereas our analysis revealed the
Km for MgATP in the MgATPase reaction to be close
to 1.5–2 mm in saponin-skinned cardiac fibers, the
value of Km was more than two orders of magnitude
less in isolated myofibrils (10–50 lm) [54,55] in the
absence of oxidative phosphorylation. In both prepara-
tions the PK+phosphoenolpyruvate system was used
for measurements of ADP produced by ATPases.
However, in contrast to isolated myofibrils, where the
PK+phosphoenolpyruvate system could effectively
eliminate the accumulation of ADP (a product of the
ATPase reaction), thereby conferring high ATP-sensi-
tivity to myofibrils, the PK+phosphoenolpyruvate
system was unable to consume the endogenous ADP
produced in the interior space of the ICEUs in skinned
fibers, as it has been many times demonstrated
[35,37,39]. Hence, ADP could accumulate and remain
inside the ICEUs owing to restricted diffusion out
from that structure. For the same reasons, ATP could
Contraction and respiration T. Anmann et al.
3154 FEBS Journal 272 (2005) 3145–3161 ª 2005 FEBS

not effectively diffuse into the ICEU. As a result, the
ATP ⁄ADP ratio near ATPases would decrease and
ADP would accumulate in this space, thereby causing
inhibition of ATPases as a result of the decreased free
energy of ATP hydrolysis [56] and inhibition of
MgATPases by MgADP which has a high affinity to
these enzymes (the Ki is close to 200 lm) [57–59]. To
overcome this inhibition, large doses of ATP had to be
added, which explains the high apparent Km for ATP.
In the cells in vivo this inhibition is overcome by effect-
ive supply of phosphocreatine to myofibrillar creatine
kinase via an energy transfer pathway and rapid rep-
hosphorylation of MgADP [25,37,39–41,58].
Notably, when the intracellular MgATPases oper-
ated under steady state conditions, coupled to the
mitochondrial respiration and rephosphorylation of
endogenous ADP into endogenous ATP, the overall
apparent Km for ATP was decreased, as compared to
MgATPases in the absence of oxidative phosphoryla-
tion (compare Fig. 6B and 9B). This effect, first
observed by Kummel in 1988 [57], is explained by an
increased turnover of ADP and ATP inside the ICEUs
owing to the channelling of both nucleotides. Indeed,
if the accumulation of ADP inside the ICEUs is
responsible for the low apparent affinity of ATPase to
ATP, the removal of ADP should decrease the Km
value. That in this process the mitochondria really
consumed ADP became evident from the observation
that the ADP flux from the ICEUs to the PK+phos-
phoenolpyruvate system decreased after switching on
the oxidative phosphorylation (Fig. 9). Similarly, in
skinned fibers, phosphocreatine shifted the apparent
Km for MgATP for relaxation of rigor tension from
300 lm to 10 lm owing to the coupling of myofibrillar
creatine kinase (MM-CK) to myofibrillar ATPase [58].
The observation that the coupling between ATP pro-
duction and consumption persisted in our experiments
despite the presence of the powerful PK+phos-
phoenolpyruvate system that is capable of eliminating
all cytoplasmic ADP (Fig. 9), indicates directly that
the coupling occurs within the ICEUs and that the dif-
fusion of endogenous ADP out of ICEUs is probably
restricted. Fukuda et al. have shown that MgADP
alone is capable of sigmoidally increasing the active
tension in cardiac cells as a result of the formation of
actomyosin–ADP rigor complexes [59]. In the presence
of the exogenous ATP regenerating system and of high
concentrations of ATP, but in the absence of mitoch-
ondrial substrates, the ATP ⁄ADP ratio was diminished
as a result of the local accumulation of a large quan-
tity of endogenous ADP. This occurs because of high
ATP splitting activity and because the exogenous
PK+phosphoenolpyruvate system was unable to
rephosphorylate the ADP produced in the vicinity of
myosin ATPase [37,39]. Clearly, irrespectively of the
cytoplasmic free [Ca2+], the mitochondria, by phos-
phorylating ADP produced by ATPases, were able to
effectively control the [ADP] and maintain a high
[ATP] : [ADP] ratio near the contractile apparatus.
This type of effective crosstalk between mitochondria
and sarcoplasmic reticulum Ca-dependent MgATPase
was shown by Kaasik et al. by measuring the calcium
accumulation in permeabilized fibers [41].
In our experiments, calcium induced contraction and
increased the proportion of ADP that became avail-
able for phosphorylation by the PK+phospho-
enolpyruvate system. At the same time, exogenously
added ADP became more easily available to mitochon-
dria, as indicated by the decreased Km for ADP in the
regulation of respiration. Both of these findings suggest
that maximal sarcomere shortening may lead to disin-
tegration of the structures of ICEU so that the diffu-
sion restriction for adenine nucleotides through its
barriers decreases. This conclusion conforms to our
understanding that the mitochondria and sarcomeres
are structurally tightly linked to each other so that
changes in sarcomere length ultimately lead to corres-
ponding changes in the length of the adjacent mito-
chondria [60]. These structural relationships are strong
enough to modulate the energy transfer and feedback
systems between the ATPases and mitochondria. Very
recently, reversible and remarkable force development
in myofibrils by the changes of mitochondrial func-
tion ⁄morphology has been directly demonstrated in
cardiomyocytes [61]. Our findings clearly show a
reverse (backward) effect of the regulation in mito-
chondrial function by the changes in sarcomere length
during contraction (shortening).
However, the physiological meaning of the effects
shown in this and other work [41,61,62] remains to be
elucidated. Under physiological conditions, with a high
turnover of contractile cycles during high workloads
and as a result of the presence of creatine kinase and
adenylate kinase systems, the channelling of adenine
nucleotides and metabolic signalling occur mostly via
coupled reactions within the energy transfer networks.
This ensures the highest efficiency of work perform-
ance and overcomes the effects of restrictions of ADP
and ATP diffusion within the ICEUs and at the outer
mitochondrial membrane [37,39]. As a result, the rate
of respiration is controlled by the mitochondrial creat-
ine kinase and adenylate kinase reactions and prob-
ably, to some extent, by the direct channelling of
ADP. The structural changes caused by strong sarco-
mere contractions induced by elevated calcium may
influence all these pathways of energy transfer and
T. Anmann et al. Contraction and respiration
FEBS Journal 272 (2005) 3145–3161 ª 2005 FEBS 3155

feedback signalling. Further experiments under more
physiological conditions (for example, with a complete
contraction–relaxation cycle) are necessary to answer
this question.
Experimental procedures
Animals and tissue preparations
Male Wistar rats (300–350 g in weight) were used in all
experiments. The investigation conformed to the Guide for
the Care and Use of Laboratory Animals published by the
National Institutes of Health (NIH Publication no. 85–23,
revised in 1985).
Mitochondria were isolated from rat hearts, as described
previously [63]. Calcium-tolerant myocytes were isolated by
perfusion with a collagenase-containing medium, as des-
cribed previously [64]. Skinned (permeabilized) fibers were
prepared from rat cardiac muscle and from musculus
soleus, according to the method described previously [65].
Solutions
Composition of the solutions used for the preparation of
skinned fibers and for oxygraphy was based on the informa-
tion of the ionic contents in the muscle cell cytoplasm [66].
Solution A contained, in mm: CaK2-EGTA, 1.9;
K2-EGTA, 8.1; MgCl2, 9.5; dithiothreitol, 0.5; potassium
2-(N-morpholino)ethanesulfonate (K-Mes), 50; imidazole,
20; taurine, 20; Na2ATP, 2.5; phosphocreatine, 15; pH 7.0,
adjusted at 25 �C. Solution B (with 0.1 lm free calcium)
contained, in mm: CaK2-EGTA, 1.9; K2-EGTA, 8.1;
MgCl2, 4.0; dithiothreitol, 0.5; K-Mes 100; pH 7.1, adjusted
at 25 �C; imidazole, 20; taurine, 20; K2HPO4, 3. For oxy-
graphy, 5 mm pyruvate (or 5 mm glutamate) and 2 mm
malate were added as respiratory substrates and used as
sodium salts.
Solution B with different free calcium concentrations
(0.2–4.0 lm) was made by adding CaK2-EGTA and
K2-EGTA stock solutions in different ratios that were cal-
culated by winmaxc, according to the scheme described
below (see the section ‘Calculation of free Ca2+ concentra-
tion’ and Appendix I). Other components were the same as
in solution B. The pH of solutions was adjusted to 7.1
before the kinetic experiments. In some experiments with
confocal microscopy, an increasing amount of CaCl2 stock
solution (270 mm) was added into solution B to adjust the
free Ca2+ concentration to 0.1 or 1.0 lm. A decrease in pH
of <0.3 units, according to our direct measurements, as a
result of the addition of Ca2+ into EGTA-containing buf-
fer, was considered to be too small to interfere with the
results of the experiment. This was confirmed by the
absence of any effects of calcium in the ghost cells or fibers
(see below).
Solution KCl contained, in mm: KCl, 125; Hepes, 20;
glutamate, 4; malate, 2; Mg-acetate, 3; KH2PO4, 5; EGTA,
0.4; and dithiothreitol, 0.3; pH 7.0, adjusted at 25 �C and
5 mgÆmL)1 of BSA was added.
All reagents were purchased from Sigma.
Determination of the rate of mitochondrial respir-
ation in isolated mitochondria, permeabilized
cardiomyocytes, and skinned and ‘ghost’ fibers
The steady state rates of oxygen consumption by isolated
mitochondria, permeabilized cardiomyocytes, and skinned
and ‘ghost’ fibers were recorded as a decrease in oxygen
concentration over time by using the two-channel high
resolution respirometer (Oroboros Oxygraph; Paar KG,
Graz, Austria) or by a Yellow Spring Clark oxygen elec-
trode in solution B with different free calcium concentra-
tion, containing respiratory substrates (see section of
Solution) and 5 mgÆmL)1 of fatty acid free BSA. The rate
of mitochondrial respiration was assessed in response to the
addition of ADP or ATP to different final concentrations
at different free calcium concentrations to determine the
apparent kinetic parameters of respiration regulation.
Determinations were carried out at 25 �C, and the solubil-
ity of oxygen was taken as 215 nmolÆml)1 [43]. The method
of calculation of free calcium concentration in solution B is
given below and in the Appendix.
Confocal microscopy
Isolated saponin-permeabilized cardiomyocytes or fibers
were fixed in a Heraeus flexiperm chamber (Heraus, Hanau,
Germany) using a microscope glass cover slide. The fibers
were fixed at both ends between the flexiperm chamber and
a 22 · 50 mm microscope cover slide. Cardiomyocytes were
simply sedimented in these chambers or in LAB-TEKR
chambered microscopic cover-glasses (Nalge-Nunc Interna-
tional, Naperville, IL, USA). Then, 200 lL of respiration
medium was immediately added to the chamber. A fully
oxidized state of mitochondrial flavoproteins was achieved
by substrate deprivation and equilibration of the medium
with air. To analyze mitochondrial calcium [Ca2+]m, isola-
ted cardiomyocytes or permeabilized myocardial fibers were
preloaded with the fluorescent Ca2+-specific probe, Rhod-2
(Sigma). For this, cells or fibers were incubated for 30 min
at room temperature in the respiration solution B (see Solu-
tions) with freshly added 5 lm Rhod-2. Rhod-2 has a net
positive charge, allowing its accumulation in mitochondria.
The fluorescence of Rhod-2 in loaded myocytes or fibers
was excited with a 543 nm Helium-Neon laser. The laser
output power was set to an average of 1 mW. The Rhod-2
fluorescence and the flavoprotein autofluorescence were
imaged by using a confocal microscope (LSM510NLO;
Zeiss, Jena, Germany) with a ·40 water immersion lens
Contraction and respiration T. Anmann et al.
3156 FEBS Journal 272 (2005) 3145–3161 ª 2005 FEBS

(NA 1.2). The use of such a water immersion lens preven-
ted geometrical aberrations when observing living cells. The
autofluorescence of flavoproteins was excited with the
488 nm line of an Argon laser, and the laser output power
was set to an average power of 8 mW. The fluorescence sig-
nals were collected through a multiline beam splitter with
maximum reflections at 488±10 nm (for rejection of the
488 nm line) and at 543 nm (for rejection of the 543 nm
line). A second 545 nm beam splitter was used to discrimin-
ate the Rhod-2 signal from the flavoprotein signal. Then,
the flavoprotein signal passed through a 505 nm long-pass
filter before being collected through a pinhole (one Airy
disk unit). The Rhod-2 signal was redirected to a 560 nm
long-pass filter before being collected through a pinhole
(one Airy disk unit).
To analyze the intracellular mitochondrial distribution
and mitochondrial inner membrane potential, myocytes or
fibers were incubated for 30 min at room temperature with
50 nm tetramethylrhodamine ethyl ester (TMRE), added to
respiration medium B. Imaging of TMRE fluorescence was
performed as described for the imaging of mitochondrial
calcium.
In isolated mitochondria the membrane potential was
measured spectrofluorometrically, as described previously
[42].
Quantitative analysis of mitochondrial positioning in the
cell was performed using the method developed in our
laboratories and described very recently [33]. In brief, the
confocal images of the cardiac muscle fibers with easily dis-
tinguishable mitochondria preloaded with TMRE (50 nm)
were used. Each image was rotated until the muscle fiber’s
or cell’s long axis was oriented in a vertical direction, as
judged by eye. Next, the centre of the mitochondria were
marked manually, and the distances to the closest neighbor-
ing mitochondria were computed. The statistical analysis
was performed by computing the distribution function of
the distance between the centres of adjacent mitochondria
[33].
Determination of ATPase activity and direct
channelling of ADP to mitochondria
ATPase activity was determined spectrophotometrically by
monitoring the absorbance decrease at 340 nm in a cuvette
containing solution B complemented with 5 mm phos-
phoenolpyruvate, 0.24 mm NADH, a large excess of PK
(20 IU mL)1), LDH and � 3 mg of skinned fibers, in the
absence or presence of 0.1 or 2.0 lm [Ca2+], at 25 �C.The extent of mitochondrial rephosphorylation of the
ADP produced in ATPase reactions was quantified as a
decrease in the ADP flux through the phosphoenolpyru-
vate-PK system after the addition of respiratory substrates
(10 mm glutamate and 2 mm malate). This part of the ADP
flux was considered to be directly channelled from ATPases
to mitochondria. In some experiments the respiratory sub-
strates and atractyloside (98 lm) were subsequently added
after recording the ADP production vs. [ATP] relationships,
to monitor the effect of mitochondria on ADP production
in the same fiber. For the same purpose, in other experi-
ments atractyloside was added to originally respiring fibers.
Protein concentration determination
Protein concentration in mitochondrial preparations was
determined by ELISA using the ELx800 Universal Micro-
plate Reader from Bio-Tek instruments and a bicinchoninic
acid kit (Protein Assay Reagent) from Pierce (Winooski,
Vermont, USA).
Analysis of the experimental results
The values in the figures are expressed as means ± SD.
The apparent Km and maximal respiration rate for exogen-
ous ADP and ATP were estimated by the Michaelis–Men-
ten equation from the nonlinear least squares fit, applying
simple weighting of the experimental data (from measure-
ments of the respiration of skinned and permeabilized ghost
fibers). Statistical comparisons were made by using analysis
of variance (anova) (variance analysis and Fisher test), and
a P-value of <0.05 was taken as the level of significance.
Calculation of the free concentration of Ca2+
Calculations of the composition of EGTA-Ca buffer were
made according to Fabiato & Fabiato [67], first for a total
calcium concentration of 1.878 mm. In our calculations,
dissociation constants of the complexes of Mg2+ with ADP
and ATP were taken from previously published references
[63,68], as described in the Appendix; 10 mm EGTA and
2.26 mm ATP were used as ligands, and 9.5 mm magnesium
and 1.878 or 2.77 mm calcium were used as metals for cal-
culations for solution A. For solution B we replaced
2.26 mm ATP with 1 mm ADP and changed the concentra-
tion of magnesium to 4 mm and added 3 mm phosphate.
The concentration of free calcium, in the case of 1.878 mm
total calcium, was found to be 1.11 · 10)7 m for solution A
and 1.04 · 10)7 m for solution B. In the case of 2.77 mm
total calcium, free calcium was 1.84 · 10)7 m for solution
A and 1.72 · 10)7 m for solution B.
To increase the free calcium concentration in the confo-
cal microscopic experiments, the total EGTA concentration
in solution B was kept constant at 10 mm and the total cal-
cium concentration changed by adding calculated aliquots
of stock solution of 270 mm CaCl2. In some experiments
the binary mixture of different ratios of K2CaEGTA and
K2EGTA was used in buffer preparation and the Ca2+
concentration was not changed after the pH adjustment.
The necessary total calcium concentrations for achieving
the corresponding free calcium concentrations were calcula-
T. Anmann et al. Contraction and respiration
FEBS Journal 272 (2005) 3145–3161 ª 2005 FEBS 3157

ted by using the winmaxc program according to the
scheme described above. Analysis of the calculations
allowed us also to use a simpler empirical formula:
½Ca�total ¼a½Ca�free
bþ ½Ca�free;
where a ¼ 10.0945 ± 0.01406, and b ¼ 0.4574 ± 0.0021;
for these coefficients, [Ca]free is given in lm and [Ca]total in
mm.
Acknowledgements
This work was supported by INSERM, France, and
Estonian Science Foundation grants No. 5515 and
6142, by the Marie Curie Fellowship of the European
Community programme ‘Improving Human Research
Potential and the Socio-economic Knowledge Base’
(M.V., contract No HPMF-CT-2002–01914) and by
grant no. 0182549s03 from the Ministry of Education
and Science of the Estonian Republic. We wish to
acknowledge Y. Usson (Grenoble, France), Mrs
E. Gvozdkova, M. Peitel and Mr H. Vija (Estonia) for
excellent technical assistance.
References
1 Bers D (2001) Excitation-Contraction Coupling and Car-
diac Contraction. Kluwer Academic Publishers, Dord-
recht.
2 Berridge MJ, Bootman MD & Roderick HL (2003) Cal-
cium signalling: dynamics, homeostasis and remodelling.
Nat Rev Mol Cell Biol 4, 517–529.
3 Carafoli E (2002) Calcium signalling: a tale for all sea-
sons. Proc Natl Acad Sci USA 99, 1115–1122.
4 Hansford RG (1985) Relation between mitochondrial
calcium transport and control of energy metabolism.
Rev Physiol Biochem Pharmacol 102, 1–72.
5 McCormack JG & Denton RM (1990) The role of mito-
chondrial Ca2+ transport and matrix Ca2+ in signal
transduction in mammalian tissues. Biochim Biophys
Acta 1018, 287–291.
6 McCormack JG, Halestrap AP & Denton RM (1990)
Role of calcium ions in regulation of mammalian intra-
mitochondrial metabolism. Physiol Rev 70, 391–425.
7 Gunter TE, Yule DI, Gunter KK, Eliseev RA & Salter
JD (2004) Calcium and mitochondria. FEBS Lett 567,
96–102.
8 Nicolls DG & Chalmers S (2004) The integration of
mitochondrial calcium transport and storage. J Bioenerg
Biomembr 36, 277–281.
9 Brooks PS, Yoon Y, Robotham YL, Anders MW &
Sheu SS (2004) Calcium, ATP and ROS: a mitochon-
drial love-hate triangle. Am J Cell Physiol 287, C817–
C833.
10 Rizzuto R, Bernardi P & Pozzan T (2000) Mitochondria
as all-around players of the calcium game. J Physiol
529, 37–47.
11 Duchen MR (2000) Mitochondria and calcium: from
cell signalling to cell death. J Physiol 529, 57–68.
12 Bianchi K, Rimessi A, Prandini A, Szabadkai G &
Rizzuto R (2004) Calcium and mitochondria: mechan-
isms and functions of a troubled relationship. Biochim
Biophys Acta 1742, 119–131.
13 Mackenzie L, Roderick HL, Berridge MJ, Covway SJ &
Bootman MD (2004) The spatial pattern of atrial cardio-
myocyte calcium signaling modulates contraction. J Cell
Sci 117, 6327–6337.
14 Brini M (2003) Ca2+ signalling in mitochondria: mech-
anism and role in physiology and pathology. Cell
Calcium 34, 399–405.
15 Duchen MR (2004) Roles of mitochondria in health
and disease. Diabetes 53, S96–S102.
16 Jouaville LS, Pinton P, Bastianutto C, Rutter GA &
Rizzuto R (1999) Regulation of mitochondrial synthesis
by calcium: evidence for a long-term metabolic priming.
Proc Natl Acad Sci USA 96, 13807–13812.
17 Robb-Gaspers LD, Burnett P, Rutter G, Denton RM,
Rizzuto R & Thomas AP (1998) Integrating cytosolic
calcium signals into mitochondrial metabolic responses.
EMBO J 17, 4987–5000.
18 Beutner G, Sharma VK, Giovannucci DR, Yule DI &
Sheu SS (2004) Identification of a ryanodine receptor in
rat heart mitochondria. J Biol Chem 276, 21482–21488.
19 Balaban RS (2002) Cardiac energy metabolism homeo-
stasis: role of cytosolic calcium. J Mol Cell Cardiol 34,
1259–1271.
20 Korzeniewski B (1998) Regulation of ATP supply dur-
ing muscle contraction: theoretical studies. Biochem J
330, 1189–1195.
21 Territo PR, Mootha VK, French SA & Balaban RS
(2000) Ca2+ activation of heart mitochondrial oxidative
phosphorylation: role of the F0 ⁄F1-ATPase. Am J Phys-
iol 278, C423–C435.
22 Territo PR, French SA, Dunleavy MC, Evans FJ &
Balaban RS (2001) Calcium activation of heart mito-
chondrial oxidative phosphorylation. Rapid kinetics of
mvO2, NADH and light scattering. J Biol Chem 276,
2586–2599.
23 Cortassa S, Aon M, Marban E, Winslow RL & O’Rou-
rke B (2003) An integrated model of cardiac mitochond-
rial energy metabolism and calcium dynamics. Biophys J
84, 2734–2755.
24 Williamson JR, Ford C, Illingworth J & Safer B (1976)
Coordination of cyclic acid cycle activity with electron
transport flux. Circ Res 38 (Suppl. I), 39–51.
25 Saks VA, Kuznetsov AV, Vendelin M, Guerrero K,
Kay L & Seppet EK (2004) Functional coupling as a
basic mechanism of feedback regulation of cardiac energy
metabolism. Mol Cell Biochem 256 ⁄ 257, 185–199.
Contraction and respiration T. Anmann et al.
3158 FEBS Journal 272 (2005) 3145–3161 ª 2005 FEBS
26 Neely JR, Denton RM, England PJ & Randle PJ (1972)
The effects of increased heart work on the tricarboxy-
late cycle and its interactions with glycolysis in the per-
fused rat heart. Biochem J 128, 147–159.
27 Balaban RS, Kantor HL, Katz LA & Briggs RW (1986)
Relation between work and phosphate metabolite in the
in vivo paced mammalian heart. Science 232, 1121–1123.
28 Starling EH & Visscher MB (1926) The regulation of
the energy output of the heart. J Physiol 62, 243–261.
29 Opie LH (1998) The Heart. Physiology, from Cell to
Circulation, 3rd edn. Lippincott-Raven Publishers,
Philadelphia.
30 Kentish JC & Wrzosek A (1998) Changes in force and
cytosolic Ca2+ concentration after length changes in
isolated rat ventricular trabeculae. J Physiol 506,
431–444.
31 Allen DG & Kentish JC (1985) The cellular basis of the
length-tension relation in cardiac muscle. J Mol Cell
Cardiol 17, 821–840.
32 Shimizu J, Todaka K & Burkoff D (2002) Load depen-
dence of ventricular performance explained by model of
calcium–myofilament interactions. Am J Physiol 282,
H1081–H1091.
33 Vendelin M, Beraud N, Guerrero K, Andrienko T,
Kuznetsov AV, Olivares J & Saks VA (2004) Mitochon-
drial regular arrangement in muscle cells: a ‘crystal-like’
pattern. Am J Physiol Cell Physiol 288, C757–C767
(10.1152/ajpcell.00281, 2005).
34 Vendelin M, Eimre M, Seppet E, Peet N, Andrienko T,
Lemba M, Engelbrecht J, Seppet EK & Saks VA (2004)
Intracellular diffusion of adenosine phosphates is locally
restricted in cardiac muscle. Mol Cell Biochem 256 ⁄ 257,229–241.
35 Andrienko T, Kuznetsov AV, Kaambre T, Usson Y,
Orosco A, Appaix F, Tiivel T, Sikk P, Vendelin M,
Margreiter R et al. (2003) Metabolic consequences of
functional complexes of mitochondria, myofibrils and
sarcoplasmic reticulum in muscle cells. J Exp Biol 206,
2059–2072.
36 Birkedal R & Gesser H (2004) Regulation of mitochon-
drial energy production in cardiac cells of rainbow trout
(Oncorhynchus mykiss). J Comp Physiol [B] 174, 255–
262.
37 Saks T, Kaambre VA, Sikk P, Eimre M, Orlova E,
Paju K, Piirsoo A, Appaix F, Kay L, Regiz-Zagrosek V
et al. (2001) Intracellular energetic units in red muscle
cells. Biochem J 356, 643–657.
38 Seppet EK, Eimre M, Andrienko T, Kaambre T, Sikk
P, Kuznetsov AV & Saks V (2004) Studies of mitochon-
drial respiration in muscles cells in situ: Use and misuse
of experimental evidence in mathematical modelling.
Mol Cell Biochem 256 ⁄ 257, 219–227.39 Seppet E, Kaambre T, Sikk P, Tiivel T, Vija H, Kay L,
Appaix F, Tonkonogi M, Sahlin K & Saks VA (2004)
Functional complexes of mitochondria with MgATPases
of myofibrils and sarcoplasmic reticulum in muscle cells.
Biochim Biophys Acta 1504, 379–395.
40 Saks V, Kuznetsov AV, Andrienko T, Usson Y, Appaix
F, Guerrero K, Kaambre T, Sikk P, Lemba M & Ven-
delin M (2003) Heterogeneity of ADP diffusion and
regulation of respiration in cardiac cells. Biophys J 84,
3436–3456.
41 Kaasik A, Veksler V, Boehm E, Novotova M,
Minajeva A & Ventura-Clapier R (2001) Energetic
crosstalk between organelles. Architectural integration
of energy production and utilization. Circ Res 89,
153–159.
42 Appaix F, Guerrero K, Rampal D, Izziki M, Kaambre
T, Sikk P, Brdiczka D, Riva-Lavieille C, Olivares J,
Longuet M et al. (2002) Bax and heart mitochondria:
uncoupling and inhibition of oxidative phosphorylation
without permeability transition. Biochim Biophys Acta
1556, 155–167.
43 Kuznetsov AV, Tiivel T, Sikk P, Kaambre T, Kay L,
Daneshrad Z, Rossi A, Kadaja L, Peet N, Seppet E
et al. (1996) Striking difference between slow and fast
twitch muscles in the kinetics of regulation of respir-
ation by ADP in the cells in vivo. Eur J Biochem 241,
909–915.
44 Holmuhamedov EL, Ozcan C, Jahangir A & Terzic A
(2001) Restoration of Ca2+-inhibited oxidative phos-
phorylation in cardiac mitochondria by mitochondrial
Ca2+ unloading. Mol Cell Biochim 220, 135–140.
45 Jacobus WE, Tiozzo R, Lugli G, Lehninger AL &
Carafoli E (1975) Aspects of energy-linked calcium
accumulation by rat heart mitochondria. J Biol Chem
250, 7863–7870.
46 Carafoli E, (2003) Historical review: mitochondria and
calcium: ups and downs of an unusual relationship.
Trends Biochem Sci 28, 175–181.
47 Rizzuto R, Pinton P, Brini M, Chiesa A, Filippin L &
Pozzan T (1999) Mitochondria as biosensors of calcium
microdomains. Cell Calcium 26, 193–199.
48 Robert V, Gurlini P, Tosello V, Nagai T, Miyawaki A,
Di Lisa F & Pozzan T (2001) Beat-to-beat oscillations
of mitochondrial [Ca2+] in cardiac cells. EMBO J 20,
4998–5007.
49 Pacher P, Thomas AP & Hajnoczky G (2002) Ca2+
marks: Miniature calcium signals in single mitochondria
driven by ryanodine receptors. Proc Natl Acad Sci USA
99, 2380–2385.
50 Landesberg A (1996) End-systolic pressure-volume rela-
tionship and intracellular control of contraction. Am J
Physiol 270, H338–H349.
51 Landesberg A & Sideman S (1999) Regulation of energy
consumption in cardiac muscle: analysis of isometric
contractions. Am J Physiol 276, H998–H1011.
52 Kobayashi T & Solaro RJ (2005) Calcium, thin fila-
ments, and integrative biology of cardiac contractility.
Annu Rev Physiol 67, 02.10–02.29.
T. Anmann et al. Contraction and respiration
FEBS Journal 272 (2005) 3145–3161 ª 2005 FEBS 3159

53 Khuchua Z, Belikova Y, Kuznetsov AV, Gellerich FN,
Schild L, Neumann HW & Kunz WS (1994) Caffeine
and Ca2+ stimulate mitochondrial oxidative phosphory-
lation in saponin-skinned human skeletal muscle fibers
due to activation of actomyosin ATPase. Biochim Bio-
phys Acta 1188, 373–379.
54 Glyn H & Sleep J (1985) Dependence of adenosine tri-
phosphatase activity of rabbit psoas muscle fibers and
myofibrils on substrate concentration. J Physiol 365,
259–276.
55 Swartz DR, Zhang D & Yancey KW (1999) Cross
bridge-dependent activation of contraction in cardiac
myofibrils at low pH. Am J Physiol 276, H1460–
H1467.
56 Kammermeier H, Schmidt P & Jungling E (1982) Free
energy change of ATP-hydrolysis: a causal factor of
early hypoxic failure of the myocardium. J Mol Cell
Cardiol 14, 267–277.
57 Kummel L (1988) Ca,MgATPase activity of permeabi-
lized rat heart cells and its functional coupling to oxida-
tive phosphorylation in the cells. Cardiovasc Res 22,
359–367.
58 Ventura-Clapier R, Veksler V & Hoerter JA (1994)
Myofibrillar creatine kinase and cardiac contraction.
Mol Cell Biochem 133 ⁄ 134, 125–144.59 Fukuda N, Fujita H, Fujita T & Ishiwata S (1998)
Regulatory roles of MgADP and calcium in tension
development of skinned cardiac muscle. J Muscle Res
Cell Motil 19, 909–921.
60 Nozaki T, Kagaya Y, Ishide N, Kitada S, Miura M,
Nawata J, Ohno I, Watanabe J & Shirato K (2001)
Interaction between sarcomere and mitochondrial length
in normoxic and hypoxic rat ventricular papillary mus-
cles. Cardiovasc Pathol 10, 125–132.
61 Kaasik A, Joubert F, Ventura-Clapier R & Veksler V
(2004) A novel mechanism of regulation of cardiac con-
tractility by mitochondrial functional state. FASEB J
18, 1219–1227.
62 Gueguen N, Lefaucheur L, Ecolan P, Fillaut M & Her-
pin P (2005) Ca2+-activated myosin-ATPases, creatine
and adenylate kinases regulate mitochondrial function
according to myofibre type. J Physiol (Lond) (February
24, as 10.1113 ⁄ jphysiol.2005.083030).63 Saks VA, Chernousova GB, Gukovsky DE, Smirnov
VN & Chazov EI (1975) Studies of energy transport in
heart cells. Mitochondrial isoenzyme of creatine phos-
phokinase: kinetic properties and regulatory action of
Mg2+ ions. Eur J Biochem 57, 273–290.
64 Kay L, Li Z, Fontaine E, Leverve X, Olivares J,
Tranqui L, Tiivel T, Sikk P, Kaambre T, Samuel JL
et al. (1997) Study of functional significance of mitoch-
ondrial–cytoskeletal interactions. In vivo regulation of
respiration in cardiac and skeletal muscle cells of des-
min-deficient transgenic mice. Biochim Biophys Acta
1322, 41–59.
65 Saks VA, Veksler VI, Kuznetsov AV, Kay L, Sikk P,
Tiivel T, Tranqui L, Olivares J, Winkler K, Wied-
emann F et al. (1998) Permeabilized cell and skinned
fiber techniques in studies of mitochondrial function in
vivo. Mol Cell Biochem 184, 81–100.
66 Godt RE & Maughan DW (1988) On the composition
of the cytosol of relaxed skeletal muscle of the frog. Am
J Physiol 254, C591–C604.
67 Fabiato A & Fabiato F (1979) Calculator programs for
computing the composition of the solutions containing
multiple metals and ligands used for experiments in
skinned muscle cells. J Physiol (Paris) 75, 463–505.
68 Phillips RC, George P & Rutman RJ (1966) Thermo-
dynamic studies of the formation and ionization of the
magnesium (II) complexes of ADP and ATP over the
pH range 5–9. J Am Chem Soc 88, 2631–2640.
69 Patton C, Thompson S & Epel D (2004) Some precau-
tions in using chelators to buffer metals in biological
solutions. Cell Calcium 35, 427–431.
Appendix
Corrections introduced into the programme of
calculations of the free [Ca2+] and [Mg2+]
In the solutions used, it is not only the concentration
of [Ca2+]free that is critical but also the concentration
of Mg2+ this ion participates in many reactions in the
form of MgATP and MgADP complexes. Four ligands
used in the solutions ) EGTA, ATP (in solution A),
ADP (in solution B) and phosphate ) have significant
affinity towards Ca2+ and Mg2+ and their influence
has to be taken into account. To calculate the buffer
compositions, temperature, pH and overall ionic
strength also have to be taken into account. Many
important aspects of the preparation of such kind of
buffers were published recently in [69] by the author
of the software we used for our calculations (see
below).
The influence of temperature (van’t Hoff equation,
see below) and pH on the dissociation constants of
the complexes were calculated by the program itself.
Free calcium concentrations were calculated using
winmaxc (Chris Patton, Stanford University; http://
www.stanford.edu/�cpatton/maxc.html), which is
based largely on the algorithm developed by Fabiato
and Fabiato [67].
Many important features have been added to the
program and the concentrations were checked to take
into account not only pH and ionic strength, but also
the complex formation between other ligands and
metals in the solutions. For our calculations, dissoci-
ation constants for ADP and ATP were taken from
Contraction and respiration T. Anmann et al.
3160 FEBS Journal 272 (2005) 3145–3161 ª 2005 FEBS
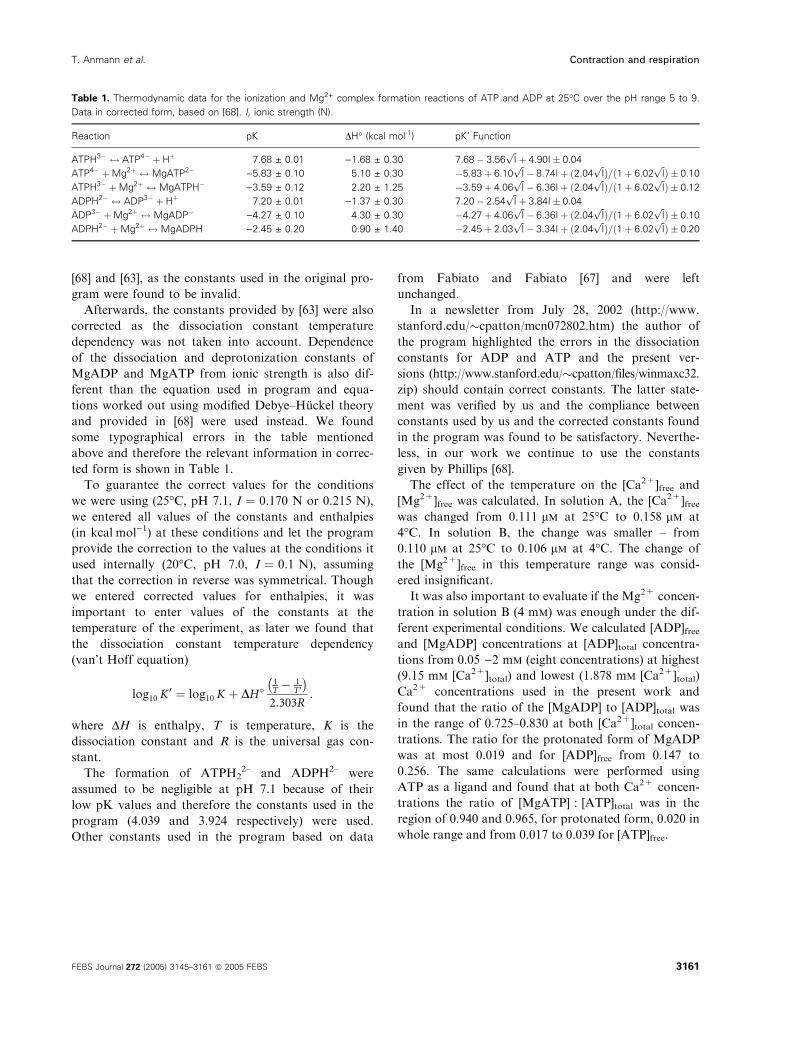
[68] and [63], as the constants used in the original pro-
gram were found to be invalid.
Afterwards, the constants provided by [63] were also
corrected as the dissociation constant temperature
dependency was not taken into account. Dependence
of the dissociation and deprotonization constants of
MgADP and MgATP from ionic strength is also dif-
ferent than the equation used in program and equa-
tions worked out using modified Debye–Huckel theory
and provided in [68] were used instead. We found
some typographical errors in the table mentioned
above and therefore the relevant information in correc-
ted form is shown in Table 1.
To guarantee the correct values for the conditions
we were using (25�C, pH 7.1, I ¼ 0.170 N or 0.215 N),
we entered all values of the constants and enthalpies
(in kcalÆmol)1) at these conditions and let the program
provide the correction to the values at the conditions it
used internally (20�C, pH 7.0, I ¼ 0.1 N), assuming
that the correction in reverse was symmetrical. Though
we entered corrected values for enthalpies, it was
important to enter values of the constants at the
temperature of the experiment, as later we found that
the dissociation constant temperature dependency
(van’t Hoff equation)
log10 K0 ¼ log10 K þ DH�
1T � 1
T0
� �
2:303R:
where DH is enthalpy, T is temperature, K is the
dissociation constant and R is the universal gas con-
stant.
The formation of ATPH22– and ADPH2– were
assumed to be negligible at pH 7.1 because of their
low pK values and therefore the constants used in the
program (4.039 and 3.924 respectively) were used.
Other constants used in the program based on data
from Fabiato and Fabiato [67] and were left
unchanged.
In a newsletter from July 28, 2002 (http://www.
stanford.edu/�cpatton/mcn072802.htm) the author of
the program highlighted the errors in the dissociation
constants for ADP and ATP and the present ver-
sions (http://www.stanford.edu/�cpatton/files/winmaxc32.
zip) should contain correct constants. The latter state-
ment was verified by us and the compliance between
constants used by us and the corrected constants found
in the program was found to be satisfactory. Neverthe-
less, in our work we continue to use the constants
given by Phillips [68].
The effect of the temperature on the [Ca2+]free and
[Mg2+]free was calculated. In solution A, the [Ca2+]freewas changed from 0.111 lm at 25�C to 0.158 lm at
4�C. In solution B, the change was smaller – from
0.110 lm at 25�C to 0.106 lm at 4�C. The change of
the [Mg2+]free in this temperature range was consid-
ered insignificant.
It was also important to evaluate if the Mg2+ concen-
tration in solution B (4 mm) was enough under the dif-
ferent experimental conditions. We calculated [ADP]freeand [MgADP] concentrations at [ADP]total concentra-
tions from 0.05 )2 mm (eight concentrations) at highest
(9.15 mm [Ca2+]total) and lowest (1.878 mm [Ca2+]total)
Ca2+ concentrations used in the present work and
found that the ratio of the [MgADP] to [ADP]total was
in the range of 0.725–0.830 at both [Ca2+]total concen-
trations. The ratio for the protonated form of MgADP
was at most 0.019 and for [ADP]free from 0.147 to
0.256. The same calculations were performed using
ATP as a ligand and found that at both Ca2+ concen-
trations the ratio of [MgATP] : [ATP]total was in the
region of 0.940 and 0.965, for protonated form, 0.020 in
whole range and from 0.017 to 0.039 for [ATP]free.
Table 1. Thermodynamic data for the ionization and Mg2+ complex formation reactions of ATP and ADP at 25�C over the pH range 5 to 9.
Data in corrected form, based on [68]. I, ionic strength (N).
Reaction pK DH� (kcal mol-1) pK’ Function
ATPH3� $ ATP4� þ Hþ 7.68 ± 0.01 )1.68 ± 0.30 7:68 � 3:56ffiffiI
pþ 4:90I � 0:04
ATP4� þ Mg2þ $ MgATP2� )5.83 ± 0.10 5.10 ± 0.30 �5:83 þ 6:10ffiffiI
p� 8:74I þ ð2:04
ffiffiI
pÞ=ð1 þ 6:02
ffiffiI
pÞ � 0:10
ATPH3� þ Mg2þ $ MgATPH� )3.59 ± 0.12 2.20 ± 1.25 �3:59 þ 4:06ffiffiI
p� 6:36I þ ð2:04
ffiffiI
pÞ=ð1 þ 6:02
ffiffiI
pÞ � 0:12
ADPH2� $ ADP3� þ Hþ 7.20 ± 0.01 )1.37 ± 0.30 7:20 � 2:54ffiffiI
pþ 3:84I � 0:04
ADP3� þ Mg2þ $ MgADP� )4.27 ± 0.10 4.30 ± 0.30 �4:27 þ 4:06ffiffiI
p� 6:36I þ ð2:04
ffiffiI
pÞ=ð1 þ 6:02
ffiffiI
pÞ � 0:10
ADPH2� þ Mg2þ $ MgADPH )2.45 ± 0.20 0.90 ± 1.40 �2:45 þ 2:03ffiffiI
p� 3:34I þ ð2:04
ffiffiI
pÞ=ð1 þ 6:02
ffiffiI
pÞ � 0:20
T. Anmann et al. Contraction and respiration
FEBS Journal 272 (2005) 3145–3161 ª 2005 FEBS 3161
Copyright © 2022 FDOKUMEN