Fish vs. Human - Respiration: External, Internal and Cellular
Upload
independentCategory
view
2download
0
Pelagic community respiration on the continental shelfoff Georgia, USA
Li-Qing Jiang Æ Wei-Jun Cai Æ Yongchen Wang ÆJulia Diaz Æ Patricia L. Yager Æ Xinping Hu
Received: 12 August 2008 / Accepted: 24 April 2009 / Published online: 24 September 2009! Springer Science+Business Media B.V. 2009
Abstract The South Atlantic Bight (SAB) has been a
focus for the study of continental shelf ecosystemrespiration during the past two decades. However, two
questions concerning respiration in this area have yet to
be answered. First, why do previous estimates ofrespiration in the SAB exceed measured carbon
fixation rates by almost an order of magnitude?Second, considering that bacteria are responsible for
most of the pelagic community respiration in the SAB,
why is respiration almost uniform from the coastline tothe shelf break, while bacterial production estimates
decrease offshore? This study addresses these critical
questions by presenting new pelagic communityrespiration data that were collected across the entire
width of the continental shelf off Georgia, USA from
June 2003 toMay 2006. The respiration was calculated
as in vitro changes of dissolved oxygen and dissolvedinorganic carbon concentrations during deck incuba-
tions. The measured respiration rates ranged from
0.3(±0.1) to 21.2(±1.4) mmol m-3 day-1. They fol-lowed a clear seasonal pattern, being lowest over the
entire shelf in winter and reaching maxima in summer.Summertime respiration rateswere highest on the inner
shelf and decreased with distance offshore. Consistent
with this trend, bacterial abundance measurementstaken during the samplingmonth of July 2005 followed
a pattern of seaward decline. The SAB organic carbon
fluxes calculated from the respiration data are close tothe estimates for primary production, which resolves a
long-standing mystery regarding perceived carbon
imbalance in the SAB.
Keywords Respiration ! Continental shelf !Southeastern United States ! South Atlantic Bight !Bacteria ! Organic carbon flux
AbbreviationsBOD Biochemical oxygen demand
CFZ Coastal frontal zoneDIC Dissolved inorganic carbon
DO Dissolved oxygen
pCO2 Partial pressure of carbon dioxideRQ Respiratory quotient
SAB South Atlantic Bight
SSS Sea surface salinitySST Sea surface temperature
L.-Q. Jiang ! W.-J. Cai (&) ! Y. Wang !J. Diaz ! P. L. Yager ! X. HuDepartment of Marine Sciences, The Universityof Georgia, Athens, GA 30602, USAe-mail: [email protected]
Present Address:L.-Q. JiangNational Oceanic and Atmospheric Administration,Climate Program Office, Silver Spring, MD 20910, USA
Present Address:J. DiazSchool of Earth and Atmospheric Sciences, GeorgiaInstitute of Technology, Atlanta, GA 30332, USA
123
Biogeochemistry (2010) 98:101–113
DOI 10.1007/s10533-009-9379-8
Introduction
Most organic carbon flux studies on continentalshelves have focused solely on carbon fixation
processes due to the relative ease of the 14C technique
(Steemann-Nielsen 1952) for measuring primaryproduction (Jahnke and Craven 1995; del Giorgio
and Williams 2005). However, estimates of primary
production on continental shelves are often subject tolarge uncertainties and errors. These uncertainties
arise from the fact that continental shelf ecosystem
production is strongly dependent on nutrient intru-sions that are highly variable in magnitude and
patchy in distribution (Yoder et al. 1985). Several
assumptions related to the frequency and extent ofsuch intrusions have to be made in order to estimate
annual primary production (Lee et al. 1991; Menzel
1993).Recent studies have shown that although meta-
bolic systems are charged up by intermittent photo-synthesis, they are most likely discharged by steady
respiration (Ari9stegui and Harrison 2002; Karl et al.
2003; Williams and del Giorgio 2005). Becauserespiration integrates all organic carbon sources to
the ecosystem both spatially and temporally, it is
likely a better index for the flow of organic carbonthrough the biota (Jahnke and Craven 1995; Williams
and del Giorgio 2005). More importantly, under-
standing decomposition processes (in addition tofixation processes) is an essential component in the
efforts to understand coastal carbon cycling.
Richly studied relative to the meager global data-base of continental shelf respiration rates (Williams
and del Giorgio 2005), the South Atlantic Bight (SAB)
has been the location for three shelf-wide respirationstudies (Griffith et al. 1990; Griffith and Pomeroy
1995; Pomeroy et al. 2000). Despite intensive study,
unanswered questions remain for this region (Menzel1993). First, considering that bacteria are responsible
for most of the respiration (Hopkinson et al. 1989;
Griffith et al. 1990), the uniformly high rates ofrespiration from onshore to offshore (Pomeroy et al.
2000) in summer are hard to reconcile with a seaward
decrease of bacterial production (Griffith et al. 1990).Second, estimates of water column respiration in the
SAB are so much (6–20 times) higher than primary
production estimates that it is impossible to findadequate allochthonous organic carbon supply to
account for the difference (Yoder 1985; Menzel1993; Pomeroy et al. 2000).
This study set out to try to resolve the carbon
budget discrepancies by measuring respiration acrossthe region with greater spatial and temporal resolu-
tion and using what we argue are improved methods.
Specifically, we measured respiration in larger,submerged bottles following changes in dissolved
oxygen (verified with measurements of changes in
dissolved inorganic carbon) over 24 h. Further, wemeasured respiration along three transects on nine
cruises spanning all four seasons to assess spatial and
temporal variability. Following these efforts, thecarbon budget of the SAB may not be as imbalanced
as previously thought. This study is also an important
part of an overall effort to understand controls on seasurface pCO2 and the associated air-sea CO2 fluxes in
the SAB shelf (Jiang et al. 2008a; Jiang et al. 2009;
Cai, unpublished data).
Study site and methods
Site description
The climate of the continental shelf off Georgia, USA
is subtropical with a surface water temperature range
of 10–30"C. The shallow shelf extends 130 km out tothe shelf break where the water depth is about 60 m.
The continental shelf has traditionally been divided
into three regimes: the inner shelf, from the coastlineto the 20-m isobath (roughly 45 km offshore); the
middle shelf, from the 20-m to the 40-m isobath
(roughly 90 km offshore); and the outer shelf, fromthe 40-m to the 100-m isobath (roughly 130 km
offshore) (Fig. 1). The north-flowing Gulf Stream
runs along the shelf break.The coastline features a series of barrier islands,
with extensive salt marshes between the barrier
islands and the coastline (Menzel 1993). Tides floodand drain the salt marsh estuaries twice daily and
transport sediments and organic materials back andforth between the continental shelf and the estuaries
(Hopkinson 1985). From north to south, the Savan-
nah, Ogeechee, and Altamaha Rivers supply fresh-water to this region (Fig. 1). For most of the year, a
coastal frontal zone (CFZ) located 10–30 km off-
shore separates a low salinity coastal current from
102 Biogeochemistry (2010) 98:101–113
123

waters further offshore (Blanton 1981). The CFZ
presents a dynamic barrier to the seaward transport of
dissolved and particulate materials introduced fromthe rivers and estuaries.
Shelf water shoreward of the CFZ is turbid,
containing accumulated discharge of the river andwater exchanged with intertidal salt marshes (Jiang
et al. 2008b). Production here is mainly driven by
nutrients that are recycled (Hanson et al. 1990) andresuspended from the sediments (Jahnke et al. 2005).
The middle and outer shelves are strongly influenced
by the Gulf Stream. Intrusions can be induced byGulf Stream meanders and eddies (Atkinson et al.
1984). During fall, winter, and spring, cross-shelfdensity gradients restrict the intruded water to the
outer shelf (Atkinson et al. 1984). In summer, when
aided by upwelling-favorable winds, the offshorewater may penetrate to the middle or even inner shelf
as subsurface intrusions and stay on the shelf for
weeks (Atkinson et al. 1984).
Materials and methods
A total of nine cruises were conducted along three
transects (Fig. 1) to measure pelagic community
respiration on the continental shelf off Georgia. Thesurveys were carried out on W-transect in June 2003,
June 2004, and October 2004; on D-transect in
August 2003; and on S-transect in January 2005,
March 2005, July 2005, October 2005, and May 2006(Fig. 1). These three nearby transects are viewed to
be similar (except for the very nearshore areas) in
their biogeochemical properties according to a studythat covered a more extensive area between North
Carolina and Florida (Jiang et al. 2008a). They
showed much smaller alongshore variations com-pared to those in the cross-shelf direction (Jiang et al.
2008a). Not all stations were sampled for respiration
during all cruises due to personnel constraints.Surface water temperature and salinity were recorded
continuously with an onboard flow-through system
on the research vessel. Vertical temperature andsalinity profiles were measured at each sampling
station with a Sea-Bird Electronics SBE-25 CTD. In
August 2003, sea surface pCO2 (partial pressure ofcarbon dioxide) was also measured on D-transect.
A detailed description of how pCO2 was determined
can be found in Jiang et al. (2008a).Respiration measurements were performed
onboard. Water samples were taken using 30-l Niskin
bottles from the surface. The water was then trans-ferred into six 300-ml black rubber-covered BOD
bottles (for DO measurement) and six 250-ml glass
bottles (for DIC measurement). Three of the 300-mlBOD and three of the 250-ml glass bottles were killed
immediately with 150 and 125 ll of saturated
mercuric chloride (HgCl2) solution, respectively.Stoppers with pointed ends were used to avoid
bubbles in all bottles. The 250-ml glass bottles were
wrapped with aluminum foil. Then all the bottleswere incubated dark for 24 h in coolers through
which in situ seawater continuously flowed. The
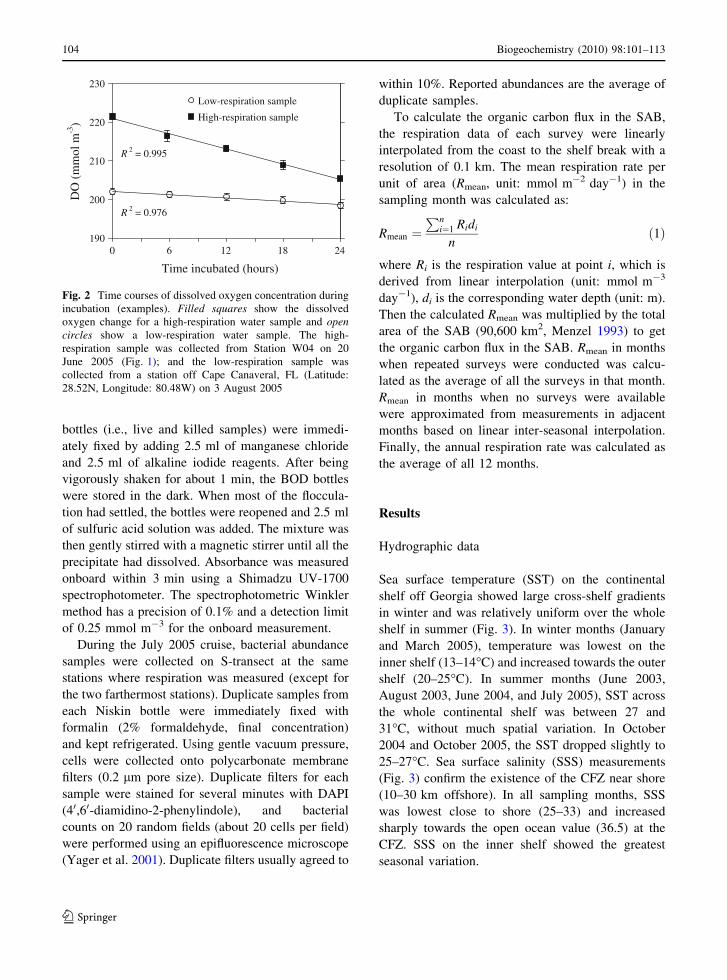
duration of the incubation was chosen based on timecourse measurements showing linear decreases in DO
over 24 h (Fig. 2). In order to avoid contamination,
the killed and live samples were incubated in separatecoolers.
At the end of incubation, 125 ll of saturated
mercuric chloride reagent was added to the three non-preserved 250-ml glass bottles. Then, all six 250-ml
glass bottles were stored in a refrigerator on the shipand analyzed for DIC concentration in the lab within
2 days after each cruise using an automated DIC
analyzer with a precision of 0.1% (Cai and Wang1998). The changes of DO concentration during
incubation in the 300-ml BOD bottles were measured
onboard using a spectrophotometric Winkler method(Pai et al. 1993). At the end of incubation, all BOD
W17
40 m
W14
W12
W10
W08
W04
D16D12
D10D08D06
D04D02 W16
Altamaha R.
Savannah R.
S15
S01S03
S05S07
S09S10
S12
S13
Ogeechee R.
20 m
200
m
100
m
30.8 N
31.0 N
31.2 N
31.4 N
31.6 N
31.8 N
32.0 N
32.2 N
79.5 W80.0 W80.5 W81.0 W81.5 W
Georgia, USA
Longitude
Lat
itude
GA SC
FLN
20 km
Fig. 1 Study area is the continental shelf off Georgia, USA.Respiration was measured on three transects: filled circles arethe stations on W-transect (starting from Wassaw Sound), filledsquares are the stations on S-transect (starting from SapeloSound), and filled triangles are the stations on D-transect(starting from Doboy Sound)
Biogeochemistry (2010) 98:101–113 103
123
bottles (i.e., live and killed samples) were immedi-
ately fixed by adding 2.5 ml of manganese chloride
and 2.5 ml of alkaline iodide reagents. After beingvigorously shaken for about 1 min, the BOD bottles
were stored in the dark. When most of the floccula-
tion had settled, the bottles were reopened and 2.5 mlof sulfuric acid solution was added. The mixture was
then gently stirred with a magnetic stirrer until all the
precipitate had dissolved. Absorbance was measuredonboard within 3 min using a Shimadzu UV-1700
spectrophotometer. The spectrophotometric Winkler
method has a precision of 0.1% and a detection limitof 0.25 mmol m-3 for the onboard measurement.
During the July 2005 cruise, bacterial abundance
samples were collected on S-transect at the samestations where respiration was measured (except for
the two farthermost stations). Duplicate samples from
each Niskin bottle were immediately fixed withformalin (2% formaldehyde, final concentration)
and kept refrigerated. Using gentle vacuum pressure,
cells were collected onto polycarbonate membranefilters (0.2 lm pore size). Duplicate filters for each
sample were stained for several minutes with DAPI
(40,60-diamidino-2-phenylindole), and bacterialcounts on 20 random fields (about 20 cells per field)
were performed using an epifluorescence microscope(Yager et al. 2001). Duplicate filters usually agreed to
within 10%. Reported abundances are the average ofduplicate samples.
To calculate the organic carbon flux in the SAB,
the respiration data of each survey were linearlyinterpolated from the coast to the shelf break with a
resolution of 0.1 km. The mean respiration rate per
unit of area (Rmean, unit: mmol m-2 day-1) in thesampling month was calculated as:
Rmean "Pn
i"1 Ridin
#1$
where Ri is the respiration value at point i, which isderived from linear interpolation (unit: mmol m-3
day-1), di is the corresponding water depth (unit: m).
Then the calculated Rmean was multiplied by the totalarea of the SAB (90,600 km2, Menzel 1993) to get
the organic carbon flux in the SAB. Rmean in months
when repeated surveys were conducted was calcu-lated as the average of all the surveys in that month.
Rmean in months when no surveys were available
were approximated from measurements in adjacentmonths based on linear inter-seasonal interpolation.
Finally, the annual respiration rate was calculated as
the average of all 12 months.
Results
Hydrographic data
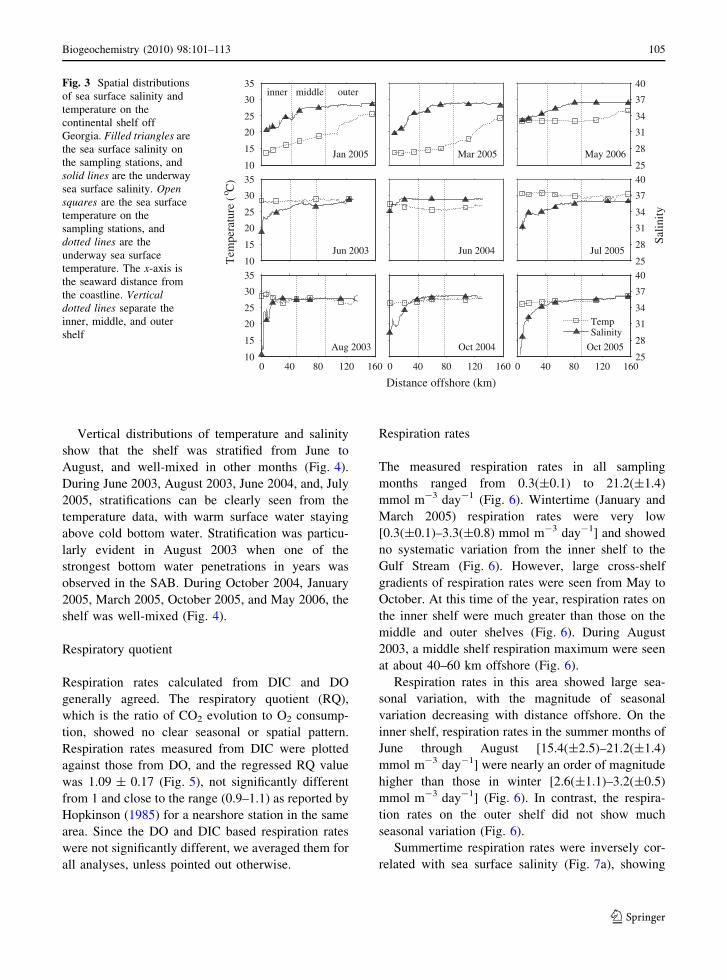
Sea surface temperature (SST) on the continental
shelf off Georgia showed large cross-shelf gradients
in winter and was relatively uniform over the wholeshelf in summer (Fig. 3). In winter months (January
and March 2005), temperature was lowest on the
inner shelf (13–14"C) and increased towards the outershelf (20–25"C). In summer months (June 2003,
August 2003, June 2004, and July 2005), SST across
the whole continental shelf was between 27 and31"C, without much spatial variation. In October
2004 and October 2005, the SST dropped slightly to
25–27"C. Sea surface salinity (SSS) measurements(Fig. 3) confirm the existence of the CFZ near shore
(10–30 km offshore). In all sampling months, SSS
was lowest close to shore (25–33) and increasedsharply towards the open ocean value (36.5) at the
CFZ. SSS on the inner shelf showed the greatest
seasonal variation.
R 2 = 0.995
R 2 = 0.976
190
200
210
220
230
0 6 12 18 24
Time incubated (hours)
DO
(mm
ol m
-3)
Low-respiration sample
High-respiration sample
Fig. 2 Time courses of dissolved oxygen concentration duringincubation (examples). Filled squares show the dissolvedoxygen change for a high-respiration water sample and opencircles show a low-respiration water sample. The high-respiration sample was collected from Station W04 on 20June 2005 (Fig. 1); and the low-respiration sample wascollected from a station off Cape Canaveral, FL (Latitude:28.52N, Longitude: 80.48W) on 3 August 2005
104 Biogeochemistry (2010) 98:101–113
123
Vertical distributions of temperature and salinity
show that the shelf was stratified from June toAugust, and well-mixed in other months (Fig. 4).
During June 2003, August 2003, June 2004, and, July
2005, stratifications can be clearly seen from thetemperature data, with warm surface water staying
above cold bottom water. Stratification was particu-
larly evident in August 2003 when one of thestrongest bottom water penetrations in years was
observed in the SAB. During October 2004, January
2005, March 2005, October 2005, and May 2006, theshelf was well-mixed (Fig. 4).
Respiratory quotient
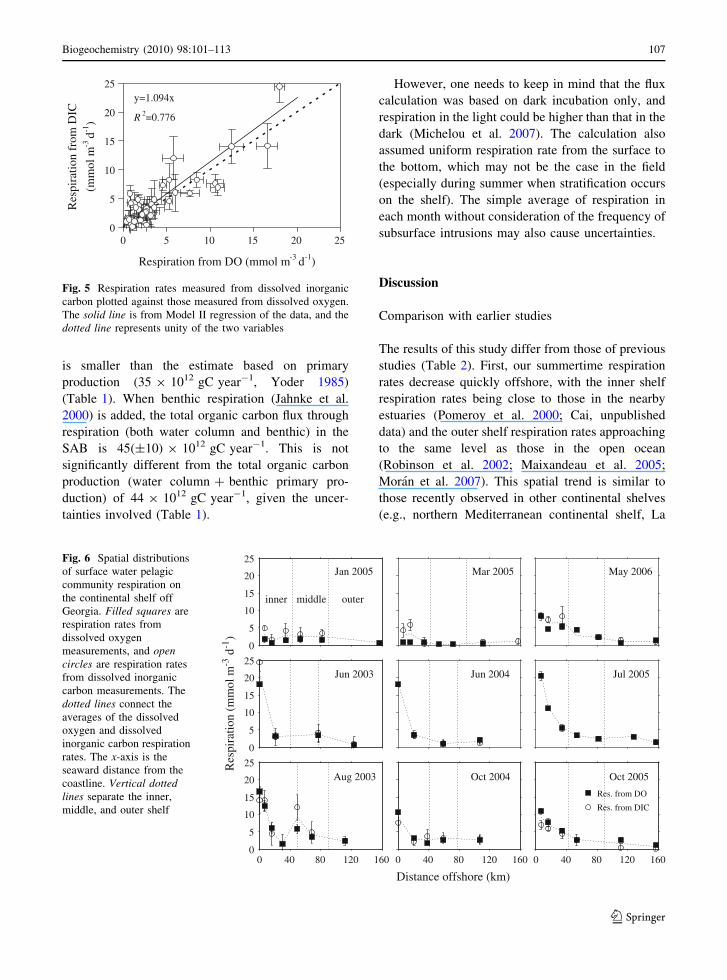
Respiration rates calculated from DIC and DO
generally agreed. The respiratory quotient (RQ),which is the ratio of CO2 evolution to O2 consump-
tion, showed no clear seasonal or spatial pattern.
Respiration rates measured from DIC were plottedagainst those from DO, and the regressed RQ value
was 1.09 ± 0.17 (Fig. 5), not significantly different
from 1 and close to the range (0.9–1.1) as reported byHopkinson (1985) for a nearshore station in the same
area. Since the DO and DIC based respiration rateswere not significantly different, we averaged them for
all analyses, unless pointed out otherwise.
Respiration rates
The measured respiration rates in all sampling
months ranged from 0.3(±0.1) to 21.2(±1.4)mmol m-3 day-1 (Fig. 6). Wintertime (January and
March 2005) respiration rates were very low
[0.3(±0.1)–3.3(±0.8) mmol m-3 day-1] and showedno systematic variation from the inner shelf to the
Gulf Stream (Fig. 6). However, large cross-shelf
gradients of respiration rates were seen from May toOctober. At this time of the year, respiration rates on
the inner shelf were much greater than those on the
middle and outer shelves (Fig. 6). During August2003, a middle shelf respiration maximum were seen
at about 40–60 km offshore (Fig. 6).
Respiration rates in this area showed large sea-sonal variation, with the magnitude of seasonal
variation decreasing with distance offshore. On the
inner shelf, respiration rates in the summer months ofJune through August [15.4(±2.5)–21.2(±1.4)
mmol m-3 day-1] were nearly an order of magnitude
higher than those in winter [2.6(±1.1)–3.2(±0.5)mmol m-3 day-1] (Fig. 6). In contrast, the respira-
tion rates on the outer shelf did not show much
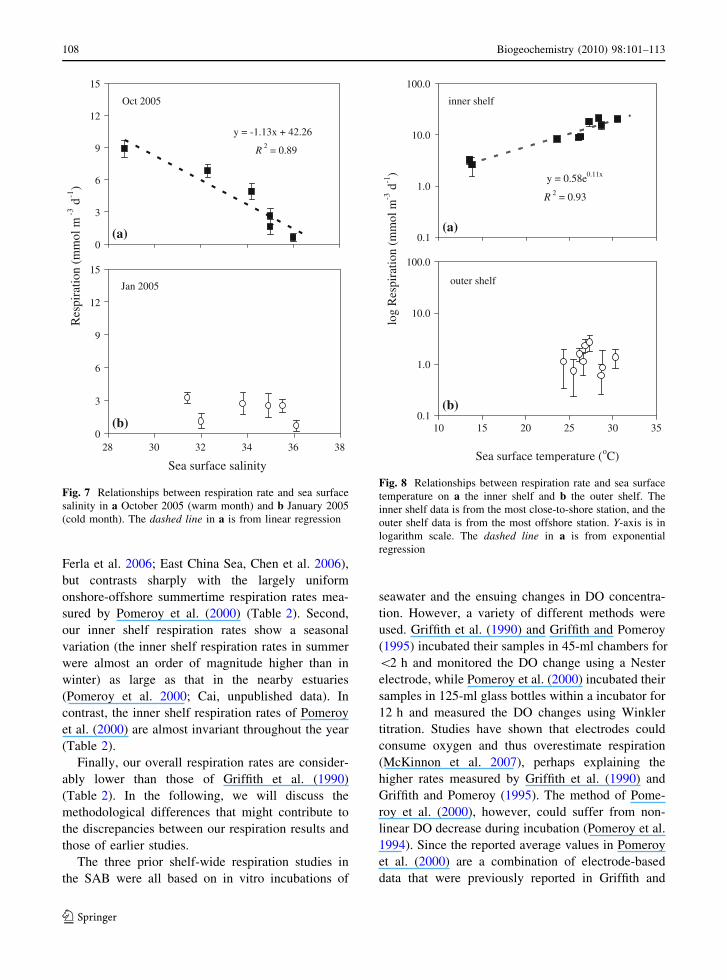
seasonal variation (Fig. 6).Summertime respiration rates were inversely cor-
related with sea surface salinity (Fig. 7a), showing
10
15
20
25
30
35
25
28
31
34
37
40
10
15
20
25
30
35
25
28
31
34
37
40
0 40 80 120 16010
15
20
25
30
35
0 40 80 120 160 0 40 80 120 160
Jan 2005 Mar 2005 May 2006
Jun 2003 Jun 2004 Jul 2005
Aug 2003 Oct 2004 Oct 2005
Distance offshore (km)
Tem
pera
ture
(o C
)
Salin
ity
inner middle outer
TempSalinity
25
28
31
34
37
40
Fig. 3 Spatial distributionsof sea surface salinity andtemperature on thecontinental shelf offGeorgia. Filled triangles arethe sea surface salinity onthe sampling stations, andsolid lines are the underwaysea surface salinity. Opensquares are the sea surfacetemperature on thesampling stations, anddotted lines are theunderway sea surfacetemperature. The x-axis isthe seaward distance fromthe coastline. Verticaldotted lines separate theinner, middle, and outershelf
Biogeochemistry (2010) 98:101–113 105
123

that freshwater supply, likely rich in terrestrial
matter, strongly influences the respiration on theinner shelf. In contrast, wintertime respiration rate
(January and March 2005) did not show a clear
relationship with salinity (Fig. 7b).The inner shelf respiration rate exhibited a good
logarithmic relationship with sea surface temperature
(Q10, the factor by which the rate increases for every10-degree temperature rise, was 3.0 ± 1.4), suggest-
ing that temperature played an important role in
controlling the seasonal variation of respiration(Fig. 8a). On the outer shelf, however, the respiration
rates were much less dependent on the relatively
stable SST (24–31"C) (Fig. 8b).
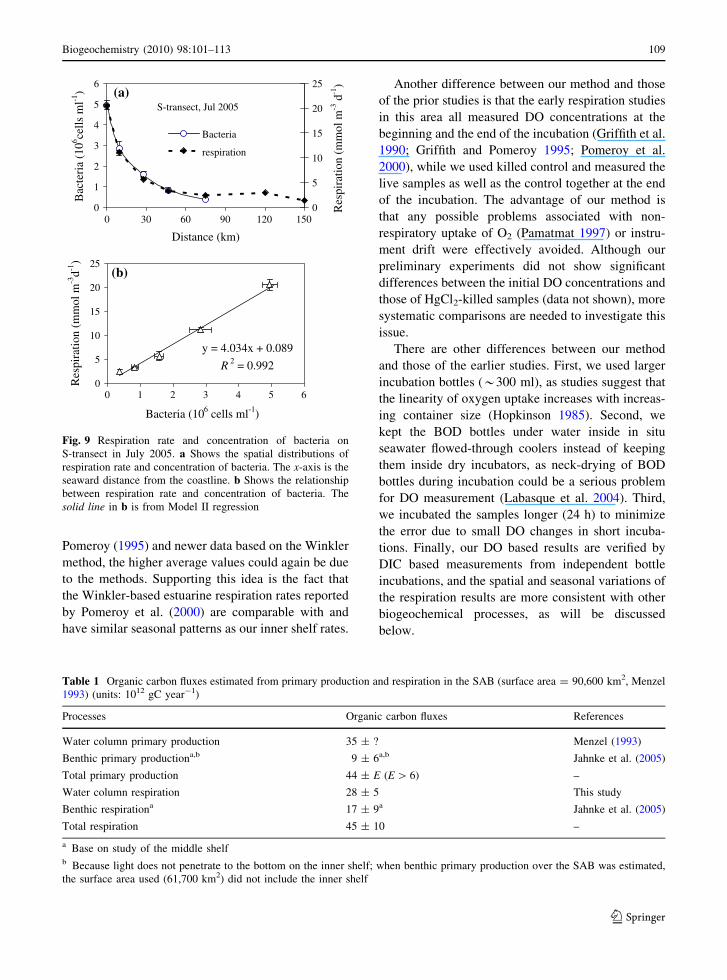
Bacteria
Bacterial abundance ranged from 0.36(±0.01) to
4.95(±0.23) 9 106 cells ml-1. It was highest near-shore and decreased with distance from the coastline
(Fig. 9a). Where samples were collected in tandem,
the offshore decrease in bacterial abundanceaccounted for much of the cross-shelf variability in
pelagic community respiration (R2 = 0.992; Fig. 9b).
Regional fluxes for SAB
Our calculated organic carbon flux through respira-tion in the SAB is 28(±5) 9 1012 gC year-1, which
Fig. 4 Verticaldistributions of temperatureand salinity on thecontinental shelf offGeorgia during all samplingmonths. The upper ninepanels show temperature,and the lower nine panelsshow salinity
106 Biogeochemistry (2010) 98:101–113
123
is smaller than the estimate based on primaryproduction (35 9 1012 gC year-1, Yoder 1985)
(Table 1). When benthic respiration (Jahnke et al.
2000) is added, the total organic carbon flux throughrespiration (both water column and benthic) in the
SAB is 45(±10) 9 1012 gC year-1. This is not
significantly different from the total organic carbonproduction (water column ? benthic primary pro-
duction) of 44 9 1012 gC year-1, given the uncer-
tainties involved (Table 1).
However, one needs to keep in mind that the fluxcalculation was based on dark incubation only, and
respiration in the light could be higher than that in the
dark (Michelou et al. 2007). The calculation alsoassumed uniform respiration rate from the surface to
the bottom, which may not be the case in the field
(especially during summer when stratification occurson the shelf). The simple average of respiration in
each month without consideration of the frequency of
subsurface intrusions may also cause uncertainties.
Discussion
Comparison with earlier studies
The results of this study differ from those of previous
studies (Table 2). First, our summertime respiration
rates decrease quickly offshore, with the inner shelfrespiration rates being close to those in the nearby
estuaries (Pomeroy et al. 2000; Cai, unpublished
data) and the outer shelf respiration rates approachingto the same level as those in the open ocean
(Robinson et al. 2002; Maixandeau et al. 2005;
Moran et al. 2007). This spatial trend is similar tothose recently observed in other continental shelves
(e.g., northern Mediterranean continental shelf, La
0
5
10
15
20
25
0 5 10 15 20 25
Respiration from DO (mmol m-3 d-1)
Res
pira
tion
from
DIC
(mm
ol m
-3 d-1
)y=1.094x
R 2=0.776
Fig. 5 Respiration rates measured from dissolved inorganiccarbon plotted against those measured from dissolved oxygen.The solid line is from Model II regression of the data, and thedotted line represents unity of the two variables
0
5
10
15
20
25
0
5
10
15
20
25
0 40 80 120 1600
5
10
15
20
25
0 40 80 120 160 0 40 80 120 160
Res. from DO
Res. from DIC
Jan 2005 Mar 2005 May 2006
Jun 2003 Jun 2004 Jul 2005
Aug 2003 Oct 2004 Oct 2005
inner middle outer
Distance offshore (km)
Res
pira
tion
(mm
ol m
-3 d
-1)
Fig. 6 Spatial distributionsof surface water pelagiccommunity respiration onthe continental shelf offGeorgia. Filled squares arerespiration rates fromdissolved oxygenmeasurements, and opencircles are respiration ratesfrom dissolved inorganiccarbon measurements. Thedotted lines connect theaverages of the dissolvedoxygen and dissolvedinorganic carbon respirationrates. The x-axis is theseaward distance from thecoastline. Vertical dottedlines separate the inner,middle, and outer shelf
Biogeochemistry (2010) 98:101–113 107
123
Ferla et al. 2006; East China Sea, Chen et al. 2006),
but contrasts sharply with the largely uniform
onshore-offshore summertime respiration rates mea-sured by Pomeroy et al. (2000) (Table 2). Second,
our inner shelf respiration rates show a seasonal
variation (the inner shelf respiration rates in summerwere almost an order of magnitude higher than in
winter) as large as that in the nearby estuaries
(Pomeroy et al. 2000; Cai, unpublished data). Incontrast, the inner shelf respiration rates of Pomeroy
et al. (2000) are almost invariant throughout the year
(Table 2).Finally, our overall respiration rates are consider-
ably lower than those of Griffith et al. (1990)
(Table 2). In the following, we will discuss themethodological differences that might contribute to
the discrepancies between our respiration results and
those of earlier studies.The three prior shelf-wide respiration studies in
the SAB were all based on in vitro incubations of
seawater and the ensuing changes in DO concentra-
tion. However, a variety of different methods wereused. Griffith et al. (1990) and Griffith and Pomeroy
(1995) incubated their samples in 45-ml chambers for
\2 h and monitored the DO change using a Nesterelectrode, while Pomeroy et al. (2000) incubated their
samples in 125-ml glass bottles within a incubator for
12 h and measured the DO changes using Winklertitration. Studies have shown that electrodes could
consume oxygen and thus overestimate respiration
(McKinnon et al. 2007), perhaps explaining thehigher rates measured by Griffith et al. (1990) and
Griffith and Pomeroy (1995). The method of Pome-
roy et al. (2000), however, could suffer from non-linear DO decrease during incubation (Pomeroy et al.
1994). Since the reported average values in Pomeroyet al. (2000) are a combination of electrode-based
data that were previously reported in Griffith and
y = -1.13x + 42.26
R 2 = 0.89
0
3
6
9
12
15
Oct 2005
0
3
6
9
12
15
28 30 32 34 36 38
Sea surface salinity
Jan 2005
Res
pira
tion
(mm
ol m
-3 d
-1)
(a)
(b)
Fig. 7 Relationships between respiration rate and sea surfacesalinity in a October 2005 (warm month) and b January 2005(cold month). The dashed line in a is from linear regression
y = 0.58e0.11x
R 2 = 0.93
0.1
1.0
10.0
100.0
inner shelf
0.1
1.0
10.0
100.0
10 15 20 25 30 35
Sea surface temperature (oC)
outer shelf
log
Res
pira
tion
(mm
ol m
-3 d
-1)
(a)
(b)
Fig. 8 Relationships between respiration rate and sea surfacetemperature on a the inner shelf and b the outer shelf. Theinner shelf data is from the most close-to-shore station, and theouter shelf data is from the most offshore station. Y-axis is inlogarithm scale. The dashed line in a is from exponentialregression
108 Biogeochemistry (2010) 98:101–113
123
Pomeroy (1995) and newer data based on the Winkler
method, the higher average values could again be dueto the methods. Supporting this idea is the fact that
the Winkler-based estuarine respiration rates reported
by Pomeroy et al. (2000) are comparable with andhave similar seasonal patterns as our inner shelf rates.
Another difference between our method and thoseof the prior studies is that the early respiration studies
in this area all measured DO concentrations at the
beginning and the end of the incubation (Griffith et al.1990; Griffith and Pomeroy 1995; Pomeroy et al.
2000), while we used killed control and measured the
live samples as well as the control together at the endof the incubation. The advantage of our method is
that any possible problems associated with non-
respiratory uptake of O2 (Pamatmat 1997) or instru-ment drift were effectively avoided. Although our
preliminary experiments did not show significant
differences between the initial DO concentrations andthose of HgCl2-killed samples (data not shown), more
systematic comparisons are needed to investigate this
issue.There are other differences between our method
and those of the earlier studies. First, we used larger
incubation bottles (*300 ml), as studies suggest thatthe linearity of oxygen uptake increases with increas-
ing container size (Hopkinson 1985). Second, we
kept the BOD bottles under water inside in situseawater flowed-through coolers instead of keeping
them inside dry incubators, as neck-drying of BOD
bottles during incubation could be a serious problemfor DO measurement (Labasque et al. 2004). Third,
we incubated the samples longer (24 h) to minimize
the error due to small DO changes in short incuba-tions. Finally, our DO based results are verified by
DIC based measurements from independent bottle
incubations, and the spatial and seasonal variations ofthe respiration results are more consistent with other
biogeochemical processes, as will be discussed
below.
0
1
2
3
4
5
6
0 30 60 90 120 150
Distance (km)
Bac
teri
a (1
06 cells
ml-1
)
0
5
10
15
20
25
Res
pira
tion
(mm
ol m
-3 d
-1)
Bacteria
respiration
y = 4.034x + 0.089R 2 = 0.992
0
5
10
15
20
25
0 1 2 3 4 5 6
Bacteria (106 cells ml-1)
Res
pira
tion
(mm
ol m
-3d-1
)
S-transect, Jul 2005(a)
(b)
Fig. 9 Respiration rate and concentration of bacteria onS-transect in July 2005. a Shows the spatial distributions ofrespiration rate and concentration of bacteria. The x-axis is theseaward distance from the coastline. b Shows the relationshipbetween respiration rate and concentration of bacteria. Thesolid line in b is from Model II regression
Table 1 Organic carbon fluxes estimated from primary production and respiration in the SAB (surface area = 90,600 km2, Menzel1993) (units: 1012 gC year-1)
Processes Organic carbon fluxes References
Water column primary production 35 ± ? Menzel (1993)
Benthic primary productiona,b 9 ± 6a,b Jahnke et al. (2005)
Total primary production 44 ± E (E[ 6) –
Water column respiration 28 ± 5 This study
Benthic respirationa 17 ± 9a Jahnke et al. (2005)
Total respiration 45 ± 10 –
a Base on study of the middle shelfb Because light does not penetrate to the bottom on the inner shelf; when benthic primary production over the SAB was estimated,the surface area used (61,700 km2) did not include the inner shelf
Biogeochemistry (2010) 98:101–113 109
123

Respiration versus temperature and supply
of organic matter
The respiration patterns observed in this study are
similar to those usually observed, with the seasonal
temperature cycle and supply of organic matterprobably being the most important controlling factors
(Hopkinson and Smith 2005). This study shows that
respiration rates on the inner shelf changed withseason at a much greater magnitude than those on the
outer shelf. This is partly due to the larger seasonal
temperature range on the inner shelf. Inner shelf SSTduring winter (as low as 10"C) was substantially
lower than during summer (*30"C); while the SSTon the outer shelf was more stable throughout the
year (from *20"C in winter to *30"C in summer)
(Fig. 3). The offshore weakening of seasonal depen-dence of respiration was also reported in the same
region by Hopkinson (1985), Hopkinson et al. (1989)
and Griffith et al. (1990).In summer, when SST was almost uniform from
the coastline to the shelf break (Fig. 3), respiration
was most likely controlled by organic matter supply.The summertime offshore decrease in respiration rate
is consistent with previous observations showing that
allochthonous organic carbon inputs (Hopkinsonet al. 1989; Moran et al. 1991; DeAlteris 2007) and
primary production (Yoder et al. 1993; Verity et al.
1993) are highest nearshore where rivers and saltmarshes are a strong influence. This is also consistent
with the fact that interactions between water column
and sediments help resuspension of more organicdetritus shoreward of the CFZ (Pomeroy et al. 1983;
Pomeroy 1985), and the CFZ significantly diminishes
cross-shelf exchange of both dissolved and particu-late constituents (Blanton 1981).
Respiration and bacteria
Size-fractionated experiments have shown that bac-teria and microprotozoa are responsible for 65 and
85% of the pelagic community respiration in the
nearshore and offshore SAB, respectively (Griffithet al. 1990). It is therefore expected that respiration
rates should follow bacterial activity. In this study,
we found a remarkably good correlation betweenrespiration and bacterial abundance along a single
transect in July 2005 when both respiration and
bacterial abundance were measured (Fig. 9). Thiscorrelation is expected when turnover (due to mor-
tality from bacterivory or bacteriophage) is high and
bacterial abundance well reflects bacterial activity.Other regions have also exhibited good correlations
between bacterial abundance and respiration (Robin-
son et al. 2002), although the relationship breaksdown when data sets from many regions are
combined (Robinson and Williams 2005).
However, one needs to be aware that we arecomparing respiration rates with bacterial abundance,
while in fact bacterial abundance is not necessarily
equivalent to bacterial activity. In addition, otherplanktonic communities might contribute significantly
Table 2 Pelagic community respiration on the continental shelf off Georgia: comparison between previous investigations and thecurrent study
Respiration rates (mmol m-3 day-1) References
Inner shelf Middle shelf Outer shelf
Summer Winter Summer Winter Summer Winter
43.1 8.3 ND ND ND ND Hopkinson (1985)
30.0 7.6 ND ND ND ND Hopkinson et al. (1989)
148–190 ND 48–115 ND 30–96 ND Griffith et al. (1990)
74.4 11.5 67.2 2.0 62.4 2.5 Griffith and Pomeroy (1995)
22.8 ± 1.9 26.4 ± 3.4 31.2 ± 6.7 16.8 ± 2.6 24.0 ± 7.2 7.2 ± 2.4 Pomeroy et al. (2000)
15.5 ± 5.4 2.9 ± 0.5 2.5 ± 0.9/8.9 ± 2.7a 1.3 ± 1.4 1.8 ± 0.8 0.8 ± 0.5 This study
ND no dataa The middle shelf respiration rates in summer differed greatly depending on whether subsurface intrusions were present or not, herewe list the respiration results for the two scenarios
110 Biogeochemistry (2010) 98:101–113
123

to the respiration (e.g., about 35 and 19% in nearshoreand offshore area of Georgia shelf water, respectively,
Griffith et al. 1990).
Middle shelf respiration maxima
During the sampling months of June and August of2003, middle shelf maxima were observed on the
cross-shelf distributions of respiration rates (Fig. 6).
They can be better seen from the data of August 2003when water samples were taken at a higher spatial
resolution (Fig. 10a). Similar to respiration, sea
surface pCO2 measurements in August 2003 showeda middle shelf maximum (Fig. 10b), which was not
seen during the other sea surface pCO2 surveys in this
area (Jiang et al. 2008a). One possibility is that thewater is a body of inner shelf water that was deflected
offshore. However, the salinity distribution does not
support this explanation (Fig. 3).Compared to other sampling months, August 2003
showed a strong subsurface intrusion (Fig. 4). Sub-
surface intrusions have been shown to impact thedistribution of microbial concentrations on the SAB
shelf. At the peak of subsurface intrusions, much
higher than usual microbial concentrations wererepeatedly found in the water above the intrusion
(Pomeroy et al. 1983; Pomeroy 1985). The hydro-
graphic data in August 2003 show that the targetedarea of the intrusion coincided with the respiration
maximum in the surface water (Fig. 10). Considering
that microbial organisms contribute predominantly torespiration in this area (Hopkinson et al. 1989;
Griffith et al. 1990), we suggest that during subsur-
face intrusions, the increased microbial activity in thesurface water overlaying the intruded water was
responsible for the middle shelf respiration maxima.
Since microbial abundance or biomass was notmeasured for the intrusion events observed during
this study, further research is needed to verify this
explanation.
Organic carbon fluxes through respiration
The organic carbon fluxes through water column
respiration in the SAB would be 780, 285, and230 9 1012 gC year-1 based on prior respiration
studies of Griffith et al. (1990), Griffith and Pomeroy
(1995), and Pomeroy et al. (2000), respectively. Theyare 6–22 times higher than the SAB water column
primary production estimate of 35 9 1012 gC year-1
(Yoder 1985; Menzel 1993). Thus, the SAB organic
carbon budget has been considered for many years to
300
400
500
600
700
800
p CO2
0
5
10
15
20
25
Res
pira
tion
(mm
ol m
-3 d-1
) from DIC
from DO
Average
respiration
Dep
th (m
)
106 106
105
104
bacteria
concentration
(ml-1)
pC
O2
(µat
m)
Distance offshore
0 125100 75 5025 150
0
100
80
60
40
20
(a)
(b)
(c)
Fig. 10 a Shows the spatial distribution of surface waterrespiration rates on the continental shelf off Georgia in August2003. Open circles are respiration from DIC measurement,filled squares are from DO measurement, and the dotted lineconnects the averages of the two methods. b Shows the in situmeasurement of partial pressure of carbon dioxide in thesurface water in August 2003. c Shows the typical verticaldistribution of total bacteria concentration during subsurfaceintrusions on the continental shelf of the southeastern UnitedStates. The solid lines (above the bottom of the continentalshelf) are concentrations of bacteria and the dashed line showsthe intrusion (c is modified from Pomeroy 1985). The x-axis isthe seaward distance from the coastline
Biogeochemistry (2010) 98:101–113 111
123
be greatly out of balance. Studies examining partic-ulate and dissolved organic matter flux from rivers
and estuaries have been unable to find an allochth-
onous source of organic carbon capable of supportingthis excess respiration (Menzel 1993; Pomeroy et al.
2000). Similarly, benthic primary production can not
explain the large gap between respiration and primaryproduction. Even though benthic production contrib-
utes significantly to the organic carbon production in
the SAB (Nelson et al. 1999), it is usually exceededby benthic respiration (Jahnke et al. 2000, 2005). The
SAB organic carbon fluxes calculated from the
respiration results of this study seem to be able toresolve the mystery of the perceived carbon imbal-
ance. Our rates, when combined with those of Menzel
(1993) and Jahnke et al. (2005) reveal an ecosystemin greater balance (Table 1). This conclusion sup-
ports the SAB ecosystem characteristic as a microbial
food web with a production/respiration ratio close to1 as prescribed by Pomeroy et al. (2000).
Comparison with global respiration on continentalshelves
The average area-based pelagic community respira-tion in the SAB is about 300 gC m-2 year-1. Wollast
(1998) estimated this value to be 70 gC m-2 year-1
(or 2 9 1015 gC year-1) for global continentalshelves, assuming pelagic respiration accounting for
on average 30% of the continental shelf primary
production. Unless the result of Wollast (1998) is anunderestimation, the respiration of the SAB is at the
higher end of the global database (even though the
SAB is fairly shallow compared to most continentalshelves). On the other hand, the large differences
between these two estimates may suggest that more
work is needed to constrain global estimate ofrespiration on continental shelves.
Acknowledgments Support for this work was provided bythe NSF grant (OCE-0425153) and the Georgia CoastalEcosystem LTER program (OCE-9982133). Jack Blantonprovided ship time for the June 2003 cruise. We thank thecrew of R/V Savannah and R/V Cape Hatteras for theirwonderful cooperation in the field. We are grateful to L. R.Pomeroy, E. M. Smith, and C. S. Hopkinson for constructivediscussion. The paper was greatly improved with the input ofAssociate Editor Melany Fisk and three anonymous reviewers.We also want to thank G. Han for laboratory support, andJustin Hartmann, Matt Erickson, Ed Sheppard, Feizhou Chen,and Haibing Ding for help with field sampling.
References
Arıstegui J, Harrison WG (2002) Decoupling of primary pro-duction and community respiration in the ocean: impli-cations for regional carbon studies. Aquat Microb Ecol29:199–209
Atkinson LP, Yoder JA, Lee TN (1984) Review of upwellingoff the southeastern United States and its effect on con-tinental-shelf nutrient concentrations and primary pro-ductivity. Rapp P–v Cons Int Explor Mer 183:70–78
Blanton JO (1981) Ocean currents along a nearshore frontalzone on the continental shelf of the southeastern UnitedStates. J Phys Oceanogr 11:1627–1637
Cai W-J, Wang Y (1998) The chemistry, fluxes, and sources ofcarbon dioxide in the estuarine waters of the Satilla andAltamaha Rivers, Georgia. Limnol Oceanogr 43:657–668
Chen C–C, Chiang K-P, Gong G-C, Shiah F-K, Tseng C-M,Liu KK (2006) Importance of planktonic communityrespiration on the carbon balance of the East China Sea insummer. Global Biogeochem Cycles 20:GB4001. doi:10.1029/2005GB002647
DeAlteris JA (2007) Elemental and isotopic characterization oforganic matter and carbon in the South Atlantic Bight.Dissertation, College of William & Mary
del Giorgio PA, Williams PJ (2005) Respiration in aquaticecosystems. Oxford University Press, Oxford
Griffith PC, Pomeroy LR (1995) Seasonal and spatial varia-tions in pelagic community respiration on the southeasternUS continental shelf. Cont Shelf Res 15:815–825
Griffith PC, Douglas DJ, Wainright SC (1990) Metabolicactivity of size-fractionated microbial plankton in estua-rine, nearshore, and continental shelf waters of Georgia.Mar Ecol Prog Ser 59:263–270
Hanson RB, Robertson CY, Yoder JA, Verity PG, Bishop SS(1990) Nitrogen recycling in coastal waters of southeast-ern U.S. during summer 1986. J Mar Res 48:641–660
Hopkinson CS (1985) Shallow-water benthic and pelagicmetabolism: evidence of heterotrophy in the nearshoreGeorgia Bight. Mar Biol 87:19–32
Hopkinson CS, Smith EM (2005) Estuarine respiration: anoverview of benthic, pelagic, and whole system respira-tion. In: del Giorgio PA, Williams PJ (eds) Respiration inaquatic ecosystems. Oxford University Press, Oxford
Hopkinson CS, Sherr B, Wiebe WJ (1989) Size fractionatedmetabolism of coastal microbial plankton. Mar Ecol ProgSer 51:155–166
Jahnke RA, Craven DB (1995) Quantifying the role of het-erotrophic bacteria in the carbon cycle: a need for respi-ration rate measurements. Limnol Oceanogr 40:436–441
Jahnke RA, Nelson JR, Marinelli RL, Eckman JE (2000)Benthic flux of biogenic elements on the Southeastern UScontinental shelf: influence of pore water advectivetransport and benthic microalgae. Cont Shelf Res 20:109–127
Jahnke RA, Richards M, Nelson J, Robertson C, Rao A, JahnkeD (2005) Organic matter remineralization and porewaterexchange rates in permeable South Atlantic Bight conti-nental shelf sediments. Cont Shelf Res 25:1433–1452
Jiang L-Q, Cai W-J, Wanninkhof R, Wang Y, Luger H (2008a)Air-sea CO2 fluxes on the U.S. South Atlantic Bight:
112 Biogeochemistry (2010) 98:101–113
123
spatial and seasonal variability. J Geophys Res113:C07019. doi:10.1029/2007JC004366
Jiang L-Q, Cai W-J, Wang Y (2008b) A comparative study ofcarbon dioxide degassing in river- and marine-dominatedestuaries. Limnol Oceanogr 53:2603–2615
Jiang L-Q, Cai W-J, Wang Y, Bauer JE (2009) Controllingmechanisms of carbon dioxide on the U.S. South AtlanticBight. J Geophys Res (in review)
Karl DM, Morris PJ, Williams PJ, Emerson S (2003) Metabolicbalance of the open sea. Nature 426:32
La Ferla R, Azzaro M, Maimone G (2006) Microbial respira-tion and trophic regimes in the Northern Adriatic Sea(Mediterranean Sea). Est Coast Shelf Sci 69:196–204
Labasque T, Chaumery C, Aminot A, Kergoat G (2004)Spectrophotometric Winkler determination of dissolvedoxygen: re-examination of critical factors and reliability.Mar Chem 88:53–60
Lee TN, Yoder JA, Atkinson LP (1991) Gulf Stream frontaleddy influence on productivity of the southeast U.S.continental shelf. J Geophys Res 96:22191–22205
Maixandeau A, Lefevre D, Fernandez IC, Sempere R, SohrinR, Ras J, van Wambeke F, Caniaux G, Queguiner B(2005) Mesoscale and seasonal variability of communityproduction and respiration in the surface waters of theN.E. Atlantic Ocean. Deep-Sea Res I 52:1663–1676
McKinnon AD, Carleton JH, Duggan S (2007) Pelagic pro-duction and respiration in the Gulf of Papua during May2004. Cont Shelf Res 27:1643–1655
Menzel DW (1993) Ocean processes: U. S. southeast conti-nental shelf. US Department of Energy, Washington, DC
Michelou VK, Cottrell MT, Kirchman DL (2007) Light-stim-ulated bacterial production and amino acid assimilation bycyanobacteria and other microbes in the North AtlanticOcean. Appl Environ Microbiol 73:5539–5546
Moran MA, Pomeroy LR, Sheppard ES, Atkinson LP, HodsonRE (1991) Distribution of terrestrial derived dissolvedorganic matter on the southeastern U.S. continental shelf.Limnol Oceanogr 36:1134–1149
Moran G, Perez V, Fernandez E (2007) Mismatch betweencommunity respiration and the contribution of heterotro-phic bacteria in the NE Atlantic open ocean: what causeshigh respiration in oligotrophic waters? J Mar Res65:545–560
Nelson JR, Eckman JE, Robertson CY, Marinelli RL, JahnkeRA (1999) Benthic microalgal biomass and irradiance atthe sea floor on the continental shelf of the South AtlanticBight: spatial and temporal variability and storm effects.Cont Shelf Res 19:477–505
Pai S-C, Gong G-C, Liu K-K (1993) Determination of dis-solved oxygen in seawater by direct spectrophotometry oftotal iodine. Mar Chem 41:343–351
Pamatmat MM (1997) Non-photosynthetic oxygen productionand non-respiratory oxygen uptake in the dark: a theory ofoxygen dynamics in plankton communities. Mar Biol129:735–746
Pomeroy LR (1985) The microbial food web of the south-eastern U.S. continental shelf. In: Atkinson LP, Menzel
DW, Bush KA (eds) Oceanography of the southeasternU.S. continental shelf. American Geophysical Union,Washington, DC
Pomeroy LR, Atkinson LP, Blanton JO, Campbell WB, Jac-obsen TR, Kerrick KH, Wood AM (1983) Microbialdistribution and abundance in response to physical andbiological processes on the continental shelf of south-eastern U.S.A. Cont Shelf Res 2:1–20
Pomeroy LR, Sheldon JE, Sheldon WM (1994) Changes inbacterial numbers and leucine assimilation during esti-mations of microbial respiration rates in seawater by theprecision winkler method. Appl Environ Microbiol60:328–332
Pomeroy LR, Sheldon JE, Sheldon WM, Blanton JO, Amft J,Peters F (2000) Seasonal changes in microbial processesin estuarine and continental shelf waters of the south-eastern U.S.A. Est Coast Shelf Sci 51:415–428
Robinson C, Williams PJ (2005) Respiration and its measure-ment in surface marine waters. In: del Giorgio PA, Wil-liams PJ (eds) Respiration in aquatic ecosystems. OxfordUniversity Press, Oxford
Robinson C, Serret P, Tilstone G, Teira E, Zubkov MV, ReesAP, Woodward MS (2002) Plankton respiration in theEastern Atlantic Ocean. Deep-Sea Res I 49:787–813
Steemann-Nielsen E (1952) The use of radioactive carbon(C14) for measuring organic production in the sea. J ConsInt Explor Mer 18:117–140
Verity PG, Bishop SS, Nelson JR, Craven DB, Blanton JO,Robertson CY, Tronzo CR (1993) Composition, produc-tivity, and nutrient chemistry of a coastal ocean plank-tonic food web. Cont Shelf Res 13:741–776
Williams PJ, del Giorgio PA (2005) Respiration in aquaticecosystems: history and background. In: del Giorgio PA,Williams PJ (eds) Respiration in aquatic ecosystems.Oxford University Press, Oxford
Wollast R (1998) Evaluation and comparison of the globalcarbon cycle in the coastal zone and the open ocean. In:Brink KH, Robinson AR (eds) The sea. Wiley, New York
Yager PL, Connelly TL, Mortazavi B, Wommack KE, Bano N,Bauer JE, Opsahl S, Hollibaugh JT (2001) Dynamicbacterial and viral response to an algal bloom at subzerotemperatures. Limnol Oceanogr 46:790–801
Yoder JA (1985) Environmental control of phytoplanktonproduction on the southeastern U.S. continental shelf. In:Atkinson LP, Menzel DW, Bush KA (eds) Oceanographyof the southeastern U.S. continental shelf. AmericanGeophysical Union, Washington, DC
Yoder JA, Atkinson LP, Bishop SS, Blanton JO, Lee TN,Pietrafesa LJ (1985) Phytoplankton dynamics within GulfStream intrusions on the southeastern United States con-tinental shelf during summer 1981. Cont Shelf Res 4:611–635
Yoder JA, Verity PG, Bishop SS, Hoge FE (1993) Phyto-plankton chl a, primary production, and nutrient distri-butions across a coastal frontal zone off Georgia, USA.Cont Shelf Res 13:131–141
Biogeochemistry (2010) 98:101–113 113
123
Copyright © 2022 FDOKUMEN