Supplement of Decadal evolution of ship emissions in China ...

ARTICLE IN PRESS
0967-0645/$ - se
doi:10.1016/j.ds
�CorrespondiE-mail addre
Deep-Sea Research II 52 (2005) 3462–3477
www.elsevier.com/locate/dsr2
Multi-decadal synthesis of benthic–pelagic coupling in thewestern arctic: Role of cross-shelf advective processes
Kenneth H. Duntona,�, Jonathan L. Goodallb, Susan V. Schonberga,Jacqueline M. Grebmeierc, David R. Maidmentb
aThe University of Texas at Austin Marine Science Institute, 750 Channel View Drive, Port Aransas, TX 78373, USAbDepartment of Civil Engineering, The University of Texas at Austin, JJ Pickle Research Campus Bldg #119,
10100 Burnet Rd. Austin, TX 78712, USAcDepartment of Ecology and Evolutionary Biology, Marine Biogeochemistry and Ecology Group, The University of Tennessee,
10515 Research Dr., Bldg A, Suite 100, Knoxville, TN 37932, USA
Received 5 October 2004; accepted 19 September 2005
Abstract
Using geographic information systems (GIS) software and geostatistical techniques, we utilized three decades of water-
column chlorophyll a data to examine the relative importance of autochthonous versus allochthonous sources of reduced
carbon to benthic communities that occur from the northern Bering to the eastern Beaufort Sea shelf. Spatial trend
analyses revealed areas of high benthic biomass (4300 gm�2) and chlorophyll (4150mgm�2) on both the southern and
northern Chukchi shelf; both areas are known as depositional centers for reduced organic matter that originates on the
Bering Sea shelf and is advected northward in Anadyr and Bering shelf water masses. We found a significant correlation
between biomass and chlorophyll a in the Chukchi Sea, reflective of the strong benthic–pelagic coupling in a system that is
utilized heavily by benthic-feeding marine mammals. In contrast, there was no significant correlation between biomass and
chlorophyll in the Beaufort Sea, which by comparison, is considerably less productive (biomass and chlorophyll,
o75 gm�2 and o50mgm�2, respectively). One notable exception is an area of relatively high biomass (50–100 gm�2) and
chlorophyll (80mgm�2) near Barter Island in the eastern Beaufort Sea. Compared to other adjacent areas in the Beaufort
Sea, the chlorophyll values in the vicinity of Barter Island were considerably higher and likely reflect a long-hypothesized
upwelling in that area and close coupling between the benthos and autochthonous production. In the Bering Sea, a drop in
benthic biomass in 1994 compared with previous measurements (1974–1993) may support earlier observations that
document a decline in biomass that began between the 1980s and 1990s in the Chirikov Basin and south of St. Lawrence
Island. The results of this study indicate that the benthos is an excellent long-term indicator of both local and physical
advective processes. In addition, this work provides further evidence that secondary production on arctic shelves can be
significantly augmented by reduced carbon advected from highly productive adjacent shelves.
r 2005 Elsevier Ltd. All rights reserved.
Keywords: Benthic; Fauna; Biomass; Beaufort Sea; Chukchi Sea; Bering Sea
e front matter r 2005 Elsevier Ltd. All rights reserved.
r2.2005.09.007
ng author. Tel.: +361 749 6744; fax: +361 749 6777.
ss: [email protected] (K.H. Dunton).
ARTICLE IN PRESSK.H. Dunton et al. / Deep-Sea Research II 52 (2005) 3462–3477 3463
1. Introduction
Despite numerous studies that have looked at thecomposition, abundance and biomass of benthicepifaunal and infaunal organisms in the Arctic, onlya few studies have focused on the benthos as long-term integrators of overlying water column pro-cesses (Grebmeier and Cooper, 1994; Grebmeier etal., 1995; Cooper et al., 2002). It is well known thatspatial and temporal patterns in the flux of sinkingmatter are critical to the development of thebenthos, particularly at high latitudes (Kroncke,1994; Grebmeier et al., 1995; Hobson et al., 1995;Reigstad and Wassmann, 1996; Wassmann et al.,1996; Clough et al., 1997). But it is the input of thisenergy, in the form of highly reduced organic matterthat ultimately links production in the water columnwith benthic productivity (Grebmeier and Barry,1991; Wassmann, 1991). Unlike highly dynamicestuarine systems, which are populated by short-lived annual species (Montagna and Kalke, 1992,1995), the benthos of western arctic shelves arerelatively stable communities dominated by largelong-lived perennial organisms that include seaanemones, bryozoans, sea urchins, molluscs, crus-taceans, and large polychaetes (Grebmeier et al.,1989). Evidence of this stability was noted byGrebmeier (1987), who found no major change in
Fig. 1. Station locations in the study area. Measurements of integrate
locations of quantitative benthic grab samples.
the benthic faunal structure of the Bering andChukchi Seas between her study and that of Stoker(1978) made over 10 years earlier.
Current evidence suggests that the degree ofbenthic–pelagic coupling is largely a product ofdepth, zooplankton species composition, and phy-sical processes that control the rates of horizontaland vertical advection of zooplankton and particu-late organic matter flux (Wassmann et al., 1996).Hydrodynamic processes are ultimately most im-portant, and at high latitudes the predominance oflarge seasonal variations in physical forcing eventscan result in decoupling between primary andsecondary producers in the water column andincreased sedimentation of ungrazed phytoplank-ton, particularly on relatively shallow continentalshelves (Laws et al., 1988; Wassmann, 1991;Grebmeier et al., 1995). On the Bering-Chukchishelf (Fig. 1), Springer and McRoy (1993) estimatedthat benthic biomass was two to ten times greaterunder plumes of highly productive water advectednorthward from the Anadyr Basin. Tight benthic–pelagic coupling probably has been best documen-ted on the Chukchi Shelf as reflected by stableisotopic measurements of benthic food webs(Dunton et al., 1989), rates of sediment oxygenuptake (Grebmeier, 1993; Naidu et al., 2003), andbenthic biomass concentrations (Zenkevitch, 1963;
d chlorophyll a are depicted in yellow. Points in brown denote

ARTICLE IN PRESSK.H. Dunton et al. / Deep-Sea Research II 52 (2005) 3462–34773464
Golikov et al., 1990; Grebmeier and Barry, 1991). Itis apparent, however, based on both published andunpublished literature, that the character of thebenthos is a time-averaged integration of thedominant physical forcing events that reflect totalsystem productivity (Carey, 1991; Grebmeier, 1993;Ambrose and Renaud, 1995; Wassmann et al.,1996).
Changes in overlying water flow can directlyimpact benthic community structure, carbon de-position, and sediment composition (Feder et al.,1994a; Grebmeier et al., 1995). Roach et al. (1995)noted that interannual variability of Pacific Oceanwater north through Bering Strait in the AnadyrStream can reach nearly 50% of the mean; long-term changes in this flow could therefore have amajor impact on carbon transport and depositionon the Chukchi shelf and slope regions of the ArcticOcean. Springer and McRoy (1993) noted thecritical role of the Anadyr Stream as an advectiveprocess that provides nutrients for nearly contin-uous summer phytoplankton production in north-ern Bering and southern Chukchi Sea shelves.Woodgate and Aagaard (2005) recently documentedsignificant seasonal variability in temperature,salinity, and volume of Bering Strait throughflowinto the Arctic Ocean. Such variability not only hasimportant implications on the ventilation of Pacificwaters in the arctic halocline, which is linked toworld climate (Woodgate et al., 2005 and referencestherein), but directly influences the timing andmagnitude of materials transported onto adjacentarctic shelves. We argue that variability over short-time scales is not easy to detect in a system knownfor extremes in physical processes. Instead signifi-cant long-term decadal changes, however subtle, arelikely to be reflected in the character of the benthiccommunity, which is otherwise resilient to seasonalvariability in physical processes.
Finally, there is strong evidence that advection ofcarbon between arctic shelves (Grebmeier et al.,1988) and between shelves and basins (Grebmeier,2003; Kroncke, 1994; Wassmann et al., 1996) is ofmajor importance in understanding the productivityof arctic shelves. The apparent paucity of publisheddata for the arctic region has limited our under-standing of the biological and physical processesthat influence biological productivity of arcticshelves and basins, yet there exist large andpotentially invaluable historical databases fromthe region that have not been synthesized. Theseinclude tens of thousands of largely unpublished
records on the biomass, density, and composition ofbenthic organisms from the Chukchi and BeaufortSeas. Other unpublished information includes awide variety of physical and geochemical data,including the seasonal extent of ice cover, circula-tion patterns, water column characteristics, andsediment parameters.
The initial objective of this study was to compileand spatially map the distribution of all availablebenthic infaunal biomass data collected in thewestern arctic since the early 1970s. To examinelinkages between benthos and water column, wecompiled water-column chlorophyll a data collectedthroughout the study area during the same period.We also attempted to relate our knowledge of majoradvective processes in this region to explain theunique spatial patterns of benthic biomass andchlorophyll data collected over a 25-year collectionperiod (1970–1995). The knowledge gained from anunderstanding of the linkages between physics andbiology is critical to our ability to assess the effectsof climate change on arctic benthic communitiesand higher trophic level populations (e.g. graywhales and walruses; Moore et al., 2003) that utilizethe benthos as their primary food source.
2. Methods
2.1. Digital base map
The study area extends from 621 to 751N andfrom 1601E to 1281W, encompassing the northernpart of the Bering Sea, Bering Strait, and coastalshelves along the East Siberian, Chukchi andBeaufort Seas (Fig. 1). Since a single digitalbathymetric/topographic base map was not avail-able for the study area, one was constructed usingpoint elevations from three different sources: aNGDC 5-min digital elevation model (http://www.ngdc.noaa.gov/mgg/global/seltopo.html), glo-bal sea-floor topography from satellite altimetryand ship depth (http://topex.ucsd.edu/cgi-bin/get_data.cgi), and for landmasses, a US GeologicalSurvey global 30 arc second elevation data set,GTOPO30 (http://edc.usgs.gov/landdaac/gtopo30/gtopo30.html). Point elevations were incorporatedinto the program Topogrid in ArcInfo (Environ-mental Systems Research Institute (ESRI), 2000)and a grid was built with a cell size of1� 1 km2.Coastline, political boundaries, and riversextracted from the ESRI Digital Chart of the Worldwere added for orientation. The resulting map was

ARTICLE IN PRESSK.H. Dunton et al. / Deep-Sea Research II 52 (2005) 3462–3477 3465
projected to a Lambert Azimuthal Equal-Areaprojection because it retains the true earth surfacearea at one scale that is critical for the entry ofgeographic information systems (GIS) data that isentered as (x, y) coordinates.
2.2. Benthic biomass and chlorophyll data
Our knowledge of productivity along arctic shelvesis based largely on a series of intensive surveysprompted by the discovery of oil in Prudhoe Bay andcompleted between the 1970s and early 1990s in theBering, Chukchi and Beaufort Seas under thefederally sponsored Outer Continental Shelf Envir-onmental Assessment Program (OCSEAP). TheOCSEAP program was the first comprehensive studyof America’s arctic coastline, ultimately involvingthousands of scientists and the expenditure of over 50million dollars for studies of the benthic environmentalone (Houghton et al., 1984; Capuzzo et al., 1992).Nearly all of the data collected under the AlaskanOCSEAP program in the 1970s and 1980s weredeposited with the National Oceanographic DataCenter (NODC) for archival storage.
Benthic biomass was compiled from numeroussources (Table 1), organized as a relational database
Table 1
Data sources used in the compilation of benthic biomass
Principal
investigator
References Sampling dates Re
Sta
Broad Broad (1980) 1975–1980 3
Carey Carey (1971, 1976,
unpublished), Carey et al.
(1984a)
1971, 1975–1978 5
Feder Feder (1986,
unpublished), Feder et al.
(1985), Feder et al.
(1994a)
1979–1980, 1986 5
Grebmeier Grebmeier (1987,
1992a, b), Grebmeier and
McRoy (1989),
Grebmeier et al. (1988,
1989), Grebmeier and
Cooper (1995), Reed
(1998), Grebmeier
(unpublished data)
1984–1986, 1988,
1990, 1993–1995
4
Stoker Stoker (1978, 1981) 1970–1974 5
Wacasey Wacasey (1975) 1971–1975 3–1
The majority of samples were collected during the summer open-water
in Microsoft Access, and then mapped onto a digitalbase map using GIS. The majority of samples werecollected during summer months with the largestnumber from August. Several of the data sets wereentered from handwritten datasheets, others fromold mainframe printouts, and others laboriouslyextracted from an antiquated NODC database.Only a fraction of the OCSEAP data is publishedin the scientific literature although it represents asubstantial proportion of our knowledge for thisgeographic region. Since the data were stored inmany different formats, a considerable effort wasrequired to convert and transfer the data intoMicrosoft Access files. Investigators used threetypes of quantitative grabs to collect the benthicsamples: van Veen, Smith-McIntyre (42m depths),and Ekman grabs (o2m). The actual grab area wasextrapolated mathematically to a square meter topresent biomass in gm�2. Station means reportedhere normally represent the average of three to fivegrab samples. Previous work in the Bering Sea(Feder et al., 1985; Grebmeier, 1987) demonstratedthat four grab samples per station were adequate toprovide statistically representative samples.
Samples were preserved in 10% buffered formalinand with the exception of Stoker (1978, 1981),
ps/ Sampling gear Sieve mesh
(mm)
Sampling area
0.1m2
Smith–McIntyre
0.5 Bering &
Beaufort
0.02m2 Eckman Nearshore
0.1m2
Smith–McIntyre
0.42 Beaufort Sea
shelf
0.1m2 van Veen 1 Bering &
Chukchi Seas
0.1m2 van Veen 1 Bering, Chukchi,
& East Siberian
Seas
m2 van Veen 3 Bering &
Chukchi
0 Grab 1? Canadian
Beaufort
period (late June–September).

ARTICLE IN PRESSK.H. Dunton et al. / Deep-Sea Research II 52 (2005) 3462–34773466
sieved through a 1-mm sieve. Stoker reported resultsfrom 3-mm screen fractions based on his analysisthat there was no significant difference between 1and 3-mm fractions. All biomass values reflectformalin-preserved wet weights (molluscs in theshells and polychaetes without tubes). Animals wereeither blotted dry before weighing or alternatively,animals were placed on filters and excess surfacewater was removed with a vacuum.
Chlorophyll a data were compiled from numer-ous sources (Table 2) and arranged into an Accessdatabase and mapped using ArcInfo’s GIS. As withbiomass, the majority of samples were collectedduring summer months with the largest numberfrom August. A trapezoidal integration macro,written in Visual Basic, was used to integratechlorophyll a data (mgm�2) collected from a seriesof water depths. Shallow-water stations (20–50m)with only one measurement were excluded on thebasis that they did not accurately represent inte-grated chlorophyll a at the measurement location.
Following examination of the raw data, two typesof geostatistical analyses were performed on the dataset. Firstly, spatial trend analyses of biomass andchlorophyll a data were used to create maps ofpredicted continuous spatial distribution over thedefined study area. The resulting maps providedvisual images of abnormally high or low biomass andchlorophyll concentrations. Secondly, the entirebenthic biomass data set was analyzed by location,year, and month of collection in an attempt toidentify stations that had been revisited over time.The only location within the study area with repeatedsampling over a span of several years was in thevicinity of St. Lawrence Island in the Bering Sea.
Table 2
Data sources used in the compilation of integrated chlorophyll a
Principal
investigator
References
Cota & Pomeroy Subset of data compiled for SBI I, Cota and
Wang et al. (2005, this volume)
Macdonald et al. NOGAP B.6 Dept. Fisheries & Oceans, Mac
(1988a–c)
ISHTAR Data Reports UAF, IMS, 1985–19
Grebmeier Grebmeier (1987), Grebmeier and McRoy (19
al. (1988, 1989), Grebmeier and Cooper (199
(2002), Grebmeier and Cooper (unpublished
Parrish Parrish (1987)
The majority of samples were collected during the ice-free period from
Temporal analyses of two areas located north andsouth St. Lawrence Island in the Bering Sea wereperformed to determine if there was a significantchange in benthic biomass over a 30-year time span.Although our temporal analysis does not addressdifferences in specific benthic community compo-nents and is limited by the frequency of sampling,overall trends are apparent and can be useful indocumenting ecosystem-wide changes.
In the Chirikov Basin north of St. LawrenceIsland, and in the northern Bering Sea south of St.Lawrence Island, we identified two 200� 200-km2
regions that each contained over 20 stations ofbenthic measurements collected between 1973 and1994. In Chirikov Basin, samples were collected at35 stations in the summers of 1973 and 1974. Thesedata were compared with biomass measurementscollected during the period 1984–1988 (28 stationstotal). In the region south of St. Lawrence Island,summer biomass samples were only available in1974 (six stations) and from 1988 to 1994 (46stations). Because previous observations in this areasuggest a significant decline in biomass that beganby the early 1990s (see Grebmeier et al., 1995,Grebmeier and Dunton, 2000, Cooper et al., 2002,Lovvorn et al., 2003, Simpkins et al., 2003), aninterannual comparison was considered a moreappropriate statistical analysis.
2.3. GIS and geostatistical analysis
The spatial and temporal distribution in the benthiccommunity of the western Arctic Ocean was analyzedfor trends through geostatistical interpolation of aretrospective (1970–1995) database of 1093 point
Sampling dates Sampling area
Pomeroy (2001), 1974–1979 Bering, Beaufort
Seas
donald et al. 1986–1987 Canadian Beaufort
Sea
88 1985–1988 Bering, Chukchi
Seas
89), Grebmeier et
5), Cooper et al.
data)
1984–1986,
1990,
1994–1995
Bering, Chukchi,
East Siberian Seas
1980–1983 Bering, Chukchi,
Beaufort Seas
late May to September.

ARTICLE IN PRESSK.H. Dunton et al. / Deep-Sea Research II 52 (2005) 3462–3477 3467
measurements that represented station averages ofthree to five replicate grab samples. For chlorophyll a,the final data set included 2514 integrated stationvalues. We used GIS software to manage, analyze,and display spatially referenced point samples, andinterpolate surfaces of benthic biomass and integratedchlorophyll a. ArcGIS 8.2 was chosen for the analysissince it is appropriate for spatially referenced datameasurements and related attributes (Minami et al.,1999). The geostatistical interpolation of benthicbiomass and chlorophyll a values produced bothmean predictions and prediction standard errors on acontinuous scale within the study region that includedthe Bering, Chukchi, East Siberian, and Beaufort Seas(Fig. 1). Natural variability of benthic biomass wasevident in the standard deviations, which oftenmatched or slightly exceeded the calculated meanbiomass in each of the four regions (Goodall, 2003).
Geostatistical modeling of benthic biomass andintegrated chlorophyll a was accomplished in foursteps (for details see Goodall, 2003). Firstly,exploratory data analyses were performed on rawsamples to understand their basic statistical dis-tributions in time and space. These initial analysesidentified the presence of outliers, large-scale trends,and small or micro-scale variability which deter-mined the selection of a geostatistical model.Secondly, a geostatistical model was developed tointerpolate data and create continuous predictedsurfaces of benthic biomass and chlorophyll a in thestudy area. Thirdly, a temporal analysis wasconducted to determine where repeated samplinghad occurred over time and whether any long-termtrends were evident in the data set. Finally, spatialand temporal interpolated surfaces were subjectedto uncertainty analysis that displayed predictionerrors that indicated how well the model estimatedthe unmeasured locations.
Data interpolation followed geostatistical techni-ques that accounted for the spatial correlation indata when predicting values at unmeasured loca-tions (Isaaks and Srivastava, 1989). The attributevalue at an unmeasured location ðxÞ is calculated asthe sum of three factors: (1) the deterministic trendmðxÞ, (2) the autocorrelated variation e0ðxÞ, and (3) aconstant correction factor for statistical noise, e00
(Burrough and McDonnell, 1998). The generalequation for kriging interpolation is shown as.
ZðxÞ ¼ mðxÞ þ e0ðxÞ þ e00. (1)
Ordinary kriging, the geostatistical techniqueused in this study, assumes that mðxÞ is constant
over space and equal to the mean of the samplespace (Johnston et al., 2001). Thus, the attributevalue at unmeasured location x, ZðxÞ, is estimatedas a spatially correlated term ðe0ðxÞÞ and randomnoise term ðe00ðxÞÞ around a constant mean value(m). We used the Geostatistical Analyst extension toArcGIS 8.2 to describe the spatial and temporaldistribution of benthos from within a GIS environ-ment. The geostatistical interpolation producedboth mean predictions and prediction standarderrors on a continuous scale within the studyregion. To reduce the variability of the predictions,samples were binned and averaged over 100-km2
grid cells to smooth small-scale variabiliy (‘‘patchi-ness’’) prior to geostatistical interpolation (Goodall,2003). To examine the relationship between chlor-ophyll a and benthic biomass using simple regres-sion analysis, samples were binned and averagedwithin 10-km2 grid cells.
3. Results
3.1. Spatial trend analyses
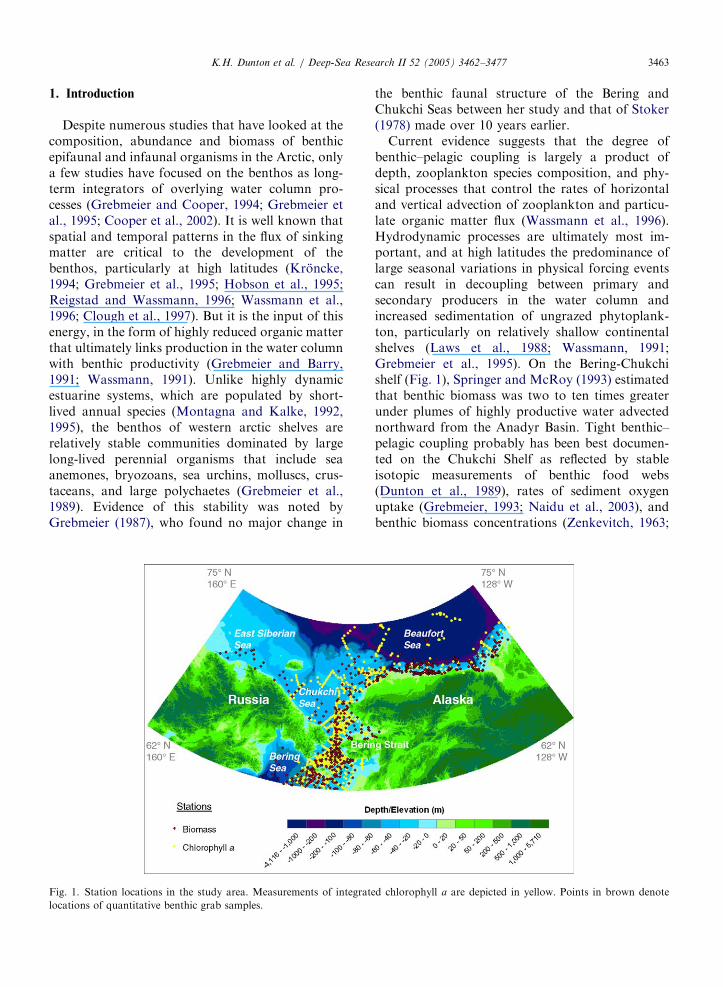
Several interesting features were visually distin-guished using geostatistical techniques. Firstly,contour lines showed very distinct trends ofdecreasing benthic biomass along the Beaufort Seacoast from west to east and with increasing distanceoffshore (Fig. 2). The decrease in biomass westwardinto the East Siberian Sea was much less dramatic.Secondly, areas of highest biomass occurred in thenorthern Bering and Chukchi Seas. Hanna Shoal, inthe northeastern Chukchi Sea, was characterized bya predicted mean benthic biomass of over 360 gm�2.A large area including the western portion of thenorthern Bering Sea, Bering Strait, and the south-western Chukchi Sea were also characterized byextremely high biomass values (up to 1500 gm�2).In contrast, an area of very low benthic biomass(o1 gm�2) occurred at the mouth of the MackenzieRiver. The mapped benthic biomass clearly showsthat values in the Beaufort Sea were distinct fromthat of the other seas in the study area. The meanbenthic biomass for the Beaufort Sea was 33 gm�2,which is significantly lower than the means for theBering, East Siberian, and Chukchi Seas (370, 225,and 167 gm�2, respectively). Over the entire studyarea, biomass ranged from a minimum of 0.01 gm�2
to a maximum value of 3222 gm�2. Analysis ofunpublished data (Table 3) revealed that across theAlaskan Beaufort Sea coast, from Pt. Barrow to
ARTICLE IN PRESS
Fig. 2. The spatial variation in benthic biomass (gm�2) recorded in numerous studies for the period from 1971 to 1995 (see Table 1). Black
points denote locations of quantitative benthic grab samples.
Table 3
Variation in species composition (percentage of total biomass) of benthic organisms collected in summer 1976 by A.G. Carey from Barrow
(1571W) to Barter Island (1441W) on the Beaufort Sea coast at depths varying from 5 to 25m
Location
Group Pt. Barrow (5) Pingok Island (3) Barter Island (5)
Anthozoa 5.976.7 — 1.772.4
Annelida 32.6728.5 48.9735.2 41.6715.7
Arthropoda 28.3727.0 6.377.0 14.0723.1
Mollusca 27.4728.4 35.6731.3 25.0714.8
Echinodermata 0.470.1 0.170.2 1.872.4
Misc. Phyla 5.777.5 9.1712.8 15.8714.6
Values are station mean percentages 7SD. The number of stations analyzed to calculate a mean percentage is denoted in parentheses
(n ¼ 325).
K.H. Dunton et al. / Deep-Sea Research II 52 (2005) 3462–34773468
Barter Island, annelids, arthropods, and molluscsdominated the infaunal species composition.
After initial development of a geostatistical modelbased on the complete data set, we determined thatthe small variability in Beaufort Sea biomass valueswas overwhelmed by higher values in other parts ofthe study area. The Beaufort Sea benthos data wereremoved and modeled separately to reveal finerspatial distribution patterns within this area (Fig. 3).Analysis of these data showed that in stark contrastto the relatively barren nearshore shelf at theMackenzie River, an area of relatively high biomass(4100 gm�2) occurred directly offshore of theColville River. A tongue of elevated biomass(450 gm�2) also extended eastward on the shelfto Barter Island.
Integrated chlorophyll a values showed similar,but not identical spatial trends. Across the entirestudy area, chlorophyll a ranged from 0.15 to1831.55mgm�2, but was generally highest (above150mgm�2) along the western portions of thenorthern Bering Sea, Bering Strait, and ChukchiSea (Fig. 4). Peak values (4300mgm�2) occurredin a defined area southeast of Wrangell Island in thenorthern Chukchi Sea. Higher values of chlorophylla were coincident with increased benthic biomass; inthe Chukchi Sea, the correlation between chloro-phyll a and biomass was significant (r2 ¼ 0:21,p ¼ 0:0015, n ¼ 44). Chlorophyll a values wereclearly lowest along the Alaskan Bering andChukchi coasts and with increasing distance off-shore in Beaufort Sea. The Beaufort Sea was

ARTICLE IN PRESSK.H. Dunton et al. / Deep-Sea Research II 52 (2005) 3462–3477 3469
generally characterized by comparably lower chlor-ophyll values (o50mgm�2) with the exception of adistinct region at Barter Island. Here, integratedchlorophyll a measurements rise to 80mgm�2.However, in contrast to the Chukchi, there was noobvious correlation between chlorophyll andbenthic biomass in the Beaufort (r2 ¼ 0:001,p ¼ 0:88, n ¼ 20).
Fig. 3. Benthic biomass (gm�2) in the Beaufort Sea (1571–1301W). Yel
Fig. 4. Contours of integrated chlorophyll a concentrations (mgm�2)
locations) collected during the period 1974–1995 (see Table 2).
3.2. Temporal trends
Using ordinary kriging, benthic biomass wasinterpolated for each of the two time periods forthe Chirikov Basin north of St. Lawrence Island(Fig. 5). This region did not show a significant(p ¼ 0:22) change in benthic biomass when the1973–1974 sample data (mean annual range
low points denote locations of quantitative benthic grab samples.
based on discreet measurements (black points denote sampling

ARTICLE IN PRESS
F
1
b
p
p
n
w
K.H. Dunton et al. / Deep-Sea Research II 52 (2005) 3462–34773470
490–650 gm�2) were compared with the period1984–1988 (mean annual range 374–878 gm�2).Similarly, no temporal trend was observed in theregion south of St. Lawrence Island as reflected inmean annual biomass values that ranged from 302to 405 gm�2 over the period 1974–1993. However,the mean biomass at 12 stations in 1994 (229 gm�2)was 35% lower than the average biomass(350 gm�2) recorded in this area in all previousyears. Because of the high variances and modestsamples that are inherent with benthic biomassmeasurements from this region (see Grebmeier andDunton, 2000), this difference was not significant(p ¼ 0:16; one-way ANOVA).
4. Discussion
4.1. Benthic– pelagic coupling and role of
environmental factors
Large spatial variations in benthic faunal biomassand abundance have been noted previously onwestern arctic shelves by Carey et al. (1974),Thomson (1982), Feder et al. (1994b), and Greb-meier and Cooper (1994). In the northeasternChukchi Sea, Feder et al. (1994b) noted highbenthic biomass north of Icy Cape and, based ona multiple discriminate analysis, concluded thatvariations in benthic faunal biomass were notrelated to differences in sediment sorting, but toenhanced local depositional flux of particulateorganic carbon (POC). In the Canadian Arctic,Thomson (1982) also attributed the high standingcrop of benthos in Lancaster Sound to greater foodavailability. By comparison, hydrography, water-column chlorophyll a content, and sediment grainsize were key factors in benthic biomass andcommunity structure in the northern Bering andChukchi Seas (Grebmeier et al., 1988, 1989, 1995).
Other factors, including ice gouging, wave-cur-rent action, and marine mammal feeding activitieshave explained differences in faunal diversitybetween inshore and offshore regions (Feder et al.,1994b), but are probably not responsible for thelarge geographic-wide changes in benthic biomass
ig. 5. Top panel: temporal distribution of benthic collection efforts th
990’s: red). Long-term comparisons of benthic biomass in 200� 200 km
oxes, inset). For Chirikov Basin, north of St. Lawrence Island, sample
eriod 1984–1988 (n ¼ 28). For the region south of St. Lawrence Island
eriod 1974–1994 (bottom panel). No significant (p ¼ 0:22) temporal d
orth of St. Lawrence Island (middle panel). A 35% drop in biomass wa
as not significant (p ¼ 0:16) because of the high sample variance, espe
observed here. Wave-generated bottom turbulencein the ice-dominated Beaufort Sea ecosystem isminimal and therefore not a reasonable explanationfor the decreased abundance of infauna (Carey etal., 1984b); instead, run-off and ice-related stressesare probably more important, especially on regionalscales. Feeding by gray whales and walrus cancreate large excavations (2–20m2) on the seabed(Oliver and Slattery, 1985; Moore et al., 2000), butthese disturbances occur on relatively fine spatialscales relative to variations in benthic biomass,which were averaged over 100 km2 grid cells in thisstudy.
Analysis of the NODC database revealed thatannelids, arthropods, and molluscs generally char-acterize benthic fauna across the entire study area.Carey et al. (1974) found that these groupsdominated the benthos in the western BeaufortSea, but noted no transitional trends in speciescomposition with increasing depth or distance fromshore. They concluded that broad geographicreductions in density and biomass of the benthicmacroinfauna occurred only at the shallowest shelfstations due to grounded ice or pressure ridge keels(Carey et al., 1974). Such groundings can producesevere perturbations of the substrate that can varyconsiderably in size and orientation (Reimnitz et al.,1972). The nearshore infauna at the mouth of theMackenzie River is also characterized by low speciesdiversity (Wacasey, 1975) and biomass (Fig. 3).However, the impoverished nature of the benthicfauna here can be attributed to the area’s highlyestuarine conditions and low productivity (Waca-sey, 1975; Carmack et al., 2004).
In contrast, the large patch of relatively highbiomass in the vicinity of Barter Island correspondswith a well-documented upwelling of deeper shelf-basin waters (Hufford, 1974; Mountain, 1974). Theupwelling appears to be related to the east–westorientation of the coast, and the predominance ofeasterly winds, which transport surface water off-shore (Hufford, 1974). Integrated values of chlor-ophyll a are 5 times higher in the vicinity of BarterIsland than on the adjacent shelf. Consequently, thisupwelling may be a consistent feature of the eastern
roughout the study area by decade (1970’s: blue; 1980’s: green;2 areas were possible north and south of St. Lawrence Island (see
s collected from 1973 to 1974 (n ¼ 35) were compared with the
, interannual variations in biomass (x7SE) were plotted for the
ifference in the biomass among sites was detected in the region
s observed south of St. Lawrence Island in 1994, but this change
cially in 1988 (see text for details). nd: no data available.

ARTICLE IN PRESSK.H. Dunton et al. / Deep-Sea Research II 52 (2005) 3462–3477 3471
ARTICLE IN PRESSK.H. Dunton et al. / Deep-Sea Research II 52 (2005) 3462–34773472
Beaufort Sea, and could explain the high summerconcentration of bowhead whales that are recordedbetween Barter Island and east to Demarcation Bay.Benthic biomass near Barter Island (50–100 gm�2)was two to three times greater than at similar depthsin adjacent areas of the eastern Beaufort Sea andrepresents some of the greatest values for high arcticcontinental shelves (Golikov et al., 1990; Scarlato,1994a, b, c), excluding Barrow Canyon and thesoutheast Chukchi Sea (Grebmeier and Dunton,2000; Grebmeier unpubl. data). For comparativepurposes, it should be noted that the ‘‘hot spot’’region in the southern Chukchi Sea (Hope Basin;Fig. 2) had wet weight values of �1500 gwet wtm�2
(�50–68 gCm�2; Grebmeier, 1987; Grebmeieret al., 1988). The average benthic biomass valuesin Bering Shelf-Anadyr water in the north centralportion of the northern Bering Sea were about300–500 gwetwtm�2 (20–30 gCm�2); in Alaskancoastal water, benthic biomass values were less than100 gwetwtm�2 (o10 gCm�2). Therefore, eventhough the Barter Island biomass is high for theBeaufort Sea and indicates hydrographic focusing,the values are still on the low end in comparisonwith Bering/Chukchi communities, indicative of theoverall lower primary production observed in theBeaufort Sea (Parrish, 1987).
4.2. Role of physical advective processes
High concentrations of benthic infaunal organ-isms (as reflected by elevated biomass), in areascharacterized by lower water-column chlorophyll,suggest that external contributions of POC mayplay an important role in this linked shelf ecosystem(Hansell et al., 1989; Feder et al., 1994b). Forexample, a region of high biomass occurs near themouth of Barrow Canyon (Hanna Shoal) in thenortheastern Chukchi Sea (also noted by Feder etal., 1994b; Grebmeier unpubl. SBI data). Faunalbiomass was greatest in the trough (not its sides),suggesting a shunting of organic-rich material fromthe shelf downslope (Grebmeier and Cooper, 1994;Grebmeier unpubl. SBI data). This physical trans-port of carbon-rich waters from the productivesouthern Chukchi to the northern outer shelf (Federet al., 1994b; Weingartner et al., 1998), thendownslope via canyons into the Arctic Basin mayexplain the high benthic biomass west of PointBarrow (1571W) on the northeastern Chukchi coast.This tongue of high biomass extends eastward intothe Beaufort Sea to at least Harrison Bay (1501W),
north of the Colville River Delta. Biomass inHarrison Bay averages 100 gm�2, with somepatches reaching 200 gm�2 (Fig. 3). Interestingly,the carbon isotopic signatures of fauna in HarrisonBay closely match those of the same organisms inthe Chukchi Sea, indicating a common source offixed carbon that is derived from the northernBering (Dunton et al., 1989). The high biomass ofpolychaetous annelids in Harrison Bay in conjunc-tion with the presence of Bering shelf water ledCarey and Ruff (1977) and Bilyard and Carey(1979) to hypothesize that organic contributionsfrom these waters enrich the benthos west of 1481W.
The integrated chlorophyll a data presented hereare in agreement with those published previouslyfor areas of the Chukchi (Hansell et al., 1989;Grebmeier, 1993; Springer and McRoy, 1993). Thehigh biomass of infaunal organisms in the northernBering Sea (Chirikov Basin), in the southernChukchi, and near Hanna Shoal likely reflect anintegrated and long-term response by the benthiccommunity to a continuous and abundant supply ofadvected nutrients and fixed carbon that originatesin the Gulf of Anadyr (Springer and McRoy, 1993;Grebmeier, 1993). The plume of nutrient-richAnadyr water flows eastward through the ChirikovBasin (Fig. 6) then northward through the southernChukchi Sea and Herald Valley between WrangellIsland and Herald Shoal (Coachman et al., 1975).Anadyr water is joined by water flowing south-eastward from the East Siberian Sea, but it is clearthat northward flowing Anadyr water is associatedwith high benthic biomass along its entire routeonto the Chukchi Shelf.
The effects of northward flowing Anadyr wateron phytoplankton production can clearly be seen indistinctly elevated chlorophyll a concentrations inthe southern Chukchi and southeast of WrangellIsland (Fig. 4). In contrast, low phytoplanktonbiomass along the coast reflects the characteristiclow-salinity and nutrient-poor Alaskan coastalwater (ACW), which originates in the southeasternBering Sea and flows northward across the easternChukchi shelf into the Beaufort Sea as a swiftcoastal current (Coachman et al., 1975; Walsh et al.,1989). The third water mass, Bering shelf water(BSW), originates on the middle shelf of the BeringSea (Fig. 6) and becomes entrained with high levelsof POC as it transits the Chirikov Basin andsouthern Chukchi into the northern Chukchi, eastof Herald Shoal (Whitledge et al., 1986; Walshet al., 1989; Hansell et al., 1989). Feder et al. (1994b)

ARTICLE IN PRESS
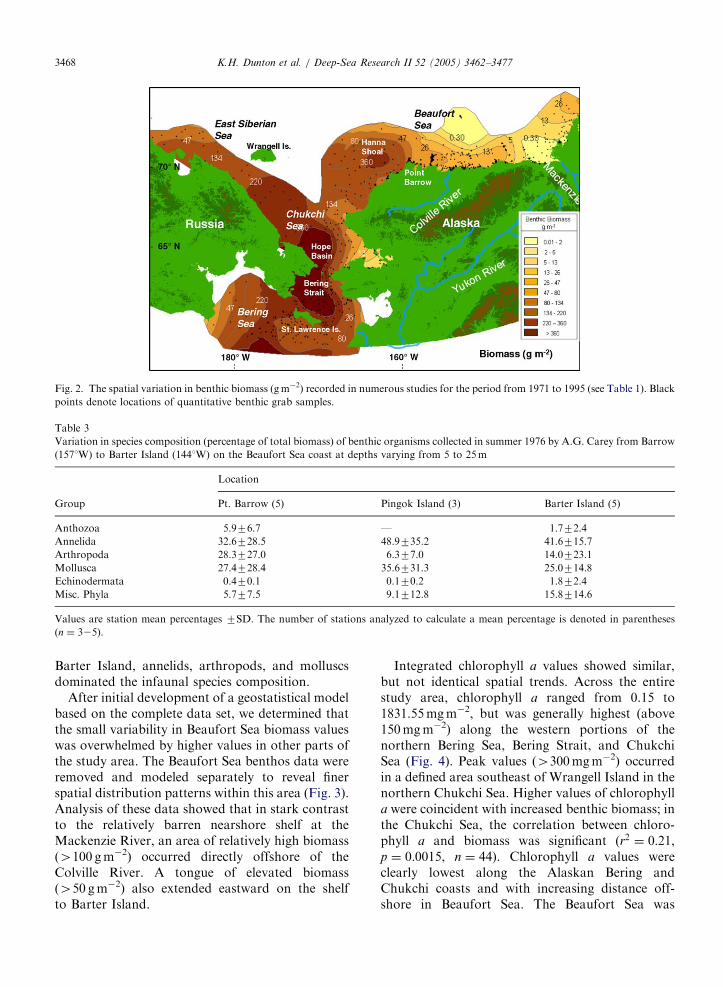
Fig. 6. Major water currents in relation to benthic biomass (gm�2) in the SBI study area. Numbers in parentheses denote specific
northward flowing water masses: (1) Anadyr water, (2) Bering Sea water (BSW), and (3) Alaskan coastal water (ACW). See corresponding
text for details. The Siberian Coastal Current (SCC) is an unsteady southward flowing current in the western Chukchi Sea. Black points
denote locations of quantitative benthic grab samples.
K.H. Dunton et al. / Deep-Sea Research II 52 (2005) 3462–3477 3473
argued that the high benthic biomass in the north-eastern Chukchi Sea (near the mouth of the BarrowCanyon) was a product of POC transported byBSW that provided an allochthonous supplement tolocal food production. It appears, based on our dataand Feder et al. (1994b), that an eastward branch ofthe BSW probably mixes with or closely parallelsthe northward flow of the ACW. Consequently, webelieve that the high benthic biomass on the easternChukchi shelf, especially along the coast, is also aresult of advective processes that provide a POCsubsidy from more productive southern shelfsystems.
4.3. Long-term decadal changes
Recent retrospective studies of benthic commu-nities indicate a changing marine system in theBering and Chukchi Seas (Sirenko and Koltun,1992; Grebmeier and Cooper, 1995, 2004; Francis etal., 1996; Grebmeier and Dunton, 2000). Inparticular, the region just north of Bering Straithas historically been a settling basin for organiccarbon, resulting in extremely high benthic standingstock and oxygen uptake rates (Grebmeier andMcRoy, 1989; Grebmeier et al., 1988, 1989;Grebmeier, 1993). Studies south of St. LawrenceIsland also indicate a region of high benthic biomassand carbon deposition, but recent time-series studies
suggest that changes in bivalve populations over thelast few decades may be associated with changes inthe northward transport of water across the shelf(Walsh et al., 1989; Grebmeier and Cooper, 1995,2004; Grebmeier and Dunton, 2000; Lovvorn et al.,2005). Benthic productivity in the northern Beringand Chukchi Seas is directly linked to higher trophiclevels, including marine mammals and seabirds,since the regional food web is dominated bypredation on bivalves and amphipods (Oliver andSlattery, 1985; Grebmeier and Harrison, 1992;Grebmeier and Dunton, 2000; Lovvorn et al.,2003, 2005; Moore et al., 2003; Richman andLovvorn, 2003; Simpkins et al., 2003). The preybase for both gray whales and walruses is appar-ently declining as these apex predators approach orexceed carrying capacity (Lowry et al., 1980; High-smith and Coyle, 1992; Moore et al., 2003) so thatenvironmental changes affecting prey communitiesare likely to have significant effects. Potentialwidespread changes in a variety of marine habitatson the Chukchi and Beaufort shelves could havecascading effects from lower to higher trophicpopulations, emphasizing the importance of under-standing links between climate change, benthiccommunities, and top benthic predators.
Our temporal analysis of benthic biomass in thearea south of St. Lawrence Island showed a decreasein biomass in 1994 relative to all previous years for

ARTICLE IN PRESSK.H. Dunton et al. / Deep-Sea Research II 52 (2005) 3462–34773474
which we have data. A decrease in biomass for thisregion was first noted by Grebmeier and Cooper(1995; unpublished data) and reported later byGrebmeier and Dunton (2000). These observationsare coincident with indications that benthic com-munity structure in this region also has beenchanging (Sirenko and Koltun, 1992) and may berelated to hydrographic changes that have led todecreased water column productivity that is influen-cing spectacled eider populations (Grebmeierand Cooper, 1995; Grebmeier and Dunton, 2000;Richman and Lovvorn, 2003). Other, more recentstudies in the northern Bering Sea show thatdeclines in carbon flux and benthic biomass havecontinued into the late 1990s and early 2000s(Grebmeier and Cooper, 2004; unpublished data)along with declines in benthic amphipod biomass,the main food for gray whales, starting in the late1990s in Chirikov Basin, north of St. LawrenceIsland (Moore et al., 2003).
Consequently, evaluation of potential relation-ships between physical processes and biologicalproductivity, as reflected by the benthos, wouldprovide an unprecedented opportunity to increaseour understanding of the Arctic Ocean system. Inparticular, it is clear that there are undeniablelinkages between advective processes and ecosystemproductivity. Long-term measurements of watercolumn chlorophyll a and benthic standing stocksrepresent key ecosystem processes that provide apowerful tool to assess change, both on largetemporal and spatial scales.
Acknowledgments
We dedicate this paper to the late A.C. Broad whoplaced his trust and confidence in a young graduatestudent (K.H.D.) to implement a coast-wide benthicsampling program in the Beaufort Sea in 1977 andfor providing the data that made this paper possible.We also thank A.G. Carey and H.M. Feder for theirsupport and sharing invaluable unpublished datathroughout the duration of this project, which begannearly three decades ago. We are grateful to JonaFinndıs Jonsdottir (The University of Texas) for herearly contributions to the GIS component of thisproject and to Holly Kelly, Becky Brown andAndrew Reed (The University of Tennessee) forproviding valuable technical assistance for data setpreparations. This research was supported by NSFGrant OPP-9815808 to K.H.D. and OPP-9815497to J.M.G.
References
Ambrose Jr., W.G., Renaud, P.E., 1995. Benthic response to
water column productivity: evidence for benthic–pelagic
coupling in the Northeast Water Polynya. Journal of
Geophysical Research 100C (3), 4411–4421.
Bilyard, G.R., Carey Jr., A.G., 1979. Distribution of Western
Beaufort Sea polychaetous annelids. Marine Biology 54,
329–339.
Broad, A.C., 1980. Intertidal Organisms and Habitats (File 030).
National Oceanographic Data Center, Washington, DC.
Burrough, P.A., McDonnell, R.A., 1998. Principles of Geogra-
phical Information Systems. Oxford University Press, New
York (346pp).
Capuzzo, J.M., Brown, E.J., Crosby, D.G., Dayton, P.K.,
Fraker, M., Hofmann, E., Hunt Jr., G.L., Lindstedt-Siva,
J., Nisbet, I., Paine, R.T., Siniff, D.B., Sissenwine, M.P.,
1992. Assessment of the US Outer Continental Shelf
Environmental Studies Program, II: Ecology. National
Academy Press, Washington, DC, 152pp.
Carey Jr., A.G., 1991. Ecology of North American Arctic
Continental shelf benthos: a review. Continental Shelf
Research 11 (8–10), 865–883.
Carey Jr., A.G., Ruff, R.E., 1977. Ecological studies of the
benthos in the western Beaufort Sea with special reference to
bivalve mollusks. In: Dunbar, M.J. (Ed.), Polar Oceans.
Arctic Institute of North America, Calgary, Alberta,
pp. 505–530.
Carey Jr., A.G., Ruff, R.E., Castillo, J.G., Dickinson, J.J., 1974.
Benthic ecology of the western Beaufort Sea continental
margin: preliminary results. In: Reed, J.C., Sater, J.E. (Eds.),
The Coast and Shelf of the Beaufort Sea. Arctic Institute of
North America, Arlington, VA, pp. 665–680.
Carey Jr., A.G., Boudrias, M.A., Kern, J.C., Ruff, R.E., 1984a.
Selected ecological studies on continental shelf benthos and
sea ice fauna in the southwestern Beaufort Sea. Final Report,
vol. 23. Outer Continental Shelf Environmental Assessment
Program, Fairbanks, AK, pp. 1–164.
Carey Jr., A.G., Scott, P.H., Walters, K.R., 1984b. Distributional
ecology of shallow southwestern Beaufort Sea (Arctic Ocean)
bivalve Mollusca. Marine Ecology Progress Series 17,
125–134.
Carmack, E.C., Macdonald, R.W., Jasper, S., 2004. Pelagic
phytoplankton productivity on the Canadian shelf of the
Beaufort Sea. Marine Ecology Progress Series 277, 37–50.
Clough, L.M., Ambrose Jr., W.G., Cochran, J.K., Barnes, C.,
Renaud, P.E., Aller, R.C., 1997. Infaunal density, biomass
and bioturbation in the sediments of the Arctic Ocean. Deep-
Sea Research II 44, 1683–1704.
Coachman, L.K., Aagaard, K., Tripp, R.B., 1975. A diffusion
model of cross-shelf exchange of nutrients in the southeastern
Bering Sea. Deep-Sea Research 28A (8), 819–846.
Cooper, L.W., Grebmeier, J.M., Larsen, I.L., Egorov, V.G.,
Theodorakis, C., Kelly, H.P., Lovvorn, J.R., 2002. Seasonal
variation in water column processes and sedimentation of
organic materials in the St. Lawrence Island polynya region,
Bering Sea. Marine Ecology Progress Series 226, 13–26.
Cota, G., Pomeroy, L., 2001. SBI: Arctic Nutrient Database.
http://www.joss.ucar.edu/sbi/
Dunton, K.H., Saupe, S.M., Golikov, A.N., Schell, D.M.,
Schonberg, S.V., 1989. Trophic relationships and isotopic

ARTICLE IN PRESSK.H. Dunton et al. / Deep-Sea Research II 52 (2005) 3462–3477 3475
gradients among arctic and subarctic marine fauna. Marine
Ecology Progress Series 56, 89–97.
Feder, H.M., Day, R.H., Jewett, S.C., McCumby, K., McGee, S.,
Schonberg, S.V., 1985. Infauna of the northeastern Bering
and southeastern Chukchi Seas. Final Report. Outer Con-
tinental Shelf Environmental Assessment Program. Fair-
banks, AK, 120pp.
Feder, H.M., Foster, N.R., Jewett, S.C., Weingartner, T.J.,
Baxter, R., 1994a. Mollusks in the Northeastern Chukchi Sea.
Arctic 47 (2), 145–163.
Feder, H.M., Naidu, A.S., Jewett, S.C., Hameedi, J.M., Johnson,
W.R., Whitledge, T.E., 1994b. The northeastern Chukchi Sea:
benthos–environmental interactions. Marine Ecology Pro-
gress Series 111, 171–190.
Francis, R.C., Anderson, L.G., Bowen, W.D., Davis, S.K.,
Grebmeier, J.M., Lowry, L.F., Merculieff, I., Mirovitskaya,
N., Peterson, C.H., Pungowiyi, C., Royer, T.C., Springer,
A.M., Wooster, W.S., 1996. The Bering Sea Ecosystem,
Committee on the Bering Sea Ecosystem. Polar Research
Board, National Research Council. National Academy Press,
Washington, DC, 320pp.
Golikov, A.N., Scarlato, O.A., Averincev, V.G., Menshutkina,
T.V., Novikov, O.K., Sheremetevsky, A.M., 1990. Ecosys-
tems of the New Siberian shoals, their distribution and
functioning. In: Ecosystems of the New Siberian Shoal and
the fauna of the Laptev Sea and adjacent waters. Explorations
of the fauna of the seas. Academy of Sciences of the USSR,
Zoological Institute, vol. 37 (45), pp. 4–88 (in Russian).
Goodall, J.L., 2003. Spatial and temporal trends of the western
Arctic Ocean benthic community. M.S. Thesis, Department
of Environmental and Water Resources Engineering, The
University of Texas at Austin, Austin, TX, 89pp, unpub-
lished.
Grebmeier, J.M., 1987. The ecology of benthic carbon cycling in
the northern Bering and Chukchi Seas. Ph.D. Dissertation,
Institute of Marine Science, University of Alaska, Fairbanks,
AK, 189pp.
Grebmeier, J.M., 1992a. Studies of pelagic–benthic coupling
extended onto the Soviet continental shelf in the Bering and
Chukchi Seas. Continental Shelf Research 13, 653–668.
Grebmeier, J.M., 1992b. Benthic processes on the shallow
continental shelf of the northern Bering and Chukchi Seas.
In: Nagel, P.A. (Ed.), Results of the Third Joint US–USSR
Bering & Chukchi Seas Expedition (BERPAC), Summer
1988. US Fish and Wildlife Service, Washington, DC,
pp. 234–251.
Grebmeier, J.M., 1993. Studies on pelagic–benthic coupling
extended onto the Soviet continental shelf in the northern
Bering and Chukchi seas. Continental Shelf Research 13 (5/6),
653–668.
Grebmeier, J.M., 2003. The Western Arctic Shelf-Basin Interac-
tions Project. In: The Arctic Research of the United States,
vol. 17. National Science Foundation, pp. 24–32.
Grebmeier, J.M., Barry, J.P., 1991. The influence of oceano-
graphic processes on pelagic–benthic coupling in polar
regions: a benthic perspective. Journal of Marine Systematics
2, 495–518.
Grebmeier, J.M., Cooper, L.W., 1994. A decade of benthic
research on the continental shelves of the northern Bering and
Chukchi Seas: lessons learned. In: Meehan, R.H., Sergienko,
V., Weller, G. (Eds.), Bridges of Science between North
America and the Russian Far East. Arctic Division, American
Association for the Advancement of Science, Fairbanks, AK,
pp. 87–98.
Grebmeier, J.M., Cooper, L.W., 1995. Influence of the St.
Lawrence Island Polynya on the Bering Sea benthos. Journal
of Geophysical Research 100, 4439–4460.
Grebmeier, J.M., Cooper, L.W., 2004. Biological implications of
arctic change. In: ACIA International Symposium on
Climate Change in the Arctic: Extended Abstracts. Reykjavik,
Iceland, 9–12 November 2004. AMAP Report 2004:4,
pp. 1–4.
Grebmeier, J.M., Dunton, K.H., 2000. Benthic processes in the
Northern Bering/Chukchi Seas: status and global change. In:
Huntington, H.P. (Ed.), Impacts of Changes in Sea Ice and
Other Environmental Parameters in the Arctic. Marine
Mammal Commission Workshop, Girdwood, Alaska,
pp. 80–93.
Grebmeier, J.M., Harrison, N.M., 1992. Seabird feeding on
benthic amphipods facilitated by gray whale activity in the
northern Bering Sea. Marine Ecology Progress Series 80,
125–133.
Grebmeier, J.M., McRoy, C.P., 1989. Pelagic–benthic coupling
on the shelf of the northern Bering and Chukchi Seas, III:
benthic food supply and carbon cycling. Marine Ecology
Progress Series 53, 79–91.
Grebmeier, J.M., McRoy, C.P., Feder, H.M., 1988. Pelagic–
benthic coupling on the shelf of the northern Bering and
Chukchi Seas, I: food supply source and benthic biomass.
Marine Ecology Progress Series 48, 57–67.
Grebmeier, J.M., Feder, H.M., McRoy, C.P., 1989. Pelagic–
benthic coupling on the shelf of the northern Bering and
Chukchi Seas, II: benthic community structure. Marine
Ecology Progress Series 51, 253–268.
Grebmeier, J.M., Smith Jr., W.O., Conover, R.B., 1995.
Biological processes on Arctic Continental Shelves:
ice–ocean–biotic interactions. In: Smith Jr., W.O., Grebmeier,
J.M. (Eds.), Arctic Oceanography: Marginal Ice Zones and
Continental Shelves. Washington, DC, pp. 231–261.
Hansell, D.A., Goering, J.J., Walsh, J.J., McRoy, C.P., Coach-
man, L.K., Whitledge, T.E., 1989. Summer phytoplankton
production and transport along the shelf break in the Bering
Sea. Continental Shelf Research 9 (12), 1085–1104.
Highsmith, R.C., Coyle, K.O., 1992. Productivity of arctic
amphipods relative to gray whale energy requirements.
Marine Ecology Progress Series 83, 141–150.
Hobson, K.A., Ambrose, W.G., Renaud, P.E., 1995. Sources of
primary production, benthic–pelagic coupling, and trophic
relationships within the Northeast Water Polynya: insights
from d 13C and d 15N analysis. Marine Ecology Progress
Series 128, 1–10.
Houghton, J.P., Segar, D.A., Zeh, I.E., 1984. In: Beaufort Sea
Monitoring Program: Proceedings of a Workshop (September
1983) and Sampling Design Recommendations. US Depart-
ment of the Interior. NOAA, OCSEAP, lllpp.
Hufford, G.L., 1974. On apparent upwelling in the southern
Beaufort Sea. Journal of Geophysical Research 79 (9),
1305–1306.
Isaaks, E.H., Srivastava, R.M., 1989. An Introduction to Applied
Geostatistics. Oxford University, New York, NY, 561pp.
ISHTAR Data Reports, 1985, 1986, 1987, 1988. Hydrographic
Data STD, Nutrients and Chlorophyll, Nos. 1, 4, 9.
University of Alaska Institute of Marine Science, Fairbanks,
AK, USA, unpublished.
ARTICLE IN PRESSK.H. Dunton et al. / Deep-Sea Research II 52 (2005) 3462–34773476
Johnston, K., Ver Hoef, J.M., Krivoruchko, K., Lucas, N., 2001.
Using ArcGIS Geostatistical Analyst. ESRI Press, Redlands,
CA (300pp).
Kroncke, I., 1994. Macrobenthos composition, abundance and
biomass in the Arctic Ocean along a transect between
Svalbard and the Makarov Basin. Polar Biology 14, 519–529.
Laws, E.A., Bienfang, P.K., Ziemann, A.S., Conquest, L.D.,
1988. Phytoplankton populations dynamics and the fate of
production during the spring bloom in Auke Bay, Alaska.
Limnology and Oceanography 33, 57–65.
Lovvorn, J.R., Richman, S.E., Grebmeier, J.M., Cooper, L.W.,
2003. Diet and body condition of spectacled eiders in pack ice
of the Bering Sea. Polar Biology 26, 259–267.
Lovvorn, J.R., Cooper, L.W., Brooks, M.L., De Ruyck, C.C.,
Bump, J.K., Grebmeier, J.M., 2005. Organic matter pathways
to zooplankton and benthos under pack ice in late winter and
open water in late summer in the north-central Bering Sea.
Marine Ecology Progress Series 291, 135–150.
Lowry, L.F., Frost, K.J., Burns, J.J., 1980. Feeding of bearded
seals in the Bering and Chukchi Seas and trophic interaction
with Pacific walruses. Arctic 33, 330–342.
Macdonald, R.W., Iseki, K., Carmack, E.C., Macdonald, D.M.,
O’Brien, M.C., McLaughlin, F.A., 1988a. Data Report
NOGAP B6 Beaufort Sea Oceanography, September 1988a.
Canadian Data Report of Hydrography and Ocean Sciences.
Institute of Ocean Sciences, Department of Fisheries and
Oceans, Sidney, BC 58, 68pp.
Macdonald, R.W., Iseki, K., O’Brien, M.C., McLaughlin, F.A.,
McCullough, D., Macdonald, D.M., Carmack, E.C., Adams,
H., Yunker, M., Miskulin, G., Buckingham, S., 1988b.
NOGAP B.6, vol. 4: Chemical Data Collected in the Beaufort
Sea, Summer 1987. Beaufort Sea Oceanography Canadian
Data Report of Hydrography and Ocean Sciences. Institute of
Ocean Sciences, Department of Fisheries and Oceans, Sidney,
BC 60, 103pp.
Macdonald, R.W., Iseki, K., O’Brien, M.C., McLaughlin, F.A.,
McCullough, D., Macdonald, D.M., Carmack, E.C., Yunker,
M., Buckingham, S., Miskulin, G., 1988c. NOGAP B.6; vol.
5: Chemical data collected in the Beaufort Sea and Mackenzie
River Delta, March–July, 1987. Canadian Data Report of
Hydrography and Ocean Sciences. Department of Fisheries
and Oceans, Sidney, BC 60, 55pp.
Montagna, P.A., Kalke, R.D., 1992. The effect of freshwater
inflow on meiofaunal and macrofaunal populations in the
Guadalupe and Nueces Estuaries, Texas. Estuaries 15,
266–285.
Montagna, P.A., Kalke, R.D., 1995. Ecology of infaunal
Mollusca in south Texas estuaries. American Malacological
Bulletin 11, 163–175.
Minami, M., Sakala, M., Wrightsell, J., 1999. Using ArcMap.
ESRI Press, Redlands, CA (576pp).
Moore, S.E., DeMaster, D.P., Dayton, P.K., 2000. Cetacean
Habitat Selection in the Alaskan Arctic during Summer and
Autumn. Arctic 53 (4), 432–447.
Moore, S.E., Grebmeier, J.M., Davis, J.R., 2003. Gray whale
distribution relative to forage habitat in the northern Bering
Sea: current conditions and retrospective summary. Canadian
Journal of Zoology 81 (4), 734–742.
Mountain, D.G., 1974. Preliminary analysis of Beaufort Shelf
circulation in summer. In: Reed, J.C., Sater, J.E. (Eds.), The
Coast and Shelf of the Beaufort Sea. Arctic Institute of North
America, Arlington, VA, pp. 27–48.
Naidu, A.S., Cooper, L.W., Grebmeier, J.M., Whitledge, T.E.,
2003. Sources, fluxes, accumulation and burial rates of
organic carbon in continental margin sediments of North
Bering-Chukchi Sea. In: Stein, R., Macdonald, R.W. (Eds.),
The Organic Carbon Cycle in the Arctic Ocean. Springer,
Berlin, pp. 193–203.
Oliver, J.S., Slattery, P.N., 1985. Destruction and opportunity on
the Sea floor: effects of gray whale feeding. Ecology 66 (6),
1965–1975.
Parrish, D.M., 1987. Annual Primary Production in the Alaskan
Arctic Ocean. M.S. Thesis, University of Alaska, Fairbanks,
AK, 175pp.
Reed, A.J., 1998. Benthic macrofaunal invertebrates of the east
Siberian and Chukchi seas: benthic biomass, community
structure and radionuclide contamination. M.S. Thesis, The
University of Tennessee, Knoxville, TN, 133pp.
Reigstad, M., Wassmann, P., 1996. Importance of advection for
pelagic–benthic coupling in north Norwegian Fjords. Sarsia
80, 245–257.
Reimnitz, E., Barnes, P., Forgatsch, T., Rodeick, C., 1972.
Influence of grounding ice on the arctic shelf of Alaska.
Marine Geology 13, 323–334.
Richman, S.E., Lovvorn, J.R., 2003. Effects of clam species
dominance on nutrient and energy acquisition by spectacled
eiders in the Bering Sea. Marine Ecology Progress Series 261,
283–297.
Roach, A.T., Aagaard, K., Pease, C.H., Salo, S.A., Weingartner,
T., Pavlov, V., Kulakov, M., 1995. Direct measurements of
transport and water properties through the Bering Strait.
Journal of Geophysical Research 100, 18,443–18,457.
Scarlato, O.A. (Ed.), 1994a. Ecosystems and the flora and fauna
of the Chaun Bay of the East-Siberian Sea, Part I:
explorations of the fauna of the seas. Russian Academy
of Sciences, Zoological Institute, vol. 47(55), 264pp.
(in Russian).
Scarlato, O.A. (Ed.), 1994b. Ecosystems and fauna of the Chaun
Bay and neighbouring waters of the East Siberian Sea, Part II:
explorations of the fauna of the seas. Russian Academy of
Sciences, Zoological Institute, vol. 48(56), 151pp. (in Rus-
sian).
Scarlato, O.A. (Ed.), 1994c. Fauna of the East Siberian Sea, Part
III: explorations of the fauna of the seas. Russian Academy
of Sciences, Zoological Institute, vol. 49(57), 182pp.
(in Russian).
Simpkins, M.A., Hiruki-Raring, L.M., Sheffield, G., Grebmeier,
J.M., Bengston, J.L., 2003. Habitat selection by ice-associated
pinnipeds near St. Lawrence Island, Alaska. Polar Biology 26
(9), 577–586.
Sirenko, B.I., Koltun, V.M., 1992. Characteristics of benthic
biocenoses of the Chukchi and Bering Seas. In: Nagel, P.A.
(Ed.), Results of the Third US-USSR Bering and Chukchi
Seas Expedition (BERPAC), Summer 1988. US Fish &
Wildlife Service, Washington, DC, pp. 251–258.
Springer, A.M., McRoy, C.P., 1993. The paradox of pelagic food
webs in the northern Bering Sea—III. Patterns of primary
production. Continental Shelf Research 13 (5/6), 575–599.
Stoker, S.W., 1978. Benthic invertebrate macrofauna of the
eastern Bering and Chukchi seas. Ph.D. Dissertation, Institute
for Marine Science, University of Alaska, Fairbanks, AK,
259pp.
Stoker, S.W., 1981. Benthic invertebrate macrofauna of the
eastern Bering/Chukchi continental shelf. In: Hood, D.W.,
ARTICLE IN PRESSK.H. Dunton et al. / Deep-Sea Research II 52 (2005) 3462–3477 3477
Calder, J.A. (Eds.), The Eastern Bering Sea Shelf: Oceano-
graphy and Resources, vol. 2. University of Washington
Press, Seattle, WA, pp. 1069–1091.
Thomson, D.H., 1982. Marine benthos in the eastern Canadian
high arctic: Multivariate analyses of standing crop and
community structure. Arctic 35 (1), 61–74.
Wacasey, J.W., 1975. Biological productivity of the southern
Beaufort Sea: Zoobenthic Studies. Beaufort Sea Technical
Report #12b. Department of the Environment, Victoria, BC,
39pp.
Walsh, J.J., McRoy, C.P., Coachman, L.K., Goering, J.J.,
Nihoul, J.J., Whitledge, T.E., Blackburn, T.H., Parker,
P.L., Wirick, C.D., Shuert, P.O., Grebmeier, J.M., Springer,
A.M., Tripp, R.D., Hansell, D.A., Djenidi, S., Deleersnijder,
E., Henricksen, K., Lund, B.A., Andersen, P., Mkller-Karger,
F.E., Dean, K., 1989. Carbon and nitrogen cycling within the
Bering/Chukchi Seas: Source regions for organic matter
effecting AOU demands of the Arctic Ocean. Progress in
Oceanography 22, 277–359.
Wang, J.W., Cota, G.F., Comiso, J.C., 2005. Phytoplankton in
the Beaufort and Chukchi Seas: distributions, dynamics, and
environmental forcing. Deep-Sea Research II, this issue
[doi:10.1016/j.dsr2.2005.10.014].
Wassmann, P., 1991. Dynamics of primary production and
sedimentation in shallow fjords and polls of western Norway.
Oceanography andMarine Biology Annual Review 29, 87–154.
Wassmann, P., Andreassen, I., Reigstad, M., Slagstad, D., 1996.
Pelagic–benthic coupling in the Nordic Seas: the role of
episodic events. Marine Ecology 17 (l–3), 447–471.
Weingartner, T.J., Cavalieri, D.J., Aagaard, K., Sasaki, Y., 1998.
Circulation, dense water formation, and outflow on the
northeast Chukchi shelf. Journal of Geophysical Research
103, 7647–7661.
Whitledge, T.E., Reeburgh, W.S., Walsh, J.J., 1986. Seasonal
inorganic nitrogen distribution and dynamics in the south-
eastern Bering Sea. Continental Shelf Research 5, 109–132.
Woodgate, R.A., Aagaard, K., 2005. Revising the Bering Strait
freshwater flux into the Arctic Ocean. Geophysical Research
Letters 32, L02602, doi:10.1029/2004GL021747.
Woodgate, R.A., Aagaard, K., Weingartner, T., 2005. Monthly
temperature, salinity, and transport variability of the Bering
Strait throughflow. Geophysical Research Letters 32, L04601,
doi:10.1029/2004GL021880.
Zenkevitch, L., 1963. General characteristics of the Northern
Seas. In: Alien, G. (Ed.), Biology of the Seas of the USSR.
London, pp. 27–71, 675–713, 255–269.
Copyright © 2022 FDOKUMEN