Report on the Status of Pelagic Fishes (Capelin off ...
27
DFO Atlantic Fisheries Stock Status Report 94/ 3 REPORT ON THE STATUS OF PELAGIC FISHES (CAPELIN OFF NEWFOUNDLAND AND IN THE GULF OF ST . LAWRENCE, AND HERRIN G OFF THE EAST, SOUTHEAST AND SOUTH COASTS OF NEWFOUNDLAND ) Atlantic Stock Assessment Secretariat Science Branch, Stn . 21 5 Department of Fisheries and Oceans P .O . Box 1006 Dartmouth, Nova Scotia B2Y 4A2 Canad a May 1994
-
Upload
khangminh22 -
Category
Documents
-
view
0 -
download
0
Transcript of Report on the Status of Pelagic Fishes (Capelin off ...
DFO Atlantic FisheriesStock Status Report 94/3
REPORT ON THE STATUS OF PELAGIC FISHES (CAPELIN OFF NEWFOUNDLANDAND IN THE GULF OF ST . LAWRENCE, AND HERRIN G
OFF THE EAST, SOUTHEAST AND SOUTH COASTS OF NEWFOUNDLAND )
Atlantic Stock Assessment SecretariatScience Branch, Stn . 21 5
Department of Fisheries and OceansP .O. Box 1006
Dartmouth, Nova Scotia B2Y 4A2Canada
May 1994
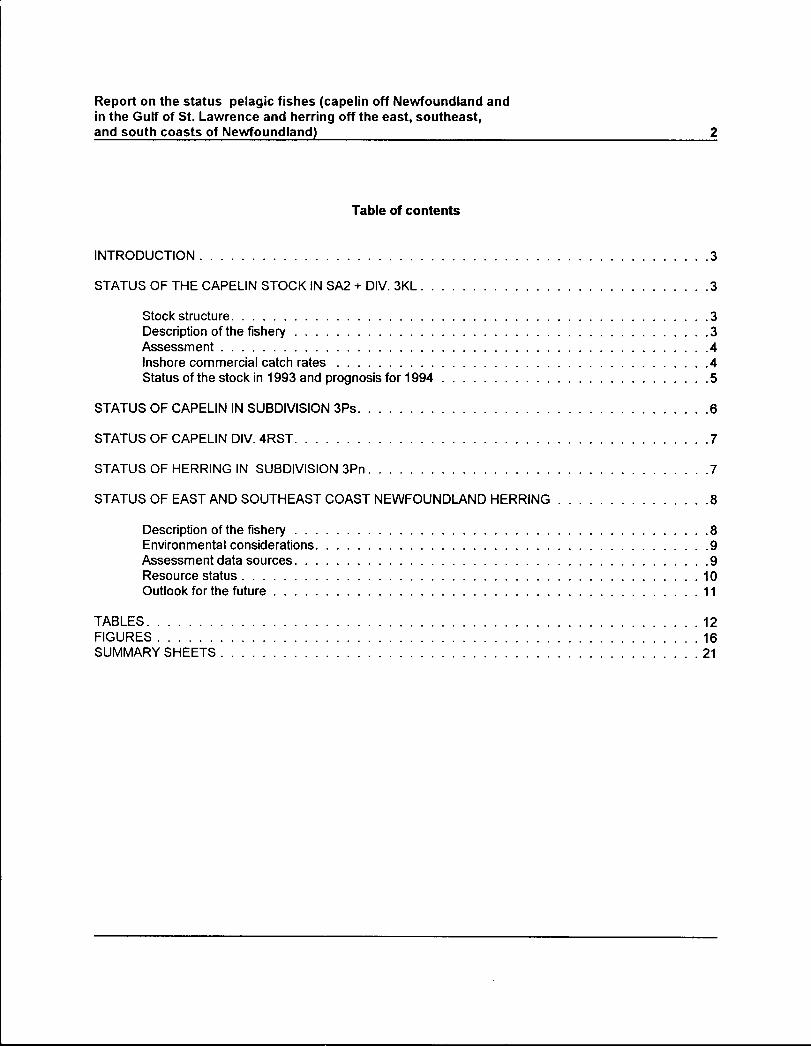
Report on the status pelagic fishes (capelin off Newfoundland andin the Gulf of St . Lawrence and herring off the east, southeast ,and south coasts of Newfoundland)
Table of contents
2
INTRODUCTION . . . . . . . . . . . . . . . . . . . . . . . . . . . . . . . . . . . . . . . . . . . . . . . . . 3
STATUS OF THE CAPELIN STOCK IN SA2 + DIV . 3KL . . . . . . . . . . . . . . . . . . . . . . . . . . . . 3
Stock structure . . . . . . . . . . . . . . . . . . . . . . . . . . . . . . . . . . . . . . . . . . . . . . 3Description of the fishery . . . . . . . . . . . . . . . . . . . . . . . . . . . . . . . . . . . . . . . .3Assessment . . . . . . . . . . . . . . . . . . . . . . . . . . . . . . . . . . . . . . . . . . . . . . .4Inshore commercial catch rates . . . . . . . . . . . . . . . . . . . . . . . . . . . . . . . . . . . .4Status of the stock in 1993 and prognosis for 1994 . . . . . . . . . . . . . . . . . . . . . . . . . . 5
STATUS OF CAPELIN IN SUBDIVISION 3Ps . . . . . . . . . . . . . . . . . . . . . . . . . . . . . . . . . .6
STATUS OF CAPELIN DIV. 4RST . . . . . . . . . . . . . . . . . . . . . . . . . . . . . . . . . . . . . . . .7
STATUS OF HERRING IN SUBDIVISION 3Pn . . . . . . . . . . . . . . . . . . . . . . . . . . . . . . . . .7
STATUS OF EAST AND SOUTHEAST COAST NEWFOUNDLAND HERRING . . . . . . . . . . . . . . . 8
Description of the fishery . . . . . . . . . . . . . . . . . . . . . . . . . . . . . . . . . . . . . . . .8Environmental considerations . . . . . . . . . . . . . . . . . . . . . . . . . . . . . . . . . . . . . . 9Assessment data sources . . . . . . . . . . . . . . . . . . . . . . . . . . . . . . . . . . . . . . . . 9Reso u rce status . . . . . . . . . . . . . . . . . . . . . . . . . . . . . . . . . . . . . . . . . . . . 10Outlook for the future . . . . . . . . . . . . . . . . . . . . . . . . . . . . . . . . . . . . . . . . . 1 1
TABLES . . . . . . . . . . . . . . . . . . . . . . . . . . . . . . . . . . . . . . . . . . . . . . . . . . . . .12FIGURES . . . . . . . . . . . . . . . . . . . . . . . . . . . . . . . . . . . . . . . . . . . . . . . . . . . .16SUMMARY SHEETS . . . . . . . . . . . . . . . . . . . . . . . . . . . . . . . . . . . . . . . . . . . . . . 21
Repo rt on the status of pelagic fishes (capelin off Newfoundland andin the Gulf of St . Lawrence, and herring off the east, southeast ,and south coasts of Newfoundlandy
INTRODUCTION
This report contains assessments of the status of capelin stocks in Subarea 2 and divisions 3KL, Subdivision3Ps, and in the Gulf of St . Lawrence (Div . 4RST), in addition to herring stocks along the east and southeastcoasts of Newfoundland and in Subdivision 3Pn . Scientists from Atlantic Canada and from the Headqua rtersof the Depa rtment of Fisheries and Oceans in O ttawa have reviewed the data and analyses used to es timatethe present status of these stocks . The data used to prepare these assessments, with details of analyses used,will be published in the depa rtment's research document series dealing with the Atlantic fisheries .
STATUS OF THE CAPELIN STOCK IN SA2 + DIV. 3KL
Stock structure
Beginning in the mid-1970s, capelin off Newfoundland's east coast were assessed and managed as"northern" (NAFO SA2 + Div . 3K) and "southern" (NAFO Div . 3LNOPs) components . The "southern" stockswere further subdivided during the late 1970s and early 1980s such that separate management units in Div .3L, 3NO and 3Ps were identified .
The original stock designations in the early 1970s were based on tenuous and circumstantial evidence fromresearch vessel surveys . Numerous studies during the 1970s and 1980s failed to provide strong evidenceto support the existing stock designations but tagging studies indicated substantial migration of maturecapelin between Div . 3L and Div . 3K. There are also similarities in age structure and year-class strength ofcapelin between the two areas, and as a result of this accumulated evidence, scientists recommended in1992 that capelin in SA2 + Div. 3K and Div. 3L be considered as one stock complex . Therefore, theinformation in the present document is presented for the stock complex of Subarea 2 + Division 3KL .
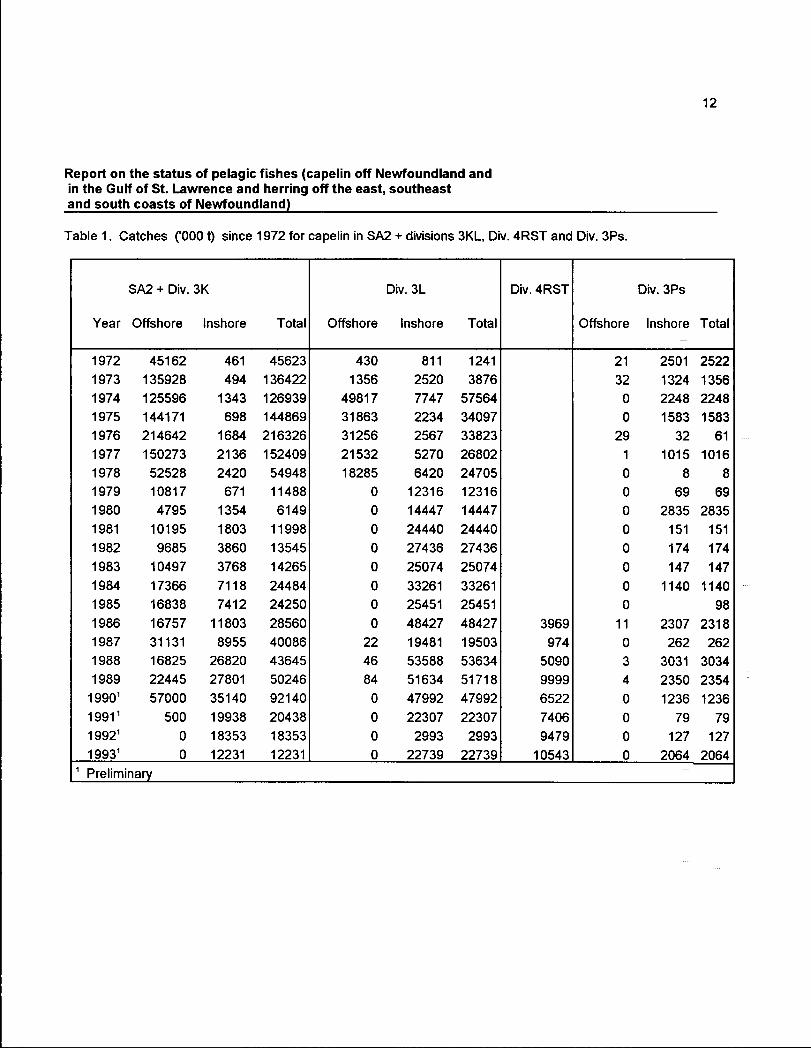
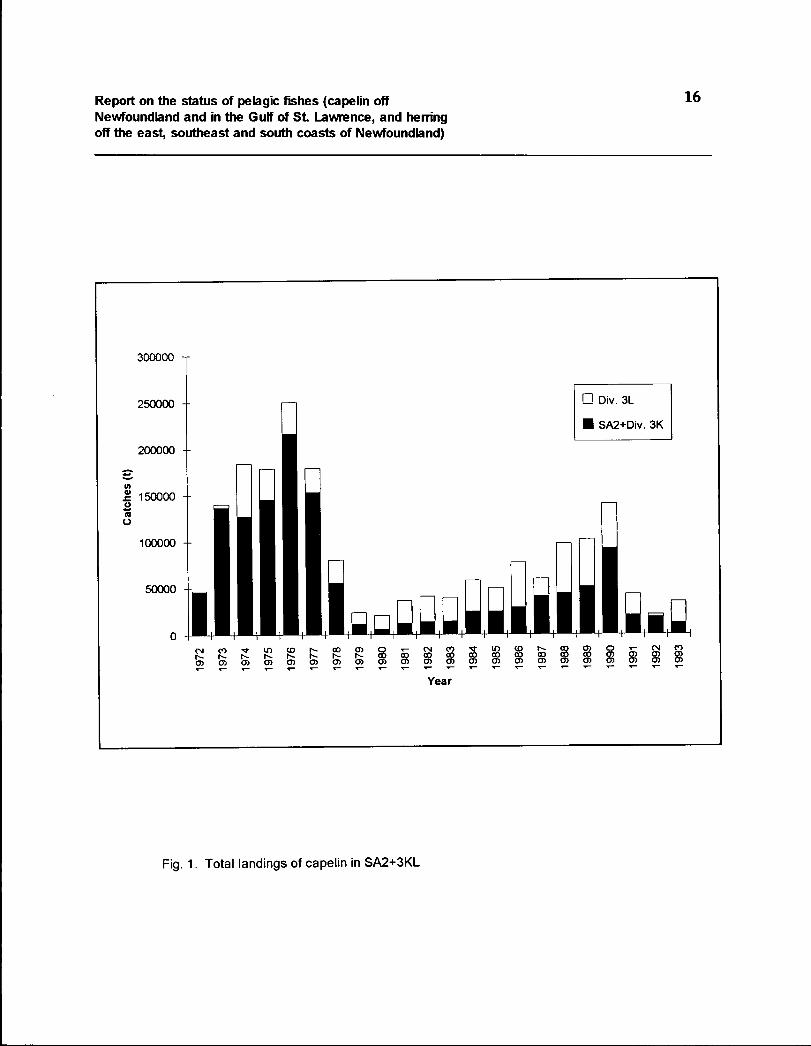
Description of the fishery Table 1, Figure 1
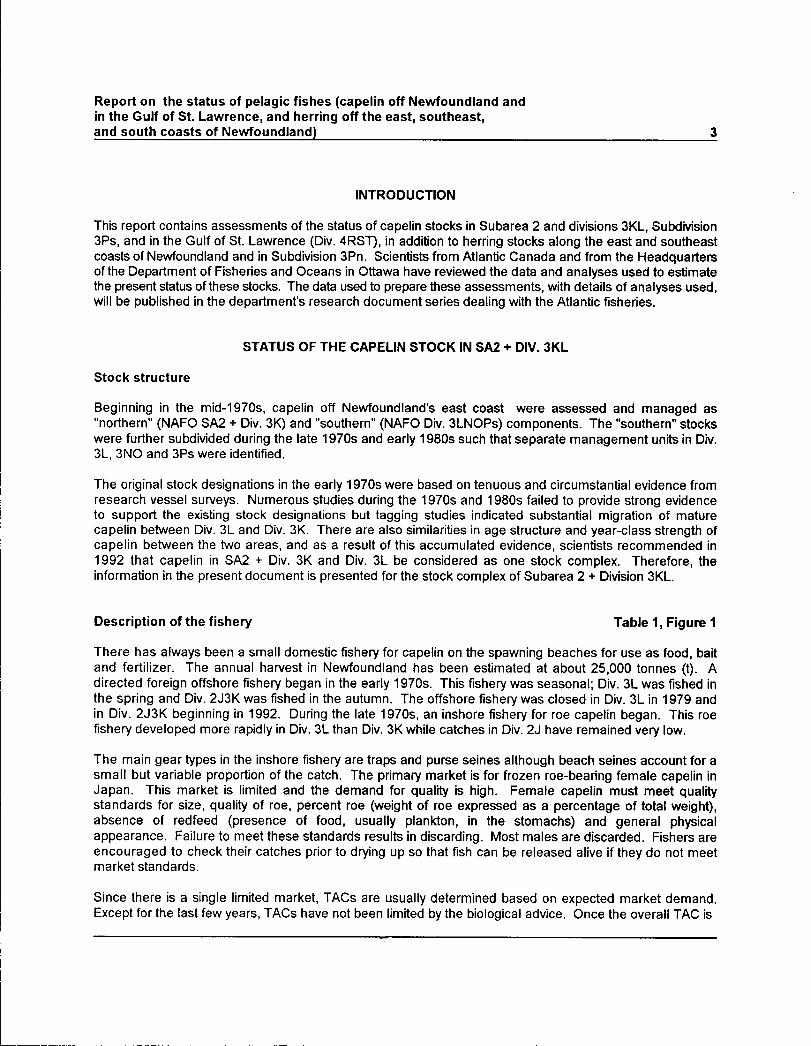
There has always been a small domestic fishery for capelin on the spawning beaches for use as food, baitand fertilizer. The annual harvest in Newfoundland has been estimated at about 25,000 tonnes (t) . Adirected foreign offshore fishery began in the early 1970s . This fishery was seasonal ; Div . 3L was fished inthe spring and Div . 2J3K was fished in the autumn . The offshore fishery was closed in Div . 3L in 1979 andin Div . 2J3K beginning in 1992 . During the late 1970s, an inshore fishery for roe capelin began . This roefishery developed more rapidly in Div . 3L than Div . 3K while catches in Div . 2J have remained very low .
The main gear types in the inshore fishery are traps and purse seines although beach seines account for asmall but variable proportion of the catch . The primary market is for frozen roe-bearing female capelin inJapan. This market is limited and the demand for quality is high . Female capelin must meet qualitystandards for size, quality of roe, percent roe (weight of roe expressed as a percentage of total weight),absence of redfeed (presence of food, usually plankton, in the stomachs) and general physicalappearance . Failure to meet these standards results in discarding . Most males are discarded . Fishers areencouraged to check their catches prior to drying up so that fish can be released alive if they do not meetmarket standards .
Since there is a single limited market, TACs are usually determined based on expected market demand .Except for the last few years, TACs have not been limited by the biological advice . Once the overall TAC is
Report on the status of pelagic fishes (capelin off Newfoundland andin the Gulf of St. Lawrence, and herring off the east, southeast ,and south coasts of Newfoundland )
determined, it is allocated by bay and gear type. The overall TAC, bay and gear allocations as well as othermanagement practices (eg . opening dates) have been determined after consulta tion with representa tives ofthe fishing indust ry . In recent years, opening dates in some areas have been determined by fishers andprocessors by monitoring test catches for marketable capelin .
Catches have usually been about the same as the TAC largely because the TAC is based on expected marketdemand . An exception occurred in Div . 3L in 1992 when catches of about 2,000 t were well below the 19,300tTAC. Capelin were unusually small that year and did not meet market standards . In 1991, a 50,000 t offshoreallocation was given to a Canadian company in Div . 2J3K but the 70,000 t total offshore alloca tion was nottaken. In 1992, less than 1,000 t of the 57,900 t offshore alloca tion in Div. 2J3K was taken because the fleetcould not find capelin .
During the 1980s, there was a general seasonal progression of the fishery from the south coast ofNewfoundland (St. Mary's Bay), along the east coast to the northeast coast (Notre Dame Bay and White Bay) .This fishery tracked the influx of ripe capelin to the spawning beaches . Thus, the fishery usually began bymid-June in the south and finished about mid-July in the north . The fishery in any one area was usually shortbut intense often lasting only a few days . Because of the northward progression of the fishery, fixed gear fishersin northern areas often complained of filled markets before the fish arrived in their area, in spite of the bayallocations. Since 1991, the timing of the fishery has been later by up to four weeks because of the late arrivalof capelin, probably linked with unusual water temperatures. In 1993, the capelin season was also longer thanusual and some fishers identified larger (and more marketable) capelin that moved into their area after thefishery was closed . In addition, fishers stated that abundance of capelin was higher in 1993 than in 1992 .
Assessment
In the inshore, catch rates and an aerial survey index were evaluated as indicators of stock status while for theoffshore, acoustic estimates of abundance were considered . Catch rates in the capelin fishery and the aerialsurvey index have never been confirmed as indicators of stock status although research is continuing to testthis possibility . Abundance estimates can be derived from acoustic surveys although the variances are largeand in recent years, these surveys may not be indicators of stock abundance . Other information, some of itmore qualitative in nature, was examined to help evaluate capelin stock status . These other data included by-catch data from groundfish research vessel surveys, acoustic data from a groundfish migration survey, verticaldistribution data and survival estimates from capelin acoustic surveys, egg deposition data, seabird data, sealfeeding data, cod feeding data, and capelin distribution data .
Inshore commercial catch rates Figure 2
Catch rates for purse seines and traps have been collected using a research logbook program since 1981 .These logbooks have been designed by scientists and are voluntarily completed by fishers . In addition tocatch and effort data, other information such as the amount of capelin discarded or released alive, reasonsfor discarding capelin, and other species discarded is also collected . Most of the fishers have participatedin this logbook program since its inception . Information collected in the program is considered confidentialand close contact with fishers has been maintained to ensure high data quality. Annual results derived fromall Iogbooks are sent to the participants .
Report on the status of pelagic fishes ( capelin off Newfoundland andin the Gulf of St . Lawrence, and herring off the east, southeast ,and south coasts of Newfoundlandy 5
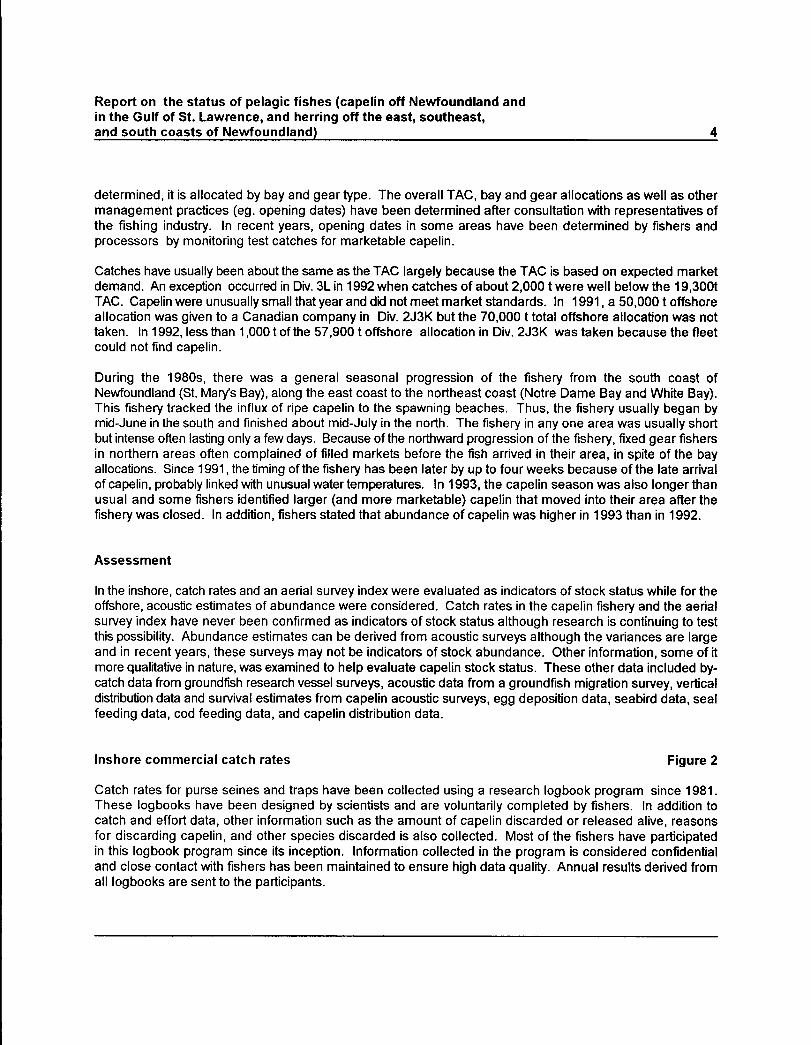
Purse seine catch rates follow the same trends as trap catch rates ; however, the purse seine catch rate hasnot been considered as an abundance index because catch rates of purse seines for other pelagic fish specieshave not been reliable indicators of stock abundance . Trap catch rates (t/day) have risen from low valuesduring 1981-84 and have remained at average or above average levels since 1985 .
Ae rial su rveys of capelin schools near spawning beaches along transects in Concep tion and T rinity bays havebeen conducted since 1982 . From 1982 to 1989 school su rface areas were measured from aerial photographsbut since 1990, school areas have been es ti mated from digital data collected by a Compact AirborneSpectrographic Imager (CASI) . This instrument collects data on various spectral band widths and stores theimages in digital form, making it more amenable to computerized image classi fication techniques . This processhas been compared to the older technique of measuring schools and has proven supe ri or . The index,expressed as school su rface area, follows the same pa ttern as catch rates . The 1993 index was the lowestsince 1989 and 72% of the value in 1992 .
An acoustic survey for capelin from 46°N to 55°N and out to the 500 m depth contour was conducted fromAugust 29 to October 19, 1993. This combined Div . 2J3KL survey replaces previous surveys in Div . 3L duringthe spring (usually May) and in Div. 2J3K during the autumn (usually October) . The total biomass estimate was45,600 t and when comparing the same survey area in Div . 2J3K, the biomass showed a further decline from31,900 t in 1992 to 17,900 t in 1993 . This is the fourth consecutive year of low biomass estimates for capelinin Div . 2J3K in the autumn and the third consecutive year of few or no capelin in Div . 2J . The average biomassestimate in Div . 2J3K, 1990-93, is about 5% of the average biomass estimated during 1981-89 (there was noestimate for 1982) . Capelin older than two years were more common in Div . 3K but one-year-olds were thedominant age in survey trawl catches in Div . 3L . This pattern of older capelin in the more northerly part of thedistribution area and younger capelin in the more southerly area is comparable to past observations except thatthe entire distribution area is shifted to the south .
Capelin are a normal by-catch in bottom trawls in groundfish surveys conducted immediately after the capelinsurvey. These groundfish surveys cover a wider area and a comparison of distribution of capelin detected inboth surveys did not suggest that there were large concentrations of capelin outside the area covered duringthe acoustic survey .
The vertical distribution patterns of capelin observed during eleven years of acoustic surveys during the springin Div . 3L have now been documented . Capelin clearly rise toward the surface at night and descend deeperin the water column during the day . The extent of this vertical migration varies from year to year but the overallpatterns are consistent . Densities were different between day and night . However, a change in depthdistribution pattern in recent years with a concomitant change in density could not account for the low biomassestimates since late 1990. The maximum change in density was about 58% which could not explain a 70-folddecrease in biomass estimated in Div . 3L between 1990 and 1991 .
Status of the stock in 1993 and prognosis for 1994
Catch rates from the inshore fishery and the aerial survey index were at least average in 1993 . While they havenot been shown to be directly related to spawning abundance, these measures did not decline to the extent thatwould have been predicted from the previous year's acoustic surveys . Furthermore, the egg depositionabundances and the generally positive comments concerning the abundance of capelin from participants inthe inshore fishery, suggest that the prognosis presented in last year's assessment was overly pessimistic .
Report on the status of pelagic fishes (capelin off Newfoundland andin the Gulf of St . Lawrence, and herring off the east, southeast ,and south coasts of Newfoundland )
The 1993 acoustic survey estimate was again low, even though this was the most extensive synoptic surveyever conducted in this area . These acoustic surveys have been designed to provide a recruitment index andtherefore, were expected to provide a basis for prediction of the spawning biomass inshore the following year .In recent years, these expectations have not been met . Consistently low biomasses have been estimatedoffshore but there have been no decreases in catch rates or aerial survey indices inshore of the magnitude thatwould be expected from the low acoustic indices . In addition, egg depositions have been consistent throughthe same time period, indicating that spawning escapement has been occurring . As a result of theseinconsistencies, the acoustic biomass in 1993 cannot be used to predict stock status in 1994 . However, thisdoes not mean that the survey estimate is invalid ; in fact, there is no technical reason to discount the resultsof the acoustic survey . The low abundance estimates since the autumn of 1990 over a very large area of theNewfoundland Shelf and Grand Banks, including an almost complete absence of capelin in Div . 2J for the lastthree years is perplexing and continues to be a cause for concern . There is no doubt that capelin behaviourhas changed over the same period as evidenced by the late spawning times and unusual distribution patterns .It is possible that changes in behaviour have biased the biomass estimates since most of the surveys have beenfixed spatially and temporally . However, this effect has not been quantified . Therefore, the hypothesis that thedecline in the biomass estimates in the survey area also reflect a decline in population abundance could notbe evaluated .
There is a statistically significant relationship between catch rate of younger fish in the inshore fishery and catchrate of the same year-classes one year later . The high catch rates of younger fish (ages 2 and 3) in the fisheryin 1993 implies that the catch rate of the dominant age groups (ages 3 and 4) in the 1994 fishery will be good .However, as previously noted, a direct relationship between catch rate and spawning biomass has not beenconfirmed and the possibility exists that the catch rates could remain average or better at low stockabundances .
In the past, a conservative exploitation rate of 10% of the spawning stock biomass has been advised andfollowed as a management objective . This conserva tive strategy was recommended because of theimpo rtance of capelin as a forage species and because of the poten tially large variability in abundance indices .There are no biological reasons to deviate from a conse rva tive management approach although it is notpossible to provide a quan titative compa rison of recent catch levels and the target exploita tion rate . There isalso merit in continuing some of the present management practices . For example, alloca tions based on marketdemand and opening and closing fishe ries to maintain quality through monito ring of fish size should preventexcessive discarding and thereby provide a measure of stock protec tion . The distribu tion of effo rt by enactingbay and gear quotas has the potential to protect individual spawning components .
STATUS OF CAPELIN IN SUBDIVISION 3P s
The provisional catch in 1993 of 2,064 t was just below the 2,090 t quota and much higher than the 1990and 1991 catches which were less than 100 t . The 1993 catch was comparable to the 1988-90 catcheswhich ranged from 1,200 to 3,000 t .
No fishery or biological data were available for this stock and therefore, the status of this stock could not beassessed. Because catches for this stock are low relative to other areas and biomass estimates probablywill not be available, it is unlikely that this stock will be reviewed annually .
Report on the status of pelagic fishes (capelin off Newfoundland andin the Gulf of St . Lawrence, and herring off the east, southeast ,and south coasts of Newfoundland) 7
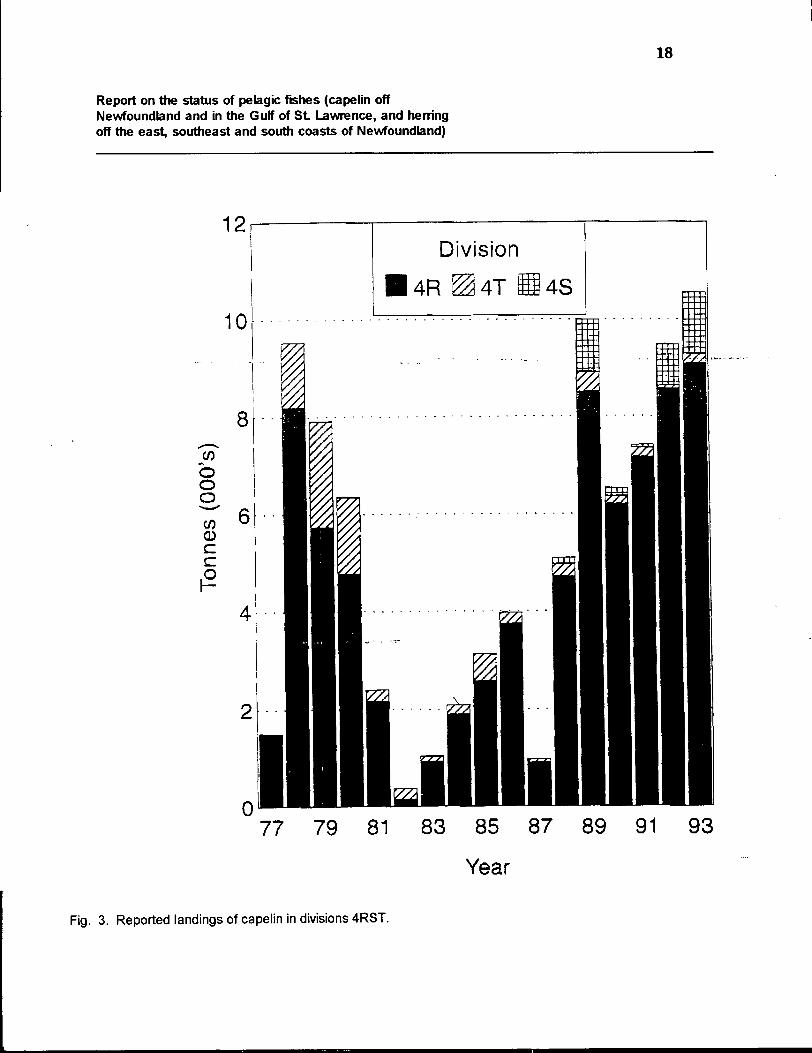
STATUS OF CAPELIN IN DIV. 4RST Table 1, Figure 3
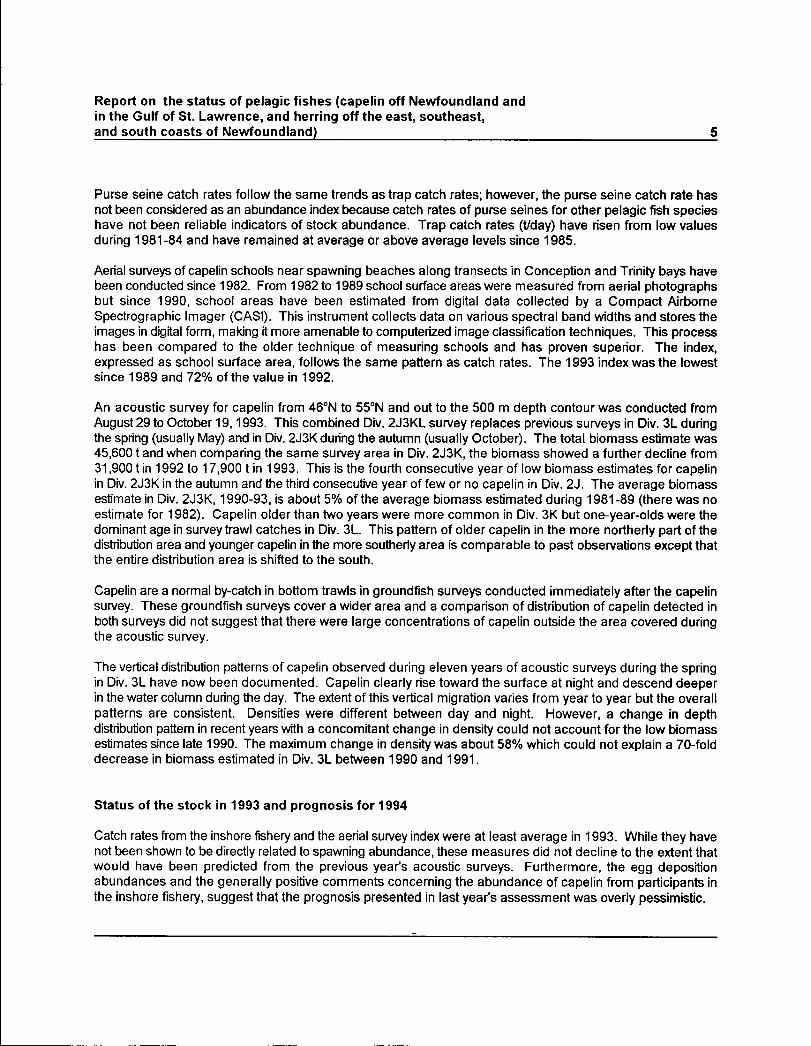
With declining groundfish stocks, fishing effort on capelin has increased steadily in the Gulf of St . Lawrence .Historically, landings in Div. 4R have been the largest in the Gulf. They have been increasing since 1987and are now over 9,000 t . Purse seiners account for the majority (73% in 1993) of the landings in thisdivision . Trap nets, exclusively utilized in the northern part of the division, landed approximately 2,500 t in1993 . In Div . 4S, the issuing of new licenses led to a major increase in landings in 1989, followed by asharp drop in the next two years, and increases in 1992 and 1993 to reach 1,262 t in 1993 . Landings allcame from the Lower North Shore where the main gear is the trap net . In Div . 4T, the fish are too small forthe Japanese roe market . The principal target markets are thus products for animal consumption, andaccordingly more limited . However, in 1993, purse seine tests were conducted in Chaleur Bay to supply anew roe market in Taiwan . Landings reflect the scope of markets and the exploitation of the resource in thisdivision has to date been fairly low .
The fishery for capelin in the Gulf of St . Lawrence is expanding and should be monitored closely . Capelinrecruitment is variable and the fishery is accordingly subject to fluctuations . In 1993, the catches of age 2females in Div . 4R were by far the highest seen over the last five years . Consequently, the 1991 year-classis expected to contribute significantly to the fishery in 1994 at age 3 .
In 1994, an index fishers program for capelin will be implemented . In addition, acoustic monitoring will beperformed during the summer shrimp-groundfish bottom trawling survey. A stock discrimination study willbe initiated in 1994, which will examine stock structure on the basis of the type of parasites found indifferent areas .
STATUS OF HERRING IN SUBDIVISION 3P n
From the mid-1960s to the early-1970s, a substantial purse seine fishery in 3Pn was supported largely bycatches of overwintering southern Gulf 4T spring and autumn spawners, as determined bytagging-recapture experiments (Winters and Beckett, 1978), length frequency and age distributioncomparisons. Landings by purse seiners in 3Pn ranged from 10,000 t in 1964 to nearly 140,000t in1968-69, subsequently declining to 25,000 t by 1972. The catches were dominated by two large year-classes (1958 autumn and 1959 spring spawners) which were the main contributors to the fishery from1964 to 1970 . The proportion of southern Gulf 4T herring stock migrating to 3Pn increased with age, with100% migration in the older age groups . Studies in the mid-1970s (Winters and Hodder, 1975) concludedthat the abundance of 4T herring in 3Pn would have declined significantly even if there had been no fisherybecause subsequent recruitment had been poor . No major purse seine fishery has taken place insouthwestern Newfoundland's 3Pn area since the late 1970s .
A 24 hour acoustic survey was conducted in 3Pn on January 12, 1994 . Coverage started in the ConnoireBay area and stopped in the Rose Blanche area to the west, with an incursion into La Poile Bay . Transectswere run perpendicular to the coast, out to a distance of 5 nautical miles ; approximately 100 nautical mileswere surveyed . No acoustic backscatter was detected . However, a more extensive survey would berequired to cover the entire historic distribution of herring in the 3Pn area .
Stock composition in the area is thought to be a mixture of 4R, 4T, 3Ps and local stocks . Considering thatno recent information on stock status is available and that request for access to this area comes from
Report on the status of pelagic fishes (capelin off Newfoundland andin the Gulf of St. Lawrence, and herring off the east, southeast ,and south coasts of Newfoundland )
industry, an exploratory fishery might be appropriate to gain knowledge on the present timing, distribution, stockcomposition and biomass of herring available in 3Pn . Close monitoring of the fishery in order to gaininformation from biological and acoustic samples using commercial fleet vessels would be required to meetthis objective .
References:
Winters G .H . and V .M. Hodder, 1975. Analysis of the Southern Gulf of St . Lawrence herring stock andimplications concerning its future management . ICNAF Res . Bul . No . 11, p 43-59 .
Winters G .H . and J .S. Beckett, 1978 . Migrations, biomass and stock interrelationships of southernNewfoundland-southern Gulf herring from mark-recapture experiments . ICNAF Res. Bul . No. 13, p . 67-79 .
STATUS OF EAST AND SOUTHEAST COAST NEWFOUNDLAND HERRIN G
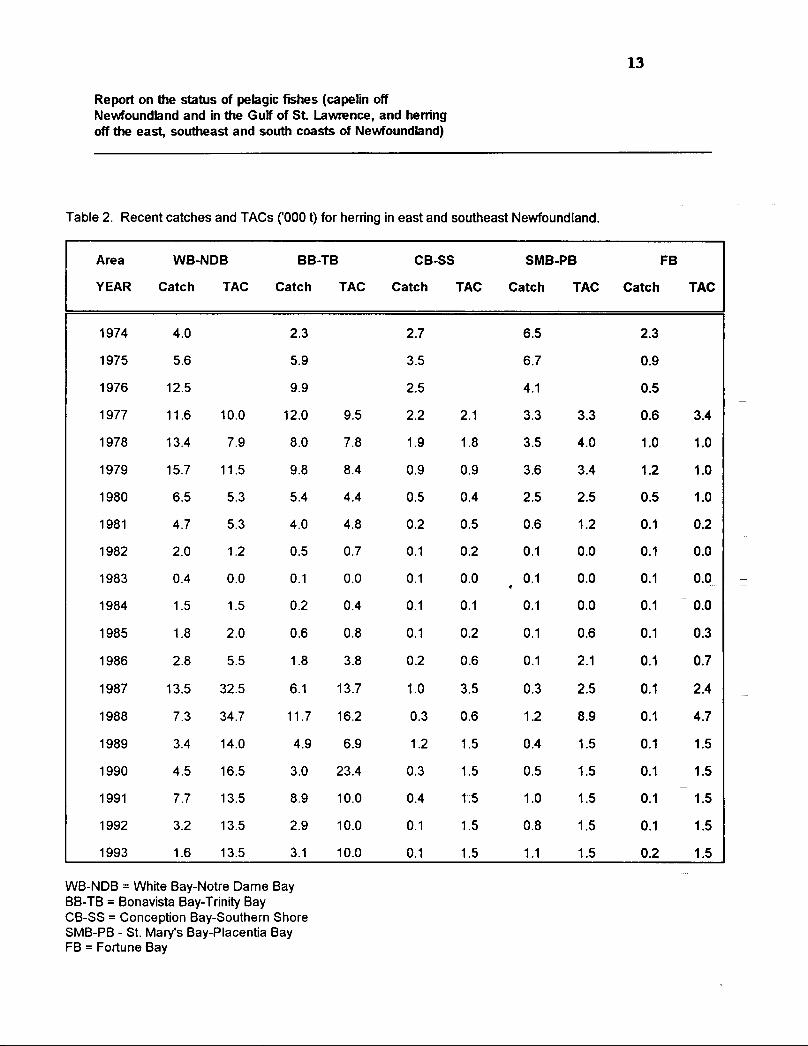
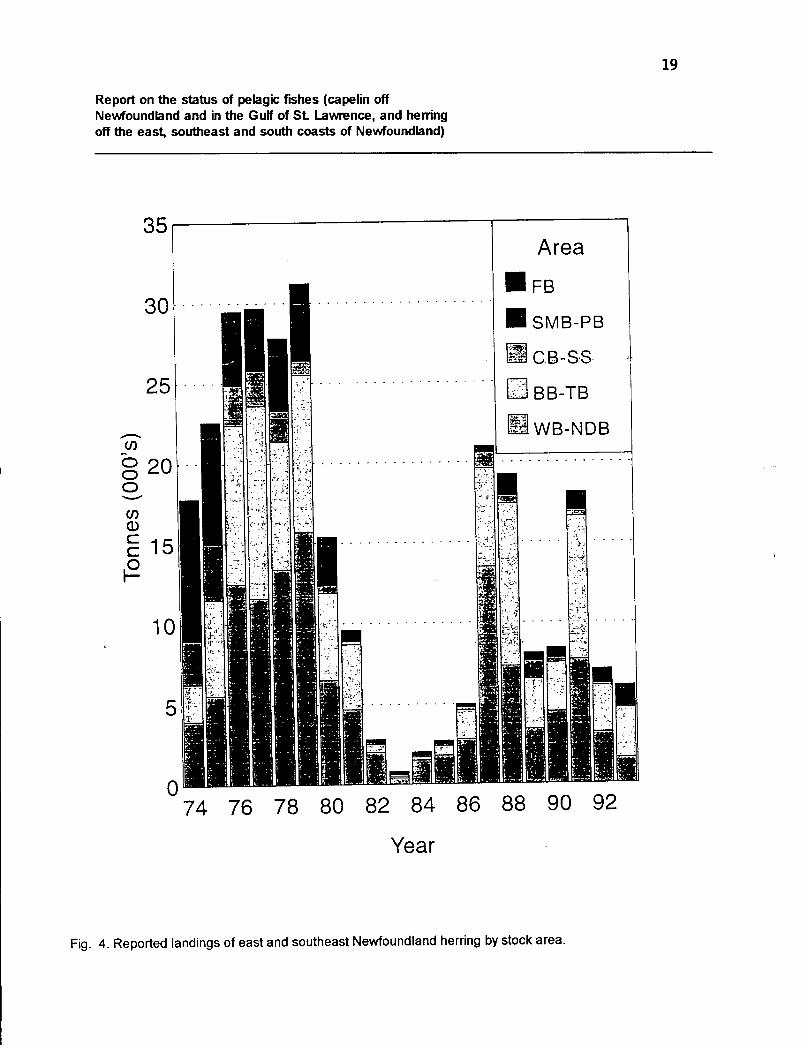
Description of the fishery Table 2, Figure 4
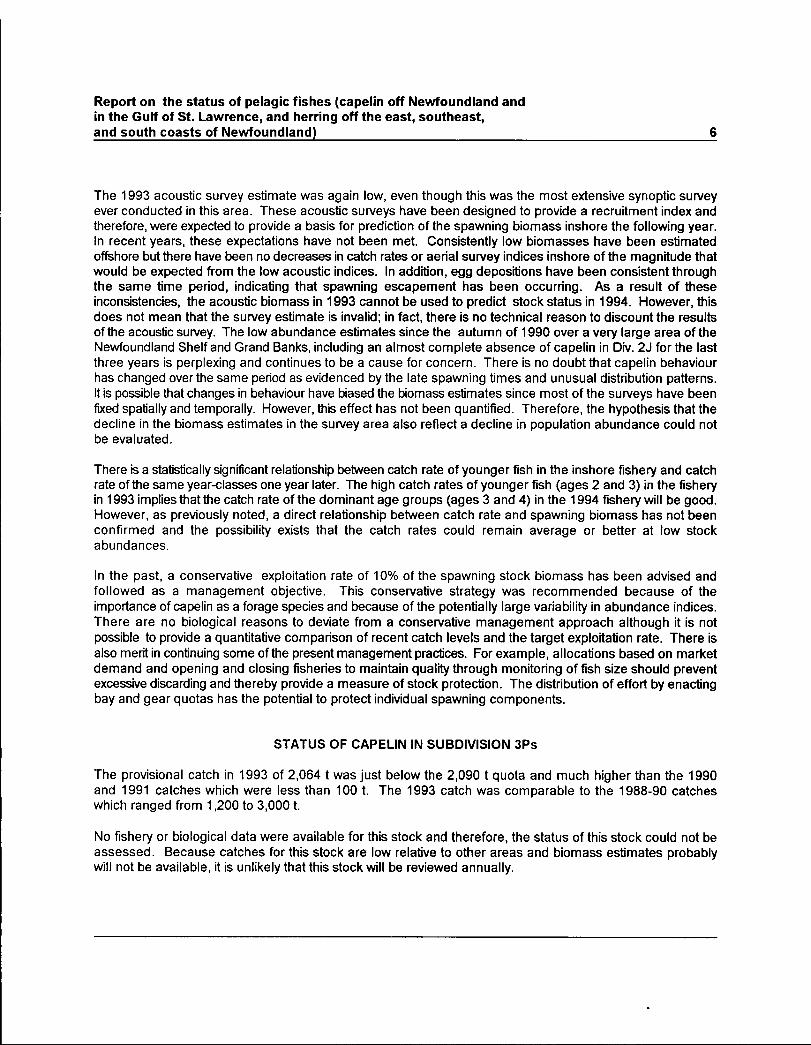
Herring landings from east and southeast Newfoundland herring stocks peaked at 31,000 t in 1979 . Theincreased landings through the late 1970s coincided both with the recruitment of the ve ry strong 1968 year-class and with increased markets due to the collapse of the No rth Sea herring stocks. Commercialfisheries were closed, or reduced to bait fishe ries only, during the early 1980s due to a decline inabundance caused by poor recruitment subsequent to the 1968 year-class . Stock sizes increased throughthe 1980s with the recruitment of the moderately sized 1982 year-class and the somewhat smaller 1987year-class . Landings over the last five years have been controlled by available markets ; TACs have notbeen a limiting factor . During this time, annual landings have been between 6,000 - 8,000 t, with theexception of 1991, when landings increased to 17,000 t due to a government subsidy program paid tofishers and processors .
Landings in 1993 were approximately 6,000 t. Similar to recent years, most fish were landed in White Bay -Notre Dame Bay and Bonavista Bay - Trinity Bay during the autumn purse seine fishery . There was also alimited winter purse seine fishery in St . Mary's Bay - Placentia Bay. The fisheries in the remaining twoareas, Conception Bay - Southern Shore and Fortune Bay were negligible (<300 t) and were spring gillnetfisheries for bait only . There was little effort exerted in the autumn purse seine fishery in the two northernareas due to the low price of herring . In White Bay - Notre Dame Bay, the purse seine fleet directed theirefforts towards mackerel because of its higher value . Herring were taken when fish of the required marketsize were encountered . This was confounded by the presence of numerous concentrations of small fish,primarily of the 1991 year-class . Similarly, in Bonavista Bay - Trinity Bay, fishers reported that theiroperations during the autumn fishery were hampered by concentrations of small herring . The marketrequirements in both areas were for large herring, greater than 300 g (age 9+) ; the combination of thepresence of small fish and low prices reduced the fishing effort in Bonavista Bay - Trinity Bay .
Report on the status of pelagic fishes ( capelin off Newfoundland andin the Gulf of St. Lawrence, and herring off the east, southeast ,and south coasts of Newfoundland )
Environmental considerations
9
Most herring from the east and southeast Newfoundland stocks are spring spawners . Due to the coldoceanographic conditions in recent years, spawning has been delayed . This was again evident in 1993 but notas pronounced as in 1991 and 1992 when spawning along the northeast coast was delayed by four to sixweeks . Cold environmental conditions have also affected herring growth rates ; mean weights at age havedeclined during the past three years .
Assessment data source s
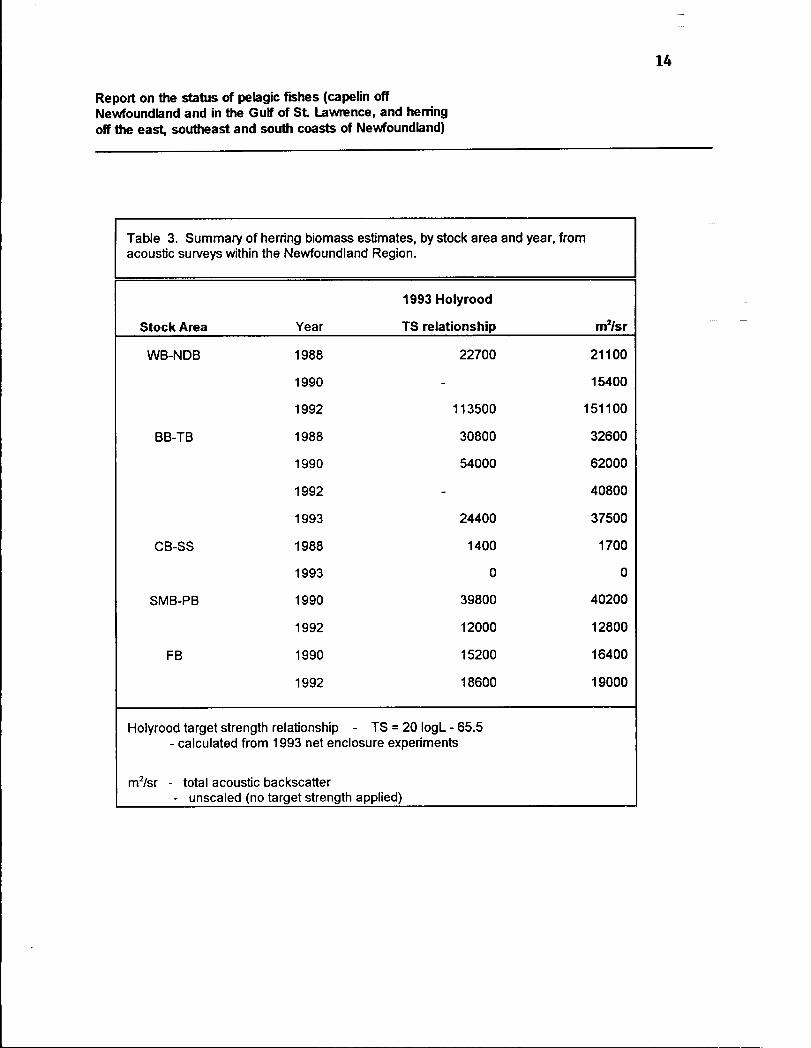
Target strength experiments Table 3
The target strength, or echo intensity, of different sizes of fish must be known to quantify the results ofacoustic biomass-estimation surveys . Although it is desirable to quantify acoustic survey estimates with fishin their natural environment , this has been very difficult during herring surveys due to the dense schoolingbehavior of the fish . From 1988 to 1992, the results of east and southeast Newfoundland herring acousticsurveys were quantified from an experimentally derived target strength-fish length relationship . A detailedreanalysis of these experimental data during the winter of 1993 indicated that there had been errors in thehydroacoustic system calibration . As it was impossible to quantify these errors, a detailed series ofexperiments was conducted in 1993 within a net enclosure in Holyrood, Conception Bay . The purpose ofthese experiments was to measure the target strengths of a broad length range of live herring and to derivea target strength-fish length relationship to quantify the results of all east and southeast Newfoundlandherring acoustic surveys .
Although there are still concerns regarding the applicability of an experimentally derived target strength-fishlength relationship to survey results, the 1993 Holyrood relationship was considered the best available toapply to all east and southeast Newfoundland herring acoustic surveys until it is possible to use in situmeasurements .
Acoustic surveys
Results were available from 1992 acoustic surveys of White Bay - Notre Dame Bay and Bonavista Bay -Trinity Bay and 1993 surveys of Conception Bay - Southern Shore and Bonavista Bay - Trinity Bay .
The 1992 acoustic su rvey es timate of White Bay - Notre Dame Bay was 113,500 t . By number, the 1992year-class was dominant, occurring along several transects on the eastern side of White Bay andaccounting for 87% of the population estimate . However, by weight, the 1987 year-class dominatedaccounting for 41% of the popula tion estimate . Herring aged 6+ accounted for 33% of the biomassestimate .
During the 1992 Bonavista Bay - Trinity Bay acoustic survey, herring concentrations were detectedacoustically throughout the area . However, it was impossible to derive a biomass estimate as no biologicalsamples were obtained to determine length, weight, and age distributions of the population .

Report on the status of pelagic fishes (capelin off Newfoundland andin the Gulf of St . Lawrence, and herring off the east, southeast ,and south coasts of Newfoundland) 1 0
No herring were detected during the 1993 acoustic survey of Conception Bay - Southern Shore . This surveywas conducted in January to measure overwintering herring concentrations . It is possible that there were eitherno overwintering fish or, due to the small population size, that they were not detected .
The 1993 acous tic survey estimate of Bonavista Bay - Trinity Bay was 24,400 t . The 1991 year-class dominatedboth in numbers and weight, accoun ting for 80% of population numbers and 61 % of population weight. Her ringaged 6+, including the 1987 year-class, accounted for only 22% of the biomass estimate .
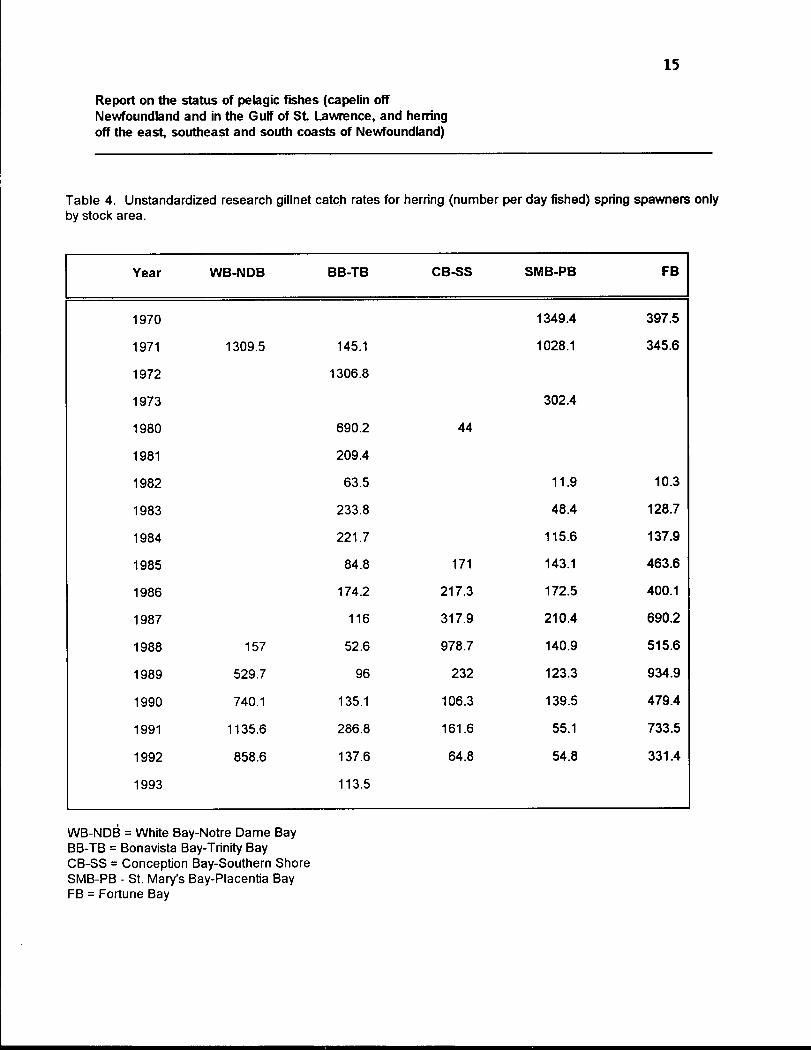
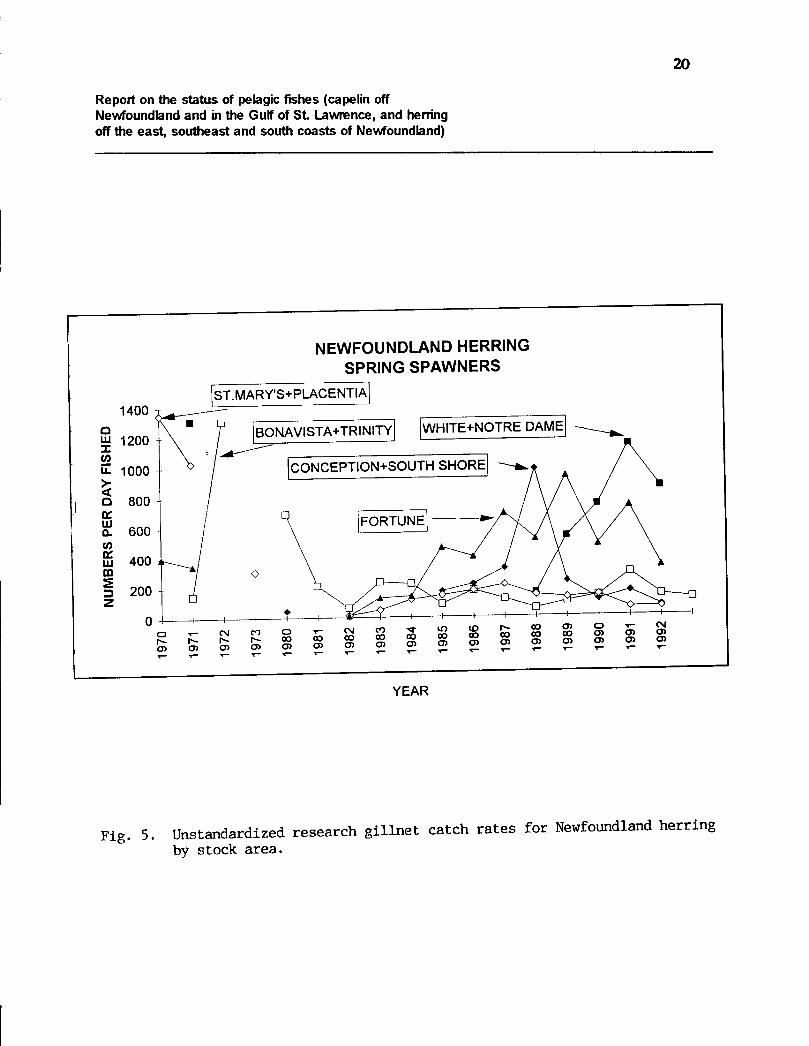
Research gillnet program Table 4, Figure 5
The research gillnet program was initiated in the Newfoundland Region in 1980 to derive an abundanceindex independent of the commercial fishery . Commercial fishers in each of the five stock areas areprovided with a fleet of five standardized gillnets, with mesh sizes ranging from 2" to 3" . They arecontracted to fish these nets for a period of one month each year, to maintain an accurate daily log recordof their catches, and to collect samples of their catch at specified intervals .
During the spring of 1992, a total of 25 fishers participated in the spring research gillnet program . Inaddition, 1993 research gillnet catch rates were available from Bonavista Bay - Trinity Bay only ; biologicalsamples from other areas were not yet processed .
Age distributions, by number, from 1992 and 1993 showed the continued dominance of the 1987 year-classin White Bay - Notre Dame Bay and Bonavista Bay - Trinity Bay . The percentage of older fish (ages 6+)was less in these areas than in the three southern areas . There was no evidence of the 1988 or 1989 year-classes in any of the areas . More recent year-classes would not be recruited to the research gillnets .
Catch rates decreased from 1991 to 1992 in four of the five stock areas . Similarly, there has been adeclining trend in catch rates in most areas since the late 1980s . There is evidence in all areas from catchrates at ages 4 and 5, that the 1987 year-class is much smaller (10% - 50%) than the 1982 year-class ;other year-classes are ve ry small . For two areas from which there are research gillnet catch rates from theearly 1970s, there is some evidence that the 1982 year-class is also much smaller than the ve ry large 1968year-class .
Resource statu s
East and southeast Newfoundland herring stocks rebuilt through the 1980s with the recruitment of the 1982and 1987 year-classes . However, acoustic biomass estimates and research gillnet catch rates at agesuggest that stocks have not increased to the levels observed during the 1970s . There are good indicationsof small herring (the 1991 and 1992 year-classes) in most areas, but sizes of these year-classes cannot yetbe quantified .
The most recent acoustic biomass estimate of the White Bay - Notre Dame Bay stock in 1992 indicated amature biomass (ages 5+) of approximately 100,000 t. Research gillnet catch rates increased consistentlyfrom 1988 to 1991 and remained at a high level in 1992 . Catches in the order of recent TACs are notexpected to exert excessive exploitation rates .
Report on the status of pelagic fishes (capelin off Newfoundland andin the Gulf of St. Lawrence, and herring off the east, southeast,and south coasts of Newfoundland) 1 1
The mature biomass es timate for Bonavista Bay - T rinity Bay from the two most recent acousti c su rveys was
low, approximately 13,000 t from the 1990 acous tic su rvey and approximately 6,500 t from the 1993 su rvey .
Research gillnet catch rates have fluctuated th rough the late 1980s with recruitment of the 1982 and 1987 year-classes but have declined in each of the past two years . Recent exploitation rates may have been high andcatches in the order of recent TACs could cause excessive exploitaiton rates . Caution should be exercised inse tt ing catch levels for this stock .
There is limited information available for Concep tion Bay - Southern Shore . No her ring were detected du ring
the most recent acous tic su rvey . The only other acoustic estimate, from 1988, was 1,400 t . Research gillnetcatch rates have fluctuated in recent years but decreased by a factor of three between 1991 and 1992. Stockaffinity is also not clear, especially du ring the autumn when her ri ng from adjacent stock areas frequent the area .Histo rically, this stock complex has been small . Caution should also be exercised in setting catch levels for
this area .
The 1992 acoustic biomass es timate for St. Mary's Bay - Placenta Bay was 12,000 t, 72% of which was maturefish . Research gillnet catch rates have declined since the late 1980s but remained stable between 1991 and1992. This stock may be in gradual decline but catches in the order of recent TACs are not expected to exe rtexcessive exploitation rates .
The 1992 acoustic biomass estimate for Fortune Bay was 18,600 t, 96% of which was mature fish . Althoughresearch gillnet catch rates have declined in recent years, they continue to remain at relatively high levels .Catch levels from this stock over the past decade indicate that it is the least exploited of the Newfoundlandstocks. Increasing exploitation to recent TACs of 1,500 t for this stock is not expected to exert excessiveexploitaiton rates .
Outlook for the future
The outlook for the future will depend upon the recruitment of the 1991 and 1992 year-classes . The importanceof the 1982 year-class has declined as it has passed through in most areas . The 1987 year-class, estimatedto be much smaller than the 1982 year-class, will have to sustain the fisheries until at least 1996 or 1997 whenthe 1991 and 1992 year-classes are recruited .
Market requirements must also be considered in the outlook for the future . In recent years, the autumn purseseine fishery in the two northern areas has been targeting larger fish (>300 g) . Most of the mature fish in theseareas are of the 1987 year-class . In 1994, these fish will range from 275 - 300 g and may or may not meetmarket requirements . Based upon acoustic survey estimates, herring greater than 300 g (ages 9+) will accountfor approximately 30% of the biomass in White Bay - Notre Dame Bay and less than 5% in Bonavista Bay -Trinity Bay. Targeting older fish may be complicated by the presence of the 1991 and 1992 year-classes .Unless market requirements change, this problem will continue for the near future .
1 2
Report on the status of pelagic fishes (capelin off Newfoundland andin the Gulf of St . Lawrence and herring off the east, southeastand south coasts of Newfoundland )
Table 1 . Catches ('000 t) since 1972 for capelin in SA2 + divisions 3KL, Div . 4RST and Div . 3Ps .
Year
SA2 + Div . 3K
Offshore Inshore Total Offshore
Div . 3L
Inshore Total
Div . 4RST
Offshore
Div. 3Ps
Inshore Total
1972 45162 461 45623 430 811 1241 21 2501 2522
1973 135928 494 136422 1356 2520 3876 32 1324 13561974 125596 1343 126939 49817 7747 57564 0 2248 2248
1975 144171 698 144869 31863 2234 34097 0 1583 15831976 214642 1684 216326 31256 2567 33823 29 32 6 1
1977 150273 2136 152409 21532 5270 26802 1 1015 101 61978 52528 2420 54948 18285 6420 24705 0 8 81979 10817 671 11488 0 12316 12316 0 69 691980 4795 1354 6149 0 14447 14447 0 2835 2835
1981 10195 1803 11998 0 24440 24440 0 151 15 1
1982 9685 3860 13545 0 27436 27436 0 174 174
1983 10497 3768 14265 0 25074 25074 0 147 147
1984 17366 7118 24484 0 33261 33261 0 1140 1140
1985 16838 7412 24250 0 25451 25451 0 981986 16757 11803 28560 0 48427 48427 3969 11 2307 231 81987 31131 8955 40086 22 19481 19503 974 0 262 2621988 16825 26820 43645 46 53588 53634 5090 3 3031 30341989 22445 27801 50246 84 51634 51718 9999 4 2350 2354
19901 57000 35140 92140 0 47992 47992 6522 0 1236 1236
19911 500 19938 20438 0 22307 22307 7406 0 79 7919921 0 18353 18353 0 2993 2993 9479 0 127 12719931 0 12231 12231 0 22739 22739 10543 0 2064 2064
1 1 Prelimina
13
Report on the status of pelagic fishes (capelin offNewfoundland and in the Gulf of St Lawrence, and herringoff the east, southeast and south coasts of Newfoundland )
Table 2. Recent catches and TACs ('000 t) for herring in east and sou theast Newfoundland .
Area WB-NDB 1313-TB CB-SS SMB-PB FB
YEAR Catch TAC Catch TAC Catch TAC Catch TAC Catch TA C
1974
1975
1976
1977
1978
1979
1980
1981
1982
1983
1984
1985
1986
1987
1988
1989
1990
1991
1992
1993
4.0
5 .6
12.5
11 .6 10 .0
13.4 7 .9
15.7 11 .5
6.5 5.3
4.7 5 .3
2.0 1 .2
0.4 0 .0
1 .5 1 .5
1 .8 2 .0
2.8 5 .5
13.5 32 .5
7 .3 34 .7
3.4 14 .0
4 .5 16 .5
7.7 13 .5
3.2 13 .5
1 .6 13 .5
2.3
5.9
9.9
12.0
8 .0
9 .8
5 .4
4 .0
0 .5
0 .1
0 .2
0 .6
1 .8
9.5
7.8
8.4
4.4
4.8
0.7
0.0
0.4
0.8
3 .8
6.1 13.7
11 .7 16.2
4 .9 6.9
3.0 23.4
8.9 10.0
2.9 10.0
3.1 10. 0
WB-NDB = White Bay-Notre Dame BayBB-TB = Bonavista Bay-Trinity BayCB-SS = Conception Bay-Southern ShoreSMB-PB - St . Mary's Bay-Placentia BayFB = Fortune Bay
2 .7
3 .5
2 .5
2.2 2. 1
1 .9 1 .8
0.9 0.9
0.5 0.4
0.2 0.5
0.1 0.2
0.1 0.0
0.1 0.1
0.1 0.2
0.2 0.6
1 .0 3.5
0.3 0.6
1 .2 1 .5
0 .3 1 .5
0 .4 1 .5
0 .1 1 .5
0.1 1 .5
6.5 2.3
6.7 0.9
4.1 0.5
3.3 3.3 0.6 3.4
3.5 4.0 1.0 1 .0
3.6 3.4 1.2 1 .0
2.5 2.5 0.5 1 .0
0.6 1.2 0.1 0.2
0.1 0.0 0.1 0.0
0.1 0.0 0.1 0.0
0.1 0.0 0.1 0.0
0.1 0.6 0.1 0.3
0.1 2.1 0.1 0.7
0.3 2.5 0.1 2.4
1.2 8.9 0.1 4.7
0.4 1.5 0.1 1 .5
0.5 1.5 0.1 1 .5
1 .0 1.5 0.1 1 .5
0.8 1.5 0.1 1 .5
1 .1 1.5 0.2 1 .5
14
Report on the status of pelagic fishes (capelin offNewfoundland and in the Gulf of St Lawrence, and herringoff the east, southeast and south coasts of Newfoundland )
Table 3 . Summary of herring biomass estimates, by stock area and year, fro macoustic surveys within the Newfoundland Region .
1993 Holyrood
Stock Area Year TS relationship m2/sr
WB-NDB 1988 22700 21100
1990 - 15400
1992 113500 151100
BB-TB 1988 30800 32600
1990 54000 62000
1992 - 40800
1993 24400 37500
CB-SS 1988 1400 1700
1993 0 0
SMB-PB 1990 39800 40200
1992 12000 12800
FB 1990 15200 16400
1992 18600 19000
Holyrood target strength relationship - TS = 20 IogL - 65 . 5calculated from 1993 net enclosure experiment s
m2/sr - total acoustic backscatte runscaled (no target strength applied)
15
Report on the status of pelagic fishes (capelin offNewfoundland and in the Gulf of St . Lawrence, and herringoff the east, southeast and south coasts of Newfoundland )
Table 4 . Unstandardized research gillnet catch rates for herring (number per day fished) spring spawners onlyby stock area .
Yea r
1970
1971
1972
WB-NDB
1309 .5
BB-TB
145 .1
1306.8
CB-SS SMB-PB
1349 .4
1028 .1
FB
397 . 5
345 . 6
1973 302.4
1980 690.2 44
1981 209. 4
1982 63.5 11.9 10.3
1983 233.8 48.4 128.7
1984 221.7 115.6 137.9
1985 84.8 171 143.1 463.6
1986 174.2 217.3 172.5 400.1
1987 116 317.9 210.4 690.2
1988 157 52.6 978.7 140.9 515.6
1989 529.7 96 232 123.3 934.9
1990 740.1 135.1 106.3 139.5 479.4
1991 1135.6 286.8 161.6 55.1 733.5
1992 858.6 137.6 64.8 54.8 331.4
1993 113. 5
WB-ND6 = White Bay-Notre Dame BayBB-TB = Bonavista Bay-Trinity BayCB-SS = Conception Bay-Southern ShoreSMB-PB - St . Mary's Bay-Placentia BayFB = Fortune Bay
Report on the status of pelagic fishes (capelin offNewfoundland and in the Gulf of St Lawrence, and herringoff the east, southeast and south coasts of Newfoundland)
16
250000
200000
Nt 150000
10U
100000
50000
f-1 r-l Il n Il ~ ~0
N M 'q- LA (D I~ ~ ~ W
à~ ~ ~ ~ W Co
Q) m § à
$ C4 m
$~ C2 Q) O) ~ Q) O) O) ~
Year
El Div. 3 L
■ SA2+Div . 3 K
Fig . 1 . Total landings of capelin in SA2+3KL

17
Report on the status of pelagic fishes (capelin offNewfoundland and in the Gulf of St Lawrence, and herringoff the east, southeast and south coasts of Newfoundland )
Subarea 2 + Divisions 3KL CapelinAbundance indice s
2-
1 .8
1 .6
1 .4
1 .2
1
0 .8
0 .6
0 .4
0 .2
0~ N c+) ~ to
G)00
OCC)
) OCo
) OCo
)
oO)o)
Acoustic
MO~o)~
T 2000
1800
1600
1400 00o
1200 ~N
1000 "MI
800
600
400
200 S
0Q
Fig . 2 . Subarea 2 + Divisions 3KL capelin abundance indices
18
Report on the status of pelagic fishes (capelin offNewfoundland and in the Gulf of St Lawrence, and herringoff the east, southeast and south coasts of Newfoundland )
12Divisio n
M4R 04T
10
Ud 4S
6
Z9
4
®
Z?2
. . . . . . . . . . . . . . . . . . . . . . . .
a
%ZZ2
/ J
77 79 81 83 85 87 89 91 93o
Yea r
Fig. 3 . Reported landings of capelin in divisions 4RST .
19
Report on the status of pelagic fishes (capelin offNewfoundland and in the Gulf of St Lawrence, and herringoff the east, southeast and south coasts of Newfoundland )
n74 76 78 80 82 84 86 88 90 9 2
Year
M SMB-P B
Area
~ F B
C.B-S -S
BB-T B
WB-ND B
Fig . 4. Reported landings of east and southeast Newfoundland herring by stock area .
20
Report on the status of pelagic fishes (capelin offNewfoundland and in the Gulf of St . Lawrence, and herringoff the east, southeast and south coasts of Newfoundland )
1400 a
BONAVISTA+TRINITY WHITE+NOTRE DAM E
CONCEPTION+SOUTH SHOR E
FORTUNE
N- N C) -e tA Co N. Oo 0) OCo Co CD Co 00 00 Co Co Co (7) 0) (7)Q) O) Q1 O) O) O) O) O) O) Q) O) G)
YEAR
NEWFOUNDLAND HERRINGSPRING SPAWNERS
ST.MARY'S+PLACENTI A
Fig . S . Unstandardized research gillnet catch rates for Newfoundland herring
by stock area .
Capelin in SA2 + Div . 3KLSummary
21
Year 1986 1987 1988 1989 1990 1991 1992 1993 Min. Max. Mean
SA2 + Div . 3K Reference Leve l
Offshore 50 47 200-250 107 57 - -
Inshore 60 29 200-250 107 332 2
Total 110 76 200-250 10 7
Offshore TAC 17 31 17 20 71 57 0 0
Inshore TAC 19 9 21 .5 24 .1 29 29 17 1 1
Total TAC 36 40 38 .5 44 .1 100 86 17 1 1
Offshore catches 17 31 17 22 57 0 .5 0 0
InIhRre purse sein eca c es
4 3 10 7 10 1 6
Inshore trap catches 5 5 13 18 21 16 1 1
sebeach sein e
lp
âi3 2 4 3 4 3 1
ccé
Total catch 29 41 44 50 92 20 .5 18 12 14 34 92
Div . 3L Reference Level 130 283 990 335 3503 3 2
Div . 3L TAC 55 25 45 46 56 56 19.3 2 1
3L Purse seine catches 21 6 19 20 15 9 2
3L Trap catches 26 13 34 32 33 13 +
3L Beach seine catches 1 + 1 + + + +
Total 3L catch 48 19 54 52 48 22 3 23 3 33 54
catché Div. 3KL Total 77 61 98 102 140 68.5 21 44
Biomass SA2 + Div . 3K 431 112 1804 1744 96 55 34 18 18 568 1804
Biomass Div . 3L 3697 2576 4551 3829 6958 116 206 84 2387 6958
All catch and biomass numbers are in '000 tonnes (t) . Biomasses are fr om acoustic su rv eys, sp ri ng in Div . 3L and autumn in SA2 + Div . 3K.
Min ., max ., and mean biomass values are 1983-1992 for SA2 + Div . 3K, 1982-92 for Div . 3L. Min ., max ., an d mean catches from 1982 to
1992 .' data not adequate to calculate a reference level . CAFSAC indicated that 1987 harvest level would not have an adverse effect
2 lowest possible leve l' STACFIS concluded that a catch of 50,000 t as in recent years would not exceed a 10% exploitation rat e
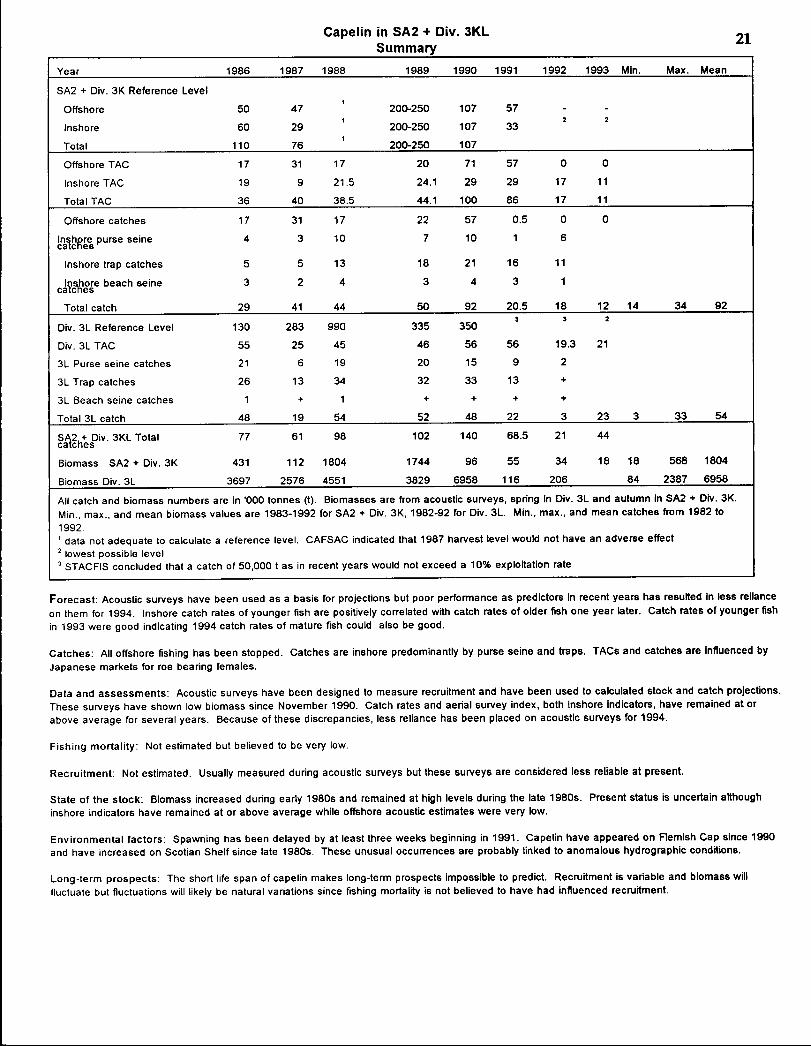
Forecast : Acoustic surveys have been used as a basis for projections but poor performance as predictors in recent years has resulted in less reliance
on them for 1994 . Inshore catch rates of younger fish are positively correlated with catch rates of older fish one year later. Catch rates of younger fish
in 1993 were good indicating 1994 catch rates of mature fish could also be good .
Catches : All offshore fishing has been stopped . Catches are inshore predominantly by purse seine and traps. TACs and catches are influenced by
Japanese markets for roe bea ri ng females .
Data and assessments : Acoustic surveys have been designed to measure recruitment and have been used to calculated stock and catch projections .
These surveys have shown low biomass since November 1990 . Catch rates and ae rial su rvey index, both inshore indicators, have remained at or
above average for several years . Because of these discrepancies, less reliance has been placed on acoustic surveys for 1994 .
Fishing mortality : Not estimated but believed to be very low .
Recruitment: Not estimated . Usually measured during acoustic surveys but these surveys are considered less reliable at present .
State of the stock : Biomass increased during early 1980s and remained at high levels during the late 1980s . Present status is uncertain althoughinshore indicators have remained at or above average while offshore acoustic estimates were very low .
Environmental factors : Spawning has been delayed by at least three weeks beginning in 1991 . Capelin have appeared on Flemish Cap since 1990
and have increased on Scotian Shelf since late 1980s . These unusual occurrences are probably linked to anomalous hydrographic conditions .
Long-term prospects : The short life span of capelin makes long-term prospects impossible to predict. Recruitment is variable and biomass willfluctuate but fluctuations will likely be natural variations since fishing mortality is not believed to have had influenced recruitment .
22
Capelin in 3PsSummary
Year 1986 1987 1988 1989 1990 1991 1992 1993 Min. Max. Mean
3Ps Reference 1000 2000leve l
3Ps TAC 2000 1300 3400 3100 3600 3600 2090 2090
Purse seinecatches
234 4 192 5 - - 0 59 234
Trap catches 2048 277 2844 2291 1164 20 70 20 898 2844
Beach seine 113 111 147 59 67 59 57 11 69 147
catche s
Total catches 2395 392 3183 2350 1236 79 127 2064 79 1026 3183
All catch and biomass numbers are in tonnes ( t) . Min ., max ., and mean values are from 1982-92.
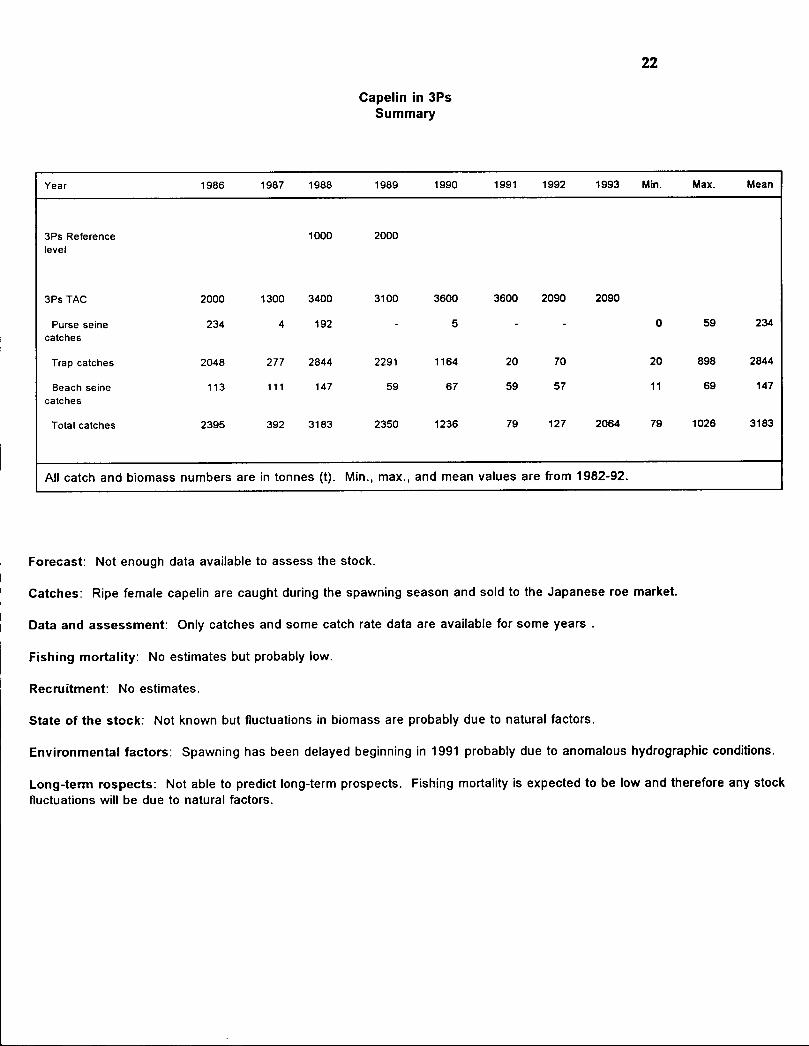
Forecast : Not enough data available to assess the stock .
Catches : Ripe female capelin are caught during the spawning season and sold to the Japanese roe market .
Data and assessment: Only catches and some catch rate data are available for some years .
Fishing mortality : No estimates but probably low .
Recruitment : No estimates .
State of the stock : Not known but fluctuations in biomass are probably due to natural factors .
Environmental factors : Spawning has been delayed beginning in 1991 probably due to anomalous hydrographic conditions .
Long-term rospects : Not able to predict long-term prospects . Fishing mortality is expected to be low and therefore any stockfluctuations will be due to natural factors .
23
4RST capelinSUMMARY
Year 1986 1987 n . Max.' Mean'
4R TAC ( mobile)2 5300 4400 3900 4875 16250 10250 11770 677 0
4R TAC ( foced)2 700 600 1400 2825 8250 7750 8255 225 5
4ST TAC 3000 2000 5000 3000 2900 2000 2000 1725
Total TAC 9000 7000 10300 10700 27400 20000 22025 10750
4R Purse seine catches 3539 841 3259 6010 4214 6952 7488 6664 841 7488 4299
4R Trap catches 204 65 1454 2502 1991 214 1079 2419 65 2502 796
4S Catches < 1 < 1 129 1078 164 58 856 1262 0 1262 355
4T Catches 226 68 248 409 153 182 56 198 56 545 227
Total catches 3969 974 5090 9999 6522 7406 9479 10543 974 10543 5919
All catches are in tonnes (t) . 1993 catches are provisiona l
'Min, max and mean values are from 1984 to 1993 .
2TACs from 1990 to 1992 inclu de Over-the-side and Over-the-Wharf TACs .
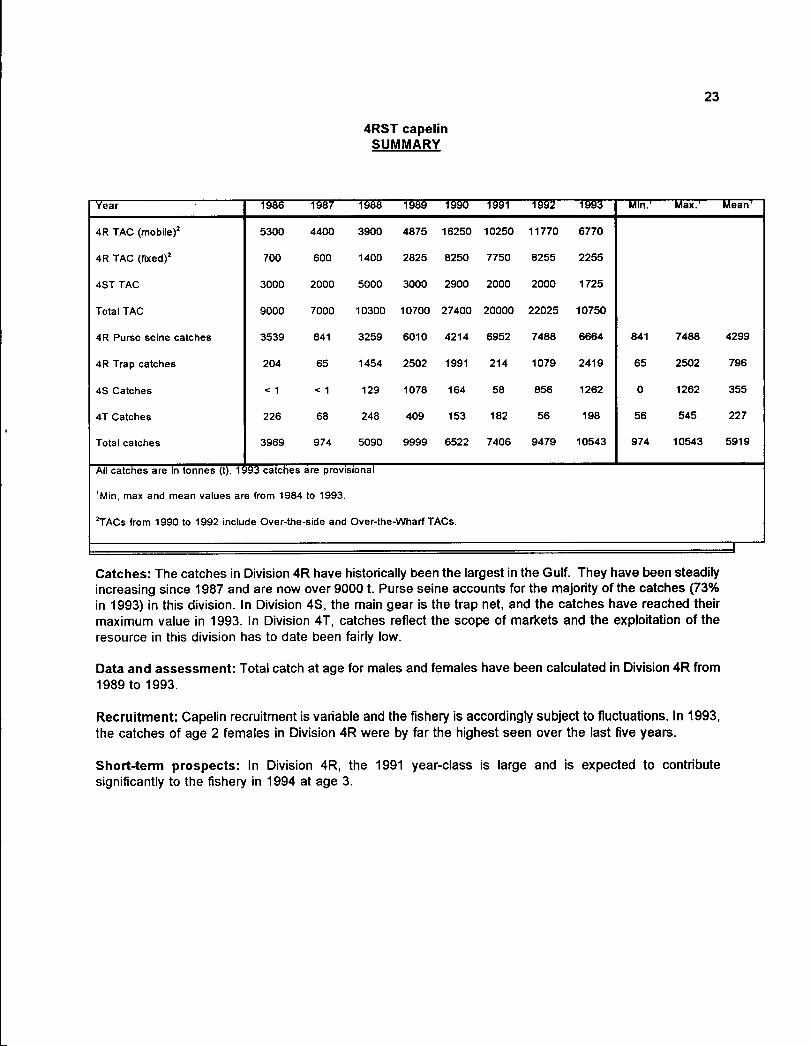
Catches : The catches in Division 4R have historically been the largest in the Gulf . They have been steadilyincreasing since 1987 and are now over 9000 t . Purse seine accounts for the majority of the catches (73%in 1993) in this division . In Division 4S, the main gear is the trap net, and the catches have reached theirmaximum value in 1993. In Division 4T, catches reflect the scope of markets and the exploitation of theresource in this division has to date been fairly low .
Data and assessment : Total catch at age for males and females have been calculated in Division 4R from1989 to 1993 .
Recruitment : Capelin recruitment is variable and the fishery is accordingly subject to fluctuations . In 1993,the catches of age 2 females in Division 4R were by far the highest seen over the last five years .
Short-term prospects : In Division 4R, the 1991 year-class is large and is expected to contributesignificantly to the fishery in 1994 at age 3 .
24
East and Southeast Newfoundland HerringSummarv
White Bay - Notre Dame Bay ('000 t)
Year 1986 1987 1988 1989 1990 1991 1992 1993 Min .' Mean' Max . '
Reference Level 5.5 32.5 34 .7 14 .0 16 .5 13 .5 13 .5 13 .5
TAC 5.5 32.5 34 .7 14 .0 16 .5 13 .5 13 .5 13 .5
Purse Seine Catches 1 .3 10.9 6 .2 5.0 2 .9 6 .3 1 .8 0.7 0.0 3 .2 10 .9
Gillnet Catches 1 .3 1 .4 0 .8 1 .1 1 .4 1 .3 1 .4 0.9 0.4 2 .5 9 .9
Total Catches2 2.8 13.5 7 .3 3 .4 4 .5 7 .7 3 .2 1 .6 0.4 6 .4 15 . 7
Total Biomass' 23 114 23 68 11 4Spawning Biomass' 15 100 15 58 100
Bonavista Bay - Trinity Bay ('000 t )
Reference Level 3.8 13.7 16 .2 6 .9 23 .4 10 .0 10 .0 10 .0
TAC 3.8 13.7 16 .2 6 .9 23 .4 10 .0 10 .0 10 .0
Purse Seine Catches 1 .1 5.6 11 .0 4 .6 2 .0 8 .1 2 .6 2 .8 0 .0 3 .5 10 . 9
Gillnet Catches 0.6 0.4 0 .2 0 .1 0 .2 0 .2 0 .2 0 .3 0 .1 0 .7 3 . 1
Total Catches' 1 .8 6 .1 11 .7 4 .9 3 .0 8 .9 2 .9 3 .1 0 .1 4 .9 12 . 0
Total Biomass 31 54 24 24 18 5 4
Spawning Biomass' 22 13 7 7 14 2 2
Conception Bay - Southern Shore ('000 t )
Reference Level 0.6 3.5 0 .6 1 .5 1 .5 1 .5 1 .5 1 .5
TAC 0.6 3.5 0.6 1 .5 1 .5 1 .5 1 .5 1 . 5
Purse Seine Catches 0 .1 0 .6 0 .2 1 .2 0.3 0 .4 0 .1 <0 .1 0 .0 0.4 1 . 7
Gilinet Catches 0 .1 0.2 <0 .1 0 .1 0.1 <0 .1 <0 .1 0 .1 <0.1 0.1 0 . 5
Total CatchesZ 0.2 1 .0 0 .3 1 .2 0 .3 0 .4 0 .1 0 .1 <0.1 0 .6 2 . 2
Total Biomass' 1Spawning Biomass3 < 1
' Min ., mean and max . catches for the period 1977-1992 .2 Total catches include bar seine and trap c atches . Catches for 1991, 1992 and 1993 are preliminary .3 From acoustic surveys.
25
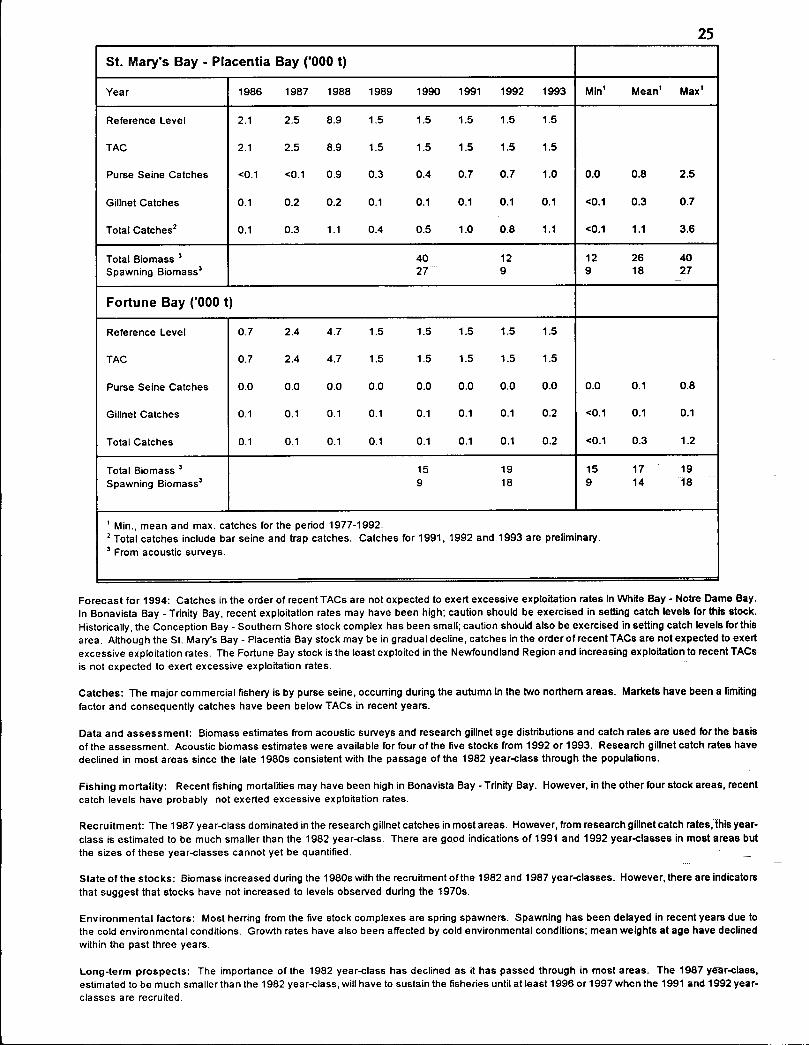
St. Mary's Bay - Placentia Bay ('000 t)
Year 1986 1987 1988 1989 1990 1991 1992 1993 Min' Mean' Max '
Reference Level 2 .1 2 .5 8 .9 1 .5 1 .5 1 .5 1 .5 1 . 5
TAC 2 .1 2 .5 8 .9 1 .5 1 .5 1 .5 1 .5 1 .5
Purse Seine Catches <0 .1 <0 .1 0 .9 0 .3 0 .4 0 .7 0 .7 1 .0 0 .0 0 .8 2 . 5
Gillnet Catches 0 .1 0 .2 0.2 0 .1 0 .1 0 .1 0 .1 0.1 <0 .1 0 .3 0 . 7
Total Catches= 0 .1 0 .3 1 .1 0 .4 0 .5 1 .0 0 .8 1 .1 <0 .1 1 .1 3 . 6
Total Biomass' 40 12 12 26 40Spawning Biomass' 27 9 9 18 27
Fortune Bay ('000 t )
Reference Level 0 .7 2 .4 4 .7 1 .5 1 .5 1 .5 1 .5 1 .5
TAC 0.7 2 .4 4 .7 1 .5 1 .5 1 .5 1 .5 1 .5
Purse Seine Catches 0 .0 0 .0 0 .0 0 .0 0 .0 0.0 0 .0 0 .0 0 .0 0 .1 0 . 8
Gillnet Catches 0 .1 0 .1 0 .1 0 .1 0 .1 0 .1 0 .1 0 .2 <0 .1 0 .1 0. 1
Total Catches 0 .1 0 .1 0 .1 0 .1 0 .1 0 .1 0 .1 0 .2 <0 .1 0 .3 1 . 2
Total Biomass' 15 19 15 17 1 9Spawning Biomass' 9 18 9 14 1 8
' Min ., mean and max . catches for the period 1977-1992 .2 Total catches include bar seine and trap catches . Catches for 1991, 1992 an d 1993 a re preliminary .' From acoustic surveys .
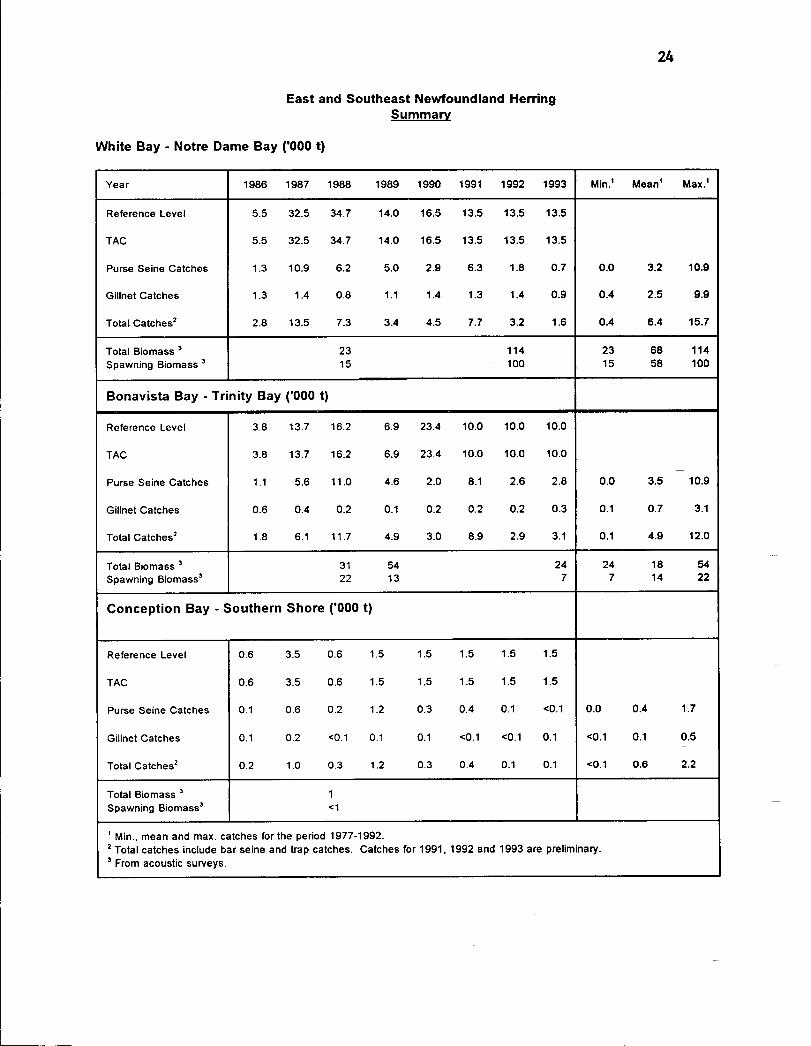
Forecast for 1994 : Catches in the order of recent TACs are not expected to exert excessive exploitation rates in White Bay - Notre Dame Bay .
In Bonavista Bay - Trinity Bay, recent exploitation rates may have been high ; caution should be exercised in setting catch levels for this stock .
Historically, the Conception Bay - Southem Shore stock complex has been small; caution should also be exercised in sett ing catch levels for this
area . Although the St . Mary's Bay - Placentia Bay stock may be in gradual decline, catches in the order of recent TACs are not expected to exert
excessive exploitation rates . The Fortune Bay stock is the least exploited in the Newfoundland Region and Increasing exploitation to recent TACs
is not expected to exert excessive exploitation rates .
Catches : The major commercial fishery is by purse seine, occurring during the autumn in the two northern areas . Markets have been a limitingfactor and consequently catches have been below TACs in recent years .
Data and assessment : Biomass estimates from acoustic surveys and research gillnet age distributions and catch rates are used for the basis
of the assessment. Acoustic biomass estimates were available for four of the five stocks from 1992 or 1993 . Research gillnet catch rates havedeclined in most areas since the late 1980s consistent with the passage of the 1982 year-class through the populations .
Fishing mortality : Recent fishing mortalities may have been high in Bonavista Bay - Trinity Bay . However, in the other four stock areas, recent
catch levels have probably not exerted excessive exploitation rates .
Recruitment : The 1987 year-class dominated in the research gillnet catches in most areas . However, from research glllnet catch rates, this year-
class is estimated to be much smaller than the 1982 year-class . There are good indications of 1991 and 1992 year-classes in most areas butthe sizes of these year-classes cannot yet be quantified .
State of the stocks : Biomass increased during the 1980s with the recruitment of the 1982 and 1987 year-classes . However, there are Indicatorsthat suggest that stocks have not increased to levels observed during the 1970s .
Environmental factors : Most herring from the five stock complexes are sp ri ng spawners . Spawning has been delayed in recent years due tothe cold environmental conditions . Growth rates have also been affected by cold environmental conditions ; mean weights at age have declinedwithin the past three years .
Long-term prospects : The importance of the 1982 year-class has declined as it has passed through in most areas . The 1987 ye ar-class,
estimated to be much smaller than the 1982 year-class, will have to sustain the fisheries until at least 1996 or 1997 when the 1991 and 1992 year-classes are recruited .