Police building gets reprieve Feds poised to cripple mining ...
Upload
independentCategory
view
2download
0
The Australian Economic Review, vol. 40, no. 1, pp. 37–61
©
2007 The University of Melbourne, Melbourne Institute of Applied Economic and Social ResearchPublished by Blackwell Publishing Asia Pty Ltd
Abstract
We use Centrelink payment records on Dis-ability Support Pension (DSP) recipients overthe period 1995 to 2002 to investigate individ-ual transitions off payments. Our findings areconsistent with the existence of a close corre-spondence between disability benefit receiptand labour market outcomes: entry to DSP viaunemployment benefits is associated with sub-stantially reduced prospects of exiting DSP,while employment during the DSP spell is as-sociated with not only an increased probabilityof exiting DSP, but also more success in stay-ing off payments once an exit has been made. Afurther finding of our analysis is that personswho exit DSP due to take-up of employmenthave a relatively high rate of return to pay-ments compared with persons who exit forother reasons, and indeed exhibit a high pro-pensity to cycle off and on payments.
1. Introduction
There has been strong growth in the number ofpersons receiving the Disability Support Pen-sion (DSP) over the last 30 years, particularlysince the implementation of the Disability Re-form Package in November 1991.
1
In June1991, there were 334000 recipients, amountingto 2.96 per cent of the age-eligible population(persons aged between 16 years and the mini-mum age of eligibility for the Age Pension). ByJune 2003, this had doubled to 673000 recipi-ents, or 5.14 per cent of the age-eligible popu-lation (Department of Family and CommunityServices 2004). While it is recognised that suchpayments provide an important safety net forpeople with disabilities who cannot work full-time, welfare dependence associated with dis-ability has become an extremely important so-cial policy issue for Australia. The widespreadview is that the growth in DSP receipt has hadadverse consequences for both the (new) recip-ients and the wider community.
Much of the public discussion in relation tothis issue rightly focuses on inflows to the pro-gram—for example, examining ways to reducethe number of people entering DSP. However,the stock of DSP recipients is the outcome ofnot only inflows, but also outflows. For exam-ple, Cai and Gregory (2003) find importantroles for both inflows and outflows in explain-ing the growth in the number of DSP recipientsover the period 1971 to 1999. Policies that pro-mote sustained exit from payments are there-fore likely to be an important component ofpolicies to reduce disability-related welfare de-pendence.
2
Appropriate formulation of such
Disability Support Pension Recipients: Who Gets Off (and Stays Off) Payments?
Lixin Cai, Ha Vu and Roger Wilkins*Melbourne Institute of Applied Economic and Social ResearchThe University of Melbourne
* This article derives from a study funded by the AustralianGovernment Department of Families, Community Ser-vices and Indigenous Affairs (FaCSIA). The views ex-pressed in this article are those of the authors and do notrepresent the views of FaCSIA. We thank two anonymousreferees for helpful comments.
38 The Australian Economic Review March 2007
©
2007 The University of Melbourne, Melbourne Institute of Applied Economic and Social Research
policies is in turn likely to benefit from under-standing the determinants of exit behaviour.
This policy context provides the motivationfor the current study, in which we make use ofpayments administration records on DSP recip-ients to investigate the factors associated withsustained exit from DSP that represents amovement towards increased self-reliance.
3
The data consist of Centrelink fortnightly wel-fare payment records, which provide a com-plete history of individuals’ income supportreceipt over the period 1995 to 2002, as well asinformation on personal characteristics andexit destinations.
The econometric models we estimate areaimed at formally investigating the factors as-sociated with successful transition off DSP,and the factors associated with sustained exit.Consistent with this two-pronged objective,our analysis consists of two complementaryapproaches. The first approach is what could betermed an ‘entry cohort’ analysis, whereby we‘follow’ all persons who commenced a DSPspell in a given period. The second approach isan ‘exit cohort’ analysis, whereby we ‘follow’those who exited DSP in a given period. Theentry cohort approach allows us to investigatethe factors associated with exit from a DSPspell, while the exit cohort approach allows usto investigate the factors associated with sus-tained exit, given exit has occurred.
The motivation for this dual approach is es-sentially the limited observation period pro-vided by the data. While the dataset runs fromJanuary 1995 to November 2002, only fromMay 1998 does it contain all of the informationnecessary for our analysis, implying our effec-tive window is restricted to four and a halfyears. DSP is, by its nature, a long-term pay-ment. A four-and-a-half year observation pe-riod therefore significantly constrains theinferences that can be made from a single co-hort of entrants to DSP on the determinants ofboth exit from DSP and the length of time exitis sustained. Our response is to examine twodistinct samples: an entry cohort sample thatcomprises persons who commenced a spell onDSP in the period July 1998 to June 1999; andan exit cohort sample that comprises (mostlydifferent) persons who exited a DSP spell in the
same period. By examining exit behaviour of acohort of entrants to DSP, and then the lengthof time exit is sustained for a cohort that exitedDSP in the same period that the entry cohortcommenced on DSP, we effectively double thespan of the data for our purposes.
2. Previous Literature
Inflows and outflows are the key dynamic di-mensions of disability benefit receipt and to-gether determine the growth of the disabilitybenefit program. Studies examining issues sur-rounding disability benefit programs can there-fore generally be classified into inflow studiesand outflow studies.
Inflow studies have largely focused on theroles played by benefit levels and labour mar-ket conditions in affecting take-up. Interna-tional studies (albeit of disability benefitsystems that generally differ somewhat fromthe Australian system) have generally foundprogram participation increasing in benefit lev-els—for example, Halpern (1979), Lando,Coate and Kraus (1979), Leonard (1979),Halpern and Hausman (1986), Bound (1987),Kreider (1997), Bound and Burkhauser (1999)and Black, Daniel and Sanders (2002)—al-though estimated elasticities vary widely, from0.2 to 1.3. Labour market conditions have alsobeen found to have marked effects on both thenumber of applications and the number ofawards of disability benefits—for example,Lando, Coate and Kraus (1979), Rupp and Sta-pleton (1995), Stapleton, Coleman and Di-etrich (1995), Stapleton, Coleman, Dietrichand Livermore (1998) and Black, Daniel andSanders (2002) for the United States, and Dis-ney and Webb (1991) and Piachaud (1986) forthe United Kingdom. In Australia, Cai andGregory (2004) similarly find that increases inthe unemployment rate have been associatedwith increased application and grant rates ofDSP, while Cai and Gregory (2005) further-more find that duration on unemployment ben-efits is an important determinant of subsequenttransition to DSP. The role of population age-ing in affecting inflows has also received atten-tion in Australia, two studies finding that it hasin fact played little role in the growth in DSP

Cai, Vu and Wilkins: Disability Support Pension Recipients 39
©
2007 The University of Melbourne, Melbourne Institute of Applied Economic and Social Research
inflows (Jackson 1999; Cai and Gregory2003).
Less numerous are studies of outflows,which have generally focused on either dura-tions of spells on disability benefits, or thedestinations of exits. International durationanalyses include Holmes and Lynch (1990) forthe United Kingdom and Rupp and Scott(1995) for the United States. Cai (2006) con-ducts a similar analysis to Holmes and Lynch(1990) using Australian administrative data. Interms of exit destination studies, Hennesseyand Dykacz (1989) use a random sample of so-cial security beneficiaries who were first enti-tled to disability benefits in 1972 in the UnitedStates and who were followed until 1981. Theyestimated that 11 per cent of this cohort wouldeventually leave the program due to return towork or recovery, 53 per cent would exit due toretirement at age 65 years and 36 per centwould exit due to death. Buddelmeyer (2001)models the labour supply behaviour of a cohortof disabled workers in the Netherlands andfinds that those who were younger and moreeducated were more likely to leave disabilitybenefits for work.
The only Australian study of exit destina-tions of disability benefit recipients is that byCai (2002). Using a 1 per cent sample of DSPrecipients who exited the benefit between July1998 and February 2000, and distinguishingfour destinations (Age Pension, employment,death and ‘other’), Cai found that those who re-turned to work were more likely than thosewho exited to the Age Pension to be youngwhen entering DSP, be male, have earned in-come while on DSP and be multiple-spell re-cipients. He also found those who exited forother reasons were likewise more likely thanthose who exited to the Age Pension to beyoung when entering DSP, be male and bemultiple-spell recipients, but were nonethelessdifferent from those who returned to work inmost other characteristics. The current studybuilds on Cai (2002) by examining a substan-tially larger sample and longer time-frame, byinvestigating the determinants of exit desti-nation in greater depth (including modelling
failure
to exit DSP), and by additionally con-sidering the issue of the extent to which exit is
sustained. Our analysis is further distinguishedby the adoption of sample selection rules thatexclude transitions to the Age Pension, on thebasis that such transitions are simply a deter-ministic function of age.
3. Data
The data used comprise payment records of a50 per cent random sample of persons who re-ceived DSP in the period January 1995 to No-vember 2002. For each individual in thesample, a payment record is generated forevery fortnight in which that individual re-ceived an income support payment in the pe-riod. Information included with each paymentrecord includes sex, date of birth, postcode ofresidence, partner status, number of dependentchildren, age of youngest dependent child,earnings, other non-welfare (unearned) in-come, partner income, payment type, paymententitlement and, depending on the paymenttype, potentially other information (such as ac-tivity type for Newstart Allowance recipients).From May 1998, we also have available themain medical condition and, for those whosepayments were cancelled or suspended, thereason for the cancellation or suspension.
4
For the purposes of this study, we define a
spell on payments to have ended only if there isa break in payments of seven or more fort-nights. This is a high threshold, but is moti-vated by our view that shorter payment breakscould not sensibly be viewed as true exits, es-pecially in the context of the long average du-ration of spells on DSP. One particular benefitof the seven-fortnight rule is that it makes it rel-atively unlikely that we will treat as spellbreaks any periods off payments caused by ad-ministrative factors that do not reflect actualmovements off payments.
5
Exits from DSP can arise for a number of
reasons, and it is valuable to distinguish thesereasons given our interest in exits that representa movement towards increased self-reliance.Up until May 1998, exit ‘destinations’ that canbe distinguished comprise transfers to other in-come support payments (which can be furtherdistinguished by payment type), exit due todeath and other (non-transfer non-death) exits.

40 The Australian Economic Review March 2007
©
2007 The University of Melbourne, Melbourne Institute of Applied Economic and Social Research
Clearly, it is the last type of exit in which weare interested. From May 1998, the administra-tive dataset notionally contains cancellationand suspension reasons for all completed in-come support spells, permitting further disag-gregation of non-transfer non-death exits.There are approximately 60 distinct reasonsthat apply to DSP recipients, which we aggre-gate into three groups which reflect pertinentdistinctions from the perspective of our analy-sis: ‘return to work’, ‘other positive exit’ and‘other exit’. As the label suggests, a return towork exit occurs when an individual ceasesDSP due to take-up of employment. Althoughthe label implies the individual is returning to ajob previously held, it in fact applies to any in-dividual exiting DSP due to take-up of employ-
ment. The ‘other positive exit’ group consistsof reasons such as exceeding income or assetstests, improvements in health, voluntary with-drawal and receipt of a compensation pay-out.As our label for this group reveals, we viewthese as ‘positive’ reasons for exit, but ones wethink important to distinguish from a move into(substantive) employment. The remainder ofexit types we interpret as largely not for posi-tive reasons, primarily comprising failures tocomply with administrative requirements.
6
We begin our analysis of exits from DSP by
describing the number and nature of all exitsfrom DSP that occur in the full sample period,before moving on to present results whenadopting the entry cohort and exit cohort ap-proaches. Table 1 presents the destination
Table 1 Destination Composition of Exits from DSP, by Year of Exit, 1995–2002
All exits
a
(per cent)Non-transfer non-death exits
a
(per cent)
Number of exits
Total number
of spells
b
Transferto Age
Pension(1)
Transferto other payment
(2)Death
(3)
Non-transfer
non-death exit(4)
Return to work(5)
Other positive
exits(6)
Other exits(7)
Males
1995 57.8 1.1 22.2 18.9 17898 181180
1996 59.5 1.0 20.8 18.7 18219 188190
1997 53.3 1.8 21.3 23.6 18137 192579
1998 51.3 4.3 20.5 23.9
34.9 30.2 34.9
18577 198355
1999 50.1 2.6 19.7 27.6
39.3 25.9 34.9
19426 204750
2000 51.1 2.4 19.0 27.5
44.7 17.3 38.0
19194 209164
2001 50.0 2.1 18.7 29.2
39.5 19.2 41.4
19796 215299
2002 55.5 2.1 20.2 22.1
46.3 17.3 36.4
16488 218338
All years 53.5 2.2 20.3 24.1
41.2 21.2 37.4
147735 344654
Females
1995 30.0 2.7 28.6 38.8 3950 78763
1996 45.5 1.5 20.8 32.1 5856 88153
1997 31.4 4.8 26.1 37.7 5114 96145
1998 49.1 5.6 18.4 26.9
26.4 43.3 30.4
7577 105404
1999 39.3 4.9 21.5 34.3
30.6 35.7 33.7
7037 113503
2000 56.0 3.4 16.0 24.7
33.3 28.9 37.7
9326 121269
2001 40.1 4.1 21.0 34.9
32.0 27.5 40.5
7334 129179
2002 59.2 3.8 17.6 19.4
37.3 26.6 36.2
8594 136106
All years 46.0 3.9 20.3 29.8
32.2 31.4 36.5
54788 186400
Notes
: (a) Columns (1) to (4) sum to 100 and columns (5) to (7) sum to 100.(b) Total number of DSP spells in progress at some stage of the relevant period.
Cai, Vu and Wilkins: Disability Support Pension Recipients 41
©
2007 The University of Melbourne, Melbourne Institute of Applied Economic and Social Research
composition of exits from DSP in each yearover the period 1995 to 2002. The table showsthat around half of DSP exits are transfers tothe Age Pension, while 20 per cent are exitsdue to death and about one-quarter are otherexits from DSP that do not involve transferringto other income support payments (which werefer to as ‘non-transfer non-death’ exits).
An important feature of DSP receipt evidentfrom Table 1 is that non-transfer non-deathexits from DSP are not common. For example,the sample estimates imply that fewer than40000 male DSP spells were completed in2001 (recalling that we have a 50 per cent sam-ple), of which fewer than 12000 were non-transfer non-death exits. This constitutes asmall proportion of the 431000 male DSPspells that were in progress at some stage ofthat year. The number of exits in each year in-creases over the sample period (excluding2002, for which only exits up until November2002 are available), but this may simply be aproduct of growth in the number receiving DSPover the period.
In many respects, the low rate of non-transfernon-death exit is to be expected. Disabilities, bytheir nature, tend to be long term and thereforethe conditions leading to entry to DSP in thefirst place are likely to be highly persistent overtime. Furthermore, in recent years the incometest applied to DSP recipients has meant few arelikely to be rendered ineligible by excessiveearnings if working less than 30 hours per week(the working-time threshold beyond which anindividual would be deemed ineligible for DSPdue to insufficient work incapacity). For exam-ple, in the last quarter of 2002, a single personwith no dependent children would need to haveearned in excess of $31000 per annum to be in-eligible for DSP on the grounds of exceedingmaximum allowable income.
Non-transfer non-death exits (column (4) ofTable 1) can in general be regarded as reflect-ing a move to increased self-reliance, whereasother exit destinations cannot. However, thedegree to which this is in fact the case will de-pend on the exit reason or destination and theextent to which the exits are sustained. Col-umns (5) to (7) of Table 1 present the composi-tion of non-transfer non-death exits in terms of
three destinations from May 1998. Amongnon-transfer non-death exits, approximately 60per cent are known to be for reasons that couldbe regarded as ‘positive’—returning to work,exceeding allowable income or assets, im-proved health or voluntary withdrawal. Exitsdue to take-up of employment alone accountfor approximately 40 per cent of non-transfernon-death exits for males and for 32 per cent ofthese exits for females. Between 1998 and2002, the exit destination composition of thesenon-transitional exits changes significantlyfrom year to year. While somewhat volatile, ageneral trend apparent is an increase in the pro-portion of non-transitional exits due to return towork.
4. Entry Cohort Analysis
An entry cohort approach involves followingeach individual who commenced a DSP spellin a particular period until the spell ends, oruntil a pre-specified spell duration is reached(for example, three years). We define the desti-nation of a completed (uncensored) DSP spellto be the first destination following the spellend. Table 2 provides some descriptive infor-mation on DSP spell destinations of the 1995 to2000 entry cohort.
7
The destinations distin-guished are the same as for Table 1, but here weexamine the proportion of the spells in thisentry cohort ending at each destination, byelapsed duration.
Panel A presents the proportion exiting DSPwithin pre-specified periods of commencementof the spell, distinguishing between the samefour destinations as in columns (1) to (4) ofTable 1. The first column shows that, withinone year of commencement, 2.2 per cent ofmale spells and 1.5 per cent of female spellsended via a transfer to the Age Pension, 0.3 percent of male spells and 0.2 per cent of femalespells ended via a transfer to another incomesupport payment, 4 per cent of male spells and3.1 per cent of female spells ended due to therecipient’s death, and 6.1 per cent of malespells and 4.3 per cent of female spells endeddue to a non-transfer non-death exit. Within sixyears of spell commencement (last column ofTable 2), 18.7 per cent of male recipients and

42 The Australian Economic Review March 2007
©
2007 The University of Melbourne, Melbourne Institute of Applied Economic and Social Research
14.1 per cent of female recipients transferredfrom DSP to the Age Pension, 1.2 per cent ofmale recipients and 1.6 per cent of female re-cipients transferred to another income supportpayment, 9.9 per cent of male recipients and7.5 per cent of female recipients died, and 14.6per cent of male recipients and 13 per cent offemale recipients exited all income supportpayments.
Comparisons across the columns of Panel Aindicate that the rate of exit from all paymentsis decreasing in spell duration. For example,6.1 per cent of male DSP recipients exited all
payments in the first year following spell com-mencement, compared with 3.6 per cent in thesecond year, 2.4 per cent in the third year and1.4 per cent in the fourth year.
8
Thus, if a ‘suc-cessful’ exit from DSP is to occur (defined as anon-death transition off all payments), it is ingeneral going to happen quite quickly afterspell commencement. This is prima facie evi-dence of negative duration dependence for non-transfer non-death exits. Of course, the extentto which this derives from a ‘lock-in’ effect,whereby increased time on DSP itself makesexit more difficult, as opposed to systematic
Table 2 Proportion Exiting to Each Destination, by Spell Duration
(per cent)
Spell duration
≤
1 year
≤
2 years
≤
3 years
≤
4 years
≤
5 years
≤
6 years
A. Persons who commenced a DSP spell in the period 1995 to 2000
a
Males
Age pension 2.2 5.2 8.2 11.3 14.9 18.7
Other payment 0.3 0.4 0.9 1.0 1.0 1.2
Death 4.0 5.7 6.9 7.9 9.0 9.9
Non-transfer non-death exit 6.1 9.7 12.1 13.5 14.2 14.6
Still on DSP 87.5 79.0 72.0 66.3 61.0 55.5
Females
Age pension 1.5 4.0 6.5 9.4 11.9 14.1
Other payment 0.2 0.4 1.0 1.1 1.2 1.6
Death 3.1 4.5 5.4 6.3 7.0 7.5
Non-transfer non-death exit 4.3 7.2 9.4 11.0 12.0 13.0
Still on DSP 90.9 83.9 77.7 72.2 67.9 63.8
B. Disaggregation of non-transfer non-death exits—Persons who commenced a DSP spell in the period June 1998 to May 1999
Males
Return to work 2.8 4.6 5.7
Other positive exits 2.1 2.8 3.2
Other exits 1.9 3.3 4.6
Total 6.8 10.7 13.5
Females
Return to work 1.4 2.4 3.1
Other positive exits 1.9 2.6 3.2
Other exits 1.4 2.4 3.5
Total 4.7 7.4 9.8
Note
: (a) Only persons who can potentially be observed for a greater spell duration than indicated by the column headingare included. For example, only those commencing prior to December 1996 were used to estimate the proportion exitingwithin six years of spell commencement (last column).
Cai, Vu and Wilkins: Disability Support Pension Recipients 43
©
2007 The University of Melbourne, Melbourne Institute of Applied Economic and Social Research
differences in the characteristics of DSP recip-ients by duration of receipt, cannot be resolvedby examination of Table 2 alone.
Panel B of Table 2 examines exit reasons ofnon-transfer non-death exits in the three yearsfollowing spell commencement for personswho commenced a DSP spell between June1998 and May 1999. It reports the proportionof spells commenced in this period exiting foreach of the three groups of reasons described inSection 3, with the cumulative proportions re-ported at one year, two years and three yearsafter spell commencement. For example, 2.8per cent of males who commenced a spell onDSP between June 1998 and May 1999 exitedwith a cancellation or suspension reason of‘return to work’ within one year of com-mencement. Within three years of spell com-mencement, 5.7 per cent of males had exitedwith this cancellation or suspension reason.
Return to work accounts for 42 per cent ofthe male non-transfer non-death exits thatoccur within three years of spell commence-ment, and 32 per cent of the female non-transfer non-death exits. A further 24 per centof male and 33 per cent of female non-transfernon-death exits can be characterised as ‘posi-tive’. These shares are relatively stable irre-spective of the spell duration window, beingroughly the same for spells ending within oneyear as for all spells ending within three years.They are also similar to the shares identified forall non-transfer non-death exits in Table 1,which is further indication that the relativelikelihood of exiting to each of these three ‘des-tinations’ is reasonably invariant with respectto spell duration.
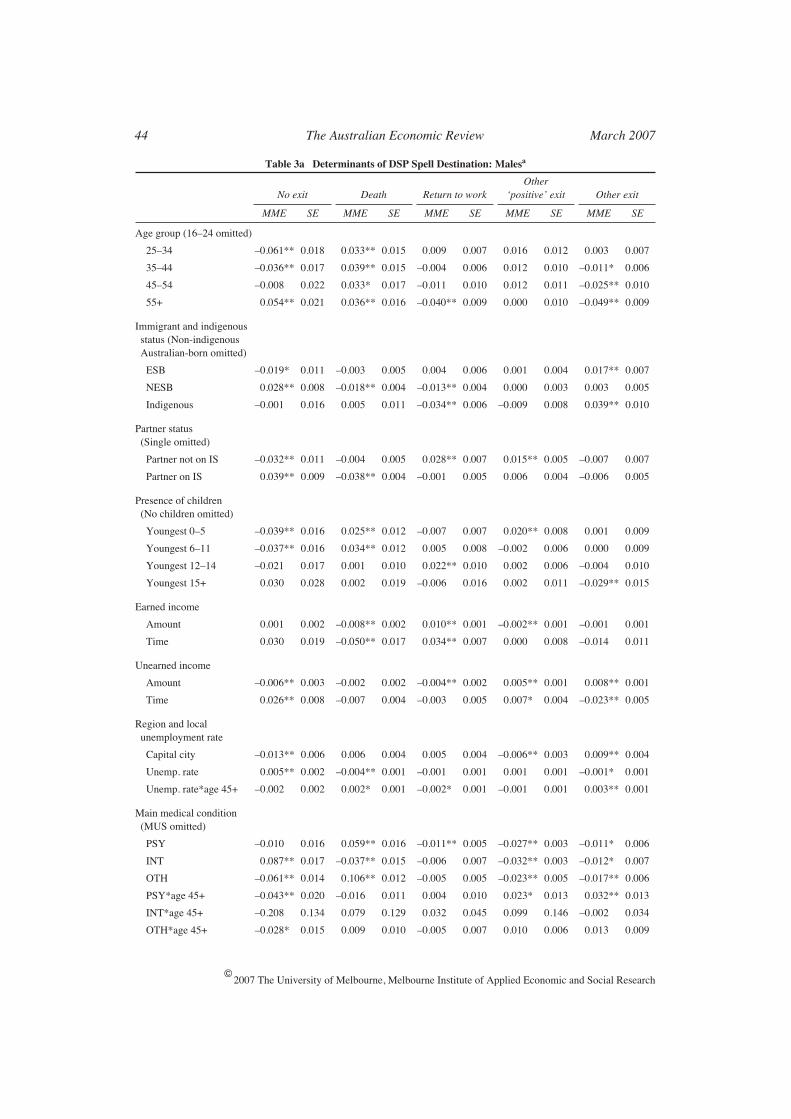
The entry cohort analysis involves estima-tion of multinomial logit models of the proba-bility of each of several DSP spell destinationsoccurring within three years of commencing aspell on DSP. Five destinations are distin-guished: return to work, other ‘positive’ exit,other exit, no exit, and death. The definitionsfor the first three categories are the same as inTables 1 and 2, while the no exit category com-prises those still on DSP and those who hadtransferred to other income support payments.There are in fact very few transfers to otherpayments in our sample, because we eliminate
the possibility of transitions to the Age Pen-sion. This restriction is achieved by includingonly persons below the qualification age for theAge Pension for the entire three-year window.Thus, the maximum age at DSP spell com-mencement is 62 years for males and 58.5years for females.
9
The choice of the three-year observation
window for examining exit destinations is theoutcome of a trade-off between maximising thenumber of spells in our sample and maximisingthe observation window. With a three-yearwindow, we can examine spells commencingbetween May 1998 and August 1999. Spellscommencing earlier will not have completeexit reason data, while the three-year destina-tion will not be known for all spells commenc-ing later.
10
We in fact restrict our sample toDSP spells commenced in the period June 1998to May 1999. Consequently, each calendarmonth is represented in the sample only once,thereby eliminating effects of seasonal varia-tion in the composition of DSP inflows. Notethat, while the exclusion of spells commencingprior to June 1998 is not ideal, this restrictiondoes have the benefit of providing us with overthree years of income support payment history(from 1995 onwards) for each sample member.
Explanatory variables (full details on whichare provided in the Appendix) are included forage, immigrant indigenous status, partner sta-tus and income support receipt, presence of de-pendent children, earned and unearned income,location of residence, the local unemploymentrate, main medical condition, income supportpayment history and housing circumstances.With the exception of income, all time-varyingvariables are evaluated at commencement ofthe DSP spell to eliminate endogeneity thatcould result from evaluation after commence-ment of the spell. For example, one alternativeis to evaluate variables in the last fortnight theindividual is observed on payments, but if vari-ables are affected by duration on DSP they willbe endogenous with respect to spell destina-tion.
For income, we distinguish between labourmarket income and other personal (non-welfare) income on the basis that they po-tentially have different implications for exit
44 The Australian Economic Review March 2007
©
2007 The University of Melbourne, Melbourne Institute of Applied Economic and Social Research
Table 3a Determinants of DSP Spell Destination: Males
a
No exit Death Return to workOther
‘positive’ exit Other exit
MME SE MME SE MME SE MME SE MME SE
Age group (16–24 omitted)
25–34 –0.061** 0.018 0.033** 0.015 0.009 0.007 0.016 0.012 0.003 0.007
35–44 –0.036** 0.017 0.039** 0.015 –0.004 0.006 0.012 0.010 –0.011* 0.006
45–54 –0.008 0.022 0.033* 0.017 –0.011 0.010 0.012 0.011 –0.025** 0.010
55+ 0.054** 0.021 0.036** 0.016 –0.040** 0.009 0.000 0.010 –0.049** 0.009
Immigrant and indigenous status (Non-indigenous Australian-born omitted)
ESB –0.019* 0.011 –0.003 0.005 0.004 0.006 0.001 0.004 0.017** 0.007
NESB 0.028** 0.008 –0.018** 0.004 –0.013** 0.004 0.000 0.003 0.003 0.005
Indigenous –0.001 0.016 0.005 0.011 –0.034** 0.006 –0.009 0.008 0.039** 0.010
Partner status (Single omitted)
Partner not on IS –0.032** 0.011 –0.004 0.005 0.028** 0.007 0.015** 0.005 –0.007 0.007
Partner on IS 0.039** 0.009 –0.038** 0.004 –0.001 0.005 0.006 0.004 –0.006 0.005
Presence of children (No children omitted)
Youngest 0–5 –0.039** 0.016 0.025** 0.012 –0.007 0.007 0.020** 0.008 0.001 0.009
Youngest 6–11 –0.037** 0.016 0.034** 0.012 0.005 0.008 –0.002 0.006 0.000 0.009
Youngest 12–14 –0.021 0.017 0.001 0.010 0.022** 0.010 0.002 0.006 –0.004 0.010
Youngest 15+ 0.030 0.028 0.002 0.019 –0.006 0.016 0.002 0.011 –0.029** 0.015
Earned income
Amount 0.001 0.002 –0.008** 0.002 0.010** 0.001 –0.002** 0.001 –0.001 0.001
Time 0.030 0.019 –0.050** 0.017 0.034** 0.007 0.000 0.008 –0.014 0.011
Unearned income
Amount –0.006** 0.003 –0.002 0.002 –0.004** 0.002 0.005** 0.001 0.008** 0.001
Time 0.026** 0.008 –0.007 0.004 –0.003 0.005 0.007* 0.004 –0.023** 0.005
Region and local unemployment rate
Capital city –0.013** 0.006 0.006 0.004 0.005 0.004 –0.006** 0.003 0.009** 0.004
Unemp. rate 0.005** 0.002 –0.004** 0.001 –0.001 0.001 0.001 0.001 –0.001* 0.001
Unemp. rate*age 45+ –0.002 0.002 0.002* 0.001 –0.002* 0.001 –0.001 0.001 0.003** 0.001
Main medical condition (MUS omitted)
PSY –0.010 0.016 0.059** 0.016 –0.011** 0.005 –0.027** 0.003 –0.011* 0.006
INT 0.087** 0.017 –0.037** 0.015 –0.006 0.007 –0.032** 0.003 –0.012* 0.007
OTH –0.061** 0.014 0.106** 0.012 –0.005 0.005 –0.023** 0.005 –0.017** 0.006
PSY*age 45+ –0.043** 0.020 –0.016 0.011 0.004 0.010 0.023* 0.013 0.032** 0.013
INT*age 45+ –0.208 0.134 0.079 0.129 0.032 0.045 0.099 0.146 –0.002 0.034
OTH*age 45+ –0.028* 0.015 0.009 0.010 –0.005 0.007 0.010 0.006 0.013 0.009
Cai, Vu and Wilkins: Disability Support Pension Recipients 45
©
2007 The University of Melbourne, Melbourne Institute of Applied Economic and Social Research
Table 3a Continued
a
No exit Death Return to workOther
‘positive’ exit Other exit
MME SE MME SE MME SE MME SE MME SE
Spell origin (Outside IS omitted)
Unemployment 0.157** 0.009 –0.032** 0.006 –0.062** 0.005 –0.015** 0.004 –0.048** 0.005
Other IS payment 0.104** 0.014 –0.019** 0.009 –0.042** 0.006 –0.018** 0.005 –0.024** 0.009
Past IS receipt (TTO = 0 omitted)
TTO: 1–50% –0.190** 0.017 0.008 0.010 0.068** 0.010 0.022** 0.008 0.092** 0.014
TTO: 50–99% –0.137** 0.017 –0.022** 0.008 0.066** 0.010 –0.007 0.006 0.100** 0.015
TTO: 100% –0.012 0.019 –0.015 0.011 –0.001 0.010 –0.022** 0.005 0.050** 0.015
TTO: 1–50%*age 45+ 0.045** 0.015 –0.002 0.010 0.003 0.009 –0.019** 0.005 –0.026** 0.007
TTO: 50–99%*age 45+ 0.030* 0.016 0.005 0.012 0.009 0.010 –0.006 0.007 –0.037** 0.007
TTO: 100%*age 45+ 0.016 0.021 0.025 0.015 –0.002 0.016 –0.017** 0.008 –0.021** 0.009
Number of observations 20375
Log likelihood –14424.0
Pseudo R
2
0.144
Notes
: (a) Estimates are multinomial logit mean marginal effects on the probability of each spell destination. The samplecomprises persons who commenced a DSP spell in the period June 1998 to May 1999. Specification includes controls forhousing status and state of residence. MME denotes mean marginal effect; SE denotes standard error of the estimate, derivedfrom 400 bootstrap samples. * and ** indicate significance at the 10 per cent and 5 per cent levels, respectively. See theAppendix for an explanation of the variables.
behaviour. In general, one might expect non-welfare income that does not affect paymententitlement (because it is sufficiently low) toreduce labour supply and hence reduce thelikelihood of exit from payments. However,unlike other income, earnings are an indicatorof successful labour market participation, andmay therefore be associated with increasedprospects of exit. Two variables are employedfor each of these two types of income: (i) theproportion of time in the spell that the recipienthad income; and (ii) mean income evaluatedover those fortnights in the spell in which it ispositive. By construction, these variables neednot be systematically related to DSP spell dura-tion, which therefore reduces their potential tobe endogenous with respect to exit behaviour.
A strength of the administrative data is thecomprehensive nature of the information on re-ceipt of income support payments. One of theuses to which we put this information is to ex-plore the effects associated with income sup-port payment history prior to DSP spellcommencement. Two sets of variables for pay-
ment receipt in the three and a half years lead-ing up to the DSP spell are included in ourreported specification. The first set captures theextent of reliance on income support payments,comprising four dummy variables for the pro-portion of ‘Total Time On’ income supportpayments (TTO) (see Gottschalk and Moffitt1994): 0, 1–50 per cent, 50–99 per cent and 100per cent. The second set comprises threedummy variables for the origin of the indi-vidual immediately prior to DSP spell com-mencement: not on income support, onunemployment benefits, and on other incomesupport payment.
We allow for differential effects by age forthe variables for the local unemployment rate,main medical condition and pre-DSP TTO byinteracting them with a dummy variable equalto one if the individual was aged over 45 yearsat spell commencement. While in principle allage dummy variables could be interacted withall other variables, we settled on distinguishingbetween those under the age of 45 and thoseover the age of 45 on the basis that this should

46 The Australian Economic Review March 2007
©
2007 The University of Melbourne, Melbourne Institute of Applied Economic and Social Research
Table 3b Determinants of DSP Spell Destination: Females
a
No exit Death Return to workOther
‘positive’ exit Other exit
MME SE MME SE MME SE MME SE MME SE
Age group (16–24 omitted)
25–34 –0.083** 0.027 0.034* 0.019 –0.005 0.005 0.039* 0.023 0.015 0.010
35–44 –0.059** 0.023 0.049** 0.018 –0.011** 0.005 0.027 0.017 –0.006 0.008
45–54 –0.037 0.027 0.080** 0.022 –0.018** 0.008 0.004 0.014 –0.029** 0.012
55+ –0.012 0.029 0.076** 0.027 –0.022** 0.006 –0.007 0.013 –0.035** 0.009
Immigrant and indigenous status (Non-indigenous Australian-born omitted)
ESB –0.040** 0.013 0.004 0.007 0.009 0.006 0.003 0.006 0.024** 0.009
NESB 0.022** 0.009 –0.012** 0.005 –0.013** 0.004 –0.002 0.004 0.005 0.006
Indigenous –0.015 0.018 0.001 0.010 –0.013** 0.006 0.005 0.011 0.022* 0.011
Partner status (Single omitted)
Partner not on IS –0.010 0.010 0.007 0.006 –0.010** 0.005 0.015** 0.006 –0.003 0.006
Partner on IS 0.032** 0.009 –0.022** 0.005 –0.011** 0.005 0.005 0.005 –0.005 0.006
Presence of children (No children omitted)
Youngest 0–5 0.021 0.018 –0.005 0.011 –0.025** 0.004 –0.003 0.007 0.012 0.011
Youngest 6–11 0.000 0.016 0.013 0.010 –0.025** 0.004 –0.005 0.007 0.017 0.010
Youngest 12–14 0.011 0.015 –0.014* 0.007 –0.008 0.006 0.009 0.008 0.002 0.010
Youngest 15+ 0.017 0.020 –0.010 0.011 –0.015** 0.008 0.025* 0.014 –0.017* 0.010
Earned income
Amount 0.005 0.003 –0.009** 0.003 0.007** 0.001 –0.004** 0.002 0.002 0.001
Time –0.032* 0.018 –0.015 0.015 0.018** 0.005 0.011 0.009 0.018** 0.009
Unearned income
Amount –0.011** 0.005 0.003 0.002 0.001 0.004 0.006** 0.001 0.002 0.003
Time 0.016* 0.009 –0.004 0.005 –0.002 0.004 0.001 0.004 –0.011** 0.006
Region and local unemployment rate
Capital city 0.000 0.007 –0.004 0.004 0.005 0.003 0.001 0.003 –0.003 0.004
Unemp. rate 0.003* 0.002 –0.002** 0.001 –0.001 0.001 0.000 0.001 0.000 0.001
Unemp. rate*age 45+ 0.001 0.002 0.000 0.001 0.000 0.001 0.000 0.001 0.000 0.001
Main medical condition (MUS omitted)
PSY –0.007 0.024 0.044* 0.024 –0.006 0.005 –0.021** 0.005 –0.011* 0.006
INT 0.076** 0.030 0.014 0.029 –0.024** 0.004 –0.030** 0.003 –0.036** 0.005
OTH –0.065** 0.020 0.109** 0.019 –0.004 0.005 –0.025** 0.006 –0.015** 0.006
PSY*age 45+ –0.025 0.023 –0.031** 0.011 0.014 0.013 0.023 0.015 0.020 0.014
INT*age 45+ 0.010 0.097 0.005 0.069 –0.032** 0.001 –0.032** 0.014 0.050 0.080
OTH*age 45+ –0.026 0.019 –0.007 0.014 0.010 0.010 0.019* 0.010 0.004 0.010
Cai, Vu and Wilkins: Disability Support Pension Recipients 47
©
2007 The University of Melbourne, Melbourne Institute of Applied Economic and Social Research
capture in a parsimonious manner any age de-pendence in the effects of other characteris-tics.
11
Mean marginal effects estimates, evaluated
over all observations in the sample, are re-ported in Table 3a and Table 3b. Althoughmean marginal effects sum to zero across thefive outcomes, estimates are reported for allfive outcomes for the purposes of statistical in-ference (since standard errors for the omittedoutcome cannot be inferred from the estimatesfor the other outcomes). Our primary interest isin the effects of characteristics on the probabil-ity of return to work and other positive exits,and so our discussion correspondingly focuseson the third and fourth set of data columns.Models are estimated separately for males andfemales to allow for differences in the determi-nants of three-year destinations of DSP spells.However, it turns out that, although there areimportant differences, there are many similari-ties in the results for males and females; conse-quently, we discuss the results for males andfemales concurrently.
Considering first age, the point estimatesimply that, for both males and females, returnto work within three years of spell commence-ment is less likely the older the recipient. How-ever, for males, most of the differences by ageare not statistically significant, with only thoseaged over 55 years having an estimated meanmarginal effect significantly lower than that ofthe ‘aged 16–24 years’ reference group. Theprobability of other positive exit does not sig-nificantly differ by age for males or females.Also notable is that, beyond age 25, the olderthe DSP recipient at entry, the more likely he orshe is to remain on DSP for the entire three-year period (first column). Persons aged 16–24years at entry to DSP have a higher probabilityof remaining on income support than all olderpersons except those aged over 55 years at en-try, which is likely to reflect differences in thenature of the disabilities of young entrants (thatare not captured by ‘main medical condition’).For example, a number of persons in this agegroup will have severe disabilities acquired atbirth.
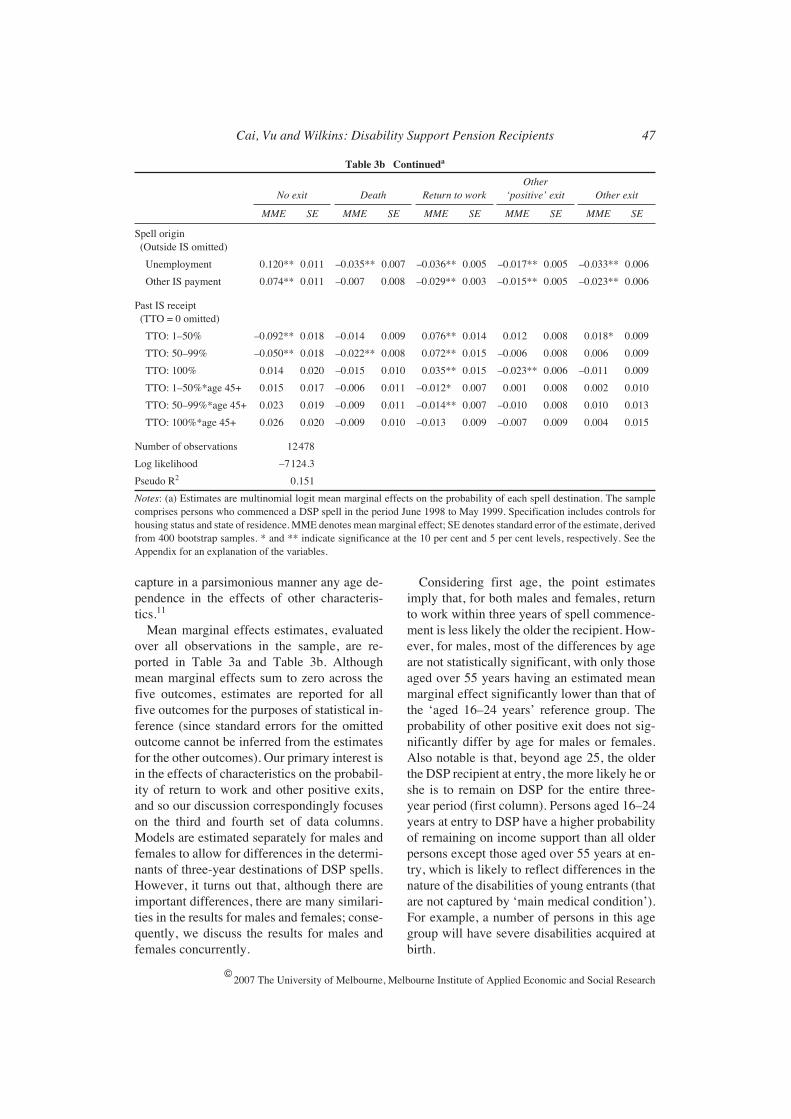
Table 3b Continued
a
No exit Death Return to workOther
‘positive’ exit Other exit
MME SE MME SE MME SE MME SE MME SE
Spell origin (Outside IS omitted)
Unemployment 0.120** 0.011 –0.035** 0.007 –0.036** 0.005 –0.017** 0.005 –0.033** 0.006
Other IS payment 0.074** 0.011 –0.007 0.008 –0.029** 0.003 –0.015** 0.005 –0.023** 0.006
Past IS receipt (TTO = 0 omitted)
TTO: 1–50% –0.092** 0.018 –0.014 0.009 0.076** 0.014 0.012 0.008 0.018* 0.009
TTO: 50–99% –0.050** 0.018 –0.022** 0.008 0.072** 0.015 –0.006 0.008 0.006 0.009
TTO: 100% 0.014 0.020 –0.015 0.010 0.035** 0.015 –0.023** 0.006 –0.011 0.009
TTO: 1–50%*age 45+ 0.015 0.017 –0.006 0.011 –0.012* 0.007 0.001 0.008 0.002 0.010
TTO: 50–99%*age 45+ 0.023 0.019 –0.009 0.011 –0.014** 0.007 –0.010 0.008 0.010 0.013
TTO: 100%*age 45+ 0.026 0.020 –0.009 0.010 –0.013 0.009 –0.007 0.009 0.004 0.015
Number of observations 12478
Log likelihood –7124.3
Pseudo R
2
0.151
Notes
: (a) Estimates are multinomial logit mean marginal effects on the probability of each spell destination. The samplecomprises persons who commenced a DSP spell in the period June 1998 to May 1999. Specification includes controls forhousing status and state of residence. MME denotes mean marginal effect; SE denotes standard error of the estimate, derivedfrom 400 bootstrap samples. * and ** indicate significance at the 10 per cent and 5 per cent levels, respectively. See theAppendix for an explanation of the variables.
48 The Australian Economic Review March 2007
©
2007 The University of Melbourne, Melbourne Institute of Applied Economic and Social Research
The variables for immigrant and indigenousstatus indicate a positive impact on theprobability of return to work of being eithernon-indigenous Australian-born or English-speaking background foreign-born. No signifi-cant differences in the probability of otherpositive exit exist for the immigrant and indig-enous status variables.
Partner status and partner income support re-ceipt are associated with different effects onthe likelihood of return to work for males andfemales. For females, being single is associatedwith a higher probability of return to workcompared with being partnered, whether or notthe partner is on income support. For males, bycontrast, being partnered with a non-recipientis associated with a higher probability of returnto work than being partnered with an incomesupport recipient or being single. This differ-ence by partner income support status might re-flect higher disincentives for working when apartner is on income support, because of its ef-fects on the partner’s income support pay-ments. The absence of this differential bypartner income support status for females mayderive from social norms with respect to labourforce participation for women in couple fami-lies.
Also significant to note with respect to part-ner status is that, for both males and females,having a partner who is on income support onaverage increases the probability of not exitingDSP. In particular, compared with having apartner who is not on income support, having apartner on income support on average increasesthe probability of remaining on DSP for the en-tire three-year period by 0.04 for females andby 0.07 for males. As with the finding with re-spect to return to work for males, this is consis-tent with reduced incentives to exit forrecipients whose partner is also on income sup-port. However, it could also derive from unob-served characteristics correlated with partnerstatus.
The presence of young dependent children isassociated with an increased probability of exitfrom DSP for males. However, this largelyarises via an increased probability of death, im-plying it is driven by a selection effect: maleswith young children who enter DSP are rela-
tively more likely to have a terminal illness.For females, having dependent children is as-sociated with a decreased probability of returnto work. On average, the presence of dependentchildren, the youngest of whom is below sec-ondary school age, decreases a female’s proba-bility of return to work within three years ofDSP spell commencement by approximately0.03. This likely reflects associated caring re-sponsibilities acting to decrease labour supply(see, for example, Kalb 2002). Having ayoungest dependent child aged 15 or older isalso associated with a decreased probability ofreturn to work within three years of spell com-mencement, which is less easily explained. Se-lection effects are likely to be at least part of theexplanation. For example, entry to DSP formany of these females is likely to be triggeredby loss of eligibility for Parenting Paymentsdue to the youngest child reaching 16 years ofage, and it may be that such females tend tohave lower skills than other female entrants toDSP.
As suggested by the estimated effects of thepartner status variables, income from sourcesother than own income support payments islikely to impact on DSP spell destination.Earned income has the potential to be particu-larly important, not so much because of the in-come it delivers per se, but rather because itsfrequency and level are proximate measures ofwork capacity and the level of engagement withthe labour market of the individual while re-ceiving DSP. The estimates obtained bear thisout, with both the earned income variables hav-ing statistically significant effects on the returnto work probability of both males and females.However, neither of these effects is large in aneconomic sense. A $100 increase in mean fort-nightly earnings in those fortnights in whichearnings were positive is associated with an in-crease in the probability of return to work ofonly 0.01 for males and 0.007 for females. Sim-ilarly, an increase in the proportion of the spellthat an individual has earnings from zero to 100per cent increases the probability of return towork by 0.034 for males and 0.018 for females.
Importantly, greater earnings do not signifi-cantly impact on the probability of staying onDSP for the entire three-year period. It might
Cai, Vu and Wilkins: Disability Support Pension Recipients 49
©
2007 The University of Melbourne, Melbourne Institute of Applied Economic and Social Research
have been expected that the increased probabil-ity of return to work would have been associ-ated with a reduced probability of non-exit.However, the increased probability of return towork in fact comes about largely via a lowerprobability of death. This suggests that some ofthe effect we are capturing for the earningsvariables is in fact a health effect rather than a‘labour market engagement’ effect. That is,healthier recipients, as measured by risk ofdeath, are more likely to work while on DSP.
Unearned income is associated with quitedifferent effects to earned income. Only formales is there a discernible impact on the like-lihood of return to work, which is that in-creased unearned income marginally
decreases
the probability of return to work. Unearned in-come does, however, increase the probabilityof ‘other positive’ exits for both males and fe-males, which may be connected with partnerearnings and income and assets payment eligi-bility criteria. Interestingly, increased timewith unearned income increases the likelihoodof remaining on DSP for the entire three yearsfollowing spell commencement, whereas in-creased mean unearned income decreases thislikelihood. The former effect may reflect a neg-ative labour supply effect of unearned income,while the latter result possibly reflects greaterrisk of failing the income test—that is, thehigher is unearned income, the more likely it isto subsequently increase beyond the allowablelimit. The latter result may also in part reflect alower opportunity cost of exiting DSP: un-earned income will cause a reduction in bene-fits payable once the ‘free area’ is exceeded,implying the loss of benefits from exiting DSPis lower the higher is unearned income.
Variables for the location of residence atcommencement of the spell comprise a capitalcity dummy, state dummies and the local un-employment rate. Residing in a capital city isnot associated with any significant effects forfemales, but for males it does have a significantnegative effect on the probability of ‘other pos-itive exit’. We use the unemployment rate inthe individual’s Australian Bureau of Statistics(ABS) labour force statistical region (of whichthere are 63; for details see ABS 2002) to proxyfor labour demand conditions faced by the in-
dividual. Estimates imply that labour demandconditions impact on the probability of remain-ing on DSP for males, each percentage pointincrease in the local unemployment rate on av-erage increasing the probability of remainingon DSP for the entire window by 0.005 formales and 0.003 for females. This does nottranslate into a significantly lower probabilityof return to work; rather, it largely reflects a re-duced likelihood of death within three years ofspell commencement. This may in turn reflectthe fact that adverse labour market conditionsincrease inflows of ‘healthier’ persons. That is,a higher unemployment rate may reduce em-ployment prospects for a wider spectrum ofpersons with disabilities and lead to an in-creased inflow to DSP of persons with less se-vere disabilities (where severity is measured byrisk of death).
The specification reported in Table 3a andTable 3b allows the effect of the local unem-ployment rate to differ between recipientsunder 45 years of age and recipients over 45years of age. For males, significant (but small)differences do exist between the two agegroups. In particular, there is a weak significantnegative effect on the likelihood of return towork associated with an increased local unem-ployment rate for males aged over 45 years,which is not present for males under 45 yearsof age.
The nature and severity of the disability ex-perienced by the DSP recipient are likely to bevery important to three-year spell destination.While the administrative dataset does not con-tain information on disability severity, it doescontain information on the type of the disabil-ity as captured by the data item ‘main medicalcondition’. We use this information to generatefour dummy variables: musculoskeletal andconnective tissue (MUS), psychological andpsychiatric (PSY), intellectual and learning(INT), and other (OTH). Point estimates implythat, for persons under 45 years of age, ‘returnto work’, ‘other positive exit’ and ‘other exit’are more likely if the individual has a muscu-loskeletal condition, although for return towork the difference from other main medicalconditions is mostly not statistically signifi-cant. Also notable for females in the under-45
50 The Australian Economic Review March 2007
©
2007 The University of Melbourne, Melbourne Institute of Applied Economic and Social Research
age group is that intellectual disability is asso-ciated with a significantly lower probability ofreturn to work than the other medical condi-tions. ‘Other’ medical conditions are associ-ated with the highest likelihood of death withinthree years of spell commencement, whilemusculoskeletal conditions are associated withthe lowest likelihood of death.
Interactions between the medical conditiondummies and the age dummy variable indicateseveral differences between younger and olderpersons in the effects associated with medicalcondition, although these differ between malesand females. For males, psychological and psy-chiatric conditions are associated with an in-creased probability of ‘other exit’ for thoseover 45, which is not apparent for males under45; and the negative effect of such conditionson the probability of ‘other positive exit’ com-pared with musculoskeletal conditions that isevident for males under 45 is not evident formales over 45. ‘Other’ medical conditions arealso associated with a greater increase in prob-ability of exit from DSP (first column) for oldermales compared with younger males. For fe-males, intellectual or learning conditions havea larger negative mean impact on probabilitiesof return to work and other positive exit forthose over the age of 45. In addition, the in-creased probability of death associated withpsychological or psychiatric conditions for fe-males under 45 does not hold for females over45.
Recent income support history is captured bytwo sets of variables: three dummy variablesfor spell origin and four dummy variables forthe proportion of the three years precedingDSP spell commencement on income support(TTO). The estimates for these variables implysubstantial effects on spell destination associ-ated with both spell origin and time spent on in-come support prior to DSP entry.
In terms of spell origin, compared with entryto DSP from outside the income support sys-tem, transferral from unemployment paymentson average decreases the probability of returnto work substantially—by 0.06 for males andby 0.04 for females. Transferral from other in-come support payments is likewise associatedwith a (smaller) negative impact on probability
of return to work when compared with entryfrom outside the income support system.Transferral to DSP from income support pay-ments (whether or not unemployment pay-ments) also decreases the probability of otherpositive exit. Perhaps most telling is that, rela-tive to originating from outside the incomesupport system, transferring from unemploy-ment payments on average increases the prob-ability of staying on DSP for the entire three-year period following spell commencement by0.16 for males and 0.12 for females. The corre-sponding figures for transferral from other in-come support payments are 0.1 and 0.07.
A recent history of income support receipt isassociated with an increased probability of re-turn to work, and a decreased probability of re-maining on DSP for the entire three-yearperiod, provided the period was not entirelyspent on income support—and provided the in-dividual did not transfer directly from anotherincome support payment. For example, focus-ing on persons under 45 years of age, comparedwith no recent history of income support re-ceipt, the mean effect of
some
receipt in thethree-year period prior to spell commencementis to increase the probability of return to workby approximately 0.07, and to decrease theprobability of remaining on DSP for the entirethree-year period by at least 0.14 for males andby at least 0.05 for females. On the surface, thisappears to be a somewhat odd result—that ahistory of income support receipt increases thelikelihood of returning to work compared withno history. It appears to reflect a relatively highdegree of churning behaviour (that is, cyclingon and off payments) by individuals who exitDSP due to return to work, the reasons forwhich are unclear.
In terms of differences in effects of recent in-come support receipt by age, the main findingis that positive effects on the likelihood of exitassociated with recent history of income sup-port receipt are less pronounced for older recip-ients. For example, the estimates imply that ahistory of some income support receipt de-creases the probability of remaining on pay-ments for the entire three years by at least 0.11for males aged over 45 (compared with 0.13 forunder-45s) and by at least 0.03 for females
Cai, Vu and Wilkins: Disability Support Pension Recipients 51
©
2007 The University of Melbourne, Melbourne Institute of Applied Economic and Social Research
aged over 45 (compared with 0.05 for under-45s). For males, this derives from lower proba-bilities of other positive exits and other exits,while for females it derives from a lowerreturn-to-work probability.
5. Exit Cohort Analysis
Our exit cohort analysis involves followingDSP recipients for a pre-specified period fol-lowing exit from DSP. Our interest is in the ex-tent to which the transition off DSP issustained, which naturally limits our focus tonon-transfer non-death exits. The reason forexcluding transfers to other income supportpayments is that we are primarily interested inthe predictors of exit off
all
income supportpayments.
Analogous to the entry cohort analysis, weexamine the June 1998 to May 1999 exit co-hort, employ a three-year observation windowand exclude those whose age at exit was above62 years for males and above 58.5 years for fe-males. The ‘dual’ nature of the entry cohort andexit cohort analyses is achieved by further re-stricting the exit cohort sample to persons exit-ing a DSP spell of duration no greater thanthree years. Thus, while for the most part theexit cohort sample comprises different individ-uals to the entry cohort sample, we are in es-sence examining the same individuals as werefound in the entry cohort analysis to make anon-transfer non-death exit.
12
Of course, co-hort differences and changes over time in eco-nomic conditions, government policy and otherfactors mean that inferences from the exit co-hort analysis may not actually hold for theentry cohort members who subsequently exit.
We use the ‘proportion of time off incomesupport payments’ (PTO) in the three-year pe-riod following exit from DSP as our measure ofexit success. This measure provides an aggre-gate summary measure of the extent to which aperson who exits DSP is reliant on income sup-port in the subsequent period.
13
We estimatelinear models of three-year PTO, thereby in-vestigating the question ‘given exit, what arethe predictors of more successful exit?’, wherean exit is defined to be more successful thegreater is the PTO in the three years following
initial exit.
14
Implicit is the assumption that aperson not on income support is in some sense‘self-reliant’, an assumption that will usuallybe correct, but which will in some cases be in-correct—for example, because a person diedsubsequent to exiting DSP.
Most of the explanatory variables employedfor the exit cohort model are the same as thoseemployed for the entry cohort analysis—namely the variables for age, immigrant and in-digenous status, partner status, presence ofchildren, earned and unearned income, locationof residence, the local unemployment rate,main medical condition, DSP spell origin andhousing status. Note, however, that character-istics evaluated at the point of spell commence-ment for the entry cohort analysis are evaluatedat the point of exit for the exit cohort analysis.The income variables are also somewhat differ-ent in nature in the exit cohort model: becausethey are defined in the same way as for theentry cohort analysis, they capture recent his-tory of income receipt, as opposed to the con-temporaneous information they represent forthe entry cohort analysis.
Similar to the variables for recent history ofincome support receipt included in the entrycohort analysis, we include variables for in-come support receipt in the three years preced-ing exit. These comprise a set of dummyvariables for the proportion of time on incomesupport in the three-year period (1–50 per cent,50–75 per cent, 75–99 per cent and 100 percent) and an indicator variable equal to one ifthe number of spells on income support in theperiod exceeds one. We furthermore explicitlyinvestigate the implications of exit reason forthe sustainability of exit by including dummyvariables for the three reasons distinguished inthe entry cohort analysis for non-transfer non-death exits: return to work, other positive exitand other exit. One of the criteria for distin-guishing between these three exit destinationsin the entry cohort analysis was that they arelikely to correspond to different degrees of exit‘success’. By establishing whether there are infact systematic differences in sustainability ofexit across these exit destinations, inclusion ofthese variables in the exit cohort model there-fore provides direct information on this front.
52 The Australian Economic Review March 2007
©
2007 The University of Melbourne, Melbourne Institute of Applied Economic and Social Research
As with the entry-cohort econometric analy-sis, we investigate the dependence of the ef-fects of characteristics on the age of theindividual by interacting variables with an‘aged over 45’ dummy variable. Age interac-tions were tried with the variables for income,the local unemployment rate, main medicalcondition, DSP spell origin, the proportion oftime on income support in the three years pre-ceding exit, the multiple-spell indicator andcancellation or suspension reason. However,our reported specification only contains inter-actions with the main medical condition andcancellation or suspension reason variables,since all of the coefficient estimates for interac-tions with the other variables were not statisti-cally significant, implying no age dependencefor these characteristics.
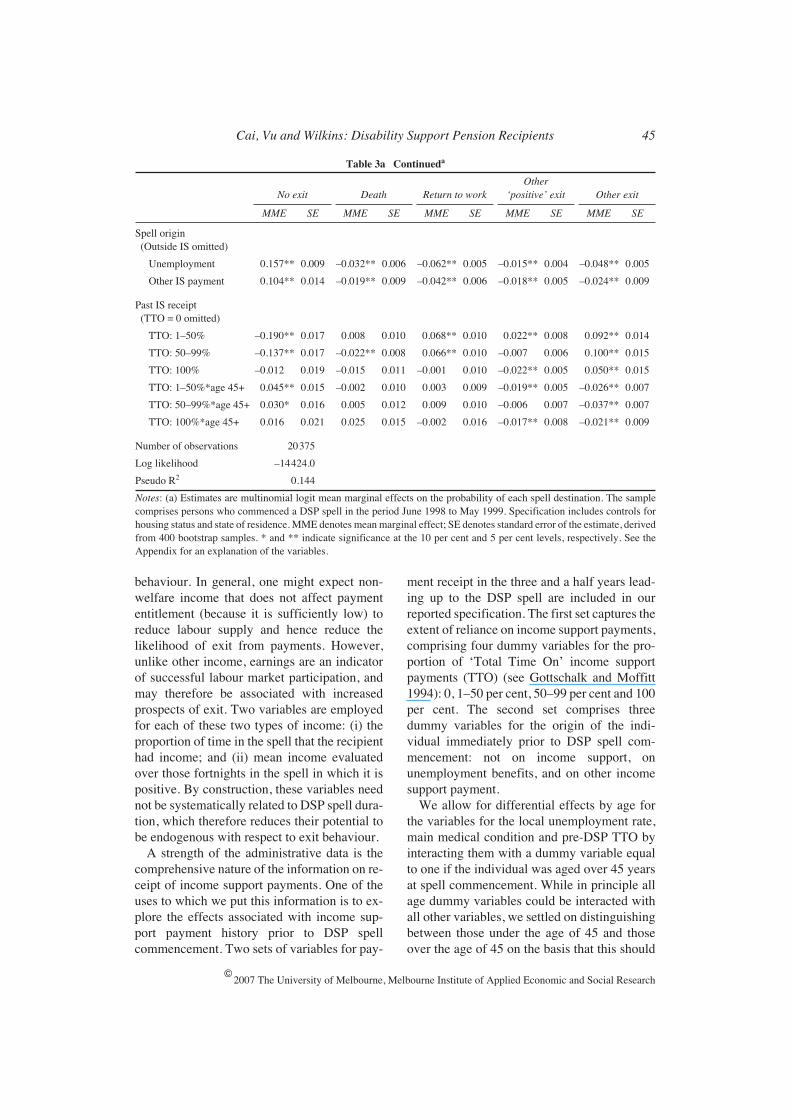
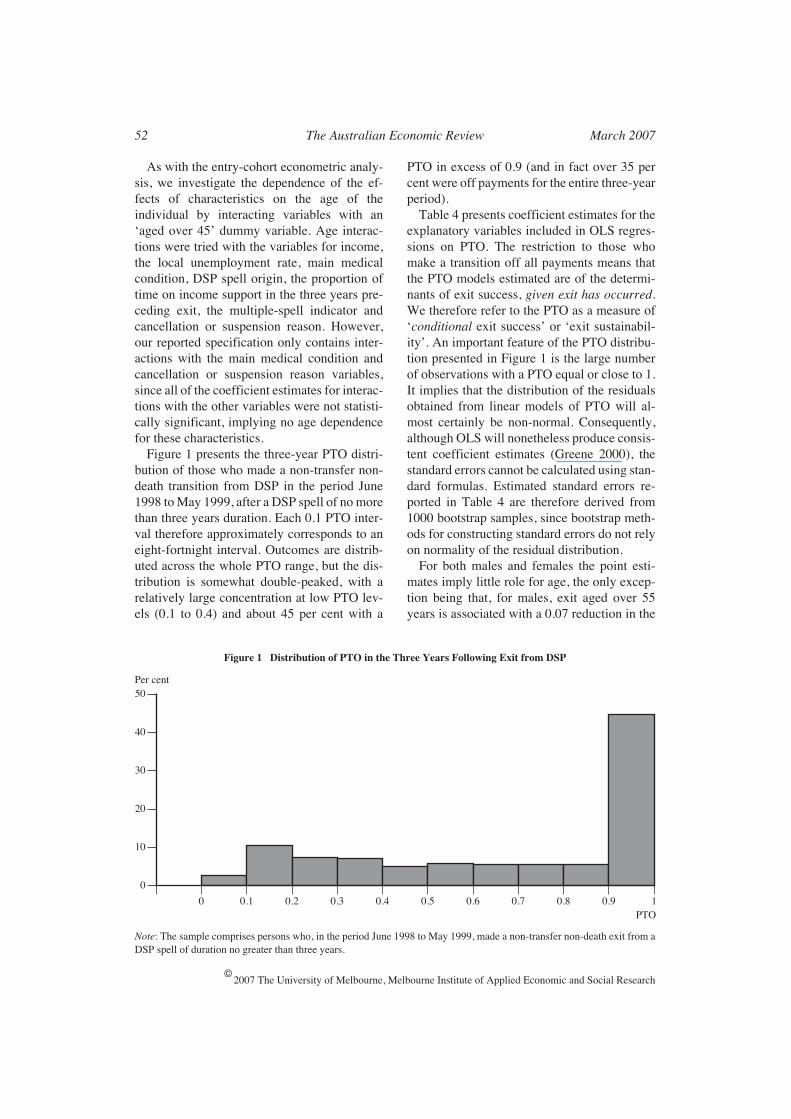
Figure 1 presents the three-year PTO distri-bution of those who made a non-transfer non-death transition from DSP in the period June1998 to May 1999, after a DSP spell of no morethan three years duration. Each 0.1 PTO inter-val therefore approximately corresponds to aneight-fortnight interval. Outcomes are distrib-uted across the whole PTO range, but the dis-tribution is somewhat double-peaked, with arelatively large concentration at low PTO lev-els (0.1 to 0.4) and about 45 per cent with a
PTO in excess of 0.9 (and in fact over 35 percent were off payments for the entire three-yearperiod).
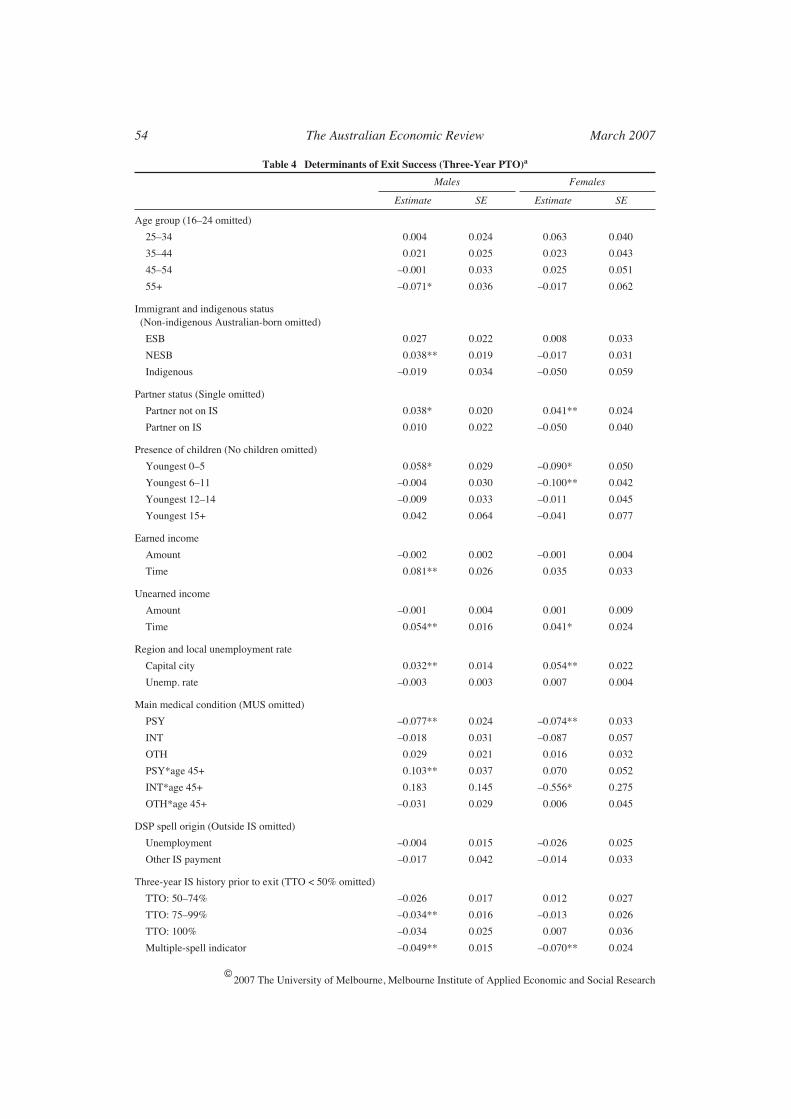
Table 4 presents coefficient estimates for theexplanatory variables included in OLS regres-sions on PTO. The restriction to those whomake a transition off all payments means thatthe PTO models estimated are of the determi-nants of exit success,
given exit has occurred
.We therefore refer to the PTO as a measure of‘
conditional
exit success’ or ‘exit sustainabil-ity’. An important feature of the PTO distribu-tion presented in Figure 1 is the large numberof observations with a PTO equal or close to 1.It implies that the distribution of the residualsobtained from linear models of PTO will al-most certainly be non-normal. Consequently,although OLS will nonetheless produce consis-tent coefficient estimates (Greene 2000), thestandard errors cannot be calculated using stan-dard formulas. Estimated standard errors re-ported in Table 4 are therefore derived from1000 bootstrap samples, since bootstrap meth-ods for constructing standard errors do not relyon normality of the residual distribution.
For both males and females the point esti-mates imply little role for age, the only excep-tion being that, for males, exit aged over 55years is associated with a 0.07 reduction in the
0 0.1 0.2 0.3 0.4 0.5 0.6 0.7 0.8 0.9 1
0
10
20
30
40
50
Figure 1 Distribution of PTO in the Three Years Following Exit from DSP
Note
: The sample comprises persons who, in the period June 1998 to May 1999, made a non-transfer non-death exit from aDSP spell of duration no greater than three years.
PTO
Per cent
Cai, Vu and Wilkins: Disability Support Pension Recipients 53
©
2007 The University of Melbourne, Melbourne Institute of Applied Economic and Social Research
predicted PTO. Immigrant and indigenous sta-tus are similarly associated with few effects onPTO. A significant positive effect associatedwith NESB immigrant status is evident formales, but all other coefficient estimates arenot significantly different from zero. Having apartner is associated with a 0.04 increase inPTO compared with being single, for bothmales and females, but only if that partner wasnot on income support at the time of exit fromDSP. Indeed, for partnered females, the pre-dicted PTO is lower than for single females ifthe partner was on income support. Consistentwith effects on the likelihood of exit from DSP,young dependent children decrease the pre-dicted PTO for females. For males, a depen-dent child under 5 years of age acts to increasethe three-year PTO.
With respect to earned and unearned income,the striking finding for males is that PTO is in-creasing in the proportion of the DSP spell inwhich the individual had income. All elseequal, a male with earned income in every fort-night of the DSP spell has a predicted PTO thatis 0.08 higher than a male who did not haveearned income in any fortnight of the DSPspell. Similarly, a male with unearned incomein every fortnight of the DSP spell has a pre-dicted PTO that is 0.05 higher than a male whodid not have unearned income in any fortnight.The larger size of the coefficient estimate forearned income is likely to derive from a labourmarket engagement effect that does not operatefor unearned income. Positive effects of theproportion of the spell with income are also ev-ident for females, but the statistical signifi-cance of the estimates is weak. Significantly,the level of income, whether earned or un-earned, does not appear to matter, with none ofthe variables for their mean values having asignificant impact.
The local unemployment rate is not associ-ated with any discernible impact on conditionalexit success, but residing in a capital city is as-sociated with a sizeable positive effect, in-creasing the predicted PTO by 0.03 for malesand by 0.05 for females. The main medicalcondition coefficient estimates show that, forpersons under 45 years of age, those with psy-chological or psychiatric conditions have the
lowest conditional exit success, all else equal.For persons over 45 years of age, effects asso-ciated with psychological or psychiatric condi-tions are not significantly different from effectsassociated with musculoskeletal conditions(the omitted category).
In contrast to the finding of the entry cohortanalysis that transferral from unemploymentbenefits acts to reduce the likelihood of exitfrom DSP, it has no (direct) implications forthe extent to which exit is sustained in the eventthat exit does occur. For males, however, thetotal amount of time spent on income supportin the three years leading up to exit does seemto matter, with the predicted PTO lower formales who spent more than half the three-yearperiod on income support. For both males andfemales, the predicted PTO is also lower, allelse equal, if the individual had more than oneincome support spell in the three-year periodpreceding exit—that is, if the individual is a re-cent churner. It follows that conditional exitsuccess is greatest for persons who have a sin-gle short DSP spell with no prior time on in-come support. Interestingly, a person with twoor more short spells prior to exit will, all othercharacteristics held constant, have a lower pre-dicted PTO than a person with a single longspell prior to exit, even if that spell had a dura-tion as long as three years. It therefore seemsthat past churning is particularly detrimental tosustaining exit, or reflective of characteristicsparticularly detrimental to sustained exit.
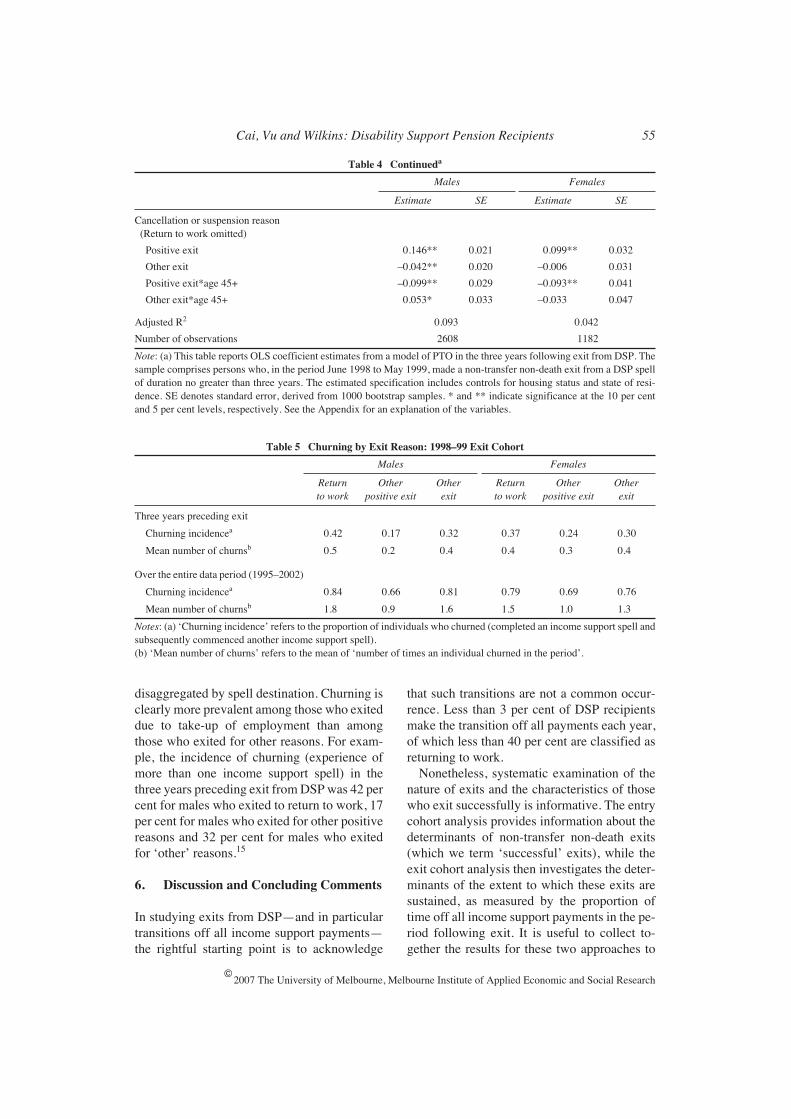
Cancellation reason variables show that, forpersons under 45 years of age, those making‘other positive’ exits have the greatest condi-tional exit success and those making ‘other’(negative) exits have the lowest conditionalexit success. It is significant that ‘other posi-tive’ exits are associated with a higher PTOthan return to work exits, since it suggests thatmany persons who exit to return to work havedifficulty in maintaining employment over theintermediate term. The indications are that per-sons who exit due to take-up of employmentare relatively more likely to ‘churn’.
Table 5 provides support for this contention.It presents, for the exit cohort, information onchurning in the three years leading up to exitand over the period 1995 to 2002 as a whole,
54 The Australian Economic Review March 2007
©
2007 The University of Melbourne, Melbourne Institute of Applied Economic and Social Research
Table 4 Determinants of Exit Success (Three-Year PTO)
a
Males Females
Estimate SE Estimate SE
Age group (16–24 omitted)
25–34 0.004 0.024 0.063 0.040
35–44 0.021 0.025 0.023 0.043
45–54 –0.001 0.033 0.025 0.051
55+ –0.071* 0.036 –0.017 0.062
Immigrant and indigenous status (Non-indigenous Australian-born omitted)
ESB 0.027 0.022 0.008 0.033
NESB 0.038** 0.019 –0.017 0.031
Indigenous –0.019 0.034 –0.050 0.059
Partner status (Single omitted)
Partner not on IS 0.038* 0.020 0.041** 0.024
Partner on IS 0.010 0.022 –0.050 0.040
Presence of children (No children omitted)
Youngest 0–5 0.058* 0.029 –0.090* 0.050
Youngest 6–11 –0.004 0.030 –0.100** 0.042
Youngest 12–14 –0.009 0.033 –0.011 0.045
Youngest 15+ 0.042 0.064 –0.041 0.077
Earned income
Amount –0.002 0.002 –0.001 0.004
Time 0.081** 0.026 0.035 0.033
Unearned income
Amount –0.001 0.004 0.001 0.009
Time 0.054** 0.016 0.041* 0.024
Region and local unemployment rate
Capital city 0.032** 0.014 0.054** 0.022
Unemp. rate –0.003 0.003 0.007 0.004
Main medical condition (MUS omitted)
PSY –0.077** 0.024 –0.074** 0.033
INT –0.018 0.031 –0.087 0.057
OTH 0.029 0.021 0.016 0.032
PSY*age 45+ 0.103** 0.037 0.070 0.052
INT*age 45+ 0.183 0.145 –0.556* 0.275
OTH*age 45+ –0.031 0.029 0.006 0.045
DSP spell origin (Outside IS omitted)
Unemployment –0.004 0.015 –0.026 0.025
Other IS payment –0.017 0.042 –0.014 0.033
Three-year IS history prior to exit (TTO < 50% omitted)
TTO: 50–74% –0.026 0.017 0.012 0.027
TTO: 75–99% –0.034** 0.016 –0.013 0.026
TTO: 100% –0.034 0.025 0.007 0.036
Multiple-spell indicator –0.049** 0.015 –0.070** 0.024
Cai, Vu and Wilkins: Disability Support Pension Recipients 55
©
2007 The University of Melbourne, Melbourne Institute of Applied Economic and Social Research
disaggregated by spell destination. Churning isclearly more prevalent among those who exiteddue to take-up of employment than amongthose who exited for other reasons. For exam-ple, the incidence of churning (experience ofmore than one income support spell) in thethree years preceding exit from DSP was 42 percent for males who exited to return to work, 17per cent for males who exited for other positivereasons and 32 per cent for males who exitedfor ‘other’ reasons.
15
6. Discussion and Concluding Comments
In studying exits from DSP—and in particulartransitions off all income support payments—the rightful starting point is to acknowledge
that such transitions are not a common occur-rence. Less than 3 per cent of DSP recipientsmake the transition off all payments each year,of which less than 40 per cent are classified asreturning to work.
Nonetheless, systematic examination of thenature of exits and the characteristics of thosewho exit successfully is informative. The entrycohort analysis provides information about thedeterminants of non-transfer non-death exits(which we term ‘successful’ exits), while theexit cohort analysis then investigates the deter-minants of the extent to which these exits aresustained, as measured by the proportion oftime off all income support payments in the pe-riod following exit. It is useful to collect to-gether the results for these two approaches to
Table 4 Continued
a
Males Females
Estimate SE Estimate SE
Cancellation or suspension reason (Return to work omitted)
Positive exit 0.146** 0.021 0.099** 0.032
Other exit –0.042** 0.020 –0.006 0.031
Positive exit*age 45+ –0.099** 0.029 –0.093** 0.041
Other exit*age 45+ 0.053* 0.033 –0.033 0.047
Adjusted R
2
0.093 0.042
Number of observations 2608 1182
Note
: (a) This table reports OLS coefficient estimates from a model of PTO in the three years following exit from DSP. Thesample comprises persons who, in the period June 1998 to May 1999, made a non-transfer non-death exit from a DSP spellof duration no greater than three years. The estimated specification includes controls for housing status and state of resi-dence. SE denotes standard error, derived from 1000 bootstrap samples. * and ** indicate significance at the 10 per centand 5 per cent levels, respectively. See the Appendix for an explanation of the variables.
Table 5 Churning by Exit Reason: 1998–99 Exit Cohort
Males Females
Return to work
Other positive exit
Other exit
Return to work
Other positive exit
Other exit
Three years preceding exit
Churning incidence
a
0.42 0.17 0.32 0.37 0.24 0.30
Mean number of churns
b
0.5 0.2 0.4 0.4 0.3 0.4
Over the entire data period (1995–2002)
Churning incidence
a
0.84 0.66 0.81 0.79 0.69 0.76
Mean number of churns
b
1.8 0.9 1.6 1.5 1.0 1.3
Notes
: (a) ‘Churning incidence’ refers to the proportion of individuals who churned (completed an income support spell andsubsequently commenced another income support spell). (b) ‘Mean number of churns’ refers to the mean of ‘number of times an individual churned in the period’.

56 The Australian Economic Review March 2007
©
2007 The University of Melbourne, Melbourne Institute of Applied Economic and Social Research
consider the total impact on exit success ofcharacteristics common to both approaches.While the samples for the two sets of analysesdiffer, implying we should be cautious in ourinferences, our sample selection rules havebeen designed such that the exit cohort is es-sentially the group found to make a non-transfer non-death exit in the entry cohort an-alysis.
Combining the results of the entry cohort andexit cohort analyses in this manner indicatesthat persons with no earnings while on DSP,persons with a partner on income support, per-sons with a psychological or psychiatric dis-ability, indigenous persons, males aged over 55years and females with a dependent child under12 years of age have both the lowest probabili-ties of making a successful exit, and the leastsuccess in sustaining such exits when they domake them. Individuals with one or more ofthese characteristics are therefore compara-tively unlikely to make the transition to sus-tained non-reliance on income support.
While the variables for income support re-ceipt patterns in the period leading up to entryor exit are necessarily different for the entryand exit cohort approaches, the collective find-ings for these variables are also interesting.Those with a recent history of some incomesupport receipt prior to commencement of theDSP spell are more likely to exit than thosewith no history, provided they did not transferdirectly to DSP from another income supportpayment; but those with more time on pay-ments in the period leading up to exit from DSPdo not sustain exit as well. Furthermore, a re-cent history of churning prior to exit has a neg-ative effect on the extent to which exit issustained. The question then arises of how wereconcile these findings. The answer wouldseem to be found in the churning behaviour ofthose who exit to return to work—they aremore likely to exit, but are also more likely toreturn to payments. While the reasons for thispredisposition towards churning cannot be as-certained from our analysis, we note that thispattern is
consistent
with this group of recipi-ents having fluctuating earnings capacity, per-haps deriving from fluctuations in health orability to manage a disability.
A further significant finding from the entrycohort analysis is that individuals who transferto DSP from unemployment payments havevery low exit rates from DSP. Compared withentry to DSP from outside the income supportsystem, transferral from unemployment pay-ments decreases the probability of exit fromDSP by 0.16 for males and 0.12 for females.The clear implication is that failure to exit DSPis for many members of this group intimatelyconnected to difficulties in the labour marketthat are not just a function of disability. For ex-ample, evidence from other studies (Nickelland Bell 1995; Borland 2000; Wooden 2000)suggests demand for low-skill workers hasdeclined in recent years, and growth in DSPreceipt via transfers from unemployment pay-ments may be one manifestation of this.
What policy implications emerge from theabove findings? As indicated in the introduc-tion, the key policy concern at present appearsto be to reduce the extent of reliance on DSP,while still providing social support to those in-capable of maintaining sufficient employmentbecause of disability. In this context, severalconcrete policy implications are forthcoming.First, the findings obtained with respect to per-sons entering DSP from unemployment pay-ments suggest that particular policy attentionought to be focused on this group of DSP recip-ients. There is no apparent reason to believedisabilities experienced by this group of recip-ients are in general more prejudicial to employ-ment than those experienced by other DSPrecipients (and indeed there is possibly reasonto believe quite the reverse). The administra-tive dataset employed in this study does notpermit identification of the reasons for the ad-verse effects associated with transferral fromunemployment payments—and therefore theappropriate policy responses—but, as we sug-gest above, one suspects these reasons are con-nected to mismatches between skills of DSPrecipients and skills demanded in the labourmarket.
A second policy implication concerns thechurning behaviour of those who exit DSP toreturn to work. The relatively high probabilityof return to income support for this grouprepresents a prima facie case for additional
Cai, Vu and Wilkins: Disability Support Pension Recipients 57
©
2007 The University of Melbourne, Melbourne Institute of Applied Economic and Social Research
assistance when in employment in order to pro-mote
sustainability
of employment. Our studydoes not, however, provide specific informa-tion on the reasons why the rate of return topayments is so high for those who exit to returnto work —and it therefore provides little guid-ance on the particular steps that could assistthem in sustaining exit. Identifying the appro-priate policies in this regard requires the collec-tion of information on experiences while offincome support payments, since this could beused to determine the roles played by variousfactors, such as unstable health, unstable em-ployment and the two-year limit on paymentsuspensions, in driving returns to DSP.
A third policy implication concerns our find-ing that earnings while on DSP are associatedwith a higher probability of exit, and more sus-tained exit when it occurs. While earnings arelikely to be correlated with the work capacityof an individual that is permitted by his or herhealth, this result nonetheless suggests that pol-icies which promote employment of DSP re-cipients while on DSP may have beneficialeffects on rates of sustained exit from incomesupport.
First version received August 2006;final version accepted October 2006 (Eds).
Appendix 1: Explanatory Variables
Table A1 presents a description of the explan-atory variables. Unless otherwise stated, vari-ables are evaluated at commencement of theDSP spell for the entry cohort analysis and atexit from DSP for the exit cohort analysis. Cat-egories in parentheses are the omitted dum-mies.
Endnotes
1. The income support payment for personswith disabilities was called the Invalid Pensionuntil November 1991, and has since beencalled the Disability Support Pension.
2. We use the term ‘sustained exit’ as short-hand for ‘exit followed by a sustained periodoff all income support payments’.
3. Arguably, a movement from a full rate to apartial rate of payment by a DSP recipient alsorepresents a move towards increased self-reliance. However, our focus in this study is on‘clean breaks’ from DSP receipt, partly be-cause of the difficulty in identifying all partial-rate recipients in the dataset, but also becausepolicy debate has largely focused on the num-ber of recipients, rather than the level of pay-ments being received.
4. The dataset was provided by the AustralianGovernment Department of Families, Commu-nity Services and Indigenous Affairs, whichinitiated and partially funded this study. Mostof the information on recipient characteristicsin the dataset is likely to be accurate because itis used to determine payment eligibility andpayment levels, such that program administra-tors make considerable efforts to verify the in-formation. However, it is possible that non-welfare income is under-reported, since theability of administrators to verify some formsof income (such as ‘cash economy’ earnings) islimited.
5. The seven-fortnight break is also consistentwith the required payment break under the
So-cial Security Act
1991
(section 38B) for a no-tional continuous payment spell to be deemedended when the spell is in excess of 12 monthsduration at the end of the break in payments.Specifically, section 38B defines a continuouspayment spell to be a period on income supportin which the maximum break in payments is sixweeks in the first 39 weeks of the spell and 13weeks thereafter. In practice, our results werenot very sensitive to the adoption of a shorter(three-fortnight) minimum break requirement.
6. See Cai, Vu and Wilkins (2006) for detailson the administrative cancellation and suspen-sion reasons assigned to each of these three cat-egories.
7. Our requirement of a seven-fortnight breakin payments before a new spell can be deemedto have commenced means that the earliest dateof spell commencement in our sample is 22April 1995.
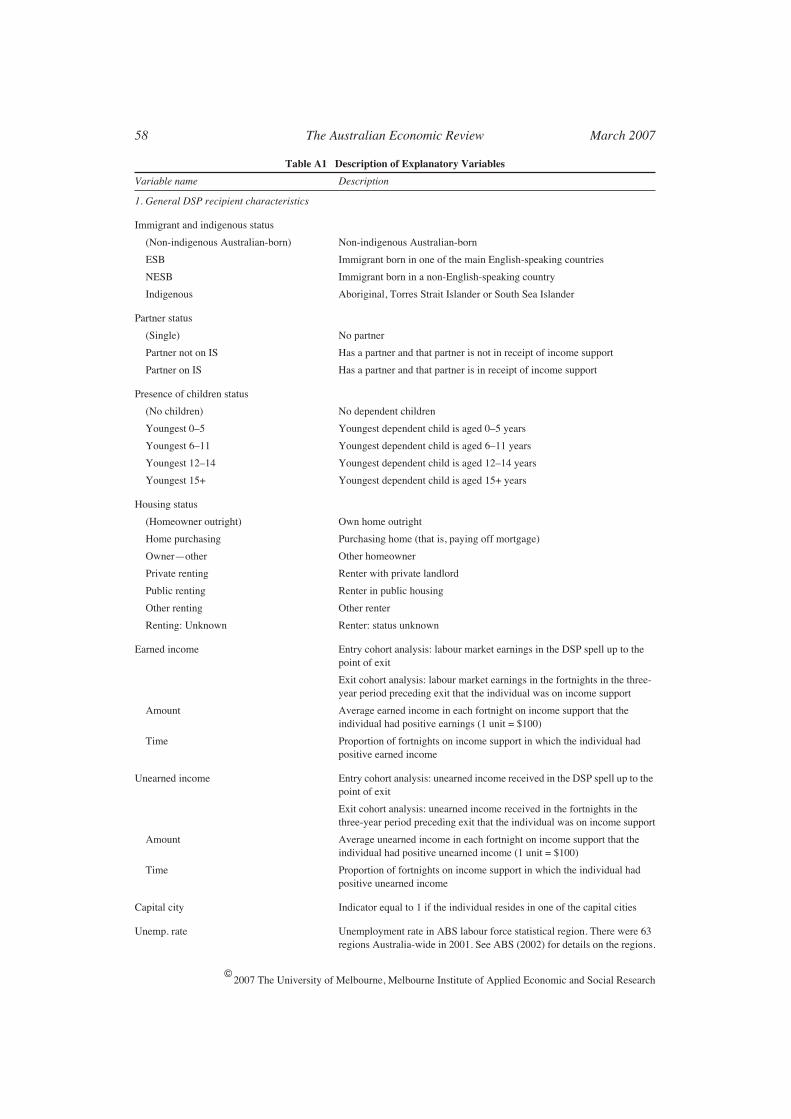
58 The Australian Economic Review March 2007
©
2007 The University of Melbourne, Melbourne Institute of Applied Economic and Social Research
Table A1 Description of Explanatory Variables
Variable name Description
1. General DSP recipient characteristics
Immigrant and indigenous status
(Non-indigenous Australian-born) Non-indigenous Australian-born
ESB Immigrant born in one of the main English-speaking countries
NESB Immigrant born in a non-English-speaking country
Indigenous Aboriginal, Torres Strait Islander or South Sea Islander
Partner status
(Single) No partner
Partner not on IS Has a partner and that partner is not in receipt of income support
Partner on IS Has a partner and that partner is in receipt of income support
Presence of children status
(No children) No dependent children
Youngest 0–5 Youngest dependent child is aged 0–5 years
Youngest 6–11 Youngest dependent child is aged 6–11 years
Youngest 12–14 Youngest dependent child is aged 12–14 years
Youngest 15+ Youngest dependent child is aged 15+ years
Housing status
(Homeowner outright) Own home outright
Home purchasing Purchasing home (that is, paying off mortgage)
Owner—other Other homeowner
Private renting Renter with private landlord
Public renting Renter in public housing
Other renting Other renter
Renting: Unknown Renter: status unknown
Earned income Entry cohort analysis: labour market earnings in the DSP spell up to the point of exit
Exit cohort analysis: labour market earnings in the fortnights in the three-year period preceding exit that the individual was on income support
Amount Average earned income in each fortnight on income support that the individual had positive earnings (1 unit = $100)
Time Proportion of fortnights on income support in which the individual had positive earned income
Unearned income Entry cohort analysis: unearned income received in the DSP spell up to the point of exit
Exit cohort analysis: unearned income received in the fortnights in the three-year period preceding exit that the individual was on income support
Amount Average unearned income in each fortnight on income support that the individual had positive unearned income (1 unit = $100)
Time Proportion of fortnights on income support in which the individual had positive unearned income
Capital city Indicator equal to 1 if the individual resides in one of the capital cities
Unemp. rate Unemployment rate in ABS labour force statistical region. There were 63 regions Australia-wide in 2001. See ABS (2002) for details on the regions.
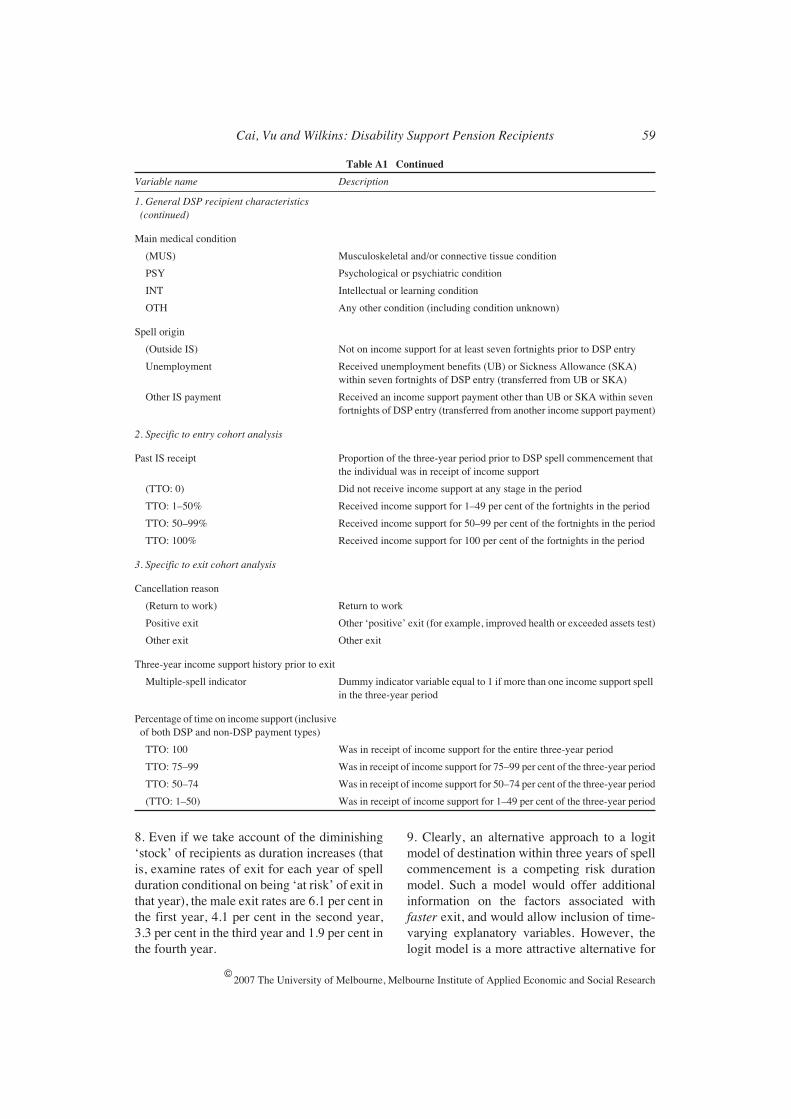
Cai, Vu and Wilkins: Disability Support Pension Recipients 59
©
2007 The University of Melbourne, Melbourne Institute of Applied Economic and Social Research
8. Even if we take account of the diminishing‘stock’ of recipients as duration increases (thatis, examine rates of exit for each year of spellduration conditional on being ‘at risk’ of exit inthat year), the male exit rates are 6.1 per cent inthe first year, 4.1 per cent in the second year,3.3 per cent in the third year and 1.9 per cent inthe fourth year.
9. Clearly, an alternative approach to a logitmodel of destination within three years of spellcommencement is a competing risk durationmodel. Such a model would offer additionalinformation on the factors associated with
faster
exit, and would allow inclusion of time-varying explanatory variables. However, thelogit model is a more attractive alternative for
Table A1 Continued
Variable name Description
1. General DSP recipient characteristics (continued)
Main medical condition
(MUS) Musculoskeletal and/or connective tissue condition
PSY Psychological or psychiatric condition
INT Intellectual or learning condition
OTH Any other condition (including condition unknown)
Spell origin
(Outside IS) Not on income support for at least seven fortnights prior to DSP entry
Unemployment Received unemployment benefits (UB) or Sickness Allowance (SKA) within seven fortnights of DSP entry (transferred from UB or SKA)
Other IS payment Received an income support payment other than UB or SKA within seven fortnights of DSP entry (transferred from another income support payment)
2. Specific to entry cohort analysis
Past IS receipt Proportion of the three-year period prior to DSP spell commencement that the individual was in receipt of income support
(TTO: 0) Did not receive income support at any stage in the period
TTO: 1–50% Received income support for 1–49 per cent of the fortnights in the period
TTO: 50–99% Received income support for 50–99 per cent of the fortnights in the period
TTO: 100% Received income support for 100 per cent of the fortnights in the period
3. Specific to exit cohort analysis
Cancellation reason
(Return to work) Return to work
Positive exit Other ‘positive’ exit (for example, improved health or exceeded assets test)
Other exit Other exit
Three-year income support history prior to exit
Multiple-spell indicator Dummy indicator variable equal to 1 if more than one income support spell in the three-year period
Percentage of time on income support (inclusive of both DSP and non-DSP payment types)
TTO: 100 Was in receipt of income support for the entire three-year period
TTO: 75–99 Was in receipt of income support for 75–99 per cent of the three-year period
TTO: 50–74 Was in receipt of income support for 50–74 per cent of the three-year period
(TTO: 1–50) Was in receipt of income support for 1–49 per cent of the three-year period
60 The Australian Economic Review March 2007
©
2007 The University of Melbourne, Melbourne Institute of Applied Economic and Social Research
investigating the determinants of
whether
exitoccurs, particularly in the context of the verylow rates of exit and the need to model four dis-tinct exit destinations (five outcomes). None-theless, a limitation of our approach vis-à-vis aduration model is that we are unable to identifyeffects of within-spell changes in time-varyingcharacteristics (such as partner status) on exitbehaviour.
10. Our definition of exit (off payments for atleast seven consecutive fortnights) means thatwe require an observation window of threeyears plus seven fortnights, giving us the Au-gust 1999 cut-off.
11. We experimented with interactions be-tween the age dummy and the spell origin andincome variables, but the coefficient estimatesfor these interaction terms were all statisticallyinsignificant and so the reported specificationexcludes them.
12. Only persons who commenced a DSP spellin 1998–99 and exited that spell in 1998–99 ap-pear in both the entry cohort and exit cohortsamples.
13. One alternative measure to PTO would beto examine continuous duration off incomesupport following exit. We prefer PTO, since ashort duration off income support followed bya short income support spell and then perma-nent exit is preferable to an intermediate dura-tion off income support followed by permanentre-entry.
14. The potential exists for the linear model toproduce predictions of PTO outside the [0, 1]interval, suggesting that it might be preferableto employ a non-linear model that guaranteespredictions within the [0, 1] interval. However,estimates from a linear specification are con-siderably easier to interpret than estimates fromnon-linear models, and in practice this is not asignificant problem for the models we esti-mate. Only nine observations in the male sam-ple and one observation in the female samplehad a predicted PTO in excess of 1, and all pre-dicted values were between 0 and 1.002.
15. One might expect that churning reflects thenature of the disability, but we could not findany evidence of this in the administrative data.Among those who exited DSP due to take-up ofemployment, the medical condition profile ofchurners was almost identical to that of non-churners.
References
Australian Bureau of Statistics 2002,
Statisti-cal Geography, Volume 2, Census Geo-graphic Areas Australia 2001
, Cat. no.2905.0, ABS, Canberra.
Black, D., Daniel, K. and Sanders, S. 2002,‘The impact of economic conditions on par-ticipation in disability programs: Evidencefrom the coal boom and bust’,
AmericanEconomic Review
, vol. 92, no. 2, pp. 27–50.Borland, J. 2000, ‘Disaggregated models of un-
employment in Australia’, Melbourne Insti-tute of Applied Economic and SocialResearch Working Paper 16/00, Universityof Melbourne.
Bound, J. 1987, ‘The disincentive effects of theSocial Security Disability Insurance pro-gram’, PhD thesis, Harvard University.
Bound, J. and Burkhauser, R. V. 1999, ‘Eco-nomic analysis of transfer programs targetedon people with disabilities’, in
Handbook ofLabour Economics, vol. 3, eds O. Ashen-felter and D. Card, Elsevier Science, NewYork.
Buddelmeyer, H. 2001, ‘Re-employment dy-namics of disabled workers’, IZA Discus-sion Paper no. 269, Bonn.
Cai, L. 2002, ‘The dynamics of the DisabilitySupport Pension (DSP) recipients in Austra-lia’, PhD thesis, Australian National Univer-sity.
Cai, L. 2006, ‘An analysis of duration on theDisability Support Pension program’, Aus-tralian Economic Papers, vol. 45, pp. 106–26.
Cai, L. and Gregory, R. G. 2003, ‘Inflows, out-flows and the growth of the Disability Sup-port Pension (DSP) program’, AustralianSocial Policy, 2002–03, pp. 121–43.
Cai, L. and Gregory, R. G. 2004, ‘Labour mar-ket conditions, applications and grants of
Cai, Vu and Wilkins: Disability Support Pension Recipients 61
© 2007 The University of Melbourne, Melbourne Institute of Applied Economic and Social Research
Disability Support Pension in Australia’,Australian Journal of Labour Economics,vol. 7, pp. 375–94.
Cai, L. and Gregory, R. G. 2005, ‘Unemploy-ment duration and inflows onto the Disabil-ity Support Pension (DSP) program:Evidence from FaCS LDS data’, AustralianEconomic Review, vol. 38, pp. 233–52.
Cai, L., Vu, H. and Wilkins, R. 2006, ‘Disabil-ity Support Pension recipients: Who gets off(and stays off) payments?’, Melbourne Insti-tute of Applied Economic and Social Re-search Working Paper no. 18/06, Universityof Melbourne.
Department of Family and Community Ser-vices 2004, ‘Characteristics of DisabilitySupport Pension customers June 2003’,viewed October 2004, <http://www.facs.gov.au>.
Disney, R. and Webb, S. 1991, ‘Why are thereso many long term sick in Britain?’, Eco-nomic Journal, vol. 101, pp. 252–62.
Gottschalk, P. and Moffitt, R. 1994, ‘Welfaredependence: Concepts, measures andtrends’, American Economic Review, vol. 84,no. 2, pp. 38–42.
Greene, W. 2000, Econometric Analysis, Pren-tice Hall, New Jersey.
Halpern, J. 1979, ‘The Social Security Disabil-ity Insurance program: Reasons for itsgrowth and prospects for the future’, New En-gland Economic Review, vol. 79, pp. 30–48.
Halpern, J. and Hausman, J. A. 1986, ‘Choiceunder uncertainty: A model of applicationsfor the Social Security Disability Insuranceprogram’, Journal of Public Economics, vol.31, pp. 131–61.
Hennessey, J. C. and Dykacz, J. M. 1989, ‘Pro-jected outcomes and length of time in theDisability Insurance program’, Social Secu-rity Bulletin, vol. 52, no. 9, pp. 2–41.
Holmes, P. and Lynch, M. 1990, ‘An analysisof invalidity benefit claim durations for newmale claimants in 1977/1978’, Journal ofHealth Economics, vol. 8, pp. 71–83.
Jackson, N. 1999, ‘Understanding populationageing: A background’, Australian SocialPolicy, no. 1, pp. 203–23.
Kalb, G. 2002, ‘Estimation of labour supplymodels for four separate groups in the Aus-
tralian population’, Melbourne Institute ofApplied Economic and Social ResearchWorking Paper no. 24/02, University of Mel-bourne.
Kreider, B. 1997, ‘Latent work disability andreporting bias’, unpublished paper, Depart-ment of Economics, University of Virginia.
Lando, M. E., Coate, M. B. and Kraus, R. 1979,‘Disability benefit applications and the econ-omy’, Social Security Bulletin, vol. 42, no.10, pp. 3–10.
Leonard, J. S. 1979, ‘The Social Security Dis-ability program and labor force partici-pation’, National Bureau of EconomicResearch Working Paper no. 392, Cam-bridge, Massachusetts.
Nickell, S. and Bell, B. 1995, ‘The collapse indemand for the unskilled and unemploymentacross the OECD’, Oxford Review of Eco-nomic Policy, vol. 11, no. 1, pp. 40–62.
Piachaud, D. 1986, ‘Disability, retirement andunemployment of old men’, Journal of So-cial Policy, vol. 15, pp. 145–62.
Rupp, K. and Scott, C. G. 1995, ‘Length of stayon the Supplemental Security Income dis-ability program’, Social Security Bulletin,vol. 58, no. 1, pp. 29–47.
Rupp, K. and Stapleton, D. C. 1995, ‘Determi-nants of the growth in the Social SecurityAdministration’s disability programs—Anoverview’, Social Security Bulletin, vol. 58,no. 4, pp. 43–70.
Stapleton, D., Coleman, K. A. and Dietrich, K.A. 1995, ‘The effects of business cycle onthe disability applications and awards’,paper presented to 1995 Annual Conferenceof the Society of Government Economists,Allied Social Science Associations’ Meet-ings, Washington, DC.
Stapleton, D., Coleman, K. A., Dietrich, K. A.and Livermore, G. A. 1998, ‘Econometricanalysis of DI and SSI application and awardgrowth’, in Growth in Disability Benefits:Explanations and Policy Implications, edsK. Rupp and D. C. Stapleton, W.E. UpjohnInstitute for Employment Research, Kalama-zoo, Michigan.
Wooden, M. 2000, ‘The changing skill compo-sition of labour demand’, Australian Bulletinof Labour, vol. 26, pp. 191–8.
Copyright © 2022 FDOKUMEN