Who Gets What, According to Whom? An Analysis of Fairness ...
11
Who Gets What, According to Whom? An Analysis of Fairness Perceptions in Service Allocation Jacqueline Hannan jmhannan@bualo.edu University at Bualo Bualo, NY, USA Huei-Yen Winnie Chen winchen@bualo.edu University at Bualo Bualo, NY, USA Kenneth Joseph kjoseph@bualo.edu University at Bualo Bualo, NY, USA ABSTRACT Algorithmic fairness research has traditionally been linked to the disciplines of philosophy, ethics, and economics, where notions of fairness are prescriptive and seek objectivity. Increasingly, however, scholars are turning to the study of what dierent people perceive to be fair, and how these perceptions can or should help to shape the design of machine learning, particularly in the policy realm. The present work experimentally explores ve novel research questions at the intersection of the “Who,” “What,” and “How” of fairness perceptions. Specically, we present the results of a multi-factor conjoint analysis study that quanties the eects of the specic context in which a question is asked, the framing of the given question, and who is answering it. Our results broadly suggest that the “Who” and “What,” at least, matter in ways that are 1) not easily explained by any one theoretical perspective, 2) have critical implications for how perceptions of fairness should be measured and/or integrated into algorithmic decision-making systems. Scholarship within the algorithmic fairness community has tra- ditionally focused on identifying and formalizing mathematical denitions of fairness. This work has developed a robust suite of quantitative and at least seemingly objective denitions of fairness that match perspectives in law, philosophy, statistics, and ethics [18]. However, rather than seek a single mathematical denition of algorithmic fairness, scholars have more recently begun to un- derstand it as a subjective quantity [9, 12, 26, 35, 41, 43, 44]. This psychological perspective, as psychologists Van den Bos and Lind put it, denes fairness as "an idea that exists in the minds of in- dividuals. . . This subjective sense of what is fair or unfair...can be contrasted with objective principles of fairness and justice that are studied by philosophers, among others” [39, pg.7]. From this perspective, then, the goal of algorithmic fairness re- search shifts from dening the right “objective” measure of fairness to understanding, acknowledging, and addressing the myriad per- spectives that exist within the sociotechnical system into which an algorithm will be placed [12, 44]. For example, scholars have looked at how perceptions of fairness in automated decisions vary across application contexts [35], who is being asked [41], and ap- proaches to explaining what the algorithm is doing [5]. In turning Permission to make digital or hard copies of all or part of this work for personal or classroom use is granted without fee provided that copies are not made or distributed for prot or commercial advantage and that copies bear this notice and the full citation on the rst page. Copyrights for components of this work owned by others than the author(s) must be honored. Abstracting with credit is permitted. To copy otherwise, or republish, to post on servers or to redistribute to lists, requires prior specic permission and/or a fee. Request permissions from [email protected]. AIES ’21, May 19–21, 2021, Virtual Event, USA © 2021 Copyright held by the owner/author(s). Publication rights licensed to ACM. towards these questions, the study of algorithmic fairness connects with a large literature in the social sciences. In political science, for example, the widely acknowledged deservingness heuristic states that people are generally motivated to believe it is fair to allocate public goods to “deserving” others, i.e., people who need the service because they are unlucky and not because they are lazy [40]. There is, however, an important distinction between work in the social sciences and in the AIES/FAccT community. Namely, the AIES/FAccT community is concerned not only with what people believe to be fair or unfair, but also how these beliefs can inform the development of automated decision-making (or decision-assistive) technology. That is, many AIES/FAccT scholars are interested in how we can take measurements on what a population considers to be (un)fair and incorporate them into, e.g., the automated allocation of a public good [10, 22], risk assessments in the criminal justice system [21], or the decision of a self-driving car [4, 27]. While such approaches hold the potential to equalize the ways in which AI distributes power [22], these eorts make it all the more critical to understand the sources of variation in our measurements of fairness perceptions, and how these sources of variation may lead to dierent measurements in dierent contexts and across dierent populations. Our work is driven by ve research questions that address these sources of variation in measurements of fairness perceptions. As in prior work, we operationalize fairness perceptions as the ways in which survey respondents choose to allocate (or remove) services (or resources) from dierent hypothetical individuals. While such allocation tasks do not cover all contexts, they are perhaps the most common setting in which fairness has been studied. Specically, we address questions pertaining to how fairness perceptions vary based on 1) the particular service being allocated or 2) demographics of the respondent, and 3) how questions that theoretically target dierent cognitive mechanisms can impact measurements. To address these questions, we develop and carry out an exten- sive conjoint analysis [14] survey experiment on a large, U.S.-centric sample of Mechanical Turk workers. Examples of the main types of questions we ask survey respondents are presented in Figure 1. Con- joint analysis is widely used across other disciplines, in particular political science and healthcare, to identify the attributes people use to make decisions. Indeed, others have used it in similar analyses of fairness perceptions [4, 32]. This wide use is because conjoint analysis has been shown to reliably identify factors relevant to real- life decision-making in ways that more reective ways of asking survey questions, e.g. Likert-scale responses, do not [14, 23]. For example, Hainmueller et al. [13] validated conjoint analysis and vignette-based surveys against real-world behavior. Their ndings show that the conjoint method comes within 2 percentage points
-
Upload
khangminh22 -
Category
Documents
-
view
0 -
download
0
Transcript of Who Gets What, According to Whom? An Analysis of Fairness ...
Who Gets What, According to Whom? An Analysis of FairnessPerceptions in Service Allocation
Jacqueline Hannanjmhannan@bu�alo.eduUniversity at Bu�aloBu�alo, NY, USA
Huei-Yen Winnie Chenwinchen@bu�alo.eduUniversity at Bu�aloBu�alo, NY, USA
Kenneth Josephkjoseph@bu�alo.eduUniversity at Bu�aloBu�alo, NY, USA
ABSTRACTAlgorithmic fairness research has traditionally been linked to thedisciplines of philosophy, ethics, and economics, where notions offairness are prescriptive and seek objectivity. Increasingly, however,scholars are turning to the study of what di�erent people perceive tobe fair, and how these perceptions can or should help to shape thedesign of machine learning, particularly in the policy realm. Thepresent work experimentally explores �ve novel research questionsat the intersection of the “Who,” “What,” and “How” of fairnessperceptions. Speci�cally, we present the results of a multi-factorconjoint analysis study that quanti�es the e�ects of the speci�ccontext in which a question is asked, the framing of the givenquestion, and who is answering it. Our results broadly suggestthat the “Who” and “What,” at least, matter in ways that are 1) noteasily explained by any one theoretical perspective, 2) have criticalimplications for how perceptions of fairness should be measuredand/or integrated into algorithmic decision-making systems.
Scholarship within the algorithmic fairness community has tra-ditionally focused on identifying and formalizing mathematicalde�nitions of fairness. This work has developed a robust suite ofquantitative and at least seemingly objective de�nitions of fairnessthat match perspectives in law, philosophy, statistics, and ethics[18]. However, rather than seek a single mathematical de�nitionof algorithmic fairness, scholars have more recently begun to un-derstand it as a subjective quantity [9, 12, 26, 35, 41, 43, 44]. Thispsychological perspective, as psychologists Van den Bos and Lindput it, de�nes fairness as "an idea that exists in the minds of in-dividuals. . . This subjective sense of what is fair or unfair...can becontrasted with objective principles of fairness and justice that arestudied by philosophers, among others” [39, pg.7].
From this perspective, then, the goal of algorithmic fairness re-search shifts from de�ning the right “objective” measure of fairnessto understanding, acknowledging, and addressing the myriad per-spectives that exist within the sociotechnical system into whichan algorithm will be placed [12, 44]. For example, scholars havelooked at how perceptions of fairness in automated decisions varyacross application contexts [35], who is being asked [41], and ap-proaches to explaining what the algorithm is doing [5]. In turning
Permission to make digital or hard copies of all or part of this work for personal orclassroom use is granted without fee provided that copies are not made or distributedfor pro�t or commercial advantage and that copies bear this notice and the full citationon the �rst page. Copyrights for components of this work owned by others than theauthor(s) must be honored. Abstracting with credit is permitted. To copy otherwise, orrepublish, to post on servers or to redistribute to lists, requires prior speci�c permissionand/or a fee. Request permissions from [email protected] ’21, May 19–21, 2021, Virtual Event, USA© 2021 Copyright held by the owner/author(s). Publication rights licensed to ACM.
towards these questions, the study of algorithmic fairness connectswith a large literature in the social sciences. In political science, forexample, the widely acknowledged deservingness heuristic statesthat people are generally motivated to believe it is fair to allocatepublic goods to “deserving” others, i.e., people who need the servicebecause they are unlucky and not because they are lazy [40].
There is, however, an important distinction between work inthe social sciences and in the AIES/FAccT community. Namely, theAIES/FAccT community is concerned not only with what peoplebelieve to be fair or unfair, but also how these beliefs can inform thedevelopment of automated decision-making (or decision-assistive)technology. That is, many AIES/FAccT scholars are interested inhow we can take measurements on what a population considers tobe (un)fair and incorporate them into, e.g., the automated allocationof a public good [10, 22], risk assessments in the criminal justicesystem [21], or the decision of a self-driving car [4, 27]. While suchapproaches hold the potential to equalize the ways in which AIdistributes power [22], these e�orts make it all the more criticalto understand the sources of variation in our measurements offairness perceptions, and how these sources of variation may leadto di�erent measurements in di�erent contexts and across di�erentpopulations.
Our work is driven by �ve research questions that address thesesources of variation in measurements of fairness perceptions. As inprior work, we operationalize fairness perceptions as the ways inwhich survey respondents choose to allocate (or remove) services(or resources) from di�erent hypothetical individuals. While suchallocation tasks do not cover all contexts, they are perhaps the mostcommon setting in which fairness has been studied. Speci�cally,we address questions pertaining to how fairness perceptions varybased on 1) the particular service being allocated or 2) demographicsof the respondent, and 3) how questions that theoretically targetdi�erent cognitive mechanisms can impact measurements.
To address these questions, we develop and carry out an exten-sive conjoint analysis [14] survey experiment on a large, U.S.-centricsample of Mechanical Turk workers. Examples of the main types ofquestions we ask survey respondents are presented in Figure 1. Con-joint analysis is widely used across other disciplines, in particularpolitical science and healthcare, to identify the attributes people useto make decisions. Indeed, others have used it in similar analysesof fairness perceptions [4, 32]. This wide use is because conjointanalysis has been shown to reliably identify factors relevant to real-life decision-making in ways that more re�ective ways of askingsurvey questions, e.g. Likert-scale responses, do not [14, 23]. Forexample, Hainmueller et al. [13] validated conjoint analysis andvignette-based surveys against real-world behavior. Their �ndingsshow that the conjoint method comes within 2 percentage points

Figure 1: Two examples (top and bottom) of questions askedto respondents of our survey experiment. The top is fromthe Low Severity, Social work service setting, and the Re-ward x Fairness Cued question framing condition. The bot-tom is from the High Severity, COVID setting, and the Pun-ish x non-fairness cued question framing condition. See be-low for details.
of the behavioral benchmarks used in their study, implying that aconjoint design replicates a true decision-making situation moreaccurately than a vignette or direct survey-based approach.
Our analysis results in 4 main �ndings:• What resource is being allocated is important - Percep-tions of who should get services varied in both predictable
and unpredictable ways. For example, predictably, it wasperceived to be fair to consider a person’s upbringing whenallocating a�ordable housing, but not a COVID medication.Unexpectedly, however, respondents weremore likely to giveold people (relative to young people) palliative care, but lesslikely to give them to be given life-saving resources.
• Who allocates the resource is important - Survey re-spondents’ fairness perceptions varied along partisan lines.These variations manifested in ways that emphasize group-justifying preferences (e.g. Democrats givemore toDemocrats)and ideological di�erences (e.g. Democrats are more inclinedto consider an individual’s upbringing).
• How one asks about fairness perceptions is less impor-tant - Di�erent ways of asking (what seem like) the samequestion can produce di�erent results, but rarely. In partic-ular, question framing seemed to have e�ects only in low-stakes allocation settings, and questions that triggered re�ex-ive cognition were broadly consistent with those targetingmore subconscious mechanisms.
• Racial inequality consistently manifests in our anal-yses, regardless of What, Who, or How- While respon-dents almost universally treat race, when explicitly stated,as a variable to be ignored, racial biases existed in fairnessperceptions via indirect paths related to systemic racial in-equality in the United States, speci�cally in the context of thecriminal justice system. These e�ects were observed acrossall services, question framings, and respondent political af-�liations.
Taken together, our �ndings imply that perceptions of fairnessare di�cult to know a priori, and thus empirical measurement innew settings of “What”, “Who,” or “How” are critical. At the sametime, however, our results can be explained by a mix of existingsocial theory, suggesting continuing e�orts to marry social theory,subjective fairness, and automated decision making are critical[12, 22]. To encourage further work along these lines, all codeand data used in this study are available at https://github.com/kennyjoseph/fairness_perceptions_aies.
1 BACKGROUND AND MOTIVATIONA host of theories exist to explain how individuals make decisionsabout what is fair and/or who deserves certain (usually public)goods or services. Here, we present four representative perspectivesthat help to shape our study design and analysis, and where theyhave been leveraged in prior work on algorithmic fairness. Note thatabsent from our analysis here are discussions about philosophical–or what Grgic-Hlaca et al. [12] call “prescriptive”– notions of fair-ness, where one seeks to identify the “right” de�nition. Rather, wehere focus on what is known about why people are likely to havecertain views on what is fair, linking the discussion of our results tothe prescriptive models.
Perhaps the most straightforward view is that people are morelikely to allocate to others that hold similar, salient social identities.This perspective– that Jost [19] calls the ego-justifying or group-justifying perspective– aligns with both notions of self-interest andin-group favoritism. However, sometimes, neither self-interest nor

in-group favoritism can readily explain preferences for the allo-cation of public goods. For example, Americans tend to supportcapitalist notions of the unequal distribution of wealth, even whenthey know it will not bene�t them or their group. In response tothese observations, Jost and Banaji [20] developed Systems Justi�-cations Theory [for a recent review, see 19]. Systems Justi�cationTheory proposes the idea that individuals, often subconsciously, aremotivated to respond to the distribution of goods and services inways that re�ect their perceptions of the status quo. This tendencytowards the status quo leads us to allocate goods and services in away that maintains existing social structures and hierarchies.
In Political Science, the deservingness heuristic presents a sim-ilar perspective to systems justi�cation [31]. The deservingnessheuristic focuses on the (theorized) evolutionary habit of humansto prefer allocating services to those who are unlucky, rather thanthose who are lazy. Thus, the theory assumes that when allocatingservices, we �rst categorize others based on whether (we believe)they are unlucky or lazy. We then use this categorization to de-termine whether a person is deserving or not. Lazy people areundeserving, because they have put in no e�ort that should berewarded, whereas unlucky individuals are deserving because thecircumstances resulting in a need for resources are perceived tobe out of their control [30]. Importantly, while the deservingnessheuristic suggests that resource allocation should be consistentacross public services given knowledge of how people categorizeothers as unlucky or lazy, it leaves room for the fact that these cat-egorization processes may di�er substantially across a population[1].
Finally, economists have developed a similar model around theidea of Equality of Opportunity (EOP) [33]. The EOP model statesthat individuals should be treated similarly, regardless of arti�cialsocial barriers. The model breaks an individual’s attributes downinto 2 categories: circumstance — those that should not impactjudgement about the individual (e.g. race) – and e�ort (those thatshould, e.g. need). EOP models assume that the expected utility forindividuals with similar e�ort should not be impacted by changesin circumstance. Yaghini et al. [44], adopt EOP to study fairnessperceptions in work closely related to ours; we return to this workin our Discussion section.
Collectively, these four perspectives of how individuals makedecisions about the allocation of goods and services present twocritical ways in which fairness perceptions may vary. First, bothSystems Justi�cation Theory and the EOP model suggest that theservice being allocated should impact fairness perceptions. SystemsJusti�cation Theory makes what is essentially an assumption aboutprototypicality - that is, we should expect that an individual willallocate services to those who currently (are perceived to) get theservice. In contrast, EOP allows for the assumption that the featuresutilized across service allocation conditions may be consistent (the“circumstance” is a consistent set), but that the weight of the “e�ort”variables can change across contexts. Thus, these theories makedi�erent mathematical but similar conceptual arguments about theimportance of individual features in perceptions of how a serviceshould be allocated.
However, we are unaware of any studies that consider thesetheoretical predictions by testing them across di�erent service al-location settings within a single experiment. The closest work we
are aware of is that of Srivastava et al. [35], who study di�erentperceptions of fairness across di�erent contexts, but focus on dif-ferent mathematical de�nitions of fairness as opposed to studyingthe attributes respondents use in their decisions. This leads to our�rst research question:
RQ1: How do fairness perceptions vary across di�erent servicesthat are allocated?
Second, the ego- and group-justifying perspective and the de-servingness heuristic imply that there should be variation acrossrespondents in the ways that services are allocated. This has beenobserved in other related work. For example, Yaghini et al. [44],using an EOP-style analysis, �nd that respondents with di�erentages and genders vary in their view of what features should beconsidered circumstance versus e�ort-related. And Awad et al. [4]observe country-level variation in perceptions of life-and-deathsettings for self-driving cars. However, it remains to be seen howsuch di�erences emerge across a range of di�erent service decisions.This leads to our second research question:
RQ2: (How) do fairness perceptions vary across respondents withdi�erent demographics in the context of service allocation?
In addition to these two theoretical dimensions of variation, thereare also important methodological factors that may change the waythat individuals respond. One important question is whether ornot individuals who are primed to think about fairness speci�cally,rather than just who “should” get a given service, respond di�er-ently to questions about service allocation. AIES/FAccT scholarshave used question wordings that sometimes cue fairness and some-times do not. For example, Saxena et al. [34] asks participants toselect the individual who should receive a loan payment from apair, whereas Harrison et al. [15] instructs participants to rate thefairness level for a particular individual receiving bail.
However, there is reason to believe that prompting individualsto think about fairness (or not) might impact their decision-making,by impacting the extent to which respondents use “fast” thinking,driven primarily by emotional, reactive, gut responses, and “slow”thinking, driven by more cognitive, re�ective responses, dependingon the situation [38, 39]. In the latter case, respondents may re�ecton, e.g., institutional norms, driving their responses to re�ect whatis socially desirable [25]. Given the normative associations with theconcept of fairness, we might expect that individuals use a more“gut reaction” when asked who should get a service, but are primedto be more re�ective (and thus change their feature preferences)when asked to allocate fairly. This leads to the following researchquestion:
RQ3: How do fairness perceptions vary when measured usingquestions that do or do not cue people to think about fairness?
Similarly, algorithmic fairness scholars have looked at both caseswhere judgements result in punishments, e.g. in the context ofrecidivism [11, 12, 26], and where services are rewards, e.g. in hiringsettings [24]. Once again, there is reason to suspect that this subtledi�erence may result in di�erent ways that individuals respond.Speci�cally, in punishment contexts, respondents are primed witha negative connotation, and may therefore be prompted to look for“issues,” whereas services-as-bene�ts may lead individuals to looktowards aspects of people that emphasize positive qualities. Thispotential discrepancy leads to the following research question:

RQ4: How do fairness perceptions vary when measured usingquestions that prompt punishment (e.g. service removal) versus reward(e.g. service provision)?
Finally, existing work also varies widely on how responses aresolicited. Scholars in the AIES/FAccT community have primarilyleveraged three di�erent approaches to soliciting perceptions offairness. First, several scholars have taken a feature-speci�c ap-proach, asking on a Likert scale how important a given feature wasin their decision-making. For example, Yaghini et al. [44] asked par-ticipants which parameters are acceptable to consider when makinga recidivism prediction, such as race or criminal record. And Grgic-Hlaca et al. [12] ask respondents survey questions about both whichfeatures are fair, and properties of those features. Second, schol-ars have relied on what we will call forced choice hypotheticalindividual decisions, where participants are asked whether or notthey would allocate a particular good or service to a single indi-vidual or to choose between several individuals. Perhaps the mostwell-known example of this is the work of Awad et al. [4], whoseMoral Machine experiment employed this design to study moraldecisions in a trolley problem-like setting with self-driving cars,but other examples exist [21]. Finally, several works have focusedspeci�cally on fairness measure decisions, where participants areasked to choose an established, mathematical de�nition of fairnessthat they prefer [15, 35].
These di�erent methods have di�erent mathematical aims, butalso, again, trigger potentially distinct cognitive mechanisms. Forexample, forced-choice designs used by AIES/FAccT scholars de-rive from approaches that speci�cally aim to trigger subconsciouspreferences that align with behavior [14], whereas Likert-scale re-sponses are known to encourage more re�ection on the speci�cfeature or decision criterion. This di�erence is related to the dis-tinction between what people think they believe, and what theyactually do. As an example, consider that individuals on datingwebsites are likely to state that they have no racial preferenceson questionnaires, but empirically show strong racial preferences.When asked directly to re�ect on race, individuals largely invokesocial norms that dictate one should not have racial preferences.But when selecting partners on the site, individuals are largelydriven by their faster, more reactive thinking, where stereotypesand prejudices are more likely to be re�ected [3].
As such, we expect there may be di�erences in the ways in theimportance respondents place on di�erent features based on howwe inquire about that feature, speci�cally, in the di�erence betweenforce choice responses from questions like those in Figure 1, andthe feature-speci�c Likert-scale questions in prior work. This leadsto our �nal research question:
RQ5: How do di�erent features vary in their impact of fairnessjudgements depending on how the response is solicited?
2 EXPERIMENTAL DESIGNOur studywas conducted with 747 participants on AmazonMechan-ical Turk (MTurk), see below for further details on the participantsample. The study was approved by the Institutional Review Boardat the University at Bu�alo.
After consenting to the study, participants �rst saw a tutorialintroducing them to the types of questions asked in the survey. The
tutorial included three comprehension questions. If the participantcould not correctly answer the three questions, they were not al-lowed to continue. The main portion of the survey is an experimentthat asks ten questions, like those in Figure 1. We vary both thequestion prompt (i.e. what service the respondent is cued with andhow the question is worded) and whom the respondent is asked todecide between (i.e. who Person A and Person B are in Figure 1).
With respect to the question prompt, we construct a 4-way,2x2x2x2 fully factorial experiment. The �rst two factors are relevantto the service setting (to address RQ1), and the second two to thephrasing of the question (to address RQ3 and RQ4). Participantsare placed randomly into one of 16 conditions of the full-factorialdesign, meaning that a study participant is asked about only onetype of service and shown one question phrasing for all ten surveyquestions. Additional details on the factorial design for the questionprompt are given below.
We then explore the preferences that respondents have on whomto allocate services to, and how these are impacted by the promptgiven. We do so by �rst identifying a set of possible attributes (e.g.Age) and then a set of attribute levels (e.g. 20, 40, and 70 years old).Table 1 provides the attributes and attribute levels that we considerin our study. We then construct two hypothetical individuals, whoreceive a random level for each attribute. In Figure 1, these hypothet-ical individuals are “Person A” and “Person B.” Survey respondentsare then asked to choose whom between the two individuals wouldbe given the service or have it taken from them (depending on theprompt).1 This random sampling approach allows us to causallyinterpret the impact of di�erent attribute levels on respondents’service allocation decisions. Full details on this part of the approachto identifying respondent preferences across attributes are givenbelow.
After the survey experiment, respondents answered a set of Lik-ert questions asking them how much they believed they weightedeach attribute in their decision (to address RQ5). Speci�cally, foreach attribute, we asked respondents to “indicate how important[this attribute was] to you in your earlier decisions about allocat-ing services.” Finally, respondents answered a standard battery ofdemographic questions for age, race, gender, political a�liation,education, and prior experiences with the services being allocated.In the present work, we focus only on respondent’s political a�li-ation, however, all demographics are provided in the data releasefor this study.
2.1 Factorial Experiment DesignWe refer to the question prompt shown to respondents as theirdecision context. When designing the parameters that de�ned thedecision context, two main categories are taken into consideration.First, to address RQ1, we vary the service setting, i.e. we considerwhich service is being allocated. To do so, we vary two factors- aservice context (relating to the high-level institutional context inwhich the service is allocated), and a service severity level (relatingto the importance of the resource available). Second, we considervariations on question framing to address RQ3 and RQ4. Full prompts
1Respondents were, in some cases, also provided a response on a slider to indicatehow con�dent they were in their response. Analyses of respondent con�dence are notconsidered in the present work, however, data on the sliders are provided in the datarelease for this paper.
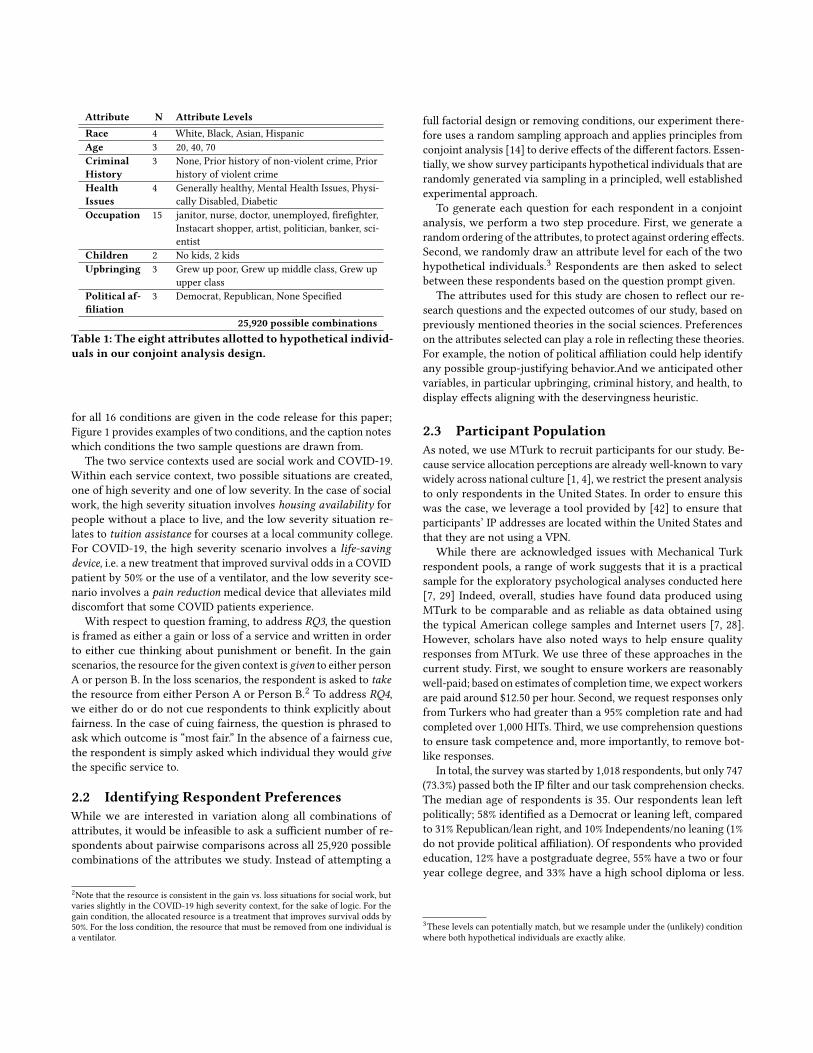
Attribute N Attribute LevelsRace 4 White, Black, Asian, HispanicAge 3 20, 40, 70CriminalHistory
3 None, Prior history of non-violent crime, Priorhistory of violent crime
HealthIssues
4 Generally healthy, Mental Health Issues, Physi-cally Disabled, Diabetic
Occupation 15 janitor, nurse, doctor, unemployed, �re�ghter,Instacart shopper, artist, politician, banker, sci-entist
Children 2 No kids, 2 kidsUpbringing 3 Grew up poor, Grew up middle class, Grew up
upper classPolitical af-�liation
3 Democrat, Republican, None Speci�ed
25,920 possible combinationsTable 1: The eight attributes allotted to hypothetical individ-uals in our conjoint analysis design.
for all 16 conditions are given in the code release for this paper;Figure 1 provides examples of two conditions, and the caption noteswhich conditions the two sample questions are drawn from.
The two service contexts used are social work and COVID-19.Within each service context, two possible situations are created,one of high severity and one of low severity. In the case of socialwork, the high severity situation involves housing availability forpeople without a place to live, and the low severity situation re-lates to tuition assistance for courses at a local community college.For COVID-19, the high severity scenario involves a life-savingdevice, i.e. a new treatment that improved survival odds in a COVIDpatient by 50% or the use of a ventilator, and the low severity sce-nario involves a pain reduction medical device that alleviates milddiscomfort that some COVID patients experience.
With respect to question framing, to address RQ3, the questionis framed as either a gain or loss of a service and written in orderto either cue thinking about punishment or bene�t. In the gainscenarios, the resource for the given context is given to either personA or person B. In the loss scenarios, the respondent is asked to takethe resource from either Person A or Person B.2 To address RQ4,we either do or do not cue respondents to think explicitly aboutfairness. In the case of cuing fairness, the question is phrased toask which outcome is “most fair.” In the absence of a fairness cue,the respondent is simply asked which individual they would givethe speci�c service to.
2.2 Identifying Respondent PreferencesWhile we are interested in variation along all combinations ofattributes, it would be infeasible to ask a su�cient number of re-spondents about pairwise comparisons across all 25,920 possiblecombinations of the attributes we study. Instead of attempting a
2Note that the resource is consistent in the gain vs. loss situations for social work, butvaries slightly in the COVID-19 high severity context, for the sake of logic. For thegain condition, the allocated resource is a treatment that improves survival odds by50%. For the loss condition, the resource that must be removed from one individual isa ventilator.
full factorial design or removing conditions, our experiment there-fore uses a random sampling approach and applies principles fromconjoint analysis [14] to derive e�ects of the di�erent factors. Essen-tially, we show survey participants hypothetical individuals that arerandomly generated via sampling in a principled, well establishedexperimental approach.
To generate each question for each respondent in a conjointanalysis, we perform a two step procedure. First, we generate arandom ordering of the attributes, to protect against ordering e�ects.Second, we randomly draw an attribute level for each of the twohypothetical individuals.3 Respondents are then asked to selectbetween these respondents based on the question prompt given.
The attributes used for this study are chosen to re�ect our re-search questions and the expected outcomes of our study, based onpreviously mentioned theories in the social sciences. Preferenceson the attributes selected can play a role in re�ecting these theories.For example, the notion of political a�liation could help identifyany possible group-justifying behavior.And we anticipated othervariables, in particular upbringing, criminal history, and health, todisplay e�ects aligning with the deservingness heuristic.
2.3 Participant PopulationAs noted, we use MTurk to recruit participants for our study. Be-cause service allocation perceptions are already well-known to varywidely across national culture [1, 4], we restrict the present analysisto only respondents in the United States. In order to ensure thiswas the case, we leverage a tool provided by [42] to ensure thatparticipants’ IP addresses are located within the United States andthat they are not using a VPN.
While there are acknowledged issues with Mechanical Turkrespondent pools, a range of work suggests that it is a practicalsample for the exploratory psychological analyses conducted here[7, 29] Indeed, overall, studies have found data produced usingMTurk to be comparable and as reliable as data obtained usingthe typical American college samples and Internet users [7, 28].However, scholars have also noted ways to help ensure qualityresponses from MTurk. We use three of these approaches in thecurrent study. First, we sought to ensure workers are reasonablywell-paid; based on estimates of completion time, we expect workersare paid around $12.50 per hour. Second, we request responses onlyfrom Turkers who had greater than a 95% completion rate and hadcompleted over 1,000 HITs. Third, we use comprehension questionsto ensure task competence and, more importantly, to remove bot-like responses.
In total, the surveywas started by 1,018 respondents, but only 747(73.3%) passed both the IP �lter and our task comprehension checks.The median age of respondents is 35. Our respondents lean leftpolitically; 58% identi�ed as a Democrat or leaning left, comparedto 31% Republican/lean right, and 10% Independents/no leaning (1%do not provide political a�liation). Of respondents who providededucation, 12% have a postgraduate degree, 55% have a two or fouryear college degree, and 33% have a high school diploma or less.
3These levels can potentially match, but we resample under the (unlikely) conditionwhere both hypothetical individuals are exactly alike.

Finally, our sample skews White, 76% of respondents said they areWhite, compared to only, e.g. 7% Latinx and 11% Black.4
In sum, our sample is not representative of any clear population,and thus, as we emphasize below, one should be cautious aboutgeneralizing speci�c results on speci�c attributes to any populationbeyond the study participants. In contrast, we focus mainly onmore generalizable e�ects of our experimental manipulations anddemographic di�erences that align with existing theory.
3 RESULTS3.1 RQ1: Variation across ServiceWe �nd that the service setting respondents are given had a sig-ni�cant impact on their responses, but that these impacts 1) arenot systematic across the di�erent attributes and 2) often are a-priori non-obvious for particular attribute levels. Figure 2 presentsmarginal mean estimates for each level of each attribute, with thedi�erent service settings presented in varying colors and pointshapes. Notably, e�ects do not consistently vary across the main ef-fects of our 2x2 service context by severity experimental design, andthus we consider each cell of the 2x2 separately. Marginal means inconjoint analysis experiments are a causal quantity that representthe probability of a respondent giving (or not taking away) a serviceto (or from) an individual with the certain attribute level, relative toany other level, for a given service condition [23]. For example, thepurple cross in the “Age” subplot can be read as, “Respondents gave(took away from) 70 year olds signi�cantly less (more) tuition assis-tance than would be expected by chance, allocating the assistanceto 70 year olds only around 40% of the time.” Note that despite thedi�erent number of levels across factors, marginal means are al-ways estimated relative to a base rate of being selected in a pairwisecomparison, and thus the base (chance) rate is always 50%.
Across all service settings, respondents most consistently relyon age, criminal history, and whether or not an individual has kids.The direction of e�ects for having kids and having a prior criminalhistory are consistent across contexts; respondents were alwaysmore likely to give to individuals with kids, no criminal history, anda history of only non-violent crime relative to a history of violentcrime. In contrast, while age is a consistently strong predictor, thedirection of e�ects vary across service setting. Older individualsare signi�cantly more likely to be given pain reduction medicine orhousing, and signi�cantly less likely to be given tuition assistanceor a life-saving device.
E�ects for attribute levels of the other variables are less con-sistent. Political a�liation is generally a weak predictor acrosscontexts; however, as we discuss next, this e�ect is to some de-gree masked because of group-justifying behavior. With respect tohealth issues, respondents are much more likely to provide housingto the physically disabled, less likely to provide life saving devicesto those with mental health issues but more likely to provide thedevice to those with diabetes, and less likely to give healthy peoplehousing or pain medicine. Respondents largely do not factor ex-plicit mentions of race into their decisions, although Black peopleare slightly more likely to be given tuition assistance. Finally, sig-ni�cant preferences in allocation across occupations are sporadic.
4We did not request information about the respondent’s gender because we had noreason to believe this was of theoretical interest to the present work.
PoliticalAffiliation
AgeU
pbringingC
riminal
History
Occupation
Children
Health
IssuesR
ace
40% 50% 60%
Democrat
None specified
Republican
20
40
70
Grew up middle class
Grew up poor
Grew up upper class
None
Prior history of non−violent crime
Prior history of violent crime
artist
banker
doctor
firefighter
Instacart shopper
janitor
nurse
scientist
unemployed
No kids
Two kids
Diabetic
Generally Healthy
Mental health issues
Physically disabled
Asian
Black
Hispanic
White
Marginal Prob. Individual withFeature is given Service
Feat
ure
ServiceSetting
Life−savingdevice(COVID High)
Painreduction(COVID Low)
Housing(Social WorkHigh)TuitionAssist(Social WorkLow)
Figure 2: The marginal probability (x-axis) that a hypotheti-cal individual having a given attribute value (y-axis) is givena particular service. Services are di�erentiated by color andshape. Values not signi�cantly di�erent from chance (U =.05) are dimmed. Con�dence intervals are 95% standard er-rors, controlling for multiple observations of respondents.Di�erent attribute types are separated into di�erent sub-plots.

PoliticalAffiliation
Upbringing
Crim
inalH
istoryC
hildrenH
ealthIssues
Race
40.0%45.0%50.0%55.0%60.0%
Democrat
None specified
Republican
Grew up middle class
Grew up poor
Grew up upper class
None
Prior history of non−violent crime
Prior history of violent crime
No kids
Two kids
Diabetic
Generally Healthy
Mental health issues
Physically disabled
Asian
Black
Hispanic
White
Marginal Prob. Individual withFeature is given Service
Feat
ure
RespondentPoliticalAffiliation
Other/Independent
Republican
Democrat
Figure 3: The marginal probability (x-axis) that a hypotheti-cal individual having a given attribute value (y-axis) is givenany service, based on the respondent’s political a�liation(di�erent color/shaped point ranges).
Perhaps more telling for occupation is where results are unexpect-edly null. In particular, respondents are no more likely to givedoctors or nurses assistance in the COVID settings than individualswith other occupations, although doctors are signi�cantly morelikely to get COVID assistance than social work services.
In sum, Figure 2 tells a complex story at the attribute level. How-ever, three overarching �ndings are worth summarizing. First, theservice being allocated clearly matters. For example, our resultsshow that one should not expect that the ways in which particularattributes impact fairness perceptions in life saving or life de�ningsituations remain the same in less critical situations. Second, and incontrast, is that service setting does not always matter. In particular,the importance of criminal history is relatively consistent acrossthe four di�erent scenarios studied. Finally, speci�c preferences atthe attribute level are di�cult to predict a priori. For example, it isnot immediately obvious why respondents disliked the idea of olderpeople su�ering from pain or homelessness, but felt they shouldnot live or be given an opportunity for education at the expense ofa younger individual.
3.2 RQ2: Variation across RespondentWe �nd signi�cant evidence of group-justifying e�ects on serviceallocation, in that respondents prefer to allocate services to in-dividuals who share their partisanship. Figure 3 shows the sameinformation as Figure 2, except that results are now aggregated
Framing Service Condition Fval p
Fairness Cue (RQ3)
Pain reduction 1.45 0.07Life-saving 0.99 0.48Tuition Assist 1.62 0.03Housing 0.74 0.82
Punishment vs.Reward (RQ4)
Pain reduction 1.64 0.03Life-saving 1.37 0.11Tuition Assist 2.20 < .001Housing 1.31 0.14
Table 2: Results of F-test on signi�cance of changing fram-ing from Gain to Loss, or from "should get" to “fair” (i.e. forRQ3 and RQ4). The degrees of freedom for all tests is 24.Rows are bolded if p-values are signi�cant at U = .05
across respondent’s political a�liation instead of service setting.5We �nd that Democrats allocate almost 10% more services to otherDemocrats, and Republicans allocate around 5% more to other Re-publicans. For Democrats this di�erence is driven not only by in-group favoritism – a preference for allocation to Democrats – butalso by “out-group hate” [6]– a term coined to denote distaste forallocating services to Republicans .
However, di�erences between individuals aligning with thesepolitical parties do not stop at a preference (distaste) for (dis)similarothers. Most notably, Democrats are signi�cantly more likely toconsider class, or upbringing, than Republicans. Democrats arealmost 10% more likely to allocate services to individuals who grewup poor, relative to those who grew up upper class, whereas no sig-ni�cant di�erence existed for Republican respondents. Democratsare also slightly more likely to allocate services to Black people;Republicans are not. These results show that di�erences betweenrespondents move beyond a preference for those with the sameidentities to ideological di�erences as well.
While these di�erences are important, it is also worth notingsigni�cant similarities also exist across parties. In particular, re-spondents across the political spectrum have relatively consistentviews on criminal history and having (or not having) children. Theprimary di�erence across the spectrum on these variables is fromIndependents, who showed no preference for individuals who com-mitted no crimes relative to those who committed only non-violentcrimes. Racial perspectives, too, were similar across the politicalspectrum outside of the di�erence in views towards Black people.
3.3 RQ3-4: Variations on Question StructureWe �nd inconsistent evidence that manipulations to whether ornot respondents are cued with fairness (RQ3) or primed to thinkabout punishment versus reward (RQ4) had strong e�ects on re-spondent preferences, especially in high-severity settings. Table 2shows results from F-tests to evaluate whether or not di�erentiatingresponses by question framing manipulation signi�cantly improvesthe explainability of regression models of conjoint responses. TheseF-tests represent the standard approach to evaluating the impor-tance of potential moderating variables in conjoint analysis [23].5We do not show results for age, due to the contrasting impacts across context, andalso do not show occupation for space reasons. These results can be found in the codeand data release for this article.

Age: 40Age: 70
Children: No kidsChildren: Two kids
Criminal History: NoneHealth Issues: Mental health issues
Occupation: bankerOccupation: janitorOccupation: nurse
Political Affl.: None specified
−20% 0% 20%Estimated difference in margial mean
Attri
bute
Lev
el Manipulation
Fairness Cue
Reward vsPunishment
Figure 4: E�ects of question manipulations for RQ3 (purple)and RQ4 (orange) for attribute levelswhere themanipulationresults in a signi�cant di�erence across conditions (U = .05).For RQ3, results represent mean + 95% CI (standard error) es-timates of the increase in odds than an individual gets a ser-vice if fairness is cued. For RQ4, results represent an increaseor decrease if reward, rather than punishment, is cued.
We �nd that RQ3 and RQ4 manipulations only have a signi�cante�ect (U = .05) for 3 out of the 8 possible context/manipulatorcombinations, and in only one of those conditions is ? < .01.
We do �nd, however, that both manipulations have signi�cantoverall e�ects for the conditionwhere tuition is allocated (low sever-ity, Social Work context), and the Punishment vs. Reward has ane�ect in the Pain Reduction setting (low severity, COVID context).Our results therefore leave open the possibility that decisions aremore sensitive to the way things are asked in less critical contexts.
Even here, however, e�ects on speci�c attribute levels are not ob-viously systematic. Figure 4 presents attribute levels for the two re-search questions where the manipulation has a signi�cant e�ect onresponses. With respect to the fairness manipulation, respondentsare more likely to provide individuals with children with tuition,as well as nurses and janitors, and less likely to give individualswith no political a�liation, bankers, or middle-aged individuals,when cued with fairness. When cued with reward (versus punish-ment), respondents are less likely to provide tuition to those withmental health issues or older individuals, and more likely to rewardindividuals with no criminal history.
3.4 RQ5: Variations on Question TypeWe �nd evidence that respondents are generally good at inferringwhich attributes they relied on in the conjoint analysis, althoughthis was not the case for Health Issues. Figure 5 plots two measuresof importance for the di�erent attributes in our study, with resultssplit on the political a�liation of respondents. Results in purplerepresent the importance respondents stated for that variable usingthe Likert questions given to them after the conjoint experiment.Results in orange represent the importance of each attribute torespondents in the conjoint analysis, as estimated by the averageamount of variation in responses explained by the variable. As isstandard, we use McFadden’s Pseudo-'2 as a measure of variationexplained, implemented in the dominanceAnalysis [8] packagein R [37]. Note that this measure accounts for overall variationexplained in ways that may not re�ect signi�cance levels for speci�cattribute levels in Figure 2. For example, we see that Occupationexplains more variation in the data than Political A�liation, even
Republican
Democrat
Age
Children
Crimina
l Histo
ry
Occupa
tion
Health
Issu
es
Upbrin
ging
Politica
l Affl.
Race
Importance Measure
Likert
ConjointAnalysis
Figure 5: The y-axis represents estimates for the importanceof attributes to respondents. For Likert-scale questions (pur-ple), this is estimated by the respondents themselves (aver-age Likert response). For conjoint responses (orange), this isestimated by the average importance of variables in regres-sions predicting responses. Results are split by respondentpolitical a�liation, and the twomeasures of importance arestandardized so they can be plotted together. The horizontalpurple dashed line represents a response of “Neutral” on the7-point Likert scale, and is given for reference. Results arecomputed separately for each of the four service contexts,and then averaged together.
though we see some signi�cant e�ects for speci�c levels of PoliticalA�liation in Figure 2.
Both Democrats and Republicans respondents were consistent intheir perception that Upbringing, Political A�liation, and Race arenot important to their fairness decisions in both their responses onthe conjoint analyses and their re�ections in the Likert responses.However, we do not observe this agreement for all variables. Specif-ically, respondents consistently state that they believe they relymore heavily on Health Issues than we �nd in their behavior in theconjoint analyses. Although not shown here, we �nd this is drivenheavily by the life-saving device service setting, where respondentsstate a strong reliance on Health Issues, but did not heavily rely onthe attribute as a whole in their conjoint responses.
Overall, Democrats are better than Republicans at identifyingwhich variables they relied on in the conjoint analysis. This claimis based on an analysis of the correlation between Democrats’ andRepublicans’ stated view of how heavily they rely on attributesand their actual use as measured in the conjoint analysis. UsingSpearman’s rank correlation metric, we �nd a large and signi�-cant relationship between these two quantities for Democrats (.76,p=.037). In contrast, there is no signi�cant correlation (.55, p=.17)between these two quantities for Republicans.
Finally, while Democrats and Republicans agreed on what not touse, there is less consistency in the relative importance of what wasused. Setting aside the outlier of Health Issues, the most importantattributes for Democrats according to both measures are, in order,

Age, Children, Criminal History, and Occupation. Republicans, re-lied on these same factors, but ordering varied from Democrats andacross importance metrics. Republicans perceive themselves to rely,in order, on Age, Criminal History, Children, and then Occupation.We �nd, however, in the conjoint analysis, that they rely, in order,on Criminal History, Children, Age, and then Occupation.
4 DISCUSSIONOur results do not align neatly with any one theoretical under-standing of how individuals perceive fairness. For example, theideological di�erences we �nd for RQ2 �t with the deservingnessheuristic, which presumes that ideology drives categorization pro-cesses that lead to service allocation decisions based on whetherone is perceived to be lazy or unlucky. But other results do notline up along the lazy versus unlucky divide. In particular, it isunclear from a deservingness perspective why either having chil-dren or being old would be a signi�cant factor, despite these tworepresenting the most important preferences driving respondents’fairness perceptions in our study. These results, instead, perhapsalign better with a Systems Justi�cation perspective, which itselfexplicitly discounts the observed group-justifying observations inFigure 3.
Rather, for any given respondent and service setting, our resultssuggest we should expect to require amix of theoretical perspectivesto understand fairness perceptions. This, in turn, points to a need fortheoretically-driven empirical approaches to identifying fairnessperceptions across the rich arena in which algorithms are nowmaking policy decisions. Several important examples already existfor how to do such work. In sociology, Hoey and MacKinnon [17]presents a framework for understanding social decision-makingthrough a mix of empirical estimates derived from surveys andtheoretically informed parameter settings. More in line with thealgorithmic fairness work, Grgic-Hlaca et al. [12] presents a modelin which they assume that features are drawn from a distributionof various properties, e.g. reliability and relevance, that can bemeasured via survey data and then used to understand fairnessjudgements in novel settings. Yaghini et al. [44] proposes an EOP-style model that �rst identi�es circumstance versus e�ort valuesusing surveys, and then uses a conjoint design to estimate utility.And Lee et al. [22] developed WeBuildAI, an approach built ontheory from the collective participation literature, that allows forthe measurement and aggregation of scale-based fairness inputs.
Our work emphasizes the need for approaches like these, and ex-tends existing work in several important ways. First and foremost,we cross-compare decisions on multiple services/resources withinthe same study. In other words, the decision being made is, unlikeany prior work, a variable within our experimental design. We �ndthat the decision being made impacts fairness perceptions in bothexpected and, more notably, unexpected ways. Indeed, there werealmost no clear main e�ects that emerged from our hypothesized2x2 service setting model. The takeaway is that while others havestudied properties of attributes that inform their use in fairnessjudgements [12], and demographics are salient factors di�erentiat-ing respondents, our work shows we have little current understandingof the ways in which we can break down di�erent kinds of servicessystematically.
Second, our work �nds no systematic e�ects of priming respon-dents to consider fairness, relative to simply asking them who“should” get a service. It is of course possible that our fairness ma-nipulation is too weak, or that our sample size is too small. However,if it is indeed the case that “fair” and “should” are largely the same,as has in any case been implicitly assumed in some prior work,then researchers should be cautious about how these judgementsare used to inform a machine learning model’s decisions. This isbecause the data on which such models are trained, particularlyin settings like Social Work and health, already contain decisionson who “should” get services. This is, of course, what a machinelearning model seeks to learn. Adding fairness judgements, then,risks simply substituting one de�nition of “should” for another. Atits best, this has the potential to bring power to voices absent in ourdata and model construction. At worst, it provides yet another leverupon which power inequalities in the machine learning pipelinecan be pulled.
Third, while question framing posed limited impacts, we do �ndat least one obvious di�erence between the behaviorally-orientedconjoint analysis questions and the more re�exive Likert scale ques-tions we asked. Scholars seeking to use fairness judgements toguide model decisions can learn from this observation. Namely, thegoal of soliciting what people “really think” may be best servedby a conjoint design. But, using a Likert design may help to en-force social norms that are known to have favorable properties,e.g. in the reduction of prejudice [36]. In the context of studyingfairness perceptions, then, it is critical to decide whether we wantto understand implicit preferences–in which case one might turnto conjoint approaches– or to solicit normative values– in whichcase a Likert approach may be more appropriate.
Finally, and related, is that regardless of how one asks questions,fairness perceptions should not be seen as a panacea for creatingfair, just, or equitable models. The most obvious example in ourwork is that among the most consistent e�ects were 1) a lack of useof race as a decision factor, and 2) a consistently strong use of crim-inal history. Given the systematic construction of an associationbetween Blackness and criminality [2], a model that uses crimi-nal history as a decision factor is one that further enables whitesupremacy [16]. Further, Systems Justi�cation Theory suggests thatthis relationship does not necessarily subside if we solicit fairnessperceptions from a�ected individuals. If we seek to be fair “in analready unjust world” [16], then, fairness perceptions must be usedin concert with a socio-theoretic understanding of the attributesunder study.
5 CONCLUSIONThe present work conducts a conjoint analysis, with associatedLikert-scale questions, to analyze fairness perceptions of a largesample of Mechanical Turk participants across di�erent service al-location contexts and task framings. Put simply, our results provideevidence that the What and Who of fairness perceptions matter,but that there are limited e�ects of question framing, at least forhigh-severity allocation contexts.
Our work does, however, su�er from several limitations. Many ofthese are similar to those in prior work; in particular, Yaghini et al.[44] list a comprehensive set of limitations including assumptions

about linearity of attribute e�ects, the requirement that respondentsare forced to choose between two options they may feel similarlyabout, and the hypothetical nature of the decisionsmade. In additionto these limitations noted in prior work, three additional points areof importance here. First, our work is largely exploratory, in thatwe address a number of di�erent research questions with a singlesample. Our goal in doing so was to lay groundwork for future,more directed analysis, but this decision limits the extent to whichwe explore more mechanistic explanations of respondent behavior.Future work could, for example, better address the latent constructsthat di�erentiate service conditions tested here.
Second, and related, results presented here are necessarily se-lective - while they show results from our survey data that webelieve are most salient and generalizable, we nonetheless leaveseveral important questions unanswered. For example, we do nottest whether or not e�ects of respondent partisanship change fordi�erent service allocation contexts. To this end, we provide someadditional results in the code and data release for this paper, andprovide all data needed to ask these additional questions. Second,our analysis is conducted on a non-representative sample of U.S.adults. While we have tried to focus on results that theories andconnections to prior work imply are generalizable, we cannot guar-antee this to be true. Thus, more work is needed, for example, toaddress in a causal fashion why we observe di�erences betweenDemocrats and Republicans in our sample.
Despite these limitations, however, this work opens a varietyof future research questions targeted at the complex interactionsbetween what decisions are being made, who is making them, andhow they are being asked to make them. As scholarship in theAIES/FAccT community moves towards the use of subjective per-ceptions in de�ning fairness criteria for machine learning models,we believe these questions will be critical to address.
6 ACKNOWLEDGEMENTSThe authors would like to thank Atri Rudra, Krithika Raj DoraiRaj, Lalit Jain, Anna Gilbert, Connor Wurst, Yuhao Du, Sauvik Das,and the Anonymous Reviewers for thoughts on prior iterations ofthis work. All authors were funded by Amazon and the NSF underaward NSF IIS-1939579.
REFERENCES[1] Lene Aarøe and Michael Bang Petersen. 2014. Crowding Out Culture: Scandina-
vians and Americans Agree on Social Welfare in the Face of Deservingness Cues.The Journal of Politics 76, 3 (July 2014), 684–697. https://doi.org/10/f58t6g
[2] Michelle Alexander. 2020. The new Jim Crow: Mass incarceration in the age ofcolorblindness. The New Press.
[3] Ashtom Anderson, Sharad Goel, Gregory Huber, Neil Malhotra, and Duncan J.Watts. 2014. Political Ideology and Racial Preferences in Online Dating. Sociolog-ical Science 1 (Feb. 2014), 28–40. https://doi.org/10.15195/v1.a3
[4] Edmond Awad, Sohan Dsouza, Richard Kim, Jonathan Schulz, Joseph Henrich,Azim Shari�, Jean-François Bonnefon, and Iyad Rahwan. 2018. The Moral Ma-chine Experiment. Nature 563, 7729 (Nov. 2018), 59. https://doi.org/10.1038/s41586-018-0637-6
[5] Reuben Binns, Max Van Kleek, Michael Veale, Ulrik Lyngs, Jun Zhao, and NigelShadbolt. 2018. ’It’s Reducing a Human Being to a Percentage’: Perceptions ofJustice in Algorithmic Decisions. In Proceedings of the 2018 CHI Conference onHuman Factors in Computing Systems. ACM, 377.
[6] Marilynn B. Brewer. 1999. The Psychology of Prejudice: Ingroup Love andOutgroup Hate? Journal of social issues 55, 3 (1999), 429–444.
[7] Michael Buhrmester, Tracy Kwang, and Samuel D. Gosling. 2016. Amazon’sMechanical Turk: A New Source of Inexpensive, yet High-Quality Data? American
Psychological Association, Washington, DC, US. 139 pages. https://doi.org/10.1037/14805-009
[8] C Bustos Navarrete and F Coutinho Soares. 2020. dominanceanalysis: DominanceAnalysis. R package version 1.3. 0.
[9] Rachel Freedman, Jana Schaich Borg, Walter Sinnott-Armstrong, John P. Dicker-son, and Vincent Conitzer. 2018. Adapting a Kidney Exchange Algorithm to AlignWith Human Values. In Thirty-Second AAAI Conference on Arti�cial Intelligence.
[10] Rachel Freedman, Jana Schaich Borg, Walter Sinnott-Armstrong, John P. Dick-erson, and Vincent Conitzer. 2020. Adapting a Kidney Exchange Algorithmto Align with Human Values. Arti�cial Intelligence 283 (June 2020), 103261.https://doi.org/10.1016/j.artint.2020.103261
[11] Ben Green and Yiling Chen. 2019. Disparate Interactions: An Algorithm-in-the-Loop Analysis of Fairness in Risk Assessments. In Proceedings of the Conference onFairness, Accountability, and Transparency (FAT* ’19). Association for ComputingMachinery, Atlanta, GA, USA, 90–99. https://doi.org/10.1145/3287560.3287563
[12] Nina Grgic-Hlaca, Elissa M. Redmiles, Krishna P. Gummadi, and Adrian Weller.2018. Human Perceptions of Fairness in Algorithmic Decision Making: A CaseStudy of Criminal Risk Prediction. In Proceedings of the 2018 World Wide WebConference (WWW ’18). International World Wide Web Conferences SteeringCommittee, Republic and Canton of Geneva, Switzerland, 903–912. https://doi.org/10.1145/3178876.3186138
[13] Jens Hainmueller, Dominik Hangartner, and Teppei Yamamoto. 2015. Validat-ing Vignette and Conjoint Survey Experiments against Real-World Behavior.Proceedings of the National Academy of Sciences 112, 8 (Feb. 2015), 2395–2400.https://doi.org/10.1073/pnas.1416587112
[14] Jens Hainmueller, Daniel J. Hopkins, and Teppei Yamamoto. 2014. Causal Infer-ence in Conjoint Analysis: Understanding Multidimensional Choices via StatedPreference Experiments. Political analysis 22, 1 (2014), 1–30.
[15] Galen Harrison, Julia Hanson, Christine Jacinto, Julio Ramirez, and Blase Ur. 2020.An empirical study on the perceived fairness of realistic, imperfect machinelearning models. In Proceedings of the 2020 Conference on Fairness, Accountability,and Transparency. 392–402.
[16] Jonathan Herington. 2020. Measuring fairness in an unfair World. In Proceedingsof the AAAI/ACM Conference on AI, Ethics, and Society. 286–292.
[17] Jesse Hoey and Neil J. MacKinnon. 2019. "Conservatives Over�t, Liberals Under-�t": The Social-Psychological Control of A�ect and Uncertainty. arXiv:1908.03106[cs] (Sept. 2019). arXiv:1908.03106 [cs]
[18] Ben Hutchinson and Margaret Mitchell. 2019. 50 Years of Test (Un)Fairness:Lessons for Machine Learning. Proceedings of the Conference on Fairness, Ac-countability, and Transparency - FAT* ’19 (2019), 49–58. https://doi.org/10.1145/3287560.3287600 arXiv:1811.10104
[19] John T Jost. 2019. A quarter century of system justi�cation theory: Questions,answers, criticisms, and societal applications. British Journal of Social Psychology58, 2 (2019), 263–314.
[20] John T Jost and Mahzarin R Banaji. 1994. The role of stereotyping in system-justi�cation and the production of false consciousness. British journal of socialpsychology 33, 1 (1994), 1–27.
[21] Christopher Jung, Michael Kearns, Seth Neel, Aaron Roth, Logan Stapleton, andZhiwei Steven Wu. 2019. Eliciting and Enforcing Subjective Individual Fairness.arXiv:1905.10660 [cs, stat] (May 2019). arXiv:1905.10660 [cs, stat]
[22] Min Kyung Lee, Daniel Kusbit, Anson Kahng, Ji Tae Kim, Xinran Yuan, Al-lissa Chan, Daniel See, Ritesh Noothigattu, Siheon Lee, Alexandros Psomas, andAriel D. Procaccia. 2019. WeBuildAI: Participatory Framework for AlgorithmicGovernance. Proceedings of the ACM on Human-Computer Interaction 3, CSCW(Nov. 2019), 181:1–181:35. https://doi.org/10.1145/3359283
[23] Thomas J. Leeper, Sara B. Hobolt, and James Tilley. 2020. Measuring SubgroupPreferences in Conjoint Experiments. Political Analysis 28, 2 (2020), 207–221.
[24] Weiwen Leung, Zheng Zhang, Daviti Jibuti, Jinhao Zhao, Maximilian Klein, CaseyPierce, Lionel Robert, and Haiyi Zhu. 2020. Race, Gender and Beauty: The E�ectof Information Provision on Online Hiring Biases. In Proceedings of the 2020 CHIConference on Human Factors in Computing Systems. 1–11.
[25] Omar Lizardo and Michael Strand. 2010. Skills, Toolkits, Contexts and Institu-tions: Clarifying the Relationship between Di�erent Approaches to Cognition inCultural Sociology. Poetics 38, 2 (April 2010), 205–228. https://doi.org/10.1016/j.poetic.2009.11.003
[26] Keri Mallari, Kori Inkpen, Paul Johns, Sarah Tan, Divya Ramesh, and Ece Kamar.2020. Do I Look Like a Criminal? Examining how Race Presentation ImpactsHuman Judgement of Recidivism. In Proceedings of the 2020 CHI Conference onHuman Factors in Computing Systems. 1–13.
[27] Ritesh Noothigattu, Snehalkumar S. Gaikwad, Edmond Awad, Sohan Dsouza, IyadRahwan, Pradeep Ravikumar, and Ariel D. Procaccia. 2018. A Voting-Based Sys-tem for Ethical Decision Making. In Thirty-Second AAAI Conference on Arti�cialIntelligence.
[28] Gabriele Paolacci and Jesse Chandler. 2014. Inside the Turk: UnderstandingMechanical Turk as a Participant Pool. Current Directions in Psychological Science23, 3 (June 2014), 184–188. https://doi.org/10.1177/0963721414531598
[29] Gabriele Paolacci, Jesse Chandler, and Panagiotis G. Ipeirotis. 2010. RunningExperiments on Amazon Mechanical Turk. Judgment and Decision making 5, 5

(2010), 411–419.[30] Michael Bang Petersen. 2012. Social Welfare as Small-Scale Help: Evolutionary
Psychology and the Deservingness Heuristic. American Journal of Political Science56, 1 (2012), 1–16.
[31] Michael Bang Petersen, Rune Slothuus, Rune Stubager, and Lise Togeby. 2011.Deservingness versus Values in Public Opinion on Welfare: The Automaticity ofthe Deservingness Heuristic. European Journal of Political Research 50, 1 (2011),24–52.
[32] Toni Rodon and Marc Sanjaume-Calvet. 2020. How Fair Is It? An ExperimentalStudy of Perceived Fairness of Distributive Policies. The Journal of Politics 82, 1(2020), 384–391.
[33] John E. Roemer and Alain Trannoy. 2016. Equality of Opportunity: Theory andMeasurement. Journal of Economic Literature 54, 4 (2016), 1288–1332.
[34] Nripsuta Ani Saxena, Karen Huang, Evan DeFilippis, Goran Radanovic, David C.Parkes, and Yang Liu. 2020. How Do Fairness De�nitions Fare? Testing PublicAttitudes towards Three Algorithmic De�nitions of Fairness in Loan Allocations.Arti�cial Intelligence 283 (June 2020), 103238. https://doi.org/10.1016/j.artint.2020.103238
[35] Megha Srivastava, Hoda Heidari, and Andreas Krause. 2019. MathematicalNotions vs. Human Perception of Fairness: A Descriptive Approach to Fairnessfor Machine Learning. In Proceedings of the 25th ACM SIGKDD InternationalConference on Knowledge Discovery & Data Mining (KDD ’19). Association forComputing Machinery, Anchorage, AK, USA, 2459–2468. https://doi.org/10.1145/3292500.3330664
[36] M.E. Tankard and Elizabeth Levy Paluck. 2016. Norm Perception as a Vehicle forSocial Change. Social Issues and Policy Review 10, 1 (2016), 181–211.
[37] R Core Team et al. 2013. R: A language and environment for statistical computing.(2013).
[38] Kees Van den Bos. 2003. On the Subjective Quality of Social Justice: The Roleof A�ect as Information in the Psychology of Justice Judgments. Journal ofpersonality and social psychology 85, 3 (2003), 482.
[39] Kees Van den Bos and E. Allan Lind. 2002. Uncertainty Management by Meansof Fairness Judgments. (2002).
[40] Wim van Oorschot. 2000. Who Should Get What, and Why? On DeservingnessCriteria and the Conditionality of Solidarity among the Public. Policy & Politics28, 1 (2000), 33–48.
[41] Ruotong Wang, F Maxwell Harper, and Haiyi Zhu. 2020. Factors In�uencingPerceived Fairness in Algorithmic Decision-Making: Algorithm Outcomes, De-velopment Procedures, and Individual Di�erences. In Proceedings of the 2020 CHIConference on Human Factors in Computing Systems. 1–14.
[42] Nicholas Winter, Tyler Burleigh, Ryan Kennedy, and Scott Cli�ord. 2019. ASimpli�ed Protocol to Screen Out VPS and International Respondents Using Qualtrics.SSRN Scholarly Paper ID 3327274. Social Science Research Network, Rochester,NY.
[43] Allison Woodru�, Sarah E. Fox, Steven Rousso-Schindler, and Je�rey Warshaw.2018. A Qualitative Exploration of Perceptions of Algorithmic Fairness. In Pro-ceedings of the 2018 CHI Conference on Human Factors in Computing Systems(CHI ’18). Association for Computing Machinery, Montreal QC, Canada, 1–14.https://doi.org/10.1145/3173574.3174230
[44] Mohammad Yaghini, Hoda Heidari, and Andreas Krause. 2019. A Human-in-the-Loop Framework to Construct Context-Dependent Mathematical Formulationsof Fairness. arXiv:1911.03020 [cs] (Nov. 2019). arXiv:1911.03020 [cs]