Good Gets - Wwipl.com
188
Better Good Gets 24 th Annual Report 2016-17
-
Upload
khangminh22 -
Category
Documents
-
view
0 -
download
0
Transcript of Good Gets - Wwipl.com

BetterGood Gets
24th Annual Report
2016-17
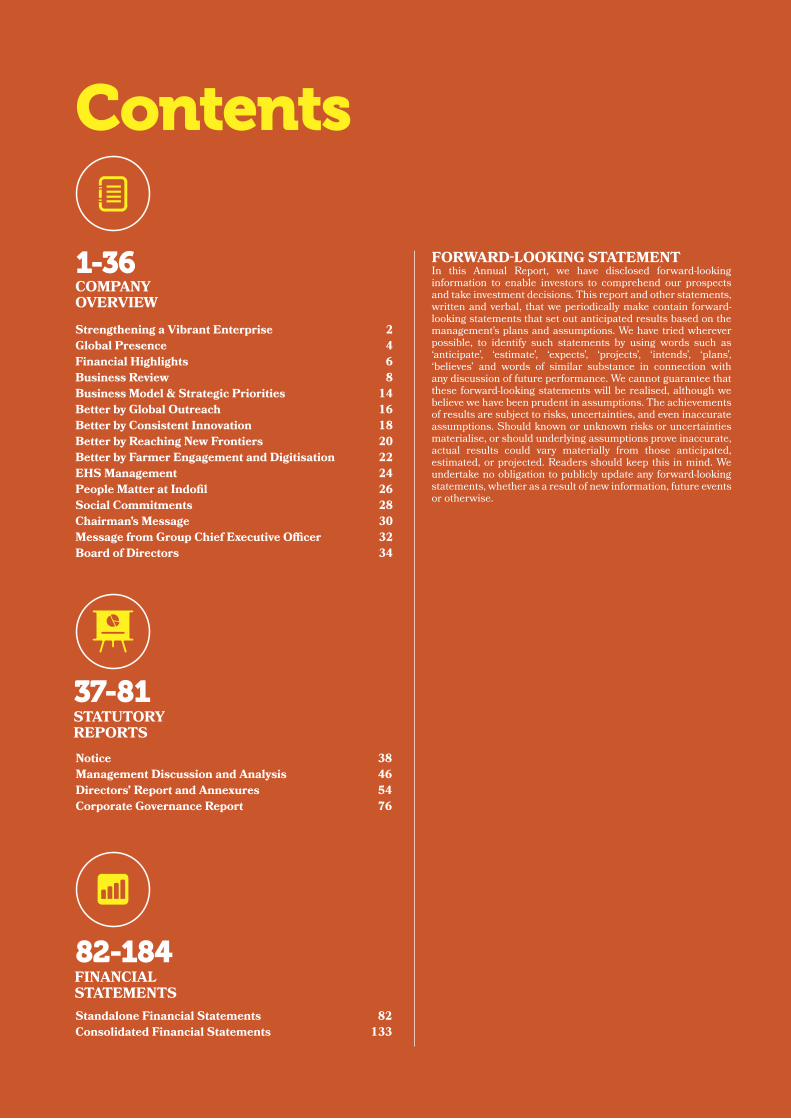
1-36
STATUTORY REPORTS
FINANCIAL STATEMENTS
COMPANY OVERVIEW
Strengthening a Vibrant Enterprise 2
Global Presence 4
Financial Highlights 6
Business Review 8
Business Model & Strategic Priorities 14
Better by Global Outreach 16
Better by Consistent Innovation 18
Better by Reaching New Frontiers 20
Better by Farmer Engagement and Digitisation 22
EHS Management 24
People Matter at Indofil 26
Social Commitments 28
Chairman’s Message 30
Message from Group Chief Executive Officer 32
Board of Directors 34
37-81
82-184
Contents
Notice 38
Management Discussion and Analysis 46
Directors’ Report and Annexures 54
Corporate Governance Report 76
Standalone Financial Statements 82
Consolidated Financial Statements 133
FORWARD-LOOKING STATEMENTIn this Annual Report, we have disclosed forward-looking information to enable investors to comprehend our prospects and take investment decisions. This report and other statements, written and verbal, that we periodically make contain forward-looking statements that set out anticipated results based on the management’s plans and assumptions. We have tried wherever possible, to identify such statements by using words such as ‘anticipate’, ‘estimate’, ‘expects’, ‘projects’, ‘intends’, ‘plans’, ‘believes’ and words of similar substance in connection with any discussion of future performance. We cannot guarantee that these forward-looking statements will be realised, although we believe we have been prudent in assumptions. The achievements of results are subject to risks, uncertainties, and even inaccurate assumptions. Should known or unknown risks or uncertainties materialise, or should underlying assumptions prove inaccurate, actual results could vary materially from those anticipated, estimated, or projected. Readers should keep this in mind. We undertake no obligation to publicly update any forward-looking statements, whether as a result of new information, future events or otherwise.

One of the fascinating aspects of India is that the creativity of its people, along with their innovation and entrepreneurial skills is setting an interesting benchmark in socio-economic growth. That too at a time, when the world is passing through a phase of significant volatility and fragile economic growth.
At Indofil, we work hard to create
a better future every day. We
partner our clients to increase their
productivity with our agro and
specialty chemicals and help them
enhance productivity.
Our outlook is inherently long term.
Our objective is to support farmers
in their journey towards sustainable
success. We aim to be flexible,
innovative and efficient in all our
operations consistently.
Our strategic focus is on increasing
and delivering specific solutions to
help farmers meet and exceed the
challenges of today and tomorrow.
We are committed to boosting
agricultural productivity through
innovation and technology.
At Indofil, we have crossed several
milestones, but our achievements
have never made us complacent.
We are enhancing our capability to
deliver on the expectations of our
customers every day.
We strengthened our business
across multiple fronts and continued
to move towards building a long
term strategy. During the year, we
grew our offerings and geographic
reach to address food security. We
enhanced our R&D investments
to drive leadership in advancing
agricultural technologies. At the
same time, we forayed into the Plant
Nutrition business to seek new
avenues of growth.
We invested and added our
manufacturing capability for future
growth requirements. Above all,
we improved farmer profitability
through more efficient, sustainable
technology and products that
increase their productivity.
The outcome of our initiatives is
encouraging from a financial and
operational perspective. And we will
continue to focus on making a good
company an even better one.
2
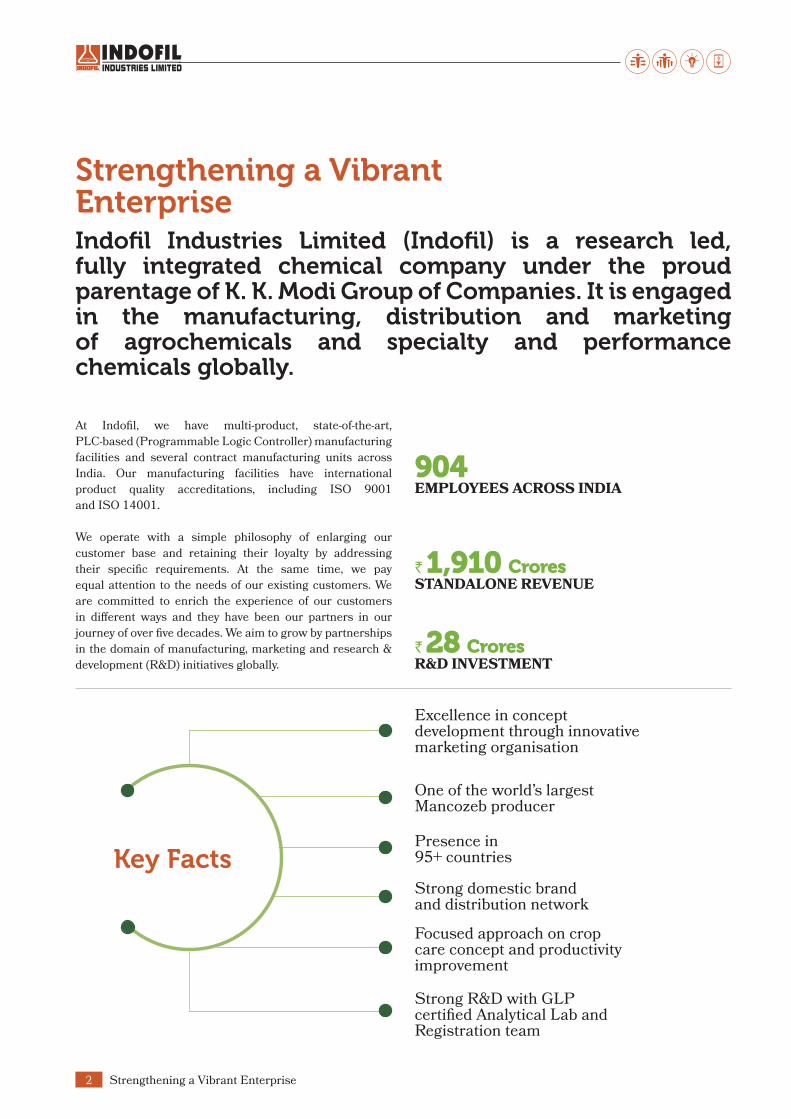
Strengthening a Vibrant Enterprise Indofil Industries Limited (Indofil) is a research led, fully integrated chemical company under the proud parentage of K. K. Modi Group of Companies. It is engaged in the manufacturing, distribution and marketing of agrochemicals and specialty and performance chemicals globally.
At Indofil, we have multi-product, state-of-the-art,
PLC-based (Programmable Logic Controller) manufacturing
facilities and several contract manufacturing units across
India. Our manufacturing facilities have international
product quality accreditations, including ISO 9001
and ISO 14001.
We operate with a simple philosophy of enlarging our
customer base and retaining their loyalty by addressing
their specific requirements. At the same time, we pay
equal attention to the needs of our existing customers. We
are committed to enrich the experience of our customers
in different ways and they have been our partners in our
journey of over five decades. We aim to grow by partnerships
in the domain of manufacturing, marketing and research &
development (R&D) initiatives globally.
Key Facts
EMPLOYEES ACROSS INDIA
STANDALONE REVENUE
R&D INVESTMENT
904
` 1,910 Crores
` 28 Crores
One of the world’s largest Mancozeb producer
Presence in 95+ countries
Excellence in concept development through innovative marketing organisation
Focused approach on crop care concept and productivity improvement
Strong domestic brand and distribution network
Strong R&D with GLP certified Analytical Lab and Registration team
Strengthening a Vibrant Enterprise

Annual Report 2016-17 3
COMPANY OVERVIEW
1-36 37-81 82-184
STATUTORY REPORTS FINANCIAL STATEMENTS
Vision To be a global leader in
growth and customer success.
Mission Our mission is to achieve leadership in growth rate. We
all leverage our efficient R&D, registration, manufacturing
and marketing competencies through our committed and
proficient team. We will strive to make our customers
successful by providing high quality products, services
and solutions in domestic and global markets. To expedite
growth, we will use collaborations, acquisitions and
manufacturing proximity to the market in the segments of
crop care, specialty & performance chemicals.
Enduring ValuesCustomer Success Believing that our success lies in the success of existing
and potential customers. Based on this foundation, Indofil
is doing all possible to understand, fulfil and exceed the
customer’s stated and unstated needs, thus enabling them to
succeed on a continual basis.
Knowledge Continuously upgrading skills and knowledge about
technology, markets, products, customers, regulations
and business processes. Encourage new ideas and
their implementation across the Company for
commercial benefits.
ProsperityWinning, doing better than others through exploiting new
opportunities and enhancing the interests of every employee,
shareholder and stakeholder. To be recognised and perceived
among the leaders in the segment of operation.
TeamworkEmployees and channel partners thinking and working
together across functions, businesses and geographies,
leveraging the available resources to achieve common goals.
VelocityResponding to internal and external customers with a sense
of urgency by consistent, focused and accelerated growth
of the organisation with timely and optimal utilisation
of all resources.
Plant
Thane, Maharashtra
Dahej, Gujarat
Synthesis Plant, Dahej, Gujarat
Existing Capacity (Tonnes)
20,000 TPA
30,000 TPA
4,000 TPA
Business DomainsAgrochemicals (fungicides, insecticides, herbicides,
acaricides, plant growth regulators, surfactants and
plant nutrition)
Specialty and Performance Chemicals (Performance
chemicals for textile, plastic, coating & construction, and
leather industries)
Manufacturing Capacities

4
GlobalPresence
New Registrations/Approvals Submitted 71 applications for International registrations
Received 49 Overseas registrations.
AccreditationsIn addition to being ISO 9001 certified, our facilities have the
following accreditations:
Good Laboratory Practices (GLP) Certification for our
R&D facility.
National Accreditation Board for Testing and Calibration
Laboratories (NABL) for our R&D facility.
OHSAS 18001 and ISO 14001 for Dahej Plant.
Offices1 Mumbai, India2 Dhaka, Bangladesh3 Shanghai, China4 Amsterdam, Netherlands5 Milan, Italy6 Costa Rica7 Sao Paulo, Brazil8 Yangon, Myanmar
Exploratory Markets Existing Markets
6
7
Global Presence

Annual Report 2016-17 5
COMPANY OVERVIEW
1-36 37-81 82-184
STATUTORY REPORTS FINANCIAL STATEMENTS
Awards & Recognition Recognised as the Industry Best (Manufacturing &
Production) and India’s Best companies to work for 2017
– Top 50 a study conducted by The Economic Times in
partnership with the Great Place to Work ® Institute.
2017- ‘Best Welfare Practices Award 2017’ (Rank 2)
was awarded to Thane Plant by the Directorate of
Industrial Safety And Health (DISH) covering the entire
Thane Division, at the Belapur Industrial Association
Hall, Thane.
‘Silver Award’ to Thane Plant under HR (Retention
Strategy) category. The award was presented by ‘Ek
Kaam Desh Ke Naam (EKDKN)’ in 1st Annual EKDKN
Exceed Award 2017 at New Delhi.
‘Gold Award’ to Thane Plant & Dahej Plant Under ‘Best
OHS System Award’ category. The award was presented
by ‘Ek Kaam Desh Ke Naam (EKDKN)’ in 1st Annual
EKDKN Exceed Award 2017 at New Delhi.
‘Gold Medal and Achievement Certificate’ to Dahej Plant
from India Green Manufacturing Challenge 2016.
Honourable Chairman Shri K. K. Modi awarded
‘Excellence as The Agro ALCHEMIST’ at the GLOBE
Platinum Awards 2016 (World Business Conclave,
December 11, 2016).
Indofil was awarded ‘The Pioneer in Agrochemical
Manufacturing’ at the GLOBE Platinum Awards 2016
(World Business Conclave, December 11, 2016).
Indofil Thane Plant awarded the Certificate of Merit for
achieving Zero Accident Frequency in the year by the
National Safety Council – Maharashtra Chapter.
Indofil won a Silver award in the Coaching and Mentoring
Category at the TISS – Leap Vault CLO Awards held
during the 5th edition of Chief Learning Officers Summit
in Mumbai.
1 2
3
4
5
8

6
Standalone Total Revenue (` in Lakhs)
1,90,960
2012-13 2013-14 2014-15 2015-16 2016-17
1,71,555
1,49,9061,36,640
1,12,977
Standalone EBITDA (` in Lakhs)
36,237
2012-13 2013-14 2014-15 2015-16 2016-17
29,805
24,50623,486
13,258
Standalone Profit After Tax (` in Lakhs)
21,804
2012-13 2013-14 2014-15 2015-16 2016-17
16,519
10,2649,095
6,231
Standalone Net Worth (` in Lakhs)
94,535
2012-13 2013-14 2014-15 2015-16 2016-17
74,419
59,325
43,12534,998
Financial Highlights
Financial Highlights

Annual Report 2016-17 7
COMPANY OVERVIEW
1-36 37-81 82-184
STATUTORY REPORTS FINANCIAL STATEMENTS
Standalone Net Profit Margin (%)
11
2012-13 2013-14 2014-15 2015-16 2016-17
10
77
6
Standalone Gross Fixed Assets (` in Lakhs)
86,222
2012-13 2013-14 2014-15 2015-16 2016-17
75,055
57,783
81,75872,836
Standalone Book Value Per Share (`)
443
2012-13 2013-14 2014-15 2015-16 2016-17
349
279
209169
Standalone EBITDA Margin (%)
19
2012-13 2013-14 2014-15 2015-16 2016-17
1716
17
12
Standalone Earnings Per Share (`)
102
2012-13 2013-14 2014-15 2015-16 2016-17
77
4944
30

8
AgrochemicalsIndofil’s portfolio of agrochemicals
includes fungicides, insecticides,
herbicides, acaricides, plant growth
regulators, surfactants and plant
nutrition. The division can develop and
deliver innovative active ingredients and
improved formulations that increase
the crop health and lead to a better
farm output.
We are committed to excellence in
product quality and service. Our
focus is on ensuring the well-being
of farmers and to protect crops and
Key Highlights – 2016-17 Achieved record growth in revenue
and profitability vis-à-vis the previous
year, despite adverse climatic
condition due to optimum product
positioning and pricing
Introduced Zechor, a herbicide in
the paddy segment; its early post
emergent paddy herbicide having
best efficacy against sedges, broad
leaf weeds and grasses
Co-marketing initiative helped
to support business growth and
penetration; introduced three new
products by way of Co-marketing
(Indo TPM – Thiophanate Methyl,
Speed Extra – Pendimethalin CS
and Prakat – Metsulfuron Methyl)
generate better farm yield. The division
is supported by agricultural graduates/
doctorates and strong marketing,
technical, sales/logistics group.
The crop productivity improvement
programme is designed to educate
farmers for effective and economic
ways of crop protection and improve
crop yields.
Domestic
REGIONAL SALES OFFICES IN INDIA
9
DISTRIBUTORS ACROSS INDIA
5,400
REVENUE` 901 Crores
REVENUE SHARE46%
REVENUE GROWTH14%
Business Review
Business Review

Annual Report 2016-17 9
COMPANY OVERVIEW
1-36 37-81 82-184
STATUTORY REPORTS FINANCIAL STATEMENTS

10
FungicidesFungicides represent a class of pesticides, made of chemical
compounds and biological organisms. These are used to kill
or prevent the growth of fungi in crops, thus ensuring better
quality and enhanced productivity.
BrandsIndofil M-45, Indofil Z-78, Avtar, Sprint, Merger, Indofil’s
Baan, Baan Gold, Matco 8-64, Moximate, Companion,
Boon, Noor, Bactrinashak, Benfil, Captra, Dhan,
Eurofil-NT, Sitara, Sulfil, Trucop, Manfil, Sitara Plus,
Share, Debut, Indo TPM.
Business Review (Contd.)
HerbicidesHerbicides play a major role in ensuring proper growth of
crops. These products comprises of a class of pesticides,
popularly known as weed killers, which kill unwanted plants
and weeds without harming the desired crop.
BrandsSociety, Oxygold, Passport, Gromate, Zechor, Chase,
Offset, Clean up, Atrafil, Overtake, Prakat, Speed Extra.
InsecticidesOnce insects infect crops, it becomes difficult to contain the
infection naturally. They spread fast, causing considerable
loss to crops. Insecticides offered by us kills or prevents
multiplication of insects in the crop. These also help to
increase farm yield significantly.
BrandsRimon, Token, Beacon GR, Becon SP, Atom, Atom Power,
Agent plus, Agent Capsule, Volax, Lift, Gem, Blaze, Stalker
SC, Stalker GR, Click, Flash, Dash, Asset, Raze.
Business Review
Annual Report 2016-17 11
COMPANY OVERVIEW
1-36 37-81 82-184
STATUTORY REPORTS FINANCIAL STATEMENTS
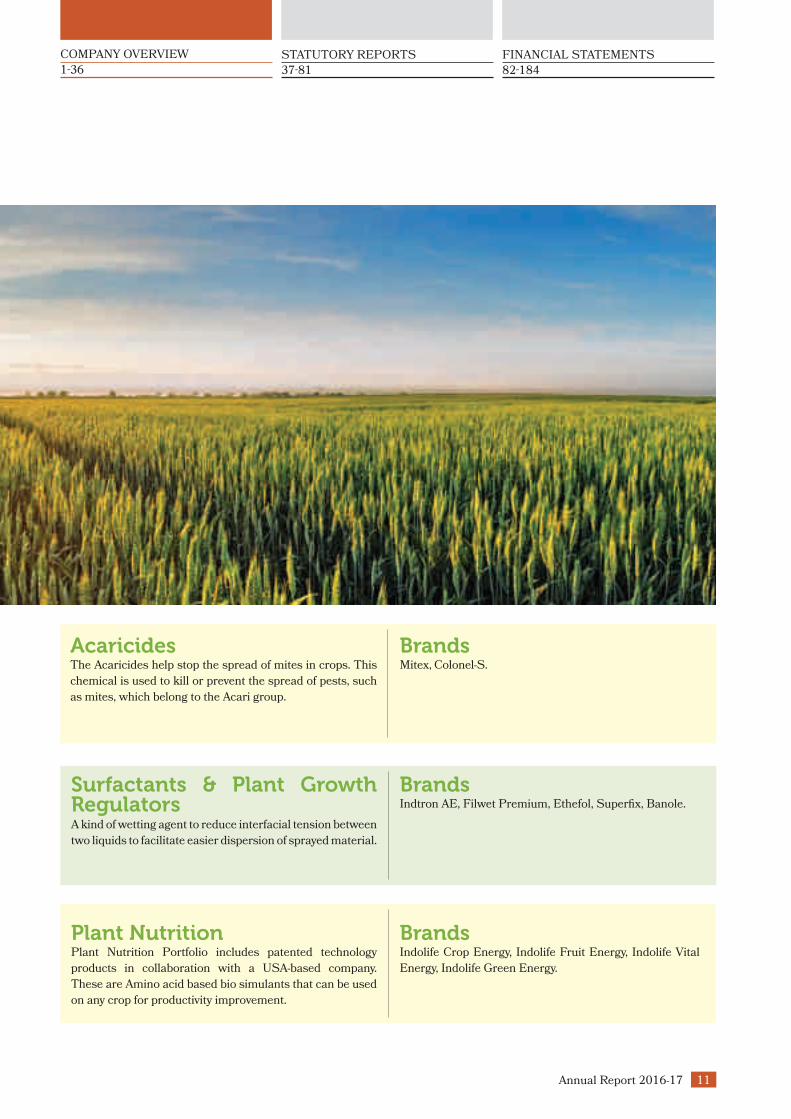
AcaricidesThe Acaricides help stop the spread of mites in crops. This
chemical is used to kill or prevent the spread of pests, such
as mites, which belong to the Acari group.
BrandsMitex, Colonel-S.
Plant Nutrition Plant Nutrition Portfolio includes patented technology
products in collaboration with a USA-based company.
These are Amino acid based bio simulants that can be used
on any crop for productivity improvement.
BrandsIndolife Crop Energy, Indolife Fruit Energy, Indolife Vital
Energy, Indolife Green Energy.
Surfactants & Plant Growth RegulatorsA kind of wetting agent to reduce interfacial tension between
two liquids to facilitate easier dispersion of sprayed material.
BrandsIndtron AE, Filwet Premium, Ethefol, Superfix, Banole.

12
REVENUE SHARE43%
REVENUE GROWTH15%
International OfferingsIndofil's International Business
comprises offerings from
Agrochemicals as well as Specialty
Chemicals across 95+ countries
TechnicalsMancozeb, Cymoxanil, Metalaxyl,
Tricyclazole, Myclobutanil, Maneb,
Zineb, Dodine
Ethylene-bis-dithiocarbamates(EBDC) mixtures and formulations
Mancozeb + Metalaxyl, Mancozeb
+ Carbendazim, Mancozeb
+ Cymoxanil, Mancozeb +
Hexaconazole, Mancozeb +
Tricyclazole, Myclobutanil WP/EC,
Mancozeb WP/WG/SC, Tricyclazole
75% WP, Dodine 65% WP
International
OVERSEASOFFICES
7
DISTRIBUTORS300+
REVENUE` 846 Crores
International BusinessKey Highlights – 2016-17 Achieved a record growth over
previous years in stark contrast to
a challenging global agrochemical
market, aggressive pricing and
competition.
Fully operationalised our
Netherlands subsidiary, registering
a record profit during the year. The
focus now would be on increasing
our market penetration further in
Europe.
In line with our global outreach
programme, set up offices in Brazil,
Myanmar and at advanced stages in
the Philippines.
Focusing on improving our global
registration portfolio, especially in
Europe, LATAM and APAC regions.
Business Review

Annual Report 2016-17 13
COMPANY OVERVIEW
1-36 37-81 82-184
STATUTORY REPORTS FINANCIAL STATEMENTS
REVENUE SHARE REVENUE SHARE10% 1%
REVENUE GROWTH REVENUE GROWTH14% 27%
Specialty and Performance Chemicals Division (SPCD)
The Specialty and Performance
Chemicals (SPC) division caters to
the needs of small, medium and large
industrial manufacturers globally
through a network of zonal, regional
offices and stock points at major centres.
With our state-of-the-art technologies
and strong brand equity, we emerged as
the leading manufacturer and supplier
in the SPCD industry. We have three
manufacturing facilities in Thane, Navi
Mumbai and Vapi, along with highly
qualified and well-experienced sales
team. The primary industries to whom
we supply comprises leather, coating,
textile, plastics and construction.
Leather IndustryPreservatives, Soaking and Wetting
Agents, Degreasing Agents, Powder
Syntans, Acrylic Syntans, Fatliquors,
WR Fats, Resin
Binders, Impegnation systems,
Compact Binders, PU Binders,
Protein Binders, Lacquer and
Lacquer Emulsions, Waxes and
Fillers
Textile IndustryAcrylic Binders, PU Emulsions,
Silicone Emulsions, Water
Repellents, Fixing Agents,
Pigment Emulsions, Customised
Compounds, Thickners
Coatings and ConstructionWater Based Emulsions, Dispersing
Agents, Thickners, Defoamers/Wetting
Agents, Re-Dispersible Powders,
Cement Modifiers, Water Proofing
Chemicals, Rheology Modifiers
Plastic IndustryImpact modifiers, Plasticisers,
Processing aids, Heat stabilisers,
Blowing Agents and lubricants
Domestic International
OFFICES4
DISTRIBUTORS80
REVENUE REVENUE` 185.53 Crores ` 28.52 Crores
Key Highlights SPCD Business has seen an increase
in customer engagements, by
getting new application laboratories
established in key customer demand
zones. This has led to an increase
in the number of end users for
the products and partners with
enhanced geographic reach.
It has successfully launched new
products in key growth industries
such as Plastics Additives
and Coatings.
It is working in close partnership
with end customers and is now
progressing to establish applications
in new innovative requirements of
the industry.

14
Business Model & Strategic Priorities
Robust Model for Value CreationAt Indofil, our key differentiation rests in the unique value proposition we provide to our customers.
We leverage our capabilities across the value chain and provide integrated and innovative solutions.
We believe in partnership approach, which we have built over the years on the strong foundation of Trust,
Integrity and IP protection.
What We Do
What We Create
The Value we Provide
Integrated Business Model Our end-to-end capabilities across research & development,
manufacturing and formulation, product development, brand
building, marketing and distribution and a strong customer
connect, based on partnership method differentiate us. This
strategy provides control over the complete value chain and
helps produce consistent product excellence, delivered on
time across geographies.
Agriculture Chemicals Fungicides, Insecticides,
Herbicides, Acaricides,
Plant Growth Regulators,
Surfactants, Plant Nutrition.
CustomersWe offer complete crop care solutions
from seeds to post-harvest solutions.
(Key Differentiators)
(Products, Services and Solutions)
(Key Beneficiaries)
Business Model & Strategic Priorities

Annual Report 2016-17 15
COMPANY OVERVIEW
1-36 37-81 82-184
STATUTORY REPORTS FINANCIAL STATEMENTS
EmployeesWe employ a global talent pool of
915 employees from 5 countries.
We drive business growth
through efficient team operations.
CommunityWe invest in community support
initiatives in the fields of health
and education.
ShareholdersWe appreciate shareholder value
(Net Worth) by 2.7 times over the last
five years.
Specialty & Performance Chemicals Textile, Plastic, Coating and
Leather Chemicals.
Long-Standing Relationship We have built a reputation of trust
and reliability with global innovators
over the last several decades. We have
nurtured a strong relationship with our
farmers by providing reliable products
and solutions to their needs.
Focused Approach We focus on creating products and
solutions for major food grains, fruits
and vegetables.
We concentrate on markets and develop
products and solutions according to the
requirements of those geographies.
We enhance distribution to reach key
markets and within these markets
penetrate deeper.
World-class infrastructureOur research facilities, QC laboratories
and manufacturing units are equipped
with modern machinery, equipment,
technology and processes and
have best-in-class certifications and
accreditations.
Strategic PrioritiesAugment and Modernise Production
Capacities: Indofil has drawn up plans
to modernise its production facility,
particularly for the specialty and
performance chemicals division.
Launch New Products and Chemicals:
The Company is constantly launching
new products and brands every year. To
expand the market share further and
tap into new markets, we will continue
to focus on introducing new brands in
the coming years.
Increase International Presence:
Experts have warned that global
warming will affect agricultural
production across the world, with
increased incidences of droughts, floods
and other extreme weather events.
The global demand for agrochemicals
is thus estimated to grow attractively.
Indofil is rapidly expanding its
international business, along with value-
added distribution and collaboration to
capitalise on this opportunity.
Strengthen the R&D Activities:
Indofil is among the few companies
in the agrochemical industry to have
been accredited by NABL (National
Accreditation Board for Testing and
Calibration Laboratories). Going
forward, we will sharpen our focus
on R&D initiatives to accelerate
product development.

16
We are expanding our capacity, enhancing our global presence and developing our capabilities in line with the customer aspirations. At the same time, we are building a risk-minimised business model as a part of our commitment to create long term value for all stakeholders.
Better by
Global Outreach

17
COMPANY OVERVIEW
1-36 37-81 82-184
STATUTORY REPORTS FINANCIAL STATEMENTS
Capacity ExpansionDuring the year, we completed
the setting up of a new Greenfield
Multipurpose Agro Synthesis
facility (Synthesis Project) for the
manufacturing of multi-products
(Technical and Export Formulations)
at the new plot in Dahej SEZ,
Gujarat. This facility has a production
capacity of 4,000 TPA of Technicals.
This plant is operational from
August 2016. It plant is yet another
milestone in Indofil’s journey towards
manufacturing excellence, quality
and efficiency.
In view of the increasing demand,
we also commenced Green-Field
Mancozeb (EBDC) and Specialty
& Performance Chemicals Plant
with an annual production capacity
of 35,000 MTs of EBDC chemicals
and 36,000 MTs of Specialty &
Performance Chemicals.
Offices in Brazil, Myanmar and The PhilippinesWe have forayed into the international
market to emerge as the most
preferred supplier. Over the years,
we have covered a lot of ground
across global markets. We are
recognised across geographies for
being in step with evolving customer
aspirations, offering a wider range of
quality products, technical & logistic
support, customised packing and
prompt delivery.
Our products have reached 95+
countries and our clients include
multinationals. Over the years, we have
worked on backward integration and
fortified our raw materials position to
ensure uninterrupted supply.
During the year, we set up offices
in Sao Paulo, Brazil and Yangon,
Myanmar. We are also in advanced
stage of setting up a office in Manila,
The Philippines. These offices
will facilitate the organisation
and development of various agro
business activities and bolstering
business development in these
countries. The facilities mark a new
beginning towards the expansion of
our Agrochemicals business.
Going forward, the key focus will
be to achieve full potential of all
these markets by elevating them to
the next growth phase. With our
continued success and profound
insight of domestic markets, we will
explore new geographies and build
new relations, while strengthening
our existing markets and customer
relationships. Today, we have carved
out a presence in the global arena
and earned the recognition of being a
reputed supplier.

18
Better by
Creating value proposition in a world that is constantly changing is a challenge in itself. At Indofil, we have progressed by developing innovative processes, upgrading technologies and staying relevant to the business across global markets. Our strong R&D expertise and rich industry experience enable us to launch new products with speed and precision.
Consistent Innovation
Annual Report 2016-17 19
COMPANY OVERVIEW STATUTORY REPORTS FINANCIAL STATEMENTS
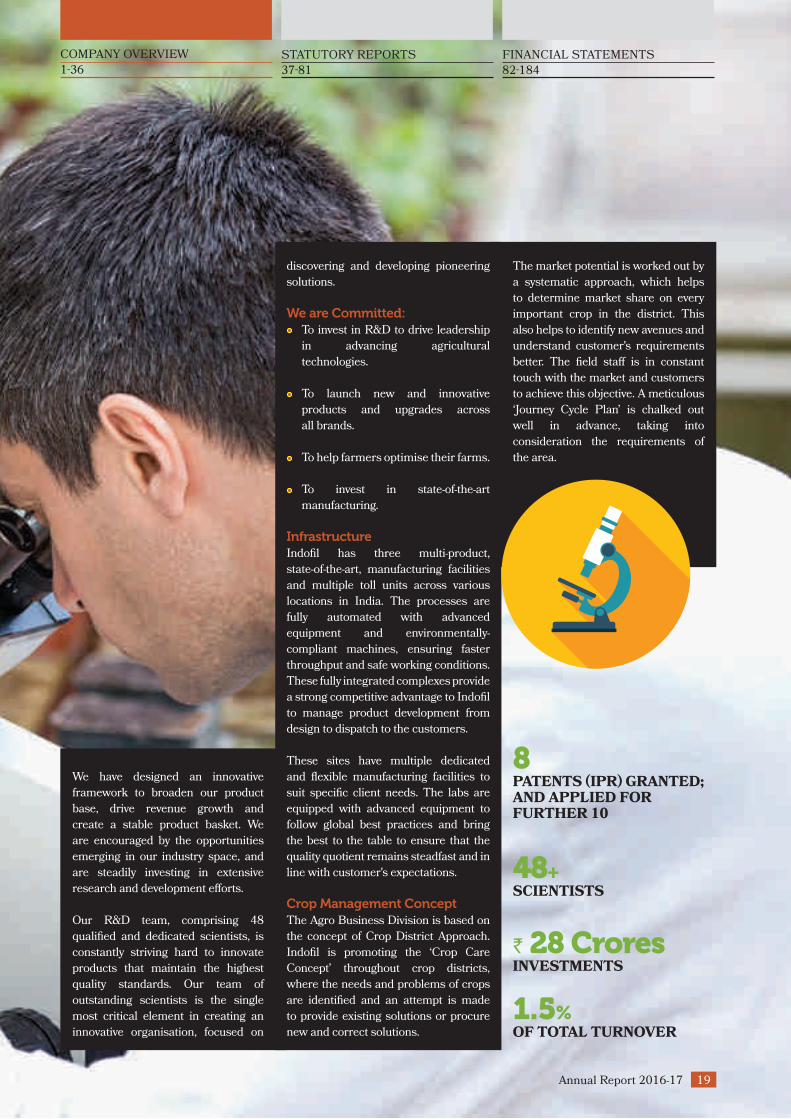
discovering and developing pioneering
solutions.
We are Committed: To invest in R&D to drive leadership
in advancing agricultural
technologies.
To launch new and innovative
products and upgrades across
all brands.
To help farmers optimise their farms.
To invest in state-of-the-art
manufacturing.
InfrastructureIndofil has three multi-product,
state-of-the-art, manufacturing facilities
and multiple toll units across various
locations in India. The processes are
fully automated with advanced
equipment and environmentally-
compliant machines, ensuring faster
throughput and safe working conditions.
These fully integrated complexes provide
a strong competitive advantage to Indofil
to manage product development from
design to dispatch to the customers.
These sites have multiple dedicated
and flexible manufacturing facilities to
suit specific client needs. The labs are
equipped with advanced equipment to
follow global best practices and bring
the best to the table to ensure that the
quality quotient remains steadfast and in
line with customer's expectations.
Crop Management ConceptThe Agro Business Division is based on
the concept of Crop District Approach.
Indofil is promoting the ‘Crop Care
Concept’ throughout crop districts,
where the needs and problems of crops
are identified and an attempt is made
to provide existing solutions or procure
new and correct solutions.
The market potential is worked out by
a systematic approach, which helps
to determine market share on every
important crop in the district. This
also helps to identify new avenues and
understand customer's requirements
better. The field staff is in constant
touch with the market and customers
to achieve this objective. A meticulous
‘Journey Cycle Plan’ is chalked out
well in advance, taking into
consideration the requirements of
the area.
PATENTS (IPR) GRANTED; AND APPLIED FOR FURTHER 10
8
SCIENTISTS48+
OF TOTAL TURNOVER1.5%
INVESTMENTS` 28 Crores
We have designed an innovative
framework to broaden our product
base, drive revenue growth and
create a stable product basket. We
are encouraged by the opportunities
emerging in our industry space, and
are steadily investing in extensive
research and development efforts.
Our R&D team, comprising 48
qualified and dedicated scientists, is
constantly striving hard to innovate
products that maintain the highest
quality standards. Our team of
outstanding scientists is the single
most critical element in creating an
innovative organisation, focused on
37-81 82-1841-36

20
Better by
Reaching New FrontiersFarmers constantly face the challenge to cater to the growing global food demand, while reducing the adverse impact of crop protection practices on consumers, farm workers and the environment. The development of agricultural practices in India has led to the increasing elimination of secondary nutrients and micronutrients from the soil and multiple nutrient deficiencies. These deficiencies are becoming a major restraint to further increase production. This is basically due to nutrient removals far more than nutrient additions.

21
COMPANY OVERVIEW STATUTORY REPORTS FINANCIAL STATEMENTS
The frequent use of synthetic
fertilisers leads to soil infertility,
eutrophication of water bodies
and accumulation of toxic heavy
metals in soil. Thanks to the
recent technological advances and
increasing environment and safety
concerns, biologically-derived
products are becoming increasingly
important.
During the year, we at Indofil, added
the Plant Nutrition vertical under
the brand name of Indolife Super
Specialty Chemicals. The Plant
Nutrition portfolio includes patented
technology products in collaboration
with a USA-based Company. These
are Amino acid based bio simulants
that can be used on any crop for
productivity improvement. This
business complements our efforts
to improve farm productivity by
supplementing secondary and
micronutrient deficiency, prevailing
in Indian soils and focuses on the
marketing of concept products for
Indian agriculture.
In our effort to encourage balanced
fertilisation, our objective is to
emerge as a plant nutrition solution
company by adding speciality
nutrients to our portfolio. We focus
on enhanced customisation to
cater to the varying needs of our
customers.
37-81 82-1841-36

22
Better by
and
Farmer Engagement
Digitisation

Engagement
23
COMPANY OVERVIEW STATUTORY REPORTS FINANCIAL STATEMENTS
We have steadily evolved from our role as a company focusing only on product sale to one putting emphasis on enhancing farmer prosperity. Our function has been that of an evangelist in educating farmers, creating cost-effective products around their specific needs and preparing adequate response to counter climate change and cropping patterns through innovative initiatives. At the same time, we have elevated ourselves from a product supplier to an inclusive crop-solutions company.
In response to the growing digitisation
in the agriculture sector, we plan to
develop an exclusive digital platform.
The strategy is to create specific
data models in the realm of digital
farming, so that we can give farmers
more tailored and sustainable
agronomic recommendations for
improving their yields.
Key Initiatives Agricultural information services,
providing early warning of weather
events, information on the best
times to harvest and guidance on
crop techniques to enhance yields
Field audit enabling auditors
observing quality, sustainability
and certification requirements to
move away from paper records
and as an alternative implement
electronic reporting via tablets and
mobile data, thereby enhancing
efficiency
Smartphone-enabled services
to offer deeper functionality and
better source of information than
is possible, using basic SMS and
voicemail services
We have modified the distribution
network to ensure a constant
interaction between the sales force,
the distributor and the end consumer.
Besides, we have shifted our focus from
crop protection chemical supplier to a
Crop Care Company to stimulate crop
care concept (right solution to crop
problem).
Regular Crop Care training
programmes for farmers are organised
to create awareness of effective crop
protection techniques to minimise crop
losses and improve yields.
The Company’s business processes are
online and are guided through a robust
ERP platform. This is done with the
objective of making sure the products
and services reach the customers in
the shortest possible time. Indofil
consistently strives to develop new
concepts to meet the challenges of
changing crop requirements.
At Indofil, we help farmers to develop
their productivity, increase resource
efficacy and earn a better living. Our
training and support enable farmers
to add value to communities, while
improving food security for millions
of people.
igitisation
37-81 82-1841-36

24
Environment, Health and Safety
Indofil is committed to integrating EHS excellence into business decisions and activities to protect the environment and ensure the safety of employees, contractors, visitors, the communities it operates in and any activity, connected directly or indirectly with Indofil.
The Company operates facilities in a manner that
is consistent with all applicable EHS laws and
regulations and proactively responds to any emergency
situation that may originate from its operations.
Designing and operating facilities and operations
with process safety in mind to prevent events that
could have an adverse impact on people, property
and the environment
Providing a safe and healthy work environment
to all employees, contractors and subcontractors,
including transporters
Conserving natural resources, energy efficiency
and minimising waste from operations and
prevent pollution; and thus strive for Sustainable
Development
Reviewing and reporting EHS performance
externally, while constantly challenging ourselves
to do better
Putting in place appropriate international EHS
standards and resources to ensure Indofil can
achieve EHS goals
Environment, Health and Safety

Annual Report 2016-17 25
COMPANY OVERVIEW
1-36 37-81 82-184
STATUTORY REPORTS FINANCIAL STATEMENTS
Responsible OperationsWe focus on continuous improvement
of occupational safety and welfare as
well as reducing the environmental
impact of our own operations. Our
objective is zero harm. We have also set
strong targets for reducing water and
energy consumption as well as waste
generation, including protecting the
land and conserving scarce resources.
Our Synthesis Plant at Dahej, Gujarat
as well as proposed EBDC plant are
Zero Discharge (ZLD) Plant. This will
ensure sustainability and environment
friendliness.
EnvironmentalStewardshipThe aim of our environmental
stewardship initiative is to be a
prominent business promoter and
conserve the environment for the
benefit of future generations. We
recognise the potential of working
in a manner that is environmentally
suitable and responsible.
We are dedicated to working with our
employees, suppliers and customers
to deliver on our promise environment
friendly practices. We continue to
support sustainable agriculture by
increasing best practices with farmers.
26
People Matter at Indofil
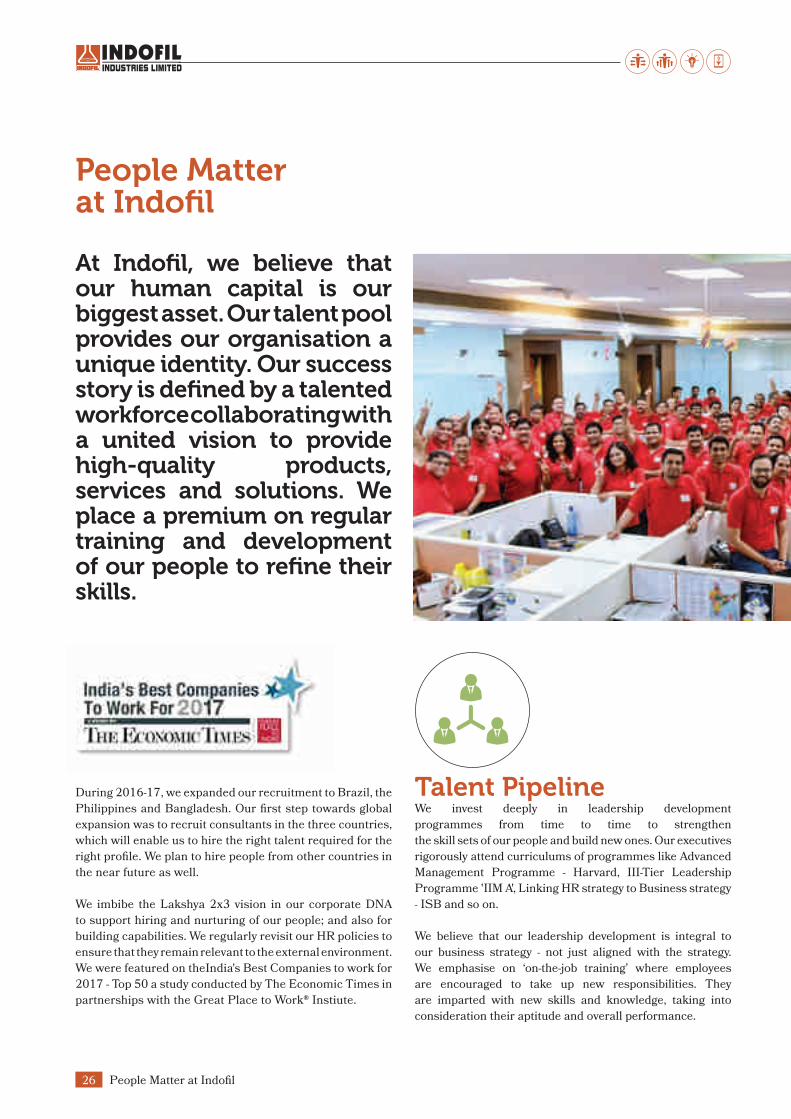
At Indofil, we believe that our human capital is our biggest asset. Our talent pool provides our organisation a unique identity. Our success story is defined by a talented workforce collaborating with a united vision to provide high-quality products, services and solutions. We place a premium on regular training and development of our people to refine their skills.
People Matter at Indofil
Talent PipelineWe invest deeply in leadership development
programmes from time to time to strengthen
the skill sets of our people and build new ones. Our executives
rigorously attend curriculums of programmes like Advanced
Management Programme - Harvard, III-Tier Leadership
Programme 'IIM A', Linking HR strategy to Business strategy
- ISB and so on.
We believe that our leadership development is integral to
our business strategy - not just aligned with the strategy.
We emphasise on ‘on-the-job training’ where employees
are encouraged to take up new responsibilities. They
are imparted with new skills and knowledge, taking into
consideration their aptitude and overall performance.
During 2016-17, we expanded our recruitment to Brazil, the
Philippines and Bangladesh. Our first step towards global
expansion was to recruit consultants in the three countries,
which will enable us to hire the right talent required for the
right profile. We plan to hire people from other countries in
the near future as well.
We imbibe the Lakshya 2x3 vision in our corporate DNA
to support hiring and nurturing of our people; and also for
building capabilities. We regularly revisit our HR policies to
ensure that they remain relevant to the external environment.
We were featured on theIndia's Best Companies to work for
2017 - Top 50 a study conducted by The Economic Times in
partnerships with the Great Place to Work® Instiute.

Annual Report 2016-17 27
COMPANY OVERVIEW
1-36 37-81 82-184
STATUTORY REPORTS FINANCIAL STATEMENTS
Workplace SafetyIn the areas of efficient energy usage, environmental protection
and workplace safety, we meet the highest standards of
corporate citizenship. We have a zero-tolerance policy towards
ensuring the safety and discipline of our employees. We treat
safety as an ongoing process and conduct regular meetings to
drive safety in our facilities. It has led to a significant reduction
of grievances of our employees.
Rewards & RecognitionWe recognise our employees’ contribution and reward
superlative performance by providing both training opportunities
and development on the job. Further, our compensation
practices ensure employees receive incentives for good work.
We celebrate both individual and team achievements and
ensure colleagues are recognised for their contributions.
Leadership Developmenton the JobOur plant-centric approach allows employees to develop a
strong sense of self-motivation, initiative and leadership.
They have the opportunity to independently manage day-to-day
activities at the local level, while keeping the overall company
goals and profitability in sight.
Executive Vice President People Strategy along with Chief Operating Officers of
Global Agro I and II Business receiving the "Great Place To Work 2017" award.

28
At Indofil, we believe that corporate social responsibility (CSR) is critical to our organisational growth and sustainability. Our CSR initiatives are not just about this mandate, but also about working towards improving the lives of the communities we touch.
Our CSR strategy ensures that along with business development, the living standards of communities around our projects also improve. Our CSR Committee actively considers the policies to be implemented and initiatives to be undertaken to align with our philosophy of being a responsible corporate citizen.
PARTNERING IN EDUCATIONOur CSR Committee has identified ‘Promoting and
Supporting Education Programmes’ as the thrust area of our
social endeavours. We believe that the strength of a nation
lies in the hands of an empowered and enlightened society.
The K.K. Modi Group has continued to follow its corporate
credo and has been supporting philanthropic education
for over six decades. The group has created multiple trusts
that own and operate several educational institutes, schools,
colleges and training centres, among others. These
organisations have imparted education to over half a
million students.
The Modi Innovative Education Society (MIES),
Chhattisgarh, is a registered Society, engaged in educational
activities, is establishing a private University, K.K. Modi
University in Village Mahmara, District Durg, Chhattisgarh.
In line with ‘Promoting Education’ as the thrust area of the
Company’s CSR initiatives, contributions have been made to
Social Commitments
Social Commitments

Annual Report 2016-17 29
COMPANY OVERVIEW
1-36 37-81 82-184
STATUTORY REPORTS FINANCIAL STATEMENTS
MIES. For this purpose, Samaj Kalyan Parishad, Ghaziabad,
Uttar Pradesh, a Modi Group Society (registered in 1956)
and having significant experience in educational initiatives
has been appointed as an Implementing Agency to conduct
CSR initiatives, along with MIES and to exercise supervisory
role for completing the said project. The said project is in
accordance with Schedule VII of the Companies Act, 2013.
The Company has contributed an amount of ` 10 Lakhs
to Centre for Research in Information, Publication and
Training (CRIPT), Hyderabad for their Health Skill Training
Program for Youth to be carried in Uttar Pradesh under the
Skill Development and Health awarness initiative.
The Company has contributed an amount of ` 5 Lakhs
as donation to Rajasthan Bal Kalyan Samiti, Udaipur,
Rajasthan, a society registered under Society Registration
Act, 1958 towards their 'Hansraj Children Home' Project for
imparting education to orphan girls children and activities in
relation thereto.
EDUCATION` 178 Lakhs
PUBLIC HEALTH` 10 Lakhs
OTHERS` 32.29 Lakhs
For the year 2015-16
EDUCATION` 274 Lakhs
OTHERS` 32.29 Lakhs
For the year 2016-17

30
Chairman’s Message
We successfully commissioned our 4,000 TPA Agro Synthesis Plant at Dahej this year and taking forward our legacy of ‘Making Good Better’. We commenced the construction of our largest Mancozeb manufacturing facility.
CONSOLIDATED TOTAL INCOME
CONSOLIDATED NET PROFIT
` 1 ,971 Crores ` 259 Crores
Dear Fellow Shareholders,It gives me immense pleasure to
report that your Company has
delivered a remarkable financial
performance, improved capital
efficiency and continued strong
project execution. Our financial and
operational performance in 2016-17
was outstanding, materialising into a
record net profit.
India’s GDP grew by 7.1%, supported
by strong consumption and enhanced
government spending. The agricultural
sector began on a positive note in 2016,
with a better monsoon and good initial
rainfall. The increase in acreages and
production had a critical impact on the
agri input industry as well.
Growth was not consistent across
India, with some areas undergoing the
delayed onset of monsoon or dry spells
and excess rainfall in other areas.
Demonetisation had a pronounced
broad-based impact on the economy in
the fourth quarter. Despite economic
slowdown, the agricultural sector held
up with robust consumption.
On the other side, the pace of global
economic activity was mixed in 2016
due to monetary and fiscal crisis
looming across several developed
economies and uncertainties
surrounding Brexit. Overall, the
demand for crop protection chemicals
from Latin America and Europe was
favourable and a depreciating rupee
during the most part of the year
enhanced the profit pool.
At Indofil, ‘Good keeps getting Better’ as
we continue our quest for sustainable
growth. Our Consolidated Total
Income for the year ended March
31, 2017 stood at ` 1,971 Crores,
a growth of 14.4% vis-à-vis last year.
Our Consolidated Net Profit for the
year stood at ` 259 Crores, compared
Chairman’s Message

Annual Report 2016-17 31
COMPANY OVERVIEW
1-36 37-81 82-184
STATUTORY REPORTS FINANCIAL STATEMENTS
We continue to invest in people with right expertise at all levels, technology and advanced analytics to keep pace with the growth and to ensure that we are well positioned to leverage our established and growing network.
to ` 161 Crores in 2015-16, crossing
yet another milestone. We witnessed a
62% growth vis-à-vis last year and it is
one of the best in the industry.
We successfully commissioned our
4,000 TPA Agro Synthesis Plant at
Dahej, Gujarat this year and taking
forward our legacy of ‘making
good better’, We commenced the
construction of our largest Mancozeb
manufacturing facility. With this facility,
we have embarked upon the journey to
become one of the world’s largest and
preferred Mancozeb supplier. Besides,
we also initiated the construction of our
Specialty & Performance Chemicals
plant to make our business self-reliant
and sustainable.
With our Netherlands subsidiary fully
operational, we have set eyes on Brazil
and the Philippines for expanding
our Value Added Distribution (VAD)
network.
Future AheadAs an economy with a strong
agricultural base, India is blessed with
immense natural resources, which
if harnessed responsibly have the
potential to impel us to sustainable
economic growth for the next few
decades.
The focus of the current regime
is towards creating a strong, self-
reliant nation. Goods and Service
Tax (GST), Make In India Campaign
and other such reform measures are
expected to go a long way in fulfilling
this desire. The Government has
also put significant thrust on rural
and farm development, evident
through its record high budgetary
allocation towards agricultural credit,
development and integration of
NABARD, Fasal Bima Yojna, National
Agricultural Market (e-NAM) and
MGNREGA, among others.
We are aware that this vision of ours
will come true only if we are able
to successfully partner with our
consumer (crop), user (farmer) and
customer (channel). At Indofil, we
have taken necessary steps towards
the realisation of our final goal. We are
certain that we will be able to achieve
our goals and create greater value,
going forward.
We are continuously investing in
our strong in-house research and
incentivising our R&D team to create
farm solutions. These solutions are
agronomically conducive and add
value to customers and our portfolio.
We are confident that the long term
dynamics of Indian agriculture are very
attractive. We, at Indofil, are committed
to leverage the growth prospects
nationally and internationally. Besides,
with plans in the near future to expand
internationally, the Company believes
that we are well placed to embark
upon the next stage of growth and
stakeholder value creation.
We continue to invest in people with
relevant expertise at all levels. We
are also adopting high technology
standards and advanced analytics to
keep pace with growth; and to ensure
that we are well-positioned to leverage
our established and growing network.
Our success is attributed to our robust
sales force, research and development
team, committed leadership,
distributors, suppliers, shareholders,
bankers and most importantly the
farmers with whom we work. I am
grateful to my fellow shareholders for
supporting our vision and encouraging
us to keep making good better.
I take this opportunity to express
my sincere appreciation to all our
stakeholders for their steadfast support
that helped set new benchmarks and
seek new frontiers.
We look forward to your continued
support and co-operation in our journey
towards making Indofil an even better
company, in the years to come.
Regards,
K.K. ModiChairman and Managing Director
32
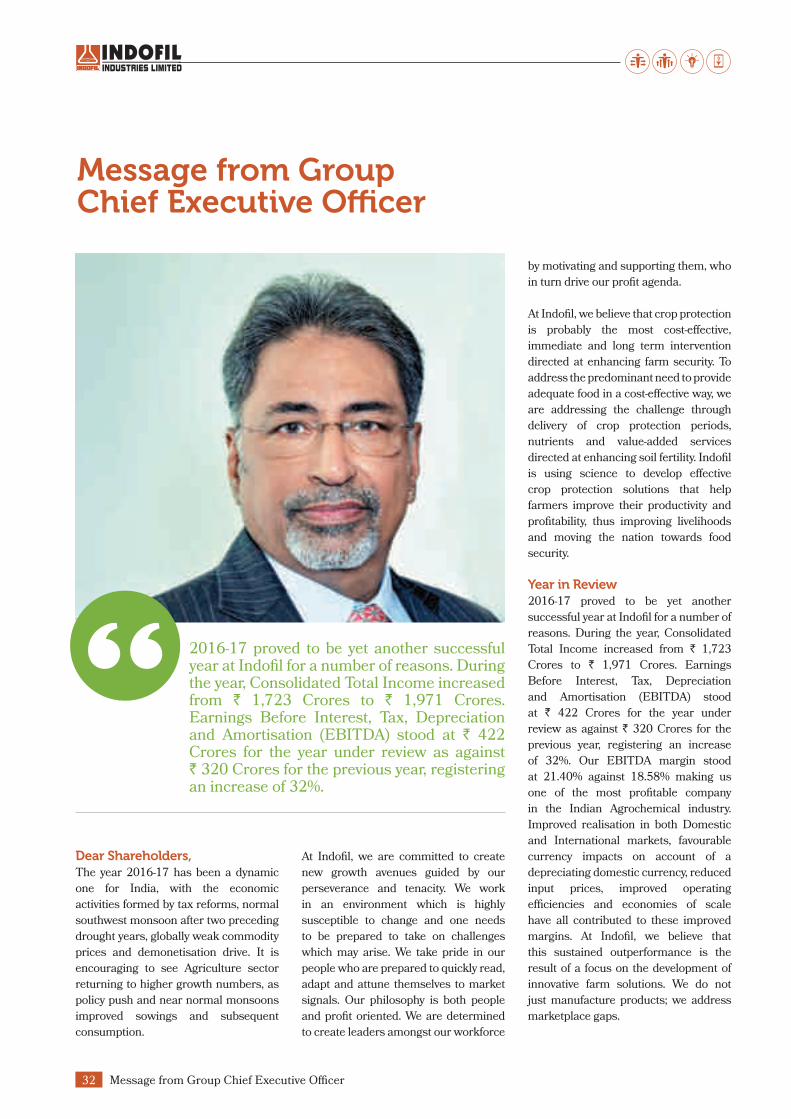
Message from Group Chief Executive Officer
Dear Shareholders,The year 2016-17 has been a dynamic
one for India, with the economic
activities formed by tax reforms, normal
southwest monsoon after two preceding
drought years, globally weak commodity
prices and demonetisation drive. It is
encouraging to see Agriculture sector
returning to higher growth numbers, as
policy push and near normal monsoons
improved sowings and subsequent
consumption.
2016-17 proved to be yet another successful year at Indofil for a number of reasons. During the year, Consolidated Total Income increased from ` 1,723 Crores to ` 1,971 Crores. Earnings Before Interest, Tax, Depreciation and Amortisation (EBITDA) stood at ` 422 Crores for the year under review as against ` 320 Crores for the previous year, registering an increase of 32%.
At Indofil, we are committed to create
new growth avenues guided by our
perseverance and tenacity. We work
in an environment which is highly
susceptible to change and one needs
to be prepared to take on challenges
which may arise. We take pride in our
people who are prepared to quickly read,
adapt and attune themselves to market
signals. Our philosophy is both people
and profit oriented. We are determined
to create leaders amongst our workforce
by motivating and supporting them, who
in turn drive our profit agenda.
At Indofil, we believe that crop protection
is probably the most cost-effective,
immediate and long term intervention
directed at enhancing farm security. To
address the predominant need to provide
adequate food in a cost-effective way, we
are addressing the challenge through
delivery of crop protection periods,
nutrients and value-added services
directed at enhancing soil fertility. Indofil
is using science to develop effective
crop protection solutions that help
farmers improve their productivity and
profitability, thus improving livelihoods
and moving the nation towards food
security.
Year in Review 2016-17 proved to be yet another
successful year at Indofil for a number of
reasons. During the year, Consolidated
Total Income increased from ` 1,723
Crores to ` 1,971 Crores. Earnings
Before Interest, Tax, Depreciation
and Amortisation (EBITDA) stood
at ` 422 Crores for the year under
review as against ` 320 Crores for the
previous year, registering an increase
of 32%. Our EBITDA margin stood
at 21.40% against 18.58% making us
one of the most profitable company
in the Indian Agrochemical industry.
Improved realisation in both Domestic
and International markets, favourable
currency impacts on account of a
depreciating domestic currency, reduced
input prices, improved operating
efficiencies and economies of scale
have all contributed to these improved
margins. At Indofil, we believe that
this sustained outperformance is the
result of a focus on the development of
innovative farm solutions. We do not
just manufacture products; we address
marketplace gaps.
Message from Group Chief Executive Officer

Annual Report 2016-17 33
COMPANY OVERVIEW
1-36 37-81 82-184
STATUTORY REPORTS FINANCIAL STATEMENTS
Last year, through Lakshya 2x3 we
had laid our aspiration to become a
two billion dollar company (Enterprise
Value) over the next three years. During
the financial year 2016-17, the team
has articulated the detailed road map to
achieve these. These plans are being very
well executed and constantly monitored
by the top management. We have aligned
our strategic priorities in line with this
vision and we are confident that we will
be able to achieve our vision.
The new Agro Synthesis Plant at Dahej,
Gujarat commenced commercial
production during the year. The plant
achieved a production of over 467 MT
with 4 products during the year in review.
Now that the manufacturing operations
at the new plant have been stabilised,
the scale of activity is expected to be
pumped up and commercial production
of newer molecules is expected to
commence during the coming financial
year. Our business development team
is closely working on increasing the
market penetration and customer base
for these products.
As a first major step towards achieving
our Value Added Distribution (VAD)
targets, our Netherlands subsidiary
namely, Indofil Industries (Netherlands)
B.V. successfully completed its first full
year of commercial operations. The Net
Profit for the year of the entity stood at
Euro 3.48 million during the year under
review against a loss of Euro 0.63 million
in the last year.
To further our VAD goals, we have also
set up a step down subsidiary in Brazil
namely, Indofil Industries DO Brasil
LTDA. There was no activity/transaction
in the subsidiary during the year under
review. We are also in advanced stage of
setting up a subsidiary in Philippines.
In view of the changing requirements of
local regulations in Bangladesh and to
further boost our VAD activities in the
country, the management has decided
to set up a Formulation/Packing unit
at Bangladesh. We are currently in the
process of completing all necessary
regulatory formalities and due diligence
for the same.
We have also set up a Liaison Office
at Myanmar with a view to strengthen
our product registration portfolio
in the country as well as obtain first
hand market information, customer
insights, etc.
These are the stepping stones towards
our long term target of replicating
our distribution expertise in these
geographies.
With a view to align our operational
capacities with our long term strategies,
we initiated the construction of a 35,000
TPA EBDC plant at Dahej, Gujarat.
This state-of-the-art facility will be
Indofil’s largest manufacturing plant and
together with our existing capacities will
make us one of the biggest Mancozeb
player in India and a preferred supplier
to most MNC’s. Our team is confident of
commencing commercial production at
the plant in a record time.
We reinforced our product basket by
launching the plant nutrition business
under the brand name of Indolife Super
Specialty Chemicals. We foresee, that
it has a huge potential which needs to
be unlocked and the day is yet to come
when this business also should grow
and give substantial profits.
Innovation has always been central to
the value we bring, and that remains true
today. But now, more than ever before,
we are leveraging digital capabilities
to expand the reach and impact of
our solutions. Through connected
technology and data-driven insight, our
ability to help customers understand
their operations better and reliably do
more with less is even greater.
We are reinforcing our competitiveness
through stretch targets achieved
within stipulated tenures, collaborative
engagements between the R&D and
production teams to achieve process and
product improvements.
We have reinforced our focus on our
Specialty and Performance Chemical
Division and the divisions profitability
has improved significantly over the last
few years. We have also invested in a
new manufacturing facility which should
commence production in the 1st Quarter
of 2018. We strongly believe that this
division will contribute substantially in
our growth strategy.
Looking aheadWith expectation of normal, well
distributed monsoons and relatively
lower channel inventories in the system,
the business outlook seems positive
for a prosperous year ahead. Further,
introduction of GST in 2017-18 lends
vigour, going forward. At Indofil, we have
aligned our processes to meet these
changing scenarios and hope to partner
with our stakeholders to enable an
instant transition. It is our endeavour to
accomplish farmers’ expectations and I
am confident that our agri solutions will
continue to touch farmer’s hearts and
add to his well-being.
We are aware of the huge potential that
agriculture sector has to offer and we
hope to become strategic partners in the
development of the same. We are grateful
to our shareholders for supporting our
vision, plans and strategic initiatives and
as before, we will remain steadfast to
enhance shareholder value in the future.
Warm Regards,
R.K. MalhotraGroup Chief Executive Officer

34
Member of the Board of Governors
- Indian Institute of Management
(IIM), Lucknow
Life Member - All India Heart
Foundation, Delhi
As the President of FICCI, Mr. Modi
put his efforts to initiate Government
investments in infrastructure and
privatisation in various sectors. He has
also contributed in restructuring and
redesigning of Indian enterprises to
make them globally competitive. Besides,
he is actively involved in various social
issues, including supporting a number of
educational institutions, healthcare and
hospital services, spiritual and religious
centres and charitable trusts.
MS. CHARU MODI
Executive Director:Indofil Industries Limited
Promoter and Shareholder:K. K. Modi Group
Vice Chairperson and CEO:Modi Academic International
Institute
Founder and Promoter:Modi Healthcare Placement
Ms. Charu Modi, daughter of Mr. K. K.
Modi, is an eminent educationist, who
has played an instrumental role in the
field of education in India. Educated at
Lady Shriram College, New Delhi and
Thunderbird - The American Graduate
School of International Management
at USA, Ms. Modi continues to pursue
higher academic specialisation in her
area of expertise. Her deep knowledge
and interest in academics gives her the
Board of Directors
Chairman & Managing Director: Indofil Industries Ltd.
President & Managing Director: Godfrey Philips India Ltd.
Chairman:Modi Enterprises
Emerge as a growth leader by enabling
the success of customers.
Mr. K. K. Modi guides Indofil
Industries Limited in its strategic
business decisions, which elevated the
Company to new heights of success.
His revolutionary vision introduces a
global perspective that drives Indofil
to continue and increase its markets,
both domestically and abroad. He has
partnered with several international
companies in his various businesses,
bringing a global vision and the best of
international technology to India.
Mr. Modi has contributed significantly
to India’s industrial development. He
has occupied numerous prestigious
positions in various industry, trade,
education, sport and charitable
organisations, including:
President - Confederation of Asia-
Pacific Chambers of Commerce
and Industry (CACCI) (2002-2004,
2004-2006)
President - Federation of Indian
Chamber of Commerce and
Industry (FICCI) (1997-98)
President - PHD Chamber
of Commerce and Industry
(1983-84)
ability to envision a future, which provides
easy access to finest global education to
the deserving Indian students. She has
already established several institutions
in India in collaboration with world’s
leading academic bodies.
Her expertise continuously introduces
new avenues in her field of interest, and
she concentrates her efforts towards
achieving the Group’s overall vision of
becoming a global leader.
. MR. SAMIR KUMAR MODI
Non-Executive and Non-Independent Director:Indofil Industries Limited
Executive Director:Godfrey Philips India Limited
Mr. Samir Modi, son of Mr. K. K. Modi,
has been crucial in conceptualising,
strategising, establishing and running
new businesses of the Group. A
Graduate from Hindu College, Delhi
University and an alumnus of the famed
Harvard Business School, USA, Mr.
Modi’s strength lies in his extensive
leadership and management experience,
coupled with excellent analytical and
interpersonal skills. His new philosophy
of management, innovative strategy and
lateral thinking help him catalysing new
groundbreaking ideas for successful
profit-making ventures.
He was instrumental in starting India’s
first network marketing company
- Modicare, marketing consumer
products. He also is the brain behind
India’s first-of-its-kind convenience store
- Twenty Four Seven retail stores that are
open 24 hours, 7 days a week throughout
the year.
MR. K. K. MODI
Board of Directors

Annual Report 2016-17 35
COMPANY OVERVIEW
1-36 37-81 82-184
STATUTORY REPORTS FINANCIAL STATEMENTS
He has been a part of the following
institutions:
Member - Executive Committee of
Federation of Indian Chamber of
Commerce and Industry (FICCI)
Prominent Member - Retailers’
Association of India
Chairman - CSR Committee of PHD
Chamber of Commerce & Industry
Life Member - All India
Management Association (AIMA)
Moreover, he also actively campaigns
for the cause of HIV/AIDS, and has
established the Modicare Foundation
to prevent the spread of AIDS,
enhance awareness and dispel myths
and misconceptions.
MS. ALIYA MODI
Non-Executive and Non-Independent Director: Indofil Industries Limited
Ms. Aliya Modi grand daughter of
Mr. K. K. Modi has graduated from
Brandeis University located in
Waltham, Massachusetts, USA. She
holds a degree in Bachelor of Arts,
Major in Art History, Criticism and
Conservation. Given her international
qualification, experience and credentials,
the Board is confident that it will help
Indofil enhance its international market.
She joined the Board on March 18, 2016.
MR. M. N. THAKKAR
Non-Executive and Independent Director:Indofil Industries Limited
Mr. M. N. Thakkar is a practising
Chartered Accountant since 1967 and
was the Senior Partner of M/s. N. M.
Raiji & Co. Chartered Accountants,
Mumbai. He has a wealth of experience
in handling accounting, auditing and
management consultancy matters of
large corporate clients in diversified
sectors. He occupies the following
prestigious positions:
Director - Samkrg Pistons & Rings
Limited
Director - Bangalore Softsell
Limited
Director - Haldyn Corporation
Limited
MR. S. K. ALAGH
Non-Executive and Independent Director:Indofil Industries Limited
Mr. Sunil K. Alagh, a graduate from
St. Xavier’s College (Calcutta) and a
postgraduate in Marketing from Indian
Institute of Management Calcutta (IIMC),
has a rich experience in marketing
and brand building strategies. During
his tenure as the Managing Director,
Britannia Industries Limited figured
in the Forbes List of the 300 Best
Companies in the World in 1999, 2000
and 2002. It also became the most trusted
Food Brand in India in 2002. He is also
a gold medalist in Kashalkar Memorial
Award - 2000 (Outstanding contribution
to Food Processing Industry in India) and
a finalist of Ernst & Young Entrepreneur
of the Year Award 2002.
He has occupied the following positions
in the industry:
Non-Executive Director - United
Breweries Limited (JV of Heineken
and Mallya Group)
Non-Executive Director - Gati
Limited & Gati Import Export
Trading Limited
Board Member - Prasar Bharti
Chairman - SKA Advisors Private
Limited
Member of Board of Governors -
Indian Institute of Management,
Bangalore
Member of Governing Board
of the Indian Music Group -
St Xavier’s College, Mumbai
Member of Round Table on Higher
Education - Ministry of HRD,
Government of India
Member of Advisory Board -
Jawaharlal Darda Institute of
Engineering & Technology, Yavatmal
Former Member of Advisory Board
- Setco Atomotive Limited
Former Managing Director & CEO -
Britannia Industries Limited
Former President - The Federation
of Biscuit Manufacturers of India
Former President - The Bangalore
Chamber of Commerce & Industry
Former President - All India
Management Association, Delhi
Former Member of the Board of
Governors - Indian Institute of
Management, Indore
Former Member of the Governing
Council - National Institute of
Design, Ahmedabad
Former Member of the Board of
IL&FS Investmart Limited
Former Member of the Indian
Advisory Board of Schindler
Management Limited, Switzerland

36
MR. S. LAKSHMI-NARAYANAN, IAS (RETD.)
Non-Executive and Independent Director: Indofil Industries Limited
Mr. S. Lakshminarayanan has over
36 years of service in the Indian
Government. He holds Master’s
degrees in Science in Chemistry and
has a Postgraduate Diploma from
University of Manchester (the U.K.)
in Advanced Social and Economic
Studies. Mr. Lakshminarayanan is a
member of the Indian Administrative
Service (retired) and has held several
senior positions in the Ministry of Home
Affairs, Ministry of Communications
and Information Technology, Ministry
of Information and Broadcasting of
the Government of India and in the
Department of Tourism, Culture and
Public Relations, Department of Mines,
Mineral Resources, Revenue and Relief
and Rehabilitation of the Government
of Madhya Pradesh.
His last assignment with the
Government was of the Secretary in the
Union Ministry of Home Affairs. During
his tenure with the Government of India,
he had travelled extensively all over the
world. He has served as Vice-Chairman
in UNESCO’s Communication
Development Program in Paris, for
five years. He was also awarded the
Honorary of Doctorate Degree by
Forode Federaciones, Mexico, in March
2008.
At present, Mr. Lakshminarayanan
holds the following positions:
Chairman - Shriram Transport
Finance Co. Ltd.
Independent Director - Shriram
Life Insurance Co. Ltd.
Independent Director - Shriram
Automall India Ltd.
Member - Board of Trustees of
Lilavati Hospital and Research
Centre, Mumbai
Member - Advisory Board of
Hughes Communication India
Ltd.
Member - Advisory Board of
NXP Semiconductors Pvt. Ltd.
Director - Corporate Affairs,
SUN Group
Chairman - ELCOM Group
MR. RANVIR PRASAD
Nominee Director:Indofil Industries Limited
Mr. Ranvir Prasad, I.A.S., is the
Nominee Director of Uttar Pradesh
State Industrial Development
Corporation Limited, Kanpur and a
senior I.A.S. officer in the Government
of Uttar Pradesh. He is B. Tech in
Electrical Engineering and is a member
of Indian Administrative Service (IAS).
He is the Managing Director of Uttar
Pradesh State Industrial Development
Corporation Limited, Kanpur and
Commissioner and Director - Industries
Department, Government of Uttar
Pradesh. Mr. Ranvir Prasad joined the
Board on June 29, 2017.
MR. SANJAY BUCH
Non-Executive and Independent Director: Indofil Industries Limited
Mr. Sanjay Buch is a practising
advocate and solicitor at the High
Court of Judicature in Mumbai. With an
expertise of 20 years, he advises several
companies, including large domestic
and international corporations having
their establishments in India. Besides
Business and Corporate law practice, he
also practises in the area of Transaction
Advisory (including Mergers and
Acquisitions). He has been advising
several Fortune 500 companies, large
and medium domestic corporations,
domestic and international lending
agencies, and foreign banks having
their establishments in India over the
last 20 years.
Mr. Buch is also registered with the Bar
Council of Maharashtra and Goa and
the Bombay Incorporated Law Society.
Apart from Indofil, he also occupies the
position of an Independent Director
in DIL Limited, Fermenta Bio-tech
Limited and Convergence Chemicals
Private Limited and Indo Baijin
Chemical Private Limited.
DR. ATCHUTUNI L. RAO
Whole time Director – Operations:Indofil Industries Limited
Dr. Atchutuni L. Rao, designated as
Whole time Director – Manufacturing,
Operations and Safety joined Indofil
in February, 2012. Prior to joining
Indofil, he worked with Clariant
Chemicals India Limited and Clariant
International for 19 years in various
positions as Technical Manager,
General Manager Production, as
Vice President and Head of Roha plant.
Dr. Rao holds a Bachelor’s degree in
Chemical Technology from UDCT,
Mumbai, an M. Tech Degree from IIT,
Delhi and a Ph.D in Chemistry from
South Gujarat University. Dr. Rao
has attended Advanced Management
Program at Harvard Business
School, USA. He joined the Board on
March 18, 2016.
Board of Directors

Annual Report 2016-17 37
COMPANY OVERVIEW
1-36 37-81 82-184
STATUTORY REPORTS FINANCIAL STATEMENTS
STATUTORY REPORTS
FINANCIAL STATEMENTS
Notice 38
Management Discussion and Analysis 46
Directors’ Report and Annexures 54
Corporate Governance Report 76
Standalone Financial Statements 82
Consolidated Financial Statements 133

Notice38
Notice
NOTICE is hereby given that 24th Annual General Meeting
of the Members of the Company will be held on Friday, the
15th September, 2017 at 11.00 A.M. at Rama & Sundri
Watumull Auditorium, K.C. College, Dinshaw Wacha Road,
Churchgate, Mumbai – 400 020 to transact the following
business:
ORDINARY BUSINESS1. To consider and adopt the audited financial statements,
including audited consolidated financial statements, of
the Company for the financial year ended March 31,
2017 and the reports of the Board of Directors and
Auditors thereon.
2. To declare a dividend on Equity Shares.
3. To appoint a Director in place of Mr. Samir Modi (DIN
00029554), who retires by rotation at this Annual
General Meeting and being eligible, has offered himself
for re-appointment.
4. To appoint Auditors and to fix their remuneration and in
this regard to consider and if thought fit, to pass, with or
without modification(s), the following resolution as an
Ordinary Resolution:
“RESOLVED THAT the Company hereby ratifies
the appointment of Messrs Bansi S. Mehta & Co,
Chartered Accountants, Mumbai (Firm Registration No
100991W), as approved by the members at the 23rd
Annual General Meeting, as Statutory Auditors of the
Company to hold office till the conclusion of the 25th
Annual General Meeting to be held in the year 2018
on such remuneration as shall be fixed by the Board of
Directors of the Company”
SPECIAL BUSINESS5. To re-appoint Mr. Krishna Kumar Modi (DIN: 00029407)
as Chairman and Managing Director and in this regard
to consider and if thought fit, to pass, with or without
modification(s), the following resolution as a Special
Resolution:
“RESOLVED AS A SPECIAL RESOLUTION THAT in
accordance with the provisions of Sections 196, 197
and 203 read with Schedule V and all other applicable
provisions, if any, of the Companies Act, 2013 and
the Companies (Appointment and Remuneration of
Managerial Personnel) Rules, 2014 (including any
statutory modification(s) or re-enactment thereof, for
the time being in force) and subject to such approvals
as may be required, approval of the Company be
and is hereby accorded to the re-appointment of Mr.
Krishna Kumar Modi (DIN: 00029407) as Chairman
and Managing Director of the Company, for a period
of 5 (five) years with effect from 1st March, 2017 on
the terms and conditions including remuneration as
set out hereunder, with remuneration payable from
April 1, 2017, with liberty to the Board of Directors
(which shall be deemed to include the Nomination and
Remuneration Committee of the Board of Directors) to
alter and vary the terms and conditions of the said re-
appointment and / or remuneration as it may deem fit
and as may be acceptable to Mr Krishna Kumar Modi,
subject to the same not exceeding the limits specified
under Schedule V to the Companies Act, 2013 or any
statutory modification(s) or re-enactment thereof or any
other guidelines relating to managerial remuneration
as may be notified by the Government of India from
time to time;
a. Salary : ` 60 lakhs per month, subject to revision
upwards as may be permitted under Companies
Act, 2013 and/or any amendment thereof and/or
as may be approved by the Board including the
Nomination & Remuneration Committee of the
Board.
b. Commission : Payment of Commission equivalent
to 5% of the net profits of the Company, for each
financial year, less salary and value of perquisites/
allowances/benefits paid for each financial
year, computed in the manner laid down under
Sections 198 and other applicable provisions of
the Companies Act, 2013
c. Perquisites : In addition to salary and commission,
he shall be entitled to the following perquisites:
I. Rent free, furnished accommodation owned
/leased by the Company or house rent
allowance in lieu thereof as per rules of the
Company
II. Re-imbursement of expenses on actual
pertaining to gas, electricity, water and other
expenses for upkeep, maintenance and
security of residential accommodation.
III. Two personal attendants.

COMPANY OVERVIEW
1-36 37-81 82-184
STATUTORY REPORTS FINANCIAL STATEMENTS
Annual Report 2016-17 39
IV. Contribution to Provident Fund and
Superannuation Fund up to such limits as
may be prescribed under the Income-tax
Act and the Rules made thereunder for this
purpose.
V. Medical Expenses : Reimbursement of all
expenses including mediclaim insurance
premium incurred for self and members of
his family, at actual.
VI. Club Fees : Fees of club subject to a
maximum of two clubs
VII. Leave Travel Concession : For self and family
in accordance with rules of the Company.
VIII. Gratuity at the time of retirement / cessation
of service as per rules of the Company.
IX. Leave and encashment of unavailed leave, as
per rules of the Company.
X. Company maintained chauffer driven car for
use on Company’s business and personal
purposes.
XI. Fees for credit cards.
XII. Personal Accident Insurance Premium as
per rules of the Company.
XIII. Telecommunication facility at residence
including mobile phone, internet facility and
any other means of communication facility
XIV. Re-imbursement of entertainment, travelling
and other expenses incurred for the business
of the Company as per rules of the Company
XV. Re-imbursement of expenses incurred in
connection with transfer as per rules of the
Company.
RESOLVED FURTHER THAT the aggregate of the
remuneration i.e. Salary, Commission, Perquisites,
allowances and benefits etc payable to Mr. Krishna
Kumar Modi shall be subject to overall ceiling of 5% of the
net profits for one such managerial personnel and 10%
of the net profits for all the managerial personnel in case
of more than one such managerial personnel, provided
that the total managerial remuneration including the
remuneration received by him from Godfrey Phillips
India Limited as President and Managing Director shall
not be higher than the maximum limit payable from
either of the two Companies in terms of the applicable
provisions and Schedule V of the Companies Act, 2013.
RESOLVED FURTHER THAT where in any financial
year during the term of office of Mr. Krishna Kumar
Modi as Chairman and Managing Director, the
Company makes no profits or the profits made are
inadequate, the Company may pay Mr. Krishna Kumar
Modi the remuneration by way of salary, perquisites,
allowances and benefits as may be agreed to by the
Board of Directors and Mr. Krishna Kumar Modi not
exceeding the limits laid down in Section II of Part II of
Schedule V to the Companies Act, 2013 or any statutory
modification(s) or re-enactment thereof.
RESOLVED FURTHER THAT Mr. Krishna Kumar
Modi shall not be paid any Sitting Fees for attending the
meetings of the Board of Directors or any Committee
thereof during the currency of his tenure as Managing
Director of the Company.
RESOLVED FURTHER THAT the Board of Directors
of the Company (which shall be deemed to include the
Nomination & Remuneration Committee of the Board
of Directors) be and is hereby authorised to do all such
acts and take all such steps as it may consider necessary
or desirable to give effect to this resolution including
obtaining approval of the Central Government, if
required, and to alter and vary the terms and conditions
of the said reappointment and / or remuneration as it
may deem fit and as may be acceptable to Mr Krishna
Kumar Modi, subject to the same not exceeding the
limits specified under Section 197 and Schedule V to the
Companies Act, 2013 or any statutory modifications(s)
or re-enactment thereof or any other guidelines relating
to managerial remuneration as may be notified by the
Government of India from time to time.
RESOLVED FURTHER THAT Mr Krishna Kumar
Modi shall have the general control and management
of the business of the Company and strategic business
decisions and initiatives which span a variety of
areas, including corporate strategy, business growth
strategy, strategic planning, portfolio strategy, business
restructuring and be and is hereby vested with the same

Notice40
powers and authorities as are vested in the Board of
Directors of the Company, subject to such restrictions
and limitations which the Board may prescribe from
time to time or which under the Articles of Association
of the Company or under the Companies Act, 2013 can
only be exercised either with the approval of the Board
or Shareholders of the Company.
RESOLVED FURTHER THAT in view of appointment
of Dr Atchutuni Rao, Director – Operations, as Occupier
under Factories Act, 1948 and rules made there under,
of all factories and manufacturing units and plants of
the Company, Mr. K.K. Modi, as Managing Director of
the Company, shall not be a person in charge of and/or
a person responsible for the management, supervision
and/or day to day affairs and/or operations of any and
all the factories/ manufacturing units and plants of the
Company at various locations.
6. To approve revision in terms of remuneration of Ms.
Charu Modi (DIN: 00029625), Executive Director and
in this regard to consider and if thought fit, to pass, with
or without modification(s), the following resolution as
an Ordinary Resolution:
“RESOLVED THAT in partial modification of
Resolution passed at the 22nd Annual General Meeting
of the Company held on 16th September, 2015 for
revision in terms of remuneration of Ms. Charu Modi
(DIN: 00029625), Executive Director of the Company
and pursuant to the provisions of Sections 196, 197,
198 and other applicable provisions, if any, of the
Companies Act, 2013 (the Act) and the Rules made
thereunder, as amended from time to time, read with
Schedule V to the Act, consent of the Company be
and is hereby accorded to the revision in the terms of
remuneration of Ms. Charu Modi, Executive Director of
the Company with effect from 1st April, 2017 for the
remaining period of her tenure i.e upto 31st March,
2019, on the terms and conditions as set out hereunder,
with liberty to the Board of Directors (which shall be
deemed to include Nomination and Remuneration
Committee of the Board of Directors) to fix, alter and
vary the terms and conditions of appointment and /
or remuneration as it may deem fit and as may be
acceptable to Ms. Charu Modi, subject to the same not
exceeding the limits specified under Section 197 read
with Schedule V to the Companies Act, 2013 or any
statutory modification(s) or re-enactment thereof or any
other guideline relating to the managerial remuneration
as may be notified by the Government of India from
time to time:
a. Salary : ` 30 lakhs per month, subject to revision
upwards as may be permitted under Companies
Act, 2013 and/or any amendment thereof and/or
as may be approved by the Board including the
Nomination & Remuneration Committee of the
Board.
b. Commission : Payment of Commission equivalent
to 5% of the net profits of the Company, for each
financial year, less salary and value of perquisites/
allowances/benefits paid to her and whole time
director, if any, for each financial year, computed in
the manner laid down under Sections 198 and other
applicable provisions of the Companies Act, 2013
c. Perquisites : In addition to salary and commission,
she shall be entitled to the following perquisites:
I. Rent free, furnished accommodation owned
/ leased by the Company or house rent
allowance in lieu thereof as per rules of the
Company.
II. Re-imbursement of expenses on actual
pertaining to gas, electricity, water and other
expenses for upkeep, maintenance and
security of residential accommodation.
III. Two personal attendants.
IV. Contribution to Provident Fund and
Superannuation Fund up to such limits as
may be prescribed under the Income-tax
Act and the Rules made thereunder for this
purpose.
V. Medical Expenses : Reimbursement of all
expenses including mediclaim insurance
premium incurred for self and members of
her family, at actual.
VI. Club Fees : Fees of club subject to a maximum
of two clubs.
VII. Leave Travel Concession: For self and family
in accordance with rules of the Company
VIII. Gratuity at the time of retirement / cessation
of service as per rules of the Company.
IX. Leave and encashment of unavailed leave, as
per rules of the Company.
X. Company maintained chauffer driven car for
use on Company’s business and personal
purposes.

COMPANY OVERVIEW
1-36 37-81 82-184
STATUTORY REPORTS FINANCIAL STATEMENTS
Annual Report 2016-17 41
XI. Fees for credit cards.
XII. Personal Accident Insurance Premium as
per rules of the Company.
XIII. Telecommunication facility at residence
including mobile phone, internet facility and
any other means of communication facility
XIV. Re-imbursement of entertainment, travelling
and other expenses incurred for the business
of the Company as per rules of the Company
XV. Re-imbursement of expenses incurred in
connection with transfer as per rules of the
Company.
RESOLVED FURTHER THAT the aggregate of the
remuneration i.e. Salary, Commission, Perquisites,
allowances and benefits etc payable to Ms. Charu Modi
shall be subject to overall ceiling of 5% of the net profits
for one such managerial personnel and 10% of the net
profits for all the managerial personnel in case of more
than one such managerial personnel as computed in
accordance with the relevant provisions of Companies
Act, 2013.
RESOLVED FURTHER THAT where in any financial
year during the term of office of Ms. Charu Modi as
Executive Director, the Company makes no profits or
the profits made are inadequate, the Company may pay
Ms. Charu Modi the remuneration by way of salary,
perquisites, allowances and benefits as may be agreed
to by the Board of Directors and Ms. Charu Modi not
exceeding the limits laid down in Section II of Part
II of Schedule V and other applicable provisions of
Companies Act, 2013 or any statutory modification(s)
or re-enactment thereof, unless permission from the
Central Government is obtained for paying more.
RESOLVED FURTHER THAT Ms. Charu Modi shall
not be paid any Sitting Fees for attending the meetings
of the Board of Directors or any Committee thereof
during the currency of her tenure as Executive Director
of the Company.
RESOLVED FURTHER THAT subject to the
supervision, overall control of the Chairman & Managing
Director and the Board of Directors, Ms. Charu Modi will
be primarily responsible for setting-up the Company’s
and its international subsidiaries’ strategic direction
and supporting a range of strategic initiatives which
initiatives span a variety of areas, including corporate
strategy, business growth strategy, strategic planning,
portfolio strategy, business restructuring. In addition,
Ms. Charu Modi will be carrying out such duties and
exercise such powers as may be entrusted to her by the
Chairman and Managing Director and / or the Board of
Directors of the Company from time to time.
RESOLVED FURTHER THAT in view of appointment
of Dr. Atchutuni Rao, Director – Operations, as Occupier
under Factories Act, 1948 and rules made there under,
of all factories and manufacturing units and plants of
the Company, Ms. Charu Modi, as Executive Director of
the Company, shall not be a person in charge of and/or
a person responsible for the management, supervision
and/or day to day affairs and/or operations of any and
all the factories/ manufacturing units and plants of the
Company at various locations.
RESOLVED FURTHER THAT the Board of Directors
of the Company be and is hereby authorised to do all
acts and take all such steps as may be necessary, proper
or expedient to give effect to this resolution.”
7. To approve the remuneration of the Cost Auditors for
the financial year ending March 31, 2018 and in this
regard to consider and if thought fit, to pass, with or
without modification(s), the following resolution as an
Ordinary Resolution.
“RESOLVED THAT pursuant to the provisions of Section
148 and all other applicable provisions of the Companies Act,
2013 and the Companies (Audit and Auditors) Rules, 2014
(including any statutory modification(s) or re-enactment
thereof, for the time being in force), the remuneration payable
to M/s Kalpana P. Mehta & Company, Cost Accountants,
(Membership Number 21623) the Cost Auditors appointed
by the Board of Directors of the Company, to conduct the
audit of the cost records of the Company for the financial
year ending March 31, 2018, amounting upto ` 2,20,000
plus taxes as applicable and out-of-pocket expenses incurred
by them in connection with the said audit be and is hereby
ratified and confirmed.
RESOLVED FURTHER THAT the Board of Directors of the
Company be and is hereby authorised to do all acts and take
all such steps as may be necessary, proper or expedient to
give effect to this resolution.”
By Order of the Board, For Indofil Industries Limited
CS. Chintamani D Thatte
Mumbai, June 29, 2017 Head Compliance and
Company Secretary

Notice42
NOTES:
1. A member entitled to attend and vote at the meeting
is entitled to appoint a proxy to attend and to vote
instead of himself. The proxy need not be a member
of the Company. A person can act as proxy on behalf
of members not exceeding fifty (50) and holding in the
aggregate not more than ten percent of the total share
capital of the Company. The proxy form duly completed
and signed should be deposited at the Company’s
Registered Office at Mumbai, not later than 48 hours
before the time fixed for the meeting.
2. An Explanatory Statement pursuant to Section 102 of
the Companies Act, 2013, in respect of Item nos 5, 6
and 7 which set out details relating to Special Business
at the meeting, is annexed hereto.
3. All documents referred to in the accompanying Notice
are open for inspection at the Registered Office of the
Company during office hours on all working days except
Saturday between 11.00 A.M. to 1.00 P.M. up to the
date of the Annual General Meeting.
4. Members holding shares in physical form are requested
to notify change of address or bank mandates, under
their signatures to M/s. MAS Services Limited, T-34,
Okhla Industrieal Area, Phase II, New Delhi-110020,
the Registrars and Transfer Agents (RTA) of the
Company, quoting Folio Numbers. Members holding
shares in electronic form may update such details with
their respective Depository Participants (DPs). All
correspondence regarding electronic form / Transfer
/ Consolidation / Split-up of shares etc. should be
addressed to them for expeditious disposal.
5. The Register of Members and Shares Transfer Books
will remain closed from Saturday, the 9th September,
2017 to Friday, the 15th September, 2017 (both days
inclusive) for the purpose of payment of dividend to
those Members who hold shares in physical form
and whose names stand on the Register of Members
as on 15th September, 2017. The dividend in respect
of shares held in electronic form will be payable to
the beneficial owners of the shares as at the close of
business hours on Friday, the 8th September, 2017
as per details furnished by the depositories for this
purpose.
6. To avoid loss of dividend warrants in transit, undue
delay and incidence of fraudulent encashment of the
dividend warrants, the Company has provided a facility
to the members for remittance of dividend through the
National Electronic Clearing system (NECS). The NECS
facility is available at locations identified by Reserve
Bank of India from time to time and covers most of the
cities and towns. Members holding shares in physical
form and desirous of availing this facility are requested to
contact the Company’s Registrars and Transfer Agents.
In case of members holding shares in demat mode, they
should furnish details in the prescribed format of their
Depository Participants (DP).
7. Members/Proxies should bring duly filled attendance
slip sent herewith for attending the meeting.
8. The relevant details, brief resume of the Directors,
seeking appointment/reappointment at the Annual
General Meeting as per Item No(s) 3, 5 and 6 are
provided in the Annual Report.
9. Members who have not registered their e-mail addresses
so far are requested to register their e-mail address for
receiving all communication including Annual Report,
Notices, Circulars, etc. from the Company electronically.
10. Instructions for E-Voting:
(1) In compliance with the provisions of Section
108 of the Companies Act, 2013 read with the
Companies (Management and Administration)
Rules, 2014 as amended by the Companies
(Management and Administration) Rules, 2015,
the Company is pleased to offer e-voting facility
to exercise their right to vote on resolutions
proposed to be considered at the ensuing Annual
General Meeting (AGM) by electronic means and
the business may be transacted through e-Voting
Services. The facility of casting the votes by the
members using an electronic voting system from
a place other than venue of the AGM (“remote
e-voting”) will be provided by National Securities
Depository Limited (NSDL).
(2) The facility for voting through ballot paper shall
be made available at the AGM and the members
attending the meeting who have not cast their vote
by remote e-voting shall be able to exercise their
right at the meeting through ballot paper.
(3) The members who have cast their vote by remote
e-voting prior to the AGM may also attend the AGM
but shall not be entitled to cast their vote again.
(4) The remote e-voting period commences on 12th
September, 2017 (9:00 am) and ends on 14th
September, 2017 (5:00 pm). During this period
members of the Company, holding shares either
in physical form or in dematerialised form, as on
the cut-off date of 8th September, 2017, may cast
their vote by remote e-voting. The remote e-voting
module shall be disabled by NSDL for voting

COMPANY OVERVIEW
1-36 37-81 82-184
STATUTORY REPORTS FINANCIAL STATEMENTS
Annual Report 2016-17 43
thereafter. Once the vote on a resolution is cast by
the member, the member shall not be allowed to
change it subsequently.
(5) The process and manner for remote e-voting are
as under:
Members are requested to refer the Notice of Annual
General Meeting (AGM) and Attendance Slip
a. Initial Password is provided, as follows :
EVEN (Electronic Voting
Event Number)
User ID Password/
PIN
Provided in the Electronic Voting Particulars Portion of the
Attendance Slip
b. Launch internet browser by typing the following
URL: https://www.evoting. nsdl.com/
c. Click on Shareholder – Login
d. Insert User ID and Initial Password as noted in
step (a) above and click ‘Login’
e. Password change menu will appear. Change the
Password with a new Password of your choice
with minimum 8 digits/characters or combination
thereof. Please keep a note of the new Password.
It is strongly recommended not to share your
Password with any person and take utmost care to
keep it confidential.
f. Home page of remote e-voting will open. Click on
remote e-voting – Active Voting Cycles.
g. Select ‘EVEN’ (E-voting Event Number) of Indofil
Industries Limited.
h. Now you are ready for remote e-voting as ‘Çast
Vote’ page opens.
i. Cast your vote by selecting appropriate option
and click on ‘Submit’. Click on ‘Confirm’ when
prompted.
j. Upon confirmation, the message ‘Vote cast
successfully’ will be displayed.
k. Once you have voted on the resolution, you will not
be allowed to modify your vote.
l. Institutional shareholders (i.e. other than
individuals, HUF, NRI, etc.) are required to send
scanned copy (PDF/JPG Format) of the relevant
Board Resolution/ Authority Letter, etc. together
with attested specimen signature of the person(s)
who are authorised to vote, to the Scrutiniser
through e-mail to scrutiniserindofil@ modi.com
with a copy marked to [email protected].
(6) General Instructions:
A. In case of any queries, please refer to the Frequently
Asked Questions (FAQs) and the e-voting user
manual for members available in the ‘Downloads’
section of http://www.evoting.nsdl.com. You can
also contact NSDL via email at [email protected]
B. If you are already registered with NSDL for
e-voting then you can use your existing User ID
and Password for casting vote.
C. The voting rights of Members shall be in proportion
to their share in the paid-up equity share capital
of the Company as on the cut-off date of 8th
September, 2017.
D. Member(s) can opt for only one mode of voting i.e.
either physical voting through ballot or e-voting.
In case a member has used both means then vote
cast by e-voting will alone be treated as valid.
E. Any person, who acquires shares of the Company
and becomes a member of the Company after
dispatch of the notice and holding shares as of the
cut-off date i.e. 8th September, 2017, may obtain
the login ID and password by sending a request
at [email protected] or RTA, MAS Services
Limited.
However, if you are already registered with NSDL
for remote e-voting then you can use your existing
user ID and password for casting your vote. If you
forgot your password, you can reset your password
by using “Forgot User Details/Password” option
available on www.evoting.nsdl.com or contact
NSDL at the following toll free no.: 1800-222-990.
F. Mr. Amit Dadheech, proprietor, M/s Amit R
Dadheech & Associates, Company Secretaries, 63,
Rajgir Chambers, 12, Shahid Bhagat Singh Marg,
Opp. Old Custom House, Mumbai, 400 023 has
been appointed as the Scrutiniser to scrutinise the
e-voting process in a fair and transparent manner.
G. The Chairman shall, at the AGM, at the end of
discussion on the resolutions on which voting
is to be held, allow voting with the assistance
of scrutiniser, by use of “Ballot Paper” for all
those members who are present at the AGM but
have not cast their votes by availing the remote
e-voting facility

Notice44
H. The Scrutiniser shall after the conclusion of
voting at the AGM, will first count the votes cast
at the meeting and thereafter unblock the votes
cast through remote e-voting in the presence of
at least two witnesses not in the employment of
the Company and shall make, not later than three
days of the conclusion of the AGM, a consolidated
scrutiniser’s report of the total votes cast in
favour or against, if any, to the Chairman or a
person authorised by him in writing, who shall
countersign the same and declare the result of the
voting forthwith
I. The Results declared along with the report of the
Scrutiniser shall be placed on the website of the
Company www.indofilcc.com and on the website of
NSDL immediately after the declaration of result
by the Chairman or a person authorised by him in
writing.
EXPLANATORY STATEMENT IN RESPECT OF
THE SPECIAL BUSINESS AT ITEM NOS 5, 6 and 7
PURSUANT TO SECTION 102 OF THE COMPANIES
ACT, 2013
Item No. 5
Mr. Krishna Kumar Modi was appointed as Chairman and
Managing Director of the Company at the 19th Annual
General Meeting of the Company held on September
12, 2012 at a remuneration of ` 10,00,000/- per month,
Commission of 2% of the net profits of the Company
computed under then provisions of Sections 349 and 350
of the Companies Act, 1956, for a particular year, along with
perquisites, allowances and benefits with effect from March
1, 2012 for a period of five years. Mr Krishna Kumar Modi
is also President and Managing Director of Godfrey Phillips
India Limited and drawing remuneration from there.
The aforesaid term of appointment and payment of
remuneration to Mr Krishna Kumar Modi was valid upto
February 28, 2017 and as such keeping in view a substantial
increase in the turnover and profits of the Company
with substantial growth in domestic and international
business under his dynamic leadership and able control,
management and valuable guidance and his vast long and
rich experience and expertise in various fields, the Board of
Directors at their meeting held on 23rd December, 2016,
on the recommendation of Nomination & Remuneration
Committee, reappointed him as Chairman and Managing
Director for a further period of five years with effect from
March 1, 2017 and at their subsequent meeting held on
3rd March, 2017, on the recommendation of Nomination
& Remuneration Committee, approved the payment
of increased remuneration of ` 60,00,000 per month,
Commission along with Perquisites, allowances, benefits,
and other terms and condition as stated in the resolution
with effect from April 1, 2017 till remaining period of his
tenure upto February 28, 2022.
Mr Krishna Kumar Modi has attained the age of 75 years
and hence in terms of the provisions of Schedule V of the
Companies Act, 2017 a special resolution is needed to be
passed as mentioned in item no 5 of the accompanying
notice. The Directors recommend the passing of special
resolution.
The Company has received a notice in writing from a
member along with the deposit of requisite amount under
section 160 of the Act, proposing his candidature for the
office of Director.
No Director except Mr. K.K. Modi, Ms Charu Modi, Mr. Samir
Kumar Modi and Ms. Aliya Modi and No Key Managerial
Personnel or their relatives are concerned or interested in
the proposed resolution. Mr. Krishna Kumar Modi is the
father of Ms. Charu Modi and Mr. Samir Kumar Modi and is
grandfather Ms. Aliya Modi.
Item No. 6
The shareholders will recall the appointment of Ms. Charu
Modi as Executive Director of the Company with effect from
1st April, 2014 for a period of 5 years at the 21st Annual
General Meeting of the Company held on 22nd September,
2014
Since her appointment as Executive Director of the
Company, with effect from 1st April, 2014, the Company
has achieved remarkable growth in overall performance
including turnover and profits. Moreover, the Company is
aggressively concentrating on its expansion plans besides
exploring opportunities both in India and abroad. Under
her leadership, apart from existing plant at Dahej for
manufacture of Mancozeb, the Company has set up new
Synthesis plant at Dahej and has been setting up another
EBDC & SPC products plant at Dahej. These new facilities
will significantly increase the Company’s manufacturing
strength, thereby expanding its product portfolio. As a part
of expanding business to new geographies, the Company has
set-up a subsidiary in Brazil. Ms Charu Modi has been leading
as Sponsor to activate the operations of this subsidiary to
make it a successful business venture.
Keeping in view a considerable increase in the duties and
responsibilities performed by Ms. Charu Modi and the
growth in performance of the Company during her tenure
as Executive Director and after considering the prevailing
managerial remuneration in industry, the Board of
Directors at their meeting held on 3rd March, 2017, on the
recommendation made by the Nomination and Remuneration
Committee, decided to increase the same suitably so as to

COMPANY OVERVIEW
1-36 37-81 82-184
STATUTORY REPORTS FINANCIAL STATEMENTS
Annual Report 2016-17 45
bring it in line with the remuneration of Executive Directors
in other comparable organisations and also considering the
general increase in cost of living. The Board has approved
the revision in her salary from ` 20 lacs per month to ` 30
lacs per month and payment of Commission @ 5% of the
net profits of the Company, for each financial year, less
salary and value of perquisites/allowances/benefits paid to
her and whole time director, if any, for each financial year,
computed in manner as provided under Companies Act,
2013 and rules there under and/or any amendment thereof
w.e.f. 1st April, 2017 to remaining period of her tenure i.e.
upto 31st March, 2019. All other terms and conditions of
her appointment as the Executive Director of the Company
as approved earlier, shall remain unchanged and have been
reproduced in the resolution for reference of shareholders,
provided that the salary, commission and monetary value
of perquisites/allowances/benefits shall be subject to the
provisions of Section 197 read with Schedule V and other
applicable provisions, if any, the Companies Act, 2013.
However, the Board of Directors shall be authorised to make
necessary variations, amendments or revisions in the salary,
commission, perquisites and benefits etc., within the ceiling
of total remuneration approved by the shareholders.
No Director except Ms Charu Modi, Mr. K.K. Modi, Mr. Samir
Kumar Modi and Ms Aliya Modi and No Key Managerial
Personnel or their relatives are concerned or interested
in the proposed resolution. Ms. Charu Modi is daughter of
Mr. K. K. Modi and sister of Mr. Samir Kumar Modi. Ms Aliya
Modi is the niece of Ms Charu Modi.
The Board recommends the resolution as set out at item 6
for approval by shareholders.
Item No. 7
The Board, on the recommendation of the Audit Committee,
has approved the appointment and remuneration of
M/s. Kalpana P. Mehta & Co, Cost Accountants, as the Cost
Auditors to conduct the audit of the cost records of the
Company in respect of products Insecticides, Organic &
Inorganic chemicals of Thane plant for the financial year
ending March 31, 2018. They are proposed to be appointed
at a remuneration of upto ` 2,20,000/- per annum for cost
audit of these products for the financial year ending March
31, 2018.
In accordance with the provisions of Section 148 of the Act
read with the Companies (Audit and Auditors) Rules, 2014,
the remuneration payable to the Cost Auditors has to be
ratified by the shareholders of the Company.
Accordingly, consent of the members is sought for passing an
Ordinary Resolution as set out at Item No. 7 of the Notice for
ratification of the remuneration payable to the Cost Auditors
for the financial year ending March 31, 2018.
None of the Directors / Key Managerial Personnel of the
Company / their relatives is concerned or interested in the
resolution set out at Item No. 7 of the Notice. The Board
recommends the Resolution as set out at item No. 7 for
approval by the shareholders.
By Order of the Board, For Indofil Industries Limited
CS. Chintamani D Thatte
Mumbai, June 29, 2017 Head Compliance and
Company Secretary
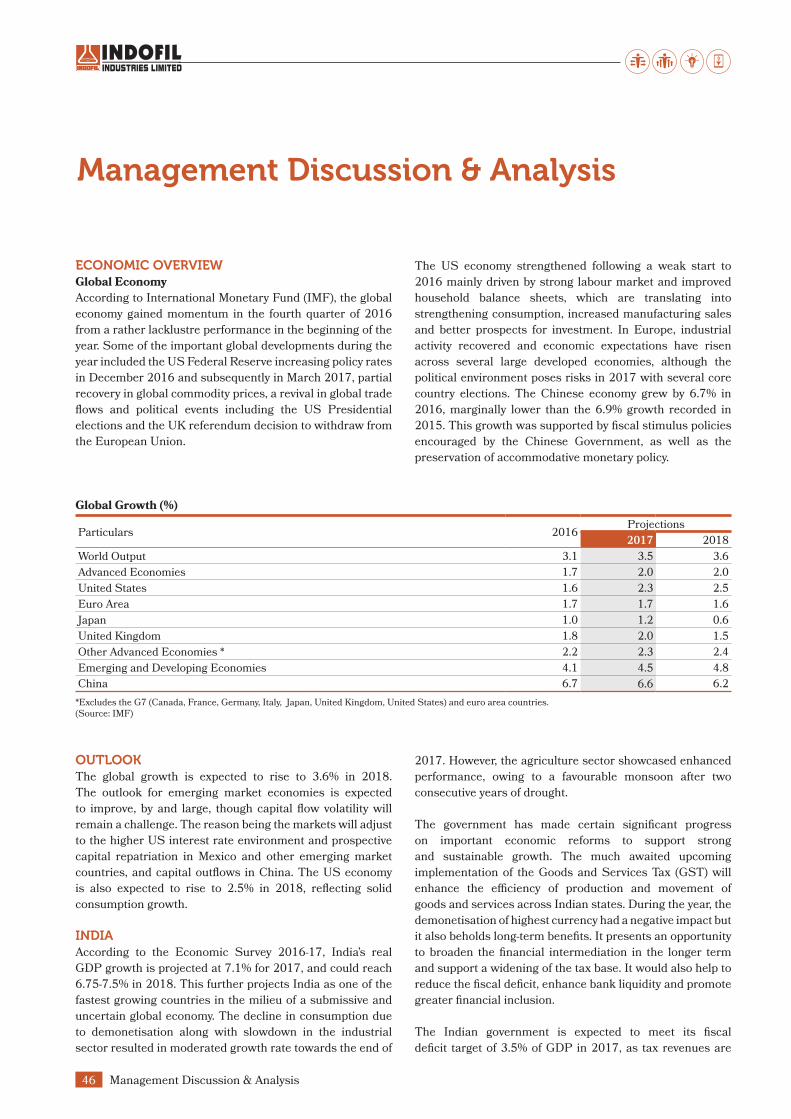
Management Discussion & Analysis46
Management Discussion & Analysis
ECONOMIC OVERVIEWGlobal Economy
According to International Monetary Fund (IMF), the global
economy gained momentum in the fourth quarter of 2016
from a rather lacklustre performance in the beginning of the
year. Some of the important global developments during the
year included the US Federal Reserve increasing policy rates
in December 2016 and subsequently in March 2017, partial
recovery in global commodity prices, a revival in global trade
flows and political events including the US Presidential
elections and the UK referendum decision to withdraw from
the European Union.
The US economy strengthened following a weak start to
2016 mainly driven by strong labour market and improved
household balance sheets, which are translating into
strengthening consumption, increased manufacturing sales
and better prospects for investment. In Europe, industrial
activity recovered and economic expectations have risen
across several large developed economies, although the
political environment poses risks in 2017 with several core
country elections. The Chinese economy grew by 6.7% in
2016, marginally lower than the 6.9% growth recorded in
2015. This growth was supported by fiscal stimulus policies
encouraged by the Chinese Government, as well as the
preservation of accommodative monetary policy.
Global Growth (%)
Particulars 2016Projections
2017 2018
World Output 3.1 3.5 3.6
Advanced Economies 1.7 2.0 2.0
United States 1.6 2.3 2.5
Euro Area 1.7 1.7 1.6
Japan 1.0 1.2 0.6
United Kingdom 1.8 2.0 1.5
Other Advanced Economies * 2.2 2.3 2.4
Emerging and Developing Economies 4.1 4.5 4.8
China 6.7 6.6 6.2
*Excludes the G7 (Canada, France, Germany, Italy, Japan, United Kingdom, United States) and euro area countries.(Source: IMF)
OUTLOOKThe global growth is expected to rise to 3.6% in 2018.
The outlook for emerging market economies is expected
to improve, by and large, though capital flow volatility will
remain a challenge. The reason being the markets will adjust
to the higher US interest rate environment and prospective
capital repatriation in Mexico and other emerging market
countries, and capital outflows in China. The US economy
is also expected to rise to 2.5% in 2018, reflecting solid
consumption growth.
INDIAAccording to the Economic Survey 2016-17, India’s real
GDP growth is projected at 7.1% for 2017, and could reach
6.75-7.5% in 2018. This further projects India as one of the
fastest growing countries in the milieu of a submissive and
uncertain global economy. The decline in consumption due
to demonetisation along with slowdown in the industrial
sector resulted in moderated growth rate towards the end of
2017. However, the agriculture sector showcased enhanced
performance, owing to a favourable monsoon after two
consecutive years of drought.
The government has made certain significant progress
on important economic reforms to support strong
and sustainable growth. The much awaited upcoming
implementation of the Goods and Services Tax (GST) will
enhance the efficiency of production and movement of
goods and services across Indian states. During the year, the
demonetisation of highest currency had a negative impact but
it also beholds long-term benefits. It presents an opportunity
to broaden the financial intermediation in the longer term
and support a widening of the tax base. It would also help to
reduce the fiscal deficit, enhance bank liquidity and promote
greater financial inclusion.
The Indian government is expected to meet its fiscal
deficit target of 3.5% of GDP in 2017, as tax revenues are

Annual Report 2016-17 47
COMPANY OVERVIEW
1-36 37-81 82-184
STATUTORY REPORTS FINANCIAL STATEMENTS
anticipated to increase post the launch of income disclosure
schemes in 2017. Moreover, consumer inflation moderated
to 4.5% in 2017 vis-à-vis 4.9% in 2016; and is expected to
remain below 5% in 2018. Due to moderation in inflation
and normal monsoons, RBI reduced the repo rate by 50 bps
during 2017.
India's GDP Growth (` in million)
7.1
2012-13 2013-14 2014-15 2015-16 2016-17
7.9
7.2
6.6
5.6
1st
Revi
sed
Est
ima
tes
2n
d A
dva
nce
Est
ima
tes
2n
d R
evi
sed
Est
ima
tes
(Source: CSO)
OUTLOOKIndia is poised to grow at 7.6% in 2017-18 and 7.8% in
2018-19. Owing to shift in consumer behaviour and
expenditure pattern, the country is expected to become the
third largest consumer economy in the world. India has
positioned itself as the most dynamic emerging economy
among the largest countries. It is also expected to remain the
fastest growing on the back of robust private consumption and
significant domestic reforms gradually being implemented
by the Government.
AGRICULTURE SECTORGlobal
Agriculture is an important source of employment and
is a basic necessity for everyone’s livelihood. By 2050, the
global food requirement will increase considerably, driven
by a population increase to and demand for improved
diets, predominantly in emerging markets. Agriculture is
receiving increasing attention worldwide as government and
non-government authorities identify a need to accelerate
productivity in order to ensure food security and enriched
nutrition to a growing population. Farmers will need to
produce around 1.4% more grain every year, representing
an increase of approximately 30% by 2030 and around 70%
by 2050. (Source: FAO) At the same time, responding to
changes in climate, using the limited natural resources in a
sustainable way and respecting biodiversity pose additional
challenges to achieving increased farm productivity at the
required promptness.
The world has the resources and technology to remove
hunger and ensure long-term food security for all, in spite
of many challenges and risks. It needs to mobilise political
will and build the essential institutions to make sure that key
decisions on investment and policies to eradicate hunger are
taken and executed effectively. The time to act is now.
India
Agriculture, with its allied sectors, is indisputably the largest
livelihood provider in India, more so in the vast rural areas.
It also contributes a significant figure to the Gross Domestic
Product (GDP). Sustainable agriculture, in terms of food
security, rural employment, and environmentally sustainable
technologies such as soil conservation, natural resource
management and biodiversity protection, are essential for
holistic rural development.
According to the Central Statistics Office (CSO), the share
of agriculture and allied sectors is expected to be at 17.3%
of the Gross Value Added (GVA) during 2016-17 at 2011-12
prices. The agriculture sector alone is poised to grow at 4.4%
in GVA for 2016-17, an aggressive jump from the previous
year’s growth rate of 0.8%. This growth however, shows
the high dependency on the monsoons and the continued
reliance on traditional methods. The country observed
highest food grain production due to good rainfall in 2016
and various policy initiatives taken by the Government.
Foodgrain production in India has grown by 8.1% to 271.98
million tonnes in 2016-17, as per the 2nd advance estimates
released by the ministry of agriculture and farmer welfare. The
main reason for this growth was driven by favourable monsoon
and various policy initiatives taken by the government.
Rice: Total production of rice is estimated at record 108.86
million tonnes which is a new record. Production of rice
The share of agriculture and allied sectors is expected to be at 17.3% of the Gross Value Added (GVA) during 2016-17 at 2011-12 prices.

Management Discussion & Analysis48
has increased significantly by 4.45 million tonnes than the
production of 104.41 million tonnes during 2015-16.
Wheat: Production of wheat, estimated at 96.64 million
tonnes is also a record. Production of Wheat during 2016-17
is also higher by 4.03 million tonnes than the average wheat
production. The current year’s production is higher by 4.36
million tonnes as compared to Wheat production of 92.29
million tonnes achieved during 2015-16.
Coarse Cereals: Total production of coarse cereals is
estimated at a new record level of 44.34 million tonnes,
higher than the average production by 3.00 million tonnes.
Current year’s production is also higher by 5.82 million
tonnes as compared to production of 38.52 million tonnes
achieved during 2015-16.
OUTLOOKThe Indian agriculture sector remains a key component
of the economy, despite of the persistent challenges. To
mitigate the challenges and enhance the productivity of the
agricultural sector, Government has been very supportive
through a number of policy measures and initiatives. With
the help of rising income of the farmers and the initiatives
taken by Government, there has been a substantial increase
in Minimum Support Prices (MSPs) across crop categories
and in the outlay for rural welfare schemes. Going forward,
the agriculture sector in India is expected to gain further
momentum due to the increased investments in agricultural
infrastructure.
AGROCHEMICAL INDUSTRYGlobal
The global agrochemical industry is expected to witness
decent growth and reach an estimate of US $266 billion
by 2021 from $213.2 billion in 2016 at a CAGR of 4.5%.
A rise in the global demand for nutritious and high-quality
food and the shrinking of arable land is likely to drive the
agrochemical industry over the forecast period. (Source:
Research and Markets)
The Agrochemical industry is highly consolidated and
consists of insecticides, fungicides, and herbicides.
Agrochemicals have significantly increased farm productivity
India's GDP Growth (` in million)
2009-10
139.39
2008-09
141.77
2015-16
244.74
2014-15
256.23
2007-08
162.67
2006-07
137.17
2013-14
132.71
2012-13
140.77
2011-12
160.80
2010-11
157.35
Source: Ministry of Agriculture, Print Release, RBI, TechSci Research Notes: GDP – Gross Domestic Product, MOSPI – Ministry of Statistics and Programme Implementation FY16 – Advance Estimates
2nd Advance Estimates of production of major crops for 2016-17
Commodity2015-16
(million tonnes)2016-17
(million tonnes)y-o-y %
Foodgrains 251.57 271.98 8.1
Rice 104.41 108.86 4.3
Wheat 92.29 96.64 4.7
Coarse Cereals 38.52 44.34 15.1
Pulses 16.35 22.14 35.4
Oilseeds 25.25 33.6 33.1
Soyabean 8.57 14.13 64.9
Groundnut 6.73 8.47 25.9
Cotton* 30.01 32.51 8.3
Sugarcane 348.45 309.98 (11.0)
*million bales of 170 kg each

Annual Report 2016-17 49
COMPANY OVERVIEW
1-36 37-81 82-184
STATUTORY REPORTS FINANCIAL STATEMENTS
in both developed and developing countries. Increased
production of soybeans and sugarcane in Latin America is
also driving growth in the region. Fungicide products based
on innovative technology offer proficient and long-lasting
disease control and have positive effects on plant physiology,
which in turn increases its adaptability across the globe.
India
The Agrochemical industry has transformed the agricultural
landscape in India, promoting the farming community in
terms of better yields and crop performance. India is currently
the fourth largest producer of agrochemicals globally, after
US, Japan and China. The sector is expected to grow at
a rate of 8% per annum to become ` 180 billion entity by
2017-18. The Indian agrochemicals market is supported
by strong growth drivers. Availability of cheap labour and
low processing costs offers opportunity for MNCs to setup
their manufacturing hubs in India for their export markets.
The sector is also driven by huge probability for contract
manufacturing and research for Indian players due to large
accessibility of technically skilled labour.
In India, on an average 15-25% of food produced are
damaged by pests. Due to the rising population and
decreasing arable land, demand for food grains is increasing
at a much larger pace. Therefore, there is an emerging need
for crop protection. The usage of suitable chemicals and
medicines will prevent pest damage, while improving the
crop productivity and soil fertility.
KEY SEGMENTS OF THE AGROCHEMICAL INDUSTRYInsecticides: It provides protection to the crops from the
insects by either killing them or by preventing their attack.
They also help in controlling the pest population below a
desired threshold level. Consumption of insecticides for
cotton has significantly reduced to 50% from 63% of the total
volume after introduction of BT cotton.
Fungicides: Major crop loss across the world is due to
Fungi. In order to protect the crops from the attack of fungi,
fungicides are used. It is of two types – protectants and
eradicates. Fungicides help in improving productivity, reduce
blemishes on crop and also improve storage life and quality
of harvested crop. The growing horticulture market in India
owing to the government support has further boosted the
fungicide usage.
Herbicides: They are also termed as weedicides, and are
used to kill undesirable plants. Their main competition is
cheap labour which is employed to manually pull out weeds.
Sales are seasonal, owing to the fact that weeds flourish in
damp, warm weather and die in cold spells.
Bio-pesticides: These are derived from natural substances
like animals, plants, bacteria and certain minerals. Currently
a small segment, but it is expected to enhance in future with
respect to government support and increasing awareness
about use of non-toxic, environment friendly pesticides.
OPPORTUNITIES OF THE INDIAN AGROCHEMICAL INDUSTRYRobust manufacturing potential
India stands amongst the largest exporter of pesticides.
The demand driving factors are its capability in low cost
manufacturing, the availability of technically trained
resources, seasonal domestic demand, overcapacity, better
price realisation globally and a strong presence in generic
pesticide manufacturing.
Off-patent products and export opportunities
It is expected that Indian agrochemicals worth US$ 4.1
billion would go off-patent by 2020. This would further boost
demand and provide significant export opportunities for
Indian companies which will have expertise in manufacturing
generic products.
Growth in Herbicides and Fungicides
Over the past few years, the availability of cheap labour for
manually picking up weed has limited growth for herbicides.
With the rising labour shortages, enhancing labour costs
and new genetically modified crops have increased usage of
herbicides. This has eventually led to an increase of 15% per
year and will keep increasing over the next five years. In the
last five years, it has grown by 7.5% and is expected to grow
further, going forward.
Low consumption of pesticides in India
As compared to other countries, India’s per hectare
consumption of pesticides is the lowest. In comparison
to China’s 13 kg per hectare, India is 0.6 kg per hectare.
Increasing usage will help to boost production yields.
Rising innovation in agro-chemistry
Due to excessive labour shortage, the introduction of slow
and controlled release type of formulations helps in avoiding
multiple sprays. In today’s world with innovation at a rise,
new technologies are being introduced to help boost farm
productivity. With this farmer are also investing more and
more in better seed treatment agrochemicals to ensure
disease resistance along with uniformed germination.
The Agrochemical sector is expected to grow at a rate of 8% per annum to become ` 180 billion entity by 2017-18.

Management Discussion & Analysis50
CHALLENGES FACED BY THE INDIAN AGROCHEMICAL INDUSTRYLack of proper awareness and education among farmers:
Despite the strong growth drivers, Indian agrochemicals
industry faces challenges in terms of low awareness
among farmers (only 25-30% of the farmers are aware of
agrochemical products and their usage). It is very important
to educate famers about the appropriate kind of pesticide,
its dosage and quantity and application frequency, without
which it can also damage the crop. However, the Government
of India has now started taking corrective measures to
educate the farmers in many different languages which in
turn, would provide better crop quality.
Low focus on R&D by domestic manufacturers:
For development of any specialty molecule, huge capital
and manpower investments are required. However, Indian
companies spend only 1-2% of their revenues in R&D as
compared to global multinational companies which invests
around 8-10% of their revenues.
Need for efficient distribution systems:
Effectiveness of current supply chain management (SCM)
practices in agrochemicals is another area of concern for
the industry. In India, there is a definite lack of strong and
efficient distribution network for the crop protection market.
Furthermore, the industry has been plagued by problems
arising out of inadequate storage and infrastructure
problems. Due to lack of proper distribution system, it
becomes difficult for agrochemical companies to reach out to
farmers and promote their products and also educate them
about their benefits.
OUTLOOKThe Indian Agrochemical industry holds huge potential in
today’s emerging markets. With government policies such
as Make in India and other tax reforms measures such as
the Goods and Services Tax (GST), crop protection and crop
enhancement solutions are being developed based on best
global practices and latest technologies. Accurately designed
and executed, current initiatives can help India become
a global manufacturing hub of quality crop protection
chemicals. Regulators need to increase their inspection staff
to ensure regular checks to contain the growth of spurious
products. There is also a need to encourage R&D and ease
registration process for development of new molecules.
Large MNCs can look at strategic alliances with Indian
counterparts to increase their marketing and distribution
reach or expand into newer product categories. Smaller
Indian companies can look at tie-ups with MNCs to explore
opportunities in contract research and manufacturing.
Companies also need to relook at strengthening their supply
chain strategies to improve their distribution reach.
SPECIALTY CHEMICALS INDUSTRYGlobal
The global specialty chemicals market is estimated to be
valued at US$ 828.9 billion in 2015 and is expected to grow
at a CAGR of 5% during 2016-2022. The factors influencing
the growth are large base of end-use industries, high demand
from Asia-Pacific, increasing demand from automotive
industry and technological advancements in the industry.
(Source: P&S Market Research)
The increasing demand for foodgrains and rapid
urbanisation in countries such as Brazil, Russia, India,
China and South Africa (BRICS) is boosting the growth
of the global specialty chemicals market. The increasing
partnerships and enhancement of the distribution channels
are projected to contribute extensively towards the overall
development of the global specialty chemicals market in
the next few years. The overall industry is majorly driven
by the high demand for specialty chemicals agriculture and
construction industries. On the other hand, the growing
construction activities in Asia-Pacific and development
of environment friendly products offer ample revenue
generation opportunities to the manufacturers of specialty
chemicals.
India
According to Indian Specialty Chemical Manufacturer’s
Association (ISCMA), India’s speciality chemicals industry is
valued at about $25 billion, has successfully delivered 13%
growth over the past five years, primarily led by domestic
consumption. By constituting about 3% of the global
speciality chemicals market, this sector has great potential
and is to grow to 6-7% in 2023 with market size in the range
of $ 80-100 billion.
From past several years, foreign firms have strengthened
their presence in India due to its massive size and returns
of the market. The total FDI inflows from April 2000 to
September 2016 were US$ 12.43 billion. In 2016, polymer
production was recorded at around 9 million tonnes. To
further attract more FDIs, the Government has allowed
100% FDI for the chemical industry.
The Government has also launched the Draft National
Chemical Policy, which aims to further augment the
sector growth. In 2016, Department of Chemicals and
Petrochemicals, Ministry of Chemicals & Fertilisers,
India’s speciality chemicals industry is valued at about $25 billion, has successfully delivered 13% growth over the past five years, primarily led by domestic consumption.
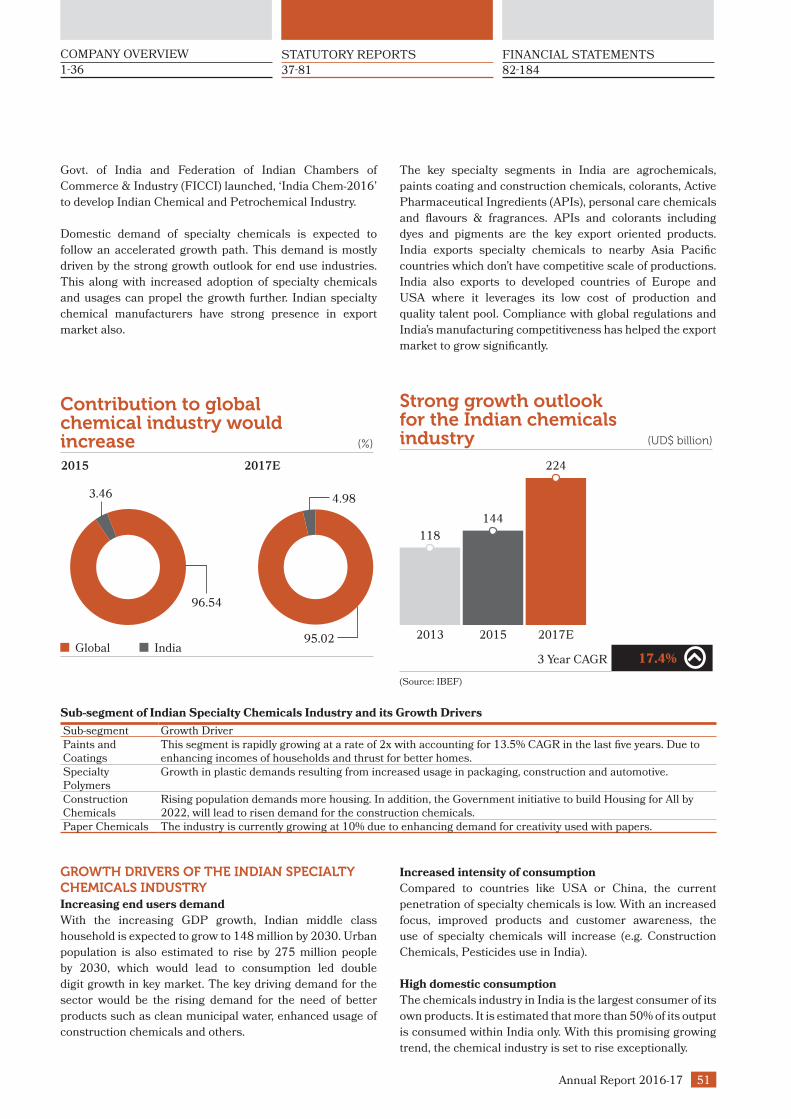
Annual Report 2016-17 51
COMPANY OVERVIEW
1-36 37-81 82-184
STATUTORY REPORTS FINANCIAL STATEMENTS
Govt. of India and Federation of Indian Chambers of
Commerce & Industry (FICCI) launched, ‘India Chem-2016’
to develop Indian Chemical and Petrochemical Industry.
Domestic demand of specialty chemicals is expected to
follow an accelerated growth path. This demand is mostly
driven by the strong growth outlook for end use industries.
This along with increased adoption of specialty chemicals
and usages can propel the growth further. Indian specialty
chemical manufacturers have strong presence in export
market also.
The key specialty segments in India are agrochemicals,
paints coating and construction chemicals, colorants, Active
Pharmaceutical Ingredients (APIs), personal care chemicals
and flavours & fragrances. APIs and colorants including
dyes and pigments are the key export oriented products.
India exports specialty chemicals to nearby Asia Pacific
countries which don’t have competitive scale of productions.
India also exports to developed countries of Europe and
USA where it leverages its low cost of production and
quality talent pool. Compliance with global regulations and
India’s manufacturing competitiveness has helped the export
market to grow significantly.
Contribution to global chemical industry would increase (%)
3.46
Global India
96.54
2015 2017E
4.98
95.02
Strong growth outlook for the Indian chemicals industry (UD$ billion)
224
2013 2015 2017E
144
118
17.4%3 Year CAGR
(Source: IBEF)
Sub-segment of Indian Specialty Chemicals Industry and its Growth Drivers
Sub-segment Growth DriverPaints and Coatings
This segment is rapidly growing at a rate of 2x with accounting for 13.5% CAGR in the last five years. Due to enhancing incomes of households and thrust for better homes.
Specialty Polymers
Growth in plastic demands resulting from increased usage in packaging, construction and automotive.
Construction Chemicals
Rising population demands more housing. In addition, the Government initiative to build Housing for All by 2022, will lead to risen demand for the construction chemicals.
Paper Chemicals The industry is currently growing at 10% due to enhancing demand for creativity used with papers.
GROWTH DRIVERS OF THE INDIAN SPECIALTY CHEMICALS INDUSTRYIncreasing end users demand
With the increasing GDP growth, Indian middle class
household is expected to grow to 148 million by 2030. Urban
population is also estimated to rise by 275 million people
by 2030, which would lead to consumption led double
digit growth in key market. The key driving demand for the
sector would be the rising demand for the need of better
products such as clean municipal water, enhanced usage of
construction chemicals and others.
Increased intensity of consumption
Compared to countries like USA or China, the current
penetration of specialty chemicals is low. With an increased
focus, improved products and customer awareness, the
use of specialty chemicals will increase (e.g. Construction
Chemicals, Pesticides use in India).
High domestic consumption
The chemicals industry in India is the largest consumer of its
own products. It is estimated that more than 50% of its output
is consumed within India only. With this promising growing
trend, the chemical industry is set to rise exceptionally.

Management Discussion & Analysis52
Diversified industry
The Indian chemicals industry has a huge diversified
manufacturing base which produces world-class products.
There is a substantial presence of downstream industries
in all segments. Further, this large and expanding domestic
chemicals market also boasts of a large pool of highly-trained
scientific manpower.
Government initiatives
Favourable initiatives by the Indian government in developing
chemical clusters with adequate infrastructure, expediting
international investment and the Make in India campaign
gives better visibility for the industry.
OUTLOOKThe outlook for the chemical industry is poised to grow
further. Despite a spate of headwinds and sudden shock of
demonetisation affect in the overall economy, the industry
has performed well due to continued support from growing
automotive and construction markets. The industry will keep
improving and growing on account of enhancing operating
environment and strategic measures including productivity
improvement and portfolio re-structuring. Going further,
it would accelerate because of the enhancing government
attention and polices accompanied with increasing mergers
and acquisitions in the industry.
COMPANY OVERVIEWA part of well renowned K. K. Modi Group of Companies,
Indofil has emerged as a prominent and customer-centric
brand. Headquartered in Mumbai, the Company runs on
a simple philosophy of retaining loyalty and enlarging its
fold of satisfied customers. Over the years, it has grown
tremendously and occurred as a fully integrated and research
led chemical company.
The Company holds a very strong domestic base, with
well recognition internationally. It is constantly growing
and expanding in both of its businesses i.e., Agricultural
Chemicals and Specialty & Performance Chemicals through
partnerships and joint ventures for manufacturing and
research & development activities. The Company aims to
build strong partnerships in the domain of manufacturing,
marketing and R&D globally.
RESEARCH AND DEVELOPMENTR&D success is a key element of Indofil’s strategic roadmap,
driving best-in-class performance through agility and
innovation. We believe that being truly innovative requires
global ambitions, significant investments and a diverse
approach where multiple initiatives go hand in hand. Our
continued focus is to keep improving the current processes,
aimed at better operations and productivity. We are focused
on undertaking dedicated R&D in areas, which we believe,
have significant growth potential. We believe that our R&D
has led, and will continue to lead to new, innovative processes
that can increase the efficiencies of production including
developing cost effective manufacturing processes, as well
as address opportunities that we have identified in the global
market for our businesses.
Our R&D team not only focuses on projects that would
generate short-term profit, but emphasises on the future
aspects as well. The pipeline has been designed for catering
to molecules of variable complexities in areas of chemistry,
IP, regulatory, engineering and manufacturing. The centre’s
infrastructure is being developed, with priority given to safety
and quality of the products. We invest actively in R&D to
ensure that we continue manufacturing quality products and
deliver the best. Our operational team focuses on improving
processes in order to improve yield, and reduce waste and
develop technologically advanced products.
HUMAN RESOURCEAt Indofil, we believe a determined and motivated team
can drive our long-term growth strategies sustainably.
We are imparting industry relevant training to our people
and providing them the right environment to grow their
professional acumen. We are proud of our people and of
the open, innovative culture at the heart of our company.
We strive towards diversity among our employees, to obtain
beneficial effects on creativity, innovation, progress and
mutual enrichment. Such diversity establishes conditions
that allow all employees, without discrimination in any
criteria, to enrich their professional skills and career within
the Company.
FINANCIAL REVIEWSnapshot
(` in Crores)
Year 2016-17 2015-16 Growth (%)
Total Revenue 1,90,959.57 1,71,554.77 11.31
EBITDA 36,236.51 29,805.45 21.57
PBT 28,079.68 21,406.25 31.17
PAT 21,804.21 16,519.01 31.99

Annual Report 2016-17 53
COMPANY OVERVIEW
1-36 37-81 82-184
STATUTORY REPORTS FINANCIAL STATEMENTS
RISK MANAGEMENTIncreasing competition - The Company has effectively
predicted and responded to changing trends in the sector.
It has innovated new marketing tools and programmes to
reach its customers/farmers. The Company has maintained
an effective distribution system, ensuring that new and
existing products reach its customers.
Public acceptance of products - The Company’s products
go through rigorous testing procedures clearly showcasing
positive impacts on human, crop and environment.
Rainfall variation across geographies - Indofil has a pan-
India presence, which insures the Company from any
seasonal variation in one particular region. Besides, the
Company is increasingly focusing on irrigated areas to
counter the effects of rainfall variation.
Fluctuation in India rupee against foreign currency - The
Company’s exports form an important part of the total
revenues; and therefore, fluctuations in foreign currency may
impact its overall margins. The Company actively monitors
the movements of foreign currency and takes significant
steps to counter the foreign currency risk.
Instability in prices of raw materials - Instability in input
prices significantly impacts the growth of the chemical
sector. The Company has quickly read, adapted and adjusted
itself to market tendencies. It has also achieved operational
efficiencies to reduce costs in plants.
INTERNAL CONTROL SYSTEMS AND ADEQUACYThe Company has adequate internal control system to
safeguard all assets and ensure operational excellence.
Timely reviews ensure that all transactions are correctly
authorised and reported. The internal control systems
are regularly reviewed and corrective actions are initiated
wherever necessary. Corporate policies, management
information and reporting system for key operational areas
constitute the overall control mechanism. The Company
has also adopted an Enterprise wide Risk Management
Framework.
CAUTIONARY STATEMENTStatements in the Management Discussion and Analysis
describing the Company’s objectives, projections,
estimates and expectations may be ‘forward-looking
statements’ within the meaning of applicable securities
laws and regulations. Actual results could differ materially
from those expressed or implied. Important factors
that could influence the Company’s operations include
economic developments within the country, demand and
supply conditions in the industry, input prices, changes in
Government regulations, tax laws and other factors, such
as litigation and industrial relations.
The Company’s products go through rigorous testing procedures clearly showcasing positive impacts on human, crop and environment.

54 Directors' Report
Directors’ Report
To the Shareholders,
Your Directors have pleasure in presenting the 24th Annual Report with Audited Financial Statements for the year ended
March 31, 2017.
FINANCIAL HIGHLIGHTS
` in Crores
Year Ended
March 31, 2017
Year Ended March 31, 2016
Revenue from Operations 1,892.96 1,708.70
Total Income 1,909.60 1,715.55
Earnings Before Interest, Tax, Depreciation & Amortisation 362.37 298.05
Finance Cost 34.65 50.96
Depreciation and Amortisation 46.92 33.03
Profit before Exceptional Item &Tax 280.80 214.06
Exceptional Item Nil Nil
Profit before Tax 280.80 214.06
Tax Expense 62.75 48.87
Profit After Tax 218.04 165.19
The Financial statements for the year 2016-17 have been
prepared under Indian Accounting Standards (IND AS)
notified under the Companies (Indian Accounting Standard)
Rules, 2015 read with Section 133 of the Companies Act
2013 ("the Act") with effect from April 01, 2016.
The Company does not propose to transfer any amount to
General Reserve.
DIVIDENDThe Board of Directors have decided to recommend dividend
of ` 8 per share (80%) on fully paid-up Equity Shares of ` 10
each and pro-rata on partly paid-up Rights Equity Shares of
` 10 each (paid up amount ` 3 each) for the year ended
March 31, 2017. This dividend, if approved by the members
at the Annual General meeting, will absorb ` 20.65 Crores
(P.Y. ` 15.49 Crores) including tax on dividend. The dividend
amount has been arrived at keeping in view the requirement
of funds for on-going projects.
STATE OF COMPANY’S AFFAIRS AND OPERATIONSDuring the year under review, the Company’s Operating
Revenue was up from ̀ 1,708.70 Crores to ̀ 1,892.96 Crores.
Profit before Tax and Exceptional Items was ̀ 280.80 Crores
for the year under review as against ` 214.06 Crores for the
previous year, registering an increase of 31%. The Company
has mainly been in the Agro Chemicals segment for more
than five decades and enjoys a strong brand image and recall
with its customers.
Production volume of Agrochemicals Division for the year
has been 67,013 MT as against 60,775 MT in the previous
year and sales volume have been 54,453 MT against
50,065 MT in the previous year.
In case of Specialty Chemicals Division, the production
volume has been 19,719 MT as against 15,674MT in the
previous year and the sales volume have been 20,718 MT
against 17,784 MT in the previous year.
EXPORTSThe Company made exports (FOB) worth ` 807.06 Crores
against ` 742.81 Crores in the previous year. The company
has initiated renewed steps to enhance exports of both its
Agrochemicals and Specialty & Performance Chemicals
Divisions.
CAPACITY EXPANSIONManufacturing facilities was able to meet the demand for the
current year and shall also be able to meet the requirements
for the year 2017-18.
Annual Report 2016-17 55
COMPANY OVERVIEW
1-36 37-81 82-184
STATUTORY REPORTS FINANCIAL STATEMENTS
Your Directors are pleased to inform that the Company
has completed setting up a new Greenfield Multipurpose
Agro Synthesis facility (Synthesis Project) for manufacture
of Multi-products (Technical and Export Formulations) at
Company’s new Plot at Dahej SEZ, Gujarat with production
capacity of 4000 TPA of Technicals and the commercial
production at the plant was started successfully in November,
2016. This plant is another landmark in company’s journey
towards manufacturing excellence, quality and efficiency.
Keeping in view the increasing demand, the Company has
now commenced the setting up of a Green-Field Mancozeb
(EBDC) and Specialty & Performance Chemicals Plant with
production capacity of 35,000 MTs per annum of EBDC and
36,000 MTs per annum of SP Chemicals. The Company has
already identified and purchased land admeasuring 101,945
sq. mtrs at GIDC Dahej, Gujarat for this.
With a vision to graduate to be a global leader in growth for
Agro and Specialty Chemicals, the Company has embarked
upon new initiative “Lakshya 2x3’ which aims to drive
Indofil’s value to $2B in next 3 years. This initiative will
be of utmost importance to us in further accelerating our
growth plans. In order to ensure satisfaction and prosperity
of its customers, the company has been constantly providing
customised solutions with a more focused approach.
JOINT VENTURE WITH SHANGHAI BAIJIN CHEMICAL GROUP CO. (SBC), CHINA FOR CARBON DISULPHIDE (CS2)The Joint Venture project of the Company at Dahej for
manufacturing of Carbon Di-Sulphide (CS2), a major raw
material for Mancozeb, has ensured uninterrupted supply of
CS2 to the Company, eliminating the import of CS2 and thus
help saving significant amount of foreign exchange. Besides,
the JV is actively catering to external demand for CS2 in
India & overseas. For the first time the JV reported a Profit
Before Tax of ` 37.35 Crores during F.Y. 2016-17.
SETTING UP OF OFFICES/SUBSIDIARY IN MYANMAR, BRAZIL AND PHILIPPINESThe company has set up office/subsidiary in Yangon,
Myanmar and Sao Paulo, Brazil and is in advanced stages
of setting up a office in Manila, The Philippines. These
offices will work as a significant facility in coordinating and
developing various agro business activities and boosting
business development in these countries. The facilities
certainly mark a new beginning towards the expansion of
Company’s Agrochemicals business.
AGRICULTURAL BUSINESS DIVISIONOpportunities and Threats
A rise in the global demand for nutritious and high-quality
food, rising population, the shrinking of arable land and
consumer awareness associated with the benefits of
pesticides in crop production is expected to drive the
growth of agrochemicals industry. The global agrochemicals
industry is estimated to reach US$ 250.5 billion at a CAGR
of 3.2% by 2020.
Agrochemicals have significantly increased farm productivity
in both developed and developing countries. Improving
income levels coupled with demand for higher volumes of
balanced nutrition in developing countries such as China
and India will further boost the demand for agrochemicals.
The high growth potential in emerging markets and
untapped regions, provide new growth opportunities for the
market players. Further the growth of this market is driven
by growing farmer’s attention towards superior quality
agrochemicals, which should be balanced and nutritive.
The European region is expected to be the fastest-growing
market in the near future, due to the growing concentration
of farmers towards technology driven agriculture practices.
Increased production of soyabeana and sugarcane in Latin
America is also driving the growth in the region.
Indofil has aligned its strategy to meet these challenges with
New Product Development as the key driver Initiative for the
coming years.
Outlook
The agriculture sector in India continues to receive focused
attention from governments, government bodies, banks,
financial institutions and other agencies and authorities. The
Central Government has initiated several policy measures to
enable farmers to gain access to credit facilities, the primary
driver for the agrochemicals market. There is a huge potential
for growth in the future as currently the consumption levels
of agrochemicals are low as compared to the world. Further,
we are all set to receive normal rains in 2017 strengthening
the prospects of plentiful farm output. These factors are
contributing to growth of agriculture and consequently the
agrochemicals market.
The Company is all geared up not only to extract maximum
from this positive outlook in domestic scene but also
ensuring dedicated efforts towards geographic expansion
in Latin America, Europe, and Russia. Achieving full
potential of Offices in Netherlands, Bangladesh, Myanmar

56 Directors' Report
and Philippines is among the strategic imperatives Indofil is
looking at besides increasing the product portfolio.
SPECIALTY AND PERFORMANCE CHEMICALS DIVISIONIndustry scenario
The Indian Specialty Chemicals market, which witnessed
a growth of 14% in last five years, has potential to reach
USD 70 Billion to USD 90 Billion by 2021. Buoyed by
key factors such as robust growth in end user segments,
government’s and industry’s focus towards manufacturing,
value addition accompanied by global shift towards Asia as
world’s chemicals manufacturing hub accompanied by India,
is likely to emerge as a major player in the global specialty
chemicals domain
The specialty chemicals market size in terms of value is
projected to reach $470 Billion by 2020, at a CAGR of 5.42%,
between 2015 and 2020. The specialty chemicals market is
witnessing a steady growth from 2015 to 2020 mainly due
to the growth in the end-user industries. This increases the
scope of applications and focus on innovation to produce
efficient and safe chemicals.
Opportunities
India has only 3% share of the global specialty chemicals
market. With current market growth rate, by 2020 India will
double its share in global market. This will position India as
one of the key players in global specialty chemicals industry.
With ‘Make in India’ as new major national program designed
to facilitate investment, a large number of multinational
companies are considering India as the sourcing &
manufacturing hub due to its cost advantages. India can
emerge as a major global player subject to availability of
infrastructure, key feed stocks (raw materials) and energy
essential to manufacture specialty chemicals at low cost.
The real edge would however, come from product technology
and innovation.
RESEARCH AND DEVELOPMENTIndofil’s Research and Development is playing a vital role in
company’s growth journey.
Agrochemicals
Your Company has started new Synthesis facility in Dahej
as planned. R&D is playing a critical role by providing
cost effective processes with improved quality of products.
Production of five products has already commenced whereas
balance are in line. The focus now is effluent reduction which
will bring down the treatment cost.
Synthesis team was also engaged in developing processes
for new products. Besides in-house efforts , partnerships
with private CROs and Institutes of International repute has
brought velocity. Exposure to Institutes like IIT Mumbai, ICT,
Mumbai University, IICT Hyderabad is providing opportunity
to scientists to update knowledge and skills.
Formulation team continues its efforts in developing
newer formulations and three way mixtures which will be
patentable, providing unique position to our marketing.
Formulations developed by our team have been recognised
and appreciated by International clients.
Specialty and Performance Chemicals Division
The Specialty and Performance Chemical Division has four
verticals viz. Coating, Leather, Textile and Plastics. Focus
is on profitable and unique products. R&D is working on
improving the processes so that profitability can be improved.
Coating focus is on user friendly products like waterproofing
products and new concept of anti-efflorescence whereas
Leather focus is on new chemistry with differentiated
Acrylic syntans. Efforts are being taken to expand range of
fat liquor for shoe and gloves and high performance binder
and compact. Textile targeted diversed applications like
fire retardants, flock binders, coir doormat printing binder,
carpet back adhesion and printing additives. Plastics mainly
addressed environmental concerns and focused on wood
substitute, Foamed PVC for household interiors, PVC pipes
with lead free stabilisers
The team work
The team is totally charged and highly motivated to fulfill
Company’s dream of ambitious plans.
ENERGY CONSERVATION/TECHNOLOGY ABSORPTION AND FOREIGN EXCHANGE EARNINGS AND OUT GODetails of Energy Conservation, technology absorption,
foreign exchange earnings and out go, required to be
disclosed under Section 134(3)(m) of the Companies Act,
2013 read with Rule 8 of The Companies (Accounts) Rules,
2014, is annexed as Annexure C to this report and forms
part of it.
INTERNAL CONTROL SYSTEMS AND THEIR ADEQUACYThe Company has an adequate system of internal control
commensurate with the size of the Company and the nature
of its business, to ensure that transactions are recorded,
authorised and reported correctly apart from safeguarding
its assets against loss from wastage, unauthorised use
and disposition. The internal control is supplemented by
an extensive program of internal audit by Messrs Aneja
Associates, Chartered Accountants, to ensure compliance
with policies and procedures.

Annual Report 2016-17 57
COMPANY OVERVIEW
1-36 37-81 82-184
STATUTORY REPORTS FINANCIAL STATEMENTS
VIGIL MECHANISM / WHISTLE BLOWER POLICYThe Company has adopted a Vigil Mechanism / Whistle
Blower Policy with the objective of strengthening the
governance mechanism and to report to the management
instances of unethical behavior, actual or suspected
misconduct or fraud.
The Auditors of the Company have not reported any fraud in
terms of the provisions of Section 149(6) of the Companies
Act, 2013.
SIGNIFICANT AND MATERIAL ORDERS PASSED BY THE REGULATORS OR COURTS OR TRIBUNALSThere are no significant material orders passed by the
Regulators or Courts or Tribunals which would impact
the going concern status of the Company and its future
operations.
FIXED DEPOSITSDuring the year the Company has not accepted any deposit
from the Public within the ambit of the provisions of
Companies Act, 2013. As on March 31, 2017, there are no
fixed deposits outstanding or unclaimed.
PARTICULARS OF LOANS, GUARANTEES OR INVESTMENTSDetails of Loans, Guarantees and Investments covered
under the provisions of Section 186 of the Companies Act,
2013 are given in the notes to the Financial Statements.
RELATED PARTY TRANSACTIONSAll related party transactions that were entered into during
the financial year were on an arm’s length basis and were
in the ordinary course of business. There are no materially
significant related party transactions made by the Company
with Promoters, Directors and Key Managerial Personnel
which may have a potential conflict with the interest of the
Company at large. Details of material significant transactions
made at arm’s length are given in Annexure ‘F’.
All Related Party Transactions are placed before the Audit
Committee as also the Board for approval, wherever required.
The Company has formulated a Related Party Transactions
Policy that provides guidelines that facilitate the basis for
analysis of related party transactions to be entered.
None of the Directors has any pecuniary relationships or
transactions vis-à-vis the Company.
MANAGEMENT DISCUSSION & ANALYSISA detailed report on the Management Discussion & Analysis
is provided as a separate section in the Annual Report.
CORPORATE SOCIAL RESPONSIBILITY INITIATIVEAs per the CSR Policy of the Company, approved by the
Board, ‘Promoting and Supporting Education Programs’
has been the thrust area of Company’s CSR activities.
Modi Innovative Education Society (MIES), Chhattisgarh,
a registered Society, engaged in educational activities, is
establishing a private University, K.K.Modi University in
Village Mahmara, District Durg, Chhattisgarh. In line with
‘Promoting Education’ as thrust area of Company’s CSR
initiative, the CSR contributions in this regard for the
F.Y 2016-17 have been made to MIES. For this purpose
Samaj Kalyan Parishad, Ghaziabad, Uttar Pradesh, a Modi
Group Society registered in 1956 and having significant
experience in education activities has been appointed as
an Implementing Agency to carry out CSR activities along
with MIES and to exercise supervisory role for completing
the said project. The said project is in accordance with
Schedule VII of the Companies Act, 2013.
The Company has contributed an amount of ` 5
lakhs as Donation to Rajasthan Bal Kalyan Samiti,
Udaipur, Rajasthan, a Society registered under Society
Registration Act, 1958 towards their ‘Hansraj Children
Home’ Project for imparting education to orphan girls
children and activities in relation thereto. The Company
has contributed an amount of ` 10 lakhs as Donation
to ‘Centre for Research in Information, Publication
and Training’ (CRIPT), Hyderabad for their Heath Skill
Training Program for Youth to be carried in Uttar Pradesh
under their ‘Skill development and Health awareness’
initiative. These contributions are towards Company’s
CSR activity for the financial year 2016-17.
The total CSR contribution during the year stands at ` 306
lakhs.
The Annual Report on CSR activities and Company’s CSR
Policy are annexed herewith as “Annexure A”.
DIRECTORSIn terms of the provisions of Section 152 of the Companies
Act, 2013 and th e Articles of Association of the Company,
Mr. Samir Modi is liable to retirement by rotation at the
ensuing Annual General Meeting and, being eligible, has
offered himself for reappointment. The Board recommends
his appointment.
All Independent Directors have given declarations that
they meet the criteria of independence as laid down under
Section 149(6) of the Companies Act, 2013.
During the year, the tenure of Mr Krishna Kumar Modi
as Chairman & Managing Director came to an end on
28th February, 2017 and the Board of Directors at
their meeting held on 23rd December, 2016, on the
recommendation of Nomination & Remuneration
Committee, reappointed him as Chairman & Managing
Director for a period of 5 years with effect from 1st
March, 2017 on the terms subject to the approval of the

58 Directors' Report
shareholders at the ensuing Annual General Meeting to be
held on 15th September, 2017. The Company has received
a notice in writing from a member along with the deposit of
requisite amount under Section 160 of the Act proposing
his candidature for the office of Director.
During the year, UPSIDC appointed Mr Amit Kumar Ghosh,
IAS, as nominee Director on the Board of the Company in
place of Mr Manoj Singh, IAS with effect from 22nd June,
2016.
Further, UPSIDC has appointed Mr. Ranvir Prasad, IAS,
as Nominee Director on the Board of the Company in place
of Mr. Amit Kumar Ghosh, IAS with effect from 29th June,
2017.
None of the Directors of the Company is disqualified as per
the provisions of Section 164(2) of the Companies Act, 2013.
During the year four Board Meetings were convened and held,
the details of which are given in the Corporate Governance
Report. The intervening gap between the Meetings was
within the period prescribed under the Companies Act, 2013.
Remuneration Policy: The Board has, on the recommendation
of the Nomination & Remuneration Committee framed
a policy relating to appointment and remuneration of
Directors, key managerial personnel and other employees.
The Remuneration Policy is stated in the Corporate
Governance Report.
AUDITORSStatutory Auditors
M/s Bansi S. Mehta & Co, Chartered Accountants, who
are the statutory auditors of the Company, hold office till
the conclusion of the ensuing Annual General Meeting
and are eligible for re-appointment. Pursuant to the
provisions of Section 139 of the Companies Act, 2013
and the Rules framed thereunder, it is proposed to
appoint M/s Bansi S. Mehta & Co as statutory auditors of
the Company from the conclusion of the ensuing Annual
General Meeting till the conclusion of the twenty-fifth
Annual General Meeting to be held in the year 2018,
subject to ratification of their appointment at the ensuing
Annual General Meeting.
Cost Auditors
The Board of Directors have appointed Messrs. Kalpana
P. Mehta & Co., Cost Accountants, Mumbai as Cost
Auditors to conduct the Cost Audit of the cost records
of the Company for the financial year 2017-18 on a
remuneration payable upto ` 2,20,000 per annum, which
is subject to ratification by a resolution by members at the
Annual General Meeting.
Secretarial Audit
Pursuant to the provisions of Section 204 of the Companies
Act, 2013 and The Companies (Appointment and
Remuneration of Managerial Personnel) Rules, 2014, the
Company has appointed Messrs Ragini Chokshi & Company,
Mumbai, Practicing Company Secretaries, as Secretarial
Auditor of the Company for the year 2017-18. The Report of
the Secretarial Audit for year 2016-17 is annexed herewith
as “Annexure B” and doesn’t contain any qualification,
reservation, adverse remark or disclaimer.
DIRECTORS’ RESPONSIBILITY STATEMENTPursuant to Section 134(3)(C) of the Companies Act, 2013
the Directors confirm to the best of their knowledge and
belief:
(a) that in the preparation of the annual accounts for the
financial year ended March 31, 2017, the applicable
accounting standards had been followed along with
proper explanation relating to material departures;
(b) that the Directors had selected such accounting policies
and applied them consistently and made judgments and
estimates that were reasonable and prudent so as to give
a true and fair view of the state of affairs of the Company
at the end of the financial year and of the profit and loss
of the Company for the year under review;
(c) that the Directors had taken proper and sufficient care
for the maintenance of adequate accounting records in
accordance with the provisions of the Companies Act,
2013 for safeguarding the assets of the Company and for
preventing and detecting fraud and other irregularities;
(d) that the Directors had prepared the annual accounts
for the financial year ended March 31, 2017 on a ‘going
concern’ basis;
(e) that the Directors had devised proper systems to ensure
compliance with the provisions of all applicable laws
and that such systems were adequate and operating
effectively.
There have been no material changes and commitments
affecting the financial position of the Company which have
occurred between the end of the financial year 2016-17 and
the date of this report. There has been no change, during
the financial year under review, in the nature of Company’s
business.
SUBSIDIARY COMPANIESIndo Baijin Chemicals Private Limited (IBCPL): IBCPL
which started the commercial production of Carbon Di-
sulphide (CS2) in April, 2014 produced 50,438 MTs and sold
50,546 MTs of CS2 and achieved a turnover of ` 183 Crores.

Annual Report 2016-17 59
COMPANY OVERVIEW
1-36 37-81 82-184
STATUTORY REPORTS FINANCIAL STATEMENTS
Indofil Industries (Netherlands) B.V. (IIN): The Company
had set up this wholly owned subsidiary in March, 2014
and all intangible assets that the Company had acquired
from Dow AgroScience in Europe were assigned to IIN.
This restructuring will enable the Company to have ease of
business operations in Europe.
Indofil Industries Brazil: The Company has set up a wholly
owned stepdown subsidiary in Brazil. The Company did not
have major operations during the year.
Indofil Industries (International) B.V. (IIIN): The Company
has set up another wholly owned subsidiary in October,
2015. This Company did not have major operations during
the year.
Good Investment (India) Limited and Quick Investment
(India) Limited, the wholly owned investments subsidiaries
of the company and the other two subsidiaries Indofil
Bangladesh Industries Private Limited and Indofil Costa
Rica S.A. did not have major operations during the year. As
required in terms of Section 129(3) of the Companies Act,
2013 a separate statement containing the salient features
of the financial statement of these subsidiaries has been
attached as annexure D
CONSOLIDATED FINANCIAL SATEMENTSIn accordance with Accounting Standard 21 – Consolidated
Financial Statements, form part of this Annual Report.
The Consolidated Accounts have been prepared on the
basis of audited financial statements received from the
subsidiary and associate companies, as approved by their
respective Boards.
RIGHTS ISSUE AND PAID UP SHARE CAPITALTo part finance the multipurpose agro synthesis and
specialty chemicals projects at Dahej SEZ and Dahej GIDC,
Dist Bharuch, Gujarat, the Company had issued 22,95,822
equity shares of ` 10 each at premium of ` 254 per share
(issue price ` 264 per share) on Rights basis in the ratio of
one equity share for every nine existing equity shares held
with ` 80 per share (` 3 on Capital and ` 77 on premium)
payable on Application, to the existing shareholders of the
Company in terms of Letter of Offer dated 28th October,
2014. The issue was oversubscribed and accordingly the
Rights Issue Allotment Committee of the Board of Directors
at their meeting held on 29th December, 2014 allotted
22,95,822 equity shares to the successful applicants.
The paid up Share Capital as on March 31, 2017 stood at
` 21,35,11,466 with 2,06,62,400 Equity Shares of ` 10 each
fully paid and 22,95,822 Equity Shares of ` 10 each with `
3 per Equity Share paid up. The Company has yet not made
a call for payment of 1st call money and shall make a call as
per requirement of funds.
PERSONNELDuring the year the Industrial Relations continued to be
cordial and healthy. Training continues to be the thrust for
building the right competencies. New initiatives in the areas
of Competency Mapping and Performance Management
have started showing results.
The information required pursuant to Section 197 read with
Rule 5 of The Companies (Appointment and Remuneration of
Managerial Personnel) Rules, 2014 in respect of employees
of the Company, are set out in the annexure forming part of
this report.
CORPORATE GOVERNANCECompany is committed to improve transparency,
professionalism, accountability and practice good corporate
governance. Accordingly a detailed report on Corporate
Governance is provided as a separate section in the
Annual Report.
RISK MANAGEMENT POLICYThe Company has adopted a Risk Management Policy which
outlines the Company philosophy and efficient approach
towards identification, analysis and mitigation of risks
and reporting on the risk environment of the respective
business segments in the Company. The Policy covers the
following aspects:
Roles and responsibilities of Risk Management
Committee, Audit Committee and other senior
executives of the Company with respect to risk
assessment and management.
Approach in identification, analysis and treatment
of risk.
The Risks are identified under broad categories as Strategic,
Business, Finance, Environment, Personnel, Operational,
Reputation, Regulatory, Technology and Political. This is an
illustrative list and the Policy is applicable to all the functions
within the Company.
Considering risk as an integral part of its business, your
Company takes proper steps to manage all risks in a
proactive and efficient manner. There are no risks which, in
the opinion of the Board, threaten the very existence of your
Company.
EXTRACT OF ANNUAL RETURNThe details forming part of the extract of the Annual Return
in form MGT 9 is annexed herewith as “Annexure E”.
CEO/CFO CERTIFICATEA Certificate from Mr. K. K. Modi, Chairman and Managing
Director as the Chief Executive Officer and Mr. Rajib

60 Directors' Report
Mukhopadhyay, Sr. Vice President-Finance as the Chief
Finance Officer in relation to the financial statements for the
year ended March 31, 2017 was submitted to the Board of
Directors of the Company and the same was taken note of.
APPRECIATIONYour Directors would like to express their sincere
appreciation to the various Departments of the Central and
State Governments, Financial Institutions, Banks, Investors,
Customers and Suppliers for their continued valuable
support and assistance. Your Directors appreciate and wish
to thank all the Officers, Staff and Workmen of the Company
at all levels for their dedication, commitment, contribution,
support and valuable co-operation throughout the year.
For and on behalf of the Board,
Mumbai (K. K. Modi)
Date: June 29, 2017 Chairman & Managing Director

Annual Report 2016-17 61
COMPANY OVERVIEW
1-36 37-81 82-184
STATUTORY REPORTS FINANCIAL STATEMENTS
Annexure ‘A’ to Directors' ReportANNUAL REPORT ON CORPORATE SOCIAL RESPONSIBILITY (CSR) ACTIVITIES
1. A brief outline of the Company’s CSR policy, including overview of projects or programs proposed to be
undertaken and a reference to the web-link to the CSR policy and projects or programs:
CSR Policy is stated herein below:
Weblink: https://indofilcc.com/profile/corporate-social-responsibility
2. Composition of the CSR Committee:
Mr. K.K. Modi, Chairman
Mr. Sunil Kumar Alagh, Independent Director
Mr. Ranvir Prasad, Nominee Director
3. Average net profit of the Company for last three financial years:
Average net profit: ` 152.15 Crores
4. Prescribed CSR Expenditure (two percent of the amount as in item 3 above):
The Company was required to spend ` 3.04 Crores towards CSR acitivities.
5. Details of CSR spend for the financial year:
a. Total amount spent for the financial year: ` 3.06 Crores
b. Amount unspent, if any: Nil
c. Manner in which the amount spent during the financial year is detailed below:
Sr. No.
Project Activities
Sector Locations
Locations District (State)
Amount Outlay
(Budget) Project or
Programwise
Amount spent on project programs
Cumulative Expenditure
upto reporting
period
amount spent direct or through
implementing Agency
1. Promoting Education: Establishing Private University K.K. Modi University*
Education Village Mahmara District: Durg Chhattisgarh
` 2.74 crore ` 2.74 crore ` 2.74 crore ` 2.74 crore
2. Rajasthan Bal Kalyan Samiti
Education Village UdaipurDist: Udaipur,Rajasthan
` 0.05 crore ` 0.05 crore ` 0.05 crore ` 0.05 crore
3. Centre for Information, Publication & Training (CRIPT)
Education Village HyderabadDist: HyderabadTelangana
` 0.10 crore ` 0.10 crore ` 0.10 crore ` 0.10 crore
4. Others Education/Public Welfare
Dahej Gujarat
` 0.17 crore ` 0.17 crore ` 0.17crore ` 0.17 crore
* Implementing Agency: Samaj Kalyan Parishad, Modi Nagar, Uttar Pradesh, in coordination with Modi Innovative Education Society, Chhattisgarh
6. Responsibility Statement of the CSR Committee: The implementation and monitoring of CSR Policy is in compliance
with CSR objectives and Policy of the Company.
(K. K. Modi)
Chairman, CSR Committee
62 Directors' Report
‘Indofil’ Corporate Social Responsibility Policy (approved by the Board of Directors on 22nd September, 2014)
A. POLICY OBJECTIVE Indofil Industries Limited (‘’Indofil”) is committed
to conduct its business in a socially responsible,
ethical and environmentally friendly manner and to
continuously work towards improving quality of life of
the communities in its operational areas.
B. POLICY DETAILS Core Values
The CSR activities of the Company will be implemented
in accordance with the following core values:
Protecting Stakeholder Interests
Pro-actively engage with relevant stakeholders,
understand their concerns and be responsive to
their needs
Use & promote systematic processes to engage
with the stakeholders and address their issues in a
just, fair and equitable manner
Proactive Engagement with the Local Communities
Respecting cultural ethnicity and dignity of
individuals and foster positive relationship with
the people in the project areas where the Company
operates
Providing development opportunities to local
communities in a culturally appropriate manner, in
consultation & cooperation with local government
authorities and other stakeholders, as may be
appropriate
Inclusive Development
Channelising resources & efforts towards making
positive and sustainable contribution in social and
economic development
Aligning CSR practices & programs to complement
and support the developmental priorities at local,
state and national levels
Inclusive approach towards stakeholders and
promote diversity through affirmative action
CSR Activities
The CSR activities will be focused on the four broad themes
with goals to improve overall socio- economic indicators of
Company’s area of operation:
Promoting and supporting education programs
Ensuring sustainable environment
Support programs for farmers
Philanthropic and charitable activities
The CSR projects and programs to be undertaken by the
Company shall include activities falling within the preview of
schedule VII of Companies Act, 2013. These programs will
be executed by Indofil and where appropriate in partnership
with local government, various NGO partners, service
providers and others.
The surplus, if any, arising out of CSR initiatives of the
Company shall not form part of its business profits
Monitoring Mechanism
Monitoring of the CSR activities would be done, which may
include:
Periodic assessment of key programs
Baseline and impact assessment with key indicators in
our areas of operation every two years and
Regular review by the CSR Committee and reporting to
the Board on:
- amount spent on each activity and
- achievement against milestones and objectives
Responsibility
The responsibility for compliance with this policy lies with
the CSR Committee, the Directors, Group Chief Executive
Officer, Senior Managers and all employees and consultants
working for Indofil.
Review of Policy
The CSR Policy will be reviewed as may be recommended by
the CSR Committee of the Company.

Annual Report 2016-17 63
COMPANY OVERVIEW
1-36 37-81 82-184
STATUTORY REPORTS FINANCIAL STATEMENTS
Annexure ‘B’ to Directors' ReportFORM No. MR-3
SECRETARIAL AUDIT REPORT
FOR THE FINANCIAL YEAR ENDED MARCH 31, 2017
[Pursuant to Section 204(1) of the Companies Act, 2013 and Rule No. 9 of the Companies
(Appointment and Remuneration Personnel) Rules, 2014]
To,
The Members
INDOFIL INDUSTRIES LIMITED
Kalpataru Square, 4th Floor, Kondivita Road,
Off Andheri Kurla Road, Andheri (East)
Mumbai - 400059.
We have conducted the secretarial audit of the compliance
of applicable statutory provisions and the adherence to good
corporate practices by INDOFIL INDUSTRIES LIMITED
(CIN NO. U24110MH1993PLC070713) (hereinafter called
“the Company”). Secretarial Audit was conducted in a
manner that provided us a reasonable basis for evaluating the
corporate conducts/statutory compliances and expressing
our opinion thereon.
Based on our verification of the Company’s books, papers,
minute books, forms and returns filed and other records
maintained by the Company and also the information
provided by the Company, its officers, agents and authorised
representatives during the conduct of secretarial audit, we
hereby report that in our opinion, the Company has, during
the audit period covering the financial year ended March
31, 2017, complied with the statutory provisions listed
hereunder and also that the Company has proper Board-
processes and compliance-mechanism in place to the extent,
in the manner and subject to the reporting made hereinafter:
We have examined the books, papers, minute books,
forms and returns filed and other records maintained by
the Company for the financial year ended March 31, 2017
according to the provisions of:
(i) The Companies Act, 2013 (the Act) and the rules made
there under;
(ii) The Securities Contracts (Regulation) Act, 1956
(‘SCRA’) and the rules made there under;
(iii) The Depositories Act, 1996 and the Regulations and
Bye-laws framed there under;
(iv) Foreign Exchange Management Act,1999 and the
rules and regulations made there under to the extent of
Foreign Direct Investment, Overseas Direct Investment
and External Commercial Borrowings;
(v) The Regulations and Guidelines prescribed under the
Securities and Exchange Board of India Act, 1992
(‘SEBI Act’):- (Not Applicable)
(vi) We have relied on the Compliance Reports given by
Functional Heads of the Company, representation
made by the Company and its Officers for systems and
mechanism formed by the Company for compliances
under other applicable Acts, Laws and Regulations to
the Company.
We are of the opinion that the management has complied with
the following laws specifically applicable to the Company:
(a) Insecticides Act, 1968
(b) Factories Act, 1948
(c) Environment Protection Act, 1986 and Air, Water and
Noise Pollution laws
(d) Hazardous Wastes (Management and Handling) Rules,
1989
(e) Legal Metrology Act, 2009
(f) Trade Marks Act, 1999
We have also examined compliance with applicable clauses
of the following:
a) Secretarial Standards issued by The Institute of
Company Secretaries of India.
b) As the company is an unlisted company, the provisions
of listing agreement and the Securities Exchange Board
of India act, 1992 and the rules and regulations there
under are not applicable to the company
During the period under review the Company has complied
with the provisions of the Act, Rules, Regulations, Guidelines,
Standards, etc. mentioned above.
We further report that the Board of Directors of the Company
is duly constituted with proper balance of Executive Directors,
Non-Executive Directors and Independent Directors. The
changes in the composition of the Board of Directors that

64 Directors' Report
took place during the period under review were carried out
in compliance with the provisions of the Act.
Adequate notice is given to all directors to schedule the
Board Meetings, agenda and detailed notes on agenda were
sent at least seven days in advance and a system exists for
seeking and obtaining further information and clarifications
on the agenda items before the meeting and for meaningful
participation at the meeting.
Majority decision is carried through while the dissenting
members’ views are captured and recorded as part of the
minutes.
We further report that there are adequate systems and
processes in the Company commensurate with the size and
operations of the Company to monitor and ensure compliance
with applicable laws, rules, regulations and guidelines.
We further report that during the audit period there were
no specific events/actions having a major bearing on the
Company’s affairs in pursuance of the above referred laws,
rules, regulations, guidelines and standards.
For Ragini Chokshi & Co.
Mrs. Rahini Chokshi
(Partner)
Place: Mumbai C.P. No. 1436
Date: May 2, 2017 FCS No. 2390

Annual Report 2016-17 65
COMPANY OVERVIEW
1-36 37-81 82-184
STATUTORY REPORTS FINANCIAL STATEMENTS
Annexure ‘C’ to Directors' Report
CONSERVATION OF ENERGY, TECHNOLOGY ABSORPTION AND FOREIGN EXCHANGE EARNINGS AND OUTGO[Section 134(3)(m) of The Companies Act, 2013 read with Rule 8(3) of The Companies (Accounts) Rules, 2014]
A) CONSERVATION OF ENERGY a) The company has received full bonus subsidy by achieving the power factor.
b) Improved the manufacturing process for Agro technical products, especially in new Synthesis plant at Dahej.
B) TECHNOLOGY ABSORPTION(i) R & D and technology absorption
1. The focus continued on developing user friendly products, new chemistry and diversified application for products of
SPCD verticals of textile, coating, plastic and leather.
2. Enhanced the focus on newer technologies for agro-chemicals which satisfy the quality and cost expectations besides
meeting the requirement of zero liquid discharge.
3. The R&D is accredited with NABL, GLP certification that speaks volumes of the capability of the department in terms
of its ability to quantify with confidence and accuracy the composition of products, actives and their purity. The GLP
accreditation endows the power of this department to generate data for five batch analysis that is mandatory for product
registrations worldwide.
4. R&D is also certified with ISO 9001 and ISO14000 requirements that allow maintaining discipline, order and clarity of
all business activities and decisions taken.
(ii) Benefits from R & D:
Improved manufacturing process resulting in reduction in raw material consumption, solvent load and water load
(effluent)
SPCD group has developed several new products reaching out to the popular segments in textile and leather verticals
(iii) Future plan:
Continued efforts for development of new products for Specialty and Performance Chemicals business groups
Ongoing research on development of combination of existing and new fungicides
(iv) Expenditure on R& D
Particulars As at
March 31, 2017
As at March 31, 2016
Capital including Capital Work in Progress 1,647.66 2,773.89
Recurring 1,141.89 1,020.03
TOTAL 2,789.55 3,793.92
R & D Expenditure as a percentage of Revenue from Operation 1.5% 2.22%
C) Foreign Exchange Earnings and Outgo
Particulars As at
March 31, 2017
As at March 31, 2016
i) Foreign Exchange Earned 80,705.51 74,280.61
ii) Foreign Exchange expensed 35,699.91 42,275.51

66 Directors' Report
PART “A”: SUBSIDIARIES(Information in respect of each subsidiary to be presented with amounts)
` in Lakhs
1 Sl No 1 2 3 4 5 6 7
2 Name of the subsidiary :
Good Investment
(India) Limited
Quick Investment
(India) Limited
Indo Baijin Chemicals
Pvt. Ltd.
Indofil Bangladesh
Industries Private Ltd.
Indofil Industries
(Netherlands) B.V.
Indofil Industries
(International) B.V.
Indofil Costa Rica,
S.A.
3 Reporting period for the subsidiary concerned, if different from the holding company’s reporting period
NA NA NA NA NA NA NA
4 Reporting currenct and Exchange Rate as on last date of the relevant Financial Year in the case of foreign subsidiaries
NA NA NA BDT - ` 0.81 /
BDT
Euro - ` 69.22 /
Euro
Euro - ` 69.22 /
Euro
Costa Rica Colon - ` 0.12 /
Colon
5 Share Capital 70.11 12.52 8,560.97 257.94 69.22 69.22 0.016 Reserves & Surplus 4,890.65 1,859.63 706.46 (243.74) 9,588.70 Nil Nil7 Total Assets 4,961.15 1,886.67 31,268.70 16.38 34,258.51 69.22 0.018 Total Liabilities 0.39 14.47 22,001.27 2.18 24,600.59 Nil Nil9 Investments 4,890.41 1,832.31 Nil Nil Nil Nil Nil10 Turnover (Total Revenue) 348.20 213.59 18,689.09 - 20,813.83 Nil Nil11 Profit Before Taxation 328.72 211.34 3,735.04 (90.05) 3,237.66 Nil Nil12 Provision for Taxation 0.53 3.03 532.61 - 676.66 Nil Nil13 Profit after taxation 328.19 208.31 3,202.43 (90.05) 2,560.27 Nil Nil14 Proposed Dividend Nil Nil Nil Nil Nil Nil Nil
15 % of Shareholding 100% 100% 51% 100% 100% 100% 100%
1. Names of subsidiaries which are yet to commence operations : Indofil Bangladesh Industries Pvt. Ltd.
Indofil Costa Rica, S.A.
Indofil Industries (International) B.V.
Indofil Industries DO Brasil LTDA
2. Names of subsidiaries which have been liquidated or sold during the year : NA
Annexure ‘D’ to Directors’ ReportForm No. AOC-I
(Pursuant to first proviso to sub-section (3) of section 129 read with rule 5 of Companies (Accounts) Rules, 2014)
Statement containing salient features of the financial statement of subsidiaries / associate companies / joint ventures

Annual Report 2016-17 67
COMPANY OVERVIEW
1-36 37-81 82-184
STATUTORY REPORTS FINANCIAL STATEMENTS
PART “B”: ASSOCIATES AND JOINT VENTURES
Name of Associates/Joint VenturesHIFIL Chemicals
Pvt. Ltd.
1. Latest audited Balance Sheet Date 31/03/2017
2. Shares of Associate /Joint Ventures held by the company on the year end
No. 4900
Amount of Investment in Associates / Joint Venture (` in lacs) 0.49
Extend of Holding % 49%
3. Description of how there is significant influence By virtue of holdings
4. Reason why the associate / joint venture is not consolidated NA
6. Networth attributable to Shareholding as per latest audited Balance Sheet (` in lacs) (0.13)
7. Profit / Loss for the year
i. Considered in Consolidation (` in lacs) (0.17)
i. Not Considered in Consolidation (` in lacs) (0.46)
1. Names of associates or joint ventures which are yet to commence operations Hifil Chemicals Pvt. Ltd.
2. Names of associates or joint ventures which have been liquidated or sold during the year. NA
For and on behalf of the Board of Directors
R.K. MALHOTRA K.K. MODI
Group Chief Executive Officer Chairman and Managing Director
CHINTAMANI D THATTE CHARU MODI
Head Compliance & Company Secretary Executive Director
RAJIB MUKHOPADHYAY
Chief Financial Officer
M. N. THAKKAR
DirectorsSANJAY BUCH
SUNIL ALAGH
DR. ATCHUTUNI L. RAO
Mumbai, June 29, 2017
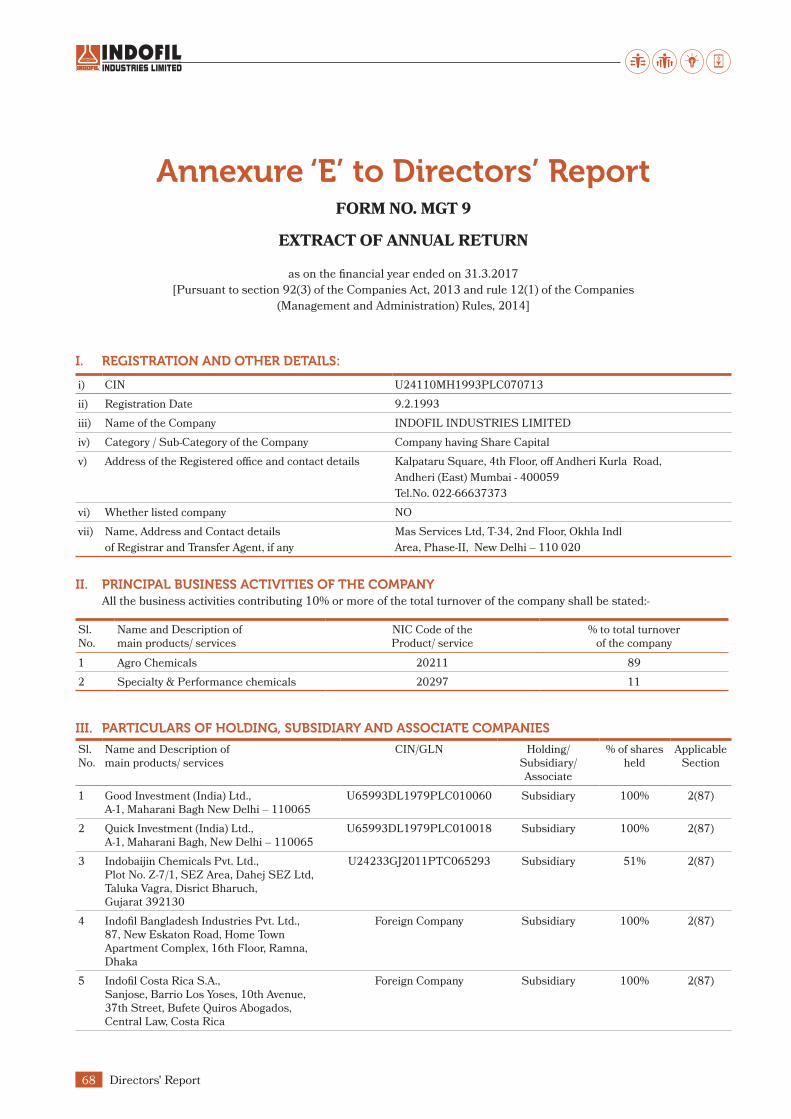
68 Directors' Report
Annexure ‘E’ to Directors’ ReportFORM NO. MGT 9
EXTRACT OF ANNUAL RETURN
as on the financial year ended on 31.3.2017
[Pursuant to section 92(3) of the Companies Act, 2013 and rule 12(1) of the Companies
(Management and Administration) Rules, 2014]
I. REGISTRATION AND OTHER DETAILS:
i) CIN U24110MH1993PLC070713
ii) Registration Date 9.2.1993
iii) Name of the Company INDOFIL INDUSTRIES LIMITED
iv) Category / Sub-Category of the Company Company having Share Capital
v) Address of the Registered office and contact details Kalpataru Square, 4th Floor, off Andheri Kurla Road,
Andheri (East) Mumbai - 400059
Tel.No. 022-66637373
vi) Whether listed company NO
vii) Name, Address and Contact details
of Registrar and Transfer Agent, if any
Mas Services Ltd, T-34, 2nd Floor, Okhla Indl
Area, Phase-II, New Delhi – 110 020
II. PRINCIPAL BUSINESS ACTIVITIES OF THE COMPANY All the business activities contributing 10% or more of the total turnover of the company shall be stated:-
Sl. No.
Name and Description ofmain products/ services
NIC Code of the Product/ service
% to total turnover of the company
1 Agro Chemicals 20211 89
2 Specialty & Performance chemicals 20297 11
III. PARTICULARS OF HOLDING, SUBSIDIARY AND ASSOCIATE COMPANIES
Sl. No.
Name and Description ofmain products/ services
CIN/GLN Holding/ Subsidiary/Associate
% of shares held
Applicable Section
1 Good Investment (India) Ltd., A-1, Maharani Bagh New Delhi – 110065
U65993DL1979PLC010060 Subsidiary 100% 2(87)
2 Quick Investment (India) Ltd., A-1, Maharani Bagh, New Delhi – 110065
U65993DL1979PLC010018 Subsidiary 100% 2(87)
3 Indobaijin Chemicals Pvt. Ltd., Plot No. Z-7/1, SEZ Area, Dahej SEZ Ltd, Taluka Vagra, Disrict Bharuch, Gujarat 392130
U24233GJ2011PTC065293 Subsidiary 51% 2(87)
4 Indofil Bangladesh Industries Pvt. Ltd., 87, New Eskaton Road, Home Town Apartment Complex, 16th Floor, Ramna, Dhaka
Foreign Company Subsidiary 100% 2(87)
5 Indofil Costa Rica S.A., Sanjose, Barrio Los Yoses, 10th Avenue, 37th Street, Bufete Quiros Abogados, Central Law, Costa Rica
Foreign Company Subsidiary 100% 2(87)

Annual Report 2016-17 69
COMPANY OVERVIEW
1-36 37-81 82-184
STATUTORY REPORTS FINANCIAL STATEMENTS
Sl. No.
Name and Description ofmain products/ services
CIN/GLN Holding/ Subsidiary/Associate
% of shares held
Applicable Section
6 Indofil Industries (Netherlands) B.V., Piet Heinkade 55, 1019 GM, Amsterdam, Netherlands.
Foreign Company Subsidiary 100% 2(87)
7 Indofil Industries (Internationl) BVPiet Heinkade 55, 1019 GM Amsterdam,Netherklands
Foreign Company Subsidiary 100% 2(87)
8 Hifil Chemicals Private Ltd., Kalpataru Square, 4th Floor, Kondivita Road, Off. Andheri Kurla Road, Andheri (E) Mumbai 400059
U24110MH2009PTC198057 Associate 49% 2(6)
IV. SHARE HOLDING PATTERN (EQUITY SHARE CAPITAL BREAKUP AS PERCENTAGE OF TOTAL EQUITY)i) Category-wise Share Holding
Category of Shareholders
No. of Shares held at the beginning of the year No. of Shares held at the end of the year % Change during
the yearDemat Physical Total% of Total
SharesDemat Physical Total
% of Total Shares
A. Promoters
(1) Indian
a) Individual/ HUF – 4,98,550 4,98,550 2.172 – 4,98,550 4,98,550 2.172 –
b) Central Govt – – – – – – – – –
c) State Govt (s) – – – – – – – – –
d) Bodies Corp. 1,06,91,504 19,16,666 1,26,08,170 54.918 1,29,18,170 – 1,29,18,170 56.268 1.350
e) Banks/FI – – – – – – – – –
f) Any Other. 1,45,722 7,01,033 8,46,755 3.688 1,45,722 7,01,033 8,46,755 3.688 –
Sub-total (A) (1):- 1,08,37,226 31,16,249 1,39,53,475 60.778 1,30,63,892 11,99,583 1,42,63,475 62.128 1.350
(2) Foreign
a) NRIs Individuals – – – – – – – – –
b) Other individuals – – – – – – – – –
c) Bodies Corp. – – – – – – – – –
d) Banks / FI – – – – – – – – –
e) Any Other.... – – – – – – – – –
Sub-total (A) (2):- – – – – – – – – –
Total shareholding of Promoter (A) = (A)(1)+(A)(2)
1,08,37,226 31,16,249 1,39,53,475 60.778 1,30,63,892 11,99,583 1,42,63,475 62.128 1.350
B. Public Shareholding
1. Institutions
a) Mutual Funds 450 1,050 1,500 0.007 450 1,050 1,500 0.007 –
b) Banks/FI 150 562 712 0.003 150 562 712 0.003 –
c) Central Govt – – – – – – – – –
d) State Govt(s) 21,69,956 – 21,69,956 9.452 21,69,956 – 2,1,69,956 9.452 –
e) Venture Capital Funds – – – – – – – – –
f) Insurance Companies – – – – – – –
g) FIIs
h) Foreign Venture Capital Funds
2,96,557 – 2,96,557 1.292 2,96,557 – 2,96,557 1.292 –
i) Others (specify) – – – – – – – – –
Sub-total (B)(1):- 24,67,113 1,612 24,68,725 10.754 24,67,113 1,612 24,68,725 10.754 –

70 Directors' Report
Category of Shareholders
No. of Shares held at the beginning of the year No. of Shares held at the end of the year % Change during
the yearDemat Physical Total% of Total
SharesDemat Physical Total
% of Total Shares
2. Non-Institutions
a) Bodies Corp.
i) Indian 12,19,683 11,61,559 23,81,242 10.372 9,32,856 11,61,559 20,94,415 9.123 (1.249)
ii) Overseas – – – – – – – – –
b) Individuals
i) Individual shareholders holding nominal share capital upto ` 2 lakhs
5,65,271 4,72,627 10,37,898 4.521 8,98,972 4,78,074 13,77,046 5.998 1.477
ii) Individual shareholders holding nominal share capital in excess of ` 1 lakhs
2,79,610 2,35,149 5,14,759 2.242 2,68,560 1,83,343 4,51,903 1.968 (0.274)
c) Others (specify)
i) NRI/OCB 25,61,723 75 25,61,798 11.158 22,62,130 75 22,62,205 9.854 (1.304)
ii) Clearing Member 285 – 285 0.001 413 – 413 0.001 –
iii) Trust 83 – 83 – 83 – 83 – –
iv) Directors & their relatives
39,957 – 39,957 0.174 39,957 – 39,957 0.174 –
Sub-total (B)(2):- 46,66,612 18,69,410 65,36,022 28.469 44,02,971 18,23,051 62,26,022 27.119 (1.350)
Total Public Shareholding (B) = (B)(1) + (B)(2)
71,33,725 18,71,022 90,04,747 39.222 68,70,084 18,24,663 86,94,747 37.872 (1.350)
C. Shares held by Custodian for GDRs & ADRs
– – – – – – – – –
Grand Total (A+B+C) 1,79,70,951 49,87,271 2,29,58,222 100.00 1,99,33,976 30,24,246 2,29,58,222 100.00 0
(ii) Shareholding of Promoters
Sl.No.
Shareholder’s Name
Shareholding at the beginning of the year
Share holding at the end of the year % change
in share holding during
the year
No. of Shares
% of total Shares
of the company
%of Shares Pledged/
encumbered to total shares
No. of Shares
% of total Shares
of the company
%of Shares Pledged/
encumbered to total shares
1 K.K.Modi Investment & Financial Services Private Limited
1,00,98,073 43.985 – 1,02,73,073 44.747 0.762
2 Rajputana Fertilisers Limited 19,16,666 8.348 – – – – (8.348)
3 Rajputana Developers Limited – – – 19,16,666 8.348 – 8.348
4 Premium Merchants Limited 4,64,760 2.024 – 4,64,760 2.024 – –
5 Kaushambi Industries Private Limited
3,671 0.016 – 3,671 0.016
6 Super Investment (India) Limited 1,25,000 0.544 – 1,25,000 0.544 – –
7 HMA Udyog Pvt. Ltd – – – 1,35,000 0.588 – 0.588
8 Mr. K. K. Modi 2,33,850 1.019 – 2,33,850 1.019 – –
9 Mrs. Bina Modi 2,18,607 0.952 – 2,18,607 0.952 – –
10 Mr. Lalit K. Modi 10,455 0.046 – 10,455 0.046 – –
11 Mr. Ruchirkumar Lalit Modi 9,873 0.043 – 9,873 0.043 – –
12 Mr. Samir K. Modi 25,765 0.112 – 25,765 0.112 – –
13 IOIL Senior Executives (O) Benefit Trust
9,877 0.042 – 9,877 0.042 – –
14 IOIL Senior Executives (O) Welfare Trust
2,39,144 1.042 – 2,39,144 1.042 – –
15 IOIL Senior Executives (F) Welfare Trust
1,42,698 0.622 – 1,42,698 0.622 – –

Annual Report 2016-17 71
COMPANY OVERVIEW
1-36 37-81 82-184
STATUTORY REPORTS FINANCIAL STATEMENTS
Sl.No.
Shareholder’s Name
Shareholding at the beginning of the year
Share holding at the end of the year % change
in share holding during
the year
No. of Shares
% of total Shares
of the company
%of Shares Pledged/
encumbered to total shares
No. of Shares
% of total Shares
of the company
%of Shares Pledged/
encumbered to total shares
16 IOIL Junior Employees (O) Welfare Trust
1,42,698 0.622 – 1,42,698 0.622 – –
17 IOIL Junior Employees (F)Welfare Trust
1,75,805 0.766 – 1,75,805 0.766 – –
18 IOIL Senior Executives (F)Benefit Trust
65,127 0.284 – 65,127 0.284 – –
19 IOIL Junior Employees (O) Benefit Trust
25,914 0.113 – 25,914 0.113 – –
20 IOIL Junior Employees (F) Benefit Trust
45,492 0.198 – 45,492 0.198 – –
Total 1,39,53,475 60.778 – 1,42,63,475 62.128 – 1.350
(iii) Change in Promoters’ Shareholding (Please specify, if there is no change)
Sl.No.
Shareholding at the beginning of the year
Cumulative share holding during the year
No. of shares % of total shares of the
company
No. of shares % of total shares of the
company
1. At the beginning of the year 1,39,53,475 60.778 1,39,53,475 60.778
2.Date wise Increase/ Decrease in Promoters Share holding during the year specifying the reasons for increase/decrease (e.g. allotment/transfer/bonus/ sweat equity etc):7th April, 2016 transfer from APMS Investment Fund Ltd. to K. K. Modi Investment & Financial Services Pvt. Ltd.
– – 1,75,000 0.762
31st January, 2017 (transfer from APMS Investment Fund Ltd. to HMA Udyog Pvt Ltd.)
– – 1,35,000 0.588
3. At the End of the year 1,39,53,475 60.778 1,42,63,475 62.128
(iv) Shareholding Pattern of top ten Shareholders (other than Directors, Promoters and Holders of GDRs and ADRs):
Sl.No.
For Each of the Top 10 Shareholders Shareholding at the beginning of the year
Cumulative share holding during the year
No. of shares % of total shares of the
company
No. of shares % of total shares of the
company
At the beginning of the year
1. APMS Investment Fund Ltd 19,45,822 8.475 16,35,822 7.1252. UPSIDC Ltd. 21,69,956 9.452 21,69,956 9.4523. Modi Industries Limited 10,50,000 4.574 10,50,000 4.5744. Status Mark Finvest Ltd 9,86,666 4.298 6,52,666 2.8425. Cresta Fund Limited 5,00,000 2.178 5,00,000 2.1786. Life Ins. Corp.of India 2,96,482 1.291 2,96,482 1.2917. Umesh Kumar Modi 1,11,678 0.486 1,11,678 0.4868. Govind Swaroop 1,00,000 0.436 1,00,000 0.344
9. Laoleen Investment Pvt. Ltd 62,394 0.272 62,394 0.272
10. Arms Securties. (P)Ltd 58,586 0.255 – –11. Shree Parasram Holding Pvt Ltd – – 79,053 0.43612. Anupam Securities Pvt. Ltd – – 50,595 0.220

72 Directors' Report
(v) Shareholding of Directors and Key Managerial Personnel:
Sl.No.
For Each of the Directors and KMP Shareholding at the beginning of the year
Cumulative Shareholding during the year
No. of shares % of total shares of the
company
No. of shares % of total shares of the
company
1. For Each of the Directors and KMP
2.At the beginning of the yearDirectors1. Mr. K. K. Modi 2,33,850 1.019 2,33,850 1.0192. Ms. Charu Modi – – – –3. Ms. Aliya Modi – – – –4. Mr. Samir Kumar Modi 25,765 0.112 25,765 0.1125. Mr. M.N. Thakkar 11,417 0.050 11,417 0.0506. Mr. S.K. Alagh 28,540 0.124 28,540 0.1247. Mr. Sanjay Buch – – – –8. Mr. S. Lakshminarayanan – – – –9. Mr. Amit Kumar Ghosh – – – –10. Dr. Atchutuni Rao – – – –KMP1. Mr R.K. Malhotra 22,933 0.010 22,933 0.010
2. Mr. Chintamani Thatte 30 – 30 –
3. Date wise Increase / Decrease in Share holding during the year specifying the reasons for increase / decrease (e.g. allotment / transfer / bonus/ sweat equity etc):
Nil No Change Nil No Change
At the End of the yearDirectors1. Mr. K.K. Modi – – 2,33,850 1.0192. Ms. Charu Modi – – – –3. Ms. Aliya Modi – – – –4. Mr. Samir Kumar Modi – – 25,765 0.1125. Mr. M.N. Thakkar – – 11,417 0.0506. Mr. S.K. Alagh – – 28,540 0.1247. Mr. Sanjay Buch – – – –8. Mr. S. Lakshminarayanan – – – –9. Mr. Amit Kumar Ghose – – – –10. Dr. Atchutuni Rao – – – –KMP1. Mr. R.K. Malhotra – – 22,933 1.0192. Mr. Chintamani Thatte – – 30 –

Annual Report 2016-17 73
COMPANY OVERVIEW
1-36 37-81 82-184
STATUTORY REPORTS FINANCIAL STATEMENTS
V. INDEBTEDNESS Indebtedness of the Company including interest outstanding/accrued but not due for payment
(` in Lakhs)
Secured Loans excluding Deposits
Unsecured Loans
Deposits Total Indebtness
i) Principal Amount 53,822.34 Nil Nil 53,822.34
ii) Interest due but not paid Nil Nil Nil Nil
iii) Interest accrued but not due 98.17 Nil Nil 98.17
Total (i+ii+iii) 53,920.51 Nil Nil 53,920.51
Change in Indebtedness during the financial year
• Addition 26,123.69 Nil Nil 26,123.69
• Reduction (8,670.21) Nil Nil (8,670.21)
Net Change 17,453.48 Nil Nil 17,453.48
Indebtedness at the end of the financial year
i) Principal Amount 71,308.58 Nil Nil 71,308.58
ii) Interest due but not paid Nil Nil Nil Nil
iii) Interest accrued but not due 65.41 Nil Nil 65.41
Total (i+ii+iii) 71,373.99 Nil Nil 71,373.99
VI. REMUNERATION OF DIRECTORS AND KEY MANAGERIAL PERSONNELA. Remuneration to Managing Director, Whole Time Directors and/or Manager
(` in Lakhs)
Sl. No. Particulars of Remuneration Name of MD/WTD/ Manager
Total Amount ` Lakhs
Mr. K.K. ModiChairman &
Managing Director
Ms. Charu ModiExecutive Director
Dr. Atchutuni RaoWhole Time
Director
1. Gross salary(a) Salary as per provisions contained in
section 17(1) of the Income-tax Act, 1961
120.00 240.00 67.57 427.57
(b) Value of perquisites u/s 17(2) Income-tax Act, 1961
28.70 93.53 16.93 139.16
(c) Profits in lieu of salary under section 17(3) Income- tax Act, 1961
– – – –
2. Stock Option – – – –3. Sweat Equity – – – –4. Commission
- as % of profit436.48 100.00 – 536.48
- others, specify... – – – –
5. Others, please specify (Retirals) 47.78 81.71 – 129.49
Total (A) 632.96 515.24 84.50 1,232.70
Ceiling as per the Act 2,946.71
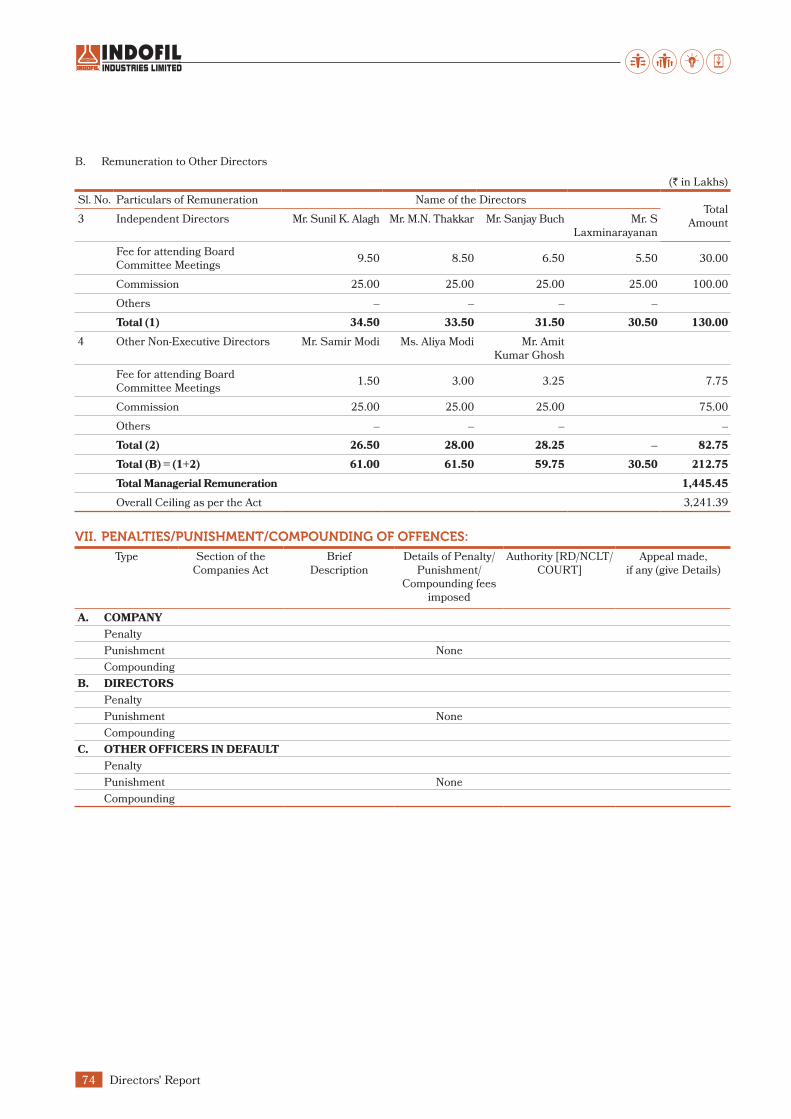
74 Directors' Report
B. Remuneration to Other Directors
(` in Lakhs)
Sl. No. Particulars of Remuneration Name of the DirectorsTotal
Amount3 Independent Directors Mr. Sunil K. Alagh Mr. M.N. Thakkar Mr. Sanjay Buch Mr. S Laxminarayanan
Fee for attending Board Committee Meetings
9.50 8.50 6.50 5.50 30.00
Commission 25.00 25.00 25.00 25.00 100.00
Others – – – –
Total (1) 34.50 33.50 31.50 30.50 130.00
4 Other Non-Executive Directors Mr. Samir Modi Ms. Aliya Modi Mr. Amit Kumar Ghosh
Fee for attending Board Committee Meetings
1.50 3.00 3.25 7.75
Commission 25.00 25.00 25.00 75.00
Others – – – –
Total (2) 26.50 28.00 28.25 – 82.75
Total (B) = (1+2) 61.00 61.50 59.75 30.50 212.75
Total Managerial Remuneration 1,445.45
Overall Ceiling as per the Act 3,241.39
VII. PENALTIES/PUNISHMENT/COMPOUNDING OF OFFENCES:
Type Section of the Companies Act
Brief Description
Details of Penalty/ Punishment/
Compounding fees imposed
Authority [RD/NCLT/COURT]
Appeal made, if any (give Details)
A. COMPANY
Penalty
Punishment None
Compounding
B. DIRECTORS
Penalty
Punishment None
Compounding
C. OTHER OFFICERS IN DEFAULT
Penalty
Punishment None
Compounding

Annual Report 2016-17 75
COMPANY OVERVIEW
1-36 37-81 82-184
STATUTORY REPORTS FINANCIAL STATEMENTS
Annexure ‘F’ to Directors’ ReportForm No. AOC-2
(Pursuant to clause (h) of sub-section (3) of section 134 of the Act and Rule 8(2) of the Companies (Accounts) Rules, 2014)
Form for disclosure of particulars of contracts/arrangements entered into by the company with related parties referred to
in sub-section (1) of section 188 of the Companies Act, 2013 including certain arm’s length transactions under third proviso
thereto.
1. DETAILS OF CONTRACTS OR ARRANGEMENTS OR TRANSACTIONS NOT AT ARM’S LENGTH BASIS:
(a) Name(s) of the related party and nature of relationship – Nil
(b) Nature of contracts/arrangements/transactions – Nil
(c) Duration of the contracts / arrangements/transactions – Not Applicable
(d) Salient terms of the contracts or arrangements or transactions including the value, if any – Nil
(e) Justification for entering into such contracts or arrangements or transactions – Nil
(f) Date(s) of approval by the Board – Not Applicable
(g) Amount paid as advances, if any – Nil
(h) Date on which the special resolution was passed in general meeting as required under first proviso to section 188 – Nil
2. DETAILS OF MATERIAL CONTRACTS OR ARRANGEMENT OR TRANSACTIONS AT ARM’S LENGTH BASIS:
(a) Name(s) of the related party and nature of relationship : NIl
(b) Nature of contracts/arrangements/transactions : Nil
(c) Duration of the contracts / arrangements/transactions – Not applicable
(d) Salient terms of the contracts or arrangements or transactions including the value, if any : Not applicable
(e) Date(s) of approval by the Board, if any : Not applicable
(f) Amount paid as advances, if any : Nil
(K. K. Modi)
Chairman
DIN No. 00029407
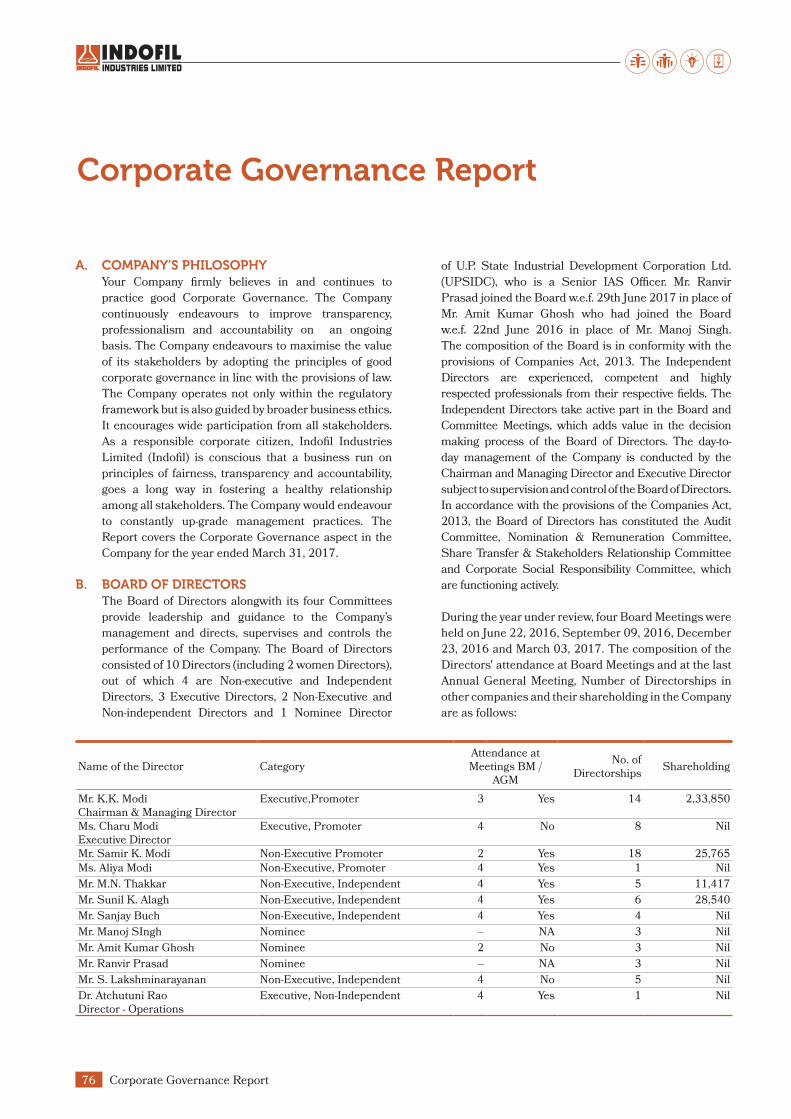
Corporate Governance Report76
Corporate Governance Report
A. COMPANY’S PHILOSOPHY Your Company firmly believes in and continues to
practice good Corporate Governance. The Company
continuously endeavours to improve transparency,
professionalism and accountability on an ongoing
basis. The Company endeavours to maximise the value
of its stakeholders by adopting the principles of good
corporate governance in line with the provisions of law.
The Company operates not only within the regulatory
framework but is also guided by broader business ethics.
It encourages wide participation from all stakeholders.
As a responsible corporate citizen, Indofil Industries
Limited (Indofil) is conscious that a business run on
principles of fairness, transparency and accountability,
goes a long way in fostering a healthy relationship
among all stakeholders. The Company would endeavour
to constantly up-grade management practices. The
Report covers the Corporate Governance aspect in the
Company for the year ended March 31, 2017.
B. BOARD OF DIRECTORS The Board of Directors alongwith its four Committees
provide leadership and guidance to the Company’s
management and directs, supervises and controls the
performance of the Company. The Board of Directors
consisted of 10 Directors (including 2 women Directors),
out of which 4 are Non-executive and Independent
Directors, 3 Executive Directors, 2 Non-Executive and
Non-independent Directors and 1 Nominee Director
of U.P. State Industrial Development Corporation Ltd.
(UPSIDC), who is a Senior IAS Officer. Mr. Ranvir
Prasad joined the Board w.e.f. 29th June 2017 in place of
Mr. Amit Kumar Ghosh who had joined the Board
w.e.f. 22nd June 2016 in place of Mr. Manoj Singh.
The composition of the Board is in conformity with the
provisions of Companies Act, 2013. The Independent
Directors are experienced, competent and highly
respected professionals from their respective fields. The
Independent Directors take active part in the Board and
Committee Meetings, which adds value in the decision
making process of the Board of Directors. The day-to-
day management of the Company is conducted by the
Chairman and Managing Director and Executive Director
subject to supervision and control of the Board of Directors.
In accordance with the provisions of the Companies Act,
2013, the Board of Directors has constituted the Audit
Committee, Nomination & Remuneration Committee,
Share Transfer & Stakeholders Relationship Committee
and Corporate Social Responsibility Committee, which
are functioning actively.
During the year under review, four Board Meetings were
held on June 22, 2016, September 09, 2016, December
23, 2016 and March 03, 2017. The composition of the
Directors' attendance at Board Meetings and at the last
Annual General Meeting, Number of Directorships in
other companies and their shareholding in the Company
are as follows:
Name of the Director Category Attendance at Meetings BM /
AGM
No. of Directorships
Shareholding
Mr. K.K. Modi Chairman & Managing Director
Executive,Promoter 3 Yes 14 2,33,850
Ms. Charu Modi Executive Director
Executive, Promoter 4 No 8 Nil
Mr. Samir K. Modi Non-Executive Promoter 2 Yes 18 25,765
Ms. Aliya Modi Non-Executive, Promoter 4 Yes 1 Nil
Mr. M.N. Thakkar Non-Executive, Independent 4 Yes 5 11,417
Mr. Sunil K. Alagh Non-Executive, Independent 4 Yes 6 28,540
Mr. Sanjay Buch Non-Executive, Independent 4 Yes 4 Nil
Mr. Manoj SIngh Nominee – NA 3 Nil
Mr. Amit Kumar Ghosh Nominee 2 No 3 Nil
Mr. Ranvir Prasad Nominee – NA 3 Nil
Mr. S. Lakshminarayanan Non-Executive, Independent 4 No 5 Nil
Dr. Atchutuni Rao Director - Operations
Executive, Non-Independent 4 Yes 1 Nil

Annual Report 2016-17 77
COMPANY OVERVIEW
1-36 37-81 82-184
STATUTORY REPORTS FINANCIAL STATEMENTS
C. AUDIT COMMITTEE The Board has constituted the Audit Committee of the
Board of Directors in terms of the provisions of the
Companies Act, 2013 and consists of Mr. M. N. Thakkar
– Independent Director as Chairman, Mr. Sunil Kumar
Alagh and Mr. Sanjay Buch – Independent Directors as
Members. Mr. Chintamani Thatte is the Secretary of the
Committee.
Besides the Committee Members, Chairman &
Managing Director, Group Chief Executive Officer, Head
Compliance and Company Secretary, Chief Finance
Officer and other concerned Senior Executives of the
Company, and Partner/other Representatives of the
Firms of Statutory Auditors and Internal Auditors also
attend the Meetings on the invitation of the Chairman.
During the financial year 2016-17 the Audit Committee
held three meetings on June 22, 2016, December 23,
2016 and March 03, 2017.
The scope of the Audit Committee includes the following:
(i) the recommendation for appointment,
remuneration and terms of appointment of
auditors of the company;
(ii) review and monitor the auditor’s independence
and performance, and effectiveness of audit
process;
(iii) examination of the financial statement and the
auditors’ report thereon;
(iv) approval or any subsequent modification of
transactions of the Company with related parties;
(v) scrutiny of inter-corporate loans and investments;
(vi) valuation of undertakings or assets of the Company,
wherever it is necessary;
(vii) evaluation of internal financial controls and risk
management systems;
(viii) monitoring the end use of funds raised through
public offers and related matters;
(ix) review, examine and investigate any related issues
as the Board may refer.
D. NOMINATION & REMUNERATION COMMITTEE (NRC)
The Board has constituted a Nomination & Remuneration
Committee in terms of the provisions of the Companies
Act, 2013 and consists of Mr. S. Lakshminarayanan
Independent Director as Chairman, Mr. Sunil Kumar
Alagh and Mr. M.N. Thakkar Independent Directors
as Members and Mr. Chintamani Thatte as Secretary
of the Committee. During the Financial Year 2016-17,
the Committee held four meetings on June 22, 2016,
September 09, 2016, December 23, 2016 and March
03, 2017.The Committee holds its meetings as and
when need arises. The scope of the Nomination &
Remuneration Committee includes the following:
(i) identify the persons who are qualified to become
the Directors and who may be appointed in senior
management in accordance with criteria laid
down;
(ii) recommend to the Board their appointment and
removal;
(iii) carry out evaluation of every Director’s
performance;
(iv) formulate the criteria for determining the
qualifications, positive attributes and independence
of a Director;
(v) recommend to the Board a policy relating to the
remuneration for the Directors, key managerial
personnel and other employees;
(vi) examine related issues as the Board may refer.
The Independent/Non-Executive Directors are paid
sitting fees for attending each meeting of the Board/
Committee thereof. Each of these Directors is also
paid commission on an annual basis in accordance
with the provisions of the Companies Act, 2013.
Details of remuneration paid to the Directors of the
Company during the year ended March 31, 2017 are
as under:

Corporate Governance Report78
DirectorsSalary Commission
Perquisites &
Retirement Benefits.Sitting Fees Board/
Committee Meetings
` ` ` `
Mr. K. K. Modi Chairman & Managing Director
1,20,00,000 4,36,47,648 54,11,196 -
Ms. Charu Modi Executive Director
2,40,00,000 1,00,00,000 1,64,28,395 -
Mr. Samir K. Modi - 25,00,000 - 1,50,000Ms. Aliya Modi - 25,00,000 - 3,00,000 Mr. M. N. Thakkar - 25,00,000 - 8,50,000Mr. Sunil K. Alagh - 25,00,000 - 9,50,000Mr. Sanjay Buch - 25,00,000 - 6,50,000Mr. S. Lakshminarayanan - 25,00,000 - 5,50,000Mr. Manoj Singh/Mr. Amit K. Ghosh* - 25,00,000 - 3,25,000Dr. Atchutuni Rao Director - Operations
67,57,110 Nil 16,92,539 Nil
*Total Paid to UPSIDC Limited on account of their Nominee Director
NRC has formulated the following Nomination & Remuneration Policy which has been approved by the Board of Directors.
NOMINATION & REMUNERATION POLICYGuiding Principle
The Nomination & Remuneration Policy of Indofil is
designed to attract, motivate, improve productivity and
retain manpower, by creating a congenial work environment,
encouraging initiatives, personal growth and teamwork,
and inculcating a sense of belonging and involvement,
besides offering appropriate remuneration packages and
superannuation benefits. The policy reflects the Company’s
objectives for good corporate governance as well as sustained
long term value creation for shareholders.
Objective of the Policy
The objective of the policy is that the remuneration and
the other terms of employment should effectively help in
attracting and retaining committed and competent personnel.
The Nomination & Remuneration Committee (NRC) while
designing the remuneration package ensures that
(i) the level and composition of remuneration is reasonable
and sufficient to attract, retain and motivate the person
to ensure the quality required to run the Company
successfully.
(ii) Relationship of remuneration to performance is clear
and meets appropriate performance benchmarks and
(iii) There is a balance between fixed and performance
linked variable pay reflecting short and long term
performance objectives appropriate to the working of
the Company and its goals.
The NRC considers that a successful Remuneration Policy
must ensure that some part of the remuneration package is
linked to the achievement of corporate performance targets
and a strong alignment of interest with stakeholders.
NRC shall consult with the Chairman of the Board as it may
deem appropriate.
This Policy has been formulated by the NRC and was
adopted by the Board of Directors at its meeting held on
November 17, 2014.
Applicability
This Policy applies to directors, senior management
including its Key Managerial Personnel (KMP) and other
employees of the Company.
Reward principles and objectives
The Company’s Remuneration Policy is guided by a reward
framework and set of principles and objectives as more
fully and particularly envisaged under Section 178 of the
Companies Act 2013, inter alia principles pertaining to
determining qualifications, positive attributes, integrity and
independence etc.
Appointment of Non-Executive Director, KMP and senior
management personnel
The NRC shall identify and ascertain the integrity,
qualification, expertise and experience of the person for
appointment as non-executive director, KMP and other
senior management personnel.
In case of appointment of Independent Directors, the NRC
shall satisfy itself with regard to the independent nature of
the Directors vis-à-vis the Company
The NRC shall ensure that the candidate identified for
appointment as a Director is not disqualified for appointment
under Section 164 of the Companies Act, 2013
The appointment recommended by the NRC shall require
the approval of the Board.
Remuneration
1 (a) As regards the remuneration for the Directors: In case
of remuneration of Managing Director, Executive/
Whole Time Director the same is recommended by
the Committee to the Board and then is decided and

Annual Report 2016-17 79
COMPANY OVERVIEW
1-36 37-81 82-184
STATUTORY REPORTS FINANCIAL STATEMENTS
approved by the Board subject to further approval by the
shareholders, wherever necessary, in compliance with
the provisions of Companies Act, 2013, relevant Rules
thereunder and other applicable laws.
1 (b) As regards the remuneration for the Non-Executive
and Independent Directors: In case of remuneration of
Non-Executive and Independent Directors, the sitting
fees for attending Board/Committee meetings and
commission payable on profits is recommended by
the Committee to the Board and then is decided and
approved by the Board, subject to the further approval
of shareholders, wherever necessary, in compliance
with the provisions of the Companies Act, 2013,
relevant Rules thereunder and applicable laws.
2. As regards the remuneration for the Key Managerial
Personnel and other employees: In case of remuneration
of KMP (other than MD/ ED/ WTD/ Group CEO) and
other employees, People Strategy department from
time to time formulates the overall Remuneration Policy
for the employees subject to the approval of the Group
CEO and further approval of Chairman and Managing
Director and Executive Director of the Company.
Amendment to the Policy
The Board of Directors on its own or on the recommendation
of NRC can amend this Policy, as and when deemed
necessary.
E. SHARE TRANSFER & STAKEHOLDERS RELATIONSHIP COMMITTEE
The Board has constituted a Share Transfer &
Stakeholders Relationship Committee in terms of the
provisions of the Companies Act, 2013 and consists of
Mr. M.N. Thakkar - Independent Director as Chairman,
Mr. Sunil Kumar Alagh and Mr. Sanjay Buch –
Independent Directors as Members and Mr. Chintamani
Thatte as Secretary of the Committee, to look after the
redressal of stakeholders complaints if any, as and when
lodged with the company. During the year ended March
31, 2017, routine complaints/ clarifications etc. were
lodged / sought by the Shareholders regarding change
of address, annual report, unclaimed dividend and the
same were solved to their satisfaction through Mas
Services Ltd., the Registrars and Transfer Agents of
the Company. During the year 2016-17, the Committee
held three meetings on June 22, 2016, December 23,
2016 and March 03, 2017.
F. CORPORATE SOCIAL RESPONSIBILITY COMMITTEE
As required under Section 135 of the Companies Act,
2013, the Board has constituted the Corporate Social
Responsibility Committee (CSR Committee) comprising
Mr. K.K. Modi as Chairman, Mr. Sunil Kumar Alagh and
Mr. Amit Kumar Ghosh as Members and Mr. Chintamani
Thatte as Secretary of the Committee.
The said Committee has formulated and recommended
to the Board, a Corporate Social Responsibility Policy
(CSR Policy) indicating the activities to be undertaken
by the Company, monitoring the implementation of the
framework of the CSR Policy and recommending the
amount to be spent on CSR activities. The Board has
approved the said CSR Policy with thrust CSR area as
“Promoting the education activities”. During the year
2016-17, the Committee held two meetings on June 22,
2016 and March 03, 2017.
G. ANNUAL GENERAL MEETINGS Location, Date and Time for the last 3 Annual General Meetings were as under
Year Type Location Date Time
31.03.2016 AGM Hall of Culture, Nehru Centre, Worli, Mumbai - 400 018 23.09.2016 11.00 A.M
31.03.2015 AGM Hall of Culture, Nehru Centre, Worli, Mumbai - 400 018 16.09.2015 11.00 A.M
31.03.2014 AGM Hall of Culture, Nehru Centre, Worli, Mumbai - 400 018 22.09.2014 11.30 A.M
In terms of the provisions of new Companies Act, 2013,
three Ordinary Resolutions were passed in the last AGM for
appointment of Ms. Aliya Modi as Director of the Company,
appointment and payment of remuneration to Dr. Atchutuni
Rao, as Whole Time Director and approval of remuneration
of Cost Auditors.
H. PERFORMANCE EVALUATION: Pursuant to the provisions of the Companies Act, 2013
the Board has carried out the annual performance
evaluation of its own performance and the Directors
individually.
A structured questionnaire was prepared after taking into
consideration various aspects of the composition of Board
and committees, execution and performance of duties and
functions. A separate exercise was carried out to evaluate the
performance of individual Directors including the Chairman
of the Board, who were evaluated on parameters such as level
of engagement and contribution, independence of judgment,
safeguarding the interest of the Company and its shareholders
etc. The performance evaluation of the Independent Directors
was carried out by the entire Board. The performance
evaluation of the Chairman and the Non Independent
Directors was carried out by the Independent Directors
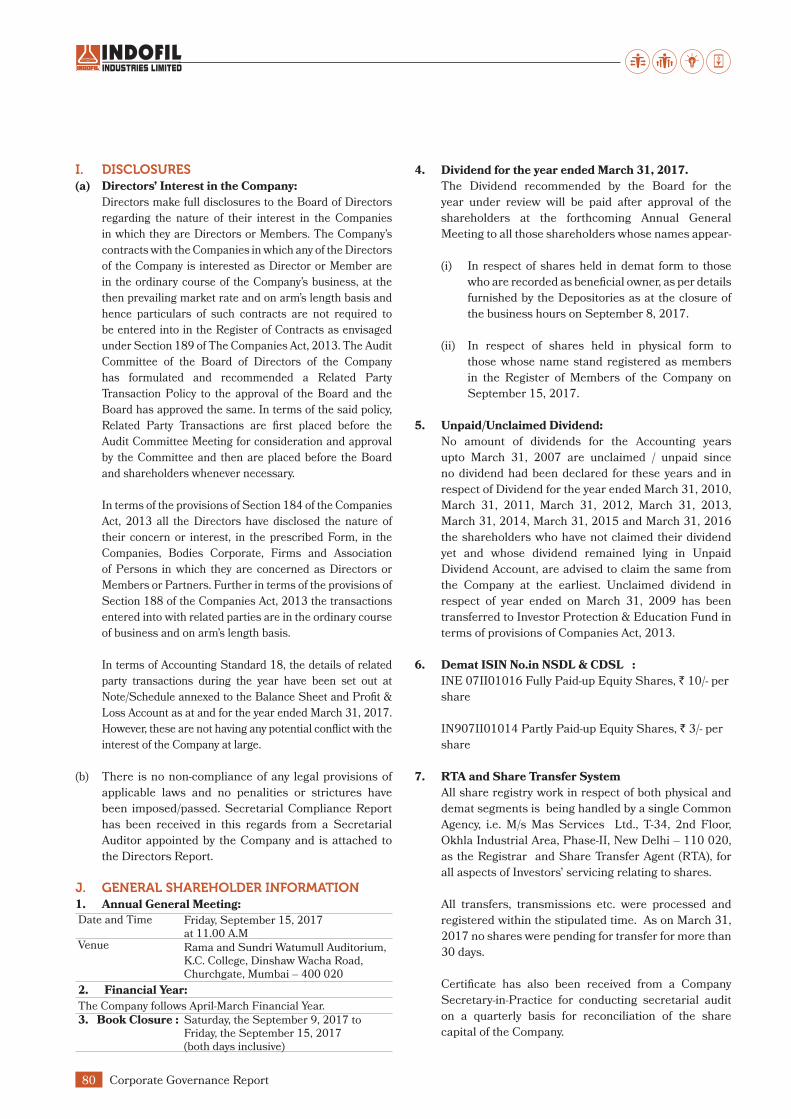
Corporate Governance Report80
I. DISCLOSURES(a) Directors’ Interest in the Company:
Directors make full disclosures to the Board of Directors
regarding the nature of their interest in the Companies
in which they are Directors or Members. The Company’s
contracts with the Companies in which any of the Directors
of the Company is interested as Director or Member are
in the ordinary course of the Company’s business, at the
then prevailing market rate and on arm’s length basis and
hence particulars of such contracts are not required to
be entered into in the Register of Contracts as envisaged
under Section 189 of The Companies Act, 2013. The Audit
Committee of the Board of Directors of the Company
has formulated and recommended a Related Party
Transaction Policy to the approval of the Board and the
Board has approved the same. In terms of the said policy,
Related Party Transactions are first placed before the
Audit Committee Meeting for consideration and approval
by the Committee and then are placed before the Board
and shareholders whenever necessary.
In terms of the provisions of Section 184 of the Companies
Act, 2013 all the Directors have disclosed the nature of
their concern or interest, in the prescribed Form, in the
Companies, Bodies Corporate, Firms and Association
of Persons in which they are concerned as Directors or
Members or Partners. Further in terms of the provisions of
Section 188 of the Companies Act, 2013 the transactions
entered into with related parties are in the ordinary course
of business and on arm’s length basis.
In terms of Accounting Standard 18, the details of related
party transactions during the year have been set out at
Note/Schedule annexed to the Balance Sheet and Profit &
Loss Account as at and for the year ended March 31, 2017.
However, these are not having any potential conflict with the
interest of the Company at large.
(b) There is no non-compliance of any legal provisions of
applicable laws and no penalities or strictures have
been imposed/passed. Secretarial Compliance Report
has been received in this regards from a Secretarial
Auditor appointed by the Company and is attached to
the Directors Report.
J. GENERAL SHAREHOLDER INFORMATION1. Annual General Meeting: Date and Time Friday, September 15, 2017
at 11.00 A.M Venue Rama and Sundri Watumull Auditorium,
K.C. College, Dinshaw Wacha Road, Churchgate, Mumbai – 400 020
2. Financial Year:The Company follows April-March Financial Year.
3. Book Closure : Saturday, the September 9, 2017 to Friday, the September 15, 2017 (both days inclusive)
4. Dividend for the year ended March 31, 2017.
The Dividend recommended by the Board for the
year under review will be paid after approval of the
shareholders at the forthcoming Annual General
Meeting to all those shareholders whose names appear-
(i) In respect of shares held in demat form to those
who are recorded as beneficial owner, as per details
furnished by the Depositories as at the closure of
the business hours on September 8, 2017.
(ii) In respect of shares held in physical form to
those whose name stand registered as members
in the Register of Members of the Company on
September 15, 2017.
5. Unpaid/Unclaimed Dividend:
No amount of dividends for the Accounting years
upto March 31, 2007 are unclaimed / unpaid since
no dividend had been declared for these years and in
respect of Dividend for the year ended March 31, 2010,
March 31, 2011, March 31, 2012, March 31, 2013,
March 31, 2014, March 31, 2015 and March 31, 2016
the shareholders who have not claimed their dividend
yet and whose dividend remained lying in Unpaid
Dividend Account, are advised to claim the same from
the Company at the earliest. Unclaimed dividend in
respect of year ended on March 31, 2009 has been
transferred to Investor Protection & Education Fund in
terms of provisions of Companies Act, 2013.
6. Demat ISIN No.in NSDL & CDSL :
INE 07II01016 Fully Paid-up Equity Shares, ` 10/- per
share
IN907II01014 Partly Paid-up Equity Shares, ` 3/- per
share
7. RTA and Share Transfer System
All share registry work in respect of both physical and
demat segments is being handled by a single Common
Agency, i.e. M/s Mas Services Ltd., T-34, 2nd Floor,
Okhla Industrial Area, Phase-II, New Delhi – 110 020,
as the Registrar and Share Transfer Agent (RTA), for
all aspects of Investors’ servicing relating to shares.
All transfers, transmissions etc. were processed and
registered within the stipulated time. As on March 31,
2017 no shares were pending for transfer for more than
30 days.
Certificate has also been received from a Company
Secretary-in-Practice for conducting secretarial audit
on a quarterly basis for reconciliation of the share
capital of the Company.
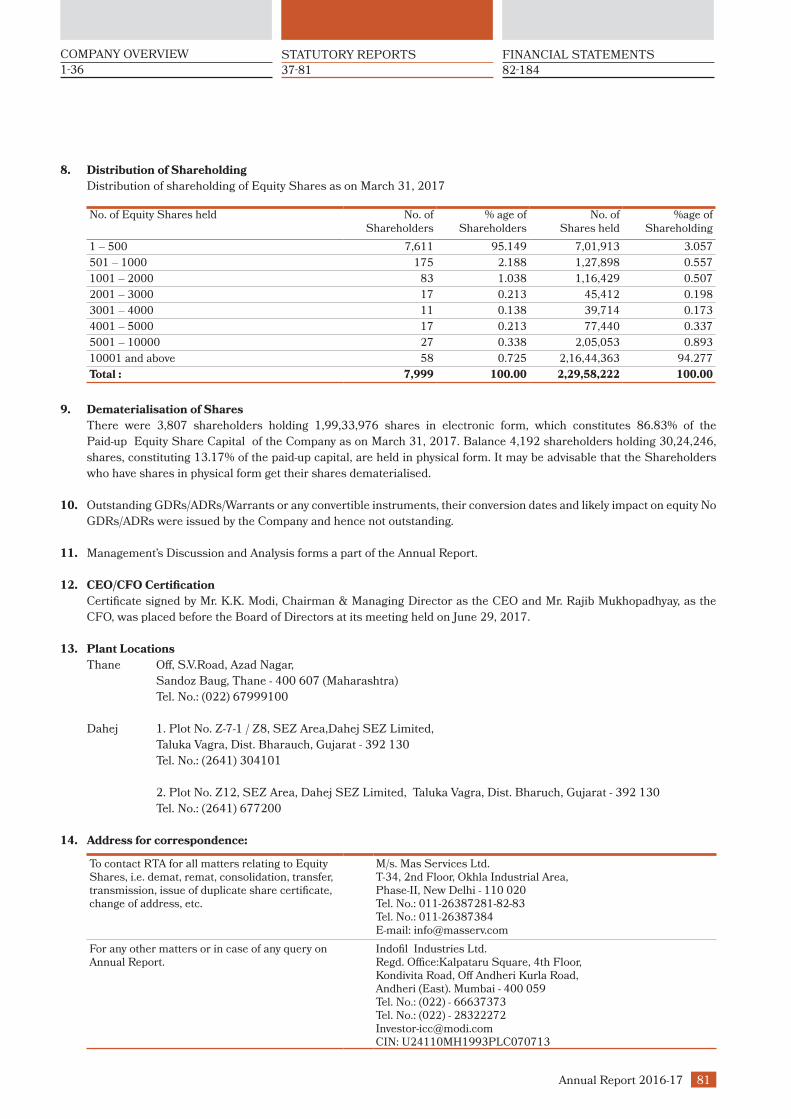
Annual Report 2016-17 81
COMPANY OVERVIEW
1-36 37-81 82-184
STATUTORY REPORTS FINANCIAL STATEMENTS
8. Distribution of Shareholding
Distribution of shareholding of Equity Shares as on March 31, 2017
No. of Equity Shares held No. of Shareholders
% age of Shareholders
No. of Shares held
%age of Shareholding
1 – 500 7,611 95.149 7,01,913 3.057
501 – 1000 175 2.188 1,27,898 0.557
1001 – 2000 83 1.038 1,16,429 0.507
2001 – 3000 17 0.213 45,412 0.198
3001 – 4000 11 0.138 39,714 0.173
4001 – 5000 17 0.213 77,440 0.337
5001 – 10000 27 0.338 2,05,053 0.893
10001 and above 58 0.725 2,16,44,363 94.277
Total : 7,999 100.00 2,29,58,222 100.00
9. Dematerialisation of Shares
There were 3,807 shareholders holding 1,99,33,976 shares in electronic form, which constitutes 86.83% of the
Paid-up Equity Share Capital of the Company as on March 31, 2017. Balance 4,192 shareholders holding 30,24,246,
shares, constituting 13.17% of the paid-up capital, are held in physical form. It may be advisable that the Shareholders
who have shares in physical form get their shares dematerialised.
10. Outstanding GDRs/ADRs/Warrants or any convertible instruments, their conversion dates and likely impact on equity No
GDRs/ADRs were issued by the Company and hence not outstanding.
11. Management’s Discussion and Analysis forms a part of the Annual Report.
12. CEO/CFO Certification
Certificate signed by Mr. K.K. Modi, Chairman & Managing Director as the CEO and Mr. Rajib Mukhopadhyay, as the
CFO, was placed before the Board of Directors at its meeting held on June 29, 2017.
13. Plant Locations
Thane Off, S.V.Road, Azad Nagar,
Sandoz Baug, Thane - 400 607 (Maharashtra)
Tel. No.: (022) 67999100
Dahej 1. Plot No. Z-7-1 / Z8, SEZ Area,Dahej SEZ Limited,
Taluka Vagra, Dist. Bharauch, Gujarat - 392 130
Tel. No.: (2641) 304101
2. Plot No. Z12, SEZ Area, Dahej SEZ Limited, Taluka Vagra, Dist. Bharuch, Gujarat - 392 130
Tel. No.: (2641) 677200
14. Address for correspondence:
To contact RTA for all matters relating to Equity Shares, i.e. demat, remat, consolidation, transfer, transmission, issue of duplicate share certificate, change of address, etc.
M/s. Mas Services Ltd. T-34, 2nd Floor, Okhla Industrial Area, Phase-II, New Delhi - 110 020 Tel. No.: 011-26387281-82-83 Tel. No.: 011-26387384 E-mail: [email protected]
For any other matters or in case of any query on Annual Report.
Indofil Industries Ltd. Regd. Office:Kalpataru Square, 4th Floor, Kondivita Road, Off Andheri Kurla Road, Andheri (East). Mumbai - 400 059 Tel. No.: (022) - 66637373 Tel. No.: (022) - 28322272 [email protected] CIN: U24110MH1993PLC070713

Standalone82
Independent Auditor’s ReportTO THE MEMBERS OF INDOFIL INDUSTRIES LIMITED
1. REPORT ON THE STANDALONE IND AS FINANCIAL STATEMENTS
We have audited the accompanying Standalone Ind
AS Financial Statements of Indofil Industries Limited
(“the Company”), comprising the Balance Sheet as
at March 31, 2017, the Statement of Profit and Loss
(including Other Comprehensive Income), the Cash
Flow Statement and the Statement of Changes in
Equity for the year then ended, and a summary of the
significant accounting policies and other explanatory
information (herein after referred to as “the Standalone
Ind AS Financial Statements”).
2. MANAGEMENT’S RESPONSIBILITY FOR THE STANDALONE IND AS FINANCIAL STATEMENTS
The Company’s Board of Directors is responsible
for the matters stated in section 134(5) of the
Companies Act, 2013 (“the Act”) with respect to the
preparation and presentation of these Standalone
Ind AS Financial Statements that give a true and fair
view of the financial position, financial performance
including Other Comprehensive Income, cash flows
and changes in equity of the Company in accordance
with the accounting principles generally accepted in
India, including the Indian Accounting Standards (“Ind
AS”) prescribed under section 133 of the Act, read with
relevant rules issued thereunder.
This responsibility also includes maintenance of
adequate accounting records in accordance with the
provisions of the Act for safeguarding the assets of
the Company and for preventing and detecting frauds
and other irregularities; selection and application of
appropriate accounting policies; making judgments
and estimates that are reasonable and prudent; and
design, implementation and maintenance of adequate
internal financial controls, that were operating
effectively for ensuring the accuracy and completeness
of the accounting records, relevant to the preparation
and presentation of the Standalone Ind AS Financial
Statements that give a true and fair view and are free
from material misstatement, whether due to fraud or
error.
3. AUDITOR’S RESPONSIBILITY Our responsibility is to express an opinion on these
Standalone Ind AS Financial Statements based on our
audit.
We have taken into account the provisions of the Act,
the accounting and auditing standards and matters
which are required to be included in the Audit Report
under the provisions of the Act and the Rules made
thereunder.
We conducted our audit in accordance with the
Standards on Auditing specified under section 143(10)
of the Act. Those Standards require that we comply
with ethical requirements and plan and perform the
audit to obtain reasonable assurance about whether the
Standalone Ind AS Financial Statements are free from
material misstatement.
An audit involves performing procedures to obtain
audit evidence about the amounts and the disclosures
in the Standalone Ind AS Financial Statements. The
procedures selected depend on the auditor’s judgment,
including the assessment of the risks of material
misstatement of the Standalone Ind AS Financial
Statements, whether due to fraud or error. In making
those risk assessments, the auditor considers internal
financial control relevant to the Company’s preparation
of the Standalone Ind AS Financial Statements
that give a true and fair view in order to design audit
procedures that are appropriate in the circumstances.
An audit also includes evaluating the appropriateness
of the accounting policies used and the reasonableness
of the accounting estimates made by the Company’s
Directors, as well as evaluating the overall presentation
of the Standalone Ind AS Financial Statements.
We believe that the audit evidence we have obtained
is sufficient and appropriate to provide a basis for our
audit opinion on the Standalone Ind AS Financial
Statements.
4. OPINION In our opinion and to the best of our information and
according to the explanations given to us, the aforesaid
Standalone Ind AS Financial Statements give the
information required by the Act in the manner so
required and give a true and fair view in conformity
with the accounting principles generally accepted in
India including the Ind AS, of the financial position of
the Company as at March 31, 2017 and its financial
performance including Other Comprehensive Income,
its cash flows and the changes in equity for the year
ended on that date.

COMPANY OVERVIEW
1-36 37-81 82-184
STATUTORY REPORTS FINANCIAL STATEMENTS
Annual Report 2016-17 83
5. REPORT ON OTHER LEGAL AND REGULATORY REQUIREMENTS
5.1 As required by the Companies (Auditor’s Report)
Order, 2016 (‘the Order’) issued by the Central
Government of India in terms of section 143(11)
of the Act, we enclose in the “Annexure A”, a
statement on the matters specified in paragraph 3
and 4 of the Order.
5.2 As required by section 143 (3) of the Act, we
report that:
a. We have sought and obtained all the
information and explanations which to
the best of our knowledge and belief were
necessary for the purposes of our audit;
b. In our opinion, proper books of account
as required by law have been kept by the
Company so far as it appears from our
examination of those books;
c. The Balance Sheet, the Statement of Profit
and Loss and (including Other Comprehensive
Income), the Cash Flow Statement and the
Statement of Changes in Equity dealt with by
this Report are in agreement with the books
of account;
d. In our opinion, the aforesaid Standalone Ind
AS Financial Statements comply with the
Indian Accounting Standards prescribed
under Section 133 of the Act, read with
relevant rules issued thereunder;
e. On the basis of the written representations
received from the Directors as on March 31,
2017 and taken on record by the Board of
Directors, none of the directors is disqualified
as on March 31, 2017 from being appointed
as a Director of the Company in terms of
section 164 (2) of the Act;
f. With respect to the adequacy of the internal
financial controls over financial reporting of
the Company and the operating effectiveness
of such controls, refer to our separate Report
in “Annexure B”, and
g. With respect to the other matters to be
included in the Auditor’s Report in accordance
with Rule 11 of the Companies (Audit and
Auditors) Rules, 2014, in our opinion and to
the best of our information and according to
the explanations given to us:
i. The Company has disclosed the impact of
pending litigations as on March 31, 2017
on its financial position in its Standalone
Ind AS Financial Statements – Refer
Note 36 to the Standalone Financial
Statements;
ii. The Company has long term contracts
including derivative contracts. However
no provision is required to be made for
any foreseeable loss in respect thereof.
Accordingly, no such provision is
reflected in Standalone Ind AS Financial
Statements;
iii. There were no amounts which were
required to be transferred as on March
31, 2017 to the Investor Education and
Protection Fund by the Company.
iv. The Company has provided requisite
disclosures in the Standalone Ind AS
Financial Statements as to holding
as well as dealings in Specified Bank
Notes during the period from November
8, 2016 to December 30, 2016. Based
on audit procedures and relying on the
management representation, we report
that the disclosures are in accordance
with books of account maintained by
the Company and as produced to us by
the Management – Refer Note 13 to the
Standalone Ind AS Financial Statements.
For BANSI S. MEHTA & CO.
Chartered Accountants
Firm Reg. No. 100991W
H.G. BUCH
Place : Mumbai Partner
Date : June 29, 2017 Membership No. 033114

Standalone84
ANNEXURE ”A“ TO THE INDEPENDENT AUDITOR’S REPORT
[Referred to in paragraph 5.1 of the Independent Auditor’s Report of even date to the members of Indofil Industries
Limited on the Standalone Ind AS Financial Statements for the year ended March 31, 2017.]
On the basis of such checks, as we considered appropriate
and in terms of information and explanations given to us, we
report that:
(i) (a) The Company has maintained proper records
showing full particulars, including quantitative
details and situation of fixed assets.
(b) The Company has a regular programme of physical
verification of its fixed assets by which fixed assets
are verified in a phased manner over a period of
three years. In accordance with this programme,
certain fixed assets were verified during the year
and no material discrepancies were noticed on
such verification. In our opinion, this periodicity of
physical verification is reasonable having regard
to the size of the Company and the nature of its
assets.
(c) The title deeds of Immovable property are held in
the name of the Company.
(ii) Inventories (other than stocks-in-transit) have been
physically verified by the management during the year.
In our opinion, the frequency of such verification is
reasonable. For stocks-in-transit at the year-end, the
necessary documentary evidences have been obtained.
In case of stocks lying with third parties, certificates
confirming such stocks have been received in respect
of stocks held as on March 31, 2017. The discrepancies
noticed on verification between physical inventories
and book records were not material in relation to the
size of operations of the Company and the same have
been properly dealt with in the books of account.
(iii) The Company has not granted any loans, secured or
unsecured, to companies, firms or other parties covered
in the register maintained under section 189 of the Act.
Therefore, the provision of Clause (iii)(a),(iii)(b) and (iii)
(c) of the said Order are not applicable to the Company.
(iv) The Company has complied with the provisions of
section 185 and 186 of the Act with respect to the loans,
investments, guarantees and securities made.
(v) The Company has not accepted any deposits from
the public during the year and hence, the question of
complying with the directives issued by the Reserve
Bank of India and the provisions of Section 73 to 76 or
any other relevant provisions of the Act and the Rules
framed there under, does not arise
(vi) We have broadly reviewed the cost records maintained
by the Company pursuant to the Companies (Cost
Records and Audit) Rules, 2014 as specified by the
Central Government under Section 148(1) of the Act in
respect of its products and are of the opinion that prima
facie, the prescribed accounts and records have been
made and maintained. However, we have not made a
detailed examination of the said records with a view to
determine whether they are accurate or complete.
(vii) (a) The Company has generally been regular in
depositing undisputed statutory dues including
Provident Fund, Employees’ State Insurance,
Income-tax, Sales-tax, Service tax, Customs Duty,
Excise Duty, Value Added Tax, Cess, Professional
Tax and other material statutory dues applicable
to it with the appropriate authorities and there
were no arrears of outstanding statutory dues as
on March 31, 2017 for a period of more than six
months from the date they became payable.
(b) On the basis of the books and records examined
by us, as applicable, given herein below are the
details of dues of Sales-tax, Service Tax, Excise
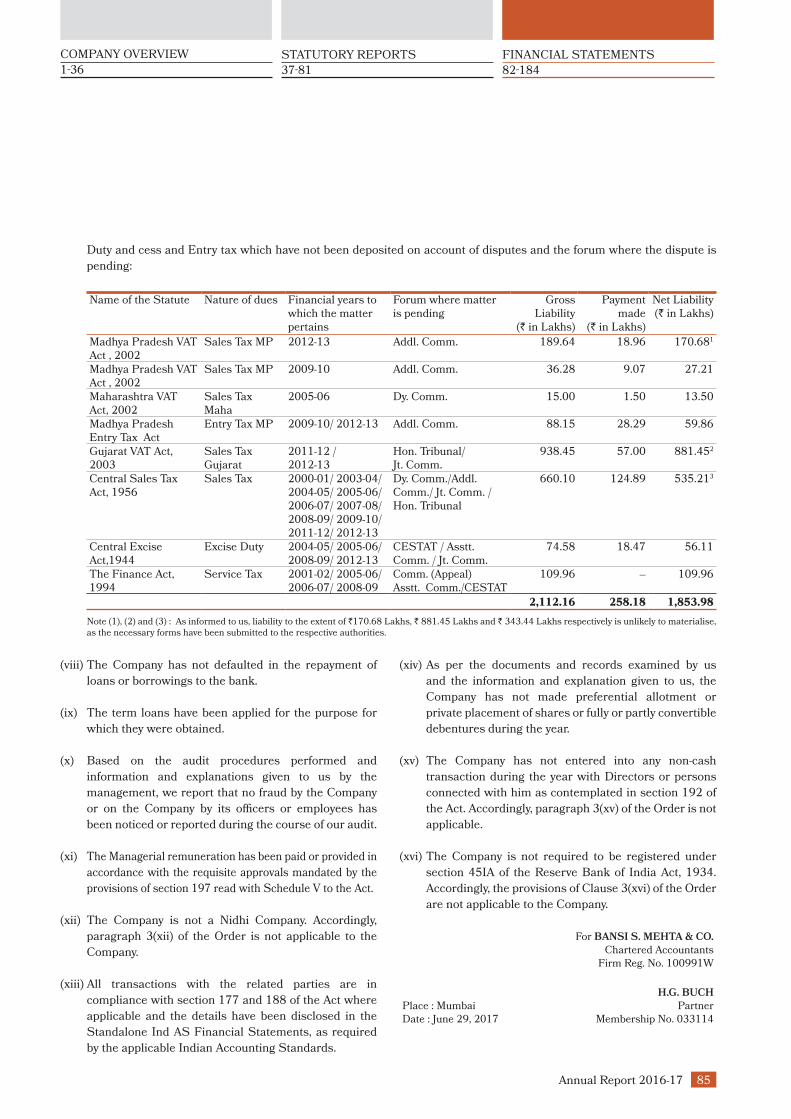
COMPANY OVERVIEW
1-36 37-81 82-184
STATUTORY REPORTS FINANCIAL STATEMENTS
Annual Report 2016-17 85
Duty and cess and Entry tax which have not been deposited on account of disputes and the forum where the dispute is
pending:
Name of the Statute Nature of dues Financial years to which the matter pertains
Forum where matter is pending
Gross Liability
(` in Lakhs)
Payment made
(` in Lakhs)
Net Liability (` in Lakhs)
Madhya Pradesh VAT Act , 2002
Sales Tax MP 2012-13 Addl. Comm. 189.64 18.96 170.681
Madhya Pradesh VAT Act , 2002
Sales Tax MP 2009-10 Addl. Comm. 36.28 9.07 27.21
Maharashtra VAT Act, 2002
Sales Tax Maha
2005-06 Dy. Comm. 15.00 1.50 13.50
Madhya Pradesh Entry Tax Act
Entry Tax MP 2009-10/ 2012-13 Addl. Comm. 88.15 28.29 59.86
Gujarat VAT Act, 2003
Sales Tax Gujarat
2011-12 /2012-13
Hon. Tribunal/Jt. Comm.
938.45 57.00 881.452
Central Sales Tax Act, 1956
Sales Tax 2000-01/ 2003-04/2004-05/ 2005-06/2006-07/ 2007-08/ 2008-09/ 2009-10/2011-12/ 2012-13
Dy. Comm./Addl. Comm./ Jt. Comm. / Hon. Tribunal
660.10 124.89 535.213
Central Excise Act,1944
Excise Duty 2004-05/ 2005-06/ 2008-09/ 2012-13
CESTAT / Asstt. Comm. / Jt. Comm.
74.58 18.47 56.11
The Finance Act, 1994
Service Tax 2001-02/ 2005-06/ 2006-07/ 2008-09
Comm. (Appeal)Asstt. Comm./CESTAT
109.96 – 109.96
2,112.16 258.18 1,853.98
Note (1), (2) and (3) : As informed to us, liability to the extent of `170.68 Lakhs, ` 881.45 Lakhs and ` 343.44 Lakhs respectively is unlikely to materialise, as the necessary forms have been submitted to the respective authorities.
(viii) The Company has not defaulted in the repayment of
loans or borrowings to the bank.
(ix) The term loans have been applied for the purpose for
which they were obtained.
(x) Based on the audit procedures performed and
information and explanations given to us by the
management, we report that no fraud by the Company
or on the Company by its officers or employees has
been noticed or reported during the course of our audit.
(xi) The Managerial remuneration has been paid or provided in
accordance with the requisite approvals mandated by the
provisions of section 197 read with Schedule V to the Act.
(xii) The Company is not a Nidhi Company. Accordingly,
paragraph 3(xii) of the Order is not applicable to the
Company.
(xiii) All transactions with the related parties are in
compliance with section 177 and 188 of the Act where
applicable and the details have been disclosed in the
Standalone Ind AS Financial Statements, as required
by the applicable Indian Accounting Standards.
(xiv) As per the documents and records examined by us
and the information and explanation given to us, the
Company has not made preferential allotment or
private placement of shares or fully or partly convertible
debentures during the year.
(xv) The Company has not entered into any non-cash
transaction during the year with Directors or persons
connected with him as contemplated in section 192 of
the Act. Accordingly, paragraph 3(xv) of the Order is not
applicable.
(xvi) The Company is not required to be registered under
section 45IA of the Reserve Bank of India Act, 1934.
Accordingly, the provisions of Clause 3(xvi) of the Order
are not applicable to the Company.
For BANSI S. MEHTA & CO.
Chartered Accountants
Firm Reg. No. 100991W
H.G. BUCH
Place : Mumbai Partner
Date : June 29, 2017 Membership No. 033114

Standalone86
ANNEXURE “B” TO THE INDEPENDENT AUDITOR’S REPORT OF EVEN DATE ON THE STANDALONE IND AS FINANCIAL STATEMENTS OF INDOFIL INDUSTRIES LIMITED
1. REPORT ON THE INTERNAL FINANCIAL CONTROLS UNDER CLAUSE (I) OF SUB-SECTION 3 OF SECTION 143 OF THE COMPANIES ACT, 2013 (“THE ACT”)
We have audited the internal financial controls over
financial reporting of INDOFIL INDUSTRIES
LIMITED (“the Company”) as of March 31, 2017 in
conjunction with our audit of the Standalone Ind AS
Financial Statements of the Company for the year
ended on that date.
2. MANAGEMENT’S RESPONSIBILITY FOR INTERNAL FINANCIAL CONTROLS
The Company’s management is responsible for
establishing and maintaining internal financial controls
based on the internal controls over financial reporting
criteria established by the Company considering the
essential components of internal controls stated in the
Guidance Note on Audit of Internal Financial Controls
over Financial Reporting issued by the Institute
of Chartered Accountants of India (“ICAI”). These
responsibilities include the design, implementation and
maintenance of adequate internal financial controls that
were operating effectively for ensuring the orderly and
efficient conduct of its business, including adherence
to Company’s policies, the safeguarding of its assets,
the prevention and detection of frauds and errors,
the accuracy and completeness of the accounting
records, and the timely preparation of reliable financial
information, as required under the Companies Act,
2013 (“the Act”) .
3. AUDITORS’ RESPONSIBILITY Our responsibility is to express an opinion on the
Company’s internal financial controls over financial
reporting based on our audit. We conducted our audit
in accordance with the Guidance Note on Audit of
Internal Financial Controls Over Financial Reporting
(the “Guidance Note”) and the Standards on Auditing,
issued by ICAI and deemed to be prescribed under
section 143(10) of the Act, to the extent applicable to
an audit of internal financial controls, both applicable
to an audit of Internal Financial Controls and, both
issued by the ICAI. Those Standards and the Guidance
Note require that we comply with ethical requirements
and plan and perform the audit to obtain reasonable
assurance about whether adequate internal financial
controls over financial reporting were established and
maintained and if such controls operated effectively in
all material respects.
Our audit involves performing procedures to obtain audit
evidence about the adequacy of the internal financial
controls system over financial reporting and their
operating effectiveness. Our audit of internal financial
controls over financial reporting included obtaining
an understanding of internal financial controls over
financial reporting, assessing the risk that a material
weakness exists, and testing and evaluating the design
and operating effectiveness of internal controls based
on the assessed risk. The procedures selected depend
on the auditor’s judgment, including the assessment of
the risks of material misstatement of the Standalone
Ind AS financial statements, whether due to fraud or
error.
We believe that the audit evidence we have obtained
is sufficient and appropriate to provide a basis for
our audit opinion on the Company’s internal financial
controls system over financial reporting.

COMPANY OVERVIEW
1-36 37-81 82-184
STATUTORY REPORTS FINANCIAL STATEMENTS
Annual Report 2016-17 87
4. MEANING OF INTERNAL FINANCIAL CONTROLS OVER FINANCIAL REPORTING
A company’s internal financial controls over financial
reporting is a process designed to provide reasonable
assurance regarding the reliability of financial reporting
and the preparation of financial statements for external
purposes in accordance with generally accepted
accounting principles. A company’s internal financial
controls over financial reporting includes those policies
and procedures that (1) pertain to the maintenance of
records that, in reasonable detail, accurately and fairly
reflect the transactions and dispositions of the assets
of the Company; (2) provide reasonable assurance
that transactions are recorded as necessary to permit
preparation of financial statements in accordance
with generally accepted accounting principles, and
that receipts and expenditures of the Company are
being made only in accordance with authorisations of
management and directors of the Company; and (3)
provide reasonable assurance regarding prevention or
timely detection of unauthorised acquisition, use, or
disposition of the Company’s assets that could have a
material effect on the financial statement.
5. INHERENT LIMITATIONS OF INTERNAL FINANCIAL CONTROLS OVER FINANCIAL REPORTING
Because of the inherent limitations of internal financial
controls over financial reporting, including the possibility
of collusion or improper management override of
controls, material misstatements due to error or fraud
may occur and not be detected. Also, projections of
any evaluation of the internal financial controls over
financial reporting to future periods are subject to the
risk that the internal financial controls over financial
reporting may become inadequate because of changes
in conditions, or that the degree of compliance with the
policies or procedures may deteriorate.
6. OPINION In our opinion, the Company has, in all material
respects, an adequate internal financial controls system
over financial reporting and such internal financial
controls over financial reporting were operating
effectively as at March 31, 2017, based on the relevant
criteria established by the Company, considering the
essential components of internal controls stated in the
Guidance Note on Audit of Internal Financial Controls
Over Financial Reporting issued by ICAI.
For BANSI S. MEHTA & CO.
Chartered Accountants
Firm Reg. No. 100991W
H.G. BUCH
Place : Mumbai Partner
Date : June 29, 2017 Membership No. 033114

Standalone88
` in Lakhs
ParticularsNote No.
As at
March 31, 2017
As at March 31, 2016
As atApril 01, 2015
ASSETS
Non - Current Assets
Property, Plant & Equipment 3 44,357.21 26,734.19 24,688.87
Capital Work - In - Progress 3 4,457.84 15,769.82 5,397.35
Investment Property 3 – – –
Other Intangible Assets 3 7,231.79 7,276.96 6,337.70
Intangible Assets under Development 3 9,196.83 8,988.30 8,345.16
Financial Assets
(i) Investments 4 16,201.60 15,610.96 14,901.83
(ii) Loans 5 911.29 2,067.81 2,141.87
(iii) Others 6 836.59 889.23 506.18
Deferred Tax Assets 7 3,284.21 3,369.32 3,455.96
Non - Current Tax Assets 8 824.18 87.17
Other Non - Current Assets 9 4,396.82 2,654.35 1,391.91
Total Non - Current Assets 91,698.36 83,360.94 67,254.00
Current Assets
Inventories 10 27,715.91 26,324.15 27,664.28
Financial Assets
(i) Investments 11 4,553.74 – –
(ii) Trade Receivables 12 60,434.73 44,052.30 42,945.73
(iii) Cash & Cash Equivalents 13 20,327.91 2,689.96 1,387.40
(iv) Bank Balance other than (iii) above 14 615.32 213.39 69.03
(v) Loans 15 555.00 1,175.00 900.00
(vi) Others 16 328.25 445.47 1,266.50
Other Current Assets 17 3,467.26 2,418.89 2,829.09
Total Current Assets 117,998.12 77,319.16 77,062.03
TOTAL ASSETS 209,696.48 160,680.10 144,316.03
Standalone Balance Sheet as at March 31, 2017

COMPANY OVERVIEW
1-36 37-81 82-184
STATUTORY REPORTS FINANCIAL STATEMENTS
Annual Report 2016-17 89
Standalone Balance Sheet as at March 31, 2017
As per our report attached For and on behalf of the Board of Directors
For BANSI S. MEHTA & CO.,
Chartered Accountants R.K. Malhotra K.K. Modi
Firm Reg. No. 100991W Group CEO Chairman and Managing Director
H.G. BUCH Chintamani D Thatte Charu Modi
Partner Head Compliance & Company Secretary Executive Director
Membership No. 033114
Rajib Mukhopadhyay M.N. Thakkar
DirectorsMumbai, June 29, 2017 Chief Financial Officer Sanjay Buch
Sunil Alagh
Dr. Atchutuni L. Rao
Mumbai, June 29, 2017
` in Lakhs
ParticularsNote No.
As at
March 31, 2017
As at March 31, 2016
As atApril 01, 2015
EQUITY AND LIABILITIES
Equity
Equity Share Capital 18 2,135.11 2,135.11 2,135.11
Other Equity 92,400.38 72,283.98 57,190.08
Total Equity 94,535.49 74,419.09 59,325.19
Liabilities
Non - Current Liabilities
Financial Liabilities
(i) Borrowings 19 39,418.10 18,924.60 10,497.61
(ii) Other Financial Liabilities 20 1,354.24 1,293.60 1,250.80
Provisions 21 1,024.52 851.30 699.10
Total Non - Current Liabilities 41,796.86 21,069.50 12,447.51
Current Liabilities
Financial Liabilities
(i) Borrowings 22 28,413.64 32,007.53 41,762.12
(ii) Trade Payables 23 19,311.79 15,125.17 17,726.94
(iii) Other Financial Liabilities 24 20,878.69 13,350.53 10,480.17
Other Current Liabilities 25 4,065.89 3,459.93 2,053.94
Provisions 26 694.12 611.58 520.16
Current Tax Liabilities (Net) 8 636.77
Total Current Liabilities 73,364.13 65,191.51 72,543.33
Total Liabilities 115,160.99 86,261.01 84,990.84
TOTAL EQUITY AND LIABILITIES 209,696.48 160,680.10 144,316.03
Corporate Information 1
Significant Accounting Policies 2
Notes on Accounts 3-48
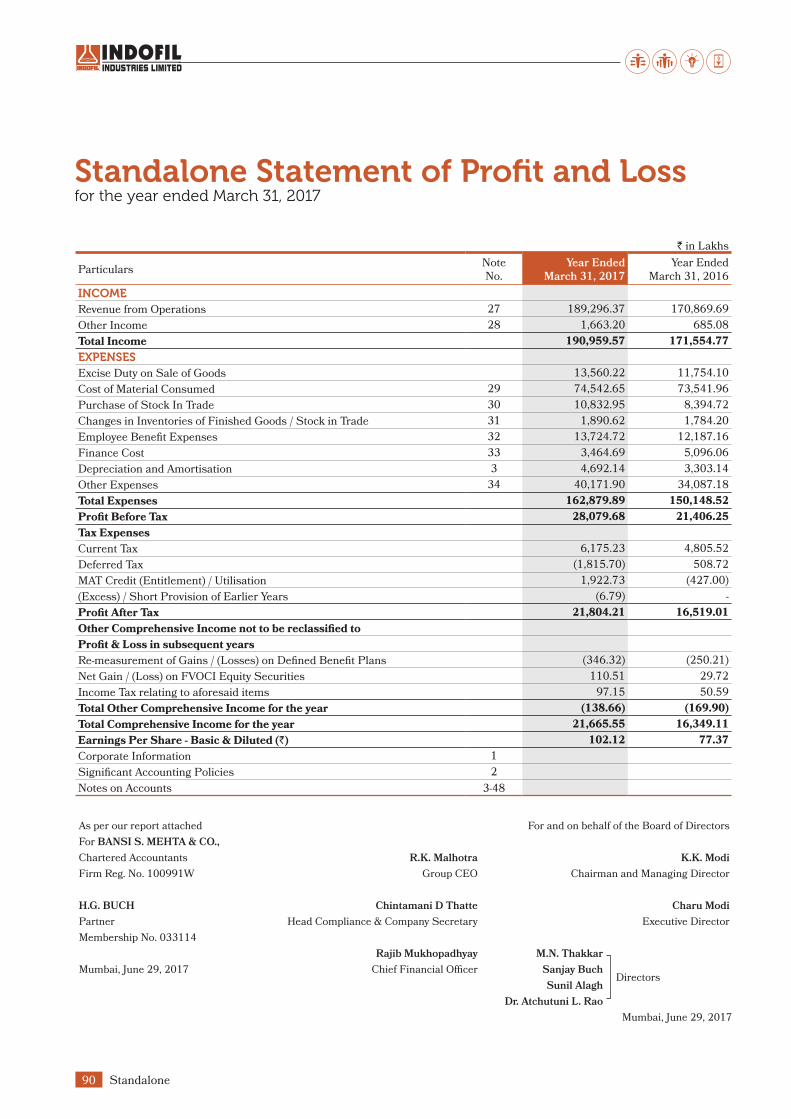
Standalone90
Standalone Statement of Profit and Lossfor the year ended March 31, 2017
` in Lakhs
ParticularsNote No.
Year Ended
March 31, 2017
Year Ended March 31, 2016
INCOME
Revenue from Operations 27 189,296.37 170,869.69
Other Income 28 1,663.20 685.08
Total Income 190,959.57 171,554.77
EXPENSES
Excise Duty on Sale of Goods 13,560.22 11,754.10
Cost of Material Consumed 29 74,542.65 73,541.96
Purchase of Stock In Trade 30 10,832.95 8,394.72
Changes in Inventories of Finished Goods / Stock in Trade 31 1,890.62 1,784.20
Employee Benefit Expenses 32 13,724.72 12,187.16
Finance Cost 33 3,464.69 5,096.06
Depreciation and Amortisation 3 4,692.14 3,303.14
Other Expenses 34 40,171.90 34,087.18
Total Expenses 162,879.89 150,148.52
Profit Before Tax 28,079.68 21,406.25
Tax Expenses
Current Tax 6,175.23 4,805.52
Deferred Tax (1,815.70) 508.72
MAT Credit (Entitlement) / Utilisation 1,922.73 (427.00)
(Excess) / Short Provision of Earlier Years (6.79) -
Profit After Tax 21,804.21 16,519.01
Other Comprehensive Income not to be reclassified to
Profit & Loss in subsequent years
Re-measurement of Gains / (Losses) on Defined Benefit Plans (346.32) (250.21)
Net Gain / (Loss) on FVOCI Equity Securities 110.51 29.72
Income Tax relating to aforesaid items 97.15 50.59
Total Other Comprehensive Income for the year (138.66) (169.90)
Total Comprehensive Income for the year 21,665.55 16,349.11
Earnings Per Share - Basic & Diluted (`) 102.12 77.37
Corporate Information 1
Significant Accounting Policies 2
Notes on Accounts 3-48
As per our report attached For and on behalf of the Board of Directors
For BANSI S. MEHTA & CO.,
Chartered Accountants R.K. Malhotra K.K. Modi
Firm Reg. No. 100991W Group CEO Chairman and Managing Director
H.G. BUCH Chintamani D Thatte Charu Modi
Partner Head Compliance & Company Secretary Executive Director
Membership No. 033114
Rajib Mukhopadhyay M.N. Thakkar
DirectorsMumbai, June 29, 2017 Chief Financial Officer Sanjay Buch
Sunil Alagh
Dr. Atchutuni L. Rao
Mumbai, June 29, 2017

COMPANY OVERVIEW
1-36 37-81 82-184
STATUTORY REPORTS FINANCIAL STATEMENTS
Annual Report 2016-17 91
Statement of Cash Flowfor the year ended March 31, 2017
` in Lakhs
Particulars Year Ended
March 31, 2017
Year Ended March 31, 2016
A CASH FLOW FROM OPERATING ACTIVITIES
Net Profit / (Loss) Before Tax 28,079.67 21,406.23
Add / (Less):- Adjustments for Non-Cash / Non-Operating Items:
Depreciation & Amortisation 4,692.14 3,303.14
Finance Cost 3,464.70 5,096.06
Interest Income (333.55) (322.25)
Dividend Income (1.14) (1.43)
Profit on Sale of Investments (67.38) -
Guarantee Commission (327.50) (359.80)
Sundry Balances Written Back (15.45) (6.17)
(Profit) / Loss on Sale of Assets 3.69 2.59
(Gain) / Loss on Fair Valuation of Investments (55.78) 8.53
Bad Debts 10.43 -
Provision for Bad and Doubtful Debts 701.12 8,071.28 719.90 8,440.57
Operating Profit Before Changes in Working Capital 36,150.95 29,846.80
Adjustment for Changes in Working Capital
(Increase) / Decrease in Trade Receivables (17,093.98) (1,826.47)
(Increase) / Decrease in Inventories (1,391.75) 1,340.12
(Increase) / Decrease in Other Financial Assets 107.31 332.83
(Increase) / Decrease in Other Non - Financial Assets (2,790.86) (852.22)
Increase / (Decrease) in Trade Payables 4,202.06 (2,595.60)
Increase / (Decrease) in Other Financial Liabilities 6,625.88 3,495.02
Increase / (Decrease) in Provisions (83.78) (6.58)
Increase / (Decrease) in Other Non - Financial Liabilities 605.97 (9,819.15) 1,405.99 1,293.09
Cash Generated from Operations 26,331.80 31,139.89
Less: Taxes Paid (Net of refund received) (7,560.96) (4,026.06)
Net Cash Flow From operating Activity (A) 18,770.84 27,113.83
B CASH FLOW FROM INVESTING ACTIVITIES
Purchase of Property, Plant & Equipment & Intangible Assets (11,170.23) (17,311.50)
Sale of Property, Plant & Equipment & Intangible Assets - 5.57
Investments during the year (4,910.72) (687.94)
Financial Assets - Loans (Made) /Repaid 1,776.52 (200.94)
Interest Received 396.10 427.41
Dividend Received 1.14 1.43
Guarantee Commission 327.50 359.80
Net Cash Flow From Investing Activity (B) (13,579.69) (17,406.17)
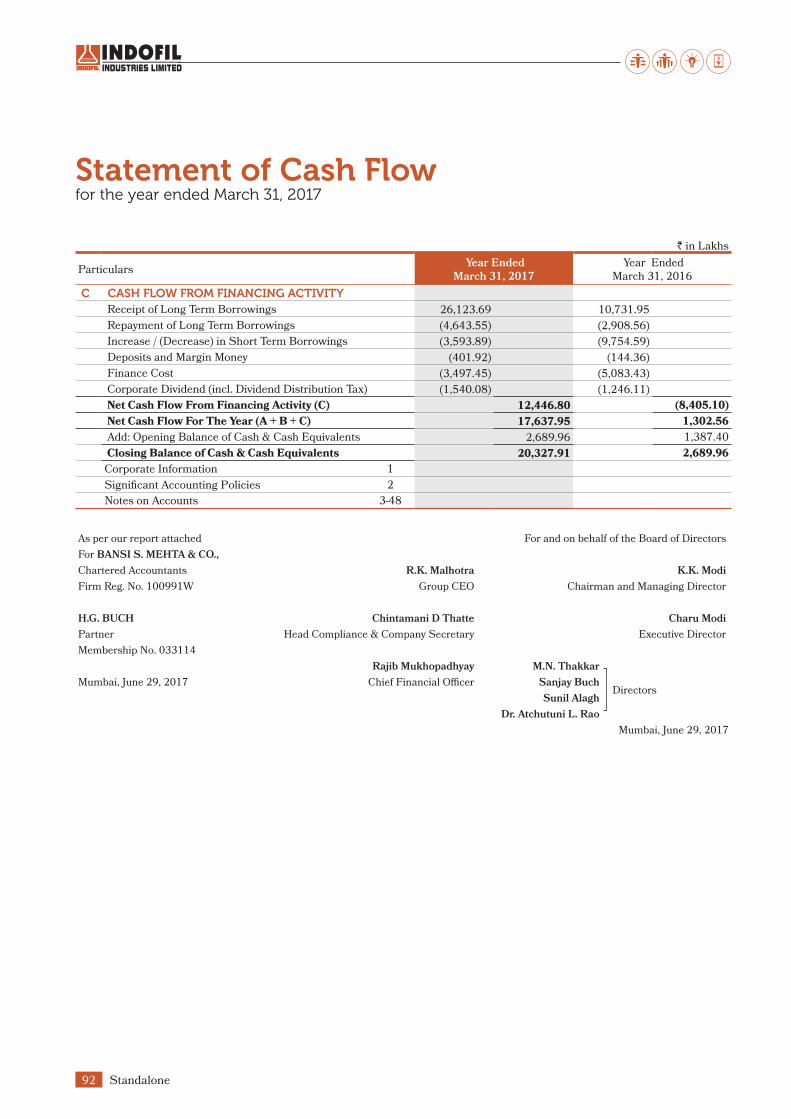
Standalone92
Statement of Cash Flowfor the year ended March 31, 2017
As per our report attached For and on behalf of the Board of Directors
For BANSI S. MEHTA & CO.,
Chartered Accountants R.K. Malhotra K.K. Modi
Firm Reg. No. 100991W Group CEO Chairman and Managing Director
H.G. BUCH Chintamani D Thatte Charu Modi
Partner Head Compliance & Company Secretary Executive Director
Membership No. 033114
Rajib Mukhopadhyay M.N. Thakkar
DirectorsMumbai, June 29, 2017 Chief Financial Officer Sanjay Buch
Sunil Alagh
Dr. Atchutuni L. Rao
Mumbai, June 29, 2017
` in Lakhs
Particulars Year Ended
March 31, 2017
Year Ended March 31, 2016
C CASH FLOW FROM FINANCING ACTIVITY
Receipt of Long Term Borrowings 26,123.69 10,731.95
Repayment of Long Term Borrowings (4,643.55) (2,908.56)
Increase / (Decrease) in Short Term Borrowings (3,593.89) (9,754.59)
Deposits and Margin Money (401.92) (144.36)
Finance Cost (3,497.45) (5,083.43)
Corporate Dividend (incl. Dividend Distribution Tax) (1,540.08) (1,246.11)
Net Cash Flow From Financing Activity (C) 12,446.80 (8,405.10)
Net Cash Flow For The Year (A + B + C) 17,637.95 1,302.56
Add: Opening Balance of Cash & Cash Equivalents 2,689.96 1,387.40
Closing Balance of Cash & Cash Equivalents 20,327.91 2,689.96
Corporate Information 1
Significant Accounting Policies 2
Notes on Accounts 3-48

COMPANY OVERVIEW
1-36 37-81 82-184
STATUTORY REPORTS FINANCIAL STATEMENTS
Annual Report 2016-17 93
Statement of Changes in Equityfor the year ended March 31, 2017
A. EQUITY SHARE CAPITAL
` in lakhs
Particulars
Balance as at April 01, 2015 2,135.11
Add: Changes in Equity Share Capital during the F.Y. 2015-16 -
Balance as at March 31, 2016 2,135.11
Add: Changes in Equity Share Capital during the F.Y. 2016-17 -
Balance as at March 31, 2017 2,135.11
B. OTHER EQUITY
` in lakhs
Particulars Capital
Redemption Reserve
Securities Premium
Capital Reserve
General Reserve
Retained Earnings
Equity Instruments through OCI
Total
Balance as at April 01, 2015 508.00 10,804.26 1.36 4,972.79 40,903.67 57,190.08
Profit for the period 16,519.01 16,519.01
Other Comprehensive Income -
- Remeasurements gains / (loss) on defined benefit plans
(250.21) (199.62)
- Fair value gain on FVOCI financial asset 29.72 29.72
Income Tax relating to aforesaid items 50.59
Dividends on Shares paid during the year (1,041.89) (1,041.89)
Dividend Distribution Tax paid during the year
(213.32) (213.32)
Balance as at March 31, 2016 508.00 10,804.26 1.36 4,972.79 55,967.85 29.72 72,283.98
Profit for the period 21,804.21 21,804.21
Other Comprehensive Income -
- Remeasurements gains / (loss) on defined benefit plans
(346.32) (249.17)
- Fair value gain on FVOCI financial asset 110.51 110.51
Income Tax relating to aforesaid items 97.15
Dividends on Shares paid during the year (1,281.07) (1,281.07)
Dividend Distribution Tax paid during the year (268.08) (268.08)
Balances at March 31, 2017 508.00 10,804.26 1.36 4,972.79 75,973.74 140.23 92,400.38

Standalone94
Statement of Changes in Equityfor the year ended March 31, 2017
Nature and Purpose of the Reserves
Capital Redemption Reserve
Capital redemption reserve is created due to redemption of preference share capital in earlier years as per the requirement
of the Companies Act.
Securities Premium
Security premium account is created on shares issued at premium. A company may utilise the security premium reserve account
as per the requirements of the Companies Act.
Capital Reserve
Capital reserve is created on account of forfeiture of share capital in earlier years.
General Reserve
The Company has transferred a portion of Net Profits of the Company before declaring Dividends to General Reserve
pursuant to the earlier provision of the Companies Act, 1956. Mandatory transfer to General Reserve, is not required under
the Companies Act, 2013.
C. DIVIDENDS PAID / PROPOSED DURING THE YEAR
Particulars Year ended
March 31, 2017
Year ended March 31, 2016
Corporate Dividend Paid During the year
Dividend Paid (` in lakhs) 1,281.07 1,041.89
Dividend Per Fully Paid Up Share 6.00 5.00
Corporate Dividend Proposed for the year
Dividend Proposed (` in lakhs) 1,708.09 1,281.07
Dividend Per Fully Paid Up Share 8.00 6.00
Corporate Information 1
Significant Accounting Policies 2
Notes on Accounts 3-48
As per our report attached For and on behalf of the Board of Directors
For BANSI S. MEHTA & CO.,
Chartered Accountants R.K. Malhotra K.K. Modi
Firm Reg. No. 100991W Group CEO Chairman and Managing Director
H.G. BUCH Chintamani D Thatte Charu Modi
Partner Head Compliance & Company Secretary Executive Director
Membership No. 033114
Rajib Mukhopadhyay M.N. Thakkar
DirectorsMumbai, June 29, 2017 Chief Financial Officer Sanjay Buch
Sunil Alagh
Dr. Atchutuni L. Rao
Mumbai, June 29, 2017

Notes forming part of Financial Statementsfor the year ended March 31, 2017
Annual Report 2016-17 95
COMPANY OVERVIEW
1-36 37-81 82-184
STATUTORY REPORTS FINANCIAL STATEMENTS
NOTE 1: CORPORATE INFORMATIONIndofil Industries Limited (‘the Company’) is a research led,
fully integrated multi-product chemical company engaged
in manufacturing and distribution of Agrochemicals and
Specialty & Performance Chemicals.
The Company is a public limited company incorporated
in India with its registered office at Kalpataru Square, 4th
Floor, Kondivita Road, Off. Andheri Kurla Road, Andheri
(East), Mumbai 400059, Maharashtra.
The financial statements for the year ended March 31, 2017
were approved by the Board of Directors and authorised for
issue on June 29, 2017.
NOTE 2: SIGNIFICANT ACCOUNTING POLIICES2.1 Statement of Compliance
In accordance with the notification issued by the
Ministry of Corporate Affairs, the Company has
adopted Indian Accounting Standards (referred to
as “Ind AS”) notified under the Companies (Indian
Accounting Standards) Rules, 2015, read with
Section 133 of the Companies Act 2013 (“the Act”)
with effect from April 01, 2016
The Financial Statements for the year ended March
31, 2017 have been prepared in accordance with
the Ind AS issued and effective as at the reporting
date. Previous periods have been restated in line
with Ind AS.
The Company has presented a reconciliation
from the presentation of financial statements
under Accounting Standards notified under the
Companies (Accounting Standards) Rules, 2006
(“Indian GAAP”) to Ind AS, of the Shareholders’
Equity as at March 31, 2016 and April 01, 2015
and of the Total Comprehensive Income for the
year ended March 31, 2016.
2.2 Basis of preparation
These financial statements have been prepared
and presented on the basis of going concern,
under historical cost convention, except for certain
financial instruments which are measured at
fair value at the end of each reporting period, as
explained in the accounting policies below.
2.3 Use of Estimates and Judgements
The preparation of the financial statements, in
conformity with the recognition and measurement
principles of Ind AS, requires management to make
estimates and assumptions that affect the reported
amounts of assets and liabilities, revenues and
expenses and disclosure of contingent liabilities at
the date of the financial statements. Actual results
could differ from those estimates. Management
believes that the estimates used in the preparation
of the financial statements are prudent and
reasonable. Any revision to the accounting
estimates is recognised prospectively.
Information about critical judgements in applying
accounting policies, as well as estimates and
assumptions that have the most significant effect
on the carrying amounts of assets and liabilities
within the next financial year are included in the
following Notes:
Measurement of Defined Benefit Obligation –
Note No. 42
Measurement and likelihood of occurrence of
provisions and contingencies – Note No. 21,
26 and 36
Recognition of Deferred Tax Assets /
(Liabilities) – Note No. 7
Key Assumptions used in Fair Valuation
Methods of Financial Assets – Note No. 41
Impairment of Financial Assets (Trade
Receivables) – Note No. 8
2.4 Classification of Assets and Liabilities
Assets and Liabilities are classified as current or
non – current, inter-alia considering the normal
operating cycle of the Company’s operations being
8 months and the expected realisation/settlement
thereof within 12 months after the Balance Sheet
date.
2.5 Property, Plant and Equipment
Property, Plant and Equipment are stated at cost of
acquisition or construction including attributable
borrowing cost till such assets are ready for
intended use, less accumulated depreciation,
impairment losses and credits received if any.
Cost of acquisition for the aforesaid purpose
comprises its purchase price, including import

Notes forming part of Financial Statementsfor the year ended March 31, 2017
Standalone96
duties and other non-refundable taxes or levies and
any directly attributable cost of bringing the asset
to its working condition for its intended use, net of
trade discounts, rebates and credits received, if any.
In case of new projects and substantial expansion
of existing capacity, expenditure incurred including
trial production expenses, net of revenue earned
and attributable interest and financing costs, prior
to commencement of commercial production are
capitalised.
Property, Plant and Equipment which are not
ready for intended use as at the date of Balance
Sheet are disclosed as “Capital Work in Progress”
Depreciation is provided on a pro-rata basis as per
useful lives prescribed by Schedule II of the Act on
Straight Line Method on Plant and Machinery and
on Written Down Value Method for others.
Upon first time adoption of Ind AS, the Company
has elected to measure all its Property, Plant and
Equipment at the Indian GAAP carrying amount
as its deemed cost on the date of transition to Ind
AS, i.e., April 01, 2015.
2.6 Intangible Assets
Intangible Assets acquired separately are measured
on initial recognition at cost. Subsequently,
Intangible Assets are carried at cost less any
accumulated amortisation and impairment losses.
The useful lives of intangible assets are assessed
as either finite or indefinite. Finite – life Intangible
Assets are amortised on a straight line basis over
the period of their expected useful lives. Estimated
useful lives by major class of finite – life Intangible
assets are as follows
10 years in case of Patents and Know-How
comprised in the Dithane Fungicide Business
in certain countries in the European
continent acquired under a Busines Purchase
Agreement;
7 years in case of other Intangible Assets.
2.7 Research and Development Cost
Revenue expenditure on Research and
Development is charged off as expense in the
year in which it is incurred under the respective
natural heads of account. Expenditure resulting in
creation of Capital Assets (Including Intangibles)
is capitalised and depreciated / amortised
accordingly.
2.8 Investments
Investments in subsidiaries and joint venture
are carried at cost less accumulated impairment
losses, if any. Where an indication of impairment
exists, the carrying amount of the investment
is assessed and written down immediately to its
recoverable amount. On disposal of investment
in subsidiaries and joint venture, the difference
between net disposal proceeds and the carrying
amounts are recognised in the Statement of Profit
and Loss.
Upon first-time adoption of Ind AS, the Company
has elected to measure its investments in
subsidiaries and joint ventures at the Indian GAAP
carrying amount as its deemed cost on the date of
transition to Ind AS i.e. April 01, 2015
2.9 Inventories
Raw Material and Packaging Materials – at
weighted average cost or net realisable value
whichever is lower.
Finished Goods and Goods-in-process –
at lower of cost or net realisable value on
First In - First out basis. Goods-in-process
are classified as Raw Materials or Finished
Goods considering the stage of completion.
Stores and Spares – at weighted average cost
or net realisable value whichever is lower.
Goods-in-transit – at cost.
2.10 Financial instruments
A financial instrument is any contract that gives
rise to a financial asset of one entity and a financial
liability or equity instrument of another entity.
Financial Assets
Initial recognition and measurement
On initial recognition, a financial asset
is recognised at fair value. In case of
Financial Assets which are recognised at
fair value through profit and loss (FVTPL),

Notes forming part of Financial Statementsfor the year ended March 31, 2017
Annual Report 2016-17 97
COMPANY OVERVIEW
1-36 37-81 82-184
STATUTORY REPORTS FINANCIAL STATEMENTS
its transaction costs are recognised in the
Statement of Profit and Loss, while in other
cases, the transaction costs are attributed to
the acquisition value of the financial asset.
Subsequent Measurement
Financial Assets are subsequently classified
as measured at
- Amortised cost
- Fair Value through Profit and Loss
(FVTPL)
- Fair Value through Other Comprehensive
Income (FVOCI)
Financial Assets are not reclassified
subsequent to their recognition, except in
the period when the Company changes its
business model for managing financial assets.
Financial Assets at Amortised Cost
Financial Assets are subsequently measured at
amortised cost if these financial assets are held
within a business whose objective is to hold these
assets to collect contractual cash flows and the
contractual terms of the financial assets give rise
on specified dates to cash flows that are solely
payments of principal and interest on the principal
amount outstanding.
Financial Assets at Fair Value through Other
Comprehensive Income
Financial Assets are measured at fair value
through Other Comprehensive Income if these
financial assets are held within a business
whose objective is achieved by both collecting
contractual cash flows on specified dates that
are solely payments of principal and interest on
the principal amount outstanding and selling
financial assets.
The Company has made an irrevocable election
to present in Other Comprehensive Income,
subsequent changes in the fair value of equity
investments not held for trading.
Financial Assets at Fair Value through Profit and Loss
Financial Assets are measured at fair value
through Profit and Loss unless it is measured
at amortised cost or at Fair Value through Other
Comprehensive Income on initial recognition.
Cash and Cash Equivalents
Cash and Cash Equivalent comprises of Balances
with Bank and in hand as well as short-term and
highly liquid investments with an original maturity
of three months or less, which are subject to an
insignificant risk of changes in value.
Derecognition
The Company derecognises a financial asset
when the contractual rights to the cash flows
from the financial asset expire, or it transfers
the contractual right to receive the cash flows
from the asset.
Financial liabilities
Initial recognition and measurement
On initial recognition, all financial liabilities
are recognised at fair value and in case
of loans and borrowings, net of directly
attributable transaction costs.
Subsequent measurement
Financial Assets are subsequently classified
as measured at
- Amortised cost
- Fair Value through Profit and Loss (FVTPL)
Financial Liabilities are measured at amortised
cost using the Effective Interest Rate (EIR)
method. Financial Liabilities carried at fair value
through profit and loss are measured at fair value
with all changes in fair value recognised in the
Statement of Profit and Loss.
Derecognition
A financial liability is derecognised when the
obligation under the liability is discharged or
cancelled or expires.
Offsetting of financial instruments
Financial assets and financial liabilities are offset
and the net amount is reported in the balance
sheet if there is a currently enforceable legal right
to offset the recognised amounts and there is an
intention to settle on a net basis, to realise the
assets and settle the liabilities simultaneously.

Notes forming part of Financial Statementsfor the year ended March 31, 2017
Standalone98
2.11 Impairment
Financial Assets (Other than at Fair Value)
The Company assesses at each date of
Balance Sheet whether a financial asset or
a group of financial asset is impaired. Ind
AS 109 requires expected credit losses to
be measured through loss allowance. The
Company recognises lifetime expected
losses for all contract assets and / or all trade
receivables that do not constitute a financing
transaction. For all other financial assets,
expected credit losses are measured at an
amount equal to 12 month expected credit
losses or at an amount equal to the life time
expected credit losses if the credit risk on the
financial asset has increased significantly
since initial recognition.
Non – Financial Assets
If internal/external indications suggest that
an asset of the Company may be impaired, the
recoverable amount of asset/cash generating
unit is determined on the Balance Sheet date
and if it is less than its carrying amount, the
carrying amount of the asset/cash generating
unit is reduced to the said recoverable
amount.
The recoverable amount is measured as
the higher of the fair value less cost of
disposal and value in use of such assets/cash
generating unit, which is determined by the
present value of the estimated future cash
flows.
Assessment is also done at each Balance Sheet
date as to whether there is any indication that
an impairment loss recognised for an asset in
prior accounting periods may no longer exist
or may have decreased, basis the assessment,
a reversal of an impairment loss for an asset
is recognised in the Statement of Profit and
Loss.
2.12 Provisions and Contingent Liabilities / Assets
Provisions are recognised when the Company has
a present obligation (legal or constructive) as a
result of a past event, it is probable that an outflow
of resources embodying economic benefits will
be required to settle the obligation and a reliable
estimate can be made of the amount of the
obligation. The expense relating to a provision is
presented in the Statement of Profit and Loss.
If the effect of the time value of money is material,
provisions are discounted using a current pre-tax
rate that reflects the current market assessments
of the time value of money and the risks specific
to the obligation. When discounting is used, the
increase in the provision due to the passage of
time is recognised as a finance cost.
Contingent liability is disclosed in the case of:
A present obligation arising from past events,
when it is not probable that an outflow
of resources will be required to settle the
obligation;
A present obligation arising from past events,
when no reliable estimate is possible;
A present obligation arising from past events,
unless the probability of outflow of resources
is remote.
Contingent Assets are not recognised and are
disclosed when inflow of economic benefits is
probable
Provisions, contingent liabilities and contingent
assets are reviewed at each balance sheet date.
2.13 Revenue Recognition
Revenue from sale of goods is recognised, when
all the significant risks and rewards of ownership
are transferred to the buyer, as per the terms of
the contracts, there is no continuing managerial
involvement with the goods and the amount of
revenue can be measured reliably, the Company
retains no effective control of the goods transferred
to a degree usually associated with ownership and
no significant uncertainty exists regarding the
amount of the consideration that will flow from the
sale of goods.
Revenue is measured at fair value of the
consideration received or receivable, net of
returns, allowances, trade discounts and volume
rebates. Revenue is recorded inclusive of excise
duty but excluding any value added tax / sales tax.

Notes forming part of Financial Statementsfor the year ended March 31, 2017
Annual Report 2016-17 99
COMPANY OVERVIEW
1-36 37-81 82-184
STATUTORY REPORTS FINANCIAL STATEMENTS
Income from Export Benefit Entitlement under the
Duty Drawback Scheme / Focus Market Scheme
/ Focus Product Scheme of the Government of
India are recognised in the year in which the
Revenue from related Export Sales is accounted
for. Advance License Benefits on Exports are
recognised in the year of utilisation of license.
Insurance claims are accounted upon acceptance
of claims.
Dividend Income is recognised when the right to
receive the payment is established.
Interest income is recognised on a time proportion
basis taking into account the amount outstanding
and the applicable interest rates. Interest income
is included under the head “Other Income” in the
Statement of Profit and Loss.
2.14 Foreign Currencies
The Financial Statements of the Company are
presented in Indian Rupee (INR), which is also the
functional currency of the Company.
Foreign currency transactions are translated into
the functional currency, using the exchange rate at
the date of the transaction. Foreign exchange gains
and losses from settlement of these transactions,
and from restatement of monetary assets and
liabilities at the reporting date are recognised in
the Statement of Profit and Loss.
Non – monetary foreign currency items are carried
at cost translated at an exchange rate prevailing on
the date of transaction.
Exchange difference arising on settlement or
restatement of foreign currency denominated
liabilities existing as on / incurred on or after
01.04.2011 but before 31.03.2016 relating to
acquisition of depreciable capital assets, have been
added to/deducted from the cost of the respective
asset and depreciated over the balance life of the
asset.
2.15 Employee Benefits
Defined Contribution Plans
Company’s contributions paid/payable during
the year to Employees’ Provident Fund, Family
Pension Fund, ESIC, Labour Welfare Fund,
Superannuation Fund are recognised in the
Statement of Profit and Loss.
Defined Benefit Plans
Company’s accrued liabilities towards Gratuity and
Leave Encashment are determined on actuarial
basis using the projected unit credit method for the
period of service to build up the final obligation.
Service Cost (Both Current and Past) and Net
Interest Expenses or Income is recognised as
expenses in the Statement of Profit and Loss.
Any difference between the interest income on
plan assets and the return actually achieved and
any changes in the liabilities over the year due to
changes in actuarial assumptions or experience
adjustments within the plans are recognised
immediately in Other Comprehensive Income and
subsequently not reclassified to the Statement of
Profit and Loss.
Gratuity and Superannuation Scheme are
administered by Life Insurance Corporation of
India to which contributions are made.
The Retirement Benefit Obligation recognised in
the Balance Sheet represents the present value of
the Defined Benefit Obligation reduced by the Fair
Value of the Plan Assets.
2.16 Borrowing Costs
Borrowing costs that are attributable to the
acquisition, construction, or production of a
qualifying asset are capitalised as a part of the cost
of such asset till such assets are ready for their
intended use.
A qualifying asset is an asset that necessarily
requires a substantial period of time to get ready
for its intended use or sale.
All other borrowing costs are recognised as
expense in the Statement of Profit and Loss in the
period in which they are incurred.
2.17 Leases
Leases in which a substantial portion of the risks
and rewards of ownership are retained by the
lessor are classified as operating leases. Payments

Notes forming part of Financial Statementsfor the year ended March 31, 2017
Standalone100
and receipts under such leases are recognised in
the Statement of Profit and Loss on a straight line
basis over the term of the lease unless the lease
payments to the lessor are structured to increase in
line with expected general inflation to compensate
for the lessor’s expected inflationary cost
increases, in which case the same are recognised
as an expense in line with the contractual term.
Leases are classified as finance lease whenever
the terms of the lease transfer substantially all the
risks and rewards incidental to ownership to the
lessee.
2.18 Taxes
Income Tax expenses comprise of Current Tax and
Deferred Tax. It is recognised in the Statement of
Profit and Loss except to the extent it relates to an
item which is recognised directly in Equity or in
Other Comprehensive Income, in which case, the
same are recognised therein.
Current Income Tax
Provision for Current Tax is made on the basis of
taxable income for the current year in accordance
with the provisions of Income Tax Act, 1961 (“the
IT Act”). Credit for Minimum Alternate Tax (MAT)
is recognised in respect of liability under MAT
provisions, based on expected tax liability under
normal provisions of the IT Act during the period
specified thereunder.
Deferred Tax
Deferred Tax is recognised in respect of temporary
differences between the carrying amount of assets
and liabilities for financial reporting purposes
and the corresponding amounts used for taxation
purposes.
A Deferred Tax Liability is recognised based on the
expected realisation or settlement of the carrying
amount of assets and liabilities, using tax rates
enacted or substantively enacted, by the end of the
reporting period. Deferred Tax Asset is recognised
only to the extent that it is probable that future
taxable profits will be available against which
the asset can be utilised. Deferred Tax Assets
and Deferred Tax Liabilities are reviewed at each
reporting date.
2.19 Earnings Per Share
Basic earnings per share is computed by dividing
the net profits for the year attributable to the equity
shareholders of the Company by the weighted
average number of equity shares outstanding
during the period.
For the purpose of calculating diluted earnings
per share, the net profit attributable to equity
shareholders and the weighted average number of
shares outstanding during the period is adjusted
for the effects of all dilutive potential equity shares.

Notes forming part of Financial Statementsfor the year ended March 31, 2017
Annual Report 2016-17 101
COMPANY OVERVIEW
1-36 37-81 82-184
STATUTORY REPORTS FINANCIAL STATEMENTSN
OT
E 3
: P
RO
PE
RT
Y, P
LA
NT
& E
QU
IPM
EN
T, IN
TA
NG
IBLE
AS
SE
TS
AN
D I
NT
AN
GIB
LE
AS
SE
TS
UN
DE
R D
EV
EL
OP
ME
NT
` i
n L
ak
hs
Pa
rtic
ula
rs
Gro
ss B
lock
(a
t co
st)
D
ep
reci
ati
on
/ A
mo
rtis
ati
on
Ne
t B
lock
As
at
Ap
ril
1, 2
01
6A
dd
itio
ns
/ T
ran
sfe
rsD
ed
uct
ion
sA
s a
t M
arc
h
31
, 2
01
7
As
at
Ap
ril
1, 2
01
6 F
or
Th
e
Ye
ar
On
D
ed
uct
ion
sA
s a
t M
arc
h
31
, 2
01
7
As
at
Ma
rch
31
, 2
01
7
As
at
Ma
rch
3
1, 2
01
6
(A)
TA
NG
IBLE
AS
SE
TS
La
nd
- F
reeh
old
17
6.5
4
–
–
17
6.5
4
–
–
–
–
17
6.5
4
17
6.5
4
Fa
cto
ry B
uil
din
gs
5,1
51
.03
5
,78
7.1
8
–
10
,93
8.2
1
2,0
75
.20
5
22
.38
–
2
,59
7.5
8
8,3
40
.63
3
,07
5.8
3
No
n-F
act
ory
Bu
ild
ing
s ²
⁴ 9
,95
1.1
5
39
0.3
8
–
10
,34
1.5
3
2,0
94
.96
4
62
.47
–
2
,55
7.4
3
7,7
84
.10
7
,85
6.1
9
Cu
lve
rts
–
19
.69
–
1
9.6
9
–
0.7
7
–
0.7
7
18
.92
–
Pla
nt
& M
ach
ine
ry
⁴ 1
6,8
39
.97
1
0,6
72
.95
–
2
7,5
12
.92
4
,55
2.7
8
98
6.9
9
–
5,5
39
.77
2
1,9
73
.15
1
2,2
87
.19
Oth
er
Pla
nt
Eq
uip
me
nt
2,3
21
.83
1
,75
4.1
1
–
4,0
75
.94
5
79
.78
4
67
.33
–
1
,04
7.1
1
3,0
28
.83
1
,74
2.0
5
Ele
ctri
cal
Inst
all
ati
on
&
Eq
uip
me
nt
–
1,1
57
.58
–
1
,15
7.5
8
–
12
4.2
0
–
12
4.2
0
1,0
33
.38
–
Fu
rnit
ure
& F
ixtu
re 6
46
.48
7
6.6
7
–
72
3.1
5
44
4.3
1
64
.89
–
5
09
.20
2
13
.95
2
02
.17
Veh
icle
s ¹
1,8
15
.51
2
46
.10
–
2
,06
1.6
1
1,3
50
.57
2
11
.59
–
1
,56
2.1
6
49
9.4
5
46
4.9
4
Offi
ce E
qu
ipm
en
ts 9
02
.26
1
73
.35
–
1
,07
5.6
1
78
9.5
1
75
.06
–
8
64
.57
2
11
.04
1
12
.75
Ro
ad
s –
4
37
.04
–
4
37
.04
–
6
0.9
8
–
60
.98
3
76
.06
–
Co
mp
ute
rs 6
71
.57
7
2.6
8
–
74
4.2
5
53
3.2
6
82
.26
–
6
15
.52
1
28
.73
1
38
.31
Ca
pit
al
Ex
pe
nd
itu
re O
n
Re
sea
rch
& D
evel
op
me
nt
Bu
ild
ing
s 4
26
.69
–
–
4
26
.69
1
50
.98
2
8.6
5
–
17
9.6
3
24
7.0
6
27
5.7
1
Pla
nt
& M
ach
ine
ry 8
81
.19
–
–
8
81
.19
4
85
.22
7
5.4
3
–
56
0.6
5
32
0.5
4
39
5.9
7
Fu
rnit
ure
& F
ixtu
re 2
3.5
4
–
–
23
.54
1
7.4
3
1.6
7
–
19
.10
4
.44
6
.11
Oth
er
Eq
uip
me
nts
4.3
3
–
–
4.3
3
3.9
0
0.0
4
–
3.9
4
0.3
9
0.4
3
To
tal
- Ta
ng
ible
Ass
ets
39
,81
2.0
9
20
,78
7.7
3
–
60
,59
9.8
2
13
,07
7.9
0
3,1
64
.71
–
1
6,2
42
.61
4
4,3
57
.21
2
6,7
34
.19
(B)
INT
AN
GIB
LE
AS
SE
TS
Pa
ten
ts a
nd
Kn
ow
-ho
w i
n
resp
ect
of
Acq
uir
ed
Bu
sin
ess
1,6
79
.13
–
–
1
,67
9.1
3
51
8.0
0
16
7.9
0
–
68
5.9
0
99
3.2
3
1,1
61
.13
Sci
en
tifi
c R
ese
arc
h
Ex
pe
nd
itu
re f
or
Pro
du
ct
Deve
lop
me
nt
8,7
43
.81
1
,43
0.5
5
–
10
,17
4.3
6
2,6
82
.31
1
,33
9.0
3
–
4,0
21
.34
6
,15
3.0
2
6,0
61
.50
So
ftw
are
Lic
en
ces
62
.07
5
1.7
1
–
11
3.7
8
7.7
4
20
.50
–
2
8.2
4
85
.54
5
4.3
3
To
tal
- In
tan
gib
le A
sse
ts 1
0,4
85
.01
1
,48
2.2
6
–
11
,96
7.2
7
3,2
08
.05
1
,52
7.4
3
–
4,7
35
.48
7
,23
1.7
9
7,2
76
.96
(C)
CA
PIT
AL
WO
RK
IN
PR
OG
RE
SS
3
15
,76
9.8
2
7,8
79
.27
1
9,1
91
.25
4
,45
7.8
4
–
–
–
–
4,4
57
.84
1
5,7
69
.82
(D)
INT
AN
GIB
LE
S U
ND
ER
DE
VE
LO
PM
EN
T
Sci
en
tifi
c R
ese
arc
h f
or
P
rod
uct
Un
de
r D
eve
lop
me
nt
8,9
88
.30
1
,64
7.6
6
1,4
39
.13
9
,19
6.8
3
–
–
–
–
9,1
96
.83
8
,98
8.3
0
(E)
INV
ES
TM
EN
T P
RO
PE
RT
Y 5
–
–
–
–
–
–
–
–
–
–
To
tal
(A)+
(B)+
(C)+
(D)+
(E )
75
,05
5.2
2
31
,79
6.9
2
20
,63
0.3
8
86
,22
1.7
6
16
,28
5.9
5
4,6
92
.14
–
2
0,9
78
.09
6
5,2
43
.67
5
8,7
69
.27
Pre
vio
us
Ye
ar'
s T
ota
l 5
7,7
83
.40
2
2,1
64
.29
4
,89
2.4
9
84
,84
0.1
8
13
,01
4.3
3
3,3
03
.14
3
1.5
4
16
,34
9.0
1
68
,49
1.1
7
44
,76
9.0
7

Notes forming part of Financial Statementsfor the year ended March 31, 2017
Standalone102
NO
TE
3:
PR
OP
ER
TY
, P
LA
NT
& E
QU
IPM
EN
T, IN
TA
NG
IBLE
AS
SE
TS
AN
D I
NT
AN
GIB
LE
AS
SE
TS
UN
DE
R D
EV
EL
OP
ME
NT
` i
n L
ak
hs
Pa
rtic
ula
rs
Gro
ss B
lock
(a
t co
st)
D
ep
reci
ati
on
/ A
mo
rtis
ati
on
Ne
t B
lock
As
at
Ap
ril
1, 2
01
5A
dd
itio
ns
/ T
ran
sfe
rsD
ed
uct
ion
sA
s a
t M
arc
h
31
, 2
01
6A
s a
t A
pri
l 1
, 2
01
5 F
or
Th
e
Ye
ar
On
D
ed
uct
ion
sA
s a
t M
arc
h
31
, 2
01
6A
s a
t M
arc
h
31
, 2
01
6A
s a
t M
arc
h
31
, 2
01
5
(A)
TA
NG
IBLE
AS
SE
TS
La
nd
- F
reeh
old
17
6.5
4
–
–
17
6.5
4
–
–
–
–
17
6.5
4
17
6.5
4
Fa
cto
ry B
uil
din
gs
5,0
78
.02
7
3.0
1
–
5,1
51
.03
1
,75
5.9
2
31
9.2
8
–
2,0
75
.20
3
,07
5.8
3
3,3
22
.10
No
n-F
act
ory
Bu
ild
ing
s ²
⁴ 8
,46
4.4
6
1,4
86
.68
–
9
,95
1.1
4
1,7
08
.14
3
86
.82
–
2
,09
4.9
6
7,8
56
.18
6
,75
6.3
2
Cu
lve
rts
–
–
–
–
–
–
–
–
–
–
Pla
nt
& M
ach
ine
ry
⁴ 1
6,0
35
.94
8
04
.03
–
1
6,8
39
.97
3
,82
4.7
9
72
8.0
1
–
4,5
52
.80
1
2,2
87
.17
1
2,2
11
.15
Oth
er
Pla
nt
Eq
uip
me
nt
93
7.9
3
1,3
83
.91
–
2
,32
1.8
4
42
6.0
2
15
3.7
6
–
57
9.7
8
1,7
42
.06
5
11
.91
Ele
ctri
cal
Inst
all
ati
on
&
Eq
uip
me
nt
–
–
–
–
–
–
–
–
–
–
Fu
rnit
ure
& F
ixtu
re 6
00
.39
4
6.0
9
–
64
6.4
8
37
3.5
2
70
.78
–
4
44
.30
2
02
.18
2
26
.87
Veh
icle
s ¹
1,6
99
.00
1
56
.20
3
9.7
0
1,8
15
.50
1
,18
6.3
8
19
5.7
4
31
.54
1
,35
0.5
8
46
4.9
2
51
2.6
2
Offi
ce E
qu
ipm
en
ts 8
72
.90
2
9.3
6
–
90
2.2
6
69
7.1
6
92
.35
–
7
89
.51
1
12
.75
1
75
.74
Ro
ad
s –
–
–
–
–
–
–
–
–
–
Co
mp
ute
rs 5
47
.76
1
23
.81
–
6
71
.57
4
51
.09
8
2.1
7
–
53
3.2
6
13
8.3
1
96
.67
Ca
pit
al
Ex
pe
nd
itu
re o
n
Re
sea
rch
& D
evel
op
me
nt
Bu
ild
ing
s 4
26
.69
–
–
4
26
.69
1
18
.90
3
2.0
8
–
15
0.9
8
27
5.7
1
30
7.7
9
Pla
nt
& M
ach
ine
ry 7
87
.42
9
3.7
8
–
88
1.2
0
40
5.4
3
79
.78
–
4
85
.21
3
95
.99
3
81
.99
Fu
rnit
ure
& F
ixtu
re 2
3.5
4
–
–
23
.54
1
4.8
4
2.5
8
–
17
.42
6
.12
8
.70
Oth
er
Eq
uip
me
nts
4.3
3
–
–
4.3
3
3.8
6
0.0
4
–
3.9
0
0.4
3
0.4
7
To
tal
- Ta
ng
ible
Ass
ets
35
,65
4.9
2
4,1
96
.87
3
9.7
0
39
,81
2.0
9
10
,96
6.0
5
2,1
43
.39
3
1.5
4
13
,07
7.9
0
26
,73
4.1
9
24
,68
8.8
7
(B)
INT
AN
GIB
LE
AS
SE
TS
Pa
ten
ts a
nd
Kn
ow
-ho
w i
n
Re
spe
ct o
f A
cqu
ire
d B
usi
ne
ss
1,6
79
.13
–
–
1
,67
9.1
3
35
0.0
9
16
7.9
1
–
51
8.0
0
1,1
61
.13
1
,32
9.0
4
Sci
en
tifi
c R
ese
arc
h
Ex
pe
nd
itu
re f
or
Pro
du
ct
Deve
lop
me
nt
6,7
06
.84
2
,03
6.9
7
–
8,7
43
.81
1
,69
8.1
8
98
4.1
3
–
2,6
82
.31
6
,06
1.5
0
5,0
08
.66
So
ftw
are
Lic
en
ces
–
62
.07
–
6
2.0
7
–
7.7
4
–
7.7
4
54
.33
–
To
tal
- In
tan
gib
le A
sse
ts 8
,38
5.9
7
2,0
99
.04
–
1
0,4
85
.01
2
,04
8.2
7
1,1
59
.78
–
3
,20
8.0
5
7,2
76
.96
6
,33
7.7
0
(C)
CA
PIT
AL
WO
RK
IN
PR
OG
RE
SS
³
5,3
97
.35
1
3,1
88
.29
2
,81
5.8
2
15
,76
9.8
2
–
–
–
–
15
,76
9.8
2
5,3
97
.35
(D)
INT
AN
GIB
LE
S U
ND
ER
DE
VE
LO
PM
EN
T
Sci
en
tifi
c R
ese
arc
h
Ex
pe
nd
itu
re f
or
Pro
du
ct U
nd
er
Deve
lop
me
nt
8,3
45
.16
2
,68
0.1
1
2,0
36
.97
8
,98
8.3
0
–
–
–
–
8,9
88
.30
8
,34
5.1
6
(E )
INV
ES
TM
EN
T P
RO
PE
RT
Y 5
–
–
–
–
–
–
–
–
–
–
TO
TA
L (
A)+
(B)+
(C)+
(D)+
(E)
57
,78
3.4
0
22
,16
4.3
1
4,8
92
.49
7
5,0
55
.22
1
3,0
14
.32
3
,30
3.1
7
31
.54
1
6,2
85
.95
5
8,7
69
.27
4
4,7
69
.08

Notes forming part of Financial Statementsfor the year ended March 31, 2017
Annual Report 2016-17 103
COMPANY OVERVIEW
1-36 37-81 82-184
STATUTORY REPORTS FINANCIAL STATEMENTS
1 Includes Assets taken on Hire Purchase :-
` in Lakhs
Particulars As at March 31, 2017 As at March 31, 2016 As at April 01, 2015
Cost Value W.D.V Cost Value W.D.V Cost Value W.D.V
Vehicles – – 1,040.71 272.81 1,046.48 407.11
2 Non - Factory Building includes Cost of Shares of Face Value of ` 1,350/-
3 Includes Borrowing Cost of ̀ 328.03 lakhs (31 March 2016: ̀ 334.16 lakhs, 1 April 2015: ̀ 385.39 lakhs) capitalised during
the year in terms of Para 8 of the “Indian Accounting Standard 23- Borrowing Costs” and Employee Cost of ̀ 160.87 lakhs
(March 31, 2016: ` 142.59 lakhs, April 1, 2015: ` 111.92 lakhs). The Effecitive Interest Rate (EIR) used to determine the
amount of borrowing cost eligible for capitalisation is the EIR of the specific borrowing”
4 Includes Foreign Exchange Differences arising on restatement of foreign currency denominated liabilities relating to the
acquistion of Fixed Assets ` 415.54 lakhs (March 31, 2016: ` 409.35 lakhs and April 1, 2015: ` 112.63 lakhs) capitalised
during the year in terms of Para 7AA of “Indian Accounting Standard 21 - The Effects of Changes in Foreign Exchange
Rates”. Unamortised Amount as at the year end was ̀ 1,191.51 lakhs ( March 31, 2016: ̀ 900.08 lakhs and April 1, 2015:
` 518.04 lakhs)
5 Property at Sameer Vihar, Modi Nagar yielding rental income to the Company is not recognised as Investment Property
due to non availability of reliable measurement of cost. The Fair Value of the said Investment Property based on the
Management Estimate is ` 2,609.88 lakhs as at the year end.

Notes forming part of Financial Statementsfor the year ended March 31, 2017
Standalone104
NOTE 4 : FINANCIAL ASSETS - INVESTMENTS (NON - CURRENT)
Particulars As at March 31, 2017 As at March 31, 2016 As at April 01, 2015
No. of Shares ` in Lakhs No. of Shares ` in Lakhs No. of Shares ` in Lakhs
INVESTMENT IN EQUITY INSTRUMENTS
Investment in Subsidiaries (Unquoted At Cost)
Indofil Industries (Netherlands) B.V. 100,000 8,584.44 100,000 8,584.44 100,000 8,513.11
(Face Value - Euro 1 /- each)
Indofil Industries (International) B.V. 100,000 70.28 – – – –
(Face Value - Euro 1 /- each)
Indofil Bangladesh Industries Pvt. Ltd. 319,993 264.45 233,907 189.94 109,386 87.31
(Face Value - BDT 100 /- each)
Indofil Costa Rica, S.A. 10 0.01 10 0.01 10 0.01
(Face Value - Costa Rican Colon 1000 /- each)
Quick Investment (India) Ltd. 12,515 342.27 10,015 10.01 10,015 10.01
(Face Value - ` 100 /- each)
Good Investment (India) Ltd. 70,105 2,173.26 70,105 2,173.26 70,105 2,173.26
(Face Value - ` 100 /- each)
Investment in Joint Venture (Unquoted At Cost)
Indobaijin Chemicals Pvt. Ltd. 4,366,096 4,366.10 4,366,096 4,366.10 3,852,113 3,852.11
(Face Value - ` 100 /- each)
Hifil Chemicals Pvt. Ltd. 4,900 0.49 4,900 0.49 4,900 0.49
(Face Value - ` 10 /- each)
Others (Quoted At Fair Value)
Modi Rubber Ltd. 214,211 197.93 214,211 95.00 214,211 62.34
(Face Value - ` 10 /- each)
Union KBC Mutual Fund 249,990 35.45 249,990 32.37 249,990 40.90
(Face Value - ` 10 /- each)
Others (Unquoted At Fair Value)
The Cosmos Co-Op. Bank Ltd. 14,250 70.79 14,250 70.79 14,250 84.50
(Face Value - ` 100 /- each)
KKM Management Centre Pvt. Ltd. 338,100 96.13 338,100 88.55 338,100 77.79
(Face Value - ` 10 /- each)
Total 16,201.60 15,610.96 14,901.83
` in Lakhs ` in Lakhs ` in Lakhs
Aggregate Amount of Quoted Investment & Maket Value thereof
233.38 127.37 103.24
Aggregate amount of Unqouted Investments
15,968.22 15,483.59 14,798.59
Aggregate amount of impairment in value of Investments
– – –

Notes forming part of Financial Statementsfor the year ended March 31, 2017
Annual Report 2016-17 105
COMPANY OVERVIEW
1-36 37-81 82-184
STATUTORY REPORTS FINANCIAL STATEMENTS
NOTE 5: FINANCIAL ASSETS - LOANS (NON-CURRENT)
` in Lakhs
Particulars As at
March 31, 2017
As at March 31, 2016
As at April 01, 2015
Unsecured Considered Good
Loan to Related Parties 836.07 1,981.91 2,041.42
Secured Considered Good
Loan to Employees 75.22 85.90 100.45
Total 911.29 2,067.81 2,141.87
NOTE 6: FINANCIAL ASSETS - OTHERS (NON-CURRENT)
` in Lakhs
Particulars As at
March 31, 2017
As at March 31, 2016
As at April 01, 2015
Security and Other Deposits 609.38 480.09 380.82
Fixed Deposits maturing after 12 months 227.21 409.14 125.36
Total 836.59 889.23 506.18
NOTE 7: DEFERRED TAX ASSETS
` in Lakhs
Particulars As at
March 31, 2017
As at March 31, 2016
As at April 01, 2015
Deferred Tax Assets
Other items giving rise to temporary differences 1,401.91 1,100.25 769.84
MAT Credit Entitlement 6,377.58 8,278.39 7,856.31
7,779.49 9,378.64 8,626.15
Deferred Tax Liabilities
Accelerated depreciation for tax purposes (4,495.28) (6,009.32) (5,170.19)
(4,495.28) (6,009.32) (5,170.19)
Net Deferred Tax Assets 3,284.21 3,369.32 3,455.96
Reconcilation of Deferred Tax Assets / (Liability) for the year
` in Lakhs
Particulars
Deferred Tax Assets Deferred Tax Liabilities
MAT Credit Entitlement
Items giving rise to temporary differences
Accelerated Depreciation for
Tax Purpose
Balance as at April 01, 2015 7,856.31 769.84 (5,170.19)
MAT Credit Entitlement / (Utilisation) during F.Y. 2015-16 422.07 – –
DTA on Items giving rise to temporary differences – 330.42 –
DTL on Accelerated Depreciation for tax purpose – – (839.13)
Balance as at March 31, 2016 8,278.38 1,100.26 (6,009.32)
MAT Credit Entitlement / (Utilisation) during F.Y. 2016-17 (1,900.81) – –
DTA on Items giving rise to temporary differences – 301.66 –
DTA on Accelerated Depreciation for tax purpose – – 1,514.04
Closing Balance as at March 31, 2017 6,377.57 1,401.92 (4,495.28)

Notes forming part of Financial Statementsfor the year ended March 31, 2017
Standalone106
NOTE 8: NON - CURRENT TAX ASSETS / (LIABILITIES)
` in Lakhs
Particulars As at
March 31, 2017
As at March 31, 2016
As at April 01, 2015
Non Current Tax Asset / (Liabilities) [Net] 824.18 (636.77) 87.17
Total 824.18 (636.77) 87.17
Reconciliation of Effective Tax Rates
The reconciliation between the statutory income tax rate applicable to the Company and the effective income tax rate of the
Company is as follows:
` in Lakhs
Particulars As at
March 31, 2017
As at March 31, 2016
Statutory Income Tax Rate 34.61% 34.61%
Differences due to:
Temporary Differences (4.52%) 0.23%
Income Tax Incentives (10.20%) (12.03%)
Others 2.49% 0.02%
Effective Tax Rate 22.37% 22.83%
NOTE 9: OTHER NON-CURRENT ASSETS
Particulars As at March 31, 2017 As at March 31, 2016 As at April 01, 2015
` in Lakhs ` in Lakhs ` in Lakhs ` in Lakhs ` in Lakhs ` in Lakhs
Long Term Trade Receivables 2,452.67 1,751.55 1,031.65
Less: Impairment Allowance (2,452.67) – (1,751.55) – (1,031.65) –
Capital Advances 2,416.66 1,900.95 672.04
Prepaid Leases 1,615.33 430.33 450.76
Balances with Govt. Authorities under Litigation
364.83 323.07 269.11
Total 4,396.82 2,654.35 1,391.91
NOTE 10: INVENTORIES
` in Lakhs
Particulars As at
March 31, 2017
As at March 31, 2016
As at April 01, 2015
At Lower of Cost or Net Realisable Value
Raw Materials 7,909.43 5,908.25 5,416.52
Raw Materials in Transit 3,789.23 2,823.29 2,854.88
Finished Goods 12,423.21 14,105.88 15,703.01
Finished Goods in Transit 219.63 – –
Stock in Trade 2,860.30 3,068.25 3,255.32
Stores and Spares 514.11 418.48 434.55
Total 27,715.91 26,324.15 27,664.28

Notes forming part of Financial Statementsfor the year ended March 31, 2017
Annual Report 2016-17 107
COMPANY OVERVIEW
1-36 37-81 82-184
STATUTORY REPORTS FINANCIAL STATEMENTS
NOTE 11: FINANCIAL ASSETS - INVESTMENTS (CURRENT)
Particulars As at March 31, 2017 As at March 31, 2016 As at April 01, 2015
No. of Shares ` in Lakhs No. of Shares ` in Lakhs No. of Shares ` in Lakhs
INVESTMENT IN EQUITY INSTRUMENTS
Others (Quoted At Fair Value)
Birla Sun Life Floating Rate Fund Short Term Plan
1,121,940 2,426.06 – – – –
(Face Value - ` 100 /- each)
LIC MF Fund - Growth Plan - LF - GP 65,443 1,922.98 – – – –
(Face Value - ` 1000 /- each)
HDFC Liquid Fund - Regular Plan 6,398 204.70 – – – –
(Face Value - ` 1000 /- each)
Total 4,553.74 – –
` in Lakhs ` in Lakhs ` in Lakhs
Aggregate Amount of Quoted Investment & Maket Value thereof
4,553.74 – –
Aggregate amount of Unqouted Investments
– – –
Aggregate amount of impairment in value of Investments
– – –
NOTE 12: FINANCIAL ASSETS - TRADE RECEIVABLES
Particulars As at March 31, 2017 As at March 31, 2016 As at April 01, 2015
No. of Shares ` in Lakhs No. of Shares ` in Lakhs No. of Shares ` in Lakhs
Trade Receivables at Amortised CostDebts due for more than six months
Secured - Considered Good 113.44 87.11 57.76
Unsecured - Considered Good 5,038.54 5,151.98 2,698.86 2,785.97 1,909.28 1,967.04
OthersSecured - Considered Good 397.27 503.99 469.74
Unsecured - Considered Good 54,885.48 55,282.75 40,762.34 41,266.33 40,508.95 40,978.69
Total 60,434.73 44,052.30 42,945.73
NOTE 13: FINANCIAL ASSETS - CASH & CASH EQUIVALENTS
` in Lakhs
Particulars As at
March 31, 2017
As at March 31, 2016
As at April 01, 2015
Balances with Banks in Current Accounts 20,274.05 2,159.57 117.53
Cheques in Hand – 512.64 –
Cash on Hand 51.90 17.75 9.06
Fixed Deposits maturing within 3 months 1.96 – 1,260.81
Total 20,327.91 2,689.96 1,387.40
During the year the Company had Specified Bank Notes (SBN’s) and other denomination notes as defined in MCA notification
G.S.R. 308 (E) dated March 31, 2017 on the details of SBN’s held and transacted during the period November 08, 2016 to
December 30, 2016.

Notes forming part of Financial Statementsfor the year ended March 31, 2017
Standalone108
NOTE 14: FINANCIAL ASSETS - BANK BALANCES OTHER THAN CASH & CASH EQUIVALENTS
` in Lakhs
Particulars As at
March 31, 2017
As at March 31, 2016
As at April 01, 2015
Unpaid Dividend Account 58.42 49.37 40.26
Margin Money Pledged with Banks 3.00 3.00 3.00
Fixed Deposits maturing between 3 to 12 months 553.90 161.02 25.77
Total 615.32 213.39 69.03
NOTE 15: FINANCIAL ASSETS - LOANS (CURRENT ASSETS)
` in Lakhs
Particulars As at
March 31, 2017
As at March 31, 2016
As at April 01, 2015
Loan to Related Parties – 275.00 –
Loan to Others 555.00 900.00 900.00
Total 555.00 1,175.00 900.00
NOTE 16: FINANCIAL ASSETS - OTHERS (CURRENT)
` in Lakhs
Particulars As at
March 31, 2017
As at March 31, 2016
As at April 01, 2015
Advance to Related Parties 166.16 302.49 967.09
Export Incentives Receivable 15.75 37.37 82.94
Interest Receivable 43.06 105.61 210.77
Forward Contract Receivable 103.28 – 5.70
Total 328.25 445.47 1,266.50
NOTE 17: OTHER CURRENT ASSETS
` in Lakhs
Particulars As at
March 31, 2017
As at March 31, 2016
As at April 01, 2015
Export Incentive Receivable 772.69 30.96 30.02
Prepaid Expenses 736.36 316.55 488.68
Other Advances 80.15 332.11 482.41
Balances with Excise and VAT Authorities 1,827.04 1,718.84 1,807.55
Prepaid Lease 51.02 20.43 20.43
Total 3,467.26 2,418.89 2,829.09
`
Particulars Specified Bank
Notes
Other Denomination
Notes Total
Closing Cash in Hand as on November 08, 2016 4,472,500 314,719 4,787,219
Add: Permitted Receipts – 2,189,690 2,189,690
Less: Permitted Payments – 821,307 821,307
Less: Amount Deposited in Banks 4,472,500 – 4,472,500
Closing Cash in Hand as on December 30, 2016 – 1,683,102 1,683,102

Notes forming part of Financial Statementsfor the year ended March 31, 2017
Annual Report 2016-17 109
COMPANY OVERVIEW
1-36 37-81 82-184
STATUTORY REPORTS FINANCIAL STATEMENTS
NOTE 18: EQUITY SHARE CAPITAL
` in Lakhs
Particulars As at
March 31, 2017
As at March 31, 2016
As at April 01, 2015
Authorised
4,40,00,000 (4,40,00,000) Equity shares of ` 10/- par value 4,400.00 4,400.00 4,400.00
6,00,000 (6,00,000) 6% Non Cumulative Redeemable Preference Shares of ` 100/- par value
600.00 600.00 600.00
Total Authorised Share Capital 5,000.00 5,000.00 5,000.00
Issued, Subscribed & Paid Up
2,06,62,400 (2,06,62,400) Equity Shares ` 10/- par value fully paid - up
2,066.24 2,066.24 2,066.24
22,95,822 (22,95,822) Equity Shares of ` 10/- par value, ` 3/- called up
68.87 68.87 68.87
Total Issued, Subscribed and paid up Share Capital 2,135.11 2,135.11 2,135.11
a) Reconciliation of the number of shares outstanding :
Particulars As at March 31, 2017 As at March 31, 2016 As at April 01, 2015
No. of Shares ` in Lakhs No. of Shares ` in Lakhs No. of Shares ` in Lakhs
Shares at the beginning 22,958,222 2,135.11 22,958,222 2,135.11 20,662,400 2,066.02
Add: Rights Issue of Equity Share during the year
– – – – 2,295,822 68.87
Add : Calls in arrears received during the year
– – – – – –
Less: Shares Forfeited During the year – – – – (4,335) (0.21)
Add : Re-issue of Forfeited Shares – – – – 4,335 0.43
Shares at the end 22,958,222 2,135.11 22,958,222 2,135.11 22,958,222 2,135.11
b) Equity shares are entitled to one vote per share.
c) Shareholders holding more than 5% shares each :
Particulars As at March 31, 2017 As at March 31, 2016 As at April 01, 2015
No. of Shares % No. of Shares % No. of Shares %
K.K.Modi Investment and Financial Services Pvt. Ltd.
10,273,073 44.75% 10,098,073 43.99% 9,748,073 42.46%
APMS Investment Fund Ltd.(FII) 1,635,822 7.13% 1,945,822 8.48% 2,295,822 10.00%
U.P. State Indl. Dev. Corp. Ltd. 2,169,956 9.45% 2,169,956 9.45% 2,169,956 9.45%
Rajputana Fertilisers Ltd. 1,916,666 8.35% 1,916,666 8.35% 1,916,666 8.35%
NOTE 19: FINANCIAL LIABILITIES (LONG TERM BORROWINGS)
` in Lakhs
Particulars As at
March 31, 2017
As at March 31, 2016
As at April 01, 2015
From Banks (Secured):
Rupee Term Loan 2,891.38 3,750.00 5,000.00
Foreign Currency Term Loan 36,526.72 15,119.36 5,366.32
Rupee Hire Purchase Loans - 55.24 131.29
Total 39,418.10 18,924.60 10,497.61

Notes forming part of Financial Statementsfor the year ended March 31, 2017
Standalone110
A RUPEE TERM LOANS :1 Term Loan amounting to ` 3,000 lakhs (` 4,000 lakhs
as on March 31, 2016 and ` 5,000 lakhs as on April
01, 2015) carries interest at the rate of 11.75% p.a.
(11.75% p.a. as on March 31, 2016 and 12.75% p.a. as
on April 01, 2015) as at year end and is repayable in 12
Equal quarterly installments of ` 250 lakhs each.
2 Term Loan amounting to ` 656.25 lakhs (` 1,125 lakhs
as on March 31, 2016 and ` 1,500 lakhs as on April
01, 2015) carries interest at the rate of 11.95% p.a.
(12.20% p.a as on March 31, 2016 and 12.70% p.a. as
on April 01, 2015 ) as at year end and is repayable in 7
Equal quarterly installments of ` 93.75 lakhs each.
3 Term loan amounting to ` 760.13 lakhs (Nil) carries
interest at the rate of 11.00% p.a. as at year end and is
repayable over 20 quarterly installments of ` 75 lakhs
each starting from December 01, 2017.
4 Hire purchase loan amounting to ` 131.29 lakhs,
outstanding as on March 31, 2016 has been repaid
during the year.
B FOREIGN CURRENCY TERM LOANS:1 All term loans carry interest rate between 3.00% p.a.
to 5.00% p.a. (3.00% p.a. to 5.00% p.a. as on March 31,
2016 and April 01, 2015)
2 Term loan amounting to ` 4,477.26 lakhs (` 5,873.25
lakhs as on March 31, 2016 and ` 6,132.94 lakhs as
on April 01, 2015) is repayable over 11 installments of
` 231.58 lakhs each and 1 installment of ` 1,929.86
lakhs.
3 Term loan amounting to ` 1,325.83 lakhs (` 1,873.38
lakhs as on March 31, 2016 and Nil as on April 01, 2015)
is repayable over 40 equated monthly installments of
` 33.15 lakhs each.
4 Term loan amounting to ` 4,936.69 lakhs (` 5,046.38
lakhs as on March 31, 2016 and Nil as on April 01,
2015) is repayable over 15 quaterly installments of
` 148.10 lakhs each and 10 quaterly installments of
` 271.52 lakhs each.
5 Term loan amounting to ` 5,307.21 lakhs (` 2,942.91
lakhs as on March 31, 2016 and Nil as on April 01,
2015) is repayable over 48 monthly installments of
` 110.57 lakhs each starting from March 31, 2018.
6 Term loan amounting to ` 3,589.95 lakhs (` 822.59
lakhs as on March 31, 2016 and Nil as on April 01,
2015) is repayable over 48 monthly installments of
` 74.79 lakhs each starting from March 31, 2018.
7 Term loan amounting to ` 1,016.64 lakhs (Nil) is
repayable over 20 quarterly installments of ` 125 lakhs
each starting from November 30, 2017.
8 Term loans amounting to ` 18,224.97 lakhs (Nil) are
repayable over 12 quarterly installments of ` 532.84
lakhs each and 16 quarterly installments of ` 710.45
lakhs each starting from September 30, 2018.
All the above term loans, except loans amounting to
` 5,803.10 lakhs (` 7,877.92 lakhs as on March 31, 2016 and
` 6,391.31 lakhs as on April 01, 2015) are secured by first
pari passu charge on the present and future Property, Plant
& Equipment as well as Other Intangible Assets including
Capital Work in Progress of the Company (except those
assets which have been specifically financed) and second
pari passu charge on present and future current assets of the
Company inter se the Working Capital Lenders.
Term Loan amounting to ` 5,803.10 lakhs (` 7,746.63 as on
March 31, 2016 and ` 6,132.94 lakhs as on April 01, 2015)
are secured by specific assets financed by them.
Term Loan aggregating to ` 656.25 lakhs (` 1,125 lakhs as
on March 31, 2016 and ` 1,500 lakhs as on April 01, 2015)
have an additional exclusive pari passu charge on the assets
financed by them.
An amount of ` 592.40 lakhs (` 409.14 lakhs as on March
31, 2016 and ` 1,250 lakhs as on April 01, 2015) has been
held as Debt Service Reserve Account with Bank. (Refer
Note No. 6, Note No. 13 and Note. No. 14)
Amounts falling due in respect of all the above loans
upto March 31, 2017 have been grouped under “Current
maturities of Long Term Debts” under Note No. 24.

Notes forming part of Financial Statementsfor the year ended March 31, 2017
Annual Report 2016-17 111
COMPANY OVERVIEW
1-36 37-81 82-184
STATUTORY REPORTS FINANCIAL STATEMENTS
NOTE 20: FINANCIAL LIABILITIES - OTHERS (NON-CURRENT)
` in Lakhs
Particulars As at
March 31, 2017
As at March 31, 2016
As at April 01, 2015
Security Deposit Received from Customers 1,150.03 1,021.83 930.53
Financial Guarantee Obligation 127.78 195.34 243.84
Others 76.43 76.43 76.43
Total 1,354.24 1,293.60 1,250.80
NOTE 21: PROVISIONS (NON-CURRENT)
` in Lakhs
Particulars As at
March 31, 2017
As at March 31, 2016
As at April 01, 2015
Provision for Employee Benefits 1,024.52 851.30 699.10
Total 1,024.52 851.30 699.10
NOTE 22: FINANCIAL LIABILITIES (SHORT TERM BORROWINGS)
` in Lakhs
Particulars As at
March 31, 2017
As at March 31, 2016
As at April 01, 2015
At Amortised Cost (Secured)
Working Capital Loans from Banks 28,413.64 32,007.53 41,762.12
Total 28,413.64 32,007.53 41,762.12
Secured by first pari passu charge, by way of hypothecation of Company’s current assets and other movable assets and second
pari passu charge on the fixed assets both present and future, inter se the Term Lenders.
NOTE 23: FINANCIAL LIABILITIES - TRADE PAYABLES
` in Lakhs
Particulars As at
March 31, 2017
As at March 31, 2016
As at April 01, 2015
At Amortised Cost
Sundry Creditors for Goods & Services 19,311.79 15,125.17 17,726.94
Total 19,311.79 15,125.17 17,726.94
Based on the information in possession with the Company, no supplier has been identified as being covered under Micro,
Small and Medium Enterprise Development Act, 2006 (“the Act”). Accordingly, no amount of dues outstanding as at 31st
March 2017 have been identified as relating to Micro, Small and Medium Enterprises referred to in the said Act.

Notes forming part of Financial Statementsfor the year ended March 31, 2017
Standalone112
NOTE 24: FINANCIAL LIABILITIES - OTHERS (CURRENT)
` in Lakhs
Particulars As at
March 31, 2017
As at March 31, 2016
As at April 01, 2015
Current Maturities of Long Term Debts 3,876.84 2,890.21 3,493.81
Interest Accrued but not due on Borrowings 65.41 98.17 85.54
Financial Guarantee Obligation 63.32 64.73 62.04
Forward Contract Payable - 4.47 -
Unclaimed Dividend* 58.42 49.37 40.26
Other Payables 16,814.70 10,243.58 6,798.52
Total 20,878.69 13,350.53 10,480.17
* There is no amount due and outstanding to be credited to Investor Education and Protection Fund
NOTE 25: OTHER CURRENT LIABILITIES
` in Lakhs
Particulars As at
March 31, 2017
As at March 31, 2016
As at April 01, 2015
Other Payables 4,065.89 3,459.93 2,053.94
Total 4,065.89 3,459.93 2,053.94
NOTE 26: PROVISIONS (CURRENT)
` in Lakhs
Particulars As at
March 31, 2017
As at March 31, 2016
As at April 01, 2015
Provision for Employee Benefits 694.12 604.79 513.37
Other - 6.79 6.79
Total 694.12 611.58 520.16
NOTE 27: REVENUE FROM OPERATIONS
` in Lakhs
ParticularsYear ended
March 31, 2017
Year ended March 31, 2016
Sale of Products
Agrochemical 166,830.69 152,141.24
Specialty & Performance Chemicals 21,358.25 188,188.94 18,546.08 170,687.32
Other Operating Income:
Indenting Commission - 32.38
Export Incentives & Entitlements 1,089.74 145.91
Miscellaneous Income 17.69 4.08
Total 189,296.37 170,869.69
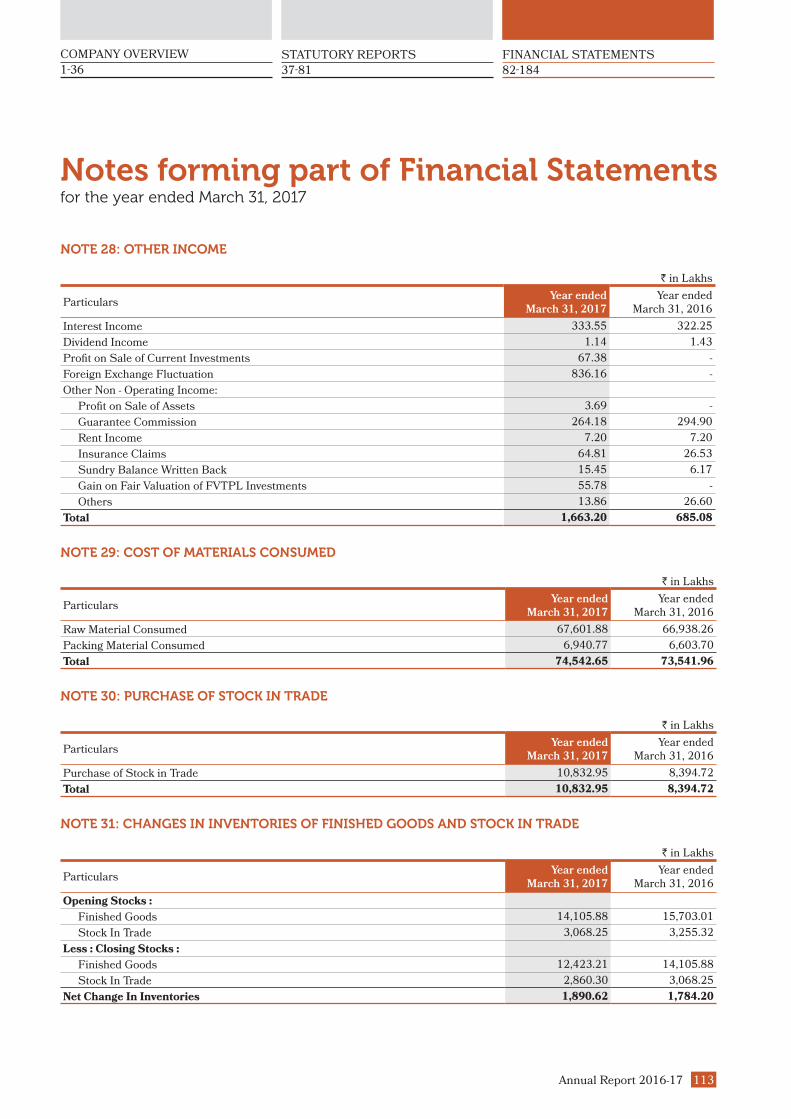
Notes forming part of Financial Statementsfor the year ended March 31, 2017
Annual Report 2016-17 113
COMPANY OVERVIEW
1-36 37-81 82-184
STATUTORY REPORTS FINANCIAL STATEMENTS
NOTE 28: OTHER INCOME
` in Lakhs
ParticularsYear ended
March 31, 2017
Year ended March 31, 2016
Interest Income 333.55 322.25
Dividend Income 1.14 1.43
Profit on Sale of Current Investments 67.38 -
Foreign Exchange Fluctuation 836.16 -
Other Non - Operating Income:
Profit on Sale of Assets 3.69 -
Guarantee Commission 264.18 294.90
Rent Income 7.20 7.20
Insurance Claims 64.81 26.53
Sundry Balance Written Back 15.45 6.17
Gain on Fair Valuation of FVTPL Investments 55.78 -
Others 13.86 26.60
Total 1,663.20 685.08
NOTE 29: COST OF MATERIALS CONSUMED
` in Lakhs
ParticularsYear ended
March 31, 2017
Year ended March 31, 2016
Raw Material Consumed 67,601.88 66,938.26
Packing Material Consumed 6,940.77 6,603.70
Total 74,542.65 73,541.96
NOTE 30: PURCHASE OF STOCK IN TRADE
` in Lakhs
ParticularsYear ended
March 31, 2017
Year ended March 31, 2016
Purchase of Stock in Trade 10,832.95 8,394.72
Total 10,832.95 8,394.72
NOTE 31: CHANGES IN INVENTORIES OF FINISHED GOODS AND STOCK IN TRADE
` in Lakhs
ParticularsYear ended
March 31, 2017
Year ended March 31, 2016
Opening Stocks :
Finished Goods 14,105.88 15,703.01
Stock In Trade 3,068.25 3,255.32
Less : Closing Stocks :
Finished Goods 12,423.21 14,105.88
Stock In Trade 2,860.30 3,068.25
Net Change In Inventories 1,890.62 1,784.20
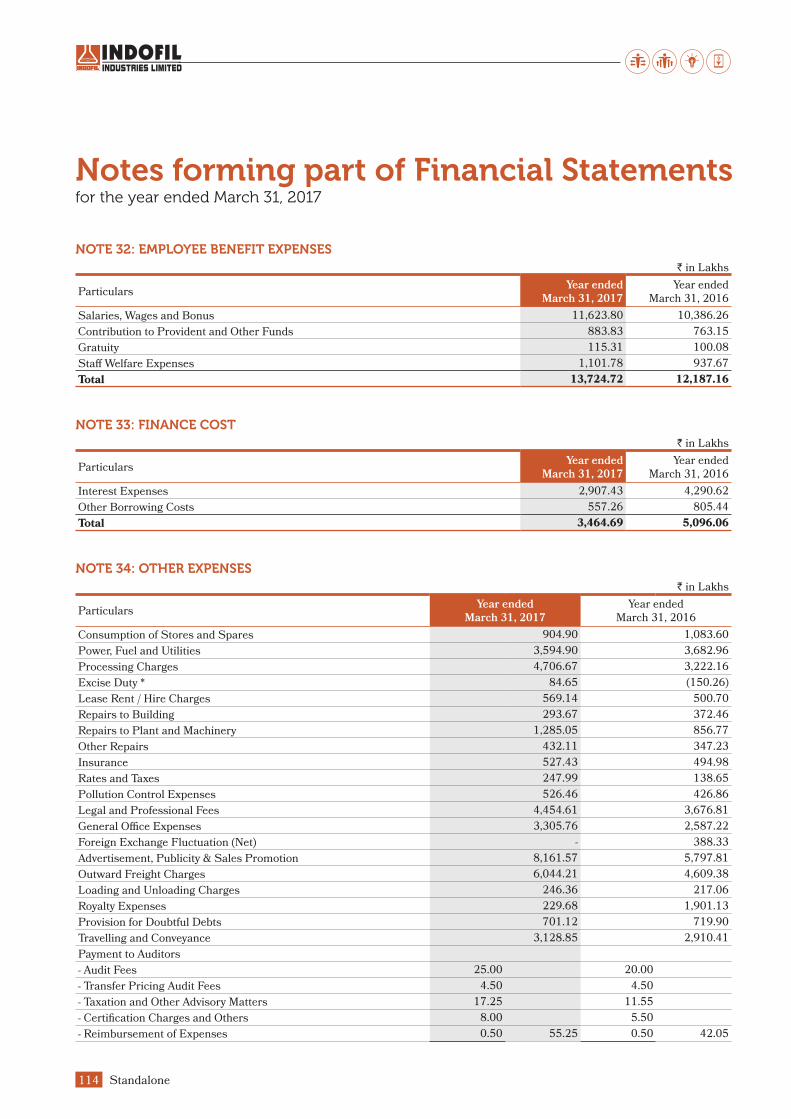
Notes forming part of Financial Statementsfor the year ended March 31, 2017
Standalone114
NOTE 32: EMPLOYEE BENEFIT EXPENSES
` in Lakhs
ParticularsYear ended
March 31, 2017
Year ended March 31, 2016
Salaries, Wages and Bonus 11,623.80 10,386.26
Contribution to Provident and Other Funds 883.83 763.15
Gratuity 115.31 100.08
Staff Welfare Expenses 1,101.78 937.67
Total 13,724.72 12,187.16
NOTE 33: FINANCE COST
` in Lakhs
ParticularsYear ended
March 31, 2017
Year ended March 31, 2016
Interest Expenses 2,907.43 4,290.62
Other Borrowing Costs 557.26 805.44
Total 3,464.69 5,096.06
NOTE 34: OTHER EXPENSES
` in Lakhs
ParticularsYear ended
March 31, 2017
Year ended March 31, 2016
Consumption of Stores and Spares 904.90 1,083.60
Power, Fuel and Utilities 3,594.90 3,682.96
Processing Charges 4,706.67 3,222.16
Excise Duty * 84.65 (150.26)
Lease Rent / Hire Charges 569.14 500.70
Repairs to Building 293.67 372.46
Repairs to Plant and Machinery 1,285.05 856.77
Other Repairs 432.11 347.23
Insurance 527.43 494.98
Rates and Taxes 247.99 138.65
Pollution Control Expenses 526.46 426.86
Legal and Professional Fees 4,454.61 3,676.81
General Office Expenses 3,305.76 2,587.22
Foreign Exchange Fluctuation (Net) - 388.33
Advertisement, Publicity & Sales Promotion 8,161.57 5,797.81
Outward Freight Charges 6,044.21 4,609.38
Loading and Unloading Charges 246.36 217.06
Royalty Expenses 229.68 1,901.13
Provision for Doubtful Debts 701.12 719.90
Travelling and Conveyance 3,128.85 2,910.41
Payment to Auditors
- Audit Fees 25.00 20.00
- Transfer Pricing Audit Fees 4.50 4.50
- Taxation and Other Advisory Matters 17.25 11.55
- Certification Charges and Others 8.00 5.50
- Reimbursement of Expenses 0.50 55.25 0.50 42.05

Notes forming part of Financial Statementsfor the year ended March 31, 2017
Annual Report 2016-17 115
COMPANY OVERVIEW
1-36 37-81 82-184
STATUTORY REPORTS FINANCIAL STATEMENTS
` in Lakhs
ParticularsYear ended
March 31, 2017
Year ended March 31, 2016
Corporate Social Responsibility 306.29 208.31
Donations 354.80 41.54
Loss on Sale of Fixed Assets (Net) – 2.59
Loss on Fair Valuation of FVTPL Investments – 8.53
Bad Debts 10.43 –
Total 40,171.90 34,087.18
* Represents the difference between the Excise Duty on Opening and Closing Stock of Finished Goods.
NOTE 35(I): FIRST TIME ADOPTION OF INDIAN ACCOUNTING STANDARDS (IND AS)The financial statements of the Company, for the year ended March 31, 2017, have been prepared in accordance with the Indian Accounting Standards (“Ind AS”) prescribed under section 133 of the Act 2013, read with Companies (Indian Accounting Standards) Rules, 2015 . For all periods upto and including the year ended March 31, 2016, the Company prepared its financial statements in accordance with the Accounting Standards (“Indian GAAP”) notified under the section 133 of the Companies Act 2013, read together with paragraph 7 of the Companies (Accounts) Rules, 2014.
Accordingly, the Company has prepared the comparative period data as at and for the year ended March 31, 2016, as described in the summary of Significant Accounting Policies. In preparing these financial statements, the Company’s opening balance sheet was prepared as at April 01, 2015, the Company’s date of transition to Ind AS. This note explains the principal adjustments made by the Company in restating its Indian GAAP financial statements as at and for the year ended March 31, 2016, including the balance sheet as at April 01, 2015
Exemptions appliedInd AS 101 “First-time adoption of Indian Accounting Standards” allows first-time adopters certain exemptions from the retrospective application of certain requirements under Ind AS. The Company has applied the following exemptions:
1 As per Ind AS 101, a first-time adopter has an option, inter alia, to use carrying values of property, plant and equipment and intangible assets as on the date of transition to Ind AS, if there has been no change in its functional currency on the date of transition. The Company has accordingly elected to continue with the carrying values under previous GAAP for all the items of property, plant and equipment and intangible assets.
2 Ind AS 101, permits an entity to continue the policy adopted for accounting of exchange differrences arising from translation of long-term foreign currency monetary items recognised in the financial statements
for the period ending immediately before the beginning of the first Ind AS financial reporting period as per the provision of Indian GAAP. The Company has accordingly elected to continue with the same.
3 Ind AS 101 permits an entity to designate particular equity investments (other than equity investment in subsidiaries, associates and joint arrangements) at Fair Value Through Other Comprehensive Income (FVOCI) based on facts and circumstances at the date of transition to Ind AS (rather than at initial recognition). Other equity investments are classified as Fair Value Through Profit or Loss (FVTPL). The Company has opted to avail this exemption to designate certain equity investments as FVOCI on date of transition.
4 The Company has elected to apply previous GAAP carrying amounts of its investment in Subsidiaries and Joint Venture as deemed cost as on the date of transition to Ind AS.
Exceptions1 Estimates The estimates at April 01, 2015 and March 31, 2016
are consistent with those made for the same dates in accordance with Indian GAAP (after adjustments to reflect any differences if any, in accounting policies) apart from the following items where application of Indian GAAP did not require estimation:
- FVOCI – unquoted equity shares
- Impairment of financial assets based on expected credit loss model
The estimates used by the Company to present these amounts in accordance with Ind AS reflect conditions at April 01, 2015 and March 31, 2016.
2 Classification and measurement of financial assets The Company has classified the financial assets in
accordance with Ind AS 109 on the basis of facts and circumstances that exist at the date of transition to Ind AS.

Notes forming part of Financial Statementsfor the year ended March 31, 2017
Standalone116
NOTE 35(II): RECONCILATION OF EQUITY AS AT APRIL 01, 2015 AND MARCH 31, 2016
` in Lakhs
Particulars
As at March 31, 2016
As at April 01, 2015
Indian GAAP Adjustments Ind AS Indian GAAP Adjustments Ind AS
ASSETS
Non-Current Assets
Property, Plant & Equipment 27,184.95 (450.76) 26,734.19 25,160.06 (471.19) 24,688.87
Capital Work - In - Progress 15,769.82 – 15,769.82 5,397.35 – 5,397.35
Investment Property – – – – –
Goodwill – – – –
Other Intangible Assets 7,276.96 – 7,276.96 6,337.70 – 6,337.70
Intangible Assets under Development 8,988.30 – 8,988.30 8,345.16 – 8,345.16
Financial Assets – –
(i) Investments 15,397.30 213.66 15,610.96 14,709.36 192.47 14,901.83
(ii) Loans 12,727.23 (10,659.42) 2,067.81 11,412.71 (9,270.84) 2,141.87
(iii) Others 889.23 889.23 506.18 506.18
Deferred Tax Assets 3,369.32 3,369.32 3,455.96 3,455.96
Non-Current Tax Assets 87.17 87.17
Other Non-Current Assets 323.07 2,331.28 2,654.35 269.11 1,122.80 1,391.91
Total Non-Current Assets 87,667.63 (4,306.69) 83,360.94 71,631.44 (4,377.45) 67,254.00
Current Assets
Inventories 26,324.16 (0.01) 26,324.15 27,664.28 – 27,664.28
Financial Assets
(i) Investments – – – –
(ii) Trade Receivables 44,052.30 – 44,052.30 42,945.73 – 42,945.73
(iii) Cash & Cash Equivalents 3,312.49 (622.53) 2,689.96 1,581.80 (194.40) 1,387.40
(iv) Bank Balance other than (iii) above
213.39 213.39 69.03 69.03
(v) Loans 3,844.98 (2,669.98) 1,175.00 4,645.73 (3,745.73) 900.00
(vi) Others 445.47 445.47 1,266.50 1,266.50
Current Tax Assets (Net) – – – –
Other Current Assets 202.78 2,216.11 2,418.89 325.75 2,503.34 2,829.09
Total Current Assets 77,736.71 (417.55) 77,319.16 77,163.29 (101.26) 77,062.03
Total Assets 165,404.34 (4,724.24) 160,680.10 148,794.73 (4,478.71) 144,316.03

Notes forming part of Financial Statementsfor the year ended March 31, 2017
Annual Report 2016-17 117
COMPANY OVERVIEW
1-36 37-81 82-184
STATUTORY REPORTS FINANCIAL STATEMENTS
NOTE 35(II): RECONCILATION OF EQUITY AS AT APRIL 01, 2015 AND MARCH 31, 2016
` in Lakhs
ParticularsAs at March 31, 2016 As at April 01, 2015
Indian GAAP Adjustments Ind AS Indian GAAP Adjustments Ind AS
EQUITY AND LIABILITIES
Equity
Equity Share Capital 2,135.11 – 2,135.11 2,135.11 – 2,135.11
Other Equity 70,824.54 1,459.44 72,283.98 56,044.61 1,145.47 57,190.08
Total Equity 72,959.65 1,459.44 74,419.09 58,179.72 1,145.47 59,325.19
Liabilities
Non - Current Liabilities
Financial Liabilities
(i) Borrowings 18,924.59 0.01 18,924.60 10,497.61 – 10,497.61
(ii) Other Financial Liabilities 1,293.60 1,293.60 1,250.80 1,250.80
Provisions 851.30 – 851.30 699.10 – 699.10
Deferred Tax Liabilities (Net) 4,899.09 (4,899.09) – 4,400.35 (4,400.35) –
Other Non - Current Liabilities 1,098.26 (1,098.26) – 1,006.96 (1,006.96) –
Total Non - Current Liabilities 25,773.24 (4,703.74) 21,069.50 16,604.02 (4,156.51) 12,447.51
Current Liabilities
Financial Liabilities
(i) Borrowings 32,007.53 – 32,007.53 41,762.12 – 41,762.12
(ii) Trade Payables 15,125.17 – 15,125.17 17,726.94 – 17,726.94
(iii) Other Financial Liabilities 13,350.53 13,350.53 10,480.17 10,480.17
Other Current Liabilities 16,741.26 (13,281.33) 3,459.93 12,472.05 10,418.12 2,053.94
Provisions 2,797.49 (2,185.91) 611.58 2,049.88 (1,529.72) 520.16
Current Tax Liabilities (Net) – 636.77 636.77 – – –
Total Current Liabilities 66,671.45 (1,479.94) 65,191.51 74,010.99 (1,467.67) 72,543.33
Total Liabilities 92,444.69 (6,183.68) 86,261.01 90,615.01 (5,624.18) 84,990.84
Total Equity And Liabilities 165,404.34 (4,724.24) 160,680.10 148,794.73 (4,478.71) 144,316.03

Notes forming part of Financial Statementsfor the year ended March 31, 2017
Standalone118
NOTE 35(III): RECONCILATION OF STATEMENT OF PROFIT AND LOSS FOR THE YEAR ENDED MARCH 31, 2016
` in Lakhs
Particulars For the year ended March 31, 2016
Indian GAAP Adjustments Ind AS
INCOME
Revenue from Operations 163,809.85 7,059.84 170,869.69
Other Income 620.16 64.92 685.08
Total Income 164,430.01 7,124.76 171,554.77
EXPENSES
Excise Duty on Sale of Goods 11,754.10 11,754.10
Cost of Material Consumed 73,541.96 – 73,541.96
Purchase of Stock In Trade 8,394.72 – 8,394.72
Changes in Inventories of Finished Goods / Stock in Trade 1,784.20 – 1,784.20
Employee Benefit Expenses 12,437.37 (250.21) 12,187.16
Finance Cost 5,096.06 – 5,096.06
Depreciation and Amortisation 3,323.57 (20.43) 3,303.14
Other Expenses 38,696.40 (4,609.22) 34,087.18
Total Expenses 143,274.28 6,874.24 150,148.52
Profit Before Tax 21,155.73 250.52 21,406.25
Tax Expenses
Current Tax 4,750.00 55.52 4,805.52
Deferred Tax 498.74 9.98 508.72
Deferred Tax - MAT Credit Entitlement (422.07) (4.93) (427.00)
(Excess) / Short Provision of Earlier Years – – –
Profit After Tax 16,329.06 189.95 16,519.01
Other Comprehensive Income not to be reclassified to
Profit & Loss in subsequent years
Re-measurement of Gains / (Losses) on Defined Benefit Plans – (250.21) (250.21)
Net Gain (Loss) on FVOCI Equity Securities – 29.72 29.72
Income Tax relating to aforesaid items – 50.59 50.59
Total Other Comprehensive Income for the year – (169.90) (169.90)
Total Comprehensive Income for the year 16,329.06 20.05 16,349.11

Notes forming part of Financial Statementsfor the year ended March 31, 2017
Annual Report 2016-17 119
COMPANY OVERVIEW
1-36 37-81 82-184
STATUTORY REPORTS FINANCIAL STATEMENTS
NOTE 35 (IV): NOTES TO RECONCILATION OF EQUITY AS AT APRIL 01, 2015 AND MARCH 31, 2016 AND PROFIT & LOSS FOR THE YEAR ENDED MARCH 31, 20161 Leasehold land
Leasehold land has been assessed as operating lease
under Ind AS 17 “Leases”. Consequently, the same has
been considered as Prepaid Lease instead of “Fixed
Assets” (“Property, Plant and Equipment” in terms of
Ind AS) and amortised as lease rent over the remaining
lease period.
2 Fair valuation of investments
Under the Indian GAAP, investments in equity
instruments and mutual funds were classified as long-
term investments or current investments based on
the intended holding period and realisability. Long-
term investments were carried at cost less provision
for other than temporary decline in the value of such
investments. Current investments were carried at lower
of cost and fair value. Under Ind AS, these Investments
are measured at Fair Value Through Profit or Loss
(FVTPL) or through Other Comprehensive Income
(FVOCI) as permissible. Fair Value is determined by the
Company in accordance with the principles of Ind AS
109 “”Financial Instruments””.
Accordingly, the Company has designated Investments
in Equity shares of Modi Rubber Ltd., KKM Management
Centre Pvt. Ltd. and The Cosmos Co-Op. Bank Ltd.
as FVOCI. Other Investments, excluding Investments
in Subsidiaries and Joint Ventures are designated as
FVTPL.
3 Investment in Indobaijin Chemicals Pvt. Ltd.
The Company holds 51% equity shares in Indobaijin
Chemicals Private Limited. The shareholders
agreement indicated the arrangement as a Joint Venture.
However, in terms of provisions of AS 27 “Financial
Reporting of Interests in Joint Ventures”, read with
AS 21 on “Consolidated Financial Statements” the
Company has consolidated its interest in the entity as
a subsidiary. In terms of the provisions of Ind AS 111
“Joint Arrangements”, the company’s interest in the
entity has been classified as Joint Venture.
4 Premium on Forward contracts and Deferred Tax Effects
The premium paid on forward contracts is recognised
as an expense in Statement of Profit and Loss in the year
of acquisition of the contract which was amortised over
the period of contract under Indian GAAP. Accordingly,
unamortised premium on Forward Contracts has been
charged off to Statement of Profit and Loss.
Further, as required under Ind AS 109 “Financial
Instruments”, Forward Contracts outstanding as at the
year end have been fair valued.
Deferred Tax Asset / (Liability) arising on above
adjustments have been recognised.
5 Dividends
Under Ind AS 10 “Events after the Reporting Period”,
Corporate Dividends (including Corporate Dividend
Tax thereon) are accounted for in the year in which they
are declared / distributed / paid as against in the year to
which they relate under Indian GAAP.
6 Revenue from Operations / Excise Duty
Under Ind AS, Excise Duty on Sale of Goods is
presented as an item of expenses instead of netting it
off from Revenue from Operations under Indian GAAP.
7 Cash discount
Under Ind AS, Cash Discount provided to its customers
as well as Direct Commissions paid to Selling Agents
is netted off from Revenue from Operations instead of
disclosing the same as an item of Expenses
8 Actuarial gain and loss
Under Ind AS, all actuarial gains and losses on employee
benefits are recognised in Other Comprehensive
Income (OCI) instead of Statement of Profit & Loss as
required under Indian GAAP.
9 Other adjustments
Assets and Liabilities as well as items of Income and
Expenses have been regrouped / re-classified wherever
necessary to align with the provisions of Ind AS.
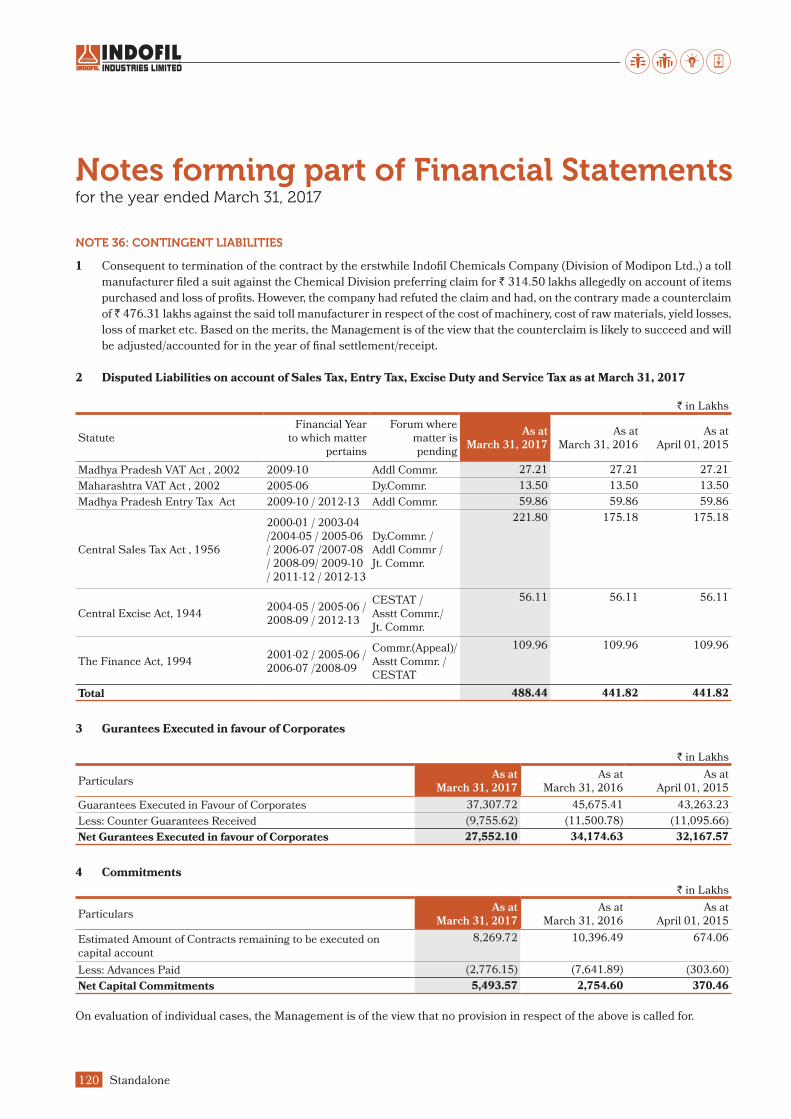
Notes forming part of Financial Statementsfor the year ended March 31, 2017
Standalone120
NOTE 36: CONTINGENT LIABILITIES
1 Consequent to termination of the contract by the erstwhile Indofil Chemicals Company (Division of Modipon Ltd.,) a toll
manufacturer filed a suit against the Chemical Division preferring claim for ` 314.50 lakhs allegedly on account of items
purchased and loss of profits. However, the company had refuted the claim and had, on the contrary made a counterclaim
of ̀ 476.31 lakhs against the said toll manufacturer in respect of the cost of machinery, cost of raw materials, yield losses,
loss of market etc. Based on the merits, the Management is of the view that the counterclaim is likely to succeed and will
be adjusted/accounted for in the year of final settlement/receipt.
2 Disputed Liabilities on account of Sales Tax, Entry Tax, Excise Duty and Service Tax as at March 31, 2017
` in Lakhs
StatuteFinancial Year
to which matter pertains
Forum where matter is pending
As at
March 31, 2017
As at March 31, 2016
As at April 01, 2015
Madhya Pradesh VAT Act , 2002 2009-10 Addl Commr. 27.21 27.21 27.21
Maharashtra VAT Act , 2002 2005-06 Dy.Commr. 13.50 13.50 13.50
Madhya Pradesh Entry Tax Act 2009-10 / 2012-13 Addl Commr. 59.86 59.86 59.86
Central Sales Tax Act , 1956
2000-01 / 2003-04 /2004-05 / 2005-06 / 2006-07 /2007-08 / 2008-09/ 2009-10 / 2011-12 / 2012-13
Dy.Commr. / Addl Commr / Jt. Commr.
221.80 175.18 175.18
Central Excise Act, 19442004-05 / 2005-06 / 2008-09 / 2012-13
CESTAT / Asstt Commr./ Jt. Commr.
56.11 56.11 56.11
The Finance Act, 19942001-02 / 2005-06 / 2006-07 /2008-09
Commr.(Appeal)/ Asstt Commr. / CESTAT
109.96 109.96 109.96
Total 488.44 441.82 441.82
3 Gurantees Executed in favour of Corporates
` in Lakhs
Particulars As at
March 31, 2017
As at March 31, 2016
As at April 01, 2015
Guarantees Executed in Favour of Corporates 37,307.72 45,675.41 43,263.23
Less: Counter Guarantees Received (9,755.62) (11,500.78) (11,095.66)
Net Gurantees Executed in favour of Corporates 27,552.10 34,174.63 32,167.57
4 Commitments
` in Lakhs
Particulars As at
March 31, 2017
As at March 31, 2016
As at April 01, 2015
Estimated Amount of Contracts remaining to be executed on capital account
8,269.72 10,396.49 674.06
Less: Advances Paid (2,776.15) (7,641.89) (303.60)
Net Capital Commitments 5,493.57 2,754.60 370.46
On evaluation of individual cases, the Management is of the view that no provision in respect of the above is called for.

Notes forming part of Financial Statementsfor the year ended March 31, 2017
Annual Report 2016-17 121
COMPANY OVERVIEW
1-36 37-81 82-184
STATUTORY REPORTS FINANCIAL STATEMENTS
NOTE 37: CORPORATE SOCIAL RESPONSIBILITY
` in Lakhs
ParticularsYear ended
March 31, 2017
Year ended March 31, 2016
Paid
Construction / Acquistion of any Asset 274.00 178.00
On purposes other than above 32.29 30.31
Total Paid 306.29 208.31
Yet to be paid
Construction / Acquistion of any Asset – –
On purposes other than above – –
Total Yet to be Paid – –
Gross Total 306.29 208.31
The above includes contribution of ` 274 lakhs (` 178 lakhs) made to Modi Innovative Education Society which is in the
process of establishing a university in the state of Chhattisgarh.
NOTE 38: EARNINGS PER SHARE
` in Lakhs
ParticularsYear ended
March 31, 2017
Year ended March 31, 2016
Profit for the year as per Statement of Profit & Loss 21,804.21 16,519.01
Weighted Average No. of Equity Shares for of Face Value ` 10 each 21,351,147 21,351,147
Earnings Per Share - Basic & Diluted 102.12 77.37
NOTE 39: CAPITAL MANAGEMENTThe Company’s objective for Capital Management is to
maximise shareholder value, safeguard business continuity,
and support the growth of the Company. Capital includes,
Equity Capital, Securities Premium and other reserves
and surplus attributable to the equity shareholders of the
Company. The Company determines the capital requirement
based on annual operating plans and long term and strategic
investment and capital expenditure plans. The funding
requirements are met through a mix of equity, operating
cash flows generated and debt. The operating management,
supervised by the Board of Directors of the Company
regularly monitors its key gearing ratios and other financials
parameters and takes corrective actions wherever necessary.
The relevant quantitative information on the aforesaid
parameters are disclosed in these financial statements.
NOTE 40: FINANCIAL RISK MANAGEMENT AND POLICIESThe Company’s activities exposes it to a variety of financial
risks: market risks, credit risks and liquidity risks. The
Company’s focus is to foresee the unpredictability of financial
markets and seek to minimise potential adverse effects on
its financial performance. The Company has an established
Risk Management Policy towards risk identification, analysis
& prioritisation of risks, development of risk mitigation
plans & reporting on the risk environment of the respective
business segments in the Company. A Risk Management
Comittee (RMC) is formed which comprises of the Executive
Management which reports to the Audit Committee of the
Directors.
The Company’s principal financial liabilities, other than
derivatives, comprise loans and borrowings, trade and
other payables, and financial guarantee contracts. The
main purpose of these financial liabilities is to finance the
Company’s operations and to provide guarantees to support
its operations. The Company’s principal financial assets
include investments, loans, trade and other receivables,
and cash and cash equivalents that derive directly from its
operations.

Notes forming part of Financial Statementsfor the year ended March 31, 2017
Standalone122
(a) Management of Market Risks
The Company’s size and operation results in it being exposed to the following market risks that arise from its use of
financial instruments
Currency Risk
Interest Rate Risk
Price Risk
The above risks may affect the Company’s income and expenses, or the value of its financial instruments. The Company’s
exposure to and management of these risks are explained below:
Potential Impact of Risk Management Policy Sensitivity to Risk
1 Currency Risk
The Company is subject to risk that changes in foreign currency values impact the Company’s export revenue and imports of raw material and Property, Plant and Equipments primarily with respect to USD and Euro
As at March 31, 2017, the net unhedged exposure to the Company on holding Financial Assets (Trade Receivables & Other Advances) and Financial Liabilities (Trade Payables and Other Payables) other than in functional currency amounted to USD 100.49 lakhs receivable and Euro 435.20 lakhs payable [` 23,599.89 lakhs net payable] (USD 33.22 lakhs payable and Euro 153.41 lakhs payable [` 13,746.79 lakhs net payable] as on March 31, 2016 and USD 202.34 lakhs payable and Euro 88.78 lakhs receivable [` 6,731.89 lakhs payable as on April 01, 2015)
The Company manages currency exposures through use of Forward Exchange Contracts and effecting netting and matching of Foreign Currency Inflows and Outflows. The aim of the Company’s approach to management of Currency Risk is to leave the Company with minimal residual risk.
A 5% strengthning of INR against key currencies to which the Company is exposed (Net) would have led to approximately an additional ` 1,179.99 lakhs gain in the Statement of Profit & Loss (2015-16 ` 687.34 lakhs). A 5% weakning of INR against key currencies would have led to an equal but opposite effect.
2 Interest Rate Risk
The Company is mainly exposed to Interest Rate risk due to its Long Term and Short Term Borrowings. The interest rate risk arises due to uncertanities about prevailing base rates in future.
The group manages its Interest Rate Risk by having a balanced portfolio of floating rate loans based on Euribor, Libor and INR Base Rate.
A 0.25% decrease in interest rate would have led to approximately an additional ` 179.27 lakhs gain in the Statement of Profit & Loss (2015-16 ` 134.56 lakhs). A 0.25% increase in interest rates would have led to an equal but opposite effect.
As at March 31, 2017 the exposure to the Company on account of borrowings is ` 71,708.58 lakhs (` 53,822.34 as on March 31, 2016 and ` 55,753.54 lakhs as on April 01, 2015)
3 Price Risk
The Company has investments in listed units of Mutual Funds reflecting its temporary surplus of funds. As at March 31, 2017 the next exposure to the Company on account of these investments is ` 4,553.75 lakhs (Nil as on March 31, 2016 and April 01, 2015)
The Company manages the Equity Price Risk of such invesments through diversification and by placing limits on individual investments
A 5% increase in prices would have led to approximately and additional ` 227.69 lakhs gain in the Statement of Profit & Loss. A 1% decrease in prices would have led to an equal but opposite effect.
However, a substantial part of the Company's investments are in Equity Instruments of Subsidiaries, Joint Ventures, Group Companies and other investments mandated by lenders to the Company. These being strategic investments, the Company does not evaluate the equity price risk of such investments.

Notes forming part of Financial Statementsfor the year ended March 31, 2017
Annual Report 2016-17 123
COMPANY OVERVIEW
1-36 37-81 82-184
STATUTORY REPORTS FINANCIAL STATEMENTS
The following table shows the maturity analysis of the Company’s Financial Liabilities based on contractually agreed
undiscounted cash flows along with its carrying value as at the Balance Sheet Date
` in Lakhs
Particulars As at March 31, 2017 As at March 31, 2016 As at April 01, 2015
Less than 12
months
More than 12
months
Less than 12 months
More than 12 months
Less than 12 months
More than 12 months
Long Term Borrowings 3,876.84 39,418.10 2,890.21 18,924.60 3,493.81 10,497.61
Security Deposits 1,150.03 1,021.83 930.53
Working Capital Loans from Banks 28,413.64 32,007.53 41,762.12
Trade Payables 19,311.79 15,125.17 17,726.94
Other Financial Liabilities 17,001.85 204.21 10,460.32 271.77 6,986.36 320.27
Total 68,604.12 40,772.34 60,483.23 20,218.20 69,969.23 11,748.41
(d) Collateral
The Company has pledged its Non-Current as well as Current Assets to a consortium of lenders as collateral towards
borrowings by the Company. Refer Note No. 19 and Refer Note No. 22 for the detailed terms and conditions of the
collaterals pledged.
(b) Credit Risk
Credit Risk is the risk of financial loss to the Company
if a customer or a counter party fails to meet its
contractual obligation.
Trade Receivables and Other Financial Assets
Concentration of Credit Risk with respect to Trade
Receivables are limited, due to Company’s customer
base being large and diverse. All Trade Receivables and
other Financial Assets are reviewed and assessed for
default on monthly basis. Our historical experience of
collecting all receivables is that their Credit Risk is low.
The Company’s maximum exposure to Credit Risk as at
March 31, 2017, March 31, 2016 and April 01, 2015 is
the carrying value of each class of Financial Asset.
(c) Liquidity Risk
Liquidity Risk is the risk that the Company will face
in meeting its obligation associated with its financial
liabilities. The Company’s approach in managing
liquidity is to ensure that it will have sufficient funds
to meet its liabilities when due without incurring
unacceptable losses. The Company regularly monitors
the rolling forecast to ensure it has sufficient cash on an
ongoing basis to meet operational needs. Any short term
surplus cash generated, over and above the amount
required for working capital management and other
operational requirements is retained as Cash and Cash
Equivalents (to the extent required) and any excess is
invested in any highly marketable equity instruments to
optimise cash returns on investments while ensuring
sufficient liquidity to meet its liabilities.

Notes forming part of Financial Statementsfor the year ended March 31, 2017
Standalone124
NOTE 41: FINANCIAL INSTRUMENTS - CLASSIFICATION AND FAIR VALUE MEASUREMENT
(a) Financial Assets and Liabilities
The carrying value of financial instruments by categories as at March 31, 2017 is as follows:
` in Lakhs
Particulars As at
March 31, 2017
As at March 31, 2016
As at April 01, 2015
FINANCIAL ASSETS
Fair Value Through Profit & Loss
Investments (Other than in Subsidiary) 4,589.19 32.37 40.90
Fair Value Through Other Comprehensive Income
Investments (Other than in Subsidiary) 364.85 254.34 224.63
Derivative Instruments not in Hedging Relationship
Forward Contract Receivable 103.28 – 5.70
Amortised Cost
Loans 1,466.29 3,242.81 3,041.87
Trade Receivables 60,434.73 44,052.30 42,945.73
Cash & Cash Equivalents 20,327.91 2,689.96 1,387.40
Other Bank Balances 615.32 213.39 69.03
Other Financial Assets 1,061.56 1,334.70 1,766.98
Total 88,963.13 51,819.87 49,482.24
FINANCIAL LIABILITIES
Fair Value Through Profit & Loss
Financial Guarantee Obligation 191.10 260.07 305.88
Derivative Instruments not in Hedging Relationship
Forward Contract Payable – 4.47 –
Amortised Cost
Borrowings 67,831.74 50,932.13 52,259.73
Trade Payable 19,311.79 15,125.17 17,726.94
Other Financial Liabilities 22,041.83 14,379.59 11,425.09
Total 109,376.46 80,701.43 81,717.64
Carrying amounts of Loans, Trade Receivables, Cash
and Cash Equivalents, Other Bank Balances, Other
Financial Assets, Borrowings, Trade Payables and
Other Financial Liabilities as at March 31, 2017, March
31, 2016 and April 01, 2015 approximate the fair value
because of the short term nature.
(b) Fair Value Hierarchy
The Fair Value Hierarchy is based on inputs to valuation
techniques that are used to measure fair value that are
either observable or unobservable and consist of the
following three levels:
Level 1 - Inputs are quoted prices (unadjusted) in active
markets for indentical assets or liabilities.
Level 2 - Inputs are other than quoted prices included in
Level 1 that are observable for the assets or liabilities,
either directly or indirectly.
Level 3 - Inputs are not based on observable market
data (unobservable inputs).
The Financial Instruments included in Level 2 of fair
value hierarchy have been valued using quotes available
for similar assets and liabilities in the active market.
The financial instruments included in Level 3 of Fair
Value Hierarchy have been valued using whole or in
part using a valuation model based on assumptions as
described below:
Fair Value of Investment in Unquoted Equity Shares is
determined using the Net Asset Value of the Investee
Company as on the Balance Sheet Date.
Fair Value of the Financial Guarantee Obligation is
determined through a Discounted Cash Flow Model using
weighted average borrowing rate as the discount rate.

Notes forming part of Financial Statementsfor the year ended March 31, 2017
Annual Report 2016-17 125
COMPANY OVERVIEW
1-36 37-81 82-184
STATUTORY REPORTS FINANCIAL STATEMENTS
For Assets and Liabilities which are Measured at Fair Values as at the Balance Sheet date, the classification of fair value
calculations by category is summarised below:
` in Lakhs
Particulars As at
March 31, 2017
As at March 31, 2016
As at April 01, 2015
Financial Assets
Level 1
Investment in Quoted Equity Shares 197.93 95.00 62.34
Mutual Fund Units 4,589.19 32.37 40.90
Level 2
Derivative Financial Assets 103.28 – 5.70
Level 3
Investment in Unquoted Equity Shares 166.92 159.34 162.29
Total 5,057.32 286.71 271.23
Financial Liability
Level 2
Derivative Financial Liability – 4.47 –
Level 3
Financial Guarantee Obligation 191.10 260.07 305.88
Total 191.10 264.54 305.88
Description of Significant Unobservable Input used in Fair Value measurement categorised within Level 3 of Fair Value
Hierarchy
Particulars Significant Unobservable Input Sensitivity of Input to Fair Value Measurement
Investment in Unquoted Equity Shares Fair Value of Net Assets 5% increase in forecasted fair value will increase the value of investment by ` 8.35 lakhs (` 7.97 lakhs as on March 31, 2016) and 5% decrease will have equal but opposite effect.
Financial Guarantee Obligation Discount Rate 6.23% 1 % increase in Discount Rate will have P&L Loss of ` 1.24 lakhs (` 1.27 lakhs as on March 31, 2016) and a 1% decrease in Discount Rate will have a equal but opposite effect.
(c) Reconcilation of Level 3 Fair Value Measurement
` in Lakhs
Particulars As at
March 31, 2017
As at March 31, 2016
Opening Balance of Level 3 Financial Assets / (Liability) (100.73) (143.59)
Add / (Less): Changes during the year
Guarantee Commission Income recognised 63.32 64.90
Fair Valuation Gain / (Loss) on Investments in Unquoted Equity Instruments through OCI 7.58 (2.95)
Fair Valuation Gain / (Loss) on Financial Guarantee Obligation 5.65 (19.09)
Closing Balance of Level 3 Financial Assets / (Liability) (24.18) (100.73)

Notes forming part of Financial Statementsfor the year ended March 31, 2017
Standalone126
NOTE 42: EMPLOYEE BENEFITS(a) Defined contribution plans
Retirement benefit in the form of provident fund, Employee State Insurance Corporation (ESIC), Pension, SANN Fund
and MLWF are defined contribution schemes. The Company has no obligation, other than the contribution payable to
these funds / schemes. The Company recognises contribution payable to such schemes as an expense, when an employee
renders the related service.
Amount recognised and included in Note No. 32, “Employee Benefits Expenses” of Statement of Profit and Loss
` 883.83 lakhs (` 763.15 lakhs).
(b) Defined benefit plans
Gratuity is administered under the GGCA scheme of Life Insurance Corporation of India to which the contributions are made.
The following tables summarise the components of net benefit expenses recognised in the statement of profit and loss
and the funded status and amounts recognised in the balance sheet for the respective plans:
` in Lakhs
Sr. No.
Particulars FY 2016-17
(Funded)
FY 2015-16 (Funded)
I Change in present value of defined benefit obligation during the year
1 Present Value of defined benefit obligation at the beginning of the year 2,401.45 2,132.17
2 Interest cost 193.08 170.36
3 Current service cost 97.78 84.80
4 Past Service Cost - Non-Vested Benefit Incurred During the Period – –
5 Past Service Cost - Vested Benefit Incurred During the Period – –
6 Liability Transferred In/ Acquisitions – –
7 Liability Transferred out / Divestment – –
8 (Gains)/ Losses on Curtailment – –
9 Liabilities Extinguished on Settlement – –
10 Benefits paid directly by the employer – –
11 Benefits paid from the fund (182.56) (229.74)
12 The Effect Of Changes in Foreign Exchange Rates – –
13 Actuarial changes arising from changes in demographic assumptions – –
14 Actuarial changes arising from changes in financial assumptions 78.29 (24.24)
15 Actuarial changes arising from changes in experience adjustments 251.06 268.09
16 Present Value of defined benefit obligation at the end of the year 2,839.10 2,401.44
II Change in fair value of plan assets during the year
1 Fair value of plan assets at the beginning of the year 2,183.41 1,940.96
2 Interest Income 175.55 155.08
3 Contributions paid by the employer 350.29 323.47
5 Expected Contributions by the Employees – –
6 Assets Transferred In/ Acquisitions – –
7 Assets transferred out / divestments – –
8 Benefits paid from the fund (182.56) (229.74)
9 Assets Distributed on Settlements – –
10 Effects of Asset Ceiling – –
11 The Effect of Changes In Foreign Exchange Rates – –
12 Return on plan assets excluding interest income (16.97) (6.36)
13 Fair value of plan assets at the end of the year 2,509.72 2,183.41

Notes forming part of Financial Statementsfor the year ended March 31, 2017
Annual Report 2016-17 127
COMPANY OVERVIEW
1-36 37-81 82-184
STATUTORY REPORTS FINANCIAL STATEMENTS
` in Lakhs
Sr. No.
Particulars FY 2016-17
(Funded)
FY 2015-16 (Funded)
III Net asset / (liability) recognised in the balance sheet
1 Present Value of defined benefit obligation at the end of the year (2,839.10) (2,401.44)
2 Fair value of plan assets at the end of the year 2,509.72 2,183.41
3 Funded Status (Surplus/ (Deficit)) (329.38) (218.03)
4 Net (Liability)/Asset Recognised in the Balance Sheet (329.38) (218.03)
IV Net Interest Cost for Current Period
1 Present Value of Benefit Obligation at the Beginning of the Period 2,401.44 2,132.17
2 Fair Value of Plan Assets at the Beginning of the Period (2,183.41) (1,940.96)
3 Net Liability/(Asset) at the Beginning 218.03 191.21
4 Interest Cost 193.08 170.36
5 Interest Income (175.55) (155.08)
6 Net Interest Cost for Current Period 17.53 15.28
V Expenses recognised in the statement of profit and loss for the year
1 Current service cost 97.78 84.80
2 Interest cost on benefit obligation (Net) 17.53 15.28
3 Past Service Cost - Non-Vested Benefit Recognised During the year – –
4 Past Service Cost - Vested Benefit Recognised During the year – –
5 Expected Contributions by the Employees – –
6 (Gains)/Losses on Curtailments And Settlements – –
7 Net Effect of Changes in Foreign Exchange Rates – –
8 Total expenses included in employee benefits expense 115.31 100.08
VI Recognised in other comprehensive income for the year
1 Actuarial changes arising from changes in demographic assumptions – –
2 Actuarial changes arising from changes in financial assumptions 78.29 (24.24)
3 Actuarial changes arising from changes in experience adjustments 251.06 268.09
4 Return on plan assets excluding interest income 16.97 6.36
5 Change in Asset Ceiling – –
6 Recognised in other comprehensive income 346.32 250.21
VII Cash Flow Projection: From the Fund
1 Within the next 12 months (next annual reporting period) 1,547.45 1,286.62
2 2nd following year 78.70 143.78
3 3rd following year 132.28 115.09
4 4th following year 112.25 118.87
5 5th following year 153.19 107.06
6 Sum of years 6 to 10 766.13 631.41
The average duration of the defined benefit plan obligation at the end of the reporting period is 5 years (31 March 2016: 5 years).

Notes forming part of Financial Statementsfor the year ended March 31, 2017
Standalone128
` in Lakhs
Sr. No.
Particulars FY 2016-17
(Funded)
FY 2015-16 (Funded)
VIIQuantitative sensitivity analysis for significant assumption Projected Benefit Obligation on Current Assumptions
(i) Delta Effect of +1% Change in Rate of Discounting (92.32) (73.17)
(ii) Delta Effect of -1% Change in Rate of Discounting 104.49 82.58
(i) Delta Effect of +1% Change in Rate of Salary Increase 106.83 85.12
(ii) Delta Effect of -1% Change in Rate of Salary Increase (95.86) (76.53)
(i) Delta Effect of +1% Change in Rate of Employee Turnover 22.78 23.97
(ii) Delta Effect of -1% Change in Rate of Employee Turnover (25.29) (26.51)
2 Usefulness and Methodology adopted for Sensitivity Analysis
Sensitity Analysis is an analysis which will give the movement in liability if the assumption were not proved to be true on differrent count. This only signifies the change in the liability if the differrence between the assume and the actual is not following the parameters of the sensitivity analysis.
` in Lakhs
Sr. No.
Particulars FY 2016-17
(Funded)
FY 2015-16 (Funded)
VIII The major categories of plan assets as a percentage of total
Insurer managed funds 100% 100%
IX Actuarial assumptions
1 Discount rate 7% 8%
2 Salary escalation 4% 4%
3 Mortality rate during employment Indian Assured Lives Mortality
(2006-08)
Indian Assured Lives Mortality
(2006-08)
4 Mortality post retirement rate N.A. N.A.
5 Rate of Employee Turnover 2% 2%
7 Expected Return on Plan Assets 7% 8%
c) Other Long Term Employee Benefits The defined benefit obligations which are provided for but not funded as on March 31, 2017 are as under :
` in Lakhs
Sr. No.
Particulars FY 2016-17 FY 2015-16
1 Leave Encashment 1,718.64 1,456.09

Notes forming part of Financial Statementsfor the year ended March 31, 2017
Annual Report 2016-17 129
COMPANY OVERVIEW
1-36 37-81 82-184
STATUTORY REPORTS FINANCIAL STATEMENTS
NOTE 43: LEASES The Company has entered into Operating Leases on Immovable Properties and Plant & Machinery. There are no escalation clauses in the lease arrangements for which Lease Rent is provided on straight line basis.
Future minimum rentals payable under non-cancellable operating leases as at March 31, 2017 are, as follows:
` in Lakhs
Sr. No.
Particulars As at
March 31, 2017
As at March 31, 2016
(a) In respect of operating lease on Immovable properties and Plant & Machineries lease payments recognised in Statement of Profit and Loss.
569.14 500.70
(b) Future minimum lease payments under operating leases:
For a period not later than one year 211.29 199.84
For the period later than one year and not later than five years 383.17 279.99
Assets Given on Lease
` in Lakhs
Sr. No.
Particulars As at
March 31, 2017
As at March 31, 2016
(a) In respect of Immovable properties given under operating lease, lease rent received and recognised in Statement of Profit and Loss.
7.20 7.20
(b) Future minimum lease payments under operating leases :
For a period not later than one year 7.20 7.20
For the period later than one year and not later than five years 28.80 28.80
NOTE 44: RELATED PARTYList of related parties
Wholly Owned Subsidiaries
Quick Investments (India) Ltd
Good Investment (India) Ltd
Indofil Bangladesh Industries Private Ltd
Indofil Costa Rica SA
Indofil Industries (International) BV
Indofil Industries (Netherlands) BV
Other Related Parties in which directors are interested
Godfrey Phillips India Ltd
H.M.A. Udyog Pvt. Ltd.
Modi Care Ltd.
Beacon Travels Pvt. Ltd.
Bina Fashions & Food Pvt. Ltd.
Premium Merchants Ltd.
Modi Rubber Ltd.
KKM Management Centre Pvt. Ltd
Joint Ventures (Extent of holding)
Indo baijin Chemicals Private Ltd (51%)
Hifil Chemicals Private Ltd (49%)
Key Management Personnel
Executive Director
Mr. Krishan Kumar Modi
Ms. Charu Modi
Mr Atuchutni Rao
Non Executive Director
Ms. Aliya Modi
Mr. Samir Modi
Mr. Mahendra Naranji Thakkar
Mr. Sunil Kumar Alagh
Mr. Sanjay Buch
Mr. Lakshminarayanan Subramanian
Mr. Amit Kumar Ghosh (with effect
from 9th September, 2016)
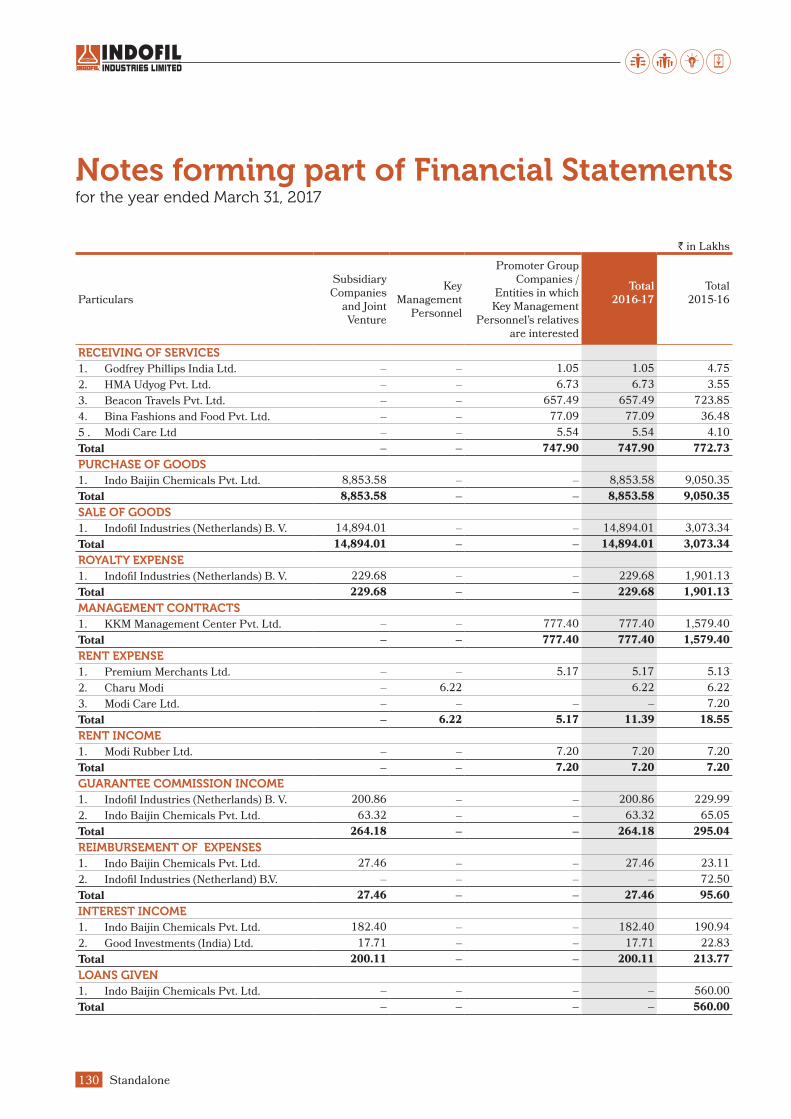
Notes forming part of Financial Statementsfor the year ended March 31, 2017
Standalone130
` in Lakhs
Particulars
Subsidiary Companies
and Joint Venture
Key Management
Personnel
Promoter Group Companies /
Entities in which Key Management
Personnel’s relatives are interested
Total
2016-17
Total 2015-16
RECEIVING OF SERVICES
1. Godfrey Phillips India Ltd. – – 1.05 1.05 4.75
2. HMA Udyog Pvt. Ltd. – – 6.73 6.73 3.55
3. Beacon Travels Pvt. Ltd. – – 657.49 657.49 723.85
4. Bina Fashions and Food Pvt. Ltd. – – 77.09 77.09 36.48
5 . Modi Care Ltd – – 5.54 5.54 4.10
Total – – 747.90 747.90 772.73
PURCHASE OF GOODS
1. Indo Baijin Chemicals Pvt. Ltd. 8,853.58 – – 8,853.58 9,050.35
Total 8,853.58 – – 8,853.58 9,050.35
SALE OF GOODS
1. Indofil Industries (Netherlands) B. V. 14,894.01 – – 14,894.01 3,073.34
Total 14,894.01 – – 14,894.01 3,073.34
ROYALTY EXPENSE
1. Indofil Industries (Netherlands) B. V. 229.68 – – 229.68 1,901.13
Total 229.68 – – 229.68 1,901.13
MANAGEMENT CONTRACTS
1. KKM Management Center Pvt. Ltd. – – 777.40 777.40 1,579.40
Total – – 777.40 777.40 1,579.40
RENT EXPENSE
1. Premium Merchants Ltd. – – 5.17 5.17 5.13
2. Charu Modi – 6.22 6.22 6.22
3. Modi Care Ltd. – – – – 7.20
Total – 6.22 5.17 11.39 18.55
RENT INCOME
1. Modi Rubber Ltd. – – 7.20 7.20 7.20
Total – – 7.20 7.20 7.20
GUARANTEE COMMISSION INCOME
1. Indofil Industries (Netherlands) B. V. 200.86 – – 200.86 229.99
2. Indo Baijin Chemicals Pvt. Ltd. 63.32 – – 63.32 65.05
Total 264.18 – – 264.18 295.04
REIMBURSEMENT OF EXPENSES
1. Indo Baijin Chemicals Pvt. Ltd. 27.46 – – 27.46 23.11
2. Indofil Industries (Netherland) B.V. – – – – 72.50
Total 27.46 – – 27.46 95.60
INTEREST INCOME
1. Indo Baijin Chemicals Pvt. Ltd. 182.40 – – 182.40 190.94
2. Good Investments (India) Ltd. 17.71 – – 17.71 22.83
Total 200.11 – – 200.11 213.77
LOANS GIVEN
1. Indo Baijin Chemicals Pvt. Ltd. – – – – 560.00
Total – – – – 560.00

Notes forming part of Financial Statementsfor the year ended March 31, 2017
Annual Report 2016-17 131
COMPANY OVERVIEW
1-36 37-81 82-184
STATUTORY REPORTS FINANCIAL STATEMENTS
` in Lakhs
Particulars
Subsidiary Companies
and Joint Venture
Key Management
Personnel
Promoter Group Companies /
Entities in which Key Management
Personnel’s relatives are interested
Total
2016-17
Total 2015-16
ADVANCE GIVEN TO SUBSIDIARIES
1. Indofil Industries (Netherlands) B. V. 655.64 – – 655.64 302.49
2. Good Investments (India) Ltd. – – – – 600.00
3. Hilfil Chemicals Pvt. Ltd. 0.68 – – 0.68 –
Total 656.32 – – 656.32 902.49
OUTSTANDING BALANCES
Receivables
1. Indofil Industries (Netherlands) B.V. 7,605.57 – – 7,605.57 2,485.01
2. Godfrey Phillips India Ltd. – – 18.11 18.11 0.78
Total 7,605.57 – 18.11 7,623.68 2,485.79
Payables
1. Modi Care Ltd. – – 0.48 0.48 –
2. Beacon Travels Pvt. Ltd. – – 50.83 50.83 46.90
3. KKM Management Center Pvt. Ltd. – – 96.75 96.75 162.17
4. Bina Fashion Pvt. Ltd. – – 17.94 17.94 0.16
5. Indofil Industries (Netherlands) B. V. 102.37 – – 102.37 64.49
6. Indo Baijin Chemicals Pvt. Ltd. 633.82 – – 633.82 795.79
7. HMA Udyog Pvt ltd – – 0.61 0.61 –
Total 736.19 – 166.61 902.80 1,069.51
INVESTMENTS
1. Indo Baijin Chemicals Pvt. Ltd. 4,366.10 – – 4,366.10 4,366.10
2. Indofil Bangladesh Industries Pvt. Ltd. 264.45 – – 264.45 189.94
3. Indofil - Cost Rica SA 0.01 – – 0.01 0.01
4. Quick investment (India) Ltd. 342.27 – – 342.27 10.02
5. Good Investment (India) Ltd. 2,173.26 – – 2,173.26 2,173.26
6. KKM Management Center Pvt. Ltd. – – 96.13 96.13 33.81
7. Hilfil Chemicals Pvt. Ltd. 0.49 – – 0.49 0.49
8. Indofil Industries (Netherlands) B. V. 8,584.44 – – 8,584.44 8,584.44
9. Indofil Industries (International) B. V. 70.28 – – 70.28 –
10. Modi Rubber Ltd. – – 197.93 197.93 –
Total 15,801.30 – 294.06 16,095.36 15,358.07
LOANS GIVEN
1. Indo Baijin Chemicals Pvt. Ltd. 860.80 – – 860.80 1,981.91
Total 860.80 – – 860.80 1,981.91
ADVANCES – –
1. Indofil Industries (Netherlands) B. V. 140.76 – – 140.76 302.49
2. Good Investments (India) Ltd – – – – 275.00
3. Hilfil Chemicals Pvt. Ltd 0.68 – – 0.68 –
Total 141.44 – – 141.44 577.49
CORPORATE GUARANTEES
1. Indo Baijin Chemicals Pvt. Ltd. 10,153.81 – – 10,153.81 23,470.98
2. Indofil Industries (Netherlands) B.V. 17,398.29 – – 17,398.29 22,204.43
Total 27,552.10 – – 27,552.10 45,675.41
REMUNERATION PAYABLE TO KMP – 1,502.41 – 1,502.41 1,157.04
Total – 1,502.41 – 1,502.41 1,157.04

Notes forming part of Financial Statementsfor the year ended March 31, 2017
Standalone132
Terms and conditions of transactions with related parties
The sales to and purchases from related parties are made on terms equivalent to those that prevail in arm’s length transactions.
Outstanding balances at the year-end are unsecured and settlement occurs in cash. For the year ended 31 March 2017, the
Company has not recorded any impairment of receivables relating to amounts owed by related parties (31 March 2017: `Nil,
31st March 2016: Nil). This assessment is undertaken each financial year through examining the financial position of the
related party and the market in which the related party operates.
Loan to Joint Venture:
The loan granted to Indo Baijin Chemicals Private Limited is intended to business purpose. The loan is unsecured and
repayable in full. The loan has been utilised for the purpose it was granted.
Remuneration to KMP:
` in Lakhs
For the Year Ended March 31, 2017 For the Year Ended March 31, 2016
Particulars Executive
Directors
Non -
Executive
Diectors
Total Executive Directors
Non - Executive
Diectors Total
Short-term employee benefits 1,158.88 180.00 1,338.88 896.24 137.04 1,033.28
Post-employment gratuity and medical benefits
125.40 – 125.40 95.46 – 95.46
Sitting Fees – 38.13 38.13 – 28.30 28.30
1,284.28 218.13 1,502.41 991.70 165.34 1,157.04
NOTE 45: SEGMENT REPORTING As per Ind AS 108 on “Operating Segments”, segment information has been provided under the Notes to
Consolidated Financial Statements.
NOTE 46: Loans given, Investments made and Corporate Guarantees given u/s 186(4) of the Companies Act, 2013 are
disclosed under the respective notes. Interest and Commission are recovered where incurred.
NOTE 47: Balances of Trade Receivables, Trade Payables, Advances and Deposits received / given, from / to customers
are subject to confirmation and subsequent reconcilation.
NOTE 48: Figures in brackets indicate previous year’s figures.
Corporate Information 1
Significant Accounting Policies 2
Notes on Accounts 3-48
As per our report attached For and on behalf of the Board of Directors
For BANSI S. MEHTA & CO.,
Chartered Accountants R.K. Malhotra K.K. Modi
Firm Reg. No. 100991W Group CEO Chairman and Managing Director
H.G. BUCH Chintamani D Thatte Charu Modi
Partner Head Compliance & Company Secretary Executive Director
Membership No. 033114
Rajib Mukhopadhyay M.N. Thakkar
DirectorsMumbai, June 29, 2017 Chief Financial Officer Sanjay Buch
Sunil Alagh
Dr. Atchutuni L. Rao
Mumbai, June 29, 2017

Annual Report 2016-17 133
COMPANY OVERVIEW
1-36 37-81 82-184
STATUTORY REPORTS FINANCIAL STATEMENTS
Independent Auditor’s ReportTO THE MEMBERS OF INDOFIL INDUSTRIES LIMITED
1. REPORT ON THE CONSOLIDATED IND AS FINANCIAL STATEMENTS
We have audited the accompanying Consolidated Ind
AS Financial Statements of INDOFIL INDUSTRIES
LIMITED (herein after referred to as “the Holding
Company”) and its subsidiary companies (the
Holding Company and its subsidiary companies
together referred to as “the Group”) , comprising the
Consolidated Balance Sheet as at March 31, 2017, the
Consolidated Statement of Profit and Loss (including
other comprehensive income), the Consolidated Cash
Flow Statement and the Consolidated Statement
of Changes in Equity for the year then ended, and a
summary of the significant accounting policies and
other explanatory information (hereinafter referred to
as “the Consolidated Ind AS Financial Statements”).
2. MANAGEMENT’S RESPONSIBILITY FOR THE CONSOLIDATED IND AS FINANCIAL STATEMENTS
The Holding Company’s Board of Directors (BoD) is
responsible for the preparation and presentation of
these Consolidated Ind AS Financial Statements in
terms of the requirements of the Companies Act, 2013
(herein after referred to as “the Act”) that give a true
and fair view of the consolidated financial position,
consolidated financial performance (including other
comprehensive income), consolidated cash flows
and consolidated changes in equity of the Group in
accordance with the accounting principles generally
accepted in India, including the Indian Accounting
Standards prescribed under Section 133 of the Act,
read with relevant rules issued thereunder. The
respective BoD of the companies included in the Group
are responsible for maintenance of adequate accounting
records in accordance with the provisions of the Act for
safeguarding the assets of the Group and for preventing
and detecting frauds and other irregularities; selection
and application of the appropriate accounting policies;
making judgments and estimates that are reasonable
and prudent; and the design, implementation and
maintenance of adequate internal financial controls,
that were operating effectively for ensuring the accuracy
and completeness of the accounting records, relevant to
the preparation and presentation of the standalone Ind
AS financial statements that give a true and fair view
and are free from material misstatement, whether due
to fraud or error, which have been used for the purpose
of preparation of the Consolidated Ind AS Financial
Statements by the Directors of the Holding Company,
as aforesaid.
3. AUDITOR’S RESPONSIBILITY Our responsibility is to express an opinion on these
Consolidated Ind AS Financial Statements based on
our audit.
We have taken into account the provisions of the Act,
the relevant accounting and auditing standards and
matters which are required to be included in the Audit
Report under the provisions of the Act and the Rules
made thereunder.
We conducted our audit in accordance with the relevant
Standards on Auditing specified under section 143(10)
of the Act. Those standards require that we comply
with ethical requirements and plan and perform the
audit to obtain reasonable assurance about whether
the Consolidated Ind AS Financial Statements are free
from material misstatement.
An audit involves performing procedures to obtain
audit evidence about the amounts and disclosures in
the Consolidated Ind AS Financial Statements. The
procedures selected depend on the auditor’s judgment,
including the assessment of the risks of material
misstatement of the Consolidated Ind AS Financial
Statements, whether due to fraud or error. In making
those risk assessments, the auditor considers internal
financial control relevant to the Holding Company’s
preparation and presentation of the Consolidated Ind
AS Financial Statements that give a true and fair view
in order to design audit procedures that are appropriate
in the circumstances. An audit also includes evaluating
the appropriateness of the accounting policies used and
the reasonableness of the accounting estimates made
by the Holding Company’s BoD, as well as evaluating
the overall presentation of the Consolidated Ind AS
Financial Statements.
We believe that the audit evidence obtained by us and
the audit evidence obtained by the other auditors in
terms of their reports referred to in the Other Matters
paragraph below, is sufficient and appropriate to provide
a basis for our audit opinion on the Consolidated Ind
AS Financial Statements.
4. OPINION In our opinion and to the best of our information and
according to the explanations given to us, and based on
the consideration of the reports of other auditor on the
financial statements of the subsidiary companies, the
aforesaid Consolidated Ind AS Financial Statements
Consolidated134
give the information required by the Act in the manner
so required and give a true and fair view in conformity
with the accounting principles generally accepted in
India including the Ind AS, of the consolidated financial
position of the Group as at March 31, 2017, and its
consolidated financial performance (including other
comprehensive income), its consolidated cash flows
and consolidated statement of changes in equity for the
year ended on that date.
5. OTHER MATTERS We did not audit the financial statements and financial
information of the subsidiary companies, whose
financial statements and financial information reflect
total assets of ` 41,299.29 lakhs and net assets of `
16,574 lakhs as at March 31, 2017, total revenue of
` 21,417.79 lakhs and net cash inflows of ` 1,663.91
lakhs for the year ended on that date, as considered in
the preparation of the Consolidated Ind AS Financial
Statements. These financial statements and financial
information have been audited by other auditors whose
Reports have been furnished to us by the Management
and our opinion on the Consolidated Ind AS Financial
Statements, in so far as it relates to the amounts and
disclosures included in respect of these subsidiary
companies and our Report in terms of section 143(3) of
the Act, in so far as it relates to the aforesaid subsidiary
companies, are based solely on the Reports of the other
auditors.
Our opinion on the Consolidated Ind AS Financial
Statements, and our Report on Other Legal and
Regulatory Requirements below, are not modified in
respect of the above matters with respect to our reliance
on the work done and the Reports of the other auditors
including the respective financial statements.
6. REPORT ON OTHER LEGAL AND REGULATORY REQUIREMENTS
As required by section 143(3) of the Act, we report, to
the extent applicable, that:
a. We have sought and obtained all the information
and explanations which to the best of our
knowledge and belief were necessary for the
purpose of our audit of the aforesaid Consolidated
Ind AS Financial Statements.
b. In our opinion and as reported by the auditors
of the subsidiary companies, proper books of
account as required by law relating to preparation
of the aforesaid Consolidated Ind AS Financial
Statements have been kept by the respective
companies included in the Group, so far as it
appears from the examination of those books.
c. the Consolidated Balance Sheet, the Consolidated
Statement of Profit and Loss (including the
statement of other comprehensive income), the
Consolidated Cash Flow Statement and the
Consolidated Statement of Changes in Equity
dealt with by this Report are in agreement with
the relevant financial statements adopted by the
BoD of respective companies and the related
working statements maintained for the purpose of
preparation of the Consolidated Ind AS Financial
Statements.
d. In our opinion, the aforesaid Consolidated Ind AS
Financial Statements comply with the relevant
Indian Accounting Standards prescribed under
section 133 of the Act, read with relevant rules
issued thereunder.
e. On the basis of the written representations received
from the Directors of the Holding Company as on
March 31, 2017 taken on record by the BoD of the
Holding Company and as reported by the statutory
auditors of its subsidiary companies incorporated
in India, none of the directors of the Group are
disqualified as on March 31, 2017 from being
appointed as a Director of the respective company
in terms of section 164 (2) of the Act.
f. With respect to the adequacy of the internal
financial controls over financial reporting of the
Holding Company and its subsidiary companies
incorporated in India and the operating
effectiveness of such controls, refer to our separate
report in ‘Annexure A’; and
g. With respect to the other matters to be included in
the Auditor’s Report in accordance with Rule 11 of
the Companies (Audit and Auditor’s) Rules, 2014,
in our opinion and to the best of our information
and according to the explanations given to us and
based on the consideration of the reports of the
other auditors on separate financial statements of a
subsidiary, as noted in the ‘Other Matter’ paragraph:
i. The Consolidated Ind AS Financial
Statements disclose the impact of pending

Annual Report 2016-17 135
COMPANY OVERVIEW
1-36 37-81 82-184
STATUTORY REPORTS FINANCIAL STATEMENTS
litigations on the Consolidated Financial
Position of the Group - Refer Note 36 to the
Consolidated Ind AS Financial Statements;
ii. The Holding Company and certain subsidiary
companies have long term contracts including
derivative contracts. However, no provision
is required to be made for any foreseeable
loss in respect thereof. Accordingly, no such
provision is reflected in the Consolidated Ind
AS Financial Statements;
iii. There were no amounts which were required
to be transferred as on March 31, 2017 to
the Investor Education and Protection Fund
by the Holding Company, its subsidiary
companies and the associate company
incorporated in India.
iv. The requisite disclosures in the Consolidated
Ind AS Financial Statements as to holding
as well as dealings in Specified Bank Notes
during the period from November 8, 2016 to
December 30, 2016 have been provided with
respect to Holding Company and subsidiaries
incorporated in India. Based on audit
procedures and relying on the management
representation, we report that the disclosures
are in accordance with books of account
maintained by the Holding Company and
subsidiaries incorporated in India and as
produced to us by the Management of the
Holding Company – Refer Note 13 to the
Consolidated Ind AS Financial Statements.
For BANSI S. MEHTA & CO.
Chartered Accountants
Firm Reg. No. 100991W
H.G. BUCH
Place : Mumbai Partner
Date : June 29, 2017 Membership No. 033114

Consolidated136
1. REPORT ON THE INTERNAL FINANCIAL CONTROLS UNDER CLAUSE (I) OF SUB-SECTION 3 OF SECTION 143 OF THE COMPANIES ACT, 2013 (“THE ACT”)
In conjunction with our audit of the Consolidated Ind
AS Financial Statements of the Company as of and
for the year ended March 31, 2017, we have audited
the internal financial controls over financial reporting
of INDOFIL INDUSTRIES LIMITED (hereinafter
referred to as “the Holding Company”), its subsidiary
companies, which are companies incorporated
in India (the Holding Company and its subsidiary
companies together referred to as “the Group”), as of
that date(Refer paragraph 7 below on “Other Matters”).
2. MANAGEMENT’S RESPONSIBILITY FOR INTERNAL FINANCIAL CONTROLS
The respective Board of Directors (BoD) of the Group,
are responsible for establishing and maintaining
internal financial controls based on the internal
controls over financial reporting criteria established
by the respective company, considering the essential
components of internal control stated in the Guidance
Note on Audit of Internal Financial Controls over
Financial Reporting issued by the Institute of Chartered
Accountants of India (“ICAI”). These responsibilities
include the design, implementation and maintenance of
adequate internal financial controls that were operating
effectively for ensuring the orderly and efficient conduct
of its business, including adherence to company’s
policies, the safeguarding of its assets, the prevention
and detection of frauds and errors, the accuracy and
completeness of the accounting records, and the
timely preparation of reliable financial information, as
required under the Companies Act, 2013 (“the Act”).
3. AUDITORS’ RESPONSIBILITY Our responsibility is to express an opinion on the Group’s
internal financial controls over financial reporting based
on our audit. We conducted our audit in accordance
with the Guidance Note on Audit of Internal Financial
Controls Over Financial Reporting (the “Guidance
Note”) and the Standards on Auditing, issued by ICAI
and deemed to be prescribed under section 143(10) of
the Act, to the extent applicable to an audit of internal
financial controls, both applicable to an audit of Internal
Financial Controls and, both issued by the ICAI. Those
Standards and the Guidance Note require that we
comply with ethical requirements and plan and perform
the audit to obtain reasonable assurance about whether
adequate internal financial controls over financial
reporting was established and maintained and if such
controls operated effectively in all material respects.
Our audit involves performing procedures to obtain
audit evidence about the adequacy of the internal
financial controls system over financial reporting and
their operating effectiveness. Our audit of internal
financial controls over financial reporting included
obtaining an understanding of internal financial
controls over financial reporting, assessing the risk that
a material weakness exists, and testing and evaluating
the design and operating effectiveness of internal
control based on the assessed risk. The procedures
selected depend on the auditor’s judgment, including
the assessment of the risks of material misstatement of
the financial statements, whether due to fraud or error.
We believe that the audit evidence we have obtained
and the audit evidence obtained by the other
auditors of Group companies in terms of their
reports referred to in the Other Matters paragraph
below, is sufficient and appropriate to provide a
basis for our audit opinion on the Group’s internal
financial controls system over financial reporting.
4. MEANING OF INTERNAL FINANCIAL CONTROLS OVER FINANCIAL REPORTING
A company’s internal financial control over financial
reporting is a process designed to provide reasonable
assurance regarding the reliability of financial reporting
and the preparation of financial statements for external
purposes in accordance with generally accepted
accounting principles. A company’s internal financial
control over financial reporting includes those policies
and procedures that (1) pertain to the maintenance of
records that, in reasonable detail, accurately and fairly
reflect the transactions and dispositions of the assets
of the company; (2) provide reasonable assurance
that transactions are recorded as necessary to permit
preparation of financial statements in accordance
with generally accepted accounting principles, and
that receipts and expenditures of the company are
being made only in accordance with authorisations
of management and directors of the company; and
(3) provide reasonable assurance regarding prevention
or timely detection of unauthorised acquisition, use,
or disposition of the company’s assets that could
have a material effect on the financial statements.
ANNEXURE ‘A’ TO THE INDEPENDENT AUDITOR’S REPORT OF EVEN DATE ON THE CONSOLIDATED FINANCIAL STATEMENTS OF INDOFIL INDUSTRIES LIMITED

Annual Report 2016-17 137
COMPANY OVERVIEW
1-36 37-81 82-184
STATUTORY REPORTS FINANCIAL STATEMENTS
5. INHERENT LIMITATIONS OF INTERNAL FINANCIAL CONTROLS OVER FINANCIAL REPORTING
Because of the inherent limitations of internal
financial controls over financial reporting, including
the possibility of collusion or improper management
override of controls, material misstatements due to
error or fraud may occur and not be detected. Also,
projections of any evaluation of the internal financial
controls over financial reporting to future periods are
subject to the risk that the internal financial control over
financial reporting may become inadequate because of
changes in conditions, or that the degree of compliance
with the policies or procedures may deteriorate.
6. OPINION In our opinion, the Group companies have, in all
material respects, an adequate internal financial
controls system over financial reporting and such
internal financial controls over financial reporting
were operating effectively as at March 31, 2017 based
on the internal control over financial reporting criteria
established by the respective company, considering
the essential components of internal control stated
in the Guidance Note on Audit of Internal Financial
Controls Over Financial Reporting issued by ICAI
(Refer paragraph 7 below on “Other Matters”).
7. OTHER MATTERS Our aforesaid report under Section 143(3)(i) of the
Act on the adequacy and operating effectiveness
of the internal financial controls over financial
reporting, in so far as it relates to two subsidiary
companies ,which are companies incorporated
in India and which have been considered for
consolidation, is based on the corresponding reports
in that regards of the auditors of such companies.
For BANSI S. MEHTA & CO.
Chartered Accountants
Firm Reg. No. 100991W
H.G. BUCH
Place : Mumbai Partner
Date : June 29, 2017 Membership No. 033114

Consolidated138
` in Lakhs
ParticularsNote No.
As at
March 31, 2017
As at March 31, 2016
As atApril 01, 2015
ASSETS
Non-Current Assets
Property, Plant & Equipment 3 44,357.52 26,734.19 24,688.87
Capital Work - In - Progress 3 4,457.84 15,769.82 5,397.35
Investment Property 3 – – –
Other Intangible Assets 3 30,024.71 31,654.82 32,180.60
Intangible Assets under Development 3 9,196.83 8,988.30 8,358.03
Financial Assets
(i) Investments 4 79,472.36 80,617.05 31,282.10
(ii) Loans 5 911.29 2,067.81 2,141.87
(iii) Others 6 1,258.18 1,286.27 607.86
Deferred Tax Assets 7 3,164.09 3,808.62 3,757.68
Non - Current Tax Assets (Net) 8 447.88 – 87.31
Other Non-Current Assets 9 4,396.82 2,654.35 1,391.91
Total Non - Current Assets 177,687.52 173,581.23 109,893.58
Current Assets
Inventories 10 27,715.91 26,388.67 27,664.28
Financial Assets
(i) Investments 11 4,553.74 – –
(ii) Trade Receivables 12 60,573.31 44,382.17 43,019.65
(iii) Cash & Cash Equivalents 13 22,209.56 2,838.48 1,439.78
(iv) Bank Balance other than (iii) above 14 724.32 413.67 172.38
(v) Loans 15 555.00 900.00 900.00
(vi) Others 16 191.42 130.21 745.42
Other Current Assets 17 3,477.74 2,431.26 2,829.47
Total Current Assets 120,001.00 77,484.46 76,770.98
TOTAL ASSETS 297,688.52 251,065.69 186,664.56
Consolidated Balance Sheet as at March 31, 2017

Annual Report 2016-17 139
COMPANY OVERVIEW
1-36 37-81 82-184
STATUTORY REPORTS FINANCIAL STATEMENTS
` in Lakhs
ParticularsNote No.
As at
March 31, 2017
As at March 31, 2016
As atApril 01, 2015
EQUITY AND LIABILITIES
Equity
Equity Share Capital 18 2,135.11 2,135.11 2,135.11
Other Equity 163,387.31 141,174.84 79,881.64
Total Equity 165,522.42 143,309.95 82,016.75
Liabilities
Non-Current Liabilities
Financial Liabilities
(i) Borrowings 19 52,857.41 37,427.28 30,056.74
(ii) Other Financial Liabilities 20 1,354.24 1,293.60 1,250.80
Provisions 21 1,024.52 851.30 699.10
Total Non - Current Liabilities 55,236.17 39,572.18 32,006.64
Current Liabilities
Financial Liabilities
(i) Borrowings 22 28,413.64 32,007.53 41,762.12
(ii) Trade Payables 23 19,226.96 15,034.53 17,061.70
(iii) Other Financial Liabilities 24 24,529.29 16,709.27 11,243.27
Other Current Liabilities 25 4,065.92 3,459.95 2,053.92
Provisions 26 694.12 611.58 520.16
Current Tax Liabilities (Net) 8 – 360.70 –
Total Current Liabilities 76,929.93 68,183.56 72,641.17
Total Liabilities 132,166.10 107,755.74 104,647.81
TOTAL EQUITY AND LIABILITIES 297,688.52 251,065.69 186,664.56
Corporate Information 1
Significant Accounting Policies 2
Notes on Accounts 3-48
Consolidated Balance Sheet as at March 31, 2017
As per our report attached For and on behalf of the Board of Directors
For BANSI S. MEHTA & CO.,
Chartered Accountants R.K. Malhotra K.K. Modi
Firm Reg. No. 100991W Group CEO Chairman and Managing Director
H.G. BUCH Chintamani D Thatte Charu Modi
Partner Head Compliance & Company Secretary Executive Director
Membership No. 033114
Rajib Mukhopadhyay M.N. Thakkar
DirectorsMumbai, June 29, 2017 Chief Financial Officer Sanjay Buch
Sunil Alagh
Dr. Atchutuni L. Rao
Mumbai, June 29, 2017

Consolidated140
Consolidated Statement of Profit and Lossfor the year ended March 31, 2017
` in Lakhs
ParticularsNote No.
Year Ended
March 31, 2017
Year Ended March 31, 2016
INCOME Revenue from Operations 27 195,677.93 171,826.39
Other Income 28 1,444.64 432.25
Total Income 197,122.57 172,258.64
EXPENSES Excise Duty on Sale of Goods 13,560.22 11,754.10
Cost of Material Consumed 29 74,697.76 73,544.53
Purchase of Stock In Trade 30 10,832.95 8,394.72
Changes in Inventories of Finished Goods / Stock in Trade 31 1,735.51 1,719.68
Employee Benefit Expenses 32 13,954.79 12,290.88
Finance Cost 33 4,131.60 5,923.59
Depreciation and Amortisation 3 6,237.75 4,817.13
Other Expenses 34 40,154.85 32,542.14
Total Expenses 165,305.43 150,986.77 Profit Before Tax 31,817.14 21,271.87 Tax Expenses
Current Tax 6,860.10 4,876.47
Deferred Tax (1,251.87) 371.13
MAT Credit Entitlement 1,918.33 (427.00)
(Excess) / Short Provision of Earlier Years (6.92) (1.62)
Profit After Tax 24,297.50 16,452.89 Share of Profit / (Loss) of Joint Ventures 1,633.06 (397.56)
Profit For The Year 25,930.56 16,055.33 Other Comprehensive Income to be reclassified to Profit & Loss in subsequent years
Exchange Differences on Translation of Financial Statements of Foreign Operations 1,529.00 (2,115.10)
Other Comprehensive Income not to be reclassified to Profit & Loss in subsequent years
Re-measurement of Gains / (Losses) on Defined Benefit Plans (346.32) (250.21)
Net Gain / (Loss) on FVOCI Equity Securities (3,444.90) 48,807.83
Share of OCI of Joint Ventures (3.89) –
Tax Effect relating to aforesaid items 97.15 50.59
Total Other Comprehensive Income for the year (2,168.96) 46,493.11 Total Comprehensive Income for the year 23,761.60 62,548.44 Earnings Per Share - Basic & Diluted (`) 121.45 75.20 Corporate Information 1
Significant Accounting Policies 2
Notes on Accounts 3-48
As per our report attached For and on behalf of the Board of Directors
For BANSI S. MEHTA & CO.,
Chartered Accountants R.K. Malhotra K.K. Modi
Firm Reg. No. 100991W Group CEO Chairman and Managing Director
H.G. BUCH Chintamani D Thatte Charu Modi
Partner Head Compliance & Company Secretary Executive Director
Membership No. 033114
Rajib Mukhopadhyay M.N. Thakkar
DirectorsMumbai, June 29, 2017 Chief Financial Officer Sanjay Buch
Sunil Alagh
Dr. Atchutuni L. Rao
Mumbai, June 29, 2017
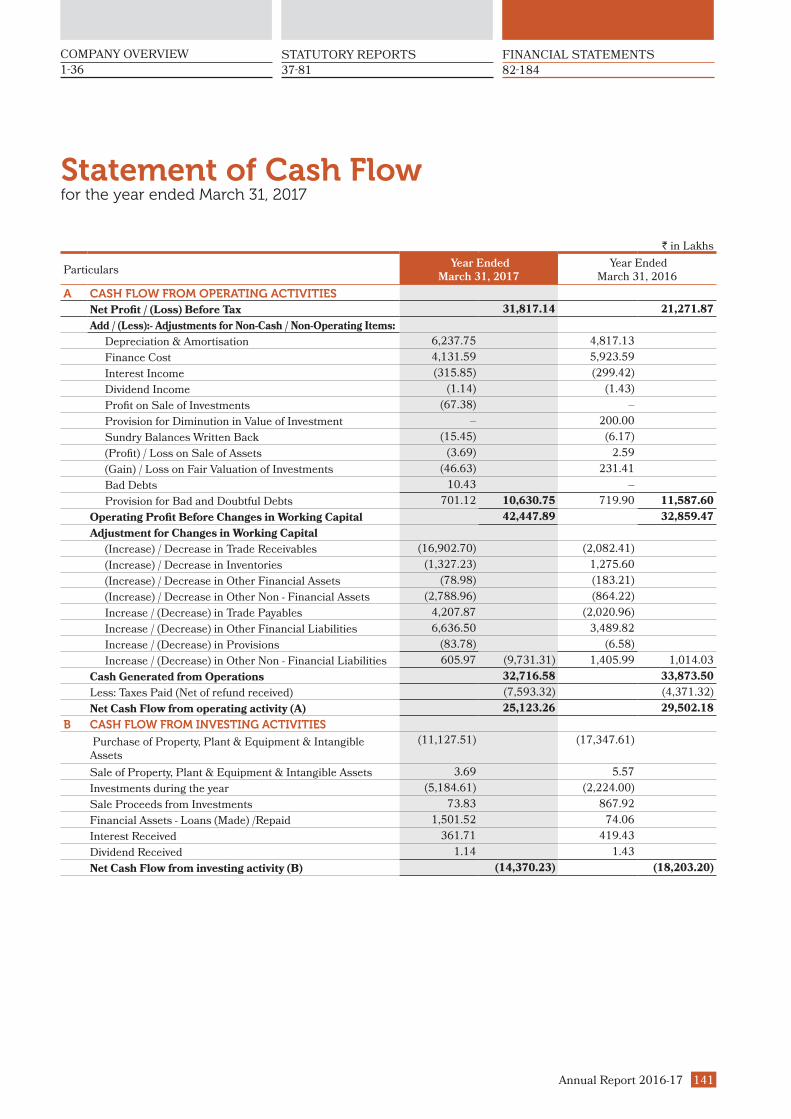
Annual Report 2016-17 141
COMPANY OVERVIEW
1-36 37-81 82-184
STATUTORY REPORTS FINANCIAL STATEMENTS
Statement of Cash Flowfor the year ended March 31, 2017
` in Lakhs
Particulars Year Ended
March 31, 2017
Year Ended March 31, 2016
A CASH FLOW FROM OPERATING ACTIVITIES
Net Profit / (Loss) Before Tax 31,817.14 21,271.87
Add / (Less):- Adjustments for Non-Cash / Non-Operating Items:
Depreciation & Amortisation 6,237.75 4,817.13
Finance Cost 4,131.59 5,923.59
Interest Income (315.85) (299.42)
Dividend Income (1.14) (1.43)
Profit on Sale of Investments (67.38) –
Provision for Diminution in Value of Investment – 200.00
Sundry Balances Written Back (15.45) (6.17)
(Profit) / Loss on Sale of Assets (3.69) 2.59
(Gain) / Loss on Fair Valuation of Investments (46.63) 231.41
Bad Debts 10.43 –
Provision for Bad and Doubtful Debts 701.12 10,630.75 719.90 11,587.60
Operating Profit Before Changes in Working Capital 42,447.89 32,859.47
Adjustment for Changes in Working Capital
(Increase) / Decrease in Trade Receivables (16,902.70) (2,082.41)
(Increase) / Decrease in Inventories (1,327.23) 1,275.60
(Increase) / Decrease in Other Financial Assets (78.98) (183.21)
(Increase) / Decrease in Other Non - Financial Assets (2,788.96) (864.22)
Increase / (Decrease) in Trade Payables 4,207.87 (2,020.96)
Increase / (Decrease) in Other Financial Liabilities 6,636.50 3,489.82
Increase / (Decrease) in Provisions (83.78) (6.58)
Increase / (Decrease) in Other Non - Financial Liabilities 605.97 (9,731.31) 1,405.99 1,014.03
Cash Generated from Operations 32,716.58 33,873.50
Less: Taxes Paid (Net of refund received) (7,593.32) (4,371.32)
Net Cash Flow from operating activity (A) 25,123.26 29,502.18
B CASH FLOW FROM INVESTING ACTIVITIES
Purchase of Property, Plant & Equipment & Intangible Assets
(11,127.51) (17,347.61)
Sale of Property, Plant & Equipment & Intangible Assets 3.69 5.57
Investments during the year (5,184.61) (2,224.00)
Sale Proceeds from Investments 73.83 867.92
Financial Assets - Loans (Made) /Repaid 1,501.52 74.06
Interest Received 361.71 419.43
Dividend Received 1.14 1.43
Net Cash Flow from investing activity (B) (14,370.23) (18,203.20)

Consolidated142
Statement of Cash Flowfor the year ended March 31, 2017
` in Lakhs
Particulars Year Ended
March 31, 2017
Year Ended March 31, 2016
C CASH FLOW FROM FINANCING ACTIVITY
Receipt of Long Term Borrowings 26,123.71 10,731.93
Repayment of Long Term Borrowings (9,417.09) (1,365.02)
Increase / (Decrease) in Short Term Borrowings (3,593.89) (9,754.59)
Deposits and Margin Money (310.65) (241.29)
Finance Cost (4,172.95) (5,910.10)
Corporate Dividend (incl. Dividend Distribution Tax) (1,540.08) (1,246.11)
Net Cash Flow from Financing Activity (C) 7,089.05 (7,785.18)
Exchange Differrences On Translation Of Foreign Operations 1,529.00 (2,115.10)
Net Cash Flow for the year (A + B + C) 19,371.08 1,398.70
Add: Opening Balance of Cash & Cash Equivalents 2,838.48 1,439.78
Closing Balance of Cash & Cash Equivalents 22,209.56 2,838.48
Corporate Information 1
Significant Accounting Policies 2
Notes on Accounts 3-48
As per our report attached For and on behalf of the Board of Directors
For BANSI S. MEHTA & CO.,
Chartered Accountants R.K. Malhotra K.K. Modi
Firm Reg. No. 100991W Group CEO Chairman and Managing Director
H.G. BUCH Chintamani D Thatte Charu Modi
Partner Head Compliance & Company Secretary Executive Director
Membership No. 033114
Rajib Mukhopadhyay M.N. Thakkar
DirectorsMumbai, June 29, 2017 Chief Financial Officer Sanjay Buch
Sunil Alagh
Dr. Atchutuni L. Rao
Mumbai, June 29, 2017

Annual Report 2016-17 143
COMPANY OVERVIEW
1-36 37-81 82-184
STATUTORY REPORTS FINANCIAL STATEMENTS
Statement of Changes in Equityfor the year ended March 31, 2017
A. EQUITY SHARE CAPITAL
` in lakhs
Particulars
Balance as at April 01, 2015 2,135.11
Add: Changes in Equity Share Capital during the F.Y. 2015-16 –
Balance as at March 31, 2016 2,135.11
Add: Changes in Equity Share Capital during the F.Y. 2016-17 –
Balance as at March 31, 2017 2,135.11
B. OTHER EQUITY
` in lakhs
Particulars
Capital
Reserve on
Consolidation
Capital
Redemption
Reserve
Securities
Premium
Capital
Reserve
Special
Reserve
Foreign
Currency
Translation
General
Reserve
Retained
Earnings
Equity
Instruments
through OCI
Total
Balance as at April 01, 2015 629.54 508.00 10,804.26 1.36 666.76 1,606.15 5,170.27 60,495.30 - 79,881.64
Profit for the period 16,055.33 16,055.33
Transfer from Surplus 89.32 (89.32) -
Other Comprehensive Income
- Exchange Differences on translation of foreign operations
(2,115.10) (2,115.10)
- Remeasurements gains / (loss) on defined benefit plans
(250.21) (250.21)
- Fair value gain on FVOCI financial asset
48,807.83 48,807.83
- Share of OCI of Joint Ventures - -
- Tax Effect on aforesaid items 50.59 50.59
Dividends on Shares (1,041.89) (1,041.89)
Dividend Distribution Tax (213.35) (213.35)
Balance as at March 31, 2016 629.54 508.00 10,804.26 1.36 756.08 (508.95) 5,170.27 75,006.45 48,807.83 141,174.84
Profit for the period 25,930.56 25,930.56
Transfer from Surplus 107.31 (107.31) -
Other Comprehensive Income
- Exchange Differences on translation of foreign operations
1,529.00 1,529.00
- Remeasurements gains / (loss) on defined benefit plans
(346.32) (249.15)
- Fair value loss on FVOCI financial asset
(3,444.90) (3,444.90)
- Share of OCI of Joint Ventures (3.89) (3.89)
- Tax Effect on aforesaid items 97.15 -
Dividends on Shares (1,281.07) (1,281.07)
Dividend Distribution Tax (268.08) (268.08)
Balance as at March 31, 2017 629.54 508.00 10,804.26 1.36 863.39 1,020.05 5,170.27 99,031.40 45,359.04 163,387.31
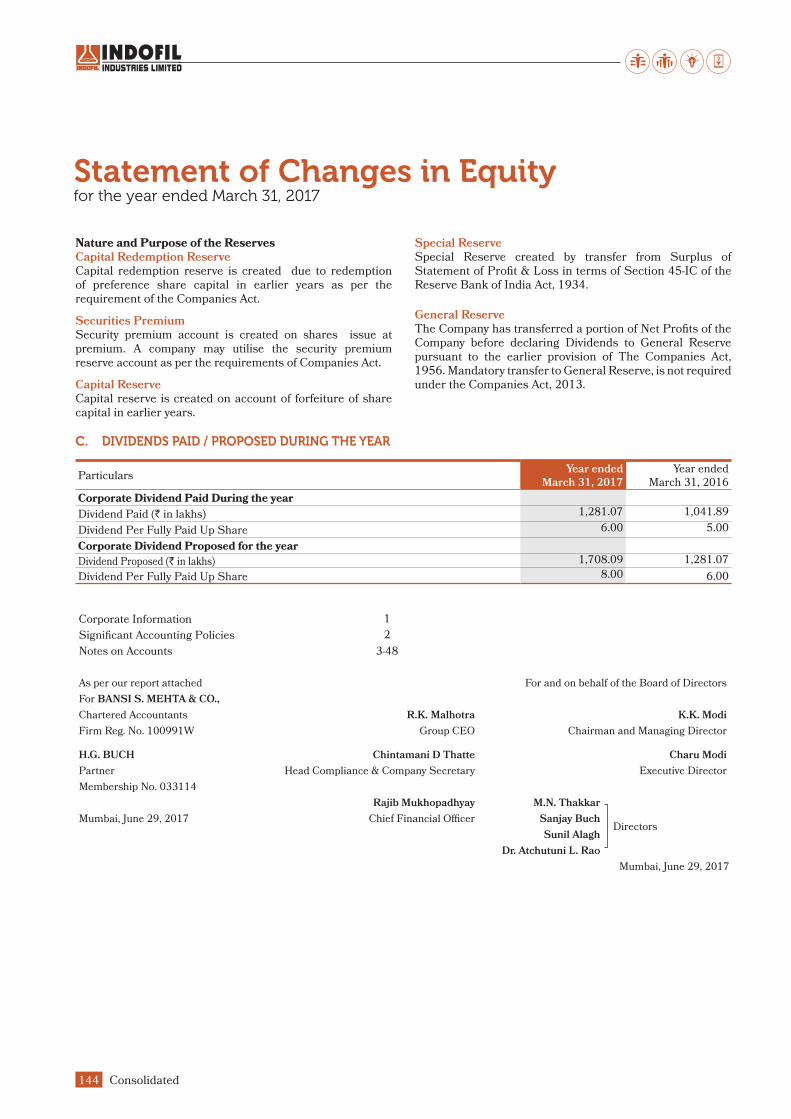
Consolidated144
Statement of Changes in Equityfor the year ended March 31, 2017
Nature and Purpose of the ReservesCapital Redemption ReserveCapital redemption reserve is created due to redemption of preference share capital in earlier years as per the requirement of the Companies Act.
Securities PremiumSecurity premium account is created on shares issue at premium. A company may utilise the security premium reserve account as per the requirements of Companies Act.
Capital ReserveCapital reserve is created on account of forfeiture of share capital in earlier years.
Special ReserveSpecial Reserve created by transfer from Surplus of Statement of Profit & Loss in terms of Section 45-IC of the Reserve Bank of India Act, 1934.
General ReserveThe Company has transferred a portion of Net Profits of the Company before declaring Dividends to General Reserve pursuant to the earlier provision of The Companies Act, 1956. Mandatory transfer to General Reserve, is not required under the Companies Act, 2013.
C. DIVIDENDS PAID / PROPOSED DURING THE YEAR
Particulars Year ended
March 31, 2017
Year ended March 31, 2016
Corporate Dividend Paid During the year
Dividend Paid (` in lakhs) 1,281.07 1,041.89
Dividend Per Fully Paid Up Share 6.00 5.00
Corporate Dividend Proposed for the year
Dividend Proposed (` in lakhs) 1,708.09 1,281.07
Dividend Per Fully Paid Up Share 8.00 6.00
Corporate Information 1
Significant Accounting Policies 2
Notes on Accounts 3-48
As per our report attached For and on behalf of the Board of Directors
For BANSI S. MEHTA & CO.,
Chartered Accountants R.K. Malhotra K.K. Modi
Firm Reg. No. 100991W Group CEO Chairman and Managing Director
H.G. BUCH Chintamani D Thatte Charu Modi
Partner Head Compliance & Company Secretary Executive Director
Membership No. 033114
Rajib Mukhopadhyay M.N. Thakkar
DirectorsMumbai, June 29, 2017 Chief Financial Officer Sanjay Buch
Sunil Alagh
Dr. Atchutuni L. Rao
Mumbai, June 29, 2017

Notes forming part of Financial Statementsfor the year ended March 31, 2017
Annual Report 2016-17 145
COMPANY OVERVIEW
1-36 37-81 82-184
STATUTORY REPORTS FINANCIAL STATEMENTS
NOTE 1: CORPORATE INFORMATIONIndofil Industries Limited (‘the Company’) is a research led,
fully integrated multi-product chemical company engaged
in manufacturing and distribution of Agrochemicals and
Specialty & Performance Chemicals.
The Company is a public limited company incorporated
in India with its registered office at Kalpataru Square, 4th
Floor, Kondivita Road, Off. Andheri Kurla Road, Andheri
(East), Mumbai 400059, Maharashtra.
The Company, its Subsidiaries and its Joint Ventures (jointly
referred to as the “Group” herein under) considered in these
Consolidated Financial Statements (“CFS”) are:
a) Subsidiaries
Name of the Company
Country of Incorporation
Principal Activities
Proportion of Equity
Interest (%)
Indofil Industries (Netherlands) B.V.
The Netherlands Marketing &
Distribution of
grochemicals
100%
Indofil Bangladesh Industries Pvt. Ltd.
Bangladesh100%
Indofil Costa Rica S.A.
Costa Rica100%
Indofil Industries (International) B.V.
The Netherlands
Holding Company
100%
Good Investment (India) Ltd.
India
Investment Company
100%
Quick Investment (India) Ltd.
India100%
Share Capital of Indofil Industries (International) B.V. has
been subscribed during the year. There is no change during
the year ended March 31, 2017 and March 31, 2016 in the
proportion of Equity Interest (%) in any other subsidiaries.
b) Joint Ventures
Name of the Company
Country of Incorporation
Principal Activities
Proportion of Equity
Interest (%)
Indobaijin Chemicals Pvt. Ltd.
India Manufacture, Marketing & Distribution of Chemicals
51%
Hifil Chemicals Pvt. Ltd.
India49%
There is no change during the year ended March 31, 2017
and March 31, 2016 in the proportion of Equity Interest (%)
in any of the Joint Ventures.
c) Group Companies not considered for Consolidated
Financial Statements:
The Group holds 20% of the Equity Interest of
International Research Park Laboratories Ltd.
Indirectly through its subsidiaries. However, the Group
does not exercise any significant influence on the
investee company in terms of para 5 and 6 of Ind AS
28 on “Investment in Associates and Joint Ventures”
and hence such companies are not considered for
consolidation purpose.
NOTE 2: SIGNIFICANT ACCOUNTING POLIICES2.1 Statement of Compliance
In accordance with the notification issued by the
Ministry of Corporate Affairs, the Group has adopted
Indian Accounting Standards (referred to as “Ind AS”)
notified under the Companies (Indian Accounting
Standards) Rules, 2015 read with Section 133 of the
Companies Act 2013 with effect from April 01, 2016, the
Consolidated Financial Statements for the year ended
March 31, 2017 have been prepared in accordance with
the Ind AS issued and effective as at the reporting date.
Previous periods have been restated in line with Ind AS.
The Group has presented a reconciliation from the
presentation of financial statements under Accounting
Standards notified under the Companies (Accounting
Standards) Rules, 2006 (“Indian GAAP”) to Ind AS,
of the Shareholders’ Equity as at March 31, 2016 and
April 01, 2015 and of the total Comprehensive Income
for the year ended March 31, 2016.
2.2 Basis of preparation
The financial statements of the Subsidiaries and
the Joint Ventures used for consolidation are drawn/
prepared for consolidation upto the same reporting date
as the Holding Company. The CFS have been prepared
on the following basis:
The financial statements of subsidiary companies
have been combined on line to line basis by adding
together the book values of like items of assets,
liabilities, income and expenses, after fully eliminating
intra group balances, intra group transactions and the
unrealised profits/losses in accordance with Ind AS
110 – “Consolidated Financial Statements”
In case of foreign subsidiary companies, revenue and
expense items are converted at the average exchange
rate prevailing during the period. All assets and liabilities

Notes forming part of Financial Statementsfor the year ended March 31, 2017
Consolidated146
are converted at the exchange rate prevailing at the year
end. All resulting exchange differences arising out of
translation are accumulated in the Foreign Currency
Translation Reserve in accordance with Ind AS 21 –
“The Effects of Changes in Foreign Exchange Rates”.
The difference between the cost of investments in
subsidiary companies over the respective net assets
at the time of acquisition of shares in the subsidiary
companies are recognised in the CFS as Goodwill or
Capital Reserve, as the case may be.
Minority interest’s share of net profit of consolidated
subsidiary companies for the year is identified and
adjusted against the income of the Group in order to
arrive at the net income attributable to shareholders of
the Holding Company.
Minority interest’s share of net assets of consolidated
subsidiary companies for the year is identified and
presented in the consolidated balance sheet separate
from liabilities and the equity of the Holding Company’s
shareholders.
The investments in the Joint Ventures are accounted
for using the Equity Method of accounting as laid down
under Ind AS 28 – “Investment in Associates and Joint
Ventures”. The investments are initially recognised at
cost, and the carrying amount is increased or decreased
to recognise the investor’s share of the profit or loss of
the investee after the acquisition date. The unrealised
profits/losses on transactions with the associate
company are eliminated by reducing the carrying
amount of investments.
The difference between the cost of investment in the
Joint Ventures and the share of net asset at the time of
acquisition of shares in the Joint Ventures is identified
in the CFS as Goodwill or Capital Reserve as the case
may be.
The CFS are prepared using uniform accounting
policies for like transactions and other events in similar
circumstances and are presented in the same manner
as the Holding Company’s Standalone Financial
Statement (“SFS”), except as specified
2.3 Use of Estimates and Judgements
The preparation of the financial statements, in
conformity with the recognition and measurement
principles of Ind AS, requires management to make
estimates and assumptions that affect the reported
amounts of assets and liabilities, revenues and
expenses and disclosure of contingent liabilities at the
date of the financial statements. Actual results could
differ from those estimates. Management believes that
the estimates used in the preparation of the financial
statements are prudent and reasonable. Any revision to
the accounting estimates is recognised prospectively.
Information about critical judgements in applying
accounting policies, as well as estimates and
assumptions that have the most significant effect on
the carrying amounts of assets and liabilities within the
next financial year are included in the following notes:
Measurement and likelihood of occurrence of provisions
and contingencies – Note No. 21, 26 and 36
Recognition of Deferred Tax Assets / (Liabilities) – Note
No. 7
Key Assumptions used in Fair Valuation Methods of
Financial Assets – Note No. 40
Impairment of Financial Assets (Trade Receivables) –
Note No. 12
2.4 Intangible Assets
The Intangible Assets in Indofil Industries (Netherlands)
B.V. are amortised on Straight Line Method over a
period of twenty years
2.5 Other Significant Accounting Policy and Additional
Information’s
The other Significant Accounting Policies are set out
in Significant Accounting Policies as given in the SFS.
Additional information and notes not impacted by
consolidation are set out in the SFS.

Notes forming part of Financial Statementsfor the year ended March 31, 2017
Annual Report 2016-17 147
COMPANY OVERVIEW
1-36 37-81 82-184
STATUTORY REPORTS FINANCIAL STATEMENTSN
OT
E 3
: P
RO
PE
RT
Y, P
LA
NT
& E
QU
IPM
EN
T, IN
TA
NG
IBLE
AS
SE
TS
AN
D I
NT
AN
GIB
LE
AS
SE
TS
UN
DE
R D
EV
EL
OP
ME
NT
` i
n L
ak
hs
De
scri
pti
on
Gro
ss B
lock
(a
t co
st)
D
ep
reci
ati
on
/ A
mo
rtis
ati
on
Ne
t B
lock
As
at
A
pri
l 1
, 2
01
6A
dd
itio
ns
/ T
ran
sfe
rs D
ed
uct
ion
s /
Ad
just
me
nt
As
at
Ma
rch
31
, 2
01
7
As
at
A
pri
l 1
, 2
01
6 F
or
Th
e
Ye
ar
Ad
just
me
nts
O
n
D
ed
uct
ion
sA
s a
t M
arc
h
31
, 2
01
7
As
at
Ma
rch
31
, 2
01
7
As
at
A
pri
l 1
, 2
01
6
(A)
TA
NG
IBLE
AS
SE
TS
La
nd
- F
reeh
old
17
6.5
4
–
–
17
6.5
4
–
–
–
–
–
17
6.5
4
17
6.5
4
Fa
cto
ry B
uil
din
gs
5,1
51
.03
5
,78
7.1
8
–
10
,93
8.2
1
2,0
75
.20
5
22
.38
–
–
2
,59
7.5
8
8,3
40
.63
3
,07
5.8
3
No
n-F
act
ory
Bu
ild
ing
s ²
⁴ 9
,95
1.1
5
39
0.3
8
–
10
,34
1.5
3
2,0
94
.96
4
62
.47
–
–
2
,55
7.4
3
7,7
84
.10
7
,85
6.1
9
Cu
lve
rts
–
19
.69
–
1
9.6
9
–
0.7
7
–
–
0.7
7
18
.92
–
Pla
nt
& M
ach
ine
ry
⁴ 1
6,8
39
.97
1
0,6
72
.95
–
2
7,5
12
.92
4
,55
2.7
8
98
6.9
8
–
–
5,5
39
.76
2
1,9
73
.16
1
2,2
87
.19
Oth
er
Pla
nt
Eq
uip
me
nt
2,3
21
.83
1
,75
4.1
1
–
4,0
75
.94
5
79
.78
4
67
.33
–
–
1
,04
7.1
1
3,0
28
.83
1
,74
2.0
5
Ele
ctri
cal
Inst
all
ati
on
&
Eq
uip
me
nt
–
1,1
57
.58
–
1
,15
7.5
8
–
12
4.2
0
–
–
12
4.2
0
1,0
33
.38
–
Fu
rnit
ure
& F
ixtu
re 6
46
.48
7
6.6
7
–
72
3.1
5
44
4.3
1
64
.89
–
–
5
09
.20
2
13
.95
2
02
.17
Veh
icle
s ¹
1,8
15
.51
2
46
.10
–
2
,06
1.6
1
1,3
50
.57
2
11
.59
–
–
1
,56
2.1
6
49
9.4
5
46
4.9
4
Offi
ce E
qu
ipm
en
ts 9
02
.26
1
73
.35
–
1
,07
5.6
1
78
9.5
1
75
.06
–
–
8
64
.57
2
11
.04
1
12
.75
Ro
ad
s –
4
37
.04
–
4
37
.04
–
6
0.9
8
–
–
60
.98
3
76
.06
–
Co
mp
ute
rs 6
71
.57
7
3.0
6
–
74
4.6
3
53
3.2
6
82
.34
–
–
6
15
.60
1
29
.03
1
38
.31
Ca
pit
al
Ex
pe
nd
itu
re O
n
Re
sea
rch
& D
evel
op
me
nt
Bu
ild
ing
s 4
26
.69
–
–
4
26
.69
1
50
.98
2
8.6
5
–
–
17
9.6
3
24
7.0
6
27
5.7
1
Pla
nt
& M
ach
ine
ry 8
81
.19
–
–
8
81
.19
4
85
.22
7
5.4
3
–
–
56
0.6
5
32
0.5
4
39
5.9
7
Fu
rnit
ure
& F
ixtu
re 2
3.5
4
–
–
23
.54
1
7.4
3
1.6
7
–
–
19
.10
4
.44
6
.11
Oth
er
Eq
uip
me
nts
4.3
3
–
–
4.3
3
3.9
0
0.0
4
–
–
3.9
4
0.3
9
0.4
3
To
tal
- Ta
ng
ible
Ass
ets
39
,81
2.0
9
20
,78
8.1
1
–
60
,60
0.2
0
13
,07
7.9
0
3,1
64
.78
–
–
1
6,2
42
.68
4
4,3
57
.52
2
6,7
34
.19
(B)
INT
AN
GIB
LE
AS
SE
TS
Lic
en
se, R
eg
istr
ati
on
, E
tc. In
R
esp
ect
of
Acq
uir
ed
Bu
sin
ess
27
,94
7.0
0
–
38
.97
2
7,9
08
.03
2
,41
9.6
7
1,7
11
.49
–
–
4
,13
1.1
6
23
,77
6.8
7
25
,52
7.3
3
Sci
en
tifi
c R
ese
arc
h
Ex
pe
nd
itu
re f
or
Pro
du
ct
Deve
lop
me
nt
8,7
57
.42
1
,42
9.9
4
–
10
,18
7.3
6
2,6
84
.26
1
,34
0.9
8
(0
.18
) –
4
,02
5.0
6
6,1
62
.30
6
,07
3.1
6
So
ftw
are
Lic
en
ces
62
.07
5
1.7
1
–
11
3.7
8
7.7
4
20
.50
–
–
2
8.2
4
85
.54
5
4.3
3
To
tal
- In
tan
gib
le A
sse
ts 3
6,7
66
.49
1
,48
1.6
5
38
.97
3
8,2
09
.17
5
,11
1.6
7
3,0
72
.97
(
0.1
8)
–
8,1
84
.46
3
0,0
24
.71
3
1,6
54
.82
(C)
CA
PIT
AL
WO
RK
IN
PR
OG
RE
SS
³ 5
15
,76
9.8
2
7,8
79
.27
1
9,1
91
.25
4
,45
7.8
4
–
–
–
–
–
4,4
57
.84
1
5,7
69
.82
(D)
INT
AN
GIB
LE
S U
ND
ER
DE
VE
LO
PM
EN
T
Sci
en
tifi
c R
ese
arc
h
Ex
pe
nd
itu
re f
or
Pro
du
ct U
nd
er
Deve
lop
me
nt
8,9
88
.30
1
,64
7.6
6
1,4
39
.13
9
,19
6.8
3
–
–
–
–
–
9,1
96
.83
8
,98
8.3
0
(E )
INV
ES
TM
EN
T P
RO
PE
RT
Y 5
–
–
–
–
–
–
–
–
–
–
To
tal
(A)+
(B)+
(C)+
(D)+
(E )
10
1,3
36
.70
3
1,7
96
.69
2
0,6
69
.35
1
12
,46
4.0
4
18
,18
9.5
7
6,2
37
.75
(
0.1
8)
–
24
,42
7.1
4
88
,03
6.9
0
83
,14
7.1
3
Pre
vio
us
Ye
ar'
s T
ota
l 7
5,6
70
.74
1
9,5
33
.14
2
,85
5.5
2
92
,34
8.3
6
13
,40
3.9
2
4,8
17
.13
0
.02
3
1.5
4
18
,18
9.5
3
83
,14
7.1
3
70
,62
4.8
5
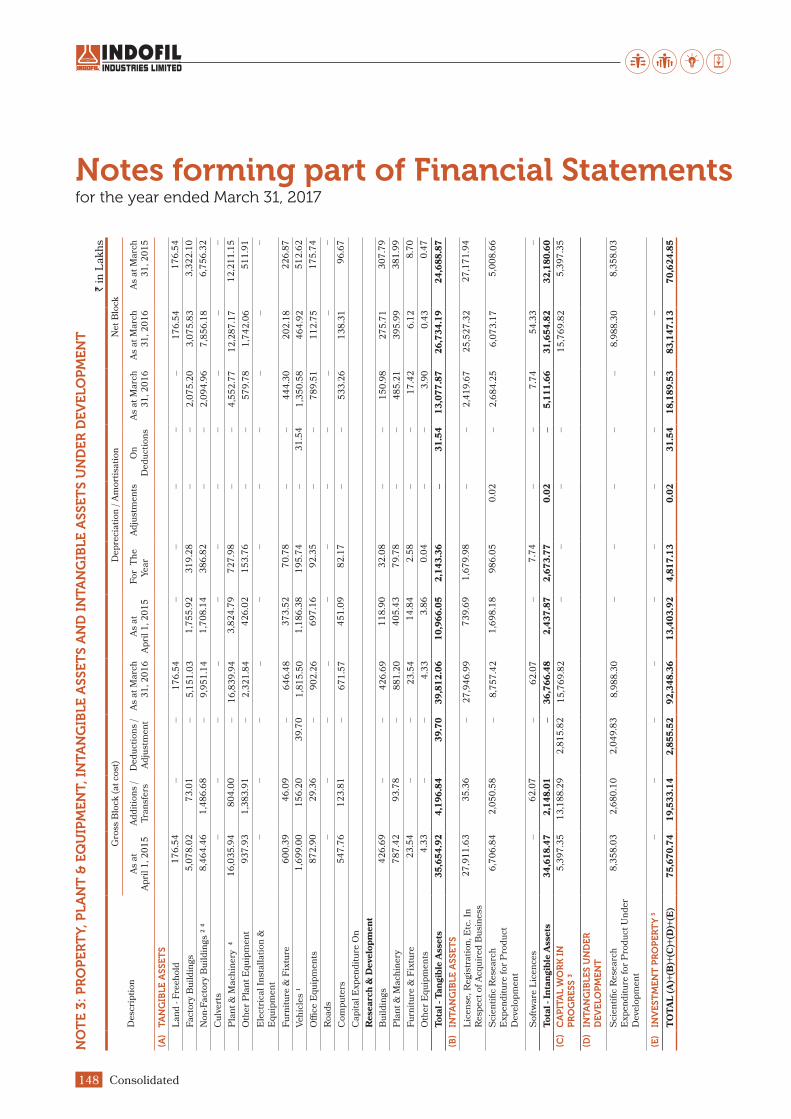
Notes forming part of Financial Statementsfor the year ended March 31, 2017
Consolidated148
NO
TE
3:
PR
OP
ER
TY
, P
LA
NT
& E
QU
IPM
EN
T, IN
TA
NG
IBLE
AS
SE
TS
AN
D I
NT
AN
GIB
LE
AS
SE
TS
UN
DE
R D
EV
EL
OP
ME
NT
` i
n L
ak
hs
De
scri
pti
on
Gro
ss B
lock
(a
t co
st)
D
ep
reci
ati
on
/ A
mo
rtis
ati
on
Ne
t B
lock
As
at
A
pri
l 1
, 2
01
5A
dd
itio
ns
/ T
ran
sfe
rsD
ed
uct
ion
s /
Ad
just
me
nt
As
at
Ma
rch
3
1, 2
01
6A
s a
t
Ap
ril
1, 2
01
5 F
or
Th
e
Ye
ar
Ad
just
me
nts
O
n
D
ed
uct
ion
sA
s a
t M
arc
h
31
, 2
01
6A
s a
t M
arc
h
31
, 2
01
6A
s a
t M
arc
h
31
, 2
01
5
(A)
TA
NG
IBLE
AS
SE
TS
La
nd
- F
reeh
old
17
6.5
4
–
–
17
6.5
4
–
–
–
–
–
17
6.5
4
17
6.5
4
Fa
cto
ry B
uil
din
gs
5,0
78
.02
7
3.0
1
–
5,1
51
.03
1
,75
5.9
2
31
9.2
8
–
–
2,0
75
.20
3
,07
5.8
3
3,3
22
.10
No
n-F
act
ory
Bu
ild
ing
s ²
⁴ 8
,46
4.4
6
1,4
86
.68
–
9
,95
1.1
4
1,7
08
.14
3
86
.82
–
–
2
,09
4.9
6
7,8
56
.18
6
,75
6.3
2
Cu
lve
rts
–
–
–
–
–
–
–
–
–
–
–
Pla
nt
& M
ach
ine
ry
⁴ 1
6,0
35
.94
8
04
.00
–
1
6,8
39
.94
3
,82
4.7
9
72
7.9
8
–
–
4,5
52
.77
1
2,2
87
.17
1
2,2
11
.15
Oth
er
Pla
nt
Eq
uip
me
nt
93
7.9
3
1,3
83
.91
–
2
,32
1.8
4
42
6.0
2
15
3.7
6
–
–
57
9.7
8
1,7
42
.06
5
11
.91
Ele
ctri
cal
Inst
all
ati
on
&
Eq
uip
me
nt
–
–
–
–
–
–
–
–
–
–
–
Fu
rnit
ure
& F
ixtu
re 6
00
.39
4
6.0
9
–
64
6.4
8
37
3.5
2
70
.78
–
–
4
44
.30
2
02
.18
2
26
.87
Veh
icle
s ¹
1,6
99
.00
1
56
.20
3
9.7
0
1,8
15
.50
1
,18
6.3
8
19
5.7
4
–
31
.54
1
,35
0.5
8
46
4.9
2
51
2.6
2
Offi
ce E
qu
ipm
en
ts 8
72
.90
2
9.3
6
–
90
2.2
6
69
7.1
6
92
.35
–
–
7
89
.51
1
12
.75
1
75
.74
Ro
ad
s –
–
–
–
–
–
–
–
–
–
–
Co
mp
ute
rs 5
47
.76
1
23
.81
–
6
71
.57
4
51
.09
8
2.1
7
–
–
53
3.2
6
13
8.3
1
96
.67
Ca
pit
al
Ex
pe
nd
itu
re O
n
Re
sea
rch
& D
evel
op
me
nt
Bu
ild
ing
s 4
26
.69
–
–
4
26
.69
1
18
.90
3
2.0
8
–
–
15
0.9
8
27
5.7
1
30
7.7
9
Pla
nt
& M
ach
ine
ry 7
87
.42
9
3.7
8
–
88
1.2
0
40
5.4
3
79
.78
–
–
4
85
.21
3
95
.99
3
81
.99
Fu
rnit
ure
& F
ixtu
re 2
3.5
4
–
–
23
.54
1
4.8
4
2.5
8
–
–
17
.42
6
.12
8
.70
Oth
er
Eq
uip
me
nts
4.3
3
–
–
4.3
3
3.8
6
0.0
4
–
–
3.9
0
0.4
3
0.4
7
To
tal
- Ta
ng
ible
Ass
ets
35
,65
4.9
2
4,1
96
.84
3
9.7
0
39
,81
2.0
6
10
,96
6.0
5
2,1
43
.36
–
3
1.5
4
13
,07
7.8
7
26
,73
4.1
9
24
,68
8.8
7
(B)
INT
AN
GIB
LE
AS
SE
TS
Lic
en
se, R
eg
istr
ati
on
, E
tc. In
R
esp
ect
of
Acq
uir
ed
Bu
sin
ess
27
,91
1.6
3
35
.36
–
2
7,9
46
.99
7
39
.69
1
,67
9.9
8
–
–
2,4
19
.67
2
5,5
27
.32
2
7,1
71
.94
Sci
en
tifi
c R
ese
arc
h
Ex
pe
nd
itu
re f
or
Pro
du
ct
Deve
lop
me
nt
6,7
06
.84
2
,05
0.5
8
–
8,7
57
.42
1
,69
8.1
8
98
6.0
5
0.0
2
–
2,6
84
.25
6
,07
3.1
7
5,0
08
.66
So
ftw
are
Lic
en
ces
–
62
.07
–
6
2.0
7
–
7.7
4
–
–
7.7
4
54
.33
–
To
tal
- In
tan
gib
le A
sse
ts 3
4,6
18
.47
2
,14
8.0
1
–
36
,76
6.4
8
2,4
37
.87
2
,67
3.7
7
0.0
2
–
5,1
11
.66
3
1,6
54
.82
3
2,1
80
.60
(C)
CA
PIT
AL
WO
RK
IN
P
RO
GR
ES
S ³
5
,39
7.3
5
13
,18
8.2
9
2,8
15
.82
1
5,7
69
.82
–
–
–
–
1
5,7
69
.82
5
,39
7.3
5
(D)
INT
AN
GIB
LE
S U
ND
ER
D
EV
EL
OP
ME
NT
Sci
en
tifi
c R
ese
arc
h
Ex
pe
nd
itu
re f
or
Pro
du
ct U
nd
er
Deve
lop
me
nt
8,3
58
.03
2
,68
0.1
0
2,0
49
.83
8
,98
8.3
0
–
–
–
–
–
8,9
88
.30
8
,35
8.0
3
(E)
INV
ES
TM
EN
T P
RO
PE
RT
Y 5
–
–
–
–
–
–
–
–
–
–
TO
TA
L (
A)+
(B)+
(C)+
(D)+
(E)
75
,67
0.7
4
19
,53
3.1
4
2,8
55
.52
9
2,3
48
.36
1
3,4
03
.92
4
,81
7.1
3
0.0
2
31
.54
1
8,1
89
.53
8
3,1
47
.13
7
0,6
24
.85
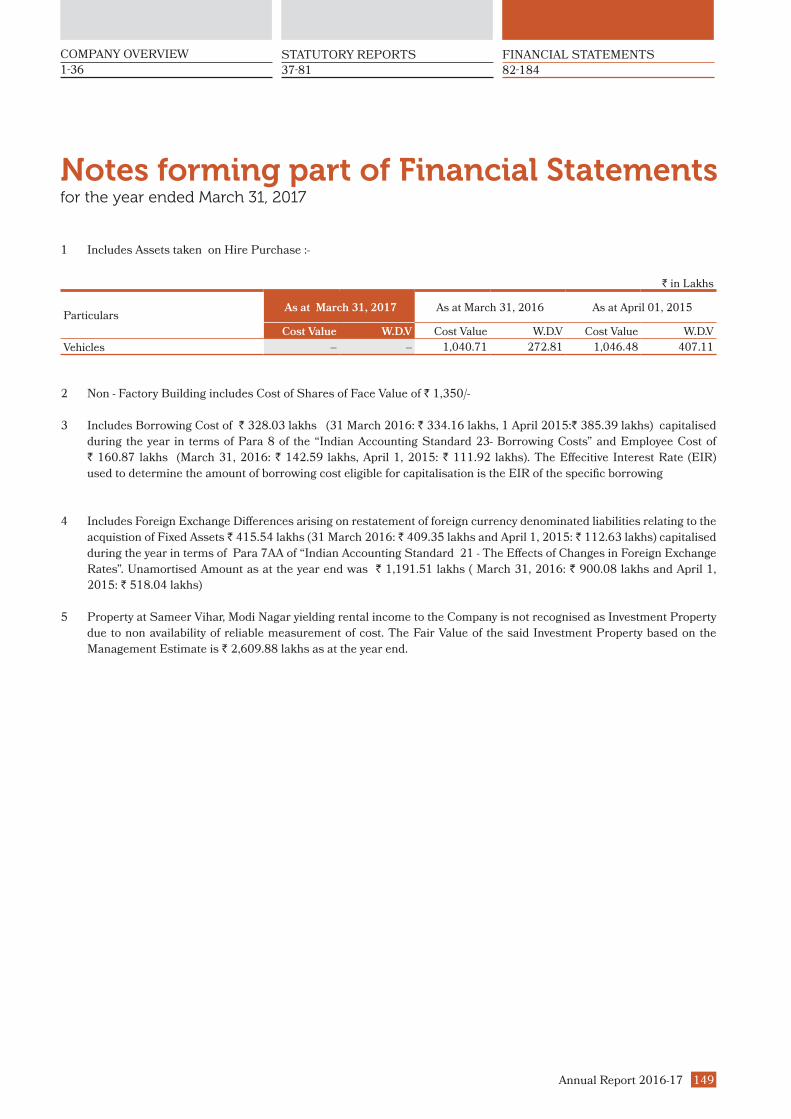
Notes forming part of Financial Statementsfor the year ended March 31, 2017
Annual Report 2016-17 149
COMPANY OVERVIEW
1-36 37-81 82-184
STATUTORY REPORTS FINANCIAL STATEMENTS
1 Includes Assets taken on Hire Purchase :-
` in Lakhs
Particulars As at March 31, 2017 As at March 31, 2016 As at April 01, 2015
Cost Value W.D.V Cost Value W.D.V Cost Value W.D.V
Vehicles – – 1,040.71 272.81 1,046.48 407.11
2 Non - Factory Building includes Cost of Shares of Face Value of ` 1,350/-
3 Includes Borrowing Cost of ` 328.03 lakhs (31 March 2016: ` 334.16 lakhs, 1 April 2015:` 385.39 lakhs) capitalised
during the year in terms of Para 8 of the “Indian Accounting Standard 23- Borrowing Costs” and Employee Cost of
` 160.87 lakhs (March 31, 2016: ` 142.59 lakhs, April 1, 2015: ` 111.92 lakhs). The Effecitive Interest Rate (EIR)
used to determine the amount of borrowing cost eligible for capitalisation is the EIR of the specific borrowing
4 Includes Foreign Exchange Differences arising on restatement of foreign currency denominated liabilities relating to the
acquistion of Fixed Assets ` 415.54 lakhs (31 March 2016: ` 409.35 lakhs and April 1, 2015: ` 112.63 lakhs) capitalised
during the year in terms of Para 7AA of “Indian Accounting Standard 21 - The Effects of Changes in Foreign Exchange
Rates”. Unamortised Amount as at the year end was ` 1,191.51 lakhs ( March 31, 2016: ` 900.08 lakhs and April 1,
2015: ` 518.04 lakhs)
5 Property at Sameer Vihar, Modi Nagar yielding rental income to the Company is not recognised as Investment Property
due to non availability of reliable measurement of cost. The Fair Value of the said Investment Property based on the
Management Estimate is ` 2,609.88 lakhs as at the year end.

Notes forming part of Financial Statementsfor the year ended March 31, 2017
Consolidated150
NOTE 4 : FINANCIAL ASSETS - INVESTMENTS (NON - CURRENT)
Particulars As at March 31, 2017 As at March 31, 2016 As at April 01, 2015
No. of Shares ` in Lakhs No. of Shares ` in Lakhs No. of Shares ` in Lakhs
INVESTMENT IN EQUITY
INSTRUMENTS
Investment in Joint Venture (Unquoted)
Indobaijin Chemicals Pvt. Ltd. 4,366,096 4,726.39 4,366,096 3,097.04 3,852,113 2,980.58
(Face Value - ` 100 /- each)
Hifil Chemicals Pvt. Ltd. 4,900 – 4,900 0.17 4,900 0.21
(Face Value - ` 10 /- each)
Others (Quoted At Fair Value)
Godfrey Philips India Limited 6,545,020 74,158.35 6,476,020 76,967.50 6,177,020 26,227.63
(Face Value - ` 2 /- each)
Modi Rubber Ltd. 215,311 198.95 214,211 95.49 214,211 62.66
(Face Value - ` 10 /- each)
Modi Spinning & Weaving Mills Co. Ltd.
75,631 7.60 75,631 7.60 75,631 7.60
(Face Value - ` 10 /- each)
Less: Provision for Diminution in Value of Investment
(7.60) (7.60) (7.60)
Modi Industries Limited 5,580 0.88 5,580 0.88 5,580 0.88
(Face Value - ` 10 /- each)
Less: Provision for Diminution in Value of Investment
(0.88) (0.88) (0.88)
Union KBC Mutual Fund 249,990 35.45 249,990 32.37 249,990 40.90
(Face Value - ` 10 /- each)
Birla Sunlife Dynamic Bond Fund - Growth
– – – – 1,621,977 396.45
(Face Value - ` 10 /- each)
Kotak Bond Short Term Plan - Growth – – – – 536,510 140.07
(Face Value - ` 10 /- each)
DSP Blackrock Strategy Bond Fund - Growth
– – – – 14,947 272.12
(Face Value - ` 10 /- each)
JP Morgan India Short Term Income Fund - Growth
– – 602,462 82.98 1,583,884 242.72
(Face Value - ` 10 /- each)
ICICI Prudential Income Plan - Growth – – – – 148,151 65.03
(Face Value - ` 10 /- each)
ICICI Prudential Dynamic Bond - Growth
– – – – 366,757 57.38
(Face Value - ` 10 /- each)
Others (Unquoted At Fair Value)
The Cosmos Co-Op. Bank Ltd. 14,250 70.79 14,250 70.79 14,250 84.50
(Face Value - ` 100 /- each)
KKM Management Centre Pvt. Ltd. 338,100 96.13 338,100 88.55 338,100 77.79

Notes forming part of Financial Statementsfor the year ended March 31, 2017
Annual Report 2016-17 151
COMPANY OVERVIEW
1-36 37-81 82-184
STATUTORY REPORTS FINANCIAL STATEMENTS
Particulars As at March 31, 2017 As at March 31, 2016 As at April 01, 2015
No. of Shares ` in Lakhs No. of Shares ` in Lakhs No. of Shares ` in Lakhs
(Face Value - ` 10 /- each)
International Research Park Laboratories
50,000 51.78 50,000 51.78 50,000 57.94
(Face Value - ` 10 /- each)
Beacon Travels Pvt. Ltd. 4,500 38.90 4,500 34.76 4,500 30.50
(Face Value - ` 10 /- each)
Modi Care Limited 8,000,000 200.00 8,000,000 200.00 8,000,000 200.00
(Face Value - ` 2.5 /- each)
Less: Diminution in Value of Investment
(200.00) (200.00)
Agache Associates Limited 6,250 0.63 6,250 0.63 6,250 0.63
(Face Value - ` 10 /- each)
Less: Diminution in Value of Investment
(0.62) (0.62) (0.62)
Rajputana Fertiliser Limited 15,126 – 15,126 – 15,126 –
(Face Value - ` 10 /- each)
Harayana Distillery Limited 15,126 – 15,126 – 15,126 –
(Face Value - ` 10 /- each)
Rajputana Developers Limited 15,126 – 15,126 – 15,126 –
(Face Value - ` 10 /- each)
INVESTMENT IN PREFERENCE
SHARES
Others (Quoted At Fair Value)
Modi Spinning & Weaving Mills Co. Ltd.
165 0.17 165 0.17 165 0.17
(Face Value - ` 100 /- each)
Less: Provision for Diminution in Value of Investment
(0.16) (0.16) (0.16)
Others (Unquoted At Fair Value)
Premium Tradelinks Pvt. Ltd. 956,000 95.60 956,000 95.60 956,000 95.60
(Face Value - ` 10 /- each)
Modi Care Limited 2,500,000 – 2,500,000 – 2,500,000 250.00
(Face Value - ` 10 /- each)
INVESTMENT IN DEBENTURES
Modi Industries Limited 328 0.66 328 0.66 328 0.66
(Face Value - ` 200 /- each)
Less: Provision for Diminution in Value of Investment
(0.66) (0.66) (0.66)
Total 79,472.36 80,617.05 31,282.10
` in Lakhs ` in Lakhs ` in Lakhs
Aggregate Amount of Quoted Investment & Maket Value thereof
74,392.76 77,178.35 27,504.97
Aggregate amount of Unqouted Investments
5,079.60 3,438.70 3,777.13
Aggregate amount of impairment in value of Investments
209.92 209.92 9.92

Notes forming part of Financial Statementsfor the year ended March 31, 2017
Consolidated152
NOTE 5: FINANCIAL ASSETS - LOANS (NON-CURRENT)
` in Lakhs
Particulars As at
March 31, 2017
As at March 31, 2016
As at April 01, 2015
Unsecured Considered Good Loans to Related Parties 836.07 1,981.91 2,041.42
Secured Considered Good Loans to Employees 75.22 85.90 100.45
Total 911.29 2,067.81 2,141.87
NOTE 6: FINANCIAL ASSETS - OTHERS (NON-CURRENT)
` in Lakhs
Particulars As at
March 31, 2017
As at March 31, 2016
As at April 01, 2015
Security and Other Deposits 618.72 489.91 387.98
Fixed Deposits maturing after 12 months 639.46 796.36 219.88
Total 1,258.18 1,286.27 607.86
NOTE 7: DEFERRED TAX ASSETS
` in Lakhs
Particulars As at
March 31, 2017
As at March 31, 2016
As at April 01, 2015
Deferred Tax Assets Undistributed Losses of Joint Ventures - 439.30 301.72
Other items giving rise to temporary differences 1,401.91 1,100.25 769.84
MAT Credit Entitlement 6,381.98 8,278.39 7,856.31
7,783.89 9,817.94 8,927.87 Deferred Tax Liabilities Undistributed Profits of Joint Ventures (124.52) - -
Accelerated depreciation for tax purposes (4,495.28) (6,009.32) (5,170.19)
(4,619.80) (6,009.32) (5,170.19)Net Deferred Tax Assets 3,164.09 3,808.62 3,757.68
Reconcilation of Deferred Tax Assets / (Liability) for the year
` in Lakhs
Particulars
Deferred Tax Assets / (Liability)
MAT Credit Entitlement
Items giving rise to temporary differences
Accelerated Depreciation for
Tax Purpose
Undistributed Profits / (Losses)
Balance as at April 01, 2015 7,856.31 769.84 (5,170.19) 301.72 MAT Credit Entitlement / (Utilisation) during F.Y. 2015-16 422.14
DTA on Items giving rise to temporary differences 330.42
DTL on Accelerated Depreciation for tax purpose (839.13)
DTA on Undistributed Losses of Joint Ventures 137.59
Balance as at March 31, 2016 8,278.45 1,100.26 (6,009.32) 439.31 MAT Credit Entitlement / (Utilisation) during F.Y. 2016-17 (1,896.41)
DTA on Items giving rise to temporary differences 301.66
DTA on Accelerated Depreciation for tax purpose 1,514.04
DTL on Undistributed Profits of Joint Ventures (563.83)
Balance as at March 31, 2017 6,382.04 1,401.92 (4,495.28) (124.52)

Notes forming part of Financial Statementsfor the year ended March 31, 2017
Annual Report 2016-17 153
COMPANY OVERVIEW
1-36 37-81 82-184
STATUTORY REPORTS FINANCIAL STATEMENTS
NOTE 8: NON - CURRENT TAX ASSETS / (LIABILITIES)
` in Lakhs
Particulars As at
March 31, 2017
As at March 31, 2016
As at April 01, 2015
Non Current Tax Asset / (Liabilities) [Net] 447.88 (360.70) 87.31
447.88 (360.70) 87.31
Reconciliation of Effective Tax Rates The reconciliation between the statutory income tax rate applicable to the Company and the effective income tax rate of the
Company is as follows:
` in Lakhs
Particulars As at
March 31, 2017
As at March 31, 2016
Statutory Income Tax Rate 34.61% 34.61%
Differences due to:
Temporary Differences -2.22% 0.23%
Income Tax Incentives -9.01% -12.03%
Tax on Income at Different Rates -1.39% 0.00%
Others 1.64% -0.16%
Effective Tax Rate 21.99% 22.81%
NOTE 9: OTHER NON-CURRENT ASSETS
` in Lakhs
Particulars As at
March 31, 2017
As at March 31, 2016
As at April 01, 2015
Long Term Trade Receivables 2,452.67 1,751.55 1,031.65
Less: Impairment Allowance (2,452.67) – (1,751.55) – (1,031.65) –
Capital Advances 2,416.66 1,900.95 672.04
Prepaid Leases 1,615.33 430.33 450.76
Balances with Govt. Authorities under litigation
364.83 323.07 269.11
Total 4,396.82 2,654.35 1,391.91
NOTE 10: INVENTORIES
` in Lakhs
Particulars As at
March 31, 2017
As at March 31, 2016
As at April 01, 2015
At Lower of Cost or Net Realisable Value
Raw Materials 7,909.43 5,908.25 5,416.52
Raw Materials - Goods in Transit 3,789.23 2,823.29 2,854.88
Finished Goods 12,423.21 14,105.88 15,703.01
Finished Goods in Transit 219.63 64.52 –
Stock in Trade 2,860.30 3,068.25 3,255.32
Stores and Spares 514.11 418.48 434.55
Total 27,715.91 26,388.67 27,664.28
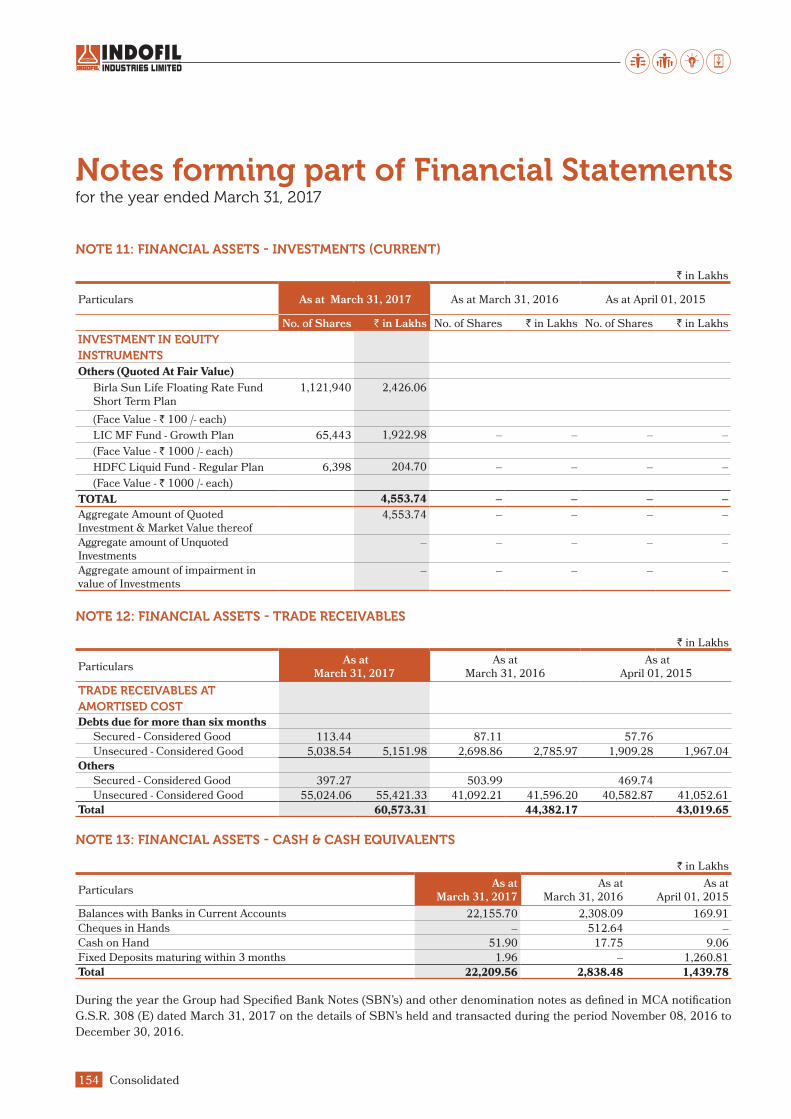
Notes forming part of Financial Statementsfor the year ended March 31, 2017
Consolidated154
NOTE 11: FINANCIAL ASSETS - INVESTMENTS (CURRENT)
` in Lakhs
Particulars As at March 31, 2017 As at March 31, 2016 As at April 01, 2015
No. of Shares ` in Lakhs No. of Shares ` in Lakhs No. of Shares ` in Lakhs
INVESTMENT IN EQUITY
INSTRUMENTS
Others (Quoted At Fair Value)
Birla Sun Life Floating Rate Fund Short Term Plan
1,121,940 2,426.06
(Face Value - ` 100 /- each)
LIC MF Fund - Growth Plan 65,443 1,922.98 – – – –
(Face Value - ` 1000 /- each)
HDFC Liquid Fund - Regular Plan 6,398 204.70 – – – –
(Face Value - ` 1000 /- each)
TOTAL 4,553.74 – – – –
Aggregate Amount of Quoted Investment & Market Value thereof
4,553.74 – – – –
Aggregate amount of Unquoted Investments
– – – – –
Aggregate amount of impairment in value of Investments
– – – – –
NOTE 12: FINANCIAL ASSETS - TRADE RECEIVABLES
` in Lakhs
Particulars As at
March 31, 2017
As at March 31, 2016
As at April 01, 2015
TRADE RECEIVABLES AT
AMORTISED COST
Debts due for more than six monthsSecured - Considered Good 113.44 87.11 57.76
Unsecured - Considered Good 5,038.54 5,151.98 2,698.86 2,785.97 1,909.28 1,967.04
OthersSecured - Considered Good 397.27 503.99 469.74
Unsecured - Considered Good 55,024.06 55,421.33 41,092.21 41,596.20 40,582.87 41,052.61
Total 60,573.31 44,382.17 43,019.65
NOTE 13: FINANCIAL ASSETS - CASH & CASH EQUIVALENTS
` in Lakhs
Particulars As at
March 31, 2017
As at March 31, 2016
As at April 01, 2015
Balances with Banks in Current Accounts 22,155.70 2,308.09 169.91
Cheques in Hands – 512.64 –
Cash on Hand 51.90 17.75 9.06
Fixed Deposits maturing within 3 months 1.96 – 1,260.81
Total 22,209.56 2,838.48 1,439.78
During the year the Group had Specified Bank Notes (SBN’s) and other denomination notes as defined in MCA notification
G.S.R. 308 (E) dated March 31, 2017 on the details of SBN’s held and transacted during the period November 08, 2016 to
December 30, 2016.

Notes forming part of Financial Statementsfor the year ended March 31, 2017
Annual Report 2016-17 155
COMPANY OVERVIEW
1-36 37-81 82-184
STATUTORY REPORTS FINANCIAL STATEMENTS
`
Particulars Specified Bank
Notes
Other Denomination
Notes Total
Closing Cash in Hand as on November 08, 2016 4,472,500 314,719 4,787,219
Add: Permitted Receipts – 2,189,690 2,189,690
Less: Permitted Payments – 821,307 821,307
Less: Amount Deposited in Banks 4,472,500 – 4,472,500
Closing Cash in Hand as on December 30, 2016. – 1,683,102 1,683,102
NOTE 14: FINANCIAL ASSETS - BANK BALANCES OTHER THAN CASH & CASH EQUIVALENTS
` in Lakhs
Particulars As at
March 31, 2017
As at March 31, 2016
As at April 01, 2015
Unpaid Dividend Account 58.42 49.37 40.26
Margin Money Pledged with Banks 3.00 3.00 3.00
Fixed Deposits maturing within 3 to 12 months 662.90 361.30 129.12
Total 724.32 413.67 172.38
NOTE 15: FINANCIAL ASSETS - LOANS (CURRENT ASSETS)
` in Lakhs
Particulars As at
March 31, 2017
As at March 31, 2016
As at April 01, 2015
Loans to Others 555.00 900.00 900.00
Total 555.00 900.00 900.00
NOTE 16: FINANCIAL ASSETS - OTHERS (CURRENT)
` in Lakhs
Particulars As at
March 31, 2017
As at March 31, 2016
As at April 01, 2015
Advances to Related Parties 25.85 0.44 444.37
Export Incentives Receivable 15.75 37.37 82.94
Interest Receivable 46.54 92.40 212.41
Forward Contract Recievable 103.28 – 5.70
Total 191.42 130.21 745.42
NOTE 17: OTHER CURRENT ASSETS
` in Lakhs
Particulars As at
March 31, 2017
As at March 31, 2016
As at April 01, 2015
Export Incentives Receivable 772.69 30.96 30.02
Prepaid Expenses 736.59 316.75 488.86
Other Advances 84.72 340.47 482.61
Balances with Excise and VAT Authorities 1,832.72 1,722.65 1,807.55
Prepaid Lease 51.02 20.43 20.43
Total 3,477.74 2,431.26 2,829.47

Notes forming part of Financial Statementsfor the year ended March 31, 2017
Consolidated156
NOTE 18: EQUITY SHARE CAPITAL
` in Lakhs
Particulars As at
March 31, 2017
As at March 31, 2016
As at April 01, 2015
Authorised
4,40,00,000 (4,40,00,000) Equity shares of ` 10/- par value 4,400.00 4,400.00 4,400.00
6,00,000 (6,00,000) 6% Non Cumulative Redeemable Preference Shares of ` 100/- par value
600.00 600.00 600.00
Total Authorised Share Capital 5,000.00 5,000.00 5,000.00
Issued, Subscribed & Paid Up
2,06,62,400 (2,06,62,400) Equity Shares ` 10/- par value fully paid - up
2,066.24 2,066.24 2,066.24
22,95,822 (22,95,822) Equity Shares of ` 10/- par value, ` 3/- called up
68.87 68.87 68.87
Total issued, subscribed and paid up share capital 2,135.11 2,135.11 2,135.11
a) Reconciliation of the number of shares outstanding :
Particulars As at March 31, 2017 As at March 31, 2016 As at April 01, 2015
No. of Shares ` in Lakhs No. of Shares ` in Lakhs No. of Shares ` in Lakhs
Shares at the beginning 22,958,222 2,135.11 22,958,222 2,135.11 20,662,400 2,066.02
Add: Rights Issue of Equity Shares made during the year
– – – – 2,295,822 68.87
Add : Calls in arrears received during the year
– – – – – –
Less: Shares Forfeited during the year – – – – (4,335) (0.21)
Add : Re-issue of Forfeited Shares – – – – 4,335 0.43
Shares at the end 22,958,222 2,135.11 22,958,222 2,135.11 22,958,222 2,135.11
b) Equity shares are entitled to one vote per share.
c) Shareholders holding more than 5% shares each :
Name of the Shareholder As at March 31, 2017 As at March 31, 2016 As at April 01, 2015
No. of Shares % No. of Shares % No. of Shares %
K.K.Modi Investment and Financial Services Pvt. Ltd.
10,273,073 44.75% 10,098,073 43.99% 9,748,073 42.46%
APMS Investment Fund Ltd.(FII) 1,635,822 7.13% 1,945,822 8.48% 2,295,822 10.00%
U.P. State Indl. Dev. Corp. Ltd. 2,169,956 9.45% 2,169,956 9.45% 2,169,956 9.45%
Rajputana Fertilisers Ltd. 1,916,666 8.35% 1,916,666 8.35% 1,916,666 8.35%

Notes forming part of Financial Statementsfor the year ended March 31, 2017
Annual Report 2016-17 157
COMPANY OVERVIEW
1-36 37-81 82-184
STATUTORY REPORTS FINANCIAL STATEMENTS
A Rupee Term Loans:
1. Term Loan amounting to ` 3,000 lakhs (` 4,000 lakhs
as on March 31, 2016 and ` 5,000 lakhs as on April
01, 2015) carries interest at the rate of 11.75% p.a.
(11.75% p.a. as on March 31, 2016 and 12.75% as on
April 01, 2015) as at year end and is repayable in 12
Equal quarterly installments of ` 250 lakhs each.
2. Term Loan amounting to ` 656.25 lakhs (` 1,125
lakhs as on March 31, 2016 and ` 1500 lakhs as
on April 01, 2015) carries interest at the rate of
11.95% p.a. (12.20% p.a as on March 31, 2016 and
12.70% as on April 01, 2015 ) as at year end and
is repayable in 7 Equal quarterly installments of
` 93.75 lakhs each.
3. Term loan amounting to ` 760.13 lakhs (Nil) carries
interest at the rate of 11.00% p.a. as at year end and is
repayable 20 quarterly installments of ` 75 lakhs each
starting from December 01, 2017
4. Hire purchase loan amounting to ` 131.29 lakhs,
outstanding as on March 31, 2016 has been repaid
during the year.
B Foreign Currency Term Loans:
1 All term loans carry interest rate between of 3.00% p.a.
to 5.00% p.a. (3.00% p.a. to 5.00% p.a. as on March 31,
2016 and April 01, 2015)
2. Term loan amounting to ` 4,477.26 lakhs (` 5,873.25
lakhs as on March 31, 2016 and ` 6,132.94 lakhs as
on April 01, 2015) is repayable over 11 installments of
` 231.58 lakhs each and 1 installment of ` 1,929.86
lakhs.
3. Term loan amounting to ` 1,325.83 lakhs (` 1,873.38
lakhs as on March 31, 2016 and Nil as on April 01, 2015)
is repayable over 40 equated monthly installments of `
33.15 lakhs each.
4. Term loan amounting to ` 4,936.69 lakhs (` 5,046.38
lakhs as on March 31, 2016 and Nil as on April 01,
2015) is repayable over 15 quaterly installments of
` 148.10 lakhs each and 10 quaterly installments of `
271.52 lakhs each.
5. Term loan amounting to ` 5,307.21 lakhs (` 2,942.91
lakhs as on March 31, 2016 and Nil as on April 01,
2015) is repayable over 48 monthly installments of `
110.57 lakhs each starting from March 31, 2018.
6. Term loan amounting to ` 3,589.95 lakhs (` 822.59
lakhs as on March 31, 2016 and Nil as on April 01,
2015) is repayable over 48 monthly installments of `
74.79 lakhs each starting from March 31, 2018.
7. Term loan amounting to ` 1,016.64 lakhs (Nil) is
repayable over 20 quarterly installments of ` 125 lakhs
each starting from November 30, 2017.
8. Term loan amounting to ̀ 6,380.45 lakhs (` 8,172.83 lakhs
as on March 31, 2016 and ` 7,594.92 lakhs as on April
01, 2015) is repayable over 11 quaterly installments of
` 335.81 lakhs each and 1 installments of ` 2,686.50
lakhs each.
9. Term loan amounting to ` 4,957 lakhs (` 6340.94 lakhs
as on March 31, 2016 and ` 5,890.28 lakhs as on April
01, 2015) is repayable over 19 quaterly installments of
` 260.89 lakhs each.
10. Term loan amounting to ` 5,685.69 lakhs (` 7,282.90
lakhs as on March 31, 2016 and ` 6,767.91 lakhs
as on April 01, 2015) is repayable over 19 quaterly
installments of ` 268.98 lakhs each.
NOTE 19: FINANCIAL LIABILITIES (LONG TERM BORROWINGS)
` in Lakhs
Particulars As at
March 31, 2017
As at March 31, 2016
As at April 01, 2015
From Banks (Secured):
Rupee Term Loan 2,891.38 3,750.00 5,000.00
Foreign Currency Term Loan 49,966.03 33,622.04 24,925.45
Rupee Hire Purchase Loans – 55.24 131.29
Total 52,857.41 37,427.28 30,056.74

Notes forming part of Financial Statementsfor the year ended March 31, 2017
Consolidated158
NOTE 20: FINANCIAL LIABILITIES - OTHERS (NON-CURRENT)
` in Lakhs
Particulars As at
March 31, 2017
As at March 31, 2016
As at April 01, 2015
Security Deposit Received from Customers 1,150.03 1,021.83 930.53
Financial Gurantee Obligation 127.78 195.34 243.84
Others 76.43 76.43 76.43
Total 1,354.24 1,293.60 1,250.80
NOTE 21: PROVISIONS (NON-CURRENT)
` in Lakhs
Particulars As at
March 31, 2017
As at March 31, 2016
As at April 01, 2015
Provision for Employee Benefits 1,024.52 851.30 699.10
Total 1,024.52 851.30 699.10
NOTE 22: FINANCIAL LIABILITIES (SHORT TERM BORROWINGS)
` in Lakhs
Particulars As at
March 31, 2017
As at March 31, 2016
As at April 01, 2015
At Amortised Cost (Secured)
Working Capital Loans from Banks 28,413.64 32,007.53 41,762.12
Total 28,413.64 32,007.53 41,762.12
(Secured by first pari passu charge, by way of hypothecation of Company’s current assets and other movable assets and
second pari passu charge on the fixed assets both present and future, inter se the Term Lenders).
11. Term loans amounting to ` 18,224.97 lakhs (Nil) is
repayable over 12 quarterly installments of ` 532.84
lakhs each and 16 quarterly installments of ` 710.45
lakhs each starting from September 30, 2018
All the above term loans, except loans amounting to `
5,803.10 lakhs (` 7,877.92 lakhs as on March 31, 2016 and
` 6,391.31 lakhs as on April 01, 2015) are secured by first
pari passu charge on the present and future Property, Plant
& Equipment as well as Other Intangible Assets including
Capital Work in Progress of the Company (except those
assets which have been specifically financed) and second
pari passu charge on present and future current assets of the
Company inter se the Working Capital Lenders.
Term Loan amounting to ` 5,803.10 lakhs (` 7,746.63) are
secured by specific assets financed by them.
Term Loan aggregating to ` 656.25 lakhs (` 1,125 lakhs)
have an additional exclusive pari passu charge on the assets
financed by them.
An amount of ` 1,004.65 lakhs (` 796.36 lakhs as at March
31, 2016 and ` 1,344.51 lakhs as on April 01, 2015) has
been held as Debt Service Reserve Account with Bank.
(Refer Note No. 6, 13 and 14)
Amounts falling due in respect of all the above loans
upto March 31, 2017 have been grouped under “Current
maturities of Long Term Debts ‘’ under Note No. 24.

Notes forming part of Financial Statementsfor the year ended March 31, 2017
Annual Report 2016-17 159
COMPANY OVERVIEW
1-36 37-81 82-184
STATUTORY REPORTS FINANCIAL STATEMENTS
NOTE 23: FINANCIAL LIABILITIES - TRADE PAYABLES
` in Lakhs
Particulars As at
March 31, 2017
As at March 31, 2016
As at April 01, 2015
At Amortised Cost
Sundry Creditors for Goods & Services 19,226.96 15,034.53 17,061.70
Total 19,226.96 15,034.53 17,061.70
Based on the information in possession with the Company, no supplier has been identified as being covered under Micro,
Small and Medium Enterprise Development Act, 2006 (“the Act”). Accordingly, no amount of dues outstanding as at 31st
March 2017 have been identified as relating to Micro and Small Enterprises referred to in the said Act.
NOTE 24: FINANCIAL LIABILITIES - OTHERS (CURRENT)
` in Lakhs
Particulars As at
March 31, 2017
As at March 31, 2016
As at April 01, 2015
Current Maturities of Long Term Debts 7,460.66 6,184.19 4,187.81
Interest Accrued but not due on Borrowings 111.21 152.57 139.08
Financial Guarantee Obligation 63.32 64.73 62.04
Forward Contract Payable – 4.47 –
Unclaimed Dividend* 58.42 49.37 40.26
Other Payables 16,835.68 10,253.94 6,814.08
Total 24,529.29 16,709.27 11,243.27
* There is no amount due and outstanding to be credited to Investor Education and Protection Fund
NOTE 25: OTHER CURRENT LIABILITIES
` in Lakhs
Particulars As at
March 31, 2017
As at March 31, 2016
As at April 01, 2015
Other Payables 4,065.92 3,459.95 2,053.92
Total 4,065.92 3,459.95 2,053.92
NOTE 26: PROVISIONS (CURRENT)
` in Lakhs
Particulars As at
March 31, 2017
As at March 31, 2016
As at April 01, 2015
Provision for Employee Benefits 694.12 604.79 513.37
Other – 6.79 6.79
Total 694.12 611.58 520.16

Notes forming part of Financial Statementsfor the year ended March 31, 2017
Consolidated160
NOTE 27: REVENUE FROM OPERATIONS
` in Lakhs
ParticularsYear ended
March 31, 2017
Year ended March 31, 2016
Sale of Products
Agrochemical 172,659.61 152,578.29
Specialty & Performance Chemicals 21,358.25 194,017.86 18,546.08 171,124.37
Interest Income 15.59 12.31
Dividend Income 518.08 518.08
Profit on Sale of Current Investments 18.97 (10.74)
Other Operating Income:
Indenting Commission – 32.38
Compensation Received – –
Export Incentives & Entitlements 1,089.74 145.91
Miscellaneous Income 17.69 4.08
Total 195,677.93 171,826.39
NOTE 28: OTHER INCOME
` in Lakhs
ParticularsYear ended
March 31, 2017
Year ended March 31, 2016
Interest Income 315.85 299.42
Dividend Income 1.14 1.43
Profit on Sale of Current Investments 67.38 –
Foreign Exchange Fluctuation (Net) 836.16
Other Non - Operating Income:
Profit on Sale of Assets 3.69 –
Guarantee Commission 63.32 64.90
Rent Income 7.20 7.20
Insurance Claims 64.81 26.53
Sundry Balance Written Back 15.45 6.17
Gain on Fair Valuation of FVTPL Investments 55.78 –
Others 13.86 26.60
Total 1,444.64 432.25
NOTE 29: COST OF MATERIALS CONSUMED
` in Lakhs
ParticularsYear ended
March 31, 2017
Year ended March 31, 2016
Raw Material Consumed 67,756.99 66,940.83
Packing Material Consumed 6,940.77 6,603.70
Total 74,697.76 73,544.53

Notes forming part of Financial Statementsfor the year ended March 31, 2017
Annual Report 2016-17 161
COMPANY OVERVIEW
1-36 37-81 82-184
STATUTORY REPORTS FINANCIAL STATEMENTS
NOTE 30: PURCHASE OF STOCK IN TRADE
` in Lakhs
ParticularsYear ended
March 31, 2017
Year ended March 31, 2016
Purchase of Stock in Trade 10,832.95 8,394.72
Total 10,832.95 8,394.72
NOTE 31: CHANGES IN INVENTORIES OF FINISHED GOODS AND STOCK IN TRADE
` in Lakhs
ParticularsYear ended
March 31, 2017
Year ended March 31, 2016
Opening Stocks :
Finished Goods 14,170.40 15,703.01
Stock In Trade 3,068.25 3,255.32
Less : Closing Stocks :
Finished Goods 12,642.84 14,170.40
Stock In Trade 2,860.30 3,068.25
Net Change In Inventories 1,735.51 1,719.68
NOTE 32: EMPLOYEE BENEFIT EXPENSES
` in Lakhs
ParticularsYear ended
March 31, 2017
Year ended March 31, 2016
Salaries, Wages and Bonus 11,840.04 10,485.44
Contribution to Provident and Other Funds 892.84 766.07
Gratuity 115.31 100.08
Staff Welfare Expenses 1,106.60 939.29
Total 13,954.79 12,290.88
NOTE 33: FINANCE COST
` in Lakhs
ParticularsYear ended
March 31, 2017
Year ended March 31, 2016
Interest Expenses 3,548.66 4,988.25
Other Borrowing Costs 582.94 935.34
Total 4,131.60 5,923.59

Notes forming part of Financial Statementsfor the year ended March 31, 2017
Consolidated162
NOTE 34: OTHER EXPENSES
` in Lakhs
ParticularsYear ended
March 31, 2017
Year ended March 31, 2016
Consumption of Stores and Spares 904.90 1,083.60
Power, Fuel and Utilities 3,594.90 3,682.96
Processing Charges 4,706.67 3,222.16
Excise Duty * 84.65 (150.26)
Lease Rent / Hire Charges 616.90 541.25
Repairs to Building 293.67 372.46
Repairs to Plant and Machinery 1,285.05 856.77
Other Repairs 432.11 347.23
Insurance 529.77 494.98
Rates and Taxes 248.33 138.65
Pollution Control Expenses 526.46 426.86
Legal and Professional Fees 4,495.54 3,732.28
General Office Expenses 3,378.48 2,631.36
Foreign Exchange Fluctuation (Net) – 388.33
Advertisement, Publicity & Sales Promotion 8,161.85 5,800.03
Outward Freight Charges 6,044.21 4,609.38
Loading and Unloading Charges 246.36 217.06
Provision for Doubtful Debts 701.12 719.90
Travelling and Conveyance 3,175.40 2,922.87
Payment to Auditors
- Audit Fees 26.71 21.25
- Transfer Pricing Audit Fees 4.50 4.50
- Taxation and Other Advisory Matters 17.25 11.55
- Certification Charges and Others 8.00 5.50
- Reimbursement of Expenses 0.50 56.96 0.50 43.30
Corporate Social Responsibility 306.29 208.31
Donations 354.80 41.54
Loss on Sale of Fixed Assets (Net) – 2.59
Loss on Fair Valuation of FVTPL Investments 8.53
Provision for Diminution in Value of Investment – 200.00
Bad Debts 10.43 –
Total Other Expenses 40,154.85 32,542.14
* Represents the difference between the Excise Duty on Opening and Closing Stock of Finished Goods.

Notes forming part of Financial Statementsfor the year ended March 31, 2017
Annual Report 2016-17 163
COMPANY OVERVIEW
1-36 37-81 82-184
STATUTORY REPORTS FINANCIAL STATEMENTS
NOTE 35(I): FIRST TIME ADOPTION OF INDIAN ACCOUNTING STANDARDS (IND AS)The financial statements of the Group, for the year ended March 31, 2017, have been prepared in accordance with the Indian Accounting Standards (“Ind AS”) prescribed under the section 133 of the Companies Act 2013, read with the Companies (Indian Accounting Standards) Rules, 2015 . For all periods upto and including the year ended March 31, 2016, the Group prepared its financial statements in accordance with the Accounting Standards (“Indian GAAP”) notified under the section 133 of the Companies Act 2013, read together with paragraph 7 of the Companies (Accounts) Rules, 2014.
Accordingly, the Group has prepared the comparative period data as at and for the year ended March 31, 2016, as described in the summary of significant accounting policies. In preparing these financial statements, the Group’s opening balance sheet was prepared as at April 01, 2015, the Group’s date of transition to Ind AS. This note explains the principal adjustments made by the Group in restating its Indian GAAP financial statements as at and for the year ended March 31, 2016, including the balance sheet as at April 01, 2015.
Exemptions appliedInd AS 101 “First-time adoption of Indian Accounting Standards” allows first-time adopters certain exemptions from the retrospective application of certain requirements under Ind AS. The Group has applied the following exemptions:
1 As per Ind AS 101, a first-time adopter has an option, inter alia, to use carrying values of property, plant and equipment and intangible assets as on the date of transition to Ind AS, if there has been no change in its functional currency on the date of transition. The Group has accordingly elected to continue with the carrying values under previous GAAP for all the items of property, plant and equipment and intangible assets.
2 Ind AS 101, permits an entity to continue the policy adopted for accounting of exchange differrences arising from translation of long-term foreign currency monetary items recognised in the financial statements for the period ending immediately before the begning of the first Ind AS financial reporting period as per the provision of Indian GAAP. The Group has accordingly elected to continue with the same.
3 Ind AS 101 permits an entity to designate particular equity investments (other than equity investment in subsidiaries, associates and joint arrangements) as at fair value through other comprehensive income (FVOCI) based on facts and circumstances at the date of transition to Ind AS (rather than at initial recognition). Other equity investments are classified as fair value through profit or loss (FVTPL).
The Group has opted to avail this exemption to designate certain equity investments as FVOCI on the date of transition.
4 The Group holds 51% interest in Indobaijin Chemicals Private Limited. The shareholders agreement indicated the arrangement as a Joint Venture. However, in terms of provisions of AS 27 , “Financial Reporting of Interests in Joint Ventures”, the Group has consolidated its interest in the entity as a subsidiary. In terms of the provisions of Ind AS 111 “Joint Arrangements”, the Group’s interest in the entity has been classified as Joint Venture.
5 The Group has elected to apply previous GAAP carrying amount of its investment in subsidiaries, associates and Joint venture as deemed cost as on the date of transition to Ind AS.
Exceptions1 Estimates The estimates at 1 April 2015 and 31 March 2016
are consistent with those made for the same dates in accordance with Indian GAAP (after adjustments to reflect any differences if any, in accounting policies) apart from the following items where application of Indian GAAP did not require estimation:
- FVOCI – unquoted equity shares
- Impairment of financial assets based on expected credit loss model
The estimates used by the Group to present these amounts in accordance with Ind AS reflect conditions at 1 April 2015 and as at 31 March 2016.
2 Classification and measurement of financial assets The Group has classified the financial assets in accordance
with Ind AS 109 on the basis of facts and circumstances that exist at the date of transition to Ind AS.

Notes forming part of Financial Statementsfor the year ended March 31, 2017
Consolidated164
NOTE 35(II): RECONCILATION OF EQUITY AS AT APRIL 01, 2015 AND MARCH 31, 2016
` in Lakhs
Particulars
As at March 31, 2016
As at April 01, 2015
Indian GAAP Adjustments Ind AS Indian GAAP Adjustments Ind AS
ASSETS
Non - Current Assets
Property, Plant & Equipment 55,291.78 (28,557.59) 26,734.19 53,772.18 (29,083.31) 24,688.87
Capital Work - In - Progress 15,769.82 – 15,769.82 5,397.35 – 5,397.35
Investment Property – – – – – –
Other Intangible Assets 32,157.35 (502.53) 31,654.82 32,195.94 (15.34) 32,180.60
Intangible Assets under Development 8,988.30 – 8,988.30 8,358.03 – 8,358.03
Financial Assets – –
(i) Investments 6,109.54 74,507.51 80,617.05 5,467.47 25,814.63 31,282.10
(ii) Loans 11,235.60 (9,167.79) 2,067.81 9,785.39 (7,643.52) 2,141.87
(iii) Others 1,286.27 1,286.27 607.86 607.86
Deferred Tax Assets 3,808.62 3,808.62 3,757.68 3,757.68
Non - Current Tax Assets (Net) – 87.31 87.31
Other Non - Current Assets 323.07 2,331.28 2,654.35 269.11 1,122.80 1,391.91
Total Non - Current Assets 129,875.46 43,705.77 173,581.23 115,245.47 (5,351.89) 109,893.58
Current Assets
Inventories 27,569.77 (1,181.10) 26,388.67 28,397.38 (733.10) 27,664.28
Financial Assets
(i) Investments – – – –
(ii) Trade Receivables 46,719.44 (2,337.27) 44,382.17 43,868.01 (848.36) 43,019.65
(iii) Cash & Cash Equivalents 4,247.18 (1,408.70) 2,838.48 2,037.05 (597.27) 1,439.78
(iv) Bank Balance other than (iii) above 413.67 413.67 – 172.38 172.38
(v) Loans 3,410.69 (2,510.69) 900.00 3,748.40 (2,848.40) 900.00
(vi) Others – 130.21 130.21 – 745.42 745.42
Other Current Assets 189.57 2,241.69 2,431.26 327.40 2,502.07 2,829.47
Total Current Assets 82,136.65 (4,652.19) 77,484.46 78,378.24 (1,607.26) 76,770.98
Total Assets 212,012.11 39,053.58 251,065.69 193,623.71 (6,959.15) 186,664.56
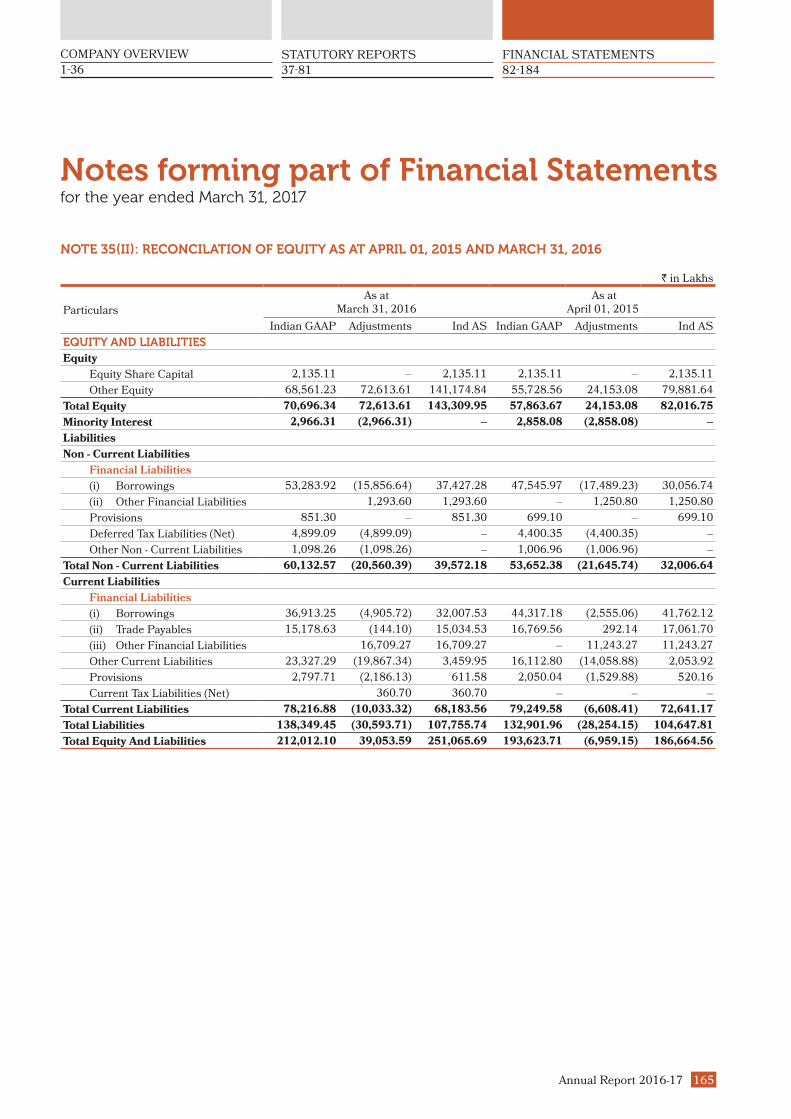
Notes forming part of Financial Statementsfor the year ended March 31, 2017
Annual Report 2016-17 165
COMPANY OVERVIEW
1-36 37-81 82-184
STATUTORY REPORTS FINANCIAL STATEMENTS
NOTE 35(II): RECONCILATION OF EQUITY AS AT APRIL 01, 2015 AND MARCH 31, 2016
` in Lakhs
Particulars
As at March 31, 2016
As at April 01, 2015
Indian GAAP Adjustments Ind AS Indian GAAP Adjustments Ind AS
EQUITY AND LIABILITIES
Equity
Equity Share Capital 2,135.11 – 2,135.11 2,135.11 – 2,135.11
Other Equity 68,561.23 72,613.61 141,174.84 55,728.56 24,153.08 79,881.64
Total Equity 70,696.34 72,613.61 143,309.95 57,863.67 24,153.08 82,016.75
Minority Interest 2,966.31 (2,966.31) – 2,858.08 (2,858.08) –
Liabilities
Non - Current Liabilities
Financial Liabilities
(i) Borrowings 53,283.92 (15,856.64) 37,427.28 47,545.97 (17,489.23) 30,056.74
(ii) Other Financial Liabilities 1,293.60 1,293.60 – 1,250.80 1,250.80
Provisions 851.30 – 851.30 699.10 – 699.10
Deferred Tax Liabilities (Net) 4,899.09 (4,899.09) – 4,400.35 (4,400.35) –
Other Non - Current Liabilities 1,098.26 (1,098.26) – 1,006.96 (1,006.96) –
Total Non - Current Liabilities 60,132.57 (20,560.39) 39,572.18 53,652.38 (21,645.74) 32,006.64
Current Liabilities
Financial Liabilities
(i) Borrowings 36,913.25 (4,905.72) 32,007.53 44,317.18 (2,555.06) 41,762.12
(ii) Trade Payables 15,178.63 (144.10) 15,034.53 16,769.56 292.14 17,061.70
(iii) Other Financial Liabilities 16,709.27 16,709.27 – 11,243.27 11,243.27
Other Current Liabilities 23,327.29 (19,867.34) 3,459.95 16,112.80 (14,058.88) 2,053.92
Provisions 2,797.71 (2,186.13) 611.58 2,050.04 (1,529.88) 520.16
Current Tax Liabilities (Net) 360.70 360.70 – – –
Total Current Liabilities 78,216.88 (10,033.32) 68,183.56 79,249.58 (6,608.41) 72,641.17
Total Liabilities 138,349.45 (30,593.71) 107,755.74 132,901.96 (28,254.15) 104,647.81
Total Equity And Liabilities 212,012.10 39,053.59 251,065.69 193,623.71 (6,959.15) 186,664.56

Notes forming part of Financial Statementsfor the year ended March 31, 2017
Consolidated166
NOTE 35(III): RECONCILATION OF STATEMENT OF PROFIT AND LOSS FOR THE YEAR ENDED MARCH 31, 2016
` in Lakhs
Particulars
For the year ended March 31, 2016
Indian GAAP Adjustments Ind AS
INCOME
Revenue from Operations 168,600.48 3,225.91 171,826.39
Other Income 188.26 243.99 432.25
Total Income 168,788.74 3,469.90 172,258.64
EXPENSES
Excise Duty on Sale of Goods 11,754.10 11,754.10
Cost of Material Consumed 71,766.36 1,778.17 73,544.53
Purchase of Stock In Trade 8,275.97 118.75 8,394.72
Changes in Inventories of Finished Goods / Stock in Trade 1,704.27 15.41 1,719.68
Employee Benefit Expenses 13,468.64 (1,177.76) 12,290.88
Finance Cost 7,388.87 (1,465.28) 5,923.59
Depreciation and Amortisation 6,710.56 (1,893.43) 4,817.13
Other Expenses 38,900.87 (6,358.73) 32,542.14
Total Expenses 148,215.54 2,771.23 150,986.77
Profit Before Tax 20,573.20 698.67 21,271.87
Tax Expenses
Current Tax 4,820.95 55.52 4,876.47
Deferred Tax 498.74 (127.61) 371.13
Deferred Tax - MAT Credit Entitlement (422.07) (4.93) (427.00)
(Excess) / Short Provision of Earlier Years (1.62) – (1.62)
Profit After Tax 15,677.20 775.69 16,452.89
Unrealised Profit on Stock in Hand (31.84) 31.84
Minority Interest 391.21 (391.21)
Share of Profit / (Loss) of Joint Ventures (0.04) (397.52) (397.56)
Profit For The Year 16,036.53 18.80 16,055.33
Other Comprehensive Income to be reclassified to
Profit & Loss in subsequent years
Exchange Differences on Translation of Financial Statements of Foreign Operations – (2,115.10) (2,115.10)
Other Comprehensive Income not to be reclassified to
Profit & Loss in subsequent years
Re-measurement of Gains / (Losses) on Defined Benefit Plans – (250.21) (250.21)
Net Gain (Loss) on FVOCI Equity Securities – 48,807.83 48,807.83
Share of OCI of Joint Ventures – – –
Tax Effect relating to aforesaid items – 50.59 50.59
Total Other Comprehensive Income for the year – 46,493.11 46,493.11
Total Comprehensive Income for the year 16,036.53 46,511.91 62,548.44
NOTE 35 (IV): NOTES TO RECONCILATION OF EQUITY AS AT APRIL 01, 2015 AND MARCH 31, 2016 AND PROFIT & LOSS FOR THE YEAR ENDED MARCH 31, 2016
1 Joint Venture
The group holds 51% interest in Indobaijin Chemicals
Pvt. Ltd. By virtue of the holding-subsidiary relationship,
the group had consolidated its interest as Subsidiary
under Indian GAAP using total consolidation approach.
However, under Ind AS, interest in Joint Ventures are
required to be consolidated using Equity Method.
2 Deferred Tax on Undistributed Profits / Losses of
Joint Ventures
Ind AS 12 on “Income Taxes”, in certain cases, requires
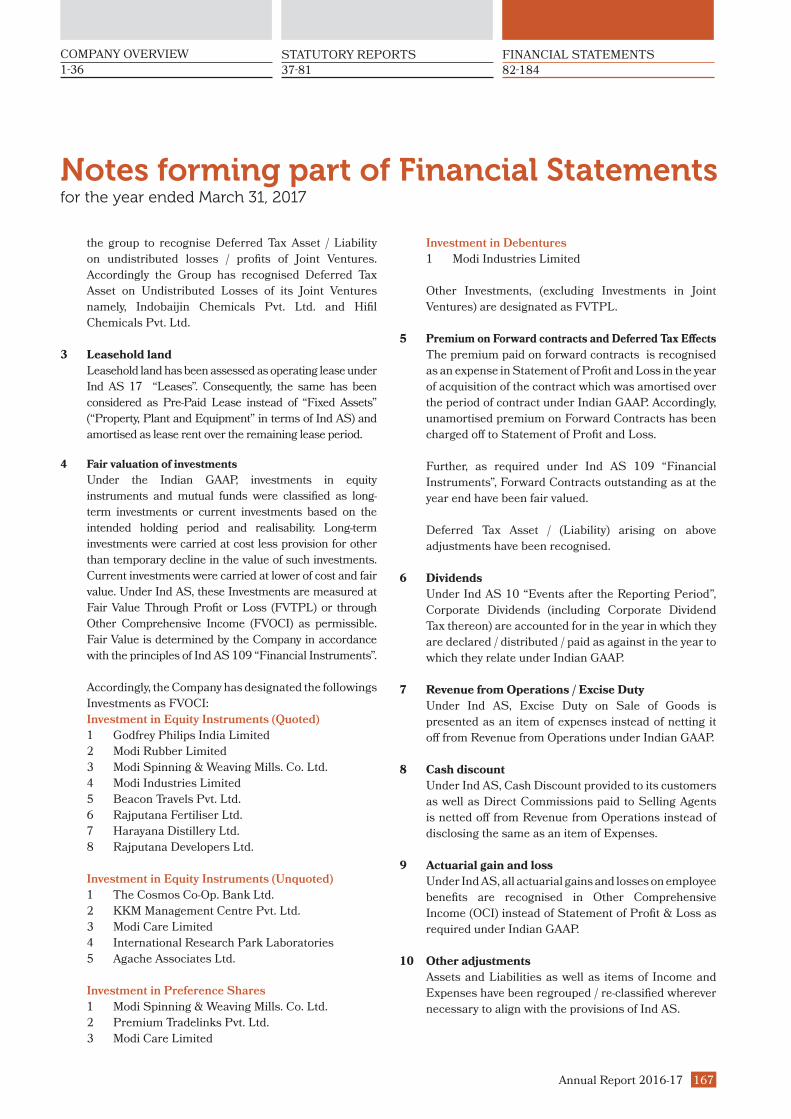
Notes forming part of Financial Statementsfor the year ended March 31, 2017
Annual Report 2016-17 167
COMPANY OVERVIEW
1-36 37-81 82-184
STATUTORY REPORTS FINANCIAL STATEMENTS
the group to recognise Deferred Tax Asset / Liability
on undistributed losses / profits of Joint Ventures.
Accordingly the Group has recognised Deferred Tax
Asset on Undistributed Losses of its Joint Ventures
namely, Indobaijin Chemicals Pvt. Ltd. and Hifil
Chemicals Pvt. Ltd.
3 Leasehold land
Leasehold land has been assessed as operating lease under
Ind AS 17 “Leases”. Consequently, the same has been
considered as Pre-Paid Lease instead of “Fixed Assets”
(“Property, Plant and Equipment” in terms of Ind AS) and
amortised as lease rent over the remaining lease period.
4 Fair valuation of investments
Under the Indian GAAP, investments in equity
instruments and mutual funds were classified as long-
term investments or current investments based on the
intended holding period and realisability. Long-term
investments were carried at cost less provision for other
than temporary decline in the value of such investments.
Current investments were carried at lower of cost and fair
value. Under Ind AS, these Investments are measured at
Fair Value Through Profit or Loss (FVTPL) or through
Other Comprehensive Income (FVOCI) as permissible.
Fair Value is determined by the Company in accordance
with the principles of Ind AS 109 “Financial Instruments”.
Accordingly, the Company has designated the followings
Investments as FVOCI:
Investment in Equity Instruments (Quoted)
1 Godfrey Philips India Limited
2 Modi Rubber Limited
3 Modi Spinning & Weaving Mills. Co. Ltd.
4 Modi Industries Limited
5 Beacon Travels Pvt. Ltd.
6 Rajputana Fertiliser Ltd.
7 Harayana Distillery Ltd.
8 Rajputana Developers Ltd.
Investment in Equity Instruments (Unquoted)
1 The Cosmos Co-Op. Bank Ltd.
2 KKM Management Centre Pvt. Ltd.
3 Modi Care Limited
4 International Research Park Laboratories
5 Agache Associates Ltd.
Investment in Preference Shares
1 Modi Spinning & Weaving Mills. Co. Ltd.
2 Premium Tradelinks Pvt. Ltd.
3 Modi Care Limited
Investment in Debentures
1 Modi Industries Limited
Other Investments, (excluding Investments in Joint
Ventures) are designated as FVTPL.
5 Premium on Forward contracts and Deferred Tax Effects
The premium paid on forward contracts is recognised
as an expense in Statement of Profit and Loss in the year
of acquisition of the contract which was amortised over
the period of contract under Indian GAAP. Accordingly,
unamortised premium on Forward Contracts has been
charged off to Statement of Profit and Loss.
Further, as required under Ind AS 109 “Financial
Instruments”, Forward Contracts outstanding as at the
year end have been fair valued.
Deferred Tax Asset / (Liability) arising on above
adjustments have been recognised.
6 Dividends
Under Ind AS 10 “Events after the Reporting Period”,
Corporate Dividends (including Corporate Dividend
Tax thereon) are accounted for in the year in which they
are declared / distributed / paid as against in the year to
which they relate under Indian GAAP.
7 Revenue from Operations / Excise Duty
Under Ind AS, Excise Duty on Sale of Goods is
presented as an item of expenses instead of netting it
off from Revenue from Operations under Indian GAAP.
8 Cash discount
Under Ind AS, Cash Discount provided to its customers
as well as Direct Commissions paid to Selling Agents
is netted off from Revenue from Operations instead of
disclosing the same as an item of Expenses.
9 Actuarial gain and loss
Under Ind AS, all actuarial gains and losses on employee
benefits are recognised in Other Comprehensive
Income (OCI) instead of Statement of Profit & Loss as
required under Indian GAAP.
10 Other adjustments
Assets and Liabilities as well as items of Income and
Expenses have been regrouped / re-classified wherever
necessary to align with the provisions of Ind AS.

Notes forming part of Financial Statementsfor the year ended March 31, 2017
Consolidated168
NOTE 36: CONTINGENT LIABILITIES
1 Consequent to termination of the contract by the erstwhile Indofil Chemicals Company (Division of Modipon Ltd.,) a toll
manufacturer filed a suit against the Chemical Division preferring claim for ` 314.50 lakhs allegedly on account of items
purchased and loss of profits. However, the company had refuted the claim and had, on the contrary made a counterclaim
of ̀ 476.31 lakhs against the said toll manufacturer in respect of the cost of machinery, cost of raw materials, yield losses,
loss of market etc. Based on the merits, the Management is of the view that the counterclaim is likely to succeed and will
be adjusted/accounted for in the year of final settlement/receipt.
2 Disputed Liabilities on account of Sales Tax, Entry Tax, Excise Duty and Service Tax as at March 31, 2017
` in Lakhs
StatuteFinancial Year to which matter pertains
Forum where matter is pending
As at
March 31, 2017
As at March 31, 2016
As at March 31, 2015
Madhya Pradesh VAT Act , 2002 2009-10 Addl Commr. 27.21 27.21 27.21
Maharashtra VAT Act , 2002 2005-06 Dy.Commr. 13.50 13.50 13.50
Madhya Pradesh Entry Tax Act 2009-10 / 2012-13 Addl Commr. 59.86 59.86 59.86
Central Sales Tax Act , 1956
2000-01 / 2003-04 /2004-05 / 2005-06 / 2006-07 /2007-08 / 2008-09/ 2009-10 / 2012-13
Dy.Commr. / Addl Commr / Jt. Commr.
221.80 175.18 175.18
Central Excise Act,1944 2004-05 / 2005-06 / 2008-09 / 2012-13
CESTAT / Asstt Commr./ Jt. Commr.
56.11 56.11 56.11
The Finance Act, 1994 2001-02 / 2005-06 / 2006-07 /2008-09
Commr.(Appeal)/ Asstt Commr. / CESTAT
109.96 109.96 109.96
Total 488.44 441.82 441.82
3 Gurantees Executed in favour of Corporates
` in Lakhs
Particulars As at
March 31, 2017
As at March 31, 2016
As at April 01, 2015
Guarantees Executed in Favour of Corporates 19,909.43 23,470.98 22,644.20
Less: Counter Guarantees Received (9,755.62) (11,500.78) (11,095.66)
Net Gurantees Executed in favour or Corporates 10,153.81 11,970.20 11,548.54
4 Comittments
` in Lakhs
Particulars As at
March 31, 2017
As at March 31, 2016
As at April 01, 2015
Estimated Amount of Contracts remaining to be executed on capital account
8,269.72 10,396.49 674.06
Less: Advances Paid (2,776.15) (7,641.89) (303.60)
Net Capital Commitments 5,493.57 2,754.60 370.46
On evaluation of individual cases, the Management is of the view that no provision in respect of the above is called for.

Notes forming part of Financial Statementsfor the year ended March 31, 2017
Annual Report 2016-17 169
COMPANY OVERVIEW
1-36 37-81 82-184
STATUTORY REPORTS FINANCIAL STATEMENTS
NOTE 37: EARNINGS PER SHARE
` in Lakhs
Particulars For the year ended
March 31, 2017
For the year endedMarch 31, 2016
Profit for the year as per Statement of Profit & Loss 25,930.56 16,055.33
Weighted Average No. of Equity Shares for of Face Value ` 10 each 21,351,147 21,351,147
Earnings Per Share - Basic & Diluted 121.45 75.20
NOTE 38: CAPITAL MANAGEMENTThe Group’s objective for Capital Management is to
maximise shareholder value, safeguard business continuity,
and support the growth of the Group. Capital includes,
Equity Capital, Securities Premium and other reserves and
surplus attributable to the equity shareholders of the Group.
The capital requirement is determined based on annual
operating plans and long term and strategic investment and
capital expenditure plans of each company within the group.
The funding requirements are met through a mix of equity,
operating cash flows generated and debt. The operating
management, supervised by the Board of Directors of each
Company within the Group as well as the Board of Directors
of the parent company regularly monitors its key gearing
ratios and other financials parameters and takes corrective
actions wherever necessary. The relevant quantitative
information on the aforesaid parameters are disclosed in
these financial statements.
NOTE 39: FINANCIAL RISK MANAGEMENT AND POLICIESThe Group’s activities exposes it to a variety of financial
risks: market risks, credit risks and liquidity risks. The
Group’s focus is to foresee the unpredictability of financial
markets and seek to minimise potential adverse effects on its
financial performance. The Group has an established Risk
Management Policy towards risk identification, analysis &
prioritisation of risks, development of risk mitigation plans &
reporting on the risk environment of the respective business
segments in the Group.
The Group’s principal financial liabilities, other than
derivatives, comprise loans and borrowings, trade and
other payables, and financial guarantee contracts. The
main purpose of these financial liabilities is to finance the
Group’s operations and to provide guarantees to support its
operations. The Group’s principal financial assets include
investments, loans, trade and other receivables, and cash
and cash equivalents that derive directly from its operations.
(a) Management of Market Risks
The Group’s size and operation results in it being
exposed to the following market risks that arise from its
use of financial instruments
Currency Risk
Interest Rate Risk
Price Risk
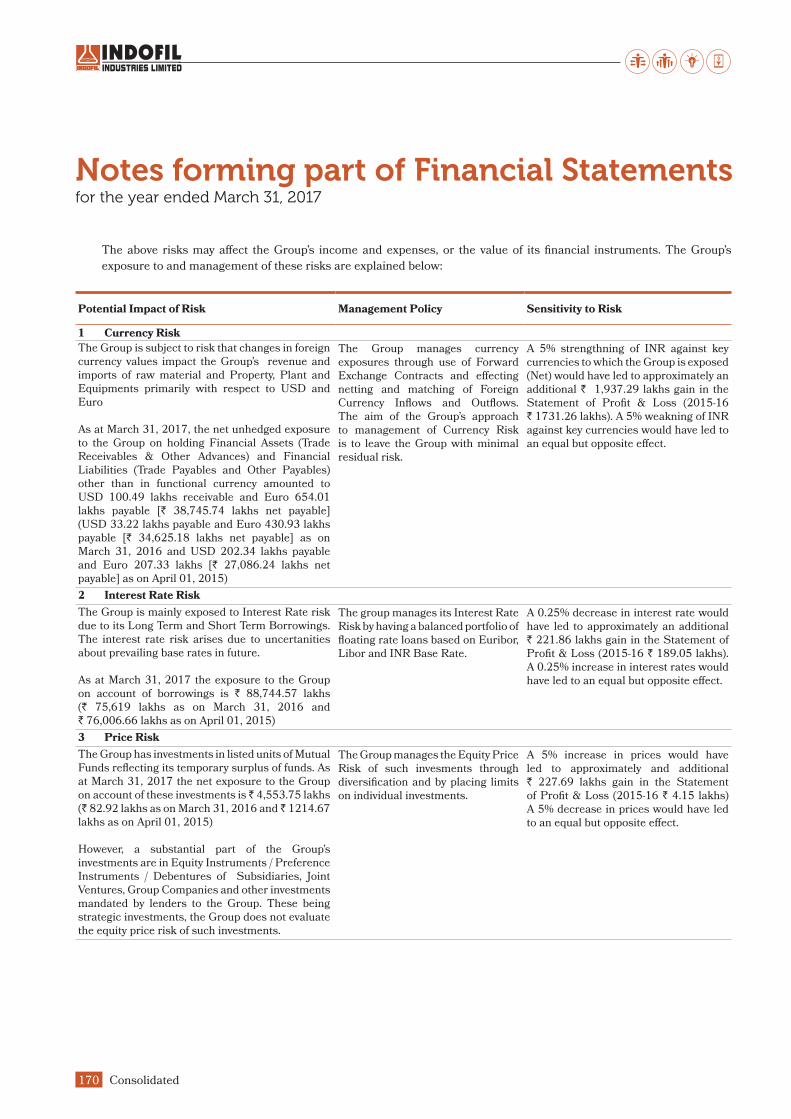
Notes forming part of Financial Statementsfor the year ended March 31, 2017
Consolidated170
The above risks may affect the Group’s income and expenses, or the value of its financial instruments. The Group’s
exposure to and management of these risks are explained below:
Potential Impact of Risk Management Policy Sensitivity to Risk
1 Currency Risk
The Group is subject to risk that changes in foreign currency values impact the Group’s revenue and imports of raw material and Property, Plant and Equipments primarily with respect to USD and Euro
As at March 31, 2017, the net unhedged exposure to the Group on holding Financial Assets (Trade Receivables & Other Advances) and Financial Liabilities (Trade Payables and Other Payables) other than in functional currency amounted to USD 100.49 lakhs receivable and Euro 654.01 lakhs payable [` 38,745.74 lakhs net payable] (USD 33.22 lakhs payable and Euro 430.93 lakhs payable [` 34,625.18 lakhs net payable] as on March 31, 2016 and USD 202.34 lakhs payable and Euro 207.33 lakhs [` 27,086.24 lakhs net payable] as on April 01, 2015)
The Group manages currency exposures through use of Forward Exchange Contracts and effecting netting and matching of Foreign Currency Inflows and Outflows. The aim of the Group’s approach to management of Currency Risk is to leave the Group with minimal residual risk.
A 5% strengthning of INR against key currencies to which the Group is exposed (Net) would have led to approximately an additional ` 1,937.29 lakhs gain in the Statement of Profit & Loss (2015-16 ` 1731.26 lakhs). A 5% weakning of INR against key currencies would have led to an equal but opposite effect.
2 Interest Rate Risk
The Group is mainly exposed to Interest Rate risk due to its Long Term and Short Term Borrowings. The interest rate risk arises due to uncertanities about prevailing base rates in future.
As at March 31, 2017 the exposure to the Group on account of borrowings is ` 88,744.57 lakhs (` 75,619 lakhs as on March 31, 2016 and ` 76,006.66 lakhs as on April 01, 2015)
The group manages its Interest Rate Risk by having a balanced portfolio of floating rate loans based on Euribor, Libor and INR Base Rate.
A 0.25% decrease in interest rate would have led to approximately an additional ` 221.86 lakhs gain in the Statement of Profit & Loss (2015-16 ` 189.05 lakhs). A 0.25% increase in interest rates would have led to an equal but opposite effect.
3 Price Risk
The Group has investments in listed units of Mutual Funds reflecting its temporary surplus of funds. As at March 31, 2017 the net exposure to the Group on account of these investments is ̀ 4,553.75 lakhs (` 82.92 lakhs as on March 31, 2016 and ̀ 1214.67 lakhs as on April 01, 2015)
However, a substantial part of the Group’s investments are in Equity Instruments / Preference Instruments / Debentures of Subsidiaries, Joint Ventures, Group Companies and other investments mandated by lenders to the Group. These being strategic investments, the Group does not evaluate the equity price risk of such investments.
The Group manages the Equity Price Risk of such invesments through diversification and by placing limits on individual investments.
A 5% increase in prices would have led to approximately and additional ` 227.69 lakhs gain in the Statement of Profit & Loss (2015-16 ` 4.15 lakhs) A 5% decrease in prices would have led to an equal but opposite effect.
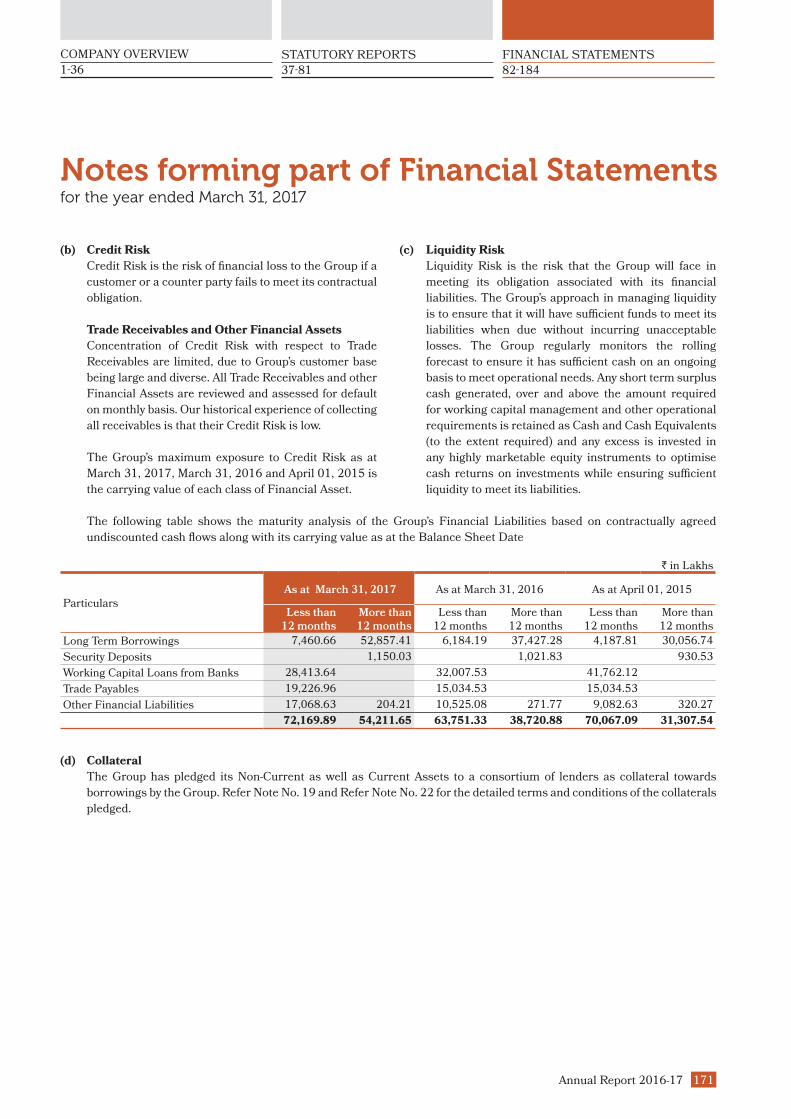
Notes forming part of Financial Statementsfor the year ended March 31, 2017
Annual Report 2016-17 171
COMPANY OVERVIEW
1-36 37-81 82-184
STATUTORY REPORTS FINANCIAL STATEMENTS
The following table shows the maturity analysis of the Group’s Financial Liabilities based on contractually agreed
undiscounted cash flows along with its carrying value as at the Balance Sheet Date
` in Lakhs
Particulars As at March 31, 2017 As at March 31, 2016 As at April 01, 2015
Less than
12 months
More than
12 months
Less than 12 months
More than 12 months
Less than 12 months
More than 12 months
Long Term Borrowings 7,460.66 52,857.41 6,184.19 37,427.28 4,187.81 30,056.74
Security Deposits 1,150.03 1,021.83 930.53
Working Capital Loans from Banks 28,413.64 32,007.53 41,762.12
Trade Payables 19,226.96 15,034.53 15,034.53
Other Financial Liabilities 17,068.63 204.21 10,525.08 271.77 9,082.63 320.27
72,169.89 54,211.65 63,751.33 38,720.88 70,067.09 31,307.54
(d) Collateral
The Group has pledged its Non-Current as well as Current Assets to a consortium of lenders as collateral towards
borrowings by the Group. Refer Note No. 19 and Refer Note No. 22 for the detailed terms and conditions of the collaterals
pledged.
(b) Credit Risk
Credit Risk is the risk of financial loss to the Group if a
customer or a counter party fails to meet its contractual
obligation.
Trade Receivables and Other Financial Assets
Concentration of Credit Risk with respect to Trade
Receivables are limited, due to Group’s customer base
being large and diverse. All Trade Receivables and other
Financial Assets are reviewed and assessed for default
on monthly basis. Our historical experience of collecting
all receivables is that their Credit Risk is low.
The Group’s maximum exposure to Credit Risk as at
March 31, 2017, March 31, 2016 and April 01, 2015 is
the carrying value of each class of Financial Asset.
(c) Liquidity Risk
Liquidity Risk is the risk that the Group will face in
meeting its obligation associated with its financial
liabilities. The Group’s approach in managing liquidity
is to ensure that it will have sufficient funds to meet its
liabilities when due without incurring unacceptable
losses. The Group regularly monitors the rolling
forecast to ensure it has sufficient cash on an ongoing
basis to meet operational needs. Any short term surplus
cash generated, over and above the amount required
for working capital management and other operational
requirements is retained as Cash and Cash Equivalents
(to the extent required) and any excess is invested in
any highly marketable equity instruments to optimise
cash returns on investments while ensuring sufficient
liquidity to meet its liabilities.
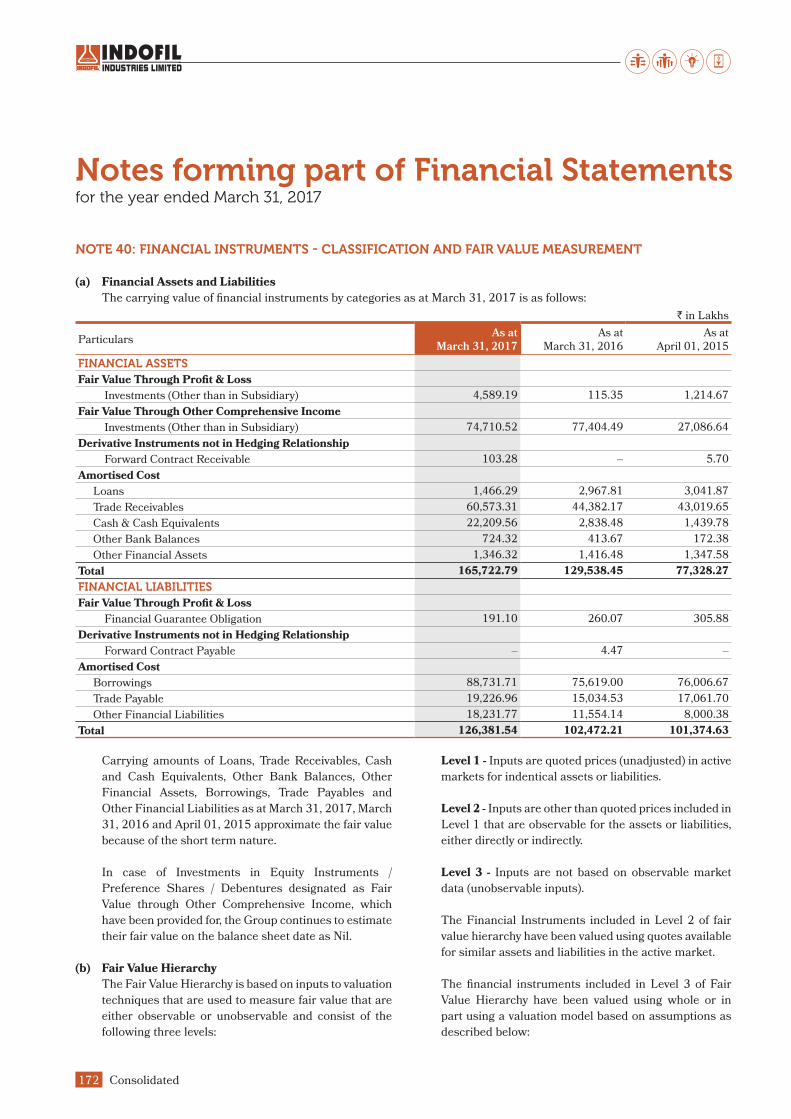
Notes forming part of Financial Statementsfor the year ended March 31, 2017
Consolidated172
NOTE 40: FINANCIAL INSTRUMENTS - CLASSIFICATION AND FAIR VALUE MEASUREMENT
(a) Financial Assets and Liabilities
The carrying value of financial instruments by categories as at March 31, 2017 is as follows:
` in Lakhs
Particulars As at
March 31, 2017
As at March 31, 2016
As at April 01, 2015
FINANCIAL ASSETS
Fair Value Through Profit & Loss
Investments (Other than in Subsidiary) 4,589.19 115.35 1,214.67
Fair Value Through Other Comprehensive Income
Investments (Other than in Subsidiary) 74,710.52 77,404.49 27,086.64
Derivative Instruments not in Hedging Relationship
Forward Contract Receivable 103.28 – 5.70
Amortised Cost
Loans 1,466.29 2,967.81 3,041.87
Trade Receivables 60,573.31 44,382.17 43,019.65
Cash & Cash Equivalents 22,209.56 2,838.48 1,439.78
Other Bank Balances 724.32 413.67 172.38
Other Financial Assets 1,346.32 1,416.48 1,347.58
Total 165,722.79 129,538.45 77,328.27
FINANCIAL LIABILITIES
Fair Value Through Profit & Loss
Financial Guarantee Obligation 191.10 260.07 305.88
Derivative Instruments not in Hedging Relationship
Forward Contract Payable – 4.47 –
Amortised Cost
Borrowings 88,731.71 75,619.00 76,006.67
Trade Payable 19,226.96 15,034.53 17,061.70
Other Financial Liabilities 18,231.77 11,554.14 8,000.38
Total 126,381.54 102,472.21 101,374.63
Carrying amounts of Loans, Trade Receivables, Cash
and Cash Equivalents, Other Bank Balances, Other
Financial Assets, Borrowings, Trade Payables and
Other Financial Liabilities as at March 31, 2017, March
31, 2016 and April 01, 2015 approximate the fair value
because of the short term nature.
In case of Investments in Equity Instruments /
Preference Shares / Debentures designated as Fair
Value through Other Comprehensive Income, which
have been provided for, the Group continues to estimate
their fair value on the balance sheet date as Nil.
(b) Fair Value Hierarchy
The Fair Value Hierarchy is based on inputs to valuation
techniques that are used to measure fair value that are
either observable or unobservable and consist of the
following three levels:
Level 1 - Inputs are quoted prices (unadjusted) in active
markets for indentical assets or liabilities.
Level 2 - Inputs are other than quoted prices included in
Level 1 that are observable for the assets or liabilities,
either directly or indirectly.
Level 3 - Inputs are not based on observable market
data (unobservable inputs).
The Financial Instruments included in Level 2 of fair
value hierarchy have been valued using quotes available
for similar assets and liabilities in the active market.
The financial instruments included in Level 3 of Fair
Value Hierarchy have been valued using whole or in
part using a valuation model based on assumptions as
described below:

Notes forming part of Financial Statementsfor the year ended March 31, 2017
Annual Report 2016-17 173
COMPANY OVERVIEW
1-36 37-81 82-184
STATUTORY REPORTS FINANCIAL STATEMENTS
Fair Value of Investment in Unquoted Equity Shares / Preference Shares / Debentures is determined based on the Net Asset
Value of the Investee Company as on the Balance Sheet Date.
Fair Value of the Financial Guarantee Obligation is determined through a Discounted Cash Flow Model using weighted
average borrowing rate as the discount rate.
For Assets and Liabilities which are measured at Fair Values as at the Balance Sheet date, the classification of fair value
calculations by category is summarised below:
` in Lakhs
Particulars As at
March 31, 2017
As at March 31, 2016
As at April 01, 2015
Financial Assets
Level 1
Investment in Quoted Equity Shares 74,357.30 77,062.99 26,290.29
Mutual Fund Units 4,589.19 115.35 1,214.67
Level 2
Derivative Financial Assets 103.28 – 5.70
Level 3
Investment in Unquoted Equity Shares 353.22 341.50 796.35
Total 79,402.99 77,519.84 28,307.01
Financial Liability
Level 2
Derivative Financial Liability – 4.47 –
Level 3
Financial Guarantee Obligation 191.10 260.07 305.88
Total 191.10 264.54 305.88
Description of Significant Unobservable Input used in Fair Value measurement categorised within Level 3 of Fair Value
Hierarchy
Particulars Significant Unobservable Input
Sensitivity of Input to Fair Value Measurement
Investment in Unquoted Equity Shares Fair Value of Net Assets
5% increase in forecasted fair value will increase the value of investment by ` 27.13 lakhs (` 26.75 lakhs as on March 31, 2016 and 5% decrease will have equal but opposite effect.
Financial Guarantee Obligation Discount Rate 6.23%
1 % increase in Discount Rate will have P&L Loss of ` 1.24 lakhs (` 1.27 lakhs as on March 31, 2016) and a 1% decrease in Discount Rate will have a equal but opposite effect.
(c) Reconcilatison of Level 3 Fair Value Measurement
` in Lakhs
Particulars As at
March 31, 2017
As at March 31, 2016
Opening Balance of Level 3 Financial Assets / (Liability) 81.41 490.47
Add / (Less): Changes during the year
Guarantee Commission Income recognised 63.32 64.90
Fair Valuation Gain / (Loss) on Investments in Unquoted Equity Instruments through OCI 11.73 (454.86)
Fair Valuation Gain / (Loss) on Financial Guarantee Obligation 5.65 (19.10)
Closing Balance of Level 3 Financial Assets / (Liability) 162.11 81.41

Notes forming part of Financial Statementsfor the year ended March 31, 2017
Consolidated174
NOTE 41: LEASES The Group has entered into Operating Leases on Immovable Properties and Plant & Machinery. There are no escalation clauses in the lease arrangements for which Lease Rent is provided on straight line basis.
Future minimum rentals payable under non-cancellable operating leases as at 31 March are, as follows:
` in Lakhs
Sr. No.
Particulars As at
March 31, 2017
As at March 31, 2016
(a) In respect of operating lease on Immovable properties and Plant & Machineries lease payments recognised in Statement of Profit and Loss.
616.90 541.25
(b) Future minimum lease payments under operating leases
For a period not later than one year 245.45 236.98
For the period later than one year and not later than five years 417.33 354.26
Assets Given on Lease
` in Lakhs
Sr. No.
Particulars As at
March 31, 2017
As at March 31, 2016
(a) In respect of Immovable properties given under operating lease, lease rent received and recognised in Statement of Profit and Loss.
7.20 7.20
(b) Future minimum lease payments under operating leases
For a period not later than one year 7.20 7.20
For the period later than one year and not later than five years 28.80 28.80
NOTE 42: RELATED PARTYList of related parties
Joint Ventures (Extent of holding)
Indo baijin Chemicals Private Ltd (51%)
Hifil Chemicals Private Ltd (49%)
Other Related Parties in which directors are interested
Godfrey Phillips India Ltd
H.M.A. Udyog Pvt. Ltd.
Modi Care Ltd.
Beacon Travels Pvt. Ltd.
Bina Fashions & Food Pvt. Ltd.
Premium Merchants Ltd.
Modi Rubber Ltd.
KKM Management Centre Pvt. Ltd
Key Management Personnel
Executive Director
Mr. Krishan Kumar Modi
Ms. Charu Modi
Mr Atuchutni Rao
Pankaj Patil
Ashrant Bhartia
Mukter Ahmed Sarkar
Non Executive Director
Ms. Aliya Modi
Mr. Samir Modi
Mr. Mahendra Naranji Thakkar
Mr. Sunil Kumar Alagh
Mr. Sanjay Buch
Mr. Lakshminarayanan Subramanian
Mr. Amit Kumar Ghosh (with effect
from 9th September, 2016)
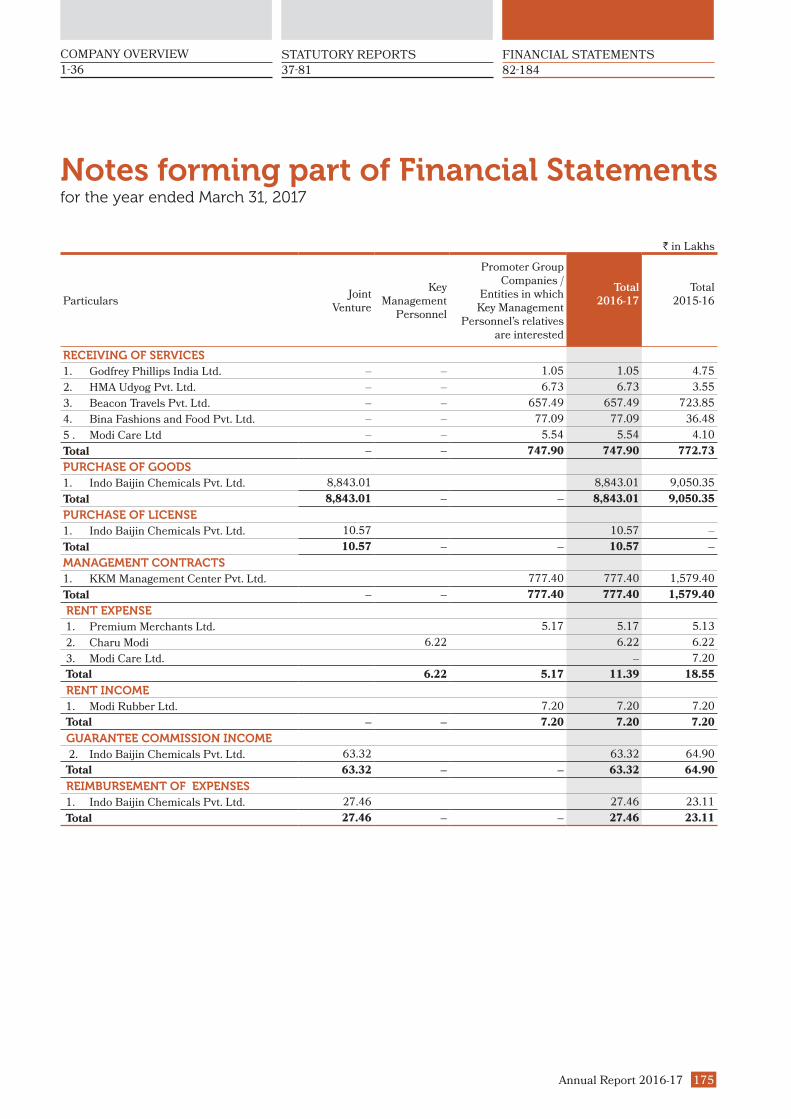
Notes forming part of Financial Statementsfor the year ended March 31, 2017
Annual Report 2016-17 175
COMPANY OVERVIEW
1-36 37-81 82-184
STATUTORY REPORTS FINANCIAL STATEMENTS
` in Lakhs
ParticularsJoint
Venture
Key Management
Personnel
Promoter Group Companies /
Entities in which Key Management
Personnel’s relatives are interested
Total
2016-17
Total 2015-16
RECEIVING OF SERVICES
1. Godfrey Phillips India Ltd. – – 1.05 1.05 4.75
2. HMA Udyog Pvt. Ltd. – – 6.73 6.73 3.55
3. Beacon Travels Pvt. Ltd. – – 657.49 657.49 723.85
4. Bina Fashions and Food Pvt. Ltd. – – 77.09 77.09 36.48
5 . Modi Care Ltd – – 5.54 5.54 4.10
Total – – 747.90 747.90 772.73
PURCHASE OF GOODS
1. Indo Baijin Chemicals Pvt. Ltd. 8,843.01 8,843.01 9,050.35
Total 8,843.01 – – 8,843.01 9,050.35
PURCHASE OF LICENSE
1. Indo Baijin Chemicals Pvt. Ltd. 10.57 10.57 –
Total 10.57 – – 10.57 –
MANAGEMENT CONTRACTS
1. KKM Management Center Pvt. Ltd. 777.40 777.40 1,579.40
Total – – 777.40 777.40 1,579.40
RENT EXPENSE
1. Premium Merchants Ltd. 5.17 5.17 5.13
2. Charu Modi 6.22 6.22 6.22
3. Modi Care Ltd. – 7.20
Total 6.22 5.17 11.39 18.55
RENT INCOME
1. Modi Rubber Ltd. 7.20 7.20 7.20
Total – – 7.20 7.20 7.20
GUARANTEE COMMISSION INCOME
2. Indo Baijin Chemicals Pvt. Ltd. 63.32 63.32 64.90
Total 63.32 – – 63.32 64.90
REIMBURSEMENT OF EXPENSES
1. Indo Baijin Chemicals Pvt. Ltd. 27.46 27.46 23.11
Total 27.46 – – 27.46 23.11

Notes forming part of Financial Statementsfor the year ended March 31, 2017
Consolidated176
` in Lakhs
ParticularsJoint
Venture
Key Management
Personnel
Promoter Group Companies /
Entities in which Key Management
Personnel’s relatives are interested
Total
2016-17
Total 2015-16
INTEREST INCOME
1. Indo Baijin Chemicals Pvt. Ltd. 182.40 182.40 190.94
Total 182.40 – – 182.40 190.94
LOANS GIVEN DURING THE YEAR
1. Indo Baijin Chemicals Pvt. Ltd. – 560.00
Total – – – 560.00
DIVIDEND INCOME
1. Godfrey Phillips India Ltd. 518.08 518.08 518.08
Total – – 518.08 518.08 518.08
LOANS GIVEN CLOSING BALANCE
1. Indo Baijin Chemicals Pvt. Ltd. 860.80 860.80 1,981.91
Total 860.80 – – 860.80 1,981.91
ADVANCE GIVEN DURING THE YEAR
1. Hilfil Chemicals Pvt. Ltd 0.68 0.68 –
Total – – 0.68 –
ADVANCES CLOSING BALANCE
1. Hilfil Chemicals Pvt. Ltd 0.68 0.68 –
Total 0.68 – – 0.68 –
GURANTEES GIVEN
1. Indo Baijin Chemicals Pvt. Ltd. 10,153.81 10,153.81 23,470.98
Total 10,153.81 – – 10,153.81 23,470.98
OUTSTANDING BALANCES
Receivables
1. Godfrey Phillips India Ltd. – 18.11 18.11 0.78
Total – – 18.11 18.11 0.78
Payables
1. Modi Care Ltd. 0.48 0.48 –
2. Beacon Travels Pvt. Ltd. 50.83 50.83 46.90
3. KKM Management Center Pvt. Ltd. 96.75 96.75 162.17
4. Bina Fashion Pvt. Ltd. 17.94 17.94 0.16
5. Indo Baijin Chemicals Pvt. Ltd. 633.82 633.82 795.79
6. HMA Udyog Pvt ltd 0.61 0.61
Total 633.82 – 166.61 800.43 1,005.01
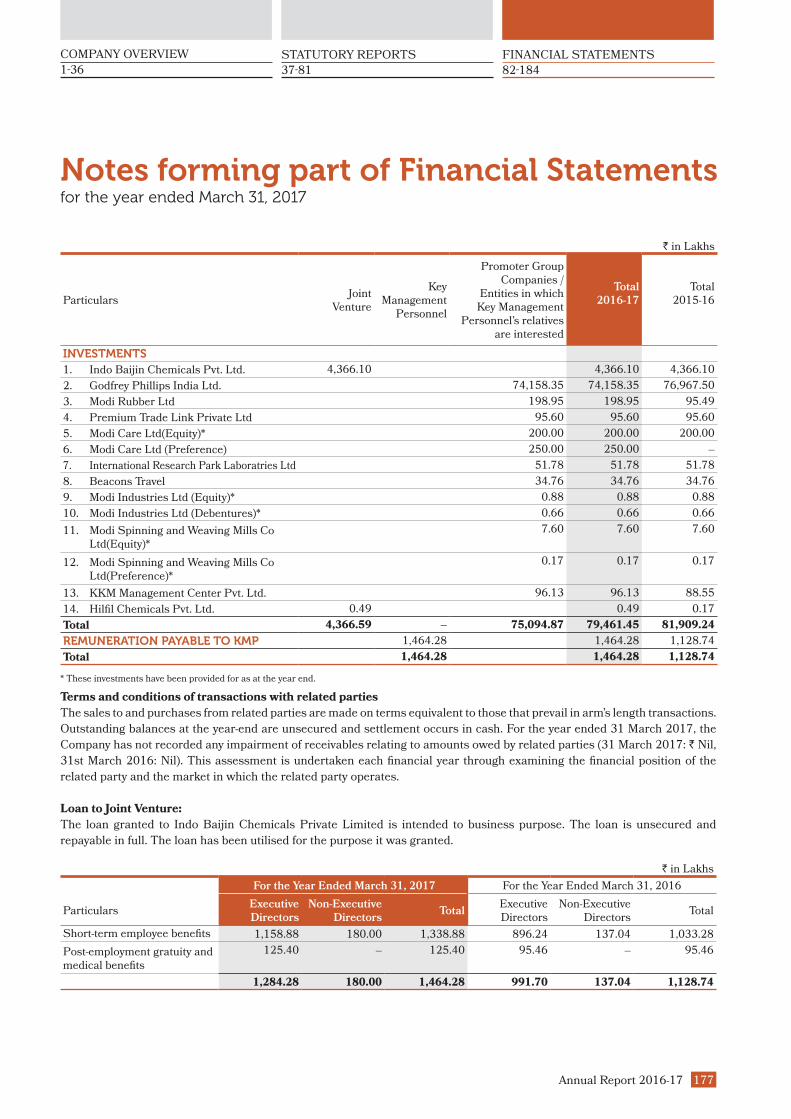
Notes forming part of Financial Statementsfor the year ended March 31, 2017
Annual Report 2016-17 177
COMPANY OVERVIEW
1-36 37-81 82-184
STATUTORY REPORTS FINANCIAL STATEMENTS
` in Lakhs
ParticularsJoint
Venture
Key Management
Personnel
Promoter Group Companies /
Entities in which Key Management
Personnel’s relatives are interested
Total
2016-17
Total 2015-16
INVESTMENTS
1. Indo Baijin Chemicals Pvt. Ltd. 4,366.10 4,366.10 4,366.10
2. Godfrey Phillips India Ltd. 74,158.35 74,158.35 76,967.50
3. Modi Rubber Ltd 198.95 198.95 95.49
4. Premium Trade Link Private Ltd 95.60 95.60 95.60
5. Modi Care Ltd(Equity)* 200.00 200.00 200.00
6. Modi Care Ltd (Preference) 250.00 250.00 –
7. International Research Park Laboratries Ltd 51.78 51.78 51.78
8. Beacons Travel 34.76 34.76 34.76
9. Modi Industries Ltd (Equity)* 0.88 0.88 0.88
10. Modi Industries Ltd (Debentures)* 0.66 0.66 0.66
11. Modi Spinning and Weaving Mills Co Ltd(Equity)*
7.60 7.60 7.60
12. Modi Spinning and Weaving Mills Co Ltd(Preference)*
0.17 0.17 0.17
13. KKM Management Center Pvt. Ltd. 96.13 96.13 88.55
14. Hilfil Chemicals Pvt. Ltd. 0.49 0.49 0.17
Total 4,366.59 – 75,094.87 79,461.45 81,909.24
REMUNERATION PAYABLE TO KMP 1,464.28 1,464.28 1,128.74
Total 1,464.28 1,464.28 1,128.74
* These investments have been provided for as at the year end.
Terms and conditions of transactions with related parties
The sales to and purchases from related parties are made on terms equivalent to those that prevail in arm’s length transactions.
Outstanding balances at the year-end are unsecured and settlement occurs in cash. For the year ended 31 March 2017, the
Company has not recorded any impairment of receivables relating to amounts owed by related parties (31 March 2017: ` Nil,
31st March 2016: Nil). This assessment is undertaken each financial year through examining the financial position of the
related party and the market in which the related party operates.
Loan to Joint Venture:
The loan granted to Indo Baijin Chemicals Private Limited is intended to business purpose. The loan is unsecured and
repayable in full. The loan has been utilised for the purpose it was granted.
` in Lakhs
For the Year Ended March 31, 2017 For the Year Ended March 31, 2016
Particulars Executive
Directors
Non-Executive
Directors Total
Executive Directors
Non-Executive Directors
Total
Short-term employee benefits 1,158.88 180.00 1,338.88 896.24 137.04 1,033.28
Post-employment gratuity and medical benefits
125.40 – 125.40 95.46 – 95.46
1,284.28 180.00 1,464.28 991.70 137.04 1,128.74

Notes forming part of Financial Statementsfor the year ended March 31, 2017
Consolidated178
NOTE 43: SUMARISED FINANCIAL INFORMATION FOR JOINT VENTUREThe Group has a 51% equity interest in Indobaijin Chemicals Pvt. Ltd. and 49% equity interest in HIFIL Chemicals Pvt. Ltd,
joint ventures involved in Manufacture, Marketing and Distribution of Chemicals. The Group’s interest in both of these JVs is
accounted for in the consolidated financial statements, using the Equity Method prescribed under Ind AS 28 - Investment in
Associates and Joint Ventures. Summarised Financial Information of the Joint Venture, based on its Financial Statements and
reconciliation with the carrying amount of the investment in consolidated financial statements are set out below:
Indobaijin Chemicals Pvt. Ltd.
A Summarised Balance Sheet :
Particulars As at
March 31, 2017
As at March 31, 2016
As at April 01, 2015
Current Assets 4,623.40 4,665.68 3,121.96
Non-Current Assets 26,645.30 28,286.87 28,806.14
Current Liabilities 10,042.23 8,994.90 6,553.18
Non-Current Liabilities 11,959.03 17,885.03 19,530.65
Equity 9,267.44 6,072.62 5,844.27
Carrying Amount of Investment 4,726.39 3,097.04 2,980.58
B Summarised Statement of Profit and Loss:
Particulars Year ended
March 31, 2017
Year ended March 31, 2016
Revenue 18,689.09 13,154.66
Cost of Material Consumed 8,472.30 7,246.43
Employee benefit 779.16 931.98
Depreciation & amortisation 1,852.62 1,852.37
Finance cost 1,598.61 1,662.52
Other expense 2,251.37 2,240.82
Profit Before Tax 3,735.03 (779.46)
Income Tax Expense 532.61 –
Profit For The Year 3,202.42 (779.46)
Other Comprehensive Income (7.62) –
Total comprehensive income for the year 3,194.80 (779.46)
Group's Share of Profit For The Year 1,633.24 (397.52)
Group's Share of Other Comprehensive Income (3.89) –
Hifil Chemicals Pvt. Ltd.
A Summarised Balance Sheet :
Particulars As at
March 31, 2017
As at March 31, 2016
As at April 01, 2015
Current Assets 0.44 0.44 0.44
Non-Current Assets – – –
Current Liabilities 0.71 0.08 0.01
Non-Current Liabilities – – –
Equity (0.27) 0.36 0.43
Carrying Amount of Investment – 0.17 0.21
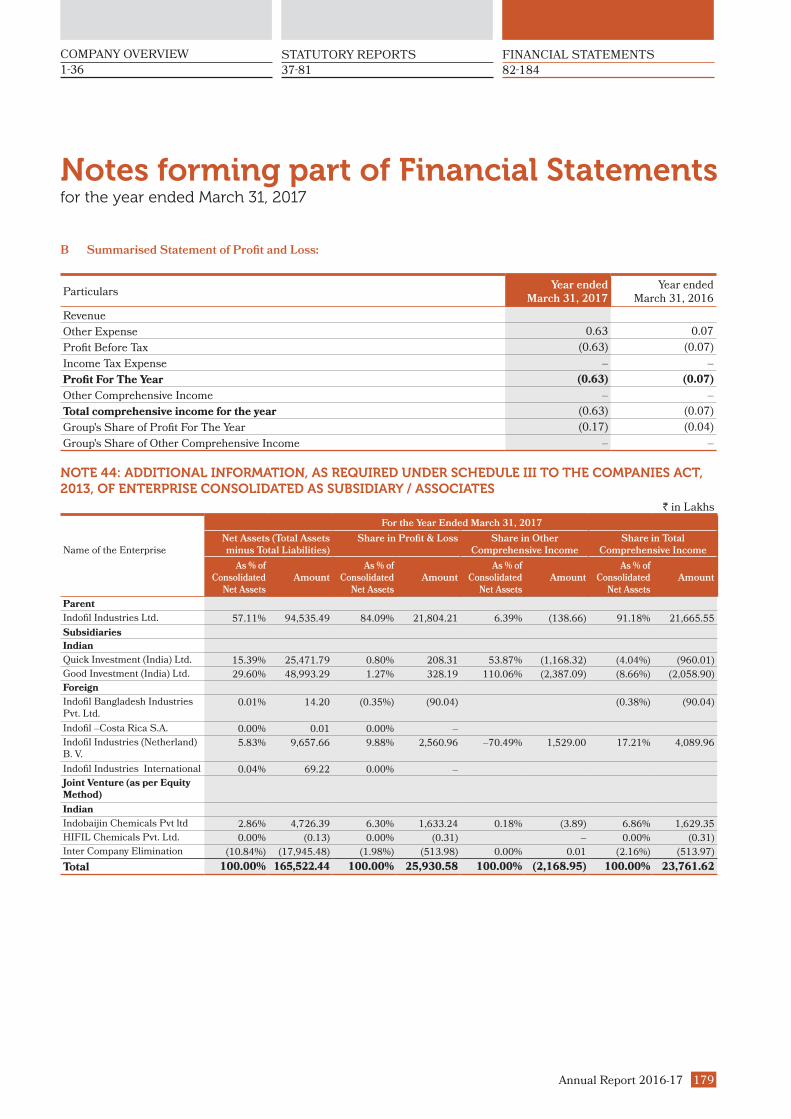
Notes forming part of Financial Statementsfor the year ended March 31, 2017
Annual Report 2016-17 179
COMPANY OVERVIEW
1-36 37-81 82-184
STATUTORY REPORTS FINANCIAL STATEMENTS
B Summarised Statement of Profit and Loss:
Particulars Year ended
March 31, 2017
Year ended March 31, 2016
Revenue
Other Expense 0.63 0.07
Profit Before Tax (0.63) (0.07)
Income Tax Expense – –
Profit For The Year (0.63) (0.07)
Other Comprehensive Income – –
Total comprehensive income for the year (0.63) (0.07)
Group's Share of Profit For The Year (0.17) (0.04)
Group's Share of Other Comprehensive Income – –
NOTE 44: ADDITIONAL INFORMATION, AS REQUIRED UNDER SCHEDULE III TO THE COMPANIES ACT, 2013, OF ENTERPRISE CONSOLIDATED AS SUBSIDIARY / ASSOCIATES
` in Lakhs
Name of the Enterprise
For the Year Ended March 31, 2017
Net Assets (Total Assets
minus Total Liabilities)
Share in Profit & Loss Share in Other
Comprehensive Income
Share in Total
Comprehensive Income
As % of
Consolidated
Net Assets
Amount
As % of
Consolidated
Net Assets
Amount
As % of
Consolidated
Net Assets
Amount
As % of
Consolidated
Net Assets
Amount
Parent
Indofil Industries Ltd. 57.11% 94,535.49 84.09% 21,804.21 6.39% (138.66) 91.18% 21,665.55
Subsidiaries
Indian
Quick Investment (India) Ltd. 15.39% 25,471.79 0.80% 208.31 53.87% (1,168.32) (4.04%) (960.01)
Good Investment (India) Ltd. 29.60% 48,993.29 1.27% 328.19 110.06% (2,387.09) (8.66%) (2,058.90)
Foreign
Indofil Bangladesh Industries Pvt. Ltd.
0.01% 14.20 (0.35%) (90.04) (0.38%) (90.04)
Indofil –Costa Rica S.A. 0.00% 0.01 0.00% –
Indofil Industries (Netherland) B. V.
5.83% 9,657.66 9.88% 2,560.96 –70.49% 1,529.00 17.21% 4,089.96
Indofil Industries International 0.04% 69.22 0.00% –
Joint Venture (as per Equity Method)
Indian
Indobaijin Chemicals Pvt ltd 2.86% 4,726.39 6.30% 1,633.24 0.18% (3.89) 6.86% 1,629.35
HIFIL Chemicals Pvt. Ltd. 0.00% (0.13) 0.00% (0.31) – 0.00% (0.31)
Inter Company Elimination (10.84%) (17,945.48) (1.98%) (513.98) 0.00% 0.01 (2.16%) (513.97)
Total 100.00% 165,522.44 100.00% 25,930.58 100.00% (2,168.95) 100.00% 23,761.62

Notes forming part of Financial Statementsfor the year ended March 31, 2017
Consolidated180
NOTE 45: SEGMENT REPORTING
` in Lakhs
APrimary Segment (by Business Segment)
For the Year Ended March 31, 2017 For the Year Ended March 31, 2016
AGRO SPCD Investment Total AGRO SPCD Investment Total
a) Revenue :
External Sales and other Income 174,702.85 21,404.27 552.63 196,659.76 152,851.55 18,579.39 519.66 171,950.59
Inter Segment Sales Revenue – – – – – – – –
Total Revenue 174,702.85 21,404.27 552.63 196,659.76 152,851.55 18,579.39 519.66 171,950.59
b) Result :
Segment Result 34,268.95 992.36 548.61 35,809.92 26,141.11 748.53 315.89 27,205.53
Unallocable Corporate Expenses (323.98) (318.14)
Unallocable Corporate Income 462.79 308.04
Profit before Interest and Tax 34,268.95 992.36 548.61 35,948.73 26,141.11 748.53 315.89 27,195.43
Less :- Finance Cost 4,131.60 5,923.59
Profit Before Tax 31,817.14 21,271.84
Provision for Tax & Deferred Taxes 7,519.64 4,818.98
Profit After Tax 24,297.50 16,452.86
Share of profit(Loss) of Joint Venture 1,633.06 (397.55)
Profit For the Year 25,930.56 16,055.30
c) Other Information :
Segment Assets 165,948.11 11,047.32 74,470.30 251,465.73 139,564.92 11,938.77 77,249.65 228,753.34
Unallocable Assets 46,222.79 22,312.32
Total Assets 297,688.52 251,065.66
Segment Liabilities 19,580.35 3,263.41 0.76 22,844.52 15,655.96 2,394.23 0.76 18,050.95
Unallocable Liabilities 20,589.83 14,085.76
Total Liabilities 43,434.35 32,136.71
Capital Expenditure during the Year 10,940.80 186.55 – 11,127.35 17,287.85 195.46 – 17,483.31
` in Lakhs
Name of the Enterprise
FY 2015-16
Net Assets (Total Assets minus Total Liabilities)
Share in Profit & LossShare in Other
Comprehensive IncomeShare in Total
Comprehensive Income
As % of Consolidated
Net Assets Amount
As % of Consolidated
Net AssetsAmount
As % of Consolidated
Net AssetsAmount
As % of Consolidated
Net AssetsAmount
Parent
Indofil Industries Ltd. 51.93% 74,419.07 102.89% 16,518.99 –0.37% (169.90) 26.14% 16,349.09
Subsidiaries
Indian
Quick Investment (India) Ltd. 10.08% 14,442.62 1.51% 242.09 35.29% 16,409.13 26.62% 16,651.22
Good Investment (India) Ltd. 43.76% 62,718.33 1.27% 204.50 69.62% 32,368.99 52.08% 32,573.49
Foreign
Indofil Bangladesh Industries Pvt. Ltd.
0.02% 31.84 –0.67% (107.93) 0.00% –0.17% (107.93)
Indofil –Costa Rica S.A. 0.00% 0.01 0.00% – 0.00% 0.00%
Indofil Industries (Netherland) B. V.
5.50% 7,877.46 –2.83% (454.18) –4.55% (2,115.10) –4.11% (2,569.28)
Indofil Industries International 0.00% – 0.00% – 0.00% 0.00%
Joint Venture (as per Equity Method)
Indian
Indobaijin Chemicals Pvt ltd 2.16% 3,097.04 –2.48% (397.52) 0.00% – –0.64% (397.52)
HIFIL Chemicals Pvt. Ltd. 0.00% 0.17 0.00% (0.04) 0.00% – 0.00% (0.04)
Inter Company Elimination –13.45% (19,276.60) 0.31% 49.39 0.00% (0.01) 0.08% 49.38
Total 100.00% 143,309.94 100.00% 16,055.30 100.00% 46,493.11 100.00% 62,548.41

Notes forming part of Financial Statementsfor the year ended March 31, 2017
Annual Report 2016-17 181
COMPANY OVERVIEW
1-36 37-81 82-184
STATUTORY REPORTS FINANCIAL STATEMENTS
NOTE 46: Loans given, Investments made and Corporate Guarantees given u/s 186(4) of the Companies Act, 2013 are
disclosed under the respective notes. Interest and Commission are recovered where incurred.
NOTE 47: Balances of Trade Receivables, Trade Payables, Advances and Deposits received / given, from / to customers are
subject to confirmation and subsequent reconcilation.
NOTE 48: FIGURES IN BRACKETS INDICATE PREVIOUS YEAR’S FIGURES.
` in Lakhs
APrimary Segment (by Business Segment)
For the Year Ended March 31, 2017 For the Year Ended March 31, 2016
AGRO SPCD Investment Total AGRO SPCD Investment Total
Depreciation & Amortisation 5,807.05 106.72 – 5,913.77 4,387.68 111.31 – 4,498.99
Unallocable Depreciation 323.98 318.14
Non-Cash Expense other than Depreciation
701.12 719.90
` in Lakhs
BSecondary Segment Information (by Geographic Segments)
For the Year Ended March 31, 2017 For the Year Ended March 31, 2016
Domestic Export Total Domestic Export Total
Revenues
AGRO 90,140.82 84562.03 174,702.85 79,319.37 73,532.18 152,851.55
SPCD 18,552.69 2851.59 21,404.08 16,333.88 2,245.51 18,579.39
Investment 552.63 552.63 519.66 519.66
Total 109,246.14 87,413.62 196,659.76 96,172.91 75,777.69 171,950.59
Notes:
The Group has identified three reportable business segments viz. Agrochemicals (AGRO), Specialty & Performance Chemicals
Division (SPCD) and Investments as primary segment and geographic segments viz. Domestic and Export as secondary
segment. Segments have been identified and reported taking into account the nature of products and services, the different
risks and returns and the internal business reporting systems. The accounting policies adopted are in line with the accounting
policy of the Company with following additional policies for segment reporting.
i. Revenue and Expenses have been identified to a segment on the basis of relationship to operating activities of the
segment. Revenue and Expenses which relate to enterprise as a whole and are not allocable to a segment on reasonable
basis have been disclosed as “Unallocable”.
ii. Segment Assets and Segment Liabilities represent Assets and Liabilities in respective segments. Tax related assets and
other assets and liabilities that cannot be allocated to a segment on reasonable basis have been disclosed as “Unallocable”.
As per our report attached For and on behalf of the Board of Directors
For BANSI S. MEHTA & CO.,
Chartered Accountants R.K. Malhotra K.K. Modi
Firm Reg. No. 100991W Group CEO Chairman and Managing Director
H.G. BUCH Chintamani D Thatte Charu Modi
Partner Head Compliance & Company Secretary Executive Director
Membership No. 033114
Rajib Mukhopadhyay M.N. Thakkar
DirectorsMumbai, June 29, 2017 Chief Financial Officer Sanjay Buch
Sunil Alagh
Dr. Atchutuni L. Rao
Mumbai, June 29, 2017

Notes forming part of Financial Statementsfor the year ended March 31, 2017
Consolidated182
Notes
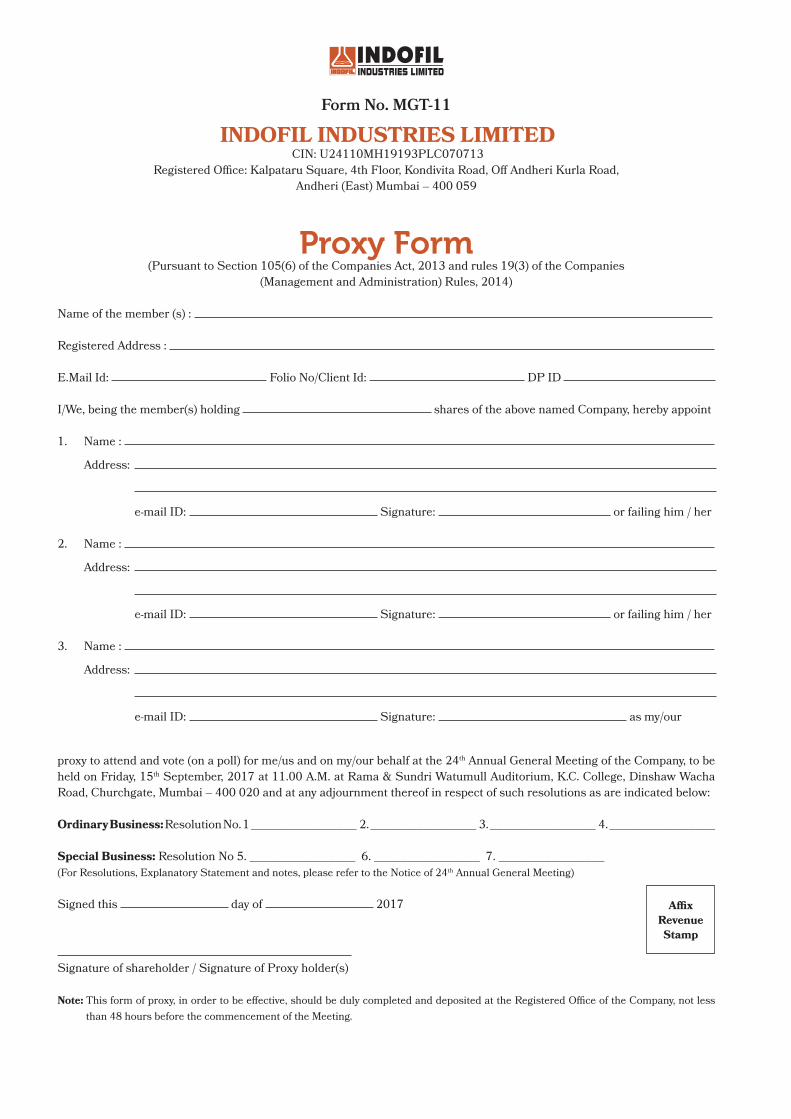
Form No. MGT-11
INDOFIL INDUSTRIES LIMITED CIN: U24110MH19193PLC070713
Registered Office: Kalpataru Square, 4th Floor, Kondivita Road, Off Andheri Kurla Road,
Andheri (East) Mumbai – 400 059
Proxy Form(Pursuant to Section 105(6) of the Companies Act, 2013 and rules 19(3) of the Companies
(Management and Administration) Rules, 2014)
Name of the member (s) :
Registered Address :
E.Mail Id: Folio No/Client Id: DP ID
I/We, being the member(s) holding shares of the above named Company, hereby appoint
1. Name :
Address:
e-mail ID: Signature: or failing him / her
2. Name :
Address:
e-mail ID: Signature: or failing him / her
3. Name :
Address:
e-mail ID: Signature: as my/our
proxy to attend and vote (on a poll) for me/us and on my/our behalf at the 24th Annual General Meeting of the Company, to be
held on Friday, 15th September, 2017 at 11.00 A.M. at Rama & Sundri Watumull Auditorium, K.C. College, Dinshaw Wacha
Road, Churchgate, Mumbai – 400 020 and at any adjournment thereof in respect of such resolutions as are indicated below:
Ordinary Business: Resolution No. 1 ________________ 2. ________________ 3. ________________ 4. ________________
Special Business: Resolution No 5. ________________ 6. ________________ 7. ________________
(For Resolutions, Explanatory Statement and notes, please refer to the Notice of 24th Annual General Meeting)
Signed this day of 2017
Signature of shareholder / Signature of Proxy holder(s)
Note: This form of proxy, in order to be effective, should be duly completed and deposited at the Registered Office of the Company, not less
than 48 hours before the commencement of the Meeting.
Affix Revenue Stamp

ROUTE MAP TO THE VENUE OF THE 24TH ANNUAL GENERAL MEETING OFINDOFIL INDUSTRIES LIMITED

Corporate Information
BOARD OF DIRECTORSMr. K. K. Modi
Chairman and Managing Director
Ms. Charu Modi
Executive Director
Mr. Samir Kumar Modi
Non-Executive, Non Independent
Director
Ms. Aliya Modi
Non-Executive, Non Independent
Director
Mr. M. N. Thakkar
Independent Director
Mr. S. K. Alagh
Independent Director
Mr. Sanjay Buch
Independent Director
Mr. S. Lakshminarayanan,
IAS (Retd.)
Independent Director
Mr. Manoj Singh
Nominee Director - UPSIDCL
(upto September 9, 2016)
Mr. Amit Kumar Ghosh
Nominee Director - UPSIDCL
(upto June 29, 2017)
Mr. Ranvir Prasad
Nominee Director - UPSIDCL
(w.e.f. June 29, 2017)
Dr. Atchutuni Rao
Director - Operations
Mr. R. K. Malhotra
Group Chief Executive Officer
Mr. Chintamani Thatte
Head Compliance & Company
Secretary
Mr. Rajib Mukhopadhyay
Chief Financial Officer
STATUTORY AUDITORSM/s. Bansi S. Mehta & Co.
INTERNAL AND OPERATIONAL AUDITORSM/s. Aneja Associates
COST AUDITORSM/s. Kalpana P. Mehta & Co.
SOLICITORSM/s. Crawford Bayley & Co.
BANKERSUnion Bank of India
IndusInd Bank Ltd.
Rabo Bank plc
Export-Import Bank of India
ICICI Bank Ltd.
Indian Overseas Bank
Bank of India
Syndicate Bank
Hongkong and Shanghai Banking
Corporation Ltd.
South Indian Bank Ltd.
Kotak Mahindra Bank Ltd.
Yes Bank Ltd.
DBS Bank Ltd.
Ratnakar Bank Ltd.
HDFC Bank Ltd.
Cosmos Co-operative Bank Ltd.
The Shamrao Vitthal Co-operative
Bank Ltd.
Development Credit Bank Ltd.
REGISTRAR AND SHARE TRANSFER AGENTMAS Services Limited
T-34, 2nd Floor, Okhla Industrial Area
Phase - II, New Delhi - 110 020.
Tel. No.: 011 2638 7281 - 82 - 83
Fax No.: 011 2638 7384
E-mail: [email protected]
REGISTERED OFFICEKalpataru Square, 4th Floor,
Kondivita Road,
Off Andheri-Kurla Road,
Andheri (East), Mumbai - 400 059.
CIN No. U24110MH1993PLC070713
Tel. No.: +91 22 6663 7373
Fax No.: +91 22 2832 2272
E-mail: [email protected]
Website: www.indofilcc.com
WORKS1. Off S.V. Road, Azad Nagar,
Sandoz Baug,
P. O. Thane - 400 607.
Maharashtra.
Tel. No.: +91 22 6799 9100
Fax No.: +91 22 2589 8357
2. Plot No. Z8, SEZ Area,
Dahej SEZ Limited,
Taluka Vagra, Dist. Bharuch,
Gujarat - 392 130.
Tel No.: +91 2641 677201
Fax No.: +91 2641 304126
3. Plot No. 212, SEZ Area,
Dahej SEZ Limited,
Taluka Vagra,
Dist; Bharuch, Gajaral - 392 130
Tel. No.: +91 2641 282501
Fax No.: +91 2641 304126
Registered Office:Kalpataru Square, 4th Floor, Kondivita Road,Off. Andheri Kurla Road,Andheri East,Mumbai 400 059India
Contact:+91 22 [email protected] | www.indofilcc.com
CIN:U24110MH1993PLC070713