Who gets sick and why?
57
Who gets sick and why? HEALTH PSYCHOLOGY Psych 242 (sect 1) © Prof . T. Revenson October 23, 2013
-
Upload
independent -
Category
Documents
-
view
8 -
download
0
Transcript of Who gets sick and why?

Who gets sick and why?
HEALTH PSYCHOLOGY Psych 242 (sect 1) © Prof. T. Revenson October 23, 2013

Who gets sick and why? Predictors FACTORS ARE RELATED TO WHO GETS SICK? Stress Coping Support Health Behaviors Personality
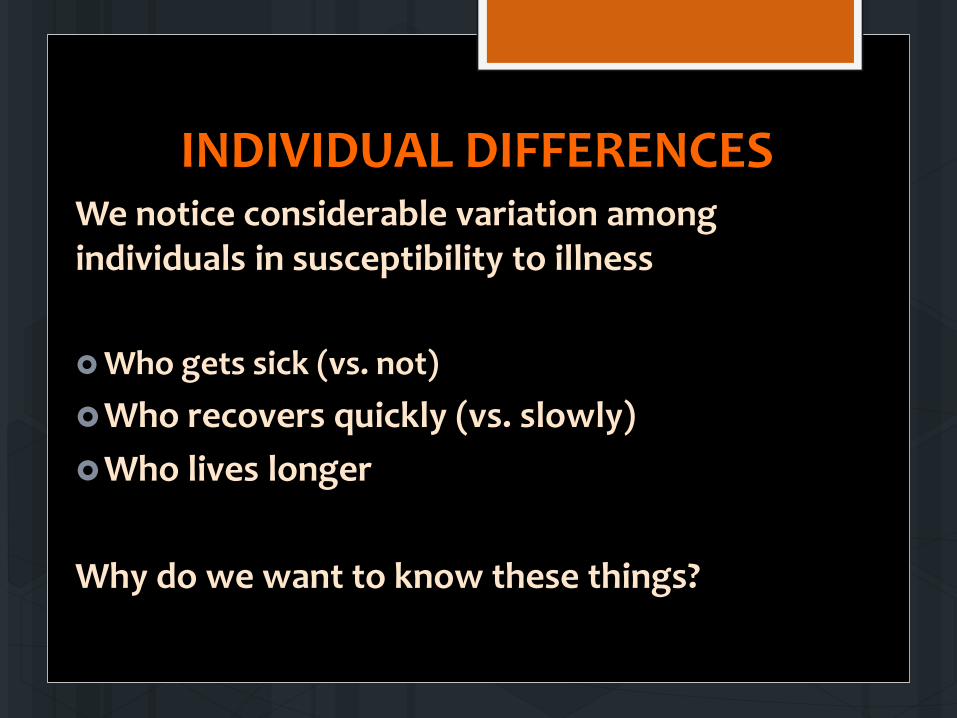
INDIVIDUAL DIFFERENCES We notice considerable variation among individuals in susceptibility to illness Who gets sick (vs. not) Who recovers quickly (vs. slowly) Who lives longer
Why do we want to know these things?

PERSONALITY Personality as characteristics individuals have A person’s pattern of reactions and behaviors Stable dispositions or life orientations Part biologically-based, develops in a family and
cultural environment Predisposes individuals to particular emotional states
Characteristics of persons that are relatively stable over situations and time

5-FACTOR MODEL OF PERSONALITY
extraversion
conscientiousness
neuroticism openness
agreeableness

CAUSATION BETWEEN PERSONALITY AND HEALTH
A correlation or statistical relation is not enough Must be able to suggest causation Can’t do experiments Need prospective longitudinal studies

HOW MIGHT PERSONALITY AFFECT HEALTH?

Social support Exercise Health Health Behaviors
Social support
Self-esteem, Perceived control, Reappraisal Health
Psychological
Social support
Neuroendocrine responses Health
Biological

PLAUSIBLE Mediating Mechanisms How PERSONALITY affects Health
Personality Health
Behaviors Health
Health Behaviors
Personality Self-esteem, Perceived control, Reappraisal
Health
Psychological
Personality Neuroendocrine responses Health
Biological

PROTECTIVE BEHAVIORS Proper nutrition Weight control Exercise Sleep Immunizations Safe driving Regular checkups
RISK BEHAVIORS Smoking/Tobacco use Substance abuse Unprotected sex
Personality Health
Behaviors Health

Personlity Neuroendocrine responses Health

Personality Appraisals Coping
responses
Neuroendocrine responses Health

Personality Self-esteem, Perceived control, Reappraisal
Health

3 Models of how personality may increase illness risk
3 models (pathways) Do not assume that risk is conferred by
only one path

1. Personality-induced hyper-reactivity model

2. Constitutional Predisposition model

3. Dangerous Behaviors model

Personality as a risk factor for health The literature in health psychology focuses primarily on negative personality traits Neuroticism Type A behavior/cynical hostility
Risk Factors

Neuroticism
Another way to talk about negative affect Definition: the tendency to experience negative emotions (frequently) Related to: Greater symptom reports Some actual illnesses – ulcers, chronic fatigue sydrome,
headaches, nausea, asthma, arthritis

TYPE A BEHAVIOR PATTERN

TYPE A BEHAVIOR PATTERN Original model: 3 components 1. A very high competitive drive 2. A constant sense of time urgency 3. Easily-aroused hostility Type B individuals…. Did not show this behavior pattern (it is defined as the absence of Type A)

How do you measure Type A? Self-report questionnaires/scales (10 of 30 items)
Reponse format: Almost always, often, sometimes, almost never
1. I feel presssed for time to meet my deadlines
2. I am competitive with myself and/or with others.
3. I talk rapidly, often with a lot of emphasis in my voice.
4. I am very demanding and critical of myself and others.
5. I notice with irritation the faults in the behavior of others
6. It is hard for me to relax.
7. I am sensitive to criticism or uncomplimentary remarks from others.
8. I get frustrated easily.
9. It is important for me to feel in control of things.
10. In playing any game or sport, I have a real need to win.

How do you measure Type A?
Self-report questionnaires/scales Example: the Jenkins Activity Survey (JAS), Thoresen Chronic Stress Inventory questions about your degree of impatience, job
involvement, competitiveness (based on the SI) Asked to judge whether they experience these qualities
and whether others perceive their behavior in this regard

How do you measure Type A?
Structured Interview (SI) Individual interview Designed to be stressful People are asked questions about ambition, hostility, competiveness, time urgency
But response to interviewer is what counts.

Type A behavior pattern is a person-situation interaction
Persons Contexts

TYPE A BEHAVIOR PATTERN RESEARCH EVIDENCE
Friedman and Rosenman studied 3500 men over an 8-1/2 year period Compared to Type B men, Type A men were: 2 times as likely to develop heart disease 5 times as likely to have a second heart attack 2 times as likely to die from a heart attack Another study of > 3,000 men: Of 133 men who had CHD, 94 (71%) were Type A.

TYPE A BEHAVIOR PATTERN – MECHANISMS (How)
Traditional risk factors Types A’s have higher levels of cholesterol and arterial
damage than Type B’s Type A’s have more fluctuations in blood pressure Type A is an independent risk factor

Stressor
Cognitive Appraisals
Physiological Arousal
TYPE A BEHAVIOR PATTERN –MECHANISMS

Cognitive Appraisals
Physiological arousal
Athero-sclerosis
Arterial damage
Heart Disease
TYPE A BEHAVIOR PATTERN –CHD

What about positive personality traits? The literature in health psychology focuses primarily on negative personality traits Neuroticism Type A behavior/cynical hostility
What about positive personality traits? Hardiness Optimism Psychological Control
Stress-Resistance Resources
Risk Factors

Personality Hardiness Why do some people get sick in the face of stress and others don’t? What is it about those individuals that protects them?
Control
Commitment
Challenge
Hardiness

Personality Hardiness Original study: Kobasa (1979) Retrospective study Examined the personality differences – hardiness – among those who became ill and those who did not Sample: 325 business executives – all under stress – who became ill and who didn’t? Measures: Stressful life events over past 3 years Hardiness measures (3 C’s) Self-reported Illness over past 3 years

Personality Hardiness
0
50
100
150
200
250
300
Control Commitment Challenge
High Stress/High IllnessHigh Stress/Low Illness
Hardiness score

Moderation: Changes the association between two variables, X and Y Moderator
X Y
Y =
Dep
ress
ion
X = Stress Low High
Low support
High support
High
Low

STRESS-BUFFERING Y
=
X axis = Stress
Low Hardiness
High Hardiness

DISPOSITIONAL OPTIMISM
Definition: the expectation that good things will happen the future and bad things will not Sense of hope Focus on pursuing goals combined with an expectation
that goals can be achieved

Life Orientation Test (LOT) Please be as honest and accurate as you can throughout. Try not to let your response to one statement influence your responses to other statements. There are no "correct" or "incorrect" answers. Answer according to your own feelings, rather than how you think "most people" would answer. 1 = I DISagree a lot 2 = I DISagree a little 3 = I neither agree nor disagree 4 = I agree a little 5= I agree a lot

Life Orientation Test (LOT) 1 Disagree a lot 2. Disagree a little 3. Neither agree nor disagree 4. Agree a little 5. Agree a lot
1. In uncertain times, I usually expect the best.
2. It's easy for me to relax.
3. If something can go wrong for me, it will.
4. I'm always optimistic about my future
5. I enjoy my friends a lot.
6. It's important for me to keep busy.
7. I hardly ever expect things to go my way.
8. I don't get upset too easily.
9. I rarely count on good things happening to me.
10. Overall, I expect more good things to happen to me than bad.

Research evidence Among college students Lower symptom reports More problem-focused coping More seeking social support Emphasizing the positives in a situation Among those with chronic disease (CHD and breast cancer) Predictor of coping and recovery from surgery More problem-focused coping and less denial Faster rate of recovery post-surgical quality of life


Obesity in a social network

http://www.youtube.com/watch?v=2U-tOghblfE

An American Undergraduate Horror Story
The Spread of Obesity in a Large Social Network over 32 Years
Nicholas A. Christakis, M.D., Ph.D., M.P.H., and James H. Fowler, Ph.D.

What was the objective or aim of this study?
STUDY QUESTIONS: 1. Whether obesity or weight gain over time was related to the
nature of one’s social ties 2. Whether sex, smoking behavior and geographic distance from social contacts was related to obesity UNDERLYING QUESTION: To examine if having obese social contacts might change a person’s tolerance for being obese or might influence positive health behaviors

Why did they do this study? What was the rationale?
Obesity is an epidemic Increasing Increases can’t be explained by genetics; occurs across
social and cultural groups

METHODS : So what did they do? Evaluated a network of 12,067 people who were repeatedly measured over 32 years provides data to study change over time
Framingham Heart Study used the offspring of the original cohort and their
spouses Super computing for social network analysis

MEASURES Types of friendships: 1. ego-perceived friendship An ego identifies an alter as a friend
2. Alter-perceived friendship An alter identifies an ego as a friend
3. Mutual friendship Both identify each other (reciprocal)
Obesity BMI

RESULTS – SELECTED HIGHLIGHTS I will translate into English: The risk of obestity among alters who were connected to
an obese ego (1 degree of separation) was 45% higher than would randomly occur.
The risk of obesity was about 20% higher for alters’ alters (2 degrees of separation)
10% higher for alters’ alters’ alters’ (3 degrees of separation No increase at 4 degrees of separation or more.

Put another way: My best friend Andrea is obese. I have a 45% risk of also being obese. My friend Marji has a 20% increased risk of being obese because she is my friend and I am Andrea’s friend. Marji’s friend Rachel has a 10% increased risk of being obese because Marji is my friend and I am a friend of Andrea. (Marji and Andrea don’t know each other; neither do Rachel and Andrea.)

RESULTS – GEOGRAPHIC DISTANCE Does geographic distance change these findings? NO Greater geographic distance doesn’t matter. Social distance plays a stronger role in spreading norms or behaviors

FRIENDSHIPS Which is the worst for your weight?
Ego-perceived friendship An ego identifies an alter as a friend
Alter-perceived friendship An alter identifies an ego as a friend
Mutual friendship Both identify each other as friends)
57% increased risk if alter becomes obese
171% increased risk if alter becomes obese

GENDER Which is the worst for your weight?
Same sex friendships
71% increased risk if alter becomes obese
Opposite sex friendships: No association
38% increased
risk
100% increased
risk
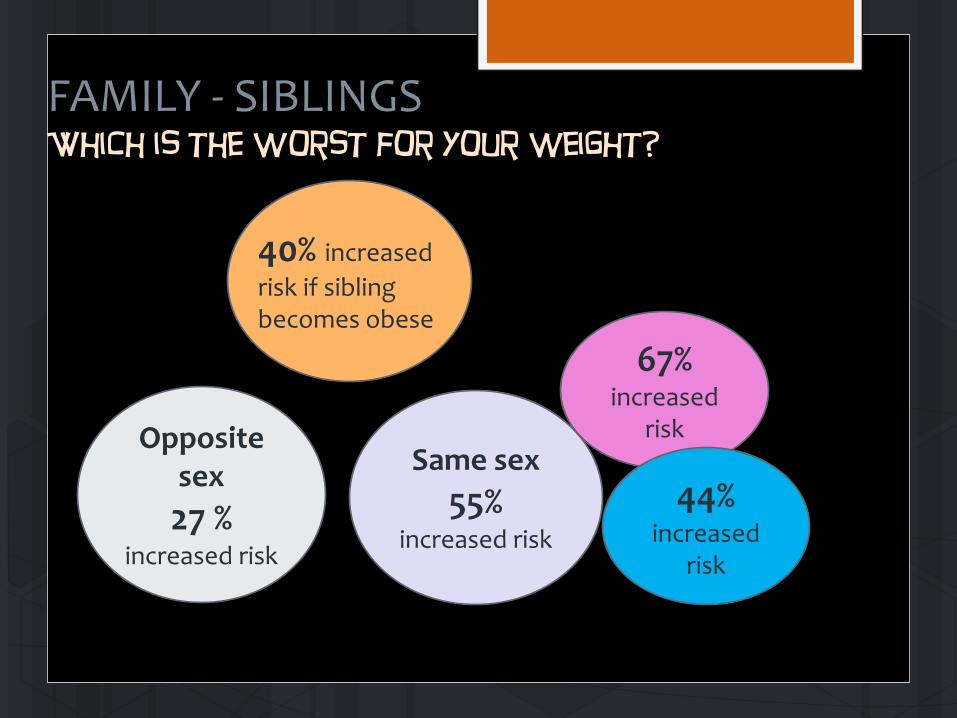
FAMILY - SIBLINGS Which is the worst for your weight?
40% increased risk if sibling becomes obese
Same sex 55%
increased risk
Opposite sex 27 %
increased risk
67% increased
risk
44% increased
risk

FAMILY –MARRIED COUPLES Which is the worst for your weight?
37% increased risk if spouse becomes obese
37% increased risk if wife
becomes obese
44% increased risk if husband becomes obese

BEST for your weight?

WHY IS THIS STUDY IMPORTANT? Obesity may spread in social networks Social distance important Friends influence each others’ weight more than spouses
Doesn’t answer how Are people influenced more by those they resemble? By
those in proximity? Do obese people change network members’ social norms
about the acceptability of being overweight?

HAPPY HALLOWEEN!