Supplement of Decadal evolution of ship emissions in China ...
40
Supplement of Atmos. Chem. Phys., 18, 6075–6093, 2018 https://doi.org/10.5194/acp-18-6075-2018-supplement © Author(s) 2018. This work is distributed under the Creative Commons Attribution 4.0 License. Supplement of Decadal evolution of ship emissions in China from 2004 to 2013 by using an integrated AIS-based approach and projection to 2040 Cheng Li et al. Correspondence to: J. Zheng ([email protected]) The copyright of individual parts of the supplement might differ from the CC BY 4.0 License.
-
Upload
khangminh22 -
Category
Documents
-
view
1 -
download
0
Transcript of Supplement of Decadal evolution of ship emissions in China ...

Supplement of Atmos. Chem. Phys., 18, 6075–6093, 2018https://doi.org/10.5194/acp-18-6075-2018-supplement© Author(s) 2018. This work is distributed underthe Creative Commons Attribution 4.0 License.
Supplement of
Decadal evolution of ship emissions in China from 2004 to 2013 byusing an integrated AIS-based approach and projection to 2040Cheng Li et al.
Correspondence to: J. Zheng ([email protected])
The copyright of individual parts of the supplement might differ from the CC BY 4.0 License.
2
Abbreviations
AB: Auxiliary Boilers
AE: Auxiliary Engine
AIS: Automatic Identification System
BC: Black Carbon 5
CCTD: Statistics Communique of China on the Traffic and Transportation Industry Development
CO: Carbon monoxide
CPSY: China Port Statistics Yearbook
CVs: Coastal Vessels
DECAs: Domestic Emission Control Areas 10
DWT: Dead Weight Tonnage
ECA: Emission Control Area
EGR: Exhaust Gas Recirculation
GDP: Gross Domestic Product
HC: Hydrocarbon 15
HFO: Heavy Fuel Oil
ICF international: A global Consulting and Technology Services Company
IMO: International Maritime Organization
LNG: Liquefied Natural Gas
LRS: Lloyd’s Register of Ships 20
MD: Marine Department
MDO: Marine Diesel Oil
ME: Main Engine
MEIC: Multi-resolution Emission Inventory for China
NECA: NOx-DECA, Domestic Emission Control Areas for NOx Control 25
Nm: Nautical Miles
NMVOC: Non-methane Volatile Organic Compounds
NOx: Nitrogen oxide
3
OGVs: Ocean-going Vessels
OC: Organic Carbon
PM: Particulate Matter
PoLa: Los Angeles and Long Beach
PRD: Pearl River Delta Region 5
QAQC: Quality Assurance and Quality Control
RVs: River Vessels
SCR: Selective Catalyst Reduction
SECA: SO2-DECA, Domestic Emission Control Areas for SO2 Control
SI: Supporting Information 10
SO2: Sulfur dioxide
tce/10kt:Ton of Standard Coal Equivalent per 10 Kiloton
U.S.EPA: United States Environment Protection Agency
VAN: Vessel Arrived Number
WHO: world health organization 15
YRD: Yangtze River Delta Region

4
1. Domain and ship categorization
According to the "United Nations convention on the law of the sea" approved by United Nations conference on the
third law of the sea in 1982, which indicated that 200 nautical miles (Nm) exclusive economic zone (EEZ) belongs
to the scope of the jurisdiction of the state, further explain in article 56 of the convention mentioned the right
regulation of EEZ including the jurisdiction on the area of artificial islands, installations and science research and 5
Marine environmental protection fields, that is to say the research domain of ship emissions in China expand to 200
Nm zone is acceptable. However, science research does not mean the legislative power, have jurisdiction over 12
Nm of ship emissions control area (ECA) needs to be approved by IMO, e.g., Beihai ECA, Mediterranean ECA.
The scope of these international ECAs are 200 Nm, which support the domain in this study, and also enhance the
referable of this study. By the way, the domain chosen in this study reflects our focus on densely populated areas 10
and does not represent any national boundaries.
There were 18000 km coastline covered 31760 harbors in this region, which contains 5675 coast harbors and 2001
10kt carrier harbors. More detail for 10kt carrier harbors in table SI-1, SI-2.
Table SI-1 the distribution of 10kt carrier ports in China, 2013
Port size Coast port River port Total
Total 1607 394 2001
[10kt, 30kt] 567 169 736
[30kt, 50kt] 254 102 356
[50kt, 100kt] 532 116 648
≥100kt 254 7 261
Table SI-2 the distribution of the function of 10kt carrier ports in China, 2013 15
Function Container Coal Metal
ore
Crude
Oil
Oil
product
Chemical Food General
bulk
General
cargo
Total
Number 321 206 61 68 124 157 6 414 345 2001
Four sub-categories were classified by cargo types, i.e. container ships carrying containers, cargo ships carrying dry
bulk like ore, construction materials, coal and its products, tankers carrying chemicals, gas, oil and its products, and
others. More detailed information for sub-categorizes of DWT.
20
5
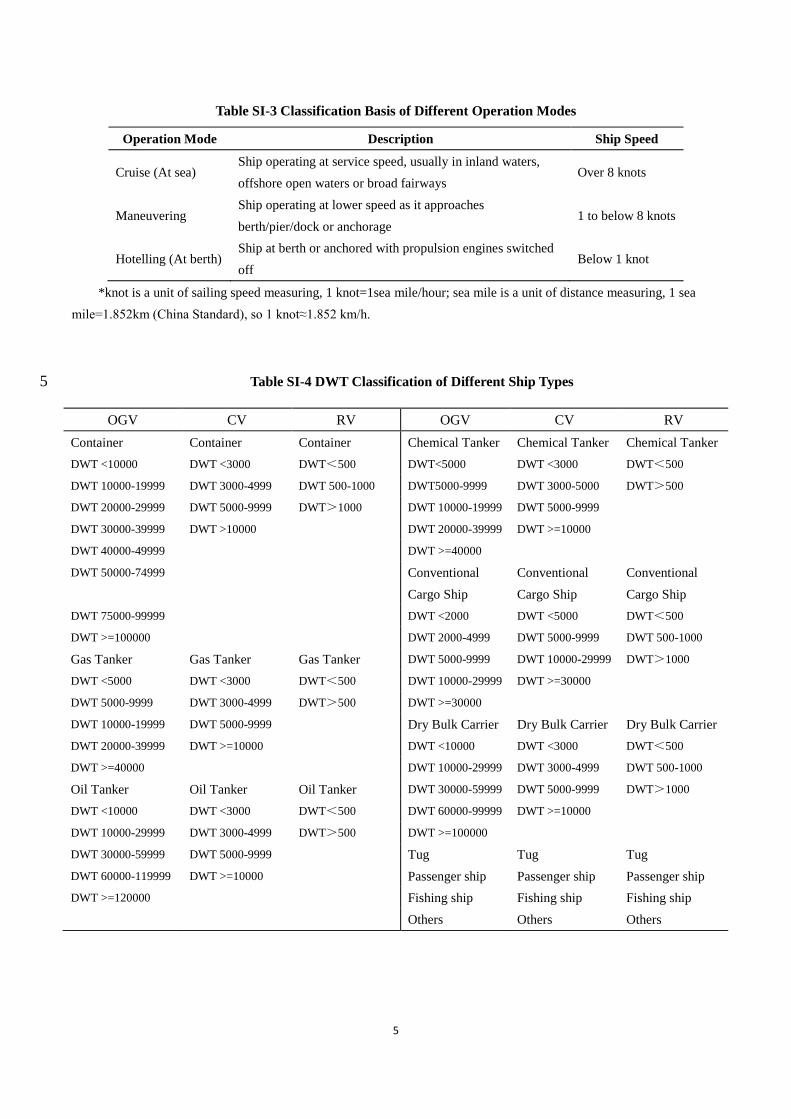
Table SI-3 Classification Basis of Different Operation Modes
Operation Mode Description Ship Speed
Cruise (At sea) Ship operating at service speed, usually in inland waters,
offshore open waters or broad fairways Over 8 knots
Maneuvering Ship operating at lower speed as it approaches
berth/pier/dock or anchorage 1 to below 8 knots
Hotelling (At berth) Ship at berth or anchored with propulsion engines switched
off Below 1 knot
*knot is a unit of sailing speed measuring, 1 knot=1sea mile/hour; sea mile is a unit of distance measuring, 1 sea
mile=1.852km (China Standard), so 1 knot≈1.852 km/h.
Table SI-4 DWT Classification of Different Ship Types 5
OGV CV RV OGV CV RV
Container Container Container Chemical Tanker Chemical Tanker Chemical Tanker
DWT <10000 DWT <3000 DWT<500 DWT<5000 DWT <3000 DWT<500
DWT 10000-19999 DWT 3000-4999 DWT 500-1000 DWT5000-9999 DWT 3000-5000 DWT>500
DWT 20000-29999 DWT 5000-9999 DWT>1000 DWT 10000-19999 DWT 5000-9999
DWT 30000-39999 DWT >10000 DWT 20000-39999 DWT >=10000
DWT 40000-49999 DWT >=40000
DWT 50000-74999 Conventional
Cargo Ship
Conventional
Cargo Ship
Conventional
Cargo Ship
DWT 75000-99999 DWT <2000 DWT <5000 DWT<500
DWT >=100000 DWT 2000-4999 DWT 5000-9999 DWT 500-1000
Gas Tanker Gas Tanker Gas Tanker DWT 5000-9999 DWT 10000-29999 DWT>1000
DWT <5000 DWT <3000 DWT<500 DWT 10000-29999 DWT >=30000
DWT 5000-9999 DWT 3000-4999 DWT>500 DWT >=30000
DWT 10000-19999 DWT 5000-9999 Dry Bulk Carrier Dry Bulk Carrier Dry Bulk Carrier
DWT 20000-39999 DWT >=10000 DWT <10000 DWT <3000 DWT<500
DWT >=40000 DWT 10000-29999 DWT 3000-4999 DWT 500-1000
Oil Tanker Oil Tanker Oil Tanker DWT 30000-59999 DWT 5000-9999 DWT>1000
DWT <10000 DWT <3000 DWT<500 DWT 60000-99999 DWT >=10000
DWT 10000-29999 DWT 3000-4999 DWT>500 DWT >=100000
DWT 30000-59999 DWT 5000-9999 Tug Tug Tug
DWT 60000-119999 DWT >=10000 Passenger ship Passenger ship Passenger ship
DWT >=120000 Fishing ship Fishing ship Fishing ship
Others Others Others

6
2. Potential influence of transit ships
We did roughly estimate the contribution from passing ships, and concluded that their contribution is relatively low
but with potentially high uncertainties. Therefore, we decide to exclude it into this study to avoid negative impact
on the results. The research domain is 200Nm to the coast of Mainland China. The main routes in this domain
include all routes from/to Chinese ports and the passing routes, mainly from Busan, Korea to Southeast Asia (Busan 5
route) and from Taiwan to destinations other than Mainland China ports (Taiwan route). In order to study the
fraction of Busan route and Taiwan route in our research domain, we extracted a real-time AIS map, and
highlighted the passing ship routes by red lines (Fig. SI-1).
There were 368 shipping route from/to Korea in 2013, including 85 Southeast Asia routes and 26 Europe routes. As
the throughput of Busan port accounted for 75.4% of total throughput (17686kt) in Korea, we estimated that Busan 10
route roughly accounted for 7100kt throughput. With around 800Nm passing distance in our research domain, we
estimated the fuel consumption from Busan route was around 70kt HFO. The total throughput in Taiwan was 14
million TEU in 2013, including 2.5 million TEU between Taiwan and Mainland China. Therefore, Taiwan route
contributed around 11.5 million TEU. If we assume 1TEU=15t and the average travel distance was 500Nm, the fuel
consumption from Taiwan route was around 1070kt HFO. Therefore, the total consumption of Busan route and 15
Taiwan route was around 1140kt HFO, only 7% of total fuel consumption in our research domain. Therefore, we
believe excluding the passing route would not significantly impact our analysis results.
Fig. SI-1 Major shipping routes extracted from a real-time AIS digital map
7
3. Transport volume information
Transport volume is the real weight of transport cargo for a period time, different statistic approaches used for
the Yangtze River ports and other coast ports, the former statistics output cargo weight, and the later statistics
input cargo weight. Transport volume statistics from the Chinese National Statistics Bureau and China port
statistical yearbook with different classification, but no significant differences of the total amount. 5
There are 92 Chinese ports with cargo types-based transport volume statistic in this study. Raw data shown
below. The regional transport volume statistics including liquid cargo, dry bulk, general cargo, container
corresponding to tanker, bulk ship, general cargo ship, container ship, respectively. Among them, liquid cargo
cover oil and gas; dry bulk cover ore, coal and building material; general cargo cover food, wood and
chemical material; container cover container and roro-car. 10
Table SI-5 shown in the last.
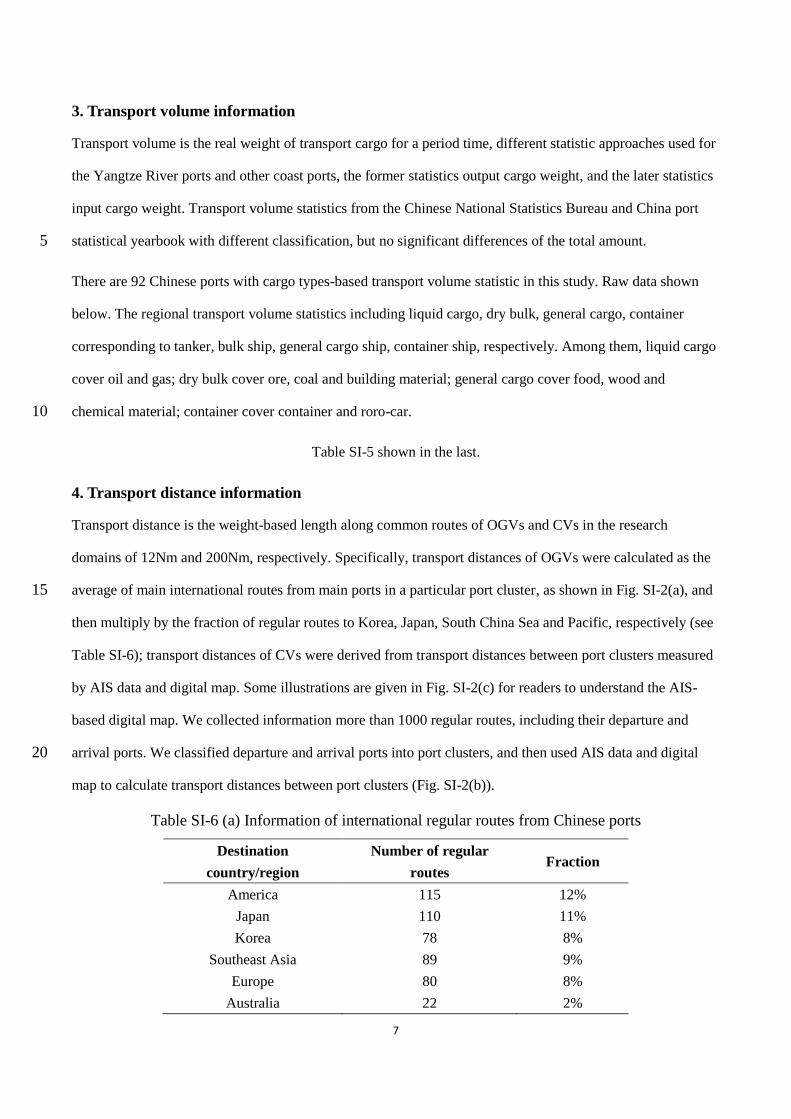
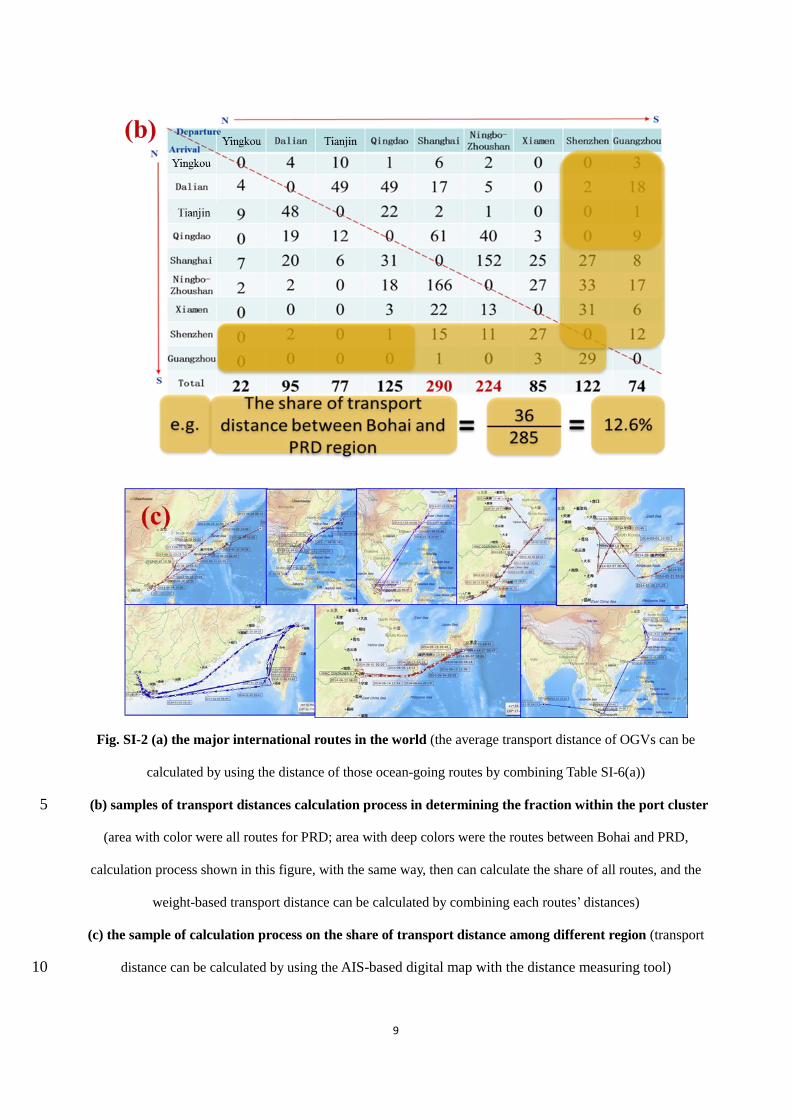
4. Transport distance information
Transport distance is the weight-based length along common routes of OGVs and CVs in the research
domains of 12Nm and 200Nm, respectively. Specifically, transport distances of OGVs were calculated as the
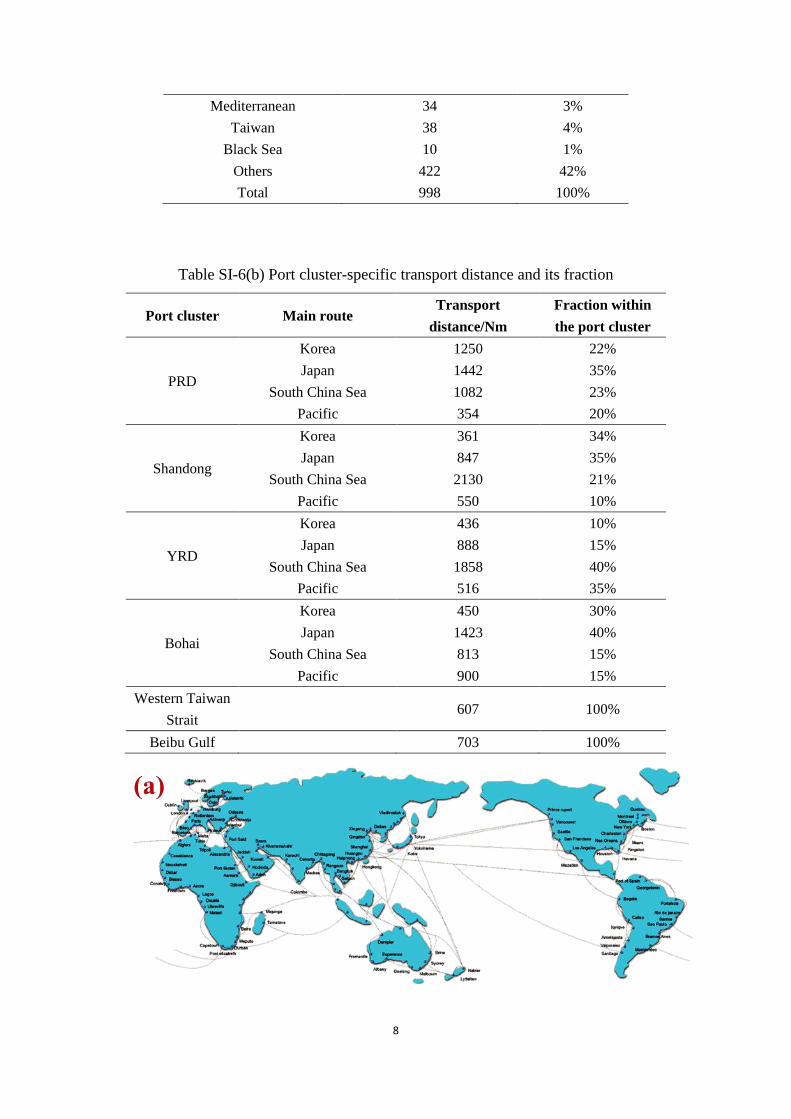
average of main international routes from main ports in a particular port cluster, as shown in Fig. SI-2(a), and 15
then multiply by the fraction of regular routes to Korea, Japan, South China Sea and Pacific, respectively (see
Table SI-6); transport distances of CVs were derived from transport distances between port clusters measured
by AIS data and digital map. Some illustrations are given in Fig. SI-2(c) for readers to understand the AIS-
based digital map. We collected information more than 1000 regular routes, including their departure and
arrival ports. We classified departure and arrival ports into port clusters, and then used AIS data and digital 20
map to calculate transport distances between port clusters (Fig. SI-2(b)).
Table SI-6 (a) Information of international regular routes from Chinese ports
Destination
country/region
Number of regular
routes Fraction
America 115 12%
Japan 110 11%
Korea 78 8%
Southeast Asia 89 9%
Europe 80 8%
Australia 22 2%
8
Mediterranean 34 3%
Taiwan 38 4%
Black Sea 10 1%
Others 422 42%
Total 998 100%
Table SI-6(b) Port cluster-specific transport distance and its fraction
Port cluster Main route Transport
distance/Nm
Fraction within
the port cluster
PRD
Korea 1250 22%
Japan 1442 35%
South China Sea 1082 23%
Pacific 354 20%
Shandong
Korea 361 34%
Japan 847 35%
South China Sea 2130 21%
Pacific 550 10%
YRD
Korea 436 10%
Japan 888 15%
South China Sea 1858 40%
Pacific 516 35%
Bohai
Korea 450 30%
Japan 1423 40%
South China Sea 813 15%
Pacific 900 15%
Western Taiwan
Strait 607 100%
Beibu Gulf 703 100%
9
Fig. SI-2 (a) the major international routes in the world (the average transport distance of OGVs can be
calculated by using the distance of those ocean-going routes by combining Table SI-6(a))
(b) samples of transport distances calculation process in determining the fraction within the port cluster 5
(area with color were all routes for PRD; area with deep colors were the routes between Bohai and PRD,
calculation process shown in this figure, with the same way, then can calculate the share of all routes, and the
weight-based transport distance can be calculated by combining each routes’ distances)
(c) the sample of calculation process on the share of transport distance among different region (transport
distance can be calculated by using the AIS-based digital map with the distance measuring tool) 10

10
5. Uncertainties estimation
Uncertainties of emissions factors and activity time for estimation were shown as following.
Table SI-7 Uncertainties of emissions factors for estimation
Pollutants Categories Distribution types Mean Confidence interval
SO2 HFO(2.7%) Weibull 11.3 (-18.2%, 11.3%)
MDO(0.5%) Weibull 1.4 (-74.8%, 107.4%)
NOx
SSD Gamma 16.3 (-19.7%, 21.6%)
MSD Gamma 13.8 (-9.6%, 10.4%)
HSD* Gamma 11.5 (-26.0%, 29.2%)
CO OGVs/CVs Gamma 1.3 (-22.4%, 25.0%)
RVs Gamma 1.3 (-22.4%, 25.0%)
PM10 HFO(2.7%) Gamma 1.5 (-14.7%, 16.4%)
MDO(0.5%) Weibull 0.4 (-42.4%, 34.6%)
PM2.5 HFO(2.7%) Weibull 1.3 (-14.7%, 16.4%)
MDO(0.5%) Gamma 0.4 (-42.4%, 34.6%)
HC OGVs/CVs Gamma 0.5 (-32.7%, 36.5%)
RVs Weibull 0.4 (-65.3%, 72.0%)
BC* All Weibull 0.3 (-97.7%, 126.5%)
OC* All Weibull 0.2 (-68.2%, 111.6%)
*the value of BC and OC were the ratio of BC/PM2.5 and OC/PM2.5, respectively.
Table SI-8 Uncertainties of time-in-modes for estimation 5
Ship types Modes Distribution
types Mean/hours
Lower bound
of uncertainty
Upper bound
of uncertainty
OGVs
Tanker Maneuvering Weibull 4.3 -28% 31%
Hoteling Weibull 25.3 -17% 16%
Cargo ship Maneuvering Gamma 3.4 -15.1% 20.9%
Hoteling Weibull 15.8 -9.8% 6.0%
Container
ship
Maneuvering Weibull 3.7 -11% 10%
Hoteling Weibull 22.2 -16% 17%
Others Maneuvering Weibull 1.1 -62.1% 96.5%
Hoteling Gamma 17.2 -50.0% 60.1%
CVs
Tanker Maneuvering Gamma 2.3 -35.9% 53.8%
Hoteling Normal 23.5 -15.3% 19.0%
Cargo ship Maneuvering Gamma 3.2 -84.3% 160.4%
Hoteling Gamma 16.8 -17.5% 18.7%
Container
ship
Maneuvering Normal 3.9 -53.0% 46.7%
Hoteling Weibull 19.1 -29.9% 29.4%
Others Maneuvering Gamma 2.7 -84.8% 164.9%
Hoteling Gamma 17.7 -84.2% 172.6%
11
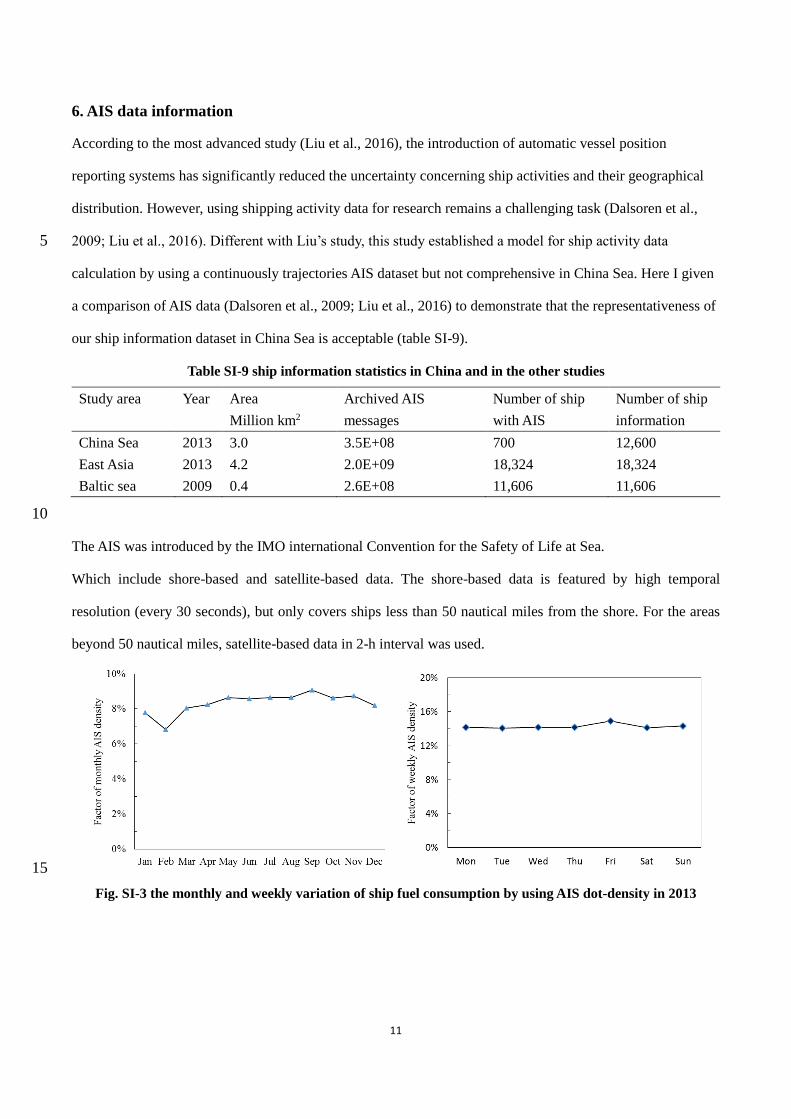
6. AIS data information
According to the most advanced study (Liu et al., 2016), the introduction of automatic vessel position
reporting systems has significantly reduced the uncertainty concerning ship activities and their geographical
distribution. However, using shipping activity data for research remains a challenging task (Dalsoren et al.,
2009; Liu et al., 2016). Different with Liu’s study, this study established a model for ship activity data 5
calculation by using a continuously trajectories AIS dataset but not comprehensive in China Sea. Here I given
a comparison of AIS data (Dalsoren et al., 2009; Liu et al., 2016) to demonstrate that the representativeness of
our ship information dataset in China Sea is acceptable (table SI-9).
Table SI-9 ship information statistics in China and in the other studies
Study area Year Area
Million km2
Archived AIS
messages
Number of ship
with AIS
Number of ship
information
China Sea 2013 3.0 3.5E+08 700 12,600
East Asia 2013 4.2 2.0E+09 18,324 18,324
Baltic sea 2009 0.4 2.6E+08 11,606 11,606
10
The AIS was introduced by the IMO international Convention for the Safety of Life at Sea.
Which include shore-based and satellite-based data. The shore-based data is featured by high temporal
resolution (every 30 seconds), but only covers ships less than 50 nautical miles from the shore. For the areas
beyond 50 nautical miles, satellite-based data in 2-h interval was used.
15
Fig. SI-3 the monthly and weekly variation of ship fuel consumption by using AIS dot-density in 2013

12
Fig. SI-4 Summary of the stock of ship types navigated in different regions for OGVs, CVs and RVs
5
0%
20%
40%
60%
80%
100%Ocean-going vessel
Container
Dry bulk Carrier
Chemical tanker
Gas tanker
Oil Tanker
General cargo
Passenger ship
Tug
Others
0%
20%
40%
60%
80%
100%Coast vessel
Container
Dry bulk Carrier
Chemical tanker
Gas tanker
Oil Tanker
General cargo
Passenger ship
Tug
Others
0%
20%
40%
60%
80%
100%River vessel
Container
Dry bulk Carrier
Chemical tanker
Gas tanker
Oil Tanker
General cargo
Passenger ship
Tug

13
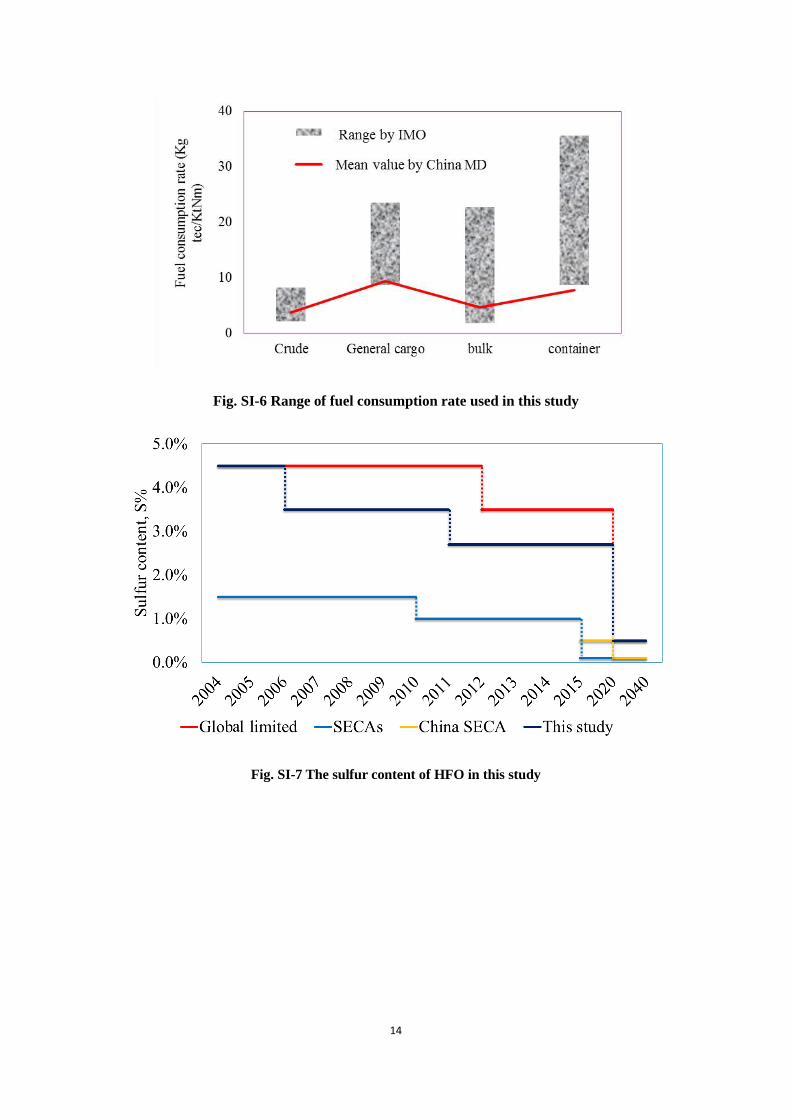
7. Fuel consumption information
For fuel consumption rate (Kg tce/KtNm), the value of different ship types can be obtained from CCTD in 2010-
2015, but the value of OGVs are not within the typical ranges of corresponding ship type from IMO report (IMO,
2015), as detailed in Fig. SI-6, that maybe caused by the statistics of the international trade in ocean going cargo
companies. So the median value of the range provided by IMO were used to estimate in cargo-based approach. 5
For the fuel consumption rate for RVs, which refer to the value from CCTD, 5.2 tce/10kt, that why we do not
need the transport distance of RVs.
Fig. SI-5 Data sources and flowchart used for emissions estimates in this study
10
14
Fig. SI-6 Range of fuel consumption rate used in this study
Fig. SI-7 The sulfur content of HFO in this study
15
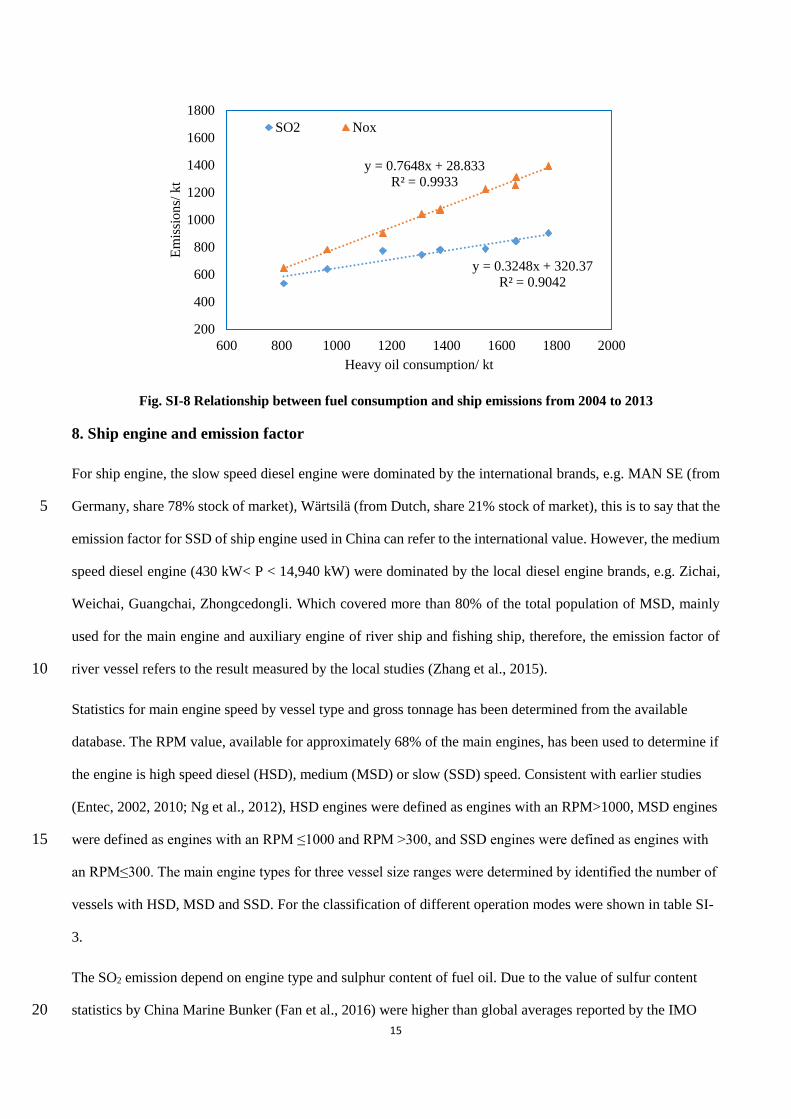
Fig. SI-8 Relationship between fuel consumption and ship emissions from 2004 to 2013
8. Ship engine and emission factor
For ship engine, the slow speed diesel engine were dominated by the international brands, e.g. MAN SE (from
Germany, share 78% stock of market), Wärtsilä (from Dutch, share 21% stock of market), this is to say that the 5
emission factor for SSD of ship engine used in China can refer to the international value. However, the medium
speed diesel engine (430 kW< P < 14,940 kW) were dominated by the local diesel engine brands, e.g. Zichai,
Weichai, Guangchai, Zhongcedongli. Which covered more than 80% of the total population of MSD, mainly
used for the main engine and auxiliary engine of river ship and fishing ship, therefore, the emission factor of
river vessel refers to the result measured by the local studies (Zhang et al., 2015). 10
Statistics for main engine speed by vessel type and gross tonnage has been determined from the available
database. The RPM value, available for approximately 68% of the main engines, has been used to determine if
the engine is high speed diesel (HSD), medium (MSD) or slow (SSD) speed. Consistent with earlier studies
(Entec, 2002, 2010; Ng et al., 2012), HSD engines were defined as engines with an RPM>1000, MSD engines
were defined as engines with an RPM ≤1000 and RPM >300, and SSD engines were defined as engines with 15
an RPM≤300. The main engine types for three vessel size ranges were determined by identified the number of
vessels with HSD, MSD and SSD. For the classification of different operation modes were shown in table SI-
3.
The SO2 emission depend on engine type and sulphur content of fuel oil. Due to the value of sulfur content
statistics by China Marine Bunker (Fan et al., 2016) were higher than global averages reported by the IMO 20
y = 0.3248x + 320.37
R² = 0.9042
y = 0.7648x + 28.833
R² = 0.9933
200
400
600
800
1000
1200
1400
1600
1800
600 800 1000 1200 1400 1600 1800 2000
Em
issi
on
s/ k
t
Heavy oil consumption/ kt
SO2 Nox
16
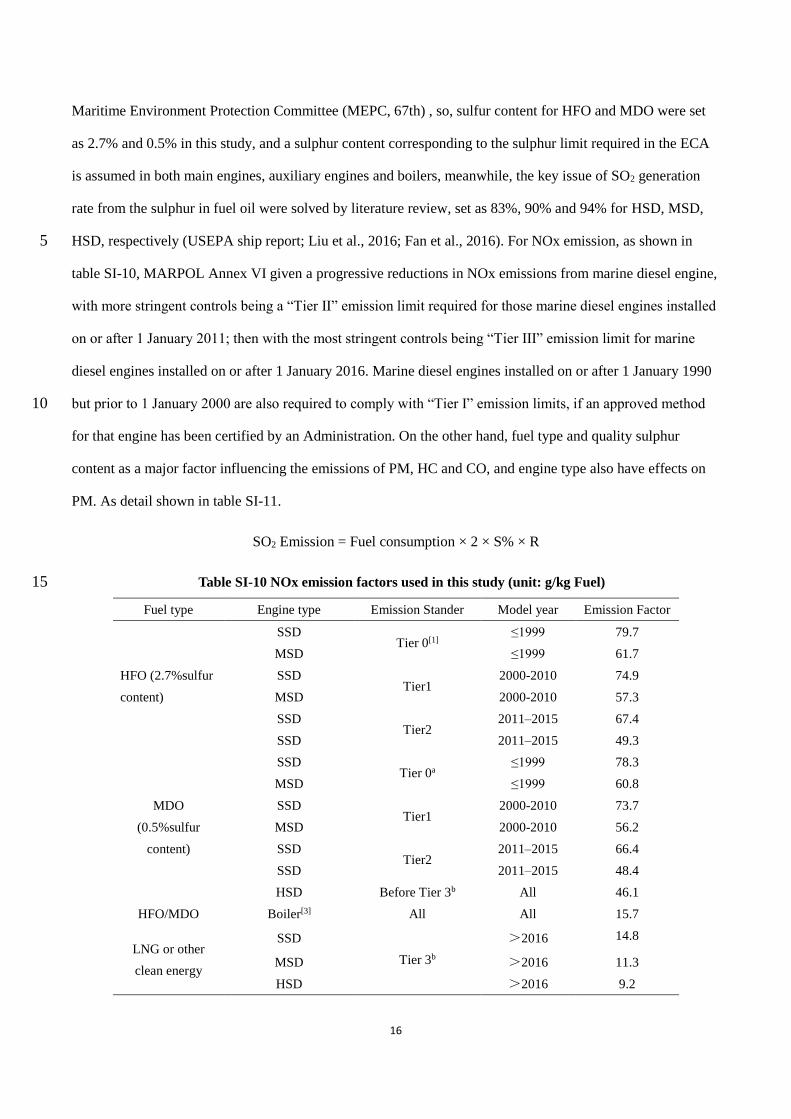
Maritime Environment Protection Committee (MEPC, 67th) , so, sulfur content for HFO and MDO were set
as 2.7% and 0.5% in this study, and a sulphur content corresponding to the sulphur limit required in the ECA
is assumed in both main engines, auxiliary engines and boilers, meanwhile, the key issue of SO2 generation
rate from the sulphur in fuel oil were solved by literature review, set as 83%, 90% and 94% for HSD, MSD,
HSD, respectively (USEPA ship report; Liu et al., 2016; Fan et al., 2016). For NOx emission, as shown in 5
table SI-10, MARPOL Annex VI given a progressive reductions in NOx emissions from marine diesel engine,
with more stringent controls being a “Tier Ⅱ” emission limit required for those marine diesel engines installed
on or after 1 January 2011; then with the most stringent controls being “Tier III” emission limit for marine
diesel engines installed on or after 1 January 2016. Marine diesel engines installed on or after 1 January 1990
but prior to 1 January 2000 are also required to comply with “Tier I” emission limits, if an approved method 10
for that engine has been certified by an Administration. On the other hand, fuel type and quality sulphur
content as a major factor influencing the emissions of PM, HC and CO, and engine type also have effects on
PM. As detail shown in table SI-11.
SO2 Emission = Fuel consumption × 2 × S% × R
Table SI-10 NOx emission factors used in this study (unit: g/kg Fuel) 15
Fuel type Engine type Emission Stander Model year Emission Factor
HFO (2.7%sulfur
content)
SSD Tier 0[1]
≤1999 79.7
MSD ≤1999 61.7
SSD Tier1
2000-2010 74.9
MSD 2000-2010 57.3
SSD Tier2
2011–2015 67.4
SSD 2011–2015 49.3
MDO
(0.5%sulfur
content)
SSD Tier 0a
≤1999 78.3
MSD ≤1999 60.8
SSD Tier1
2000-2010 73.7
MSD 2000-2010 56.2
SSD Tier2
2011–2015 66.4
SSD 2011–2015 48.4
HSD Before Tier 3b All 46.1
HFO/MDO Boiler[3] All All 15.7
LNG or other
clean energy
SSD
Tier 3b
>2016 14.8
MSD >2016 11.3
HSD >2016 9.2
17
aIMO Tier 0 refers to all ships constructed prior to January 1, 2000 which did not have an IMO Tier requirement at the
time of construction.
bTier 3 means conduct NOx emission control measures, e.g. LNG-fueled engine, Emission gas recycle, Selective catalytic
reduction of NOx (SCR), that means the control policies of Emission Control Area (ECA). [3] Which means Boiler
engine. 5
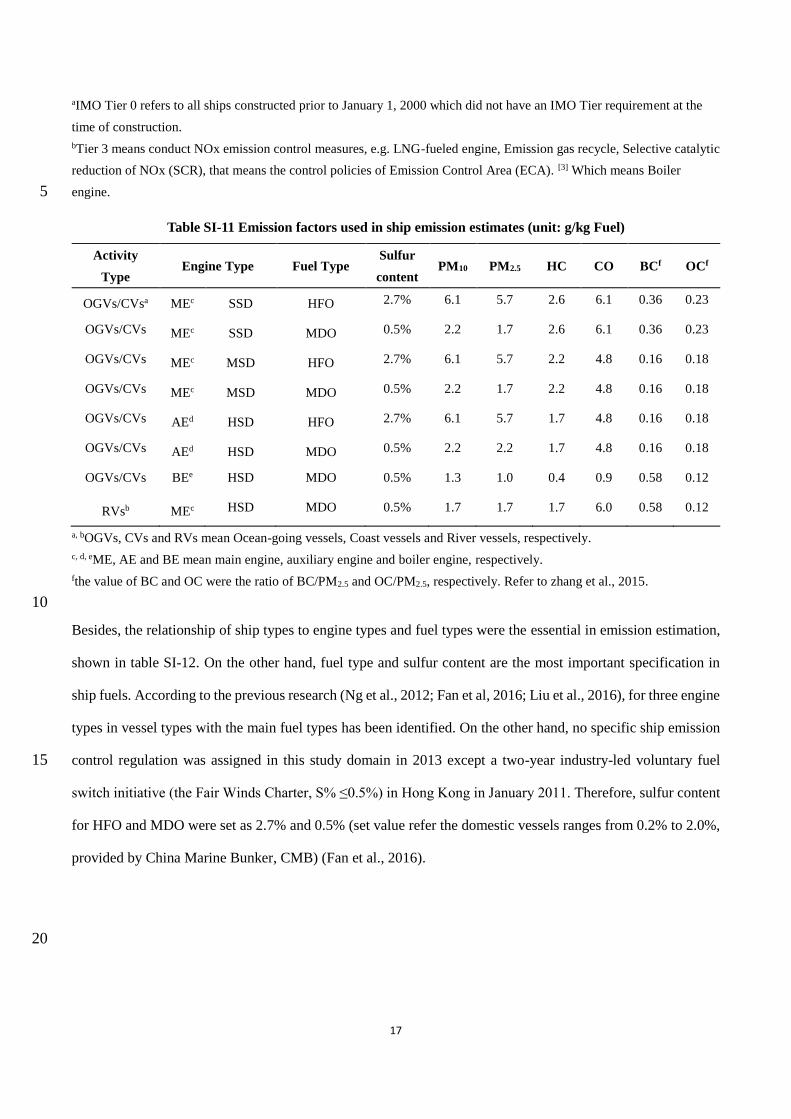
Table SI-11 Emission factors used in ship emission estimates (unit: g/kg Fuel)
Activity
Type Engine Type Fuel Type
Sulfur
content PM10 PM2.5 HC CO BCf OCf
OGVs/CVsa MEc SSD HFO 2.7% 6.1 5.7 2.6 6.1 0.36 0.23
OGVs/CVs MEc SSD MDO 0.5% 2.2 1.7 2.6 6.1 0.36 0.23
OGVs/CVs MEc MSD HFO 2.7% 6.1 5.7 2.2 4.8 0.16 0.18
OGVs/CVs MEc MSD MDO 0.5% 2.2 1.7 2.2 4.8 0.16 0.18
OGVs/CVs AEd HSD HFO 2.7% 6.1 5.7 1.7 4.8 0.16 0.18
OGVs/CVs AEd HSD MDO 0.5% 2.2 2.2 1.7 4.8 0.16 0.18
OGVs/CVs BEe HSD MDO 0.5% 1.3 1.0 0.4 0.9 0.58 0.12
RVsb MEc HSD MDO 0.5% 1.7 1.7 1.7 6.0 0.58 0.12
a, bOGVs, CVs and RVs mean Ocean-going vessels, Coast vessels and River vessels, respectively.
c, d, eME, AE and BE mean main engine, auxiliary engine and boiler engine, respectively.
fthe value of BC and OC were the ratio of BC/PM2.5 and OC/PM2.5, respectively. Refer to zhang et al., 2015.
10
Besides, the relationship of ship types to engine types and fuel types were the essential in emission estimation,
shown in table SI-12. On the other hand, fuel type and sulfur content are the most important specification in
ship fuels. According to the previous research (Ng et al., 2012; Fan et al, 2016; Liu et al., 2016), for three engine
types in vessel types with the main fuel types has been identified. On the other hand, no specific ship emission
control regulation was assigned in this study domain in 2013 except a two-year industry-led voluntary fuel 15
switch initiative (the Fair Winds Charter, S% ≤0.5%) in Hong Kong in January 2011. Therefore, sulfur content
for HFO and MDO were set as 2.7% and 0.5% (set value refer the domestic vessels ranges from 0.2% to 2.0%,
provided by China Marine Bunker, CMB) (Fan et al., 2016).
20

18
Table SI-12 Relationship of ship types to engine types and fuel types
Ship types
Engine Types Fuel Types
DWT≤5000GT 5000<DWT<
25000 ≥25000GT ME AE BE
OGVs
and
CVs
Dry Bulk
Carrier MSD MSD SSD HFO HFO MDO
Container MSD MSD SSD HFO HFO MDO
General cargo
ship MSD SSD SSD HFO HFO MDO
Tanker MSD SSD SSD HFO HFO MDO
Others MSD MSD SSD MDO MDO MDO
River ships HSD MDO
*SSD, MSD, HSD mean Slow speed diesel engine, Medium speed diesel engine, High speed diesel engine, respectively.
HFO and MDO mean Marine heavy oil and Marine diesel oil.
Table SI-13 Low load adjustment multipliers for emission factors
LF SO2 NOX CO PM HC
0.01 1.00 11.47 19.32 19.17 59.28
0.02 1.00 4.63 9.68 7.29 21.18
0.03 1.00 2.92 6.46 4.33 11.68
0.04 1.00 2.21 4.86 3.09 7.71
0.05 1.00 1.83 3.89 2.44 5.61
0.06 1.00 1.6 3.25 2.04 4.35
0.07 1.00 1.45 2.79 1.79 3.52
0.08 1.00 1.35 2.45 1.61 2.95
0.09 1.00 1.27 2.18 1.48 2.52
0.1 1.00 1.22 1.96 1.38 2.2
0.11 1.00 1.17 1.79 1.3 1.96
0.12 1.00 1.14 1.64 1.24 1.76
0.13 1.00 1.11 1.52 1.19 1.6
0.14 1.00 1.08 1.41 1.15 1.47
0.15 1.00 1.06 1.32 1.11 1.36
0.16 1.00 1.05 1.24 1.08 1.26
0.17 1.00 1.03 1.17 1.06 1.18
0.18 1.00 1.02 1.11 1.04 1.11
0.19 1.00 1.01 1.05 1.02 1.05
0.20 1.00 1.00 1.00 1.00 1.00
5

19
9. Emissions intensity calculation
Fig. SI-9 Spatial allocation of typical navigating lines in Emission intensities calculation
10. Emission trends analysis
5
0
1000
2000
3000
4000
5000
6000
2 0 0 4 2 0 0 5 2 0 0 6 2 0 0 7 2 0 0 8 2 0 0 9 2 0 1 0 2 0 1 1 2 0 1 2 2 0 1 3
Co
nta
nin
er t
urn
ove
r/1
0kT
EU
(A)Liaoning Tianjin Shandong Jiangsu
Shanghai Zhejiang Fujian Guangdong
HongKong Others
20
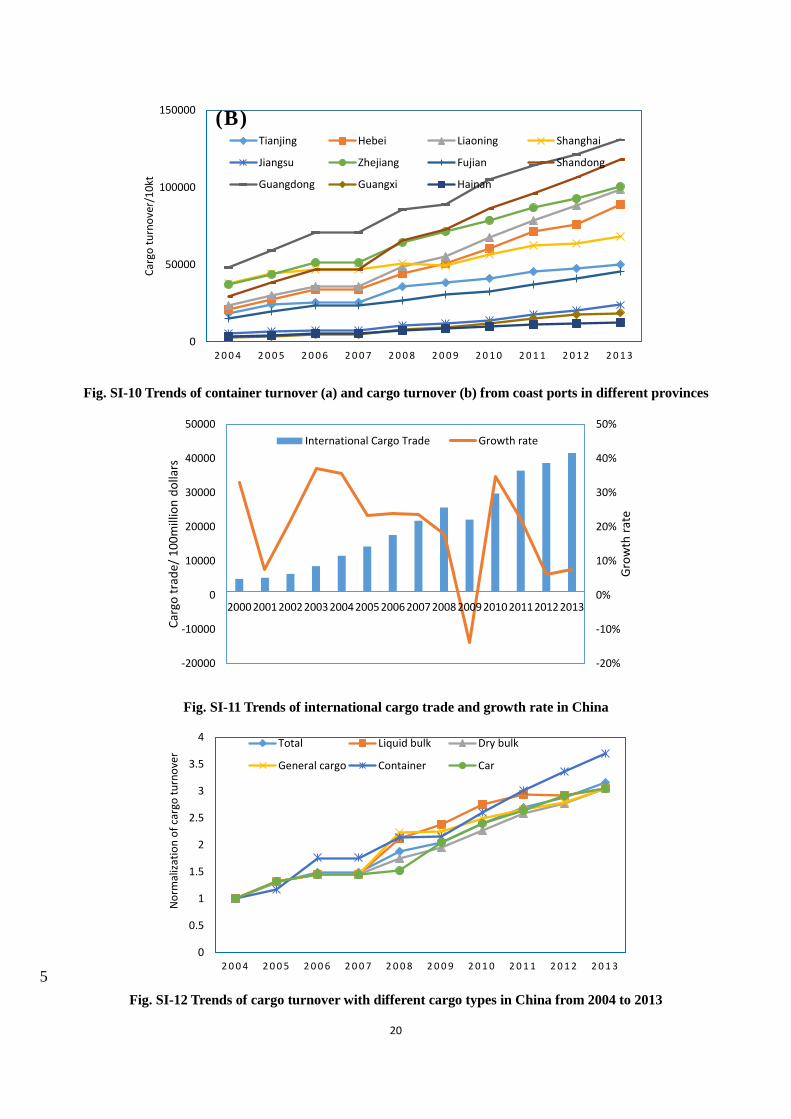
Fig. SI-10 Trends of container turnover (a) and cargo turnover (b) from coast ports in different provinces
Fig. SI-11 Trends of international cargo trade and growth rate in China
5
Fig. SI-12 Trends of cargo turnover with different cargo types in China from 2004 to 2013
0
50000
100000
150000
2 0 0 4 2 0 0 5 2 0 0 6 2 0 0 7 2 0 0 8 2 0 0 9 2 0 1 0 2 0 1 1 2 0 1 2 2 0 1 3
Car
go t
urn
ove
r/1
0kt
(B)Tianjing Hebei Liaoning Shanghai
Jiangsu Zhejiang Fujian Shandong
Guangdong Guangxi Hainan
-20%
-10%
0%
10%
20%
30%
40%
50%
-20000
-10000
0
10000
20000
30000
40000
50000
20002001200220032004200520062007200820092010201120122013
Gro
wth
rat
e
Car
go t
rad
e/ 1
00
mill
ion
do
llars
International Cargo Trade Growth rate
0
0.5
1
1.5
2
2.5
3
3.5
4
2 0 0 4 2 0 0 5 2 0 0 6 2 0 0 7 2 0 0 8 2 0 0 9 2 0 1 0 2 0 1 1 2 0 1 2 2 0 1 3
No
rmal
izat
ion
of
carg
o t
urn
ove
r
Total Liquid bulk Dry bulk
General cargo Container Car
21
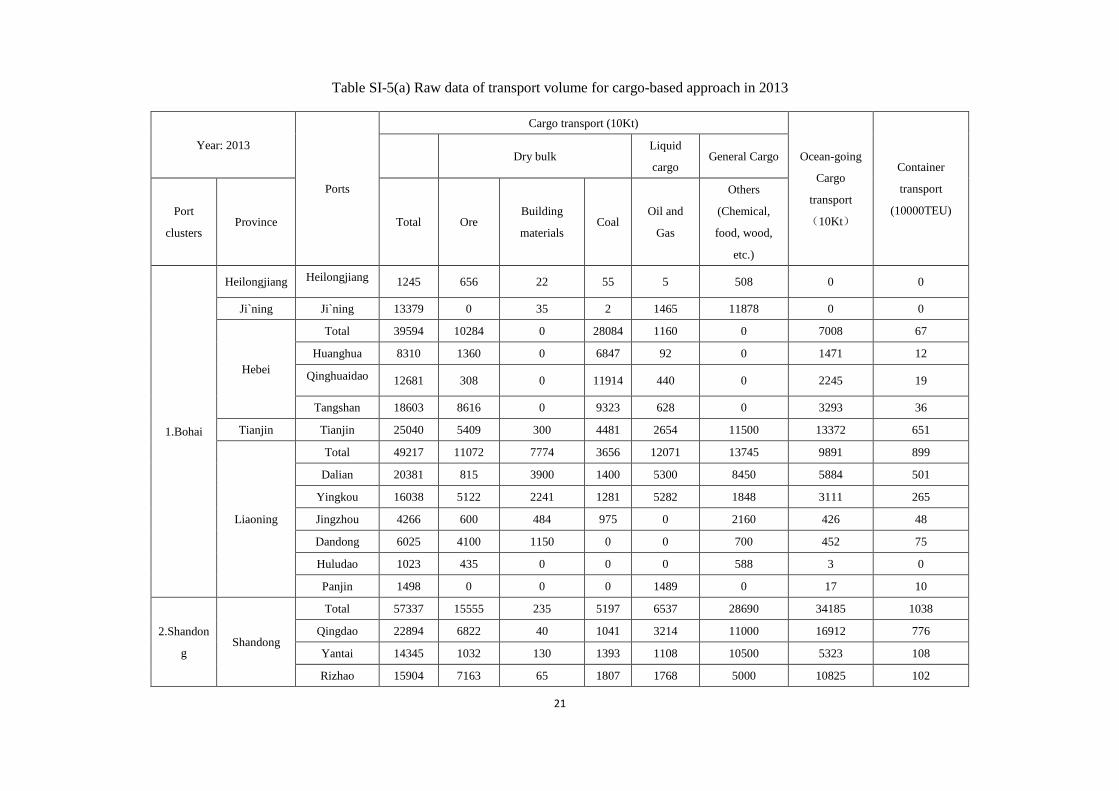
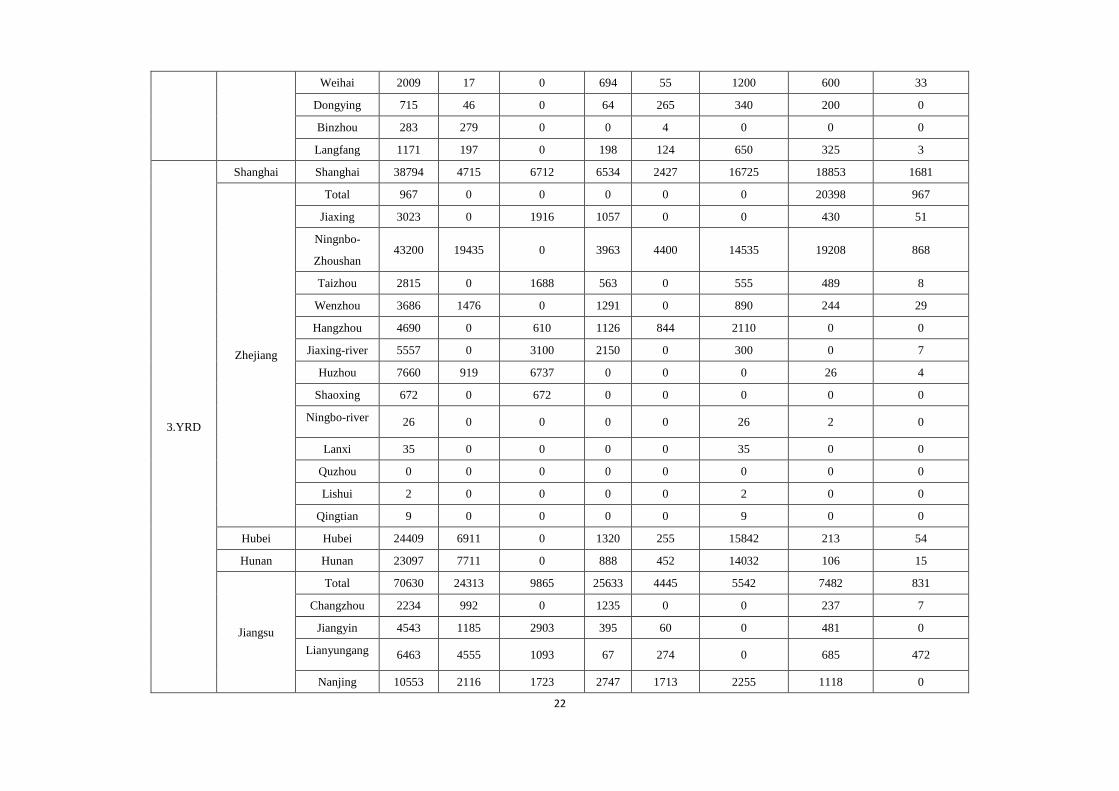
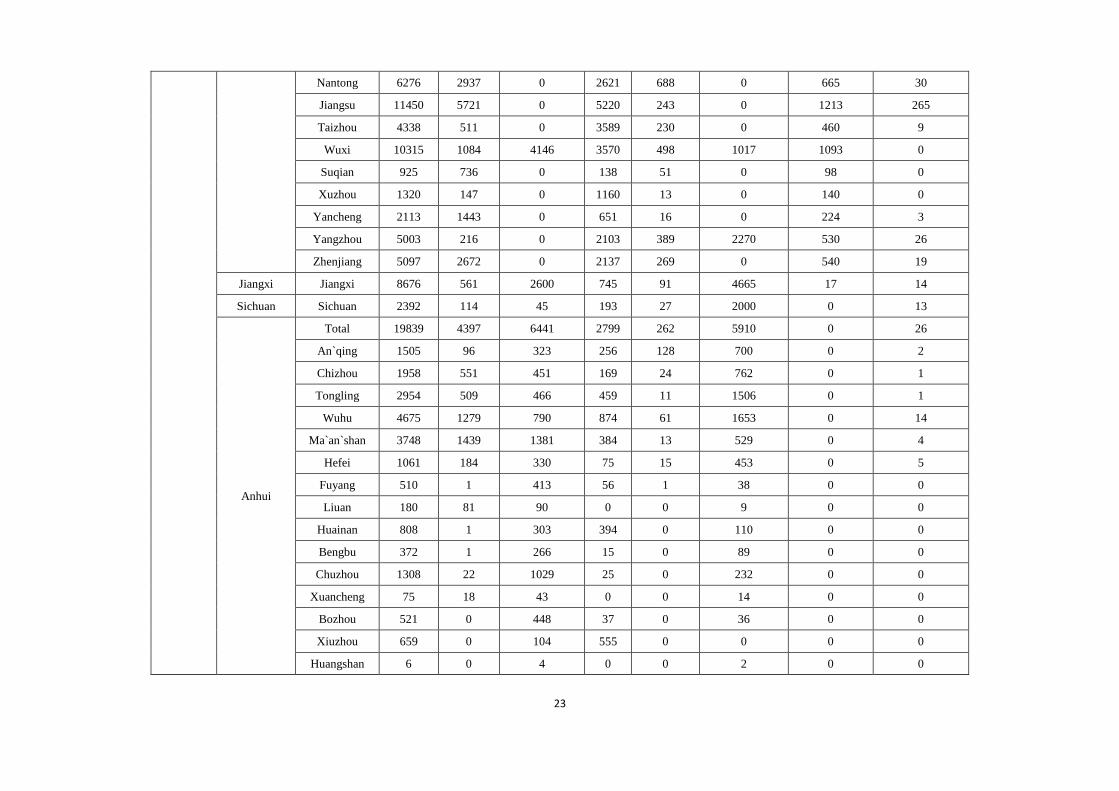
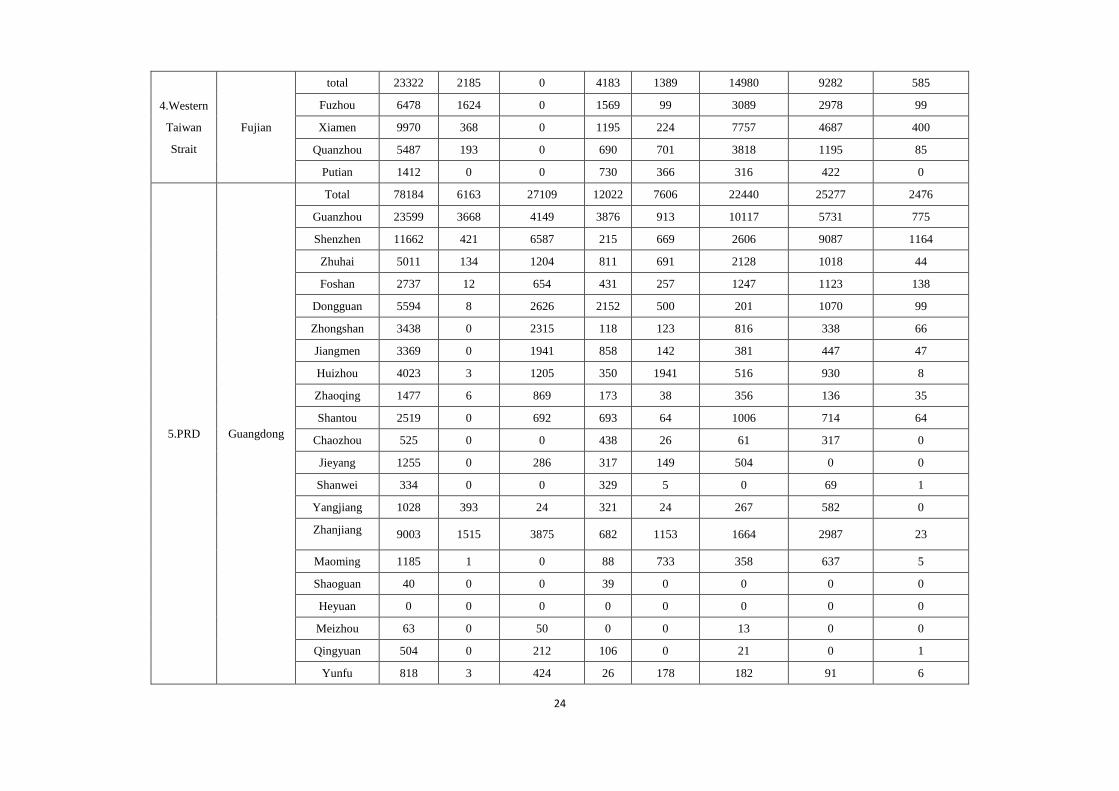
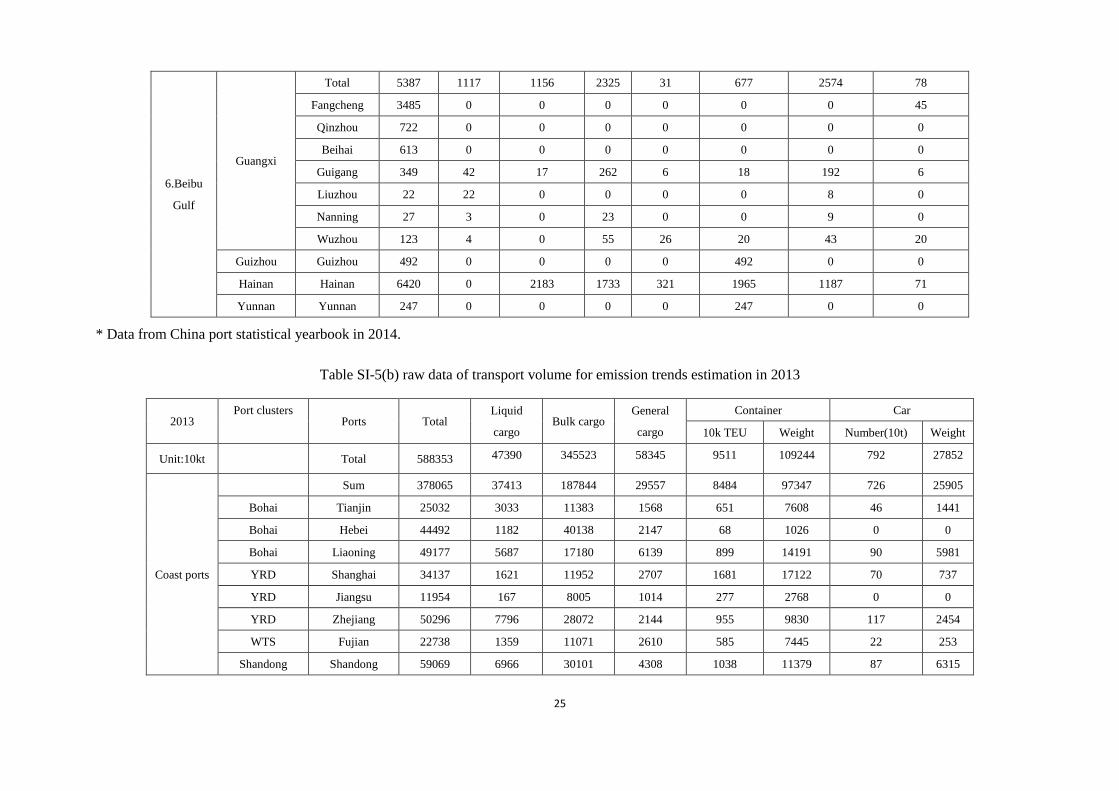
Table SI-5(a) Raw data of transport volume for cargo-based approach in 2013
Year: 2013
Ports
Cargo transport (10Kt)
Ocean-going
Cargo
transport
(10Kt)
Container
transport
(10000TEU)
Dry bulk Liquid
cargo General Cargo
Port
clusters Province Total Ore
Building
materials Coal
Oil and
Gas
Others
(Chemical,
food, wood,
etc.)
1.Bohai
Heilongjiang Heilongjiang 1245 656 22 55 5 508 0 0
Ji`ning Ji`ning 13379 0 35 2 1465 11878 0 0
Hebei
Total 39594 10284 0 28084 1160 0 7008 67
Huanghua 8310 1360 0 6847 92 0 1471 12
Qinghuaidao 12681 308 0 11914 440 0 2245 19
Tangshan 18603 8616 0 9323 628 0 3293 36
Tianjin Tianjin 25040 5409 300 4481 2654 11500 13372 651
Liaoning
Total 49217 11072 7774 3656 12071 13745 9891 899
Dalian 20381 815 3900 1400 5300 8450 5884 501
Yingkou 16038 5122 2241 1281 5282 1848 3111 265
Jingzhou 4266 600 484 975 0 2160 426 48
Dandong 6025 4100 1150 0 0 700 452 75
Huludao 1023 435 0 0 0 588 3 0
Panjin 1498 0 0 0 1489 0 17 10
2.Shandon
g Shandong
Total 57337 15555 235 5197 6537 28690 34185 1038
Qingdao 22894 6822 40 1041 3214 11000 16912 776
Yantai 14345 1032 130 1393 1108 10500 5323 108
Rizhao 15904 7163 65 1807 1768 5000 10825 102
22
Weihai 2009 17 0 694 55 1200 600 33
Dongying 715 46 0 64 265 340 200 0
Binzhou 283 279 0 0 4 0 0 0
Langfang 1171 197 0 198 124 650 325 3
3.YRD
Shanghai Shanghai 38794 4715 6712 6534 2427 16725 18853 1681
Zhejiang
Total 967 0 0 0 0 0 20398 967
Jiaxing 3023 0 1916 1057 0 0 430 51
Ningnbo-
Zhoushan 43200 19435 0 3963 4400 14535 19208 868
Taizhou 2815 0 1688 563 0 555 489 8
Wenzhou 3686 1476 0 1291 0 890 244 29
Hangzhou 4690 0 610 1126 844 2110 0 0
Jiaxing-river 5557 0 3100 2150 0 300 0 7
Huzhou 7660 919 6737 0 0 0 26 4
Shaoxing 672 0 672 0 0 0 0 0
Ningbo-river 26 0 0 0 0 26 2 0
Lanxi 35 0 0 0 0 35 0 0
Quzhou 0 0 0 0 0 0 0 0
Lishui 2 0 0 0 0 2 0 0
Qingtian 9 0 0 0 0 9 0 0
Hubei Hubei 24409 6911 0 1320 255 15842 213 54
Hunan Hunan 23097 7711 0 888 452 14032 106 15
Jiangsu
Total 70630 24313 9865 25633 4445 5542 7482 831
Changzhou 2234 992 0 1235 0 0 237 7
Jiangyin 4543 1185 2903 395 60 0 481 0
Lianyungang 6463 4555 1093 67 274 0 685 472
Nanjing 10553 2116 1723 2747 1713 2255 1118 0
23
Nantong 6276 2937 0 2621 688 0 665 30
Jiangsu 11450 5721 0 5220 243 0 1213 265
Taizhou 4338 511 0 3589 230 0 460 9
Wuxi 10315 1084 4146 3570 498 1017 1093 0
Suqian 925 736 0 138 51 0 98 0
Xuzhou 1320 147 0 1160 13 0 140 0
Yancheng 2113 1443 0 651 16 0 224 3
Yangzhou 5003 216 0 2103 389 2270 530 26
Zhenjiang 5097 2672 0 2137 269 0 540 19
Jiangxi Jiangxi 8676 561 2600 745 91 4665 17 14
Sichuan Sichuan 2392 114 45 193 27 2000 0 13
Anhui
Total 19839 4397 6441 2799 262 5910 0 26
An`qing 1505 96 323 256 128 700 0 2
Chizhou 1958 551 451 169 24 762 0 1
Tongling 2954 509 466 459 11 1506 0 1
Wuhu 4675 1279 790 874 61 1653 0 14
Ma`an`shan 3748 1439 1381 384 13 529 0 4
Hefei 1061 184 330 75 15 453 0 5
Fuyang 510 1 413 56 1 38 0 0
Liuan 180 81 90 0 0 9 0 0
Huainan 808 1 303 394 0 110 0 0
Bengbu 372 1 266 15 0 89 0 0
Chuzhou 1308 22 1029 25 0 232 0 0
Xuancheng 75 18 43 0 0 14 0 0
Bozhou 521 0 448 37 0 36 0 0
Xiuzhou 659 0 104 555 0 0 0 0
Huangshan 6 0 4 0 0 2 0 0
24
4.Western
Taiwan
Strait
Fujian
total 23322 2185 0 4183 1389 14980 9282 585
Fuzhou 6478 1624 0 1569 99 3089 2978 99
Xiamen 9970 368 0 1195 224 7757 4687 400
Quanzhou 5487 193 0 690 701 3818 1195 85
Putian 1412 0 0 730 366 316 422 0
5.PRD Guangdong
Total 78184 6163 27109 12022 7606 22440 25277 2476
Guanzhou 23599 3668 4149 3876 913 10117 5731 775
Shenzhen 11662 421 6587 215 669 2606 9087 1164
Zhuhai 5011 134 1204 811 691 2128 1018 44
Foshan 2737 12 654 431 257 1247 1123 138
Dongguan 5594 8 2626 2152 500 201 1070 99
Zhongshan 3438 0 2315 118 123 816 338 66
Jiangmen 3369 0 1941 858 142 381 447 47
Huizhou 4023 3 1205 350 1941 516 930 8
Zhaoqing 1477 6 869 173 38 356 136 35
Shantou 2519 0 692 693 64 1006 714 64
Chaozhou 525 0 0 438 26 61 317 0
Jieyang 1255 0 286 317 149 504 0 0
Shanwei 334 0 0 329 5 0 69 1
Yangjiang 1028 393 24 321 24 267 582 0
Zhanjiang 9003 1515 3875 682 1153 1664 2987 23
Maoming 1185 1 0 88 733 358 637 5
Shaoguan 40 0 0 39 0 0 0 0
Heyuan 0 0 0 0 0 0 0 0
Meizhou 63 0 50 0 0 13 0 0
Qingyuan 504 0 212 106 0 21 0 1
Yunfu 818 3 424 26 178 182 91 6
25
6.Beibu
Gulf
Guangxi
Total 5387 1117 1156 2325 31 677 2574 78
Fangcheng 3485 0 0 0 0 0 0 45
Qinzhou 722 0 0 0 0 0 0 0
Beihai 613 0 0 0 0 0 0 0
Guigang 349 42 17 262 6 18 192 6
Liuzhou 22 22 0 0 0 0 8 0
Nanning 27 3 0 23 0 0 9 0
Wuzhou 123 4 0 55 26 20 43 20
Guizhou Guizhou 492 0 0 0 0 492 0 0
Hainan Hainan 6420 0 2183 1733 321 1965 1187 71
Yunnan Yunnan 247 0 0 0 0 247 0 0
* Data from China port statistical yearbook in 2014.
Table SI-5(b) raw data of transport volume for emission trends estimation in 2013
2013 Port clusters
Ports Total Liquid
cargo Bulk cargo
General
cargo
Container Car
10k TEU Weight Number(10t) Weight
Unit:10kt Total 588353 47390 345523 58345 9511 109244 792 27852
Coast ports
Sum 378065 37413 187844 29557 8484 97347 726 25905
Bohai Tianjin 25032 3033 11383 1568 651 7608 46 1441
Bohai Hebei 44492 1182 40138 2147 68 1026 0 0
Bohai Liaoning 49177 5687 17180 6139 899 14191 90 5981
YRD Shanghai 34137 1621 11952 2707 1681 17122 70 737
YRD Jiangsu 11954 167 8005 1014 277 2768 0 0
YRD Zhejiang 50296 7796 28072 2144 955 9830 117 2454
WTS Fujian 22738 1359 11071 2610 585 7445 22 253
Shandong Shandong 59069 6966 30101 4308 1038 11379 87 6315

26
PRD Guangdong 65416 7581 22192 5052 2210 23974 202 6618
Beibu Gulf Guangxi 9337 1079 6415 945 50 852 1 48
Beibu Gulf Hainan 6420 945 1336 925 71 1155 93 2060
River ports
Sum 210288 9977 157680 28788 1027 11897 66 1947
Bohai Liaoning 23 0 17 7 0 0 0 0
Bohai Ji`ning 31 0 31 0 0 0 0 0
Bohai Heilongjiang 233 5 179 40 0 0 1 9
YRD Shanghai 4651 25 3857 769 0 0 0 0
YRD Jiangsu 95040 6371 65348 16895 555 6406 2 20
YRD Zhejiang 18730 518 16600 1515 12 98 0 0
YRD Anhui 19809 295 16899 2349 27 230 4 37
WTS Fujian 218 0 180 39 0 0 0 0
YRD Jiangxi 13122 125 12205 619 15 174 0 0
Shandong Shandong 3674 0 3604 71 0 0 0 0
YRD Henan 101 0 86 15 0 0 0 0
YRD Hubei 13110 370 9209 1787 54 787 28 958
YRD Hunan 11572 539 9932 912 15 191 0 0
PRD Guangdong 12771 1342 7096 1452 266 2881 0 0
Beibu Gulf Guangxi 5331 74 3901 886 28 472 0 0
YRD Chongqing 6838 225 4420 750 46 521 32 923
YRD Sichuan 4098 28 3576 355 13 140 0 0
Beibu Gulf Guizhou 492 62 166 265 0 0 0 0
Beibu Gulf Yunnan 248 0 196 52 0 0 0 0
* Data from China port statistical yearbook in 2014. WTS is “Western taiwan strait”
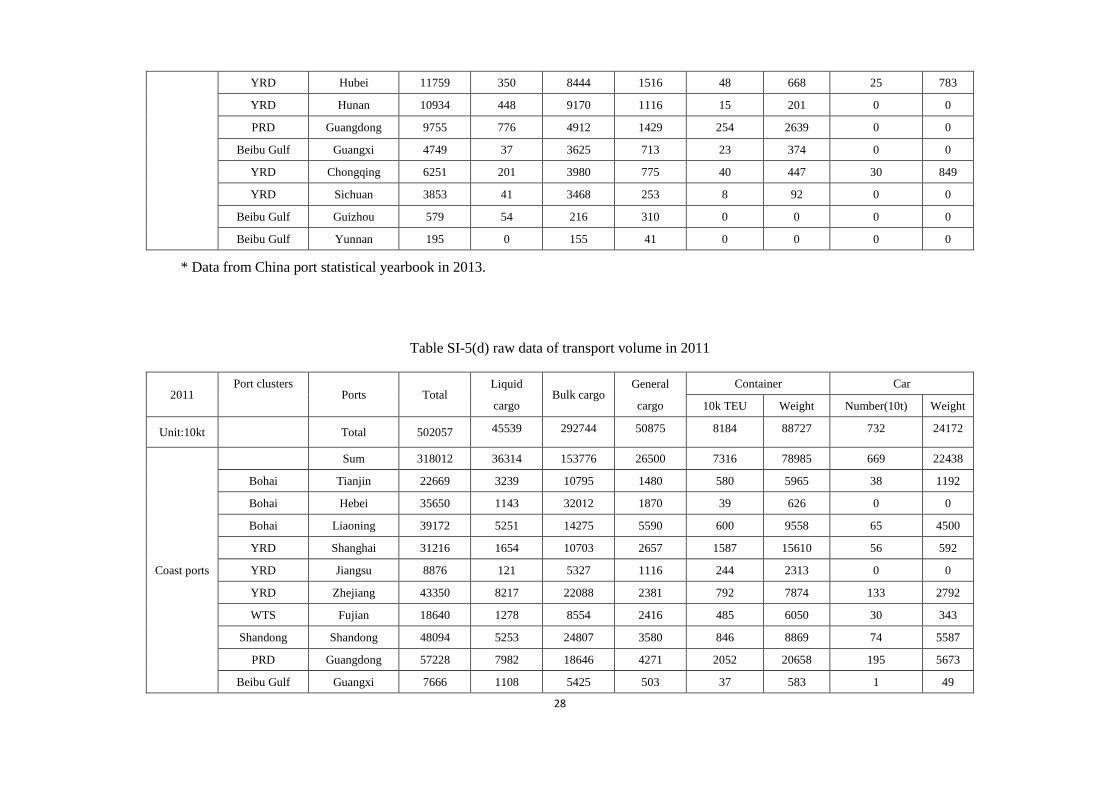
Table SI-5(c) raw data of transport volume in 2012
2012 Port clusters Ports Total Bulk cargo Container Car

27
Liquid
cargo
General
cargo 10k TEU Weight Number(10t) Weight
Unit:10kt Total 538802 45313 314550 53218 8874 99074 757 26649
Coast ports
Sum 343988 35913 168320 26802 7899 87993 697 24960
Bohai Tianjin 23849 3071 11208 1561 615 6721 42 1288
Bohai Hebei 38117 1213 34105 2124 45 676 0 0
Bohai Liaoning 44251 5337 15401 #VALUE! 757 12367 76 5217
YRD Shanghai 31870 1624 10806 2521 1627 16240 64 680
YRD Jiangsu 10252 200 6735 812 252 2506 0 0
YRD Zhejiang 46380 7567 25267 1971 880 8906 130 2671
WTS Fujian 20680 1340 10113 2235 537 6654 29 338
Shandong Shandong 53328 6156 27034 3395 950 9956 86 6788
PRD Guangdong 60633 7147 20449 4699 2128 22248 189 6091
Beibu Gulf Guangxi 8719 1149 6003 845 41 679 1 45
Beibu Gulf Hainan 5910 1111 1202 712 69 1042 82 1844
River ports
Sum 194815 9400 146230 26416 975 11081 60 1689
Bohai Liaoning 25 0 15 10 0 0 0 0
Bohai Ji`ning 32 0 32 0 0 0 0 0
Bohai Heilongjiang 232 #VALUE! 172 40 0 1 1 15
YRD Shanghai 4910 37 4077 797 0 0 0 0
YRD Jiangsu 87457 6709 60395 14070 548 6278 1 7
YRD Zhejiang 19586 325 17031 2170 7 61 0 0
YRD Anhui 18049 285 15030 2506 23 194 4 36
WTS Fujian 230 0 184 45 0 0 0 0
YRD Jiangxi 12636 136 11842 530 12 128 0 0
Shandong Shandong 3301 0 3257 45 0 0 0 0
YRD Henan 118 0 81 38 0 0 0 0
28
YRD Hubei 11759 350 8444 1516 48 668 25 783
YRD Hunan 10934 448 9170 1116 15 201 0 0
PRD Guangdong 9755 776 4912 1429 254 2639 0 0
Beibu Gulf Guangxi 4749 37 3625 713 23 374 0 0
YRD Chongqing 6251 201 3980 775 40 447 30 849
YRD Sichuan 3853 41 3468 253 8 92 0 0
Beibu Gulf Guizhou 579 54 216 310 0 0 0 0
Beibu Gulf Yunnan 195 0 155 41 0 0 0 0
* Data from China port statistical yearbook in 2013.
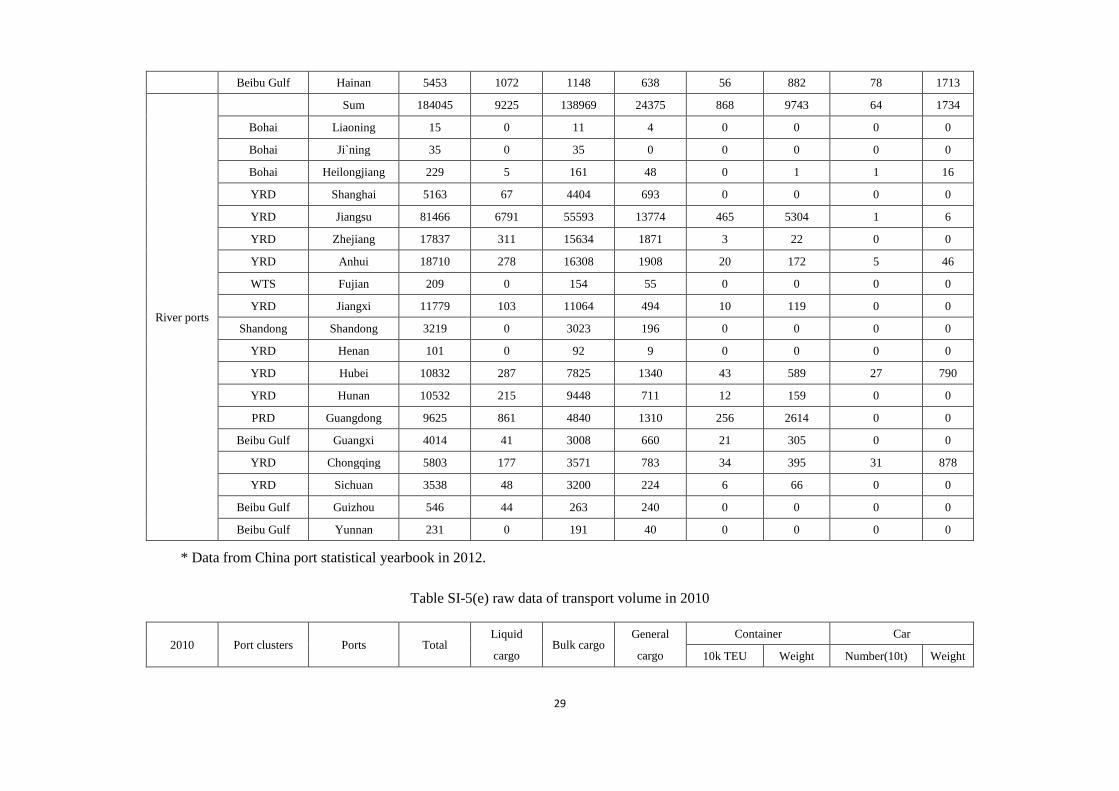
Table SI-5(d) raw data of transport volume in 2011
2011 Port clusters
Ports Total Liquid
cargo Bulk cargo
General
cargo
Container Car
10k TEU Weight Number(10t) Weight
Unit:10kt Total 502057 45539 292744 50875 8184 88727 732 24172
Coast ports
Sum 318012 36314 153776 26500 7316 78985 669 22438
Bohai Tianjin 22669 3239 10795 1480 580 5965 38 1192
Bohai Hebei 35650 1143 32012 1870 39 626 0 0
Bohai Liaoning 39172 5251 14275 5590 600 9558 65 4500
YRD Shanghai 31216 1654 10703 2657 1587 15610 56 592
YRD Jiangsu 8876 121 5327 1116 244 2313 0 0
YRD Zhejiang 43350 8217 22088 2381 792 7874 133 2792
WTS Fujian 18640 1278 8554 2416 485 6050 30 343
Shandong Shandong 48094 5253 24807 3580 846 8869 74 5587
PRD Guangdong 57228 7982 18646 4271 2052 20658 195 5673
Beibu Gulf Guangxi 7666 1108 5425 503 37 583 1 49
29
Beibu Gulf Hainan 5453 1072 1148 638 56 882 78 1713
River ports
Sum 184045 9225 138969 24375 868 9743 64 1734
Bohai Liaoning 15 0 11 4 0 0 0 0
Bohai Ji`ning 35 0 35 0 0 0 0 0
Bohai Heilongjiang 229 5 161 48 0 1 1 16
YRD Shanghai 5163 67 4404 693 0 0 0 0
YRD Jiangsu 81466 6791 55593 13774 465 5304 1 6
YRD Zhejiang 17837 311 15634 1871 3 22 0 0
YRD Anhui 18710 278 16308 1908 20 172 5 46
WTS Fujian 209 0 154 55 0 0 0 0
YRD Jiangxi 11779 103 11064 494 10 119 0 0
Shandong Shandong 3219 0 3023 196 0 0 0 0
YRD Henan 101 0 92 9 0 0 0 0
YRD Hubei 10832 287 7825 1340 43 589 27 790
YRD Hunan 10532 215 9448 711 12 159 0 0
PRD Guangdong 9625 861 4840 1310 256 2614 0 0
Beibu Gulf Guangxi 4014 41 3008 660 21 305 0 0
YRD Chongqing 5803 177 3571 783 34 395 31 878
YRD Sichuan 3538 48 3200 224 6 66 0 0
Beibu Gulf Guizhou 546 44 263 240 0 0 0 0
Beibu Gulf Yunnan 231 0 191 40 0 0 0 0
* Data from China port statistical yearbook in 2012.
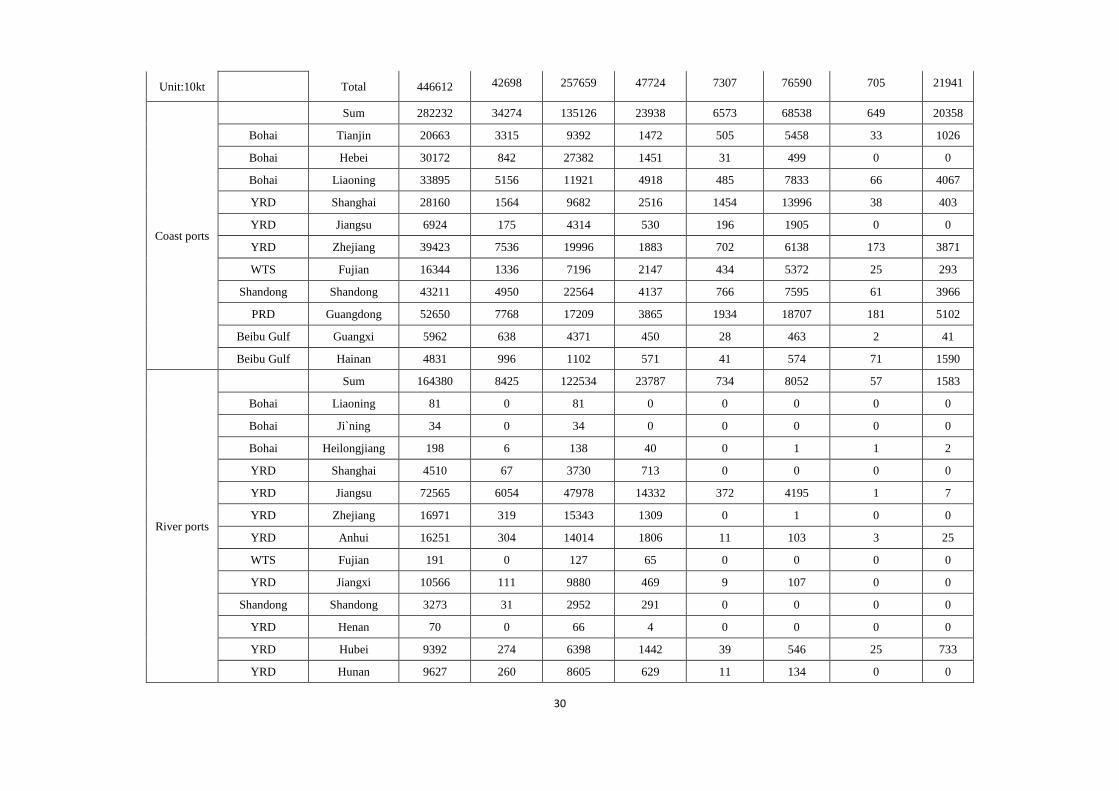
Table SI-5(e) raw data of transport volume in 2010
2010 Port clusters Ports Total Liquid
cargo Bulk cargo
General
cargo
Container Car
10k TEU Weight Number(10t) Weight
30
Unit:10kt Total 446612 42698 257659 47724 7307 76590 705 21941
Coast ports
Sum 282232 34274 135126 23938 6573 68538 649 20358
Bohai Tianjin 20663 3315 9392 1472 505 5458 33 1026
Bohai Hebei 30172 842 27382 1451 31 499 0 0
Bohai Liaoning 33895 5156 11921 4918 485 7833 66 4067
YRD Shanghai 28160 1564 9682 2516 1454 13996 38 403
YRD Jiangsu 6924 175 4314 530 196 1905 0 0
YRD Zhejiang 39423 7536 19996 1883 702 6138 173 3871
WTS Fujian 16344 1336 7196 2147 434 5372 25 293
Shandong Shandong 43211 4950 22564 4137 766 7595 61 3966
PRD Guangdong 52650 7768 17209 3865 1934 18707 181 5102
Beibu Gulf Guangxi 5962 638 4371 450 28 463 2 41
Beibu Gulf Hainan 4831 996 1102 571 41 574 71 1590
River ports
Sum 164380 8425 122534 23787 734 8052 57 1583
Bohai Liaoning 81 0 81 0 0 0 0 0
Bohai Ji`ning 34 0 34 0 0 0 0 0
Bohai Heilongjiang 198 6 138 40 0 1 1 2
YRD Shanghai 4510 67 3730 713 0 0 0 0
YRD Jiangsu 72565 6054 47978 14332 372 4195 1 7
YRD Zhejiang 16971 319 15343 1309 0 1 0 0
YRD Anhui 16251 304 14014 1806 11 103 3 25
WTS Fujian 191 0 127 65 0 0 0 0
YRD Jiangxi 10566 111 9880 469 9 107 0 0
Shandong Shandong 3273 31 2952 291 0 0 0 0
YRD Henan 70 0 66 4 0 0 0 0
YRD Hubei 9392 274 6398 1442 39 546 25 733
YRD Hunan 9627 260 8605 629 11 134 0 0

31
PRD Guangdong 8479 792 4186 1088 246 2414 0 0
Beibu Gulf Guangxi 3354 29 2565 582 15 179 0 0
YRD Chongqing 4834 133 2995 571 28 331 28 805
YRD Sichuan 3194 42 2929 180 4 44 0 0
Beibu Gulf Guizhou 445 7 216 222 0 0 0 0
Beibu Gulf Yunnan 210 0 173 37 0 0 0 0
* Data from China port statistical yearbook in 2011.
Table SI-5(f) raw data of transport volume in 2009
2009 Port clusters Ports Total Liquid
cargo Bulk cargo
General
cargo
Container Car
10k TEU Weight Number(10t) Weight
Unit:10kt Total 382854 37063 220221 43025 6120 63764 638 18739
Coast ports
Sum 243686 29477 117441 22866 5510 57208 579 16697
Bohai Tianjin 19056 2644 9795 1592 435 4436 20 591
Bohai Hebei 25437 513 23530 961 29 435 0 0
Bohai Liaoning 27630 4146 9075 6063 406 5859 36 2488
YRD Shanghai 24734 1489 8416 2316 1250 12310 20 204
YRD Jiangsu 5854 201 3506 712 153 1436 0 0
YRD Zhejiang 35731 6972 16850 1772 559 4920 235 5219
WTS Fujian 15271 975 7843 1741 358 4501 18 212
Shandong Shandong 36536 4265 18699 3415 656 6909 53 3249
PRD Guangdong 44562 6954 15266 3245 1618 15716 136 3382
Beibu Gulf Guangxi 4704 378 3554 472 18 278 1 23
Beibu Gulf Hainan 4173 943 909 579 30 411 61 1332
River ports Sum 139169 7632 102781 20159 610 6557 60 2042
Bohai Shanxi 0 0 0 0 0 0 0 0
32
Bohai Liaoning 127 0 127 0 0 0 0 0
Bohai Ji`ning 42 0 42 0 0 0 0 0
YRD Heilongjiang 179 4 119 45 0 0 1 11
YRD Shanghai 4869 31 4229 609 0 0 0 0
YRD Jiangsu 60539 5396 41454 10473 287 3210 1 7
YRD Zhejiang 16141 289 14614 1238 0 0 0 0
WTS Anhui 13225 233 10531 2354 10 95 2 14
YRD Fujian 145 0 130 15 0 0 0 0
Shandong Jiangxi 7505 127 6927 365 8 87 0 0
YRD Shandong 2407 8 2225 174 0 0 0 0
YRD Henan 44 0 43 2 0 0 0 0
YRD Hubei 8336 252 5512 1193 34 457 19 923
PRD Hunan 8470 242 7569 550 10 110 0 0
Beibu Gulf Guangdong 6819 863 2204 1648 222 2105 0 0
YRD Guangxi 2748 18 2025 554 12 152 0 0
YRD Chongqing 4306 126 2277 538 26 299 37 1067
Beibu Gulf Sichuan 2550 43 2292 151 3 44 1 21
Beibu Gulf Guizhou 389 1 177 211 0 0 0 0
Yunnan 170 0 141 30 0 0 0 0
Shanxi 160 0 145 15 0 0 0 0
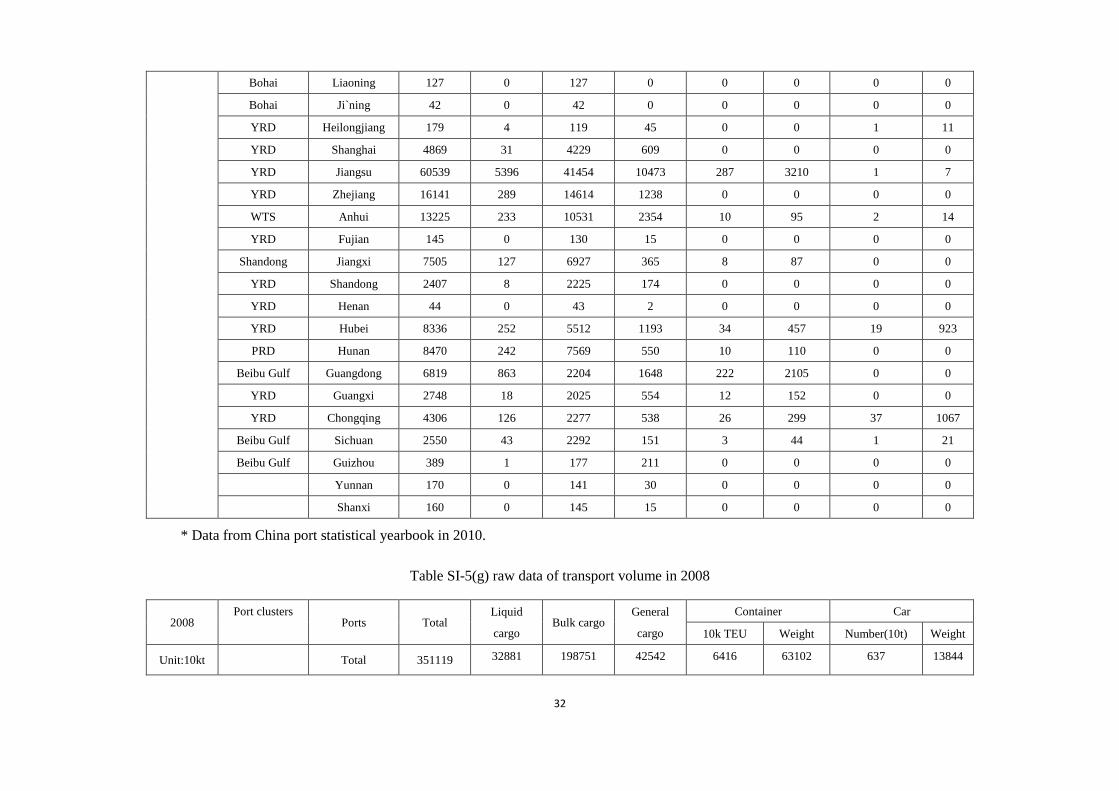
* Data from China port statistical yearbook in 2010.
Table SI-5(g) raw data of transport volume in 2008
2008 Port clusters
Ports Total Liquid
cargo Bulk cargo
General
cargo
Container Car
10k TEU Weight Number(10t) Weight
Unit:10kt Total 351119 32881 198751 42542 6416 63102 637 13844
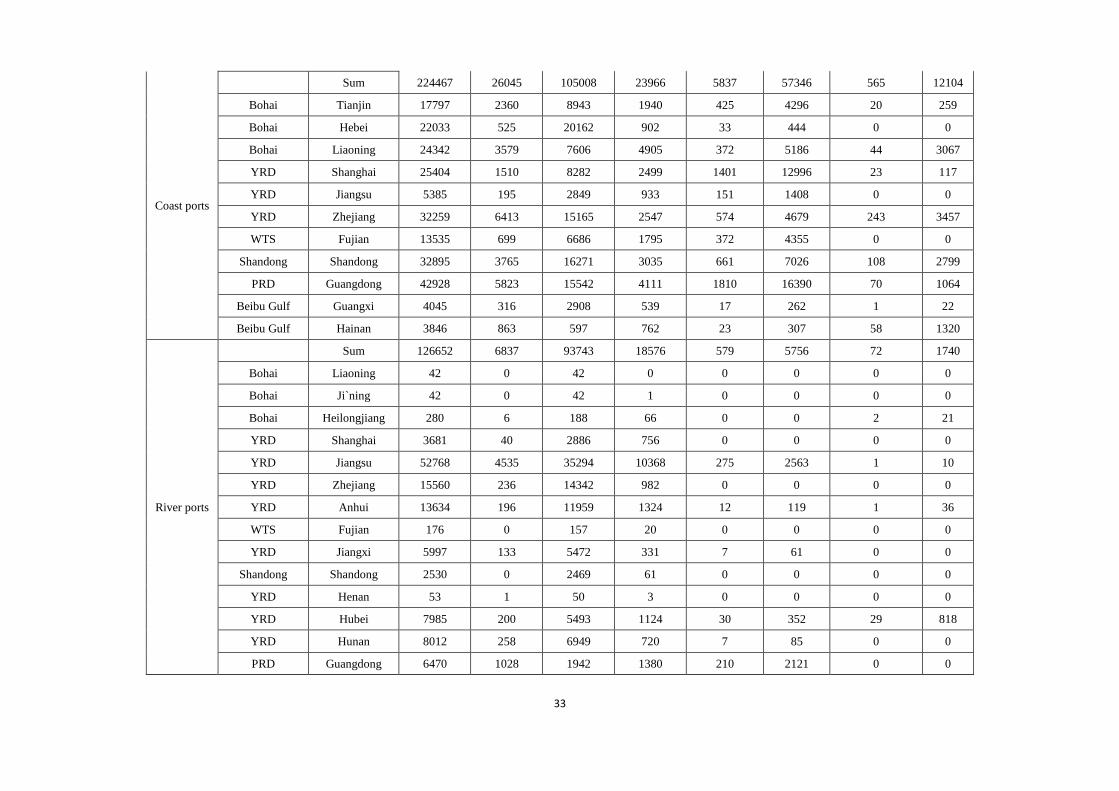
33
Coast ports
Sum 224467 26045 105008 23966 5837 57346 565 12104
Bohai Tianjin 17797 2360 8943 1940 425 4296 20 259
Bohai Hebei 22033 525 20162 902 33 444 0 0
Bohai Liaoning 24342 3579 7606 4905 372 5186 44 3067
YRD Shanghai 25404 1510 8282 2499 1401 12996 23 117
YRD Jiangsu 5385 195 2849 933 151 1408 0 0
YRD Zhejiang 32259 6413 15165 2547 574 4679 243 3457
WTS Fujian 13535 699 6686 1795 372 4355 0 0
Shandong Shandong 32895 3765 16271 3035 661 7026 108 2799
PRD Guangdong 42928 5823 15542 4111 1810 16390 70 1064
Beibu Gulf Guangxi 4045 316 2908 539 17 262 1 22
Beibu Gulf Hainan 3846 863 597 762 23 307 58 1320
River ports
Sum 126652 6837 93743 18576 579 5756 72 1740
Bohai Liaoning 42 0 42 0 0 0 0 0
Bohai Ji`ning 42 0 42 1 0 0 0 0
Bohai Heilongjiang 280 6 188 66 0 0 2 21
YRD Shanghai 3681 40 2886 756 0 0 0 0
YRD Jiangsu 52768 4535 35294 10368 275 2563 1 10
YRD Zhejiang 15560 236 14342 982 0 0 0 0
YRD Anhui 13634 196 11959 1324 12 119 1 36
WTS Fujian 176 0 157 20 0 0 0 0
YRD Jiangxi 5997 133 5472 331 7 61 0 0
Shandong Shandong 2530 0 2469 61 0 0 0 0
YRD Henan 53 1 50 3 0 0 0 0
YRD Hubei 7985 200 5493 1124 30 352 29 818
YRD Hunan 8012 258 6949 720 7 85 0 0
PRD Guangdong 6470 1028 1942 1380 210 2121 0 0

34
Beibu Gulf Guangxi 2338 18 1560 649 10 112 0 0
YRD Chongqing 3947 148 2234 445 27 300 33 820
YRD Sichuan 2459 38 2227 133 4 45 7 18
Beibu Gulf Guizhou 379 3 250 126 0 0 0 0
Beibu Gulf Yunnan 158 0 73 66 0 0 1 19
* Data from China port statistical yearbook in 2009.
Table SI-5(h) raw data of transport volume in 2007
2007 Port clusters
Ports Total Liquid
cargo Bulk cargo
General
cargo
Container Car
10k TEU Weight Number(10t) Weight
Unit:10kt Total 314818 27657 181158 35080 5459 57408 506 13514
Coast ports
Sum 200491 21756 96355 18883 4899 51398 452 12099
Bohai Tianjin 15338 1960 7400 1373 380 4105 22 500
Bohai Hebei 19468 487 17705 859 29 417 0 0
Bohai Liaoning 21086 2820 6917 3565 349 5165 38 2618
YRD Shanghai 24462 1313 8258 2182 1279 12396 35 312
YRD Jiangsu 4613 124 2710 629 120 1149 0 0
YRD Zhejiang 28944 5193 14735 1820 530 4844 151 2354
WTS Fujian 12690 703 6226 1577 338 4116 6 66
Shandong Shandong 28199 3268 14124 2375 537 5777 71 2656
PRD Guangdong 39143 4960 13768 3420 1502 14674 89 2320
Beibu Gulf Guangxi 3260 301 2304 394 15 244 1 17
Beibu Gulf Hainan 3284 632 581 577 27 398 48 1096
River ports
Sum 114327 5838 85113 16270 538 5763 52 1342
Bohai Liaoning 23 0 22 1 0 0 0 0
Bohai Ji`ning 69 0 69 0 0 0 0 0

35
Bohai Heilongjiang 324 6 235 64 0 0 1 18
YRD Shanghai 3518 29 2834 655 0 0 0 0
YRD Jiangsu 46053 3586 31171 8680 252 2607 1 9
YRD Zhejiang 15507 332 14019 1116 5 40 0 0
YRD Anhui 11816 172 10244 1255 13 118 1 27
WTS Fujian 133 0 115 18 0 0 0 0
YRD Jiangxi 6546 100 6036 333 7 77 0 0
Shandong Shandong 2206 0 2157 49 0 0 0 0
YRD Henan 44 0 39 4 0 0 0 0
YRD Hubei 7632 202 5303 1058 30 394 22 675
YRD Hunan 5973 221 5163 515 6 75 0 0
PRD Guangdong 6231 829 2635 1031 167 1736 0 0
Beibu Gulf Guangxi 2103 22 1463 480 10 138 0 0
YRD Chongqing 3328 119 1993 371 22 253 22 593
YRD Sichuan 2216 26 1974 152 5 56 3 9
Beibu Gulf Guizhou 320 18 169 133 0 0 0 0
Beibu Gulf Yunnan 156 0 97 49 0 0 0 10
* Data from China port statistical yearbook in 2008.
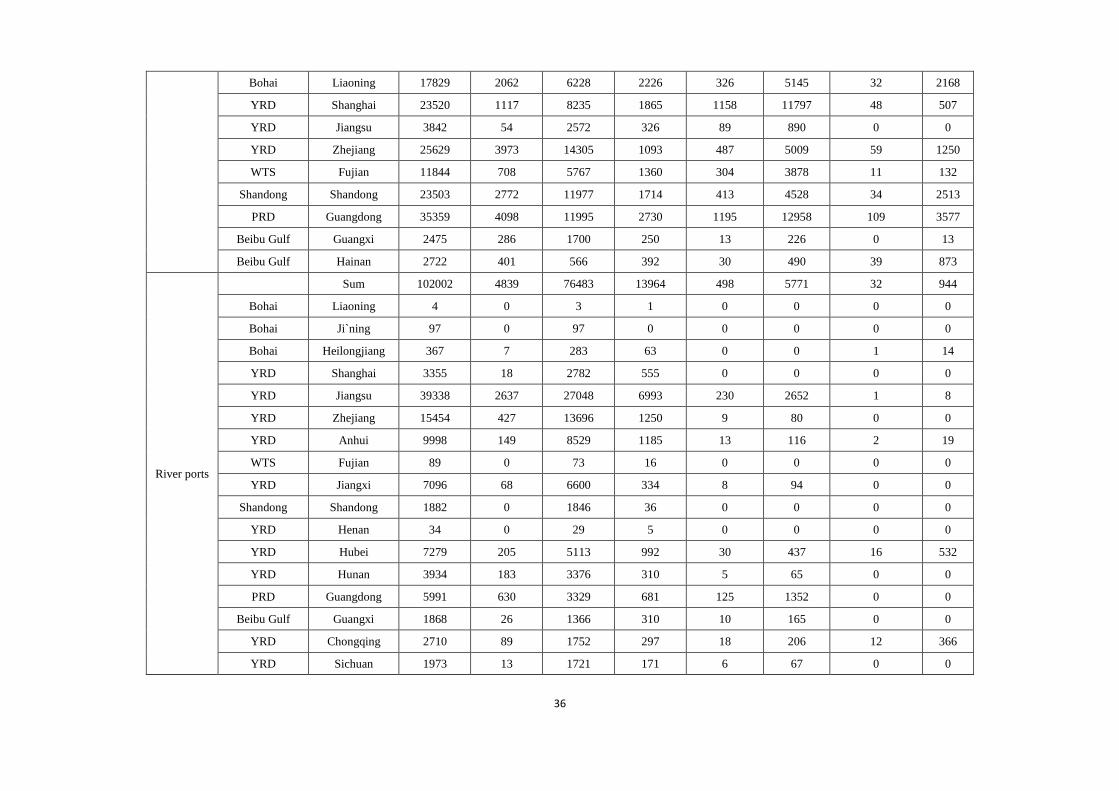
Table SI-5(i) raw data of transport volume in 2006
2006 Port clusters
Ports Total Liquid
cargo Bulk cargo
General
cargo
Container Car
10k TEU Weight Number(10t) Weight
Unit:10kt Total 278517 22434 163565 27619 4502 51714 375 13184
Coast ports
Sum 176516 17468 87703 13800 3961 45450 339 12095
Bohai Tianjin 12880 1560 5857 807 335 3915 24 741
Bohai Hebei 16903 449 15248 815 26 390 0 0
36
Bohai Liaoning 17829 2062 6228 2226 326 5145 32 2168
YRD Shanghai 23520 1117 8235 1865 1158 11797 48 507
YRD Jiangsu 3842 54 2572 326 89 890 0 0
YRD Zhejiang 25629 3973 14305 1093 487 5009 59 1250
WTS Fujian 11844 708 5767 1360 304 3878 11 132
Shandong Shandong 23503 2772 11977 1714 413 4528 34 2513
PRD Guangdong 35359 4098 11995 2730 1195 12958 109 3577
Beibu Gulf Guangxi 2475 286 1700 250 13 226 0 13
Beibu Gulf Hainan 2722 401 566 392 30 490 39 873
River ports
Sum 102002 4839 76483 13964 498 5771 32 944
Bohai Liaoning 4 0 3 1 0 0 0 0
Bohai Ji`ning 97 0 97 0 0 0 0 0
Bohai Heilongjiang 367 7 283 63 0 0 1 14
YRD Shanghai 3355 18 2782 555 0 0 0 0
YRD Jiangsu 39338 2637 27048 6993 230 2652 1 8
YRD Zhejiang 15454 427 13696 1250 9 80 0 0
YRD Anhui 9998 149 8529 1185 13 116 2 19
WTS Fujian 89 0 73 16 0 0 0 0
YRD Jiangxi 7096 68 6600 334 8 94 0 0
Shandong Shandong 1882 0 1846 36 0 0 0 0
YRD Henan 34 0 29 5 0 0 0 0
YRD Hubei 7279 205 5113 992 30 437 16 532
YRD Hunan 3934 183 3376 310 5 65 0 0
PRD Guangdong 5991 630 3329 681 125 1352 0 0
Beibu Gulf Guangxi 1868 26 1366 310 10 165 0 0
YRD Chongqing 2710 89 1752 297 18 206 12 366
YRD Sichuan 1973 13 1721 171 6 67 0 0
37
Beibu Gulf Guizhou 261 33 88 140 0 0 0 0
Beibu Gulf Yunnan 153 0 121 32 0 0 0 0
* Data from China port statistical yearbook in 2007.
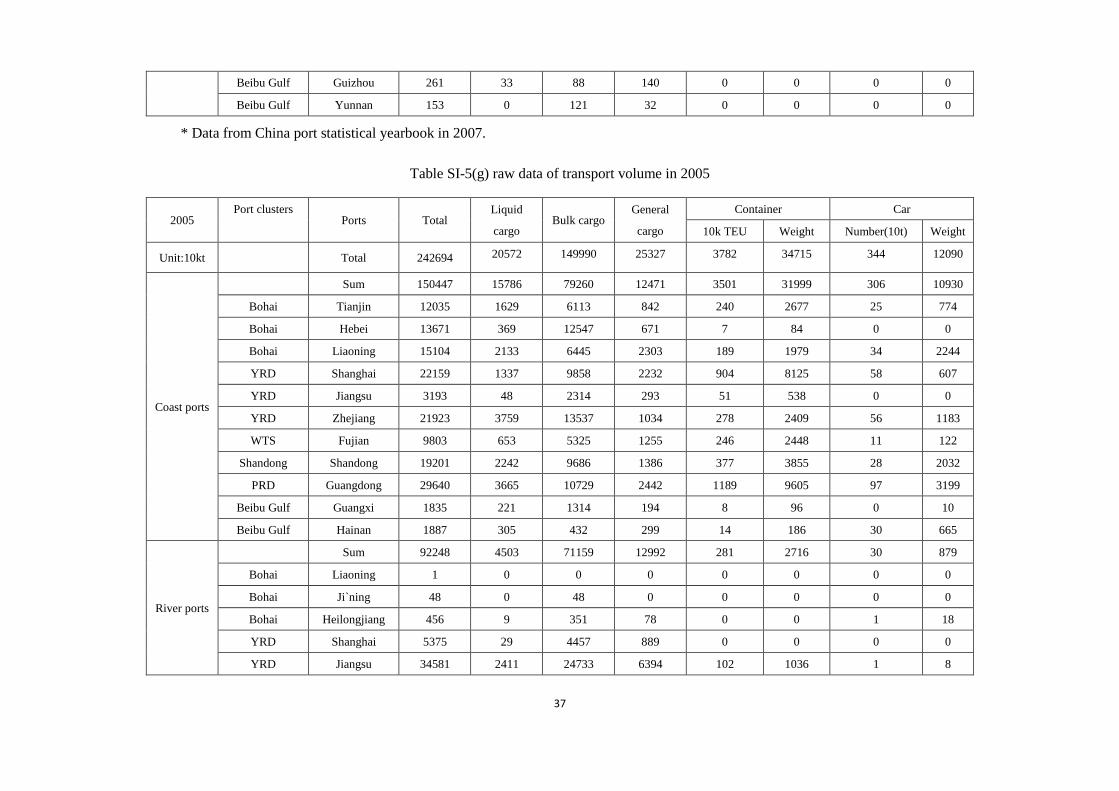
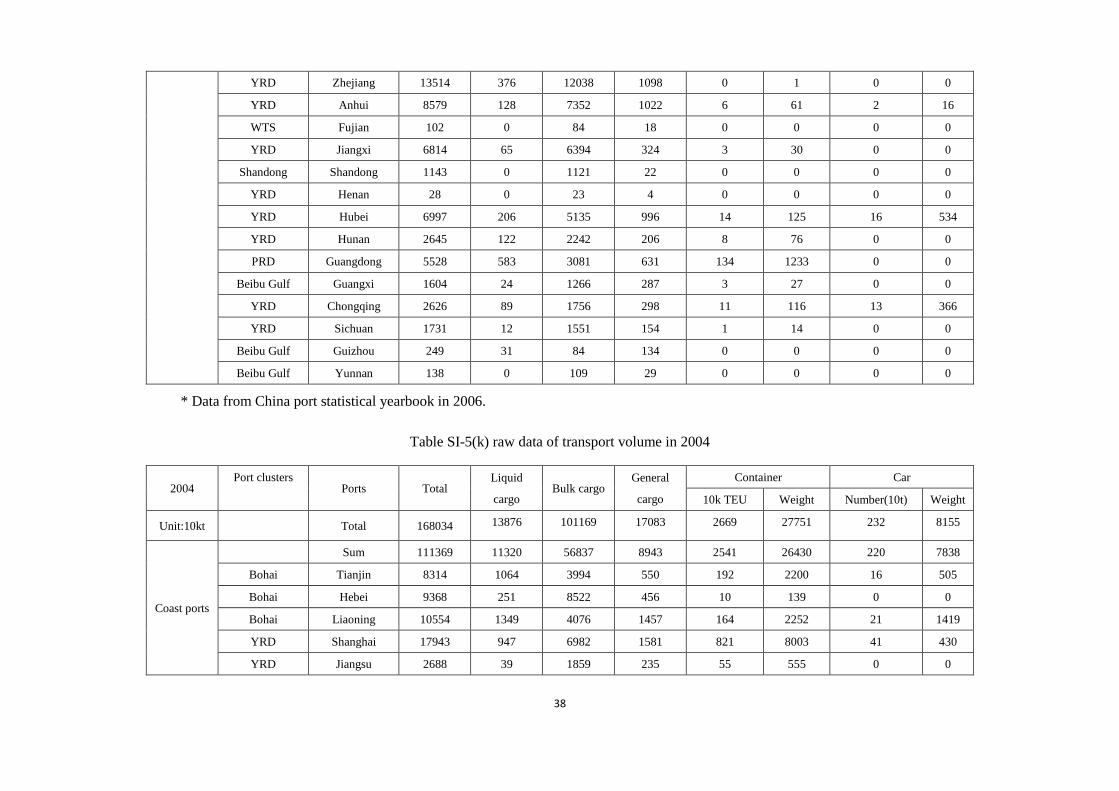
Table SI-5(g) raw data of transport volume in 2005
2005 Port clusters
Ports Total Liquid
cargo Bulk cargo
General
cargo
Container Car
10k TEU Weight Number(10t) Weight
Unit:10kt Total 242694 20572 149990 25327 3782 34715 344 12090
Coast ports
Sum 150447 15786 79260 12471 3501 31999 306 10930
Bohai Tianjin 12035 1629 6113 842 240 2677 25 774
Bohai Hebei 13671 369 12547 671 7 84 0 0
Bohai Liaoning 15104 2133 6445 2303 189 1979 34 2244
YRD Shanghai 22159 1337 9858 2232 904 8125 58 607
YRD Jiangsu 3193 48 2314 293 51 538 0 0
YRD Zhejiang 21923 3759 13537 1034 278 2409 56 1183
WTS Fujian 9803 653 5325 1255 246 2448 11 122
Shandong Shandong 19201 2242 9686 1386 377 3855 28 2032
PRD Guangdong 29640 3665 10729 2442 1189 9605 97 3199
Beibu Gulf Guangxi 1835 221 1314 194 8 96 0 10
Beibu Gulf Hainan 1887 305 432 299 14 186 30 665
River ports
Sum 92248 4503 71159 12992 281 2716 30 879
Bohai Liaoning 1 0 0 0 0 0 0 0
Bohai Ji`ning 48 0 48 0 0 0 0 0
Bohai Heilongjiang 456 9 351 78 0 0 1 18
YRD Shanghai 5375 29 4457 889 0 0 0 0
YRD Jiangsu 34581 2411 24733 6394 102 1036 1 8
38
YRD Zhejiang 13514 376 12038 1098 0 1 0 0
YRD Anhui 8579 128 7352 1022 6 61 2 16
WTS Fujian 102 0 84 18 0 0 0 0
YRD Jiangxi 6814 65 6394 324 3 30 0 0
Shandong Shandong 1143 0 1121 22 0 0 0 0
YRD Henan 28 0 23 4 0 0 0 0
YRD Hubei 6997 206 5135 996 14 125 16 534
YRD Hunan 2645 122 2242 206 8 76 0 0
PRD Guangdong 5528 583 3081 631 134 1233 0 0
Beibu Gulf Guangxi 1604 24 1266 287 3 27 0 0
YRD Chongqing 2626 89 1756 298 11 116 13 366
YRD Sichuan 1731 12 1551 154 1 14 0 0
Beibu Gulf Guizhou 249 31 84 134 0 0 0 0
Beibu Gulf Yunnan 138 0 109 29 0 0 0 0
* Data from China port statistical yearbook in 2006.
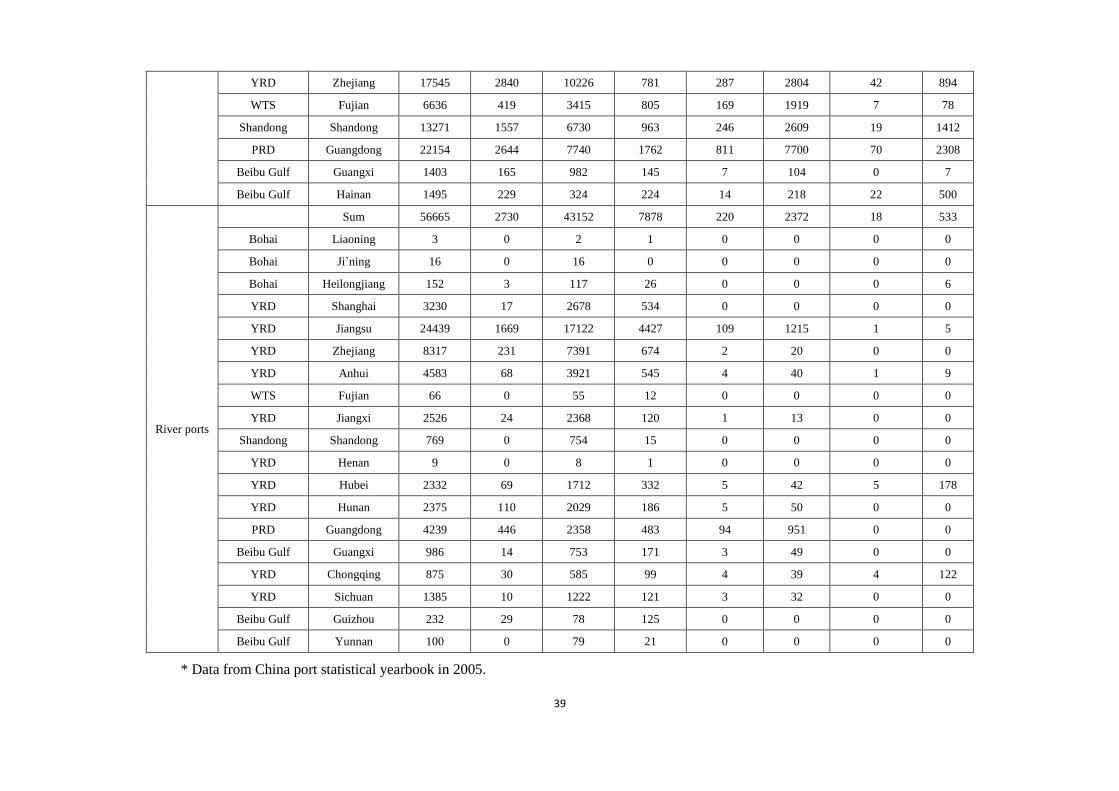
Table SI-5(k) raw data of transport volume in 2004
2004 Port clusters
Ports Total Liquid
cargo Bulk cargo
General
cargo
Container Car
10k TEU Weight Number(10t) Weight
Unit:10kt Total 168034 13876 101169 17083 2669 27751 232 8155
Coast ports
Sum 111369 11320 56837 8943 2541 26430 220 7838
Bohai Tianjin 8314 1064 3994 550 192 2200 16 505
Bohai Hebei 9368 251 8522 456 10 139 0 0
Bohai Liaoning 10554 1349 4076 1457 164 2252 21 1419
YRD Shanghai 17943 947 6982 1581 821 8003 41 430
YRD Jiangsu 2688 39 1859 235 55 555 0 0
39
YRD Zhejiang 17545 2840 10226 781 287 2804 42 894
WTS Fujian 6636 419 3415 805 169 1919 7 78
Shandong Shandong 13271 1557 6730 963 246 2609 19 1412
PRD Guangdong 22154 2644 7740 1762 811 7700 70 2308
Beibu Gulf Guangxi 1403 165 982 145 7 104 0 7
Beibu Gulf Hainan 1495 229 324 224 14 218 22 500
River ports
Sum 56665 2730 43152 7878 220 2372 18 533
Bohai Liaoning 3 0 2 1 0 0 0 0
Bohai Ji`ning 16 0 16 0 0 0 0 0
Bohai Heilongjiang 152 3 117 26 0 0 0 6
YRD Shanghai 3230 17 2678 534 0 0 0 0
YRD Jiangsu 24439 1669 17122 4427 109 1215 1 5
YRD Zhejiang 8317 231 7391 674 2 20 0 0
YRD Anhui 4583 68 3921 545 4 40 1 9
WTS Fujian 66 0 55 12 0 0 0 0
YRD Jiangxi 2526 24 2368 120 1 13 0 0
Shandong Shandong 769 0 754 15 0 0 0 0
YRD Henan 9 0 8 1 0 0 0 0
YRD Hubei 2332 69 1712 332 5 42 5 178
YRD Hunan 2375 110 2029 186 5 50 0 0
PRD Guangdong 4239 446 2358 483 94 951 0 0
Beibu Gulf Guangxi 986 14 753 171 3 49 0 0
YRD Chongqing 875 30 585 99 4 39 4 122
YRD Sichuan 1385 10 1222 121 3 32 0 0
Beibu Gulf Guizhou 232 29 78 125 0 0 0 0
Beibu Gulf Yunnan 100 0 79 21 0 0 0 0
* Data from China port statistical yearbook in 2005.
40