Ship Air Emissions - IMarEST
56
Ship Air Emissions Main Challenges, Policies and Industry Developments Stefanos CHATZINIKOLAOU Senior Manager, Marine Research & Innovation RINA Hellas Ltd IMarEST U.A.E. branch technical meeting Dubai 10 May 2018
-
Upload
khangminh22 -
Category
Documents
-
view
1 -
download
0
Transcript of Ship Air Emissions - IMarEST
Ship Air EmissionsMain Challenges, Policies and
Industry Developments
Stefanos CHATZINIKOLAOU
Senior Manager, Marine Research & Innovation
RINA Hellas Ltd
IMarEST U.A.E. branch
technical meeting
Dubai 10 May 2018

Subtopic 1 (CO2 emissions)Data Collection System (DCS) for fuel consumption monitoring
IMO Strategy for GHG
Ship Air EmissionsMain Challenges, Policies and Industry Developments
Subtopic 2 (SOx emissions)Market response to the 2020 Global Sulphur Cap
Exhaust gas cleaning
LNG
Alternative fuels
Intro Facts for shipping, main challenges

Ship Air EmissionsMain Challenges, Policies and Industry Developments
Intro Facts for shipping, main challenges
Dubai .11/5/2018
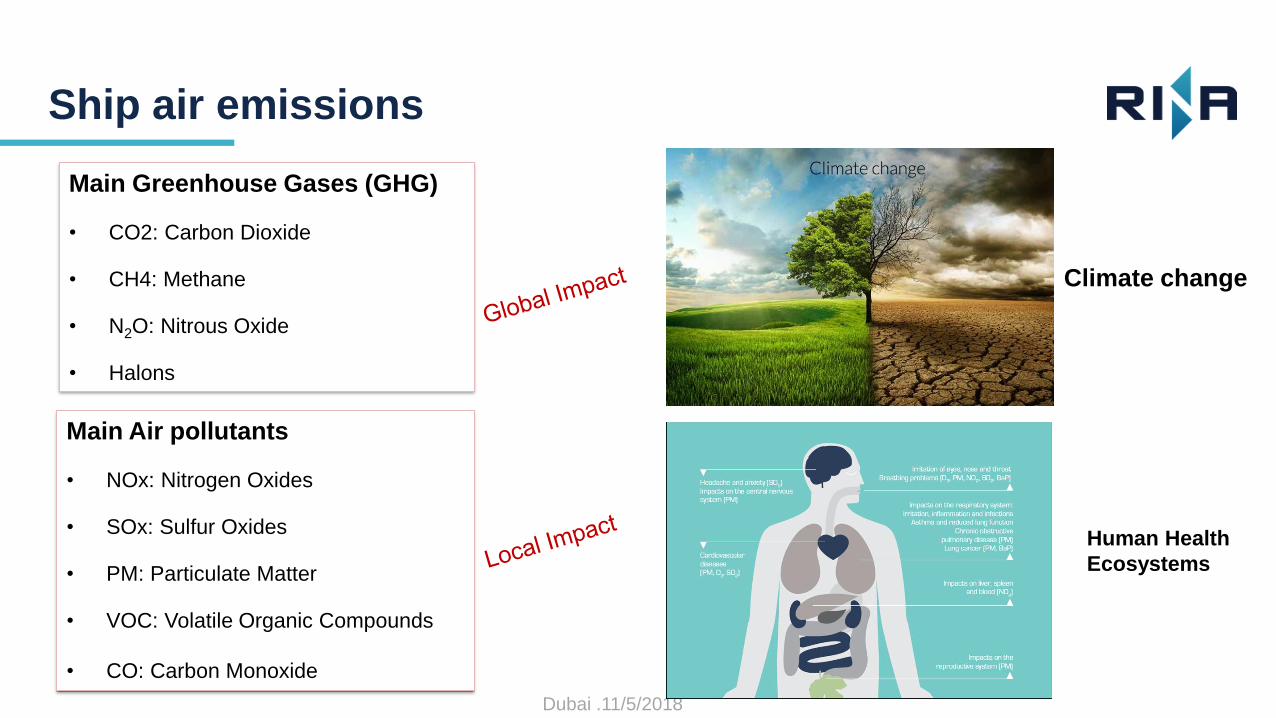
Ship air emissions
Main Greenhouse Gases (GHG)
• CO2: Carbon Dioxide
• CH4: Methane
• N2O: Nitrous Oxide
• Halons
Main Air pollutants
• NOx: Nitrogen Oxides
• SOx: Sulfur Oxides
• PM: Particulate Matter
• VOC: Volatile Organic Compounds
• CO: Carbon Monoxide
Human Health
Ecosystems
Climate change

Dubai .11/5/2018
CO2 facts of shipping
90%Global transport work
50,000ships
International Shipping

Dubai .11/5/2018
CO2 Comparisons
Source: International Council on Clean Transportation, 2014
Dubai .11/5/2018
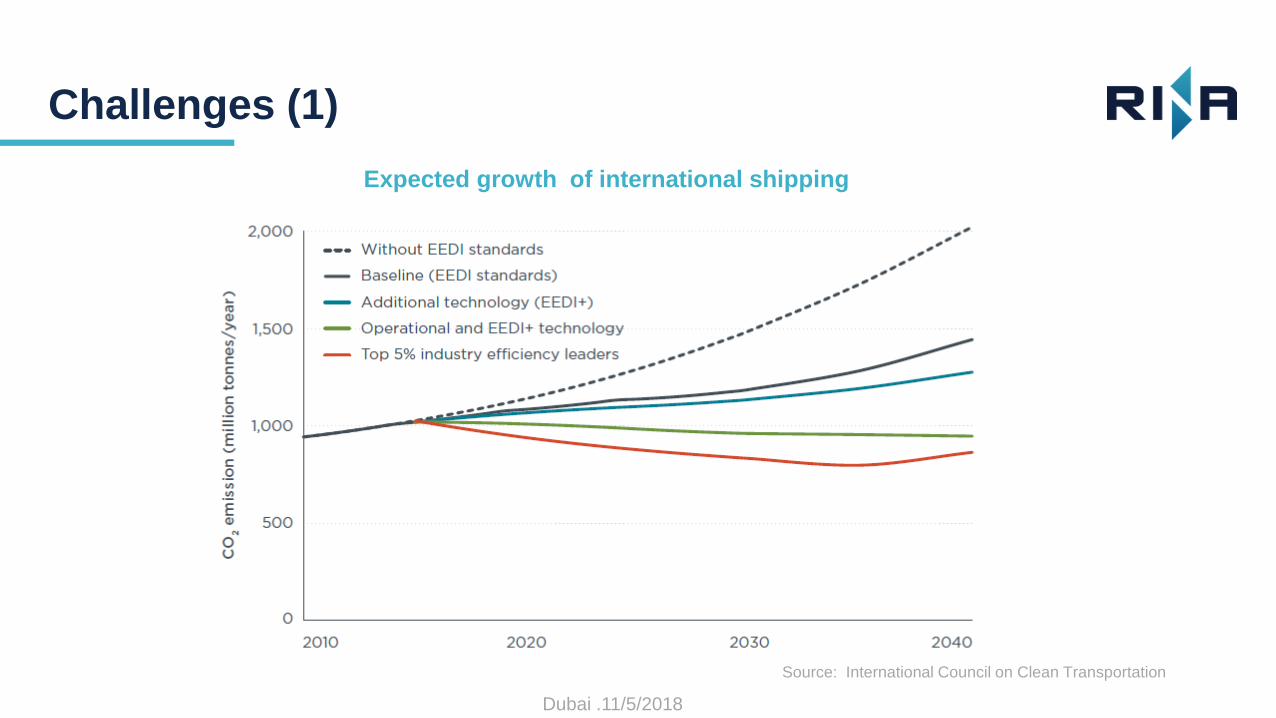
Challenges (1)
Expected growth of international shipping
Source: International Council on Clean Transportation

Dubai .11/5/2018
Challenges (2)
Quality of Marine fuels

Dubai .11/5/2018
Challenges (3)
DESIGN (New ships)Saving of
CO2/tonne-mileCombined Combined
Concept, speed & capability 2% to 50%
10% to 50%
25% to 75%
Hull and superstructure 2% to 20%
Power and propulsion systems 5% to 15%
Low-carbon fuels 5% to 15%
Renewable energy 1% to 10%
Exhaust gas CO2 reduction 0%
OPERATION (All ships)
Fleet management, logistics &
incentives5% to 50%
10% to 50%Voyage optimization 1% to 10%
Energy management 1% to 10%
Green house gas reduction potential

Dubai .11/5/2018
Challenges (4): Energy efficiency
Reduce fuel consumption
Less Fuel Cost
Economic Sustainability
Reduce Emissions
Reduce environmental
impact
Environmental Sustainability
Reduce health impacts
Improve company’s image
Social Sustainability
Energy efficiency is cost effective and is becoming a
necessity from: society, industry and regulations
Dubai .11/5/2018
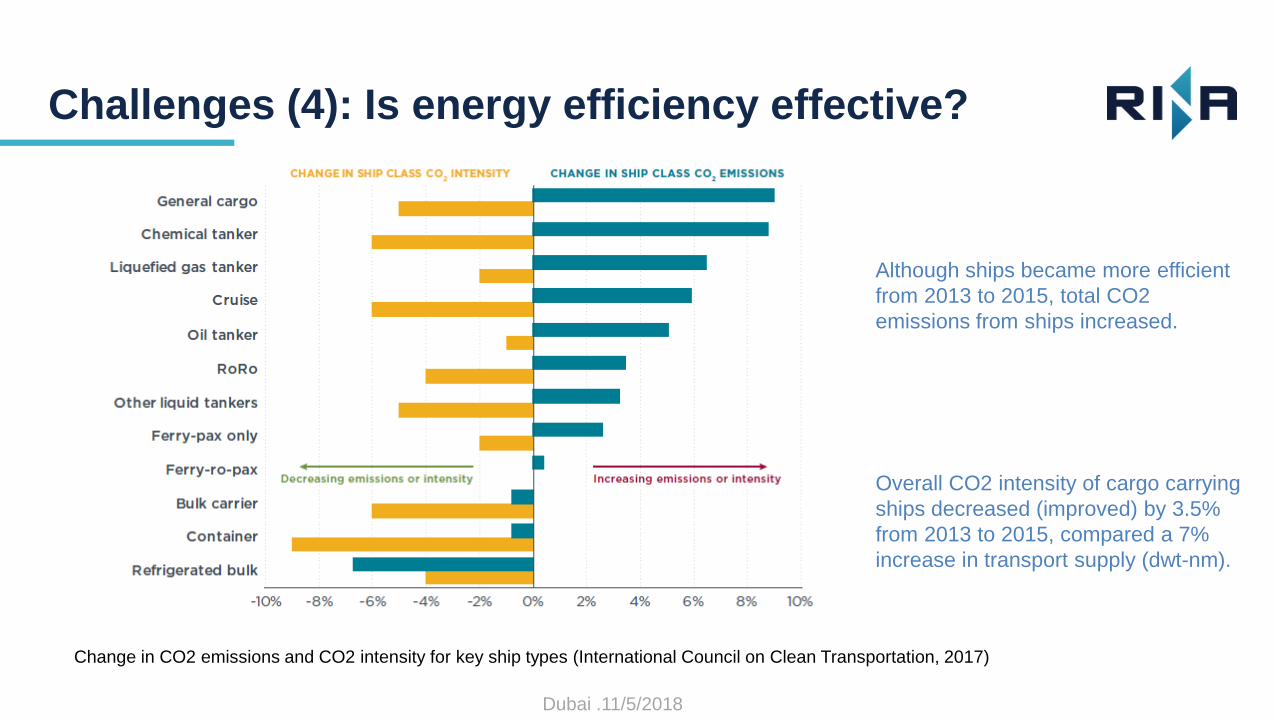
Challenges (4): Is energy efficiency effective?
Change in CO2 emissions and CO2 intensity for key ship types (International Council on Clean Transportation, 2017)
Although ships became more efficient
from 2013 to 2015, total CO2
emissions from ships increased.
Overall CO2 intensity of cargo carrying
ships decreased (improved) by 3.5%
from 2013 to 2015, compared a 7%
increase in transport supply (dwt-nm).
Dubai .11/5/2018
Environmental Challenges
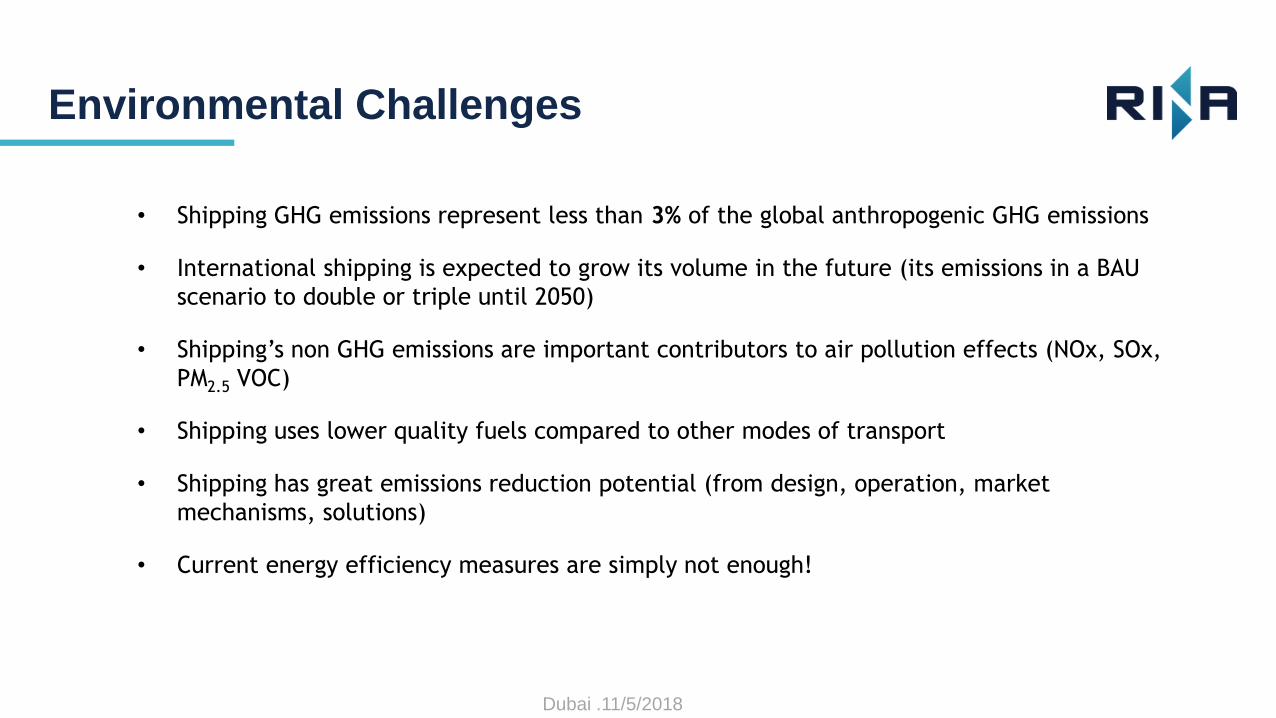
• Shipping GHG emissions represent less than 3% of the global anthropogenic GHG emissions
• International shipping is expected to grow its volume in the future (its emissions in a BAU
scenario to double or triple until 2050)
• Shipping’s non GHG emissions are important contributors to air pollution effects (NOx, SOx,
PM2.5 VOC)
• Shipping uses lower quality fuels compared to other modes of transport
• Shipping has great emissions reduction potential (from design, operation, market
mechanisms, solutions)
• Current energy efficiency measures are simply not enough!

Subtopic 1 (CO2 emissions)Data Collection System (DCS) for fuel consumption monitoring
IMO Strategy for GHG
Ship Air EmissionsMain Challenges, Policies and Industry Developments

Dubai .11/5/2018
IMO Data Collection System (DCS)
IMO has developed a Data Collection
System for fuel oil consumption of ships, to
address CO2 emissions
In MARPOL Annex VI (Reg. 22A)

Dubai .11/5/2018
Timeline – Activities
IMO Data Collection System (DCS)
01.01.2019 31.12.2019 31.03.2020 31.05.2020 30.06.2020
Data collection method: SEEMP part II
Verify that SEEMP part II is in compliance with the Regulation
1st reporting period
Submit data collected
Verify the reported data of fuel consumption
Shall issue a statement of compliance
Transfer the data to IMOs ships fuel oil consumption database
The ship
The Flag/RO

Dubai .11/5/2018
IMO Data Collection System (DCS)
• Main Engines
• Auxiliary Engines
• Boilers
• Gas Turbines
• Inert Gas Generators
Sources of CO2 emissions
Incinerators are not subject to DCS

Dubai .11/5/2018
Methods of monitoring fuel consumption
IMO Data Collection System (DCS)
Method A
Bunker Fuel
Delivery Note
(BDN) and periodic
stocktakes of fuel
tanks
Method C
Flow meters for
applicable
combustion
processes
Method B
Bunker fuel tank
monitoring on board

Dubai .11/5/2018
Process
IMO Data Collection System (DCS)
Ship Flag State Administration
IMO Secretariat IMO Ship Fuel Consumption
DatabaseSubmits data to flag State or RO in
accordance with regulation 22A.
Data collection methodology to be
included in the ship’s SEEMP
Aggregates data and submits to IMO
Secretariat.
Verifies the ship’s SEEMP and the data reported
complies with regulation 22A.
Issues Statement of Compliance to the ship
Aggregates all data submitted by flag
States, ROs, and non-party ships.
Provides Flag States with anonymized
data from the IMO Ship Fuel
Consumption Database
Data will be anonymized to the extent that
individual ships cannot be identified.
Access to anonymized data will be restricted to IMO Member States only

Dubai .11/5/2018
Be conscious!
Many ships may have to monitor and report two times following
the requirements of:
1. The Monitoring Reporting and Verification (MRV Reg.) of EU
2. The Data Collection System (DCS) of IMO

Dubai .11/5/2018
IMO DCS vs. EU MRV
Timeline 2015 2016 2017 2018 2019 2020
Start monitoring
MEPC68May
MEPC69April
MEPC70October
MEPC71June
MEPC72Feb.
MEPC73October
MEPC74June
Start data collection
Draft amendments
(MARPOL Annex VI)
ApprovalAmendments to
MARPOL Annex VI
Adoption
AdoptionApril
Entry into forceJuly
Submission of MP
By August
IMO
EU
Entry into force
1 March
Delegated / Implementing
Reg. Publication
Dubai .11/5/2018
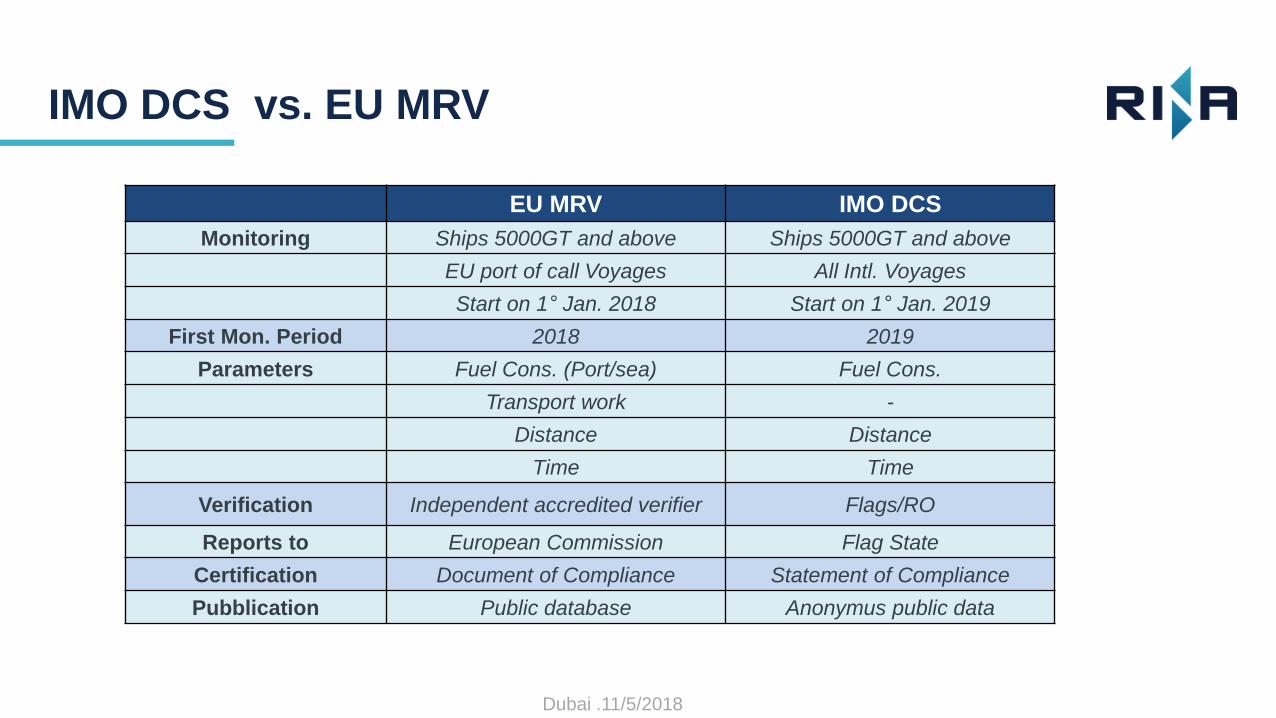
IMO DCS vs. EU MRV
EU MRV IMO DCS
Monitoring Ships 5000GT and above Ships 5000GT and above
EU port of call Voyages All Intl. Voyages
Start on 1° Jan. 2018 Start on 1° Jan. 2019
First Mon. Period 2018 2019
Parameters Fuel Cons. (Port/sea) Fuel Cons.
Transport work -
Distance Distance
Time Time
Verification Independent accredited verifier Flags/RO
Reports to European Commission Flag State
Certification Document of Compliance Statement of Compliance
Pubblication Public database Anonymus public data

Dubai .11/5/2018
EU MRV alignment to the IMO DCS
IMO DCS vs. EU MRV
A. No alignment: Two sets of data, two different verification approaches, and EU data to be
published.
B. Full alignment: The EU-MRV is fully aligned to the IMO data collection system but ships using
EEA ports have to submit reports in both systems with the reports for the EU system only covering
voyages from and to EEA ports.
C. Partial alignment: EU MRV is maintained, including all elements (monitoring, reporting,
verification and publication). Similar elements are harmonised in order to minimize administrative
burden.
Publication of EC final proposal is being expected the 2nd quarter of 2018

Dubai .11/5/2018
IMO roadmap

Dubai .11/5/2018
MEPC 72 OutcomeTargets set for shipping’s GHG
Level1
Carbon Intensity of the ship
•Carbon intensity at the ship level to decline
•implementation of further phases of the EEDI for new ships
• to review and strengthen the EEDI limits for ships (improvement for each phase to be determined for each ship type, as appropriate0
Level 2
Carbon Intensity of international shipping
•Carbon intensity of international shipping to decline
•CO2 emissions per transport work, as an average across international shipping, by at least 40% by 2030, pursuing efforts towards 70% by 2050, compared to 2008
Level 3
GHG from international shipping
• to peak GHG emissions from international shipping as soon as possible
• to reduce the total annual GHG emissions by at least 50% by 2050 compared to 2008
• whilst pursuing efforts towards phasing them out consistent with the Paris Agreement temperature goals

Dubai .11/5/2018
What is next?IMO GHG Strategy, Short term measures (2018 – 2023)
1. Energy efficiency with focus on EEDI and SEEMP EEDI =𝑃𝑜𝑤𝑒𝑟 × 𝑆𝐹𝐶 ×𝐶𝑓
𝐶𝑎𝑟𝑔𝑜 𝐶𝑎𝑝𝑎𝑐𝑖𝑡𝑦 × 𝑠𝑝𝑒𝑒𝑑[ 𝑔 𝐶𝑂2
𝑇𝑜𝑛𝑠 ×𝑀𝑖𝑙𝑒𝑠]
2. Consider and analyse speed optimization and
speed reduction as a measure
Cut fuel
Cut CO2
Slow steami
ng

Dubai .11/5/2018
What is next?IMO GHG Strategy, Short term measures (2018 – 2023)
3 Initiate R&D. Establish an International
Maritime Research Board to coordinate research
4 Consideration of other indicators that can be utilized
to indicate and enhance the energy efficiency
• Annual Efficiency Ratio (AER),
• Energy Efficiency per Service Hour (EESH),
• Individual Ship Performance Indicator (ISPI)
• Fuel Oil Reduction Strategy (FORS);

Dubai .11/5/2018
What is next?IMO GHG Strategy, Short term measures (2018 – 2023)
5 Address emissions of methane and Volatile
Organic Compounds
6 Incentives for first movers to develop and take up
new technologies

Dubai .11/5/2018
What is next?IMO GHG Strategy, Mid- term measures (2023 – 2030)
7 Market based measurers, (e.g. emissions trading)
8 Implementation programme for the effective uptake
of alternative low-carbon and zero-carbon fuels,

Dubai .11/5/2018
What is next?IMO GHG Strategy, Long- term measures (2030 - )
9 De – carbonization (fossil free, or zero carbon fuels)

End of Subtopic 1

Ship Air EmissionsMain Challenges, Policies and Industry Developments
Subtopic 2 (SOx emissions)Market response to the 2020 Global Sulphur Cap
Exhaust gas cleaning
LNG
Alternative fuels

Dubai .11/5/2018
Global Sulphur LimitFacts – Air Pollution
Contribution of the transport
sector to total emissions of the
main air pollutants (%)
international shipping in EU
• 16 % of NOx,
• 4 % of PM10,
• 7 % of PM2.5
• 16 % of SOx
(European Environmental Agency, 2017).
Dubai .11/5/2018
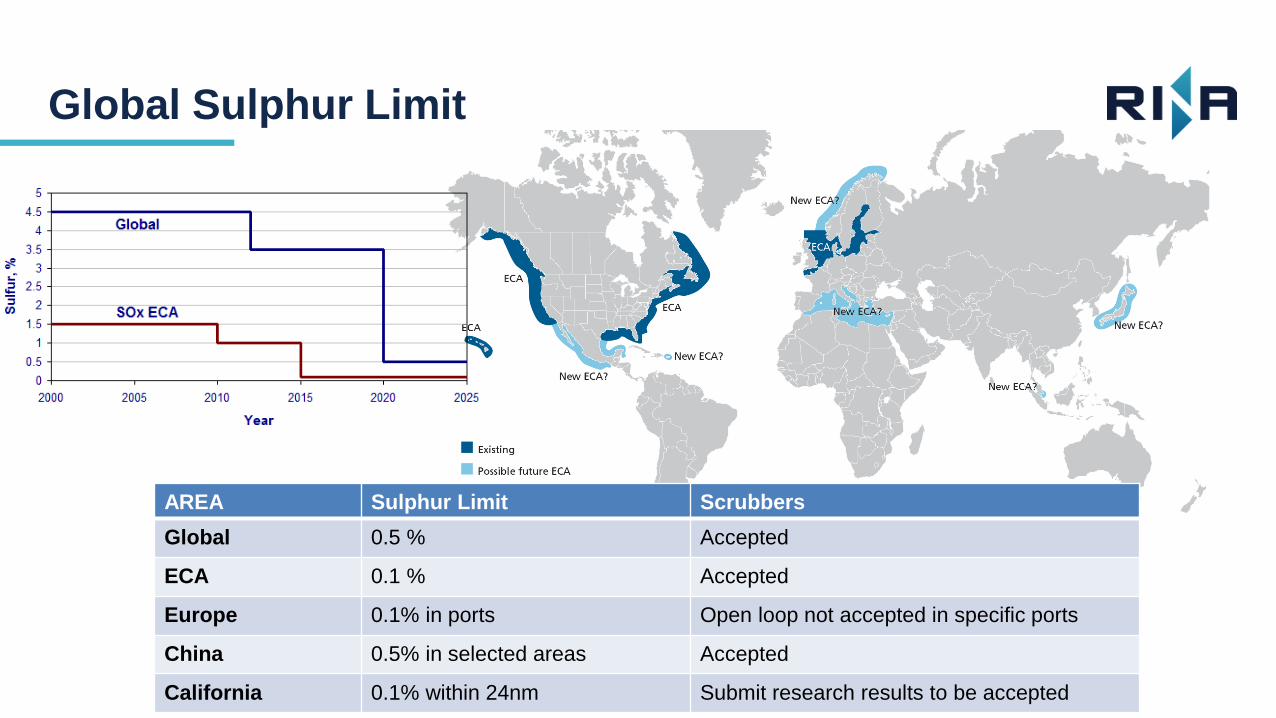
Global Sulphur Limit
AREA Sulphur Limit Scrubbers
Global 0.5 % Accepted
ECA 0.1 % Accepted
Europe 0.1% in ports Open loop not accepted in specific ports
China 0.5% in selected areas Accepted
California 0.1% within 24nm Submit research results to be accepted

Dubai .11/5/2018
Global Sulphur LimitOptions
• MDO,
• MGO
• Low Sulphur HFOLow Sulphur fuels
• Bio fuels
• Methanol
• LNG Alternative fuels
• Wet type - open loop
• Wet type - closed loop
• Wet type - Hybrid
• Dry type
Scrubbers
Dubai .11/5/2018
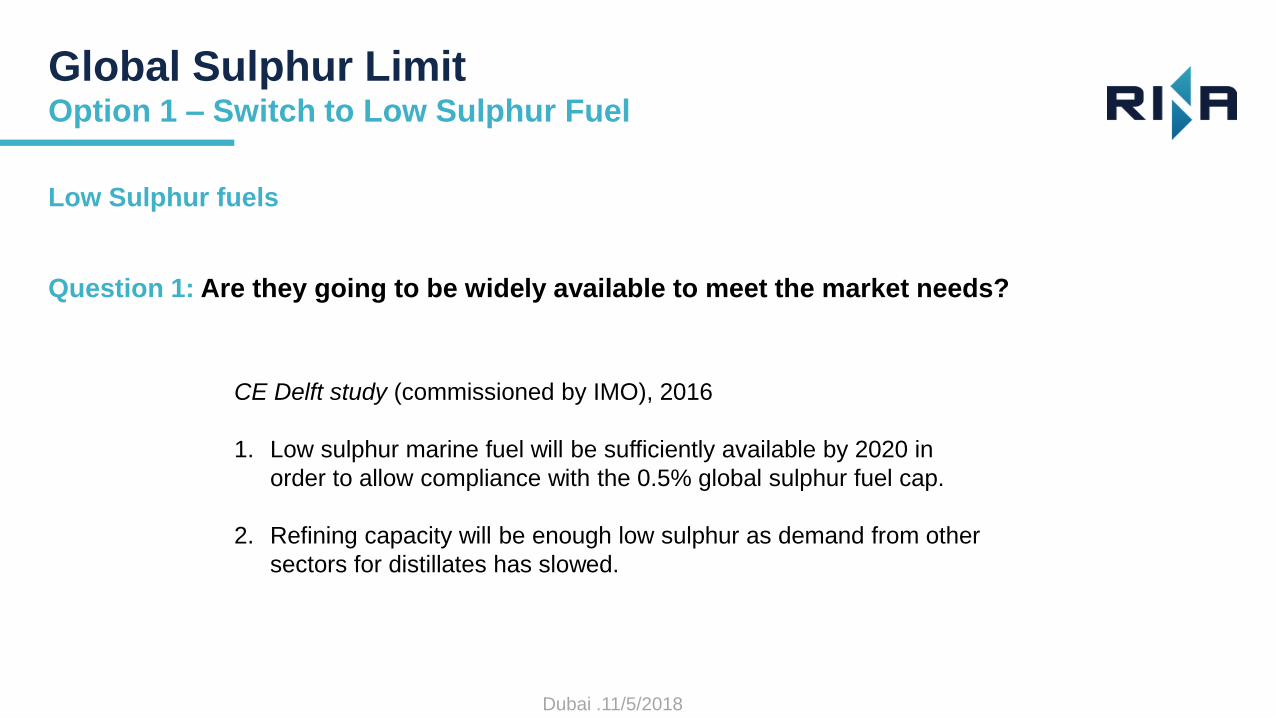
Global Sulphur LimitOption 1 – Switch to Low Sulphur Fuel
CE Delft study (commissioned by IMO), 2016
1. Low sulphur marine fuel will be sufficiently available by 2020 in
order to allow compliance with the 0.5% global sulphur fuel cap.
2. Refining capacity will be enough low sulphur as demand from other
sectors for distillates has slowed.
Low Sulphur fuels
Question 1: Are they going to be widely available to meet the market needs?

Dubai .11/5/2018
Global Sulphur LimitOption 1 – Switch to Low Sulphur Fuel
Low Sulphur fuels
Question 2: What will be the price of low Sulphur fuels?

Dubai .11/5/2018
Global Sulphur LimitOption 1 – Switch to Low Sulphur Fuel
Low Sulphur fuels
Question 2: What will be the price of low Sulphur fuels?
1. The price difference is the important parameter
2. Shipping industry (currently) adopts a wait-and-see approach
3. This makes the switching to MGO/MDO the preferred option at
least until 2020
4. The same happened when the SECA regime entered into force,
resulting in increased MGO price
Dubai .11/5/2018
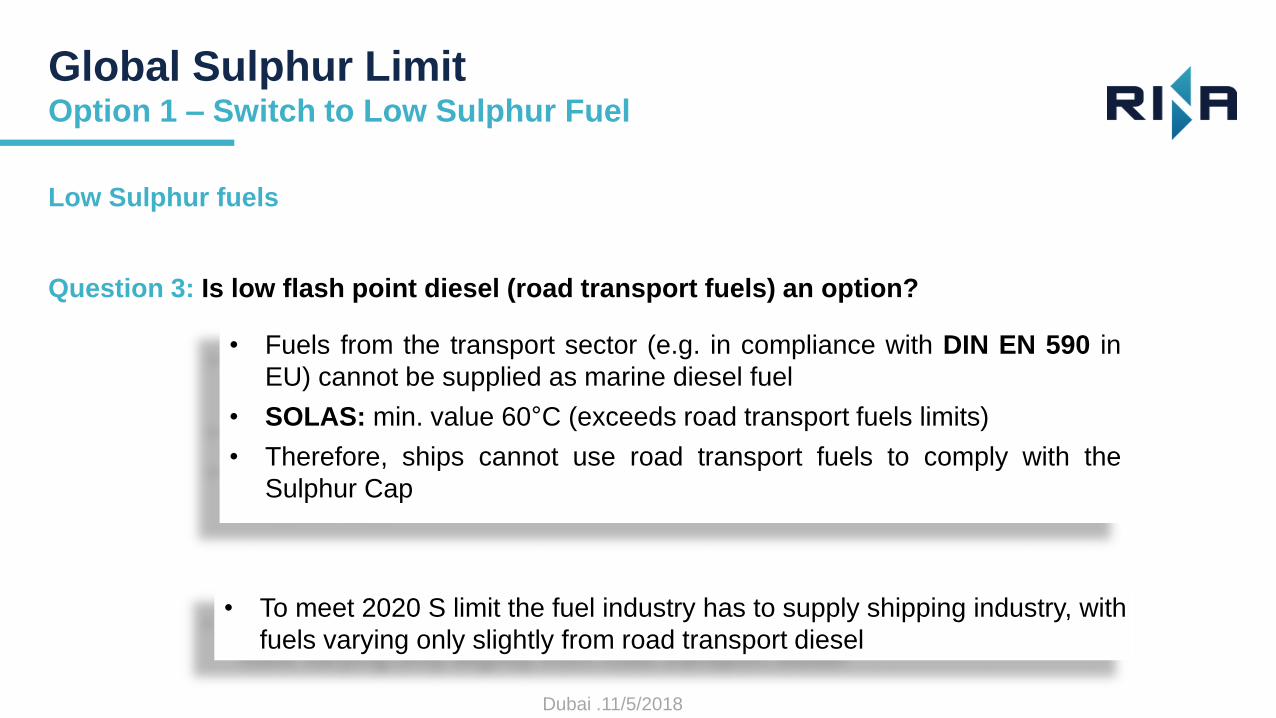
Global Sulphur LimitOption 1 – Switch to Low Sulphur Fuel
Low Sulphur fuels
Question 3: Is low flash point diesel (road transport fuels) an option?
• Fuels from the transport sector (e.g. in compliance with DIN EN 590 in
EU) cannot be supplied as marine diesel fuel
• SOLAS: min. value 60°C (exceeds road transport fuels limits)
• Therefore, ships cannot use road transport fuels to comply with the
Sulphur Cap
• To meet 2020 S limit the fuel industry has to supply shipping industry, with
fuels varying only slightly from road transport diesel

Dubai .11/5/2018
Market TrendsOption 2 – Scrubbers
It is expected that about 2000 ships
will install scrubbers until 2020
Makers projection is up to 5000
until 2025
Projected share in the range of
10% to 20%
Dubai .11/5/2018
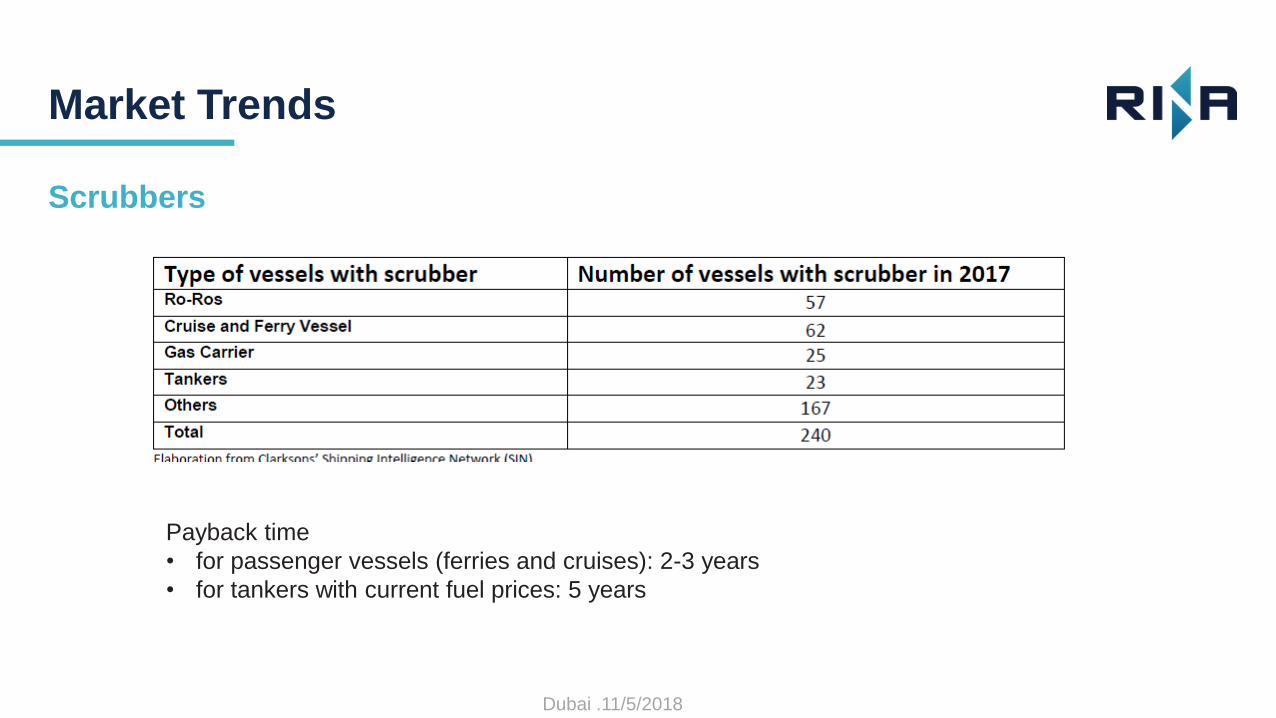
Scrubbers
Market Trends
Payback time
• for passenger vessels (ferries and cruises): 2-3 years
• for tankers with current fuel prices: 5 years
Dubai .11/5/2018
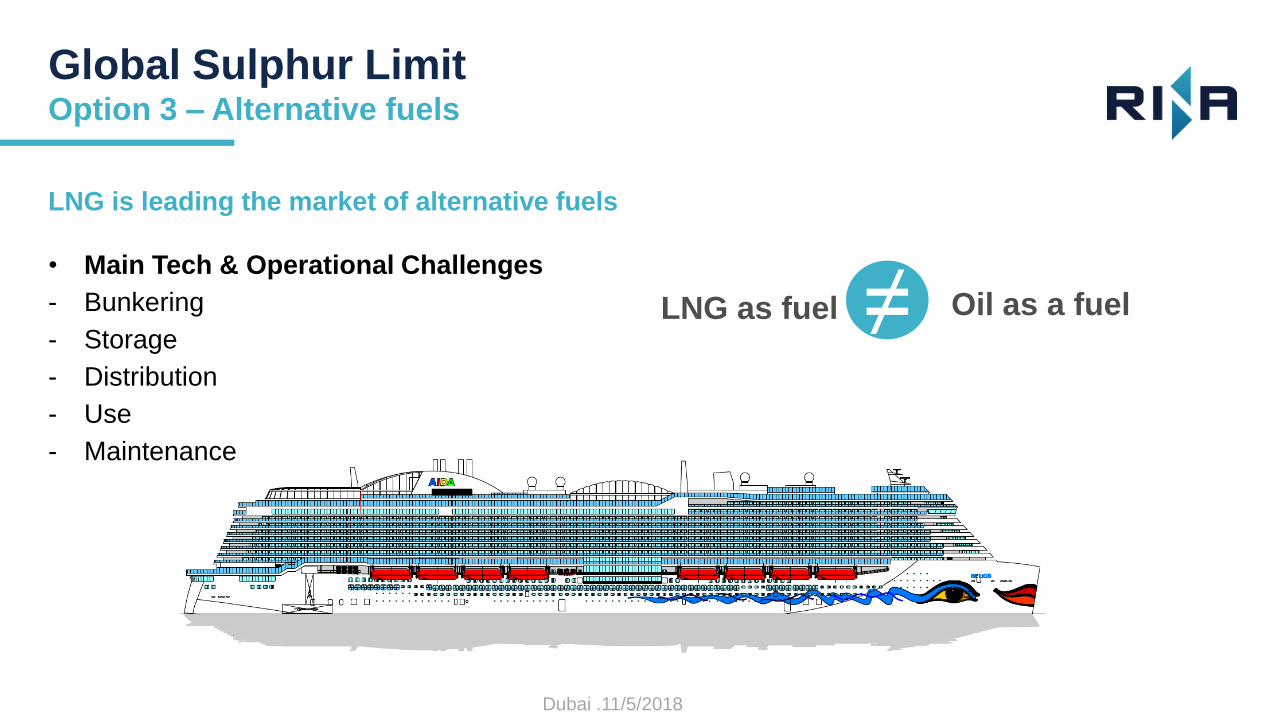
Global Sulphur LimitOption 3 – Alternative fuels
• Main Tech & Operational Challenges
- Bunkering
- Storage
- Distribution
- Use
- Maintenance
LNG as fuel Oil as a fuel≠
LNG is leading the market of alternative fuels

Dubai .11/5/2018
LNG as fuel Newbuilding projects
• Shipyard: Sefine Shipyard
• Shipowner: Caronte & Tourist
• Size: 1+1 × Ro-Ro passenger ferry (290 cars; 1,000 pax)
• Designed to provide a 20-25% efficiency saving
• The first ferries to be powered at sea by LNG in the Mediterranean

Dubai .11/5/2018
LNG as fuel Newbuilding projects
• Shipyard: Cantiere Navale Visentini
• Shipowner: Balearia
• Size: 2 × Ro-Ro passenger ferry (25,000 GT; 810 pax)
• The ships will be able to reach 24 knots speed with a total power of
20,600 KW
• Decline CO2 and NOx emissions

Dubai .11/5/2018
LNG as fuel Newbuilding projects
Revolutionary “green design”
The first ships in the cruise industry to be powered at sea by LNG
Shipyard: Meyer Werft- Papenburg
Shipowner: AIDA
Size: 2 × cruise ships (180,000 gt)
Shipyard: Meyer - Turku
Shipowner: Costa Crociere
Size: 2 × cruise ships (180,000 gt)

Dubai .11/5/2018
LNG as fuel Is it the fuel of the future?
1ton of HFO burned in a ship’s engine produces 3.11 tons of CO2
1ton of LNG burned in a ship’s engine produces ? tons of CO2

Dubai .11/5/2018
LNG as fuel Is it the fuel of the future?
1ton of HFO burned in a ship’s engine produces 3.11 tons of CO2
1ton of LNG burned in a ship’s engine produces 2.75 tons of CO2

Dubai .11/5/2018
LNG as fuel Remarks
Human Health & Ecosystems Climate change
A. Transition fuel: LNG is going to be a transition fuel for maritime transport,
B. Air pollution: Clear benefits in the elimination of air pollution, expensive option
C. Climate change: LNG is not the solution for combating climate change

Dubai .11/5/2018
Future trends…

Dubai .11/5/2018
Future trends…Electric Ships

Dubai .11/5/2018
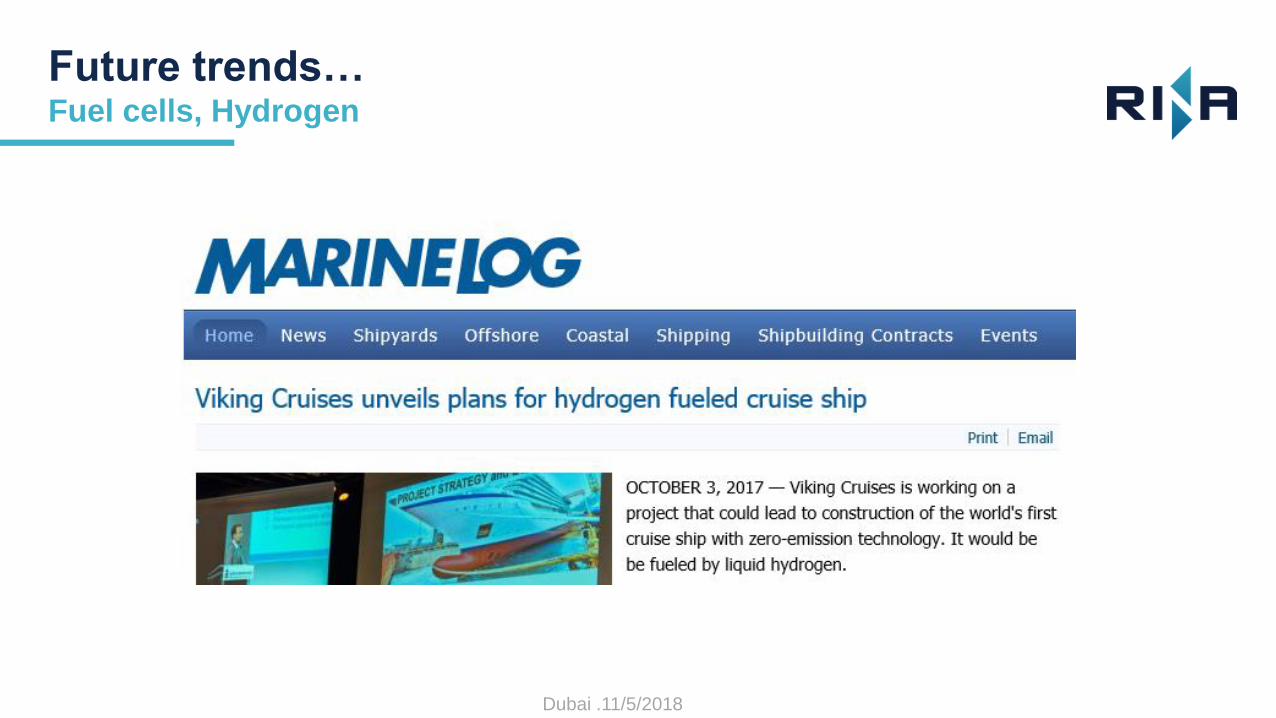
Future trends…Fuel cells, Hydrogen
Anode: Η2 2Η+ + 2e-
Cathode: 1/2 O2 + 2H+ + 2e- Η2Ο
Η2 +1/2 O2 H2O
Half Reactions on the electrodes
Total Reaction

Dubai .11/5/2018
Future trends…Fuel cells, Hydrogen
Dubai .11/5/2018
Future trends…Fuel cells, Hydrogen

Dubai .11/5/2018
Future trendsDigital Era
The world’s most valuable resource is no longer oil, but data

Dubai .11/5/2018
Future trendsDigital Era
Digital Ship Digital Platforms
Unmanned Ship
Monitoring & Inspection
ToolsDigital Twin
Smart Ships & Big Data

Dubai .11/5/2018
Future trendsDigital Era
RINA Digital Platform CUBE
Fleet Certificates Book a Survey Training
Electronic Log
Books
Cyber Security
Self Assessment
Fleet Operative
Center
Maintenance Energy Efficiency
& Sustainability
Fleet Tracking &
Piracy Warnings
Digital
Twin

Stefanos CHATZINIKOLAOU
Senior Manager, Marine Research & Innovation
RINA Hellas Ltd
Phone: +30 210 4292144
Mobile: +30 693 2719772
hiip://www.rinagroup.org