Directivity Patterns of Ship Underwater Noise Emissions
7
DIRECTIVITY PATTERNS OF SHIP UNDERWATER NOISE EMISSIONS Tomaso Gaggero a , Mike van der Schaar b , Raul Salinas c , Publio Beltrán c , Enrico Rizzuto a , Michel André b a University of Genoa, Genoa, Italy b Laboratory of Applied Bioacoustics, BarcelonaTech (UPC), Spain c Técnicas y Servicios de Ingenieria S.L. (TSI), Madrid, ES Tomaso Gaggero, Via Montallegro 1, 16145, Genova, Italy. [email protected] Abstract: The Underwater Radiated Noise (URN) from ships has gained growing attention in the last years. The evaluation of the acoustic impact of shipping activity (as well as of other anthropogenic noise types) on marine fauna has become an important issue for society and regulators. The normative framework on the subject is not yet in place, but it is in rapid evolution and in the process of being finalized soon, as reflected by the research efforts being deployed on the subject by the E.U. (see the completed SILENV project and the ongoing AQUO and SONIC projects). In parallel, at an international level, the same subject has been covered by the International Maritime Organisation (IMO) through the activity of a dedicated Working Group. A key aspect of the control problem for URN from ships is a proper characterization of the source represented by the vessel. This item presents peculiar aspects due to the environment in which radiation occurs, but it is also driven by the complex features and large dimensions of the ship source. An important issue is the directivity of the emission, which influences: the patterns of the radiation, the distance at which the presence of the ship is perceived and the acoustic impact of the vessel. In this paper, experimental surveys performed at sea within the SILENV project are analysed to derive the directivity patterns of different ships in different conditions at different frequencies. The work covers the measurement procedure adopted, as well as the post-processing techniques and the uncertainties affecting the results. Keywords: ship underwater noise, ship underwater noise directivity, 1st International Conference and Exhibition on Underwater Acoustics 1295
Transcript of Directivity Patterns of Ship Underwater Noise Emissions
DIRECTIVITY PATTERNS OF SHIP UNDERWATER NOISE EMISSIONS
Tomaso Gaggeroa, Mike van der Schaarb, Raul Salinasc, Publio Beltránc, Enrico Rizzutoa, Michel Andréb
aUniversity of Genoa, Genoa, Italy bLaboratory of Applied Bioacoustics, BarcelonaTech (UPC), Spain cTécnicas y Servicios de Ingenieria S.L. (TSI), Madrid, ES
Tomaso Gaggero, Via Montallegro 1, 16145, Genova, Italy. [email protected]
Abstract: The Underwater Radiated Noise (URN) from ships has gained growing attention in the last years. The evaluation of the acoustic impact of shipping activity (as well as of other anthropogenic noise types) on marine fauna has become an important issue for society and regulators. The normative framework on the subject is not yet in place, but it is in rapid evolution and in the process of being finalized soon, as reflected by the research efforts being deployed on the subject by the E.U. (see the completed SILENV project and the ongoing AQUO and SONIC projects). In parallel, at an international level, the same subject has been covered by the International Maritime Organisation (IMO) through the activity of a dedicated Working Group. A key aspect of the control problem for URN from ships is a proper characterization of the source represented by the vessel. This item presents peculiar aspects due to the environment in which radiation occurs, but it is also driven by the complex features and large dimensions of the ship source. An important issue is the directivity of the emission, which influences: the patterns of the radiation, the distance at which the presence of the ship is perceived and the acoustic impact of the vessel. In this paper, experimental surveys performed at sea within the SILENV project are analysed to derive the directivity patterns of different ships in different conditions at different frequencies. The work covers the measurement procedure adopted, as well as the post-processing techniques and the uncertainties affecting the results.
Keywords: ship underwater noise, ship underwater noise directivity,
1st International Conference and Exhibition on Underwater Acoustics
1295
1. INTRODUCTION
The underwater radiated noise from commercial shipping activities has gained in recent years an increased attention. The subject of noise emitted by ships into water was previously treated exclusively in a military context and related to the detection of targets. More recently, episodes of mass stranding of cetaceans have been correlated to the use of military sonars [1], thus focussing the attention on the negative (and often lethal) effects on marine mammals of strong underwater sources (sonar, submarine explosion, etc.). More recently, attention has been devoted also to the impact of commercial shipping on the marine life. The known effects of this anthropogenic noise range from behavioural changes to a reduction in the communication range (masking) of large mammals. IMO has dealt with the problem since 2009, establishing the Correspondence Group on the issue of “Noise from commercial shipping and its adverse impact on marine life” [2].
Dealing with this problem means dealing with the study of three main elements: the source (ship), the transmission path (oceans) and the receiver (marine fauna). The present paper deals with the problem of the source characterisation. In particular the directivity patterns of the underwater noise emissions from three different kinds of ships are presented.
2. MEASUREMENT PROCEDURE
The standard for the measurement procedure of the ship radiated noise issued by the American National Standards Institute and by the Acoustical Society of America [3] has been adopted in the study. It applies to all kind of surface vessels (with no limitations in size) transiting at a speed not greater than 50 knots in deep waters. In the document the possible aims for the measurements are identified as: showing compliance with contractual requirements, allowing periodic signature assessments and carrying out R&D activities on the subject. The standard offers three grades of measurement (A, B, C) which differ in terms of uncertainty, complexity and repeatability. For the present experimental campaign procedure B (intermediate complexity) was followed.
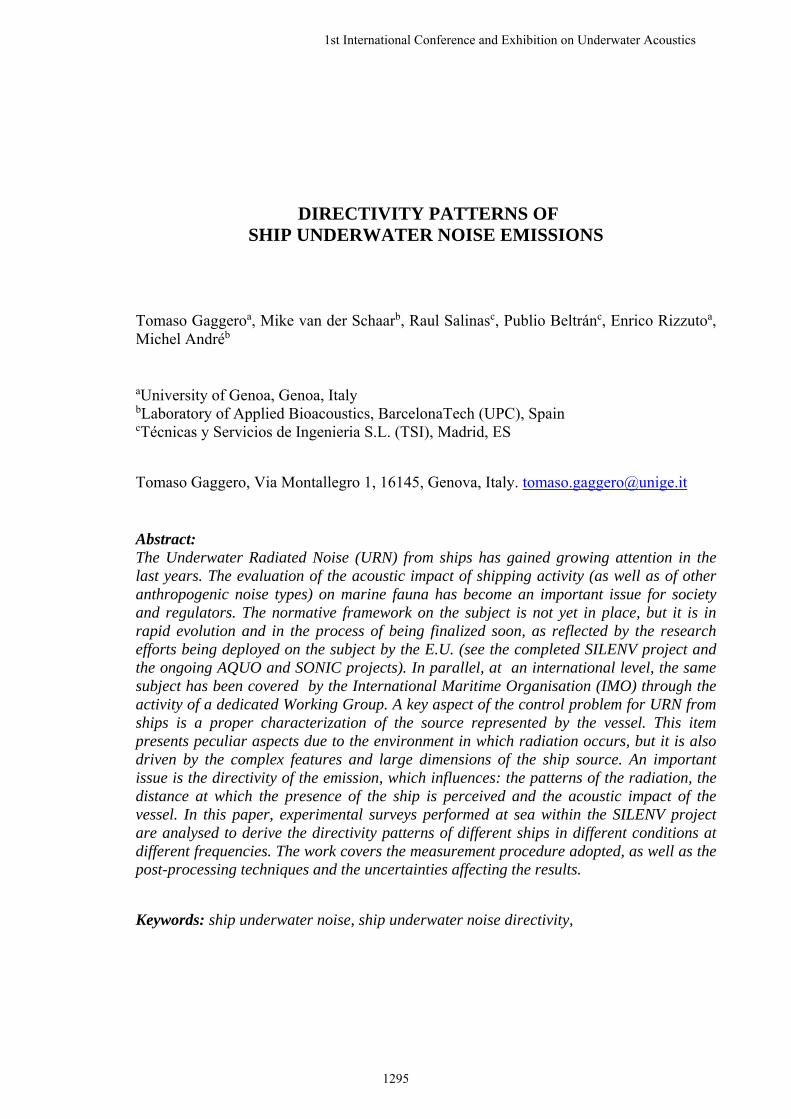
Fig. 1: Test arrangement from [3]
In particular, the layout represented in the first sketch of Figure 1 for the hydrophones
has been adopted. This configuration, with the hydrophone cable deployed from a support vessel, is the most flexible solution, but, unfortunately, it results to be more prone to environmental conditions. The supply vessel, in fact, cannot be moored (in order to avoid
1st International Conference and Exhibition on Underwater Acoustics
1296

noise from the anchor chain) and this implies that the vessel drifts under the action of wind and current.
The use of multiple hydrophones is fundamental to capture the source directivity in the vertical plane. In the present case, two hydrophones were used.
For each operating condition the procedure consists in passages with the buoy at the side. Figure 2 reports the sketch of the test course.
A vertical view of the measurement layout is presented on the left side of Figure 2. As it can be seen, the different hydrophones measure the noise at different vertical angles relative to the ship. A good characterisation of the vertical directivity of the emission is facilitated by passages at different distances from the array and by sensors well distributed in depth.
On the right side of Figure 2, the course of the surveyed ship is presented in a plane view, with the different time windows considered in the measurements. The time at which data start to be recorded is important for the characterization of the source directivity in the horizontal plane. Even more, the time duration of recordings [usually performed symmetrically around the closest point of approach (CPA)] influences the range of variation of the angle formed between the buoy-ship line and the course of the ship. The longer the time record is, the wider is the range of angles, under which the characterisation is performed in the horizontal plane during the ship advance.
Fig. 2: Measurements layout from [3]
The propagation law suggested by the standard to normalise the sound levels to 1 meter
from the source is the typical spherical law ( 20 log(d)). In this work, as it will be detailed later, the transmission loss has been evaluated instead by means of simulations based on a normal modes propagation model.
3. DATA PROCESSING
In the following, the procedure adopted to post process the raw data from the acquisition system as well as the GPS data will be demonstrated using a specific case. The procedure has been applied in the same way to each measurement.
As discussed above, the test consisted in several passages abeam the hydrophones array at fixed velocities. The output of the measurement consisted in two text files. Synchronised GPS data from both the supply and the surveyed vessel were recorded, too in two codified formats: GPVTG and GPGGA, reporting respectively the heading and the speed and the Latitude and the Longitude of the two vessels. This way the route of the two
1st International Conference and Exhibition on Underwater Acoustics
1297

vessels can be computed for each run. Knowing the position of the two ships during the measurements it is easy to calculate the distance and the relative angle between the surveyed ship and the hydrophones. In Figure 3 received noise levels are presented for a given frequency together with the relative angle (a) and the distance (b). The distance is needed to compute the transmission losses in order to normalise the recorded levels to the reference distance of 1 meter to the source.
4. TRANSMISSION LOSS EVALUATION
The standards available for the characterisation of the ship underwater noise signature suggest the use of simplified formulations to evaluate the transmission losses (perfect spherical 20 log(r) in [3] and 18 log(r) in [4]). In the present study, the transmission losses have been evaluated with a simulation model based on a normal modes method (ORCA [5]). This was done because the output sought is represented by the ship noise directivity at different frequencies and not just by an averaged overall level. In the simulation model the source is considered punctual even if, in some cases, due to a low distance between the ship and the hydrophones, more complex sources should be, in principle, taken into account. The parameters in input to the propagation model are: frequency; sea depth; water column celerity and bottom composition. As regards the frequencies, 4 bands were investigated: 63, 125, 1000 and 5000 Hz. The water depth was monitored during measurements via eco-sonar; alternatively it can be found from the General Bathymetric Chart of the Oceans (GEBCO, http://www.gebco.net/) database which reports the world’s elevation with a definition of one degree (in latitude and longitude).
0 20 40 60 80 100 120 140155
160
165
170
175
Receiv
ed levels
[dB
]
Time [s]
0 20 40 60 80 100 120 140100
200
300
400
Rela
tive a
ngle
[°]
0 20 40 60 80 100 120 140155
160
165
170
175
Receiv
ed levels
[dB
]
Time [s]
0 20 40 60 80 100 120 140200
400
600
800
1000
Dis
tance [
m]
Fig. 3: Correlation between recorded noise levels and reciprocal position of the surveyed vessel
The other environmental parameters were not directly surveyed, but looked up in
databases. Temperature and salinity were taken by the World Ocean Database 2009 [6], in which historic measurements of various sea characteristics are stored for different areas. Temperature, salinity and depth were combined together using the UNESCO Equation [7], to compute the celerity profile in the water column.
As regards the bottom profile, important parameters are the sediment thickness and composition, in particular its acoustic characteristics (density, sound speed). The sediment thickness is derived by [8] where information on a grid of points on the ocean bottoms are reported with a resolution of one minute. The type of sediment was looked up in the Deck41 database, (www.ngdc.noaa.gov/mgg/geology/deck41.html), where the classification is made on the basis of ten classes .
1st International Conference and Exhibition on Underwater Acoustics
1298

As a result of the data processing described above, the underwater noise emission by the ships at 1 metre is evaluated. The results are presented for the two recorded channels (2 hydrophones) and for the port and starboard sides.
5. RESULTS
In the light of all the above considerations, the horizontal directivity diagrams for three ships with different characteristics (see Table 1) have been computed at four frequency bands: 63,125,100 and 5000 Hz. The tests were carried out at the design speed of each vessel, representing the most frequent sailing condition during the ship life.
Main characteristics
Ship Type Fishing vessel Fishing research v. Merchant
L [m] 25.5 66.7 209.43 B 7.5 11.25 26.5 D 3.9 7 9.6 T 2.8 5 6 v [kn] 10 10 26 # of propellers 1 1 2 # of blades 4 4 4
Table 1 Main characteristics of the measured ships
In Figure 4 the directivity diagram of the fishing vessel is reported. The diagram shows a strong directivity in the stern zone. For both starboard and port side, the maximum level is for angles between 150 and 180 for all the frequencies considered. This is due to the particular shapes of the stern counter. As a matter of fact, in this zone the direct noise produced by the propeller is summed to noise reflected on the stern counter. The angles closer to 0 and 180 present many oscillations due to the route corrections of the autopilot.
Fig. 4: Ship noise horizontal directivity for a fishing vessel (hydrophone 1 and 2). The
levels are in dB re 1µPa reported to 1 m using the actual transmission losses.
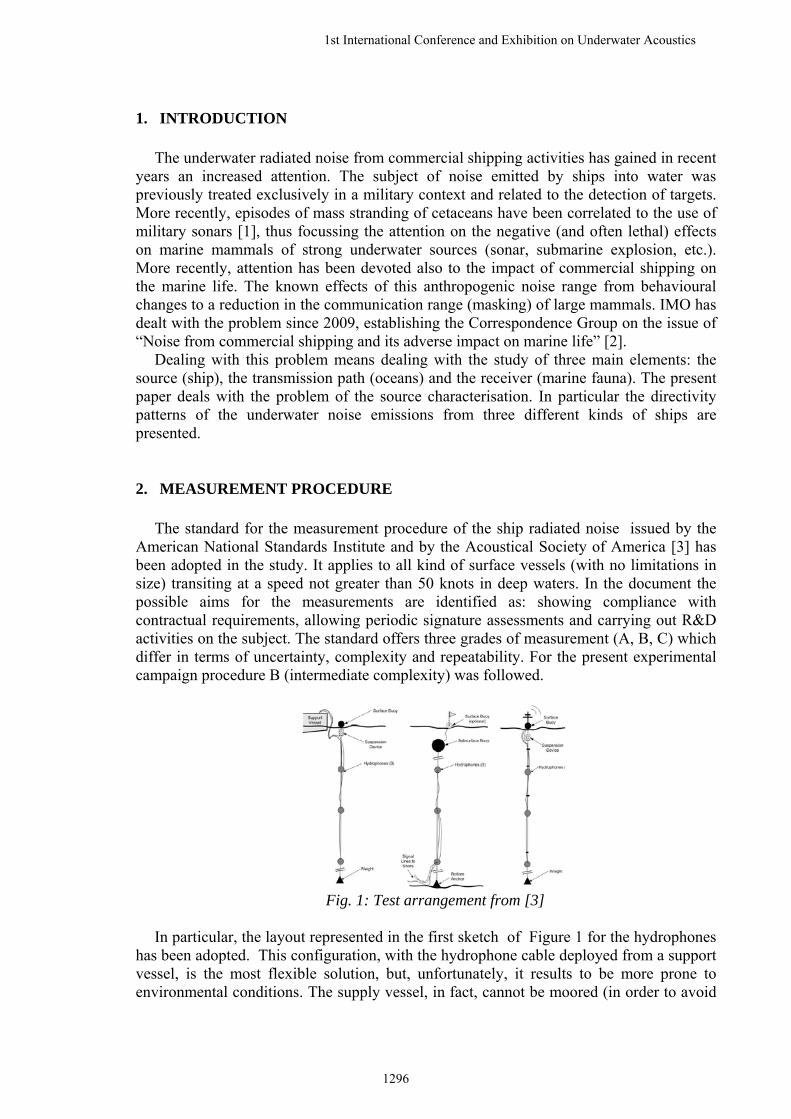
In Figure 5 the directivity diagram of the merchant vessel is reported. In this case the
directivity is relatively low (except at high frequency), even though a certain dissymmetry (port-starboard) is present. The diagram is not very well described at bow (345°- 15°) and stern (165°- 200°), probably because of the difficulties in passing very near the buoy with
1st International Conference and Exhibition on Underwater Acoustics
1299
the target ship. This is more evident for the port passage. The bands at 1 and 5 kHz have quite lower levels than those at 63 and 125 Hz.
Fig. 5: Ship noise horizontal directivity for a merchant ship (hydrophone 1 and 2). The
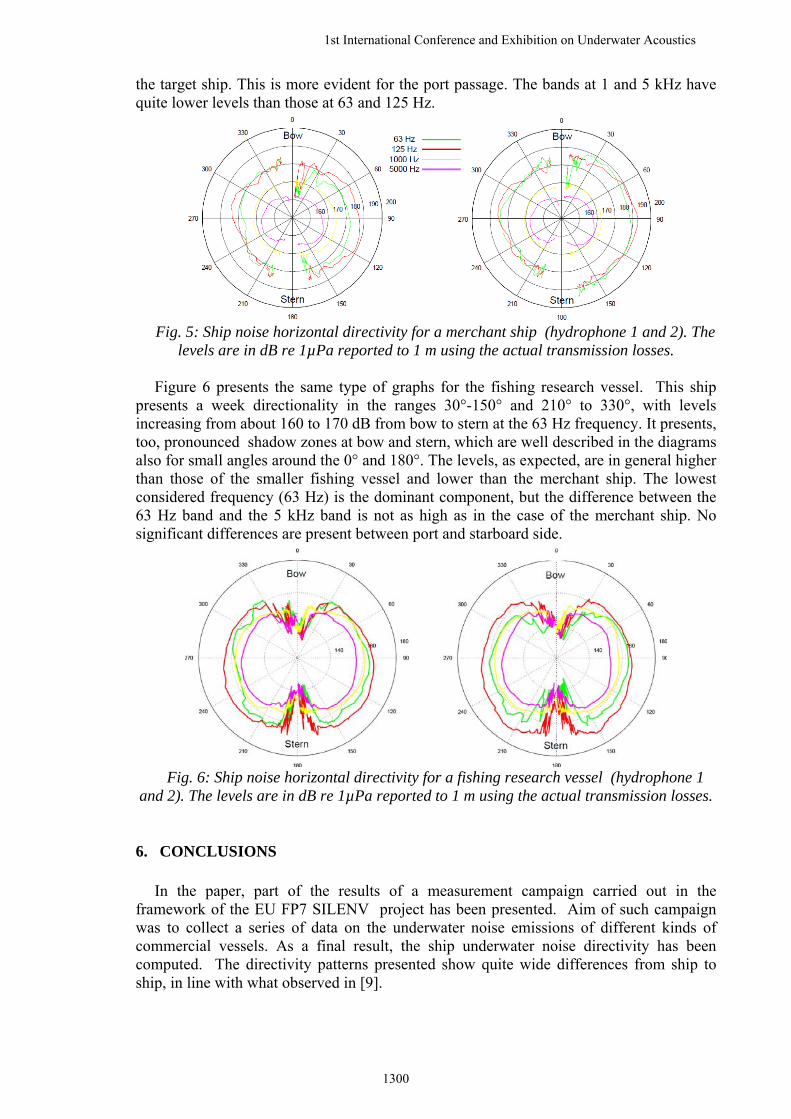
levels are in dB re 1µPa reported to 1 m using the actual transmission losses. Figure 6 presents the same type of graphs for the fishing research vessel. This ship
presents a week directionality in the ranges 30°-150° and 210° to 330°, with levels increasing from about 160 to 170 dB from bow to stern at the 63 Hz frequency. It presents, too, pronounced shadow zones at bow and stern, which are well described in the diagrams also for small angles around the 0° and 180°. The levels, as expected, are in general higher than those of the smaller fishing vessel and lower than the merchant ship. The lowest considered frequency (63 Hz) is the dominant component, but the difference between the 63 Hz band and the 5 kHz band is not as high as in the case of the merchant ship. No significant differences are present between port and starboard side.
Fig. 6: Ship noise horizontal directivity for a fishing research vessel (hydrophone 1
and 2). The levels are in dB re 1µPa reported to 1 m using the actual transmission losses.
6. CONCLUSIONS
In the paper, part of the results of a measurement campaign carried out in the framework of the EU FP7 SILENV project has been presented. Aim of such campaign was to collect a series of data on the underwater noise emissions of different kinds of commercial vessels. As a final result, the ship underwater noise directivity has been computed. The directivity patterns presented show quite wide differences from ship to ship, in line with what observed in [9].
1st International Conference and Exhibition on Underwater Acoustics
1300

A proper characterisation of the source is an important input for propagation models and this should include the aspect of directivity, which presently is accounted for in the measurement standards only in a partial way, as averages of the surveyed noise levels are foreseen for a time window symmetric around the closest point of approach (CPA), i.e. around a 90° beam angle, which not necessarily represents the highest emission. On the contrary, the results presented above show that, at least in some cases, the highest radiation occurs from the quarter stern zone, thus suggesting the possibility of adopting time windows asymmetrically placed around the CPA.
The directivity in the ship emissions, furthermore, can be important in the study of specific effects on the marine fauna (e.g. collisions of cetaceans with the ship’s bow in the presence of a shadow zone in front of the ship).
7. ACKNOWLEDGEMENTS
This work was developed in the frame of the collaborative project SILENV-Ships oriented Innovative soLutions to rEduce Noise & Vibrations, funded by the E.U. within the Call FP7-SST-2008-RTD-1, Grant Agreement SCP8-GA-2009-234182.
REFERENCES
[1] A. Frantzis. Does acoustic testing strand whales? Nature, 392(6671):29–29, Mar. 1998.
[2] IMO. Noise from Commercial Ships and its Adverse Impacts on Marine Life. International Maritime Organization, 4, Albert Embankment London, UK, MEPC 59/19 edition, 2009.
[3] ANSI/ASA. ANSI /ASA S12.64-2009/Part 1. Quantities and Procedures for Description and Measurement of Underwater Sound from Ships - Part 1: General Requirements. Acoustical Society of America, 2009.
[4] DNV. Rules for Classification of Ships, Silent Class Notation, Part 6, Chapter 24. Det Norske Veritas, 2010
[5] E. K. Westwood, C. T. Tindle, and N. R. Chapman. A normal mode model for acousto-elastic ocean environments. The Journal of the Acoustical Society of America, 100(6):3631–3645, 1996.
[6] Ocean data base, http://www.nodc.noaa.gov/OC5/SELECT/dbsearch/dbsearch.html, 2009
[7] G. S. K. Wong and S. Ming Zhu. Speed of sound in seawater as a function of salinity, temperature, and pressure. The Journal of the Acoustical Society of America, 97(3):1732–1736, 1995.
[8] D. Divins. Total sediment thickness of the world’s oceans & marginal seas. Technical report, NOAA National Geophysical Data Center, Boulder, CO, 2003.
[9] Megan F. McKenna, Donald Ross, Sean M. Wiggins, and John A. Hildebrand, J. , Underwater radiated noise from modern commercial ships, Acoust. Soc. Am. 131, 92 (2012), DOI:10.1121/1.3664100
1st International Conference and Exhibition on Underwater Acoustics
1301