Planktonic Community Dynamics over Time in a Large Reservoir and their Influence on Carbon Budgets
Upload
khangminh22Category
view
0download
0
The ISME Journal (2020) 14:544–559https://doi.org/10.1038/s41396-019-0542-5
ARTICLE
The planktonic protist interactome: where do we stand aftera century of research?
Marit F. Markussen Bjorbækmo1● Andreas Evenstad1
● Line Lieblein Røsæg1● Anders K. Krabberød 1
●
Ramiro Logares 1,2
Received: 14 May 2019 / Revised: 17 September 2019 / Accepted: 24 September 2019 / Published online: 4 November 2019© The Author(s) 2019. This article is published with open access
AbstractMicrobial interactions are crucial for Earth ecosystem function, but our knowledge about them is limited and has so farmainly existed as scattered records. Here, we have surveyed the literature involving planktonic protist interactions andgathered the information in a manually curated Protist Interaction DAtabase (PIDA). In total, we have registered ~2500ecological interactions from ~500 publications, spanning the last 150 years. All major protistan lineages were involved ininteractions as hosts, symbionts (mutualists and commensalists), parasites, predators, and/or prey. Predation was the mostcommon interaction (39% of all records), followed by symbiosis (29%), parasitism (18%), and ‘unresolved interactions’(14%, where it is uncertain whether the interaction is beneficial or antagonistic). Using bipartite networks, we found thatprotist predators seem to be ‘multivorous’ while parasite–host and symbiont–host interactions appear to have moderatedegrees of specialization. The SAR supergroup (i.e., Stramenopiles, Alveolata, and Rhizaria) heavily dominated PIDA, andcomparisons against a global-ocean molecular survey (TARA Oceans) indicated that several SAR lineages, which areabundant and diverse in the marine realm, were underrepresented among the recorded interactions. Despite historical biases,our work not only unveils large-scale eco-evolutionary trends in the protist interactome, but it also constitutes an expandableresource to investigate protist interactions and to test hypotheses deriving from omics tools.
Introduction
Aquatic microbes, including unicellular eukaryotes andprokaryotes, are essential for the functioning of the bio-sphere [1–4]. Microbes exist in diverse ecological
communities where they interact with each other as well aswith larger multicellular organisms and viruses.
Interaction between microbial species has playedimportant roles in evolution and speciation. One of thebest examples is that the origin of eukaryotes is groundedin the interaction-events of endosymbiosis; giving rise tomitochondria, chloroplasts, and other metabolic capacitiesin the eukaryotic cell [5–8]. Microbial interactionsguarantee ecosystem function, having crucial roles in, forinstance, carbon channeling in photosymbiosis, control ofmicroalgae blooms by parasites, and phytoplankton-associated bacteria influencing the growth and health oftheir host. Despite their importance, our understanding ofmicrobial interactions in the ocean and other aquaticsystems is rudimentary, and the majority of them are stillunknown [4, 9–11]. The earliest surveys of interactionsbetween aquatic microbes date back to the 19th century.In 1851, while on board H.M.S Rattlesnake in the PacificOcean, Thomas Huxley discovered small yellow–greencells inside the conspicuous planktonic radiolarians whichhe thought were organelles [12]. Later on, Karl Brandtestablished that the yellowish cells were symbiotic alga
These authors contributed equally: Marit F. Markussen Bjorbækmo,Andreas Evenstad, Line Lieblein Røsæg
* Anders K. Krabberø[email protected]
* Ramiro [email protected]
1 Department of Biosciences, Section for Genetics and EvolutionaryBiology (Evogene), University of Oslo, Blindernv. 31, N-0316Oslo, Norway
2 Institut de Ciències del Mar (CSIC), Passeig Marítim de laBarceloneta, 37-49, ES-08003 Barcelona, Catalonia, Spain
Supplementary information The online version of this article (https://doi.org/10.1038/s41396-019-0542-5) contains supplementarymaterial, which is available to authorized users.
1234
5678
90();,:
1234567890();,:

and named them Zooxanthella nutricola [13]. Since theseearly studies, hundreds of others have reported microbialinteractions by using classic tools, mainly microscopy, butthis knowledge has not yet been gathered into oneaccessible database. Over the last ~15 years, High-Throughput Sequencing (HTS) [14–16] of environmentalDNA or RNA has transformed our understanding ofmicrobial diversity [17] and evolution [18]. Furthermore,HTS studies have generated hypotheses on microbialinteractions based on correlations of estimated microbialabundances over spatiotemporal scales [19–22]. Thesehypotheses need to be tested with other types of data, suchas known interactions from the literature [23]. Overall,HTS will allow to start addressing key driving questionsin microbiology such as, what are the main types ofinteractions in the protist world? Does cooperation out-weigh competition among protists? What is the archi-tecture of the protist interactome? And how does thisinteractome change over spatiotemporal scales?
Here, our main objectives were to assemble theknowledge on aquatic protist interactions from the lit-erature and make it available to the scientific community.We also report the main patterns found in this survey. Weexamined the available scientific literature spanning thelast ~150 years, and recorded ~2500 ecological interac-tions from ~500 publications going back to the late 1800s[24] (Supplementary Fig. 1). Based on this, we generateda manually curated and publicly available Protist Inter-action DAtabase (PIDA; https://doi.org/10.5281/zenodo.1195514). PIDA entries have been grouped into fourtypes of pairwise ecological interactions: parasitism,predation, symbiosis, and ‘unresolved interaction’. Para-sitism is an antagonistic relationship between organisms,which is beneficial to one partner but harmful to the other,while predation refers for the most part to the engulfmentof smaller cells through phagocytosis. In PIDA symbiosisrefers to interactions beneficial for both partners (mutu-alism, e.g., photosymbiosis) or beneficial for one andpotentially neutral for the other (commensalism, e.g., hostdefense). The fourth category ‘unresolved interactions’are associations where it is uncertain whether the inter-actions are beneficial or antagonistic to the involvedpartners. The taxonomic classification in PIDA includesgenus and species level, in addition to three levels thatwere chosen pragmatically to make the database user-friendly and portable.
Materials and methods
PIDA was assembled between January and November2017 through a recursive survey of papers on microbialinteractions published between 1894 and 2017. The
search strategy to find the relevant literature and thetemplate for organizing the database was performed fol-lowing Lima-Mendez et al. [21]. Initially, reviewsresulting from the Boolean search string (plankton* AND(marin* OR ocean*)) AND (parasit* OR symbios* ORmutualis*) in Scopus (https://www.scopus.com/) and Webof Science (http://webofknowledge.com/) were examined,then the references therein were further explored. Inaddition, literature on protist predation on other protistsand bacteria were also screened. Entries from the Aqua-Symbio database (http://aquasymbio.fr/) were comparedagainst the entries in PIDA, and occasionally used as asource of additional literature. The overlap betweenAquaSymbio and PIDA is ~20% (~500 entries). Many ofthe entries in AquaSymbio are interactions between pro-tists and multicellular organisms, therefore they are notincluded in PIDA.
PIDA documents the ecological interaction between twoorganisms, identified down to the species level, if possible.Interactions are characterized as parasitism, predation,symbiosis (either mutualism or commensalism), or ‘unre-solved’. Parasitism is used in cases where the study clearlyidentifies a parasitic interaction. Cases of kleptoplasty andmixotrophy together with classical predation are containedwithin the group of entries termed predation. Symbiosisincludes endo- and ectosymbiosis and is categorized intothe different forms of symbiosis (e.g., photosymbiosis). Theunresolved interactions include associations/interactionsbetween organisms where it is yet unknown whether theassociations are beneficial or antagonistic.
In addition to genus and species levels, the taxonomicclassification includes three additional levels chosen prag-matically to make the database more user-friendly andportable. The highest level distinguishes between eukar-yotes and prokaryotes. The second level places each taxonwithin supergroups or other high taxonomic ranks (e.g.,Rhizaria or Alveolata) following the scheme of Adl et al.[25, 26]. The third level places each taxon in groups belowthe supergroup taxonomic rank (phylum, e.g., Ciliophora,Dinoflagellata, and Acantharia, or class levels, e.g., Chlor-ophyceae, Kinetoplastea, and Diplomonadida). The taxo-nomic names at the third level follows the nomenclature ofthe SILVA database (release 128, May/June 2017) [27–29].Species names in PIDA have been updated to the mostrecent agreed-upon classification and can therefore deviatefrom the original papers they stem from due to synonymi-zation. PIDA also documents the methods used to determinethe interacting species. Symbionts and/or hosts determinedby any form of microscopy or direct observation aredenoted (1). Symbionts and/or hosts determined bysequencing or Fluorescence In Situ Hybridization (FISH)are denoted (2). The combination of the former two isdenoted (3). Most interactions with observation type 2 also
The planktonic protist interactome: where do we stand after a century of research? 545
have GenBank [30] accession numbers. A published paperis associated to each interaction entry, and when a DOI isavailable, it is included. Only interactions from aquaticsystems are included (marine, brackish, and freshwater).The resulting PIDA contains 2422 entries from 528 pub-lications and is publicly available at github (https://github.com/ramalok/PIDA).
Bipartite networks
Bipartite networks are the representation of interactionsbetween two distinct classes of nodes, such asplant–pollinator, parasite–host, or prey–predator. Identi-fying patterns in bipartite networks is useful in explainingtheir formation and function. We investigated how sym-biosis, parasitism, and predation differ in terms of spe-cialization. For example, if parasite taxa have a broaderhost range compared with the host range of symbionts,this indicates that parasites are less specialized (andconsequently more generalists) than symbionts. We alsoused the bipartite networks to investigate whether pre-dators are omnivorous (generalists) or picky (specialists)in their diets. All analyses were conducted in thestatistical environment R v. 3.5.0 [31]. We constructedbipartite qualitative (binary) directional networks usingthe R-package bipartite v. 2.08 [32]. All taxa where thetaxonomy assigned to one of the ‘partners’ in PIDAwas ‘unknown eukaryote’, ‘unidentified bacteria’, or‘unidentified prokaryote’ were removed before furtheranalyses of the bipartite networks. Bipartite networkindices were calculated using the functions networklevel[33] and specieslevel [34] (default settings exceptweighted= FALSE) in the R-package bipartite. Bipartitenetworks and network analyses were performed at fourtaxonomic levels (‘supergroup’, ‘phylum’, genus, andspecies). Found patterns were consistent across the taxo-nomic levels, therefore only the species level is shown.Degree (number of links/edges/interactions per node) wascalculated for prey, predators, parasites, symbionts,‘interactors’, and hosts at the species level. The speciali-zation index d’ (Kullback–Leibler distance) [35], mea-sures the degree of specialization at the species level, andwas calculated as deviation of the actual interaction fre-quencies from a null model that assumes all partners in theother level of the bipartite network are used in proportionto their availability. The specialization index d’ rangesfrom 0 for the most generalist to 1 for the most specialist,and was calculated for prey, predators, parasites, sym-bionts, ‘interactors’, and hosts at the species level.
All barplots and density plots were constructed usingthe R-package ggplot2 v. 3.1.0 [36] and the networksin Fig. 1a–d and Supplementary Fig. 2 were visualized inCytoScape v. 3.6.1 [32, 37].
Interlinked species
Interlinked species are taxa that are present in either severaltypes of interactions, or on both sides of the same interac-tion. Interlinked species were determined using the R-package systemPipeR v. 3.8 [38] for all interaction types,except the unresolved interactions (since the nature of theseinteraction is unknown). Only taxa with full species nameswere included to avoid overestimating overlapping species(e.g., Amoebophrya sp. and similar were excluded from thelist of overlapping species). Venn diagram intersectswere computed using the function overLapper and plottedusing the function vennPlot. Parasites only overlappedwith parasite hosts and were subsequently added to theVenn plot.
Results
Aquatic microbial interactions
The literature in PIDA was dominated by studies based ondirect observation of interactions such as light microscopy.In total, 82% of the entries were based on microscopy, andonly 38% of those were combined with molecular methods.The most commonly studied interaction in the literaturewas predation, representing 39% of all entries, followedby symbiosis (29%), parasitism (18%), and unresolvedinteractions (14%).
The SAR supergroup (Alveolata, Stramenopiles, andRhizaria) dominated with ~92% of the total entries(Figs. 1 and 2). Of all host and predator records, ~90%belonged to the SAR supergroup (Alveolata 51%, Stra-menopiles 12%, and Rhizaria 27%; Fig. 2). The SARsupergroup was less dominant as symbiont/ parasite/interactor/ prey, but still represented the largest group,with 50% of all entries (Alveolata 33%, Stramenopiles16%, and Rhizaria 1%; Fig. 2).
The majority of interactions (82%) were from marine orbrackish waters, while studies from freshwater systemsaccounted for a smaller fraction of the interactions (18%).This is not surprising given the larger number of studiesfrom the marine phototrophic zone compared to otherenvironments.
Predator–prey interactions
Predator–prey interactions constituted the majority ofentries in PIDA. We acknowledge that separating predationinto categories represents a simplified version of howpredator–prey interactions are in nature, where e.g., mixo-trophy is challenging old paradigms [39–42]. However, forsimplicity, we here divided predation into three different
546 M. F. M. Bjorbækmo et al.

categories depending on the type of prey involved:herbivory (grazing on autotrophic/chloroplast containingeukaryotic algae), bacterivory (feeding on autotrophic and/
or heterotrophic bacteria) or ‘carnivory’ (predation on otherheterotrophic protists). Based on this definition, herbivorywas the most common form of predation in our survey (68%
Host
Parasite
50100
200Number of interactions
59 2022
23
28
29
33
34
36
44
43
4950
5354
57565910
76
5
1
24
28
29
30
48
47
46
5453
5150 49
Rh
Al
StEx
Ob
Ba
Rh
Al
StC
yAp
Ex
Ob
AmD
Host
Symbiont
50
100
300Number of interactions
ObSt
Ha
Ar
Ba
Rh
Al
Cy
ExAl
HaCy
ApO
b
2 4
1 2
3 6
1
4 2
3 4
1 1
3 64 4
4 9
3 14 3 2 5
89 1 0
4
6 0
5 7
6
5 3
4 0
5 55 6
4 2
4 3
4 9
C
Prey
Predator
50150400
Number of interactions
Cu Am
Ob
Ex
Cy
Ha
St
Alv
RhBa
Ex
ApH
aSt
Al
Rh
Ap
Cy
IsAp
1718
2431
3029
34363542403938
3744
45
4847
4952
5354555657585910986
21
2930
3132
33
3634
4142484745
4443
5453
5049
5957
14 15
2526
2721222316B
900
500
200
100
Number of edges
SymbiosisParasitismPredation
Edges
Unresolved
(15)
Anc
yrom
onad
idae
(1
4) T
elon
ema
(13)
Hal
retcaboia
(42) Prym
nesiophyceae
(41) Pavlovophyceae
(40) Heterophryidae
(39) Actinophryidae
(38) Raphidiophryidae
(37) Acanthocystidae
(36) Cryptophytes
(35) Palpitomonas
(34) Chlorophytes (33) Charophyta
(32) Rhodophyta (31) Euglenida (30) Kinetoplastea
(29) Other excavates
(28) Chytridiomycetes
(27) Filozoa
(26) Apusomonadida
(25) Breviatea
(24) Other obazoa
(23) Discosea
(22) Tubulinea
(21) Arch
amoebae
(20) D
ictyo
stelia
(19)
Oth
er a
moe
b.(1
8) R
igifi
lida
(17)
Col
lodi
ctyo
nida
e (1
6) M
antv
amon
as
aiD
te
mo) 34(
a
Methanom
icrobia (12)M
ethanobacteria (11)O
ther bacteria (10)Cyanophyceae (9)
Firmicutes (8)
Actinobacteria (7)
Proteobacteria (6)
Chlamydiae (5)
Verrucomicrobia (4)
Planctomycetes (3)
Chlorobiales (2)
Bacteroidetes (1)
Other rhizarians (60)
Cercozoa (59)
Spironemidae (58)
Acantharia (57)
Polycystinea (56)Foraminifera (55)Other alveolates (54)
Ciliophora (53)
Colpodellida (5
2)
Perkinsid
ae (51
)
Syndin
iales
(50)
Din
ofla
gella
ta (4
9)
Oth
er s
tram
enop
iles
(48)
Laby
rinth
ulom
ycet
es (4
7)
Per
onos
poro
myc
etes
(46)
Rap
hido
phyc
eae
(45)
Chr
ysop
hyce
ae (4
4)
Arch
aepl
astid
a
Exca
vata
Oba
zoa
Amoebo
zoa
CRuMS
An I.S Archaea
Bacteria
Rhizaria
Alveolata
StramenopilesHaptista
Cryptis
ta
A
The planktonic protist interactome: where do we stand after a century of research? 547

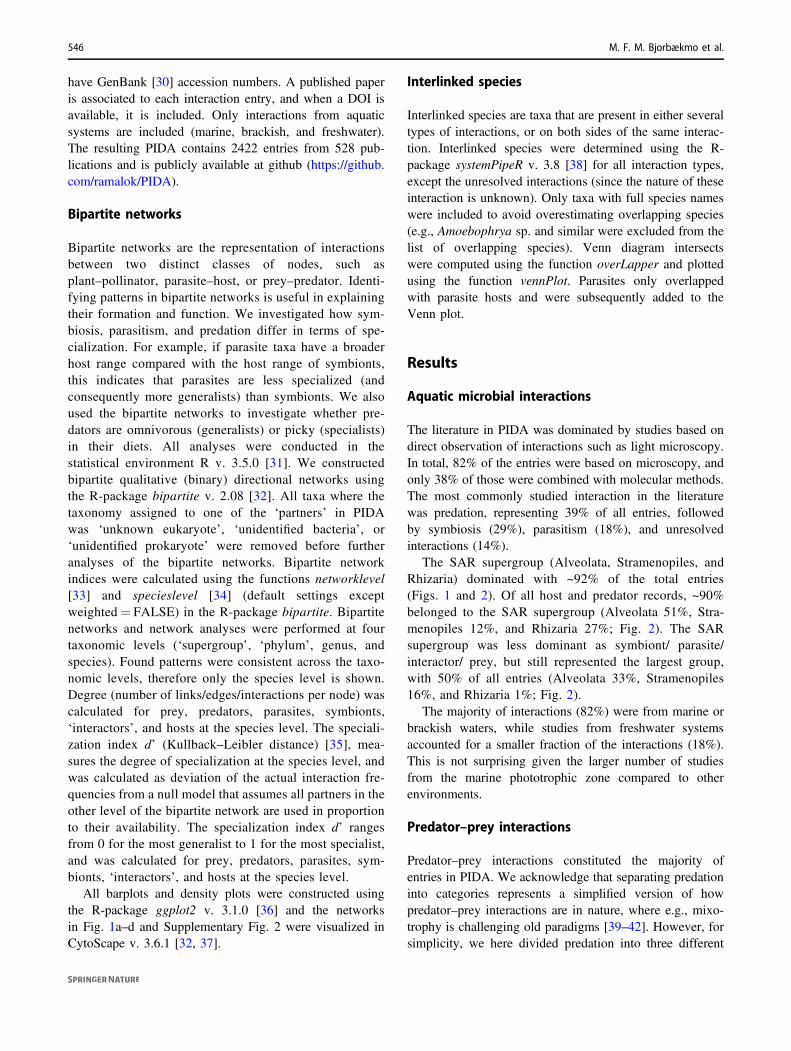
of the predator–prey interactions) with all the majoreukaryotic lineages represented among the predators.Entries of herbivore dinoflagellates and ciliates (bothAlveolata) dominated (Fig. 1a, b). Bacterivory accountedfor 16% of the predator–prey interactions and was alsodocumented in most eukaryotic groups (Fig. 1b), with anexpected predominance of small heterotrophic flagellates.
Symbiont–host interactions
Symbiotic protist–protist interactions made up 81% of thesymbiont entries and all of these interactions representedphotosymbiosis. Dinoflagellates, diatoms, chlorophyceans,trebouxiophyceans, and prymnesiophytes accounted for mostof the recorded photosymbionts, living in symbiosis withrhizarian, ciliate, and dinoflagellate hosts (Fig. 1a, c).Bacteria–protist interactions represented 16% of the total
number of symbiont entries in PIDA, and was dominated bybacterial entries belonging to Proteobacteria and Cyanophy-ceae that mainly interacted with Alveolata (dinoflagellatesand ciliates), Stramenopiles (diatoms), and Excavata (eugle-nids); Fig. 1a, c. The bacteria–protist interactions wereinvolved in many different types of symbiotic relationships,from photosymbiosis (13%) to nitrogen fixation (46%) andvitamin exchange (36%). Symbiotic archaea–protist inter-actions represented 3% of symbiont entries in PIDA, and themajority of these were methanogenic symbiont interactionsbetween archaeal Metanomicrobia and anaerobic Ciliophora(Fig. 1a, c).
Unresolved interactions
The unresolved interactions represent all ecologicalinteractions where the functional role of the relationshipbetween the partners was not determined. Several of thesecases likely represent commensalism. The unresolved‘interactor’–host category mainly consisted of protist-bacteria interactions (73%), dominated by interactionsbetween Proteobacteria and Alveolata (ciliates and dino-flagellates) or Proteobacteria and Stramenopiles (diatoms;Fig. 1a & Supplementary Fig. 2). Protist–protist interac-tions represented 27% of the unresolved interactions, andmainly included alveolate, excavate, and stramenopilesymbionts that interacted with alveolate, rhizarian, strame-nopile, and amoebozoan hosts (Fig. 1a & SupplementaryFig. 2). The amoebozoan hosts (Neoparamoeba spp.) wereonly registered to interact with unknown kinetoplastids(Excavata), which is likely an example of an unusual formof endosymbiosis [43]. The biological nature of theseinteractions still remains unknown.
Parasite–host interactions
Parasites in PIDA were dominated by a few taxonomicgroups that all belonged to Alveolata, such as Syndiniales(~50% Amoebophrya), Perkinsidae (~98% Parvilucifera),and Dinoflagellata. Together they accounted for 2/3 of theparasite entries (Fig. 1a, d). These alveolate parasites mainlyinfected other alveolates such as dinoflagellates and ciliates,but rhizarian and diatom hosts were also recorded (Fig. 1d).Parasites belonging to different stramenopiles lineages suchas Peronosporomycetes (oomycetes), Labyrinthulomycetes,and Pirsonia were mainly described from diatom hosts(Fig. 1d). Rhizarian parasites constituted 5% of the parasiterecords and were represented by just a few cercozoans andphagomyxids, which parasitized diatoms, as well as therhizarian phytomyxid Woronina pythii, which parasitizeddifferent Pythium species (Perenosporomycetes). Parasiticfungi from Chytridiomycetes, Microsporidia, and Sordar-iomycetes (the last two included in ‘other Obazoa’ in
Fig. 1 Overview of the interactions included in PIDA. Nomenclatureand taxonomic order of Eukaryota is based on Adl et al. 2019 [25].Nomenclature and taxonomic order of Bacteria is based on Schultzet al. 2017 [87]. The nodes are grouped (outer circle) according toeukaryotic supergroups (or Incertae sedis), Bacteria and Archaea.a Network based on the 2422 entries in PIDA. Nodes representeukaryotic and prokaryotic taxa and are colored accordingly. Nodesize indicates the number of edges/links that are connected to thatnode. Each node/taxon is assigned a number, which corresponds withthe numbers for taxa in b–d. Edges represent interactions between twotaxa and are colored according to ecological interaction type: preda-tion (orange), symbiosis (green), and parasitism (purple). The networkis undirected, meaning that a node can contain both parasites/sym-bionts/prey and hosts/predators. To avoid cluttering of the figure,‘Self-loops’, which represent cases where both interacting organismsbelong to the same taxon (e.g., a dinoflagellate eating another dino-flagellate) are not shown as edges/links in this figure, but are con-sidered in the size of nodes. The outermost circle groups taxa in thedifferent eukaryotic ‘supergroups’ or the prokaryotic domains Bacteriaand Archaea. Ancryomonadidae is abbreviated An. Telonema is notplaced into any of the supergroups, but classified as Incertae sedis(abbreviated I.S. in the figure). In b, c, and d the following abbre-viations for supergroups are used: Ar Archaea, Ba Bacteria, Rh Rhi-zaria, Al Alveolata, St Stramenopiles, Ha Haptista, Cy Cryptista, ApArchaeplastida, Ex Excavata, Ob Obazoa, Am Amoebozoa, CuCRuMS, An Ancryomonadidae, Is Incertae sedis. b Predator–preyinteractions in PIDA. The node numbers correspond to taxanode numbers in a. Abbreviations for supergroups are describedabove. Background and nodes are colored according to functional rolein the interaction: Prey are colored light orange (left part of figure),while predators are depicted in dark orange (right part of figure). Thesize of each node represents the number of edges connected to thatnode. c Symbiont–host interactions included in PIDA. The nodenumbers correspond to node numbers in a. Abbreviations for super-groups are described above. Symbionts are to the left, colored lightgreen, and their hosts are to the right in dark green. The size of eachnode represents the number of edges connected to that node.d Parasite–host interactions included in PIDA. The node numberscorrespond to node numbers in a. Abbreviations for supergroups aredescribed above. Parasite taxa are depicted in light purple (left), hostsin dark purple (right). (The unresolved interactions are shown inSupplementary Fig. 7)
548 M. F. M. Bjorbækmo et al.

Fig. 1a, d) were also represented by relatively few entries(only 7% of the parasite records). Yet, the records ofparasitic fungi demonstrated that they infect a relativelybroad range of protists, such as dinoflagellates, apicom-plexans, ciliates, and diatoms. Bacterial parasites of protistsaccounted for 8% of the parasite entries and were registeredmainly from amoebozoan, excavate, and ciliate hosts(Fig. 1d).
Bipartite interaction networks
Since PIDA consists of pairwise interactions between aquaticmicrobes where the roles of the participants are known we canrepresent the interactions as bipartite networks. Bipartite net-works provide a systematic way of representing data thatconsist of two distinct guilds, such as plant–pollinator,parasite–host, or predator–prey. These networks are composedof nodes (representing species or genera) connected by links(edges) representing the interactions between nodes. Thedegree of a node (species) is the sum of links connecting theparticular node to the nodes from the other guild. Conse-quently, a higher degree value indicates a higher level ofgeneralism [33]. For example, a parasite that has gone throughmultiple host-shifts and has the capacity to parasitize differenthosts would display a higher degree than a parasite specializedto interact with only one host. We have constructed binary(presence/absence) bipartite networks for predator–prey,symbiont–host, and parasite–host interactions, as well as forthe unresolved interactions (Supplementary Figs. 3–6). Wecalculated specialization indices to analyze variation in
specialization within the bipartite networks and to examine ifthe four interaction types differed in terms of specialization(Fig. 3a–d; Supplementary Fig. 7; Table 1).
The predator–prey bipartite interaction networks had342 prey and 337 predator species (Supplementary Fig. 3).Although the number of prey and predators in the networkwere almost equal, there were multiple shared interactions.That is, several predators feed on the same prey (i.e., theprey has a high degree) and conversely, generalist predatorspreying on multiple prey organisms (i.e., predators having ahigh degree; Fig. 3a, c; Supplementary Figs. 3 and 7). Thefive predators with highest degree included four dino-flagellates and one cercozoan (Table 1).
The prey organisms with highest degree belonged toHaptista, Cryptista, Stramenopiles, and Alveolata (Table 1).The specialization index (d’) was uniformly distributed from0 (generalist) to 1 (specialist) indicating that predation wasnot driving predator or prey to specialization (Fig. 3b, d).
The symbiont–host interaction networks consisted of98 symbiont and 188 host species (Supplementary Fig. 4).The majority of both hosts and symbionts had a low degree(Fig. 3a, c; Supplementary Fig. 7). The distribution of thespecialization index (d’) for hosts indicates that PIDAincludes both, specialists interacting with only one or a fewsymbionts, as well as hosts that interact with multiplesymbionts (Fig. 3b). The five host taxa that had the highestnumber of associated symbionts (i.e., highest degree) werefour foraminiferans (Rhizaria) and one ciliate (Alveolata;Table 1). Very few hosts were ‘true generalists’ (i.e., with d’close to 0, Fig. 3b). The symbionts in PIDA had high d’
Alv
eola
ta
Stra
men
opile
s
Rhi
zaria
Arc
haep
last
ida
Hap
tista
Exc
avat
a
Cry
ptis
ta
Am
oebo
zoa
Oba
zoa
Arc
haea
Bac
teria
0
200
400
600
800
Num
ber o
f int
erac
tions
Parasite/host Symbiont/hostPrey/predator Unresolved interactor/ host
Fig. 2 Interactions in PIDA.Number of interactionsregistered in the PIDA databasefor the different taxonomicgroups at ‘supergroup level’(corresponding to the secondtaxonomic level in PIDA). Redbars show predation, purpleparasitism, green representsymbiosis, and gray unresolvedinteractions. Solid colorsrepresent predator/host andtransparent colors representprey/symbiont/parasite/interactor. Because CRuMS,Ancyromonadidae, and Incertaesedis comprised very few entries(5, 1, and 2 predator entries,respectively), they are notincluded in this figure
The planktonic protist interactome: where do we stand after a century of research? 549

values in general, which indicate that they are specialized(d’ 0.75–1; Fig. 3d). This was coherent with the low degreeof most symbionts, which showed few links to differenthosts (Fig. 3c; Supplementary Fig. 7). The five symbiontswith highest degree included taxa belonging to five different‘supergroups’ (Haptista, Stramenopiles, Cyanobacteria,Alveolata, and Chlorophyta; Table 1).
The network for the unresolved interactor–host interac-tions had 85 ‘interactors’ and 141 host species (Supple-mentary Fig. 5). The distribution of the specialization index(d’) for hosts and interactors showed high d’ values for mosttaxa (Fig. 3b, d). Concordantly, the majority of hosts andinteractors also had a low degree (Fig. 3a, c; SupplementaryFig. 7). Altogether, this could indicate that the majority ofthe unresolved interactor–host interactions are specialized,or that they are simply understudied. The five interactorsand the five hosts with highest degree are shown in Table 1.
The network for parasitism had 130 parasites and 262hosts (Supplementary Fig. 6). Hosts were dominated bytaxa with low degree (i.e., few parasites per host, maximumnumber was five; Table 1), which indicated that they areinfected by a relatively low number of parasites (Fig. 3a;Supplementary Fig. 7). The d’ values showed, however, thatthere was an equal distribution of host taxa ranging from‘true generalists’ (d’ value of 0) to ‘true specialists’ (d’value of 1; Fig. 3b). The parasites had for the most part a
low degree, and the distribution of the specialization indexindicated that several of the parasites were specialists(d’ values ~1; Fig. 3d). Parasites showed the highest relativenumber of specialized taxa in PIDA. However, parasitesalso included the taxa with the highest degree (Fig. 3c;Supplementary Fig. 7), the well-known parasites belongingto Syndiniales (MALV II) and Perkinsidae (Table 1).
Interlinked species
Interlinked species [44] are taxa present in either several typesof interactions, or on both sides of the same interaction. Aninterlinked species is for example a species that is registeredas a predator in the predator–prey network, and is also presentas a host in the symbiont–host network. The unresolvedinteractions were excluded from these analyses since thenature of these interactions are unknown. In total there were94 interlinked species in PIDA (~4% of the total entries,Fig. 4; Table 2). The maximum number of interaction typesfor any species was three (Table 2; panels A–D). The majorityof interlinked species occurred in the overlap of speciesrecorded as predator, as prey and as host of parasites (Table 2;panel A). There was only a single interlinked species that helda role in each of the three independent bipartite networks(i.e., predator–prey, symbiont–host, and parasite–host),Paramecium bursaria (Table 2, panel B; corresponding to the
Degree (log10)
A
0.0 0.5 1.0 1.5
01
23
45
6
Degree (log10)
Den
sity
Unresolved
PredatorsSymbiont hostsParasite hosts
0.0 0.5 1.0
0.0
0.5
1.0
1.5
2.0
Specialization index (d’)
Den
sity
B
Unresolved
PredatorsSymbiont hostsParasite hosts
0.0 0.5 1.0 1.5
01
23
45
6D
ensi
ty Unresolved
PreySymbiontsParasites
C
0.0 0.5 1.0
0.0
0.5
1.0
1.5
2.0
Specialization index (d’)D
ensi
ty
D
Unresolved
PreySymbiontsParasites
Fig. 3 Density plots for degree and specialization indices for thebipartite networks in PIDA. a Degree (number of links/edges/inter-actions) for predators, hosts of parasites, hosts of symbionts, and hostsof interactors in the bipartite networks. b Specialization index d’(Kullback–Leibler distance) [35], for predators, hosts of parasites,
hosts of symbionts, and host of interactors. The specialization index d’ranges from 0 for the most generalized to 1 for the most specialized.c Degree (number of links/edges/interactions) for prey, parasites,symbionts, and interactors. d Specialization index d’ for prey, para-sites, symbionts, and interactors
550 M. F. M. Bjorbækmo et al.

Table 1 Degree and specialization index (d’), for the five species with highest degree (highest number of links/edges) in the bipartite networks foreach interaction type
Type Taxaa Species Phylum (Supergroup) Degree d'
Predators 337 Leptophrys vorax Cercozoa (Rhizaria) 34 0.8
Oblea rotunda Dinoflagellata (Alveolata) 27 0.6
Karlodinium armiger Dinoflagellata (Alveolata) 26 0.6
Diplopsalis lenticula Dinoflagellata (Alveolata) 15 0.4
Diplopsalopsis bomba Dinoflagellata (Alveolata) 15 0.4
Hosts ofsymbionts
188 Amphistegina lobifera Foraminifera (Rhizaria) 17 0.6
Amphistegina lessonii Foraminifera (Rhizaria) 15 0.6
Borelis schlumbergi Foraminifera (Rhizaria) 12 0.6
Heterostegina depressa Foraminifera (Rhizaria) 12 0.5
Paramecium bursaria Ciliophora (Alveolata) 9 0.8
Hosts ofinteractors
141 Diophrys scutum Ciliophora (Alveolata) 4 0.2
Euplotes harpa Ciliophora (Alveolata) 4 0.9
Euplotes woodruffi Ciliophora (Alveolata) 4 0.7
Hemigastrostyla elongata Ciliophora (Alveolata) 4 0.3
Petalomonas spagnophila Euglenida (Excavata) 4 0.4
Hosts ofparasites
262 Alexandrium minutum Dinoflagellata (Alveolata) 5 0.3
Collozoum NA Polycystinea (Rhizaria) 5 0.8
Guinardia delicatula Diatomea (Stramenopiles) 5 0.6
Alexandrium catenella Dinoflagellata (Alveolata) 4 0.1
Coscinodiscus granii Diatomea (Stramenopiles) 4 0.5
Prey 342 Isochrysis galbana Prymnesiophyceae (Haptista) 31 0.3
Rhodomonas salina Cryptophyceae (Cryptista) 27 0.4
Skeletonema costatum Diatomea (Stramenopiles) 27 0.3
Heterocapsa triquetra Dinoflagellata (Alveolata) 20 0.3
Heterosigma akashiwo Raphidiophyceae (Stramenopiles) 19 0.2
Symbionts 98 Phaeocystis NA Prymnesiophyceae (Haptista) 29 1.0
diatom NA Diatomea (Stramenopiles) 21 0.9
cyanophyte NA Cyanophyceae (Cyanobacteria) 18 0.9
dinoflagellate NA Dinoflagellata (Alveolata) 15 0.9
Chlorella NA Trebouxiophyceae (Chlorophyta) 11 0.7
Interactors 85 alphaproteobacter NA Alphaproteobacteria(Proteobacteria)
20 0.5
gammaproteobacteria NA Gammaproteobacteria(Proteobacteria)
19 0.6
Gyrodinium NA Dinoflagellata (Alveolata) 12 1.0
cyanophyte NA Cyanophyceae (Cyanobacteria) 8 1.0
Polynucleobacter necessarius Betaproteobacteria(Proteobacteria)
7 0.8
Parasites 130 Amoebophrya NA Syndiniales (Alveolata) 61 0.8
Parvilucifera infectans Perkinsidae (Alveolata) 29 0.5
Euduboscquella NA Syndiniales (Alveolata) 18 1.0
Cryothecomonas longipes Cercozoa (Rhizaria) 14 0.6
Pirsonia formosa I.s. Stramenopiles 14 0.6
aTaxa displays the number of species registered in PIDA for the different interaction types. The taxonomy of the five species with highest degree isshown at species, phylum, and supergroup level. Degree shows the number of edges for the top five taxa. Specialization index d’(Kullback–Leibler distance) [30] ranges from 0 for the most generalized to 1 for the most specialized. Abbreviations used: Type interaction type.
The planktonic protist interactome: where do we stand after a century of research? 551

overlap B in Fig. 4). The majority of interlinked species hadtwo interaction types (Table 2; panels E–L). There were alsotwo examples of hyperparasitism where the species wereparasites as well as hosts of other parasites (Table 2; panel G).
The SAR supergroup: dominance in literature vs.dominance in environmental studies
The SAR supergroup heavily dominated PIDA and weexamined it in depth. Within the SAR supergroup the well-known and species rich Diatomea (Stramenopiles), Dino-flagellata, and Ciliophora (both Alveolata) are pre-valent (Fig. 5). Since SAR is also known to dominateenvironmental sequencing studies [45–47], we comparedthe SAR records in PIDA with one of the most well-knownrecent environmental diversity studies; the Tara Oceanssurvey [45]. We identified taxonomic groups that displayedhigh diversity and abundance in the Tara Oceans survey,but that had few entries in PIDA (yellow circles in Fig. 5).Within Stramenopiles, the groups that appeared to beespecially underrepresented compared with environmentalsequencing data were the Labyrinthulomycetes and MarineStramenopiles (MASTs). These groups were represented by~1100 Operational Taxonomic Units (OTUs, a speciesproxy) in the environmental study by de Vargas et al. [35],while comprising only 12 entries in PIDA (~0.5% of thetotal entries). The most prominent underrepresentation of
alveolates in PIDA compared with Tara Oceans was Syn-diniales (MALV II). Even though Syndiniales were rela-tively numerous in PIDA (200 entries; ~8% of the totalentries), the MALV II/Syndiniales comprised an astonish-ing ~5600 OTUs in the study by de Vargas et al. [45].Within Rhizaria the foraminifers were fairly well repre-sented in PIDA (330 entries, >55 unique species) comparedwith Tara Oceans (~250 OTUs) and also compared with arecent study of Morard et al. [48]. The other rhizariangroups such as Acantharia, Polycystinea, and Cercozoawere, however, poorly represented in PIDA compared withthe diversity in the Tara Oceans study (~100–150 entriesvs. ~1000 to >5000 OTUs in Tara Oceans). Apicomplexadid not comprise many entries in PIDA because theseparasites only infect multicellular (metazoan) hosts. There-fore, the few apicomplexans that are present in PIDA arerecorded as hosts of parasites, symbionts, or as prey.
Discussion
As expected, the data assembled in PIDA reflected biasesrelated to ease of study (e.g., accessibility to the interaction,cell size, organismal abundance), research interests andhistorical traditions, as well as available technology. Yet,PIDA represents a useful framework to investigate protistecological interactions that should be expanded and
180
250
265163
82
21 (I) 15 (H)
7 (E)
0
15 (K)
1 (J)
3 (F)
9 (L)
0 0
17 (A)1 (B)
0
2 (D)
0
0
0
1(C)0
0
00
0
0
0 0
Hosts of parasites
Prey
Predators Hosts of symbionts
Symbionts
Parasites
2 (G)331
Fig. 4 Interlinked species. Venn diagram illustrating the number ofspecies in PIDA that hold multiple ‘roles’ and are present in more thanone interaction network/type; i.e., either present in two distinct net-works (e.g., registered as ‘Prey’ in the predator–prey network, and alsoas ‘Symbiont’ in the symbiont–host network) or on both sides of thesame network (e.g., registered as both ‘Predator’ and ‘Prey’ in thepredator–prey network). Letters A–L refers to the panels in Table 2,where the taxonomy of the different overlapping species and their roles
are presented. ‘Parasites’ were only found to overlap with ‘Host ofparasites’, representing two cases of hyperparasitism (i.e., parasitespecies parasitizing other parasite species). The unresolved interactionsare not included in this analysis since their functional roles areunknown. Only taxa with full species name determined were includedto avoid overestimating overlapping species (e.g., Amoebophrya NAand similar were excluded)
552 M. F. M. Bjorbækmo et al.

Table 2 Interlinked species in PIDA
Panel Species Phylum Supergroup No Present as
A Akashiwo sanguinea Dinoflagellata Alveolata 3 Prey Predator Host of par
A Alexandrium catenella Dinoflagellata Alveolata 3 Prey Predator Host of par
A Alexandrium ostenfeldii Dinoflagellata Alveolata 3 Prey Predator Host of par
A Alexandrium tamarense Dinoflagellata Alveolata 3 Prey Predator Host of par
A Cochlodinium polykrikoides Dinoflagellata Alveolata 3 Prey Predator Host of par
A Dinophysis acuminata Dinoflagellata Alveolata 3 Prey Predator Host of par
A Gymnodinium catenatum Dinoflagellata Alveolata 3 Prey Predator Host of par
A Gymnodinium sanguineum Dinoflagellata Alveolata 3 Prey Predator Host of par
A Heterocapsa rotundata Dinoflagellata Alveolata 3 Prey Predator Host of par
A Heterocapsa triquetra Dinoflagellata Alveolata 3 Prey Predator Host of par
A Neoceratium furca Dinoflagellata Alveolata 3 Prey Predator Host of par
A Oblea rotunda Dinoflagellata Alveolata 3 Prey Predator Host of par
A Oxyrrhis marina Dinoflagellata Alveolata 3 Prey Predator Host of par
A Prorocentrum micans Dinoflagellata Alveolata 3 Prey Predator Host of par
A Prorocentrum minimum Dinoflagellata Alveolata 3 Prey Predator Host of par
A Protoperidinium pellucidum Dinoflagellata Alveolata 3 Prey Predator Host of par
A Scrippsiella trochoidea Dinoflagellata Alveolata 3 Prey Predator Host of par
B Paramecium bursaria Ciliophora Alveolata 3 Prey Host of symb Host of par
C Heterocapsa rotunda Dinoflagellata Alveolata 3 Symbiont Prey Predator
D Noctiluca scintillans Dinoflagellata Alveolata 3 Predator Host of symb Host of par
D Thalassicolla nucleata Polycystinea Rhizaria 3 Predator Host of symb Host of par
E Durinskia baltica Dinoflagellata Alveolata 2 Host of symb Host of par –
E Durinskia dybowskii Dinoflagellata Alveolata 2 Host of symb Host of par –
E Kryptoperidinium foliaceum Dinoflagellata Alveolata 2 Host of symb Host of par –
E Stentor polymorphus Ciliophora Alveolata 2 Host of symb Host of par –
E Acanthometra pellucida Acantharia Rhizaria 2 Host of symb Host of par –
E Acanthostaurus purpurascens Acantharia Rhizaria 2 Host of symb Host of par –
E Collozoum caudatum Polycystinea Rhizaria 2 Host of symb Host of par –
F Chlamydomonas hedleyi Chlorophyceae Archaeplastida 2 Prey Symbiont –
F Nitzschia frustulum Diatomea Stramenopiles 2 Prey Symbiont –
F Protodinium simplex Dinoflagellata Alveolata 2 Prey Symbiont –
G Keppenodinium mycetoides Syndiniales Alveolata 2 Parasite Host of par –
G Oodinium acanthometrae Dinoflagellata Alveolata 2 Parasite Host of par –
H Acanthamoeba castellanii Discosea Amoebozoa 2 Predator Host of par –
H Acanthamoeba polyphaga Discosea Amoebozoa 2 Predator Host of par –
H Dinophysis acuta Dinoflagellata Alveolata 2 Predator Host of par –
H Dinophysis norvegica Dinoflagellata Alveolata 2 Predator Host of par –
H Diplopsalis lenticula Dinoflagellata Alveolata 2 Predator Host of par –
H Euplotes woodruffi Ciliophora Alveolata 2 Predator Host of par –
H Eutintinnus pectinis Ciliophora Alveolata 2 Predator Host of par –
H Favella ehrenbergii Ciliophora Alveolata 2 Predator Host of par –
H Gonyaulax polygramma Dinoflagellata Alveolata 2 Predator Host of par –
H Karlodinium veneficum Dinoflagellata Alveolata 2 Predator Host of par –
H Trithigmostoma cucullulus Ciliophora Alveolata 2 Predator Host of par –
H Protoperidinium bipes Dinoflagellata Alveolata 2 Predator Host of par –
H Protoperidinium minutum Dinoflagellata Alveolata 2 Predator Host of par –
H Protoperidinium steinii Dinoflagellata Alveolata 2 Predator Host of par –
H Strombidium capitatum Ciliophora Alveolata 2 Predator Host of par –
I Coscinodiscus granii Diatomea Stramenopiles 2 Prey Host of par –
I Coscinodiscus radiatus Diatomea Stramenopiles 2 Prey Host of par –
I Cylindrotheca closterium Diatomea Stramenopiles 2 Prey Host of par –
I Eucampia zoodiacus Diatomea Stramenopiles 2 Prey Host of par –
I Chaetoceros didymus Diatomea Stramenopiles 2 Prey Host of par –
I Guinardia delicatula Diatomea Stramenopiles 2 Prey Host of par –
I Guinardia flaccida Diatomea Stramenopiles 2 Prey Host of par –
I Leptocylindrus danicus Diatomea Stramenopiles 2 Prey Host of par –
The planktonic protist interactome: where do we stand after a century of research? 553

improved with future studies and observations. In particular,future interconnections between PIDA and molecular stu-dies should enhance the power of both and lead to moresolid conclusions. Despite its biases, PIDA can be used toinitialize biological hypotheses that should be further tested,and can serve as a guide for future experiments on inter-actions in underrepresented protists groups.
Our comprehensive bibliographic survey shows thatmicrobial interactions are spread across all major eukaryoticgroups as well as across the main bacterial (e.g., Cyano-bacteria, Bacteroidetes, Proteobacteria, and Firmicutes) and
archaeal (Halobacteria, Methanobacteria, and Methanomi-crobia) lineages. All major protistan groups were involvedin interactions in one or multiple ways; as hosts, symbionts,parasites, predators, and/or prey (Fig. 1a–d). The well-known representatives of the SAR supergroup (i.e.,Stramenopiles, Alveolata, and Rhizaria) were howeveroverrepresented compared with the other ‘supergroups’ inPIDA. Within SAR the distribution was further skewedtoward certain well-characterized and species-rich lineages,such as dinoflagellates, ciliates, and diatoms. SAR membershave historically gained much attention since they hold
Table 2 (continued)
Panel Species Phylum Supergroup No Present as
I Stephanopyxis turris Diatomea Stramenopiles 2 Prey Host of par –
I Thalassionema nitzschioides Diatomea Stramenopiles 2 Prey Host of par –
I Thalassiosira nordenskioeldii Diatomea Stramenopiles 2 Prey Host of par –
I Thalassiosira punctigera Diatomea Stramenopiles 2 Prey Host of par –
I Thalassiosira rotula Diatomea Stramenopiles 2 Prey Host of par –
I Odontella sinensis Diatomea Stramenopiles 2 Prey Host of par –
I Gymnodinium instriatum Dinoflagellata Alveolata 2 Prey Host of par –
I Gymnodinium mikimotoi Dinoflagellata Alveolata 2 Prey Host of par –
I Gyrodinium aureolum Dinoflagellata Alveolata 2 Prey Host of par –
I Neoceratium fusus Dinoflagellata Alveolata 2 Prey Host of par –
I Neoceratium lineatum Dinoflagellata Alveolata 2 Prey Host of par –
I Neoceratium tripos Dinoflagellata Alveolata 2 Prey Host of par –
I Paramecium tetraurelia Ciliophora Alveolata 2 Prey Host of par –
J Thalassiosira pseudonana Diatomea Stramenopiles 2 Prey Host of symb –
K Heterosigma akashiwo Raphidophyceae Stramenopiles 2 Prey Predator –
K Pseudobodo tremulans Bicosoecida Stramenopiles 2 Prey Predator –
K Fibrocapsa japonica Raphidophyceae Stramenopiles 2 Prey Predator –
K Archerella flavum Labyrinthulomycetes Stramenopiles 2 Prey Predator –
K Lingulodinium polyedrum Dinoflagellata Alveolata 2 Prey Predator –
K Myrionecta rubra Ciliophora Alveolata 2 Prey Predator –
K Pfiesteria piscicida Dinoflagellata Alveolata 2 Prey Predator –
K Prorocentrum triestinum Dinoflagellata Alveolata 2 Prey Predator –
K Euplotes aediculatus Ciliophora Alveolata 2 Prey Predator –
K Favella taraikaensis Ciliophora Alveolata 2 Prey Predator –
K Amphidinium carterae Dinoflagellata Alveolata 2 Prey Predator –
K Rhyncomonas nasuta Kinetoplastea Excavata 2 Prey Predator –
K Bodo saltans Kinetoplastea Excavata 2 Prey Predator –
K Prymnesium parvum Prymnesiophyceae Haptophyta 2 Prey Predator –
K Chrysochromulina polylepis Prymnesiophyceae Haptophyta 2 Prey Predator –
L Peridinium quinquecorne Dinoflagellata Alveolata 2 Predator Host of symb –
L Euplotes daidaleos Ciliophora Alveolata 2 Predator Host of symb –
L Climacostomum virens Ciliophora Alveolata 2 Predator Host of symb –
L Orbulina universa Foraminifera Rhizaria 2 Predator Host of symb –
L Archaias angulatus Foraminifera Rhizaria 2 Predator Host of symb –
L Globigerinoides ruber Foraminifera Rhizaria 2 Predator Host of symb –
L Globigerinoides sacculifer Foraminifera Rhizaria 2 Predator Host of symb –
L Globorotalia menardii Foraminifera Rhizaria 2 Predator Host of symb –
L Lenisia limosa Breviatea Obazoa 2 Predator Host of symb –
Panels A–L refer to the 12 overlapping sections in the Venn diagram (Fig. 5). The taxonomy of the overlapping species in PIDA is listed at species,phylum and supergroup level. The column ‘No’ refers to the number of roles the overlapping species held, i.e., the number of bipartite networks(or interaction types in the same network) the species occurred in. The column ‘Present as’ displays which interaction types, or networks theoverlapping species occurred in (i.e., what roles they held). Only taxa with full species name determined were included to avoid overestimatingoverlapping species (e.g., Amoebophrya sp. and similar were excluded). Abbrevations: host of par = host of parasite, host of symb = Host of symbiont.
554 M. F. M. Bjorbækmo et al.

important roles as primary producers, parasites, symbionts,and predators/grazers [49]). In particular, the dinoflagellateand diatom lineages include many species that hold keyroles as primary producers, fixating substantial amounts ofatmospheric CO2 in the surface ocean [50], and have con-sequently been the subject of many studies. Dinoflagellatesalso include species that can form harmful algal blooms(HABs) [51], producing toxins that can have devastatingeffects on fisheries and aquaculture, making the researchon their ecology and life cycles a priority [52]. Other
heterotrophic dinoflagellates and ciliates are among themost important microzooplankton predators in the ocean,consuming between 60 and 80% of the primary productionevery day at a global scale [53–56]. Although the SARsupergroup dominated PIDA, our comparison of the SARrecords with the Tara Oceans data [45] revealed that thereare several SAR lineages, which are abundant and diverse inthe marine realm, that were underrepresented when it comesto characterization of their ecological roles as interactors inaquatic environments, such as Labyrinthulomycetes andMAST (Stramenopiles), Syndiniales (MALV II; Alveolata),Acantharia, Polycystinea, and Cercozoa (Rhizaria).
Compared with environmental studies there were alsoseveral other protist lineages that were underrepresented inPIDA. Fungi, for example, have been shown to be diversein environmental HTS surveys of several aquatic environ-ments [57–59] and some of these have been proposed asimportant parasites of protists [60, 61]. Judging from thescant number of entries in PIDA and the relativelybroad host ranges that these organisms had, we suggestthat future investigations should focus on revealing moreabout the ecological function of aquatic fungi. Anotherunderrepresented lineage in PIDA is Excavata. In the TaraOceans surveys the diplonemids were shown to be hyper-diverse, with more than 12 000 OTUs, while they have onlyfour entries in PIDA. It was not surprising that diplonemidswere poorly represented in PIDA since their immensediversity was only recently discovered [45], and becauselittle is known about the lifestyle of these excavates [62].But it underlines that diplonemids and other excavatesrepresent a black box also when it comes to ecologicalinteractions.
Protist predation or grazing is crucial for channelingcarbon and energy to higher trophic levels [55, 63] as wellas for the release of dissolved nutrients to the base ofaquatic food webs [64]. The bipartite network analysis ofthe predator–prey interactions in PIDA indicated that pre-dation as an ecological strategy is not directed toward eitherspecialization nor generalization, but that predators are‘multivorous’ and feed on several different prey organisms.Instead of hunting for prey many organisms depend onother strategies for resource acquisition that involve moreintimate relationships, such as the interaction betweenparasites or symbionts and their hosts. These intimateinteractions have evolved independently from freelivingancestors multiple times in diverse and evolutionary unre-lated protist lineages. To develop such intimate interactionsrequires a high degree of specialization as it necessitates ametabolic dialog between the interacting organisms.Our bipartite network analyses for symbiont–host andparasite–host interactions showed that many of the sym-biont and parasite species seemed to be moderatelyspecialized.
Diatomea
Chrysophyceae
Stramenopiles i.s.
Raphidophyceae
Peronosporo mycetes
Actinophryidae
Labyrinthulomycetes
MAST−4
Platysulcidae
Developea
Bolidomonas
Bicosoecida
Pelagophyceae
MAST−3
Dictyochophyceae
Ciliata
Syndiniales
Perkinsidae
Acavomonidia
Apicomplexa
Colpodellida
Colponemidia
Alveolata i.s.
Foraminifera
Acantharia
Polycystinea
Cercozoa
Cercozoa i.s.
Dinoflagellata
0 100 200 300 400 500 600Number of taxa
Stram
enopiles
Alveo
lataRhizaria
Parasite / HostSymbiont / HostPrey / PredatorUnresolved interaction
Fig. 5 The dominating SAR supergroup. Number of interactionsregistered in PIDA belonging to the SAR supergroup (Stramenopiles,Alveolates, and Rhizaria). For each of the SAR supergroups the entriesof the different taxonomic groups at ‘phylum level’ are shown (cor-responding to the third taxonomic level in PIDA). Red bars showpredators, green represent symbiosis, purple parasitism, and grayunresolved interactions. Solid colors represent host/predator andtransparent colors represent prey/symbiont/parasite/interactor. Yellowcircles highlight the ‘phyla’ that comprise few records in PIDAcompared with the (hyper)diversity these ‘phyla’ represent in envir-onmental HTS studies, such as the Tara Oceans study [45]. Abbre-viations used in this figure: i.s. refers to Incertae sedis or unknown
The planktonic protist interactome: where do we stand after a century of research? 555

The importance and scientific relevance of symbiosis wasreflected by the great variety of symbiotic interactionwe found. Several protists harbor microbial symbionts(eukaryotic and prokaryotic) that provide e.g., carbohydrates(through photosynthesis), vitamins, Nitrogen (throughN2-fixation), and defense to their hosts, in exchange forother nutrients, vitamins, and protection [1, 4]. An exampleof this is Cyanobacteria that live inside their protist hosts(e.g., diatoms, dinoflagellates, or radiolarians) and providephotosynthesis products [65, 66] or nitrogen through nitro-gen fixation [67–69], in exchange for protection and/ornutrients. There were also many records of heterotrophicbacteria engaged in symbiosis with protists in PIDA, wherebacteria provide their hosts with vitamins and other types ofnutrients in exchange for photosynthesis products (carbo-hydrates), nutrients, or protection. Such types of symbioticinteractions have been demonstrated for several relationshipsbetween bacteria and microalgae [70–72]. One example isthe relationship between the diatom Pseudo-nitzschia mul-tiseries and Sulfitobacter sp. SA11. Pseudo-nitzschia mul-tiseries secretes organic carbon and a sulphonated metabolitecalled taurine which is taken up by the Sulfitobacter sp., andthe Sulfitobacter sp. bacteria respond by secreting ammo-nium for the diatom and then switch their preference fromammonium to nitrate, thereby promoting the growth rate ofboth partners involved in the symbiosis [73]. There wereremarkably few studies demonstrating symbiotic relation-ships between two or more heterotrophic protists in theaquatic environment. The only records we found all repre-sented the same type of symbiotic relationship between theparasite Neoparamoeba perurans and its kinetoplastidendosymbionts. Neoparamoeba perurans is a well-studiedorganism since it causes disease in salmon, and conse-quently is a threat for aquaculture [74–77].
Compared with the other three categories (symbiont–host,parasite–host, and predator–prey) the unresolved interactionswere heavily dominated by bacteria–protist interactions,mainly between Alpha- or Gammaproteobacteria interactingwith Ciliophora, Dinoflagellata (both Alveolates), or Diato-mea (Stramenopiles). Since the functional role of the rela-tionship between these bacteria and protist hosts is notdetermined, future studies should focus on elucidating theseinteractions as they could be important components in protistholobiomes. The holobiome concept includes the host andall associated microbes (eukaryotes, prokaryotes, and viru-ses). There has been a growing awareness that microbesassociated with larger hosts (e.g., humans) have profoundeffects on the host’s health and development [22, 78], andthis most likely applies to protist holobiomes too.
Parasites are present in most phylogenetic groups andhold important roles in ecosystems where they can forinstance alter both the structure and dynamics of food webs[79, 80]. Parasites are likely largely underrepresented in
studies of microbial interactions with only 18% of theentries in PIDA. This is especially prominent in the light ofrecent results from environmental DNA surveys, whichindicate that parasites are particularly diverse and abundantin marine as well as terrestrial ecosystems [9, 45, 81, 82].Cercozoan parasites were only described from diatoms,although several of their close relatives are knownto parasitize a plethora of macroscopic hosts [83–86].Likewise, parasites belonging to different stramenopilelineages such as Peronosporomycetes (oomycetes), Labyr-inthulomycetes, and Pirsonia were also registered to mostlyinfect diatoms (Fig. 1d). This probably reflects that diatomshave been the subject of more scientific studies than otherprotist hosts, although the true diversity of parasitesinfecting diatoms is likely larger than what is currentlyknown [84].
The bipartite network analyses indicated that there weresome parasites in PIDA that infected many different hosts(i.e., broad host range). But in general, the majorityof parasites in PIDA appeared to infect few hosts, andaltogether, parasite–host interactions seemed to beslightly more dominated by specialized interactions than insymbiont–host networks. For symbionts and parasites, theobserved patterns could indicate that several studies haveinvestigated these relationships from ‘the parasite/symbiontpoint of view’, and consequently, well-known taxa (e.g., theparasite Amoebophrya) have been investigated more thor-oughly leading to broader host ranges. In contrast, severalother symbionts/parasites have been detected only asso-ciated with one host, pointing to many specialized ‘one-to-one’ relationships in the microbial world. It could also bespeculated that this pattern results from accidental detec-tions of parasites or symbionts. For instance, research ondiatoms would from time to time observe cells that areinfected with a parasite or that host a symbiont, withoutlooking more into the host range of these parasites orsymbionts, as that was not the original focus of the study.Both the symbiont–host, interactor–host, and parasite–hostcategories in PIDA are dominated by host entries (~doublenumber of hosts compared with the number of interactingpartners), and this observation could support that several ofthe detections of symbionts, parasites, and interactors mayrepresent ‘accidental detections’. The search for a parasiteor symbiont’s host range has until recently been likesearching for a needle in a haystack.
In conclusion, summarizing the data on ecologicalinteractions involving aquatic protists and other microbesfrom the past ~150 years allowed us to obtain a uniqueoverview of the known interactions and derive relevantbiological hypotheses. Despite the biases and knowledgegaps we identified, PIDA can be used for multiple purposesin future studies (which is beyond the scope of this work),for example: (1) to identify the functional role of a
556 M. F. M. Bjorbækmo et al.

microbe using taxonomically annotated environmentalDNA sequences, (2) to investigate whether ecologicalinteraction hypotheses that derive from association net-works [23] are supported by previous studies in PIDA, and(3) to obtain information about the host range of a particularparasite, the predators of a specific prey, or the symbiontsfrom a given host. Last but not least, our work identifiesknowledge gaps that could be the focus of future research.
Acknowledgements This work has been supported by the projectsMicroEcoSystems (Research Council of Norway 240904) as well asINTERACTOMICS (CTM2015-69936-P, MINECO, Spain) to RL.RL was supported by a Ramón y Cajal fellowship (RYC-2013-12554,MINECO, Spain). We thank four anonymous reviewers, in addition toJavier del Campo and Rannveig M. Jacobsen, for useful suggestionsand comments that helped to improve this work.
Compliance with ethical standards
Conflict of interest The authors declare that they have no conflict ofinterest.
Publisher’s note Springer Nature remains neutral with regard tojurisdictional claims in published maps and institutional affiliations.
Open Access This article is licensed under a Creative CommonsAttribution 4.0 International License, which permits use, sharing,adaptation, distribution and reproduction in any medium or format, aslong as you give appropriate credit to the original author(s) and thesource, provide a link to the Creative Commons license, and indicate ifchanges were made. The images or other third party material in thisarticle are included in the article’s Creative Commons license, unlessindicated otherwise in a credit line to the material. If material is notincluded in the article’s Creative Commons license and your intendeduse is not permitted by statutory regulation or exceeds the permitteduse, you will need to obtain permission directly from the copyrightholder. To view a copy of this license, visit http://creativecommons.org/licenses/by/4.0/.
References
1. Caron DA, Alexander H, Allen AE, Archibald JM, Armbrust EV,Bachy C, et al. Probing the evolution, ecology and physiologyof marine protists using transcriptomics. Nat Rev Microbiol.2017;15:6–20.
2. Falkowski P. The power of plankton. Nature. 2012;483:S17–20.3. Falkowski PG, Fenchel T, Delong EF. The microbial engines that
drive Earth’s biogeochemical cycles. Science. 2008;320:1034–9.4. Worden AZ, Follows MJ, Giovannoni SJ, Wilken S, Zimmerman
AE, Keeling PJ. Rethinking the marine carbon cycle: factoring in themultifarious lifestyles of microbes. Science. 2015;347:1257594.
5. Margulis L, Fester R. Symbiosis as a source of evolutionaryinnovation: speciation and morphogenesis. Cambridge, MA: MITPress; 1991.
6. Lopez-Garcia P, Eme L, Moreira D. Symbiosis in eukaryoticevolution. J Theor Biol. 2017;434:20–33.
7. Archibald JM. Endosymbiosis and eukaryotic cell evolution. CurrBiol. 2015;25:R911–921.
8. Cavalier-Smith T. Symbiogenesis: mechanisms, evolutionaryconsequences, and systematic implications. Annu Rev Ecol EvolSyst. 2013;44(44):145–72.
9. Mahé F, de Vargas C, Bass D, Czech L, Stamatakis A, Lara E,et al. Parasites dominate hyperdiverse soil protist communities inNeotropical rainforests. Nat Ecol Evol. 2017;1:91.
10. Biard T, Stemmann L, Picheral M, Mayot N, Vandromme P,Hauss H, et al. In situ imaging reveals the biomass of giant protistsin the global ocean. Nature. 2016;532:504–7.
11. Finlay BJ, Esteban GF. Freshwater protozoa: biodiversity andecological function. Biodivers Conserv. 1998;7:1163–86.
12. Huxley T. Zoological notes and observations made on board H.M.S Rattlesnake. III. Upon Thalassicolla, a new zoophyte. Ann MagNat Hist Ser 2. 1851;8:433–42.
13. Brandt K. Uber das Zusammenleben von Thieren und Algen. VerhPhysiol Ges. 1881;1:524–7.
14. Logares R, Haverkamp THA, Kumar S, Lanzen A, Nederbragt AJ,Quince C, et al. Environmental microbiology through the lens ofhigh-throughput DNA sequencing: Synopsis of current platforms andbioinformatics approaches. J Microbiol Methods. 2012;91:106–13.
15. Sogin ML, Morrison HG, Huber JA, Mark Welch D, Huse SM,Neal PR, et al. Microbial diversity in the deep sea and theunderexplored “rare biosphere”. Proc Natl Acad Sci USA.2006;103:12115–20.
16. Goodwin S, McPherson JD, McCombie WR. Coming of age: tenyears of nextgeneration sequencing technologies. Nat Rev Genet.2016;17:333–51.
17. Pedrós-Alió C, Acinas SG, Logares R, Massana R. Marinemicrobial diversity as seen by high throughput sequencing. In:Gasol J, Kirchman D, editors. Microbial ecology of the oceans.New Jersey: Wiley-Blackwell; 2018. p. 47–87.
18. Spang A, Saw JH, Jorgensen SL, Zaremba-Niedzwiedzka K,Martijn J, Lind AE, et al. Complex archaea that bridge the gapbetween prokaryotes and eukaryotes. Nature 2015;521:173–9.
19. Faust K, Lahti L, Gonze D, de Vos WM, Raes J. Metagenomicsmeets time series analysis: unraveling microbial communitydynamics. Curr Opin Microbiol. 2015;25:56–66.
20. Faust K, Raes J. Microbial interactions: from networks to models.Nat Rev Microbiol. 2012;10:538–50.
21. Lima-Mendez G, Faust K, Henry N, Decelle J, Colin S, Carcillo F,et al. Determinants of community structure in the global planktoninteractome. Science. 2015;348:1–10.
22. Layeghifard M, Hwang DM, Guttman DS. Disentangling inter-actions in the microbiome: a network perspective. TrendsMicrobiol. 2017;25:217–28.
23. Röttjers L, Faust K. From hairballs to hypotheses-biological insightsfrom microbial networks. FEMS Microbiol Rev. 2018;42:761–80.
24. Koeppen N. Amoebophrya stycholonchae nov. gen. et sp. (corpsspiral de Fol). Zoologischer Anz. 1894;17:417–24.
25. Adl SM, Bass D, Lane CE, Lukes J, Schoch CL, Smirnov A, et al.Revisions to the classification, nomenclature, and diversity ofeukaryotes. J Eukaryot Microbiol. 2019;66:4–119.
26. Adl SM, Simpson AG, Lane CE, Lukes J, Bass D, Bowser SS,et al. The revised classification of eukaryotes. J Eukaryot Micro-biol. 2012;59:429–93.
27. Yilmaz P, Parfrey LW, Yarza P, Gerken J, Pruesse E, Quast C,et al. The SILVA and “All-species Living Tree Project (LTP)”taxonomic frameworks. Nucleic Acids Res. 2014;42:D643–648.
28. Quast C, Pruesse E, Yilmaz P, Gerken J, Schweer T, Yarza P,et al. The SILVA ribosomal RNA gene database project:improved data processing and web-based tools. Nucleic AcidsRes. 2013;41:D590–6.
29. Pruesse E, Quast C, Knittel K, Fuchs BM, Ludwig W, Peplies J,et al. SILVA: a comprehensive online resource for quality checkedand aligned ribosomal RNA sequence data compatible with ARB.Nucleic Acids Res. 2007;35:7188–96.
30. Benson DA, Cavanaugh M, Clark K, Karsch-Mizrachi I, LipmanDJ, Ostell J, et al. GenBank. Nucleic Acids Res. 2017;45:D37–42.
The planktonic protist interactome: where do we stand after a century of research? 557

31. R Core Development Team. R: A language and environment forstatistical computing. Vienna: R Foundation for Statistical Com-puting; 2018. http://www.R-project.org.
32. Dormann CF, Gruber B, Fruend J. Introducing the bipartitepackage: analysing ecological networks. R News. 2008;8:8–11.
33. Dormann CF, Frueund J, Bluethgen N, Gruber B. Indices, graphsand null models: analyzing bipartite ecological networks. OpenEcol J. 2009;2:7–24.
34. Dormann CF. How to be a specialist? Quantifying specialisationin pollination networks. Network Biol. 2011;1:1–20.
35. Bluthgen N, Menzel F, Bluthgen N. Measuring specialization inspecies interaction networks. BMC Ecol. 2006;6:9.
36. Wickham H. ggplot2: elegant graphics for data analysis. NewYork: Springer-Verlag; 2016.
37. Shannon P, Markiel A, Ozier O, Baliga NS, Wang JT, Ramage D,et al. Cytoscape: a software environment for integrated models ofbiomolecular interaction networks. Genome Res. 2003;13:2498–504.
38. Backman T, Girke T. systemPipeR: NGS workflow and reportgeneration environment. BMC Bioinforma. 2016;17:388.
39. Mitra A, Flynn KJ, Tillmann U, Raven JA, Caron D, StoeckerDK, et al. Defining planktonic protist functional groups onmechanisms for energy and nutrient acquisition: incorporation ofdiverse mixotrophic strategies. Protist. 2016;167:106–20.
40. Stoecker DK, Hansen PJ, Caron DA, Mitra A. Mixotrophy in theMarine Plankton. Ann Rev Mar Sci. 2017;9:311–35.
41. Selosse MA, Charpin M, Not F. Mixotrophy everywhere on land andin water: the grand écart hypothesis. Ecol Lett. 2017;20:246–63.
42. Flynn KJ, Mitra A, Anestis K, Anschütz AA, Calbet A, FerreiraGD, et al. Mixotrophic protists and a new paradigm for marineecology: where does plankton research go now? J Plankton Res.2019;41:375–91.
43. Tanifuji G, Cenci U, Moog D, Dean S, Nakayama T, David V,et al. Genome sequencing reveals metabolic and cellular inter-dependence in an amoeba-kinetoplastid symbiosis. Sci Rep.2017;7:11688.
44. Fontaine C, Guimaraes PR Jr., Kefi S, Loeuille N, Memmott J,van der Putten WH, et al. The ecological and evolutionaryimplications of merging different types of networks. Ecol Lett.2011;14:1170–81.
45. de Vargas C, Audic S, Henry N, Decelle J, Mahe F, Logares R,et al. Eukaryotic plankton diversity in the sunlit ocean. Science.2015;348:1261605.
46. Massana R, Gobet A, Audic S, Bass D, Bittner L, Boutte C, et al.Marine protist diversity in European coastal waters and sedimentsas revealed by high-throughput sequencing. Environ Microbiol.2015;17:4035–49.
47. Logares R, Audic S, Bass D, Bittner L, Boutte C, Christen R, et al.Patterns of rare and abundant marine microbial eukaryotes. CurrBiol. 2014;24:813–21.
48. Morard R, Garet-Delmas MJ, Mahe F, Romac S, Poulain J,Kucera M, et al. Surface ocean metabarcoding confirms limiteddiversity in planktonic foraminifera but reveals unknown hyper-abundant lineages. Sci Rep. 2018;8:2539.
49. Banerjee S, Schlaeppi K, van der Heijden MGA. Keystone taxa asdrivers of microbiome structure and functioning. Nat RevMicrobiol. 2018;16:567–76.
50. Hopkinson BM, Dupont CL, Allen AE, Morel FM. Efficiency ofthe CO2-concentrating mechanism of diatoms. Proc Natl Acad SciUSA. 2011;108:3830–7.
51. Hallegraeff GM, Jeffrey SW. Annually recurrent diatom bloomsin spring along the New-South-Wales coast of Australia. Aust JMar Freshw Res. 1993;44:325–34.
52. Granéli E, Turner JT. Ecology of harmful algae. New York:Springer, Berlin; 2008.
53. Pernthaler J. Predation on prokaryotes in the water column and itsecological implications. Nat Rev Microbiol 2005;3:537–46.
54. Sherr EB, Sherr BF. Capacity of herbivorous protists to controlinitiation and development of mass phytoplankton blooms. AquatMicrob Ecol. 2009;57:253–62.
55. Del Giorgio PA, Williams PJl. Respiration in aquatic ecosystems.Oxford, New York: Oxford University Press; 2005.
56. Armengol L, Calbet A, Franchy G, Rodriguez-Santos A,Hernandez-Leon S. Planktonic food web structure and trophictransfer efficiency along a productivity gradient in the tropical andsubtropical Atlantic Ocean. Sci Rep. 2019;9:2044.
57. Richards TA, Leonard G, Mahe F, Del Campo J, Romac S, JonesMD, et al. Molecular diversity and distribution of marine fungiacross 130 European environmental samples. Proc Biol Sci.2015;282:20152243.
58. Yi Z, Berney C, Hartikainen H, Mahamdallie S, Gardner M,Boenigk J, et al. Highthroughput sequencing of microbial eukar-yotes in Lake Baikal reveals ecologically differentiated commu-nities and novel evolutionary radiations. FEMS Microbiol Ecol.2017;93:fix073.
59. Grossart HP, Van den Wyngaert S, Kagami M, Wurzbacher C,Cunliffe M, RojasJimenez K. Fungi in aquatic ecosystems. NatRev Microbiol. 2019;17:339–54.
60. Lepere C, Ostrowski M, Hartmann M, Zubkov MV, Scanlan DJ.In situ associations between marine photosynthetic picoeukaryotesand potential parasites - a role for fungi? Environ Microbiol Rep.2016;8:445–51.
61. Richards TA, Jones MD, Leonard G, Bass D. Marine fungi: theirecology and molecular diversity. Ann Rev Mar Sci. 2012;4:495–522.
62. Lukes J, Flegontova O, Horak A. Diplonemids. Curr Biol.2015;25:R702–4.
63. Sherr EB, Sherr BF. Significance of predation by protistsin aquatic microbial food webs. Antonie Van Leeuwenhoek.2002;81:293–308.
64. Azam F, Fenchel T, Field JG, Gray JS, Meyerreil LA, ThingstadF. The ecological role of water-column microbes in the sea. MarEcol Prog Ser. 1983;10:257–63.
65. Foster RA, Carpenter EJ, Bergman B. Unicellular cyanobionts inopen ocean dinoflagellates, radiolarians, and tintinnids: ultra-structural characterization and immunolocalization of phycoery-thrin and nitrogenase. J Phycol. 2006;42:453–63.
66. Foster RA, Collier JL, Carpenter EJ. Reverse transcription PCRamplification of cyanobacterial symbiont 16S rRNA sequencesfrom single non-photosynthetic eukaryotic marine planktonic hostcells. J Phycol. 2006;42:243–50.
67. Gordon N, Angel DL, Neori A, Kress N, Kimor B. Heterotrophicdinoflagellates with symbiotic cyanobacteria and nitrogen limita-tion in the Gulf of Aqaba. Mar Ecol Prog Ser. 1994;107:83–8.
68. Foster RA, Kuypers MM, Vagner T, Paerl RW, Musat N, Zehr JP.Nitrogen fixation and transfer in open ocean diatom-cyanobacterial symbioses. ISME J. 2011;5:1484–93.
69. Foster RA, O’Mullan GD. Nitrogen-fixing and nitrifying sym-bioses in the marine environment. In: Capone DG, Bronk DA,Mulholland MR, Carpenter EJ, editors. Nitrogen in the marineenvironment. 2nd ed. Elsevier; 2008. pp 1197–218.
70. Ramanan R, Kim BH, Cho DH, Oh HM, Kim HS. Algae-bacteriainteractions: evolution, ecology and emerging applications. Bio-technol Adv. 2016;34:14–29.
71. Cole JJ. Interactions between bacteria and algae in aquatic eco-systems. Annu Rev Ecol Syst. 1982;13:291–314.
72. Cooper MB, Smith AG. Exploring mutualistic interactionsbetween microalgae and bacteria in the omics age. Curr OpinPlant Biol. 2015;26:147–53.
73. Amin SA, Hmelo LR, van Tol HM, Durham BP, Carlson LT, HealKR, et al. Interaction and signalling between a cosmopolitanphytoplankton and associated bacteria. Nature. 2015;522:98–101.
74. Dykova I, Nowak B, Peckova H, Fiala I, Crosbie P, Dvorakova H.Phylogeny of Neoparamoeba strains isolated from marine fish and
558 M. F. M. Bjorbækmo et al.

invertebrates as inferred from SSU rDNA sequences. Dis AquatOrgan. 2007;74:57–65.
75. Dykova I, Fiala I, Peckova H. Neoparamoeba spp. and theireukaryotic endosymbionts similar to Perkinsela amoebae (Hol-lande, 1980): coevolution demonstrated by SSU rRNA genephylogenies. Eur J Protistol. 2008;44:269–77.
76. Young ND, Dykova I, Crosbie PB, Wolf M, Morrison RN, BridleAR, et al. Support for the coevolution of Neoparamoeba and theirendosymbionts, Perkinsela amoebae-like organisms. Eur J Pro-tistol. 2014;50:509–23.
77. Caraguel CG, O’Kelly CJ, Legendre P, Frasca S Jr., Gast RJ,Despres BM, et al. Microheterogeneity and coevolution: anexamination of rDNA sequence characteristics in Neoparamoebapemaquidensis and its prokinetoplastid endosymbiont. J EukaryotMicrobiol. 2007;54:418–26.
78. Cho I, Blaser MJ. The human microbiome: at the interface ofhealth and disease. Nat Rev Genet. 2012;13:260–70.
79. Lafferty KD, Allesina S, Arim M, Briggs CJ, De Leo G, DobsonAP, et al. Parasites in food webs: the ultimate missing links. EcolLett. 2008;11:533–46.
80. Amundsen PA, Lafferty KD, Knudsen R, Primicerio R, Kle-metsen A, Kuris AM. Food web topology and parasites in thepelagic zone of a subarctic lake. J Anim Ecol. 2009;78:563572.
81. Park MG, Yih W, Coats DW. Parasites and phytoplankton, withspecial emphasis on dinoflagellate infections. J Eukaryot Micro-biol. 2004;51:145–55.
82. Skovgaard A. Dirty tricks in the plankton: diversity and role ofmarine parasitic protists. Acta Protozoologica. 2014;53:51–62.
83. Hartikainen H, Ashford OS, Berney C, Okamura B, Feist SW,Baker-Austin C, et al. Lineage-specific molecular probing revealsnovel diversity and ecological partitioning of haplosporidians.ISME J. 2014;8:177–86.
84. Scholz B, Guillou L, Marano AV, Neuhauser S, Sullivan BK,Karsten U, et al. Zoosporic parasites infecting marine diatoms - Ablack box that needs to be opened. Fungal Ecol. 2016;19:59–76.
85. Ward GM, Bennett M, Bateman K, Stentiford GD, Kerr R, FeistSW, et al. A new phylogeny and environmental DNA insight intoparamyxids: an increasingly important but enigmatic clade ofprotistan parasites of marine invertebrates. Int J Parasitol.2016;46:605–19.
86. Sierra R, Canas-Duarte SJ, Burki F, Schwelm A, Fogelqvist J,Dixelius C, et al. Evolutionary origins of rhizarian parasites. MolBiol Evol. 2016;33:980–3.
87. Schulz F, Eloe-Fadrosh EA, Bowers RM, Jarett J, Nielsen T,Ivanova NN, et al. Towards a balanced view of the bacterial treeof life. Microbiome. 2017;5:140.
The planktonic protist interactome: where do we stand after a century of research? 559
Copyright © 2022 FDOKUMEN