
A Human Interactome
191
Dissertation zur Erlangung des Doktorgrades der Fakultät für Chemie und Pharmazie der Ludwig-Maximilians-Universität München A Human Interactome Marco Yannic Hein aus Böblingen, Deutschland 2014
-
Upload
khangminh22 -
Category
Documents
-
view
2 -
download
0
Transcript of A Human Interactome
Dissertation zur Erlangung des Doktorgrades
der Fakultät für Chemie und Pharmazie
der Ludwig-Maximilians-UniversitätMünchen
AHuman Interactome
Marco YannicHein
aus
Böblingen, Deutschland
2014


Erklärung
Diese Dissertation wurde im Sinne von § 7 der Promotionsordnung vom 28. November
2011 von Herrn Professor Dr. Matthias Mann betreut.
Eidesstattliche Versicherung
Diese Dissertation wurde eigenständig und ohne unerlaubte Hilfe erarbeitet.
München, den 19.12.2014
Marco Yannic Hein
Dissertation eingereicht am 30.06.2014
1. Gutachter: Prof. Dr. Matthias Mann
2. Gutachter: Prof. Dr. Anthony Hyman
Mündliche Prüfung am 19.09.2014
iii
●

Abstract
Abstract
Protein interactions are the key to our understanding of virtually all biological processes.
The entirety of protein interactions in a biological system is described by the term ‘in-
teractome’. Mass spectrometry-based proteomics is the method of choice to study the
protein interactome, because it is the only method that can identify and quantify pro-
teins directly and in an unbiased manner.
In this thesis, I present a large-scale study of the human interactome. This work is based
on an interaction proteomics method that captures protein interactions in a system as
close to the in vivo situation as possible. This method, called quantitative BAC-GFP
interactomics (QUBIC), uses cell lines expressing GFP-tagged proteins from bacterial
artificial chromosome (BAC) transgenes. These mimic the endogenous loci and ensure
near-endogenous expression levels and regulation patterns. I coordinated a proteome-
wide screen and acquired interactomics data for more than 1,100 tagged bait proteins.
To analyse these data, I developed strategies that enable the relative and absolute quan-
tification of proteins without the use of stable isotope labels. These strategies can be ap-
plied proteome-wide, from the lowest to highest abundant proteins in the cells, spanning
orders of magnitude of individual protein enrichment factors, and across thousands of
samples. Overall, the analysis revealed 28,000 interactions that connect more than half
of all proteins expressed in HeLa cells. This represents a valuable resource of unpreced-
ented size for the scientific community.
The combination of relative and absolute quantification is the foundation of a novel
concept of interactome analysis in three quantitative dimensions. The first dimension
discriminates specific interactors from background binders. The second dimension es-
timates the stoichiometries of interacting proteins. The third dimension quantifies their
cellular abundances.
A distinct stoichiometry signature identifies both known and novel stable protein com-
plexes. These complexes constitute a small minority among a wealth of weak interac-
tions. Strikingly, weak interactions turned out to be the most critical for the overall
structure of the network and are responsible for its ‘small world’ property. They explain
why most proteins are connected with each other via few intermediate steps.
v
●

Contents
Contents
Abbreviations vii
1 Introduction 11.1 Biological networks . . . . . . . . . . . . . . . . . . . . . 1
1.1.1 Mapping protein-protein interaction networks . . . . . . . . . . 2
1.1.2 Network analysis . . . . . . . . . . . . . . . . . . . . 5
1.1.3 Network visualization . . . . . . . . . . . . . . . . . . . 7
1.2 Mass spectrometry-based proteomics . . . . . . . . . . . . . . . 8
1.3 Proteomic analysis of cellular systems . . . . . . . . . . . . . . . 8
1.4 Aims of the thesis . . . . . . . . . . . . . . . . . . . . . . 31
2 Applications of the QUBIC technology 352.1 Functional repurposing revealed by comparing genetic interactions . . . . 35
2.2 Decoding human cytomegalovirus . . . . . . . . . . . . . . . . 36
2.3 A systematic mammalian genetic interaction map . . . . . . . . . . 37
2.4 CCDC22 deficiency blunts proinflammatory NF-κb signaling . . . . . . 37
2.5 Interaction between AP-5 and hereditary spastic paraplegia proteins . . . . 38
3 Technologies for large-scale relative and absolute protein quantification 393.1 MaxLFQ allows accurate proteome-wide label-free quantification . . . . . 39
3.2 A ‘proteomic ruler’ for protein copy number and concentration estimation . 56
4 State-of-the-art affinity enrichment–mass spectrometry 674.1 Accurate protein complex retrieval by affinity enrichment MS . . . . . . 67
5 A quantitative map of the human interactome 855.1 The human interactome in three quantitative dimensions . . . . . . . . 85
6 Discussion 1116.1 The future of proteomic quantification. . . . . . . . . . . . . . . 111
6.2 The future of interaction proteomics . . . . . . . . . . . . . . . 112
6.3 The nature of the interactome . . . . . . . . . . . . . . . . . . 114
References 117
Appendix 123
vi

Abbreviations
Abbreviations
AP-MS affinity purification followed by
mass spectrometry
BAC bacterial artificial chromosome
FastLFQ fast label-free quantification
FDR false discovery rate
GFP green fluorescent protein
HCMV human cytomegalovirus
iBAQ intensity-based absolute
quantification
ICAT isotope-coded affinity tag
IP immunoprecipitation
iTRAQ isobaric tag for relative and
absolute quantitation
LAP localization and affinity
purification tag
LFQ label-free quantification
MaxLFQ label-free quantification in
MaxQuant
MS mass spectrometry
ORF open reading frame
PTM post-translational modification
QUBIC quantitative BAC-GFP
interactomics
SILAC stable isotope labelling with
amino acids in cell culture
TAP tandem affinity purification
TMT tandem mass tag
TPA total protein approach
XLID X-linked intellectual disability
Y2H yeast-two-hybrid
vii
●


1 Introduction
1.1 Biological networks
Anetwork describes relationships between entities. In its graphical representation, these
entities are drawn as nodes (vertices) and relationships are drawn as edges connecting
the nodes. Many systems can be captured as networks: Social interactions between
people, the electrical power grid, the connectivity of servers and clients in the World
Wide Web, the ecological network of dependencies between species or the synapses
between neurons in the brain [1].
In molecular biology, metabolic networks describe chemical reactions catalysed by en-
zymes that interconvert metabolites (Figure 1 a). Gene regulatory networks capture the
interplay of factors governing gene expression (Figure 1 b): Upstream signalling mo-
lecules alter the binding state of transcription factors to genetic regions on the DNA,
thereby switching transcription on or off. Transcripts or proteins translated from them
may further exceed feedback signalling. In gene regulatory networks, nodes represent
genetic regions, mRNAs or proteins and edges indicate physical binding, translocation,
functional inhibition or activation of a process.
a b c
Figure 1: Types of biological net-worksa. Metbolic networkb. Gene regulatory networkc. Protein interaction network
The prototypical biological network types describe interactions between genes or pro-
teins (Fig. 1 c). Genetic interactions denote mutual interdependencies of perturbations
of individual genes. Upon deletion of an individual gene, or knockdown or overexpres-
sion of its product, a certain phenotype is observed. If several genes are perturbed to-
gether, the resulting phenotype is typically a combination of the individual ones. For
functionally connected genes, however, the double perturbation phenotype can deviate
from the expected outcome: It may be aggravated, for instance in the case of genes that
encode functionally redundant proteins. In that case, loss of both gene products may
be well tolerated individually, but not in combination. In contrast, alleviating genetic
interactions denote that the double perturbation is less severe than the combination of
the individual ones. This can be the result of signalling cascades, where single or double
interruption block signal propagation alike, similar to one or multiple serial road-blocks
1
●

1 Introduction
having the same effect, as traffic is stopped in any case. Alternatively, alleviating genetic
interactionsmay occur for the genes encoding subunits of stable protein complexes: De-
letion of either subunit can render the complex non-functional, or trigger the degrad-
ation of unbound subunits. Genetic interactions only manifest in perturbed states of a
biological system. For practical reasons, genetic interaction phenotypes are usually read
out via cell growth or survival [2]. This limits the observable interaction space. On the
other hand, genetic interactions can be probed under diverse stress conditions, which
translate different biological functions to observable phenotypes. Upon discovery of a
genetic interaction, its mechanistic cause is not necessarily apparent. One way of elucid-
ating the nature of a functional relationship is to probe whether it is caused by a physical
interaction between proteins.
Proteins interact physically by forming macromolecular structures and stable protein
complexes. Interactions can also be of a transient or weak nature, as in the case of regu-
latory interactions or enzyme-substrate relationships. While a physical protein-protein
interaction is mechanistically very straightforward to interpret, its functional implica-
tions may be manifold. For that reason, genetic and physical interaction data ideally
complement each other.
1.1.1 Mapping protein-protein interaction networks
Global mapping of protein-protein interactions is the goal of a variety of methods [3].
Most of them can be classified as flavours of the yeast-two-hybrid (Y2H) approach (Fig.
2 a, b), or of affinity purification followed by mass spectrometry (AP-MS) (Fig. 2 c).
Figure 2: Approaches of protein-protein in-teractionmapping.a. Yeast-two-hybrid (Y2H). Bait and prey pro-teins are fused to activation or DNA-bindingdomains (AD, BD) and reconstitute an activetranscription factor upon interaction.b. Split-ubiquitin system. Interaction of baitand prey complements a split ubiquitin (Ub),which leads to the proteolytic release of an act-ive transcription factor that translocates intothe nucleus.c. Affinity-purification followed by mass spec-trometry (AP-MS). A (tagged) bait protein ispurified from a cell extract via affinity enrich-ment. Co-purifying proteins are identified bymass spectrometry.
a c
b
AD
BD
bait
prey
reporter gene antibody
a�nity matrix
mass spectrometerreporter gene
transcriptionfactor
baitprey
Ub
tagprey
bait
Y2H and related split-protein methods map binary interactions between pairs of pro-
teins in a targeted fashion. To that end, each protein of the candidate pair is fused to one
‘half ’ of a split reporter protein. If the candidate proteins do interact, they bring the two
2

1.1 Biological networks
‘halves’ of the reporter into close proximity, forming a functional reporter. In the clas-
sical yeast-two-hybrid approach, the Gal4 transcription factor serves as reporter and its
DNA-binding domain (BD) and activation domain (AD) are fused to either candidate
interactor [4]. Active Gal4 then leads to the transcription of reporter genes, which can
be read out via cell growth or chromophore formation (Fig. 2 a). Y2H is limited to pro-
teins that can be solubly expressed and that form a binary complex in the yeast nucleus.
This excludesmembrane proteins and proteins that are unstable or insoluble in isolation,
for instance outside of an obligate multiprotein complex. The split-ubiquitin method is
a variation of the Y2H concept that is applicable to integral or peripheral membrane
proteins [5] (Fig. 2 b). All current high-throughput implementations of the Y2H sys-
tem are carried out in a systematic fashion: Defined libraries of candidate interactors
are cloned into AD or BD fusion vectors and integrated into the yeast genome. Pairs are
then screened by selective mating. The attainable search space is the square of all pair-
wise combinations, that isn(n−1)
2combinations for n proteins. From this, one can derive
a static definition of the interactome as the sum of all binary protein-protein interac-
tions within this search space [6] (Fig. 3 a). Given that all interactions within the cell
can be decomposed into binary contacts, complete knowledge of this interactome mat-
rix should allow the delineation of all interactions happening in vivo. Y2H was used to
generate interactionmaps for variousmodel organisms, ranging from S. cerevisiae [7–9],C. elegans [10],A. thaliana [11] to human [6, 12, 13]. Recent developments in theY2Hfield
include the use of robotics for cloning and yeast handling and the use of next-generation
sequencing as a quantitative readout rather than colony size [14, 15].
AP-MS takes a conceptually different route to protein-protein interaction mapping [16].
A protein assembly is purified from its endogenous source via an affinity matrix. In its
simplest form, endogenous protein complexes are purified to homogeneity by exploit-
ing available affinities or specific antibodies. Alternatively, one ‘bait’ protein is selected
and expressed as a fusion protein with an affinity tag. The composition of the complex is
then delineated, in the past typically by cutting out visible gel bands and subjecting them
to mass spectrometric analysis. This approach has three major drawbacks: (i) it requires
substantial amounts of inputmaterial; (ii) it is only applicable to those complexes against
which antibodies are available, which can be tagged or which possess inherent affinities
that can be used; and (iii) mass spectrometry is prone to identify co-purifying ‘contam-
inant’ proteins, generating many false positives.
One development addressing some of these shortcomings was the invention of the tan-
dem affinity purification (TAP) tag [17]. The budding yeast S. cerevisiae has a very effi-
cient homologous recombinationmachinery, enabling the straightforwardmodification
of endogenous loci, for instance by the insertion of a C-terminal affinity tag. The TAP tag
is a combination of a calmodulin binding peptide, a tobacco etch virus (TEV) protease
cleavage site and Staphylococcus aureus protein A. The protein complexes containing the
tagged protein can then be purified in several consecutive steps, first using the affinity of
3
●

1 Introduction
protein A to immunoglobulin G (IgG), followed by TEV cleavage and finally via a cal-
modulin column, from which highly purified complexes can be eluted by withdrawal of
calcium by EGTA. This procedure is the same for all tagged proteins and the amounts of
contaminant proteins are reduced, which enabled one of the first global studies of pro-
tein complexes in yeast [18]. However, it comes at the price of losing weak interactors
[19].
With the advent of modern mass spectrometers, the TAP-MS approach was faced with
the predicament that betterMS performance leads to worse data quality, because the no-
tion that each identified protein equals an interactor fails. Even seemingly clean prepar-
ations of protein complexes contain traces of many co-purifying proteins that sensitive
MS can detect. The remedy came in the form of quantitative proteomics [20, 21]. True
interactors can be distinguished from background binders by quantifying each identi-
fied protein in specific affinity purifications with a negative control sample. Background
binders are retrieved in either sample in roughly the same amounts, whereas specific
interactors are characterized by quantitative enrichment compared to the control. Even
with this realization, large-scale interaction proteomics datasets often failed to incorpor-
ate quantitative strategies, for various reasons. Initially, quantitative workflows required
the use of stable isotope labels, which was often cost-prohibitive. Early studies there-
fore relied on subtraction of frequently identified ‘contaminants’ [18, 22–24], which is an
overly simplistic concept that nonetheless persists to date [25]. Later, quantification, if
used at all, was done in a semi-quantitative fashion, for instance by counting how often
peptides derived from a certain protein were fragmented during MS analysis [26–29].
In recent years, however, truly quantitative approaches are gaining momentum, making
full use of the power of proteomics [30, 31].
Despite remaining methodological issues associated with AP-MS interactome datasets,
there is emerging evidence that, in contrast to binary datasets ofmutual protein affinities,
they are much better suited to describe the modular architecture of the interactome invivo [32, 33]. In this view, the interactome cannot be described as one static matrix of
all possible pair-wise combinations of interacting proteins. Rather, the interactome is a
reflection of the cellular proteome and integrates all subordinate layers such as protein
abundance, post-translational modifications and subcellular localization (Fig. 3 b).
Figure 3: Definitions of the inter-actome.a. Matrix of all possible binaryprotein-protein interactions.b. Additional layer on top of genome,transcriptome and proteome.
a b
prot
ein
1pr
otei
n 2
prot
ein
3pr
otei
n 4
prot
ein
5
prot
ein
n
protein 1protein 2protein 3protein 4protein 5
protein n
Interactome
Genome
Transcriptome
Proteome
...
...
4

1.1 Biological networks
1.1.2 Network analysis
Many available datasets describe biological networks at a global scale. Such datasets can
not only be analysed at the level of individual interactions, but also from the perspective
of the network structure itself. In this way, network analysis is an essential technique for
systems biology, which seeks to describe, understand and predict life at the molecular
level in a holistic way. Mathematically speaking, a network is a graph and the analysis of
its properties is the subject of the field of graph theory, founded originally by Leonhard
Euler. In a seminal paper published in 1741, he solved a problem emerging from seven
bridges in the city of Königsberg, connecting the mainland on both sides of the river
Pregel via two river islands [34] (Fig. 4 a). The question was whether one could walk
across each bridge exactly once and visit all islands and each bank along the way. Euler
realized that the problem can be described as a graph, where each landmass represents
a node and each bridge an edge (Fig. 4 b). The graph describes only the connectivity
between landmasses but is agnostic to their actual geographical position. Looking at the
degree of connectivity, one quickly realizes that all nodes are of odd-numbered degree.
Because each node that is to be visited ‘in passing’ needs to have the same number of
incoming as outgoing edges, hence an even-numbered degree, there is no such path that
crosses each bridge exactly once.
a b c
a
c
b
d
ab
f
e
gdcGrüne Brücke
Krämerbrücke
Schmiedebrücke
Köttelbrücke
Honigbrücke
Hohe Brücke
Holzbrücke
=
Figure 4: The Königsberg Bridge Problem.a. Reproduction of the original figure from Leonhard Euler [34]. Landmasses A–D are connected bybridges a–g.b. Graph representation of the same topological problem.c. Illustration of the fact that the exact same graphs can be visualized differently.
This relatively simple problem can be expanded to answer all kinds of questions arising
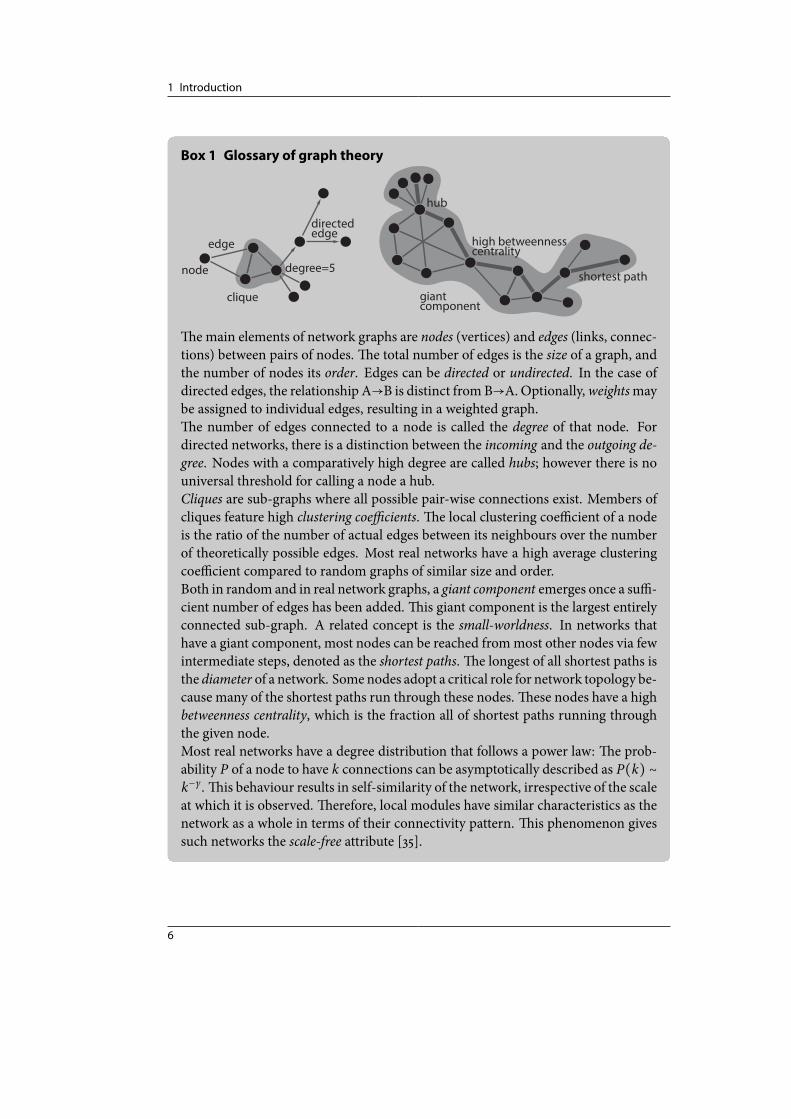
frommore complex networks. A summary of the terminology of graph theory is presen-
ted in Box 1. One critical discovery around 15 years ago was a unique feature of network
structure: The degree distribution in real networks follows a power law. In other words,
most nodes have few connections whereas few nodes have many connections. Such
networks are called scale-free [35]. This network structure is highly non-random and
5
●
1 Introduction
Box 1 Glossary of graph theory
edge
degree=5
directededge
node
clique giantcomponent
shortest path
hub
high betweennesscentrality
The main elements of network graphs are nodes (vertices) and edges (links, connec-tions) between pairs of nodes. The total number of edges is the size of a graph, andthe number of nodes its order. Edges can be directed or undirected. In the case of
directed edges, the relationship A→B is distinct fromB→A.Optionally,weightsmay
be assigned to individual edges, resulting in a weighted graph.
The number of edges connected to a node is called the degree of that node. For
directed networks, there is a distinction between the incoming and the outgoing de-gree. Nodes with a comparatively high degree are called hubs; however there is nouniversal threshold for calling a node a hub.
Cliques are sub-graphs where all possible pair-wise connections exist. Members of
cliques feature high clustering coefficients. The local clustering coefficient of a node
is the ratio of the number of actual edges between its neighbours over the number
of theoretically possible edges. Most real networks have a high average clustering
coefficient compared to random graphs of similar size and order.
Both in random and in real network graphs, a giant component emerges once a suffi-
cient number of edges has been added. This giant component is the largest entirely
connected sub-graph. A related concept is the small-worldness. In networks that
have a giant component, most nodes can be reached frommost other nodes via few
intermediate steps, denoted as the shortest paths. The longest of all shortest paths is
the diameter of a network. Somenodes adopt a critical role for network topology be-
cause many of the shortest paths run through these nodes. These nodes have a high
betweenness centrality, which is the fraction all of shortest paths running through
the given node.
Most real networks have a degree distribution that follows a power law: The prob-
ability P of a node to have k connections can be asymptotically described as P(k) ∼k−γ. This behaviour results in self-similarity of the network, irrespective of the scale
at which it is observed. Therefore, local modules have similar characteristics as the
network as a whole in terms of their connectivity pattern. This phenomenon gives
such networks the scale-free attribute [35].
6
1.1 Biological networks
thought to have originated through evolution from simpler networks by preferential at-
tachment of new nodes to existing ones. It has important implications for real networks.
First, it explains the so called ‘small world phenomenon’: almost all nodes can be reached
with few steps from each other node. The shortest paths in a network usually route via
a few highly connected hub proteins. Targeted removal of these hubs or critical edges
connecting them has dramatic consequences for overall network structure. Conversely,
the network is resilient towards random removal of nodes or edges [36]. This property
gives biological networks a remarkable degree of robustness.
When constructing protein interaction networks from experimental data, several as-
pects need to be taken into account: Y2H and related methods directly yield binary in-
teraction data, whereas AP-MS yields compositions of assemblies surrounding particu-
lar baits. Moreover, raw data contain varying amounts of noise and, depending on the
coverage and experimental biases, a large fraction of the interactome space may remain
unexplored. Networks can therefore be de-noised or completed by means of network
analysis [37, 38]. For instance, edges may be removed if reciprocal evidence is missing.
Conversely one can predict binary interactions between prey proteins co-purifying with
a given bait. Most network analysis approaches regard all edges as equal. However, for
the purpose of analysing network structure or for correcting noise or missing values,
assigning weight to the edges would be useful, reflecting their different nature and the
different degrees of certainty.
1.1.3 Network visualization
The graphical representation of a network is not trivial. Typically node-link diagrams
are used (Fig. 1); an alternative representation is a Boolean matrix of all possible pair-
wise combinations (Fig. 3) [39]. While simple node-link diagrams are intuitively inter-
pretable, they scale very badly with the size of the network, giving rise to the ‘hairball’
appearance of large network graphs. Another challenge is that conceptually, a network
describes only the connectivity of nodes, but not their position. Therefore, the exact
same networks can be represented in very different ways, which an observer will judge
to be different (Fig. 1 c). This is because the positioning of elements in a graph is the
strongest visual cue [40]. As a result, it is virtually impossible to compare large network
graphs and all that a viewer will absorb is a network’s rough size and its complexity. A
number of strategies have been developed to mitigate this problem and the search for
new visualization approaches often provided unforeseen insight into the nature of the
networks themselves. For instance, power graphs enable a compressed graphical repres-
entation of complex graphs [41]. The amount of compression in turn can be used as a
measure of data quality, because real networks are rich in highly compressible modules
[32, 42]. Hive plots tackle the visualization problem from a different angle, by projecting
nodes and edges to a defined coordinate system [43].
7
●

1 Introduction
1.2 Mass spectrometry-based proteomics
In the past two decades, mass spectrometry (MS) has emerged as the method of choice
for the global characterization of biological systems at the level of proteins, which are
the principal agents ofmost biological processes. Today,MS-based proteomics allows re-
searchers to identify and quantify proteins comprehensively inmany biological samples.
This development required concerted efforts from the scientific community, to which
our laboratory as contributed substantially: Early developments laid the foundations for
MS-based protein analysis, starting from the concept of electrospray ionization, which
first enabled the transfer of intact proteins or peptides into the vacuum inside the mass
spectrometer [44]. Later, sample preparation methods such as in-gel digestion allowed
researchers to couple their biochemical workflowswithmass spectrometric readout [45].
Sample preparation continues to be a critical part of the proteomics workflow, with re-
cent developments enabling the analysis of complete proteomes without systematic bi-
ases and from low amounts of inputmaterial [46, 47]. MS-based proteomics went quant-
itative with the introduction of stable isotope labelling techniques such as ICAT, SILAC,
TMT or iTRAQ [48–51]. Another critical ingredient was the maturation of the techno-
logical platform, with a swathe of high-resolution, fast mass spectrometers having been
introduced to the marked in recent years [52–54]. All wet-lab developments were closely
accompanied by computational advances, from strategies to deduce peptide sequences
from fragment spectra [55], via the development of statistical frameworks to tackle the
false discovery rate problem on a large scale [56] to user-friendly, end-to-end software
solutions for streamlined proteomics data analysis [57]. The bioinformatics pipeline is
slowly taking over responsibilities from the upfront wet-lab procedures. For instance,
label-free in silico quantification approaches are to some degree superseding isotope la-
bels or spike-in references. Furthermore, recalibration, normalization, deconvolution
and data integration steps can be applied in retrospect analysis. Together, these devel-
opments are now turning MS-based proteomics into a mature technology platform that
can be coupled to almost any biochemical workflow, providing functional readout about
proteins, their abundances, post-translational modifications (PTMs), interactions, loc-
alization and turnover.
1.3 Proteomic analysis of cellular systems
The utility of mass spectrometry-based proteomics for systems biology was the topic of
the opening chapter of the Handbook of Systems Biology. I wrote most of the chapter
together with Matthias Mann; Kirti Sharma contributed the section on PTM analysis
and Jürgen Cox wrote the part on computational proteomics.
Hein, M. Y., Sharma, K., Cox, J., & Mann, M. Handbook of Systems Biology: Conceptsand Insights: Proteomic Analysis of Cellular Systems, 3–25. Academic Press (2013).
8
Publication: Proteomic analysis of cellular systems
Chapter 1
Proteomic Analysis of Cellular Systems
Marco Y. Hein, Kirti Sharma, Jurgen Cox and Matthias MannDepartment of Proteomics and Signal Transduction, Max-Planck-Institute of Biochemistry, Am Klopferspitz 18, 82152 Martinsried, Germany
Chapter OutlineIntroduction 3
MS-Based Proteomics Workflow 4
Computational Proteomics 7
Deep Expression Proteomics 11
Interaction Proteomics 13
Large-Scale Determination of Post-Translational
Modifications 15
Outlook and Future Challenges 18
References 19
INTRODUCTION
A prerequisite for a system-wide understanding of cellularprocesses is a precise knowledge of the principal actorsinvolved, which are biomolecules such as oligonucleotides,proteins, carbohydrates and small molecules. Ever moresophisticated methods to measure the identity and amountof such biomolecules were an integral component of mostof the biological breakthroughs of the last century. At thelevel of the genome, DNA sequencing technology can nowgive us a complete inventory of the basic set of geneticinstructions of any organism of interest. Furthermore,recent breakthroughs in next-generation sequencing arepromising to allow large-scale comparison of the genomesof individuals. However, genomic sequences and theirvariations between individuals are completely unin-terpretable without knowledge of the encoded genes as wellas the biological processes in which they are involved.Therefore, the growing ability to obtain genetic dataprovides an increasing need and impetus to study thefunctions of gene products individually (classic molecularbiology) and at a large scale (systems biology). The firstsuch system-wide studies were performed at the level ofmRNA (‘transcriptomics’). They enable an unbiased andincreasingly comprehensive view of which parts of thegenome are actually expressed in a given situation. Tran-scriptomics also revealed that the relationship between thegenomic coding sequences and their corresponding RNAmolecules can be exceedingly complex. However, in termsof cellular function, the transcriptome still represents onlya middle layer of information transmission, with no or littlefunction of its own. The actual ‘executives’ of the cell are
the proteins, which perform myriad roles, from orches-trating gene expression to catalyzing chemical reactions,directing the information flow of the cell and performingstructural roles in cells and organisms. This crucial role ofproteins is also underlined by the fact that diseases alwaysinvolve malfunctioning proteins, and that drugs are almostinvariably directed against proteins or modify theirexpression levels.
Unfortunately, given the central importance of proteins,until recently there were no methods of protein measure-ment that were comparable to the powerful sequencing,hybridization or amplification-based methods to charac-terize oligonucleotides. This is finally beginning to changeowing to the introduction of mass spectrometry, first inprotein science and later for the large-scale study ofproteins, a field called mass spectrometry (MS)-basedproteomics [1].
The proteome of a cell designates the totality of allexpressed proteins in a given biological situation, and istherefore a dynamic entity. It encompasses not only theidentity and amount of all proteins but also their state ofmodification, their turnover, location in the cell, interactionpartners and e by some definitions e their structures andfunctions. Clearly, the proteome of the cell is the mostcomplex and functionally most relevant level of cellularregulation and function.
Accordingly, in systems biology it is usually the pro-teome that is the object of modeling. Typically only verysmall subsets of all proteins e those participating ina defined function of interest e are included in thesemodels. Even then, reliable and relevant information on
Handbook of Systems Biology Concepts and Insights. http://dx.doi.org/10.1016/B978-0-12-385944-0.00001-0 3Copyright � 2013 Elsevier Inc. All rights reserved.
9
●
1 Introduction
these few proteins has been hard to come by. This hasmeant that systems biological models suffered froma paucity of hard parameters, and instead usually had tomake do with very rough estimates of the identities,abundances, localization and modification states of theinvolved proteins. Modern MS-based proteomics is nowready to change this situation completely.
Its success in protein analysis comes as the last chapterin the very long history of mass spectrometry, which beganwith the observation of Kanalstrahlen (anode rays) byEugen Goldstein in 1886 and the construction of the firstmass spectrometer by Francis William Aston in 1919. Thefirst application to amino acids by Carl-Ove Anderssondates back to 1958. Later, both the quadrupole and thethree-dimensional ion traps were developed by WolfgangPaul, for which in 1989 he received the Nobel Prize inPhysics, together with Hans Georg Dehmelt. However, thebreakthrough for MS in biology came with the develop-ment of soft ionization technologies that enabled gentletransfer of peptides or proteins into the mass spectrometer,for which the Nobel Prize in Chemistry in 2002 wasawarded. The emergence of MS as a powerful ‘omics’discipline was also enabled by continuous developments insample preparation, separation technologies and break-throughs in the capabilities of the mass spectrometersthemselves, some of which are detailed below. In parallelwith these improvements on the ‘wet side’, data analysisand computational strategies on the ‘in silico side’ over thelast 20 years have been just as important, as they allow theidentification of peptides in sequence databases froma minimum of mass and fragmentation information. Orig-inally applied to one peptide at a time in a manual fashion,these algorithms now deal with hundreds of thousands ofpeptides in multifaceted projects and require large-scaledata management issues to be addressed which are just asdemanding as they are in the other ‘omics’ technologies.
The development of relative and absolute quantificationmethods over the last decade has been particularly crucialto proteomics. Using the latest proteomics technologies, itis now possible to quantify essentially complete proteomesof model organisms such as yeast [2]. More complexorganisms are also coming within reach [3e5]. However,quantitative proteomics not only permits precise proteomequantification in one state compared to another (termed‘expression proteomics’ and providing data conceptuallysimilar to transcriptomics) but also enables ‘functionalproteomics’, when combined with appropriate biochemicalworkflows. This can, for example, identify specific proteininteractions or reveal the composition of subcellularstructures [6e8]. Together, these methods allow the pro-teome to be studied in space and time, something thatcannot easily be done on a large scale and in an unbiasedmanner by other technologies [9]. The resulting proteomicdata perfectly complement large-scale studies following
individual proteins in single cells, for instance by means ofimmunostaining [10] or protein tagging [11].
One of the most important areas for MS-based proteo-mics is the analysis of post-translational modifications(PTMs) [12,13]. During recent years, MS-based proteomicshas revealed an unexpected diversity and extent of proteinmodifications. For example, phosphorylation turns out tooccur not only on a few key proteins but on thousands ofthem, which possibly also applies to less studied PTMs.How to model their regulatory roles will long be a keychallenge for systems biology.
MS-based proteomics now for the first time opens upthe entire universe of cellular proteins to detailed study.Protein amount, localization, modification state, turnoverand interactions can all be measured with increasingprecision and increasingly sophisticated approaches, asdetailed below. There is a unique opportunity to employthese data as a crucial underpinning for building accurateand comprehensive models of the cell [14].
MS-BASED PROTEOMICS WORKFLOW
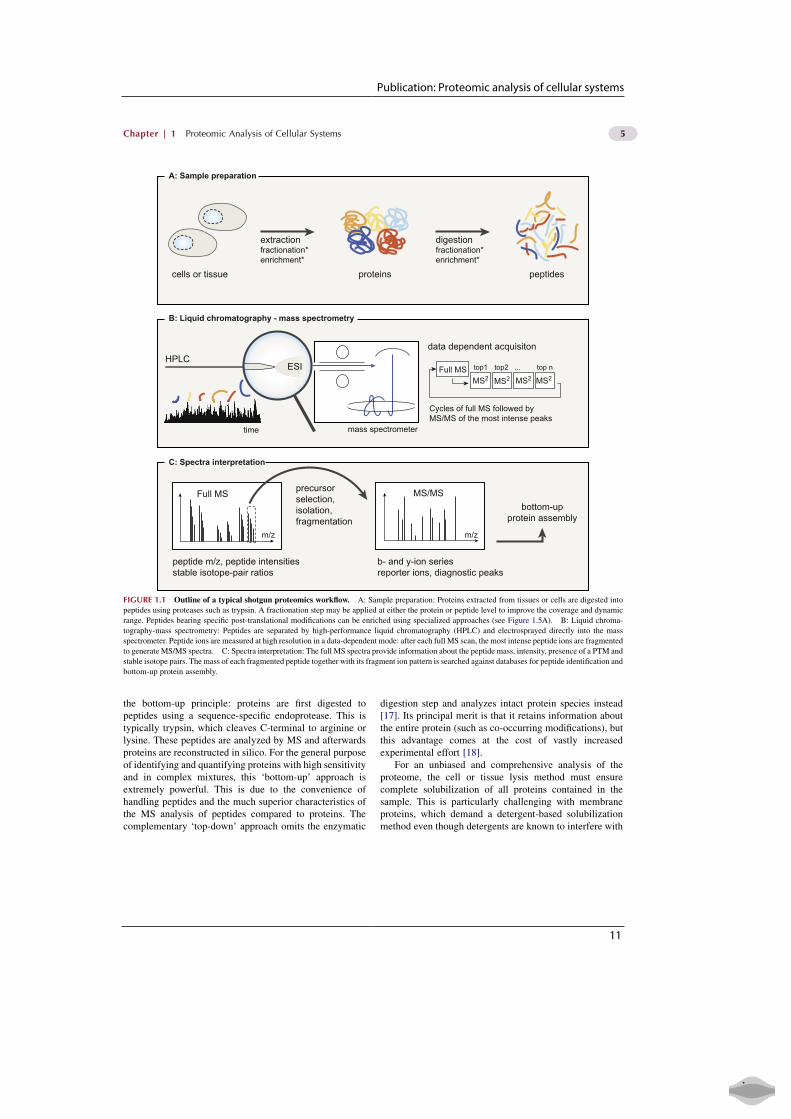
The analysis of complex protein mixtures is very difficult.Accordingly, the field of MS-based proteomics has beenmade possible by seminal advances in technology that havehelped to overcome a number of critical challenges.Together, they have resulted in a generic and general‘shotgun’ workflow that can be applied to any source ofproteins and almost any problem that can be addressed byMS-based proteomics (Figure 1.1). Here we explain theprinciples of this workflow, but also point out variations tothe general theme.
Until the 1980s proteins or peptides were largelyincompatible with MS, as they could not be transferred intothe vacuum of the mass spectrometer without beingdestroyed. Two alternative approaches solved this funda-mental problem: electrospray ionization (ESI), for whicha share of the 2002 Nobel Prize in Chemistry was awardedto John B. Fenn, and matrix-assisted laser desorption/ionization (MALDI). MALDI involves embedding theanalyte in a solid matrix of an organic compound, followedby transfer into the vacuum system. A laser pulse thenexcites the matrix molecules, leading to their desorptionalong with the ionized analyte molecules, whose mass ismeasured in a time-of-flight (TOF) analyzer [15]. Incontrast, in electrospray a stream of liquid is dispersed intoa charged aerosol when high voltage is applied to theemitter. Solvent molecules in aerosol droplets rapidlyevaporate, and charged analyte molecules are then trans-ferred into the vacuum of the mass spectrometer, wherethey finally arrive as ‘naked’ ions [16].
Even with appropriate ionization techniques at hand,large intact proteins are usually difficult to handle, there-fore the standard MS-based proteomic workflow follows
4 SECTION | I Components of Biological Systems
10
Publication: Proteomic analysis of cellular systems
the bottom-up principle: proteins are first digested topeptides using a sequence-specific endoprotease. This istypically trypsin, which cleaves C-terminal to arginine orlysine. These peptides are analyzed by MS and afterwardsproteins are reconstructed in silico. For the general purposeof identifying and quantifying proteins with high sensitivityand in complex mixtures, this ‘bottom-up’ approach isextremely powerful. This is due to the convenience ofhandling peptides and the much superior characteristics ofthe MS analysis of peptides compared to proteins. Thecomplementary ‘top-down’ approach omits the enzymatic
digestion step and analyzes intact protein species instead[17]. Its principal merit is that it retains information aboutthe entire protein (such as co-occurring modifications), butthis advantage comes at the cost of vastly increasedexperimental effort [18].
For an unbiased and comprehensive analysis of theproteome, the cell or tissue lysis method must ensurecomplete solubilization of all proteins contained in thesample. This is particularly challenging with membraneproteins, which demand a detergent-based solubilizationmethod even though detergents are known to interfere with
A: Sample preparation
B: Liquid chromatography - mass spectrometry
C: Spectra interpretation
cells or tissue
HPLC
Full MS MS/MS
peptide m/z, peptide intensitiesstable isotope-pair ratios
b- and y-ion seriesreporter ions, diagnostic peaks
precursorselection,isolation,fragmentation
bottom-upprotein assembly
m/z m/z
ESI
time mass spectrometer
Cycles of full MS followed byMS/MS of the most intense peaks
Full MS top1 top2 ... top n
MS2 MS2 MS2 MS2
proteins peptides
data dependent acquisiton
extractionfractionation*enrichment*
digestionfractionation*enrichment*
FIGURE 1.1 Outline of a typical shotgun proteomics workflow. A: Sample preparation: Proteins extracted from tissues or cells are digested into
peptides using proteases such as trypsin. A fractionation step may be applied at either the protein or peptide level to improve the coverage and dynamic
range. Peptides bearing specific post-translational modifications can be enriched using specialized approaches (see Figure 1.5A). B: Liquid chroma-
tography-mass spectrometry: Peptides are separated by high-performance liquid chromatography (HPLC) and electrosprayed directly into the mass
spectrometer. Peptide ions are measured at high resolution in a data-dependent mode: after each full MS scan, the most intense peptide ions are fragmented
to generate MS/MS spectra. C: Spectra interpretation: The full MS spectra provide information about the peptide mass, intensity, presence of a PTM and
stable isotope pairs. The mass of each fragmented peptide together with its fragment ion pattern is searched against databases for peptide identification and
bottom-up protein assembly.
5Chapter | 1 Proteomic Analysis of Cellular Systems
11
●

1 Introduction
subsequent MS analysis. Furthermore, endoproteinaseswork optimally in a detergent-free environment. The firstMS sample preparation methods successfully employed onbiological samples used detergent-mediated solubilizationfollowed by SDS polyacrylamide gel electrophoresis andin-gel enzymatic digestion of proteins [19]. ‘In-solution’digestion methods employed detergent-free proteinextraction using strong chaotropic agents such as urea, anddigestion of proteins under denaturing conditions. In theearly days of applying MS to protein identification, stainedprotein bands were excised from one-dimensional gelelectrophoresis runs, in-gel digested and analyzed directlyin the mass spectrometer by MALDI or electrospray. Forsamples containing peptides from only one or a fewproteins, the combination of several peptide masses may besufficient for identification. This technique is called ‘massfingerprinting’ and it is still often used in conjunction withtwo-dimensional gel electrophoresis (2D-GE). However,both mass fingerprinting and 2D-GE have serious analyticallimitations in the dynamic range of protein abundances thatthey can handle, as well as many other issues, and they areno longer generally used in proteomics. Today the inherentcomplexity of proteomic samples is being addressed bya combination of fractionation techniques as well as fastand sensitive mass spectrometers, but it remains a majorchallenge when the goal is to define complete proteomes[20]. For these very complex mixtures, electrospray, andnot MALDI, is the ionization method of choice. This isbecause electrospray handles analytes in solution, whichallows it to be coupled directly or ‘on-line’ to liquidchromatography (LC) by applying the spray voltage to theend of the chromatographic column. LC is arguably themost powerful separation technique available for peptides,which can then be analyzed sequentially as they elute fromthe column. Current developments in peptide LC aim atfurther improvements in separation as well as decreasingflow rates and column diameters, which increases sensi-tivity [21].
In addition, a multitude of gel-based and gel-free frac-tionation techniques have been developed that are appliedon either the protein or the peptide level prior to the liquidchromatography step [22e26]. While increasing thenumber of separation steps generally increases the depth ofcoverage of the proteome, it also increases the sampleprocessing and MS-measurement time, as well as require-ments for sample amount. Therefore, proteomics experi-ments should be planned with the minimum number offractionation steps possible. This is especially importantwhen several conditions are to be measured and compared.
Although online coupling of LC with MS via electro-spray is clearly the method of choice for complex proteinmixtures, the MALDI method still offers advantages inspecific situations. For instance, in principle the spatialresolution of the MALDI laser spot makes it possible to
‘image’ analytes in situ, e.g. on tissue slices treated withappropriate MALDI matrices [27, 28].
Once peptides have been transferred into the vacuum ofthe mass spectrometer, their mass-to-charge ratio (m/z) andintensity have to be measured. For unambiguous identifi-cation, it is additionally necessary to fragment each peptidein turn and to record the resulting mass spectrum, a tech-nique called MS/MS, MS2 or tandem mass spectrometry. Inthe data-dependent ‘shotgun’ approach, the most abundantpeptide species eluting from the LC column at a given timeare isolated one at a time and activated in the mass spec-trometer, usually by collisions at low pressure of an inertgas. Peptides mainly dissociate at the amide bonds,generating overlapping series of N-terminal and C-terminalfragments (called b-ions and y-ions, respectively) [29]. Inprinciple, the peptide sequence can be reconstructed ‘denovo’ from a complete fragment ion series. In practice, it ismuch easier to match uninterpreted fragment informationto a comprehensive protein sequence database of theorganism under investigation. There are many differentalgorithms and search engines for this (see sectionComputational Proteomics), but virtually all are based onthe comparison of measured masses with the theoreticalmasses of expected peptides and their fragments.
Determining accurate masses is a key step in thisprocedure, and advances in mass spectrometric technologyin recent years have made significant contributions to theachievable depth of analysis. Key characteristics of a high-performance mass spectrometer are resolution, massaccuracy, speed, sensitivity and dynamic range [30]. Highresolution is the ability to distinguish two peaks of onlyslightly different m/z ratio, while mass accuracy describesthe difference between measured and theoretical mass [31].Sensitivity is the capacity to detect low abundant analyteswhereas dynamic range of an instrument denotes thedifference between the lowest and highest abundant speciesthat are detected. Together, the aforementioned propertiesshould allow a high-performance instrument to performpeptide sequencing at sufficiently high speed to obtainadequate coverage of the complexity of the sample withinthe timeframe of analysis. The Orbitrap mass analyzer isa particularly powerful instrument in proteomics [32e34],but modern TOF-based analyzers are also popular [35,36].
However, even today’s best mass spectrometers aretechnically unable to isolate and sequence all peptidespecies present in an LC-MS run, resulting in extensiveundersampling of the observable peptides [37]. This leadsto a certain degree of stochastic behavior between shotgunruns, which can complicate analysis, especially in systemsbiology applications. In such cases, it is often attractive tomeasure only a subset of peptides e such as those of a fewkey proteins e but to ensure that they are measured in eachof multiple conditions. This requirement has led to so-called targeted approaches, where the mass spectrometer is
6 SECTION | I Components of Biological Systems
12
Publication: Proteomic analysis of cellular systems
fed with a list of predefined peptide species and their cor-responding fragments. It then simply records series oftransitions from precursor to fragment ions; this is referredto as multiple or selected reaction monitoring (SRM orMRM) [38]. Both shotgun and targeted approaches havetheir advantages and drawbacks: the shotgun approach doesnot require prior development of peptide-specific assaysand in principle can measure the entire proteome. There-fore, it is the method of choice for the discovery phase ofproteomic studies. However, it may require extensivemeasurement time and proteins of interest may be missed.In contrast, the targeted approach can be performed rapidlyand in principle without pre-fractionation, but is necessarilybiased in the sense that only predefined peptides aremeasured.
The most promising approach is probably a hybrid one,which is facilitated by the latest generation of mass spec-trometric hardware: a combination of general shotgunsequencing with targeted sequencing of a list of preselectedcandidates. Another interesting hybrid approach has beencalled SWATH-MS and involves the acquisition of frag-ment data for all precursor masses in consecutive masswindows of 25 m/z units (termed ‘swaths’) across the entiremass scale in rapid succession. When combined with tar-geted data extraction, this enables repeated scanning of thesame fragment ion maps for quantification of proteins orpeptides of interest [39].
Relative or absolute quantification has increasinglybecome the focus of proteomics experiments and haslargely replaced the initial goal of only generating accurateand complete lists of identified proteins [40]. This isa challenging task because mass spectrometry is notinherently quantitative. A number of elegant approacheshave been developed that now make MS the most quanti-tatively accurate protein technology by far; these aresummarized in Box 1.1.
The correct identification and quantification of peptidesby MS/MS sequencing, the assembly of a series of peptidesequences into protein identifications and the integration ofpeptide quantification into protein quantification becomesincreasingly challenging as the complexity of the sampleincreases. It can only be dealt with correctly using rigorousstatistical methods. To this end, a plethora of software toolsand mass spectra search engines have been developed,which are discussed in the next section.
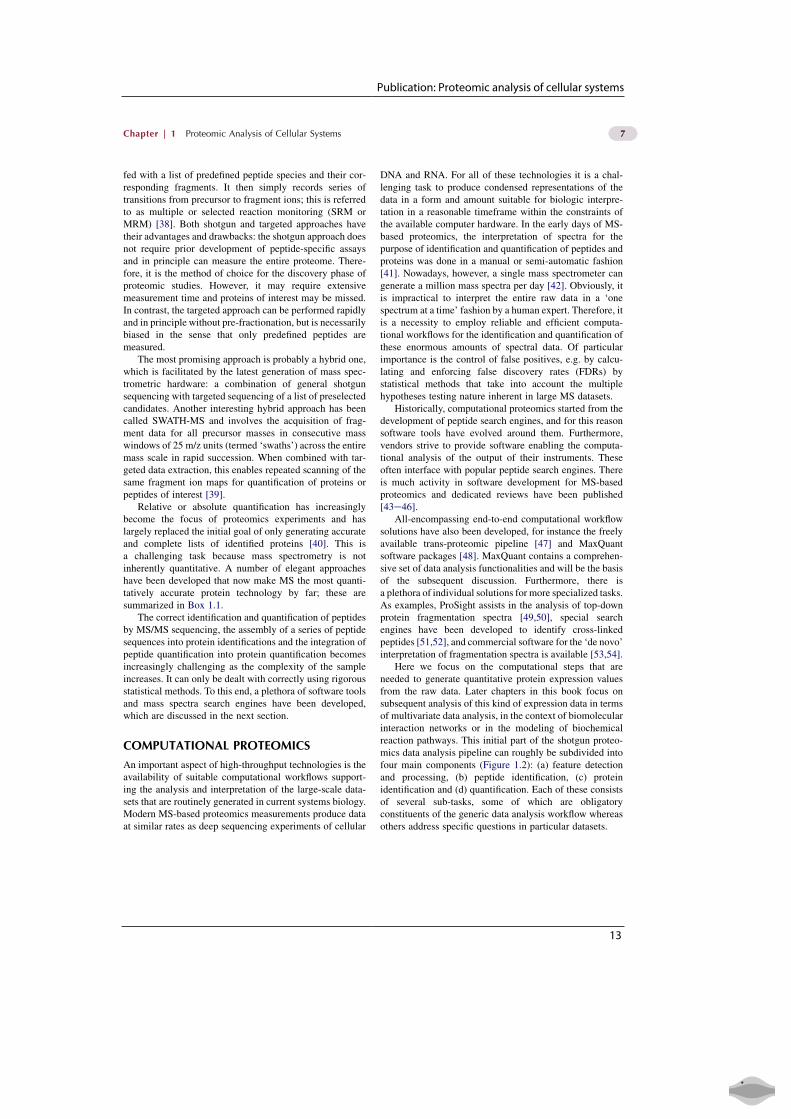
COMPUTATIONAL PROTEOMICS
An important aspect of high-throughput technologies is theavailability of suitable computational workflows support-ing the analysis and interpretation of the large-scale data-sets that are routinely generated in current systems biology.Modern MS-based proteomics measurements produce dataat similar rates as deep sequencing experiments of cellular
DNA and RNA. For all of these technologies it is a chal-lenging task to produce condensed representations of thedata in a form and amount suitable for biologic interpre-tation in a reasonable timeframe within the constraints ofthe available computer hardware. In the early days of MS-based proteomics, the interpretation of spectra for thepurpose of identification and quantification of peptides andproteins was done in a manual or semi-automatic fashion[41]. Nowadays, however, a single mass spectrometer cangenerate a million mass spectra per day [42]. Obviously, itis impractical to interpret the entire raw data in a ‘onespectrum at a time’ fashion by a human expert. Therefore, itis a necessity to employ reliable and efficient computa-tional workflows for the identification and quantification ofthese enormous amounts of spectral data. Of particularimportance is the control of false positives, e.g. by calcu-lating and enforcing false discovery rates (FDRs) bystatistical methods that take into account the multiplehypotheses testing nature inherent in large MS datasets.
Historically, computational proteomics started from thedevelopment of peptide search engines, and for this reasonsoftware tools have evolved around them. Furthermore,vendors strive to provide software enabling the computa-tional analysis of the output of their instruments. Theseoften interface with popular peptide search engines. Thereis much activity in software development for MS-basedproteomics and dedicated reviews have been published[43e46].
All-encompassing end-to-end computational workflowsolutions have also been developed, for instance the freelyavailable trans-proteomic pipeline [47] and MaxQuantsoftware packages [48]. MaxQuant contains a comprehen-sive set of data analysis functionalities and will be the basisof the subsequent discussion. Furthermore, there isa plethora of individual solutions for more specialized tasks.As examples, ProSight assists in the analysis of top-downprotein fragmentation spectra [49,50], special searchengines have been developed to identify cross-linkedpeptides [51,52], and commercial software for the ‘de novo’interpretation of fragmentation spectra is available [53,54].
Here we focus on the computational steps that areneeded to generate quantitative protein expression valuesfrom the raw data. Later chapters in this book focus onsubsequent analysis of this kind of expression data in termsof multivariate data analysis, in the context of biomolecularinteraction networks or in the modeling of biochemicalreaction pathways. This initial part of the shotgun proteo-mics data analysis pipeline can roughly be subdivided intofour main components (Figure 1.2): (a) feature detectionand processing, (b) peptide identification, (c) proteinidentification and (d) quantification. Each of these consistsof several sub-tasks, some of which are obligatoryconstituents of the generic data analysis workflow whereasothers address specific questions in particular datasets.
7Chapter | 1 Proteomic Analysis of Cellular Systems
13
●

1 Introduction
Box 1.1 Quantification in MS-Based Proteomics
Mass spectrometric approaches providing relative and absolute
quantification have been a focus of many recent developments
in the field. MS-based quantification is non-trivial because for
different peptide species there is no proportionality between
their respective amounts and the signal intensities they generate
in the mass spectrometer. This is due to the very diverse
chemicophysical properties of peptides with different
sequences, resulting in widely varying ionization efficiencies.
For chemically identical peptides, however, signal intensity is
proportional to the amount e within the linear range of the
instrumente and this is the basis of all isotope labeling methods
as well as of many label-free quantification approaches. In
addition, it is often assumed that the most readily detected
peptides of each protein have roughly similar ionization effi-
ciencies across all proteins, and that their signal is therefore
a proxy for the protein amount.
Label-free approaches are appealing because they can be
used on any sample and do not require any additional experi-
mental steps. A basic version of label-free quantification is
called spectral counting, and simply compares the number of
times a peptide has been fragmented. Since there is a stochastic
tendency of shotgun proteomics to fragment more abundant
peptides more often, this provides a rough measure of peptide
abundance [180,181]. In a more accurate version of label-free
quantification, the MS signals of each peptide identifying
a protein are added and this protein intensity value is compared
between the different experiments [75]. Ideally, the intensities
of the same peptide species are directly compared across
experiment. Challenges in label-free workflows are day-to-day
variations in instrument performance or slight variations in
sample preparation, which can reduce accuracy. Nevertheless,
they are gaining ground owing to the increasing availability of
high-resolution mass spectrometers and the development of
sophisticated algorithms. They are best suited to cases where at
least several-fold changes in protein or peptide intensities are
expected.
The most accurate methods for quantification by MS make
use of the fact that the MS response of the same compound in
different isotopic states is the same. This principle has been
employed for decades in the small molecule field, where it is
sometimes called isotope dilution MS, and it has also been used
for many years with peptides. In proteomics, the peptide pop-
ulations from two different samples are labeled by the intro-
duction of light or heavy stable isotopes such as 12C vs. 13C and14N vs. 15N, mixed and analyzed together. The mass spec-
trometer easily distinguishes heavy peptides from light peptides
by their mass shift, but since they are chemically equivalent
they behave the same during chromatographic separation and
ionization. The ratio of the heavy and light peak intensities
therefore represents the relative amounts of the corresponding
proteins in the samples to be compared. There are many
different methods of introducing labels, for example metabolic
labeling methods such as SILAC [182], or chemical ones such
as TMT [183], iTRAQ [184] and di-methyl labeling [185,186].
The metabolic methods have the principal advantage that the
two populations to be compared can be mixed at a very early
stage of sample preparation. All variations in sample prepara-
tion are then experienced by both samples equally, leading to
very high quantitative accuracy. Chemical methods are usually
applied at a later stage, by which time quantitative differences
due to separate sample preparation may already be established.
Furthermore, care has to be taken that the chemical labeling
procedure proceed to the same degrees of completeness in the
different samples and that chemical side reactions are
minimized.
Metabolic methods almost always quantify the peptide in
the intact form in the MS spectrum, whereas some of the
chemical methods use differentially isotope labeled fragment
ions (‘reporter ions’) to determine the relative ratios from the
MS/MS spectra. A disadvantage of the latter methods is that, in
complex mixtures, peptides apart from the intended one are co-
fragmented. These also contribute their identical reporter ions,
distorting measured ratios [77].
Targeted approaches (SRM or MRM) are also fragmentation-
based quantification methods but they aim to monitor only
transitions from precursor to sequence-specific fragments.
Several such transitions are monitored in rapid succession for
a single peptide and several peptides can be targeted at any
given elution time. This ensures that the recorded signal is due
to the intended peptide. For quantification, an isotope-labeled,
synthetic peptide standard for each peptide of interest needs to
be introduced. However, since synthesis, purification and
storage of many labeled peptides are resource-intensive, the
label-free transition data is often used for approximate quanti-
fication. In general, MRM-based quantification methods
require extensive method development because the most
sensitive and specific transitions need to be determined for each
peptide separately. There are therefore a number of large-scale
projects to construct such data on a global, organism-wide
scale [187e189].
Apart from relative quantification of two or more proteomes,
it is in many instances necessary to estimate the absolute
amounts of proteins. If a known amount of a synthetic, labeled
peptide is added to the sample, the ratio of the heavy to the light
version of the peptide immediately yields the absolute amount
of the endogenous peptide present (absolute quantification or
‘AQUA’ method [190]). If the extraction and digestion effi-
ciency of the protein in the sample is also known, this further-
more yields the absolute amount of protein in the sample. The
same principle also applies to spiking in known amounts of
proteins, except that this automatically controls for digestion
efficiency, including the tendency of the enzyme to produce
peptides with missed cleavages [191].
Absolute protein amounts can be converted into copy
numbers per cell, an important parameter for modeling.
Evidently, it is impractical to spike in reference peptides or
proteins for an entire proteome. Therefore, in the simplest case,
the MS signals of peptides identifying a given protein are
summed up and divided by the total MS signal of all proteins.
This procedure can be calibrated by the estimated total protein
amount or with the help of reference peptides or proteins for
a select subset of proteins across the dynamic range [2,86,91].
8 SECTION | I Components of Biological Systems
14

Publication: Proteomic analysis of cellular systems
The first group of tasks is concerned with extractingfeatures from the raw data that correspond to peptides in theMS spectra and to peptide fragments in the MS/MS spectra(Figure 1.2A). Depending on the specific details of the MStechnology employed, pre-processing steps may be
required, for instance subtraction of a background level, orsmoothing and filtering of the raw data [43]. Then, peaksare detected, which in LC-MS constitute three-dimensional‘hills’ over the mass-retention time plane. These 3D peaksusually occur in co-eluting isotope patterns that correspond
A: Feature detection
B: Peptide identification
D: Quantification
C: Protein identification
3D peak detection
sequencedatabase
search
non-uniquepeptide
uniquepeptides
score calculation
target-decoy-basedFDR thresholding
peptide to protein mappingFDR thresholding
stable isotope-basedSILAC, dimethyl
label-free
retentiontime
retentiontime
retention timealignment
12C13C
13C2
massrecalibration
Δm/z
m/z
m/z m/z
run #1
run #2
MS/MS reporter ion-basediTRAQ, TMT
inte
nsity
inte
nsity
inte
nsity
compare intensities across runs
de-isotoping
P E P T I D Eb1
y6 y5 y4 y3 y2 y1
b2 b3 b4 b5 b6
FIGURE 1.2 Overview of the main components of the computational workflow of shotgun proteomics. A: Detection and processing of peptide
features in LC-MS runs. B: Identification of peptides based on their characteristic fragmentation patterns. C: Assembly of peptides into proteins. D:
Quantification of peptides and proteins based on stable isotope labeling or by label-free quantification.
9Chapter | 1 Proteomic Analysis of Cellular Systems
15
●

1 Introduction
to peptides with a given charge. For a peptide this patternis mainly due to the natural content of 13C atoms. In the caseof stable-isotope-based quantification methods the peptideexists in different labeling states, such as heavy and lightSILAC partners. These have to be assigned to each otherbased on characteristic mass differences and similarity ofelution profiles.
Often there are systematic errors in the measuredmasses of these peptide features that vary continuouslywith mass and retention time. Algorithms can be applied torecalibrate the mass measurements and thereby removethese systematic errors, resulting in very accurate massmeasurements with solely non-systematic and smallrandom errors remaining [55]. From the standard devia-tions in the mass measurements one can calculate indi-vidual mass tolerances for each peptide, which aid peptideidentification by restricting the possible molecules toelemental compositions that are consistent with the indi-vidual peptide mass tolerance. Similar to this recalibrationof mass measurements, the retention times of peptides canalso be recalibrated. Here the goal is to make the retentiontimes in different LC-MS runs as comparable to each otheras possible using computational means.
The next important computational block is concernedwith the identification of peptides from fragmentationspectra [29,56] (Figure 1.2B). Here one can follow one oftwo approaches: The de novo approach starts with inter-preting mass differences between fragment peaks as aminoacids and tries to build up amino acid sequences, often byrepresenting MS/MS spectra as spectrum graphs [57]. Thiseither results in a de novo sequence of the whole peptide orin a sequence tag within the peptide[58]. In the databasesearch approach one first digests the protein sequences ofan organism in-silico to obtain a list of peptides thata certain protease, typically trypsin, can potentiallygenerate. Peptides are then identified by scoring MS/MSspectra against the sequences from the database, either witha cross-correlation approach as used in SEQUEST[59], orwith a probability-based strategy as used by the Mascot[60] and Andromeda [61] search engines, for instance. Inthe latter case, for each peptideespectrum comparison theprobability is calculated to obtain the observed number ofmatching peaks between the spectrum and the theoreticalfragment series derived from the peptide sequence bychance. The peptide identification rate can be furtherimproved by taking into account peptide properties such assequence length, number of missed cleavages, and others,either with the help of bayesian methods [48,62] or withmachine learning techniques [63]. A false discovery rate(FDR) can be imposed on the peptide identification processby modeling of the score distribution [62] or by the target-decoy approach [64]. Statistical techniques controlling theFDR [65] are superior to simple ad hoc methods, such asusing a fixed score cutoff, since they properly take into
account multiple hypothesis testing and incorporate prop-erties of the search space. Peptide identifications can betransferred between LC-MS runs based on highly accuratemass measurements and optimally aligned retention-timevalues. We recently developed a method for determining anFDR for this procedure [66]. Post-translational modifica-tions of proteins can be identified by incorporating theminto the database search in the form of variable modifica-tions. In principle, scoring is similar to the scoring ofunmodified peptides. However, the search space mayincrease dramatically, especially when considering severalmodifications at once. Additionally, the specific amino acidthat has been modified needs to be pinpointed. This posi-tioning of the identified modifications can be carried out inseveral ways, which usually provide scores that reflect thecertainty of the localization [67e71]. A larger class ofmodifications can be detected with peptide sequence tags[58], the error-tolerant search in Mascot [72], or with thecompletely unbiased dependent peptide search [73], whichdoes, however, require the unmodified peptide to have beenfragmented and identified as well. Finally, in order tovalidate the identification of peptides or proteins ofparticular interest it is useful to visualize and export theirfragmentation spectra. At this stage extensive peak anno-tation, including peaks resulting from neutral losses andoriginating from other peptide chemistry reactions, can alsobe provided.
Once peptides and their modifications are identifiedthey need to be assigned to proteins, a non-trivial task thathas been termed the ‘protein inference problem’(Figure 1.2C) [74]. The basic challenge is that a peptidemay occur in several proteins. The reason might be thatthese proteins result from alternative splicing and thereforeshare common exons, or that the proteins originate fromdistinct genomic locations that encode homologous geneswith very high sequence identity. A pragmatic approach tothe protein redundancy problem is to assemble proteins intogroups of non-distinguishable members based on the sets ofidentified peptides either being identical between thesemembers or containing each other. Additionally, one canmap peptides to the protein coding regions of knowntranscripts and investigate whether unknown splice variantscan be detected by identifying peptides that span new splicejunctions.
Most proteomics datasets that are generated withcurrent equipment are sufficiently large that one needs totake care of the FDR on the protein level as well as thepeptide level. Approaches that have only a peptide-basedcontrol of false identifications, even if it is quite stringent,will accumulate false positive protein identifications ifsufficiently large amounts of data are measured, and shouldtherefore be used with caution.
After peptides and proteins are identified, the absoluteor relative amounts of proteins in different samples usually
10 SECTION | I Components of Biological Systems
16

Publication: Proteomic analysis of cellular systems
need to be calculated, which requires quantification of theidentified peptides (Box 1.1 and Figure 1.2D). In stableisotope labeling approaches that produce pairs or highermultiples of peptide isotope patterns in the MS spectra, onecan use algorithms that provide very precise estimates ofpeptide abundance ratios. In MaxQuant this is done bycomparing the full elution profiles and isotope patterns ofthe labeled partners. Once peptide ratios are calculated theyneed to be combined in appropriate ways to obtain proteinratios. In isobaric labeling techniques the relative peptideabundances are read out at specific mass values in the MS/MS spectra [75]. Here special attention needs to be devotedto the distortion of the signal by co-fragmented peptidesand to filtering the peptides accordingly for quantification[76e78]. Finally, samples can be measured withoutisotopic labeling, which is referred to as ‘label-free quan-tification’. In this case optimal alignment of the runs shouldbe performed, and further normalization steps should beincluded to make peptide signals from different LC-MSruns comparable to each other. This is computationallychallenging, in particular if the samples are each pre-frac-tionated into several LC-MS runs.
In addition to the basic workflow described so far,which provides quantitative protein expression data,several additional downstream computational tasks need tobe performed. Fortunately, once the proteomic expressiondata matrix has been obtained, many statistical andcomputational methods that were developed for microarraydata analysis can be re-used for proteomics. For instance,clustering, principal component analysis, tests for differ-ential regulation, time series, pathway and ontologyenrichment analysis and many other methods can beapplied just as well to proteomics data. The Perseus moduleof MaxQuant assembles these capabilities into a single,user-friendly platform for high-resolution proteomic data.Modeling in systems biology has so far relied on eithermRNA levels as proxies for protein expression or on small-scale protein data that monitored only a few differentmolecular species. In the future, modeling will surelybenefit from the increasing availability of large-scale andprecise proteomics data.
DEEP EXPRESSION PROTEOMICS
One of the limitations of proteomics so far has been itsinability to probe the proteome in great depth. Over the lastfew decades, 2D gel electrophoresis, for instance, hasproduced gels that visualized hundreds or thousands ofspots. Upon identification, however, they generally provedto derive from a very small number of highly expressedgenes. The difficulties in exploring the proteome in depthare mostly related to the ‘dynamic range problem’, that is,the difficulty of measuring extremely low abundanceproteins in the presence of very high abundant ones. Until
a few years ago many thought that this problem would beunsolvable even in principle [79]. Fortunately, it has nowbecome clear that the dramatic improvements in the pro-teomic workflow do indeed allow complete characteriza-tion of proteomes.
Like its genome, the proteome of the yeast modelsystem was the first to be completely analyzed [2]. Haploidand diploid yeasts were SILAC-labeled, mixed andmeasured together. With a combination of differentapproaches, 4400 yeast proteins were identified with 99%confidence, a larger number than detected either bygenome-wide TAP (tandem affinity purification) tagging orGFP (green fluorescent protein) tagging of all yeast openreading frames [11,80]. The most regulated genes belongedto the yeast mating pathway, most of which are expressed atvery low levels and are only functionally relevant inhaploid yeast. However, not all members of this pathwaywere differentially regulated, immediately highlighting thatthey must have additional roles in other cellular processes.The total dynamic range of the yeast proteome under thesebasal conditions turned out to be between 104 and 105.
A targeted analysis of the yeast proteome likewiseidentified proteins across its entire dynamic range [81].SRM assays were developed on triple quadrupole instru-ments for members of the glycolysis pathway, andexpression changes upon metabolic shifts were measuredacross multiple time points in relatively short LC-MS runs.
Recently, our group has proposed ‘single-shot proteo-mics’ as a complement to the shotgun and targetedapproaches: single-shot proteomics simply means theanalysis of as much of the proteome as possible by a singleLC MS/MS run [82]. Its attractions are that sampleconsumption and measurement times are very low, whilestill preserving the large-scale, unbiased and systemsbiology character of the measurement. Employing recentadvances in chromatography, mass spectrometry and bio-informatics, the yeast proteome can now be coveredalmost completely in this mode. This was illustrated byinvestigating the heat-shock response of the yeast pro-teome in quadruplicate measurements with nearlycomplete coverage and with about a day of totalmeasurement time [83].
The human proteome is more complex than the yeastproteome (Figure 1.3A), but until very recently it wasunknown how many different proteins a single cell lineactually expresses. Using deep shotgun proteomicsapproaches two different human cancer cell lines haverecently been investigated in depth by MS-based proteomics[3,5]. Both studies found that such cell lines contain at least10 000 different proteins. Saturation analysis [5] orcomparison to deep RNA-seq data [3] suggested that thisnumber is not very far from the total number of expressedproteins with functional roles in these cells. A subsequentstudy of 11 commonly used cell lines also identified
11Chapter | 1 Proteomic Analysis of Cellular Systems
17
●

1 Introduction
>10000 proteins each [84]. Although none of the abovestudies employed accurate quantification strategies, thesummed and normalized peptide intensities neverthelessallow important insights into the proteome of cancer celllines. One such conclusion from the 11 cell lines study, andan earlier study that also used deep transcriptomesequencing and large-scale imaging with an antibodycollection [85], was that cellular proteomes are remarkablysimilar in terms of the identity of their expressed proteins.The expression levels even of household proteins, however,often vary quite significantly across different cell lines [84].The dynamic range of protein expression was larger thanthat of the yeast proteome and was estimated to be more than106 (Figure 1.3B), but at the same time, about 90% of theproteome lies within a 60-fold expression range compared tothe median level in the HeLa proteome [84]. Rather thanbeing estimated indirectly from total proteome measure-ments, copy numbers have also been measured by moredirect methods in microorganisms [86] or in human celllines [87]. In the latter study, copy numbers for 40 proteinswere determined in HeLa cells and ranged from 20� 106 forthe cytoskeletal protein vimentin to 6000 copies for thetranscription factor FOS. Such data can now be generatedquite accurately and readily, and should greatly assist inestimating parameters for systems biologic models.
Although proteomics is still in the process ofapproaching comprehensiveness, by its nature it can answermany questions that are outside of the scope of transcript-based gene expression studies. The reason for this is thatthe proteome integrates the effects of post-transcriptionalregulation as well as regulation by targeted protein degra-dation. As an example, two studies have used proteomics todelineate the effects of micro-RNAs on expression levels of
their targets [88,89]. These studies concluded that theseeffects were relatively small and dispersed to manysubstrates for each different micro-RNA.
The availability of deep and accurate proteome dataalso sheds new light on the longstanding question of theextent of correlation of transcript levels with the corre-sponding protein levels. Many early studies had found verypoor correlation between levels of mRNA and protein.However, this seems to have been caused in large part bythe relatively primitive state of the art of transcriptomics,and especially proteomics, at the time. The technicalimperfections of the two technologies frequently led toincorrectly measured protein or transcript levels; however,because they are independent of each other, this suggestedartificially low correlation of message and protein levels.Recent studies have revealed higher correlation coefficientsfor steady-state levels, generally in the range of 0.6. Thecorrelation of mRNA changes with protein changes is evenhigher [85,90]. This level of correlation is biologicallyplausible, given the flow of genetic information frommRNA to protein. Nevertheless, even when there is goodcorrelation, the level of protein change cannot easily bepredicted from the level of transcript change. Interestingly,a recent cell line-based study has shown that the discrep-ancies between message and protein levels can mostly beexplained by differences in mRNA translation rates [91].However, these translation rates are themselves subject toregulation, which cannot easily be measured withoutdetermining protein levels and protein turnover.
More fundamentally, a major potential of proteomics isthat it can measure the protein expression levels as a func-tion of subcellular compartment, as well as the redistribu-tion of the proteome between compartments as a function
proteins expressedin one growth
conditionproteins span >6 orders ofmagnitude in abundance
the first 40 proteinscontribute 25% ofthe protein mass
90% of all proteinsoccur 60-fold
around the mediancopy number
mass fraction
median = 18,000
protein rank (%)0
93.8% 5% 1% 0.2%
25 50 75 100
log(
copy
num
bers
)
numberof genes
proteinsexpressedin one cell type
~4,500
~12,000
6,000
20,300
S. cerevisiae
H. sapiens
A: Genome and proteome sizes B: Properties of the human proteome
FIGURE 1.3 Properties of complete proteomes. A: Comparison of genome and proteome sizes in yeast and human. With increasing complexity of
the organism, a smaller fraction of the genome appears to be expressed in individual cells. B: The human cell line proteome spans more than six orders of
magnitude in the abundance of individual proteins. However, 90% of all proteins occur within 60-fold above or below the median copy number.
12 SECTION | I Components of Biological Systems
18

Publication: Proteomic analysis of cellular systems
of stimulus [92e94]. Given increasing coverage of theproteome, even the isoform specific regulation of the pro-teome can be investigated [95].
INTERACTION PROTEOMICS
Specific interactions of proteins with other proteins, withnucleic acids, lipids, carbohydrates, and metabolites orother small molecules, orchestrate all aspects of life at themolecular level. The dissection of molecular assemblieshas been a longstanding goal of modern biology, whichrequires identification of the constituent partners as the firststep. This is a field at which MS-based proteomics hasexcelled from its early days. The ultimate goal is thedelineation of the ‘interactome’, which is defined as thesum of all molecular interactions of a biological system.The size of the interactome of a given organism is a matterof debate and of how the definition is interpreted, but it isundoubtedly far more complex than the genome or pro-teome; current interactome datasets likely merely scratchits surface [96].
Mass spectrometry has the unique ability to identifyvery small amounts of any protein without prior knowl-edge, and in principle it can therefore directly unravel theprotein composition of any molecular assembly. Alterna-tive methods of unbiased interaction detection, such asphage display [97] or the yeast two hybrid assay (Y2H)[98], use genetic readouts that test for direct binding but donot involve the formation of actual multi-proteincomplexes. All approaches in MS-based interaction pro-teomics are based on the assumption that a molecularinteraction is the result of an affinity that can be exploitedto purify or enrich the assembly from a crude mixture.Typically, one molecule serves as the ‘bait’ which iscoupled to an affinity matrix. This can be done via anantibody or a genetically encoded tag in the case of proteinsor via chemical synthesis in the case of peptides, nucleicacids or small molecules. Mass spectrometry is then used toidentify the ‘prey’ proteins that interact with the bait. Thisworkflow is known as affinity purification followed bymass spectrometry (AP-MS) (Figure 1.4A).
The first application of this methodology was theidentification of the members of protein complexes [99],classically defined as entities that can be purified bio-chemically. This was fuelled by the development of thetandem affinity purification (TAP) tag, which resulted inclean preparations of protein complexes from endogenoussources by two consecutive purification steps [99,100].This technology was mostly used for the generation of thefirst large-scale AP-MS interaction datasets of modelorganisms such as the budding yeast [101e104].
These datasets allowed the first comparisons of AP-MSdata with each other and with previously available large-scale Y2H datasets [105,106]. The overlap turned out to be
surprisingly low, pointing to technical limitations of theindividual approaches and emphasizing that, despite beinglarge-scale, all datasets were non-saturating, samplingdifferent parts of a vast interactome [107]. In addition, italso emphasizes the fundamentally different, but highlycomplementary nature of AP-MS and Y2H [108]: Y2Hdata consist of binary combinations of proteins with mutualaffinity, including weak interactions, which can be recordedas long as they lead to activation in the genetic readout. Incontrast, AP-MS data provide lists of proteins that co-occurin protein complexes e including indirect binders e butprovide no direct topological information. Comparison ofdata from both sources therefore requires the conversion ofco-complex members into binary contacts, which can bedone using different models [107].
Weak or transient interactors tend to be under-repre-sented in AP-MS datasets because they easily get lostduring washing steps in the sample preparation workflow.These washing steps are necessary to reduce the number ofproteins that bind non-specifically to the affinity matrix.Unspecific interactors have been the bane of interactionproteomics and were originally dealt with by extensiveblacklisting of proteins that were identified across manydifferent affinity purifications. However, this is a less-than-ideal solution as it inevitably leads to lower true positiverates while also failing to remove many false positives.
Virtually all of these drawbacks have been overcome bythe advent of quantitative proteomics: specific interactorscan easily be distinguished from unspecific backgroundbinders by directly comparing their quantities in affinitypurifications vs. controls [109,110]. This paved the way forsecond-generation quantitative interaction proteomicstudies (Figure 1.4A). Isotopic labeling techniques allowedthe detection of interactions in the presence of highamounts of background binders, and of molecular assem-blies which could not be purified extensively. Importantly,this principle is applicable to any conceivable bait moleculethat can be immobilized on the affinity matrix. For instance,early highlights include the identification of proteins thatinteract with specific post-translational modifications rep-resented as modified, synthetic peptides [111,112]. Suchassays can be streamlined and used to probe the biologicalrelevance of large-scale PTM datasets. For instance,synthetic peptides corresponding to phosphotyrosine siteswith potential key functions as molecular switches havebeen synthesized and their cellular interaction partnershave been determined [113,114].
In a similar fashion, oligonucleotides can be immobi-lized to identify proteins binding to specific DNA [115] orRNA sequences [116]. In this way, quantitative interactionproteomics identified the transcriptional repressor respon-sible for the difference between a fat and a lean pig geno-type, which is caused by a single nucleotide mutation[117,118].
13Chapter | 1 Proteomic Analysis of Cellular Systems
19
●

1 Introduction
‘Chemical proteomics’ approaches make use ofimmobilized small molecule inhibitors to capture andidentify their cellular binding proteins [119]. Although thisconstitutes a powerful and generic approach, synthesizinga suitable, immobilizable derivative of an individual smallmolecule of interest can be challenging and in some casesimpossible. Alternatively, broadly selective inhibitors canbe used for affinity-capture of a target protein class. Thishas been successfully applied for profiling inhibitors tar-geting kinases [120,121] and more recently histonedeacetylases [122]. Inhibitor affinity towards its bindingpartners can be measured by quantitative, dose-dependentassays by monitoring the binding response to differentconcentrations of the free molecule. Quantitative drug
affinity purification experiments thereby provide a concep-tual framework for identifying the protein targets thatmediate drug responsiveness and those that potentiallycause side effects. Proteome-wide determination of drugtargets may also reveal alternate therapeutic uses.
Quantitative MS-based approaches furthermore enableresearchers to determine the proteomes of subcellularstructures or organelles, which can only be enriched froma whole-cell preparation, but not be purified biochemically[123,124]. One principle is to profile proteins alonggradients or across different enrichment steps and to clas-sify them by correlation to known marker proteins. Thisapproache termed protein correlation profilingewas usedto assign proteins to their respective compartments [125],
A: Affinity purification – mass spectrometry workflow
B: Interaction topology C: Interaction networks
IP
AB
chemicalcrosslinker
digestion
identifycross-linkedpeptides
extract interactorsfrom large-scaleAP-MS dataset
constructinteractionnetwork
buildtopologicalmodel
Abaits
prey
s A
AB
C D
E
BC
D
E
B C D E
control IP
quantitativemass spectormetry
specific interactors
background binders
-log
p va
lue
ratio0
AB
tagbait
bait
Inter-actor
Inter-actor
back-ground
back-ground
FIGURE 1.4 Interaction proteomics. A: Generic scheme of the affinity purificationemass spectrometry workflow. Quantitative comparison of the
amounts of proteins in affinity purifications vs. control purifications distinguishes specific interactors from background binders. B: Protein complexes
treated with chemical cross-linkers. The identification of cross-linked peptides yields spatial restraints that can be used to infer the topology of interactions
and to map binding sites. C: Construction of interaction networks from large-scale AP-MS datasets.
14 SECTION | I Components of Biological Systems
20
Publication: Proteomic analysis of cellular systems
and even substructures of organelles, such as the contactsites between outer and inner mitochondrial membranes,can be distinguished [126]. Another study integrated suchdata with other MS-based datasets to comprehensivelyidentify chromosome-associated proteins across differentphases of the cell cycle [127].
For systems biological applications it is attractive togenerate datasets of sufficient size to capture a reasonablylarge part of the interactome. Because isotopic labeling,which helps to ensure accurate quantitative data, is morechallenging to perform at a very large scale, recent high-throughput proteineprotein interaction datasets mostlyemployed simple label-free quantification methods, such ascounting the number of times peptides belonging toa certain protein have been sequenced as a proxy for itsabundance (see Box 1.1). Based on this technology, largescale proteineprotein interaction datasets of human[128,129] and Drosophila [130] have been published.Today, high-resolution MS data are routinely available andcan be analyzed with very sophisticated label-free quanti-fication algorithms. As a result, datasets with much highertrue positive and lower false negative rates should becomeavailable for systems biological modeling.
Beyond the goal of accurate and comprehensivemapping of the interactome into lists of proteins associatedin complexes, the next challenge is to provide additionalfunctionally relevant information such as topology andstoichiometry. One future direction involves the use ofchemical cross-linkers in combination with bioinformaticalgorithms to help deduce the three-dimensional architec-ture of protein complexes [131,132] (Figure 1.4B). Thistechnology is still under development and currently limitedto purified complexes, but it has the potential to beextended towards more complex samples, ultimatelyoffering the vision of ‘the interactome in a single experi-ment’. MS-based interaction proteomics is also uniquelysuited to measuring the dynamics of protein interactions inresponse to stimuli. Such effects range from subtle modu-lations of the interaction network, e.g. in the case ofautophagy-related proteins when that process was triggered[133], or the changing composition of Wnt signalingcomplexes [134], to extensive disruption of complexes, e.g.of the Bcr-Abl kinase complex after drug treatment [135].
Accurate quantification is paramount when it comes todynamic interactions, and various groups have addressedthis with isotope-labeled reference peptides and absolutequantification, which also allows estimation of the stoi-chiometries of interacting proteins [136,137]. The ultimatechallenge in interaction proteomics is to achieve highthroughput and coverage while maintaining very highquality standards. With the proteomics methods evolvingand quantification being increasingly accurate, the biolog-ical samples from which the interactions are determinedshould also represent the in vivo situation in the best
possible way. For proteineprotein interaction data, onecritical parameter is the expression level of the bait protein.Ideally, this should be adjusted to near-physiologic levels toavoid aberrant localization and to ensure that bona fideinteraction partners are present in appropriate amountscompared to the bait [138]. This can be achieved by taggingthe endogenous locus encoding the bait, which is straight-forward in lower organisms such as yeasts, but much morecomplicated in human cell lines. A recent method based onbacterial artificial chromosome (BAC) transgenes allevi-ates these limitations and allows the expression of GFP-tagged proteins under fully endogenous gene regulatorycontrol [139]. In addition to providing a subcellular local-ization tool via the fluorescent tag, this method can easilybe combined with quantitative interaction analysis, forexample to allow the splice isoform-specific interactionpartners of a bait protein to be identified [140]. BACeGFPinteraction data have also been combined with phenotypicdata from RNA interference screens to place genesinvolved in mitosis into the context of protein complexes[141]. This study showed how physical interactions derivedfrom proteomics integrate beautifully with other omicsdata, providing functional relationships of genes orproteins. Consolidating physical with functional interactiondata will ultimately allow the placing of proteins intocomplexes and arranging complexes into dynamic path-ways and networks.
In this way ever-growing large-scale datasets willbecome increasingly useful for biologists and systemsbiologists alike (Figure 1.4C). Systems biologists willbetter understand the intricate interplay of molecules insidethe cell, while biologists will find new interaction partnersof their protein of interest, and they will be able to placespecific genes into pathways, helping to explain observedphenotypes.
However, the complete characterization of a mamma-lian proteineprotein interactome and its integration withother omics data of the same scale is a vision of the futureand is just coming into reach for the most primitiveorganisms [142e144].
LARGE-SCALE DETERMINATION OF POST-TRANSLATIONAL MODIFICATIONS
Post-translational modifications (PTMs) of proteins area key regulatory mechanism in signal transmission thatcontrols nearly all aspects of cellular function. Tradition-ally, signaling processes are perceived as discrete linearpathways that transduce external signals via the post-translational modification of a few key sites. For example,a specific phosphorylation event might regulate the func-tion of a crucial pathway. These pathways have typicallybeen studied in the conventional, reductionist manner, with
15Chapter | 1 Proteomic Analysis of Cellular Systems
21
●

1 Introduction
researchers focusing on the characterization of individualcomponents and causal interactions in an individualcascade. However, this biochemical simplicity as usuallyvisualized fails to account for the systems properties thatare an inherent part of any pathway. It has becomeincreasingly clear that the specificity of signaleresponseevents, for example for individual receptor pathways, doesnot rely on a single protein or gene that is responsible forsignaling specificity. Instead, it has been shown that path-ways are extensively connected and embedded in signaling‘networks’ rather than ‘linear pathways’ [145]. Therefore,the analysis of complex networks as large functionalensembles may be necessary to infer their behavior. Engi-neering techniques such as control theory, which weredeveloped to analyze self-regulating technological systems,have become popular for describing complex and dynamiccellular control mechanisms. Among these, a key mecha-nism is the regulation of the expression levels of proteinsthrough the gene expression program. However, cells alsoextensively use PTMs, which constitute an important classof molecular switches, for signal propagation to control theactivity, structure, localization and interactions of proteins.Often a signal to the cell will initially lead to a cascade ofPTM changes, which can happen very rapidly, and later toa change in the expression of a specific set of proteins. Thespecificity as well as the robustness of biological controlmechanisms is largely determined by a combinatorialsystem of regulated post-translational modifications, theresulting proteineprotein interactions, and protein expres-sion of downstream signaling components along thetemporal and spatial axes. An example illustrating thespecificity of PTM-induced cell decisions is the classic caseof stimulation of ERK activity in PC12 cells: when theseneuronal cells are stimulated for a short time they prolif-erate, whereas a longer-term activation of the samepathway leads to their differentiation [146].
As a first step towards understanding the over-whelmingly complex circuitry of signaling networks, thePTMs should be identified and quantified in an unbiasedand global manner (Figure 1.5). For this purpose, modernquantitative mass spectrometry has proved an ideal plat-form because it is a highly precise yet generic method fordetecting PTMs: MS directly measures the presence ofa PTM by a defined corresponding shift in the mass of themodified peptide. MS-based mapping and quantification ofPTMs is set to revolutionize signaling research and isalready providing large-scale information on the extent anddiversity of different PTMs in the expressed proteome andtheir regulation in response to perturbations [147]. To date,about 300 different types of protein modifications havebeen reported to occur physiologically, and yet more arebeing discovered [148]. However, just a few PTMs haveaccounted for the majority of classic and MS-basedinvestigations. Representative examples include
phosphorylation [67,149,150], lysine acetylation [151,152],glycosylation [153,154], ubiquitylation [155e158] andmethylation [159]. Remarkably, these reports oftenexpanded the known universe of the PTM under investiga-tion 10e100-fold compared to the previous non-MS-basedstate [147].
Despite this impressive progress in MS-based PTMproteomics, exhaustive mapping of protein modifications ischallenging for a number of reasons: (i) modified peptidesare present in sub-stoichiometric amounts in complexmixtures; (ii) the peptides carrying certain PTMs displaymore complicated MS/MS fragmentation patterns that canbe difficult to interpret; (iii) the effective database searchspace explodes when the search program is allowed toconsider potential PTMs at each modifiable amino acidresidue; and (iv) in addition to identifying the modifiedpeptide, the PTM needs to be placed with single amino acidaccuracy in the sequence.
To address the sub-stoichiometric amounts of PTMs,much effort has been put into improving pre-fractionationand specific enrichment of PTM-carrying peptides. In thisway, more input material is used, leading to higher amountsof modified peptides and improving their mass-spectro-metric analysis. At the same time the sample complexity isreduced, facilitating proteome-wide mapping of modifica-tions [160] (Figure 1.5A). These methods can be evaluatedby the enrichment factor with respect to the starting peptidemixture, or the enrichment efficiency, which refers to thefraction of modified peptides in the enriched population.For phosphorylation, strong cation exchange chromatog-raphy or metal affinity complexation allow up to 100-foldenrichment and often close to 100% efficiency of phos-phopeptide enrichment [161]. At the other extreme, meth-ylated peptides are only enriched a few fold, andenrichment efficiency is about 5% using antibodies directedtowards Lys-acetylated peptides. Analysis of methylation,acetylation and many others has lagged behind those PTMsfor which very specific tools have been available. Illus-trating the importance of such reagents, the recent devel-opment of a monoclonal antibody to profile lysineubiquitylation has dramatically boosted our knowledgeabout the extent of this PTM [156e158]. This antibodyrecognizes peptides containing lysine residues modified bydiglycine, a ubiquitin remnant at the modification site aftertrypsin digestion of the sample.
Confident localization of the PTM on modified peptidesrequires the presence of the relevant fragment ions in theMS/MS spectra. Usually, as mentioned above, algorithmsfor the analysis of modified peptides provide a PTMlocalization score, which indicates how much confidenceshould be placed in the site assignment (Figure 1.5B).Because of the technical challenges in mapping PTMs theyare particularly prone to being undersampled, i.e., to bemissing in certain runs, thereby leading to incomplete
16 SECTION | I Components of Biological Systems
22

Publication: Proteomic analysis of cellular systems
datasets. In principle, this can be addressed by targetedmethods in which the mass spectrometer is directed toacquire data for a particular set of modified peptides [162].
Quantification of PTM sites is achieved in the sameways as for non-modified peptides. However, this becomesmore complicated when a single peptide has multiplemodification sites. By employing quantification at differenttime points, kinetic maps of PTM-site dynamics inresponse to various perturbations can be obtained[67,163,164]. PTM-level information can be combinedwith information on protein levels, as we have recentlyshown in a combined phosphoproteomic and proteomicanalysis of the cell cycle [67]. However, when measuring
early signaling changes, for example downstream ofreceptor tyrosine kinase activation, one usually assumesthat proteomic changes will be minimal and that observedquantitative changes in phosphopeptides can directly beattributed to changes at the modification site level.Furthermore, it may be desirable in a systems biologycontext to quantify not only the relative change of a modi-fication site but also the fraction of the protein that ismodified at this site (Figure 1.5C). First reports of the large-scale determination of phosphorylation stoichiometry haverecently appeared [165,166]. Thus, with ever improvingtechnology, proteomics can now deliver key parameterson PTMs that are important for cellular modeling, such
T Eb1
y9
Hb2
y8
Eb3
y7
Pb4
y6
Eb5
y5
Pb6
y4
Tb7
y3
Ib8
y2
Db9
y1
T EH E P E P T I D
T EH E P E P T I D
digestion
stimulus
alteredPTM level
mAB
antibody-basedp-Tyr, ac-Lys, diGly-Lys
ionic interactionphospho-peptides
TiO2
affinity ligandglyco-peptides
OP
lectin
enrichment ofPTM-bearing
peptides
O O–
peptide massincreased bymass of the PTM
fraction of the proteinmodified at a given site
modifiedpeptide
unmodifiedpeptideprotein
occupancy · ratio(
+ (1 – occupancy) · ratio(
= ratio(
)/
/ )
/ )
mass of somefragmentsshifted by Δm
localizationscore
ΔmΔm
Δm
A: PTM enrichment
B: PTM identification and localization C: PTM site occupancy
FIGURE 1.5 Analysis of post-translational modifications by MS. A: PTM enrichment: Substoichiometric PTM-bearing proteins or peptides are
enriched using various strategies, including PTM-directed antibodies, metal ion complexation and affinity ligands. B: PTM identification and locali-
zation: MS directly measures the presence of a PTM by a defined corresponding shift in mass of the peptide and PTM location within the peptide is
obtained by the MS/MS pattern with single amino acid resolution. C: PTM site occupancy represents the fraction of a protein that is modified at a given
PTM site. Site occupancies can be calculated if one can quantify changing amounts of a modified peptide, the corresponding unmodified peptide and the
entire protein in a perturbed system.
17Chapter | 1 Proteomic Analysis of Cellular Systems
23
●

1 Introduction
as PTM site occupancy together with kinetics uponperturbation.
Even after correctly and comprehensively measuringthe phosphorylation changes upon cellular perturbation, thequestion remains which kinase or kinases are responsiblefor a given phosphorylation site. A variety of combinationsof quantitative phosphoproteomics and chemical geneticsapproaches can answer this question by identifying directkinase substrates. For instance, this can involve controlledinhibition of a genetically engineered cellular kinase bya small molecule [167]. In an alternative approach, phos-phorylation patterns in 124 kinase and phosphatase yeastdeletion strains have been measured to globally extractkinaseesubstrate relationships [168]. To understand thecircuitry that underpins cellular information flow, thechanges in PTM dynamics can additionally be overlaidwith direct proteineprotein interaction datasets such asthose of kinases and phosphatases from yeast [169].Clearly, it would also be important to understand how thedynamic kinaseesubstrate interactions vary under differentgrowth and stress conditions.
From a cellular control perspective, a significantincrease in information content can be achieved if manyproteins are multiply modified, especially if these PTMsacted combinatorially. In fact, it has become increasinglyclear that a number of cellular processes are regulated byPTM cross-talk, as exemplified by phosphorylation andubiquitylation [170]. Another example is the intimateinterplay of different histone modification marks in thehistone code, which represents one of the most importantepigenetic regulatory mechanisms governing the structureand function of the genome [171]. To understand such PTMcross-talk codes that mediate cellular control, MS-basedproteomics is an excellent large-scale method. However,owing to the fact that correlating PTMs may occur on
different peptides, specialized MS strategies may have to beused, such as top-down proteomics [172,173].
As described above, MS-based PTM analysis isuncovering an unexpectedly large extent and diversity ofPTMs that occur on multiple but specific residues on mostproteins. These large-scale PTM studies now serve as aninformation-rich resource to the community. For example,biological researchers can focus on regulatory PTM sites inhigh-quality MS data for their proteins or processes ofinterest. The data can also be used to investigate basiccharacteristics of particular PTMs, such as their evolu-tionary conservation [154,174,175] and preferential local-ization across secondary structures of proteins [154,176].
In addition, in vivo maps of many PTMs are beginningto emerge [150,157,177,178] and a first example of large-scale PTM quantification in a mouse organ after perturba-tion has been described [179]. This is now unlocking theopportunity to study PTM dynamics in tissues to charac-terize the physiological or pathological responses ofdifferent organs in mammals. With their key roles incellular control, MS-enabled PTM signatures also holdgreat potential as prognostic and therapeutic biomarkers.
OUTLOOK AND FUTURE CHALLENGES
As detailed in this chapter, MS-based proteomics isa technology-driven discipline that has made tremendousprogress during recent years. These advances affect theentire proteomics workflow, starting with sample prepara-tion and ending with computational proteomics. The adventof high-resolution high-accuracy MS data, combined withsophisticated quantification strategies, has been especiallyimportant in obtaining biologically relevant informationfrom MS-based proteomics. This technology has nowclearly become the method of choice for studying
A: Genomics B: Transcriptomics C: Proteomics
gene regulation
replication transcription transcription
splicingtranslation
proteins
transcriptomesin time
ncRNAs
genes
translational modification
epigeneticsgene
products
many genomesin parallel
#1 #2 #3 #4
post-
proteinlocalization
protein turnover
protein interaction
proteomes in time and spaceprotein interactionpost-translational modificationprotein localization, dynamics and turnover
signaltransduction
FIGURE 1.6 Unique contribution of different ‘omics’ technologies to systems biology. A: Genomics investigates the sequences of genomes and
their epigenetic marks for many genomes in parallel, but does not provide direct information about the fate of the gene products. B: Transcriptomics
measures the gene expression program and allows the comparison of changes of gene expression in different cellular states or over time. C: Proteomics
strives to provide a complete picture of all proteins, the primary agents of cellular processes. Proteins can be monitored over time and with sub-cellular
resolution along with their post-translational modifications, interactions and turnover.
18 SECTION | I Components of Biological Systems
24
Publication: Proteomic analysis of cellular systems
endogenous proteins, either at a small scale involving oneor a few different proteins or involving entire cellularproteomes. It provides a crucial layer of information on theproteins that previously had to be inferred indirectly fromother measurements, or was absent altogether.
Given the increasingly mature proteomics toolbox, anever larger set of cell biological and biomedical problemscan now be tackled. For instance, we expect many morereports of essentially complete proteome measurements, aswell as highly accurate comparative transcriptome andproteome studies. It will be interesting to see whether MS-based proteomics can make inroads into the clinical area,for instance in classifying cancer patients by their proteinexpression patterns.
Despite these promises, major challenges with MS-based proteomics remain. Foremost among these is thelimited community access to high-accuracy in-depth pro-teomics. Compared to transcriptomics and the currentmassive investments into deep-sequencing based technol-ogies, the area of MS-based proteomics remains tiny. Thereare also entire areas, such as body fluid-based biomarkerdiscovery, where MS-based proteomics could in principlemake a revolutionary impact but where our current tech-nology fails woefully to live up to expectations. On theother hand, this means that MS-based proteomics will offerexciting opportunities for young researchers for years tocome.
From a systems biology perspective, the ability ofproteomics to detect not only the presence of but to also toestimate copy numbers of virtually all proteins in a pro-teome will be crucial in modeling the cellular proteome.Equally important, proteomics is now poised to deliverincreasingly comprehensive lists of the major PTMs,including phosphorylation, ubiquitylation, acetylation,glycosylation and many more. This is a precondition fordetermining their function, which will be a monumentaltask for the years ahead, and for accurate models ofinformation processing in the cell. Identification andquantification of protein isoforms is still a challenge forMS-based proteomics, but it is becoming increasinglyaccessible due to more extensive sequence coverage of theidentified proteins. The direct analysis of undigestedproteins by MS (‘top-down’ proteomics) will alsocontribute to this question.
Figure 1.6 summarizes the indispensable role of pro-teomics in the context of other large-scale methods ofgenomics and gene expression analysis. Both genomics andtranscriptomics benefit from the current revolution in next-generation sequencing methods. We expect deep-sequencing data to be readily accessible for essentiallyevery situation of interest in systems biology in the nearfuture. This includes the genomes of different individualsas well as differences between normal and cancer genomesin the same individuals. Likewise, deep sequencing will
contribute tremendously to accurate and comprehensivemapping of the abundance of mRNA molecules, an earlystep in the gene expression program. However, this is stillonly half of the story. Proteomics can give us a detailedpicture of the end product of the gene expression cascade,the mature, active and fully modified protein form. It alsomeasures regulation directly at the expression level of allproteins, which cannot be predicted from transcript levels.In contrast to genomics and transcriptomics, it can char-acterize gene expression at subcellular resolution, i.e., byanalyzing the proteomes of different cellular compart-ments. Furthermore, the interactions and dynamics of theproteome can likewise be studied either at a whole cell levelor in individual subcellular compartments. In conclusion,despite the technological challenges it faces, MS-basedproteomics is crucial to a systems-level understanding ofcellular function, and is ready to make even more extensivecontributions to the field in the future.
REFERENCES[1] Aebersold R, Mann M. Mass spectrometry-based proteomics.
Nature 2003;422:198e207.
[2] de Godoy LM, Olsen JV, Cox J, Nielsen ML, Hubner NC,
Frohlich F, et al. Comprehensive mass-spectrometry-based pro-
teome quantification of haploid versus diploid yeast. Nature
2008;455:1251e4.
[3] Nagaraj N, Wisniewski JR, Geiger T, Cox J, Kircher M, Kelso J,
et al. Deep proteome and transcriptome mapping of a human
cancer cell line. Mol Syst Biol 2011;7:548.
[4] Munoz J, Low TY, Kok YJ, Chin A, Frese CK, Ding V, et al. The
quantitative proteomes of human-induced pluripotent stem cells
and embryonic stem cells. Mol Syst Biol 2011;7:550.
[5] Beck M, Schmidt A, Malmstroem J, Claassen M, Ori A,
Szymborska A, et al. The quantitative proteome of a human cell
line. Mol Syst Biol 2011;7:549.
[6] Yates 3rd JR, Gilchrist A, Howell KE, Bergeron JJ. Proteomics of
organelles and large cellular structures. Nat Rev Mol Cell Biol
2005;6:702e14.
[7] Au CE, Bell AW, Gilchrist A, Hiding J, Nilsson T, Bergeron JJ.
Organellar proteomics to create the cell map. Curr Opin Cell Biol
2007;19:376e85.
[8] Walther TC, Mann M. Mass spectrometry-based proteomics in
cell biology. J Cell Biol 2010;190:491e500.
[9] Lamond AI, Uhlen M, Horning S, Makarov A, Robinson CV,
Serrano L, et al. Advancing cell biology through Proteomics in
Space and Time (PROSPECTS). Mol Cell Proteomics
2012;11:O112.017731.
[10] Berglund L, Bjorling E, Oksvold P, Fagerberg L, Asplund A,
Szigyarto CA, et al. A genecentric Human Protein Atlas for
expression profiles based on antibodies. Mol Cell Proteomics
2008;7:2019e27.
[11] Huh WK, Falvo JV, Gerke LC, Carroll AS, Howson RW,
Weissman JS, et al. Global analysis of protein localization in
budding yeast. Nature 2003;425:686e91.
[12] Jensen ON. Interpreting the protein language using proteomics.
Nat Rev Mol Cell Biol 2006;7:391e403.
19Chapter | 1 Proteomic Analysis of Cellular Systems
25
●

1 Introduction
[13] Wolf-Yadlin A, Hautaniemi S, Lauffenburger DA, White FM.
Multiple reaction monitoring for robust quantitative proteomic
analysis of cellular signaling networks. Proc Natl Acad Sci U S A
2007;104:5860e5.
[14] Cox J, Mann M. Quantitative, high-resolution proteomics for
data-driven systems biology. Annu Rev Biochem 2011;80:
273e99.
[15] Karas M, Hillenkamp F. Laser desorption ionization of proteins
with molecular masses exceeding 10,000 daltons. Anal Chem
1988;60:2299e301.
[16] Fenn JB, Mann M, Meng CK, Wong SF, Whitehouse CM. Elec-
trospray ionization for mass spectrometry of large biomolecules.
Science 1989;246:64e71.
[17] Breuker K, Jin M, Han X, Jiang H, McLafferty FW. Top-down
identification and characterization of biomolecules by mass
spectrometry. J Am Soc Mass Spectrom 2008;19:1045e53.
[18] Tran JC, Zamdborg L, Ahlf DR, Lee JE, Catherman AD,
Durbin KR, et al. Mapping intact protein isoforms in discovery
mode using top-down proteomics. Nature 2011;480:254e8.
[19] Shevchenko A, Wilm M, Vorm O, Mann M. Mass spectrometric
sequencing of proteins silver-stained polyacrylamide gels.
Analytical chemistry 1996;68:850e8.
[20] Beck M, Claassen M, Aebersold R. Comprehensive proteomics.
Curr Opin Biotechnol 2011;22:3e8.
[21] Altelaar AM, Heck AJ. Trends in ultrasensitive proteomics. Curr
Opin Chem Biol 2012.
[22] Washburn MP, Wolters D, Yates 3rd JR. Large-scale analysis of
the yeast proteome by multidimensional protein identification
technology. Nat Biotechnol 2001;19:242e7.
[23] Herbert B, Righetti PG. A turning point in proteome analysis:
sample prefractionation via multicompartment electrolyzers with
isoelectric membranes. Electrophoresis 2000;21:3639e48.
[24] Shen Y, Berger SJ, Anderson GA, Smith RD. High-efficiency
capillary isoelectric focusing of peptides. Anal Chem 2000;
72:2154e9.
[25] Peng J, Elias JE, Thoreen CC, Licklider LJ, Gygi SP. Evaluation
of multidimensional chromatography coupled with tandem mass
spectrometry (LC/LC-MS/MS) for large-scale protein analysis:
the yeast proteome. J Proteome Res 2003;2:43e50.
[26] Horth P, Miller CA, Preckel T, Wenz C. Efficient fractionation
and improved protein identification by peptide OFFGEL elec-
trophoresis. Mol Cell Proteomics 2006;5:1968e74.
[27] Caldwell RL, Caprioli RM. Tissue profiling by mass spectrom-
etry: a review of methodology and applications. Mol Cell Pro-
teomics 2005;4:394e401.
[28] Schwamborn K, Caprioli RM. Molecular imaging by mass
spectrometry e looking beyond classical histology. Nat Rev
Cancer 2010;10:639e46.
[29] Steen H, Mann M. The ABC’s (and XYZ’s) of peptide
sequencing. Nat Rev Mol Cell Biol 2004;5:699e711.
[30] Domon B, Aebersold R. Mass spectrometry and protein analysis.
Science 2006;312:212e7.
[31] Zubarev R, Mann M. On the proper use of mass accuracy in
proteomics. Mol Cell Proteomics 2007;6:377e81.
[32] Hu Q, Noll RJ, Li H, Makarov A, Hardman M, Graham Cooks R.
The Orbitrap: a new mass spectrometer. J Mass Spectrom
2005;40:430e43.
[33] Olsen JV, Schwartz JC, Griep-Raming J, Nielsen ML, Damoc E,
Denisov E, et al. A dual pressure linear ion trap orbitrap instru-
ment with very high sequencing speed. Mol Cell Proteomics
2009;8:2759e69.
[34] Michalski A, Damoc E, Lange O, Denisov E, Nolting D,
Mueller M, et al. Ultra high resolution linear ion trap Orbitrap
mass spectrometer (Orbitrap Elite) facilitates top down LC MS/
MS and versatile peptide fragmentation modes. Mol Cell Pro-
teomics 2012;11:O111.013698.
[35] Silva JC, Gorenstein MV, Li GZ, Vissers JP, Geromanos SJ.
Absolute quantification of proteins by LCMSE: a virtue of
parallel MS acquisition. Mol Cell Proteomics 2006;5:144e56.
[36] Geromanos SJ, Vissers JP, Silva JC, Dorschel CA, Li GZ,
Gorenstein MV, et al. The detection, correlation, and comparison
of peptide precursor and product ions from data independent
LC-MS with data dependant LC-MS/MS. Proteomics 2009;9:
1683e95.
[37] Michalski A, Cox J, Mann M. More than 100,000 detectable
peptide species elute in single shotgun proteomics runs but the
majority is inaccessible to data-dependent LC-MS/MS. J Pro-
teome Res 2011;10:1785e93.
[38] Lange V, Picotti P, Domon B, Aebersold R. Selected reaction
monitoring for quantitative proteomics: a tutorial. Mol Syst Biol
2008;4:222.
[39] Gillet LC, Navarro P, Tate S, Roest H, Selevsek N, Reiter L, et al.
Targeted data extraction of the MS/MS spectra generated by data
independent acquisition: a new concept for consistent and accu-
rate proteome analysis. Mol Cell Proteomics 2012;11:
O111.016717.
[40] Ong SE, Mann M. Mass spectrometry-based proteomics turns
quantitative. Nat Chem Biol 2005;1:252e62.
[41] Biemann K. Four decades of structure determination by mass
spectrometry: from alkaloids to heparin. J Am Soc Mass Spectrom
2002;13:1254e72.
[42] Michalski A, Damoc E, Hauschild JP, Lange O, Wieghaus A,
Makarov A, et al. Mass spectrometry-based proteomics using Q
Exactive, a high-performance benchtop quadrupole Orbitrap mass
spectrometer. Mol Cell Proteomics 2011;10. M111.011015.
[43] Listgarten J, Emili A. Statistical and computational methods for
comparative proteomic profiling using liquid chromatography-
tandem mass spectrometry. Mol Cell Proteomics 2005;4:419e34.
[44] Deutsch EW, Lam H, Aebersold R. Data analysis and bio-
informatics tools for tandem mass spectrometry in proteomics.
Physiol Genomics 2008;33:18e25.
[45] Mueller LN, Brusniak MY, Mani DR, Aebersold R. An assessment
of software solutions for the analysis of mass spectrometry based
quantitative proteomics data. J Proteome Res 2008;7:51e61.
[46] Kumar C, Mann M. Bioinformatics analysis of mass spectrom-
etry-based proteomics data sets. FEBS Lett 2009;583:1703e12.
[47] Keller A, Shteynberg D. Software pipeline and data analysis for
MS/MS proteomics: the trans-proteomic pipeline. Methods Mol
Biol 2011;694:169e89.
[48] Cox J, Mann M. MaxQuant enables high peptide identification
rates, individualized p.p.b.-range mass accuracies and proteome-
wide protein quantification. Nat Biotechnol 2008;26:1367e72.
[49] Taylor GK, Kim YB, Forbes AJ, Meng F, McCarthy R,
Kelleher NL. Web and database software for identification of
20 SECTION | I Components of Biological Systems
26
Publication: Proteomic analysis of cellular systems
intact proteins using ‘top down’ mass spectrometry. Anal Chem
2003;75:4081e6.
[50] Zamdborg L, LeDuc RD, Glowacz KJ, Kim YB, Viswanathan V,
Spaulding IT, et al. ProSight PTM 2.0: improved protein identi-
fication and characterization for top down mass spectrometry.
Nucleic Acids Res 2007;35:W701e6.
[51] Rinner O, Seebacher J, Walzthoeni T, Mueller LN, Beck M,
Schmidt A, et al. Identification of cross-linked peptides from large
sequence databases. Nat Methods 2008;5:315e8.
[52] Rappsilber J. The beginning of a beautiful friendship: cross-
linking/mass spectrometry and modelling of proteins and multi-
protein complexes. J Struct Biol 2011;173:530e40.
[53] Ma B, Zhang K, Hendrie C, Liang C, Li M, Doherty-Kirby A,
et al. PEAKS: powerful software for peptide de novo sequencing
by tandem mass spectrometry. Rapid Commun Mass Spectrom
2003;17:2337e42.
[54] Ma B, Johnson R. De novo sequencing and homology searching.
Mol Cell Proteomics 2012;11. O111 014902.
[55] Cox J, Michalski A, Mann M. Software lock mass by two-
dimensional minimization of peptide mass errors. Journal of the
American Society for Mass Spectrometry 2011;22:1373e80.
[56] Sadygov RG, Cociorva D, Yates 3rd JR. Large-scale database
searching using tandem mass spectra: looking up the answer in
the back of the book. Nat Methods 2004;1:195e202.
[57] Dancik V, Addona TA, Clauser KR, Vath JE, Pevzner PA. De
novo peptide sequencing via tandem mass spectrometry. Journal
of computational biology: a journal of computational molecular
cell biology 1999;6:327e42.
[58] Mann M, Wilm M. Error-tolerant identification of peptides in
sequence databases by peptide sequence tags. Anal Chem
1994;66:4390e9.
[59] Eng JK, McCormack AL, Yates JR. An approach to correlate
tandem mass spectral data of peptides with amino acid sequences
in a protein database. J Am Soc Mass Spectrom 1994;5:976e89.
[60] Perkins DN, Pappin DJ, Creasy DM, Cottrell JS. Probability-
based protein identification by searching sequence databases
using mass spectrometry data. Electrophoresis 1999;20:3551e67.
[61] Cox J,NeuhauserN,MichalskiA, ScheltemaRA,Olsen JV,MannM.
Andromeda: a peptide search engine integrated into the MaxQuant
environment. Journal of proteome research 2011;10:1794e805.
[62] Keller A, Nesvizhskii AI, Kolker E, Aebersold R. Empirical
statistical model to estimate the accuracy of peptide identifica-
tions made by MS/MS and database search. Analytical chemistry
2002;74:5383e92.
[63] Brosch M, Yu L, Hubbard T, Choudhary J. Accurate and sensitive
peptide identification with Mascot Percolator. J Proteome Res
2009;8:3176e81.
[64] Elias JE, Gygi SP. Target-decoy search strategy for increased
confidence in large-scale protein identifications by mass spec-
trometry. Nat Methods 2007;4:207e14.
[65] Nesvizhskii AI, Vitek O, Aebersold R. Analysis and validation of
proteomic data generated by tandem mass spectrometry. Nat
Methods 2007;4:787e97.
[66] Geiger T, Wehner A, Schaab C, Cox J, Mann M. Comparative
proteomic analysis of eleven common cell lines reveals ubiquitous
but varying expression of most proteins. Mol Cell Proteomics
2012;11(3):M111.014050.
[67] Olsen JV, Blagoev B, Gnad F, Macek B, Kumar C, Mortensen P,
et al. Global, in vivo, and site-specific phosphorylation dynamics
in signaling networks. Cell 2006;127:635e48.
[68] Beausoleil SA, Villen J, Gerber SA, Rush J, Gygi SP. A proba-
bility-based approach for high-throughput protein phosphoryla-
tion analysis and site localization. Nat Biotechnol 2006;24:
1285e92.
[69] Bailey CM, Sweet SMM, Cunningham DL, Zeller M, Heath JK,
Cooper HJ. SLoMo: Automated Site Localization of Modifica-
tions from ETD/ECD Mass Spectra. J Proteome Res 2009;8:
1965e71.
[70] Savitski MM, Lemeer S, Boesche M, Lang M, Mathieson T,
Bantscheff M, et al. Confident phosphorylation site localization
using the Mascot Delta Score. Mol Cell Proteomics
2012;11(3):M110.003830.
[71] Taus T, Kocher T, Pichler P, Paschke C, Schmidt A, Henrich C,
et al. Universal and confident phosphorylation site localization
using phosphoRS. J Proteome Res 2011;10:5354e62.
[72] Creasy DM, Cottrell JS. Error tolerant searching of uninterpreted
tandem mass spectrometry data. Proteomics 2002;2:1426e34.
[73] Savitski MM, Nielsen ML, Zubarev RA. ModifiComb, a new
proteomic tool for mapping substoichiometric post-translational
modifications, finding novel types of modifications, and finger-
printing complex protein mixtures. Mol Cell Proteomics
2006;5:935e48.
[74] Nesvizhskii AI, Aebersold R. Interpretation of shotgun proteomic
data: the protein inference problem. Mol Cell Proteomics
2005;4:1419e40.
[75] Bantscheff M, Schirle M, Sweetman G, Rick J, Kuster B. Quan-
titative mass spectrometry in proteomics: a critical review. Anal
Bioanal Chem 2007;389:1017e31.
[76] Ow SY, Salim M, Noirel J, Evans C, Rehman I, Wright PC.
iTRAQ underestimation in simple and complex mixtures: ‘the
good, the bad and the ugly’. Journal of proteome research
2009;8:5347e55.
[77] Mertins P, Udeshi ND, Clauser KR, Mani DR, Patel J, Ong SE,
et al. iTRAQ labeling is superior to mTRAQ for quantitative
global proteomics and phosphoproteomics. Mol Cell Proteomics
2012;11:M111.014423.
[78] Christoforou A, Lilley KS. Taming the isobaric tagging elephant
in the room in quantitative proteomics. Nat Methods 2011;8:
911e3.
[79] Malmstrom J, Lee H, Aebersold R. Advances in proteomic work-
flows for systems biology. Curr Opin Biotechnol 2007;18:378e84.
[80] Ghaemmaghami S, Huh WK, Bower K, Howson RW, Belle A,
Dephoure N, et al. Global analysis of protein expression in yeast.
Nature 2003;425:737e41.
[81] Picotti P, Bodenmiller B, Mueller LN, Domon B, Aebersold R.
Full dynamic range proteome analysis of S. cerevisiae by targeted
proteomics. Cell 2009;138:795e806.
[82] Thakur SS, Geiger T, Chatterjee B, Bandilla P, Frohlich F, Cox J,
et al. Deep and highly sensitive proteome coverage by LC-MS/
MS without prefractionation. Mol Cell Proteomics 2011;10.
M110.003699.
[83] Nagaraj N, Kulak NA, Cox J, Neuhaus N, Mayr K, Hoerning O,
et al. Systems-wide perturbation analysis with near complete
coverage of the yeast proteome by single-shot UHPLC runs on
21Chapter | 1 Proteomic Analysis of Cellular Systems
27
●

1 Introduction
a bench-top Orbitrap. Mol Cell Proteomics 2012;11:
M111.013722.
[84] Geiger T, Wehner A, Schaab C, Cox J, Mann M. Comparative
proteomic analysis of eleven common cell lines reveals ubiquitous
but varying expression of most proteins. Mol Cell Proteomics
2012;11:M111.014050.
[85] Lundberg E, Fagerberg L, Klevebring D, Matic I, Geiger T, Cox J,
et al. Defining the transcriptome and proteome in three func-
tionally different human cell lines. Mol Syst Biol 2010;6:450.
[86] Malmstrom J, Beck M, Schmidt A, Lange V, Deutsch EW,
Aebersold R. Proteome-wide cellular protein concentrations of
the human pathogen Leptospira interrogans. Nature
2009;460:762e5.
[87] Zeiler M, Straube WL, Lundberg E, Uhlen M, Mann M. A protein
epitope signature Tag (PrEST) library allows SILAC-based
absolute quantification and multiplexed determination of protein
copy numbers in cell lines. Mol Cell Proteomics 2012;11:
O111.009613.
[88] Selbach M, Schwanhausser B, Thierfelder N, Fang Z, Khanin R,
Rajewsky N. Widespread changes in protein synthesis induced by
microRNAs. Nature 2008;455:58e63.
[89] Baek D, Villen J, Shin C, Camargo FD, Gygi SP, Bartel DP. The
impact of microRNAs on protein output. Nature 2008;455:64e71.
[90] Bonaldi T, Straub T, Cox J, Kumar C, Becker PB, Mann M.
Combined use of RNAi and quantitative proteomics to study gene
function in Drosophila. Mol Cell 2008;31:762e72.
[91] Schwanhausser B, Busse D, Li N, Dittmar G, Schuchhardt J,
Wolf J, et al. Global quantification of mammalian gene expression
control. Nature 2011;473:337e42.
[92] Andersen JS, Lam YW, Leung AK, Ong SE, Lyon CE,
Lamond AI, et al. Nucleolar proteome dynamics. Nature
2005;433:77e83.
[93] Boisvert FM, Lam YW, Lamont D, Lamond AI. A quantitative
proteomics analysis of subcellular proteome localization and
changes induced by DNA damage. Mol Cell Proteomics
2010;9:457e70.
[94] Boisvert FM, Ahmad Y, Gierlinski M, Charriere F, Lamont D,
Scott M, et al. A quantitative spatial proteomics analysis of pro-
teome turnover in human cells. Mol Cell Proteomics 2010;
9:457e70.
[95] Ahmad Y, Boisvert FM, Lundberg E, Uhlen M, Lamond AI.
Systematic analysis of protein pools, isoforms and modifications
affecting turnover and subcellular localisation. Mol Cell Proteo-
mics 2012;11:M111.013680.
[96] Stumpf MP, Thorne T, de Silva E, Stewart R, An HJ, Lappe M,
et al. Estimating the size of the human interactome. Proc Natl
Acad Sci U S A 2008;105:6959e64.
[97] Smith GP. Filamentous fusion phage: novel expression vectors
that display cloned antigens on the virion surface. Science
1985;228:1315e7.
[98] Fields S, Song O. A novel genetic system to detect proteine
protein interactions. Nature 1989;340:245e6.
[99] Rigaut G, Shevchenko A, Rutz B, Wilm M, Mann M, Seraphin B.
A generic protein purification method for protein complex char-
acterization and proteome exploration. Nat Biotechnol
1999;17:1030e2.
[100] Burckstummer T, Bennett KL, Preradovic A, Schutze G,
Hantschel O, Superti-Furga G, et al. An efficient tandem affinity
purification procedure for interaction proteomics in mammalian
cells. Nat Methods 2006;3:1013e9.
[101] Gavin AC, Bosche M, Krause R, Grandi P, Marzioch M, Bauer A,
et al. Functional organization of the yeast proteome by systematic
analysis of protein complexes. Nature 2002;415:141e7.
[102] Ho Y, Gruhler A, Heilbut A, Bader GD, Moore L, Adams SL,
et al. Systematic identification of protein complexes in Saccha-
romyces cerevisiae by mass spectrometry. Nature 2002;415:
180e3.
[103] Gavin AC, Aloy P, Grandi P, Krause R, Boesche M, Marzioch M,
et al. Proteome survey reveals modularity of the yeast cell
machinery. Nature 2006;440:631e6.
[104] Krogan NJ, Cagney G, Yu H, Zhong G, Guo X, Ignatchenko A,
et al. Global landscape of protein complexes in the yeast
Saccharomyces cerevisiae. Nature 2006;440:637e43.
[105] Uetz P, Giot L, Cagney G, Mansfield TA, Judson RS, Knight JR,
et al. A comprehensive analysis of proteineprotein interactions in
Saccharomyces cerevisiae. Nature 2000;403:623e7.
[106] Ito T, Chiba T, Ozawa R, Yoshida M, Hattori M, Sakaki Y. A
comprehensive two-hybrid analysis to explore the yeast protein
interactome. Proc Natl Acad Sci U S A 2001;98:4569e74.
[107] Bader GD, Hogue CW. Analyzing yeast proteineprotein inter-
action data obtained from different sources. Nat Biotechnol
2002;20:991e7.
[108] Yu H, Braun P, Yildirim MA, Lemmens I, Venkatesan K,
Sahalie J, et al. High-quality binary protein interaction map of the
yeast interactome network. Science 2008;322:104e10.
[109] Blagoev B, Kratchmarova I, Ong SE, Nielsen M, Foster LJ,
Mann M. A proteomics strategy to elucidate functional proteine
protein interactions applied to EGF signaling. Nat Biotechnol
2003;21:315e8.
[110] Ranish JA, Yi EC, Leslie DM, Purvine SO, Goodlett DR, Eng J,
et al. The study of macromolecular complexes by quantitative
proteomics. Nat Genet 2003;33:349e55.
[111] Schulze WX, Mann M. A novel proteomic screen for peptidee
protein interactions. J Biol Chem 2004;279:10756e64.
[112] Vermeulen M, Mulder KW, Denissov S, Pijnappel WW, van
Schaik FM, Varier RA, et al. Selective anchoring of TFIID to
nucleosomes by trimethylation of histone H3 lysine 4. Cell
2007;131:58e69.
[113] Schulze WX, Deng L, Mann M. Phosphotyrosine interactome of
the ErbB-receptor kinase family. Mol Syst Biol 2005;1:
2005.0008.
[114] Hanke S, Mann M. The phosphotyrosine interactome of the
insulin receptor family and its substrates IRS-1 and IRS-2. Mol
Cell Proteomics 2009;8:519e34.
[115] Mittler G, Butter F, Mann M. A SILAC-based DNA protein
interaction screen that identifies candidate binding proteins to
functional DNA elements. Genome Res 2009;19:284e93.
[116] Butter F, Scheibe M, Morl M, Mann M. Unbiased RNA-protein
interaction screen by quantitative proteomics. Proc Natl Acad Sci
U S A 2009;106:10626e31.
[117] Markljung E, Jiang L, Jaffe JD, Mikkelsen TS, Wallerman O,
Larhammar M, et al. ZBED6, a novel transcription factor derived
from a domesticated DNA transposon regulates IGF2 expression
and muscle growth. PLoS Biol 2009;7:e1000256.
[118] Butter F, Kappei D, Buchholz F, Vermeulen M, Mann M. A dom-
esticated transposon mediates the effects of a single-nucleotide
22 SECTION | I Components of Biological Systems
28

Publication: Proteomic analysis of cellular systems
polymorphism responsible for enhanced muscle growth. EMBO
Rep 2010;11:305e11.
[119] Bantscheff M, Eberhard D, Abraham Y, Bastuck S, Boesche M,
Hobson S, et al. Quantitative chemical proteomics reveals
mechanisms of action of clinical ABL kinase inhibitors. Nat
Biotechnol 2007;25:1035e44.
[120] Rix U, Superti-Furga G. Target profiling of small molecules by
chemical proteomics. Nat Chem Biol 2009;5:616e24.
[121] Sharma K, Weber C, Bairlein M, Greff Z, Keri G, Cox J, et al.
Proteomics strategy for quantitative protein interaction profiling
in cell extracts. Nat Methods 2009;6:741e4.
[122] Bantscheff M, Hopf C, Savitski MM, Dittmann A, Grandi P,
Michon AM, et al. Chemoproteomics profiling of HDAC inhibi-
tors reveals selective targeting of HDAC complexes. Nat Bio-
technol 2011;29:255e65.
[123] Andersen JS, Wilkinson CJ, Mayor T, Mortensen P, Nigg EA,
Mann M. Proteomic characterization of the human centro-
some by protein correlation profiling. Nature 2003;426:
570e4.
[124] Dunkley TP, Watson R, Griffin JL, Dupree P, Lilley KS. Locali-
zation of organelle proteins by isotope tagging (LOPIT). Mol Cell
Proteomics 2004;3:1128e34.
[125] Foster LJ, de Hoog CL, Zhang Y, Xie X, Mootha VK, Mann M. A
mammalian organelle map by protein correlation profiling. Cell
2006;125:187e99.
[126] Harner M, Korner C, Walther D, Mokranjac D, Kaesmacher J,
Welsch U, et al. The mitochondrial contact site complex,
a determinant of mitochondrial architecture. EMBO J
2011;30:4356e70.
[127] Ohta S, Bukowski-Wills JC, Sanchez-Pulido L, Alves Fde L,
Wood L, Chen ZA, et al. The protein composition of mitotic
chromosomes determined using multiclassifier combinatorial
proteomics. Cell 2010;142:810e21.
[128] Ewing RM, Chu P, Elisma F, Li H, Taylor P, Climie S, et al.
Large-scale mapping of human protein-protein interactions by
mass spectrometry. Mol Syst Biol 2007;3:89.
[129] Malovannaya A, Lanz RB, Jung SY, Bulynko Y, Le NT,
Chan DW, et al. Analysis of the human endogenous coregulator
complexome. Cell 2011;145:787e99.
[130] Guruharsha KG, Rual JF, Zhai B, Mintseris J, Vaidya P, Vaidya N,
et al. A protein complex network of Drosophila melanogaster.
Cell 2011;147:690e703.
[131] Leitner A, Walzthoeni T, Kahraman A, Herzog F, Rinner O,
Beck M, et al. Probing native protein structures by chemical
cross-linking, mass spectrometry, and bioinformatics. Mol Cell
Proteomics 2010;9:1634e49.
[132] Chen ZA, Jawhari A, Fischer L, Buchen C, Tahir S, Kamenski T,
et al. Architecture of the RNA polymerase II-TFIIF complex
revealed by cross-linking and mass spectrometry. EMBO J
2010;29:717e26.
[133] Behrends C, Sowa ME, Gygi SP, Harper JW. Network organi-
zation of the human autophagy system. Nature 2010;466:
68e76.
[134] Hilger M, Mann M. Triple SILAC to determine stimulus specific
interactions in the wnt pathway. J Proteome Res 2012;11:982e94.
[135] Brehme M, Hantschel O, Colinge J, Kaupe I, Planyavsky M,
Kocher T, et al. Charting the molecular network of the drug target
Bcr-Abl. Proc Natl Acad Sci U S A 2009;106:7414e9.
[136] Wepf A, Glatter T, Schmidt A, Aebersold R, Gstaiger M. Quan-
titative interaction proteomics using mass spectrometry. Nat
Methods 2009;6:203e5.
[137] Bennett EJ, Rush J, Gygi SP, Harper JW. Dynamics of cullin-
RING ubiquitin ligase network revealed by systematic quantita-
tive proteomics. Cell 2010;143:951e65.
[138] Gingras AC, Gstaiger M, Raught B, Aebersold R. Analysis of
protein complexes using mass spectrometry. Nat Rev Mol Cell
Biol 2007;8:645e54.
[139] Poser I, Sarov M, Hutchins JR, Heriche JK, Toyoda Y,
Pozniakovsky A, et al. BAC TransgeneOmics: a high-throughput
method for exploration of protein function in mammals. Nat
Methods 2008;5:409e15.
[140] Hubner NC, Bird AW, Cox J, Splettstoesser B, Bandilla P, Poser I,
et al. Quantitative proteomics combined with BAC Trans-
geneOmics reveals in vivo protein interactions. J Cell Biol
2010;189:739e54.
[141] Hutchins JR, Toyoda Y, Hegemann B, Poser I, Heriche JK,
Sykora MM, et al. Systematic analysis of human protein
complexes identifies chromosome segregation proteins. Science
2010;328:593e9.
[142] Kuhner S, van Noort V, Betts MJ, Leo-Macias A, Batisse C,
Rode M, et al. Proteome organization in a genome-reduced
bacterium. Science 2009;326:1235e40.
[143] Guell M, van Noort V, Yus E, Chen WH, Leigh-Bell J,
Michalodimitrakis K, et al. Transcriptome complexity in
a genome-reduced bacterium. Science 2009;326:1268e71.
[144] Yus E, Maier T, Michalodimitrakis K, van Noort V, Yamada T,
Chen WH, et al. Impact of genome reduction on bacterial
metabolism and its regulation. Science 2009;326:1263e8.
[145] Jordan JD, Landau EM, Iyengar R. Signaling networks: the
origins of cellular multitasking. Cell 2000;103:193e200.
[146] Marshall CJ. Specificity of receptor tyrosine kinase signaling:
transient versus sustained extracellular signal-regulated kinase
activation. Cell 1995;80:179e85.
[147] Choudhary C, Mann M. Decoding signalling networks by mass
spectrometry-based proteomics. Nature reviews. Molecular cell
biology 2010;11:427e39.
[148] Witze ES, Old WM, Resing KA, Ahn NG. Mapping protein post-
translational modifications with mass spectrometry. Nature
methods 2007;4:798e806.
[149] Ficarro S, Chertihin O, Westbrook VA, White F, Jayes F, Kalab P,
et al. Phosphoproteome analysis of capacitated human sperm.
Evidence of tyrosine phosphorylation of a kinase-anchoring
protein 3 and valosin-containing protein/p97 during capacitation.
J Biol Chem 2003;278:11579e89.
[150] Huttlin EL, Jedrychowski MP, Elias JE, Goswami T, Rad R,
Beausoleil SA, et al. A tissue-specific atlas of mouse protein
phosphorylation and expression. Cell 2010;143:1174e89.
[151] Kim SC, Sprung R, Chen Y, Xu Y, Ball H, Pei J, et al. Substrate
and functional diversity of lysine acetylation revealed by a pro-
teomics survey. Mol Cell 2006;23:607e18.
[152] Choudhary C, Kumar C, Gnad F, Nielsen ML, Rehman M,
Walther TC, et al. Lysine acetylation targets protein complexes
and co-regulates major cellular functions. Science 2009;325:
834e40.
[153] Kaji H, Kamiie J, Kawakami H, Kido K, Yamauchi Y,
Shinkawa T, et al. Proteomics reveals N-linked glycoprotein
23Chapter | 1 Proteomic Analysis of Cellular Systems
29
●

1 Introduction
diversity in Caenorhabditis elegans and suggests an atypical
translocation mechanism for integral membrane proteins. Mol
Cell Proteomics 2007;6:2100e9.
[154] Zielinska DF, Gnad F, Wisniewski JR, Mann M. Precision
mapping of an in vivo N-glycoproteome reveals rigid topological
and sequence constraints. Cell 2010;141:897e907.
[155] Peng J, Schwartz D, Elias JE, Thoreen CC, Cheng D,
Marsischky G, et al. A proteomics approach to understanding
protein ubiquitination. Nat Biotechnol 2003;21:921e6.
[156] Xu G, Paige JS, Jaffrey SR. Global analysis of lysine ubiquiti-
nation by ubiquitin remnant immunoaffinity profiling. Nat Bio-
technol 2010;28:868e73.
[157] Wagner SA, Beli P, Weinert BT, Nielsen ML, Cox J, Mann M,
et al. A proteome-wide, quantitative survey of in vivo ubiq-
uitylation sites reveals widespread regulatory roles. Mol Cell
Proteomics 2011;10:M111.013284.
[158] Kim W, Bennett EJ, Huttlin EL, Guo A, Li J, Possemato A, et al.
Systematic and quantitative assessment of the ubiquitin-modified
proteome. Mol Cell 2011;44:325e40.
[159] Ong SE, Mittler G, Mann M. Identifying and quantifying in vivo
methylation sites by heavy methyl SILAC. Nat Methods 2004;1:
119e26.
[160] Zhao Y, Jensen ON. Modification-specific proteomics: strategies
for characterization of post-translational modifications using
enrichment techniques. Proteomics 2009;9:4632e41.
[161] Macek B, Mann M, Olsen JV. Global and site-specific quantitative
phosphoproteomics: principles and applications. Annual review of
pharmacology and toxicology 2009;49:199e221.
[162] Wolf-Yadlin A, Hautaniemi S, Lauffenburger DA, White FM.
Multiple reaction monitoring for robust quantitative proteomic
analysis of cellular signaling networks. Proc Natl Acad Sci U S A
2007;104:5860e5.
[163] Salomon AR, Ficarro SB, Brill LM, Brinker A, Phung QT,
Ericson C, et al. Profiling of tyrosine phosphorylation pathways in
human cells using mass spectrometry. Proc Natl Acad Sci U S A
2003;100:443e8.
[164] Blagoev B, Ong SE, Kratchmarova I, Mann M. Temporal analysis
of phosphotyrosine-dependent signaling networks by quantitative
proteomics. Nat Biotechnol 2004;22:1139e45.
[165] Olsen JV, Vermeulen M, Santamaria A, Kumar C, Miller ML,
Jensen LJ, et al. Quantitative phosphoproteomics reveals wide-
spread full phosphorylation site occupancy during mitosis. Sci
Signal 2010;3:ra3.
[166] Wu RH, Haas W, Dephoure N, Huttlin EL, Zhai B, Sowa ME,
et al. A large-scale method to measure absolute protein phos-
phorylation stoichiometries. Nat Methods 2011;8:677e83.
[167] Bishop AC, Buzko O, Shokat KM. Magic bullets for protein
kinases. Trends in Cell Biology 2001;11:167e72.
[168] Bodenmiller B, Wanka S, Kraft C, Urban J, Campbell D,
Pedrioli PG, et al. Phosphoproteomic analysis reveals inter-
connected system-wide responses to perturbations of kinases and
phosphatases in yeast. Sci Signal 2010;3(153). rs4.
[169] Breitkreutz A, Choi H, Sharom JR, Boucher L, Neduva V,
Larsen B, et al. A global protein kinase and phosphatase inter-
action network in yeast. Science 2010;328:1043e6.
[170] Hunter T. The age of crosstalk: phosphorylation, ubiquitination,
and beyond. Molecular Cell 2007;28:730e8.
[171] Lee JS, Smith E, Shilatifard A. The language of histone crosstalk.
Cell 2010;142:682e5.
[172] Wu SL, Kim J, Bandle RW, Liotta L, Petricoin E, Karger BL.
Dynamic profiling of the post-translational modifications and
interaction partners of epidermal growth factor receptor signaling
after stimulation by epidermal growth factor using Extended
Range Proteomic Analysis (ERPA). Mol Cell Proteomics 2006;5:
1610e27.
[173] Siuti N, Kelleher NL. Decoding protein modifications using top-
down mass spectrometry. Nature methods 2007;4:817e21.
[174] Gnad F, Ren S, Cox J, Olsen JV, Macek B, Oroshi M, et al.
PHOSIDA (phosphorylation site database): management, struc-
tural and evolutionary investigation, and prediction of phospho-
sites. Genome Biol 2007;8:R250.
[175] Zhang J, Sprung R, Pei J, Tan X, Kim S, Zhu H, et al. Lysine
acetylation is a highly abundant and evolutionarily conserved
modification in Escherichia coli. Mol Cell Proteomics
2009;8:215e25.
[176] Collins MO, Yu L, Campuzano I, Grant SGN, Choudhary JS.
Phosphoproteomic analysis of the mouse brain cytosol reveals
a predominance of protein phosphorylation in regions of intrinsic
sequence disorder. Mol Cell Proteomics 2008;7:1331e48.
[177] Villen J, Beausoleil SA, Gerber SA, Gygi SP. Large-scale phos-
phorylation analysis of mouse liver. Proc Natl Acad Sci U S A
2007;104:1488e93.
[178] Wisniewski JR, Nagaraj N, Zougman A, Gnad F, Mann M. Brain
phosphoproteome obtained by a FASP-based method reveals
plasma membrane protein topology. J Proteome Res 2010;9:
3280e9.
[179] Monetti M, Nagaraj N, Sharma K, Mann M. Large-scale phos-
phosite quantification in tissues by a spike-in SILAC method. Nat
Methods 2011;8(8):655e8.
[180] Liu H, Sadygov RG, Yates 3rd JR. A model for random sampling
and estimation of relative protein abundance in shotgun proteo-
mics. Anal Chem 2004;76:4193e201.
[181] Gao J, Opiteck GJ, Friedrichs MS, Dongre AR, Hefta SA.
Changes in the protein expression of yeast as a function of carbon
source. J Proteome Res 2003;2:643e9.
[182] Mann M. Functional and quantitative proteomics using SILAC.
Nat Rev Mol Cell Biol 2006;7:952e8.
[183] Thompson A, Schafer J, Kuhn K, Kienle S, Schwarz J,
Schmidt G, et al. Tandem mass tags: a novel quantification
strategy for comparative analysis of complex protein mixtures by
MS/MS. Anal Chem 2003;75:1895e904.
[184] Ross PL, Huang YN, Marchese JN, Williamson B, Parker K,
Hattan S, et al. Multiplexed protein quantitation in Saccharo-
myces cerevisiae using amine-reactive isobaric tagging reagents.
Mol Cell Proteomics 2004;3:1154e69.
[185] Hsu JL, Huang SY, Chow NH, Chen SH. Stable-isotope dimethyl
labeling for quantitative proteomics. Anal Chem 2003;75:
6843e52.
[186] Boersema PJ, Raijmakers R, Lemeer S, Mohammed S, Heck AJ.
Multiplex peptide stable isotope dimethyl labeling for quantitative
proteomics. Nat Protoc 2009;4:484e94.
[187] Picotti P, Lam H, Campbell D, Deutsch EW, Mirzaei H, Ranish J,
et al. A database of mass spectrometric assays for the yeast pro-
teome. Nat Methods 2008;5:913e4.
24 SECTION | I Components of Biological Systems
30

1.4 Aims of the thesis
1.4 Aims of the thesis
The aim of my PhD project was to advance interaction proteomics to the next level.
The foundation for this was interaction proteomics work done earlier in our group and
work done in Tony Hyman’s group at theMax Planck Institute of Molecular Cell Biology
and Genetics, Dresden. Ina Poser and Mihail Sarov streamlined the concept of bac-
terial artificial chromosome (BAC) recombineering and set it up in a high-throughput
format [58]. BACs harbour large pieces of a mammalian genome on what is essentially
a large, single-copy bacterial plasmid. With the help of inducible recombinases, BACs
can be easily modified and tags or mutations can be introduced. In particular, N- or
C-terminal green fluorescent protein (GFP) tags can be introduced in 96-well format
with high efficiency. GFP with a long linker with extended functionality is an ideal tag
for protein localization and affinity purification (LAP) [59]. When re-introduced into a
mammalian cell, BAC transgenes look to the cell like additional copies of genetic loci.
The cell therefore expresses GFP-tagged proteins at near-endogenous levels and under
endogenous regulation patterns. Ina Poser in Tony Hyman’s group set out to gener-
ate BAC-GFP HeLa lines in a proteome-wise fashion. Nina Hubner in our group then
combined such cell lines with our expertise on interaction proteomics and developed a
streamlined strategy to delineate protein-protein interactions, called quantitative BAC-
GFP interactomics (QUBIC) [30, 60]. Together with Peter Bandilla, she implemented
most of the wet-lab workflow on a robotics platform and started a high-throughput
pipeline for interactome mapping.
The initial goal of for my PhD work was to carry out QUBIC for a large number of bait
proteins to map human protein-protein interactions globally. In the course of four years
and with a lot of technical help from Bianca Splettstößer, Daniela Vogg, Bhaswati Chat-
terjee, Mario Grötzinger and Susanne Kroiß, we produced more than 10,000 immun-
oprecipitation (IP) samples of thousands of BAG-GFP cell lines. This required careful
logistical planning, a robotics platform, a dedicated mass spectrometer, and sophistic-
ated data management.
A major challenge was the development of appropriate data analysis strategies for large
datasets. The initial approach involved comparing each immunoprecipitation (IP) sample
in three replicates to three negative controls. While this is very straightforward for a
small scale setup, there are certain drawbacks when applying it at a large scale. Since
all interactors emerge by quantitative comparison to the negative control, this becomes
the most important sample of all: If a specific bait IP fails, only data for this bait will be
affected. If the control is not ideal, however, all samples will be compromised. Moreover,
negative control samples would have to be acquired in regular intervals to avoid batch
artifacts. The solution was to develop a strategy that operates without dedicated negative
controls, but uses all appropriate samples as controls for each specific sample. I devised
a strategy that scales favourably to large samples numbers, but also works for smaller
31
●
1 Introduction
sample numbers, because specifically enriched cases are automatically excluded from
the control cohort. All bioinformatics procedureswere implemented based on the plugin
architecture for the Perseus data analysis suite, which Jürgen Cox had developed. While
the described bioinformatics workflow constitutes the backbone for the proteome-wide
interactomemapping approach, we included some of the strategies in a joint publication
with Eva Keilhauer, describing a medium-scale interactomics workflow for the budding
yeast.
During the process of acquiring data for the human interactome, it became clear that the
algorithms for label-free quantification in theMaxQuant software, now termedMaxLFQ,
run into performance issues when applied to very large numbers of samples. The rate-
limiting step is called ‘label-free normalization’ and involves the calculation of a global
normalization factor for each sample, which, for ‘single-shot’ runs, accounts mostly for
the amount of sample injected into themass spectrometer. The calculations require pair-
wise comparisons of all sampleswith one another, and therefore computation time grows
quadratically to the point of becoming impracticable for more than 100 samples. Jürgen
Cox and I devised a heuristic approach, which Jürgen implemented as the ‘FastLFQ’
option into MaxQuant, which brings the computational effort back to linear scaling be-
haviour.
Looking at larger and larger interactome datasets while the data were being acquired, I
realized that there was much more insight to be gained than long lists of protein inter-
actions. First, I found that stoichiometry information could be extracted from label-free
quantification (LFQ) intensities of the proteins. As a by-product from switching from
label-based quantification approaches (such as SILAC) to the label-free method, the ‘ab-
solute’ intensities of the proteins, in addition to the relative ratios, now took the centre
stage. With SILAC they had remained largely hidden within the reported protein ra-
tios. Protein intensities, which are calculated as the sum of all peptide intensities for a
given protein, can be used as a proxy for the absolute molar protein amount, when one
accounts for the size of the protein [61]. In the context of protein immunoprecipitation
samples, the stoichiometries of recovery of interacting proteins can be calculated from
their absolute quantities. From a range of well-characterized complexes, it became ap-
parent that core complex members tend to be recovered near 1:1 stoichiometry with the
respective bait, whereas transient interactors are recovered substoichiometrically.
Interaction stoichiometries as observed in immunoprecipitates depend on a number of
factors, including the thermodynamic and kinetic stability of an interaction under assay
conditions. Moreover, the recoverable amount of each interactor is limited by its cellu-
lar abundance. Therefore, knowing the underlying proteome composition is a critical
parameter for data interpretation. Work by Nagarjuna Nagaraj in the group had pion-
eered the acquisition of deep mammalian whole proteome datasets to the point of near-
complete coverage [62]. Naga provided me with a set of deep HeLa proteomes recorded
with the latest generation of sample preparation and mass spectrometry methods.
32

1.4 Aims of the thesis
The next challenge was to extract absolute protein copy numbers from the HeLa pro-
teome data. Earlier studies relied on exogenous standards, spiked into the samples in
known quantities. These references were critical for scaling the intensity readout accur-
ately. In the course of a discussion among several proteomics groups around potential
scaling errors in existing proteomic datasets based on spike-in standards [63], I realized
that a quick way of cross-checking correct scaling is to compare the sum of all individual
proteinmasses to the expected proteinmass per cell. This idea can be reversed, using the
total protein amount per cell as a scaling factor. Later, my colleague Jacek Wiśniewski
found that absolute scaling is possible even without knowledge of the total cellular pro-
tein mass. This is because the mass of histones is roughly equivalent to the cellular DNA
mass, which can be calculated from the genome size and the ploidy of a cell. We teamed
up to contribute the biochemical and bioinformatics foundation for our ‘proteomic ruler’
method for absolute protein quantification without spike-in standards.
Combining interactome andproteomedata revealed anunprecedented richness of quant-
itative information in three dimensions. The first dimension addresses specific enrich-
ment and served as a filter to discriminate true interactors from background binders.
The second dimension is the stoichiometry of interactors, which I showed to encode the
functional strength of an interaction. Finally, the third dimension describes the cellular
abundances of proteins involved in the interactome network. Taken together, these three
dimensions offer intriguing insights into the structure of the human interactome.
Next to the analysis of the interactome as a whole, each bit of data alone constitutes a
valuable resource for researchers interested in the proteins involved. Therefore, in par-
allel to the human interactome project, I collaborated with a number of colleagues and
external groups on the interactomes of their proteins of interest. This resulted in a num-
ber of collaboration papers on various topics, from the dissection of alternative com-
positions of protein complexes, to the discovery of new, short open reading frames in
cytomegalovirus, to protein complexes with clinical relevance, such as the hereditary
spastic paraplegia proteins, which associate with adaptor protein complex 5.
33
●


2 Applications of the QUBIC technology
QUBIC is a versatile and accurate technology to detect interactions between proteins. Its
defining features are a biological system that recapitulates the in vivo situation as closely
as possible, a streamlinedwet-labworkflowusingmild buffer conditions that retainweak
and transient interactions, and state-of-the-art quantitative proteomic readout in a label-
free format. BAC-GFP cell lines are valuable resources for various applications [58, 64,
65]. Firstly, theGFP signal can be used for live cell imaging of subcellular localization and
dynamics. It is straightforward to introduce mutations in the coding sequence [66]. For
functional studies, this can be used to make the BAC-encoded gene resistant to RNAi-
depletion of the endogenous counterpart. Alternatively, the mouse ortholog of the gene
can be used as a surrogate.
QUBIC was well received in the interaction community. The original papers are highly
cited and other groups have adopted the technology. While QUBIC was optimized for
GFP-tagged proteins expressed in BAC-transgenic cell lines, in principle, any cell extract
containing aGFP-tagged bait protein can be used as inputmaterial. We have successfully
applied the QUBIC strategy to embryonic stem cells expressing GFP tagged proteins
from the endogenous loci or cells transfectedwith cDNAconstructs, toGFP-tagged yeast
strains, organs from GFP-transgenic mice as well as Drosophila larvae and adult flies.
In a series of collaborative papers with different laboratories, my role was to delineate
the interactomes of a number of proteins of interest. The papers published by the time
of initial submission of this thesis can be found in the appendix.
2.1 Functional repurposing revealed by comparing genetic interactions
Frost, A., Elgort, M.G., Brandman, O., Ives, C., Collins, S. R., Miller-Vedam, L., Weibe-
zahn, J., Hein, M. Y., Poser, I., Mann, M., Hyman, A. A. & Weissman, J. S. Functional
repurposing revealed by comparing S. pombe and S. cerevisiae genetic interactions. Cell149(6), 1339–1352 Jun (2012).
A fruitful collaboration with Jonathan Weissman’s group at the University of Califor-
nia, San Francisco, was initiated in 2010 by Jimena Weibezahn’s stay in our laboratory
as a guest scientist. Her colleague Adam Frost was comparing genetic interaction net-
works of S. cerevisiae with S. pombe. He then looked at deviating patterns of genetic
interactions that pointed him to repurposing of certain proteins to different roles after
separation of the two species. One example of a protein complex that was repurposed
in evolution is the six-membered factor arrest (FAR) complex in S. cerevisiae, respons-ible for cell-cycle arrest upon mating pheromone signalling [67]. Some of its members
are unique to budding yeast, with no apparent orthologs in S. pombe or metazoa. In
35
●

2 Applications of the QUBIC technology
many aspects, S. pombe is much closer to metazoans. For that reason, genetic interac-
tion data from fission yeast can often be predictive of mammalian biology. In contrast
to budding yeast, FAR complex members of S. pombe interacted genetically with Golgi
proteins and proteins involved cytogenesis and mitosis. Moreover, their orthologs were
found as part of the striatin-interacting phosphatase and kinase (STRIPAK) complex in
mammals [68].
I performed interaction proteomics analyses of GFP-tagged striatin 3 (STRN3). The bait
protein localized to the Golgi and its interactors showed a physical connection between
theGolgi, nuclear envelope proteins and kinase-activating proteins associatedwith centro-
somes, reflecting the genetic interactions found in fission yeast. This suggested that in
budding yeast, the STRIPAK complex was repurposed in light of major evolutionary
differences in cytokinesis and Golgi morphology.
2.2 Decoding human cytomegalovirus
Stern-Ginossar, N., Weisburd, B., Michalski, A., Le, V. T.,Hein, M. Y., Huang, S. X., Ma,
M, Shen, B., Qian, S. B., Hengel, H., Mann, M, Ingolia, N. T. &Weissman, J. S. Decoding
human cytomegalovirus. Science 338(6110), 1088–1093 Nov (2012).
The second collaboration with the Weissman group was with Noam Stern-Ginossar. To
map the complex transcriptomic landscape of human cytomegalovirus (HCMV) and to
characterize its protein coding potential, Noam used ribosome profiling [69] on cells in-
fected with that virus. Ribosome footprints revealed novel open reading frames (ORFs)
in sense or antisense orientation within known ORFs, short ORFs (often upstream of
canonical ones) and ORFs with non-canonical start codons. Annette Michalski in
our group confirmed some of the newly discovered short ORFs on protein level. Noam
cloned selected new ORFs as GFP fusion proteins and we performed interactomics ana-
lyses to screen for interaction partners. Strikingly, a number of GFP-tagged new ORFs
showed distinct subcellular localizations. Their interactome profiles reflected their loc-
alization. For instance, ORF359W-GFP localized to mitochondria and we found it to
interact with the TIMM complex, the transporter of the inner membrane. ORF370W-
GFP localized to the ER and interactedwith the antigen peptide transporter 1 (TAP1) and
HLA-B/C, relevant for the presentation of peptide antigens to immune cells. While the
functional relevance of these short viral proteins remains elusive, distinct localization
and interaction patterns point at critical roles for viral infection.
36
2.3 A systematic mammalian genetic interaction map
2.3 A systematic mammalian genetic interaction map
Bassik,M. C., Kampmann,M., Lebbink, R. J.,Wang, S.,Hein,M. Y., Poser, I.,Weibezahn,
J., Horlbeck, M.A., Chen, S., Mann, M., Hyman, A. A., Leproust, E.M., McManus, M. T.
& Weissman, J. S. A systematic mammalian genetic interaction map reveals pathways
underlying ricin susceptibility. Cell 152(4), 909–922 Feb (2013).
The third collaboration project with the Weissman group was with Mike Bassik and
Martin Kampmann. Mike and Martin established a methodology to measure genetic
interactions in mammalian cells by shRNA knockdown. In a first step, ultra-complex,
pooled shRNA libraries are transfected into cells and the cells are grown under select-
ive conditions. After some time, the shRNA constructs are quantified in the surviving
population by next generation sequencing. Quantitative comparison to the state before
selection yields a shortlist of genes with knockdown phenotypes. In a second step, ge-
netic interactions are detected by transfecting defined constructs encoding select pairs
of candidate genes with each other or with global knockdown constructs. As the selec-
tion marker, they used the toxin ricin at low concentrations. Ricin is a protein that has a
very complex mode of action. It needs to be taken up by endocytosis, before retrograde
transport to the ER and ‘dislocation’ to the cytosol. There, it depurinates a critical aden-
ine residue in the rRNA of the 60S ribosomal subunits, shutting down all translation in
the cell. This complex pathway offers plenty of possibilities for genetic intervention.
One protein complex whose subunits showed knockdown phenotypes was the vesicle
tethering TRAPP complex. Strikingly, while knockdown of some subunits protected the
cells from ricin toxicity, lack of others rendered the cells sensitized. We solved this puzzle
with the help of interaction proteomics usingGFP-taggedTRAPPCproteins. We showed
that there is a core complex with mutually exclusive binding either to TRAPPC9/10 or
TRAPP8/11/12/13. Most likely, both complex types have opposite roles in ricin transport.
TRAPPC13 was a new subunit, previously called C5orf44, that we proposed based on the
combined genetic and physical interaction data.
Moreover, we identified a novel complex consisting of WDR11 and C17orf75, whose
knockdown sensitized against ricin.
2.4 CCDC22 deficiency blunts proinflammatory NF-κb signaling
Starokadomskyy, P., Gluck, N., Li, H., Chen B., Wallis, M., Maine, G.N., Mao, X., Zaidi,
I.W., Hein M.Y., McDonald, F. J., Lenzner, S., Zecha, A., Ropers, H.H., Kuss, A.W.,
McGaughran, J., Gecz, J. & Burstein, E. CCDC22 deficiency in humans blunts activation
of proinflammatory NF-κb signaling. J Clin Invest 123(5), 2244–2256 May (2013).
X-linked intellectual disability (XLID) is a genetically heterogeneous condition affect-
ing a substantial fraction of men with mental retardation. In a collaboration with Hilger
37
●

2 Applications of the QUBIC technology
Ropers and Andreas Kuss from the Max Planck Institute for Molecular Genetics, Ber-
lin, we included a number of genes implicated in XLID into the QUBIC interactomics
pipeline to study their interactors and possibly the effects of disease-associated muta-
tions on the interaction pattern. CCDC22 is a gene on the X chromosome and several
mutations were found in affected families [70]. While my interaction data of CCDC22
revealed little changes between the wild type protein and mutants, I found CCDC22
to reside in a novel, uncharacterized complex including CCDC93, DSCR3, FAM45A/B,
RANBP1, C16orf62 and several copper metabolism gene MURR1 domain (COMMD)
proteins. These interaction data laid the foundation for a joint collaboration with Ezra
Burstein’s group at the University of Texas, who found evidence for that complex com-
ing from the COMMD side. They gathered additional data suggesting that CCDC22-
COMMD complexes are implicated in NF-κB activation and that CCDC22 mutations
interfere with that process.
2.5 Interaction between AP-5 and hereditary spastic paraplegia proteins
Hirst, J., Borner, G.H., Edgar, J., Hein, M. Y., Mann, M., Buchholz, F., Antrobus, R. &
Robinson, M. S. Interaction between AP-5 and the hereditary spastic paraplegia proteins
SPG11 and SPG15. Mol. Biol. Cell 24(16), 2558–2569 Aug (2013).
My collaborationwithGeorg Borner fromMargaret Robinson’s group in Cambridge was
initiated when Georg stayed as a guest scientist in our laboratory in 2012. The Robin-
son group is interested in vesicle transport, in particular the role of adaptor protein (AP)
complexes. AP complexes sort cargo into vesicles for transport betweenmembrane com-
partments. There are four classical AP complexes AP-1/2/3/4 and the recently discovered
AP-5 [71]. All of them are heterotetramers composed of a two large and two small sub-
units. The large subunit of AP-5 was first identified in a screen for DNA repair pro-
teins and shown to be mutated in patients suffering from hereditary spastic paraplegia,
a characteristic shared with two of its interacting proteins, SPG11 and SPG15 [72]. In our
collaboration paper, we used QUBIC to characterize the composition of the AP-5 com-
plex. For the first time, we implemented absolute quantification to narrow down the
stoichiometry of the subunits and found that the four core subunits as well as SPG11 and
SPG15 are all present in equimolar amounts, forming a relatively stable six-membered
functional complex. This sets this complex apart from other AP complexes, which are
stable tetramers in solution that interact with other proteins primarily onmembranes.
38
3 Technologies for large-scale relative and absolute protein quan-tification
Key ingredients for a large-scale proteomics study to investigate the human proteome
and interactome are efficient tools for quantifying thousands of proteins accurately across
thousands of samples. In each dataset, there are two inherent dimensions of quantifica-
tion: Relative quantification of a given protein across samples, and ‘absolute’ quantifica-
tion of different proteins in the same sample. Relative quantification of proteins across
samples is conceptually straightforward because one is comparing apples to apples. How-
ever, there are many challenges in the details. ‘Absolute’ quantification is conceptually
more difficult because one has to compare apples to oranges, in this case different pro-
tein species. In its simplest form, the goal is to compare the molar amounts of different
proteins, i. e. their stoichiometry, in a given sample. Often, these quantities should be
lifted to an absolute scale such as copies per cell or femtomoles. The ultimate goal is to
have a quantification scheme that combines all these characteristics. It should produce
a data matrix with values that can be compared in all dimensions: for selected proteins
across samples, for different proteins in one sample, and for different proteins in different
samples.
To come closer to this goal, I worked on two papers together with Jürgen Cox and Jacek
Wiśniewski in our group, introducing methods for label-free relative and absolute pro-
tein quantification.
3.1 MaxLFQ allows accurate proteome-wide label-free quantification
Cox, J.,Hein,M. Y., Luber, C. A., Paron, I., Nagaraj, N. &Mann, M. Accurate Proteome-
wide Label-free Quantification by Delayed Normalization and Maximal Peptide Ratio
Extraction, Termed MaxLFQ.Mol Cell Proteomics 13(9):2513-26 (2014)
Relative quantification of proteins across conditions was the earliest aim of quantitative
proteomics. All strategies based on stable isotope labels were developed to this end [48–
51]. After incorporation of the label, samples can be mixed and analysed together in
the mass spectrometer. Peptides or proteins then appear in multiplets in single mass
spectrometric runs and their relative quantities can be read off the ratio of the intensities
of the individual peaks making up the multiplets. The number of total ‘plexes’ that can
be combined into a single analysis is limited by the number of available stable isotopes
with amenable chemistry for metabolic or chemical incorporation. Recent advances in
isobaric, MS2-based quantification strategies in combination with the use of labels of
equal nominal masses that can only be distinguished with ultra-high resolution mass
spectrometers allow up to 54-plex analyses [73–75]. However, this comes at considerable
39
●

3 Technologies for large-scale relative and absolute protein quantification
reagent cost, increased sample complexity and quantification being necessarily coupled
to MS/MS identification.
Arguably the simplest quantification approach is the label-freemethod, where all samples
are measured sequentially and hence there is no principal limitation for the number of
samples to be compared. The actual quantification happens entirely in silico and all pos-sible biases introduced during sample preparation need to be accounted for at this stage
(Fig. 5).
Figure 5: Strategies for proteomicquantification.Two samples (blue and yellow) are tobe compared to each other. The typeof isotope label used (if at all) dictatesthe earliest step at which samples canbe mixed. Dashed boxes indicateparallel sample processing concom-itant with the potential introductionof biases. Adapted from [76]
Metaboliclabelling
Chemicallabelling
Spikedstandards
Labelfree
Cells/tissue
Extraction
Proteins
Peptides
MS data
Dataanalysis
Jürgen Cox developed a label-free quantification (LFQ) module for MaxQuant as early
as 2009. The trigger was a project carried out by Christian Luber that sought to de-
termine the proteomic differences between two rare subtypes of murine dendritic cells
[77]. Use of the SILAC mouse [78] was not practicable for this project because of the
required number of animals. The idea was therefore to apply the conceptual advantages
of SILAC to the label-free scenario and to compare the intensities of corresponding pep-
tide features across runs. To make the approach compatible with sample fractionation,
normalization factors had to be calculated for each run and MS signals had to be integ-
rated across all fractions. Finally, the software would calculate a matrix of all available
pair-wise peptide ratios. Each peptide ratio alone already serves as a proxy for the pro-
tein ratio and the idea was to calculate profiles of protein intensities across all samples
that best fulfil the constraints imposed by individual peptide ratios.
When I applied the LFQ algorithm on interaction datasets that grew larger and larger
over time, I realized that there were two pitfalls of the current implementation. Firstly,
the computing time for calculating normalization factors for each MS run scaled quad-
ratically with the number of samples. Up to about 40 samples per dataset, the time
MaxQuant spent on these calculations was almost negligible, but in datasets of around
100 samples, it became the rate limiting step. Given that the result of this calculation was
a single factor per raw file, it was obvious that this should be approximable by a heuristic
approach which we termed ‘FastLFQ’. FastLFQ constructs a graph of all pair-wise file
40
3.1 Publication: MaxLFQ allows accurate proteome-wide label-free quantification
comparisons and then sequentially removes edges while maintaining overall connectiv-
ity and user-definable minimum and average connectivity parameters for each file. As a
result, label-free normalization now scales linearly with the number of files and I have
successfully used it on datasets containing more than 700 experiments.
The second pitfall affected proteins with very high ratios across samples. This is a com-
mon scenario in interaction proteomics where specific interactors that are present in
high amounts in some samples are virtually absent in other samples. However, we ob-
served cases where ratios were dramatically underestimated, because of high apparent
amounts of interactors in negative control samples. This was the result of a feature of
the algorithm that was designed to produce accurate ratios, but turned out to be error-
prone for proteins with extreme ratios. To generate a robust estimate of protein ratios,
only peptides shared across samples are considered for ratio estimation and the median
of individual ratios was used for further calculations. In the case of proteins with very
high ratios across conditions, not onlywere individual peptide ratios very high, butmany
more peptides were identified in some samples compared to the others. This led to the
paradoxical situation that much of the information content was effectively discarded,
as only shared peptides were taken into account. This was not only against the idea of
extracting the maximal quantitative information. It also made the algorithm sensitive
to outliers as protein ratios could be based on a very small subset of peptide ratios. We
solved this problem by interpolating between two kinds of ratio estimations: the median
of pair-wise peptide ratios as the default, and the ratio of the sum of individual peptide
intensities for extreme cases.
41
●
3 Technologies for large-scale relative and absolute protein quantification
Accurate Proteome-wide Label-free Quantificationby Delayed Normalization and Maximal PeptideRatio Extraction, Termed MaxLFQ*□S
Jurgen Cox‡§, Marco Y. Hein‡, Christian A. Luber‡, Igor Paron‡, Nagarjuna Nagaraj‡,and Matthias Mann‡§
Protein quantification without isotopic labels has been along-standing interest in the proteomics field. However,accurate and robust proteome-wide quantification with la-bel-free approaches remains a challenge. We developed anew intensity determination and normalization procedurecalled MaxLFQ that is fully compatible with any peptide orprotein separation prior to LC-MS analysis. Protein abun-dance profiles are assembled using the maximum possibleinformation from MS signals, given that the presence ofquantifiable peptides varies from sample to sample. For abenchmark dataset with two proteomes mixed at knownratios, we accurately detected the mixing ratio over theentire protein expression range, with greater precision forabundant proteins. The significance of individual label-freequantifications was obtained via a t test approach. For asecond benchmark dataset, we accurately quantify foldchanges over several orders of magnitude, a task that ischallenging with label-based methods. MaxLFQ is a genericlabel-free quantification technology that is readily applica-ble to many biological questions; it is compatible withstandard statistical analysis workflows, and it has beenvalidated in many and diverse biological projects. Our algo-rithms can handle very large experiments of 500� samplesin a manageable computing time. It is implemented in thefreely available MaxQuant computational proteomics plat-form and works completely seamlessly at the click of abutton. Molecular & Cellular Proteomics 13: 10.1074/mcp.M113.031591, 2513–2526, 2014.
Mass-spectrometry-based proteomics has become an in-creasingly powerful technology not only for the identificationof large numbers of proteins, but also for their quantification
(1–3). Modern mass spectrometer hardware, in combinationwith increasingly sophisticated bioinformatics software fordata analysis, is now ready to tackle the proteome on a global,comprehensive scale and in a quantitative fashion (4–6).
Stable isotope-based labeling methods are the gold stand-ard for quantification. However, despite their success, theyinherently entail extra preparation steps, whereas label-freequantification is by its nature the simplest and most econom-ical approach. Label-free quantification is in principle appli-cable to any kind of sample, including materials that cannotbe directly metabolically labeled (for instance, many clinicalsamples). In addition, there is no limit on the number ofsamples that can be compared, in contrast to the finite num-ber of “plexes” available for label-based methods (7).
A vast literature on label-free quantification methods, re-viewed in Ref. 3 and Refs. 8–13, and associated softwareprojects (14–31) already exist. These computational methodsinclude simple additive prescriptions to combine peptide in-tensities (32, 33), reference-peptide-based estimates (34),and statistical frameworks utilizing additive linear models (35,36). However, major bottlenecks remain: Most methods re-quire measurement of samples under uniform conditions withstrict adherence to standard sample-handling procedures,with minimal fractionation and in tight temporal sequence.Also, many methods are tailored toward a specific biologicalquestion, such as the detection of protein interactions (37),and are therefore not suitable as generic tools for quantifica-tion at a proteome scale. Finally, the modest accuracy of theirquantitative readouts relative to those obtained with stable-isotope-based methods often prohibits their use for biologicalquestions that require the detection of small changes, such asproteome changes upon stimulus.
Metabolic labeling methods such as SILAC1 (38) excel be-cause of their unparalleled accuracy and robustness, whichare mainly due to stability with regard to variability in sampleprocessing and analysis steps. When isotope labels are intro-
From the ‡Department of Proteomics and Signal Transduction,Max Planck Institute of Biochemistry, Am Klopferspitz 18, D-82152Martinsried, Germany
Author’s Choice—Final version full access.Received June 7, 2013, and in revised form, June 10, 2014Published, MCP Papers in Press, June 17, 2014, DOI 10.1074/
mcp.M113.031591Author contributions: J.C., M.Y.H., and M.M. designed research;
J.C., C.A.L., I.P., N.N., and M.M. performed research; M.Y.H. con-tributed new reagents or analytic tools; J.C. and M.Y.H. analyzeddata; J.C. and M.M. wrote the paper.
1 The abbreviations used are: SILAC, stable isotope labeling byamino acids in cell culture; MS, mass spectrometry; LC-MS, liquidchromatography–mass spectrometry; MS/MS, tandem mass spec-trometry; XIC, extracted ion current; LFQ, label-free quantification;UPS, universal protein standard; FDR, false discovery rate.
Technological Innovation and Resources
Author’s Choice © 2014 by The American Society for Biochemistry and Molecular Biology, Inc.This paper is available on line at http://www.mcponline.org
Molecular & Cellular Proteomics 13.9 2513
42
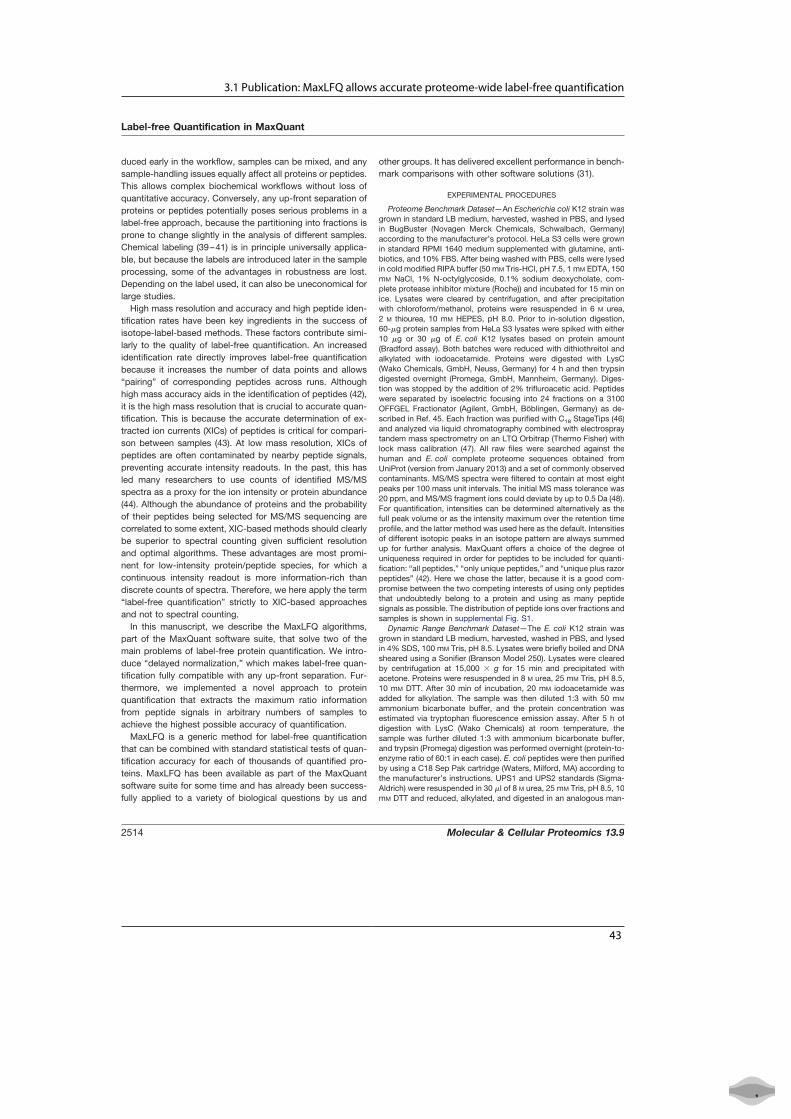
3.1 Publication: MaxLFQ allows accurate proteome-wide label-free quantification
duced early in the workflow, samples can be mixed, and anysample-handling issues equally affect all proteins or peptides.This allows complex biochemical workflows without loss ofquantitative accuracy. Conversely, any up-front separation ofproteins or peptides potentially poses serious problems in alabel-free approach, because the partitioning into fractions isprone to change slightly in the analysis of different samples.Chemical labeling (39–41) is in principle universally applica-ble, but because the labels are introduced later in the sampleprocessing, some of the advantages in robustness are lost.Depending on the label used, it can also be uneconomical forlarge studies.
High mass resolution and accuracy and high peptide iden-tification rates have been key ingredients in the success ofisotope-label-based methods. These factors contribute simi-larly to the quality of label-free quantification. An increasedidentification rate directly improves label-free quantificationbecause it increases the number of data points and allows“pairing” of corresponding peptides across runs. Althoughhigh mass accuracy aids in the identification of peptides (42),it is the high mass resolution that is crucial to accurate quan-tification. This is because the accurate determination of ex-tracted ion currents (XICs) of peptides is critical for compari-son between samples (43). At low mass resolution, XICs ofpeptides are often contaminated by nearby peptide signals,preventing accurate intensity readouts. In the past, this hasled many researchers to use counts of identified MS/MSspectra as a proxy for the ion intensity or protein abundance(44). Although the abundance of proteins and the probabilityof their peptides being selected for MS/MS sequencing arecorrelated to some extent, XIC-based methods should clearlybe superior to spectral counting given sufficient resolutionand optimal algorithms. These advantages are most promi-nent for low-intensity protein/peptide species, for which acontinuous intensity readout is more information-rich thandiscrete counts of spectra. Therefore, we here apply the term“label-free quantification” strictly to XIC-based approachesand not to spectral counting.
In this manuscript, we describe the MaxLFQ algorithms,part of the MaxQuant software suite, that solve two of themain problems of label-free protein quantification. We intro-duce “delayed normalization,” which makes label-free quan-tification fully compatible with any up-front separation. Fur-thermore, we implemented a novel approach to proteinquantification that extracts the maximum ratio informationfrom peptide signals in arbitrary numbers of samples toachieve the highest possible accuracy of quantification.
MaxLFQ is a generic method for label-free quantificationthat can be combined with standard statistical tests of quan-tification accuracy for each of thousands of quantified pro-teins. MaxLFQ has been available as part of the MaxQuantsoftware suite for some time and has already been success-fully applied to a variety of biological questions by us and
other groups. It has delivered excellent performance in bench-mark comparisons with other software solutions (31).
EXPERIMENTAL PROCEDURES
Proteome Benchmark Dataset—An Escherichia coli K12 strain wasgrown in standard LB medium, harvested, washed in PBS, and lysedin BugBuster (Novagen Merck Chemicals, Schwalbach, Germany)according to the manufacturer’s protocol. HeLa S3 cells were grownin standard RPMI 1640 medium supplemented with glutamine, anti-biotics, and 10% FBS. After being washed with PBS, cells were lysedin cold modified RIPA buffer (50 mM Tris-HCl, pH 7.5, 1 mM EDTA, 150mM NaCl, 1% N-octylglycoside, 0.1% sodium deoxycholate, com-plete protease inhibitor mixture (Roche)) and incubated for 15 min onice. Lysates were cleared by centrifugation, and after precipitationwith chloroform/methanol, proteins were resuspended in 6 M urea,2 M thiourea, 10 mM HEPES, pH 8.0. Prior to in-solution digestion,60-�g protein samples from HeLa S3 lysates were spiked with either10 �g or 30 �g of E. coli K12 lysates based on protein amount(Bradford assay). Both batches were reduced with dithiothreitol andalkylated with iodoacetamide. Proteins were digested with LysC(Wako Chemicals, GmbH, Neuss, Germany) for 4 h and then trypsindigested overnight (Promega, GmbH, Mannheim, Germany). Diges-tion was stopped by the addition of 2% trifluroacetic acid. Peptideswere separated by isoelectric focusing into 24 fractions on a 3100OFFGEL Fractionator (Agilent, GmbH, Böblingen, Germany) as de-scribed in Ref. 45. Each fraction was purified with C18 StageTips (46)and analyzed via liquid chromatography combined with electrospraytandem mass spectrometry on an LTQ Orbitrap (Thermo Fisher) withlock mass calibration (47). All raw files were searched against thehuman and E. coli complete proteome sequences obtained fromUniProt (version from January 2013) and a set of commonly observedcontaminants. MS/MS spectra were filtered to contain at most eightpeaks per 100 mass unit intervals. The initial MS mass tolerance was20 ppm, and MS/MS fragment ions could deviate by up to 0.5 Da (48).For quantification, intensities can be determined alternatively as thefull peak volume or as the intensity maximum over the retention timeprofile, and the latter method was used here as the default. Intensitiesof different isotopic peaks in an isotope pattern are always summedup for further analysis. MaxQuant offers a choice of the degree ofuniqueness required in order for peptides to be included for quanti-fication: “all peptides,” “only unique peptides,” and “unique plus razorpeptides” (42). Here we chose the latter, because it is a good com-promise between the two competing interests of using only peptidesthat undoubtedly belong to a protein and using as many peptidesignals as possible. The distribution of peptide ions over fractions andsamples is shown in supplemental Fig. S1.
Dynamic Range Benchmark Dataset—The E. coli K12 strain wasgrown in standard LB medium, harvested, washed in PBS, and lysedin 4% SDS, 100 mM Tris, pH 8.5. Lysates were briefly boiled and DNAsheared using a Sonifier (Branson Model 250). Lysates were clearedby centrifugation at 15,000 � g for 15 min and precipitated withacetone. Proteins were resuspended in 8 M urea, 25 mM Tris, pH 8.5,10 mM DTT. After 30 min of incubation, 20 mM iodoacetamide wasadded for alkylation. The sample was then diluted 1:3 with 50 mM
ammonium bicarbonate buffer, and the protein concentration wasestimated via tryptophan fluorescence emission assay. After 5 h ofdigestion with LysC (Wako Chemicals) at room temperature, thesample was further diluted 1:3 with ammonium bicarbonate buffer,and trypsin (Promega) digestion was performed overnight (protein-to-enzyme ratio of 60:1 in each case). E. coli peptides were then purifiedby using a C18 Sep Pak cartridge (Waters, Milford, MA) according tothe manufacturer’s instructions. UPS1 and UPS2 standards (Sigma-Aldrich) were resuspended in 30 �l of 8 M urea, 25 mM Tris, pH 8.5, 10mM DTT and reduced, alkylated, and digested in an analogous man-
Label-free Quantification in MaxQuant
2514 Molecular & Cellular Proteomics 13.9
43
●

3 Technologies for large-scale relative and absolute protein quantification
ner, but with a lower protein-to-enzyme ratio (12:1 for UPS1 and 10:1for UPS2, both LysC and trypsin). UPS peptides were then purifiedusing C18 StageTips. E. coli and UPS peptides were quantified basedon absorbance at 280 nm using a NanoDrop spectrophotometer(Fisher Scientific). For each run, 2 �g of E. coli peptides were thenspiked with 0.15 �g of either UPS1 or UPS2 peptides, and about 1.6�g of the mix was then analyzed via liquid chromatography combinedwith mass spectrometry on a Q Exactive (Thermo Fisher). Data wereanalyzed with MaxQuant as described above for the proteome dataset.All files were searched against the E. coli complete proteome se-quences plus those of the UPS proteins and common contaminants.
Retention Time Alignment and Identification Transfer—To increasethe number of peptides that can be used for quantification beyondthose that have been sequenced and identified by an MS/MS data-base search engine, one can transfer peptide identifications tounsequenced or unidentified peptides by matching their mass andretention times (“match-between-runs” feature in MaxQuant). A pre-requisite for this is that retention times between different LC-MS runsbe made comparable via alignment. The order in which LC-MS runsare aligned is determined by hierarchical clustering, which allows oneto avoid reliance on a single master run. The terminal branches of thetree from the hierarchical clustering typically connect LC-MS runs ofthe same or neighboring fractions or replicate runs, as they are themost similar. These cases are aligned first. Moving along the treestructure, increasingly dissimilar runs are integrated. The calibrationfunctions that are needed to completely align LC-MS runs are usuallytime-dependent in a nonlinear way. Every pair-wise alignment step isperformed via two-dimensional Gaussian kernel smoothing of themass matches between the two runs. Following the ridge of thehighest density region determines the recalibration function. At eachtree node the resulting recalibration function is applied to one of thetwo subtrees, and the other is left unaltered.
Unidentified LC-MS features are then assigned to peptide identifi-cations in other runs that match based on their accurate masses andaligned retention times. In complex proteomes, the high mass accu-racy on current Orbitrap instruments is still insufficient for an unequiv-ocal peptide identification based on the peptide mass alone. How-ever, when comparing peptides in similar LC-MS runs, the informationcontained in peptide mass and recalibrated retention time is enoughto transfer identifications with a sufficiently low FDR (in the range of1%), which one can estimate by comparing the density of matchesinside the match time window to the density outside this window (49).
The matching procedure takes into account the up-front separa-tion, in this case isoelectric focusing of peptides into 24 fractions.Identifications are only transferred into adjacent fractions. If, for in-stance, for a given peptide sequenced in fraction 7, isotope patternsare found to match by mass and retention time in fractions 6, 8, and17, the matches in fraction 17 are discarded because they have amuch greater probability of being false. The same strategy can beapplied to any other up-front peptide or protein separation (e.g.one-dimensional gel electrophoresis). All matches with retention timedifferences of less than 0.5 min after recalibration are accepted.Further details on the alignment and matching algorithms, includinghow to control the FDR of matching, will be described in a futuremanuscript.
Software and Data Availability—The label-free software MaxLFQ iscompletely integrated into the MaxQuant software (42) and can beactivated by one additional click. It is freely available to academic andcommercial users as part of MaxQuant and can be downloaded viathe Internet. MaxQuant runs on Windows desktop computers withVista or newer operating systems, preferably the 64-bit versions.There is a large user community at the MaxQuant Google group.
All downstream analysis was done using our in-house developedPerseus software, which is also freely available from the MaxQuantwebsite.
The mass spectrometry proteomics data have been depositedto the ProteomeXchange Consortium (http://proteomecentral.proteomexchange.org) via the PRIDE partner repository with thedataset identifier PXD000279.
RESULTS
Proteome-wide Benchmark Dataset—Evaluation of the ac-curacy of a label-free workflow at a proteome scale requires adataset with known ratios. To this end we produced a bench-mark dataset by mixing whole, distinguishable proteomes indefined ratios. Combined trypsin-digested lysates of HeLacells and E. coli cells were extensively separated via isoelec-tric focusing into 24 fractions as described (45) and analyzedvia LC-MS/MS in three replicates (“Experimental Proce-dures”). This was repeated with the same quantity of HeLa,but admixed with a 3-fold increased amount of E. coli lysate.In the resulting six samples all human proteins thereforeshould have had one-to-one ratios and all E. coli proteinsshould have had a ratio of three to one between replicategroups.
Raw data were processed with MaxQuant (42) and itsbuilt-in Andromeda search engine (50) for feature extraction,peptide identification, and protein inference. Peptide and pro-tein FDRs were both set at 1%. MaxQuant identified a total of789,978 isotope clusters through MS/MS sequencing. Trans-ferring identifications to other LC-MS runs by matching themto unidentified features based on their masses and recali-brated retention times increased the number of quantifiableisotope patterns more than 2-fold (“match-between-runs,”“Experimental Procedures”).
A Novel Solution to the Normalization Problem—A majorchallenge of label-free quantification with prefractionation isthat separate sample processing inevitably introduces differ-ences in the fractions to be compared. In principle, correctnormalization of each fraction can eliminate this error. How-ever, the total peptide ion signals, necessary in order toperform normalization of the LC MS/MS runs of each fraction,are spread over several adjacent runs. Therefore one cannotsum up the peptide ion signals before one knows the normal-ization coefficients for each fraction.
We solve this dilemma by delaying normalization. Aftersumming up intensities with normalization factors as freevariables, we determine their quantities via a global optimiza-tion procedure based on achieving the least overall proteomevariation.
Formally, we want to determine normalization coefficientsNj, which multiply all intensities in the jth LC-MS run (j runsfrom 1 to 144 in our example). The normalization is donepurely from the data obtained and without the addition ofexternal quantification standards or reliance on a fixed set of“housekeeping” proteins. Directly adjusting the normalizationcoefficients Nj for each of the fractions so that the total signal
Label-free Quantification in MaxQuant
Molecular & Cellular Proteomics 13.9 2515
44
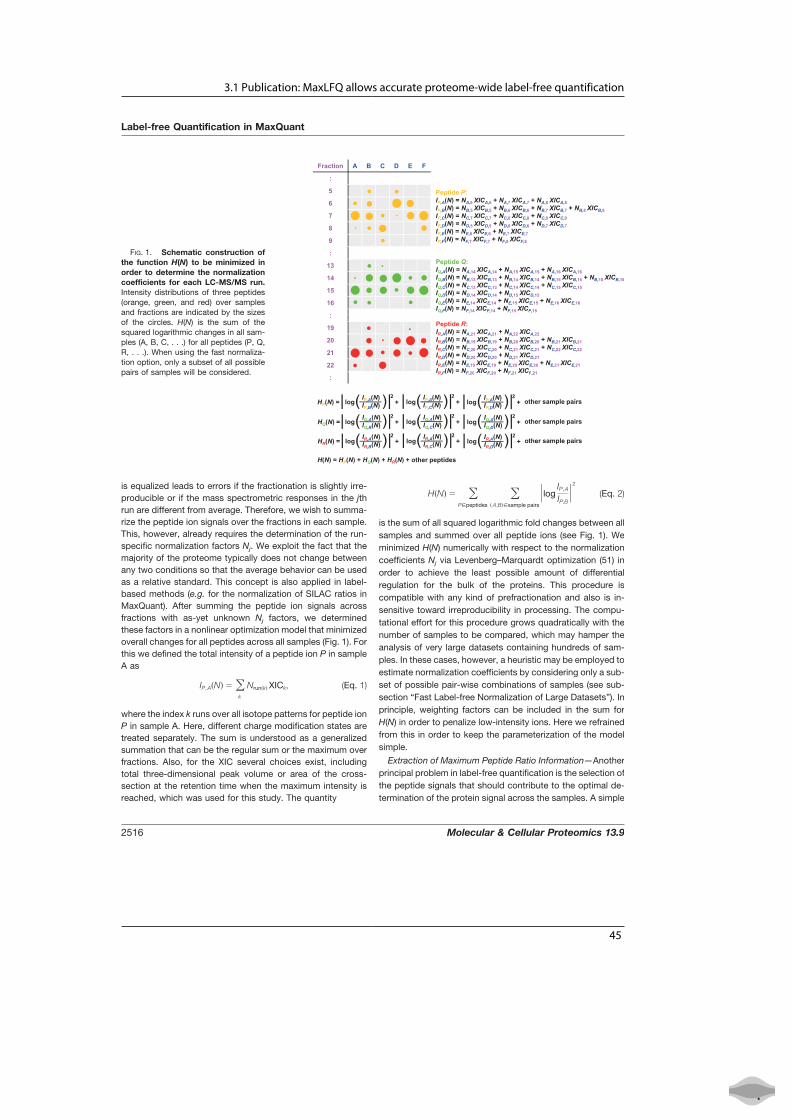
3.1 Publication: MaxLFQ allows accurate proteome-wide label-free quantification
is equalized leads to errors if the fractionation is slightly irre-producible or if the mass spectrometric responses in the jthrun are different from average. Therefore, we wish to summa-rize the peptide ion signals over the fractions in each sample.This, however, already requires the determination of the run-specific normalization factors Nj. We exploit the fact that themajority of the proteome typically does not change betweenany two conditions so that the average behavior can be usedas a relative standard. This concept is also applied in label-based methods (e.g. for the normalization of SILAC ratios inMaxQuant). After summing the peptide ion signals acrossfractions with as-yet unknown Nj factors, we determinedthese factors in a nonlinear optimization model that minimizedoverall changes for all peptides across all samples (Fig. 1). Forthis we defined the total intensity of a peptide ion P in sampleA as
IP, A�N� � �k
Nrun�k� XICk, (Eq. 1)
where the index k runs over all isotope patterns for peptide ionP in sample A. Here, different charge modification states aretreated separately. The sum is understood as a generalizedsummation that can be the regular sum or the maximum overfractions. Also, for the XIC several choices exist, includingtotal three-dimensional peak volume or area of the cross-section at the retention time when the maximum intensity isreached, which was used for this study. The quantity
H�N� � �P�peptides
�� A,B��sample pairs
�logIP, A
IP,B�2
(Eq. 2)
is the sum of all squared logarithmic fold changes between allsamples and summed over all peptide ions (see Fig. 1). Weminimized H(N) numerically with respect to the normalizationcoefficients Nj via Levenberg–Marquardt optimization (51) inorder to achieve the least possible amount of differentialregulation for the bulk of the proteins. This procedure iscompatible with any kind of prefractionation and also is in-sensitive toward irreproducibility in processing. The compu-tational effort for this procedure grows quadratically with thenumber of samples to be compared, which may hamper theanalysis of very large datasets containing hundreds of sam-ples. In these cases, however, a heuristic may be employed toestimate normalization coefficients by considering only a sub-set of possible pair-wise combinations of samples (see sub-section “Fast Label-free Normalization of Large Datasets”). Inprinciple, weighting factors can be included in the sum forH(N) in order to penalize low-intensity ions. Here we refrainedfrom this in order to keep the parameterization of the modelsimple.
Extraction of Maximum Peptide Ratio Information—Anotherprincipal problem in label-free quantification is the selection ofthe peptide signals that should contribute to the optimal de-termination of the protein signal across the samples. A simple
Fraction A B C D E F
:
5 Peptide P:6
7
8
9
:
IP,A(N) = NA,6XICA,6 + NA,7 XICA,7 + NA,8XICA,8IP,B(N) = NB,5XICB,5 + NB,6 XICB,6 + NB,7XICB,7 + NB,8XICB,8IP,C(N) = NC,7XICC,7 + NC,8 XICC,8 + NC,9XICC,9IP,D(N) = ND,5XICD,5 + ND,6 XICD,6 + ND,7XICD,7IP,E(N) = NE,6XICE,6 + NE,7XICE,7IP,F(N) = NF,7XICF,7 + NF,8XICF,8
13
14
15
16
:
Peptide Q:IQ,A(N) = NA,14XICA,14 + NA,15 XICA,15 + NA,16 XICA,16IQ,B(N) = NB,13XICB,13 + NB,14 XICB,14 + NB,15 XICB,15 + NB,16 XICB,16IQ,C(N) = NC,13XICC,13 + NC,14 XICC,14 + NC,15 XICC,15IQ,D(N) = ND,14XICD,14 + ND,15 XICD,15IQ,E(N) = NE,14 XICE,14 + NE,15XICE,15 + NE,16XICE,16IQ,F(N) = NF,14XICF,14 + NF,15 XICF,15
:
19
20
21
22
Peptide R:IR,A(N) = NA,21XICA,21 + NA,22 XICA,22IR,B(N) = NB,19XICB,19 + NB,20 XICB,20 + NB,21 XICB,21IR,C(N) = NC,20XICC,20 + NC,21 XICC,21 + NC,22 XICC,22IR,D(N) = ND,20XICD,20 + ND,21 XICD,21IR,E(N) = NE,19 XICE,19 + NE,20 XICE,20 + NE,21XICE,21IR F(N) = NF 20 XICF 20 + NF 21XICF 21
( ) ( ) ( ) | | IP,A(N)
IP,B(N)( ) :
IR,F(N) NF,20 XICF,20 NF,21XICF,21
log2
+HP(N) = | | IP,A(N)IP,C(N)log
2+ | | IP,A(N)
IP,D(N)log2
+ other sample pairs
( ) ( ) | | IQ,A(N)IQ,B(N)log
2+HQ(N) = | | IQ,A(N)
IQ,C(N)log2
+ | | IQ,A(N)IQ,D(N)log
2+ other sample pairs
( ) ( ) ( ) | | IR,A(N)IR,B(N)log
2+HR(N) = | | IR,A(N)
IR,C(N)log2
+ | | IR,A(N)IR,D(N)log
2+ other sample pairs
H(N) = HP(N) + HQ(N) + HR(N) + other peptides
FIG. 1. Schematic construction ofthe function H(N) to be minimized inorder to determine the normalizationcoefficients for each LC-MS/MS run.Intensity distributions of three peptides(orange, green, and red) over samplesand fractions are indicated by the sizesof the circles. H(N) is the sum of thesquared logarithmic changes in all sam-ples (A, B, C, . . .) for all peptides (P, Q,R, . . .). When using the fast normaliza-tion option, only a subset of all possiblepairs of samples will be considered.
Label-free Quantification in MaxQuant
2516 Molecular & Cellular Proteomics 13.9
45
●
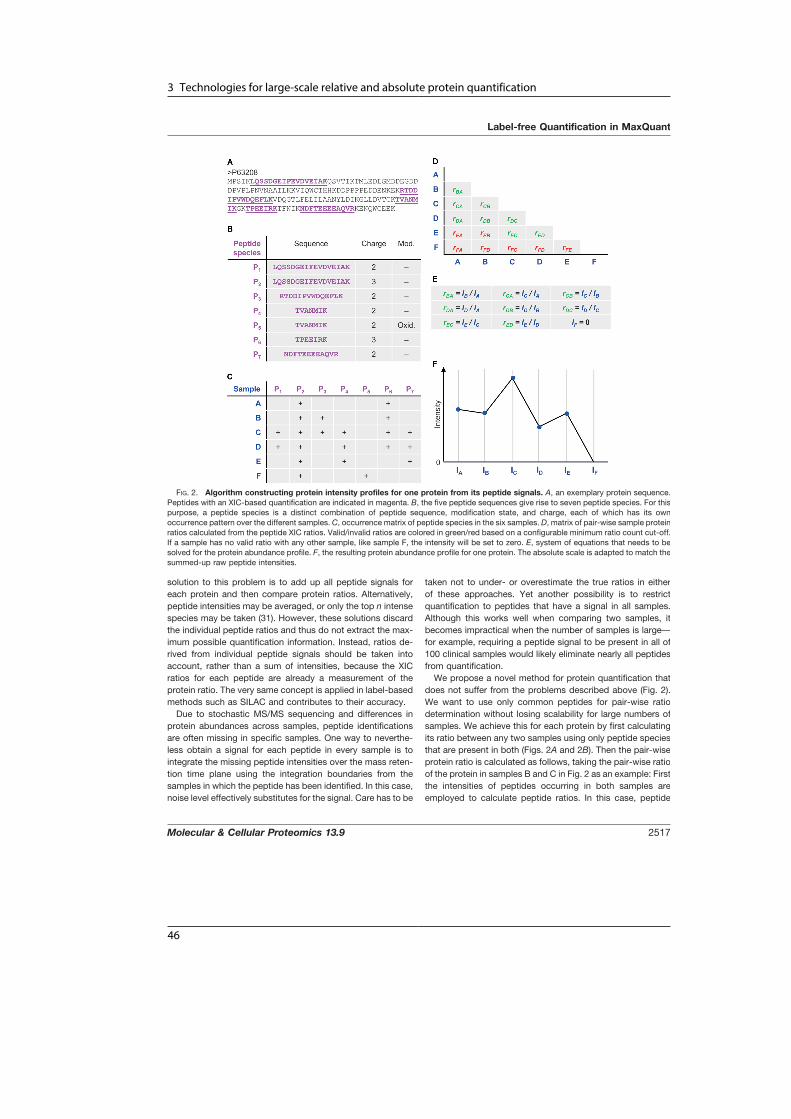
3 Technologies for large-scale relative and absolute protein quantification
solution to this problem is to add up all peptide signals foreach protein and then compare protein ratios. Alternatively,peptide intensities may be averaged, or only the top n intensespecies may be taken (31). However, these solutions discardthe individual peptide ratios and thus do not extract the max-imum possible quantification information. Instead, ratios de-rived from individual peptide signals should be taken intoaccount, rather than a sum of intensities, because the XICratios for each peptide are already a measurement of theprotein ratio. The very same concept is applied in label-basedmethods such as SILAC and contributes to their accuracy.
Due to stochastic MS/MS sequencing and differences inprotein abundances across samples, peptide identificationsare often missing in specific samples. One way to neverthe-less obtain a signal for each peptide in every sample is tointegrate the missing peptide intensities over the mass reten-tion time plane using the integration boundaries from thesamples in which the peptide has been identified. In this case,noise level effectively substitutes for the signal. Care has to be
taken not to under- or overestimate the true ratios in eitherof these approaches. Yet another possibility is to restrictquantification to peptides that have a signal in all samples.Although this works well when comparing two samples, itbecomes impractical when the number of samples is large—for example, requiring a peptide signal to be present in all of100 clinical samples would likely eliminate nearly all peptidesfrom quantification.
We propose a novel method for protein quantification thatdoes not suffer from the problems described above (Fig. 2).We want to use only common peptides for pair-wise ratiodetermination without losing scalability for large numbers ofsamples. We achieve this for each protein by first calculatingits ratio between any two samples using only peptide speciesthat are present in both (Figs. 2A and 2B). Then the pair-wiseprotein ratio is calculated as follows, taking the pair-wise ratioof the protein in samples B and C in Fig. 2 as an example: Firstthe intensities of peptides occurring in both samples areemployed to calculate peptide ratios. In this case, peptide
FIG. 2. Algorithm constructing protein intensity profiles for one protein from its peptide signals. A, an exemplary protein sequence.Peptides with an XIC-based quantification are indicated in magenta. B, the five peptide sequences give rise to seven peptide species. For thispurpose, a peptide species is a distinct combination of peptide sequence, modification state, and charge, each of which has its ownoccurrence pattern over the different samples. C, occurrence matrix of peptide species in the six samples. D, matrix of pair-wise sample proteinratios calculated from the peptide XIC ratios. Valid/invalid ratios are colored in green/red based on a configurable minimum ratio count cut-off.If a sample has no valid ratio with any other sample, like sample F, the intensity will be set to zero. E, system of equations that needs to besolved for the protein abundance profile. F, the resulting protein abundance profile for one protein. The absolute scale is adapted to match thesummed-up raw peptide intensities.
Label-free Quantification in MaxQuant
Molecular & Cellular Proteomics 13.9 2517
46

3.1 Publication: MaxLFQ allows accurate proteome-wide label-free quantification
species P2, P3, and P6 are shared (Fig. 2C). The pair-wiseprotein ratio rCB (Fig. 2D) is then defined as the median ofthe peptide ratios, to protect against outliers. We then pro-ceed to determine all pair-wise protein ratios. In the examplein Fig. 2, we require a minimal number of two peptide ratios inorder for a given protein ratio to be considered valid. Thisparameter is configurable in the MaxQuant software. Setting ahigher threshold will lead to more accurate quantitative val-ues, at the expense of more missing values.
At this point we have constructed a triangular matrix contain-ing all pair-wise protein ratios between any two samples, whichis the maximal possible quantification information. This matrixcorresponds to an overdetermined system of equations for theunderlying protein abundance profile (IA, IB, IC, . . .) across thesamples (Fig. 2E). We perform a least-squares analysis to re-construct the abundance profile optimally satisfying the individ-ual protein ratios in the matrix based on the sum of squareddifferences
�� j,k��valid pairs
�log rj,k � log Ij � log Ik�2. (Eq. 3)
Then we rescale the whole profile to the cumulative inten-sity across samples, thereby preserving the total summedintensity for a protein over all samples (Figs. 2E and 2F). Thisprocedure is repeated for all proteins, resulting in an accurateabundance profile for each protein across the samples. Thecomputational effort grows quadratically with the number ofsamples in which a protein is present; however, it is readilyparallelizable at the protein level.
All resulting profiles are written into the MaxQuant outputtables in columns starting with “LFQ intensity.”
Quantification Results for the Proteome BenchmarkSet—To apply the algorithms to the E. coli and HeLa cellmixture, we required a protein to have non-zero intensity intwo out of the three replicates for each condition. In addition,protein groups had to be unambiguously assignable to one
1.741.95
-2 -1 0 1 2 3 4 -2 -1 0 1 2 3 4 -2 -1 0 1 2 3 4
-2 -1 0 1 2 3 4 -2 -1 0 1 2 3 4 -2 -1 0 1 2 3 4
78
119
1012
78
119
1012
78
119
1012
78
119
1012
78
119
1012
78
119
1012
Log2(ratio) Log2(ratio) Log2(ratio)
Log1
0(su
mm
ed in
tens
ity)
Log1
0(su
mm
ed in
tens
ity)
C
D E F
G H
A B
-2 -1 0 1 2 3 4 -2 -1 0 1 2 3 4 -2 -1 0 1 2 3 4Log2(ratio) Log2(ratio) Log2(ratio)
I
0% 50% 75% 90% 95% 100%
σ = 0.60
σ = 0.46
σ = 0.69
σ = 0.51σ = 0.55σ = 0.86
Spectral count Summed intensities MaxLFQ
-0.48
1.262.32
0.37-0.53
1.421.95
Rel
ativ
e fre
quen
cies
excluded fraction
HumanE. coli
HumanE. coli
FIG. 3. Quantification results forthe proteome benchmark dataset.Replicate groups were filtered for twoout of three valid values and averaged,and the log ratios of the E. coli (orange)/human (blue) 3:1 versus 1:1 sampleswere plotted against the logarithm ofsummed peptide intensities from the 1:1sample as a proxy for absolute proteinabundance. A, quantification usingspectral counts. B, quantification usingsummed peptide intensities. C, quantifi-cation using MaxLFQ. D–F, same asA–C, but colored using density estima-tion. G, H, histograms of the ratio distri-butions of human and E. coli proteinsobtained using the different quantifica-tion methods.
Label-free Quantification in MaxQuant
2518 Molecular & Cellular Proteomics 13.9
47
●
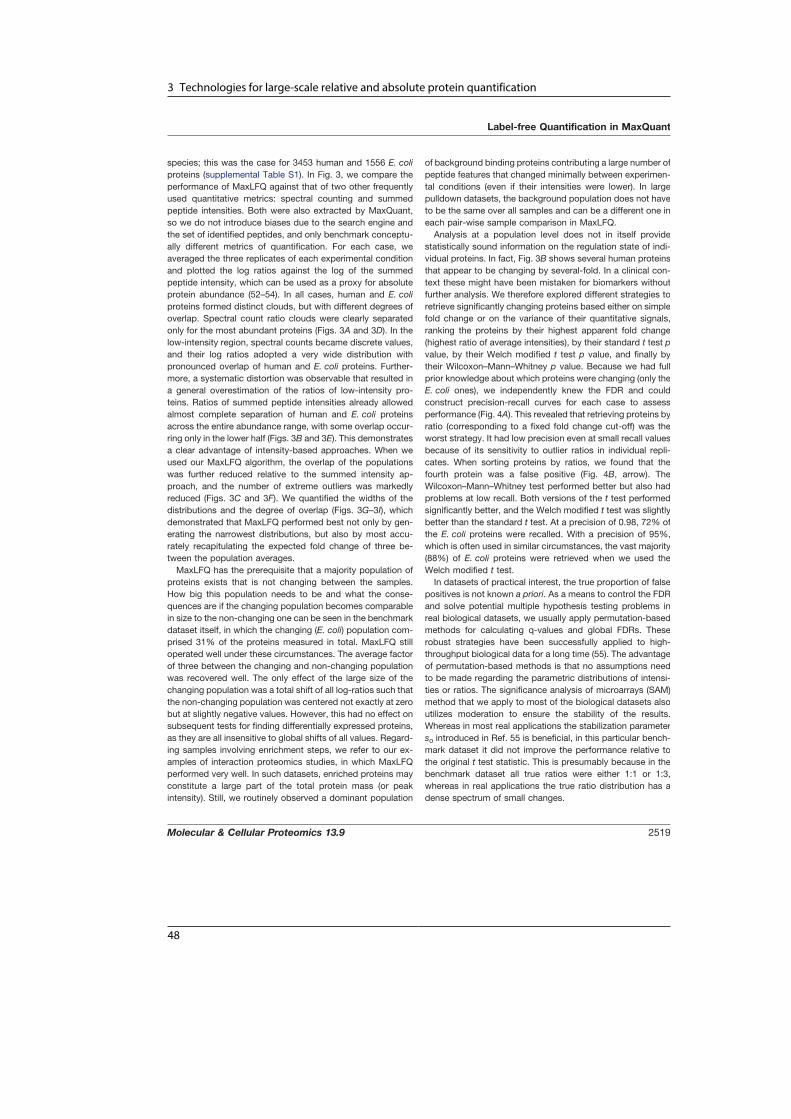
3 Technologies for large-scale relative and absolute protein quantification
species; this was the case for 3453 human and 1556 E. coliproteins (supplemental Table S1). In Fig. 3, we compare theperformance of MaxLFQ against that of two other frequentlyused quantitative metrics: spectral counting and summedpeptide intensities. Both were also extracted by MaxQuant,so we do not introduce biases due to the search engine andthe set of identified peptides, and only benchmark conceptu-ally different metrics of quantification. For each case, weaveraged the three replicates of each experimental conditionand plotted the log ratios against the log of the summedpeptide intensity, which can be used as a proxy for absoluteprotein abundance (52–54). In all cases, human and E. coliproteins formed distinct clouds, but with different degrees ofoverlap. Spectral count ratio clouds were clearly separatedonly for the most abundant proteins (Figs. 3A and 3D). In thelow-intensity region, spectral counts became discrete values,and their log ratios adopted a very wide distribution withpronounced overlap of human and E. coli proteins. Further-more, a systematic distortion was observable that resulted ina general overestimation of the ratios of low-intensity pro-teins. Ratios of summed peptide intensities already allowedalmost complete separation of human and E. coli proteinsacross the entire abundance range, with some overlap occur-ring only in the lower half (Figs. 3B and 3E). This demonstratesa clear advantage of intensity-based approaches. When weused our MaxLFQ algorithm, the overlap of the populationswas further reduced relative to the summed intensity ap-proach, and the number of extreme outliers was markedlyreduced (Figs. 3C and 3F). We quantified the widths of thedistributions and the degree of overlap (Figs. 3G–3I), whichdemonstrated that MaxLFQ performed best not only by gen-erating the narrowest distributions, but also by most accu-rately recapitulating the expected fold change of three be-tween the population averages.
MaxLFQ has the prerequisite that a majority population ofproteins exists that is not changing between the samples.How big this population needs to be and what the conse-quences are if the changing population becomes comparablein size to the non-changing one can be seen in the benchmarkdataset itself, in which the changing (E. coli) population com-prised 31% of the proteins measured in total. MaxLFQ stilloperated well under these circumstances. The average factorof three between the changing and non-changing populationwas recovered well. The only effect of the large size of thechanging population was a total shift of all log-ratios such thatthe non-changing population was centered not exactly at zerobut at slightly negative values. However, this had no effect onsubsequent tests for finding differentially expressed proteins,as they are all insensitive to global shifts of all values. Regard-ing samples involving enrichment steps, we refer to our ex-amples of interaction proteomics studies, in which MaxLFQperformed very well. In such datasets, enriched proteins mayconstitute a large part of the total protein mass (or peakintensity). Still, we routinely observed a dominant population
of background binding proteins contributing a large number ofpeptide features that changed minimally between experimen-tal conditions (even if their intensities were lower). In largepulldown datasets, the background population does not haveto be the same over all samples and can be a different one ineach pair-wise sample comparison in MaxLFQ.
Analysis at a population level does not in itself providestatistically sound information on the regulation state of indi-vidual proteins. In fact, Fig. 3B shows several human proteinsthat appear to be changing by several-fold. In a clinical con-text these might have been mistaken for biomarkers withoutfurther analysis. We therefore explored different strategies toretrieve significantly changing proteins based either on simplefold change or on the variance of their quantitative signals,ranking the proteins by their highest apparent fold change(highest ratio of average intensities), by their standard t test pvalue, by their Welch modified t test p value, and finally bytheir Wilcoxon–Mann–Whitney p value. Because we had fullprior knowledge about which proteins were changing (only theE. coli ones), we independently knew the FDR and couldconstruct precision-recall curves for each case to assessperformance (Fig. 4A). This revealed that retrieving proteins byratio (corresponding to a fixed fold change cut-off) was theworst strategy. It had low precision even at small recall valuesbecause of its sensitivity to outlier ratios in individual repli-cates. When sorting proteins by ratios, we found that thefourth protein was a false positive (Fig. 4B, arrow). TheWilcoxon–Mann–Whitney test performed better but also hadproblems at low recall. Both versions of the t test performedsignificantly better, and the Welch modified t test was slightlybetter than the standard t test. At a precision of 0.98, 72% ofthe E. coli proteins were recalled. With a precision of 95%,which is often used in similar circumstances, the vast majority(88%) of E. coli proteins were retrieved when we used theWelch modified t test.
In datasets of practical interest, the true proportion of falsepositives is not known a priori. As a means to control the FDRand solve potential multiple hypothesis testing problems inreal biological datasets, we usually apply permutation-basedmethods for calculating q-values and global FDRs. Theserobust strategies have been successfully applied to high-throughput biological data for a long time (55). The advantageof permutation-based methods is that no assumptions needto be made regarding the parametric distributions of intensi-ties or ratios. The significance analysis of microarrays (SAM)method that we apply to most of the biological datasets alsoutilizes moderation to ensure the stability of the results.Whereas in most real applications the stabilization parameters0 introduced in Ref. 55 is beneficial, in this particular bench-mark dataset it did not improve the performance relative tothe original t test statistic. This is presumably because in thebenchmark dataset all true ratios were either 1:1 or 1:3,whereas in real applications the true ratio distribution has adense spectrum of small changes.
Label-free Quantification in MaxQuant
Molecular & Cellular Proteomics 13.9 2519
48

3.1 Publication: MaxLFQ allows accurate proteome-wide label-free quantification
Interestingly, about one-third of the proteome was chang-ing in the benchmark dataset, which is a large amount, con-sidering that the normalization was based on the assumptionof a dominating population of non-changing proteins. Theeffect of this can be observed in Fig. 3I. The center of the 1:1population is shifted to slightly negative values. However, thedistance between the means of the 3:1 and 1:1 populations isnear the correct value of log2(3). Such a global shift of allratios will not affect statistical testing, as a test such as the ttest is insensitive to such a global shift of all values. If oneinsists on having a 1:1 distribution centered exactly at 0, onecan apply another normalization step in which one subtractsthe most frequent value (i.e. the position of the globalmaximum).
So far we have assessed the measurability of 3:1 changesover the whole accessible dynamic range of protein abun-dances. Another question of interest is how measurablesmaller ratios are. For this purpose we conducted an in silicoexperiment in which the results of the actual 3:1 experimentwere rescaled in order to mimic results obtained with lowermixing ratios. We rescaled the log ratios of all E. coli proteinsin the three samples with the 3-fold increased E. coli abun-dance by adding the constant
�1 � S� � �mean�human� � mean�E. coli�� (Eq. 4)
to all of these values. Here, mean(E. coli) is the average dif-ference in log intensities between the two replicate groups forthe E. coli proteins, mean(human) is the same quantity calcu-lated for all human proteins, and s is a scaling factor between0 and 1. For s � 1, the original data are recovered, whereas fors � 0 the mean ratio is 1:1 for all proteins, in particular for theE. coli proteins. For a given value of s, the correspondingsimulated ratio is r � 3s.
Fig. 5A shows precision-recall curves similar to those in Fig.4A. This time, only the t test was used for determining signif-icant changes, and we scanned through several values for thesimulated ratio r. As an example, we tolerated a proportion offalse discoveries (Q, the value estimated by the FDR) of 10%for calling changes significant. Although in that case almost alltruly changing proteins are recovered with a ratio of 3, abouthalf of them are still obtained at a ratio of 1.6. Going below amean ratio change of 1.6 will lead to strong drop in coverage.The FDR threshold that one wishes to apply depends on theexperimental situation and on the biological or technologicalquestion. There is no a priori given FDR that is applicable toevery case. For instance, if pre-screening is done (e.g. toexplore regulated pathways or biological processes), a 25%FDR might still be tolerable, whereas in other cases a 5% FDRmight not be stringent enough. To get an idea about therelationship between protein ratio and coverage achieved forproteins having this ratio, we plotted this dependence in Fig.5B for several values of Q. In particular, for low stringencythere is a very rapid drop of coverage around a well-definedratio. For instance, the Q � 0.25 curve has a steep slopearound a ratio of 1.4 where it achieves half of the coverage.One could define this “half-coverage point” as the situation forwhich it still makes sense to look for ratio changes. In Fig. 5Cwe show the ratio at the point of half-coverage as a functionof Q. These ratios can achieve values of far less than 2 forlarger values of Q.
Dynamic Range Benchmark Set—So far, we have demon-strated that MaxLFQ is able to accurately and robustlyquantify small fold changes on a proteome scale. This isrelevant, for instance, for the analysis of cellular proteomeremodeling upon stimulation. Next, we wanted to test theperformance of the algorithm in the quantification of high
1.0
1.0
Pre
cisi
on T
P/(T
P+F
P)
A
Recall TP/(TP+FN)0.80.60.40.20.0
0.9
0.8
Ratiot-testWelch testWilcoxon test
20
46
0 1 2 3 4Log2(ratio)
-Log
10(p
-val
ue)
BHumanE. coli
FIG. 4. Statistical significance of protein regulation. A, precision-recall curves based on four different strategies. TP, true positives; FP,false positives; FN, false negatives. B, the Welch modified t test p value is plotted logarithmically against the ratio. The vast majority of E. coliproteins (orange) have p values better than 0.05, indicating significant regulation. An extremely small number of human proteins (blue) appearto have a large ratio and significant p value (false positives for quantification). The arrows indicate that the best strategy is to select significantlyregulated proteins by t test p value (first false positive after hundreds of correct hits with better p values) rather than fold change (first falsepositive after three correct hits with higher fold change).
Label-free Quantification in MaxQuant
2520 Molecular & Cellular Proteomics 13.9
49
●

3 Technologies for large-scale relative and absolute protein quantification
ratios in the range of several orders of magnitude. Suchratios typically occur in the context of interaction proteom-ics experiments (56), where early mixing of isotope-labeledsamples is usually not possible and some of the principal ad-vantages of metabolic labeling are therefore lost. We have re-cently shown that both SILAC and MaxLFQ generate similarratio distributions (57), indicating that in such cases MaxLFQ iscapable of achieving quantification accuracies comparable tothose obtained with SILAC.
As a benchmark dataset for high protein ratios, we madeuse of the universal protein standard (UPS) (Sigma-Aldrich), amixture of 48 recombinant human proteins that is available asan equimolar mixture (UPS1) or mixed at defined ratios span-ning 5 orders of magnitude (UPS2). This dataset does notcontain fractionation and is used for showing that MaxLFQperforms well at high dynamic range quantification in general.We separately digested UPS1 and UPS2 with trypsin andspiked the peptides into a trypsin-digested E. coli lysate. Weanalyzed each condition in four replicates via single-shot LC-MS/MS. Raw data were processed as described for the pro-teome benchmark dataset, with some exceptions as outlinedbelow. MaxQuant identified 232,835 isotope clusters by MS/MS, and matching between runs increased the number ofquantifiable features by 38%. After protein inference, thisresulted in 2200 non-redundant E. coli protein groups. Weidentified all of the 48 human UPS proteins in all samplescontaining E. coli with the equimolar UPS1 standard (supple-mental Table S2). In the sample of E. coli plus UPS2, 15 of the
lower abundant human UPS proteins were never sequencedby MS/MS, but 10 of them could be identified and quantifiedin at least some of the replicates through matching to theUPS1-containing samples. Applying the same requirementof two shared peptides for each pair-wise comparison (asused in the proteome benchmark dataset) expectedly re-sulted in missing values for samples in which only individualpeptides were found; therefore we lowered this threshold toone. Extreme ratios typically coincide with very differentpeptide populations identified in the samples to be com-pared: many in the sample with high protein abundance, ofwhich only a small subset is found in the low-abundancesample. This can make the protein ratio determination relyon very few quantification events, which increases the sen-sitivity to outliers. To address this issue, we implemented anoptional feature called “large ratio stabilization,” whichmodifies the ratio determination for pair-wise comparisonswhere the number of peptides quantified in the two samplesdiffers substantially. In a case when fewer than one out offive peptides is shared between samples, the ratio of thesummed-up peptide intensities is taken for quantification. Ifmore than two out of five peptides are shared, the median ofpair-wise ratios is used. For intermediate cases, we inter-polate linearly between these two kinds of ratio determina-tions. In summary, the protein ratio r is determined by themedian of peptide ratios rm and the ratio of summed-uppeptide intensities rs by the formula
1.0
1.0
Pre
cisi
on T
P/(T
P+F
P)
A
Recall TP/(TP+FN)0.80.60.40.20.0
0.9
0.8
B
0.7
0.6
0.5
r = 3r = 2
r = 1.7
r = 1.6
r = 1.5
1.0
0.8
0.6
0.4
0.2
0
1 1.5 2 2.5 3Ratio
Cov
erag
e
Q = 0.01
Q = 0.02
Q = 0.03Q = 0.05
Q = 0.1
Q = 0.25
Q = 0.5
C1
23
0.0 0.1 0.2 0.3 0.4 0.5Q = FP/(TP+FP)
Rat
io a
t hal
f cov
erag
e
FIG. 5. Statistical significance ofsmall protein ratios. A, precision-recallcurves based on a t test on a set ofratios that were simulated in silico byshrinking the experimental ratio of three.B, ratio-coverage plots for these simu-lated ratios at a set of fixed proportionsof false discoveries among the discov-eries (Q). One can see a drop in cover-age around a given ratio, which is par-ticularly steep for large values of Q. C,simulated ratio at which one achieveshalf-coverage plotted against the valueof Q.
Label-free Quantification in MaxQuant
Molecular & Cellular Proteomics 13.9 2521
50
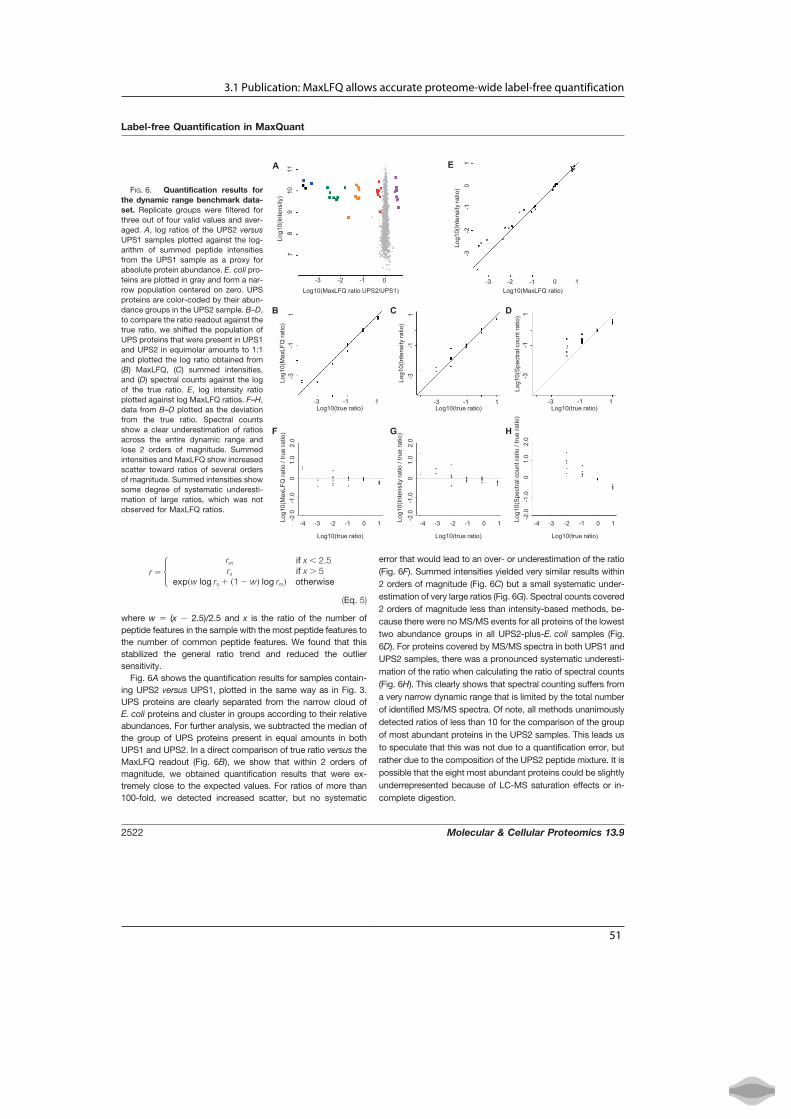
3.1 Publication: MaxLFQ allows accurate proteome-wide label-free quantification
r � � rm if x � 2.5rs if x � 5
exp�w log rs � �1 � w� log rm� otherwise
(Eq. 5)
where w � (x � 2.5)/2.5 and x is the ratio of the number ofpeptide features in the sample with the most peptide features tothe number of common peptide features. We found that thisstabilized the general ratio trend and reduced the outliersensitivity.
Fig. 6A shows the quantification results for samples contain-ing UPS2 versus UPS1, plotted in the same way as in Fig. 3.UPS proteins are clearly separated from the narrow cloud ofE. coli proteins and cluster in groups according to their relativeabundances. For further analysis, we subtracted the median ofthe group of UPS proteins present in equal amounts in bothUPS1 and UPS2. In a direct comparison of true ratio versus theMaxLFQ readout (Fig. 6B), we show that within 2 orders ofmagnitude, we obtained quantification results that were ex-tremely close to the expected values. For ratios of more than100-fold, we detected increased scatter, but no systematic
error that would lead to an over- or underestimation of the ratio(Fig. 6F). Summed intensities yielded very similar results within2 orders of magnitude (Fig. 6C) but a small systematic under-estimation of very large ratios (Fig. 6G). Spectral counts covered2 orders of magnitude less than intensity-based methods, be-cause there were no MS/MS events for all proteins of the lowesttwo abundance groups in all UPS2-plus-E. coli samples (Fig.6D). For proteins covered by MS/MS spectra in both UPS1 andUPS2 samples, there was a pronounced systematic underesti-mation of the ratio when calculating the ratio of spectral counts(Fig. 6H). This clearly shows that spectral counting suffers froma very narrow dynamic range that is limited by the total numberof identified MS/MS spectra. Of note, all methods unanimouslydetected ratios of less than 10 for the comparison of the groupof most abundant proteins in the UPS2 samples. This leads usto speculate that this was not due to a quantification error, butrather due to the composition of the UPS2 peptide mixture. It ispossible that the eight most abundant proteins could be slightlyunderrepresented because of LC-MS saturation effects or in-complete digestion.
Log10(MaxLFQ ratio UPS2/UPS1)
0Lo
g10(
Inte
nsity
)-1-2-3
78
910
11-3 -2 -1 0 1
-31
0-1
-2
-3 -1 1
-1.0
1.0
-3-1
1
-3 -1 1 -3 -1 1
-3 -1 1
-3-1
1
-3-1
1
Log1
0(M
axLF
Qra
tio)
Log1
0(In
tens
ity ra
tio)
Log1
0(S
pect
ral c
ount
ratio
)
Log1
0(In
tens
ity ra
tio)
Log10(MaxLFQ ratio)
Log10(true ratio)
Log10(true ratio)Log10(true ratio)Log10(true ratio)
Log10(true ratio)Log10(true ratio)
Log1
0(M
axLF
Qra
tio /
true
ratio
)
Log1
0(In
tens
ity ra
tio /
true
ratio
)
Log1
0(S
pect
ral c
ount
ratio
/ tru
e ra
tio)
A E
HGF
DCB
0-2
.02.
0
-1.0
1.0
0-2
.02.
0
-1.0
1.0
0-2
.02.
0-2 0-4 -3 -1 1-2 0-4 -3 -1 1-2 0-4
FIG. 6. Quantification results forthe dynamic range benchmark data-set. Replicate groups were filtered forthree out of four valid values and aver-aged. A, log ratios of the UPS2 versusUPS1 samples plotted against the log-arithm of summed peptide intensitiesfrom the UPS1 sample as a proxy forabsolute protein abundance. E. coli pro-teins are plotted in gray and form a nar-row population centered on zero. UPSproteins are color-coded by their abun-dance groups in the UPS2 sample. B–D,to compare the ratio readout against thetrue ratio, we shifted the population ofUPS proteins that were present in UPS1and UPS2 in equimolar amounts to 1:1and plotted the log ratio obtained from(B) MaxLFQ, (C) summed intensities,and (D) spectral counts against the logof the true ratio. E, log intensity ratioplotted against log MaxLFQ ratios. F–H,data from B–D plotted as the deviationfrom the true ratio. Spectral countsshow a clear underestimation of ratiosacross the entire dynamic range andlose 2 orders of magnitude. Summedintensities and MaxLFQ show increasedscatter toward ratios of several ordersof magnitude. Summed intensities showsome degree of systematic underesti-mation of large ratios, which was notobserved for MaxLFQ ratios.
Label-free Quantification in MaxQuant
2522 Molecular & Cellular Proteomics 13.9
51
●

3 Technologies for large-scale relative and absolute protein quantification
Fast Label-free Normalization of Large Datasets—In theanalysis of very large datasets, one of the computationallymost expensive steps is the determination of the normaliza-tion factors for each LC-MS run by minimizing the quantityH(N) described earlier and depicted in Fig. 1. This quantitycontains a sum running over all pairs of samples that growsquadratically with the number of samples. (Note that in thecase of pre-fractionation, multiple LC-MS runs contribute toone sample and do not contribute to a further quadraticincrease of the computational effort.) One approach would beto do normalization in a more simplistic way and only use thereconstruction of protein abundances based on paired pep-tide ratios from MaxLFQ. However, because the normalizationis crucial with fractionated samples, we wanted to find analgorithm that delivered results very similar to those of the fullMaxLFQ computation, but within a much smaller computationtime.
Because the resulting minimization problem becomes in-creasingly overdetermined for larger numbers of samples, wereasoned that a meaningful subset of comparisons wouldsignificantly reduce the computing time while still deliveringcorrect normalization factors. Even a linear chain of compar-isons in which every sample occurs exactly once would inprinciple be sufficient to determine all normalization factors.However, this minimal strategy may lead to unstable anderror-prone calculations, as the failure or imprecision of asingle comparison may propagate into the calculation of allnormalization factors. As a compromise considering stability,correctness, and computational efficiency, a reasonable androbust subset of pair-wise comparisons needs to be found.We started by creating a graph with all samples as nodes. Alarge overlap of peptides between each pair of nodes wasinterpreted as a small distance between them. A subgraph wasthen determined in which each node had a minimum number ofthree nearest neighbors and the average number of neighborsover all nodes was six. All edges that were not needed to fulfillthese criteria were removed while making sure that all nodesremained connected. For the sum in H(N) in Fig. 1, only thosesample pairs were taken into account that had an edge in thisgraph, resulting in linear scaling of the computational effort withthe number of samples. This “fast” normalization option can beoptionally activated in MaxQuant, and the parameters for sub-graph determination are adjustable by the user.
DISCUSSION
We have introduced MaxLFQ as a suite of novel algorithmsfor relative protein quantification without stable isotopes. “De-layed normalization” efficiently solves the problem of how tocompare sample fractions that have been handled in slightlydifferent ways and analyzed with different MS performance.Importantly, delayed normalization does not require “house-hold” proteins, which are assumed to be unchanging in theexperiment. The only prerequisite is a dominant populationof proteins that change minimally between experimental
conditions. The second algorithm allows the retrieval of themaximum possible information from peptide ratios acrosssamples, without resorting to arbitrary assignment of thesignal when a peptide signal cannot be detected. Finally, aprofile of “LFQ” intensities is calculated for each protein asthe best estimate satisfying all the pair-wise peptide com-parisons. Importantly, this intensity profile retains the abso-lute scale from the original summed-up peptide intensities.This should readily qualify it as a proxy for absolute proteinabundance. MaxLFQ is a generic approach that works in-dependently of the experimental question under investiga-tion, and we have demonstrated equally good performancefor the determination of small and very large ratios. Forassessing the statistical significance of individual proteinratios, we found that t testing on a dataset with three ormore replicates delivered the best results and was superiorto a simple fold-change cut-off.
Our laboratory has successfully used MaxLFQ in a num-ber of studies with very diverse biological questions. Forinstance, in measurements that spanned more than a year,we studied the proteomic differences of rare immunologicalcell types and found mutually exclusive expressions of pat-tern recognition receptors (58). We have also followed theproteome rearrangements during colon cancer develop-ment and metastasis in the colon mucosa (54). Furthermore,we have used label-free quantification to study protein–protein interactions expressed as GFP-tagged constructsfrom bacterial artificial chromosomes under endogenouscontrol (56) and screened for interactors of post-translation-ally modified histone tails in mouse tissues (57). In that casewe showed that MaxLFQ achieved similar quantificationaccuracies as SILAC. Interaction proteomics experimentstypically detect specific interactors with enrichment factorson the order of several magnitudes. Here, the general ratiotrend is sometimes more important than a very accuratereadout of the actual ratio. Such cases offer a straightfor-ward remedy for dealing with missing values: they cansimply be imputed as simulated values forming a distribu-tion around the detection limit of measured intensities andserve as the basis for judging enrichment factors. This is aprincipal advantage over label-based ratio determination,where dealing with infinite ratios is conceptually moredifficult.
In a very recent study, we used MaxLFQ to study thesecretome of activated immune cells and detected proteinswhose abundance was increased by several orders of mag-nitude in the culture medium upon stimulation (59).
We have already been making MaxLFQ available as part ofthe MaxQuant software for some time, and other groups havemade frequent use of it (60–75). It has also been bench-marked against other software solutions for label-free quan-tification (31), independently confirming the excellent per-formance of our software.
Label-free Quantification in MaxQuant
Molecular & Cellular Proteomics 13.9 2523
52

3.1 Publication: MaxLFQ allows accurate proteome-wide label-free quantification
Recent advances in mass spectrometer hardware (76, 77)have provided a boost in the depth of standard analyses andenabled near-complete model proteome quantification inminimal measuring time (6). Label-free quantification benefitsdramatically from this depth, as it increases the number ofquantifiable features present in a given LC-MS run and allowsaveraging over more peptides for protein quantification. Illus-trating this, in our dynamic-range benchmark dataset we re-corded one of the largest published E. coli proteomes so far,resulting in a high sequence coverage and hence a verynarrow cloud of E. coli protein quantifications.
Some challenges for label-free quantification remain: Sam-ple handling variability needs to be minimized when samplesare to be recorded over the course of many months, ondifferent machines, or by different laboratories. Standardiza-tion of instrumentation, simplification of sample preparationprocedures, and automation using multiwell systems or ro-botics will help to mitigate this issue. Biological studies thatdepend on the ultimate accuracy of the ratio readout or onquantitative information about individual peptides, such aspost-translationally modified ones, will still rely on isotopelabels. In addition, applications that require extreme robust-ness, such as sample handling in a clinical setting, will likelybenefit from spike-in references that serve as internal stand-ards. That said, we expect label-free quantification methods ingeneral and MaxLFQ in particular to gain further momentum inthe proteomics community and become the method of choicefor many applications. The ease of use of MaxLFQ as part of theMaxQuant software suite should enable our technology to bewidely adopted by nonspecialized labs as well.
Acknowledgments—We thank all members of the Proteomics andSignal Transduction Group for help and discussions and FrancescaForner, Charo Robles, and Gabriele Stoehr for critical reading of themanuscript.
* This project was supported by the European Commission’s 7thFramework Program PROteomics SPECificat Ion in Time and Space(PROSPECTS, HEALTH-F4-2008-021,648) and by the German Fed-eral Ministry of Education and Research (DiGtoP Consortium,FKZ01GS0861).
□S This article contains supplemental material.§ To whom correspondence should be addressed: E-mail: cox@
biochem.mpg.de or [email protected].
REFERENCES
1. Aebersold, R., and Mann, M. (2003) Mass spectrometry-based proteomics.Nature 422, 198–207
2. Ong, S. E., and Mann, M. (2005) Mass spectrometry-based proteomicsturns quantitative. Nat. Chem. Biol. 1, 252–262
3. Bantscheff, M., Schirle, M., Sweetman, G., Rick, J., and Kuster, B. (2007)Quantitative mass spectrometry in proteomics: a critical review. Anal.Bioanal. Chem. 389, 1017–1031
4. Cox, J. and Mann, M. (2007) Is proteomics the new genomics? Cell 130,395–398
5. Altelaar, A. F., Munoz, J., and Heck, A. J. (2013) Next-generation proteom-ics: towards an integrative view of proteome dynamics. Nat. Rev. Genet.14, 35–48
6. Mann, M., Kulak, N. A., Nagaraj, N., and Cox, J. (2013) The coming age ofcomplete, accurate, and ubiquitous proteomes. Mol. Cell 49, 583–590
7. Dephoure, N. and Gygi, S. P. (2012) Hyperplexing: a method for higher-order multiplexed quantitative proteomics provides a map of the dy-namic response to rapamycin in yeast. Sci. Signal. 5, rs2
8. Listgarten, J. and Emili, A. (2005) Statistical and computational methods forcomparative proteomic profiling using liquid chromatography-tandemmass spectrometry. Mol. Cell. Proteomics 4, 419–434
9. Domon, B. and Aebersold, R. (2006) Mass spectrometry and protein anal-ysis. Science 312, 212–217
10. Mueller, L. N., Brusniak, M. Y., Mani, D. R., and Aebersold, R. (2008) Anassessment of software solutions for the analysis of mass spectrometrybased quantitative proteomics data. J. Proteome Res. 7, 51–61
11. Nahnsen, S., Bielow, C., Reinert, K., and Kohlbacher, O. (2012) Tools forlabel-free peptide quantification. Mol. Cell. Proteomics 12, 549–556
12. Bantscheff, M., Lemeer, S., Savitski, M. M., and Kuster, B. (2012) Quanti-tative mass spectrometry in proteomics: critical review update from 2007to the present. Anal. Bioanal. Chem. 404, 939–965
13. Matzke, M. M., Brown, J. N., Gritsenko, M. A., Metz, T. O., Pounds, J. G.,Rodland, K. D., Shukla, A. K., Smith, R. D., Waters, K. M., McDermott,J. E., and Webb-Robertson, B. J. (2013) A comparative analysis ofcomputational approaches to relative protein quantification using pep-tide peak intensities in label-free LC-MS proteomics experiments. Pro-teomics 13, 493–503
14. Mueller, L. N., Rinner, O., Schmidt, A., Letarte, S., Bodenmiller, B., Brus-niak, M. Y., Vitek, O., Aebersold, R., and Muller, M. (2007) SuperHirn—anovel tool for high resolution LC-MS-based peptide/protein profiling.Proteomics 7, 3470–3480
15. Bellew, M., Coram, M., Fitzgibbon, M., Igra, M., Randolph, T., Wang, P.,May, D., Eng, J., Fang, R., Lin, C., Chen, J., Goodlett, D., Whiteaker, J.,Paulovich, A., and McIntosh, M. (2006) A suite of algorithms for thecomprehensive analysis of complex protein mixtures using high-resolu-tion LC-MS. Bioinformatics 22, 1902–1909
16. Rauch, A., Bellew, M., Eng, J., Fitzgibbon, M., Holzman, T., Hussey, P.,Igra, M., Maclean, B., Lin, C. W., Detter, A., Fang, R., Faca, V., Gafken,P., Zhang, H., Whiteaker, J., States, D., Hanash, S., Paulovich, A., andMcIntosh, M. W. (2006) Computational Proteomics Analysis System(CPAS): an extensible, open-source analytic system for evaluating andpublishing proteomic data and high throughput biological experiments.J. Proteome Res. 5, 112–121
17. May, D., Fitzgibbon, M., Liu, Y., Holzman, T., Eng, J., Kemp, C. J., White-aker, J., Paulovich, A., and McIntosh, M. (2007) A platform for accuratemass and time analyses of mass spectrometry data. J. Proteome Res. 6,2685–2694
18. Jaffe, J. D., Mani, D. R., Leptos, K. C., Church, G. M., Gillette, M. A., andCarr, S. A. (2006) PEPPeR, a platform for experimental proteomic patternrecognition. Mol. Cell. Proteomics 5, 1927–1941
19. Kohlbacher, O., Reinert, K., Gropl, C., Lange, E., Pfeifer, N., Schulz-Trieglaff, O., and Sturm, M. (2007) TOPP—the OpenMS proteomicspipeline. Bioinformatics 23, e191–e197
20. Palagi, P. M., Walther, D., Quadroni, M., Catherinet, S., Burgess, J., Zim-mermann-Ivol, C. G., Sanchez, J. C., Binz, P. A., Hochstrasser, D. F., andAppel, R. D. (2005) MSight: an image analysis software for liquid chro-matography-mass spectrometry. Proteomics 5, 2381–2384
21. Johansson, C., Samskog, J., Sundstrom, L., Wadensten, H., Bjorkesten, L.,and Flensburg, J. (2006) Differential expression analysis of Escherichiacoli proteins using a novel software for relative quantitation of LC-MS/MS data. Proteomics 6, 4475–4485
22. Roy, S. M. and Becker, C. H. (2007) Quantification of proteins and metab-olites by mass spectrometry without isotopic labeling. Methods Mol.Biol. 359, 87–105
23. Katajamaa, M., Miettinen, J., and Oresic, M. (2006) MZmine: toolbox forprocessing and visualization of mass spectrometry based molecularprofile data. Bioinformatics 22, 634–636
24. Leptos, K. C., Sarracino, D. A., Jaffe, J. D., Krastins, B., and Church, G. M.(2006) MapQuant: open-source software for large-scale protein quanti-fication. Proteomics 6, 1770–1782
25. Smith, R. D., Anderson, G. A., Lipton, M. S., Pasa-Tolic, L., Shen, Y.,Conrads, T. P., Veenstra, T. D., and Udseth, H. R. (2002) An accuratemass tag strategy for quantitative and high-throughput proteome mea-surements. Proteomics 2, 513–523
26. Old, W. M., Meyer-Arendt, K., Aveline-Wolf, L., Pierce, K. G., Mendoza, A.,Sevinsky, J. R., Resing, K. A., and Ahn, N. G. (2005) Comparison of
Label-free Quantification in MaxQuant
2524 Molecular & Cellular Proteomics 13.9
53
●
3 Technologies for large-scale relative and absolute protein quantification
label-free methods for quantifying human proteins by shotgun proteom-ics. Mol. Cell. Proteomics 4, 1487–1502
27. Sturm, M., Bertsch, A., Gropl, C., Hildebrandt, A., Hussong, R., Lange, E.,Pfeifer, N., Schulz-Trieglaff, O., Zerck, A., Reinert, K., and Kohlbacher, O.(2008) OpenMS—an open-source software framework for mass spec-trometry. BMC Bioinformatics 9, 163
28. Listgarten, J., Neal, R. M., Roweis, S. T., Wong, P., and Emili, A. (2007)Difference detection in LC-MS data for protein biomarker discovery.Bioinformatics 23, e198–e204
29. Park, S. K., Venable, J. D., Xu, T., and Yates, J. R., 3rd (2008) A quantitativeanalysis software tool for mass spectrometry-based proteomics. Nat.Methods 5, 319–322
30. Bridges, S. M., Magee, G. B., Wang, N., Williams, W. P., Burgess, S. C., andNanduri, B. (2007) ProtQuant: a tool for the label-free quantification ofMudPIT proteomics data. BMC Bioinformatics 8 Suppl 7, S24
31. Weisser, H., Nahnsen, S., Grossmann, J., Nilse, L., Quandt, A., Brauer, H.,Sturm, M., Kenar, E., Kohlbacher, O., Aebersold, R., and Malmstrom, L.(2013) An automated pipeline for high-throughput label-free quantitativeproteomics. J. Proteome Res.
32. Ning, K., Fermin, D., and Nesvizhskii, A. I. (2012) Comparative analysis ofdifferent label-free mass spectrometry based protein abundance esti-mates and their correlation with RNA-Seq gene expression data. J.Proteome Res. 11, 2261–2271
33. Cheng, F. Y., Blackburn, K., Lin, Y. M., Goshe, M. B., and Williamson, J. D.(2009) Absolute protein quantification by LC/MS(E) for global analysis ofsalicylic acid-induced plant protein secretion responses. J. ProteomeRes. 8, 82–93
34. Polpitiya, A. D., Qian, W. J., Jaitly, N., Petyuk, V. A., Adkins, J. N., Camp,D. G., 2nd, Anderson, G. A., and Smith, R. D. (2008) DAnTE: a statis-tical tool for quantitative analysis of -omics data. Bioinformatics 24,1556–1558
35. Karpievitch, Y., Stanley, J., Taverner, T., Huang, J., Adkins, J. N., Ansong,C., Heffron, F., Metz, T. O., Qian, W. J., Yoon, H., Smith, R. D., andDabney, A. R. (2009) A statistical framework for protein quantitation inbottom-up MS-based proteomics. Bioinformatics 25, 2028–2034
36. Clough, T., Key, M., Ott, I., Ragg, S., Schadow, G., and Vitek, O. (2009)Protein quantification in label-free LC-MS experiments. J. Proteome Res.8, 5275–5284
37. Choi, H., Glatter, T., Gstaiger, M., and Nesvizhskii, A. I. (2012) SAINT-MS1:protein-protein interaction scoring using label-free intensity data in af-finity purification-mass spectrometry experiments. J. Proteome Res. 11,2619–2624
38. Ong, S. E., Blagoev, B., Kratchmarova, I., Kristensen, D. B., Steen, H.,Pandey, A., and Mann, M. (2002) Stable isotope labeling by amino acidsin cell culture, SILAC, as a simple and accurate approach to expressionproteomics. Mol. Cell. Proteomics 1, 376–386
39. Gygi, S. P., Rist, B., Gerber, S. A., Turecek, F., Gelb, M. H., and Aebersold,R. (1999) Quantitative analysis of complex protein mixtures using iso-tope-coded affinity tags. Nat. Biotechnol. 17, 994–999
40. Ross, P. L., Huang, Y. N., Marchese, J. N., Williamson, B., Parker, K.,Hattan, S., Khainovski, N., Pillai, S., Dey, S., Daniels, S., Purkayastha, S.,Juhasz, P., Martin, S., Bartlet-Jones, M., He, F., Jacobson, A., andPappin, D. J. (2004) Multiplexed protein quantitation in Saccharomycescerevisiae using amine-reactive isobaric tagging reagents. Mol. Cell.Proteomics 3, 1154–1169
41. Boersema, P. J., Aye, T. T., van Veen, T. A., Heck, A. J., and Mohammed,S. (2008) Triplex protein quantification based on stable isotope labelingby peptide dimethylation applied to cell and tissue lysates. Proteomics 8,4624–4632
42. Cox, J. and Mann, M. (2008) MaxQuant enables high peptide identificationrates, individualized p.p.b.-range mass accuracies and proteome-wideprotein quantification. Nat. Biotechnol. 26, 1367–1372
43. Andersen, J. S., Wilkinson, C. J., Mayor, T., Mortensen, P., Nigg, E. A., andMann, M. (2003) Proteomic characterization of the human centrosome byprotein correlation profiling. Nature 426, 570–574
44. Ishihama, Y., Oda, Y., Tabata, T., Sato, T., Nagasu, T., Rappsilber, J., andMann, M. (2005) Exponentially modified protein abundance index(emPAI) for estimation of absolute protein amount in proteomics by thenumber of sequenced peptides per protein. Mol. Cell. Proteomics 4,1265–1272
45. Hubner, N. C., Ren, S., and Mann, M. (2008) Peptide separation with
immobilized pI strips is an attractive alternative to in-gel protein digestionfor proteome analysis. Proteomics, Dec. 8 (23–24), 4862–4872
46. Rappsilber, J., Ishihama, Y., and Mann, M. (2003) Stop and go extractiontips for matrix-assisted laser desorption/ionization, nanoelectrospray,and LC/MS sample pretreatment in proteomics. Anal. Chem. 75,663–670
47. Olsen, J. V., de Godoy, L. M., Li, G., Macek, B., Mortensen, P., Pesch, R.,Makarov, A., Lange, O., Horning, S., and Mann, M. (2005) Parts permillion mass accuracy on an Orbitrap mass spectrometer via lock massinjection into a C-trap. Mol. Cell. Proteomics 4, 2010–2021
48. Cox, J., Hubner, N. C., and Mann, M. (2008) How much peptide sequenceinformation is contained in ion trap tandem mass spectra? J. Am. Soc.Mass Spectrom. 19, 1813–1820
49. Geiger, T., Wehner, A., Schaab, C., Cox, J., and Mann, M. (2012) Compar-ative proteomic analysis of eleven common cell lines reveals ubiquitousbut varying expression of most proteins. Mol. Cell. Proteomics 11,M111.014050
50. Cox, J., Neuhauser, N., Michalski, A., Scheltema, R. A., Olsen, J. V., andMann, M. (2011) Andromeda: a peptide search engine integrated into theMaxQuant environment. J. Proteome Res. 10, 1794–1805
51. Press, W. H., Teukolsky, S. H., Vetterling, W. T., and Flannery, B. P. (2007)Numerical Recipes: The Art of Scientific Computing, 3rd ed., CambridgeUniversity Press, Cambridge, UK
52. de Godoy, L. M., Olsen, J. V., Cox, J., Nielsen, M. L., Hubner, N. C.,Frohlich, F., Walther, T. C., and Mann, M. (2008) Comprehensive mass-spectrometry-based proteome quantification of haploid versus diploidyeast. Nature 455, 1251–1254
53. Schwanhausser, B., Busse, D., Li, N., Dittmar, G., Schuchhardt, J., Wolf, J.,Chen, W., and Selbach, M. (2011) Global quantification of mammaliangene expression control. Nature 473, 337–342
54. Wisniewski, J. R., Ostasiewicz, P., Dus, K., Zielinska, D. F., Gnad, F., andMann, M. (2012) Extensive quantitative remodeling of the proteomebetween normal colon tissue and adenocarcinoma. Mol. Syst. Biol. 8,611
55. Tusher, V. G., Tibshirani, R., and Chu, G. (2001) Significance analysis ofmicroarrays applied to the ionizing radiation response. Proc. Natl. Acad.Sci. U.S.A. 98, 5116–5121
56. Hubner, N. C., Bird, A. W., Cox, J., Splettstoesser, B., Bandilla, P., Poser,I., Hyman, A., and Mann, M. (2010) Quantitative proteomics combinedwith BAC TransgeneOmics reveals in vivo protein interactions. J. CellBiol. 189, 739–754
57. Eberl, H. C., Spruijt, C. G., Kelstrup, C. D., Vermeulen, M., and Mann, M.(2013) A map of general and specialized chromatin readers in mousetissues generated by label-free interaction proteomics. Mol. Cell 49,368–378
58. Luber, C. A., Cox, J., Lauterbach, H., Fancke, B., Selbach, M., Tschopp, J.,Akira, S., Wiegand, M., Hochrein, H., O’Keeffe, M., and Mann, M. (2010)Quantitative proteomics reveals subset-specific viral recognition in den-dritic cells. Immunity 32, 279–289
59. Meissner, F., Scheltema, R. A., Mollenkopf, H. J., and Mann, M. (2013)Direct proteomic quantification of the secretome of activated immunecells. Science 340, 475–478
60. Batruch, I., Smith, C. R., Mullen, B. J., Grober, E., Lo, K. C., Diamandis,E. P., and Jarvi, K. A. (2012) Analysis of seminal plasma from patientswith non-obstructive azoospermia and identification of candidate bio-markers of male infertility. J. Proteome Res. 11, 1503–1511
61. Boerries, M., Grahammer, F., Eiselein, S., Buck, M., Meyer, C., Goedel, M.,Bechtel, W., Zschiedrich, S., Pfeifer, D., Laloe, D., Arrondel, C., Gon-calves, S., Kruger, M., Harvey, S. J., Busch, H., Dengjel, J., and Huber,T. B. (2013) Molecular fingerprinting of the podocyte reveals novel geneand protein regulatory networks. Kidney Int. 83, 1052–1064
62. de Godoy, L. M., Marchini, F. K., Pavoni, D. P., Rampazzo, R. de C., Probst,C. M., Goldenberg, S., and Krieger, M. A. (2012) Quantitative proteomics ofTrypanosoma cruzi during metacyclogenesis. Proteomics 12, 2694–2703
63. Lopez-Contreras, A. J., Ruppen, I., Nieto-Soler, M., Murga, M., Rodriguez-Acebes, S., Remeseiro, S., Rodrigo-Perez, S., Rojas, A. M., Mendez, J.,Munoz, J., and Fernandez-Capetillo, O. (2013) A proteomic character-ization of factors enriched at nascent DNA molecules. Cell Rep. 3,1105–1116
64. Smaczniak, C., Li, N., Boeren, S., America, T., van Dongen, W., Goerdayal,S. S., de Vries, S., Angenent, G. C., and Kaufmann, K. (2012) Proteomics-
Label-free Quantification in MaxQuant
Molecular & Cellular Proteomics 13.9 2525
54
3.1 Publication: MaxLFQ allows accurate proteome-wide label-free quantification
based identification of low-abundance signaling and regulatory proteincomplexes in native plant tissues. Nat. Protoc. 7, 2144–2158
65. Gamez-Pozo, A., Ferrer, N. I., Ciruelos, E., Lopez-Vacas, R., Martinez,F. G., Espinosa, E., and Vara, J. A. (2013) Shotgun proteomics ofarchival triple-negative breast cancer samples. Proteomics Clin. Appl.7, 283–291
66. Sakurai, H., Kubota, K., Inaba, S. I., Takanaka, K., and Shinagawa, A. (2013)Identification of a metabolizing enzyme in human kidney by proteomiccorrelation profiling. Mol. Cell. Proteomics 12, 2313–2323
67. Liu, N. Q., Braakman, R. B., Stingl, C., Luider, T. M., Martens, J. W.,Foekens, J. A., and Umar, A. (2012) Proteomics pipeline for biomarkerdiscovery of laser capture microdissected breast cancer tissue. J. Mam-mary Gland Biol. Neoplasia 17, 155–164
68. Tao, Y., Fang, L., Yang, Y., Jiang, H., Yang, H., Zhang, H., and Zhou, H.(2013) Quantitative proteomic analysis reveals the neuroprotective ef-fects of huperzine A for amyloid beta treated neuroblastoma N2a cells.Proteomics 13, 1314–1324
69. Craven, R. A., Cairns, D. A., Zougman, A., Harnden, P., Selby, P. J., andBanks, R. E. (2013) Proteomic analysis of formalin-fixed paraffin-embed-ded renal tissue samples by label-free MS: assessment of overall tech-nical variability and the impact of block age. Proteomics Clin. Appl. 7,273–282
70. Hogl, S., van Bebber, F., Dislich, B., Kuhn, P. H., Haass, C., Schmid, B., andLichtenthaler, S. F. (2013) Label-free quantitative analysis of the mem-brane proteome of Bace1 protease knock-out zebrafish brains. Proteom-ics 13, 1519–1527
71. Tsai, S. T., Tsou, C. C., Mao, W. Y., Chang, W. C., Han, H. Y., Hsu, W. L., Li,C. L., Shen, C. N., and Chen, C. H. (2012) Label-free quantitative proteom-
ics of CD133-positive liver cancer stem cells. Proteome Sci. 10, 6972. Aye, T. T., Soni, S., van Veen, T. A., van der Heyden, M. A., Cappadona, S.,
Varro, A., de Weger, R. A., de Jonge, N., Vos, M. A., Heck, A. J., andScholten, A. (2012) Reorganized PKA-AKAP associations in the failinghuman heart. J. Mol. Cell. Cardiol. 52, 511–518
73. Merl, J., Ueffing, M., Hauck, S. M., and von Toerne, C. (2012) Directcomparison of MS-based label-free and SILAC quantitative proteomeprofiling strategies in primary retinal Muller cells. Proteomics 12,1902–1911
74. Sessler, N., Krug, K., Nordheim, A., Mordmuller, B., and Macek, B. (2012)Analysis of the Plasmodium falciparum proteasome using Blue NativePAGE and label-free quantitative mass spectrometry. Amino Acids 43,1119–1129
75. Zelenak, C., Foller, M., Velic, A., Krug, K., Qadri, S. M., Viollet, B., Lang, F.,and Macek, B. (2011) Proteome analysis of erythrocytes lacking AMP-activated protein kinase reveals a role of PAK2 kinase in eryptosis. J.Proteome Res. 10, 1690–1697
76. Michalski, A., Damoc, E., Lange, O., Denisov, E., Nolting, D., Muller, M.,Viner, R., Schwartz, J., Remes, P., Belford, M., Dunyach, J. J., Cox, J.,Horning, S., Mann, M., and Makarov, A. (2012) Ultra high resolution linearion trap Orbitrap mass spectrometer (Orbitrap Elite) facilitates top downLC MS/MS and versatile peptide fragmentation modes. Mol. Cell. Pro-teomics 11, O111.013698
77. Michalski, A., Damoc, E., Hauschild, J. P., Lange, O., Wieghaus, A.,Makarov, A., Nagaraj, N., Cox, J., Mann, M., and Horning, S. (2011)Mass spectrometry-based proteomics using Q Exactive, a high-per-formance benchtop quadrupole Orbitrap mass spectrometer. Mol.Cell. Proteomics 10, M111.011015
Label-free Quantification in MaxQuant
2526 Molecular & Cellular Proteomics 13.9
55
●

3 Technologies for large-scale relative and absolute protein quantification
3.2 A ‘proteomic ruler’ for protein copy number and concentration estimation
Wiśniewski, J. R.*,Hein,M. Y.*, Cox, J., &Mann,M.A ‘proteomic ruler’ for protein copy
number and concentration estimation without spike-in standards. Mol Cell Proteomics13(12):3497-506 (2014)
While many proteomics analysis strategies are based on relative protein quantification
across conditions, others require absolute quantities of proteins in ‘hard’ units such as
protein copies per cell. Classically, absolute amounts of individual proteins were determ-
ined by quantification relative to an isotopically labelled reference that was spiked into
the sample in a defined amount (see Fig. 5). This is clearly not practicable for quantifying
large numbers of different proteins.
A challenge for absolute quantifcation without labelled standards is the fact that for in-
dividual peptides, there is no linearity between input amount and signal intensity due
to their different ‘flyabilities’ reflecting their chemical nature. However, taking the top
three best flying peptides of a protein [79] or integrating all peptides and normalizing
for protein length or the number of theoretically expected peptides [61] provides values
with very good correlation to the molar amounts of individual proteins. To bring these
values to absolute levels requires knowledge of a scaling factor that can, for instance,
be calculated by extrapolating from a limited number of ‘anchor’ proteins quantified via
spiked-in standards.
In the course of a discussion following the original description of the intensity-based
absolute quantification (iBAQ) method [61, 63], I proposed a simple sanity check: For
a deep proteome dataset, all protein copy numbers multiplied by their respective mo-
lecular masses should add up to the total protein amount per cell. Reversing this logic,
the total protein amount per cell can serve as the scaling factor without requiring actual
spike-in references. Jacek Wiśniewski in the group had the same idea in the course of a
study on proteomic changes during colon cancer metastasis [80].
To determine the total protein amount per cell, one has to count cells and measure their
protein content. This sounds straightforward, but the accuracy of many protein determ-
ination assays is limited by the reference standards used [81]. Moreover, counting cells in
tissue samples or in non-monodispersed cultures can be difficult. To solve this problem,
Jacek had the idea to use the amount of DNA in the sample as a standard that replaces the
need for cell counting, because the total cellular DNA amount can be calculated from the
ploidy and the genome size or the organism. Going one step further, the mass spectro-
metric signal derived from histones can be used as a ‘proteomic ruler’, because histones
are wrapped aroundDNA in a defined ratio [82]. We teamed upwith the goal to describe
the use of our ‘proteomic ruler’ method and to provide a computational framework to
make its use straightforward for many users.
56

3.2 Publication: A ‘proteomic ruler’ for protein copy number and concentration estimation
A “Proteomic Ruler” for Protein Copy Numberand Concentration Estimation without Spike-inStandards*□S
Jacek R. Wisniewski‡§¶, Marco Y. Hein‡§, Jurgen Cox‡, and Matthias Mann‡¶
Absolute protein quantification using mass spectrometry(MS)-based proteomics delivers protein concentrations orcopy numbers per cell. Existing methodologies typicallyrequire a combination of isotope-labeled spike-in refer-ences, cell counting, and protein concentration measure-ments. Here we present a novel method that deliverssimilar quantitative results directly from deep eukaryoticproteome datasets without any additional experimentalsteps. We show that the MS signal of histones can beused as a “proteomic ruler” because it is proportional tothe amount of DNA in the sample, which in turn dependson the number of cells. As a result, our proteomic rulerapproach adds an absolute scale to the MS readout andallows estimation of the copy numbers of individual pro-teins per cell. We compare our protein quantifications withvalues derived via the use of stable isotope labeling byamino acids in cell culture and protein epitope signaturetags in a method that combines spike-in protein fragmentstandards with precise isotope label quantification. Theproteomic ruler approach yields quantitative readouts thatare in remarkably good agreement with results from theprecision method. We attribute this surprising result to thefact that the proteomic ruler approach omits error-pronesteps such as cell counting or protein concentration mea-surements. The proteomic ruler approach is readily appli-cable to any deep eukaryotic proteome dataset—even inretrospective analysis—and we demonstrate its usefulnesswith a series of mouse organ proteomes. Molecular &Cellular Proteomics 13: 10.1074/mcp.M113.037309, 3497–3506, 2014.
Mass spectrometry (MS)1 is now capable of analyzing theproteome to considerable depth, and more than 10,000 pro-
teins have been reported in single mammalian cell types (1). Inthe past decade, MS-based proteomics has gone from soleidentification to the quantification of proteins, which has typ-ically meant relative quantification between samples (2–4).Apart from the presence of a protein and its relative foldchanges between different conditions (5), it is often desirableto estimate absolute quantities such as molar concentrationsor copy numbers per cell, which can be compared for differentproteins (6). For instance, in systems biology, even a roughestimate of the copy number can help to establish initialparameters for simulation (7). Likewise, clinical protein mea-surements are typically done in absolute terms of titers, suchas milligrams per deciliter. For this purpose various ap-proaches have been utilized, including correlating total MSsignals to visualized structures in the cell (8) and extrapolatingfrom spiked-in reference protein mixtures (9) or from endog-enous proteins quantified via accurately characterized, isoto-pically labeled peptide (10) or protein fragment standards (11).Absolute quantification is then achieved through quantifica-tion relative to a known reference. In all cases, results scalewith the amount of input material or amount of spiked-instandard. Accurate protein concentration measurements arethus an essential and often limiting factor for overall accuracy.Commonly used dye-based protein determination methodsrely on the reactivity of few amino acid residues—mainlytryptophan and tyrosine (12) in the case of the Lowry and BCAassays, or a hydrophilic/hydrophobic balance of the proteinsin the case of Bradford reagent (13). Systematic errors of up toa factor of 2 may therefore arise from the selection of anon-optimal protein standard (14). An additional, often ig-nored source of errors is the cross-reactivity of the reagentswith non-proteinaceous cell components such as thiols, nu-cleic acids, and phospholipids.
To convert protein quantities to copies per cell, all methodsrequire knowledge of the number of cells used for the analy-sis. This can be obtained directly via cell counting or indirectlythrough knowledge of the total protein amount per cell, whichin turn is a function of cell volume and total protein concen-tration. However, cells are not necessarily uniform; thereforescaling by cell numbers may be inaccurate, as a 25% variation
From the ‡Department of Proteomics and Signal Transduction,Max Planck Institute of Biochemistry, Am Klopferspitz 18, 82152Martinsried, Germany
Author’s Choice—Final version full access.Received December 19, 2013, and in revised form, September 8,
2014Published, MCP Papers in Press, September 15, 2014, DOI 10.1074/
mcp.M113.037309Author contributions: J.R.W., M.Y.H., and M.M. designed research;
J.R.W. performed research; J.R.W., M.Y.H., and J.C. contributed newreagents or analytic tools; J.R.W. and M.Y.H. analyzed data; J.R.W.,M.Y.H., and M.M. wrote the paper.
1 The abbreviations used are: MS, mass spectrometry; SILAC, sta-ble isotope labeling by amino acids in cell culture; PrEST, protein
epitope signature tag; FASP, filter-aided sample preparation; PTM,posttranslational modification.
Research
Author’s Choice © 2014 by The American Society for Biochemistry and Molecular Biology, Inc.This paper is available on line at http://www.mcponline.org
Molecular & Cellular Proteomics 13.12 3497
57
●
3 Technologies for large-scale relative and absolute protein quantification
of the diameter of a sphere-shaped cell corresponds to a2-fold change in cell volume. In tissues, not only are cell sizesvariable, but visual counting of cells is also problematic. Forinstance, up to 5-fold differences in calculated cell volumeshave been reported for enterocytes of the intestinal mucosa(15).
Any deviations in protein determination or cell counts willinevitably carry over to the final readout, even when veryprecise MS methods are used. This limits the overall accu-racy, without showing up as a decrease in the precision of thequantification, as measured by standard deviations or coeffi-cients of variation.
In the course of studying the colon cancer proteome, werecently devised a method for estimating absolute amounts ofindividual proteins or protein classes based on the proportionof their MS signals to the total MS signal (16). We termed themethod the Total Protein Approach, because we relate thisproportion to a total protein mass. To obtain copy numbers,we specifically used the total protein mass per cell, whichneeds to be determined or estimated separately.
In this study, we expanded the method by a concept we callthe “proteomic ruler” to further allow correct absolute scalingof the readout without additional steps. We made use of thedefined amount of genetic information in each cell, encoded ina known amount of DNA. We show that an accurate determi-nation of the DNA content in a proteomic sample helps todirectly determine the number of cells. We then demonstratethat the MS signal derived from histones, around which DNAis wrapped in a defined ratio, can be used as a naturalstandard in a whole proteome dataset. It serves as a pro-teomic ruler that allows the estimation of total proteinamounts per cell. Thereby the quantitative readout can beabsolutely scaled to copies per cell without the need for cellcounting or protein concentration determination.
EXPERIMENTAL PROCEDURES
Plasma Lysate—The author’s blood was capillary-collected via skinpuncture of the middle finger. It was immediately supplemented with0.05 M EDTA and centrifuged at 5000 � g for 1 min to separate bloodcells from plasma. Plasma was diluted 10-fold with lysis buffer con-taining 0.1 M Tris-HCl, pH 8.0, 0.1 M DTT, and 2% SDS, and themixture was incubated at 70 °C for 5 min.
Whole Cell and Tissue Lysates—U87-MG, A549, PC-3, andHep-G2 cells were grown in DMEM supplemented with 10% FBS and1% streptomycin. The cells were harvested at 70% confluenceand dissolved in lysis buffer at 100 °C for 5 min. After being chilled toroom temperature, the lysates were briefly sonicated to reduce theviscosity of the sample. Frozen mouse tissues (Pel-Freez, Rogers, AR)were homogenized with T10 basics Ultra-Turrax dispenser in the lysisbuffer at a tissue-to-buffer ratio of 1:10. The homogenates wereincubated at 100 °C for 5 min. Finally, the cell and tissue lysates wereclarified by centrifugation at 16,000 � g for 10 min.
Protein Determination—Protein content was determined using aCary Eclipse Fluorescence Spectrometer (Varian, Palo Alto, CA) asdescribed previously (17). Briefly, aliquots of 1 to 3 �l of whole celllysates were mixed with 2 ml of 8 M urea in 10 mM Tris-HCl, pH 8.5.The fluorescence was measured at 295 nm for excitation and 350 nm
for emission. The slits were set to 5 nm and 20 nm for excitation andemission, respectively. Tryptophan was used as a standard. Theprotein content was calculated from the following relationship: thefluorescence of 0.1 �g of tryptophan equals 9 �g of total protein,which reflects an average 1.1% weight content of tryptophan in wholelysates of human cells.
Cell Counting—Tissue cultures were trypsinized at 37 °C for 2 min,and the released cells were washed with PBS and collected at 1000 �g for 1 min. Then the pellets were suspended in PBS and the cellswere stained with 0.2% Trypan Blue (Invitrogen). Cell counting wascarried out on an automated cell counter (Countess, Invitrogen).
FASP-based Protein Processing—Aliquots of lysates containing100 �g of total protein were processed according to the multi-enzymedigestion FASP protocol (18). Briefly, protein lysates were depletedfrom the detergent using 8 M urea in 0.1 M Tris/HCl, pH 8.5, thiols werealkylated with iodoacetamide, and proteins were consecutively di-gested with endoproteinase LysC and trypsin. Digests of plasmafractions were fractionated using a pipette tip strong anion exchangemethod into four and two fractions as described previously (19).
FASP-based Cleavage and Determination of RNA and DNA—Aftercollection of the peptides released by trypsin, the material remainingin the filter was washed once with TE buffer (10 mM Tris-HCl, pH 8.0)and then was digested with 0.5 �l (0.5 U) of RiboShredder (Epicenter,Madison, WI) in 60 �l of TE buffer at 37 °C for 1 h to digest RNA. Thereleased ribonucleotides were collected via centrifugation at14,000 � g. Next the material on filters was washed twice with 80 �lof TE buffer, and then it was cleaved with 6 �g of DNAse (DN25,Sigma, St. Louis, MO) in 60 �l of 10 mM Tris-HCl, pH 7.8, containing2.5 mM MgCl2 and 0.5 mM CaCl2 at 37 °C for 1 h. The obtaineddeoxynucleotides were collected via centrifugation. The RNA andDNA contents were determined by means of UV spectrometry usingextinction coefficients of 0.025 and 0.030 (�g/ml)�1cm�1 at 260 nm,respectively. The ratio of the spectral densities at 260 nm to 280 nmwas �2, indicating an absence of protein contamination that couldcontribute to A260 measurement.
LC-MS/MS and Data Analysis—Peptides were quantified by tryp-tophan fluorescence as described above, with the exception that themeasurements were performed directly in 0.2 ml of 0.05 M Tris/HCl,pH 8.5, in 5 mm � 5 mm quartz cells. 4-�g aliquots of total peptidewere loaded onto C18 reverse phase columns (20 cm long, 75 �minner diameter, in-house packed with ReproSil-Pur C18-AQ 1.8-�mresin (Dr. Maisch GmbH, Ammerbuch-Entringen, Germany)) withbuffer A (0.5% acetic acid). Peptides were eluted with a linear gradi-ent of 5% to 30% buffer B (80% acetonitrile and 0.5% acetic acid) ata flow rate of 250 nl/min over 195 min. This was followed by 10 minfrom 30% to 60% buffer B, a washout of 95% buffer B, and re-equilibration with buffer A. Peptides were electrosprayed and ana-lyzed on Q Exactive mass spectrometers using a data-dependenttop-10 method with higher energy collisional dissociation fragmenta-tion. Mouse organ samples were loaded onto a 15-cm reverse-phasecolumn packed with 3-�m resin, separated over 320 min of gradienttime, and analyzed on an LTQ Orbitrap mass spectrometer usingcollision-induced dissociation fragmentation. MS data were analyzedusing the MaxQuant software environment (20), version 1.3.10.18,and its built-in Andromeda search engine (21). Proteins were identi-fied by searching MS and MS/MS data against the human and mousecomplete proteome sequences from UniProtKB (May 2013 versioncontaining 88,820 and 50,807 sequences, respectively). Carbami-domethylation of cysteines was set as a fixed modification. N-terminalacetylation and oxidation of methionines were set as variable modi-fications. Up to two missed cleavages were allowed. The initial al-lowed mass deviation of the precursor ion was up to 6 ppm, and forthe fragment masses it was up to 20 ppm (higher energy collisionaldissociation, Orbitrap readout) and 0.5 Da (collision-induced dissoci-
Absolute Protein Quantification without Spike-in References
3498 Molecular & Cellular Proteomics 13.12
58

3.2 Publication: A ‘proteomic ruler’ for protein copy number and concentration estimation
ation, ion trap readout). The mass accuracy of the precursor ions wasimproved by time-dependent recalibration algorithms of MaxQuant.The “match between runs” option was enabled to match identifica-tions across samples within a time window of 30 s of the alignedretention times. The maximum false peptide and protein discoveryrates were set to 0.01. Protein matching to the reverse database andproteins identified only with modified peptides were filtered out. Pro-tein abundances and copy numbers were calculated on the basis ofsummed peptide intensities of unique and “razor” peptides as re-ported by MaxQuant using the Perseus plugin described in this study.Finally, we removed all protein groups with fewer than two uniquepeptides (with the exception of two isoforms of creatine kinase in ourplasma analysis), as they were less likely to yield highly accurate copynumbers.
Software Availability—The proteomic ruler Perseus plugin is avail-able as a source code and as compiled binary from the Perseuswebsite.
RESULTS
The Total Protein Approach Gives Accurate Estimates ofProtein Concentrations—Using our Total Protein Approach,we previously demonstrated that a protein’s abundancewithin the cell as a fraction of the total protein is reflected bythe proportion of its MS signal to the total MS signal (16).
Protein massTotal protein mass
�Protein MS signalTotal MS signal
(Eq. 1)
This proportion can easily be extracted from any MS-basedproteomics measurement, and its accuracy will improve withthe depth of measurement. The value has to be scaled by atotal protein mass, which can conceptually be the entire pro-tein amount of a cell, the protein amount in a given volume ofbody fluid, or even a fixed unit such as 1 g. In that way weobtain the absolute amount of the protein or protein class percell, per unit of volume, or per 1 g of total protein. To showthat this principle is universally applicable, beyond the cell lineand cancer tissue cases that we investigated before (16), weused it to estimate the concentrations of different diagnosti-cally relevant proteins or protein classes in blood plasma afterdigesting plasma proteins using the FASP method (18). Thetotal protein concentration in plasma varies around a typicalvalue of 70 g/l within a narrow margin (22), so we scaled theMS readout by a total amount of 70 g to obtain grams per liter.We were able to quantify proteins within their expected phys-iological ranges over at least 5 orders of magnitude (Fig. 1,supplemental Table S1).
Nucleic Acid Quantification and Cell Counting via FASP-based Sample Preparation—In the case of a body fluid suchas plasma, the total protein concentration is a readily acces-sible scaling parameter, and protein concentrations aremeaningful and relevant. In the case of a cellular proteome,however, many applications require quantities of copies percell, which necessitates cell counting. We wondered whethercell counting could be replaced by accurate DNA quantifica-tion when the genome size and ploidy were known. DNAconcentration was shown to be proportional to the cell count
and was successfully used to normalize enzyme activities,transcript and protein amounts, and metabolome data (23–25). We hypothesized that DNA quantities could be measureddirectly from the proteomic sample, provided that the chro-matin fraction was retained during sample preparation. Incontrast to in-solution or in-gel approaches, the FASP methodis reactor based (26) and allows sequential processing of thesample and separation of reaction products. Detergents arewashed out at the beginning of the FASP procedure, and RNAand DNA, the major components remaining after proteasedigestion, can be cleanly released from the filter via RNase orDNase digestion (Fig. 2A). To test the feasibility of nucleic aciddetermination in the FASP format after digestion of proteinsand elution of peptides, we consecutively digested the mate-rial retained on the filter with RNase and DNase. After eachcleavage we collected the digestion products and determinedtheir content based on UV absorbance at 260 nm. We ob-served a linear correlation between the amount of the elutednucleotides and the amount of the sample. In parallel, weprocessed samples supplemented with defined amounts ofpurified calf thymus RNA and DNA. Yields were greater than95% and were independent of the protein content (Fig. 2B),indicating that post-FASP digestion of a sample with DNaseand RNase is a suitable method for determination of the RNAand DNA content in a proteomic sample that does not requireadditional preparative steps.
Next, we processed aliquots of total lysates prepared fromcounted numbers of four different human cell lines usingtwo-step LysC/trypsin digestion of the proteins (multi-enzymedigestion FASP) (27). Both the starting protein amounts andthe generated peptides were quantified. We then quantifiedthe ribonucleotides and deoxyribonucleotides eluted afterRNase and DNase treatment, respectively. The tryptic andLysC peptides obtained in the multi-enzyme digestion FASP-processed cell lysates (above) were analyzed in 4-h LC-
10−5 10−4 10−3 10−2 0.1 1 10 100
Creatine kinaseC−reactive protein
Sex hormone−binding globulinThyroxine−binding globulin
CeruloplasminAntitrypsinFibrinogenTransferrin
Albumin
g/l
FIG. 1. Analysis of protein abundances in human plasma usingthe Total Protein Approach. Whole plasma was processed using themulti-enzyme digestion FASP approach with strong anion exchangepeptide fractionation before LC-MS/MS analysis as described in “Ex-perimental Procedures.” Quantifications of selected target proteinsare indicated as black dots; the reference values (red bars) are fromRefs. 22 and 41. Two isoforms of creatine kinase were identified withone peptide each, for which we provide annotated MS/MS spectra insupplemental Fig. S1.
Absolute Protein Quantification without Spike-in References
Molecular & Cellular Proteomics 13.12 3499
59
●

3 Technologies for large-scale relative and absolute protein quantification
MS/MS runs. In triplicate analyses, MaxQuant identified about7000 proteins in each of the cell lines (supplemental Table S1).The human genome contains around 3.2 � 109 base pairs(28). Multiplying this number by the average mass of a basepair (615.9 Da) and by the ploidy of the respective cell typeyields an expected amount of cellular DNA. We used a valueof 6.5 pg for a diploid human cell to calculate cell numbers.Dividing the total amount of protein input by these cell num-bers, we obtained a protein mass per cell that was very similarto that obtained by dividing the total protein input amount bythe counted cell numbers (supplemental Table S2).
Histones Serve as a “Proteomic Ruler” for Absolute Scalingof Proteomic Data—In eukaryotic cells, DNA is packaged inchromatin by histones, and the mass of the DNA is aboutequal to the combined mass of histones (29). We thereforewondered whether the summed intensity of histones in adeep, eukaryotic proteome could serve as a proxy for theamount of DNA and therefore for the cell number. There arefive major histone types, which are expressed in many iso-forms and variants that are relevant for many aspects ofchromatin biology. For our approach, however, we employedthe summed MS signal of all histone-derived peptides, irre-spective of which histone they mapped to or how they wereassembled in protein groups. This value reflects the cumula-
tive histone mass. In this way, we used the MS signal of anentire class of proteins as a proteomic ruler and related it to aquantity that is not directly amenable to mass spectrometry.Our hypothesis of the histone proteomic ruler predicts thefollowing relationship (Fig. 3A):
Histone masstotal protein mass
�Histone MS signal
Total MS signal
�Cellular DNA mass
Cellular protein mass(Eq. 2)
In our four-cell-line dataset, the histone MS signalamounted to 2.07% to 4.03% of the total MS signal. Equatingthis fraction with 6.5 pg as the DNA mass of diploid humancells, we obtained cellular protein masses within a factor of1.24 � 0.29 compared with the value obtained via cell count-ing (Fig. 3B; supplemental Table S2). This is close to thehypothesized value of 1 and implies that the ratio of histoneMS signal to total MS signal allows the estimation of the totalcellular protein mass without any additional measurements.
The error of the histone MS signal fraction depends on howaccurately the histone MS signal and the total MS signal canbe determined. For histones, a large number of various post-translational modifications (PTMs) have been identified, lysine
LysC
Trypsin RNAse DNAse
NTPs dNTPs
LysCpeptides
trypticpeptides
13
4urea
extra step required for cell count-based scaling
SDS,urea
25 6
A count cellslyse in SDSquantify total protein
LC-MS/MS,quantify cellular proteome
quantify totalcellular RNA and DNA
extra step required for DNA-based scaling
no extra steps required for histone proteomic ruler scaling Total protein (μg)
0 20 40 60 80 100 120 140 160
0
2
4
6
8
Sample digested with RNAse
Sample + 2 μg RNA digested with RNAse
Sample digested with DNAse
Sample + 2 μg RNA digested with DNAse
Sample + 2 μg DNA digested with DNAse
(deo
xy)r
ibon
ucle
otid
es (μ
g R
NA
/DN
A eq
uiva
lent
)B
FIG. 2. A, the proteomic workflow. Cells were counted and lysed in a buffer containing SDS. Protein concentrations in the whole lysates weredetermined, and 100-�g aliquots of the whole lysates were successively processed in the proteomic reactor (FASP) format. After detergentremoval, proteins were consecutively cleaved with endoproteinase LysC and trypsin. The released LysC and tryptic peptides were subjectedto proteomic analysis. Next, RNA and DNA were digested, and the released ribo- and deoxyribonucleotides were spectrophotometricallyquantified at 260 nm. Protein contents per single cell were calculated from the cell numbers and the protein concentrations. Alternatively,values of protein mass of single cells were obtained from DNA contents and the protein concentrations. B, determination of the efficiency andyield of RNase and DNase cleavages. Aliquots of mouse liver lysates were processed with the FASP method, and the residual high-molecular-weight material was sequentially cleaved with RNase and DNase (labeled “samples digested with DNase and RNase”). The released ribo- anddeoxyribonucleotides were quantified spectrophotometrically at 260 nm. To demonstrate the completeness of digestion over the analyzedrange, samples were supplemented with constant amounts of 2 �g of purified DNA or RNA prior to sample processing (labeled “samples �2 �g RNA/DNA digested with DNase/RNase”). To demonstrate the specificity of the initial RNase digestion, samples were supplemented withDNA and digested with RNase (labeled “samples � 2 �g DNA digested with RNase”).
Absolute Protein Quantification without Spike-in References
3500 Molecular & Cellular Proteomics 13.12
60

3.2 Publication: A ‘proteomic ruler’ for protein copy number and concentration estimation
acetylation, serine and threonine phosphorylation, and lysinemethylation being the most frequent. In most standard pro-teomics workflows, these modifications are not routinely in-cluded in the database search, and we were wonderingwhether this affects the ratio of histone MS signal to total MSsignal, which is critical for our scaling approach. To addressthis question, we searched the data again with combinationsof acetylation, phosphorylation, and methylation set as vari-able modifications. Although individual histones had changesin their relative abundances, in particular histone H3 (Figs.4A–4C), the fraction of the cumulative histone to total MSsignal changed only by 5% to 10% (Fig. 4D). This indicatesthat, with the exception of histone H3, the fraction of the MSsignal derived from histone peptides that have PTMs is lowand can be neglected in the overall data scaling process.
The accuracy of the total MS signal depends on the depthof the proteomic analysis. To estimate the required depth fora robust readout, we ranked all peptides by intensity andcalculated the histone-MS fraction as a function of the num-ber of identified peptides (Fig. 4E). Because peptide intensi-ties span many orders of magnitude, the most intense pep-tides contribute a large part of the total intensity. Within thefirst few thousand peptides, the histone fraction is overesti-mated because histones contribute some of the most intensepeptides. From a depth of around 12,000 or more peptides,however, the histone fraction stabilizes within tight margins.This depth of analysis is easily attainable with minimal sample
fractionation and also with single run analyses on latest-generation machines (30).
For each protein in the measured proteome, we can nowestimate its mass per cell solely from its MS signal as theproduct of its MS signal fraction and the cellular protein mass.This value easily converts to copies per cell.
Protein copies per cell
�Protein MS signal
total MS signal�
NA
M� cellular protein mass
(Eq. 3)
� protein MS signal �NA
M�
DNA massHistone MS signal
where NA is Avogadro’s constant and M is the molar mass ofthe protein.
Ribosomal Proteins as a Proteomic Ruler for Cellular RNA—Next, we investigated whether the proteomic ruler concept isalso applicable to cellular RNA. Ribosomal RNA typically rep-resents about 80% of total RNA (31), and in eukaryotic ribo-somes there is a ratio of about 1:1 between RNA and protein(32). The summed MS signal for all ribosomal proteinsamounted to values between 3.61% and 5.27% of the totalMS signal across the cell lines. We compared this result bythe biochemical quantification of the total RNA content usingthe FASP method in relation to the total protein input (sup-plemental Table S2). Our results were within a factor of 1.01 �
A549 Hep−G2 PC−3 U87−MG
Tota
l pro
tein
per
cel
l [pg
]0
100
200
300
400
500
C
total MS-signal ~ cellular protein mass
cellular protein mass= total protein concentration × cell volume
histone MS-signal ~ histone mass
known DNA mass per cell(in G1 phase)
DNA mass/histone mass ≈ 1
proteomic rulerMS
-sig
nals
for a
ll pr
otei
ns
BA
brain liver spleen thymus
Tota
l pro
tein
per
cel
l [pg
]0
100
200
300
400
500
Tota
l pro
tein
per
cel
l [pg
]0
2040
6080
100
120
CD4 CD8a DN pDCs
D
cell countingDNA determinationhistone proteomic ruler
FIG. 3. Estimation of protein massper cell using two biochemical ap-proaches and the proteomic rulermethod. A, the histone proteomic rulerconcept. The mass of cellular DNA isapproximately equal to the protein massof histones. Relating the histone MS sig-nal to the total MS signal therefore al-lows one to estimate the protein massper cells at a given cell ploidy and ge-nome size. This method requires neithercell counting nor the determination ofprotein concentration. B, C, comparisonof the values of total protein per cellobtained based on cell counting, DNAdetermination, and the histone pro-teomic ruler method. D, cell sizes ob-tained from retrospective analysis ofpublished proteome datasets of CD4 orCD8a positive or double negative (DN)dendritic cell subtypes and plasmacy-toid dendritic cells (pDCs) (36). All valuesrepresent the mean of two (cell counting)or three replicates (DNA and histone pro-teomic ruler quantifications) � S.D.
Absolute Protein Quantification without Spike-in References
Molecular & Cellular Proteomics 13.12 3501
61
●

3 Technologies for large-scale relative and absolute protein quantification
0.13 of the biochemical measurements, indicating that the MSsignal of ribosomal proteins can indeed be used as a pro-teomic ruler to estimate cellular RNA amounts.
Histone Proteomic Ruler Provides Estimates of Cell Sizes inTissues—Counting cells in tissue samples is not trivial. How-ever, determining the DNA and RNA content using our pro-teomic reactor format is equally straightforward as for celllines. We prepared lysates from mouse brain, liver, and thy-mus; measured protein, RNA, and DNA contents; and per-formed proteomic analysis. There was excellent agreementbetween the total cellular protein mass values derived fromthe DNA-based method and our histone proteomic ruler ap-proach (Fig. 3C; supplemental Table S3). This demonstratesthat the histone proteomic ruler serves as a good proxy forestimating cellular protein masses in tissues.
The total cellular protein concentration typically lies within arange of 20% to 30% (w/v) (i.e. 200 to 300 g/l) in many celltypes and organisms (33). This constraint can be used toconvert between cellular protein mass and cell volume. Hepa-tocytes, the predominant cell type in liver, are roughly cubicalcells with a 15-�m edge length (34). Assuming a total proteinconcentration of 200 g/l, this translates to 675 pg of protein
per cell. This compares to our estimate of 464 � 35 pg totalprotein per average liver cell, which is reasonable given thatnon-hepatocytes contribute the same amount of DNA or his-tones but less overall protein mass. Thymocytes are at theother end of the size scale with an average volume of 250 �m3
(35). This translates to 50 pg of protein, as compared with ourestimate of 59 � 31 pg.
To test the applicability of the histone proteomic ruler to theretrospect analysis of existing datasets, we reevaluated whole-proteome measurements of murine dendritic cell populationspublished by our group in 2010 (36). Samples had been pre-pared via one-dimensional SDS gel electrophoresis followed byin-gel digestion, an approach distinct from our FASP-basedmethod and incompatible with direct DNA quantification fromthe proteomic sample. Mature dendritic cells have diametersbetween 10 and 15 �m (37). We compared these cell sizes toour proteomic ruler estimates that ranged between 64 � 14 and95 � 25 pg total protein per cell for the different dendritic cellsubtypes (Fig. 3D). These values translated to diameters of 8.5to 9.7 �m for spherical cell shapes, which is expected to beslightly smaller than observed cell sizes, given the numerousdendrites projecting from the cell surfaces. Interestingly, our
A54
9
Hep
-G2
PC-3
U87
-MG
no variable PTMs
A54
9
Hep
-G2
PC-3
U87
-MG
K-Acetyl + STY-phospho K-Acetyl, (mono, di, tri-methyl) + STY-phospho
total histone signal
0
1
2
3
4
5
A54
9
Hep
-G2
PC-3
U87
-MG
His
tone
sig
nal/t
otal
sig
nal (
%) no PTM
all PTMs
A54
9
Hep
-G2
PC-3
U87
-MG
His
tone
sig
nal/t
otal
sig
nal (
%)
His
tone
sig
nal/t
otal
sig
nal (
%)
0.0
0.2
0.4
0.6
0.8
1.0
1.2
1.4
H1H2AH2BH3H4
H1H2AH2BH3H4
His
tone
sig
nal/t
otal
sig
nal (
%)
0.0
0.2
0.4
0.6
0.8
1.0
1.2
1.4
H1H2AH2BH3H4
0.0
0.2
0.4
0.6
0.8
1.0
1.2
1.4
A
D
B
�
ranked peptides
cum
ulat
ive
hist
one
fract
ion
0 12500 25000 37500 50000 62500
0
0.02
0.04
0.06
0.08
0.1 A549Hep-G2PC-3U87-MG
C
E
FIG. 4. The contribution of PTMs to the estimated total protein content of histones. Comparison of the fractions of the MS signals ofindividual histones, accumulated by histone type, derived by including different combinations of variable modifications in the database search.A, no variable PTMs (except for the default methionine oxidation and N-terminal acetylation). B, lysine acetylation and serine/threonine/tyrosinephosphorylation. C, lysine mono-, di-, and trimethylation in addition to the modifications searched in B. Comparison of the sum of all histoneMS signals without PTMs (from A) and with all PTMs (from C). D, histone MS signal fraction as a function of the depth of analysis, simulatedby intensity-based ranking of peptides.
Absolute Protein Quantification without Spike-in References
3502 Molecular & Cellular Proteomics 13.12
62

3.2 Publication: A ‘proteomic ruler’ for protein copy number and concentration estimation
observed similarities in cell sizes correlate with overall patternsof proteomic similarity on the level of individual proteins thatwere observed in the original study (36).
Label-free Copy Number Estimations Are Strikingly Close toPrecise Spike-in Quantifications—We previously employedspiked-in protein epitope signature tags (PrESTs) of knownquantities in combination with isotopic labeling, cell counting,and total protein concentration determination to obtain highlyreliable copy number values of selected proteins (11). Toassess the accuracy of our proteomic-ruler-derived proteincopy numbers, we reanalyzed the same dataset used in theoriginal PrEST-SILAC study and applied our calculations onthe “heavy” labeled proteome without considering the ratioinformation from the “light” PrEST peptides. We recapitulatednot only the correct scaling of the total protein mass, but alsothe copy numbers of the individual PrEST-quantified proteinswithin an average deviation of 1.5-fold (Fig. 5A; supplementalTable S4) and comparable precisions judged by the standarddeviations from three replicates. We attribute the surprisinglygood performance of the proteomic ruler quantifications tothe fact that our label-free quantification on average made useof 19.4 peptides along the entire length of the proteins,whereas the PrEST-SILAC quantification used 4.7 peptideson average. This might compensate for some of the principallimitations of the label-free approach. Looking at the devia-tions of individual quantifications, we saw that the minority oflarger deviations occurred exclusively with PrEST-SILACquantifications based on two or fewer peptides or label-freequantifications based on 11 or fewer peptides (Fig. 5B). Thisobservation underlines the benefits of approaches that rely onmultiple independent quantifications instead of single peptideratios, as commonly used, for example, with AQUA peptides.We conclude that for those proteins quantified with more thana few peptides, the proteomic ruler approach could offer a
surprisingly high level of accuracy, making it an attractivealternative to label-based methods.
In addition to the comparison with spike-in quantificationdata, macromolecular complexes offer another option for val-idating protein copy numbers. Many obligate protein com-plexes are well characterized in terms of their compositionand stoichiometry with subunits expressed at equimolar lev-els. Fig. 5C shows that our histone proteomic-ruler-derivedcopy numbers of members of the pyruvate dehydrogenasecomplex and the TRiC chaperone closely match the expected1:1 stoichiometry among subunits.
The Muscle Proteome Is Quantitatively Dominated by Large,Abundant Proteins—As a practical example of the usefulnessof “easy” absolute protein quantification, we determined cellsizes and cellular copy numbers of proteins in a panel of othermouse organs (Fig. 6A). Ovaries consist predominantly ofsmall follicular cells and showed the least protein per cell (42pg). Leg muscle cells, in contrast, had around 675 pg ofprotein per nucleus. Considering that muscle fibers are syn-cytial, multi-nucleated cells, the histone proteomic ruler de-livered protein amounts per nucleus and not per cell in thisparticular case. Despite the huge differences in cellular pro-tein amounts, we observed much less variation in the depend-ence of the abundance of a protein and its molecular mass,irrespective of the tissue of origin. This is reflected in theaverage molecular mass of a protein, which is calculated asthe ratio of the total protein mass per cell to the total numberof protein molecules (Fig. 6B). This number is rather similaracross tissues, with the notable exception of muscle tissues.The reason for this becomes apparent when we look at thedistribution of protein sizes across the dynamic range ofthe individual proteins (Figs. 6C and 6D). Independent of thetissue of origin, low-abundant proteins had an average mo-lecular mass of around 100 kDa, and this value decreased
proteomic ruler quantification [copies/cell]
PrE
ST−
SIL
AC q
uant
ifica
tion
[cop
ies/
cell]
104 105 106 107 108
104
105
106
107
108
# peptides proteomic ruler
# pe
ptid
es P
rES
T−S
ILAC
02468
1012
0 10 20 30 40 50 60 70 80
deviation1−fold2−fold4−fold
A C
A54
9
Hep
-G2
PC-3
U87
-MG
Cop
y nu
mbe
r (10
-6)
0.01
0.1
1
10PDHA1/2PDHB
DLATDLD
Cop
y nu
mbe
r (10
-7)
0.01
0.1
1
10
A54
9
Hep
-G2
PC-3
U87
-MG
TCP1CCT2CCT3CCT4
CCT5CCT6CCT7CCT8
B
FIG. 5. Comparison of absolute protein abundances calculated using the spike-in and proteomic ruler approaches. A, comparison ofprotein copy numbers of selected proteins in HeLa cells obtained using spiked-in protein fragments (PrESTs) of known quantities and isotopiclabel quantification (11) to those calculated using the label-free histone proteomic ruler method. Values represent the mean of threereplicates � S.D. B, comparison of the numbers of peptides overlapping with the PrEST standard used for the SILAC quantification and thetotal number of peptides used for the proteomic ruler quantification. The deviations of the label-free values from the PrEST-SILAC values arerepresented as the sizes of the points. C, D, label-free protein copy number estimates correlate with the composition of protein complexes.C, pyruvate dehydrogenase complex. D, TRiC chaperonin.
Absolute Protein Quantification without Spike-in References
Molecular & Cellular Proteomics 13.12 3503
63
●
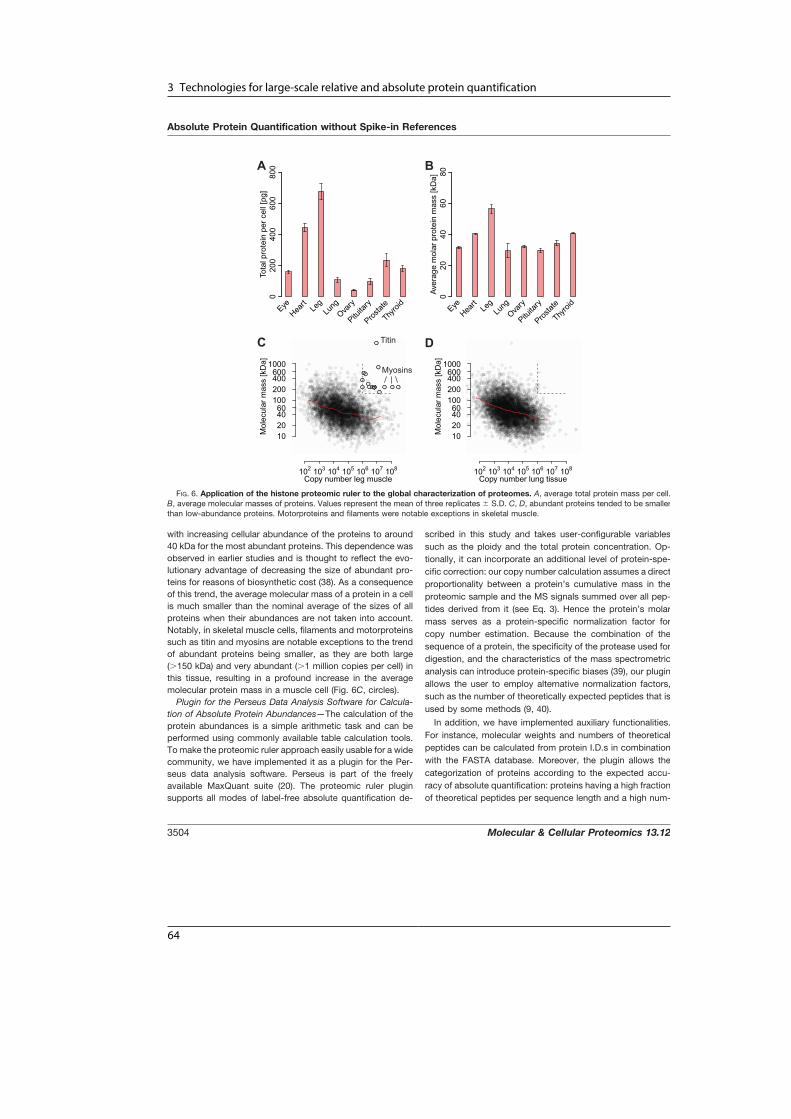
3 Technologies for large-scale relative and absolute protein quantification
with increasing cellular abundance of the proteins to around40 kDa for the most abundant proteins. This dependence wasobserved in earlier studies and is thought to reflect the evo-lutionary advantage of decreasing the size of abundant pro-teins for reasons of biosynthetic cost (38). As a consequenceof this trend, the average molecular mass of a protein in a cellis much smaller than the nominal average of the sizes of allproteins when their abundances are not taken into account.Notably, in skeletal muscle cells, filaments and motorproteinssuch as titin and myosins are notable exceptions to the trendof abundant proteins being smaller, as they are both large(�150 kDa) and very abundant (�1 million copies per cell) inthis tissue, resulting in a profound increase in the averagemolecular protein mass in a muscle cell (Fig. 6C, circles).
Plugin for the Perseus Data Analysis Software for Calcula-tion of Absolute Protein Abundances—The calculation of theprotein abundances is a simple arithmetic task and can beperformed using commonly available table calculation tools.To make the proteomic ruler approach easily usable for a widecommunity, we have implemented it as a plugin for the Per-seus data analysis software. Perseus is part of the freelyavailable MaxQuant suite (20). The proteomic ruler pluginsupports all modes of label-free absolute quantification de-
scribed in this study and takes user-configurable variablessuch as the ploidy and the total protein concentration. Op-tionally, it can incorporate an additional level of protein-spe-cific correction: our copy number calculation assumes a directproportionality between a protein’s cumulative mass in theproteomic sample and the MS signals summed over all pep-tides derived from it (see Eq. 3). Hence the protein’s molarmass serves as a protein-specific normalization factor forcopy number estimation. Because the combination of thesequence of a protein, the specificity of the protease used fordigestion, and the characteristics of the mass spectrometricanalysis can introduce protein-specific biases (39), our pluginallows the user to employ alternative normalization factors,such as the number of theoretically expected peptides that isused by some methods (9, 40).
In addition, we have implemented auxiliary functionalities.For instance, molecular weights and numbers of theoreticalpeptides can be calculated from protein I.D.s in combinationwith the FASTA database. Moreover, the plugin allows thecategorization of proteins according to the expected accu-racy of absolute quantification: proteins having a high fractionof theoretical peptides per sequence length and a high num-
Tota
l pro
tein
per
cel
l [pg
]0
200
400
600
800
EyeHea
rt Leg
Lung
Ovary
Pituita
ry
Prostat
e
Thyroi
d
A
Aver
age
mol
ar p
rote
in m
ass
[kD
a]0
2040
6080
EyeHea
rt Leg
Lung
Ovary
Pituita
ry
Prostat
e
Thyroi
d
B
C
Copy number leg muscle
Mol
ecul
ar m
ass
[kD
a]
102 103 104 105 106 107 108
10204060
100200400600
1000
Copy number lung tissue
Mol
ecul
ar m
ass
[kD
a]
102 103 104 105 106 107 108
10204060
100200400600
1000
DTitin
Myosins
FIG. 6. Application of the histone proteomic ruler to the global characterization of proteomes. A, average total protein mass per cell.B, average molecular masses of proteins. Values represent the mean of three replicates � S.D. C, D, abundant proteins tended to be smallerthan low-abundance proteins. Motorproteins and filaments were notable exceptions in skeletal muscle.
Absolute Protein Quantification without Spike-in References
3504 Molecular & Cellular Proteomics 13.12
64

3.2 Publication: A ‘proteomic ruler’ for protein copy number and concentration estimation
ber of actually identified peptides, most of which are group-unique, are expected to yield better quantification.
DISCUSSION
In this paper, we propose that accurate absolute quantifi-cation is possible without the use of spike-in standardsthrough the use of a concept we call the “proteomic ruler.”Using the MS signal derived from histones and relating it toa known amount of DNA per cell provides accurate esti-mates of the total protein amount per cell that can be usedas scaling factors for calculating cellular copy numbers ofany protein of interest. We note that our approach makes anumber of assumptions that allow us to omit any spike-instandards. At the same time, it eliminates several experi-mental steps such as cell counting and absolute proteinconcentration determination, which are themselves prone toerrors, in particular stemming from issues with protein de-termination assays.
We found the quantitative results of our proteomic rulerapproach to be typically within a factor of 2 of precisionmeasurements or literature values. Importantly, this informa-tion comes for free, in that it incorporates absolute quantifi-cation into any kind of in-depth proteome dataset, even inretrospective analysis. The only prerequisite is a eukaryotic,whole-cell proteome dataset where the chromatin fraction isnot over- or underrepresented as a result of sample handling.The latter is a specific requirement for an accurate estimationof the total protein mass per cell, but all whole proteomedatasets should aim at an unbiased representation of all pro-tein classes. A reasonable depth of proteomic analysis isneeded to ensure a robust contribution of the histone MSsignal, but the necessary depth should be readily attainablewith many experimental setups. We expect that in the future,more and more proteomics projects will reach the requireddepth of proteome coverage and will be able to incorporateabsolute quantification via the histone proteomic ruler. Addi-tionally, individual protein copy numbers will become moreaccurate with increased peptide coverage in deep datasets.
Furthermore, we envision a generalization of the proteomicruler concept beyond using the histone signal to estimatecellular protein amounts. For instance, using characteristicprotein classes such as membrane or mitochondrial proteins,it should be possible to infer insights into subcellular archi-tecture solely from proteomics datasets.
Acknowledgments—We thank Katharina Zettl for technical assistance.The mass spectrometry proteomics data have been deposited to the
ProteomeXchange Consortium (http://proteomecentral.proteomexchange.org) via the PRIDE partner repository with the dataset identifierPXD000661.
* This work was supported by the Max Planck Society for the Ad-vancement of Science, the European Commission’s 7th FrameworkProgram (grant agreement HEALTH-F4–2008-201648/PROSPECTS),and the Munich Center for Integrated Protein Science (CIPSM).
□S This article contains supplemental material.
¶ To whom correspondence should be addressed: E-mail:[email protected]; E-mail: [email protected].
§ These authors contributed to this work equally.
REFERENCES
1. Beck, M., Claassen, M., and Aebersold, R. (2011) Comprehensive proteo-mics. Curr. Opin. Biotechnol. 22, 3–8
2. Altelaar, A. F., Munoz, J., and Heck, A. J. (2013) Next-generation proteo-mics: towards an integrative view of proteome dynamics. Nat. Rev.Genet. 14, 35–48
3. Hein, M. Y., Sharma, K., Cox, J., and Mann, M. (2012) Proteomic analysisof cellular systems. Handbook of Systems Biology, pp. 3–25 A. J. MarianWalhout, Marc Vidal, Job Dekker (eds), Academic Press/Elsevier, Lon-don, UK
4. Aebersold, R., and Mann, M. (2003) Mass spectrometry-based proteomics.Nature 422, 198–207
5. Cox, J., Hein, M. Y., Luber, C. A., Paron, I., Nagaraj, N., and Mann, M.(2014) Accurate Proteome-wide Label-free Quantification by DelayedNormalization and Maximal Peptide Ratio Extraction, Termed MaxLFQ.Mol. Cell. Proteomics 13, 2513–2526
6. Bantscheff, M., Lemeer, S., Savitski, M. M., and Kuster, B. (2012) Quanti-tative mass spectrometry in proteomics: critical review update from 2007to the present. Anal. Bioanal. Chem. 404, 939–965
7. Bork, P., and Serrano, L. (2005) Towards cellular systems in 4D. Cell 121,507–509
8. Malmstrom, J., Beck, M., Schmidt, A., Lange, V., Deutsch, E. W., andAebersold, R. (2009) Proteome-wide cellular protein concentrations ofthe human pathogen Leptospira interrogans. Nature 460, 762–765
9. Schwanhausser, B., Busse, D., Li, N., Dittmar, G., Schuchhardt, J., Wolf, J.,Chen, W., and Selbach, M. (2011) Global quantification of mammaliangene expression control. Nature 473, 337–342
10. Beck, M., Schmidt, A., Malmstroem, J., Claassen, M., Ori, A., Szymborska,A., Herzog, F., Rinner, O., Ellenberg, J., and Aebersold, R. (2011) Thequantitative proteome of a human cell line. Mol. Syst. Biol. 7, 549
11. Zeiler, M., Straube, W. L., Lundberg, E., Uhlen, M., and Mann, M. (2012) Aprotein epitope signature tag (PrEST) library allows SILAC-based abso-lute quantification and multiplexed determination of protein copy num-bers in cell lines. Mol. Cell. Proteomics 11, O111.009613
12. Wiechelman, K. J., Braun, R. D., and Fitzpatrick, J. D. (1988) Investigationof the bicinchoninic acid protein assay: identification of the groupsresponsible for color formation. Anal. Biochem. 175, 231–237
13. Fountoulakis, M., Juranville, J. F., and Manneberg, M. (1992) Comparisonof the Coomassie Brilliant Blue, bicinchoninic acid and Lowry quanti-tation assays, using non-glycosylated and glycosylated proteins.J. Biochem. Biophys. Methods 24, 265–274
14. Noble, J. E., and Bailey, M. J. A. (2009) Quantitation of Protein. In Methodsin Enzymology (Richard, R. B., and Murray, P. D., Eds.), pp. 73–95,Academic Press/Elsevier, London, UK
15. Crowe, P. T., and Marsh, M. N. (1993) Morphometric analysis of smallintestinal mucosa. IV. Determining cell volumes. Virchows Archive APathol. Anat. Histopathol. 422, 459–466
16. Wisniewski, J. R., Ostasiewicz, P., Dus, K., Zielinska, D. F., Gnad, F., andMann, M. (2012) Extensive quantitative remodeling of the proteomebetween normal colon tissue and adenocarcinoma. Mol. Syst. Biol. 8,611
17. Wisniewski, J. R. (2013) Proteomic sample preparation from formalin fixedand paraffin embedded tissue. J. Vis. Exp. 79, e50589
18. Wisniewski, J. R., Zougman, A., Nagaraj, N., and Mann, M. (2009) Universalsample preparation method for proteome analysis. Nat. Methods 6,359–362
19. Wisniewski, J. R., Dus, K., and Mann, M. (2012) Proteomic workflow foranalysis of archival formalin fixed and paraffin embedded clinical sam-ples to a depth of 10,000 proteins. Proteomics. Clin. Applicat. 7, 225–233
20. Cox, J., and Mann, M. (2008) MaxQuant enables high peptide identificationrates, individualized p.p.b.-range mass accuracies and proteome-wideprotein quantification. Nat. Biotechnol. 26, 1367–1372
21. Cox, J., Neuhauser, N., Michalski, A., Scheltema, R. A., Olsen, J. V., andMann, M. (2011) Andromeda: a peptide search engine integrated into theMaxQuant environment. J. Proteome Res. 10, 1794–1805
22. Kratz, A., Ferraro, M., Sluss, P. M., and Lewandrowski, K. B. (2004) Caserecords of the Massachusetts General Hospital. Weekly clinicopatholog-
Absolute Protein Quantification without Spike-in References
Molecular & Cellular Proteomics 13.12 3505
65
●

3 Technologies for large-scale relative and absolute protein quantification
ical exercises. Laboratory reference values. N. Engl. J. Med. 351,1548–1563
23. Papadimitriou, E., and Lelkes, P. I. (1993) Measurement of cell numbers inmicrotiter culture plates using the fluorescent dye Hoechst 33258. J. Im-munol. Methods 162, 41–45
24. Shimada, H., Obayashi, T., Takahashi, N., Matsui, M., and Sakamoto, A.(2010) Normalization using ploidy and genomic DNA copy number allowsabsolute quantification of transcripts, proteins and metabolites in cells.Plant Methods 6, 29
25. Silva, L. P., Lorenzi, P. L., Purwaha, P., Yong, V., Hawke, D. H., andWeinstein, J. N. (2013) Measurement of DNA concentration as a normal-ization strategy for metabolomic data from adherent cell lines. Anal.Chem. 85, 9536–9542
26. Zhou, H., Ning, Z., Wang, F., Seebun, D., and Figeys, D. (2011) Proteomicreactors and their applications in biology. FEBS J. 278, 3796–3806
27. Wisniewski, J. R., and Mann, M. (2012) Consecutive proteolytic digestion inan enzyme reactor increases depth of proteomic and phosphoproteomicanalysis. Anal. Chem. 84, 2631–2637
28. International Human Genome Sequencing C. (2004) Finishing the euchro-matic sequence of the human genome. Nature 431, 931–945
29. van Holde, K. E. (1989) Chromatin, Springer Verlag, New York30. Nagaraj, N., Alexander Kulak, N., Cox, J., Neuhauser, N., Mayr, K., Hoern-
ing, O., Vorm, O., and Mann, M. (2012) System-wide perturbation anal-ysis with nearly complete coverage of the yeast proteome by single-shotultra HPLC runs on a bench top Orbitrap. Mol. Cell. Proteomics 11,M111.013722
31. Warner, J. R. (1999) The economics of ribosome biosynthesis in yeast.Trends Biochem. Sci. 24, 437–440
32. Melnikov, S., Ben-Shem, A., Garreau de Loubresse, N., Jenner, L., Yu-supova, G., and Yusupov, M. (2012) One core, two shells: bacterial and
eukaryotic ribosomes. Nat. Struct. Mol. Biol. 19, 560–56733. Brown, G. C. (1991) Total cell protein concentration as an evolutionary
constraint on the metabolic control distribution in cells. J. Theor. Biol.153, 195–203
34. Lodish, H., Berk, A., Zipursky, S., Matsudaira, P., Baltimore, D., and Darnell,J., Eds. (2000), Molecular Cell Biology 4th ed., W.H. Freeman, New York
35. Salinas, F. A., Smith, L. H., and Goodman, J. W. (1972) Cell size distributionin the thymus as a function of age. J. Cell. Physiol. 80, 339–345
36. Luber, C. A., Cox, J., Lauterbach, H., Fancke, B., Selbach, M., Tschopp, J.,Akira, S., Wiegand, M., Hochrein, H., O’Keeffe, M., and Mann, M. (2010)Quantitative proteomics reveals subset-specific viral recognition in den-dritic cells. Immunity 32, 279–289
37. Dumortier, H., van Mierlo, G. J., Egan, D., van Ewijk, W., Toes, R. E.,Offringa, R., and Melief, C. J. (2005) Antigen presentation by an immaturemyeloid dendritic cell line does not cause CTL deletion in vivo, butgenerates CD8� central memory-like T cells that can be rescued for fulleffector function. J. Immunol. 175, 855–863
38. Warringer, J., and Blomberg, A. (2006) Evolutionary constraints on yeastprotein size. BMC Evolutionary Biol. 6, 61
39. Peng, M., Taouatas, N., Cappadona, S., van Breukelen, B., Mohammed, S.,Scholten, A., and Heck, A. J. (2012) Protease bias in absolute proteinquantitation. Nat. Methods 9, 524–525
40. Ishihama, Y., Oda, Y., Tabata, T., Sato, T., Nagasu, T., Rappsilber, J., andMann, M. (2005) Exponentially modified protein abundance index (em-PAI) for estimation of absolute protein amount in proteomics by thenumber of sequenced peptides per protein. Mol. Cell. Proteomics 4,1265–1272
41. James, M. M., Verhofste, M., Franklin, C., Beilman, G., and Goldman, C.(2010) Dissection of the left main coronary artery after blunt thoracictrauma: case report and literature review. World J. Emerg. Surg. 5, 21
Absolute Protein Quantification without Spike-in References
3506 Molecular & Cellular Proteomics 13.12
66

4 State-of-the-art affinity enrichment–mass spectrometry
A crucial part on the way to a high-quality human interactome dataset was the devel-
opment of the strategies to record and extract protein interactions from quantitative MS
datasets. NinaHubner hat largely established the ‘wet lab’ part of theQUBIC interactom-
ics pipeline by the time I joined the project. An issue I addressed was to streamline the
mode in which we carried out biological triplicate experiments in a format that controls
for batch effects, biological variability and performance drifts. The solution was to har-
vest cell pellets for replicates from in several subsequent passages, to perform pulldowns
in batches that contained only one replicate of each cell line, and finally to measure MS
samples in randomized order to avoid artifacts introduced by column carryover or drifts
in machine performance. This setup was largely adopted in the group for the growing
number of projects where is it not practicable to carry out all experiments in parallel.
The interactomics data analysis pipeline required a substantial makeover from the low
throughputmodedescribed in the originalQUBICpublications [30, 60]. The low through-
put mode involved a dedicated negative control in the form of triplicate pulldowns from
the untagged, parental cell line and statistical testing would always be carried out against
this control. In addition, finding interactors required the manual definition of a statist-
ical cut-off specific to each bait protein. Some of the key innovations in this regard were
incorporated into a joint publication with Eva Keilhauer on interactomics in yeast.
4.1 Accurate protein complex retrieval by affinity enrichment MS
Keilhauer, E. C., Hein, M. Y. & Mann, M. Accurate Protein Complex Retrieval by Af-
finity Enrichment Mass Spectrometry (AE-MS) Rather than Affinity Purification Mass
Spectrometry (AP-MS)Mol Cell Proteomicsmcp.M114.041012 (2014)
When Eva Keilhauer joined the group in 2011, the startup project on which we worked
together was to transfer the ideas developed for QUBIC in the mammalian system to
budding yeast, the organism that served as the model system for many large-scale, non-
quantitative interactomics studies in the past [18, 22–24]. A library of strains express-
ing GFP-tagged proteins was available from earlier work in theWeissman laboratory on
protein localization [83]. Therefore, most wet lab protocols could be re-used. New de-
velopments involved an efficient cell lysis protocol and the generation of a control strain
that could be cultured under the same conditions as the non-histidine auxotroph GFP
strains. Eva recorded interactomics data for a number of known protein complexes for
benchmark purposes.
One early finding was that in a typical yeast pulldown sample we identified around 2,000
proteins, which equals half of the expressed proteome. Therefore, we reasoned that the
idea of ‘affinity purification’ has to be re-defined as ‘affinity enrichment’. Moreover this
67
●

4 State-of-the-art affinity enrichment–mass spectrometry
emphasized a shift in the role of background binders from a nuisance to an essential part
of the analysis pipeline, as they serve as a means of quality control and as a reference for
normalization. The dataset was of sufficient size to apply strategies I developed for my
human datasets: the use of a reference cohort instead of a dedicated negative control for
statistical testing, superseding the need for the control strain. In addition, once the data-
set becomes sufficiently large, protein profiles across samples start carrying meaningful
information. Profiles of interacting proteins tend to show good correlation; therefore
the correlation coefficient of a candidate interactor to the bait protein serves as an ad-
ditional parameter next to the enrichment factor to de-noise the interaction data in the
borderline area of statistical significance. Eva implemented and tested these strategies
systematically on her datasets.
68

4.1 Publication: Accurate protein complex retrieval by affinity enrichment MS
Accurate Protein Complex Retrieval by AffinityEnrichment Mass Spectrometry (AE-MS)Rather than Affinity Purification MassSpectrometry (AP-MS)*□S
Eva C. Keilhauer‡, Marco Y. Hein‡, and Matthias Mann‡§
Protein–protein interactions are fundamental to the under-standing of biological processes. Affinity purification cou-pled to mass spectrometry (AP-MS) is one of the mostpromising methods for their investigation. Previously, com-plexes were purified as much as possible, frequently fol-lowed by identification of individual gel bands. However,todays mass spectrometers are highly sensitive, and pow-erful quantitative proteomics strategies are available to dis-tinguish true interactors from background binders. Here wedescribe a high performance affinity enrichment-massspectrometry method for investigating protein–protein in-teractions, in which no attempt at purifying complexes tohomogeneity is made. Instead, we developed analysismethods that take advantage of specific enrichment of in-teractors in the context of a large amount of unspecificbackground binders. We perform single-step affinity enrich-ment of endogenously expressed GFP-tagged proteins andtheir interactors in budding yeast, followed by single-run,intensity-based label-free quantitative LC-MS/MS analysis.Each pull-down contains around 2000 background binders,which are reinterpreted from troubling contaminants to cru-cial elements in a novel data analysis strategy. First thebackground serves for accurate normalization. Second, in-teracting proteins are not identified by comparison to asingle untagged control strain, but instead to the othertagged strains. Third, potential interactors are further vali-dated by their intensity profiles across all samples. Wedemonstrate the power of our AE-MS method using severalwell-known and challenging yeast complexes of variousabundances. AE-MS is not only highly efficient and robust,but also cost effective, broadly applicable, and can beperformed in any laboratory with access to high-resolutionmass spectrometers. Molecular & Cellular Proteomics14: 10.1074/mcp.M114.041012, 1–16, 2015.
Protein–protein interactions are key to protein-mediatedbiological processes and influence all aspects of life. There-fore, considerable efforts have been dedicated to the map-ping of protein–protein interactions. A classical experimentalapproach consists of co-immunoprecipitation of protein com-plexes combined with SDS-PAGE followed by Western blot-ting to identify complex members. More recently, high-throughput techniques have been introduced; among theseaffinity purification-mass spectrometry (AP-MS)1 (1–3) and theyeast two-hybrid (Y2H) approach (4–6) are the most promi-nent. AP-MS, in particular, has great potential for detectingfunctional interactions under near-physiological conditions,and has already been employed for interactome mapping inseveral organisms (7–15). Various AP-MS approaches haveevolved over time, that differ in expression, tagging, andaffinity purification of the bait protein; fractionation, LC-MSmeasurement, and quantification of the sample; and in dataanalysis. Recent progress in the AP-MS field has been drivenby two factors: A new generation of mass spectrometers (16)providing higher sequencing speed, sensitivity, and mass ac-curacy, and the development of quantitative MS strategies.
In the early days of AP-MS, tagged bait proteins weremostly overexpressed, enhancing their recovery in the pull-down. However, overexpression comes at the cost of obscur-ing the true situation in the cell, potentially leading to thedetection of false interactions (17). Today, increased MS in-strument power helps in the detection of bait proteins andinteractors expressed at endogenous levels, augmenting thechances to detect functional interactions. In some simpleorganisms like yeast, genes of interest can directly be taggedin their genetic loci and expressed under their native pro-
From the ‡Department Proteomics and Signal Transduction, MaxPlanck Institute of Biochemistry, Martinsried, Germany
Received, May 7, 2014 and in revised form, October 17, 2014Published, MCP Papers in Press, November 2, 2014, DOI 10.1074/
mcp.M114.041012Author’s Choice—Final version full access.
Author contributions: E.C.K. and M.M. designed research; E.C.K.performed research; M.Y.H. contributed new reagents or analytictools; E.C.K., M.Y.H., and M.M. analyzed data; E.C.K. and M.M. wrotethe paper.
1 The abbreviations used are: AP-MS, Affinity purification massspectrometry; AE-MS, Affinity enrichment mass spectrometry; GFP,Green fluorescent protein; (Co-)IP, (Co-) Immunoprecipitation; Y2H,Yeast two-hybrid; BAC, Bacterial artificial chromosome; QUBIC,Quantitative BAC green fluorescent protein interactomics; TAP, Tan-dem affinity purification; LFQ, Label-free quantification; MaxLFQ,MaxQuant Label-free quantification; CAA, Chloroacetamide; ES, Ex-perimental series; FDR, False discovery rate; SC, Synthetic complete;YPD, Yeast extract peptone dextrose; BSCG, Bait specific controlgroup; NPC, Nuclear pore complex; SPB, Spindle pole body.
tapraid4/zjw-macp/zjw-macp/zjw00115/zjw4939-14a xppws S�3 2/12/14 15:57 4/Color Figure(s) F1–5 ARTNO: M114.041012
•
Research
Author’s Choice © 2015 by The American Society for Biochemistry and Molecular Biology, Inc.This paper is available on line at http://www.mcponline.org
Molecular & Cellular Proteomics 14.1 1
AQ: A
Fn1
69
●

4 State-of-the-art affinity enrichment–mass spectrometry
moter. In higher organisms, tagging proteins in their endoge-nous locus is more challenging, but also for mammalian cells,methods for close to endogenous expression are available.For instance, in controlled inducible expression systems, theconcentration of the tagged bait protein can be titrated toclose to endogenous levels (18). A very powerful approach isBAC transgenomics (19), as used in our QUBIC protocol (20),where a bacterial artificial chromosome (BAC) containing atagged version of the gene of interest including all regulatorysequences and the natural promoter is stably transfected intoa host cell line.
The affinity purification step has also been subject to sub-stantial changes over time. Previously, AP has been com-bined with nonquantitative MS as the readout, meaning allproteins identified by MS were considered potential interac-tors. Therefore, to reduce co-purifying “contaminants,” strin-gent two-step AP protocols using dual affinity tags like theTAP-tag (21) had to be employed. However, such stringentand multistep protocols can result in the loss of weak ortransient interactors (3), whereas laborious and partially sub-jective filtering still has to be applied to clean up the list ofidentified proteins. The introduction of quantitative massspectrometry (22–25) to the interactomics field about tenyears ago was a paradigm shift, as it offered a proper way ofdealing with unspecific binding and true interactors could bedirectly distinguished from background binders (26, 27). Im-portantly, quantification enables the detection of true interac-tors even under low-stringent conditions (28). In turn, thisallowed the return to single-step AP protocols, which aremilder and faster, and hence more suitable for detecting weakand transient interactors.
Despite these advances, nonquantitative methods—oftenin combination with the TAP-tagging approach—are still pop-ular and widely used, presumably because of reagent ex-penses and labeling protocols used in label-based ap-proaches. However, there are ways to determine relativeprotein abundances in a label-free format. A simple, semi-quantitative label-free way to estimate protein abundance isspectral counting (29). Another relative label-free quantifica-tion strategy is based on peptide intensities (30). In recentyears high resolution MS has become much more widelyaccessible and there has been great progress in intensity-based label-free quantification (LFQ) approaches. Togetherwith development of sophisticated LFQ algorithms, this hasboosted obtainable accuracy. Intensity-based LFQ now offersa viable and cost-effective alternative to label-based methodsin most applications (31). The potential of intensity-based LFQapproaches as tools for investigating protein–protein interac-tions has already been demonstrated by us (20, 32, 33) andothers (34, 35). We have further refined intensity-based LFQ inthe context of the MaxQuant framework (36) using sophisti-cated normalization algorithms, achieving excellent accuracyand robustness of the measured “MaxLFQ” intensities (37).
Another important advance in AP-MS, again enabled byincreased MS instrument power, was the development ofsingle-shot LC-MS methods with comprehensive coverage.Instead of extensive fractionation, which was previouslyneeded to reduce sample complexity, nowadays even entiremodel proteomes can be measured in single LC-MS runs (38).The protein mixture resulting from pull-downs is naturally oflower complexity compared with the entire proteome. There-fore, modern MS obviates the need for gel-based (or other)fractionation and samples can be analyzed in single runs.Apart from avoiding selection of gel bands by visual exami-nation, this has many advantages, including decreased sam-ple preparation and measurement time, increased sensitivity,and higher quantitative accuracy in a label-free format.
In this work, we build on many of the recent advances in thefield to establish a state of the art LFQ AE-MS method. Basedon our previous QUBIC pipeline (20), we developed an ap-proach for investigating protein–protein interactions, whichwe exemplify in Saccharomyces cerevisiae. We extended thedata analysis pipeline to extract the wealth of informationcontained in the LFQ data, by establishing a novel conceptthat specifically makes use of the signature of backgroundbinders instead of eliminating them from the data set. Thelarge amount of unspecific binders detected in our experi-ments rendered the use of a classic untagged control strainunnecessary and enabled comparing to a control group con-sisting of many unrelated pull-downs instead. Our protocol isgeneric, practical, and fast, uses low input amounts, andidentifies interactors with high confidence. We propose thatsingle-step pull-down experiments, especially when coupledto high-sensitivity MS, should now be regarded as affinityenrichment rather than affinity purification methods.
EXPERIMENTAL PROCEDURES
Yeast Strains—For all experiments GFP-tagged yeast strains orig-inating from the Yeast-GFP Clone Collection were used, a library with4156 GFP-tagged proteins representing about 63% of S. cerevisiaeopen reading frames (39). The haploid parental strain of this library,BY4741 (ATCC 201388), served as an initial control strain and toconstruct the strain pHis3-GFP-HIS3kMX6 (short name pHis3-GFP).To do so, we used the His3 locus in BY4741, which is nonfunctionalbecause of a deletion of several amino acids in the middle of thecoding sequence. We amplified a cassette containing a GFP genewithout start codon and a His3 gene of Saccharomyces kluyveri undercontrol of the TEF promoter and terminator out of the vector pFA6a-GFP(S65T)-HIS3kMX6. This cassette was integrated into the His3locus of BY4741 directly after the original His3 promoter and startcodon by homologous recombination, replacing the rest of the non-functional His3 sequence. As a result, our pHis3-GFP strain is able tosynthesize histidine and expresses moderate amounts of cytosolicGFP just as the tagged library strains.
Culture of Yeast Strains and anti-GFP Immunoprecipitation—Tagged yeast strains, the parental strain BY4741 and the controlstrain pHis3-GFP were first grown on plates (YDP plates for BY4741,SC-His plates for all other strains) and then in YPD liquid medium atstandard culture conditions. Cell growth was regularly examined bymeasuring OD600 nm. Yeast cells were grown until they reachedan OD600 nm of around 1, followed by harvesting culture volumes
High Accuracy Label-free Quantitative AE-MS in Yeast
2 Molecular & Cellular Proteomics 14.1
tapraid4/zjw-macp/zjw-macp/zjw00115/zjw4939-14a xppws S�3 2/12/14 15:57 4/Color Figure(s) F1–5 ARTNO: M114.041012
70
4.1 Publication: Accurate protein complex retrieval by affinity enrichment MS
equaling 50 ODs. For biochemical triplicates (experimental series 1(ES1)), three times 50 ODs were harvested out of the same culture andfrom then on processed separately. For biological quadruplicates(experimental series 2 (ES2)), four different colonies were picked ondifferent days and processed separately from the beginning. Yeastcell pellets were dissolved in 1.5 ml lysis buffer (150 mM NaCl, 50 mM
Tris HCl pH 7.5, 1 mM MgCl2, 5% glycerol, 1% IGEPAL CA-630(SIGMA-ALDRICH GmbH, Taufkirchen, Germany), Complete® prote-ase inhibitors (Roche Diagnostics Deutschland GmbH, Mannheim,Germany), and 1% benzonase (Merck KGgA, Darmstadt, Germany)),transferred into FastPrep® tubes (MP Biomedicals GmbH, Es-chwege, Germany) containing 1 mm silica spheres (lysing matrix C,MP Biomedicals), frozen in liquid nitrogen and stored at �80 °C untillysis. The frozen samples were thawed and then lysed in a Fast-Prep24® instrument (MP Biomedicals) for 6 � 1 min at maximumspeed. Lysates were cleared by a 10 min centrifugation step at 4 °Cand 4000 � g; and 800 �l of the clear lysates were transferred into adeep-well plate for immunoprecipitation. IP of yeast protein com-plexes was essentially performed as described before for a mamma-lian cell culture system (20). IPs were performed on a Freedom EVO®200 robot (Tecan Deutschland GmbH, Crailsheim, Germany)equipped with a MultiMACS™ M96 separation unit (Miltenyi BiotecGmbH, Bergisch Gladbach, Germany) that contains a strong perma-nent magnet. (Miltenyi Biotec also supplies equipment for performingthe same pull-downs in a manual fashion.) The basic steps of the IPprotocol are as follows: First the lysates are mixed with 50 �l mag-netic �MACS Anti-GFP MicroBeads (Miltenyi Biotec) and incubatedfor 15 min at 4 °C. Because of the favorable kinetics of the mi-crobeads, tagged proteins are efficiently captured in only 15 min (40).Then the Multi-96 separation columns are equilibrated with 250 �lequilibration buffer (same as lysis buffer). After that, the lysates areadded to the columns with the magnet turned on, retaining themagnetic MicroBeads on the column. Once all the liquid has passedthrough the columns, they are first washed with 3 � 800 �l ice coldwash buffer I (0.05% IGEPAL CA-630, 150 mM NaCl, 50 mM Tris HClpH 7.5, and 5% glycerol), then with 2 � 500 �l of wash buffer II (150mM NaCl, 50 mM Tris HCl pH 7.5, and 5% glycerol). Afterward 25 �lof elution buffer I (5 ng/�l trypsin, 2 M Urea, 50 mM Tris HCl pH 7.5,and 1 mM DTT) are added and the columns are incubated for 30 minat room temperature. In this “in-column digest,” the proteins arepartially digested to allow elution from the columns, and reduced byDTT. Subsequently the resulting peptides are eluted and alkylatedwith 2 � 50 �l elution buffer II (2 M Urea, 50 mM Tris HCl pH 7.5, and5 mM CAA), and collected in a 96-well plate.
The plate was incubated at room temperature overnight to ensurea complete tryptic digest. The next morning the digest was stoppedby addition of 1 �l Trifluoroacetic acid (TFA) per well. The acidifiedpeptides were loaded on StageTips (self-made pipette tips containingtwo layers of C18) to desalt and purify them according to the standardprotocol (41). Every sample was divided onto two StageTips to giveone “working” StageTip and one “backup” StageTip. The StageTipswere stored at 4 °C until the day of LC-MS/MS measurement.
LC-MS/MS Measurement—Samples were eluted from StageTipswith 2 � 20 �l buffer B (80% ACN and 0.5% acetic acid). The organicsolvent was removed in a SpeedVac concentrator for 20 min, then theremaining 4 �l of peptide mixture were acidified with 1 �l of bufferA*(2% ACN and 0.1% TFA) resulting in 5 �l final sample size. 2 �l ofeach sample were analyzed by nanoflow liquid chromatography on anEASY-nLC system (Thermo Fisher Scientific, Bremen, Germany) thatwas on-line coupled to an LTQ Orbitrap classic (Thermo Fisher Sci-entific) through a nanoelectrospray ion source (Thermo Fisher Scien-tific). A 15 cm column with 75 �m inner diameter was used for thechromatography, in-house packed with 3 �m reversed-phase silicabeads (ReproSil-Pur C18-AQ, Dr. Maisch GmbH, Germany). Peptides
were separated and directly electrosprayed into the mass spectrom-eter using a linear gradient from 5.6% to 25.6% acetonitrile in 0.5%acetic acid over 100 min at a constant flow of 250 nl/min. The lineargradient was followed by a washout with up to 76% ACN to clean thecolumn for the next run. The overall gradient length was 134 min. TheLTQ Orbitrap was operated in a data-dependent mode, switchingautomatically between one full-scan and subsequent MS/MS scansof the five most abundant peaks (Top5 method). The instrument wascontrolled using Tune Plus 2.0 and Xcalibur 2.0. Full-scans (m/z300–1650) were acquired in the Orbitrap analyzer with a resolution of60,000 at 400 m/z. The five most intense ions were sequentiallyisolated with a target value of 1000 ions and an isolation width of 2m/z and fragmented using CID in the linear ion trap with a normalizedcollision energy of 40. The activation Q was set to 0.25, the activationtime to 30 ms. Maximum ion accumulation times were set to 500 msfor full scans and 1000 ms for MS/MS scans. Dynamic exclusion wasenabled; with an exclusion list size of 500 and an exclusion durationof 180 s. Standard MS parameters were set as follows: 2.2 kV sprayvoltage; no sheath and auxiliary gas; 200 °C heated capillary temper-ature and 110 V tube lens voltage.
Raw Data Processing—All raw files were analyzed together usingthe in-house built software MaxQuant (36) (version 1.4.0.6). The de-rived peak list was searched with the built-in Andromeda searchengine (42) against the reference yeast proteome downloaded fromUniprot (http://www.uniprot.org/) on 03–20-2013 (6651 sequences)and a file containing 247 frequently observed contaminants such ashuman keratins, bovine serum proteins, and proteases. Strict trypsinspecificity was required with cleavage C-terminal after K or R, allow-ing up to two missed cleavages. The minimum required peptidelength was set to seven amino acids. Carbamidomethylation of cys-teine was set as a fixed modification (57.021464 Da) and N-acetyla-tion of proteins N termini (42.010565 Da) and oxidation of methionine(15.994915 Da) were set as variable modifications. As no labeling wasperformed, multiplicity was set to 1. During the main search, parentmasses were allowed an initial mass deviation of 4.5 ppm and frag-ment ions were allowed a mass deviation of 0.5 Da. PSM and proteinidentifications were filtered using a target-decoy approach at a falsediscovery rate (FDR) of 1%. The second peptide feature was enabled.The match between runs option was also enabled with a match timewindow of 0.5 min and an alignment time window of 20 min. Relative,label-free quantification of proteins was done using the MaxLFQalgorithm (37) integrated into MaxQuant. The parameters were asfollows: Minimum ratio count was set to 1, the FastLFQ option wasenabled, LFQ minimum number of neighbors was set to 3, and theLFQ average number of neighbors to 6, as per default. The “protein-Groups” output file from MaxQuant is available in the supplement(supplemental Table S1), as well as all spectra for single-peptide-based protein identifications (supplemental Spectra).
Data Analysis—Further analysis of the MaxQuant-processed datawas performed using the in-house developed Perseus software (ver-sion 1.4.2.30). The “proteingroups.txt” file produced by MaxQuantwas loaded into Perseus. First, hits to the reverse database, contam-inants and proteins only identified with modified peptides were elim-inated. Then the LFQ intensities were logarithmized, and the pull-downs were divided into ES1 and ES2 and from then on analyzedseparately. Samples were first grouped in triplicates or quadrupli-cates and identifications were filtered for proteins having at least threeor four valid values in at least one replicate group, respectively. Forevery bait a separate grouping was defined, and the data was indi-vidually filtered for proteins containing at least two (ES1) or three (ES2)valid values in the specific bait pull-downs. After this, missing valueswere imputed with values representing a normal distribution aroundthe detection limit of the mass spectrometer. To that end, mean andstandard deviation of the distribution of the real intensities were
High Accuracy Label-free Quantitative AE-MS in Yeast
Molecular & Cellular Proteomics 14.1 3
AQ: B
AQ: C
ZSI
ZSI
tapraid4/zjw-macp/zjw-macp/zjw00115/zjw4939-14a xppws S�3 2/12/14 15:57 4/Color Figure(s) F1–5 ARTNO: M114.041012
71
●

4 State-of-the-art affinity enrichment–mass spectrometry
determined, then a new distribution with a downshift of 1.8 standarddeviations and a width of 0.25 standard deviations was created. Thetotal matrix was imputed using these values, enabling statistical anal-ysis. Now a student’s t-tests was performed comparing the baitpull-down (in replicates) to its individual bait specific control group(BSCG). This BSCG contained all other pull-downs in the data setexcept those of known complex members. This whole procedure ofindividual filtering, imputation and t test was repeated for every bait.The resulting differences between the logarithmized means of the twogroups (“log2(bait/background”) and the negative logarithmized pvalues were plotted against each other using R (version 2.15.3) in“volcano plots.” We introduced two different cutoff lines with thefunction y � c/(x - x0), dividing enriched proteins into mildly andstrongly enriched proteins (c � curvature, x0 � minimum fold change).The positions of the cutoff lines were defined for each experimentalseries separately by first plotting the distribution of all observedenrichment factors and deriving the standard deviation of this distri-bution. The x0 parameter for the inner curve and outer curve was thenset to one and two standard deviations (rounded to one significantdigit), respectively (supplemental Fig. S6B and S6F). The curvatureparameters were obtained by overlaying all plots within one series,using only pull-downs of functional baits and rather small definedcomplexes (ES1: all but CDC73, PUP1, and PUP2; ES2: all but NUP84and NUP145). The c parameter of the outer line was then adjusted tooptimally separate true interactors from false positives (for moredetails see supplemental Fig.S6C, 6D, 6G, and 6H). The curvature ofthe inner line was then set to half of the curvature of the outer line.Cut-off parameters for ES1 were x0 � 0.9 and c � 4 for the innercurve, and x0 � 1.8 and c � 8 for the outer curve. Cutoff parametersfor ES2 were x0 � 0.5 and c � 4 for the inner curve, and x0 � 1 andc � 8 for the outer curve. For all enriched proteins outside the innercutoff line, we calculated the Pearson correlation of their LFQintensity profile across all runs to the LFQ intensity profile of thecorresponding bait. Enriched proteins were assigned to interactorconfidence classes A, B, or C according to their position in thevolcano plot and their correlation value. Cutoffs for the correlationscores were defined for both series individually by analyzing allcorrelations within one series using a quantile–quantile plot (Q–Qplot), which compares the real distribution of all correlation valuesto a theoretical normal distribution (supplemental Fig. S6E and 6F).The correlation cutoff was 0.55 for experimental series 1and 0.35for experimental series 2. Note that these cutoff criteria do notrepresent absolute fixed values, but rather help to interpret theindividual pull-down result.
RESULTS
Establishing a High Performance AE-MS Method for De-tecting Interactions in Yeast—First, we set out to develop ageneric and robust, yet high performance affinity enrichment-mass spectrometry (AE-MS) method for investigating protein–protein interactions in yeast. This organism is amenable togenetic and biochemical approaches and has already servedas a model in many of the classical interactome studies. Wechose to work with a GFP-tag system, because this tag is welltolerated and highly specific antibodies have been generated.Furthermore, a library of GFP-tagged yeast strains is com-mercially available, covering about 4000 open reading frames,and also offering localization data (34). The GFP-tagged baitproteins in this library are expressed at endogenous levels, agreat advantage for detecting functional interactions. Wechose a subset of 36 strains from this library, containing
tagged bait proteins that are members of characterized com-plexes from various cellular compartments and cover theentire abundance range of the yeast proteome (supplementalFig. S1).
Next, we wished to construct a control strain that was asgenetically similar to the strains of the library as possible. Be-cause the parental strain of the GFP-library, BY4741, is histidineauxotroph and does not express GFP, we reintroduced theHIS3 selection marker gene and a GFP gene into the dysfunc-tional HIS3 locus of BY4741 (Experimental Procedures). Theresulting control strain can be grown under the same conditionsas the strains of the GFP library, expresses moderate amountsof cytosolic GFP and was termed pHIS3-GFP.
An overview of our AE-MS workflow is depicted in Fig. 1.We combined a mild detergent-based lysis buffer with exten-sive bead beating to efficiently extract yeast proteins withoutdisrupting interactions. We investigated the needed inputamounts, and found that a 50 ml yeast culture volume with anOD600 nm of 1.0 provided ample material for an IP experimenteven with very low expressed baits. Starting from these initial50 ODs of yeast cells allowed us to save material as backupat various stages of the sample preparation. The final amountinjected into the mass spectrometer corresponded to onlyabout 5.3 ODs; a very low amount of starting material, espe-cially considering that baits were not overexpressed. Thesingle-step affinity enrichment was performed with highlyspecific monoclonal anti-GFP antibodies coupled to magneticmicrobeads in a flow-through column format using mild wash-ing conditions to preserve weak or transient interactions (Ex-perimental Procedures). The whole pull-down procedure wasrather short, taking only about 2.5 h from lysis to elution.Proteins were eluted by in-column predigestion with trypsin,then digested to completion overnight. For all complexestested, we found that the resulting peptides could be analyzedwithout any prefractionation in single-shot LC-MS/MS runs onOrbitrap instrumentation, which considerably shortens overallexperiment time, provides greater reproducibility especially ina label-free format and higher sensitivity. All experiments wereperformed in several replicates; either biochemical triplicates(experimental series 1, ES1) or biological quadruplicates (ex-perimental series 2, ES2).
Raw data were analyzed using MaxQuant (36), providingppm level mass accuracy, confident identification of proteins(False Discovery Rate of less than 1%), and accurate intensi-ty-based label-free quantification, thanks to recently devel-oped sophisticated normalization and matching algorithms(37). Remarkably, all our pull-downs resulted in the identifica-tion of thousands of unspecific binders in addition to thespecific interactors, leading to quantification of about half ofthe yeast proteome in every single sample. On the one hand,this was because of the low stringent single-step protocol inwhich we attempt enrichment instead of proper purification ofprotein complexes. On the other hand, it resulted from thehigh instrument sensitivity of the LTQ Orbitrap instrument,
High Accuracy Label-free Quantitative AE-MS in Yeast
4 Molecular & Cellular Proteomics 14.1
ZSI
ZSI
ZSI
F1
tapraid4/zjw-macp/zjw-macp/zjw00115/zjw4939-14a xppws S�3 2/12/14 15:57 4/Color Figure(s) F1–5 ARTNO: M114.041012
72

4.1 Publication: Accurate protein complex retrieval by affinity enrichment MS
and was also promoted by the “match between runs” algo-rithm in MaxQuant. Matching between runs transfers identifi-cations from one MS run to another run, where the samepeptide feature was present, but not selected for fragmenta-tion and hence not identified. High confidence matching isenabled by the high mass precision of the Orbitrap andachieved using unique m/z and retention time information ofthe features, after the retention times of all runs have beenaligned (43). Processing with matching between runs in-creased the number of available quantifications in the com-bined (ES1�ES2) unfiltered LFQ matrix of 196 samples times2304 proteins from 45 to 80%. The very large number ofproteins quantified per IP prompted us to establish novel dataanalysis strategies, exploiting the information-rich intensity-based LFQ data, as described in the following sections.
AE-MS Produces Internal Beadomes for Every Pull-down—Together, our pull-downs identified a large set of backgroundbinders specific for the affinity matrix and conditions used inour experiments. As these proteins are usually detected be-cause they bind to the beads used in the purification, thetotality of them has been called the “bead proteome” or“beadome” (44, 45). Instead of having to determine thisbeadome from separate control experiments, here we detectit as a byproduct in the specific pull-downs (“internalbeadome”). In total, after standard filtering (Experimental Pro-cedures) of the data we quantified 2245 different proteingroups in the combined ES1 and ES2 experimental series(Fig. 2A). Per pull-down, we quantified on average 1860 pro-teins in ES1 and 1825 proteins in ES2. Only a tiny fraction ofthe detected proteins in each pull-down were actual interac-tors of the corresponding tagged protein. For example, usingMCM2 as bait recovered the six MCM complex members
along with 1891 unspecific background proteins on average.These six proteins constituted only 0.3% of all identified pro-teins and only 1.3% of the summed LFQ intensity in thecorresponding pull-downs, although the bait was among thehighest intense proteins.
The unspecific binders identified in our internal beadomecover the entire abundance range, with only a small biastoward more highly abundant proteins when compared withthe yeast proteome as a whole (46) (Fig. 2B). GOBP andGOCC term analysis by category counting of the identifiedproteins did not indicate cellular functions or compartmentsthat are strongly over-or underrepresented (supplemental Fig.S2A). However, the intensity at which we detect proteins inthe beadome is dependent on two factors: their abundance inthe proteome and their affinity to the beads. Whereas lowabundant proteins are generally not found at high intensities inthe beadome, the intensities of high abundant proteins canvary from high to low signals (supplemental Fig. S2B and 2C).Pearson correlation between beadome intensity and pro-teome copy numbers was 0.53 for both ES1 and ES2. Next,we performed 2D enrichment analysis (47), in which we com-pared protein annotations between beadome and proteome inan intensity-dependent fashion. The major protein classesthat showed higher intensities in the beadome than whatwould be expected from their cellular abundance were RNA orDNA related (e.g. ribosome, spliceosome, nucleolus, and DNArecombination). This confirms former findings that ribosomalproteins have a high affinity to the beads. Interestingly, pro-teins in metabolic categories, which are ubiquitously presentin pull-downs because of their high abundance, tended to bede-enriched (supplemental Fig. S2D and 2E). We concludethat the beadome is in essence a scaled down version of the
U
U
BI
I
BI
I UU
Harvest and lysis
Protein identificationand label-free quanti-
fication with MaxQuant
MS full scan
MS/MS scan
Mild washing
Elution by digestion
Peptides
Proteinmixture
Top5
baits
preys
inte
nsity
inte
nsity
LFQ intensity matrix
Downstream data analysis and identification
of interactors
LTQOrbitrap
Endogenousexpression Single-shot
FIG. 1. Schematic representation of the AE-MS workflow. A, Endogenously expressed GFP-tagged proteins are extracted from yeast cellsusing mild, nondenaturing conditions. B � Bait, I � Interactor, U � Unspecific binder. B, Bait protein and specific interactors are enriched ina single-step immunoprecipitation using anti-GFP antibodies. Subsequently, bound proteins are digested into peptides. C, The peptide mixtureis analyzed by single-shot liquid chromatography tandem mass spectrometry (LC-MS/MS) on an Orbitrap instrument. D, Raw data areprocessed with MaxQuant to identify and quantify proteins. The resulting label-free quantification (LFQ) intensity matrix is the basis for alldownstream data analysis aimed at identifying interactors of the tagged bait proteins.
High Accuracy Label-free Quantitative AE-MS in Yeast
Molecular & Cellular Proteomics 14.1 5
F2
AQ: D
COLOR
ZSI
ZSI
ZSI
tapraid4/zjw-macp/zjw-macp/zjw00115/zjw4939-14a xppws S�3 2/12/14 15:57 4/Color Figure(s) F1–5 ARTNO: M114.041012
73
●

4 State-of-the-art affinity enrichment–mass spectrometry
proteome, albeit with some preferences related to generalprotein binding properties.
The reproducible identification of unspecific binders acrossall runs is of course correlated with their intensity; higherintense background binders are more likely to always bedetected, whereas background binders that are close to thelevel of detection may only be identified in some of the runs.Therefore, the LFQ intensity matrix contains missing valuesamong the lower intense proteins (marked gray in Fig. 2A). Toenable statistical analysis, such missing values can be “im-puted.” Therefore, after discarding proteins that are not re-producibly detected in at least one replicate group, weimputed the remaining missing values using a normal distri-bution around the detection limit of the mass spectrometer.These simulated low intensity values fit well into the profiles ofthe low abundant proteins, and because of its randomness,imputation does not create artifacts in t-tests or in intensity
profile analyses. A comparison of the data set processed withand without matching identifications between runs, and theresult of imputation are illustrated in supplemental Fig. S3.
Most of the background proteins are characterized byhighly similar intensities in nearly all of the pull-downs withinan experimental series, and we denote these as typical back-ground binders. Both in ES1 and ES2 for about 90% of alldetected proteins the standard deviation of their intensityprofile was lower than 1.5 log2 LFQ intensity units; and forabout 70% even lower than 1 (Fig. 2C). As expected, thisanalysis also confirms that proteins with higher intensity tendto have more stable background profiles. Next to the typicalbackground binders, we also found a small number of pro-teins with irregular profiles. Those atypical background bind-ers are usually among the lower intense proteins. Both typesof unspecific binders can readily be distinguished from aspecific interactor, whose profile ideally fluctuates mildly
D
B
Elog2 Molecules/cell
Num
ber o
f Pro
tein
s
nd 0 2 4 6 8 10 14 18 22
010
020
030
0
Yeast Proteome ( 4577 proteins )
ES1+ES2 ( 2245 proteins )
Loading...
PAFcomplex
SETcomplex
log2 LFQ intensity
196 raw files
ES1 ES2
2245
iden
tifie
d pr
otei
ns
with
qua
ntita
tive
info
rmat
ion
Missing quantitative information
pHIS
3-G
FPS
ET1
PA
F1
pHIS3-GFP
SET1PAF1
Pearson Correlation
LFQ
inte
nsity
SE
T1_0
1
LFQ intensity PAF1_01
R=0.945
Mean log2 LFQ intensity20 30
Ran
k
Standard deviation in log2 LFQ intensity units
040
080
012
0016
0020
00
1893 1852
1448 146769%
90% 93%
74%
1 2 3 4 5 1 2 3 4 50 0
ES1 2106 proteins ES2 1980 proteins
01
02
03
01
02
03
01
02
03
01 02 03 01 02 0301 02 03 14 16 18 20 22 24 26 28 30 32 34
14
16
18
20
22
24
26
28
30
32
34
12 16 20 24 28 3214 18 22 26 3430
0.94 0.96 0.98 1.0
C
FIG. 2. The proteomic nature of the background in AE-MS. A, Heatmap of the LFQ intensities of all proteins identified in two experimentalseries (ES1 and ES2). Hierarchical row clustering was performed on the logarithmized LFQ intensities of more than 2000 quantified preyproteins in the 196 pull-downs, without data imputation. B, Histogram of the copy numbers of all proteins quantified in our pull-downscompared with the entire yeast proteome as in Kulak et al. C, The standard deviation of the LFQ intensity profile for each identified protein wascalculated after imputing missing values. Proteins were then ranked according to the standard deviation of their profile. About 70% of detectedproteins show a profile varying less than 1 log2 LFQ intensity unit and about 90% vary less than 1.5 log2 LFQ intensity units. D, Comparisonof the control strain pHIS3-GFP with the two tagged strains SET1-GFP and PAF1-GFP; all measured in triplicates. The matrix of 36 correlationplots reveals very high correlations between LFQ intensities within triplicates (Pearson correlation coefficient � 0.977 for all strains). Thecorrelation between different strains is always higher than 0.935. Average correlation of the corresponding nine comparisons were: SET1-GFPto PAF1-GFP 0.946, SET1-GFP to control strain 0.938, and PAF1-GFP to control strain 0.945. E, Zoom into the SET1-GFP_01 versusPAF1-GFP_01 correlation plot. The majority of proteins are detected at very similar LFQ intensities in both pull downs. The proteins that differthe most between the two strains are the members of the two targeted complexes highlighted in color.
High Accuracy Label-free Quantitative AE-MS in Yeast
6 Molecular & Cellular Proteomics 14.1
COLOR
ZSI
tapraid4/zjw-macp/zjw-macp/zjw00115/zjw4939-14a xppws S�3 2/12/14 15:57 4/Color Figure(s) F1–5 ARTNO: M114.041012
74
4.1 Publication: Accurate protein complex retrieval by affinity enrichment MS
around an average background intensity and only deviatesfrom that behavior in specific pull-downs, where it is detectedreproducibly and at higher intensities. The relationship ofmean LFQ intensity and standard deviation of the intensityprofile as well as the profiles of some typical and atypicalunspecific binders are further documented in supplemental Fig.S4. Again, there is a clear trend that the intensity profiles ofhigher intense proteins have a smaller standard deviation.Among the proteins with the highest standard deviation (�1.5log2 LFQ intensity units) many bait proteins and interactors arefound.
A closer look at the heat map in Fig. 2A reveals the back-ground in ES1 and ES2 to be slightly different. Sample prep-aration was similar in both experiments; however, ES1 andES2 were measured on two different LC-MS systems of thesame type but at different time periods, which introducesnoticeable variation of the corresponding background. Thevariation between pull-downs is lower in ES2 because sam-ples were measured directly after each other in contrast toES1 where samples were measured in blocks according tobaits. Because of the slight variations in the backgroundsignature between ES1 and ES2, data analysis was performedseparately for each experimental series. The differences be-tween ES1 and ES2 allowed us to study the influence of theseworkflow parameters.
Exploiting the High Coverage Background for IdentifyingProtein Complexes—Evidently, the extremely large number ofunspecific binders detected in addition to the specific inter-actors in AE-MS represents a completely different experimentreadout than that of classic AP-MS protocols. This large back-ground needs specialized data analysis, which is; however, notaimed at removing the unspecific binders, but instead exploitsthem for high confidence detection of interactors. We recog-nized four different ways in which the unspecific binders de-tected in our pull-downs can be used beneficially.
First, they form the basis for intensity-based LFQ in Max-Quant. To produce reliable and accurate quantification re-sults, the normalization procedure performed in MaxQuantrequires a background proteome that is assumed to be un-changing. This function is provided here by a large number ofunspecific binders identified in all samples. Normalization canthen correct for differences in sample loading and sampleconcentration, which is a prerequisite to making the pull-downs comparable at all and constitutes the basis for furtherdata analysis.
Second, the unspecific binders can serve as a quality con-trol. We observed that deviation of the detected backgroundbinders from the standard behavior can indicate insufficientquality of a specific pull-down, which easily became apparentby hierarchical clustering of the data matrix. As an example,see the vertical stripe close to the middle of ES2 in Fig. 2A,which is a replicate of a pHIS3-GFP pull-down. Close inspec-tion of the raw data revealed generally low peptide intensitiesand polymer contamination in this sample. In another case, a
difference in background signature was not because of sam-ple quality, but seemed to be because of the nature of thetagged complex: All six proteasome pull-downs reproduciblyfeatured a slightly but clearly different background than theother pull-downs. This can be explained by the fact thatproteasome subunits have high cellular copy numbers and arepart of a very large complex; together this alters conditions onthe beads, “crowding out” some of the normally observedbackground binders.
Third, the high number of unspecific binders reproduciblyquantified in all samples resulted in very high correlationsbetween different pull-downs. In Fig. 2D, these correlationsare plotted for two tagged strains, SET1-GFP and PAF1-GFP,and the control strain pHIS3-GFP. Within triplicate pull-downs, the average Pearson correlation coefficients were al-ways greater than 0.977. Between the different strains, cor-relation was always higher than 0.935, indicating that theintensities of the background proteins in the three yeaststrains are highly similar. In fact, the correlation of SET1-GFPto PAF1-GFP was even higher than the correlation of SET1-GFP to the control strain pHIS3-GFP (0.945 versus 0.937). Theproteins most changing in intensity between the two pull-downs were the expected SET1 and PAF1 interactors (Fig.2E). These findings led us to investigate the possibility ofcomparing pull-downs not to an untagged control strain as itis usually done, but instead to compare them to each other,which will be further explored in the next section.
Finally, we reasoned that next to the pair-wise correlation ofsamples across all protein intensities, pair-wise correlation ofintensity profiles across all samples should contain meaning-ful information. Specifically, intensity profiles of true interac-tors across all pull-downs, when compared with the intensityprofile of the corresponding bait, should be correlated. Thecharacteristic profile of interactors compared with the un-changing profile of typical background binders or the randomprofile of atypical background binders could therefore beuseful in verifying interactor candidates, as we will demon-strate later on.
Defining Interactors by Comparing Against Other TaggedStrains—To identify interactors of a specific bait protein in thepresence of the large amount of background binders, weperformed a student’s t test comparing the LFQ intensities ofall proteins identified in replicates of that bait with the LFQintensities of all proteins identified in the control (ExperimentalProcedures). When the resulting differences between the log2mean protein intensities between bait and control are plottedagainst the negative logarithmized p values in volcano plots,the unspecific background binders center around zero. Theenriched interactors appear on the right side of the plot,whereas ideally no proteins should appear on the left sidewhen comparing to an empty control, as these would representproteins depleted by the bait, which is not expected to happen.The higher the difference between the group means (i.e. theenrichment) and the p value (i.e. the reproducibility), the more
High Accuracy Label-free Quantitative AE-MS in Yeast
Molecular & Cellular Proteomics 14.1 7
ZSI
tapraid4/zjw-macp/zjw-macp/zjw00115/zjw4939-14a xppws S�3 2/12/14 15:57 4/Color Figure(s) F1–5 ARTNO: M114.041012
75
●
4 State-of-the-art affinity enrichment–mass spectrometry
the interactors move to the top right corner of the plot, which isthe area of highest confidence for a true interaction.
We started by comparing a specific pull-down to an emptycontrol strain as it is usually done in AP-MS experiments. Firstwe used BY4741, the parental strain of the GFP library, ascontrol; however, cross-reactivity of the anti-GFP antibodycould occur in the complete absence of GFP. Therefore, wehad constructed pHIS3-GFP, a control strain highly similar tothe strains of the GFP library, as it could be grown under thesame selective conditions and expressed moderate amountsof cytosolic GFP (see above). When we compared the pHIS3-GFP control strain to its parental strain BY4741, we detectedonly one yeast protein to be enriched, which was imidazole-glycerol-phosphate dehydratase, the protein the HIS3 geneencodes for (Fig. 3A). This illustrates that GFP does not inter-act with any yeast protein, and furthermore demonstrates thatour AE-MS workflow is sensitive to an extent that it picks upgenetic differences between strains. This confirms the bene-
fits of using a control strain as similar as possible to the actualbait strain, and supports our hypothesis that other taggedstrains of the GFP-library could present an excellent control,as they are genetically identical except for the different taggedprotein. When we tested this idea on the example of the SKIcomplex we indeed did not observe any differences in theidentified interactors of the bait SKI2, whether we comparedwith pHis3-GFP or a tagged strain, e.g. SMC2-GFP (Fig. 3Band 3C). As the only side-effect the specific interactors of theother strain now appeared as de-enriched proteins. (We notethat even this could be put to good use in certain cases, as itin principle enables detection of the interactors of two differ-ent bait proteins in only one comparison and without employ-ing a control.)
A larger control group consisting of many control pull-downs should help to better identify interactors; and we nexttested whether this holds true for our pull-downs. Comparinga specific pull-down to eight pHis3-GFP pull-downs, consist-
−10 −5 0 5 100
5
10
15
20
25
�HIS3
−10 −5 0 5 100
5
10
15
20
25
SKI2SKI3
SKI8
−10 −5 0 5 100
5
10
15
20
25
� �
��
SKI2SKI3
SKI8SMC2
SMC4BRN1
YCG1
−10 −5 0 5 100
5
10
15
20
25
SKI2
SKI3 SKI8
−10 −5 0 5 100
5
10
15
20
25
SKI2
SKI3
SKI8
−10 −5 0 5 100
5
10
15
20
25 SKI2SKI3
SKI8
-log1
0 p-
valu
e
log2(bait/background) log2(bait/background) log2(bait/background)
log2(bait/background) log2(bait/background) log2(bait/background)
-log1
0 p-
valu
e
-log1
0 p-
valu
e
-log1
0 p-
valu
e
-log1
0 p-
valu
e
-log1
0 p-
valu
e
A B C
D E F
FIG. 3. Comparing to unrelated tagged strains. All pull-downs in this figure were measured in quadruplicates. Cut-off lines were those ofES2 (see Experimental Procedures). Red dots represent members of the SKI complex and blue dots represent members of the condensincomplex. A, Comparison of the control strain pHIS3-GFP against its parental strain BY4741. B, Classic comparison of a tagged strain againstan untagged control strain, in this case SKI2-GFP against pHIS3-GFP. C, SKI2-GFP compared with an unrelated tagged strain, SMC2-GFP.D, SKI2-GFP compared with 8 � pHIS3-GFP in quadruplicate (� 32 control pull-downs). E, SKI2-GFP compared with eight unrelated taggedstrains in quadruplicate (APC1-GFP, CAF1-GFP, CCR4-GFP, PAF1-GFP, PEP5-GFP, SMC1-GFP, SMC2-GFP, and SNF4-GFP � 32 controlpull-downs). F, SKI2-GFP compared with its bait specific control group (BSCG) consisting of all other pull-downs in the data set except for theSKI3 quadruplicate (� 116 control pull-downs).
High Accuracy Label-free Quantitative AE-MS in Yeast
8 Molecular & Cellular Proteomics 14.1
F3
COLOR
tapraid4/zjw-macp/zjw-macp/zjw00115/zjw4939-14a xppws S�3 2/12/14 15:57 4/Color Figure(s) F1–5 ARTNO: M114.041012
76

4.1 Publication: Accurate protein complex retrieval by affinity enrichment MS
ing of four biological replicates each, clearly led to betterseparation of interactors from the background cloud than justcomparing to one pHIS3-GFP pull-down (compare Fig. 3D toFig. 3B). The larger control group provided a less error-proneaverage background intensity of every protein, which in turnresulted in higher p values of the enriched true interactingproteins. This is particularly beneficial to separate weaker ortransient interactors, which by their nature tend to only bemildly enriched, from the background cloud, as long as theirlow enrichment is highly reproducible. The more control pull-downs are included into the control group, the better theresults should become. However, performing a large numberof empty control experiments consumes considerable re-sources. In a human interactome study in 2007 for example,the authors conducted 202 control experiments (12). We rea-soned that if we are able to compare tagged strains to eachother, we would naturally obtain a large control group withoutany additional efforts. To test this concept, we first comparedthe SKI complex pull-downs to eight unrelated tagged strains.This resulted in the same or better statistical improvement ofthe interactors as we had obtained when using the samenumber of control strains (Fig. 3E and 3D). We chose thetagged strains serving as the control group to be unrelated tothe specific bait of interest, in the sense that their taggedproteins do not reside in a known complex with this bait. Toobtain the largest possible control group, we selected allunrelated pull-downs in the data set and termed this the “baitspecific control group” (BSCG). If interacting proteins areincluded in the BSCG, they can increase the calculated aver-age background intensity of interactors and therefore artifi-cially decrease the t test result. For large control groups;however, wrong assignment would generally not dramaticallychange results, as demonstrated by comparing the SKI2 pull-downs against all other pull-downs in the data set (supple-mental Fig. S5). Although we here constructed the BSCG fromprior knowledge, it could also be constructed in an iterativeway. In the case of SKI2, the BSCG included all pull-downsexcept the replicates of SKI3, resulting in 116 controls. Thisled by far to the best separation, placing the SKI complex intothe far upper right corner of the volcano plot (Fig. 3F). There-fore, we concluded that other pull-downs can serve as excel-lent controls and in the following determined interactors bycomparing each specific pull-down to its BSCG.
Combining Enrichment Over Background with Intensity Pro-file Analysis Leads to High Quality Interaction Data—To clas-sify a protein as an interactor, we needed to introduce a cutoffthat separates enriched proteins from the unchanged cloud ofbackground binders centered around zero in the volcanoplots. The position of this cutoff is crucial: A stringent cutoffleads to a low false positive rate, but may miss weaker ormore transient interactors, whereas a permissive cutoff wouldinclude these, but at the cost of increasing false positives. Topreserve information about weak or transient interactors, wedecided to use a two cutoff strategy, which divides interactor
candidates into mildly and strongly enriched proteins (Fig.4A). To define the position of the two cutoff lines, we plottedthe distribution of all enrichment factors within one series andplaced two minimum fold change cutoffs at one and twostandard deviations, respectively. Interestingly, in the case ofES2, the series with biological quadruplicates that had beenmeasured in one block, the standard deviation was muchlower than for ES1. The cutoff lines were placed once for allpull-downs within an experimental series with curvature pa-rameters that best separate the outliers from the cumulativebackground cloud (for more details see Experimental Proce-dures and supplemental Fig. S6A–6H).
We then introduced a new criterion to deal with the falsepositives among the mildly enriched interactors close to thecutoff lines. This criterion makes use of the above mentionedtendency of intensity profiles of true interactors of a baitprotein to be correlated, because interacting proteins shouldbe enriched whenever one of the complex members istagged. Moreover, slight variations across samples becauseof background binding should be followed by all complexsubunits. This concept requires a complete LFQ intensitymatrix, produced by imputing missing values from a suitablychosen random distribution, to not artificially increase or de-crease the correlation (Experimental Procedures). To evaluatethe similarity of a given profile to the profile of the bait, wecalculated the Pearson correlation of the two profiles; and thiswas repeated for every enriched protein (Fig. 4B). Althoughstrongly enriched proteins generally show medium to highcorrelations, mildly enriched proteins generally show lowercorrelations, but with a much higher variation from high toeven negative values (supplemental Fig. S7). This indicatesthat true interactors exist among those borderline interac-tors that can be detected with the help of the correlationanalysis. For the example of the MCM4 pull-down in Fig. 4,five out of the six complex members were highly enriched,but one (MCM3) only scored a mild enrichment and mod-erate p value, but a high correlation (0.56), which led to itscorrect identification as an interactor of MCM4. In this ex-emplary pull-down, the detected true interactors showed anaverage correlation of 0.68 to the bait, whereas the detectedunspecific binders showed an average correlation of 0.42. InES2, the average correlation of detected unspecific binderswas generally even lower. We determined a series specificcorrelation cutoff for ES1 and ES2 by evaluating the corre-lation of all proteins detected in all pull-downs in a Q-Q-plot,which visualizes the real distribution of all correlation valuescompared with a theoretical normal distribution (supple-mental Fig. S6I and 6J). The point, where actual and theo-retical distribution sharply deviated was chosen as the cor-relation cutoff. Correlation analysis worked particularly wellwith our data set, as it contains at least two entry points forevery complex.
We then proceeded to group enriched proteins into inter-actor confidence classes A–C by their enrichment, p value
High Accuracy Label-free Quantitative AE-MS in Yeast
Molecular & Cellular Proteomics 14.1 9
ZSI
F4
ZSI
ZSI
ZSI
tapraid4/zjw-macp/zjw-macp/zjw00115/zjw4939-14a xppws S�3 2/12/14 15:57 4/Color Figure(s) F1–5 ARTNO: M114.041012
77
●

4 State-of-the-art affinity enrichment–mass spectrometry
and correlation to the bait as summarized in Fig. 4C. Class Cproteins are proteins between the two cutoff lines with lowor medium correlation to the bait and are not regarded asinteractors. Class B proteins are proteins between the cutofflines with high correlation or proteins outside the outercutoff line with medium correlation, and represent lowerconfidence interactors. Finally, class A proteins are proteinsoutside the outer cutoff line with high correlation and areconsidered high confidence interactors. The result of theclassification is shown for the MCM complex in Fig. 4C, andthe same color scheme is used in all volcano plots throughoutthe supplemental Material ES1/ES2. Although we found theabove classification scheme to be very efficient, it should not beseen as absolute, but rather as a help in interpreting the pull-downs results.
How the intensity profile analysis can recognize false-pos-itives is illustrated by the profiles of SFC1 and SDH3 in Fig.4B. They represent atypical background binders (see above)fluctuating from low to high intensities across pull-downs.Because they appeared by chance in all of the replicates ofthe specific pull-down they scored both a good enrichmentfactor and p value. However, because of the fluctuations intheir profiles, the correlation to the bait intensity profile ispoor, which reclassifies SFC1 as lower confidence interactorand SDH3 as noninteractor. Without the correlation analysis,SFC1 would have been considered a high confidence inter-
actor. Conversely, proteins that are only minimally but repro-ducibly enriched are likely to still be true interactors if theyshow good correlation (See MCM3 in Fig. 4B). Using thedata set-dependent cutoff definition, the average complexcoverage per pull-down (calculated as true positives/(truepositives � false negatives), with true complex members de-rived from UniProt) was 74% for ES1 and even 83% for ES2.Among the 82 and 79 class A interactors, the false-positiverates (calculated as false positives/(true positives � falsepositives) were only 6 and 0% for ES1 and ES2 respectively.Among the 32 class B interactors in ES1, the false-positiverate was 53%; however, 15 out of these 17 false positiveswere downgraded from class A and therefore rightfully clas-sified as lower confidence interactors. Among the 15 class Binteractors in ES2, the false positive rate was 20%. False-negative rates in class C (calculated as true complex mem-bers falsely classified as class C/all proteins in class C) werevery low with 3% (4 out of 133) for ES1 and 6% (2 out of 35)for ES2. For all the aforementioned calculations, the twolarge complexes (NPC and proteasome) as well as the com-plexes were no classification could be performed (APC2,CDC73, and TEF1) were excluded.
Defining Complexes of Various Sizes, Abundances, andCellular Localizations—The bait proteins in our study hadbeen selected to represent a wide range of cellular abun-dances (supplemental Fig. S1), localizations (e.g. cytosolic,
Position inVolcano Plot
Cor
rela
tion
between the two curves
outsideouter curve
low
medium
high
CC
BBA
2025
3020
2530
2025
3020
2530
2025
30
−15 −10 −5 0 5 10 150
5
10
15
20
25
−15 −10 −5 0 5 10 150
5
10
15
20
25
AP
C1
AP
C2
BR
E2
BY
4741
CC
R4
CD
C73
MC
M2
MC
M4
MC
M6
MC
M7
NO
T3
OR
M1
OR
M2
PAF
1P
HIS
3−G
FP
PU
P1
PU
P2
SE
T1
SH
G1
SM
C1
SM
C2
SM
C3
SM
C4
SW
D3
MCM4c=1
MCM6c=0.77
MCM3c=0.56
SFC1c=0.49
SDH3 c=0.38
log2
LFQ
inte
nsity
log2(bait/background)
−log
10 p
-val
ue
log2(bait/background)
−log
10 p
-val
ue
MCM4
MCM5
MCM6
MCM7MCM2
TOF1 MCM3SFC1
SDH3
MCM4
MCM5
MCM6
MCM7MCM2
TOF1 MCM3SFC1
SDH3
Outer curveInner curve
A CB
FIG. 4. Classification of interactors. Proteins are classified as interactors according to their position in the volcano plot and according totheir correlation to the corresponding bait protein. A, Volcano Plot. Potential interactors are preclassified according to their position in thevolcano plot into “mildly enriched” (between the two curves) and “strongly enriched” (outside the blue curve) proteins B, Intensity profileanalysis of some enriched proteins from the volcano plot in A. From top to bottom: intensity profile of MCM4 (the bait protein), MCM6, andMCM3 (true interactors), and SFC1 and SDH3 (false positives) with the according calculated correlation to the profile of MCM4. C, Samevolcano plot as in A, but with classification of interactors. Insert: Enrichment, reproducibility and correlation are combined to score interactorsinto interactor confidence classes A, B and C. Proteins between the cutoff curves with a low correlation (lower than 0.1) were not consideredat all. Both proteins between the cutoff curves with a medium correlation (between 0.1 and the series-specific correlation cutoff) and proteinsoutside the outer cutoff curve with a low correlation (lower than 0.1) were assigned to class C (noninteractors). Proteins between the cutoffcurves with a high correlation (higher than the series-specific correlation cutoff) as well as proteins outside the outer cutoff curve with a mediumcorrelation were assigned to class B (lower confidence interactors). Proteins outside the outer cutoff curve with a high correlation wereassigned to class A (high confidence interactors).
High Accuracy Label-free Quantitative AE-MS in Yeast
10 Molecular & Cellular Proteomics 14.1
ZSI
COLOR
ZSI
tapraid4/zjw-macp/zjw-macp/zjw00115/zjw4939-14a xppws S�3 2/12/14 15:57 4/Color Figure(s) F1–5 ARTNO: M114.041012
78

4.1 Publication: Accurate protein complex retrieval by affinity enrichment MS
nuclear, and membrane bound), and functions (e.g. cell cycle,transcription, translation-elongation, and transport). For eachof the pull-downs, the volcano plot containing the results ofour analysis is depicted in supplemental Material ES1 and/orsupplemental Material ES2. All bait proteins and the pagenumber of the corresponding volcano plot within the supple-mental Material ES1/ES2 are summarized in a table on thefirst page of both files. Given the diversity of these complexes,they serve to illustrate different aspects of our method.
When we used very low abundant proteins as baits, wewere still able to identify interactors with a surprisingly highcomplex coverage, especially considering that our systemuses endogenous expression and relatively little input mate-rial. For instance the members of the anaphase promotingcomplex, which has a key regulatory role in the cell cycle, areexpressed at an estimated average of about 70 copies per cellin unsynchronized yeast cells (46). Using APC1 (about 30copies/cell) as the entry point to the APC, our standard pull-down protocol already identified 11 out of 13 APC members.The two missing complex members (APC9 and APC11) arepotentially even lower abundant in unsynchronized cells asthey were also not detected in a deep yeast proteome (46).Similarly, pull-down of the SET1/COMPASS histone methyl-transferase complex by its SET1 (135 copies/cell) and SWD3(74 copies/cell) subunits revealed all eight complex membersas clear outliers in the volcano plots.
Conversely, we were also able to detect interactors of veryhigh abundant proteins. Here the challenge is that these pro-teins often have very high background intensities – ranging inour workflow to a log2 intensity of up to about 36 – over whichthey can hardly be further enriched. For the elongation factorCAM1 (49,500 copies/cell, average log2 background intensity29.9) we identified CAM1 itself and its direct interactor EFB1with a moderate but clear enrichment but an extremely sig-nificant p value (p � 10�25). However, TEF1 (630,000 copies/cell, average log2 background intensity of 34.8), another elon-gation factor 1 complex member, did not register as aninteractor as its background intensity is so high that it cannotbe significantly further enriched. Even when we tagged TEF1,this bait was not an outlier, although all three interactorsCAM1, EFB1, and TEF4 were significantly enriched. We alsotargeted another very high abundant complex, the ribosome-associated complex (RAC) through its components SSZ1(59,450 copies/cell, average log2 background intensity of32.2) and ZUO1 (45,188 copies/cell, average log2 backgroundintensity of 31.4). Although SSZ1 only retrieved itself as out-lier, when we tagged ZUO, we could indeed detect SSZ1 withmild enrichment but with a very good p value (p � 10�22).
Although the above examples serve as positive controls,illustrating aspects of our affinity enrichment workflow, wealso we detected some interactors that are not part of thestable, known core complexes. The MCM complex presentsthe core of the replicative DNA helicase in yeast and forms adouble hexameric ring around the DNA (48). We identified
TOF1 (Topoisomerase 1-associated factor 1) which is not partof the core helicase but which has been shown to interact andregulate it (49). TOF1 is an example of an interactor that waspromoted to likely interactor status (class B), because of itshigh correlation with complex members.
The yeast proteasome consists of a 20S core particle com-posed of 28 � and �-subunits assembled into four rings, anda 19S regulatory particle on both sides of the core composedof 19 proteins. As the proteasome is a highly dynamic holo-complex, its purification is not trivial (50). Using two 20Smembers, PUP1 (� subunit) and PUP2 (� subunit), retrievedthe complete 20S complex and most of the 19S members.Additionally, we found a number of transient interactors, suchas the proteasome activator BLM10, the proteasome stabiliz-ing component ECM29, the proteasome chaperone PBA1 andthe uncharacterized protein YCR076C. The latter has alreadybeen reported to interact with proteasome core particle sub-units (51), an association that we now confirm. Other enrichedproteins found in the PUP1/PUP2 pull-downs that are notreported to interact with the complex could be proteasomesubstrates.
The nuclear pore complex (NPC) represents an example ofa very large complex (about 30 different proteins in multiplecopies) that is embedded in the nuclear membrane (52). Per-forming pull-downs with two of the subunits (NUP84 andNUP145), we found many components of the NPC (19 and 16respectively), which, remarkably, is more than what was iden-tified for these two baits in a dedicated membrane interac-tome (53). Additionally, we identified proteins that are not onlycomponents of the NPC but also of the spindle pole body(SPB), namely CDC31 (54, 55) and NDC1 (56). Consequently,other components of the SPB including SPC110 and SPC42were among the outliers. We also identified the inner nuclearmembrane protein HEH2, which has been proposed to beimportant for a proper distribution of nuclear pores across thenuclear envelope (57).
Two further examples are PAF1 (RNA polymerase II-asso-ciated protein 1), pull-down of which resulted in all five corecomplex members as well as RPO21. This protein is a subunitof the RNA polymerase II. Likewise pull-down of PEP5, amember of the HOPS complex, retrieved all its members, andfurthermore VPS8, a component of the CORVET complexsharing four subunits (PEP3,PEP5,VPS16, and VPS33) withthe HOPS complex (58).
Apart from core and transient, proteins can also be mutuallyexclusive complex members. As an example, the SNF1 pro-tein kinase complex is a hetero-trimeric complex consisting ofthe alpha subunit SNF1, the gamma subunit SNF4, and one ofthree alternative beta subunits SIP1, SIP2, or GAL83 (Fig. 5A)(59). This complex proved to be a good case to investigate theeffects of mutually exclusive complex members on the inten-sity profile analysis. We used SNF4 and GAL83 as baits,hence SIP1 and SIP2 were only identified in the SNF4 pull-down, as expected (Fig. 5B and 5C). Nevertheless they
High Accuracy Label-free Quantitative AE-MS in Yeast
Molecular & Cellular Proteomics 14.1 11
ZSI
ZSI
ZSI
F5
tapraid4/zjw-macp/zjw-macp/zjw00115/zjw4939-14a xppws S�3 2/12/14 15:57 4/Color Figure(s) F1–5 ARTNO: M114.041012
79
●
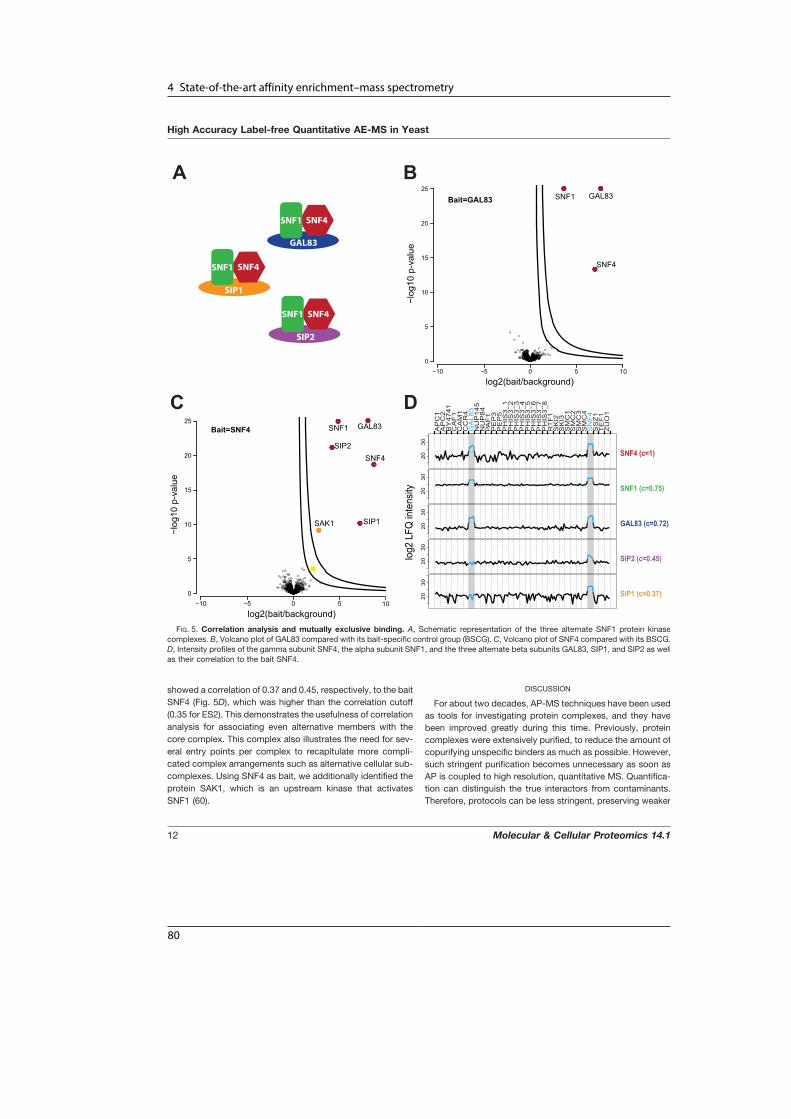
4 State-of-the-art affinity enrichment–mass spectrometry
showed a correlation of 0.37 and 0.45, respectively, to the baitSNF4 (Fig. 5D), which was higher than the correlation cutoff(0.35 for ES2). This demonstrates the usefulness of correlationanalysis for associating even alternative members with thecore complex. This complex also illustrates the need for sev-eral entry points per complex to recapitulate more compli-cated complex arrangements such as alternative cellular sub-complexes. Using SNF4 as bait, we additionally identified theprotein SAK1, which is an upstream kinase that activatesSNF1 (60).
DISCUSSION
For about two decades, AP-MS techniques have been usedas tools for investigating protein complexes, and they havebeen improved greatly during this time. Previously, proteincomplexes were extensively purified, to reduce the amount ofcopurifying unspecific binders as much as possible. However,such stringent purification becomes unnecessary as soon asAP is coupled to high resolution, quantitative MS. Quantifica-tion can distinguish the true interactors from contaminants.Therefore, protocols can be less stringent, preserving weaker
SNF4
GAL83
SNF1
SNF4
SIP1
SNF1
SNF4
SIP2
SNF1
SNF4 (c=1)
SNF1 (c=0.75)
GAL83 (c=0.72)
SIP1 (c=0.37)
SIP2 (c=0.45)
AP
C1
AP
C2
BY
4741
CA
F1
CA
M1
CC
R4
GA
L83
NU
P14
5N
UP
84PA
F1
PE
P3
PE
P5
PH
IS3_
1P
HIS
3_2
PH
IS3_
3P
HIS
3_4
PH
IS3_
5P
HIS
3_6
PH
IS3_
7P
HIS
3_8
RT
F1
SK
I2S
KI3
SM
C1
SM
C2
SM
C3
SM
C4
SN
F4
SS
Z1
TE
F1
ZU
O1
log2
LFQ
inte
nsity
log2(bait/background)
−log
10 p
-val
ue
log2(bait/background)
−log
10 p
-val
ue
SNF1
SNF4
GAL83
SNF1
SNF4
SIP1
SIP2
SAK1
GAL83
Bait=GAL83
Bait=SNF420
3020
3020
3020
3020
30
−10 −5 0 5 100
5
10
15
20
25
−10 −5 0 50
5
10
15
20
25
10
A
S
A
C D
B
FIG. 5. Correlation analysis and mutually exclusive binding. A, Schematic representation of the three alternate SNF1 protein kinasecomplexes. B, Volcano plot of GAL83 compared with its bait-specific control group (BSCG). C, Volcano plot of SNF4 compared with its BSCG.D, Intensity profiles of the gamma subunit SNF4, the alpha subunit SNF1, and the three alternate beta subunits GAL83, SIP1, and SIP2 as wellas their correlation to the bait SNF4.
High Accuracy Label-free Quantitative AE-MS in Yeast
12 Molecular & Cellular Proteomics 14.1
COLOR
tapraid4/zjw-macp/zjw-macp/zjw00115/zjw4939-14a xppws S�3 2/12/14 15:57 4/Color Figure(s) F1–5 ARTNO: M114.041012
80
4.1 Publication: Accurate protein complex retrieval by affinity enrichment MS
interactions, while resulting in a higher background. In thiswork, we have taken this concept to its logical conclusion byemploying low stringent single-step enrichment of proteincomplexes followed by label-free quantitative MS analysis inwhich we co-purify a very large number of unspecific bindersrepresenting about half of the yeast proteome. Complexescan still be confidently identified because of their enrichmentin specific bait pull-downs versus all other pull-downs. As wedo not aim to purify but only to enrich, we suggest termingsuch methods AE-MS. Our methodology is solely based onintensity-based label-free quantification, which has advancedconsiderably and for pull-downs is now comparable with la-bel-based quantification approaches like SILAC (20, 33).
Identification of a large number of background binders isunavoidable with modern MS instrumentation. Perhaps coun-terintuitively, our results demonstrate that these unspecificproteins can actually be beneficial, elevating them from anuisance to an essential part of the analysis. Apart from theiressential use in normalization, they are indicators of the re-producibility within a specific workflow and serving as qualitycontrol. As unchanging background binders greatly outnum-ber changing interactors, pull-downs are highly similar to eachother, which in turn obviates the need for a dedicated controlstrain. Finally, we have shown that reproducible detection ofunspecific binders allows further characterization of interactorcandidates by correlating their intensity profiles to the profileof the bait. Using our pipeline, we identified interactors of adiverse set of endogenously expressed bait proteins with highconfidence, starting from minimal input amounts of unlabeledyeast, and requiring modest measuring times despite repli-cate analysis. In medium or large-scale projects, our workflowautomatically provides a large control group, without actuallyperforming any control pull-downs. However, as illustratedwith the SKI complex, using only one tagged strain as control(or an empty stain) already correctly identified all complexmembers, demonstrating the feasibility of AE-MS also forsmall scale projects.
Although a large improvement, our AE-MS workflow doesnot solve all issues in MS-based interaction studies. Mem-brane complexes always present a challenge because of theirhydrophobic nature. However, our protocol yielded excellentresults for the HOPS vacuolar membrane complex and thenuclear pore complex without adapting it in any way. For theSPOTS complex, we only retrieved two out of the six complexmembers. Adapting the type of detergent or the detergentconcentration in the lysis buffer may help to better identifymembrane complexes (53). To further verify interactors, wehave introduced intensity profile analysis, which proved to bevery helpful for upgrading weaker interactors and uncoveringfalse positives. As this method relies on correlation to the baitprofile, it could; however, not be used in three cases where wedid not detect the bait as an outlier (in ES1: APC2 and CDC73;in ES2: TEF1). In the case of CDC73, the bait was incorrectlytagged in the strain we used, as we subsequently found by a
control PCR. For APC2 the very low copy number was pre-sumably the reason, as even in ES2 where we found APC2, itwas only identified with two peptides. Finally, as already men-tioned, for TEF1 the background intensity was so high that itdid not form a useful profile. However, the intensity profilingonly serves as additional information, and in all these casesthe correct interacting proteins were still identified throughtheir enrichment. A final potential caveat for the intensityprofile analysis are newly identified proteins interacting withseveral baits, which decreases their correlation score. How-ever, provided their enrichment is high, they would still beconsidered (class B) interactors. Examination of the actualintensity profile of such promiscuous interactors could alsohelp in judging whether weak correlation to the bait is causedby strong fluctuation between all samples, making the proteina false positive, or caused by strong fluctuation betweenseveral replicate groups, making it a potential link betweenseveral complexes.
The two largest yeast interactomes published in 2006 byGavin et al. and Krogan et al. both employed TAP-taggingcoupled to nonquantitative MS and among other frequencyfiltering of detected proteins to remove unspecific binders (9,10). This can be problematic in the case of atypical back-ground binders that appear spontaneously at high intensity inonly some pull-downs. In our AE-MS approach, pull-downsare performed in replicates, hence such proteins are rarelyscored as interactors. Even if an atypical background binder isby chance detected in all replicates, the intensity profile anal-ysis can still uncover it. With very few exceptions, all of theproteins listed as contaminant in the above studies were alsofound in our data set. However, they did not appear as inter-actors in any of our pull-downs other than where expected.The data sets of Gavin et al. and Krogan et al. only shareabout one quarter of detected interactions (61) and did notcontain 1/3 or 1/2 of the baits that we had tagged here,respectively. For each of the pull-downs that we could com-pare between all three studies (APC2, BRE2, CCR4, NUP84,NUP145, POP2, RTF1, SET1, SKI2, SMC1, SSZ1, and SWD3)the complex coverage was equal or better using the AE-MSmethod. In one case, we only retrieved EFB1 as interactors ofCAM1 whereas Gavin et al. also found TEF1 and TEF2. Al-though these proteins were also found in a mock TAP-tagpurification and therefore included in the contaminant list, wereason that more stringent purification could be helpful fordetecting interactors of extremely high expressed proteinssuch as CAM1.
Recent interaction proteomics efforts typically at least em-ploy semiquantitative approaches; however, removal of con-taminants can still be problematic. There is an ongoing col-laborative effort to establish a “contaminant repository foraffinity purification,” the “CRAPome,” containing control pull-downs from various laboratories performed under variousexperimental conditions (62). In the case of yeast 17 controlpull-downs are currently available, of which 12 have been
High Accuracy Label-free Quantitative AE-MS in Yeast
Molecular & Cellular Proteomics 14.1 13
tapraid4/zjw-macp/zjw-macp/zjw00115/zjw4939-14a xppws S�3 2/12/14 15:57 4/Color Figure(s) F1–5 ARTNO: M114.041012
81
●

4 State-of-the-art affinity enrichment–mass spectrometry
performed using GFP-tagged proteins and nano-magneticbeads. However, a larger number of controls may be neces-sary to comprehensively cover all nonspecific binders andthereby avoid incorrectly classifying a nonspecific binder asan interactor. Our AE-MS method sidesteps this problem, asthe samples themselves are the controls. The minor but cleardifferences between our two experimental series (Fig. 2A)demonstrate that minor changes in the workflow like using adifferent machine of the same type can already alter thedetected low abundant background binders, making the no-tion of a universal CRAPome problematic.
From the differences between the two experimental serieswe also conclude that for the most optimal output, AE-MSexperiments should be executed in a reproducible mannerfrom sample preparation to MS measurement, which shouldideally be conducted on one machine and in one batch as inES2. However, the MaxLFQ normalization algorithm success-fully corrected for most of the variability in the ES1 series ingeneral and in the proteasome pull-downs in particular, re-sulting in excellent results even for ES1.
To perform the AE-MS workflow described here, only threeelements were needed: tagged proteins of interest, a highresolution LC-MS system, and sophisticated software toquantify proteins and analyze the data. Here we used the LTQOrbitrap classic, which—although not being the latest Or-bitrap technology—proved to be sufficient for identifying evenvery low abundant protein complexes. Such technology isnow widely accessible, as is the MaxQuant software for per-forming accurate intensity-based label-free quantification andthe Perseus program for statistical analysis of the data. OurAE-MS protocol is equally suited to investigate a small, me-dium or large number of samples. For a smaller set of sam-ples, SILAC labeling could easily be implemented, whichmight provide even more accurate ratios in the case ofborderline enrichment. More and more AP-MS workflows al-ready use single-step protocols and employ high resolution MS,and therefore rather represent AE-MS methods. The shift in theconceptual framework from AP-MS to AE-MS and the develop-ment of sophisticated analysis tools for AE-MS experimentsshould contribute to higher quality interaction data, therebymaking studies more comparable, and helping to solve openchallenges in the interactomics field.
Acknowledgments—We thank Nils A. Kulak for input regardingyeast culture, Jurgen Cox for advice regarding data analysis andRoland Wedlich-Soldner for providing the strains of the yeast-GFPclone collection.
* This work was supported by the Bundesministerium fur Bildungund Forschung (grant number FKZ01GS0861, DiGtoP consortium)and the European Commission’s 7th Framework Program PROS-PECTS (HEALTH-F4-2008-201648).
□S This article contains supplemental Figs. S1 to S7, Table S1,Spectra, and Experimental Series S1 and S2.
§ To whom correspondence should be addressed: Department ofProteomics and Signal Transduction, Max-Planck Institute of Bio-
chemistry, Am Klopferspitz 18, Martinsried (near Munich) D-82152Germany. Tel.: 49-89-8578 2557; Fax: 49-89-8578 2219; E-mail:[email protected].
DATA AVAILABILITY: The mass spectrometry proteomics datahave been deposited to the ProteomeXchange Consortium (63).(http://proteomecentral.proteomexchange.org) via the PRIDE partnerrepository (64) with the data set identifier PXD000955.
REFERENCES
1. Gingras, A. C., Gstaiger, M., Raught, B., and Aebersold, R. (2007) Analysisof protein complexes using mass spectrometry. Nat. Rev. Mol. Cell Biol.8, 645–654
2. Oeffinger, M. (2012) Two steps forward–one step back: advances in affinitypurification mass spectrometry of macromolecular complexes. Proteom-ics 12, 1591–1608
3. Gavin, A. C., Maeda, K., and Kuhner, S. (2011) Recent advances in chartingprotein–protein interaction: mass spectrometry-based approaches. Curr.Opin. Biotechnol. 22, 42–49
4. Fields, S., and Song, O. (1989) A novel genetic system to detectprotein–protein interactions. Nature 340, 245–246
5. Rajagopala, S. V., Sikorski, P., Caufield, J. H., Tovchigrechko, A., and Uetz,P. (2012) Studying protein complexes by the yeast two-hybrid system.Methods 58, 392–399
6. Parrish, J. R., Gulyas, K. D., and Finley, R. L., Jr. (2006) Yeast two-hybridcontributions to interactome mapping. Curr. Opin. Biotechnol. 17,387–393
7. Gavin, A. C., Bosche, M., Krause, R., Grandi, P., Marzioch, M., Bauer, A.,Schultz, J., Rick, J. M., Michon, A. M., Cruciat, C. M., Remor, M., Hofert,C., Schelder, M., Brajenovic, M., Ruffner, H., Merino, A., Klein, K., Hudak,M., Dickson, D., Rudi, T., Gnau, V., Bauch, A., Bastuck, S., Huhse, B.,Leutwein, C., Heurtier, M. A., Copley, R. R., Edelmann, A., Querfurth, E.,Rybin, V., Drewes, G., Raida, M., Bouwmeester, T., Bork, P., Seraphin,B., Kuster, B., Neubauer, G., and Superti-Furga, G. (2002) Functionalorganization of the yeast proteome by systematic analysis of proteincomplexes. Nature 415, 141–147
8. Ho, Y., Gruhler, A., Heilbut, A., Bader, G. D., Moore, L., Adams, S. L., Millar,A., Taylor, P., Bennett, K., Boutilier, K., Yang, L., Wolting, C., Donaldson,I., Schandorff, S., Shewnarane, J., Vo, M., Taggart, J., Goudreault, M.,Muskat, B., Alfarano, C., Dewar, D., Lin, Z., Michalickova, K., Willems,A. R., Sassi, H., Nielsen, P. A., Rasmussen, K. J., Andersen, J. R.,Johansen, L. E., Hansen, L. H., Jespersen, H., Podtelejnikov, A., Nielsen,E., Crawford, J., Poulsen, V., Sorensen, B. D., Matthiesen, J., Hendrick-son, R. C., Gleeson, F., Pawson, T., Moran, M. F., Durocher, D., Mann,M., Hogue, C. W., Figeys, D., and Tyers, M. (2002) Systematic identifi-cation of protein complexes in Saccharomyces cerevisiae by mass spec-trometry. Nature 415, 180–183
9. Gavin, A. C., Aloy, P., Grandi, P., Krause, R., Boesche, M., Marzioch, M.,Rau, C., Jensen, L. J., Bastuck, S., Dumpelfeld, B., Edelmann, A., Heurt-ier, M. A., Hoffman, V., Hoefert, C., Klein, K., Hudak, M., Michon, A. M.,Schelder, M., Schirle, M., Remor, M., Rudi, T., Hooper, S., Bauer, A.,Bouwmeester, T., Casari, G., Drewes, G., Neubauer, G., Rick, J. M.,Kuster, B., Bork, P., Russell, R. B., and Superti-Furga, G. (2006) Pro-teome survey reveals modularity of the yeast cell machinery. Nature 440,631–636
10. Krogan, N. J., Cagney, G., Yu, H., Zhong, G., Guo, X., Ignatchenko, A., Li, J.,Pu, S., Datta, N., Tikuisis, A. P., Punna, T., Peregrin-Alvarez, J. M., Shales,M., Zhang, X., Davey, M., Robinson, M. D., Paccanaro, A., Bray, J. E.,Sheung, A., Beattie, B., Richards, D. P., Canadien, V., Lalev, A., Mena, F.,Wong, P., Starostine, A., Canete, M. M., Vlasblom, J., Wu, S., Orsi, C.,Collins, S. R., Chandran, S., Haw, R., Rilstone, J. J., Gandi, K., Thompson,N. J., Musso, G., St Onge, P., Ghanny, S., Lam, M. H., Butland, G., Altaf-Ul,A. M., Kanaya, S., Shilatifard, A., O’Shea, E., Weissman, J. S., Ingles, C. J.,Hughes, T. R., Parkinson, J., Gerstein, M., Wodak, S. J., Emili, A., andGreenblatt, J. F. (2006) Global landscape of protein complexes in the yeastSaccharomyces cerevisiae. Nature 440, 637–643
11. Butland, G., Peregrin-Alvarez, J. M., Li, J., Yang, W., Yang, X., Canadien, V.,Starostine, A., Richards, D., Beattie, B., Krogan, N., Davey, M., Parkin-son, J., Greenblatt, J., and Emili, A. (2005) Interaction network containingconserved and essential protein complexes in Escherichia coli. Nature433, 531–537
High Accuracy Label-free Quantitative AE-MS in Yeast
14 Molecular & Cellular Proteomics 14.1
ZSI
tapraid4/zjw-macp/zjw-macp/zjw00115/zjw4939-14a xppws S�3 2/12/14 15:57 4/Color Figure(s) F1–5 ARTNO: M114.041012
82
4.1 Publication: Accurate protein complex retrieval by affinity enrichment MS
12. Ewing, R. M., Chu, P., Elisma, F., Li, H., Taylor, P., Climie, S., McBroom-Cerajewski, L., Robinson, M. D., O’Connor, L., Li, M., Taylor, R., Dharsee,M., Ho, Y., Heilbut, A., Moore, L., Zhang, S., Ornatsky, O., Bukhman,Y. V., Ethier, M., Sheng, Y., Vasilescu, J., Abu-Farha, M., Lambert, J. P.,Duewel, H. S., Stewart, II, Kuehl, B., Hogue, K., Colwill, K., Gladwish, K.,Muskat, B., Kinach, R., Adams, S. L., Moran, M. F., Morin, G. B.,Topaloglou, T., and Figeys, D. (2007) Large-scale mapping of humanprotein–protein interactions by mass spectrometry. Mol. Syst. Biol. 3, 89
13. Kuhner, S., van Noort, V., Betts, M. J., Leo-Macias, A., Batisse, C., Rode,M., Yamada, T., Maier, T., Bader, S., Beltran-Alvarez, P., Castano-Diez,D., Chen, W. H., Devos, D., Guell, M., Norambuena, T., Racke, I., Rybin,V., Schmidt, A., Yus, E., Aebersold, R., Herrmann, R., Bottcher, B.,Frangakis, A. S., Russell, R. B., Serrano, L., Bork, P., and Gavin, A. C.(2009) Proteome organization in a genome-reduced bacterium. Science326, 1235–1240
14. Guruharsha, K. G., Rual, J. F., Zhai, B., Mintseris, J., Vaidya, P., Vaidya, N.,Beekman, C., Wong, C., Rhee, D. Y., Cenaj, O., McKillip, E., Shah, S.,Stapleton, M., Wan, K. H., Yu, C., Parsa, B., Carlson, J. W., Chen, X.,Kapadia, B., VijayRaghavan, K., Gygi, S. P., Celniker, S. E., Obar, R. A.,and Artavanis-Tsakonas, S. (2011) A protein complex network of Dro-sophila melanogaster. Cell 147, 690–703
15. Malovannaya, A., Lanz, R. B., Jung, S. Y., Bulynko, Y., Le, N. T., Chan,D. W., Ding, C., Shi, Y., Yucer, N., Krenciute, G., Kim, B. J., Li, C., Chen,R., Li, W., Wang, Y., O’Malley, B. W., and Qin, J. (2011) Analysis of thehuman endogenous coregulator complexome. Cell 145, 787–799
16. Makarov, A. (2000) Electrostatic axially harmonic orbital trapping: a high-performance technique of mass analysis. Anal. Chem. 72, 1156–1162
17. Gibson, T. J., Seiler, M., and Veitia, R. A. (2013) The transience of transientoverexpression. Nat. Methods 10, 715–721
18. Glatter, T., Wepf, A., Aebersold, R., and Gstaiger, M. (2009) An integratedworkflow for charting the human interaction proteome: insights into thePP2A system. Mol. Syst. Biol. 5, 237
19. Poser, I., Sarov, M., Hutchins, J. R., Heriche, J. K., Toyoda, Y., Pozniak-ovsky, A., Weigl, D., Nitzsche, A., Hegemann, B., Bird, A. W., Pelletier, L.,Kittler, R., Hua, S., Naumann, R., Augsburg, M., Sykora, M. M.,Hofemeister, H., Zhang, Y., Nasmyth, K., White, K. P., Dietzel, S., Mech-tler, K., Durbin, R., Stewart, A. F., Peters, J. M., Buchholz, F., and Hyman,A. A. (2008) BAC TransgeneOmics: a high-throughput method for explo-ration of protein function in mammals. Nat. Methods 5, 409–415
20. Hubner, N. C., Bird, A. W., Cox, J., Splettstoesser, B., Bandilla, P., Poser,I., Hyman, A., and Mann, M. (2010) Quantitative proteomics combinedwith BAC TransgeneOmics reveals in vivo protein interactions. J. CellBiol. 189, 739–754
21. Rigaut, G., Shevchenko, A., Rutz, B., Wilm, M., Mann, M., and Seraphin, B.(1999) A generic protein purification method for protein complex char-acterization and proteome exploration. Nat. Biotechnol. 17, 1030–1032
22. Ong, S. E., Blagoev, B., Kratchmarova, I., Kristensen, D. B., Steen, H.,Pandey, A., and Mann, M. (2002) Stable isotope labeling by amino acidsin cell culture, SILAC, as a simple and accurate approach to expressionproteomics. Mol. Cell. Proteomics 1, 376–386
23. Gygi, S. P., Rist, B., Gerber, S. A., Turecek, F., Gelb, M. H., and Aebersold,R. (1999) Quantitative analysis of complex protein mixtures using iso-tope-coded affinity tags. Nat. Biotechnol. 17, 994–999
24. Ross, P. L., Huang, Y. N., Marchese, J. N., Williamson, B., Parker, K.,Hattan, S., Khainovski, N., Pillai, S., Dey, S., Daniels, S., Purkayastha, S.,Juhasz, P., Martin, S., Bartlet-Jones, M., He, F., Jacobson, A., andPappin, D. J. (2004) Multiplexed protein quantitation in Saccharomycescerevisiae using amine-reactive isobaric tagging reagents. Mol. Cell.Proteomics 3, 1154–1169
25. Thompson, A., Schafer, J., Kuhn, K., Kienle, S., Schwarz, J., Schmidt, G.,Neumann, T., Johnstone, R., Mohammed, A. K., and Hamon, C. (2003)Tandem mass tags: a novel quantification strategy for comparative anal-ysis of complex protein mixtures by MS/MS. Anal. Chem. 75, 1895–1904
26. Blagoev, B., Kratchmarova, I., Ong, S. E., Nielsen, M., Foster, L. J., andMann, M. (2003) A proteomics strategy to elucidate functionalprotein–protein interactions applied to EGF signaling. Nat. Biotechnol.21, 315–318
27. Ranish, J. A., Yi, E. C., Leslie, D. M., Purvine, S. O., Goodlett, D. R., Eng, J.,and Aebersold, R. (2003) The study of macromolecular complexes byquantitative proteomics. Nat. Genet. 33, 349–355
28. Paul, F. E., Hosp, F., and Selbach, M. (2011) Analyzing protein–protein
interactions by quantitative mass spectrometry. Methods 54, 387–39529. Liu, H., Sadygov, R. G., and Yates, J. R., 3rd (2004) A model for random
sampling and estimation of relative protein abundance in shotgun pro-teomics. Anal. Chem. 76, 4193–4201
30. Bondarenko, P. V., Chelius, D., and Shaler, T. A. (2002) Identification andrelative quantitation of protein mixtures by enzymatic digestion followedby capillary reversed-phase liquid chromatography-tandem mass spec-trometry. Anal. Chem. 74, 4741–4749
31. Nahnsen, S., Bielow, C., Reinert, K., and Kohlbacher, O. (2013) Tools forlabel-free peptide quantification. Mol. Cell Proteomics 12, 549–556
32. Luber, C. A., Cox, J., Lauterbach, H., Fancke, B., Selbach, M., Tschopp, J.,Akira, S., Wiegand, M., Hochrein, H., O’Keeffe, M., and Mann, M. (2010)Quantitative proteomics reveals subset-specific viral recognition in den-dritic cells. Immunity 32, 279–289
33. Eberl, H. C., Spruijt, C. G., Kelstrup, C. D., Vermeulen, M., and Mann, M.(2013) A map of general and specialized chromatin readers in mousetissues generated by label-free interaction proteomics. Mol. Cell 49,368–378
34. Choi, H., Glatter, T., Gstaiger, M., and Nesvizhskii, A. I. (2012) SAINT-MS1:protein–protein interaction scoring using label-free intensity data in af-finity purification-mass spectrometry experiments. J. Proteome Res. 11,2619–2624
35. Poulsen, J. W., Madsen, C. T., Young, C., Poulsen, F. M., and Nielsen, M. L.(2013) Using guanidine-hydrochloride for fast and efficient protein diges-tion and single-step affinity-purification mass spectrometry. J. ProteomeRes. 12, 1020–1030
36. Cox, J., and Mann, M. (2008) MaxQuant enables high peptide identificationrates, individualized p.p.b.-range mass accuracies and proteome-wideprotein quantification. Nat. Biotechnol. 26, 1367–1372
37. Cox, J., Hein, M. Y., Luber, C. A., Paron, I., Nagaraj, N., and Mann, M.(2014) Accurate proteome-wide label-free quantification by delayed nor-malization and maximal peptide ratio extraction, termed MaxLFQ. Mol.Cell. Proteomics 13, 2513–2526
38. Nagaraj, N., Kulak, N. A., Cox, J., Neuhauser, N., Mayr, K., Hoerning, O.,Vorm, O., and Mann, M. (2012) System-wide perturbation analysis withnearly complete coverage of the yeast proteome by single-shot ultraHPLC runs on a bench top Orbitrap. Mol. Cell. Proteomics 11, M111013722
39. Huh, W. K., Falvo, J. V., Gerke, L. C., Carroll, A. S., Howson, R. W.,Weissman, J. S., and O’Shea, E. K. (2003) Global analysis of proteinlocalization in budding yeast. Nature 425, 686–691
40. Hubner, N. C., and Mann, M. (2011) Extracting gene function fromprotein–protein interactions using Quantitative BAC InteraCtomics(QUBIC). Methods 53, 453–459
41. Rappsilber, J., Mann, M., and Ishihama, Y. (2007) Protocol for micro-purification, enrichment, prefractionation, and storage of peptides forproteomics using StageTips. Nat. Protoc. 2, 1896–1906
42. Cox, J., Neuhauser, N., Michalski, A., Scheltema, R. A., Olsen, J. V., andMann, M. (2011) Andromeda: a peptide search engine integrated into theMaxQuant environment. J. Proteome Res. 10, 1794–1805
43. Geiger, T., Wehner, A., Schaab, C., Cox, J., and Mann, M. (2012) Compar-ative proteomic analysis of eleven common cell lines reveals ubiquitousbut varying expression of most proteins. Mol. Cell. Proteomics 11, M111014050
44. Trinkle-Mulcahy, L., Boulon, S., Lam, Y. W., Urcia, R., Boisvert, F. M.,Vandermoere, F., Morrice, N. A., Swift, S., Rothbauer, U., Leonhardt, H.,and Lamond, A. (2008) Identifying specific protein interaction partnersusing quantitative mass spectrometry and bead proteomes. J. Cell Biol.183, 223–239
45. Rees, J. S., Lowe, N., Armean, I. M., Roote, J., Johnson, G., Drummond, E.,Spriggs, H., Ryder, E., Russell, S., St Johnston, D., and Lilley, K. S. (2011)In vivo analysis of proteomes and interactomes using Parallel AffinityCapture (iPAC) coupled to mass spectrometry. Mol. Cell. Proteomics 10,M110 002386
46. Kulak, N. A., Pichler, G., Paron, I., Nagaraj, N., and Mann, M. (2014)Minimal, encapsulated proteomic-sample processing applied to copy-number estimation in eukaryotic cells. Nat. Methods 11, 319–324
47. Cox, J., and Mann, M. (2012) 1D and 2D annotation enrichment: a statisticalmethod integrating quantitative proteomics with complementary high-throughput data. BMC Bioinformatics 13, S12
48. Remus, D., Beuron, F., Tolun, G., Griffith, J. D., Morris, E. P., and Diffley,
High Accuracy Label-free Quantitative AE-MS in Yeast
Molecular & Cellular Proteomics 14.1 15
tapraid4/zjw-macp/zjw-macp/zjw00115/zjw4939-14a xppws S�3 2/12/14 15:57 4/Color Figure(s) F1–5 ARTNO: M114.041012
83
●

4 State-of-the-art affinity enrichment–mass spectrometry
J. F. (2009) Concerted loading of Mcm2–7 double hexamers around DNAduring DNA replication origin licensing. Cell 139, 719–730
49. Nedelcheva, M. N., Roguev, A., Dolapchiev, L. B., Shevchenko, A., Taskov,H. B., Shevchenko, A., Stewart, A. F., and Stoynov, S. S. (2005) Uncou-pling of unwinding from DNA synthesis implies regulation of MCM heli-case by Tof1/Mrc1/Csm3 checkpoint complex. J. Mol. Biol. 347,509–521
50. Forster, F., Unverdorben, P., Sledz, P., and Baumeister, W. (2013) Unveilingthe long-held secrets of the 26S proteasome. Structure 21, 1551–1562
51. Hatanaka, A., Chen, B., Sun, J. Q., Mano, Y., Funakoshi, M., Kobayashi, H.,Ju, Y., Mizutani, T., Shinmyozu, K., Nakayama, J., Miyamoto, K., Uchida,H., and Oki, M. (2011) Fub1p, a novel protein isolated by boundary screen-ing, binds the proteasome complex. Genes Genet. Syst. 86, 305–314
52. Fernandez-Martinez, J., and Rout, M. P. (2012) A jumbo problem: mappingthe structure and functions of the nuclear pore complex. Curr. Opin. CellBiol. 24, 92–99
53. Babu, M., Vlasblom, J., Pu, S., Guo, X., Graham, C., Bean, B. D., Burston,H. E., Vizeacoumar, F. J., Snider, J., Phanse, S., Fong, V., Tam, Y. Y.,Davey, M., Hnatshak, O., Bajaj, N., Chandran, S., Punna, T., Christopolous,C., Wong, V., Yu, A., Zhong, G., Li, J., Stagljar, I., Conibear, E., Wodak,S. J., Emili, A., and Greenblatt, J. F. (2012) Interaction landscape ofmembrane–protein complexes in Saccharomyces cerevisiae. Nature 489,585–589
54. Spang, A., Courtney, I., Fackler, U., Matzner, M., and Schiebel, E. (1993)The calcium-binding protein cell division cycle 31 of Saccharomycescerevisiae is a component of the half bridge of the spindle pole body.J. Cell Biol. 123, 405–416
55. Rout, M. P., Aitchison, J. D., Suprapto, A., Hjertaas, K., Zhao, Y., and Chait,B. T. (2000) The yeast nuclear pore complex: composition, architecture,and transport mechanism. J. Cell Biol. 148, 635–651
56. Chial, H. J., Rout, M. P., Giddings, T. H., and Winey, M. (1998) Saccharo-myces cerevisiae Ndc1p is a shared component of nuclear pore com-plexes and spindle pole bodies. J. Cell Biol. 143, 1789–1800
57. Yewdell, W. T., Colombi, P., Makhnevych, T., and Lusk, C. P. (2011)Lumenal interactions in nuclear pore complex assembly and stability.
Mol. Biol. Cell 22, 1375–138858. Balderhaar, H. J., and Ungermann, C. (2013) CORVET and HOPS tethering
complexes - coordinators of endosome and lysosome fusion. J. Cell Sci.126, 1307–1316
59. Nath, N., McCartney, R. R., and Schmidt, M. C. (2002) Purification andcharacterization of Snf1 kinase complexes containing a defined Betasubunit composition. J. Biol. Chem. 277, 50403–50408
60. Hedbacker, K., and Carlson, M. (2008) SNF1/AMPK pathways in yeast.Front. Biosci. 13, 2408–2420
61. Kiemer, L., Costa, S., Ueffing, M., and Cesareni, G. (2007) WI-PHI: aweighted yeast interactome enriched for direct physical interactions.Proteomics 7, 932–943
62. Mellacheruvu, D., Wright, Z., Couzens, A. L., Lambert, J. P., St-Denis, N. A.,Li, T., Miteva, Y. V., Hauri, S., Sardiu, M. E., Low, T. Y., Halim, V. A.,Bagshaw, R. D., Hubner, N. C., Al-Hakim, A., Bouchard, A., Faubert, D.,Fermin, D., Dunham, W. H., Goudreault, M., Lin, Z. Y., Badillo, B. G.,Pawson, T., Durocher, D., Coulombe, B., Aebersold, R., Superti-Furga,G., Colinge, J., Heck, A. J., Choi, H., Gstaiger, M., Mohammed, S.,Cristea, I. M., Bennett, K. L., Washburn, M. P., Raught, B., Ewing, R. M.,Gingras, A. C., and Nesvizhskii, A. I. (2013) The CRAPome: a contami-nant repository for affinity purification-mass spectrometry data. Nat.Methods 10, 730–736
63. Vizcaino, J. A., Deutsch, E. W., Wang, R., Csordas, A., Reisinger, F., Rios,D., Dianes, J. A., Sun, Z., Farrah, T., Bandeira, N., Binz, P. A., Xenarios,I., Eisenacher, M., Mayer, G., Gatto, L., Campos, A., Chalkley, R. J.,Kraus, H. J., Albar, J. P., Martinez-Bartolome, S., Apweiler, R., Omenn,G. S., Martens, L., Jones, A. R., and Hermjakob, H. (2014) Proteome-Xchange provides globally coordinated proteomics data submission anddissemination. Nat. Biotechnol. 32, 223–226
64. Vizcaino, J. A., Cote, R. G., Csordas, A., Dianes, J. A., Fabregat, A., Foster,J. M., Griss, J., Alpi, E., Birim, M., Contell, J., O’Kelly, G., Schoenegger,A., Ovelleiro, D., Perez-Riverol, Y., Reisinger, F., Rios, D., Wang, R., andHermjakob, H. (2013) The PRoteomics IDEntifications (PRIDE) databaseand associated tools: status in 2013. Nucleic Acids Res. 41,D1063–D1069
High Accuracy Label-free Quantitative AE-MS in Yeast
16 Molecular & Cellular Proteomics 14.1
tapraid4/zjw-macp/zjw-macp/zjw00115/zjw4939-14a xppws S�3 2/12/14 15:57 4/Color Figure(s) F1–5 ARTNO: M114.041012
84

5 A quantitative map of the human interactome
Mymain project combinesmany aspects introduced in the publications discussed earlier
in this thesis: Quantitative BAC-GFP interactomics as the conceptual foundation, label-
free quantification as an essential tool to allow for a project of the given scale, and new
strategies for extracting high-confidence interactors as the statistics back-end.
Novel aspects that are unique to my main manuscript are the scale, encompassing more
than 1,000 bait proteins or around one year of net MSmeasurement time. Furthermore,
I introduced a concept that uses three dimensions of quantification. The first dimension
serves as a specificity filter, for which I additionally introduced a false discovery rate
(FDR)-controlled method for defining cut-offs. The second dimension applied absolute
quantification on the interactors relative to the bait, yielding the stoichiometries of inter-
actions. The third dimension requires the incorporation of whole proteome data for the
biological system in which interactions are being detected, in this case the HeLa cell line.
Absolute quantification of protein copy numbers inHeLa enables the analysis of the rela-
tionship of the interactome to its underlying proteome. These three dimensions allowed
me to carry out quantitative analyses that were not even conceptually applicable to pre-
vious interactomics studies. In particular, I showed that the interaction stoichiometries
are a proxy for the functional strength of an interaction, which carries over to the topo-
logical properties of that interaction in the global interactome network. An unexpected
finding was that the wealth of weak interactions appear to be most critical for overall
network structure and form the glue that holds the network ‘hairball’ together.
5.1 The human interactome in three quantitative dimensions
Hein,M. Y., Hubner, N. C., Poser, I., Cox, J., Nagaraj, N., Toyoda, Y., Gak, I.,Weisswange,
I., Mansfeld, J., Buchholz, F., Hyman, A. A. &Mann,M. The human interactome in three
quantitative dimensions. Under review (2014).
85
●

5 A quantitative map of the human interactome
The human interactome in three quantitative dimensionsMarco Y. Hein1,6, Nina C. Hubner1,†,6, Ina Poser2, Jürgen Cox1, Nagarjuna Nagaraj1, Yusuke
Toyoda2,‡, IgorGak3, InaWeisswange4,5, JörgMansfeld3, FrankBuchholz4, AnthonyA.Hyman2,*
& Matthias Mann1,*
1 Max Planck Institute of Biochemistry, Martinsried, Germany
2 Max Planck Institute of Molecular Cell Biology and Genetics, Dresden, Germany
3 Cell Cycle, Biotechnology Center, TU Dresden, Dresden, Germany
4 Medical Systems Biology, UCC, Medical Faculty Carl Gustav Carus, TU Dresden, Dresden,
Germany
5 Eupheria Biotech GmbH, Dresden, Germany
† present address: Radboud Institute for Molecular Life Sciences, Radboud University, Nijme-
gen, The Netherlands
‡ present address: Institute of Life Science, Kurume University, Kurume, Japan
6 equal contribution
* corresponding author
The organisation of a cell emerges from the interactions in protein networks. The inter-actome is critically dependent on the strengths of interactions and the cellular abundancesof interactors, both of which span orders of magnitude. However, these two aspects have notyet been analysed globally. Here, we have generated a library of HeLa cell lines expressing1,125 distinct GFP-tagged proteins under endogenous control, which we used as input for anext-generation interaction proteomic survey. Three quantitative dimensions measure spe-cificity, interaction stoichiometry, and cellular abundances. Our analyses demonstrate thatthe interactions in protein networks are dominated by weak, substoichiometric interactionsthat play a pivotal role in defining network topology. The minority of stable complexes canbe identified by their unique stoichiometry signature. This study provides a rich interactiondataset connecting more than 5,400 proteins with more than 28,000 statistically significantinteractions, and introduces a novel framework for quantitative network analysis.
Proteins are the protagonists of life at the mo-
lecular level. They interact with each other for
structural, regulatory and catalytic purposes,
forming macromolecular structures as well as
stable or transient multi-protein complexes.
Accordingly, protein interactions vary greatly
in their thermodynamic and kinetic proper-
ties and protein abundances range from just a
few to millions of copies per cell. The inter-
actome is therefore the product of two factors:
binary affinities between protein interfaces1–3
as well as the cellular proteome, which it-
self is characterized by subcellular localiza-
tion, post-translational modifications and pro-
tein concentrations4,5. Mapping the protein in-
teractome landscape has been a long-standing
goal of modern biology and a variety of meth-
ods have been developed to this end6. Af-
finity purification followed by mass spectro-
metry (AP-MS) can determine the members of
protein complexes in their cellular context in
an unbiased manner7 and has enabled large-
scale protein interaction studies of yeast8–11,
fruit fly12 and human13,14. Nanoscale liquid
chromatography (LC) coupled to sensitive and
fast mass spectrometers has boosted interac-
tion proteomics technology, increasing proteo-
mic coverage and minimizing false negative
rates. It has also enabled a paradigm shift from
identification to quantification of interacting
proteins15. Instead of employingmultiple strin-
gent washing steps, quantitative approaches
86
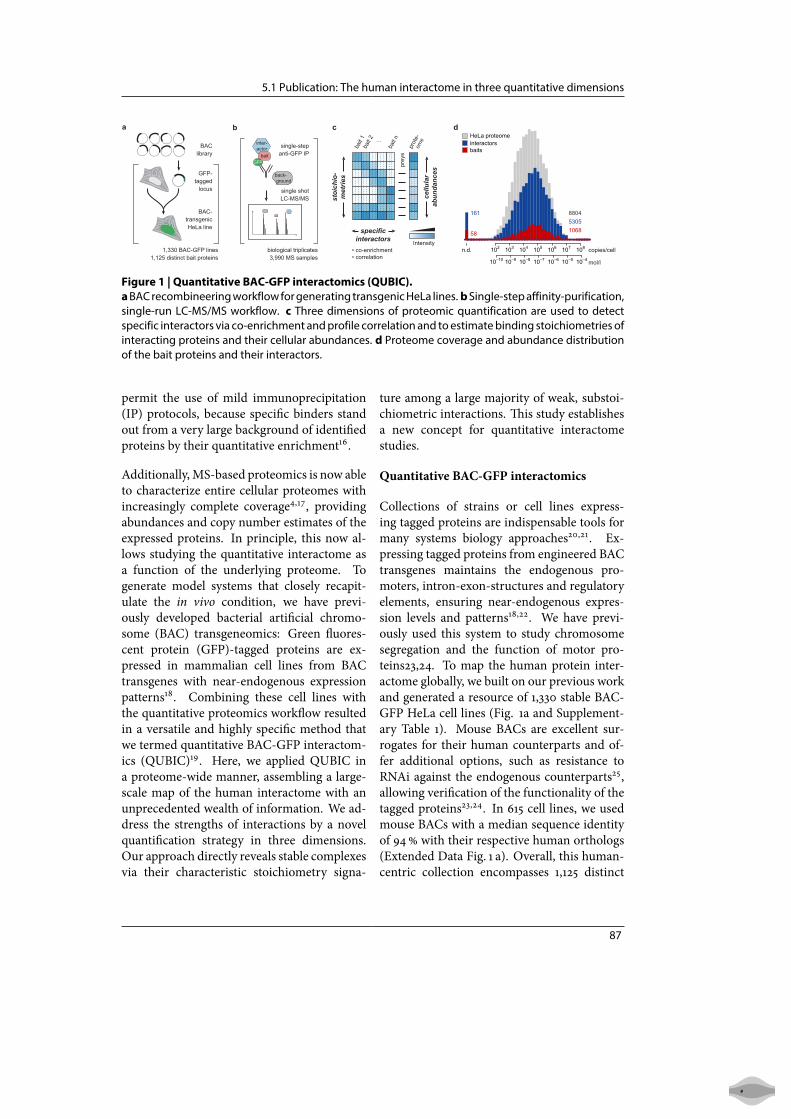
5.1 Publication: The human interactome in three quantitative dimensions
BAClibrary
GFP-tagged
locus
BAC-transgenicHeLa line
1,330 BAC-GFP lines1,125 distinct bait proteins
inter-actor
GFPbait
back- ground
single-stepanti-GFP IP
single shotLC-MS/MS
biological triplicates3,990 MS samples
Intensity
prey
s
specificinteractors
stoi
chio
-m
etrie
s
cellu
lar
abun
danc
es
bait
1ba
it 2
bait
n
prot
e-om
e...
• co-enrichment• correlation
102 103 104 105 106 107 108n.d.
10−10 10−9 10−8 10−7 10−6 10−5 10−4
HeLa proteomeinteractorsbaits
161
58
880453051068
copies/cell
mol/l
a b c d
Hein et al. Figure 1
Figure 1 | Quantitative BAC-GFP interactomics (QUBIC).aBAC recombineering workflow for generating transgenic HeLa lines. bSingle-step affinity-purification,single-run LC-MS/MS workflow. c Three dimensions of proteomic quantification are used to detectspecific interactors via co-enrichment and profile correlation and to estimate binding stoichiometries ofinteracting proteins and their cellular abundances. d Proteome coverage and abundance distributionof the bait proteins and their interactors.
permit the use of mild immunoprecipitation
(IP) protocols, because specific binders stand
out from a very large background of identified
proteins by their quantitative enrichment16.
Additionally, MS-based proteomics is now able
to characterize entire cellular proteomes with
increasingly complete coverage4,17, providing
abundances and copy number estimates of the
expressed proteins. In principle, this now al-
lows studying the quantitative interactome as
a function of the underlying proteome. To
generate model systems that closely recapit-
ulate the in vivo condition, we have previ-
ously developed bacterial artificial chromo-
some (BAC) transgeneomics: Green fluores-
cent protein (GFP)-tagged proteins are ex-
pressed in mammalian cell lines from BAC
transgenes with near-endogenous expression
patterns18. Combining these cell lines with
the quantitative proteomics workflow resulted
in a versatile and highly specific method that
we termed quantitative BAC-GFP interactom-
ics (QUBIC)19. Here, we applied QUBIC in
a proteome-wide manner, assembling a large-
scale map of the human interactome with an
unprecedented wealth of information. We ad-
dress the strengths of interactions by a novel
quantification strategy in three dimensions.
Our approach directly reveals stable complexes
via their characteristic stoichiometry signa-
ture among a large majority of weak, substoi-
chiometric interactions. This study establishes
a new concept for quantitative interactome
studies.
Quantitative BAC-GFP interactomics
Collections of strains or cell lines express-
ing tagged proteins are indispensable tools for
many systems biology approaches20,21. Ex-
pressing tagged proteins from engineered BAC
transgenes maintains the endogenous pro-
moters, intron-exon-structures and regulatory
elements, ensuring near-endogenous expres-
sion levels and patterns18,22. We have previ-
ously used this system to study chromosome
segregation and the function of motor pro-
teins23,24. To map the human protein inter-
actome globally, we built on our previous work
and generated a resource of 1,330 stable BAC-
GFP HeLa cell lines (Fig. 1a and Supplement-
ary Table 1). Mouse BACs are excellent sur-
rogates for their human counterparts and of-
fer additional options, such as resistance to
RNAi against the endogenous counterparts25,
allowing verification of the functionality of the
tagged proteins23,24. In 615 cell lines, we used
mouse BACs with a median sequence identity
of 94% with their respective human orthologs
(Extended Data Fig. 1 a). Overall, this human-
centric collection encompasses 1,125 distinct
87
●

5 A quantitative map of the human interactome
bait proteins, across all protein classes (Exten-
ded Data Fig. 1 b-d) some of which are present
as both mouse and human forms, or individu-
ally tagged on both termini. For all cell lines,
we performed QUBIC in three biological rep-
licate experiments, resulting in 3,990 LC-MS
runs recorded on an Orbitrap mass spectro-
meter in a net measurement time of around
one year (Fig. 1 b). To define specific inter-
actors, we employed MaxLFQ, the label-free
quantification (LFQ)module of theMaxQuant
software26,27. Bait proteins and their inter-
actors are characterized by quantitative co-
enrichment when tracing their intensity pro-
files across many samples (Fig. 1 b–c). Select-
ing threshold criteria for accepting a given can-
didate as interactor is a critical step during
data analysis. Whereas previous studies of-
ten used empirical cut-offs28 or relied on data
randomization29,30 or reference datasets31, we
developed an entirely data-driven and false dis-
covery rate (FDR)-controlled approach, har-
nessing asymmetries in the outlier distribu-
tions of enrichment factors (Extended Data
Fig. 1 e–f).
In addition to local co-enrichment, we found
the intensity profiles of interacting proteins to
be closely correlated globally (Online Meth-
ods). Such profile correlations alone can
indicate protein interactions when proteome
samples are subjected to extensive native
fractionation32,33. Here we employed them
as additional classifiers of our interactions16.
The combination of enrichment FDRs and pro-
file correlation coefficients defines the con-
fidence class of each interaction (Extended
Data Fig. 1 g). Because this approach does
not require gold standards of known interac-
tions or non-interactions34, nor subtracts pre-
sumed contaminant proteins35, it allows us to
retain weak and commonly blacklisted inter-
actors, such as chaperones and cytoskeletal or
ribosomal proteins. Our analysis resulted in
28,504 unique and statistically significant inter-
actions involving 5,462 distinct proteins (Sup-
plementary Table 2).
Interaction stoichiometries and proteinabundances
A second dimension of quantification can
be applied to determine the stoichiometries
of proteins within complexes36,37. These
can be computationally extracted from label-
free affinity purification data with remarkable
accuracy38. If a stable protein complex con-
tained one copy of each subunit, they should all
be retrieved in equimolar amounts after IP39,40.
However, measured stoichiometries between
preys and baits span orders of magnitude in
practice. Limited kinetic and thermodynamic
stability can result in substoichiometric recov-
ery of interacting proteins. Proteins may reside
in many different molecular assemblies with
fractions of their cellular pools. Finally, the cel-
lular abundance of an interactor can be a limit-
ing factor for howmuch is recoverable after IP;
therefore, cellular copy numbers must be de-
termined as a third quantitative dimension in
a separate experiment.
For each pair of interacting proteins, we first
quantified their stoichiometry in the immun-
oprecipitates using a label-free strategy that
combines the MaxLFQ algorithm with a nor-
malization step accounting for the varying
detectabilities of different proteins41 (Online
Methods). To determine the precision of our
method, we systematically compared label-free
interaction stoichiometries from experiments
where the same bait proteins were tagged on
different termini, or where we had data from
both human and mouse bait orthologs (Exten-
ded Data Fig. 2 a–e). The results showed a high
degree of reliability (r ≈ 0.8) and a precision
within a factor of three. Importantly, there
were no systematic biases introduced by the
position of the tag or the BAC species. This
validates our approach and demonstrates re-
markable conservation of protein interactions
across species. Next, we performed a deep
proteomic sequencing experiment on the par-
ental HeLa cell line that all our BAC-transgenic
lines are derived from. In one day of measure-
ment time per replicate, we reached a depth of
88

5.1 Publication: The human interactome in three quantitative dimensions
about 9,000 proteins. To estimate cellular pro-
tein abundances, we applied a similar label-free
approach and scaled the values to copies per
cell42,43 (OnlineMethods). The proteomedata-
set provided cellular copy numbers for 5,305
proteins from the interactome dataset, cover-
ing 97% of all interactors (Fig. 1 d). Only a
small minority of proteins were found as inter-
actors, but escaped detection in our proteome
data, which we attribute mostly to low cellu-
lar abundance. The abundances of interacting
proteins closely follow the distribution of bait
abundances, covering the entire dynamic range
of the proteome. This demonstrates that our
BAC-based system closely recapitulates the in
vivo situation, enabling us to probe the inter-
actome as a function of the endogenous cellu-
lar proteome.
Quantifying the interactome in three dimen-sions
The combination of interaction stoichiomet-
ries and relative cellular abundances of inter-
actors paint a unique picture of the interactome
that remained unexplored in previous studies.
This stoichiometry plot (Fig. 2 a) is a power-
ful tool to organize long lists of interactors,
because each region reflects a different scen-
ario (Fig. 2 b): Stable, one-to-one and fully re-
covered complexes in which the partners have
equal cellular abundance appear around the
origin of the plot (case 1 in Fig. 2 b). Super-
stoichiometry, the recovery of more prey than
bait, is only expected for stable complexes con-
taining more prey than bait copies. Indeed, we
find few substantially superstoichiometric in-
teractions. If interactions are weak and com-
plexes dissociate partially during IP, or if inter-
actions involve only part of the bait pool, inter-
actors are recovered at substoichiometric levels
(case 2), reflecting lower occupancy of interac-
tion interfaces of the bait. A vast predomin-
ance of sub- over superstoichiometry confirms
that stability and occupancy are the main de-
terminants for most interactions. Many stable
interactions featured abundance stoichiomet-
ries greater than one (case 3). This reflects 1:1
binding of a more abundant prey, such as the
interaction of the abundant GTP-binding pro-
tein RAN with its guanine-nucleotide releas-
ing factor RCC1 or that of α-tubulin with the
NEK9 kinase (see Supplementary Table 2). The
reciprocal interaction stoichiometry readouts
are necessarily smaller than one, because any
higher abundant bait can maximally recover
the entire pool of its lower abundant prey
(case 4). This would also be the default case
for overexpressed baits. Substoichiometric
interactions are retrieved over an estimated
five orders of magnitude; for example, NEK9
is recovered at 6 ⋅ 10−6× the amount of α-
tubulin. The proteome-interactome relation-
ship – which implies that there should be few
points below the diagonal – together with the
dynamic range limit, results in a characteristic
triangular shape of the ‘cloud’ of interactions
(Fig. 2 a).
About 10% of our interactions connected
members of well-characterized complexes an-
notated in the CORUM database44. They pop-
ulate a confined area characterized by a sig-
nature of balanced stoichiometries (case 1 in
Fig. 2b). These findings suggest that subunits
of prototypical complexes are mostly part of
one predominant, stable complex type in the
cell and that their abundances are regulated
to avoid an excess of unbound members. Ex-
trapolating from the signature of know com-
plexes, we reasoned that inference of stable
complexes should be possible solely from the
stoichiometry signature of individual baits as
opposed to analysis of the entire network45,46.
We filtered our data for those featuring the
core stoichiometry signature (dashed circle
in Fig. 2 c), yielding a larger cluster connect-
ing several molecular assemblies such as ma-
jor cytoskeletal proteins, the nuclear pore
complex and the ribosome as well as 194
isolated putative core complexes (Fig. 2 d).
These recapitulated the majority of CORUM-
annotated complexes that involve our bait pro-
teins (Fig. 2 e).
89
●

5 A quantitative map of the human interactome
SAPNuRD
SET1
EMC
AP1
AP4
ExosomeProteasome
Spliceosome
eIF3
Dynein
CytoskeletonCaveolin/Flotillin
PRC1
BCOR
ANAPC
POLG
MAX-MYCSPT
TSC1/2
Cohesin
CPSF
NUMAC
TREX
Centrosome NatA
APC-Axin
CCR4/NOT
NDC80
NELF
CBC
MCMKinesin
HAUS
Shelterin
Septin
Integrator
Kinesin
CEN
CCC
PER/CRY
WASH
BRAFT
RISC
TFIIH
TFIIIC
VPS11/16/18SKA
DDB2/COP9
STAGADecapping
PAF
INO80 PrefoldinPRC2
SMN
RibosomeNOP56
mitochondrialRibosome
ESCRT
RNA Pol
Mediator
Condensin
Nuclear pore
STRIPAK ORC
TUBG
abun
danc
e st
oich
iom
etry
10−4
10−3
10−2
0.1
1
10
100
interaction stoichiometry10−5 10−4 10−3 10−2 0.1 1 10
2 3 5 10 20 50 100
known complexesunknown complexes
proteins per complex
dens
ity
annotated complexesinvolving our baits
125 70
548=
286
core complexesin this study
+1135 others
abun
danc
e st
oich
iom
etry
10−4
10−3
10−2
0.1
1
10
100
10−4 10−3 10−2 0.1 1 10
12
4
3
interaction stoichiometry
3
4
2
1
interaction stoichiometry
abun
danc
e st
oich
iom
etry
10−4 10−3 10−2 0.1 1 10
10−4
10−3
10−2
0.1
1
10
100
a b c
d
e f
Hein et al. Figure 2
Figure 2 | The stoichiometry plot.a Overlay of all interaction and abundance stoichiometry data for all interactions. The characteristictriangular shape is a consequence of the dynamic range limits in the interactome (left border), in theproteome (top border) and the stoichiometry limit imposed by the relative cellular protein abundances(diagonal). b Schematic interaction scenarios: (1) Equal cellular abundance, stable interaction. (2)Equal cellular abundance, weak interaction. (3) Stable interaction where cellar abundance of the preyis higher than that of the bait. (4) Reciprocal case where a stable interaction retrieves the entirepool of the less abundant prey. c Stoichiometry plot of interactions between proteins annotated asCORUM complex members. The area of highest density can be approximated by a circle containing58 % of those interactions (dashed circle, centre: 0, –0.5; radius: 1). d Sub-networks of interactionsmatching the CORUM-characteristic stoichiometry signature. Known interactions annotated in UniProtor CORUM are displayed in red. e Quantification of the CORUM overlap. 125 isolated networksremain unannotated; 70 networks are annotated with 548 partially redundant CORUM terms; 286terms assigned to our baits were not recovered as interactions. f Size distribution of annotated vs.unannotated networks.
90

5.1 Publication: The human interactome in three quantitative dimensions
We confirmed the known tendency of large
complexes to be well annotated33, while smal-
ler assemblies lacked previous description
(Fig. 2 f). The largest of our 125 networks with
no database annotation was the recently dis-
covered COMMD/CCDC22/CCDC93 (CCC)
complex47. The stoichiometry plot offers a
unique opportunity for comparing the over-
lap of our dataset with published data (Exten-
ded Data Fig. 3 a–c). For instance, the intersec-
tionwith a recent co-fractionation interactome
study33 closely recapitulated the core-complex
signature. Conversely, the overlap with iRef-
Web, a portal of consolidated protein interac-
tions from different sources48, reached much
further into the substoichiometric region. Fi-
nally, the modest overlap with recent large-
scale yeast-two-hybrid data3 was mostly lim-
ited to cases characterized by quantitative prey
recovery to the extent permitted by cellular
abundance. Moreover, the stoichiometry plot
quantitatively confirmed the intuitive notion
that high-stoichiometry interactions are easier
to detect as they are enriched in the 1 % FDR
compared to the 5% FDR cohort (Extended
Data Fig. 3 d–e). This is also reflected in the
agreement of gene ontology (GO) annotations
in pairs of interacting proteins (Extended Data
Fig. 3 f).
Interactions explain phenotypes and geneticassociations
Our dataset provides an extensive resource that
can be mined for poorly characterized protein
interactions to gain insight into biological pro-
cesses. In the following, we investigate cases of
both new stable core complexes and substoi-
chiometric assemblies. Our dataset suggested
a novel stable complex involving SUCO and
TAPT1, two integral membrane proteins of the
endoplasmic reticulum (Fig. 3 a–c). Mutants
of their murine orthologs exhibit severe de-
fects during skeletal development: Truncation
of TAPT1 causes transformations in the axial
skeleton and perinatal lethality49, whereas loss
of the SUN domain-containing ossification
factor SUCO (also known as OPT) impairs
postnatal bone formation, causing fractures
and neonatal death50. The latter study linked
the phenotype to impaired rough ER expan-
sion and consequent failure of osteoblasts to
secrete collagen required for bone formation.
Knockdown of human SUCO increased the
cells’ resistance against ricin, whose toxicity
depends on endocytosis and retrograde traf-
ficking to the ER51. Similarly, the yeast ortho-
log of TAPT1, EMP65 (YER140W), is involved
in protein folding in the ER and shows buf-
fering genetic and physical interactions with
the SUNdomain protein SLP1 (YOR154W)52,53.
We used our interactionmethodology onGFP-
tagged strains to confirm this complex in
yeast. Although EMP65 consists almost en-
tirely of transmembrane segments, we found
clear evidence for their interaction irrespect-
ive of which served as bait (Extended Data
Fig. 4 a–b). Similarly, we validated the recip-
rocal interaction in the mammalian system us-
ing TAPT1 as bait (Extended Data Fig. 4 c). To-
gether, these data and our findings establish
TAPT1–SUCO as the higher eukaryote ortho-
log of SLP1–EMP65: a novel, low abundant ER
membrane complex (Extended Data Fig. 4 d),
which is required for skeletal development.
Going beyond stable complexes, we discovered
an interaction between the anaphase promot-
ing complex or cyclosome (APC/C) and the
uncharacterized protein KIAA1430. The stoi-
chiometry plot indicated that KIAA1430 is of
lower cellular abundance and not an oblig-
ate member of the APC/C, as the partners
were recovered substoichiometrically at ∼1 %
of the respective baits in reciprocal experi-
ments (Fig. 3 d–e). In interphase, a fraction of
GFP-tagged KIAA1430 localized to the centro-
somes, in particular the centrioles, and was
largely excluded from the nucleus (Fig. 3 f),
while theAPC/C is predominantly nuclear19,54.
During mitosis, after nuclear envelope break-
down (NEBD), APC/C accumulates onmitotic
spindles, centromeres and centrosomes54,55,
reflecting a partially common localization with
KIAA1430.
91
●

5 A quantitative map of the human interactome
Consistently, we confirmed the APC/C–
KIAA1430 interaction in mitotically arrested,
but not in interphase cells (Fig. 3 g). To func-
tionally investigate the mitotic interaction, we
used time-lapse microscopy to determine the
time cells require from NEBD to the onset
of anaphase as a function of APC/C activ-
ity. KIAA1430 knockdown resulted in a mild
delay that was sensitive to reversine, a small
molecule inhibitor of the mitotic checkpoint
kinase MPS1 (Fig. 3h–i, ref. 56). These findings
suggest that the depletion of KIAA1430 activ-
ates the spindle assembly checkpoint, thereby
postponing the activation of the APC/C. Re-
cent reports identified the ciliary protein hem-
ingway (HMW) as the Drosophila ortholog of
KIAA1430 (ref. 57) and implicated the APC/C
in regulating ciliary length and polarity58,59.
Given that centrioles are common features of
cilia and centrosomes, our data suggest that in
human cells, KIAA1430 recruits a sub-fraction
of the APC/C to the centrosome to facilitate
mitotic progression.
GFP tubulin DNAGFP
TAP
T1-L
AP
SU
CO
-LA
P
10−4 10−3 10−2 0.1 1 10
0.1
1
10
102
103
TAPT1SUCO
interaction stoichiometry
abun
danc
e st
oich
iom
etry
enrichment [standard deviations]−15 −10 −5 0 5 10 15
0
5
10
15
TAPT1
SUCO
-log 10
p v
alue
interaction stoichiometry
abun
danc
e st
oich
iom
etry
10−4 10−3 10−2 0.1 1 10
0.1
1
10
102
103
104
interaction stoichiometry
abun
danc
e st
oich
iom
etry
10−4 10−3 10−2 0.1 1 10
10−3
10−2
0.1
1
10
102
KIAA1430KIAA1430
APC/C
APC/C(CDC23)
interphase prometaphase metaphase anaphase cytokinesis
GFP
H3.
1-iR
FPK
IAA
1430
-LA
P
inpu
t (1/
60)
cont
rol
ANAP
C3co
ntro
lAN
APC3
inpu
t (1/
60)
cont
rol
ANAP
C3co
ntro
lAN
APC3
KDa
97
114
21ANAPC10
KIAA1430-LAP
ANAPC4
interphase prometaphase
IP FTIP FT
72h 120h
esi c
ontro
les
i KIA
A143
0es
i con
trol
esi K
IAA1
430
KDa
55
114
tubulin
KIAA1430-LAP
KIAA14300
20
40
60
80
NEB
D to
Ana
phas
e (m
in)
28.2123.27 14.43 14.84 mean (min)
esiRNA
p<0.0001 p=0.11
+ 0.5 µM reversineKIAA1430control control
a cb
d fe
g i h
Hein et al. Figure 3
Figure 3 | The TAPT1–SUCO complex and the KIAA1430–APC/C interaction.a Volcano plot of SUCO interactors. b Stoichiometry plot indicates that TAPT1 and SUCO form a corecomplex. c Immunofluorescence imaging of C-terminally GFP-tagged TAPT1 and SUCO in HeLa showsER localizations. d Stoichiometry plot of APC/C interactors (bait: CDC23) identifies KIAA1430 (red) assubstoichiometric binder. e Stoichiometry plot of KIAA1430 interactors shows APC/C subunits (blue)as substoichiometric interactors. f Maximum intensity projections of living interphase and mitotic cellsexpressing KIAA1430-GFP and histone 3.1-iRFP indicate that KIAA1430 localizes to centrioles. gWesternblot analysis of ANAPC3 IPs from interphase and mitotically arrested cells expressing KIAA1430-LAP.hWestern analyses showing the extent of KIAA1430 depletion before and after the time-lapse analysespresented in panel i. i Time KIAA1430-depleted cells require to proceed from NEBD to anaphase,compared to control cells (n=300 each). Adding 0.5 µM reversine rescues the delay (n=200 each). Redlines: mean. Significance according to two-tailed Mann-Whitney test. Scale bars: 10 µM.
92

5.1 Publication: The human interactome in three quantitative dimensions
These examples illustrate how the combina-
tion of three quantitative dimensions offers a
unique view on the interactions of individual
proteins and facilitates their functional invest-
igation. We have compiled this information
into an easily usable resource, provided as Sup-
plementary Data and available via the IntAct
database upon publication: For each of the
1,330 tagged cell lines, we present a concise,
one-page summary outlining the abundance of
the bait protein, the co-enrichment and con-
fidence classification of candidate interactors
along with the stoichiometry plot and the pre-
dictions of the core complexes. A reading guide
is presented in Extended Data Fig. 5.
The relevance of weak, substoichiometric in-teractions
Our study revealed that interactions within ob-
ligate complexes constitute only a small minor-
ity of the interactome. We reasoned that the
majority of remaining interactions, which we
refer to as ‘weak’, should be of a function-
ally and conceptually different nature, as indic-
ated by our example of the KIAA1430–APC/C
interaction. To directly investigate the in-
terplay of strong and weak interactions on a
biologically relevant example, we interrogated
the chaperonin TRiC (also called CCT) that
is known to act on a large number of client
proteins60. Its coremachinery of eight subunits
was clearly identified as an abundant obligate
complex (Fig. 4 a), and represents a promin-
ent hub in our interactome dataset. Virtually
all interactors co-enriched with tagged TRiC
core subunits were co-chaperones, regulatory
proteins or proteins containing known sub-
strate motifs61 (Extended Data Table 1). Char-
acteristic of all was lower cellular abundance
than TRiC (except for some cytoskeletal pro-
teins) and substoichiometric recovery, classify-
ing these interactors as distinct from the core
subunits. We consistently found the unchar-
acterized protein FAM203A/B as a weak inter-
actor. Its ortholog in C. elegans shows a cyto-skeletal knockdown phenotype62, which we
found to be reminiscent of phosducin proteins.
TRiC requires these to fold actin and tubulin63
and we therefore speculate that FAM203A/B
might have a similar function.
In reciprocal experiments, TRiC core complex
members were co-enriched by 5% of all bait
proteins (Fig. 4 b, Extended Data Table 2). This
is in line with estimates of TRiC being in-
volved in folding of 5–10% of the proteome60.
However, only some of these baits were also
found in TRiC IPs. This asymmetry can be
explained with knowledge of the underlying
proteome: At 1.3 million copies of the hexade-
cameric complex, TRiC is much more abund-
ant than most substrates, of which only a frac-
tion will be in the process of folding at any
given time (Supplementary Table 3). Con-
sequently, only a minute fraction of the TRiC
pool will be acting on each substrate and its
recovery will be ‘diluted’ to substoichiomet-
ric levels. In the reciprocal case, however,
TRiC occupies a significant fraction of the cli-
ent protein population – the fraction in the
state of folding – rendering the interaction
more readily detectable within the dynamic
range (Fig. 4 b). The stoichiometry of TRiC
recovery in the substrate IPs ranges from less
than 10−3 to above 10−1 (Fig. 4 b). As TRiC
substrates are thought to comprise 5–10% of
all protein molecules60, which we estimate at
6 ⋅ 109 protein molecules per HeLa cell, our
stoichiometry data imply that on average 0.2–
0.4% of them are bound to the chaperone at
any time. While the stoichiometry readout
classified these interactions as ‘weak’, they fulfil
an important function as they connect a very
diverse set of protein classes. Moreover, our
data suggest that a proteome–interactome re-
lationship balances the amount of TRiC with
the cumulative amount of its substrates.
Extrapolating from our chaperone example,
we wondered whether the differences between
‘strong’ and ‘weak’ interactions, as judged by
their stoichiometry readout, carry over to
other characteristics. First, we investigated
whether interaction stoichiometry is indic-
ative of co-expression across tissues or cell
93
●

5 A quantitative map of the human interactome
interaction stoichiometry
abun
danc
e st
oich
iom
etry
10−5 10−4 10−3 10−2 0.1 1 10
10−3
10−2
0.1
1
10
102
interaction stoichiometry
abun
danc
e st
oich
iom
etry
10−4 10−3 10−2 0.1 1 10
0.1
1
10
102
103
104
core
phosducins
tubulin
FAM203A/B
prefoldincore
TRiC coreregulatory proteinco−chaperone
cytoskeletonWD domain proteinPPP2 phosphataseother
a b
Hein et al. Figure 4
Figure 4 | The TRiC interactome is defined by weak links.a Stoichiometry plot of N-terminally tagged CCT3 interactors as a representative TRiC subunit. b Re-ciprocal stoichiometry plot of the averaged positions of the TRiC subunits from all bait pull-downsthat co-enrich at least three TRiC subunits. Symbol shapes and colours indicate the category of theinteractors; symbol size is scaled according to profile correlation.
types. To this end, we extracted protein
abundance correlation profiles across many
tissues from a recent human proteome draft
dataset64. While co-expression coefficients
scattered widely, there was a notable relation-
ship with interaction stoichiometry (Extended
Data Fig Fig. 6 a): strong, stoichiometric in-
teractors were more likely to be coherently
expressed. This is in agreement with earlier
findings in yeast showing that members of
stable complexes are enriched in co-regulated
modules65. Conversely, ‘weak’ interactions in-
volve proteins that are not necessarily tightly
co-regulated across conditions.
Next, we tested how strong and weak interac-
tions behave with regard to their role in net-
work topology and analysed a sub-network of
interactors surrounding RNA polymerases I, II
and III. Our data recapitulated shared subunits
and interactions with other complexes, such
as general transcription factor complexes, the
negative elongation factor (NELF) complex,
the mediator complex and the polymerase-
associated factor (PAF) (Fig. 5 a). Sequen-
tial removal of substoichiometric interactions
from the network led to fragmentation events,
in which the individual complexes gradually
lose their interconnections and emerge as in-
dividual modules (Fig. 5 b). Finally, the three
polymerases remain internally connected via
their shared subunits.
Taking this approach to a global level, we then
probed the response of our entire network to
the in silico removal of edges according to their
stoichiometry characteristics. Seminal studies
on the topology of networks have used sim-
ilar approaches, showing that scale-free net-
works are resilient to random removal of edges,
but sensitive to targeted attacks66. Specific-
ally, removal of the topologically most critical
edges led to rapid fragmentation of the net-
work. We targeted edges for removal agnostic
to their global network properties, but solely
by their local stoichiometry readout, compar-
ing preferential removal of strong vs. weak
interactions with random removal. This re-
vealed vastly different network characteristics
of weak and strong interactions. The weakest
interactions turned out to be most critical for
network topology: Their preferential removal
led to a rapid increase of the number of isol-
ated network fragments, whereas removing the
strongest 50% of edges hardly resulted in any
network fragmentation (Fig. 5c). The largest
connected component, which causes the typ-
ical ‘hairball’ appearance of large-scale net-
work, shrunk about linearly with removal of
weak interactions (Fig. 5d) and also left more
94

5.1 Publication: The human interactome in three quantitative dimensions
number of interactions removedfra
ctio
n of
larg
est n
etw
ork
0 2500 7500 12500
00.
20.
40.
60.
81
number of interactions removed
prot
eins
in th
e la
rges
t net
wor
k
0 2500 7500 12500
010
0020
0030
0040
00
number of interactions removed
num
ber o
f iso
late
d ne
twor
ks
0 2500 7500 12500
050
100
150
200
randomweak firststrong first
number of removed edges
netw
ork
size
s
0 25 50 75 125 175100 150
025
5075
100
Mediator complexPAF complex
NELF complex
networkfragmentation
GTF2E
RNA Pol I/II/III
low high stoichiometry
MED18
MED12
MED4
MED14
MED22
CDK8
MED17
MED16
MED31
MED24
MED20
MED10
MED30/30S
MED9
MED7
MED11MED13
MED27
MED8
MED13L
MED28
TCEA1
SUPT4H1
PAF1
TCEB3
TCEB2
TCEB1
CTR9
SUPT5H
SUPT6H
WHSC2
WDR61
CDC73
LEO1
RDBP
TH1LCOBRA1
ZNRD1TAF1C
POLR1ECD3EAP
POLR1C
TAF1B
POLR2F
POLR1D
POLR2E
POLR1A
POLR2H
POLR1B
POLR2K
GTF2F2
POLR2J
POLR2G
POLR2D
POLR2I
POLR2L
POLR2CPOLR2B
POLR2A
CTDP1
GTF2F1
POLR2M
RPAP2
POLR2MGTF2B
POLR3G
CRCP
POLR3D
POLR3K
POLR3GLPOLR3B
POLR3A
POLR3E
POLR3F
POLR3C
POLR3H
RPRD1A
ELL
RPRD1B
ELL2
ELOF1GTF2E1
GTF2E2
SUPT16H
CCNC
MED26
MED15
MED21MED29
MED23
MED25
MED6
MED1
Mediator
RNA Pol III
RNA Pol II
NELF complex
PAF complex
GTFs
RNA Pol I
stoichiometry
baits
preys
profile correlation
low high
ba
c d e
Hein et al. Figure 5
Figure 5 | Strong and weak interactions have different global properties.a Sub-network of complexes surrounding RNA polymerases I/II/III. Proteins are colour-coded by knowncomplex memberships, edges are color-coded by protein correlation coefficient, edge widths rep-resent interaction stoichiometries. b Effect of removal of weak, substoichiometric interactors on thepolymerase network. The grey area visualizes how the network size changes with sequential removal ofsubstoichiometric interactions. Points where removal of an edge fragments the network into separatenetworks are indicated. The sizes of individual networks are then separated by white lines. c Globalnetwork effect of random or targeted removal of interactions on the total number of isolated sub-networks. d Effect on the number of proteins present in the largest entirely connected sub-network.e Effect on the fraction of total connected proteins that are part of this largest sub-network until aminimum is reached.
proteins entirely unconnected (Extended Data
Fig. 5 a).
Conversely, preferential removal of strong in-
teractions led to a network response that in-
creased its small-world characteristics: the
largest network encompasses the vast majority
of connected proteins (Fig. 5e), fewer proteins
are left without connections (Extended Data
Fig. 5b) and isolated network fragments are
smaller (Extended Data Fig. 5 c).
Together, these analyses indicate that interac-
tion stoichiometries, which are ‘local’ proper-
ties extracted from single interaction experi-
ments, predict the ‘global’ behaviour of the pro-
teins involved: Strong interactions are indic-
ative of proteins that are co-regulated across
cell types. In the network, they form modules
of high interconnectivity, rendering the net-
work topologically resilient to their removal.
Weak interactions, on the other hand, domin-
ate the network both in numbers and by their
topologically critical role as long-range inter-
actions between more diverse sets of proteins.
As a consequence of this investigation, inter-
action networks can be fragmented into indi-
vidual, definedmodules, by identifying and re-
moving weak links. In summary, availability
of interaction stoichiometries on a global scale
effectively allows us to ‘comb’ the interactome
hairball, to identifymodules and visualize their
interconnectedness.
95
●
5 A quantitative map of the human interactome
Discussion
Here we have introduced a novel concept of
interactome analysis. Using an efficient, low-
stringent IP protocol, accurate label-free quan-
tification of both the IPs and the complete pro-
teome, we extracted three quantitative dimen-
sions, all of which proved critical for charac-
terizing protein interactions. While the first
dimension identifies statistically significant in-
teractions, the second and third dimension
define their stoichiometric contexts. Earlier
large-scale studies did not address these addi-
tional dimensions, in part because of the chal-
lenges involved in extracting accurate quant-
itative values. Moreover, past studies often
employed overexpression of bait proteins, pre-
cluding meaningful stoichiometry readout22,
and near-complete proteome coverage was
not attainable. Finding stable protein com-
plexes is usually a major goal of interactom-
ics studies14,33. We showed that obligate pro-
tein complexes feature a unique signature of
balanced stoichiometries – an infrequent oc-
currence among the multitude of interactions
documented here. Such a signature led us to
discover TAPT1-SUCO, a low abundant integ-
ral membrane complex of the ER. This com-
plex elegantly ties together a body of available
evidences, including knockout phenotypes of
both TAPT1 and SUCO and genetic interac-
tions of their yeast orthologs. This mani-
festation of genotype as phenotype may ap-
ply to many of the complexes and interactions
provided here67.
As a representative of the majority of weaker,
non-obligate interactions, we characterized the
binding of KIAA1430 to the APC/C, suggest-
ing that low interaction stoichiometries are
the result of an interaction that is limited to
centrioles in mitotic cells. We provided func-
tional data pointing at a role of KIAA1430
in recruitment of APC/C to centrioles, failure
of which delays cell cycle progression. Our
stoichiometry-based classification subdivided
the interactome of the TRiC chaperonin into
obligate core subunits, regulatory interactors
and a large number of substrates. We find that
lack of reciprocal verification can be indicative
of an inherently asymmetric nature of true and
biologically relevant interactions, particularly
outside obligate core complexes. This example
also illustrates how the observed interactome is
shaped by protein abundances and, conversely,
implies overall regulation of protein abund-
ances by protein interactions. Therefore, the
interactome always has to be interpreted as a
function of the underlying proteome.
Substoichiometric interactions have frequently
gone undetected in interactome studies and
may be thought to be less important; never-
theless they have been suggested to be cru-
cial features of all networks68. Our study dir-
ectly and quantitatively demonstrates the pre-
dominance of ‘weak’ interactions in the pro-
tein interactome. MS-based methods cover
more than four orders of magnitude of interac-
tion stoichiometry28, and our low-stringency
biochemical workflow ideally harnesses this
sensitivity. However, substoichiometric in-
teractions involving low abundance preys can
still be challenging to detect (Extended Data
Fig. 3 d–e). Therefore, the prevalence of weak
interactions is likely to be even more pro-
nounced and their relevance vastly underap-
preciated. Previous studies typically recor-
ded all interactions as equal, except for statist-
ical scores. Therefore, the roles of individual
interactions had to be predicted from prior
knowledge or from global network properties.
Highly connected proteins were described as
interaction hubs, regions of high clustering
coefficients withmany shared pathway annota-
tions were characterized as complexes45,46, and
weak interactions were inferred from weaker
connectivity patterns14. However, this is prob-
lematic because of the limited coverage of ex-
isting datasets. For the first time, we have
showndirectly that local stoichiometry data re-
flect global network topological properties of
interactions, setting the stage for quantitative
network analysis from the ground up. Weak
links form the ‘glue’ that holds the cellular net-
96

5.1 Publication: The human interactome in three quantitative dimensions
work together – as we have shown specific-
ally for the RNApolymerase network and glob-
ally for the entire network – and are hence
much more important for network structure.
This property, which may seem counterintuit-
ive at first glance, has been shown for mobile
communication networks before69, indicating
that it is a feature of networks in general. If
weak links are removed, networks collapse into
defined modules that are tightly interconnec-
ted by strong links. Translated into biological
terms, stable complexes would remain in isol-
ation, but without weak links, they would not
be able to connect to each other or to transient,
dynamic regulators.
A major contribution of this study lies in the
characterization of the interactomes surround-
ing more than 1,100 different baits, which to-
gether cover a large part of the expressed pro-
teome with more than 28,000 high confidence
interactions. We present our results in an ac-
cessible format that can be easilymined and in-
terpreted by non-specialists. Our resource of
mammalian cell lines expressing GFP-tagged
proteins under endogenous control can also
be employed for other studies, for example fo-
cusing on subcellular localization or functional
characterization of individual proteins. The in-
teraction data validate these cell lines for such
uses. We approach saturation with respect to
the number of coverable proteins (Extended
Data Fig. 7 a), but observe only part of the en-
tire interactome directly, which we predict to
encompass between 80,000 and 180,000 de-
tectable interactions in HeLa (Extended Data
Fig. 7 b). Our additional quantitative dimen-
sions may prove helpful for increasing inter-
actome coverage in silico, for example by se-
lective matrix expansion6. Given its useful-
ness in interpreting interaction data, the stoi-
chiometry readout developed here can become
a general basis for future interactome studies
and for the analysis of interactome dynamics,
whichwillmanifest foremost as quantitative al-
teration of occupancies rather than qualitative
gain or loss of interactors.
MethodsCell culture
HeLa Kyoto cell lines expressing N- or C-
terminally GFP tagged proteins from BAC
transgenes were generated and cultured as pre-
viously described18. For APC3 immunoprecip-
itations, cells were arrested in mitosis with
330 nM nocodazole (Sigma) using a double
thymidine block and release protocol70. His-
tone 3.1-iRFP expressing cells were created by
gene targeting as described earlier71. All BAC
cell lines and exact tag sequences are listed in
Supplementary Table 1 along with proteome
and interactomemetadata on the bait proteins.
For interaction experiments, cells were grown
to near-confluency on two 15 cm cell culture
dishes per experiment, detached with accutase
(PAA) and snap frozen. Replicates samples
were harvested in at least two different pas-
sages. Immunofluorescence imaging was per-
formed as described23.
Affinity-purification–mass spectrometry
Cell pellets were lysed and subjected to affin-
ity purification on a robotic system and sub-
sequent single-shot mass spectrometric ana-
lysis on an Orbitrap instrument as previously
described19. We processed triplicates separ-
ately on different days and carried out MS-
analyses in randomized order over the course
of weeks to months, to minimize any influence
of column carryover and drifts in instrument
performance.
Whole proteome measurements
HeLa cells were lysed in guanidinium chlor-
ide lysis buffer and digested sequentially with
LysC and trypsin as described72. Peptides
were desalted on stacked C18 reverse phase
(Waters Sep-pak) and strong cation exchange
cartridges and eluted using 70% acetonitrile.
Pooled eluates were separated into six fractions
on strong anion exchange (SAX) StageTips73.
MS measurements were performed in three
replicates on a quadrupoleOrbitrapmass spec-
trometer as described72.
97
●
5 A quantitative map of the human interactome
Data processing
Raw files were processed with MaxQuant26
(version 1.3.9.10) in seven sets, each contain-
ing ∼600 AP-MS runs and the HeLa pro-
teome fractions. MS/MS spectra were searched
against a modified version of the November
2012 release of the UniProt complete human
proteome sequence database. For each bait
protein expressed from a mouse BAC locus,
the human sequence in the fasta file was con-
catenated with the mouse sequence (unless
identical), to enable the identification of pep-
tides unique to the mouse sequence. For all
steps of protein quantification, we employed
MaxLFQ,MaxQuant’s label-free quantification
(LFQ) algorithm27. This algorithm compares
the intensities of individual peptides across
runs and calculates an LFQ intensity profile for
each protein group, while retaining the abso-
lute component of the sum of peptide intensit-
ies. Thereby they also serve as a proxy for abso-
lute molar protein abundance, when normal-
ized by the number of theoretical tryptic pep-
tides expected for each protein41. We required
one ratio count for each pair-wise comparison
step and activated the FastLFQ settingwith two
minimum and two average comparisons to en-
able the normalization of large datasets inman-
ageable computing time (one week per set on a
desktop workstation).
Detection of protein interactions
Protein identifications were filtered, removing
hits to the reverse decoy database as well as
proteins only identified by modified peptides.
We required that each protein be quantified
in all replicates from the AP-MS samples of at
least one cell line. Protein LFQ intensities were
logarithmized and missing values imputed by
values simulating noise around the detection
limit. For each protein, a non-parametric
method was used to select a subset of samples
that provide a distribution of background in-
tensities for this protein (SupplementaryMeth-
ods). This subset was used first to normalize all
protein intensities to represent relative enrich-
ment, and then to serve as the control group
for a two-tailed Welch’s t test. Specific out-
liers in the volcanoplots of logarithmized p val-
ues against enrichments were determined by
an approach making use of the asymmetry in
the outlier population (Extended Data Fig. 1 e–
f). We used two cut-offs of different stringen-
cies, representing 1 and 5% of enrichment false
discovery rate (FDR), respectively. Correlation
coefficients between the intensity profiles of in-
teracting proteins were calculated as additional
quality parameters16. Enrichment FDR (classes
A, B and C) and profile correlation (modifier +
or –) define the confidence class of an interac-
tion (Extended Data Fig. 2 g).
Estimation of binding stoichiometries andcellular copy numbers
Estimating stoichiometries requires the com-
parison of the amounts of different proteins re-
lative to each other in one IP. To this end, we
first subtracted the median intensity across all
samples to account for the proportion due to
unspecific binding. We then divided LFQ in-
tensities by the number of theoretically observ-
able peptides for this protein, as in the iBAQ
method41. This corrects for biases introduced
by different lengths of the protein sequences
and the frequency and distribution of proteo-
lytic cleavage sites. Finally, we expressed stoi-
chiometries relative to the bait protein. Cellu-
lar copy numbers and abundances were calcu-
lated using a similar approach43 on the whole
proteome data and brought to absolute scale
by normalization to a total protein amount of
200 pg in a cell volume of 1 pl for aHeLa cell.
Network analyses
Network analyses were performed based on
the data listed in Supplementary Table 2 using
custom-made plugins in the Perseus environ-
ment that is part of MaxQuant. For the pur-
pose of counting unique interactions and for
the histogram of the numbers of interactors,
we regarded interactions as non-directional,
flattened multiple protein groups mapping to
98

5.1 Publication: The human interactome in three quantitative dimensions
the same gene name and to the most abund-
ant isoform and considered interactions found
multiple times only once. For network per-
turbation analyses, we selected all non-self-
interactions of confidence classes A+, A, B+,
and assembled them into graphs. We then re-
moved edges sequentially according to their
interaction stoichiometry readout. Prey-bait
combinations discovered multiple times were
treated as separate edges. Once a protein had
lost all its edges, it was removed. As control,
we deleted edges randomly and represented the
median of 100 random repetitions, and repres-
ent the scatter as the first or third quartile ±1.5
interquartile ranges.
References1. Rual, J. F. et al. Towards a proteome-scale map of
the human protein-protein interaction network.
Nature 437, 1173-1178, (2005).2. Stelzl, U. et al. A human protein-protein interac-
tion network: a resource for annotating the pro-
teome. Cell 122, 957-968, (2005).3. Rolland, T. et al. A Proteome-Scale Map of the
Human Interactome Network. Cell 159, 1212-1226 (2014).
4. Mann, M., Kulak, N. A., Nagaraj, N. & Cox, J.
The coming age of complete, accurate, and ubi-
quitous proteomes.Mol. Cell 49, 583-590, (2013).5. Hein, M. Y., Sharma, K., Cox, J. & Mann, M.
inHandbook of Systems Biology (eds A.J. Marian
Walhout, Marc Vidal, & Job Dekker) 3-25 (Aca-
demic Press, 2013).
6. Seebacher, J. & Gavin, A. C. SnapShot: Protein-
protein interaction networks. Cell 144, 1000,1000 e1001, (2011).
7. Gingras, A. C., Gstaiger, M., Raught, B. & Ae-
bersold, R. Analysis of protein complexes using
mass spectrometry. Nat. Rev. Mol. Cell Biol. 8,645-654, (2007).
8. Gavin, A. C. et al. Functional organization of theyeast proteome by systematic analysis of protein
complexes. Nature 415, 141-147, (2002).9. Ho, Y. et al. Systematic identification of protein
complexes in Saccharomyces cerevisiae by mass
spectrometry. Nature 415, 180-183, (2002).10. Gavin, A. C. et al. Proteome survey revealsmod-
ularity of the yeast cell machinery. Nature 440,631-636, (2006).
11. Krogan, N. J. et al. Global landscape of proteincomplexes in the yeast Saccharomyces cerevisiae.Nature 440, 637-643, (2006).
12. Guruharsha, K. G. et al. A protein complex net-
work of Drosophila melanogaster. Cell 147, 690-703, (2011).
13. Ewing, R. M. et al. Large-scale mapping of hu-
man protein-protein interactions by mass spec-
trometry. Mol. Syst. Biol. 3, 89, (2007).14. Malovannaya, A. et al. Analysis of the human
endogenous coregulator complexome. Cell 145,787-799, (2011).
15. Bantscheff, M., Lemeer, S., Savitski, M. M. &
Kuster, B. Quantitative mass spectrometry in
proteomics: critical review update from 2007 to
the present. Anal. Bioanal. Chem. 404, 939-965,(2012).
16. Keilhauer, E. C., Hein, M. Y. &Mann, M. Accur-
ate protein complex retrieval by affinity enrich-
ment MS rather than affinity purification MS.
Mol. Cell. Proteomics, (2014).17. Beck,M., Claassen,M.&Aebersold, R. Compre-
hensive proteomics. Curr. Opin. Biotechnol. 22,3-8, (2011).
18. Poser, I. et al. BAC TransgeneOmics: a high-
throughput method for exploration of protein
function in mammals. Nat. Methods 5, 409-415,(2008).
19. Hubner, N. C. et al. Quantitative proteomics
combined with BAC TransgeneOmics reveals in
vivo protein interactions. J. Cell Biol. 189, 739-754, (2010).
20. Ghaemmaghami, S. et al. Global analysis of pro-tein expression in yeast. Nature 425, 737-741,(2003).
21. Huh, W. K. et al. Global analysis of protein loc-
alization in budding yeast. Nature 425, 686-691,(2003).
22. Gibson, T. J., Seiler, M. & Veitia, R. A. The tran-
sience of transient overexpression. Nat. Methods10, 715-721, (2013).
23. Hutchins, J. R. et al. Systematic analysis of
human protein complexes identifies chromo-
some segregation proteins. Science 328, 593-599,(2010).
24. Maliga, Z. et al. A genomic toolkit to investigate
kinesin andmyosinmotor function in cells. Nat.Cell Biol. 15, 325-334, (2013).
25. Kittler, R. et al. RNA interference rescue by
bacterial artificial chromosome transgenesis in
99
●

5 A quantitative map of the human interactome
mammalian tissue culture cells. Proc. Natl.Acad. Sci. USA 102, 2396-2401, (2005).
26. Cox, J. &Mann,M.MaxQuant enables high pep-
tide identification rates, individualized p.p.b.-
range mass accuracies and proteome-wide pro-
tein quantification. Nat. Biotechnol. 26, 1367-1372, (2008).
27. Cox, J. et al. Accurate Proteome-wide Label-
free Quantification by Delayed Normalization
and Maximal Peptide Ratio Extraction, Termed
MaxLFQ. Mol. Cell. Proteomics 13, 2513-2526,(2014).
28. Collins, B. C. et al. Quantifying protein inter-
action dynamics by SWATHmass spectrometry:
application to the 14-3-3 system. Nat. Methods10, 1246-1253, (2013).
29. Jager, S. et al. Global landscape of HIV-human
protein complexes. Nature 481, 365-370, (2012).30. Sowa, M. E., Bennett, E. J., Gygi, S. P. & Harper,
J. W. Defining the human deubiquitinating en-
zyme interaction landscape. Cell 138, 389-403,(2009).
31. Breitkreutz, A. et al. A global protein kinase and
phosphatase interaction network in yeast. Sci-ence 328, 1043-1046, (2010).
32. Kristensen, A. R., Gsponer, J. & Foster, L. J. A
high-throughput approach for measuring tem-
poral changes in the interactome. Nat. Methods9, 907-909, (2012).
33. Havugimana, P. C. et al. A census of human
soluble protein complexes. Cell 150, 1068-1081,(2012).
34. Blohm, P. et al. Negatome 2.0: a database of
non-interacting proteins derived by literature
mining, manual annotation and protein struc-
ture analysis. Nucleic Acids Res. 42, D396-400,(2014).
35. Mellacheruvu, D. et al. The CRAPome: a
contaminant repository for affinity purification-
mass spectrometry data. Nat. Methods 10, 730-736, (2013).
36. Wepf, A. et al. Quantitative interaction proteo-
mics using mass spectrometry. Nat. Methods 6,203-205, (2009).
37. Hauri, S. et al. Interaction proteome of hu-
manHippo signaling: modular control of the co-
activator YAP1. Mol. Syst. Biol. 9, 713, (2013).38. Smits, A. H. et al. Stoichiometry of chromatin-
associated protein complexes revealed by label-
free quantitative mass spectrometry-based pro-
teomics. Nucleic Acids Res., (2012).
39. Holzmann, J. et al. Lesson from the stoi-
chiometry determination of the cohesin com-
plex: a short protease mediated elution in-
creases the recovery fromcross-linked antibody-
conjugated beads. J. Proteome Res. 10, 780-789,(2011).
40. Ding, C. et al. Quantitative analysis of cohesincomplex stoichiometry and SMC3modification-
dependent protein interactions. J. Proteome Res.10, 3652-3659, (2011).
41. Schwanhäusser, B. et al. Global quantification
of mammalian gene expression control. Nature473, 337-342, (2011).
42. Wiśniewski, J. R. et al. Extensive quantitative
remodeling of the proteome between normal
colon tissue and adenocarcinoma. Mol. Syst.Biol. 8, 611, (2012).
43. Wiśniewski, J. R., Hein, M. Y., Cox, J. & Mann,
M. A ’proteomic ruler’ for protein copy number
and concentration estimation without spike-in
standards. Mol. Cell. Proteomics, (2014).44. Ruepp, A. et al. CORUM: the comprehensive re-
source of mammalian protein complexes–2009.
Nucleic Acids Res. 38, D497-501, (2010).45. Collins, S. R. et al. Toward a comprehensive at-
las of the physical interactome of Saccharomy-ces cerevisiae. Mol. Cell. Proteomics 6, 439-450,(2007).
46. Hart, G. T., Lee, I. & Marcotte, E. R. A high-
accuracy consensus map of yeast protein com-
plexes reveals modular nature of gene essential-
ity. BMC Bioinformatics 8, 236, (2007).47. Phillips-Krawczak, C. A. et al. COMMD1 is
linked to the WASH complex and regulates en-
dosomal trafficking of the copper transporter
ATP7A.Mol. Biol. Cell, (2014).48. Turner, B. et al. iRefWeb: interactive analysis of
consolidated protein interaction data and their
supporting evidence. Database : the journal ofbiological databases and curation 2010, baq023,(2010).
49. Howell, G. R. et al. Mutation of a ubiquit-
ously expressed mouse transmembrane protein
(Tapt1) causes specific skeletal homeotic trans-
formations. Genetics 175, 699-707, (2007).50. Sohaskey, M. L. et al. Osteopotentia regu-
lates osteoblast maturation, bone formation, and
skeletal integrity in mice. J. Cell Biol. 189, 511-525, (2010).
100

5.1 Publication: The human interactome in three quantitative dimensions
51. Bassik, M. C. et al. A systematic mammalian ge-
netic interaction map reveals pathways underly-
ing ricin susceptibility. Cell 152, 909-922, (2013).52. Jonikas, M. C. et al. Comprehensive characteriz-
ation of genes required for protein folding in the
endoplasmic reticulum. Science 323, 1693-1697,(2009).
53. Friederichs, J. M. et al. Genetic analysis of
Mps3 SUN domain mutants in Saccharomycescerevisiae reveals an interaction with the SUN-
like protein Slp1. textit G3 2, 1703-1718, (2012).54. Kraft, C. et al. Mitotic regulation of the human
anaphase-promoting complex by phosphoryla-
tion. textit EMBO J. 22, 6598-6609, (2003).55. Acquaviva, C., Herzog, F., Kraft, C. & Pines, J.
The anaphase promoting complex/cyclosome is
recruited to centromeres by the spindle assembly
checkpoint. Nat. Cell Biol. 6, 892-898, (2004).56. Santaguida, S. et al. Dissecting the role of MPS1
in chromosome biorientation and the spindle
checkpoint through the smallmolecule inhibitor
reversine. J. Cell Biol. 190, 73-87, (2010).57. Soulavie, F. et al. hemingway is required for
sperm flagella assembly and ciliary motility in
Drosophila. Mol. biol. cell 25, 1276-1286, (2014).58. Ganner, A. et al. Regulation of ciliary polarity
by the APC/C. Proc. Natl. Acad. Sci. USA 106,17799-17804, (2009).
59. Wang,W.,Wu, T. &Kirschner, M.W.Themaster
cell cycle regulator APC-Cdc20 regulates ciliary
length and disassembly of the primary cilium.
eLife 3, e03083, (2014).60. Hartl, F. U., Bracher, A. & Hayer-Hartl, M. Mo-
lecular chaperones in protein folding and pro-
teostasis. Nature 475, 324-332, (2011).61. Yam, A. Y. et al. Defining the TRiC/CCT in-
teractome links chaperonin function to stabiliz-
ation of newly made proteins with complex to-
pologies. Nat. Struct. Mol. Biol. 15, 1255-1262,(2008).
62. Fievet, B. T. et al. Systematic genetic interac-
tion screens uncover cell polarity regulators and
functional redundancy. Nat. Cell Biol. 15, 103-U229, (2013).
63. Hayes, N. V. L., Josse, L., Smales, C. M. &
Carden, M. J. Modulation of Phosducin-Like
Protein 3 (PhLP3) Levels Promotes Cytoskeletal
Remodelling in a MAPK and RhoA-Dependent
Manner. PloS one 6, (2011).64. Kim, M. S. et al. A draft map of the human pro-
teome. Nature 509, 575-581, (2014).
65. Simonis, N. et al. Modularity of the transcrip-
tional response of protein complexes in yeast. J.Mol. Biol. 363, 589-610, (2006).
66. Albert, R., Jeong, H. & Barabasi, A. L. Error and
attack tolerance of complex networks. Nature406, 378-382, (2000).
67. Beyer, A., Bandyopadhyay, S. & Ideker, T. Integ-
rating physical and genetic maps: from genomes
to interaction networks. Nat. Rev. Genet. 8, 699-710, (2007).
68. Csermely, P. Weak links: stabilizers of complexsystems from proteins to social networks. 1st edn,(Springer, 2006).
69. Onnela, J. P. et al. Structure and tie strengths
in mobile communication networks. Proc. Natl.Acad. Sci. USA 104, 7332-7336, (2007).
70. Mansfeld, J. et al. APC15 drives the turnover
of MCC-CDC20 to make the spindle assembly
checkpoint responsive to kinetochore attach-
ment. Nat. Cell Biol. 13, 1234-1243, (2011).71. Collin, P., Nashchekina, O., Walker, R. & Pines,
J. The spindle assembly checkpoint works like a
rheostat rather than a toggle switch. Nat. CellBiol. 15, 1378-1385, (2013).
72. Kulak, N. A. et al. Minimal, encapsulated
proteomic-sample processing applied to copy-
number estimation in eukaryotic cells. Nat.Methods, (2014).
73. Wiśniewski, J. R. et al. Brain phosphopro-
teome obtained by a FASP-basedmethod reveals
plasma membrane protein topology. J. ProteomeRes. 9, 3280-3289, (2010).
101
●
5 A quantitative map of the human interactome
Acknowledgements
This work was performed within the project
framework of the German medical genome re-
search funded by the Bundesministerium für
Bildung und Forschung with grant number
FKZ01GS0861 in the DiGtoP consortium. J.M.
is supported by the German Research Found-
ation (DFG) (Emmy Noether, MA 5831/1-1),
I.G. is a member of the DIGS-BB PhD pro-
gram. We thank M. Leuschner, A. Ssykor, M.
Augsburg, A. Schwager, G. Sowa, K. Mayr, I.
Paron, B. Splettstößer, D. Vogg, B. Chatterjee,
M. Grötzinger and S. Kroiß for technical as-
sistance. H.C. Eberl, T. Viturawong, E.C. Keil-
hauer, M. Räschle andM. Seiler provided input
on data analysis. C. Schaab and S. Schloissnig
provided bioinformatics support. M. Bassik as
well as S. Pinkert and A. Bracher gave input re-
garding the TAPT1/SUCO complex and chap-
erone interactors, respectively.
Author contributions
M.Y.H. did the experiments, conceived and im-
plemented the bioinformatics methods, ana-
lysed and interpreted the data. N.C.H. de-
veloped theQUBIC pipeline in a high through-
put format. J.C. developed the MaxQuant soft-
ware modules for label-free quantification of
very large datasets and contributed to data ana-
lysis. N.N. provided the whole proteome data.
I.P. and Y.T. generated the BAC-GFP cell lines.
I.P. performed fluorescence microscopy ana-
lyses. I.G., I.W. and J.M. generated the data
shown in Fig. 3 f–i. J.M. and F.B. conceived,
supervised and interpreted the experiments
in Fig. 3 f–i. M.M. and A.A.H. conceived the
study and supervised the experiments. M.Y.H.
and M.M. wrote the manuscript.
Author informationUpon publication, we will make all supple-
mentary interaction data also available via the
IntAct database. The authors declare no com-
peting financial interests. Correspondence and
request for materials should be addressed to
M.M. ([email protected]) or A.A.H.
Request for cell lines should be addressed to I.P.
102
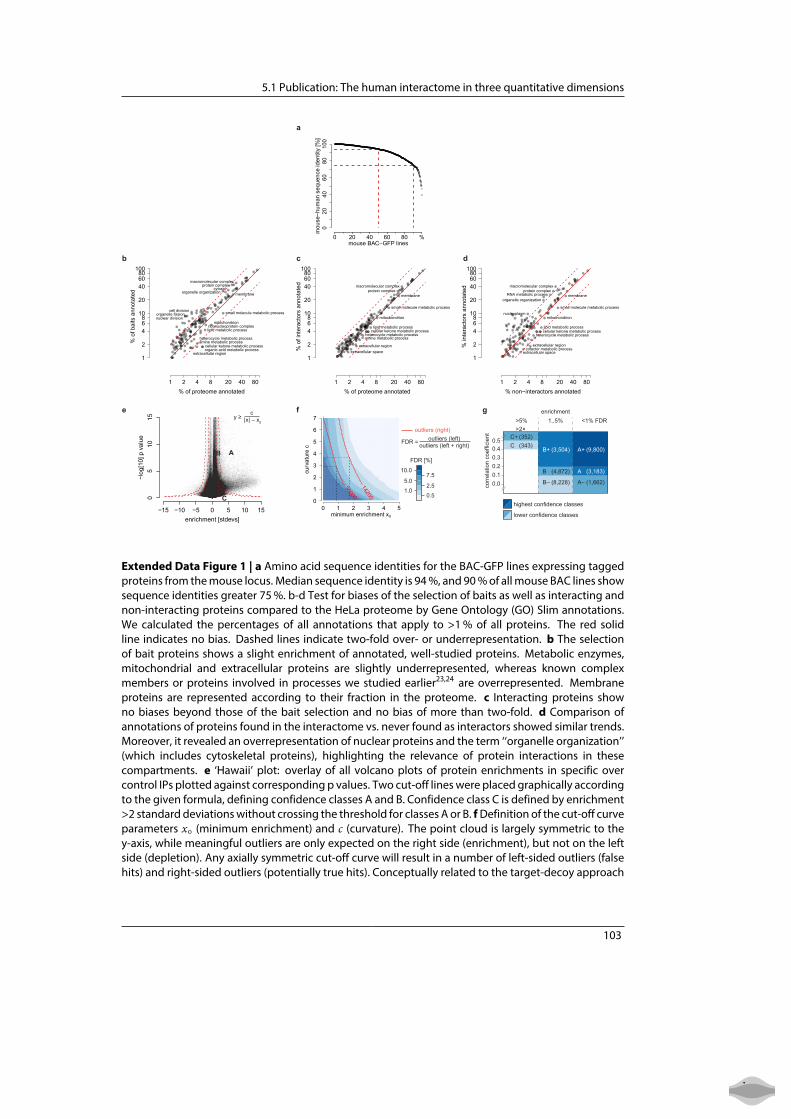
5.1 Publication: The human interactome in three quantitative dimensions
mouse BAC−GFP lines
mou
se−h
uman
seq
uenc
e id
entit
y [%
]
0 20 40 60 80 %
020
4060
8010
0
% of proteome annotated
% o
f bai
ts a
nnot
ated
1 2 4 8 20 40 80
1
2
468
10
20
406080
100
membrane
small molecule metabolic process
ribonucleoprotein complexmitochondrion
lipid metabolic process
heterocycle metabolic process
organic acid metabolic processcellular ketone metabolic process
amine metabolic process
extracellular region
macromolecular complexprotein complex
cytosolorganelle organization
cell divisionorganelle fissionnuclear division
% of proteome annotated
% o
f int
erac
tors
ann
otat
ed
1 2 4 8 20 40 80
1
2
468
10
20
406080
100
membrane
small molecule metabolic process
mitochondrion
lipid metabolic process
heterocycle metabolic processcellular ketone metabolic process
amine metabolic process
extracellular regionextracellular space
macromolecular complexprotein complex
% non−interactors annotated
% in
tera
ctor
s an
nota
ted
1 2 4 8 20 40 80
1
2
468
10
20
406080
100
membrane
small molecule metabolic process
mitochondrion
lipid metabolic process
heterocycle metabolic processcellular ketone metabolic process
extracellular region
extracellular spacecofactor metabolic process
macromolecular complexprotein complex
organelle organizationRNA metabolic process
nucleoplasm
enrichment [stdevs]
−log
[10]
p v
alue
−15 −10 −5 0 5 10 15
05
1015
0 1 2 3 4 50
1
2
3
4
5
6
7 14200
30000
minimum enrichment xo
curv
atur
e c
0.51.0
5.0
10.0
FDR [%]
2.5
7.5
FDR = outliers (left)outliers (left + right)
outliers (right)
0.10.0
0.20.30.40.5
<1% FDR>5%>2×
1..5%enrichment
corr
elat
ion
coef
ficie
ntA– (1,662)
A+ (9,800)
A (3,183)
B– (8,228)
B+ (3,504)
B (4,872)
C+ (352)C (343)
highest confidence classes
lower confidence classes
y ≥c
|x| – x0
C
AB
b d
a
c
e gf
Hein et al. Extended Data Figure 1
Extended Data Figure 1 | a Amino acid sequence identities for the BAC-GFP lines expressing taggedproteins from the mouse locus. Median sequence identity is 94 %, and 90 % of all mouse BAC lines showsequence identities greater 75 %. b-d Test for biases of the selection of baits as well as interacting andnon-interacting proteins compared to the HeLa proteome by Gene Ontology (GO) Slim annotations.We calculated the percentages of all annotations that apply to >1 % of all proteins. The red solidline indicates no bias. Dashed lines indicate two-fold over- or underrepresentation. b The selectionof bait proteins shows a slight enrichment of annotated, well-studied proteins. Metabolic enzymes,mitochondrial and extracellular proteins are slightly underrepresented, whereas known complexmembers or proteins involved in processes we studied earlier23,24 are overrepresented. Membraneproteins are represented according to their fraction in the proteome. c Interacting proteins showno biases beyond those of the bait selection and no bias of more than two-fold. d Comparison ofannotations of proteins found in the interactome vs. never found as interactors showed similar trends.Moreover, it revealed an overrepresentation of nuclear proteins and the term ‘‘organelle organization’’(which includes cytoskeletal proteins), highlighting the relevance of protein interactions in thesecompartments. e ‘Hawaii’ plot: overlay of all volcano plots of protein enrichments in specific overcontrol IPs plotted against corresponding p values. Two cut-off lines were placed graphically accordingto the given formula, defining confidence classes A and B. Confidence class C is defined by enrichment>2 standard deviations without crossing the threshold for classes A or B. f Definition of the cut-off curveparameters x0 (minimum enrichment) and c (curvature). The point cloud is largely symmetric to they-axis, while meaningful outliers are only expected on the right side (enrichment), but not on the leftside (depletion). Any axially symmetric cut-off curve will result in a number of left-sided outliers (falsehits) and right-sided outliers (potentially true hits). Conceptually related to the target-decoy approach
103
●

5 A quantitative map of the human interactome
for peptide and protein identification, the fraction of the left-sided outliers to the total number ofoutliers serves as an FDR estimate. For a given FDR (shaded areas), a combination of x0 and c can beselected that maximizes the number of right-sided outliers (red lines). Our cut-offs of 1 % and 5 % FDRare indicated by dashed lines. g We combined the enrichment FDR with protein profile correlationcoefficients across IPs16 to define confidence classes. Classes C and C+ represent cases that did notcross the FDR threshold, but showed enrichments >2 fold and correlation coefficients >0.4 and 0.5,respectively. Numbers in brackets represent the numbers of hits for a given confidence class. Note thatthe number of unique interactions is lower as bait proteins also represent hits and some interactionsmay be found several times or involving several isoforms.
Extended Data Figure 2 (opposite page) | a Correlation of interaction stoichiometries values derivedfrom cell lines using human and mouse ortholog bait sequences (n=103). b Correlation of interactionstoichiometries values derived from cell lines using N- and C-terminal tags on the same bait sequence(n=50). c No systematic biases between human/mouse and N/C-terminal tags and a precision ofstoichiometries within a factor of three. d 50 representative examples for mouse vs. human. e 40representative examples for N- vs. C-terminal tag.
104

5.1 Publication: The human interactome in three quantitative dimensions
−4 −3 −2 −1 0 1 2
−4
−3
−2
−1
0
1
2 r = 0.792
−4 −3 −2 −1 0 1 2
−4
−3
−2
−1
0
1
2 r = 0.803
0.01 0.1 1/3 1 3 10 100
APC − 90%
human, C−term
mou
se, N
−ter
m
−4 −3 −2 −1 0 1 2
−4
−3
−2
−1
0
1
2
BUB1 − 71.8%
human, C−term
mou
se, C
−ter
m
−4 −3 −2 −1 0 1 2
−4
−3
−2
−1
0
1
2
CASC5 − 39.2%
human, C−term
mou
se, C
−ter
m
−4 −3 −2 −1 0 1 2
−4
−3
−2
−1
0
1
2
CBX4 − 86.7%
human, C−term
mou
se, C
−ter
m
−4 −3 −2 −1 0 1 2
−4
−3
−2
−1
0
1
2
CDC16 − 95.5%
human, C−term
mou
se, C
−ter
m
−4 −3 −2 −1 0 1 2
−4
−3
−2
−1
0
1
2
CDC37 − 95.2%
human, N−term
mou
se, C
−ter
m
−4 −3 −2 −1 0 1 2
−4
−3
−2
−1
0
1
2
CDK1 − 97%
human, C−term
mou
se, C
−ter
m
−4 −3 −2 −1 0 1 2
−4
−3
−2
−1
0
1
2
CENPE − 50%
human, N−term
mou
se, C
−ter
m
−4 −3 −2 −1 0 1 2
−4
−3
−2
−1
0
1
2
CEP135 − 83.3%
human, C−term
mou
se, C
−ter
m
−4 −3 −2 −1 0 1 2
−4
−3
−2
−1
0
1
2
CKAP5 − 95%
human, C−term
mou
se, C
−ter
m
−4 −3 −2 −1 0 1 2
−4
−3
−2
−1
0
1
2
CNOT2 − 99.8%
human, N−term
mou
se, N
−ter
m
−4 −3 −2 −1 0 1 2
−4
−3
−2
−1
0
1
2
CSDE1 − 98.5%
human, C−term
mou
se, C
−ter
m
−4 −3 −2 −1 0 1 2
−4
−3
−2
−1
0
1
2
CXXC1 − 96.1%
human, C−term
mou
se, C
−ter
m
−4 −3 −2 −1 0 1 2
−4
−3
−2
−1
0
1
2
DCLRE1B − 79.4%
human, C−term
mou
se, C
−ter
m
−4 −3 −2 −1 0 1 2
−4
−3
−2
−1
0
1
2
KIF3C − 94.8%
human, C−term
mou
se, N
−ter
m
−4 −3 −2 −1 0 1 2
−4
−3
−2
−1
0
1
2
KIF5B − 97.2%
human, C−term
mou
se, N
−ter
m
−4 −3 −2 −1 0 1 2
−4
−3
−2
−1
0
1
2
KIF15 − 86.2%
human, N−term
mou
se, N
−ter
m
−4 −3 −2 −1 0 1 2
−4
−3
−2
−1
0
1
2
KIF20A − 87%
human, C−term
mou
se, C
−ter
m
−4 −3 −2 −1 0 1 2
−4
−3
−2
−1
0
1
2
KIFC3 − 92.7%
human, C−term
mou
se, C
−ter
m
−4 −3 −2 −1 0 1 2
−4
−3
−2
−1
0
1
2
KLC2 − 95.3%
human, C−term
mou
se, C
−ter
m
−4 −3 −2 −1 0 1 2
−4
−3
−2
−1
0
1
2
KLC3 − 90.3%
human, C−term
mou
se, N
−ter
m
−4 −3 −2 −1 0 1 2
−4
−3
−2
−1
0
1
2
LGALS3BP − 68.8%
human, C−term
mou
se, C
−ter
m
−4 −3 −2 −1 0 1 2
−4
−3
−2
−1
0
1
2
MAD2L1 − 94.2%
human, C−term
mou
se, C
−ter
m
−4 −3 −2 −1 0 1 2
−4
−3
−2
−1
0
1
2
MAD2L2 − 98.6%
human, C−term
mou
se, C
−ter
m
−4 −3 −2 −1 0 1 2
−4
−3
−2
−1
0
1
2
MARK2 − 95.8%
human, C−term
mou
se, N
−ter
m
−4 −3 −2 −1 0 1 2
−4
−3
−2
−1
0
1
2
MIS12 − 78.9%
human, C−term
mou
se, C
−ter
m
−4 −3 −2 −1 0 1 2
−4
−3
−2
−1
0
1
2
MYH9 − 97.1%
human, C−term
mou
se, C
−ter
m
−4 −3 −2 −1 0 1 2
−4
−3
−2
−1
0
1
2
NCAPH − 76.9%
human, C−termm
ouse
, N−t
erm
−4 −3 −2 −1 0 1 2
−4
−3
−2
−1
0
1
2
NCSTN − 89%
human, C−term
mou
se, C
−ter
m
−4 −3 −2 −1 0 1 2
−4
−3
−2
−1
0
1
2
ORC2 − 78.9%
human, C−term
mou
se, C
−ter
m
−4 −3 −2 −1 0 1 2
−4
−3
−2
−1
0
1
2
PARD6B − 91.4%
human, C−term
mou
se, C
−ter
m
−4 −3 −2 −1 0 1 2
−4
−3
−2
−1
0
1
2
PCNA − 96.9%
human, C−term
mou
se, C
−ter
m
−4 −3 −2 −1 0 1 2
−4
−3
−2
−1
0
1
2
PPP1CB − 100%
human, N−term
mou
se, C
−ter
m
−4 −3 −2 −1 0 1 2
−4
−3
−2
−1
0
1
2
PPP2R1A − 99.8%
human, C−term
mou
se, C
−ter
m
−4 −3 −2 −1 0 1 2
−4
−3
−2
−1
0
1
2
PPP2R2A − 100%
human, C−term
mou
se, C
−ter
m
−4 −3 −2 −1 0 1 2
−4
−3
−2
−1
0
1
2
PRKCI − 98.3%
human, N−term
mou
se, C
−ter
m
−4 −3 −2 −1 0 1 2
−4
−3
−2
−1
0
1
2
RAB5C − 98.5%
human, N−term
mou
se, N
−ter
m
−4 −3 −2 −1 0 1 2
−4
−3
−2
−1
0
1
2
RAD21 − 96.5%
human, N−term
mou
se, C
−ter
m
−4 −3 −2 −1 0 1 2
−4
−3
−2
−1
0
1
2
RFX5 − 71.4%
human, C−termm
ouse
, C−t
erm
−4 −3 −2 −1 0 1 2
−4
−3
−2
−1
0
1
2
SKP1 − 99.4%
human, C−term
mou
se, C
−ter
m
−4 −3 −2 −1 0 1 2
−4
−3
−2
−1
0
1
2
SLAIN2 − 94%
human, C−term
mou
se, C
−ter
m
−4 −3 −2 −1 0 1 2
−4
−3
−2
−1
0
1
2
SMC1A − 99.8%
human, C−term
mou
se, N
−ter
m
−4 −3 −2 −1 0 1 2
−4
−3
−2
−1
0
1
2
SMC3 − 99.9%
human, C−term
mou
se, C
−ter
m
−4 −3 −2 −1 0 1 2
−4
−3
−2
−1
0
1
2
SMEK1 − 99.3%
human, C−term
mou
se, C
−ter
m
−4 −3 −2 −1 0 1 2
−4
−3
−2
−1
0
1
2
SOD1 − 83.8%
human, N−term
mou
se, C
−ter
m
−4 −3 −2 −1 0 1 2
−4
−3
−2
−1
0
1
2
STRN3 − 96.1%
human, C−term
mou
se, C
−ter
m
−4 −3 −2 −1 0 1 2
−4
−3
−2
−1
0
1
2
TGS1 − 72.7%
human, C−term
mou
se, C
−ter
m
−4 −3 −2 −1 0 1 2
−4
−3
−2
−1
0
1
2
TUBGCP5 − 88.5%
human, C−term
mou
se, N
−ter
m
−4 −3 −2 −1 0 1 2
−4
−3
−2
−1
0
1
2
VIM − 97.4%
human, C−term
mou
se, C
−ter
m
−4 −3 −2 −1 0 1 2
−4
−3
−2
−1
0
1
2
WIZ − 77.5%
human, C−term
mou
se, C
−ter
m
−4 −3 −2 −1 0 1 2
−4
−3
−2
−1
0
1
2
BAG3 human
LAP
NLA
P
−4 −3 −2 −1 0 1 2
−4
−3
−2
−1
0
1
2
BAP1 mouse
LAP
NLA
P
−4 −3 −2 −1 0 1 2
−4
−3
−2
−1
0
1
2
CCDC22 human
LAP
NFL
AP
−4 −3 −2 −1 0 1 2
−4
−3
−2
−1
0
1
2
CCT4 mouse
LAP
NFL
AP
−4 −3 −2 −1 0 1 2
−4
−3
−2
−1
0
1
2
CDC23 mouse
LAP
N−V
enus
(neo
)
−4 −3 −2 −1 0 1 2
−4
−3
−2
−1
0
1
2
CDK1 human
FLAP
NFL
AP
−4 −3 −2 −1 0 1 2
−4
−3
−2
−1
0
1
2
CDK2 human
LAP
NLA
P
−4 −3 −2 −1 0 1 2
−4
−3
−2
−1
0
1
2
CENPE mouse
LAP
NFL
AP
−4 −3 −2 −1 0 1 2
−4
−3
−2
−1
0
1
2
CERK human
LAP
NLA
P
−4 −3 −2 −1 0 1 2
−4
−3
−2
−1
0
1
2
CHMP4B mouse
LAP
NFL
AP
−4 −3 −2 −1 0 1 2
−4
−3
−2
−1
0
1
2
CRY1 mouse
LAP
NFL
AP
−4 −3 −2 −1 0 1 2
−4
−3
−2
−1
0
1
2
ID1 human
LAP
NFL
AP
−4 −3 −2 −1 0 1 2
−4
−3
−2
−1
0
1
2
JUP mouse
LAP
NFL
AP
−4 −3 −2 −1 0 1 2
−4
−3
−2
−1
0
1
2
KBTBD7 human
LAP
NLA
P
−4 −3 −2 −1 0 1 2
−4
−3
−2
−1
0
1
2
KIF5B human
LAP
NFL
AP
−4 −3 −2 −1 0 1 2
−4
−3
−2
−1
0
1
2
KIF15 human
LAP
NFL
AP
−4 −3 −2 −1 0 1 2
−4
−3
−2
−1
0
1
2
KIF18B mouse
LAP
NFL
AP
−4 −3 −2 −1 0 1 2
−4
−3
−2
−1
0
1
2
KIFAP3 human
LAP
NFL
AP
−4 −3 −2 −1 0 1 2
−4
−3
−2
−1
0
1
2
KIFC3 human
LAP
NFL
AP
−4 −3 −2 −1 0 1 2
−4
−3
−2
−1
0
1
2
KLC2 human
LAP
NFL
AP
−4 −3 −2 −1 0 1 2
−4
−3
−2
−1
0
1
2
KLC2 mouse
LAP
NFL
AP
−4 −3 −2 −1 0 1 2
−4
−3
−2
−1
0
1
2
LRPPRC human
LAP
NLA
P
−4 −3 −2 −1 0 1 2
−4
−3
−2
−1
0
1
2
MKNK2 human
LAP
NLA
P
−4 −3 −2 −1 0 1 2
−4
−3
−2
−1
0
1
2
MYH9 mouse
LAP
NFL
AP
−4 −3 −2 −1 0 1 2
−4
−3
−2
−1
0
1
2
MYH9 human
LAP
NFL
AP
−4 −3 −2 −1 0 1 2
−4
−3
−2
−1
0
1
2
MYO19 human
LAP
NFL
AP
−4 −3 −2 −1 0 1 2
−4
−3
−2
−1
0
1
2
RAB5B mouse
LAP
NFL
AP
−4 −3 −2 −1 0 1 2
−4
−3
−2
−1
0
1
2
RAB5C mouse
LAP
NFL
AP
−4 −3 −2 −1 0 1 2
−4
−3
−2
−1
0
1
2
RASSF8 human
LAP
NLA
P
−4 −3 −2 −1 0 1 2
−4
−3
−2
−1
0
1
2
SKA3 human
LAP
NFL
AP
−4 −3 −2 −1 0 1 2
−4
−3
−2
−1
0
1
2
SLAIN2 human
LAP
NFL
AP
−4 −3 −2 −1 0 1 2
−4
−3
−2
−1
0
1
2
SMC3 mouse
LAP
NFL
AP
−4 −3 −2 −1 0 1 2
−4
−3
−2
−1
0
1
2
SPTLC2 mouse
LAP
NFL
AP
−4 −3 −2 −1 0 1 2
−4
−3
−2
−1
0
1
2
TSC1 mouse
LAP
NFL
AP
−4 −3 −2 −1 0 1 2
−4
−3
−2
−1
0
1
2
TUBE1 mouse
LAP
NFL
AP
−4 −3 −2 −1 0 1 2
−4
−3
−2
−1
0
1
2
UBE2K mouse
FLAP
NFL
AP
−4 −3 −2 −1 0 1 2
−4
−3
−2
−1
0
1
2
VPS16 human
LAP
NFL
AP
−4 −3 −2 −1 0 1 2
−4
−3
−2
−1
0
1
2
VPS18 human
LAP
NFL
AP
−4 −3 −2 −1 0 1 2
−4
−3
−2
−1
0
1
2
VPS26B human
LAP
NLA
P
−4 −3 −2 −1 0 1 2
−4
−3
−2
−1
0
1
2
VPS41 mouse
LAP
NFL
AP
−4 −3 −2 −1 0 1 2
−4
−3
−2
−1
0
1
2
log 10
inte
ract
ion
stoi
chio
met
ry
(mou
se b
ait s
eque
nce)
dens
ity
human vs. mouse baitC- vs. N-terminal tag
p value = 0.78
log10 interaction stoichiometry (human bait sequence)
log 10
inte
ract
ion
stoi
chio
met
ry
(N-te
rmin
al ta
g)
log10 interaction stoichiometry (C-terminal tag) ratio of interaction stoichiometries
a
d
e
b c
Hein et al. Extended Data Figure 2
105
●
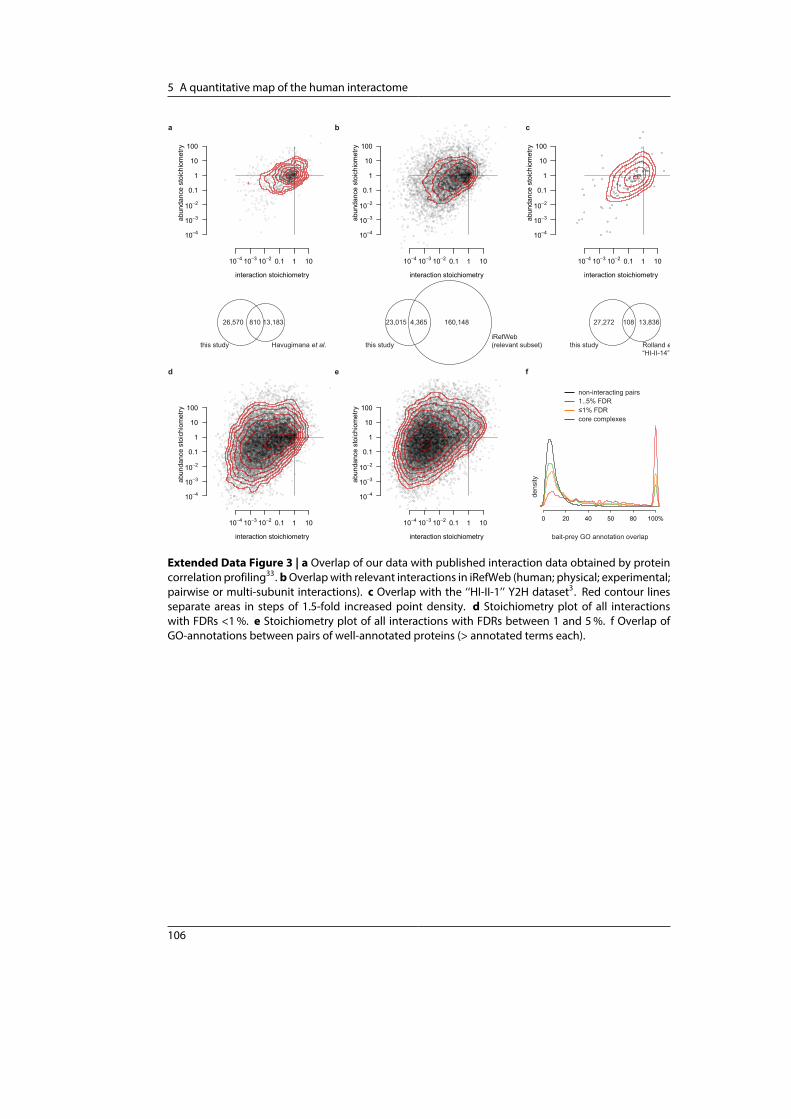
5 A quantitative map of the human interactome
interaction stoichiometry
abun
danc
e st
oich
iom
etry
10−4 10−3 10−2 0.1 1 10
10−4
10−3
10−2
0.1
1
10
100
interaction stoichiometry
abun
danc
e st
oich
iom
etry
10−4 10−3 10−2 0.1 1 10
10−4
10−3
10−2
0.1
1
10
100
interaction stoichiometry
abun
danc
e st
oich
iom
etry
10−4 10−3 10−2 0.1 1 10
10−4
10−3
10−2
0.1
1
10
100
26,570
this study this study this studyHavugimana et al.iRefWeb(relevant subset) Rolland et al.
“HI-II-14”
810 27,272 10813,183 13,83623,015 4,365 160,148
interaction stoichiometry
abun
danc
e st
oich
iom
etry
10−4 10−3 10−2 0.1 1 10
10−4
10−3
10−2
0.1
1
10
100
interaction stoichiometry
abun
danc
e st
oich
iom
etry
10−4 10−3 10−2 0.1 1 10
10−4
10−3
10−2
0.1
1
10
100
0 20 40 50 80 100%
bait-prey GO annotation overlap
non-interacting pairs 1..5% FDR≤1% FDRcore complexes
dens
ity
d e f
a b c
Hein et al. Extended Data Figure 3
Extended Data Figure 3 | a Overlap of our data with published interaction data obtained by proteincorrelation profiling33. bOverlap with relevant interactions in iRefWeb (human; physical; experimental;pairwise or multi-subunit interactions). c Overlap with the ‘‘HI-II-1’’ Y2H dataset3. Red contour linesseparate areas in steps of 1.5-fold increased point density. d Stoichiometry plot of all interactionswith FDRs <1 %. e Stoichiometry plot of all interactions with FDRs between 1 and 5 %. f Overlap ofGO-annotations between pairs of well-annotated proteins (> annotated terms each).
106
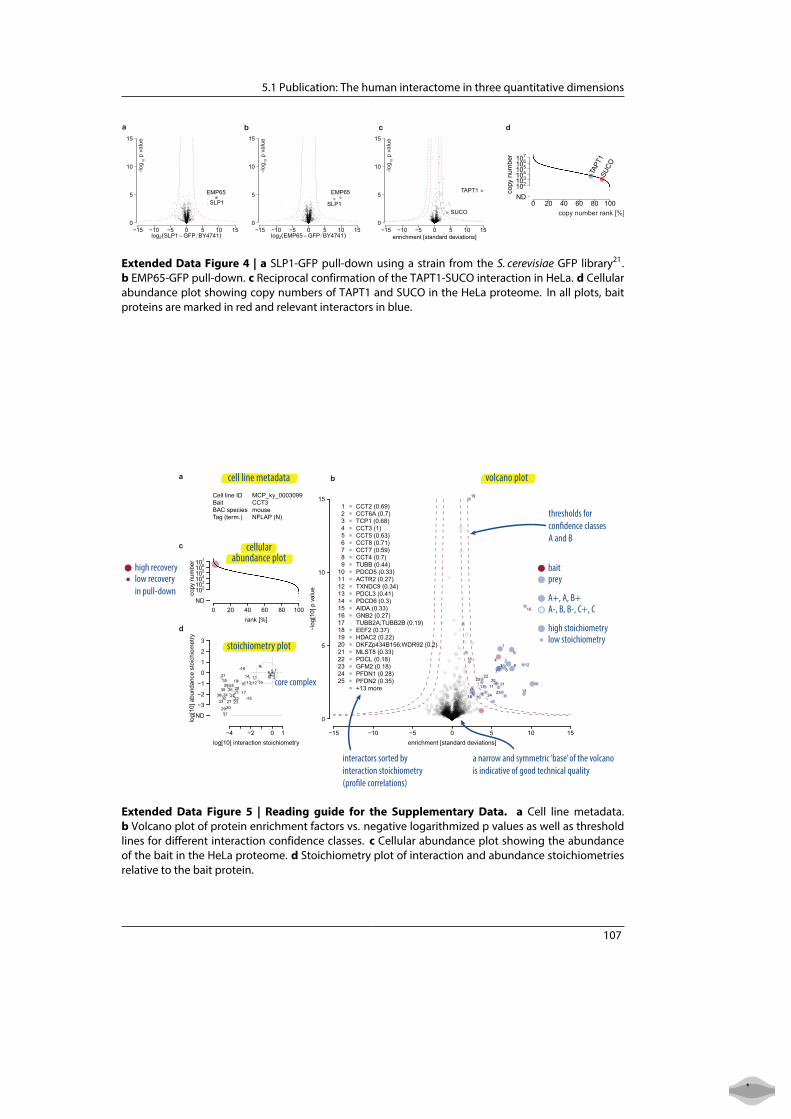
5.1 Publication: The human interactome in three quantitative dimensions
log2(SLP1 − GFP BY4741)−15 −10 −5 0 5 10 15
0
5
10
15
EMP65
SLP1
-log 1
0 p v
alue
enrichment [standard deviations]−15 −10 −5 0 5 10 15
0
5
10
15
TAPT1
SUCO
-log 1
0 p v
alue
log2(EMP65 − GFP BY4741)−15 −10 −5 0 5 10 15
0
5
10
15
EMP65
SLP1
-log 1
0 p v
alue
copy
num
ber
0 20 40 60 80 100
102103104105106107
ND
SUCO
TAPT
1
copy number rank [%]
a b c d
Hein et al. Extended Data Figure 4
Extended Data Figure 4 | a SLP1-GFP pull-down using a strain from the S. cerevisiae GFP library21.b EMP65-GFP pull-down. c Reciprocal confirmation of the TAPT1-SUCO interaction in HeLa. d Cellularabundance plot showing copy numbers of TAPT1 and SUCO in the HeLa proteome. In all plots, baitproteins are marked in red and relevant interactors in blue.
enrichment [standard deviations]
−log
[10]
p v
alue
−15 −10 −5 0 5 10 15
0
5
10
15
1
23
4
5
6
78
91011
12
13
14
15
16
17
18
19
2021
22
2324
25
123456789
10111213141516171819202122232425
CCT2 (0.69)CCT6A (0.7)TCP1 (0.68)CCT3 (1)CCT5 (0.63)CCT8 (0.71)CCT7 (0.59)CCT4 (0.7)TUBB (0.44)PDCD5 (0.33)ACTR2 (0.27)TXNDC9 (0.34)PDCL3 (0.41)PDCD6 (0.3)AIDA (0.33)GNB2 (0.27)TUBB2A;TUBB2B (0.19)EEF2 (0.37)HDAC2 (0.22)DKFZp434B156;WDR92 (0.2)MLST8 (0.33)PDCL (0.18)GFM2 (0.18)PFDN1 (0.28)PFDN2 (0.35)+13 more
log[10] interaction stoichiometry
log[
10] a
bund
ance
sto
ichi
omet
ry
−4 −2 0 1
−3
−2
−1
0
1
2
3
ND
1
234
5678
9
10111213
14
15
16
17
18
19
20212223
24
2526
27
28
293031
3233
34
35
36
37
38
rank [%]
copy
num
ber
0 20 40 60 80 100
102103104105106107
ND
Cell line IDBaitBAC speciesTag (term.)
MCP_ky_0003099CCT3mouseNFLAP (N)
interactors sorted byinteraction stoichiometry(pro�le correlations)
thresholds forcon�dence classesA and B
a narrow and symmetric ‘base’ of the volcanois indicative of good technical quality
high recoverylow recoveryin pull-down
baitprey
high stoichiometrylow stoichiometry
A+, A, B+A-, B, B-, C+, C
core complex
cell line metadata
stoichiometry plot
cellularabundance plot
volcano plot
Hein et al. Extended Data Figure 5
a
c
b
d
Extended Data Figure 5 | Reading guide for the Supplementary Data. a Cell line metadata.b Volcano plot of protein enrichment factors vs. negative logarithmized p values as well as thresholdlines for different interaction confidence classes. c Cellular abundance plot showing the abundanceof the bait in the HeLa proteome. d Stoichiometry plot of interaction and abundance stoichiometriesrelative to the bait protein.
107
●

5 A quantitative map of the human interactome
number of interactions removed
aver
age
size
of i
sola
ted
netw
orks
0 2500 7500 12500
01
23
45
number of interactions removed
prot
eins
with
≥1
inte
ract
ions
0 2500 7500 12500
010
0020
0030
0040
00
randomweak firststrong first
interaction stoichiometry
prot
ein
coex
pres
sion
−1
−0.5
0
0.5
1
10−410−310−2 0.1 1 10
ba c
Hein et al. Extended Data Figure 6
Extended Data Figure 6 | a Protein co-expression correlation coefficients (from ref. 64) as a functionof interaction stoichiometries. b Effect of the random or targeted removal of interactions on the totalnumber of connected proteins (proteins with ⩾ 1 interactions). c Effect on the average size of networksisolated from the largest network.
number of cell lines analysed
num
ber o
f uni
que
inte
ract
ions
0 2500 7500 12500
050
000
1e+0
515
0000
number of cell lines analysed
num
ber o
f uni
que
inte
ract
ions
0 1000 2000
010
000
3000
0
exponential modeln = nmax∙(1−e−bxc)
number of cell lines analysed
num
ber o
f uni
que
inte
ract
ors
0 1000 3000 5000
020
0040
0060
00
exponential modeln = nmax∙(1−e−bxc)
classes A+, A, B+all interactions
a b
Hein et al. Extended Data Figure 7
ExtendedData Figure 7 | aNumber of distinct interactors as a function of the number of BAC-GFP lineanalysed. Solid lines represent the median of 100 trajectories in randomized order; the scatter indicatesthe standard deviation from bootstrapping with 100 repetitions. Dashed lines are projections basedon a linear model n = nmax((1− e)−bx
c) that was fit to the data in the range between cell lines #500 and
#1330. The model predicts 6240 and 6420 proteins, respectively, to be coverable. b Number of distinctinteractions as a function of the number of BAC-GFP lines analysed, with projections representing ananalogous fit of an exponential model. The model predicts 84,400 and 183,500 as the asymptoticnumbers of distinct interactions that can be covered with the highest or with all confidence classes,respectively.
108
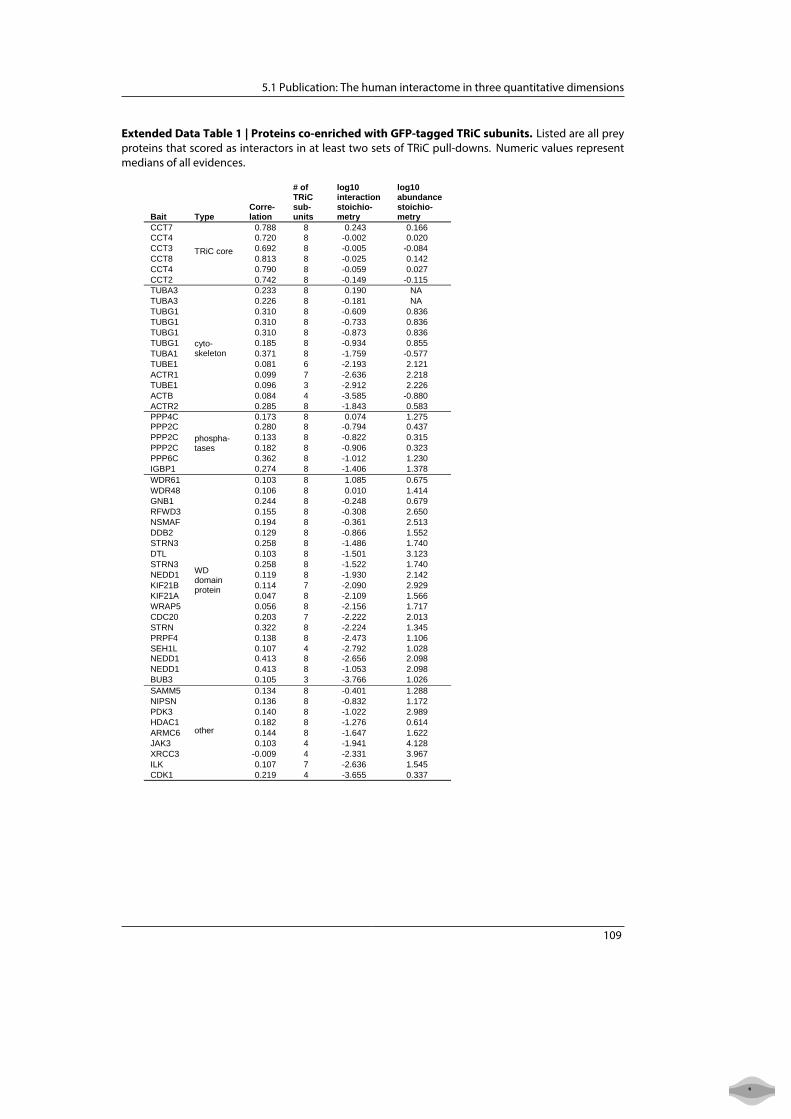
5.1 Publication: The human interactome in three quantitative dimensions
Extended Data Table 1 | Proteins co-enriched with GFP-tagged TRiC subunits. Listed are all preyproteins that scored as interactors in at least two sets of TRiC pull-downs. Numeric values representmedians of all evidences.
Hein et al., Extended Data Table 2
Bait Type Corre-lation
# of TRiC sub-units
log10interaction stoichio-metry
log10abundancestoichio-metry
CCT7
TRiC core
0.788 8 0.243 0.166CCT4 0.720 8 -0.002 0.020 CCT3 0.692 8 -0.005 -0.084 CCT8 0.813 8 -0.025 0.142 CCT4 0.790 8 -0.059 0.027 CCT2 0.742 8 -0.149 -0.115 TUBA3
cyto-skeleton
0.233 8 0.190 NA TUBA3 0.226 8 -0.181 NA TUBG1 0.310 8 -0.609 0.836 TUBG1 0.310 8 -0.733 0.836 TUBG1 0.310 8 -0.873 0.836 TUBG1 0.185 8 -0.934 0.855 TUBA1 0.371 8 -1.759 -0.577 TUBE1 0.081 6 -2.193 2.121 ACTR1 0.099 7 -2.636 2.218 TUBE1 0.096 3 -2.912 2.226 ACTB 0.084 4 -3.585 -0.880 ACTR2 0.285 8 -1.843 0.583 PPP4C
phospha-tases
0.173 8 0.074 1.275 PPP2C 0.280 8 -0.794 0.437 PPP2C 0.133 8 -0.822 0.315 PPP2C 0.182 8 -0.906 0.323 PPP6C 0.362 8 -1.012 1.230 IGBP1 0.274 8 -1.406 1.378 WDR61
WD domain protein
0.103 8 1.085 0.675 WDR48 0.106 8 0.010 1.414 GNB1 0.244 8 -0.248 0.679 RFWD3 0.155 8 -0.308 2.650 NSMAF 0.194 8 -0.361 2.513 DDB2 0.129 8 -0.866 1.552 STRN3 0.258 8 -1.486 1.740 DTL 0.103 8 -1.501 3.123 STRN3 0.258 8 -1.522 1.740 NEDD1 0.119 8 -1.930 2.142 KIF21B 0.114 7 -2.090 2.929 KIF21A 0.047 8 -2.109 1.566 WRAP5 0.056 8 -2.156 1.717 CDC20 0.203 7 -2.222 2.013 STRN 0.322 8 -2.224 1.345 PRPF4 0.138 8 -2.473 1.106 SEH1L 0.107 4 -2.792 1.028 NEDD1 0.413 8 -2.656 2.098 NEDD1 0.413 8 -1.053 2.098 BUB3 0.105 3 -3.766 1.026 SAMM5
other
0.134 8 -0.401 1.288 NIPSN 0.136 8 -0.832 1.172 PDK3 0.140 8 -1.022 2.989 HDAC1 0.182 8 -1.276 0.614 ARMC6 0.144 8 -1.647 1.622 JAK3 0.103 4 -1.941 4.128 XRCC3 -0.009 4 -2.331 3.967 ILK 0.107 7 -2.636 1.545 CDK1 0.219 4 -3.655 0.337
109
●
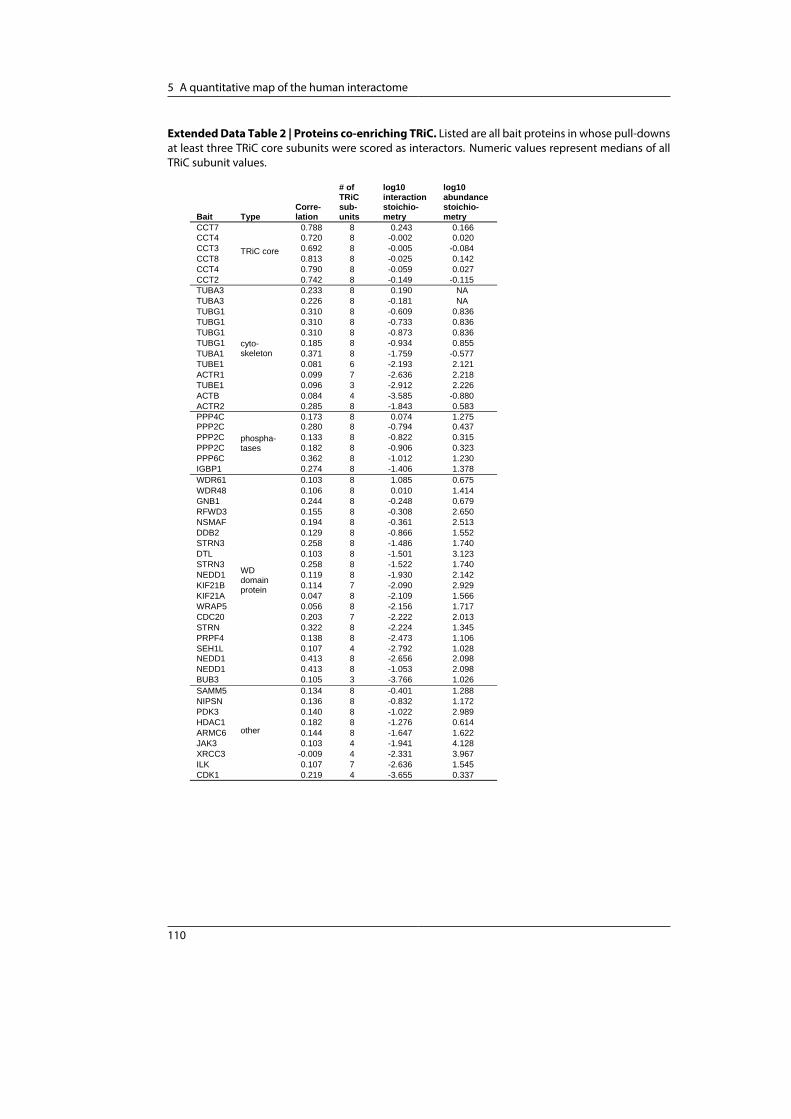
5 A quantitative map of the human interactome
ExtendedData Table 2 | Proteins co-enriching TRiC. Listed are all bait proteins in whose pull-downsat least three TRiC core subunits were scored as interactors. Numeric values represent medians of allTRiC subunit values.
Hein et al., Extended Data Table 2
Bait Type Corre-lation
# of TRiC sub-units
log10interaction stoichio-metry
log10abundancestoichio-metry
CCT7
TRiC core
0.788 8 0.243 0.166CCT4 0.720 8 -0.002 0.020 CCT3 0.692 8 -0.005 -0.084 CCT8 0.813 8 -0.025 0.142 CCT4 0.790 8 -0.059 0.027 CCT2 0.742 8 -0.149 -0.115 TUBA3
cyto-skeleton
0.233 8 0.190 NA TUBA3 0.226 8 -0.181 NA TUBG1 0.310 8 -0.609 0.836 TUBG1 0.310 8 -0.733 0.836 TUBG1 0.310 8 -0.873 0.836 TUBG1 0.185 8 -0.934 0.855 TUBA1 0.371 8 -1.759 -0.577 TUBE1 0.081 6 -2.193 2.121 ACTR1 0.099 7 -2.636 2.218 TUBE1 0.096 3 -2.912 2.226 ACTB 0.084 4 -3.585 -0.880 ACTR2 0.285 8 -1.843 0.583 PPP4C
phospha-tases
0.173 8 0.074 1.275 PPP2C 0.280 8 -0.794 0.437 PPP2C 0.133 8 -0.822 0.315 PPP2C 0.182 8 -0.906 0.323 PPP6C 0.362 8 -1.012 1.230 IGBP1 0.274 8 -1.406 1.378 WDR61
WD domain protein
0.103 8 1.085 0.675 WDR48 0.106 8 0.010 1.414 GNB1 0.244 8 -0.248 0.679 RFWD3 0.155 8 -0.308 2.650 NSMAF 0.194 8 -0.361 2.513 DDB2 0.129 8 -0.866 1.552 STRN3 0.258 8 -1.486 1.740 DTL 0.103 8 -1.501 3.123 STRN3 0.258 8 -1.522 1.740 NEDD1 0.119 8 -1.930 2.142 KIF21B 0.114 7 -2.090 2.929 KIF21A 0.047 8 -2.109 1.566 WRAP5 0.056 8 -2.156 1.717 CDC20 0.203 7 -2.222 2.013 STRN 0.322 8 -2.224 1.345 PRPF4 0.138 8 -2.473 1.106 SEH1L 0.107 4 -2.792 1.028 NEDD1 0.413 8 -2.656 2.098 NEDD1 0.413 8 -1.053 2.098 BUB3 0.105 3 -3.766 1.026 SAMM5
other
0.134 8 -0.401 1.288 NIPSN 0.136 8 -0.832 1.172 PDK3 0.140 8 -1.022 2.989 HDAC1 0.182 8 -1.276 0.614 ARMC6 0.144 8 -1.647 1.622 JAK3 0.103 4 -1.941 4.128 XRCC3 -0.009 4 -2.331 3.967 ILK 0.107 7 -2.636 1.545 CDK1 0.219 4 -3.655 0.337
110

6 Discussion
In this thesis, I presented an interactomics dataset that covers a large part of the human
protein interactome. I developed methods for proteomic quantification in both the re-
lative and the absolute dimensions. Combining both enabled a unique analysis of the
strengths of protein interactions, the discovery of novel protein complexes and a better
understanding of the nature and topology of the interactome network.
6.1 The future of proteomic quantification
Label-free quantification is rapidly gainingmomentum in our group (which ironically is
most renowned for the invention of SILAC [49]). SILAC still remains powerful in some
areas that rely on labelled spike-in references. For instance, protein correlation profiling
methods result in fractions of very different composition [84]. The assumption underly-
ing the label-free normalization procedures is overall similarity of sample composition,
which is not the case here. A SILAC standard accounts for this by providing a ‘local’ ref-
erence. Moreover, super-SILAC spike-ins [85] have their merits for applications where
samples are to be measured on different machines, in different laboratories or over long
periods of time. Local normalization by SILAC references accounts for such biases. For
virtually all other research applications, label-free strategies are superseding SILAC –
even in areas such as phosphoproteomics.
Work presented here contributes to this development by providing a framework for rel-
ative and absolute proteomic quantification. The MaxLFQ algorithms for relative label-
free quantification have proven very mature in a large number of diverse projects in
our group. A critical ingredient is the ease of use of MaxLFQ at the click of a button in
MaxQuant, doing awaywith computational obstacles that non-specialist users otherwise
have to face.
A challenge that needs to be addressed in the future is the accuracy of label-free absolute
quantification, which currently only provides estimates. Proper quantification schemes
acquire one quantitative piece of evidence per peptide and become very accurate by av-
eraging over many of them. In contrast, label-free absolute estimation approaches such
as ‘top three’ or iBAQ rely on the empirical observation that peptide-specific behaviour
can be neglected if one integrates over many peptides derived from one protein. There-
fore, the combination of the protein sequence and the protease used for digestion may
introduce a quantification bias [86]. This bias is more prominent for proteins with only
few peptides and conceptually difficult to control for.
Even with this limitation in mind, our ‘proteomic ruler’ already provides a very con-
venient and straightforward way for many proteomics projects to implement absolute
quantification into the data analysis workflow. The proteomic ruler method should be a
111
●

6 Discussion
welcome tool for the proteomics community and widen the perspective of scientists that
have so far only looked at ratios of protein amounts between conditions and neglected
absolute abundances.
Quantification in multiple dimensions clearly appears to be the way into the future for
proteomics. Irrespective of the actual quantification methodology, the computational
back-end should integrate all available label-based and label-free quantification events
and transform the quantitative readout into the following format: A comprehensive
– ideally complete – matrix of identified proteins and their absolute quantities in all
samples. All values should be properly normalized so that quantitative comparisons can
be made both across samples and across proteins (Fig. 6).
Figure 6: Future of proteomic quantification.The ideal protomics quantification strategy should resultin a comprehensive matrix of absolute protein abund-ances that can be compared quantitatively both acrosssamples and across proteins.
‘relative’ quanti�cation
unlimited number of samples
‘abs
olut
e’qu
anti�
catio
n
com
preh
ensi
velis
t of i
dent
i�ed
pro
tein
s sam
ple
1sa
mpl
e 2
sam
ple
3sa
mpl
e 4
sam
ple
5
sam
ple
n
protein 1protein 2protein 3protein 4protein 5
protein n
...
...
6.2 The future of interaction proteomics
The interactomics work presented here built on ‘wet lab’ and MS procedures that have
matured into a very robust tool for cell biology. I have applied this tool in focused collab-
oration projects in diverse biological areas. Moreover, in a joint effort with TonyHyman’s
group and with the help of a team of technicians, we have shown that we are are able to
investigate the human interactome globally.
Our interactomics platform is gradually adopted by the life science community, but
some misconceptions remain. First and foremost, many life scientists still see AP-MS
as conceptually different from classical immunoprecipitation followed by western blot-
ting, which it is not. We just replace the western blot with a mass spectrometric readout.
They also assume our technology to be less sensitive and noisier. Given the five orders
of dynamic range seen in the human interactome dataset, this is clearly not the case. To-
gether with Eva Keilhauer, I have shown that our affinity enrichment workflow is at least
as easy, if not easier than conventional methods and any laboratory with access to high
resolution mass spectrometry could and should adopt it.
112

6.2 The future of interaction proteomics
One major area of improvement presented here is the data analysis side. The workflow
consisting of generic label-free quantification inMaxQuant, and standardized statistical
testing in Perseus, combined with FDR-controlled threshold definition provide a prin-
cipled approach for the analysis of any kind of protein interactions. The quantitative
protein profile correlations across samples serve as additional criteria to narrow down
borderline interactors and cases of alternative complex compositions, mutually exclus-
ive binding or protein moonlighting. Moreover, the signature of background binding
proteins provides a built-in quality control metric that comes entirely ‘for free’ and that
western blot-based approaches lack in principle. A novel concept for the analysis of
the human interactome was to apply multiple dimensions of relative absolute proteo-
mic quantification. This has the potential to become a new standard for analysing and
visualizing protein interaction data.
The ‘wet lab’ side of the workflow is largely based on protocols borrowed from classical
protein biochemistry, with the exception of improvements such as the shift from 1D gel
electrophoresis to on-bead or in-column digestion. While individual interactomics ex-
periments are now straightforward to perform, a global interactomics study requires
considerable amounts of input material and MS measurement time: Data acquisition
for our human interactome dataset took almost four years and a substantial amount of
molecular biology and cell culture work. This poses obstacles for continued exploration
of the interactome, for instance if one seeks to study the human interactome dynamically
or to extend the work to other species.
In light of improvements in mass spectrometer speeds as well as laboratory automation
and miniaturization, it would now be logical to implement radical changes also on the
‘wet lab’ side. The goal is a substantial decrease in the sample requirements and a dra-
matic increase in throughput, without compromising on data quality. In this regard, a
major challenge will be to maintain the dynamic range of interactome detection while
scaling down the amount of input material. Given the dynamic range of interaction
strengths, the weakest interactors will be the first ones lost when one reduces measure-
ment time or input material. Recent studies have introduced an orthogonal method for
protein interaction detection, based on protein correlation profiling across extensively
fractionated cell extracts [87, 88]. Thismethod provides a straightforward shortcut to the
core set of protein complexes. What distinguishes our approach, however, is the ability
to capture a wealth of weak interactions in a quantitative fashion, in addition to stable
core complexes.
113
●

6 Discussion
6.3 The nature of the interactome
My analysis into the stoichiometric nature of obligate, stable protein complexes revealed
that these are a small minority in the interactome dataset. Looking at the entire inter-
actome space, it is conceivable that the distribution of interaction strengths follows a
power law, similar to the distribution of the degree of connectivity in the network: Most
proteins will have very low affinities to most proteins, whereas only few proteins engage
in strong interactions with few select other proteins. The dynamic range of interaction
strengths will likely be much wider than the dynamic range of protein concentrations
in the cell, rendering most weak interactions functionally irrelevant. However, bioin-
formatic analyses suggest that weak, non-specific interactions are a driving force for the
evolution of the proteome [89]. In this sense, protein concentrations are maintained at
theminimum levels that allow for specific interactions, keeping deleterious, non-specific
interactions to a minimum. This concept also sheds additional light on the increasing
specialization of cell types and compartmentalization inside the cell in higher organisms,
because increasing complexity in one compartment hampers specific interactions while
boosting non-specific ones. Weak, non-specific interactions are also a playground for
evolution to form functionally relevant links.
An important consequence of the dynamic range of interaction strengths is that weak
interactions form the ‘glue’ of the network by interconnecting virtually all proteins in
the cell. This poses a challenge for the visualization of large networks, as they inevit-
ably grow into impenetrable ‘hairballs’ with size [43]. On a personal note, I initially felt
that hairballness or small-worldness of a network was a sign of bad data quality and a
high fraction of false positives. However, I learnt that small-worldness is the very nature
of networks in general and the protein interactome in particular. The predominance of
weak interactions is also likely to be an underappreciated cause for the minimal overlap
between different large-scale datasets. Strong interactions are easy to detect and there-
fore reproducible, but they constitute only the minority of all interactions. Weak inter-
actions are by their nature more difficult to detect, making them less reproducible.
One aspect of the interactome that I highlighted in my thesis is its tight interconnec-
tion with the underlying proteome. Protein abundances are critical determinants of the
outcome of an interaction experiment: Interactors may be missed if the bait is much
more abundant in the cell, while they may be recoverable easily in the reciprocal experi-
ment. At first glance, this can be seen as just a feature of the immunoprecipitation assay.
However, it is more than that, as it is indicative of an inherent asymmetry of the interac-
tion. The majority of the pool of the less abundant partner might be bound to the higher
abundant partner, which in turn only finds a fraction of its pool engaged in this interac-
tion. This asymmetry that is the consequence of the intertwined proteome-interactome
relationship is likely to extend to other tiers in the omics space (see Fig. 3). Genetic
interaction phenotypes may be asymmetric because of the abundances of the products
114
6.3 The nature of the interactome
of the interacting genes, and because of the asymmetries in their corresponding phys-
ical interactions. Establishing systematic, fully quantitative, cross-omics approaches will
become strong tools for the future of systems biology.
With global, sophisticated, quantitative, sensitive and increasingly fast interactomics
methods at hand, one might ask the question of whether we will ever be able to draft a
reference human interactome or to map the complete interactome? This question takes
us back to the definition of the interactome itself. As a metaphor, one could equate the
sequencing of the human genome to drawing a topographicalmap of an island, sayGreat
Britain. Initially, there are blank areas on the map, but over time the map will become
more refined and exact. Calculating the landmass area will be relatively accurate once
all regions have been explored at least once and all further mapping will only lead to
incremental improvements. At a certain point, one will come up with a reference map.
This map would be the equivalent to the human genome, which serves as anchor point
for many follow-up studies. In this analogy, mapping the human proteome is like the at-
tempt to measure the length of the coastline. The length of the line depends on the scale
of measurement due to its fractal properties [90]: The smaller the scale, the longer the
measurement. On an infinitesimally small scale, the coastline becomes arbitrarily long.
This illustrates the meaninglessness of the concept itself: There is no one human pro-
teome or a reference thereof. The more one measures, the deeper one will get, but one
will never achieve completion. In this sense, drafting a reference human interactome
is the equivalent of measuring the 3D surface area of Britain. It depends on the scale
of measurement and changes constantly, both of which make it an equally impossible
task. However, we will gain enormous insight from trying to get deeper and deeper if we
redefine our goal as the process itself.
115
●


References
References
[1] Newman, M., Barabási, A.-L., & Watts, D. J.
The structure and dynamics of networks. Prin-ceton University Press, (2006). (↑ p. 1)
[2] Dixon, S. J., Costanzo, M., Baryshnikova, A.,
Andrews, B., & Boone, C. Systematic map-
ping of genetic interaction networks. AnnuRevGenet 43, 601–625 (2009). (↑ p. 2)
[3] Seebacher, J. & Gavin, A.-C. SnapShot:
Protein-protein interaction networks. Cell144(6), 1000, 1000.e1 Mar (2011). (↑ p. 2)
[4] Fields, S. & Song, O. A novel genetic system
to detect protein-protein interactions. Nature340(6230), 245–246 Jul (1989). (↑ p. 3)
[5] Johnsson, N. & Varshavsky, A. Split ubiquitin
as a sensor of protein interactions in vivo. ProcNatl Acad Sci U S A 91(22), 10340–10344 Oct
(1994). (↑ p. 3)
[6] Rual, J.-F., Venkatesan, K., Hao, T., et al. To-
wards a proteome-scale map of the human
protein-protein interaction network. Nature437(7062), 1173–1178 Oct (2005). (↑ p. 3)
[7] Uetz, P., Giot, L., Cagney, G., et al. A com-
prehensive analysis of protein-protein inter-
actions in Saccharomyces cerevisiae. Nature403(6770), 623–627 Feb (2000). (↑ p. 3)
[8] Ito, T., Chiba, T., Ozawa, R., et al. A com-
prehensive two-hybrid analysis to explore the
yeast protein interactome. Proc Natl Acad SciU S A 98(8), 4569–4574 Apr (2001).
[9] Yu, H., Braun, P., Yildirim, M. A., et al. High-quality binary protein interaction map of the
yeast interactome network. Science 322(5898),104–110 Oct (2008). (↑ p. 3)
[10] Simonis, N., Rual, J.-F., Carvunis, A.-R.,
et al. Empirically controlled mapping of the
Caenorhabditis elegans protein-protein inter-
actome network. Nat. Methods 6(1), 47–54 Jan(2009). (↑ p. 3)
[11] Arabidopsis Interactome Mapping Consor-
tium. Evidence for network evolution in anAr-
abidopsis interactomemap. Science 333(6042),601–607 Jul (2011). (↑ p. 3)
[12] Stelzl, U., Worm, U., Lalowski, M., et al. A
human protein-protein interaction network: a
resource for annotating the proteome. Cell122(6), 957–968 Sep (2005). (↑ p. 3)
[13] Rolland, T., Tasan, M.an, M., Charloteaux, B.,
et al. A proteome-scale map of the human in-
teractome network. Cell 159(5), 1212–1226 Nov(2014). (↑ p. 3)
[14] Yu, H., Tardivo, L., Tam, S., et al. Next-
generation sequencing to generate interactome
datasets. Nat Methods 8(6), 478–480 Jun
(2011). (↑ p. 3)
[15] Weimann, M., Grossmann, A., Woodsmith, J.,
et al. A Y2H-seq approach defines the human
protein methyltransferase interactome. NatMethods 10(4), 339–342 Apr (2013). (↑ p. 3)
[16] Gingras, A.-C., Gstaiger, M., Raught, B., & Ae-
bersold, R. Analysis of protein complexes us-
ingmass spectrometry. Nat. Rev.Mol. Cell Biol.8(8), 645–654 Aug (2007). (↑ p. 3)
[17] Rigaut, G., Shevchenko, A., Rutz, B., et al. A
generic protein purification method for pro-
tein complex characterization and proteome
exploration. Nat Biotechnol 17(10), 1030–1032Oct (1999). (↑ p. 3)
[18] Gavin, A.-C., Bösche, M., Krause, R., et al.Functional organization of the yeast proteome
by systematic analysis of protein complexes.
Nature 415(6868), 141–147 Jan (2002). (↑ pp. 4
and 67)
[19] Gavin, A.-C., Maeda, K., & Kühner, S. Recent
advances in charting protein-protein interac-
tion: mass spectrometry-based approaches.
Curr. Opin. Biotechnol. 22(1), 42–49 Feb (2011).(↑ p. 4)
[20] Ranish, J. A., Yi, E. C., Leslie, D. M., et al. The
study of macromolecular complexes by quant-
itative proteomics. Nat Genet 33(3), 349–355Mar (2003). (↑ p. 4)
[21] Schulze, W. X. & Mann, M. A novel proteo-
mic screen for peptide-protein interactions. J.Biol. Chem. 279(11), 10756–10764 Mar (2004).
(↑ p. 4)
[22] Ho, Y., Gruhler, A., Heilbut, A., et al. System-
atic identification of protein complexes in Sac-
charomyces cerevisiae by mass spectrometry.
117
●
References
Nature 415(6868), 180–183 Jan (2002). (↑ pp. 4
and 67)
[23] Gavin, A.-C., Aloy, P., Grandi, P., et al. Pro-
teome survey reveals modularity of the yeast
cell machinery. Nature 440(7084), 631–636Mar (2006).
[24] Krogan, N. J., Cagney, G., Yu, H., et al. Globallandscape of protein complexes in the yeast
Saccharomyces cerevisiae. Nature 440(7084),637–643 Mar (2006). (↑ pp. 4 and 67)
[25] Mellacheruvu, D., Wright, Z., Couzens, A. L.,
et al. The CRAPome: a contaminant reposit-
ory for affinity purification-mass spectrometry
data. Nat. Methods 10(8), 730–736 Aug (2013).(↑ p. 4)
[26] Sowa, M. E., Bennett, E. J., Gygi, S. P., &
Harper, J. W. Defining the human deubiquit-
inating enzyme interaction landscape. Cell138(2), 389–403 Jul (2009). (↑ p. 4)
[27] Behrends, C., Sowa, M. E., Gygi, S. P., &
Harper, J. W. Network organization of the hu-
man autophagy system. Nature 466(7302), 68–76 Jul (2010).
[28] Breitkreutz, A., Choi, H., Sharom, J. R., et al. Aglobal protein kinase and phosphatase interac-
tion network in yeast. Science 328(5981), 1043–1046 May (2010).
[29] Malovannaya, A., Lanz, R. B., Jung, S. Y., et al.Analysis of the human endogenous coregu-
lator complexome. Cell 145(5), 787–799 May
(2011). (↑ p. 4)
[30] Hubner, N. C., Bird, A. W., Cox, J., et al.Quantitative proteomics combined with BAC
TransgeneOmics reveals in vivo protein in-
teractions. J. Cell Biol. 189(4), 739–754 May
(2010). (↑ pp. 4, 31, and 67)
[31] Choi, H., Glatter, T., Gstaiger, M., & Nesv-
izhskii, A. I. SAINT-MS1: protein-protein
interaction scoring using label-free intensity
data in affinity purification-mass spectrometry
experiments. J Proteome Res 11(4), 2619–2624Apr (2012). (↑ p. 4)
[32] Royer, L., Reimann, M., Stewart, A. F., &
Schroeder, M. Network compression as a qual-
ity measure for protein interaction networks.
PLoS One 7(6), e35729 (2012). (↑ pp. 4 and 7)
[33] Brettner, L. M. & Masel, J. Protein stickiness,
rather than number of functional protein-
protein interactions, predicts expression noise
and plasticity in yeast. BMC Syst Biol 6, 128(2012). (↑ p. 4)
[34] Euler, L. Solutio problematis ad geometriam
situs pertinentis. Commentarii academiaescientiarum Petropolitanae 8, 128–140 (1741).
(↑ p. 5)
[35] Barabasi & Albert. Emergence of scaling in
random networks. Science 286(5439), 509–512Oct (1999). (↑ pp. 5 and 6)
[36] Albert, Jeong, & Barabasi. Error and at-
tack tolerance of complex networks. Nature406(6794), 378–382 Jul (2000). (↑ p. 7)
[37] Collins, S. R., Kemmeren, P., Zhao, X.-C., et al.Toward a comprehensive atlas of the physical
interactome of Saccharomyces cerevisiae. Mol.Cell. Proteomics 6(3), 439–450 Mar (2007).
(↑ p. 7)
[38] Hart, G. T., Lee, I., & Marcotte, E. R. A high-
accuracy consensus map of yeast protein com-
plexes reveals modular nature of gene essenti-
ality. BMCBioinformatics 8, 236 (2007). (↑ p. 7)
[39] Gehlenborg, N. & Wong, B. Points of view:
networks. Nat Methods 9(2), 115 Feb (2012).
(↑ p. 7)
[40] Wong, B. Points of view: Design of data fig-
ures. Nature Methods 7(9), 665 (2010). (↑ p. 7)
[41] Royer, L., Reimann, M., Andreopoulos, B., &
Schroeder, M. Unraveling protein networks
with power graph analysis. PLoS Comput Biol4(7), e1000108 (2008). (↑ p. 7)
[42] Ahnert, S. E. Generalised power graph com-
pression reveals dominant relationship pat-
terns in complex networks. Sci Rep 4, 4385(2014). (↑ p. 7)
[43] Krzywinski, M., Birol, I., Jones, S. J. M., &
Marra, M. A. Hive plots–rational approach
to visualizing networks. Brief Bioinform 13(5),627–644 Sep (2012). (↑ pp. 7 and 114)
[44] Fenn, J. B.,Mann,M.,Meng, C. K.,Wong, S. F.,
& Whitehouse, C. M. Electrospray ionization
for mass spectrometry of large biomolecules.
Science 246(4926), 64–71 Oct (1989). (↑ p. 8)
[45] Shevchenko, A.,Wilm,M., Vorm, O., &Mann,
M. Mass spectrometric sequencing of proteins
118

References
silver-stained polyacrylamide gels. Anal Chem68(5), 850–858 Mar (1996). (↑ p. 8)
[46] Wiśniewski, J. R., Zougman, A., Nagaraj, N.,
& Mann, M. Universal sample preparation
method for proteome analysis. Nat. Methods6(5), 359–362 May (2009). (↑ p. 8)
[47] Kulak, N. A., Pichler, G., Paron, I., Naga-
raj, N., & Mann, M. Minimal, encapsulated
proteomic-sample processing applied to copy-
number estimation in eukaryotic cells. Nat.Methods 11(3), 319–324 Mar (2014). (↑ p. 8)
[48] Gygi, S. P., Rist, B., Gerber, S. A., et al.Quantit-ative analysis of complex protein mixtures us-
ing isotope-coded affinity tags. Nat Biotechnol17(10), 994–999 Oct (1999). (↑ pp. 8 and 39)
[49] Ong, S.-E., Blagoev, B., Kratchmarova, I., et al.Stable isotope labeling by amino acids in cell
culture, SILAC, as a simple and accurate ap-
proach to expression proteomics. Mol. Cell.Proteomics 1(5), 376–386 May (2002). (↑ p. 111)
[50] Thompson, A., Schäfer, J., Kuhn, K., et al. Tan-dem mass tags: a novel quantification strategy
for comparative analysis of complex protein
mixtures by MS/MS. Anal Chem 75(8), 1895–1904 Apr (2003).
[51] Ross, P. L., Huang, Y. N., Marchese, J. N., et al.Multiplexed protein quantitation in Saccharo-
myces cerevisiae using amine-reactive isobaric
tagging reagents. Mol Cell Proteomics 3(12),1154–1169 Dec (2004). (↑ pp. 8 and 39)
[52] Hu, Q., Noll, R. J., Li, H., et al. The Orbit-
rap: a newmass spectrometer. J Mass Spectrom40(4), 430–443 Apr (2005). (↑ p. 8)
[53] Olsen, J. V., Schwartz, J. C., Griep-Raming,
J., et al. A dual pressure linear ion trap Or-
bitrap instrument with very high sequencing
speed. Mol. Cell. Proteomics 8(12), 2759–2769Dec (2009).
[54] Michalski, A., Damoc, E., Hauschild, J.-P.,
et al.Mass spectrometry-based proteomics us-
ing Q Exactive, a high-performance benchtop
quadrupole Orbitrap mass spectrometer. Mol.Cell. Proteomics 10(9), M111.011015 Sep (2011).
(↑ p. 8)
[55] Mann,M.&Wilm,M. Error-tolerant identific-
ation of peptides in sequence databases by pep-
tide sequence tags. Anal Chem 66(24), 4390–4399 Dec (1994). (↑ p. 8)
[56] Elias, J. E. & Gygi, S. P. Target-decoy search
strategy for increased confidence in large-scale
protein identifications by mass spectrometry.
NatMethods 4(3), 207–214Mar (2007). (↑ p. 8)
[57] Cox, J. & Mann, M. MaxQuant enables high
peptide identification rates, individualized
p.p.b.-range mass accuracies and proteome-
wide protein quantification. Nat. Biotechnol.26(12), 1367–1372 Dec (2008). (↑ p. 8)
[58] Poser, I., Sarov, M., Hutchins, J. R. A., et al.BAC TransgeneOmics: a high-throughput
method for exploration of protein function in
mammals. Nat. Methods 5(5), 409–415 May
(2008). (↑ pp. 31 and 35)
[59] Cheeseman, I. M. & Desai, A. A combined ap-
proach for the localization and tandem affinity
purification of protein complexes from meta-
zoans. Sci STKE 2005(266), pl1 Jan (2005).
(↑ p. 31)
[60] Hubner, N. C. & Mann, M. Extracting
gene function from protein-protein interac-
tions using Quantitative BAC InteraCtomics
(QUBIC). Methods 53(4), 453–459 Apr (2011).(↑ pp. 31 and 67)
[61] Schwanhäusser, B., Busse, D., Li, N., et al.Global quantification of mammalian gene ex-
pression control. Nature 473(7347), 337–342May (2011). (↑ pp. 32 and 56)
[62] Nagaraj, N., Wisniewski, J. R., Geiger, T., et al.Deep proteome and transcriptomemapping of
a human cancer cell line. Mol. Syst. Biol. 7, 548(2011). (↑ p. 32)
[63] Schwanhäusser, B., Busse, D., Li, N., et al.Corrigendum: Global quantification of mam-
malian gene expression control. Nature495(7439), 126–127Mar (2013). (↑pp. 33 and 56)
[64] Hutchins, J. R. A., Toyoda, Y., Hegemann,
B., et al. Systematic analysis of human pro-
tein complexes identifies chromosome segreg-
ation proteins. Science 328(5978), 593–599 Apr(2010). (↑ p. 35)
[65] Maliga, Z., Junqueira, M., Toyoda, Y., et al. Agenomic toolkit to investigate kinesin and my-
osin motor function in cells. Nat. Cell Biol.15(3), 325–334 Mar (2013). (↑ p. 35)
[66] Bird, A. W., Erler, A., Fu, J., et al. High-
efficiency counterselection recombineering for
site-directed mutagenesis in bacterial artificial
119
●

References
chromosomes. Nat. Methods 9(1), 103–109 Jan(2012). (↑ p. 35)
[67] Kemp, H. A. & Sprague, Jr, G. F. Far3 and
five interacting proteins prevent premature re-
covery from pheromone arrest in the budding
yeast Saccharomyces cerevisiae. Mol Cell Biol23(5), 1750–1763 Mar (2003). (↑ p. 35)
[68] Goudreault, M., D’Ambrosio, L. M., Kean,
M. J., et al. A PP2A phosphatase high density
interaction network identifies a novel striatin-
interacting phosphatase and kinase complex
linked to the cerebral cavernous malformation
3 (CCM3) protein. Mol. Cell. Proteomics 8(1),157–171 Jan (2009). (↑ p. 36)
[69] Ingolia, N. T., Ghaemmaghami, S., Newman,
J. R. S., & Weissman, J. S. Genome-wide
analysis in vivo of translation with nucleotide
resolution using ribosome profiling. Science324(5924), 218–223 Apr (2009). (↑ p. 36)
[70] Voineagu, I., Huang, L., Winden, K., et al.CCDC22: a novel candidate gene for syn-
dromic X-linked intellectual disability. MolPsychiatry 17(1), 4–7 Jan (2012). (↑ p. 38)
[71] Hirst, J., Barlow, L. D., Francisco, G. C., et al.The fifth adaptor protein complex. PLoS Biol9(10), e1001170 Oct (2011). (↑ p. 38)
[72] Słabicki, M., Theis, M., Krastev, D. B., et al. Agenome-scale DNA repair RNAi screen iden-
tifies SPG48 as a novel gene associated with
hereditary spastic paraplegia. PLoS Biol 8(6),e1000408 (2010). (↑ p. 38)
[73] Merrill, A. E., Hebert, A. S., MacGilvray, M. E.,
et al. NeuCode labels for relative protein quan-tification. Mol Cell Proteomics Jun (2014).
(↑ p. 39)
[74] Werner, T., Sweetman, G., Savitski, M. F., et al.Ion coalescence of neutron encoded TMT 10-
plex reporter ions. Anal Chem 86(7), 3594–3601 Apr (2014).
[75] Everley, R. A., Kunz, R. C., McAllister, F. E.,
& Gygi, S. P. Increasing throughput in tar-
geted proteomics assays: 54-plex quantitation
in a single mass spectrometry run. Anal Chem85(11), 5340–5346 Jun (2013). (↑ p. 39)
[76] Bantscheff, M., Lemeer, S., Savitski, M. M., &
Kuster, B. Quantitative mass spectrometry in
proteomics: critical review update from 2007
to the present. Anal Bioanal Chem 404(4),
939–965 Sep (2012). (↑ p. 40)
[77] Luber, C. A., Cox, J., Lauterbach, H., et al.Quantitative proteomics reveals subset-
specific viral recognition in dendritic cells.
Immunity 32(2), 279–289 Feb (2010). (↑ p. 40)
[78] Krüger, M., Moser, M., Ussar, S., et al. SILACmouse for quantitative proteomics uncovers
kindlin-3 as an essential factor for red blood
cell function. Cell 134(2), 353–364 Jul (2008).
(↑ p. 40)
[79] Malmström, J., Beck, M., Schmidt, A., et al.Proteome-wide cellular protein concentra-
tions of the human pathogen Leptospira in-
terrogans. Nature 460(7256), 762–765 Aug
(2009). (↑ p. 56)
[80] Wiśniewski, J. R., Ostasiewicz, P., Duś, K.,
et al. Extensive quantitative remodeling of the
proteome between normal colon tissue and ad-
enocarcinoma. Mol. Syst. Biol. 8, 611 (2012).(↑ p. 56)
[81] Noble, J. E. & Bailey, M. J. A. Quantitation of
protein. Methods Enzymol 463, 73–95 (2009).(↑ p. 56)
[82] van Holde, K. E. Chromatin. Springer, (1988).(↑ p. 56)
[83] Huh, W.-K., Falvo, J. V., Gerke, L. C., et al.Global analysis of protein localization in bud-
ding yeast. Nature 425(6959), 686–691 Oct
(2003). (↑ p. 67)
[84] Andersen, J. S., Wilkinson, C. J., Mayor, T.,
et al. Proteomic characterization of the hu-
man centrosome by protein correlation profil-
ing. Nature 426(6966), 570–574 Dec (2003).
(↑ p. 111)
[85] Geiger, T., Cox, J., Ostasiewicz, P., Wisniewski,
J. R., &Mann, M. Super-SILACmix for quant-
itative proteomics of human tumor tissue. Nat.Methods 7(5), 383–385 May (2010). (↑ p. 111)
[86] Peng, M., Taouatas, N., Cappadona, S., et al.Protease bias in absolute protein quantitation.
NatMethods 9(6), 524–525 Jun (2012). (↑ p. 111)
[87] Kristensen, A. R., Gsponer, J., & Foster, L. J. A
high-throughput approach formeasuring tem-
poral changes in the interactome. NatMethods9(9), 907–909 Sep (2012). (↑ p. 113)
[88] Havugimana, P. C., Hart, G. T., Nepusz, T.,
et al. A census of human soluble protein
120

References
complexes. Cell 150(5), 1068–1081 Aug (2012).(↑ p. 113)
[89] Zhang, J., Maslov, S., & Shakhnovich, E. I.
Constraints imposed by non-functional
protein-protein interactions on gene expres-
sion and proteome size. Mol Syst Biol 4, 210(2008). (↑ p. 114)
[90] Mandelbrot, B. How long is the coast of bri-
tain? Statistical self-similarity and fractional
dimension. Science 156(3775), 636–638 May
(1967). (↑ p. 115)
121
●

Publication: Functional repurposing revealed by comparing genetic interactions
Functional Repurposing Revealedby Comparing S. pombe andS. cerevisiae Genetic InteractionsAdam Frost,1,* Marc G. Elgort,1 Onn Brandman,2,3,4 Clinton Ives,2,3,4 Sean R. Collins,7 Lakshmi Miller-Vedam,2,3,4
Jimena Weibezahn,2,3,4 Marco Y. Hein,5 Ina Poser,6 Matthias Mann,5 Anthony A. Hyman,6 and Jonathan S. Weissman2,3,41Department of Biochemistry and Huntsman Cancer Institute, University of Utah, School of Medicine, Salt Lake City, UT 84112, USA2Department of Cellular and Molecular Pharmacology3California Institute for Quantitative Biomedical Research4Howard Hughes Medical Institute
University of California, San Francisco, San Francisco, CA 94158, USA5Proteomics and Signal Transduction, Max Planck Institute of Biochemistry, Am Klopferspitz 18, 82152 Martinsried, Germany6Max Planck Institute of Molecular Cell Biology and Genetics, 01307 Dresden, Germany7Department of Chemical and Systems Biology, Stanford University, 318 Campus Drive, Clark BuildingW2.1, Stanford, CA 94305-5174, USA
*Correspondence: [email protected]
DOI 10.1016/j.cell.2012.04.028
SUMMARY
We present a genetic interaction map of pairwisemeasures including �40% of nonessential S. pombegenes. By comparing interaction maps for fissionand budding yeast, we confirmed widespread con-servation of genetic relationships within and betweencomplexes and pathways. However, we identified animportant subset of orthologous complexes thathave undergone functional ‘‘repurposing’’: the evolu-tion of divergent functions and partnerships. Wevalidated three functional repurposing events inS. pombe and mammalian cells and discovered that(1) two lumenal sensors of misfolded ER proteins,the kinase/nuclease Ire1 and the glucosyltransferaseGpt1, act together to mount an ER stress response;(2) ESCRT factors regulate spindle-pole-body dupli-cation; and (3) a membrane-protein phosphataseand kinase complex, the STRIPAK complex, bridgesthe cis-Golgi, the centrosome, and the outer nuclearmembrane to direct mitotic progression. Eachdiscovery opens new areas of inquiry and—together—have implications for model organism-based research and the evolution of genetic systems.
INTRODUCTION
Understanding the relationships between gene products is
fundamental to biology. Measuring genetic interactions (GIs),
the extent to which the function of one gene depends on a
second, is an unbiased way of determining functional relation-
ships and has proven to be a powerful technique for discovering
gene function, grouping genes into complexes, and organizing
them into pathways (Tong et al., 2004; Schuldiner et al., 2005;
Ooi et al., 2006; Roguev et al., 2008; Costanzo et al., 2010;
Horn et al., 2011). The development of high-density, quantitative
assays for GI mapping in the budding yeast S. cerevisiae (Sc)
led to numerous findings. For example, maps of endoplasmic
reticulum (ER) and mitochondrial genes led to the discovery of
the complex responsible for very-long-chain fatty-acid biosyn-
thesis (Denic and Weissman, 2007), identification of the GET
complex and other factors responsible for tail-anchored mem-
brane protein insertion (Schuldiner et al., 2008, 2005; Costanzo
et al., 2010; Jonikas et al., 2009), discovery of the SPOTS
complex as a regulator of sphingolipid homeostasis (Breslow
et al., 2010), and identification ofMitOS as a determinant of mito-
chondrial morphology (Hoppins et al., 2011). GI maps of other
pathways have led to a range of insights, including discovery
of novel mechanisms of epigenetic control (Collins et al., 2007;
Costanzo et al., 2010; Dai et al., 2008).
These discoveries speak to the power of GI analysis to group
genes into complexes and to chart connections between path-
ways independently of a priori knowledge. But how plastic are
genetic pathways over the course of evolution? In addition to
searching for novel factors and pathways in the fission yeast
Schizosaccharomyces pombe (Sp), we sought to determine
systematically the extent to which conserved genes have
adapted to serve in different roles with different partners. It is
a fundamental consequence of evolution that conserved genes
encode macromolecules with conserved biochemical proper-
ties. Yet gene-to-phenotype relationships are not as predictable.
For example, hypoxanthine-guanine phosphoribosyltransferase
(HGPRT) catalyzes purine monophosphate generation in every
organism, but mutations in yeast lead to abnormal mitochondrial
genome maintenance and cisplatin resistance (Kowalski et al.,
2008), whereas mutations in humans lead to the neuropsychi-
atric signs of Lesch-Nyhan syndrome. Developmental biologists
have noted that orthologous genes have been repurposed to
control the morphologies of distinct body parts in highly diver-
gent organisms (Niwa et al., 2010). Furthermore, point mutations
Cell 149, 1339–1352, June 8, 2012 ª2012 Elsevier Inc. 1339
123
●

Appendix
in the active sites of metabolic enzymes can change substrate
specificity or electron transfer steps with profound phenotypic
consequences (e.g., IDH1/2, Dang et al., 2009). Finally, genetic
relationships have been reported to changemarkedly when cells
are challenged with a stress like DNA damage (Bandyopadhyay
et al., 2010).
Efforts to study functional repurposing have been limited by
a lack of global comparisons. Work in Sp nowmakes large-scale
comparisons to Sc possible. Fission yeasts diverged from
budding yeasts �500 million years ago, and their genomes
show no synteny (Rhind et al., 2011). Efforts to curate the
genomes of Sp and Sc have identified a shared subset of
�4,450 apparent orthologs (Wood, 2006). In light of extensive
GI data generated in Sc, availability of a Sp deletion collection
(Kim, et al., 2010), high-throughput methods for generating Sp
double mutants (Roguev et al., 2007; Dixon et al., 2008), and
annotation of orthologous genes in these organisms, we saw a
unique opportunity to assess how often conserved genes
acquire new functions and partners over the course of evolution.
In addition to an evolutionary analysis, functional mapping in
Sp is valuable for discovering new cell biology. Investigators
from many disciplines have reported that certain aspects of Sp
are better models of metazoan biology. For example, they
possess (1) an RNAi pathway, (2) repetitive centromeres, (3)
G2/M cell-cycle control, (4) contractile ring-driven cytokinesis,
and (5) complex heterochromatin and splicing regulation (Saba-
tinos and Forsburg, 2010; Rhind et al., 2011). Some of these
processes have been studied extensively, whereas others have
received limited attention. We intended to characterize func-
Figure 1. Data Set Overview and Reproduc-
ibility Benchmarks
(A) Functional classification of genes in the map.
(B) Scatter plot comparing scores from reciprocal
crosses.
(C) Scatter plot of correlation coefficients between
genetic interaction (GI) profiles for query versus
array pairs of strains.
See Figures S1 and S2 for additional information
about how we generated our Sp GI map.
tional repurposing through evolution
and to identify processes in which Sp
genetics can predict the properties of
mammalian cells.
We report that many genes displayed
conserved patterns of GI, and that core
complexes or modules displayed highly
correlated patterns of GI (Roguev et al.,
2008; Dixon et al., 2008). However, an
important subset of conserved genes
manifested divergent genetic relation-
ships. By comparing the functional pro-
files of annotated orthologs, we identified
genes that had acquired new partners
or were participating in different or addi-
tional pathways in Sp versus Sc. We
chose three disparate cases of diver-
gence for detailed investigation. Our findings reveal organelle
homeostasis mechanisms and mitosis control factors. Consid-
ered together, our findings suggest applications for model
organism-based research and impact our view of evolution.
RESULTS AND DISCUSSION
S. pombe Genetic Interaction MapWe evaluated pairwise GIs for 1,297 alleles in G418-marked
‘‘array’’ strains crossed against 597 nourseothricin (NAT)-
marked ‘‘query’’ strains (Figure S1 available online). Strains
harboring 1,503 unique gene deletions and 64 unique hypomor-
phic (Degron-DAmP; Schuldiner et al., 2005; Breslow et al.,
2008) alleles of essential genes were used to generate 774,309
double mutants (expanding by �8-fold the number of GIs
measured in Sp; Figure 1A). Interaction scores were determined
by comparing the observed fitness of the double mutants with
the typical fitness determined empirically from the expected
penalty associated with each mutation (Figure S2) (Collins
et al., 2010). Our map consists of a matrix of GIs for 40% of
the nonessential genome. Each row and column corresponds
to the GI profile for one allele and is a phenotypic signature.
We sorted the rows and columns of the matrix using hierarchical
clustering such that neighbors have similar functional profiles.
The resulting map is modular: correlated genes cluster together
as a result of their shared GIs (Figure S3).
Multiple metrics for evaluating the data set argued for its
quality. First, biological triplicate measurements revealed that
the scores are reproducible (overall correlation of �0.78).
1340 Cell 149, 1339–1352, June 8, 2012 ª2012 Elsevier Inc.
124
Publication: Functional repurposing revealed by comparing genetic interactions
Second, the same triplicate sets measured 6–12 months later
remained highly correlated (�0.72). We also assessed the
reproducibility of scores identified for reciprocal crosses: two
scores that derived from independent measurements in which
the antibiotic-resistance marker and the mating type of each
strain were swapped (query A 3 array B versus query B 3 array
A). Query strains and array strains have different histories and are
subjected to different storage and growth conditions during the
assay and consequently may have differences in fitness. Despite
these differences, the correlation of 0.65 for scores derived from
reciprocal crosses is comparable to the highest quality Sc
studies (Figure 1B) (Baryshnikova et al., 2010; Collins et al.,
2010; Hoppins et al., 2011). From the scorematrix, we computed
pairwise correlations for all pairs of alleles from cells of the same
mating type background and the reproducibility of the correla-
tions observed between profiles (Figure 1C). Irreproducible
correlations between profiles do occur as the majority of scores
are between unrelated genes, but the diagonal is enriched with
gene-to-gene correlations that are reproducible whether the
strains being compared are h� or h+ pairs.
Our Sp map identified > 700 high-confidence gene-to-gene
correlations indicative of genes with related functions. Many of
these are internal validations because they are known to be
related (Figures 2A and S3). Among the most notable clusters
of genes, our analysis identified correctly the relationships
between factors involved in the contractile ring, glycosylation,
autophagy, retromer and ESCRT pathways, protein folding
and quality control, the peroxisome, the G2/M transition,
spindle and kinetochore assembly, lipid biosynthesis, hypoxia
responses, clathrin adaptors and SNARE complexes, prefoldin,
ubiquitin ligases and substrate adapters, mannosyltransferase
and N-acetyltransferase complexes, mitochondria import and
export, G protein-coupled receptor signaling, the Elongator
complex, mRNA splicing, histone deacetylases, and the relation-
ship between the alternative translocon and ER membrane
protein complex (Data S1 and S2; Figures 2A and S3).
How reliable are such pairwise correlations for identifying
bona fide functional partners? In addition to the reproducibility
within a single data set as shown in Figure 1C, the adoption of
high-throughput GI assays by multiple groups makes it possible
to compare inter-lab reproducibility. We compared the Sc
gene-to-gene correlations reported by Costanzo et al. with those
reported by Hoppins et al. from a shared subset of interactions
that overlapped partially with orthologous interactions sampled
in our Sp study (�500 interaction scores per profile). Gene-to-
gene correlations that exceed �0.4 between labs or within a
data set (Figure 1C versus Figure 2B) are highly likely to be repro-
ducible, true positives that are robust to differences in data
collection or analysis.
Functional Conservation versus FunctionalRepurposingUsing this same subset of orthologous interactions, we com-
pared the gene-to-gene correlations observed in our Sp data
set with those observed in Sc (Figure 2C). As reported (Roguev
et al., 2008; Dixon et al., 2008), there is widespread functional
conservation of gene-to-gene relationships. This is true espe-
cially for known complexes and pathways that appear to have
descended from the last common ancestor unmodified (green,
Table S1). However, our systematic view also revealed subsets
of genes whose correlations in Sc were not observed in Sp
and another subset whose correlations in Sp were not observed
inSc (Figures 2B–2D; Table S1).We considered these to be plau-
sible cases of functional repurposing: the adaption of conserved
factors to serve additional or different roles in one organism
versus the other (Figure 2E). We computed amino acid sequence
comparison-based statistics for each case of highly correlated
pairwise relationships conserved between Sp and Sc (green),
versus relationships that are correlated in Sc but not Sp (cyan)
or Sp but not Sc (red). Lower amino acid similarity did not corre-
late with repurposing (Figure 2D, left), but lower percentage
coverage (i.e., additional motifs or domains present in only one
of the orthologs) did correlate with apparent repurposing (Fig-
ure 2D, right). At the same time, these genes appear to be unique
descendants of the same ancestral gene and to have adapted
within the system of one organism versus the other to serve
alternative functions.
Another explanation for some cases of divergent genetic rela-
tionships is the relative degree of redundancy within a pathway.
For example, inSp there are only two genes of theGOLD-domain
family of COP-II coat components (SPAC17A5.08 and
SPBC16E9.09). InSc, there are three homologs of SPAC17A5.08
(ERP2, ERP3, and ERP4) and two homologs of SPBC16E9.09
(ERP5 and ERP6). SPAC17A5.08 and SPBC16E9.09 share
virtually all of the same interactions in Sp, whereas none of the
pairwise comparisons of ERP2/3/4 versus ERP5/6 profiles
shared significant overlap in Sc (Figure 2C). This is expected
but also highlights the value of Sp as a model eukaryote: it
contains few paralogs, and thus there is an increased probability
of detecting relationships between nonredundant factors (Aslett
and Wood, 2006). A third explanation for divergent genetic
correlations is simply that these organisms have different depen-
dencies on a given process under the conditions of the assay
(‘‘organismal emphasis’’). For example, autophagy genes were
identified in Sc, but this analysis derived from growth on rich
media where autophagy genes display few robust interactions
in Sc. In Sp, autophagy pathway genes displayed strong interac-
tions under the conditions used in our protocol (Data S1 and S2).
As we were interested in functional repurposing, we selected
three disparate cases of divergence that we could not explain
by environmental dependencies or redundancy (Figure 2D; Table
S1). The divergence was evident when comparing correlations
from the subset of interactions used for Figure 2 and was clear
when comparing the entire data sets. Each case represents
a distinct pathway: the unfolded protein response (UPR),
spindle-pole-body (SPB) duplication, and mitosis. The genes
involved have strong GIs and robust—but different—correlated
partners in Sc versus Sp. Validation assays in all cases indicated
that these genes have evolved different genetic relationships and
serve in new or additional roles in fission versus budding yeast.
The UPR Requires Gpt1 and Ire1Ire1 is a conserved transmembrane kinase and nuclease that
serves as the central sensor for misfolding stress in the ER. In
Sc, Ire1 senses ER stress via its lumenal domains, leading to
oligomerization and activation of Ire1’s nuclease to catalyze
Cell 149, 1339–1352, June 8, 2012 ª2012 Elsevier Inc. 1341
125
●
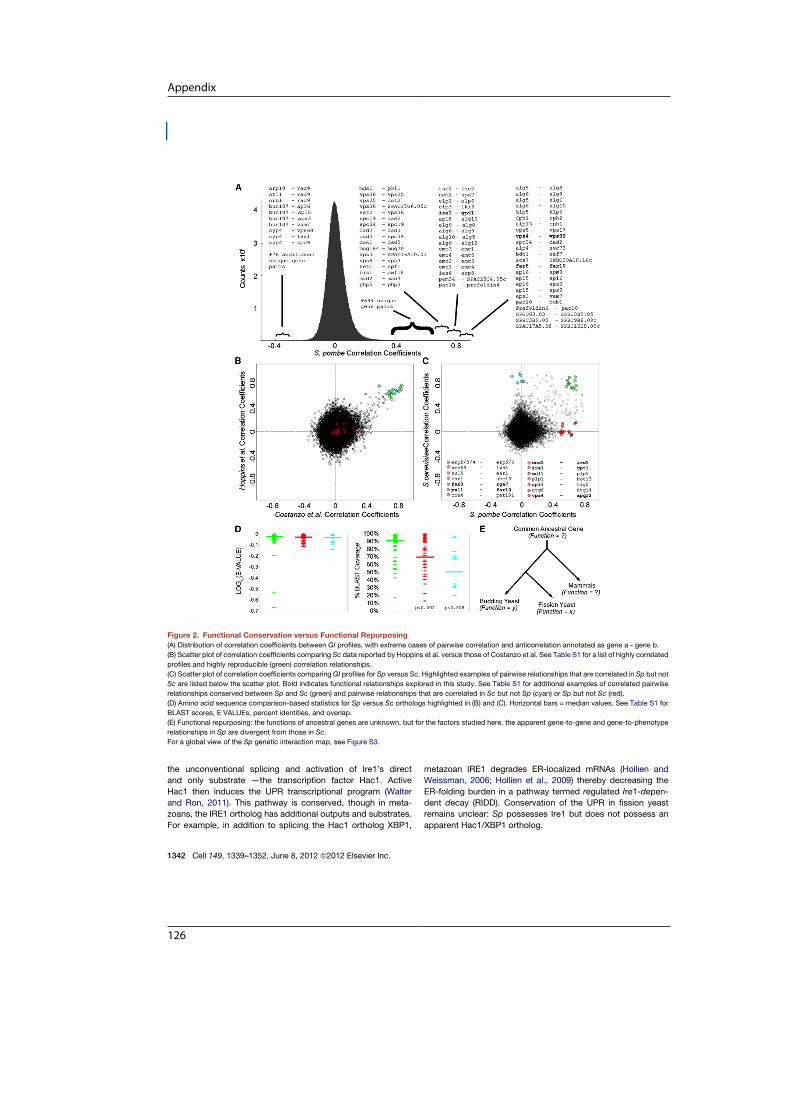
Appendix
the unconventional splicing and activation of Ire1’s direct
and only substrate —the transcription factor Hac1. Active
Hac1 then induces the UPR transcriptional program (Walter
and Ron, 2011). This pathway is conserved, though in meta-
zoans, the IRE1 ortholog has additional outputs and substrates.
For example, in addition to splicing the Hac1 ortholog XBP1,
metazoan IRE1 degrades ER-localized mRNAs (Hollien and
Weissman, 2006; Hollien et al., 2009) thereby decreasing the
ER-folding burden in a pathway termed regulated Ire1-depen-
dent decay (RIDD). Conservation of the UPR in fission yeast
remains unclear: Sp possesses Ire1 but does not possess an
apparent Hac1/XBP1 ortholog.
Figure 2. Functional Conservation versus Functional Repurposing
(A) Distribution of correlation coefficients between GI profiles, with extreme cases of pairwise correlation and anticorrelation annotated as gene a - gene b.
(B) Scatter plot of correlation coefficients comparing Sc data reported by Hoppins et al. versus those of Costanzo et al. See Table S1 for a list of highly correlated
profiles and highly reproducible (green) correlation relationships.
(C) Scatter plot of correlation coefficients comparingGI profiles for Sp versus Sc. Highlighted examples of pairwise relationships that are correlated in Sp but not
Sc are listed below the scatter plot. Bold indicates functional relationships explored in this study. See Table S1 for additional examples of correlated pairwise
relationships conserved between Sp and Sc (green) and pairwise relationships that are correlated in Sc but not Sp (cyan) or Sp but not Sc (red).
(D) Amino acid sequence comparison-based statistics for Sp versus Sc orthologs highlighted in (B) and (C). Horizontal bars = median values. See Table S1 for
BLAST scores, E VALUEs, percent identities, and overlap.
(E) Functional repurposing: the functions of ancestral genes are unknown, but for the factors studied here, the apparent gene-to-gene and gene-to-phenotype
relationships in Sp are divergent from those in Sc.
For a global view of the Sp genetic interaction map, see Figure S3.
1342 Cell 149, 1339–1352, June 8, 2012 ª2012 Elsevier Inc.
126
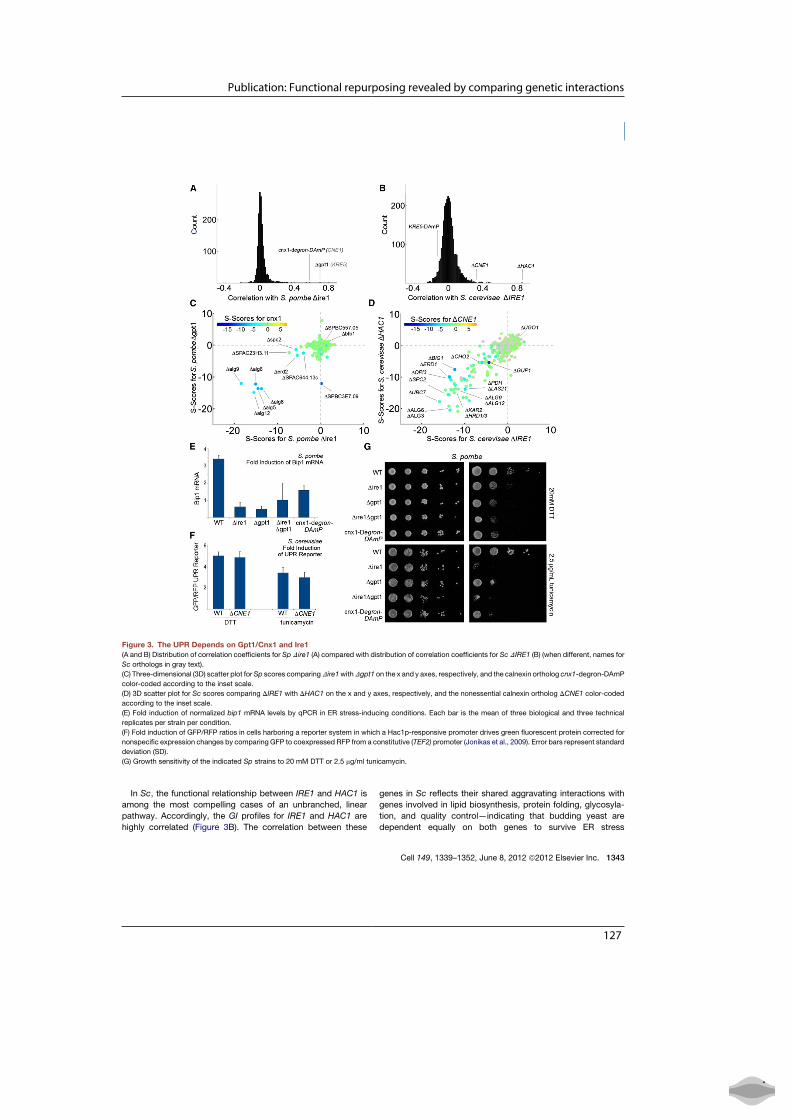
Publication: Functional repurposing revealed by comparing genetic interactions
In Sc, the functional relationship between IRE1 and HAC1 is
among the most compelling cases of an unbranched, linear
pathway. Accordingly, the GI profiles for IRE1 and HAC1 are
highly correlated (Figure 3B). The correlation between these
genes in Sc reflects their shared aggravating interactions with
genes involved in lipid biosynthesis, protein folding, glycosyla-
tion, and quality control—indicating that budding yeast are
dependent equally on both genes to survive ER stress
Figure 3. The UPR Depends on Gpt1/Cnx1 and Ire1
(A and B) Distribution of correlation coefficients for Sp Dire1 (A) compared with distribution of correlation coefficients for Sc DIRE1 (B) (when different, names for
Sc orthologs in gray text).
(C) Three-dimensional (3D) scatter plot forSp scores comparingDire1withDgpt1 on the x and y axes, respectively, and the calnexin ortholog cnx1-degron-DAmP
color-coded according to the inset scale.
(D) 3D scatter plot for Sc scores comparing DIRE1 with DHAC1 on the x and y axes, respectively, and the nonessential calnexin ortholog DCNE1 color-coded
according to the inset scale.
(E) Fold induction of normalized bip1 mRNA levels by qPCR in ER stress-inducing conditions. Each bar is the mean of three biological and three technical
replicates per strain per condition.
(F) Fold induction of GFP/RFP ratios in cells harboring a reporter system in which a Hac1p-responsive promoter drives green fluorescent protein corrected for
nonspecific expression changes by comparing GFP to coexpressed RFP from a constitutive (TEF2) promoter (Jonikas et al., 2009). Error bars represent standard
deviation (SD).
(G) Growth sensitivity of the indicated Sp strains to 20 mM DTT or 2.5 mg/ml tunicamycin.
Cell 149, 1339–1352, June 8, 2012 ª2012 Elsevier Inc. 1343
127
●
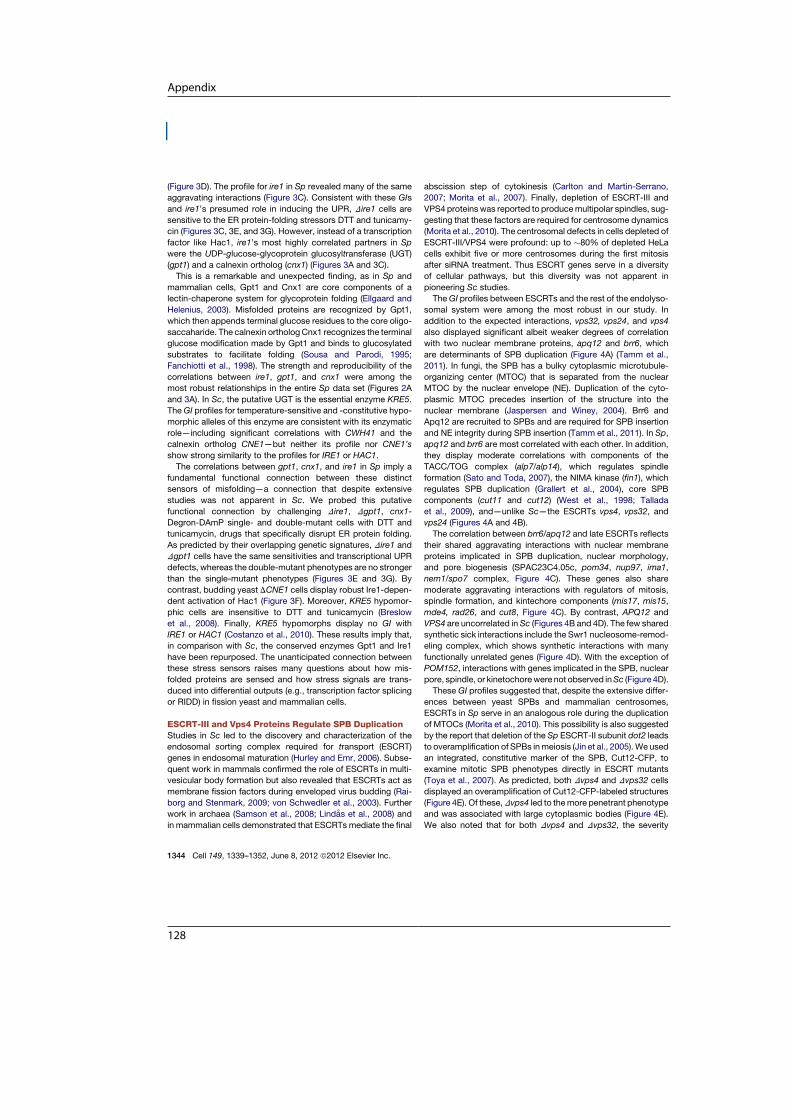
Appendix
(Figure 3D). The profile for ire1 in Sp revealed many of the same
aggravating interactions (Figure 3C). Consistent with these GIs
and ire1’s presumed role in inducing the UPR, Dire1 cells are
sensitive to the ER protein-folding stressors DTT and tunicamy-
cin (Figures 3C, 3E, and 3G). However, instead of a transcription
factor like Hac1, ire1’s most highly correlated partners in Sp
were the UDP-glucose-glycoprotein glucosyltransferase (UGT)
(gpt1) and a calnexin ortholog (cnx1) (Figures 3A and 3C).
This is a remarkable and unexpected finding, as in Sp and
mammalian cells, Gpt1 and Cnx1 are core components of a
lectin-chaperone system for glycoprotein folding (Ellgaard and
Helenius, 2003). Misfolded proteins are recognized by Gpt1,
which then appends terminal glucose residues to the core oligo-
saccaharide. The calnexin ortholog Cnx1 recognizes the terminal
glucose modification made by Gpt1 and binds to glucosylated
substrates to facilitate folding (Sousa and Parodi, 1995;
Fanchiotti et al., 1998). The strength and reproducibility of the
correlations between ire1, gpt1, and cnx1 were among the
most robust relationships in the entire Sp data set (Figures 2A
and 3A). In Sc, the putative UGT is the essential enzyme KRE5.
TheGI profiles for temperature-sensitive and -constitutive hypo-
morphic alleles of this enzyme are consistent with its enzymatic
role—including significant correlations with CWH41 and the
calnexin ortholog CNE1—but neither its profile nor CNE1’s
show strong similarity to the profiles for IRE1 or HAC1.
The correlations between gpt1, cnx1, and ire1 in Sp imply a
fundamental functional connection between these distinct
sensors of misfolding—a connection that despite extensive
studies was not apparent in Sc. We probed this putative
functional connection by challenging Dire1, Dgpt1, cnx1-
Degron-DAmP single- and double-mutant cells with DTT and
tunicamycin, drugs that specifically disrupt ER protein folding.
As predicted by their overlapping genetic signatures, Dire1 and
Dgpt1 cells have the same sensitivities and transcriptional UPR
defects, whereas the double-mutant phenotypes are no stronger
than the single-mutant phenotypes (Figures 3E and 3G). By
contrast, budding yeast DCNE1 cells display robust Ire1-depen-
dent activation of Hac1 (Figure 3F). Moreover, KRE5 hypomor-
phic cells are insensitive to DTT and tunicamycin (Breslow
et al., 2008). Finally, KRE5 hypomorphs display no GI with
IRE1 or HAC1 (Costanzo et al., 2010). These results imply that,
in comparison with Sc, the conserved enzymes Gpt1 and Ire1
have been repurposed. The unanticipated connection between
these stress sensors raises many questions about how mis-
folded proteins are sensed and how stress signals are trans-
duced into differential outputs (e.g., transcription factor splicing
or RIDD) in fission yeast and mammalian cells.
ESCRT-III and Vps4 Proteins Regulate SPB DuplicationStudies in Sc led to the discovery and characterization of the
endosomal sorting complex required for transport (ESCRT)
genes in endosomal maturation (Hurley and Emr, 2006). Subse-
quent work in mammals confirmed the role of ESCRTs in multi-
vesicular body formation but also revealed that ESCRTs act as
membrane fission factors during enveloped virus budding (Rai-
borg and Stenmark, 2009; von Schwedler et al., 2003). Further
work in archaea (Samson et al., 2008; Lindas et al., 2008) and
in mammalian cells demonstrated that ESCRTs mediate the final
abscission step of cytokinesis (Carlton and Martin-Serrano,
2007; Morita et al., 2007). Finally, depletion of ESCRT-III and
VPS4 proteins was reported to producemultipolar spindles, sug-
gesting that these factors are required for centrosome dynamics
(Morita et al., 2010). The centrosomal defects in cells depleted of
ESCRT-III/VPS4 were profound: up to �80% of depleted HeLa
cells exhibit five or more centrosomes during the first mitosis
after siRNA treatment. Thus ESCRT genes serve in a diversity
of cellular pathways, but this diversity was not apparent in
pioneering Sc studies.
TheGI profiles between ESCRTs and the rest of the endolyso-
somal system were among the most robust in our study. In
addition to the expected interactions, vps32, vps24, and vps4
also displayed significant albeit weaker degrees of correlation
with two nuclear membrane proteins, apq12 and brr6, which
are determinants of SPB duplication (Figure 4A) (Tamm et al.,
2011). In fungi, the SPB has a bulky cytoplasmic microtubule-
organizing center (MTOC) that is separated from the nuclear
MTOC by the nuclear envelope (NE). Duplication of the cyto-
plasmic MTOC precedes insertion of the structure into the
nuclear membrane (Jaspersen and Winey, 2004). Brr6 and
Apq12 are recruited to SPBs and are required for SPB insertion
and NE integrity during SPB insertion (Tamm et al., 2011). In Sp,
apq12 and brr6 are most correlated with each other. In addition,
they display moderate correlations with components of the
TACC/TOG complex (alp7/alp14), which regulates spindle
formation (Sato and Toda, 2007), the NIMA kinase (fin1), which
regulates SPB duplication (Grallert et al., 2004), core SPB
components (cut11 and cut12) (West et al., 1998; Tallada
et al., 2009), and—unlike Sc—the ESCRTs vps4, vps32, and
vps24 (Figures 4A and 4B).
The correlation between brr6/apq12 and late ESCRTs reflects
their shared aggravating interactions with nuclear membrane
proteins implicated in SPB duplication, nuclear morphology,
and pore biogenesis (SPAC23C4.05c, pom34, nup97, ima1,
nem1/spo7 complex, Figure 4C). These genes also share
moderate aggravating interactions with regulators of mitosis,
spindle formation, and kintechore components (mis17, mis15,
mde4, rad26, and cut8, Figure 4C). By contrast, APQ12 and
VPS4 are uncorrelated in Sc (Figures 4B and 4D). The few shared
synthetic sick interactions include the Swr1 nucleosome-remod-
eling complex, which shows synthetic interactions with many
functionally unrelated genes (Figure 4D). With the exception of
POM152, interactions with genes implicated in the SPB, nuclear
pore, spindle, or kinetochorewere not observed inSc (Figure 4D).
These GI profiles suggested that, despite the extensive differ-
ences between yeast SPBs and mammalian centrosomes,
ESCRTs in Sp serve in an analogous role during the duplication
of MTOCs (Morita et al., 2010). This possibility is also suggested
by the report that deletion of the Sp ESCRT-II subunit dot2 leads
to overamplification of SPBs inmeiosis (Jin et al., 2005).We used
an integrated, constitutive marker of the SPB, Cut12-CFP, to
examine mitotic SPB phenotypes directly in ESCRT mutants
(Toya et al., 2007). As predicted, both Dvps4 and Dvps32 cells
displayed an overamplification of Cut12-CFP-labeled structures
(Figure 4E). Of these,Dvps4 led to themore penetrant phenotype
and was associated with large cytoplasmic bodies (Figure 4E).
We also noted that for both Dvps4 and Dvps32, the severity
1344 Cell 149, 1339–1352, June 8, 2012 ª2012 Elsevier Inc.
128

Publication: Functional repurposing revealed by comparing genetic interactions
and penetrance of the phenotype decreased over time, perhaps
explaining why this phenotype was only observed in Ddot2 cells
during meiotic divisions.
We next explored in detail the possibility that ESCRT factors
regulate SPB dynamics in Sc. We examined four different SPB
proteins: the core component Spc42p, outer plaque (Cnm67p-
GFP) and inner plaque (Spc110p-GFP) components, and
gamma-tubulin (Tub4p-GFP) (Figures 4F and S4); however, we
were unable to observe any indication of SPB duplication or
fragmentation errors. Thus, both the global GI analysis and
focused studies indicate that the role of the ESCRTs in regulating
SPB duplication represents a novel activity not seen in Sc. In
addition to identifying another example of functional repurpos-
ing, these studies indicate that fission yeast will become an
important model for further study of ESCRT factors and their
role at centrosomes.
Figure 4. ESCRT-III Proteins and Vps4 Regulate SPB Duplication
(A and B) Distribution of correlation coefficients for Sp apq12 (A) compared with distribution of correlation coefficients for Sc APQ12 (B) (when different, names for
Sc orthologs shown in gray text).
(C) Scatter plot of mean scores for Sp apq12 and brr6 versus mean scores for vps32, vps24, and vps4. The following Sc orthologs have different names:
SPAC23C4.05c = MSC1, mik1 = SWE1, rad26 = LCD1, mis15 = CHL4, mde4 = LRS4, cut8 = STS1, kap111 = KAP122, nup97 = NIC96, and mph1 = MPS1.
(D) Scatter plot of mean scores for Sc APQ12 versus VPS4.
(E and F) DIC and fluorescence micrographs of the indicated cells expressing constitutive SPB markers (Cut12-CFP in Sp, Spc42p-GFP in Sc). For the frag-
mentation/duplication phenotypes observed in Sp, the percent penetrance ± SD is noted. In addition to Spc42p, outer plaque (Cnm67p-GFP), inner plaque
(Spc110p-GFP), and gamma-tubulin (Tub4p-GFP) marked strains were scored (see Figure S4).
Cell 149, 1339–1352, June 8, 2012 ª2012 Elsevier Inc. 1345
129
●

Appendix
The FAR Complex Regulates Mitosis in Fission YeastIn Sc, mating pheromones initiate signaling cascades that lead
to cell-cycle arrest (Elion, 2000). Multiple genes implicated in
this phenomenon have been named FAR (factor arrest) genes,
including a six-member complex composed of FAR3, FAR7,
FAR8, FAR9/VPS64, FAR10, and FAR11. Initial characterizations
indicated that mutation of this complex did not prevent phero-
mone-induced cell-cycle arrest but rather premature resumption
of budding (Kemp and Sprague, 2003). Sc studies have found
that the functional profiles of the FAR complex correlate with
one another and other factors (Figure 5B) (Hoppins et al., 2011;
Costanzo et al., 2010). Among the most salient, a moderate
degree of correlation between the FAR complex and protein
phosphatase type 2A (PP2A, PPG1 subunit) and notable anticor-
relation with a well-characterized factor arrest gene, FAR1,were
observed (Figure 5B). The shared interactions between compo-
nents of the FAR complex include the TORC2 kinase complex,
lipid synthesis, and ERMES complex genes (Figure 5D). These
finding are consistent with the idea that the FAR complex regu-
lates PP2A but suggest it has pleiotropic roles.
The FAR complex is an intriguing candidate for functional re-
purposing in that some of its constituents are unique to budding
yeast. FAR3 and FAR7 are only found in a restricted set of
budding yeasts (Figure S5) with no apparent orthologs in meta-
zoa orSp.Recently, an immunoprecipitation/mass spectrometry
(IP-MS) study of human PP2A complexes identified a homolo-
gous complex: the striatin-interacting phosphatase and kinase
(STRIPAK) complex (Goudreault et al., 2009). STRIPAK contains
the PP2A catalytic (PP2Ac) and scaffolding (PP2A A) subunits,
the striatins (FAR8 homologs that possess PP2A regulatory B00 0
domains), the transmembrane striatin-interacting proteins
(STRIP1 and STRIP2, FAR11 homologs), and the tail-anchored
membrane protein sarcolemmal membrane-associated protein
(SLMAP, a FAR10 homolog).
In addition to the above, STRIPAK contains a homolog of the
yeast protein Mob1 (Moreno et al., 2001; Goudreault et al.,
2009)—named MOBKL3 in human cells—that is a critical
component of the septation initiation network (SIN) in fission
yeast (McCollum and Gould, 2001). Multiple Mob1 homologs
exist in mammals, and their function as kinase activators
appears to be conserved (Hergovich et al., 2006). STRIPAK
assemblies also contain Ste20-family kinases (Goudreault
et al., 2009). The absence of FAR3 and FAR7 from Sp and
metazoa and the presence of additional proteins not found in
the Sc complex suggest that the cellular roles of STRIPAK
complexes have ramified. Recent studies have identified
STRIPAK as a regulator of the Hippo pathway (Ribeiro et al.,
2010), as a modulator of Ras-MAPK signaling (Horn et al.,
2011), and as a regulator of SIN in Sp (Singh et al., 2011).
The GI profiles for Sp far8 (SPBC1773.01), far10
(SPBC3H7.13), and far11 (SPBC27B12.04c) are correlated with
each other and—in contrast to Sc—with multiple genes involved
in cytokinesis and mitosis, including components of the actomy-
osin contractile ring (rlc1, cam2, fic1, rga8, imp2, ccd15, pxl1,
rga7, myp2), the CDC14 ortholog clp1, the kinase pck1, and
Golgi proteins zrg17, cis4, and SPCC613.03 (Figure 5A). This
pattern suggested that the FAR complex plays a role in mitosis
control in Sp. The correlations between FAR complex genes in
Sp reflect strong aggravating interactions with a PP2A regulatory
subunit (par1) and aggravating interactions with the mitotic exit
phosphatase (clp1 /CDC14), core components of the contractile
ring, and the catalytic PP2Asubunit (SPAC22H10.04) (Figure 5C).
Shared alleviating interactions include interactions between
different FAR subunits, a spindle attachment factor (mad1),
and a phosphatase (stp1) implicated in the G2/M transition
(Figure 5C).
These relationships suggest that the FAR complex regulates
PP2A-mediated mitotic transitions. Moreover, the strong aggra-
vating interaction between FAR complex genes and par1
suggests that the regulatory specificity conferred on PP2A by
the FAR complex can be compensated for in Sp by this alterna-
tive B subunit. Single mutants of far8, far10, and far11 do not
have striking phenotypes, as assayed by flow cytometry for
size and DNA content or by DIC imaging (Figure 5E). However,
as predicted by theirGIs, double mutants of FAR complex genes
with genes functioning in mitotic signaling, cytokinesis, or
abscission have profound phenotypes. Double mutations with
the type II myosin heavy chain myp2, an AAA ATPase we have
named ATPase-like fidgetin-1 (alf1), and the CDC14-related
protein phosphatase clp1 have abnormal morphologies and
enhanced ploidy as measured by flow cytometry and DIC
microscopy (Figure 5E). The aggravating interactions seen in
Sp were not observed in Sc. DFAR8 and DFAR10 cells do not
have cell-cycle defects, and double mutants with a ts allele of
CDC14 have the same maximum permissive temperature as
the single mutant CDC14-3 (32�C). After 2 hr at 32�C, single-mutant CDC14-3 cells manifest clear shifts in ploidy and
bud hyperelongation. Double-mutant DFAR8/CDC14-3 and
DFAR10/CDC14-3 cells are indistinguishable from CDC14-3
single mutants (Figure 5E). Thus, as indicated by the systematic
GI data, the role of the FAR complex in directing late mitotic
events is not found in Sc.
STRIPAK Signaling Complexes Bridge the Golgi, theCentrosome, and the Nuclear MembraneWe sought to determine whether the gene-to-phenotype rela-
tionships observed for the Sp FAR complex were predictive of
human STRIPAK complexes. The mitocheck consortium re-
ported that silencing of STRN (Far8) resulted in binuclear cells
and cell death (Neumann et al., 2010). We found that siRNA-
mediated depletions of core STRIPAK components, including
STRN3 (Far8) and STRIP1 (Far11), in HeLa cells resulted in
strong shifts from 2C to 4C DNA content (Figure 6A). Microscopy
of silenced cells corroborated the increase in DNA content and
revealed a range from binuclear to horseshoe- and torus-shaped
nuclei or fragmented nuclear remnants. Most remarkable, we
often observed that centrosomes and intact Golgi stacks were
found within the cavity of horseshoe- or torus-shaped nuclei
(Figures 6C, S6B, and S6C).
Given that STRIPs (Far11) and SLMAP (Far10) are membrane
proteins and depletion of STRN3 or STRIP1 led to Golgi ribbons
surrounded by dysmorphic nuclei, we sought to determine in
which organelle this complex resides. We generated HeLa lines
expressing STRN3-eGFP and STRIP1-eGFP from single-copy
bacterial artificial chromosomes (Poser et al., 2008) under
control of native promoters and untranslated sequences.
1346 Cell 149, 1339–1352, June 8, 2012 ª2012 Elsevier Inc.
130
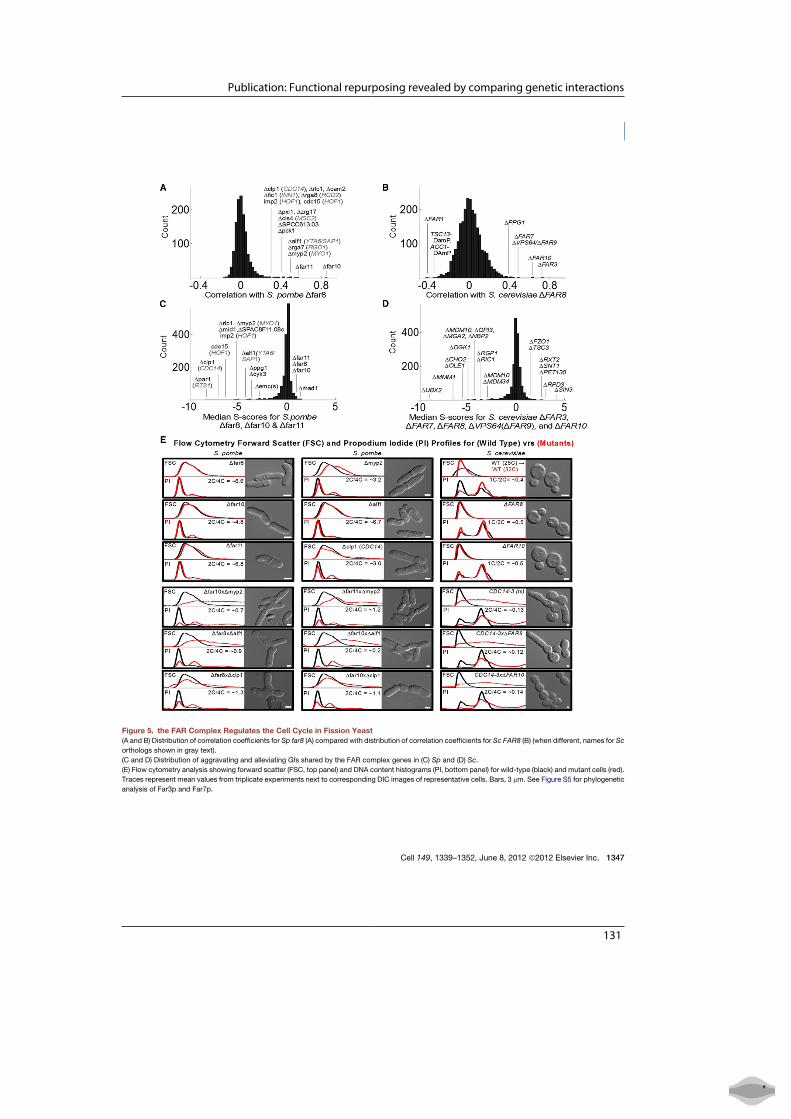
Publication: Functional repurposing revealed by comparing genetic interactions
Figure 5. the FAR Complex Regulates the Cell Cycle in Fission Yeast
(A and B) Distribution of correlation coefficients for Sp far8 (A) compared with distribution of correlation coefficients for Sc FAR8 (B) (when different, names for Sc
orthologs shown in gray text).
(C and D) Distribution of aggravating and alleviating GIs shared by the FAR complex genes in (C) Sp and (D) Sc.
(E) Flow cytometry analysis showing forward scatter (FSC, top panel) and DNA content histograms (PI, bottom panel) for wild-type (black) and mutant cells (red).
Traces represent mean values from triplicate experiments next to corresponding DIC images of representative cells. Bars, 3 mm. See Figure S5 for phylogenetic
analysis of Far3p and Far7p.
Cell 149, 1339–1352, June 8, 2012 ª2012 Elsevier Inc. 1347
131
●
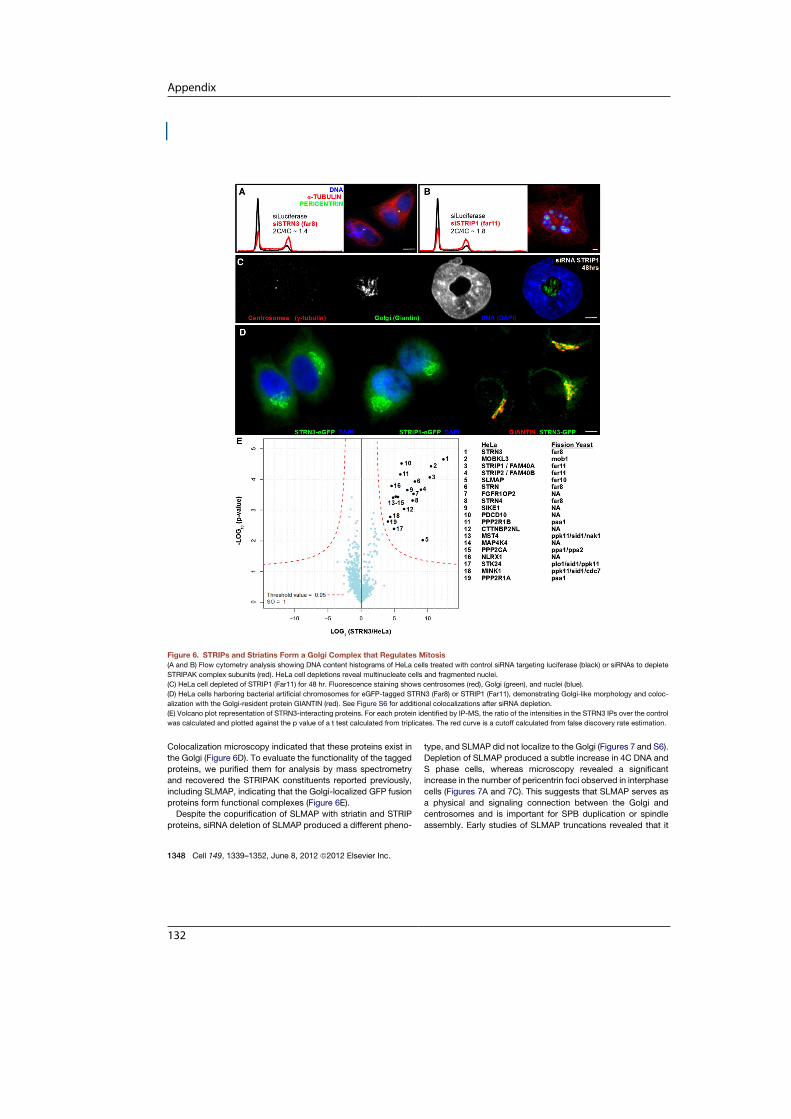
Appendix
Colocalization microscopy indicated that these proteins exist in
the Golgi (Figure 6D). To evaluate the functionality of the tagged
proteins, we purified them for analysis by mass spectrometry
and recovered the STRIPAK constituents reported previously,
including SLMAP, indicating that the Golgi-localized GFP fusion
proteins form functional complexes (Figure 6E).
Despite the copurification of SLMAP with striatin and STRIP
proteins, siRNA deletion of SLMAP produced a different pheno-
type, and SLMAP did not localize to the Golgi (Figures 7 and S6).
Depletion of SLMAP produced a subtle increase in 4C DNA and
S phase cells, whereas microscopy revealed a significant
increase in the number of pericentrin foci observed in interphase
cells (Figures 7A and 7C). This suggests that SLMAP serves as
a physical and signaling connection between the Golgi and
centrosomes and is important for SPB duplication or spindle
assembly. Early studies of SLMAP truncations revealed that it
Figure 6. STRIPs and Striatins Form a Golgi Complex that Regulates Mitosis
(A and B) Flow cytometry analysis showing DNA content histograms of HeLa cells treated with control siRNA targeting luciferase (black) or siRNAs to deplete
STRIPAK complex subunits (red). HeLa cell depletions reveal multinucleate cells and fragmented nuclei.
(C) HeLa cell depleted of STRIP1 (Far11) for 48 hr. Fluorescence staining shows centrosomes (red), Golgi (green), and nuclei (blue).
(D) HeLa cells harboring bacterial artificial chromosomes for eGFP-tagged STRN3 (Far8) or STRIP1 (Far11), demonstrating Golgi-like morphology and coloc-
alization with the Golgi-resident protein GIANTIN (red). See Figure S6 for additional colocalizations after siRNA depletion.
(E) Volcano plot representation of STRN3-interacting proteins. For each protein identified by IP-MS, the ratio of the intensities in the STRN3 IPs over the control
was calculated and plotted against the p value of a t test calculated from triplicates. The red curve is a cutoff calculated from false discovery rate estimation.
1348 Cell 149, 1339–1352, June 8, 2012 ª2012 Elsevier Inc.
132

Publication: Functional repurposing revealed by comparing genetic interactions
can localize to centrosomes via the FHA domain, and that over-
expression of SLMAP truncations induces mitotic arrest (Guzzo
et al., 2004). C-terminal truncations of SLMAP localized to
centrosomes—however, the tail-anchored and full-length
membrane protein tagged at the N terminus localized to the
outer NE during interphase (Figure 7D). During mitosis, full-
length SLMAP localized clearly to centrosomes and the
membranous material surrounding the mitotic spindle after NE
breakdown (Figure 7E).
The presence of the striatins and STRIPs in theGolgi, the pres-
ence of SLMAP in the outer NE, the association between SLMAP
and centrosomes, and the copurification of MOBKL3 and
PP2A with the complex are important clues to one function of
the STRIPAK complex in human cells. Mob1-like proteins acti-
vate mitotic kinases after being recruited to the spindle poles
(Wurzenberger and Gerlich, 2011). Disruption of these signals
results in mitotic failures in yeast. Accordingly, when we
depleted MOBKL3 in HeLa cells, we observed nearly universal
spindle failures followed by cell death (Figures 7B and S6D). Inte-
grating these observations, we propose that human STRIPAK
complexes serve to direct mitotic signaling events (Figure 7G).
STRIPAK complexes appear positioned to regulate the activity
Figure 7. STRIPAK Signaling Complexes Bridge the NE, Centrosomes, and Golgi
(A and B) Flow cytometry analysis showing DNA content histograms of HeLa cells treated with control siRNA targeting luciferase (black) or siRNAs to deplete
SLMAP (Far10) or MOBKL3 (Mob1). HeLa cells were depleted of the designated proteins and labled for immunofluorescence. See Figure S6 for additional images
of siMOBKL3 phenotypes.
(C) Fraction of interphase cells with abnormal numbers of pericentrin foci following siRNA treatment. Errors bars represent standard error of the mean (SEM).
(D and E) HeLa cells transiently expressing mCherry-SLMAP and labeled for immunofluorescence. See Figure S6 for the lack of colocalization betweenmCherry-
SLMAP and the Golgi.
(F) Domain architecture of the FAR/STRIPAK components.
(G) STRIPAK model: striatin and STRIPs reside at the Golgi. Striatins serve as regulatory B00 0 subunits of a PP2A trimer. Striatin/STRIP recruit MOBKL3. STRIPs
interact with SLMAP in the outer nuclear membrane, bridging the Golgi, the centrosome, and the NE. These interactions are likely restricted to specific cell-cycle
phases, and the interaction between SLMAP and centrosomes predominates during mitosis. Disruption of STRIPAK leads to diverse failures during mitosis:
including centrosome duplication errors, spindle assembly errors, and cytokinesis failure. For related data, see Figure S6.
Cell 149, 1339–1352, June 8, 2012 ª2012 Elsevier Inc. 1349
133
●

Appendix
of Mob/kinase complexes and to form a unique PP2A holoen-
zyme directed toward mitotic substrates. Furthermore, the fact
that two components of this complex reside in the Golgi and
a third resides in the outer NE suggests that STRIPAK complexes
participate in the tethering of centrosomes to the Golgi, centro-
some duplication signaling, Golgi fragmentation at the G2/M
transition, or targeting Golgi fragments to spindle poles during
mitosis (Figure 7G). Given the increasing evidence that the Golgi
and spindles have functional interactions throughout the cell
cycle (Sutterlin and Colanzi, 2010), our observations suggest
that the STRIPAK complex mediates communication between
these organelles. The functional repurposing of the STRIPAK
complex in Sc, in contrast to the distinctly different complex
formed in Sp and mammals, correlates with the evolution of
major differences between these organisms in cytokinesis,
cell-cycle phasing, and Golgi morphology.
PerpsectiveJacquesMonod’s expression of biological unity, ‘‘Anything found
to be true of E. coli must also be true of elephants,’’ can be
answered with a nuanced view in light of the dramatic increase
in functional genomic information.Weanalyzedgenesconserved
in budding yeast, fission yeast, and mammals with a focus on
functional divergence. In an important subset of genes, we found
evidence of functional repurposing: the use of conserved
machines in different pathways with different inputs or outputs.
Monod’s reductionist view describes the depth of conservation
between structure and function: folds and key residues confer
durable properties through evolution. Protein complexes tend
to be conserved but not as deeply as structure, whereas connec-
tions between complexes or pathways can be quite plastic.
The unique opportunity to conduct a functional comparison
between two divergent eukaryotes with comprehensive ortholog
mapping provided us with an unparalleled view of repurposing.
Having this view enabled us to document an unanticipated
degree of malleability in function and functional connections.
Our Spmap led to several mechanistic insights that are relevant
to understandingmammalian cells. It also yielded a rich resource
for other investigators as we have described only a fraction of the
connections in our data. To aid these efforts, we have appended
two files (Data S1 and S2) and created a website for the commu-
nity to navigate this data set (http://yeastquantitativegenetics.
ucsf.edu:8000/DataBrowser.html). Future studies will enhance
our understanding of which components and connections are
invariant across evolution versus those that are adaptable.
Moreover, it should be possible to connect repurposing events
to changes in cellular physiology (e.g., switching from fission to
budding cell division). Such insights may prove to be useful in
medicine in that malignancy and infection are both problems
of rapid evolution. Our ability to design ‘‘conditionally lethal’’
therapies will also depend on understanding which functional
relationships can be repurposed.
EXPERIMENTAL PROCEDURES
Strains and Genetic Crosses
Array G418-resistant haploid single-deletion mutants were isogenic to SP286
(h+ ade6-M210;ura4-D18;leu1-32) selected from the BIONEER collection
(Kim et al., 2010). The nourseothricin-resistant h� query strains were made
in the PEM2 strain (Roguev et al., 2007). Targeting cassettes were built using
a two-step, fusion PCR protocol in which long (�3 kb) cassettes were ampli-
fied after annealing mediated by nonpalindromic and unique GC-rich overlap-
ping sequences (Figure S1). Integration of the resistance markers into the
target locus was verified by PCR. Query strains harboring constitutive hypo-
morphic Degron-DAmP alleles were made via the same strategy, except a
degron sequence (Ravid and Hochstrasser, 2008) was fused in place of the
stop codon, followed by a selectable maker in place of the 30 untranslatedregion (UTR). Mating, selection, and propagation of the double mutants
were carried on a Singer RoToR pinning robot using the PEM2 procedure
(Roguev et al., 2008, 2007). For directed assays in Sc, single and double muta-
tions were generated in W303 diploids followed by sporulation and tetrad
dissection.
Genetic Interaction Score Acquisition and Analysis
Double-mutant plates were scanned on a flat-bed scanner (EPSON PhotoPer-
fection 350, Figure S2), and integrated colony intensities were extracted using
a custom algorithm (scripts available upon request) executed in MATLAB (The
Mathworks, Natcik, MA, USA). Fitness analysis was performed by a strategy
modified from Collins et al. (2010), including normalization of plate-surface
artifacts, row/column normalization artifacts, and batch artifacts. Linkage
biases due to the reduced frequency of recombination between linked loci
(manifested by a reduced number of spores and a spurious negative score)
were used to identify contaminated or misannotated strains (Figure S2D).
See the Extended Experimental Procedures for a full description of the
materials and methods.
SUPPLEMENTAL INFORMATION
Supplemental Information includes Extended Experimental Procedures, six
figures, one table, and two data sets and can be found with this article online
at doi:10.1016/j.cell.2012.04.028.
ACKNOWLEDGMENTS
We thank A. Roguev, N. Krogan, C. Ryan, P. Espenshade, W. Sundquist,
D. Ward, and T. Formosa for helpful discussions, reagents, and protocols;
N. Elde, J. Kaplan, L. Colf, and M. Karen for critical discussions of the manu-
script; and J. Rutter and J. Shaw for microscope access. This work was
support by funds from HHMI (J.S.W.), NIH MCRTP 5T32 CA93247-9
(M.G.E.), the German National Genome Research Network grant (01GS0861,
A.A.H., M.M.), and the Huntsman Cancer Institute Center Grant (P30
CA042014, A.F.). O.B. and S.R.C. are HHMI fellows of the Helen Hay Whitney
Foundation. J.W. was supported by a long-term fellowship from the Interna-
tional Human Frontier Science Program (LT 00821/2007-L). A.F. was an
HHMI Fellow of the Life Science Research Foundation and is supported by
the University of Utah.
Received: September 23, 2011
Revised: March 8, 2012
Accepted: April 2, 2012
Published: June 7, 2012
REFERENCES
Aslett, M., andWood, V. (2006). Gene Ontology annotation status of the fission
yeast genome: preliminary coverage approaches 100%. Yeast 23, 913–919.
Bandyopadhyay, S., Mehta, M., Kuo, D., Sung, M.-K., Chuang, R., Jaehnig,
E.J., Bodenmiller, B., Licon, K., Copeland, W., Shales, M., et al. (2010).
Rewiring of genetic networks in response to DNA damage. Science 330,
1385–1389.
Baryshnikova, A., Costanzo, M., Kim, Y., Ding, H., Koh, J., Toufighi, K., Youn,
J.-Y., Ou, J., San Luis, B.-J., Bandyopadhyay, S., et al. (2010). Quantitative
analysis of fitness and genetic interactions in yeast on a genome scale. Nat.
Methods 7, 1017–1024.
1350 Cell 149, 1339–1352, June 8, 2012 ª2012 Elsevier Inc.
134
Publication: Functional repurposing revealed by comparing genetic interactions
Breslow, D.K., Cameron, D.M., Collins, S.R., Schuldiner, M., Stewart-Ornstein,
J., Newman, H.W., Braun, S., Madhani, H.D., Krogan, N.J., and Weissman,
J.S. (2008). A comprehensive strategy enabling high-resolution functional
analysis of the yeast genome. Nat. Methods 5, 711–718.
Breslow, D.K., Collins, S.R., Bodenmiller, B., Aebersold, R., Simons, K.,
Shevchenko, A., Ejsing, C.S., and Weissman, J.S. (2010). Orm family proteins
mediate sphingolipid homeostasis. Nature 463, 1048–1053.
Carlton, J.G., andMartin-Serrano, J. (2007). Parallels between cytokinesis and
retroviral budding: a role for the ESCRT machinery. Science 316, 1908–1912.
Collins, S.R., Miller, K.M., Maas, N.L., Roguev, A., Fillingham, J., Chu, C.S.,
Schuldiner, M., Gebbia, M., Recht, J., Shales, M., et al. (2007). Functional
dissection of protein complexes involved in yeast chromosome biology using
a genetic interaction map. Nature 446, 806–810.
Collins, S.R., Roguev, A., and Krogan, N.J. (2010). Quantitative genetic
interaction mapping using the E-MAP approach. Methods Enzymol. 470,
205–231.
Costanzo, M., Baryshnikova, A., Bellay, J., Kim, Y., Spear, E.D., Sevier, C.S.,
Ding, H., Koh, J.L., Toufighi, K., Mostafavi, S., et al. (2010). The genetic land-
scape of a cell. Science 327, 425–431.
Dai, J., Hyland, E.M., Yuan, D.S., Huang, H., Bader, J.S., and Boeke, J.D.
(2008). Probing nucleosome function: a highly versatile library of synthetic
histone H3 and H4 mutants. Cell 134, 1066–1078.
Dang, L., White, D.W., Gross, S., Bennett, B.D., Bittinger, M.A., Driggers, E.M.,
Fantin, V.R., Jang, H.G., Jin, S., Keenan,M.C., et al. (2009). Cancer-associated
IDH1 mutations produce 2-hydroxyglutarate. Nature 462, 739–744.
Denic, V., and Weissman, J.S. (2007). A molecular caliper mechanism for
determining very long-chain fatty acid length. Cell 130, 663–677.
Dixon, S.J., Fedyshyn, Y., Koh, J.L.Y., Prasad, T.S.K., Chahwan, C., Chua, G.,
Toufighi, K., Baryshnikova, A., Hayles, J., Hoe, K.-L., et al. (2008). Significant
conservation of synthetic lethal genetic interaction networks between distantly
related eukaryotes. Proc. Natl. Acad. Sci. USA 105, 16653–16658.
Elion, E.A. (2000). Pheromone response, mating and cell biology. Curr. Opin.
Microbiol. 3, 573–581.
Ellgaard, L., and Helenius, A. (2003). Quality control in the endoplasmic retic-
ulum. Nat. Rev. Mol. Cell Biol. 4, 181–191.
Fanchiotti, S., Fernandez, F., D’Alessio, C., and Parodi, A.J. (1998). The UDP-
Glc:Glycoprotein glucosyltransferase is essential for Schizosaccharomyces
pombe viability under conditions of extreme endoplasmic reticulum stress.
J. Cell Biol. 143, 625–635.
Goudreault, M., D’Ambrosio, L.M., Kean, M.J., Mullin, M.J., Larsen, B.G.,
Sanchez, A., Chaudhry, S., Chen, G.I., Sicheri, F., Nesvizhskii, A.I., et al.
(2009). A PP2A phosphatase high density interaction network identifies a novel
striatin-interacting phosphatase and kinase complex linked to the cerebral
cavernous malformation 3 (CCM3) protein. Mol. Cell. Proteomics 8, 157–171.
Grallert, A., Krapp, A., Bagley, S., Simanis, V., and Hagan, I.M. (2004). Recruit-
ment of NIMA kinase shows thatmaturation of the S. pombe spindle-pole body
occurs over consecutive cell cycles and reveals a role for NIMA in modulating
SIN activity. Genes Dev. 18, 1007–1021.
Guzzo, R.M., Sevinc, S., Salih, M., and Tuana, B.S. (2004). A novel isoform of
sarcolemmal membrane-associated protein (SLMAP) is a component of the
microtubule organizing centre. J. Cell Sci. 117, 2271–2281.
Hergovich, A., Stegert, M.R., Schmitz, D., and Hemmings, B.A. (2006). NDR
kinases regulate essential cell processes from yeast to humans. Nat. Rev.
Mol. Cell Biol. 7, 253–264.
Hollien, J., and Weissman, J.S. (2006). Decay of endoplasmic reticulum-local-
ized mRNAs during the unfolded protein response. Science 313, 104–107.
Hollien, J., Lin, J.H., Li, H., Stevens, N., Walter, P., and Weissman, J.S. (2009).
Regulated Ire1-dependent decay of messenger RNAs in mammalian cells. J.
Cell Biol. 186, 323–331.
Hoppins, S., Collins, S.R., Cassidy-Stone, A., Hummel, E., Devay, R.M.,
Lackner, L.L., Westermann, B., Schuldiner, M., Weissman, J.S., and Nunnari,
J. (2011). A mitochondrial-focused genetic interaction map reveals a scaffold-
like complex required for inner membrane organization in mitochondria. J. Cell
Biol. 195, 323–340.
Horn, T., Sandmann, T., Fischer, B., Axelsson, E., Huber, W., and Boutros, M.
(2011). Mapping of signaling networks through synthetic genetic interaction
analysis by RNAi. Nat. Methods 8, 341–346.
Hurley, J.H., and Emr, S.D. (2006). The ESCRT complexes: structure and
mechanism of a membrane-trafficking network. Annu. Rev. Biophys. Biomol.
Struct. 35, 277–298.
Jaspersen, S.L., and Winey, M. (2004). The budding yeast spindle pole body:
structure, duplication, and function. Annu. Rev. Cell Dev. Biol. 20, 1–28.
Jin, Y., Mancuso, J.J., Uzawa, S., Cronembold, D., and Cande, W.Z. (2005).
The fission yeast homolog of the human transcription factor EAP30 blocks
meiotic spindle pole body amplification. Dev. Cell 9, 63–73.
Jonikas, M.C., Collins, S.R., Denic, V., Oh, E., Quan, E.M., Schmid, V., Weibe-
zahn, J., Schwappach, B., Walter, P., Weissman, J.S., and Schuldiner, M.
(2009). Comprehensive characterization of genes required for protein folding
in the endoplasmic reticulum. Science 323, 1693–1697.
Kemp, H.A., and Sprague, G.F., Jr. (2003). Far3 and five interacting proteins
prevent premature recovery from pheromone arrest in the budding yeast
Saccharomyces cerevisiae. Mol. Cell. Biol. 23, 1750–1763.
Kim, D.-U., Hayles, J., Kim, D., Wood, V., Park, H.-O., Won, M., Yoo, H.-S.,
Duhig, T., Nam, M., Palmer, G., et al. (2010). Analysis of a genome-wide set
of gene deletions in the fission yeast Schizosaccharomyces pombe. Nat. Bio-
technol. 28, 617–623.
Kowalski, D., Pendyala, L., Daignan-Fornier, B., Howell, S.B., and Huang,
R.-Y. (2008). Dysregulation of purine nucleotide biosynthesis pathways modu-
lates cisplatin cytotoxicity in Saccharomyces cerevisiae. Mol. Pharmacol. 74,
1092–1100.
Lindas, A.-C., Karlsson, E.A., Lindgren, M.T., Ettema, T.J.G., and Bernander,
R. (2008). A unique cell division machinery in the Archaea. Proc. Natl. Acad.
Sci. USA 105, 18942–18946.
McCollum, D., and Gould, K.L. (2001). Timing is everything: regulation of
mitotic exit and cytokinesis by the MEN and SIN. Trends Cell Biol. 11, 89–95.
Moreno, C.S., Lane, W.S., and Pallas, D.C. (2001). A mammalian homolog of
yeast MOB1 is both a member and a putative substrate of striatin family-
protein phosphatase 2A complexes. J. Biol. Chem. 276, 24253–24260.
Morita, E., Sandrin, V., Chung, H.Y., Morham, S.G., Gygi, S.P., Rodesch, C.K.,
and Sundquist, W.I. (2007). Human ESCRT and ALIX proteins interact with
proteins of the midbody and function in cytokinesis. EMBO J. 26, 4215–4227.
Morita, E., Colf, L.A., Karren, M.A., Sandrin, V., Rodesch, C.K., and Sundquist,
W.I. (2010). Human ESCRT-III and VPS4 proteins are required for centrosome
and spindle maintenance. Proc. Natl. Acad. Sci. USA 107, 12889–12894.
Neumann, B., Walter, T., Heriche, J.K., Bulkescher, J., Erfle, H., Conrad, C.,
Rogers, P., Poser, I., Held, M., Liebel, U., et al. (2010). Phenotypic profiling
of the human genome by time-lapse microscopy reveals cell division genes.
Nature 464, 721–727.
Niwa, N., Akimoto-Kato, A., Niimi, T., Tojo, K., Machida, R., and Hayashi, S.
(2010). Evolutionary origin of the insect wing via integration of two develop-
mental modules. Evol. Dev. 12, 168–176.
Ooi, S.L., Pan, X., Peyser, B.D., Ye, P., Meluh, P.B., Yuan, D.S., Irizarry, R.A.,
Bader, J.S., Spencer, F.A., and Boeke, J.D. (2006). Global synthetic-lethality
analysis and yeast functional profiling. Trends Genet. 22, 56–63.
Poser, I., Sarov, M., Hutchins, J.R.A., Heriche, J.-K., Toyoda, Y., Pozniakov-
sky, A., Weigl, D., Nitzsche, A., Hegemann, B., Bird, A.W., et al. (2008). BAC
TransgeneOmics: a high-throughputmethod for exploration of protein function
in mammals. Nat. Methods 5, 409–415.
Raiborg, C., and Stenmark, H. (2009). The ESCRT machinery in endosomal
sorting of ubiquitylated membrane proteins. Nature 458, 445–452.
Rhind, N., Chen, Z., Yassour, M., Thompson, D.A., Haas, B.J., Habib, N., Wa-
pinski, I., Roy, S., Lin, M.F., Heiman, D.I., et al. (2011). Comparative functional
genomics of the fission yeasts. Science 332, 930–936.
Cell 149, 1339–1352, June 8, 2012 ª2012 Elsevier Inc. 1351
135
●

Appendix
Ribeiro, P.S., Josue, F., Wepf, A., Wehr, M.C., Rinner, O., Kelly, G., Tapon, N.,
and Gstaiger, M. (2010). Combined functional genomic and proteomic
approaches identify a PP2A complex as a negative regulator of Hippo
signaling. Mol. Cell 39, 521–534.
Roguev, A., Wiren, M., Weissman, J.S., and Krogan, N.J. (2007). High-
throughput genetic interaction mapping in the fission yeast Schizosaccharo-
myces pombe. Nat. Methods 4, 861–866.
Roguev, A., Bandyopadhyay, S., Zofall, M., Zhang, K., Fischer, T., Collins,
S.R., Qu, H., Shales, M., Park, H.O., Hayles, J., et al. (2008). Conservation
and rewiring of functional modules revealed by an epistasis map in fission
yeast. Science 322, 405–410.
Sabatinos, S.A., and Forsburg, S.L. (2010). Molecular genetics of Schizosac-
charomyces pombe. Methods Enzymol. 470, 759–795.
Samson, R.Y., Obita, T., Freund, S.M., Williams, R.L., and Bell, S.D. (2008).
A role for the ESCRT system in cell division in archaea. Science 322, 1710–
1713.
Sato, M., and Toda, T. (2007). Alp7/TACC is a crucial target in Ran-GTPase-
dependent spindle formation in fission yeast. Nature 447, 334–337.
Schuldiner, M., Collins, S.R., Thompson, N.J., Denic, V., Bhamidipati, A.,
Punna, T., Ihmels, J., Andrews, B., Boone, C., Greenblatt, J.F., et al. (2005).
Exploration of the function and organization of the yeast early secretory
pathway through an epistatic miniarray profile. Cell 123, 507–519.
Schuldiner, M., Metz, J., Schmid, V., Denic, V., Rakwalska, M., Schmitt, H.D.,
Schwappach, B., and Weissman, J.S. (2008). The GET complex mediates
insertion of tail-anchored proteins into the ER membrane. Cell 134, 634–645.
Singh, N.S., Shao, N., McLean, J.R., Sevugan, M., Ren, L., Chew, T.G., Bimbo,
A., Sharma, R., Tang, X., Gould, K.L., and Balasubramanian, M.K. (2011).
SIN-inhibitory phosphatase complex promotes Cdc11p dephosphorylation
and propagates SIN asymmetry in fission yeast. Curr. Biol. 21, 1968–1978.
Sousa, M., and Parodi, A.J. (1995). The molecular basis for the recognition of
misfolded glycoproteins by the UDP-Glc:glycoprotein glucosyltransferase.
EMBO J. 14, 4196–4203.
Sutterlin, C., and Colanzi, A. (2010). The Golgi and the centrosome: building
a functional partnership. J. Cell Biol. 188, 621–628.
Tallada, V.A., Tanaka, K., Yanagida, M., and Hagan, I.M. (2009). The S. pombe
mitotic regulator Cut12 promotes spindle pole body activation and integration
into the nuclear envelope. J. Cell Biol. 185, 875–888.
Tamm, T., Grallert, A., Grossan, E.P.S., Alvarez-Tabares, I., Stevens, F.E., and
Hagan, I.M. (2011). Brr6 drives the Schizosaccharomyces pombe spindle pole
body nuclear envelope insertion/extrusion cycle. J. Cell Biol. 195, 467–484.
Tong, A.H., Lesage, G., Bader, G.D., Ding, H., Xu, H., Xin, X., Young, J., Berriz,
G.F., Brost, R.L., Chang, M., et al. (2004). Global mapping of the yeast genetic
interaction network. Science 303, 808–813.
Toya, M., Sato, M., Haselmann, U., Asakawa, K., Brunner, D., Antony, C., and
Toda, T. (2007). Gamma-tubulin complex-mediated anchoring of spindle
microtubules to spindle-pole bodies requires Msd1 in fission yeast. Nat. Cell
Biol. 9, 646–653.
von Schwedler, U.K., Stuchell, M., Muller, B., Ward, D.M., Chung, H.-Y.,
Morita, E., Wang, H.E., Davis, T., He, G.-P., Cimbora, D.M., et al. (2003). The
protein network of HIV budding. Cell 114, 701–713.
Walter, P., and Ron, D. (2011). The unfolded protein response: from stress
pathway to homeostatic regulation. Science 334, 1081–1086.
West, R.R., Vaisberg, E.V., Ding, R., Nurse, P., and McIntosh, J.R. (1998).
cut11(+): A gene required for cell cycle-dependent spindle pole body
anchoring in the nuclear envelope and bipolar spindle formation in Schizosac-
charomyces pombe. Mol. Biol. Cell 9, 2839–2855.
Wood, V. (2006). Schizosaccharomyces pombe comparative genomics; from
sequence to systems. In Comparative Genomics using Fungi as Models,
Topics in Current Genetics, Volume 15, P. Sunnerhagen and J. Piskur, eds.
(Berlin: Springer-Verlag), pp. 233–285.
Wurzenberger, C., and Gerlich, D.W. (2011). Phosphatases: providing safe
passage through mitotic exit. Nat. Rev. Mol. Cell Biol. 12, 469–482.
1352 Cell 149, 1339–1352, June 8, 2012 ª2012 Elsevier Inc.
136

Publication: Decoding human cytomegalovirus
11. J. G. Kingsolver, Am. Nat. 174, 755 (2009).12. R. W. Eppley, Fish Bull. 70, 1063 (1972).13. T. L. Martin, R. B. Huey, Am. Nat. 171, E102 (2008).14. J. Norberg, Limnol. Oceanogr. 49, 1269 (2004).15. S. A. H. Geritz, É. Kisdi, G. Meszéna, J. A. J. Metz,
Evol. Ecol. 12, 35 (1997).16. P. A. Abrams, Ecol. Lett. 4, 166 (2001).17. J. C. Stegen, R. Ferriere, B. J. Enquist, Proc. Biol. Sci.
279, 1051 (2011).18. R. W. Reynolds et al., J. Clim. 20, 5473 (2007).19. R. W. Reynolds, N. A. Rayner, T. M. Smith, D. C. Stokes,
W. Wang, J. Clim. 15, 1609 (2002).20. M. R. Kearney, W. Porter, Ecol. Lett. 12, 334 (2009).21. Intergovernmental Panel on Climate Change (IPCC),
Climate Change 2007: The Physical Science Basis.Contribution of Working Group I to the Fourth AssessmentReport of the Intergovernmental Panel on ClimateChange, S. Solomon et al., Eds. (Cambridge Univ. Press,Cambridge, 2007).
22. N. Nakićenović et al., Special Report on EmissionsScenarios: A Special Report of Working Group IIIof the Intergovernmental Panel on Climate Change,N. Nakićenović, R. Swart, Eds. (Cambridge Univ. Press,Cambridge, 2000); www.osti.gov/energycitations/product.biblio.jsp?osti_id=15009867.
23. T. Delworth et al., J. Clim. 19, 643 (2006).
24. D. W. McKenney, J. H. Pedlar, K. Lawrence, K. Campbell,M. F. Hutchinson, Bioscience 57, 939 (2007).
25. D. U. Hooper et al., Nature 486, 105 (2012).26. D. Tilman, D. Wedin, J. Knops, Nature 379, 718
(1996).27. P. B. Reich et al., Science 336, 589 (2012).28. C. A. Deutsch et al., Proc. Natl. Acad. Sci. U.S.A. 105,
6668 (2008).29. K. Härnström, M. Ellegaard, T. J. Andersen, A. Godhe,
Proc. Natl. Acad. Sci. U.S.A. 108, 4252 (2011).30. A. F. Bennett, R. E. Lenski, in In the Light of Evolution.
Volume 1. Adaptation and Complex Design, J. C. Avise,F. J. Ayala, Eds. (National Academies Press, Washington,DC, 2007), pp. 225–238.
31. J. L. Knies, R. Izem, K. L. Supler, J. G. Kingsolver,C. L. Burch, PLoS Biol. 4, e201 (2006).
32. I. E. Huertas, M. Rouco, V. López-Rodas, E. Costas,Proc. Biol. Sci. 278, 3534 (2011).
33. S. L. Chown et al., Clim. Res. 43, 3 (2010).34. M. J. Angilletta Jr., R. S. Wilson, C. A. Navas, R. S. James,
Trends Ecol. Evol. 18, 234 (2003).
Acknowledgments: This research was supported by NSF(grants DEB-0845932, DEB-0845825, and OCE-0928819),including the BEACON Center for the Study of Evolutionin Action (grant DBI-0939454) and a Graduate Research
Fellowship to C.T.K., as well as a grant from the James S. McDonnellFoundation. K. Edwards and N. Swenson provided statisticaladvice, and J. Lennon, G. Mittelbach, and Е. Miller providedcomments on the manuscript. The trait data presented areshown in table S5, and the collated growth rate data are intable S6. Also thanks to NOAA/OAR/ESRL PSD, Boulder, CO,USA, for NOAA_OI_SST_V2 data provided at their Web site,www.esrl.noaa.gov/psd/. This is W. K. Kellogg BiologicalStation contribution number 1694. E.L. and M.K.T. conceivedthe original idea; M.K.T. collected the growth-temperaturedata; M.K.T. and C.T.K. analyzed the data; C.T.K. and C.A.K.developed and C.T.K. analyzed the eco-evolutionary model;M.K.T. and C.T.K. ran the mechanistic species distributionmodels; and M.K.T., C.T.K., and E.L. wrote and C.A.K.commented on the manuscript.
Supplementary Materialswww.sciencemag.org/cgi/content/full/science.1224836/DC1Materials and MethodsFigs. S1 to S12Tables S1 to S6References (35–135)
17 May 2012; accepted 10 October 2012Published online 25 October 2012;10.1126/science.1224836
Decoding Human CytomegalovirusNoam Stern-Ginossar,1 Ben Weisburd,1 Annette Michalski,2* Vu Thuy Khanh Le,3 Marco Y. Hein,2
Sheng-Xiong Huang,4 Ming Ma,4 Ben Shen,4,5,6 Shu-Bing Qian,7 Hartmut Hengel,3
Matthias Mann,2 Nicholas T. Ingolia,1† Jonathan S. Weissman1*
The human cytomegalovirus (HCMV) genome was sequenced 20 years ago. However, like thoseof other complex viruses, our understanding of its protein coding potential is far from complete.We used ribosome profiling and transcript analysis to experimentally define the HCMV translationproducts and follow their temporal expression. We identified hundreds of previously unidentifiedopen reading frames and confirmed a fraction by means of mass spectrometry. We foundthat regulated use of alternative transcript start sites plays a broad role in enabling tight temporalcontrol of HCMV protein expression and allowing multiple distinct polypeptides to be generatedfrom a single genomic locus. Our results reveal an unanticipated complexity to the HCMV coding capacityand illustrate the role of regulated changes in transcript start sites in generating this complexity.
The herpesvirus human cytomegalovirus(HCMV) infects the majority of human-ity, leading to severe disease in newborns
and immunocompromised adults (1). The HCMVgenome is ~240 kbwith estimates of between 165and 252 open reading frames (ORFs) (2, 3). Theseannotations likely do not capture the complex-ity of the HCMV proteome (4) because HCMV
has a complex transcriptome (5, 6), and genomicregions studied in detail reveal noncanonical trans-lational events, including regulatory (7) and over-lapping ORFs (8–11). Defining the full set oftranslation products—both stable and unstable,the latter with potential regulatory/antigenic func-tion (12)—is critical for understanding HCMV.
To identify the range of HCMV-translatedORFs and monitor their temporal expression, weinfected human foreskin fibroblasts (HFFs) withthe clinical HCMV strain Merlin and harvestedcells at 5, 24, and 72 hours after infection usingfour approaches to generate libraries of ribosome-protectedmRNA fragments (Fig. 1A and table S1).The first two measured the overall in vivo distri-bution of ribosomes on a givenmessage; infectedcells were either pretreated with the translationelongation inhibitor cycloheximide or, to excludedrug artifacts, lysed without drug pretreatment(no-drug). Additionally, cells were pretreated withharringtonine or lactimidomycin (LTM), two drugswith distinct mechanisms, which lead to strongaccumulation of ribosomes at translation initia-tion sites and depletion of ribosomes over thebody of the message (Fig. 1A) (13–15). A modi-
fied RNA sequencing protocol allowed quanti-fication of RNA levels as well as identificationof 5′ transcript ends by generating a strong over-representation of fragments that start at the 5′ endof messages (fig. S1) (16).
The ability of these approaches to provide acomprehensive view of gene organization is il-lustrated for the UL25 ORF: A single transcriptstart site is found upstream of the ORF (Fig. 1A,mRNA panel). Harringtonine and LTM mark asingle translation initiation site at the first AUGdownstream of the transcript start (Fig. 1A, Harrand LTM). Ribosome density accumulates overthe ORF body ending at the first in-frame stopcodon (Fig. 1A, CHX and no-drug). In the no-drug sample, excess ribosome density accumu-lates at the stop codon (Fig. 1A, no-drug) (14).
Examination of the full range of HCMVtranslation products, as reflected by the ribo-some footprints, revealed many putative previ-ously unidentified ORFs: internal ORFs lyingwithin existing ORFs either in-frame, resulting inN-terminally truncated translation products (Fig.1B), or out of frame, resulting in entirely previous-ly unknown polypeptides (Fig. 1C); short uORFs(upstream ORFs) lying upstream of canonicalORFs (Fig. 2A); ORFs within transcripts anti-sense to canonical ORFs (Fig. 2B); and previ-ously unidentified short ORFs encoded by distincttranscripts (Fig. 2C). For all of these categories,we also observed ORFs starting at near-cognatecodons (codons differing from AUG by one nu-cleotide), especially CUG (Fig. 2D).
HCMVexpresses several long RNAs lackingcanonical ORFs, including b2.7, an abundantRNA, which inhibits apoptosis (17). In agree-ment with b2.7’s observed polysome associa-tion (18), multiple short ORFs are translatedfrom this RNA (Fig. 2E and fig. S2), and thecorresponding proteins for two of these ORFswere detected by means of high-resolution MS(Fig. 2E). Although the translation efficiency
1Department of Cellular and Molecular Pharmacology, HowardHughes Medical Institute, University of California, San Francisco,San Francisico, CA 94158, USA. 2Department of Proteomicsand Signal Transduction, Max Planck Institute of Biochem-istry, Martinsried D-82152, Germany. 3Institut für Virologie,Heinrich-Heine-Universität Düsseldorf, 40225 Düsseldorf, Ger-many. 4Department of Chemistry, Scripps Research Institute,130 Scripps Way #3A2, Jupiter, FL 33458, USA. 5Departmentof Molecular Therapeutics, Scripps Research Institute, 130Scripps Way #3A2, Jupiter, FL 33458, USA. 6Natural ProductsLibrary Initiative at The Scripps Research Institute, ScrippsResearch Institute, 130 Scripps Way #3A2, Jupiter, FL 33458,USA. 7Division of Nutritional Sciences, Cornell University,Ithaca, NY 14853, USA.
*To whom correspondence should be addressed. E-mail:[email protected] (A.M.); [email protected] ( J.S.W.)†Present address: Department of Embryology, Carnegie Insti-tute for Science, Baltimore, MD 21218, USA.
23 NOVEMBER 2012 VOL 338 SCIENCE www.sciencemag.org1088
REPORTS
137
●

Appendix
of these ORFs is low, four of them are highlyconserved across HCMV strains (table S2). Wefound three similar polycistronic coding RNAs(including RNA1.2 and RNA4.9), and twoshort proteins encoded by these RNAs wereconfirmed with MS (fig. S3).
To define systematically the HCMV-translatedORFs using the ribosome profiling data, we firstannotated HCMV splice junctions, identifying88 splice sites (table S3). We then exploited theharringtonine-induced accumulation of ribo-somes at translation start sites so as to identifyORFs using a support vector machine (SVM)–based machine learning strategy (14, 19). Weobserved a strong enrichment for AUG (33-fold)and near cognate codons in the translation initia-tion sites identified with this analysis (Fig. 3A).Visual inspection of the ribosome profiling data
confirmed the SVM-identified ORFs and sug-gested an additional 53 putative ORFs (table S4).The large majority (86%) of the SVM-identifiedORFs, and all of the manually identified ones,were identified by means of SVM analysis ofan independent biological replicate (table S5 andfig. S4). The observed initiation sites were notcaused by harringtonine because LTM treatmentalso induced ribosome accumulation at the vastmajority (>98%) of these positions (Fig. 3B).
In total, we identified 751 translated ORFsthat were supported by both the LTM andharringtonine data (tables S5 and S6 and file S1).The footprint density measurements for theseORFs were reproducible between biological rep-licates (figs. S5 and S6). Of these ORFs, 147werepreviously suggested to be coding (Fig. 3C). Wedid not find strong evidence of translation for 24
previously annotated ORFs (table S7), althoughthese proteins may well be expressed under dif-ferent conditions.
Many newly identified ORFs are very short(245 ORFs ≤ 20 codons) (Fig. 3C) and are foundupstream of longer ORFs. We also identified 239short ORFs (21 to 80 codons) (Fig. 3D). Last,we identified 120 ORFs that are longer than 80amino acids. These are primarily ORFs that con-tain splice junctions or alternative 5′ ends ofprevious annotations.
Several lines of evidence support the valid-ity of the ORFs we identified. First, as seen forthe previously annotated ORFs, newly iden-tified ORFs showed a significant [P < 10−70;Kolmogorov-Smirnov (K-S) test] excess of ri-bosome footprints at the predicted stop codon(Fig. 1A and fig. S7). Because our ORF predictions
Fig. 1. Ribosome profiling of HCMV-infected cells. (A) Ribosome occupanciesafter various treatments (illustrated to left); cycloheximide (CHX), no-drug,harringtonine (Harr), and LTM together with mRNA profiles of the UL25 gene
at 72 hours after infection. An arrow marks the mRNA start. (B and C) Ribo-some occupancy profiles for (B) UL38 and (C) UL10 genes that contain internalinitiations. The gray area symbolizes a low-complexity region.
www.sciencemag.org SCIENCE VOL 338 23 NOVEMBER 2012 1089
REPORTS
138
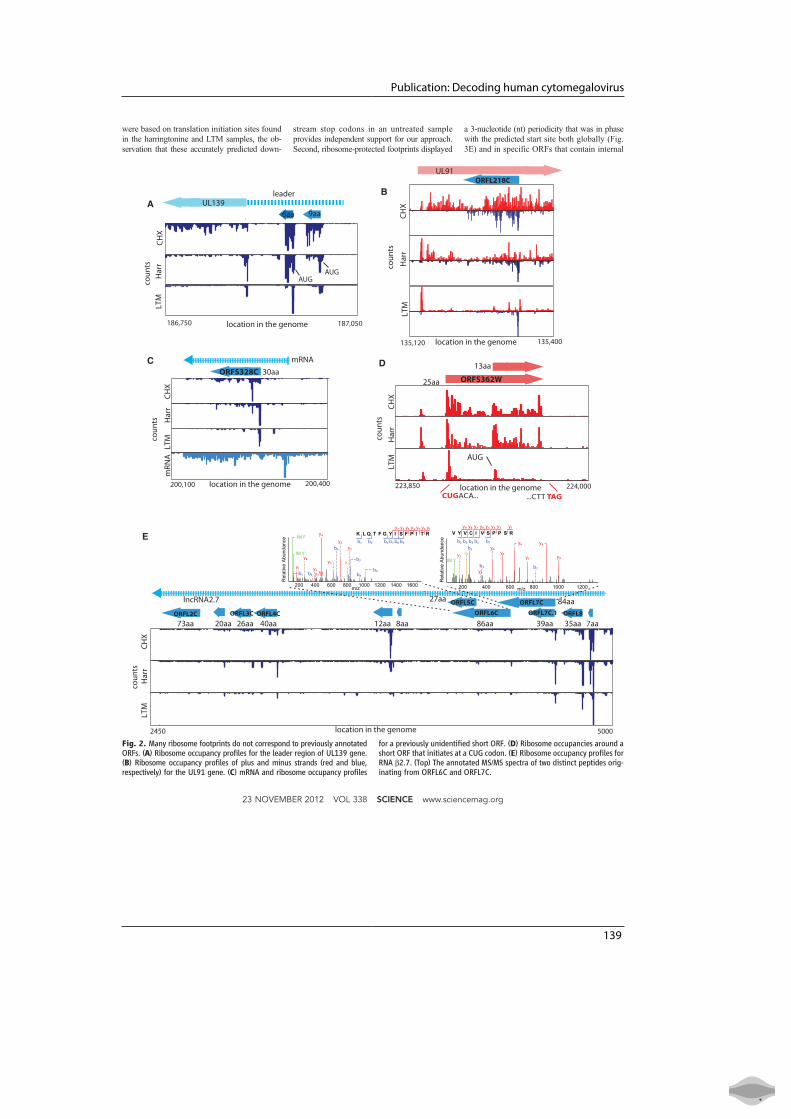
Publication: Decoding human cytomegalovirus
were based on translation initiation sites foundin the harringtonine and LTM samples, the ob-servation that these accurately predicted down-
stream stop codons in an untreated sampleprovides independent support for our approach.Second, ribosome-protected footprints displayed
a 3-nucleotide (nt) periodicity that was in phasewith the predicted start site both globally (Fig.3E) and in specific ORFs that contain internal
Fig. 2. Many ribosome footprints do not correspond to previously annotatedORFs. (A) Ribosome occupancy profiles for the leader region of UL139 gene.(B) Ribosome occupancy profiles of plus and minus strands (red and blue,respectively) for the UL91 gene. (C) mRNA and ribosome occupancy profiles
for a previously unidentified short ORF. (D) Ribosome occupancies around ashort ORF that initiates at a CUG codon. (E) Ribosome occupancy profiles forRNA b2.7. (Top) The annotated MS/MS spectra of two distinct peptides orig-inating from ORFL6C and ORFL7C.
23 NOVEMBER 2012 VOL 338 SCIENCE www.sciencemag.org1090
REPORTS
139
●

Appendix
out-of-frame ORFs (fig. S8). Third, brief inhi-bition of translation initiation using an eIF4Ainhibitor Pateamine A (20) led to depletion of ri-bosome density from the body of the large ma-jority of the predicted ORFs (fig. S9), indicatingthat the ribosomes were engaged in active elon-gation. The newly identified ORFs also exhibiteda distribution of expression levels similar to thatof previously annotated canonical ORFs (fig. S10).Last, many of the newly identified ORFs areconserved in other HCMV strains (table S2).
High-resolution tandem mass spectrometricmeasurements on virally infected cells by usingstringent criteria and manual validation (files S2and S3) (16, 21) unambiguously detected 53 pre-viously unidentified proteins out of the 96 ge-nomic loci that are not overlapping with annotatedORFs and contain at least one specific previouslyunidentified protein that is longer than 55 aminoacids (table S8). For classes of new ORFs thatwere difficult to monitor withMS (truncated formsof longer proteins or short proteins), we used atagging approach. For two N-terminally trun-cated proteins (derived fromUL16 andUL38), weconfirmed the appearance of alternative shortertranscripts and detected the expected full lengthand truncated tagged protein products (fig. S11).
The truncated protein derived from UL16 wasalso observed in the context of the native virus(fig. S12), and we confirmed a splice variant ofUL138 by using an antibody (fig. S12). For fiveshort ORFs (including two initiated at near cog-nate start sites), we fused the ORFs in frame to agreen fluorescent protein (GFP)–coding regionin their otherwise native transcript context. Weidentified protein products of the expected sizesand confirmed that we correctly identified thetranslation start sites (fig. S13). We also showedthat one of these short proteins (US33A-57aa),which was not identified with MS but was re-cently predicted by means of transcript analysisto be coding (6), is expressed in the context ofthe native virus (Fig. 3F and fig. S12). Addition-ally, we focused on the very short, near cognatedriven uORFs that lie directly upstream of UL119and US9, whose inclusion changes during infec-tion as a result of changes in the 5′ end of thetranscripts. We found that these uORFs modu-lated the translation efficiency of a downstreamreporter gene (fig. S14).
Last, we examined the subcellular localiza-tion for 18 newly identified ORFs (11 of whichwere detected by means of mass spectrometry)(table S9) using transient expression of GFP-
tagged proteins. We detected 15 proteins, 10 ofwhich showed specific subcellular localizationpatterns: six in mitochondria, three in the endo-plasmic reticulum (ER), and one in the nucleus(Fig. 3G and fig. S15). Immunoprecipation andMS experiments on two of these GFP-taggedproteins, ORF359W (ER localized) and US33A(mitochondrially localized), identified a few spe-cific interacting proteins. Western blot analysisconfirmed the interactions with TAP1 (ORF359W)and the mitochondrial inner membrane transportTIM machinery (US33A) (fig. S16).
HCMV genes are expressed in a temporallyregulated cascade. Our data provides an oppor-tunity to monitor viral protein translation through-out infection. Most of the viral genes, includingnewly identified ORFs, showed tight temporalregulation of protein synthesis levels; 82% ofORFs varied by at least fivefold. Hierarchicalclustering of viral coding regions by their foot-print densities during infection (a measure ofthe relative translation rates) revealed several dis-tinct temporal expression patterns (fig. S17).
As was seen previously for a limited numberof genomic loci (8–11, 22), examination of viraltranscripts during infection revealed a pervasiveuse of alternative 5′ ends that is critical to the
Fig. 3. Annotating the HCMV-translated ORFs. (A) Foldenrichment of AUG and near-cognate codons at pre-dicted sites of translation initiation compared with theirgenomic distribution. (B) The ribosome footprints occu-pancy after LTM treatment at each start codon (relativeto the median density across the gene) is depicted forthe previously annotated ORFs (blue) and newly iden-tified ORFs (red; empty red for ORFs that were removed).The occupancy at a codon five positions downstream ofthe start codon is depicted as a control (green). (C) Venndiagram summarizing the HCMV-translated ORFs. Fifty-three ORFs were initially identified through manual in-spection. (D) The lengths distribution of newly identifiedORFs (red) and previously annotated ORFs (blue). (E) Po-sition of 30-nt ribosome footprints relative to the readingframe in the newly identified ORFs (red) and previous-ly annotated ORFs (blue). (F) MRC-5 cells were mock-treated or infected with TB40-US33A-hemagglutinin(HA), and protein lysates were analyzed with Westernblotting with indicated antibodies. (G) HeLa cells were
transfected with GFP fusion proteins together with an ER marker (KDEL-mCherry) or stained with MitoTracker Red (Invitrogen, Grand Island) andimaged by means of confocal microscopy.
www.sciencemag.org SCIENCE VOL 338 23 NOVEMBER 2012 1091
REPORTS
140

Publication: Decoding human cytomegalovirus
tight temporal regulation of viral genes expres-sion and production of alternate protein productsduring infection. For example, at the US18-US20locus, 5 hours after infection there is one maintranscript starting just upstream ofUS20 enablingUS20 translation. At 24 hours after infection, ashorter version of the transcript is detected startingimmediately upstream of US18, enabling its trans-lation. A third previously unknown transcriptisoform starting within the US18 coding sequenceemerges at 72 hours after infection, resultingin translation of a truncated version of US18(ORFS346C.1) at this time point (Fig. 4, A and B).Another example is detailed in fig. S18, and weidentified reproducible temporal regulation of
5′ ends in 61 viral loci (encompassing ~350 ORFs)(figs. S19 and S20 and table S10), six of whichwe confirmedwithNorthern blot analysis (Fig. 4Band figs. S11 and S21). Thus, our studies reveal apervasive mode of viral gene regulation in whichdynamic changes in 5′ ends of transcripts con-trol protein expression from overlapping codingregions. Just as alternative splicing (a process inwhich a single gene codes for multiple proteins)expands protein diversity, alternative transcriptstart sites may provide a broadly usedmechanismfor generating complex proteomes.
The genomic era began with the sequencingof the bacterial DNAvirus, phi X, in 1977 (23)and the mammalian DNAvirus, Simian virus 40
(24), the following year. Since then, extraordinaryadvances in sequencing technology have enabledthe determination of a vast array of viral genomes.Deciphering their protein coding potential, how-ever, remains challenging. Here, we present anexperimentally based analysis of translation ofa complex DNA virus, HCMV, by using bothnext-generation sequencing and high-resolutionproteomics. It is possible that many of the shortORFs we have identified are rapidly degradedand do not act as functional polypeptides. None-theless, these could still have regulatory functionor be an important part of the immunologicalrepertoire of the virus as major histocompatibilitycomplex (MHC) class I bound peptides are
Fig. 4. A major source of ORFs’ diversity during infection originates fromalternative transcripts starts. (A) The mRNA and ribosome occupancy profilesaround US18 to US20 loci at different infection times (marked left). Smallarrows denote the different mRNA starts, and (top) the corresponding mRNAs
are illustrated. (Bottom) An expanded view of the US18 locus at 72 hours afterinfection and includes the harringtonine and LTM profiles (asterisks indicatethe internal initiation). (B) Total RNA extracted at different time points duringinfection was subjected to Northern blotting for ORFS346C.1.
23 NOVEMBER 2012 VOL 338 SCIENCE www.sciencemag.org1092
REPORTS
141
●

Appendix
Resource
A Systematic Mammalian GeneticInteraction Map Reveals PathwaysUnderlying Ricin SusceptibilityMichael C. Bassik,1,6,* Martin Kampmann,1,6,* Robert Jan Lebbink,2,7 Shuyi Wang,1 Marco Y. Hein,3 Ina Poser,4
Jimena Weibezahn,1 Max A. Horlbeck,1 Siyuan Chen,5 Matthias Mann,3 Anthony A. Hyman,4 Emily M. LeProust,5
Michael T. McManus,2 and Jonathan S. Weissman11Department of Cellular and Molecular Pharmacology, California Institute for Quantitative Biomedical Research and Howard Hughes
Medical Institute2Department of Microbiology and Immunology and University of California San Francisco Diabetes Center
University of California, San Francisco, San Francisco, CA 94122, USA3Proteomics and Signal Transduction, Max Planck Institute of Biochemistry, Martinsried 82152, Germany4Max Planck Institute of Molecular Cell Biology and Genetics, Dresden 01307, Germany5Genomics Solution Unit, Agilent Technologies Inc., Santa Clara, CA 95051, USA6These authors contributed equally to this work7Present address: Department of Medical Microbiology, University Medical Center Utrecht, 3584 CX Utrecht, The Netherlands*Correspondence: [email protected] (M.C.B.), [email protected] (M.K.)
http://dx.doi.org/10.1016/j.cell.2013.01.030
SUMMARY
Genetic interaction (GI) maps, comprising pairwisemeasures of how strongly the function of one genedepends on the presence of a second, have enabledthe systematic exploration of gene function in micro-organisms. Here, we present a two-stage strategy toconstruct high-density GI maps in mammalian cells.First, we use ultracomplex pooled shRNA libraries(25 shRNAs/gene) to identify high-confidence hitgenes for a given phenotype and effective shRNAs.We then construct double-shRNA libraries fromthese to systematically measure GIs between hits.A GI map focused on ricin susceptibility broadlyrecapitulates known pathways and provides manyunexpected insights. These include a noncanonicalrole for COPI, a previously uncharacterized proteincomplex affecting toxin clearance, a specializedrole for the ribosomal protein RPS25, and func-tionally distinct mammalian TRAPP complexes. Theability to rapidly generate mammalian GI mapsprovides a potentially transformative tool for defininggene function and designing combination therapiesbased on synergistic pairs.
INTRODUCTION
Analysis of mammalian genomic sequences provides a parts list
of the proteins that comprise a cell. The remaining challenge is to
define functions for these parts and understand how they act
together. Work in model organisms, especially budding yeast,
has demonstrated the broad utility of comprehensive genetic
interaction (GI) maps in defining gene function in a systematic
and unbiased manner (Collins et al., 2009; Dixon et al., 2009).
GIs, which measure the extent to which the phenotype of a first
mutation is modified by the presence of a second, reveal func-
tional relationships between genes. Additionally, the pattern of
GIs of a gene provides an information-rich description of its
phenotype, which can be used to detect functional similarities
between genes and reveal pathways without prior assumptions
about cellular functions.
Systematic quantitative analysis of GIs in yeast has allowed
rapid identification of new functional complexes, predicted
roles for uncharacterized genes, revealed network rewiring in
response to environmental changes, and demonstrated func-
tional repurposing of complexes and interactions during evolu-
tion (Bandyopadhyay et al., 2010; Collins et al., 2009; Dixon
et al., 2009; Frost et al., 2012). More recently, GI maps have
also been used with great success in Gram-negative bacteria,
fission yeast, and cultured cells from fruit flies (Butland et al.,
2008; Frost et al., 2012; Horn et al., 2011; Ryan et al., 2012;
Typas et al., 2008).
In mammalian cells, an approach for systematic mapping of
GIs could have broad utility for unbiased functional annotation
of the human genome as well as for targeted investigation of
mammalian-specific pathways. More generally, a better under-
standing of the structure of GIs may clarify the complex herita-
bility of common traits (Zuk et al., 2012). Furthermore, GIs are
important in both the pathogenesis and treatment of a number
of human diseases, such as cancer (Ashworth et al., 2011). For
example, pairs of genes that exhibit synthetic lethality in cancer
cells, but not healthy cells, are ideal targets for combination
therapies aimed at limiting the emergence of drug resistance in
rapidly evolving cells.
A number of challenges confront any effort to systematically
quantify GIs. First, high-precision phenotypic measurements
are needed to accurately determine GIs, which are quantified
as the deviation of an observed double-mutant phenotype
Cell 152, 909–922, February 14, 2013 ª2013 Elsevier Inc. 909
142

Publication: A systematic mammalian genetic interaction map
from that expected from two individual mutants. Second, GIs are
typically rare (Collins et al., 2009; Dixon et al., 2009), and
therefore a scalable high-throughput approach is required to
generate large, high-density GI maps. At the same time, the large
number of possible pairwise interactions in the human genome
(�4 3 108) makes it necessary to focus on a subset of genes
with common biological functions to create a sufficiently dense
GI map to reveal meaningful insights.
Recent developments in screening technologies have laid the
groundwork for systematic forward genetics in mammalian cells.
Both short-hairpin RNA (shRNA)-based RNA interference (RNAi)
and haploid insertion approaches lend themselves to pooled
screening, which, when combined with deep-sequencing-based
readouts (Bassik et al., 2009; Carette et al., 2011; Silva et al.,
2008), allows massive multiplexing and provides a controlled,
identical environment for all cells. Nevertheless, the extraction
of robust biological information from genome-wide screening
data is challenging (Kaelin, 2012); for RNAi-based screens in
particular, the problems of false-positive hits caused by off-
target effects and false-negative hits caused by ineffective
RNAi agents can limit reliability. Despite these challenges,
screens for modifiers of single genes have demonstrated the
value of investigating GIs by RNAi (Barbie et al., 2009; Luo
et al., 2009).
We have developed a scalable, high-precision pooled
shRNA-based approach for robustly conducting RNAi-based
screens and measuring GIs in high throughput in mammalian
cells. We used our method to examine genetic modifiers of
cellular susceptibility to ricin. Ricin is a member of a broad class
of AB-type protein toxins that includes major human pathogens.
Similar to many viral pathogens, these toxins enter cells by
endocytosis and hijack intracellular trafficking pathways.
Though medically important in their own right, these agents
have also been used with great success to probe various
aspects of cell biology (Johannes and Popoff, 2008; Spooner
and Lord, 2012). Because the general biology of ricin has
been extensively studied, it is well suited to evaluate screening
approaches. Indeed, several recent screens have been con-
ducted to identify factors whose depletion protects against
AB-toxins (Carette et al., 2009; Guimaraes et al., 2011; Moreau
et al., 2011; Pawar et al., 2011). Nonetheless, a comprehensive
understanding of the pathways exploited by ricin is missing,
and little is known about factors whose loss enhances ricin
toxicity.
In a primary genome-wide screen for modifiers of ricin suscep-
tibility, we found �200 known and previously uncharacterized
factors that either sensitized or protected cells against ricin
intoxication; with some interesting exceptions, these factors
were remarkably well focused on the retrograde transport
pathway. We then defined functional relationships among these
genes in a GI map. We could broadly recapitulate existing
complexes and pathways, functionally dissect multiprotein com-
plexes, identify new complexes with uncharacterized compo-
nents, and provide unexpected insights into the functions of
well-characterized genes. More broadly, this work establishes
a strategy that integrates a robust method for RNAi screening
with scalable, systematic analysis of GIs, which should be appli-
cable to diverse biological problems.
RESULTS AND DISCUSSION
Strategy for Primary Screens Using UltracomplexshRNA LibrariesThe first step in our strategy is to conduct a genome-wide screen
to identify genes that function within a biological pathway of
interest and effective shRNAs that target them, using ultracom-
plex shRNA libraries. Ultracomplex libraries increase the likeli-
hood of targeting each gene with several effective shRNAs, thus
reducing the false-negative rate. Additionally, requiring several
active shRNAs to identify a hit gene reduces the rate of false
positives, as it is unlikely that several shRNAs targeting a non-
hit gene have off-target effects relevant to the phenotype of
interest. Two key technical developments enable ultrahigh-
coverage screening: the ability to construct ultracomplex libraries
using massively parallel oligonucleotide synthesis (Cleary et al.,
2004; Silva et al., 2005) and the capacity of deep sequencing to
monitor screening results (Bassik et al., 2009; Silva et al., 2008).
To determine the best design for a genome-wide ultracomplex
shRNA library, we conducted a pilot screen with a limited library
targeting �1,000 genes with 50 shRNAs each. We chose ricin as
a selective agent for our screen because it efficiently kills cells
and relies on numerous host cell factors for its toxicity. In our pilot
library,we includedshRNAs targetinganumberofgenes thatwere
previously reported to affect ricin sensitivity. In addition, we
included more than 1,000 negative control shRNAs that had the
same overall base composition as the other shRNAs in the library
but that did not match the sequence of any human transcript.
We infected K562 human myelogenous leukemia cells with
these libraries and subjected one half of the population to four
pulses of ricin treatment while the other half was grown
in the absence of ricin. After 12 days, genomic DNA was
isolated from cells of the treated and untreated populations,
the shRNA-encoding cassettes were PCR amplified, and their
frequencies were quantified by deep sequencing (Figure 1A).
Comparison of the frequency of each shRNA in the treated and
untreated populations yielded an enrichment ratio. To enable
direct comparisons between different experiments, we defined
a metric r for ricin resistance, which quantifies the differential
effect that an shRNA has on cell growth in the presence versus
absence of ricin (see Extended Experimental Procedures avail-
able online and M.K., M.C.B., and J.S.W., unpublished data).
An shRNA without effect on ricin sensitivity has a r of 0; shRNAs
conferring ricin resistance have positive r values; and shRNAs
sensitizing cells to ricin have negative r values. The criterion
for hit genes was based on a p value, which reports on the prob-
ability that the distribution of rs for all shRNAs targeting a given
gene was significantly different from the distribution for negative
control shRNAs (reflecting both random noise and off-target
effects), as determined by the Mann-Whitney U test (Figure 1B).
The robustness of this approach is supported by the agreement
of hit genes obtained when we constructed and screened two
independent shRNA libraries targeting the same genes but using
different shRNA designs and target sites (Figure S1A).
To identify an appropriate complexity for a genome-wide
library, we examined how the number of shRNAs targeting
each gene affects the confidence of hit detection. Specifically,
we calculated p values based on random subsets of shRNAs
910 Cell 152, 909–922, February 14, 2013 ª2013 Elsevier Inc.
143
●

Appendix
for each gene and determined the effect of subset size on the
p value for three example genes: the strong hit gene RAB1A,
the weaker hit gene STX16, and the non-hit gene CRYAB (Fig-
ure 1C). In our experimental system, the ability to confidently
resolve STX16 from background began at �15 shRNAs per
gene and increased steadily as more shRNAs were included.
These examples are representative of the entire spectrum of
genes (Figure 1D): increasing the coverage of shRNAs per
gene improved the signal for hits without spuriously increasing
p values for non-hits. Based on these results, we chose
a coverage of 25 shRNAs per gene for a genome-wide library.
Reproducibility and Performance of UltracomplexLibraries in a Pilot Ricin ScreenTo test the ability of our screening approach to identify effective
shRNAs targeting hit genes, we carried out the ricin resistance
pilot screen in duplicate. The quantitative phenotypes of shRNAs
targeting hit genes correlated reasonably well between repli-
cates (Figure S1B). A main source of noise in pooled screens is
thought to be Poisson sampling error, originating from repeated
passaging of cells through a population bottleneck (Pierce et al.,
2007). Indeed, conducting a batch retest of shRNAs chosen
based on primary screen results with a coverage of �50,000
cells per shRNA species, as compared with �1,000 cells per
shRNA during the primary screen, strongly suppressed the level
of observed variability (Figure S1C). In future screens, a small-
scale (2 l) bioreactor should allow one to conduct an entire
primary genome-wide screen in a single batch of suspension
cells with �4,000-fold coverage of cells per shRNA.
We validated phenotypes for single shRNAs individually (Fig-
ure S1D) and in a pooled batch retest or individual competitive
growth assays. These two quantitative assays gave highly corre-
lated results (Figure S1E). Generally, the phenotypic strength of
shRNAs targetingagivenhitgenealsocorrelatedwellwith theeffi-
ciency of target mRNA knockdown (Figure S1F), suggesting that
shRNAs were predominantly acting through the intended target.
A Genome-wide, High-Coverage shRNA Screen forModifiers of Ricin Toxicity Yields Diverse Hits Focusedon Key PathwaysWe next designed a library targeting each annotated human
protein-coding gene with 25 independent shRNAs on average,
Log2 counts, untreated
Log 2
coun
ts, r
icin
-tre
ated
0 4 8 12 16
4
8
12
16
b
Infected cells,Before selection
aa
cc a
bK562 cells
High-coverage shRNA library
Lentiviral infection
ba
cc
a
bc
bc a
bbbb
Untreated
Split
Ricin
Count shRNAs by deep sequencing
Numbers of shRNAs per gene40 02 04200 0
12
0Gen
es, s
orte
d by
p v
alue
sca
lcul
ated
from
45
shR
NA
s
Numbers of shRNAs per gene 0 10 04030302
–log
10 p
val
ue fo
r ge
ne (
mea
n +
/– S
D)
RAB1ASTX16CRYAB
Negative control shRNAsshRNAs targeting RAB1B
Negative control shRNAsshRNAs targeting COPA
Protective
Sensitizing
0.5
–0.5
0 = WT
Log2 counts, untreated
Log 2
coun
ts, r
icin
-tre
ated
0 4 8 12 16
4
8
12
16
12
8
4
8
4
–log10 p
C D
B
A
p = p =
Figure 1. Pooled High-Coverage RNAi
Screen for Ricin Resistance and Sensiti-
zation
(A) Experimental strategy: A population of K562
cells was infected with a pooled high-cover-
age shRNA library and split into two subpopu-
lations, one of which was treated with ricin.
The frequency of shRNA-encoding constructs in
each subpopulation was determined by deep
sequencing.
(B) Based on the frequency in the treated and
untreated subpopulations, a quantitative resis-
tance phenotype r was calculated for each
shRNA. Comparing the distribution of rs for
shRNAs targeting a gene of interest to the r
distribution for negative control shRNAs using the
Mann-Whitney U test yielded a p value for the
gene. RAB1B knockdown protects cells from ricin
(p = 6.9 3 10�8), whereas knockdown of COPA
sensitizes cells to ricin (p = 2.4 3 10�8).
(C and D) Increasing the coverage of the shRNA
library improves the detection of hit genes above
background. p values for each gene in a test library
were calculated on the basis of random subsets
of the data; the number of shRNAs included per
gene was varied. Random subsampling was
repeated 100 times; means of –log10 P values are
shown. Gray dotted lines indicated a coverage of
25 shRNAs per gene, which we chose for our
genome-wide library.
(C) Means of –log10 p values ± SD for three
example genes: a strong hit (RAB1A), a moderate
hit (STX16), and a non-hit (CRYAB).
(D) Means of –log10 p values for all 1,079 genes
targeted by the library (left) and for the top 50 hits
based on the p value calculated from 45 shRNAs
(right).
See also Figure S1.
Cell 152, 909–922, February 14, 2013 ª2013 Elsevier Inc. 911
144

Publication: A systematic mammalian genetic interaction map
as well as at least 500 negative control shRNAs per experiment.
The shRNAswere grouped in nine sublibraries of 55,000 shRNAs
each, based on annotated biological functions (Extended
Experimental Procedures).
For our first application of the genome-wide screening
approach, we also used ricin, as it should give access to the
rich biology of host pathways exploited by this toxin (Lord
et al., 2005; Sandvig et al., 2010; Spooner and Lord, 2012).
Specifically, ricin is internalized by endocytosis and traffics retro-
gradely through the secretory pathway to the ER, where its A and
B subunits are dissociated. The catalytic A subunit is then retro-
translocated to the cytoplasm, where it depurinates a single
base in the 28S rRNA, shutting down translation and leading to
apoptosis (Figure 2A).
We defined a set of hit genes based on false discovery rate
(FDR; Storey and Tibshirani, 2003); this set contained the 73
strongest protective hits (FDR <0.05) and the 83 strongest sensi-
tizing hits (FDR <0.02) (Table S1). These hits were strongly
enriched for genes related to trafficking along the secretory
pathway (Figure 2B). Figure 2C displays the top hits in their
A B
Cp value
p value :
Figure 2. Hits from a Genome-wide Screen
Recapitulate Known Ricin Biology
(A) Overview of ricin intoxication of mammalian
cells. Ricin is taken up by endocytosis and traffics
retrogradely to the ER, where ricin A and B chains
dissociate. The A chain retrotranslocates to the
cytoplasm and cleaves ribosomal RNA, thereby
inhibiting protein synthesis and ultimately trig-
gering apoptosis.
(B) GO-term enrichment analysis for top hits. Top
hits were defined as the set of 73 protective genes
with an FDR <0.05 and 83 sensitizing genes with
an FDR <0.02. Nonredundant GO terms with an
FDR <0.05 are shown. (Black bars) biological
process; (gray bars) cellular component.
(C) Visualization of top hits in cellular pathways as
blue circles (protective hits) and red circles (sen-
sitizing hits); circle area is proportional to –log10p value. Selected hits below the top hit cutoff were
included (pink and light blue circles) if they were
part of a known physical complex containing a top
hit or if they were part of the GI map presented in
Figure 5. Gray ovals indicate known physical
complexes, and the asterisk identifies theWDR11/
C17orf75 complex identified in this study.
See also Figure S2 and Table S1.
canonical cellular context (see also Fig-
ure S2). A large fraction of characterized
hits included genes either acting in the
secretory pathway or otherwise expected
based on known ricin biology. In addition,
we tagged several poorly characterized
hit genes with GFP, expressed them
from their native chromosomal context
in BACs (Poser et al., 2008), and con-
firmed that they were localized to secre-
tory pathway organelles (Figure S3). We
found that many of the top hits in the
screen are also known to exist in physical complexes with
each other, with strong protection upon knockdown of compo-
nents of COPII, TRAPP, and GARP and strong sensitization
upon knockdown of components of COPI, the ribosome, and
the proteasome. Taken together, the above results illustrate
the specificity and robustness of the hits identified by our
approach.
Consistent with results from previous ricin screens and indi-
vidual gene studies, we found that the early endocytic factors
clathrin and Rab5 (Moreau et al., 2011) were required for ricin
toxicity, as well as STX16, a snare protein involved in vesicle
fusion at the TGN (Amessou et al., 2007). Among the most
strongly enriched were components of the GARP complex
known to be required for tethering endosome-derived vesicles
to the Golgi (Bonifacino and Hierro, 2011). Knockdowns of
several (but not all, see below) components of the vesicle-
tethering TRAPP complex were among the most strongly
protective.
Surprisingly, a large number of components of the COPII
machinery required for anterograde vesicle budding from the
912 Cell 152, 909–922, February 14, 2013 ª2013 Elsevier Inc.
145
●

Appendix
ER were strongly protective against ricin when knocked down,
which has not been previously observed. It is likely that shut-
down of ER-Golgi trafficking (and consequent Golgi collapse)
prevents ER delivery of ricin.
Depletion of ribosomal components and ribosome biogenesis
factors sensitized cells to the toxin, as expected given that ricin
targets the ribosome. A notable exception was RPS25, whose
knockdown was strongly protective against ricin, as discussed
below.
Identification of Atorvastatin as a Small-MoleculeInhibitor of Ricin Transport to the EROne goal of RNAi-based forward genetic screens is to identify
therapeutically valuable targets for small-molecule inhibitors.
Consistent with previous studies (Grimmer et al., 2000), our
primary screen identified components of the cholesterol biosyn-
thesis pathway, including HMG-CoA reductase (HMGCR). We
observed a dose-dependent protection of ricin-treated cells by
the HMGCR inhibitor atorvastatin (Figure 3A), confirming the
role of HMGCR in modulating the toxicity of ricin and demon-
strating that our primary screen could identify effective pharma-
cological targets.
To assess whether inhibition of HMGCR by atorvastatin
affected delivery of ricin to the ER, we expressed an ER-targeted
SNAP protein (Geiger et al., 2011) in cells and added benzylgua-
nine (BG)-coupled ricin to measure ricin flux into the ER. Upon
delivery of toxin to the ER, an irreversible bond can form between
ricin-BG and ER-SNAP, which we could quantify as an increase
in molecular weight by western blot (Figure 3B). The fraction
of SNAP that is present in ricin conjugates was reduced
by �80% upon treatment with atorvastatin (Figures 3B and
3C), suggesting that toxin traffic to the ER was blocked upon
HMGCR inhibition.
A Paradoxical Role for COPI in Diverting Ricin fromthe EROne of the more surprising results from the primary screen was
a profound sensitization to ricin upon depletion of COPI compo-
nents (Figure 2C and Table S1), which are normally involved in
retrograde endosome-Golgi and Golgi-ER transport (Popoff
et al., 2011). Several groups have observed a lack of requirement
for retrograde COPI components in trafficking of ricin or Shiga
toxin (Chen et al., 2002; Girod et al., 1999; Llorente et al.,
2003). However, sensitization by COPI depletion or inactivation
has not been described previously.
Primary hits from the ricin screen were retested in batch in
a second cell type (Raji B) for their effects on sensitivity to both
ricin and Shiga toxin, a similar AB toxin (data not shown). Again,
we observed sensitization to ricin upon COPI knockdown but
strong protection against Shiga toxin, revealing an unexpected
difference between the trafficking pathways of these two well-
studied toxins. Individual shRNAs targeting COPI components
ARCN1 or COPZ1 confirmed this finding (Figure 3D). This diver-
gent set of requirements was the exception rather than the rule:
ARF1 is a representative factor whose knockdown protected
against both toxins (Figure 3D). COPI depletion enhanced
delivery of toxin to the ER based on the SNAP assay (Figure 3E).
It may be that COPI knockdown upregulates a compensatory
alternative pathway or that it normally functions in transport
steps that divert ricin from the ER.
A Strategy for Generating High-Density GI Maps Basedon Double-shRNA ScreensThough our screen accurately identified genes that are important
for ricin pathology, the large number of hits makes individual vali-
dation and characterization challenging. Indeed, the difficulty in
pinpointing promising hits for in-depth follow up represents
DC
A B
E
Figure 3. Characterization of Hit Genes
from the Primary Screen
(A) K562 cells were treated with ricin in the pres-
ence or absence of atorvastatin for 24 hr and were
then allowed to recover in the continued presence
of atorvastatin. The mean percentage of viable
cells in triplicate measurements ± SD was quan-
tified using flow cytometry.
(B) Cells expressing ER-localized SNAP were
intoxicated with benzylguanine-labeled ricin, and
covalent ricin-SNAP complexes were detected by
anti-SNAP western blot.
(C) Quantification of ricin-modified fraction of ER-
SNAP (mean of triplicate experiments ± SD).
(D) Raji B cells were infected with shRNAs target-
ing the indicated genes, and a competitive growth
assaywas performed in the presence of either ricin
or shiga toxin (Stx). Mean of triplicate ricin resis-
tance (r) measurements ± SD is shown.
(E) COPZ1 knockdown increases levels of ER-
localized ricin (mean of triplicate experiments ±
SD), as measured by the SNAP assay.
Error bars represent SD. See also Figure S3.
Cell 152, 909–922, February 14, 2013 ª2013 Elsevier Inc. 913
146

Publication: A systematic mammalian genetic interaction map
A
B
D
C
E
F
Figure 4. Effects of Combinatorial Gene Knockdowns by Double-shRNAs
(A) Experimental strategy: Active shRNAs targeting hit genes from the primary screen were individually cloned, and barcodes were added upstream and
downstream of the miR30 context. Pooled ligation yielded a library of all pairwise combinations of shRNAs. Ricin resistance phenotypes of double-shRNAs were
determined as for the primary screen; double-shRNAs were identified by sequencing the combinatorial barcode (red arrow).
(B) Reproducibility between phenotypes of individual shRNAs in a batch retest (mean of two experiments ± spread) and the same shRNAs paired with negative
control shRNAs in a double-shRNA screen (mean ± SD for combinations with 12 different negative control shRNAs).
(C) Reproducibility between two permutations of double-shRNA constructs representing (negative control + targeted) or (targeted + negative control), mean ±SD
for combinations with 12 different negative control shRNAs.
(legend continued on next page)
914 Cell 152, 909–922, February 14, 2013 ª2013 Elsevier Inc.
147
●

Appendix
a general bottleneck for the interpretation of RNAi screens.
To address this issue, we developed a strategy to systematically
determine GIs between the hits based on double-knockdown
phenotypes. For this purpose, we created a double-shRNA
library based on effective shRNAs identified from the primary
screen. shRNA-encoding cassettes were individually barcoded,
pooled, and ligated to obtain all pairwise combinations (Figures
4A and S4). This double-shRNA library was introduced into cells
and subjected to a ricin resistance screen under the same condi-
tions as those in the primary screen to quantify double-shRNA
phenotypes.
In order to obtain single-shRNA phenotypes from the same
screen, we included 12 negative control shRNAs in the double-
shRNA library pool. Importantly, phenotypes of single shRNAs
as quantified by batch retest were in excellent agreement with
phenotypes of double shRNAs combining the same shRNAs
with negative control shRNAs (Figure 4B). Moreover, the pres-
ence of a second shRNA and the order of shRNAs within the
double-shRNA construct had minimal impact on the measured
phenotypes (Figure 4C) or knockdown efficiency (Figures S5,
S6D, and S6E).
We found that the typical phenotype of a given double shRNA
could be reliably predicted by a linear relationship of the pheno-
types of the two individual shRNAs (Figure 4D). GIs were thus
quantified as deviations from the linear fit of this typical
double-mutant phenotype. Deviations toward the phenotype of
WT cells were defined as buffering GIs, and deviations away
from WT were defined as synergistic GIs. As expected, two
shRNAs targeting the same gene typically showed buffering
GIs (e.g., SEC23B in Figure 4D), whereas synergistic GIs could
be observed for some shRNAs targeting genes acting in parallel
(e.g., shRNAs targeting SEC23A and SEC23B, two isoforms with
partially distinct functions; Fromme et al., 2008; Schwarz et al.,
2009; Figure 4D). GIs observed in the pooled double-shRNA
screen could also be reproduced in individual validation experi-
ments. For example, SEC23A and SEC23B knockdown (whose
specificity was validated by rescue experiments; Figures S6A–
S6C) synergized to create highly ricin-resistant cells, as moni-
tored by the competitive growth assay (Figure 4E). A similar
synergistic effect was seen when the amount of ricin reaching
the ER was assessed by ER-SNAP assay (Figures 4F and S6F).
Construction and Benchmarking of a Ricin GI MapA major motivation for systematic GI mapping beyond the direct
analysis of pairwise interactions between genes is the possibility
of analyzing the correlation of global GI patterns between
different genes. Genes with highly correlated GI patterns tend
to be functionally related (Collins et al., 2009; Dixon et al., 2009).
Correlations between shRNA GI patterns derived from our
double-shRNA screens were highly reproducible between inde-
pendent experimental replicates (Figure 5A). As expected,
shRNAs targeting the same gene had more correlated GI
patterns than other shRNAs (Figure 5B), indicating that their
phenotypes were mostly due to on-target knockdown. Similarly,
shRNA pairs targeting different members of the same protein
complex had highly correlated GI patterns, which were clearly
distinct from the bulk of shRNA pairs. This result demonstrates
the ability of our approach to broadly identify genes encoding
members of the same physical complex. Interestingly, shRNAs
targeting a small set of genes produced GI patterns that were
anticorrelated with those targeting other components of the
same physical complex (Figure 5B), causing an overall bimodal
distribution of intracomplex GIs. These genes also had the oppo-
site phenotype in the primary screen: TRAPPC9 (anticorrelated
with other members of the TRAPP complex), SEC23A (anticorre-
lated with other COPII components), and RPS25 (uncorrelated
with ribosomal proteins of the large subunit). The unusual
behavior of these three genes is robustly observed for all three
shRNAs targeting each of them and is therefore likely to reflect
the functional differences. These findings illustrate that our
genetic results can functionally dissect known physical com-
plexes, which we explore below in more detail for RPS25 and
the TRAPP complex.
A possible source of noise in an RNAi-based GI map is the fact
that an effective on-target shRNA can have partial off-target
effects, which can confound its GI pattern. To minimize this
effect, we required each gene in the GI map to be targeted by
at least two (and typically three) shRNAs whose GI patterns
were sufficiently correlated (Extended Experimental Procedures;
M.K., M.C.B., and J.S.W., unpublished data) and averaged the
GIs of these highly correlated shRNAs for each gene. Using
these stringent criteria, the resulting GI map (Figure 5C) encom-
passed pairwise interactions between 60 genes, each repre-
sented by three shRNAs on average, and was based on the
pooled measurement of >36,000 double-shRNA phenotypes.
The main limitation for increasing the scale of GI maps is the
availability of highly validated shRNAs, as a single bioreactor
run can measure >500,000 shRNA pairs.
Functional Predictions from the Ricin GI MapHierarchical clustering of genes based on the correlation of their
GIs was remarkably successful at recapitulating a number of
well-characterized complexes, including the COPI and COPII
vesicle coats, clathrin, GARP, and the ribosome, as well as
complexes with unknown roles in ricin biology, such as the cohe-
sins (Figure 5C). In addition, the map demonstrated clustering of
functionally interacting proteins, such as the small GTPase ARF1
and its guanine nucleotide exchange factor GBF1.
The GI map also led to numerous functional predictions, three
of which are highlighted below.
(D) Genetic interactions are calculated as deviations from the typical double-mutant phenotype. The relationship between single shRNA phenotypes and double-
shRNA phenotypes in combination with an shRNA of interest (in this example, SEC23B_i) is typically linear (red line). Deviations from this line are defined as
genetic interactions. Buffering interactions (yellow) are closer to WT phenotype than expected, as in this case found for double-shRNAs targeting SEC23B twice.
Synergistic interactions (blue) are further away fromWT than expected, as in this case found for double-shRNAs targeting both isoforms of SEC23, SEC23A, and
SEC23B.
(E) Phenotypes for individual and combinatorial SEC23A, SEC23B knockdown measured in competitive growth assay (mean of triplicate experiments ± SD).
(F) Quantification of ER localization of ricin measured by the SNAP assay in different knockdown strains (mean of triplicate experiments ± SD).
See also Figures S4, S5, and S6.
Cell 152, 909–922, February 14, 2013 ª2013 Elsevier Inc. 915
148

Publication: A systematic mammalian genetic interaction map
A B
C
Figure 5. A GI Map Reveals Functionally and Physically Interacting Genes
(A and B) Correlations of GI patterns between shRNA pairs: shRNAs targeting the same gene in orange, shRNAs targeting different genes in previously known
physical complexes in purple, and other pairs of shRNAs in gray.
(A) Reproducibility of GI correlations between shRNA pairs in two experimental replicates.
(B) High intragene and intracomplex correlation of GIs. Distributions of correlation coefficients between shRNA pairs are shown for the three classes of shRNA
pairs. The anticorrelated part of the bimodal distribution of intracomplex shRNA pairs is fully accounted for by pairs including shRNAs targeting TRAPPC9,
SEC23A, and RPS25.
(C) GIs for all gene pairs were calculated (shown as a yellow-cyan heatmap), and genes were clustered hierarchically based on the correlation of their GIs.
Individual phenotypes are indicated by sidebars using a red-blue heatmap. Genes marked with asterisks were imported from a separate double-shRNA screen
that we conducted with a partially overlapping gene set. Gene pairs for which no GIs were measures are indicated in gray. Known physically or functionally
interacting groups of genes are labeled by vertical lines; diamonds mark interactions defined in this study.
916 Cell 152, 909–922, February 14, 2013 ª2013 Elsevier Inc.
149
●
Appendix
An Unexpected Role for Ribosomal Protein RPS25
Remarkably, we found that RPS25 knockdown conferred ricin
resistance. By contrast, all other ribosomal hits sensitized cells
to ricin, as expected given that ribosome inactivation is the basis
for ricin cytotoxicity. The GI map provided a clue to the divergent
role of RPS25: RPS25 formed a cluster with ILF2 and ILF3 (Fig-
ure 5C). ILF2/3 encode heterodimeric nucleic-acid-binding
proteins with roles in transcription, mRNA stability, and transla-
tional control (Barber, 2009). ILF2/3 knockdown protected
against ricin, and we confirmed that the shRNAs against
RPS25 and ILF2/3 acted through their intended target genes
(Figure S7). As expected for proteins in a physical complex,
shRNAs targeting ILF2 showed buffering GIs with shRNAs
targeting ILF3 (Figures 6A and 6B). Surprisingly, we also
observed very strong buffering interactions between ILF2/3
and RPS25, which was consistent for all combinations of the
nine shRNAs targeting ILF2, ILF3, and RPS25 (Figure 6B).
Previous literature has implicated both RPS25 and ILF2/3 in
translational control: RPS25 has been shown to be required for
translation of IRES-containing mRNAs in cricket paralysis virus
(Landry et al., 2009), whereas ILF2/3 can bind viral IRES and
control translation (Merrill and Gromeier, 2006). Therefore, it is
tempting to speculate that ILF2/3 and RPS25may work together
to control translation of certain transcripts that affect ricin sensi-
tivity, possibly under particular stress conditions.
Identification of the WDR11/C17orf75 Complex
One unexpected prediction was the interaction betweenWDR11
and C17orf75, two poorly characterized genes. Both sensitized
cells to ricin when depleted, exhibited highly correlated profiles
in the GI map, and showed buffering interactions with each
other, which is often a signature for genes encoding proteins in
the same pathway or physical complex. Indeed, we found that
the encoded proteins interacted in reciprocal immunoprecipita-
tion experiments (Figures 6C and 6D).
Previously, WDR11was suggested to interact with a transcrip-
tion factor (Kim et al., 2010), as well as to impact flux through the
autophagy pathway (Behrends et al., 2010). Consistent with the
latter observation, we found that GFP-tagged WDR11 partially
colocalized with the autophagosome marker LC3 (Figure 6E).
This suggests a potential role for WDR11 in toxin degradation.
Indeed, depletion of WDR11 or BECN1, a regulator of auto-
phagy, caused an increase in total cellular ricin (Figure 6F). By
contrast, other genes that sensitized (COPZ1) or protected
(TRAPPC8) cells against ricin had an insignificant effect on total
toxin levels (although they do affect toxin delivery to the ER; Fig-
ure 6G). When degradation pathways are inhibited, more ricin
can enter the productive intoxication pathway (Figure 6H), which
provides a potential explanation for the observed increase in
delivery of toxin to the ER upon depletion ofWDR11 (Figure 6G).
Nonetheless, further study will be required to define the precise
role of this complex.
Functional Dissection of the Mammalian TRAPP
Complex
Two of themost strongly protective hits from our primary screen,
C4orf41 and KIAA1012, were poorly characterized at the onset
of our studies. In our GI map, these genes formed a highly corre-
lated cluster connected by buffering GIs with another poorly
characterized gene, C5orf44, and with TRAPPC1, a member of
the TRAPP complex, a highly conserved multisubunit complex
involved in ER-Golgi, endosome-Golgi, and autophagosome
transport (Barrowman et al., 2010). Based on this pattern, we
predicted that C4orf41, KIAA1012, and C5orf44 function as
TRAPP complex components. To test this, we GFP tagged and
immunoprecipitated these components (Figures 7A and 7B).
We could identify most TRAPP components described to date,
as well as C5orf44, in both immunoprecipitations. C4orf41 and
KIAA1012 were previously identified as TRAPP3 interactors in
a high-throughput immunoprecipitation study (Gavin et al.,
2002) and, concurrent with our studies, were independently
identified as TRAPP components and designated TRAPPC8
and TRAPPC11, respectively (Scrivens et al., 2011). Additionally,
C5orf44 was recently shown to exhibit homology to yeast Trs65
and to physically interact with other TRAPP components (Choi
et al., 2011). Based on these observations, we designate
C5orf44 as TRAPPC13.
In yeast, several TRAPP complexes have been identified
(Barrowman et al., 2010) with distinct roles in ER-Golgi traffic
(TRAPPI), intra-Golgi and endosome-Golgi traffic (TRAPPII),
and autophagy (TRAPPIII). In mammalian cells, TRAPP has
been suggested to form a single large complex (Scrivens et al.,
2011), and it has been unclear whether this complex is respon-
sible for all observed TRAPP activities.
Our data revealed a clear functional distinction between
different TRAPP components. We found only a subset of TRAPP
components as strongly protective hits, whereas other com-
ponents had either no phenotype or, in the case of TRAPPC9,
were mildly sensitizing (Table S1; Figure S7E). Moreover, the
genetic interaction pattern of TRAPPC9 showed a striking anti-
correlation with other TRAPP components (Figures 7C and
5C), suggesting that complexes containing these proteins are
distinct and have opposing roles in ricin trafficking. Indeed, we
found that immunoprecipitation of either TRAPPC8 or
TRAPPC11 pulled down the COPII components SEC31A and
SEC23IP as well as the other known TRAPP components, with
the prominent exception of TRAPPC9 and TRAPPC10 (Fig-
ure 7D). Similarly, previous immunoprecipitation experiments
found that TRAPPC9 did not recover TRAPPC8 (Zong et al.,
2011). Conversely, we found that immunoprecipitation of
TRAPPC10 pulled down core TRAPP components, but not
TRAPPC8/11/12/13, SEC31, or SEC23IP (Figure 7D). Based on
this, we examined the migration properties of the various TRAPP
components by size exclusion chromatography. These studies
directly established the existence of two physically distinct
complexes: a larger complex containing TRAPPC8 and
TRAPPC11 and a smaller one containing TRAPPC10 (Figure 7E).
To further define mammalian TRAPP complexes, we exam-
ined their interactions with COPII components. The yeast
TRAPPI complex is a COPII-vesicle-tethering factor (Sacher
et al., 2001), and COPII and TRAPPC3 interact in yeast and
mammalian cells (Cai et al., 2007). Consistent with this, GFP-
labeled TRAPPC8 and TRAPPC11 colocalized with SEC31A
(Figure S7F). Our finding that TRAPPC8 and TRAPPC11, but
not TRAPPC10, coimmunoprecipitated the COPII component
SEC31A (Figure 7F) suggests that differential interaction with
COPII may functionally distinguish the two mammalian TRAPP
complexes. Indeed, knockdown of TRAPC11 or TRAPC12, but
Cell 152, 909–922, February 14, 2013 ª2013 Elsevier Inc. 917
150

Publication: A systematic mammalian genetic interaction map
A
B
C D F
E GH
p va
lue
Figure 6. Interactions Predicted from the GI Map: RPS25/ILF2/3 and WDR11/C17orf75
(A) Buffering genetic interactions between shRNAs targeting ILF3, the ribosomal subunit RPS25, and ILF2/ILF3.
(B) Correlation and buffering genetic interactions between shRNAs targeting ILF2, ILF3, and RPS25 in an shRNA-based genetic interaction map.
(C and D) The poorly characterized, genetically correlated proteins WDR11 and C17orf75 interact physically, as shown by reciprocal coimmunoprecipitation
and MS.
(E) GFP-WDR11 partially colocalizes with the autophagosome/lysosome marker mCherry-LC3 in HeLa cells.
(F) Total cellular ricin levels after intoxication, as quantified by western blotting, are increased upon knockdown of degradation-related genes andWDR11 (which
sensitizes to ricin);meanof triplicate experiments±SD. Theasterisk indicates statistically significant differences (p<0.05,Student’s t test). Error bars represent SD.
(legend continued on next page)
918 Cell 152, 909–922, February 14, 2013 ª2013 Elsevier Inc.
151
●

Appendix
not TRAPPC9, disrupted the interaction of TRAPPC8 with
SEC31A (Figure 7F). Thus, the two distinct mammalian TRAPP
complexes, defined by the presence of TRAPPC9/10 or
TRAPPC8/11/12/13, differentially interact with COPII (Figure 7H);
we refer to these as mTRAPPII and mTRAPPIII, respectively.
The two TRAPP complexes seem to have opposing roles in
ricin transport. Because we observe protection against ricin
with COPII or mTRAPPIII knockdowns and these components
interact physically, it is tempting to speculate that this complex
functions similarly to yeast TRAPPI in COPII vesicle tethering.
Additionally, TRAPPC8 knockdown has been reported to impact
flux through the autophagy pathway (Behrends et al., 2010), and
we observed a mild enhancement of toxin degradation upon
TRAPPC8 knockdown (Figure 6H), raising the possibility that
mTRAPPIII functions in both COPII-mediated trafficking and
autophagy. By contrast, TRAPPC9/10 was previously reported
to interact with COPI components (Yamasaki et al., 2009). More-
over, we find that both COPI and TRAPPC9 knockdown sensitize
cells to ricin, suggesting that mTRAPPII may function in tethering
of COPI vesicles. More generally, our findings establish that
there are functionally distinct mammalian TRAPP complexes
and lay the groundwork for a mechanistic understanding of their
specialized functions.
PerspectiveBuilding on previous pooled shRNA strategies (e.g., Moffat et al.,
2006; Silva et al., 2005), we have developed an integrated plat-
form to functionally dissect complex biological processes in
mammalian cells using high-density genetic interaction maps.
Our strategy opens mammalian cell biology to the types of
systematic genetic analyses that have been highly successful
in microorganisms (Collins et al., 2009; Dixon et al., 2009).
Our first application of the platform elucidated key cellular
pathways and revealed how they modulate ricin susceptibility.
Our analysis of the TRAPP complex, in particular, illustrates
how genetic and physical interactions provide complementary
approaches to understand the functions of multiprotein com-
plexes, as our studies revealed two functionally distinct mamma-
lian TRAPP complexes.
A key aspect of our primary screening platform is the ability to
identify hit genes based on the likelihood that shRNAs act
through the intended target gene rather than solely the strength
and reproducibility of observed shRNA phenotypes. This is facil-
itated by the use of ultracomplex shRNA libraries that include
a large number of negative controls. Our approach also provides
a principled way to benchmark shRNA library design and
screening systems based not only on the strength of on-target
mRNA knockdown, but also by the ability to distinguish true
hits from background (e.g., off-target effects or statistical noise).
Using this criterion, we are currently exploring modifications to
the experimental strategy and shRNA design of our ultracomplex
libraries. Another important feature of ultracomplex libraries is
that they target each gene with a wide spectrum of shRNAs
with different knockdown strengths, effectively creating an allelic
series. This will facilitate the study of essential genes, as well as
gene dosage effects. Though our genetic interaction maps are
currently based on shRNAs identified in a primary screen, our
growing library of validated shRNAs will soon enable the
mapping of interactions between genes that do not have an
individual phenotype and the detection of synergistic genetic
interactions between them. Ongoing efforts by several groups
to identify effective shRNAs (Cheung et al., 2011; Fellmann
et al., 2011; Marcotte et al., 2012) will greatly facilitate the
construction of larger GI maps.
Our approach should be broadly applicable to the study of
complex biological systems. Although we present a pooled
screening strategy based on cell growth and viability, other
phenotypic readouts that physically separate cell populations
can be used, such as fluorescence-activated cell sorting or
migration assays. In addition, the ability to rapidly generate
and screen a double-shRNA library will allow one to explore
conservation and rewiring of genetic interactions in diverse cell
types and under different conditions (Bandyopadhyay et al.,
2010; M.K., M.C.B., and J.S.W., unpublished data).
The systematic exploration of genetic interactions in human
cells also has broad medical relevance, especially for cancer
biology and therapy. Functional surveys of genes in cancer cells
can distinguish oncogenic drivers from mere passengers.
Genetic interactions are thought to be crucial determinants of
properties of individual cancer cells (Ashworth et al., 2011),
such as their resistance to therapeutic agents. A better under-
standing of resistance pathways in specific genetic back-
grounds could pave the way for personalized combination
therapies that preemptively block the cancer’s escape routes.
More generally, as demonstrated for HIV, combination therapy
is a promising strategy to counter the problem of rapidly evolving
drug resistance in tumors. The ability to identify rare synthetic
lethal interactions between huge numbers of gene pairs maxi-
mizes the opportunity to identify pairs of drugs that synergisti-
cally target a disease state.
EXPERIMENTAL PROCEDURES
shRNA Libraries
To express shRNAs from a Pol II promoter in a miR30-derived context, we
adapted strategies developed by the Hannon and Elledge groups (Paddison
et al., 2004; Silva et al., 2005). Construction of pooled libraries was conducted
essentially as previously described (Bassik et al., 2009). The genome-wide
library was divided into nine sublibraries with 55,000 shRNA each and
targeted each human protein-coding gene with �25 independent shRNAs.
Each sublibrary also contained 500 or more negative control shRNAs, which
were designed to match the base composition of targeted shRNAs within
the same sublibrary without targeting any transcript in the human genome.
Table S2 contains the sequences of all primers used in this study, and Table
S3 includes target sequences of all active shRNAs used for follow-up
experiments.
(G) WDR11 and COPZ1 knockdown increase levels of ER-localized ricin as measured by the SNAP assay, whereas TRAPPC8 knockdown decreases levels of
ER-localized ricin; mean of triplicate experiments ± SD. The asterisks indicate statistically significant differences (**p < 0.01; ***p < 0.001; Student’s t test). Error
bars represent SD.
(H) Model: Ricin partitions between degradation and productive intoxication pathways; inhibition of degradation increases productive intoxication.
See also Figure S7.
Cell 152, 909–922, February 14, 2013 ª2013 Elsevier Inc. 919
152
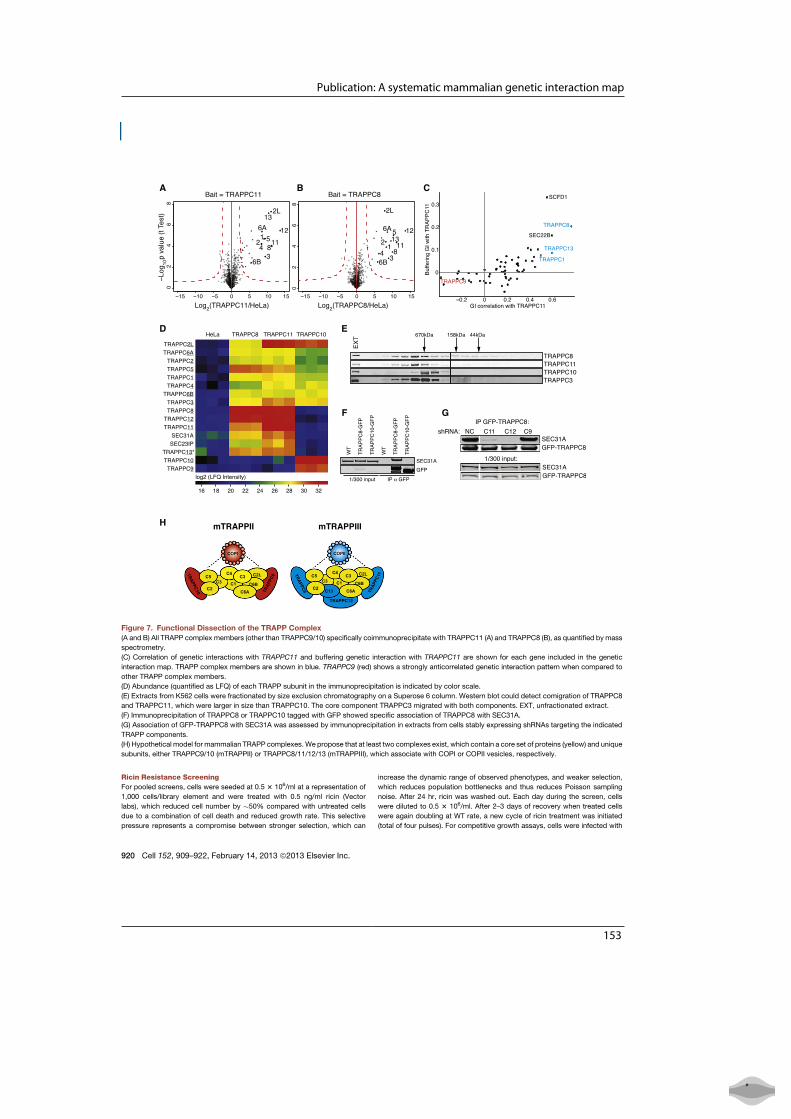
Publication: A systematic mammalian genetic interaction map
Ricin Resistance Screening
For pooled screens, cells were seeded at 0.5 3 106/ml at a representation of
1,000 cells/library element and were treated with 0.5 ng/ml ricin (Vector
labs), which reduced cell number by �50% compared with untreated cells
due to a combination of cell death and reduced growth rate. This selective
pressure represents a compromise between stronger selection, which can
increase the dynamic range of observed phenotypes, and weaker selection,
which reduces population bottlenecks and thus reduces Poisson sampling
noise. After 24 hr, ricin was washed out. Each day during the screen, cells
were diluted to 0.5 3 106/ml. After 2–3 days of recovery when treated cells
were again doubling at WT rate, a new cycle of ricin treatment was initiated
(total of four pulses). For competitive growth assays, cells were infected with
D
A B C
E
GF
H
p va
lue
Figure 7. Functional Dissection of the TRAPP Complex
(A and B) All TRAPP complex members (other than TRAPPC9/10) specifically coimmunoprecipitate with TRAPPC11 (A) and TRAPPC8 (B), as quantified by mass
spectrometry.
(C) Correlation of genetic interactions with TRAPPC11 and buffering genetic interaction with TRAPPC11 are shown for each gene included in the genetic
interaction map. TRAPP complex members are shown in blue. TRAPPC9 (red) shows a strongly anticorrelated genetic interaction pattern when compared to
other TRAPP complex members.
(D) Abundance (quantified as LFQ) of each TRAPP subunit in the immunoprecipitation is indicated by color scale.
(E) Extracts from K562 cells were fractionated by size exclusion chromatography on a Superose 6 column. Western blot could detect comigration of TRAPPC8
and TRAPPC11, which were larger in size than TRAPPC10. The core component TRAPPC3 migrated with both components. EXT, unfractionated extract.
(F) Immunoprecipitation of TRAPPC8 or TRAPPC10 tagged with GFP showed specific association of TRAPPC8 with SEC31A.
(G) Association of GFP-TRAPPC8 with SEC31A was assessed by immunoprecipitation in extracts from cells stably expressing shRNAs targeting the indicated
TRAPP components.
(H) Hypothetical model for mammalian TRAPP complexes. We propose that at least two complexes exist, which contain a core set of proteins (yellow) and unique
subunits, either TRAPPC9/10 (mTRAPPII) or TRAPPC8/11/12/13 (mTRAPPIII), which associate with COPI or COPII vesicles, respectively.
920 Cell 152, 909–922, February 14, 2013 ª2013 Elsevier Inc.
153
●

Appendix
lentivirus-encoding individual shRNAs. After 3 days, cells were seeded in 24-
well plates at 0.5 3 106/ml and treated with 0.5 ng/ml ricin. After 24 hr, ricin
was washed out, and cells were adjusted to 0.5 3 106/ml. Percentages of
mCherry-positive cells were assessed by FACS 24–48 hr later.
SUPPLEMENTAL INFORMATION
Supplemental Information includes Extended Experimental Procedures, three
tables, and seven figures and can be found with this article online at http://dx.
doi.org/10.1016/j.cell.2013.01.030.
ACKNOWLEDGMENTS
We thank M. Augsburg, O. Chen, C. Chu, S. Churchman, S. Collins, R. Geiger,
A. Heidersbach, N. Ingolia, M. Leuscher, J. Lund, L. Mitic, W. Patena, M.
Pham, D. Root, M. Schuldiner, A. Ssykor, N. Stern-Ginossar, K. Thorn, and
X. Wang for technical advice and assistance and S. Collins, A. Frost,
M. Jonikas, C. Jan, G. Ku, N. Shariat, P. Temkin, M. von Zastrow,
D. Acosta-Alvear, and members of the McManus andWeissman labs for help-
ful discussions and critical reading of the manuscript. The work is supported
by the Jane Coffin Childs Memorial Fund and the UCSF Program for Break-
through Biomedical Research (M.K. and M.T.M and J.S.W.), the Leukemia
and LymphomaSociety (M.C.B.), TheGermanmedical genome research grant
FKZ01GS0861 (M.M. and A.A.H.), the European Community’s FP7/2007-2013
under grant agreement 241548 (MitoSys Project, A.A.H.), the HHMI (J.S.W.),
the NIH (1U01CA168370-01, J.S.W. and M.T.M; RO1 GM80783, M.T.M.),
and a Howard Hughes Collaborative Initiative Award (J.S.W.). E.M.L. and
S.C. are employees of Agilent Technologies.
Received: August 24, 2012
Revised: November 29, 2012
Accepted: January 18, 2013
Published: February 7, 2013
REFERENCES
Amessou, M., Fradagrada, A., Falguieres, T., Lord, J.M., Smith, D.C., Roberts,
L.M., Lamaze, C., and Johannes, L. (2007). Syntaxin 16 and syntaxin 5 are
required for efficient retrograde transport of several exogenous and endoge-
nous cargo proteins. J. Cell Sci. 120, 1457–1468.
Ashworth, A., Lord, C.J., and Reis-Filho, J.S. (2011). Genetic interactions in
cancer progression and treatment. Cell 145, 30–38.
Bandyopadhyay, S., Mehta, M., Kuo, D., Sung, M.K., Chuang, R., Jaehnig,
E.J., Bodenmiller, B., Licon, K., Copeland, W., Shales, M., et al. (2010). Rewir-
ing of genetic networks in response to DNA damage. Science 330, 1385–1389.
Barber, G.N. (2009). The NFAR’s (nuclear factors associated with dsRNA):
evolutionarily conserved members of the dsRNA binding protein family. RNA
Biol. 6, 35–39.
Barbie, D.A., Tamayo, P., Boehm, J.S., Kim, S.Y., Moody, S.E., Dunn, I.F.,
Schinzel, A.C., Sandy, P., Meylan, E., Scholl, C., et al. (2009). Systematic
RNA interference reveals that oncogenic KRAS-driven cancers require
TBK1. Nature 462, 108–112.
Barrowman, J., Bhandari, D., Reinisch, K., and Ferro-Novick, S. (2010). TRAPP
complexes in membrane traffic: convergence through a common Rab. Nat.
Rev. Mol. Cell Biol. 11, 759–763.
Bassik, M.C., Lebbink, R.J., Churchman, L.S., Ingolia, N.T., Patena, W.,
LeProust, E.M., Schuldiner, M., Weissman, J.S., and McManus, M.T. (2009).
Rapid creation and quantitative monitoring of high coverage shRNA libraries.
Nat. Methods 6, 443–445.
Behrends, C., Sowa, M.E., Gygi, S.P., and Harper, J.W. (2010). Network orga-
nization of the human autophagy system. Nature 466, 68–76.
Bonifacino, J.S., and Hierro, A. (2011). Transport according to GARP: receiving
retrograde cargo at the trans-Golgi network. Trends Cell Biol. 21, 159–167.
Butland, G., Babu, M., Dıaz-Mejıa, J.J., Bohdana, F., Phanse, S., Gold, B.,
Yang, W., Li, J., Gagarinova, A.G., Pogoutse, O., et al. (2008). eSGA: E. coli
synthetic genetic array analysis. Nat. Methods 5, 789–795.
Cai, H., Yu, S., Menon, S., Cai, Y., Lazarova, D., Fu, C., Reinisch, K., Hay, J.C.,
and Ferro-Novick, S. (2007). TRAPPI tethers COPII vesicles by binding the coat
subunit Sec23. Nature 445, 941–944.
Carette, J.E., Guimaraes, C.P., Varadarajan, M., Park, A.S., Wuethrich, I.,
Godarova, A., Kotecki, M., Cochran, B.H., Spooner, E., Ploegh, H.L., and
Brummelkamp, T.R. (2009). Haploid genetic screens in human cells identify
host factors used by pathogens. Science 326, 1231–1235.
Carette, J.E., Guimaraes, C.P., Wuethrich, I., Blomen, V.A., Varadarajan, M.,
Sun, C., Bell, G., Yuan, B., Muellner, M.K., Nijman, S.M., et al. (2011). Global
gene disruption in human cells to assign genes to phenotypes by deep
sequencing. Nat. Biotechnol. 29, 542–546.
Chen, A., Hu, T., Mikoryak, C., and Draper, R.K. (2002). Retrograde transport
of protein toxins under conditions of COPI dysfunction. Biochim. Biophys.
Acta 1589, 124–139.
Cheung, H.W., Cowley, G.S., Weir, B.A., Boehm, J.S., Rusin, S., Scott, J.A.,
East, A., Ali, L.D., Lizotte, P.H., Wong, T.C., et al. (2011). Systematic investiga-
tion of genetic vulnerabilities across cancer cell lines reveals lineage-specific
dependencies in ovarian cancer. Proc. Natl. Acad. Sci. USA 108, 12372–
12377.
Choi, C., Davey, M., Schluter, C., Pandher, P., Fang, Y., Foster, L.J., and
Conibear, E. (2011). Organization and assembly of the TRAPPII complex.
Traffic 12, 715–725.
Cleary, M.A., Kilian, K., Wang, Y., Bradshaw, J., Cavet, G., Ge,W., Kulkarni, A.,
Paddison, P.J., Chang, K., Sheth, N., et al. (2004). Production of complex
nucleic acid libraries using highly parallel in situ oligonucleotide synthesis.
Nat. Methods 1, 241–248.
Collins, S.R., Weissman, J.S., and Krogan, N.J. (2009). From information to
knowledge: new technologies for defining gene function. Nat. Methods 6,
721–723.
Dixon, S.J., Costanzo, M., Baryshnikova, A., Andrews, B., and Boone, C.
(2009). Systematic mapping of genetic interaction networks. Annu. Rev.
Genet. 43, 601–625.
Fellmann, C., Zuber, J., McJunkin, K., Chang, K., Malone, C.D., Dickins, R.A.,
Xu, Q., Hengartner, M.O., Elledge, S.J., Hannon, G.J., and Lowe, S.W. (2011).
Functional identification of optimized RNAi triggers using a massively parallel
sensor assay. Mol. Cell 41, 733–746.
Fromme, J.C., Orci, L., and Schekman, R. (2008). Coordination of COPII
vesicle trafficking by Sec23. Trends Cell Biol. 18, 330–336.
Frost, A., Elgort, M.G., Brandman, O., Ives, C., Collins, S.R., Miller-Vedam, L.,
Weibezahn, J., Hein, M.Y., Poser, I., Mann, M., et al. (2012). Functional
repurposing revealed by comparing S. pombe and S. cerevisiae genetic inter-
actions. Cell 149, 1339–1352.
Gavin, A.C., Bosche, M., Krause, R., Grandi, P., Marzioch, M., Bauer, A.,
Schultz, J., Rick, J.M., Michon, A.M., Cruciat, C.M., et al. (2002). Functional
organization of the yeast proteome by systematic analysis of protein
complexes. Nature 415, 141–147.
Geiger, R., Andritschke, D., Friebe, S., Herzog, F., Luisoni, S., Heger, T., and
Helenius, A. (2011). BAP31 and BiP are essential for dislocation of SV40
from the endoplasmic reticulum to the cytosol. Nat. Cell Biol. 13, 1305–1314.
Girod, A., Storrie, B., Simpson, J.C., Johannes, L., Goud, B., Roberts, L.M.,
Lord, J.M., Nilsson, T., and Pepperkok, R. (1999). Evidence for a COP-I-
independent transport route from the Golgi complex to the endoplasmic retic-
ulum. Nat. Cell Biol. 1, 423–430.
Grimmer, S., Iversen, T.G., van Deurs, B., and Sandvig, K. (2000). Endosome
to Golgi transport of ricin is regulated by cholesterol. Mol. Biol. Cell 11,
4205–4216.
Guimaraes, C.P., Carette, J.E., Varadarajan, M., Antos, J., Popp, M.W., Spoo-
ner, E., Brummelkamp, T.R., and Ploegh, H.L. (2011). Identification of host cell
factors required for intoxication through use of modified cholera toxin. J. Cell
Biol. 195, 751–764.
Cell 152, 909–922, February 14, 2013 ª2013 Elsevier Inc. 921
154
Publication: A systematic mammalian genetic interaction map
Horn, T., Sandmann, T., Fischer, B., Axelsson, E., Huber, W., and Boutros, M.
(2011). Mapping of signaling networks through synthetic genetic interaction
analysis by RNAi. Nat. Methods 8, 341–346.
Johannes, L., and Popoff, V. (2008). Tracing the retrograde route in protein traf-
ficking. Cell 135, 1175–1187.
Kaelin, W.G., Jr. (2012). Molecular biology. Use and abuse of RNAi to study
mammalian gene function. Science 337, 421–422.
Kim, H.G., Ahn, J.W., Kurth, I., Ullmann, R., Kim, H.T., Kulharya, A., Ha, K.S.,
Itokawa, Y., Meliciani, I., Wenzel, W., et al. (2010). WDR11, a WD protein that
interacts with transcription factor EMX1, is mutated in idiopathic hypogonado-
tropic hypogonadism and Kallmann syndrome. Am. J. Hum. Genet. 87,
465–479.
Landry, D.M., Hertz, M.I., and Thompson, S.R. (2009). RPS25 is essential for
translation initiation by the Dicistroviridae and hepatitis C viral IRESs. Genes
Dev. 23, 2753–2764.
Llorente, A., Lauvrak, S.U., van Deurs, B., and Sandvig, K. (2003). Induction of
direct endosome to endoplasmic reticulum transport in Chinese hamster ovary
(CHO) cells (LdlF) with a temperature-sensitive defect in epsilon-coatomer
protein (epsilon-COP). J. Biol. Chem. 278, 35850–35855.
Lord, J.M., Roberts, L.M., and Lencer, W.I. (2005). Entry of protein toxins into
mammalian cells by crossing the endoplasmic reticulummembrane: co-opting
basic mechanisms of endoplasmic reticulum-associated degradation. Curr.
Top. Microbiol. Immunol. 300, 149–168.
Luo, J., Emanuele, M.J., Li, D., Creighton, C.J., Schlabach, M.R., Westbrook,
T.F., Wong, K.K., and Elledge, S.J. (2009). A genome-wide RNAi screen iden-
tifies multiple synthetic lethal interactions with the Ras oncogene. Cell 137,
835–848.
Marcotte, R., Brown, K.R., Suarez, F., Sayad, A., Karamboulas, K., Krzyza-
nowski, P.M., Sircoulomb, F., Medrano, M., Fedyshyn, Y., Koh, J.L., et al.
(2012). Essential gene profiles in breast, pancreatic, and ovarian cancer cells.
Cancer Discov. 2, 172–189.
Merrill, M.K., and Gromeier, M. (2006). The double-stranded RNA binding
protein 76:NF45 heterodimer inhibits translation initiation at the rhinovirus
type 2 internal ribosome entry site. J. Virol. 80, 6936–6942.
Moffat, J., Grueneberg, D.A., Yang, X., Kim, S.Y., Kloepfer, A.M., Hinkle, G.,
Piqani, B., Eisenhaure, T.M., Luo, B., Grenier, J.K., et al. (2006). A lentiviral
RNAi library for human and mouse genes applied to an arrayed viral high-
content screen. Cell 124, 1283–1298.
Moreau, D., Kumar, P., Wang, S.C., Chaumet, A., Chew, S.Y., Chevalley, H.,
and Bard, F. (2011). Genome-wide RNAi screens identify genes required for
Ricin and PE intoxications. Dev. Cell 21, 231–244.
Paddison, P.J., Cleary, M., Silva, J.M., Chang, K., Sheth, N., Sachidanandam,
R., and Hannon, G.J. (2004). Cloning of short hairpin RNAs for gene knock-
down in mammalian cells. Nat. Methods 1, 163–167.
Pawar, V., De, A., Briggs, L., Omar, M.M., Sweeney, S.T., Lord, J.M., Roberts,
L.M., Spooner, R.A., and Moffat, K.G. (2011). RNAi screening of Drosophila
(Sophophora) melanogaster S2 cells for ricin sensitivity and resistance.
J. Biomol. Screen. 16, 436–442.
Pierce, S.E., Davis, R.W., Nislow, C., and Giaever, G. (2007). Genome-wide
analysis of barcoded Saccharomyces cerevisiae gene-deletion mutants in
pooled cultures. Nat. Protoc. 2, 2958–2974.
Popoff, V., Adolf, F., Brugger, B., and Wieland, F. (2011). COPI budding within
the Golgi stack. Cold Spring Harb. Perspect. Biol. 3, a005231.
Ryan, C.J., Roguev, A., Patrick, K., Xu, J., Jahari, H., Tong, Z., Beltrao, P.,
Shales, M., Qu, H., Collins, S.R., et al. (2012). Hierarchical modularity and
the evolution of genetic interactomes across species. Mol. Cell 46, 691–704.
Sacher, M., Barrowman, J., Wang, W., Horecka, J., Zhang, Y., Pypaert, M.,
and Ferro-Novick, S. (2001). TRAPP I implicated in the specificity of tethering
in ER-to-Golgi transport. Mol. Cell 7, 433–442.
Sandvig, K., Torgersen, M.L., Engedal, N., Skotland, T., and Iversen, T.G.
(2010). Protein toxins from plants and bacteria: probes for intracellular trans-
port and tools in medicine. FEBS Lett. 584, 2626–2634.
Schwarz, K., Iolascon, A., Verissimo, F., Trede, N.S., Horsley, W., Chen, W.,
Paw, B.H., Hopfner, K.P., Holzmann, K., Russo, R., et al. (2009). Mutations
affecting the secretory COPII coat component SEC23B cause congenital dys-
erythropoietic anemia type II. Nat. Genet. 41, 936–940.
Scrivens, P.J., Noueihed, B., Shahrzad, N., Hul, S., Brunet, S., and Sacher, M.
(2011). C4orf41 and TTC-15 are mammalian TRAPP components with a role at
an early stage in ER-to-Golgi trafficking. Mol. Biol. Cell 22, 2083–2093.
Silva, J.M., Li, M.Z., Chang, K., Ge, W., Golding, M.C., Rickles, R.J., Siolas, D.,
Hu, G., Paddison, P.J., Schlabach, M.R., et al. (2005). Second-generation
shRNA libraries covering the mouse and human genomes. Nat. Genet. 37,
1281–1288.
Silva, J.M., Marran, K., Parker, J.S., Silva, J., Golding, M., Schlabach, M.R.,
Elledge, S.J., Hannon, G.J., and Chang, K. (2008). Profiling essential genes
in human mammary cells by multiplex RNAi screening. Science 319, 617–620.
Spooner, R.A., and Lord, J.M. (2012). How ricin and Shiga toxin reach the
cytosol of target cells: retrotranslocation from the endoplasmic reticulum.
Curr. Top. Microbiol. Immunol. 357, 19–40.
Storey, J.D., and Tibshirani, R. (2003). Statistical significance for genomewide
studies. Proc. Natl. Acad. Sci. USA 100, 9440–9445.
Typas, A., Nichols, R.J., Siegele, D.A., Shales, M., Collins, S.R., Lim, B.,
Braberg, H., Yamamoto, N., Takeuchi, R., Wanner, B.L., et al. (2008). High-
throughput, quantitative analyses of genetic interactions in E. coli. Nat.
Methods 5, 781–787.
Yamasaki, A., Menon, S., Yu, S., Barrowman, J., Meerloo, T., Oorschot, V.,
Klumperman, J., Satoh, A., and Ferro-Novick, S. (2009). mTrs130 is a com-
ponent of a mammalian TRAPPII complex, a Rab1 GEF that binds to COPI-
coated vesicles. Mol. Biol. Cell 20, 4205–4215.
Zong, M., Wu, X.G., Chan, C.W., Choi, M.Y., Chan, H.C., Tanner, J.A., and Yu,
S. (2011). The adaptor function of TRAPPC2 in mammalian TRAPPs explains
TRAPPC2-associated SEDT and TRAPPC9-associated congenital intellectual
disability. PLoS ONE 6, e23350.
Zuk, O., Hechter, E., Sunyaev, S.R., and Lander, E.S. (2012). The mystery of
missing heritability: Genetic interactions create phantom heritability. Proc.
Natl. Acad. Sci. USA 109, 1193–1198.
922 Cell 152, 909–922, February 14, 2013 ª2013 Elsevier Inc.
155
●

Appendix
2558 | J. Hirst et al. Molecular Biology of the Cell
MBoC | ARTICLE
Interaction between AP-5 and the hereditary spastic paraplegia proteins SPG11 and SPG15Jennifer Hirsta, Georg H. H. Bornera, James Edgara, Marco Y. Heinb, Matthias Mannb, Frank Buchholzc, Robin Antrobusa, and Margaret S. Robinsona
aCambridge Institute for Medical Research, University of Cambridge, Cambridge CB2 0XY, United Kingdom; bMax Planck Institute of Biochemistry, 82152 Martinsried, Germany; cUCC, Medical Systems Biology, Medical Faculty, Technical University, Dresden, 01307 Dresden, Germany
ABSTRACT The AP-5 complex is a recently identified but evolutionarily ancient member of the family of heterotetrameric adaptor proteins (AP complexes). It is associated with two proteins that are mutated in patients with hereditary spastic paraplegia, SPG11 and SPG15. Here we show that the four AP-5 subunits can be coimmunoprecipitated with SPG11 and SPG15, both from cytosol and from detergent-extracted membranes, with a stoichiometry of ∼1:1:1:1:1:1. Knockdowns of SPG11 or SPG15 phenocopy knockdowns of AP-5 subunits: all six knockdowns cause the cation-independent mannose 6-phosphate receptor to become trapped in clusters of early endosomes. In addition, AP-5, SPG11, and SPG15 colocalize on a late endosomal/lysosomal compartment. Both SPG11 and SPG15 have predicted secondary structures containing α-solenoids related to those of clathrin heavy chain and COPI subunits. SPG11 also has an N-terminal, β-propeller–like domain, which interacts in vitro with AP-5. We propose that AP-5, SPG15, and SPG11 form a coat-like complex, with AP-5 involved in pro-tein sorting, SPG15 facilitating the docking of the coat onto membranes by interacting with PI3P via its FYVE domain, and SPG11 (possibly together with SPG15) forming a scaffold.
INTRODUCTIONAP-5 is the most recently identified and the least well characterized of the heterotetrameric adaptor protein (AP) complexes (Hirst et al., 2011). Its subunits share so little sequence identity with the subunits of the other AP complexes that they cannot be found using stan-dard bioinformatics tools such as BLAST, and so for many years the existence of a fifth AP complex was unsuspected. However, struc-tural prediction programs indicate that the subunits of AP-5 adopt similar folds to their counterparts in APs 1–4, and so their nomencla-
ture follows the same convention: ζ and β5 for the two large sub-units, μ5 for the medium subunit, and σ5 for the small subunit, en-coded by the genes AP5Z1, AP5B1, AP5M1, and AP5S1, respectively. Like all of the AP complexes, AP-5 is evolutionarily ancient (Hirst et al., 2011) and ubiquitously expressed (http://biogps.org/, www .ncbi.nlm.nih.gov/UniGene/), although its expression profile in de-veloping chick embryos (Hirst et al., 2013) suggests that it may be particularly important in neurons.
Characterization of AP-5 has been somewhat hampered by its low abundance (Hirst et al., 2013) and absence from a number of model organisms (Hirst et al., 2011). However, an important insight into its function came from the discovery by Słabicki et al. (2010) that AP-5 subunits could be coimmunoprecipitated with two proteins mutated in patients with hereditary spastic paraplegia (HSP), SPG11 and SPG15 (also known as spatacsin and spastizin/ZFYVE26/FYVE-CENT, respectively). HSP is a group of genetic disorders character-ized by progressive spasticity in the lower limbs. Mutations in SPG11 and SPG15 are the major causes of HSP accompanied by thin cor-pus callosum and mental impairment (Boukhris et al., 2008), and patients with mutations in these two genes present with the same clinical features. In addition, morpholino knockdowns of SPG11 and
Monitoring EditorAnne SpangUniversity of Basel
Received: Mar 29, 2013Revised: Jun 18, 2013Accepted: Jun 21, 2013
This article was published online ahead of print in MBoC in Press (http://www .molbiolcell.org/cgi/doi/10.1091/mbc.E13-03-0170) on July 3, 2013.
Address correspondence to: Jennifer Hirst ([email protected]); Margaret S. Robinson ([email protected]).
© 2013 Hirst et al. This article is distributed by The American Society for Cell Biol-ogy under license from the author(s). Two months after publication it is available to the public under an Attribution–Noncommercial–Share Alike 3.0 Unported Creative Commons License (http://creativecommons.org/licenses/by-nc-sa/3.0).“ASCB®,” “The American Society for Cell Biology®,” and “Molecular Biology of the Cell®” are registered trademarks of The American Society of Cell Biology.
Abbreviations used: AP, adaptor protein; CIMPR, cation-independent mannose 6-phosphate receptor; GFP, green fluorescent protein; GST, glutathione S-trans-ferase; HSP, hereditary spastic paraplegia; PI3P, phosphatidylinositol 3-phos-phate.
http://www.molbiolcell.org/content/suppl/2013/06/30/mbc.E13-03-0170.DC1.htmlSupplemental Material can be found at:
156
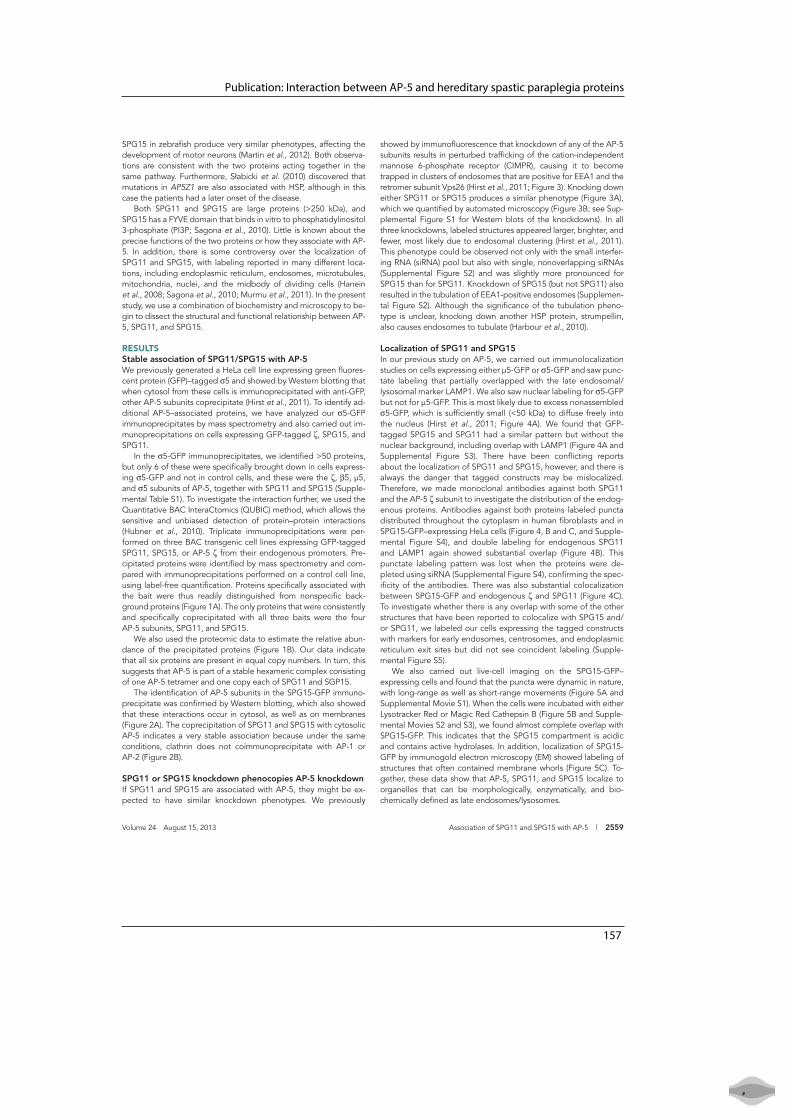
Publication: Interaction between AP-5 and hereditary spastic paraplegia proteins
Volume 24 August 15, 2013 Association of SPG11 and SPG15 with AP-5 | 2559
SPG15 in zebrafish produce very similar phenotypes, affecting the development of motor neurons (Martin et al., 2012). Both observa-tions are consistent with the two proteins acting together in the same pathway. Furthermore, Słabicki et al. (2010) discovered that mutations in AP5Z1 are also associated with HSP, although in this case the patients had a later onset of the disease.
Both SPG11 and SPG15 are large proteins (>250 kDa), and SPG15 has a FYVE domain that binds in vitro to phosphatidylinositol 3-phosphate (PI3P; Sagona et al., 2010). Little is known about the precise functions of the two proteins or how they associate with AP-5. In addition, there is some controversy over the localization of SPG11 and SPG15, with labeling reported in many different loca-tions, including endoplasmic reticulum, endosomes, microtubules, mitochondria, nuclei, and the midbody of dividing cells (Hanein et al., 2008; Sagona et al., 2010; Murmu et al., 2011). In the present study, we use a combination of biochemistry and microscopy to be-gin to dissect the structural and functional relationship between AP-5, SPG11, and SPG15.
RESULTSStable association of SPG11/SPG15 with AP-5We previously generated a HeLa cell line expressing green fluores-cent protein (GFP)–tagged σ5 and showed by Western blotting that when cytosol from these cells is immunoprecipitated with anti-GFP, other AP-5 subunits coprecipitate (Hirst et al., 2011). To identify ad-ditional AP-5–associated proteins, we have analyzed our σ5-GFP immunoprecipitates by mass spectrometry and also carried out im-munoprecipitations on cells expressing GFP-tagged ζ, SPG15, and SPG11.
In the σ5-GFP immunoprecipitates, we identified >50 proteins, but only 6 of these were specifically brought down in cells express-ing σ5-GFP and not in control cells, and these were the ζ, β5, μ5, and σ5 subunits of AP-5, together with SPG11 and SPG15 (Supple-mental Table S1). To investigate the interaction further, we used the Quantitative BAC InteraCtomics (QUBIC) method, which allows the sensitive and unbiased detection of protein–protein interactions (Hubner et al., 2010). Triplicate immunoprecipitations were per-formed on three BAC transgenic cell lines expressing GFP-tagged SPG11, SPG15, or AP-5 ζ from their endogenous promoters. Pre-cipitated proteins were identified by mass spectrometry and com-pared with immunoprecipitations performed on a control cell line, using label-free quantification. Proteins specifically associated with the bait were thus readily distinguished from nonspecific back-ground proteins (Figure 1A). The only proteins that were consistently and specifically coprecipitated with all three baits were the four AP-5 subunits, SPG11, and SPG15.
We also used the proteomic data to estimate the relative abun-dance of the precipitated proteins (Figure 1B). Our data indicate that all six proteins are present in equal copy numbers. In turn, this suggests that AP-5 is part of a stable hexameric complex consisting of one AP-5 tetramer and one copy each of SPG11 and SGP15.
The identification of AP-5 subunits in the SPG15-GFP immuno-precipitate was confirmed by Western blotting, which also showed that these interactions occur in cytosol, as well as on membranes (Figure 2A). The coprecipitation of SPG11 and SPG15 with cytosolic AP-5 indicates a very stable association because under the same conditions, clathrin does not coimmunoprecipitate with AP-1 or AP-2 (Figure 2B).
SPG11 or SPG15 knockdown phenocopies AP-5 knockdownIf SPG11 and SPG15 are associated with AP-5, they might be ex-pected to have similar knockdown phenotypes. We previously
showed by immunofluorescence that knockdown of any of the AP-5 subunits results in perturbed trafficking of the cation-independent mannose 6-phosphate receptor (CIMPR), causing it to become trapped in clusters of endosomes that are positive for EEA1 and the retromer subunit Vps26 (Hirst et al., 2011; Figure 3). Knocking down either SPG11 or SPG15 produces a similar phenotype (Figure 3A), which we quantified by automated microscopy (Figure 3B; see Sup-plemental Figure S1 for Western blots of the knockdowns). In all three knockdowns, labeled structures appeared larger, brighter, and fewer, most likely due to endosomal clustering (Hirst et al., 2011). This phenotype could be observed not only with the small interfer-ing RNA (siRNA) pool but also with single, nonoverlapping siRNAs (Supplemental Figure S2) and was slightly more pronounced for SPG15 than for SPG11. Knockdown of SPG15 (but not SPG11) also resulted in the tubulation of EEA1-positive endosomes (Supplemen-tal Figure S2). Although the significance of the tubulation pheno-type is unclear, knocking down another HSP protein, strumpellin, also causes endosomes to tubulate (Harbour et al., 2010).
Localization of SPG11 and SPG15In our previous study on AP-5, we carried out immunolocalization studies on cells expressing either μ5-GFP or σ5-GFP and saw punc-tate labeling that partially overlapped with the late endosomal/lysosomal marker LAMP1. We also saw nuclear labeling for σ5-GFP but not for μ5-GFP. This is most likely due to excess nonassembled σ5-GFP, which is sufficiently small (<50 kDa) to diffuse freely into the nucleus (Hirst et al., 2011; Figure 4A). We found that GFP-tagged SPG15 and SPG11 had a similar pattern but without the nuclear background, including overlap with LAMP1 (Figure 4A and Supplemental Figure S3). There have been conflicting reports about the localization of SPG11 and SPG15, however, and there is always the danger that tagged constructs may be mislocalized. Therefore, we made monoclonal antibodies against both SPG11 and the AP-5 ζ subunit to investigate the distribution of the endog-enous proteins. Antibodies against both proteins labeled puncta distributed throughout the cytoplasm in human fibroblasts and in SPG15-GFP–expressing HeLa cells (Figure 4, B and C, and Supple-mental Figure S4), and double labeling for endogenous SPG11 and LAMP1 again showed substantial overlap (Figure 4B). This punctate labeling pattern was lost when the proteins were de-pleted using siRNA (Supplemental Figure S4), confirming the spec-ificity of the antibodies. There was also substantial colocalization between SPG15-GFP and endogenous ζ and SPG11 (Figure 4C). To investigate whether there is any overlap with some of the other structures that have been reported to colocalize with SPG15 and/or SPG11, we labeled our cells expressing the tagged constructs with markers for early endosomes, centrosomes, and endoplasmic reticulum exit sites but did not see coincident labeling (Supple-mental Figure S5).
We also carried out live-cell imaging on the SPG15-GFP–expressing cells and found that the puncta were dynamic in nature, with long-range as well as short-range movements (Figure 5A and Supplemental Movie S1). When the cells were incubated with either Lysotracker Red or Magic Red Cathepsin B (Figure 5B and Supple-mental Movies S2 and S3), we found almost complete overlap with SPG15-GFP. This indicates that the SPG15 compartment is acidic and contains active hydrolases. In addition, localization of SPG15-GFP by immunogold electron microscopy (EM) showed labeling of structures that often contained membrane whorls (Figure 5C). To-gether, these data show that AP-5, SPG11, and SPG15 localize to organelles that can be morphologically, enzymatically, and bio-chemically defined as late endosomes/lysosomes.
157
●

Appendix
2560 | J. Hirst et al. Molecular Biology of the Cell
Dependence of AP-5 on SPG11 and SPG15To investigate whether AP-5, SPG11, and SPG15 are dependent on each other for their localization and/or stability, we knocked down one protein and then looked for effects on the others by immunofluores-cence microscopy. Knockdown of either SPG11 or SPG15 resulted in a dramatic loss of σ5-GFP punctate labeling, comparable to the loss of σ5-GFP labeling when other subunits of AP-5 are knocked down (Figure 6A). Western blotting indicated that AP-5 subunits may be destabilized when SPG15 is depleted (Supplemental Figure S1), so the loss of punctate AP-5 labeling could result from effects on stability, recruit-ment, or both. In contrast, knocking down AP-5 subunits produced little or no effect on the localization of GFP-tagged SPG15 or SPG11. We also observed that AP-5 ζ label-ing was brighter in cells expressing SPG15-GFP (Figure 4C), suggesting that increasing the expression of SPG15 increases the membrane localization of AP-5. Thus AP-5 appears to depend on SPG11/SPG15 for its localization and/or stability but not vice versa.
A number of vesicle coat proteins, in-cluding AP-1, AP-3, and AP-4, require the small GTPase ARF1 to localize to mem-branes, and become cytosolic when cells are treated with the drug brefeldin A, which inhibits guanine nucleotide exchange fac-tors for ARF1. Neither AP-5 nor SPG15 is affected by brefeldin A (Hirst et al., 2011; Figure 6B), however, indicating that their localization to membranes is ARF1 inde-pendent. The plasma membrane adaptor AP-2 is also ARF1 independent, but it re-quires a specific phosphoinositide for its
FIGURE 1: Stable association of SPG11 and SPG15 with AP-5. (A) QUBIC interaction proteomic analysis. GFP-tagged AP-5 ζ, SPG11, and SPG15 were stably expressed under the control of their endogenous promoters. Immunoprecipitations were performed with an anti-GFP antibody and compared by label-free quantitative mass spectrometry with immunoprecipitations (IPs) performed on a control cell line with no GFP bait protein. Every experiment was performed in triplicate. Data were analyzed with a t test to determine significant interactions (Hubner et al., 2010) and visualized in a “volcano plot.” For each identified protein, plots show the fold difference in abundance (bait IP vs. control IP; x-axis, log2 scale), as well as a p-value indicating robustness of the observed difference (y-axis, –log10 scale). Specific interactors have high fold differences and low p values (top right quadrant of the plot). The “volcano” lines indicate the significance cut-off that separates specific interactors from background. With every bait, all four AP-5 subunits, SPG11, and SPG15 are specifically coimmunoprecipitated. The SPG11 bait also coIPs a number of abundant cytoskeletal proteins, but since these proteins were not identified in the other two QUBIC experiments, it seems unlikely that these interactions are physiologically relevant. Furthermore, the SPG11 pull down has a greater scatter of background proteins than the AP-5 ζ and SGP15 pull downs, suggesting that it may be slightly less specific. (B) Stoichiometry analysis. Normalized peptide intensities were used to estimate the relative abundance of specific interactors identified in A (iBAQ method; Schwanhäusser et al., 2011). For each protein, the values from all triplicate repeats were plotted. Only coimmunoprecipitated
proteins were included, since the bait protein tends to be overrepresented in immunoprecipitation experiments. The relative abundances of proteins were normalized to the median abundance of all proteins across each experiment (i.e., median set to 1.0). The data show that regardless of the bait protein, roughly equal molar amounts of AP-5 subunits, SPG11, and SPG15 are coprecipitated, which supports the existence of an equimolar hexameric complex consisting of AP-5, SPG11, and SPG15. The only exception is a substantially higher proportion of AP-5 σ precipitated with AP-5 ζ (top). Based on structural information on other AP complexes (Page and Robinson, 1995; Collins et al., 2002), these two subunits may form a stable subcomplex, and expression of tagged AP-5 ζ may thus stabilize and increase the recovery of AP-5 σ.
158
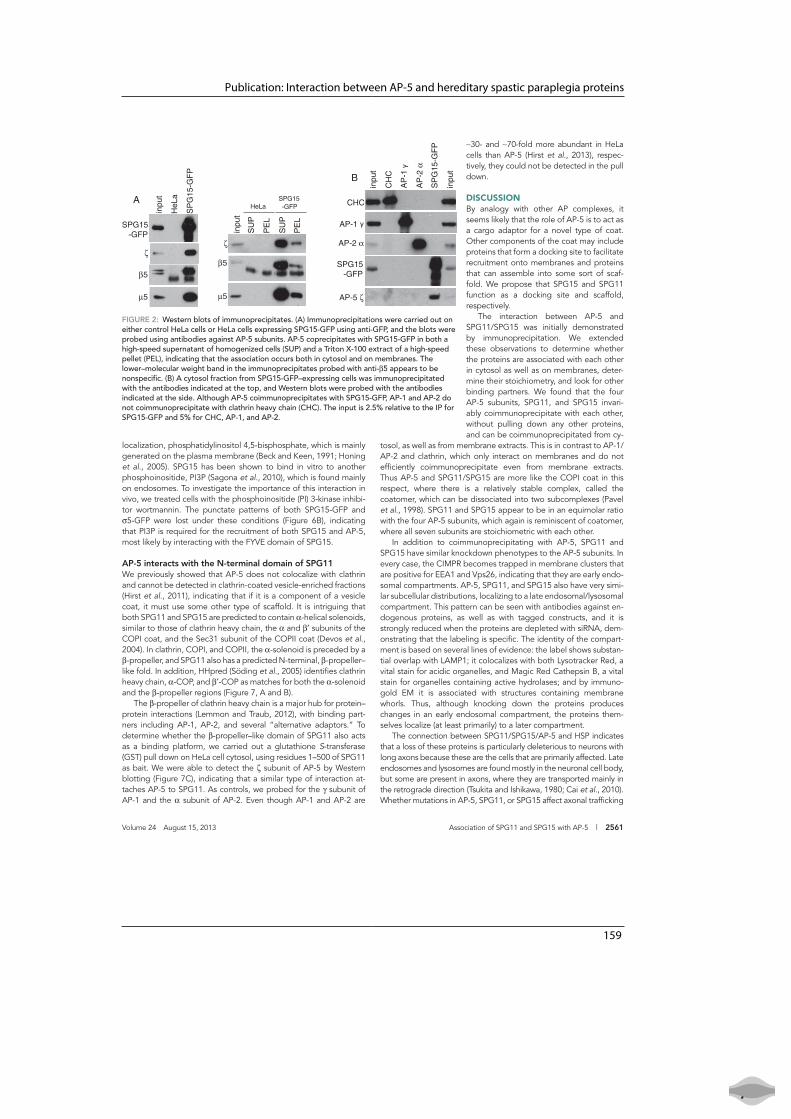
Publication: Interaction between AP-5 and hereditary spastic paraplegia proteins
Volume 24 August 15, 2013 Association of SPG11 and SPG15 with AP-5 | 2561
FIGURE 2: Western blots of immunoprecipitates. (A) Immunoprecipitations were carried out on either control HeLa cells or HeLa cells expressing SPG15-GFP using anti-GFP, and the blots were probed using antibodies against AP-5 subunits. AP-5 coprecipitates with SPG15-GFP in both a high-speed supernatant of homogenized cells (SUP) and a Triton X-100 extract of a high-speed pellet (PEL), indicating that the association occurs both in cytosol and on membranes. The lower–molecular weight band in the immunoprecipitates probed with anti-β5 appears to be nonspecific. (B) A cytosol fraction from SPG15-GFP–expressing cells was immunoprecipitated with the antibodies indicated at the top, and Western blots were probed with the antibodies indicated at the side. Although AP-5 coimmunoprecipitates with SPG15-GFP, AP-1 and AP-2 do not coimmunoprecipitate with clathrin heavy chain (CHC). The input is 2.5% relative to the IP for SPG15-GFP and 5% for CHC, AP-1, and AP-2.
β5
SPG15 -GFP
µ5
ζ
inpu
t
HeL
a
SP
G15
-GF
P
β5
µ5
ζ in
put
SU
P
PE
L
SU
P
PE
L
HeLa SPG15 -GFP
A CHC
AP-2 α
AP-5 ζ
CH
C
inpu
t
AP
-1
AP
-2 α
SP
G15
-GF
P
SPG15 -GFP
inpu
t
AP-1
B
localization, phosphatidylinositol 4,5-bisphosphate, which is mainly generated on the plasma membrane (Beck and Keen, 1991; Honing et al., 2005). SPG15 has been shown to bind in vitro to another phosphoinositide, PI3P (Sagona et al., 2010), which is found mainly on endosomes. To investigate the importance of this interaction in vivo, we treated cells with the phosphoinositide (PI) 3-kinase inhibi-tor wortmannin. The punctate patterns of both SPG15-GFP and σ5-GFP were lost under these conditions (Figure 6B), indicating that PI3P is required for the recruitment of both SPG15 and AP-5, most likely by interacting with the FYVE domain of SPG15.
AP-5 interacts with the N-terminal domain of SPG11We previously showed that AP-5 does not colocalize with clathrin and cannot be detected in clathrin-coated vesicle-enriched fractions (Hirst et al., 2011), indicating that if it is a component of a vesicle coat, it must use some other type of scaffold. It is intriguing that both SPG11 and SPG15 are predicted to contain α-helical solenoids, similar to those of clathrin heavy chain, the α and β′ subunits of the COPI coat, and the Sec31 subunit of the COPII coat (Devos et al., 2004). In clathrin, COPI, and COPII, the α-solenoid is preceded by a β-propeller, and SPG11 also has a predicted N-terminal, β-propeller–like fold. In addition, HHpred (Söding et al., 2005) identifies clathrin heavy chain, α-COP, and β′-COP as matches for both the α-solenoid and the β-propeller regions (Figure 7, A and B).
The β-propeller of clathrin heavy chain is a major hub for protein–protein interactions (Lemmon and Traub, 2012), with binding part-ners including AP-1, AP-2, and several “alternative adaptors.” To determine whether the β-propeller–like domain of SPG11 also acts as a binding platform, we carried out a glutathione S-transferase (GST) pull down on HeLa cell cytosol, using residues 1–500 of SPG11 as bait. We were able to detect the ζ subunit of AP-5 by Western blotting (Figure 7C), indicating that a similar type of interaction at-taches AP-5 to SPG11. As controls, we probed for the γ subunit of AP-1 and the α subunit of AP-2. Even though AP-1 and AP-2 are
∼30- and ∼70-fold more abundant in HeLa cells than AP-5 (Hirst et al., 2013), respec-tively, they could not be detected in the pull down.
DISCUSSIONBy analogy with other AP complexes, it seems likely that the role of AP-5 is to act as a cargo adaptor for a novel type of coat. Other components of the coat may include proteins that form a docking site to facilitate recruitment onto membranes and proteins that can assemble into some sort of scaf-fold. We propose that SPG15 and SPG11 function as a docking site and scaffold, respectively.
The interaction between AP-5 and SPG11/SPG15 was initially demonstrated by immunoprecipitation. We extended these observations to determine whether the proteins are associated with each other in cytosol as well as on membranes, deter-mine their stoichiometry, and look for other binding partners. We found that the four AP-5 subunits, SPG11, and SPG15 invari-ably coimmunoprecipitate with each other, without pulling down any other proteins, and can be coimmunoprecipitated from cy-
tosol, as well as from membrane extracts. This is in contrast to AP-1/AP-2 and clathrin, which only interact on membranes and do not efficiently coimmunoprecipitate even from membrane extracts. Thus AP-5 and SPG11/SPG15 are more like the COPI coat in this respect, where there is a relatively stable complex, called the coatomer, which can be dissociated into two subcomplexes (Pavel et al., 1998). SPG11 and SPG15 appear to be in an equimolar ratio with the four AP-5 subunits, which again is reminiscent of coatomer, where all seven subunits are stoichiometric with each other.
In addition to coimmunoprecipitating with AP-5, SPG11 and SPG15 have similar knockdown phenotypes to the AP-5 subunits. In every case, the CIMPR becomes trapped in membrane clusters that are positive for EEA1 and Vps26, indicating that they are early endo-somal compartments. AP-5, SPG11, and SPG15 also have very simi-lar subcellular distributions, localizing to a late endosomal/lysosomal compartment. This pattern can be seen with antibodies against en-dogenous proteins, as well as with tagged constructs, and it is strongly reduced when the proteins are depleted with siRNA, dem-onstrating that the labeling is specific. The identity of the compart-ment is based on several lines of evidence: the label shows substan-tial overlap with LAMP1; it colocalizes with both Lysotracker Red, a vital stain for acidic organelles, and Magic Red Cathepsin B, a vital stain for organelles containing active hydrolases; and by immuno-gold EM it is associated with structures containing membrane whorls. Thus, although knocking down the proteins produces changes in an early endosomal compartment, the proteins them-selves localize (at least primarily) to a later compartment.
The connection between SPG11/SPG15/AP-5 and HSP indicates that a loss of these proteins is particularly deleterious to neurons with long axons because these are the cells that are primarily affected. Late endosomes and lysosomes are found mostly in the neuronal cell body, but some are present in axons, where they are transported mainly in the retrograde direction (Tsukita and Ishikawa, 1980; Cai et al., 2010). Whether mutations in AP-5, SPG11, or SPG15 affect axonal trafficking
159
●

Appendix
2562 | J. Hirst et al. Molecular Biology of the Cell
FIGURE 3: Knockdown of SPG11 and SPG15 phenocopies AP-5 knockdown. (A) HeLa cells were treated with siRNAs as indicated and double labeled for the CIMPR and the retromer protein Vps26. In the siRNA-treated cells, the CIMPR clusters in Vps26-positive endosomes. There also appears to be increased colocalization of CIMPR and Vps26 in these cells. All of the images of siRNA-treated cells were taken at half the exposure time of the controls because of the increased brightness. Scale bar, 20 μm. (B) The knockdown phenotypes were quantified using an ArrayScan VTI microscope and Spot Detector V4 algorithm application for automated image collection and analysis. Means of CIMPR labeling in control and knockdown cells were compared using repeated-measures analysis of variance and the post hoc Tukey–Kramer significance test (*p < 0.05, **p < 0.01, ***p < 0.001). More than 1500 cells were scored per knockdown condition (two independent repeats). In every knockdown, there is an increase in the area and intensity of spots and a concomitant decrease in the number of spots (although the decrease in spot number could be a result of increased clustering rather than fewer structures).
160

Publication: Interaction between AP-5 and hereditary spastic paraplegia proteins
Volume 24 August 15, 2013 Association of SPG11 and SPG15 with AP-5 | 2563
FIGURE 4: Immunofluorescence labeling of AP-5, SPG15, and SPG11. (A) Cells stably expressing either σ5-GFP or SPG15-GFP were fixed and double labeled with antibodies against GFP (to enhance the signal) and the late endosomal/lysosomal protein LAMP1. Cytosolic σ5-GFP was washed out by saponin before fixation, leaving nuclear staining (this construct is likely to diffuse freely in and out of the nucleus). The punctate GFP labeling throughout the cytoplasm is partially coincident with LAMP1. (B) Primary human fibroblasts were double labeled for endogenous SPG11 and LAMP1. The two antibodies show good colocalization. (C) Cells expressing SPG15-GFP were fixed and double labeled with anti-GFP and monoclonal antibodies against either SPG11 or ζ subunit of AP-5. The labeling patterns for tagged SPG15 and endogenous ζ or SPG11 are largely coincident. Scale bars, 20 μm.
of these organelles or cause HSP for some other reason (e.g., by im-pairing axonal maintenance) remains to be determined.
The PI 3-kinase inhibitor wortmannin causes AP-5, SPG11, and SPG15 to appear cytosolic rather than membrane associated, indi-cating that the phosphoinositide PI3P acts as a membrane identity marker, most likely by binding to the FYVE domain of SPG15.
Although PI3P is usually regarded as marker for an early endosomal compartment, there is at least one other protein, sorting nexin 16 (Snx16), that binds to PI3P (via a PX domain) but localizes to a late endosomal compartment (Brankatschk et al., 2011). In the case of Snx16, another domain also contributes to localization (Hanson and Hong, 2003), and it seems likely that additional interactions will be
161
●

Appendix
2564 | J. Hirst et al. Molecular Biology of the Cell
FIGURE 5: SPG15 localization. (A) Stills from a movie (Supplemental Movie S1) showing cells expressing SPG15-GFP. Cells were imaged every 10 s over 15 min. Motile structures can be seen moving over short (arrows) and long distances (circle). Scale bar, 20 μm. (See Supplemental Movie S1.) (B) Cells expressing SPG15-GFP were either incubated with Lysotracker Red, a vital stain for acidic organelles, and imaged immediately, or incubated with Magic Red Cathepsin B substrate, a vital stain for active lysosomal hydrolases, for 30 min and then imaged. SPG15-GFP colocalizes with both markers. Scale bar: 20 μm. (See Supplemental Movies S2 and S3.) (C) Immunogold labeling of SPG15-GFP–expressing cells. Because of the low abundance of the protein, labeling was sparse, but there was very little background. Gold particles can be seen associated with organelles containing membrane whorls, characteristic of late endosomes/lysosomes, but we did not find any label associated with budding profiles. Scale bar, 200 nm.
162

Publication: Interaction between AP-5 and hereditary spastic paraplegia proteins
Volume 24 August 15, 2013 Association of SPG11 and SPG15 with AP-5 | 2565
SPG11 or SPG15. Most organisms have either both AP-5 and SPG11/SPG15 or neither, but there are a few exceptions, including Drosophila, that have SPG11/SPG15 but not AP-5 (Hirst et al., 2011). Thus it is possible that SPG11/SPG15 may be able to function in the absence of AP-5. The observation that patients with mutations in
found to facilitate the binding of SPG11/SPG15 to late endosomes, similar to the “coincidence detection” mechanism used to recruit AP-2 onto membranes (Haucke, 2005).
Although knockdown of SPG11 or SPG15 affects the localization of AP-5, knocking down AP-5 does not affect the localization of
FIGURE 6: Localization of AP-5 depends on SPG11/SPG15 and is sensitive to wortmannin. (A) Cells stably expressing σ5-GFP, SPG15-GFP, or SPG11-GFP were treated with siRNAs and then labeled with anti-GFP. The σ5-GFP–expressing cells were treated with saponin before fixation to wash out cytosolic proteins. The punctate labeling of σ5-GFP is lost when ζ, SPG11, or SPG15 is depleted. In contrast, the punctate labeling of SPG15-GFP or SPG11-GFP is not lost when ζ is depleted. SPG15 labeling becomes diffuse when SPG11 is depleted, however, and SPG11 labeling becomes diffuse when SPG15 is depleted. In both cases, siRNAs targeting the construct itself (plus the endogenous version of the protein) strongly reduce the total fluorescence. (B) Cells stably expressing either SPG15-GFP or σ5-GFP were treated with 5 μg/ml brefeldin A (BFA) for 5 min or 100 nM wortmannin for 1 h and then fixed. The σ5-GFP–expressing cells were treated with saponin to wash out cytosolic proteins before fixation. The punctate labeling of both proteins is insensitive to brefeldin A but is lost upon treatment with wortmannin. Scale bars, 20 μm.
163
●

Appendix
2566 | J. Hirst et al. Molecular Biology of the Cell
FIGURE 7: Domain organization of SPG15 and SPG11. (A) The domain organization of SPG15 was predicted by DOMpred, and then homology searching with each domain was carried out using HHpred (http://toolkit.tuebingen .mpg.de/hhpred). More information about the HHpred hits is available in Supplemental Table S2. PSIpred was used to carry out a secondary structure prediction for each residue. The α-helices are in magenta and β-strands in cyan. The height of each colored vertical line is proportional to the confidence of the secondary structure prediction (McGuffin et al., 2000). (B) A similar analysis was carried out on SPG11. (C) GST alone or the N-terminal domain of SPG11 coupled to GST was incubated with HeLa cell cytosol, and bound AP-5 ζ was detected by Western blotting. The N-terminal domain of SPG11 (GST-SPG11N) pulls down AP-5 ζ from cytosol. We estimate, however, that no more than ∼10% of the total AP-5 ζ was pulled down by the SPG11 construct, probably because most of the AP-5 already has SPG11 stably associated with it, so the pull down only captures “unoccupied” AP-5. As controls, blots of the cytosol and pull downs were also probed with antibodies against the AP-1 γ and AP-2 α subunits. Although both of these proteins are much more abundant in cytosol than AP-5 ζ, neither was detected in the GST-SPG11N pull down.
164

Publication: Interaction between AP-5 and hereditary spastic paraplegia proteins
Volume 24 August 15, 2013 Association of SPG11 and SPG15 with AP-5 | 2567
(Carlsbad, CA). Monoclonal antibodies were raised against peptides from AP5Z1 (1H1) and SPG11 (4C10, 4L15, 3I13) by Abmart (Shang-hai, China). Sixteen peptide immunogens for either SPG11 or ζ were overexpressed in Escherichia coli, purified by Ni-affinity chromatog-raphy, and injected into BALB/C mice. Spleen cells were fused with SP2/0 myeloma cells, and selected clonal cell lines were used to produce ascites fluid, from which antibodies were purified by pro-tein A/G affinity chromatography. Where known, the epitope is indi-cated: 3I13 (KDHAKTSDPG), 4L15 (PVQNYKTKEG), and 4C10 (PQELQGSKQE). The isotypes of the mouse monoclonal antibodies made for this study are immunoglobulin G2b (IgG2b; 1H1 and 4C10), IgG2a (4L15), and IgG3 (3I13). The mouse monoclonals against EEA1, C-NAP1, and LAMP1 are all IgG1, and the mouse anti-GFP is IgG2a.
For pull-down experiments, a cDNA encoding residues 1–500 of SPG11 was cloned into pGEX4T-1 for expression of GST-SPG11N, and the resulting fusion protein (which was partially insoluble and degraded) was purified using glutathione-Sepharose, as specified by the manufacturer (GE Healthcare, Piscataway, NJ).
RNA interferenceKnockdowns were performed using the following On-Target Plus siRNA reagents from Dharmacon, Lafayette, CO) or a nontargeting SMARTpool siRNA (D-001810-10) as a control. The siRNAs were as follows: μ5 (C14orf108), J-015523-09, J-015523-10; ζ (KIAA0415), L-025284-01; SPG11 (FLJ21439), L-017138-00; SPG15 (ZFYVE26), J-031136-09, J-031136-10, J-031136-11, J-031136-12; all used at a concentration of 25 nM. Knockdowns were performed with a single-hit 72-h protocol using Oligofectamine (Invitrogen) and Opti-Mem (Invitrogen) following the manufacturer’s instructions.
Tissue cultureHeLaM cells (Tiwari et al., 1987) were grown in DMEM (Sigma-Al-drich) supplemented with 10% (vol/vol) fetal calf serum (Sigma-Al-drich), 2 mM l-glutamine, 50 U/ml penicillin, and 50 μg/ml strepto-mycin. A stable clonal cell line expressing σ5-GFP (Hirst et al., 2011) was derived by G418 selection. HeLa cells stably expressing GFP-tagged SPG11, SPG15, and KIAA0415 (ζ) have been previously de-scribed (Słabicki et al., 2010). Because of loss of expression over time in culture, the cells were sorted by flow cytometry for medium to high expression of GFP and maintained in G418-containing medium.
Fluorescence microscopyFor immunofluorescence microscopy, cells were plated into glass-bottom dishes (MatTek, Ashland, MA) and treated where indicated with 5 μg/ml brefeldin A for 5 min, 100 nM wortmannin for 1 h, or 0.05% (wt/vol) saponin in phosphate-buffered saline (PBS) for 1 min. The cells were then fixed with 3% formaldehyde, permeabilized with 0.1% Triton X-100, and labeled as indicated. The cells were imaged with a Zeiss Axiovert 200 inverted microscope (Carl Zeiss, Jena, Ger-many) using a Zeiss Plan Achromat 63× oil immersion objective (nu-merical aperture 1.4), an OCRA-ER2 camera (Hamamatsu, Hama-matsu, Japan), and Improvision Openlab software (PerkinElmer, Waltham, MA).
For live-cell microscopy, cells were plated into glass-bottom dishes (MatTek) and incubated in CO2-independent media with 50 nM Lysotracker Red DND-99 (Invitrogen) or Magic Red Cathepsin B substrate (AbD Serotec, Raleigh, NC), following manufacturer’s instructions. The cells were imaged on a Zeiss LSM710 confocal microscope with Zeiss ZEN software. Movie images were captured every 10 s for a period of up to 15 min.
AP-5 ζ/AP5Z1 have a later onset of HSP than patients with muta-tions in SPG11 or SPG15 (Słabicki et al., 2010) is consistent with this possibility. However, only two AP5Z1-deficient patients from a single family have been identified, so more examples will be needed be-fore firm conclusions can be drawn. Fifty-two different loci associ-ated with HSP have been identified, but the causative genes have been found for only 31 of these (Finsterer et al., 2012), and there are likely to be other, as-yet-unidentified loci. Whole-genome or whole-exome sequencing may be the most efficient way of identifying ad-ditional HPS-causing mutations (Züchner, 2010; Bettencourt et al., 2013; Gonzalez et al., 2013). AP5B1, AP5M1, and AP5S1 are prom-ising candidates for some of the other HPS causative genes, espe-cially since mutations in all four of the AP-4 subunit genes have been shown to cause a form of “complex” HSP (reviewed in Hirst et al., 2013).
Unlike SPG15, SPG11 does not have any obvious functional do-mains; however, its predicted secondary structure, consisting of a β-propeller–like N-terminal domain followed by an α-solenoid, to-gether with its homology to other coat components, including clath-rin, suggests that it may form some sort of scaffold. Clathrin uses its N-terminal β-propeller domain to interact with AP complexes, and our pull-down experiments suggest that the same is true for the in-teraction between SPG11 and AP-5. It is interesting that this domain is missing in SPG11 from insects, which also lack AP-5. The α-solenoids of SPG11 and SPG15 may interact with each other to form a scaffold, similar to the clathrin, COPI, and COPII coats. It is not clear, however, what the morphology of such a scaffold might be because the labeling we observe for tagged SPG15 does not ap-pear to be associated with budding profiles, suggesting that the AP-5/SPG11/SPG15 complex may be more analogous to the flat, bilayered clathrin/ESCRT-0 coats on early endosomes (Raiborg et al., 2002), which are believed to hold cargo proteins in place rather than package them into vesicles.
If AP-5 is indeed involved in cargo selection, what cargo proteins does it sort? We had hoped to find candidates in our immunopre-cipitates, but the only proteins that were clearly being brought down specifically were AP-5 subunits, SPG11, and SPG15. This result is not entirely unexpected because coat–cargo interactions are very transient and often difficult to capture. We have recently been able to use the “knocksideways” technique for rapid protein inactivation, followed by subcellular fractionation and comparative proteomics, to identify >50 cargo proteins that are dependent on AP-1 and/or GGA2 for efficient packaging into CCVs (Hirst et al., 2012). By using a similar approach on AP-5, SPG11, and SPG15, we hope to be able to establish the precise functions of each of these proteins.
MATERIALS AND METHODSAntibodies and constructsAntibodies used in this study include in-house antibodies against clathrin and AP-1 (Simpson et al., 1996) and commercial antibodies against EEA1 (E41120; BD Transduction Labs, Lexington, KY), LAMP1 (sc18821; Santa Cruz Biotechnology, Santa Cruz, CA), GFP (ab6556; Abcam, Cambridge, MA), CIMPR (ab2733; Abcam), C-NAP1 (BD611375; BD Biosciences, San Diego, CA), AP-2 α (610502; BD Biosciences), and AP5Z1 (KIAA0415; sc139260; Santa Cruz Bio-technology). Rabbit anti-GFP and sheep anti-SEC16A were kind gifts from Matthew Seaman (Cambridge Institute for Medical Re-search, Cambridge, United Kingdom) and David Stephens (Univer-sity of Bristol, Bristol, United Kingdom), respectively. Horseradish peroxidase–labeled secondary antibodies were purchased from Sigma-Aldrich (St. Louis, MO) and fluorescently labeled secondary antibodies (species and/or isotype specific) from Invitrogen
165
●

Appendix
2568 | J. Hirst et al. Molecular Biology of the Cell
control cell lines reveals proteins specifically associated with the bait. QUBIC was performed essentially as described by Hubner et al. (2010). Anti-GFP immunoprecipitations of BAC and control cell lines were performed in triplicate. The precipitated proteins were analyzed by mass spectrometry and compared using label-free quantification. The following cell lines were analyzed. BAC cell lines: SGP11-GFP, AP-5 ζ-GFP (Słabicki et al., 2010), SPG15-GFP (origi-nally established by Słabicki et al., 2010; we selected a clonal cell line from this); control cell line: derived from the SPG15-GFP cell line; we selected cells that had lost expression of the SPG15-GFP bait (as determined by immunofluorescence microscopy and West-ern blotting). This control cell line therefore closely corresponds to the parental HeLa cells used to generate all of the BAC cell lines.
To gauge the stoichiometry of identified proteins, we used in-tensity-based absolute quantification (iBAQ) estimation of protein abundance (Schwanhäusser et al., 2011; implemented in the Max-Quant package by Cox and Mann, 2008). iBAQ sums the intensi-ties of all identified peptides for each protein and normalizes the total intensity to the number of theoretically obtainable tryptic peptides of the protein. Unlike the original publication, we omitted a spike-in standard and assumed proportionality between the iBAQ intensity and protein molarity. iBAQ can be used to estimate the relative abundance of subunits in a protein complex (Arike et al., 2012). Although the accuracy of the method is limited, it can clearly distinguish between stoichiometric (1:1) and substoichio-metric (<<1:1) interactions. For each individual pull down, iBAQ values of coimmunoprecipitated proteins were first normalized to the iBAQ value of the bait protein. Data from pull downs with the same bait (triplicate repeats) were then combined and iBAQ values normalized to the median iBAQ value of the set (excluding the bait protein). Values were then log-transformed and plotted (Figure 1B).
To quantify knockdown phenotypes, we used an automated ArrayScan VTI microscope (Cellomics/Thermo Fisher, Pittsburgh, PA) and the SpotDetector V4 assay algorithm. Cells were plated onto 96-well PerkinElmer microplates and stained with anti-CIMPR, followed by Alexa Fluor 488–donkey anti-mouse IgG and whole-cell stain (Invitrogen). The cells were imaged with a modified Zeiss Axio-vert 200M inverted microscope, a Zeiss 40×/0.5 Achroplan objec-tive, and a Hamamatsu OCRA-ER camera, and >1500 cells quanti-fied for each condition using ARRAYSCAN software.
Electron microscopyFor immunogold electron microscopy, a clonal line of cells express-ing SPG15-GFP was derived, permeabilized by immersion in liquid N2, and fixed by adding an equal volume of freshly prepared 8% paraformaldehyde/0.2% gluteraldehyde in 0.1 M phosphate buffer, pH 7.4. After 5 min the solution was removed and cells were post-fixed in 4% paraformaldehyde/0.1% glutaraldehyde in 0.1 M phos-phate buffer, pH 7.4, for 1 h at room temperature and further pro-cessed as previously described (Hirst et al., 2009). Ultrathin sections were labeled with the commercial GFP antibody (see previous de-scription), followed by protein A conjugated to colloidal gold (Utrecht University, Utrecht, Netherlands), and viewed using a Phil-lips CM 100 transmission electron microscope (Philips Electron Optics, Cambridge, United Kingdom) at an operating voltage of 80 kV.
Immunoprecipitation and GST pull-down experimentsFor immunoprecipitations from whole-cell lysates, cells stably ex-pressing σ5-GFP or SPG15-GFP were solubilized in PBS containing 1% Triton X-100 and insoluble material removed before incubation with GFP-Trap (ChromoTek, Martinsried, Germany), according to the manufacturer’s instructions. For analysis by mass spectrometry, proteins were processed by filter-aided sample preparation solution digest (Wisniewski et al., 2009), and the sample was analyzed by liquid chromatography–tandem mass spectrometry in an Orbitrap mass spectrometer (Thermo Scientific; Waltham, MA; Antrobus and Borner, 2011). For immunoprecipitations from cytosol and mem-brane fractions, cells stably expressing SPG15-GFP were scraped in PBS and lysed by six passages through a 21-gauge needle/5-ml sy-ringe. Nuclei and unbroken cells were removed by centrifugation at 4000 × g for 5 min, and then membranes were recovered at 50,000 × g for 1 h. The membrane pellet was solubilized in PBS containing 1% Triton X-100 and clarified by centrifugation. Triton X-100 was also added to the supernatant to a concentration of 1%, and then both samples were incubated with GFP-Trap (ChromoTek) accord-ing to the manufacturer’s instructions.
For GST pull-down experiments, cells were solubilized in PBS containing 1% NP40, and insoluble material was removed by cen-trifugation at 20,000 × g for 30 min. Samples containing 5 mg of starting lysate were precleared with 50 μg/ml GST, followed by glu-tathione–Sepharose. The lysates were then incubated with 50 μg/ml GST-SPG11N, followed by glutathione–Sepharose, and washed with PBS containing 1% NP40, followed by PBS. Bound proteins were eluted with SDS–PAGE loading buffer.
Several cell lines were analyzed by QUBIC. QUBIC is a recent proteomics method for unbiased and sensitive identification of pro-tein–protein interactions (Hubner and Mann, 2011). It is based on the generation of stable cell lines that express a GFP-tagged, full-length bait protein under control of its endogenous promoter. The tagged bait protein is expressed at near-physiological levels and can be immunoprecipitated with an anti-GFP antibody. Quantitative mass spectrometric analysis of immunoprecipitates from bait and
ACKNOWLEDGMENTSWe thank Damien Devos for help with structural predictions, Nick Bright for initial electron microscope characterization, Matthew Sea-man and David Stephens for antibodies, Evan Reid for helpful ad-vice, and Mark Bowen for help with confocal microscopy.
REFERENCESAntrobus R, Borner GHH (2011). Improved elution conditions for native co-
immunoprecipitation. PLoS One 23, e18218.Arike L, Valgepea K, Peil L, Nahku R, Adamberg K, Vilu R (2012). Compari-
son and applications of label-free absolute proteome quantification methods on Escherichia coli. J Proteomics 75, 5437–5448.
Beck KA, Keen JH (1991). Interaction of phosphoinositide cycle intermedi-ates with the plasma membrane-associated clathrin assembly protein AP-2. J Biol Chem 266, 4442–4447.
Bettencourt C et al. (2013). Exome sequencing is a useful diagnostic tool for complicated forms of hereditary spastic paraplegia. Clin Genet, doi: 10.1111/cge.12133.
Boukhris A et al. (2008). Hereditary spastic paraplegia with mental impair-ment and thin corpus callosum in Tunisia: SPG11, SPG15, and further genetic heterogeneity. Arch Neurol 65, 393–402.
Brankatschk B, Pons V, Parton RG, Gruenberg J (2011). Role of SNX16 in the dynamics of tubulo-cisternal membrane domains of late endosomes. PLoS One 6, e21771.
Cai Q, Lu L, Tian JH, Zhu YB, Qiao H, Sheng ZH (2010). Snapin-regulated late endosomal transport is critical for efficient autophagy-lysosomal function in neurons. Neuron 68, 73–86.
Collins BM, McCoy AJ, Kent HM, Evans PR, Owen DJ (2002). Molecular architecture and functional model of the endocytic AP2 complex. Cell 109, 523–535.
Cox J, Mann M (2008). MaxQuant enables high peptide identification rates, individualized p.p.b.-range mass accuracies and proteome-wide protein quantification. Nat Biotechnol 26, 1367–1372.
166

Publication: Interaction between AP-5 and hereditary spastic paraplegia proteins
Volume 24 August 15, 2013 Association of SPG11 and SPG15 with AP-5 | 2569
Lemmon SK, Traub LM (2012). Getting in touch with the clathrin terminal domain. Traffic 13, 511–519.
Martin E, Yanicostas C, Rastetter A, Naini SM, Maouedj A, Kabashi E, Rivaud-Péchoux S, Brice A, Stevanin G, Soussi-Yanicostas N (2012). Spa-tacsin and spastizin act in the same pathway required for proper spinal motor neuron axon outgrowth in zebrafish. Neurobiol Dis 48, 299–308.
McGuffin LJ, Bryson K, Jones DT (2000). The PSIPRED protein structure prediction server. Bioinformatics 16, 404–405.
Murmu RP et al. (2011). Cellular distribution and subcellular localization of spatacsin and spastizin, two proteins involved in hereditary spastic paraplegia. Mol Cell Neurosci 47, 191–202.
Page LJ, Robinson MS (1995). Targeting signals and subunit interactions in coated vesicle adaptor complexes. J Cell Biol 131, 619–630.
Pavel J, Harter C, Wieland FT (1998). Reversible dissociation of coatomer: functional characterization of a beta/delta-coat protein subcomplex. Proc Natl Acad Sci USA 95, 2140–2145.
Raiborg C, Bache KG, Gillooly DJ, Madshus IH, Stang E, Stenmark H (2002). Hrs sorts ubiquitinated proteins into clathrin-coated microdomains of early endosomes. Nat Cell Biol 4, 394–398.
Sagona AP, Nezis IP, Pedersen NM, Liestøl K, Poulton J, Rusten TE, Skotheim RI, Raiborg C, Stenmark H (2010). PtdIns(3)P controls cy-tokinesis through KIF13A-mediated recruitment of FYVE-CENT to the midbody. Nat Cell Biol 12, 362–371.
Schwanhäusser B, Busse D, Li N, Dittmar G, Schuchhardt J, Wolf J, Chen W, Selbach M (2011). Global quantification of mammalian gene expression control. Nature 473, 337–342.
Simpson F, Bright NA, West MA, Newman LS, Darnell RB, Robinson MS (1996). A novel adaptor-related protein complex. J Cell Biol 133, 749–760.
Słabicki M et al. (2010). A genome-scale DNA repair RNAi screen identifies SPG48 as a novel gene associated with hereditary spastic paraplegia. PLoS Biol 8, e1000408.
Söding J, Biegert A, Lupas AN (2005). The HHpred interactive server for protein homology detection and structure prediction. Nucleic Acids Res 33, W244–W248.
Tiwari RK, Kusari J, Sen GC (1987). Functional equivalents of interferon-mediated signals needed for induction of an mRNA can be generated by double-stranded RNA and growth factors. EMBO J 6, 3373–3378.
Tsukita S, Ishikawa H (1980). The movement of membranous organelles in axons. Electron microscopic identification of anterogradely and retro-gradely transported organelles. J Cell Biol 84, 513–530.
Wis´niewski JR, Zougman A, Nagaraj N, Mann M (2009). Universal sample preparation method for proteome analysis. Nat Methods 6, 359–362.
Züchner S (2010). Peripheral neuropathies: whole genome sequencing identifies causal variants in CMT. Nat Rev Neurosci 6, 424–425.
Devos D, Dokudovskaya S, Alber F, Williams R, Chait BT, Sali A, Rout MP (2004). Components of coated vesicles and nuclear pore complexes share a common molecular architecture. PLoS Biol 2, e380.
Finsterer J, Löscher W, Quasthoff S, Wanschitz J, Auer-Grumbach M, Steva-nin G (2012). Hereditary spastic paraplegias with autosomal dominant, recessive, X-linked, or maternal trait of inheritance. J Neurol Sci 318, 1–18.
Gonzalez MA, Lebrigio RF, Van Booven D, Ulloa RH, Powell E, Speziani F, Tekin M, Schüle R, Züchner S (2013). GEnomes Management Ap-plication (GEM.app): a new software tool for large-scale collaborative genome analysis. Hum Mutat 34, 842–846.
Hanein S et al. (2008). Identification of the SPG15 gene, encoding spastizin, as a frequent cause of complicated autosomal-recessive spastic paraple-gia, including Kjellin syndrome. Am J Hum Genet 82, 992–1002.
Hanson BJ, Hong W (2003). Evidence for a role of SNX16 in regulating traf-fic between the early and later endosomal compartments. J Biol Chem 278, 34617–34630.
Harbour ME, Breusegem SY, Antrobus R, Freeman C, Reid E, Seaman MNJ (2010). The cargo-selective retromer complex is a recruiting hub for protein complexes that regulate endosomal tubule dynamics. J Cell Sci 123, 3703–3717.
Haucke V (2005). Phosphoinositide regulation of clathrin-mediated endocy-tosis. Biochem Soc Trans 33, 1285–1289.
Hirst J, Barlow LD, Francisco GC, Sahlender DA, Seaman MNJ, Dacks JB, Robinson MS (2011). The fifth adaptor protein complex. PLoS Biol 9, e1001170.
Hirst J, Borner GHH, Antrobus R, Peden AA, Hodson NA, Sahlender DA, Robinson MS (2012). Distinct and overlapping roles for AP-1 and GGAs revealed by the “knocksideways” system. Curr Biol 22, 1711–1716.
Hirst J, Irving C, Borner GHH (2013). Adaptor protein complexes AP-4 and AP-5: new players in endosomal trafficking and progressive spastic paraplegia. Traffic 14, 153–164.
Hirst J, Sahlender DA, Choma M, Sinka R, Harbour ME, Parkinson M, Robinson MS (2009). Spatial and functional relationship of GGAs and AP-1 in Drosophila and HeLa cells. Traffic 10, 1696–1710.
Honing S, Ricotta D, Krauss M, Spate K, Spolaore B, Motley A, Robinson M, Robinson C, Haucke V, Owen DJ (2005). Phosphatidylinositol-(4,5)-bisphosphate regulates sorting signal recognition by the clathrin-associ-ated adaptor complex AP2. Mol Cell 18, 519–531.
Hubner NC, Bird AW, Cox J, Splettstoesser B, Bandilla P, Poser I, Hyman A, Mann M (2010). Quantitative proteomics combined with BAC Transge-neOmics reveals in vivo protein interactions. J Cell Biol 189, 739–754.
Hubner NC, Mann M (2011). Extracting gene function from protein-protein interactions using Quantitative BAC InteraCtomics (QUBIC). Methods 53, 453–459.
167
●
Appendix
Research article
2244 The Journal of Clinical Investigation http://www.jci.org Volume 123 Number 5 May 2013
CCDC22 deficiency in humans blunts activation of proinflammatory NF-κB signaling
Petro Starokadomskyy,1,2 Nathan Gluck,3,4 Haiying Li,1 Baozhi Chen,1 Mathew Wallis,5 Gabriel N. Maine,6 Xicheng Mao,1 Iram W. Zaidi,1 Marco Y. Hein,7 Fiona J. McDonald,8
Steffen Lenzner,9 Agnes Zecha,9 Hans-Hilger Ropers,9 Andreas W. Kuss,9,10 Julie McGaughran,5,11 Jozef Gecz,12,13 and Ezra Burstein1,2
1Department of Internal Medicine and 2Department of Molecular Biology, University of Texas Southwestern Medical Center, Dallas, Texas, USA. 3Department of Biochemistry and Molecular Biology, School of Medicine, Hebrew University, Jerusalem, Israel. 4Gastroenterology Institute,
Tel Aviv Sourasky Medical Center, Tel Aviv, Israel. 5Genetic Health Queensland at the Royal Brisbane and Women’s Hospital, Herston, Queensland, Australia. 6Department of Clinical Pathology, Beaumont Health System, Royal Oak, Michigan, USA. 7Max Planck Institute of Biochemistry, Martinsried, Germany.
8Department of Physiology, University of Otago, Dunedin, New Zealand. 9Max Planck Institute for Molecular Genetics, Berlin, Germany. 10Human Molecular Genetics, Institute for Human Genetics, University Medicine Greifswald and Institute for Genetics and Functional Genomics,
Ernst-Moritz-Arndt University, Greifswald, Germany. 11School of Medicine at University of Queensland, Brisbane, Queensland, Australia. 12SA Pathology at the Women’s and Children’s Hospital, North Adelaide, South Australia, Australia.
13Department of Paediatrics, The University of Adelaide, Adelaide, South Australia, Australia.
NF-κB is a master regulator of inflammation and has been implicated in the pathogenesis of immune dis-orders and cancer. Its regulation involves a variety of steps, including the controlled degradation of inhibi-tory IκB proteins. In addition, the inactivation of DNA-bound NF-κB is essential for its regulation. This step requires a factor known as copper metabolism Murr1 domain–containing 1 (COMMD1), the prototype mem-ber of a conserved gene family. While COMMD proteins have been linked to the ubiquitination pathway, little else is known about other family members. Here we demonstrate that all COMMD proteins bind to CCDC22, a factor recently implicated in X-linked intellectual disability (XLID). We showed that an XLID-associated CCDC22 mutation decreased CCDC22 protein expression and impaired its binding to COMMD proteins. Moreover, some affected individuals displayed ectodermal dysplasia, a congenital condition that can result from developmental NF-κB blockade. Indeed, patient-derived cells demonstrated impaired NF-κB activation due to decreased IκB ubiquitination and degradation. In addition, we found that COMMD8 acted in conjunc-tion with CCDC22 to direct the degradation of IκB proteins. Taken together, our results indicate that CCDC22 participates in NF-κB activation and that its deficiency leads to decreased IκB turnover in humans, highlight-ing an important regulatory component of this pathway.
IntroductionCopper metabolism Murr1 domain–containing (COMMD) pro-teins are a group of 10 evolutionarily conserved factors present in a wide range of organisms, including plants, protozoa, worms, insects, and vertebrates (1). COMMD1, the prototype member of the family, has been linked to a number of physiologic processes, including copper homeostasis (2–4), sodium balance (5–8), and adaptation to hypoxia (9, 10). COMMD1 has also been found to inhibit NF-κB (11, 12), a proinflammatory transcription factor that regulates close to 400 target genes that play essential roles in immune responses, immune system development, and cell survival and proliferation (13–15).
The underlying mechanism for the diverse functions of COMMD1 has not been fully elucidated, but in several instances, COMMD1 has been shown to promote the ubiquitination of spe-cific cellular proteins (12). Recently, it was shown that COMMD1 and other COMMD family members interact with and regulate the activation of a class of ubiquitin ligases known as Cullin-RING ligases (CRLs) (16). CRLs are multiprotein complexes containing a Cullin family member as the main scaffold protein (Cul1, Cul2,
Cul3, Cul4a, Cul4b, Cul5, and Cul7 in humans). To form the active ligase, each Cullin associates with a RING finger protein (Rbx1 or Rbx2) and any of various substrate binding partner proteins specif-ic to each Cullin. This prolific group of enzymes accounts for more than 25% of all ubiquitin ligases in mammals and regulate diverse cellular processes, including cell cycle progression, DNA repair, and many signal transduction pathways, including NF-κB (17).
Activation of NF-κB is controlled by various ubiquitination events, including the critically important degradation of IκB, a constitutive inhibitor of this pathway (18). This step is mediated by Cul1 in association with β-transducin repeat–containing pro-tein (βTrCP), which form the complex CRL1-βTrCP (also known as SCFβTrCP) (19–21). Under basal conditions, so-called “classical” IκB proteins (IκB-α, IκB-β, or IκB-ε) bind to NF-κB dimers and mask their nuclear localization sequence, keeping them inac-tive in the cytosol (22). IκB phosphorylation by the IκB kinase complex (IKK) generates a phospho-serine motif at the amino termini of classical IκB proteins. This motif is recognized by the F-box proteins βTrCP1 or βTrCP2, the substrate binding subunit of the CRL1-βTrCP ligase, leading to rapid ubiquitination and degradation of IκB (23).
Another CRL-regulated step in the NF-κB pathway is the degra-dation of chromatin-associated NF-κB subunits such as RelA (also known as p65), which plays an essential role in limiting gene expres-sion (11, 12). This event is triggered by IKK-dependent phosphor-
Authorship note: Petro Starokadomskyy and Nathan Gluck contributed equally to this work.
Conflict of interest: The authors have declared that no conflict of interest exists.
Citation for this article: J Clin Invest. 2013;123(5):2244–2256. doi:10.1172/JCI66466.
Downloaded on May 18, 2014. The Journal of Clinical Investigation. More information at www.jci.org/articles/view/66466
168

Publication: CCDC22 deficiency blunts proinflammatory NF-κ B signaling
research article
The Journal of Clinical Investigation http://www.jci.org Volume 123 Number 5 May 2013 2245
ylation of RelA (24, 25) and is mediated by a CRL2 complex that depends on COMMD1 for its activation (12, 16). Interestingly, while certain COMMD proteins, such as COMMD8 and COMMD10, bind to Cul1 (16), it was not previously known whether these factors promote the ubiquitination of CRL1 targets such as IκB.
In this study, we demonstrated that coiled-coil domain–con-taining protein 22 (CCDC22), a highly conserved protein recently implicated in X-linked intellectual disability (XLID) (26), is an asso-ciated factor that binds to all COMMD family members. CCDC22 was required for the ubiquitination and subsequent turnover of IκB proteins. Individuals with a hypomorphic mutation in CCDC22 demonstrated IκB stabilization and a blunted NF-κB response. These findings highlight a novel aspect in the activation of IκB ubiquitination and the control of NF-κB through CCDC22.
ResultsCOMMD proteins associate with CCDC22, a broadly expressed gene. We hypothesized that, given their structural homology, COMMD proteins might assemble similar molecular complexes in vivo and that the identification and characterization of potential protein partners might provide insights into the mechanism of action of COMMD family members in general. In order to accomplish our goal, we began to systematically characterize protein com-plexes associated with COMMD proteins in vivo using tandem affinity purification (TAP). In these screens, 3 COMMD protein baits were used: COMMD1, COMMD9, and COMMD10. Con-sistent with the known ability of COMMD proteins to interact with each other (1), the TAP screens identified other endogenous COMMD proteins. Interestingly, these baits interacted with a spe-cific and unique combination of COMMD partners: COMMD1 brought down COMMD3, COMMD4, and COMMD6, whereas COMMD9 and COMMD10 interacted with each other as well as with COMMD5 and COMMD6 (Figure 1A).
In addition, in all 3 screens, mass spectrometry analysis iden-tified peptides that matched with high confidence to a protein of previously unknown function, termed CCDC22 (Figure 1A). Using deposited data available from BioGPS (27), we found that CCDC22 is broadly expressed in human tissues (Supplemental Figure 1A; supplemental material available online with this article; doi:10.1172/JCI66466DS1). Moreover, we examined the pattern of expression for the Ccdc22 ortholog in mouse tissues and confirmed similar findings at the mRNA level by quantitative real-time RT-PCR (qRT-PCR) and at the protein level by Western blot analysis (Sup-plemental Figure 1, B and C).
CCDC22-COMMD interactions were readily validated in endog-enous coimmunoprecipitations using 2 antisera raised against CCDC22, which coprecipitated endogenous COMMD1 (Figure 1B). Reciprocal precipitations using antisera against COMMD1, COMMD6, COMMD9, and COMMD10 also coprecipitated endog-enous CCDC22 (Figure 1C). Consistent with prior reports (1, 28), COMMD1 and COMMD6 were present in the same complex (Figure 1C). The interaction of CCDC22 with 4 COMMD fam-ily members suggested the possibility that other COMMD proteins might also interact with this factor. Given the paucity of characterized antibodies to other COMMD family members, we expressed COMMD proteins fused to glutathione S-transferase (GST) in mammalian cells and subsequently precipitated these proteins from cell lysates. All 10 COMMD proteins were able to coprecipitate endogenous CCDC22 to a similar extent (Figure 1D). Finally, a quantitative BAC-GFP interactomics experiment (29) using GFP-tagged CCDC22 as bait
was also performed. For these experiments, CCDC22 was stably expressed in HeLa cells through the introduction of a BAC encoding GFP-tagged CCDC22 from its native locus (30). Again, all COMMD proteins were identified with high confidence as interacting partners of CCDC22 using 2 distinct affinity tag combinations (Figure 1E and Supplemental Figure 2), which confirmed that this protein is an associated factor of all COMMD family members.
CCDC22 regulates the cellular localization of COMMD proteins. Next, we examined the cellular distribution of CCDC22. Using a yellow fluorescent protein (YFP) fusion protein, we found CCDC22 to be localized primarily in the cytosol, with a punctate perinuclear distribution, and with minor presence in the nucleus (Supplemen-tal Figure 1D), in agreement with what is reported for the endog-enous protein by the Protein Atlas project (31). Since the cellular distribution of CCDC22 was similar to the pattern displayed by several COMMD proteins (16), we also analyzed whether CCDC22 and COMMD1 could colocalize. Using GFP- and DsRed2-tagged versions of CCDC22 and COMMD1, respectively, we identified clear colocalization, while at the same time, some fraction of these proteins displayed exclusive cellular localization (Figure 2A). This colocalization is in agreement with the protein-protein interaction identified biochemically.
In order to clarify the role of CCDC22 binding to all COMMD proteins, we examined whether CCDC22 regulates the ability of COMMD proteins to interact with each other. After CCDC22 silencing, the amount of COMMD1 or COMMD10 bound to endogenous COMMD6 was unaffected (Figure 2B), which suggests that these key protein-protein interactions are not controlled by CCDC22. Next, we evaluated whether CCDC22 plays a role in the cellular distribution of COMMD proteins. Silencing of CCDC22 dramatically changed the cellular localization of fluorescently tagged COMMD family members, inducing redistribution to large perinuclear punctate foci (Figure 2C). Quantitatively, CCDC22 defi-ciency led to a nearly 5-fold higher number of cells with YFP-tagged COMMD1 or COMMD10 aggregates (Figure 2D). These data indi-cate that CCDC22 regulates the cellular distribution of COMMD proteins, but is not required for COMMD-COMMD interactions.
The amino terminus of CCDC22 and the COMM domain are necessary and sufficient for interaction. Homology analysis using the Conserved Domain Database (32) indicates that CCDC22 is highly conserved and a single ortholog is present in plants, protozoa, worms, insects, and vertebrates, a range of organisms similar to that in which COMMD genes are found. Notably, CCDC22 and COMMD orthologs are not evident in yeast or bacteria. The areas of highest homology among CCDC22 orthologs (Figure 3A) are their extreme amino termini (first ∼150 amino acids) and their carboxyl termini (∼350 amino acids). This latter region corresponds to a coil-coiled domain and bears similarity to structural maintenance of chro-mosomes (SMC) proteins, factors that bind to chromatin and are involved in meiosis and DNA repair (33). Further characterization of the CCDC22-COMMD1 interaction showed that COMMD1 bound to the amino terminus of CCDC22 (Figure 3B). In addition, the COMM domain of COMMD1, a carboxyterminal homology domain present in all COMMD proteins, was necessary and suf-ficient for CCDC22 binding (Figure 3C), in agreement with the binding of all COMM domain–containing proteins to CCDC22.
An XLID-associated CCDC22 mutation impairs COMMD binding. Recently, a mutation in CCDC22 was identified in a family with XLID (OMIM 300859) and other developmental abnormalities (26). Affected members carry a single point mutation in CCDC22
Downloaded on May 18, 2014. The Journal of Clinical Investigation. More information at www.jci.org/articles/view/66466
169
●

Appendix
research article
2246 The Journal of Clinical Investigation http://www.jci.org Volume 123 Number 5 May 2013
(c.49A>G/p.T17A) that changes codon 17 from Thr to Ala, a high-ly conserved residue among vertebrates. It has been shown that this T17A mutation, by virtue of its close proximity to a splice site, results in abnormal splicing and diminished mRNA levels (26). Indeed, we found that EBV-immortalized B lymphocytes (lymphoblastoid cell lines; LCLs) from affected individuals had reduced CCDC22 transcript levels, whereas expression of fork-head box P3 (FOXP3), a gene in close proximity to CCDC22, was not affected (Supplemental Figure 3, A and B). Interestingly, the corresponding reduction in CCDC22 protein levels was relatively modest in LCLs (Figure 3D, input), and we therefore speculated
that the T17A mutation may also result in functional alterations of the CCDC22 protein. Indeed, endogenous T17A was unable to bind to COMMD1 in lymphoid cells from affected individu-als, a finding that was disproportionate to the small decrement in CCDC22 expression noted in these cells (Figure 3D). Similarly, T17A expressed in HEK 293 cells was defective in its ability to bind to endogenous COMMD1, even when both the WT and mutant CCDC22 proteins were expressed at comparable levels (Figure 3E).
Several other rare variants of CCDC22 were identified in additional families (Figure 3A). Although some of them, such as the E239K vari-ant, have subsequently been found at a low frequency in the NHLBI
Figure 1Identification of CCDC22 as a COMMD associated factor. (A) TAP screen identification of CCDC22. CCDC22 peptides identified with high con-fidence in TAP screens using 3 different COMMD protein baits are indicated by blue shading. The specific COMMD proteins identified with each bait are shown at right. (B and C) Endogenous CCDC22 coimmunoprecipitated with endogenous COMMD proteins. (B) Endogenous CCDC22 was immunoprecipitated (IP) from HEK 293 cell lysates using 2 anti-CCDC22 antisera, and the recovered material was immunoblotted for COMMD1. Preimmune serum (PIS) or beads only were used as negative controls. (C) COMMD1, COMMD6, COMMD9, and COMMD10 were pulled down with polyclonal immune sera, and the precipitated material was immunoblotted for CCDC22. Some input lanes corresponded to different exposures of the same film. (D) CCDC22 associated with all COMMD family members. COMMD proteins fused to GST were expressed in HEK 293 cells and precipitated from Triton X-100 lysates. The recovered material was immunoblotted for endogenous CCDC22. PD, pulldown; NS, nonspecific band. (E) COMMD proteins were the main interaction partners of CCDC22. Volcano plot representation of CCDC22-interacting proteins. LAP-tagged CCDC22 was immunoprecipitated using an antibody directed against the tag. Nontransfected parental HeLa cells served as control. For each protein identified by mass spectrometry, the ratio of the intensities in the CCDC22 IPs over the control was calculated and plotted against the P value (2-tailed t test) calculated from triplicate experiments, both on a logarithmic scale. Dashed curves represent the cutoff, calculated based on a false discovery rate estimation. Specific interactors (top right) are indicated.
Downloaded on May 18, 2014. The Journal of Clinical Investigation. More information at www.jci.org/articles/view/66466
170

Publication: CCDC22 deficiency blunts proinflammatory NF-κ B signaling
research article
The Journal of Clinical Investigation http://www.jci.org Volume 123 Number 5 May 2013 2247
exome sequencing project (12 of 8,627 genomes), the other variants appear to be unique to the XLID kindred. Therefore, we examined how these CCDC22 variants bind to COMMD1 using a coimmu-noprecipitation approach. None of these variants seemed to affect COMMD1 binding when tested in LCLs or after expression in HEK 293 cells (Figure 3, F and G). Similarly, quantitative BAC-GFP interactomics experiments with T30A, R128Q, E239K, and R321W failed to disclose any changes in their binding to COMMD proteins (data not shown). However, 2 of the variants, R128Q and R321W, displayed substantial changes in their cellular localization patterns, demonstrating a fine speckled distribution in the cell that was dif-ferent from the coarse dots noted when expressing the WT protein (Figure 3, H and I). Thus, independent of their binding to COMMD proteins, these 2 mutants demonstrated a functional impairment.
The T17A mutation or CCDC22 deficiency leads to blunted NF-κB acti-vation. Given the role of COMMD1 in the regulation of NF-κB, we turned our attention to a possible role for CCDC22 in this path-way. Careful examination of the XLID kindred carrying the T17A mutation revealed that some affected individuals had aplasia cutis and markedly abnormal dentition (Figure 4A), 2 manifestations of ectodermal dysplasia. This congenital change can be found in individuals with hypomorphic mutations in NEMO (34, 35), which encodes an essential scaffold protein in the IKK complex. Ectodermal dysplasia can be similarly observed as a result of IκB-α mutations that alter its degradation (36), or in individuals with
mutations in the ectodysplasin (EDA) pathway, a TNF-related sig-naling cascade that is involved in ectodermal development (37). Therefore, this clinical phenotype suggested a potential blockade of NF-κB activation during development (38).
Consistent with this, primary fibroblasts from 2 probands dem-onstrated decreased TNF-dependent activation of NF-κB target genes, such as IL8 and TNF-α–induced protein 3 (TNFAIP3; also known as A20), when compared with their heterozygous carrier mother (Figure 4B). Moreover, NF-κB–dependent gene expression in response to CD40 ligand (CD40L) stimulation was impaired in an LCL from an individual with the T17A mutation compared with a normal control LCL (Figure 4C). Similar to the effect of the T17A mutation, CCDC22 silencing led to impaired activation of NF-κB target genes in the control LCL (Figure 4D and Supple-mental Figure 4). Finally, to exclude the possibility of an off-target effect of the siRNA experiments, these were repeated using 2 sepa-rate siRNA duplexes in HEK 293 cells. Again, in both instances, CCDC22 silencing led to decreased TNF-induced activation of NF-κB–dependent genes (Figure 4E and Supplemental Figure 5A). Conversely, CCDC22 overexpression led to greater IL8 activation in this system (Supplemental Figure 5B).
Given these effects on NF-κB activity, we examined whether CCDC22 was itself regulated by NF-κB in any way. We found that CCDC22 expression was not inducible by NF-κB activation, and its binding to COMMD1 was constitutive and not induced
Figure 2CCDC22 is required for proper cellular distribution of COMMD family proteins. (A) Colocalization of CCDC22 with COMMD1. GFP-tagged CCDC22 and DsRed2-tagged COMMD1 were overexpressed in U2OS cells. Cells were counter-stained with Hoechst and imaged by confocal microscopy. Scale bars: 10 μm. The merged view is also shown enlarged (merged and zoom; enlarged ×3-fold). (B) CCDC22 was not required for COMMD-COMMD interaction. HEK 293 cells were transfected with an siRNA targeting CCDC22 (siCCDC22) or a control duplex. After 48 hours, endogenous COMMD6 was immuno-precipitated, and the recovered mate-rial was immunoblotted for endogenous COMMD1 and COMMD10. (C and D) CCDC22 deficiency led to COMMD mislocalization. U2OS cells were trans-fected with YFP-tagged COMMD1 or COMMD10 together with siRNA against CCDC22 or a control duplex (siCon-trol). (C) Nuclear counterstaining with Hoechst was performed just prior to confocal imaging. Scale bars: 10 μm. (D) The proportion of cells with a large perinuclear punctate pattern was deter-mined by examining more than 100 cells per dish in a blinded manner.
Downloaded on May 18, 2014. The Journal of Clinical Investigation. More information at www.jci.org/articles/view/66466
171
●

Appendix
research article
2248 The Journal of Clinical Investigation http://www.jci.org Volume 123 Number 5 May 2013
Figure 3CCDC22-COMMD interactions and the effects of XLID-associated variants. (A) Schematic representation of CCDC22. Conserved regions and the location of nonrecurrent sequence variants identified in XLID patients are displayed. (B and C) The amino terminus of CCDC22 and the COMM domain of COMMD1 were necessary and sufficient for binding. (B) Full-length (F.L.) and indicated domains of CCDC22 were expressed fused to GST, and their binding to endogenous COMMD1 was examined by coprecipitation. (C) Similar experiments were performed to detect coprecipita-tion of endogenous CCDC22 with full-length COMMD1 or its aminoterminal (N-term; amino acids 1–118) or carboxyterminal (C-term; amino acids 119–190) domains. (D and E) The XLID-associated mutation CCDC22 T17A impaired COMMD1 binding. (D) Coimmunoprecipitation between endogenous CCDC22 and COMMD1 was examined in LCLs derived from the kindred with the T17A mutation and a healthy control subject (WT). (E) Endogenous COMMD1 was similarly immunoprecipitated from HEK 293 cells expressing CCDC22 T17A or the WT. (F and G) Interaction of COMMD1 with other XLID-associated variants of CCDC22. (F) The ability of endogenous COMMD1 and CCDC22 E239K to interact was exam-ined using available LCLs. (G) Interactions were examined by expressing HA-tagged CCDC22 proteins in HEK 293 cells. Immunoprecipitation of endogenous COMMD1 was followed by immunoblotting for HA-tagged CCDC22. (H and I) Abnormal cellular distribution of CCDC22 variants. (H) Distribution of YFP-tagged CCDC22 variants, determined by confocal microscopy. Scale bars: 10 μm. (I) Cellular distribution after examination of more than 100 cells per group in a blinded manner.
Downloaded on May 18, 2014. The Journal of Clinical Investigation. More information at www.jci.org/articles/view/66466
172
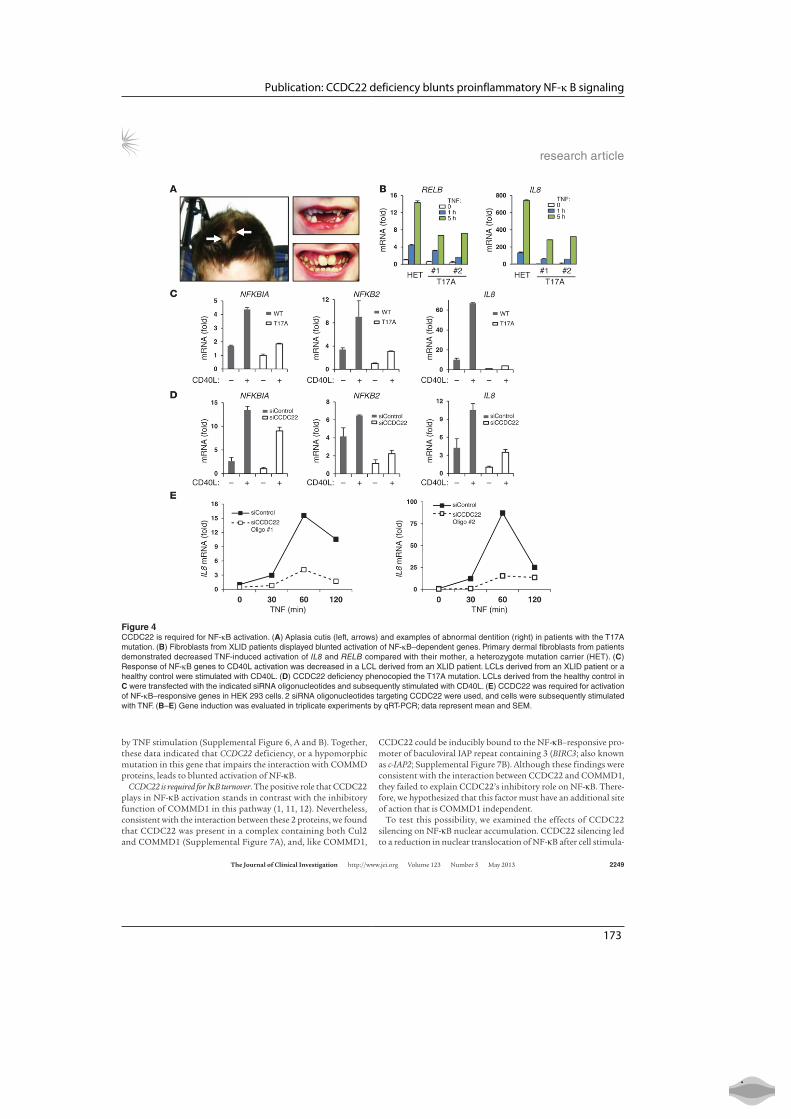
Publication: CCDC22 deficiency blunts proinflammatory NF-κ B signaling
research article
The Journal of Clinical Investigation http://www.jci.org Volume 123 Number 5 May 2013 2249
by TNF stimulation (Supplemental Figure 6, A and B). Together, these data indicated that CCDC22 deficiency, or a hypomorphic mutation in this gene that impairs the interaction with COMMD proteins, leads to blunted activation of NF-κB.
CCDC22 is required for IκB turnover. The positive role that CCDC22 plays in NF-κB activation stands in contrast with the inhibitory function of COMMD1 in this pathway (1, 11, 12). Nevertheless, consistent with the interaction between these 2 proteins, we found that CCDC22 was present in a complex containing both Cul2 and COMMD1 (Supplemental Figure 7A), and, like COMMD1,
CCDC22 could be inducibly bound to the NF-κB–responsive pro-moter of baculoviral IAP repeat containing 3 (BIRC3; also known as c-IAP2; Supplemental Figure 7B). Although these findings were consistent with the interaction between CCDC22 and COMMD1, they failed to explain CCDC22’s inhibitory role on NF-κB. There-fore, we hypothesized that this factor must have an additional site of action that is COMMD1 independent.
To test this possibility, we examined the effects of CCDC22 silencing on NF-κB nuclear accumulation. CCDC22 silencing led to a reduction in nuclear translocation of NF-κB after cell stimula-
Figure 4CCDC22 is required for NF-κB activation. (A) Aplasia cutis (left, arrows) and examples of abnormal dentition (right) in patients with the T17A mutation. (B) Fibroblasts from XLID patients displayed blunted activation of NF-κB–dependent genes. Primary dermal fibroblasts from patients demonstrated decreased TNF-induced activation of IL8 and RELB compared with their mother, a heterozygote mutation carrier (HET). (C) Response of NF-κB genes to CD40L activation was decreased in a LCL derived from an XLID patient. LCLs derived from an XLID patient or a healthy control were stimulated with CD40L. (D) CCDC22 deficiency phenocopied the T17A mutation. LCLs derived from the healthy control in C were transfected with the indicated siRNA oligonucleotides and subsequently stimulated with CD40L. (E) CCDC22 was required for activation of NF-κB–responsive genes in HEK 293 cells. 2 siRNA oligonucleotides targeting CCDC22 were used, and cells were subsequently stimulated with TNF. (B–E) Gene induction was evaluated in triplicate experiments by qRT-PCR; data represent mean and SEM.
Downloaded on May 18, 2014. The Journal of Clinical Investigation. More information at www.jci.org/articles/view/66466
173
●

Appendix
research article
2250 The Journal of Clinical Investigation http://www.jci.org Volume 123 Number 5 May 2013
tion, as shown by DNA-protein coprecipitation using oligonucle-otides containing tandem κB sites or by direct Western blotting of nuclear extracts (Figure 5A). This finding suggested a possible blockade in IκB degradation, akin to that observed in hypomorph-ic NEMO mutations (35). This possibility was examined in a vari-ety of systems. First, primary dermal fibroblasts from individuals with the T17A mutation displayed markedly delayed or absent IκB degradation compared with cells derived from their mother, a heterozygous carrier (Figure 5B). All 3 classical IκB proteins were affected, and the basal level of IκB-α was also notably ele-
vated. In addition, CCDC22 protein levels were more significantly reduced in mutant fibroblasts than in LCLs (compare Figure 3D and Figure 5B), highlighting the variable effect of the mutation on mRNA splicing and gene expression (26). Experiments using siRNA in HEK 293 cells demonstrated a similar result, although in these cells, the effects were most dramatic for IκB-β and IκB-ε (Figure 5C). Moreover, the changes in IκB-β turnover proved to result from altered protein stability, not from alterations in mRNA expression. Using cycloheximide (CHX) to block new protein synthesis, we found that TNF-induced degradation of IκB-β was
Figure 5CCDC22 is required for RelA nuclear transport and IκB degradation. (A) CCDC22 deficiency resulted in depressed nuclear accumulation of active NF-κB. HEK 293 cells were transfected with the indicated siRNAs and stimulated with TNF. The presence of active NF-κB complexes in nuclear extracts was assessed by a DNA-protein coprecipitation assay (top) or by direct immunoblotting (input, bottom). RNA polymerase II (Pol II) served as a loading control. (B) TNF-induced degradation of classical IκB proteins was impaired in primary fibroblasts bearing the T17A mutation. Primary dermal fibroblasts from 2 patients demonstrate decreased TNF-induced degradation of IκB-α, IκB-β, and IκB-ε compared with fibroblasts from their mother, a heterozygote mutation carrier. (C) CCDC22 deficiency impaired TNF-induced IκB degradation. HEK 293 cells were transfected with the indicated siRNA oligonucleotides and treated with TNF. IκB degradation was determined by Western blot analysis. (D) CCDC22 deficiency affected IκB-β stability. Cells transfected with the indicated siRNA were subsequently treated with cycloheximide (CHX) to inhibit new protein synthesis. IκB-β stability after TNF stimulation was examined by immunoblotting. (E) IκB-α degradation was impaired in XLID-derived LCLs. LCLs derived from a healthy control subject and an XLID patient with the T17A mutation were stimulated with PMA, and IκB-α degradation was examined by immunoblotting. (F) IκB-α phosphorylation was not affected in XLID-derived LCLs. LCLs derived from a healthy control and an XLID patient were stimulated with PMA for indicated times. Phosphorylation of IκB-α at serines 32 and 36 was determined by immunoblotting using a phosphospecific antibody.
Downloaded on May 18, 2014. The Journal of Clinical Investigation. More information at www.jci.org/articles/view/66466
174

Publication: CCDC22 deficiency blunts proinflammatory NF-κ B signaling
research article
The Journal of Clinical Investigation http://www.jci.org Volume 123 Number 5 May 2013 2251
Figure 6CCDC22 is required for IκB ubiquitination. (A) IκB-α ubiquitination is reduced in lymphoid cells bearing the T17A mutation. LCLs derived from a healthy control subject and an XLID patient with the T17A mutation were stimulated with PMA. The protease inhibitor MG-132 was concurrently administered. Ubiquitinated phospho–IκB-α levels were determined by immunoprecipitating NF-κB complexes with a RelA antibody, followed by phospho–IκB-α immunoblotting. (B) CCDC22 interacted with various CRL1-βTrCP components. FLAG-tagged Cul1, βTrCP1, or SKP1 were expressed along with CCDC22 in HEK 293 cells. CRL components were immunoprecipitated using a FLAG antibody, and CCDC22 was detected in the recovered material by immunoblotting. (C) Endogenous CCDC22 interacted with Cul1, Cul2, and Cul3. CCDC22 was immunoprecipitated, and the recovered material was immunoblotted for endogenous Cul1, Cul2, and Cul3. Some input lanes corresponded to different exposures of the same film. (D) Cul1 and Cul2 were not required for CCDC22-COMMD interaction. HEK 293 cells were treated with siRNA against Cul1, Cul2, or an irrelevant control. Endogenous CCDC22 was subsequently immunoprecipitated, and the recovered material was immunoblotted for endogenous COMMD1 and COMMD10. (E) CCDC22 was not required for Cullin-COMMD interaction. HEK 293 cells were transfected with GST, GST-COMMD1, or GST-COMMD8 along with control or anti-CCDC22 siRNA. After 48 hours, cell lysates were purified on GST-agarose, and the recovered material was immunoblotted for endogenous Cul1, Cul2, Cul3, and COMMD1.
Downloaded on May 18, 2014. The Journal of Clinical Investigation. More information at www.jci.org/articles/view/66466
175
●

Appendix
research article
2252 The Journal of Clinical Investigation http://www.jci.org Volume 123 Number 5 May 2013
nous IκB-α ubiquitination after PMA stimulation (Figure 6A). IκB ubiquitination in response to this signal is carried out by CRL1-βTrCP, a Cul1-containing complex. As noted previously, certain COMMD proteins — most notably COMMD8 and COMMD10 (16) — can bind to Cul1, which suggests the possibility that CCDC22 might interact with this complex as well. Indeed, CCDC22 coprecipitated various components of this multimeric ligase when expressed in HEK 293 cells (Figure 6B). Moreover, pre-cipitation of endogenous CCDC22 led to the recovery of endog-enous Cul1, Cul2, and Cul3 (Figure 6C). Finally, CCDC22 was able to interact with other Cullin family members (Supplemental Figure 9A), in line with similar observations for COMMD family members (16). Together, these data demonstrated that CCDC22 interacts with the ligase that targets IκB proteins for degradation and is required for its ability to ubiquitinate this substrate in vivo.
The ability of both CCDC22 and COMMD family members to interact with CRLs led us to examine whether CRLs play a role in the interactions between CCDC22 and COMMD proteins. Silencing
markedly delayed by RNAi against CCDC22 (Figure 5D). Finally, LCLs from individuals with the T17A mutation also displayed reduced degradation of IκB-α after PMA or CD40L stimulation (Figure 5E and Supplemental Figure 8A). Less dramatic changes in IκB-β degradation at later time points were also evident in this LCL model (Supplemental Figure 8B).
In all instances, the impaired degradation of IκB-α was not associ-ated with reduced IκB-α phosphorylation (Figure 5F and Supple-mental Figure 8C), which indicates that the blockade in degradation was not caused by impaired IKK function. In fact, phospho–IκB-α levels were higher in mutant cells, which indicates that the reduced IκB degradation is caused by an event that occurs after phosphoryla-tion. Thus, these data suggest that impaired CCDC22 activity leads to decreased degradation of phosphorylated IκB.
CCDC22 is required for IκB ubiquitination. Based on the above find-ings, we reasoned that the ubiquitination of phosphorylated IκB proteins might be regulated by CCDC22. Indeed, in an LCL from a T17A-affected patient, we noted marked reductions in endoge-
Figure 7COMMD8, a partner of CCDC22, is also required for IκB degradation. (A and B) COMMD8 deficiency impaired TNF-induced IκB-α degradation. (A) HEK 293 cells were transfected with the indicated siRNA oligonucleotides, and the effectiveness of the silencing was determined by qRT-PCR. (B) In parallel, cells were stimulated with TNF, and IκB-α degradation was examined by immunoblotting. (C and D) COMMD8 was required for NF-κB–responsive gene expression. (C) HEK 293 cells were transfected with the indicated siRNA oligonucleotides and subsequently treated with TNF. Induction of several NF-κB–responsive genes was examined. (D) The findings in C were recapitulated using 2 distinct siRNA oligonucle-otides against COMMD8. (A, C, and D) Gene induction was evaluated in triplicate experiments by qRT-PCR; data represent mean and SEM.
Downloaded on May 18, 2014. The Journal of Clinical Investigation. More information at www.jci.org/articles/view/66466
176

Publication: CCDC22 deficiency blunts proinflammatory NF-κ B signaling
research article
The Journal of Clinical Investigation http://www.jci.org Volume 123 Number 5 May 2013 2253
on previously published studies indicating that COMMD proteins form dimers (1, 39) and on our mass spectrometry data demonstrating that only certain COMMD combinations were pres-ent in vivo (Figure 1A). Thus, based on the avail-able data, we conclude that CCDC22 plays a criti-cal role in controlling the cellular distribution of these complexes (Figure 2), and in so doing, it seems to be necessary for their normal function. We postulate that the specific composition of COMMD proteins present in any given CCDC22-COMMD complex, as well as the specific CRLs to which they bind, ultimately determine their unique functions. In addition, we speculate that CCDC22 and COMMD proteins work in con-cert to regulate these ligases, probably acting as a complex to displace the CRL inhibitor CAND1, as recently reported in the case of COMMD1 (16).
Since CRLs are involved in a vast array of cel-lular processes, we anticipate that CCDC22 will
have pleiotropic effects in multiple pathways besides the effects on NF-κB transcription observed here. Indeed, the complex pheno-type noted in individuals carrying the hypomorphic T17A muta-tion indicates that CCDC22 plays an important developmental role in the nervous system and beyond. In this regard, it is noteworthy that Cul4b has been similarly linked to XLID, and CCDC22 may therefore also be involved in the regulation of CRL4B targets that are important for neuronal biology (40). Other rare variants in this gene were also noted in families with XLID; in the case of 2 of these variants, R128Q and R321W, we demonstrated a clear functional alteration of the mutant proteins, which were mislocalized in the cell. The mechanism for this abnormal localization was not medi-ated by altered COMMD binding, but may involve other protein-protein interactions that remain to be elucidated. With regard to the T30A and E239K variants, no functional effects were identified by our studies; with respect to E239K, we speculate that this may be a rare but functionally normal protein, since it can be found in the NHLBI exome database. Ultimately, we anticipate that addi-tional mutations in this gene will be uncovered in the context of XLID and other X-linked developmental disorders.
Our data suggested that in the NF-κB pathway, a CCDC22-COMMD8 complex plays an important role in IκB turnover and NF-κB activation through its interaction with Cul1, the ligase that targets IκB (21). However, we conversely found that CCDC22-COMMD1 complexes bound preferentially to Cul2, a ligase involved in NF-κB/RelA ubiquitination and removal of chromatin-bound NF-κB (12, 25). With these dual functions, CCDC22 deficiency or mutation would impair the activity of both COMMD1 and COMMD8 complexes, but the lack of IκB degra-dation, an upstream and initial step in this pathway, had a domi-nant role and was responsible for the impaired NF-κB activation described herein (Figure 8). The role of CCDC22 in IκB degrada-tion is supported by ample analysis of cells derived from individu-als with the hypomorphic T17A mutation. Moreover, our concor-dant findings after RNAi-induced silencing of CCDC22 confirmed the role of this factor in NF-κB activation. In agreement with these observations, some of the individuals with XLID affected by the T17A mutation displayed ectodermal dysplasia, a congenital change that can result from blunted NF-κB activation down-stream of EDAR, a member of the TNF receptor superfamily (37).
of Cul1 or Cul2 did not affect CCDC22-COMMD1 or CCDC22-COMMD10 interactions in coimmunoprecipitation experiments (Figure 6D and Supplemental Figure 9B). Conversely, we next evalu-ated whether CCDC22 could play a role in the interaction between COMMD proteins and CRLs. The binding between COMMD1 or COMMD8 and their respective preferential Cullin partners was not substantially affected by CCDC22 silencing (Figure 6E and Supple-mental Figure 9C). This experiment also served as a further dem-onstration that COMMD1 binds preferentially to Cul2, whereas COMMD8 binds better to Cul1 and Cul3. Thus, these data sug-gested that despite the ability of COMMDs, CCDC22, and Cullin to form a triple complex, none of them seems to play a scaffold role.
COMMD8 is also required for IκB turnover and NF-κB activation. Our results indicated that CCDC22 promotes IκB ubiquitination and degradation, and we reasoned that this effect might be mediated by CCDC22’s interaction with another COMMD family member or might be COMMD independent. To identify a possible COMMD protein that might be similarly involved in the degradation of IκB, we focused our attention on COMMD family members that inter-act with Cul1 (the central subunit in the CRL1-βTrCP complex), such as COMMD8 and COMMD10 (16). COMMD8 repression led to decreased IκB-α degradation, an effect not seen after COMMD1 or COMMD10 RNAi (Figure 7, A and B). Similarly, COMMD8 or CCDC22 silencing led to decreased activation of several NF-κB tar-get genes, while an opposite effect was seen after COMMD1 RNAi (Figure 7C). These observations were recapitulated using 2 inde-pendent RNAi duplexes targeting COMMD8 (Figure 7D), which indicates that this is unlikely to be an off-target effect. Together, these data suggested that a CCDC22-COMMD8 complex partici-pates in the activation of CRL1-βTrCP and is required for optimal IκB degradation and subsequent activation of NF-κB target genes.
DiscussionIn this study, we identified CCDC22 as a novel interacting protein that binds avidly to COMMD family members. Our data indicate that each COMMD protein, from COMMD1 to COMMD10, interacts with CCDC22. However, it is unlikely that this occurs in a single complex containing CCDC22 and all 10 COMMD family members at the same time. Rather, we postulate that different and distinct CCDC22-COMMD complexes exist in vivo. This is based
Figure 8Role of CCDC22-COMMD complexes in NF-κB pathway regulation.
Downloaded on May 18, 2014. The Journal of Clinical Investigation. More information at www.jci.org/articles/view/66466
177
●

Appendix
research article
2254 The Journal of Clinical Investigation http://www.jci.org Volume 123 Number 5 May 2013
the corresponding pEBB-FLAG vectors. All other plasmids used were described previously (1, 3, 16, 25, 28, 46–48). See Supplemental Table 1 for target sequences of the siRNA duplexes used.
Cell culture and transfection. HEK 293, HeLa, and U2OS cell lines were obtained from ATCC and cultured in DMEM supplemented with 10% FBS and l-glutamine. A standard calcium phosphate transfection proto-col was used to transfect plasmids and siRNA in HEK 293 cells (48); the Fugene transfection system (Invitrogen) was used for HeLa and U2OS cells. Patient-derived cells were obtained after IRB approval and informed consent. LCLs were generated by immortalization of peripheral lympho-cytes with EBNA as previously described (49). Primary human fibroblasts of XLID patients and their mother, a heterozygote carrier of the CCDC22 mutation, were obtained from skin punch biopsies. LCLs and primary fibroblasts were cultured in RPMI 1640 (Cellgro, 10-040-CM) supplement-ed with 10% FBS. For siRNA transfection of LCLs, electroporation was performed using the Neon Transfection System (Invitrogen) following the manufacturer’s recommendations. Briefly, 1 × 10⁸ cells in 10 ml RPMI 1640 supplemented with 10% FBS and l-glutamine were pulsed 2 times (pulse voltage, 1,100 V; pulse width, 30 ms each). In certain experiments, TNF (1,000 U/ml; Roche), cycloheximide (60 μg/ml; BioVision), PMA (250 nM; Fisher BioReagents), CD40L (50 ng/ml; Enzo Life Science), and/or MG-132 (40 μM; Boston Biochem) were applied to the growth media.
qRT-PCR. Total RNA was extracted from cells using the RNeasy proce-dure (Qiagen) according to the manufacturer’s instructions. An RT reac-tion with 5 μg total RNA in 20 μl was performed, using random hexamers and reverse transcription reagents according to the manufacturer’s instruc-tions (Invitrogen). This was followed by qRT-PCR performed using a Mas-tercycler ep realplex2 system (Eppendorf). Oligonucleotides and internal probes for NFKBIA, CUL1, and IL8 transcripts were obtained from Applied Biosystems, and a Taqman PCR Master Mix with GAPDH mRNA quantita-tion was duplexed in the same well as an internal control. See Supplemen-tal Table 2 for primers used for Sybr green–based qRT-PCR of other genes.
Immunoblotting and precipitation. Whole cell lysates were prepared by add-ing Triton lysis buffer (25 mM HEPES, 100 mM NaCl, 10 mM DTT, 1 mM EDTA, 10% glycerol, 1% Triton X-100) or RIPA buffer (PBS, 1% NP-40, 0.5% sodium deoxycholate, 0.1% SDS, 10 mM DTT) supplemented with 1 mM sodium orthovanadate and protease inhibitors (Roche), as indi-cated in each experiment. Cytosolic and nuclear extracts were prepared as previously described (1). Native immunoprecipitation, denatured immunoprecipitation, GSH precipitation, and immunoblotting were performed as previously described (1, 3, 50). Antiserum to COMMD1 has been previously described (1). Antisera against human CCDC22, COMMD6, COMMD9, and COMMD10 were generated by serial immu-nization of rabbits with purified full-length recombinant proteins pre-pared in E. coli. These antibodies were validated by Western blot for their ability to detect overexpressed protein after transient transfection, as well as the loss of a specific band of the correct molecular weight after RNAi (silencing confirmed by qRT-PCR). Antiserum to Cul3 was provided by M. Peter (ETH Zurich, Zurich, Switzerland). See Supplemental Table 3 for all commercial antibodies used.
TAP and bimolecular affinity purification. TAP screening for COMMD1 has been previously reported (1). TAP screening for COMMD9 and COMMD10 were performed by sequential purification through HA bind-ing resin (Roche) and streptavidin agarose (Pierce). Briefly, 10 plates of seeded HEK 293 cells (15 cm each) were transfected with pEBB-2×HA-COMMD9-TB or pEBB-2×HA-COMMD10-TB. 2 days later, nuclear and cytosolic extracts were prepared as previously described (1) and pooled as a single lysate prior to purification. The lysate was incubated with HA binding resin at 4°C for 2 hours. At that point, the bait was eluted 3 times using excess HA peptide (1 mg/ml in 20 mM Tris-HCl [pH 7.4], 100 mM
Moreover, NF-κB plays an important role in neuronal function and learning processes (41, 42) and is similarly important for myelination and Schwann cell function (43). Therefore, the altera-tions in the NF-κB pathway seen in these patients may contribute to their neurologic phenotype.
With respect to the role of CCDC22 in immune function, our observations were mainly restricted to 6 individuals with the T17A mutation, with only 2 of them being of adult age at this point. Nevertheless, increased infections, autoimmunity, or unusual malignancies have not been noted thus far. This may indicate that chronic CCDC22 deficiency is better compensated in vivo than in isolated culture systems or that this hypomorphic mutation is not severe enough to result in an obvious immune phenotype in chil-dren. Alternatively, the immune defects in vivo may be restricted to selective microorganisms; this has been observed with impor-tant immune regulators, such as TRIF, for which inactivating mutations lead to a narrow and specific susceptibility to herpes encephalitis (44). If this were the case here, a larger patient cohort and longer-term follow-up may be needed to fully comprehend the immune phenotypes of CCDC22 mutations. Nevertheless, it is interesting to note that a genetic study has indicated that single nucleotide polymorphisms in the CCDC22 gene affect the risk for allergic rhinitis (45). However, because the CCDC22 gene is located in the complementary strand and in close proximity to FOXP3, a major regulator of immune function, it is possible that such poly-morphisms may be more relevant to the function of FOXP3. In any event, it is important to note that the functional analysis of CCDC22 presented here, including various RNAi experiments, did not reflect FOXP3 function, and that the T17A mutation did not affect FOXP3 expression (Supplemental Figure 3B). Finally, the high level of CCDC22 expression observed in the immune system, particularly in myeloid and T cells (Supplemental Figure 1A), suggests an important immunological role, in keeping with the NF-κB regulatory function reported here.
The involvement of CCDC22 and COMMD8 in the ubiquitina-tion of IκB represents a novel aspect in the regulation of this criti-cal pathway that might be amenable to therapeutic manipulation. Disrupting CCDC22-COMMD interactions in a manner akin to the effect of the T17A mutation should result in impaired IκB degradation and NF-κB blockade, an effect that would be desir-able in certain contexts, such as chronic inflammatory disorders or specific cancers.
MethodsPlasmids and siRNAs. Expression vectors for CCDC22 (pEBB-FLAG-CCDC22, pEBB-HA-CCDC22, pEBB-YFP-CCDC22, pEBB-GFP-CCDC22, and pEBG-CCDC22) were generated by PCR amplification of the coding sequence using IMAGE clone 3449051 as template. Expression vector for βTrCP1 (pEBB-FLAG-βTrCP1) was generated by PCR ampli-fication of the coding sequence using as template a plasmid obtained from Y. Ben-Neriah (Hebrew University of Jerusalem, Jerusalem, Israel). Deletion constructs for CCDC22 were similarly generated by PCR, with the amino acid boundaries of the encoded mutant proteins being 1–320 and 321–627. Point mutations T17A, T30A, R128Q, E239K, and R321W were introduced into pEBB-HA-CCDC22 by site-directed mutagenesis (Stratagene). The pEBB-2×HA-TB vector used for TAP screening was constructed using complementary oligonucleotides coding tandem HA tags, which were inserted into the BamHI site of pEBB-TB. Subsequently, pEBB-2×HA-COMMD9-TB and pEBB-2×HA-COMMD10-TB were con-structed by subcloning the COMMD9 and COMMD10 sequences from
Downloaded on May 18, 2014. The Journal of Clinical Investigation. More information at www.jci.org/articles/view/66466
178

Publication: CCDC22 deficiency blunts proinflammatory NF-κ B signaling
research article
The Journal of Clinical Investigation http://www.jci.org Volume 123 Number 5 May 2013 2255
mittee of the Women’s and Children’s Health Network (Adelaide, South Australia, Australia). Animal studies were approved by the IACUC at UT Southwestern (protocol no. 2008-0327).
Note added in proof. Recent data from a genome-wide siRNA screen for regulators of NOD2-regulated pathways also identified that COMMD8 is required for NF-κB activation (53).
AcknowledgmentsThe authors are grateful to the patients and family members that participated in this study. This work was supported by NIH R01 grant DK073639, a CCFA Senior Research Award, and the Disease Oriented Clinical Scholars’ Program at UT Southwest-ern to E. Burstein; by German medical genome research grant FKZ01GS0861 to M.Y. Hein; by Australian NH&MRC Project Grant 1008077 to J. Gecz, who is supported by a NH&MRC Princi-pal Research Fellowship; and by EURO-MRX support to A.W. Kuss. The authors thank Irit Alkalai, Yinon Ben-Neriah, Denis Guttridge, Michele Pagano, Ina Poser, and Anthony A. Hyman for providing reagents; Marit Leuschner, Andrea Ssykor, Ina Poser, and Anthony A. Hyman for generating stable BAC transgenic HeLa cell lines expressing the GFP-tagged mutated and nonmutated CCDC22; Matthias Peter for providing the Cul3 antibody; Marie Shaw and Renee Carroll for handling patient cell lines; and Andrew Syvyk for help with electroporation of lymphocytes with siRNA. The authors are also grateful to Colin Duckett for his support and assistance during the transition of the Burstein lab to UT Southwestern.
Received for publication August 23, 2012, and accepted in revised form February 14, 2013.
Address correspondence to: Ezra Burstein, 5323 Harry Hines Boulevard, Room J5.126, Dallas, Texas 75390-9151, USA. Phone: 214.648.2008; Fax: 214.648.2022; E-mail: [email protected].
NaCl, 0.1 mM EDTA). This pooled eluate was applied to a streptavidin agarose column to bind the bait at 4°C for 2 hours. The column was washed with detergent-free buffer, and beads were then submitted to the proteomic facility for trypsin digestion and LC/MS-MS analysis. Quan-titative BAC-GFP interactomics (QUBIC) for CCDC22 was performed as described previously (29). A BAC harboring the locus for CCDC22 was modified to include a carboxyterminal (LAP) or aminoterminal (NFLAP) GFP tag by BAC transgenomic method (30). Engineered BACs were used as transgenes to generate HeLa cells stably expressing GFP-tagged CCDC22 under endogenous control. Affinity purifications were performed and analyzed as described previously (29). Finally, bimolecular affinity puri-fication of the Cul2-COMMD1 complex (GST-Cul2, COMMD1-TB) was performed as described previously (51).κB pulldown assay. Nuclear extracts (100 μg) were incubated with a bioti-
nylated 2κB oligonucleotide and subsequently precipitated using strepta-vidin agarose beads (Thermo Scientific), as described previously (52).
Confocal microscopy. HeLa or U2OS cells were plated in chambered cov-erglass plates and transfected with the indicated plasmids. Cells were counterstained with Hoechst 33342 (8 μM) for 30 minutes, and images were obtained with a Zeiss LSM 510 META confocal microscope equipped with a Chameleon XR NIR laser. All confocal microscopy experiments were repeated at least twice; representative results are shown.
ChIP. ChIP was performed as previously reported (50). Briefly, HEK 293 cells were cultured overnight in low serum media and stimulated with TNF (1,000 U/ml for 30 minutes) prior to ChIP. The antibodies used included RelA (Santa Cruz, sc-372), COMMD1 (1), CCDC22 (generated as described above), and normal rabbit IgG (Cell Signaling, 2729). After immunoprecipitation, DNA was extracted and used as template for PCR. The primers used for amplification of the BIRC3 promoter were 5′-GCAT-GCTTACCAATACGTGC-3′ and 5′-ATTGCGCAATTGTAGCGGTA-3′.
Statistics. In all gene expression experiments, data represent mean ± SEM. A P value less than 0.05 was considered significant.
Study approval. All patient-related evaluation was performed with the written consent of the participants or their legal guardians, after review and approval of the study protocols by the human research ethics com-
1. Burstein E, et al. COMMD proteins: A novel family of structural and functional homologs of MURR1. J Biol Chem. 2005;280(23):22222–22232.
2. van de Sluis B, Rothuizen J, Pearson PL, van Oost BA, Wijmenga C. Identification of a new cop-per metabolism gene by positional cloning in a purebred dog population. Hum Mol Genet. 2002; 11(2):165–173.
3. Burstein E, et al. A novel role for XIAP in copper homeostasis through regulation of MURR1. EMBO J. 2004;23(1):244–254.
4. Klomp AE, van de Sluis B, Klomp LW, Wijmenga C. The ubiquitously expressed MURR1 protein is absent in canine copper toxicosis. J Hepatol. 2003; 39(5):703–709.
5. Biasio W, Chang T, McIntosh CJ, McDonald FJ. Identification of Murr1 as a regulator of the human δ epithelial sodium channel. J Biol Chem. 2004; 279(7):5429–5434.
6. Ke Y, Butt AG, Swart M, Liu YF, McDonald FJ. COMMD1 downregulates the epithelial sodium channel through Nedd4-2. Am J Physiol Renal Physiol. 2010;298(6):F1445–F1456.
7. Chang T, Ke Y, Ly K, McDonald FJ. COMMD1 reg-ulates the delta epithelial sodium channel (δENaC) through trafficking and ubiquitination. Biochem Biophys Res Commun. 2011;411(3):506–511.
8. Drevillon L, et al. COMMD1-mediated ubiquitina-tion regulates CFTR trafficking. PLoS One. 2011; 6(3):e18334.
9. van de Sluis B, et al. Increased activity of hypoxia-
inducible factor 1 is associated with early embryon-ic lethality in Commd1 null mice. Mol Cell Biol. 2007; 27(11):4142–4156.
10. van de Sluis B, et al. COMMD1 disrupts HIF-1α/β dimerization and inhibits human tumor cell inva-sion. J Clin Invest. 2010;120(6):2119–2130.
11. Ganesh L, et al. The gene product Murr1 restricts HIV-1 replication in resting CD4+ lymphocytes. Nature. 2003;426(6968):853–857.
12. Maine GN, Mao X, Komarck CM, Burstein E. COMMD1 promotes the ubiquitination of NF-κB subunits through a Cullin-containing ubiquitin ligase. EMBO J. 2007;26(2):436–447.
13. Burkly L, et al. Expression of relB is required for the development of thymic medulla and dendritic cells. Nature. 1995;373(6514):531–536.
14. Kontgen F, et al. Mice lacking the c-rel proto-onco-gene exhibit defects in lymphocyte proliferation, humoral immunity, and interleukin-2 expression. Genes Dev. 1995;9(16):1965–1977.
15. Sha WC, Liou HC, Tuomanen EI, Baltimore D. Tar-geted disruption of the p50 subunit of NF-κB leads to multifocal defects in immune responses. Cell. 1995;80(2):321–330.
16. Mao X, et al. Copper metabolism MURR1 domain containing 1 (COMMD1) regulates Cullin-RING ligases by preventing Cullin-associated NEDD8-dissociated (CAND1) binding. J Biol Chem. 2011; 286(37):32355–32365.
17. Petroski MD, Deshaies RJ. Function and regulation of cullin-RING ubiquitin ligases. Nat Rev Mol Cell
Biol. 2005;6(1):9–20. 18. Hayden MS, Ghosh S. Shared principles in NF-κB
signaling. Cell. 2008;132(3):344–362. 19. Chen Z, et al. Signal-induced site-specific phos-
phorylation targets IκBα to the ubiquitin-protea-some pathway. Genes Dev. 1995;9:1586–1597.
20. Henkel T, Machleidt T, Alkalay I, Krönke M, Ben-Neriah Y, Baeuerle PA. Rapid proteolysis of IκB-α is necessary for activation of transcription factor NF-κB. Nature. 1993;365(6442):182–185.
21. Yaron A, et al. Identification of the receptor com-ponent of the IκBα-ubiquitin ligase. Nature. 1998; 396(6711):590–594.
22. Baeuerle PA, Baltimore D. IκB: a specific inhibitor of the NF-κB transcription factor. Science. 1988; 242(4878):540–546.
23. Frescas D, Pagano M. Deregulated proteolysis by the F-box proteins SKP2 and β-TrCP: tipping the scales of cancer. Nat Rev Cancer. 2008;8(6):438–449.
24. Geng H, Wittwer T, Dittrich-Breiholz O, Kracht M, Schmitz ML. Phosphorylation of NF-κB p65 at Ser468 controls its COMMD1-dependent ubiquiti-nation and target gene-specific proteasomal elimi-nation. EMBO Rep. 2009;10(4):381–386.
25. Mao X, et al. GCN5 is a required cofactor for a ubiqui-tin ligase that targets NF-κB/RelA. Genes Dev. 2009; 23(7):849–861.
26. Voineagu I, et al. CCDC22: a novel candidate gene for syndromic X-linked intellectual disability. Mol Psychiatry. 2012;17(1):4–7.
27. Wu C, et al. BioGPS: an extensible and customiz-
Downloaded on May 18, 2014. The Journal of Clinical Investigation. More information at www.jci.org/articles/view/66466
179
●

Appendix
research article
2256 The Journal of Clinical Investigation http://www.jci.org Volume 123 Number 5 May 2013
able portal for querying and organizing gene anno-tation resources. Genome Biol. 2009;10(11):R130.
28. de Bie P, et al. Characterization of COMMD protein-protein interactions in NF-κB signalling. Biochem J. 2006;398(1):63–71.
29. Hubner NC, et al. Quantitative proteomics com-bined with BAC TransgeneOmics reveals in vivo protein interactions. J Cell Biol. 2010;189(4):739–754.
30. Poser I, et al. BAC TransgeneOmics: a high-through-put method for exploration of protein function in mammals. Nat Methods. 2008;5(5):409–415.
31. Barbe L, et al. Toward a confocal subcellular atlas of the human proteome. Mol Cell Proteomics. 2008; 7(3):499–508.
32. Marchler-Bauer A, et al. CDD: a Conserved Domain Database for the functional annotation of proteins. Nucleic Acids Res. 2011;39(Database issue):D225–D229.
33. Schleiffer A, Kaitna S, Maurer-Stroh S, Glotzer M, Nasmyth K, Eisenhaber F. Kleisins: a superfamily of bacterial and eukaryotic SMC protein partners. Mol Cell. 2003;11(3):571–575.
34. Doffinger R, et al. X-linked anhidrotic ectoder-mal dysplasia with immunodeficiency is caused by impaired NF-κB signaling. Nat Genet. 2001; 27(3):277–285.
35. Jain A, Ma CA, Liu S, Brown M, Cohen J, Strober W. Specific missense mutations in NEMO result in hyper-IgM syndrome with hypohydrotic ectoder-mal dysplasia. Nat Immunol. 2001;2(3):223–228.
36. Picard C, Casanova JL, Puel A. Infectious diseases in patients with IRAK-4, MyD88, NEMO, or IκBα deficiency. Clin Microbiol Rev. 2011;24(3):490–497.
37. Mikkola ML. Molecular aspects of hypohidrotic ectodermal dysplasia. Am J Med Genet A. 2009; 149A(9):2031–2036.
38. Schmidt-Ullrich R, Aebischer T, Hulsken J, Birch-meier W, Klemm U, Scheidereit C. Requirement of NF-κB/Rel for the development of hair follicles and other epidermal appendices. Development. 2001; 128(19):3843–3853.
39. Narindrasorasak S, Kulkarni P, Deschamps P, She YM, Sarkar B. Characterization and copper bind-ing properties of human COMMD1 (MURR1). Biochemistry. 2007;46(11):3116–3128.
40. Nakagawa T, Xiong Y. X-linked mental retardation gene CUL4B targets ubiquitylation of H3K4 methyl-transferase component WDR5 and regulates neuronal gene expression. Mol Cell. 2011;43(3):381–391.
41. Boersma MC, Dresselhaus EC, De Biase LM, Miha-las AB, Bergles DE, Meffert MK. A requirement for nuclear factor-κB in developmental and plas-ticity-associated synaptogenesis. J Neurosci. 2011; 31(14):5414–5425.
42. Meffert MK, Chang JM, Wiltgen BJ, Fanselow MS, Baltimore D. NF-κB functions in synaptic signaling and behavior. Nat Neurosci. 2003;6(10):1072–1078.
43. Chen Y, et al. HDAC-mediated deacetylation of NF-κB is critical for Schwann cell myelination. Nat Neurosci. 2011;14(4):437–441.
44. Sancho-Shimizu V, et al. Herpes simplex encepha-litis in children with autosomal recessive and dominant TRIF deficiency. J Clin Invest. 2011; 121(12):4889–4902.
45. Suttner K, et al. Genetic variants harbored in the
forkhead box protein 3 locus increase hay fever risk. J Allergy Clin Immunol. 2010;125(6):1395–1399.
46. Duckett CS, Li F, Wang Y, Tomaselli KJ, Thompson CB, Armstrong RC. Human IAP-like protein regu-lates programmed cell death downstream of Bcl-xL and cytochrome c. Mol Cell Biol. 1998;18(1):608–615.
47. Richter BW, et al. Molecular cloning of ILP-2, a novel member of the inhibitor of apoptosis protein family. Mol Cell Biol. 2001;21(13):4292–4301.
48. Duckett CS, Gedrich RW, Gilfillan MC, Thompson CB. Induction of nuclear factor κB by the CD30 receptor is mediated by TRAF1 and TRAF2. Mol Cell Biol. 1997;17(3):1535–1542.
49. Neitzel H. A routine method for the establishment of permanent growing lymphoblastoid cell lines. Hum Genet. 1986;73(4):320–326.
50. Li H, et al. Regulation of NF-κB activity by competi-tion between RelA acetylation and ubiquitination. Oncogene. 2012;31(5):611–623.
51. Maine GN, Gluck N, Zaidi IW, Burstein E. Bimo-lecular Affinity Purification (BAP): Tandem affin-ity purification using two protein baits. Cold Spring Harb Protoc. 2009;2009(11):pdb.prot5318.
52. Vaira S, Alhawagri M, Anwisye I, Kitaura H, Fac-cio R, Novack DV. RelA/p65 promotes osteoclast differentiation by blocking a RANKL-induced apoptotic JNK pathway in mice. J Clin Invest. 2008; 118(6):2088–2097.
53. Warner N, et al. A genome-wide siRNA screen reveals positive and negative regulators of the NOD2 and NF-κB signaling pathways. Sci Signal. 2013;6(258):rs3.
Downloaded on May 18, 2014. The Journal of Clinical Investigation. More information at www.jci.org/articles/view/66466
180

Acknowledgements
Acknowledgements
I want to express my deep graditute to everyone who contributed to this work:
Matthias Mann for being a great mentor. I’m very grateful for your guidance, your sup-
port, your trust in me and your inspiration.
JürgenCox for your invaluable bioinformaticsmentoring, for developingMaxQuant and
Perseus and for motivating me to learn C#.
Ina Poser and Tony Hyman for a phenomenal collaboration over many years.
Eva Keilhauer for being my ‘partner in crime’ in the interaction office.
Bianca Splettstößer, Daniela Vogg, Bhaswati Chatterjee, Mario Grötzinger and Susanne
Kroiß for your tremendous help in mastering the interactome project.
Chris Eberl for our discussions on life in general and science in particular, for your black
humour and for your friendship.
Tar Viturawong for sharing your passion for mathematics, R and music and for making
me honorary member of the evil office.
Felix Meißner and Markus Räschle for your scientific outlook and reminding me that
technology is there to serve biology.
Nils Kulak for our discussions onnew technologies and for your entrepreneurial spirit.
Georg Borner for inspiring conversations on science, language and philosophy.
NagarjunaNagaraj for a lot of help and SeanHumphrey for sharing in the ups and downs
of Perseus plugin programming.
My colleagues in the interaction office and the Blümchen office for the great time.
Jacek Wiśniewski for keeping up the good aspects of the old school.
Korbinian Mayr, Igor Paron, Richard Scheltema, Mario Oroshi and Gaby Sowa for help
in keeping Orbi2 running.
JonathanWeissman, JimenaWeibezahn, AdamFrost, NoamStern-Ginossar,MikeBassik
and Martin Kampmann for terrific collaborations in the past (and in the future).
The Conti department for their hospitality and my lunch-club-turned-friends (and col-
laborators): Ben Schuch, Sebastian Falk and dearest Sutapa Chakrabarti.
My family for their unconditional support and faith.
Ajla Hrle for your love, for being my toughest critic and my strongest supporter.
181
●

Colophon
Colophon
This thesis was typeset in LATEX using MiKTeX and TeXnicCenter.
The body font is Minion Pro. Headings are set in Myriad Pro.
182

Wie jede Blüte welkt und jede JugendDem Alter weicht, blüht jede Lebensstufe,Blüht jede Weisheit auch und jede TugendZu ihrer Zeit und darf nicht ewig dauern.Es muß das Herz bei jedem LebensrufeBereit zum Abschied sein und Neubeginne,Um sich in Tapferkeit und ohne TrauernIn andre, neue Bindungen zu geben.Und jedem Anfang wohnt ein Zauber inne,Der uns beschützt und der uns hilft, zu leben.
Wir sollen heiter Raum um Raum durchschreiten,An keinem wie an einer Heimat hängen,Der Weltgeist will nicht fesseln uns und engen,Er will uns Stuf ’ um Stufe heben, weiten.Kaum sind wir heimisch einem LebenskreiseUnd traulich eingewohnt, so droht Erschlaffen,Nur wer bereit zu Aufbruch ist und Reise,Mag lähmender Gewöhnung sich entraffen.
Es wird vielleicht auch noch die TodesstundeUns neuen Räumen jung entgegensenden,Des Lebens Ruf an uns wird niemals enden. . .Wohlan denn, Herz, nimm Abschied und gesunde!
Hermann Hesse
183
●