Computational Modeling of Planktonic and Biofilm Metabolism
373
Computational Modeling of Planktonic and Biofilm Metabolism Weihua Guo Dissertation submitted to the faculty of the Virginia Polytechnic Institute and State University in partial fulfillment of the requirements for the degree of Doctor of Philosophy In Biological Systems Engineering Xueyang Feng, Chair Zhen (Jason) He Ryan S. Senger Chenming (Mike) Zhang September 27 th , 2017 Blacksburg, VA Key words: 13 C assisted pathway and flux analysis, planktonic and biofilm metabolism, flux balance analysis, multi-omics analysis, machine learning, CRISPR-Cas9, metabolic engineering, biofuels, cell-free protein synthesis. Copyright© 2017 by Weihua Guo
-
Upload
khangminh22 -
Category
Documents
-
view
3 -
download
0
Transcript of Computational Modeling of Planktonic and Biofilm Metabolism

Computational Modeling of Planktonic and Biofilm Metabolism
Weihua Guo
Dissertation submitted to the faculty of the Virginia Polytechnic Institute and State
University in partial fulfillment of the requirements for the degree of
Doctor of Philosophy
In
Biological Systems Engineering
Xueyang Feng, Chair
Zhen (Jason) He
Ryan S. Senger
Chenming (Mike) Zhang
September 27th, 2017
Blacksburg, VA
Key words: 13C assisted pathway and flux analysis, planktonic and biofilm metabolism,
flux balance analysis, multi-omics analysis, machine learning, CRISPR-Cas9, metabolic
engineering, biofuels, cell-free protein synthesis.
Copyright© 2017 by Weihua Guo

Computational Modeling of Planktonic and Biofilm Metabolism
Weihua Guo
Abstract
Most of microorganisms are ubiquitously able to live in both planktonic and biofilm
states, which can be applied to dissolve the energy and environmental issues (e.g.,
producing biofuels and purifying waste water), but can also lead to serious public health
problems. To better harness microorganisms, plenty of studies have been implemented to
investigate the metabolism of planktonic and/or biofilm cells via multi-omics approaches
(e.g., transcriptomics and proteomics analysis). However, these approaches are limited to
provide the direct description of intracellular metabolism (e.g., metabolic fluxes) of
microorganisms.
Therefore, in this study, I have applied computational modeling approaches (i.e.,
13C assisted pathway and flux analysis, flux balance analysis, and machine learning) to
both planktonic and biofilm cells for better understanding intracellular metabolisms and
providing valuable biological insights. First, I have summarized recent advances in
synergizing 13C assisted pathway and flux analysis and metabolic engineering. Second, I
have applied 13C assisted pathway and flux analysis to investigate the intracellular
metabolisms of planktonic and biofilm cells. Various biological insights have been
elucidated, including the metabolic responses under mixed stresses in the planktonic states,
the metabolic rewiring in homogenous and heterologous chemical biosynthesis, key
pathways of biofilm cells for electricity generation, and mechanisms behind the electricity
generation. Third, I have developed a novel platform (i.e., omFBA) to integrate multi-
omics data with flux balance analysis for accurate prediction of biological insights (e.g.,

key flux ratios) of both planktonic and biofilm cells. Fourth, I have designed a
computational tool (i.e., CRISTINES) for the advanced genome editing tool (i.e., CRISPR-
dCas9 system) to facilitate the sequence designs of guide RNA for programmable control
of metabolic fluxes. Lastly, I have also accomplished several outreaches in metabolic
engineering.
In summary, during my Ph.D. training, I have systematically applied computational
modeling approaches to investigate the microbial metabolisms in both planktonic and
biofilm states. The biological findings and computational tools can be utilized to guide the
scientists and engineers to derive more productive microorganisms via metabolic
engineering and synthetic biology. In the future, I will apply 13C assisted pathway analysis
to investigate the metabolism of pathogenic biofilm cells for reducing their antibiotic
resistance.

Computational Modeling of Planktonic and Biofilm Metabolism
Weihua Guo
General Audience Abstract
Most of microorganisms are ubiquitously able to live in both planktonic and biofilm
states (i.e., floating in a flow and anchoring on a surface, respectively), which can be
applied to dissolve the energy and environmental issues (e.g., producing biofuels and
purifying waste water), but can also lead to serious public health problems (e.g., chronic
infections). Therefore, deciphering the metabolism of both planktonic and biofilm cells are
of great importance to better harness microorganism. Plenty of studies have been
implemented to investigate the metabolism of planktonic and/or biofilm cells by measuring
the abundances of single type of biological components (e.g., gene expression and
proteins). However, these approaches are limited to provide the direct description of
intracellular metabolism (e.g., enzyme activities) of microorganisms.
Therefore, in this study, I have applied computational modeling approaches to both
planktonic and biofilm cells for providing valuable biological insights (e.g., enzyme
activities). The biological insights include 1) how planktonic cells response to mixed
stresses (e.g., acids and organics) 2) how planktonic cells produce various chemicals, and
3) how biofilm cells generate electricity by rewiring the intracellular metabolic pathways.
I also developed a novel platform to utilize multiple types of biological data for improving
the prediction accuracy of biological insights of both planktonic and biofilm cells. In
addition, I designed a computational tool to facilitate the sequence designs of an advanced
genome editing tool for precisely controlling the corresponding enzyme activities. Lastly,
I have also accomplished several outreaches in metabolic engineering.

v
In summary, during my Ph.D. training, I have systematically applied computational
modeling approaches to investigate the microbial metabolisms in both planktonic and
biofilm states. The biological findings and computational tools can be utilized to guide the
metabolic engineered to derive more productive microorganisms via metabolic engineering
and synthetic biology. In the future, I plan to investigate how the pathogenic biofilm cells
improve their antibiotic resistance and attempt to reduce such strong resistance.

vi
Dedication
To my dear parents and girlfriend

vii
Acknowledgements
I would like to give my greatest thanks to Dr. Xueyang Feng, my advisor and
mentor, for personally training me in metabolic flux analysis. He provided the generous
support on my research work and constant help in my life. He untiringly seeks opportunities
to advance my research skills, collaborate with renowned scientists, and apply to
fellowships. It is my fortune to have an advisor like him who is always optimistic,
energetic, and backing me. I am also thankful to Dr. Zhen (Jason) He with his student Shuai
Luo and Dr. Barry Goodell with his student Liangpeng Zhuang for providing me
opportunities to study the environmental microorganisms; to Dr. Zengyi Shao with her
students Dr. Miguel Suastegui and Meirong Gao, as well as Dr. Wei Na with her student
Yingying Chen for productive collaborations; and Dr. Huimin Zhao, Dr. Tong Si, and Dr.
Jiazhang Lian for collaborations in metabolic engineering and synthetic biology. I am also
grateful to my committee members, Dr. Zhen (Jason) He, Dr. Ryan Senger, and Dr.
Chenming (Mike) Zhang for their kind guidance and support. I am thankful for the
generous funding support from Virginia Tech start-up funding (#175323).
Very special thanks to my colleges Dr. Jiayuan Sheng for teaching me research
skills in synthetic biology and metabolic engineering. I also am grateful for the help
provided by Dr. Mary Leigh Wolfe, Barbara Wills, Liza Spradlin, Denton Yoder, Ling Li,
and Melody Clark.
This dissertation is dedicated to my parents for their unconditional love and
unwavering support and to my beautiful girlfriend, Lu Wang, for her constant supports. I
can never adequately thank my parents for bringing out the best in me. I would like to

viii
express my deepest thanks and love to my dear girlfriend and to remember every moment
that we spent together although at the opposite two coastlines of American continent.

ix
Table of Contents
Abstract ............................................................................................................................... ii
General Audience Abstract ................................................................................................ iv
Dedication .......................................................................................................................... vi
Acknowledgements ........................................................................................................... vii
Table of Contents ............................................................................................................... ix
List of Figures ................................................................................................................. xvii
List of Tables ................................................................................................................ xxvii
List of Abbreviations ..................................................................................................... xxix
Chapter 1: Introduction ....................................................................................................... 1
1.1 Planktonic and biofilm metabolism........................................................................... 1
1.1.1 Planktonic and biofilm states of microorganisms............................................... 1
1.1.2 Current approaches to understanding planktonic and biofilm metabolism ........ 3
1.2 Computational modeling of microbial metabolism ................................................... 4
1.3 Scope of the dissertation ........................................................................................... 5
References ....................................................................................................................... 8
Chapter 2: Synergizing 13C Metabolic Flux Analysis and Metabolic Engineering for
Biochemical Production .................................................................................................... 13
Abstract ......................................................................................................................... 14
Key Words..................................................................................................................... 14

x
2.1 Introduction ............................................................................................................. 15
2.2 Technology Platform of 13C Metabolic Flux Analysis ........................................... 16
2.2.1 Cell Culture and Fermentation ......................................................................... 17
2.2.2 Isotopic Analysis of Metabolites ...................................................................... 19
2.2.3 13C-Assisted Pathway and Flux Analysis ......................................................... 20
2.3 Synergy of 13C Metabolic Flux Analysis and Metabolic Engineering .................... 21
2.3.1 Uncovering the Bottleneck Steps in Biochemical Production .......................... 22
2.3.2 Identifying Cofactor Imbalance Issues of Host Metabolism ............................ 27
2.3.3 Revealing Cell Maintenance Requirement of Industrial Microorganisms ....... 32
2.3.4 Elucidating the Mechanism of Microbial Resistance to Fermentation Inhibitors
................................................................................................................................... 34
2.4 Perspectives of Synergizing 13C Metabolic Flux Analysis with Metabolic
Engineering ................................................................................................................... 36
2.4.1 Expand 13C-MFA into Genome Scale .............................................................. 37
2.4.2 Isotopic Non-Stationary 13C-MFA (13C-INST-MFA) ...................................... 37
2.4.3 13C-Based Dynamic Metabolic Flux Analysis (13C-DMFA) ............................ 38
2.4.4 Improve Flux Resolution of 13C-MFA via the Integration of Isotopic Patterns
from Parallel Labeling Experiments .......................................................................... 39
Acknowledgements ....................................................................................................... 40
References ..................................................................................................................... 41

xi
Chapter 3: 13C Assisted Pathway and Flux Analysis for Planktonic and Biofilm Cells ... 61
3.1 13C Assisted Pathway and Flux Analysis ................................................................ 61
3.2 Investigate the Metabolic Reprogramming of Saccharomyces cerevisiae for
Enhanced Resistance to Mixed Fermentation Inhibitors via 13C Metabolic Flux
Analysis ......................................................................................................................... 62
Abstract ...................................................................................................................... 63
3.2.1 Introduction ...................................................................................................... 64
3.2.2 Materials and Methods ..................................................................................... 66
3.2.3 Results .............................................................................................................. 69
3.2.4 Discussion ......................................................................................................... 75
3.2.5 Conclusion ........................................................................................................ 78
Acknowledgements ................................................................................................... 79
3.3 Investigating Strain Dependency in the Production of Aromatic Compounds in
Saccharomyces cerevisiae. ............................................................................................ 90
Abstract ...................................................................................................................... 91
Key Words ................................................................................................................. 91
Key Points.................................................................................................................. 92
3.3.1 Introduction ...................................................................................................... 92
3.3.2 Materials and Methods ..................................................................................... 94
3.3.3 Results and Discussion ..................................................................................... 98

xii
3.3.4 Conclusion ...................................................................................................... 108
Acknowledgements ................................................................................................. 108
3.4 Investigating Oxalate Biosynthesis in Wood-decaying Fungus Gloeophyllum
trabeum Using 13C Metabolic Flux Analysis .............................................................. 117
Acknowledgements ................................................................................................. 125
3.5 13C Pathway Analysis of Biofilm Metabolism of Shewanella oneidensis MR-1 .. 128
3.6 13C Pathway Analysis for the Role of Formate in Electricity Generation by
Shewanella oneidensis MR-1 Using Lactate in Microbial Fuel Cells ........................ 138
Abstract .................................................................................................................... 139
3.6.1 Introduction .................................................................................................... 140
3.6.2 Results and Discussion ................................................................................... 142
3.6.3 Methods .......................................................................................................... 148
Acknowledgements ................................................................................................. 150
References ................................................................................................................... 157
Chapter 4: OM-FBA: Integrate Transcriptomics Data with Flux Balance Analysis to
Decipher the Cell Metabolism ........................................................................................ 171
Abstract ....................................................................................................................... 172
4.1 Introduction ........................................................................................................... 173
4.2 Results ................................................................................................................... 175
4.2.1 Overview of omFBA Algorithm..................................................................... 175

xiii
4.2.2 Module 1: Transcriptomics-Phenotype Data Collection ................................ 176
4.2.3 Module 2: “Phenotype-Match” Algorithm ..................................................... 178
4.2.3 Module 3 and 4: Application and Validation of Omics-Guided Objective
Function ................................................................................................................... 180
4.3 Discussion ............................................................................................................. 183
4.3.1 Comparison between omFBA Algorithm and the “Big Data” Regression
Approach ................................................................................................................. 183
4.3.2 Prerequisites of omFBA Algorithm ................................................................ 185
4.4 Methods and Models ............................................................................................. 187
4.4.1 Transcriptomics and Phenotype Data Collection ........................................... 187
4.4.2 Phenotype-Match Algorithm .......................................................................... 188
4.4.3 Omics-Guided Objective Function in FBA .................................................... 191
4.4.4 Comparison of Prediction Accuracies and Genetic Markers of Big Data and
omFBA Algorithm ................................................................................................... 192
Acknowledgements ..................................................................................................... 192
References ................................................................................................................... 201
Chapter 5: Data-Driven Prediction of CRISPR-Based Transcription Regulation for
Programmable Control of Metabolic Flux ...................................................................... 204
Abstract ....................................................................................................................... 205
5.1 Introduction ........................................................................................................... 206
5.2 Results ................................................................................................................... 207

xiv
5.2.1 Gene Activation and Repression by Using a CRISPR-based Transcriptional
Regulator. ................................................................................................................ 207
5.2.2 Data-Driven Model of Transcriptional Regulation by Using dCas9-VP64. .. 209
5.2.3 Design dCas9-VP64 to Reprogram Metabolic Fluxes in Yeast. .................... 212
5.3 Discussion ............................................................................................................. 213
5.4 Methods and Models ............................................................................................. 214
5.4.1 Strain and Plasmid Construction in Saccharomyces cerevisiae. .................... 214
5.4.2 Fluorescence Assays ....................................................................................... 215
5.4.3 Qualitative Analysis of Key Parameters. ........................................................ 215
5.4.4 Modeling ......................................................................................................... 216
5.4.5 Ten-Fold Cross Validation ............................................................................. 216
5.4.6 Analysis of Products from Violacein Pathway. .............................................. 216
Acknowledgements ..................................................................................................... 217
References ................................................................................................................... 223
Chapter 6: Outreaches in Metabolic Engineering ........................................................... 226
6.1 Metabolic Engineering of Saccharomyces cerevisiae to Produce 1-Hexadecanol
from Xylose ................................................................................................................. 226
Abstract .................................................................................................................... 227
Key Words ............................................................................................................... 228
6.1.1 Introduction ........................................................................................................ 229

xv
6.1.2 Materials and Methods ................................................................................... 231
6.1.3 Results and Discussion ................................................................................... 235
6.1.4 Conclusion ...................................................................................................... 242
Acknowledgements ................................................................................................. 242
6.2 Mini-review: In vitro Metabolic Engineering for Biomanufacturing of High-Value
Products ....................................................................................................................... 251
Abstract .................................................................................................................... 252
Key Words. .............................................................................................................. 252
6.2.1 Introduction .................................................................................................... 253
6.2.2 Cell-Free Synthetic Enzyme Engineering ...................................................... 256
6.2.3 Cell-free Protein Synthesis (CFPS)-based Metabolic Engineering ................ 263
6.2.4 Summary and Perspectives ............................................................................. 267
Acknowledgements ................................................................................................. 270
References ................................................................................................................... 272
Chapter 7: General Conclusions and Future Works ....................................................... 280
References ................................................................................................................... 282
Appendix A: Supplementary Material of Chapter 3.3 .................................................... 283
Appendix B: Supplementary Material of Chapter 3.4 .................................................... 292
Appendix C: Supplementary Material of Chapter 4 ....................................................... 296
Appendix D: Supplementary Material of Chapter 5 ....................................................... 303

xvi
Appendix E: Supplementary Material of Chapter 6.1 .................................................... 331

xvii
List of Figures
Chapter 1
Fig. 1.1 13C-assisted pathway analysis and constraint-based metabolic modeling. ........... 7
Chapter 2
Fig. 2.1 Technology platform for 13C-MFA. .................................................................... 56
Fig. 2.2 Summary of current 13C-MFA studies on different organisms. .......................... 57
Fig. 2.3 Case studies that identify key bottleneck steps of biochemical production via 13C-
MFA and the corresponding metabolic engineering strategies. (A) n-Butanol biosynthesis
in S. cerevisiae; (B) fatty acid synthesis in E. coli. Please note that the pathways showed in
Fig. 2.3 were schematic and there could be missing pathways. Definitions of abbreviations
are shown in List of Abbreviations. .................................................................................. 58
Fig. 2.4 Cofactor imbalance issues identified by 13C-MFA and the corresponding metabolic
engineering strategies. Left column: cofactor imbalance issues in (A) xylose utilization of
S. cerevisiae strains, (B) fatty acid and fatty acid-derived chemical production, and (C) L-
valine production. Right column: the corresponding metabolic engineering strategies to
tackle cofactor imbalance issues: (D) altering the co-factor specificities of xylose reductase
(XR) or xylitol dehydrogenase (XDH); (E) overexpressing transhydrogenase to balance the
NADH and NADPH. Definitions of abbreviations are shown in List of Abbreviations. . 59
Fig. 2.5 Mechanisms of microbial stress responses identified by 13C-MFA. Top: Stress
responses of S. cerevisiae to the furfural; bottom: Stress responses of E. coli to octanoic
acid. Definitions of abbreviations are shown in List of Abbreviations. ........................... 60

xviii
Chapter 3
Fig. 3.2.1 Metabolic flux distribution of the S-C1 strain and YC1 strain under different
stress conditions. The values outside the bracket are relative flux values normalized to
glucose uptake rates as 100. Definitions of abbreviations are shown in the List of
Abbreviations. The values inside the bracket are real flux values in mmol/g/h. The line
widths are linearly correlated with the normalized flux values (glucose uptake rate as 100).
The dashed line indicates the flux is zero. ........................................................................ 84
Fig. 3.2.2 Production and consumption of cofactor and energy. The consumption (blue bar),
production (red bar), and net production (black dots) of ATP, NADH, and NADPH are
shown for different stress conditions. The error bars present the standard deviations, which
can be too small to be seen. .............................................................................................. 85
Fig. 3.2.3 Fold changes of key fluxes between the S-C1 and YC1 strain under different
stress conditions. Definitions of abbreviations are shown in the List of Abbreviations. .. 86
Fig. 3.2.4 Generalized mechanisms used by S. cerevisiae strains in different stress
conditions. (A): acetic acid stress condition; (B): furfural stress condition; (C): dual-stress
condition. Definitions of abbreviations are shown in the List of Abbreviations. ............. 87
Fig. 3.2.S1 Simulated and observed SFLs for S-C1 strain and YC1 strain under different
stress conditions. ............................................................................................................... 88
Fig. 3.2.S2 Linear correlation between OD600 and CFU................................................... 89
Fig. 3.3.1 Pathway depicting engineering efforts for the accumulation of SA. The arrows
in green represent the overexpressed enzymes for unlocking the production of SA.
Definitions of abbreviations are shown in the List of Abbreviations. ............................ 112

xix
Fig. 3.3.2 Media optimization for the production of SA. To allow the accumulation of SA
in all fours strains, it was necessary to incorporate the three aromatic amino acids into the
growth media, through which the conversion of SA into downstream metabolites was at
least partially reduced and hence the positive outcome of expressing the mutant ARO1D920A
was observed. Samples were taken after 24 h of fermentation. The variation is represented
as the standard deviation from three biological replicates. ............................................. 113
Fig. 3.3.3 Isotropic distribution of labeled and non-labeled amino acids. Strains INVSC1-
SA2 and BY4741-SA2 showed higher percentages of labeled a) phenylalanine and b)
tyrosine compared to YSG50-SA2 and BY4743-SA2. This corroborated the higher fluxes
into the biosynthesis of aromatic compounds in the strains with higher SA accumulation
levels. c) Analysis of leucine, another non-labeled amino acid, showed equal distribution
across all four strains. ..................................................................................................... 114
Fig. 3.3.4 Major intracellular metabolic flux distributions in the engineered strains in group
SA2 (Table 3.3.1). All fermentations were performed in batch mode supplemented with 20
g L-1 of 80% [1-13C] glucose and 20% [U-13C] glucose. The fluxes are expressed as
normalized values relative to specific glucose uptake rate (Table 3.3.2). These values
represent a global solution obtained via isotopomer modeling of the 13C labeled
proteinogenic amino acids. To emphasize the flux differences in the SA pathway, the
thickness of the arrows of reactions v9 to v11 was normalized by a value of 5; a value of
25 was used otherwise. P5P: pentose phosphate sugar. .................................................. 115
Fig. 3.3.5 Phenotypic comparison of S. cerevisiae engineered for the production of SA. a)
Growth percentage of strains in the group SA2 versus strains carrying empty plasmids
(group SA0, Table 3.3.1). b) Correlation between SA production and plasmid maintenance.

xx
The ratio between plasmid pRS426-aro1D920A and pRS413-aro4K229L-tkl was calculated and
plotted on the x-axis. c) Accumulation of SA in the strains of groups SA2, SA3, and SA4.
All strains showed an increased production of SA when the genes were encoded in the
plasmid pRS413 (group SA4). Conversely, incorporating all three genes into the backbone
of pRS426 resulted in extremely low production of SA. Samples were taken after 24 h of
growth in minimal media. Variation is represented as the standard deviation from three
biological replicates. ....................................................................................................... 116
Fig. 3.4.1. Metabolic pathway map and key flux distributions for G. trabeum under
different C/N ratios. (A) Central carbon metabolic pathways and oxalate synthesis
pathways of G. trabeum. Transport fluxes between mitochondria and peroxisome were
simplified to a single dash-dot line. (B) The flux ratio between OAH and GLX pathways
for LN and HN conditions with the OAH/GLX ratio highlighted. (C) Key metabolic flux
distributions for G. trabeum under LN and HN conditions. Definitions of abbreviations are
shown in the List of Abbreviations. ................................................................................ 127
Fig. 3.5.1 Fermentation profile of S. oneidensis MR-1 in the sealed bottle reactor.
......................................................................................................................................... 136
Fig. 3.5.2 Central carbon metabolic pathways of S. oneidensis MR-1 from biofilm
and planktonic growth. The 13C and 12C atoms were labeled as filled and empty dots,
respectively. The lactate utilization pathways were colored as blue while the C1
metabolic pathways were colored as red. The number on the left side of each
isotopomer (green) was the M-57 values of proteinogenic amino acids from the
biofilm cells while the number on the right side of each isotopomer (blue) was the

xxi
M-57 value of proteinogenic amino acids from the planktonic cells. Definitions of
abbreviations are shown in the List of Abbreviations. ............................................. 137
Fig. 3.6.1 Current generation in the MFC supplied with various electron donors. Note: “L”
means lactate; “F” means formate; “(F+L)” means addition of both substrate together;
“0.8mM” means 0.8 mM of each substrate added each cycle. ....................................... 152
Fig. 3.6.2 CR and TC obtained in the MFC under different supplies of formate and lactate.
Note: “L” means lactate; “F” means formate; “(F+L)” means addition of both substrate
together; “13C” represents the isotopomer addition; “0.8mM” means 0.8 mM of each
substrate added each cycle. ............................................................................................. 153
Fig. 3.6.3 Current generation in the MFC supplied with 0.8 mM 13C isotopic formate and
0.8mM non-labelled lactate. ........................................................................................... 154
Fig. 3.6.4 Proposed pathway of formate in the metabolism of S. oneidensis MR-1 after 13C
formate experimental analysis. Definitions of abbreviations are shown in the List of
Abbreviations. ................................................................................................................. 155
Fig. 3.6.S1 Schematic of a three-chamber system consisting of an anode chamber, a
cathode chamber, and a control chamber. The electrodes in the anode and the cathode
chambers were connected to form an electrical circuit (functioning MFC). .................. 156
Chapter 4
Fig. 4.1 Complex interactions of various components in cell metabolism. Multi-omics data
has provided the quantitative readouts of these components, which helps us to elucidate the
interactions between the multi-layer regulations. ........................................................... 194
xxii
Fig. 4.2 Scheme of omFBA algorithm. Four modules are designed to implement omFBA
algorithm: 1) transcriptomic-phenotype data collection (Step 1~2), 2) “phenotype match”
algorithm (Step 3~5), 3) omics-guided objective function in FBA (Step 6~7), and 4)
phenotype data validation (Step 8). ................................................................................ 195
Fig. 4.3 “Phenotype match” algorithm for low and high glucose conditions. The simulated
and observed ethanol yields matched well for low (A) and high (B) glucose conditions,
respectively. Negative correlations between the weighting factors of minimizing the
overall enzyme usage and the observed ethanol yield were found for low (C) and high (D)
glucose conditions. .......................................................................................................... 196
Fig. 4.4 Correlation between phenotype-matched weighting factors and gene expressions.
The absolute values of the correlation coefficients in one of the training datasets were
ranked from high to low (only the top 30 genes were shown here). The top 3 genes were
chosen as the genetic markers to derive the omics-guided objective function (blue bars).
......................................................................................................................................... 197
Fig. 4.5. Prediction accuracy of omFBA algorithm. Direct comparison of the predicted and
observed ethanol yields in low (A) and high (B) glucose conditions. The omFBA algorithm
was repeated for 40 times and the percentage of matched predictions of omFBA algorithm
were calculated and ranked for low (C) and high (D) glucose conditions...................... 198
Fig. 4.6 Effect of cutoff p-value on omFBA prediction using “small pool” of genes. Three
cutoff p-values, i.e., 0.05, 0.67, and 0.95, were used to filter the trancriptomics data. For
each cutoff p-value, we re-ran the omFBA algorithm for 40 times and calculated the
percentage of matches between the predicted and the observed ethanol yields in the
validation datasets. .......................................................................................................... 199

xxiii
Fig. 4.7. Key flux ratio analysis. Four key flux ratios (PGI/G6PDH2, FBA/TKT1,
ENO/PPCK, and PYK/PDC) were selected to be correlated with phenotype-matched
weighting factors, observed ethanol yields, and the ratios of the corresponding gene
expression levels for low and high glucose condition. All the values of the ratios were
exponential. Definitions of abbreviations are shown in the List of Abbreviations. ....... 200
Chapter 5
Fig. 5.1 Multi-directional transcriptional regulation by dCas9-VP64. (A) Hypothesized
mechanism of transcriptional regulation by dCas9-VP64 to achieve both gene activation
and gene repression. (B) The measured fold changes of gene expressions from the four
synthetic genetic cassettes based on the PAM position. (C) The distributions of fold
changes of gene expressions. (D) Comparison of fold changes of gene expressions from
two groups: PAM sites located in the promoter regions and PAM sites located in the ORF
region. ***: p < 0.01. (E) Effects of different PAM sites on transcriptional regulation by
dCas9-VP64. *: p < 0.05. ................................................................................................ 218
Fig. 5.2 Data-driven model of transcriptional regulation by using dCas9-VP64. (A) Binary
regression tree model trained with all the screening data from the four synthetic genetic
cassettes. The regression tree model consisted of 58 decision nodes and used six design
parameters of guide RNAs as input. (B) and (C) Prediction accuracy of the regression tree
model from ten-fold cross validation. (D) Impact of data size on model prediction. For
data-driven model, the prediction increased with the inclusion of more datasets. For linear
model, the prediction decreased when more datasets were used. The shadow areas indicate
the 95% confidence interval of model prediction. (E) Validation of the regression tree

xxiv
model by comparing the simulated and experimentally measured gene regulations on
Eno2p-tdTomato cassette subject to dCas9-VP64 regulation. ........................................ 220
Fig. 5.3 Design dCas9-VP64 to reprogram metabolic fluxes in yeast. (A) Violacein
pathway in yeast used in this study to demonstrate the programmable control of metabolic
fluxes by using dCas9-VP64. Five enzymatic steps (vioA, vioB, vioC, vioD, and vioE) and
two non-enzymatic steps led to four products from the violacein pathway: proviolacein,
prodeoxyviolacein, violacein, and deoxyviolacein. (B) A panel of genes subject to
regulation of dCas9-VP64 were chosen to control metabolic fluxes to various products
from the violacein pathway. WT: wild type gene without any regulation; High: highly up-
regulated gene expression by dCas9-VP64; Medium: medium-level up-regulated gene
expression by dCas9-VP64; Low: down-regulated gene expression by dCas9-VP64. (C)
The compassion between the model-predicted and experimentally measured products from
the violacein pathway. The high correlation coefficient (PCC=0.84) indicated that the data-
driven model could accurately predict the effects of artificial Cas9-based regulator on
metabolic flux reprogramming. ...................................................................................... 221
Chapter 6
Fig. 6.1.1 Overview of the approaches for xylose-based fatty alcohol production and
improvement. (A) Scheme for the introduction of xylose utilization pathway to a fatty
alcohol-producing S. cerevisiae strain. The xylose utilization pathway was constituted with
three fungal enzymes, XR, XDH and XKS, from our previous study. This pathway has
been confirmed to use xylose as the sole carbon source. The XF3 strain was selected from
our previous study in which we over-expressed a bird FAR to produce the 1-hexdecanol
and engineered the yeast lipid metabolism to further improve the fatty alcohol production.

xxv
(B) Plasmid design for promoter engineering to further improve the xylose-based fatty
alcohol production. We designed 27 different plasmids to exhaust all of the combinations
of the promoters in front of XR, XDH, and XKS whose strengths were low, medium and
high, respectively. The fatty alcohol production and growth behavior were monitored in
these 27 recombinant strains. .......................................................................................... 246
Fig. 6.1.2 1-Hexadecanol produced and growth rates of engineered S. cerevisiae strains via
promoter engineering. All the strains were cultured in the SC-xylose (4%) medium for 48
h. The bars with lighter color were the values for the control strain (i.e., XF3XP) with the
xylose utilization pathway using the native promoters. .................................................. 248
Fig. 6.1.3 Evolutionary engineering of XF3X07 and XF3X25. 1-Hexadecanol production
(A) and growth rates (B) of the XF3X07 and XF3X25 in each round were normalized with
1-hexadecanol titer and growth rates of the XF3X07 and XF3X25 in round zero,
respectively. .................................................................................................................... 249
Fig. 6.1.4 Fed-batch fermentation of xylose-based 1-hexadecanol production by (A)
XF3XP and (B) XF3XP07. Ethanol was detected as the only byproduct other than 1-
hexadecanol. Black square: the 1-hexadecanol concentration; blue triangle: the xylose
consumed; red dot: OD600. .............................................................................................. 250
Fig. 6.2.1 Summary of in vitro metabolic engineering (ME) approaches. 1. In vivo
metabolic engineering, in which model microorganisms like Escherichia coli and
Saccharomyces cerevisiae are often accompanied with inefficient and time-consuming
pathways construction, transformation and fermentation; 2. Cell-free synthetic enzyme
engineering, which allows fast pathway prototyping; however, molecular cloning and
enzyme production could be time consuming and the high cost associated with production

xxvi
could make the process scale-up questionable. 3. The cell-free protein synthesis (CFPS)-
based metabolic engineering, which could accelerate the pathway prototyping in a cytosol
mimic environment by using enzymes that are directly produced in a cell-free system and
assembling pathways in a “mix-and-match” fashion. ..................................................... 271

xxvii
List of Tables
Chapter 2
Table 2.1 Summary of 13C-MFA software. ....................................................................... 52
Table 2.2 Summary of synergistic tactics of 13C-MFA and metabolic engineering in
identifying and overcoming the bottleneck steps of biochemical production. ................. 53
Table 2.3 bSummary of synergistic tactics of 13C-MFA and metabolic engineering in
uncovering and solving the cofactor imbalance issues. .................................................... 54
Table 2.4 bSummary of synergistic tactics of 13C-MFA and metabolic engineering in
revealing and compensating cell maintenance requirement of industrial microorganisms.
........................................................................................................................................... 55
Chapter 3
Table 3.2.1. Plasmids and Strains. .................................................................................... 80
Table 3.2.2. Growth of S-C1 strain and YC1 strain under different stress conditions. .... 81
Table 3.2.S1 The central metabolic model used in this study. ......................................... 82
Table 3.2.S2 Metabolic fluxes of S-C1 strain and YC1 strain under different stress
conditions. All the flux values were normalized to glucose uptake rates (set as 100),
respectively. ...................................................................................................................... 83
Table 3.3.1. The constructed plasmids and strains. ........................................................ 110
Table 3.3.2. Physiological characterization of SA producing strains. μ (h-1), specific growth
rate; r (mmol gDCW-1 h-1), rate of consumption or production; Ymax (mmol gDCW-1), molar
yield based on consumed glucose; titer (mg L-1). ........................................................... 111

xxviii
Table 3.4.1. Growth behaviour of G. trabeum under different nitrogen conditions. ...... 126
Table 3.5.1. Mass distribution of detected metabolites for the 13C tracing experiments (n =
2) a ................................................................................................................................... 135
Table 3.6.1 Mass distribution vectors of the key proteiogenic amino acids. .................. 151
Chapter 4
Table 4.1 Key flux ratios compared with previous studies using 13C metabolic flux analysis.
......................................................................................................................................... 193
Chapter 6
Table 6.1.1 Plasmids and strains used in this study. ....................................................... 243
Table 6.1.2 Batch fermentation profiles of engineered S. cerevisiae strains. ................. 245

xxix
List of Abbreviations
6PG 6-Phosphogluconate
AA Amino Acids
AAla Alanine
ACAL Acetaldehyde
ACC Acetyl-CoA carboxylase
AcCoA Acetyl-CoA
ACE (Ace) Acetate
AceP Acetyl-P
ACK Acetate kinase
ACL ATP citrate lyase
ACS Acetyl-CoA synthetase
ADH Alcohol dehydrogenase
ADH1/5 Alcohol dehydrogenase 1/5
AKG α-Ketoglutarate
ALDH Aldehyde dehydrogenase
ARO Pentafunctional protein ARO1p
ARO1 Pentafunctional enzyme converting DAHP to EPSP
ARO1A ESPS synthase
ARO1B SA kinase
ARO1C DHQ synthase
ARO1D DHS dehydrogenase

xxx
ARO1D920A Mutant ARO1 with disrupted activity of shikimate kinase
subunit
ARO1E DHQ dehydratase
ARO2 Chorismate synthase
ARO3/4 DAHP synthase isoenzymes
ARO4K229L Feedback insensitive DAHP synthase
ARO7 chorismate mutase.
Asp Aspartate
C1 C1 molecule
CIT Citrate
Cyc BO Cytochrome bo oxidase
Cyc c Cytochrome C
CymA
Tetraheme cytochrome anchored in inner membrane, accepts
electrons from formate and transfers them to MtrA, MtrB and
MtrC
cyto-PDH Cytosolic pyruvate dehydrogenase
DAHP 3-deoxy-D-arabinoheptulosonate 7-phosphate
DHAP Dihydroxyacetone phosphate
DHQ Dehydroquinoate
DHS Dehydroshikimate
E4P Erythrose 4-Phosphate
ENO Enolase
EPSP 5-enolpyruvyl-3-shikimate phosphate

xxxi
ETH (EtOH) Ethanol
ETHOUT Extracellular ethanol
F6P Fructose 6-phosphate
FAD Fatty acids degradation enzymes.
FAS Fatty acid synthesis enzymes
FBA Fructose-bisphosphate aldolase
FDH Formate dehydrogenase
FMNOX Oxidized flavin mononucleotide
FMNRED Reduced flavin mononucleotide
FUM Fumarate
G1P Glucose-1-phosphate
G3P Glyceraldehyde 3-phosphate
G6P Glucose 6-Phosphate
G6PDH G6P dehydrogenase
G6PDH2 Glucose 6-phosphate dehydrogenase
GLC Glucose
Glox Glyoxylate
GLOX Glyoxylate
Glu Glutamate
Gly Glycine
Glyc Glycerol
GLYC Glycerol
GLYCOUT Extracellular glycerol

xxxii
GPD Glycerol-3-phosphate dehydrogenase
ICIT Isocitrate
ICL Isocitrate lyase
IM Inner membrane
MAA Mycosporine-like Amino Acids
MaCoA Malonyl-CoA
MAL Malate
MLS Malate synthetase
MtrA,MtrB,MtrC Three kinds of periplasmic decaheme c-type cytochrome
cytochromes anchored on outer membrane
mXDH Mutated xylitol dehydrogenase
mXR Mutated xylose reductase
NADH-DH NADH dehydrogenase
OAA Oxaloacetate
OAAMIT/OAACYT Oxaloacetate (Mitochondria/Cytosol)
OM Outer membrane
OXA Oxalate
OXO 2-oxoglutarate
oxPP pathway Oxidative pentose phosphate pathway
P5P Ribulose 5-phosphate
pc Pyruvate carboxylase
PDC Pyruvate decarboxylase
PDH Pyruvate dehydrogenase

xxxiii
PdhR Pyruvate dehydrogenase regulator
PEP Phosphoenolpyruvate
PGA 3-phosphoglycerate
PGI Phosphoglucose isomerase
PoxB Pyruvate oxidase
PPCK (ppck) Phosphoenolpyruvate carboxykinase
PYK (pyk) Pyruvate kinase
Pyr Pyruvate
PYRCYT Pyruvate in cytosol
PYRDC Pyruvate decarboxylase.
PYRMIT/PYRCYT Pyruvate (Mitochondria/Cytosol)
R5P Ribose 5-Phosphate
Ri5P Ribulose-5-phosphate
ROS Reactive oxygen species
Ru5P Ribulose 5-Phosphate
S3P Shikimate-3-phosphate
S7P Sedoheptulose 7-phosphate
SA Shikimic acid
SER (Ser) Serine
SUC Succinate
TCA cycle tricarboxylic acid cycle.
TKL (TKL1, TKT1) Transketolase
TRP Formate transporter.

xxxiv
TRP2 Anthranilate synthase
TRP3 Indole-3-glycerol-phosphate synthase
X5P(P5P) Xylulose 5-phosphate
XpkA Phosphoketolase
zwf1 Glucose-6-phosphate 1-dehydrogenase

1
Chapter 1: Introduction
1.1 Planktonic and biofilm metabolism
1.1.1 Planktonic and biofilm states of microorganisms
The planktonic (free floating) and biofilm (anchored to a surface) states are two
ubiquitous living states for both prokaryotic and eukaryotic microorganisms[1-4]. When
microorganisms are initially inoculated into an aqueous environment, they quickly
reproduce in the planktonic state. Biofilms are initiated when planktonic cells recognize
specific or non-specific attachment sites on a surface, as well as in response to some type
of stress (e.g., antibiotic treatments)[5, 6]. Biofilms start as single cells and subsequently
grow to consist of multiple layers of cells [5, 7]. As more and more planktonic cells stick
onto the multi-layer biofilm, over-mature cells are flushed out of the biofilm and become
planktonic again. The cycling of cells between planktonic and biofilm states has been
identified as the lifecycle of biofilms.
Microorganisms in the planktonic state are usually better able to directly absorb
soluble nutrients (e.g., sugar and amino acids) and excrete products or waste than those in
the biofilm state. Those features lead to the fast growth associated with the planktonic state
and, more importantly, make it easier to culture the microorganisms and separate products
of interest. Therefore, microorganisms cultured in the planktonic state (e.g., in fermenters)
have been widely used to produce various products such as biofuels[8-10], proteins[11-
13], drugs[14, 15], and biomaterials[16, 17]. Because microorganisms in the planktonic
state can easily access any solvable chemicals present in the culture environment,

2
planktonic cells can be compressed or even eliminated by various stresses (e.g., strong
acids, strong bases, and antibiotics)[18]. Therefore, it is important to understand how the
metabolisms of planktonic cells are reprogramed in response to different stresses in order
to keep such cells as the workhorses of the microbial industries.
One the other hand, matrix-enclosed biofilms may provide a self-protected niche
for microorganisms, a stable environment that is relatively free of harmful stresses such as
antibiotics [2, 19-25]. The increased resistance of biofilm-associated pathogens to
antibiotic drugs and the potential for antibiotic-resistant microbes to cause infections in
patients with indwelling medical devices make biofilms a serious public health issue[21,
24-26]. For example, biofilms play a major role in the dissemination and protection of
various bacterial pathogens (e.g., Staphylococcus), facilitating chronic infections and
enhanced antibiotic resistance[27-35]. Such pathogens cause 1.2 million infections and
over 20,000 deaths each year in the United States. Although biofilms can be dangerous,
they also provide opportunities. The attachment of microorganisms to living or non-living
surfaces provides an alternative approach for the transfer of substrates or products[36-39],
which could be applied to solve environmental issues. For instance, biofilm and granular-
sludge processes are widely applied in wastewater treatment to efficiently oxidize various
organic compounds in the wastewater[40-42]. Given the dangers and opportunities
presented by biofilms, an in-depth understanding of biofilm metabolism is crucial for both
environmental applications and public health.

3
1.1.2 Current approaches to understanding planktonic and biofilm
metabolism
To better harness microorganisms in both the planktonic and the biofilm states, it
is important to understand the physiology and intracellular metabolism of cells in each state
and also the processes involved in the conversion of cells from one state to the other[43].
The planktonic state, as the most common state for microorganisms, has received the most
study and provides a convenient platform to illustrate cell metabolisms. Multi-omics
approaches such as transcriptomics, proteomics, metabolomics, and fluxomics have been
developed based on the planktonic platform to disclose complex microbial metabolisms by
measuring and analyzing the abundances of mRNAs, proteins, metabolites, and metabolic
fluxes, respectively. Those approaches cannot, however, unravel the intrinsic and
complicated interactions among the multi-omics layers, which poses barriers to the rational
reprogramming of planktonic microorganisms to achieve specific goals.
The biofilm state is not as well studied as the planktonic state because of its
complex lifecycle and intrinsic structures [43]. Since the early 1980s, researchers have
studied the lifecycle of biofilms[38, 39, 44], which includes formation, maturation, and
dispersion. They found that there are huge differences in genetic regulation and pathway
utilization between biofilm cells and planktonic cells[4, 45, 46]. Molecular biology studies
have identified key genes and regulatory circuits related to the life cycle of biofilms[3, 23,
47, 48], providing valuable insights to help decipher biofilm metabolism. Nevertheless,
researchers are still far from elucidating the mystery of biofilm metabolism. In particular,
very few studies have investigated the differences in metabolic pathway usage between
biofilm cells and planktonic cells. It is important to know how intracellular metabolic

4
fluxes are regulated in biofilm cells, because that knowledge will reveal the regulatory
machinery that reprograms biofilm cells to have distinct functionalities different from those
of planktonic cells.
1.2 Computational modeling of microbial metabolism
It is important to decipher microbial metabolism in order to solve public health and
energy issues worldwide. Several centuries’ worth of microbial metabolism studies [49]
have shown that microbial metabolism is an extremely complex biological phenomenon
involving thousands of genes, proteins, and metabolites as well as interactions among those
components. Therefore, it is very difficult to examine the entire metabolism of a given
microbe by directly measuring the abundances of all the components of the metabolism.
Computational modeling provides an efficient and feasible alternative approach to
understanding microbial metabolism [50, 51].
In general, the computational modeling of microbial metabolism includes two
major approaches (Fig. 1): 13C metabolic flux analysis (13C-MFA)[52-54] and flux balance
analysis (FBA)[55-57]. Those two approaches have distinct functionalities, but both have
been widely applied to the study of various biological systems[58-64] and provided
numerous biological insights to better understand cell metabolism. 13C-MFA aims to
rigorously elucidate metabolic reprogramming (e.g., changes in the intracellular flux
distribution) by implementing 13C-labeling experiments to trace pathway usages[52]. FBA
aims to predict phenotypes (e.g., growth rates) by reconstructing genome-scale metabolic
models with an arbitrary objective function[65].
In addition, molecular modeling provides a nanoscale-to-microscale understanding
of cell metabolism[66]. In particular, machine learning approaches, especially artificial

5
intelligence[67], are applied to understand cell metabolisms and to predict various
biological properties (e.g., alternative splicing and sequence binding specificities)[68-71].
Machine learning algorithms are remarkably accurate and capable of describing highly
complex systems using large-scale data[72], which makes them suitable to modeling
intricate metabolisms and processing petabyte-level biological data[70, 73].
1.3 Scope of the dissertation
There have been many studies of the metabolisms of planktonic and biofilm
microorganisms using various computational modeling approaches. Many key questions
are still unanswered, however, including: 1) How do microorganisms reprogram their
metabolisms to resist mixed stresses or synthesize specific chemicals in the planktonic state
or generate electrons in the biofilm state? 2) How can transcriptomics and fluxomics be
integrated via computational modeling? 3) What regulatory rules govern genome editing?
To answer those questions, I applied three computational modeling approaches
(i.e., 13C-MFA, FBA, and machine learning) to study both planktonic and biofilm
microorganisms. In Chapter 2 of this dissertation, I provide a comprehensive review of
recent advances in 13C-assisted pathway and flux analysis and metabolic engineering, with
a brief introduction to the technologies used in 13C-assisted pathway and flux analysis and
how those technologies synergize with metabolic engineering for biochemical
production[74]. In Chapter 3, I apply 13C-MFA to unravel the metabolic responses (i.e.,
changes in metabolic flux) of Saccharomyces cerevisiae to multiple stresses[75]. In
addition, I apply 13C-MFA to reveal the metabolic reprogramming of Gloeophyllum
trabeum for oxalate biosynthesis[76]. I also use 13C-MFA combined with transcriptomics
analysis to investigate strain dependency in the production of aromatic compounds in S.

6
cerevisiae [77]. In Chapter 4, I use 13C-assisted pathway analysis to examine intracellular
metabolic reprogramming in a biofilm of Shewanella oneidensis strain MR-1 growing on
the anode of a microbial fuel cell. Two continuous projects reveal the different intracellular
metabolisms of planktonic and biofilm cells, identify key pathways in the biofilm, and
demonstrate the mechanisms behind the generation of electricity by the biofilm [78, 79].
In Chapter 5, I develop a novel platform for FBA (omFBA) that has increased prediction
accuracy and simultaneously integrates multi-omics data by replacing the arbitrary
objective function (e.g., maximize the growth rate) with an omics-guided objective
function[80]. The omFBA platform can be applied to microorganisms in either the
planktonic or the biofilm state. In Chapter 6, I develop a data-driven machine learning tool
for predicting clustered regularly interspaced short palindromic repeats (CRISPR)-based
transcriptional regulation, which could be used to facilitate the sequence design of guide
RNAs in the CRISPR system to achieve programmable control of metabolic flux[81]. In
Chapter 7, I implement several outreaches to supplement the computational modeling of
planktonic cells[82, 83]. In Chapter 8, I summarize my plans for future work on
deciphering the intracellular metabolism of biofilm cells.

7
Fig. 1.1 13C-assisted pathway analysis and constraint-based metabolic modeling.

8
References
1. Reynolds, T.B. and G.R. Fink, Bakers' Yeast, a Model for Fungal Biofilm Formation. Science, 2001. 291(5505): p. 878-881.
2. Chandra, J., et al., Biofilm Formation by the Fungal PathogenCandida albicans: Development, Architecture, and Drug Resistance. Journal of Bacteriology, 2001. 183(18): p. 5385-5394.
3. Davies, D.G., et al., The Involvement of Cell-to-Cell Signals in the Development of a Bacterial Biofilm. Science, 1998. 280(5361): p. 295-298.
4. McLean, J.S., et al., Investigations of structure and metabolism within Shewanella oneidensis MR-1 biofilms. Journal of Microbiological Methods, 2008. 74(1): p. 47-56.
5. Karatan, E. and P. Watnick, Signals, Regulatory Networks, and Materials That Build and Break Bacterial Biofilms. Microbiology and Molecular Biology Reviews, 2009. 73(2): p. 310-347.
6. Billings, N., et al., The extracellular matrix Component Psl provides fast-acting antibiotic defense in Pseudomonas aeruginosa biofilms. PLoS Pathog, 2013. 9(8): p. e1003526.
7. O'Toole, G.A. and R. Kolter, Flagellar and twitching motility are necessary for Pseudomonas aeruginosa biofilm development. Molecular Microbiology, 1998. 30(2): p. 295-304.
8. Lennen, R.M. and B.F. Pfleger, Microbial production of fatty acid-derived fuels and chemicals. Curr Opin Biotechnol, 2013. 24(6): p. 1044-53.
9. Fillet, S. and J.L. Adrio, Microbial production of fatty alcohols. World Journal of Microbiology and Biotechnology, 2016. 32(9): p. 152.
10. Sheng, J., J. Stevens, and X. Feng, Pathway Compartmentalization in Peroxisome of Saccharomyces cerevisiae to Produce Versatile Medium Chain Fatty Alcohols. Sci Rep, 2016. 6: p. 26884.
11. Baneyx, F., Recombinant protein expression in Escherichia coli. Current Opinion in Biotechnology, 1999. 10(5): p. 411-421.
12. Cereghino, J.L. and J.M. Cregg, Heterologous protein expression in the methylotrophic yeast Pichia pastoris. FEMS Microbiology Reviews, 2000. 24(1): p. 45-66.
13. Madzak, C., C. Gaillardin, and J.-M. Beckerich, Heterologous protein expression and secretion in the non-conventional yeast Yarrowia lipolytica: a review. Journal of Biotechnology, 2004. 109(1): p. 63-81.
14. Paddon, C.J., et al., High-level semi-synthetic production of the potent antimalarial artemisinin. Nature, 2013. 496(7446): p. 528-532.
15. Westfall, P.J., et al., Production of amorphadiene in yeast, and its conversion to dihydroartemisinic acid, precursor to the antimalarial agent artemisinin. Proceedings of the National Academy of Sciences, 2012. 109(3): p. E111-E118.
16. Aldor, I.S. and J.D. Keasling, Process design for microbial plastic factories: metabolic engineering of polyhydroxyalkanoates. Current Opinion in Biotechnology, 2003. 14(5): p. 475-483.
17. Chen, G.-Q., A microbial polyhydroxyalkanoates (PHA) based bio- and materials industry. Chemical Society Reviews, 2009. 38(8): p. 2434-2446.

9
18. Olson, M.E., et al., Biofilm bacteria: formation and comparative susceptibility to antibiotics. Canadian Journal of Veterinary Research, 2002. 66(2): p. 86-92.
19. Mah, T.-F., et al., A genetic basis for Pseudomonas aeruginosa biofilm antibiotic resistance. Nature, 2003. 426(6964): p. 306-310.
20. Davies, D., Understanding biofilm resistance to antibacterial agents. Nat Rev Drug Discov, 2003. 2(2): p. 114-122.
21. Drenkard, E. and F.M. Ausubel, Pseudomonas biofilm formation and antibiotic resistance are linked to phenotypic variation. Nature, 2002. 416(6882): p. 740-743.
22. Mah, T.-F.C. and G.A. O'Toole, Mechanisms of biofilm resistance to antimicrobial agents. Trends in Microbiology, 2001. 9(1): p. 34-39.
23. Ghigo, J.-M., Natural conjugative plasmids induce bacterial biofilm development. Nature, 2001. 412(6845): p. 442-445.
24. Donlan, R.M., Biofilm Formation: A Clinically Relevant Microbiological Process. Clinical Infectious Diseases, 2001. 33(8): p. 1387-1392.
25. Costerton, W., et al., The application of biofilm science to the study and control of chronic bacterial infections. Journal of Clinical Investigation, 2003. 112(10): p. 1466-1477.
26. Hall-Stoodley, L. and P. Stoodley, Biofilm formation and dispersal and the transmission of human pathogens. Trends in Microbiology, 2005. 13(1): p. 7-10.
27. Arciola, C.R., et al., Biofilm formation in Staphylococcus implant infections. A review of molecular mechanisms and implications for biofilm-resistant materials. Biomaterials, 2012. 33(26): p. 5967-5982.
28. O'Neill, E., et al., Association between Methicillin Susceptibility and Biofilm Regulation in Staphylococcus aureus Isolates from Device-Related Infections. Journal of Clinical Microbiology, 2007. 45(5): p. 1379-1388.
29. de Allori, M., et al., Antimicrobial Resistance and Production of Biofilms in Clinical Isolates of Coagulase-Negative <i>Staphylococcus</i> Strains. Biological and Pharmaceutical Bulletin, 2006. 29(8): p. 1592-1596.
30. Hall-Stoodley, L., J.W. Costerton, and P. Stoodley, Bacterial biofilms: from the Natural environment to infectious diseases. Nat Rev Micro, 2004. 2(2): p. 95-108.
31. Costerton, J.W., P.S. Stewart, and E.P. Greenberg, Bacterial Biofilms: A Common Cause of Persistent Infections. Science, 1999. 284(5418): p. 1318-1322.
32. Otto, M., Staphylococcal Biofilms. Current topics in microbiology and immunology, 2008. 322: p. 207-228.
33. Archer, N.K., et al., Staphylococcus aureus biofilms: Properties, regulation and roles in human disease. Virulence, 2011. 2(5): p. 445-459.
34. Percival, S.L., et al., Microbiology of the skin and the role of biofilms in infection. International Wound Journal, 2012. 9(1): p. 14-32.
35. Davis, S.C., et al., Microscopic and physiologic evidence for biofilm-associated wound colonization in vivo. Wound Repair and Regeneration, 2008. 16(1): p. 23-29.
36. Ram, R.J., et al., Community Proteomics of a Natural Microbial Biofilm. Science, 2005. 308(5730): p. 1915-1920.

10
37. Mahadevan, R., J.S. Edwards, and F.J. Doyle, Dynamic flux balance analysis of diauxic growth in Escherichia coli. Biophysical Journal, 2002. 83(3): p. 1331-1340.
38. O'Toole, G., H.B. Kaplan, and R. Kolter, Biofilm Formation as Microbial Development. Annual Review of Microbiology, 2000. 54(1): p. 49-79.
39. de Beer, D., et al., Effects of biofilm structures on oxygen distribution and mass transport. Biotechnology and Bioengineering, 1994. 43(11): p. 1131-1138.
40. Venkata Mohan, S., et al., Bioelectricity generation from chemical wastewater treatment in mediatorless (anode) microbial fuel cell (MFC) using selectively enriched hydrogen producing mixed culture under acidophilic microenvironment. Biochemical Engineering Journal, 2008. 39(1): p. 121-130.
41. He, Z., S.D. Minteer, and L.T. Angenent, Electricity Generation from Artificial Wastewater Using an Upflow Microbial Fuel Cell. Environmental Science & Technology, 2005. 39(14): p. 5262-5267.
42. Liu, Y. and J.-H. Tay, The essential role of hydrodynamic shear force in the formation of biofilm and granular sludge. Water Research, 2002. 36(7): p. 1653-1665.
43. Monroe, D., Looking for Chinks in the Armor of Bacterial Biofilms. PLOS Biology, 2007. 5(11): p. e307.
44. Rittmann, B.E. and P.L. McCarty, Evaluation of steady-state-biofilm kinetics. Biotechnology and Bioengineering, 1980. 22(11): p. 2359-2373.
45. Yang, Y., et al., Differential biofilms characteristics of Shewanella decolorationis microbial fuel cells under open and closed circuit conditions. Bioresource Technology, 2011. 102(14): p. 7093-7098.
46. Stewart, P.S. and M.J. Franklin, Physiological heterogeneity in biofilms. Nat Rev Micro, 2008. 6(3): p. 199-210.
47. De Windt, W., et al., AggA is required for aggregation and increased biofilm formation of a hyper-aggregating mutant of Shewanella oneidensis MR-1. Microbiology, 2006. 152(3): p. 721-729.
48. Thormann, K.M., et al., Induction of Rapid Detachment in Shewanella oneidensis MR-1 Biofilms. Journal of Bacteriology, 2005. 187(3): p. 1014-1021.
49. Eknoyan, G., Santorio Sanctorius (1561–1636) – Founding Father of Metabolic Balance Studies. American Journal of Nephrology, 1999. 19(2): p. 226-233.
50. Bower, J.M. and H. Bolouri, Computational modeling of genetic and biochemical networks. 2001: MIT press.
51. Kitano, H., Computational systems biology. Nature, 2002. 420(6912): p. 206-210. 52. Zamboni, N., et al., 13C-based metabolic flux analysis. Nat. Protocols, 2009. 4(6):
p. 878-892. 53. Young, J.D., 13C metabolic flux analysis of recombinant expression hosts. Current
Opinion in Biotechnology, 2014. 30: p. 238-245. 54. Antoniewicz, M., Methods and advances in metabolic flux analysis: a mini-
review. Journal of Industrial Microbiology & Biotechnology, 2015. 42(3): p. 317-325.
55. Orth, J.D., I. Thiele, and B.O. Palsson, What is flux balance analysis? Nat Biotech, 2010. 28(3): p. 245-248.

11
56. Edwards, J.S., M. Covert, and B. Palsson, Metabolic modelling of microbes: the flux-balance approach. Environmental Microbiology, 2002. 4(3): p. 133-140.
57. Kauffman, K.J., P. Prakash, and J.S. Edwards, Advances in flux balance analysis. Current Opinion in Biotechnology, 2003. 14(5): p. 491-496.
58. Papp, B., C. Pal, and L.D. Hurst, Metabolic network analysis of the causes and evolution of enzyme dispensability in yeast. Nature, 2004. 429(6992): p. 661-664.
59. Edwards, J.S. and B.O. Palsson, The Escherichia coli MG1655 in silico metabolic genotype: Its definition, characteristics, and capabilities. Proceedings of the National Academy of Sciences, 2000. 97(10): p. 5528-5533.
60. Bartek, T., et al., Comparative 13C Metabolic Flux Analysis of Pyruvate Dehydrogenase Complex-Deficient, l-Valine-Producing Corynebacterium glutamicum. Applied and Environmental Microbiology, 2011. 77(18): p. 6644-6652.
61. Fu, Y., et al., Metabolic flux analysis of Escherichia coli MG1655 under octanoic acid (C8) stress. Applied Microbiology and Biotechnology, 2015. 99(10): p. 4397-4408.
62. Hayakawa, K., et al., 13C-metabolic flux analysis in S-adenosyl-l-methionine production by Saccharomyces cerevisiae. Journal of Bioscience and Bioengineering, 2015.
63. Cordova, L.T. and M.R. Antoniewicz, 13C metabolic flux analysis of the extremely thermophilic, fast growing, xylose-utilizing Geobacillus strain LC300. Metabolic Engineering.
64. Crown, S.B., C.P. Long, and M.R. Antoniewicz, Integrated 13C-metabolic flux analysis of 14 parallel labeling experiments in Escherichia coli. Metabolic Engineering, 2015. 28: p. 151-158.
65. Schuetz, R., L. Kuepfer, and U. Sauer, Systematic evaluation of objective functions for predicting intracellular fluxes in Escherichia coli. Molecular Systems Biology, 2007. 3: p. 119.
66. Schlick, T., Molecular modeling and simulation: an interdisciplinary guide: an interdisciplinary guide. Vol. 21. 2010: Springer Science & Business Media.
67. LeCun, Y., Y. Bengio, and G. Hinton, Deep learning. Nature, 2015. 521(7553): p. 436-444.
68. Xiong, H.Y., et al., The human splicing code reveals new insights into the genetic determinants of disease. Science, 2015. 347(6218).
69. Zhou, J. and O.G. Troyanskaya, Predicting effects of noncoding variants with deep learning-based sequence model. Nat Meth, 2015. 12(10): p. 931-934.
70. Tarca, A.L., et al., Machine Learning and Its Applications to Biology. PLOS Computational Biology, 2007. 3(6): p. e116.
71. Iniesta, R., D. Stahl, and P. McGuffin, Machine learning, statistical learning and the future of biological research in psychiatry. Psychological Medicine, 2016: p. 1-11.
72. Schmidhuber, J., Deep learning in neural networks: An overview. Neural Networks, 2015. 61: p. 85-117.
73. Michalski, R.S., J.G. Carbonell, and T.M. Mitchell, Machine learning: An artificial intelligence approach. 2013: Springer Science & Business Media.

12
74. Guo, W., J. Sheng, and X. Feng, 13C-Metabolic Flux Analysis: An Accurate Approach to Demystify Microbial Metabolism for Biochemical Production. Bioengineering, 2016. 3(1): p. 3.
75. Guo, W., et al., Investigate the Metabolic Reprogramming of Saccharomyces cerevisiae for Enhanced Resistance to Mixed Fermentation Inhibitors via 13C Metabolic Flux Analysis. PLOS ONE, 2016. 11(8): p. e0161448.
76. Zhuang, L., et al., Investigating oxalate biosynthesis in the wood-decaying fungus Gloeophyllum trabeum using 13C metabolic flux analysis. RSC Advances, 2015. 5(126): p. 104043-104047.
77. Miguel Suastegui, et al., Investigating strain dependency in the production of aromatic compounds in Saccharomyces cerevisiae. Biotechnol Bioeng., 2016. Accepted: p. 9.
78. Guo, W., et al., 13C pathway analysis of biofilm metabolism of Shewanella oneidensis MR-1. RSC Advances, 2015. 5(50): p. 39840-39843.
79. Luo, S., et al., (13)C Pathway Analysis for the Role of Formate in Electricity Generation by Shewanella Oneidensis MR-1 Using Lactate in Microbial Fuel Cells. Sci Rep, 2016. 6: p. 20941.
80. Guo, W. and X. Feng, OM-FBA: Integrate Transcriptomics Data with Flux Balance Analysis to Decipher the Cell Metabolism. PLoS One, 2016. 11(4): p. e0154188.
81. Sheng, J., et al., Data-Driven Prediction of CRISPR-Based Transcription Regulation for Programmable Control of Metabolic Flux. arXiv preprint arXiv:1704.03027, 2017.
82. Guo, W., et al., Metabolic engineering of Saccharomyces cerevisiae to produce 1-hexadecanol from xylose. Microb Cell Fact, 2016. 15: p. 24.
83. Guo, W., J. Sheng, and X. Feng, Mini-review: In vitro Metabolic Engineering for Biomanufacturing of High-value Products. Computational and Structural Biotechnology Journal, 2017. 15: p. 161-167.

13
Chapter 2: Synergizing 13C Metabolic Flux Analysis and Metabolic
Engineering for Biochemical Production
Weihua Guoa, Jiayuan Shenga, Xueyang Fenga, †
a Department of Biological Systems Engineering, Virginia Tech University, Blacksburg, VA
24061, United States
†Correspondence to: Xueyang Feng.
Phone: +1-(540)231-2974
Email: [email protected]
This manuscript has been published on Springer Berlin Heidelberg: Berlin, Heidelberg. p. 1-35.
Reprinted with permission of the publisher.

14
Abstract
Metabolic engineering of industrial microorganisms to produce chemicals, fuels, and drugs
has attracted increasing interests since it provides an environment-friendly and renewable route
that does not depend on depleting petroleum sources. However, the microbial metabolism is so
complex that metabolic engineering efforts often have difficulty in achieving a satisfactory yield,
titer or productivity of the target chemical. To overcome this challenge, 13C Metabolic Flux
Analysis (13C-MFA) has been developed to rigorously investigate the cell metabolism and quantify
the carbon flux distribution in central metabolic pathways. In the past decade, 13C-MFA has been
widely used in academic labs and biotechnology industry to pinpoint the key issues related to
microbial-based chemical production and guide the development of the appropriate metabolic
engineering strategies for improving the biochemical production. In this chapter, we will introduce
the basics of 13C-MFA and illustrate how 13C-MFA has been applied to synergize with metabolic
engineering to identify and tackle the rate-limiting steps in biochemical production.
Key Words
Bottleneck, isotope, cofactor imbalance, cell metabolism, synthetic biology, biofuels.

15
2.1 Introduction
Producing chemicals from renewable resources would reduce strong dependence on
petroleum and damage to the environment. Recently, with the development of metabolic
engineering and synthetic biology, microbial production of a wide range of bulk chemicals [1-4],
biofuels [5-9], and drugs [10-17], from renewable feedstock has been achieved successfully in
many industrial microorganisms such as Escherichia coli [18-23] and Saccharomyces cerevisiae
[24-27]. Among all of the biosynthesized chemicals, however, only a few have achieved a
satisfactory production level with a titer, yield, and productivity high enough for industrial
commercialization [28, 29]. Therefore, it is crucial to develop novel strategies in metabolic
engineering to improve microbial-based chemical production.
One of the main reasons for the low production level of engineered microorganisms is the
complexity of cell metabolism [29]. Microbial production of chemicals is more than converting
the precursors to the products. Instead, the microbial metabolism needs to coordinate the carbon
flux [30, 31], cofactor supply [32-34], cell maintenance [10, 35, 36], as well as other factors [37-
40] to achieve the production of target chemicals at a high level. Often, the metabolic engineering
strategies adopted to manipulate microbial metabolism only focus on a few known challenges (e.g.,
poor gene expression) but also introduce new problems (e.g., metabolic burden) that prevent the
microorganisms from achieving high-level chemical production. Such complex behavior of
microbial physiology presents one of the biggest obstacles in current microbial-based chemical
production.
To elucidate the metabolic rewiring of microorganisms, and more importantly, to derive
the appropriate strategy to engineer microorganisms for biochemical production, a technology
named 13C Metabolic Flux Analysis (13C-MFA) has been developed in the 1990s [41-46].

16
Basically, 13C-MFA applies carbon isotopes to trace the cell metabolism and uses mathematical
modeling to uncover the carbon flux distributions in metabolic network of microorganisms [41,
42, 47-50]. By comparing the variations of metabolic fluxes among different engineered
microorganisms, the key issues, such as the bottleneck pathway, could often be discovered and
hence guide the bioengineers to develop more appropriate metabolic engineering strategies [51-
57] to improve chemical production. In the past decade, we have witnessed many successful
applications of 13C-MFA on helping metabolic engineers to improve the microbial production of
chemicals [31, 35, 52, 54, 58, 59], and 13C-MFA has been widely recognized as one of the most
important tools to diagnose microbial metabolism and develop novel metabolic engineering
strategies [30, 31, 33, 35, 36, 54, 60-62].
In this chapter, we aim to summarize the synergistic tactics of 13C-MFA and metabolic
engineering from cases of improving microbial-based chemical production in the past decade. We
will first briefly introduce the principle of 13C-MFA, and then categorize the ways that 13C-MFA
synergizes with metabolic engineering into four groups: 1) uncovering the bottleneck steps in
biochemical production; 2) identifying cofactor imbalance issues of host metabolism; 3) revealing
cell maintenance requirement of industrial microorganisms; and 4) elucidating the mechanism of
microbial resistance to fermentation inhibitors. We also point to emerging areas where
breakthroughs of 13C-MFA could potentially benefit rational metabolic engineering for improving
microbial-based chemical production in the near future.
2.2 Technology Platform of 13C Metabolic Flux Analysis
The technology platform of 13C-MFA was first developed in 1990s [41-46]. In the past
two decades, mathematical algorithms and high-throughput mass spectrometry technology have
been rapidly developed and have enabled more accurate quantitative analyses of metabolic fluxes

17
for a broad scope of species. Because several protocols have been published to describe the
procedures for both model and non-model organisms [47, 63], we focus on providing a concise
introduction for 13C-MFA, which includes cell culture and fermentation, isotopic analysis of
metabolites, and 13C-assisted pathway and flux analysis (Fig. 2.1).
2.2.1 Cell Culture and Fermentation
Cell culture on 13C labeled carbon substrates is the first step for 13C-MFA and plays a vital
role for the entire analysis. Three key factors have been recognized in this step, namely the
composition of the medium, the cultivation mode, and the selection of 13C-labeled substrates.
First, a strictly minimal medium with a single carbon source is often required for the 13C-
labeling experiments. This is because multiple carbon substrates and unlabeled nutrients could be
assimilated by microorganisms, which “dilutes” the isotopic labeling of key metabolites, mystifies
the carbon fate of metabolites of interests, and increases the difficulty of both carbon consumption
measurements and accurate flux calculations [64]. However, it is worth mentioning that for certain
genetically engineered strains (e.g., S. cerevisiae) with auxotrophic markers, a trace amount of
unlabeled exogenous amino acids could be supplemented into the minimal medium in order to
support cell growth. Recently, several studies have reported alternative approaches for calculating
the intracellular fluxes with complex medium composition and/or additional nutrients [65, 66].
Second, 13C-MFA traditionally focuses on the metabolic flux distributions at the metabolic
steady states, which requires both metabolic and isotopic steady states of microorganisms, i.e., the
concentration and isotopic labeling of intracellular metabolites do not change. Such requirements
can be met by culturing microorganisms in either of the two modes: 1) batch mode, often using
shaking flask or culture tubes to culture microorganisms and harvesting biomass samples in log
growth phase as a “pseudo” metabolic and isotopic steady state; and 2) chemostat mode, often

18
using bioreactors with continuous feeding to culture microorganisms and harvest biomass samples
after 2~3 generations as the “real” metabolic and isotopic steady state. While a chemostat setup
can precisely control the desired metabolic status for metabolic flux analysis, the batch mode is
simpler and more cost-effective. Till now, the majority of the 13C-MFA in academic labs were
accomplished by sampling the 13C-labeled biomass in late-log or early stationary growth phase
when culturing microorganisms in batch mode [63]. Several advanced 13C-assisted flux analysis
approaches can also be implemented at either metabolic non-steady-state [30] or isotopic non-
steady-state [67-71] to uncover the kinetic behaviors of intracellular metabolic rewiring by using
novel computational tools (discussed in 2.4.2 and 2.4.3).
Third, the choice of 13C-labeled substrate that should be used for 13C-MFA is case-specific.
In general, traditional 13C-labeled glucose composition, i.e. 80% [1-13C] and 20% [U-13C] glucose
(w/w), can easily introduce sufficient 13C carbons into the metabolites of interests for accurate
mass spectrometry analysis and further flux analysis [47, 72-75]. On the other hand, pure and
singly labeled carbon substrates are more sensitive for detection of novel pathways because it is
easier to trace labeled carbons in intermediate metabolites. For example, the [3-13C] lactate was
used to investigate the biofilm metabolism of Shewanella oneidensis MR-1 and elucidated the
heavy use of C1 metabolism in biofilm cells [76]. In brief, it was expected that 13C would
accumulate in most metabolites because it was difficult to remove the labeled carbon of the lactate
from the S. oneidensis cells through well-known central pathways such as the TCA cycle.
However, the high concentration of unlabeled metabolites in the biofilm cells indicated that the
high activity of C1 metabolism, which was the only known metabolic pathway to release the
labeled carbon of lactate from S. oneidensis cells as 13CO2. Additionally, multiple 13C tracers are
also used sometimes as they can also improve the flux resolution.

19
2.2.2 Isotopic Analysis of Metabolites
Experimental measurements of isotopic labeling of 13C-labeled metabolites, e.g.
proteinogenic amino acids, are often achieved by mass spectrometry, which detects the fractions
of the total population of any molecular fragment that is unlabeled, singly labeled, doubly labeled,
etc. By correcting the effects of naturally labeled isotopes on the analysis of 13C-labeled
metabolites, we can obtain the isotopic distributions for the metabolites of interests with high
sensitivity and further use them as isotopic “fingerprints” to determine the metabolic fluxes [47,
77, 78]. Generally, three major procedures are commonly used to obtain such isotopic
“fingerprints”: metabolite extraction and separation; isotopic labeling detection; and correction of
natural isotopomers.
Overall, many of the metabolite candidates for the flux analysis are required to be extracted
from cell biomass or culture medium. Sometimes, the intracellular metabolites have low
abundance and stability. Thus, a quick metabolite quenching method and sensitive mass
spectrometry are often used to collect the isotopic labeling data [79]. The extracted metabolites
could either be treated with the low heat derivatization group, N,O-
Bis(trimethylsilyl)trifluoroacetamide (BSTFA) or N-Methyl-N-(trimethylsilyl)trifluoroacetamide
(MSTFA), followed by analyzing in gas chromatography–mass spectrometry (GC-MS)[80], or
directly injected without any treatment into liquid chromatography–mass spectrometry (LC-
MS)[81], a machine that has much higher sensitivity than GC-MS.
For those metabolites with high abundance and stability, such as over-produced chemicals
[81] and proteinogenic amino acids, the quenching step could be bypassed. Instead, the samples
are often treated with N-tert-butyldimethylsilyl-N-methyltrifluoroacetamide (MTBSTFA), a cheap
and commonly used derivatization group in a high heat process, followed by GC-MS analysis of

20
the isotopic labeling. The derivatization process will render the molecules volatile enough to enter
the GC column but also introduce un-ignorable amounts of naturally labeled isotopes. Therefore,
a systematic correction is required for the raw mass isotopomer spectrum prior to flux calculation.
Several algorithms [82-84] have been well established to curate the isotopic labeling and remove
the effects of natural isotopes so that a mass distribution vector (MDV) for each metabolite can be
generated and directly used for the pathway and flux analysis.
2.2.3 13C-Assisted Pathway and Flux Analysis
Based on the corrected MDV, the metabolic behaviors of microorganisms can be elucidated
both qualitatively (i.e., pathway analysis) and quantitatively (i.e., flux analysis). On one hand, the
13C-assisted pathway analysis often aims to answer whether a metabolic pathway is active in non-
model microorganisms by measuring the 13C labeled patterns (i.e. MDVs) in key metabolites and
determining the fate of biomolecule synthesis in the denoted biochemical pathways. One example
of the 13C-assisted pathway analysis is the discovery of C1 metabolism in biofilm S. oneidensis as
mentioned above. On the other hand, the 13C-assisted flux analysis aims to quantify the carbon
fluxes in multiple metabolic pathways by simulating the 13C labeled patterns (i.e. MDVs) in key
metabolites and searching for the “real” metabolic fluxes that could lead to the best fit of the
measured 13C labeled patterns. Such quantitative analysis often reveals the network level rewiring
of carbons fluxes in industrial workhorses (e.g., E. coli) when engineered for biochemical
production. In short, while 13C-assisted pathway analysis is suitable for pathway discovery in non-
model microorganisms, 13C-assisted flux analysis is more useful in identifying the metabolic
rewiring in industrial microorganisms.
In the past decade, 13C-assisted flux analysis has been widely applied to uncover the central
metabolisms of various species. Accordingly to a curated database [84] that was recently

21
developed to collect the central carbon metabolic flux distributions investigated by 13C-MFA, over
500 metabolic flux analyses have been accomplished so far for 36 organisms (Fig. 2.2). Most of
the 13C-MFA studies focus on investigating metabolism of E. coli and S. cerevisiae. However,
there is a trend that other industrial microorganisms, such as Clostridium and Cyanobacteria, will
initiate more 13C-MFA studies due to their importance in biochemical production and relatively
less well-known cell metabolism. Also, with the wide application of 13C-MFA, many 13C-MFA
software packages, such as OpenFLUX2 [85], 13CFLUX2 [86], Metran [87], INCA [88],
FiatFLUX [89], and Biomet Toolbox 2.0 [90], have been developed by using highly efficient
mathematical algorithms (e.g., elementary metabolite unit, EMU [87, 91]) to simulate 13C labeled
patterns and calculating carbon fluxes in metabolic network (Table 2.1). Thus, some of the
difficulties, especially the computational load, of 13C-MFA have been dramatically decreased. It
is reasonable to believe that the numbers of 13C-MFA studies could increase by orders of
magnitudes in the next decade or two.
2.3 Synergy of 13C Metabolic Flux Analysis and Metabolic Engineering
The ultimate goals of metabolic engineering is to design and build engineered biological
systems that can produce chemicals, materials, food, and drugs at high yield [92]. However, the
lack of fundamental understanding of cellular responses during industrial fermentation often
prevents metabolic engineers to achieve a satisfactory production of biochemical. In the past
decade, 13C-MFA has been widely used to provide insightful information about microbial
metabolism and successfully helped metabolic engineers to improve biochemical production.
Here, we have summarized recent successes on synergizing 13C-MFA and metabolic engineering
(Table 2.2-2.4), and organized them into four categories: 1) uncovering the bottleneck steps in
biochemical production; 2) identifying cofactor imbalance issues of host metabolism; 3) revealing

22
cell maintenance requirement of industrial microorganisms; and 4) elucidating the mechanism of
microbial resistance to fermentation inhibitors.
2.3.1 Uncovering the Bottleneck Steps in Biochemical Production
Bottlenecks in Acetyl-CoA Synthesis. As a central metabolite, acetyl-CoA plays an
important role in a series of cellular functions. In metabolic engineering, acetyl-CoA is a key
precursor in the biosynthesis of sterols, amino acids, fatty acid-derived chemicals, polyketides,
and isoprenoid-derived drugs [93]. To accommodate the cellular requirement, the organisms use a
variety of routes for acetyl-CoA synthesis (Fig. 2.3), such as the oxidative decarboxylation of
pyruvate, the oxidation of long-chain fatty acids, and the oxidative degradation of certain amino
acids. The most common way to produce the acetyl-CoA is the direct conversion from pyruvate
by pyruvate dehydrogenase (PDH) [94, 95], pyruvate ferredoxin oxidoreductase (PFO), pyruvate
NADPH oxidoreductase (PNO)[96], or pyruvate formate lyase (PFL)[97] under anaerobic
conditions. Other acetyl-CoA synthesis pathways, e.g., acetyl-CoA synthetase (ACS) [98] and
citrate lyase (ACL) [99] also play important roles in acetyl-CoA supplement for different
organisms, especially for supplying the cytosolic acetyl-CoA as the precursor for various
biochemical products.
In order to investigate the acetyl-CoA biosynthesis in living cells, 13C-MFA was used to
compare S. cerevisiae strains growing under purely oxidative, respiro-fermentative and
predominantly fermentative conditions [100]. Based on the flux distributions, the activated
pyruvate bypass pathway, i.e. converting pyruvate to acetaldehyde and then to acetate for synthesis
of cytosolic acetyl-CoA, was found to be the main pathway used by S. cerevisiae to supply
cytosolic acetyl-CoA. However, the flux in the pyruvate bypass pathway was not strong enough
to supply sufficient cytosolic acetyl-CoA when engineering S. cerevisiae to produce acetyl-CoA-

23
derived chemicals, such as n-butanol. To increase the capability of producing cytosolic acetyl-
CoA in S. cerevisiae, various metabolic engineering strategies have been adopted to further
enhance cytosolic acetyl-CoA availability, including the disruption of competing pathways [51]
and the introduction of heterologous biosynthetic pathways with higher catalytic efficiency and
lower energy input requirement, such as cytosolic localized PDHs (cytoPDHs) [51] and ATP-
citrate lyase (ACLs) [101]. In one of the studies that evaluated the effects of various acetyl-CoA
synthesis pathways on n-butanol production, the cytoPDHs was found to work best and led to 3-
fold increased n-butanol production in the engineered S. cerevisiae (Fig. 2.3A & Table 2.2) [93].
In addition to uncovering the bottleneck of cytosolic acetyl-CoA biosynthesis for wild-type
yeast, 13C-MFA was also used to elucidate the effect of a heterogonous acetyl-CoA enhanced
pathway, i.e. phosphoketolase pathway (PHK), in a genetically modified yeast strain in which the
genes xpkA and ack from Aspergillus nidulans were introduced [52]. The PHK pathway was
originally utilized by several bacterial species [102] and filamentous fungi for glucose
dissimilation as an alternative to the Embden-Meyerhof-Parnas pathway (EMP). For example, in
A. nidulans, the utilization of this metabolic pathway led to increased carbon flow towards acetate
and acetyl-CoA through the action of a phosphotransacetylase [103]. Flux distribution in the
central metabolic pathways showed the positive role of the PHK pathway on improving the supply
of cytosolic acetyl-CoA in the S. cerevisiae strain, which also accounted for the improved acetate
yield. Encouraged by this discovery, the same PHK pathway was co-expressed together with a
wax ester synthase (ws2) and successfully improved the titer of fatty acid ethyl esters by 1.7 fold
[104]. Such proof-of-concept study indicated that the PHK pathway could be established as stand-
alone route to divert flux from glycolysis to cytosolic acetyl-CoA supply, and hold great potential
for future improving the production of acetyl-CoA-derived chemicals.

24
Bottlenecks in Fatty Acid Synthesis. Fatty acids are the precursors to produce
transportation fuels and industrial chemicals including surfactants, solvents, and lubricants [58].
The microbial production of fatty acid-derived chemicals has recently been achieved in many
industrial applications. Escherichia coli can serve as an excellent host for fatty acids production
due to its fast growth, simple nutrient requirements, well-understood metabolism, and well-
established genetic tools. But only a small amount of free fatty acids is detectable under normal
conditions in the wild-type E. coli. The synthesis of saturated fatty acid starts with the conversion
of acetyl-CoA into malonyl-CoA catalyzed by ATP-dependent acetyl-CoA carboxylase and the
transesterification of malonyl-CoA into an acyl carrier protein (ACP) catalyzed by malonyl-CoA
ACP transacylase (fabD), followed by cyclic chain elongation (Table 2.2) [105].
In spite of various fatty acid over-producing strains that have been created, most studies
focus on engineering terminal enzymes in fatty acid biosynthesis pathways and little is known
about how central metabolism responds to fatty acid production. To reveal the metabolic
bottlenecks in fatty acid production, 13C-MFA has been performed by using an engineered fatty
acid over-producing E. coli DH1 strain with over-expression of tesA, and fadR genes and knock-
out of fadE gene (Fig. 2.3B) [58]. This 13C-MFA study clearly showed the E. coli metabolic flux
were redistributed in response to over-production of fatty acid. Basically, compared to the wild-
type E. coli strain, the flux in the engineered strain was significantly diverted from acetate
synthesis to fatty acid synthesis, indicating that an increase in the supply of key precursors in fatty
acid synthesis is crucial to increasing subsequent fatty acid synthesis. The fluxes of pentose
phosphate pathway (PPP) also dramatically increased to supply large amount of reduction powers,
mostly NADPH, to support the fatty acid production in the engineered strain. Finally, the flux of
the anaplerotic pathway into the TCA cycle decreased 1.7-fold in the engineered strain, and

25
consequently, more carbon fluxes were diverted to supply cytosolic acetyl-CoA, the starting point
of fatty acid biosynthesis. Overall, as indicated by 13C-MFA, the supply of fatty acid precursor and
NADPH was recognized as the key bottleneck in microbial engineering for fatty acid production.
In order to improve fatty acid production, numerous engineering strategies have been
suggested and explored. For example, to overcome the challenge of limited supply of fatty acid
precursors, the acetyl-CoA carboxylase was over-expressed to provide more malonyl-CoA, a key
precursor for fatty acid synthesis, which successfully enhanced the production of fatty acids [106,
107]. In another study, the fatty acid degradation pathway was removed by knocking out fadE in
E. coli. Together with the over-expression of tesA and fabF, the yield of fatty acids was enhanced
by nearly 3-fold [108]. Similarly, another study showed that by co-expressing fabZ and a
thioesterase from Ricinus communis in a fadD (a key gene in fatty acid degradation) deletion
mutant, the fatty acid titer was enhanced by nearly 3-fold (Table 2.2) [109]. In sum, the precursor
issue identified by 13C-MFA has now been well addressed in microbial engineering for fatty acid
production. The insufficient supply of NADPH, another issue revealed by 13C-MFA in fatty acid
production, could be the next direction that metabolic engineers need to pay attention.
Bottlenecks in Pentose Phosphate Pathway. Pentose phosphate pathway, well known as
the limitation step in providing sufficient NADPH for biochemical synthesis (discussed in 2.3.2),
is also the essential pathway to provide the precursors for the synthesis of nucleotides and nucleic
acids from ribose 5-phosphate and aromatic amino acids (e.g., phenylalanine and tyrosine). Several
aromatic compounds, such as shikimic acid, a valuable drug precursor, could be produced from
metabolites in pentose phosphate pathway. To investigate the bottleneck in pentose phosphate
pathway for the biosynthesis process of shikimic acid, 13C-MFA was recently applied to four
different engineered S. cerevisiae strains which were engineered to produce shikimic acids at

26
different amount [110]. By comparing flux distributions of the four strains with different shikimic
acid productions, a higher flux through pentose phosphate pathway was positively correlated with
higher production of shikimic acid. This analysis indicated that the low flux into PP pathway could
be the bottleneck for the shikimic acid production. Indeed, it was found that when removing the
original phenylalanine and tyrosine synthesis pathway, and overexpressing aro1, aro4 and tkl
genes to improve the metabolic fluxes in PP pathway, the shikimic acid was increased by nearly
2-fold in S. cerevisiae (Table 2.2).
Similarly, riboflavin is an important industrial bio-product from PP pathway, which has
been commercially produced by engineering Bacillus subtilis strains [111]. 13C-MFA has also been
implemented for both wild type and engineered B. subtilis strains in the past two decades [112,
113] to unravel the metabolic rewiring in the riboflavin producing strain, which could further
improve the riboflavin production. The intracellular flux distributions of a riboflavin-producing B.
subtilis strain has been rigorously investigated via 13C-MFA under three different dilution rates in
chemostats [112]. It found that PP pathway was activated, which not only supplied sufficient
precursors but also produced sufficient NADPH. More interestingly, cofactor NADPH was always
excessively produced in B. subtilis strains under all the three dilution rates based on the flux
analysis, especially in the low dilution rate without riboflavin production. In other words, the
estimated amount of NADPH requirements was found to be less than the NADPH formations for
both biomass and riboflavin production. Thus, the high production of riboflavin and purine
nucleotides is attributed to the sufficient precursor supply from PP pathway in B. subtilis. It is
worth noting that the transhydrogenase, which catalyzed the reversible conversion of NADPH to
NADH, played an important role to re-oxidize the excessive NADPH that was generated due to
the highly activated PP pathways.

27
2.3.2 Identifying Cofactor Imbalance Issues of Host Metabolism
Cofactors, e.g. NADH/NAD+ and NADPH/NADP+, play a major role as the redox carriers
for catabolic and anabolic reactions as well as the important agents in transfer of energy for the
cell. NADH/NAD+ functions as a cofactor pair in over 300 redox reactions and regulates various
enzymes and genetic processes [56]. Under aerobic growth, NADH acts as an electron carrier for
the transportation of electrons from the carbon source to the final electron acceptor: oxygen. Under
anaerobic growth with the absence of an alternative oxidizing agent, the regeneration of NAD+ is
of great significance for the redox balance, which is achieved through fermentation by using
NADH to reduce metabolic intermediates [114, 115]. Thus, the balance issue of NADH/NAD+ is
crucial for both aerobic and anaerobic conditions. NADPH/NADP+, as the phosphorylation
products of NADH/NAD+, drives the anabolic reactions. The enzymatic synthesis of some
important compounds, e.g. fatty acids and amino acids, depends heavily on cofactor NADPH as
the reducing equivalents. The major pathways supplying NADPH during heterotrophic growth on
glucose are the oxidative pentose phosphate pathway, the Entner-Doudoroff pathway, and NADP+-
dependent isocitrate dehydrogenase in the TCA cycle [53]. Additionally, the balance between
NADH and NADPH also plays an important role to provide sufficient NADPH for the anabolic
reactions. NAD(P) transhydrogenase can catalyze the reversible conversion between NADH and
NADPH to balance the cofactors [116]. With the expense of 1 mol ATP, NAD kinase also can
catalyze the conversion from NADH to NADPH [55].
It is conceivable that in cofactor-dependent production systems, cofactor availability and
balance issue plays a vital role in dictating the overall process yield. Hence, the identification of
key pathways to balance the cofactor levels would be helpful for the rational design of metabolic
engineering strategies to further increase biochemical production. 13C-MFA is one of few

28
analytical tools that can rigorously determine the cofactor usage in cell metabolism and has been
applied in many industrial microorganisms to reveal the cofactor imbalance issues related to
biochemical production. In this section, we summarized several important discoveries of the
cofactor balance issues via 13C-MFA and the corresponding metabolic engineering strategies to
solve such issues (Fig. 2.4 & Table 2.3).
Cofactor Imbalance in Xylose Fermentation of S. cerevisiae. S. cerevisiae with the
ability to anaerobically ferment sugars to ethanol at high rates has been domesticated for millennia
and continuously selected as a workhorse for bioethanol production. However, S. cerevisiae cannot
utilize xylose anaerobically, which is the second abundant composition in lignocellulose, a
renewable and non-food-competitive resource. One of the commonly used strategies to engineer
S. cerevisiae to utilize xylose is introducing a fungal xylose pathway from xylose-utilizing yeasts
such as Pichia stipites. Through this fungal xylose pathway, xylose could be converted to
fermentable xylulose through the consecutive redox reactions catalyzed by NADPH-dependent
xylose reductase (XR) and NAD+-dependent xylitol dehydrogenases (XDH), with xylitol produced
as the intermediate. However, the usage of different cofactors in the fungal xylose pathway brings
a notorious cofactor imbalance issue and severely limits the xylose utilization in S. cerevisiae.
More importantly, the cofactor imbalance issue is not standalone. Rather, as shown in a few 13C-
MFA studies, it is intertwined with the central metabolism to induce network-level rewiring of
carbon fluxes. Basically, a systematic investigation of xylose utilization of recombinant S.
cerevisiae strains in an oxygen limited condition for ethanol production was accomplished by 13C-
MFA [36]. By implementing the 13C tracer experiments and running metabolic flux analysis for
six recombinant strains with different origins of XR and XDH in the xylose pathway [36], a
universally high activity of oxidative pentose phosphate pathway was found to supply the NADPH

29
for the XR. The strong activities in TCA cycle was also found and indicated that huge amount of
NADH needed to be consumed by oxidative phosphorylation. Concurrent with the global
metabolic rewiring, only a small amount of the carbon fluxes was diverted to ethanol production.
To solve the cofactor-imbalance issues in the xylose utilization of S. cerevisiae, numerous
efforts in metabolic engineering have been devoted. One of the strategies is the partial alteration
of the cofactor preference for these two enzymes, i.e. altering the preference of XR to use NADH
or altering XDH to use NADP+ as the cofactors, which would generate a cofactor-balance cycle
for the initial two steps of xylose utilization to balance the cofactor utilization. The cofactor
engineering strategy has proved to be functional in several studies. For example, by replacing the
native P. stipitis XR with a mutated XR with increased preference of NADH, the ethanol yield
was improved by ~40% with the decreased xylitol production [117-123]. The similar successes
have also been achieved in several other attempts to increase the NADP+ preference for the XDH,
which have successfully improved the ethanol production by 28%~41% [124-127]. The other
strategy used to tackle the cofactor imbalance issue is to engineer the cofactor-dependent metabolic
pathways that could decrease the xylitol production and enhance ethanol yield. For instance,
lowering the flux through the NADPH-producing pentose phosphate pathway could lead to
increasing ethanol yield and decreasing xylitol production. This is attributed to an insufficient
supplement of NADPH which could improve the NADH preference of XR, and thus partially
balance the cofactor usage of XR and XDH [128]. In addition, replacing the NADPH-producing
PP pathway (glucose-6-phosphate dehydrogenase) with a fungal NADP+-dependent D-
glyceraldehyde-3-phosphate dehydrogenase (NADP-GAPDH) could produce NADPH for the XR
without losing any carbon, and provide more carbon for the ethanol production [129]. Improving
the NAD+ regeneration directly by introducing the heterogeneous genes could also decrease the

30
xylitol production and increase ethanol production [130]. Beside the two-step xylose utilization
pathway, using xylose isomerase is another efficient approach for the xylose fermentation since it
does not require cofactor when converting xylose to xylulose, and hence, bypasses the cofactor
imbalance issue (Table 2.3). However, as indicated by a recent 13C-MFA study, the lower
glycolysis activity that led to inefficient re-oxidation of NADH could be potentially a new
bottleneck step when using xylose isomerase in S. cerevisiae [131].
Cofactor Imbalance in Chemical Biosynthesis. The production of many chemicals, such
as fatty acids and amino acids, requires a large amount of cofactors. Thus, cofactor imbalance
issues are tightly related to not only the sugar utilization but also the chemical production. For
example, by using 13C-MFA to analyze the cell metabolism in wild-type and fatty acid over-
producing E. coli strains, it was found that the engineered strain requires excessive NADPH
compared to the wild-type strain, i.e. 255 units compared to 179 units NADPH with the flux of
glucose uptake was normalized of 100 units. However, the sum of NADPH supplied from central
metabolism could only reach 100 units [58], which clearly indicated that more NADPH production
would be needed to increase fatty acid production in E. coli. To balance the NADPH usage, an
alternative transdehydrogenase pathway that converted NADH to NADPH was activated in the
engineered E. coli. The flux of the transdehydrogenase pathway was increased by 70% compared
to that in wild-type strains (i.e. from 90 units to 153 units) to support fatty acid biosynthesis.
Realizing the importance of cofactor balance, particularly the NADPH supply, in
biochemical production, metabolic engineers have adopted various strategies to overcome this
challenge. One strategy is switching the specificities of glycolytic enzymes, e.g. GAPDH, from
NAD+-dependence to NADP+-dependence, which could build a NADPH-producing glycolysis
pathway to increase the bioavailability of NADPH and further improved the NADPH-dependent

31
lycopene production by ~100% (Table 2.3)[53]. Also, it is used to redirect the metabolic flux from
the glycolysis pathway into the pentose phosphate pathway to enhance NADPH supply by the
overexpression of zwf that encodes glucose-6-phosphate dehydrogenase (G6PDH) [132-134],
deletion of pfkA and pfkB that encode the phosphofructokinase (PFK) [135], or deletion of pgi that
encodes phosphoglucose isomerase [136, 137]. In addition, transhydrogenase [138, 139] or NAD
kinase [53] was overexpressed to further boost the NADPH/NADP+ availability in E. coli and
other microorganisms.
In addition to the production of fatty acids, biosynthesis of amino acids, such as L-lysine
and L-valine, requires NADPH as cofactors of the enzymatic reactions. Corynebacterium
glutamicum, one of the industrial workhorses for producing amino acids, has been considered an
important microorganism with extensive 13C-MFA studies [46, 140-143]. Many metabolic
engineering strategies provided by 13C-MFA have been developed to improve the amino acids
production. For example, L-lysine is one of the major products of C. glutamicum, which is
synthesized from the pyruvate and oxaloacetate consuming 4 moles NADPH for 1 mole L-lysine.
To study the intracellular metabolic rewiring of the L-lysine producing C. glutamicum strains,
several 13C-MFA studies have been implemented and uncovered that the PP pathway has been
increased to supply NADPH. The anaplerotic carboxylation pathway was also enhanced to provide
enough precursors for L-lysine synthesis [141, 142, 144]. Similarly, a significant increase in the
PP pathway flux was also found to be associated with L-valine production in a pyruvate
decarboxylase deficient C. glutamicum strain via 13C-MFA, which again indicated that the
NADPH supply was the key issue in L-valine production [54].
Based on the insightful information from 13C-MFA studies, various metabolic strategies
have been developed to improve the L-lysine and L-valine production. First, to overcome the

32
insufficient NADPH supply, the enzymes in PP pathway, such as glucose-6-phosphate
dehydrogenase [145], transketolase, and transaldolase [146], as well as 1, 6-bisphosphatase [147],
were overexpressed to redirect fluxes towards PP pathway to improve lysine production. In
addition to the strategy of overexpressing the native enzymes in PP pathway, the alteration of
cofactor specificity of GAPDH from NAD+-dependence to NADP+-dependence has successfully
improved the L-lysine production by ~50% without decreasing cell growth rate [148]. To further
investigate the metabolic responses of such alteration, 13C-MFA was performed again to compare
the intracellular flux distributions between wild-type strains and mutants with alternated GAPDH.
It was found that the mutated GAPDH pathway was the major source of the NADPH in the mutated
strain with the similar PP pathway flux, but with higher lysine production. At last but not least, by
cloning a transhydrogenase from E.coli to enhance NADPH supply in C. glutamicum, L-valine
yield in C. glutamicum strain was dramatically improved by ~200% (Fig. 2.4C & Table 2.3) [54].
These discoveries were consistent with the expectations of the metabolic engineering strategies,
and more importantly, demonstrated that 13C-MFA could indeed rationally guide the metabolic
engineering and improve the microbial performance.
2.3.3 Revealing Cell Maintenance Requirement of Industrial Microorganisms
Metabolic engineering is frequently equated with the heterologous production of a series
of recombinant proteins. Nowadays, with the development of synthetic biology approaches, more
and more heterologous pathways have been introduced into a host cell to produce non-natural
products with multiple genes inserted, deleted, replaced, or overexpressed. On one hand, the
genetic manipulation could modify cell metabolism and divert more carbon flux into the desired
chemicals. On the other hand, the metabolic engineering, particularly heterologous protein
overexpression, could interfere the host metabolism and generate severe metabolic burdens since

33
the protein expression could be energetically expensive during transcription and translation. Such
issues, however, has not yet been well studied in the field of metabolic engineering.
The metabolic burden of industrial microorganisms is often reflected as elevated cell
maintenance energy of industrial microorganisms, as revealed in several pioneering 13C-MFA
studies. In one of the 13C-MFA studies, Pichia pastoris, a methylotrophic yeast with an attractive
system to produce various heterologous proteins [65-68] was investigated by introducing a mock
plasmid, a low-copy plasmid to express R. oryzae lipase, and a high-copy plasmid to express R.
oryzae lipase, respectively. It was found that the TCA cycle fluxes of both protein-expressing P.
pastoris strains were much higher than the control strain to produce more ATP to sustain cell
growth, confirming that the protein folding and conformational stress indeed imposed a metabolic
burden on the microbial host. The similar metabolic rewiring, i.e., elevated TCA cycle fluxes to
provide more ATP for cell maintenance, was also found in a S-Adenosyl-L-methionine (SAM)
producing S. cerevisiae strain [35] and a xylose-utilization S. cerevisiae strain (Table 2.4) [36].
To avoid introducing metabolic burdens, metabolic engineers have explored three
strategies: medium optimization, using low-copy plasmids, and promoter engineering.
Optimization of cultural medium and fermentation condition could potentially remove stresses
such as nutrient limitation and hence reduce the requirement for cell maintenance energy. For
example, by using several novel feeding strategies to cultural SAM-producing P. pastoris, the
production of SAM was found to be improved by ~35% [149, 150]. In addition, it has been found
that the utilization of a high-copy plasmid may increase risk of plasmid instability and metabolic
burden [151], since the protein over-expression requires tremendous amount of building blocks
and energy, which could jeopardize the normal cell growth and increase the metabolic burden. It
was found that using a low-copy plasmid sometimes could be a better choice for chemical

34
production. For example, in the study that aimed to engineer E. coli to produce lycopene [152],
the cell density of the engineered E. coli with high-copy plasmid at stationary phase was
approximately 24% lower than the one with low-copy and 30% lower than the control culture.
Similarly, the titer of lycopene in the E. coli with high-copy plasmid was 20% lower than that with
low-copy plasmid. Another method to decrease metabolic burden is to tune the promoter strengths
of various genes to balance the pathways and avoid the accumulation of certain toxic intermediates
as the growth inhibitor. One example uses this method to engineer a more efficient production of
taxadiene in E. coli [10]. In general, by tuning the expression levels of two modules in the
taxadiene pathway, a native upstream methylerythritol-phosphate (MEP) pathway forming
isopentenyl pyrophosphate and a heterologous downstream pathway forming terpenoid, an
inhibitory intermediate compound for cell growth, indole, was achieved the minimal accumulation
by expressing the upstream pathway in a very low level. Correspondingly, the taxadiene
production was improved by ~15-fold.
2.3.4 Elucidating the Mechanism of Microbial Resistance to Fermentation Inhibitors
Environmental stresses, such as physical heat shock [153] and chemical acidity [154],
could affect the physiology and viability of microbial cells and decrease or even cease the
bioprocess productivity. For example, the lignocellulosic biofuels hold promises for a sustainable
fuel economy. However, the chemical stresses from the toxic compounds in processed
lignocellulosic hydrolysates, e.g. weak acids, furans, and phenolic compounds [155], have
hampered the economic feasibility of biofuels. Thus, it is important to identify the intracellular
metabolic responses of industrial microorganisms to various stresses in order to rationally improve
their resistance to inhibitors [156]. Compared to other commonly used approaches such as
transcriptomics and proteomics analysis, 13C-MFA is more intuitive and provides direct and
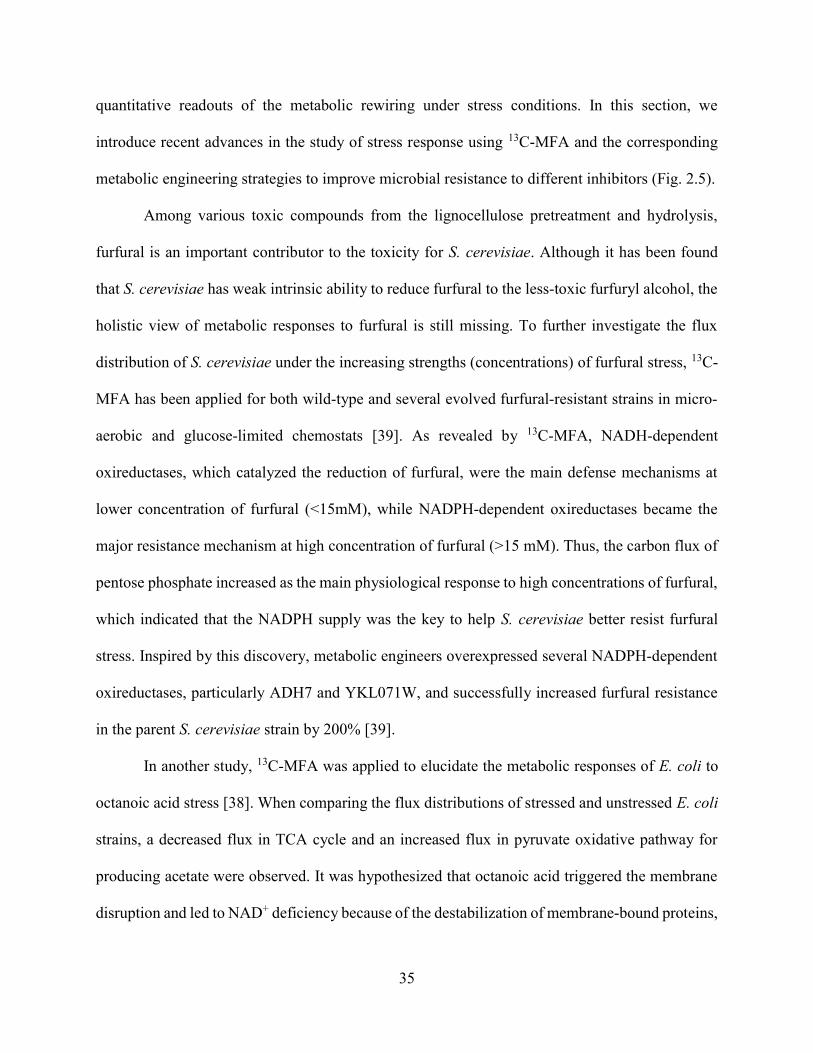
35
quantitative readouts of the metabolic rewiring under stress conditions. In this section, we
introduce recent advances in the study of stress response using 13C-MFA and the corresponding
metabolic engineering strategies to improve microbial resistance to different inhibitors (Fig. 2.5).
Among various toxic compounds from the lignocellulose pretreatment and hydrolysis,
furfural is an important contributor to the toxicity for S. cerevisiae. Although it has been found
that S. cerevisiae has weak intrinsic ability to reduce furfural to the less-toxic furfuryl alcohol, the
holistic view of metabolic responses to furfural is still missing. To further investigate the flux
distribution of S. cerevisiae under the increasing strengths (concentrations) of furfural stress, 13C-
MFA has been applied for both wild-type and several evolved furfural-resistant strains in micro-
aerobic and glucose-limited chemostats [39]. As revealed by 13C-MFA, NADH-dependent
oxireductases, which catalyzed the reduction of furfural, were the main defense mechanisms at
lower concentration of furfural (<15mM), while NADPH-dependent oxireductases became the
major resistance mechanism at high concentration of furfural (>15 mM). Thus, the carbon flux of
pentose phosphate increased as the main physiological response to high concentrations of furfural,
which indicated that the NADPH supply was the key to help S. cerevisiae better resist furfural
stress. Inspired by this discovery, metabolic engineers overexpressed several NADPH-dependent
oxireductases, particularly ADH7 and YKL071W, and successfully increased furfural resistance
in the parent S. cerevisiae strain by 200% [39].
In another study, 13C-MFA was applied to elucidate the metabolic responses of E. coli to
octanoic acid stress [38]. When comparing the flux distributions of stressed and unstressed E. coli
strains, a decreased flux in TCA cycle and an increased flux in pyruvate oxidative pathway for
producing acetate were observed. It was hypothesized that octanoic acid triggered the membrane
disruption and led to NAD+ deficiency because of the destabilization of membrane-bound proteins,

36
such as NADH dehydrogenase, which would down-regulate several key NAD+ dependent
pathways, such as the malate dehydrogenase pathways in TCA cycle, and the pyruvate
dehydrogenase multi-enzyme complex pathway. Also, the pyruvate pool shrank under octanoic
acid stress condition, which could be attributed to the repression of the pdhR regulator, a regulator
with high sensitivity to pyruvate in controlling the expressions of the PDH complex, NADH
dehydrogenase II, and cytochrome bo-type oxidase encoded by aceEF and lpdA, ndh, and
cyoABCDE, respectively [157]. Based on the discussion of 13C-MFA results, several possible
strategies to further enhance the C8 acid tolerance were proposed, including the supplement of
pyruvate in the medium and the replacement of NADH/NAD+-sensitive enzymes.
2.4 Perspectives of Synergizing 13C Metabolic Flux Analysis with
Metabolic Engineering
The conventional 13C-MFA has been widely applied to determine microbial metabolism
and guide metabolic engineers to develop numerous strategies to improve biochemical production.
However, there are still several technique limitations that restrict the accuracy and flexibility of
13C-MFA. For example, the 13C-MFA can only be applied at metabolic and isotopic steady states
[63], which could be difficult to use when the target chemicals are produced in non-steady state
(e.g., drug synthesis in the stationary growth phase). In addition, most of the conventional 13C-
MFA studies are limited in central metabolism [158], which has very limited use when analyzing
the secondary metabolism of microorganisms. To overcome these challenges, novel experimental
and computational methods have recently been developed to empower 13C-MFA studies. In this
section, we will summarize recent breakthroughs in 13C-MFA and provide a perspective for novel
routes to achieve synergy of 13C-MFA and metabolic engineering.

37
2.4.1 Expand 13C-MFA into Genome Scale
The conventional 13C-MFA can only be applied to determine flux distribution in the central
metabolic network, mainly because of the difficulties in 1) measuring the isotopic labeling of the
numerous low-abundant metabolites and 2) the huge computational burden of simulating isotopic
labeling of all metabolites in genome-scale metabolic networks. However, with the rapid
development of high-resolution mass spectrometry, the accurate measurement of isotopic labeling
of low-abundant metabolites becomes possible, as reported by several groups [159-161]. For the
computational simulation, an E. coli genome-scale model (imPR90068) has recently been
constructed for 13C-MFA [158], which spans 1,039 metabolites and 2,077 reactions. In order to
calculate the genome-scale metabolic flux distribution, a total of 1.37×10157 isotopomers need to
be simulated [158]. Thanks to the implementation of EMU method [87], the computational burden
was decreased by 1~2 orders of magnitude and for the first time, the fluxes in all the metabolic
pathways of E. coli were elucidated. Compared to the conventional 13C-MFA, the genome-scale
13C-MFA could rigorously determine the metabolic rewiring in secondary metabolism, from which
many high-value chemicals, such as drugs, could be produced. The genome-scale 13C-MFA could
provide valuable information about the metabolic rewiring in response to the production of these
secondary metabolites and guide the development of rational metabolic engineering strategies in
a similar way as that has been used for improving bulk chemical production.
2.4.2 Isotopic Non-Stationary 13C-MFA (13C-INST-MFA)
13C-INST-MFA is a cutting-edge technology that was recently developed [67-71] to enable
the application of 13C-MFA for various autotrophic systems including cyanobacteria and plants.
In brief, instead of collecting 13C-labeling patterns at the isotopic steady state, 13C-INST-MFA
tracks the dynamics of 13C-labeling in intracellular metabolites and applies computational
38
algorithms to calculate the steady-state metabolic fluxes that can best fit the 13C-labeling kinetics.
13C-INST-MFA has been applied to determine the photosynthetic metabolism of Synechocystis sp.
PCC6803 [162] and Arabidopsis thaliana [163]. Such autotrophic metabolism is unable to be
elucidated via the conventional 13C-MFA because all of the metabolites will be universally labeled
at the isotopic steady state when feeding with 13CO2 and the information about pathway usage is
completely lost. The merit of 13C-INST-MFA for metabolic engineering lies on the fact that the
metabolisms of numerous autotrophic systems, which used to be mysterious, can now be
rigorously determined. Because many autotrophic systems are promising cell factories [164-166]
that convert CO2 into valuable chemicals, we can envision that 13C-INST-MFA could guide
metabolic engineers to better understand and more rationally modify such systems for improving
the production of autotrophic products.
2.4.3 13C-Based Dynamic Metabolic Flux Analysis (13C-DMFA)
13C-DMFA has recently been developed as an approach to investigate microbial
metabolism at metabolic non-steady state [30]. Compared to conventional kinetic models to
describe microbial dynamics [167-170], 13C-DMFA could reveal the dynamic reprogramming of
intracellular fluxes and thus provides in-depth understanding of microbial metabolism in pathway
level. In one of the proof-of-concept studies, the E. coli metabolism in a fed-batch fermentation
process for overproduction of 1,3-propanediol was investigated. By introducing several additional
parameters to describe the fed-batch fermentation process, a time-resolved flux map was generated
and showed that the intracellular flux associated with PDO pathway increased by 10% and the split
ratio between glycolysis and pentose phosphate pathway decreased from 70/30 to 50/50. 13C-
DMFA has provided a way for metabolic engineer to investigate the dynamic metabolism during
industrial fermentation, especially the fed-batch fermentation. It is also expected that 13C-DMFA

39
could be further extended to study microbial metabolism at stationary growth phase, during which
numerous high-value secondary metabolites are often produced. With the insightful information
about the metabolic rewiring at non-steady state, metabolic engineers could develop more
appropriate strategies to improve the biochemical production, particularly microbial-based drug
production.
2.4.4 Improve Flux Resolution of 13C-MFA via the Integration of Isotopic Patterns
from Parallel Labeling Experiments
Parallel labeling experiment design has been widely applied in 13C-MFA to improve the
observability of global metabolic network by conducting multiple labeling experiments with
different isotopic tracers simultaneously [171-174]. Another recent advance in 13C-MFA is the
integration of the data (i.e., isotopic labeling patterns) from parallel labeling experiments to
improve the flux resolution [175-177]. The integration of the data from parallel labeling
experiments have been combined with rapid development of the high-throughput measure
techniques and computational algorithms [175-177] which would offer unique advantages
compared to conventional 13C-MFA [178], particularly by improving the precision of flux
estimation [175, 176] and reducing the time of labeling experiments. With the more precise
measurement of intracellular carbon fluxes, it is reasonable to conclude that higher resolution of
microbial metabolism will be provided for metabolic engineers in near future and fine-tuned
engineering strategies will be developed for general applications in improving biochemical
production.

40
Acknowledgements
We thank Herbert Huttanus in Virginia Tech for improving the language of the paper. This
study was supported by start-up fund (#175323) from Virginia Tech and Junior Faculty Award
from Institute for Critical Technology and Applied Science.

41
References
1. Sheng, J. and X. Feng, Metabolic engineering of yeast to produce fatty acid-derived biofuels: bottlenecks and solutions. Front. Microbiol., 2015. 6(554).
2. Shin, J.H., et al., Production of bulk chemicals via novel metabolic pathways in microorganisms. Biotechnology Advances, 2013. 31(6): p. 925-935.
3. Weusthuis, R.A., et al., Microbial production of bulk chemicals: development of anaerobic processes. Trends in Biotechnology, 2011. 29(4): p. 153-158.
4. Hermann, B.G., K. Blok, and M.K. Patel, Producing Bio-Based Bulk Chemicals Using Industrial Biotechnology Saves Energy and Combats Climate Change. Environmental Science & Technology, 2007. 41(22): p. 7915-7921.
5. Stephanopoulos, G., Challenges in Engineering Microbes for Biofuels Production. Science, 2007. 315(5813): p. 801-804.
6. Peralta-Yahya, P.P. and J.D. Keasling, Advanced biofuel production in microbes. Biotechnology Journal, 2010. 5(2): p. 147-162.
7. Peralta-Yahya, P.P., et al., Microbial engineering for the production of advanced biofuels. Nature, 2012. 488(7411): p. 320-328.
8. Lee, S.K., et al., Metabolic engineering of microorganisms for biofuels production: from bugs to synthetic biology to fuels. Current Opinion in Biotechnology, 2008. 19(6): p. 556-563.
9. Stephanopoulos, G., Metabolic engineering: Enabling technology for biofuels production. Metabolic Engineering, 2008. 10(6): p. 293-294.
10. Ajikumar, P.K., et al., Isoprenoid Pathway Optimization for Taxol Precursor Overproduction in Escherichia coli. Science, 2010. 330(6000): p. 70-74.
11. Lee, S.Y., et al., Metabolic engineering of microorganisms: general strategies and drug production. Drug Discovery Today, 2009. 14(1–2): p. 78-88.
12. Martin, V.J.J., et al., Engineering a mevalonate pathway in Escherichia coli for production of terpenoids. Nat Biotech, 2003. 21(7): p. 796-802.
13. Chang, M.C.Y. and J.D. Keasling, Production of isoprenoid pharmaceuticals by engineered microbes. Nat Chem Biol, 2006. 2(12): p. 674-681.
14. Demain, A.L. and S. Sanchez, Microbial drug discovery: 80 years of progress. J Antibiot, 2009. 62(1): p. 5-16.
15. Ferrer-Miralles, N., et al., Microbial factories for recombinant pharmaceuticals. Microbial Cell Factories, 2009. 8(1): p. 1-8.
16. Keasling, J.D., Manufacturing Molecules Through Metabolic Engineering. Science, 2010. 330(6009): p. 1355-1358.
17. Huttanus, H., J. Sheng, and X. Feng, Metabolic Engineering for Production of Small Molecule Drugs: Challenges and Solutions. Fermentation, 2016. 2(1): p. 4.
18. Atsumi, S., et al., Metabolic engineering of Escherichia coli for 1-butanol production. Metabolic Engineering, 2008. 10(6): p. 305-311.
19. Blattner, F.R., et al., The Complete Genome Sequence of Escherichia coli K-12. Science, 1997. 277(5331): p. 1453-1462.
20. Huang, C., Jr., H. Lin, and X. Yang, Industrial production of recombinant therapeutics in Escherichia coli and its recent advancements. Journal of Industrial Microbiology & Biotechnology, 2012. 39(3): p. 383-399.

42
21. Alper, H., K. Miyaoku, and G. Stephanopoulos, Construction of lycopene-overproducing E. coli strains by combining systematic and combinatorial gene knockout targets. Nat Biotech, 2005. 23(5): p. 612-616.
22. Farmer, W.R. and J.C. Liao, Improving lycopene production in Escherichia coli by engineering metabolic control. Nat Biotech, 2000. 18(5): p. 533-537.
23. Clomburg, J. and R. Gonzalez, Biofuel production in Escherichia coli: the role of metabolic engineering and synthetic biology. Applied Microbiology and Biotechnology, 2010. 86(2): p. 419-434.
24. Borneman, A.R., et al., Whole-Genome Comparison Reveals Novel Genetic Elements That Characterize the Genome of Industrial Strains of Saccharomyces cerevisiae. PLoS Genet, 2011. 7(2): p. e1001287.
25. Ostergaard, S., L. Olsson, and J. Nielsen, Metabolic Engineering of Saccharomyces cerevisiae. Microbiology and Molecular Biology Reviews, 2000. 64(1): p. 34-50.
26. Giaever, G., et al., Functional profiling of the Saccharomyces cerevisiae genome. Nature, 2002. 418(6896): p. 387-391.
27. Nielsen, J. and M.C. Jewett, Impact of systems biology on metabolic engineering of Saccharomyces cerevisiae. Vol. 8. 2008. 122-131.
28. Chen, G.-Q., New challenges and opportunities for industrial biotechnology. Microbial Cell Factories, 2012. 11: p. 111-111.
29. Kwok, R., Five hard truths for synthetic biology. Nature, 2010. 463(7279): p. 288. 30. Antoniewicz, M., Methods and advances in metabolic flux analysis: a mini-review.
Journal of Industrial Microbiology & Biotechnology, 2015. 42(3): p. 317-325. 31. Young, J.D., 13C metabolic flux analysis of recombinant expression hosts. Current
Opinion in Biotechnology, 2014. 30: p. 238-245. 32. Wang, Y., K.-Y. San, and G.N. Bennett, Cofactor engineering for advancing chemical
biotechnology. Current Opinion in Biotechnology, 2013. 24(6): p. 994-999. 33. Wasylenko, T.M., W.S. Ahn, and G. Stephanopoulos, The oxidative pentose phosphate
pathway is the primary source of NADPH for lipid overproduction from glucose in Yarrowia lipolytica. Metabolic Engineering, 2015. 30: p. 27-39.
34. Hollinshead, W.D., et al., Rapid metabolic analysis of Rhodococcus opacus PD630 via parallel 13C-metabolite fingerprinting. Biotechnology and Bioengineering, 2015: p. n/a-n/a.
35. Hayakawa, K., et al., 13C-metabolic flux analysis in S-adenosyl-l-methionine production by Saccharomyces cerevisiae. Journal of Bioscience and Bioengineering, 2015.
36. Feng, X. and H. Zhao, Investigating xylose metabolism in recombinant Saccharomyces cerevisiae via 13C metabolic flux analysis. Microbial Cell Factories, 2013. 12(1): p. 114.
37. Lam, F.H., et al., Engineering alcohol tolerance in yeast. Science, 2014. 346(6205): p. 71-75.
38. Fu, Y., et al., Metabolic flux analysis of Escherichia coli MG1655 under octanoic acid (C8) stress. Applied Microbiology and Biotechnology, 2015. 99(10): p. 4397-4408.
39. Heer, D., D. Heine, and U. Sauer, Resistance of Saccharomyces cerevisiae to High Concentrations of Furfural Is Based on NADPH-Dependent Reduction by at Least Two Oxireductases. Applied and Environmental Microbiology, 2009. 75(24): p. 7631-7638.
40. Çakar, Z.P., et al., Evolutionary engineering of multiple-stress resistant Saccharomyces cerevisiae. Vol. 5. 2005. 569-578.

43
41. Wittmann, C. and E. Heinzle, Mass spectrometry for metabolic flux analysis. Biotechnology and Bioengineering, 1999. 62(6): p. 739-750.
42. Wiechert, W., 13C Metabolic Flux Analysis. Metabolic Engineering, 2001. 3(3): p. 195-206.
43. Dauner, M. and U. Sauer, GC-MS analysis of amino acids rapidly provides rich information for isotopomer balancing. Biotechnology Progress, 2000. 16: p. 642-649.
44. de Graaf, A.A., Use of 13C labelling and NMR Spectroscopy in Metabolic Flux Analysis, in NMR in Biotechnology: Theory and Applications, J.N. Barbotin and J.C. Portais, Editors. 2000, Horizon Scientific Press: Norwich, UK.
45. Christensen, B. and J. Nielsen, Isotopomer Analysis Using GC-MS. Metabolic Engineering, 1999. 1(4): p. 282-290.
46. Szyperski, T., 13C-NMR, MS and metabolic flux balancing in biotechnology research. Quarterly Reviews of Biophysics, 1998. 31(01): p. 41-106.
47. Feng, X., et al., Metabolic pathway determination and flux analysis in nonmodel microorganisms through 13C-isotope labeling. Methods Mol Biol, 2012. 881: p. 309-30.
48. You, L., et al., Metabolic pathway confirmation and discovery through 13C-labeling of proteinogenic amino acids. J Vis Exp, 2012(59): p. e3583.
49. Sauer, U., Metabolic networks in motion: 13C‐based flux analysis. Vol. 2. 2006. 50. Tang, Y.J., et al., Advances in analysis of microbial metabolic fluxes via 13C isotopic
labeling. Mass Spectrometry Reviews, 2009. 28(2): p. 362-375. 51. Lian, J., et al., Design and construction of acetyl-CoA overproducing Saccharomyces
cerevisiae strains. Metabolic Engineering, 2014. 24: p. 139-149. 52. Papini, M., et al., Physiological characterization of recombinant Saccharomyces
cerevisiae expressing the Aspergillus nidulans phosphoketolase pathway: validation of activity through 13C-based metabolic flux analysis. Applied Microbiology and Biotechnology, 2012. 95(4): p. 1001-1010.
53. Wang, Y., K.-Y. San, and G.N. Bennett, Improvement of NADPH bioavailability in Escherichia coli by replacing NAD+-dependent glyceraldehyde-3-phosphate dehydrogenase GapA with NADP+-dependent GapB from Bacillus subtilis and addition of NAD kinase. Journal of Industrial Microbiology & Biotechnology, 2013. 40(12): p. 1449-1460.
54. Bartek, T., et al., Comparative 13C Metabolic Flux Analysis of Pyruvate Dehydrogenase Complex-Deficient, l-Valine-Producing Corynebacterium glutamicum. Applied and Environmental Microbiology, 2011. 77(18): p. 6644-6652.
55. Hou, J., et al., Impact of overexpressing NADH kinase on glucose and xylose metabolism in recombinant xylose-utilizing Saccharomyces cerevisiae. Applied Microbiology and Biotechnology, 2009. 82(5): p. 909-919.
56. Berrı, et al., Metabolic Engineering of Escherichia coli: Increase of NADH Availability by Overexpressing an NAD+-Dependent Formate Dehydrogenase. Metabolic Engineering, 2002. 4(3): p. 217-229.
57. Feng, X. and H. Zhao, Investigating xylose metabolism in recombinant Saccharomyces cerevisiae via 13C metabolic flux analysis. Microbial Cell Factories, 2013. 12.
58. He, L., et al., Central metabolic responses to the overproduction of fatty acids in Escherichia coli based on 13C-metabolic flux analysis. Biotechnology and Bioengineering, 2014. 111(3): p. 575-585.

44
59. Ranganathan, S., et al., An integrated computational and experimental study for overproducing fatty acids in Escherichia coli. Metabolic Engineering, 2012. 14(6): p. 687-704.
60. Guo, W., et al., Investigate the Metabolic Reprogramming of Saccharomyces cerevisiae for Enhanced Resistance to Mixed Fermentation Inhibitors via 13C Metabolic Flux Analysis. PLOS ONE, 2016. 11(8): p. e0161448.
61. Quarterman, J., et al., Rapid and efficient galactose fermentation by engineered Saccharomyces cerevisiae. J Biotechnol, 2016. 229: p. 13-21.
62. Guo, W., J. Sheng, and X. Feng, 13C-Metabolic Flux Analysis: An Accurate Approach to Demystify Microbial Metabolism for Biochemical Production. Bioengineering, 2016. 3(1): p. 3.
63. Zamboni, N., et al., 13C-based metabolic flux analysis. Nat. Protocols, 2009. 4(6): p. 878-892.
64. Tang, Y.J., et al., Invariability of central metabolic flux distribution in Shewanella oneidensis MR-1 under environmental or genetic perturbations. Biotechnology Progress, 2009. 25(5): p. 1254-1259.
65. Adler, P., et al., Core Fluxome and Metafluxome of Lactic Acid Bacteria under Simulated Cocoa Pulp Fermentation Conditions. Applied and Environmental Microbiology, 2013. 79(18): p. 5670-5681.
66. Klein, T., et al., Overcoming the metabolic burden of protein secretion in Schizosaccharomyces pombe – A quantitative approach using 13C-based metabolic flux analysis. Metabolic Engineering, 2014. 21: p. 34-45.
67. Jazmin, L., et al., Isotopically Nonstationary MFA (INST-MFA) of Autotrophic Metabolism, in Plant Metabolic Flux Analysis, M. Dieuaide-Noubhani and A.P. Alonso, Editors. 2014, Humana Press. p. 181-210.
68. Murphy, T.A., C.V. Dang, and J.D. Young, Isotopically nonstationary 13C flux analysis of Myc-induced metabolic reprogramming in B-cells. Metabolic Engineering, 2013. 15: p. 206-217.
69. Jazmin, L. and J. Young, Isotopically Nonstationary 13C Metabolic Flux Analysis, in Systems Metabolic Engineering, H.S. Alper, Editor. 2013, Humana Press. p. 367-390.
70. Wiechert, W. and K. Nöh, Isotopically non-stationary metabolic flux analysis: complex yet highly informative. Current Opinion in Biotechnology, 2013. 24(6): p. 979-986.
71. Wiechert, W. and K. Nöh, From Stationary to Instationary Metabolic Flux Analysis, in Technology Transfer in Biotechnology, U. Kragl, Editor. 2005, Springer Berlin Heidelberg. p. 145-172.
72. Pingitore, F., et al., Analysis of Amino Acid Isotopomers Using FT-ICR MS. Analytical Chemistry, 2007. 79(6): p. 2483-2490.
73. Wiechert, W. and A.A. de Graaf, Bidirectional reaction steps in metabolic networks: I. Modeling and simulation of carbon isotope labeling experiments. Biotechnology and Bioengineering, 1997. 55(1): p. 101-117.
74. Wiechert, W., et al., Bidirectional reaction steps in metabolic networks: II. Flux estimation and statistical analysis. Biotechnology and Bioengineering, 1997. 55(1): p. 118-135.
75. Wittmann, C. and E. Heinzle, MALDI-TOF MS for quantification of substrates and products in cultivations of Corynebacterium glutamicum. Biotechnology and Bioengineering, 2001. 72(6): p. 642-647.

45
76. Guo, W., et al., 13C pathway analysis of biofilm metabolism of Shewanella oneidensis MR-1. RSC Advances, 2015. 5(50): p. 39840-39843.
77. Christensen, B., A. Karoly Gombert, and J. Nielsen, Analysis of flux estimates based on 13C-labelling experiments. European Journal of Biochemistry, 2002. 269(11): p. 2795-2800.
78. Christensen, B. and J. Nielsen, Metabolic network analysis of Penicillium chrysogenum using 13C-labeled glucose. Biotechnology and Bioengineering, 2000. 68(6): p. 652-659.
79. Bennett, B.D., et al., Absolute quantitation of intracellular metabolite concentrations by an isotope ratio-based approach. Nat. Protocols, 2008. 3(8): p. 1299-1311.
80. Dauner, M. and U. Sauer, GC-MS Analysis of Amino Acids Rapidly Provides Rich Information for Isotopomer Balancing. Biotechnology Progress, 2000. 16(4): p. 642-649.
81. Iwatani, S., et al., Determination of metabolic flux changes during fed-batch cultivation from measurements of intracellular amino acids by LC-MS/MS. Journal of Biotechnology, 2007. 128(1): p. 93-111.
82. Millard, P., et al., IsoCor: correcting MS data in isotope labeling experiments. Bioinformatics, 2012. 28(9): p. 1294-1296.
83. Wahl, S.A., M. Dauner, and W. Wiechert, New tools for mass isotopomer data evaluation in 13C flux analysis: Mass isotope correction, data consistency checking, and precursor relationships. Biotechnology and Bioengineering, 2004. 85(3): p. 259-268.
84. Zhang, Z., et al., CeCaFDB: a curated database for the documentation, visualization and comparative analysis of central carbon metabolic flux distributions explored by 13C-fluxomics. Nucleic Acids Research, 2014.
85. Shupletsov, M.S., et al., OpenFLUX2: 13C-MFA modeling software package adjusted for the comprehensive analysis of single and parallel labeling experiments. Microbial Cell Factories, 2014. 13: p. 152.
86. Weitzel, M., et al., 13CFLUX2—high-performance software suite for 13C-metabolic flux analysis. Bioinformatics, 2013. 29(1): p. 143-145.
87. Antoniewicz, M.R., J.K. Kelleher, and G. Stephanopoulos, Elementary metabolite units (EMU): A novel framework for modeling isotopic distributions. Metabolic Engineering, 2007. 9(1): p. 68-86.
88. Young, J.D., INCA: a computational platform for isotopically non-stationary metabolic flux analysis. Bioinformatics, 2014. 30(9): p. 1333-1335.
89. Zamboni, N., E. Fischer, and U. Sauer, FiatFlux – a software for metabolic flux analysis from 13C-glucose experiments. BMC Bioinformatics, 2005. 6: p. 209-209.
90. Garcia-Albornoz, M., et al., BioMet Toolbox 2.0: genome-wide analysis of metabolism and omics data. Nucleic Acids Research, 2014. 42(Web Server issue): p. W175-W181.
91. Young, J.D., et al., An elementary metabolite unit (EMU) based method of isotopically nonstationary flux analysis. Biotechnology and Bioengineering, 2008. 99(3): p. 686-699.
92. Chopra, P. and A. Kamma, Engineering life through Synthetic Biology. In Silico Biol, 2006. 6(5): p. 401-10.
93. Lian, J., et al., Design and construction of acetyl-CoA overproducing Saccharomyces cerevisiae strains. Metab Eng, 2014. 24: p. 139-49.
94. Chen, Y., et al., Establishing a platform cell factory through engineering of yeast acetyl-CoA metabolism. Metab Eng, 2013. 15: p. 48-54.

46
95. Jing, F., et al., Phylogenetic and experimental characterization of an acyl-ACP thioesterase family reveals significant diversity in enzymatic specificity and activity. BMC Biochem, 2011. 12: p. 44.
96. Inui H, O.K., Miyatake K, Nakano Y, Kitaoka S, Purification and characterization of pyruvate:NADP+ oxidoreductase in Euglena gracilis. J Biol Chem, 1987. 262(19): p. 6.
97. Kozak, B.U., et al., Replacement of the Saccharomyces cerevisiae acetyl-CoA synthetases by alternative pathways for cytosolic acetyl-CoA synthesis. Metab Eng, 2014. 21: p. 46-59.
98. Shiba, Y., et al., Engineering of the pyruvate dehydrogenase bypass in Saccharomyces cerevisiae for high-level production of isoprenoids. Metabolic Engineering, 2007. 9(2): p. 160-168.
99. Zaidi, N., J.V. Swinnen, and K. Smans, ATP-Citrate Lyase: A Key Player in Cancer Metabolism. Cancer Research, 2012. 72(15): p. 3709-3714.
100. Frick, O. and C. Wittmann, Characterization of the metabolic shift between oxidative and fermentative growth in Saccharomyces cerevisiae by comparative 13C flux analysis. Microbial Cell Factories, 2005. 4: p. 30-30.
101. Zaidi, N., J.V. Swinnen, and K. Smans, ATP-citrate lyase: a key player in cancer metabolism. Cancer Res, 2012. 72(15): p. 3709-14.
102. Meile, L., et al., Characterization of the D-xylulose 5-phosphate/D-fructose 6-phosphate phosphoketolase gene (xfp) from Bifidobacterium lactis. J Bacteriol, 2001. 183(9): p. 2929-36.
103. Panagiotou, G., et al., Systems analysis unfolds the relationship between the phosphoketolase pathway and growth in Aspergillus nidulans. PLoS One, 2008. 3(12): p. e3847.
104. de Jong, B.W., et al., Improved production of fatty acid ethyl esters in Saccharomyces cerevisiae through up-regulation of the ethanol degradation pathway and expression of the heterologous phosphoketolase pathway. Microbial Cell Factories, 2014. 13: p. 39-39.
105. Feng, Y. and J.E. Cronan, Escherichia coli unsaturated fatty acid synthesis: complex transcription of the fabA gene and in vivo identification of the essential reaction catalyzed by FabB. J Biol Chem, 2009. 284(43): p. 29526-35.
106. Davis, M.S., J. Solbiati, and J.E. Cronan, Jr., Overproduction of acetyl-CoA carboxylase activity increases the rate of fatty acid biosynthesis in Escherichia coli. J Biol Chem, 2000. 275(37): p. 28593-8.
107. Lu, X., H. Vora, and C. Khosla, Overproduction of free fatty acids in E. coli: implications for biodiesel production. Metab Eng, 2008. 10(6): p. 333-9.
108. Zhang, F., et al., Enhancing fatty acid production by the expression of the regulatory transcription factor FadR. Metab Eng, 2012. 14(6): p. 653-60.
109. Subrahmanyam, S. and J.E. Cronan, Jr., Overproduction of a functional fatty acid biosynthetic enzyme blocks fatty acid synthesis in Escherichia coli. J Bacteriol, 1998. 180(17): p. 4596-602.
110. Suástegui, M., et al., Investigating strain dependency in the production of aromatic compounds in Saccharomyces cerevisiae. Biotechnology and Bioengineering, 2016. 113(12): p. 2676-2685.
111. Perkins, J.B., et al., Genetic engineering of Bacillus subtilis for the commercial production of riboflavin. Journal of Industrial Microbiology and Biotechnology, 1999. 22(1): p. 8-18.

47
112. Sauer, U., et al., Metabolic fluxes in riboflavin-producing Bacillus subtilis. Nat Biotech, 1997. 15(5): p. 448-452.
113. Dauner, M., J.E. Bailey, and U. Sauer, Metabolic flux analysis with a comprehensive isotopomer model in Bacillus subtilis. Biotechnology and Bioengineering, 2001. 76(2): p. 144-156.
114. Berrı, et al., The Effect of Increasing NADH Availability on the Redistribution of Metabolic Fluxes in Escherichia coli Chemostat Cultures. Metabolic Engineering, 2002. 4(3): p. 230-237.
115. San, K.-Y., et al., Metabolic Engineering through Cofactor Manipulation and Its Effects on Metabolic Flux Redistribution in Escherichia coli. Metabolic Engineering, 2002. 4(2): p. 182-192.
116. Sonderegger, M., et al., Molecular Basis for Anaerobic Growth of Saccharomyces cerevisiae on Xylose, Investigated by Global Gene Expression and Metabolic Flux Analysis. Applied and Environmental Microbiology, 2004. 70(4): p. 2307-2317.
117. Watanabe, S., et al., Ethanol production from xylose by recombinant Saccharomyces cerevisiae expressing protein-engineered NADH-preferring xylose reductase from Pichia stipitis. Microbiology, 2007. 153(9): p. 3044-3054.
118. Jeppsson, M., et al., The expression of a Pichia stipitis xylose reductase mutant with higher KM for NADPH increases ethanol production from xylose in recombinant Saccharomyces cerevisiae. Biotechnology and Bioengineering, 2006. 93(4): p. 665-673.
119. Watanabe, S., et al., The Positive Effect of the Decreased NADPH-Preferring Activity of Xylose Reductase from Pichia stipitis on Ethanol Production Using Xylose-Fermenting Recombinant Saccharomyces cerevisiae. Bioscience, Biotechnology, and Biochemistry, 2007. 71(5): p. 1365-1369.
120. Runquist, D., B. Hahn-Hägerdal, and M. Bettiga, Increased expression of the oxidative pentose phosphate pathway and gluconeogenesis in anaerobically growing xylose-utilizing Saccharomyces cerevisiae. Microbial Cell Factories, 2009. 8: p. 49-49.
121. Petschacher, B. and B. Nidetzky, Altering the coenzyme preference of xylose reductase to favor utilization of NADH enhances ethanol yield from xylose in a metabolically engineered strain of Saccharomyces cerevisiae. Microbial Cell Factories, 2008. 7: p. 9-9.
122. Bengtsson, O., B. Hahn-Hägerdal, and M.F. Gorwa-Grauslund, Xylose reductase from Pichia stipitis with altered coenzyme preference improves ethanolic xylose fermentation by recombinant Saccharomyces cerevisiae. Biotechnology for Biofuels, 2009. 2: p. 9-9.
123. Runquist, D., B. Hahn-Hägerdal, and M. Bettiga, Increased Ethanol Productivity in Xylose-Utilizing Saccharomyces cerevisiae via a Randomly Mutagenized Xylose Reductase. Applied and Environmental Microbiology, 2010. 76(23): p. 7796-7802.
124. Watanabe, S., et al., Ethanol production from xylose by recombinant Saccharomyces cerevisiae expressing protein engineered NADP+-dependent xylitol dehydrogenase. Journal of Biotechnology, 2007. 130(3): p. 316-319.
125. Matsushika, A., et al., Expression of protein engineered NADP+-dependent xylitol dehydrogenase increases ethanol production from xylose in recombinant Saccharomyces cerevisiae. Applied Microbiology and Biotechnology, 2008. 81(2): p. 243-255.
126. Krahulec, S., M. Klimacek, and B. Nidetzky, Engineering of a matched pair of xylose reductase and xylitol dehydrogenase for xylose fermentation by Saccharomyces cerevisiae. Biotechnology Journal, 2009. 4(5): p. 684-694.

48
127. Matsushika, A., et al., Efficient Bioethanol Production by a Recombinant Flocculent Saccharomyces cerevisiae Strain with a Genome-Integrated NADP+-Dependent Xylitol Dehydrogenase Gene. Applied and Environmental Microbiology, 2009. 75(11): p. 3818-3822.
128. Jeppsson, M., et al., Reduced Oxidative Pentose Phosphate Pathway Flux in Recombinant Xylose-Utilizing Saccharomyces cerevisiae Strains Improves the Ethanol Yield from Xylose. Applied and Environmental Microbiology, 2002. 68(4): p. 1604-1609.
129. Verho, R., et al., Engineering Redox Cofactor Regeneration for Improved Pentose Fermentation in Saccharomyces cerevisiae. Applied and Environmental Microbiology, 2003. 69(10): p. 5892-5897.
130. Zhang, G.-C., J.-J. Liu, and W.-T. Ding, Decreased Xylitol Formation during Xylose Fermentation in Saccharomyces cerevisiae Due to Overexpression of Water-Forming NADH Oxidase. Applied and Environmental Microbiology, 2012. 78(4): p. 1081-1086.
131. Wasylenko, T.M. and G. Stephanopoulos, Metabolomic and 13C-metabolic flux analysis of a xylose-consuming Saccharomyces cerevisiae strain expressing xylose isomerase. Biotechnology and Bioengineering, 2015. 112(3): p. 470-483.
132. Kim, Y.M., et al., Engineering the pentose phosphate pathway to improve hydrogen yield in recombinant Escherichia coli. Biotechnology and Bioengineering, 2011. 108(12): p. 2941-2946.
133. Lee, W.-H., et al., Enhanced production of ɛ-caprolactone by overexpression of NADPH-regenerating glucose 6-phosphate dehydrogenase in recombinant Escherichia coli harboring cyclohexanone monooxygenase gene. Applied Microbiology and Biotechnology, 2007. 76(2): p. 329-338.
134. Chin, J.W. and P.C. Cirino, Improved NADPH supply for xylitol production by engineered Escherichia coli with glycolytic mutations. Biotechnology Progress, 2011. 27(2): p. 333-341.
135. Wang, Y., K.-Y. San, and G. Bennett, Improvement of NADPH bioavailability in Escherichia coli through the use of phosphofructokinase deficient strains. Applied Microbiology and Biotechnology, 2013. 97(15): p. 6883-6893.
136. Chemler, J.A., et al., Improving NADPH availability for natural product biosynthesis in Escherichia coli by metabolic engineering. Metabolic Engineering, 2010. 12(2): p. 96-104.
137. Kim, S., et al., Alteration of reducing powers in an isogenic phosphoglucose isomerase (pgi)-disrupted Escherichia coli expressing NAD(P)-dependent malic enzymes and NADP-dependent glyceraldehyde 3-phosphate dehydrogenase. Letters in Applied Microbiology, 2011. 52(5): p. 433-440.
138. Sánchez, A.M., et al., Effect of Overexpression of a Soluble Pyridine Nucleotide Transhydrogenase (udhA) on the Production of Poly(3-hydroxybutyrate) in Escherichia coli. Biotechnology Progress, 2006. 22(2): p. 420-425.
139. Chou, H.-H., C.J. Marx, and U. Sauer, Transhydrogenase Promotes the Robustness and Evolvability of E. coli Deficient in NADPH Production. PLoS Genet, 2015. 11(2): p. e1005007.
140. Wiechert, W. and A.A. de Graaf, In vivo stationary flux analysis by 13C labeling experiments, in Metabolic Engineering, H. Sahm and C. Wandrey, Editors. 1996, Springer Berlin Heidelberg. p. 109-154.

49
141. Wittmann, C. and E. Heinzle, Application of MALDI-TOF MS to lysine-producing Corynebacterium glutamicum. European Journal of Biochemistry, 2001. 268(8): p. 2441-2455.
142. Klapa, M.I., J.-C. Aon, and G. Stephanopoulos, Systematic quantification of complex metabolic flux networks using stable isotopes and mass spectrometry. European Journal of Biochemistry, 2003. 270(17): p. 3525-3542.
143. Quek, L.-E., et al., OpenFLUX: efficient modelling software for 13C-based metabolic flux analysis. Microbial Cell Factories, 2009. 8(1): p. 25.
144. Krömer, J.O., et al., In-Depth Profiling of Lysine-Producing Corynebacterium glutamicum by Combined Analysis of the Transcriptome, Metabolome, and Fluxome. Journal of Bacteriology, 2004. 186(6): p. 1769-1784.
145. Becker, J., et al., Metabolic flux engineering of l-lysine production in Corynebacterium glutamicum—over expression and modification of G6P dehydrogenase. Journal of Biotechnology, 2007. 132(2): p. 99-109.
146. Becker, J., et al., From zero to hero—Design-based systems metabolic engineering of Corynebacterium glutamicum for l-lysine production. Metabolic Engineering, 2011. 13(2): p. 159-168.
147. Becker, J., et al., Amplified Expression of Fructose 1,6-Bisphosphatase in Corynebacterium glutamicum Increases In Vivo Flux through the Pentose Phosphate Pathway and Lysine Production on Different Carbon Sources. Applied and Environmental Microbiology, 2005. 71(12): p. 8587-8596.
148. Bommareddy, R.R., et al., A de novo NADPH generation pathway for improving lysine production of Corynebacterium glutamicum by rational design of the coenzyme specificity of glyceraldehyde 3-phosphate dehydrogenase. Metabolic Engineering, 2014. 25: p. 30-37.
149. Hu, X.-Q., et al., A novel feeding strategy during the production phase for enhancing the enzymatic synthesis of S-adenosyl-l-methionine by methylotrophic Pichia pastoris. Enzyme and Microbial Technology, 2007. 40(4): p. 669-674.
150. Hu, X.-Q., et al., Effects of different glycerol feeding strategies on S-adenosyl-l-methionine biosynthesis by PGAP-driven Pichia pastoris overexpressing methionine adenosyltransferase. Journal of Biotechnology, 2008. 137(1–4): p. 44-49.
151. Birnbaum, S. and J.E. Bailey, Plasmid presence changes the relative levels of many host cell proteins and ribosome components in recombinant Escherichia coli. Biotechnol Bioeng, 1991. 37(8): p. 736-45.
152. Jones, K.L., S.W. Kim, and J.D. Keasling, Low-copy plasmids can perform as well as or better than high-copy plasmids for metabolic engineering of bacteria. Metab Eng, 2000. 2(4): p. 328-38.
153. Guyot, S., et al., Surviving the heat: heterogeneity of response in Saccharomyces cerevisiae provides insight into thermal damage to the membrane. Environmental Microbiology, 2015: p. n/a-n/a.
154. Nugroho, R.H., K. Yoshikawa, and H. Shimizu, Metabolomic analysis of acid stress response in Saccharomyces cerevisiae. Journal of Bioscience and Bioengineering.
155. Parawira, W. and M. Tekere, Biotechnological strategies to overcome inhibitors in lignocellulose hydrolysates for ethanol production: review. Critical Reviews in Biotechnology, 2011. 31(1): p. 20-31.

50
156. Çakar, Z.P., et al., Evolutionary engineering of multiple-stress resistant Saccharomyces cerevisiae. FEMS Yeast Research, 2005. 5(6-7): p. 569-578.
157. King, T., et al., Transcriptomic Analysis of Escherichia coli O157:H7 and K-12 Cultures Exposed to Inorganic and Organic Acids in Stationary Phase Reveals Acidulant- and Strain-Specific Acid Tolerance Responses. Applied and Environmental Microbiology, 2010. 76(19): p. 6514-6528.
158. Ravikirthi, P., P.F. Suthers, and C.D. Maranas, Construction of an E. coli genome-scale atom mapping model for MFA calculations. Biotechnology and Bioengineering, 2011. 108(6): p. 1372-1382.
159. Zamboni, N. and U. Sauer, Novel biological insights through metabolomics and 13C-flux analysis. Current Opinion in Microbiology, 2009. 12(5): p. 553-558.
160. Büscher, J.M., et al., Cross-Platform Comparison of Methods for Quantitative Metabolomics of Primary Metabolism. Analytical Chemistry, 2009. 81(6): p. 2135-2143.
161. Christen, S. and U. Sauer, Intracellular characterization of aerobic glucose metabolism in seven yeast species by 13C flux analysis and metabolomics. FEMS Yeast Research, 2011. 11(3): p. 263-272.
162. Young, J.D., et al., Mapping photoautotrophic metabolism with isotopically nonstationary 13C flux analysis. Metabolic Engineering, 2011. 13(6): p. 656-665.
163. Ma, F., et al., Isotopically nonstationary 13C flux analysis of changes in Arabidopsis thaliana leaf metabolism due to high light acclimation. Proceedings of the National Academy of Sciences, 2014. 111(47): p. 16967-16972.
164. Brennan, L. and P. Owende, Biofuels from microalgae—A review of technologies for production, processing, and extractions of biofuels and co-products. Renewable and Sustainable Energy Reviews, 2010. 14(2): p. 557-577.
165. Varman, A., et al., Photoautotrophic production of D-lactic acid in an engineered cyanobacterium. Microbial Cell Factories, 2013. 12(1): p. 117.
166. Zhou, J. and Y. Li, Engineering cyanobacteria for fuels and chemicals production. Protein & Cell, 2010. 1(3): p. 207-210.
167. Feng, X., Y. Tang, and K.D. Dolan, Construction of a parsimonious kinetic model to capture microbial dynamics via parameter estimation. Inverse Problems in Science & Engineering, 2014. 22(2): p. 309-324.
168. Xiao, Y., et al., Kinetic Modeling and Isotopic Investigation of Isobutanol Fermentation by Two Engineered Escherichia coli Strains. Industrial & Engineering Chemistry Research, 2012. 51(49): p. 15855-15863.
169. Hoefnagel, M.H.N., et al., Metabolic engineering of lactic acid bacteria, the combined approach: kinetic modelling, metabolic control and experimental analysis. Microbiology, 2002. 148(4): p. 1003-1013.
170. Gombert, A.K. and J. Nielsen, Mathematical modelling of metabolism. Current Opinion in Biotechnology, 2000. 11(2): p. 180-186.
171. Wittmann, C., P. Kiefer, and O. Zelder, Metabolic Fluxes in Corynebacterium glutamicum during Lysine Production with Sucrose as Carbon Source. Applied and Environmental Microbiology, 2004. 70(12): p. 7277-7287.
172. Becker, J., C. Klopprogge, and C. Wittmann, Metabolic responses to pyruvate kinase deletion in lysine producing Corynebacterium glutamicum. Microbial Cell Factories, 2008. 7(1): p. 8.

51
173. Kiefer, P., et al., Comparative Metabolic Flux Analysis of Lysine-Producing Corynebacterium glutamicum Cultured on Glucose or Fructose. Applied and Environmental Microbiology, 2004. 70(1): p. 229-239.
174. Wittmann, C. and E. Heinzle, Genealogy Profiling through Strain Improvement by Using Metabolic Network Analysis: Metabolic Flux Genealogy of Several Generations of Lysine-Producing Corynebacteria. Applied and Environmental Microbiology, 2002. 68(12): p. 5843-5859.
175. Leighty, R.W. and M.R. Antoniewicz, COMPLETE-MFA: Complementary parallel labeling experiments technique for metabolic flux analysis. Metabolic Engineering, 2013. 20: p. 49-55.
176. Crown, S.B., C.P. Long, and M.R. Antoniewicz, Integrated 13C-metabolic flux analysis of 14 parallel labeling experiments in Escherichia coli. Metabolic Engineering, 2015. 28: p. 151-158.
177. Leighty, R.W. and M.R. Antoniewicz, Parallel labeling experiments with [U-13C]glucose validate E. coli metabolic network model for 13C metabolic flux analysis. Metabolic Engineering, 2012. 14(5): p. 533-541.
178. Crown, S.B. and M.R. Antoniewicz, Parallel labeling experiments and metabolic flux analysis: Past, present and future methodologies. Metabolic Engineering, 2013. 16: p. 21-32.
179. Wiechert, W., et al., A Universal Framework for 13C Metabolic Flux Analysis. Metabolic Engineering, 2001. 3(3): p. 265-283.
180. Cvijovic, M., et al., BioMet Toolbox: genome-wide analysis of metabolism. Nucleic Acids Research, 2010. 38(suppl 2): p. W144-W149.
181. Srour, O., J.D. Young, and Y.C. Eldar, Fluxomers: a new approach for 13C metabolic flux analysis. BMC Systems Biology, 2011. 5: p. 129-129.
182. Kajihata, S., et al., OpenMebius: An Open Source Software for Isotopically Nonstationary 13C-Based Metabolic Flux Analysis. BioMed Research International, 2014. 2014: p. 10.
183. Sokol, S., P. Millard, and J.-C. Portais, influx_s: increasing numerical stability and precision for metabolic flux analysis in isotope labelling experiments. Bioinformatics, 2012. 28(5): p. 687-693.
184. Gombert, A.K., et al., Network Identification and Flux Quantification in the Central Metabolism of Saccharomyces cerevisiae under Different Conditions of Glucose Repression. Journal of Bacteriology, 2001. 183(4): p. 1441-1451.
185. Gill, P.E., W. Murray, and M.A. Saunders, SNOPT: An SQP Algorithm for Large-Scale Constrained Optimization. SIAM Review, 2005. 47(1): p. 99-131.
186. Press, W.H., et al., Numerical recipes in C: the art of scientific computing. 1988: Cambridge University Press. 735.
187. Jordà, J., et al., Metabolic flux profiling of recombinant protein secreting Pichia pastoris growing on glucose:methanol mixtures. Microbial Cell Factories, 2012. 11: p. 57-57.
188. Hayakawa, K., F. Matsuda, and H. Shimizu, Metabolome analysis of Saccharomyces cerevisiae and optimization of culture medium for S-adenosyl-l-methionine production. AMB Express, 2016. 6(1): p. 38.

52
Table 2.1 Summary of 13C-MFA software.
Software name
Capabilities Labeled pattern Key solver (algorithm) Platform
Developer Steady-state
aINST-13C-
MFA
bPLE integration
cEMU dMDV eSFL Cumomer fmincon IPOPT Others MATLAB UNIX/Linux
13CFLUX ● ● ● ● Wiechert’s group[179]
13CFLUX2 ● ● ● ● Wiechert’s group[86]
Metran ● ● ● ● ● Antoniewicz’s
group[87]
C13 ● ● ● ● Nielsen’s
group[180]
OpenFLUX ● ● ● ● Krömer’s
group[143]
OpenFLUX2 ● ● ● ● ● Mashko’s group[85]
FiatFLUX ● ● ● ● Sauer’s
group[89]
FIA ● f● g● ● Young’s
group[181]
INCA ● ● ● h● ● Young’s
group[88]
OpenMebius ● ● ● i● ● Shimizu’s group[182]
influx_s ● ● j● ● Portais’s
group[183]
Notes: aINST-13C -MFA: isotopic nonstationary 13C-metabolic flux analysis. bPLE: Parallel labeling experiments. cEMU: elementary metabolite unit [87]. dSFL: summed fractional labeling [184]. eMDV: mass distribution vectors. fFluxomer. gSNOPT [185]. hCustomized Differential Equation Solver [91]. iLevenberg-Marquardt method[186]. jNLSIC [183].
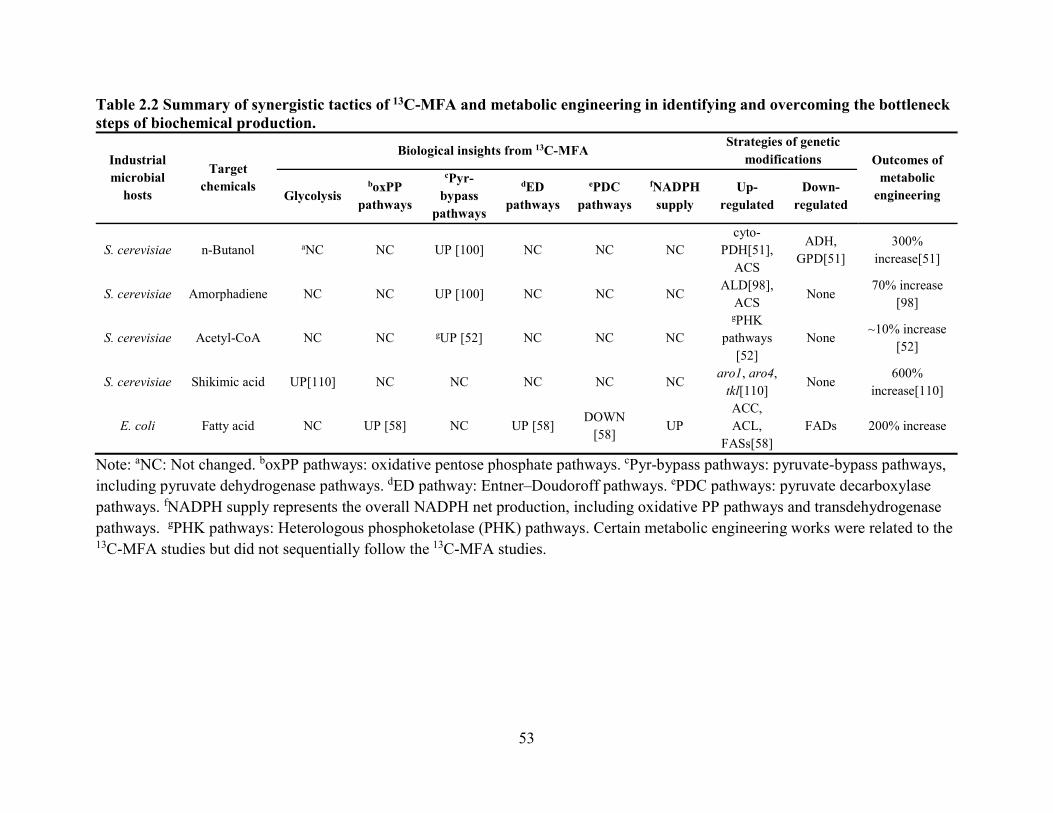
53
Table 2.2 Summary of synergistic tactics of 13C-MFA and metabolic engineering in identifying and overcoming the bottleneck steps of biochemical production.
Industrial microbial
hosts
Target chemicals
Biological insights from 13C-MFA Strategies of genetic
modifications Outcomes of metabolic
engineering Glycolysis boxPP
pathways
cPyr-bypass
pathways
dED pathways
ePDC pathways
fNADPH supply
Up-regulated
Down-regulated
S. cerevisiae n-Butanol aNC NC UP [100] NC NC NC cyto-
PDH[51], ACS
ADH, GPD[51]
300% increase[51]
S. cerevisiae Amorphadiene NC NC UP [100] NC NC NC ALD[98],
ACS None
70% increase [98]
S. cerevisiae Acetyl-CoA NC NC gUP [52] NC NC NC
gPHK pathways
[52] None
~10% increase [52]
S. cerevisiae Shikimic acid UP[110] NC NC NC NC NC aro1, aro4,
tkl[110] None
600% increase[110]
E. coli Fatty acid NC UP [58] NC UP [58] DOWN
[58] UP
ACC, ACL,
FASs[58] FADs 200% increase
Note: aNC: Not changed. boxPP pathways: oxidative pentose phosphate pathways. cPyr-bypass pathways: pyruvate-bypass pathways, including pyruvate dehydrogenase pathways. dED pathway: Entner–Doudoroff pathways. ePDC pathways: pyruvate decarboxylase pathways. fNADPH supply represents the overall NADPH net production, including oxidative PP pathways and transdehydrogenase pathways. gPHK pathways: Heterologous phosphoketolase (PHK) pathways. Certain metabolic engineering works were related to the 13C-MFA studies but did not sequentially follow the 13C-MFA studies.

54
Table 2.3 bSummary of synergistic tactics of 13C-MFA and metabolic engineering in uncovering and solving the cofactor imbalance issues.
Industrial microbial
hosts
Target chemicals
Biological insights from 13C-MFA
Strategies of metabolic engineering Outcomes of metabolic
engineering aTCA cycle
oxPP pathways
NADPH supply
Up-regulated Down-
regulated Others
E. coli Lycopene NC UP[53] UP[53] G6PDH,
Transdehydrogenase [138, 139]
pgi[137] None ~100%
increase[53]
C. glutamicum
L-valine NC UP[54] UP[54] Transdehydrogenase[54] None None >200% increase
[54]
S. cerevisiae Ethanol (Xylose
utilization) UP[36] UP[36] NC None None
Alternate the cofactor specificity of XR to NADH [117-119,
121].
~40% increase [121]
Note: aTCA cycle: tricarboxylic acid cycle. bAll abbreviations and table headers in Table 3 have the same definitions in Table 2. Certain metabolic engineering works were related to the 13C-MFA studies but did not sequentially follow the 13C-MFA studies.

55
Table 2.4 bSummary of synergistic tactics of 13C-MFA and metabolic engineering in revealing and compensating cell maintenance requirement of industrial microorganisms. Industrial microbial
hosts
Target chemicals
Biological insights from 13C-MFA Strategies of metabolic
engineering Outcomes of metabolic
engineering TCA cycle oxPP
pathways PDC
pathways NADPH supply
P. pastoris R. oryzae
lipase UP[187] NC NC NC Co-substrate culture[187]
Supply additional ~30% ATP to compensate the requirement of maintenance energy[187].
S. cerevisiae aSAM UP[35] NC NC NC Nutrient medium
optimization[188] 250% increase of SAM
production[188]
S. cerevisiae (Xylose
utilization) UP[36] UP[36] NC UP[36] Nutrient medium
optimization[36] ~50% decrease the requirement
of maintenance energy[36]
S. cerevisiae Cell growth UP[39] UP[39] NC UP[39] Overexpress NADPH-
dependent oxireductase in parent strain.
More than 20% decrease of biomass production[39]
E. coli Cell growth DOWN
[38] NC UP[38] UP[38]
Decrease the cofactor (NADH/NAD+) sensitivity of relevant enzymes.
Overexpress the proteins of electron transport chain.
Add other electron acceptors.
~ 50% increase of growth rate[38]
Note: aSAM: S-Adenosyl-L-Methionine. bAll abbreviations and table headers in Table 3 have the same definitions in Table 2 and Table 3. Certain metabolic engineering works were related to the 13C-MFA studies but did not sequentially follow the 13C-MFA studies.

56
Fig. 2.1 Technology platform for 13C-MFA.
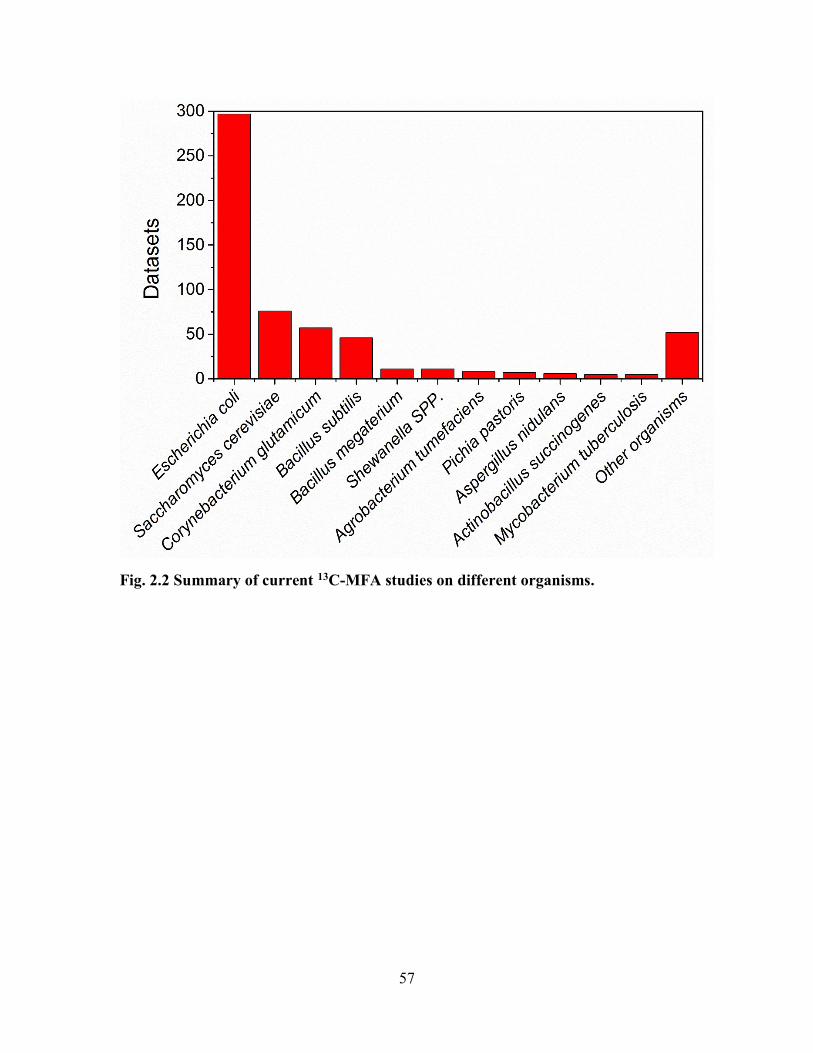
57
Fig. 2.2 Summary of current 13C-MFA studies on different organisms.

58
Fig. 2.3 Case studies that identify key bottleneck steps of biochemical production via
13C-MFA and the corresponding metabolic engineering strategies. (A) n-Butanol
biosynthesis in S. cerevisiae; (B) fatty acid synthesis in E. coli. Please note that the
pathways showed in Fig. 2.3 were schematic and there could be missing pathways.
Definitions of abbreviations are shown in List of Abbreviations.

59
Fig. 2.4 Cofactor imbalance issues identified by 13C-MFA and the corresponding
metabolic engineering strategies. Left column: cofactor imbalance issues in (A) xylose
utilization of S. cerevisiae strains, (B) fatty acid and fatty acid-derived chemical production,
and (C) L-valine production. Right column: the corresponding metabolic engineering
strategies to tackle cofactor imbalance issues: (D) altering the co-factor specificities of
xylose reductase (XR) or xylitol dehydrogenase (XDH); (E) overexpressing
transhydrogenase to balance the NADH and NADPH. Definitions of abbreviations are
shown in List of Abbreviations.

60
Fig. 2.5 Mechanisms of microbial stress responses identified by 13C-MFA. Top: Stress
responses of S. cerevisiae to the furfural; bottom: Stress responses of E. coli to octanoic
acid. Definitions of abbreviations are shown in List of Abbreviations.
61
Chapter 3: 13C Assisted Pathway and Flux Analysis for
Planktonic and Biofilm Cells
3.1 13C Assisted Pathway and Flux Analysis
Based on the review in Chapter 2, it is clear to see that 13C assisted pathway and
flux analysis is a powerful approach to demystify the complex metabolic rewiring of
microorganisms in either planktonic and biofilm state, and more importantly, to derive the
appropriate strategies to engineer microorganisms for specific purposes (e.g., improving
biochemical production) [1-6]. Generally, in 13C assisted pathway and flux analysis, carbon
isotopes have been used to trace the cell metabolism with the production of 13C-labelled
metabolites. The metabolic pathway usages or carbon flux distributions in metabolic
network of microorganisms can then be determined using several computational algorithms
by using a mathematical metabolic model and the 13C-labelled patterns of the metabolites
[1, 2, 7-10].
In this chapter, I applied 13C assisted pathway and flux analysis to different
microorganisms in either planktonic and biofilm cells for obtaining metabolic pathway
usages and carbon flux distributions. I further compared variations of metabolic pathway
usages or fluxes under different stresses, among different strains, in different states, and
feeding with different substrates to discover several critical biological insights such as the
metabolic responses under mixed stresses, the key pathways for biochemical productions
(including natural products and heterologous chemicals), the metabolic rewiring of biofilm
cells, and the roles of different substrates, respectively. These insights can guide the
biologists and engineers to develop more appropriate strategies for enhancement of
chemical production and environmental applications.

62
3.2 Investigate the Metabolic Reprogramming of Saccharomyces
cerevisiae for Enhanced Resistance to Mixed Fermentation Inhibitors via
13C Metabolic Flux Analysis
Weihua Guoa, Yingying Chenb, Na Weib, †, Xueyang Fenga, †
a Department of Biological Systems Engineering, Virginia Tech University, Blacksburg,
VA 24061, United States
b Department of Civil and Environmental Engineering and Earth Sciences, University of
Notre Dame, Notre Dame, IN 46556, United States
†Correspondence to: Na Wei and Xueyang Feng.
Phone: +1-(574)631-5164 and +1-(540)231-2974
Email: [email protected] and [email protected]
This manuscript has been published on PloS one 11 (8), e0161448.

63
Abstract
The fermentation inhibitors from the pretreatment of lignocellulosic materials, e.g.,
acetic acid and furfural, are notorious due to their negative effects on the cell growth and
chemical production. However, the metabolic reprogramming of the cells under these stress
conditions, especially metabolic response for resistance to mixed inhibitors, has not been
systematically investigated and remains mysterious. Therefore, in this study, 13C metabolic
flux analysis (13C-MFA), a powerful tool to elucidate the intracellular carbon flux
distributions, has been applied to two Saccharomyces cerevisiae strains with different
tolerances to the inhibitors under acetic acid, furfural, and mixed (i.e., acetic acid and
furfural) stress conditions to unravel the key metabolic responses. By analyzing the
intracellular carbon fluxes as well as the energy and cofactor utilization under different
conditions, we uncovered varied metabolic responses to different inhibitors. Under acetate
stress, ATP and NADH production was slightly impaired, while NADPH tended towards
overproduction. Under furfural stress, ATP and cofactors (including both NADH and
NADPH) tended to be overproduced. However, under dual-stress condition, production of
ATP and cofactors was severely impaired due to synergistic stress caused by the
simultaneous addition of two fermentation inhibitors. Such phenomenon indicated the
pivotal role of the energy and cofactor utilization in resisting the mixed inhibitors of acetic
acid and furfural. Based on the discoveries, valuable insights are provided to improve the
tolerance of S. cerevisiae strain and further enhance lignocellulosic fermentation.

64
3.2.1 Introduction
The production of biofuels and other bio-based chemicals from renewable
resources has been widely applied to overcome the limitation of non-renewable fossil fuel
energy and the challenge of global warming. Due to the fast growth and high biofuel
productivity, Saccharomyces cerevisiae is one of the most important workhorses in
producing biofuels from various carbohydrates of biomass with high abundance and low
cost. However, several fermentation inhibitors generated from the pretreatment of
lignocellulosic materials, such as acetic acid [11], furfural [12], and furan [13], seriously
impair the biofuel production by repressing or even stopping the cell growth of S.
cerevisiae [14-17]. More importantly, most of these inhibitors ubiquitously co-exist in the
practical fermentation process. Therefore, it is important to elucidate the general metabolic
responses of S. cerevisiae to different inhibitors, especially to mixed inhibitors, to further
improve stress resistance and reduce stress impairment. Constructing a general mechanism
of inhibition is important, as in reality mixed inhibitors are hard to avoid. By identifying a
common target, it is thus more likely to find a way to solve the problem in practice.
A number of biological characterizations have been accomplished to unravel the
effect of fermentation inhibitors and resistance mechanism in the yeast [11, 13-15, 18, 19],
and several key metabolic responses have been found to be related to the stress resistance
[13, 16, 17, 20-22]. It was found that acetic acid, a fermentation inhibitor commonly
presenting in the lignocellulosic hydrolysate, could lead to the fermentation arrest and
suppression of ethanol production for the S. cerevisiae strains when using glucose as the
major substrate. The mechanisms for acetic acid inhibition have been investigated in S.
cerevisiae strains [23-29]. Several strategies, such as genome screening [30-32], metabolic

65
engineering [33-35], and evolutionary engineering [36], have successfully been developed
to improve the yeast resistance to acetic acid. Similarly, the mechanism of furfural
inhibition has been studied for more than three decades [12, 13, 37-40]. It was found that
the resistance of S. cerevisiae strains to furfural could be improved by either reducing or
oxidizing the furfural to less toxic compounds [12, 37, 41]. In addition, the overexpression
of the genes in pentose phosphate pathway as well as several key transcription factors has
been implemented to successfully improve the tolerance to furfural in S. cerevisiae strains
[35, 39].
Despite growing understanding of the biomolecular mechanisms of yeast resistance
to single inhibitors (e.g., acetic acid or furfural), the general molecular basis of yeast
resistance to mixed fermentation inhibitors remains unclear. Considering the fact that
various inhibitors often co-exist in the hydrolysate and could cooperate with each other to
become even more toxic to yeast than existing alone (i.e., synergistic stress), the knowledge
on how yeast cells reprogram their metabolism in response to mixed fermentation
inhibitors is of particular interests to biofuel and biochemical production. The key
challenge in studying yeast resistance to mixed inhibitors lies in that the resistance
phenotype usually involves very complex multi-genic regulations. Additionally, various
fermentation inhibitors in the cellulosic hydrolysates usually have distinct toxicity
mechanisms. As such, the reprogramming of yeast metabolism to resist mixed fermentation
inhibitors is largely unknown. Recently, several pioneer studies have been accomplished
on the transcriptional responses to mixed inhibitors of acetate and furfural [42]. However,
metabolic reprogramming in responses to such mixed fermentation inhibitors remains
unclear. In this scenario, metabolic flux analysis could provide a “common language”, i.e.,

66
intracellular metabolic flux distributions, to uncover and evaluate different inhibitory
metabolic reprogramming for corresponding stress conditions. Therefore, in this study, we
applied 13C metabolic flux analysis (13C-MFA), a powerful and accurate tool to demystify
the intracellular metabolism [43-45], on two S. cerevisiae strains, i.e., a parent strain S-C1,
and an engineered strain YC1 with improved fermentation inhibitor resistance. We used
13C-MFA to systematically investigate the metabolic reprogramming of the S. cerevisiae
strains in four conditions, namely blank condition (without any inhibitor), acetic acid,
furfural, and dual-stress conditions with both acetic acid and furfural. By analyzing the
carbon flux distribution as well as the energy and cofactor utilization, we elucidated the
key metabolic responses under the different stress conditions. Particularly, the lack of
energy and cofactor supply was found to be the main reason for the synergistic stress
caused by the co-presence of acetic acid and furfural. To our best knowledge, it is the first
time that 13C-MFA was used to study the metabolic responses of S. cerevisiae under the
stress of mixed fermentation inhibitors. The discovery from this work provides valuable
biological insights to further improve the yeast resistance to fermentation inhibitors,
especially mixed fermentation inhibitors.
3.2.2 Materials and Methods
Plasmids, Strains and Media. All the strains and plasmids used in this study were
summarized in Table 3.2.1. The S. cerevisiae strain SR8-trp was kindly provided by Dr.
Yong-Su Jin’s lab. The parent strain (named as S-C1) and the engineered strain (named as
YC1, a mutant with improved resistance to acetic acid and furfural) were obtained through
the inverse metabolic engineering approach in our recent work [46]. Specifically, it has
been demonstrated that overexpression of WHI2, a gene target encoding a cytoplasmatic
67
globular scaffold protein in S. cerevisiae, improved the resistance of yeast to acetic acid
dramatically. Escherichia coli TOP10 strain was used for gene cloning and manipulation.
E. coli strains were grown in Luria-Bertani medium at 37 °C and 100 μg/mL of ampicillin
was added to the medium when required. Yeast strains were routinely cultivated at 30 °C
in YP medium (10 g/L of yeast extract and 20 g/L of peptone) or synthetic complete (SC)
medium (6.7 g/L of yeast nitrogen base, 0.6 g/L complete supplement mixture) containing
20 g/L of D-glucose. SC media containing 20 g/L agar and glucose, 20 mg/L histidine and
uracil and 100 mg/L leucine without tryptophan amendment was used to select
transformants using TRP1 as an auxotrophic marker.
Isotopic Labeling Experiment. The isotopic labeling experiments were
accomplished by following a previously developed protocol [47]. In general, both the S-
C1 and YC1 strains were cultured in a minimal medium with 20 g/L 13C-glucose (a mixture
of 80% [1-13C] and 20% [U-13C] glucose) as the sole carbon source at the oxygen-limited
condition. Four conditions, i.e., blank condition without any inhibitor, acetic acid stress
condition with 2 g/L acetic acid, furfural stress condition with 1g/L furfural, and the dual-
stress condition with 2 g/L acetic acid and 1g/L furfural, were used to culture the yeast
strains to study the metabolic responses. The cell growth was monitored by OD600. The
extracellular metabolite quantification using high performance liquid chromatograph
(HPLC) was also conducted to assess the consumption of glucose and the production of
ethanol, glycerol, and acetic acid (Table 3.2.2). For each of the culture conditions, the 13C-
labeled biomass was harvested during the exponential growth phase. The cell variability
was checked at OD600 under stress conditions. The OD600 was found to be linearly

68
correlated (R2 = 0.99) with colony-forming units (CFU) under the stress conditions (Fig.
3.2.S2), indicating the appropriateness of using OD600 to evaluate the cell variability.
Following harvest, isotopomer analysis of proteinogenic amino acids was
conducted as previously described [47]. In brief, the biomass was hydrolyzed using 6 M
HCl (20 h at 100 °C) and the amino acids were derivatized using 50 µl tetrahydrofuran and
50 µL N-(tert-butyldimethylsilyl)-N-methyl-trifluoroacetamide (Sigma-Aldrich) to form
tert-butyl dimethylsilyl (TBDMS) derivatives (1h at 70°C). Gas Chromatography-Mass
Spectrometry (GC-MS) was performed to analyze derivatized amino acids using a
Shimadzu GC2010 GC with a SH-Rxi-5Sil column and a Shimadzu QP2010 MS. Three
types of charged fragments were detected by GC-MS for various amino acids: the [M-57]
+ group (containing unfragmented amino acids); and the [M-159] + or [M-85] + group
(containing amino acids that had lost an α-carboxyl group). For each type of fragments,
the labeling patterns, i.e., mass distribution vectors (MDVs), were represented by M0, M1,
M2, etc., which were fractions of non-labeled, singly-labeled, and doubly-labeled amino
acids. The effects of natural isotopes on isotopomer labeling patterns were corrected by
using a previously reported algorithm [48].
Metabolic Flux Analysis. The metabolic flux analysis was accomplished by
following a previously developed protocol [47]. In general, the MDVs were used to
calculate the summed fractional labeling (SFL) values which were directly used to
calculate metabolic fluxes in Biomet Toolbox 2.0 (based on MATLAB, MathWorks, Inc.
MA) [49]. The central carbon metabolic model for the MFA was developed previously [47]
based on the KEGG database (http://www.genome.jp/kegg/), including glycolysis
pathway, pentose phosphate pathway, anaplerotic pathways, the tricarboxylic acid (TCA)

69
cycle, and the transport reactions between different cell compartments (Table 3.2.S1). For
metabolic flux analysis, flux estimation was repeated at least 50 times starting with
different initial values generated by a genetic algorithm for all the fluxes to find a likely
global solution. A fit of the simulated and measured SFLs was determined to be a global
solution only after the solution fit was obtained at least twice using this method (Fig.
3.2.S1). Based on the carbon fluxes (Table 3.2.S2), the ATP, NADH, and NADPH
production and consumption rates were estimated by following previous published works
[47, 50]. The unpaired Student’s t-test (α = 0.05) was used as the statistical method to
determine the significance of the net productions of ATP and cofactors under two different
conditions or of two different strains.
3.2.3 Results
Metabolic Responses to Acetic Acid Stress. When cultivating the parent S.
cerevisiae strain, S-C1, under the acetic acid stress condition, the growth rate and glucose
uptake rate were repressed by 80% and 60%, respectively (Table 3.2.2). Such suppression
of the growth and glucose uptake was also observed in previous studies [13, 32, 51]. By
comparing the flux distributions of S-C1 strain cultivated in blank and acetic acid stress
conditions (Fig. 3.2.1), a significant increase (33%) of carbon fluxes in the pentose
phosphate pathway (PP pathway) and a dramatic decrease (66%~87%) of carbon fluxes in
the glycolysis pathway were observed (Fig. 3.2.1). As a result, the ethanol production
decreased by >60% in the acetic acid stress condition compared to that in the blank
condition. In addition, the carbon fluxes in the TCA cycle dramatically decreased (>85%)
under the acetic acid stress condition, which is consistent with previous studies [23, 25].
The net production of ATP and NADH was decreased under the acetic acid stress condition

70
due to the decreased glycolysis and TCA cycle (Fig. 3.2.2). However, the NADPH net
production was increased due to the increased PP pathways.
Similarly as that in the S-C1 strain, when cultivating the mutant S. cerevisiae strain,
YC1, in the acetic acid stress condition, the growth rate and glucose uptake rate were
depressed by 68% and 21%, respectively (Table 3.2.2). By comparing the flux distributions
of YC1 strain cultivated in blank and acetic acid stress conditions (Fig. 3.2.1), a significant
increase (51%) of carbon fluxes in the PP pathway and a decrease (~44%) of carbon fluxes
in the glycolysis pathway were observed, which decreased the ethanol production by 32%.
The TCA cycle was also decreased (~50%) under the acetic acid stress condition, which
was similar as that in the wild-type strain. By calculating the consumption and production
of cofactors based on the flux distribution, the net production of ATP and NADH under
the acetic acid stress was found not significantly different from those under the blank
condition. However, the NADPH net production was increased by ~100% due to the
increased PP pathways (Fig. 3.2.2).
Comparing the metabolic responses between the S-C1 strain and YC1 strain under
the acetic acid stress condition, the similar pattern of the alteration of flux distributions was
observed, namely increased PP pathway, decreased glycolysis pathway, as well as the
decreased TCA cycle when comparing to the blank condition (Fig. 3.2.1). This indicated
that both the S-C1 strain and YC1 strain responded to the acetic acid stress in a similar
manner. However, the YC1 strain demonstrated better growth rate (~100% higher than the
S-C1 strain, Table 3.2.2) and glucose uptake rate (~80% higher than the S-C1 strain) under
the acetic acid stress condition. Such superior performance could be related to the higher
activities of the glycolysis and the TCA cycle in the mutant strain (Fig. 3.2.3), which

71
produced more ATP (~50% increase in net produced ATP compared to that in the S-C1
strain, Fig. 3.2.2) for relieving the oxidative stresses inflicted by acetic acid. In addition,
the higher activities of PP pathway could produce more NADPH for supporting
macromolecule synthesis for cell growth under acetic acid stress condition.
Metabolic Responses to Furfural Stress. When cultivating the S. cerevisiae S-C1
strain under the furfural stress condition, the growth rate decreased by ~50% with a slightly
increased glucose uptake rate (~10%) (Table 3.2.2). Such suppressed growth but increased
glucose uptake was also observed in a previous study on chemostat when feeding a high
concentration of furfural [38]. By comparing the flux distributions of the S-C1 strain
cultivated in blank and furfural stress condition (Fig. 3.2.1), a significant increase of carbon
fluxes in the PP pathway (~80%) as well as glycolysis pathway (~12%) was observed. The
carbon fluxes in TCA cycle were also increased by ~135% under the furfural stress
condition. The elevated activities of glycolysis, PP pathway, and the TCA cycle led to the
increased net production of ATP, NADH and NADPH in the S-C1 strain under the furfural
stress condition (Fig. 3.2.2).
Similarly, when cultivating the S. cerevisiae YC1 strain under the furfural stress
condition, the growth rate was decreased by ~56% with an increased glucose uptake rate
(~30%). By comparing the flux distributions of the YC1 strain cultivated in blank and
furfural stress condition (Fig. 3.2.1), an increase of the carbon fluxes in the PP pathway
(~118%), glycolysis pathway (~28%), and the TCA cycle (~128%) was observed under the
furfural stress condition, which is similar as that in the wild-type strain. Therefore, the net
production of ATP, NADH and NADPH were also increased in the strain YC1 under the
furfural stress condition (Fig. 3.2.2).

72
Comparing the metabolic responses between the resistant strain YC1 and control
S-C1, the carbon flux distributions were similarly altered, i.e., the activities of the PP
pathway, glycolysis pathway, TCA cycle were all elevated. Therefore, both strains
responded to the furfural stress in a similar manner (Fig. 3.2.3). As a result of such
metabolic reprogramming, the net production of ATP and NADPH was increased. The
increased ATP and NADPH production could play important roles in resisting the furfural
stress in the yeast. Basically, NADPH could be used as the cofactor for alcohol
dehydrogenase to convert furfural to furfuryl alcohol, a less toxic compound to S.
cerevisiae, while the over-production of ATP could relieve the oxidative stress inflicted by
furfural. Noticeably, the carbon fluxes in the PP pathway and the TCA cycle were higher
in the strain YC1 than that in the control strain S-C1. Although this significantly improved
the YC1 cell growth, the carbon loss in the PP pathway and the TCA cycle slightly
decreased the ethanol yield. The observation clearly indicated a trade-off between cell
growth and the ethanol production when cultivated with furfural.
Metabolic Responses to Mixed Fermentation Inhibitors. When cultivating the
S. cerevisiae S-C1 strain under the dual-stress condition with acetic acid and furfural, the
growth rate and glucose uptake rate were dramatically decreased by 82% and 84%,
respectively. By comparing the flux distributions of S-C1 strain under blank condition and
the dual-stress condition (Fig. 3.2.1), we found that all the fluxes were dramatically
decreased. For example, the carbon fluxes in the PP pathway, glycolysis, and TCA cycle
were decreased by ~53%, ~90%, and ~85%, respectively. Compared to the flux
distributions in acetic acid stress condition or furfural stress condition, the extent of carbon
flux decrease was much severe in the presence of both acetic acid and furfural. The results

73
indicated that the mixed inhibitors of acetic acid and furfural led to synergistic stress on
the S-C1 S. cerevisiae strain, i.e., the presence of both inhibitors is much more toxic than
either individual inhibitor.
Similarly, when cultivating the S. cerevisiae YC1 strain under the dual-stress
condition with both acetic acid and furfural, the growth rate and glucose uptake rate were
dramatically decreased by 80% and 80%, respectively. The synergistic stress of acetic acid
and furfural was also observed in the S. cerevisiae YC1 strain, in which the carbon fluxes
in all of the metabolic pathways significantly decreased (Fig. 3.2.1). The severe inhibitory
effects of acetic acid and furfural mixture could be highly correlated with the energy and
cofactor production. In general, for both YC1 strain and S-C1 strain, the net production of
ATP, NADH and NADPH were universally suppressed (Fig. 3.2.2). As a result, the
oxidative stress inflicted by acetic acid and furfural could not be relieved, while on the
other hand, furfural could not be sufficiently degraded to less toxic compound due to the
lack of cofactor supplies (e.g., NADPH) for the alcohol dehydrogenase.
Comparisons of Yeast Metabolic Responses to Different Fermentation
Inhibitors. To highlight the similarities and differences of yeast metabolic responses under
different inhibitor treatments, we have compared metabolic flux distributions and
corresponding ATP and cofactor balances between different stress conditions. For the
stress conditions with single inhibitors, i.e., acetic acid and furfural, the growth rate and
glucose uptake were dramatically impaired under the acetic acid stress compared to the
unstressed condition, while cell growth was impaired but glucose uptake was improved
under furfural stress condition (Table 3.2.1). As a result of improved glucose uptake,
ethanol production increased under furfural stress condition but decreased under acetic acid

74
stress condition. In addition, more carbon flux was directed towards the glycolysis pathway
under the furfural stress condition, while more carbon flux was redirected to the pentose
phosphate pathway under acetic acid stress condition. In addition, more carbon going
through the TCA cycle under furfural stress condition, but acetic acid impaired the TCA
cycle dramatically. Due to the different metabolic flux distributions, the energy and
cofactor productions also varied. Specifically, ATP net production under furfural stress
was improved from the untreated condition. Whereas, under acetic acid stress, ATP net
production was impaired slightly. NADH net productions of both inhibitors did not change
dramatically. However, both inhibitors led to a significant increase in NADPH net
production. The NADPH production under furfural stress condition was much higher than
that of acetic acid stress condition due to the enhanced glucose uptake.
Next, we compared the metabolic responses to single inhibitors (i.e., acetic acid or
furfural) with that to mixed inhibitors in order to highlight the different mechanisms used
by yeast to resist single and mixed inhibitors. Compared to acetic acid stress condition, cell
growth was similar to that of the mixed inhibitors, but glucose uptake was dramatically
impaired under dual stress condition (>59%, Table 3.2.1). Due to the impaired glucose
uptake rate, the net productions of ATP, NADH, and NADPH were also decreased
dramatically under dual-stress condition compared to those under acetic acid stress only.
Compared to furfural stress condition, both cell growth and glucose uptake under dual
stress condition decreased by ~55% and ~85%, respectively. As a result, the impaired
glucose uptake under dual-stress condition led to a decrease of net productions of ATP,
NADH, and NADPH compared to those under furfural stress only. Overall, by comparing
the metabolic responses between different inhibitors, it is evident that different inhibitors

75
could lead to varied metabolic responses to resist corresponding stress conditions, as
discussed below.
3.2.4 Discussion
Based on the metabolic reprogramming under different stress conditions, we
proposed the mechanisms that could be used by the S. cerevisiae strains for resisting acetic
acid, furfural, or mixed inhibitors of acetic acid and furfural (Fig. 3.2.4). As for the acetic
acid stress, it was found that NADPH was over-produced from the PP pathway in both the
S-C1 strain and the resistant YC1 strain. Such extra NADPH could be used to support the
macromolecule synthesis for cell growth. Meanwhile, the ATP production could be another
important factor in resisting acetic acid stress. It is well known that acetic acid could inflict
oxidative stress. At the low pH (pH<4.76) when using glucose as the substrate, the acetic
acid would enter the cells by facilitated diffusion in the un-dissociated form [52]. Once in
the cytosol with the neutral environment, the acetic acid would release proton. The
accumulation of the intracellular proton would then induce the accumulation of the reactive
oxygen species (ROS) under the aerobic or oxygen-limited condition and the dysfunction
of mitochondrial by hyper-activation of Ras–cAMP–PKA pathway (Fig. 3.2.4A) [23]. In
this scenario, the TCA cycle would be impaired severely due to the ROS accumulation and
the mitochondrial dysfunction. Therefore, as shown in the metabolic flux analysis on the
YC1 strain, the over-produced ATP from the second-half of the glycolysis (i.e., energy
releasing steps) could relieve the oxidative stress and improve the resistance of yeast cells
to the acetic acid stress. It is worth mentioning that introducing other ROS quenchers, e.g.,
oxygen, could be an effective approach to relieve the oxidative stresses induced by ROS,
but with the risk of further reprogramming the intracellular metabolism. In this case,

76
protons from dissociated acetic acid have been considered the major stress contributor. It
is also important, however, to consider acetic acid as two isolated parts, i.e., weak acid and
proton donor. Evaluating the impact of the two factors of acetic acid on yeast metabolism
is beyond the scope of this work. However, we are currently designing new experiments to
examine the corresponding metabolic reprogramming of yeast by comparing the metabolic
fluxes of yeasts when being treated with acetic acid and another inorganic acid (e.g. HCl).
In addition, it is important to point out that acetic acid could also be an endogenous
byproduct of biofuel production, which could be taken as a potential inhibitor for
fermentation. In this study, we have omitted the synthesis of endogenous acetic acid due
to the extremely low concentration compared to the exogenous acetic acid as the inhibitor.
However, metabolic responses of yeast to endogenous and exogenous acetic acids could
vary. We are currently developing new experiments to address this concern.
For the furfural stress, over-production of ATP and NADPH is pivotal (Fig.
3.2.4B). The stress responses inflicted by furfural are multiple, including oxidative stress,
nutrient starvation, and osmotic and salt stress (Fig. 3.2.4B) [37]. As consistent with
previous studies [38, 39], we found a dramatic increase of the NADPH net production (>4-
fold) was observed in both the S-C1 strain and the YC1 strain (Fig. 3.2.2). These extra
NADPH could be used by alcohol dehydrogenase to convert furfural to less toxic furfuryl
alcohol. In the meantime, during aerobic or oxygen-limited conditions, furfural could be
oxidized to furoic acid with the regeneration of NADH [21, 37]. Although the furoic acid
is less toxic compared to furfural, the dissociation of furoic acid could increase the proton
concentration inside the cell, and hence, lead to the oxidative stress. The over-produced
ATP from energy-releasing steps in glycolysis and the TCA cycle could relieve the

77
oxidative stress inflicted by furfural and improve the resistance of yeast cells. It is also
worth mentioning that the central metabolism was up-regulated but cell reproduction was
compromised in furfural stress condition. Such phenomenon is possibly related to the
enhanced glucose uptake, a step that consumed the majority of ATP. The high demand of
ATP would up-regulate energy-producing pathways such as glycolysis. However, because
majority ATP was used to uptake glucose, not enough ATP could be supplied to support
cell growth, which led to decreased cell growth rate in furfural stress condition.
For the dual-stress with acetic acid and furfural, the two inhibitors could introduce
synergistic stress. In this scenario, the glucose transport was severely limited due to the
lack of ATP caused by oxidative stress (Table 3.2.2). Consequently, the activities of all the
metabolic pathways were repressed, and the energy and cofactor production was hence
jeopardized. Without the sufficient supply of NADPH, enzymes such as alcohol
dehydrogenase could hardly convert the inhibitors into less toxic compounds. The
accumulation of these inhibitors would in return reinforce the inhibitory effects, which lead
to even more severe decrease on cell growth. It was also interesting to notice that the
reprogramming of metabolic fluxes in YC1 compared to that of S-C1 strain was much more
dramatic in the acetic acid stress condition than that of furfural stress condition or the mixed
inhibitor stress condition (Fig. 3.2.3). This is consistent with how the strain YC1 was
developed in our previous work[28]. Namely, the YC1 strain was initially developed and
screened for improved resistance to acetic acid. However, it could be possible that when
both acetic acid and furfural were present, the stress, especially the oxidative stress, could
be so strong that the cell metabolism had to prioritize the resource to compensate for the

78
ATP loss. Therefore, the engineered metabolism in the YC1 strain was not fully exploited
to demonstrate superior resistance to mixed inhibitors of acetic acid and furfural.
In summary, for the stress condition with single inhibitors, S. cerevisiae strains
intend to overproduce the energy and cofactors to either relieve oxidative stress or to
convert inhibitors to less toxic compounds. However, in the presence of mixed inhibitors,
yeast cells face difficulty in producing enough ATP and NADPH to resist the heavier
stresses, which deteriorate the inhibitor resistance and lead to dramatic impairment of cell
growth. Using metabolic flux analysis to study yeast stress responses provides a “common
language” so that different inhibitory mechanisms could be evaluated and discussed on the
same platform, which is the key to enable the correlation between different phenotypes and
genotypes. The engineering strategies focusing on optimizing energy and cofactor supply
would be worthy in improving yeast resistance to mixed fermentation inhibitors.
3.2.5 Conclusion
In this study, we applied 13C-MFA to investigate the reprogramming of cell
metabolism of two S. cerevisiae strains in the presence of various inhibitors. In general, S.
cerevisiae strains adopt different mechanisms to resist acetic acid stress, furfural stress,
and dual-stress with both acetic acid and furfural. The resistance mechanisms heavily relied
on the energy and cofactor production, especially when mixed fermentation inhibitors were
present. The lack of ATP and NADPH was found to be the main reason for the poor
performance of S. cerevisiae strains when cultivated with both acetic acid and furfural.
Based on the discovery of this study, the host engineering of S. cerevisiae strains to
improve energy and cofactor synthesis could be a potential strategy to improve yeast
resistance to fermentation inhibitors in hydrolysate from lignocellulosic materials.

79
Acknowledgements
We thank the writing center in Virginia Tech for improving the language of the
paper. This study was supported by a start-up fund (#175323) from Virginia Tech and a
start-up fund from the University of Notre Dame.

80
Table 3.2.1. Plasmids and Strains. Plasmids
and strains Description References
Plasmids pRS424 TRP1, a multicopy plasmid [53] pRS424-WHI2
pRS424 with insert of S288c yeast genomic DNA fragment chrXV: 409,259-412,369 (containing complete sequence of the WHI2 gene)
[29]
pRS424GPD pRS424 with GPDa promoter [53] Strains D452-2 MATa, leu2, his3, ura3, can1 [54] SR8 D452-2 expressing XYL1, XYL2, and XKS1 through
integration, evolutionary engineering in xylose-containing media, and ALD6 deletion.
[55]
SR8-trp SR8 with TRP1 disrupted Developed in Dr. Yong-Su Jin Lab
S-C1 SR8-trp harboring pRS424GPD, as a control [29] YC1 SR8-trp harboring pRS424-WHI2 [29]
a GPD stands for Glyceraldehyde-3-phosphate dehydrogenase, encoded by the TDH3 gene. The TDH3 promoter is often referred to as the GPD promoter, which is used in the pRS4XX series of expression vectors [53].

81
Table 3.2.2. Growth of S-C1 strain and YC1 strain under different stress conditions.
Stresses Strains Growth
rates (1/h) Specific rates (mmol/g DCW/h)
Glucose Ethanol Acetate Glycerol
Blank S-C1 0.117±0.017 16.00±1.64 23.03±1.22 0.00±0.00 1.69±0.10 YC1 0.121±0.002 14.12±0.75 19.61±0.15 0.00±0.00 1.94±0.01
Acetic acid
S-C1 0.021±0.000 6.06±0.16 8.47±0.26 -0.16±0.01 0.24±0.01 YC1 0.039±0.000 11.10±0.00 13.31±0.25 -1.13±0.04 0.58±0.00
Furfural S-C1 0.053±0.002 18.29±1.35 27.66±1.81 0.00±0.00 2.00±0.16 YC1 0.053±0.002 18.02±0.25 23.98±2.52 0.00±0.00 1.94±0.06
Mixed S-C1 0.021±0.000 2.49±0.45 2.29±0.21 -0.25±0.10 0.00±0.00 YC1 0.025±0.000 2.68±0.34 3.42±0.22 -0.19±0.02 0.74±0.03

82
Table 3.2.S1 The central metabolic model used in this study. ID Reactions v1 GLC → G6P v2 G6P ↔ F6P v3 F6P ↔ DHAP + G3P v4 DHAP ↔ G3P v5 G3P → PEP v6 PEP ↔ PYRCYT v7 G6P → CO2 + P5P v8 P5P + P5P ↔ S7P + G3P v9 S7P + G3P ↔ F6P + E4P v10 P5P + E4P ↔ F6P + G3P v12 PYRCYT ↔ ACA + CO2 v13 ACA ↔ ETH v14 ACA ↔ ACE v15 G3P ↔ GLYC v16 ACE → ACCOACYT v17 PYRCYT + CO2 ↔ OAACYT v18 PYRMIT ↔ ACCOAMIT + CO2 v19 OAAMIT + ACCOAMIT ↔ ICIT v20 ICIT ↔ AKG + CO2 v21 AKG ↔ FUM + CO2 v22 FUM + FUM ↔ OAAMIT + OAAMIT v24 OAAMIT ↔ OAACY v25 ACCOACYT ↔ ACCOAMIT v26 PYRCYT ↔ PYRMIT v27 G3P ↔ SER v28 SER ↔ GLY + C1 v29 OAACYT ↔ THR v30 THR ↔ GLY + ACA v31 PYRMIT + CO2 ↔ OAAMIT v32 G6P → G6POUT v33 P5P → P5POUT v34 E4P → E4POUT v35 G3P → G3POUT v36 PEP → PEPOUT v37 PYRMIT → PYRMITOUT v38 PYRCYT → PYRCYTOUT v39 OAACYT → OAACYTOUT v40 AKG → AKGOUT v41 ACCOACYT → ACCOACYTOUT v42 ACCOAMIT → ACCOAMITOUT v43 SER → SEROUT v44 GLY → GLYOUT v45 C1 → C1OUT v46 THR → THROUT v47 ETH → ETHOUT v48 ACE → ACEOUT v49 GLYC → GLYCOUT v50 CO2 → CO2OUT

83
Table 3.2.S2 Metabolic fluxes of S-C1 strain and YC1 strain under different stress
conditions. All the flux values were normalized to glucose uptake rates (set as 100),
respectively.
ID Blank Acetic acid Furfural Mixed
S-C1 YC1 S-C1 YC1 S-C1 YC1 S-C1 YC1 Flux STD Flux STD Flux STD Flux STD Flux STD Flux STD Flux STD Flux STD
v1 100.0 0.0 100.0 0.0 100.0 0.0 100.0 0.0 100.0 0.0 100.0 0.0 100.0 0.0 100.0 0.0 v2 71.9 1.3 75.6 1.2 24.5 0.6 53.7 1.1 70.4 2.2 59.9 0.6 33.2 0.0 31.6 0.0 v3 84.5 1.3 91.1 0.9 65.2 1.7 82.2 1.6 90.1 0.7 86.6 0.2 71.1 0.1 70.5 0.0 v4 84.5 1.3 91.1 0.9 65.2 1.7 82.2 1.6 90.1 0.7 86.6 0.2 71.1 0.1 70.5 0.0 v5 164.8 2.6 175.9 1.7 145.1 2.3 163.5 3.4 179.0 0.6 175.9 0.2 112.0 2.3 132.2 0.6 v6 164.8 2.6 175.9 1.7 144.5 1.5 153.5 3.4 178.9 0.7 175.9 0.2 111.4 2.1 132.2 0.6 v7 18.8 0.0 23.1 0.6 65.9 1.2 45.2 0.4 29.5 2.2 40.1 0.6 56.9 0.0 58.4 0.0 v8 6.3 0.0 7.7 0.2 20.6 0.9 14.3 0.3 9.9 0.7 13.4 0.2 18.9 0.0 19.5 0.0 v9 6.3 0.0 7.7 0.2 20.6 0.9 14.3 0.3 9.9 0.7 13.4 0.2 18.9 0.0 19.5 0.0
v10 6.3 0.0 7.7 0.2 20.1 0.3 14.3 0.3 9.8 0.7 13.4 0.2 18.9 0.0 19.4 0.0 v12 147.5 2.7 148.9 8.0 140.2 0.1 120.6 0.0 154.6 2.3 138.6 4.9 101.4 0.9 126.7 0.7 v13 144.1 0.7 139.1 0.5 139.8 0.1 120.6 0.1 149.7 0.6 127.0 0.6 101.3 0.8 128.0 0.4 v14 3.4 3.5 9.8 8.4 0.5 0.1 0.0 0.0 4.9 2.7 11.6 4.8 0.2 0.1 0.0 0.0 v15 10.4 0.0 13.8 0.0 4.0 0.0 5.2 0.0 11.0 0.0 10.7 0.0 47.7 2.3 27.6 0.3 v16 3.3 3.4 8.7 7.6 3.4 0.2 10.3 0.0 4.9 2.6 11.6 4.8 10.1 0.1 7.5 0.2 v17 1.7 1.7 0.0 0.0 0.8 0.3 9.5 4.4 0.0 0.0 11.6 0.6 4.7 0.8 3.3 0.8 v18 9.2 6.3 12.5 7.4 0.1 0.1 0.4 0.0 12.2 2.4 15.6 4.5 0.2 0.1 0.0 0.0 v19 8.1 1.4 14.5 2.3 3.5 0.1 9.5 2.1 17.1 0.5 26.7 0.6 9.9 0.5 7.3 0.3 v20 8.1 1.4 14.5 2.3 3.5 0.1 9.5 2.1 17.1 0.5 26.7 0.6 9.9 0.5 7.3 0.3 v21 0.0 0.0 0.4 0.0 2.5 0.1 8.5 2.1 5.0 0.0 5.0 0.0 8.4 0.5 5.6 0.3 v22 0.0 0.0 0.2 0.0 1.3 0.0 4.2 1.1 2.5 0.0 2.5 0.0 4.2 0.2 2.8 0.2 v24 -1.7 1.7 0.3 0.3 -0.7 0.4 2.0 5.1 0.0 0.0 -11.6 0.6 3.0 1.7 0.3 1.2 v25 3.0 3.4 7.2 8.3 3.4 0.2 10.3 0.0 4.9 2.6 11.6 4.8 10.1 0.0 7.5 0.2 v26 15.6 6.3 27.0 9.0 2.1 1.9 13.4 5.1 24.3 2.3 25.7 4.3 5.2 1.8 2.0 0.9 v27 0.0 0.0 0.1 0.1 0.0 0.0 0.0 0.0 0.1 0.1 0.0 0.0 0.0 0.0 0.5 0.1 v28 0.0 0.0 0.1 0.0 0.0 0.0 0.0 0.0 0.1 0.1 0.0 0.0 0.0 0.0 0.2 0.2 v29 0.0 0.0 0.1 0.1 0.1 0.1 6.0 5.3 0.0 0.0 0.0 0.0 0.3 0.2 1.4 0.3 v30 0.0 0.0 0.0 0.0 0.1 0.1 0.0 0.0 0.0 0.0 0.0 0.0 0.1 0.0 1.4 0.3 v31 6.4 2.0 14.4 2.5 0.3 0.4 3.0 5.1 12.1 0.5 10.1 0.3 4.5 1.3 2.0 0.9 v32 9.2 1.3 1.2 0.9 9.6 0.8 1.1 1.5 0.0 0.0 0.0 0.0 9.9 0.0 10.0 0.0 v33 0.0 0.0 0.0 0.0 4.6 3.1 2.4 0.4 0.0 0.0 0.0 0.0 0.1 0.1 0.0 0.0 v34 0.0 0.0 0.0 0.0 0.4 0.8 0.0 0.1 0.0 0.0 0.0 0.0 0.0 0.0 0.0 0.0 v35 0.0 0.0 0.0 0.0 1.5 2.9 10.0 0.0 0.0 0.1 0.0 0.0 1.3 1.1 0.2 0.3 v36 0.0 0.0 0.0 0.0 0.5 1.0 10.0 0.0 0.1 0.3 0.0 0.0 0.6 0.5 0.0 0.0 v37 0.0 0.0 0.1 0.2 1.7 1.7 10.0 0.0 0.0 0.1 0.0 0.0 0.5 0.7 0.0 0.0 v38 0.0 0.0 0.0 0.0 1.5 0.3 10.0 0.0 0.0 0.1 0.0 0.0 0.2 0.1 0.2 0.2 v39 0.0 0.0 0.2 0.3 0.0 0.0 5.5 2.1 0.0 0.0 0.0 0.0 7.4 1.7 2.2 0.9 v40 8.1 1.4 14.2 2.3 1.0 0.0 1.0 0.0 12.1 0.5 21.7 0.6 1.5 0.6 1.7 0.3 v41 0.2 0.2 1.5 1.8 0.0 0.0 0.0 0.0 0.0 0.0 0.0 0.0 0.0 0.0 0.0 0.0 v42 4.1 4.4 5.2 3.4 0.0 0.0 1.2 2.1 0.0 0.0 0.4 0.9 0.3 0.4 0.2 0.2 v43 0.0 0.0 0.0 0.1 0.0 0.0 0.0 0.0 0.0 0.0 0.0 0.0 0.0 0.0 0.3 0.3 v44 0.0 0.0 0.1 0.1 0.1 0.1 0.0 0.0 0.1 0.1 0.0 0.0 0.1 0.0 1.6 0.2 v45 0.0 0.0 0.1 0.0 0.0 0.0 0.0 0.0 0.1 0.1 0.0 0.0 0.0 0.0 0.2 0.2 v46 0.0 0.0 0.1 0.1 0.0 0.0 6.0 5.3 0.0 0.0 0.0 0.0 0.2 0.2 0.0 0.0 v47 144.1 0.7 139.1 0.5 139.8 0.1 120.6 0.1 149.7 0.6 127.0 0.6 101.3 0.8 128.0 0.4 v48 0.1 0.1 1.1 1.0 -3.0 0.1 -10.2 0.0 0.0 0.0 0.0 0.0 -9.9 0.1 -7.5 0.2 v49 10.4 0.0 13.8 0.0 4.0 0.0 5.2 0.0 11.0 0.0 10.7 0.0 47.7 2.3 27.6 0.3 v50 178.3 5.3 184.9 2.2 211.1 1.3 171.7 1.4 206.3 1.9 204.3 0.5 167.6 0.6 192.8 0.4

84
Fig. 3.2.1 Metabolic flux distribution of the S-C1 strain and YC1 strain under
different stress conditions. The values outside the bracket are relative flux values
normalized to glucose uptake rates as 100. Definitions of abbreviations are shown in the
List of Abbreviations. The values inside the bracket are real flux values in mmol/g/h. The
line widths are linearly correlated with the normalized flux values (glucose uptake rate as
100). The dashed line indicates the flux is zero.

85
Fig. 3.2.2 Production and consumption of cofactor and energy. The consumption (blue
bar), production (red bar), and net production (black dots) of ATP, NADH, and NADPH
are shown for different stress conditions. The error bars present the standard deviations,
which can be too small to be seen.

86
Fig. 3.2.3 Fold changes of key fluxes between the S-C1 and YC1 strain under different
stress conditions. Definitions of abbreviations are shown in the List of Abbreviations.

87
Fig. 3.2.4 Generalized mechanisms used by S. cerevisiae strains in different stress
conditions. (A): acetic acid stress condition; (B): furfural stress condition; (C): dual-stress
condition. Definitions of abbreviations are shown in the List of Abbreviations.

88
Fig. 3.2.S1 Simulated and observed SFLs for S-C1 strain and YC1 strain under
different stress conditions.
.

89
Fig. 3.2.S2 Linear correlation between OD600 and CFU.

90
3.3 Investigating Strain Dependency in the Production of Aromatic
Compounds in Saccharomyces cerevisiae.
Miguel Suástegui1,2, Weihua Guo3, Xueyang Feng3, †, Zengyi Shao1,2, †
1 Department of Chemical and Biological Engineering, Iowa State University, Ames,
USA.
2 NSF Engineering Research Center for Biorenewable Chemicals (CBiRC), Ames, IA,
USA.
3 Department of Biological Systems Engineering, Virginia Polytechnic Institute and State
University, Blacksburg, VA, USA.
†Correspondence to: Xueyang Feng and Zengyi Shao
Email: [email protected] and [email protected]
This manuscript has been published on Biotechnology and bioengineering 113 (12), 2676-
2685. Reprinted with permission of the publisher. Supplementary material of Chapter 3.3
is shown in Appendix A.

91
Abstract
Although Saccharomyces cerevisiae is the most highly domesticated yeast, strain
dependency in biotechnological processes still remains as a common, yet poorly
understood phenomenon. To investigate this, the entrance to the aromatic amino acid
biosynthetic pathway was compared in four commonly used S. cerevisiae laboratory
strains. The strains were engineered to accumulate shikimate by overexpressing a mutant
version of the pentafunctional ARO1 enzyme with disrupted activity in the shikimate
kinase subunit. Carbon tracing and 13C metabolic flux analysis combined with quantitative
PCR, revealed that precursor availability and shikimate production were dramatically
different in the four equally engineered strains, which were found to be correlated with the
strains’ capacity to deal with protein overexpression burden. By implementing a strain-
dependent approach, the genetic platform was reformulated, leading to an increase in yield
and titer in all strains. The highest producing strain, INVSc1-SA3, produced 358 mg L-1 of
shikimate with a yield of 17.9 mg g-1glucose. These results underline the importance of strain
selection in developing biological manufacturing processes, demonstrate the first case of
high production of shikimate in yeast, and provide an appropriate platform for strain
selection for future production of aromatic compounds
Key Words
shikimate pathway, protein overexpression burden, pathway balancing, 13C-metabolic
flux analysis

92
Key Points
The aspartic acid 920 is a key residue in the catalytic pocket of the shikimate kinase subunit in
the S. cerevisiae pentafunctional ARO1 enzyme.
The first report of engineering S. cerevisiae for the production of shikimate from glucose.
13C-fingerprinting and metabolic flux analysis to study the carbon flux into the aromatic amino
acid biosynthesis pathway in yeast.
Identification of strains’ different capacities to cope with protein overexpression burden.
Pathway balancing to enable high carbon channeling into the aromatic amino acid biosynthetic
pathway.
3.3.1 Introduction
The metabolic pathways for the biosynthesis of aromatic compounds are present in
many microorganisms and plants, and lead to the production of three key amino acids, i.e.,
tryptophan, phenylalanine, and tyrosine. In certain plants such as Papaver somniferum
(opium poppy) and Catharanthus roseus, these amino acids become intermediates in the
production of more complex molecules that range from pigments, tannins, and alkaloids
[56-58]. Given the versatile applications of these compounds and their great market
opportunities [59], studying the relevant endogenous pathways has been central in
metabolic engineering efforts for the production of aromatic compounds, mainly in bacteria
and yeasts. Some of the molecules that have reached considerable biotechnological
production levels in Escherichia coli include shikimate (SA) (87 g/L) [60], muconic acid
(30 g/L) [61], and phenol (9.8 g/L) [62].
The production of more specialized aromatics such as flavonoids and alkaloids
requires the functional expression of membrane-bound plant cytochrome P450 enzymes,

93
which is feasible in yeast, but remains as a challenge in E. coli [63]. For instance,
naringenin and resveratrol can only be converted through tyrosine in E. coli, but can be
synthesized from both tyrosine and phenylalanine in S. cerevisiae due to the functional
expression of cytochrome P450 reductase [64, 65], and the most recent breakthrough, the
biosynthesis of tyrosine-derived opioids [66], demonstrates the great potential of using
yeast as a host to produce plant secondary metabolites. However, due to intrinsically
complicated genetic and metabolic regulations, the efforts in engineering the central carbon
metabolism to increase the production of aromatics in yeast seem somewhat ineffective.
The reported yields in S. cerevisiae are far from reaching the theoretical values [64, 67-
69], evidencing the demand for extensive strain development efforts.
A key step in the development of microbial platforms for the production of valuable
chemicals is the appropriate selection of the host strain. Although it may sound trivial, it
becomes more and more evident that selecting strains even among those belonging to the
same species is key to ensuring optimal titers, yields, and productivities. Different S.
cerevisiae strains, varying slightly in genetic makeups, unexpectedly display disparate
behaviors [70]. The differences can be attributed to the varying capabilities of maintaining
episomal plasmids [71], expressing proteins [72], hosting heterologous pathways [73], and
responding to signaling processes [74]. However, the underlying basis for these varying
phenotypes remains unclear and may vary case by case when engineering metabolic
pathways in yeasts.
The purpose of this work was to determine an appropriate strain of S. cerevisiae
with a high potential for producing chemicals that derive from the aromatic amino acid
pathway. The main variable in play was strain ploidy, hence we compared four commonly

94
used laboratory strains, namely YSG50, BY4741, INVSc1, and BY4743, among which the
former two are haploids, the latter are diploids, and BY4743 was directly generated from
the mating of BY4741 (MATa) and BY4742 (MATα). SA was chosen as the target
compound because the biosynthesis of all the aromatic amino acid-derived compounds
share SA as a common precursor, and itself is the starter compound of the commercial
influenza antiviral Tamiflu® [75, 76]. Although being equally engineered, the four strains
produced SA at dramatically different levels. 13C-metabolic flux analysis (13C-MFA) was
implemented to systematically characterize the metabolic differences in the SA producing
strains. The results demonstrated that the flux distribution in the central metabolism was
very well conserved among all strains, but that the efficacy of producing SA was strongly
dependent on the ability of each strain to auto-adjust the copy numbers of the episomal
vectors. The strain INVSc1 showed a distinct superiority in SA production, which might
be correlated with its superior capability of dealing with protein overexpression burden.
Appropriate plasmid and strain selection was essential to ensure high flux of carbon into
the aromatic amino acid pathway. The results here can be further implemented to expand
the palate of aromatic compounds that can be produced from the SA pathway or from the
downstream branches in yeasts.
3.3.2 Materials and Methods
Strains and Media. Two haploid and two diploid strains of S. cerevisiae were
analyzed in this study (Table 3.3.1). The haploid strains include YSG50 (MATade2-1
ade322 ura3-1 his3-11,15 trp1-1 leu2-3,112 can1-100) and BY4741 (MATa his3Δ1
leu2Δ0 met15Δ0 ura3Δ0); the diploid strains include InvSc1 (MATa/ his31/his31
leu2/leu2 trp1-289/trp1-289 ura3-52/ura-52 MAT), and BY4743
95
(MATa/ his31/his31 leu20/leu20 LYS2/lys20 met150/MET15
ura30/ura30). The wild type strains were propagated in YPAD media (1% yeast
extract, 2% peptone, 0.01% adenine, and 2% dextrose). After plasmid transformation, yeast
strains were cultured in Synthetic Complete media lacking uracil and histidine (0.5%
ammonium sulfate, 0.16% yeast nitrogen without amino acid and ammonium sulfate,
complete amino acid supplement mix lacking uracil and histidine, and 2% dextrose). The
minimal growth medium composition used for labeling experiments was the same as
reported previously with 20 g/L glucose as the sole carbon substrate [77, 78]. When
culturing yeast strains with 13C-labeled glucose, the regular glucose was replaced with 80%
[1-13C] glucose and 20% [U-13C] glucose (Cambridge Isotope Laboratories, Inc.,
Tewksbury, MA). All chemicals were purchased from Fisher Scientific (Pittsburgh, PA).
E. coli BW25141 was cultured in Luria Bertani (LB) medium supplemented with 100 g
mL-1 ampicillin.
Plasmid Construction. All plasmids constructed in this study (Table 3.3.1) were
derived from the pRS shuttle vector series (New England BioLabs, Ipswich, MA). To
assemble the genetic cassettes, the DNA Assembler technique [79, 80] was implemented.
All primers in this work were synthesized by IDT (Coralville, IA). The aspartic acid at the
position of 920 in the wild type ARO1 was substituted to alanine by incorporating the
mutation into PCR primers (fwd:gttacaaattagttgacctagcggagctgtttgagcaaca, rev:
tgttgctcaaacagctccgctaggtcaactaatttgtaac) and the variant was cloned downstream of the S.
cerevisiae GPD constitutive promoter and upstream of the PYK1 terminator. The
expression cassette was assembled in the pRS426 backbone digested with XhoI, yielding
the plasmid pRS426-aro1D920A (Appendix A Fig. A.S1). Plasmid pRS413-aro4K229L-tkl1

96
was constructed in the previous study [81] and used here to enhance the entrance of carbon
into the SA pathway. Plasmid pRS413-aro1D920A-aro4K229L-tkl1 was constructed by
assembling the XhoI digested pRS413-aro4K229L-tkl1 with the PCR-amplified aro1D920A
cassette with the ends overlapping to the pRS413 backbone and TPI1 promoter. Similarly,
to construct pRS426-aro1D920A-aro4K229L-tkl1, plasmid pRS426-aro1D920A was digested
with BamHI and re-assembled by addition of the PCR cassette aro4K229L-tkl1 with the
overlapping ends to the PYK terminator and the backbone of pRS426. Plasmid
transformation was done by the lithium acetate technique [82].
Biomass and Metabolite Analysis. Biomass growth in minimal media was
monitored by optical density changes with an absorbance reader at 600 nm (OD600) (Biotek
Synergy 2 Multi-Mode Microplate Reader). Samples were taken every 2 to 3 hours until
the late exponential phase was reached. Cell-free samples were used to measure
extracellular metabolites by Shimadzu HPLC (Columbia, MD) equipped with an Aminex
HPX-87H column (Bio-Rad, Hercules, CA) and Shimadzu RID-10A refractive index
detector. The column was kept at 50°C, and 5 mM sulfuric acid solution was used as the
mobile phase with a constant flow rate of 0.6 mL/min. Standard samples of ethanol,
glucose, glycerol, and SA were purchased from ACROS Organics™ (Geel, Belgium).
Isotopomer Analysis of Proteinogenic Amino Acids and SA. The protocol for
sample preparation and amino acid analysis was followed based on Feng et al. [83]. During
the late exponential phase, 1 mL samples were collected from the cultures grown with the
labeled glucose for proteinogenic amino acid profiling. The samples were centrifuged and
the biomass was hydrolyzed with 6 M HCl at 100C for 20 h, followed by drying and
derivatization with 25 L of tetra-hydrofuran and 25 l of tert-butyldimethylsilyl ether at

97
70C for 1h. To analyze the labeled SA, 1 mL of the supernatant from the culture samples
was dried overnight followed by derivatization with 60 l of N,O-
bis(trimethylsilyl)trifluoroacetamide at 70C for 1 h. The derivatized samples were
analyzed by gas chromatograph (GC2010, Shimadzu) equipped with a SH-Rxi-5Sil
column (Shimadzu) and a mass spectrometer (QP2010, Shimadzu). Two types of charged
fragments were detected by GC-MS for various amino acids (Appendix A Table A.S1): the
[M-57]+ group (containing unfragmented amino acids), and the [M-159] + or the [M-85] +
group (containing amino acids that had lost an α-carboxyl group). The whole derivatized
SA fragment was detected from the sample supernatant. The mass distribution vectors
(MDVs) were represented by M0, M1, M2, etc., which were the corresponding fractions
of non-labeled, singly labeled, doubly labeled amino acids. The effects of natural isotopes
on isotopomer labeling patterns were corrected by the previously reported algorithms [84].
Metabolic Flux Analysis. MDVs were used to calculate the summed fractional
labeling (SFL) values which were directly used in the MFA (Biomet Toolbox 2.0 [85],
based on MATLAB (MathWorks, Inc. MA). The central carbon metabolic model for the
MFA was developed based on the KEGG database (http://www.genome.jp/kegg/), and it
included the glycolysis pathway, pentose phosphate pathway, anaplerotic pathways, the
tricarboxylic acid (TCA) cycle, the SA synthesis pathway, and the transport reactions
between different cell compartments. For our metabolic flux analysis, flux estimation was
repeated at least 50 times starting with different initial values generated by a genetic
algorithm for all the fluxes to find a likely global solution. A fit of the simulated and
measured SFLs was determined to be a global solution only after the solution fit was
obtained at least twice using this method (Appendix A Fig. A.S2).

98
Plasmid Copy Number Assay. The copy number of the two plasmids used in this
work was quantified using quantitative PCR (qPCR). Cell cultures were grown in minimal
media for 24 hours and cell amounts equivalent to 2 OD600 units were collected for total
DNA extraction as previously described [86]. The primers were designed using the online
PrimeTime© tool for qPCR assays through IDT. The primer pair p-ura3 (fwd:
tagcagaatgggcagacattac; rev: ggcctctaggttcctttgttac) was used to quantify the plasmid
pRS426; the primer pair p-his3 (fwd: gtccacacaggtatagggtttc; rev: gtgatggtcgtctatgtgtaagt)
was used to quantify the plasmid pRS413. Plasmid copy number was normalized to total
DNA with alg9 as the reference gene (fwd: ccgttgccatgttgttgtatg; rev:
gccaggaaattgtacgctaaac). A standard curve for each target was prepared using pure plasmid
or genomic DNA samples.
3.3.3 Results and Discussion
Building the First Yeast Platform for SA Production. Unlike prokaryotes and
higher eukaryotes, the five steps involved in SA biosynthesis in yeast are catalyzed by a
single pentafunctional enzyme ARO1 [87] (Fig. 3.3.1). Knocking out individual steps of
this pathway without affecting the rest of the catalytic functions in yeast could be a
cumbersome task. Hence, a single amino acid substitution in the active site of the SA kinase
subunit (ARO1B) could better ensure a functional mutant version of ARO1 capable of
halting the conversion of SA to shikimate-3-phosphate (S3P). Initially, an amino acid
sequence alignment with SA kinases from several prokaryotic and eukaryotic organisms
was performed. Despite the genetic variations within these species, it was observed that the
catalytic sites of the shikimate kinases (D920-aro1 in S. cerevisiae) are 100% conserved
(Appendix A Fig. A.S3). This residue was substituted by alanine, yielding the mutant

99
enzyme ARO1D920A. The plasmid pRS426-aro1D920A was transformed into the four S.
cerevisiae strains (YSG50, INVSc1, BY4741, and BY4743) and the resulting strains were
grown in minimal media for 48 hours. However, no SA was detected in the fermentation
media in any of the four strains (Figure 2). It was not a surprise because the endogenous
synthesis of aromatic amino acids could have (i) channeled the accumulated SA into the
downstream reactions, and (ii) feedback inhibited the first step of aromatic amino acid
biosynthesis catalyzed by 3-dehydroxy-D-arabino-heptulose-7-phosphate (DAHP)
synthase.
To characterize the activity of ARO1D920A, a complementation experiment was
carried out. The plasmid pRS426-aro1D920A was transformed into the strain BY4741 aro1
(GE Healthcare Bio-Sciences, USA) and plated onto medium lacking uracil and the three
aromatic amino acids. Cell were incubated for two days and as expected no growth was
observed, indicating that the novel mutant ARO1D920A is incapable of complementing
growth in the aro1 background (Appendix A Fig. A.S4a). To confirm that the growth
defect is caused exclusively by the disrupted kinase subunit (ARO1B) in the novel mutant
ARO1D920A, a new plasmid was constructed harboring the E. coli shikimate kinase gene
aroL (pRS426-aro1D920A – ecaroL). The strain BY4741 aro1 was transformed with the
latter plasmid and after two days of culturing in media lacking uracil and aromatic amino
acids, colonies were observed (Appendix A Fig. A.S4b). Complementation of growth by
the ecaroL, was a definitive indication that the novel enzyme ARO1D920A remains
functional in all of its subunits except for the subunit ARO1B, which catalyzes the
conversion of shikimic acid to shikimate-3-phosphate.

100
The plasmid pRS413-aro4K229L-tkl1 was transformed into the strains (Group SA2)
which carries the tyrosine-insensitive DAHP synthase to overcome the feedback inhibition,
as well as the transketolase gene tkl1 to increase the flux of the precursor erythrose-4-
phosphte (E4P) [67]. These approaches have been successfully implemented in E. coli to
produce SA and in S. cerevisiae for the production of dehydroshikimate-derived muconic
acid [61, 67, 88, 89]. Nevertheless, SA was still not observable in any of the strains. We
hypothesized that the genome-copy of aro1 was causing a rapid channeling of SA into the
production of aromatic amino acids. Hence, to completely shut down the native pathways
downstream of SA, tryptophan, phenylalanine, and tyrosine were added to the minimal
medium at low concentrations of 50 mg L-1. The presence of these three amino acids
blocked the endogenous flux into the downstream branches, and SA was finally observed
(Fig. 3.3.2). This result demonstrated that despite genotypic differences, all four S.
cerevisiae strains had undergone strong regulatory controls on the aromatic amino acid
biosynthesis. It is known that the presence of external aromatic amino acids inhibits the
first committed step in the biosynthesis of aromatics (ARO3 and ARO4) and the
downstream branch points (ARO7 and TRP2/3, Fig. 1) [87]. However, inhibition may also
have occurred at the step converting SA to S3P (ARO1B), most likely by the reduced
transcription rates of the wild type aro1, thus allowing SA to accumulate in the strains
overexpressing the mutant ARO1D920A. To our knowledge, this is the first report of success
in engineering yeasts to accumulate a significant amount of SA.
Comparison of Fermentation Profiles. Although all strains were able to produce
SA, the titers among the strains varied drastically; the lowest being 30 mg L-1 in strain
YSG50 and the highest, 350 mg L-1 in strain INVSc1. Small batch fermentations in minimal

101
media were first carried out to investigate how these four strains differ from each other
regarding fermentation characteristics. The consumption rates of glucose and the formation
rates of SA, ethanol, and glycerol among the four strains during exponential phase were
compared (Table 3.3.2, Appendix A Fig. A.S4). From the fermentation profiles it was easy
to arrange the strains into two groups; the strain pair of BY4741 and BY4743, and the pair
of YSG50 and INVSc1. Although all four strains had similar specific growth rates (0.13-
0.17 h-1), the BY474x strains did have about 2-3 fold higher rates than the other pair in
terms of glucose consumption and ethanol production. The rate of glycerol production
varied slightly, although it was not observable in strain YSG50. The production of SA
revealed the highest difference among the strains. Apparently, no correlation between
strain ploidy and SA production could be drawn since strains YSG50 and BY4743 (haploid
and diploid, respectively) showed the lowest productions, with yields around 0.83 and 0.32
mmol gDCW-1, respectively. The strain BY4741 had a mid SA production with a yield of
2.38 mmol gDCW-1, and finally, strain INVSc1 had the highest yield of 8.1 mmol gDCW-
1, 3.4-fold higher than strain BY4741, 9.8-fold higher than strain YSG50, and 25-fold
higher than BY4743. These results suggested that, despite all the strains being equally
engineered, either the expression of the pathway enzymes, the entrance into the aromatic
amino acid pathway or both were strain dependent.
Inspection of 13C Isotopic ‘‘Finger Prints’’ of Aromatic Amino Acids. The most
significant difference between strains in the group SA2 arose from comparing the
“fingerprints” of the aromatic amino acids, namely phenylalanine and tyrosine.
Interestingly, the strains with the highest production of SA (INVSc1 and BY4741) showed
the highest percentage of labeled phenylalanine and tyrosine (m1:m9), whereas the strains

102
with the lowest production (YSG50 and BY4743) showed a lower labeling distribution
(Fig. 3.3.3). This was a clear indication that not only were the strains INVSc1 and BY4741
able to accumulate SA in higher titers, but they also had a higher pull of carbon from the
downstream metabolic branch leading to the production of phenylalanine and tyrosine. It
is crucial to mention that these observations were not due to different extracellular amino
acid uptake, since measurement of the fermentation supernatant showed equal uptake rates
(data not shown here). Analyzing the isotopic labeling patterns of leucine, another non-
labeled amino acid added in the culture medium for all four strains also showed similar
labeling patterns; the non-labeled leucine (m0) constituted more than 93% in all strains.
This confirmed that the high producing SA strains had more active aromatic amino acid
biosynthetic pathway. It is noteworthy that although the endogenous entrance of carbon
into the aromatic pathway was supposedly blocked by the supplementation of aromatic
amino acids, de novo production of tyrosine and phenylalanine was observed in all strains.
Therefore, to maximize SA accumulation, future work should target the implementation of
a more stringent blockage of the downstream branches.
Comparison of Flux Distributions in Key Nodes. To further investigate the
metabolic differences in a quantitative manner, the isotopomer labeling patterns, i.e., mass
distribution vectors, of proteinogenic amino acids were utilized to obtain the metabolic
fluxes through the central carbon metabolism of the S. cerevisiae strains. By comparing the
fluxes of the engineered strains, similar fluxes were found in the glycolytic pathway up to
the formation of phosphoenolpyruvate (PEP), as well as in the oxidative pentose phosphate
pathway (PPP) (Figure 4). The main variation, as expected, resulted from the flux entrance
into the SA synthesis pathway (v11). This reflected difference in the availability of the

103
precursors PEP and E4P to enter the pathway. Less than 8% of the flux into PEP (v5),
ranging from 143 to 172, was channeled into the formation of SA in all the strains.
Therefore, a potential strategy to increase the availability of PEP is to lower the activity of
the pyruvate kinase encoded by pyk (Fig. 3.3.1). This strategy has been implemented in the
bacterium Bacillus subtilis with varying outcomes. For instance, deleting pyk caused a
slight increase in the production of SA by 8%; failure in obtaining a higher increase can be
correlated to the reduction of cell growth caused by the drastically disrupted glycolytic
pathway that directly impacted the downstream tricyclic acid cycle [90]. An alternative to
overcome this detrimental effect is to attenuate the activity of pyk instead of its complete
removal. Such a strategy has been attempted in B. subtilis via two different approaches: (i)
by expressing a mutant version of pyk with reduced activity [91] and (ii) by replacing the
native pyk promoter with an inducible one [92]. Both strategies increased the availability
of PEP, with the later being the least growth detrimental. A similar approach could be
implemented in S. cerevisiae, since complete removal of pyk would impede the cells from
growing in fermentable sugars [93].
Besides the difference in the PEP supply, another major difference occurred in the
reductive PPP, which is controlled by the TKL and the transaldolase (TAL) enzymes,
catalyzing the transfer of C2 and C3 units from a ketose donor to an aldose acceptor. The
enzyme TKL has been shown to be indispensable in the production of aromatic amino
acids; deletion of this enzyme in S. cerevisiae made the strain auxotrophic to aromatic
amino acids [94]. Furthermore, tkl1 has been overexpressed to increase the production of
DHS-derived muconic acid in combination with the deletion of the gene zwf1 to force
carbon to enter PPP at the non-oxidative node (from fructose-6-phosphate and
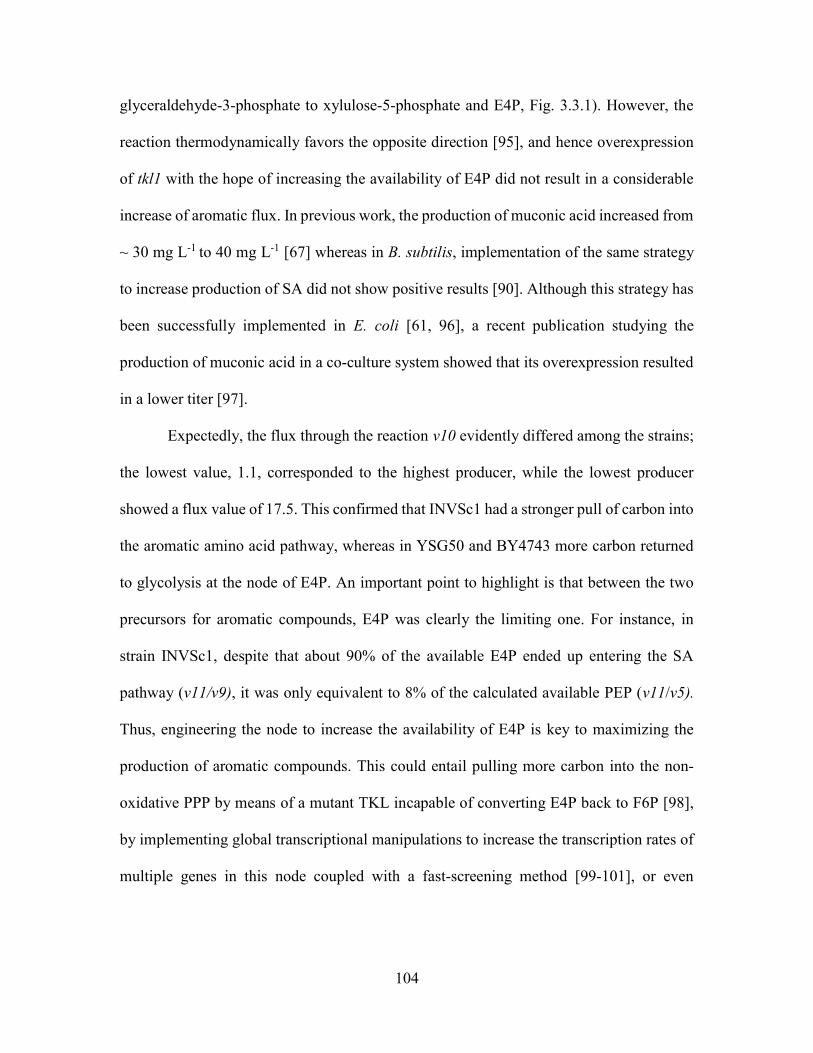
104
glyceraldehyde-3-phosphate to xylulose-5-phosphate and E4P, Fig. 3.3.1). However, the
reaction thermodynamically favors the opposite direction [95], and hence overexpression
of tkl1 with the hope of increasing the availability of E4P did not result in a considerable
increase of aromatic flux. In previous work, the production of muconic acid increased from
~ 30 mg L-1 to 40 mg L-1 [67] whereas in B. subtilis, implementation of the same strategy
to increase production of SA did not show positive results [90]. Although this strategy has
been successfully implemented in E. coli [61, 96], a recent publication studying the
production of muconic acid in a co-culture system showed that its overexpression resulted
in a lower titer [97].
Expectedly, the flux through the reaction v10 evidently differed among the strains;
the lowest value, 1.1, corresponded to the highest producer, while the lowest producer
showed a flux value of 17.5. This confirmed that INVSc1 had a stronger pull of carbon into
the aromatic amino acid pathway, whereas in YSG50 and BY4743 more carbon returned
to glycolysis at the node of E4P. An important point to highlight is that between the two
precursors for aromatic compounds, E4P was clearly the limiting one. For instance, in
strain INVSc1, despite that about 90% of the available E4P ended up entering the SA
pathway (v11/v9), it was only equivalent to 8% of the calculated available PEP (v11/v5).
Thus, engineering the node to increase the availability of E4P is key to maximizing the
production of aromatic compounds. This could entail pulling more carbon into the non-
oxidative PPP by means of a mutant TKL incapable of converting E4P back to F6P [98],
by implementing global transcriptional manipulations to increase the transcription rates of
multiple genes in this node coupled with a fast-screening method [99-101], or even

105
selecting host yeasts (e.g. Scheffersomyces stipitis) with natural higher activity in the PPP
[102].
Pathway Balancing for Enhanced Production of SA. Carbon tracing and 13C-
MFA corroborated that the four equally engineered strains had dramatically different flux
distributions through the SA pathway stretching from the upstream precursor synthesis to
the downstream aromatic amino acid production, which was likely caused by the
differential expression of the three cloned enzymes. Initially, we hypothesized that the
plasmid copy numbers could vary significantly from one strain to another, causing the
major metabolic differences observed, despite all strains being equally engineered.
Previous research has shown that specific genetic elements on the plasmid such as the
selection marker, as well as the segregation element (centromere or 2) play an important
role in the yeast’s fitness with some correlations to the strain’s ploidy [71]. Since our
platform consisted of plasmids harboring structural genes under the transcriptional control
of strong constitutive promoters, we further reasoned that the engineered strains might have
had very different capacities to deal with the energy burden posed by plasmid synthesis
and enzyme overexpression. This effect was first recognized based on the observation that
the optical densities at the late exponential phase of strain cultures in the group SA2 were
reduced compared to the strains carrying the empty plasmids (SA0 strains, Fig. 3.3.5a), but
interestingly the growth reduction did not correlate with SA production. This observation
excluded SA toxicity as the major factor causing the growth reduction, suggesting that the
actual copy numbers in the four strains might not reflect the behaviors of typical 2μand
centromere as the segregation elements.

106
Measurement of the plasmid copy numbers revealed interesting insights on the
capacity of each strain to cope with the stress caused by excessive enzyme expression. It
appeared that plasmid pRS426-aro1D920A had a significant impact on the cell’s fitness, and
most importantly, on the production of SA. As shown in Figure 5b, the copy number ratio
between the plasmid pRS426-aro1D920A and pRS413-aro4K229L-tkl1 was calculated and a
clear negative correlation was identified. The strains with the highest production of SA
(INVSc1 and BY4741) had a plasmid ratio closer to 1, whereas the poor-producing strains
(YSG50 and BY4743) had a ratio between 3 and 7. It was also noticed that although the
plasmid pRS426-aro1D920A had the 2segregation element, the copy number was
dramatically reduced to resemble a centromere-like plasmid in all the strains. The absolute
copy number of the plasmids was also compared between the strain groups SA0 and SA2
(Appendix A Fig. A.S5). The reduction in plasmid copy number was evident in all strains
in the group SA2; the most significant reductions occurred in plasmids pRS426-aro1D920A,
specifically the strain INVSc1-SA2, where the plasmid copy number was reduced 95%
compared to the empty plasmid. Contrary to our findings, Karim et al., (2012) showed that
using histidine and uracil as selection markers result in similar growth rates and plasmid
copy number when comparing strains BY4741 and BY4743. In our study, we did observe
major discrepancies that can be attained to (i) co-expression of two distinct episomal
plasmids and (ii) constitutive overexpression of structural genes. Although the four,
wildtype strains studied here have slight differences in their auxotrophic markers, no
correlation with their capacity to accumulate shikimate can be observed. For instance, the
only major auxotrophic difference between strains YSG50 and INVSc1 is the deletion of
ade1 in the former, yet these strains have the most evident disparity in accumulation of

107
shikimate. Similarly, supplementation of L-trp in the growth medium brings the strains
INVSc1 and BY4743 to the same auxotrophic level, but their capacity to produce shikimic
is considerably different. We hypothesized that overexpression of aro1D920A in the pRS426
background had a negative impact on SA production. Hence, only the strains capable of
adjusting this plasmid to a very low copy number could produce higher amounts of SA.
To test this hypothesis, we constructed a new plasmid encoding the three genes on
the pRS413 backbone (pRS413-aro1D920A-aro4K229L-tkl1). To maintain the same selective
nutrients as used previously, this new plasmid, was transformed into all strains along with
an empty pRS426 vector yielding the group SA3. As expected, all the strains in group SA3
showed increases in the SA titers. A 2-fold increase was observed for strains YSG50 and
BY4741, and the most significant increase occurred in strain BY4743-SA3, where the SA
titer was elevated 5.5-fold over the corresponding. The strain INVSc1-SA3 showed very
similar titers when compared to INVSc1-SA2 (358 and 350 mgL-1), indicating that such
strains might have reached the maximum flux attainable into the aromatic amino acid
pathway with the provided manipulations (Fig. 3.3.5c). In parallel, we reconstructed a new
plasmid encoding all three genes on the pRS426 backbone (pRS426-aro1D920A-aro4K229L-
tkl1), and co-transformed it with the empty pRS413 into all strains, yielding SA producing
groups SA4 (Table 3.3.1). Very interestingly, a dramatic decrease in titers was observed in
all strains in the group SA4. In the case of INVSc1, BY4741, and BY4743, the production
dropped 94%, 96%, and 83%, respectively, whereas the strain YSG50 showed no SA
accumulation (Fig. 3.3.5c). This result suggested that the stress caused by overexpressing
aro4K229L and tkl1 excessively added a new layer of stress that negatively affected cellular
metabolism.

108
Balancing gene expression for efficient production of chemicals is a common task
carried out in metabolic engineering research [71, 73, 103]. The results presented here
reaffirm that pathway balance and optimization is an obligated step for the construction of
efficient microbial factories. Moreover, the pipeline for optimization should also take into
consideration the selection of an appropriate host strain. Recently, it has been recognized
that yeast strains have the capability to auto-adjust plasmid copy number in accordance to
the burden of excessive enzyme expression [104]. Our study showed that four independent,
yet commonly used S. cerevisiae strains had disparate responses to simple metabolic
manipulations, which was correlated to their ability to balance the introduced plasmids. A
careful inspection of the behavior of each strain brought valuable insights into how to
properly engineer the carbon entrance into the aromatic amino acid pathway.
3.3.4 Conclusion
Altogether, we were able to observe high-level accumulation of SA in three of the
four strains engineered in this work. Having four S. cerevisiae strains with different
capacity to produce SA, allowed us to implement a strain-dependency approach to discern
the appropriate way to engineer our pathway of interest. The higher production of strains
in the group SA3 was a result of rationally engineering the entrance of carbon into the
aromatic amino acid biosynthetic pathway. This work emphasizes the significance of strain
and plasmid selection in metabolic engineering efforts and provides insights to optimize
the production of aromatic compounds in yeast.
Acknowledgements
This work is supported by the National Science Foundation Grant Numbers EEC-
0813570 and EPSC-1101284, the Center for Biorenewable Chemicals and the Plant

109
Sciences Institute at Iowa State University, and the start-up fund (#175323) from Virginia
Tech Research.

110
Table 3.3.1. The constructed plasmids and strains. Plasmid Expression Cassette Features
pRS413-aro4K229L-tkl1
TPI1p-ScARO4K229L-TDH2t ADH1p-ScTKL1-ADH1t
Feedback insensitive DHAP synthase. Transketolase 1 to increase E4P pool.
pRS426-aro1D920A GPDp-ScARO1D920A-PYK1t Mutant version of pentafunctional ScARO1 with disrupted activity of SA kinase subunit.
pRS413-aro1D920A aro4K229L-tkl1
GPDp-ScARO1D920A-PYK1t TPI1p-ScARO4K229L-TDH2t ADH1p-ScTKL1-ADH1t
Complete pathway in pRS413 backbone for accumulation of SA.
pRS426-aro1D920A aro4K229L-tkl1
Complete pathway in pRS426 backbone for accumulation of SA.
Strains Genotype / Plasmid YSG50 MAT; ade2-1; ade322; ura3-1; his3-11,15; trp1-1; leu2-3,112; can1-100
INVSc1 MATa/ his31/his31; leu2/leu2; trp1-289/ trp1-289; ura3-52/ ura-52 MAT
BY4741 MATa; his3Δ1; leu2Δ0; met15Δ0; ura3Δ0
BY4743 MATa/ his31/his31; leu20/leu20; LYS2/lys20; met150/MET15; ura30/ura30
SA0 pRS426 & pRS413 SA1 pRS426-aro1D920A SA2 pRS426-aro1D920A & pRS413 aro4K229L-tkl1 SA3 pRS426-aro1D920A- aro4K229L-tkl1 & pRS413 SA4 pRS426 & pRS413-aro1D920A-aro4K229L-tkl1
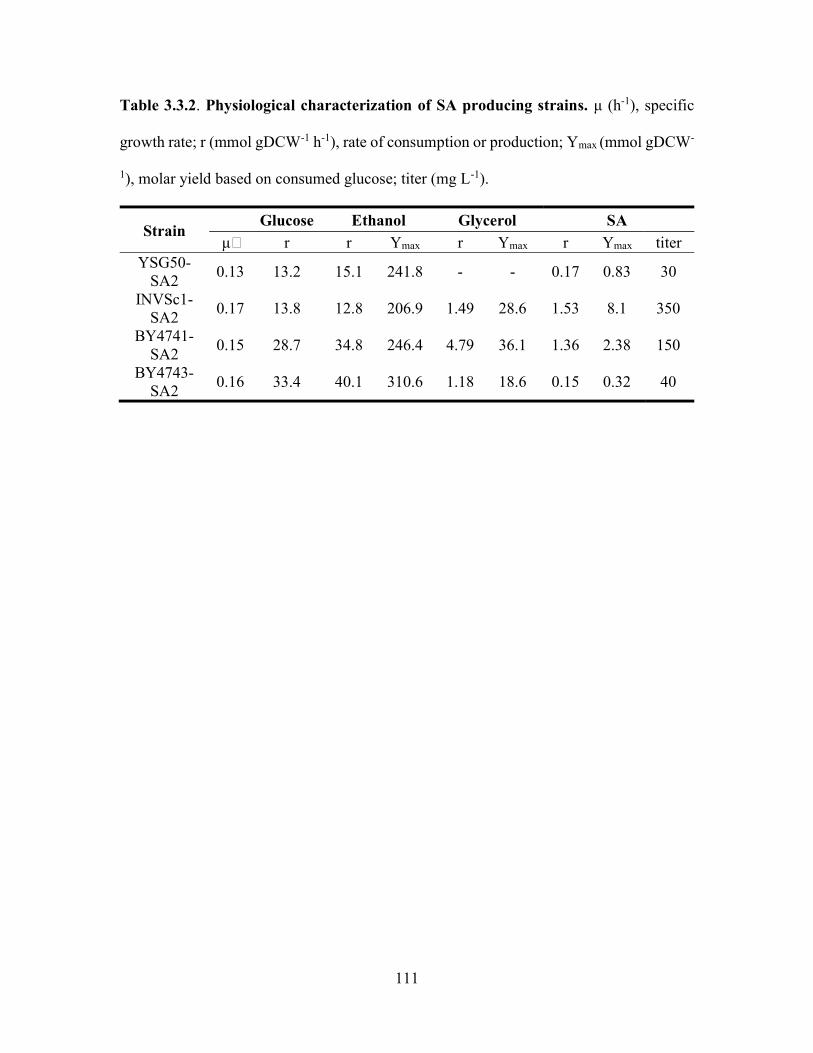
111
Table 3.3.2. Physiological characterization of SA producing strains. μ (h-1), specific
growth rate; r (mmol gDCW-1 h-1), rate of consumption or production; Ymax (mmol gDCW-
1), molar yield based on consumed glucose; titer (mg L-1).
Strain Glucose Ethanol Glycerol SA
μ r r Ymax r Ymax r Ymax titer YSG50-
SA2 0.13 13.2 15.1 241.8 - - 0.17 0.83 30
INVSc1-SA2
0.17 13.8 12.8 206.9 1.49 28.6 1.53 8.1 350
BY4741-SA2
0.15 28.7 34.8 246.4 4.79 36.1 1.36 2.38 150
BY4743-SA2
0.16 33.4 40.1 310.6 1.18 18.6 0.15 0.32 40

112
Fig. 3.3.1 Pathway depicting engineering efforts for the accumulation of SA. The
arrows in green represent the overexpressed enzymes for unlocking the production of SA.
Definitions of abbreviations are shown in the List of Abbreviations.

113
Fig. 3.3.2 Media optimization for the production of SA. To allow the accumulation of
SA in all fours strains, it was necessary to incorporate the three aromatic amino acids into
the growth media, through which the conversion of SA into downstream metabolites was
at least partially reduced and hence the positive outcome of expressing the mutant
ARO1D920A was observed. Samples were taken after 24 h of fermentation. The variation is
represented as the standard deviation from three biological replicates.

114
Fig. 3.3.3 Isotropic distribution of labeled and non-labeled amino acids. Strains
INVSC1-SA2 and BY4741-SA2 showed higher percentages of labeled a) phenylalanine
and b) tyrosine compared to YSG50-SA2 and BY4743-SA2. This corroborated the higher
fluxes into the biosynthesis of aromatic compounds in the strains with higher SA
accumulation levels. c) Analysis of leucine, another non-labeled amino acid, showed equal
distribution across all four strains.

115
Fig. 3.3.4 Major intracellular metabolic flux distributions in the engineered strains in
group SA2 (Table 3.3.1). All fermentations were performed in batch mode supplemented
with 20 g L-1 of 80% [1-13C] glucose and 20% [U-13C] glucose. The fluxes are expressed
as normalized values relative to specific glucose uptake rate (Table 3.3.2). These values
represent a global solution obtained via isotopomer modeling of the 13C labeled
proteinogenic amino acids. To emphasize the flux differences in the SA pathway, the
thickness of the arrows of reactions v9 to v11 was normalized by a value of 5; a value of
25 was used otherwise. P5P: pentose phosphate sugar.

116
Fig. 3.3.5 Phenotypic comparison of S. cerevisiae engineered for the production of SA.
a) Growth percentage of strains in the group SA2 versus strains carrying empty plasmids
(group SA0, Table 3.3.1). b) Correlation between SA production and plasmid maintenance.
The ratio between plasmid pRS426-aro1D920A and pRS413-aro4K229L-tkl was calculated
and plotted on the x-axis. c) Accumulation of SA in the strains of groups SA2, SA3, and
SA4. All strains showed an increased production of SA when the genes were encoded in
the plasmid pRS413 (group SA4). Conversely, incorporating all three genes into the
backbone of pRS426 resulted in extremely low production of SA. Samples were taken after
24 h of growth in minimal media. Variation is represented as the standard deviation from
three biological replicates.

117
3.4 Investigating Oxalate Biosynthesis in Wood-decaying Fungus
Gloeophyllum trabeum Using 13C Metabolic Flux Analysis
Liangpeng Zhuang,a, * Weihua Guo,b, * Makoto Yoshidac, Xueyang Feng,b, † and
Barry Goodella, †
a Department of Sustainable Biomaterials, Virginia Polytechnic Institute and State
University, Blacksburg, VA 24061, USA
b Department of Biological Systems Engineering, Virginia Polytechnic Institute and
State University, Blacksburg, VA 24061, USA
c Department of Environmental and Natural Resource Science, Tokyo University
of Agriculture and Technology, Tokyo, Japan
† Correspondence to: Xueyang Feng and Barry Goodell.
* LZ and WG contribute to this work equally.
Phone: +1-(540)231-2974 and +1-(540)231-8176
Email: [email protected] and [email protected]
This manuscript has been published on RSC Advances 5 (126), 104043-104047. Chapter
3.4 is reproduced by permission of The Royal Society of Chemistry. Supplementary
material of Chapter 3.4 is shown in Appendix B.

118
Oxalate synthesis was rigorously investigated in a wood-decaying fungus,
Gloeophyllum trabeum, using 13C metabolic flux analysis, a method not previously
explored in this type of system. Peroxisomal glyoxylate dehydrogenase and cytosolic
oxaloacetate acetylhydrolase were found to contribute to the majority of oxalate
synthesized under low and high nitrogen conditions, respectively.
Lignocellulose is the most abundant biomass resource in terrestrial
environments[105], and wood fiber has seen growing use as an industrial feedstock for
value-added chemical and biofuel production[106]. However, the recalcitrant structure of
lignocellulosic biomass prevents it from being converted to fermentable sugar efficiently
and research in this area is still needed. Brown rot fungi are the only organisms known that
can depolymerize crystalline cellulose without removal of lignin[107]. Gloeophyllum
trabeum, a brown rot fungus with high polysaccharide depolymerization activity has
promising industrial application prospects. For example, it has been used in a corn stover
pretreatment step for ethanol production[108], and also in a saccharification step in ethanol
production via simultaneous saccharification and fermentation (SSF)[109]. A non-
enzymatic oxidative “chelator-mediated Fenton” (CMF) system is reported to be involved
in brown rot fungi cellulose depolymerization processes[110], but many aspects of how
this system works are unknown. The process, involves the secretion of the low molecular
weight metabolites, oxalate and hydroquinone/catecholate compounds to first sequester
and then reduce iron in a sequence, which results in generation of Fenton chemistry at a
distance from the fungal hyphae within the lignocellulose cell wall. A highly reactive
hydroxyl radical is generated and has been demonstrated to be responsible for the
deconstruction of the wood cell wall in brown rot non-enzymatic decay[111-113]. Previous

119
research on the detection of oxalate and catechols in brown rot fungal liquid culture
medium in the absence of wood has demonstrated that these compounds are generated by
the fungus rather than being derivatives of wood [114-116]. Due to the important role that
oxalate and catecholates play in brown rot fungal degradation mechanisms, study of their
biosynthetic pathways will provide novel insight about how brown rot fungi regulate the
production of these compounds to break down the recalcitrant structure of lignocellulose
biomass.
In this study, we applied 13C Metabolic Flux Analysis (13C-MFA), a technique that
has been widely applied to reveal previously unknown metabolic pathways in various non-
model organisms[117-121], to provide valuable insight into the intracellular metabolisms
of G. trabeum under different culture conditions[122-124]. We found that the major source
for intracellular oxalate synthesis varied under different culture conditions. While
peroxisomal glyoxylate dehydrogenase contributed to the majority of oxalate synthesized
under low nitrogen conditions, cytosolic oxaloacetate acetylhydrolase was found to be the
main pathway for oxalate synthesis when culturing G. trabeum in a high concentration of
nitrogen. To our best knowledge, this is the first time that oxalate biosynthesis metabolism
in G. trabeum has been rigorously and quantitatively determined by 13C trace experiments
using the metabolic flux analysis approach. Research in this area will facilitate future work
in increasing the degradation efficiency for bioconversion of lignocellulosic biomass by G.
trabeum and related organisms.
G. trabeum was cultured statically, in 150mL flasks at 36 ℃ in 20mL liquid
medium containing the following basal salts per liter: 2g NH4NO3, 2g KH2PO4, 0.5g
MgSO4•7H2O, 0.1g CaCl2•2H2O, 0.57mg H3BO4, 0.036 mg CuSO4•5H2O[125], and 1%
120
glucose. All glassware was acid-washed and Fe and Mn was omitted to promote production
of secondary metabolites. After 20 days, the medium in three flasks was homogenized and
sterile water was added to bring the total volume to 150mL. The homogenate was diluted
1:40 and a 0.5 ml aliquot was used to inoculate a 13C-glucose medium containing low
nitrogen (LN), or high nitrogen (HN). These cultures contained 1% 13C-glucose (a mixture
of 80% [1-13C] and 20% [U-13C] glucose)[114] and the basal salts listed above with either
25mM NH4NO3 (HN) or 2.5mM NH4NO3 (LN). In separate work with HN and LN cultures
using non-labeled glucose, growth was analysed by weighing the dried mycelial mass at 3-
5d intervals, and HPLC of the culture filtrate was also conducted to assess glucose
consumption (Table 3.4.1). The 13C-labeled fungal cultures were harvested during the
exponential growth phase, after 14 days. Our cultivation conditions were different to those
previously used by Varela and Tien[126] in part to avoid uncontrolled levels of iron in the
media and so that nitrogen levels could be modified.
Following harvest, isotopomer analysis of proteinogenic amino acids and
intracellular oxalate was conducted using a previously developed protocol [127-129]. In
brief, the biomass was hydrolyzed using 6 M HCl (20h at 100 °C) and the amino acids and
intracellular oxalate were silyated using 50 µl tetrahydrofuran and 50 µL N-(tert-
butyldimethylsilyl)-N-methyl-trifluoroacetamide (Sigma-Aldrich) to form tert-butyl
dimethylsilyl (TBDMS) derivatives. Gas Chromatography-Mass Spectrometry (GC-MS)
was performed to analyse fungal metabolites using a Shimadzu GC2010 GC with a SH-
Rxi-5Sil column and a Shimadzu QP2010 MS. Three types of charged fragments were
detected by GC-MS for various amino acids (Table S1): the [M-57]+ group (containing
unfragmented amino acids); and the [M-159]+ or [M-85]+ group (containing amino acids

121
that had lost an α-carboxyl group). For each type of fragments, the labeling patterns, mass
distribution vectors (MDVs), were represented by M0, M1, M2, etc., which were fractions
of non-labeled, singly-labeled, and doubly-labeled amino acids. The effects of natural
isotopes on isotopomer labeling patterns were corrected by previously reported
algorithms[130]. MDVs were used to calculate the summed fractional labelling (SFL)
values which were directly used in the MFA (Biomet Toolbox 2.0[131], based on
MATLAB, MathWorks, Inc. MA). The central carbon metabolic model for the MFA was
developed based on the KEGG database (http://www.genome.jp/kegg/) and previous
reports on metabolic pathways of brown rot fungi[132, 133], which included glycolysis
pathways, pentose phosphate pathways, futile pathways, the tricarboxylic acid (TCA)
cycle, the glyoxylate cycle in peroxisomes, cytosolic oxaloacetate acetylhydrolase and
transport pathways among different cell compartments (Fig. 3.4.1A). Of particular interest,
two oxalate biosynthesis pathways, i.e., cytosolic oxaloacetate acetylhydrolase (OAH) and
peroxisomal glyoxylate dehydrogenase (GLX)[134] were examined in our metabolic
models (Fig. 3.4.1A) to assess oxalate biosynthesis. These two pathways have been
reported to contribute to fungal extracellular oxalate accumulation in other species[135].
Although little research has been done to elucidate the genes associated with oxalate
biosynthesis pathways in G. trabeum, the homologs of oxaloacetate acetylhydrolase
(fpOAH) and glyoxylate dehydrogenase (fpGLOXDH) in Fomitopsis palustris have been
indicated in the G. trabeum genome using Blastp[136] with 77% and 67% similarity
respectively, which suggested these two pathways could potentially be exploited by G.
trabeum for oxalate synthesis. For our metabolic flux analysis, flux estimation was
repeated at least 50 times starting with different initial values generated by a genetic

122
algorithm for all fluxes to find a likely global solution. A fit of the simulated and measured
summed fractional labelings was determined to be a global solution only after the solution
fit was obtained at least twice using this method (Fig. B.S1).
In addition to the MDVs detected by GC-MS, we also used a similar protocol to
detect oxalate concentrations for both soluble and insoluble oxalate from the cultivation
medium and cell biomass, respectively. To measure the concentrations of soluble oxalate,
we dried 5mL of the medium and followed the same derivatization process for GC-MS
analysis. We detected no soluble oxalate and therefore repeated this work with a more
sensitive HPLC analysis. Again, no soluble oxalate was detected (at levels down to 0.01
mM), which is consistent with previous results that G. trabeum accumulates less oxalate
compared to other brown rot fungi [137], mainly due to the presence of oxalate
decarboxylase, which has previously been shown to decompose oxalate in G. trabeum. To
measure the concentrations of insoluble oxalate, we followed similar protocols for biomass
hydrolysis followed by derivatization. We found that oxalate was produced at levels of
0.19±0.09 mM and 0.56 ±0.09 mM under LN and HN conditions, respectively. The
observation that greater amounts of oxalate were produced under high nitrogen levels was
also consistent with previous research[138].
Based on the production of insoluble oxalate, we next investigated the central
metabolic flux of G. trabeum when cultured using different nitrogen levels. In general, for
most of the central metabolic pathways such as glycolysis and pentose phosphate pathways,
the fluxes were similar despite changes in nitrogen culture levels (Fig. 3.4.1A). However,
when we next evaluated the effects of peroxisomal glyoxylate dehydrogenase (GLX) and
cytosolic oxaloacetate acetylhydrolase (OAH) on oxalate synthesis, we found that usage of

123
these two pathways was significantly different when high and low nitrogen conditions were
used (Fig. 3.4.1B). While the flux ratio of OAH/GLX for the low nitrogen condition was
only 0.01; it was as high as 56.2 for the high nitrogen condition (Fig. 3.4.1B), indicating
that the preferred pathway for oxalate production (OAH or GLX) shifts dramatically when
the fungus was grown at different nitrogen levels. Correspondingly, the fluxes of metabolic
pathways related to OAH and GLX were also found to be different. For example, the
metabolic flux of the futile pathway that supplies cytosolic oxaloacetate from cytosolic
pyruvate in the LN condition was dramatically higher than that in the HN condition (Fig.
3.4.1C). The varied flux distribution in the peroxisomal glyoxylate dehydrogenase,
cytosolic oxaloacetate acetylhydrolase and futile pathways clearly indicated that G.
trabeum metabolism was regulated in response to the C/N ratio, which confirmed that the
C/N ratio was a key factor in oxalate biosynthesis for this fungus[114].
While it is clear that the conversion of oxaloacetate to oxalate by peroxisomal
glyoxylate dehydrogenase occurred in the peroxisome, oxalate synthesis via cytosolic
oxaloacetate acetylhydrolase could potentially be from several sources since oxaloacetate,
the precursor of oxalate in synthesis via cytosolic oxaloacetate acetylhydrolase, can be
generated by either of three pathways in different regions of the cell: 1) the futile pathway,
where pyruvate is converted to oxaloacetate in the cytosol to supply the TCA cycle in
mitochondria; 2) the TCA cycle, where oxaloacetate is generated from malate in
mitochondria; and 3) the glyoxylate cycle, where oxaloacetate is generated in the
peroxisome. However, based on 13C-MFA, we found the flux for oxaloacetate synthesis in
the glyoxylate cycle was trivial under both LN and HN conditions (Fig. 3.4.1B), indicating
that glyoxylate was mainly used to produce oxalate directly rather than being converted to
124
oxaloacetate in G. trabeum. Therefore, it is likely that the oxalate generated by cytosolic
oxaloacetate acetylhydrolase is generated directly from oxaloacetate that is synthesized in
the futile cycle or the TCA cycle, rather than from oxaloacetate that is synthesized in the
glyoxylate cycle. In addition, in prior research with a related fungus, F. palustris [115,
139] under high nitrogen conditions (although with a different nitrogen source than in our
research), cytosolic oxaloacetate acetylhydrolase was the dominant precursor for oxalate
synthesis. Both F. palustris and G. trabeum have previously been reported to utilize the
non-enzymatic “chelator-mediated Fenton” system in lignocellulose deconstruction, and
therefore it is possible that these two fungi would adopt a similar regulatory system for
oxalate synthesis. It has been reported that high levels of ammonium ions may inhibit the
activity of glyoxylate dehydrogenase, the key enzyme for oxalate production in the
glyoxylate cycle[140][141], which could explain the limited role of the peroxisomal
glyoxylate dehydrogenase on oxalate synthesis when nitrogen (ammonium) concentrations
were high.
To further investigate the regulation of cytosolic oxaloacetate acetylhydrolase and
peroxisomal glyoxylate dehydrogenase, we performed qPCR (VBI – Virginia Tech) to
determine the expression level of the genes that encode these two enzymes. We followed
an established protocol[142] to extract the mRNAs of G. trabeum from both LN and HN
conditions using a FastRNA spin kit (MP Biomaterials, USA), and measured the mRNA
levels. It was found that there was no significant difference in gene expression levels
between the LN and HN conditions for both cytosolic oxaloacetate acetylhydrolase and
peroxisomal glyoxylate dehydrogenase (Fig. B.S2). Comparing with the distinct flux
results between LN and HN conditions, this indicates that the regulation of the pathways

125
for oxalate synthesis was not executed at the transcriptional level. Considering the complex
regulatory machinery in eukaryotic metabolism (e.g., G. trabeum), the peroxisomal
glyoxylate dehydrogenase and cytosolic oxaloacetate acetylhydrolase could be regulated
in translational, post-translational or even at the metabolic level (e.g., ammonium
inhibition). The systemic investigation of the regulatory mechanism is beyond the scope of
this manuscript but will be investigated by our group in the future.
In sum, this study examined the effects of peroxisomal glyoxylate dehydrogenase
and cytosolic oxaloacetate acetylhydrolase on oxalate biosynthesis in G. trabeum using 13C
tracer experiments and metabolic flux analysis; approaches not previously explored in
fungi for oxalate production. As revealed by the metabolic flux results, the pathway
selected for oxalate biosynthesis was highly dependent on the C/N ratio, with cytosolic
oxaloacetate acetylhydrolase being the dominant pathway for the oxalate synthesis under
low C/N (i.e., high nitrogen) conditions, and peroxisomal glyoxylate dehydrogenase
contributing to oxalate synthesis under high C/N (i.e., low nitrogen) conditions. Combined
with transcriptional analysis, it was determined that such metabolic reprogramming was
not transcriptionally controlled. Overall, 13C-MFA proved to be a useful approach in
evaluating the pathway usage in G. trabeum for oxalate production and could help improve
our understanding of oxalate metabolism in wood-decaying fungi and to facilitate further
improvement of the lignocellulose bioconversion technology with other fungal species. Acknowledgements
This study was supported by start-up fund (#175323) from Virginia Tech. This
work was also supported in part by the USDA-HATCH Project S-1041 VA-136288, and
by The Research Council of Norway 243663/E50 BioMim.

126
Table 3.4.1. Growth behaviour of G. trabeum under different nitrogen conditions. Nitrogen Conditions Growth rate (day-1) Glucose uptake (g/g DCW/day)
LN 0.14±0.03 0.24±0.002 HN 0.15±0.03 0.15±0.001

127
Fig. 3.4.1. Metabolic pathway map and key flux distributions for G. trabeum under
different C/N ratios. (A) Central carbon metabolic pathways and oxalate synthesis
pathways of G. trabeum. Transport fluxes between mitochondria and peroxisome were
simplified to a single dash-dot line. (B) The flux ratio between OAH and GLX pathways
for LN and HN conditions with the OAH/GLX ratio highlighted. (C) Key metabolic flux
distributions for G. trabeum under LN and HN conditions. Definitions of abbreviations are
shown in the List of Abbreviations.

128
3.5 13C Pathway Analysis of Biofilm Metabolism of Shewanella oneidensis
MR-1
Weihua Guoa, *, Shuai Luob, *, Zhen Heb, † and Xueyang Fenga, †
a Department of Biological Systems Engineering, Virginia Tech University, Blacksburg,
VA 24061, United States
b Department of Civil and Environmental Engineering, Virginia Polytechnic Institute and
State University, Blacksburg, VA 24061, United States
†Correspondence to: Zhen He and Xueyang Feng.
* WG and LS contribute to this work equally.
Phone: +1-(540)231-1346 and +1-(540)231-2974
Email: [email protected] and [email protected]
This manuscript has been published on RSC Advances 5 (50), 39840-39843. Chapter 3.5 is
reproduced by permission of The Royal Society of Chemistry

129
Biofilm metabolism of Shewanella was analyzed via 13C tracing experiments
for the first time. The activity of C1 metabolism in the biofilm cells was found to be
interestingly higher than that in planktonic cells, which could be related to utilizing
C1 metabolites as electron donors when growing Shewanella in biofilms.
The biofilms formed by Shewanella oneidensis MR-1 has been extensively
studied[143-147] and found to play pivotal roles in bioremediation of heavy metals[148-
152] and electric power generation[153, 154]. Despite recent discoveries of Shewanella
metabolism under aerobic and anaerobic conditions using various analytical
approaches[155-158], few studies have been accomplished to investigate the metabolic
pathway usage in Shewanella biofilms. In this study, we applied the 13C pathway analysis,
a reliable and well-developed technology[159], to analyze the carbon metabolism of S.
oneidensis cells derived from biofilm and planktonic growth, respectively. Through the
comparison of isotopomer labeling patterns of key proteinogenic amino acids, we found
that the C1 metabolism was much more active when growing S. oneidensis in biofilms
compared to planktonic cells, which could be related to the utilization of C1 metabolites
as electron donor by S. oneidensis when growing in biofilms. To our best knowledge, this
is the first time that the biofilm metabolism of S. oneidensis was rigorously determined by
isotopomer analysis.
S. oneidensis MR-1 was initially grown in shake flasks with minimal medium
containing 3.7 mM [3-13C] sodium L-lactate (Sigma-Aldrich) for two days at 100 rpm,
30ºC. It was then transferred to completely fill up a 140 mL sealed bottle reactor and
cultivated under oxygen-limited condition (stirrer at the bottom) at 30ºC. To grow S.
oneidensis MR-1 in a biofilm, a carbon cloth (2.5 cm×4.5 cm, Zoltek, Panex® 30 Fabric,

130
PW06) was submerged in the medium of the sealed bottle reactor, with titanium mesh
(McMaster) to support and titanium wire (Sigma-Aldrich) to bind the cloth tightly on mesh.
Duplicate reactors were processed (n=2). When lactate was depleted (<0.01 mM), the
minimal medium was refreshed by removing 10 mL medium from the sealed bottle reactor
and injecting 10 mL fresh filter (0.22um pore size) sterilized medium. The final
concentration of [3-13C] sodium L-lactate was maintained at ~0.8 mM. The biomass of
planktonic cells was monitored by OD600 using a plate reader (BioTek). The concentrations
of lactate and acetate in the sealed bottle reactor were measured by high-performance liquid
chromatography (HPLC, Shimadzu), following the method that has been previously
developed[160] (Fig. 3.5.1). It was found that lactate was consumed to produce acetate as
the sole fermentation byproduct when growing Shewanella in the sealed bottle bioreactor.
The declining OD600 of the planktonic cells in the reactor indicated that more cells would
be grown in the biofilms with the replenishment of the medium.
After five refreshment of the medium, both the planktonic cells and the biofilm
cells were collected in duplicate from the liquid culture and the carbon cloth, respectively,
followed by isotopomer analysis of proteiogenic amino acids using a previously developed
protocol[127-129]. In general, the biomass was hydrolysed using 6 M HCl (24 h at 100
°C). The amino acids were derivatized in 20 µl of tetrahydrofuran and 20 µL of N-(tert-
butyldimethylsilyl)-N-methyl-trifluoroacetamide (Sigma-Aldrich). A gas chromatograph
(GC2010, Shimadzu) equipped with a SH-Rxi-5Sil column (Shimadzu) and a mass
spectrometer (QP2010, Shimadzu) was used for analyzing the labeling profiles of
metabolites. Three types of charged fragments were detected by GC-MS for Ala, Gly, Ser,
Asp and Glu: the [M-57]+ group (containing unfragmented amino acids); and the [M-159]+
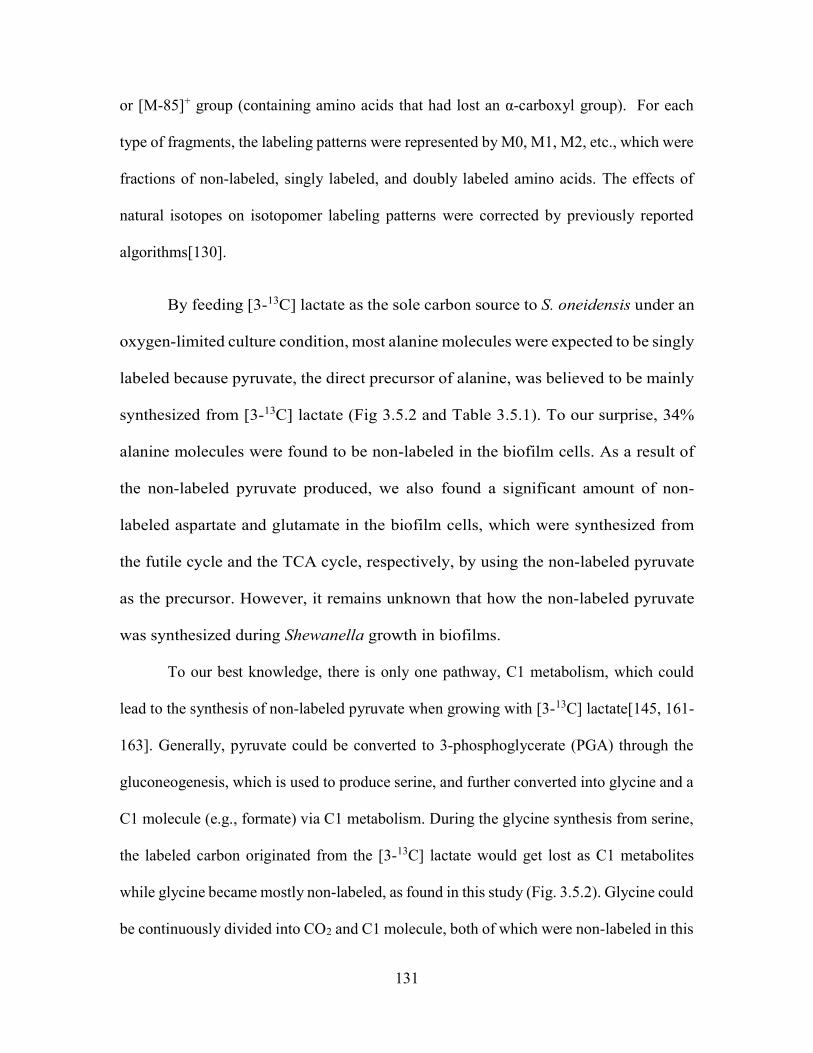
131
or [M-85]+ group (containing amino acids that had lost an α-carboxyl group). For each
type of fragments, the labeling patterns were represented by M0, M1, M2, etc., which were
fractions of non-labeled, singly labeled, and doubly labeled amino acids. The effects of
natural isotopes on isotopomer labeling patterns were corrected by previously reported
algorithms[130].
By feeding [3-13C] lactate as the sole carbon source to S. oneidensis under an
oxygen-limited culture condition, most alanine molecules were expected to be singly
labeled because pyruvate, the direct precursor of alanine, was believed to be mainly
synthesized from [3-13C] lactate (Fig 3.5.2 and Table 3.5.1). To our surprise, 34%
alanine molecules were found to be non-labeled in the biofilm cells. As a result of
the non-labeled pyruvate produced, we also found a significant amount of non-
labeled aspartate and glutamate in the biofilm cells, which were synthesized from
the futile cycle and the TCA cycle, respectively, by using the non-labeled pyruvate
as the precursor. However, it remains unknown that how the non-labeled pyruvate
was synthesized during Shewanella growth in biofilms.
To our best knowledge, there is only one pathway, C1 metabolism, which could
lead to the synthesis of non-labeled pyruvate when growing with [3-13C] lactate[145, 161-
163]. Generally, pyruvate could be converted to 3-phosphoglycerate (PGA) through the
gluconeogenesis, which is used to produce serine, and further converted into glycine and a
C1 molecule (e.g., formate) via C1 metabolism. During the glycine synthesis from serine,
the labeled carbon originated from the [3-13C] lactate would get lost as C1 metabolites
while glycine became mostly non-labeled, as found in this study (Fig. 3.5.2). Glycine could
be continuously divided into CO2 and C1 molecule, both of which were non-labeled in this

132
study. Considering the high reversibility of the C1 metabolism, the non-labeled C1
metabolites could be incorporated with non-labeled glycine to synthesize non-labeled
serine (i.e., reversed C1 metabolism), which would then be used to synthesize the non-
labeled pyruvate via serine dehydratase (SDH, EC 4.3.1.17)[164, 165]. This is possible in
the present study because we grew Shewanella in biofilms with very low concentration of
[3-13C] lactate (~0.8 mM), which was rapidly consumed for cell growth within 5~10 hours
but also produced non-labeled C1 metabolites via the C1 metabolic pathway. Once lactate
utilization stage was finished, Shewanella growing in biofilms would use the generated C1
metabolites as the secondary carbon source to continue the production of building blocks
for cell growth. As a result of the combined effects of lactate utilization and C1 metabolites
utilization, the proteinogenic amino acids, such as alanine, aspartate and glutamate,
demonstrated a high percentage of non-labeled molecules (34%, 31%, and 28%,
respectively). It is also worth noting that although most of detected glycine (84%) is non-
labeled, there was 13% single-labeled glycine detected, which could be synthesized from
glyoxylate shunt of TCA cycle as that has been discovered in previous studies.[145, 161,
163]
Compared to the isotopomer labeling patterns of the biofilm cells, the non-labeled
proteinogenic amino acids (e.g., Ala, Glu, and Asp) were also detected in the
planktonic cells of S. oneidensis MR-1, which could come from two sources. First,
the C1 metabolism could be active in the planktonic cells and generate non-labeled
amino acids. Secondly, considering the cohesiveness of the biofilm, some cells
could be washed out from the biofilm and become the planktonic cells[166, 167],
which brought non-labeled amino acids as detected in the planktonic cells. Indeed,
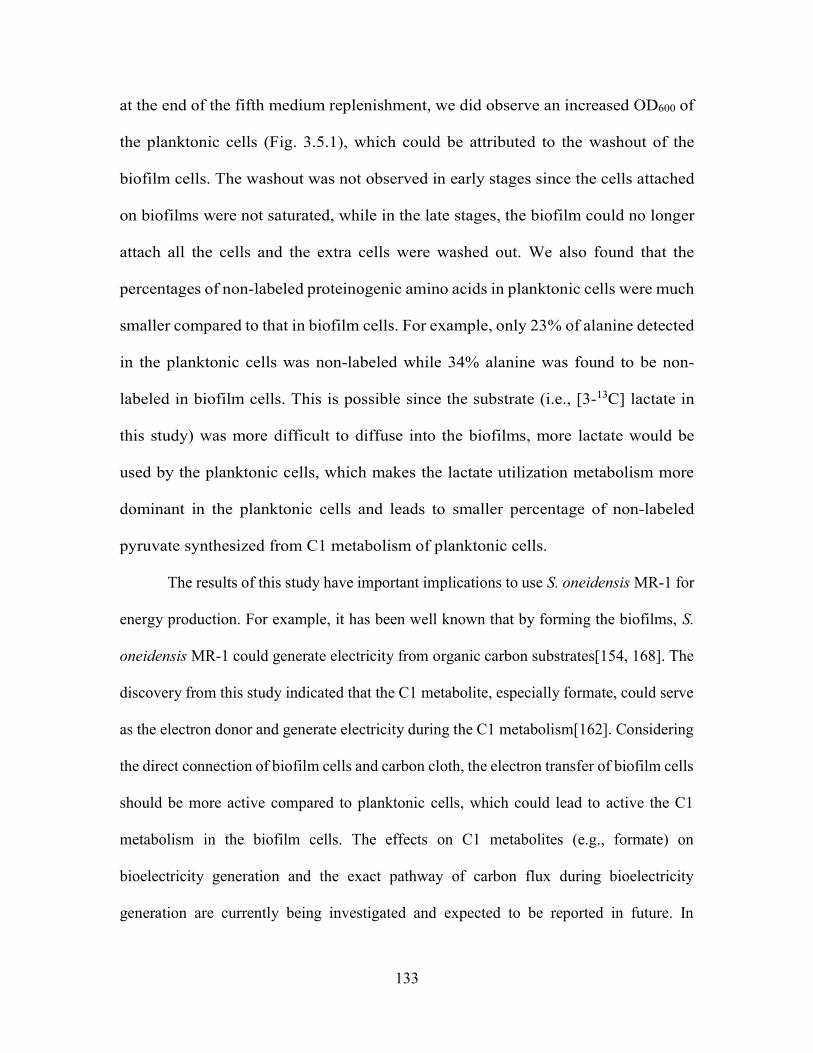
133
at the end of the fifth medium replenishment, we did observe an increased OD600 of
the planktonic cells (Fig. 3.5.1), which could be attributed to the washout of the
biofilm cells. The washout was not observed in early stages since the cells attached
on biofilms were not saturated, while in the late stages, the biofilm could no longer
attach all the cells and the extra cells were washed out. We also found that the
percentages of non-labeled proteinogenic amino acids in planktonic cells were much
smaller compared to that in biofilm cells. For example, only 23% of alanine detected
in the planktonic cells was non-labeled while 34% alanine was found to be non-
labeled in biofilm cells. This is possible since the substrate (i.e., [3-13C] lactate in
this study) was more difficult to diffuse into the biofilms, more lactate would be
used by the planktonic cells, which makes the lactate utilization metabolism more
dominant in the planktonic cells and leads to smaller percentage of non-labeled
pyruvate synthesized from C1 metabolism of planktonic cells.
The results of this study have important implications to use S. oneidensis MR-1 for
energy production. For example, it has been well known that by forming the biofilms, S.
oneidensis MR-1 could generate electricity from organic carbon substrates[154, 168]. The
discovery from this study indicated that the C1 metabolite, especially formate, could serve
as the electron donor and generate electricity during the C1 metabolism[162]. Considering
the direct connection of biofilm cells and carbon cloth, the electron transfer of biofilm cells
should be more active compared to planktonic cells, which could lead to active the C1
metabolism in the biofilm cells. The effects on C1 metabolites (e.g., formate) on
bioelectricity generation and the exact pathway of carbon flux during bioelectricity
generation are currently being investigated and expected to be reported in future. In

134
summary, by applying 13C pathway analysis to investigate microbial metabolism of S.
oneidensis MR-1 growing in biofilms, we discovered that the activity of C1 metabolism
was interestingly higher than that in planktonic cells, which could be related to the
utilization of C1 metabolites as electron donor when growing Shewanella in biofilms.

135
Table 3.5.1. Mass distribution of detected metabolites for the 13C tracing experiments
(n = 2) a
Biofilm samples Planktonic samples M-57 M-159/85 M-57 M-159/85
Ala
M0 0.34 0.35 0.21 0.22 M1 0.59 0.58 0.68 0.70 M2 0.05 0.07 0.09 0.08 M3 0.01 0.02
Gly
M0 0.84 0.87 0.85 0.88 M1 0.13 0.13 0.14 0.12 M2 0.03 0.01
Ser
M0 0.33 0.39 0.29 0.29 M1 0.58 0.56 0.66 0.66 M2 0.08 0.06 0.04 0.05 M3 0.01 0.01
Asp
M0 0.31 0.33 0.23 0.23 M1 0.19 0.25 0.22 0.31 M2 0.22 0.28 0.31 0.31 M3 0.25 0.14 0.21 0.15 M4 0.02 0.02
Glu
M0 0.28 0.29 0.19 0.20 M1 0.14 0.16 0.13 0.16 M2 0.17 0.26 0.26 0.33 M3 0.27 0.27 0.31 0.30 M4 0.12 0.03 0.10 0.02 M5 0.02 0.00
a The error in mass distribution from duplicates was <5%.

136
Fig. 3.5.1 Fermentation profile of S. oneidensis MR-1 in the sealed bottle reactor.

137
Fig. 3.5.2 Central carbon metabolic pathways of S. oneidensis MR-1 from
biofilm and planktonic growth. The 13C and 12C atoms were labeled as filled and
empty dots, respectively. The lactate utilization pathways were colored as blue while
the C1 metabolic pathways were colored as red. The number on the left side of each
isotopomer (green) was the M-57 values of proteinogenic amino acids from the
biofilm cells while the number on the right side of each isotopomer (blue) was the
M-57 value of proteinogenic amino acids from the planktonic cells. Definitions of
abbreviations are shown in the List of Abbreviations.

138
3.6 13C Pathway Analysis for the Role of Formate in Electricity
Generation by Shewanella oneidensis MR-1 Using Lactate in Microbial
Fuel Cells
Shuai Luoa, *, Weihua Guob, *, Kenneth Nealsonc, Xueyang Fengb, †, and Zhen Hea, †
a Department of Civil and Environmental Engineering, Virginia Polytechnic Institute and
State University, Blacksburg, VA 24061, USA
b Department of Biological System Engineering, Virginia Polytechnic Institute and State
University, Blacksburg, VA 24061, USA
c Department of Earth Sciences, University of Southern California, Los Angeles, CA
90089, USA.
†Correspondence to: Xueyang Feng and Zhen He.
* LS and WG contribute to this work equally.
Phone: +1-(540)231-2974 and +1-(540)231-1346
Email: [email protected] and [email protected]
This manuscript has been published on Scientific reports 6, 20941.

139
Abstract
Microbial fuel cell (MFC) is a promising technology for direct electricity generation from
organics by microorganisms. The type of electron donors fed into MFCs affects the
electrical performance, and mechanistic understanding of such effects is important to
optimize the MFC performance. In this study, we used a model organism in MFCs,
Shewanella oneidensis MR-1, and 13C pathway analysis to investigate the role of formate
in electricity generation and the related microbial metabolism. Our results indicated a
synergistic effect of formate and lactate on electricity generation, and extra formate
addition on the original lactate resulted in more electrical output than using formate or
lactate as a sole electron donor. Based on the 13C tracer analysis, we discovered decoupled
cell growth and electricity generation in S. oneidensis MR-1 during co-utilization of lactate
and formate (i.e., while the lactate was mainly metabolized to support the cell growth, the
formate was oxidized to release electrons for higher electricity generation). To our best
knowledge, it is the first time that 13C tracer analysis was applied to study microbial
metabolism in MFCs and it was proved to be a valuable tool to understand the metabolic
pathways affected by electron donors in the selected electrochemically-active
microorganisms.

140
3.6.1 Introduction
Microbial fuel cells (MFCs) are an emerging technology to convert organics in the
wastewater to electrical energy[169, 170]. Electrochemically active bacteria (EAB) serve
as effective microbial catalysts to transfer electrons from substrates to solid electron
acceptors (e.g., anode electrode) under anaerobic conditions of MFCs[171-174]. Electron
transferring mechanism between EAB and the electrode is one of the most important steps
in electricity generation by MFCs, and can be critically influenced by the type of the
electron donors that will result in difference in the composition, structure, and metabolism
of microorganisms on the anode electrode[175-177]. Therefore, understanding of the
impact from electron donors on electricity generation in MFCs is important to improve the
efficiency of energy recovery[178-180].
Shewanellaceae is a typical family including several model bacterial species that
can generate electricity in MFCs such as Shewanella oneidensis MR-1[177, 181, 182]. S.
oneidensis MR-1 can transport electrons via intracellular metabolic reactions to complete
extracellular electron transfer (EET) pathways[183], via multiple electron-transferring
mechanisms including direct contact on the electron acceptor[184], redox reactions of
mediators (e.g., flavin) to transfer electrons[185-187], and/or conductive nanowire
extension to contact the electron acceptor[188]. Versatile electron transferring abilities
allow S. oneidensis MR-1 to use multiple organics as electron donors (e.g., lactate,
pyruvate, acetate, formate) to process dissimilatory reactions to reduce insoluble metals
(e.g. Fe(III), Mn(IV)) and some inorganic ions (e.g., nitrate, nitrite) as electron
acceptors[150, 181, 189-191]. Among those electron donors, lactate has been extensively
studied. It was found that S. oneidensis MR-1 prefers to catabolize lactate because of a

141
series of internally competent enzymatic reactions that utilize the electron donors to obtain
energy for growth and electricity generation[183, 192, 193]. Under anaerobic conditions,
including the anaerobic anode of MFCs, lactate can be utilized to release electrons with the
involvement of NADH, specific cytochromes, as well as various complexes, and the lactate
is further oxidized to acetyl-CoA, and CO2 or formate[182, 183, 194]. To assess electricity
generation efficiency, Coulombic efficiency (CE) and Coulombic recovery (CR) are
quantitative indicators to show the fraction of collected electrons through EET versus total
ideal electron production[195-197]. It was reported that the lactate-fed MFC inoculated
with S. oneidensis MR-1 achieved CE at the range about 15-20%[184, 198], where there is
still a lot of room to improve electricity generation efficiency.
In addition to lactate, formate is another potentially important electron donor to
serve carbon and energy source for S. oneidensis MR-1[181, 183, 199]. S. oneidensis MR-
1 has NAD+-dependent formate dehydrogenase (FDH) to catalyze the formate oxidation to
CO2, and release electrons to complete EET pathway[182]. On the basis of EET started
from lactate and pyruvate utilization, the catabolic metabolism of formate with the help of
FDH can release and transfer more electrons to specific electron acceptors, which is
possibly helpful to improve CE/CR of S. oneidensis MR-1 in MFCs[182, 194]. Thus, it is
hypothesized that extra formate addition on lactate utilization can boost the electrical
output and improve CE/CR. However, formate is seldom studied for its effect on electricity
generation of S. oneidensis MR-1 in MFCs.
This study aims to investigate the role of formate for the catabolic metabolism and
electricity generation of S. oneidensis MR-1 in MFC. Particularly, we applied 13C tracer
experiment, which is a method widely used to facilitate the elucidation of metabolic

142
rewiring in various non-model environmental microorganisms[7, 200, 201]. Normally, by
feeding the 13C labeled substrate into culture system, the carbon flow in the intracellular
metabolism is traced to produce labeled metabolites (e.g., proteinogenesis amino acids).
By analyzing these metabolites using gas chromatography-mass spectrometry (GC-
MS) and the following natural isotopic correction of the raw mass spectrums, the isotopic
labeling patterns (e.g., mass distribution vector) would be obtained and could be directly
analyzed to reveal the metabolic rewiring of the target strains. Our previous study has, for
the first time, applied the 13C tracer experiments to a well-designed anaerobic system for
revealing the distinct intracellular metabolic behaviors between the biofilm and planktonic
S. oneidensis MR-1 cells[202]. The 13C tracer experiment successfully revealed the cell
metabolisms of S. oneidensis MR-1, and a conclusion was made that C1 metabolism such
as formate oxidation is strongly related to the electron transferring to the extracellular
environment. Therefore, in this study, 13C tracer experiment was applied to help us
rigorously analyze the effects of formate on microbial metabolism of S. oneidensis MR-1
using lactate for electricity generation in an MFC. As the novel contribution presented in
this work, we discovered, for the first time, that the addition of formate in MFCs could
indeed synergize with the lactate utilization to improve the electricity generation
efficiency, which was achieved by a unique metabolism in S. oneidensis MR-1 to decouple
cell growth and electricity generation during co-utilization of lactate and formate.
3.6.2 Results and Discussion
Combined Supply of Formate and Lactate Enhanced Current Generation. The
MFC was operated for three conditions, each of which was operated for at least three
repeated cycles and the current profile was recorded (Fig. 3.6.1). The added formate and

143
lactate in the anode chamber was completely consumed in each cycle based on the HPLC
results, indicating that the current drop at the end of each cycle was caused by the complete
consumption of electron donors (Fig. 3.6.1). In the control reactor that did not have
electricity generation (electrodes were under an open circuit condition), the electron donors
were also consumed, possibly because of oxygen intrusion from the cathode (with
continuous aeration) into the control chamber acting as the electron acceptor[203]. Though
the oxygen diffusion through cation exchange membrane (CEM) was very limited[204,
205], the electron donor for each cycle could still be consumed up because of very small
amount (~ 0.8 mM) of carbon source added into the control and anode chambers. Electricity
generation in the MFC clearly competed for electron donors, and the comparable CR
(Coulombic recovery) with other MFC studies of S. oneidensis MR-1 indicates that the
anode electrode has strong ability to compete with oxygen for the electron donors to collect
electrons (data of CR were shown in the following section)[184, 198].
The peak current of the MFC was increased from 0.194 ± 0.005 mA using lactate
alone to 0.231 ± 0.019 mA with additional formate as the extra electron donor (p<0.05,
one-tailed two-sample t-test with unequal variance at α=0.05 for all following statistical
tests). Sole supply of formate significantly decreased the peak current to 0.147 ± 0.067
mA, lower than other conditions (p<0.05). When extra lactate was added with formate at
the last two cycles, the current was boosted up again, to 0.290 ± 0.056 mA, significantly
higher than the current production with sole formate supply (p<0.05). The catholyte pH
was stable at 7.2-7.4 due to generally low current output and strong buffering capacity of
phosphate buffer saline (PBS) [206], which eliminated the limiting effects of the cathode.
The profile of current generation with the combination of formate and lactate is higher than

144
that with only lactate or formate, indicating that formate and lactate could have achieved
synergistic effect when metabolized by S. oneidensis MR-1 to benefit the electricity
generation in the MFC.
Formate Addition Resulted in Higher Conversion Efficiency. To further
understand the impact of formate on the MFC performance containing S. oneidensis MR-
1, CR (Coulombic recovery) and TC (total coulombs) are used to reflect the conversion
efficiency from electron donors to electrical output, with the equations below to calculate
both indexes for each cycle (eqs. 1-3) [195-197]:
𝐼 = (1)
TC of each cycle = ∑ 𝐼 ∗ 𝑡 (2)
CR for consumption of formate and lactate = ∑ ∗ ∗
(∆ ∗ ∆ ∗ )∗ ∗ (3)
where in Eq. 1, V represents the voltage (V); R is the external resistance (R = 8.2 Ω); where
in Eq. 2, t represents the voltage measurement interval (t=120 s) of the digital multimeter;
I represents the current (A) measured for each measurement interval, with the assumption
that the current is the same within a time interval; and where in Eq. 3, ∆CFormate and ∆CLactate
(mM) represent the moles of formate and lactate added into the reactor at the beginning of
each cycle, respectively; N1 and N2 represent the mole of electrons transferring per mole
substrate consumption, respectively, where N1=2 (formate CO2 + 2H+ +2e-)[207-209],
and N2=4 (lactate +2H2O Acetate-+ HCO3- + 5H+ +4e-, incomplete oxidation in
anaerobic condition) [184, 198, 210, 211]; V represents the reactor volume (0.14L); F
represents the Faraday constant (96485 Coulombs per mole electrons).
Combining non-labeled formate and lactate resulted in higher CR of 34.9 ± 6.0 %
than that of lactate alone (19.2 ± 0.9 %) (p<0.05), indicating that extra formate addition on

145
lactate supply can enhance the efficiency of substrate conversion to electrons, which can
be ultimately harvested by the solid electron acceptor in the anode chamber (Fig. 3.6.2).
Supplying formate as the sole electron donor was found to have a lower CR of 19.3 ± 6.8
% (p<0.05) than that condition of combined formate and lactate, suggesting that lactate
was also needed for S. oneidensis MR-1 to achieve good electron transferring efficiency.
The TC with formate addition to lactate was 30.8 ± 5.4 C, much higher than the sum of TC
(16.5 ± 2.1 C) via solely supplying formate (5.6 ± 1.9 C) and lactate (10.9 ± 0.2 C) (p<0.05)
(Fig. 2). These results demonstrate that the increased electricity generation with combined
formate with lactate was not simply “1+1=2”; instead, the combination achieved “1+1>2”.
This further confirms the pivotal role of formate in the electricity generation by S.
oneidensis MR-1. Lactate is a commonly acknowledged an electron donor in MFCs, being
involved in the central metabolism of S. oneidensis MR-1[184, 190, 198, 212, 213], while
formate is more likely an electron transferring driving stimulus, which is related to the
existence of FDH to convert the formate in periplasmic region to CO2, and finally the
electrons are released extracellularly[182, 194, 214]. Therefore, to explain the synergistic
effects of lactate and formate in electricity generation in MFCs, we hypothesize that lactate
may be more involved in central metabolism while formate may be more related to EET.
13C Tracer Experiments Facilitated the Elucidation of the Role for Formate.
To examine our hypothesis, we applied 13C tracer experiment to investigate the intracellular
metabolism of S. oneidensis MR-1 when metabolizing formate and lactate in the MFC. The
addition of 13C formate to non-labeled lactate also improved MFC electricity generation
with the peak current of 0.308 ± 0.084 mA (Fig. 3.6.3), suggesting that the labeled formate
was also favored by S. oneidensis MR-1 to produce electricity. When the labeled formate

146
was used with non-label lactate, similar improvements in both CR and TC were obtained
(Fig. 3.6.2). By examining the corrected mass distribution vectors from the isotopic
analysis, no labeled carbon was found in the proteinogensis amino acids (Table. 3.6.1),
which are the building blocks for the cell growth of both planktonic and biofilm cells in
the MFC. This indicates that formate did not participate in the central metabolism to
produce the building blocks for the cell growth. Instead, non-labeled lactate was mainly
used for growth of the S. oneidensis MR-1. In other words, the cell growth and electricity
generation could be decoupled when culturing S. oneidensis MR-1 with combined formate
and lactate in MFCs. Indeed, it has been reported that lactate was a preferential carbons
substrate than formate for cell growth of S. oneidensis MR-1. The biomass yield of S.
oneidensis MR-1 cultivating under oxygen limited conditions reached >0.22 g/g when
using lactate as the carbon substrate while only reached <0.11 g/g when using formate as
the carbon substrate[215]. On the other hand, the expression levels of FDH genes in S.
oneidensis MR-1 have been found to be up-regulated in MFCs[214]. Recently, a
recombinant S. oneidensis MR-1 that harbored additional copies of FDH genes was found
to generate electricity at a higher current density[182]. Therefore, it clearly suggested that
the pivotal roles of formate played in supplying electrons through FDH in MFCs.
Considering the importance of lactate and formate on cell growth and electricity
generation, respectively, it is interesting but unsurprising to find in this study that these two
carbon substrates could synergize with each other to improve current generation via a
decoupled metabolism of cell growth and electricity generation.
According to a proposed pathway shown in Fig. 4, lactate is metabolized in the
central metabolism of S. oneidensis MR-1 as its favorable substrate for cell growth[181,

147
182, 184, 190, 194, 198, 212, 213, 216], while formate is more likely used as an electron-
transfer driving stimulus from either extracellular exchange or the central metabolism to
release the electron in periplasm by FDH[182, 194, 214]. In this scheme, the unlabeled
lactate would be directly metabolized via central metabolism to produce various unlabeled
building block (e.g., unlabeled amino acids) as we observed, and the labeled formate would
be transported into periplasm and oxidized by inner membrane FDH to CO2 with the
release of electrons, and eventually labeled carbon was lost in the form of CO2 in the MFC
system. The released electrons from formate would be further transported by EET to the
anode electrode or riboflavin intermediate to enhance electricity generation. Therefore,
such decoupled cell growth and electricity generation is responsible for the synergistic
improvement of electricity generation with the addition of formate during the lactate uptake
by S. oneidensis MR-1 in MFCs.
In summary, this study has contributed to an initial understanding of the role of
formate in the electricity generation by S. oneidensis MR-1 using lactate in MFCs. The
results show that the co-supply of two substrates would affect the EET behaviors, and
ultimately the electricity generation in the MFC, implying the conception of synergy in
substrates. Mutually complementary substrates may take advantage of substrate interaction
in the cell metabolism, and generate a total effect greater than the sum of the individual
contribution of single substrate for electricity generation. This may raise a question if other
combinations of synergistic substrates also exist to enhance the MFC performance for pure
or mixed culture. Moreover, 13C tracer experiment proves to be an effective technique to
explore the influence of substrates on EET behavior of a selected species. Future studies
can target what substrate has greater stimulating effect on EET behavior qualitatively and

148
quantitatively to potentially improve the electricity generation. It will not only help reveal
the pathway of EET and carbon flow, but also formulate a strategy for adjusting substrate
combination to achieve optimal electricity generation under a certain special conditions
(e.g., known composition of substrates being used for MFC application).
3.6.3 Methods
Bacterial Strains and Growing Conditions in the MFC . S. oneidensis MR-1
(kindly provided by Dr. Y.J. Tang’s lab, Washington University, St. Louis, MO, USA) was
initially grown in the shaking flasks with minimal medium containing 5mM sodium L-
lactate (Sigma-Aldrich) for two days at 100 rpm and 30 °C [191, 212]. The culture medium
was then transferred to completely fill up the autoclaved anode chamber and the control
chamber of the MFC (see Fig. 3.6.S1), where both chambers were operated under oxygen-
limited condition at 30 °C.
MFC Setup and Operation. A triple-chamber MFC was constructed by
connecting three glass bottles together with two CEMs as separators (UltexCMI7000,
Membranes International, Inc., GlenRock, NJ, USA) between each set of two bottles (see
Fig. 3.6.S1). The liquid volume of three chambers was 140 mL/each. The middle chamber
served as a cathode chamber, while one bottle containing an anode electrode connected to
the cathode electrode was the functioning anode and the other bottle (also containing an
anode electrode but under the open circuit condition) was the control chamber. The anode
and cathode chambers were sealed with creamy epoxy to create oxygen-limited
environment. The anode electrode was a piece of rectangular carbon cloth (2.5 cm × 4.5
cm PANEX® 30PW06, Zoltek Corporation, St. Louis, MO, USA), and the cathode
electrode using the same carbon cloth coated with platinum/carbon as the catalyst for

149
oxygen reducing reaction (0.1 mg Pt cm-2). The cathode chamber was continually aerated
to provide sufficient oxygen for cathodic reaction. The catholyte was 50 mM PBS (2.65 g
L-1 KH2PO4 and 5.35 g L-1 K2HPO4), to buffer the catholyte pH to eliminate the limiting
effect of cathode.
The MFC was operated under a batch mode with the external resistance of 8.2 Ω.
Non-labelled electron donors were first applied, and three conditions were tested: 1) 0.8
mM lactate in 1st - 3rd cycles; 2) 0.8 mM lactate + 0.8 mM formate in 4th - 6th and 14th - 15th
cycles; 3) 0.8 mM formate in 7th - 13th cycles. Once the current dropped to the baseline (~
0.04 mA) in each cycle, the medium in the anode chamber and the control chamber was
refreshed by removing 10 mL medium with sterile syringe and then injecting 10 mL fresh
filtered (0.22 μm pore size) medium into the chambers. Depending on the substrate, each
cycle time period was 16 - 60 hours. To accelerate electron transfer, 0.2 μm riboflavin was
added as an electron mediator to the anode and the control chambers at the beginning of
the entire experiment (there was no more addition until the end of the experiment).
13C Tracer Experiment. Isotopic-labelled formate as an electron donor was
supplied after finishing the cycles with non-isotopic labeled electron donors in the MFC.
The combination of 0.8 mM [13C] sodium formate (99% purity, Cambridge Isotope
Laboratory, USA) and 0.8 mM non-labeled sodium L-lactate was supplied to the anode
and the control chambers at the beginning of a new cycle. After nine-cycle tests, both the
liquid culture and carbon cloth in the anode and the cathode chambers were extracted to
collect the planktonic and the biofilm cells, respectively, followed by the protocol
developed previously for the isotopic analysis of proteiogenic amino acids[202, 217, 218].
In general, the biomass was hydrolyzed using 6 M HCl (20 h at 100 °C). The amino acids

150
were derivatized in 50 µl of tetrahydrofuran and 50 µL of N-(tert-butyldimethylsilyl)-N-
methyl-trifluoroacetamide (Sigma-Aldrich). A gas chromatograph (GC2010, Shimadzu)
equipped with a SH-Rxi-5Sil column (Shimadzu) and a mass spectrometer (QP2010,
Shimadzu) was used for analyzing the labeling profiles of metabolites. Three types of
charged fragments were detected by GC-MS for Ala, Gly, Ser, Asp and Glu: the [M-57]+
group (containing unfragmented amino acids); and the [M-159]+ or [M-85]+ group
(containing amino acids that had lost an α-carboxyl group). For each type of fragments,
the labeling patterns were represented by M0, M1, M2, etc., which were fractions of non-
labeled, singly labeled, and doubly labeled amino acids. The effects of natural isotopes on
isotopic labeling patterns were corrected by previously reported algorithms[48].
Data Measurement. The voltage of the MFC was recorded by a digital multimeter
(2700, Keithley Instruments, Inc., Cleveland, OH, USA) with measurement interval of 2
min. The concentrations of formate and lactate at the beginning and the end of each cycle
were measured by high-performance liquid chromatorgraphy (HPLC) (Shimadzu,
Columbia, MD) equipped with an Aminex HPX-87H column (Bio-Rad, Hercules, CA) and
refractive index detector (RID, 10A, Shimadzu), with the following program: column
temperature, 65℃; mobile phase, 0.5 mM sulfuric acid solution; flow rate, 0.6mL/min. The
electrolyte pH was measured by using a pH meter (Oakton Instruments, Vernon Hills, IL,
USA).
Acknowledgements
S.L. was supported by a fellowship from Water INTERface IGEP, Graduate School
of Virginia Tech. The MFC and isotopic analysis work was financially supported by faculty
startup fund (#175323) from Virginia Tech.

151
Table 3.6.1 Mass distribution vectors of the key proteogenic amino acids. Cell
sources Anode-biofilm
Anode-planktonic
Control-biofilm Control-
planktonic Fragments M-57 M-159 M-57 M-159 M-57 M-159 M-57 M-159
Ala
M0 0.93 0.95 0.96 0.95 0.95 0.95 0.94 0.94 M1 0.06 0.03 0.04 0.02 0.05 0.03 0.05 0.03 M2 0.01 0.03 0.00 0.03 0.00 0.03 0.00 0.03 M3 0.00 0.00 0.00 0.01
Gly
M0 1.00 1.00 0.98 0.98 0.95 1.00 0.95 0.97 M1 0.00 0.00 0.02 0.02 0.05 0.00 0.05 0.03 M2 0.00 0.00 0.00 0.00
Ser
M0 0.98 0.99 0.97 0.98 0.88 0.94 0.93 0.96 M1 0.04 0.02 0.03 0.02 0.17 0.06 0.06 0.04 M2 0.00 0.00 0.00 0.00 0.00 0.00 0.01 0.00 M3 0.00 0.00 0.00 0.01
Asp
M0 0.96 0.94 0.92 0.94 0.84 0.91 0.88 0.93 M1 0.04 0.05 0.09 0.04 0.16 0.05 0.10 0.06 M2 0.00 0.01 0.00 0.00 0.00 0.02 0.03 0.00 M3 0.00 0.01 0.00 0.01 0.00 0.01 0.00 0.01 M4 0.00 0.00 0.00 0.00
Glu
M0 0.94 0.98 0.96 0.95 0.92 0.96 0.92 0.89 M1 0.06 0.01 0.03 0.05 0.10 0.03 0.08 0.10 M2 0.00 0.01 0.00 0.00 0.00 0.00 0.00 0.00 M3 0.00 0.00 0.01 0.00 0.01 0.00 0.00 0.00 M4 0.00 0.00 0.00 0.00 0.00 0.00 0.01 0.00 M5 0.00 0.00 0.00 0.00

152
Fig. 3.6.1 Current generation in the MFC supplied with various electron donors. Note:
“L” means lactate; “F” means formate; “(F+L)” means addition of both substrate together;
“0.8mM” means 0.8 mM of each substrate added each cycle.

153
Fig. 3.6.2 CR and TC obtained in the MFC under different supplies of formate and
lactate. Note: “L” means lactate; “F” means formate; “(F+L)” means addition of both
substrate together; “13C” represents the isotopomer addition; “0.8mM” means 0.8 mM of
each substrate added each cycle.

154
Fig. 3.6.3 Current generation in the MFC supplied with 0.8 mM 13C isotopic formate
and 0.8mM non-labelled lactate.

155
Fig. 3.6.4 Proposed pathway of formate in the metabolism of S. oneidensis MR-1 after
13C formate experimental analysis. Definitions of abbreviations are shown in the List of
Abbreviations.
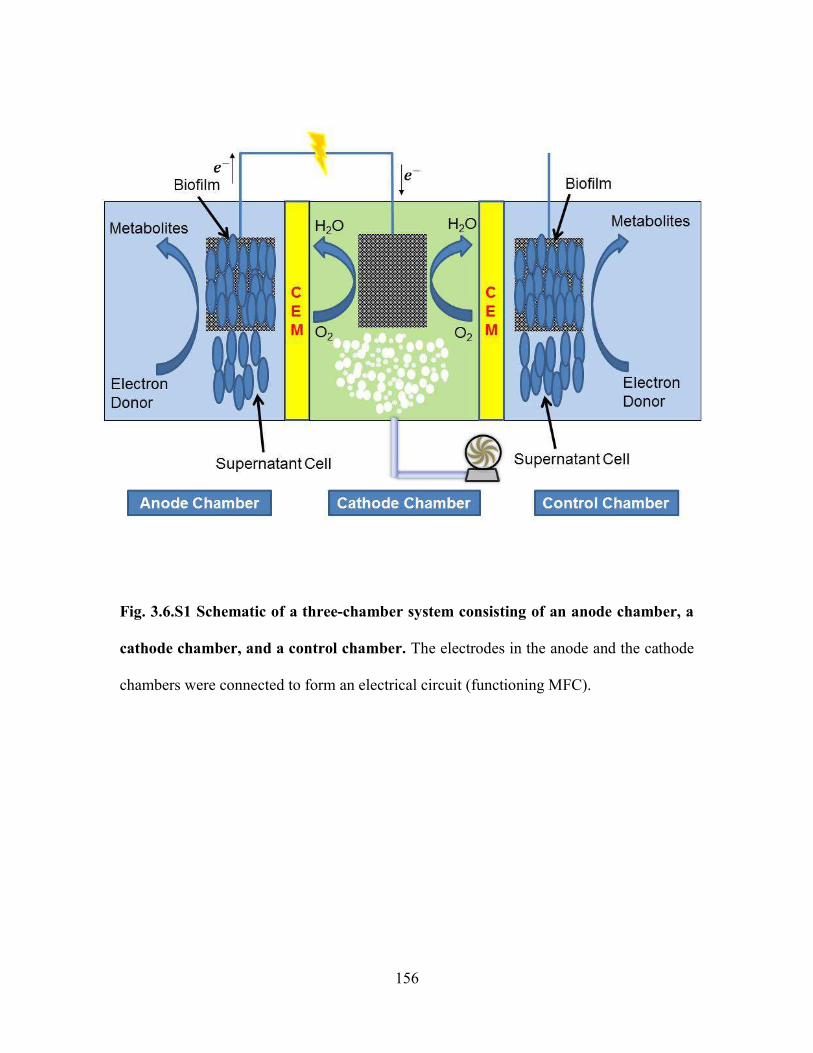
156
Fig. 3.6.S1 Schematic of a three-chamber system consisting of an anode chamber, a
cathode chamber, and a control chamber. The electrodes in the anode and the cathode
chambers were connected to form an electrical circuit (functioning MFC).

157
References
1. Wittmann, C. and E. Heinzle, Mass spectrometry for metabolic flux analysis. Biotechnology and Bioengineering, 1999. 62(6): p. 739-750.
2. Wiechert, W., 13C Metabolic Flux Analysis. Metabolic Engineering, 2001. 3(3): p. 195-206.
3. Dauner, M. and U. Sauer, GC-MS analysis of amino acids rapidly provides rich information for isotopomer balancing. Biotechnology Progress, 2000. 16: p. 642-649.
4. de Graaf, A.A., Use of 13C labelling and NMR Spectroscopy in Metabolic Flux Analysis, in NMR in Biotechnology: Theory and Applications, J.N. Barbotin and J.C. Portais, Editors. 2000, Horizon Scientific Press: Norwich, UK.
5. Christensen, B. and J. Nielsen, Isotopomer Analysis Using GC-MS. Metabolic Engineering, 1999. 1(4): p. 282-290.
6. SZYPERSKI, T., 13C-NMR, MS and metabolic flux balancing in biotechnology research. Quarterly Reviews of Biophysics, 1998. 31(01): p. 41-106.
7. Feng, X., et al., Metabolic pathway determination and flux analysis in nonmodel microorganisms through 13C-isotope labeling. Methods Mol Biol, 2012. 881: p. 309-30.
8. You, L., et al., Metabolic pathway confirmation and discovery through 13C-labeling of proteinogenic amino acids. J Vis Exp, 2012(59): p. e3583.
9. Sauer, U., Metabolic networks in motion: 13C‐based flux analysis. Vol. 2. 2006. 10. Tang, Y.J., et al., Advances in analysis of microbial metabolic fluxes via 13C
isotopic labeling. Mass Spectrometry Reviews, 2009. 28(2): p. 362-375. 11. Palmqvist, E., et al., Main and interaction effects of acetic acid, furfural, and p-
hydroxybenzoic acid on growth and ethanol productivity of yeasts. Biotechnology and Bioengineering, 1999. 63(1): p. 46-55.
12. Heer, D. and U. Sauer, Identification of furfural as a key toxin in lignocellulosic hydrolysates and evolution of a tolerant yeast strain. Microbial biotechnology, 2008. 1(6): p. 497-506.
13. Almeida, J.R.M., et al., Increased tolerance and conversion of inhibitors in lignocellulosic hydrolysates by Saccharomyces cerevisiae. Journal of Chemical Technology & Biotechnology, 2007. 82(4): p. 340-349.
14. Palmqvist, E. and B. Hahn-Hägerdal, Fermentation of lignocellulosic hydrolysates. I: inhibition and detoxification. Bioresource Technology, 2000. 74(1): p. 17-24.
15. Maiorella, B., H.W. Blanch, and C.R. Wilke, By-product inhibition effects on ethanolic fermentation by Saccharomyces cerevisiae. Biotechnology and Bioengineering, 1983. 25(1): p. 103-121.
16. Jönsson, L.J., B. Alriksson, and N.-O. Nilvebrant, Bioconversion of lignocellulose: inhibitors and detoxification. Biotechnology for Biofuels, 2013. 6(1): p. 1-10.
17. Keating, J.D., C. Panganiban, and S.D. Mansfield, Tolerance and adaptation of ethanologenic yeasts to lignocellulosic inhibitory compounds. Biotechnology and Bioengineering, 2006. 93(6): p. 1196-1206.

158
18. Krebs, H.A., S. Gurin, and L.V. Eggleston, The pathway of oxidation of acetate in baker's yeast. Biochemical Journal, 1952. 51(5): p. 614-628.
19. Palmqvist, E., J.S. Almeida, and B. Hahn-Hägerdal, Influence of furfural on anaerobic glycolytic kinetics of Saccharomyces cerevisiae in batch culture. Biotechnology and Bioengineering, 1999. 62(4): p. 447-454.
20. Sárvári Horváth, I., et al., Effects of Furfural on the Respiratory Metabolism of Saccharomyces cerevisiae in Glucose-Limited Chemostats. Applied and Environmental Microbiology, 2003. 69(7): p. 4076-4086.
21. Hohmann, S. and W.H. Mager, Yeast stress responses. Vol. 1. 2003: Springer Science & Business Media.
22. Liu, Z.L., Molecular mechanisms of yeast tolerance and in situ detoxification of lignocellulose hydrolysates. Applied Microbiology and Biotechnology, 2011. 90(3): p. 809-825.
23. Giannattasio, S., et al., Molecular mechanisms of Saccharomyces cerevisiae stress adaptation and programmed cell death in response to acetic acid. Frontiers in Microbiology, 2013. 4.
24. Sousa, M.J., et al., Stress and Cell Death in Yeast Induced by Acetic Acid. Cell Metabolism - Cell Homeostasis and Stress Response. 2012.
25. Semchyshyn, H.M., et al., Acetate but not propionate induces oxidative stress in bakers’ yeast Saccharomyces cerevisiae. Redox Report, 2011. 16(1): p. 15-23.
26. Lee, Y.J., et al., TCA cycle-independent acetate metabolism via the glyoxylate cycle in Saccharomyces cerevisiae. Yeast, 2011. 28(2): p. 153-166.
27. Bauer, B.E., et al., Weak organic acid stress inhibits aromatic amino acid uptake by yeast, causing a strong influence of amino acid auxotrophies on the phenotypes of membrane transporter mutants. European Journal of Biochemistry, 2003. 270(15): p. 3189-3195.
28. Chen, Y., L. Stabryla, and N. Wei, Improved acetic acid resistance in Saccharomyces cerevisiae by overexpression of the WHI2 gene identified through inverse metabolic engineering. Applied and Environmental Microbiology, 2016.
29. Chen, Y., et al., Transcriptional profiling reveals molecular basis and novel genetic targets for improved resistance to multiple fermentation inhibitors in Saccharomyces cerevisiae. Biotechnology for Biofuels, 2016. 9(1): p. 1-18.
30. Mira, N.P., M.C. Teixeira, and I. Sá-Correia, Adaptive Response and Tolerance to Weak Acids in Saccharomyces cerevisiae: A Genome-Wide View. OMICS: A Journal of Integrative Biology, 2010. 14(5): p. 525-540.
31. Zheng, D.-Q., et al., Drug resistance marker-aided genome shuffling to improve acetic acid tolerance in Saccharomyces cerevisiae. Journal of Industrial Microbiology & Biotechnology, 2010. 38(3): p. 415-422.
32. Mira, N.P., et al., Genome-wide identification of Saccharomyces cerevisiae genes required for tolerance to acetic acid. Microbial Cell Factories, 2010. 9(1): p. 1-13.
33. Hasunuma, T., et al., Metabolic pathway engineering based on metabolomics confers acetic and formic acid tolerance to a recombinant xylose-fermenting strain of Saccharomyces cerevisiae. Microbial Cell Factories, 2011. 10(1): p. 1-13.

159
34. Zhang, J.-G., et al., Improvement of acetic acid tolerance and fermentation performance of Saccharomyces cerevisiae by disruption of the FPS1 aquaglyceroporin gene. Biotechnology Letters, 2010. 33(2): p. 277-284.
35. Jarboe, L.R., P. Liu, and L.A. Royce, Engineering inhibitor tolerance for the production of biorenewable fuels and chemicals. Current Opinion in Chemical Engineering, 2011. 1(1): p. 38-42.
36. Martín, C., et al., Adaptation of a recombinant xylose-utilizing Saccharomyces cerevisiae strain to a sugarcane bagasse hydrolysate with high content of fermentation inhibitors. Bioresource Technology, 2007. 98(9): p. 1767-1773.
37. Lin, F.-M., B. Qiao, and Y.-J. Yuan, Comparative Proteomic Analysis of Tolerance and Adaptation of Ethanologenic Saccharomyces cerevisiae to Furfural, a Lignocellulosic Inhibitory Compound. Applied and Environmental Microbiology, 2009. 75(11): p. 3765-3776.
38. Heer, D., D. Heine, and U. Sauer, Resistance of Saccharomyces cerevisiae to High Concentrations of Furfural Is Based on NADPH-Dependent Reduction by at Least Two Oxireductases. Applied and Environmental Microbiology, 2009. 75(24): p. 7631-7638.
39. Gorsich, S.W., et al., Tolerance to furfural-induced stress is associated with pentose phosphate pathway genes ZWF1, GND1, RPE1, and TKL1 in Saccharomyces cerevisiae. Applied Microbiology and Biotechnology, 2006. 71(3): p. 339-349.
40. Banerjee, N., R. Bhatnagar, and L. Viswanathan, Inhibition of glycolysis by furfural in Saccharomyces cerevisiae. European Journal of Applied Microbiology and Biotechnology, 1981. 11(4): p. 226-228.
41. Taherzadeh, M.J., et al., Inhibition effects of furfural on aerobic batch cultivation of Saccharomyces cerevisiae growing on ethanol and/or acetic acid. Journal of Bioscience and Bioengineering, 2000. 90(4): p. 374-380.
42. Li, B.-Z. and Y.-J. Yuan, Transcriptome shifts in response to furfural and acetic acid in Saccharomyces cerevisiae. Applied Microbiology and Biotechnology, 2010. 86(6): p. 1915-1924.
43. Guo, W., J. Sheng, and X. Feng, 13C-Metabolic Flux Analysis: An Accurate Approach to Demystify Microbial Metabolism for Biochemical Production. Bioengineering, 2016. 3(1): p. 3.
44. Feng, X., et al., Metabolic Pathway Determination and Flux Analysis in Nonmodel Microorganisms Through 13C-Isotope Labeling, in Microbial Systems Biology, A. Navid, Editor. 2012, Humana Press. p. 309-330.
45. Zamboni, N., et al., 13C-based metabolic flux analysis. Nat. Protocols, 2009. 4(6): p. 878-892.
46. Chen, Y., L. Stabryla, and N. Wei, Improved acetic acid resistance in Saccharomyces cerevisiae by overexpression of the WHI2 gene identified through inverse metabolic engineering. Applied and environmental microbiology, 2016: p. AEM. 03718-15.
47. Feng, X. and H. Zhao, Investigating xylose metabolism in recombinant Saccharomyces cerevisiae via 13C metabolic flux analysis. Microbial Cell Factories, 2013. 12(1): p. 114-123.

160
48. Wahl, S.A., M. Dauner, and W. Wiechert, New tools for mass isotopomer data evaluation in 13C flux analysis: mass isotope correction, data consistency checking, and precursor relationships. Biotechnology and Bioengineering, 2004. 85(3): p. 259-268.
49. Cvijovic, M., et al., BioMet Toolbox: genome-wide analysis of metabolism. Nucleic Acids Research, 2010. 38(suppl 2): p. W144-W149.
50. Çakir, T., B. Kirdar, and K.Ö. Ülgen, Metabolic pathway analysis of yeast strengthens the bridge between transcriptomics and metabolic networks. Biotechnology and Bioengineering, 2004. 86(3): p. 251-260.
51. Casal, M., H. Cardoso, and C. Leao, Mechanisms regulating the transport of acetic acid in Saccharomyces cerevisiae. Microbiology, 1996. 142(6): p. 1385-1390.
52. Lambert, R.J. and M. Stratford, Weak-acid preservatives: modelling microbial inhibition and response. Journal of Applied Microbiology, 1999. 86(1): p. 157-164.
53. Mumberg, D., R. Müller, and M. Funk, Yeast vectors for the controlled expression of heterologous proteins in different genetic backgrounds. Gene, 1995. 156(1): p. 119-122.
54. Nikawa, J.-i., Y. Tsukagoshi, and S. Yamashita, Isolation and characterization of two distinct myo-inositol transporter genes of Saccharomyces cerevisiae. Journal of Biological Chemistry, 1991. 266(17): p. 11184-11191.
55. Kim, S.-R., et al., Rational and evolutionary engineering approaches uncover a small set of genetic changes efficient for rapid xylose fermentation in Saccharomyces cerevisiae. PLOS One, 2013. 8(2): p. e57048.
56. Bohlmann, J., et al., Anthranilate synthase from Ruta graveolens. Duplicated AS alpha genes encode tryptophan-sensitive and tryptophan-insensitive isoenzymes specific to amino acid and alkaloid biosynthesis. Plant Physiol, 1996. 111(2): p. 507-14.
57. Facchini, P.J., Alkaloid biosynthesis in plants: biochemistry, cell biology, molecular regulation, and metabolic engineering applications. Annual Review of Plant Physiology and Plant Molecular Biology, 2001. 52: p. 29-66.
58. Maeda, H. and N. Dudareva, The shikimate pathway and aromatic amino acid biosynthesis in plants. Annu Rev Plant Biol, 2012. 63: p. 73-105.
59. Evans, J., Commercial Amino Acids. 2014, BCC Research Wellesley MA USA. p. 214.
60. Chandran, S.S., et al., Phosphoenolpyruvate availability and the biosynthesis of shikimic acid. Biotechnol Prog, 2003. 19(3): p. 808-14.
61. Niu, W., K.M. Draths, and J.W. Frost, Benzene-free synthesis of adipic acid. Biotechnol Prog, 2002. 18(2): p. 201-11.
62. Kim, B., et al., Metabolic engineering of Escherichia coli for the production of phenol from glucose. Biotechnol J, 2014. 9(5): p. 621-9.
63. Leonard, E., et al., Engineering central metabolic pathways for high-level flavonoid production in Escherichia coli. Applied and Environmental Microbiology, 2007. 73(12): p. 3877-86.

161
64. Koopman, F., et al., De novo production of the flavonoid naringenin in engineered Saccharomyces cerevisiae. Microbial Cell Factories, 2012. 11(1): p. 155.
65. Shin, S.Y., et al., Production of resveratrol from tyrosine in metabolically engineered Saccharomyces cerevisiae. Enzyme Microb Technol, 2012. 51(4): p. 211-6.
66. Thodey, K., S. Galanie, and C.D. Smolke, A microbial biomanufacturing platform for natural and semisynthetic opioids. Nat Chem Biol, 2014. 10(10): p. 837-44.
67. Curran, K.A., et al., Metabolic engineering of muconic acid production in Saccharomyces cerevisiae. Metabolic Engineering, 2012. 15: p. 55-66.
68. Hansen, E.H., et al., De novo biosynthesis of vanillin in fission yeast (Schizosaccharomyces pombe) and baker's yeast (Saccharomyces cerevisiae). Applied and Environmental Microbiology, 2009. 75(9): p. 2765.
69. Rodriguez, A., et al., Establishment of a yeast platform strain for production of p-coumaric acid through metabolic engineering of aromatic amino acid biosynthesis. Metabolic Engineering, 2015. 31: p. 181-188.
70. Strucko, T., O. Magdenoska, and U.H. Mortensen, Benchmarking two commonly used Saccharomyces cerevisiae strains for heterologous vanillin-β-glucoside production. Metabolic Engineering Communications, 2015. 2: p. 99-108.
71. Karim, A.S., K.A. Curran, and H.S. Alper, Characterization of plasmid burden and copy number in Saccharomyces cerevisiae for optimization of metabolic engineering applications. FEMS Yeast Research, 2013. 13(1): p. 107-116.
72. Caesar, R., et al., Comparative proteomics of industrial lager yeast reveals differential expression of the cerevisiae and non‐cerevisiae parts of their genomes. PROTEOMICS, 2007. 7(22): p. 4135-4147.
73. Du, J., et al., Customized optimization of metabolic pathways by combinatorial transcriptional engineering. Nucleic Acids Res., 2012. 40(18): p. e142.
74. Kummel, A., et al., Differential glucose repression in common yeast strains in response to HXK2 deletion. FEMS Yeast Res., 2010. 10(3): p. 322-32.
75. Bochkov, D., et al., Shikimic acid: review of its analytical, isolation, and purification techniques from plant and microbial sources. J Chem Biol, 2012. 5(1): p. 5-17.
76. McQuade, B. and M. Blair, Influenza treatment with oseltamivir outside of labeled recommendations. American Journal of Health-System Pharmacy, 2015. 72(2): p. 112-6.
77. Feng, X. and H. Zhao, Investigating glucose and xylose metabolism in Saccharomyces cerevisiae and Scheffersomyces stipitis via 13C metabolic flux analysis. AIChE Journal, 2013. 59(9): p. 3195-3202.
78. Feng, X. and H. Zhao, Investigating xylose metabolism in recombinant Saccharomyces cerevisiae via 13C metabolic flux analysis. Microbial Cell Factories, 2013. 12: p. 114.
79. Shao, Z., Y. Luo, and H. Zhao, DNA assembler method for construction of zeaxanthin-producing strains of Saccharomyces cerevisiae. Methods Mol Biol, 2012. 898: p. 251-62.

162
80. Shao, Z. and H. Zhao, Construction and engineering of large biochemical pathways via DNA assembler. Methods in Molecular Biology, 2013. 1073: p. 85-106.
81. Suastegui, M., et al., Combining Metabolic Engineering and Electrocatalysis: Application to the Production of Polyamides from Sugar. Angewandte Chemie International Edition, 2016: p. n/a-n/a.
82. Kawai, S., W. Hashimoto, and K. Murata, Transformation of Saccharomyces cerevisiae and other fungi: methods and possible underlying mechanism. Bioengineered Bugs, 2010. 1(6): p. 395-403.
83. Feng, X., et al., Metabolic pathway determination and flux analysis in nonmodel microorganisms through 13C-isotope labeling. Methods in Molecular Biology, 2012. 881: p. 309-30.
84. Wahl, S.A., M. Dauner, and W. Wiechert, New tools for mass isotopomer data evaluation in (13)C flux analysis: mass isotope correction, data consistency checking, and precursor relationships. Biotechnol Bioeng, 2004. 85(3): p. 259-68.
85. Garcia-Albornoz, M., et al., BioMet Toolbox 2.0: genome-wide analysis of metabolism and omics data. Nucleic Acids Research, 2014. 42(Web Server issue): p. W175-81.
86. Moriya, H., Y. Shimizu-Yoshida, and H. Kitano, In vivo robustness analysis of cell division cycle genes in Saccharomyces cerevisiae. PLoS Genet, 2006. 2(7): p. e111.
87. Braus, G.H., Aromatic amino acid biosynthesis in the yeast Saccharomyces cerevisiae: a model system for the regulation of a eukaryotic biosynthetic pathway. Microbiol Rev, 1991. 55(3): p. 349-70.
88. Chen, K., et al., Deletion of the aroK gene is essential for high shikimic acid accumulation through the shikimate pathway in E. coli. Bioresource Technology, 2012. 119: p. 141-147.
89. Cui, Y.Y., et al., Production of shikimic acid from Escherichia coli through chemically inducible chromosomal evolution and cofactor metabolic engineering. Microbial Cell Factories, 2014. 13: p. 21.
90. Liu, D.F., et al., Metabolic flux responses to genetic modification for shikimic acid production by Bacillus subtilis strains. Microbial Cell Factories, 2014. 13(1): p. 40.
91. Fry, B., et al., Characterization of growth and acid formation in a Bacillus subtilis pyruvate kinase mutant. Applied Environmental Microbiology, 2000. 66(9): p. 4045-9.
92. Zhu, T., et al., Engineering of Bacillus subtilis for enhanced total synthesis of folic acid. Appl Environ Microbiol, 2005. 71(11): p. 7122-9.
93. Sprague, G.F., Jr., Isolation and characterization of a Saccharomyces cerevisiae mutant deficient in pyruvate kinase activity. J Bacteriol, 1977. 130(1): p. 232-41.
94. Schaaff-Gerstenschlager, I., et al., TKL2, a second transketolase gene of Saccharomyces cerevisiae. Cloning, sequence and deletion analysis of the gene. Eur J Biochem, 1993. 217(1): p. 487-92.

163
95. Sprenger, G.A., et al., Transketolase A of Escherichia coli K12. Purification and properties of the enzyme from recombinant strains. European Journal of Biochemistry, 1995. 230(2): p. 525.
96. Patnaik, R. and J.C. Liao, Engineering of Escherichia coli central metabolism for aromatic metabolite production with near theoretical yield. Appl Environ Microbiol, 1994. 60(11): p. 3903-8.
97. Zhang, H., et al., Engineering Escherichia coli coculture systems for the production of biochemical products. Proc Natl Acad Sci U S A, 2015. 112(27): p. 8266-71.
98. Nilsson, U., et al., Examination of substrate binding in thiamin diphosphate-dependent transketolase by protein crystallography and site-directed mutagenesis. J Biol Chem, 1997. 272(3): p. 1864-9.
99. Iraqui, I., et al., Characterisation of Saccharomyces cerevisiae ARO8 and ARO9 genes encoding aromatic aminotransferases I and II reveals a new aminotransferase subfamily. Molecular Genetics and Genomics, 1998. 257(2): p. 238-48.
100. Kim, S.R., et al., Deletion of PHO13, encoding haloacid dehalogenase type IIA phosphatase, results in upregulation of the pentose phosphate pathway in Saccharomyces cerevisiae. Appl Environ Microbiol, 2015. 81(5): p. 1601-9.
101. Lee, K. and J.S. Hahn, Interplay of Aro80 and GATA activators in regulation of genes for catabolism of aromatic amino acids in Saccharomyces cerevisiae. Mol Microbiol, 2013. 88(6): p. 1120-34.
102. Jeffries, T.W., et al., Genome sequence of the lignocellulose-bioconverting and xylose-fermenting yeast Pichia stipitis. Nat Biotechnol, 2007. 25(3): p. 319-26.
103. Kim, B., et al., Combinatorial design of a highly efficient xylose-utilizing pathway in Saccharomyces cerevisiae for the production of cellulosic biofuels. Appl Environ Microbiol, 2013. 79(3): p. 931-41.
104. Carquet, M., D. Pompon, and G. Truan, Transcription interference and ORF nature strongly affect promoter strength in a reconstituted metabolic pathway. Frontiers in Bioengeering and Biotechnology, 2015. 3: p. 21.
105. Isikgor, F.H. and C.R. Becer, Lignocellulosic biomass: a sustainable platform for the production of bio-based chemicals and polymers. Polymer Chemistry, 2015. 6(25): p. 4497-4559.
106. Arantes, V., et al., Lignocellulosic polysaccharides and lignin degradation by wood decay fungi: the relevance of nonenzymatic Fenton-based reactions. J Ind Microbiol Biotechnol, 2011. 38(4): p. 541-55.
107. Arantes, V., J. Jellison, and B. Goodell, Peculiarities of brown-rot fungi and biochemical Fenton reaction with regard to their potential as a model for bioprocessing biomass. Appl Microbiol Biotechnol, 2012. 94(2): p. 323-38.
108. Gao, Z., T. Mori, and R. Kondo, The pretreatment of corn stover with Gloeophyllum trabeum KU-41 for enzymatic hydrolysis. Biotechnol Biofuels, 2012. 5(1): p. 1-11.
109. Vincent, M., A.L. Pometto, 3rd, and J.H. van Leeuwen, Ethanol production via simultaneous saccharification and fermentation of sodium hydroxide treated corn stover using Phanerochaete chrysosporium and Gloeophyllum trabeum. Bioresour Technol, 2014. 158: p. 1-6.

164
110. Eastwood, D.C., et al., The plant cell wall-decomposing machinery underlies the functional diversity of forest fungi. Science, 2011. 333(6043): p. 762-5.
111. Suzuki, M.R., et al., Fungal hydroquinones contribute to brown rot of wood. Environmental Microbiology, 2006. 8(12): p. 2214-2223.
112. Shimokawa, T., et al., Production of 2, 5-dimethoxyhydroquinone by the brown-rot fungus Serpula lacrymans to drive extracellular Fenton reaction. Holzforschung, 2004. 58(3): p. 305-310.
113. Yelle, D.J., et al., Multidimensional NMR analysis reveals truncated lignin structures in wood decayed by the brown rot basidiomycete Postia placenta. Environmental Microbiology, 2011. 13(4): p. 1091-1100.
114. Varela, E., T. Mester, and M. Tien, Culture conditions affecting biodegradation components of the brown-rot fungus Gloeophyllum trabeum. Archives of Microbiology, 2003. 180(4): p. 251-256.
115. Munir, E., et al., A physiological role for oxalic acid biosynthesis in the wood-rotting basidiomycete Fomitopsis palustris. Proceedings of the National Academy of Sciences, 2001. 98(20): p. 11126-11130.
116. Munir, E., et al., New role for glyoxylate cycle enzymes in wood-rotting basidiomycetes in relation to biosynthesis of oxalic acid. Journal of Wood Science, 2001. 47(5): p. 368-373.
117. Guo, W., et al., 13C pathway analysis of biofilm metabolism of Shewanella oneidensis MR-1. RSC Advances, 2015. 5(50): p. 39840-39843.
118. Hollinshead, W.D., et al., Rapid metabolic analysis of Rhodococcus opacus PD630 via parallel 13C-metabolite fingerprinting. Biotechnology and Bioengineering, 2015: p. n/a-n/a.
119. Crown, S.B., C.P. Long, and M.R. Antoniewicz, Integrated 13C-metabolic flux analysis of 14 parallel labeling experiments in Escherichia coli. Metabolic Engineering, 2015. 28: p. 151-158.
120. Cordova, L.T. and M.R. Antoniewicz, 13C metabolic flux analysis of the extremely thermophilic, fast growing, xylose-utilizing Geobacillus strain LC300. Metabolic Engineering.
121. Saunders, E., et al., Use of 13C Stable Isotope Labelling for Pathway and Metabolic Flux Analysis in Leishmania Parasites, in Parasite Genomics Protocols, C. Peacock, Editor. 2015, Springer New York. p. 281-296.
122. Wasylenko, T.M. and G. Stephanopoulos, Metabolomic and 13C-metabolic flux analysis of a xylose-consuming Saccharomyces cerevisiae strain expressing xylose isomerase. Biotechnology and Bioengineering, 2015. 112(3): p. 470-483.
123. Frick, O. and C. Wittmann, Characterization of the metabolic shift between oxidative and fermentative growth in Saccharomyces cerevisiae by comparative (13)C flux analysis. Microbial Cell Factories, 2005. 4: p. 30-30.
124. Feng, X. and H. Zhao, Investigating xylose metabolism in recombinant Saccharomyces cerevisiae via 13C metabolic flux analysis. Microbial Cell Factories, 2013. 12(1): p. 114.
125. Highley, T., Influence of Carbon Source on Cellulase Activity of White-rot and Brown-rot Fungi. Wood and Fiber Science, 1973. 5(1): p. 50-58.

165
126. Varela, E. and M. Tien, Effect of pH and Oxalate on Hydroquinone-Derived Hydroxyl Radical Formation during Brown Rot Wood Degradation. Applied and Environmental Microbiology, 2003. 69(10): p. 6025-6031.
127. Feng, X. and H. Zhao, Investigating xylose metabolism in recombinant Saccharomyces cerevisiae via 13C metabolic flux analysis. Microb. Cell Fact., 2013. 12(1): p. 114.
128. Feng, X., et al., Metabolic flux analysis of the mixotrophic metabolisms in the green sulfur bacterium Chlorobaculum tepidum. J. Biol. Chem., 2010. 285(50): p. 39544-39550.
129. Feng, X., et al., Characterization of the central metabolic pathways in Thermoanaerobacter sp. strain X514 via isotopomer-assisted metabolite analysis. Appl. Environ. Microbiol., 2009. 75(15): p. 5001-5008.
130. Wahl, S.A., M. Dauner, and W. Wiechert, New tools for mass isotopomer data evaluation in 13C flux analysis: mass isotope correction, data consistency checking, and precursor relationships. Biotechnol. Bioeng., 2004. 85(3): p. 259-268.
131. Garcia-Albornoz, M., et al., BioMet Toolbox 2.0: genome-wide analysis of metabolism and omics data. Nucleic Acids Research, 2014. 42(Web Server issue): p. W175-W181.
132. Yoon, J.-J., T. Hattori, and M. Shimada, A metabolic role of the glyoxylate and tricarboxylic acid cycles for development of the copper-tolerant brown-rot fungus Fomitopsis palustris. FEMS Microbiology Letters, 2002. 217(1): p. 9-14.
133. Watanabe, T., et al., Oxalate Efflux Transporter from the Brown Rot Fungus Fomitopsis palustris. Applied and Environmental Microbiology, 2010. 76(23): p. 7683-7690.
134. Lodish, H., et al., Molecular Cell Biology. Sixth ed. 2007: W. H. Freeman. 135. Gadd, G.M., Fungal Production of Citric and Oxalic Acid: Importance in Metal
Speciation, Physiology and Biogeochemical Processes, in Advances in Microbial Physiology, R.K. Poole, Editor. 1999, Academic Press. p. 47-92.
136. Hisamori, H., et al., Cloning and expression analysis of a cDNA encoding an oxaloacetate acetylhydrolase from the brown-rot fungus Fomitopsis palustris. Sustainable humanosphere: bulletin of Research Institute for Sustainable Humanosphere Kyoto University, 2013. 9: p. 57-64.
137. Connolly, J. and J. Jellison, Oxalate production and calcium oxalate accumulation by Gloeophyllum trabeum in buffered cultures. Document-the International Research Group on Wood Preservation (Sweden), 1994.
138. Akamatsu, Y., M. Takahashi, and M. Shimada, Production of oxalic acid by wood-rotting basidiomycetes grown on low and high nitrogen culture media. Material und Organismen (Germany), 1994.
139. Tang, J.D., et al., Short-Read Sequencing for Genomic Analysis of the Brown Rot Fungus Fibroporia radiculosa. Applied and Environmental Microbiology, 2012. 78(7): p. 2272-2281.
140. Raven, J.A. and F.A. Smith, NITROGEN ASSIMILATION AND TRANSPORT IN VASCULAR LAND PLANTS IN RELATION TO INTRACELLULAR pH REGULATION. New Phytologist, 1976. 76(3): p. 415-431.

166
141. Plassard, C. and P. Fransson, Regulation of low-molecular weight organic acid production in fungi. Fungal Biology Reviews, 2009. 23(1–2): p. 30-39.
142. Feng, X. and H. Zhao, Investigating host dependence of xylose utilization in recombinant Saccharomyces cerevisiae strains using RNA-seq analysis. Biotechnology for Biofuels, 2013. 6(1): p. 96.
143. Beliaev, A.S., et al., Gene and protein expression profiles of Shewanella oneidensis during anaerobic growth with different electron acceptors. Omics., 2002. 6(1): p. 39-60.
144. Heidelberg, J.F., et al., Genome sequence of the dissimilatory metal ion-reducing bacterium Shewanella oneidensis. Nat. Biotech., 2002. 20(11): p. 1118-1123.
145. Tang, Y.J., et al., Shewanella oneidensis MR-1 fluxome under various oxygen conditions. Appl. Environ. Microbiol., 2007. 73(3): p. 718-729.
146. McLean, J.S., et al., Investigations of structure and metabolism within Shewanella oneidensis MR-1 biofilms. J. Microbiol. Methods, 2008. 74(1): p. 47-56.
147. Pinchuk, G.E., et al., Constraint-Based Model of Shewanella oneidensis MR-1 Metabolism: A Tool for Data Analysis and Hypothesis Generation. PLoS Comput. Biol., 2010. 6(6): p. e1000822.
148. Tiedje, J.M., Shewanella: the environmentally versatile genome. Nat. Biotech., 2002. 20(11): p. 1093-1094.
149. DiChristina, T., et al., Shewanella: Novel Strategies for Anaerobic Respiration, in Past and Present Water Column Anoxia, L.N. Neretin, Editor. 2006, Springer Netherlands. p. 443-469.
150. Hau, H.H. and J.A. Gralnick, Ecology and biotechnology of the genus Shewanella. Annu. Rev. Microbiol., 2007. 61: p. 237-258.
151. Fredrickson, J.K., et al., Towards environmental systems biology of Shewanella. Nat. Rev. Micro., 2008. 6(8): p. 592-603.
152. Hau, H.H., et al., Mechanism and Consequences of Anaerobic Respiration of Cobalt by Shewanella oneidensis Strain MR-1. Appl. Environ. Microbiol., 2008. 74(22): p. 6880-6886.
153. Newton, G.J., et al., Analyses of current-generating mechanisms of Shewanella loihica PV-4 and Shewanella oneidensis MR-1 in microbial fuel cells. Appl. Environ. Microbiol., 2009. 75(24): p. 7674-7681.
154. Watson, V.J. and B.E. Logan, Power production in MFCs inoculated with Shewanella oneidensis MR‐1 or mixed cultures. Biotechnol. Bioeng., 2010. 105(3): p. 489-498.
155. Renslow, R., et al., Modeling biofilms with dual extracellular electron transfer mechanisms. Phys. Chem. Chem. Phys., 2013. 15(44): p. 19262-19283.
156. Ding, Y., et al., Disruption of putrescine biosynthesis in Shewanella oneidensis enhances biofilm cohesiveness and performance in Cr (VI) immobilization. Appl. Environ. Microbiol., 2014. 80(4): p. 1498-1506.
157. Zhang, Y., et al., Cell growth and protein expression of Shewanella oneidensis in biofilms and hydrogel-entrapped cultures. Mol. BioSyst., 2014. 10(5): p. 1035-1042.
158. Grobbler, C., et al., Use of SWATH mass spectrometry for quantitative proteomic investigation of Shewanella oneidensis MR-1 biofilms grown on graphite cloth electrodes. Syst. Appl. Microbiol., 2015. 38(2): p. 135-139.

167
159. Tang, Y.J., et al., Advances in analysis of microbial metabolic fluxes via 13C isotopic labeling. Mass Spectrom. Rev., 2009. 28(2): p. 362-375.
160. Newton, G.J., et al., Analyses of Current-Generating Mechanisms of Shewanella loihica PV-4 and Shewanella oneidensis MR-1 in Microbial Fuel Cells. Applied and Environmental Microbiology, 2009. 75(24): p. 7674-7681.
161. Scott, J.H. and K.H. Nealson, A biochemical study of the intermediary carbon metabolism of Shewanella putrefaciens. J. Bacteriol., 1994. 176(11): p. 3408-3411.
162. Serres, M.H. and M. Riley, Genomic analysis of carbon source metabolism of Shewanella oneidensis MR-1: predictions versus experiments. J. Bacteriol., 2006. 188(13): p. 4601-4609.
163. Tang, Y.J., et al., Anaerobic central metabolic pathways in Shewanella oneidensis MR-1 reinterpreted in the light of isotopic metabolite labeling. J. Bacteriol., 2007. 189(3): p. 894-901.
164. Simon, D., J. Hoshino, and H. Kröger, l-serine dehydrataste from rat liver. Purification and some properties. BBA Enzymol., 1973. 321(1): p. 361-368.
165. Grabowski, R., A.E. Hofmeister, and W. Buckel, Bacterial L-serine dehydratases: a new family of enzymes containing iron-sulfur clusters. Trends Biochem. Sci., 1993. 18(8): p. 297-300.
166. Ghannoum, M. and G.A. O'Toole, Microbial biofilms. 2004: ASM Press. 167. Thormann, K.M., et al., Control of formation and cellular detachment from
Shewanella oneidensis MR-1 biofilms by cyclic di-GMP. J. Bacteriol., 2006. 188(7): p. 2681-2691.
168. Bretschger, O., et al., Current production and metal oxide reduction by Shewanella oneidensis MR-1 wild type and mutants. Appl. Environ. Microbiol., 2007. 73(21): p. 7003-7012.
169. McCarty, P.L., J. Bae, and J. Kim, Domestic wastewater treatment as a net energy producer–can this be achieved? Environmental science & technology, 2011. 45(17): p. 7100-7106.
170. Logan, B.E., et al., Microbial fuel cells: Methodology and Technology. Environ. Sci. Technol., 2006. 40(17): p. 5181-5192.
171. Phuc Thi Ha, Beomseok Tae, and I.S. Chang, Performance and Bacterial Consortium of Microbial Fuel Cell Fed with Formate. Energy & Fuels, 2008. 22: p. 164–168.
172. Li, W., H. Yu, and Z. He, Towards sustainable wastewater treatment by using microbial fuel cells-centered technologies. Energy Environ. Sci., 2013. 7(3): p. 911-924.
173. Rosenbaum, M.A. and A.W. Henrich, Engineering microbial electrocatalysis for chemical and fuel production. Curr Opin Biotechnol, 2014. 29: p. 93-8.
174. Pant, D., et al., Bioelectrochemical systems (BES) for sustainable energy production and product recovery from organic wastes and industrial wastewaters. RSC Adv., 2012. 2(4): p. 1248-1263.
175. He, Z., Microbial fuel cells: now let us talk about energy. Environ Sci Technol, 2013. 47(1): p. 332-3.
176. Schroder, U., Anodic electron transfer mechanisms in microbial fuel cells and their energy efficiency. Phys Chem Chem Phys, 2007. 9(21): p. 2619-2629.

168
177. Dhere, N.G., et al., Application of acetate, lactate, and fumarate as electron donors in microbial fuel cell. 2013. 8825: p. 1-7.
178. Lovley, D.R., The microbe electric: conversion of organic matter to electricity. Curr Opin Biotechnol, 2008. 19(6): p. 564-71.
179. Clauwaert, P., et al., Minimizing losses in bio-electrochemical systems: the road to applications. Applied Microbiology and Biotechnology, 2008. 79(6): p. 901-913.
180. Kim, B.H., I.S. Chang, and G.M. Gadd, Challenges in microbial fuel cell development and operation. Applied Microbiology and Biotechnology, 2007. 76(3): p. 485-494.
181. Fredrickson, J.K., et al., Towards environmental systems biology of Shewanella. Nat Rev Microbiol, 2008. 6(8): p. 592-603.
182. Mordkovich, N.N., et al., Effect of NAD+-dependent formate dehydrogenase on anaerobic respiration of Shewanella oneidensis MR-1. Microbiology, 2013. 82(4): p. 404-409.
183. Kouzuma, A., et al., Catabolic and regulatory systems in Shewanella oneidensis MR-1 involved in electricity generation in microbial fuel cells. Front Microbiol, 2015. 6.
184. Newton, G.J., et al., Analyses of current-generating mechanisms of Shewanella loihica PV-4 and Shewanella oneidensis MR-1 in microbial fuel cells. Appl Environ Microbiol, 2009. 75(24): p. 7674-81.
185. Marsili, E., et al., Shewanella secretes flavins that mediate extracellular electron transfer. Proceedings of the National Academy of Sciences, 2008. 105(10): p. 3968-3973.
186. Velasquez-Orta, S.B., et al., The effect of flavin electron shuttles in microbial fuel cells current production. Appl Microbiol Biotechnol, 2010. 85(5): p. 1373-81.
187. Roy, J.N., et al., A study of the flavin response by Shewanella cultures in carbon-limited environments. RSC Advances, 2012. 2(26): p. 10020-10027.
188. Gorby, Y.A., et al., Electrically conductive bacterial nanowires produced by Shewanella oneidensis strain MR-1 and other microorganisms. Proc Natl Acad Sci U S A, 2006. 103(30): p. 11358-63.
189. Meshulam-Simon, G., et al., Hydrogen metabolism in Shewanella oneidensis MR-1. Applied and environmental microbiology, 2007. 73(4): p. 1153-1165.
190. Bretschger, O., et al., Current production and metal oxide reduction by Shewanella oneidensis MR-1 wild type and mutants. Appl Environ Microbiol, 2007. 73(21): p. 7003-12.
191. Tang, Y.J., et al., Evaluation of the effects of various culture conditions on Cr(VI) reduction by Shewanella oneidensis MR-1 in a novel high-throughput mini-bioreactor. Biotechnol Bioeng, 2006. 95(1): p. 176-84.
192. Hunt, K.A., et al., Substrate-level phosphorylation is the primary source of energy conservation during anaerobic respiration of Shewanella oneidensis strain MR-1. J Bacteriol, 2010. 192(13): p. 3345-51.
193. Pinchuk, G.E., et al., Genomic reconstruction of Shewanella oneidensis MR-1 metabolism reveals a previously uncharacterized machinery for lactate utilization. Proceedings of the National Academy of Sciences, 2009. 106(8): p. 2874-2879.

169
194. Pinchuk, G.E., et al., Pyruvate and lactate metabolism by Shewanella oneidensis MR-1 under fermentation, oxygen limitation, and fumarate respiration conditions. Appl Environ Microbiol, 2011. 77(23): p. 8234-40.
195. Qin, M., et al., Recovery of nitrogen and water from landfill leachate by a microbial electrolysis cell-forward osmosis system. Bioresour Technol, 2015. 200: p. 485-492.
196. Ge, Z., et al., Reducing effluent discharge and recovering bioenergy in an osmotic microbial fuel cell treating domestic wastewater. Desalination, 2013. 312: p. 52-59.
197. Ge, Z., Q. Ping, and Z. He, Hollow-fiber membrane bioelectrochemical reactor for domestic wastewater treatment. Journal of Chemical Technology & Biotechnology, 2013. 88(8): p. 1584-1590.
198. Watson, V.J. and B.E. Logan, Power production in MFCs inoculated with Shewanella oneidensis MR-1 or mixed cultures. Biotechnol Bioeng, 2010. 105(3): p. 489-98.
199. Mao, L. and W.S. Verwoerd, Theoretical exploration of optimal metabolic flux distributions for extracellular electron transfer by Shewanella oneidensis MR-1. Biotechnology for biofuels, 2014. 7(1): p. 1-20.
200. Zhuang, L., et al., Investigating Oxalate Biosynthesis in Wood-decaying Fungus Gloeophyllum trabeum using 13C Metabolic Flux Analysis. RSC Advances, 2015.
201. Tang, Y.J., et al., Invariability of central metabolic flux distribution in Shewanella oneidensis MR‐1 under environmental or genetic perturbations. Biotechnology progress, 2009. 25(5): p. 1254-1259.
202. Guo, W., et al., 13C pathway analysis of biofilm metabolism of Shewanella oneidensis MR-1. RSC Adv., 2015. 5(50): p. 39840-39843.
203. Kim, J.R., et al., Power generation using different cation, anion, and ultrafiltration membranes in microbial fuel cells. Environmental science & technology, 2007. 41(3): p. 1004-1009.
204. Freguia, S., et al., Electron and carbon balances in microbial fuel cells reveal temporary bacterial storage behavior during electricity generation. Environmental science & technology, 2007. 41(8): p. 2915-2921.
205. Freguia, S., et al., Non-catalyzed cathodic oxygen reduction at graphite granules in microbial fuel cells. Electrochimica Acta, 2007. 53(2): p. 598-603.
206. Ahn, Y. and B.E. Logan, Saline catholytes as alternatives to phosphate buffers in microbial fuel cells. Bioresour Technol, 2013. 132: p. 436-9.
207. Bandarenka, A.S., et al., Techniques and methodologies in modern electrocatalysis: evaluation of activity, selectivity and stability of catalytic materials. Analyst, 2014. 139(6): p. 1274-1291.
208. Neurock, M., M. Janik, and A. Wieckowski, A first principles comparison of the mechanism and site requirements for the electrocatalytic oxidation of methanol and formic acid over Pt. Faraday discussions, 2009. 140: p. 363-378.
209. Chen, Y.X., et al., Kinetic isotope effects in complex reaction networks: formic acid electro-oxidation. Chemphyschem, 2007. 8(3): p. 380-5.
210. Lanthier, M., K.B. Gregory, and D.R. Lovley, Growth with high planktonic biomass in Shewanella oneidensis fuel cells. FEMS Microbiol Lett, 2008. 278(1): p. 29-35.

170
211. Yang, Y., et al., Physiological and electrochemical effects of different electron acceptors on bacterial anode respiration in bioelectrochemical systems. Bioresour Technol, 2014. 164: p. 270-5.
212. Tang, Y.J., et al., Invariability of central metabolic flux distribution in Shewanella oneidensis MR-1 under environmental or genetic perturbations. Biotechnol Prog, 2009. 25(5): p. 1254-9.
213. Tang, Y.J., et al., Anaerobic central metabolic pathways in Shewanella oneidensis MR-1 reinterpreted in the light of isotopic metabolite labeling. J Bacteriol, 2007. 189(3): p. 894-901.
214. Wang, V.B., et al., Metabolite-enabled mutualistic interaction between Shewanella oneidensis and Escherichia coli in a co-culture using an electrode as electron acceptor. Sci Rep, 2015. 5: p. 11222.
215. Pinchuk, G.E., et al., Constraint-based model of Shewanella oneidensis MR-1 metabolism: a tool for data analysis and hypothesis generation. PLoS Comput Biol, 2010. 6(6): p. e1000822.
216. Brutinel, E.D. and J.A. Gralnick, Shuttling happens: soluble flavin mediators of extracellular electron transfer in Shewanella. Appl Microbiol Biotechnol, 2012. 93(1): p. 41-8.
217. Feng, X. and H. Zhao, Investigating xylose metabolism in recombinant Saccharomyces cerevisiae via 13C metabolic flux analysis. Microb Cell Fact, 2013. 12(114): p. 1-12.
218. Feng, X., et al., Characterization of the central metabolic pathways in Thermoanaerobacter sp. strain X514 via isotopomer-assisted metabolite analysis. Applied and environmental microbiology, 2009. 75(15): p. 5001-5008.

171
Chapter 4: OM-FBA: Integrate Transcriptomics Data with
Flux Balance Analysis to Decipher the Cell Metabolism
Weihua Guoa, Xueyang Fenga, †
a Department of Biological Systems Engineering, Virginia Polytechnic Institute and State
University, Blacksburg, VA 24061, United States
†Correspondence to: Xueyang Feng.
Phone: +1-(540)231-2974
Email: [email protected]
This manuscript has been published on PloS one 11 (4), e015418. Supplementary material
of Chapter 4 is shown in Appendix C.

172
Abstract
Constraint-based metabolic modeling such as flux balance analysis (FBA) has been
widely used to simulate cell metabolism. Thanks to its simplicity and flexibility, numerous
algorithms have been developed based on FBA and successfully predicted the phenotypes
of various biological systems. However, their phenotype predictions may not always be
accurate in FBA because of using the objective function that is assumed for cell
metabolism. To overcome this challenge, we have developed a novel computational
framework, namely omFBA, to integrate multi-omics data (e.g. transcriptomics) into FBA
to obtain omics-guided objective functions with high accuracy. In general, we first
collected transcriptomics data and phenotype data from published database (e.g. GEO
database) for different microorganisms such as Saccharomyces cerevisiae. We then
developed a “Phenotype Match” algorithm to derive an objective function for FBA that
could lead to the most accurate estimation of the known phenotype (e.g. ethanol yield). The
derived objective function was next correlated with the transcriptomics data via regression
analysis to generate the omics-guided objective function, which was next used to accurately
simulate cell metabolism at unknown conditions. We have applied omFBA in studying
sugar metabolism of S. cerevisiae and found that the ethanol yield could be accurately
predicted in most of the cases tested (>80%) by using transcriptomics data alone, and
revealed valuable metabolic insights such as the dynamics of flux ratios. Overall, omFBA
presents a novel platform to potentially integrate multi-omics data simultaneously and
could be incorporated with other FBA-derived tools by replacing the arbitrary objective
function with the omics-guided objective functions.

173
4.1 Introduction
Cell metabolism is regulated over multiple levels with the participation of various
types of cell components[1], e.g., gene expression via transcription process and the protein
synthesis via translation and post-translational modification (Fig. 4.1), which mystifies
genotype-phenotype correlations. Since the phenotype is the net result of these interactions,
it is immensely important to unveil the different cell components and their interactions, not
only for an integrated understanding of physiology, but also for the practical applications
of biological systems as cell factories[2-4]. High-throughput omics data provides
quantitative readouts of these cell components, including the cell’s DNA sequence (i.e.,
genomics[5, 6]), mRNA expression (i.e., transcriptomics[7]), metabolite abundance (i.e.,
metabolomics[8, 9]), protein composition (i.e., proteomics[10-12]), and in vivo enzyme
activities (i.e., fluxomics[13, 14]). This valuable biological information enables the
identification and quantification of individual components of a biological system, and we
are now facing the challenge of understanding the interactions among these components[1,
15] by appropriately analyzing and interpreting the omics data.
Metabolic modeling is the computational approach widely used for modeling
complex metabolic networks and predicting cell phenotype based on the stoichiometric
constraints of the metabolic reactions. One of the most commonly used approaches is flux
balance analysis (FBA)[16], in which a genome-scale metabolic model is supplied in the
form of a stoichiometric matrix that conveys the molecularity of each metabolite in each
reaction. This is then followed by the identification of an arbitrary objective function to
optimize, due to the underdetermined FBA system. Since the early 1990s, FBA has been
widely used to simulate cell phenotypes with tremendous success because of its genome-

174
scale estimation and fast computation speed [16-18]. However, the arbitrary objective
function remains problematic and sometimes leads to inaccurate phenotype predictions
[16, 19]. To integrate the FBA approach with the omics data, several FBA-derived
algorithms have been developed for phenotype prediction with one or two types of omics
data. These algorithms can be broadly classified into two categories [20, 21]: 1) the switch
approach (e.g., GIMME[22] and iMAT[23]), which turns reaction fluxes on or off based
on threshold gene expression levels, and 2) the valve approach (e.g., E-Flux[24] and
PROM[25]), which regulates reaction fluxes based on relative gene/protein expressions.
One of the fundamental limitations for all of these approaches is that all make the
underlying assumption that gene transcription is linearly correlated with the flux of the
reactions that they encode[26]. This correlation has been found to be inaccurate by many
physiological studies of cells [21, 27, 28]. In addition, most of these algorithms can
integrate transcriptomics only or transcriptomics and proteomics only [27, 29]. To our best
knowledge, no algorithm can simultaneously integrate multi-omics data for phenotype
prediction so far. Therefore, to intently overcome the ill-defined assumptions of the
genotype-phenotype correlation and to potentially integrate multi-omics data for
phenotype prediction, we develop a novel FBA-derived algorithm, omFBA, to correlate
the genotype, e.g., transcriptomics data, with the phenotype, e.g., growth rate and product
yields, by using an omics-guided objective function.
In general, we implemented a proof-of-concept study for this novel algorithm,
omFBA, to accurately predict the phenotype of a model eukaryotic microorganism,
Saccharomyces cerevisiae, by integrating the transcriptomics data with FBA via the omics-
guided objective function (Fig. 4.2). We first collected the transcriptomics data, i.e.,

175
exponential fold changes of gene expression levels, and the corresponding phenotype data,
i.e., ethanol yields, from the GEO database and previous publications [30]. We randomly
separated the datasets into two equal parts: one part was used to develop the omics-guided
objective function; and the other part was used to validate the omics-guided objective
function by applying the transcriptomics data to predict cell phenotypes and comparing
them with the observed phenotypes. We found that omFBA accurately predicted the
ethanol yields in most of the cases tested (>80%) and provided valuable insights of yeast
metabolism such as the key flux ratios that were consistent with previous 13C-MFA studies
[31-33]. In sum, the novel algorithm we developed in this study, omFBA, could accurately
predict cell phenotypes, and more importantly, provide in-depth understanding of the
interactions between transcriptomics and phenotypes, which could be extended for various
cell components to help achieve better understanding of cell metabolism.
4.2 Results
4.2.1 Overview of omFBA Algorithm
To develop and validate omFBA algorithm as a novel approach to integrate
transcriptomics data with FBA via omics-guided objective function, we have designed a
computational platform with four modules: 1) transcriptomics-phenotype data collection,
2) “phenotype match” algorithm, 3) omics-guided objective function in FBA, and 4)
phenotype data validation. In brief, in Module 1, we collected the transcriptomics-
phenotype correlated data from a published study, curated the data based on p-value,
smoothed the data, and randomly separated all the datasets into two equal parts, i.e.,
training and validation datasets, for the development and validation of omFBA algorithm,
respectively. In Module 2, we developed the “phenotype match” algorithm by first using a

176
dual objective function, with unknown weighting factors assigned to minimizing overall
enzyme usage and maximizing ethanol yield, to simulate the cell phenotype; then searched
for the “phenotype matched” weighting factors that could lead to the best fitting of cell
phenotypes in the training datasets; and finally, quantitatively correlated these “phenotype
matched” weighting factors with the transcriptomics data from the training datasets via
multivariate regression. Next in Module 3, we applied such empirical correlation between
the transcriptomics data and the “phenotype matched” weighting factors in the dual
objective function in FBA, together with the transcriptomics data from validation datasets,
to derive the omics-guided objective function. We then used this omics-guided objective
function in the genome-scale metabolic model of S. cerevisiae to predict the ethanol yields
and to provide in-depth biological insights, e.g., key flux ratios. In Module 4, we compared
our predicted ethanol yields that were derived from transcriptomics data with the observed
ones in the validation datasets for evaluation of the prediction accuracy of omFBA
algorithm. We also validated the biological insights implicated by the omFBA algorithm
by comparing them with the experimental discoveries from 13C-metabolic flux analysis
(13C-MFA). To ensure our algorithm is statistically reliable, we have repeated the Module
1~4 for 40 times by randomly assigning different training and validation datasets. The
detailed development of each module was shown in the following sections.
4.2.2 Module 1: Transcriptomics-Phenotype Data Collection
We have collected the transcriptomics-phenotype correlated data from a published
study[30], in which Ronen and Botstein studied transcriptomics responses of S. cerevisiae
for the substrate shift from the unfavorable galactose to favorable glucose at low and high
concentrations (i.e., 0.2 g/L and 2g/L, respectively) at different time points. The

177
transcriptomics responses were measured by microarray and represented by the fold
changes of gene expression levels of all the detectable genes (>6300 genes) after the
substrate shift. We collected all these data from the GEO database (GSE4158) as the “big”
gene pool for omFBA algorithm by running the GEO2R web tool [34]. Comparing to this
“big” gene pool, a “small” gene pool was also defined by Ronen and Botstein [30], who
selected a small set of genes that could play deciding roles in determining the yeast
metabolic responses to substrate shift. We also extracted transcriptomics data of the same
genes from the paper as the “small” gene pool to implement the omFBA algorithm for
evaluating the impacts of transcriptomics data on the omFBA algorithm. The glucose-
based ethanol yields were selected as phenotype in this study, since no other phenotype but
ethanol yield was provided in the experimental data.
The p-values of all transcriptomics data were also collected to reflect the data
quality. To filter the low-quality data, we selected the cutoff p-value as 0.95, the same
cutoff value used in the published paper [30]. That is to say, we only used the genes that
had differentiated expression level with p<0.95 to develop omFBA. The corresponding
phenotype data, i.e., ethanol yields, was collected and calculated from the Fig 1 of the
published paper, which showed the fermentation profiles after the substrate shift. We found
only 8 time points were available with p-value-filtered transcriptomics data and the
corresponding phenotype data, which captured the dynamics of transcriptional responses
and phenotype changes but were not enough for developing omFBA algorithm. We have
used a prebuilt function namely ‘csaps’ in MATLAB to smooth the kinetic profile of gene
expression data and phenotype data, based on the raw data of gene expression and
phenotype at the 8 time points. In general, we used cubic smoothing spline to provide a

178
smoothed curve with 1000 points to capture the shape of the temporal gene expression and
phenotype. In this case, we could overcome the limitation of lacking gene expression data
for training our OM-FBA algorithm while still maintaining the high fidelity of the kinetic
profile of gene expression and phenotype. We randomly chose 500 datasets as the training
datasets while the remaining 500 datasets were used for model validation.
4.2.3 Module 2: “Phenotype-Match” Algorithm
Using the training datasets developed in Module 1, we developed the “phenotype
match” algorithm as a bi-level FBA algorithm to find the optimal objective function that
leads to accurate simulations of the observed phenotypes. To achieve this, we first selected
a dual objective function that included two items: minimizing overall enzyme usage (i.e.,
min ∑ 𝑣 ) and maximizing ethanol yield (i.e., max 𝑣 ), indicating the trade-off between
the overall enzyme activities and the ethanol production. The similar dual objective
function was previously applied to successfully predict growth kinetics of Shewanella
oneidensis [35]. The weighting factors of these two items were unknown. However, by
fine-tuning the weighting factors, we could match the phenotype predicted by FBA with
the observed phenotype very well. As shown in Fig. 4.3, a good fitting was observed from
the carbon metabolism shift in both low and high glucose conditions, which proved that it
is feasible for the “phenotype match” algorithm to find the suitable objective functions in
FBA. In addition, we correlated the observed ethanol yields with the phenotype-matched
weighting factors in front of minimizing overall enzyme usage for both low and high
glucose conditions, and found that a negative correlation was discovered between the
weighting factors and ethanol yields. In general, when the weighting factor of minimizing
overall enzyme usage increased, the ethanol production decreased, which was consistent

179
with trade-off between the overall enzyme activities and the ethanol production. We found
the flux towards biomass formation were zero when using the bi-level optimization for
minimizing enzyme usage and maximizing ethanol production. This is consistent with the
experimental data since no significant change was found in cell number and size (10%)
during the glucose pulse experiments [30]. In comparison, we have also implemented the
FBA by applying two commonly used objective functions: maximizing the growth rate,
and maximizing the ethanol yield (Fig. C.S1). The simulated ethanol yield was 0.11 g
ethanol/g glucose when maximizing the growth rate, which underestimated the ethanol
production in the real experiments. The simulated ethanol yield was 0.51 g ethanol/g
glucose when maximizing the ethanol yield, which overestimated the ethanol production
in the real experiments.
With this appropriately selected dual-objective function and the phenotype-
matched weighting factors, we next calculated the correlation coefficients between these
weighting factors and the transcriptomics data for each gene in both the “big pool” and the
“small pool”, respectively. We ranked all of the genes based on the correlation coefficients,
and picked the top 3 genes with the highest absolute values of the correlation coefficients
as the genetic markers (Fig. 4.4). We then applied the multiple linear regression approach
to quantitatively correlate the phenotype-matched weighting factors and the expression
levels of the genetic markers. The regression equation, which represents the quantitative
correlation of the transcriptomics and the phenotype, was calculated and used next in
Module 3 to derive the omics-guided objective function.

180
4.2.3 Module 3 and 4: Application and Validation of Omics-Guided Objective
Function
With the regression equation derived in Module 2 to connect the expression levels
of the genetic markers and the weighting factors used in the dual objective function of FBA,
we could use the transcriptomics data in the validation datasets to derive the so-called
“omics-guided objective function” for phenotype prediction. In general, we collected the
expression levels of the genetic markers in each of the validation datasets, applied the
regression equation to derive the weighting factors for the dual objective function, and then
used the dual objective function in a well-established genome-scale metabolic model,
iND750 [36, 37], to predict the ethanol yields.
We derived the omics-guided objective function for both the “big pool” and “small
pool” of genes, respectively, in both low and high glucose conditions. For each of the 500
validation datasets, we checked the predicted ethanol yield and the observed ones. As
mentioned previously, we randomly assigned the 1000 datasets into 500 training datasets
and 500 validation datasets, and repeated this procedure for 40 times to make sure our
predictions were statistically reliable. As shown in Fig. 4.5, we found that for all of the 40
rounds of predictions, we could obtain 80~85% (Fig 5C) and 47~63% (Fig 5D) match (i.e.,
<5% difference) between the predicted and observed ethanol yields when using the “big
pool” of genes for deriving the omics-guided objective function to simulate glucose
metabolism at low and high concentrations, respectively. When using the “small pool” of
genes, 67~77% (Fig. 4.5C) and 20~25% (Fig. 4.5D) match (i.e., <5% difference) between
the predicted and observed ethanol yields were observed for glucose metabolism at low
and high concentrations, respectively. In addition, we also plotted the raw data of ethanol

181
yields (i.e., the 8 datasets that were originally collected from Ronen and Botstein ‘s work)
versus the predicted ones in low (Fig. 4.5A) and high (Fig. 4.5B) glucose conditions and
found that using either “big pool” or “small pool” of genes could lead to good fittings
(R2>0.80). It is also worth noting that the prediction accuracy for the low and high glucose
condition was different. While at least 65% match with the experimental data could be
achieved at low glucose condition, only 60% match at best could be achieved at high
glucose condition. We have examined the reason for the difference of the prediction
between low and high concentration data. We found that at the low glucose condition, ~10%
of the genes had strong correlations with phenotype-matched weighting factors with the
absolute value of the correlation coefficient > 0.9 (Fig.4. S2). However, at the high glucose
condition, <1% of the genes had strong correlations with phenotype-matched weighting
factors with the absolute value of the correlation coefficient > 0.9. Therefore, the poor
correlation between gene expression and the phenotype-matched weighting factors could
account for the lower match at the high glucose condition.
Since the accuracy of omFBA was not satisfactory (<60% matches) when using
“small pool” of genes to predict yeast metabolism in low and high glucose condition, we
next tried to investigate the factors that could affect the omFBA prediction. One factor that
could potentially affect the omFBA prediction is the noisy gene expressions, which is
notoriously known by biologists for decades [38-41]. To examine the impact of the
variability of transcriptomics data on the omFBA algorithm, we chose three different cutoff
p-values, i.e., 0.05, 0.67, and 0.95, to represent different variability levels of the
transcriptomics data for the genes in the “small pool”. By filtering the transcriptomics data
using the selected cutoff p-values, we re-ran omFBA for 40 times and compared the

182
prediction accuracy in p=0.05, 0.67 and 0.95, respectively. As shown in Fig. 4.6, the
prediction accuracy for ethanol yields under both low and high glucose conditions
dramatically increased when we chose a smaller cutoff p-value, with >60% ethanol yields
in the validation datasets could be well matched (<5% difference) with the observed
ethanol yields at p=0.05. This clearly suggested that the quality of transcriptomics data
could be a deciding factor for accurate prediction of cell metabolism when using omFBA.
With the breakthroughs in high-throughput, high-accuracy analytical methods for omics
analysis, we envision the demand for high-quality omics data would be well met in very
near future.
Overall, omFBA could predict the ethanol yields solely from the transcriptomics
data via the development of “omics-guided objective function”. It is interesting to notice
that using “big pool” of genes led to much better accuracy than using “small pool” of genes,
indicating that there were still many unknown regulons in S. cerevisiae that played pivotal
roles in controlling yeast metabolism but have not yet been fully studied. In addition to the
accurate predictions of the phenotypes, omFBA could also provide valuable biological
insights, e.g., dynamics of flux ratios, to unravel the intracellular metabolic rewiring. Here
in this study, we selected and calculated four key flux ratios, namely PGI/G6PDH2,
FBA/TKT1, ENO/PPCK, and PYK/PDC, which controlled the flux distribution in the
central metabolism (Fig. 4.7). To study the key metabolic responses to the substrate shift
in S. cerevisiae, we have correlated these key flux ratios with the “phenotype matched”
weighting factors, observed ethanol yields, and the ratios of corresponding gene
expressions. We found clear trends between the key flux ratio and the ethanol production.
In general, when the ethanol production was increased, the ratios of glycolysis to the

183
pentose phosphate pathways were decreased, while the ratios of glycolysis to the futile
cycle and the fermentation pathway were increased. Such observations were consistent
with the previous 13C-MFA studies on yeast metabolism [32, 33, 42] (Table 4.1). However,
no correlations between the flux ratios and gene expression ratios were observed for either
low or high glucose concentration. Such poor correlation between gene expression and
metabolic fluxes has been proved by previous reports [31], and emphasized the merit of
developing novel algorithm like omFBA that does not rely on the assumption of correlated
gene expression and metabolic fluxes. Since the growth rates from 13C-MFA studies were
not exactly the same as what we observed in this study because of the different
experimental set-up, e.g., culture mode (batch culture or chemostate) and growth condition
(medium, sugar concentration), we did not directly compare the growth rate between our
studies and the 13C-MFA studies.
4.3 Discussion
4.3.1 Comparison between omFBA Algorithm and the “Big Data” Regression
Approach
With the abundance of transcriptomics-phenotype datasets, a natural question one
may ask is how good (or bad) is omFBA when compared to regression approach using the
“big data”. In brief, we could also design an algorithm using the “big data” to directly
correlate the ethanol yields and the transcriptomics data in the training datasets and apply
the regression equation to predict the ethanol yields solely from the transcriptomics data in
the validation datasets, similarly as we did for omFBA. In fact, we have implemented such
“Big Data” regression approach (Appendix C Fig. C.S3) and found that the ethanol yields
could indeed be accurately predicted (e.g., 82-90% matches when using “big pool” of genes
184
in low glucose concentration, and 80-85% matches when using “big pool” of genes in high
glucose concentration, Appendix C Fig. C.S4). Comparing omFBA to the “Big Data”
regression approach, we found that the prediction accuracy of omFBA was similarly good.
When comparing the genetic markers used by omFBA and the “Big Data” regression
approach (Appendix C Table C.S1), we indeed found some genes were used as the genetic
markers in both approaches (Appendix C Fig. C.S5), which could explain the good fittings
generated from both approaches. However, one distinct advantage of omFBA compared to
“Big Data” approach is the capability to provide valuable and reliable biological insights,
such as the dynamics of flux ratios as shown in Fig. 4.7. Rather than simply fitting the cell
phenotypes, omFBA also provides a way to investigate the complex gene-flux-phenotype
cross talking by developing the omics-guided objective functions. Such information is
particularly useful since it could decipher the interactions of various cell components and
rationally guides the metabolic engineering of organisms.
In this study, we chose the top 3 genes whose expression levels were most
correlated with the phenotype-matched weighting factors as our important factors. Because
little is known about the how exactly the genetic markers influenced the phenotype-
matched weighting factors, it is possible that the some genetic markers, which played
important roles in affecting phenotype-matched weighting factors but had expression levels
not well correlated with the phenotype-matched weighting factors, could be left out (i.e.,
omitted-variable bias). However, we would like to emphasize that purpose of this proof-
of-concept study is not to develop a “perfect” model to completely decipher the mechanism
of how gene expression and cell phenotype are linked. Instead, this study offered a novel

185
route to explore the possibility of using transcriptomics data to predict some of the
metabolic behaviors (e.g., ethanol production).
4.3.2 Prerequisites of omFBA Algorithm
It is worth noting that one of the prerequisites for developing omFBA algorithm is
the abundant, curated, and correlated omics-phenotype datasets, which, unfortunately, are
not often available. Currently, many of the database constructed only collected one type of
omics data, e.g., Gene Expression Omnibus (GEO)[34, 43-45], the European
Bioinformatics Institute (EBI)[46, 47], and Many Microbe Microarrays Database
(M3D)[48] for collecting gene expression data; and from the Proteomics DB[49] for
collecting proteomics data. Although thousands of datasets are enabled for users to query
for omics analysis (e.g., transcriptomics analysis), these datasets cannot provide the details
about the phenotype such as cell growth rate, and hence, have limited applications in
elucidating the correlations between transcriptomics and phenotype of microorganisms. To
overcome this challenge, we have done some preliminary studies to construct the correlated
omics-phenotype database, namely integrated Transcriptomic And Phenotype (iTAP)
database [50], to collect the transcriptomics-phenotype correlated data. Despite the fact
that the phenotype data was never reported in a standardized format and the curation of
correlated transcriptomics–phenotype datasets was extremely tedious and time-consuming,
till now, we have successfully correlated 57 and 143 datasets of transcriptomics and
phenotype for E. coli and S. cerevisiae, respectively. As the first of its kind, the iTAP
database was suitable for omFBA to provide sufficient data and allow the direct phenotype
prediction from the transcriptomics analysis. We are planning to use more datasets from
the iTAP database that we constructed to apply omFBA. However, one challenge in

186
extending omFBA to other studies is the incompleteness of the meta-data. Basically, when
we constructed the iTAP database, we found that many of the studies only reported the data
that was most interested to the authors, e.g., growth rates alone, and left out the rest of the
valuable information such as glucose consumption rates and ethanol production rates. The
paper published by Ronen and Botstein was so far the most complete meta-data we could
find. Therefore, we used this database to prove the concept of omFBA. It is also worth
mentioning that while only transcriptomics data was used in this study, the platform of
omFBA can be easily extended to include all types of omics data because of using the
regression analysis to derived omics-guided objective function. For example, when using
the multi-omics datasets (e.g., transcriptomics, proteomics, metabolomics datasets), we can
follow the similar flowchart of omFBA in this study to rank the top cell components, e.g.,
gene expression, protein synthesis, metabolite concentration, that are highly correlated
with the weighing factors in the “phenotype matched” objective function, and then used
such connection to simulate cell phenotypes.
In summary, we have developed a novel FBA-derived algorithm, omFBA, to
integrate the transcriptomics data into FBA via the omics-guided objective function for the
accurate prediction of phenotypes and the in-depth simulation of biological insights.
Compared to the “Big Data” regression approach, omFBA could achieve the similarly good
predication but is superior in uncovering novel biological insights such as dynamics of
metabolic flux ratios. The quality of transcriptomics data was found to be an important
factor that affected the omFBA prediction. Although the transcriptomics-phenotype
correlated datasets required by omFBA are still limiting, we envision that such challenge
could be overcome by efforts such as the construction of iTAP database. With the
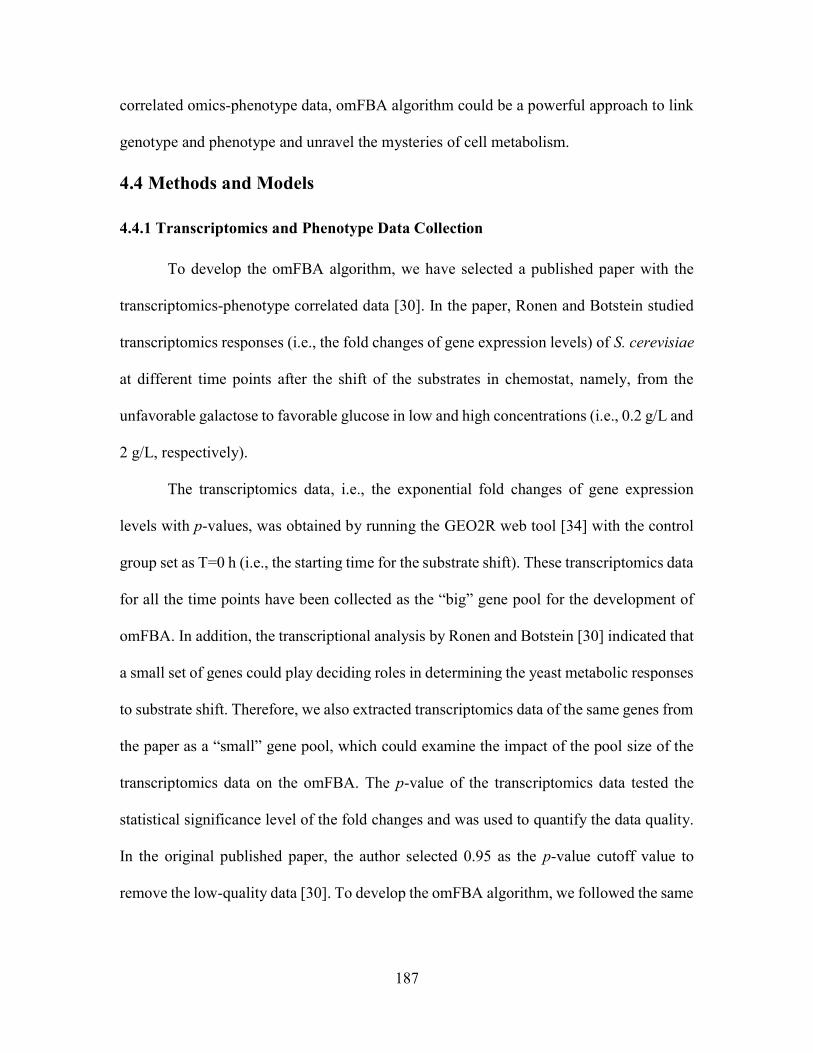
187
correlated omics-phenotype data, omFBA algorithm could be a powerful approach to link
genotype and phenotype and unravel the mysteries of cell metabolism.
4.4 Methods and Models
4.4.1 Transcriptomics and Phenotype Data Collection
To develop the omFBA algorithm, we have selected a published paper with the
transcriptomics-phenotype correlated data [30]. In the paper, Ronen and Botstein studied
transcriptomics responses (i.e., the fold changes of gene expression levels) of S. cerevisiae
at different time points after the shift of the substrates in chemostat, namely, from the
unfavorable galactose to favorable glucose in low and high concentrations (i.e., 0.2 g/L and
2 g/L, respectively).
The transcriptomics data, i.e., the exponential fold changes of gene expression
levels with p-values, was obtained by running the GEO2R web tool [34] with the control
group set as T=0 h (i.e., the starting time for the substrate shift). These transcriptomics data
for all the time points have been collected as the “big” gene pool for the development of
omFBA. In addition, the transcriptional analysis by Ronen and Botstein [30] indicated that
a small set of genes could play deciding roles in determining the yeast metabolic responses
to substrate shift. Therefore, we also extracted transcriptomics data of the same genes from
the paper as a “small” gene pool, which could examine the impact of the pool size of the
transcriptomics data on the omFBA. The p-value of the transcriptomics data tested the
statistical significance level of the fold changes and was used to quantify the data quality.
In the original published paper, the author selected 0.95 as the p-value cutoff value to
remove the low-quality data [30]. To develop the omFBA algorithm, we followed the same

188
cutoff value to filter the transcriptomics data in low quality by ignoring this gene in the
database.
The phenotype data, i.e., ethanol yield (w/w), has been calculated based on the
glucose and ethanol concentrations for the whole time courses, i.e., from 0 to 240 minutes,
extracted from figures of the original paper. We have ignored the time points in the
stationary phase of both low and high concentration datasets during the development of
omFBA algorithm.
After removing the time points in stationary phase, we found only 8 time points
were available with p-value-filtered transcriptomics data and recalculated phenotype data,
which captured the dynamics of transcriptional responses and phenotype changes but were
not enough for developing omFBA algorithm. We then smoothed both transcriptomics and
phenotype data at a linear space including 1000 points by using the prebuilt function, i.e.,
“csaps”, in MATLAB (Step 2, Fig. 4.2). Based on these 1000 points, we randomly selected
500 points as the training dataset for the development of omFBA algorithm. The other 500
points have been used to validate and evaluate the omFBA algorithm.
4.4.2 Phenotype-Match Algorithm
We developed the “phenotype match” algorithm to fine-tune FBA for accurate
prediction of the phenotype data with a selected dual objective function in a bi-level FBA
algorithm. The dual objective function includes two items: minimizing the overall enzyme
usage and maximizing the ethanol yield, which reflects the trade-off between the overall
enzyme activities and the ethanol production. The following mathematical equation was
used to represent the dual objective function:
min 𝑐 ∑ 𝑣 − (1 − 𝑐 )𝑣 (1)

189
where, vi was all the fluxes in the genome-scale metabolic model; vEtOH was the flux of the
ethanol exchange; cj was the phenotype-matched weighting factor for data point j of
training dataset. This dual-objective function has been applied to a bi-level FBA algorithm
as the inner objective function:
min (𝑌 , − 𝑌 , )
𝑠. 𝑡.
⎣⎢⎢⎢⎡
min 𝑐 ∙ ∑𝑣 − 1 − 𝑐 ∙ 𝑣
𝑠. 𝑡. 𝑆 ∙ 𝑣 = 0 𝑙𝑏 ≤ 𝑣 ≤ 𝑢𝑏
⎦⎥⎥⎥⎤
0 ≤ 𝑐 ≤ 1 (2)
where, Ysim,j and Ysim,j were the simulated and observed ethanol yields (w/w) from inner
FBA problem and training dataset, respectively. The outer objective function in this
algorithm was minimizing the variance between the simulated ethanol yields and the
observed ethanol yields from the training dataset by tuning the weighting factor of the dual-
objective function. The stoichiometric matrix and boundary conditions were derived from
the BiGG database [37], iND750[36], a genome-scale metabolic model of S. cerevisiae.
To evaluate whether or not different metabolic models would affect the phenotype-matched
weighting factors, we chose another genome-scale metabolic model of S. cerevisiae
(iMM904 [51]), and re-ran our phenotype-match algorithm. We found that the weighting
factors derived from the original model (i.e., iND750) and the new model (i.e., iMM904)
were highly correlated (Appendix C Fig. C.S6), with R2>0.99. Also, both model used
almost the same gene-protein-pathway mapping. Therefore, we concluded that the network
reconstruction would not significantly, if not at all, affect the omFBA. The inner FBA

190
problem, as a quadratic optimization problem, was solved by the prebuilt solver,
“quadprog”, in MATLAB. The outer optimization problem was solved by the “grid search”
algorithm by using an in-house MATLAB algorithm with step-wise search in a range of
the weighting factor ([0, 1.00]) with 10-4 for each step.
Next, we calculated the correlation coefficients between the phenotype-matched
weighting factors and the transcriptomics data for each gene. We selected the top 3 genes
with the highest absolute values of correlation coefficients as the genetic markers. To
prevent over-fitting the data, we applied F-test (one-tail with cutoff p-value = 0.10) [52] to
determine if we should accept (or reject) a new genetic marker in the linear regression
model that used the “genetic markers” to fit phenotype-matched weighting factors. We
found that when using top 3 instead of top 2 “genetic markers” in the linear regression
model, the fitting became significantly improved, e.g., p-value was 0.09 (< cutoff p-value)
for low concentration glucose condition using big gene pool. In other word, the
introduction of the top 3 “genetic markers” was necessary to improve the model fitting and
the data was not over-fitted.
We then quantitatively correlated the phenotype-matched weighting factors and the
expression levels of the genetic markers using the multiple linear regression approach in
MATLAB (“regress” command), which was shown in equation 3:
⎣⎢⎢⎢⎡
𝑐⋮
𝑐
⋮𝑐 ⎦
⎥⎥⎥⎤
=
⎣⎢⎢⎢⎡
𝐺#
⋮𝐺#
⋮𝐺# 1⋮ ⋮
𝐺#
⋮
𝐺#
⋮
𝐺# 1
⋮ ⋮𝐺# 𝐺# 𝐺# 1⎦
⎥⎥⎥⎤ 𝑎
𝑎𝑎𝑏
(3)
where, cj was the phenotype-matched weighting factors of training dataset j; 𝐺# , 𝐺# , 𝐺#
were the expression levels of the three genetic markers in training dataset j, respectively;

191
and a1, a2, a3, b were the regression coefficients for the genetic markers and the linear part,
respectively.
4.4.3 Omics-Guided Objective Function in FBA
With the regression equation derived from the “phenotype match” algorithm, we
then used the transcriptomics data from the validation datasets to derive the omics-guided
weighting factors:
⎣⎢⎢⎢⎡𝑐
⋮𝑐
⋮𝑐 ⎦
⎥⎥⎥⎤
=
⎣⎢⎢⎢⎡
𝐺#
⋮𝐺#
⋮𝐺# 1⋮ ⋮
𝐺#
⋮
𝐺#
⋮
𝐺# 1
⋮ ⋮𝐺# 𝐺# 𝐺# 1⎦
⎥⎥⎥⎤ 𝑎
𝑎𝑎𝑏
(4)
where cjom was the simulated omics-guided weighting factors of dataset j; 𝐺# , 𝐺# , 𝐺#
were the transcriptomics data of three genetic markers, respectively, of dataset j from the
validation dataset; and a1, a2, a3, b were the regression coefficients for the genetic markers
and the linear part, respectively, which were determined in the “phenotype match”
algorithm.
We then input these simulated omics-guided weighting factors into the dual-
objective function to set up the omics-guided objective functions in a genome-scale
metabolic model of S. cerevisiae, iND750:
min 𝑐 ∙ ∑𝑣 − 1 − 𝑐 ∙ 𝑣 (5)
𝑠. 𝑡. 𝑆 ∙ 𝑣 = 0 𝑙𝑏 ≤ 𝑣 ≤ 𝑢𝑏
𝑐 𝑑𝑒𝑡𝑒𝑟𝑚𝑖𝑛𝑒𝑑 (6)

192
The ethanol yields could be predicted by solving this problem via the same quadratic
solver, “quadprog”, in MATLAB. The flux ratios PGI/ZWF1, FBA/TKL, ENO/PCK, and
PYK/PDC, were calculated to represent the key metabolic responses, i.e., glycolysis to
oxidative pentose phosphate pathway (PP pathway), reductive PP pathway, futile cycle,
and the fermentation pathway, respectively, in yeast metabolism. The variances of fluxes
were obtained by flux variance analysis. The calculation of the variances of flux ratios were
following the formula to calculate the combinational standard deviation [53].
𝑅 = , = ( ) + ( ) (7)
where, R is the key flux ratio, F1 and F2 are the flux values, SD is the standard deviation of
the flux.
4.4.4 Comparison of Prediction Accuracies and Genetic Markers of Big Data and
omFBA Algorithm
To evaluate the prediction accuracy of omFBA algorithm, we have compared the
predicted ethanol yields to the observed ones from the validation dataset. We considered a
prediction as a “matched” prediction if the relative error (er) between the predicted and the
observed ethanol yield was smaller 5%, as shown below:
𝑒 =, ,
,×100% ≤ 5% (8)
where, Ypred,vj and Yobs,vj are the predicted and observed ethanol yields (w/w) from the
omFBA, respectively.
Acknowledgements
We thank the writing center in Virginia Tech for improving the language of the
paper. This study was supported by start-up fund (#175323) from Virginia Tech.

193
Table 4.1 Key flux ratios compared with previous studies using 13C metabolic flux analysis.
Flux ratioa
Correlation with increased ethanol
yields Corresponding genes
Correlation with gene expression ratios
omFBA Previous studies
[32, 33, 42] omFBA
Previous studies[31]
PGI/G6PDH2 Positive Positive YBR196C/ YNL241C
No correlationb
No correlation
FBA/TKT1 Positive Positive YKL060C/ YPR074C
No correlation
No correlation
ENO/PPCK Negative Negative YGR254W/ YKR097W
No correlation
No correlation
PYK/PYRDC Negative Negative YAL038W/ YLR044C
No correlation
No correlation

194
Fig. 4.1 Complex interactions of various components in cell metabolism. Multi-omics
data has provided the quantitative readouts of these components, which helps us to
elucidate the interactions between the multi-layer regulations.

195
Fig. 4.2 Scheme of omFBA algorithm. Four modules are designed to implement omFBA
algorithm: 1) transcriptomic-phenotype data collection (Step 1~2), 2) “phenotype match”
algorithm (Step 3~5), 3) omics-guided objective function in FBA (Step 6~7), and 4)
phenotype data validation (Step 8).

196
Fig. 4.3 “Phenotype match” algorithm for low and high glucose conditions. The
simulated and observed ethanol yields matched well for low (A) and high (B) glucose
conditions, respectively. Negative correlations between the weighting factors of
minimizing the overall enzyme usage and the observed ethanol yield were found for low
(C) and high (D) glucose conditions.

197
Fig. 4.4 Correlation between phenotype-matched weighting factors and gene
expressions. The absolute values of the correlation coefficients in one of the training
datasets were ranked from high to low (only the top 30 genes were shown here). The top 3
genes were chosen as the genetic markers to derive the omics-guided objective function
(blue bars).

198
Fig. 4.5. Prediction accuracy of omFBA algorithm. Direct comparison of the predicted
and observed ethanol yields in low (A) and high (B) glucose conditions. The omFBA
algorithm was repeated for 40 times and the percentage of matched predictions of omFBA
algorithm were calculated and ranked for low (C) and high (D) glucose conditions.

199
Fig. 4.6 Effect of cutoff p-value on omFBA prediction using “small pool” of genes.
Three cutoff p-values, i.e., 0.05, 0.67, and 0.95, were used to filter the trancriptomics data.
For each cutoff p-value, we re-ran the omFBA algorithm for 40 times and calculated the
percentage of matches between the predicted and the observed ethanol yields in the
validation datasets.
200
Fig. 4.7. Key flux ratio analysis. Four key flux ratios (PGI/G6PDH2, FBA/TKT1,
ENO/PPCK, and PYK/PDC) were selected to be correlated with phenotype-matched
weighting factors, observed ethanol yields, and the ratios of the corresponding gene
expression levels for low and high glucose condition. All the values of the ratios were
exponential. Definitions of abbreviations are shown in the List of Abbreviations.

201
References
1. Zhang, W., F. Li, and L. Nie, Integrating multiple ‘omics’ analysis for microbial biology: application and methodologies. Microbiology, 2010. 156(2): p. 287-301.
2. Hong, K.-K. and J. Nielsen, Metabolic engineering of Saccharomyces cerevisiae: a key cell factory platform for future biorefineries. Cellular and Molecular Life Sciences, 2012. 69(16): p. 2671-2690.
3. Nogales, J., B.Ø. Palsson, and I. Thiele, A genome-scale metabolic reconstruction of Pseudomonas putida KT2440: iJN746 as a cell factory. BMC Systems Biology, 2008. 2: p. 79-79.
4. de Jong, B., V. Siewers, and J. Nielsen, Systems biology of yeast: enabling technology for development of cell factories for production of advanced biofuels. Current Opinion in Biotechnology, 2012. 23(4): p. 624-630.
5. Morozova, O. and M.A. Marra, Applications of next-generation sequencing technologies in functional genomics. Genomics, 2008. 92(5): p. 255-264.
6. Metzker, M.L., Sequencing technologies [mdash] the next generation. Nat Rev Genet, 2010. 11(1): p. 31-46.
7. Wang, Z., M. Gerstein, and M. Snyder, RNA-Seq: a revolutionary tool for transcriptomics. Nat Rev Genet, 2009. 10(1): p. 57-63.
8. Fiehn, O., Metabolomics – the link between genotypes and phenotypes. Plant Molecular Biology, 2002. 48(1-2): p. 155-171.
9. Scalbert, A., et al., Mass-spectrometry-based metabolomics: limitations and recommendations for future progress with particular focus on nutrition research. Metabolomics, 2009. 5(4): p. 435-458.
10. Zhang, Z., et al., High-Throughput Proteomics. Annual Review of Analytical Chemistry, 2014. 7(1): p. 427-454.
11. Nilsson, T., et al., Mass spectrometry in high-throughput proteomics: ready for the big time. Nat Meth, 2010. 7(9): p. 681-685.
12. Smith, R.D., et al., An accurate mass tag strategy for quantitative and high‐throughput proteome measurements. Proteomics, 2002. 2(5): p. 513-523.
13. Wiechert, W., et al., Fluxomics: mass spectrometry versus quantitative imaging. Current Opinion in Plant Biology, 2007. 10(3): p. 323-330.
14. Poskar, C.H., et al., High-Throughput Data Pipelines for Metabolic Flux Analysis in Plants, in Plant Metabolic Flux Analysis, M. Dieuaide-Noubhani and A.P. Alonso, Editors. 2014, Humana Press. p. 223-246.
15. Celton, M., et al., A comparative transcriptomic, fluxomic and metabolomic analysis of the response of Saccharomyces cerevisiae to increases in NADPH oxidation. BMC Genomics, 2012. 13: p. 317-317.
16. Orth, J.D., I. Thiele, and B.O. Palsson, What is flux balance analysis? Nat Biotech, 2010. 28(3): p. 245-248.
17. Gianchandani, E.P., A.K. Chavali, and J.A. Papin, The application of flux balance analysis in systems biology. Wiley Interdisciplinary Reviews: Systems Biology and Medicine, 2010. 2(3): p. 372-382.
18. Lakshmanan, M., et al., Software applications for flux balance analysis. Briefings in Bioinformatics, 2012.

202
19. Schuetz, R., L. Kuepfer, and U. Sauer, Systematic evaluation of objective functions for predicting intracellular fluxes in Escherichia coli. Vol. 3. 2007.
20. Hyduke, D.R., N.E. Lewis, and B.O. Palsson, Analysis of omics data with genome-scale models of metabolism. Molecular BioSystems, 2013. 9(2): p. 167-174.
21. Saha, R., A. Chowdhury, and C.D. Maranas, Recent advances in the reconstruction of metabolic models and integration of omics data. Current Opinion in Biotechnology, 2014. 29: p. 39-45.
22. Becker, S.A. and B.O. Palsson, Context-Specific Metabolic Networks Are Consistent with Experiments. PLoS Comput Biol, 2008. 4(5): p. e1000082.
23. Zur, H., E. Ruppin, and T. Shlomi, iMAT: an integrative metabolic analysis tool. Bioinformatics, 2010. 26(24): p. 3140-3142.
24. Colijn, C., et al., Interpreting Expression Data with Metabolic Flux Models: Predicting <italic>Mycobacterium tuberculosis</italic> Mycolic Acid Production. PLoS Comput Biol, 2009. 5(8): p. e1000489.
25. Chandrasekaran, S. and N.D. Price, Probabilistic integrative modeling of genome-scale metabolic and regulatory networks in Escherichia coli and Mycobacterium tuberculosis. Proceedings of the National Academy of Sciences, 2010. 107(41): p. 17845-17850.
26. Hoppe, A., What mRNA Abundances Can Tell us about Metabolism. Metabolites, 2012. 2(3): p. 614-631.
27. O’Brien, E.J. and B.O. Palsson, Computing the functional proteome: recent progress and future prospects for genome-scale models. Current Opinion in Biotechnology, 2015. 34: p. 125-134.
28. Kim, J. and J.L. Reed, Refining metabolic models and accounting for regulatory effects. Current Opinion in Biotechnology, 2014. 29: p. 34-38.
29. Kim, M.K. and D.S. Lun, Methods for integration of transcriptomic data in genome-scale metabolic models. Computational and Structural Biotechnology Journal, 2014. 11(18): p. 59-65.
30. Ronen, M. and D. Botstein, Transcriptional response of steady-state yeast cultures to transient perturbations in carbon source. Proceedings of the National Academy of Sciences of the United States of America, 2006. 103(2): p. 389-394.
31. Moxley, J.F., et al., Linking high-resolution metabolic flux phenotypes and transcriptional regulation in yeast modulated by the global regulator Gcn4p. Proceedings of the National Academy of Sciences, 2009. 106(16): p. 6477-6482.
32. Frick, O. and C. Wittmann, Characterization of the metabolic shift between oxidative and fermentative growth in Saccharomyces cerevisiae by comparative 13C flux analysis. Microbial Cell Factories, 2005. 4(1): p. 30.
33. Raghevendran, V., et al., Phenotypic characterization of glucose repression mutants of Saccharomyces cerevisiae using experiments with 13C-labelled glucose. Yeast, 2004. 21(9): p. 769-779.
34. Barrett, T., et al., NCBI GEO: archive for high-throughput functional genomic data. Nucleic Acids Research, 2009. 37(suppl 1): p. D885-D890.
35. Feng, X., et al., Integrating Flux Balance Analysis into Kinetic Models to Decipher the Dynamic Metabolism of <italic>Shewanella oneidensis</italic> MR-1. PLoS Comput Biol, 2012. 8(2): p. e1002376.

203
36. Duarte, N.C., M.J. Herrgård, and B.Ø. Palsson, Reconstruction and Validation of Saccharomyces cerevisiae iND750, a Fully Compartmentalized Genome-Scale Metabolic Model. Genome Research, 2004. 14(7): p. 1298-1309.
37. King, Z.A., et al., BiGG Models: A platform for integrating, standardizing and sharing genome-scale models. Nucleic Acids Research, 2015.
38. Raser, J.M. and E.K. O'Shea, Noise in Gene Expression: Origins, Consequences, and Control. Science, 2005. 309(5743): p. 2010-2013.
39. Blake, W.J., et al., Noise in eukaryotic gene expression. Nature, 2003. 422(6932): p. 633-637.
40. Raser, J.M. and E.K. O'Shea, Control of Stochasticity in Eukaryotic Gene Expression. Science, 2004. 304(5678): p. 1811-1814.
41. Fraser, H.B., et al., Noise Minimization in Eukaryotic Gene Expression. PLoS Biol, 2004. 2(6): p. e137.
42. Fendt, S.-M. and U. Sauer, Transcriptional regulation of respiration in yeast metabolizing differently repressive carbon substrates. BMC Systems Biology, 2010. 4(1): p. 12.
43. Edgar, R. and T. Barrett, NCBI GEO standards and services for microarray data. Nat Biotech, 2006. 24(12): p. 1471-1472.
44. Barrett, T., et al., NCBI GEO: archive for functional genomics data sets—10 years on. Nucleic Acids Research, 2011. 39(suppl 1): p. D1005-D1010.
45. Barrett, T., et al., NCBI GEO: archive for functional genomics data sets—update. Nucleic Acids Research, 2013. 41(D1): p. D991-D995.
46. Leinonen, R., et al., The European Nucleotide Archive. Nucleic Acids Research, 2010.
47. Rodriguez-Tomé, P., et al., The European Bioinformatics Institute (EBI) databases. Nucleic Acids Research, 1996. 24(1): p. 6-12.
48. Faith, J.J., et al., Many Microbe Microarrays Database: uniformly normalized Affymetrix compendia with structured experimental metadata. Nucleic Acids Research, 2008. 36(suppl 1): p. D866-D870.
49. Wilhelm, M., et al., Mass-spectrometry-based draft of the human proteome. Nature, 2014. 509(7502): p. 582-587.
50. Sundararaman, N., et al., iTAP: integrated transcriptomics and phenotype database for stress response of Escherichia coli and Saccharomyces cerevisiae. BMC Research Notes, 2015. 8(1): p. 1-7.
51. Mo, M.L., B.Ø. Palsson, and M.J. Herrgård, Connecting extracellular metabolomic measurements to intracellular flux states in yeast. BMC Systems Biology, 2009. 3(1): p. 1-17.
52. Ott, R. and M. Longnecker, An introduction to statistical methods and data analysis. 2008: Cengage Learning.
53. Kenny, J. and E. Keeping, The Standard Deviation and Calculation of the Standard Deviation. 3. chap 6.5–6.6. Princeton NJ, 1962: p. 77-80.

204
Chapter 5: Data-Driven Prediction of CRISPR-Based
Transcription Regulation for Programmable Control of
Metabolic Flux
Jiayuan Shenga, *, Weihua Guo a, *, Christine Asha, Brendan Freitasa, Mitchell Paolettia, and Xueyang Fenga, †
a Department of Biological Systems Engineering, Virginia Polytechnic Institute and State
University, Blacksburg, VA 24061, United States
†Correspondence to: Xueyang Feng.
* JS and WG contribute to this work equally.
Phone: +1-(540)231-2974
Email: [email protected]
This manuscript has been preprinted on arXiv preprint arXiv:1704.03027. Supplementary
material of Chapter 5 is shown in Appendix D.

205
Abstract
Multiplex and multi-directional control of metabolic pathways is crucial for
metabolic engineering to improve product yield of fuels, chemicals, and pharmaceuticals.
To achieve this goal, artificial transcriptional regulators such as CRISPR-based
transcription regulators have been developed to specifically activate or repress genes of
interest. Here, we found that by deploying guide RNAs to target on DNA sites at different
locations of genetic cassettes, we could use just one synthetic CRISPR-based
transcriptional regulator to simultaneously activate and repress gene expressions. By using
the pairwise datasets of guide RNAs and gene expressions, we developed a data-driven
predictive model to rationally design this system for fine-tuning expression of target genes.
We demonstrated that this system could achieve programmable control of metabolic fluxes
when using yeast to produce versatile chemicals. We anticipate that this master CRISPR-
based transcription regulator will be a valuable addition to the synthetic biology toolkit for
metabolic engineering, speeding up the “design-build-test” cycle in industrial
biomanufacturing as well as generating new biological insights on the fates of eukaryotic
cells.

206
5.1 Introduction
Metabolic engineering has proven to be tremendously important for sustainable
production of fuels[1, 2], chemicals[3, 4], and pharmaceuticals[5, 6]. One of the critical
steps in metabolic engineering is reprogramming metabolic fluxes in host cells to optimize
the fermentation performance such as product yield[7, 8]. To achieve this goal, several
enzymes need to be activated while in the meantime others need to be repressed[9]. The
multiplex and multi-directional control of enzyme expressions is largely executed through
transcriptional regulation[9-12]. Recently, the type-II clustered regularly interspaced short
palindromic repeats (CRISPR)/Cas9 from Streptococcus pyogenes (Sp)[13-15] has been
repurposed to be a master transcriptional regulator that could activate or repress multiple
genes[16-18]. By further extending the guide RNAs of SpCas9 to include effector protein
recruitment sites and expressing the effector proteins in host cells[18, 19], a synthetic
CRISPR-based transcriptional regulator was developed to simultaneously program the
expressions of multiple genes at multiple directions (i.e., both activation and repression).
Although demonstrating great promises in controlling metabolic fluxes, the current
CRISPR-based transcription regulation faces several challenges when being applied for
metabolic engineering. First, it relies on a panel of well-characterized genetic parts (e.g.,
RNA-binding proteins) to achieve the transcriptional regulation[9, 20]. However, the
rareness of such genetic parts often limits the application of current CRISPR-based
transcription regulator in a metabolic network. Second, it requires the co-expression of
effector proteins to activate or repress the target genes[9, 20]. Therefore, the utility of
current CRISPR-based transcription regulator in metabolic engineering is mitigated by the
metabolic costs associated with protein expressions[9, 20]. To address these limitations, an
207
ideal type of CRISPR-based transcription regulation should meet two criteria: generally
applicable in any gene of interest, and requiring minimal protein expression to achieve
multi-directional gene regulation.
In this study, we have developed a data-driven approach that enables the rational
design of a new type of CRISPR-based transcription regulation. This CRISPR-based
transcription regulator uses only a fused protein of a nuclease-deficient Cas9 (dCas9) and
an effector (VP64) to achieve multi-directional and multiplex gene regulation, which
eliminates the metabolic costs associated with the expression of effector proteins in
previous studies[9, 20]. We found that the deployment of guide RNAs was the key factor
that determined the regulatory effects of our CRISPR-based transcription regulator. We
used a data-driven approach to provide accurate and target-oriented guidance on designing
the guide RNAs. As we showed in our results, this approach could be applied for any gene
of interest. Finally, using this system, we demonstrated a highly programmable control of
metabolic fluxes when using yeast to produce versatile chemicals.
5.2 Results
5.2.1 Gene Activation and Repression by Using a CRISPR-based
Transcriptional Regulator.
The CRISPR-based transcriptional regulator is composed of a codon-optimized,
catalytically dead SpCa9 (i.e., dCas9) that is fused with four tandem copies of Herpes
Simplex Viral Protein 16 (VP64, a commonly used eukaryotic transcription activator
domain). The similar molecular design was previously reported to be able to activate gene
expression in yeast[18] and mammalian cells[18]. In brief, it was found that when the
dCas9-VP64 regulator was positioned in the correct sites of promoter, the target gene could

208
be activated by the VP64. However, we hypothesized that the effects of dCas9-VP64 could
be diverse, i.e., both activation and repression could be achieved by using this master
regulator (Fig. 5.1A). For example, the transcription initiation could be blocked when
dCas9-VP64 is deployed to the transcription starting sites (TSS). The transcription
elongation could also be inhibited when dCas9-VP64 is deployed to the open reading frame
(ORF). If the hypothesis stands, we could then repurpose dCas9-VP64 as a universal
regulator to activate and repress gene expressions at the same time.
To validate our hypothesis, we designed experiments by selecting 138 sites that can
be targeted by dCas9-VP64 in four synthetic genetic cassettes (Fig. 5.1B): GFP under
TEF1p promoter, mCherry under TPI1p promoter, Sapphire under PGK1p promoter, and
Venus under PDC1p promoter. We created a library of guide RNAs and co-expressed them
with the dCas9-VP64 and the target genetic cassette. For each of the tests, we measured
the fluorescence of the reporter proteins and compared it to a control test in which dCas9-
VP64 and the genetic cassette were expressed without guide RNA. As summarized in Fig.
5.1B and Fig. 5.1C, expression of reporter genes could indeed be programmed to be either
up- or down-regulated (cutoff fold-change set as two-fold, p<0.05) when positioning the
guide RNA at different sites on the promoter or ORF. The dynamic range of transcriptional
regulation via dCas9-VP64 varied for different genetic elements, with the largest dynamic
range achieving 13.8-fold (from -1.14 to 2.65 of log2 gene fold-change) in expression of
TPI1p-mCherry cassette and the smallest log2 fold change dynamic range achieving 11.6-
fold (from -1.82 to 1.71 of log2 gene fold-change) in expression of PGK1p-Venus cassette.
We next compared the effects on transcriptional regulation when guide RNAs were
positioned in the promoter region to that were positioned in the gene region (Fig. 5.1D). A

209
significant difference (p<0.01) was revealed: while gene expression was in general down-
regulated when guide RNAs were positioned in the gene region, most of the guide RNAs
(94.2%) that were positioned in the promoter region led to gene up-regulation or no effect.
We also evaluated whether different PAM sites (i.e., 3’AGG, 3’TGG, 3’CGG, 3’GGG)
could bias the transcriptional regulation (Fig. 5.1E). We found that most of the PAM sites
(3’AGG, 3’TGG, 3’CGG) have no bias, but when guide RNAs were targeted on 3’GGG
sites, the expression of selected genes tends to be more up-regulated than other PAM sites
(p<0.05). Such difference, as we discussed in the section below, may be attributed to the
larger percentage of guanosine in 3’GGG sites. Finally, we evaluated the metabolic costs
of dCas9-VP64 by comparing the growth rates of yeast between the ones subject to
transcriptional regulation (i.e., with guide RNAs) and the ones that were not. As shown in
Appendix D Fig. D.S1, 131 out of the 138 tests showed no significant difference (p>0.05)
on cell growth rate when being compared to that of the control strain, indicating a minimal
metabolic burden when using only one synthetic protein for transcriptional regulation.
5.2.2 Data-Driven Model of Transcriptional Regulation by Using dCas9-VP64.
To determine the rule underlying transcriptional regulation by dCas9-VP64, we
solicited nine design parameters on nucleotide stability, sequence of the target genetic
element, PAM site location, and protein-DNA structure. These design parameters were
chosen based on previous studies on the activity of SpCas9 [21, 22]. Next, we correlated
these design parameters with transcriptional regulation (Appendix D Fig. D.S2A), and
calculated the Pearson’s correlation coefficients (PCC). The top 3 correlated design
parameters were location, GC content (GC%), and PAM site of GGG. Next, we aimed to
develop a predictive model that could use the design parameters to describe the effects of

210
guide RNAs positioning on gene expressions. Our first attempt is a linear regression model,
which utilized all the nine design parameters (i.e., GC%, location, number of base G,
number of base A, ΔG, AGG, TGG, CGG, and GGG) to simulate the corresponding fold
changes of gene expressions as we collected from the four synthetic genetic cassettes
(Appendix D Fig. D.S2B). However, the fitting of the linear regression model was very
bad, as demonstrated by the low PCC (0.41) between observed and simulated fold changes
(Appendix D Fig. D.S2B). This clearly indicated that the biomolecular interactions of
RNA-protein and DNA-protein in the dCas9-VP64 system were highly nonlinear, which
cannot be captured by the simple linear regression model.
We then used machine learning to derive an empirical model to quantitatively
predict the nonlinear correlation between design parameters and transcriptional regulation
by dCas9-VP64. As a data-driven modeling approach, machine learning is advantageous
than linear model in solving complex problems in two aspects[23-25]: requiring no a priori
knowledge of the system, and capable of resolving complex systems with high non-
linearity and multi-dimensionality. In this study, we used the pairwise data of the design
parameters of guide RNAs and the corresponding fold-change of gene expressions to train
the computer for developing a mathematical model that could accurately predict the causal
effects of inputs (i.e., regulated gene expression in this study). We used decision tree
method to build a machine-learning algorithm and adopted ten-fold cross validation to
evaluate the prediction accuracy of our model (Fig. 5.2A). The model construction and
model evaluation were conducted by following a toolkit developed in MATLABTM (i.e.,
“fitrtree” and “predict” in Statistics and Machine Learning Toolbox), which automatically
adjust the nodes and connections of the decision tree to optimize the fitting[26, 27]. Using

211
the 138 pairwise data collected from the synthetic genetic cassettes (i.e., TEF1p-GFP,
TPI1p-mCherry, PDC1p-Sapphire, and PGK1p-Venus), we found that the prediction
accuracy was dramatically improved with PCC reaching 0.80 (Fig. 5.2B) for overall
prediction of gene regulation and 0.72~0.93 for predicting gene regulation of individual
genetic cassettes (Fig. 5.2C). Also, we found that the prediction accuracy of our machine-
learning algorithm was improved with the enlargement of data size (Fig. 5.2D). For
example, when 20 pairwise datasets were chosen, the PCC was merely 0.66. However,
when the number of pairwise datasets reached 80, the PCC was improved to 0.78. This
demonstrated the unique advantage of data-driven algorithm, i.e., increased prediction
accuracy with more data.
To further test if our machine-learning algorithm could be generally applied for
predicting the transcriptional regulation of other genes, we designed another synthetic
genetic cassette that expressed tdTomato under Eno2p promoter. We used the machine-
learning algorithm to predict the regulated gene expressions when guide RNAs of dCas9-
VP64 were positioned at different locations of Eno2p-tdTomate cassette, followed by
constructing the genetic cassettes and conducting experimental measurements. Of the 99
guide RNAs tested, our machine-learning algorithm could achieve similarly high
prediction accuracy with PCC between the predicted and the measured gene expressions
reaching 0.87 (Fig. 5.2E). This success demonstrated that our data-driven model could be
generally applicable to guide the biomolecular design of dCas9-VP64 system to achieve
customized gene regulation.
We also packaged our machine-learning algorithm into an open-source toolbox
(Appendix D Fig. D.S3), CRISTINES (CRISPR-Cas9 Transcriptional Inactivation aNd

212
Elevation System), which is a MATLAB-based toolbox and free for downloading at
https://sites.google.com/a/vt.edu/biomolecular-engineering-lab/software. CRISTINES is
able to analyze the input DNA sequences, identify the design parameters of the dCas9-
VP64 system, and use the embedded decision-tree algorithm to provide the top five guide
RNAs that would lead to the strongest up-regulation and down-regulations, respectively.
We anticipated that CRISTINES could help biologists worldwide to customize their design
based on the target gene of interest.
5.2.3 Design dCas9-VP64 to Reprogram Metabolic Fluxes in Yeast.
We next applied dCas9-VP64 system in yeast metabolic engineering to test if the
metabolic fluxes could be flexibly reprogrammed using our CRISPR-based transcription
regulator. We chose the highly branched bacterial violacein biosynthetic pathway as our
model pathway[28] (Fig. 5.3A), which uses five enzymes (VioA, VioB, VioE, VioD, and
VioC) to produce four high-value products (violacein, proviolacein, deoxyviolacein, and
prodeoxyviolacein). By controlling the expression levels of the five enzymes, the metabolic
fluxes flowing into different branch pathways could be varied and thus leading to different
yield of the four products. In this study, we reconstituted the violacein pathway in yeast by
expressing the five enzymes under constitutive promoters (i.e., TEF1p, PGK1p, ENO2p,
TPI1p, and PDC1p). According to our data-driven model CRISTINES, we could
computationally predict the gene expression and thus predict the metabolic fluxes in the
violacein pathway. Here, we designed three guide RNAs for four genes in the violacein
pathway (VioA, VioE, VioD, and VioC). These three guide RNAs targeted on different
promoter sites and were predicted to result in high, medium and low expression of each
target gene, respectively. Correspondingly, the functional output states of the violacein

213
pathway were predicted to vary. For example, up-regulating VioA and down-regulating
VioD would increase the fluxes into deoxyviolacein and prodeoxyviolacein, but decrease
the fluxes into violacein and proviolacein. To validate our predictions on metabolic flux
reprogramming, we co-expressed the dCas9-VP64 system with the violacein pathway, and
used various guide RNAs to fine tune gene expressions. For each of the tests, we measured
the titer of violacein, proviolacein, deoxyviolacein, and prodeoxyviolacein produced by
yeast. As shown in Fig. 5.3B and 5.3C, our prediction fit well with the experimental
measurements, with PCC reaching 0.84. We noticed some of the predictions on metabolic
fluxes were not as good as we expected. This could be attributed to the posttranscriptional
regulation of the five enzymes in the violacein pathway. Overall, we demonstrated that our
master CRISPR-based transcription regulator was indeed able to program metabolic fluxes.
More importantly, our data-driven algorithm allows users to design metabolic pathways
with deterministic fates in silico.
5.3 Discussion
Using data-driven approach to investigate biomolecular interactions of CRISPR-
based systems has recently been showcased in several studies, such as rational design of
guide RNAs for maximizing editing activity and minimizing off-target effects of
SpCas9[29, 30]. This approach is advantageous compared to conventional deterministic
models because it does not require a priori knowledge on the mechanisms of RNA-protein
and DNA-protein interactions[31, 32], which still remains largely unknown in spite of
numerous studies on SpCas9 structures[33-37]. Also, because the biomolecular
interactions among Cas9 protein and nucleic acids are highly nonlinear, the linear
regression model cannot capture the essence of CRISPR-based transcription regulation. As

214
shown in our results, a machine-learning method could overcome this issue and capture the
nonlinearity of the model. Not only did we achieve high accuracy when predicting the
regulatory effects of CRISPR-based transcription regulator, but we also demonstrated that
this method was not specific to a few selected genes and could be generally applicable.
Future work will determine if the results obtained from yeast could provide useful lessons
in other eukaryotic systems such as mammalian cells.
We expect that our method will provide a valuable tool for metabolic engineering,
especially yeast metabolic engineering at this stage. S. cerevisiae is a widely used industrial
workhorse for producing a broad spectrum of chemicals that represents over quarter trillion
dollars market[38]. The experimental and analytical approaches described here raise the
possibility of genome-scale reprogramming of metabolic fluxes, which will dramatically
speed up the “design-build-test” cycle in industrial biomanufacturing[39]. We also expect
our method could be used to rewire the fate of yeast cells, such as cell cycle, and thus
generate new biological insights on the fundamentals of metabolic diseases, aging and
apoptosis by using yeast as a disease model.
5.4 Methods and Models
5.4.1 Strain and Plasmid Construction in Saccharomyces cerevisiae.
dCas9 was codon-optimized for expression in S. cerevisiae and cloned into a
pRS413 backbone under control of the GAL1 promoter. The RNA-guided transcription
factors were built by fusing four repeats of the minimal domain of the herpes simplex viral
protein 16 (VP16) to the C-terminus of dCas9 (dCas9_VP64)[18]. The reporter genes eGFP
under the control of the TEF1p promoter, sapphire under PDC1p, mCherry under TPI1p,
and venus under PGK1p were cloned into pRS416 plasmid by using the DNA assembler
215
method[40, 41]. The reporter plasmid for verification was built by cloning tdTomato under
the control of ENO2p into pRS416 plasmid. To build gRNA-expressing plasmids, empty
gRNA expressing vectors were first made by cloning the pRPR1 promoter (an RNA-
polymerase-III-dependent promoter), the gRNA handle (flanked by HindIII and Xho1
sites), and the RPR1 terminator into the SacI and KpnI sites of the pRS425 plasmid.
Sequences of the constructs that were used in this study were listed in Appendix D Table
D.S1. Strains constructed in this study were listed in Appendix D Table D.S2.
5.4.2 Fluorescence Assays
To assess expression of the reporter constructs, yeast cells expressing different
gRNAs (or no gRNA as control) were grown overnight (250 rpm, 30°C) in 3 mL SC
medium supplemented with glucose with appropriate selection (three independent cultures
for each sample). Ten microliters of these cultures were then transferred into fresh media,
supplemented with galactose and grown for 20 h (250 rpm, 30°C) before analysis by plate
reader. The wave lengths of the different reporter genes are eGFP: λex 488 nm, λem 507nm;
Sapphire: λex 399 nm, λem 511nm; Venus λex 515 nm, λem 528nm; tdTomato λex 554 nm, λem
581nm; mCherry λex 587 nm, λem 610 nm. All of the fold-changes of the synthetic genetic
cassettes, including the four cassettes for model training and the ENO2p-tdTomato cassette
for model validation, were listed in Appendix D Table D.S3 and Appendix D Table D.S4.
5.4.3 Qualitative Analysis of Key Parameters.
The exponential fold changes of different gRNA designs have been separated into
two categories, the promoter region (location < 0, n = 52) and the gene coding region
(location > 0, n = 86). The unpaired two-tail t-test was used to calculate the significance of

216
the fold changes between these two groups. For the analysis of the PAM type, the same t-
test was used for each PAM types (nAGG = 42, nTGG = 69, nCGG = 21, nGGG = 6).
5.4.4 Modeling
The multiple linear regression model was implemented by the “regress” command
in MATLAB. To evaluate the prediction power, the ten-fold cross validation was
implemented for the linear model. The Pearson’s correlation coefficient between observed
and predicted fold changes was calculated by MATLAB. The binary regression decision
tree model was developed by using “fitrtree” command in MATLAB with all the default
setting of options. The details of the decision tree model were shown in Appendix D Table
D.S5. The ten-fold cross validation was implemented for this model with the same manner.
A detailed tutorial of CRISTINES was included in the supplementary information.
5.4.5 Ten-Fold Cross Validation
All the datasets from the four synthetic genetic cassettes (n = 151) were randomly
divided into ten folds (nine folds with 15 datasets each and one-fold with 16 datasets).
Nine of the ten folds were used as training datasets, and the one-fold remaining was used
as validation datasets. By iteratively repeating the above process for ten times, all the folds
could be used as validation datasets. The Pearson’s correlation coefficient between the
observed fold changes and predicted fold changes of were calculated by MATLAB.
5.4.6 Analysis of Products from Violacein Pathway.
Yeast strains for violacein biosynthesis were constructed and product distributions
were analyzed as described previously with minor modifications. The parent yeast strain
for these experiments was BY4741. The five-gene cassette of violacein pathway was
constructed using the DNA assembler method: VioA under TEF1p; VioB under PGK1p;

217
VioC under ENO2p; VioD under TPI1p and VioE under PDC1p. Yeast strains with
violacein pathway genes and the CRISPR system with constitutive dCas9 expression were
grown in SC medium containing 5% galactose. After 3 days at 30 °C, approximately 2 mL
of yeast cultures were harvested and the cells were collected and suspended in 250 μL of
methanol, boiled at 95 °C for 15 minutes, and vortexed twice during the incubation.
Solutions were centrifuged twice to remove cell debris, and the products from violacein
pathway (i.e., violacein, proviolacein, deoxyviolacein, and prodeoxyviolacein) in the
supernatant were analyzed by HPLC on an Agilent Rapid Resolution SB-C18 column as
described previously, measuring absorbance at 565 nm[42].
Acknowledgements
We thank the Writing Center in Virginia Tech for improving the language of the
paper. This study was supported by start-up fund (#175323) and the ICTAS Junior Faculty
Award from Virginia Tech.
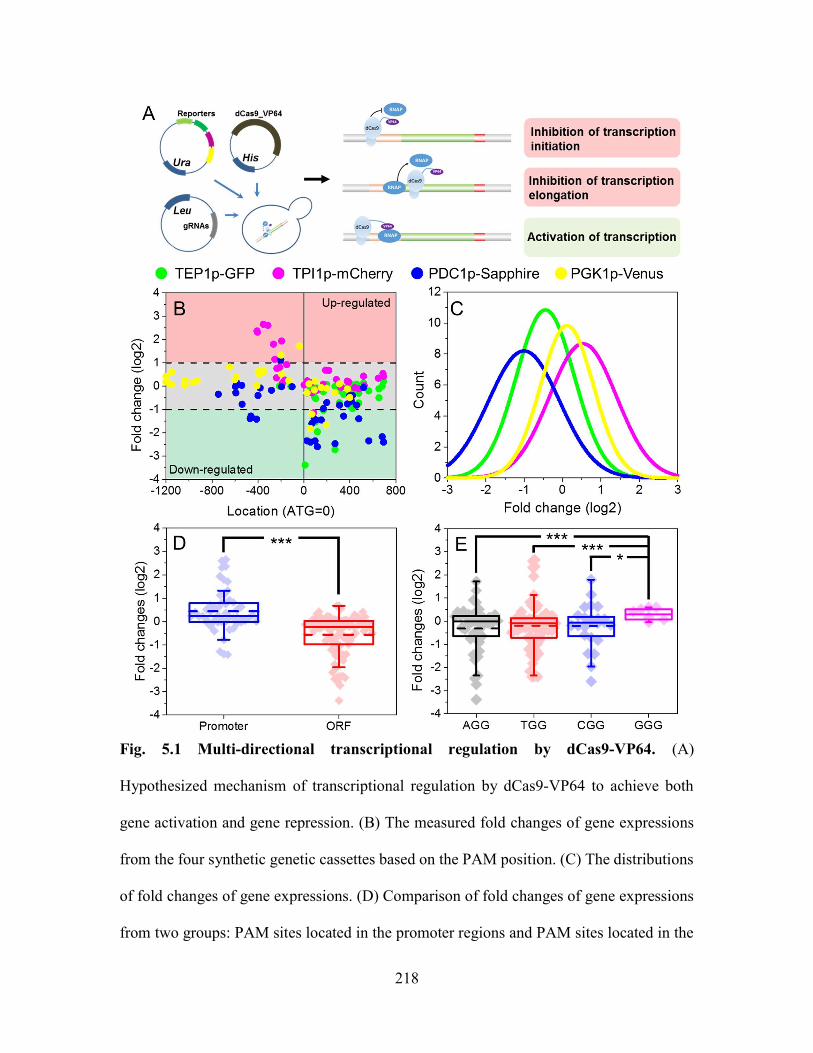
218
Fig. 5.1 Multi-directional transcriptional regulation by dCas9-VP64. (A)
Hypothesized mechanism of transcriptional regulation by dCas9-VP64 to achieve both
gene activation and gene repression. (B) The measured fold changes of gene expressions
from the four synthetic genetic cassettes based on the PAM position. (C) The distributions
of fold changes of gene expressions. (D) Comparison of fold changes of gene expressions
from two groups: PAM sites located in the promoter regions and PAM sites located in the

219
ORF region. ***: p < 0.01. (E) Effects of different PAM sites on transcriptional regulation
by dCas9-VP64. *: p < 0.05.

220
Fig. 5.2 Data-driven model of transcriptional regulation by using dCas9-VP64. (A)
Binary regression tree model trained with all the screening data from the four synthetic
genetic cassettes. The regression tree model consisted of 58 decision nodes and used six
design parameters of guide RNAs as input. (B) and (C) Prediction accuracy of the
regression tree model from ten-fold cross validation. (D) Impact of data size on model
prediction. For data-driven model, the prediction increased with the inclusion of more
datasets. For linear model, the prediction decreased when more datasets were used. The
shadow areas indicate the 95% confidence interval of model prediction. (E) Validation of
the regression tree model by comparing the simulated and experimentally measured gene
regulations on Eno2p-tdTomato cassette subject to dCas9-VP64 regulation.

221
Fig. 5.3 Design dCas9-VP64 to reprogram metabolic fluxes in yeast. (A) Violacein
pathway in yeast used in this study to demonstrate the programmable control of metabolic
fluxes by using dCas9-VP64. Five enzymatic steps (vioA, vioB, vioC, vioD, and vioE) and
two non-enzymatic steps led to four products from the violacein pathway: proviolacein,
prodeoxyviolacein, violacein, and deoxyviolacein. (B) A panel of genes subject to
regulation of dCas9-VP64 were chosen to control metabolic fluxes to various products
from the violacein pathway. WT: wild type gene without any regulation; High: highly up-
regulated gene expression by dCas9-VP64; Medium: medium-level up-regulated gene
expression by dCas9-VP64; Low: down-regulated gene expression by dCas9-VP64. (C)
The compassion between the model-predicted and experimentally measured products from
the violacein pathway. The high correlation coefficient (PCC=0.84) indicated that the data-

222
driven model could accurately predict the effects of artificial Cas9-based regulator on
metabolic flux reprogramming.

223
References
1. Lee, S.K., et al., Metabolic engineering of microorganisms for biofuels production: from bugs to synthetic biology to fuels. Current Opinion in Biotechnology, 2008. 19(6): p. 556-563.
2. Keasling, J.D. and H. Chou, Metabolic engineering delivers next-generation biofuels. Nat Biotechnol, 2008. 26(3): p. 298-9.
3. Vuoristo, K.S., et al., Metabolic Engineering of TCA Cycle for Production of Chemicals. Trends Biotechnol, 2016. 34(3): p. 191-7.
4. Chen, X., et al., Metabolic engineering of Escherichia coli: a sustainable industrial platform for bio-based chemical production. Biotechnol Adv, 2013. 31(8): p. 1200-23.
5. Yadav, V.G. and G. Stephanopoulos, Metabolic Engineering: The Ultimate Paradigm for Continuous Pharmaceutical Manufacturing. ChemSusChem, 2014. 7(7): p. 1847-1853.
6. Khosla, C. and J.D. Keasling, Metabolic engineering for drug discovery and development. Nat Rev Drug Discov, 2003. 2(12): p. 1019-25.
7. Keasling, J.D., Manufacturing Molecules Through Metabolic Engineering. Science, 2010. 330(6009): p. 1355-1358.
8. Zadran, S. and R.D. Levine, Perspectives in metabolic engineering: understanding cellular regulation towards the control of metabolic routes. Appl Biochem Biotechnol, 2013. 169(1): p. 55-65.
9. Zalatan, J.G., et al., Engineering complex synthetic transcriptional programs with CRISPR RNA scaffolds. Cell, 2015. 160(1-2): p. 339-50.
10. McNerney, M.P., D.M. Watstein, and M.P. Styczynski, Precision metabolic engineering: The design of responsive, selective, and controllable metabolic systems. Metab Eng, 2015. 31: p. 123-31.
11. Broun, P., Transcription factors as tools for metabolic engineering in plants. Curr Opin Plant Biol, 2004. 7(2): p. 202-9.
12. Kim, J. and J.L. Reed, OptORF: Optimal metabolic and regulatory perturbations for metabolic engineering of microbial strains. BMC Syst Biol, 2010. 4: p. 53.
13. Cong, L., et al., Multiplex genome engineering using CRISPR/Cas systems. Science, 2013. 339(6121): p. 819-23.
14. Jiang, W., et al., RNA-guided editing of bacterial genomes using CRISPR-Cas systems. Nat Biotechnol, 2013. 31(3): p. 233-9.
15. Gilbert, L.A., et al., CRISPR-mediated modular RNA-guided regulation of transcription in eukaryotes. Cell, 2013. 154(2): p. 442-51.
16. Larson, M.H., et al., CRISPR interference (CRISPRi) for sequence-specific control of gene expression. Nat Protoc, 2013. 8(11): p. 2180-96.
17. Qi, L.S., et al., Repurposing CRISPR as an RNA-guided platform for sequence-specific control of gene expression. Cell, 2013. 152(5): p. 1173-83.
18. Farzadfard, F., S.D. Perli, and T.K. Lu, Tunable and multifunctional eukaryotic transcription factors based on CRISPR/Cas. ACS Synth Biol, 2013. 2(10): p. 604-13.

224
19. Bikard, D., et al., Programmable repression and activation of bacterial gene expression using an engineered CRISPR-Cas system. Nucleic Acids Res, 2013. 41(15): p. 7429-37.
20. Gao, Y., et al., Complex transcriptional modulation with orthogonal and inducible dCas9 regulators. Nat Methods, 2016. 13(12): p. 1043-1049.
21. Montague, T.G., et al., CHOPCHOP: a CRISPR/Cas9 and TALEN web tool for genome editing. Nucleic Acids Research, 2014. 42(W1): p. W401-W407.
22. Labun, K., et al., CHOPCHOP v2: a web tool for the next generation of CRISPR genome engineering. Nucleic Acids Research, 2016. 44(W1): p. W272-W276.
23. Russell, S.J. and P. Norvig, Artificial Intelligence: A Modern Approach. 2003: Pearson Education. 1132.
24. Langley, P., The changing science of machine learning. Machine Learning, 2011. 82(3): p. 275-279.
25. Mohri, M., A. Rostamizadeh, and A. Talwalkar, Foundations of machine learning. 2012: MIT press.
26. Breiman, L., et al., Classification and regression trees. 1984: CRC press. 27. Loh, W.-Y. and Y.-S. Shih, Split selection methods for classification trees.
Statistica sinica, 1997: p. 815-840. 28. Hoshino, T., Violacein and related tryptophan metabolites produced by
Chromobacterium violaceum: biosynthetic mechanism and pathway for construction of violacein core. Appl Microbiol Biotechnol, 2011. 91(6): p. 1463-75.
29. Cho, S.W., et al., Analysis of off-target effects of CRISPR/Cas-derived RNA-guided endonucleases and nickases. Genome Res, 2014. 24(1): p. 132-41.
30. Haeussler, M., et al., Evaluation of off-target and on-target scoring algorithms and integration into the guide RNA selection tool CRISPOR. Genome Biol, 2016. 17(1): p. 148.
31. Delebecque, C.J., et al., Organization of intracellular reactions with rationally designed RNA assemblies. Science, 2011. 333(6041): p. 470-4.
32. Farasat, I. and H.M. Salis, A Biophysical Model of CRISPR/Cas9 Activity for Rational Design of Genome Editing and Gene Regulation. PLoS Comput Biol, 2016. 12(1): p. e1004724.
33. Nishimasu, H., et al., Crystal structure of Cas9 in complex with guide RNA and target DNA. Cell, 2014. 156(5): p. 935-49.
34. Jinek, M., et al., Structures of Cas9 endonucleases reveal RNA-mediated conformational activation. Science, 2014. 343(6176): p. 1247997.
35. Slaymaker, I.M., et al., Rationally engineered Cas9 nucleases with improved specificity. Science, 2016. 351(6268): p. 84-8.
36. Jiang, F., et al., Structures of a CRISPR-Cas9 R-loop complex primed for DNA cleavage. Science, 2016. 351(6275): p. 867-71.
37. Jiang, F., et al., STRUCTURAL BIOLOGY. A Cas9-guide RNA complex preorganized for target DNA recognition. Science, 2015. 348(6242): p. 1477-81.
38. Hittinger, C.T., Saccharomyces diversity and evolution: a budding model genus. Trends Genet, 2013. 29(5): p. 309-17.
39. Petzold, C.J., et al., Analytics for Metabolic Engineering. Frontiers in Bioengineering and Biotechnology, 2015. 3: p. 135.

225
40. Shao, Z., H. Zhao, and H. Zhao, DNA assembler, an in vivo genetic method for rapid construction of biochemical pathways. Nucleic Acids Res, 2009. 27(2): p. e16.
41. Shao, Z., Y. Luo, and H. Zhao, Rapid characterization and engineering of natural product biosynthetic pathways via DNA assembler. Mol Biosyst, 2011. 7(4): p. 1056-9.
42. Lee, M.E., et al., Expression-level optimization of a multi-enzyme pathway in the absence of a high-throughput assay. Nucleic Acids Res, 2013. 41(22): p. 10668-78.

226
Chapter 6: Outreaches in Metabolic Engineering
6.1 Metabolic Engineering of Saccharomyces cerevisiae to Produce
1-Hexadecanol from Xylose
Weihua Guoa, *, Jiayuan Shenga, *, Huimin Zhaob, †, Xueyang Fenga, †
a Department of Biological Systems Engineering, Virginia Polytechnic Institute and State
University, Blacksburg, VA 24061, United States
b Department of Chemical and Biomolecular Engineering, University of Illinois at
Urbana-Champaign, Urbana, IL 61801, United States
†Correspondence to: Huimin Zhao and Xueyang Feng.
* JS and WG contribute to this work equally.
Phone: +1-(217) 333-2631 and +1-(540)231-2974
Email: [email protected] and [email protected]
This manuscript has been published on Microbial cell factories 15 (1), 24. Supplementary
material of Chapter 6.1 is shown in Appendix E.
227
Abstract
Background. An advantageous but challenging approach to overcome the limited
supply of petroleum and relieve the greenhouse effect is to produce bulk chemicals from
renewable materials. Fatty alcohols, with a billion-dollar global market, are important raw
chemicals for detergents, emulsifiers, lubricants, and cosmetics production. Microbial
production of fatty alcohols has been successfully achieved in several industrial
microorganisms. However, most of the achievements were using glucose, an edible sugar,
as the carbon source. To produce fatty alcohols in a renewable manner, non-edible sugars
such as xylose will be a more appropriate feedstock.
Results. In this study, we aim to engineer a Saccharomyces cerevisiae strain that
can efficiently convert xylose to fatty alcohols. To this end, we first introduced the fungal
xylose utilization pathway consisting of xylose reductase (XR), xylitol dehydrogenase
(XDH), and xylulose kinase (XKS) into a fatty alcohol-producing S. cerevisiae strain
(XF3) that was developed in our previous studies to achieve 1-hexadecanol production
from xylose at 0.4 g/L. We next applied promoter engineering on the xylose utilization
pathway to optimize the expression levels of XR, XDH, and XKS, and increased the 1-
hexadecanol titer by 171%. To further improve the xylose-based fatty alcohol production,
two optimized S. cerevisiae strains from promoter engineering were evolved with the
xylose as the sole carbon source. We found that the cell growth rate was improved at the
expense of decreased fatty alcohol production, which indicated 1-hexadecanol was mainly
produced as a non-growth associated product. Finally, through fed-batch fermentation, we
successfully achieved 1-hexadecanol production at over 1.2 g/L using xylose as the sole

228
carbon source, which represents the highest titer of xylose-based 1-hexadecanol reported
in microbes to date.
Conclusions. A fatty alcohol-producing S. cerevisiae strain was engineered in this
study to produce 1-hexadecanol from xylose. Although the xylose pathway we developed
in this study could be further improved, this proof-of-concept study, for the first time to
our best knowledge, demonstrated that the xylose-based fatty alcohol could be produced in
S. cerevisiae with potential applications in developing consolidated bioprocessing for
producing other fatty acid-derived chemicals.
Key Words
Yeast, promoter engineering, evolutionary engineering, fatty alcohols.

229
6.1.1 Introduction
Producing bulk chemicals from renewable resources could reduce strong
dependence on petroleum and the damage to the environment [1, 2]. As important
chemicals with a billion-dollar market globally [3, 4], fatty alcohols have been widely used
to produce detergents, emulsifiers, lubricants, cosmetics, and have the potential to be used
as fuels [5]. Currently, fatty alcohols are produced in two ways. One is direct extraction
from natural plant oils [6], and the other is chemical synthesis from petrochemical sources.
These methods have limitations due to either competition with the food supply,
environmental concerns [7], or fast depletion of fossil sources [8].
Recently, with the development of metabolic engineering and synthetic biology,
microbial production of fatty alcohols from renewable feedstock has been achieved
successfully in both Escherichia coli [4, 9] and Saccharomyces cerevisiae [3, 10]. So far,
the highest titer of fatty alcohols produced was 1.95 g/L [11] and 1.1 g/L [10] by E. coli
and S. cerevisiae respectively. A significantly higher titer of fatty alcohols was recently
reported to be produced by R. toloroides [12]. In E. coli, fatty alcohols have been produced
by introducing heterologous enzymes such as fatty acyl-CoA reductase (FAR) [13],
carboxylic acid reductase (CAR) [14] together with aldehyde reductases (AR) , or acyl-
CoA reductase (ACR) together with aldehyde reductases (AR) [4, 15]. Compared to that
in E. coli, the synthetic route (i.e., steps of enzymatic reactions) of fatty acyl-CoA is shorter
in yeast, which allows more efficient conversion of carbohydrate substrates to fatty acids
and fatty acid-derived biofuels [9]. Also, as a well characterized robust industrial host,
yeast can grow under low pH and various harsh fermentation conditions [16]. Therefore,
there has been an increasing interest on developing yeast, such as S. cerevisiae, as a cell

230
factory for fatty acid-derived biofuel production. In S. cerevisiae, a mouse FAR has been
expressed to produce 1-hexadecanol [10]. Through over-expression of acetyl-CoA
carboxylase (ACC) and fatty-acyl-CoA synthases (FAS), the engineered S. cerevisiae
strain produced 98.0 mg/L total fatty alcohol from 20 g/L glucose in batch culture in
minimal medium [3]. Recently, by manipulating the structural genes in yeast lipid
metabolism, tuning the regulation of phospholipid synthesis, and increasing the supply of
key precursors, 1-hexadecanol was produced at 1.1 g/L using glucose as the carbon source
in a fed-batch fermentation [10].
One of the limitations for current research on metabolic engineering to produce
fatty acid-derived chemicals is that almost all of the achievements were based on glucose
as the carbon source. To produce biofuels and biochemicals in a renewable manner, non-
edible sugars such as xylose will be a more appropriate feedstock. Recently, engineering
S. cerevisiae to utilize xylose is of great interest to the biofuel industry and could solve the
major bottleneck in complete and efficient conversion of cellulosic sugars present in
solubilized cell wall of plants into biofuels [17]. The sugar D-xylose, derived from
hydrolysis of hemicellulose, is the second most abundant sugar in the plant cell wall
consisting of up to 35% of the total carbohydrate from lignocellulose biomass [18].
However, since the yeast S. cerevisiae cannot metabolize xylose, heterologous xylose
utilization pathway needs to be introduced into S. cerevisiae to achieve this objective. Two
different pathways for the catabolism of D-xylose have been established in S. cerevisiae:
the fungal xylose pathway consisting of xylose reductase (XR), xylitol dehydrogenase
(XDH), and xylulose kinase (XKS) [17, 19-21], and the xylose pathway using the enzyme,
xylose isomerase, to convert D-xylose directly into D-xylulose [22, 23], followed by the

231
phosphorylation of D-xylulose to D-xylulose-5-phosphate. Recently, xylose isomerase has
been successfully used in an industrial yeast strain [24].
In this study, we aim to engineer a S. cerevisiae strain that can efficiently convert
xylose to fatty alcohols, by expressing a heterologous fungal xylose pathway into a 1-
hexadecanol-producing S. cerevisiae strain that has been previously developed. We chose
a S. cerevisiae strain, namely XF3, as our host since it has been engineered to produce 1-
hexadecanol at over 1 g/L from glucose, and introduced xylose reductase (XR), xylitol
dehydrogenase (XDH), and xylulose kinase (XKS) into XF3 to utilize xylose as the sole
carbon source. Then, by applying combinatorial promoter engineering and evolutionary
engineering, the production of 1-hexadecanol was enhanced by 171%. Finally, over 1.2
g/L 1-hexadecanol was produced in a fed-batch fermentation using xylose as the sole
carbon source, which is at the similar level when using the glucose as the carbon source
[10]. To our best knowledge, it is first time that yeast was engineered to use a pentose sugar
for producing fatty acid-derived biofuels.
6.1.2 Materials and Methods
Yeast Strains, Media, and Transformation. The yeast strains used in this study
were derived from BY4742 (Table 6.1.1). Yeast and bacterial strains were stored in 25%
glycerol at -80 °C.E. coli DH5α strain was used to maintain and amplify plasmids, and
recombinant strains were cultured at 37 °C in Luria-Bertani (LB) broth. Ampicillin at 100
μg/mL was added to the medium when required. Yeast BY4742 strains were cultivated in
YPAD medium. Yeast cells were transformed with plasmids listed in Table 1 using the
LiAc/PEG method as described previously [25]. To select the yeast transformants, a
synthetic complete (SC) medium was used, which contains 0.17% yeast nitrogen base,

232
0.5% ammonium sulfate, and the appropriate amino acids dropout mix (MP Biomedicals,
Solon, OH). A single colony was picked and cultivated in 5 mL SC medium containing 20
g/L glucose. The cells were cultivated at 30 °C in disposable culture tubes shaken at 250
rpm for 2 days.
Plasmid Construction. A yeast homologous recombination-based method, DNA
assembler [26], was used to construct the recombinant plasmids. Briefly, DNA fragments
sharing homologous regions to adjacent DNA fragments were co-transformed into S.
cerevisiae along with the linearized backbone to assemble several elements in a single step
[27]. Oligonucleotides used in this study were listed in Appendix E Table E.S1 and the
recombinant plasmids constructed in this study were listed in Table 6.1.1. To construct the
library for promoter engineering, the csXR was amplified with forward primer
(XF_FP_csXR_ADH1t) and reverse primer (XF_RP_csXR_ADH1t); the ctXDH was
amplified with forward primer (XF_FP_ TEF1p _CYC1t) and reverse primer
(XF_RP_ctXDH_CYC1t); the ppXKS was amplified with forward primer
(XF_FP_ppXKS_ADH2t) and reverse primer (XF_FP_ppXKS_ADH2t). The resulting
PCR fragments have a 40 bp region homologous to constitutive yeast promoters and
terminators, respectively. The constitutive yeast PDC1p promoters with different strengths
for csXR were amplified with forward primer (XF_FP_PDC1p) and reverse primer
(XF_RP_PDC1p) and using mutant PDC1p templates [28]. The different versions of
TEF1p promoters for ctXDH and ENO2p promoters for ppXKS were achieved using the
same methods. The DNA Assembler method was next used to construct the xylose
utilization plasmids pRS416-PDC1p (L/M/H)-csXR-ADH1t-TEF1p(L/M/H)-ctXDH-
CYC1t-ENO2p(L/M/H)-ppXKS-ADH2t with the proper combinations of each fragment

233
(Fig. 6.1.1B). The sequences of all mutated promoters were listed in Appendix E Table
E.S2.
Determination of 1-Hexadecanol Production. The 1-hexadecanol was detected
using a method previously described [3]. In general, for screening the 1-hexadecanol
production in different strains, the engineered yeast strains were pre-cultured in 3 mL
synthetic complete (SC) medium including all the appropriate nucleotides and amino acids,
with 2% glucose for three days until saturation. The cells were then centrifuged and washed
twice with double-distilled water. The cell pellets were next inoculated into 5 mL fresh SC
medium with 40 g/L xylose in disposable glass tubes overlaid with 10% dodecane to
prevent the evaporation of fatty alcohols and enrich the fatty alcohol in the organic layer
to ease the measurement [3]. The concentrations of 1-hexadecanol were quantified at 48 h
[3]. The glass tubes of yeast cultures were allowed to sit for 2 min until the organic layer
could be clearly visualized. Then, 3 μL of dodecane was withdrawn from the organic layer
and diluted by 100 times using ethyl acetate and analyzed by GC–MS (ShimadzuGC-MS-
QP2010) with a DB-Wax column with 0.25 μm film thickness, 0.25 mm diameter, and 30
m length (Agilent Inc., Palo Alto, CA). Tridecane at a concentration of 2 mg/L was used
as the internal standard. The GC program was as follows: an initial temperature of 50 °C
was maintained for 1.5 min, followed by ramping to 180 °C at a rate of 25 °C /min. The
temperature was then ramped to 250 °C at a rate of 10 °C /min, where the temperature was
held for 3 min.
Evolutionary Engineering. To improve xylose utilization of the engineered strain,
the optimized strain was cultured and serial-transferred into 50 mL of fresh SC medium
with 40 g/L xylose as the sole carbon source in a closed 100 mL flask. The cells were

234
grown until the early stationary phase (~3 days) and spread on SC-xylose plates. After 3-
days growth, the biggest colony was inoculated into a fresh medium and grown until the
early stationary phase. Then the cells were sub-cultured with 5% inoculums in biological
triplicates into fresh medium for the second round evolutionary engineering using the SC
medium with 40 g/L xylose. The cells were grown for 3 days with typical OD600 in the
range of 1.5-2.5. For each round of cell culture, the cell growth rate and fatty alcohol titer
were measured using the method described above. We checked the plasmids intactness for
each generation of the evolved strains by colony PCR, amplifying the cassettes for each
gene, and confirming the intactness by DNA electrophoresis. All the plasmids were found
to be intact (Appendix Fig. E.S1).
Batch and fed-batch fermentation. Both XF3XP and XF3XP07 yeast strains were
first grown in 100 mL SC medium including all the appropriate nucleotides and amino
acids, with 20 g/L glucose for 2 days. Then, cells from 5 mL of culture were centrifuged,
washed twice with double-distilled water, and inoculated into 5 mL fresh SC medium with
40 g/L xylose in glass disposable tubes overlaid with 0.5 mL dodecane for batch
fermentation. The initial ODs were similar, i.e., 2.38 ± 0.05 and 2.45 ± 0.06, with no
significant difference (p-value >0.05). Samples were taken at various time points to
measure the 1-hexadecanol concentration, OD600, and xylose concentration. At each time
point, the glass tubes of yeast cultures were allowed to sit for 2 min until the organic layer
could be clearly visualized. To measure the 1-hexadecanol concentration, 3 μL of dodecane
was withdrawn from the organic layer and then diluted by 100 times using ethyl acetate
followed by the analysis using the GC–MS protocol mentioned above. To monitor OD600,
20 μL of yeast culture was taken from the water layer and mixed with 180 μL of double-

235
distilled water, followed by measuring the absorbance at 600 nm using a Biotek Synergy 2
Multi-Mode Microplate Reader (Winooski, VT). To measure the concentration of xylose,
100 μL of yeast culture was taken from the water layer and mixed with 900 μL of double-
distilled water, which was then centrifuged at 13,000 rpm for 5 min. The supernatant was
taken and analyzed by Shimadzu HPLC (Columbia, MD) equipped with an Aminex HPX-
87H column (Bio-Rad, Hercules, CA) and Shimadzu RID-10A refractive index detector.
The column was kept at 50 °C, and 5 mM sulfuric acid solution was used as a mobile phase
with a constant flow rate of 0.6 mL/min. Each data point represents the mean of triplicate
samples. In this discontinuous fed-batch fermentation, additional xylose (0.5 mL with
concentration of 200 g/L) and dodecane (0.05 mL) were fed every 12 hrs. Samples were
taken after the replenishment to measure 1-hexadecanol concentration, OD600, and xylose
concentration using the similar methods as that for batch fermentation. The biological
triplicates were implemented in both batch and fed-batch fermentation for all the strains.
6.1.3 Results and Discussion
Constructing a Xylose Utilization Pathway in a Fatty Alcohol-Producing
Strain. In order to produce the xylose-based 1-hexadecanol, we first introduced the fungal
xylose utilization pathway [29] into a 1-hexadecanol-producing S. cerevisiae strain, XF3
[10] (Fig. 6.1.1). The xylose utilization pathway was selected from our previous study [29],
which included a XR from Candida shehatae, a XDH from Candida tropicalis and a XKS
from Pichia pastoris. The XF3 strain produced 1-hexadecanol at over 1.1 g/L from glucose
in S. cerevisiae as reported in our previous study [10]. The 1-hexadecanol production in
XF3 was achieved by heterologously expressing a FAR from barn owls, over-expressing
acetyl-CoA carboxylase (ACC1 gene), knocking out a negative regulator, RPD3 gene, in

236
phospholipid synthesis, and over-expressing ATP-citrate lyases (ACL1 gene and ACL2
gene) from Yarrowia lipolytica to enhancing the supply of cytosolic acetyl-CoA (Fig.
6.1.1A). By introducing the fungal xylose utilization pathway into XF3 strain, we
successfully generated a S. cerevisiae strain (XF3XP) to produce the 1-hexadecanol from
xylose as the sole carbon source at 0.4 g/L (Table 6.1.2). The xylose-based fatty alcohol
titer was lower than the glucose-based 1-hexadecanol titer [10] and only 15 g/L xylose was
consumed to produce 1-hexadecanol, indicating the xylose utilization could be a rate-
limiting step for fatty alcohol production. We also introduced another fungal xylose
pathway in which the promoter strengths of XR, XDH, and XKS were previously
optimized to increase xylose-based ethanol production (XF3XPi, Table 6.1.2). We found
that although 1-hexadecanol production could be increased to 0.48 g/L, the xylose
utilization was even worse than the wild-type pathway with less than 5 g/L xylose
consumed. This is possibly due to the fact that the regulatory mechanism adopted by S.
cerevisiae to control xylose-based fatty alcohol production was different from that to
control xylose-based ethanol production. Therefore, the metabolic engineering of S.
cerevisiae for biofuel production is target-specific.
Promoter Engineering to Improve 1-Hexadecanol Production from Xylose. In
order to further improve the 1-hexadecanol production, we implemented a synthetic
biology approach called Customized Optimization of Metabolic Pathways by
Combinatorial Transcriptional Engineering (COMPACTER) [28] to precisely control the
gene expression levels of XR, XDH, and XKS. Basically, we chose three constitutive
promoters, PPDC1, PTEF1, and PENO2 to express XR, XDH and XKS genes, respectively. For
each of the constitutive promoters, we mutated the original promoters to create a promoter

237
library with varying strengths. We then selected promoters with high, medium, and low
strengths (Appendix E Fig. E.S2) for PPDC1, PTEF1, and PENO2, respectively, and constructed
totally 27 synthetic xylose pathways (3×3×3=27) in S. cerevisiae with all of the promoter
combinations of PPDC1, PTEF1, and PENO2 with different strengths. (Fig. 6.1.1B and Table
6.1.1). We next compared the growth rates and 1-hexadecanol titers of all the recombinant
S. cerevisiae strains to that of the control strains, XF3XP (Fig. 6.1.2). It is worth noticing
that the purpose of combinatorial promoter screening was to find the highest fatty alcohol
production strain from xylose instead of the best xylose utilization strain. Therefore, we
did not measure the xylose utilization rates here. We found that the growth rates of most
of the promoter-engineered strains were reduced to some extent, and the 1-hexadecanol
production for most of the recombinant strains was not significantly improved. However,
strain XF3X07 and XF3X25 produced 1-hexadecanol at 171% and 140% higher than that
of the control strains with a slightly deceased growth rates (0.073 h-1 and 0.080 h-1)
compared with the growth rates of control strains (0.093 h-1). Both XF3X07 and XF3X25
used a high-level TEF1 promoter to express XDH and a low-level ENO2 promoter to
express XKS. Nevertheless, XF3X07 used a low-level PDC1 promoter to express XR while
XF3X25 used a high-level PDC1 promoter. This discovery is consistent with previous
studies showing that the XDH enzymes were rate-limiting steps in converting xylose to
biomass and ethanol [30, 31]. Interestingly, despite of higher titer of 1-hexadecanol in
XF3X07 compared to XF3XPi, the xylose-based 1-hexadecanol yields were similar in
XF3XP07 and XF3XPi (p>0.1). This indicated that the combinatorial promoter
engineering mainly improved the xylose uptake rate instead of optimizing the host
pathways to improve the conversion of xylose to 1-hexadecanol.
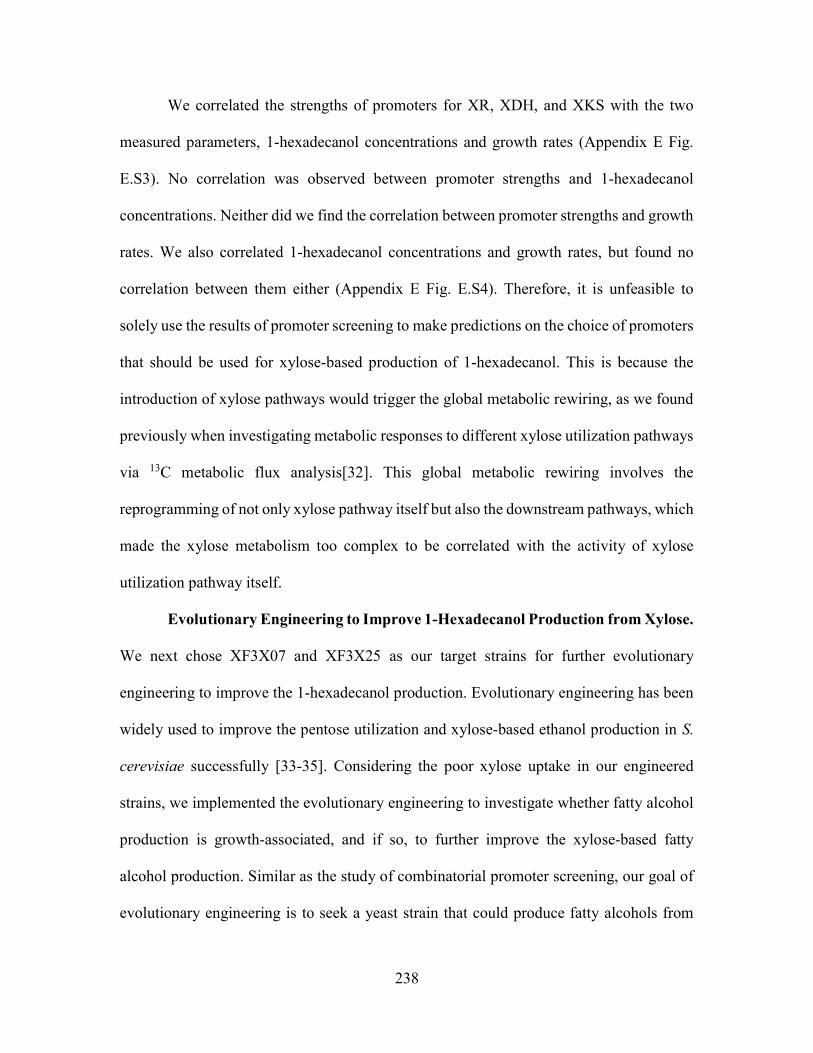
238
We correlated the strengths of promoters for XR, XDH, and XKS with the two
measured parameters, 1-hexadecanol concentrations and growth rates (Appendix E Fig.
E.S3). No correlation was observed between promoter strengths and 1-hexadecanol
concentrations. Neither did we find the correlation between promoter strengths and growth
rates. We also correlated 1-hexadecanol concentrations and growth rates, but found no
correlation between them either (Appendix E Fig. E.S4). Therefore, it is unfeasible to
solely use the results of promoter screening to make predictions on the choice of promoters
that should be used for xylose-based production of 1-hexadecanol. This is because the
introduction of xylose pathways would trigger the global metabolic rewiring, as we found
previously when investigating metabolic responses to different xylose utilization pathways
via 13C metabolic flux analysis[32]. This global metabolic rewiring involves the
reprogramming of not only xylose pathway itself but also the downstream pathways, which
made the xylose metabolism too complex to be correlated with the activity of xylose
utilization pathway itself.
Evolutionary Engineering to Improve 1-Hexadecanol Production from Xylose.
We next chose XF3X07 and XF3X25 as our target strains for further evolutionary
engineering to improve the 1-hexadecanol production. Evolutionary engineering has been
widely used to improve the pentose utilization and xylose-based ethanol production in S.
cerevisiae successfully [33-35]. Considering the poor xylose uptake in our engineered
strains, we implemented the evolutionary engineering to investigate whether fatty alcohol
production is growth-associated, and if so, to further improve the xylose-based fatty
alcohol production. Similar as the study of combinatorial promoter screening, our goal of
evolutionary engineering is to seek a yeast strain that could produce fatty alcohols from

239
xylose as much as possible. Therefore, we did not measure the xylose utilization rates. In
general, we serially transfer the strain XF3X07 and XF3X25 to synthetic medium with 40
g/L xylose twice. Namely, the optimized strain was the second generation evolved from
the wild-type strain. We found that the growth rates of two strains increased gradually
(~25% and ~35%) for every round as expected. However, such increase was associated
with reduced 1-hexadecanol production. For example, the highest growth rate was reached
for both XF3X07 and XF3X25 with the lowest titer of 1-hexadecanol in the second round
(Fig. 6.1.3). The growth rates of the evolved strains in the last round were significantly
increased for XF3XP07 and XF3XP25 (p<0.05). However, the 1-hexadecanol productions
were not significantly changed (p>0.05). Such discrepancy indicated that 1-hexadecanol,
unlike ethanol, was not a growth-associated product. Since evolutionary engineering
selects the mutant strain with higher growth rate, the 1-hexadecanol production failed to
be further improved via adaptive evolution due to the de-coupling between the cell growth
rate and the fatty alcohol production. In addition, we applied flux balance analysis to
calculate the ATP, NADH, and NADPH synthesis under different 1-hexadecanol
productions (Fig. E.S5). We found that the NADPH and ATP synthesis were positively
correlated with 1-hexadecanol production, while NADH synthesis did not change too much
with the 1-hexadecanol synthesis. Overall, the evolutionary engineering approach would
be helpful to improve the cell growth and growth-associated products such as ethanol, but
not for non-growth associated products such as fatty acid-derived chemicals.
Batch and Fed-Batch Fermentation for 1-Hexadecanol Production. With
XF3XP07 as our best strain to produce xylose-based 1-hexadecanol, we next characterized
its 1-hexadecanol production using batch and fed-batch fermentation. In batch

240
fermentation, we found that 0.79 g/L 1-hexadecanol was produced from 7.8 g/L xylose,
with a cell growth rate at 0.073 h-1 (Table 6.1.2). This 1-hexadecanol titer of XF3XP07 is
significantly higher than the ones of XF3XP and XF3XPi strain (p<0.05). More
interestingly, comparing the xylose uptakes of the XF3XP and XF3XPi, we found the
XF3XP strain consumed three-fold more xylose than the XF3XPi strain. This additional
xylose was mainly used to produce more ethanol in XF3XP strains (Table 6.1.2). In
addition, we have measured the accumulation of intracellular 1-hexadecanol, which was
less than 5% of the extracellular concentration of 1-hexadecanol from the organic layer.
Such low accumulation is consistent with several previous studies when yeast was cultured
with an organic layer [36], although it is also reported that S. cerevisiae strains could
accumulate a large amount of fatty alcohols intracellularly when cultured without the
organic layer [37].
In fed-batch fermentation, we used resting cells for fermentation, i.e., the cell
density was kept at high level to prevent using the xylose to produce biomass. Although
the fermentation at high cell density might limit the oxygen supply for the fermentation,
which is an important factor for the optimal expression of the xylose pathway genes [38],
the marginal net growth rate of yeast cells could be more important in fed-batch
fermentation because it was found in this study that fatty alcohol production was not
growth-associated and hence by removing the biomass production, yeast cells could serve
as biocatalysts to convert xylose to 1-hexadecanol with high efficiency. We found that a
long lag phase lasting around 40 h in the fed-batch fermentation, which could be due to the
repression of residue glucose from the inoculum since we cultured XF3XP and XF3XP07
with 20 g/L glucose before transferring the cells into the medium with xylose, and hence

241
cells needed a long time to accustom to xylose from glucose (Fig. 6.1.4). For the XF3XP
strain, 1-hexadecanol has been produced quickly with a low xylose consumption, and
achieved ~0.6 g/L of 1-hexadecanol at 48 h (Fig. 6.1.4A). For the XP3XP07 strain, after
the long lag phase, 1-hexadecanol was produced rapidly with the increased xylose uptake
and reached the highest titer of 1-hexadecanol at 1.2 g/L at the 69 h (Fig. 6.1.4B). However,
when continuing the fed-batch fermentation for both strains, both the 1-hexadecanol
concentrations and xylose uptake rates were decreased. The observed low xylose
consumption rate accompanied with the decrease of OD600 suggested a starvation because
of the incapability to further uptake the carbon substrate and the probable limitation by
other nutrients such as nitrogen and phosphate after the 50 h of the fermentation. In our
previous study[10], we found that fatty alcohols could be taken up by S. cerevisiae, which
could be the reason for the decreased fatty alcohol production when xylose utilization
became limited.
Comparing the xylose-based fatty alcohol production to the glucose-based one in
the previous study, the similar titer of fatty alcohol from fed-batch fermentation has been
observed, demonstrating the successful integration of xylose utilization pathway and the
fatty alcohol production pathway. However, the yields of xylose-based fatty alcohols in
both batch (0.10±0.02 g/g) and fed-batch fermentation (0.08 ±0.01 g/g) were much higher
than that of glucose-based ones (~0.03 g/g and <0.01 g/g), respectively. The theoretical
maximum yields through this production pathway from xylose and glucose were ~0.34 and
~0.35 (g/g), respectively. In this case, the yield from xylose reached nearly one third of the
theoretical yield, while the yield from glucose only reached less than 10% of the theoretical
yield. The bypass of ethanol production when feeding xylose instead of glucose likely

242
attributed to the high yield of xylose-based 1-hexadecanol, which could divert more
carbons to be utilized in the fatty alcohol production rather than ethanol production.
6.1.4 Conclusions
A fatty alcohol-producing S. cerevisiae strain was engineered in this study to
produce 1-hexadecanol from xylose. To achieve this, a xylose utilization pathway
consisting of XR, XDH and XK was heterologously expressed in S. cerevisiae, followed
by optimization of the xylose-based fatty alcohol production through promoter engineering
and evolutionary engineering to improve 1-hexadecanol production by 171%. Through
fed-batch fermentation, the highest titer of 1-hexadecanol reached 1.2 g/L with xylose used
as the sole carbon source. Although the xylose pathway we developed in this study was
still not optimal, this proof-of-concept study, for the first time to our best knowledge,
indicated that the xylose-based fatty alcohol could be achieved in S. cerevisiae with
potential applications in developing consolidated bioprocessing for producing fatty acid-
derived chemicals.
Acknowledgements
We thank the writing center in Virginia Tech for improving the language of the
paper. This study was supported by start-up fund (#175323) from Virginia Tech (X.F.)
and Energy Biosciences Institute (OO7G21) (H.Z.).

243
Table 6.1.1 Plasmids and strains used in this study.
Plasmids used in this study Name Description Reference pTaFAR_ACC1 pRS425-TEF1p-TaFAR-TEF1t-PGK1p-ACC1-HXT7t Feng et al.
(2015)[36] pYlACL pRS423-TPI1p-YlACL1-TPI1t-TEF1p-YlACL2-TEF1t Lian et al.
(2014)[39] pXF3X01 pRS416-PDC1p(L)-csXR-ADH1t-TEF1p(L)-ctXDH-CYC1t-ENO2p(L)-ppXKS-ADH2t This study pXF3X02 pRS416-PDC1p(L)-csXR-ADH1t-TEF1p(L)-ctXDH-CYC1t-ENO2p(M)-ppXKS-ADH2t This study pXF3X03 pRS416-PDC1p(L)-csXR-ADH1t-TEF1p(L)-ctXDH-CYC1t-ENO2p(H)-ppXKS-ADH2t This study pXF3X04 pRS416-PDC1p(L)-csXR-ADH1t-TEF1p(M)-ctXDH-CYC1t-ENO2p(L)-ppXKS-ADH2t This study pXF3X05 pRS416-PDC1p(L)-csXR-ADH1t-TEF1p(M)-ctXDH-CYC1t-ENO2p(M)-ppXKS-ADH2t This study pXF3X06 pRS416-PDC1p(L)-csXR-ADH1t-TEF1p(M)-ctXDH-CYC1t-ENO2p(H)-ppXKS-ADH2t This study pXF3X07 pRS416-PDC1p(L)-csXR-ADH1t-TEF1p(H)-ctXDH-CYC1t-ENO2p(L)-ppXKS-ADH2t This study pXF3X08 pRS416-PDC1p(L)-csXR-ADH1t-TEF1p(H)-ctXDH-CYC1t-ENO2p(M)-ppXKS-ADH2t This study pXF3X09 pRS416-PDC1p(L)-csXR-ADH1t-TEF1p(H)-ctXDH-CYC1t-ENO2p(H)-ppXKS-ADH2t This study pXF3X10 pRS416-PDC1p(M)-csXR-ADH1t-TEF1p(L)-ctXDH-CYC1t-ENO2p(L)-ppXKS-ADH2t This study pXF3X11 pRS416-PDC1p(M)-csXR-ADH1t-TEF1p(L)-ctXDH-CYC1t-ENO2p(M)-ppXKS-ADH2t This study pXF3X12 pRS416-PDC1p(M)-csXR-ADH1t-TEF1p(L)-ctXDH-CYC1t-ENO2p(H)-ppXKS-ADH2t This study pXF3X13 pRS416-PDC1p(M)-csXR-ADH1t-TEF1p(M)-ctXDH-CYC1t-ENO2p(L)-ppXKS-ADH2t This study pXF3X14 pRS416-PDC1p(M)-csXR-ADH1t-TEF1p(M)-ctXDH-CYC1t-ENO2p(M)-ppXKS-ADH2t This study pXF3X15 pRS416-PDC1p(M)-csXR-ADH1t-TEF1p(M)-ctXDH-CYC1t-ENO2p(H)-ppXKS-ADH2t This study pXF3X16 pRS416-PDC1p(M)-csXR-ADH1t-TEF1p(H)-ctXDH-CYC1t-ENO2p(L)-ppXKS-ADH2t This study pXF3X17 pRS416-PDC1p(M)-csXR-ADH1t-TEF1p(H)-ctXDH-CYC1t-ENO2p(M)-ppXKS-ADH2t This study pXF3X18 pRS416-PDC1p(M)-csXR-ADH1t-TEF1p(H)-ctXDH-CYC1t-ENO2p(H)-ppXKS-ADH2t This study pXF3X19 pRS416-PDC1p(H)-csXR-ADH1t-TEF1p(L)-ctXDH-CYC1t-ENO2p(L)-ppXKS-ADH2t This study pXF3X20 pRS416-PDC1p(H)-csXR-ADH1t-TEF1p(L)-ctXDH-CYC1t-ENO2p(M)-ppXKS-ADH2t This study pXF3X21 pRS416-PDC1p(H)-csXR-ADH1t-TEF1p(L)-ctXDH-CYC1t-ENO2p(H)-ppXKS-ADH2t This study pXF3X22 pRS416-PDC1p(H)-csXR-ADH1t-TEF1p(M)-ctXDH-CYC1t-ENO2p(L)-ppXKS-ADH2t This study pXF3X23 pRS416-PDC1p(H)-csXR-ADH1t-TEF1p(M)-ctXDH-CYC1t-ENO2p(M)-ppXKS-ADH2t This study pXF3X24 pRS416-PDC1p(H)-csXR-ADH1t-TEF1p(M)-ctXDH-CYC1t-ENO2p(H)-ppXKS-ADH2t This study pXF3X25 pRS416-PDC1p(H)-csXR-ADH1t-TEF1p(H)-ctXDH-CYC1t-ENO2p(L)-ppXKS-ADH2t This study pXF3X26 pRS416-PDC1p(H)-csXR-ADH1t-TEF1p(H)-ctXDH-CYC1t-ENO2p(M)-ppXKS-ADH2t This study pXF3X27 pRS416-PDC1p(H)-csXR-ADH1t-TEF1p(H)-ctXDH-CYC1t-ENO2p(H)-ppXKS-ADH2t This study pXF3XP pRS416-PDC1p-csXR-ADH1t-TEF1p-ctXDH-CYC1t-ENO2p-ppXKS-ADH2t This study
pXF3XPi pRS416-PDC1p*-csXR-ADH1t-TEF1p*-ctXDH-CYC1t-ENO2p*-ppXKS-ADH2t Jing et al. (2012)[40]
Strains used in this study Name Genotype Plasmids Reference BY4742 MATα his3Δ1 leu2Δ0 lys2Δ0 ura3Δ0 XF3 BY4742 ΔRPD3: pTaFAR_ACC1, pYlACL Feng et al. (2014) XF3XP Same as XF3 pXF3XP This study XF3XPi Same as XF3 pXF3XPi This study XF3X01 Same as XF3 pXF3X01 This study XF3X02 Same as XF3 pXF3X02 This study XF3X03 Same as XF3 pXF3X03 This study XF3X04 Same as XF3 pXF3X04 This study XF3X05 Same as XF3 pXF3X05 This study XF3X06 Same as XF3 pXF3X06 This study XF3X07 Same as XF3 pXF3X07 This study XF3X08 Same as XF3 pXF3X08 This study XF3X09 Same as XF3 pXF3X09 This study XF3X10 Same as XF3 pXF3X10 This study XF3X11 Same as XF3 pXF3X11 This study XF3X12 Same as XF3 pXF3X12 This study XF3X13 Same as XF3 pXF3X13 This study XF3X14 Same as XF3 pXF3X14 This study XF3X15 Same as XF3 pXF3X15 This study XF3X16 Same as XF3 pXF3X16 This study XF3X17 Same as XF3 pXF3X17 This study XF3X18 Same as XF3 pXF3X18 This study XF3X19 Same as XF3 pXF3X19 This study XF3X20 Same as XF3 pXF3X20 This study XF3X21 Same as XF3 pXF3X21 This study XF3X22 Same as XF3 pXF3X22 This study XF3X23 Same as XF3 pXF3X23 This study

244
* Mutated promoters used for ethanol production [40].
XF3X24 Same as XF3 pXF3X24 This study XF3X25 Same as XF3 pXF3X25 This study XF3X26 Same as XF3 pXF3X26 This study XF3X27 Same as XF3 pXF3X27 This study
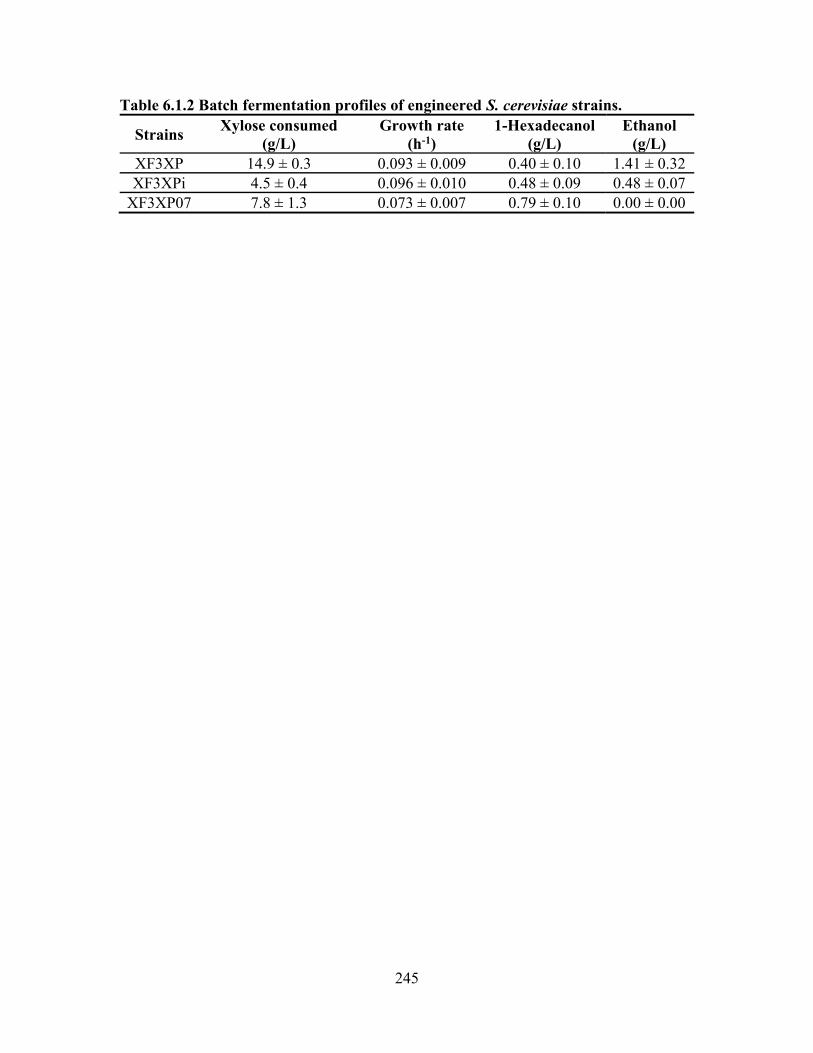
245
Table 6.1.2 Batch fermentation profiles of engineered S. cerevisiae strains.
Strains Xylose consumed
(g/L) Growth rate
(h-1) 1-Hexadecanol
(g/L) Ethanol
(g/L) XF3XP 14.9 ± 0.3 0.093 ± 0.009 0.40 ± 0.10 1.41 ± 0.32 XF3XPi 4.5 ± 0.4 0.096 ± 0.010 0.48 ± 0.09 0.48 ± 0.07
XF3XP07 7.8 ± 1.3 0.073 ± 0.007 0.79 ± 0.10 0.00 ± 0.00

246
Fig. 6.1.1 Overview of the approaches for xylose-based fatty alcohol production and
improvement. (A) Scheme for the introduction of xylose utilization pathway to a fatty
alcohol-producing S. cerevisiae strain. The xylose utilization pathway was constituted with
three fungal enzymes, XR, XDH and XKS, from our previous study. This pathway has
been confirmed to use xylose as the sole carbon source. The XF3 strain was selected from
our previous study in which we over-expressed a bird FAR to produce the 1-hexdecanol
and engineered the yeast lipid metabolism to further improve the fatty alcohol production.
(B) Plasmid design for promoter engineering to further improve the xylose-based fatty

247
alcohol production. We designed 27 different plasmids to exhaust all of the combinations
of the promoters in front of XR, XDH, and XKS whose strengths were low, medium and
high, respectively. The fatty alcohol production and growth behavior were monitored in
these 27 recombinant strains.

248
XF3
XP
XF3
X07
XF3
X25
XF3
X03
XF3
X13
XF3
X27
XF3
X02
XF3
X08
XF3
X14
XF3
X20
XF3
X18
XF3
X10
XF3
X04
XF3
X12
XF3
X05
XF3
X17
XF3
X06
XF3
X16
XF3
X22
XF3
X23
XF3
X21
XF3
X24
XF3
X19
XF3
X26
XF3
X09
XF3
X15
XF3
X11
XF3
X01
0.0
0.2
0.4
0.6
0.8
1.0
1.2
1.4
1.6
1.8
2.0
2.2
2.4
2.6
2.8
1-Hexadecanol Growth Rate
Fo
ld C
ha
nge
Strain Names
Fig. 6.1.2 1-Hexadecanol produced and growth rates of engineered S. cerevisiae
strains via promoter engineering. All the strains were cultured in the SC-xylose (4%)
medium for 48 h. The bars with lighter color were the values for the control strain (i.e.,
XF3XP) with the xylose utilization pathway using the native promoters.
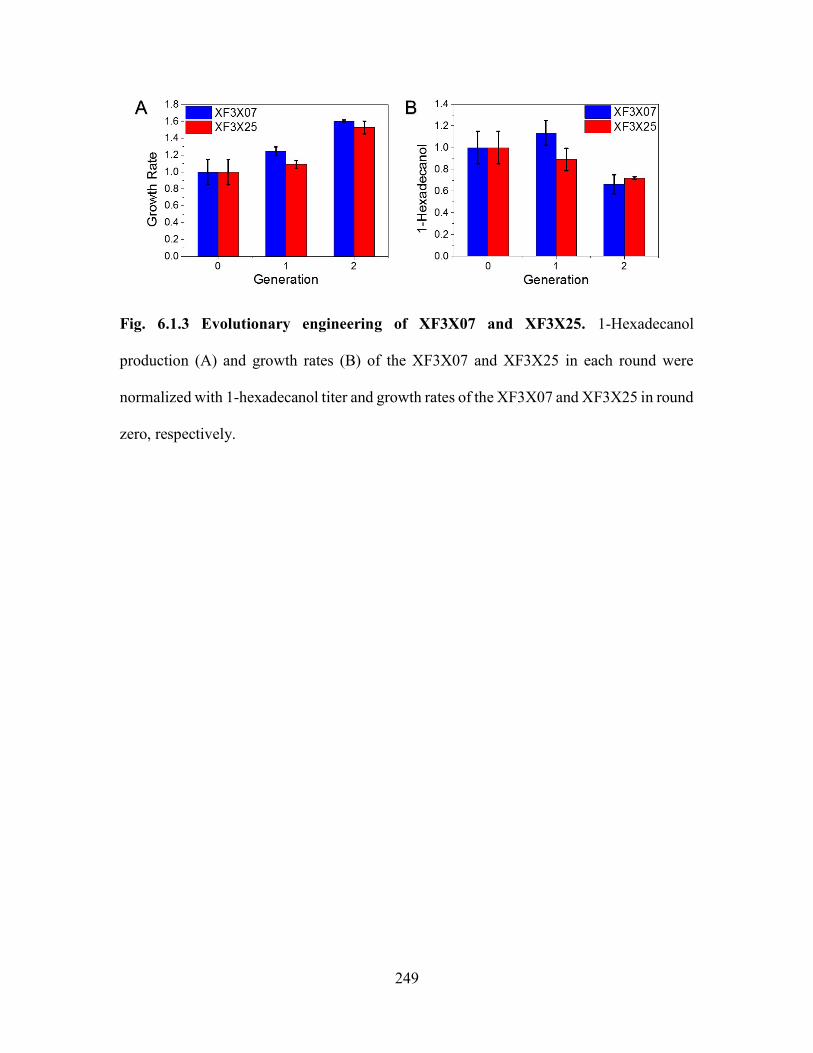
249
Fig. 6.1.3 Evolutionary engineering of XF3X07 and XF3X25. 1-Hexadecanol
production (A) and growth rates (B) of the XF3X07 and XF3X25 in each round were
normalized with 1-hexadecanol titer and growth rates of the XF3X07 and XF3X25 in round
zero, respectively.

250
Fig. 6.1.4 Fed-batch fermentation of xylose-based 1-hexadecanol production by (A)
XF3XP and (B) XF3XP07. Ethanol was detected as the only byproduct other than 1-
hexadecanol. Black square: the 1-hexadecanol concentration; blue triangle: the xylose
consumed; red dot: OD600.

251
6.2 Mini-review: In vitro Metabolic Engineering for
Biomanufacturing of High-Value Products
Weihua Guoa, *, Jiayuan Shenga, *,Xueyang Fenga, †
a Department of Biological Systems Engineering, Virginia Polytechnic Institute and State
University, Blacksburg, VA 24061, United States
†Correspondence to: Xueyang Feng.
* JS and WG contribute to this work equally.
Phone: +1-(540)231-2974
Email: [email protected]
This manuscript has been published on Computational and structural biotechnology
journal 15 161-167.

252
Abstract
With the breakthroughs in biomolecular engineering and synthetic biology, many
valuable biologically active compound and commodity chemicals have been successfully
manufactured using cell-based approaches in the past decade. However, because of the
high complexity of cell metabolism, the identification and optimization of rate-limiting
metabolic pathways for improving the product yield is often difficult, which represents a
significant and unavoidable barrier of traditional in vivo metabolic engineering. Recently,
some in vitro engineering approaches were proposed as an alternative strategy to solve this
problem. In brief, by reconstituting a biosynthetic pathway in a cell-free environment with
the supplement of cofactors and substrates, the performance of each biosynthetic pathway
could be evaluated and optimized systematically. Several value-added products, including
chemicals, nutraceuticals, and drug precursors, have been biosynthesized as proof-of-
concept demonstrations of in vitro metabolic engineering. This mini-review summarizes
the recent progresses on the emerging topic of in vitro metabolic engineering and comments
on the potential application of cell-free technology to speed up the “design-build-test”
cycles of biomanufacturing.
Key Words.
Cell-free, Biosynthesis, Metabolic Pathways, Design-Build-Test Cycle.

253
6.2.1 Introduction
For decades, scientists and engineers use metabolic engineering as a powerful
approach to optimize industrial fermentation processes through the introduction of directed
genetic changes using recombinant DNA technology. This has become an attractive,
sustainable way to produce molecules[2, 41, 42], especially when chemical synthesis is
difficult[43, 44]. Metabolic engineering aims to endow cells with improved properties and
performance[45] while synthetic biology could create new biological parts, modules,
devices and systems, in addition to re-engineering cellular components and machinery that
nature has provided[46]. Through the integration of metabolic engineering and synthetic
biology, efficient microbial cell factories can be constructed to produce biofuels,
biomaterials and drug precursors[47].
As high valued products, biologically active compound is one kind of the most
attractive engineering targets nowadays because many of them demonstrate important
pharmacological activities or biotechnological significance[48]. However, due to the
complexity of their structures which contains multiple chiral centers and labile
connectivity[49], researchers seek microbial production instead of total chemical synthesis
or semi-synthesis from isolated precursors. However, these products often lack optimal
production titer and high yield. Till now, except for a few examples such as introducing
heterologous pathways into yeast for the large scale production of an anti-malaria drug
artemisinin[50], few valuable biologically active compounds could be produced at high yield
and reach into the stage of large-scale biomanufacturing. Commodity chemicals is another
large group of chemicals that attracts researchers to use cell-based metabolic engineering
for manufacturing, mainly due to concerns of depleting fossil fuels and climate

254
changes[51]. Biomass produced from plants is the most abundant renewable resource and
is considered to be the cost-competitive energy and carbon sources that could be converted
to produce biofuels and biochemicals instead of fossil fuels[52]. Recent breakthroughs in
synthetic biology and metabolic engineering led to the production of a series of bulk
chemicals such as 1,4-butanediol[53], and isobutanol[54]. However, cell proliferation is
the primary goal of microorganisms while bioconversions are the side effects. These
inherent constraints of living microorganisms prevent them from implementing some
important chemical reactions (e.g., H2 production from glucose and water) and prohibit
them from achieving the theoretical yield of commodity chemicals.
The unsatisfactory results of large-scale biomanufacturing of high-value products
and commodity chemicals are largely due to two challenges: complex cell-wide regulation
of metabolic pathways, and difficulty in balancing biosynthesis of target products and
innate cell physiology. First, a lot of organisms are difficult to be engineered because of
unknown regulation patterns and the lack of engineering tools for non-model
organisms[55]. Even for model microorganisms like Escherichia coli and Saccharomyces
cerevisiae, which are well studied and equipped with a broad spectrum of biomolecular
tools to allow metabolic engineering easily, the effects of heterologous expression of
pathways are often unpredictable to guarantee a high productivity, as witnessed in
metabolic engineering of S. cerevisiae to produce n-butanol[56] and engineering carbon
dioxide fixation in E. coli.[57] In order to identify optimal biosynthetic systems and
discover the best sets of enzymes, the “design-build-test (DBT)” cycles[58] are often used.
However, the DBT cycles usually take months to finish, as culturing cells is time
consuming. Second, a key challenge in metabolic engineering is balancing the tug-of-war

255
that exists between the cell's physiological and evolutionary objectives on one side and the
engineer's process objectives on the other[59]. Such conflict of resource allocation
sometimes cannot be well addressed and toxic intermediates could be built up in the
unbalanced pathway thus the manufacturing of high-value products often ends up with a
low titer and yield and a high cost.
Many emerging technologies seek to address these challenges. Among them, cell-
free biotechnology is one of the promising approaches that offer complementary
advantages to in vivo metabolic engineering, especially in its potentials of speeding up the
DBT cycles[60]. In general, the cell-free biotechnology bypasses the cell growth, and thus
becomes time saving to permit more DBT cycles and avoids the conflict of resource
allocation between cell growth and biosynthesis of target products. The cell-free
biotechnology also uses an open reaction environment, which allows the easy and precise
adjustment of components such as cofactors and intermediates during a biosynthetic
reaction[61]. The cell-free biotechnology was first developed in 1961 for the purpose of
elucidating the codon usage[62] and was repurposed for protein production since the end
of the 1990s[63-66]. Recently in late 2000s, the cell-free biotechnology was further re-
engineered to produce both biologically active compound and commodity
chemicals[67],[68, 69]. In this mini-review, we summarized the experimental set-up and
computational modeling of two in vitro metabolic engineering approaches: cell-free
synthetic enzyme engineering and cell-free protein synthesis (CFPS)-based metabolic
engineering (Fig. 6.2.1).
256
6.2.2 Cell-Free Synthetic Enzyme Engineering
The principle of cell-free synthetic enzyme engineering is to purify the individual
enzymes of a biosynthetic pathway, reconstitute the pathway and study its performance in
vitro. For more than 100 years, biologists have sought to excise complete enzymatic
pathways from their native cellular environments for biochemistry research[70]. In vitro
analysis of metabolic pathways is becoming a powerful method to gain fundamental
understanding of biochemical transformations, to reveal the mechanisms of enzymatic
reactions and kinetics, and to identity key metabolites and feedback control of enzyme
activities.
Functional Investigation of Natural Enzymes and Metabolisms. As a powerful
method to investigate natural enzymes and metabolisms, some remarkable achievements
have been reported. One remarkable example is the study of the bacterial fatty acid
synthases. Although being investigated extensively at the genetic and enzymatic level, it is
still not easy to manipulate enhanced production of specific fatty acids because of the
complex cell-wide regulation of fatty acid synthesis. In 2010, Liu et al. revealed the strong
dependence of fatty acid synthesis on malonyl-CoA availability and several important
phenomena in fatty acid synthesis by a quantitative investigation of the fatty acid
biosynthesis and regulation in a cell-free synthetic enzyme system[71]. Following these
discoveries, Yu and colleagues reported an in vitro reconstitution of the fatty acid synthase
derived from E. coli by overexpressing all nine fatty acid biosynthesis (Fab) enzymes and
the acyl carrier protein (ACP) in the natural E. coli host, and purifying the enzymes to
homogeneity. Upon supplementing the ten protein species with acetyl-CoA, malonyl-CoA
and NADPH, C14-C18 fatty acids were observed in the system, evidenced by 14C-isotope

257
incorporation experiments and subsequently via UV-spectrophotometry[72]. The
reconstituted multi-enzyme system has also highlighted that the fine-tuning of each
individual components could substantially influence the partitioning between unsaturated
and saturated fatty acid products. Similar to fatty acid biosynthesis, another pathway which
synthesizes isoprenoids as key metabolites in both primary and secondary metabolisms,
was reconstituted in vitro. Basically, in order to develop a route to synthesize the jet fuel
farnesene, Zhu and colleagues reconstituted the mevalonate (MVA) pathway in a cell-free
synthetic enzyme system in vitro by expressing and purifying eight enzymes of the MVA
pathway as well as the α-farnesene synthase from an E. coli host[73]. The purified enzymes
worked in tandem with the requisite NADPH and ATP cofactors to produce farnesene, as
confirmed by gas chromatography-mass spectrometry. It was found that the
isopentenyldiphosphate (IPP) isomerase was the most influential factor on the turnover rate
of this pathway.
In addition to bacterial pathways, some eukaryotic pathways were also
reconstituted in vitro. The biosynthetic pathways of dhurrin, which plays an important role
in plant defense against pathogens[74], and camalexin, which is cytotoxic against
aggressive prostate cancer cell lines[75], have been studied in cell-free synthetic enzyme
system. Kahn and colleagues reconstituted the entire dhurrin biosynthetic pathway in vitro
using enzymes from the natural host organism[76]. Through tedious enzyme purification
processes, the researchers were able to obtain all three enzymes, CYP79,
glycosyltransferase and P450ox, in the microsomal fraction of the S. bicolor lysates. It was
found that the microsomal environment could allow functional expression of catalytically
active CYP79 and P450ox, and thus dhurrin synthesis was observed by radioactive TLC

258
analysis when combining the three enzymes with 14C-tyrosine, UDP-glucose, and NADPH.
In another study, Camalexin pathway was constructed in vitro by purifying thee enzymes:
CYP79B2, which catalyzes decarboxylation and N-hydroxylation of tryptophan to indole-
3-acetaldoxamine (IAOx); a second P450 enzyme, which was previously unknown and is
believed to catalyze an oxidative coupling of cysteine to IAOx; and CYP71A15, which
decarboxylates and cyclizes the resulting cysteine-indole-3-acetonitrile (Cys-IAN)
compound to form the thiazole ring structure within camalexin. By using a combination of
gene expression data and protein sequence analysis, Klein and coworkers were able to
identify a P450 enzyme capable of performing the C-S coupling reaction and to reconstitute
the entire camalexin pathway in vitro for the first time[77].
Production of Commercially Biocommodities. Perhaps a more advanced and
systematic application of cell-free synthetic enzyme engineering, especially for
reconstituting long biosynthetic pathways that involves a large number of enzymes for
chemical production purposes[51], is the development of Synthetic Pathway
Biotransformation (SyPaB)[47]. The development cycle of SyPaB is composed of five
parts: (i) pathway reconstruction, (ii) enzyme selection, (iii) enzyme engineering, (iv)
enzyme production, and (v) process engineering. The entire SyPaB process can be
improved in an iterative manner, which allows gradual improvement to an efficient
industrial process. The DBT cycles of SyPaB has proved to be much faster than the in vivo
systems[47]. As demonstrated in the pioneer work of high-yield cell-free hydrogen
production in Zhang’s lab, bulk chemicals could be potentially manufactured in a cost-
effective manner[78]. This cell-free hydrogen synthetic pathway contains four modules: 1)
a chain-shortening phosphorylation reaction for producing glucose-1-phosphate (G-1-P)

259
catalyzed by glucan phosphorylase; 2) conversion of G-1-P to glucose-6-phosphate (G-6-
P) catalyzed by phosphoglucomutase; 3) a pentose phosphate pathway containing 10
enzymes for producing 12 NADPH per G-6-P; and 4) hydrogen generation from NADPH
catalyzed by hydrogenase. The maximum hydrogen production rate reached 3.92 mmol of
hydrogen per hour per liter of reactor. When cellobiose was used as the substrate with a
reaction time of 150 h for a complete reaction, the overall yields of H2 was 11.2 mol per
mole of anhydroglucose unit of cellobiose, corresponding to 93.1% of the theoretical
yields. This yield was more than 2 times higher than the yield from microbial fermentations
which is limited to 4 H2 per mole of glucose[79, 80]. In another study, Honda and his
coworkers designed an in vitro non-natural, ATP balanced pathway for n-butanol
production from glucose[81]. This pathway comprised 16 thermostable enzymes with three
modules: 1) generation of two pyruvate and two NADH from one glucose molecule without
ATP accumulation, 2) generation of acetyl-CoA from pyruvate; and 3) n-butanol
production from two acetyl-CoAs. As a result, one molecule of glucose was able to produce
one molecule of n-butanol, two molecules of CO2 and one molecule of water. Recently,
Opgenorth et al. described a robust, efficient synthetic glucose breakdown pathway and
implemented it to produce bioplastic PHB[82]. The designed PBG cycle produces a net of
2 acetyl-CoA, 4 NAD(P)H, and 0 ATP for each glucose molecule and 66.6% theoretical
molar yield of carbon due to the release of CO2. Because the PBG pathway generated more
reducing equivalents than are needed to produce PHB (4 NADPH per glucose produced
but only 1 NADPH needed), the authors designed a NAD(P)H purge valve regulatory
nodes which composed of a mixture of dehydrogenases to prevent the buildup of NADPH.
Reactions were initiated with 60.7 glucose and continuously monitored in 10-h cycles by

260
absorbance at 600 nm. It was observed that by the end of the third cycle, the reaction
stopped by the depletion of glucose with a production of 57 ± 6 mM PHB (monomer
equivalents), corresponding to a 94% yield. When reactions were initiated with 109.2 mM
glucose, the system maintained >50% of the maximum activity over the entire 55 h run at
room temperature and generated 93.8 ± 6.1 mM PHB, corresponding to an 86% yield. The
high yield emphasized the importance of cofactor recycling for SyPaB system. Compared
to the microbial production of PHB using Cupriavidus necator[83], cell-free synthetic
enzyme engineering has higher (94%) yield but lower titer (~10 g/L) than microbial
bioprocess (60% yield and 83 g/L titer).
In order to further understand and predict performance of biological systems,
computational modeling has been commonly applied[84]. Cell-free synthetic enzyme
engineering can be modeled at multiple levels from molecules to modules to systems[85,
86]. Compared to in vivo cell metabolism, the relative simplicity of in vitro biological
systems makes them far easier to simulate processes and predict optimal enzyme ratios for
maximizing product yield and accelerating volumetric productivity. This simplicity could
be concluded into five aspects: 1) it is free of complex transcriptional or translational
regulations; 2) lower background noises in the defined system; 3) accurate measurements
of metabolic components; 4) better defined model parameters, and 5) smaller modeling
scales compared to in vivo systems. With the development of high-speed computers and
the accumulation of huge biological data, numerous computational tools have been
developed to simulate the in vivo cell metabolism and to facilitate the design of in vivo
metabolic engineering[87]. One of the most famous computational modeling approaches
is the flux balance analysis, which simulates cell metabolism at genome-scale to provide

261
the potential target genes for better production of chemicals[88, 89]. In addition, another
commonly used computational model is the kinetic model, in which a group of differential
equations are used to describe the dynamic behaviors of concentrations of biological
components (e.g., metabolites, mRNA, and peptides) and are solved by a set of differential
equations with defined kinetic parameters of biological reactions or processes[90]. To
explicitly solve such model, defined kinetic parameters are necessary, which are commonly
estimated by fitting the experimental data with kinetic models. With the estimated
parameters, the dynamic responses of objective biological components can be simulated in
specific conditions. However, one of the limitations of the kinetic model is the difficulty
in obtaining the kinetic parameters, especially the intracellular kinetic parameters.
Ensemble modeling[91], a novel computational approach constructing the ensemble of all
kinetic models with the same steady state, has been developed to analyze the kinetics
allowable by thermodynamics and to further facilitate the strain design for metabolic
engineering[92-96]. All approaches have been applied in in vivo metabolic engineering
with tremendous success for rational design of the host cell[84, 87]. However, only a few
pioneered studies aim at developing computational modeling approaches to predict the
behaviors of in vitro synthetic systems, even with the fact that in vitro synthetic systems
could be easier and more precisely described via kinetic models compared to in vivo
system[84, 85]. Recently, a non-linear kinetic model was used to describe the dynamic
behavior of a SyPaB system, which was able to convert the glucose and xylose from corn
stover to H2 and CO2, by estimating the kinetic parameters with the best fitting of
experimental data[78]. The key enzymes with the largest impact of the final hydrogen yield
and rate were identified by a global sensitivity analysis based on the kinetic model. By

262
tuning enzyme loading based on the identified key enzymes, the volumetric hydrogen
productivity was improved ~3-fold[78]. This improvement demonstrates the value of
computational modeling approach to the SyPaB system. In addition to enhancing the
performance of SyPaB systems, computational modeling of cell-free synthetic enzyme
system was also able to help derive and test new modeling approach[84, 85]. A cutting-
edge study attempted to derive a genome-scale cell-free kinetic modeling approach to
simulate the biosynthetic capability of important industrial organisms (e.g., E. coli) based
on the advantages of kinetic modeling in cell-free synthetic enzyme systems[85]. In brief,
the authors integrated complex allosteric regulations, which were encoded by simple
effective rules and Hill-like transfer function, with traditional kinetic modeling. By
modeling the kinetic profiles of several hypothetical cell-free metabolic networks, it was
found that their integrated kinetic modeling approach could capture both the classic
regulatory machinery (i.e., product-induced feedback regulation) and the complex
allosteric machinery (i.e., non-competitive inhibition). Recently, a forward design method
has been reported to establish an in vitro glycolysis biological process, which was
constituted of 10 enzymes[97]. The researchers combined online mass spectrometry and
continuous system operation to apply standard system theory input functions and used the
detailed dynamic system responses to parameterize a model of sufficient quality for
forward design. This allows the facile optimization of a ten-enzyme cascade to produce an
important intermediate in monosaccharide synthesis, dihydroxyacetone phosphate
(DHAP)[97].
In summary, cell-free synthetic enzyme engineering is advantageous to in vivo
metabolic engineering in speed, simplicity, and easiness of manipulation. However, there

263
are still several drawbacks associated with cell-free synthetic enzyme engineering such as
SyPaB. For example, in order to get the purified enzymes, researchers still need to spend
numerous time and effort in plasmids construction, expression optimization and protein
purification. Also, SyPaB was assembled in a complete artificial manner, which could lead
to the instability of certain purified enzymes and coenzymes[47]. More importantly, the
artificial environment could be dramatically different from the intracellular environment,
which makes the results obtained from SyPaB optimization difficult to be transferred into
in vivo metabolic engineering. The cell-free synthetic enzyme system itself, on the other
hand, is arguably difficult in being scaled up for biomanufacturing[98, 99].
6.2.3 Cell-free Protein Synthesis (CFPS)-based Metabolic Engineering
A key difference between the cell-free synthetic enzyme engineering and the CFPS-
based metabolic engineering is that the laborious in vivo protein expression and purification
steps could be bypassed in the latter, which further speed up the DBT cycles. After decades
of improving, current CFPS is well established, which could yield 200–2,300 mg/mL
protein in the batch mode reaction[100-108] and allow the CFPS-based metabolic
engineering. Recently, Jewett et al.[59] reported this novel CFPS-based metabolic
engineering framework for building biosynthetic pathways by directly synthesizing each
enzyme of a biosynthetic pathway in vitro with the use of cell-free lysates and mixing
multiple crude lysates to initiate the DBT cycle. A panel of cell-free lysates are selectively
enriched and prepared in parallel, in each of which a target enzyme is overexpressed by
using CFPS technology. Their cell-free lysates were next mixed in a combinatorial manner
to construct a mevalonate biosynthetic pathway involved in isoprenoid synthesis[109].
Using this method, Jewett’s group rapidly screened enzyme variants, optimized enzyme

264
ratios, and explored cofactor landscapes for improving pathway performance. In the
optimized system, mevalonate was synthesized at 17.6 g/L (119 mM) within 20 h compared
to the initial titer of 1.6 g/L generated in 9 h. The fast prototyping and “debugging” of
enzymatic pathways in this CFPS-based metabolic engineering framework offer unique
advantages for metabolic engineering and synthetic biology applications because of the
dramatically improved speed of DBT cycles. Encouraged by the successes of using CFPS-
based metabolic engineering framework to produce mevalonate, this system was also
applied to prototyping n-butanol biosynthesis[59]. It showed that E. coli lysates could
support a highly active 17-step CoA-dependent n-butanol pathway derived from Clostridia
metabolism involving CoA intermediates in vitro[59]. In this system, endogenous
glycolytic enzymes convert glucose to acetyl-CoA for n-butanol synthesis, another E. coli
enzyme (AtoB) converts acetyl-CoA to acetoacetyl-CoA, and heterologous enzymes (Hbd,
Crt, Ter, AdhE) convert acetoacetyl-CoA to n-butanol. It was found that by adding both
NAD and CoA with glucose to initiate n-butanol synthesis, the cell-free system could
produce 1.2 g/L n-butanol. In order to improve pathway performance, the researchers
replaced some of initial Ter and AdhE enzymes with a variety of homologs. In less than a
day, they studied 4 Ter and 3 AdhE homologs by using CFPS-based metabolic engineering
framework. Also they demonstrated the possibility of using linear DNA templates (i.e.,
linear DNAs such as PCR products containing the whole expression cassette of the desired
gene) instead of plasmids for pathway prototyping (i.e., an early-stage method to study the
constitution and function of a metabolic pathway), which would further expedite the
process as the laborious cloning steps could be avoided. Finally, the n-butanol production
was improved by 200% of the initial starting conditions (up to 1.5 g/L) by optimizing the

265
performance of different enzymes sets and adjusting the physicochemical environment.
Currently, no computational modeling approach has been reported to model the
CFPS-based metabolic engineering framework[59, 110]. However, the CFPS-based
metabolic engineering framework can be considered as the combination of two different
procedures, i.e., cell free protein synthesis and the SyPaB. In this case, it is possible to
combine a CFPS model with the SyPaB models that are described in previous section to
simulate and predict the performance of CFPS-based metabolic engineering. In spite of the
unknown kinetic parameters of CFPS systems and the unclear composition of cell
lysates[84], several studies have been implemented to develop various computational
modeling approaches for both PURE system[111] and CFPS systems[111-113]. For
example, one of the pioneered studies was recently implemented to derive a kinetic model
to describe the gene expression dynamics in a commercial CFPS system producing green
fluorescent protein (GFP) as the target[114]. By measuring the GFP expression and mRNA
levels in the CFPS system, the authors estimated the unknown kinetic parameters in the
model and predicted both DNA concentration and the experimental time as the key factors
impacting the protein titer of CFPS.[114] In addition, computational models of CFPS
systems can also elucidate the unknown impact of biological phenomena[84, 115]. In
recent studies, it was found that increasing molecular crowding of CFPS system caused by
crowding reagents or coacervation of encapsulated circuits, can improve the titer of protein
production dramatically[115]. By modeling the transcription-translation reactions of CFPS
system with the kinetic modeling approach, the author demonstrated that the improved
protein production induced by coacervation was caused by the increased association
constant of T7 polymerase as well as the kinetic transcription constant in the coacervated

266
compartments[115]. Another hybrid kinetic model that combined a biological model with
a agent-based model (or chemical kinetic model) has been developed to describe the in
vitro protein synthesis and enabled the investigation of the polysome dynamics under the
non-steady-state and non-continuum conditions[86]. We also want to point out that in
addition to modeling the whole protein synthesis processes such as transcription and
translation, many studies were also focusing on other bio-processes, e.g., peptide chain
elongation[116] and ribosome recycle[117, 118], which play pivotal roles in the entire
protein synthesis.
When using kinetic models to simulate CFPS process, one of the major limitations
is the ignorance of the transcriptional and translational regulations (e.g., transcription
factors) by using the kinetic parameters with constant values[119] to reflect time-dependent
processes. In addition, the predictive capability of kinetic models is limited due to the
unknown parameters[119]. Therefore, it is necessary to find an alternative algorithm with
higher predictive capability to facilitate the design of CFPS systems. Machine learning, a
central field of artificial intelligence, is an ideal choice for predictive analysis to devise
complex systems with high non-linearity and multi-dimensionality[120-122]. Generally,
machine learning can automatically learn the instinct correlations between the inputs and
outputs of the systems, leading to a predictive model or algorithm with high prediction
accuracy. For example, by training the machine-learning algorithm with paired inputs (e.g.,
CFPS experimental designs and properties of target proteins) and outputs (e.g., protein
productions), the trained algorithm can predict the outputs from system inputs with high
accuracy. Although CFPS are already simplified from the in vivo protein synthesis, it still
has highly non-linear regulations and large-dimensional impact factors for the protein

267
production[120]. Recently, a pioneering study has applied a machine learning algorithm
(neural network) to the CFPS systems with paired data of different experimental designs
and corresponding protein productions for learning CFPS systems and optimizing protein
production[90]. The authors first set up a CFPS system to synthesize enhanced GFP (eGFP)
by using commercial E. coli CFPS kits with fixed basic reaction system. Next, the authors
chose 11 variable components in CFPS system and specified a vector of values for each
component to build up a space of possible experiments. By using a robotic workstation for
liquid handling, a larger number of CFPS experiments was implemented in a high-
throughput manner[120]. Starting with randomly selected 49 experiments, the machine-
learning algorithm started to learn the CFPS experiments and offered optimized designs of
CFPS systems with improved eGFP production. With the optimized experimental design,
the workstation implemented the next generation of experiments to generate new
experimental data and to validate the predictions. By repeating this DBT cycles for eight
times, the machine learning algorithm provided an optimized experimental design with
~3.5-fold improvement of eGFP production. Besides the improved protein production, the
large-scale CFPS experiments and machine learning algorithm also uncovered kinetic
biological insights to better understand the CFPS system[120]. This is the first time
machine learning algorithms have been integrated with CFPS systems without an arbitrary
hypothesis, which demonstrates the capabilities and advantages of machine learning
algorithms for better understanding the CFPS process.
6.2.4 Summary and Perspectives
Compared to traditional in vivo metabolic engineering, in vitro metabolic
engineering has unique advantages in speeding up the DBT cycles. The key conceptual

268
innovation of in vitro metabolic engineering is that the components in the DBT cycle can
be purified enzymes or cell-free lysates rather than genetic constructs, thus avoiding
engineering the complex cell metabolism and the tedious pathway construction. For the
two in vitro metabolic engineering approaches discussed in this study, the major obstacles
for cell-free enzymatic pathway engineering are the lack of stable building blocks as
standardized parts and instability of costly coenzymes. By engineering thermo-stable
enzymes and using them in in vitro metabolic engineering, the high productivity is likely
to be maintained[47, 123]. CFPS-based metabolic engineering is arguably more
advantageous because it could free the researchers from tedious protein purification and
bypass the cofactor issues in a cytosol mimic environment. However, in vitro metabolic
engineering approaches face the challenge of scaling up. Because of the high cost
associated with the energy source (e.g. ATP) used in the cell-free system, the large-scale
biomanufacturing is too expensive even when producing high-value products.
Additionally, when using cell-free synthetic enzyme engineering, the stability of the
enzymes could cause the reduced productivity during biosynthesis. Nevertheless, novel
strategies from synthetic biology and protein engineering are being developed to address
both challenges. For example, Caschera et al. have designed by coupling polyphosphate
and maltodextrin for bypassing substrate level phosphorylation based on expensive energy
sources (Phosphoenolpyruvic acid (PEP) and 3-PGA)[124]. Swartz et. al demonstrated that
the cost NTP could be substituted with economic NMP and by shifting the energy source
from expensive compounds to glucose. Thus, the cost-benefit of cell-free protein synthesis
(g-product / $ reagent cost) is as much as 2.4 times higher than for reactions using costly
PEP[106]. After decades’ effort, cell-free protein synthesis could reach 2.3 mg/ml protein

269
in the batch mode reaction which was comparable to in vivo expression levels.[125]
Finally, although the scale-up of cell-free protein synthesis for in vitro metabolic remains
a challenge to be demonstrated, a milestone of the scale-up of CFPS has been achieved to
expression complex high valued proteins in a 100 L reactor[98]. Refactoring the in vitro
optimized pathway back into the host cells might be a future direction to address this scale-
up problem. However, issues of lethality, toxicity of some metabolic intermediates and the
compartmentalization of some pathways in the eukaryotic organisms should be aware
during this process and might need additional DBT cycles to further improve the
productivity. Meanwhile, to simulate and guide the design of in vitro metabolic
engineering, data-driven algorithms (e.g., machine learning and statistical learning)
represent promising approaches, especially with the fast and high-throughput biological
measurements of experimental data[122]. The data-driven algorithms can take advantage
of the “Big Data” to uncover the biological insights behind the biological systems, and to
derive the predictive models for predicting the outputs from corresponding inputs.
Currently, one of the bottlenecks to develop the data-driven models is the limitation of
high-quality and well-curated data[121]. Although several studies of in vitro metabolic
engineering have been implemented and published, there is no database that curates these
studies in a standardized manner, which obstructs the development of data-driven
algorithms. The construction of such database requires both time and labors. However, it
is still feasible to construct large-scale database including thousands of datasets in three to
five years. With sufficient experimental data and an appropriate data-driven algorithm, the
internal complex interactions in the in vitro biological systems could be captured and
explicitly elucidated in near future. It is worth noting that, biased data for training the data-

270
driven algorithm will mislead the data-driven models. Therefore, using the equally
distributed data to train the data-driven models is necessary to derive a data-driven
algorithm with high prediction accuracy. To conclude, in vitro metabolic engineering,
although still being on the infant stage, has great potentials in speeding up the DBT cycles
of biomanufacturing and serves as an alternative approach to in vivo metabolic engineering.
Acknowledgements
This study was supported by a start-up fund (#175323) and the ICTAS Junior
Faculty Award from Virginia Tech.

271
Fig. 6.2.1 Summary of in vitro metabolic engineering (ME) approaches. 1. In vivo
metabolic engineering, in which model microorganisms like Escherichia coli and
Saccharomyces cerevisiae are often accompanied with inefficient and time-consuming
pathways construction, transformation and fermentation; 2. Cell-free synthetic enzyme
engineering, which allows fast pathway prototyping; however, molecular cloning and
enzyme production could be time consuming and the high cost associated with production
could make the process scale-up questionable. 3. The cell-free protein synthesis (CFPS)-
based metabolic engineering, which could accelerate the pathway prototyping in a cytosol
mimic environment by using enzymes that are directly produced in a cell-free system and
assembling pathways in a “mix-and-match” fashion.

272
References
1. Liu, R., et al., Metabolic engineering of fatty acyl-ACP reductase-dependent pathway to improve fatty alcohol production in Escherichia coli. Metab Eng, 2014. 22: p. 10-21.
2. Du, J., Z. Shao, and H. Zhao, Engineering microbial factories for synthesis of value-added products. J Ind Microbiol Biotechnol, 2011. 38(8): p. 873-90.
3. Runguphan, W. and J.D. Keasling, Metabolic engineering of Saccharomyces cerevisiae for production of fatty acid-derived biofuels and chemicals. Metab Eng, 2014. 21: p. 103-13.
4. Youngquist, J.T., et al., Production of medium chain length fatty alcohols from glucose in Escherichia coli. Metab Eng, 2013. 20: p. 177-86.
5. Mudge, S.M., S.E. Belanger, and A.M. Nielsen, Fatty Alcohols: Anthropogenic and Natural Occurrence in the Environment. 2008, The Royal Society of Chemistry: Cambridge, UK.
6. Rupilius, W. and S. Ahmad, Palm oil and palm kernel oil as raw materials for basic oleochemicals and biodiesel. Eur J Lipid Sci Technol, 2007. 109(4): p. 433-439.
7. Fitzherbert, E., et al., How will oil palm expansion affect biodiversity? Trends Ecol Evol, 2008. 23(10): p. 538-545.
8. Hill, J., et al., Environmental, economic, and energetic costs and benefits of biodiesel and ethanol biofuels. Proc Natl Acad Sci U S A, 2006. 103(30): p. 11206-10.
9. Zhang, F., S. Rodriguez, and J.D. Keasling, Metabolic engineering of microbial pathways for advanced biofuels production. Curr Opin Biotechnol, 2011. 22(6): p. 775-83.
10. Feng, X., J. Lian, and H. Zhao, Metabolic engineering of Saccharomyces cerevisiae to improve 1-hexadecanol production. Metab Eng, 2015. 27: p. 10-9.
11. Cao, Y.X., et al., Biosynthesis of odd-chain fatty alcohols in Escherichia coli. Metab Eng, 2015.
12. Fillet, S., et al., Fatty alcohols production by oleaginous yeast. Journal of Industrial Microbiology & Biotechnology, 2015. 42(11): p. 1463-1472.
13. Zheng, Y., et al., Optimization of fatty alcohol biosynthesis pathway for selectively enhanced production of C12/14 and C16/18 fatty alcohols in engineered Escherichia coli. Microb Cell Fact, 2012. 11:65.
14. Akhtar, M.K., N.J. Turner, and P.R. Jones, Carboxylic acid reductase is a versatile enzyme for the conversion of fatty acids into fuels and chemical commodities. Proc Natl Acad Sci U S A, 2013. 110(1): p. 87-92.
15. Liu, A., et al., Fatty alcohol production in engineered E. coli expressing Marinobacter fatty acyl-CoA reductases. Appl Microbiol Biotechnol, 2013. 97(15): p. 7061-71.
16. Hong, K.K. and J. Nielsen, Metabolic engineering of Saccharomyces cerevisiae: a key cell factory platform for future biorefineries. Cell Mol Life Sci, 2012. 69(16): p. 2671-90.
17. Wei, N., et al., Enhanced biofuel production through coupled acetic acid and xylose consumption by engineered yeast. Nat Commun, 2013. 4: p. 2580.

273
18. Jeffries, T. and Y. Jin, Metabolic engineering for improved fermentation of pentoses by yeasts. Appl Microbiol Biotechnol, 2004. 63(5): p. 495-509.
19. Eliasson, A., et al., Anaerobic xylose fermentation by recombinant Saccharomyces cerevisiae carrying XYL1, XYL2, and XKS1 in mineral medium chemostat cultures. Appl Environ Microbiol, 2000. 66(8): p. 3381-6.
20. Kim, B., et al., Combinatorial design of a highly efficient xylose-utilizing pathway in Saccharomyces cerevisiae for the production of cellulosic biofuels. Appl Environ Microbiol, 2013. 79(3): p. 931-41.
21. Garcia Sanchez, R., et al., Improved xylose and arabinose utilization by an industrial recombinant Saccharomyces cerevisiae strain using evolutionary engineering. Biotechnol Biofuels, 2010. 3: p. 13.
22. Kuyper, M., et al., High-level functional expression of a fungal xylose isomerase: the key to efficient ethanolic fermentation of xylose by Saccharomyces cerevisiae? FEMS Yeast Res, 2003. 4(1): p. 69-78.
23. Zhou, H., et al., Xylose isomerase overexpression along with engineering of the pentose phosphate pathway and evolutionary engineering enable rapid xylose utilization and ethanol production by Saccharomyces cerevisiae. Metab Eng, 2012. In press.
24. Demeke, M.M., et al., Development of a D-xylose fermenting and inhibitor tolerant industrial Saccharomyces cerevisiae strain with high performance in lignocellulose hydrolysates using metabolic and evolutionary engineering. Biotechnology for Biofuels, 2013. 6(1): p. 1-24.
25. Gietz, R. and R. Schiestl, High-efficiency yeast transformation using the LiAc/SS carrier DNA/PEG method. Nat Protoc, 2007. 2(1): p. 31-4.
26. Shao, Z., H. Zhao, and H. Zhao, DNA assembler, an in vivo genetic method for rapid construction of biochemical pathways. Nucleic Acids Res, 2009. 27(2): p. e16.
27. Shao, Z., Y. Luo, and H. Zhao, Rapid characterization and engineering of natural product biosynthetic pathways via DNA assembler. Mol Biosyst, 2011. 7(4): p. 1056-9.
28. Du, J., et al., Customized optimization of metabolic pathways by combinatorial transcriptional engineering. Nucleic Acids Res, 2012. 40(18): p. e142.
29. Feng, X. and H. Zhao, Investigating host dependence of xylose utilization in recombinant Saccharomyces cerevisiae strains using RNA-seq analysis. Biotechnol Biofuels, 2013. 6:95.
30. Young, E., S. Lee, and H. Alper, Optimizing pentose utilization in yeast: the need for novel tools and approaches. Biotechnol Biofuels, 2010. 3(24).
31. Toivari, M.H., et al., Endogenous Xylose Pathway in Saccharomyces cerevisiae. Applied and Environmental Microbiology, 2004. 70(6): p. 3681-3686.
32. Feng, X. and H. Zhao, Investigating xylose metabolism in recombinant Saccharomyces cerevisiae via 13C metabolic flux analysis. Microbial Cell Factories, 2013. 12(1): p. 114.
33. Kuyper, M., et al., Evolutionary engineering of mixed-sugar utilization by a xylose-fermenting Saccharomyces cerevisiae strain. FEMS Yeast Res, 2005. 5(10): p. 925-34.

274
34. Scalcinati, G., et al., Evolutionary engineering of Saccharomyces cerevisiae for efficient aerobic xylose consumption. FEMS Yeast Res, 2012. 12(5): p. 582-97.
35. Sonderegger, M. and U. Sauer, Evolutionary engineering of Saccharomyces cerevisiae for anaerobic growth on xylose. Appl Environ Microbiol, 2003. 69(4): p. 1990-8.
36. Feng, X., J. Lian, and H. Zhao, Metabolic engineering of Saccharomyces cerevisiae to improve 1-hexadecanol production. Metabolic Engineering, 2015. 27(0): p. 10-19.
37. Tang, X. and W.N. Chen, Enhanced production of fatty alcohols by engineering the TAGs synthesis pathway in Saccharomyces cerevisiae. Biotechnology and Bioengineering, 2015. 112(2): p. 386-392.
38. Latimer, L.N., et al., Employing a combinatorial expression approach to characterize xylose utilization in Saccharomyces cerevisiae. Metabolic Engineering, 2014. 25: p. 20-29.
39. Lian, J., et al., Design and construction of acetyl-CoA overproducing Saccharomyces cerevisiae strains. Metab Eng, 2014. 24: p. 139-49.
40. Du, J., et al., Customized optimization of metabolic pathways by combinatorial transcriptional engineering. Nucleic Acids Research, 2012. 40(18): p. e142.
41. Becker, J. and C. Wittmann, Bio-based production of chemicals, materials and fuels -Corynebacterium glutamicum as versatile cell factory. Curr Opin Biotechnol, 2012. 23(4): p. 631-40.
42. Wendisch, V.F., M. Bott, and B.J. Eikmanns, Metabolic engineering of Escherichia coli and Corynebacterium glutamicum for biotechnological production of organic acids and amino acids. Curr Opin Microbiol, 2006. 9(3): p. 268-74.
43. Erickson, B., Nelson, and P. Winters, Perspective on opportunities in industrial biotechnology in renewable chemicals. Biotechnol J, 2012. 7(2): p. 176-85.
44. Nielsen, J., et al., Engineering synergy in biotechnology. Nat Chem Biol, 2014. 10(5): p. 319-322.
45. Koffas, M., et al., Metabolic engineering. Annu Rev Biomed Eng, 1999. 1: p. 535-57.
46. Andrianantoandro, E., et al., Synthetic biology: new engineering rules for an emerging discipline. Mol Syst Biol, 2006. 2: p. 2006 0028.
47. Zhang, Y.H., Production of biocommodities and bioelectricity by cell-free synthetic enzymatic pathway biotransformations: challenges and opportunities. Biotechnol Bioeng, 2010. 105(4): p. 663-77.
48. Mishra, B.B. and V.K. Tiwari, Natural products: an evolving role in future drug discovery. Eur J Med Chem, 2011. 46(10): p. 4769-807.
49. Pickens, L.B., Y. Tang, and Y.H. Chooi, Metabolic engineering for the production of natural products. Annu Rev Chem Biomol Eng, 2011. 2: p. 211-36.
50. Ro, D.K., et al., Production of the antimalarial drug precursor artemisinic acid in engineered yeast. Nature, 2006. 440: p. 940-943.
51. Zhang, Y.H., Production of biofuels and biochemicals by in vitro synthetic biosystems: Opportunities and challenges. Biotechnol Adv, 2015. 33(7): p. 1467-83.

275
52. Wyman, C.E., BIOMASS ETHANOL: Technical Progress, Opportunities, and Commercial Challenges. Annual Review of Energy and the Environment, 1999. 24(1): p. 189-226.
53. Yim, H., et al., Metabolic engineering of Escherichia coli for direct production of 1,4-butanediol. Nat Chem Biol, 2011. 7(7): p. 445-52.
54. Atsumi, S., T. Hanai, and J.C. Liao, Non-fermentative pathways for synthesis of branched-chain higher alcohols as biofuels. Nature, 2008. 451(7174): p. 86-89.
55. Lee, J.Y., et al., Metabolic engineering of Clostridium acetobutylicum M5 for highly selective butanol production. Biotechnol J. , 2009. 4(10): p. 1432-40.
56. Dong, H., et al., Engineering Escherichia coli Cell Factories for n-Butanol Production, in Bioreactor Engineering Research and Industrial Applications I: Cell Factories, Q. Ye, J. Bao, and J.-J. Zhong, Editors. 2016, Springer Berlin Heidelberg: Berlin, Heidelberg. p. 141-163.
57. Schwander, T., et al., A synthetic pathway for the fixation of carbon dioxide in vitro. Science, 2016. 354(6314): p. 900-904.
58. Kwok, R., Five hard truths for synthetic biology. Nature, 2010. 463(7279): p. 288-90.
59. Karim, A.S. and M.C. Jewett, A cell-free framework for rapid biosynthetic pathway prototyping and enzyme discovery. Metab Eng, 2016. 36: p. 116-26.
60. Hodgman, C.E. and M.C. Jewett, Cell-free synthetic biology: thinking outside the cell. Metab Eng, 2012. 14(3): p. 261-9.
61. Sun, Z.Z., et al., Linear DNA for rapid prototyping of synthetic biological circuits in an Escherichia coli based TX-TL cell-free system. ACS Synth Biol, 2014. 3(6): p. 387-97.
62. Nirenberg, M.W. and J.H. Matthaei, The dependence of cell-free protein synthesis in E. coli upon naturally occurring or synthetic polyribonucleotides. Proc Natl Acad Sci U S A, 1961. 47: p. 1588-602.
63. Iizuka, N., et al., Cap-dependent and cap-independent translation by internal initiation of mRNAs in cell extracts prepared from Saccharomyces cerevisiae. Mol Cell Biol, 1994. 14(11): p. 7322-30.
64. Kim, D.M. and J.R. Swartz, Prolonging cell-free protein synthesis with a novel ATP regeneration system. Biotechnol Bioeng, 1999. 66(3): p. 180-8.
65. Kim, D.M. and J.R. Swartz, Prolonging cell-free protein synthesis by selective reagent additions. Biotechnol Prog, 2000. 16(3): p. 385-90.
66. Kim, D.M. and J.R. Swartz, Regeneration of adenosine triphosphate from glycolytic intermediates for cell-free protein synthesis. Biotechnol Bioeng, 2001. 74(4): p. 309-16.
67. Zhang, Y.H., Reviving the carbohydrate economy via multi-product lignocellulose biorefineries. J Ind Microbiol Biotechnol, 2008. 35(5): p. 367-75.
68. Schultheisz, H.L., et al., Pathway engineered enzymatic de novo purine nucleotide synthesis. ACS Chem Biol, 2008. 3(8): p. 499-511.
69. Zhang, Y.H.P., A sweet out-of-the-box solution to the hydrogen economy: is the sugar-powered car science fiction? Energy & Environmental Science, 2009. 2(3): p. 272-282.

276
70. Lowry, B., C.T. Walsh, and C. Khosla, In Vitro Reconstitution of Metabolic Pathways: Insights into Nature's Chemical Logic. Synlett, 2015. 26(8): p. 1008-1025.
71. Liu, T., H. Vora, and C. Khosla, Quantitative analysis and engineering of fatty acid biosynthesis in E. coli. Metab Eng, 2010. 12(4): p. 378-86.
72. Yu, X., et al., In vitro reconstitution and steady-state analysis of the fatty acid synthase from Escherichia coli. Proc Natl Acad Sci U S A, 2011. 108(46): p. 18643-8.
73. Zhu, F., et al., In vitro reconstitution of mevalonate pathway and targeted engineering of farnesene overproduction in Escherichia coli. Biotechnol Bioeng, 2014. 111(7): p. 1396-405.
74. Wittstock, U. and J. Gershenzon, Constitutive plant toxins and their role in defense against herbivores and pathogens. Current Opinion in Plant Biology, 2002. 5(4): p. 300-307.
75. Smith, B.A., et al., The phytoalexin camalexin mediates cytotoxicity towards aggressive prostate cancer cells via reactive oxygen species. J Nat Med, 2013. 67(3): p. 607-18.
76. Kahn, R.A., et al., Isolation and reconstitution of cytochrome P450ox and in vitro reconstitution of the entire biosynthetic pathway of the cyanogenic glucoside dhurrin from sorghum. Plant Physiol, 1997. 115(4): p. 1661-70.
77. Klein, A.P., G. Anarat-Cappillino, and E.S. Sattely, Minimum set of cytochromes P450 for reconstituting the biosynthesis of camalexin, a major Arabidopsis antibiotic. Angew Chem Int Ed Engl, 2013. 52(51): p. 13625-8.
78. Rollin, J.A., et al., High-yield hydrogen production from biomass by in vitro metabolic engineering: Mixed sugars coutilization and kinetic modeling. Proceedings of the National Academy of Sciences, 2015. 112(16): p. 4964-4969.
79. Maeda, T., V. Sanchez-Torres, and T.K. Wood, Hydrogen production by recombinant Escherichia coli strains. Microb Biotechnol, 2012. 5(2): p. 214-25.
80. Rollin, J.A., et al., High-yield hydrogen production from biomass by in vitro metabolic engineering: Mixed sugars coutilization and kinetic modeling. Proc Natl Acad Sci U S A, 2015. 112(16): p. 4964-9.
81. Krutsakorn, B., et al., In vitro production of n-butanol from glucose. Metabolic Engineering, 2013. 20: p. 84-91.
82. Opgenorth, P.H., T.P. Korman, and J.U. Bowie, A synthetic biochemistry module for production of bio-based chemicals from glucose. Nat Chem Biol, 2016. 12(6): p. 393-5.
83. Pradella, J.G., et al., Carbon source pulsed feeding to attain high yield and high productivity in poly(3-hydroxybutyrate) (PHB) production from soybean oil using Cupriavidus necator. Biotechnol Lett, 2012. 34(6): p. 1003-7.
84. Lewis, D.D., et al., Synthetic Biology Outside the Cell: Linking Computational Tools to Cell-Free Systems. Frontiers in Bioengineering and Biotechnology, 2014. 2(66).
85. Wayman, J., A. Sagar, and J. Varner, Dynamic Modeling of Cell-Free Biochemical Networks Using Effective Kinetic Models. Processes, 2015. 3(1): p. 138.

277
86. Semenchenko, A., G. Oliveira, and A.P.F. Atman, Hybrid agent-based model for quantitative in-silico cell-free protein synthesis. Biosystems, 2016. 150: p. 22-34.
87. Gombert, A.K. and J. Nielsen, Mathematical modelling of metabolism. Current Opinion in Biotechnology, 2000. 11(2): p. 180-186.
88. Orth, J.D., I. Thiele, and B.O. Palsson, What is flux balance analysis? Nat Biotech, 2010. 28(3): p. 245-248.
89. Guo, W. and X. Feng, OM-FBA: Integrate Transcriptomics Data with Flux Balance Analysis to Decipher the Cell Metabolism. PLoS One, 2016. 11(4): p. e0154188.
90. Vital‐Lopez, F.G., et al., A computational procedure for optimal engineering interventions using kinetic models of metabolism. Biotechnology progress, 2006. 22(6): p. 1507-1517.
91. Tran, L.M., M.L. Rizk, and J.C. Liao, Ensemble Modeling of Metabolic Networks. Biophysical Journal, 2008. 95(12): p. 5606-5617.
92. Contador, C.A., et al., Ensemble modeling for strain development of l-lysine-producing Escherichia coli. Metabolic Engineering, 2009. 11(4–5): p. 221-233.
93. Lee, Y., J.G. Lafontaine Rivera, and J.C. Liao, Ensemble Modeling for Robustness Analysis in engineering non-native metabolic pathways. Metabolic Engineering, 2014. 25: p. 63-71.
94. Rizk, M.L. and J.C. Liao, Ensemble Modeling for Aromatic Production in Escherichia coli. PLOS ONE, 2009. 4(9): p. e6903.
95. Theisen, M.K., J.G. Lafontaine Rivera, and J.C. Liao, Stability of Ensemble Models Predicts Productivity of Enzymatic Systems. PLOS Computational Biology, 2016. 12(3): p. e1004800.
96. Bogorad, I.W., et al., Building carbon–carbon bonds using a biocatalytic methanol condensation cycle. Proceedings of the National Academy of Sciences, 2014. 111(45): p. 15928-15933.
97. Hold, C., S. Billerbeck, and S. Panke, Forward design of a complex enzyme cascade reaction. Nat Commun, 2016. 7: p. 12971.
98. Zawada, J.F., et al., Microscale to manufacturing scale-up of cell-free cytokine production--a new approach for shortening protein production development timelines. Biotechnol Bioeng, 2011. 108(7): p. 1570-8.
99. Dudley, Q.M., A.S. Karim, and M.C. Jewett, Cell-free metabolic engineering: biomanufacturing beyond the cell. Biotechnol J, 2015. 10(1): p. 69-82.
100. Jewett, M.C., et al., An integrated cell-free metabolic platform for protein production and synthetic biology. Mol Syst Biol, 2008. 4: p. 220.
101. Jewett, M.C. and J.R. Swartz, Mimicking the Escherichia coli cytoplasmic environment activates long-lived and efficient cell-free protein synthesis. Biotechnol Bioeng, 2004. 86(1): p. 19-26.
102. Bundy, B.C., M.J. Franciszkowicz, and J.R. Swartz, Escherichia coli-based cell-free synthesis of virus-like particles. Biotechnol Bioeng, 2008. 100(1): p. 28-37.
103. Albayrak, C. and J.R. Swartz, Cell-free co-production of an orthogonal transfer RNA activates efficient site-specific non-natural amino acid incorporation. Nucleic Acids Res, 2013. 41(11): p. 5949-63.

278
104. Calhoun, K.A. and J.R. Swartz, An Economical Method for Cell-Free Protein Synthesis using Glucose and Nucleoside Monophosphates. Biotechnology Progress, 2005. 21(4): p. 1146-1153.
105. Kim, D.M. and J.R. Swartz, Prolonging cell‐free protein synthesis with a novel ATP regeneration system. Biotechnology and bioengineering, 1999. 66(3): p. 180-188.
106. Calhoun, K.A. and J.R. Swartz, Energizing cell-free protein synthesis with glucose metabolism. Biotechnol Bioeng, 2005. 90(5): p. 606-13.
107. Kwon, Y.C. and M.C. Jewett, High-throughput preparation methods of crude extract for robust cell-free protein synthesis. Sci Rep, 2015. 5: p. 8663.
108. Pardee, K., et al., Portable, On-Demand Biomolecular Manufacturing. Cell, 2016. 167(1): p. 248-259.e12.
109. Dudley, Q.M., K.C. Anderson, and M.C. Jewett, Cell-Free Mixing of Escherichia coli Crude Extracts to Prototype and Rationally Engineer High-Titer Mevalonate Synthesis. ACS Synth Biol, 2016.
110. Goering, A.W., et al., In Vitro Reconstruction of Nonribosomal Peptide Biosynthesis Directly from DNA Using Cell-Free Protein Synthesis. ACS Synthetic Biology, 2016.
111. Mavelli, F., R. Marangoni, and P. Stano, A Simple Protein Synthesis Model for the PURE System Operation. Bulletin of Mathematical Biology, 2015. 77(6): p. 1185-1212.
112. Karzbrun, E., et al., Coarse-Grained Dynamics of Protein Synthesis in a Cell-Free System. Physical Review Letters, 2011. 106(4): p. 048104.
113. Matsuura, T., et al., Quantifying epistatic interactions among the components constituting the protein translation system. Molecular Systems Biology, 2009. 5(1).
114. Stogbauer, T., et al., Experiment and mathematical modeling of gene expression dynamics in a cell-free system. Integrative Biology, 2012. 4(5): p. 494-501.
115. Sokolova, E., et al., Enhanced transcription rates in membrane-free protocells formed by coacervation of cell lysate. Proceedings of the National Academy of Sciences, 2013. 110(29): p. 11692-11697.
116. Zouridis, H. and V. Hatzimanikatis, A Model for Protein Translation: Polysome Self-Organization Leads to Maximum Protein Synthesis Rates. Biophysical Journal, 2007. 92(3): p. 717-730.
117. Margaliot, M. and T. Tuller, Ribosome flow model with positive feedback. Journal of The Royal Society Interface, 2013. 10(85).
118. Garai, A., et al., Stochastic kinetics of ribosomes: Single motor properties and collective behavior. Physical Review E, 2009. 80(1): p. 011908.
119. Ay, A. and D.N. Arnosti, Mathematical modeling of gene expression: a guide for the perplexed biologist. Critical reviews in biochemistry and molecular biology, 2011. 46(2): p. 137-151.
120. Caschera, F., et al., Coping with complexity: Machine learning optimization of cell-free protein synthesis. Biotechnology and Bioengineering, 2011. 108(9): p. 2218-2228.
121. Michalski, R.S., J.G. Carbonell, and T.M. Mitchell, Machine learning: An artificial intelligence approach. 2013: Springer Science & Business Media.

279
122. Iniesta, R., D. Stahl, and P. McGuffin, Machine learning, statistical learning and the future of biological research in psychiatry. Psychological Medicine, 2016: p. 1-11.
123. Liu, W., et al., Fast identification of thermostable beta-glucosidase mutants on cellobiose by a novel combinatorial selection/screening approach. Biotechnol Bioeng, 2009. 103(6): p. 1087-94.
124. Caschera, F. and V. Noireaux, A cost-effective polyphosphate-based metabolism fuels an all E. coli cell-free expression system. Metab Eng, 2015. 27: p. 29-37.
125. Caschera, F. and V. Noireaux, Synthesis of 2.3 mg/ml of protein with an all Escherichia coli cell-free transcription-translation system. Biochimie, 2014. 99: p. 162-8.

280
Chapter 7: General Conclusions and Future Works
The deciphering of planktonic and biofilm metabolism is playing an increasingly
important role in reducing dependency on fossil energy and protecting the security of
public health. In the past three years, I have developed and applied computational modeling
approaches to investigate the metabolisms of planktonic and biofilm cells as part of my
Ph.D. training. In general, I have applied 13C-MFA to 1) investigate intracellular metabolic
responses to multiple stresses[1], 2) reveal the metabolisms underlying the biosynthesis of
natural and heterologous products [2], and 3) discover strain dependencies in metabolic
engineering [3]. I have also used 13C-assisted pathway analysis to systematically study
various pathway usages in planktonic and biofilm cells of S. oneidensis strain MR-1 in a
microbial fuel-cell system and to discover the key pathways and substrate for electricity
generation in the biofilm cells [4, 5]. To integrate multi-omics data with FBA, I have
developed an innovative framework for FBA (omFBA) to accurately predict biological
insights (i.e., key flux ratios) by replacing the arbitrary objective function (e.g., maximize
the growth rate) with an omics-guided objective function[6]. I have subsequently used
omFBA in a proof-of-concept study to predict ethanol production using different substrates
in yeast. Furthermore, I have applied a machine learning approach to predict CRISPR-
based transcriptional regulation in an innovative attempt at computational modeling for the
CRISPR-based system. The computational tool that I developed is able to facilitate the
sequence design of the guide RNA in the CRISPR system to achieve programmable control
of metabolic flux[7], which will accelerate the application of CRISPR-based systems to
genome editing. In addition to my computational modeling work, I have leveraged my

281
expertise in metabolic engineering to develop a novel yeast strain that utilizes xylose as the
sole carbon source to produce 1-hexadecanol[8].
In the future, I plan to continue my research on deciphering the metabolic
reprogramming of pathogenic biofilm cells in clinical infections. I will focus on three key
questions. The first question is: Which metabolic pathways are reprogrammed when cells
switch from the planktonic state to the biofilm state in the absence of antibiotics? To answer
that question, I will apply 13C-assisted pathway analysis to elucidate the differences in
pathway usage between planktonic and biofilm cells. The second question is: Do different
strains of pathogenic biofilm cells adopt a common pattern of metabolic reprogramming in
clinical infections? To answer that question, I will use 13C-assisted pathway analysis to
systematically investigate the metabolic reprogramming among various pathogenic strains
of biofilm cells that are commonly observed in clinical infections. The third question is:
How do biofilm cells reprogram their metabolism to enhance their resistance to antibiotics?
To answer that question, I will characterize the differences in pathway usage between
planktonic and biofilm cells in the presence of antibiotics.
282
References
1. Guo, W., et al., Investigate the Metabolic Reprogramming of Saccharomyces cerevisiae for Enhanced Resistance to Mixed Fermentation Inhibitors via 13C Metabolic Flux Analysis. PLOS ONE, 2016. 11(8): p. e0161448.
2. Zhuang, L., et al., Investigating oxalate biosynthesis in the wood-decaying fungus Gloeophyllum trabeum using 13C metabolic flux analysis. RSC Advances, 2015. 5(126): p. 104043-104047.
3. Miguel Suastegui, et al., Investigating strain dependency in the production of aromatic compounds in Saccharomyces cerevisiae. Biotechnol Bioeng., 2016. Accepted: p. 9.
4. Guo, W., et al., 13C pathway analysis of biofilm metabolism of Shewanella oneidensis MR-1. RSC Advances, 2015. 5(50): p. 39840-39843.
5. Luo, S., et al., (13)C Pathway Analysis for the Role of Formate in Electricity Generation by Shewanella Oneidensis MR-1 Using Lactate in Microbial Fuel Cells. Sci Rep, 2016. 6: p. 20941.
6. Guo, W. and X. Feng, OM-FBA: Integrate Transcriptomics Data with Flux Balance Analysis to Decipher the Cell Metabolism. PLoS One, 2016. 11(4): p. e0154188.
7. Sheng, J., et al., Data-Driven Prediction of CRISPR-Based Transcription Regulation for Programmable Control of Metabolic Flux. arXiv preprint arXiv:1704.03027, 2017.
8. Guo, W., et al., Metabolic engineering of Saccharomyces cerevisiae to produce 1-hexadecanol from xylose. Microb Cell Fact, 2016. 15: p. 24.

283
Appendix A: Supplementary Material of Chapter 3.3
Fig. A.S1 Plasmids used in this work.

284
Fig. A.S2 - Fitting between measured and simulated summed fractional labeling (SFL) of
strains in group SA2 (Table 3.3.1).
0
50
100
150
200
250
0 50 100 150 200 250
YSG50
Ala57 Ala159 Gly57 Gly85 Val57 Val159 Ser57 Ser159 Thr57 Thr159 Phe57 Phe159 Asp57 Asp159 Glu57 Glu159 Lys57 Lys159 Ile159 SA0
0
50
100
150
200
250
0 50 100 150 200 250
BY4743
0
50
100
150
200
250
0 50 100 150 200 250
BY4741
0
50
100
150
200
250
0 50 100 150 200 250
INVSc1
Sim
ula
ted
SF
L
Measured SFL

285
Fig. A.S3 Sequence alignment of shikimate kinases from different species. The aspartic acid
residue (D920 in S. cerevisiae) is conserved in the five selected species, from which the
corresponding residue has been reported to be the catalytic residue. UNIPROT accesion number:
S. cerevisiae: aro1B subunit (P08566), Escherichia coli (P0A6D7), Pseudomonas syringae
(Q87V14), Arabidopsis thaliana (Q8GY88), Helicobacter pylori (P56073), and Dickeya dadantii
(E0SJR7).
Scerevisiae 841 EVANPVRILERHCTGKTWPGWWDVLHSELGAKLDGAEPLECTSKKNSKKSVVIIGMRAAG Ecoli 3 ----------------------------------------------EKRNIFLVGPMGAG Psyringae 2 ------------------------------------------------RNLILVGPMGAG Athaliana 67 -------LLE---TGSLLHSPFDEEQQILKKKA------EEVKPYLNGRSMYLVGMMGSG Hpylori 2 ------------------------------------------------QHLVLIGFMGSG Ddadantii 3 ----------------------------------------------EKRNIFLVGPMGAG Scerevisiae 901 KTTISKWCASALGYKLVDLDELFEQQ-HNNQSVKQFVVENGWEKFREEETRIFKEVIQNY Ecoli 17 KSTIGRQLAQQLNMEFYDSDQEIEKR-T-GADVGWVFDLEGEEGFRDREEKVINELTE-- Psyringae 14 KSTIGRLLAKELRLPFKDSDKEIELR-T-GANIPWIFDKEGEPGFREREQAMIAELCEA- Athaliana 111 KTTVGKIMARSLGYTFFDCDTLIEQAMK-GTSVAEIFEHFGESVFREKETEALKKLSLM- Hpylori 14 KSSLAQELGLALKLEVLDTDMIISER-V-GLSVREIFEELGEDNFRMFEKNLIDELKTL- Ddadantii 17 KSTIGRQLAQQLNMEFFDSDQEIERR-T-GADVGWVFDVEGEEGFREREEKVINELTE-- Scerevisiae 960 GDDGYVFSTGGGIVESAESRKALKDFASSGGYVLHLHRDIEETIVFLQS--DPSRPAYVE Ecoli 73 -KQGIVLATGGGSVKSRETRNRL----SARGVVVYLETTIEKQLARTQR--DKKRPLLHV Psyringae 71 --DGVVLATGGGAVMRTENRQAL----RAGGRVVYLHASIEQQVGRTAR--DRNRPLLRT Athaliana 169 -YHQVVVSTGGGAVIRPINWK-Y----MHKGISIWLDVPLEALAHRIAAVGTGSRPLLHD Hpylori 71 -KTPHVISTGGGIVMHE----NL----KGLGTTFYLKMDFETLIKRLNQKEREKRPLLNN Ddadantii 73 -KQGIVLATGGGSVKSRETRNRL----SARGVVVYLETTIEKQLARTQR--DKKRPLLQV Scerevisiae 1018 --EIREV----------WNRREGWYKE------------------CSNFSFFAPHCSAEA Ecoli 126 ETPPREVLEA------LANERNPLYEE------------------IADVT---------- Psyringae 123 ADPARVLSEL-------LAIRDPLYRE------------------IADVV---------- Athaliana 223 DESGDTYTAALNRLSTIWDARGEAYTKASARVSLENITLKLGYRSVSDLT---------- Hpylori 122 LTQAKEL----------FEKRQALYEK------------------NASFI---------- Ddadantii 126 ETPPREVLEA------LAKERNPLYEE------------------IADVT----------

286
Fig. A.S4 Characterization of the novel mutant enzyme ARO1D920A. A) The strain BY4741
aro1 harboring plasmid pRS426-aro1D920A cannot grow in medium lacking aromatic amino acids
(AA). B) Complementation of growth was achieved by constructing the plasmids pRS426-
aro1D920A – ecaroL, which harbors the E. coli shikimate kinase gene aroL. C-D) Control plates
containing aromatic amino acids.

287
Fig. A.S5 Fermentation profiles of strain group SA2

288
Fig. A.S6 Absolute copy number of plasmid in strains SA0 and SA2. a) Comparison between
plasmids pRS413 and pRS413-aro4K229L-TKL1. b) Copy number comparison between plasmids
pRS426 and pRS426-aro1D920A.

289
Table A.S1. Isotopic labeling patterns of SA2 strains.
YSG50
INVSc1
BY4741
BY4743
Amino
acid
Labeling
pattern M-57 M-159 M-57 M-159 M-57 M-159 M-57 M-159
Ala m0 0.51 0.49 0.49 0.47 0.48 0.46 0.51 0.49
m1 0.32 0.34 0.34 0.35 0.35 0.35 0.32 0.34
m2 0.03 0.17 0.03 0.18 0.02 0.19 0.03 0.17
m3 0.14 0.14 0.15 0.14
Gly* m0 0.85 0.84 0.79 0.83 0.79 0.82 0.85 0.87
m1 0.03 0.16 0.06 0.17 0.05 0.18 0.02 0.13
m2 0.12 0.15 0.16 0.12
Val m0 0.32 0.31 0.27 0.28 0.26 0.26 0.32 0.31
m1 0.29 0.28 0.31 0.30 0.29 0.27 0.29 0.28
m2 0.19 0.25 0.21 0.25 0.21 0.31 0.19 0.25
m3 0.12 0.13 0.12 0.13 0.15 0.13 0.12 0.13
m4 0.05 0.03 0.07 0.03 0.06 0.04 0.05 0.03
m5 0.03 0.02 0.03 0.03
Leu m0 0.94 0.95 0.96 0.94 0.94 0.95 0.93 0.95
m1 0.06 0.04 0.04 0.05 0.06 0.04 0.06 0.03
m2 0.00 0.01 0.00 0.01 0.00 0.01 0.01 0.01
m3:6 0.00 0.00 0.00 0.00 0.00 0.00 0.00 0.00
Ile m0 0.45 0.27 0.43 0.24 0.41 0.24 0.46 0.29
m1 0.21 0.26 0.18 0.26 0.22 0.27 0.20 0.26
m2 0.17 0.26 0.19 0.28 0.18 0.26 0.19 0.25
m3 0.11 0.15 0.11 0.16 0.09 0.17 0.08 0.14
m4 0.04 0.05 0.05 0.05 0.07 0.06 0.05 0.05
m5 0.02 0.01 0.03 0.01 0.03 0.01 0.02 0.01
m6 0.00 0.00 0.01 0.00
Pro m0 0.31 0.32 0.24 0.27 0.24 0.29 0.31 0.32
m1 0.24 0.29 0.29 0.31 0.27 0.29 0.24 0.29
m2 0.25 0.24 0.28 0.27 0.28 0.27 0.25 0.24
m3 0.15 0.12 0.13 0.12 0.15 0.12 0.15 0.12
m4 0.04 0.03 0.06 0.03 0.05 0.03 0.04 0.03

290
m5 0.01 0.01 0.01 0.01
Ser m0 0.49 0.55 0.55 0.54 0.45 0.47 0.52 0.51
m1 0.32 0.32 0.29 0.34 0.37 0.39 0.31 0.34
m2 0.06 0.13 0.06 0.12 0.01 0.14 0.06 0.14
m3 0.13 0.11 0.17 0.12
Thr m0 0.42 0.39 0.41 0.41 0.41 0.43 0.48 0.47
m1 0.32 0.39 0.37 0.37 0.36 0.35 0.31 0.33
m2 0.12 0.23 0.07 0.19 0.08 0.18 0.06 0.15
m3 0.11 0.00 0.11 0.03 0.11 0.04 0.11 0.05
m4 0.03 0.05 0.03 0.04
Phe m0 0.81 0.80 0.64 0.61 0.65 0.63 0.80 0.79
m1 0.09 0.11 0.11 0.14 0.12 0.14 0.11 0.11
m2 0.04 0.04 0.06 0.10 0.08 0.10 0.03 0.04
m3 0.02 0.02 0.07 0.06 0.06 0.05 0.02 0.03
m4 0.02 0.01 0.04 0.03 0.04 0.03 0.01 0.01
m5 0.01 0.01 0.04 0.03 0.03 0.03 0.01 0.01
m6 0.01 0.01 0.01 0.02 0.02 0.02 0.01 0.01
m7 0.00 0.00 0.01 0.01 0.01 0.01 0.00 0.00
m8:9 0.00 0.00 0.00 0.00 0.00 0.00 0.00 0.00
Asp m0 0.43 0.45 0.40 0.41 0.40 0.43 0.42 0.43
m1 0.30 0.34 0.33 0.33 0.37 0.36 0.36 0.33
m2 0.12 0.17 0.12 0.21 0.06 0.16 0.09 0.19
m3 0.13 0.04 0.12 0.05 0.12 0.06 0.10 0.05
m4 0.02 0.03 0.04 0.03
Glu m0 0.27 0.29 0.23 0.23 0.20 0.23 0.31 0.32
m1 0.29 0.26 0.28 0.33 0.30 0.31 0.22 0.26
m2 0.20 0.28 0.27 0.29 0.28 0.29 0.23 0.28
m3 0.18 0.15 0.15 0.12 0.16 0.12 0.20 0.11
m4 0.06 0.03 0.05 0.03 0.05 0.04 0.05 0.03
m5 0.00 0.01 0.01 0.00
Lys m0 0.24 0.25 0.17 0.17 0.17 0.17 0.24 0.25
m1 0.18 0.23 0.20 0.21 0.21 0.22 0.18 0.23
m2 0.27 0.23 0.24 0.30 0.26 0.31 0.27 0.23

291
m3 0.19 0.20 0.23 0.21 0.22 0.20 0.19 0.20
m4 0.09 0.07 0.12 0.08 0.08 0.08 0.09 0.07
m5 0.04 0.02 0.03 0.02 0.05 0.01 0.04 0.02
m6 0.00 - 0.01 - 0.01 - 0.00 -
Tyr m0 0.66 0.57 0.52 0.52 0.48 0.44 0.66 0.57
m1 0.10 0.19 0.17 0.17 0.16 0.18 0.10 0.19
m2 0.09 0.11 0.09 0.13 0.11 0.15 0.09 0.11
m3 0.05 0.04 0.07 0.07 0.10 0.09 0.05 0.04
m4 0.05 0.04 0.05 0.04 0.06 0.06 0.05 0.04
m5 0.03 0.02 0.05 0.04 0.04 0.03 0.03 0.02
m6 0.02 0.01 0.02 0.02 0.03 0.03 0.02 0.01
m7 0.01 0.01 0.01 0.01 0.01 0.01 0.01 0.01
m8 0.01 0.00 0.01 0.00 0.01 0.00 0.01 0.00
m9 0.00 - 0.00 - 0.00 - 0.00 -
Met m0 0.27 0.33 0.26 0.28 0.82 0.88 0.27 0.33
m1 0.34 0.34 0.30 0.36 0.15 0.09 0.34 0.34
m2 0.19 0.22 0.23 0.23 0.02 0.00 0.19 0.22
m3 0.11 0.08 0.12 0.11 0.00 0.02 0.11 0.08
m4 0.09 0.02 0.07 0.02 0.01 0.00 0.09 0.02
m5 0.01 - 0.02 - 0.00 - 0.01 -
SA m0 - - 0.2193 - 0.2255 - 0.2408 -
m1 - - 0.2932 - 0.3219 - 0.3317 -
m2 - - 0.1675 - 0.124 - 0.1341 -
m3 - - 0.153 - 0.1508 - 0.1417 -
m4 - - 0.0824 - 0.1074 - 0.078 -
m5 - - 0.0846 - 0.0705 - 0.0738 -
* The fragments for glycine were M-57 and M-85.

292
Appendix B: Supplementary Material of Chapter 3.4
Fig. B.S1 Simulated isotopic labeled pattern fitting based on SFL calculation. (A)
Low nitrogen condition (LN); (B) High nitrogen condition (HN)
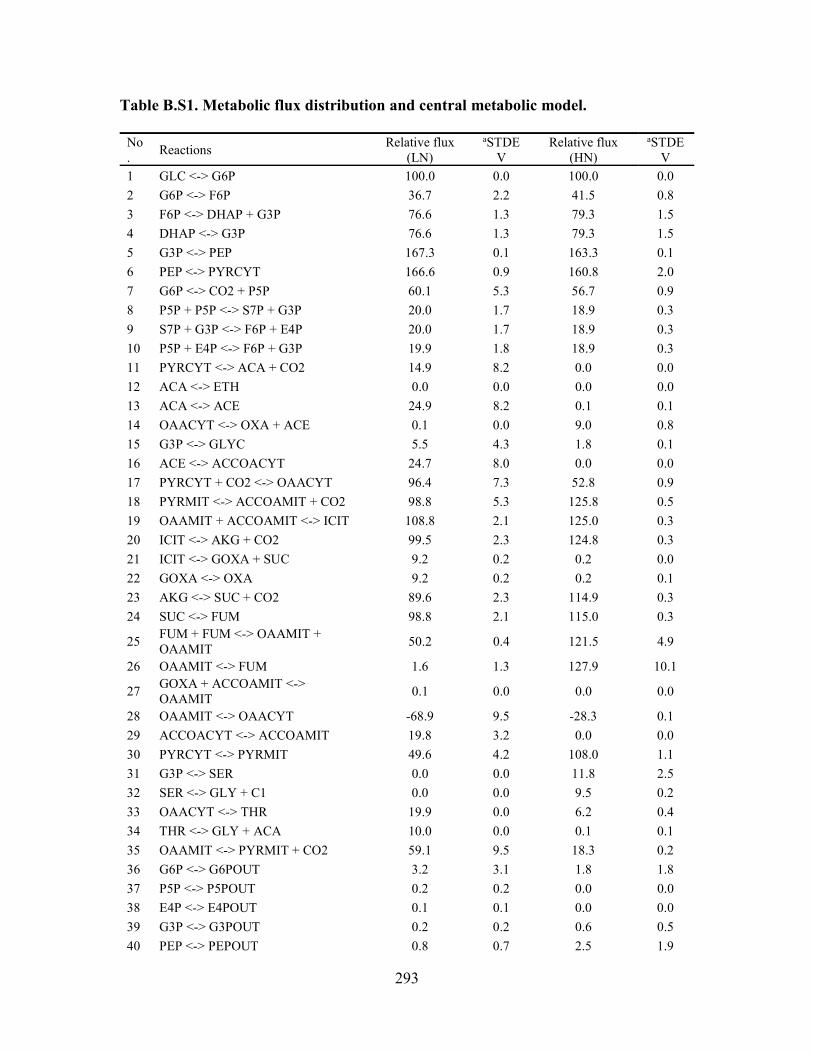
293
Table B.S1. Metabolic flux distribution and central metabolic model.
No.
Reactions Relative flux
(LN)
aSTDEV
Relative flux (HN)
aSTDEV
1 GLC <-> G6P 100.0 0.0 100.0 0.0
2 G6P <-> F6P 36.7 2.2 41.5 0.8
3 F6P <-> DHAP + G3P 76.6 1.3 79.3 1.5
4 DHAP <-> G3P 76.6 1.3 79.3 1.5
5 G3P <-> PEP 167.3 0.1 163.3 0.1
6 PEP <-> PYRCYT 166.6 0.9 160.8 2.0
7 G6P <-> CO2 + P5P 60.1 5.3 56.7 0.9
8 P5P + P5P <-> S7P + G3P 20.0 1.7 18.9 0.3
9 S7P + G3P <-> F6P + E4P 20.0 1.7 18.9 0.3
10 P5P + E4P <-> F6P + G3P 19.9 1.8 18.9 0.3
11 PYRCYT <-> ACA + CO2 14.9 8.2 0.0 0.0
12 ACA <-> ETH 0.0 0.0 0.0 0.0
13 ACA <-> ACE 24.9 8.2 0.1 0.1
14 OAACYT <-> OXA + ACE 0.1 0.0 9.0 0.8
15 G3P <-> GLYC 5.5 4.3 1.8 0.1
16 ACE <-> ACCOACYT 24.7 8.0 0.0 0.0
17 PYRCYT + CO2 <-> OAACYT 96.4 7.3 52.8 0.9
18 PYRMIT <-> ACCOAMIT + CO2 98.8 5.3 125.8 0.5
19 OAAMIT + ACCOAMIT <-> ICIT 108.8 2.1 125.0 0.3
20 ICIT <-> AKG + CO2 99.5 2.3 124.8 0.3
21 ICIT <-> GOXA + SUC 9.2 0.2 0.2 0.0
22 GOXA <-> OXA 9.2 0.2 0.2 0.1
23 AKG <-> SUC + CO2 89.6 2.3 114.9 0.3
24 SUC <-> FUM 98.8 2.1 115.0 0.3
25 FUM + FUM <-> OAAMIT + OAAMIT
50.2 0.4 121.5 4.9
26 OAAMIT <-> FUM 1.6 1.3 127.9 10.1
27 GOXA + ACCOAMIT <-> OAAMIT
0.1 0.0 0.0 0.0
28 OAAMIT <-> OAACYT -68.9 9.5 -28.3 0.1
29 ACCOACYT <-> ACCOAMIT 19.8 3.2 0.0 0.0
30 PYRCYT <-> PYRMIT 49.6 4.2 108.0 1.1
31 G3P <-> SER 0.0 0.0 11.8 2.5
32 SER <-> GLY + C1 0.0 0.0 9.5 0.2
33 OAACYT <-> THR 19.9 0.0 6.2 0.4
34 THR <-> GLY + ACA 10.0 0.0 0.1 0.1
35 OAAMIT <-> PYRMIT + CO2 59.1 9.5 18.3 0.2
36 G6P <-> G6POUT 3.2 3.1 1.8 1.8
37 P5P <-> P5POUT 0.2 0.2 0.0 0.0
38 E4P <-> E4POUT 0.1 0.1 0.0 0.0
39 G3P <-> G3POUT 0.2 0.2 0.6 0.5
40 PEP <-> PEPOUT 0.8 0.7 2.5 1.9

294
41 PYRMIT <-> PYRMITOUT 9.9 0.0 0.5 0.5
42 PYRCYT <-> PYRCYTOUT 5.6 4.3 0.0 0.0
43 OAACYT <-> OAACYTOUT 7.5 2.1 9.3 0.7
44 AKG <-> AKGOUT 9.9 0.0 10.0 0.0
45 ACCOACYT <-> ACCOACYTOUT 4.8 4.8 0.0 0.0
46 ACCOAMIT <-> ACCOAMITOUT 9.8 0.1 0.8 0.7
47 SER <-> SEROUT 0.0 0.0 2.3 2.3
48 GLY <-> GLYOUT 10.0 0.0 9.6 0.2
49 C1 <-> C1OUT 0.0 0.0 9.5 0.2
50 THR <-> THROUT 9.9 0.0 6.1 0.5
51 ETH <-> ETHOUT 0.0 0.0 0.0 0.0
52 ACE <-> ACEOUT 0.3 0.3 9.1 0.8
53 GLYC <-> GLYCOUT 5.5 4.3 1.8 0.1
54 CO2 <-> CO2OUT 325.6 1.5 387.7 0.2
55 OXA <-> OXAOUT 9.3 0.2 9.2 0.8 a Standard deviation

295
BLAST results of oxalate biosynthesis enzymes in G. trabeum
Table B.S2. BLAST results of G. trabeum from Fomitopsis palustris
Enzyme Score Expect Identities Gaps Strand Oxaloacetate
acetylhydrolase (fpOAH)
722 bits(800) 0.0 711/918(77%) 0/918(0%) Plus/Plus
Glyoxylate dehydrogenase (fpGLOXDH1)
385 bits(426) 2e-106 920/1373(67%) 45/1373(3%) Plus/Plus
>gi|472338812|dbj|AB690578.1| Fomitopsis palustris FpOAH mRNA for oxaloacetate
acetylhydrolase, complete cds
Gloeophyllum trabeum ATCC 11539 Phosphoenolpyruvate/pyruvate domain-containing
protein partial mRNA
Sequence ID: ref|XM_007867946.1| Length: 1008 Number of Matches: 1
>gi|225636765|dbj|AB079662.1| Fomitopsis palustris FPGLOXDH1 mRNA for
glyoxylate dehydrogenase, complete cds
Gloeophyllum trabeum ATCC 11539 hypothetical protein mRNA
Sequence ID: ref|XM_007868156.1| Length: 1750 Number of Matches: 1

296
Appendix C: Supplementary Material of Chapter 4
Fig. C.S1 Comparison of FBA prediction using dual objective function and the
commonly used objective function.

297
Fig. C.S2 Correlation coefficient (absolute value) between gene expression and
phenotype-matched weighting factors at low glucose condition and high glucose
condition.
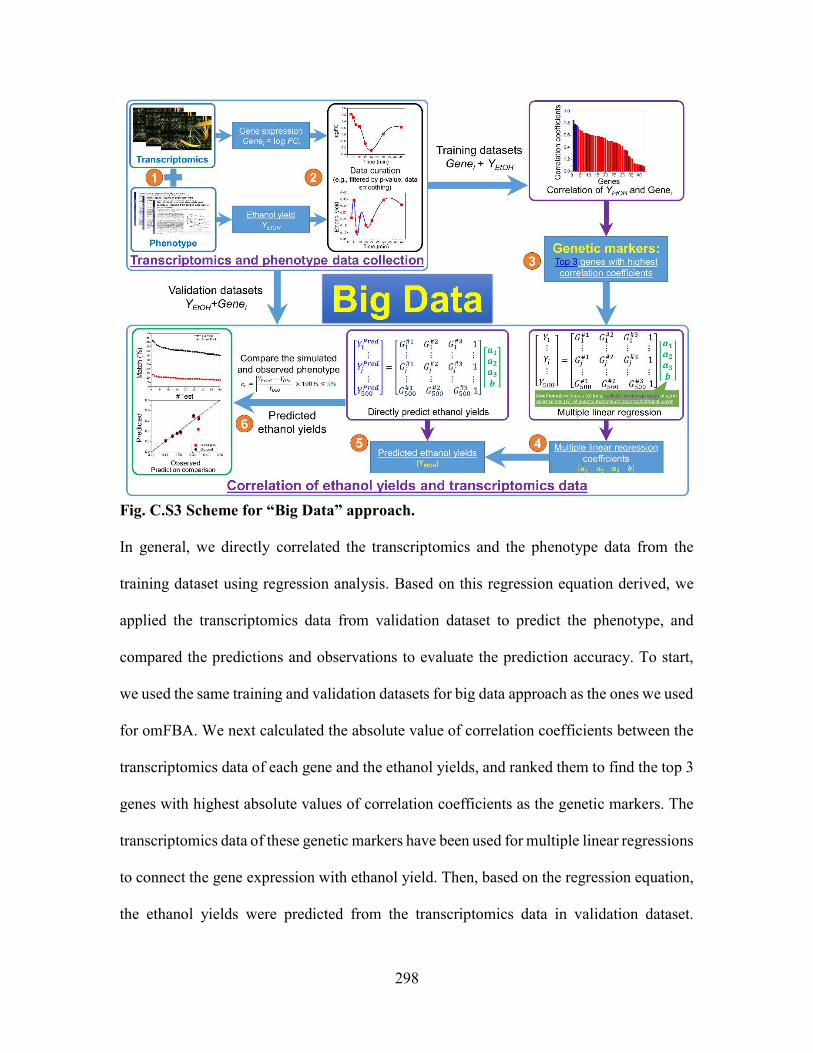
298
Fig. C.S3 Scheme for “Big Data” approach.
In general, we directly correlated the transcriptomics and the phenotype data from the
training dataset using regression analysis. Based on this regression equation derived, we
applied the transcriptomics data from validation dataset to predict the phenotype, and
compared the predictions and observations to evaluate the prediction accuracy. To start,
we used the same training and validation datasets for big data approach as the ones we used
for omFBA. We next calculated the absolute value of correlation coefficients between the
transcriptomics data of each gene and the ethanol yields, and ranked them to find the top 3
genes with highest absolute values of correlation coefficients as the genetic markers. The
transcriptomics data of these genetic markers have been used for multiple linear regressions
to connect the gene expression with ethanol yield. Then, based on the regression equation,
the ethanol yields were predicted from the transcriptomics data in validation dataset.

299
Finally, the predicted ethanol yields were compared to the observed ethanol yields in the
validation dataset. We repeated the “Big Data” regression approach for 40 times to make
sure our predictions were statistically reliable.

300
Fig. C.S4 Prediction accuracy of “Big Data” approach. Direct comparison of the
predicted and observed ethanol yields in low (A) and high (B) glucose condition. The “Big
Data” algorithm was repeated for 40 times and the proportions of matched predictions of
“Big Data” algorithm were calculated and ranked for low (C) and high (D) glucose
conditions.

301
Fig. C.S5. Venn diagram for genetic markers identified by omFBA and “Big Data”
using either “big pool” or “small pool” of genes for low and high concentration
conditions. Top 10 genes with the highest absolute values of correlation coefficients
were extracted from S1 Table and shown in this figure.

302
Fig. C.S6 Correlation of phenotype-matched weighting factors derived from two
genome-scale metabolic models of S. cerevisiae: iMM904 and iND750.

303
Appendix D: Supplementary Material of Chapter 5
1. Binary regression decision tree model
1.1. Parameterization of guide RNAs
Nine key design parameters, i.e., location, GC content (GC%), minimal free energy
(ΔG), number of base A, number of base G, AGG, TGG, CGG, and GGG, have been
extracted from guide RNAs, respectively. Location is defined as the number of bases
between the first base of guide RNA binding sequence and the A in the start codon (ATG).
Therefore, the position of A in the ATG is considered as 0. The location of guide RNAs
binding before the start codon is defined as negative, and vice versa. The GC content
(GC%) is defined as the proportion of base G and base C in the guide RNA sequence.
Minimal free energy (ΔG) is calculated by rnafold command in MATLAB. As a categorical
parameter, AGG, TGG, CGG, and GGG are four bool parameters representing four types
of the PAM site type. Each guide RNA has a set of key design parameters. The parameters
are used to train and validate the decision tree model.
1.2. Setup of regression decision tree model
To train the binary regression decision tree model, “fitrtree” command in MATLAB
was used with the default settings. In detail, the standard CART algorithm was used to
select the best split predictor, which maximized the split-criterion gain over all possible
splits of all predictors. The “fitrtree” grew the regression tree and estimated the optimal
sequence of pruned subtrees based on the equally weighted mean squared errors, but did
not prune the regression tree. During the tree growing, splitting nodes stopped when
quadratic error per node dropped below 10-6 of the quadratic error for the entire data

304
computed before the decision tree was grown. To control the depth of the tree and avoid
the over-fitting of the tree model, the maximu m splits number was the number of guide
RNAs in training datasets.
1.3. Application of regression decision tree model
To apply our binary regression decision tree model, “predict” command in MATLAB
was used to predict the fold changes of gene expression levels for specific guide RNAs.
(https://www.mathworks.com/help/stats/compactregressiontree.predict.html?searchHighli
ght=predict&s_tid=doc_srchtitle ). In general, the target guide RNA sequence will be first
processed by customized functions (supplementary software) to calculate the
corresponding design parameters. An input matrix will be generated for the tree model,
which will be used to predict the corresponding fold change of the gene expression level.
1.4 CRISTINES software and its results
CRISTINES software is an offline MATLAB-based tool to provide the guide RNA
designs to achieve gene up-regulation and down-regulation. The core algorithm is the
binary regression decision tree model that uses the key design parameters of guide RNAs
as the input. In the CRISTINES, the sequence of interest with the identification of the start
codon ATG, is used as the source file. All the possible guide RNAs from the input sequence
will be generated, and the nine design parameters, i.e., location, GC content, minimal free
energy, number of base A, number of base G, AGG, TGG, CGG, and GGG, are calculated
for each of guide RNAs. These design parameters will then be used in the binary regression
decision tree model to calculate the regulatory effects (i.e., fold change of gene expression
level) of guide RNAs. CRISTINES will report the top 5 guide RNA designs with highest

305
up- and down- regulation effects, respectively. The regulatory effects of all possible guide
RNAs can be downloaded to the local folder in Excel file.
2. Calculation of metabolic fluxes in violacein pathway subject to dCas9-VP64
regulation
We hypothesized that the changes gene expression levels would quantitatively
change the metabolic fluxes in the branches of violacein pathway, and thus, leading to
different concentrations of various products. In detail, the flows through pathways
governed by gene vioA, vioB, vioC, vioD, and vioE, are defined as fA, fB, fC, fD, and fE,
respectively. The predicted fold changes of gene vioA, vioB, vioC, vioD, and vioE, are
defined as FCA, FCB, FCC, FCD, and FCE, respectively. Similarly, the flows through the
non-enzymatic pathways for producing the final colorful chemical, proviolacein,
prodeoxyviolacein, violacein, and deoxyviolacein, are defined as fPV, fPDV, fV, and fDV,
respectively. To calculate the effects of dCas9-VP64 on metabolic fluxes in violacein
pathway, we assume a pseudo-steady state was achieved. Thus, based on the flux balance
at steady state, the quantitative relations among these parameters were shown below:
fA = fB = fE Eq. 1
fE = fDV + fPDV + fD Eq. 2
fD = fV + fPV Eq. 3
fC = fDV + fV Eq. 4
In addition, we hypothesized that the proportion between fDV and fV obeys the Hill
equation as shown in Eq. 5 with Hill coefficient defined as n:
fDV / fV =1 / (fCn + 1) Eq. 5

306
The values of fPV, fPDV, fV, and fDV can be directly obtained from the HPLC
measurements, which would serve as the experimental measurements. The constant n was
calculated as 0.356 from the measurements of the control strain by using Eq. 4 and Eq. 5.
The following methods were used to calculate the simulated fPV, fPDV, fV, and fDV.
1) If the dCas9-VP64 system regulates the gene expression of vioA or vioE, then fE
= FCA* fE, Control or fE = FCE* fE, Control, respectively; fD = FCD* fD, Control, and fC =
FCC* fC, Control.
2) If the dCas9-VP64 system regulates the gene expression of vioC, then fC = FCC*
fC, Control, fE = fE, Control, and fD = fD, Control.
3) If the dCas9-VP64 system regulates the gene expression of vioD, then fD = FCD*
fD, Control, fE = fE, Control, and fC = fC, Control.
4) If the dCas9-VP64 system is regulating multiple gene expression in the violacein
pathways, we assume that the regulation of each gene is independent to others. In
other words, we hypothesized that the regulation of dCas9-VP64 system was
independent on each gene and each pathway of the violacein pathways.
By knowing fE, fD, and fC, we could then solve Eq 1-5 together to derive the simulated
fDV, fV, fPV, and fPDV sequentially. We next compared the experimentally measured and
simulated fDV, fV, fPV, and fPDV as shown in Fig. 3B and 3C.
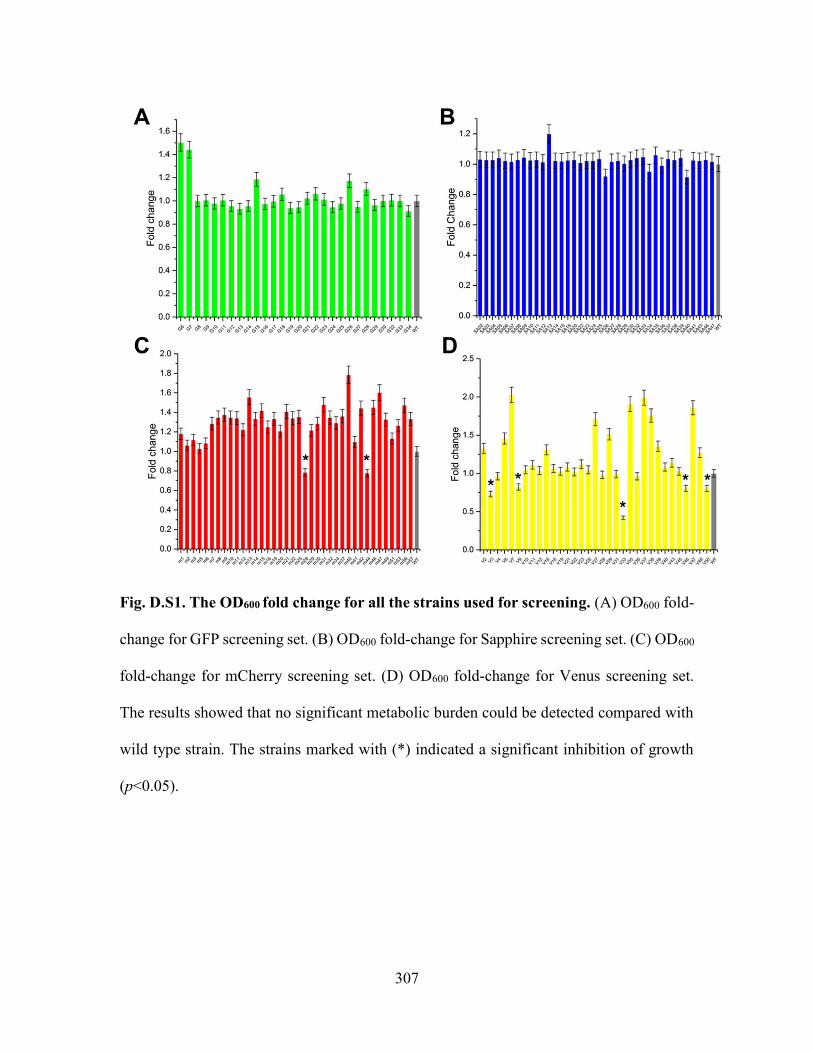
307
Fig. D.S1. The OD600 fold change for all the strains used for screening. (A) OD600 fold-
change for GFP screening set. (B) OD600 fold-change for Sapphire screening set. (C) OD600
fold-change for mCherry screening set. (D) OD600 fold-change for Venus screening set.
The results showed that no significant metabolic burden could be detected compared with
wild type strain. The strains marked with (*) indicated a significant inhibition of growth
(p<0.05).

308
Fig. D.S2. Linear model for predicting transcriptional regulation by dCas9-VP64. (A)
Pearson’s correlation coefficients between each guide RNA design parameters and the fold
changes of gene expressions from the screening data of the four synthetic genetic cassettes.
(B) Simulation accuracy of the linear model. (C) Validation of the linear model by
comparing the simulated and experimentally measured gene regulations on Eno2p-
tdTomato cassette subject to dCas9-VP64 regulation.

309
Fig. D.S3. Screenshot of CRISTINES software with a demo sequence.

310
Table D.S1. DNA sequences and plasmids used in this study. DNA Name Sequence (5’-3’)
TEF1p atagcttcaaaatgtttctactccttttttactcttccagattttctcggactccgcgcatcgccgtaccacttcaaaacacccaagcacagcatactaaatttcccctctttcttcctctagggtgtcgttaattacccgtactaaaggtttggaaaagaaaaaagagaccgcctcgtttctttttcttcgtcgaaaaaggcaataaaaatttttatcacgtttctttttcttgaaaatttttttttttgatttttttctctttcgatgacctcccattgatatttaagttaataaacggtcttcaatttctcaagtttcagtttcatttttcttgttctattacaactttttttacttcttgctcattagaaagaaagcatagcaatctaatctaagttttaattacaaa
ENO2p gtgtcgacgctgcgggtatagaaagggttctttactctatagtacctcctcgctcagcatctgcttcttcccaaagatgaacgcggcgttatgtcactaacgacgtgcaccaacttgcggaaagtggaatcccgttccaaaactggcatccactaattgatacatctacacaccgcacgccttttttctgaagcccactttcgtggactttgccatatgcaaaattcatgaagtgtgataccaagtcagcatacacctcactagggtagtttctttggttgtattgatcatttggttcatcgtggttcattaattttttttctccattgctttctggctttgatcttactatcatttggatttttgtcgaaggttgtagaattgtatgtgacaagtggcaccaagcatatataaaaaaaaaaagcattatcttcctaccagagttgattgttaaaaacgtatttatagcaaacgcaattgtaattaattcttattttgtatcttttcttcccttgtctcaatcttttatttttattttatttttcttttcttagtttctttcataacaccaagcaactaatactataacatacaataata
PDC1p catgcgactgggtgagcatatgttccgctgatgtgatgtgcaagataaacaagcaaggcagaaactaacttcttcttcatgtaataaacacaccccgcgtttatttacctatctctaaacttcaacaccttatatcataactaatatttcttgagataagcacactgcacccataccttccttaaaaacgtagcttccagtttttggtggttccggcttccttcccgattccgcccgctaaacgcatatttttgttgcctggtggcatttgcaaaatgcataacctatgcatttaaaagattatgtatgctcttctgacttttcgtgtgatgaggctcgtggaaaaaatgaataatttatgaatttgagaacaattttgtgttgttacggtattttactatggaataatcaatcaattgaggattttatgcaaatatcgtttgaatatttttccgaccctttgagtacttttcttcataattgcataatattgtccgctgcccctttttctgttagacggtgtcttgatctacttgctatcgttcaacaccaccttattttctaactattttttttttagctcatttgaatcagcttatggtgatggcacatttttgcataaacctagctgtcctcgttgaacataggaaaaaaaaatatataaacaaggctctttcactctccttgcaatcagatttgggtttgttccctttattttcatatttcttgtcatattcctttctcaattattattttctactcataacctcacgcaaaataacacagtcaaatcaatcaaa
PGK1p tcaggcatgaacgcatcacagacaaaatcttcttgacaaacgtcacaattgatccctccccatccgttatcacaatgacaggtgtcattttgtgctcttatgggacgatccttattaccgctttcatccggtgatagaccgccacagaggggcagagagcaatcatcacctgcaaacccttctatacactcacatctaccagtgtacgaattgcattcagaaaactgtttgcattcaaaaataggtagcatacaattaaaacatggcgggcacgtatcattgcccttatcttgtgcagttagacgcgaatttttcgaagaagtaccttcaaagaatggggtctcatcttgttttgcaagtaccactgagcaggataataatagaaatgataatatactatagtagagataacgtcgatgacttcccatactgtaattgcttttagttgtgtatttttagtgtgcaagtttctgtaaatcgattaatttttttttctttcctctttttattaaccttaatttttattttagattcctgacttcaactcaagacgcacagatattataacatctgcacaataggcatttgcaagaattactcgtgagtaaggaaagagtgaggaactatcgcatacctgcatttaaagatgccgatttgggcgcgaatcctttattttggcttcaccctcatactattatcagggccagaaaaaggaagtgtttccctccttcttgaattgatgttaccctcataaagcacgtggcctcttatcgagaaagaaattaccgtcgctcgtgatttgtttgcaaaaagaacaaaactgaaaaaacccagacacgctcgacttcctgtcttcctattgattgcagcttccaatttcgtcacacaacaaggtcctagcgacggctcacaggttttgtaacaagcaatcgaaggttctggaatggcgggaaagggtttagtaccacatgctatgatgcccactgtgatctccagagcaaagttcgttcgatcgtactgttactctctctctttcaaacagaattgtccgaatcgtgtgacaacaacagcctgttctcacacactcttttcttctaaccaagggggtggtttagtttagtagaacctcgtgaaacttacatttacatatatataaacttgcataaattggtcaatgcaagaaatacatatttggtcttttctaattcgtagtttttcaagttcttagatgctttctttttctcttttttacagatcatcaaggaagtaattatctactttttacaacaaatataaaaca
TPI1p tatatctaggaacccatcaggttggtggaagattacccgttctaagacttttcagcttcctctattgatgttacacctggacaccccttttctggcatccagtttttaatcttcagtggcatgtgagattctccgaaattaattaaagcaatcacacaattctctcggataccacctcggttgaaactgacaggtggtttgttacgcatgctaatgcaaaggagcctatatacctttggctcggctgctgtaacagggaatataaagggcagcataatttaggagtttagtgaacttgcaacatttactattttcccttcttacgtaaatatttttctttttaattctaaatcaatctttttcaattttttgtttgtattcttttcttgcttaaatctataactacaaaaaacacatacataaactaaaa
EGFP atgtctaaaggtgaagaattattcactggtgttgtcccaattttggttgaattagatggtgatgttaatggtcacaaattttctgtctccggtgaaggtgaaggtgatgctacttacggtaaattgaccttaaaatttatttgtactactggtaaattgccagttccatggccaaccttagtcactactttaacttatggtgttcaatgtttttctagatacccagatcatatgaaacaacatgactttttcaagtctgccatgccagaaggttatgttcaagaaagaactatttttttcaaagatgacggtaactacaagaccagagctgaagtcaagtttgaaggtgataccttagttaatagaatcgaattaaaaggtattgattttaaagaagatggtaacattttaggtcacaaattggaatacaactataactctcacaatgtttacatcatggctgacaaacaaaagaatggtatcaaagttaacttcaaaattagacacaacattgaagatggttctgttcaattagctgaccattatcaacaaaatactccaattggtgatggtccagtcttgttaccagacaaccattacttatccactcaatctgccttatccaaagatccaaacgaaaagagagaccacatggtcttgttagaatttgttactgctgctggtattacccatggtatggatgaattgtacaaataa
tdTomato atggtgagcaagggcgaggaggtcatcaaagagttcatgcgcttcaaggtgcgcatggagggctccatgaacggccacgag

311
ttcgagatcgagggcgagggcgagggccgcccctacgagggcacccagaccgccaagctgaaggtgaccaagggcggccccctgcccttcgcctgggacatcctgtccccccagttcatgtacggctccaaggcgtacgtgaagcaccccgccgacatccccgattacaagaagctgtccttccccgagggcttcaagtgggagcgcgtgatgaacttcgaggacggcggtctggtgaccgtgacccaggactcctccctgcaggacggcacgctgatctacaaggtgaagatgcgcggcaccaacttcccccccgacggccccgtaatgcagaagaagaccatgggctgggaggcctccaccgagcgcctgtacccccgcgacggcgtgctgaagggcgagatccaccaggccctgaagctgaaggacggcggccactacctggtggagttcaagaccatctacatggccaagaagcccgtgcaactgcccggctactactacgtggacaccaagctggacatcacctcccacaacgaggactacaccatcgtggaacagtacgagcgctccgagggccgccaccacctgttcctggggcatggcaccggcagcaccggcagcggcagctccggcaccgcctcctccgaggacaacaacatggccgtcatcaaagagttcatgcgcttcaaggtgcgcatggagggctccatgaacggccacgagttcgagatcgagggcgagggcgagggccgcccctacgagggcacccagaccgccaagctgaaggtgaccaagggcggccccctgcccttcgcctgggacatcctgtccccccagttcatgtacggctccaaggcgtacgtgaagcaccccgccgacatccccgattacaagaagctgtccttccccgagggcttcaagtgggagcgcgtgatgaacttcgaggacggcggtctggtgaccgtgacccaggactcctccctgcaggacggcacgctgatctacaaggtgaagatgcgcggcaccaacttcccccccgacggccccgtaatgcagaagaagaccatgggctgggaggcctccaccgagcgcctgtacccccgcgacggcgtgctgaagggcgagatccaccaggccctgaagctgaaggacggcggccactacctggtggagttcaagaccatctacatggccaagaagcccgtgcaactgcccggctactactacgtggacaccaagctggacatcacctcccacaacgaggactacaccatcgtggaacagtacgagcgctccgagggccgccaccacctgttcctgtacggcatggacgagctgtacaagtaa
Sapphire atgtctaaaggtgaagaattattcactggtgttgtcccaattttggttgaattagatggtgatgttaatggtcacaaattttctgtctccggtgaaggtgaaggtgatgctacttacggtaaattgaccttaaaatttatttgtactactggtaaattgccagttccatggccaaccttagtcactactttttcttatggtgttatggtttttgctagatacccagatcatatgaaacaacatgactttttcaagtctgccatgccagaaggttatgttcaagaaagaactatttttttcaaagatgacggtaactacaagaccagagctgaagtcaagtttgaaggtgataccttagttaatagaatcgaattaaaaggtattgattttaaagaagatggtaacattttaggtcacaaattggaatacaactttaactctcacaatgtttacatcatggctgacaaacaaaagaatggtatcaaagctaacttcaaaattagacacaacattgaagatggtggtgttcaattagctgaccattatcaacaaaatactccaattggtgatggtccagtcttgttaccagacaaccattacttatccattcaatctgccttatccaaagatccaaacgaaaagagagaccacatggtcttgttagaatttgttactgctgctggtattacccatggtatggatgaattgtacaaataa
mCherry atggttagcaaaggcgaggaagataacatggctataatcaaagagtttatgagattcaaagtacacatggagggttcagtgaatggtcatgaatttgaaattgaaggcgaaggcgagggcagaccttacgaaggaactcaaacagcaaaacttaaggtaacaaaaggtggtcctctgccattcgcctgggacattctcagtccacaattcatgtacggttctaaagcgtacgtcaaacatccagcagacattccagattacttgaaattgtcttttccagaaggctttaagtgggaaagagttatgaacttcgaggatggaggggttgtgaccgttacgcaagattcctctttacaagatggtgagtttatctacaaggtcaaattaagggggactaattttccttcagacgggccagtcatgcagaaaaagactatgggatgggaagcctcttcagagagaatgtatcctgaagatggcgctctaaaaggagaaatcaagcaaagattgaagttaaaggacggaggtcattatgatgcagaagtaaaaacaacctataaagctaaaaagccagttcaacttcctggtgcctacaatgttaacatcaagctagacattacatcccataatgaagattacactatagtggaacagtatgaacgtgctgaaggtagacacagtacaggtggtatggatgaactgtacaagtaa
Venus atgtctaaaggtgaagaattattcactggtgttgtcccaattttggttgaattagatggtgatgttaatggtcacaaattttctgtctccggtgaaggtgaaggtgatgctacttacggtaaattgaccttaaaattgatttgtactactggtaaattgccagttccatggccaaccttagtcactactttaggttatggtttgcaatgttttgctagatacccagatcatatgaaacaacatgactttttcaagtctgccatgccagaaggttatgttcaagaaagaactatttttttcaaagatgacggtaactacaagaccagagctgaagtcaagtttgaaggtgataccttagttaatagaatcgaattaaaaggtattgattttaaagaagatggtaacattttaggtcacaaattggaatacaactataactctcacaatgtttacatcactgctgacaaacaaaagaatggtatcaaagctaacttcaaaattagacacaacattgaagatggtggtgttcaattagctgaccattatcaacaaaatactccaattggtgatggtccagtcttgttaccagacaaccattacttatcctatcaatctgccttatccaaagatccaaacgaaaagagagaccacatggtcttgttagaatttgttactgctgctggtattacccatggtatggatgaattgtacaaataa
VioA atgaagcacagttctgatatttgcatagttggggcgggcatctcagggttgacctgcgcgagtcaccttcttgactctcctgcttgtcgtggcttatccctaagaatttttgatatgcaacaggaggctggaggtaggatcaggtctaagatgcttgatggcaaagcgagcattgagttgggcgctggccgttattcccctcaacttcatcctcacttccaaagcgcgatgcaacactattcacagaagagtgaggtttatccgtttacacaattaaaattcaagagccatgtccagcagaagctaaagagagctatgaatgagctttccccccgtctaaaggagcacggaaaagaatcctttctacagtttgtgtctcgttaccaaggtcacgactccgcggtcggcatgatcaggtctatgggatatgacgcgctattccttccggacatatctgcagaaatggcatacgatattgttggcaaacatcccgagatccaaagtgttactgacaatgacgctaatcagtggtttgccgcagaaactgggttcgccgggcttattcaggggattaaggcgaaagtaaaggctgcaggtgctagattttccctggggtataggttactgtcagtgaggacggacggggacggatacttgctgcaattagctggtgatgatggctggaaacttgagcatagaacaagacatctaattcttgcaatacctccatcagctatggcgggactaaatgtagattttcctgaagcgtggtcaggggccaggtatgggtcattaccgctatttaaaggcttcttaacttacggagagccatggtggttagattataagctagatg

312
accaggtgctaattgtggataatccgcttagaaagatctactttaaaggcgataagtatttatttttttacacagactcagaaatggcaaattattggagaggctgtgtagcggagggcgaggatggttatttggaacaaatccgtactcacttggcctcagcgctaggaatcgttagggagcgtataccccaaccgttagcccatgttcacaagtattgggcacatggtgtcgagttttgcagggattcagatattgaccacccatcagcccttagccaccgtgactccggaatcattgcgtgcagtgacgcctatactgaacattgcggatggatggaggggggtcttttatctgcgagagaagccagcaggctgcttctacaaaggatagccgcctaa
VioB atgagcattctggattttccacgcatccatttccgcggctgggcgcgggtcaacgcgcccaccgccaaccgcgatccgcacggccacatcgacatggccagcaatacggtggccatggcaggcgaaccgttcgacctcgcgcgccatccgaccgagttccaccgccacctgcggtcgctggggccgcgtttcggcctggacggccgggctgacccggaagggccgttcagcctggccgagggctacaacgcggccggcaacaaccatttctcctgggagagcgccaccgtcagccacgtgcagtgggatggcggcgaagcggaccgcggcgacggcctggtcggcgccaggctggcgctgtgggggcattacaacgattacctgcgcaccaccttcaaccgcgcgcgctgggtggacagcgaccccacccgccgcgacgcggcgcagatctacgccgggcagttcacgatcagcccggccggcgccggaccgggcacgccctggctgttcaccgccgacatcgacgacagccacggcgcgcgctggacgcgcggcggccacatcgccgagcgcggcggccatttcctggacgaggagttcggcctggcgcggctgttccagttctcggtgcccaaagaccatccgcacttcctgttccacccggggccattcgattccgaagcctggcgcaggctgcagctggcgctggaggacgacgacgtgctcggcctgacggtgcagtacgcgctgttcaatatgtcgacgccgccgcaacccaactcgccggtgttccacgacatggtcggcgtggtcggcctgtggcggcgcggcgaactggccagctacccggccggccggctgctgcgtccgcgccagcccgggctgggcgatctgacgctgcgcgtaagcggcggccgcgtggcgctgaatctggcctgcgccattccgttctccacccgggcggcgcagccgtccgcgccggacaggctgacgcccgatctcggggccaagctgccgttgggcgacctgctgctgcgcgacgaggacggcgcgttgctggcgcgggtgccgcaggcgctttaccaggattactggacgaaccacggcatcgtcgacctgccgctgctgcgcgagcccaggggctcgctgacgctgtccagcgagctggccgaatggcgcgagcaggactgggtcacgcagtccgacgcctccaatctttatttggaagcgccggaccgccgccacggccgtttctttccggaaagcatcgcgctgcgcagctatttccgcggcgaggcccgcgcgcgcccggacattccccaccggatcgaggggatgggtctggtcggcgtggagtcgcgccaggacggcgatgccgccgaatggcggctgaccggcctgcggcccggcccggcgcgcatcgtgctcgacgacggcgcggaggcgatcccgctgcgggtgctgccggacgactgggcgttggacgacgcgacggtggaggaggtcgattacgccttcctgtaccggcacgtgatggcctattacgagctggtctacccgttcatgtccgacaaggtgttcagcctggccgaccgctgcaagtgcgagacctacgccaggctgatgtggcagatgtgcgatccgcagaaccggaacaagagctactacatgcccagcacccgcgagctgtcggcgcccaaggccaggctgttcctcaaatacctggcccatgtcgagggccaggccaggctgcaggcgccgccgccggccgggccggcgcgcatcgagagcaaggcccagctggcggccgagctgcgcaaggcggtggatctggagttgtcggtgatgctgcagtacctgtacgccgcctattccattcccaattacgcccagggccagcagcgggtgcgcgacggcgcgtggacggcggagcagctgcagctggcctgcggcagcggcgaccggcgccgcgacggcggcatccgcgccgcgctgctggagatcgcccacgaggagatgatccattacctggtggtcaacaacctgctgatggcgctgggcgagccgttctacgccggcgtgccgctgatgggcgaggcggcgcggcaggcgttcggcctggacaccgaattcgcgctggagccgttctccgagtcgacgctggcgcgcttcgtccggctggaatggccgcacttcatccctgcgccgggcaaatccatcgccgactgctacgccgccatccgccaggcctttctcgatctgcccgacctgttcggcggcgaggccggcaagcgcggcggcgagcaccacttgttcctcaacgagctgaccaaccgcgcccatcccggctaccagctggaggtgttcgatcgcgacagcgcgctgttcggcatcgccttcgtcaccgaccagggcgagggcggggcgctggactcgccgcattacgagcattcgcatttccagcggctgcgggagatgtcggccaggatcatggcgcagtccgcgccgttcgagccggcgttgccggcgctgcgcaacccggtgctggacgagtcgccgggctgccagcgcgtggcggacggacgggcgcgcgcgctgatggcgctgtaccagggcgtgtacgagctgatgttcgcgatgatggcgcagcacttcgcggtcaagccgctgggcagcctcaggcgctcgcggctgatgaacgcggcgatcgacctgatgaccggcctgctcaggccgctgtcctgcgcgctgatgaacctgccgtcgggcatcgccggacgcaccgccgggccgccgctgccggggccggtggatacccgcagctacgacgactacgcgctgggctgccggatgctggcgcggcgctgcgagcgcctgctggagcaggcgtcgatgctggagccgggctggctgcccgacgcgcaaatggaactgctggatttctaccgccggcagatgctggatttggcttgtggaaagctttctagagaggcctaa
VioC atgcagaaagccattatcgtgggaggcggcttagccggtggcttaacagctatttacctagcaaggcgtggctatgaggtacacgtagtagagaagaggggtgaccccttgcaagatctgtcatcttatgtcgacgcagtttccagtcgtgctataggggtaagtatgacggtcaggggcattaaagcggttttggccgctggtatccccagggctgagctggatcaatgtggagagccgatagttgggatggcatttagtgtgggaggaaagttcaggatacgtgaattacaacctctggaagggctttctcccttgtccctgaatagggcagcctttcagagactgttaaatcgtcacgcgaatcgtaatggggtgaggtatcatttcgagcacaaatgtcttgacgtcgacttggaaggcaagtccgtactgattcaaagcaaggacgggcaactacaaagactgcaaggtgatatggtaattggcgccgacggcgcacatagcgccgtaaggcaggcaatgcaaagtggtatgcgtaggttcgagttccaacagactttcttccgtcatggttataaaaccttagttctgccggatgccgaggctctgggttatagaaaagatttgttgtacttcttcggtatggattctggcggtctattcgcagggagagcagctaccatcccggacgggtcagtcagcatcgccgtgtgtctgccttatgaagggacgccctcccttgctacgcaggatagacaggcgatgaaagctttcttccaaaggtattttggttctctatcagacgcagttagggaggagatgttagagcaattcctagtgaaacccagcaacgacctaataaatgttaggtccagcaccttccactacaaagggaacgttttattgcttggcgatgccgcccatgccactgcgccatttttgggccagggaatgaacatggcgctggaagacgcccacagcttcgtgaccctacttgatcaacattgtcacgatcaggagctggcattcgctgagtttacagcccaacgtaaagtgcaagctgatgcaatgcaagacatggcgcgtgcaaattac

313
gatgtgttatcctgttcaaatcccatcttctttctgagggcgagatatactaggtacatgcacggaaaattcccggagctttatccaccagatatggcgcaaaagctatattttacgagtgaaccttacgacaaactacaaacaatacaaaagaaacagaacgtttggtacaagctaggcagggtaaac
VioD atgaagaagattttagttattggggctggacccgcgggtctggtgttcgcatcacagatgaagctagcgaaaccagattggcaaattagcatagctgagaagaacgatccggaggaggtcgctggttggggtgtagttttgccggggcgtcctggccagcatcctgccaaccctttgagctatttggagcatccggagaggcttgatccgcagttcctggaagacttcaaacttatacatcataacgaacctaacctgatgtctactggagtcctactttgcggggttgaacgtagggggcttgtccaggctctgcgtgagaggtgccagtctttggggatcgcgatccactacgagagcccattactagccagggaacaattacctcttgatgactatgacttaatagtagctgcaaacggggtgaatcataaaactagccacttcacggaagcgttggcaccgaaactggaatacgggggcaacaaatatatatggttcggtacctcacaactgtttgaccaaatgaacttggtatttaggacacacggaaaagatatattcatcgcgcacgcatataagtattcaagcagaatgagtacattcgttgtcgagtgttccgaagaaaccttcgagcgtgcaaggttaggtgagatgtctgacgaagctagtgccgagtacgtagccggggtcttcagggcggagcttggtggtcacgggctggtcgcacaacctgggcttgggtggcgtaatttcatgaccctttcacacgataagtcttacgacggaaagttagttttaatcggcgacgctctgcaaagcggacacttcagtattgggcatggcacaacgatggcagtggtggctgcccagcttctagtcaaagctctgtgcgctgaagccagcgtccctgccgctctagcctcatttgacgcgagagcgatgccattagtaaagctgttttccgagcacgcgaattccagccgtgattggttcgagacggtcgatgatagaatgcacctgtcaaacgcggaattcatgcagtccttcgacgcaagaaggaaagctttgcctcccttacccgaggcgttggcccgtaatctaggctacgccttagataga
VioE atggaaaatagagagcccccactgttaccagctcgttggtctagcgcatacgtgtcctattggtccccgatgctacccgacgaccagctgacatctggttattgctggtttgactatgaaagagatatatgcagaatcgatgggctatttaatccatggagcgaacgtgacaccgggtatcgtttatggatgagtgaggtaggtaatgccgcgtctggcaggacctggaaacaaaaggtagcatacggtagggagagaactgctcttggggagcagctgtgtgaacgtccactggacgatgaaactggcccgtttgctgaactttttttgccgagagatgttctgcgtagactaggcgcacgtcacataggacgtagagttgtattaggcagagaagccgatggatggaggtatcagaggccgggaaagggcccatccaccctatatttggacgcagcatcaggcacccccttgagaatggtgacgggagacgaggccagtcgtgcgagtctaagagactttcccaatgtgagtgaagcagagatacctgatgctgtgttcgctgccaagcgctaa
dCas9_VP64 atgtctagagccccaaagaagaagagaaaagttagacccggggataagaaatactctattggtttggctatcggtacaaactctgttggttgggctgttattactgatgaatacaaggttccatccaagaagttcaaggttttgggtaacactgatagacactccatcaaaaagaacttgattggtgccttgttgttcgattctggtgaaactgctgaagctactagattgaaaagaaccgctagaagaagatacaccagaagaaagaacagaatctgctacttgcaagaaatcttctccaacgaaatggccaaggttgatgattcattcttccacagattggaagaatccttcttggtcgaagaagataagaagcacgaaagacatccaatcttcggtaacatcgttgatgaagttgcttaccacgaaaagtacccaactatctaccatttgagaaagaagttggttgactctaccgataaggctgatttgagattgatctatttggctttggcccacatgattaagttcagaggtcatttcttgatcgaaggtgatttgaacccagataactccgatgttgataagttgttcatccaattagtccaaacctacaatcaattattcgaagaaaacccaatcaacgcctctggtgttgatgctaaagctattttgtctgccagattgtccaagtccagaagattagaaaatttgatcgcccaattaccaggtgaaaagaagaatggtttgttcggtaatttgattgccttgtctttgggtttgactccaaacttcaagtccaatttcgatttggctgaagatgccaagttgcaattatctaaggatacctacgatgacgatttggataacttgttggctcaaatcggtgatcaatacgctgatttgtttttggctgctaagaacttgtccgatgccattttgttgtccgatattttgagagtcaacaccgaaattactaaggctccattgtctgcctctatgatcaaaagatacgatgaacaccaccaagacttgactttgttgaaggctttggtcagacaacaattacctgaaaagtacaaagaaattttcttcgatcaatccaagaacggttacgccggttatattgatggtggtgcttctcaagaagaattttacaagttcatcaagccaatcttggaaaagatggacggtactgaagaattattggtcaagttgaacagagaagatttgttgagaaagcaaagaaccttcgacaacggttctattccacatcaaattcacttgggtgaattgcacgcaattttgagaagacaagaagatttttatccattcttgaaggacaacagagaaaagatcgaaaagattctgaccttcagaatcccttactacgttggtccattggctagaggtaattcaagatttgcctggatgactagaaagtccgaagaaactattactccttggaacttcgaagaagttgtagataagggtgcttctgcccaatcctttattgaaagaatgaccaacttcgacaagaacttgccaaacgaaaaggttttgccaaagcactctttgttgtacgaatacttcaccgtctacaacgaattgactaaggttaagtacgtcaccgaaggtatgagaaaaccagcttttttatccggtgaacaaaagaaggctatcgtcgatttgttgttcaagaccaacagaaaggttactgtcaagcaattaaaagaagattacttcaagaaaatcgaatgcttcgactccgttgaaatttctggtgtcgaagatagattcaatgcctctttaggtacttaccatgacttgttgaaaatcatcaaggacaaggatttcttggacaacgaagaaaacgaagatattttggaagatattgtcttgacattgaccttgtttgaagatagagaaatgattgaagaaagattgaaaacctacgcccacttgttcgatgataaggttatgaagcaattaaagagaagaagatacactggttggggtagattgtccagaaaattgattaacggtatcagagacaagcaatccggtaagaccattttggactttttgaagtctgatggtttcgctaacagaaacttcatgcaattaatccacgacgattccttgactttcaaagaagatatacaaaaggcccaagtctctggtcaaggtgattctttacatgaacatatcgctaacttggctggttctccagctattaagaagggtattttacaaaccgttaaggtcgttgacgaattggtcaaagttatgggtagacataagccagaaaacatcgttatcgaaatggctagagaaaatcaaaccacccaaaagggtcaaaagaactccagagaaagaatgaagagaatcgaagaaggtatcaaagaattgggttcccaaattttgaaagaacacccagttgaaaacacccaattacaaaacgaaaagttgtacttgtactacttgcaaaacggtagagatatgtacgttgaccaagaattggacatcaacagattgtctgattacgatgttgacgctatcgttccacaatcttttttgaaggatgactccattgacaacaaggtcttgactagatccgataagaatagaggtaagtccgataacgttccatctgaagaagtcgttaagaaaatgaagaactat

314
tggagacaattattgaacgccaagttgatcacccaaagaaagtttgacaatttgaccaaggctgaaagaggtggtttgtctgaattggataaggcaggtttcatcaaaagacaattagtagaaaccagacaaatcaccaagcacgttgctcaaattttggatagtagaatgaacactaagtacgacgaaaacgacaaattgatcagagaagttaaggtcattaccttgaagtccaagttggtttccgatttcagaaaggacttccaattctacaaggtcagagaaatcaacaactaccatcatgcacatgatgcttacttgaatgctgttgttggtactgccttgattaagaagtatccaaagttggaatccgaatttgtctacggtgattacaaggtttacgacgttagaaagatgatcgccaagtccgaacaagaaattggtaaagctactgccaaatacttcttctactccaatattatgaatttctttaagaccgaaatcactttggccaacggtgaaattagaaaaagaccattgattgaaactaatggtgaaacaggtgaaatcgtttgggataagggtagagattttgccactgttagaaaggtattgtccatgccacaagtaaacatcgtcaaaaagaccgaagttcaaactggtggtttctccaaagaatccattttgcctaagagaaactccgataagttgatcgctagaaaaaaagactgggacccaaaaaagtacggtggttttgattctccaactgttgcttactctgttttggttgttgctaaggtcgaaaagggtaagagtaagaagttgaagtccgtcaaagaattattaggtatcactatcatggaaagatcctcattcgaaaagaatcctatcgactttttggaagccaagggttacaaagaagtcaagaaggacttgatcattaagttgccaaagtacagtttgttcgaattggaaaatggtagaaagagaatgttggcttctgccggtgaattacaaaagggtaatgaattggctttgccatccaagtacgttaatttcttatacttggcctcccactacgaaaaattgaaaggttctcctgaagataacgaacaaaagcaattatttgtcgaacaacacaagcactacttggacgaaatcattgaacaaatttccgaattttccaaaagagtcattttggctgacgccaatttggacaaagttttgtcagcttacaacaagcacagagataagccaattagagaacaagctgaaaacatcattcacttgttcactttgactaacttgggtgctccagctgcttttaagtatttcgataccactatcgacagaaagagatacacctctaccaaagaagttttggacgctactttgatccaccaatctattactggtttgtacgaaactagaatcgacttgtctcaattaggtggtgatggttctggtagatctggagtcgacggtggaggttctgacgctttggacgacttcgacttggatatgctgggttctgatgcgctagatgactttgacctcgacatgcttggaagtgacgccttagatgattttgacctggatatgcttggatcagacgctctggacgatttcgacttagacatgctttcctaa
gRNA expression cassette
gagctcgggggatctgccaattgaacataacatggtagttacatatactagtaatatggttcggcacacattaaaagtataaaaactatctgaattacgaattacatatattggtcataaaaatcaatcaatcatcgtgtgttttatatgtctcttatctaagtataagaatatccatagttaatattcacttacgctaccttttaacctgtaatcattgtcaacaggatatgttaacgacccacattgataaacgctagtatttctttttcctcttcttattggccggctgtctctatactcccctatagtctgtttcttttcgtttcgattgttttacgtttgaggcctcgtggcgcacatggtacgctgtggtgctcgcggctgggaacgaaactctgggagctgcgattggcagaagcttNNNNNNNNNNNNNNNNNNNNgttttagagctagaaatagcaagttaaaataaggctagtccgttatcaacttgaaaaagtggcaccgagtcggtgcttttttctcgagccatatccaacttccaatttaatctttcttttttaattttcacttatttgcgatacagaaagaaaaaagcgatagtaactattgaattttgtttggatttggttagattagatatggtttctctttatatttacatgctaaaaatgggctacaccagagatacataattagatatatatacgccagtacaccttatcggcccaagccttgtcccaaggcagcgttttgttcttggaaacgctgccctacacgttcgctatgcttcaagaacttttctgagcacttcatgatgcatgtttgttccttattggttagctttgatgttgtgaagtcattgacacagtctgtgaaacatctttctaccagattagagtacaaacgcatgaaatccttcatttgcttttgttccactactttttggaactcttgttgttctttgg
Plasmid Name Description p4FP pRS416-tef1p-GFP-tef1t-pdc1p-sapphire-pdc1t-tpi1p-mCHerry-tpi1t-pgk1p-Venus-pgk1t
pTomato pRS416-eno2p-tdTomato-eno2t
pViolacein pRS416- tef1p-VioA-tef1t- pgk1p-VioB-pgk1t- eno2p-VioC-eno2t- tpi1p-VioD-cyc1t-pdc1p-VioE-pdc1t
pCas9 pRS413-gal1p-dCas9_VP64-cyc1t
pgRNA(n)* pRS425-rpr1p-gRNA-rpr1t
* All the gRNAs use the same structure except the 20bp targeting to different sites.

315
Table D.S2. Strains used in this study.
Name Phenotype Plasmid
TEF1p(H)
INVSc1: MATa his3D1 leu2 trp1-289 ura3-52
MAT his3D1 leu2 trp1-289 ura3-52
pViolacein, pCas9, pgRNA-TEF1p(H)
TEF1p(M) Same as INVSc1 pViolacein, pCas9, pgRNATEF1p(M) TEF1p(L) Same as INVSc1 pViolacein, pCas9, pgRNATEF1p(L) PDC1p(H) Same as INVSc1 pViolacein, pCas9, pgRNAPDC1p(H) PDC1p(M) Same as INVSc1 pViolacein, pCas9, pgRNAPDC1p(M) PDC1p(L) Same as INVSc1 pViolacein, pCas9, pgRNAPDC1p(L) TPI1p(M) Same as INVSc1 pViolacein, pCas9, pgRNATPI1p(M) TPI1p(L) Same as INVSc1 pViolacein, pCas9, pgRNATPI1p (L)
ENO2p(H) Same as INVSc1 pViolacein, pCas9, pgRNAENO2p(H) ENO2p(M) Same as INVSc1 pViolacein, pCas9, pgRNAENO2p(M) ENO2p(L) Same as INVSc1 pViolacein, pCas9, pgRNAENO2p(L)
ACD Same as INVSc1 pViolacein, pCas9, pgRNATEF1p(H)-gRNAENO2p(H)-
gRNATPI1p(L) CD Same as INVSc1 pViolacein, pCas9, pgRNAENO2p(H)-gRNATPI1p(L) AD Same as INVSc1 pViolacein, pCas9, pgRNATEF1p(H)-gRNATPI1p(L)

316
Table D.S3. Key parameters of guide RNAs used in this study for model training. TEF1p-GFP
ATAGCTTCAAAATGTTTCTACTCCTTTTTTACTCTTCCAGATTTTCTCGGACTCCGCGC ATCGCCGTACCACTTCAAAACACCCAAGCACAGCATACTAAATTTCCCCTCTTTCTTC CTCTAGGGTGTCGTTAATTACCCGTACTAAAGGTTTGGAAAAGAAAAAAGAGACCGC CTCGTTTCTTTTTCTTCGTCGAAAAAGGCAATAAAAATTTTTATCACGTTTCTTTTTCT G1 TGAAAATTTTTTTTTTTGATTTTTTTCTCTTTCGATGACCTCCCATTGATATTTAAGTTA ATAAACGGTCTTCAATTTCTCAAGTTTCAGTTTCATTTTTCTTGTTCTATTACAACTTTT G2 TTTACTTCTTGCTCATTAGAAAGAAAGCATAGCAATCTAATCTAAGTTTTAATTACAAA ATGTCTAAAGGTGAAGAATTATTCACTGGTGTTGTCCCAATTTTGGTTGAATTAGATG G3 G4 G5 G6 GTGATGTTAATGGTCACAAATTTTCTGTCTCCGGTGAAGGTGAAGGTGATGCTACTTA G7 G8 G9 G10 CGGTAAATTGACCTTAAAATTTATTTGTACTACTGGTAAATTGCCAGTTCCATGGCCAA G11 G12 G13 CCTTAGTCACTACTTTAACTTATGGTGTTCAATGTTTTTCTAGATACCCAGATCATATGA G14 AACAACATGACTTTTTCAAGTCTGCCATGCCAGAAGGTTATGTTCAAGAAAGAACTAT G15 TTTTTTCAAAGATGACGGTAACTACAAGACCAGAGCTGAAGTCAAGTTTGAAGGTGA G16 G17 TACCTTAGTTAATAGAATCGAATTAAAAGGTATTGATTTTAAAGAAGATGGTAACATTT G18 G19 TAGGTCACAAATTGGAATACAACTATAACTCTCACAATGTTTACATCATGGCTGACAA G20 G21 G22 ACAAAAGAATGGTATCAAAGTTAACTTCAAAATTAGACACAACATTGAAGATGGTTCT G23 G24 GTTCAATTAGCTGACCATTATCAACAAAATACTCCAATTGGTGATGGTCCAGTCTTGTT G25 ACCAGACAACCATTACTTATCCACTCAATCTGCCTTATCCAAAGATCCAAACGAAAAG AGAGACCACATGGTCTTGTTAGAATTTGTTACTGCTGCTGGTATTACCCATGGTATGGA G26 G27 G28 TGAATTGTACAAA
No. Location GC% ΔG AGG TGG CGG GGG #G #A Fold
change (log2)
G1 -213 0.3 -9.1 1 0 0 0 2 4 0.00
G2 -114 0.1 -7.3 0 0 1 0 2 9 -0.02
G3 9 0.15 -9.3 1 0 0 0 1 9 -3.38
G4 27 0.3 -12 0 1 0 0 4 9 -0.29
G5 44 0.45 -11 0 1 0 0 4 3 0.01
G6 57 0.3 -7.8 0 1 0 0 4 6 0.07
G7 69 0.3 -7 0 1 0 0 6 7 0.03
G8 90 0.4 -8.4 0 0 1 0 3 4 -0.24

317
G9 96 0.4 -9.5 1 0 0 0 4 4 -0.50
G10 102 0.55 -10.8 1 0 0 0 7 3 -1.54
G11 117 0.45 -8.8 0 0 1 0 7 5 -0.09
G12 150 0.15 -10.4 0 1 0 0 1 7 -0.15
G13 169 0.45 -12.9 0 1 0 0 4 5 -0.24
G14 198 0.25 -8.6 0 1 0 0 1 6 0.07
G15 270 0.5 -9.9 1 0 0 0 4 5 -0.01
G16 309 0.2 -8 0 0 1 0 2 7 -0.19
G17 345 0.4 -10 1 0 0 0 6 7 -0.35
G18 378 0.2 -7.1 1 0 0 0 3 10 -0.04
G19 399 0.25 -7.9 0 1 0 0 5 8 0.05
G20 411 0.25 -10.8 1 0 0 0 4 9 0.08
G21 422 0.25 -8.1 0 1 0 0 2 8 -0.97
G22 458 0.35 -7.1 0 1 0 0 1 6 0.08
G23 477 0.35 -7.6 0 1 0 0 4 11 -0.31
G24 519 0.3 -7 0 1 0 0 3 10 0.13
G25 564 0.25 -8.1 0 1 0 0 0 10 -0.21
G26 653 0.4 -7 0 1 0 0 4 12 -0.12
G27 681 0.35 -8.9 0 1 0 0 4 4 0.00
G28 693 0.5 -14.5 0 1 0 0 4 4 0.21
TPI1p-mCherry
TATATCTAGGAACCCATCAGGTTGGTGGAAGATTACCCGTTCTAAGACTTTTCAGCTTC M1 M2 CTCTATTGATGTTACACCTGGACACCCCTTTTCTGGCATCCAGTTTTTAATCTTCAGTG M3 M4 GCATGTGAGATTCTCCGAAATTAATTAAAGCAATCACACAATTCTCTCGGATACCACCT M5 CGGTTGAAACTGACAGGTGGTTTGTTACGCATGCTAATGCAAAGGAGCCTATATACCT M6 M7 M8 M9 TTGGCTCGGCTGCTGTAACAGGGAATATAAAGGGCAGCATAATTTAGGAGTTTAGTGA M10 M11 M12 M13 M14 ACTTGCAACATTTACTATTTTCCCTTCTTACGTAAATATTTTTCTTTTTAATTCTAAATCA ATCTTTTTCAATTTTTTGTTTGTATTCTTTTCTTGCTTAAATCTATAACTACAAAAAACA CATACATAAACTAAAAATGGTTAGCAAAGGCGAGGAAGATAACATGGCTATAATCAA M15 M16 AGAGTTTATGAGATTCAAAGTACACATGGAGGGTTCAGTGAATGGTCATGAATTTGAA M17 M18 M19 ATTGAAGGCGAAGGCGAGGGCAGACCTTACGAAGGAACTCAAACAGCAAAACTTAA M20 GGTAACAAAAGGTGGTCCTCTGCCATTCGCCTGGGACATTCTCAGTCCACAATTCATG M21 M22 M23 TACGGTTCTAAAGCGTACGTCAAACATCCAGCAGACATTCCAGATTACTTGAAATTGT M24 CTTTTCCAGAAGGCTTTAAGTGGGAAAGAGTTATGAACTTCGAGGATGGAGGGGTTG M25 M26 M27 TGACCGTTACGCAAGATTCCTCTTTACAAGATGGTGAGTTTATCTACAAGGTCAAATT

318
M28 AAGGGGGACTAATTTTCCTTCAGACGGGCCAGTCATGCAGAAAAAGACTATGGGATG M29M30 M31 M32 GGAAGCCTCTTCAGAGAGAATGTATCCTGAAGATGGCGCTCTAAAAGGAGAAATCAA M33 GCAAAGATTGAAGTTAAAGGACGGAGGTCATTATGATGCAGAAGTAAAAACAACCTA M34 M35 TAAAGCTAAAAAGCCAGTTCAACTTCCTGGTGCCTACAATGTTAACATCAAGCTAGAC ATTACATCCCATAATGAAGATTACACTATAGTGGAACAGTATGAACGTGCTGAAGGTA M36 GACACAGTACAGGTGGTATGGATGAACTGTACAAG M37 M38
No. Location GC% Energy AGG TGG CGG GGG #G #A Fold
change (log2)
M1 -408 0.45 -11.8 0 1 0 0 4 6 2.36
M2 -405 0.55 -14.5 0 1 0 0 6 5 2.31
M3 -353 0.4 -8.2 0 1 0 0 2 4 2.65
M4 -314 0.3 -7.4 0 1 0 0 2 5 2.60
M5 -265 0.35 -8.2 0 0 1 0 1 8 1.79
M6 -253 0.45 -8.6 0 0 1 0 2 5 1.15
M7 -239 0.55 -10.7 1 0 0 0 4 5 0.35
M8 -236 0.55 -10.5 0 1 0 0 6 5 0.76
M9 -211 0.4 -11.4 1 0 0 0 4 6 0.81
M10 -194 0.4 -14.2 0 1 0 0 3 7 1.93
M11 -189 0.45 -12.2 0 0 1 0 4 4 0.10
M12 -176 0.55 -11.1 1 0 0 0 6 2 0.20
M13 -165 0.35 -7.4 1 0 0 0 5 8 0.26
M14 -150 0.3 -9.6 1 0 0 0 4 8 0.92
M15 2 0.2 -7 0 1 0 0 0 13 0.05
M16 29 0.45 -7 0 1 0 0 6 10 0.22
M17 68 0.3 -7 0 1 0 0 3 9 -0.29
M18 71 0.4 -7.5 1 0 0 0 5 8 0.15
M19 84 0.5 -7.7 0 1 0 0 7 6 -1.14
M20 116 0.5 -10.7 1 0 0 0 8 7 -0.17
M21 165 0.3 -7.2 1 0 0 0 3 11 -0.02
M22 168 0.3 -8.7 0 1 0 0 4 11 0.08
M23 187 0.65 -10.8 0 1 0 0 5 1 0.68
M24 216 0.4 -7 0 0 1 0 2 6 0.67
M25 282 0.3 -8.6 1 0 0 0 3 5 0.28
M26 314 0.4 -8.3 1 0 0 0 6 7 0.03
M27 322 0.4 -11.3 0 0 0 1 6 6 -0.05
M28 377 0.35 -10.3 1 0 0 0 5 6 0.22
M29 388 0.25 -7.1 1 0 0 0 2 8 0.17
M30 389 0.25 -7 0 0 0 1 2 9 0.18
M31 411 0.4 -9.9 0 0 1 0 4 5 -0.60
M32 442 0.4 -7.3 0 1 0 0 6 9 -0.07

319
M33 477 0.4 -7.2 0 1 0 0 6 8 -0.11
M34 518 0.3 -7 1 0 0 0 4 10 0.43
M35 525 0.4 -7.6 1 0 0 0 7 8 0.02
M36 647 0.25 -7.1 0 1 0 0 3 9 0.34
M37 687 0.5 -7.1 0 1 0 0 7 8 0.54
M38 692 0.45 -8.6 0 1 0 0 6 7 0.41
PDC1p-Sapphire
CATGCGACTGGGTGAGCATATGTTCCGCTGATGTGATGTGCAAGATAAACAAGCAAG S1 GCAGAAACTAACTTCTTCTTCATGTAATAAACACACCCCGCGTTTATTTACCTATCTCT AAACTTCAACACCTTATATCATAACTAATATTTCTTGAGATAAGCACACTGCACCCATA CCTTCCTTAAAAACGTAGCTTCCAGTTTTTGGTGGTTCCGGCTTCCTTCCCGATTCCG S2 S3 S4 CCCGCTAAACGCATATTTTTGTTGCCTGGTGGCATTTGCAAAATGCATAACCTATGCAT S5 S6 TTAAAAGATTATGTATGCTCTTCTGACTTTTCGTGTGATGAGGCTCGTGGAAAAAATG S7 S8 AATAATTTATGAATTTGAGAACAATTTTGTGTTGTTACGGTATTTTACTATGGAATAATC S9 S10 AATCAATTGAGGATTTTATGCAAATATCGTTTGAATATTTTTCCGACCCTTTGAGTACTT S11 TTCTTCATAATTGCATAATATTGTCCGCTGCCCCTTTTTCTGTTAGACGGTGTCTTGATC S12 TACTTGCTATCGTTCAACACCACCTTATTTTCTAACTATTTTTTTTTTAGCTCATTTGAAT CAGCTTATGGTGATGGCACATTTTTGCATAAACCTAGCTGTCCTCGTTGAACATAGGA S13 S14 AAAAAAAATATATAAACAAGGCTCTTTCACTCTCCTTGCAATCAGATTTGGGTTTGTTC S15 CCTTTATTTTCATATTTCTTGTCATATTCCTTTCTCAATTATTATTTTCTACTCATAACCTC ACGCAAAATAACACAGTCAAATCAATCAAAATGTCTAAAGGTGAAGAATTATTCACTG S16 GTGTTGTCCCAATTTTGGTTGAATTAGATGGTGATGTTAATGGTCACAAATTTTCTGTC S17 S18 TCCGGTGAAGGTGAAGGTGATGCTACTTACGGTAAATTGACCTTAAAATTTATTTGTA S19 S20 S21 S22 CTACTGGTAAATTGCCAGTTCCATGGCCAACCTTAGTCACTACTTTTTCTTATGGTGTT S23 S24 S25 ATGGTTTTTGCTAGATACCCAGATCATATGAAACAACATGACTTTTTCAAGTCTGCCAT GCCAGAAGGTTATGTTCAAGAAAGAACTATTTTTTTCAAAGATGACGGTAACTACAA S26 S27 GACCAGAGCTGAAGTCAAGTTTGAAGGTGATACCTTAGTTAATAGAATCGAATTAAAA S28 S29 GGTATTGATTTTAAAGAAGATGGTAACATTTTAGGTCACAAATTGGAATACAACTTTAA S30 S31 S32 CTCTCACAATGTTTACATCATGGCTGACAAACAAAAGAATGGTATCAAAGCTAACTTC S33 S34 AAAATTAGACACAACATTGAAGATGGTGGTGTTCAATTAGCTGACCATTATCAACAAA

320
S35 ATACTCCAATTGGTGATGGTCCAGTCTTGTTACCAGACAACCATTACTTATCCATTCAA S36 TCTGCCTTATCCAAAGATCCAAACGAAAAGAGAGACCACATGGTCTTGTTAGAATTTG TTACTGCTGCTGGTATTACCCATGGTATGGATGAATTGTACAAA S37 S38
No. Location GC% Energy AGG TGG CGG GGG #G #A Fold
change (log2)
S1 -745 0.35 -8.4 1 0 0 0 4 10 -0.35
S2 -596 0.35 -10.1 0 1 0 0 3 6 -0.02
S3 -593 0.45 -11.2 0 1 0 0 5 3 -0.29
S4 -587 0.45 -10.7 0 0 1 0 5 1 0.15
S5 -541 0.35 -8.3 0 1 0 0 3 5 0.03
S6 -538 0.45 -10.4 0 1 0 0 5 2 -0.78
S7 -468 0.4 -8.3 1 0 0 0 5 2 -1.39
S8 -461 0.5 -9.6 0 1 0 0 7 2 -1.29
S9 -413 0.25 -11.6 0 0 1 0 4 6 -1.42
S10 -400 0.3 -8.5 0 1 0 0 4 4 -0.40
S11 -381 0.25 -7.1 1 0 0 0 3 9 -0.08
S12 -283 0.45 -9.2 0 0 1 0 3 2 -0.18
S13 -202 0.35 -10.1 0 1 0 0 3 6 1.13
S14 -196 0.35 -10 0 1 0 0 5 5 -0.02
S15 -103 0.4 -9 0 1 0 0 2 5 -0.02
S16 27 0.3 -12 0 1 0 0 4 9 -2.35
S17 57 0.3 -7.8 0 1 0 0 4 6 -2.40
S18 69 0.3 -7 0 1 0 0 6 7 -1.60
S19 90 0.4 -8.4 0 0 1 0 3 4 -1.40
S20 96 0.4 -9.5 1 0 0 0 4 4 -2.35
S21 102 0.55 -10.8 1 0 0 0 7 3 -1.45
S22 117 0.45 -8.8 0 0 1 0 7 5 -2.60
S23 150 0.15 -10.4 0 1 0 0 1 7 -1.45
S24 169 0.45 -12.9 0 1 0 0 4 5 -0.97
S25 198 0.25 -8.2 0 1 0 0 1 4 -0.71
S26 270 0.5 -9.9 1 0 0 0 4 5 -2.47
S27 309 0.2 -8 0 0 1 0 2 7 -0.82
S28 345 0.4 -10 1 0 0 0 6 7 -1.29
S29 378 0.2 -7.1 1 0 0 0 3 10 -0.76
S30 399 0.25 -7.9 0 1 0 0 5 8 -0.40
S31 411 0.25 -10.8 1 0 0 0 4 9 -0.65
S32 422 0.25 -8.1 0 1 0 0 2 8 -0.40
S33 458 0.35 -7.1 0 1 0 0 1 6 -0.82
S34 477 0.35 -7.6 0 1 0 0 4 11 -1.40
S35 519 0.3 -7 0 1 0 0 3 10 -0.06
S36 564 0.25 -8.1 0 1 0 0 0 10 -2.35

321
S37 681 0.35 -8.9 0 1 0 0 4 4 -2.17
S38 693 0.5 -14.5 0 1 0 0 4 4 -2.40
PGK1p-Venus
TCAGGCATGAACGCATCACAGACAAAATCTTCTTGACAAACGTCACAATTGATCCCTC CCCATCCGTTATCACAATGACAGGTGTCATTTTGTGCTCTTATGGGACGATCCTTATTA V1V2 CCGCTTTCATCCGGTGATAGACCGCCACAGAGGGGCAGAGAGCAATCATCACCTGCA V3 V4 V5 AACCCTTCTATACACTCACATCTACCAGTGTACGAATTGCATTCAGAAAACTGTTTGC ATTCAAAAATAGGTAGCATACAATTAAAACATGGCGGGCACGTATCATTGCCCTTATCT V6 V7 TGTGCAGTTAGACGCGAATTTTTCGAAGAAGTACCTTCAAAGAATGGGGTCTCATCTT V8 GTTTTGCAAGTACCACTGAGCAGGATAATAATAGAAATGATAATATACTATAGTAGAGA V9 TAACGTCGATGACTTCCCATACTGTAATTGCTTTTAGTTGTGTATTTTTAGTGTGCAAG TTTCTGTAAATCGATTAATTTTTTTTTCTTTCCTCTTTTTATTAACCTTAATTTTTATTTTA GATTCCTGACTTCAACTCAAGACGCACAGATATTATAACATCTGCACAATAGGCATTTG CAAGAATTACTCGTGAGTAAGGAAAGAGTGAGGAACTATCGCATACCTGCATTTAAA GATGCCGATTTGGGCGCGAATCCTTTATTTTGGCTTCACCCTCATACTATTATCAGGGC V10 V11 CAGAAAAAGGAAGTGTTTCCCTCCTTCTTGAATTGATGTTACCCTCATAAAGCACGTG V12 GCCTCTTATCGAGAAAGAAATTACCGTCGCTCGTGATTTGTTTGCAAAAAGAACAAA ACTGAAAAAACCCAGACACGCTCGACTTCCTGTCTTCCTATTGATTGCAGCTTCCAAT TTCGTCACACAACAGGGTCCTAGCGACGGCTCACAGGTTTTGTAACAAGCAATCGAA V13 V14 V15 GGTTCTGGAATGGCGGGAAAGGGTTTAGTACCACATGCTATGATGCCCACTGTGATCT V16 V17 CCAGAGCAAAGTTCGTTCGATCGTACTGTTACTCTCTCTCTTTCAAACAGAATTGTCC GAATCGTGTGACAACAACAGCCTGTTCTCACACACTCTTTTCTTCTAACCAAGGGGG V18 V19 TGGTTTAGTTTAGTAGAACCTCGTGAAACTTACATTTACATATATATAAACTTGCATAAA TTGGTCAATGCAAGAAATACATATTTGGTCTTTTCTAATTCGTAGTTTTTCAAGTTCTTA V20 GATGCTTTCTTTTTCTCTTTTTTACAGATCATCAAGGAAGTAATTATCTACTTTTTACAA V21 CAAATATAAAACAATGTCTAAAGGTGAAGAATTATTCACTGGTGTTGTCCCAATTTTG V22 V23 GTTGAATTAGATGGTGATGTTAATGGTCACAAATTTTCTGTCTCCGGTGAAGGTGAA V24 V25 V26 V27 GGTGATGCTACTTACGGTAAATTGACCTTAAAATTGATTTGTACTACTGGTAAATTGCC V28

322
AGTTCCATGGCCAACCTTAGTCACTACTTTAGGTTATGGTTTGCAATGTTTTGCTAGAT V29 V30 ACCCAGATCATATGAAACAACATGACTTTTTCAAGTCTGCCATGCCAGAAGGTTATGT V31 TCAAGAAAGAACTATTTTTTTCAAAGATGACGGTAACTACAAGACCAGAGCTGAAGT V32 CAAGTTTGAAGGTGATACCTTAGTTAATAGAATCGAATTAAAAGGTATTGATTTTAAAG V33 AAGATGGTAACATTTTAGGTCACAAATTGGAATACAACTATAACTCTCACAATGTTTAC V34 ATCACTGCTGACAAACAAAAGAATGGTATCAAAGCTAACTTCAAAATTAGACACAAC ATTGAAGATGGTGGTGTTCAATTAGCTGACCATTATCAACAAAATACTCCAATTGGTG ATGGTCCAGTCTTGTTACCAGACAACCATTACTTATCCTATCAATCTGCCTTATCCAAA GATCCAAACGAAAAGAGAGACCACATGGTCTTGTTAGAATTTGTTACTGCTGCTGGTA TTACCCATGGTATGGATGAATTGTACAAA
No. Location GC% Energy AGG TGG CGG GGG #G #A Fold
change (log2)
V1 -1200 0.4 -13.6 0 1 0 0 5 2 0.18
V2 -1199 0.35 -13.9 0 0 0 1 4 2 0.42
V3 -1172 0.4 -12.6 0 0 1 0 1 3 0.11
V4 -1152 0.6 -12.3 0 0 0 1 6 6 0.07
V5 -1151 0.6 -12.1 0 0 0 1 7 6 0.60
V6 -1037 0.3 -7 0 1 0 0 3 10 0.05
V7 -1034 0.3 -7.9 0 0 1 0 3 10 0.24
V8 -965 0.35 -10.2 0 1 0 0 4 10 0.15
V9 -930 0.45 -8.9 1 0 0 0 4 5 0.22
V10 -645 0.35 -12.7 0 1 0 0 4 6 0.82
V11 -601 0.35 -7.7 1 0 0 0 0 5 0.27
V12 -589 0.4 -7 1 0 0 0 4 8 0.40
V13 -409 0.4 -7 1 0 0 0 1 7 0.01
V14 -397 0.5 -7 0 0 1 0 4 8 0.61
V15 -389 0.65 -10.3 1 0 0 0 6 4 0.51
V16 -356 0.45 -8.5 0 1 0 0 6 7 0.68
V17 -353 0.45 -9.6 0 0 1 0 7 6 0.63
V18 -199 0.35 -8.7 1 0 0 0 0 5 1.33
V19 -196 0.4 -9 0 0 0 1 2 4 0.51
V20 -132 0.15 -8.2 0 1 0 0 1 10 0.24
V21 -39 0.3 -7.1 1 0 0 0 1 5 1.71
V22 27 0.3 -12 0 1 0 0 4 9 -0.29
V23 44 0.45 -11 0 1 0 0 4 3 0.10
V24 57 0.3 -7.8 0 1 0 0 4 6 -1.82
V25 69 0.3 -7 0 1 0 0 6 7 -1.21
V26 90 0.4 -8.4 0 0 1 0 3 4 -0.17
V27 96 0.4 -9.5 1 0 0 0 4 4 0.21

323
V28 150 0.2 -8.6 0 1 0 0 2 7 -0.06
V29 192 0.4 -11.1 1 0 0 0 1 5 -1.66
V30 198 0.3 -7 0 1 0 0 3 5 -0.09
V31 270 0.5 -9.9 1 0 0 0 4 5 -0.27
V32 309 0.2 -8 0 0 1 0 2 7 0.09
V33 378 0.2 -7.1 1 0 0 0 3 10 -0.13
V34 399 0.25 -7.9 0 1 0 0 5 8 -0.49
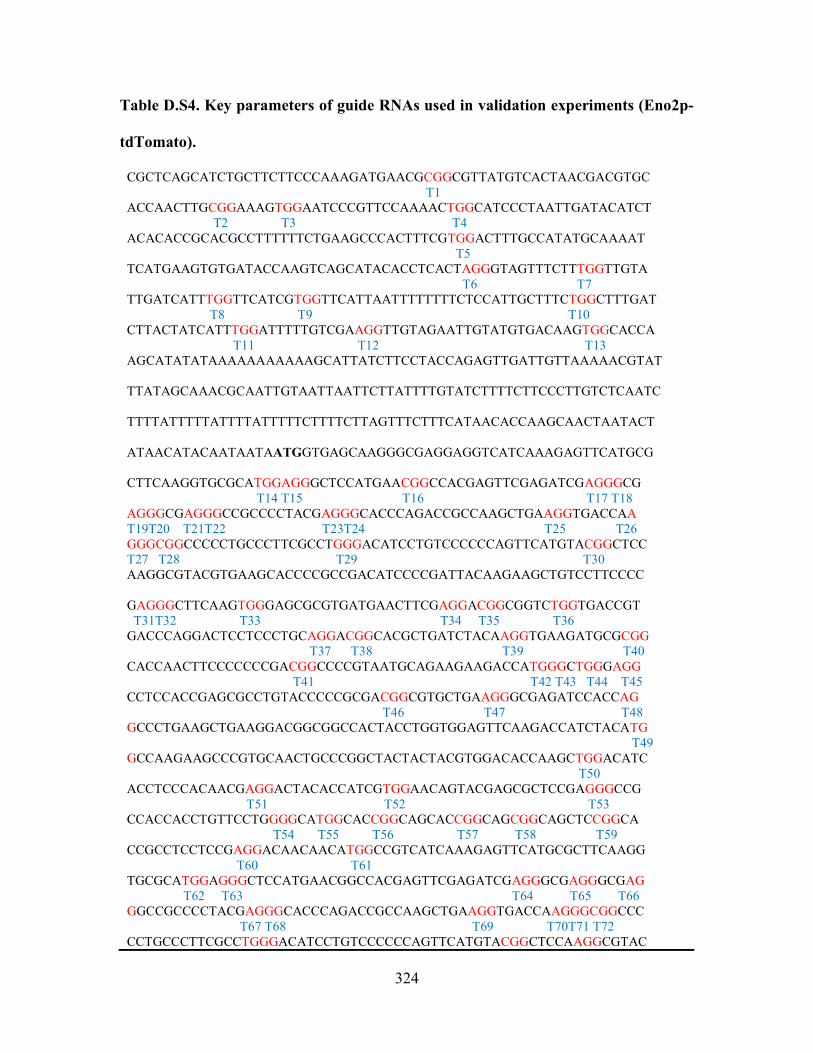
324
Table D.S4. Key parameters of guide RNAs used in validation experiments (Eno2p-
tdTomato).
CGCTCAGCATCTGCTTCTTCCCAAAGATGAACGCGGCGTTATGTCACTAACGACGTGC T1 ACCAACTTGCGGAAAGTGGAATCCCGTTCCAAAACTGGCATCCCTAATTGATACATCT T2 T3 T4 ACACACCGCACGCCTTTTTTCTGAAGCCCACTTTCGTGGACTTTGCCATATGCAAAAT T5 TCATGAAGTGTGATACCAAGTCAGCATACACCTCACTAGGGTAGTTTCTTTGGTTGTA T6 T7 TTGATCATTTGGTTCATCGTGGTTCATTAATTTTTTTTCTCCATTGCTTTCTGGCTTTGAT T8 T9 T10 CTTACTATCATTTGGATTTTTGTCGAAGGTTGTAGAATTGTATGTGACAAGTGGCACCA T11 T12 T13 AGCATATATAAAAAAAAAAAGCATTATCTTCCTACCAGAGTTGATTGTTAAAAACGTAT TTATAGCAAACGCAATTGTAATTAATTCTTATTTTGTATCTTTTCTTCCCTTGTCTCAATC TTTTATTTTTATTTTATTTTTCTTTTCTTAGTTTCTTTCATAACACCAAGCAACTAATACT ATAACATACAATAATAATGGTGAGCAAGGGCGAGGAGGTCATCAAAGAGTTCATGCG CTTCAAGGTGCGCATGGAGGGCTCCATGAACGGCCACGAGTTCGAGATCGAGGGCG T14 T15 T16 T17 T18 AGGGCGAGGGCCGCCCCTACGAGGGCACCCAGACCGCCAAGCTGAAGGTGACCAA T19T20 T21T22 T23T24 T25 T26 GGGCGGCCCCCTGCCCTTCGCCTGGGACATCCTGTCCCCCCAGTTCATGTACGGCTCC T27 T28 T29 T30 AAGGCGTACGTGAAGCACCCCGCCGACATCCCCGATTACAAGAAGCTGTCCTTCCCC GAGGGCTTCAAGTGGGAGCGCGTGATGAACTTCGAGGACGGCGGTCTGGTGACCGT T31T32 T33 T34 T35 T36 GACCCAGGACTCCTCCCTGCAGGACGGCACGCTGATCTACAAGGTGAAGATGCGCGG T37 T38 T39 T40 CACCAACTTCCCCCCCGACGGCCCCGTAATGCAGAAGAAGACCATGGGCTGGGAGG T41 T42 T43 T44 T45 CCTCCACCGAGCGCCTGTACCCCCGCGACGGCGTGCTGAAGGGCGAGATCCACCAG T46 T47 T48 GCCCTGAAGCTGAAGGACGGCGGCCACTACCTGGTGGAGTTCAAGACCATCTACATG T49 GCCAAGAAGCCCGTGCAACTGCCCGGCTACTACTACGTGGACACCAAGCTGGACATC T50 ACCTCCCACAACGAGGACTACACCATCGTGGAACAGTACGAGCGCTCCGAGGGCCG T51 T52 T53 CCACCACCTGTTCCTGGGGCATGGCACCGGCAGCACCGGCAGCGGCAGCTCCGGCA T54 T55 T56 T57 T58 T59 CCGCCTCCTCCGAGGACAACAACATGGCCGTCATCAAAGAGTTCATGCGCTTCAAGG T60 T61 TGCGCATGGAGGGCTCCATGAACGGCCACGAGTTCGAGATCGAGGGCGAGGGCGAG T62 T63 T64 T65 T66 GGCCGCCCCTACGAGGGCACCCAGACCGCCAAGCTGAAGGTGACCAAGGGCGGCCC T67 T68 T69 T70T71 T72 CCTGCCCTTCGCCTGGGACATCCTGTCCCCCCAGTTCATGTACGGCTCCAAGGCGTAC

325
T73T74 T75 T76 GTGAAGCACCCCGCCGACATCCCCGATTACAAGAAGCTGTCCTTCCCCGAGGGCTTC T77T78 AAGTGGGAGCGCGTGATGAACTTCGAGGACGGCGGTCTGGTGACCGTGACCCAGGA T79T80 T81 T82 T83 T84 T85 CTCCTCCCTGCAGGACGGCACGCTGATCTACAAGGTGAAGATGCGCGGCACCAACTT T86 CCCCCCCGACGGCCCCGTAATGCAGAAGAAGACCATGGGCTGGGAGGCCTCCACCG T87 T88 T89 AGCGCCTGTACCCCCGCGACGGCGTGCTGAAGGGCGAGATCCACCAGGCCCTGAAG T90T91 T92 CTGAAGGACGGCGGCCACTACCTGGTGGAGTTCAAGACCATCTACATGGCCAAGAAG T93 T94 T95 T96 CCCGTGCAACTGCCCGGCTACTACTACGTGGACACCAAGCTGGACATCACCTCCCAC T97 AACGAGGACTACACCATCGTGGAACAGTACGAGCGCTCCGAGGGCCGCCACCACCT T98 T99 GTTCCTGTACGGCATGGACGAGCTGTACAAG
No. Location GC% Energy AGG TGG CGG GGG #G #A Fold
change (log2)
T1 -516 0.45 -7.9 0 0 1 0 3 6 -1.81
T2 -482 0.5 -8.6 0 0 1 0 4 6 0.59
T3 -475 0.55 -9.8 0 1 0 0 6 6 -1.79
T4 -456 0.5 -11.7 0 1 0 0 4 6 -1.85
T5 -397 0.45 -14.3 0 1 0 0 3 3 -1.86
T6 -338 0.45 -7.9 1 0 0 0 2 7 -1.67
T7 -325 0.45 -12.8 0 1 0 0 4 3 -1.53
T8 -308 0.3 -11.2 0 1 0 0 4 3 0.10
T9 -298 0.35 -7.8 0 1 0 0 4 4 -0.97
T10 -266 0.3 -7 0 1 0 0 1 1 -1.12
T11 -244 0.3 -10 0 1 0 0 2 4 -0.15
T12 -230 0.3 -8 1 0 0 0 4 4 -1.94
T13 -205 0.35 -8.4 0 1 0 0 6 7 -1.72
T14 56 0.6 -15.8 0 1 0 0 6 4 -1.41
T15 59 0.65 -14.4 1 0 0 0 8 3 -1.62
T16 72 0.6 -14.9 0 0 1 0 7 5 -1.43
T17 92 0.65 -9.7 1 0 0 0 7 4 -2.29
T18 93 0.6 -9.3 0 0 0 1 7 5 -1.36
T19 98 0.65 -12.7 1 0 0 0 9 4 -1.94
T20 99 0.6 -10.6 0 0 0 1 9 5 -1.90
T21 104 0.75 -10.8 1 0 0 0 11 4 -2.27
T22 105 0.7 -8.7 0 0 0 1 11 5 -1.79
T23 119 0.85 -16.2 1 0 0 0 9 2 -2.11
T24 120 0.8 -12.8 0 0 0 1 8 3 -1.98
T25 143 0.65 -8.3 1 0 0 0 4 6 -2.41
T26 152 0.6 -11.2 1 0 0 0 6 6 -2.15
T27 153 0.55 -10.2 0 0 0 1 6 7 -1.74
T28 156 0.55 -9.5 0 0 1 0 8 7 -1.25

326
T29 176 0.8 -10.9 0 0 0 1 4 0 -1.65
T30 204 0.55 -7.4 0 0 1 0 3 3 -2.16
T31 269 0.6 -9.8 1 0 0 0 4 4 -2.20
T32 270 0.55 -10.1 0 0 0 1 4 5 -2.19
T33 280 0.65 -11.1 0 1 0 0 5 3 -1.77
T34 302 0.6 -8.8 1 0 0 0 8 4 0.10
T35 306 0.55 -9.3 0 0 1 0 7 5 -0.13
T36 314 0.65 -11.8 0 1 0 0 8 4 -2.07
T37 344 0.7 -11.5 1 0 0 0 4 3 -1.39
T38 348 0.65 -14.4 0 0 1 0 5 4 -0.44
T39 365 0.6 -8.9 1 0 0 0 6 5 -0.28
T40 378 0.45 -8.7 0 0 1 0 6 7 -0.12
T41 399 0.7 -8.6 0 0 1 0 3 4 0.33
T42 425 0.45 -7 0 1 0 0 5 9 -0.42
T43 426 0.4 -9.7 0 0 0 1 5 9 0.68
T44 430 0.55 -7 0 1 0 0 7 7 0.70
T45 434 0.6 -9 1 0 0 0 9 6 -0.60
T46 465 0.75 -8.9 0 0 1 0 6 3 -1.75
T47 476 0.8 -11 1 0 0 0 7 2 0.68
T48 491 0.65 -10.4 1 0 0 0 7 5 -0.65
T49 548 0.45 -7 0 1 0 0 4 7 0.24
T50 599 0.55 -7.8 0 1 0 0 4 6 -1.09
T51 620 0.6 -7.9 1 0 0 0 3 6 -0.55
T52 635 0.55 -8.2 0 1 0 0 4 7 -0.77
T53 657 0.6 -8.4 0 0 0 1 6 6 -0.34
T54 679 0.7 -10.1 0 0 0 1 4 2 -2.56
T55 684 0.65 -10.3 0 1 0 0 5 3 -2.05
T56 690 0.65 -9.5 0 0 1 0 7 2 -2.33
T57 699 0.75 -9.7 0 0 1 0 8 4 -2.55
T58 705 0.8 -12.5 0 0 1 0 8 4 -2.74
T59 714 0.75 -12 0 0 1 0 7 4 -2.49
T60 731 0.8 -11 1 0 0 0 4 1 -2.14
T61 743 0.55 -9.7 0 1 0 0 3 7 -2.25
T62 782 0.6 -15.8 0 1 0 0 6 4 -2.48
T63 786 0.6 -9.6 0 0 0 1 7 4 -2.37
T64 818 0.65 -9.7 1 0 0 0 7 4 -2.37
T65 824 0.65 -12.7 1 0 0 0 9 4 -2.10
T66 830 0.75 -10.8 1 0 0 0 11 4 -1.65
T67 845 0.85 -16.2 1 0 0 0 9 2 -0.04
T68 846 0.8 -12.8 0 0 0 1 8 3 -0.17
T69 869 0.65 -8.3 1 0 0 0 4 6 0.03
T70 878 0.6 -11.2 1 0 0 0 6 6 -0.30
T71 879 0.55 -10.2 0 0 0 1 6 7 -0.98
T72 882 0.55 -9.5 0 0 1 0 8 7 -0.08
T73 901 0.85 -10.6 0 1 0 0 5 0 -0.07

327
T74 902 0.8 -10.9 0 0 0 1 4 0 -1.79
T75 930 0.55 -7.4 0 0 1 0 3 3 0.18
T76 938 0.55 -7.4 1 0 0 0 4 4 0.29
T77 995 0.6 -9.8 1 0 0 0 4 4 -1.08
T78 996 0.55 -10.1 0 0 0 1 4 5 0.01
T79 1006 0.65 -11.1 0 1 0 0 5 3 0.03
T80 1007 0.6 -9.4 0 0 0 1 5 3 -0.37
T81 1028 0.6 -8.8 1 0 0 0 8 4 -0.06
T82 1032 0.55 -9.3 0 0 1 0 7 5 0.16
T83 1035 0.55 -8.1 0 0 1 0 8 5 0.26
T84 1040 0.65 -11.8 0 1 0 0 8 4 0.10
T85 1055 0.7 -14.3 1 0 0 0 7 2 -0.90
T86 1074 0.65 -14.4 0 0 1 0 5 4 -0.36
T87 1125 0.7 -8.6 0 0 1 0 3 4 -0.38
T88 1157 0.55 -7.9 0 0 0 1 7 7 0.30
T89 1160 0.6 -9 1 0 0 0 9 6 0.35
T90 1202 0.8 -11 1 0 0 0 7 2 -0.29
T91 1203 0.75 -10.2 0 0 0 1 7 3 -0.15
T92 1217 0.65 -10.4 1 0 0 0 7 5 -0.20
T93 1232 0.65 -9.5 1 0 0 0 5 5 -0.32
T94 1236 0.6 -12.1 0 0 1 0 7 6 -0.28
T95 1239 0.65 -11.7 0 0 1 0 8 5 0.14
T96 1250 0.7 -10.8 0 1 0 0 7 5 -0.01
T97 1325 0.55 -7.8 0 1 0 0 4 6 -2.05
T98 1346 0.6 -7.9 1 0 0 0 3 6 -1.95
T99 1361 0.55 -8.2 0 1 0 0 4 7 -1.96

328
Table D.S5. Binary regression decision tree model.

329
Cont. Table D.S5. Binary regression decision tree model.

330
Table D.S6. Measured and predicted concentrations of products from violacein pathway
Strains Measured concentrations (A.U.) Predicted concentrations (A.U.)
PV PDV V DV PV PDV V DV
TEF1p(H) 472.00 216.30 229.70 22.90 481.83 219.39 220.37 27.13
TEF1p(M) 392.70 206.80 294.00 32.30 422.47 191.06 191.92 24.63
TEF1p(L) 345.70 138.30 177.00 16.30 356.13 159.59 160.32 21.71
PDC1p(H) 408.30 188.60 222.50 23.50 835.91 390.75 392.48 40.50
PDC1p(M) 297.30 142.80 168.70 2.10 417.21 188.55 189.41 24.41
PDC1p(L) 55.10 40.70 60.70 0.10 85.92 35.23 35.40 7.36
TPI1p(M) 270.00 134.20 120.70 14.20 537.68 102.32 200.50 25.40
TPI1p(L) 342.20 120.00 132.90 15.90 239.27 400.73 200.50 25.40
ENO2p(H) 375.20 168.60 147.10 17.40 357.22 192.65 283.68 32.35
ENO2p(M) 337.80 156.20 199.20 19.90 425.71 198.31 215.19 26.69
ENO2p(L) 455.60 231.70 74.30 24.70 598.05 216.54 42.85 8.46
ACD 235.15 161.80 251.65 34.20 57.17 363.64 295.96 36.48
CD 219.75 149.10 245.45 28.10 57.17 297.88 295.96 36.48
AD 251.95 286.35 81.10 23.40 202.19 377.62 150.95 22.50
Note: PV: Proviolacein, PDV: Prodeoxyviolacein, V: Violacein, DV: Deoxyviolacein

331
Appendix E: Supplementary Material of Chapter 6.1
Table E.S1. Primers used in this study.
Name Primer sequence XF_FP_csXR_ADH1t ATGAGCCCAAGCCCAATTCC
XF_FP_ctXDH_CYC1t ATGACTGCAAACCCATCATT
XF_FP_ppXKS_ADH2t ATGGTTACCAAAGAAATCCA
XF_RP_csXR_ADH1t GCATGCCGGTAGAGGTGTGG
XF_RP_ctXDH_CYC1t GCAAATTAAAGCCTTCGAGC
XF_RP_ppXKS_ADH2t CTCACTAAAGGGAACAAAAGCTGGAGCTCCACCGCGGTGGAGCTACTAATAGGATAAATT
XF_FP_PDC1p AACGACGGCCAGTGAGCGCGCGTAATACGACTCACTATAGCATGCGACTGGGTGAGCATA
XF_FP_TEF1p CATGAGGTCGCTCTTATTGACCACACCTCTACCGGCATGCATAGCTTCAAAATGTTTCTA
XF_FP_ENO2p GCTTGAGAAGGTTTTGGGACGCTCGAAGGCTTTAATTTGCGTGTCGACGCTGCGGGTATA
XF_RP_PDC1p CGTTGTTCAACTTGAAAGCTGGAATTGGGCTTGGGCTCATTTTGATTGATTTGACTGTGT
XF_RP_TEF1p CGTCAACTTTGTTAAGAACTAATGATGGGTTTGCAGTCATTTTGTAATTAAAACTTAGAT
XF_RP_ENO2p TCATTGCTGAATTTCTATCTTGGATTTCTTTGGTAACCATTATTATTGTATGTTATAGTA

332
Table E.S2. Promoters used in this study
Name Promoter Strength
Promoter sequence
TEF1p(H) Strong ATAGCTTCAAAATGTTTCTACTCCTTTTTTACTCTTCCGGATTTTCTCGGACTCCGCGCATCGCCGTACCACCTCAAAACACCCAAGCACAGCATACTCAATTCCCCCTCTTTCTTCCTCTAGGGTGTCGTTAATTACCCGTACTAAAGGTTTGGAAAAGAAGAAAGAGACCGCCTCGTCTCTCTTTCTTCGTCGAAAAAGGCAATAAAAATTTTTATTACGTTTCTTTTTCTTGAAAATTTTCTTTTTTGATTTTTCTCTCTTTCGATGACCTCCCATTGATATTTAAGTCATTAAATGGTCTTCAATTTCTCAAGTTTCAGTTTCATTTTTCTTATTCTATTACGACTCTTTTTACCTCTTGCTCATTAGAAAGAAAGCATAGCAATCTAATCTAAGTTTTAATTACAAA
TEF1p(M) Medium ATAGCTTCAAAATGTTTCTACTCCTTTTTTACTCTTCCAGATTTTCTCGGACTCCGCGCACCGCCGTACCACTTCAAAACACCCAAGCACAGCATACTAAATTCCCCCTCTTTCTTCCTCTAGGGTGTCGTTAATTACCCGTACTAAAGGTTTGGAAAAGAAAAAAGAGACCGCCTCGTTTCTTTTTCTTCGTCGAAGAAGGCAATAAAAATTTTTATCACGTTTCGTTTTCTTGAAAACTTTTCTTTTTGATTCTTTTCTCTTTCGATGACCTCCCATTGATATTTAAGTTATTAGATGGTCTTCAATTTCTCAAGTTTCAGCTCCATTTTTCTTGTTCTATTACAACTTTTTTTACTTCTTGCTCATTAGAAAGAAAGCATAGCAATCTAATCTAAGTTTTAATTACAAA
TEF1p(L) Low ATAGCTTCAAAATGTTTCTACTCCTTTTTTACTCCTCCAGACTTCCTCGGACTCCGCGCATCGCCGTACCACTTCAAAACACCCAAGCACAGCATACTAAATTCCCCCTCTTTCTTCCTCTAGGGTGTCGTTAATTACCCGTACTAAAGGTTTGGAAAAGAAAAAAGAGACCGCCTCGTTTCTTTTCCTTCGTCGAAAAAGGCAATAGAAATTTTTATCACGTTTTTCCTTCTTGAAAATCTTTTTTTTTGATTTTTTTCTCTTTCGATGACCTCCCATTGACATTTAAGTTATTAAATGGTCTTCAATTTCTCAAGTTTCAGTTTCATTTTTCTTGTTCTATTACAACTTTTTTTACTTCTTGCTCATTAGAAAGAAAGCATAGCAATCTAATCTAAGTTTTAATTACAAA
TEF1p* (Mutated) ATAGCTTCAAAATGTTTCTACTCCTTTTTTACTCTTCCAGATTTTCTCGGACTCCGCGCACCGCCGTACCACTTCAAAACACCCAAGCACAGCATACTAAATTCCCCCTCTTTCTTCCTCTAGGGTGTCGTTAATTACCCGTACTAAAGGTTTGGAAAAGAAAAAAGAGACCGCCTCGTTTCTTTTTCTTCGTCGAAGAAGGCAATAAAAATTTTTATCACGTTTCGTTTTCTTGAAAACTTTTCTTTTTGATTCTTTTCTCTTTCGATGACCTCCCATTGATATTTAAGTTATTAGATGGTCTTCAATTTCTCAAGTTTCAGCTCCATTTTTCTTGTTCTATTACAACTTTTTTTACTTCTTGCTCATTAGAAAGAAAGCATAGCAATCTAATCTAAGTTTTAATTACAAA
ENO2p(H) Strong GTGTCGACGCTGCGAGTATAGAAAGGGCTCTTTACTCTATAGTACCTCCTCGCTCGGCATCTGCTTCCTCCCAAAGATGAGCGCGGCGTCATGTCACTAACGACGTGCACCAACTTGCGGAAAGTGGAATCCCGTTCCAAAACTGGCATCCACTAATTGATACATCTACACACCGCACGCCTTTTTTCTGAAGCCCACTTTCGTGGACTTTGCCATATGCAAAATTCATGAAGTGTGACACTGAGTCAGCATACACCTCACTAGGGTAGTTTCTTTGGCTGTATTGATCATTTGATTCATCGTGGTTCATTAATTTTTTTTCTCCACTGCTTTCTGGCTTTGATCTTACTATCATTTGGATTTTTGTCGAAGGTTGTAGAATTGTGTGTGACAAGTGGCACCAAGCATATATAAAAAAAAAAAGCATTATCTTCCCACCAGAGTTGATTGTTAAAAACGTATTTATAGCAAACACAATTGTGATTAATTCTTATTTTGTATCTTTTCTTCCCTTGTCTCAATCTTTTATTTTCATTTTATTTTCCTTCTCTTAGTTTCTTTCATAACACCAAGCAACTAATACTATAACGTACAATAATA
ENO2p(M) Medium GTGTCGACGCTGCGGGTATAGAAAGGGTTCTTTACTCTATAGTACCTGCTCGCTCAGCACCTGCTTCTTCCCAAAGATGAACGCGGCGTTATGTCACTAACGACGTGCACCAACTTGCGGAAAGTGGAATCCCGTTCCAAAACTGGCATCCACTAATTGATACACCTACACACTGCACGCCTTTTTTCCGAAGCCCACTTCCGTGGACTTTGCCATATGCAAAATTCATGAAATGTGATACCAAGTCAGCATACACCTCACTAGGGCAGTTTCTTTGGTTGTATTGATCATTTGGTTCATCGCGGTTCATTAATTTTTTTTCTCCATTGCTTTCTGGCTTTGATCTTACTATCATTTGGATTTTTGTCGAAAGTTGTAGAATTGTATGTGACAAGTGGCACCAAGCATATATAAAAGAAAAAAAGCATCATCTTCCTACCAGAGTTGATTGTTAAGAACGTATTTATAGCAAACGCAGTTGTAGTTAATTCTTATTTTGTATCTTTTCTTCCCTTGTCCCGATCTTTTATTTTTATTTTATCTTTCTTTTCTTAGTTTCTGTCATAGCACCAAGCAACTAATACTATAACGTACAATAATA
ENO2p(L) Low GTGTCGACGCTGCGGGTATAGAAAGGGTTCTTGACTCTATAGTACCTCCTCGCTCAGCATCTGCTTCTTCCCACAGATGAACGCGGCGTTATGTCACTAACGACGTGCACCAACTTGCGGAAAGTGGAATCCCGTTCCAAAACTGGCATCCACGAATTGATAGATCTACACACCGCACGCCTTTTTTCTGAAGCCCACCTTCGTGGACTTTGCCATACGCAGAATTCGT

333
GAAGTGTGATACCAAGTCAGCATACACCTCACCAGGGTAGTCTCTTTGGTTGTATTGATCATTTGGTTCATCGTGGTTCATTAATTTTTTTTCTCTATTGCTTTCTGGCTTTGATCTTACTATCATTTGGATTCTTGTCGAAGGTTGTAGAATTGTATGTGACAAGTGGCACCAAGCATATATAAAAAAAAAAAGCATTATCTTCCTACCAGAGTTGATTGTTAAAAACGTATTTATAGCAAACGCAATTGTAATTAATTCTTATTTTGTGTCTTTTCTTCCCTTGTCTCAATCTTTTATCTTTGTTTTATTCTTCTTTTCTTAGTTTCCTTCATAACACCAAGCAACTAACACTATAACATACAATAATA
ENO2p* (Mutated) GTGTCGACGCTGCGGGTATAGAAAGGGTTCTTTACTCTATAGTACCTCCTCGCTCAGCATCTGCTTCTTCCCAAAGATGAACACGGCGTTATGCCACTAACGGCGTGCACCGACTTGCGGAAAGTGGAATCCCGTTCCAAAACTGGCATCCACTAATTGATACATCTACACACCGCACGCCTTTTCTCTGAAACCCACTTTCGTGGACTTTGCCATATGCAAAATTTATGAAGTGTGATACCAAGTCAGCATACACCTCACTAGGGTAGTTTCTTTGGTTGTGTTGATCATTTGGTTCATCGTGGTTCATTAATTTTTTTTCTCCGTTGCTTTCTGGCCTTGATCTTACTATCATTTGGATTTTTGTCGAAGGTTGTAGAATTGTATGTGACAAGTGGCACCAAGCATATATAAAGAAAAAAAGCATTATCTTCCTACCAGAGTTGACTGCTAAAAACGTATTTATAGCAAACGCAATTGTAATTGATTCTTATTTTGTATCTTTTCTTCCCTTGTCTCAATCTTTTATTTTTATTTTATTTTTCTTTTCTTAGTTTCTTTCATAACACCAAGCAACTAATACTATAACATACAATAATA
PDC1p(H) Strong CATGCGACTGGGTGAGCATATGTTCCGCTGGTGTGATGTGCAAGATAAACAAGCAAGGCAGAAACTAACTTCTTCTTCATGTAATAAACACACCCCGCGTTTATTTACCTATCTCTAAACTTCAACACCTTATATCATAACTAGTGTTTCTTGAGGTAAGCACACTGCACCCATACCTTCCTTAAAAACGTAGCTTCCAGTTTTTGGTGGTTCCGGCTTCCTTCCCGATTCCGCCCGCTAGACGCATGTTTTTGTTGCCTGGCGGCATTTGTAAAGTGCATAACCTATGCATTTAAAAGATTATGCATGCTCTTCTGACTCTTCGTGTGATGAGGCTCGTGGAAAAAATGAATAATTTATGAATTTGAGAACAATTTTGTGTTGTTACGGTATTTTACTATGGAATAATCAATCAATTGAGGATTTTATGCAAATATTGTTTGAATATTTTTCCGACCCTTTGAGTACTTTTCTTCATAATTGCATAATATTGTCCGCTGCCCCTTTTTCTGTTAGACGGTGTCTTGATCTACTTGCTATCGTTCAACACCACCTTATTTTCTAACTATTTTTTTTTTAGCTCATTTGAATCAGCTTATGGTGATGGCACATTTTTGCATAAACCTAGCTGTCCTCGTTGAACATAGGAAAAAAAAAATATATAAACACGGCTCTTTCACTCTCCTTGCAATCAGATTTGGGTTTGTTCCCTTTATTTTCATATTTCTTGTCATATTCCTTTCTCAATTATTATTTTCTACTCATAACCTCACGCAAAATAACACAGTCAAATCAATCAAA
PDC1p(M) Medium CATGCGACTGGGTGAGCATATGTTCCGCTGATGTGATGTGCAAGATAAACAAGCAAGGCAGAAGCTAACTTCTTCTTCATGTGATAAACACACCCCGCGCTTATTTACCTATCTCTAAACCTCAACACCTTGTATCGTAACTAATATTTCTTGAGATAAGCACACTGCACCCATACCTTCCTTAAAAACGTAGCTTCCAGTTTTTGGTGGTTCCGGCTTCCTTCCCGATTCCGCCCGCTAAACGCATGTTTTTGTTGCCTGGTGGCATTTGCAAAATGCATAACCTATGCATTTAAAAGATTATGTATGCTCTTCTGACTTTTCGTGTGATGAGGCTCGTGGAAAAAATGAGTAATTTATGAACTTGAGAACAATTTTGTGTTGTTACGGTACTTTACTATGGAATAATCAATCAATTGAGGATTTTGTGTAAATATCGTTTGAATATTTCTCCGACCCTTTGAGTACTTTTCTTCATAATTGCATAATATTGTCCGCTGCCCCTTTTTCTGTTAGACGGCGTCTCGATCTACTTGCTGTCGTTCAACACCACCTTATTTTCTAACTATTTTTTTTTTAGCTCATTTGAATCGGCTTATGGTGATGGCACGTTTTTGCATAAACCTAGCTGTCCTCGTTGAACATAGGAAAAAAAAATATATAAACAAGGCTCTTTCACTCTCCTTGCAATCAGATTTGGGTTTGTTCCCTTTATTTTCATATTTCTTGCCATATTCCTTTCTCAATTATTATTTTCTACTTATAACCTCACGCAAAATAGCACAGTCAAATCAGTCAAG
PDC1p(L) Low CATGCGACTGGGTGAGCATATGTTCCGCTGATGTGATGTACAAGATAAACAAGCAAGGCAGAAACTAACTTCCTCTTCATGTAATAAACACACCCCGCGTTTATTTACCTATCTCTAAACTTCAACCCCCTATATCATAACTAATATTTCTTGAGATAAGCACACTGCACCCATACCTTTCTTAAAAGCGCAGCTTCCAGTTTTTGGTGGTTCCGGCTTCCTTCCCGATTCCGCCCGCTAAACGCATATTTTTGCTGCCTGGTGGCATTTGCAAAATGCATAACCTACGCATTTAGAAGATTATGTATGCTCTTTTGATTTTTCGCGTGATGAGGCTCGTGGAGAAAATGGATAATTTATGAATTTGAGAACAATTTCATGTTGTTACGGTATTTTACTATGGAATAATCAATCAATTGAGGATTTTATGCAAATATCGTTTGAATATCTTTCCGACCCTTCGAGTACTTTTCTTCATAATTGCATAATATTGTCCGCAGCCCCTTTTTCTGTTAGACGGTACCTTGATCTACTTGCTATCGTTCAACACCACCTTATTTTCTAACTATTTCTTCTTAGCTCATTTGAATCAGCCTGTGGTGATGGCACATTTTTGCACAAACCTAGCTGTCCTCGTTGAACATAGGAGGAAAAAACATATAAGCAGGGCTCTTTCACTCTCCTTGCAATCAGATTTGGGTTTGTTCCCTTTATTTCCATGCCTCTTGTCATATTCCTTTCTCAATTATTATTTTCTACTCATAACCTCACGCAAAATAACACAGTCAAATTAACCAAA
PDC1p* Mutated CATGCGACTGGGTGAGCATATGTTCCGCTGATGTGGTGTGCAAGATAAACAAGCAAGGCAGAAGCTAACTTCTTCTTCATGTGATAAACACACCCCGCGCTTATTTACCTATCTCTAAACCTCAACACCTTGTATCGTAACTAATATTTCTTGAGATAAGCACACTGCACCCATACCTTCCTTAAAAACGTAGCTTCCAGTTTTTGGTGGTTCCGGCTTCCTTCCCGAT

334
TCCGCCCGCTAAACGCATGTTTTTGTTGCCTGGTGGCATTTGCAAAATGCATAACCTATGCATTTAAAAGATTATGTATGCTCTTCTGACTTTTCGTGTGATGAGGCTCGTGGAAAAAATGAGTAATTTATGAACTTGAGAACAATTTTGTGTTGTTACGGTACTTTACTATGGAATAATCAATCAATTGAGGATTTTGTATAAATATCGTTTGAATATTTCTCCGACCCTTTGAGTACTTTTCTTCATAATTGCATAATATTGTCCGCTGCCCCTTTTTCTGTTAGACGGCGTCTCGATCTACTTGCTGTCGTTCAACACCACCTTATTTTCTAACTATTTTTTTTTTAGCTCATTTGAATCGGCTTATGGTGATGGCACGTTTTTGCATAAACCTAGCTGTCCTCGTTGAACATAGGAAAAAAAAATATATAAACAAGGCTCTTTCACTCTCCTTGCAATCAGATTTGGGTTTGTTCCCTTTATTTTCATATTTCTTGCCATATTCCTTTCTCAATTATTATTTTCTACTTATAACCTCACGCAAAATAGCACAGTCAAATCAGTCAAG

335
Fig. E.S1. DNA electrophoresis confirmed that all of the cassettes in both xylose
pathway and 1-hexadecanol pathway existed in the evolved strains (second
generation). (A) XR cassette (2160 bp) in pXF3X03; (B) XDH cassette (1730 bp) in
pXF3X03; (C) XK cassette (2800 bp) in in pXF3X03; (D) TaFAR cassette (2503 bp) in
pTaFAR_ACC1; (E) ACC1 cassette (7615 bp) in pTaFAR_ACC1; (F) ACL cassette1
(2840 bp) in pYlACL; (G) ACL cassette2 (2850 bp) in pYlACL.

336
Fig. E.S2. The strengths of PDC1, TEF1, and ENO2 promoters in front of EGFP.
The strength of wild-type PDC1, TEF1, and ENO2 promoter was normalized into 100.
Black, red, and blue bars represent the promoters with low, medium, and high strength,
respectively.

337
Fig. E.S3. Correlations between the promoter strengths in front of XR, XDH and
XKS in xylose utilization pathways and the growth rates (blue dots) as well as 1-
hexadecanol concentrations (red dots). The unit of promoter strength was the same as
that was used in Figure S2, i.e., normalized fluorescence (A.U.) of EGFP expressed by
PDC1, TEF1 and ENO2 promoters, respectively. No correlation was observed between
promoter strength and 1-hexadecanol concentration. Similarly, no correlation was
observed between promoter strength and growth.

338
0.6 0.7 0.8 0.9 1.00.0
0.5
1.0
1.5
2.0
2.5
3.0
1-H
exad
ecan
ol (
A.U
.)
Growth rate (A.U.)
Fig. E.S4. Correlation between the growth rates and the 1-hexadecanol titers for the
combinatorial promoter engineering.

339
Fig. E.S5. Flux balance analysis revealed correlation between the 1-hexadecanol
production and ATP (A), NADH (B), NADPH (C), and growth rate (D).
A B C
D