The Structure of the Planktonic Food-Web in the St. Lawrence Great Lakes
24
J. Great Lakes Res. 24(3):531-554 Internat. Assoc. Great Lakes Res., 1998 The Structure of the Planktonic Food-Web in the St. Lawrence Great Lakes Gary L. Fahnenstiel 1 *, Ann E. Krause 1 +, Michael J. McCormick 2 , Hunter J. Carrick 3 , and Claire L. Schelske 4 1Lake Michigan Field Station Great Lakes Environmental Research Lab/NOAA 1431 Beach St. Muskegon, Michigan 49441 2Great Lakes Environmental Research Lab/NOAA 2205 Commonwealth Blvd. Ann Arbor, Michigan 48105 3Dept. Biology/Great Lakes Center SUNY College at Buffalo Buffalo, New York 14228 4Dept. Fisheries and Aquatic Sciences University of Florida Gainesville, Florida 32653 ABSTRACT. The structure of the planktonic food-web was studied during the spring (April/May) and summer (August) periods in 1993 to 1995 at twelve stations located in the offshore region of all five Great Lakes. All components of the planktonic food-web were collectedfrom the same water sample (with the exception of crustaceans), counted microscopically, converted to carbon units, and averaged over the euphotic zone. Due to phosphorus load reductions and the impact of non-indigenous mussels in the lower lakes, physical/chemical characteristics of the lower lakes are becoming similar to those in the upper lakes. Spring total phosphorus and euphotic zone depth were relatively similar among all the stations (except western Lake Erie), ranging from 3 to 7 jig/L and 21 to 26 m, respectively. During the summer, total phosphorus concentrations were more variable, but ranged between 4 tol0 jig/L at all stations except western Lake Erie. Planktonic biomass was correlated with total phosphorus concentration. Within a season, the structure of the planktonic food-web was remarkably similar among all stations across all the lakes. Of the seventeen food-web structure parameters examined, only two exhibited signifi- cant differences among stations during the spring isothermal period; only four parameters exhibited sig- nificant differences among stations during the summer. Small plankton were very abundant in all the lakes. Picoplankton (0.2 to 2.0 jim) biomass was approximately equal to the combined biomass of nanno- and microplankton (2 to 200 jim). For microorganisms (all organisms except crustaceans) autotrophic: heterotrophic ratios averaged 1.3 (spring = 1.1, summer = 1.5). The heterotrophic microorganism com- munity was comprised of bacteria (mean = 65%), protozoans (mean = 32%), and rotifers (3%). Even though zebra mussel veligers were found in all the lakes except Lake Superior, their contribution to microorganism biomass never exceeded 1%. Due to seasonal variation in crustacean abundance, the mean contribution of major functional groups varied by season; producers (autotrophs), decomposers (bacteria), micrograzers (protozoans and rotifers), and mesograzers (crustaceans) constituted 40%,30%, 11%, and 19% of total planktonic carbon, respectively, during the spring, and 32%, 15%, 9%, and 43%, * Corresponding author. E-mail: [email protected] +Present address: Dept. Fisheries and Wildlife, Michigan State Univ., East Lansing, MI 48824 531
Transcript of The Structure of the Planktonic Food-Web in the St. Lawrence Great Lakes
J. Great Lakes Res. 24(3):531-554Internat. Assoc. Great Lakes Res., 1998
The Structure of the Planktonic Food-Web in theSt. Lawrence Great Lakes
Gary L. Fahnenstiel1*, Ann E. Krause1+, Michael J. McCormick2, Hunter J. Carrick3,
and Claire L. Schelske4
1Lake Michigan Field StationGreat Lakes Environmental Research Lab/NOAA
1431 Beach St.Muskegon, Michigan 49441
2Great Lakes Environmental Research Lab/NOAA2205 Commonwealth Blvd.
Ann Arbor, Michigan 48105
3Dept. Biology/Great Lakes CenterSUNY College at BuffaloBuffalo, New York 14228
4Dept. Fisheries and Aquatic SciencesUniversity of Florida
Gainesville, Florida 32653
ABSTRACT. The structure of the planktonic food-web was studied during the spring (April/May) andsummer (August) periods in 1993 to 1995 at twelve stations located in the offshore region of all fiveGreat Lakes. All components of the planktonic food-web were collected from the same water sample (withthe exception of crustaceans), counted microscopically, converted to carbon units, and averaged over theeuphotic zone. Due to phosphorus load reductions and the impact ofnon-indigenous mussels in the lowerlakes, physical/chemical characteristics of the lower lakes are becoming similar to those in the upperlakes. Spring total phosphorus and euphotic zone depth were relatively similar among all the stations(except western Lake Erie), ranging from 3 to 7 jig/L and 21 to 26 m, respectively. During the summer,total phosphorus concentrations were more variable, but ranged between 4 tol0 jig/L at all stationsexcept western Lake Erie. Planktonic biomass was correlated with total phosphorus concentration.Within a season, the structure of the planktonic food-web was remarkably similar among all stationsacross all the lakes. Of the seventeen food-web structure parameters examined, only two exhibited significant differences among stations during the spring isothermal period; only four parameters exhibited significant differences among stations during the summer. Small plankton were very abundant in all thelakes. Picoplankton (0.2 to 2.0 jim) biomass was approximately equal to the combined biomass of nannoand microplankton (2 to 200 jim). For microorganisms (all organisms except crustaceans) autotrophic:heterotrophic ratios averaged 1.3 (spring = 1.1, summer = 1.5). The heterotrophic microorganism community was comprised of bacteria (mean = 65%), protozoans (mean = 32%), and rotifers (3%). Eventhough zebra mussel veligers were found in all the lakes except Lake Superior, their contribution tomicroorganism biomass never exceeded 1%. Due to seasonal variation in crustacean abundance, themean contribution of major functional groups varied by season; producers (autotrophs), decomposers(bacteria), micrograzers (protozoans and rotifers), and mesograzers (crustaceans) constituted 40%,30%,11%, and 19% of total planktonic carbon, respectively, during the spring, and 32%, 15%, 9%, and 43%,
* Corresponding author. E-mail: [email protected]+Present address: Dept. Fisheries and Wildlife, Michigan State Univ.,East Lansing, MI 48824
531

532 Fahnenstiel et al.
respect~vely: during the summer. The o~erall similarity in the structure of the planktonic food-web acrossall statIOns In the Great Lakes was attributed to the strong influence ofabiotic factors.
Ifl!DEX WORDS: Microorganisms, planktonic food-web, Great Lakes, autotrophic, heterotrophicplcoplankton. '
INTRODUCTION
The unique nature of the St. Lawrence GreatLakes has contributed to a long and productive history of research. The early history of this researchwas described in much detail by Beeton and Chandler (1963) and Beeton and Schneider (1998). Mostof the early planktonic work, prior to the 1960s,was primarily descriptive in nature (Davis 1966).The late 1960s and 1970s were a golden era ofGreat Lakes research, when concern for eutrophication and the collapse of several fisheries served asthe impetus for several large interdisciplinary research programs, the most notable being the studyof Lake Ontario during IFYGL (International FieldYear on the Great Lakes) (Ludwigson 1974). Because much of the concern was centered on nutrientoverenrichment, many plankton studies were initiated during this period (e.g., Watson and Carpenter1974, Munawar and Munawar 1975, Stoermer andLadewski 1978). Our understanding of planktonecology increased substantially during this periodresulting in several published reviews of the plankton communities in the Great Lakes (Vollenweideret ai. 1974, Watson 1974, Munawar and Munawar1982).
The 1980s were a period of significant new insights into the structure of the planktonic food-webas well as of significant new perturbations. Prior tothis decade, the planktonic food-web in the GreatLakes was typically described with traditional phytoplankton and zooplankton groups (Scavia 1980).The discovery of an abundant and important microbial food-web in the 1980s forced a reevaluation ofexisting concepts of food-web structure and function in the Great Lakes (Lean et ai. 1987, Scaviaand Fahnenstiel 1988) and all aquatic environments(Azam et ai. 1983, Fenche1 1988, Hairston andHairston 1993). With the development and application of new techniques, particularly fluorochromestaining combined with epifluorescence microscopy(Hobbie et ai. 1977, Haas 1982, Caron 1983), researchers discovered abundant populations of autotrophic and heterotrophic picoplankton(organisms < 211m) and protozoans in the GreatLakes (Caron et al. 1985, Fahnenstiel et al. 1986,Scavia et ai. 1986, Pick and Caron 1987, Carrick
and Fahnenstiel 1989). Also in the 1980s, severaln?~-indigenous species that had the ability to sigmflcantly alter the planktonic community were introduced into the Great Lakes. Although the GreatLakes have had a long history of invasion by nonindigenous species (Mills et ai. 1993), most ofthose having had substantial impact on the GreatLakes had been fish, e.g., lamprey, alewife, etc.(Mills et ai. 1993); however in late 1980s and early1990s several important non-indigenous invertebrates arrived in the Great Lakes, including thezebra mussel (Dreissena poiymorpha), quagga mussel (Dreissena bugensis), and spiny water flea(Bythotrephes cederstroemi). Major changes in theabundance and composition of the plankton foodweb in the Great Lakes have been attributed tothese invertebrates (Leach 1993, Dermott and Munawar 1993, Lehman and Caceres 1993, Mills et ai.1993, Makarewicz et al. 1995, Nalepa and Fahnenstiel 1995).
Because of the profound impact of these new,non-indigenous species and the widespread availability of new techniques to enumerate all components of the planktonic food-web, a comparativestudy of the Great Lakes was conducted from 1993to 1995. Using consistent techniques and in mostcases the same water sample, the community structure of the entire planktonic food-web (organismsin size from 0.2 11m to 2.5 mm) of all five of theGreat Lakes was examined. Even though this workfocused on broad-scale patterns based on taxonomic, size and functional analyses, all organismswere counted individually using appropriate microscopy. This paper marks the first attempt tocharacterize the entire planktonic food-web in allfive Great Lakes and document the broad-scalestructural food-web similarities that exist among allfive of the Great Lakes.
METHODS
Sampling was conducted at 12 stations in the St.Lawrence Great Lakes aboard the RlV Laurentian(Fig. 1, Table 1). Two to three stations in the offshore region of each lake were sampled. With theexception of the Lake Superior stations, all stationswere sampled during two cruises (April/May and

The Structure of the Planktonic Food-Web in the St. Lawrence Great Lakes
FIG. I. Location ofsampling stations.
533
August periods) of each year, 1993 to 1995. Thus,each station was sampled six times during thisstudy. Lake Superior stations were sampled onlyduring the August 1994 cruise.
At each station, a Seabird CTD cast with fluorometer and transmissometer (25-cm beam path)
with a 2-Hz sampling rate was made from the surface to just above the bottom. The CTD profileswere used to determine the discrete samplingdepths for plankton collections whenever the watercolumn was stratified. Secchi disk transparency wasmeasured with a black/white 25-cm disk. Underwa-
TABLE 1. Physical/chemical characteristics of the sampling stations. Mean euphotic zone depth andtotal phosphorus values are presented along with standard errors. Euphotic zone depth was calculatedfrom PAR extinction coefficients or converted beam transmittance values.
Station Spring Summer Maximum Spring Total Summer TotalStation Depth Euphotic Euphotic Euphotic Phosphorus Phosphorus
Station Name Number (m) Depth (m) Depth (m) Depth (m) (/lgIL) (/lgIL)
L. Erie-West El 7m 13 ± 0.5 13 ± 0.9 14 14 ± 3.0 19 ± 4.8L. Erie-East E2 57m 23 ± 1.2 18 ± 1.7 26 5.7 ±. 1.0 6.5 ± 0.6L. Ontario-West 03 133m 25 ± 0.8 16 ± 1.1 26 6.2 ± 1.2 10 ± 1.2L. Ontario-East 04 159m 26 ± 1.5 14 ± 1.6 29 6.6 ± 1.4 8.6 ± 0.7L. Michigan-South M5 107 m 21 ± 1.4 26 ± 2.6 31 6.0 ± 1.4 5.4 ± 0.2L. Michigan-North M6 144 m 24 ± 0.7 26 ± 0.8 28 4.9 ± 1.2 7.3 ± 1.2L. Huron- South H7 37 m 25 ± 1.5 29 ± 2.2 33 3.9 ± 0.7 5.4 ± 0.8L. Huron- Central H8 68 m 27 ± 0.5 28 ± 1.5 31 3.5 ± 0.6 4.6 ± 0.7L. Huron- North H9 64m 26 ± 0.5 29 ± 1.0 31 3.2 ± 0.3 5.1 ± 0.7L. Superior-East SlO 201 m 42 42 5.6L. Superior-Central 1 Sll 220m 42 42 4L. Superior-Central 2 S12 218 m 46 46

534 Fahnenstiel et al.
ter light extinction of photosynthetic active irradiation (kPAR) was measured with a LICOR 1935Bscalar (4:;t:) light sensor and LICOR-lOOO data logger and/or a Biospherical integrating natural fluorometer equipped with a downwelling scalar PARsensor. At stations that were sampled during darkness, beam attenuation values were converted to extinction coefficients using the conversion ofFahnenstiel et al. (1995) developed in Saginaw Baywith the same transmissometer. These kPAR valueswere used to calculate the depth of the euphoticzone (1 % isolume) .
In order to minimize extraneous light effects onphytoplankton communities, plankton sampling wasconducted in almost all cases at night, usually 1 to 4hours before dawn. From the CTD profiles, vertically distinct layers were selected for sampling,e.g., epilimnion, metalimnion, and deep chlorophylllayer. At each station (with exception of westernLake Erie) discrete samples were taken from 3 to 6depths in the euphotic zone using a Niskin bottleand poured into a 24-L carboy (one carboy for eachdepth). All water samples were taken from thesecarboys. Because of the shallow water in westernLake Erie (7 m), samples were collected from onlytwo discrete depths. Chlorophyll samples were filtered onto Whatman GF/F filters, extracted with N,N-dimethylformamide, and analyzed fluorometrically (Speziale et at. 1984). Total phosphorus samples were digested with potassium persulfate andanalyzed by the molybdate/ascorbic acid method(Davis and Simmons 1979).
The methods for preserving, preparing, andcounting microbial communities have been described in detail (Scavia et at. 1986, Fahnenstieland Scavia 1987, Carrick and Fahnenstiel 1989,Carrick and Fahnenstiel 1990, Fahnenstiel and Carrick 1992) and will only be briefly described here.Plankton samples from discrete water collectionswere preserved in amber bottles as follows (all concentrations are final concentrations): Heterotrophicand autotrophic picoplankton, 2% glutaraldehyde;phytoplankton, 0.5% Lugol's solution; flagellatedprotozoans, glutaraldehyde (2%) buffered withsodium cacodylate (0.1 M); ciliated protozoans, Ito 2% Lugol's solution; rotifers and veligers, narcotization with club soda and preservation with 5%buffered formalin. All aldehyde-preserved sampleswere immediately stored at 5°C until preparation ofmicroscopic slides. Duplicate permanent or semipermanent slides were prepared (picoplankton, protozoans, and phytoplankton). All slide preparationsfor epifluorescence microscopy (heterotrophic bac-
teria, autotrophic picoplankton, and protozoans)were made within 24 h of collection, stored in afreezer until the end of the cruise, and then countedas soon as possible.
Heterotrophic bacteria were enumerated with theAODC method (Hobbie et at. 1977). Preservedsamples were stained with acridine orange, filteredonto Irgalan black-stained 0.22-~m polycarbonatefilters, and mounted onto slides with immersion oil.A minimum of 300 cells were counted with a LeitzLaborlux 12 microscope or Aus lena Research microscope equipped for blue excitation (450 to 490nm; beam splitter 510 nm). At least 30 bacteriacells from each sample were measured from projections of photomicrographs. Volumes were determined and converted to carbon using theconversion factor of 0.38 pg/~m3 (Lee and Fuhrman1987).
Autotrophic picoplankton samples were enumerated with epifluorescence microscopy to distinguishthe dominant autofluorescent emission of each cell(Fahnenstiel and Carrick 1992). Preserved sampleswere filtered onto 0.2-~m Nuclepore filters andmounted onto slides with immersion oil. An Auslena Research microscope equipped with blue (450nm) and green excitation (530 to 560 nm) was usedto enumerate prokaryotic and eukaryotic autotrophic picoplankton. At least 300 cells werecounted on each slide and at least 30 cells weremeasured from projections of photomicrographs.From these measurements, cellular volumes werecalculated and converted to carbon units using theconversion factor of 0.38 pg/~m3 for cyanobacteria(Lee and Fuhrman 1987) and 0.36 pg/~m3 for eukaryotic picoplankton (Verity et at. 1992).
Flagellated protozoans were enumerated with theprimulin technique (Caron 1983, Carrick and Fahnenstiel 1989). Preserved samples were filteredonto 0.8-~m black membrane filters, rinsed withTrizma buffer, stained with primulin, and mountedonto slides with immersion oil. A minimum of 300organisms were counted using a Leitz Laborlux orAus lena microscope equipped for both UV (320 to380 nm) and blue excitation (450 to 590 nm). Ciliated protozoans were enumerated with the Utermohl technique COtermohl 1958, Carrick andFahnenstiel 1990). Preserved aliquots (25 to 50 mL)were settled onto coverslips, and the entire area ofthe slide was scanned at 200X with an inverted microscope. Cell volumes for protozoans were estimated by determining average cell dimensions froma minimum of ten randomly chosen individuals ofeach taxa and applying these dimensions to the

The Structure of the Planktonic Food- Web in the St. Lawrence Great Lakes 535
most appropriate shape (e.g., prolate spheres, cylinders). Protozoan carbon values were estimatedfrom biovolumes using the equation (C = 0.433(BV) 0.863) from Verity et aZ. (1992).
Phytoplankton samples were filtered onto microscope slides according to the procedure of Dozierand Richerson (1975) used previously for GreatLakes phytoplankton (Fahnenstiel and Scavia 1987,Fahnenstiel and Carrick 1992). A minimum of 300phytoplankton entities were enumerated under bothhigh (1,000 to 1,200X) and low magnification(200X). Phytoplankton counts focused on non-flagellated forms and cells > 2 /lm. Smaller cells andflagellates were more adequately enumerated withepifluorescent techniques outlined above. Cell volumes were estimated by determining average celldimensions of a minimum of 100 cells for eachdominant taxa and at least ten cells for rare taxa,and then applying these dimensions to appropriategeometric shapes. The cell volumes used for thisstudy were from a compilation of values from thisand previous studies in the Great Lakes. Phytoplankton volumes were converted to carbon unitsusing the respective equations from Strathman(1967) for diatoms and Verity et aZ. (1992) for nondiatoms.
Rotifer samples were collected by filtering 8 to20 L of raw water through a 30-/lm screen and thenwashing the contents of the screen into a bottle. Rotifers and zebra mussel veligers were enumerated ina Sedgewick-Rafter cell under lOOX magnification.A total of at least 60 rotifers was counted in eachsample. Mean length for each taxa was determinedfor a minimum of ten randomly selected individuals. Rotifers were counted, sized, and convertedto dry weight using the regression (for rotifers< 400 /lm) of Sternberger and Gilbert (1987). Dryweights for zebra mussel veligers were assumed tobe 0.1 /lg (T. Nalepa, unpubl. data). Rotifer andveliger dry weights were converted to carbon usingthe factor 0.48 (Anderson and Hessen 1991).
Crustacean zooplankton abundance was determined by replicate metered net tows (0.5-m diameter, 153-/lm mesh) from just below the bottom ofthe euphotic zone or from slightly above the bottom(western Lake Erie, EI; southern Lake Huron, H7)to the surface. Collections were taken almost exclusively during the night (primarily just before dawn).Comparisons of meter readings from meters locatedinside and outside the nets indicated high efficiency(> 90%) for all tows. The depth of the tows variedfor each lake and were as follows: Lakes Michigan(M5-M6), Huron (H8-H9), and Ontario (03-04) =
o to 40 m, Eastern Basin of Lake Erie (E2) andSouthern Lake Huron (H7) = 0 to 30 m, WesternLake Erie (El) =0 to 7 m, and Lake Superior (SlOS12) = 0 to 50 m. For Bythotrephes, separate metered net tows with a 1-m 353-/lm mesh net wereperformed during the summer of 1995. All zooplankton samples were narcotized and then preserved with sugar formalin (Haney and Hall 1973).The counting of crustacean zooplankton used thesame technique as in several previous studies(Scavia et aZ. 1986, Bridgeman et aZ. 1995) and isdescribed in Evans and Jude (1986). Briefly, eachzooplankton sample was subsampled in order togive two samples of 150 to 200 organisms each. Allcladocerans and adult copepods in each subsamplewere identified to species and sex. Immature copepodites were identified to genus, while nauplii werecombined into one group. Mean length of eachtaxon was determined from a minimum of 20 randomly selected individuals of each taxon. Crustacean lengths (with the exception of Bythotrephes)were converted to dry weights using the regressionof Culver et aZ. (1985). For Bythotrephes, thelength-weight conversions of Berg and Garton(1988) were used. Crustacean dry weights wereconverted to carbon using the factor 0.48 (Andersonand Hessen 1991).
All of the plankton biomass data were normalized to carbon units. This decision was based ontwo factors: 1) carbon conversion factors are relatively robust and probably the most used biomassconversion factors (e.g., dry weight, wet weight) formicroorganisms, and 2) carbon normalized dataprovide a common basis for assessing intercomparisons with the data collected in this study and topreviously published work in the Great Lakes. Themost appropriate carbon conversion values wereused for all microorganism groups; they were internally consistent and sized-based both within allnon-picoplankton groups and among all groups. Forprotozoans and other non-picoplankton, the conversion equations of Verity et al. (1992) for all non-diatoms and Strathman (1967) for all diatoms wereused. The Strathman conversion factors are probably the most widely used and are similar to valuesfrom other studies (Cushing and Nicholson 1958,Parsons et aZ. 1961, Mullin et ai. 1966). The Verityconversion factors provided consistency among allnon-diatoms, and are relatively similar to those ofStrathman (1967) and Moal et aZ. (1987). Forprokaryotic picoplankton, the conversion factor ofLee and Fuhrman (1987) was used because it issimilar to the value used for eukaryotic picoplank-

536 Fahnenstiel et ale
ton (0.38 vs. 0.36 pg/llm3). This prokaryotic valuealso has independent support in the literature (Bratbak 1985, Borsheim and Bratbak 1987, Verity et al.1992).
All biomass estimates from specific depths weredepth-weighted and then averaged to produce amean euphotic zone value. These mean euphoticzone values were used for all subsequent analyses.During the spring isothermal mixing period, theseeuphotic zone averages are similar to the surfacemixed layer (ML) or water column averages; however, during summer stratification, they often differconsiderably. Because of highly variable surfaceML depths among years at the same station (often3X), the euphotic zone averages are a more appropriate and reliable marker for making comparisonsamong stations. Moreover, surface ML depth canexhibit large changes with potentially 90% of itsvariability concentrated on less than daily timescales (McCormick and Meadows 1988). Parametric statistics were used to analyze differencesamong and between mean euphotic zone values(e.g., one-way ANOVAs for spatial differences, ttest for seasonal differences, etc.).
RESULTS
Baseline Limnological Conditions
The sampling periods during each year corresponded to spring isothermal mixing (lateApril/May) and summer stratification (August).With the exception of two samplings at Lake Michigan stations (M5 and M6) on 30 April 1993, allspring sampling occurred during the month of May.For spring 1993 and 1994, all stations (except western Lake Erie, El) exhibited isothermal conditionswith temperatures between 1° and 4°C. Samplingoccurred two weeks later in May of 1995 than in1993 and 1994, and slight stratification was found attwo stations that were isothermal in previous years.Surface temperatures at the southern Lake Huronstation (H7) and eastern basin of Lake Erie (E2)were 5°C, whereas all other stations in Lakes Huron,Michigan, and Ontario ranged between 2.5° and4°C. The one station that consistently exhibited temperatures > 4°C during the May sampling was western Lake Erie; spring isothermal temperatures at thatstation ranged from 9° to 14°C for 1993 to 1995.
During the August sampling, surface temperatures in Lakes Michigan, Huron, and Ontario and inthe eastern basin of Lake Erie ranged from 18° to24°C. In western Lake Erie, surface temperatures
ranged from 21 ° to 26°C. In Lake Superior, surfacetemperatures ranged from 7° to 11°C. The depth ofthe surface ML ranged from 6 to 20 m among allstations. Even at the same station, there was largevariability in the depth of the ML among years. Forexample, at the eastern Lake Ontario station (04),surface ML depth ranged from 6 m in 1994 to 18 min 1993.
The depth of the euphotic zone was remarkablyconsistent among stations during the spring isothermal period (Table 1). With the exception of westernLake Erie (El), all mean euphotic zone valuesranged from 21 to 27 m. Shallow western Lake Eriewas the only station that exhibited significant differences from other stations (p < 0.05). Summer euphotic zone values were more variable anddistinguishable by lake (Table 1). Euphotic zonedepths from stations in the lower lakes were smallerthan those from upper lakes, while those from LakeSuperior were larger than those from all other lakes(p < 0.05). Maximum euphotic zone depth valueswere similar for Lakes Huron, Michigan, Ontario,and the eastern basin of Lake Erie (Table 1). One interesting difference was that maximum values forstations in Lakes Huron and Michigan occurred inthe summer, whereas maximum values for Lake Ontario and for the eastern basin of Lake Erie werefound during the spring period. Western Lake Eriehad similar values for both seasons.
Spring total P concentrations averaged over theeuphotic zone were remarkably consistent amongstations, particularly Lakes Michigan and Ontario(Table 1). Overall, Lake Huron P concentrationswere lowest, followed by a group of stations fromLakes Michigan, Ontario, and the eastern basin ofLake Erie, and then the western Lake Erie station.However, statistically significant differences wereassociated only with the western Lake Erie station(p < 0.05). Summer total P concentrations averagedover the euphotic zone were also consistent, particularly for the upper lakes (Table 1). In general, Pconcentrations in the lower lakes were higher thanthose in the upper lakes. Highest values were foundfor western Lake Erie, which were significantly different from all stations with the exception of thewestern basin of Lake Ontario (p < 0.05). Valuesfrom Lakes Michigan, Huron, and Superior wererelatively similar (p > 0.05).
Autotrophic Plankton Community
Due to the low sampling frequency, this work focused on spatial (stations) and seasonal (spring vs.

The Structure ofthe Planktonic Food-Web in the St. Lawrence Great Lakes 537
summer) comparisons by combining data from all 3years (1993 to 1995). With only three years of sampling and only one sampling per season at each station, it was not feasible to assess both seasonal andannual temporal scales. Combining annual data(three samplings per station during each season)permits examination of mean values for stationsand seasons. Moreover, the focus on spatial andseasonal data was reasonable given the uniquenessof sampling in all five lakes and previous information on structural differences between spring andsummer planktonic food-webs in the Great Lakes(Scavia and Fahnenstiel 1987). A preliminary comparison of the data supported our seasonal emphasis; of the seventeen ratios analyzed in this study(e.g., autotrophic:heterotrophic, picoplankton:nanno- and microplankton, etc.) fifteen exhibitedsignificant differences between the seasons (p <0.05).
Euphotic zone total autotrophic biomass rangedfrom 23 mg C/L to 128 mglL (Fig. 2). In general,autotrophic biomass was higher during summerstratification (40 vs. 76, p < 0.05) for all stationsexcept southern Lake Michigan (M1). Mean springphytoplankton was relatively similar among stations, ranging from 28 mg C/L at 04 to 57 mg C/L
at E1 (p > 0.05; Fig. 2a). Mean summer phytoplankton biomass was more variable, rangingfrom 23 mg C/L at S12 to 128 mg C/L at El. LakeSuperior stations (S10, Sll, S12) exhibited thelowest biomass, while western Lake Erie (E1) andeastern Lake Ontario (04) exhibited the highest(Fig.2b).
Two components of the autotrophic communitywere analyzed based on size (Fig. 2); picoplankton(organisms < 2 Jllll) and all larger autotrophs. Thecontribution of autotrophic picoplankton variedseasonally (p < 0.05), but not among stations foreither season (p > 0.05). In the spring period, picoplankton accounted for only 10% (range of station means, 2 to 19%) of total autotrophic biomasswhereas during summer stratification, picoplanktonaccounted for 32% (range in station means, 18 to58%). The greatest contribution of picoplanktonto total autotrophic biomass was found in Lake Superior (51 to 58%). Seasonal differences were mostpronounced in the lower lakes (Lakes Erie and Ontario), where picoplankton biomass increased 11 to23-fold from spring to summer (Fig. 2). In LakesHuron and Michigan, picoplankton biomass increased 2.8 to 4.0-fold from spring to summer.
150
-..J-C)
.:;c: 100o-ecao(,)
-a 50E-o-:::::s«
o
a) SPRING
~ LARGER ORGANISMS• PICOPLANKTON
..- C"\l C"") "<T LO co r-- 00 (j)W WOO:2 :2:c:c:c
Station Number
150
-..J-C)
.:;c: 100o.c'-cao(,)
-a 50E-o-:::::s«
o
b) SUMMER
LARGER ORGANISMS ~
PICOPLANKTON •
"
i II..-C"\lC"")"<TLOCOr--OO(j)~:::~wwOO:2:2:c:c:ccncncn
Station Number
FIG. 2. Autotrophic carbon ofpicoplankton « 2 pm) and larger-sized organisms for each sampling station during a) spring and b) summer sampling periods. Specific information on station locations andabbreviations can be found in Figure 1 and Table 1.

Station Number
0 N....... N('t)~L£)<O ...... OOO> .......wwOO:::2::::2:IIICf)Cf)Cf)
o
50
150 b) SUMMER• ROTIFERS~ CILIATES~ FLAGELLATES
100 ~ BACTERIA
538 Fahnenstiel et al.
120a) SPRING-..J- 100 • ROTIFERSC)
.=; ~ CILIATESC ~ FLAGELLATES -0 80 -- ..J
~ -.c BACTERIA enl- .=;ca0 60 cu 0.- .c.c l-e. 40 ca0 0I-- .~0I- 20 .cCI) e.-CI) 0:t: I--0 0
I-CI)
....... N ('t) ~ L£) <0 ...... 00 0> -W W 0 0 :::2: :::2: I I I CI)
:t:Station Number
FIG. 3. Carbon concentration of major groups of heterotrophic microorganisms for each sampling station during a) spring and b) summer sampling periods. Specific information on station locations andabbreviations can be found in Figure 1 and Table 1.
Heterotrophic Microorganisms
Taxonomic affinity was used to distinguish microorganisms. Microorganisms are defined as allautotrophic organisms and all heterotrophic organisms with the exception of crustaceans. Heterotrophic microorganisms include bacteria,protozoans, rotifers, and zebra mussel veligers. Thistaxonomic grouping also has size differentiation.The largest heterotrophic microorganism, the rotiferConochilus unicornis, had a mean length of 285 !-Lmwhereas the smallest crustaceans, copepod nauplii,had mean lengths ranging from 279 to 323 !-Lm. Further justification for this distinction comes fromsample collection. All samples for microorganismswere collected from discrete water samples. Crustaceans were collected from integrating net tows.
Total heterotrophic microorganism biomass in theeuphotic zone ranged from 12 to 116 /lg C/L. Summer biomass was higher than spring biomass (Fig.3; means = 40 !-Lg C/L and 60 !-Lg C/L, P < 0.05).During spring, biomass was relatively consistentamong stations with the exception of western LakeErie (El) (Fig. 3a; p < 0.05 for all stations exceptE6). During summer, a consistent trend of increasing biomass was found among lakes in the order of
Lakes Superior, Huron, Michigan, Ontario, and Erie(Fig.3b).
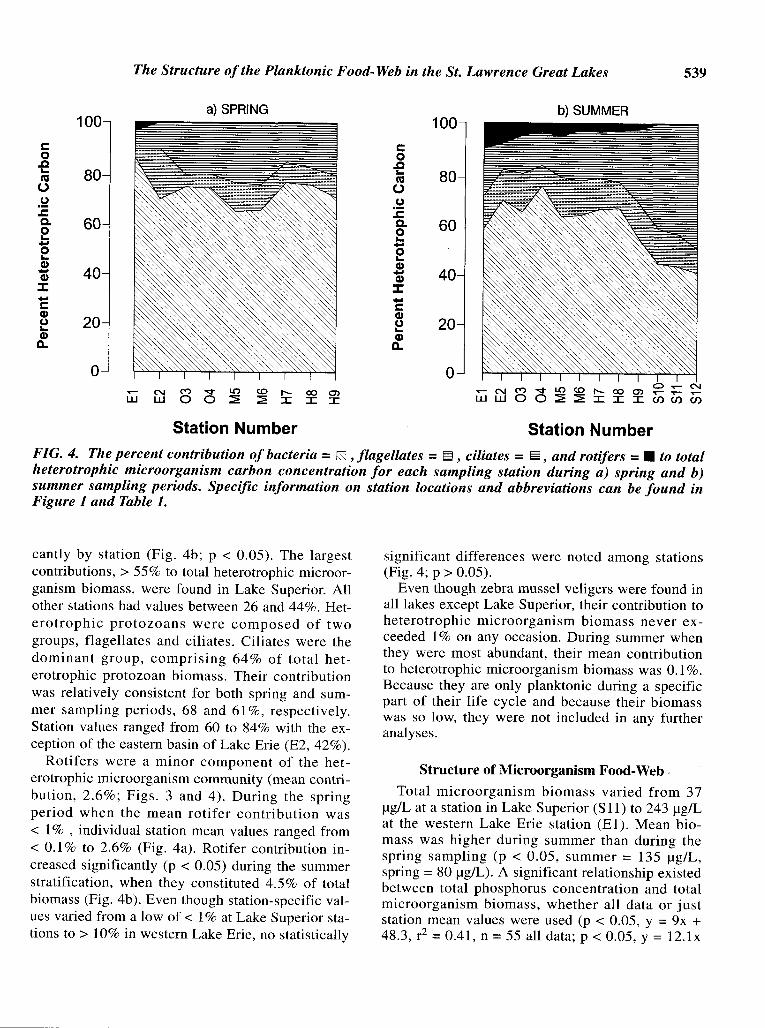
The structure of the heterotrophic microorganismcommunity was remarkably similar among lakes,especially during the spring isothermal period(Figs. 3 and 4). Significant seasonal differences inthe relative contribution to total biomass were notedfor all major groups (bacteria, protozoans, and rotifers, p < 0.05); however, with the exception ofprotozoans during the summer, no statistically significant differences were noted for any majorgroups among stations within either season. Bacteria constituted 72% of total heterotrophic microorganism biomass during the spring isothermal periodand 60% during summer (Fig. 4).
Heterotrophic protozoans (ciliates and flagellates)were another important group of heterotrophic microorganisms (Figs. 3 and 4), comprising 32% oftotal heterotrophic microorganism biomass. Thecontribution of protozoans varied with season(p < 0.05). Unlike bacteria, the greatest contributionof protozoans occurred in summer (36%) as compared to spring (28%). In the spring, the relativecontribution ranged from 13 to 36% with the lowestvalue from western Lake Erie (Fig. 4a). During thesummer, the relative contribution varied signifi-
The Structure ofthe Planktonic Food-Web in the St. Lawrence Great Lakes 539
100a) SPRING b) SUMMER
100
c c0 0.c .c... 80
... 80ns ns0 0.2 .2.s:::: .s::::Q. 60 Q. 600 0... ...- -0 0... ...CI)
40CI)- - 40CI) CI)
:J: :J:- -c cCI)
20CI)
(J (J 20... ...CI) CI)
11. 11.
0 0C") "<T LO CD N C")"<TLOCDr-ex:>O)~;::: N
...... N r- ex:> 0) ...... ......w w 0 0 ~ ~ ::c ::c ::c w w oO~~::C::C::C(J)(J) (J)
Station Number Station Number
FIG. 4. The percent contribution ofbacteria = IS] ,flagellates =~ , ciliates =§, and rotifers =• to totalheterotrophic microorganism carbon concentration for each sampling station during a) spring and b)summer sampling periods. Specific information on station locations and abbreviations can be found inFigure 1 and Table 1.
cantly by station (Fig. 4b; P < 0.05). The largestcontributions, > 55% to total heterotrophic microorganism biomass, were found in Lake Superior. Allother stations had values between 26 and 44%. Heterotrophic protozoans were composed of twogroups, flagellates and ciliates. Ciliates were thedominant group, comprising 64% of total heterotrophic protozoan biomass. Their contributionwas relatively consistent for both spring and summer sampling periods, 68 and 61 %, respectively.Station values ranged from 60 to 84% with the exception of the eastern basin of Lake Erie (E2, 42%).
Rotifers were a minor component of the heterotrophic microorganism community (mean contribution, 2.6%; Figs. 3 and 4). During the springperiod when the mean rotifer contribution was< 1% , individual station mean values ranged from< 0.1 % to 2.6% (Fig. 4a). Rotifer contribution increased significantly (p < 0.05) during the summerstratification, when they constituted 4.5% of totalbiomass (Fig. 4b). Even though station-specific values varied from a low of < 1% at Lake Superior stations to > 10% in western Lake Erie, no statistically
significant differences were noted among stations(Fig. 4; p > 0.05).
Even though zebra mussel veligers were found inall lakes except Lake Superior, their contribution toheterotrophic microorganism biomass never exceeded 1% on any occasion. During summer whenthey were most abundant, their mean contributionto heterotrophic microorganism biomass was 0.1 %.Because they are only planktonic during a specificpart of their life cycle and because their biomasswas so low, they were not included in any furtheranalyses.
Structure of Microorganism Food-Web·
Total microorganism biomass varied from 37flg/L at a station in Lake Superior (S 11) to 243 flg/Lat the western Lake Erie station (El). Mean biomass was higher during summer than during thespring sampling (p < 0.05, summer = 135 flg/L,spring = 80 flglL). A significant relationship existedbetween total phosphorus concentration and totalmicroorganism biomass, whether all data or juststation mean values were used (p < 0.05, y = 9x +48.3, r2 = 0041, n =55 all data; p < 0.05, y = 12.1x

540 Fahnenstiel et al.
FIG. 5. Ratio of autotrophic:heterotrophic carbon for microorganisms for each sampling stationduring spring and summer sampling periods. Specific information on station locations and abbreviations can be found in Figure 1 and Table 1.
Station Number
+ 25.7, r2 =0.63, n = 20, station means from eachseason). The limited range of total phosphorus concentrations from Lakes Huron, Michigan, Superior,and Ontario has an effect of overleveraging thehigher values from western Lake Erie.
For microorganisms, the ratio of autotrophic toheterotrophic biomass averaged 1.3 (Fig. 5). Significant differences were noted by season (p < 0.05).During the spring period, the ratio averaged 1.1,whereas it increased to 1.5 during summer (Fig. 5).Mean ratios for stations during the spring periodwere similar (p > 0.05), ranging from 0.78 to 1.47.The increase in the mean summer value was attributable to higher values in Lakes Huron and Superior,where the summer mean value of 2.1 was significantly higher than summer mean values for LakesMichigan, Erie, and Ontario (p < 0.05, mean = 1.1,Fig. 5). In Lakes Michigan, Erie, and Ontario, meanstation ratios, ranging from 0.8 to 1.3, were similaramong stations and between seasons (p > 0.05).
We took a simple functional approach to the microorganism community by examining the biomass of producers (autotrophs), decomposers(heterotrophic bacteria), and micrograzers (heterotrophic protozoans and rotifers) (Fig. 6). Produc-
_SUMMERI:SJSPRING
4-
2-
3-
1-CJ:cQ.
~-.s:::J«
a) SPRING b) SUMMER100 100c c
0 0.c .c"- "-ca 80 ca 800 0E E.!!! .!!!c 60 c 60ca caC) C)"- "-0 00 0"- 40 "- 40.~ .~:E :E- -c cCI) 20 CI) 20CJ ~"-CI) CI)a. a.
0 0('t) "<:f" 1.0 <.D ..... . T""" N
T""" N 00 0> T""" N ('t)"<:f"~~"",000>T"""T"""T"""W W 0 0 :::2 :::2 :::c :::c :::c w w 00 :::c:::c:::c(/)(/)(/)
Station Number Station Number
FIG. 6. Percent contribution ofproducers ([Sj I autotrophs), decomposers (~, heterotrophic bacteria), andmicrograzers (IIIIII, heterotrophic protozoans and rotifers) to total microorganism carbon for each samplingstation during a) spring and b) summer sampling periods. Specific information on station locations andabbreviations can be found in Figure 1 and Table 1.

The Structure of the Planktonic Food-Web in the St. Lawrence Great Lakes 541
ers, decomposers, and micrograzers composed onaverage 54%,31%, and 15% of total biomass, respectively. The relative contribution of all groupsvaried seasonally (p < 0.05), but limited variationwas noted among stations within a season. Duringspring, the contribution of autotrophs, bacteria, andmicrograzers was relatively similar among stations(p > 0.05) and averaged 50% (station range 42 to56%), 37% (station range 30 to 43%), and 13%(station range 8 to 16%), respectively (Fig. 6a).During the summer, however, the relative contribution among groups was more variable (Fig. 6b).Significant differences among stations were notedfor autotrophs (p < 0.05), but not for bacteria or micrograzers (p > 0.05). Autotrophs were greater contributors to total biomass in Lakes Huron andSuperior than in Lakes Erie, Michigan, and Ontario(p < 0.05, mean Superior and Huron values =64% ,mean Erie, Ontario, and Michigan values = 52%).Overall, the contribution of autotrophs, bacteria,and micrograzers for the summer sampling periodaveraged 57%, 26%, and 17% , respectively.
For size analysis we used the definitions ofSieburth et al. (1978) and maximum linear dimensions to classify microorganisms as picoplankton(0.2 to 2 flm) or nanno- and microplankton (2 to200 flm). The ratio of picoplankton biomass to totalnanno- and microplankton biomass averaged 0.96(Fig. 7). No significant differences were found in
the ratio of picoplankton to total nanno- and microplankton between seasons (spring = 1.0, summer0.91) or among stations within a season (p> 0.05 inall cases).
Crustaceans
The final component of the planktonic food-webis the mesograzers or crustaceans. Due to their sizeand biology, crustacean zooplankton occupied aunique position in this investigation, and our dataon their abundance is the least consistent with datacollected for all other groups. Because of their size,crustaceans were collected with nets, whereas allother components were collected from the samediscrete water samples. At all stations, crustaceanbiomass was much greater during summer stratification than during spring (Fig. 8; p < 0.05, springmean =18 flg /L, summer mean =107 flg/L ). During the spring, significant differences were notedamong stations (p < 0.05). Mean values from LakesHuron and Michigan were significantly larger thanvalues from Lakes Erie and Ontario (p < 0.05, meanHuron and Michigan =27 flg/L, mean Erie and Ontario = 8 flg/L). Not only did total crustacean biomass increase during the summer, but thevariability among stations did as well (Fig. 8).Crustacean biomass increased in order from LakesSuperior (28 flg/L) , Huron (79 flg/L) , Ontario (112
c
~CIIIiio(,)
ii:
2- ~SPRING .SUMMER
1 -
Station Number
-...J-C)::t-Co.c~
nl(,)
CnlCI)(Jnl-II):::J~
(,)
40
300
200
100
ISJSPRING .SUMMER
...... '" ("I) ~ LOCO r--co 0> ~::= ~w woo ::2E::2E :r::r: :r: en en en
FIG. 7. Ratio of picoplankton carbon: nannoand microplankton carbon for each sampling station during spring and summer sampling periods.Specific information on station locationsand abbreviations can be found in Figure 1 andTable 1.
Station NumberFIG. 8. Crustacean carbon for each samplingstation during spring and summer sampling periods. Specific information on station locationsand abbreviations can be found in Figure 1 andTable 1.

542 Fahnenstiel et al.
/-lg/L) , Michigan (120 /-lg/L), and Erie (168 /-lg/L)(Fig. 8). The most variability between stations inthe same lakes was found in Lake Erie, where western (El) and eastern (E2) portions of the lake variedby a factor of 2.1.
Station NumberFIG. 9. Ratio of autotrophic:heterotrophic car·bon for all planktonic organisms during springand summer sampling periods. Specific information on station locations and abbreviations can befound in Figure I and Table 1.
Structure of Planktonic Food·Web
All further analysis will consist of all planktonicorganisms including crustaceans. The ratio of autotrophic biomass to total heterotrophic biomasswas strongly influenced by crustacean biomass, asthese ratios were much lower than the ratio for microorganisms (Fig. 9). The mean ratio of autotrophic: heterotrophic biomass from spring (0.73)was significantly higher than the summer ratio(0.51; P < 0.05). During the spring, the mean ratiowas relatively similar among stations (p > 0.05),ranging from 0.5 to 1.0. During summer stratification, mean values at most stations were lower withthe exception of the Lake Huron stations (Fig. 9).Mean values from most stations also were relativelysimilar, ranging from 0.38 to 0.61, with the exception of all Lake Huron stations (H7-H9, mean =0.69) which were significantly higher than the others (p < 0.05) and the southern Lake Michigan sta-
tion (M5, mean =0.25) which was significantlylower (p < 0.05). The low values from the LakeMichigan station can be attributed to the large summertime crustacean component; crustacean biomassin Lake Huron was approximately half that of LakeMichigan (Fig. 8).
For these analyses, the planktonic food-web wasdivided into major functional groups; producers(autotrophs), decomposers (heterotrophic bacteria),micrograzers (heterotrophic protozoans, rotifers,and veligers), and mesograzers (crustaceans). Because of the large increase in mesograzers duringsummer stratification, both absolute values (Fig.10) and relative values (Fig. 11 and discussion) arepresented. With the exception of micrograzers, allmajor groups exhibited significant seasonal differences (p < 0.05) in their relative contribution tototal planktonic biomass. During the spring period,the percent contributions of autotrophs, decomposers, micrograzers, and mesograzers were 40%,30%, 11 %, and 19%, respectively. The only significant difference among stations in the relative contribution of any major group to total planktonicbiomass was the larger contribution of mesograzers(26%) in Lakes Huron and Michigan as comparedto Lakes Erie and Ontario (9%; p < 0.05; Fig. lOa).During summer stratification, the autotrophs, decomposers, micrograzers, and mesograzers constituted 32%, 15%, 9%, and 44% of total planktonbiomass, respectively. Although there were no significant differences in the relative contribution ofall major groups among stations (p > 0.05), the relative contribution of mesograzers was notably higherfor Lake Michigan than for all other lakes (Fig.lOb). Mesograzers constituted 54% of the total biomass in Lake Michigan and 41 % in the other fourlakes.
The structure of the entire planktonic food-webwas also analyzed by size by adding mesoplankton(organisms 200 to 20,000 /-lm) to the picoplankton(0.2 to 2.0 /-lm) and nanno- and microplankton (2 to200 /-lm) groups already presented. Overall, picoplankton, nanno- and microplankton, and mesoplankton constituted 29%, 33%, and 37% of totalplankton biomass (Fig. 12). The contribution of allthree groups exhibited significant differences byseason (p < 0.05, Fig. 12). The mesoplankton increased in relative contribution from spring to summer (spring = 28%, summer = 46%) whereaspicoplankton and nanno- and microplankton exhibited a decrease (spring, pico. = 34%, nanno. andmicro. = 38%; summer, pico. = 25%, nanno. andmicro. = 29% ). No significant differences were
LSlSPRING .SUMMER
0..- N..- N C") ~ LO co r- 00 0> ..- ..- ..w wOO ~~ II I (f) (f) (f)
2.0-
0.5-
1.5 -
1.0 -
.~
.cQ,
~-o:::J<C

The Structure ofthe Planktonic Food-Web in the St. Lawrence Great Lakes
~ N M ~ ~ ~ ~ ~ mW woo ~ ~ ~ ~ ~
543
~ MESOGRAZERSIII MICROGRAZERS~ DECOMPOSERS~ PRODUCERS
b) SUMMER
o
200
400
600-...J-C)
~t:o:;;~....t:CD(.)t:o
(.)
t:o.c"'co(.)
~ MESOGRAZERSmMICROGRAZERSffil DECOMPOSERS~ PRODUCERS
a) SPRING
o
50
150
100
200-...J-C)
~t:o:;;~....t:CD(.)t:o
(.)
t:o.c"'co(.)
Station Number Station Number
FIG. 10. Planktonic carbon ofproducers (autotrophs), decomposers (heterotrophic bacteria), micrograzers (protozoans and rotifers), and mesograzers (crustaceans) during a) spring and b) summer samplingperiods for each sampling station. Specific information on station locations and abbreviations can befound in Figure 1 and Table 1.
100
t: 800.c"'-co
(.) 60-co....~
40....t:CD(.)"'-CD 20a.
oQ) 0 c: c: ....
"C "C co e 0w 19 Ol "C
:.c :::l Q)c: ~ 0..0 (.) :::l
~ en
Lake
FIG. 11. Percent contribution of producers (lSI ,autotrophs) , decomposers (~ , heterotrophic bacteria), micrograzers (1lIIIll, protozoans and rotifers),and mesograzers (~, crustaceans) to total plankton carbon for each Great Lake.
noted among stations within a season for any of thegroups (p > 0.05) with the exception of mesoplankton in the spring. The contribution of mesoplanktonin Lake Erie (14%) was lower than those in LakesHuron (37%) and Michigan (35%).
DISCUSSION
Planktonic Food-Web Structure
This study represents the first attempt to characterize the entire planktonic food-web in all five St.Lawrence Great Lakes using the same techniques,and for the microplankton, the same water sample.As such, many insights into relative communitystructure should be provided that hitherto have beenimpossible" Previous descriptive work on the structure of the Great Lakes planktonic food-web hasbeen more restrictive, e.g, confined to a specifictaxonomic group or spatial area (e.g., Vollenweideret af. 1974, Watson 1974, Munawar and Munawar1986, Lean et aZ. 1987, Scavia and Fahnenstiel1987, Sprules et af. 1991, Johannsson et af. 1991).Many of these studies focused on the lowest levelof organization (species) within broad taxonomicgroups, i.e., ciliates, phytoplankton, rotifers, andconsequently differences in community structure

544 Fahnenstiel et al.
a) SPRING100
c 800.c...ca0ca 60-t=-0 40-cQ)
~Q)
20Q.
0....... N ('I") ~ LO co I"- 00 0)
w w 0 0 ~ ~ ::c ::c ::c
Station Number
100
c 800.c...ca0 60(ij-t=-0 40-cQ)u...Q) 20Q.
o
b) SUMMER
Station Number
FIG. 12. Percent contribution of picoplankton ([:S]) , nanno- and microplankton (~) and mesoplankton(1IllID) to total planktonic carbon for each sampling station during the a) spring and b) summer samplingperiods. Specific information on station locations and abbreviations can be found in Figure I and Table 1.
were emphasized. While species differences withinbroad taxonomic groups were also found and willbe discussed in future studies, the patterns elucidated in this study were only possible by analyzingall components microscopically to the lowest taxonomic level (in most cases, species) using appropriate techniques, expressing all biomass in similarunits, and focusing on broad taxonomic, functional,or size groups.
Despite the limited sampling during two majorthermal periods in this study, the similarity in thestructure o{ the planktonic food-web, as evidencedby the relative contribution of broad taxonomic,functional or size groups (Figs. 4, 6, 10, and 12)among all stations in the Great Lakes, was remarkable and surprising. Although the absolute biomassof major groups varied in some cases by a factor often among stations (Figs. 3 and 10), variation in relative contribution was far more constrained (usuallyless than a factor of two) and predictable. Most ofthe variation in structure was noted between seasons and not spatially within or among stations indifferent lakes. Of the seventeen ratios analyzed inthis study (e.g., bacteria:total microheterotrophs, picoplankton:nanno- and microplankton, autotroph:
heterotroph), fifteen varied significantly betweenseasons. However, during the spring only two parameters varied significantly among stations, and during summer only four parameters variedsignificantly among stations. Given the limitedsampling and previous literature noting differencesin the planktonic food-web among lakes at lowerlevels of organization, this much similarity amongstations was not anticipated.
The broad similarity in the structure of the microorganism community across the offshore regionsof the Great Lakes appears to be a relatively recentphenomenon, likely due to recent changes in thestructure of the community in the lower lakes. Although data are limited, previous studies fromLakes Michigan, Huron, and Ontario provide for aprovisional comparison to conditions in the 1980s.These comparisons are limited to studies of broadtaxonomic groups including the abundance and biomass of microorganisms in Lakes Michigan andHuron in the late 1980s (Scavia et ai. 1986,Makarewicz 1987, Carrick and Fahnenstiel 1989,Pernie et al. 1990, Carrick and Fahnenstiel 1990,Fahnenstiel and Carrick 1992). The comparisonsare limited to previous studies that sampled the off-

The Structure of the Planktonic Food-Web in the St. Lawrence Great Lakes 545
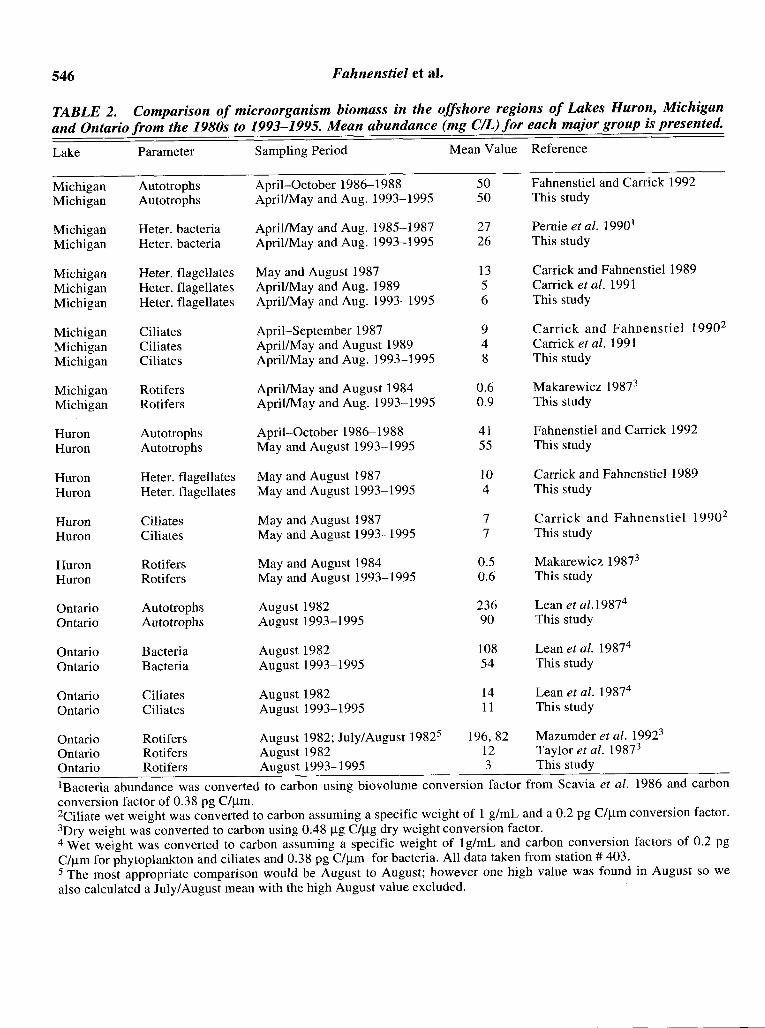
shore regions of these lakes during similar time periods and utilized similar techniques. Results fromthese studies suggest that the structure of the microorganism community has not changed in LakesMichigan and Huron from the late 1980s throughthe early/mid 1990s as abundances of all majorgroups were similar between the two time periods(Table 2).
Unlike Lakes Michigan and Huron, the structureof the microorganism community in Lake Ontario,and possibly Lake Erie, appears to have changedfrom the 1980s (Table 2). Results of a large interdisciplinary study of the Lake Ontario food-web,conducted in 1982 as part of the Lake Ontario Nutrient Assessment Study (LONAS), were reportedin several papers (Gray 1987, Pick and Caron 1987,Taylor et at. 1987, Taylor and Heynen 1987,Mazumder et al. 1992). Lean et at. (1987) summarized most of the results, expressing all values insimilar units and the results from the mid-lake station (403) are presented in Table 2. Bacteria andphytoplankton biomass in the 1993 to 1995 periodwere approximately half of 1982 values; however,ciliate biomass was relatively similar for the twoperiods (Table 2). Rotifers exhibited the most pronounced difference between the two time periods(Table 2). In 1982, rotifers constituted over 75% oftotal zooplankton biomass with rotifers biomassvalues of approximately 82 Ilg C/L during theJuly/August period. Summer rotifer biomass valuesfor Lake Ontario in this study averaged only 3.3 IlgC/L and the highest value was only 4.8 Ilg C/L. Thehigher values for rotifers in 1982 even exceeded the1993 to 1995 estimates of total heterotrophic microorganism biomass (bacteria, protozoans, and rotifers), which averaged 77 Ilg C/L. The high valuesreported by Mazumder et at. (1992) are not consistent with estimates from Haney grazing chambersreported by Taylor et at. (1987) from the samestudy period. Their rotifer biomass averaged approximately 12 Ilg C/L which are more consistentwith the numbers reported in this investigation.
Autotrophic:heterotrophic ratios for the planktoncommunities in the Great Lakes may be useful forassessing the status or health of the system. Average autotrophic/heterotrophic ratios for microorganisms and for all plankton for the Great Lakes were1.3 and 0.6, respectively (Figs. 5 and 9). The overall autotrophic:heterotrophic ratio (all plankton) ismuch lower than the microorganism ratio, due tothe inclusion of crustaceans. While this total plankton ratio is interesting and useful for future comparisons, it has limited value in assessing ecosystem
function or status. For microorganisms, the size andgeneration times of autotrophs and heterotrophs arerelatively similar, whereas crustaceans are muchlarger than the other groups and typically exhibitmuch longer generations. This longevity allowsthem to better integrate environmental variability,but provides for a less direct coupling with presentmicroplankton populations and environmentalconditions.
An interesting aspect of the autotrophic:heterotrophic ratios is the limits or constraints on variability and the role of self-regulating mechanismson these ratios. The relationship between this variability and the controlling influence of abiotic andbiotic perturbations is of particular interest for theGreat Lakes. These relationships are interesting notonly as they apply to broad functional ratios, but toall aspects of broad food-web structure discussed inthis paper. Food-web structure appears to controlthe energy transfer within the food-web, and therefore ultimately, overall trophic efficiency (Hairstonand Hairston 1993). Thus, the limits to variationand constraints of the planktonic food-web structurewill likely have implications for management of theGreat Lakes. However, without a larger number ofobservations over a greater range of conditions, it isdifficult to adequately address questions of limitsand control of variability. The present study beginsthis process, as some interesting patterns werenoted. For example, microorganism autotrophic:heterotrophic ratios were significantly higher during the summer in Lakes Huron and Superior ascompared to the other lakes which might suggestsome possible link between these ratios and the degree of anthropogenic alteration. Also, microorganism autotrophic:heterotrophic ratios might beexpected to decrease during the summer as compared to the spring because some heterotrophicgrowth rates appear to be inhibited at lower temperatures (Scavia and Laird 1987); however the opposite was found. Total autotrophic:heterotrophicratios did exhibit this seasonal pattern, but this wasrelated to the large increase in crustacean biomassduring the summer.
Abiotic and Biotic Control ofFood-Web Structure
One important environmental factor that changedfrom the 1980s to the 1990s in Lakes Ontario andErie, and likely played a role in controlling theabundance and composition of the microorganismcommunities, was the availability of phosphorus.
546 Fahnenstiel et aI.
TABLE 2. Comparison of microorganism biomass in the offshore regions of Lakes Huron, Michiganand Ontario from the 1980s to 1993-1995. Mean abundance (mg CIL) for each major group is presented.
Lake Parameter Sampling Period Mean Value Reference
Michigan Autotrophs April-October 1986-1988 50 Fahnenstiel and Carrick 1992Michigan Autotrophs April/May and Aug. 1993-1995 50 This study
Michigan Heter. bacteria April/May and Aug. 1985-1987 27 Pernie et aI. 19901
Michigan Heter. bacteria April/May and Aug. 1993-1995 26 This study
Michigan Heter. flagellates May and August 1987 13 Carrick and Fahnenstiel 1989Michigan Heter. flagellates AprillMay and Aug. 1989 5 Carrick et aI. 1991Michigan Heter. flagellates April/May and Aug. 1993-1995 6 This study
Michigan Ciliates April-September 1987 9 Carrick and Fahnenstie1 19902
Michigan Ciliates April/May and August 1989 4 Carrick et at. 1991Michigan Ciliates April/May and Aug. 1993-1995 8 This study
Michigan Rotifers April/May and August 1984 0.6 Makarewicz 19873
Michigan Rotifers April/May and Aug. 1993-1995 0.9 This study
Huron Autotrophs April-October 1986-1988 41 Fahnenstie1 and Carrick 1992Huron Autotrophs May and August 1993-1995 55 This study
Huron Heter. flagellates May and August 1987 10 Carrick and Fahnenstie1 1989Huron Heter. flagellates May and August 1993-1995 4 This study
Huron Ciliates May and August 1987 7 Carrick and Fahnenstiel 19902
Huron Ciliates May and August 1993-1995 7 This study
Huron Rotifers May and August 1984 0.5 Makarewicz 19873
Huron Rotifers May and August 1993-1995 0.6 This study
Ontario Autotrophs August 1982 236 Lean et aI.19874
Ontario Autotrophs August 1993-1995 90 This study
Ontario Bacteria August 1982 108 Lean et al. 19874
Ontario Bacteria August 1993-1995 54 This study
Ontario Ciliates August 1982 14 Lean et al. 19874
Ontario Ciliates August 1993-1995 11 This study
Ontario Rotifers August 1982; July/August 19825 196,82 Mazumder et at. 19923
Ontario Rotifers August 1982 12 Taylor et at. 19873
Ontario Rotifers August 1993-1995 3 This study
IBacteria abundance was converted to carbon using biovolume conversion factor from Scavia et at. 1986 and carbonconversion factor of 0.38 pg C/Ilm.2Ciliate wet weight was converted to carbon assuming a specific weight of 1 g/mL and a 0.2 pg C/Ilm conversion factor.3Dry weight was converted to carbon using 0.48 Ilg C/Ilg dry weight conversion factor.4 Wet weight was converted to carbon assuming a specific weight of 19/mL and carbon conversion factors of 0.2 pgC/Ilm for phytoplankton and ciliates and 0.38 pg C/Ilm for bacteria. All data taken from station # 403.5 The most appropriate comparison would be August to August; however one high value was found in August so wealso calculated a July/August mean with the high August value excluded.

The Structure ofthe Planktonic Food-Web in the St. Lawrence Great Lakes 547
Total phosphorus concentrations exhibited a largedecrease from 1980 through the 1990s due to decreased phosphorus loading and the impacts of nonindigenous mussels (Dreissena polymorpha, andpossibly D. bugensis). Phosphorus loadings to LakeOntario decreased substantially in the 1970s producing large decreases in lake concentrations by the1980s (1ohengen et al. 1994). Total phosphorusconcentrations decreased from 16 flg/L in 1981 to10 flg/L in 1991. The changes in phytoplankton biomass from the 1982 and 1993 to 1995 studies(Table 2) are consistent with the decline in phosphorus concentrations. The significant relationshipbetween total phosphorus concentrations and microorganism biomass in this study (r2 > 0.40) supports the primary role of phosphorus in controllingplanktonic biomass. Despite no further declines inphosphorus loadings in the 1990s (1. Hartig, HC,pers. comm.) these data suggest that offshore phosphorus concentrations have declined further in LakeOntario in 1993 to 1995 (Table 1). The recent decline in offshore total phosphorus concentrations,and likely nearshore concentrations, is attributableto the filtering activities of introduced mussels,Dreissena polymorpha and Dreissena bugensis, inthe late 1980s and 1990s. Tributary and other nutrient loads to the nearshore region of the lower lakesare being removed by the filtering activities ofabundant, nearshore populations of mussels. Inthese nearshore areas, mussels are an important sinkfor phosphorus (Johengen et al. 1995), and mayeven control phosphorus cycling and dynamics(Fahnenstiel et al. 1995, Heath et al. 1995, Johengen et al. 1995). Similar results were noted in Saginaw Bay, where water column phosphorusconcentrations decreased by approximately 40%after the introduction of zebra mussels even thoughphosphorus loadings to the bay were relatively similar throughout the period (Fahnenstiel et at. 1995).Thus, the water chemistry of the lower lakes is becoming similar to that of upper lakes due to thedominant input of relatively oligotrophic waterfrom upper Great Lakes via the Detroit River(Chapra and Sonzogni 1979) and the removal of nutrients and other particulates from tributaries andthe nearshore region by the filtering activities ofnon-indigenous mussels.
The similarity in the structure of the microorganism communities of all the Great Lakes in 1993 to1995, particularly in the spring, is due to the stronginfluence of abiotic factors. The lack of variabilityin the biological structure is caused by the similarity of physical/chemical forcing factors. Many of
the physical/chemical forcings in these lakes aresimilar due to their overall similarities in size, morphometry, and geographic position. Recent changesin total phosphorus concentrations in the lowerlakes have produced similar concentrations of thislimiting nutrient and similar optical characteristicsamong all the lakes (Table 1); this, in turn, furtheraccentuated the role of physical/chemical factors incontrolling the structure of microorganism communities. All of the samples were taken from the offshore waters of the Great Lakes, where regionalinfluences (e.g., riverine inputs, etc.) are minimizeddue to dilution and large-scale circulation. Thelarge-scale circulation, together with the connectingchannels, ensure similarities among the lakes, particularly the influence of the upper lakes on thelower lakes through the transport and mixing oftheir waters. The importance of physical/chemicalfactors even extends to stratified conditions whenbiological control of food-web structure is morelikely (Kitchell et ai. 1988 ); greater variability inthe structure of microorganism communities wasnoted during stratification (Figs. 4b, 6b), but theoverall similarity in structure among stations wasstill maintained for most groups. It should also benoted that the variability of abiotic controlling factors (e.g., temperature, mean irradiance in mixedlayer, mixed-layer depth, total phosphorus concentrations, etc.) also exhibited greater variability inthe summer as compared to the spring, so increasedvariability in food-web structure among stationscannot be attributed easily to biotic factors. Therefore, given the similarities in size and chemistry,their sharing of water through the connecting channels, and the impact of large-scale circulation andmixing, strong similarities in the structure of theplanktonic food-web of the Great Lakes should beexpected.
The strong similarity in structure of microoorganism communities across the Great Lakes does notpreclude the possibility of biological control, butstrong biological control would be expected to produce greater variability among the lakes consistentwith the variation of abundance and the impact ofimportant organisms (zebra mussels, and vertebrateand invertebrate planktivores) in the different lakes(Holland et al. 1995, Nalepa and Fahnenstiel 1995,Rand et al. 1995, Yurista and Schulz 1995). Biological control acting primarily through predation canbe important in controlling the abundance andstructure of microorganism communities; however,in this study evidence of strong biological controlof the broad-scale structure of microorganism com-

548 Fahnenstiel et ale
munities in the Great Lakes was not apparent. Itmust be emphasized that biological regulation ofspecies abundances within broad taxonomic groupswas not part of this investigation. Rather evidenceof strong biological control of measured parameterswas sought.
One species that has altered many parts of theGreat Lakes is the zebra mussel (Dreissena poiymorpha). Zebra mussels are an important non-indigenous species that have been demonstrated toinfluence plankton abundance and possibly evenphytoplankton species composition in parts of theGreat Lakes (Fahnenstiel et ai. 1995, Holland et ai.1995, Lavrentyev et at. 1995). In systems impactedby zebra mussels, large changes in particle andplankton abundance, with concurrent changes inoptical characteristics and nutrient concentrations,have been noted (Holland et ai. 1995, Nalepa andFahnenstiel 1995). Their perceived impact on thebroad structure of the microorganism communityseems obvious. Yet, the similarity in microorganismstructure between Lake Erie, a zebra mussel-impacted lake, and the upper Great Lakes, particularlyLakes Huron and Superior (non-impacted systems),may suggest that zebra mussels are not the dominant direct factor affecting broad-scale structure ofthe microorganism community. Zebra mussels arecontributing to the similarity in microorganismfood-web among the lakes by changing bulk orcommunity characteristics (e.g" optical, nutrient,particle characteristics) of the lower lakes makingthem more similar to those of the upper lakes, butnot necessarily by directly changing grazing differentials among the groups analyzed in this investigation. Because zebra mussels are capable of filteringall major groups of microorganisms (Lavrentyev etai. 1995, Horgan and Mills 1997), their lack of apronounced direct impact on the broad structuralgroups may not be so surprising. Thus, over shorttime periods zebra mussel influence is primarily related to regulation of bulk (community) concentrations and characteristics due to the significantincrease in overall grazing loss rates among all microorganisms. Over longer time periods, zebra mussels likely directly affect the structural compositionof the microorganism community and even speciescomposition within broad taxonomic groups whenpopulation-specific grazing differentials are manifested. Quagga mussels (Dreissena bugensis) areanother important organism with the potential toalter plankton community structure (Dermott andMunawar 1993); at this time, however, there ap-
pears to be no evidence of their large-scale impacton the variables measured in this study.
The most-studied aspect of biological control ofthe food-web structure is associated with vertebrateplanktivory, often referred to as top-down control(McQueen et ai. 1986, McQueen et ai. 1989).Planktivorous fish can strongly influence the sizestructure and species composition of zooplanktoncommunities which, in turn, can influence phytoplankton (microorganism) abundance and composition. The critical link for this top-down control ispresence of a keystone species, such as the largebodied Daphnia, D. pulicaria or D. puiex (Polis andStrong 1996). These top-down effects are primarilymanifested during summer stratification (Kitchell etai. 1988). Previous work in the Great Lakes hasdemonstrated strong top-down control of phytoplankton abundance and possibly, even structure inLake Michigan during the summers of 1983 to 1984when Daphnia puiicaria dominated the zooplankton community due to the collapse of the alewifepopulation (dominant planktivore) (Scavia et ai.1986, Fahrenstiel and Scavia 1987). Recent reanalysis of plankton and alewife data from LakeMichigan for the 1954 to 1987 period suggests thelinkage between alewife abundance, zooplanktonabundance and composition, and phytoplanktonabundance was weak and limited to the offshore region of the lake during the summer of 1983 (Evans1990, 1992). The presence of abundant populationsof Daphnia pulicaria was critical for the manifestation of top-down control of phytoplankton abundance. Similarly, in Lake Ontario, the crustaceanzooplankton community was dominated by smallcladocerans and copepods from 1981 to 1991 (Johannsson et at. 1991, O'Gorman et ai. 1997) and noevidence of top-down control of phytoplanktonabundance or composition has been reported. Because autotrophic and heterotrophic microorganisms are of similar size, the impact of top-downcontrol would likely extend to all microorganisms,not just phytoplankton.
Given the presence of abundant invertebrate andvertebrate planktivore communities and the dominance of copepods, and/or small-to-medium-sizedcladocerans in all the Great Lakes at this time, it isunlikely that planktivory would be important incontrolling the broad-scale structure of the microorganism community. In 1993 to 1995, the crustaceanzooplankton community of the Great Lakes wasdominated by copepods in the spring(> 95% biomass at all stations) and by copepodsand/or small-to-medium-sized cladocerans in the

The Structure ofthe Planktonic Food- Web in the St. Lawrence Great Lakes 549
summer. The mean size of the daphnid communitywas 1.3 mm in Lakes Huron, Michigan, and theeastern basin of Lake Erie, and 0.9 mm in Lake Ontario and the western basin of Lake Erie. Cladocerans were rare in Lake Superior, being found in onlyone sample where they constituted < 2% of totalcrustacean biomass. The important large-bodieddaphnid, D. pulicaria, was found in only two samples from the entire study, where they constituted< 1% of total crustacean biomass.
The lack of strong top-down effects on microorganism community structure in the Great Lakes islikely to continue into the future with a few unplanned exceptions due to present fishery management practices. Given the collapse of the salmonfishery in Lake Michigan in the 1980s resultingfrom the dramatic declines in alewife abundance,present fish management practice is to maintain adiverse, stable planktivore population in order tosustain the heavily stocked piscivore fishery (Eshenroder et aZ. 1995). This practice has been implemented twice in the 1990s. Concern for decliningstocks of planktivores in Lake Ontario (alewife)and the eastern basin of Lake Erie (smelt) resultedin cuts of salmonid stocking rates in these lakes (R.Eshenroder, Great Lakes Fishery Commission, pers.comm). The continued application of this practicein the Great Lakes is expected to produce smallerand fewer declines of planktivore biomass.
Importance of Microbial Food-Web
The functional group (autotrophic:heterotrophic;producers, decomposers, grazers) analysis revealedan abundant microheterotrophic community. Almost all of the heterotrophic microorganism biomass (ca. < 280 /lm) was associated with themicrobial food-web (protozoans and bacteria), asrotifer and veliger biomass were minor components. Previous work in the Great Lakes, particularly Lakes Michigan and Huron, has demonstratedan abundant and very active microbial food-web(e.g., Scavia et aZ. 1986, Pick and Caron 1987, Taylor and Heynen 1987, Carrick et aZ. 1991, Carricket aZ. 1992). This work confirms those observationsand extends them to all the Great Lakes. Heterotrophic bacteria dominated heterotroph microorganism biomass, contributing 65% of the total and31 % and 22%, respectively, of total microorganismand total plankton biomass. Previous studies in theGreat Lakes (Scavia et aZ. 1986, Pick and Caron1987) and other freshwater environments (Weisse etaZ. 1990, Lyche et aZ. 1996) have found similarly
high bacterial biomass. It should be noted that inthe highly retentive and autochthonously-drivenSargasso Sea, the ratio of heterotrophic microorganism biomass to phytoplankton biomass was 4(Fuhrman et aZ. 1989); this value is much higherthan the 0.8 ratio found in this study for the GreatLakes.
The large bacterial biomass in all the lakes andthe similarity in water chemistry may suggest a stabilizing role for the organic carbon or detrital pool.In small lakes, the dissolved organic carbon (DOC)pool plays an important role as a metabolic regulator and ecosystem stabilizer (Wetzel 1995). Thisidea was developed for small, allochthonously-driven lakes, but it may have application to the GreatLakes as well. The source of carbon, whether autochthonous or allochthonous, is probably not asimportant as the pool size and turnover rates of theDOC. Recent changes in concentrations of nutrientsin the lower lakes caused by the zebra mussel (Holland et af. 1995) likely extend to DOC (Johengen etaZ. 1995). Thus, DOC concentrations may be becoming similar in the lakes and the DOC poolwould likely have a unifying role for the heterotrophic communities in the Great Lakes. Therole that DOC concentrations play in mediating thestructure of the microorganism community in largelakes deserves more attention.
This study documents the important and ubiquitous role that picoplankton-sized organisms occupyin the Great Lakes. Picoplankton biomass (autotrophs and heterotrophs) was approximately equalto the combined biomass of nanno- and microplankton and represented 29% of total planktonic biomass. Previous analysis of nano- and microplanktonsize organisms using fluorescent microscopy alsohas documented the importance of picoplankton inthe Great Lakes (Fahnenstiel et aZ. 1986, Scavia etaZ. 1986, Pick and Caron 1987, Fahnenstiel andCarrick 1992). This work extends these observations to all the Great Lakes and places them in context with the entire planktonic community.However, not all studies on plankton communitystructure in the Great Lakes have found abundantand important populations of picoplankton-sized organisms. Sprules et aZ. (1991) and Sprules andGoyke (1994) presented information on the complete biomass size-spectrum for the planktoniccommunities from Lakes Michigan and Ontario.The unnormalized biomass spectra from both lakesexhibited two distinct peaks for phytoplankton andzooplankton (Fig. 2 in Sprules and Goyke 1994).Their peak in autotroph biomass occurred near 10

550 Fahnenstiel et al.
11m, and a conspicuous lack of significant biomassin the picoplankton-size fraction (autotrophic andheterotrophic) was found. This lack of picoplanktonbiomass, at least for their Lake Michigan work, canbe related to the use of inappropriate techniques forenumerating picoplankton-sized organisms (Pickand Caron 1987). For the Lake Michigan samples,the Utermohl technique (Munawar et aZ. 1974) wasused to enumerate all autotrophic organisms, frompicoplankton to net plankton. The Utermohl technique, based on inverted microscopy of settled samples, cannot provide accurate estimates ofpicoplankton-sized organisms (Pick and Caron1987). The lack of picoplankton biomass reportedfor the Lake Ontario samples is more difficult toexplain, but the results of Sprules and Goyke(1994) are not consistent with the results of thisstudy or with those of Pick and Caron (1987).
When picoplankton biomass is combined withprevious growth and production information onplanktonic communities in the Great Lakes, it isclear that picoplankton play an important, if notdominant, role in overall community metabolism inthe pelagic region of the Great Lakes. Picoplankton-sized organisms exhibit some of the highestgrowth rates of both heterotrophic and autotrophicorganisms in the Great Lakes. For example, in theupper Great Lakes autotrophic picoplankton have amean growth rate of approximately 0.5/d with arange of 0.1 to 1.5/d (Fahnenstiel et aZ. 1986; Fahnenstiel et a1. 1991a, b). Nanno- and net phytoplankton exhibit mean growth rates of O.l/d with arange of 0.1 to 0.5/d (Dorazio et aZ. 1987, Scavia etaZ. 1988, G. Fahnenstiel, unpubl. data). Similarly, inLake Michigan, heterotrophic protozoans exhibiteda mean growth rate of 0.3/d (Carrick et aZ. 1992),whereas heterotrophic bacteria had mean growthrates> 2.0/d (Scavia et aZ. 1986). Previous work onautotrophic and heterotrophic picoplankton productivity has also confirmed the important role that picoplankton sized organisms play in the metabolismof the Great Lakes. Autotrophic picoplankton contribute on average 20% of the total primary productivity in the upper Great Lakes; during summerstratification their contribution can exceed 40%(Fahnenstiel et aZ. 1986, Fahnenstiel and Carrick1992). Moreover, heterotrophic picoplankton (bacteria) production often exceeds total primary production during the summer in Lake Michigan(Scavia et aZ. 1986, Scavia and Laird 1987). Highmicroheterotroph productivity is possible in highlyretentive systems like the Great Lakes because of
the recycling potential of organic carbon (Scavia1988).
Finally, the conclusions of this study were simplya result of new observations of the planktonic foodweb; no novel or insightful experiments were conducted. This was a simple, but unique, look at thefood-web of the Great Lakes which used the sametechniques on the same water samples (at least formicroorganisms) from all the lakes. More insightsinto understanding the food-webs of the GreatLakes will occur when consistent and holistic approachs to sampling, analysis, and interpretation aretaken. Some of the difficulty in trying to understandthe ecology of the Great Lakes is due to variabilityin data from studies of limited scope and which employ different sampling methodologies. While thisapproach is suitable for understanding the factorscontrolling individual processes or the abundanceof specific organisms, it often produces an ecosystem view that is more variable and confusing thanall its individual components combined. Given thefunding constraints on Great Lakes research in the1990s, it will be important to apply more holisticapproaches to the study of the Great Lakes.
ACKNOWLEDGMENTS
The authors would like to thank the following individuals for their assistance: T. Bridgeman, A.Chapman, L. Courtney, W. Faust, D. Hodell, T. Johengen, W. Kenney, M. Omair, R. Stone, B. Wagoner, and the crew of the R/V Laurentian. R. Wetzeland an anonymous reviewer provided constructivecomments on an earlier version of the manuscript.This work was partially support by NSF grantOCE-9202774 and the Carl S. Swisher Endowment,Univ. Florida, to CLS and a NOAA- COP grant toGLF. GLERL contribution #1047.
REFERENCESAnderson, T., and Hessen, D. O. 1991. Carbon, nitrogen,
and phosphorus content of freshwater zooplankton.Limnol. Oceanogr. 36:807-813.
Azam, F., Fenchel, T., Field, J. G., Gray, J. S., MeyerReil, L. A., and Thingstad, F. 1983. The ecologicalrole of water-column microbes in the sea. Mar. Ecol.Prog. Ser. 10:257-263.
Beeton, A. M., and Chandler, D. C. 1963. The St.Lawrence Great Lakes. In Limnology in North America, ed. D. G. Frey, pp. 535-558. Madison, WI: Univ.Wisconsin Press.
__, and Schneider, R. S. 1998. A century of GreatLakes Research at the University of Mighigan. J.Great Lakes Res. 24:XX.

The Structure ofthe Planktonic Food-Web in the St. Lawrence Great Lakes 551
Berg, D. J., and Garton, D. W. 1988. Seasonal abundance of the exotic predatory cladoceran,Bythotrephes cederstromii, in western Lake Erie. J.Great Lakes Res. 14:479-488.
Borsheim, K. Y., and Bratbak, G. 1987. Cell volume tocell carbon conversion factors for a bacterivorousMonas sp. enriched from seawater. Mar. Ecol. Prog.Ser.36:171-175.
Bratbak, G. 1985. Bacterial biovolume and biomass estimations. Appl. Environ. Microbiol. 49: 1488-1493.
Bridgeman, T. B., Fahnenstiel, G. L., Lang, G. A., andNalepa, T. F. 1995. Zooplankton grazing during thezebra mussel (Dreissena polymorpha) colonization ofSaginaw Bay, lake Huron. J. Great Lakes Res.21:567-573.
Caron, D. A. 1983. Technique for enumeration of heterotrophic and phototrophic nanoplankton, using epifluorescent microscopy, and comparison with otherprocedures. Appl. Environ. Microbiol. 46:491-498.
__, Pick, F. R., and Lean, D. R. S. 1985. Chroococcoid cyanobacteria in Lake Ontario: Vertical and seasonal distributions during 1982. J. Phycol.21:171-175.
Carrick, H. J., and Fahnenstiel, G. L. 1989. Biomass,size structure, and composition of phototrophic andheterotrophic nanoflagellate communities in LakesHuron and Michigan. Can. 1. Fish. Aquat. Sci.46:1922-1928.
__, and Fahnenstiel, G. L. 1990. Planktonic protozoain lakes Huron and Michigan: Seasonal abundanceand composition of ciliates and dinoflagellates. J.Great Lakes Res. 16:319-329.
__, Fahnenstiel, G. L., Stoermer, E. F., and Wetzel,R. G. 1991. Observations on the importance of thezooplankton-protozoan trophic link. Limnol.Oceanogr. 36: 1335-1345.
__, Fahnenstiel, G. L., and Taylor, W. D. 1992.Growth and production of planktonic protozoa inLake Michigan: In situ versus in vitro comparisonsand importance to foodweb dynamics. Limnol.Oceanogr.37:1221-1235.
Chapra, S. c., and Sonzogni, W. C. 1979. Great Lakestotal phosphorus budget for the mid-1970s. J. WaterPoll. Contr. Fed. 51 :2524-2533
Culver, D.A., Boucherle, M. M., Bean, D. J., andFletcher, J. W. 1985. Biomass of freshwater crustacean zooplankton from length-weight regressions.Can. J. Fish. Aquat. Sci. 42:1380-1390.
Cushing, D. H., and Nicholson, H. F. 1958. The measurement of the carbon content of diatoms using theC-14 technique. A preliminary note. Rappt. ProcesVerbaux Reunions, Conseil Perm. Intern. ExplorationMer, 144:34.
Davis, C. C. 1966. Plankton studies in the largest GreatLakes of the world. Publ. No. 14, Ann Arbor, MI, GreatLakes Research Division, University of Michigan.
Davis, C. 0., and Simmons, M. S. 1979. Water chemistry
and phytoplankton field and laboratory procedures.Special Report No. 70, Ann Arbor, MI, Great LakesResearch Division, University of Michigan.
Dermott, R., and Munawar, M. 1993. Invasion of LakeErie offshore sediments by Dreissena, and its ecological implications. Can. J. Fish. Aquat. Sci.50:2298-2304.
Dorazio, R. M., Bowers, J. A., Lehman, J. T. 1987.Food-web manipulations influence grazer control ofphytoplankton growth rates in Lake Michigan. J.Plankton Res. 9:891-897.
Dozier, B. J., and Richerson, P. J. 1975. An improvedmembrane filter method for the enumeration of phytoplankton. Verh. Int. Verein. Limnol. 19:1524-1529.
Eshenroder, R. L., Holey, M. E., Gorenflo, T. K., andClark, R. D. 1995. Fish community objectives forLake Michigan. Ann Arbor, MI, Great Lakes FisheryCommission. Spec. Pub. 95-3.
Evans, M. S. 1990. Large-lake responses to declines inthe abundance of a major fish planktivore-the LakeMichigan example. Can. J. Fish. Aquat. Sci.47:1738-1754.
__. 1992. Historic changes in Lake Michigan zooplankton community structure: The 1960s revisitedwith implications for top-down control. Can. J. Fish.Aquat. Sci. 49: 1734-1749.
__, and Jude, D. J. 1986. Recent shifts in Daphniacommunity structure in southeastern Lake Michigan:A comparison of the inshore and offshore regions.Limnol. Oceanogr. 31:56-67.
Fahnenstiel, G. L., and Carrick, H. J. 1992. Phototrophicpicoplankton in lakes Huron and Michigan: Abundance, distribution, composition, and contribution tobiomass and production. Can. J. Fish Aquat. Sci.49:379-388.
__, and Scavia, D. 1987. Dynamics of Lake Michigan phytoplankton: Recent changes in surface anddeep communities. Can. J. Fish. Aquat. Sci.44:509-514.
__, Sicko-Goad, L., Scavia, D., and Stoermer, E. F.1986. Importance of picoplankton in Lake Superior.Can. J. Fish. Aquat. Sci. 43:235-240.
__, Carrick, H. J., Rogers, C. E., and Sicko-Goad, L.1991a. Red fluorescing phototrophic picoplankton inthe Laurentian Great Lakes: What are they and whatare they doing? Int. Rev. ges. Hydrobiol. 76:603-616.
__, Carrick, H. J., and Iturriaga, R. 1991b. Physiological characteristics and food-web dynamics ofSynechococcus in lakes Huron and Michigan. Limnol.Oceanogr. 36:219-234.
__, Lang, G. A., Nalepa, T. F., and Johengen, T. H.1995. Effects of zebra mussels (Dreissena polymorpha) colonization on water quality parameters in Saginaw Bay, Lake Huron. 1. Great Lakes Res.21:435-448.
Fenchel, T. 1988. Marine Plankton Food Chains. AnnRev. Ecol. Syst. 19:19-38.

552 Fahnenstiel et al.
Fuhrman, J. A., Sleeter, T. D., Carlson, C. A., and Proctor, L. M. 1989. Dominance of bacterial biomass inthe Sargasso Sea and its ecological implications. Mar.Ecol. Prog. Ser. 57:207-217.
Gray, I. M. 1987. Differences between nearshore andoffshore phytoplankton communities in Lake Ontario.Can. J. Fish. Aquat. Sci. 44:2155-2163.
Haas, L. W. 1982. Improved epifluorescence microscopyfor observing planktonic micro-organisms. Ann Inst.Oceanogr. 58 (Suppl.):261-268.
Hairston, N. G., Jr., and Hairston, N. G., Sr. 1993.Cause-effect relationships in energy flow, trophicstructure, and interspecific interactions. Am. Nat.142:379-411.
Haney, J. G., and Hall, D. J. 1973. Sugar-coated Dapjnia:preservation technique for Cladocera. Limnol.Oceanogr. 18:331-333
Heath, R. T., Fahnenstiel, G. L., Gardner, W. S., Cavaletto, J. F., and Hwang, S-J. 1995. Ecosystem-leveleffects of zebra mussels (Dreissena polymorpha): Anenclosure experiment in Saginaw Bay, Lake Huron. J.Great Lakes Res. 21:501-516.
Hobbie, J. E., Daley, R. J., and Jasper, S. 1977. Use ofNuclepore filters for counting bacteria by fluorescentmicroscopy. Appl. Environ. Microbiol. 33: 1225-1228.
Holland, R. E., Johengen, T. H., and Beeton, A. M.1995. Trends in nutrient concentrations in HatcheryBay, western Lake Erie, before and after Dreissenapolymorpha. Can. J. Fish. Aquat. Sci. 52:1202-1209.
Horgan, M. J., and Mills, E. L. 1997. Clearance rates andfiltering activity of zebra mussel (Dreissena polymorpha): implications for freshwater lakes. Can. J. Fish.Aquat. Sci. 54:249-255,
Johannsson, O. E., Mills, E. L., and O'Gorman, R. 1991.Changes in the nearshore and offshore zooplanktoncommunities in Lake Ontario: 1981-1988. Can. J.Fish. Aquat. Sci. 48:1546-1557.
Johengen, T. H., Johannsson, O. E., Pernie, G. L., andMillard, E. S. 1994. Temporal and seasonal trends innutrient dynamics and biomass measures in LakesMichigan and Ontario in response to phosphorus control. Can. J. Fish. Aquat. Sci. 51:2570-2578.
__, Nalepa, T. F., Fahnenstiel, G. L., and Goudy, G.1995. Nutrient changes in Saginaw Bay, Lake Huron,after the establishment of the zebra mussel (Dreissenapolymorpha). J. Great Lakes Res. 21:449-464.
Kitchell, J. F., Evans, M. S., Scavia, D. S., and Crowder,L. B. 1988. Regulation of water quality in LakeMichigan: Report of the food-web workshop. J. GreatLakes Res. 14:109-114.
Lavrentyev, P. J., Gardner, W. S., Cavaletto, J. F., andBeaver, 1. R. 1995. Effects of the zebra mussel(Dreissena polymorpha Pallas) on protozoa and phytoplankton from Saginaw Bay, Lake Huron. J. GreatLakes Res. 21:545-557.
Leach, J. H. 1993. Impacts of the zebra mussel (Dreissena polymorpha) on water quality and fish spawning
reefs in western Lake Erie. In Zebra Mussels: Biology, Impacts, and Control, eds. T. Nalepa and D. W.Schloesser, pp. 381-397. Boca Raton, FL: Lewis Publishers.
Lean, D. R. S., Fricker, H. J., Charlton, M. N., Cuhel, R.L., and Pick, F. R. 1987. Lake Ontario-like supportsystem. Can. J. Fish. Aquat. Sci. 44:2230-2240
Lee, S., and Fuhrman, J. A. 1987. Relationships betweenbiovolume and biomass of naturally derived marinebacterioplankton. Appl. Env. Microbiol. 53:1298-1303.
Lehman, J. T., and Caceres, C. E. 1993. Food-webresponses to species invasion by a predatory invertebrate: Bythotrephes in Lake Michigan. Limnol.Oceanogr. 38:879-891.
Ludwigson, J. O. 1974. Two nations, one lake-sciencein support of Great Lakes management. Downsview,Ont., Environment Canada, IFYGL Centre, Atmospheric Environment Science.
Lyche, A., Andersen, T., Christoffersen, K., Hessen, D.0., Hansen, P.H.B, and K1ysner, A. 1996. Mesocosmtracer studies. 2. The fate of primary production andthe role of consumers in the pelagic carbon cycle of amesotrophic lake. Limnol. Oceanogr. 41:475-487.
Makarewicz, J. C. 1987. Phytoplankton and zooplanktonin Lakes Erie, Huron, and Michigan:1984. Vol. 1Interpretive Report. Chicago, IL., U.S. EPA, ReportNo. EPA-905/3-88-001, GLNPO Report No.3.
___, Bertram, P., Lewis, T., and Brown, E. H., Jr.1995. A decade of predatory control of zooplanktonspecies composition of Lake Michigan. J. GreatLakes Res. 21 :620-640.
Mazumder, A., Lean, D. R.S., and Taylor, W.D. 1992.Dominance of small filter feeding zooplankton in theLake Ontario foodweb. J. Great Lakes Res.18:456-466.
McCormick, M. J., and Meadows, G. A. 1988. An intercomparison of four mixed-layer models in a shallowinland sea. J. Geophys. Res. 93(C6):6774-6788.
McQueen, D. J. 1990. Manipulating lake communitystructure: Where do we go from here? FreshwaterBioi. 23:613-620.
__, Post, J. R., and Mills, E. L. 1986. Trophic relationships in freshwater pelagic ecosystems. Can. J.Fish. Aquat. Sci. 43:1571-1581.
__, Johannes, M. R. S., Post, J. R., Stewart, T. J., andLean, D. R. S. 1989. Bottom-up and top-downimpacts on freshwater pelagic community structure.Ecol. Monographs. 59:289-309.
Mills, E. L., Leach, J. H., Carlton, J. T., and Secor, C. L.1993. Exotic species in the Great Lakes: A history ofbiotic crises and anthropogenic introductions. J. GreatLakes Res. 19:1-54.
Moal, J., Martin-Jezequel, V., Harris, R. P., Samain, J.F., and Poulet, S. A. 1987. Interspecific and intraspecific variability of the chemical composition ofmarine phytoplankton. Oceanol. Acta 10:339-346.
The Structure ofthe Planktonic Food-Web in the St. Lawrence Great Lakes 553
Mullin, M. M., Sloan, P. R., and Eppley, R. W. 1966.Relationship between carbon content, cell volume,and area in phytoplankton. Limnol. Oceanogr.11:307-311.
Munawar, M., and Munawar, 1. F. 1975. The abundanceand significance of phytoflagellates and nannoplankton in the Sl. Lawrence Great Lakes. 1. Phytoflagellates. Verh. Int. Verein. Limnol. 19:705-723.
__, and Munawar, 1. F. 1982. Phycological studies inlakes Ontario, Erie, Huron, and Superior. Can. J.Botany 60:1837-1858.
__, and Munwar, 1. F. 1986. The seasonality of phytoplankton in the North American Great Lakes, acomparative synthesis. Hydrobiologia 138:85-115.
__, Stadelman, P., and Munawar, I. F. 1974. Phytoplankton biomass, its species composition and primary production at a nearshore and midlake station ofLake Ontario during IFYGL. In Proc. 17th Conf.Great Lakes Res., pp. 629-652. Internal. Assoc. Greatlakes Res.
Nalepa, T. F. and Fahnenstiel, G. L. 1995. Dreissenapolymorpha in the Saginaw Bay, Lake Huron ecosystem: overview and perspective. J. Great Lakes Res.21:411-416.
0'Gorman, R., Johannsson, O. E., and Schneider, C. P.1997. Age and growth of alewives in the changingpelagia of Lake Ontario, 1978-1992. Trans. Amer.Fish. Soc. 126:112-126.
Parsons, T. R., Stephens, K., and Strickland, J. D. H.1961. On the chemical composition of eleven speciesof marine phytoplankters. J. Fish. Res. Board Can.18:1001-1016.
Pernie, G. L., Scavia, D., Pace, M. L., and Carrick, H. J.1990. Micrograzer impact and substrate limitation ofbacterioplankton in Lake Michigan. Can. 1. Fish.Aquat. Sci. 47:1836-1841.
Pick, F. R., and D. A. Caron. 1987. Picoplankton andnanoplankton biomass in Lake Ontario: relative contribution of phototrophic and heterotrophic communities. Can. J. Fish. Aquat. Sci. 44:2164-2172.
Polis, G. A., and Strong, D. R. 1996. Food web complexity and community dynamics. American Naturalist147:813-846.
Rand, P.S., Stewart, D. J., Lantry, B. F., Rudstram, L.G., Johannsson, O. E., Goyke, A. P., Brand, S. B.,O'Gorman, R., and Eck, G. W. 1995. Effects of lakewide planktivory by the pelagic prey fish communityin Lakes Michigan and Ontario. Can. J. Fish. Aquat.Sci. 52:1546-1563.
Scavia, D. 1980. An ecological model of Lake Ontario.Ecological Modelling 8:49-78.
__. 1988. On the role of bacteria in secondary production. Limnol. Oceanogr. 33:1220-1224.
__, and Fahnenstiel, G. L. 1987. Dynamics of LakeMichigan phytoplankton: Mechanisms controllingepilimnetic populations. J. Great Lakes Res.13:103-120.
__, and Fahnenstiel, G. L. 1988. From fish topicoplankton: Complex interactions in the GreatLakes. In Complex Interactions in Lake Communities,pp. 85-97, ed. S. R. Carpenter. NY: Springer-Verlag.
__, and Laird, G. A. 1987. Bacterioplankton in LakeMichigan: Dynamics, controls, and significance tocarbon flux. Limno!. Oceanogr. 32: 1017-1033.
__, Laird, G. A., and Fahnenstiel, G. L. 1986. Production of planktonic bacteria in Lake Michigan. Limno!. Oceanogr. 31:612-626.
__, Lang, G. A., and Kitchell, J. F. 1988. Dynamicsof Lake Michigan plankton: A model evaluation ofnutrient loading, competition, and predation. Can. J.Fish. Aquat. Sci. 45: 165-177
Sieburth, J. McN., Smetacek, V., and Lenz, J. 1978.Pelagic ecosystem structure: Heterotrophic compartments of the plankton and their relationship to plankton size fractions. Limnol. Oceanogr. 23:1256-1263.
Speziale, B. J., Schreiner, S. P, Giammatteo, P. A., andSchindler, J. E. 1984. Comparison of N, N- dimethylamide, dimethyl sulfoxide and aceton for extractionof phytoplankton chlorophyll. Can. J. Fish. Aquat.Sci. 41:1519-1522.
Sprules, W. G., and Goyke, A. P. 1994. Size-based structure and production in the pelagia of Lakes Ontarioand Michigan. Can. J. Fish. Aquat. Sci. 51:2603-2611
__, Riessen, H. P., and Jin, E. H. 1991. Dynamics ofthe Bythotrephes invasion of the Sl. Lawrence GreatLakes. J. Great Lakes Res. 16:346-351
Sternberger, R. S., and Gilbert, J. J. 1987. Rotifer threshold food concentrations and the size-efficiencyhypothesis. Ecology 68:181-187.
Stoermer, E. F., and Ladewski, T. B. 1978. Phytoplankton associations in Lake Ontario during IFYGL. AnnArbor, MI, Great Lakes Research Division, Universityof Michigan, Spec. Rep. No. 62.
Strathman, R. R. 1967. Estimating the organic content ofphytoplankton from cell volume or plasma volume.Limno!. Oceanogr. 12:411-418.
Taylor, W. D., and Heynen, M. L. 1987. Seasonal andvertical distribution of Ciliophora in Lake Ontario.Can. J. Fish. Aquat. Sci. 44:2185-2191.
__, Fricker, H. J., and Lean, D. R. S. 1987. Zooplankton seasonal succession in Lake Ontario atnorthshore, midlake, and southshore stations in 1982,and a comparison with 1970. Can. J. Fish. Aquat. Sci.44:2178-2184.
Dtermohl, H. 1958. Zur vervolkommnung der quantitativen Phytoplankton-Methodik. Mitt. Internat. Verein.Limnol. 9: 1-38.
Verity, P. G., Robertson, C. Y., Tronzo, C. R., Andrews,M. G., Nelson, J. R., and Sieracki, M. E. 1992. Relationship between cell volume and the carbon andnitrogen content of marine photosynthetic nanoplankton. Limnol. Oceanogr. 37:1434-1446.
Vollenweider, R. A., Munawar, M., and Stadelmann, P.1974. A comparative review of phytoplankton and

554 Fahnenstiel et al.
primary production in the Laurentian Great Lakes. J.Fish. Res. Board. Can. 31:739-762.
Watson, N. H. F. 1974. Zooplankton of the St. LawrenceGreat Lakes-Species composition, distribution, andabundance. J. Fish. Res. Board. Can. 31 :783-794.
___, and Carpenter, G. F. 1974. Seasonal abundanceof crustacean zooplankton and net plankton biomassof lakes Huron, Michigan and Ontario. J. Fish. Res.Board. Can. 31:309-317.
Weisse, T., Muller, H., Pinto-Coelho, R. M., Schweizer,A., Springmann, D., and Ba1dringer, G. 1990.
Response of the microbia11oop to the spring bloom in alarge prealpine lake. Limnol. Oceanogr. 35:781-794.
Wetzel, R. G. 1995. Death, detritus, and energy flow inaquatic systems. Freshwater BioI. 33:83-89.
Yurista, P. M., and Schulz, K. L. 1995. Bioenergeticanalysis of prey consumption by Bythotrephes cederstroemi in Lake Michigan. Can. J. Fish. Aquat. Sci.52:141-150.
Submitted: 18 July 1997Accepted: 16 April 1998