
Lawrence Thesis Post-defense
128
Neutron Spectrum Unfolding with Organic Scintillators for Arms-control Verification by Christopher C. Lawrence A dissertation submitted in partial fulfillment of the requirements for the degree of Doctor of Philosophy (Nuclear Engineering and Radiological Sciences) at The University of Michigan 2014 Doctoral Committee: Associate Professor Sara A. Pozzi, Co-Chair Emeritus Professor Frederick D. Becchetti Jr., Co-Chair Associate Research Scientist Marek Flaska Emeritus Professor Ronald F. Fleming Professor James P. Holloway Associate Professor Clayton D. Scott
-
Upload
khangminh22 -
Category
Documents
-
view
1 -
download
0
Transcript of Lawrence Thesis Post-defense

Neutron Spectrum Unfolding with Organic Scintillators for
Arms-control Verification
by
Christopher C. Lawrence
A dissertation submitted in partial fulfillmentof the requirements for the degree of
Doctor of Philosophy(Nuclear Engineering and Radiological Sciences)
at The University of Michigan2014
Doctoral Committee: Associate Professor Sara A. Pozzi, Co-Chair Emeritus Professor Frederick D. Becchetti Jr., Co-Chair Associate Research Scientist Marek Flaska Emeritus Professor Ronald F. Fleming Professor James P. Holloway Associate Professor Clayton D. Scott

Acknowledgements
My graduate experience has been flooded with amazing mentors and collaborators, coming from all directions, and at times I have only been able to skim the surface. I want to thank my advisors, Professors Sara Pozzi and Fred Becchetti. Both have offered their extensive knowledge of various fields in order to guide my research in publishable directions. They also gave me the freedom to pursue my own directions, and facilitated that by providing countless opportunities for measurements and collaboration and access to facilities. Marek Flaska has been one of my closest advisors, and has played a considerable role in the direction of my research efforts. Marek is full of original ideas, and knows one when he sees it. He also taught me how to make an idea into a physical reality. Andreas Enqvist has alternated as friend, collaborator and mentor; is always several cognitive steps ahead of me. Thanks to Ron Fleming, with whom I had the great opportunity to discuss warheads. I would say more about his encyclopedic knowledge and deep philosophical grasp of the general empirical enterprise, but it’s legend at this point. Discussions with James Holloway were instrumental in solidifying the narrative and themes of the project. And thanks to Clay Scott for his deadpan. I’m glad both he and James were there to hold my feet to the fire on the math. Mike Febbrarro and I have thought through countless problems and ideas together, and his frenetic creativity and technical capability provided help and inspiration. I made extensive use of the accelerator facilities at University of Notre Dame and at Ohio University. Huge thanks to James Kolata, Tom Massey, and all of the staff at both facilities. Also thanks to Fred and Sara for connecting me with those facilities. Shobita Parthasarathy, destroyer of worlds, introduced me to science and technology studies. PubPol 585 was the most miserable, humiliating, and important course I ever took. Gabrielle Hecht and Paul Edwards taught me science and technology studies. Both Shobita and Gabrielle have gone to great lengths to facilitate my learning and career path. Jean Krisch, Dante Amidei and Ctirad Uher were important folks during my undergraduate years. Thanks to my family and friends for all of their support, and for putting up with my shit. I’m sorry for: complaining; not answering the phone while working; verbalizing morbid subjects; being narcissistic and generally intolerable. Thanks to Tim, Aleta, Ashley and Ben for letting me stay with them. I also got more support and help from my mother and father than I can list here. Thanks to Margaret Czerwienski for putting me in my place and helping me with my defense.
ii

Table of Contents
Acknowledgements ...................................................................................................................... ii
List of Figures ............................................................................................................................... v
List of Tables ............................................................................................................................. viii
List of Abbreviations .................................................................................................................. ix
Chapter 1 Introduction................................................................................................................. 1
Chapter 2 Organic Scintillators for Neutron Detection ........................................................... 7
2.1 Pulse-height response of organic scintillators to neutrons .................................................. 9
2.2 Pulse-shape discrimination for n-γ identification ............................................................. 16
2.3 Venues for the improvement of spectrum unfolding ......................................................... 18
2.3.1 Deuterated scintillators: n-d versus n-p scattering ......................................................... 19
2.3.2 Energy resolution ........................................................................................................... 20
2.3.3 Stabilization of detector performance ............................................................................ 21
2.4 Scintillators chosen for this work ..................................................................................... 23
2.5 Remarks ............................................................................................................................ 24
Chapter 3 Neutron Spectroscopy and Spectrum Unfolding .................................................. 27
3.1.1 Neutron spectrum unfolding as an inverse problem ...................................................... 28
3.1.2 Instability of solutions ................................................................................................... 30
3.2 Methods for solving the unfolding problem ..................................................................... 33
3.2.1 Regularized matrix inversion ......................................................................................... 33
3.2.2 Inference formalisms ..................................................................................................... 35
3.3 Typical unfolding results .................................................................................................. 38
3.4 Venues for improving spectrum unfolding ....................................................................... 40
Chapter 4 Accelerator-based Measurements for Full Characterization of Detector
Pulse-height Response ............................................................................................................... 45
4.1 Discrete-energy sources versus time-of-flight gating on continuous-spectrum sources ... 45
4.2 Minimization and characterization of room-scattered neutrons ....................................... 50
4.2.1 Beam-profile measurements .......................................................................................... 54
4.3 Neutron spectrum from 11B(d,n) with deuteron energy Ed = 5.5 MeV in a stopping
target ............................................................................................................................... 55
iii

Chapter 5 Light-output Relations and Pulse-height Resolution Measurements ................. 59
5.1 Light-output relations ....................................................................................................... 59
5.1.1 Extracting light-output data for hydrogen-based scintillators ....................................... 61
5.1.2 Extracting light-output data for deuterated scintillators ................................................ 63
5.1.3 Light-output data ........................................................................................................... 64
5.2 Pulse-height resolution ..................................................................................................... 67
5.3 Remarks ............................................................................................................................ 68
Chapter 6 Measurement of Response Matrices ...................................................................... 70
Chapter 7 Response-matrix Condition .................................................................................... 77
7.1 Discretization structure: light-output-conformal versus linear pulse-height binning ....... 79
7.2 Scattering kinematics and energy resolution .................................................................... 84
7.3 Remarks ............................................................................................................................ 86
Chapter 8 Spectrum Unfolding with Measured Trial Spectra .............................................. 88
8.1 Accelerator-based measurements for spectrum-unfolding trials ...................................... 88
8.2 Diagnostics from time-of-flight data ................................................................................ 91
8.3 Unfolding results .............................................................................................................. 95
8.4 The effect of Poisson variance on unfolded spectra ......................................................... 97
8.5 Remarks ............................................................................................................................ 98
Chapter 9 Re-parametrization of the Unfolding Problem ................................................... 100
9.1 Warhead-verification scenario: three-dimensional attenuation problem ........................ 102
9.3 One-dimensional attenuation problem ............................................................................ 105
9.3.1 Measured pulse-height spectra with single attenuators ............................................... 106
9.3.2 High-explosive attenuators .......................................................................................... 107
9.4 Remarks .......................................................................................................................... 111
Chapter 10 Concluding Remarks and Future Systems ........................................................ 113
10.1 A deuterated-crystal spectrometer? ............................................................................... 114
10.2 Stabilization of PMT gain and PSD performance ......................................................... 115
10.3 Detector arrays and coincidence information ............................................................... 116
10.4 The three-dimensional warhead verification problem .................................................. 117
iv

List of Figures
Figure 2.1. Collection of scintillation light in a photomultiplier tube and conversion to electrical signal ................................................................................................................................. 8
Figure 2.2. Sequence of physical processes leading to detection of mono-energetic neutrons in an organic scintillation detector ............................................................................................ 11
Figure 2.3. Nonlinear relation between energy deposited onto a recoil nucleus in a scintillator active volume and resulting scintillation light produced in the slowing-down process .. 11
Figure 2.4. Component of observed pulse-height spectrum contributed by neutrons which collide twice on hydrogen in a scintillator active volume (courtesy of Andreas Enqvist) .......... 12
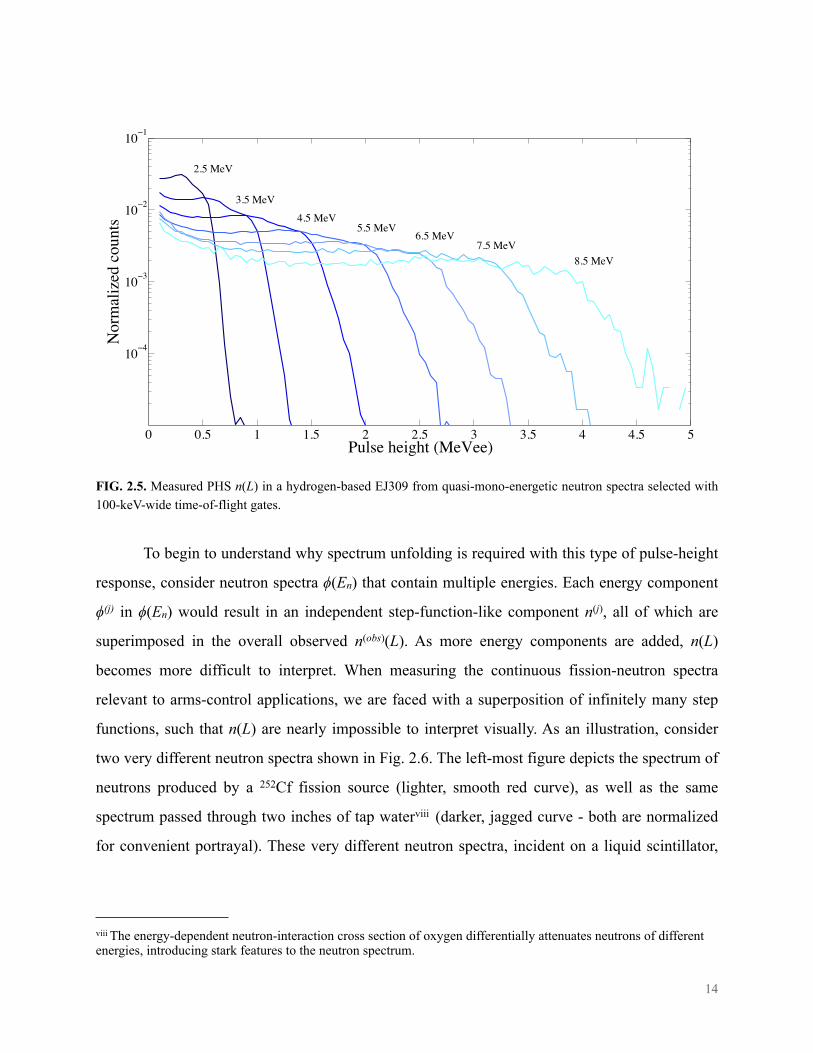
Figure 2.5. Measured pulse-height spectra in a hydrogen-based EJ309 from quasi-mono- energetic neutron spectra selected with 100-keV-wide time-of-flight gates .....................14
Figure 2.6. Examples of continuous neutron spectra and the resulting observable pulse-height spectra from hydrogen-based EJ309, (simulated using MCNP-PoliMi) ........................ 15
Figure 2.7. An example of a response matrix for a hydrogen-based EJ309 simulated using MCNP-PoliMi (courtesy of Sara Pozzi) .......................................................................... 16
Figure 2.8. Standard pulse-shape discrimination plot - tail integral versus total integral - for 105 scintillation pulses from a 252Cf source in hydrogen-base EJ309 .................................... 18
Figure 2.9. Pulse-height spectra simulated (MCNP-PoliMi) for hydrogen-base EJ309 and deuterated EJ315 for 2.5-MeV neutrons .......................................................................... 20
Figure 3.1. Illustration of the L-curve, a visualization of the compromise made in regularized matrix inversion between agreement with data and adherence to some a priori constraint like “smoothness” ............................................................................................................ 35
Figure 3.2. Early unfolding results reported by Straker et al. using the FERDOR unfolding code (Courtesy of Elsevier) ...................................................................................................... 39
Figure 3.3. Representative unfolding results reported in literature, obtained with the FORIST unfolding code (courtesy of Elsevier) .............................................................................. 40
Figure 4.1. Time-of-flight plot for neutrons produced via the reaction 11B(d,n) in a thick target, with deuteron energy Ed = 5.5 MeV at University of Notre Dame .................................. 48
Figure 4.2. The Gamma-ray peak in the time-of-flight spectrum during accelerator measurements reported ............................................................................................................................ 49
Figure 4.3. The Nuclear Structure Laboratory at University of Notre Dame .............................. 51
Figure 4.4. Design drawing of the in-wall target holder designed for creating collimated neutron sources for detector characterization at University of Notre Dame ................................. 52
Figure 4.5. Design drawing and photos of target frame and holder ............................................ 53
v

Figure 4.6. Beam-profile measurements carried out near detector location of 10.84 m for accelerator measurements reported .................................................................................. 55
Figure 4.7. Observed neutron spectrum for the reaction 11B(d,n) in a thick target with deuteron energy En = 5.5 MeV at zero degrees ............................................................................... 57
Figure 5.1. Scintillator pulse-height spectra from time-of-flight-gated quasi-mono-energetic neutron sources, measured with EJ309 ............................................................................ 61
Figure 5.2. Extraction of light-output data from pulse-height spectra for hydrogen-based scintillators ....................................................................................................................... 62
Figure 5.3. Extraction of light-output data from pulse-height spectra for deuterium-based scintillators ....................................................................................................................... 64
Figure 5.4. Light-output data for EJ309, EJ315 and EJ299-33 ................................................... 65
Figure 5.5. Light-output data for EJ315 compared with that obtained by Croft et al. for NE213 .............................................................................................................................. 66
Figure 5.6. Resolution functions for EJ309, EJ315 and EJ299-33 .............................................. 68
Figure 6.1. Measured response matrices for EJ309, EJ299-33 and EJ315 .................................. 71
Figure 6.2. Selected columns of response matrices for EJ309, EJ299-33 and EJ315 ................. 72
Figure 6.3. Measured pulse-height spectra from EJ309, EJ299-33 and EJ315 with a 252Cf neutron source ............................................................................................................................... 73
Figure 6.4. Unfolded neutron spectra from EJ309, EJ299-33 and EJ315 with a 252Cf neutron source ............................................................................................................................... 74
Figure 7.1. Conformal binning procedure to remove nonlinearity of scintillation light output from pulse-height response ....................................................................................................... 80
Figure 7.2. Response matrix of EJ315 discretized with evenly-spaced bin edges and with light- output-conformal binning ..................... ......................................................................... 82
Figure 7.3. Comparison of low-energy columns of the EJ315 response matrix with evenly-spaced pulse-height bins and light-output-conformed bins ......................................................... 83
Figure 7.4. Condition analysis for EJ315 response matrix descretized with linear and light- output-conformal binnings .............................................................................................. 83
Figure 7.5. Selected columns of response matrices for EJ309, EJ299-33 and EJ315 with light- output-conformal binning ................................................................................................ 85
Figure 7.6. Condition analysis for EJ309, EJ299-33 and EJ315 response matrices .................... 86
Figure 8.1. Attenuators used to produce finely structured neutron spectra using neutrons from 11B(d,n) ............................................................................................................................. 89
Figure 8.2. Total neutron-interaction cross sections for low-Z attenuators used for creating neutron trial spectra .......................................................................................................... 90
vi

Figure 8.3. Selected columns of response matrix for EJ315, indicating shift in PMT gain and PSD performance ............................................................................................................. 94
Figure 8.4. Unfolded trial spectra with EJ309 and EJ315 ........................................................... 96
Figure 8.5. Effect of Poisson variance on unfolding results for EJ309 and EJ315 ...................... 98
Figure 9.1. Estimated dimensions of a simplified warhead ....................................................... 103
Figure 9.2. Formulation of three-dimensional warhead-verification problem .................. 104
Figure 9.3. Simplified one-dimensional attenuation problem ........................................... 106
Figure 9.4. Attenuated neutron spectra, simulated via surface tally in MCNPx, for attenuators approximating three different HE compounds and beryllium metal........................................................................................................................... 108
Figure 9.5. Pulse-height spectra, constructed from measured data, associated with the simulated neutron spectra shown in Fig. 9.4 ........................................................ 109
Figure 9.6. Analysis of the effect of Poisson variance in pulse-height spectra on the estimated thicknesses τest of attenuating materials ............................................... 111
vii

List of Tables
Table 2.1. List of organic scintillators chosen for this study ....................................................... 23
Table 3.1. Attributes of detector pulse-height response that affect the condition of response matrix R ........................................................................................................................... 41
Table 3.2. Sources of perturbation in measured pulse-height spectra that contribute to error in unfolded spectra ............................................................................................................... 41
Table 7.1. (reproduced from Tab. 3.1) Attributes of detector pulse-height response that effect the condition of response matrix R ....................................................................................... 78
Table 8.1. Attenuator materials chosen for trial measurements, along with approximate thicknesses ....................................................................................................................... 89
Table 8.2. (reproduced from Tab. 3.2). Sources of perturbation in measured pulse-height spectra that contribute to error in unfolded spectra ...................................................................... 92
Table 9.1. Estimated attenuator thickness from measured pulse-height spectra ........................ 107
Table 9.2. Estimated attenuator thickness from pulse-height spectra constructed from measured data using simulated incident spectra ............................................................................ 110
viii

List of Abbreviations
DNNG Detection for Nuclear Nonproliferation Group
HE high explosive
UND-NSL University of Notre Dame Nuclear Structure Laboratory
PHS pulse-height spectrum (spectra)
PMT photo-multiplier tube
PSD pulse-shape discrimination
SNM special nuclear material(s)
TOF time of flight
ix
Chapter 1Neutron Spectrum Unfolding for
Warhead Verification
Nuclear-disarmament activists and treaty-verification practitioners have posed an unusual class of measurement challenge. In the warhead-dismantlement scenario they envision, the
disarming party must demonstrate certain treaty-relevant attributes of a sample - the metallic state of plutonium, the presence of high explosives, etc. - while obscuring other attributes
deemed sensitive information about weapons design. The test item is often imagined as located inside some agreed-upon container which precludes direct visual inspection, but which is
permeable to various radiative, acoustic or electromagnetic couplings so that limited measurement techniques can be used to gather information about the item [1]-[6]. Unlike
traditional measurement tasks, in which data acquisition is often an unmitigated good, here we are as interested in obscuring some forms of information as we are in measuring others. And in
planning for these exotic challenges, we face not just one set of known political constraints and priorities, but a range of unknown possible constraints in a hypothetical future context.
This set of challenges is bound to motivate some unusual choices amongst available measurement technologies. Previous applications calling for the detailed characterization of
weapons components and special nuclear materials (SNM) have often been met with extremely sensitive measurements like high-resolution gamma-ray spectroscopy. But the data from these
contain a wealth of classified design information, and would require the use of delicate information barriers which are difficult, or impossible, to validate. Instead, it may be necessary to
develop measurement systems that don’t simply obscure sensitive data, but which never physically acquire it in the first place. And to prepare for the nebulous political future, we are
wise to develop a collection of measurement tools with complimentary (in)sensitivities, rather than a particular favored system.
1

Toward this end, I have decided to revisit the prospects for single-detector neutron
spectroscopyi. Neutron spectra emanated from SNM contain much less information than gamma-
ray spectra, but may still bear defining weapons-attribute information. Sensitive design
informations like plutonium isotopics, pit mass, and shape could not be revealed by neutron
spectroscopy of any realizable resolution, but the relatively broad features of neutron spectra can
often be used to distinguish between fission and non-fission sources. Taken in conjunction with
other forms of data - limited multiplicity counting, low-resolution gamma-ray spectra,
tomographic imaging, etc. - neutron spectroscopy could help constrain an inspectorate’s
ignorance about a treaty-relevant test item.
But due to the neutron’s weakly-interacting nature, neutron spectroscopy is much more
difficult (and interesting) than gamma-ray spectroscopy. Gamma-rays can interact quite readily
with the Coulomb fields associated with electrons in matter, so that it is easier to devise a
detection medium that will absorb the full energies of incident gamma rays. Detection of fast
neutrons, on the other hand, relies on elastic scatteringii, which has little “preference” for the
fractional transfer of energy from neutrons to detecting medium. This leads to detector response
matrices that are highly ill-conditioned, such that common neutron spectra can’t be visually
interpreted from detector pulse-height data the way gamma-ray or charged-particle spectra often
can. Instead, they must be “unfolded”, and neutron-spectrum unfolding is a notoriously difficult
inverse problem. Indeed, mathematicians and nuclear scientists alike have battled the problem
for decades, and have come up against hard informatic limits that constrain the possible fidelity
of the unfolded solutions. This difficulty has largely relegated fast-neutron spectroscopy to
dosimetry applications, for which resolution of fine spectral features is unnecessary.
In order to utilize unfolded neutron spectra for treaty verification, we must carry spectrum
unfolding from dosimetry applications into a more demanding class of applications - that of
source and material characterization. The prospects for this are somewhat dimmed on first look at
the literature - mathematical techniques for inverting ill-conditioned matrices are already well
2
i I specify “single detector” to distinguish from time-of-flight spectroscopy, which is not practical for most verification scenarios.
ii Exceptions to this will be discussed in Chapter 2. The term “fast” neutrons refers roughly to neutrons out of thermal equilibrium with room-temperature media.

developed, as is their application to spectrum unfolding. Many spectrum-unfolding codes are
currently available, and they draw on a variety of theoretical frameworks. The current state of
their development is such that the quality of unfolding results is “almost independent of the
(choice of) code applied” [7]. In general, stable solutions can be obtained with neutron-energy
groupings as fine as 200-300 keV, and this is probably insufficient for verification applications.
At this stage of developmental saturation, it is unlikely that further development of algorithms
will yield better unfolding results, for a given response matrix, than current algorithms are able
to produce.
So I take a different approach. Instead of seeking better mathematical techniques for
inverting an ill-conditioned matrix, I look for ways to improve the condition of the matrix. The
possibilities for this are diverse, but generally require a focus on the particular - the particular
measurement system and the particular measurement challenge. This is in contrast to much of
the literature which focuses on the general conceptual frameworks that ground the unfolding
methods. Indeed, unfolded spectra from actual measurements in the reported literature are
surprisingly scarce, as are comparisons between different detection systems. While the general
techniques and sensibilities of the inverse-problem solver are of great necessity for unfolding, I
intend to realize hidden opportunities for improving unfolding capabilities by shifting the focus
to the measurement system and measurement task.
This thesis presents a series of developments for neutron-spectrum unfolding with
organic scintillation detectors, with an aim at future applications in the verification of arms-
control agreements. First, by focusing on the attributes of the detector itself and their effects on
the solution stability, I will surpass the limitations described above, and present unfolded spectra
with 100-keV-wide energy groupings. This focus on the detection system will be facilitated by
accelerator-based time-of-flight (TOF) measurements carried out at the Nuclear-structure
Laboratory of the University of Notre Dame. Time-of-flight techniques will permit the detailed
measurement of detector response matrices and other attributes, as well as independent
measurement of reference spectra for the validation of unfolding trials. The unfolding
performance for three different organic scintillators will be compared - the hydrogen-based
liquid EJ309, the deuterium-based liquid EJ315, and the hydrogen-based plastic EJ299-33. This
3

will elucidate the influence of scattering kinematics (n-p versus n-d scattering), scintillation light
output, and pulse-height resolution on response-matrix condition.
Second, I will describe how a particularized consideration of the measurement challenge
at hand can facilitate a re-parametrization of the unfolding problem, and dramatically constrain
the solution space. This could allow the induction of treaty-relevant parameters that would
otherwise be unavailable from scintillator pulse-height data. I will focus on a simplified, one-
dimensional case in which the elemental composition of a neutron-attenuating slab is revealed by
its differential attenuation of neutrons passing through it. This is inspired by a variant of the
warhead-verification scenario envisioned above, which includes an arrangement of near-
spherical symmetry where neutrons emitted by the fissioning content of a plutonium pit are
passed through concentric shells of neutron-reflecting and high-explosive materials, before
reaching a surrounding detection system. The low-Z components of these materials have well-
known and distinguishing features in their energy-dependent neutron-interaction cross sections,
and this information can be taken into account to constrain the inverse problem. While the
realistic three-dimensional case differs substantially from the simplified one-dimensional case,
my demonstration provides a first step in this new direction for solving unfolding problems in
treaty-verification scenarios.
Given my focus on the measurement system and particular measurement task, little
attention will be given to the unfolding algorithm itself. I argue that this isn’t a negligence, but
simply a re-focusing of efforts on the aspects of the unfolding problem that I believe are under-
addressed in the prevailing literature. Detailed reviews of unfolding procedures are given in
references [8]-[10], and it would be superfluous to channel them here. Likewise, comparison
between the performances of different unfolding codes are widespread, for instance in [11], [12].
Readers interested in the particulars of scintillator response or the history of neutron
spectroscopy are directed to the references [13] and [14], [15] respectively. I will attempt here to
convey a qualitative and intuitive understanding of the instability of unfolded solutions, and how
it arises from the ‘flatness’ of scintillator-pulse-height response to fast neutrons. I will then give a
brief description to the two main categories of approach to the unfolding problem - those which
treat it as a matrix-inversion problem in need of some stabilizing perturbation or constraint, and
those which approach it as an inference problem calling for Bayesian or thermodynamic
4

formalisms. When I unfold measured spectra, I will employ the simplest options available for
unfolding: for linear matrix inversion I will use a conjugate gradient method [16], [17], and
stabilize the solution with Tikhonov regularization [18]-[20]; for inversion of nonlinear
operators, as will be required for the re-parametrized attenuation problem, I will use the common
Levenberg-Marquardt algorithm [21].
It is also important to situate my efforts with scintillators amongst the other options
available for neutron spectroscopy, and amongst the prevailing conceptions of the coming
warhead-verification problem. A deployable system will ultimately require further improvements
on the detection system to achieve the unfolding performance I describe here. I will specify
fieldable improvements that I envision involving currently-available technologies like automated
detector calibration and temperature control. Deployable systems will also require more
advanced unfolding methods than I use here. Additionally, other options for the detection
medium exist, and may prove superior to organic liquidsiii. Finally, detailed knowledge of
neutron spectra emitted from treaty-relevant test items would only be useful in conjunction with
other forms of information. With these qualifications, my overall aim is to demonstrate that
neutron spectroscopy techniques - either with organic scintillators or some improved detector -
could be a useful addition to the overall treaty-verification toolbox.
References
[1] J. Fuller, “Verification on the Road to Zero: Issues for Nuclear Warhead Dismantlement,” Arms Control Today, pp. 1–11, Jul. 2010.
[2] T. B. Taylor, “Verified Elimination of Nuclear Warheads,” Science & Global Security, vol. 1, pp. 1–26, Mar. 1989.
[3] F. von Hippel, “Verification of Nuclear Warheads and Their Dismantlement: A Joint American-Soviet Study,” presented at the Institute for Nuclear Materials Management, 31st Annual Meeting, 1990, pp. 1–3.
[4] R. Kouzes and B. Geelhood, “Methods for Attribute Measurement and Alternatives to Multiplicity Counting,” Pacific Northwest National Laboratory, PNNL-13250, May 2000.
5
iii However, the developments described here will still be relevant for unfolding and extracting treaty-relevant information from a hypothetical future detector. It would simply have a better-conditioned response matrix, which is precisely the type of improvement argued for here.

[5] R. Whiteson and D. W. MacArthur, “Information Barriers In the Trilateral Initiative: Conceptual Description,” Los Alamos National Laboratory, LAUR-98-2137, Mar. 1998.
[6] R. Waldron, “Arms Control and Nonproliferation Technologies, Spring 2001,” Office of Nonproliferation Research and Engineering, Sep. 2001.
[7] H. Klein, “Neutron Spectrometry in Mixed Fields: NE213/BC501A Liquid Scintillation Spectrometers,” Radiation Protection and Dosimetry, vol. 107, pp. 95–109, Dec. 2003.
[8] V. B. Anykeyev, A. A. Spiridonov, and V. P. Zhigunov, “Comparative Investigation of Unfolding Methods,” Nuclear Instruments and Methods in Physics Research A, vol. 303, pp. 350–369, Jul. 1991.
[9] M. Matzke, “Unfolding Procedures,” Radiation Protection and Dosimetry, vol. 107, no. 1, pp. 155–174, Dec. 2003.
[10] M. Reginatto, “Overview of spectral unfolding techniques and uncertainty estimation,” Radiation Measurements, vol. 45, no. 10, pp. 1323–1329, Dec. 2010.
[11] R. Koohi-Fayegh, S. Green, and M. C. Scott, “A Comparison of Neutron Spectrum Unfolding Codes Used with a Miniature NE213 Detector,” Nuclear Instruments and Methods in Physics Research A, vol. 460, pp. 391–400, Mar. 2001.
[12] B. Pehlivanovic, S. Avdic, P. Marinkovic, S. Pozzi, and M. Flaska, “Comparison of Unfolding Approaches for Monoenergetic and Continuous Fast-neutron Energy Spectra,” Oct. 2011.
[13] J. Birks, Theory and Practice of Scintillation Counting. Pergemon Press.
[14] D. J. Thomas, “Neutron spectrometry,” Radiation Measurements, vol. 45, no. 10, pp. 1178–1185, Dec. 2010.
[15] F. D. Brooks and H. Klein, “Neutron Spectrometry - Historical Review and Present Status,” Nuclear Instruments and Methods in Physics Research A, vol. 476, pp. 1–11, Dec. 2001.
[16] M. Hestenes and E. Stiefel, “Methods of Conjugate Gradients for Solving Linear Systems,” Journal of Research for the National Bureau of Standards, vol. 46, pp. 1–28, Sep. 1952.
[17] J. R. Shewchuk, An Introduction to the Conjugate Gradient Method Without Agonizing Pain. 1994, pp. 1–64.
[18] D. Phillips, “A Technique for the Numerical Solution of Certain Intergral Equations of the First Kind,” pp. 1–14, Feb. 1961.
[19] P. C. Hansen, The L-curve and Its Use in the Numerical Treatment of Inverse Problems. 2003, pp. 1–24.
[20] P. C. Hansen, “MATLAB Regularization Toolbox,” Numerical Algorithms, vol. 46, pp. 189–194, Mar. 2007.
[21] R. Fletcher, “Modified Marquardt Subroutine for Non-linear Least Squares,” United Kingdom Atomic Energy Authority, AERE - R 6799, Oct. 1971.
6
Chapter 2Organic Scintillators for
Neutron Detection
Neutron-detection systems can generally be divided into two categories: those which rely
on neutron capture, and those relying on nuclear elastic scattering. These two categories can in
turn be associated with different energy ranges. Since the relevant neutron-capture cross sections
drop sharply with energy, capture detectors such as 3He tubes are typically used to detect thermal
neutronsiv. Detecting fast neutrons with capture detectors requires prior moderation in some
hydrogenous medium like polyethylene, whereby energy information about incident neutrons is
largely lost [1], [2]. Recoil detectors are more commonly used to detect fast neutrons because the
cross sections for elastic scatter (e.g. n-p, n-d, etc.) are substantial at high energies. Nuclear
recoil detectors also make better spectrometers since they can better preserve energy information
[3]. While a variety of recoil detection systems are available, I focus here on organic scintillators
because they strike a balance between detection efficiency and preservation of energy
information [4]. While detection systems exist which offer better preservation of energy
information, these have detection efficiencies on the order of 0.01% to 0.1% [5], which is likely
problematic for warhead measurements. Organic scintillators have efficiencies ranging from 10%
to 60% depending on the size of the active volume, and thus are generally more suitable [6].
A scintillating material is one which produces a small flash of light upon Coulomb
interaction with charged-particle radiation [7]. Molecules of these materials have energy-state
structures that allow excitation and de-excitation via different routes, such that they can produce
de-excitation photons to which the materials themselves are almost completely transparent [1],
7
iv The term “thermal” is colloquially used to describe neutrons which have come to thermal equilibrium with room-temperature media, such that their energies are on the order of tens of eV. This is in contrast to “fast” neutrons which are emitted from nuclear interactions with energies in the MeV range. Fission neutrons range in energy from around 0.5 - 15 MeV.

[7]. This light can be collected in a photo-multiplier tubev (PMT) and converted to a voltage
pulse for analysis (see Fig. 2.1). Measurement data from a scintillation detector is commonly
represented as a “pulse-height spectrum” (PHS) n(L), where the dependent “pulse-height”
variable L represents the “size” of the scintillation pulse - often proportional to the integrated
charge Q on the PMT anode for a given pulse - and n is simply the count of measured pulses
detected per unit of pulse height L.
FIG. 2.1. Collection of scintillation light in a photomultiplier tube. The left figure shows a diagram of the scintillation material connected to the photomultiplier tube (PMT) (reproduced from Ref. [8]). The right figure shows fifty overlapped voltage pulses from the anode of a PMT collecting light from proton-induced (above) and electron-induced scintillations in the hydrogen-based liquid EJ309 (below). Proton pulses are associated with n-p elastic scattering, and represent neutron detections, while electron pulses are associated with Compton scattering, and represent gamma-ray detections.
Since a neutron cannot directly trigger the scintillation process, it first must scatter on
some nucleus - typically hydrogen or carbon - which in turn excites the scintillator material to
produce a pulse. Therefore, the scintillating material is often dissolved in some hydrogenous
solvent to provide ample scattering centers for incoming neutrons to interact with. The resulting
solution may be in liquid, crystal or amorphous-solid form, some volume (on the order of tens to
hundreds of cubic centimeters) of which is optically coupled to a PMT. The kinematics of the
scattering process, the numbers of scintillation photons produced, the time characteristics of the
8
v It should be noted that there are other options for light collection, including silicon photodiodes. However PMTs are the common choice.

scintillation processes, and the efficiency of light collection are all important factors in
scintillator pulse-height response, and they depend in part on the choice of scintillator material
and solvent. In addition, low-Z organic scintillators are also sensitive to gamma rays by route of
Compton scatter on electrons, which then excite the scintillator material. So an important
requirement of a scintillation detector for neutron spectroscopy is the ability to distinguish
between neutron- and gamma-ray-induced pulses. Thus, choice of solution for a scintillation
detector is subject to multiple, often competing considerations. This chapter will provide a
qualitative overview of the concepts of interest to give an intuitive sense of how we can alter
detector performance. Much more detailed treatment is given in Ref. [7].
2.1 Pulse-height response of organic scintillators to neutrons
We begin with an outline of the physical processes that lead to detection of a neutron in a
scintillation detector, and the complications that each process adds to the coupling between
incident neutron energy En and resulting pulse height L. A simplified description is as follows:
1) A neutron entering the detector medium with incident energy En has some finite probability
of elastically scattering one or more times on either hydrogen or carbon, and thereon
transferring energy Ep ≤ En on the pth collision. The neutron leaves the detector medium with
remaining energy En - ∑Ep.
2) The recoiling particles (indexed by p) slow down by transferring their energy into the
surrounding detector medium via the Coulomb interaction. Some of that energy excites
scintillating molecules, which subsequently de-excite to produce scintillation light Lscint. The
fraction of energy deposited via scintillating channels is governed primarily by the linear
density of energy loss along the particle track, such that
Lscint = ∑p f(A,Z,Ep) (2.1)
where A and Z are atomic mass and number respectively. Lscint is generally non-linear in Ep.
9

3) Lscint is distributed amongst a collection of scintillation photons, with the attendant Poisson
variance, most of which are collected in a PMT to produce a pulse of total integrated charge
Q on the anode. The charge Q is converted through a calibration relation into an observed
Lobs so that, in principle, Lobs is drawn from a Poisson distribution of mean Lscint. The
observed quantity is referred to as the “pulse height” vi.
To further illustrate, imagine a stream of mono-energetic neutrons of energy En, and
consider for now only single scatters on hydrogen nuclei (see Fig. 2.2). In an ideal spectrometer,
we would like to see a PHS n(L) containing a single peak, whose location L0 along the pulse-
height axis depends linearly on the incident energy En. This type of spectral response would
require no unfolding. But steps 1-3 listed above each introduce dramatic defects such that the
observed n(L) deviate substantially from this ideal.
Step 1 is largely governed by scattering kinematics, and the angular dependence of the n-
p cross-section is flat over our energy range of interest. Thus, the resulting distribution over Ep
looks somewhat like a step function which extends to the full incident energy En. Step 2 is
similar to a quenching effect. As the recoiling particle traverses through the detecting medium, it
saturates the excitable scintillating systems within the locality along its path, and excess energy
is lost to non-scintillating systems. Slower recoil particles deposit their energy with a greater
linear density dE/dx along the path, and thus saturate the available scintillating systems more
quickly. This means that a greater fraction of their initial energy is lost to non-scintillating
systems. Faster recoil particles deposit their energy with lower linear density dE/dx, and thereby
have access to more scintillating systems on which to deposit their energy. This introduces a
nonlinearity to the relation between energy Ep deposited onto a recoil particle, and the amount of
energy transferred to scintillating systems Escint (see Fig. 2.3), which in turn tends to compress
features along the low end of the pulse-height axis.
10
vi This may be counter intuitive, since the anode pulse is integrated. However, anode signal is traditionally processed via a shaping amplifier, and height of the processed pulse is recorded - hence the descriptor “pulse height”. The hight of the processed pulse is proportional to the integral of the anode pulse.

FIG. 2.2. Sequence of physical processes leading to the detection of mono-energetic neutrons in an organic scintillation detector, along with a simplified illustration of the effect of each process on the shape of the observed pulse-height spectrum (PHS) n(L).
FIG. 2.3. Nonlinear relation Lscint(Ep) between energy Ep deposited onto a recoil nucleus and the resulting scintillation light Lscint produced in the slowing-down process.
11

Step 3 introduces a blurring or “resolution” effect. Since the scintillation light Lscint is
released in a population of photons prior to collection in a PMT, there is a Poisson variance
added to the observed flash:
δLobsLobs
∝1Escint
. (2.2)
This blurs the features in the observed PHS n(L). Thus, the predicted observable PHS n(L) from
our simplified model looks like a blurred step function, as shown in the lower right portion of
Fig. 2.2.
A more complete treatment would consider the contributions of alternative collision
histories, and this is provided in Refs. [9], [10]. Here, I will mention two important contributions
to the observed PHS, beginning with neutrons that collide twice on hydrogen. Through a
convolution of two step functions, it can be shown that the resulting contribution to the PHS
contains a prominent hump at a pulse-height location L which is shifted downward slightly from
the pulse-height Lo corresponding to single-collision full-energy deposition (see Fig. 2.4) [9].
FIG. 2.4. The component n(HH)(L) to the observed PHS n(obs)(L) contributed by neutrons which collide twice on hydrogen (resolution not included). Other collision histories with multiple collisions have a similar “peaking” effect, and together result in a small deviation of n(obs)(L) from step-function-like shape [9].
12

The other category of collision history that should be mentioned are those which involve
carbon nuclei. Since the linear density of dE/dx of energy deposited along the track length is
higher for larger recoil particles, saturation of locally-available scintillating systems is reached
with a smaller amount of energy, and more energy is “wasted” on non-scintillating systems.
Thus, heavier recoil particles produce less light for a given initial energy Ep. Additionally, the
maximum energy deposited in a neutron collision on a nucleus of size A is given by
Epmax =
2A(A+1)2
En (2.3)
so that a neutron can only deposit up to 14% of its energy onto 12C nucleus in a single collision.
These effects taken together indicate that the light output from carbon will be very small over
most of our energy range of interest, and this is in fact the case. Collisions on carbon can alter the
shape of the PHS by absorbing energies from neutrons which may then collide on hydrogen, but
the resulting contribution to the PHS is similar to that shown in Fig. 2.4.
Figure 2.5 shows measured PHS for quasi-mono-energetic neutron spectra of several
energies across the fission-energy rangevii. With the exception of multiple-collision effects
mentioned, they generally look like the blurred step functions we expect from n-p scattering. The
nonlinearity of the light output relation is betrayed by the fact that separation between edges
increases with increasing pulse height, even though the incident neutron energies En are evenly
spaced in steps of 1 MeV. And the blurring effect from Poisson statistics is apparent in the
gradual drop off of each step-function edge.
13
vii The dependent “pulse-height” variable L is presented in units of MeV “electron equivalent”, or MeVee. The MeVee scale is defined in relation to PHS from standard gamma-ray calibration sources. One MeVee is the amount of light produced by a 1-MeV electron stopping in the detector active volume.
0 0.5 1 1.5 2 2.5 3 3.5 4 4.5 5
10ï4
10ï3
10ï2
10ï1
Pulse height (MeVee)
Nor
mal
ized
cou
nts
2.5 MeV
3.5 MeV
4.5 MeV5.5 MeV
6.5 MeV7.5 MeV
8.5 MeV
FIG. 2.5. Measured PHS n(L) in a hydrogen-based EJ309 from quasi-mono-energetic neutron spectra selected with 100-keV-wide time-of-flight gates.
To begin to understand why spectrum unfolding is required with this type of pulse-height
response, consider neutron spectra ϕ(En) that contain multiple energies. Each energy component
ϕ(j) in ϕ(En) would result in an independent step-function-like component n(j), all of which are
superimposed in the overall observed n(obs)(L). As more energy components are added, n(L)
becomes more difficult to interpret. When measuring the continuous fission-neutron spectra
relevant to arms-control applications, we are faced with a superposition of infinitely many step
functions, such that n(L) are nearly impossible to interpret visually. As an illustration, consider
two very different neutron spectra shown in Fig. 2.6. The left-most figure depicts the spectrum of
neutrons produced by a 252Cf fission source (lighter, smooth red curve), as well as the same
spectrum passed through two inches of tap waterviii (darker, jagged curve - both are normalized
for convenient portrayal). These very different neutron spectra, incident on a liquid scintillator,
14
viii The energy-dependent neutron-interaction cross section of oxygen differentially attenuates neutrons of different energies, introducing stark features to the neutron spectrum.

produce the pulse-height spectra shown in the right half of the figure, which are much less
distinguishable.
FIG. 2.6. Examples of continuous neutron spectra ϕ(En), and the resulting observable PHS n(L) from the organic liquid scintillator EJ309. Distinguishable features in ϕ(En) are not visually observable in n(L), resulting in the need for spectrum unfolding.
The relation between incident neutron energy spectrum ϕ(En) and resulting PHS n(L) can
be represented as a first-order Fredholm convolution:
n(L) = ∫ R(En,L) ϕ(En) dEn (2.4)
where R(En,L) is the detector response matrix - a mapping of the probabilistic coupling between
incident neutron energy En and resulting pulse height L. The meaning of R(En,L) is as follows:
given a neutron of energy En incident on the detector, R(En,L) is the probability that the detector
will produce an observable pulse of height L. Figure 2.7 shows a representative response matrix
for a hydrogen-based liquid scintillator EJ309, simulated in MCNP-PoliMi [11]. Each column of
R(En,L) at a fixed energy En corresponds to the PHS we expect from mono-energetic neutrons of
energy En. Given the probabilistic meaning of R(En,L), it should be normalized such that each
column integrates to the detection efficiency ϵ(En) at the energy corresponding to that column.
15

This is the matrix which must be inverted in the unfolding process - its ill condition can be
associated with its general flatness and lack of feature.
Neutron Energy
Pulse height
FIG. 2.7. An example of a response matrix R(En,L) for a hydrogen-based EN309 scintillation detector, simulated with the Monte Carlo program MCNP-PoliMi [12], as reported in Ref. [11]. Response matrices presented and used in this thesis were measured using accelerator experiments.
2.2 Pulse-shape discrimination for n-γ identification
As mentioned above, organic scintillation detectors are sensitive to gamma rays as well as
neutrons. The physical processes leading to detection of gamma rays are similar to those
resulting in neutron detection, with the exception that elastic scattering of neutrons on target
nuclei is replaced with Compton scattering of gamma rays on molecular electrons. Fortunately,
many scintillator solutions enable n/γ identification through pulse-shape discrimination (PSD).
16

For these materials, the nuclei-induced pulses (associated with neutron detection) have a slightly
more pronounced tail than those induced by recoil electrons (associated with gamma rays) [3],
[13]. This can be seen in the right portion of Fig. 2.1.
The difference in pulse shape results from the fact that there are two categories of
scintillating de-excitation paths, each with a significantly different time characteristic. Direct
fluorescence results from excitation and de-excitation amongst singlet vibrational states in the
scintillating molecules, and this contributes the bulk of the scintillation pulse. But some excited
molecules transition to longer-lived triplet states prior to de-excitation, and this leads to delayed
fluorescence. The fraction of excited systems that transition to triplet states is related to the
density of singlet states that are initially excited. A larger and more durable local population of
excited singlet states will more readily “feed” the adjacent triplet states. And we saw before that
the spatial density of excited scintillation molecules is related to the linear density of energy loss
dE/dx of recoiling charged particles, which for a given energy Ep is proportional to the particles’
mass. Since nuclei are much more massive than electrons, they lead to larger relative populations
of delayed-fluorescing triplet states, and thus more prominent tail contribution to the observed
scintillation pulses [7].
A standard way to perform PSD is to take two integrals of each scintillation pulse - one of
the entire pulse, and a second of the “tail” of the pulse - and plot the tail integral versus the total
integral. Figure 2.8 shows an example of a standard PSD plot for 105 pulses measured from a 252Cf fission source with a three-by-two-inch EJ309 detector. Neutron events are clearly
separated from gamma-ray events, and can be distinguished by placing a gate around that
distribution. The separation between neutron and gamma-ray distributions in a standard PSD plot
is variant across different scintillator solutions. Crystals like stilbene and p-terphenyl tend to
produce PSD separation superior to that of liquids. We will find that deuterated scintillators have
similar PSD performance to standard hydrogen-based liquids. Since PSD performance can
substantially affect unfolding results, it is an important attribute of detector performance for any
scintillating neutron spectrometer.
17
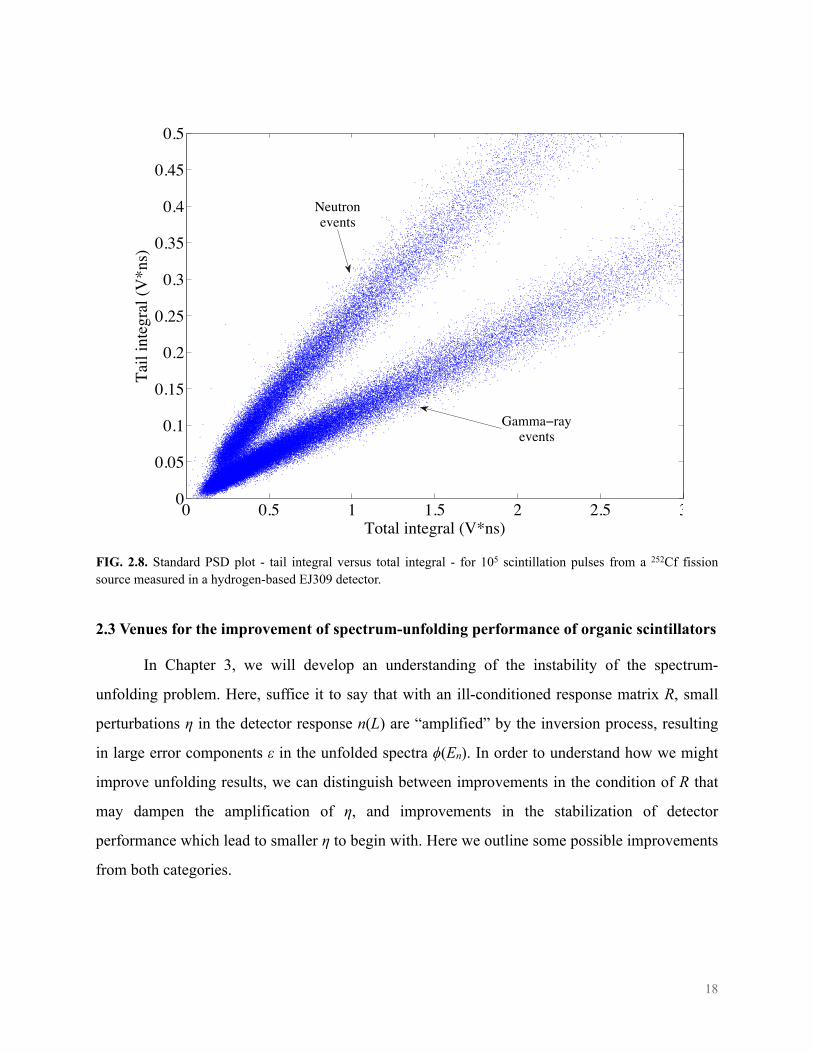
FIG. 2.8. Standard PSD plot - tail integral versus total integral - for 105 scintillation pulses from a 252Cf fission source measured in a hydrogen-based EJ309 detector.
2.3 Venues for the improvement of spectrum-unfolding performance of organic scintillators
In Chapter 3, we will develop an understanding of the instability of the spectrum-
unfolding problem. Here, suffice it to say that with an ill-conditioned response matrix R, small
perturbations η in the detector response n(L) are “amplified” by the inversion process, resulting
in large error components ε in the unfolded spectra ϕ(En). In order to understand how we might
improve unfolding results, we can distinguish between improvements in the condition of R that
may dampen the amplification of η, and improvements in the stabilization of detector
performance which lead to smaller η to begin with. Here we outline some possible improvements
from both categories.
0 0.5 1 1.5 2 2.5 30
0.05
0.1
0.15
0.2
0.25
0.3
0.35
0.4
0.45
0.5
Total integral (V*ns)
Tail
inte
gral
(V*n
s)
Neutronevents
Gammaïrayevents
18

2.3.1 Deuterated scintillators: n-d versus n-p scattering
As described above, one of the main factors that complicate the pulse-height response of
organic scintillators is the scattering kinematics of the dominant neutron interaction. Since most
detected neutrons only collide once within the detection medium, the broad features of the pulse-
height response to neutrons of a given energy correspond to the angular dependence of scattering
cross section [1]. Previous studies of neutron spectrum unfolding are almost exclusively done
with hydrogen-based liquids like NE213 or BC501Aix. With their reliance on n-p scattering,
which is isotropic in the center of mass frame, hydrogen-based scintillators represent a sort of
worst case scenario, yielding a response matrix R(En,L) that is very flat (see Fig. 2.7). However,
other scintillation detectors are available which employ “deuterated” solvents, like deuterated
benzene. The response of deuterated scintillation detectors is dominated by n-d scattering, which
is non-isotropic in the center-of-mass frame, and prefers backscattering. This preference yields a
modest “backscatter peak” in the detector response to neutrons of a given energy [14], [15] (see
Fig. 2.9). The corresponding “ridge” in the response matrix amounts to more “structure”, and this
is one of the ways we can improve the condition of the response matrix. While others have
suggested that this may improve spectrum unfolding results [16], [17], demonstration of the
unfolding capabilities of deuterated scintillators is absent from the literature, as is comparison
with the standard hydrogen-based detectors. In this thesis, I will show a modest but significant
improvement in spectrum unfolding performance for deuterated scintillators, over that of the
hydrogen-based standard.
19
ix I refer here to “many-channel” spectrum unfolding, as opposed to “few channel” unfolding from Bonner-sphere or bubble-detetector arrays. Few-channel systems are only capable of rudimentary preservation of spectral features.

FIG. 2.9. Pulse-height spectra simulated for the hydrogen-based EJ309 and the deuterium-based EJ315, to mono-energetic neutrons of 2.5 MeV. The effect of scattering kinematics on the shape of the detector response is clearly shown. (Resolution is not included).
2.3.2 Energy resolution
The energy resolution of a scintillation detector has a significant impact on the condition
of the response matrix, and it is a product of the pulse-height resolution and light-output
attributes described above (section 2.1). The pulse-height resolution is a composite of multiple
effects, and is dominated by Poisson variance. In general, it follows the relation [1]:
ΔLoutLout
⎛
⎝⎜
⎞
⎠⎟= α 2 +
β 2
Lout+
γLout
⎛
⎝⎜
⎞
⎠⎟
2
. (2.5)
This relation falls off sharply for small values of Lout, and approaches some asymptotic value α
for large values. Thus, higher light-output Lout(Ep) for a given deposition energy Ep results in
smaller fractional resolution.
There is strong variation in both Lout(Ep) and ΔL/L amongst scintillator options. For
instance, some crystals like p-terphenyl and stilbene can be optimized to have Lout(Ep) and ΔL/L
that are superior to organic liquids or plastics. While crystals are often set aside due to their non-
isotropic response (neutrons coming in at different angles w.r.t. the crystalline symmetry axes
20

produce different light-output relations), this would likely not be an issue in the controlled
environments envisioned for warhead and material accounting. Unfortunately, these crystals
were not readily available during the measurements reported here. Nevertheless, they may
provide options for future improvement of response-matrix condition.
Plastic scintillators have recently gained much enthusiasm in the neutron-detection
community, due to their wide deployment range [18]-[20]. However, they have inferior light
output and resolution relative to common liquid scintillators. While these would be an unwise
choice for warhead verification, where liquids and crystals would be unproblematic, they offer an
interesting case to demonstrate the effect of energy resolution on response-matrix condition, and
ultimately on unfolding results. Along these lines, a comparison between the unfolding
performances of plastic and liquid scintillators will be presented, partially in hopes of motivating
future development on neutron spectrometers composed of high-energy-resolution crystal
scintillators.
2.3.3 Stabilization of detector performance
Spectrum-unfolding practitioners often note the importance of the “accuracy” of the
response matrix, without elaborating on the meaning thereof. Plainly stated, the “accuracy” of
the response matrix refers to how accurately the response-matrix operator Rmodel characterizes the
pulse-height response of the detector as deployed to measure n(L). Consider some field
measurement n(f)(L) to be unfolded with response matrix Rmodel(En,L), and ask the following
questions:
• How well does Rmodel characterize the fielded spectrometer?
• Was Rmodel simulated? If so, with how accurately?
• Was Rmodel measured? If so, was it with the same detector setup? Geometry? PMT? etc.
• Even so, what about PMT gain? What about PSD performance? Are these the same for
the modeled/measured Rmodel as for the fielded detector measuring n(f)(L)?
With typical studies of the unfolding problem, detector response matrices Rmodel are simulated
using Monte Carlo simulations, or drawn from archives of detector measurements found in
21
RSICC. Often these do not account for PSD misclassification, geometric variation, or other
aspects of practical measurements n(f)(L). Also, PMT gain and PSD performance can shift during
a measurement due to temperature changes and other environmental variations. Shifts of this sort
result in a displacement of the real Rreal from that represented in the simulated or measured
model Rmodel, yielding a corresponding η which is in turn amplified by the inversion of the ill-
conditioned matrix Rmodel. This displacement is part of what we want to characterize, and
ultimately minimize, to improve unfolding results.
The most obvious discrepancy in detector performance results from shifts in PMT gain.
The thermal properties of the PMT and associated electronics can evolve during the
measurement and result in perturbations on the MeVee relation that was established prior to the
measurement via gamma-ray calibration. In addition, temperature changes in the active volume
of the detector can change detector performance. As these attributes shift, they move the features
of the pulse-height response along the pulse-height L axis, leading to perturbations η.
Another important discrepancy in detector performance is associated with PSD
performance. From Fig. 2.8, it is clear that the neutron and gamma-ray distributions merge at the
low pulse-height end of the plot. This means that some neutrons will be lost to misclassification,
while misclassified gamma-ray events will distort the shape of the low end of the observed PHS.
While this is typically not included in simulated response matrices, it can be included in a
measured response matrix. But shifts in PMT gain and pulse-height response can alter the
respective neutron and gamma-ray distributions in the PSD plot (Fig. 2.8) relative to any pre-
determined PSD gate settings, and thereby change the relative misclassification rates of neutrons
and gamma-rays. Additionally, variation in n/γ ratio (of incident radiation) can change the
absolute number of gamma-ray events which are misclassified and erroneously included as
neutrons. This will alter the shape of the measured PHS n(f) relative to that predicted by Rmodel,
and produce an additional η to be amplified in the unfolding process.
Current developments can improve many of these problems. Gain shifts can be stabilized
by automated calibration systems that inject optical signals into the PMT during measurement to
provide real-time calibration data, and alter the PMT voltage accordingly. Some chemical
22

additives to the scintillator solution can dramatically improve PSD separation, and automated
methods for the placement of the PSD gate can remove shifts in PSD performance [21]. Thus,
improvements to unfolding performance that can be derived from stabilizing PMT gain and PSD
performance may be realized in future fieldable systems.
2.4 Scintillators chosen for this work
Table (2.1) lists the detectors used in this study. They are selected to demonstrate some of
the features of detector response described throughout this chapter. Availability was also a factor
- for instance I would have liked to evaluate a high-quality crystal like p-terphenyl or stilbene,
but the crystals I had access to were not optimized for high light output or fine resolution.
TAB. 2.1. List of organic scintillators chosen for this study.
Description Model Dimensions (cyl) Dist. feature for unfolding
Hydrogen-based liquid
EJ309 7.62cm dia. by 5.08cm length Flat response matrix similar to NE213; n-p scattering
Deuterated liquid
EJ315 7.62cm dia. by 5.08cm length Back-scatter feature from anisotropy of n-d scattering
PSD plastic EJ299-33 7.62cm dia. by 7.62cm length Poor energy resolution
The hydrogen-based liquid EJ309 was chosen for its similarity to the hydrogen-based
standard NE213 by Nuclear Enterprises, or the Bicron equivalent BC501A. NE213 or BC501A
are used in nearly all studies of many-channel spectrum unfolding, but were unavailable at the
time my measurements were taken. EJ309 has been shown to perform very similarly to BC501A,
with the exception of a higher flash point [22]. Since many suitable EJ309 detectors were
available for this work, it was chosen as the hydrogen-based standard for comparison. The well-
known deuterated liquid is deuterated benzene NE230 [17]. However, since Nuclear Enterprises
is no longer manufacturing scintillators, we obtained the Eljen-technology equivalent EJ315, and
this will be the deuterated liquid used for this thesis [14], [15]. In order to look at the effects of
energy resolution, I also include the new PSD plastic EJ299-33 [18]. There is much interest in
23

EJ299-33 due to its wider fieldability [19], [23], [24], but we will find that its lower light output
and poorer resolution make it a poor choice for detailed spectrum unfolding, and an interesting
demonstration of the importance of these characteristics. Specification of the characteristics of
the detector housings and electronics will be given in appendix.
2.5 Remarks
In this chapter, I have tried to convey an intuitive sense of the relevant features of
scintillator pulse-height response, and some means by which they may be altered to improve
unfolding capabilities. Two important factors were noted to affect the condition of the response
matrix - scattering kinematics and energy resolution - and these factors have guided my choices
in the detectors evaluated for this study. In Chapters 7 and 8 we will find that deuterated
detectors offer a modest but significant improvement in unfolding response over standard
hydrogen-based liquids, while the poor resolution of the PSD plastic degrades unfolding
performance considerably. I also noted some aspects of detector performance which can shift
between or during measurements to degrade unfolding results. In Chapter 8 I will utilize
accelerator-based experiments to monitor and remove some of these shifts, and obtain excellent
unfolding as a result.
References
[1] G. Knoll, Radiation Detection and Measurement, 3rd ed. 1997.[2] T. W. Crane and M. P. Baker, “Neutron Detectors,” in Passive Nondestructive Assay of Nuclear
Materials, no. 13, United States Nuclear Regulatory Commission, 1991, pp. 1–28.[3] H. Klein and F. D. Brooks, “Scintillation Detectors for Fast Neutrons,” presented at the
International Workshop on Fast Neutron Detectors, University of Cape Town, South Africa, 2006, pp. 1–24.
[4] M. Flaska and S. Pozzi, “Identification of shielded neutron sources with the liquid scintillator BC-501A using a digital pulse shape discrimination method,” Nuclear Instruments and Methods in Physics Research Section A: Accelerators, Spectrometers, Detectors and Associated Equipment, vol. 577, no. 3, pp. 654–663, Jul. 2007.
[5] D. L. Chichester, J. T. Johnson, and E. H. Seabury, “Fast-neutron spectrometry using a 3He ionization chamber and digital pulse shape analysis,” Applied Radiation and Isotopes, vol. 70, no. 8, pp. 1457–1463, Aug. 2012.
24

[6] K. Banerjee, T. K. Ghosh, S. Kundu, T. K. Rana, C. Bhattacharya, J. K. Meena, G. Mukherjee, P. Mali, D. Gupta, S. Mukhopadhyay, D. Pandit, S. R. Banerjee, S. Bhattacharya, T. Bandyopadhyay, and S. Chatterjee, “Variation of neutron detection characteristics with dimension of BC501A neutron detector,” Nuclear inst. and Methods in Physics Research, A, vol. 608, no. 3, pp. 440–446, Sep. 2009.
[7] J. Birks, Theory and Practice of Scintillation Counting. Pergemon Press.[8] H. Klein, “Neutron Spectrometry in Mixed Fields: NE213/BC501A Liquid Scintillation
Spectrometers,” Radiation Protection and Dosimetry, vol. 107, pp. 95–109, Dec. 2003.[9] A. Enqvist and I. Pázsit, “Calculation of the light pulse distributions induced by fast neutrons in
organic scintillation detectors,” Nuclear Instruments and Methods in Physics Research Section A: Accelerators, Spectrometers, Detectors and Associated Equipment, vol. 618, no. 1, pp. 266–274, Jun. 2010.
[10] S. A. Pozzi, M. Flaska, A. Enqvist, and I. Pázsit, “Monte Carlo and analytical models of neutron detection with organic scintillation detectors,” Nuclear Instruments and Methods in Physics Research Section A: Accelerators, Spectrometers, Detectors and Associated Equipment, vol. 582, no. 2, pp. 629–637, Nov. 2007.
[11] L. Cartegni and S. Pozzi, “Determination of liquid scintillator response matrix for neutron spectrum unfolding,” pp. 1–8, Jul. 2004.
[12] S. A. Pozzi, S. D. Clarke, W. J. Walsh, E. C. Miller, J. L. Dolan, M. Flaska, B. M. Wieger, A. Enqvist, E. Padovani, J. K. Mattingly, D. L. Chichester, and P. Peerani, “MCNPX-PoliMi for nuclear nonproliferation applications,” Nuclear inst. and Methods in Physics Research, A, vol. 694, no. C, pp. 119–125, Dec. 2012.
[13] R. A. Winyard, J. E. Lutkin, and G. W. McBeth, “Pulse Shape Discrimination in Inorganic and Organic Scintillators. I,” Nuclear Instruments and Methods, vol. 95, pp. 141–153, Jun. 1971.
[14] M. I. Ojaruega, “Fast Neutron Measurements Using Deuterated Liquid Scintillators,” 2009.
[15] M. Ojaruega, F. D. Becchetti, A. N. Villano, H. Jiang, R. O. Torres-Isea, J. J. Kolata, R. J. Goldston, and C. C. Lawrence, “Evaluation of large deuterated scintillators for fast neutron detection (E=0.5–20MeV) using the D(d,n)3He, 13C(d,n) and 27Al(d,n) reactions,” Nuclear inst. and Methods in Physics Research, A, vol. 652, no. 1, pp. 397–399, Aug. 2010.
[16] F. D. Brooks, “Development of organic scintillators,” Nuclear inst. and Methods in Physics Research, A, vol. 162, pp. 477–505, Jun. 1979.
[17] S. Croft, J. M. Adams, D. S. Bond, N. P. Hawkes, and N. Watkins, “A measurement of the light output function of the deuterated liquid scintillator NE-230 to recoil deuterons with energies between 0.62 and 14.5 MeV *,” Nuclear Instruments and Methods in Physics Research A, vol. 316, pp. 324–332, Jul. 1992.
[18] N. Zaitseva, A. Glenn, L. Carman, R. Hatarik, S. Hamel, M. Faust, B. Schabes, N. Cherepy, and S. Payne, “Pulse Shape Discrimination in Impure and Mixed Single-Crystal Organic Scintillators,” IEEE Transactions on Nuclear Science, vol. 58, no. 6, pp. 3411–3420, Dec. 2011.
[19] S. A. Pozzi, M. M. Bourne, and S. D. Clarke, “Pulse-shape Discrimination in the Plastic Scintillator EJ-299-33,” Nuclear inst. and Methods in Physics Research, A, vol. 723, no. C, pp. 19–23, Sep. 2013.
25

[20] D. Cester, G. Nebbia, L. Stevanato, F. Pino, and G. Viesti, “Experimental Tests of the New Plastic Scintillaotr with Pulse-shape Discrimination Capabilities EJ-299-33,” Nuclear inst. and Methods in Physics Research, A, vol. 735, no. C, pp. 202–206, Jan. 2014.
[21] C. C. Lawrence, A. Enqvist, M. Flaska, S. A. Pozzi, and F. D. Becchetti, “Comparison of Spectrum-unfolding Performance of (EJ315_ and (EJ309) Liquid Scintillators on Measured Cf-252 Pulse-height Spectra,” Nuclear inst. and Methods in Physics Research, A, vol. 729, no. C, pp. 924–929, Nov. 2013.
[22] L. Stevanato, D. Cester, G. Nebbia, and G. Viesti, “Neutron detection in a high gamma-ray background with EJ-301 and EJ-309 liquid scintillators,” Nuclear Instruments and Methods in Physics Research Section A: Accelerators, Spectrometers, Detectors and Associated Equipment, vol. 690, pp. 96–101, Oct. 2012.
[23] N. P. Hawkes and G. C. Taylor, “Analysis of the Pulse-shape Mechanism in a Plastic Scintillator with Efficient Neutron/gamma Pulse-shape Discrimination,” Nuclear inst. and Methods in Physics Research, A, vol. 729, no. C, pp. 522–526, Nov. 2013.
[24] S. Nyibule, E. Henry, W. U. Schröder, J. Tõke, L. Acosta, L. Auditore, G. Cardella, E. De Filippo, L. Francalanza, S. Gìani, T. Minniti, E. Morgana, E. V. Pagano, S. Pirrone, G. Politi, L. Quattrocchi, F. Rizzo, P. Russotto, A. Trifirò, and M. Trimarchi, “Radioluminescent Characteristics of the EJ 299-33 Plastic Scintillator,” Nuclear inst. and Methods in Physics Research, A, vol. 728, no. C, pp. 36–39, Nov. 2013.
26
Chapter 3Neutron Spectroscopy and
Spectrum Unfolding
The overarching difficulty of fast-neutron spectroscopy is due to the neutron’s weakly-
interacting nature. Interactions by which a neutron is stopped within a detecting medium - like
neutron capture or n-p process - are of quite low cross section for fission-energy neutrons,
leading to extremely low detection efficiencies on the order or 10-4 - 10-3 in detectors employing
these processes. The cross-section is higher for elastic scattering on small nuclei, but these
interactions are unconstrained in scattering angle, and thus in fractional energy transfer. Thus,
neutron spectroscopy is generally either a low-efficiency or a statistical affair. Of course, TOF
techniques - whereby neutrons are timed as they traverse some distance - are an exception to
these generalizations, and it will be utilized them later to calculate reference spectra for
comparison with unfolded trial spectra. But TOF is only available in specialized applications,
and should be treated as a separate problem from that of single-detector spectroscopy [1]-[3].
Along with the difficulty of neutron spectroscopy, its historical uses provide an important
bit of context for us here. In his review of neutron spectroscopy techniques, D.J. Thomas
identifies four different categories of locations in which knowledge of present neutron spectra are
important: laboratory settings, workplaces, near reactor cores, and at fusion facilities [3]. The
requirements and constraints arising out of these four categories - along with the difficulties
mentioned above - have guided and constrained the development of neutron-spectroscopic
techniques over the years [3]. A few general comments can be made in this regard. Typically,
when high-resolution information has been required, as in laboratory settings, TOF spectroscopy
was possible. When TOF was not available, as in the work place or near a reactor core, lower-
resolution spectrometry was sufficient for the dose estimates necessary to characterize radiation
exposures to humans or reactor vessels, or to obtain information about plasma temperatures.
Rarely has material characterization been at stake. In order to apply neutron spectroscopy for
27

treaty verification, we must bring it into this more demanding category. This will require a
balance between high-efficiency neutron detection and detailed preservation of energy
information. In this chapter, I’ll describe the inverse problem of spectrum unfolding with organic
scintillators, why it is difficult or ill-posed, what techniques are used to solve it, and what quality
of results are typically expected.
3.1.1 Neutron spectrum unfolding as an inverse problem
Due to the complications in their pulse-height response outlined in Chapter 2, PHS n(L)
from organic scintillators cannot readily be visually interpreted. Instead, the incident spectra
ϕ(En) must be “unfolded” from n(L), i.e. the integral relation given by Eq. 2.4 must be solved for
the source term ϕ(En). This is a classic form of inverse problem that arises in many areas of the
physical sciences and it has been extensively studied:
b(s) = ∫ A(s,t) x(t) dt . (3.1)
The descriptor “inverse” refers to the direction along causality traversed by the analyst. In the
easier “forward” problem the source term x(t) - or “cause” - is propagated through a causal
operator A(s,t) to calculate the predicted observable “effect” b(s). Forward problems often have
unique and straightforward solutions. In the “inverse” problem, the posterior “effect” b is
observed, and an estimated “cause” is sought by “inverting” the causal operator A. But in many
physical systems of interest, multiple and disparate causes can lead to very similar, or even the
same, effects. The solutions x are “unstable” in these cases - either non-unique or sensitively
dependent on the inevitable fluctuations attendant to any observable b - and the analyst must
resort to inductive techniques, and/or utilize a priori information external to the data b to further
constrain the solution.
The degree of instability in x is related to the “flatness” of the matrix A(s,t) - sharp
distinguishable features in A help to constrain the solution for a given data set b [4], [5]. This
loose concept of “flatness” or “featurelessness” is analogous to the condition of a discrete matrix,
and indeed adopts this more concrete definition when the continuous Eq. 3.1 is discretized
28

Ax = b. (3.2)
Strictly speaking, the condition number of the a discrete A is defined as the ratio between the
largest and smallest singular values of A
cond(A)= σ max
σ min
(3.3)
where the singular values σi are the square roots of the eigenvalues of A†A. Higher condition
number is associated with greater instability of inverse solutions [6]. However, even though our
spectrum-unfolding problem will be discretized in practice, Eq. 3.3 will be of little use to us
because the condition of our matrices will be so horrible as to exhaust the dynamic range of 64-
bit numerical calculation. Instead, we will note that the solution instability is related to the rate of
decrease of the descending singular values [7]. When the word “condition” is used henceforth, it
will refer more qualitatively to the general instability of solutions due to the “flatness” of A, and
in Chapter 7 I will employ a framework drawn from Ref. [7] to evaluate matrix condition by
plotting the descending eigenvalues of A†A.
In this chapter, we want to develop an intuition about the instability of solutions x, how
that instability is related to the structure of a given matrix A, and how it is commonly addressed
in the context of spectrum unfolding. The labels A, x, and b will be used to refer in general to
problems of the form of Eq. 3.1, while R, ϕ, and n will indicate the particular problem of neutron
spectrum unfolding. Distinction between different vectors in the same space - for instance,
between a candidate solution x(k) and the true unknown solution x(0) - will be indicated with
superscripts, and components of a vector will be indexed with subscripts. Matrices are
capitalized and vectors are written in lower case.
The methods used for spectrum unfolding arise out of two different conceptual
frameworks, and they will be outlined in the latter half of this chapter. For now, I will make some
preliminary comments. The instability in x is typically addressed by a compromise between
agreement with observed data b, and implementation of some a-priori information. Agreement
with data is associated with a residual vector r(k)
29
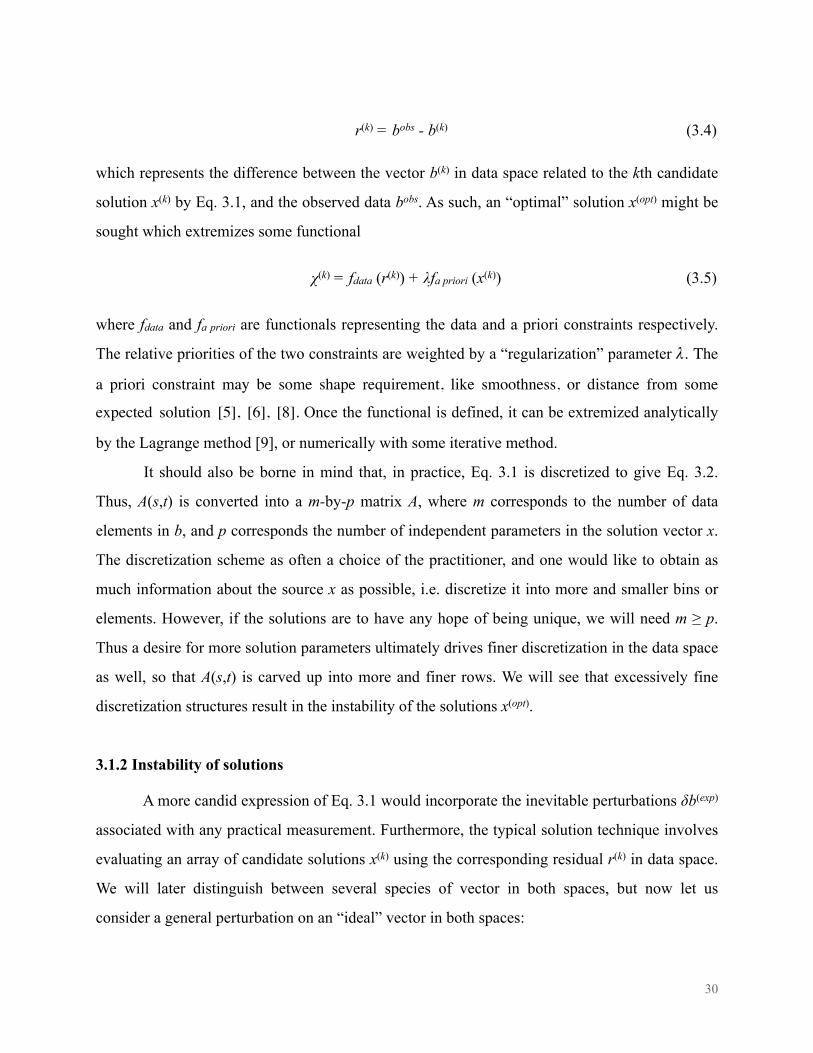
r(k) = bobs - b(k) (3.4)
which represents the difference between the vector b(k) in data space related to the kth candidate
solution x(k) by Eq. 3.1, and the observed data bobs. As such, an “optimal” solution x(opt) might be
sought which extremizes some functional
χ(k) = fdata (r(k)) + λfa priori (x(k)) (3.5)
where fdata and fa priori are functionals representing the data and a priori constraints respectively.
The relative priorities of the two constraints are weighted by a “regularization” parameter λ. The
a priori constraint may be some shape requirement, like smoothness, or distance from some
expected solution [5], [6], [8]. Once the functional is defined, it can be extremized analytically
by the Lagrange method [9], or numerically with some iterative method.
It should also be borne in mind that, in practice, Eq. 3.1 is discretized to give Eq. 3.2.
Thus, A(s,t) is converted into a m-by-p matrix A, where m corresponds to the number of data
elements in b, and p corresponds the number of independent parameters in the solution vector x.
The discretization scheme as often a choice of the practitioner, and one would like to obtain as
much information about the source x as possible, i.e. discretize it into more and smaller bins or
elements. However, if the solutions are to have any hope of being unique, we will need m ≥ p.
Thus a desire for more solution parameters ultimately drives finer discretization in the data space
as well, so that A(s,t) is carved up into more and finer rows. We will see that excessively fine
discretization structures result in the instability of the solutions x(opt).
3.1.2 Instability of solutions
A more candid expression of Eq. 3.1 would incorporate the inevitable perturbations δb(exp)
associated with any practical measurement. Furthermore, the typical solution technique involves
evaluating an array of candidate solutions x(k) using the corresponding residual r(k) in data space.
We will later distinguish between several species of vector in both spaces, but now let us
consider a general perturbation on an “ideal” vector in both spaces:
30

b(0)(s) + η(s) = ∫ A(s,t) (x(0)(t) + ε(t)) dt. (3.6)
We could call x(0) the true but unknown source (neutron spectrum) and b(0) the “ideal” dataset
that would result by propagating x(0) (if it were known) forward through Eq. 3.1; η is a
perturbation on b(0); and ε is the perturbation in solution space corresponding to η. We are
interested in the relation between the corresponding perturbations ε and η. By superposition:
η(s) = ∫ A(s,t) ε(t) dt. (3.7)
It is often stated that the η is “amplified” by ∫ dtA(s,t). But this implies an amplitude correlation
such that standard error propagation rules could be used, which is misleading. Instead, we see an
inverse relation between the amplitudes of η and the frequency (w.r.t. dependent variable t) of
structure in ε. To see this, consider a sinusoidal component of ε
εl = Cl sin(ωl t) (3.8)
giving for the corresponding component ηj
ηl = ∫ A(s,t) (Cl sin(ωl t))dt. (3.9)
It is well known that for a given (square-integrable, continuous) A, ηj vanishes as ωj increases to
infinity
lim(ωl→∞
nl )= 0 . (3.10)
Thus, high frequency components εj in the solution space are associated with only small
components ηj in the observed space. Taken the other way around, this means that very small
perturbations in the observable space correspond with high-frequency perturbations of almost
arbitrary amplitude in the solution space. We will see later that error in our unfolded solutions
often takes oscillatory form.
We can also see that the rate at which the limit expressed in Eq. 3.10 is approached is
governed by the “flatness”, or the scale of distinguishable features, in R. Regions of high slope -
31

with respect to t - in the rows of A(t) tend to slow the approach. Looking at the example matrix
presented in Fig. 3.6 of the previous chapter, we see that we are in some trouble since it is quite
flat and featureless.
We can make a similar argument in the discrete case. The “null” space of a matrix
contains all the vectors x(null) for which
Ax(null) = 0. (3.11)
A non-zero null space for A means that solutions to Ax = b are non-unique - given any solution
x(0), we can add any vector from within the x(null) to x(0) and still get a viable solution. This
corresponds to an m-by-p A for which m < p, or a system of equations bearing more unknowns
than independent equations. In practice we can discretize A(s,t) as we like, such that m ≥ p. But
for an A(s,t) of a given structure or “flatness”, if we make m large such that the data bin width Δs
is much smaller than the scale of structure in A(s,t), adjacent rows of the discretized A become
similar to each other and lose their independence. This leads to a problematic region in the
solution space x(prob) for which the corresponding observable vectors are small:
Ax(prob) = b(small). (3.12)
If b(small) is smaller than the uncertainty δb in the observable b(obs), then components within x(prob)
are invisible to the measurementx.
Now if we are faced with an inverse problem like neutron spectrum unfolding, we
naturally want to estimate the source term x(t) with as much fidelity as possible, and thus to
discretize it into as many elements as possible (i.e. to make Δt small). This, in turn, compels us to
discretize the observable into a large number m ≥ p of elements (i.e. to make Δs small). This is
limited by the “flatness” of A(s,t). If we make m and p too large, adjacent rows of A lose their
independence, and the solutions x acquire prominent oscillatory error components within the
problematic space x(prob). So our “success” at this type of inverse problem can be roughly
32
x Here, b(prob) and x(prob) are analogous to the perturbations η and ε (respectively) discussed above for the continuous treatment.

expressed as the dimension m for which a solution x can be stably obtained. In the context of
spectrum unfolding, larger m means more narrowly-spaced energy bins.
3.2 Methods for solving the unfolding problem
While the development of unfolding techniques loosely mirrors that of techniques for
solving the general Eq. 3.1, some comments here refer to the specific literature on spectrum
unfolding. With few exceptions, most literature on spectrum unfolding takes the response matrix
R, and its poor condition, as a given, and focuses on methods for constraining the solution. While
a major theme of this dissertation is the pursuit of improved matrix condition, here we will set
that aside and outline some general strategies used for solving the unfolding problem with a
given ill-conditioned R. As described above, R is discretized into m pulse-height groups and p
energy groups, and it is natural that most research activity on spectrum unfolding takes place at
the margin where m and p are large enough for instability in ϕ to onset. So the general task is to
choose amongst an array of potentially very different candidate spectra ϕ(k) which are roughly
equally compatible with the n(obs). Approaches to this problem arise out of two different
conceptual frameworks. The older framework treats spectrum unfolding as a matrix inversion
problem in need of some perturbation to stabilize the solution, often called regularization. The
second, more modern framework treats it as an inference problem. These two categories are
outlined in the following sections.
3.2.1 Regularized matrix inversion
The earlier attempts at spectrum unfolding took Rϕ = n at face value, treating it as a
matrix inversion problem. Inversion of large matrices is often carried out by minimizing some
measure of “fit” to data, such as the 2-norm of the residual vector r(k)
χ2 = r 2
= niobs −ni
(k )"# $%i∑ = ni
obs − Rijφ j(k )
j∑
"
#''
$
%((i
∑2
. (3.13)
33

However, the solution that optimally fits the data is seldom useful with an ill-conditioned R, so
some a priori constraint is added to the extremized functional to implement knowledge about the
expected solution
χreg2 = r 2
+λ f (φ) . (3.14)
This is referred to as regularization. The simplest option for f is the 2-norm of the solution itself
χreg2 = r 2
+λ x 2. (3.15)
Constraining the length of the solution vector has the effect of removing high-frequency features,
and this is reasonable given the nature of the instability described above. While there are other
options for f, such as distance from some expected spectrum, we can get a general idea of how
regularization works - and some good spectrum unfolding results - by looking at the simple
choice in expressed Eq. 3.15. The Eq. 3.15 is minimized by the solution to the equation
(R†R + λI)ϕ = R†n (3.16)
which can be solved using standard techniques like the conjugate-gradient method. Limiting
behaviors of the solution ϕ with respect to the regularization parameter λ are fairly straight
forward. With very small λ, the solution approaches the un-regularized solution, and is
dominated by the oscillatory error component. With very large λ, Eq. 3.16 approaches
λIϕ = R†n (3.17)
so that the shape of the “over-regularized” solution approaches that of R†n, which is not a useful
representation of the spectrum ϕ. This behavior is often visualized in the form of an L-curve, so
named because of its prominent L-shaped feature. A standard L-curve is a log-log plot of the
solution 2-norm versus the residual 2-norm, as is represented in Fig. 3.1. For small λ, the residual
norm is small, but the norm of the solution is large because it is dominated by large erroneous
oscillations. As λ is increased, the oscillations are damped and the solution norm is decreased.
34

But as the solution begins to approach R†n, disagreement with the data n is increased, resulting in
a larger residual norm. This results in the L-shaped feature in the L-curve, and a good
compromise is achieved by choosing a λ corresponding to the elbow of the curve.
FIG. 3.1. Illustration of the L-curve, a visualization of the compromise made in regularized matrix inversion between agreement with data and adherence to some a prior constraint, like solution “smoothness”.
One of the earliest unfolding codes developed - FERDOR - used a variant of regularized
matrix inversion [7], [10]. A more developed version of FERDOR, called FORIST, is considered
representative of the state of the art in this category, and often provides a standard to which other
unfolding algorithms are compared [11]. However, it is not clear how to estimate uncertainty in
the solutions using these codes [12]. Also, many consider justification for regularization
techniques to be ad hoc: since the matrix in question R†R is not invertible, some clever variant
like R†R + λI is substituted in order to impose smoothness, and it is hoped that the smoothed
solution approximates the correct solution [13]. These concerns led to the development of an
alternative framework for solving inverse problems which draws from information theory.
3.2.2 Inference formalisms
It seems quite natural to treat inverse problems as problems of inference, especially in the
context of spectrum unfolding, where the response matrix R represents a probabilistic coupling
35

between causes and effects. However, this approach did not become widely used until the mid
1980s and early 90s, after a somewhat supercilious E.T. Jaynes presented a sort of manifesto on
inverse problems titled Prior Information and Ambiguity in Inverse Problems. In this
wonderfully snide document, Jaynes argued that an ill-advised insistence on the appearance of
deduction had led mathematicians to replace real ill-posed problems with “ad hoc” approximates,
with little rational justification. Instead, he suggests that inverse problems should be treated as
the inference challenges they are, and approached with techniques from probability and
information theories.
In the spectrum unfolding literature, this philosophy is manifested in two types of
algorithm: one relying on maximum likelihood estimation, and one which maximizes some
notion of entropy. These principles allow the calculation of a probability distribution over
possible solutions, and thus provide a framework for uncertainty estimation. Modern unfolding-
code packages that employ these techniques include MAXED, UNFANA and HEPRO [7], [12],
[14], [15]. I will briefly review them here.
Maximum likelihood estimation is based on the concept of Bayesian inference, and can
be implemented in a number of ways. As an example, we can begin with the Poisson nature of
counting statistics. From the forward problem, we know that the mean number of counts
detected in the ith pulse-height group should be equal to
ni = Rijφ jj∑ (3.18)
and the observed counts for a given measurement ni(obs) are drawn from a Poisson distribution
P(ni(obs ) )= ni
ni(obs )
exp(−ni )ni(obs )!
. (3.19)
Plugging Eq. 3.18 into Eq. 3.19 gives
36
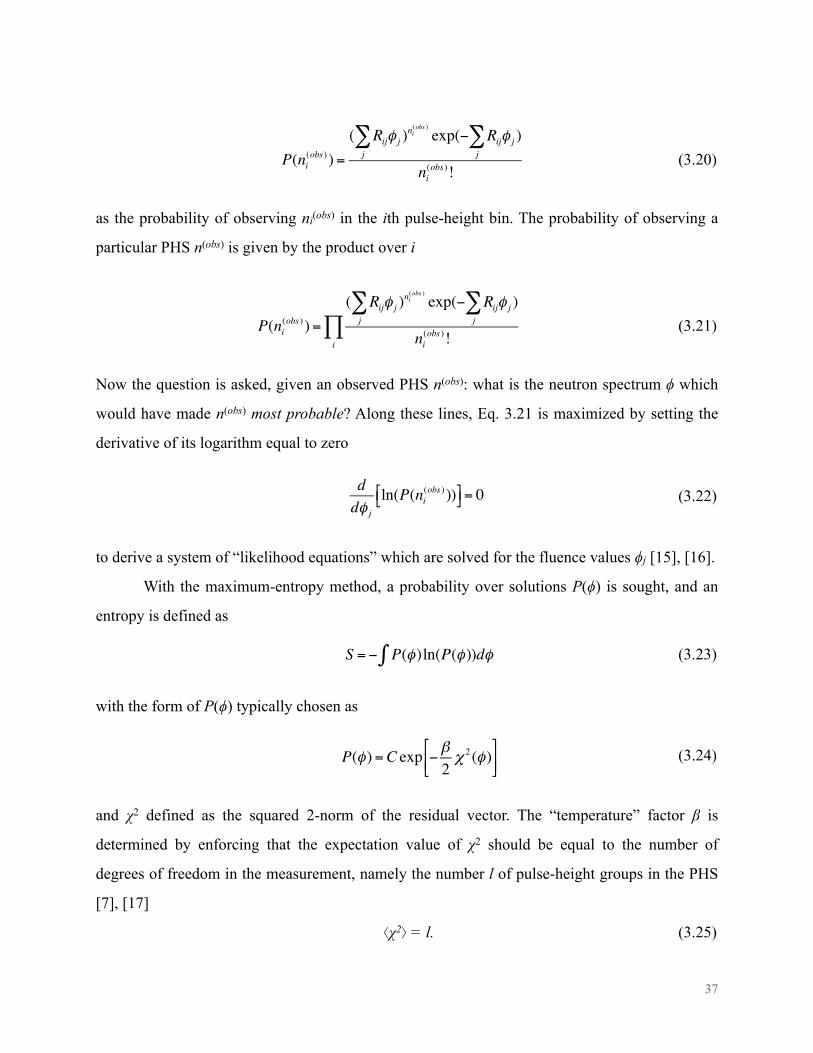
P(ni(obs ) )=
( Rijj∑ φ j )
ni(obs )
exp(− Rijj∑ φ j )
ni(obs )!
(3.20)
as the probability of observing ni(obs) in the ith pulse-height bin. The probability of observing a
particular PHS n(obs) is given by the product over i
P(ni(obs ) )=
( Rijj∑ φ j )
ni(obs )
exp(− Rijj∑ φ j )
ni(obs )!i
∏ (3.21)
Now the question is asked, given an observed PHS n(obs): what is the neutron spectrum ϕ which
would have made n(obs) most probable? Along these lines, Eq. 3.21 is maximized by setting the
derivative of its logarithm equal to zero
ddφ j
ln(P(ni(obs ) ))!" #$= 0 (3.22)
to derive a system of “likelihood equations” which are solved for the fluence values ϕj [15], [16].
With the maximum-entropy method, a probability over solutions P(ϕ) is sought, and an
entropy is defined as
S = − P(φ)ln(P∫ (φ))dφ (3.23)
with the form of P(ϕ) typically chosen as
P(φ)=C exp − β2χ 2 (φ)
"
#$%
&' (3.24)
and χ2 defined as the squared 2-norm of the residual vector. The “temperature” factor β is
determined by enforcing that the expectation value of χ2 should be equal to the number of
degrees of freedom in the measurement, namely the number l of pulse-height groups in the PHS
[7], [17]
⟨χ2⟩ = l. (3.25)
37

The entropy represented in Eq. 3.23 is then maximized by the Lagrange method [9].
3.3 Typical unfolding results
One of the earliest and most comprehensive studies of spectrum unfolding with liquid
scintillators was associated with the development of the FERDOR unfolding code. In 1969,
Burrus and Verbinski published a pair of companion articles on their developments. The first
described a calculation of the response matrix of a standard NE213 liquid scintillator, using a
combination of measurement, simulation, and interpolation. Mono-energetic neutron sources
were produced by the reactions T(p,n)3He, D(d,n)3He, and T(d,n)4He in thin reaction targetsxi, so
that PHS could be measured with fourteen different energies ranging from 0.2 < En < 22 MeV.
Other energies were simulated, and an interpolation technique was used to fill in the spaces of
the matrix between the measured and simulated energies [18]. The second article of the series
described the unfolding method used by the FERDOR code, and spectrum unfolding results from
PHS measured from a Po-Be neutron source. This study was quite holistic, in that details of
detector operation such as pulse-shape analysis and the data-acquisition electronics were
described in detail. A more thorough validation of the matrix and the unfolding code was carried
out shortly thereafter by Straker et. al [19], which compared unfolded spectra with reference
spectra obtained simultaneously using TOF. An example is shown in Fig. 3.2, where a carbon
attenuator is used to introduce sharp features to the measured spectrum. The shaded region
represents the “confidence bounds” estimated by the FERDOR code. It should be noted,
however, that these confidence bounds only account for uncertainty associated with the non-
uniqueness of the solution, and do not represent a comprehensive uncertainty analysis. It is clear
that the unfolding technique cannot resolve the finer structures of the spectrum. Nevertheless,
these results were (appropriately) deemed adequate for many dosimetry applications, and this
collection of articles laid much of the groundwork for future spectrum unfolding studies.
38
xi The word thin here can refer to “optically” thin, as the D(d,n)3He reaction was produced in a gas target.

FIG. 3.2. Early unfolding results reported by Straker et al. [19], using the FERDOR unfolding code [10]. Time-of-flight-calculated reference is a shown for comparison (courtesy of Elsevier).
Later developments in spectrum unfolding were partly driven by advances in computing
technologies, and this had two important influences. First, the computational cost of iterative
unfolding methods was dramatically reduced, so that many new techniques became practical.
Second, Monte Carlo methods for simulating detector response became much more widely
available, leading to a shift away from direct measurement of both response matrices and PHS
for unfolding trials. Taken together, these effects culminated in a general focus on developing,
improving, validating and comparing different spectrum-unfolding algorithms. While these
developments have produced a great variety of unfolding codes, many of which rest on a firmer
intellectual foundation than the earlier codes like FERDOR, they have come at the cost of a
focus on the detection system itself as it pertains to spectrum unfolding. Many detailed studies of
spectrum unfolding describe the algorithms, and validate them on artificial numerical data [15],
[20]-[23], or with simulated PHS [24] [25]. Response matrices are almost always calculated with
Monte Carlo simulation. Evaluations of spectrum unfolding with actual measurement are scarce,
and when they appear they are usually with neutron spectra that are not very well characterized,
like alpha-n sources. In one striking example, Koohi-Fayegh et al. evaluate a series of spectrum
unfolding codes by comparing how well they re-produce the results of FORIST, rather than a
39

known or TOF-calculated reference [11]. Meanwhile, detailed comparison between different
types of scintillators is rare.
FIG. 3.3. Representative unfolding results in the reported literature, obtained with the FORIST unfolding code. The solution space is discretized into 200-keV-wide energy groups. The spectrum measured is from an Am-Be α-n source. A common reference for Am-Be neutron spectrum from Kluge et al. is shown for comparison [11] (courtesy of Elsevier).
Amongst the unfolding results from measured PHS that are reported in the literature, the
best results are with energy groups that are 200-300 keV wide. This is exemplified in the
FOREST result used by Koohi-Fayegh as an unfolding standard, reproduced here in Fig. 3.3
[11]. This is likely inadequate for treaty-verification applications, for which we would like stable,
reliable solutions with energy groups that are 100 keV wide or finer [26].
3.4 Venues for improving spectrum unfolding
At the end of Chapter 2, I suggested some ways in which unfolding performance could be
improved by altering detector performance. We can divide these into two categories:
40

1) Improvements in the condition of detector response matrix;
2) Improvements in the stability and accuracy of representation of detector response.
The first category affects the extent to which measurement errors δn in the observed PHS n(obs)
are “amplified” to produce large oscillatory errors δϕ in the unfolded spectra. Improvements in
the condition of R may help to dampen this amplification. The second category corresponds to
ways in which δn are generated in the first place. Tables 1 and 2 list examples in these respective
categories. The lists are not intended to be exhaustive.
TAB. 3.1. Attributes of detector pulse-height response that affect the condition of response matrix R.
Attribute Effect on matrix Proposed improvement
Scattering kinematics
Broad features in matrix Deuterated detectors to employ backscatter-peaked n-d scattering in place of isotropic n-p scattering
Pulse-height resolution
Sharpness of features in matrix
Some organic crystals can be optimized for superior energy resolution
Discretization scheme
Mutual independence ofmatrix rows;
Conform pulse-height bin widths to the scale of matrix features
TAB. 3.2. Sources of perturbation in measured pulse-height spectra that contribute to error in unfolded spectra.
Source of perturbation Likely improvement for field
Poisson variance in PHS N/A
Inaccuracies in response matrix Detector with directly-measured response matrix
Shifts in PMT gain Direct optical input to scintillator cell for real-time calibration during measurement
Shifts in PSD discrimination threshold Elgen proprietary additive to improve PSD performance [27]; systematic placement of PSD discrimination curve [28].
Consider each attribute in Tab. 1 in the context of the earlier arguments about the mutual
independence of adjacent columns. If the matrix R is discretized with bin widths that are much
smaller than the scale of differentiable features in the continuous R, then the adjacent columns
lose their independence. It is easy to imagine that more definable features in R, like the back-
41

scatter structure associated with n-d scattering, would preserve the independence of adjacent
columns for smaller bin widths than if the matrix were simply flat. And since poorer resolution
tends to blur any features that the kinematics produce, it will also compromise column
independence. Finally, since the diminishing returns of finer binning structures is governed by
the separation of matrix features, and since limited counts must be divided amongst pulse-height
bins, the scale of this separation should be taken into account when deciding upon a
discretization scheme. Further, the scale of features is variant across the pulse-height scale, due
mainly to the nonlinear light-output relation described in Chapter 2, such that evenly space
binning across the pulse-height scale will not be ideal. I will look at these attributes further in
Chapters 7-9.
Amongst the performance attributes listed in Tab. 2, a further distinction can be made.
Poisson variance in the number of detected pulses ni falling in the ith pulse-height bin is
unavoidable, and inversely related to the the duration of measurement, which is costly. Thus, for
a given measurement time, Poisson variance represents a hard limit on how well the perturbation
δn can be constrained. In principle, the other attributes can be improved upon. I will improve
upon them in here using TOF techniques. Response matrices Rmodel will be measured using TOF
to minimize uncertainty in their accuracy. Trial measurements will be performed using the same
TOF setup, providing reliable reference spectra for evaluating the unfolded spectra. But this will
yield a more profound advantage: for any trial measurement performed, a response matrix Rtrial
can be constructed from the associated TOF data, the same way Rmodel was calculated from its
associated TOF data. In principle, if no shifts in detector performance have occurred, the
columns of Rtrial should look identical to those of Rmodel. This will allow the diagnosis and
removal of any shifts in PMT gain or PSD performance that occur. The results shown in Chapter
8 are very good in part because these shifts were removed.
Now, clearly TOF information is not available in the field, otherwise we would not be
looking at PHS or unfolding at all. But the shifts in performance that I remove with TOF can
easily be guarded against in the field using technologies and materials that are currently
available. PSD can be dramatically improved using certain proprietary additives, or with crystal
42

scintillators [27], [28]. Shifts in gain can be eliminated using automated calibration systems that
adjust PMT gain in real time. While these features were not part of the measurement system used
here, they are realistic improvements that could be made to a fieldable system.
References
[1] F. D. Brooks and H. Klein, “Neutron Spectrometry - Historical Review and Present Status,” Nuclear Instruments and Methods in Physics Research A, vol. 476, pp. 1–11, Dec. 2001.
[2] H. Klein, “Neutron Spectrometry in Mixed Fields: NE213/BC501A Liquid Scintillation Spectrometers,” Radiation Protection and Dosimetry, vol. 107, pp. 95–109, Dec. 2003.
[3] D. J. Thomas, “Neutron spectrometry,” Radiation Measurements, vol. 45, no. 10, pp. 1178–1185, Dec. 2010.
[4] R. Allen, W. R. Boland, V. Faber, and G. M. Wing, “Singular Values and Condition Number of Galerkin Matrices Arising from Linear Integral Equations of the First Kind,” Journal of Mathematical Analysis and Applications, pp. 1–27, Nov. 1985.
[5] D. Phillips, “A Technique for the Numerical Solution of Certain Intergral Equations of the First Kind,” pp. 1–14, Feb. 1961.
[6] P. C. Hansen, “MATLAB Regularization Toolbox,” Numerical Algorithms, vol. 46, pp. 189–194, Mar. 2007.
[7] M. Matzke, “Unfolding Procedures,” Radiation Protection and Dosimetry, vol. 107, no. 1, pp. 155–174, Dec. 2003.
[8] M. Freitag, “Tikhonov Regularisation for (Large) Inverse Problems,” pp. 1–157, Aug. 2011.[9] H. GoldsteinPoole, Classical Mechanics, 3rd ed. Pearson, 2002.[10] W. R. Burrus and V. V. Verbinski, “Fast-neutron Spectroscopy with Thick Organic Scintillators,”
Nuclear Instruments and Methods, vol. 67, pp. 181–196, Jun. 1969.[11] R. Koohi-Fayegh, S. Green, and M. C. Scott, “A Comparison of Neutron Spectrum Unfolding
Codes Used with a Miniature NE213 Detector,” Nuclear Instruments and Methods in Physics Research A, vol. 460, pp. 391–400, Mar. 2001.
[12] M. Matzke, “Propagation of Uncertainties in Unfolding Proceedures,” Nuclear Instruments and Methods in Physics Research A, vol. 476, pp. 230–241, Dec. 2002.
[13] E. T. Jaynes, “Prior Information and Ambiguity in Inverse Problems,” presented at the SIAM-AMS, 1984, vol. 14, pp. 151–166.
[14] M. Matzke, “The HEPROW Program System,” pp. 1–40, Jun. 2013.[15] S. Itoh, “A Fundamental Study of Neutron Spectra Unfolding Based on the Maximum Likelihood
Method,” Nuclear Instruments and Methods in Physics Research A, vol. 251, pp. 144–155, Jun. 1986.
[16] B. Pehlivanovic, S. Avdic, P. Marinkovic, S. Pozzi, and M. Flaska, “Comparison of Unfolding Approaches for Monoenergetic and Continuous Fast-neutron Energy Spectra,” Oct. 2011.
43

[17] J. Shore and R. Johnson, “Axiomatic Derivation of the Principle of Maximum Entropy and the Principle of Minimum Cross-entropy,” IEEE Transactions on Information Theory, vol. 26, no. 1, pp. 1–12, Apr. 1980.
[18] V. V. Verbinski, W. R. Burrus, T. A. Love, W. Zobel, and N. W. Hill, “Calibration of an Organic Scintillator for Neutron Spectrometry,” Nuclear Instruments and Methods, vol. 65, pp. 8–25, Jun. 1969.
[19] E. A. Straker, C. E. Burgart, T. A. Love, and R. M. Freestone, “Simultaneous Determination of Fast-neutron Spectra by Time-of-flight and Pulse-height Unfolding Techniques,” Nuclear Instruments and Methods, vol. 97, pp. 275–282, Jun. 1971.
[20] V. B. Anykeyev, A. A. Spiridonov, and V. P. Zhigunov, “Comparative Investigation of Unfolding Methods,” Nuclear Instruments and Methods in Physics Research A, vol. 303, pp. 350–369, Jul. 1991.
[21] T. Onoda and H. Sekimoto, “A Neutron Spectrometry Unfolding Code Based on Quadratic Programming,” Nuclear Instruments and Methods in Physics Research A, vol. 272, pp. 844–846, Jun. 1988.
[22] K. Weise and M. Matzke, “A Prior Distributions from the Principle of Maximum Entropy for the Monte Carlo Unfolding of Particle Energy Spectra,” Nuclear Instruments and Methods in Physics Research A, vol. 280, pp. 103–112, Jul. 1989.
[23] V. B. Anykeyev, A. A. Spiridonov, and V. P. Zhigunov, “Correcting Factors Method as an Unfolding Technique,” Nuclear Instruments and Methods in Physics Research A, vol. 332, pp. 280–285, Jun. 1992.
[24] S. Avdic, S. Pozzi, and V. PROTOPOPESCU, “Detector response unfolding using artificial neural networks,” Nuclear Instruments and Methods in Physics Research Section A: Accelerators, Spectrometers, Detectors and Associated Equipment, vol. 565, no. 2, pp. 742–752, Sep. 2006.
[25] H. Sekimoto, “An Unfolding Method Leading to a Positive Solution Only,” Nuclear Instruments and Methods in Physics Research, vol. 228, pp. 129–132, Jul. 2002.
[26] R. C. Runkle, A. Bernstein, and P. E. Vanier, “Securing special nuclear material: Recent advances in neutron detection and their role in nonproliferation,” J. Appl. Phys., vol. 108, no. 11, p. 111101, 2010.
[27] C. C. Lawrence, A. Enqvist, M. Flaska, S. A. Pozzi, and F. D. Becchetti, “Comparison of Spectrum-unfolding Performance of (EJ315_ and (EJ309) Liquid Scintillators on Measured Cf-252 Pulse-height Spectra,” Nuclear inst. and Methods in Physics Research, A, vol. 729, no. C, pp. 924–929, Nov. 2013.
[28] J. K. Polack, M. Flaska, A. P. Enqvist, and S. A. Pozzi, “A Computer-aided, Visual Charge-integration Pulse-discrimination Method for Organic Scintillators,” presented at the Institute for Nuclear Materials Management, 54th Annual Meeting, Palm Desert CA, 2013.
44
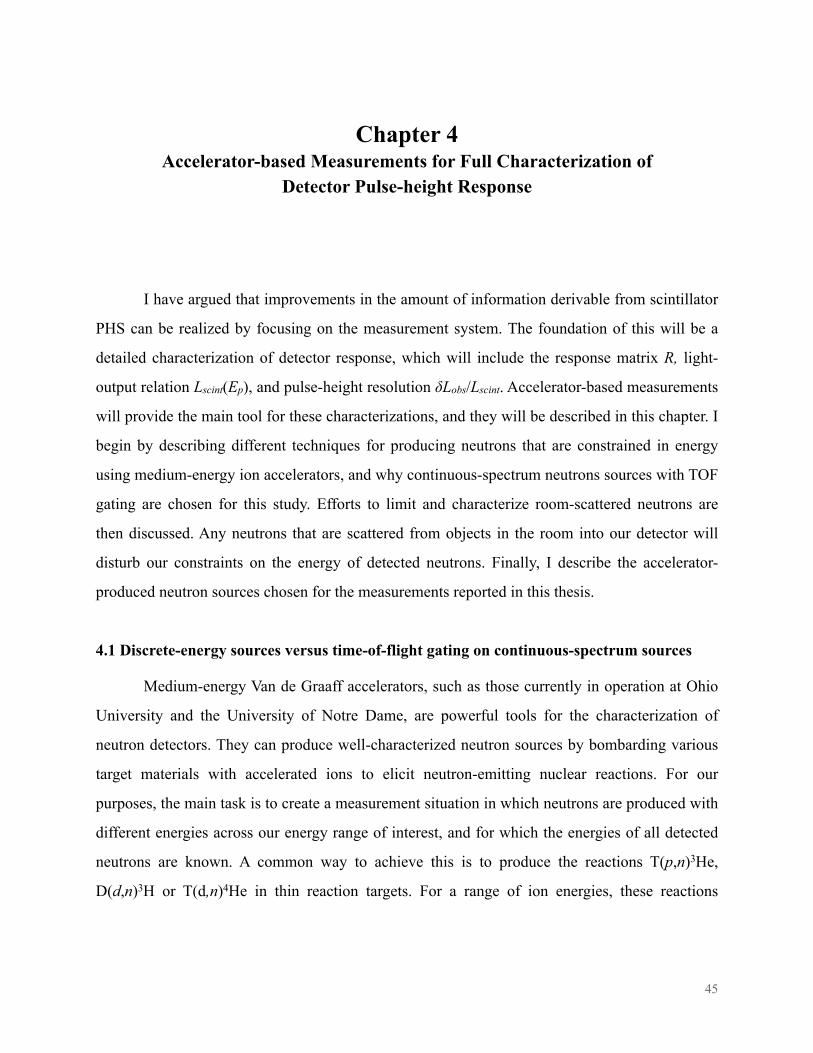
Chapter 4Accelerator-based Measurements for Full Characterization of
Detector Pulse-height Response
I have argued that improvements in the amount of information derivable from scintillator
PHS can be realized by focusing on the measurement system. The foundation of this will be a
detailed characterization of detector response, which will include the response matrix R, light-
output relation Lscint(Ep), and pulse-height resolution δLobs/Lscint. Accelerator-based measurements
will provide the main tool for these characterizations, and they will be described in this chapter. I
begin by describing different techniques for producing neutrons that are constrained in energy
using medium-energy ion accelerators, and why continuous-spectrum neutrons sources with TOF
gating are chosen for this study. Efforts to limit and characterize room-scattered neutrons are
then discussed. Any neutrons that are scattered from objects in the room into our detector will
disturb our constraints on the energy of detected neutrons. Finally, I describe the accelerator-
produced neutron sources chosen for the measurements reported in this thesis.
4.1 Discrete-energy sources versus time-of-flight gating on continuous-spectrum sources
Medium-energy Van de Graaff accelerators, such as those currently in operation at Ohio
University and the University of Notre Dame, are powerful tools for the characterization of
neutron detectors. They can produce well-characterized neutron sources by bombarding various
target materials with accelerated ions to elicit neutron-emitting nuclear reactions. For our
purposes, the main task is to create a measurement situation in which neutrons are produced with
different energies across our energy range of interest, and for which the energies of all detected
neutrons are known. A common way to achieve this is to produce the reactions T(p,n)3He,
D(d,n)3H or T(d,n)4He in thin reaction targets. For a range of ion energies, these reactions
45

produce neutrons whose energies are uniquely related to the angle of outgoing neutronsxii, so that
a detector at a given angle would detect quasi-mono-energetic neutrons. The energy of the
neutrons produced can be altered by changing the energy of incident ions, the detector location
(angle with respect to the direction of incoming ions), or the choice of reaction target and
incident ion. In one of the earliest studies of spectrum unfolding, Burrus and Verbinski
characterized an NE213 scintillator in this way, measuring PHS for neutrons of 14 different
energies ranging from 0.2 < En < 22 MeV [1]. However, this method has many drawbacks. The
energies available are limited, and each requires a different accelerator setting. Usually, only part
of the detector response matrix is measured, and the rest is either interpolated or simulated using
Monte Carlo simulations. Additionally, the energy binning is determined by the measurement
itself, and cannot be conveniently altered afterwords.
A better alternative is to produce neutrons of a continuous spectrum that covers the
energy range of interest, and use a TOF technique to determine the energy of each detected
neutron. This allows the entire response matrix to be measured in a single measurement, without
any change in the tuning of the acceleratorxiii. Since the entire energy range is measured, no
simulations are required for interpolation, except to produce the efficiency curve used to
normalize the response matrix. Also, since neutron energies are binned after the measurement,
the discretization structure can be altered at will without performing additional measurements.
This will be very important since the discretization structure is a venue on which we hope to
improve unfolding results.
Continuous spectra can be produced by choosing a reaction from which neutrons of
multiple energies are producedxiv, and generating the reactions in a thick target in which the
incident ions are stopped, so that the energetic structure of the reaction is smeared out. The width
or smearing of features in the neutron energy spectra is in part determined by the variation in
penetration of the incident ions into the target. In a “thin” target, most incident ions pass through
46
xii Only the ground state of the product nucleus is populated.
xiii With limited access to accelerator facilities, minimization of tuning time is extremely important.
xiv Multiple excited states of the product nucleus are populated.
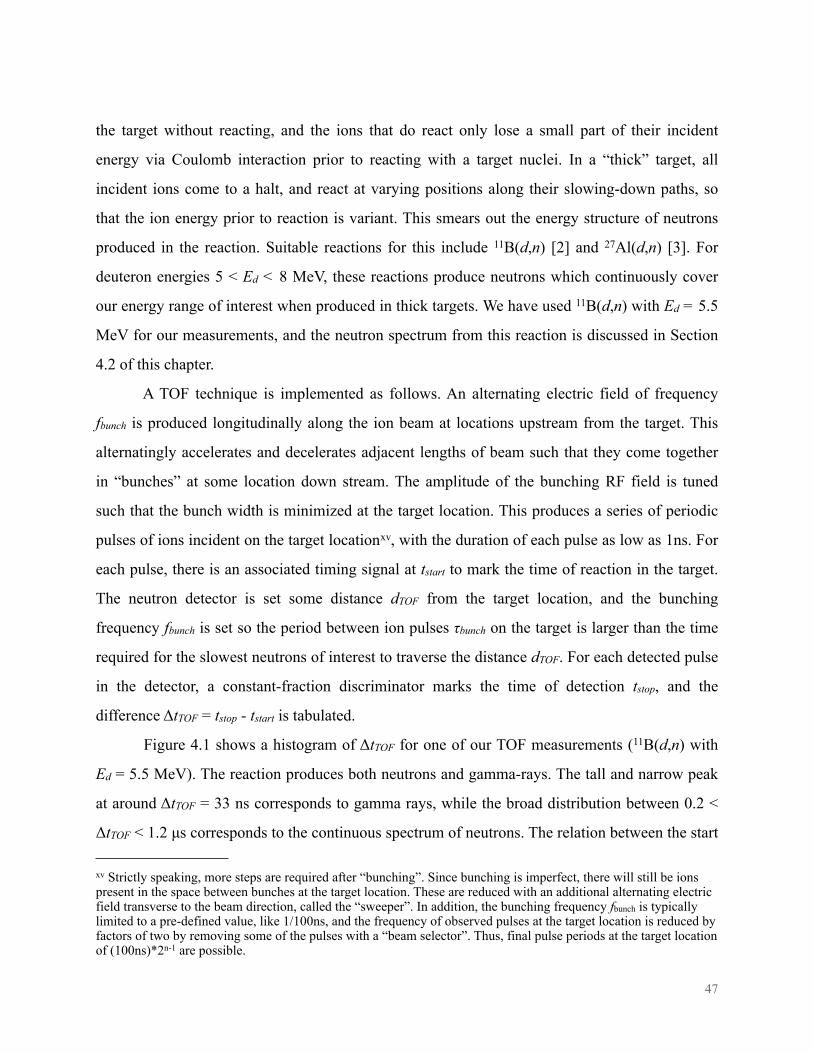
the target without reacting, and the ions that do react only lose a small part of their incident
energy via Coulomb interaction prior to reacting with a target nuclei. In a “thick” target, all
incident ions come to a halt, and react at varying positions along their slowing-down paths, so
that the ion energy prior to reaction is variant. This smears out the energy structure of neutrons
produced in the reaction. Suitable reactions for this include 11B(d,n) [2] and 27Al(d,n) [3]. For
deuteron energies 5 < Ed < 8 MeV, these reactions produce neutrons which continuously cover
our energy range of interest when produced in thick targets. We have used 11B(d,n) with Ed = 5.5
MeV for our measurements, and the neutron spectrum from this reaction is discussed in Section
4.2 of this chapter.
A TOF technique is implemented as follows. An alternating electric field of frequency
fbunch is produced longitudinally along the ion beam at locations upstream from the target. This
alternatingly accelerates and decelerates adjacent lengths of beam such that they come together
in “bunches” at some location down stream. The amplitude of the bunching RF field is tuned
such that the bunch width is minimized at the target location. This produces a series of periodic
pulses of ions incident on the target locationxv, with the duration of each pulse as low as 1ns. For
each pulse, there is an associated timing signal at tstart to mark the time of reaction in the target.
The neutron detector is set some distance dTOF from the target location, and the bunching
frequency fbunch is set so the period between ion pulses τbunch on the target is larger than the time
required for the slowest neutrons of interest to traverse the distance dTOF. For each detected pulse
in the detector, a constant-fraction discriminator marks the time of detection tstop, and the
difference ΔtTOF = tstop - tstart is tabulated.
Figure 4.1 shows a histogram of ΔtTOF for one of our TOF measurements (11B(d,n) with
Ed = 5.5 MeV). The reaction produces both neutrons and gamma-rays. The tall and narrow peak
at around ΔtTOF = 33 ns corresponds to gamma rays, while the broad distribution between 0.2 <
ΔtTOF < 1.2 µs corresponds to the continuous spectrum of neutrons. The relation between the start
47
xv Strictly speaking, more steps are required after “bunching”. Since bunching is imperfect, there will still be ions present in the space between bunches at the target location. These are reduced with an additional alternating electric field transverse to the beam direction, called the “sweeper”. In addition, the bunching frequency fbunch is typically limited to a pre-defined value, like 1/100ns, and the frequency of observed pulses at the target location is reduced by factors of two by removing some of the pulses with a “beam selector”. Thus, final pulse periods at the target location of (100ns)*2n-1 are possible.

signal tstart and the actual time at which an incident bunch of ions reaches the target is constant,
and can be deduced from the location of the gamma-ray peak (where vγ = c) and corrected for.
The flat distribution over negative regions along the ΔtTOF axis can be attributed to a constant
random gamma-ray background, and used to characterize and remove that background.
FIG. 4.1. Time-of-flight plot for neutrons produced via the reaction 11B(d,n) in a thick target, with deuteron energy Ed = 5.5 MeV, measured with an EJ309 detector placed at dTOF = 10.84 m from the target. Deuterons were accelerated using the 10-MV tandem Van de Graaff accelerator facility at the University of Notre Dame Nuclear Structure Laboratory (UND-NSL). The extraneous gamma-ray peak was attributed to collisions of deuterons on tungsten collimator slits upstream from the target, from which no neutrons are expected.
Since the ΔtTOF can be known for virtually all detected neutrons, it can be used to
determine the energy of detected neutrons as they reach the detector. In order to construct a
response matrix, detected neutrons can be binned via ΔtTOF into any desired energy-bin structure,
and further binned into any desired pulse-height-bin structure (see Chapter 6). Structures in the
response matrix can in turn be used to calculate light-output data Lscint(Ep) and pulse-height
resolution δLobs/Lscint (see Chapter 5). Also, since ΔtTOF provides an alternative means of n-γ
discrimination, independent of PSD, it can be used to evaluate PSD performance. Finally, any
ï200 0 200 400 600 800 1000 1200102
103
104
105
Time of flight (ns)
Det
ecte
d co
unts
Gammaïray peak
Neutrons
Extraneous gammaïray
peak
Gammaïray background
48

normalized TOF-gated pulse-height spectrum - i.e. any “column” of R - should look the same for
multiple measurements, even if the incident spectra prior to gating is altered between
measurements. This can be used to track changes in the pulse-height response of a detector over
time due PMT-gain shifts or changes in temperature. These attributes make TOF measurements
with continuous-spectrum neutrons an optimal technique to characterize our detectors for
spectrum unfolding.
FIG. 4.2. The gamma-ray peak in the TOF spectrum. Timing resolution of the bunching can be estimated by observing the width of the gamma-ray peak, which is a composite of the duration of beam pulses, along with the timing resolution inherent to the detector (EJ309) assembly.
The measurements reported in this thesis were carried out using the 10-MV Van de Graaff
accelerator facility at the University of Notre Dame Nuclear Structure Laboratory (UND-NSL).
A neutron TOF path of dTOF = 10.84 m was used, and the slowest neutrons of interest - of En ~
0.5 MeV - traverse this distance in approximately ΔtTOF ~ 1.2µs. In order to give provide ample
time for these slowest neutrons to reach the detector between ion pulses, the bunching period was
set to τbunch = 1.6 µs. As shown in Fig. 4.2, the width of the gamma-ray peak was approximately
25 30 35 40 450
1
2
3
4
5
6
7
8
9
10x 104
Time of flight (ns)
Gam
maï
ray
peak
peak vs. timeFWHM = 2.7 ns
49

2.7 ns, indicating adequate timing resolution, and thus low uncertainty in calculated neutron
energies δEn. Of course, En is only derivable from ΔtTOF for neutrons that travel directly from the
target to the detector without colliding in-between. Thus, we must take care to minimized the
contribution to our signal from neutrons which are scattered into our detector from objects in the
room. This is the topic of the next section.
4.2 Minimization and characterization of room-scattered neutrons
Figure 4.3 shows a layout of the accelerator facility at UND-NSL, with the 10-MV
tandem and the relevant experimental halls labeled [4]. Accelerated ions are guided along beam
lines first into the “East target room”, and then optionally into the “West target room”. This
facility has traditionally been used for basic nuclear science research, and has not been optimized
for detailed detector characterization. In particular, there is no long dedicated TOF tunnel. In
adapting the facility for this purpose, our main challenge was to enable a long TOF path - around
ten meters - while minimizing the contribution of room-scattered neutrons to our measurement.
This was achieved by using objects in the target rooms as shielding to collimate the neutrons
reaching the detector, and through careful placement of the reaction target.
The East and West target rooms are separated by a concrete wall approximately 1.3m
thick, through which a beam line passes (see the lower half of Fig. 4.3). A position inside this
wall was chosen for the target location so that the surrounding walls would absorb most neutrons
exiting the target at large angles (with respect to the incident ion-beam direction). A large ion-
beam steering magnet is located about one meter downstream from the wall, and this enhanced
the collimation of neutrons. The neutrons of interest - filling a small solid angle about zero
degrees - traversed through the zero-degree beam line passing through the magnet and some
additional length of evacuated beam line. The room is large enough to place a detector at
approximately 10 m from the in-wall target location, at zero degrees, with 4 m clearance to the
opposing wall.
50

FIG. 4.3. The layout of the nuclear structure laboratory at UND-NSL; placement of in-wall target.
51

A specially designed target holder was constructed for insertion into the beam line within
the wall. The design drawings are shown in Figs. 4.4 and 4.5. The target itself was placed inside
a target frame, shown in the upper part of Fig. 4.5. In order to focus the beam onto the target
during the experiment, and to monitor the beam current, two separate current measurements are
required from the target holder: one from the target itself, and another from a surrounding
aperture to detect any portion of the beam which misses the target. These sections of the target
holder must be electrically isolated from the beam-line pipe. On the other hand, if the target itself
is thermally isolated from the surrounding environment, it may over heat from the beam energy
and melt, and spread radioactive target material inside the pipe. In order to avoid this, good
thermal contact with the beam line pipe is required.
FIG. 4.4. Design drawing of the in-wall target holder designed for creating collimated neutron sources for detector characterization at UND-NSL.
52

FIG. 4.5. Design drawing of the target frame used in the in-wall target holder (above); photos of the constructed in-wall target holder and frame.
53

In order to meet these requirements, a 14-inch-long aluminum tube was sectioned as
shown in Fig. 4.4 (green parts). The thin slice in the middle formed the target frame. This one-
inch-outer-diameter aluminum tube was suspended in the center of the 2-inch-inner-diameter
beam-line pipe by an outer structure made of MACOR. MACOR is a machinable ceramic
material that has high electrical resistance but good thermal conductivity [5]. The long aluminum
tube served as a Faraday cup to absorb any beam current leaving the target in the form of
scattered electrons, and to accept much of the heat from the target, which could then radiate from
its large surface area. A copper ring was fixed to the upstream surface of MACOR, and this
served as the current-collecting aperture for beam tuning. Some photos of the finished target
holder are shown in the lower half of Fig. 4.5. This target holder was placed inside the beam line
at 80 cm within the concrete wall, as measured from the down-stream wall surface.
4.2.1 Beam-profile measurements
In order to determine how successful this in-wall-target arrangement was at collimating
neutrons at the detector location ten meters downstream, beam-profile measurements were
carried out in the vicinity of the detector location. The thick 11B target was bombarded with Ed =
5.5-MeV deuterons, as in the later measurements, and the beam current was set to around Itarget ~
150 nA, as measured from the target-holder Faraday cup. Current on the copper aperture was
negligible (Iaperture < 0.01Itarget) after focusing was carried out. Profile measurements were taken
with the three-by-two-inch EJ309 detector placed at several locations spaced three inches apart
along vertical and horizontal axes oriented transverse to the beam direction, at a distance of 10 m
from the target location. This was just short of the detector distance used for the later detector-
characterization measurements. Ten-minute measurements were taken at each location, and the
total integrated charge on the target was monitored for each. PSD was used to discriminate
between neutron and gamma-ray induced pulses in the detector.
Figure 4.6 shows the results of the profile measurements, plotted as the number of
detected neutrons per unit of charge on the target. These measurements indicate excellent
collimation at the detector position. There is a beam of neutrons with cross-sectional diameter of
54

approximately six inches, outside of which the neutron count rate drops by a factor of
approximately one hundred. This is surprisingly good considering that there is a pair of large
magnets positioned around four meters to the left of the detector location. The fractional
contribution of scattered neutrons is likely to be less than this since many would occur outside of
the relevant TOF window 0.2 < ΔtTOF < 1.2 µs, and can be removed. This arrangement is thus
well suited for our detector-characterization measurements.
FIG. 4.6. Beam-profile measurements carried out near detector location of ten meters.
4.3 Neutron spectrum from 11B(d,n) with deuteron energy Ed = 5.5 MeV in a stopping target
The reaction 11B(d,n) with was chosen because, with a stopping reaction target, it
produces neutrons of a continuous spectrum that extends across our energy range of interest (0.5
< En < 15 MeV). It also has some distinguishable features in the region above 9 < En < 21 MeV
which are useful for beam-tuning diagnostics. The spectrum from this reaction with Ed = 4 MeV
has previously been measured by Taddeucci et al. [2], and this can be used for comparison. Since
the neutron yield increases slightly with increasing deuteron energy Ed, we chose to use Ed = 5.5
MeV for our measurements. Thus, we expect to see a neutron spectrum of similar shape to that
reported by Taddeucci, but shifted slightly higher in energy. Agreement in shape can lend
ï15 ï10 ï5 0 5 10 15101
102
103
Horizontal position (inches transverse to beam)
Neu
trons
det
ecte
d pe
r uni
t cha
rge
(µA
)
ï15 ï10 ï5 0 5 10 15Vertical position (inches transverse to beam)
55

confidence that all of the deuteron beam is focused on the reaction target, and that all detected
neutrons are produced therein. Significant disagreement in shape between the two spectra may
indicate that some deuterons are reacting on objects upstream along the beam line, and producing
neutrons that are not TOF correlated.
The spectrum at zero degrees from 11B(d,n) with Ed = 5.5 MeV was measured over a
period of six hours via TOF, with a three-by-two-inch EJ309 detector at 10.84 m (± 5 cm) TOF
path length. Figure 4.7 shows the calculated spectrum, normalized as fluence per
(MeV*µC*steradian). The detection efficiency of our EJ309 was simulated, and divided out of
the measured spectrum. The fractional uncertainty of the normalized fluence value in each
energy bin (not shown) is estimated as the quadrature sum of the following fractional
uncertainties: uncertainty of integrated charge on the target from incident deuterons; uncertainty
in solid angle subtended by the detector; counting uncertainty from Poisson statistics of the
number of detected neutrons; and uncertainty in the simulated efficiency. Of these, uncertainty in
the simulated efficiency dominates. Comparison between measured and simulated PHS, reported
in another study [6], shows fractional agreement in overall counts within 10%, so fractional
uncertainty of 10% is attributed to the efficiency simulation. Also included in Fig. 4.3 is the
spectrum measured by Taddeucci et al. [2] for the same reaction but lower Ed = 4 MeV. Other
than the slight energy shift, which is expected due to the difference in incident Ed, there is very
good agreement between the prominent features of the two spectra. However, the absolute
fluence from our measurement is higher than that measured by Taddeucci by approximately a
factor of three. Some of this difference is likely due to higher Ed. Measurements published by
Taddeucci et al. in the same reference indicate that the total integrated neutron yield from 11B(d,n) increases with increasing Ed. From their result, we would expect our neutron yield to be
larger than theirs by a factor of ~1.5. The remaining difference, roughly a factor of two, is
outside of the uncertainties described above, and remains as a discrepancy between our result
and that of Taddeucci. However, the agreement in shape gives us confidence that no interactions
are taking place upstream from the target position. Therefore, this is the spectrum of neutrons
56

used for all of our detector-characterization measurements, carried out in multiple campaigns
throughout 2012 and 2013.
FIG. 4.7. Observed neutron spectrum for the reaction 11B(d,n) in a thick target with deuteron energy Ed = 5.5 MeV, measured with an EJ309 scintillator placed at dTOF = 10.84 m. A similar spectrum, measured by Taddeucci et al. for the same reaction with a different deuteron energy is shown for comparison [2].
References
[1] V. V. Verbinski, W. R. Burrus, T. A. Love, W. Zobel, and N. W. Hill, “Calibration of an Organic Scintillator for Neutron Spectrometry,” Nuclear Instruments and Methods, vol. 65, pp. 8–25, Jun. 1969.
[2] T. N. Taddeucci, R. L. Sheffield, T. N. Massey, D. Carter, J. E. O'Donnel, C. R. Brune, D. Ingram, D. Jacobs, and D. Dilullo, “Neutron and Gamma-ray Production with Low-energy Beams,” Los Alamos National Laboratory, LA-UR-07-2724, Apr. 2007.
[3] T. N. Massey, S. Al-Quraishi, C. E. Brient, J. F. Guillemetto, S. M. Grimes, D. Jacobs, J. E. O'Donnel, J. Oldendick, and R. Wheeler, “A Measurment of the 27AL(d,n) Spectrum for Use in Neutron Detector Calibration,” Nuclear Science and Engineering, vol. 129, pp. 175–179, Aug. 1998.
0 2 4 6 8 10 12 14 16 18 20106
107
108
Neutron energy (MeV)
Neu
trons
/(MeV
*µC*
sr)
Present study (Ed = 5.5 MeV)
Taddeucci et al. (Ed = 4 MeV)
57

[4] U. O. N. Dame, “Accelerator Facilities,” www3.nd.edu. [Online]. Available: http://www3.nd.edu/~nsl/html/research_facilities.html. [Accessed: 09-Apr-2014].
[5] “MACOR,” Corning, Aug. 2001.[6] S. A. Pozzi, S. D. Clarke, W. J. Walsh, E. C. Miller, J. L. Dolan, M. Flaska, B. M. Wieger, A.
Enqvist, E. Padovani, J. K. Mattingly, D. L. Chichester, and P. Peerani, “MCNPX-PoliMi for nuclear nonproliferation applications,” Nuclear inst. and Methods in Physics Research, A, vol. 694, no. C, pp. 119–125, Dec. 2012.
58

Chapter 5Light-output Relations and Pulse-height
Resolution Measurements
Chapter 2 described some of the important attributes of organic-scintillator response, and
how they effect the shapes of measured PHS. Scintillation light output and pulse-height
resolution are two of the most important of these attributes, and can be measured using the
accelerator measurements described in Chapter 4. This chapter will be devoted to these
calculations. In Chapter 6, I will describe how we can improve the condition of a response matrix
by choosing a discretization scheme which removes the non-linearity of the light-output relations
measured here, and how the difference in resolution between EJ309 and EJ299-33 correspond to
differences in their matrix condition. These relations are also necessary for accurate detector
simulation, and for a fair comparison between the PSD performances of different detectors. Data
needed for these calculations were acquired in nine hours for each detector, at a TOF distance
dTOF = 10.84 m, during measurement campaigns in Fall of 2012 and Fall of 2013.
5.1 Light output relations
The light-output relation Lscint(Ep) is between the amount of energy Ep deposited on a
single recoil nucleus in the detector medium, and the amount of resulting scintillation light Lscint
produced as the recoil nucleus slows down within the medium. For reasons described in Chapter
2, Lscint is commonly expressed in units of MeV “electron equivalent”, or MeVee, via calibration
with gamma-ray sources. One MeVee is the amount of light produced by a one-MeV electron
slowing down and stopping in the detection medium. As described in Chapter 3, the light output
relation is non-linear due to a quenching-like effect. As the recoil nucleus slows down and
deposits its energy along its track via the Coulomb interaction, it exhausts the excitable
scintillating systems which are locally available along that track. The remaining fraction of Ep is
59

“wasted” on the excitation of non-scintillating systems. The fraction of energy leading to
scintillation is inversely proportional to dE/dx, resulting in the nonlinearity of the Lscint(Ed) [1].
Additionally, larger recoil nuclei such as 12C, which deposit their energy along a shorter track
length than do smaller nuclei of the same initial energy, produce less overall scintillation light
[2], [3].
Using the TOF data obtained from the accelerator measurements described in Chapter 4,
we can create a series of TOF-gated PHS associated with quasi-mono-energetic neutron spectra
of different energies. An example is shown in Fig. 5.1, where PHS from the three-by-two-inch
EJ309 detector are plotted for various 100-keV-wide neutron-energy groups. Once these quasi-
mono-energetic PHS are obtained, we can associate certain features with some known fraction
fdep of energy transfer from incident neutron to recoiling particle.
Ep = fdep * En. (5.1)
Then the location of those features along the pulse-height axis L can be associated with the
estimated energy deposition Ep to extract a light-output datum (Ep,Lscint). After performing this
estimation of (Ep,Lscint) for many PHS of different incident neutron energies En, we obtain an
array of light-output data across a range of energies.
Since hydrogen-based and deuterium-based scintillators rely on different neutron
scattering kinematics (n-p versus n-d scattering), the above procedure will have to be carried out
differently for these different detector types. In Sections 5.1.1 and 5.1.2 we will consider them in
turn.
60
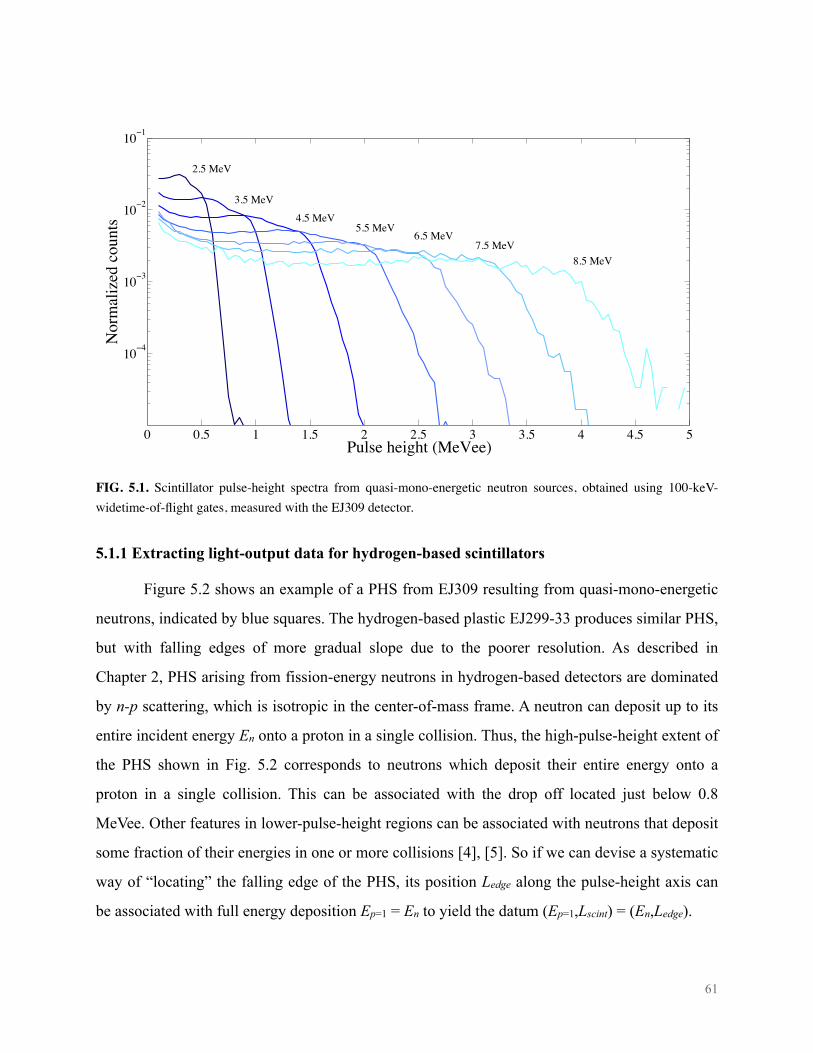
FIG. 5.1. Scintillator pulse-height spectra from quasi-mono-energetic neutron sources, obtained using 100-keV-widetime-of-flight gates, measured with the EJ309 detector.
5.1.1 Extracting light-output data for hydrogen-based scintillators
Figure 5.2 shows an example of a PHS from EJ309 resulting from quasi-mono-energetic
neutrons, indicated by blue squares. The hydrogen-based plastic EJ299-33 produces similar PHS,
but with falling edges of more gradual slope due to the poorer resolution. As described in
Chapter 2, PHS arising from fission-energy neutrons in hydrogen-based detectors are dominated
by n-p scattering, which is isotropic in the center-of-mass frame. A neutron can deposit up to its
entire incident energy En onto a proton in a single collision. Thus, the high-pulse-height extent of
the PHS shown in Fig. 5.2 corresponds to neutrons which deposit their entire energy onto a
proton in a single collision. This can be associated with the drop off located just below 0.8
MeVee. Other features in lower-pulse-height regions can be associated with neutrons that deposit
some fraction of their energies in one or more collisions [4], [5]. So if we can devise a systematic
way of “locating” the falling edge of the PHS, its position Ledge along the pulse-height axis can
be associated with full energy deposition Ep=1 = En to yield the datum (Ep=1,Lscint) = (En,Ledge).
0 0.5 1 1.5 2 2.5 3 3.5 4 4.5 5
10ï4
10ï3
10ï2
10ï1
Pulse height (MeVee)
Nor
mal
ized
cou
nts
2.5 MeV
3.5 MeV
4.5 MeV5.5 MeV
6.5 MeV7.5 MeV
8.5 MeV
61

One way of locating Ledge is described in Refs. [6] and [7]. First, the PHS is smoothed
using a running average and the smoothed PHS is differentiated, as indicated by the green
diamonds in Fig. 5.2. A Gaussian-like feature in the differentiated PHS is associated with the
falling edge of the original PHS. A Gaussian function is fit to a portion of this feature, and
location of the Gaussian centroid Lcent is associated with the the edge of the PHS Ledge, and
ultimately with the light-output Lscint resulting from full energy deposition Ep=1 = En:
Lcent ≡ Ledge ≡ Lscint (5.2)
These steps are performed for quasi-mono-energetic measured PHS arising 100-keV-wide TOF
gates extending from 0.4 to 7 MeV, for both hydrogen-based detectors EJ309 and EJ299-33.
FIG. 5.2. Extraction of one (Ep,L) datum for hydrogen-based scintillators from a quasi-mono-energetic pulse-height spectrum. The centroid of a Gaussian, fit to the differentiated curve, marks the light-output of full-energy-deposition events. The FWHM of the Gaussian provides an estimate of the resolution.
62

5.1.2 Extracting light-output data for deuterium-based scintillators
Due to the backward-peaked n-d scattering cross section, the pulse-height response from
deuterated scintillators exhibits a modest “backscatter peak”. Additionally, backscattered
neutrons from n-d scattering deposit the maximum fraction of their energy onto the recoiling
deuteron that is kinematically possible:
Ed max = 8/9 En. (5.3)
The location Lbs of the corresponding back-scatter peak can be associated with this energy
transfer. However, due to the smearing of the backscatter peak from pulse-height resolution, it
can be difficult to identify its true position.
In order to resolve this, we adopt a procedure described by Croft et al. [8]. For each
measured quasi-mono-energetic PHS, a preliminary light-output datum is calculated by
attributing the half height of the falling edge to the back-scatter-peak location Lbs. These
preliminary data are used to estimate a light-output relation for use in simulation of detector
response with MCNP-PoliMi [9], [10]. Two simulations are calculated for each measured energy
group - one for neutron energies evenly distributed across the 100-keV energy bin and with
pulse-height resolution ΔL/L folded in (measured as described in Section 5.2 of this chapter), and
one with truly mono-energetic neutrons from the energy-bin center, and with no resolution
included. Both simulated PHS are superimposed in a single plot for each energy group, as
exemplified in Fig. 5.3. Then the intersection of the two simulated PHS is used to adjust the
height fraction for attribution of the true backscatter peak for each measured energy group. With
these new height fractions - which range from 0.62 to 0.66 - the final light-output data are
calculated.
63

FIG. 5.3. Attribution of 8/9-energy transfer of a single back-scatter collision to a location along the pulse-height axis, for extraction of one (Ed,L) datum for a deuterated scintillator. In order to estimate the effect of resolution, MCNP-PoliMi simulations are performed with and without resolution. The intersection of the edges marks the fractional height ot the true back-scatter location. The calculated fraction is then used to extract the datum (Ed,L) from the measured pulse-height spectrum
5.1.3 Light-output data
Scintillation light-output data for our three-by-two-inch EJ309 and EJ315 detectors,
along with the three-by-three-inch EJ299-33, are shown in Fig. 5.4. As expected, the light output
from the hydrogen-based EJ309 is higher than that from the deuterated EJ315 [2], [3]. This is
due to the higher mass of the deuteron, resulting in higher dE/dx for recoil deuterons than from
recoil protons of the same initial energies. The fractional difference is approximately 35% across
the energy range measured. The light output for the plastic EJ299-33 falls somewhere in
between.
0 0.5 1 1.5 2 2.5 3 3.50
500
1000
1500
2000
2500
3000
3500
4000
Pulse height (MeVee)
Sim
ulat
ed c
ount
s
No resolutionResolution
64
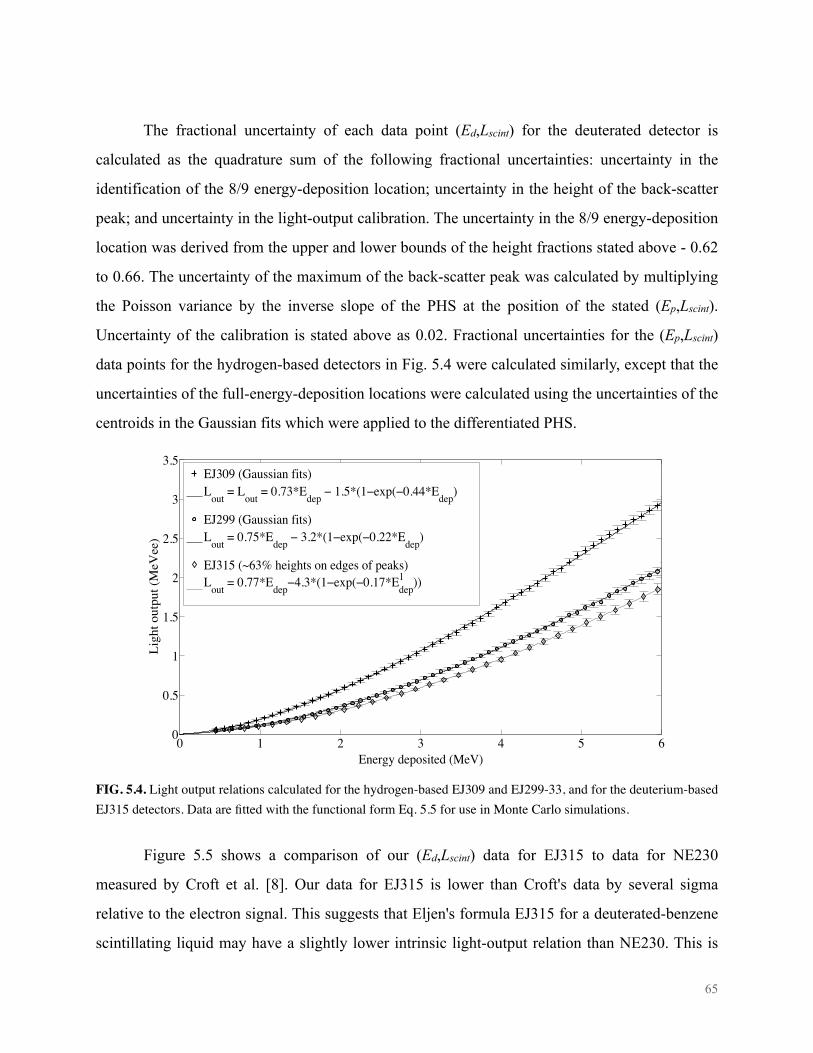
The fractional uncertainty of each data point (Ed,Lscint) for the deuterated detector is
calculated as the quadrature sum of the following fractional uncertainties: uncertainty in the
identification of the 8/9 energy-deposition location; uncertainty in the height of the back-scatter
peak; and uncertainty in the light-output calibration. The uncertainty in the 8/9 energy-deposition
location was derived from the upper and lower bounds of the height fractions stated above - 0.62
to 0.66. The uncertainty of the maximum of the back-scatter peak was calculated by multiplying
the Poisson variance by the inverse slope of the PHS at the position of the stated (Ep,Lscint).
Uncertainty of the calibration is stated above as 0.02. Fractional uncertainties for the (Ep,Lscint)
data points for the hydrogen-based detectors in Fig. 5.4 were calculated similarly, except that the
uncertainties of the full-energy-deposition locations were calculated using the uncertainties of the
centroids in the Gaussian fits which were applied to the differentiated PHS.
FIG. 5.4. Light output relations calculated for the hydrogen-based EJ309 and EJ299-33, and for the deuterium-based EJ315 detectors. Data are fitted with the functional form Eq. 5.5 for use in Monte Carlo simulations.
Figure 5.5 shows a comparison of our (Ed,Lscint) data for EJ315 to data for NE230
measured by Croft et al. [8]. Our data for EJ315 is lower than Croft's data by several sigma
relative to the electron signal. This suggests that Eljen's formula EJ315 for a deuterated-benzene
scintillating liquid may have a slightly lower intrinsic light-output relation than NE230. This is
0 1 2 3 4 5 60
0.5
1
1.5
2
2.5
3
3.5
Energy deposited (MeV)
Ligh
t out
put (
MeV
ee)
EJ309 (Gaussian fits)Lout = Lout = 0.73*Edep ï 1.5*(1ïexp(ï0.44*Edep)
EJ299 (Gaussian fits) Lout = 0.75*Edep ï 3.2*(1ïexp(ï0.22*Edep)
EJ315 (~63% heights on edges of peaks)Lout = 0.77*Edepï4.3*(1ïexp(ï0.17*Edep
1 ))
65

not without precedent - others have found differences in light output between formulas from
different brands which were claimed to be identical. For instance, it has been shown that
BC501A has 20% larger light output for photons than NE213 [11].
FIG. 5.5. Comparison between the light-output data determined here for the deuterated EJ315, and that reported by Croft. et. al. for the deuterated NE230 [8].
In order to use these light-output data for accurate simulation of detector response in
MCNP-PoliMi, we must fit some functional form, and one of the important questions is: what is
the best functional form to represent the light-output relation? Multiple functional forms have
been proposed, including simple polynomial relations, power laws [8], and rational and
exponential forms [6]. Since these curves are largely empirical, having many evenly spaced data
points is important for determining which functional form best represents the true relation. In a
recent publication, we presented measurement of light-output data for a larger (three-by-three-
inch) EJ309 detector and fit multiple functional forms to the data [7]. We then investigated the
100
10ï1
100
101
Ligh
t out
put (
MeV
ee)
Energy deposited (MeV)
Croft et al.Present study
66

performance of each functional form in simulation of detector response using MCNPX PoliMi.
We find that even similar looking functional forms lead to dramatically different simulated PHS
shapes, and that an exponential relation performs best while giving excellent fit to our measured
data [7]:
Lscint(Ep) = aEp - b(1-exp(-cEp)), (5.4)
and I adopt this functional form here. The fits of form Eq. 5.4 are included in Fig. 5.4 for each
detector.
5.2 Pulse-height resolution
The method used to calculate the light-output data for hydrogen-based detectors can also
be used to estimate the pulse-height resolution of those detectors. The widths of the Gaussian fits
correspond to a composite of several blurring effects: energy uncertainties introduced by the
timing resolutions and TOF-distance uncertainty (including variation in penetration of neutrons
into the detector active volume prior to collision); the energy widths of the TOF groupings; a
subtle blurring from the moving average smoothing; and finally, the detector resolution dL/L
itself. The extra-resolution effects can be removed to yield a calculation of detector resolution.
The calculated resolution data for our EJ299-33 plastic and EJ309 liquid detectors are shown in
Fig. 5.6. Resolution datasets were fit with the following functional form:
ΔLoutLout
⎛
⎝⎜
⎞
⎠⎟= α 2 +
β 2
Lout+
γLout
⎛
⎝⎜
⎞
⎠⎟
2
. (5.5)
Unfortunately, the shape of the PHS for the deuterated detector does not provide easy extraction
of the pulse-height resolution for that detector. However, simulation of PHS for deuterated
detectors indicates that the resolution is very similar to that for EJ309.
67

FIG. 5.6. Pulse-height resolution determined for the hydrogen-based liquid EJ309 and plastic EJ299-33.
5.3 Remarks
The results presented in this chapter suggest two important outcomes. First, the light
output for the deuterated EJ315 and the hydrogen-based plastic EJ299-33 are considerably lower
than that for the hydrogen-based liquid EJ309. Light output will be a factor in the effective
energy resolution, so lower light output is a drawback. However, we will find in the following
chapters that the advantage of n-d scattering is sufficient to yield an improvement in matrix
condition for the EJ315 over EJ309, in spite of the disadvantage in light output. The second
important result is that the EJ299-33 has much poorer pulse-height resolution than the EJ309.
The lower light output and poorer resolution will culminate in a substantial disadvantage for
unfolding with the plastic detector.
0 0.5 1 1.5 2 2.5 30
0.1
0.2
0.3
0.4
0.5
Lout (MeVee)
6 L
/L
EJ309 _=6.5eï2 `=6.1eï2 a=3.3eï2
EJ299 _=2.7eï1 `=8.4eï2 a=5.3eï2
68

References
[1] J. Birks, Theory and Practice of Scintillation Counting. Pergemon Press.[2] R. L. Craun and D. L. Smith, “Analysis of Response Data for Several Organic Scintillators,”
Nuclear Instruments and Methods, vol. 80, pp. 239–244, Jun. 1970.[3] F. D. Becchetti, C. E. Thorn, and M. J. Levine, “Response of Plastic Scintillator Detectors to
Heavy Ions, Z<=35, E<=170 MeV,” Nuclear inst. and Methods in Physics Research, A, vol. 138, pp. 93–104, Jun. 1976.
[4] A. Enqvist and I. Pázsit, “Calculation of the light pulse distributions induced by fast neutrons in organic scintillation detectors,” Nuclear Instruments and Methods in Physics Research Section A: Accelerators, Spectrometers, Detectors and Associated Equipment, vol. 618, no. 1, pp. 266–274, Jun. 2010.
[5] S. A. Pozzi, M. Flaska, A. Enqvist, and I. Pázsit, “Monte Carlo and analytical models of neutron detection with organic scintillation detectors,” Nuclear Instruments and Methods in Physics Research Section A: Accelerators, Spectrometers, Detectors and Associated Equipment, vol. 582, no. 2, pp. 629–637, Nov. 2007.
[6] N. V. Kornilov, I. Fabry, S. Oberstedt, and F. Hambsch, “Total characterization of neutron detectors with a 252Cf source and a new light output determination,” Nuclear Instruments and Methods in Physics Research Section A: Accelerators, Spectrometers, Detectors and Associated Equipment, vol. 599, no. 2, pp. 226–233, Feb. 2009.
[7] A. Enqvist, C. C. Lawrence, B. M. Wieger, S. A. Pozzi, and T. N. Massey, “Neutron Light-output Response and Resolution Functions in EJ-309 Scintillation Detectors,” Nuclear inst. and Methods in Physics Research, A, vol. 715, no. C, pp. 79–86, Jul. 2013.
[8] S. Croft, J. M. Adams, D. S. Bond, N. P. Hawkes, and N. Watkins, “A measurement of the light output function of the deuterated liquid scintillator NE-230 to recoil deuterons with energies between 0.62 and 14.5 MeV *,” Nuclear Instruments and Methods in Physics Research A, vol. 316, pp. 324–332, Jul. 1992.
[9] E. Padovani and S. A. Pozzi, “MCNP-POLIMI Manual,” pp. 1–27, Mar. 2003.[10] S. A. Pozzi, S. D. Clarke, W. J. Walsh, E. C. Miller, J. L. Dolan, M. Flaska, B. M. Wieger, A.
Enqvist, E. Padovani, J. K. Mattingly, D. L. Chichester, and P. Peerani, “MCNPX-PoliMi for nuclear nonproliferation applications,” Nuclear inst. and Methods in Physics Research, A, vol. 694, no. C, pp. 119–125, Dec. 2012.
[11] M. Moszynski, G. J. Costa, G. Guillaume, B. Heusch, A. Huck, and S. Mouatassim, “Study of n-gamma Discrimination with NE213 and BC501A Liquid Scintillators of Different Size,” Nuclear Instruments and Methods in Physics Research A, vol. 350, pp. 226–234, Jun. 1994.
69

Chapter 6Measurement of Response Matrices
Response matrices R can be calculated from TOF data measured using the experimental
techniques described in Chapter 4. Here I present measured matrices for the hydrogen-based
liquid EJ309 and plastic EJ299-33, and the deuterium-based EJ315. As indicated in the appendix,
the EJ309 and EJ315 are in identical Scionix assemblies with three-by-two-inch cylindrical
active cells, while the EJ299-33 plastic has a three-by-three-inch active volume. All three include
identical ETL 9821B photo-multiplier tubes. Data is acquired for nine hours with each detector at
a TOF distance dTOF = 10.84 m. Pulses arising from gamma-ray events are removed using PSD
techniques as described in Chapter 2. The resulting neutron pulse-height and TOF data can then
be discretized with any binning structure desired in neutron-energy En and pulse height Lscint to
produce an un-normalized response matrix. Normalization is carried out such that each column,
corresponding to an energy group ΔEj integrates to the intrinsic detection efficiency ⟨ϵ(En)⟩ΔE of
the detector averaged over the energies of the group ΔEj. Efficiency ϵ(En) is simulated using
MCNP-PoliMi [1] and this is the only reliance on Monte Carlo simulation. Since detection
efficiency relies mainly on the scattering cross sections of hydrogen, deuterium and carbon - all
of which are well known - we can expect these simulated efficiencies to be accurate [1].
As a preliminary calculation for this chapter, matrices were constructed using 100-keV
energy bins and 50-keVee pulse-height bins for all detectors. We will find in Chapter 7 that this
discretization structure is far from optimal, but it will suffice to reveal some of the structure of
each matrix.
70
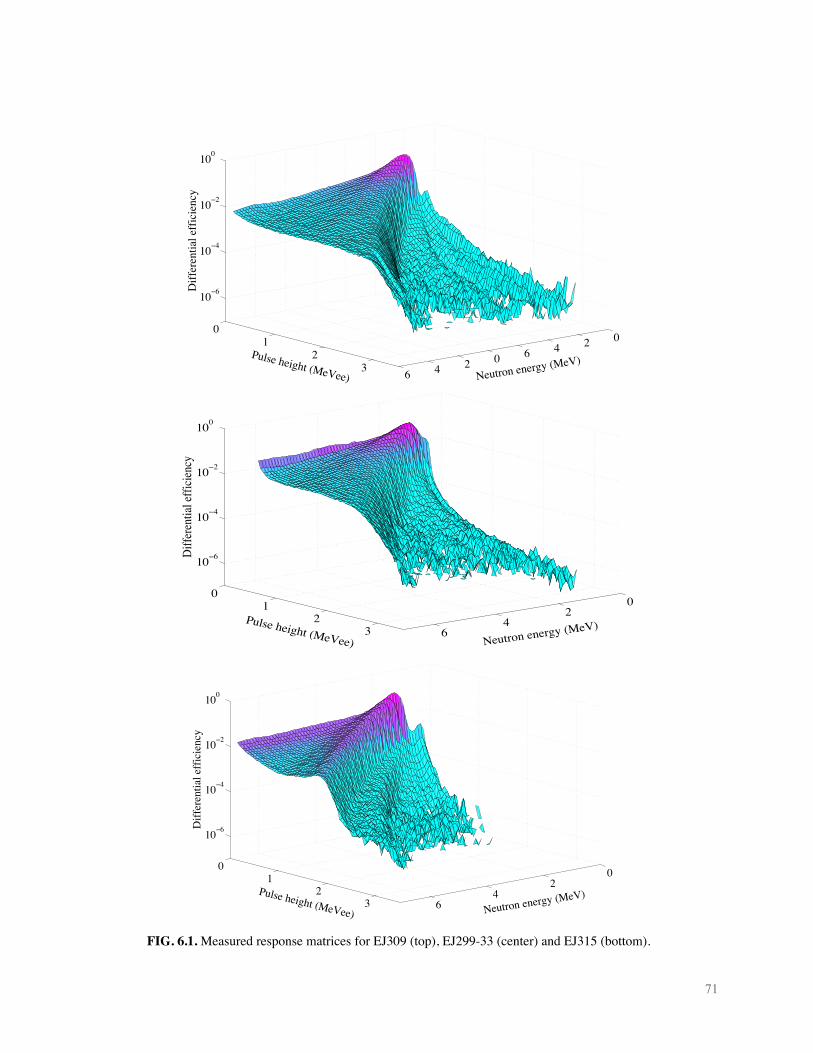
FIG. 6.1. Measured response matrices for EJ309 (top), EJ299-33 (center) and EJ315 (bottom).
02460246
01
23
10ï6
10ï4
10ï2
100
Neutron energy (MeV)Pulse height (MeVee)
Diff
eren
tial e
ffic
ienc
y
02
46
01
23
10ï6
10ï4
10ï2
100
Neutron energy (MeV)Pulse height (MeVee)
Diffe
rent
ial ef
ficien
cy
02
46
01
23
10ï6
10ï4
10ï2
100
Neutron energy (MeV)Pulse height (MeVee)
Diff
eren
tial e
ffic
ienc
y
71

The resulting matrices are shown in Fig. 6.1, with the EJ309 on top, EJ299-33 in the
center, and EJ315 on the bottom. All are truncated to highlight the prominent features below 7-
MeV neutron energy. There is a ridge in the matrix for EJ315 corresponding to the 8/9 energy
transfer in back-scattering events, while the EJ309 and EJ299-33 matrices each look more like a
plateau. We hope to exploit this difference in future studies of spectrum unfolding. Figure 6.2
shows seven selected columns from each matrix, corresponding to normalized PHS from quasi-
mono-energetic incident neutron spectra of different energies. Back-scatter peaking represents
the prominent distinction of the EJ315 PHS. The PHS from the EJ315 also shows a small amount
of structure from n-p scattering and deuteron breakup, which extends some distance past the
backscatter peaks. Some n-p scattering is expected, since EJ315 contains some hydrogen:
approximately 3.5e−3 atom fraction, versus ~ 0.496 for deuterium and ~ 0.5 for carbon. The
distance by which these structures extend past the back-scatter peaks is accounted for by the
difference in light output, as well as the fact that n-p scattering can result in full transfer of En to
the recoiling proton, as opposed to 8/9 for n-d scattering. These structures line up with the
elbows of the corresponding PHS from the EJ309 plot, as expected.
FIG. 6.2. Seven columns selected from the response matrix for EJ309 (left), EJ299-33 (center) and EJ315 (right).
As a first test, I present some initial unfolding trials. Trial spectra were obtained for each
detector using a 252Cf fission-neutron source placed a distance of 30 cm from detector face. PHS
were obtained in a measurement time of three hours for each detector. This resulted in 1.1e6
detected neutrons in the PHS from EJ309, 8e5 detected neutrons in the PHS for EJ299-33, and
7e5 detected neutrons in the PHS from EJ315. These differences are expected since the
72

differences in light-output affect the detection efficiency (less pulses are likely to break the
detection threshold), and because the cross section for n-d scattering is smaller than that for n-p
scattering over this energy range. The resulting PHS are shown in Fig. 6.3.
Unfolding for these trials is carried out using the simple unfolding code described in
appendix A.1. However, since our purpose here is to compare spectrum-unfolding performance
between our detectors with the simplest unfolding algorithm possible, I chose to forego
regularization and perform spectrum unfolding with larger energy bins, with widths of between
300 and 500 keV.
FIG. 6.3. Pulse-height spectra measured with EJ309, EJ299-33 and EJ315 detectors from a 252Cf fission-neutron source in three hour measurements for each detector. Gamma-ray pulses are removed using pulse-shape discrimination.
0 1 2 3 4 5 6 7100
101
102
103
104
105
106
Pulse height (MeVee)
Unn
orm
aliz
ed n
eutro
n co
unts
EJ299EJ309
EJ315
73

FIG. 6.4. Unfolded neutron spectra from 252Cf measured in EJ309 (left), EJ299-33 (center), and EJ315 (right). Energy-group widths of 500 keV (top), 400 keV (center), and 300 keV (bottom) are used.
From the unfolding results, we can see a number of the effects predicted in previous
chapters. Recall that our continuous-spectrum TOF measurement allows us to discretize the R
with any energy binning desired (see Chapter 4), and that R becomes ill conditioned as the
74

energy-binning is made finer (see Chapter 3). Figure 6.4 shows unfolding trials for each detector
carried out with three different discretization schemes - each with progressively more and
narrower energy bins - to demonstrate the onset of oscillatory error in the unfolded solutions due
to the progressively degraded matrix condition. We can also clearly see the disadvantage of the
lower-resolution EJ299-33 plastic - whose solutions are dominated by oscillatory error even for
the 500-keV-wide binning - and the advantage of the deuterated EJ315, which produces less
oscillations for all three binning structures.
The reader may note that the low-energy cutoff in Fig. 6.4 is higher for EJ315 than it is
for EJ309 and EJ299-33. Differences of this nature result from lower light output, and from the
difference in single-collision maximum energy transfer. The effect of this is that, for a given
pulse-height detection threshold, the minimum detectable neutron energy for EJ315 is higher
than that for EJ309 or EJ299-33, and hence the difference in low-energy cutoff. However, the
main limitation on lowering the detection threshold is PSD performance, which degrades at
lower pulse heights. This can be improved using certain proprietary additives as discussed in
Ref. [2].
The unfolding results shown in Fig. 6.4 represent a first successful unfolding result,
indicating the successful measurement of response matrices for both. They also illustrate many
of the concepts described in previous chapters. They do not, however, represent the quality of
results that can be achieved using basic regularization techniques, and more optimal
discretization structures. In the next chapter, I will investigate matrix condition further, and
describe an improved discretization structure which removes the non-linearity of the light-output
relation, and enhances matrix condition. In Chapter 8 I will present much better unfolding results
for the EJ309 and EJ315xvi, with finely-structured neutron spectra measured alongside TOF data
for reference. Spectral features on the order of 100-keV wide will be resolved, indicating a
substantial improvement over unfolding results found in the literature.
75
xvi Unfortunately, data for the trials in Chapter 8 were not taken with EJ299-33.

References
[1] S. A. Pozzi, S. D. Clarke, W. J. Walsh, E. C. Miller, J. L. Dolan, M. Flaska, B. M. Wieger, A. Enqvist, E. Padovani, J. K. Mattingly, D. L. Chichester, and P. Peerani, “MCNPX-PoliMi for nuclear nonproliferation applications,” Nuclear inst. and Methods in Physics Research, A, vol. 694, no. C, pp. 119–125, Dec. 2012.
[2] C. C. Lawrence, A. Enqvist, M. Flaska, S. A. Pozzi, and F. D. Becchetti, “Comparison of Spectrum-unfolding Performance of (EJ315_ and (EJ309) Liquid Scintillators on Measured Cf-252 Pulse-height Spectra,” Nuclear inst. and Methods in Physics Research, A, vol. 729, no. C, pp. 924–929, Nov. 2013.
76

Chapter 7Response-matrix Condition
In Chapter 3 I distinguished between two general ways in which I hope to improve
spectrum unfolding results by improving the measurement system:
1) improvements in the condition of detector response matrix
2) improvements in the stability and accuracy of the representation of detector response.
The first category determines the extent to which measurement errors δn in the measured PHS
are amplified to produce large errors δϕ. Improvements in the condition of R may help to dampen
this amplification. The second category corresponds to ways in which δn are generated in the
first place. In this chapter I consider improvements in category one, while Chapter 8 will cover
those in category two.
Table 7.1 lists some of the factors that affect the condition of R, along with some possible
improvements. The broader features are largely governed by the scattering kinematics and
statistics inside the active detector volume, and this is where deuterated detectors stand to
improve matrix condition [1]-[3], as will be borne out in the comparison between deuterated
liquid EJ315 to the hydrogen-based EJ309.
Pulse-height resolution affects the sharpness of features in the matrix, and has a strong
effect on matrix condition [4]. Many organic-crystal scintillators, like stilbene and p-terphenyl,
can be optimized to have better resolution than liquids. However, these were unavailable to us at
the time of these measurements, so I only mention them as a prospect for future improvements.
The effect of resolution will be demonstrated in the comparison of the liquid EJ309 and plastic
EJ299-33.
Finally, the binning structure used to discretize the response matrix is an important factor
governing matrix condition, and this is driven by competing interests (see Chapter 3). On one
77

hand, we want sufficient number of rows to “reveal” the structure of the matrix, but this faces
diminishing returns due to the broadness of the features. On the other hand, we will always be
dealing with finite statistics, and a finer binning structure spreads the limited event counts into
more bins, while coarser binning better manages counting statistics. While typical spectroscopy
applications divide data into evenly-spaced bins, I find that the best balance is struck by
conforming bin width to the scale of the features in the matrix, which varies with pulse height.
This variation is due mainly to the nonlinear light-output relation, which tends to compress
features in the low pulse-height region. It can be overcome with a novel discretization structure
which conforms the bin width to the differential of the light-output relation. This creates more
narrow bins in the low-pulse-height region - where typical PHS have abundant counts and
features are compressed - and wider bins for higher pulse-height regions where counts are
typically scarce and features are more spread out.
TAB. 7.1. (reproduced from Tab. 3.1) Attributes of detector pulse-height response that effect the condition of response matrix R.
Attribute Effect on matrix Proposed improvement
Scattering kinematics
Broad features in matrix Deuterated detectors to employ backscatter-peaked n-d scattering in place of isotropic n-p scattering
Pulse-height resolution
Sharpness of features in matrix
Some organic crystals can be optimized for superior energy resolution
Discretization scheme
Mutual Independence ofmatrix rows
Conform pulse-height bin widths to the scale of matrix features
In order to evaluate any improvements achieved by altering these factors, we need a way
of evaluating matrix condition. Unfortunately, the condition number - defined as the ratio
between the largest and smallest singular values of R - will be too large to calculate for any of
our matrices. Instead, we follow Matzke et al., and note that matrix condition is related to the
rate of decrease of the descending singular values of R [4]. This can be represented visually be
plotting the ratio rp between the pth singular value σp and the largest singular value σmax:
78

rp =σ p
σ max. (7.1)
While Matzke and others note the number of singular values for which rp is greater than some
limit - commonly chosen as rp > 10-4 - here I will simply point to the region 10-4 < rp < 10-3.
7.1 Discretization structure: light-output-conformal versus linear pulse-height binning
In Chapter 6, matrices for EJ309 and EJ315 were presented with 100-keV energy bins
and 50-keV pulse-height bins. This is far from optimal: much of the pulse-height structure for
low-energy neutrons is engulfed within the large pulse-height bins at the low-end of the pulse-
height axis. Using narrow pulse-height bins can uncover this structure, but spreads detected
counts - which are scarce in practical measurements - into more bins, leading to larger relative
Poisson error δnPoiss in the resulting PHS nobs, which is in turn amplified in the unfolding process.
The “separation” between features in the response matrix R is governed by the nonlinear
light-output relation Lscint(Ep), which tends to compress features in the low-energy and low-pulse-
height regions of R. An improved discretization structure is described here which removes this
nonlinearity by conforming the pulse-height bin width to be proportional to the mean differential
of the light output relation Lscint(Ep) as averaged across each light-output bin:
ΔLi(conf )∝
dLoutdEdep ΔLi
. (7.2)
The improvement is most prominent for the deuterium-based EJ315, because the back-scatter
“ridge” can be shifted onto the diagonal of the matrix. A light-output-conformal binning
procedure for deuterated detectors is as follows (see Fig. 7.1):
• begin with bin edges for the desired En binning, say
Ei = 0, 100 keV, 200 keV... (7.3)
79

• multiply each bin edge by 8/9 to account for the backscattering energy transfer fraction
Ei(bs ) = 8 9Ei (7.4)
• insert each bin edge into the light-output relation (see Eq. 5.4 of Chapter 5)
Li(conf ) = A ⋅Ei
(bs ) + B(1− e−C⋅Ei(bs )) (7.5)
to yield the bin edges of the conformed binning L(conf). Equation 7.5, by the definition of mean
slope across an interval, enforces the desired proportionality expressed in Eq. 7.2. Of course,
with unfolding this binning is to be used for the pulse-height binning of the matrix R, as well as
the measured PHS ni from which ϕj are to be unfolded. A similar procedure can be used for
hydrogen-based detectors, except the second step is omitted, since the maximum energy transfer
for n-p scattering is the total incident neutron energy En.
FIG. 7.1. Conformal binning procedure outlined in Eqs. 7.3 - 7.5, designed to remove the non-linearity of the light-
output relation. Bin width of each pulse-height bin is made proportional to the mean differential of the light-ouptut relation (see Eq. 5.4) across the bin.
80

The effect of this binning structure on the shape of the response matrix is shown in Fig.
7.2. The top half of Fig. 7.2 shows the EJ315 response matrix as it was discretized in Chapter 6,
with evenly-spaced 50-keVee-wide energy bins, while the bottom half shows an EJ315 matrix
constructed from the same data, but with light-output-conformed bins. While the back-scatter-
ridge in the linearly-binned matrix is curved and compressed due to the nonlinear light-output
relation Lscint(Edep), in the conformally-binned matrix it is located straight along the matrix
diagonal.
Since the bin-width is related to the differential of the non-linear light-output relation,
detector response is ‘stretched out’ across more bins over the low-pulse-height region; over the
high-pulse-height region, it is ‘compressed’ into fewer bins. This is quite convenient considering
the statistical challenges of typical measured PHS: for virtually all continuous neutron spectra of
interest, the bulk of pulses are in the low-pulse-height region, while in the high-pulse-height bins
data are much more scarce. This advantage is borne out in Fig. 7.3, which compares low-En’
columns for linear- and conformally-binned matrices for EJ315. Much low-pulse-height structure
is hidden for the linear-binned matrix, as nearly all columns peak in the first bin. Our conformal
binning uncovers this information, so that the sensitivities to each energy group are located in a
different pulse-height bin. This reduces the ambiguity in low-energy response from our detector,
and may be particularly useful for neutron spectroscopy of weapons-relevant sources, from
which most neutrons have energies in this region.
81

FIG. 7.2. Response matrices of the deuterated EJ315, discretized with evenly-spaced 50-keVee pulse-height bins (above), and with the light-output-conformed binning described in Eqs. 7.3-7.5 (below). The nonlinearity of the light output relation is removed with the conformal binning, improving matrix condition
82

FIG. 7.3. Comparison of low-energy columns of the EJ315 response matrix with evenly-spaced pulse-height bins
(left) and light-output-conformed bins.
FIG. 7.4. Matrix condition analysis for the EJ315 matrix discretized with the light-output-conformed binning
described in Eqs. 7.3-7.5 (bold curve), compared to evenly-spaced bins of different bin widths.
83

Figure 7.4 shows a condition analysis for the EJ315 with four different discretization
schemes. The conformal binning (bold curve) is compared to evenly-spaced binnings of several
bin widths, approaching the width of the smallest bins in the conformal scheme. For any given
limit for rlim over the region 10-4 < rlim < 10-3, the conformally binned matrix has a considerable
advantage in the number of singular values for which rp > rlim over each of the linearly-binned
matrices.
7.2 Scattering kinematics and energy resolution
Figure 7.5 shows selected columns from the response matrices measured for EJ309 (top),
EJ299-33 (center) and EJ315 (bottom). Each column corresponds the the PHS expected from
mono-energetic neutrons of the corresponding energies. I have used the light-output-conformed
discretization structure described in Section 7.1, with the light-output relations reported in
Chapter 5. The columns from the EJ315 contain prominent back-scatter peaks, while those from
the EJ309 are generally flat, with the exception of some double-scatter structure. Due to the
poorer resolution of EJ299-33, the edges of the PHS are much more blurred than those for
EJ309.
Figure 7.6 shows the condition analysis for both matrices. For any given limit rlim over
the region 10-4 < rlim < 10-3, EJ315 gives 25-30% more eigenvalues for which rp surpasses that
limit than does the EJ309 matrix. This implies a modest but significant improvement in matrix
condition for EJ315 over EJ309, similar to that observed in the previous chapter. A significant
disadvantage is seen for the EJ299-33 due to the lower resolution of the plastic relative to the
liquids.
84
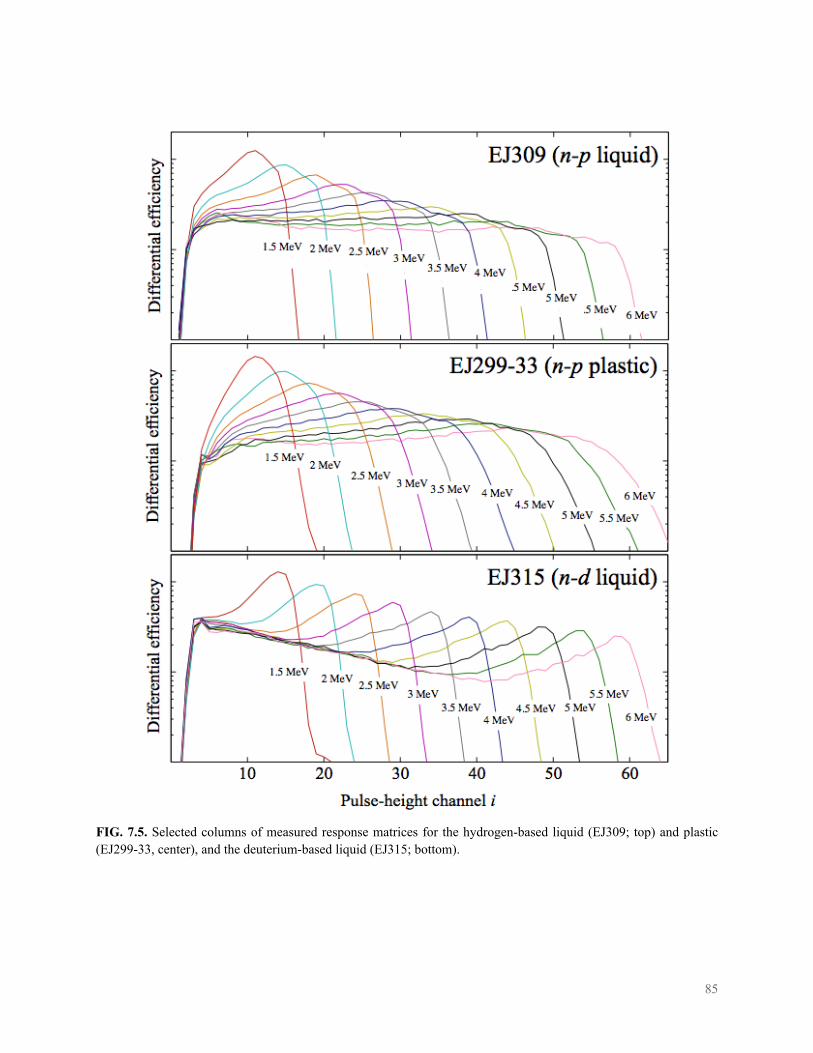
FIG. 7.5. Selected columns of measured response matrices for the hydrogen-based liquid (EJ309; top) and plastic (EJ299-33, center), and the deuterium-based liquid (EJ315; bottom).
85
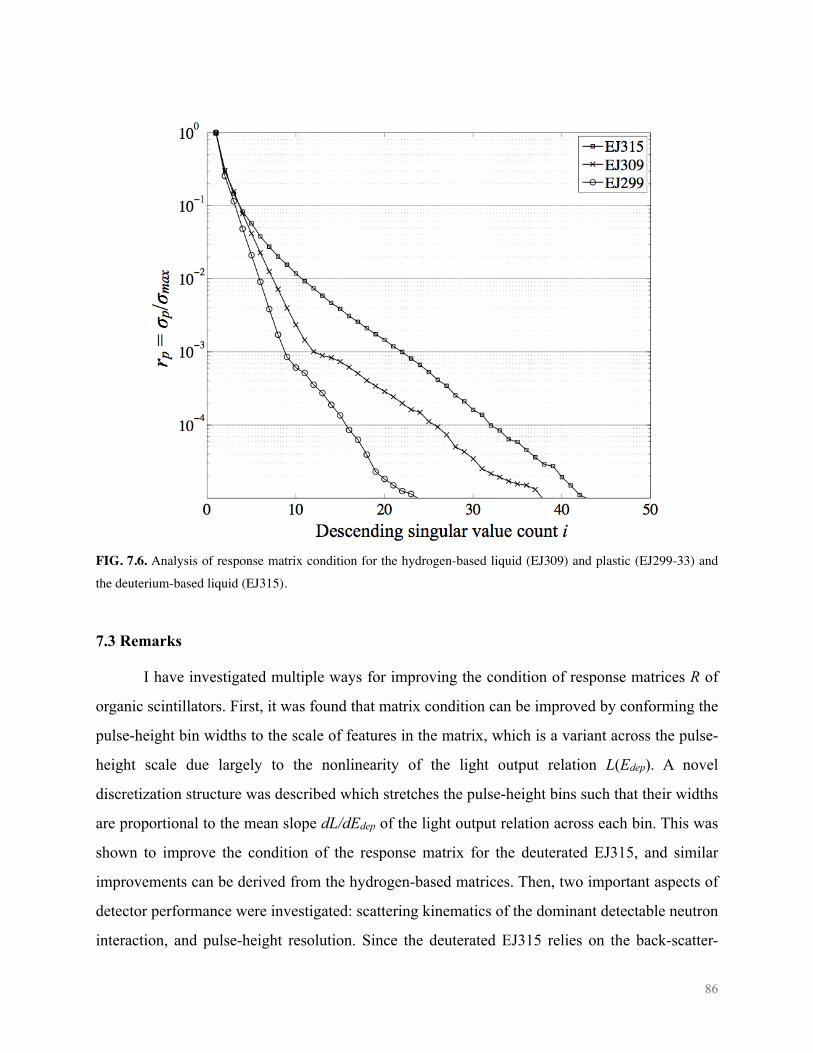
FIG. 7.6. Analysis of response matrix condition for the hydrogen-based liquid (EJ309) and plastic (EJ299-33) and
the deuterium-based liquid (EJ315).
7.3 Remarks
I have investigated multiple ways for improving the condition of response matrices R of
organic scintillators. First, it was found that matrix condition can be improved by conforming the
pulse-height bin widths to the scale of features in the matrix, which is a variant across the pulse-
height scale due largely to the nonlinearity of the light output relation L(Edep). A novel
discretization structure was described which stretches the pulse-height bins such that their widths
are proportional to the mean slope dL/dEdep of the light output relation across each bin. This was
shown to improve the condition of the response matrix for the deuterated EJ315, and similar
improvements can be derived from the hydrogen-based matrices. Then, two important aspects of
detector performance were investigated: scattering kinematics of the dominant detectable neutron
interaction, and pulse-height resolution. Since the deuterated EJ315 relies on the back-scatter-
86
peaked n-d scattering, the matrix condition is improved by the back-scatter peak in the response,
relative to the hydrogen-based detectors. The poorer resolution of the plastic EJ299-33 resulted
in a significant degradation of matrix condition. These demonstrations suggest a significant
impact of these performance aspects on the unfolding capabilities of organic scintillators.
A few comments should be made about the relevance of the comparison between EJ309
and EJ299-33, which was made in lieu of a more desirable comparison with high-resolution
crystal scintillators like p-terphenyl or stilbene. Unfortunately, the crystals available for the
measurements presented here were optimized for PSD performance rather than resolution and
light output when compared with EJ309. The comparison made between EJ309 and EJ299-33
was intended to highlight the importance of resolution for matrix condition. It is conceivable that
the benefits of n-d scattering can be combined with the higher resolution of crystals by creating
deuterated versions of high-resolution crystals. For instance, Brooks et al. have investigated the
spectroscopic capabilities of deuterated anthracene over the energy range from 5 to 30 MeV, and
in fact devise a further improvement on spectral performance by selecting back-scatter events
using special PSD techniques. It is not clear whether this is possible over the energy range of
interest for arm-control applications, but the possibility of deuterated crystals offers a promising
direction for future research along the lines suggested in this thesis.
References
[1] M. Ojaruega, F. D. Becchetti, A. N. Villano, H. Jiang, R. O. Torres-Isea, J. J. Kolata, R. J. Goldston, and C. C. Lawrence, “Evaluation of large deuterated scintillators for fast neutron detection (E=0.5–20MeV) using the D(d,n)3He, 13C(d,n) and 27Al(d,n) reactions,” Nuclear inst. and Methods in Physics Research, A, vol. 652, no. 1, pp. 397–399, Aug. 2010.
[2] C. C. Lawrence, A. Enqvist, M. Flaska, S. A. Pozzi, and F. D. Becchetti, “Comparison of Spectrum-unfolding Performance of (EJ315_ and (EJ309) Liquid Scintillators on Measured Cf-252 Pulse-height Spectra,” Nuclear inst. and Methods in Physics Research, A, vol. 729, no. C, pp. 924–929, Nov. 2013.
[3] F. D. Brooks, “Development of organic scintillators,” Nuclear inst. and Methods in Physics Research, A, vol. 162, pp. 477–505, Jun. 1979.
[4] M. Matzke, “Unfolding Procedures,” Radiation Protection and Dosimetry, vol. 107, no. 1, pp. 155–174, Dec. 2003.
87

Chapter 8Spectrum Unfolding with Measured Trial Spectra
In this chapter I present unfolding results from measured trial spectra with the hydrogen-
based EJ309 and the deuterium-based EJ315. The measurements are taken with the same
experimental arrangement, described in Chapter 4, as was used to measure the response matrices.
This allows the use of TOF to calculate reliable reference spectra for comparison with unfolded
solutions. Finely-structured neutron spectra of relevance for arms-control applications were
measured for both detectors. The trial spectra contain features on the scale of 100-keV in width,
and resolving these from scintillator PHS would represent a considerable advance in spectrum-
unfolding capabilities. In the current literature, spectral features finer than 250-keV wide are not
resolvable through unfolding, especially with standard hydrogen-based liquids.
8.1 Accelerator-based measurements for spectrum-unfolding trials
Trial neutron spectra were created by passing the beam of continuous-spectrum neutrons
from 11B(d,n) (see Fig. 4.7) through a series of low-Z materials that are relevant for warhead
verification. Conventional high explosive used to induce implosion is composed mainly of
hydrogen, carbon, nitrogen and oxygen. Beryllium metal is commonly used as a neutron reflector
in modern fission weapons. While the cross section of hydrogen is largely featureless, the other
four elements all have distinctive features in their cross sections that will add fine structure to the
otherwise smooth spectrum of neutrons from the beam. Tab. 8.1 lists the attenuating materials
used for each trial measurement, and they are shown in Fig. 8.1.
88
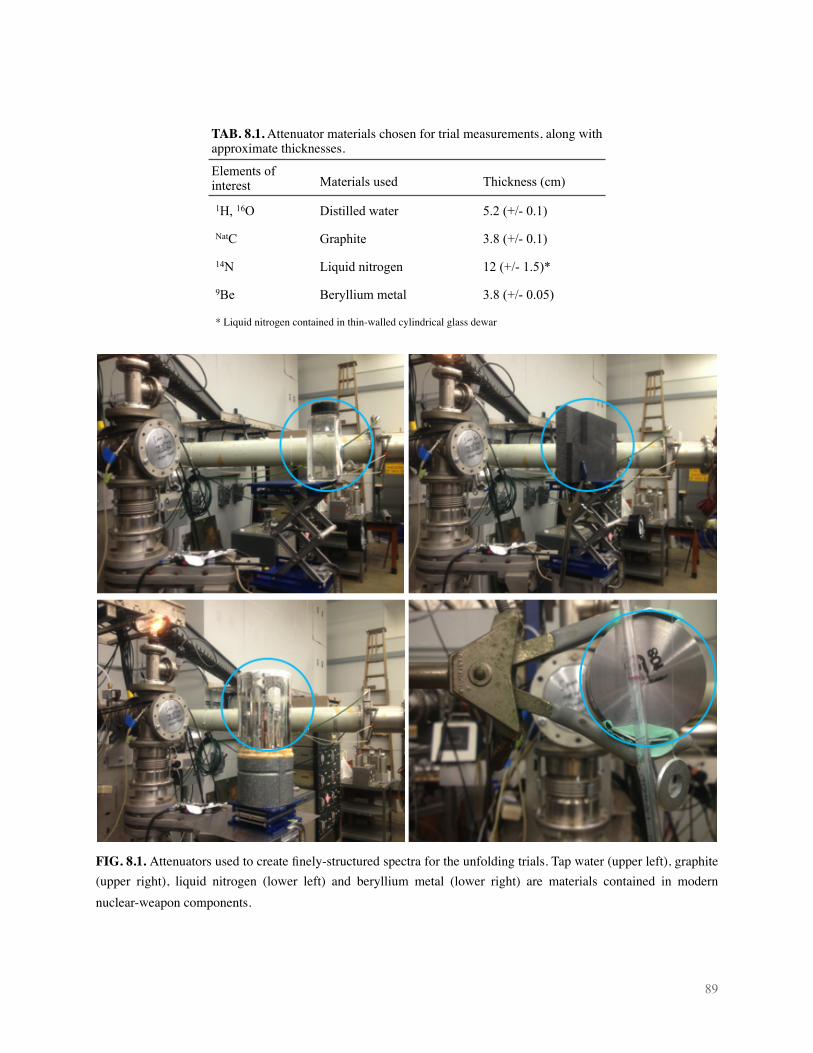
TAB. 8.1. Attenuator materials chosen for trial measurements, along with approximate thicknesses.TAB. 8.1. Attenuator materials chosen for trial measurements, along with approximate thicknesses.TAB. 8.1. Attenuator materials chosen for trial measurements, along with approximate thicknesses.
Elements of interest Materials used Thickness (cm)
1H, 16O Distilled water 5.2 (+/- 0.1)
NatC Graphite 3.8 (+/- 0.1)
14N Liquid nitrogen 12 (+/- 1.5)*
9Be Beryllium metal 3.8 (+/- 0.05)
* Liquid nitrogen contained in thin-walled cylindrical glass dewar* Liquid nitrogen contained in thin-walled cylindrical glass dewar* Liquid nitrogen contained in thin-walled cylindrical glass dewar
FIG. 8.1. Attenuators used to create finely-structured spectra for the unfolding trials. Tap water (upper left), graphite (upper right), liquid nitrogen (lower left) and beryllium metal (lower right) are materials contained in modern nuclear-weapon components.
89

It should be noted that these measurements are preceded by those of Chichester et al. who
measured simular spectra using a Cutler-Shalev 3He spectrometer. However, the 3He has
extremely low detection efficiency, on the order of 10-4 - 10-3, and this represents a significant
disadvantage. Also, no unfolding was performed on the pulse-height spectra [1].
All measurements are taken with the same experimental arrangement as that used to
measure the response matrices, and TOF data are taken alongside the pulse-height data used for
the unfolding trials. Separate measurements were taken with each attenuator and with each
detector (EJ309 and EJ315) for a total of eight trial measurements. Each trial measurement is
taken for four hours, with equal primary beam current for each sample.
FIG. 8.2. Total neutron-scattering cross sections for the low-Z elements contained in each of the attenuators used for creating trial neutron spectra (ENDF/B_6.1 [2]).
0 1 2 3 4 5 6 7 80
5
Neutron energy (MeV)
5
Tota
l cro
ss se
ctio
n (b
arns
)
5
5
16O
12C
14N
9Be
90

Figure 8.2 shows the total neutron interaction cross sections of the relevant elements
(ENDF/B_6.1 [2]). The location of the attenuating material was approximately 5 meters away
from the detector, so that the scattered neutrons were minimized due to solid-angle attenuation.
Thus, the cross sections shown in Fig. 8.2 can be treated as elimination cross sections to a very
good approximation for this geometry.
8.2 Diagnostics from time-of-flight data
Table 8.2 (reproduced for convenience from Tab, 3.2) lists some of the sources of
perturbation δn that, when amplified by an ill-conditioned matrix, distort the solution spectrum
ϕunf. The list is not claimed to be exhaustive. Poisson variance in the PHS should be singled out
amongst the rest as likely the ultimate limitation on unfolding performance. All radiation
measurements have Poisson error that is related to the number of quanta detected, and hence to
the limited commodity of measurement time. I distinguish here between Poisson variance in the
PHS, versus that in the response matrix, for practical reasons. The response matrix only needs to
be measured once for a given detector, so it is practical to make this measurement of sufficient
duration that the attendant Poisson variance in the resulting matrix is negligible. Any PHS data
taken in the field is likely subject to time constraints, so there will be non-negligible Poisson
error. The degree to which this error is amplified by the matrix will give us a sort of “upper
limit” on the unfolding performance we can hope to achieve with a given deployable detection
system. We will look at this more in depth in Section 8.4.
91

TAB. 8.2. (reproduced from Tab. 3.2). Sources of perturbation in measured pulse-height spectra that contribute to error in unfolded spectra.
Source of perturbation Likely improvement for field
Poisson variance in PHS N/A
Inaccuracies in response matrix Detector with directly-measured response matrix
Shifts in PMT gain Direct optical input to scintillator cell for real-time calibration during measurement
Shifts in PSD discrimination threshold Eljen proprietary additive to improve PSD performance [3]; systematic placement of PSD discrimination curve [4]
There is good reason to believe the other three sources can either be removed, or
dramatically improved, in a future deployable system, by incorporating currently-available
technologies. The first perturbation listed is associated with inaccuracy of the response matrix.
As described in Chapter 3, most spectrum unfolding studies reported in the literature use either
simulated matrices, or measured matrices provided with the unfolding code used. While these
may be sufficiently accurate to unfold the broad features of spectra for dosimetry applications,
they are likely insufficient for our purposes. Simulation of detector response is imperfect, and
often does not account for performance attributes such as gamma-ray and neutron
misclassification by PSD. Also, simulation often only models the detector itself, while real
measured data is governed by the PMT and data acquisition electronics as well. In order to
achieve the results that would likely be required for treaty verification, the entire measurement
system should be characterized using the methods described in Chapters 4-6.
Gain shifts in the PMT often occur during a measurement, and can broaden the detector
resolution, or shift the response altogether. Gain calibration during field measurements should be
identical to that during the measurement of the matrix, and resulting shifts can distort the
unfolded results. However, it is easy to imagine how these shifts can be prevented in a field-able
system. Scintillator housings are available with optical ports for introduction of a standardized
light pulse. This can be carried out periodically during a measurement for real-time calibration
data, and gain adjustment can even be automated.
92
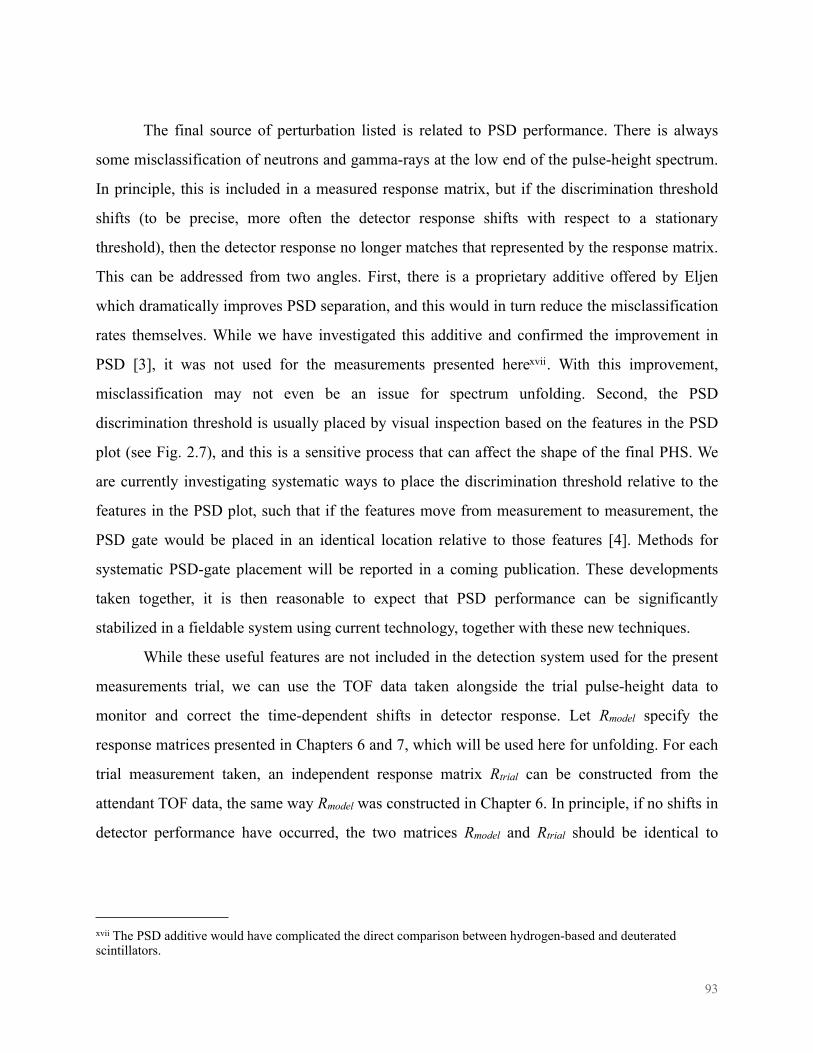
The final source of perturbation listed is related to PSD performance. There is always
some misclassification of neutrons and gamma-rays at the low end of the pulse-height spectrum.
In principle, this is included in a measured response matrix, but if the discrimination threshold
shifts (to be precise, more often the detector response shifts with respect to a stationary
threshold), then the detector response no longer matches that represented by the response matrix.
This can be addressed from two angles. First, there is a proprietary additive offered by Eljen
which dramatically improves PSD separation, and this would in turn reduce the misclassification
rates themselves. While we have investigated this additive and confirmed the improvement in
PSD [3], it was not used for the measurements presented herexvii. With this improvement,
misclassification may not even be an issue for spectrum unfolding. Second, the PSD
discrimination threshold is usually placed by visual inspection based on the features in the PSD
plot (see Fig. 2.7), and this is a sensitive process that can affect the shape of the final PHS. We
are currently investigating systematic ways to place the discrimination threshold relative to the
features in the PSD plot, such that if the features move from measurement to measurement, the
PSD gate would be placed in an identical location relative to those features [4]. Methods for
systematic PSD-gate placement will be reported in a coming publication. These developments
taken together, it is then reasonable to expect that PSD performance can be significantly
stabilized in a fieldable system using current technology, together with these new techniques.
While these useful features are not included in the detection system used for the present
measurements trial, we can use the TOF data taken alongside the trial pulse-height data to
monitor and correct the time-dependent shifts in detector response. Let Rmodel specify the
response matrices presented in Chapters 6 and 7, which will be used here for unfolding. For each
trial measurement taken, an independent response matrix Rtrial can be constructed from the
attendant TOF data, the same way Rmodel was constructed in Chapter 6. In principle, if no shifts in
detector performance have occurred, the two matrices Rmodel and Rtrial should be identical to
93
xvii The PSD additive would have complicated the direct comparison between hydrogen-based and deuterated scintillators.
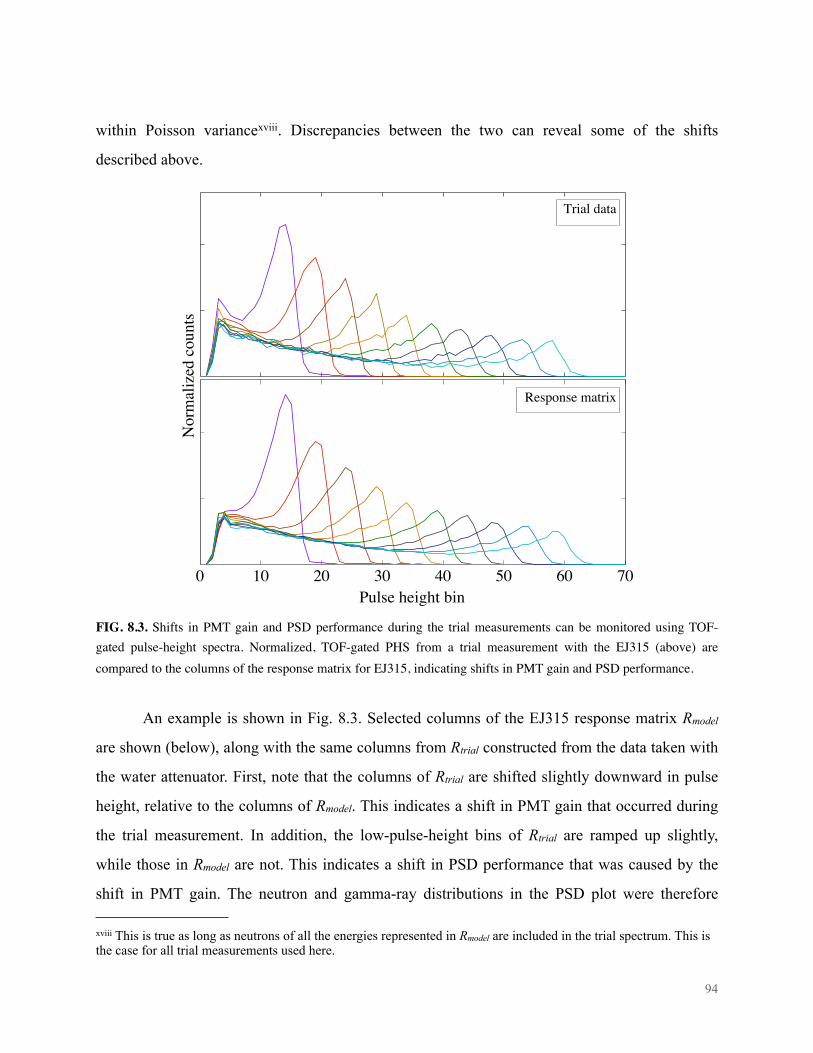
within Poisson variancexviii. Discrepancies between the two can reveal some of the shifts
described above.
FIG. 8.3. Shifts in PMT gain and PSD performance during the trial measurements can be monitored using TOF-gated pulse-height spectra. Normalized, TOF-gated PHS from a trial measurement with the EJ315 (above) are compared to the columns of the response matrix for EJ315, indicating shifts in PMT gain and PSD performance.
An example is shown in Fig. 8.3. Selected columns of the EJ315 response matrix Rmodel
are shown (below), along with the same columns from Rtrial constructed from the data taken with
the water attenuator. First, note that the columns of Rtrial are shifted slightly downward in pulse
height, relative to the columns of Rmodel. This indicates a shift in PMT gain that occurred during
the trial measurement. In addition, the low-pulse-height bins of Rtrial are ramped up slightly,
while those in Rmodel are not. This indicates a shift in PSD performance that was caused by the
shift in PMT gain. The neutron and gamma-ray distributions in the PSD plot were therefore
0 10 20 30 40 50 60 70Pulse height bin
Nor
mal
ized
cou
nts
Trial data
Response matrix
94
xviii This is true as long as neutrons of all the energies represented in Rmodel are included in the trial spectrum. This is the case for all trial measurements used here.

shifted by a small amount relative to a stationary discrimination gate, such that more gamma-ray
pulses at the low-pulse-height end were misclassified as neutrons. The amount of shift was
imperceptible from the PSD plot, but moving the discrimination gate in small increments lead to
the removal of the ramp shown in Fig. 8.3.
Performance shifts of these sorts were corrected for the trial PHS used in these trials so
that the unfolding results represent the true unfolding potential of the detectors that could be
achievable if the true detector response is accurately represented by the response matrices used.
8.3 Unfolding results
Unfolding of each trial spectrum is performed using the conjugate gradient method on
Eq. 3.16
(R†R + λI)ϕ = R†n. (8.1)
Regularization parameters λ are chosen using the L-curve method [5], [6]. The light-output-
conformal discretization schemes introduced in Chapter 7 are used, with 100-keV-wide energy
bins. Each unfolded result, along with the corresponding TOF-calculated reference spectra, are
presented in Fig. 8.4. As expected, the prominent peaks in the cross-section curves correspond to
valleys in the TOF references where neutrons of those energies are more strongly attenuated. The
unfolded spectra from both detectors follow the broad features of the references quite well,
especially considering the fine energy binning used. However, the EJ315 appears to better
preserve the finer structure, and is more stable with respect to the oscillatory error component
characteristic of unfolded spectra. Thus, we continue to see a modest but significant
improvement for the deuterated EJ315 over the hydrogen-based EJ309, as seen in previous
chapters. It is also clear that, without accurate TOF reference spectra for comparison, it would be
very difficult to distinguish between genuine well-preserved spectral features, and features added
by the oscillatory error component. The TOF reference confirms that much of the jagged
structure in the unfolded spectra, particularly in the EJ315 case, is genuine spectral structure that
is preserved through the unfolding process.
95

FIG. 8.4. Unfolding results from trial measurements with EJ309 (left) and EJ315 (right), using the attenuators listed in Tab. 8.1. TOF reference and total-interaction cross sections are included in each figure.
5
10
15
Calc
ulat
ed fl
uenc
e (1
04 )
EJ309 unfolded resultReference
EJ315 unfolded resultReference
Water attenuatorWater attenuator
5
10
15
20
Calc
ulat
ed fl
uenc
e (1
04 )
EJ309 unfolded resultTOF Reference
EJ315 unfolded resultTOF Reference
Graphite attenuator Graphite attenuator
5
10
Calc
ulat
ed fl
uenc
e (1
04 )
EJ309 unfolded resultReference
EJ315 unfolded resultReference
Liquid nitrogen attenuator
Liquid nitrogen attenuator
0 2 4 6 8
5
10
15
Nuetron energy (MeV)
Calc
ulat
ed fl
uenc
e (1
04 )
2 4 6 8Neutron energy (MeV)
EJ309 unfolded resultReference
EJ315 unfolded resultReference
Beryllium metal attenuator
Beryllium metal attenuator
96

8.4 The effect of Poisson variance on unfolded spectra
I have argued that Poisson variance (i.e. counting statistics) in the measured pulse-height
spectrum n is probably the limiting factor on the stability of unfolded solutions for a given
detector, and with a given measurement duration. The question arises: how stable are the results
presented in section 8.3 to Poisson variance? If we took the same measurements a second or third
time, would the same spectral features be preserved? In order to answer these questions, we can
create an array of Poisson-variant PHS n(p) associated with a given measurement n(trial), where the
number of counts ni(p) in each pulse-height bin i is drawn from a Poisson distribution with mean
equal to the measured counts element n(trial):
P(nip )= (ni
(trial ) )nip
e−ni( trial )
nip! . (8.2)
After unfolding each of the Poisson-variant PHS n(p), we create a corresponding array of
solutions ϕ(p), on which statistical analysis can be carried out. This process was carried out on the
water-attenuated measurements with both detectors (Fig. 8.4 top row). Figure 8.5 shows multiple
overlapped unfolded results ϕ(p) form Poisson-variant PHS n(p) for both EJ309 (left) and EJ315
(right). The top row of plots represent ten trials each, while the bottom row represents a heat map
corresponding to 103 Poisson variant trials each. This provides a good representation of the
advantage for the deuterated detector: the features are better preserved for the EJ315 trials, and
the band of variance is narrower across the spectrum, indicating higher stability of the unfolded
EJ315 solutions to Poisson variance. The standard deviation of fluences in each energy group
was 25-30% higher for the EJ309 detector than for the EJ315 detector.
97

FIG. 8.5. Unfolded results from ten (above) and 103 (below) Poisson-variant pulse-height spectra for EJ309 (left) and EJ315 (right).
8.5 Remarks
Unfolded spectra from PHS measured with the hydrogen-based EJ309 and the deuterium-
based EJ315 were presented. Trial neutron spectra for the measurements were created by passing
the neutrons from 11B(d,n) (see Chapter 4) through low-Z attenuating materials commonly found
in weapons components, listed in Tab. 8.1. Comparison was made with TOF-calculated reference
spectra, verifying the preservation of spectral features as fine as 100-keV in width. This
represents a considerable improvement over results found in published literature, which are
unable to resolve features narrower than 250 keV in width. The unfolding results for EJ315 are
superior to those of EJ309. The capability to distinguish between spectral features caused by
different attenuating materials could be useful for future warhead-verification applications.
98

References
[1] D. L. Chichester, J. T. Johnson, and E. H. Seabury, “Fast-neutron spectrometry using a 3He ionization chamber and digital pulse shape analysis,” Applied Radiation and Isotopes, vol. 70, no. 8, pp. 1457–1463, Aug. 2012.
[2] Cross-section Plotter. [Online]. Available: http://atom.kaeri.re.kr/cgi-bin/endfplot.pl. [Accessed: 09-Jun-2014].
[3] C. C. Lawrence, A. Enqvist, M. Flaska, S. A. Pozzi, and F. D. Becchetti, “Comparison of Spectrum-unfolding Performance of (EJ315_ and (EJ309) Liquid Scintillators on Measured Cf-252 Pulse-height Spectra,” Nuclear inst. and Methods in Physics Research, A, vol. 729, no. C, pp. 924–929, Nov. 2013.
[4] J. K. Polack, M. Flaska, A. P. Enqvist, and S. A. Pozzi, “A Computer-aided, Visual Charge-integration Pulse-discrimination Method for Organic Scintillators,” presented at the Institute for Nuclear Materials Management, 54th Annual Meeting, Palm Desert CA, 2013.
[5] P. C. Hansen, The L-curve and Its Use in the Numerical Treatment of Inverse Problems. 2003, pp. 1–24.
[6] P. C. Hansen, “MATLAB Regularization Toolbox,” Numerical Algorithms, vol. 46, pp. 189–194, Mar. 2007.
99

Chapter 9Re-parametrization of the
Unfolding Problem
Thus far, I have approached spectrum unfolding as a task of solving for the fluences ϕj of
neutrons contained in a series of energy groups j. If the energy range of interest extends up to 15
MeV, and if we want to see sharp spectral features of width on the order of 100-keV, this
amounts to ~150 unknown parameters ϕj. As we have seen, measured PHS ni do not contain
enough information to constrain this many free parameters, and so we must implement some a
priori information to further constrain the problem. This is typically done by including some
penalty in the extremized functional by which candidate solutions are evaluated. For the
unfolding results presented in Chapter 8, a penalty was implemented against solutions with large
oscillations (see Section 3.2.1). However, the oscillatory error from the solution instability has
tended to look similar to the genuine spectral features which we want to preserve, so the
regularization was used at the cost of dulling sensitivity to these finer features. Indeed, in the
case of the hydrogen-based detector, by the time the error components were removed from the
solutions, most of the spectral features of interest were as well.
This formulation of the unfolding problem seems natural enough, and its dominance in
the literature is motivated by a desire for generality. We would like to be able to take a neutron
spectrometer into any environment, and detect any conceivable neutron field without any
preconceived notions or commitments. But this desire itself implies an artificial distinction. A
clear line is drawn between an object to be known - i.e. the spectrum of neutrons present - and
the means by which it can be known - i.e. the detection system. According to this distinction,
preliminary knowledge about the detection system (i.e. the response matrix) is accepted as the
“data constraint”, while preliminary knowledge about the energy spectrum is sanctioned as “a
priori information”, external to the “data”, whose implementation is a regrettable but necessary
trespass.
100

But consider a practical problem like that envisioned for warhead verification. An
inspectorate desires to know a series of treaty-relevant parameters τl about an enclosed test
object, and the various radiative and acoustic couplings are the means by which these might be
known. Here the line of sanction has shifted: no one cares about the neutron or phonon
distributions themselves, but about the presence or absence of various attributes that would
define the object as a weapons component. In solving the inverse problems associated with
warhead verification, we can take this practical shift seriously by incorporating it in our
formulation. We can try to write a more direct relationship between our observables ni and the
treaty-relevant parameters τj that we desire to know:
ni = f τ1,τ 2...τ p( ) . (9.1)
Here f takes the place of the response-matrix operator, and now it can rightfully contain
information that is known about the measurement task. The operator f would take very different
form in the warhead-verification scenario than it would for, say, dosimetry applications, even if
the same detector was used. But by taking these obvious differences between measurement
challenges to heart, we may arrive at a problem with far fewer unknown parameters than if we
insisted on treating the spectrum itself as the object of interest.
This chapter will explore the possibility of using a priori information about the
measurement task at hand to re-parametrize the unfolding problem, in hopes of arriving at a
smaller solution space. I begin by describing how this might take place in the warhead-
verification scenario. The possible physical configurations that amount to a genuine nuclear
warhead are extremely limited, and involve important symmetries within a localized space.
Neutrons emitted from the plutonium pit would pass through concentric shells of neutron-
reflecting and high-explosive (HE) material, and they would be spectrally altered by those
materials before reaching a surrounding detection system. However, writing down a workable f
for this scenario would require an extensive research effort that is beyond the scope of this
dissertation. I therefore construct a simplified one-dimensional problem, in which neutrons of a
continuous spectrum are passed through an attenuating slab of low-Z materials, as in the
101

accelerator measurements discussed in the previous chapter. I will write f as a function of the
optical thicknesses of candidate attenuating materials, and solve for those thicknesses. This will
first be done using the same measured pulse-height data presented in Chapter 8. Then I will
perform MCNP-PoliMi simulations in which Watt-spectrum neutrons are passed through slabs of
HE, and the neutron spectra seen by the detector are calculated via a surface tally. Trial PHS
associated with these simulated neutron spectra will be constructed from measured pulse-height
and TOF data. From these trial spectra, the elemental compositions of the simulated HE will be
estimated to an accuracy of around 10%. These results illustrate the usefulness of approaching
the unfolding problem by focusing on the measurement system itself, and suggest an area of
future research on the warhead verification problem.
9.1 Warhead-verification scenario: three-dimensional attenuation problem
While there is some variation in the design of modern fission weapons, the constraints on
that variation are fairly severe. A metal core of either plutonium or uranium is imploded by a
surrounding arrangement of HE lenses to momentarily produce a super-critical assembly. The
essential design challenges are to minimize neutron multiplication prior to detonation to
minimize the risk of pre-detonation; maximize the criticality of the imploded assembly to
maximize yield efficiency; and to minimize “insertion time”, i.e. the time it takes for implosion
to bring the assembly into maximum criticality. A few design aspects are key to achieving these
aims [1]-[3]:
• Geometrical symmetry - either spherical or ellipsoidal - to ensure maximum insertion
speed and density of imploded metal
• Inclusion of some neutron-reflecting layer - typically of beryllium metal - to reflect
fission neutrons back into the reacting metal after implosion
• Strict separation between fissile metal - which also decays by alpha emission - and any
potential α-n target.
102
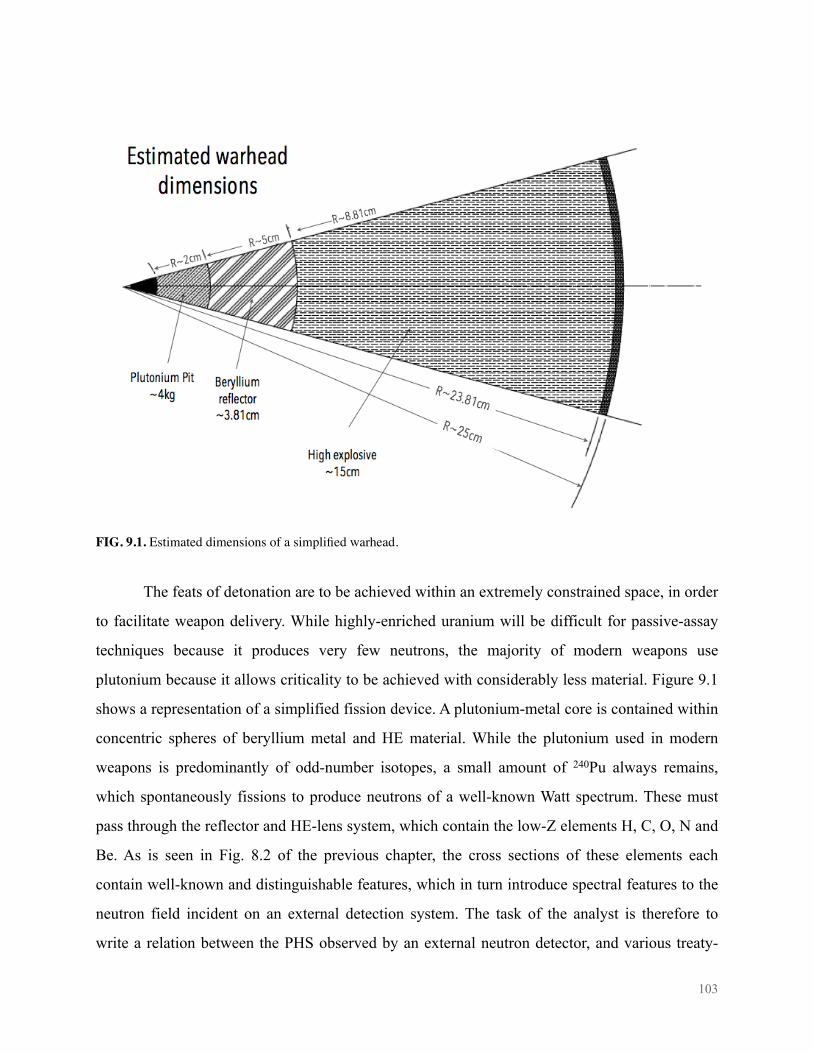
FIG. 9.1. Estimated dimensions of a simplified warhead.
The feats of detonation are to be achieved within an extremely constrained space, in order
to facilitate weapon delivery. While highly-enriched uranium will be difficult for passive-assay
techniques because it produces very few neutrons, the majority of modern weapons use
plutonium because it allows criticality to be achieved with considerably less material. Figure 9.1
shows a representation of a simplified fission device. A plutonium-metal core is contained within
concentric spheres of beryllium metal and HE material. While the plutonium used in modern
weapons is predominantly of odd-number isotopes, a small amount of 240Pu always remains,
which spontaneously fissions to produce neutrons of a well-known Watt spectrum. These must
pass through the reflector and HE-lens system, which contain the low-Z elements H, C, O, N and
Be. As is seen in Fig. 8.2 of the previous chapter, the cross sections of these elements each
contain well-known and distinguishable features, which in turn introduce spectral features to the
neutron field incident on an external detection system. The task of the analyst is therefore to
write a relation between the PHS observed by an external neutron detector, and various treaty-
103

relevant parameters, as in Eq. 9.1. Here, we would want to include parameters τl to represent the
presence of various possible neutron sources (i.e. fission versus α-n, for example), and the
optical thicknesses of any candidate low-Z elements. We would also likely need to incorporate
data other than the neutron PHS into ni. The PHS from detected gamma rays would likely add
constraints on the possible α-n reactions present (many of which produce prominent high-energy
gamma-ray lines that would be easy to detect with organic scintillators), and multiplicity
measurements could verify the presence of a multiplying source, as would be a required attribute
for a nuclear weapon.
FIG. 9.2. Formulation of warhead-verification problem, writing detector response elements as functionally dependent upon treaty-relevant parameters, such as presence of low-Z constituents of high explosive and neutron reflecting materials.
It is conceivable that some form of Eq. 9.1 could be written that depends on many fewer
parameters than our tradition unfolding problem. But the construction of a workable form for Eq.
9.1 in a given warhead-verification scenario is a research project in itself, and beyond the scope
of this dissertation. Instead, I will demonstrate the usefulness of adapting the form of Eq. 9.1 to a
given problem by considering a simplified one-dimensional attenuation problem, using the same
weapons-relevant materials with a known incident spectrum.
104

9.3 One-dimensional attenuation problem
As an example of how re-parametrization of the unfolding problem can reduce the
number of free parameters, consider a simple one-dimensional case similar to that observed in
our accelerator experiments. As in the warhead case, the initial spectrum W(En) of neutrons is
well known, as is the neutron-interaction cross section σl of the each material l through the
neutrons pass. Thus, we can represent the attenuated spectrum ϕ(mod) incident on the detector as a
product of the known initial spectrum W(En) and a series of energy-dependent attenuation
coefficients:
φ (mod ) =W (En ) exp(−σ l (En ) ⋅τ l )l∏ (9.2)
where σl(En) is the known energy-dependent total interaction cross section of the lth candidate
attenuating material, and τl the optical thickness of that material in the attenuator. In order to
translate this into a detector response ni, we can discretize the energy dependence with the same
discretization scheme used in our response matrices Rij
φ j(mod ) =W (En ) exp(−σ ljτ l )
l∏ . (9.3)
The discretized model of the incident spectrum is then acted upon by the detector response
matrix Rij to produce a model relating detector response ni directly to a series of unknown optical
thicknesses τl:
ni = Rijφ j(mod )
j∑ = RijWj exp(−σ ljτ l )
l∏
j∑ (9.4)
The solution parameters solved for are the optical thicknesses τl of the candidate materials. This
allows us to utilize the known energy dependence of each σl(En) to constrain the solution space:
if there are around ten or so candidate materials, this implies that the dimensionality of the
problem is reduced by a factor of ten. There are, of course, many materials out of which
attenuators could be made. But in this area nature appears to have been kind: the majority of
105

isotopes either contain little or no structure in their cross sections over our energy range of
interest, or they contain structure which is so fine that it appears flat to our detectors. These
might be represented by a composite term. The materials we are interested in, on the other hand,
do contain distinguishable features, as seen in Chapter 8.
FIG. 9.3. Simplified one-dimensional attenuation problem, solving for optical thickenesses τj of attenuating low-Z elements.
9.3.1 Measured pulse-height spectra with single attenuators
I first demonstrate this technique using the purely measured spectra described in Chapter
8. Each includes a single attenuating material, through which a beam of neutrons from 11B(d,n)
passes. The initial spectrum from the reaction was measured separately, and is shown in Fig. 4.7.
Cross sections for each material were obtained from ENDF [4], re-discretized into 100-keV
energy bins, and normalized by density such that the thicknesses are written in units of length. A
residual vector is calculated as
ri = ni(mod ) −ni
(meas ) . (9.6)
Four thickness terms τj are solved for by minimizing the residual 2-norm using a Levenberg-
Marquardt method.
106
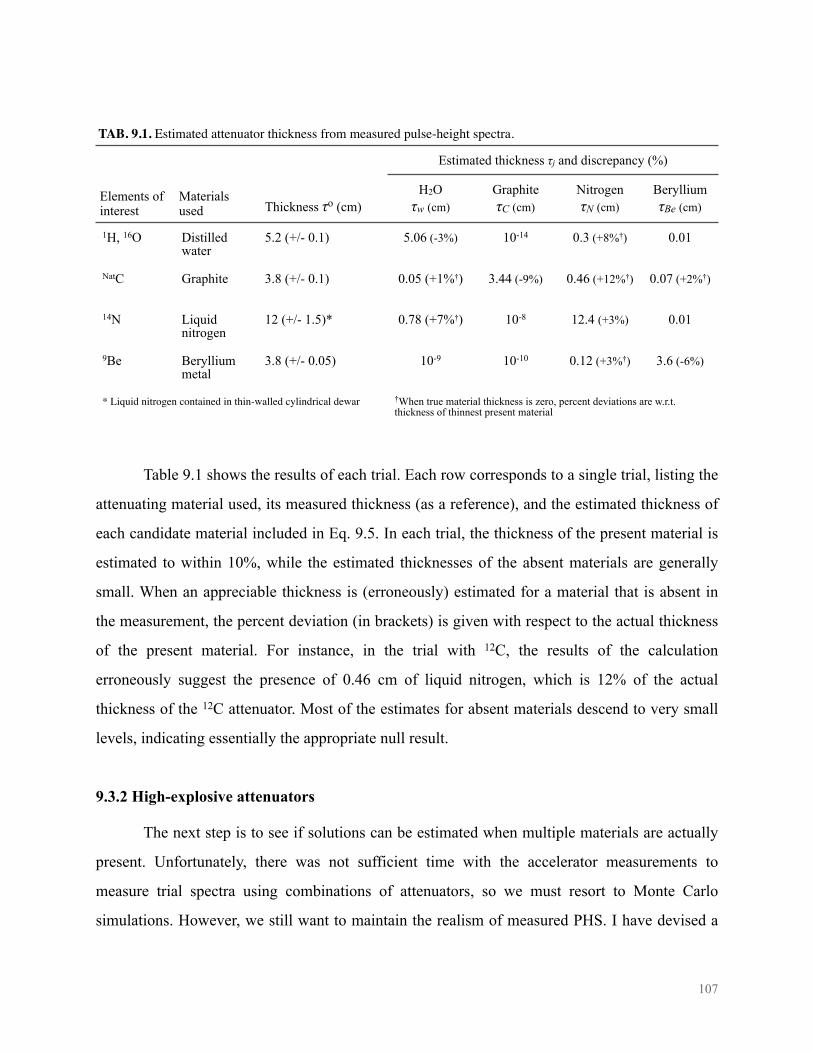
TAB. 9.1. Estimated attenuator thickness from measured pulse-height spectra.TAB. 9.1. Estimated attenuator thickness from measured pulse-height spectra.TAB. 9.1. Estimated attenuator thickness from measured pulse-height spectra.TAB. 9.1. Estimated attenuator thickness from measured pulse-height spectra.TAB. 9.1. Estimated attenuator thickness from measured pulse-height spectra.TAB. 9.1. Estimated attenuator thickness from measured pulse-height spectra.TAB. 9.1. Estimated attenuator thickness from measured pulse-height spectra.
Elements of interest
Materials used Thickness τo (cm)
Estimated thickness τj and discrepancy (%)Estimated thickness τj and discrepancy (%)Estimated thickness τj and discrepancy (%)Estimated thickness τj and discrepancy (%)
Elements of interest
Materials used Thickness τo (cm)
H2Oτw (cm)
GraphiteτC (cm)
NitrogenτN (cm)
BerylliumτBe (cm)
1H, 16O Distilled water
5.2 (+/- 0.1) 5.06 (-3%) 10-14 0.3 (+8%†) 0.01
NatC Graphite 3.8 (+/- 0.1) 0.05 (+1%†) 3.44 (-9%) 0.46 (+12%†) 0.07 (+2%†)
14N Liquid nitrogen
12 (+/- 1.5)* 0.78 (+7%†) 10-8 12.4 (+3%) 0.01
9Be Beryllium metal
3.8 (+/- 0.05) 10-9 10-10 0.12 (+3%†) 3.6 (-6%)
* Liquid nitrogen contained in thin-walled cylindrical dewar* Liquid nitrogen contained in thin-walled cylindrical dewar* Liquid nitrogen contained in thin-walled cylindrical dewar †When true material thickness is zero, percent deviations are w.r.t. thickness of thinnest present material†When true material thickness is zero, percent deviations are w.r.t. thickness of thinnest present material†When true material thickness is zero, percent deviations are w.r.t. thickness of thinnest present material†When true material thickness is zero, percent deviations are w.r.t. thickness of thinnest present material
Table 9.1 shows the results of each trial. Each row corresponds to a single trial, listing the
attenuating material used, its measured thickness (as a reference), and the estimated thickness of
each candidate material included in Eq. 9.5. In each trial, the thickness of the present material is
estimated to within 10%, while the estimated thicknesses of the absent materials are generally
small. When an appreciable thickness is (erroneously) estimated for a material that is absent in
the measurement, the percent deviation (in brackets) is given with respect to the actual thickness
of the present material. For instance, in the trial with 12C, the results of the calculation
erroneously suggest the presence of 0.46 cm of liquid nitrogen, which is 12% of the actual
thickness of the 12C attenuator. Most of the estimates for absent materials descend to very small
levels, indicating essentially the appropriate null result.
9.3.2 High-explosive attenuators
The next step is to see if solutions can be estimated when multiple materials are actually
present. Unfortunately, there was not sufficient time with the accelerator measurements to
measure trial spectra using combinations of attenuators, so we must resort to Monte Carlo
simulations. However, we still want to maintain the realism of measured PHS. I have devised a
107
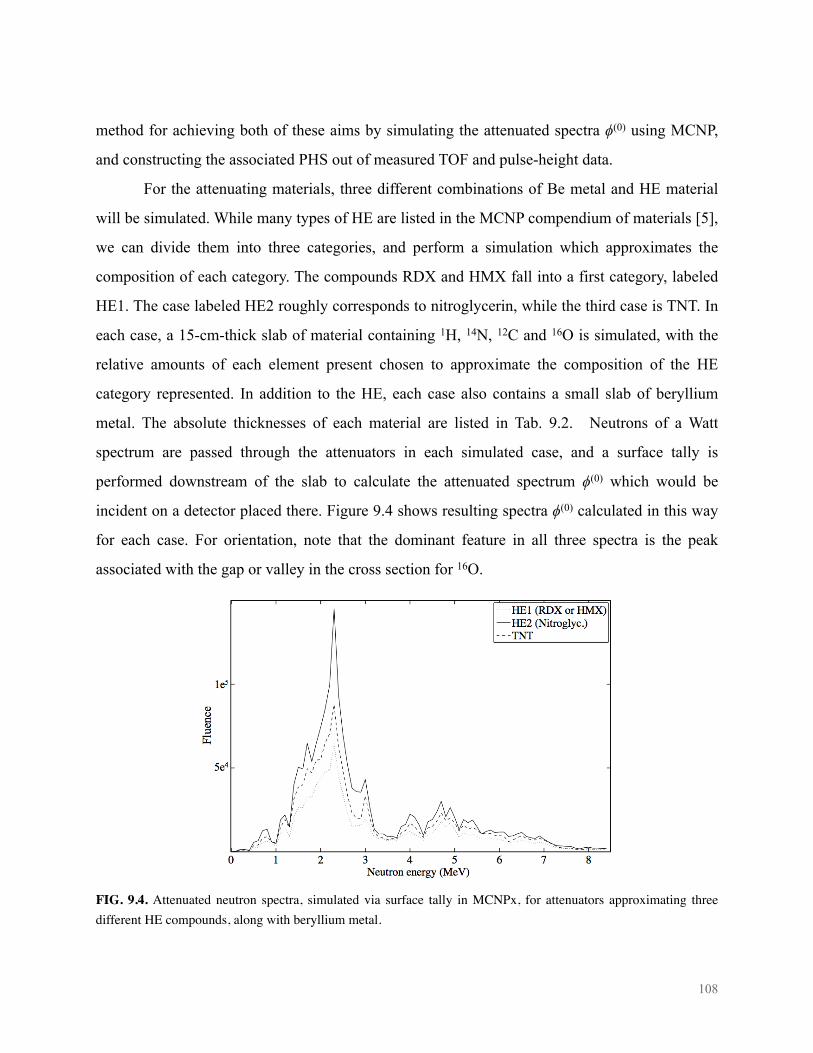
method for achieving both of these aims by simulating the attenuated spectra ϕ(0) using MCNP,
and constructing the associated PHS out of measured TOF and pulse-height data.
For the attenuating materials, three different combinations of Be metal and HE material
will be simulated. While many types of HE are listed in the MCNP compendium of materials [5],
we can divide them into three categories, and perform a simulation which approximates the
composition of each category. The compounds RDX and HMX fall into a first category, labeled
HE1. The case labeled HE2 roughly corresponds to nitroglycerin, while the third case is TNT. In
each case, a 15-cm-thick slab of material containing 1H, 14N, 12C and 16O is simulated, with the
relative amounts of each element present chosen to approximate the composition of the HE
category represented. In addition to the HE, each case also contains a small slab of beryllium
metal. The absolute thicknesses of each material are listed in Tab. 9.2. Neutrons of a Watt
spectrum are passed through the attenuators in each simulated case, and a surface tally is
performed downstream of the slab to calculate the attenuated spectrum ϕ(0) which would be
incident on a detector placed there. Figure 9.4 shows resulting spectra ϕ(0) calculated in this way
for each case. For orientation, note that the dominant feature in all three spectra is the peak
associated with the gap or valley in the cross section for 16O.
FIG. 9.4. Attenuated neutron spectra, simulated via surface tally in MCNPx, for attenuators approximating three different HE compounds, along with beryllium metal.
108

The process for constructing PHS n(obs) associated with these simulated spectra ϕ(0) out of
measured data is as follows. For each energy group j in the discretized spectrum ϕ(0), the total
fluence ϕj is multiplied by the detector efficiency εj over that energy group, to estimate the
number of detected neutrons in the group
φ j(det ) = ε j ⋅φ j
(o) . (9.7)
Then, ϕj(det) neutron pulses are drawn from within the jth TOF-calculated energy group from a set
of measured TOF and pulse-height data, measured as described in Chapter 4. The pulse-height
data from these counts are added to the constructed PHS. This constructed PHS contains all the
attributes listed in Tab. 10.2 that complicate the unfolding process with real measured spectra,
but are associated with known spectra ϕ(0) determined in the simulation process. The resultant
PHS are shown in Fig. 9.5, and they serve as the “observed” PHS n(obs) for our trials.
FIG. 9.5. Pulse-height spectra, constructed from measured data, associated with the simulated neutron spectra shown in Fig. 9.4.
109

As in the previous section, elemental compositions of the attenuator in each trial is
estimated by minimizing the 2-norm of the residual between n(model) and n(obs). The results are
given in Tab. 9.2. Most of the estimates are correct to within 10%, indicating impressive success
of the method. There appear to be some systematic effects leading to patterns in the
discrepancies. For instance, the estimate is high for carbon in all three trials, while it is
consistently low for beryllium.
TAB. 9.2. Estimated attenuator thickness from pulse-height spectra constructed from measured data using simulated incident spectra.TAB. 9.2. Estimated attenuator thickness from pulse-height spectra constructed from measured data using simulated incident spectra.TAB. 9.2. Estimated attenuator thickness from pulse-height spectra constructed from measured data using simulated incident spectra.TAB. 9.2. Estimated attenuator thickness from pulse-height spectra constructed from measured data using simulated incident spectra.TAB. 9.2. Estimated attenuator thickness from pulse-height spectra constructed from measured data using simulated incident spectra.TAB. 9.2. Estimated attenuator thickness from pulse-height spectra constructed from measured data using simulated incident spectra.TAB. 9.2. Estimated attenuator thickness from pulse-height spectra constructed from measured data using simulated incident spectra.TAB. 9.2. Estimated attenuator thickness from pulse-height spectra constructed from measured data using simulated incident spectra.
Elements of interest
Case1: RDX (approx.)Case1: RDX (approx.)Case1: RDX (approx.) Case2: NG (approx.)Case2: NG (approx.) Case3: TNT (approx.)Case3: TNT (approx.)
Elements of interest
Simulatedτo (cm)
Estimatedτest (cm)
Simulatedτo (cm)
Simulatedτo (cm)
Estimatedτest (cm)
Simulatedτo (cm)
Estimatedτest (cm)
1H 0.33 0.30 (-10%) 0.330.33 0.31 (-7%) 0.33 0.29 (-13%)
16O 6 5.6 (-7%) 99 8.5 (-6%) 6 5.8 (-3%)
NatC 3 3.27 (+9%) 33 3.32 (+11%) 6 6.5 (+8%)
14N 6 6.2 (2%) 33 3.1 (+3%) 3 3.2 (+7%)
9Be 3.81 3.6 (-5%) 2.52.5 2.35 (-6%) 3 2.75 (-8%)
In order to investigate whether these discrepancies were systematic, An analysis similar
to that described in Section 10.4 was performed. For each case presented in Tab. 9.2, 103
Poisson-variant trial spectra were created, using n(obs) for the mean of the Poisson distribution.
Estimated thicknesses τest were calculated from each of these, and the results are histogramed in
Fig. 9.6. As can be seen, the distribution of results for each material are contained within a
Gaussian-like cluster. For the estimates that deviate by a large amount, the FWHM of the
distribution of estimates is considerably smaller than the size of the discrepancy, indicating that
the discrepancy is systematic, and could potentially be corrected for.
110

FIG. 9.6. Analysis of the effect of Poisson variance in pulse-height spectra on the estimated thicknesses τest of attenuating materials. Arrows indicate correct solution values τ0.
In any case, each type of HE material is clearly distinguishable from the others in Fig.
9.6, regardless of the discrepancies mentioned above. This indicates that useful estimates of
elemental composition can be made using scintillator PHS.
9.4 Remarks
In this chapter, it was argued that the key to drawing useful information out of scintillator
PHS is to re-parametrize the unfolding problem to reflect the challenge at hand. By incorporating
a priori information about the measurement system into the functional form of an operator
111

relating detector response ni to relevant parameters of interest τw, we can constrain the inverse
problem into a lower-dimensional space. This would be a useful approach in the highly
controlled environment envisioned for warhead verification. This approach was demonstrated on
a simple one-dimensional attenuation problem, in which it was possible to extract an estimate of
the elemental composition of the attenuating material from scintillator pulse-height data alone.
While this problem differs from the three-dimensional case seen in warhead verification, it
illustrates a general approach that could prove useful for verification if developed further.
References
[1] C. Sublette, “4.1 Elements of Fission Weapon Design,” Nuclear weapon Archive, 11-Feb-1999.
[2] R. Serber, “Los Alamos Primer,” Los Alamos National Laboratory, Jul. 1996.
[3] J. Fuller, “Verification on the Road to Zero: Issues for Nuclear Warhead Dismantlement,” Arms Control Today, pp. 1–11, Jul. 2010.
[4] Cross-section Plotter. [Online]. Available: http://atom.kaeri.re.kr/cgi-bin/endfplot.pl. [Accessed: 09-Jun-2014].
[5] Employee, “Compendium of Material Composition Data for Radiation Transport Modeling,” pp. 1–375, Aug. 2011.
112

Chapter 10Concluding Remarks and
Future Systems
The overall aim of this dissertation has been to bring neutron spectroscopy with organic
scintillators into the warhead- and material-verification toolbox. Neutron spectroscopy has the
potential to fill some persistent holes in current attribute-verification capabilities, such as the
distinction between metal and oxide forms of Pu [1], [2], and confirmation of the presence of
high explosive materials in a warhead [3]. Since neutron spectra contain much less information
than gamma-ray spectra, neutron spectroscopy will likely be more palatable for practitioners
concerned with the vulnerability of sensitive warhead-design information. However, verification
of warhead and material attributes using neutron spectra would require resolution of spectral
features around 100 keV in width [4], a capability that has previously been out of reach for
standard hydrogen-based neutron spectrometers. Much progress has already occurred in the area
of neutron-spectrum unfolding, and further improvement in the performance of unfolding
algorithms comes up against hard informatic limits imposed by the ill-conditioned matrices of
standard hydrogen-based scintillators .
In order to improve the performance of neutron spectroscopy systems, I have shifted
focus from the unfolding procedure to the detection system on one hand, and to the measurement
challenge on the other. By focusing on the attributes of the detection system, I have identified
possible improvements in response-matrix condition and stability that can bring about the quality
of unfolding results we desire - namely the resolution of spectral features around 100 keV in
width. These improvements are listed in Tabs. 3.1 and 3.2. I also showed how a focus on the
measurement challenge itself can bring about a re-parametrization of the unfolding problem, and
dramatically constrain the number of free solution parameters to allow the extraction of useful
information from scintillator pulse-height spectra.
113

Two considerations are important for the interpretation of this work. First, while the
neutron spectroscopy system I envision is realizable with currently-available technologies, it was
only partially realized in the system used for this work. Many of the important attributes were
demonstrated: deuterated liquids were shown to have superior matrix condition to standard
hydrogen-based liquids; light-output-conformed pulse-height binning improved the matrix
condition; response matrices were accurately measured using accelerator-based measurements.
But other attributes like real-time automated gain adjustment and PSD-enhancing additives [5],
were not available to me at the time of these measurements.
Second, the three-dimensional scenario envisioned for warhead verification will differ
substantially from the simplified one-dimensional attenuation measurements reported in this
thesis. In order for a similar technique to yield treaty-relevant parameters τl from warhead
measurements, an appropriate model f(τ1, τ2..τp) must be devised to causally link the parameters
τl to observable data parameters ni. In a workable system, these data parameters will likely come
from multiple measurement systems, including, but not limited to, scintillator pulse-height
spectra. And while the model f used for the one-dimensional case in Chapter 9 was analytically
motivated, more complicated models may require iterative MCNP simulations, and/or insight
from measurements on actual or artificial test items.
With these considerations in mind, I use this final chapter to sketch a possible way
forward for incorporating neutron spectrometry, along with other measurements, in an overall
warhead-verification measurement system.
10.1 A deuterated crystal spectrometer?
In choosing a scintillator solution we would like to combine the desirable attributes of
deuterated detectors with the superior light output, pulse-height resolution PSD performance
obtainable from organic crystals like p-terphenyl or stilbene [6], [7]. While the anisotropic
response of organic crystals is a problem in many dosimetry applications, it would not be
problematic for the controlled measurements envisioned for warhead verification. Unfortunately,
I am unaware of any deuterated crystals that are commercially available at this time, or of any
114
previous analysis of deuterated p-terphenyl or stilbene spectrometers, and this suggests an area of
development that may hold some promise. If large crystals of deuterated p-terphenyl or stilbene
could be grown and optimized for high light output, resolution and PSD capability, it may be
possible to create a neutron spectrometer with far superior performance than has been
demonstrated for organic liquids. This would solidify the place of neutron spectrometry in the
arms control toolbox.
The idea of a deuterated crystal spectrometer is not new. In 1988, F.D. Brooks developed
a deuterated anthracene spectrometer for neutrons over the energy range from 5 < En < 30 MeV
[8]. Brooks did not take the step of unfolding the data, but he demonstrated an intriguing
possibility: he invented a PSD technique to gate on backscatter events, yielding a full-energy
peak over this energy range. While he considered the resolution of the full-energy peak sufficient
for his purposes, unfolding techniques could be used to further enhance the resolution of neutron
spectra obtainable from such a detector. If a similar technique could be devised for lower neutron
energies, it would represent a further improvement on matrix condition. Unfortunately, this
direction appears to have ended with Brooks’ 1988 study, and I am unable to find further
research on neutron spectroscopy with deuterated crystals. But in light of the potential usefulness
of neutron spectroscopy for warhead verification, this research area should be revived.
10.2 Stabilization of PMT gain and PSD performance
In order to obtain stable unfolding results, PMT gain and PSD performance must be
uniform across measurements. For the unfolding trials described in Chapter 8, uniformity of
these attributes between the matrix measurement and the trial measurements was enforced
artificially using TOF with a long flight path. Of course, long-flight-path TOF would not be
available for verification measurements, so these attributes must be stabilized using means
inherent in the detection system.
Systems for the stabilization of PMT gain are already well developed. A standardized
light pulse is periodically introduced to the scintillator active volume during the measurement,
via an optical port in the scintillator cell. Throughout the measurement, automated systems can
115

adjust the PMT gain in real time such that the total integrated charge of PMT pulses associated
with the standardized optical pulses remains constant. This calibration data can be acquired
during the matrix measurement, and used during field measurements to conform the PMT gain to
that used during the matrix measurement.
Regarding the stability of PSD performance, I have several comments. First, if crystal
scintillators are used, considerably better PSD performance can be obtained [9]. For instance, in
our stilbene detectors, there is virtually no PSD misclassification above a threshold of 100 keVee.
If liquids are used, there are ways to enhance the PSD performance using proprietary additives
available from Eljen Technologies. In a previous publication, we demonstrated PSD performance
in a PSD-enhanced EJ315 liquid that was similar to that of our stilbene crystals [5]. If neutron
and gamma-ray misclassification is negligible, then slight shifts in the location of the PSD gate
thresholds will not effect unfolding performance. Finally, other members of DNNG are currently
developing systems for automated placement of the PSD gate thresholds relative to features in
the PSD plot, such that if those features shift, the gate thresholds would shift accordingly [10].
These systems should be validated using accelerator-based TOF measurements, as in Ref. [11]. It
is important to remember that the considerations of PSD performance that are relevant to
unfolding performance are different than those relevant to other applications. But with these
developments and further research on the sensitivity of unfolding performance to PSD quality, it
is reasonable to expect that stable PSD performance will be possible with current and future
systems.
10.3 Detector arrays and coincidence information
A fieldable neutron spectrometry system for warhead verification should include multiple
detectors for two (good) reasons. Most obviously, the improvement in absolute efficiency would
be very beneficial - probably required - for obtaining measurement statistics sufficient for
arriving at a stable solution of the unfolding problem. Second, depending on how data is
acquired, multiple detectors can acquire neutron multiplicity information useful for obtaining
other treaty-relevant attribute data, or for further constraining unfolding solutions. For instance,
116
measurement of double-coincident neutron detections can distinguish between a fissioning
source and an alpha-n source, or be combined with neutron-spectral data to estimate the amount
of fissioning material [12]-[15]. Multiplying sources can be distinguished by utilizing higher-
order multiplicity counts (triples, etc.) [12], [13], or by correlating the time delay between
coincident detections with pulse-height information [14]. While it is not clear what aspects of
multiplicity counting will be considered sensitive to practitioners in a hypothetical future
dismantlement scenario, research should be carried out to determine what information is
derivable from scintillator arrays that combine spectral and multiplicity datas of various
complexities.
10.4 The three-dimensional warhead verification problem
If we approach the warhead-verification problem as we did the one-dimensional
attenuation problem in Chapter 7, then our task is to write down a forward operator f(τ1, τ2..τm)
which relates a series of treaty-relevant parameters τp to a set of observable data parameters ni
acquired by various means. Thus, an important direction for research is to turn our attention to
the possible test items themselves. Surrogate test items could be constructed out of simple fission
and α-n sources, surrounded by concentric shells of low-Z materials like Be metal and HE
simulants. Parallel models could be constructed analytically and in Monte Carlo simulations.
While a three-dimensional test item is more complicated than the one-dimensional case, our task
is likely made considerably easier by the geometrical symmetries - spherical or ellipsoidal - of
nuclear warheads. Nevertheless, the contribution of single- and double-scattered neutrons would
likely have to be incorporated into f, and/or reduced through various shielding arrangements.
Other forms of data, such as acoustic tomographic imaging [16] or electromagnetic coil
impedance measurements [2], could also be incorporated to further constrain desired parameters
τp. But whatever the forms of data, charting the space of possible test items, and constructing the
corresponding models f, would put us in the position to extract treaty-relevant parameters from
otherwise ambiguous datas ni like scintillator pulse-height spectra.
117

References
[1] A. Peurrung, R. Arthor, B. Geelhood, R. Scheel, R. Elovich, and S. Pratt, “Origin of the 871-keV Gamma Ray and the ‘Oxide’ Attribute,” Pacific Northwest National Laboratory, PNNL-13180, Mar. 2000.
[2] R. Kouzes and B. Geelhood, “Composite Signatures of Nuclear and Non-nuclear Technologies for Weapons Material Component Verification,” Pacific Northwest National Laboratory, PNNL-13861, Apr. 2002.
[3] D. Archer, “Third Generation Attribute Measurement System,” presented at the Institute for Nuclear Materials Management, 53rd Annual Meeting, 2012, pp. 1–4.
[4] R. C. Runkle, A. Bernstein, and P. E. Vanier, “Securing special nuclear material: Recent advances in neutron detection and their role in nonproliferation,” J. Appl. Phys., vol. 108, no. 11, p. 111101, 2010.
[5] C. C. Lawrence, A. Enqvist, M. Flaska, S. A. Pozzi, and F. D. Becchetti, “Comparison of Spectrum-unfolding Performance of (EJ315_ and (EJ309) Liquid Scintillators on Measured Cf-252 Pulse-height Spectra,” Nuclear inst. and Methods in Physics Research, A, vol. 729, no. C, pp. 924–929, Nov. 2013.
[6] N. P. Zaitseva, J. Newby, S. Hamel, L. Carman, M. Faust, V. Lordi, N. J. Cherepy, W. Stoeffl, and S. A. Payne, “Neutron detection with single crystal organic scintillators,” presented at the SPIE Optical Engineering + Applications, 2009, vol. 7449, pp. 744911–744911–10.
[7] C. Matei, F. J. Hambsch, and S. Oberstedt, “Nuclear Instruments and Methods in Physics Research A,” Nuclear inst. and Methods in Physics Research, A, vol. 676, no. c, pp. 135–139, Jun. 2012.
[8] F. D. Brooks, W. A. Cilliers, B. R. S. Simpson, F. D. Smit, M. S. Allie, D. T. L. Jones, W. R. McMurray, and J. V. Pilcher, “Deuterated Anthracene Spectrometer for 5-30 MeV Neutrons,” Nuclear Instruments and Methods in Physics Research A, vol. 270, pp. 149–149156, Jun. 1988.
[9] N. Zaitseva, A. Glenn, L. Carman, R. Hatarik, S. Hamel, M. Faust, B. Schabes, N. Cherepy, and S. Payne, “Pulse Shape Discrimination in Impure and Mixed Single-Crystal Organic Scintillators,” IEEE Transactions on Nuclear Science, vol. 58, no. 6, pp. 3411–3420, Dec. 2011.
[10] J. K. Polack, M. Flaska, A. P. Enqvist, and S. A. Pozzi, “A Computer-aided, Visual Charge-integration Pulse-discrimination Method for Organic Scintillators,” presented at the Institute for Nuclear Materials Management, 54th Annual Meeting, Palm Desert CA, 2013.
[11] C. C. Lawrence, A. Enqvist, M. Flaska, S. A. Pozzi, and F. D. Becchetti, “Gamma-ray and Neutron Misclassification Rates Versus Pulse-height in Organic Scintillation Detectors EJ309, and EJ315.,” presented at the Institute for Nuclear Materials Management, 53rd Annual Meeting, 2013, pp. 1–7.
[12] R. Kouzes and B. Geelhood, “Methods for Attribute Measurement and Alternatives to Multiplicity Counting,” Pacific Northwest National Laboratory, PNNL-13250, May 2000.
118

[13] N. Ensslin, W. C. Harker, M. S. Krick, D. G. Langner, M. M. Pickrell, and J. E. Stewart, “Application Guide to Neutron Multiplicity Counting,” Los Alamos National Laboratory, LA-13422-M, Apr. 1998.
[14] E. C. Miller, “Characterization of Fissionable Material using a Time-Correlated Pulse-Height Technique for Liquid Scintillators,” University of Michigan, 2012.
[15] J. Dolan, “Safeguarding Special Nuclear Material by Detecting Fast Neutrons in Liquid Scintillators,” University of Michigan, 2013.
[16] N. Duric, C. Li, O. Roy, and S. Schmidt, “Acoustic tomography: Promise versus reality,” presented at the 2011 IEEE International Ultrasonics Symposium (IUS), pp. 2033–2041.
119