Remote sensing of selective logging in Amazonia
14
Remote sensing of selective logging in Amazonia Assessing limitations based on detailed field observations, Landsat ETM+, and textural analysis Gregory P. Asner a,b, *, Michael Keller c , Rodrigo Pereira d , Johan C. Zweede d a Department of Geological Sciences and Environmental Studies Program, University of Colorado, Benson Building, Campus Box 399, Boulder, CO 80309-0399, USA b Carnegie Institution of Washington, Stanford University, Stanford, CA 94305, USA c Complex Systems Research Center, Morse Hall, University of New Hampshire, Durham, NH, 03824, USA and USDA Forest Service, International Institute of Tropical Forestry, Rio Piedras, PR, USA d Fundacao Floresta Tropical, Trv. 14 Abril, Bairro Sao Braz, Belem CEP. 66063-140 Para, Brazil Received 12 June 2001; received in revised form 1 October 2001; accepted 3 October 2001 Abstract We combined a detailed field study of forest canopy damage with calibrated Landsat 7 Enhanced Thematic Mapper Plus (ETM+) reflectance data and texture analysis to assess the sensitivity of basic broadband optical remote sensing to selective logging in Amazonia. Our field study encompassed measurements of ground damage and canopy gap fractions along a chronosequence of postharvest regrowth of 0.5 – 3.5 years. We found that canopy damage and regrowth rates varied according to the logging method used, either conventional logging or reduced impact logging. Areas used to stage felled trees prior to transport, log decks, had the largest gap fractions immediately following cutting. Log decks were quickly colonized by early successional plant species, resulting in significant gap fraction decreases within 1.5 years after site abandonment. Although log decks were the most obvious damage areas on the ground and in satellite imagery, they accounted for only 1 – 2% of the total harvested area of the blocks studied. Other forest damage features such as tree-fall gaps, skid trails, and roads were difficult to recognize in Landsat reflectance data or through textural analysis. These landscape features could be only crudely resolved in the most intensively logged forests and within about 0.5 years following harvest. We found that forest damage within any of the landscape strata (decks, roads, skids, tree falls) could not be resolved with Landsat reflectance or texture data when the canopy gap fraction was < 50%. The basic Landsat ETM+ imagery lacks the resolution of forest structural features required for quantitative studies of logging damage. Landsat textural analyses may be useful for broad delineation of logged forests, but detailed ecological and biogeochemical studies will probably need to rely on other remote sensing approaches. Until spatial gradients of canopy damage and regrowth resulting from selective logging operations in tropical forests in the Amazon region are resolved, the impacts of this land use on a continental scale will remain poorly understood. D 2002 Elsevier Science Inc. All rights reserved. 1. Introduction Forests of the Brazilian Amazon are undergoing continual land-use expansion through cattle ranching, logging, agri- culture, and urban development. The ecological and socio- economic impacts of clear-cutting Amazon forests for cattle pasture have been widely recognized (e.g., Fearnside & Barbosa, 1998; Uhl & Kauffman, 1990). However, selective logging of forests has now become a dominant land use in the Brazilian Amazon. Estimates of the area logged annually approach 15,000 km 2 (Nepstad et al., 1999), similar to the annual area of clear cuts (Houghton et al., 2000). In the Brazilian Amazon, selective logging removes timber in the range of volumes up to roughly 60 m 3 ha 1 or about 1–9 trees ha 1 (Barros & Uhl, 1995). Current logging practices result in high levels of collateral damage, as up to 27 trees can be killed for every tree harvested (Verissimo, Barreto, & Mattos, 1992). Log removal and collateral damage lead to a range of ecosystem effects including changes in the light regime and forest microcli- mate, soil erosion and compaction, disruption of nutrient 0034-4257/01/$ – see front matter D 2002 Elsevier Science Inc. All rights reserved. PII:S0034-4257(01)00326-1 * Corresponding author. Department of Geological Sciences and Environmental Studies Program, University of Colorado, Benson Building, Campus Box 399, Boulder, CO 80309-0399, USA. Tel.: +1-303-735-5033. E-mail address: [email protected] (G.P. Asner). www.elsevier.com/locate/rse Remote Sensing of Environment 80 (2002) 483 – 496
Transcript of Remote sensing of selective logging in Amazonia
Remote sensing of selective logging in Amazonia
Assessing limitations based on detailed field observations,
Landsat ETM+, and textural analysis
Gregory P. Asnera,b,*, Michael Kellerc, Rodrigo Pereirad, Johan C. Zweeded
aDepartment of Geological Sciences and Environmental Studies Program, University of Colorado, Benson Building, Campus Box 399,
Boulder, CO 80309-0399, USAbCarnegie Institution of Washington, Stanford University, Stanford, CA 94305, USA
cComplex Systems Research Center, Morse Hall, University of New Hampshire, Durham, NH, 03824, USA and USDA Forest Service,
International Institute of Tropical Forestry, Rio Piedras, PR, USAdFundacao Floresta Tropical, Trv. 14 Abril, Bairro Sao Braz, Belem CEP. 66063-140 Para, Brazil
Received 12 June 2001; received in revised form 1 October 2001; accepted 3 October 2001
Abstract
We combined a detailed field study of forest canopy damage with calibrated Landsat 7 Enhanced Thematic Mapper Plus (ETM+)
reflectance data and texture analysis to assess the sensitivity of basic broadband optical remote sensing to selective logging in Amazonia. Our
field study encompassed measurements of ground damage and canopy gap fractions along a chronosequence of postharvest regrowth of
0.5–3.5 years. We found that canopy damage and regrowth rates varied according to the logging method used, either conventional logging or
reduced impact logging. Areas used to stage felled trees prior to transport, log decks, had the largest gap fractions immediately following
cutting. Log decks were quickly colonized by early successional plant species, resulting in significant gap fraction decreases within 1.5 years
after site abandonment. Although log decks were the most obvious damage areas on the ground and in satellite imagery, they accounted for
only 1–2% of the total harvested area of the blocks studied. Other forest damage features such as tree-fall gaps, skid trails, and roads were
difficult to recognize in Landsat reflectance data or through textural analysis. These landscape features could be only crudely resolved in the
most intensively logged forests and within about 0.5 years following harvest. We found that forest damage within any of the landscape strata
(decks, roads, skids, tree falls) could not be resolved with Landsat reflectance or texture data when the canopy gap fraction was < 50%. The
basic Landsat ETM+ imagery lacks the resolution of forest structural features required for quantitative studies of logging damage. Landsat
textural analyses may be useful for broad delineation of logged forests, but detailed ecological and biogeochemical studies will probably need
to rely on other remote sensing approaches. Until spatial gradients of canopy damage and regrowth resulting from selective logging
operations in tropical forests in the Amazon region are resolved, the impacts of this land use on a continental scale will remain poorly
understood. D 2002 Elsevier Science Inc. All rights reserved.
1. Introduction
Forests of the Brazilian Amazon are undergoing continual
land-use expansion through cattle ranching, logging, agri-
culture, and urban development. The ecological and socio-
economic impacts of clear-cutting Amazon forests for cattle
pasture have been widely recognized (e.g., Fearnside &
Barbosa, 1998; Uhl & Kauffman, 1990). However, selective
logging of forests has now become a dominant land use in
the Brazilian Amazon. Estimates of the area logged annually
approach 15,000 km2 (Nepstad et al., 1999), similar to the
annual area of clear cuts (Houghton et al., 2000).
In the Brazilian Amazon, selective logging removes
timber in the range of volumes up to roughly 60 m3 ha� 1
or about 1–9 trees ha� 1 (Barros & Uhl, 1995). Current
logging practices result in high levels of collateral damage,
as up to 27 trees can be killed for every tree harvested
(Verissimo, Barreto, & Mattos, 1992). Log removal and
collateral damage lead to a range of ecosystem effects
including changes in the light regime and forest microcli-
mate, soil erosion and compaction, disruption of nutrient
0034-4257/01/$ – see front matter D 2002 Elsevier Science Inc. All rights reserved.
PII: S0034 -4257 (01 )00326 -1
* Corresponding author. Department of Geological Sciences and
Environmental Studies Program, University of Colorado, Benson Building,
Campus Box 399, Boulder, CO 80309-0399, USA. Tel.: +1-303-735-5033.
E-mail address: [email protected] (G.P. Asner).
www.elsevier.com/locate/rse
Remote Sensing of Environment 80 (2002) 483–496
cycling and possibly long-term changes in tree species
composition (Jonkers, 1987; McNabb et al., 1997; Ter
Steege et al., 1995). These changes can affect the recruit-
ment of timber species and the diversity of forest fauna
(Hill, Hamer, Lace, & Banham, 1995; Johns, 1991; Pinard,
Howlett, & Davidson, 1996; Thiollay, 1992). Selective
logging also increases the susceptibility of forests to fire
through modification of the understory microclimate and
supply of fuel (Cochrane et al., 1999; Holdsworth & Uhl,
1997; Nepstad et al., 1999; Uhl & Buschbacher, 1985).
Few studies (e.g., Nepstad et al., 1999) have quantified
the extent of selective logging in the Brazilian Amazon. The
vast area of the Amazon region and the limited infrastruc-
ture within it, as well as legal issues related to logging
activities, make it difficult to track this particular form of
land use on the ground or through inspection of government
economic statistics. Fortunately, canopy damage is highly
correlated with timber volume removed across a wide range
of humid tropical forest environments (Pereira, Zweede,
Asner, & Keller, 2001). Quantification of canopy damage
using remote sensing could therefore provide a means to
estimate both the amount of biomass harvested and the
biomass remaining as debris following selective logging.
Although remote sensing could play an important role in
quantifying forest canopy damage resulting from selective
logging in Amazonia, satellite analyses have not yet pro-
vided clear estimates of the extent or intensity of logging in
the region, where intensity refers to the ground and canopy
structural changes. One of the factors slowing the use of
remote sensing approaches is that no detailed field studies of
selective logging have been developed in the Brazilian
Amazon for a systematic analysis of the biophysical sens-
itivity of remote sensing observations. We report on a field-
based study to quantify the sensitivity of Landsat 7 Enhanced
Thematic Mapper Plus (ETM+) data to the extent and
intensity of selective logging and to the canopy closure that
occurs in the years following logging operations. We use an
intensive field survey of ground and canopy damage among
logging areas with low and high levels of damage to evaluate
the accuracy of the two most common methods for locating
selectively logged sites with multispectral satellite data—
simple band reflectance analysis and image texture analysis.
2. Methods
2.1. Site description
This study was conducted at the Fazenda Cauaxi in the
Paragominas Municipality of Para State, Brazil in the
eastern Amazon. The climate at Fazenda Cauaxi is humid
tropical with annual precipitation averaging 2200 mm
(Costa & Foley, 1998). A dry season extends from July
through November (generally < 50 mm/month), although
June and December are also frequently dry enough for
logging operations. Soils in the area are classified mainly
as dystrophic yellow latosols according to the Brazilian
system (RADAMBRASIL, 1983). The topography is flat to
mildly undulating, and the forest is classified as tropical
dense moist forest (IBGE, 1988).
Selective logging is practiced throughout the region
(Fig. 1). The Tropical Forest Foundation maintains a train-
ing center for demonstration of forest management and
reduced-impact logging (RIL) techniques (S3 * 43.8780,
W48 * 17.4380). Training courses, demonstrations, and
research activities have been conducted there since 1995
with the collaboration of the property owners. Prior to
current logging operations, there is no historical record of
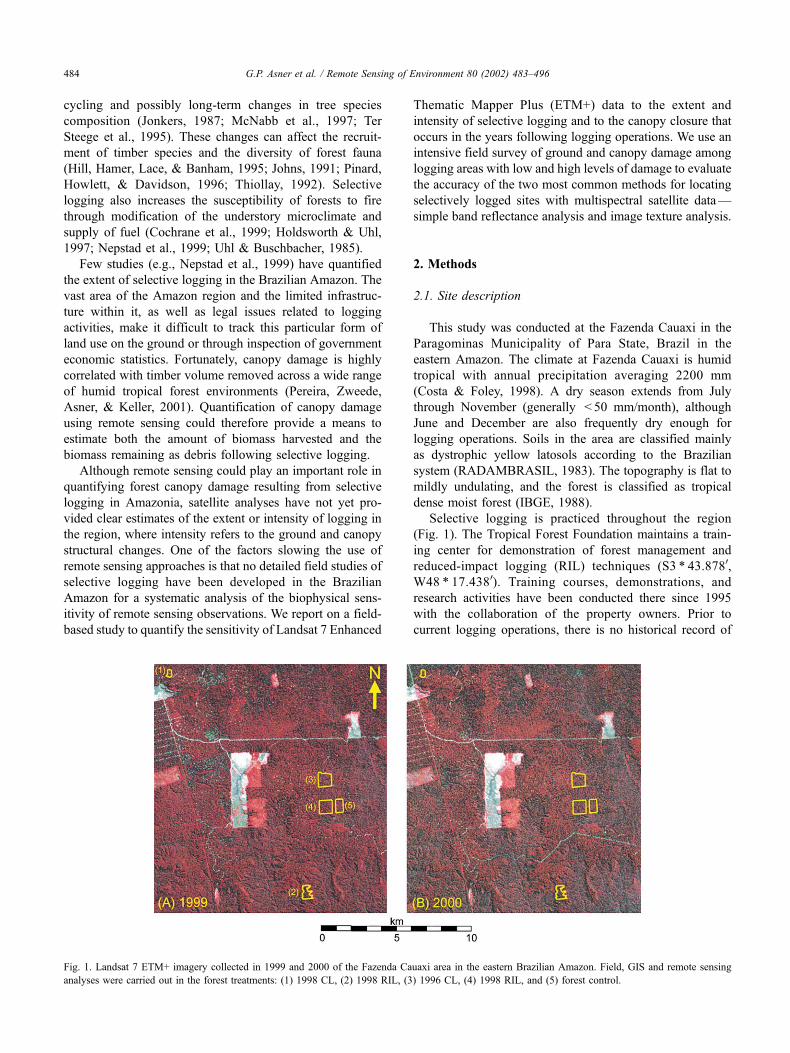
Fig. 1. Landsat 7 ETM+ imagery collected in 1999 and 2000 of the Fazenda Cauaxi area in the eastern Brazilian Amazon. Field, GIS and remote sensing
analyses were carried out in the forest treatments: (1) 1998 CL, (2) 1998 RIL, (3) 1996 CL, (4) 1998 RIL, and (5) forest control.
G.P. Asner et al. / Remote Sensing of Environment 80 (2002) 483–496484
land use or collection of nontimber forest products, although
there are indicators of indigenous activity.
We studied both conventional logging (CL; high collat-
eral damage) and RIL (low collateral damage) in order to
observe a range of canopy damage intensity. Both CL and
RIL practices in this region have been described previously
(Johns, Barreto, & Uhl, 1996; Pereira et al., 2001; Verissimo
et al., 1992). Briefly, in CL practices, woodsman marked
harvest trees that were later felled by sawyers. The sawyers
were, in turn, followed by operators who prepared roads and
decks (log landings), skidded logs, and loaded logs onto
trucks for transport. A crawler tractor without a winch was
used for road and log deck construction as well as for
skidding. Use of a single type of crawler for multiple tasks
is very common in CL operations in the Brazilian Amazon
region (Johns et al., 1996), and it plays a central role in
determining ground damages resulting from selective log-
ging operations.
In contrast to CL practices, RIL operations employed a
preharvest methodology where blocks were surveyed and
fully inventoried, roads were planned and built, and vines
were cut from harvest trees about 1 year prior to harvest to
minimize collateral damage during felling operations. Prior
to harvest, crews marked trees and determined preferred
felling directions. Trained sawyers felled trees using dir-
ectional techniques. Skid trails were then planned and
marked considering the direction of the felled trees and
the structure of the residual forest. Logs were extracted
using a wheeled skidder with a grapple and a winch
(Caterpillar 525).
We studied four logged blocks and a natural forest area
(50 ha) that had never been logged. One CL and one RIL
block each were logged in 1996 and 1998. Both 1996 blocks
were originally surveyed at 100 ha. Alongside these 100 ha
blocks were buffer strips without harvest trees of about 25 m
width on all sides. The RIL block for 1998 covered 57 ha
and the CL block for 1998 covered about 14 ha.
2.2. Field studies
The two CL and two RIL blocks were inventoried and
mapped prior to and following harvest operations. The
number of trees felled and the total geometric volume
skidded from the forest were recorded. Road, log deck,
and skid lengths and areas were measured and mapped
using fiberglass measuring tapes and compasses. Road, skid,
and log deck widths were also measured with a measuring
tape at 50-m intervals. Tree locations, road, skid, and log
deck data were transferred to paper maps at a scale of
1:1000. The maps were then digitized into a geographic
information system (GIS Arc/Info) and geo-rectified using
124 field GPS measurements. The GIS contained spatially
explicit locations and areas of all roads, skids, log decks,
and felled trees for each block (Fig. 2).
Field surveys of canopy damage were conducted in
March 1999 and July 2000. This was approximately 0.5
and 1.5 years following logging in the 1998 blocks, and 2.5
and 3.5 years following logging in the 1996 blocks. Our
surveys provided a means to construct logging chronose-
quences in both CL (high collateral damage) and RIL (low
collateral damage) timber operations.
Canopy gap fraction was used as the primary indicator of
forest canopy damage. Gap fraction (range 0–1) is defined as
the proportion of the hemisphere above the instrument that
has a clear view of the sky (no interfering plant canopy). We
measured canopy gap fraction using an optical plant canopy
analyzer (LAI-2000, Licor) at 1.5 m above the ground
surface. While the LAI-2000 instrument is often used to
report leaf area index (LAI), we choose to report gap fraction,
the basic measurement of the instrument (Welles & Norman,
1991). LAI is a quantity derived from the gap fraction
measurement and a model of leaf angle distribution. Gap
fraction is a more meaningful and repeatable result from the
LAI-2000 than is LAI under conditions of highly discon-
tinuous, spatially structured canopy coverage in this study.
The gap fraction algorithm used in the instrument
assumes a diffusely lit sky; thus we restricted our measure-
ments to about 1 h after dawn and 1 h prior to dusk (low sun
angle) or to times when there was a uniform cloud cover.
Measurements below the canopy were referenced to open
sky measurements collected in large clearings. The LAI-
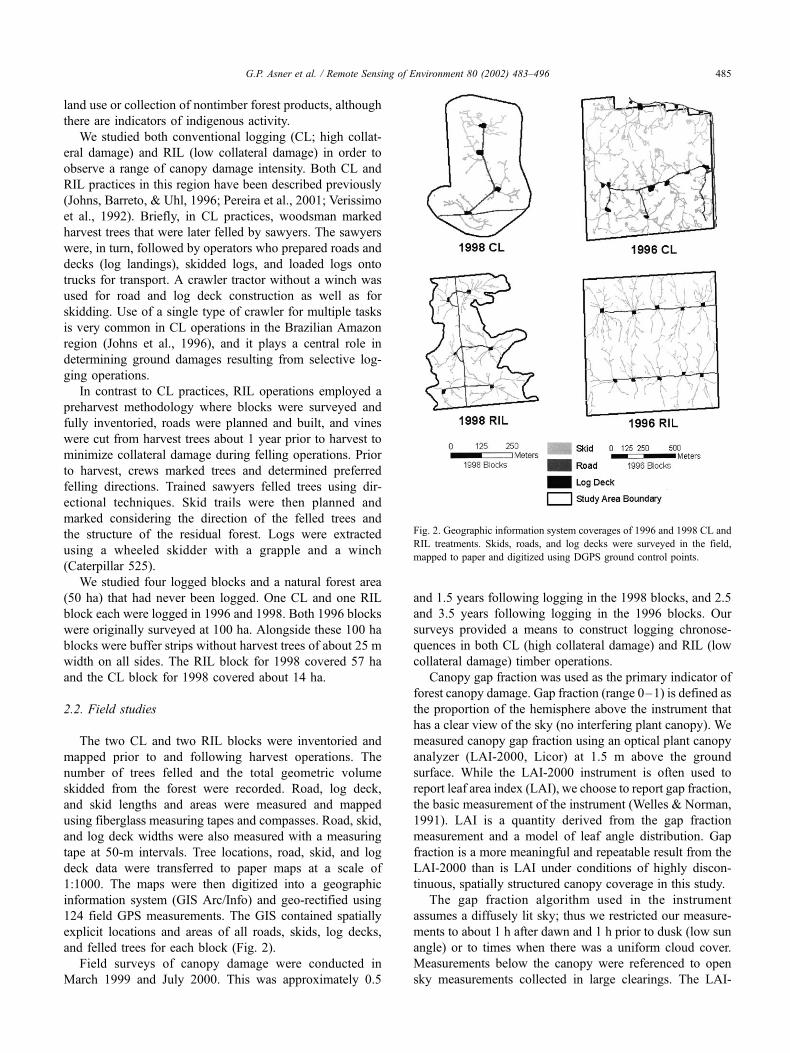
Fig. 2. Geographic information system coverages of 1996 and 1998 CL and
RIL treatments. Skids, roads, and log decks were surveyed in the field,
mapped to paper and digitized using DGPS ground control points.
G.P. Asner et al. / Remote Sensing of Environment 80 (2002) 483–496 485
2000 uses five concentric rings to measure light interception
for gap fraction analysis. Data from the outermost ring,
which views from 61� to 74�, was excluded from all
analyses in order to avoid forest edges in the clearings
during open sky calibration measurements.
Gap fraction measurements were stratified according to
landscape units. We divided the logged forests into five
strata: (1) roads, (2) log decks, (3) skid trails, (4) tree falls,
and (5) undisturbed areas. For roads, we made measure-
ments on randomly selected segments. Each segment began
at the edge of a log deck and ran along the road for 100 m or
more. Gap fraction measurements were collected at 10-m
intervals and averaged for each segment. For skid trails, we
again selected random points and followed the same pro-
cedure as for roads, but the transect always began at least
20 m from a log deck. For tree falls, random trees were
selected from the harvest maps. A sampling transect began
at the center point of the canopy gap, and ran for 100 m
along a randomly selected radius in one of eight cardinal
directions. Radii that crossed back over the skid trail, log
deck or road were excluded from random selection. Gap
fraction measurements for undisturbed forests were acquired
in the 50-ha control plot along randomly selected 500-m
transects. In total, we collected canopy gap fraction meas-
urements over 10,000 m of transect in this study.
An estimate of total gap fraction for each of the four
study blocks was made using the gap fraction measurements
extrapolated using a GIS. Total gap fraction (F) was
calculated as (Eq. (1)):
F ¼X
ðaifiÞ=A ð1Þ
where ai and fi are the area and gap fraction measured for
particular sampling strata (decks, roads, skids, tree falls, and
background area) and A is the total block area. In the case of
tree fall areas, f varied as a function of distance (x) from the
center of the crown gap according to equations of the form
(Eq. (2)):
f ¼ k * 10bx ð2Þ
where parameters k and b were estimated by least-squares
regression for each harvest block (Pereira et al., 2001). We
integrated the gap fraction over a radius of 100 m. Where
gaps overlapped with one another or with decks, roads, or
skids, the greatest gap fraction was selected. We applied no
additive effects.
2.3. Landsat ETM+ data
Landsat ETM+ imagery (Path 223, Row 63) was
acquired for the study region on July 13, 1999 and July
31, 2000. These dates correspond to the beginning of the dry
season, at which time the probability of a clear acquisition
was maximal (Asner, 2001). The 1999 image provided a
means to assess canopy damage at two time steps (0.5 and
2.5 years) following logging in both CL and RIL operations.
The 2000 image allowed for an analysis of two additional
time steps (1.5 and 3.5 years) after harvest.
The ETM+ data were calibrated to top-of-atmosphere
radiance using the published channel response coefficients
and the known solar zenith angles at the time of acquisition
(44� and 45� for 1999 and 2000 images, respectively). The
2000 image was further corrected to apparent surface
reflectance using three � 100� 100 m bare soil clearings
and a � 500 m wide artificial lake in the region. A full-
range (400–2500 nm) field spectroradiometer (ASD FR-
Pro, Analytical Spectral Devices, Boulder, CO) was used to
quantify the reflectance properties of the calibration targets
within 2 days of the 2000 Landsat overpass. The spectra
(n = 550 per soil site, n = 750 for the lake site) were collected
at nadir from 1 m above the surface under clear sky
conditions within 1 h of solar noon. The spectra were
convolved to ETM+ optical channels, and then used to
convert the 2000 imagery to surface reflectance via the
empirical line calibration method (e.g., Banin, Ben-dor, &
Kruse, 1994). The 1999 ETM+ were calibrated to the
corrected 2000 ETM+ image using a temporally invariant
surface target from a 150� 150 m bare soil area (docu-
mented during 1999 and 2000 field campaigns). Both
ETM+ images were geo-located with the GIS coverages
(Fig. 2) using a regionally extensive and locally intensive
GPS sampling scheme (n = 124 ground control points).
Locational accuracies ranged from 3 to 15 m in the
subsequent GIS and image analyses.
An image texture analysis was used to detect lateral
variation in forest structure as imaged in the ETM+ data.
Texture analysis is a common method for delineating
surface features that cause localized variations in pixel
brightness. A texture filter is passed over the image, and
local variance in pixel brightness is computed according to
Anys, Bannari, He, and Morin (1994). After testing filter
sizes ranging from 3� 3 to 15� 15 pixels, we selected
3� 3 for the study because larger filters lost sensitivity to
highly localized surface features such as logging decks and
small clearings.
In this study, we chose not to focus on Bands 1–2
because of their high susceptibility to aerosol contamination
(Krueger & Fischer, 1994) and because they were often
highly correlated with Band 3 (data not shown). Band 3
(red; centered at 0.67 mm) was thus used to represent the
visible spectrum where vegetation is extremely dark due to
strong radiation absorption by foliar chlorophyll. Soils and
surface litter (including logging slash) are somewhat
brighter than vegetation in Band 3 (Richardson & Wiegand,
1990). Band 4 (near-IR centered at 0.83 mm) was selected
because vegetation is bright due to multiscattering of
photons by foliage, while soils and litter are much darker
(Asner, 1998). Band 5 (shortwave-IR centered at 1.65 mm)
was analyzed because vegetation is moderately dark while
soils and litter are very bright. Band 7 (shortwave-IR
centered at 2.22 mm) was also selected because vegetation
is extremely dark at these wavelengths while soils and litter
G.P. Asner et al. / Remote Sensing of Environment 80 (2002) 483–496486
are extremely bright. Theoretically, Band 7 reflectance
should show the strongest contrast between forest canopy
and gaps (soils, litter), but the signal-to-noise of this band is
typically poor due to low solar irradiance in the 2.0–2.5-mmspectral region. Hence, Bands 3–5 and 7 represent differ-
ences in the biogeophysics of spectral variability as well as
solar irradiance and signal strength.
Both the calibrated reflectances and calculated texture
results in each ETM+ optical channel were compared
against the GIS coverages of the logging blocks. This
provided a means to isolate the log decks, roads, skids,
and harvested tree areas in the images. Primary forest areas
have natural intercrown shadowing and treefall gaps that
give rise to background reflectance and textural values. We
used the 50 ha forest control plot to evaluate these back-
ground values in the ETM+ imagery (Fig. 1).
3. Results and discussion
3.1. Initial ground damage
The volume of roundwood harvested from CL and
RIL blocks harvested in 1996 was nearly identical
(� 23 m3 ha� 1) (Table 1). No measurements of timber
volume were available for the 1998 blocks, but we assume
that a roughly similar volume was extracted from the 1998
RIL site. This assumption is supported by the number of
individual trees extracted per hectare from the RIL treat-
ments (3 trees ha� 1 in 1996 RIL vs. 3.5 trees ha� 1 in 1998
RIL). However, the intensity of logging was different
between the two CL blocks. The total number of trees felled
from the 1996 and 1998 conventional treatments was 415
and 88, respectively. On an area basis, the number of trees
felled was 3.7 and 6.3 individuals ha� 1, respectively, for
the two CL blocks.
Both CL and RIL logging practices affected substantial
ground areas in the study blocks (Table 1). For RIL (low
collateral damage logging) treatments, the proportion of
ground area affected was 4.8% and 4.6% for 1996 and
1998 harvests, respectively. Among CL (high collateral
damage logging) treatments, the area harvested in 1998
suffered more ground damage than the 1996 harvest area.
The high density of large decks and the irregular path of the
roads accounted for the higher proportion of damage in the
1998 CL block (Fig. 2). As a proportion of total area, CL
practice caused about twice the ground damage as RIL
practice. The distinction was particularly marked in the area
of skid trails; CL harvests had more than 200% greater skid
area than RIL harvests (Table 1).
3.2. Canopy damage and closure
Both CL and RIL harvest treatments produced notable
canopy damage. In the undisturbed forest control plot
delineated in Fig. 1, we measured a mean ( ± S.E.) canopy
gap fraction of 3.1% ( ± 0.2%) in 1999 for a total sample
size of 454 points spread throughout 50 ha. Repeated gap
fraction measurements in 2000 yielded values of 2.6%
( ± 0.3%) for the forest control area. Regardless of treatment
and sampling stratum (log deck, road, skid, tree fall), all of
the logging areas had a greater canopy gap fraction than the
forest control in both 1999 and 2000 (Table 2).
Within each sampling stratum, the 1996 treatments had
lower gap fractions than the 1998 treatments because of
forest regrowth. The major exception was in the 1996 log
decks visited in 1999 for gap fraction measurements. At
that time, the 1996 log decks in both the CL and RIL blocks
had been partially cleared as a result of local training
activities, leaving them unusually low in vegetation cover
for 3.5-year-old postharvest treatments. Because of repeated
entries by trainees and their vehicles, the log decks from the
1996 harvests should not be construed as representative of
3.5-year-old logged areas. It is notable that the gap fraction
variance in these log decks increased from 1999 to 2000,
indicating the spatial variability of the regrowth, which
typically emanates from the forest edge into the deck area.
This was observed for the 1998 CL and RIL log decks
when measured in 1999 and 2000 (Table 2).
On roads and skid trails, gap fraction values were
greatest at points near to log decks (data not shown).
Otherwise, there were no clear spatial trends for the gap
fraction along roads and skid trails. Repeated measurements
in 1999 and 2000 indicated canopy closure on roads and
skids among all treatment blocks (Table 2). Canopy closure
occurs rapidly at first and slows as plots approach back-
ground forest canopy cover. In areas containing felled trees,
the gap fraction dropped exponentially with the radial
distance from the center of the downed tree crown (Pereira
et al., 2001). Integrating over a 100 m radius circular area
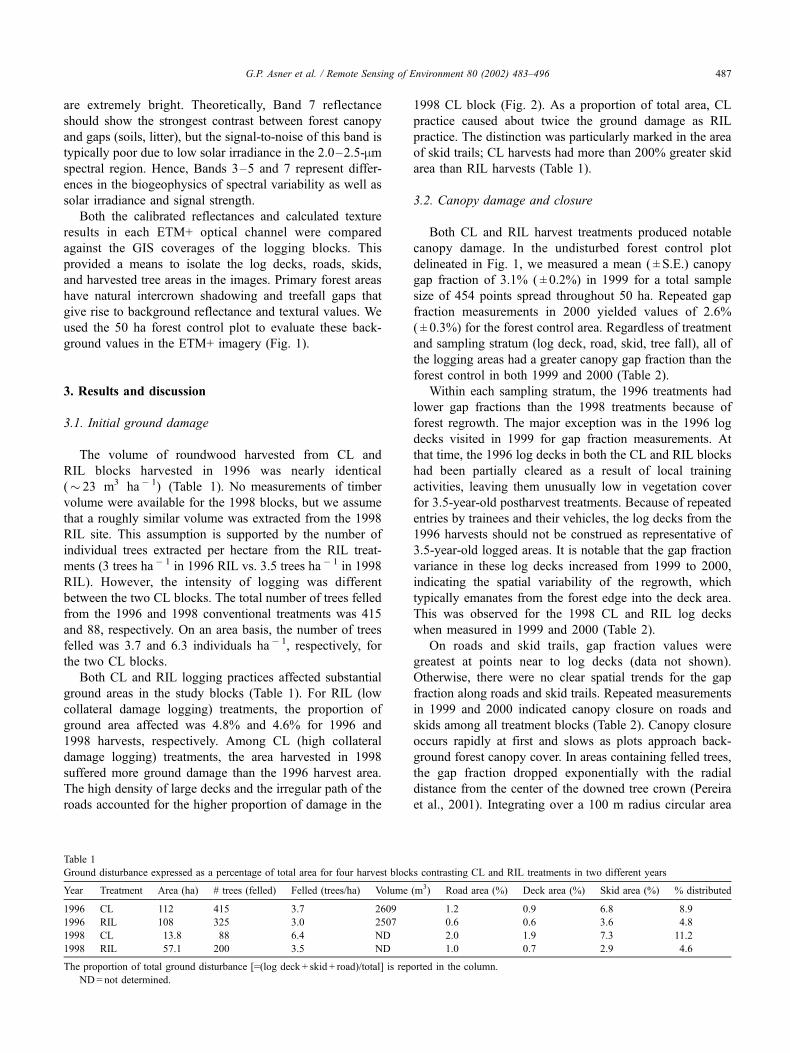
Table 1
Ground disturbance expressed as a percentage of total area for four harvest blocks contrasting CL and RIL treatments in two different years
Year Treatment Area (ha) # trees (felled) Felled (trees/ha) Volume (m3) Road area (%) Deck area (%) Skid area (%) % distributed
1996 CL 112 415 3.7 2609 1.2 0.9 6.8 8.9
1996 RIL 108 325 3.0 2507 0.6 0.6 3.6 4.8
1998 CL 13.8 88 6.4 ND 2.0 1.9 7.3 11.2
1998 RIL 57.1 200 3.5 ND 1.0 0.7 2.9 4.6
The proportion of total ground disturbance [=(log deck + skid + road)/total] is reported in the column.
ND= not determined.
G.P. Asner et al. / Remote Sensing of Environment 80 (2002) 483–496 487

surrounding each felled tree, canopy gap fraction ranged
from 4% to 29% in the immediate tree-fall areas, depending
upon logging management (CL, RIL) and regrowth time
(0.5 and 2.5 years) (Table 2).
3.3. Area-integrated damage and recovery
We modeled the landscape-scale canopy gap fraction in
the four logged areas by combining our field data with
the actual locations of all roads, skids, log decks and tree
falls as mapped and digitized in the GIS (Fig. 3). By
substituting space for time among treatments, we can
visualize the process of forest canopy damage and closure
following selective logging events in both CL and RIL
management scenarios.
Area-integrated gap fraction was largest in the 1998
CL block (21.6%) in 1999 and smallest in the 1996 RIL
block (3.4%) in 2000 (Table 3). Both the intensity of
canopy disturbance (Table 2) and the extent of ground
disturbance (Table 1) contributed to the integrated canopy
gap fraction. Although the log decks had the largest gap
fraction (Table 2), their overall area was very small (Table 1),
resulting in area-integrated gap fractions of only 0.3–1.1%
across the entire study.
The tree-fall areas within each logging block accounted
for the largest portion of the total integrated gap fraction
Table 2
Mean (S.E.) canopy gap fraction for four sampling strata in CL and RIL treatments measured in 1999 and 2000
Deck Road Skid Tree fall
Harvest year Treatment 1999 2000 1999 2000 1999 2000 1999 2000
1996 CL 0.97 (0.02) 0.78 (0.09) 0.50 (0.07) 0.43 (0.03) 0.44 (0.08) 0.12 (0.05) 0.20 (0.03) 0.11 (0.04)
1996 RIL 0.96 (0.03) 0.42 (0.16) 0.39 (0.06) 0.29 (0.05) 0.21 (0.06) 0.09 (0.03) 0.07 (0.02) 0.04 (0.02)
1998 CL 0.99 (0.01) 0.73 (0.11) 0.72 (0.12) 0.52 (0.16) 0.51 (0.13) 0.11 (0.06) 0.29 (0.10) 0.14 (0.04)
1998 RIL 0.97 (0.02) 0.46 (0.07) 0.36 (0.05) 0.22 (0.09) 0.27 (0.07) 0.11 (0.03) 0.13 (0.05) 0.07 (0.03)
Fig. 3. Area-integrated forest canopy gap fraction for 1996/1998 CL and RIL treatments. Gap fractions are based on field measurements collected in 1999 and
2000. GIS coverages in Fig. 2 were combined with ground and canopy damage surveys (Tables 1 and 2) to estimate the spatial patterning of forest canopy gap
fraction following logging and during regrowth.
G.P. Asner et al. / Remote Sensing of Environment 80 (2002) 483–496488
(Fig. 3). In 1999, the CL treatments had two to three times
higher canopy gap fraction from felled trees as did the
analogous RIL treatments (Table 3). By 2000, the area-
integrated gap fraction from tree falls had decreased by
30–45%, yet the CL areas continued to maintain higher
absolute gap percentages than the RIL blocks.
Skid trails had modest gap fractions (Table 2) but
significant spatial extent (Table 1), at times resulting in a
substantial contribution to the area-integrated gap fraction of
each treatment. The 1998 CL block had the largest skid-area
gap fraction of 3.4% in 1999, which decreased to 0.5% by
2000 (Table 3). The 1996 RIL block had a skid-area gap
content of about 0.8% in 1999 but only 0.3% by 2000. Skid-
area canopy gaps in the 1998 CL and RIL blocks underwent
analogous decreases from 1999 to 2000. Road areas had
smaller area-integrated gaps and slower rates of closure in
comparison to skids and tree-fall areas (Table 3).
Combining the ground damage surveys (Table 1) with
the gap fraction measurements (Table 2) in the GIS, we draw
the following conclusions that are pertinent to the problem
of selective logging remote sensing. First, log decks have
very small spatial extent relative to the total harvested area
(0.5–2.0%), but the large gap fraction of the decks imme-
diately following timber removal makes them useful targets
for general delineation of forest areas that may subjected to
selective logging (Stone & Lefebvre,1998). However, fast
recolonization of log decks by vegetation increases the
foliage density (lowering gap fraction) just one year after
harvest. Second, tree-fall areas have the lowest gap frac-
tions, but they are by far the most spatially extensive and
variable form of canopy damage. In contrast to log decks,
tree falls represent a diffusely distributed form of canopy
damage, yet this damage is closely related to the volume and
biomass of felled trees removed (Pereira et al., 2001). Third,
roads and skid trails have spatial extents that fall between
those of decks and tree-fall areas. Detection of the most
obvious canopy openings, log decks, may be sufficient to
identify general areas that have been logged but will not
provide a measure of logging damage. Most of the damage
related to biomass loss and the ability to recover biomass
and ecosystem functions is concentrated in the tree-fall gaps.
3.4. Basic ETM+ observations of logging treatments
Using the field survey and GIS data, we show the first
qualitative band-by-band analysis of selective logging in
Amazonia using Landsat data (Figs. 4 and 5). Although
basic, we assert that this first-time visual analysis of the
ETM+ data relative to our GIS-based canopy damage
calculations is valuable. This analysis is pertinent to
ongoing research efforts in the Amazon region that will
attempt to delineate selectively logged areas using visual
inspection of mosaicked Landsat data (T. Krug, INPE-
Brazil, personal communication). The presentation of image
reflectance results is affected by the contrast stretch applied
to the data; we interactively stretched each image to max-
imize the visibility of roads and logging decks since they are
the most pronounced features on the landscape. Remote
sensing analyses of selective logging may not have this
option when conducted over very large spatial scales (e.g.,
� 229 Landsat scenes for the Amazon basin).
Fig. 4 shows the 1998 CL and RIL treatments in ETM+
Bands 3–5 and 7. Among the 1998 CL and RIL treatments
in both the 1999 and 2000 ETM+ imagery, there was not
clear visual delineation of skid or tree-fall areas. Very heavy
road damage could be seen in the 1999 and 2000 ETM+
data of the 1998 CL block. It was not possible to view roads
in the 1998 RIL block in either image. Comparing these
observations with road gap fractions in Table 2, we suggest
a threshold of about 50% canopy gap fraction for road
delineation using visual interpretation.
Logging decks could be roughly delineated in recently
harvested areas, such as the 1998 CL and RIL blocks as
observed in the 1999 ETM+ imagery (Fig. 4a,c). Comparing
the satellite imagery in these blocks to the GIS coverages of
ground infrastructure (Fig. 2) and gap fraction (Fig. 3), it
appears that Bands 3, 5, and 7 were useful for visual selection
of log decks in the 1998 CL and RIL blocks (Fig. 4a,c). By
2000, the log decks could not be visually selected in Band 3
in the CL blocks, but Bands 4 and 5 were useful at that time
(Fig. 4b). This may indicate that visible wavelength channels
are most valuable for locating log decks immediately after
cutting, while longer wavelengths are more useful for aging
postharvest areas. Interestingly, the log decks were not
visually obvious in the 1998 RIL treatment 1.5 years fol-
lowing harvest (Fig. 4d), when canopy gap fraction in log
decks was about 42%. Like the road analysis above, the cut-
off for visual delineation of log decks thus appeared to be
about 50% canopy gap fraction (see Table 2).
A precise biophysical reason for these band-dependent
differences over time is difficult to determine. It is likely
that the visible spectrum is useful for log-deck detection
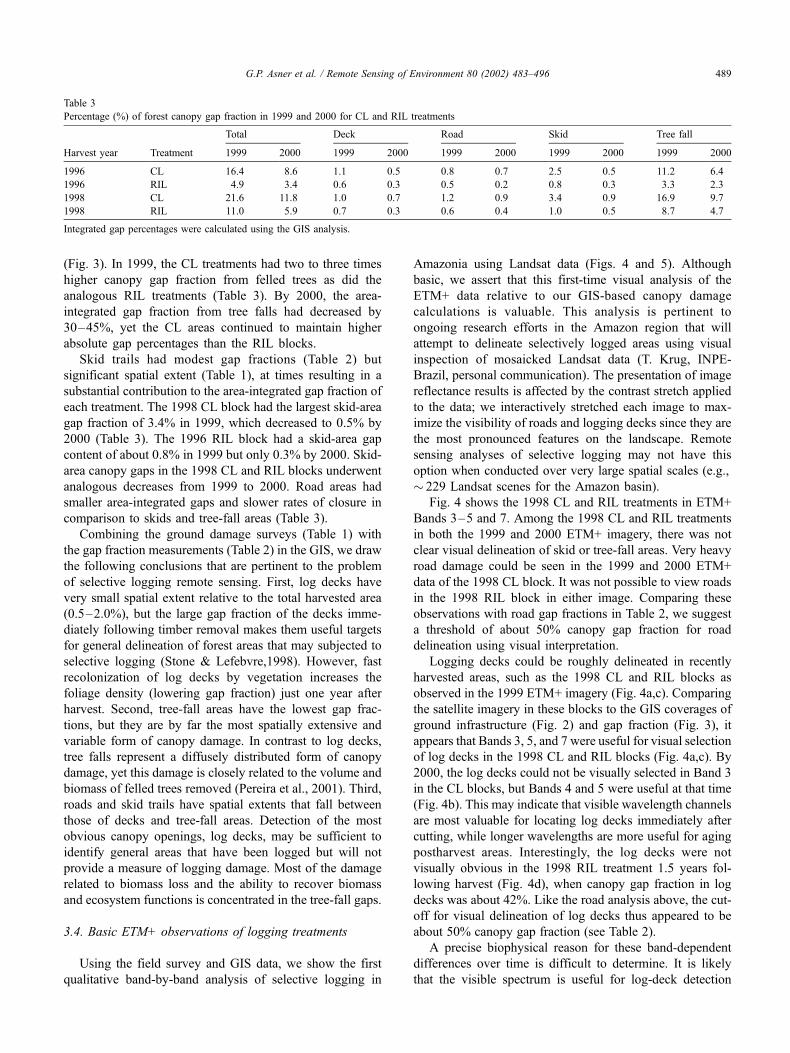
Table 3
Percentage (%) of forest canopy gap fraction in 1999 and 2000 for CL and RIL treatments
Total Deck Road Skid Tree fall
Harvest year Treatment 1999 2000 1999 2000 1999 2000 1999 2000 1999 2000
1996 CL 16.4 8.6 1.1 0.5 0.8 0.7 2.5 0.5 11.2 6.4
1996 RIL 4.9 3.4 0.6 0.3 0.5 0.2 0.8 0.3 3.3 2.3
1998 CL 21.6 11.8 1.0 0.7 1.2 0.9 3.4 0.9 16.9 9.7
1998 RIL 11.0 5.9 0.7 0.3 0.6 0.4 1.0 0.5 8.7 4.7
Integrated gap percentages were calculated using the GIS analysis.
G.P. Asner et al. / Remote Sensing of Environment 80 (2002) 483–496 489
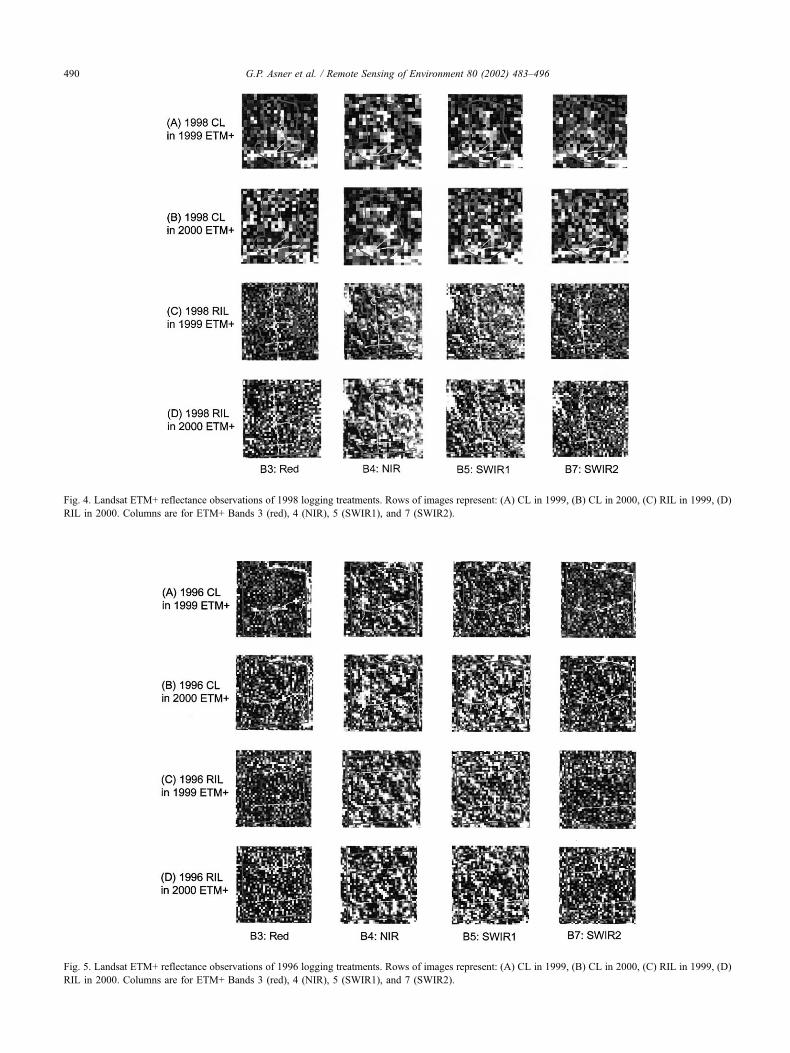
Fig. 5. Landsat ETM+ reflectance observations of 1996 logging treatments. Rows of images represent: (A) CL in 1999, (B) CL in 2000, (C) RIL in 1999, (D)
RIL in 2000. Columns are for ETM+ Bands 3 (red), 4 (NIR), 5 (SWIR1), and 7 (SWIR2).
Fig. 4. Landsat ETM+ reflectance observations of 1998 logging treatments. Rows of images represent: (A) CL in 1999, (B) CL in 2000, (C) RIL in 1999, (D)
RIL in 2000. Columns are for ETM+ Bands 3 (red), 4 (NIR), 5 (SWIR1), and 7 (SWIR2).
G.P. Asner et al. / Remote Sensing of Environment 80 (2002) 483–496490
immediately after harvest because freshly bare soil is mod-
erately bright while the surrounding forest vegetation
remains extremely dark. However, as vegetation regrowth
occurs in the log decks (more than 0.5 years following
clearing), the visible spectrum becomes much less useful
due to strong radiation absorption by chlorophyll. At this
point, the near-IR and SWIR bands may show the greatest
contrast between soils-litter and green vegetation because of
the strong multiple scattering of photons that better carry
underlying soil-litter spectral features through the early
regrowth to the overhead sensor. We are currently evaluating
this hypothesis using three-dimensional radiative transfer
modeling techniques (Asner, Keller, & Silva, in prep).
As we found for the 1998 logging blocks, it was not
possible to delineate tree-fall areas or skids in the 1996 CL
and RIL blocks, representing 2.5 and 3.5 years of regrowth
following selective logging (Fig. 5). In addition, no logging
roads could be visually located within the treatment blocks.
The gap fractions of the roads were less than 50% in all of
these observations (Table 2), which again corresponds to the
estimated cut-off value for gap closure.
The log decks could be seen in the 1996 CL treatment
with the 1999 ETM+ observations (Fig. 5a), but as dis-
cussed, these decks were partially re-cleared prior to
imaging because of visits by training courses. However,
analysis of these log decks provides information on the
potential for locating large forest gaps within dense forest
vegetation. Band 3 was again the most useful for locating
fresh bare soil areas within closed-canopy forest. Band 4
was the least useful, which is not surprising since near-IR
radiation undergoes intense scattering among dense forest
vegetation. Multiple scattering sharply decreases the con-
trast between surface features and causes a more random
variation in the reflectance images of the logging blocks.
Surprisingly, the log decks within the 1996 CL treatments
could best be located using Bands 5 and 7 (Fig. 5a,b). The
satellite observations represent about 0.5 and 1.5 years of
vegetation growth following re-clearing of the log decks in
1998. These log decks had gap fractions of 97% and 78% in
1999 and 2000, respectively (Table 2), which was well
above the estimated 50% cut-off for canopy gap fraction.
Although difficult to see in Fig. 5, log decks within the 1996
RIL treatments were also visible in Bands 3 and 5 using the
1999 ETM+ data (gap fraction of 96%), but disappeared by
2000 when gap fractions averaged 42% (Table 2).
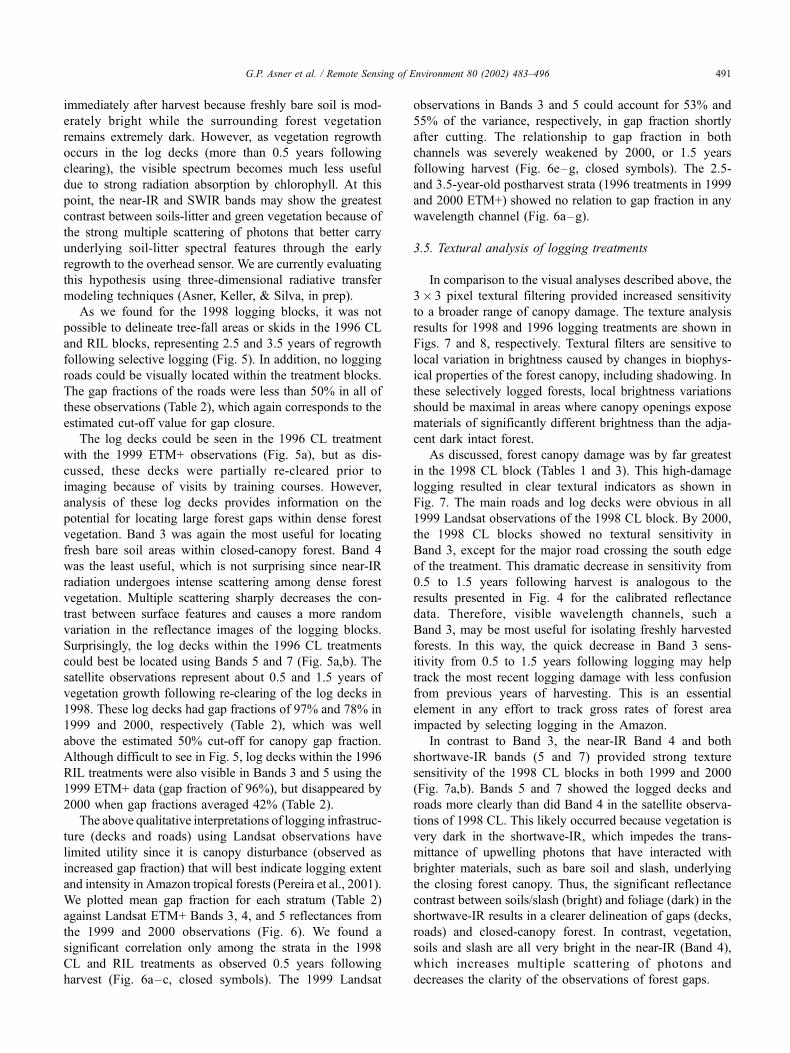
The above qualitative interpretations of logging infrastruc-
ture (decks and roads) using Landsat observations have
limited utility since it is canopy disturbance (observed as
increased gap fraction) that will best indicate logging extent
and intensity in Amazon tropical forests (Pereira et al., 2001).
We plotted mean gap fraction for each stratum (Table 2)
against Landsat ETM+ Bands 3, 4, and 5 reflectances from
the 1999 and 2000 observations (Fig. 6). We found a
significant correlation only among the strata in the 1998
CL and RIL treatments as observed 0.5 years following
harvest (Fig. 6a–c, closed symbols). The 1999 Landsat
observations in Bands 3 and 5 could account for 53% and
55% of the variance, respectively, in gap fraction shortly
after cutting. The relationship to gap fraction in both
channels was severely weakened by 2000, or 1.5 years
following harvest (Fig. 6e–g, closed symbols). The 2.5-
and 3.5-year-old postharvest strata (1996 treatments in 1999
and 2000 ETM+) showed no relation to gap fraction in any
wavelength channel (Fig. 6a–g).
3.5. Textural analysis of logging treatments
In comparison to the visual analyses described above, the
3� 3 pixel textural filtering provided increased sensitivity
to a broader range of canopy damage. The texture analysis
results for 1998 and 1996 logging treatments are shown in
Figs. 7 and 8, respectively. Textural filters are sensitive to
local variation in brightness caused by changes in biophys-
ical properties of the forest canopy, including shadowing. In
these selectively logged forests, local brightness variations
should be maximal in areas where canopy openings expose
materials of significantly different brightness than the adja-
cent dark intact forest.
As discussed, forest canopy damage was by far greatest
in the 1998 CL block (Tables 1 and 3). This high-damage
logging resulted in clear textural indicators as shown in
Fig. 7. The main roads and log decks were obvious in all
1999 Landsat observations of the 1998 CL block. By 2000,
the 1998 CL blocks showed no textural sensitivity in
Band 3, except for the major road crossing the south edge
of the treatment. This dramatic decrease in sensitivity from
0.5 to 1.5 years following harvest is analogous to the
results presented in Fig. 4 for the calibrated reflectance
data. Therefore, visible wavelength channels, such a
Band 3, may be most useful for isolating freshly harvested
forests. In this way, the quick decrease in Band 3 sens-
itivity from 0.5 to 1.5 years following logging may help
track the most recent logging damage with less confusion
from previous years of harvesting. This is an essential
element in any effort to track gross rates of forest area
impacted by selecting logging in the Amazon.
In contrast to Band 3, the near-IR Band 4 and both
shortwave-IR bands (5 and 7) provided strong texture
sensitivity of the 1998 CL blocks in both 1999 and 2000
(Fig. 7a,b). Bands 5 and 7 showed the logged decks and
roads more clearly than did Band 4 in the satellite observa-
tions of 1998 CL. This likely occurred because vegetation is
very dark in the shortwave-IR, which impedes the trans-
mittance of upwelling photons that have interacted with
brighter materials, such as bare soil and slash, underlying
the closing forest canopy. Thus, the significant reflectance
contrast between soils/slash (bright) and foliage (dark) in the
shortwave-IR results in a clearer delineation of gaps (decks,
roads) and closed-canopy forest. In contrast, vegetation,
soils and slash are all very bright in the near-IR (Band 4),
which increases multiple scattering of photons and
decreases the clarity of the observations of forest gaps.
G.P. Asner et al. / Remote Sensing of Environment 80 (2002) 483–496 491
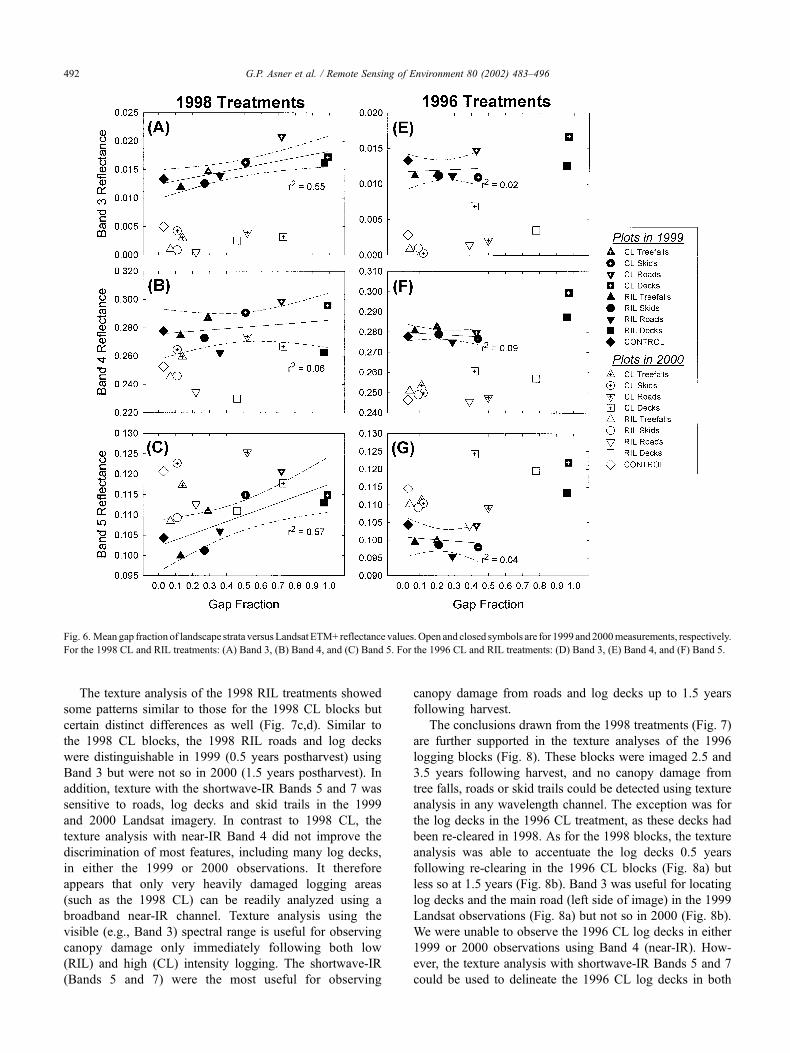
The texture analysis of the 1998 RIL treatments showed
some patterns similar to those for the 1998 CL blocks but
certain distinct differences as well (Fig. 7c,d). Similar to
the 1998 CL blocks, the 1998 RIL roads and log decks
were distinguishable in 1999 (0.5 years postharvest) using
Band 3 but were not so in 2000 (1.5 years postharvest). In
addition, texture with the shortwave-IR Bands 5 and 7 was
sensitive to roads, log decks and skid trails in the 1999
and 2000 Landsat imagery. In contrast to 1998 CL, the
texture analysis with near-IR Band 4 did not improve the
discrimination of most features, including many log decks,
in either the 1999 or 2000 observations. It therefore
appears that only very heavily damaged logging areas
(such as the 1998 CL) can be readily analyzed using a
broadband near-IR channel. Texture analysis using the
visible (e.g., Band 3) spectral range is useful for observing
canopy damage only immediately following both low
(RIL) and high (CL) intensity logging. The shortwave-IR
(Bands 5 and 7) were the most useful for observing
canopy damage from roads and log decks up to 1.5 years
following harvest.
The conclusions drawn from the 1998 treatments (Fig. 7)
are further supported in the texture analyses of the 1996
logging blocks (Fig. 8). These blocks were imaged 2.5 and
3.5 years following harvest, and no canopy damage from
tree falls, roads or skid trails could be detected using texture
analysis in any wavelength channel. The exception was for
the log decks in the 1996 CL treatment, as these decks had
been re-cleared in 1998. As for the 1998 blocks, the texture
analysis was able to accentuate the log decks 0.5 years
following re-clearing in the 1996 CL blocks (Fig. 8a) but
less so at 1.5 years (Fig. 8b). Band 3 was useful for locating
log decks and the main road (left side of image) in the 1999
Landsat observations (Fig. 8a) but not so in 2000 (Fig. 8b).
We were unable to observe the 1996 CL log decks in either
1999 or 2000 observations using Band 4 (near-IR). How-
ever, the texture analysis with shortwave-IR Bands 5 and 7
could be used to delineate the 1996 CL log decks in both
Fig. 6. Mean gap fraction of landscape strata versusLandsat ETM+ reflectance values.Open and closed symbols are for 1999 and 2000measurements, respectively.
For the 1998 CL and RIL treatments: (A) Band 3, (B) Band 4, and (C) Band 5. For the 1996 CL and RIL treatments: (D) Band 3, (E) Band 4, and (F) Band 5.
G.P. Asner et al. / Remote Sensing of Environment 80 (2002) 483–496492
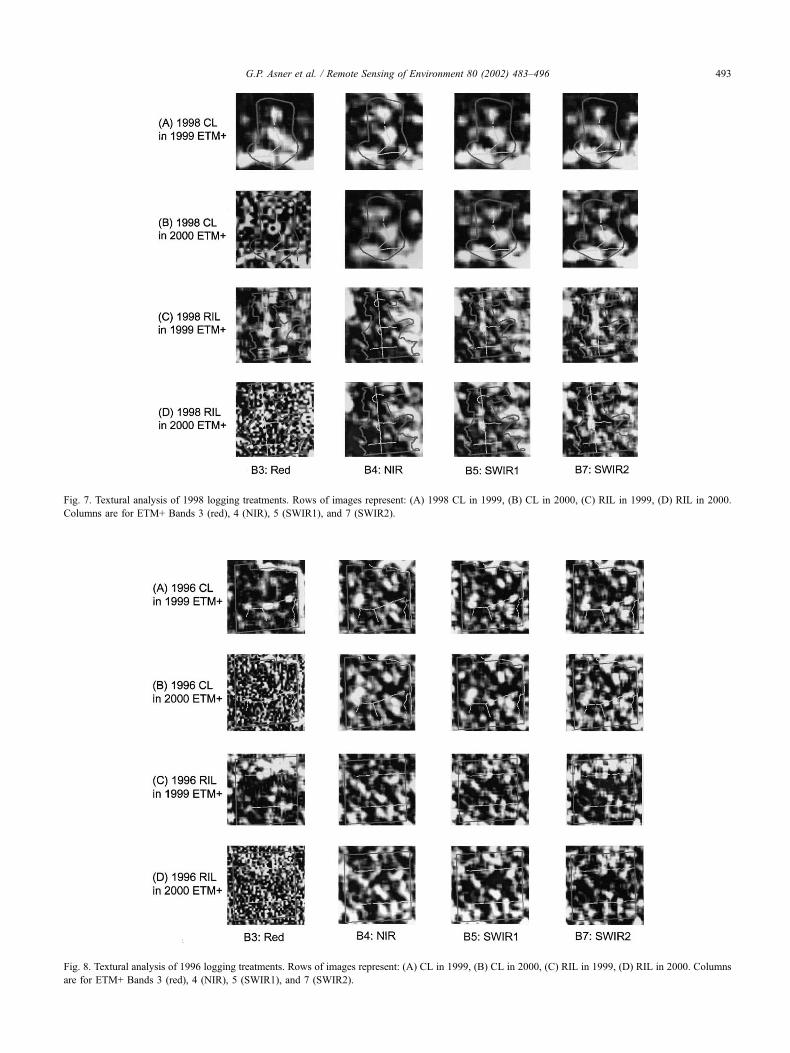
Fig. 7. Textural analysis of 1998 logging treatments. Rows of images represent: (A) 1998 CL in 1999, (B) CL in 2000, (C) RIL in 1999, (D) RIL in 2000.
Columns are for ETM+ Bands 3 (red), 4 (NIR), 5 (SWIR1), and 7 (SWIR2).
Fig. 8. Textural analysis of 1996 logging treatments. Rows of images represent: (A) CL in 1999, (B) CL in 2000, (C) RIL in 1999, (D) RIL in 2000. Columns
are for ETM+ Bands 3 (red), 4 (NIR), 5 (SWIR1), and 7 (SWIR2).
G.P. Asner et al. / Remote Sensing of Environment 80 (2002) 483–496 493
1999 and 2000 Landsat imagery. At most, a few log decks
were possibly distinguishable in the 1996 RIL logging
blocks using the shortwave-IR channels (Fig. 8c,d).
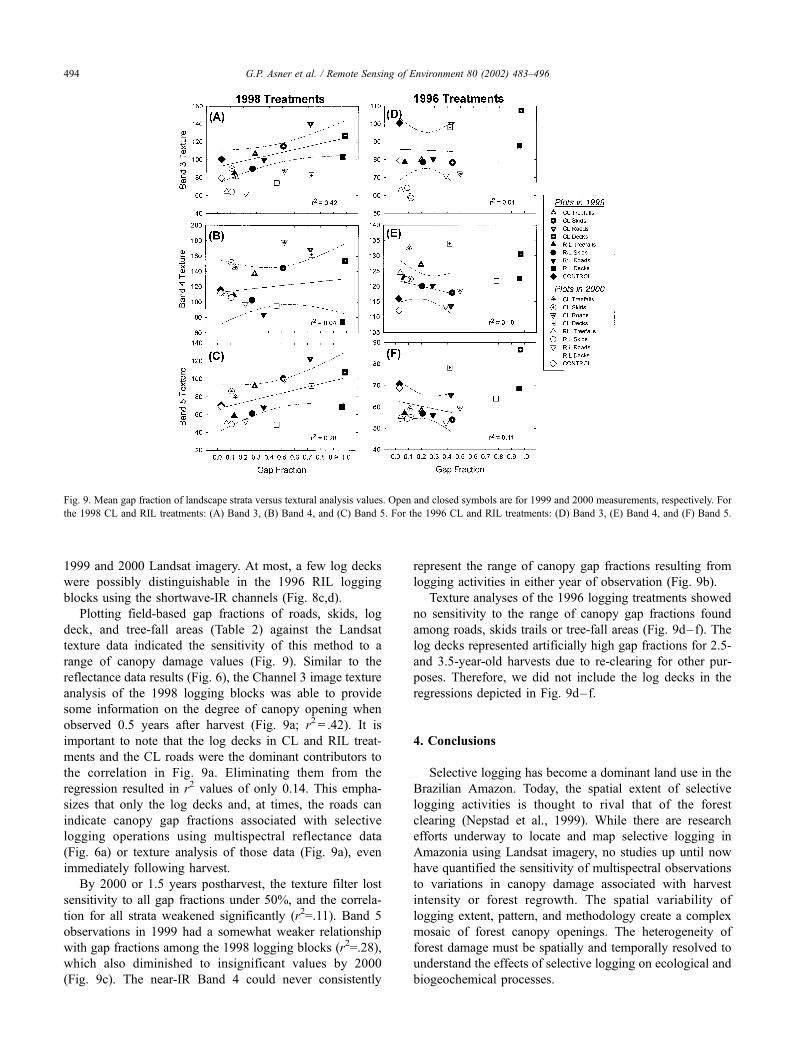
Plotting field-based gap fractions of roads, skids, log
deck, and tree-fall areas (Table 2) against the Landsat
texture data indicated the sensitivity of this method to a
range of canopy damage values (Fig. 9). Similar to the
reflectance data results (Fig. 6), the Channel 3 image texture
analysis of the 1998 logging blocks was able to provide
some information on the degree of canopy opening when
observed 0.5 years after harvest (Fig. 9a; r2 = .42). It is
important to note that the log decks in CL and RIL treat-
ments and the CL roads were the dominant contributors to
the correlation in Fig. 9a. Eliminating them from the
regression resulted in r2 values of only 0.14. This empha-
sizes that only the log decks and, at times, the roads can
indicate canopy gap fractions associated with selective
logging operations using multispectral reflectance data
(Fig. 6a) or texture analysis of those data (Fig. 9a), even
immediately following harvest.
By 2000 or 1.5 years postharvest, the texture filter lost
sensitivity to all gap fractions under 50%, and the correla-
tion for all strata weakened significantly (r2=.11). Band 5
observations in 1999 had a somewhat weaker relationship
with gap fractions among the 1998 logging blocks (r2=.28),
which also diminished to insignificant values by 2000
(Fig. 9c). The near-IR Band 4 could never consistently
represent the range of canopy gap fractions resulting from
logging activities in either year of observation (Fig. 9b).
Texture analyses of the 1996 logging treatments showed
no sensitivity to the range of canopy gap fractions found
among roads, skids trails or tree-fall areas (Fig. 9d–f). The
log decks represented artificially high gap fractions for 2.5-
and 3.5-year-old harvests due to re-clearing for other pur-
poses. Therefore, we did not include the log decks in the
regressions depicted in Fig. 9d–f.
4. Conclusions
Selective logging has become a dominant land use in the
Brazilian Amazon. Today, the spatial extent of selective
logging activities is thought to rival that of the forest
clearing (Nepstad et al., 1999). While there are research
efforts underway to locate and map selective logging in
Amazonia using Landsat imagery, no studies up until now
have quantified the sensitivity of multispectral observations
to variations in canopy damage associated with harvest
intensity or forest regrowth. The spatial variability of
logging extent, pattern, and methodology create a complex
mosaic of forest canopy openings. The heterogeneity of
forest damage must be spatially and temporally resolved to
understand the effects of selective logging on ecological and
biogeochemical processes.
Fig. 9. Mean gap fraction of landscape strata versus textural analysis values. Open and closed symbols are for 1999 and 2000 measurements, respectively. For
the 1998 CL and RIL treatments: (A) Band 3, (B) Band 4, and (C) Band 5. For the 1996 CL and RIL treatments: (D) Band 3, (E) Band 4, and (F) Band 5.
G.P. Asner et al. / Remote Sensing of Environment 80 (2002) 483–496494
We combined a detailed field study of forest canopy
damage with calibrated Landsat 7 ETM+ reflectance data
and texture analysis to assess the sensitivity of broadband
optical remote sensing to selective logging in Amazonia.
Our field study encompassed measurements of ground
damage and canopy gap fractions along a chronosequence
of logging intensity and postharvest regrowth of 0.5–3.5
years. We found that canopy damage and regrowth rates
varied by harvest method.
Within each harvest treatment, the log decks had the
largest gap fractions immediately following cutting. These
log decks were quickly colonized by pioneer plant species,
resulting in significant gap fraction decreases just 1.5 years
after site abandonment. Although log decks are the most
obvious damage type on the ground and in satellite imagery,
they accounted for only 1–2% of the total harvest area.
Because most of the Amazon basin can only be imaged
about one time per year (Asner, 2001), the fast regrowth and
small area of log decks limits their use as a means to locate
areas of selective logging over time. In addition, despite
their accessibility from Landsat data, the presence of log-
ging decks is not necessarily correlated with the degree of
forest damage and volume of wood removed. Log decks
were just as obvious in the Landsat imagery of our RIL sites
as in the conventionally logged areas. Counting the number
or area of decks per harvested area is not a strong indicator
of logging damage intensity because of variations in forest
structure, skid layout and felling methods. Moreover, much
logging in Amazonia is illegal (Nepstad et al., 1999), and
often log decks are not constructed in such clear patterns as
they were in our study sites. In some operations, logs are
loaded directly onto trucks with minimal deck construction.
Frequently decks may be located only near main roads. Log
decks along main roads may not be specifically identified as
related to logging activity.
The specific areas of the forest containing tree-fall gaps,
skid trails, and roads are usually difficult to resolve in
calibrated Landsat reflectance data or texture analysis. At
best, these landscape features can be only crudely resolved
in the most intensively logged forests and immediately
following harvest. Our 1998 conventionally logged forest
contained an exceedingly large amount of canopy damage
(Table 1), which is rarely matched by other logging oper-
ations in the eastern Amazon (e.g., Pereira et al., 2001;
Verissimo et al., 1992) and worldwide (e.g., Jonkers, 1987).
Only in this 1998 CL treatment could we argue that roads,
skids and tree-falls gap may have been resolved using the
basic reflectance data or texture analysis.
It is important to note that we were able to recognize
these features in our bottom-up scaling analysis; that is,
we knew what features to look for in the imagery. In
regional, top-down monitoring efforts using Landsat, it
would be very difficult to recognize all but the highest
canopy damage classes. In general, we found that forest
damage within any of the landscape strata (decks, roads,
skids, tree falls) could not be resolved with basic Landsat
reflectance or texture analysis when the forest gap fraction
exceeded 50%.
Although the general forest regions undergoing timber
harvest could be seen in the basic Landsat ETM+ imagery
(Fig. 1), the basic reflectance data lack the structural
resolution required for sufficiently quantitative studies
and monitoring of logging activities in the Amazon.
Landsat textural analysis may be useful for broad delin-
eation of logged forests, as is needed for law enforcement
activities in the Brazilian Amazon, but it is far from
optimal for ecological, biogeochemical, and socioeco-
nomic studies because the intensity of damage cannot be
assessed. Until we can resolve the spatial gradients of
canopy damage and regrowth that result from selective
logging operations in tropical forests, the impacts of this
land use will remain poorly understood. Potential ap-
proaches include very high spatial resolution observations
(e.g., IKONOS) or spectral mixture analysis of multi-
spectral or hyperspectral imagery.
Acknowledgments
We thank K. Cody, J. Hicke, S. Parks, and M. Palace for
assistance with field measurements and GIS analyses. We
thank the foresters and technicians of the Fundacao Floresta
Tropical for assistance in field studies and logistics. We are
grateful to CIKEL Brasil Verde for access to their land and
for operational support. This work was supported by the
NASA Terrestrial Ecology Program (NCC5-225/357), the
NASA New Millenium Program (NCC5-481), the NASA
New Investigator Program (NAG5-8709), the NASA LBA
Program, the US Forest Service, and US Agency for
International Development.
References
Anys, H., Bannari, A., He, D. C., & Morin, D. (1994). Texture analysis for
the mapping of urban areas using airborne MEIS-II images. In: First
International First Airborne Remote Sensing Conference and Exhibi-
tion (vol. 3, pp. 231–245) (Strasbourg, France).
Asner, G. P. (1998). Biophysical and biochemical sources of variability in
canopy reflectance. Remote Sensing of Environment, 64, 234–253.
Asner, G. P. (2001). Cloud cover in Landsat observations of the Brazilian
Amazon. International Journal of Remote Sensing, 22, 3855–3862.
Asner, G. P., Keller, M. M., & Silva, J. N. Sources of forest canopy re-
flectance variability in selectively logged forests of the eastern Amazon,
in preparation.
Banin, A., Ben-dor, E., & Kruse, F. A. (1994). Comparison of three cali-
bration techniques for utilization of GER 63-channel aircraft scanner
data of Makhtesh Ramon, Negev, Israel. Photogrammetric Engineering
and Remote Sensing, 60, 1339–1346.
Barros, A. C., & Uhl, C. (1995). Logging along the Amazon River and
estuary: patterns, problems, potential. Forest Ecology and Management,
77, 87–105.
Cochrane, M., Alencar, A., Schulze, M., Souza, C., Nepstad, D. C., Lefeb-
vre, P., & Davidson, E. (1999). Positive feedback in the fire dynamic of
closed canopy tropical forests. Science, 284, 1832–1835.
G.P. Asner et al. / Remote Sensing of Environment 80 (2002) 483–496 495

Costa, M. H., & Foley, J. A. (1998). A comparison of precipitation datasets
for the Amazon basin. Geophysical Research Letters, 25, 155–158.
Fearnside, P. M., & Barbosa, R. I. (1998). Soil carbon changes from con-
version of forest to pasture in Brazilian Amazonia. Forest Ecology and
Management, 108, 147–166.
Hill, J. K., Hamer, K. C., Lace, L. A., & Banham, W. M. T. (1995). Effects
of selective logging on tropical forest butterflies on Buru, Indonesia.
Journal of Applied Ecology, 32, 754–760.
Holdsworth, A. R., & Uhl, C. (1997). Fire in eastern Amazonian logged
rain forest and the potential for fire reduction. Ecological Application,
7, 713–725.
Houghton, R. A., Skole, D. L., Nobre, C. A., Hackler, J. L., Lawrence, K. T.,
& Chomentowski, W. H. (2000). Annual fluxes of carbon from defor-
estation and regrowth in the Brazilian Amazon. Science, 403, 301–304.
IBGE. (1988). Mapa de Vegetacao do Brasil. Brasilia, Brazil: Ministerio
da Agricultura.
Johns, A. D. (1991). Responses of Amazonian rain forest birds to habitat
modification. Journal of Tropical Ecology, 7, 417–437.
Johns, J. S., Barreto, P., & Uhl, C. (1996). Logging damage during planned
and unplanned logging operations in the eastern Amazon. Forest Ecol-
ogy and Management, 89, 59–71.
Jonkers, W. B. J. (1987). Vegetation structure, logging damage and silvi-
culture in a tropical rain forest in Suriname: ecology and management
of tropical rain forests in Suriname. The Netherlands: Wageningen
Agricultural University.
Krueger, O., & Fischer, J. (1994). Correction of aerosol influence in Land-
sat 5 thematic mapper data. GeoJournal, 32, 61–70.
McNabb, K. L., Miller, M. S., Lockaby, B. G., Stokes, B. J., Clawson, R.
G., Stanturf, J. A., & Silva, J. N. M. (1997). Selection harvests in
Amazonian rainforests: long-term impacts on soil properties. Forest
Ecology and Management, 93, 153–160.
Nepstad, D. C., Verissimo, A., Alencar, A., Nobre, C., Lima, E., Lefebvre,
P., Schlesinger, P., Potter, C., Moutinho, P., Mendoza, E., & Brooks,
M. (1999). Large-scale impoverishment of Amazonian forests by log-
ging and fire. Nature, 398, 505–508.
Pereira Jr., R., Zweede, J. C., Asner, G. P., & Keller, M. (2001). Forest
canopy damage and recovery in reduced impact and conventional se-
lective logging Eastern Para, Brazil. Forest Ecology and Management,
5778, 1–13.
Pinard, M., Howlett, B., & Davidson, D. (1996). Site conditions limit
pioneer tree recruitment after logging of dipterocarp forests in Sabah,
Malaysia. Biotropica, 28, 2–12.
RADAMBRASIL. (1983). Projeto RADAMBRASIL: 1973–1983, Le-
vantamento de Recursos Naturais, vols. 1–23. Rio de Janeiro: Min-
isterio das Minas e Energia, Departamento Nacional de Producao
Mineral DNPM.
Richardson, A. J., & Wiegand, C. L. (1990). Comparison of two models for
simulating the soil –vegetation reflectance of a developing cotton can-
opy. International Journal of Remote Sensing, 11, 447–458.
Stone, T. A., & Lefebvre, P. (1998). Using multi-temporal satellite data to
evaluate selective logging in Para, Brazil. International Journal of Re-
mote Sensing, 19, 2517.
Ter Steege, P., Boot, R. H., Brouwer, L., Hammond, D., Van Der Hout, P.,
Jetten, V. G., Khan, Z., Polak, A. M., Raaimakers, D., & Zagt, R.
(1995). Basic and applied research for sound rain forest management
in Guyana. Ecological Application, 5, 904–910.
Thiollay, J.-M. (1992). Influence of selective logging on bird species diver-
sity in a Guiana rain forest. Conservation and Biology, 6, 47–63.
Uhl, C., & Buschbacher, R. (1985). A disturbing synergism between cattle
ranching burning practices and selective tree harvesting in the eastern
Amazon. Biotropica, 17, 265–268.
Uhl, C., & Kauffman, J. B. (1990). Deforestation, fire susceptibility, and
potential tree responses to fire in the eastern Amazon. Ecology, 7,
437–449.
Verissimo, A., Barreto, P., & Mattos, M. (1992). Logging impacts and
prospects for sustainable forest management in an old Amazonian fron-
tier: the case of Paragominas. Forest Ecology and Management, 55,
169–184.
Welles, J. M., & Norman, J. M. (1991). Instrument for indirect measure-
ment of canopy architecture. Agronomy Journal, 83, 818–825.
G.P. Asner et al. / Remote Sensing of Environment 80 (2002) 483–496496