
APPLICATION OF SATELLITE REMOTE-SENSING ...
315
2 1 2 . 1 99AP is) Economic and Social Commission for Western Asia APPLICATION OF SATELLITE REMOTE-SENSING METHODS FOR HYDROGEOLOGY IN THE ESCWA REGION I 1 V; ''If! ft' United Nationi
-
Upload
khangminh22 -
Category
Documents
-
view
1 -
download
0
Transcript of APPLICATION OF SATELLITE REMOTE-SENSING ...
2 1 2 . 1 99AP
is)
Economic and Social Commission
for Western Asia
APPLICATION OF
SATELLITE REMOTE-SENSING METHODS
FOR HYDROGEOLOGY
IN THE ESCWA REGION
I1
V;''If!
ft'
United Nationi
IRC InterrmticnalvVatGr Distr:ana Sanitation Centra LIMITED
Fax! +1{ 70 ™, I J I °° ; E/ESCWA/ENR/1999/28 March 1999ORIGINAL: ENGLISH
ECONOMIC AND SOCIAL COMMISSION FOR WESTERN ASIA (ESCWA)
APPLICATION OF SATELLITE REMOTE-SENSINGMETHODS FOR HYDROGEOLOGY
IN THE ESCWA REGION
LIBRARY IRCPO Box 93190, 2509 AD THE HAGUE
Tel.: +31 70 30 689 80 United NationsFax: +31 70 35 899 64 ~T , , , < nnn
BARCODE: / <• ̂ ./q N e w Y o r k 1 9 9 9
LO:
Advisory Services:Federal Institute for Geosciences and Natural Resources
Issued without formal editing.

The designations employed and the presentation of the material in this publication do not imply theexpression of any opinion whatsoever on the part of the Secretariat of the United Nations concerning the statusof any country, territory, city or area, or of its authorities, or concerning the delimitation of its frontiers orboundaries.
99-0304
Foreword
With the creation of high resolution geo-information data from satellites, powerful tools for fast andefficient spatial assessment of natural resources have become available.
However, the satellite data are produced and supplied by various national institutions and privatecompanies in the industrialized countries, and it will therefore be difficult for potential users in the ESCWAmember countries to maintain up-to-date information on the available digital or image products that mayserve their requirements appropriately and cost-effectively.
It was in this context that the ESCWA secretariat took the initiative to prepare the present document,which summarizes the features of satellite data available for the region at present and in the near future.Also reviewed are the data characteristics of selected satellite systems, their practical applications and theirsources of acquisition.
Case studies from Jordan and the Syrian Arab Republic, and Oman and the desert areas of SaudiArabia offer numerous examples that demonstrate the applications and value of remote sensing techniquesfor ground as well as surface water research studies.
It is my hope that the dissemination of this study, undertaken as part of a joint ESCWA/BGR(Federal Institute for Geosciences and Natural Resources of Germany) project entitled "Advisory services toESCWA and the ESCWA member States" in the field of water resources, will encourage the nationalinstitutions to apply remote sensing techniques to a wider extent in the investigation of groundwaterresources as well as in planning the exploitation and management of natural resources.
Hazem El-BeblawiExecutive Secretary
-I-
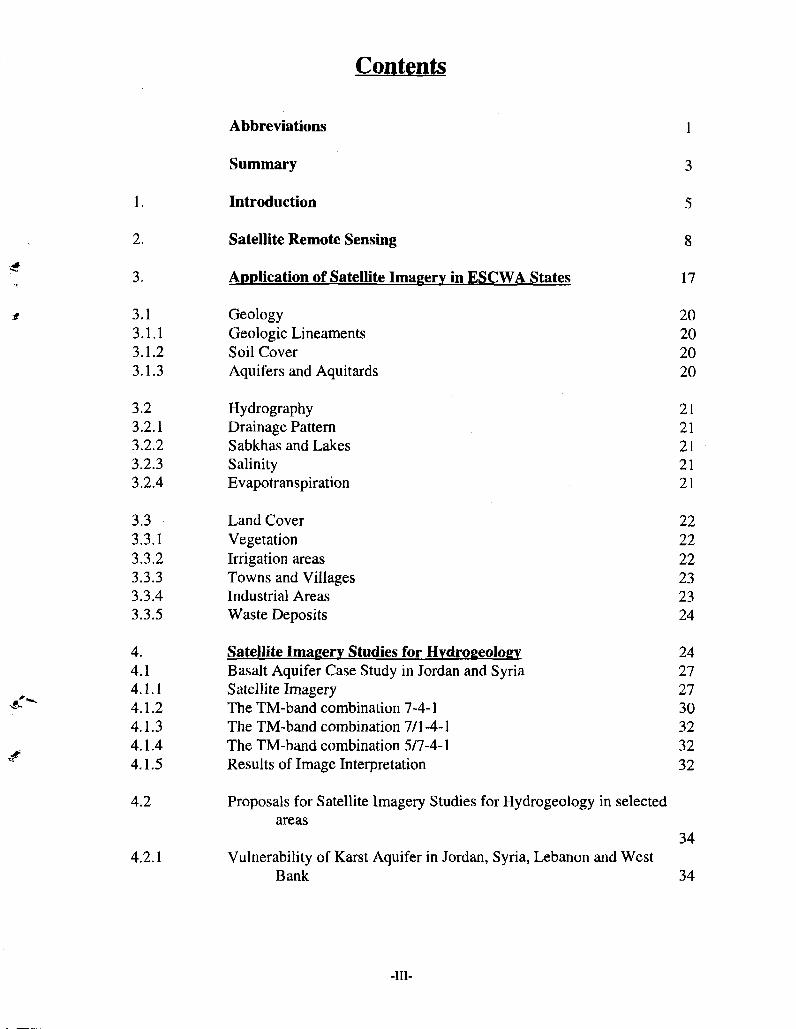
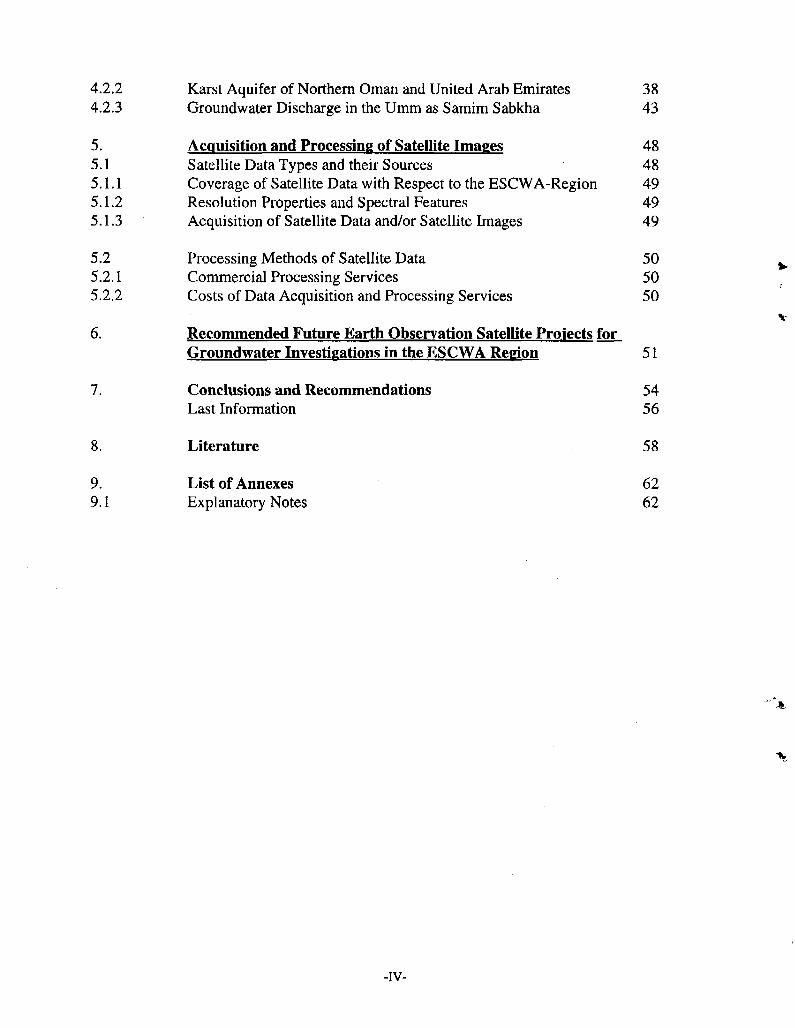
Contents
1.
2.
3.
3.13.1.13.1.23.1.3
3.23.2.13.2.23.2.33.2.4
3.33.3.13.3.23.3.33.3.43.3.5
4.4.14.1.14.1.24.1.34.1.44.1.5
Abbreviations
Summary
Introduction
Satellite Remote Sensing
ADDlication of Satellite Imagery in ESCWA States
GeologyGeologic LineamentsSoil CoverAquifers and Aquitards
HydrographyDrainage PatternSabkhas and LakesSalinityEvapotranspiration
Land CoverVegetationIrrigation areasTowns and VillagesIndustrial AreasWaste Deposits
Satellite Imagery Studies for HvdroeeologvBasalt Aquifer Case Study in Jordan and SyriaSatellite ImageryThe TM-band combination 7-4-1The TM-band combination 7/1-4-1The TM-band combination 5/7-4-1Results of Image Interpretation
1
3
5
8
17
20202020
2121212121
222222232324
24272730323232
4.2 Proposals for Satellite Imagery Studies for Hydrogeology in selectedareas
344.2.1 Vulnerability of Karst Aquifer in Jordan, Syria, Lebanon and West
Bank 34
-ill-
4.2.2 Karst Aquifer of Northern Oman and United Arab Emirates 384.2.3 Groundwater Discharge in the Umm as Samim Sabkha 43
5. Acquisition and Processing of Satellite Images 485.1 Satellite Data Types and their Sources 485.1.1 Coverage of Satellite Data with Respect to the ESCWA-Region 495.1.2 Resolution Properties and Spectral Features 495.1.3 Acquisition of Satellite Data and/or Satellite Images 49
5.2 Processing Methods of Satellite Data 505.2.1 Commercial Processing Services 505.2.2 Costs of Data Acquisition and Processing Services 50
6. Recommended Future Earth Observation Satellite Projects forGroundwater Investigations in the ESCWA Region 51
7. Conclusions and Recommendations 54Last Information 56
58
6262
8.
9.9.1
Literature
List of AnnexesExplanatory Notes
-IV-
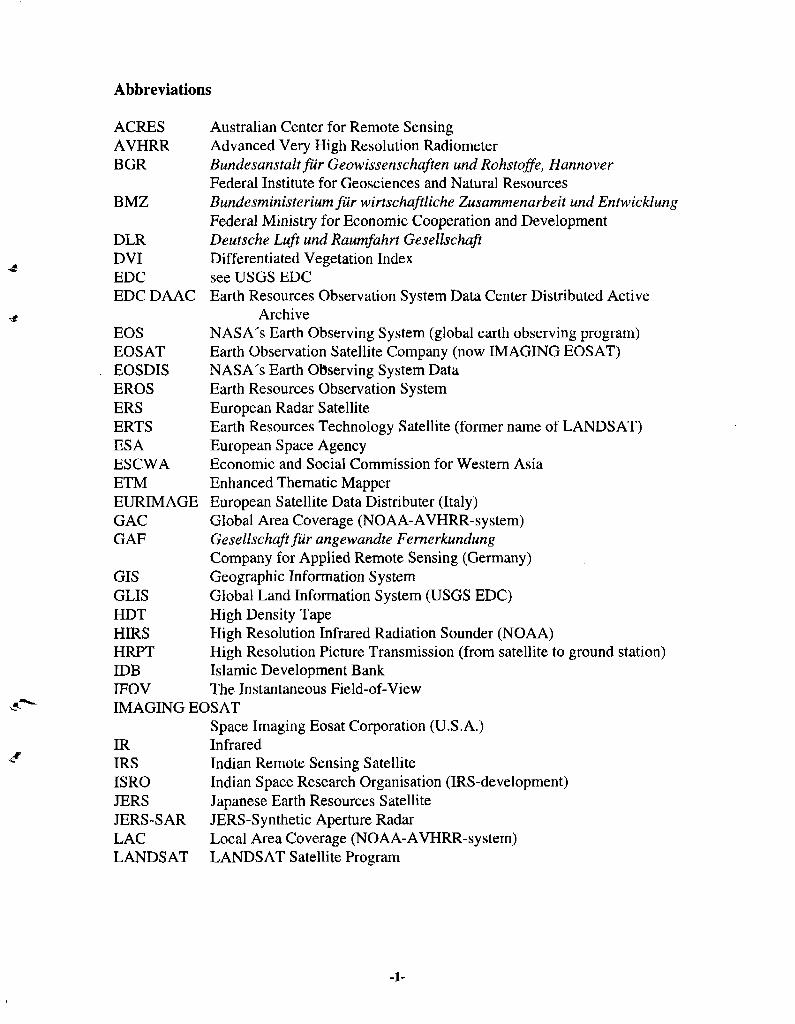
Abbreviations
ACRES Australian Center for Remote SensingAVHRR Advanced Very High Resolution RadiometerBGR Bundesanstalt fiir Geowissenschaften und Rohstoffe, Hannover
Federal Institute for Geosciences and Natural ResourcesBMZ Bundesministerium fiir wirtschaftliche Zusammenarbeit und Entwicklung
Federal Ministry for Economic Cooperation and DevelopmentDLR Deutsche Luft und Raumfahrt GesellschaftDVI Differentiated Vegetation IndexEDC see USGS EDCEDC DAAC Earth Resources Observation System Data Center Distributed Active
ArchiveEOS NASA's Earth Observing System (global earth observing program)EOSAT Earth Observation Satellite Company (now IMAGING EOSAT)EOSDIS NASA's Earth Observing System DataEROS Earth Resources Observation SystemERS European Radar SatelliteERTS Earth Resources Technology Satellite (former name of LANDSAT)ESA European Space AgencyESCWA Economic and Social Commission for Western AsiaETM Enhanced Thematic MapperEURIMAGE European Satellite Data Distributer (Italy)GAC Global Area Coverage (NOAA-AVHRR-system)GAF Gesellschaft fur angewandte Fernerkundung
Company for Applied Remote Sensing (Germany)GIS Geographic Information SystemGLIS Global Land Information System (USGS EDC)HDT High Density TapeHIRS High Resolution Infrared Radiation Sounder (NOAA)HRPT High Resolution Picture Transmission (from satellite to ground station)IDB Islamic Development BankIFOV The Instantaneous Field-of-ViewIMAGING EOSAT
Space Imaging Eosat Corporation (U.S.A.)IR InfraredIRS Indian Remote Sensing SatelliteISRO Indian Space Research Organisation (IRS-development)JERS Japanese Earth Resources SatelliteJERS-SAR JERS-Synthetic Aperture RadarLAC Local Area Coverage (NOAA-AVHRR-system)LANDSAT LANDSAT Satellite Program
-1-
LANDSAT TMsee TM and LANDSAT
LANDSAT MSSsee MSS and LANDSAT
LGSOWG LANDSAT Ground Station Operations Working GroupLISS Linear Imaging Self Scanning Sensor (IRS-Satellite)MOMS Modular Optoelectronic Scanner (ESA)MSS Multispectral ScannerMSU Microwave Sounding UnitNASA National Aeronautics and Space Agency (U.S.A.)NASDA National Aeronautics and Space Development Agency (Japan)NDVI Normalized Differentiated Vegetation IndexNIR Near InfraredNOAA National Oceanographic and Atmospheric Administration (U.S.A.)NOAA-AVHRR
NOAA-Advanced Very High ResolutionJRadiometerNSLRSDA National Satellite Remote Sensing Data Archive (U.S.A.)OPS Optical Scanner (JERS)SAR Synthetic Aperture RadarSPOT Systeme Probatoire d'Observation de la Terre (SPOT IMAGE)SSU Stratospheric Sounding UnitSWIR Short Wave InfraredTIR Thermal InfraredTM Thematic MapperTDRS Tracking and Data Relay SystemUNEP United Nations Environmental ProgramUSGAU US Government and Affiliated UsersUSGS US Geological SurveyUSGS EDC United States Geological Survey EROS Data CenterVI Vegetation IndexVIS Visible InfraredVISSR Visible and Infrared Spin Scan Radiometer (METEOSAT)WV Water Vapor
-2-
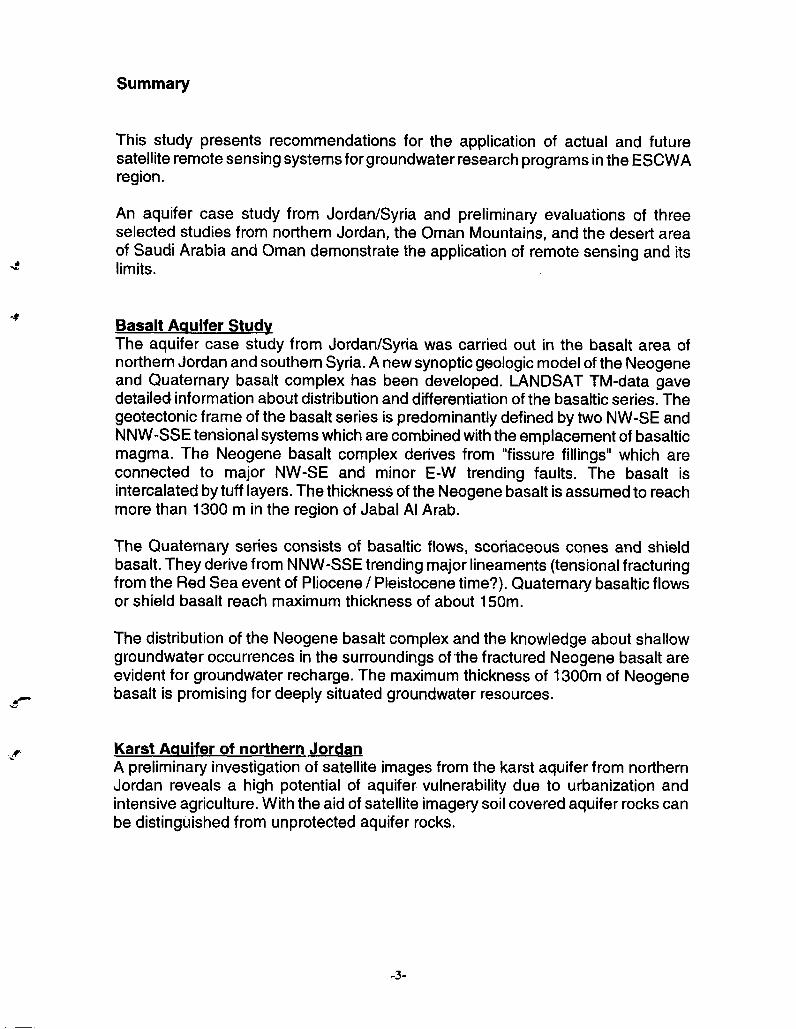
Summary
This study presents recommendations for the application of actual and futuresatellite remote sensing systems for groundwater research programs in the ESCWAregion.
An aquifer case study from Jordan/Syria and preliminary evaluations of threeselected studies from northern Jordan, the Oman Mountains, and the desert areaof Saudi Arabia and Oman demonstrate the application of remote sensing and itslimits.
Basalt Aquifer StudyThe aquifer case study from Jordan/Syria was carried out in the basalt area ofnorthern Jordan and southern Syria. A new synoptic geologic model of the Neogeneand Quaternary basalt complex has been developed. LANDSAT TM-data gavedetailed information about distribution and differentiation of the basaltic series. Thegeotectonic frame of the basalt series is predominantly defined by two NW-SE andNNW-SSE tensional systems which are combined with the emplacement of basalticmagma. The Neogene basalt complex derives from "fissure fillings" which areconnected to major NW-SE and minor E-W trending faults. The basalt isintercalated by tuff layers. The thickness of the Neogene basalt is assumed to reachmore than 1300 m in the region of Jabal Al Arab.
The Quaternary series consists of basaltic flows, scoriaceous cones and shieldbasalt. They derive from NNW-SSE trending major lineaments (tensional fracturingfrom the Red Sea event of Pliocene / Pleistocene time?). Quaternary basaltic flowsor shield basalt reach maximum thickness of about 150m.
The distribution of the Neogene basalt complex and the knowledge about shallowgroundwater occurrences in the surroundings of the fractured Neogene basalt areevident for groundwater recharge. The maximum thickness of 1300m of Neogenebasalt is promising for deeply situated groundwater resources.
Karst Aquifer of northern JordanA preliminary investigation of satellite images from the karst aquifer from northernJordan reveals a high potential of aquifer vulnerability due to urbanization andintensive agriculture. With the aid of satellite imagery soil covered aquifer rocks canbe distinguished from unprotected aquifer rocks.
-3-
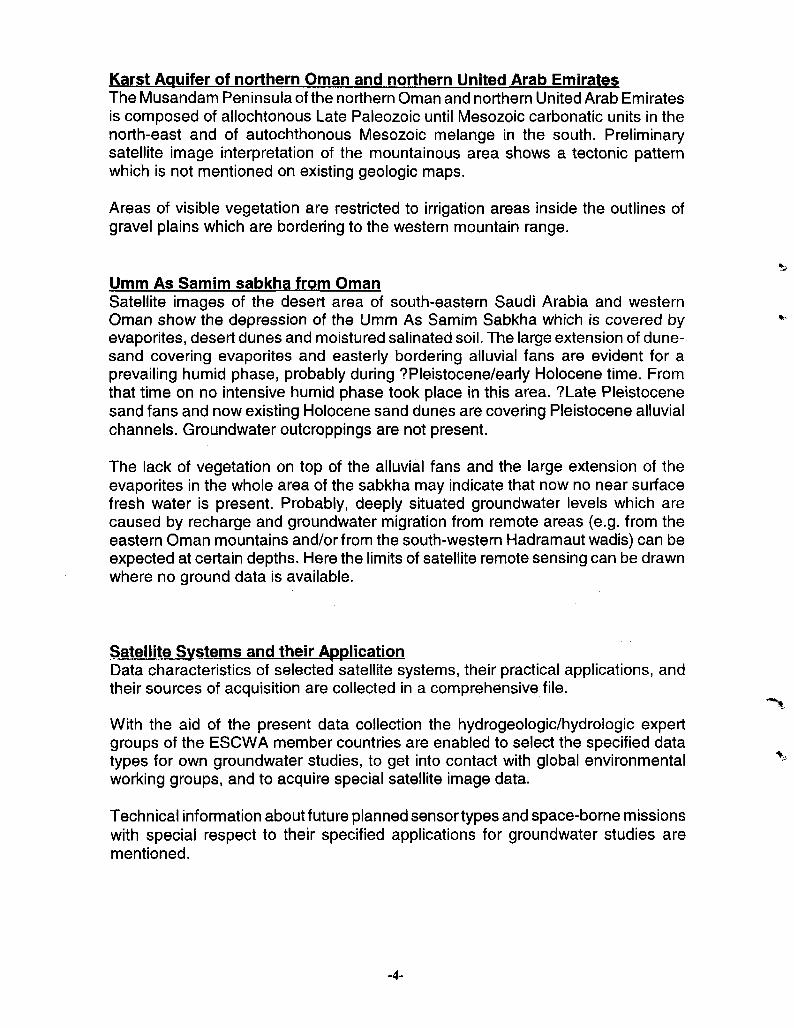
Karst Aquifer of northern Oman and northern United Arab EmiratesThe Musandam Peninsula of the northern Oman and northern United Arab Emiratesis composed of allochtonous Late Paleozoic until Mesozoic carbonatic units in thenorth-east and of autochthonous Mesozoic melange in the south. Preliminarysatellite image interpretation of the mountainous area shows a tectonic patternwhich is not mentioned on existing geologic maps.
Areas of visible vegetation are restricted to irrigation areas inside the outlines ofgravel plains which are bordering to the western mountain range.
Umm As Samim sabkha from OmanSatellite images of the desert area of south-eastern Saudi Arabia and westernOman show the depression of the Umm As Samim Sabkha which is covered byevaporites, desert dunes and moistured salinated soil. The large extension of dune-sand covering evaporites and easterly bordering alluvial fans are evident for aprevailing humid phase, probably during ?Pleistocene/early Holocene time. Fromthat time on no intensive humid phase took place in this area. ?Late Pleistocenesand fans and now existing Holocene sand dunes are covering Pleistocene alluvialchannels. Groundwater outcroppings are not present.
The lack of vegetation on top of the alluvial fans and the large extension of theevaporites in the whole area of the sabkha may indicate that now no near surfacefresh water is present. Probably, deeply situated groundwater levels which arecaused by recharge and groundwater migration from remote areas (e.g. from theeastern Oman mountains and/or from the south-western Hadramaut wadis) can beexpected at certain depths. Here the limits of satellite remote sensing can be drawnwhere no ground data is available.
Satellite Systems and their ApplicationData characteristics of selected satellite systems, their practical applications, andtheir sources of acquisition are collected in a comprehensive file.
With the aid of the present data collection the hydrogeologic/hydrologic expertgroups of the ESCWA member countries are enabled to select the specified datatypes for own groundwater studies, to get into contact with global environmentalworking groups, and to acquire special satellite image data.
Technical information about future planned sensor types and space-borne missionswith special respect to their specified applications for groundwater studies arementioned.
.4.
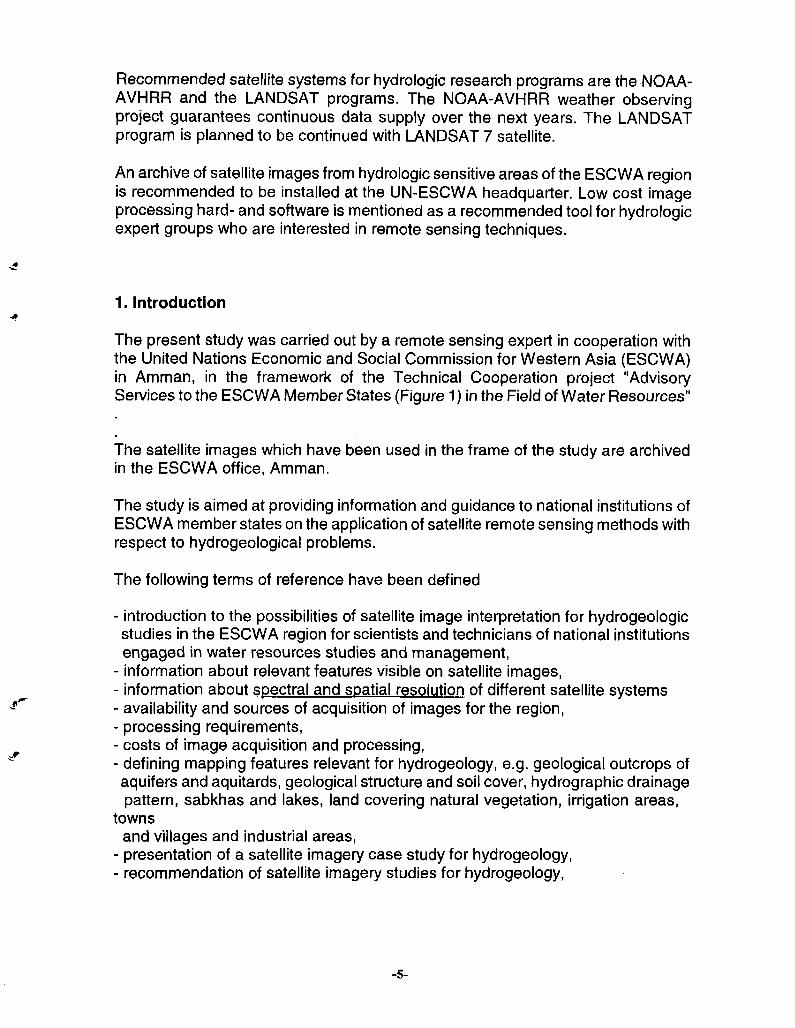
Recommended satellite systems for hydrologic research programs are the NOAA-AVHRR and the LANDSAT programs. The NOAA-AVHRR weather observingproject guarantees continuous data supply over the next years. The LANDSATprogram is planned to be continued with LANDSAT 7 satellite.
An archive of satellite images from hydrologic sensitive areas of the ESCWA regionis recommended to be installed at the UN-ESCWA headquarter. Low cost imageprocessing hard- and software is mentioned as a recommended tool for hydrologicexpert groups who are interested in remote sensing techniques.
1 . Introduction
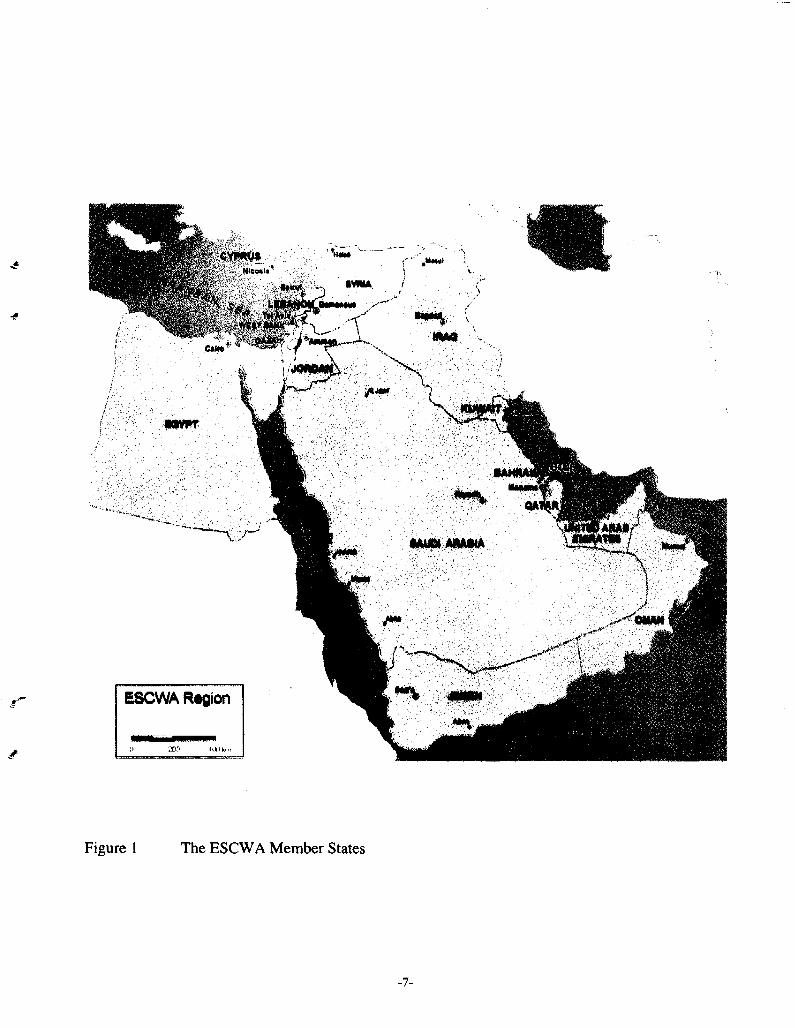
The present study was carried out by a remote sensing expert in cooperation withthe United Nations Economic and Social Commission for Western Asia (ESCWA)in Amman, in the framework of the Technical Cooperation project "AdvisoryServices to the ESCWA Member States (Figure 1) in the Field of Water Resources"
The satellite images which have been used in the frame of the study are archivedin the ESCWA office, Amman.
The study is aimed at providing information and guidance to national institutions ofESCWA member states on the application of satellite remote sensing methods withrespect to hydrogeological problems.
The following terms of reference have been defined
- introduction to the possibilities of satellite image interpretation for hydrogeologicstudies in the ESCWA region for scientists and technicians of national institutionsengaged in water resources studies and management,
- information about relevant features visible on satellite images,- information about spectral and spatial resolution of different satellite systems- availability and sources of acquisition of images for the region,- processing requirements,- costs of image acquisition and processing,- defining mapping features relevant for hydrogeology, e.g. geological outcrops ofaquifers and aquitards, geological structure and soil cover, hydrographic drainagepattern, sabkhas and lakes, land covering natural vegetation, irrigation areas,
townsand villages and industrial areas,
- presentation of a satellite imagery case study for hydrogeology,- recommendation of satellite imagery studies for hydrogeology,
-5-

- information about envisaged developments in the next few years.
The spatial resolution is the size of the pixel (picture element).The spectral resolution is the number and width of scanned single bands of theelectromagnetic spectrum.
-6-
* - •
Figure 1 The ESCWA Member States
-7-

2. Satellite Remote Sensing
Only few satellite systems exist which are designed exclusively for land-useprojects. Currently, the largest program is the Earth Observing System (EOS, annex20) which comprises long termed earth observation with numerous polar orbitingsatellite systems.
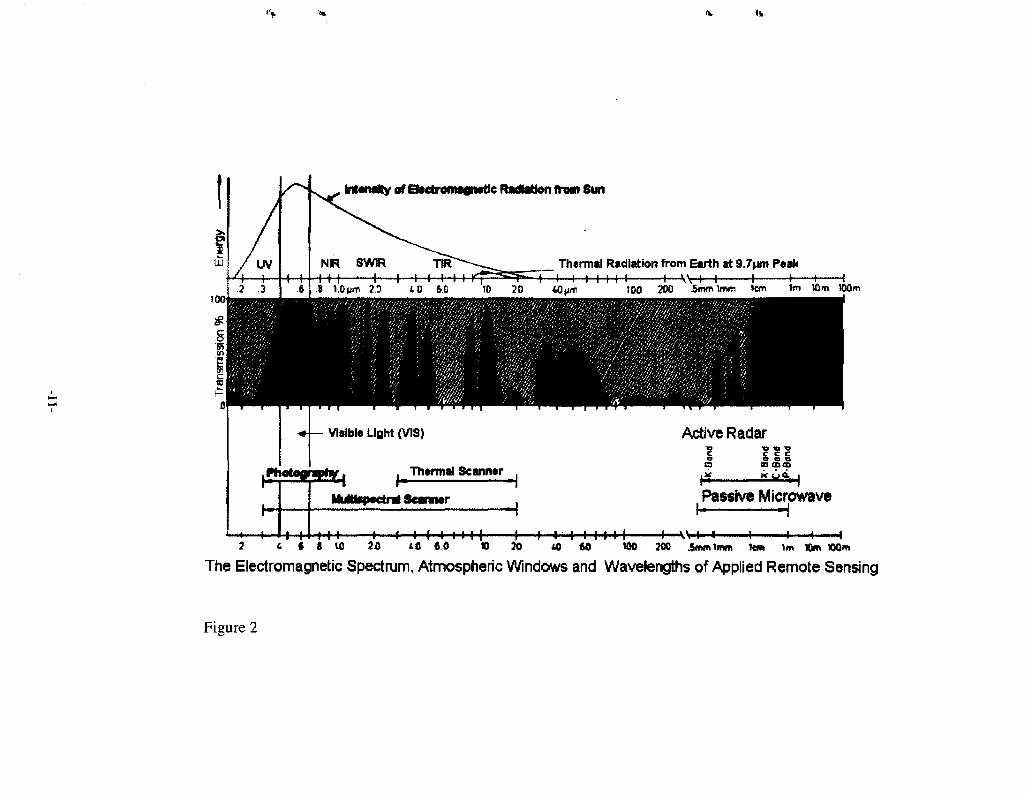
Satellite remote sensing involves gathering information about features on theearth's surface from "active" and "passive" sensor systems. A "passive" systemgenerally consists of an array of small sensors or detectors which record theamount of electro-magnetic radiation reflected and/or emitted from the earth'ssurface. A multi spectral scanner like LANDSAT Thematic Mapper (TM) is anexample of a passive system. An active system propagates its own electro-magneticradiation and measures the intensity of the return signal. Synthetic Aperture Radar(SAR) is an example of an active system (Figure 2).
Satellite images give potential information for geologic, hydrologic and land-usestudies, e.g. geological structures, drainage patterns, salinity, vegetation or croptypes, bare soil surfaces and vegetated areas, irrigation areas, industrial areas, ruraland urban coverage. Satellite remote sensing techniques are particularly usefultools for assessing the spatial and temporal distribution of land degradation. Theadvantage of satellite remote sensing is that an overview of extended areas can befrequently obtained.
The single bands of the different earth observing passive satellite systems arechosen as spectral intervals from the continuous spectrum of wavelengths within theso called atmospheric windows. The characteristics of these bands and properapplications are collected in Table 1 and Table 2.
A satellite image is the final product of numerous steps beginning from space-bornedata collection, then sending to a receiving station, and finally processing by animage processing system. The amount of data depends on the swath-widths (lengthand form of the scanned field) and the single system configuration (see below formore detailed information and in the annexes).
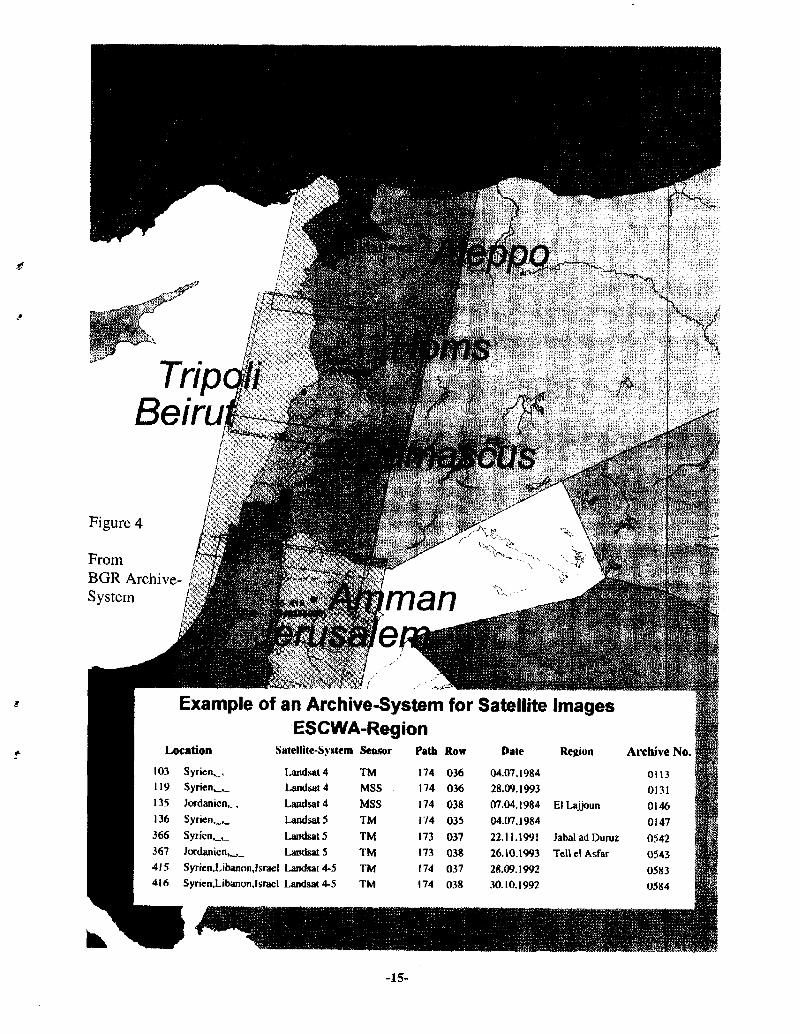
In most of the satellite imagery applications the size of a satellite image is restrictedto one data-"scene" (of polar orbiting systems). The data-scene is a defined amountof data from an endless data file. The scenes are numbered by paths (numbers of"re-visiting interval" orbits which are numbered from east to west with increasingnumbers) and by rows (the numbered scenes of the single orbits, which arenumbered from north to south with increasing numbers).
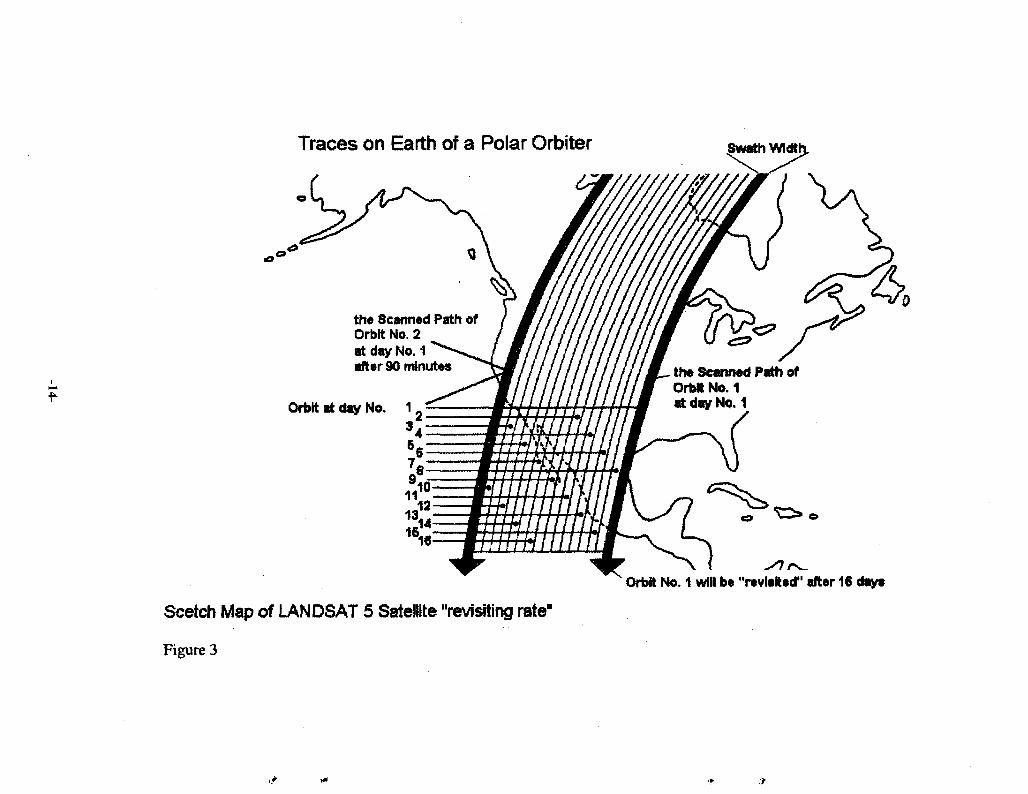
Polar orbiting systems move in a circle nearly from pole to pole. In most cases thepolar orbiters are moving in sun-synchronous circles. They are passing the same
latitude at the same time, e.g. LANDS AT satellite is crossing the equator at 9:00 am(Figure 3).
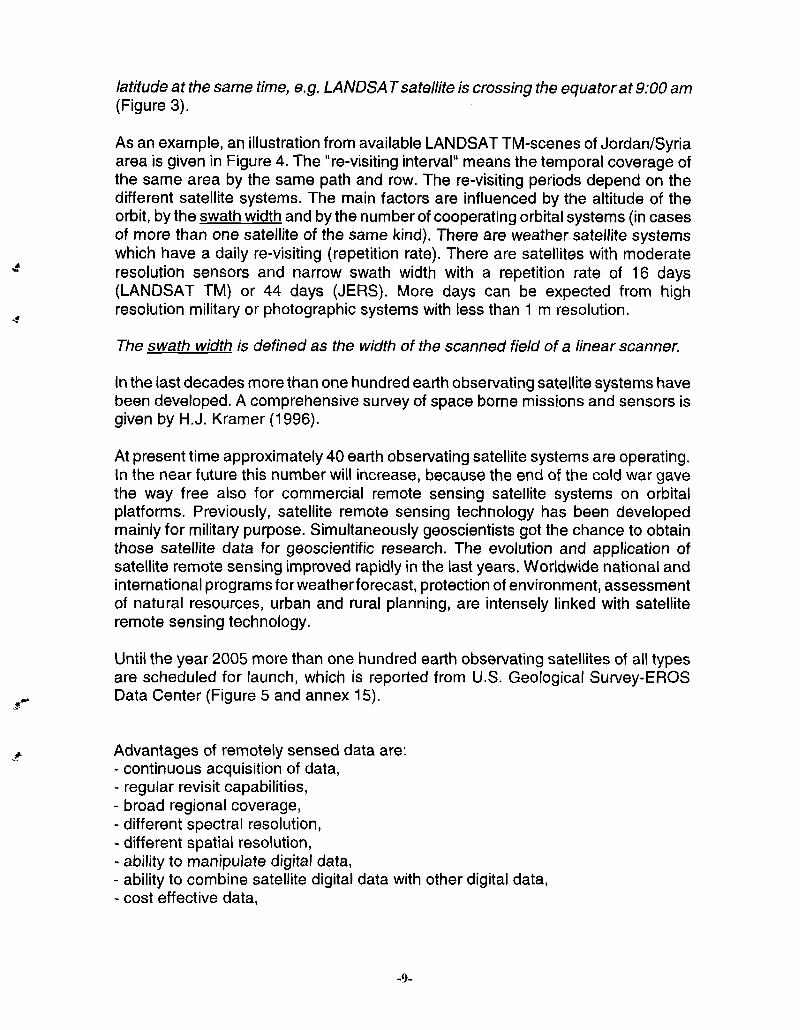
As an example, an illustration from available LANDSAT TM-scenes of Jordan/Syriaarea is given in Figure 4. The "re-visiting interval" means the temporal coverage ofthe same area by the same path and row. The re-visiting periods depend on thedifferent satellite systems. The main factors are influenced by the altitude of theorbit, by the swath width and by the number of cooperating orbital systems (in casesof more than one satellite of the same kind). There are weather satellite systemswhich have a daily re-visiting (repetition rate). There are satellites with moderateresolution sensors and narrow swath width with a repetition rate of 16 days(LANDSAT TM) or 44 days (JERS). More days can be expected from highresolution military or photographic systems with less than 1 m resolution.
The swath width is defined as the width of the scanned field of a linear scanner.
In the last decades more than one hundred earth observating satellite systems havebeen developed. A comprehensive survey of space borne missions and sensors isgiven by H.J. Kramer (1996).
At present time approximately 40 earth observating satellite systems are operating.In the near future this number will increase, because the end of the cold war gavethe way free also for commercial remote sensing satellite systems on orbitalplatforms. Previously, satellite remote sensing technology has been developedmainly for military purpose. Simultaneously geoscientists got the chance to obtainthose satellite data for geoscientific research. The evolution and application ofsatellite remote sensing improved rapidly in the last years. Worldwide national andinternational programs for weatherforecast, protection of environment, assessmentof natural resources, urban and rural planning, are intensely linked with satelliteremote sensing technology.
Until the year 2005 more than one hundred earth observating satellites of all typesare scheduled for launch, which is reported from U.S. Geological Survey-EROSData Center (Figure 5 and annex 15).
Advantages of remotely sensed data are:- continuous acquisition of data,- regular revisit capabilities,- broad regional coverage,- different spectral resolution,- different spatial resolution,- ability to manipulate digital data,- ability to combine satellite digital data with other digital data,- cost effective data,
-9-
map-accurate data,possibility of stereo viewing (special systems),large archive of historical data (special systems).
-10-
Intensity of Electromagnetic Radiation from Sun
NIR SWiR TIR Thermal Radiation from Earth at %.l\xm Peak
200 Awnl/wn tcm Vn 10m 100m.8 VOvm 2.0 4 0 60 10 20
• Phctoflraphy, Thermal Scanner
Passive Microwave
1 I I I I M I6 a WJ WO 300 Smmimm ten 1m 10m
The Electromagnetic Spectrum, Atmospheric Windows and Wavelengths of Applied Remote Sensing
Figure 2
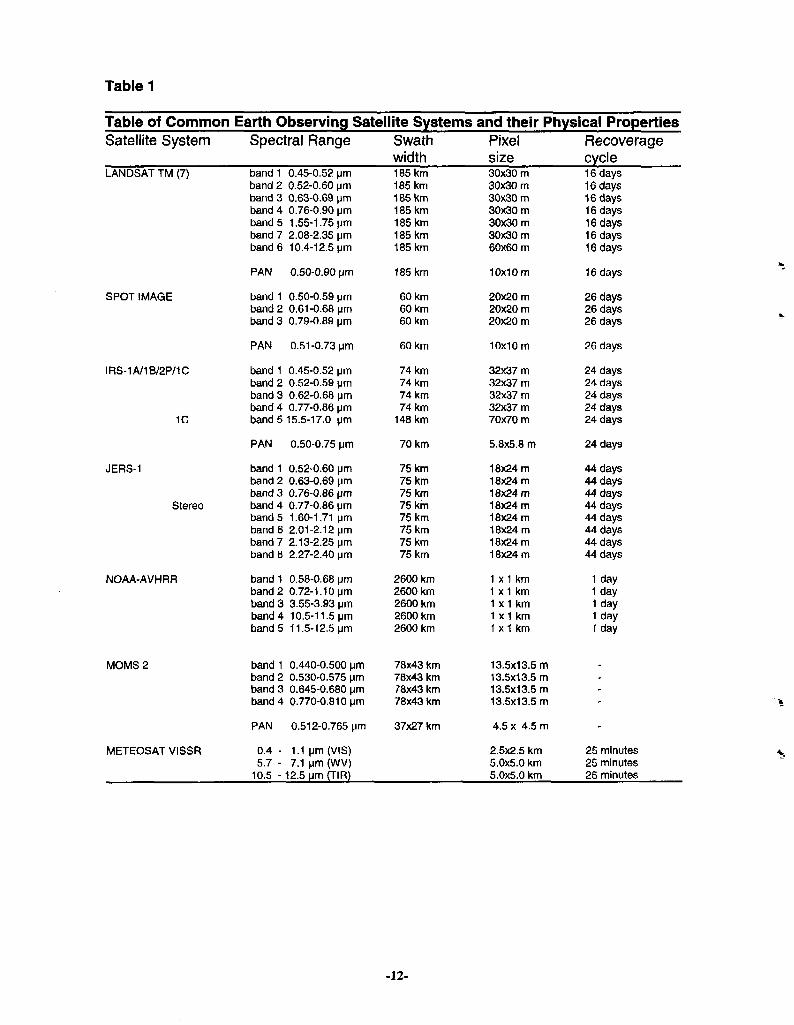
Table 1
Table of Common Earth Observing Satellite Systems and their Physical PropertiesSatellite System Spectral Range Swath Pixel Recoverage
width size cycleLANDS AT TM (7)
SPOT IMAGE
IRS-1A/1B/2P/1C
1C
JERS-1
Stereo
NOAA-AVHRR
MOMS 2
METEOSAT VISSR
band 1band 2band 3band 4band 5band 7band 6
PAN
bandiband 2band 3
PAN
bandiband 2band 3band 4band 5
PAN
bandiband 2band 3band 4bandsband 6band 7band 8
band 1band 2band 3band 4band 5
bandiband 2band 3band 4
PAN
0.4 -5.7 -
10.5 -
0.45-0.52 pm0.52-0.60 pm0.63-0.69 urn0.76-0.90 pm1.55-1.75 pm2.08-2.35 pm10.4-12.5 pm
0.50-0.90 pm
0.50-0.59 pm0.61-0.68 pm0.79-0.89 pm
0.51-0.73 pm
0.45-0.52 pm0.52-0.59 pm0.62-0.68 pm0.77-0.86 pm15.5-17.0 pm
0.50-0.75 pm
0.52-0.60 pm0.63-0.69 pm0.76-0.86 pm0.77-0.86 pm1.60-1.71 pm2.01-2.12 pm2.13-2.25 pm2.27-2.40 pm
0.58-0.68 pm0.72-1.10 pm3.55-3.93 pm10.5-11.5 pm11.5-12.5 pm
0.440-0.500 pm0.530-0.575 pm0.645-0.680 pm0.770-0.810 pm
0.512-0.765 pm
1.1 pm(VIS)7.1 pm (WV)
12.5 pm (TIR)
185 km185 km185 km185 km185 km185 km185 km
185 km
60 km60 km60 km
60 km
74 km74 km74 km74 km
148 km
70 km
75 km75 km75 km75 km75 km75 km75 km75 km
2600 km2600 km2600 km2600 km2600 km
78x43 km78x43 km78x43 km78x43 km
37x27 km
30x30 m30x30 m30x30 m30x30 m30x30 m30x30 m60x60 m
10x10 m
20x20 m20x20 m20x20 m
10x10 m
32x37 m32x37 m32x37 m32x37 m70x70 m
5.8x5.8 m
18x24m18x24 m18x24m18x24 m18x24 m18x24 m18x24 m18x24m
1 x 1 km1 x 1 km1 x1 km1 x 1 km1 x 1 km
13.5x13.5 m13.5x13.5 m13.5x13.5 m13.5x13.5 m
4.5 x 4.5 m
2.5x2.5 km5.0x5.0 km5.0x5.0 km
16 days16 days16 days16 days16 days16 days16 days
16 days
26 days26 days26 days
26 days
24 days24 days24 days24 days24 days
24 days
44 days44 days44 days44 days44 days44 days44 days44 days
1 day1 day1 day1 day1 day
-
-
25 minutes25 minutes25 minutes
-12-
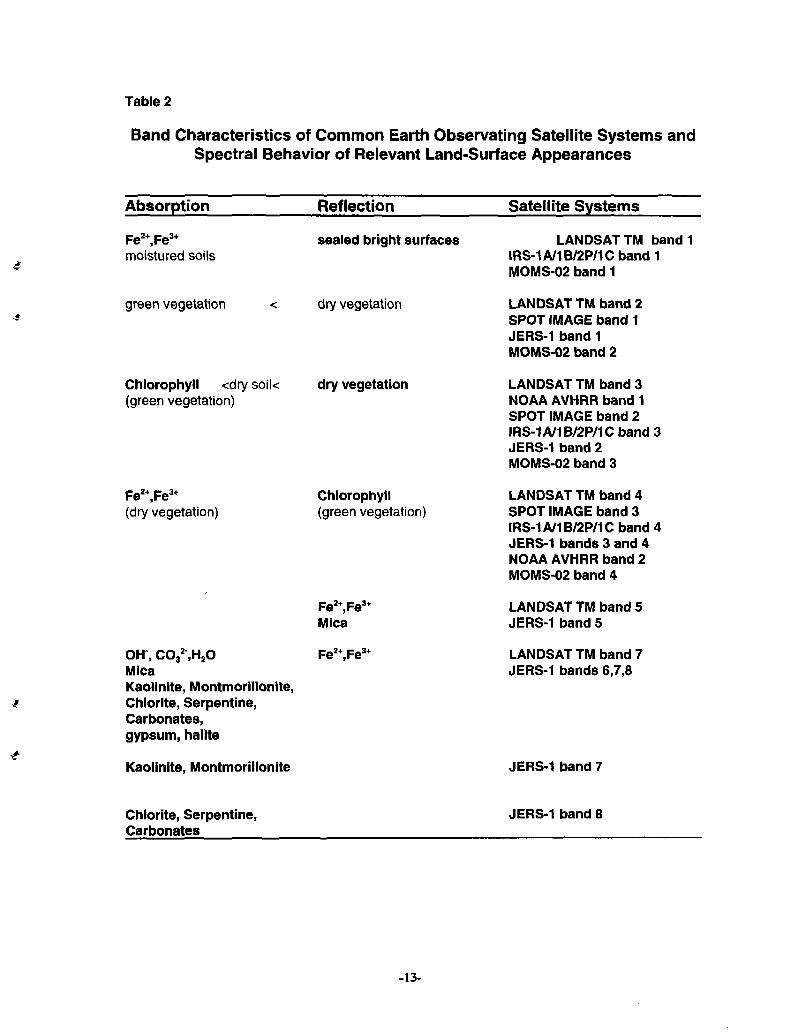
Table 2
Band Characteristics of Common Earth Observating Satellite Systems andSpectral Behavior of Relevant Land-Surface Appearances
Absorption Reflection Satellite Systems
Fe2+,Fe3+
moistured soils
green vegetation
Fe*\Fe3-(dry vegetation)
sealed bright surfaces
dry vegetation
Chlorophyll <dry soik dry vegetation(green vegetation)
OH, CO32 ,H2O
MicaKaolinite, Montmorillonlte,Chlorite, Serpentine,Carbonates,gypsum, halite
Kaolinite, Montmorillonite
Chlorophyll(green vegetation)
Fe2+,Fe3+
Mica
Fe2+,Fe3+
LANDSATTM band 1IRS-1 A/1 B/2P/1C band 1MOMS-02 band 1
LANDSAT TM band 2SPOT IMAGE band 1JERS-1 band 1MOMS-02 band 2
LANDSAT TM band 3NOAA AVHRR band 1SPOT IMAGE band 2IRS-1A/1B/2P/1Cband3JERS-1 band 2MOMS-02 band 3
LANDSAT TM band 4SPOT IMAGE band 3IRS-1 A/1 B/2P/1C band 4JERS-1 bands 3 and 4NOAA AVHRR band 2MOMS-02 band 4
LANDSAT TM band 5JERS-1 band 5
LANDSAT TM band 7JERS-1 bands 6,7,8
JERS-1 band 7
Chlorite, Serpentine,Carbonates
JERS-1 band 8
-13-
Traces on Earth of a Polar Orbiter
the Scanned Path ofOrbit No. 2at day No. 1after 90 minutes the Scanned Path of
Orbit No. 1at day No. 1Orbit at day No.
13,16
16
Orbit No. 1 will be "revisited" after 16 days
Scetch Map of LANDSAT 5 Satellite "revisiting rate"
Figure 3
TripBeiru
FromBGR Archive- |?"System
Example of an Archive-System for Satellite ImagesESCWA-Region
103 Syrien,_,
119 Syrien^,_
135 Jordanicn,.....
136 Syrien,_,_
366 Syricn^,_
367 Jordamen,
174 036
174 036
174 038
174 035
173 037
173 038
174 037
174 038
04.07.1984
28.09.1993
07.04.1984 ElLajjoun
04.07.1984
22.11.1991 JabaladDuroz
26.10.1993 TcllelAsfar
2S.09.199230.10.190?
Landsat 4
UindsatS
Landsat5
LandsatS415 Syrien.LibanonJsrael Landsat4-5416 Syrlen.Libanon,Israel l.andsat 4-5
-15-
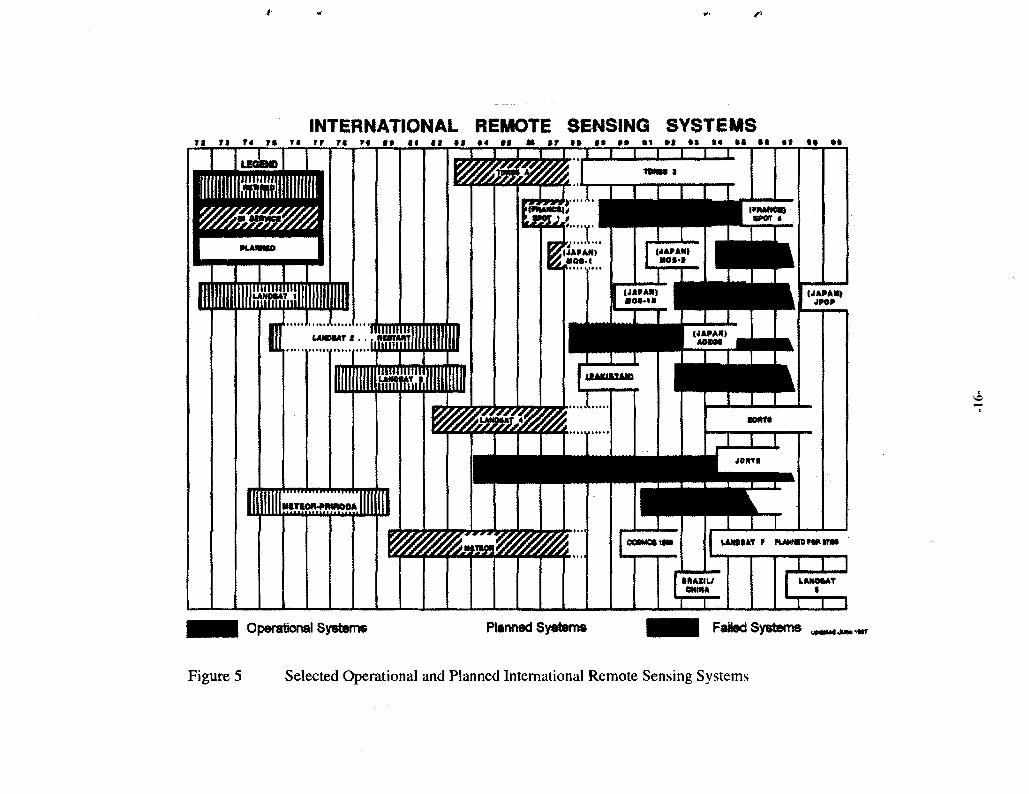
INTERNATIONAL REMOTE SENSING SYSTEMSTI n r* 7% r* »r r* ti • • «i i* it t* »i m tj it • • * * »t »t ** ** » •* tt ** *•
L.. I I 1 I 1 I I
Figure 5 Selected Operational and Planned International Remote Sensing Systems
3. Application of Satellite Imagery in ESCWA States
The application of satellite imagery depends on the orbital or geostationarycoverage of the region of interest. Most earth observating satellite systems whichcover the ESCWA region in total are global operating systems. Currently thesesystems range in the spatial resolution from 10 - 30m until several km pixel size.They have been developed for global scientific research and environmentalmonitoring.
A pixel (picture element) represents the size of the instantaneous field of view(IFOV) which defines the spatial resolution (annex 17).
Applied satellite remote sensing in geology and hydrogeology is one importantaspect of satellite imagery. This technique comprises the extraction of informationfrom satellite images and the correlation with field data or previous published data.The reader may be reminded that a satellite image never is equal to a geologicmap. Satellite imagery requires always ground data ("ground truth"). Thedistinguishing marks of reflective data are differing from one scene to the other.They depend on the statistic distribution of all pixels, and on the intensity of allpixels in one processed data file.
The geologic interpretation of satellite images is a highly adequate method tosupport geologic/hydrologic projects and programs in ESCWA countries, becausescarce vegetation and scarce soil cover in most arid or semi-arid regions providesfavorable conditions for the discrimination of surface conditions and the detectionof geologic structures from space. With the support of remote sensingenvironmental changes can be monitored on a regional scale, such as progressivedesertification and development of intensive agriculture which have complexhydrologic implications. Monitoring systems on a regional scale can be based onsatellite systems with a high repetition rate (frequent "re-visiting" or "repeatcoverage cycle") and low spatial resolution, e.g. NOAA-weather satellites (U.S.A.).Detailed studies require a high spatial resolution like LANDSATTM (U.S.A.), SPOTImage (France), IRS (India) or JERS (Japan) (chapter 5 and 6). Detailed technicaldescriptions of satellite systems are given in the annexes. Special applications arementioned in annexes 10-1,15-1,17 and 19.
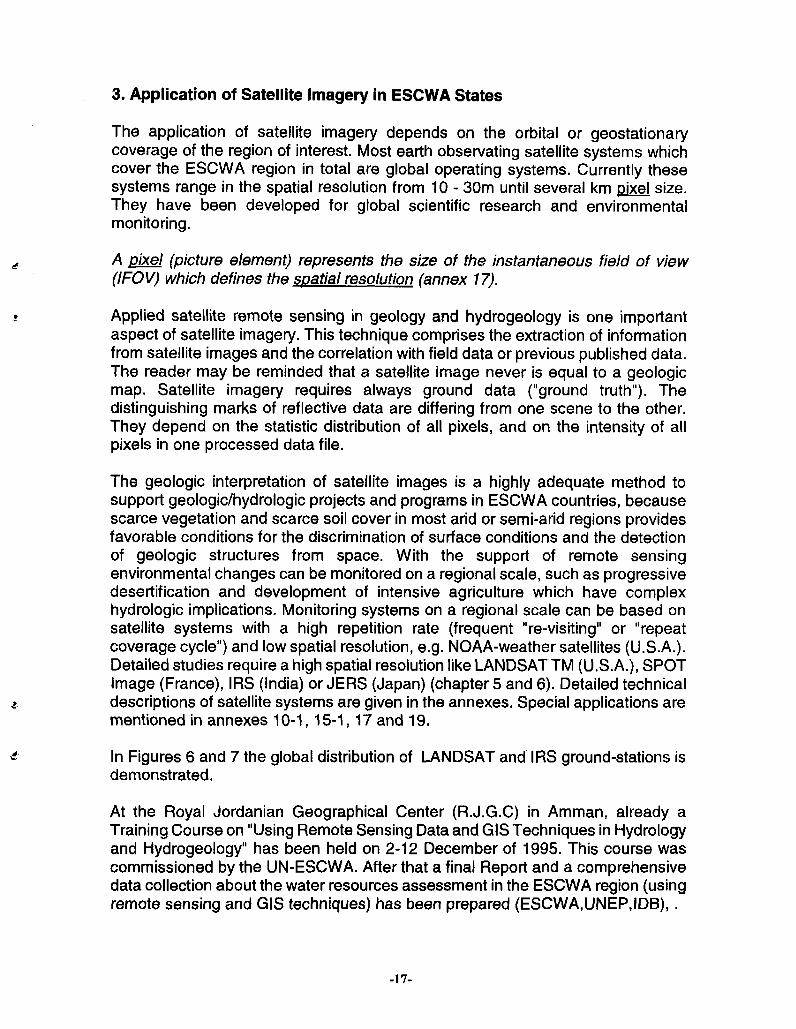
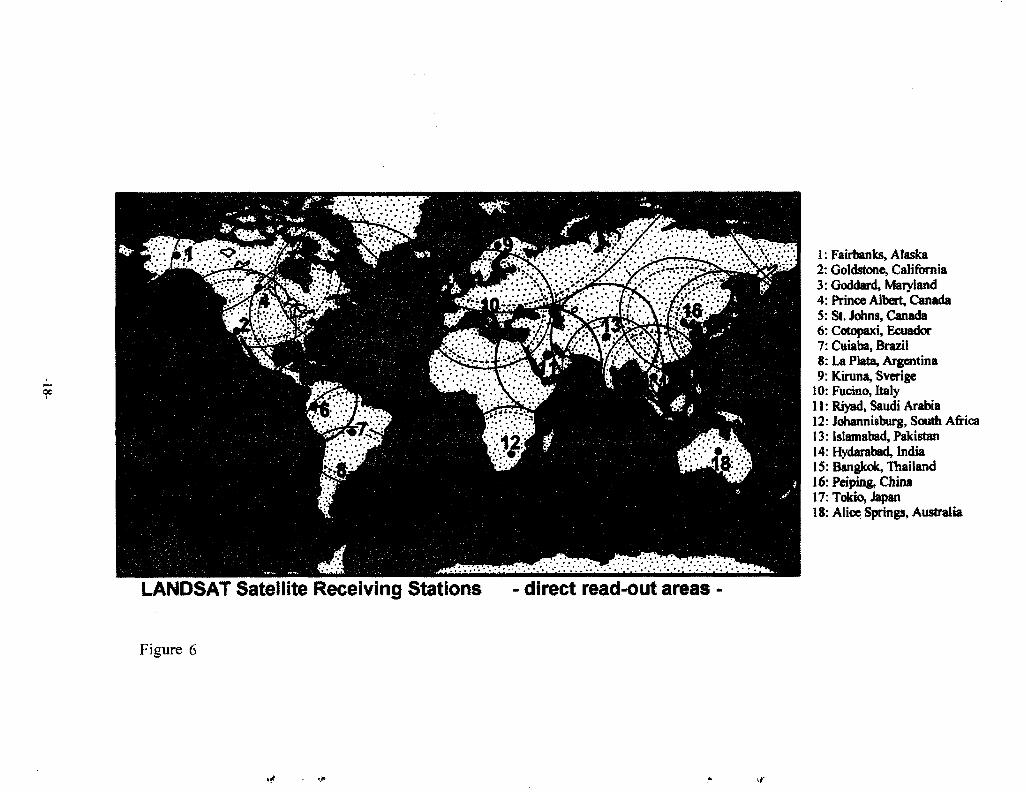
In Figures 6 and 7 the global distribution of LANDSAT and IRS ground-stations isdemonstrated.
At the Royal Jordanian Geographical Center (R.J.G.C) in Amman, already aTraining Course on "Using Remote Sensing Data and GIS Techniques in Hydrologyand Hydrogeology" has been held on 2-12 December of 1995. This course wascommissioned by the UN-ESCWA. After that a final Report and a comprehensivedata collection about the water resources assessment in the ESCWA region (usingremote sensing and GIS techniques) has been prepared (ESCWA,UNEP,IDB), .
-17-
1: Fairbanks, Alaska2: Goldstone, California3: Goddard, Maryland4: Prince Albert, CanadaS: St. Johns, Canada6: Cotopaxi, Ecuador7: Cuiaba, Brazil8: La Plata, Argentina9: Kiruna, Svcrige
10: Fucino, Italy11: Riyad, Saudi Arabia12: Johannisburg, South Africa13: Islamabad, Pakistan14: Hydarabad, India15: Bangkok, Thailand16: Peiping, China17: Tokto, Japan18: Alice Springs, Australia
LANDSAT Satellite Receiving Stations - direct read-out areas -
Figure 6
IRS-1C Network of International Ground Stations
Indian Remote Sensing Satellite (IRS) Coverage:Contact Space Imaging EOSAT foractual assessment and availabilityof data.
Figure 7
3.1 Geology
Favorable conditions for geologic research by satellite imagery are given in ESCWAcountries. Recently numerous research activities have been carried out in the regionby international and national institutions, e.g. in the Republic of Yemen by Kruckand Schaffer (1991), and Robertson Research Group (1990).
3.1.1 Geologic Lineaments
Geologic lineaments can give important information to the hydrogeologist. In distinctgeologic environments, e.g. igneous or metamorphic complexes or in fracturedcarbonates, groundwater recharge and relatively high aquifer permeabilities areoften related to fractures and fault systems.
Laterally extending structural patterns such as deep faults can be delineated bysatellite imagery, because satellite imagery provides the experts with an overviewof extended areas. Additionally, with special image enhancing methods (imageprocessing, chapter 5.2) structural patterns can be enhanced in the images. Withthe aid of aerial photograph interpretation wide extending camouflaged faults cannotbe delineated or in outline only (chapter 4.2.2).
3.1.2 Soil Cover
Different reflectance properties of soil and rock enables the expert to differentiatebetween soil covered rocks and outcropping rocks. Even if the soil derives directlyfrom the underlying rock , the reflectance differs due to chemical and/or physicalweathering processes.
The monitoring (continuous acquisition of data) of soil cover and existing vegetationgives the user important information about the degree of desertification and landdegradation.
3.1.3 Aquifers and Aquitards
Geologic interpretation of satellite images can be used for delineating outcroppingaquifers and aquitards. An existing geologic map sometimes gives not sufficientinformation about outcropping rocks or soil covered aquifer rocks. On the otherhand with new and frequent satellite data the rural and urban development can bemonitored which gives important information required for groundwater protection inareas with aquifer outcrops (chapters 3.3.3 and 3.3.4).
-20-
3.2 Hydrography
3.2.1 Drainage Pattern
Interpretation of LANDSAT TM images can provide precise information about thesurface drainage pattern. An example is given from TM scenes of the basalt aquiferof northern Jordan and southern Syria. Due to different TM-band combinations andprocessing methods the drainage pattern can be enhanced (chapter 4.1.3). Thedrainage pattern appears always as a strong element in the image.
3.2.2 Sabkhas and Lakes
Open lakes with clear water appear in the reflective spectral range outside thevisible spectrum (VIS) in black. If the water is shallow or contains impurities, theresulting color differs considerably (chapters 4.1.1 and 4.2.3). A reflecting bottomof a lake in combination with high water transparency can affect the signal in theVIS down to water depth of 40m.
3.2.3 Salinity
Dissolved salt components in open water have no influence on the absorption andreflecting signal, but salt precipitations cause strong reflection in the VIS (brightsurface in the visible part of the spectral range) and strong absorption in the shortwave infrared (SWIR).
Salt covered or salt containing soils or rocks can be delineated by satellite imageryas it is demonstrated by the study in the region around the Azraq springs in Jordan(chapter 4.1). A detailed remote sensing study of salt affected soils in Saudi Arabiahas been carried out by Saleh, A.A. and Saud AT. (1997).
Possibilities of an evaluation of the distribution of salt affected surface of the Ummas Samim Sabkha in the region of Saudi Arabia and Oman are discussed inChapter 4.2.3.
The results of the investigation of salt covered terrains by satellite imagery can, insome cases, be translated into information about evapotranspiration and the degreeof groundwater discharge in critical areas.
3.2.4 Evapotranspiration
As mentioned before, areas with a high degree of evaporation of water on the
-21-
surface can be delineated by the visible amount of salt in surface soils or rocks.
Currently there is an evolutionary trend for "microwave" and "radar" satellitesystems with applications for soil moisture estimations (X-SAR, annex 1 and JERS-SAR, annex 5). In the next future these systems will serve with reliable data andmore detailed information can be collected. Nevertheless, at the moment notenough experience is available on these methods.
3.3 Land Cover
3.3.1 Vegetation
Tucker (1979) is one of the founder of vegetation monitoring with satellite remotelysensed data. He developed an algorithm between the reflective visible red and thephotographic infrared which is called the "vegetation index". In the meantimenumerous vegetation monitoring programs have been carried out on global andregional scales which are theoretically based on the characteristic absorption in thevisible red and the reflection in the photographic infrared of the plant chlorophyll.
The "vegetation index" or the simple reflection of chlorophyll in the near infraredgive a significant information about the situation of the vegetation. Depending on theseasonally restricted rainfall in ESCWA countries the visible vegetation givesinformation about irrigation activities and therefore groundwater discharge can beestimated from space (chapter 3.3.2).
Irrigated areas in dry zones or during the dry season can be mapped from satelliteimages. From the extent of irrigation areas, estimates of volumes of consumptivewater use can be made. Crop differentiation, monitoring and computerizedclassification (chapter 6) serves the hydrogeologist with additional information aboutthe consume of water.
Some parts of the ESCWA region have a strong topographic relief, e.g. theescarpments in western Yemen and south-western Saudi Arabia. The applicabilityof satellite systems which collect data in the 10m - 30m pixel size for vegetationdifferentiation is reduced in these mountainous areas. Due to the narrow designedagricultural terraces the collected data give non reliable "mixed pixel" information.
3.3.2 Irrigation Areas
In most countries of the ESCWA region irrigated areas have an important rating foragricultural intensions. Due to the arid climatic conditions which play a major rolein the ESCWA region rainfed agriculture is restricted to limited areas where
-22-
seasonal rainfall can be expected.
Irrigated areas can be delineated by satellite imagery due to the strong reflectionproperties of the chlorophyll in the near infrared (chapter 3.3.1). This particularfeature can be applied especially from satellite data sets which have been collectedduring the dry season or for areas with scarce natural vegetation. The rough amountof groundwater discharge (pumping) can be estimated by the rate of coverage ofexisting vegetation with the aid of image interpretation (manual digitizing andlabeling of polygons) or by a GIS classification (chapter 6).
Long-term effect of salinization from intense irrigation and unsustainablegroundwater discharge from depleting aquifers can be monitored by satelliteimagery (chapter 3.2.3).
3.3.3 Towns and Villages
Populated areas appear in an image which has a sufficient resolution (e.g.LANDSAT TM) with a typical irregular or troubled pattern. This pattern results fromdifferent composed small buildings which are in size similar to the spatial range ofthe pixel size. This effect is common for the most currently available satellite datain the spatial range from 10 to 30m pixel size. Additionally, detectable roads arecrosscutting the settlements. The composites between detectable roads and theirregular pattern can be clearly delineated from the surrounding naturalenvironment.
With the aid of LANDSAT TM-band 1 and MOMS band 1 which lie in the spectralrange of 0.45-0.52 urn, sealed surfaces like roads and buildings can bedistinguished from water bearing surrounding bodies. The reason for that is thetransparency of clear water bodies, the absorption of moistured soils and areas withvegetation and the reflection of sealed surfaces.
An example of the applicability is given from a preliminary evaluation of an area fora land-use study in Jordan (chapter 4.2.1).
3.3.4 Industrial Areas
Large metal roofs of industry complexes can be delineated even in the 30m pixelrange of LANDSAT TM. Examples are given in the area of greater Amman andgreater Damascus.
The 10m resolution of the SPOT Image gives better results than LANDSAT TM, butthe costs of data acquisition is relatively high.
-23-
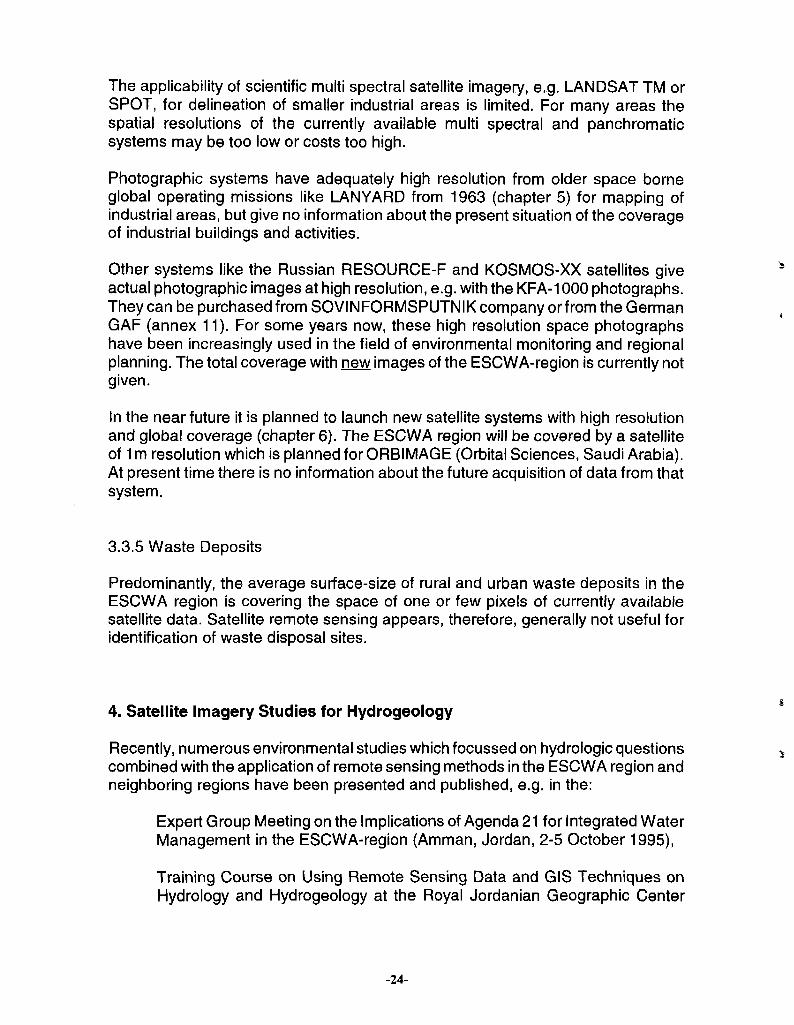
The applicability of scientific multi spectral satellite imagery, e.g. LANDSAT TM orSPOT, for delineation of smaller industrial areas is limited. For many areas thespatial resolutions of the currently available multi spectral and panchromaticsystems may be too low or costs too high.
Photographic systems have adequately high resolution from older space borneglobal operating missions like LANYARD from 1963 (chapter 5) for mapping ofindustrial areas, but give no information about the present situation of the coverageof industrial buildings and activities.
Other systems like the Russian RESOURCE-F and KOSMOS-XX satellites giveactual photographic images at high resolution, e.g. with the KFA-1000 photographs.They can be purchased from SOVINFORMSPUTNIK company orfrom the GermanGAF (annex 11). For some years now, these high resolution space photographshave been increasingly used in the field of environmental monitoring and regionalplanning. The total coverage with new images of the ESCWA-region is currently notgiven.
In the near future it is planned to launch new satellite systems with high resolutionand global coverage (chapter 6). The ESCWA region will be covered by a satelliteof 1 m resolution which is planned for ORBIMAGE (Orbital Sciences, Saudi Arabia).At present time there is no information about the future acquisition of data from thatsystem.
3.3.5 Waste Deposits
Predominantly, the average surface-size of rural and urban waste deposits in theESCWA region is covering the space of one or few pixels of currently availablesatellite data. Satellite remote sensing appears, therefore, generally not useful foridentification of waste disposal sites.
4. Satellite Imagery Studies for Hydrogeology
Recently, numerous environmental studies which focussed on hydrologic questionscombined with the application of remote sensing methods in the ESCWA region andneighboring regions have been presented and published, e.g. in the:
Expert Group Meeting on the Implications of Agenda 21 for Integrated WaterManagement in the ESCWA-region (Amman, Jordan, 2-5 October 1995),
Training Course on Using Remote Sensing Data and GIS Techniques onHydrology and Hydrogeology at the Royal Jordanian Geographic Center
-24-
(Amman, Jordan, 2-12 December 1995),
Ninth United Nations Regional Cartographic Conference for Africa (AddisAbaba, Ethiopia, 11-15 November 1996),
Third Gulf Water Conference (Muscat, Sultanate of Oman, 8-13 March1997).
Results of a basalt aquifer case study in the area of northern Jordan and southernSyria are presented below. The presentation includes detailed remarks aboutLANDSAT TM band characteristics, to give the reader an overview about reflexionand absorption properties of soils and rocks and the resulting sensor response(chapter 4.1 -4.1.4).
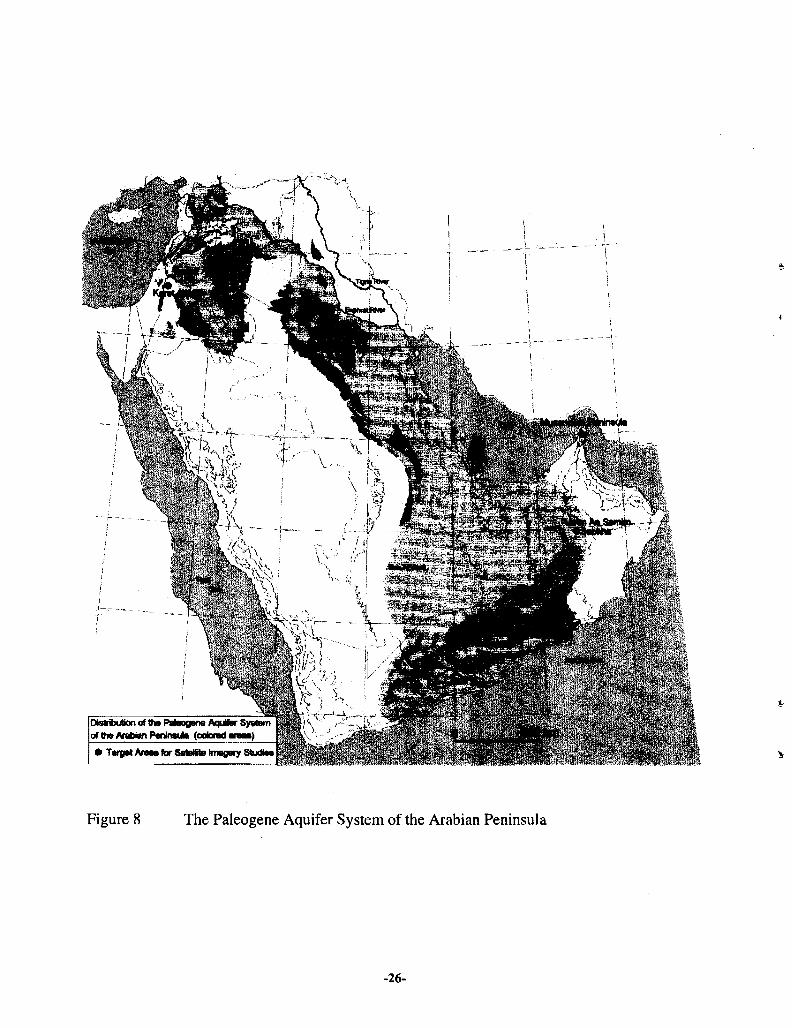
Possibilities of future remote sensing studies of extensive aquifer are discussed forthe Paleogene aquifer of Saudi Arabia/Oman, the Upper Cretaceous aquifer ofJordan and Syria, and by a Paleozoic until Mesozoic Limestone area of theMusandam Penisula from the U.A.E. and Oman (chapter 4.2). Areas and thedistribution of the main Paleogene aquifer of the Arabian Peninsula are delineatedin Figure 8.
-25-
Dtatrijubon of ttm PUwgerm Aquifer Systemof Ihe Arabian PenlnwJ* (ootorad a w )
Figure 8 The Paleogene Aquifer System of the Arabian Peninsula
-26-
4.1 Basalt Aquifer Case Study in Jordan and Syria
4.1.1 Satellite Imagery
LANDSAT - THEMATIC MAPPER (TM) satellite imagery was carried out on thebasis of different TM-band combinations in the basalt area of North-Jordan andSouth-Syria.
With the aid of satellite imagery a synoptic geologic model of the Neogene andQuaternary basalts has been developed. TM-data gave detailed new informationabout the distribution and differentiation of the basalt series (Figure 9).
For this study images of the Thematic Mapper (TM) multi spectral scanner on boardthe LANDSAT 5 satellite were chosen because of the favorable spectral and spatialresolution of the TM scanner. The LANDSAT 5 satellite was launched on 16 July1982 into a circular sunsynchronous polar orbit. It passes all parallel latitudesalways at the same time, e.g. the equator at about 09:00 am. One scanned full TM-scene has a size of 185 by 185 km (the size differs about few percentagesdepending on different processing methods from EOSAT or ESA-preprocessing) onthe earth's surface. The scene comprises about 240 megabyte of data. Thescanner records 7 spectral bands, 3 in the visible, 3 in the infrared and 1 band in thethermal section of the spectral range. The spatial resolution is about 30 m, e.g. onepicture element (pixel) covers 30m by 30 m on the earth's surface, except for thethermal channel (TM-band 6), which has a spatial resolution of 120m by 120 m.LANDSAT TM data reveal the best conditions for geological research, e.g. forlithologic discrimination including of alteration zones and the recognition ofstructures.
Standard processing revealed a high quality suitable for an appropriate visualinterpretation. The processing included a topographical standard correction.
The TM-band 1 (0.45-0.52 um) combined with a blue filter which is in the spectralrange of the visible light (VIS, the visible blue part of the VIS) shows highreflectance of bright materials which have a high albedo, e.g. clay minerals andshows strong absorption of vegetation and minerals, rocks or soil which containbivalent and/or trivalent iron (Fe2+ and/or Fe3+).
The TM-band 4 (0.76-0.90 um) combined with a green filter which is in the nearinfrared spectrum (NIR) shows high reflectance of chlorophyll, intermediatereflectance of clay and shows absorption of Fe2+ and Fe3+.
-27-
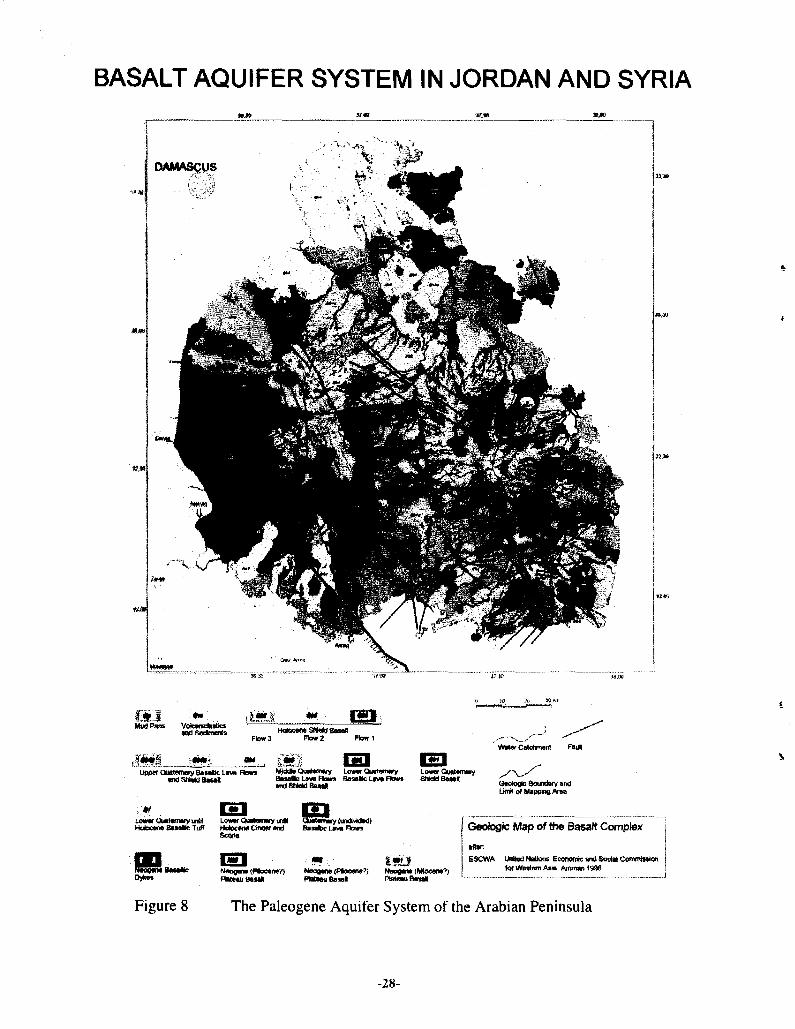
BASALT AQUIFER SYSTEM IN JORDAN AND SYRIA
DAMASCUS
IE1Mm) Pans Flow 3 Flow 2 Row 1
SSSrwyLcwOua lwy in i i l UmvrQuamwyufiM C M w y f t n d M d KHotscww 3»atic Tufl Holocone O n w and Basrfbc L*n Horn
Scoria
L O W < * » t « ™ y
Noogene(Plo«iw?) N n « m (Placarw?) Nncom (Mlowm?)nBl PBteauBaMl PtatMU Bnall
; iGeologic Map of the Basalt Complex
ESCWA United Mallont Economic tni Sodut Commrtslonfcjf W M I W H A S M , /Mwmn 1996
Figure 8 The Paleogene Aquifer System of the Arabian Peninsula
-28-
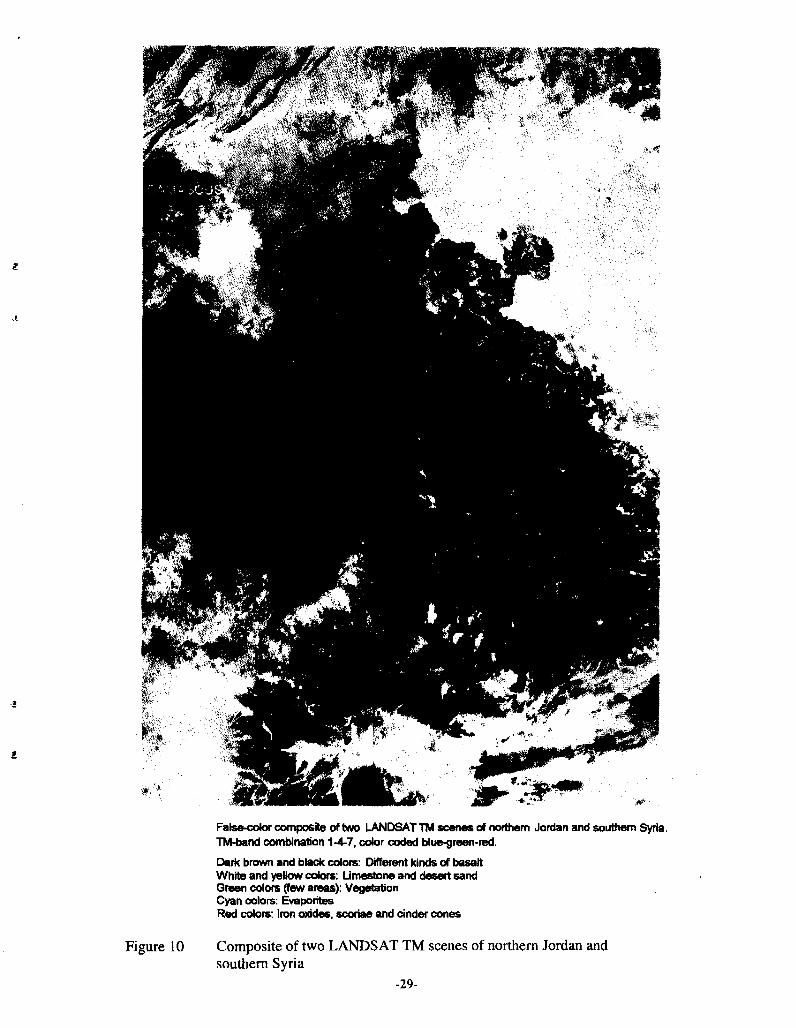
Figure 10
False-color composite of two LANDSAT TM scenes of northern Jordan and southern Syria.TM-band combination 1-4-7, color coded blue-green-red.
Dark brown and black colors: Different kinds of basaltWhite and yellow colors: Limestone and desert sandGreen colors (few areas): VegetationCyan colors: EvaporitesRed colors: Iron oxides, scoriae and cinder cones
Composite of two LANDSAT TM scenes of northern Jordan andsouthern Syria
-29-
The TM-band 5 (1.55-1.75 |jm) and TM-band 7 (2.08-2.35 urn) which are in therange of the short-wave infrared (SWIR) show high reflectance of Fe2+ and Fe3+
containing material.
Additionally, the TM-band 7 shows absorption features of anions and moleculessuch as OH , CO3
2" and H2O resulting from lattice overtone and bending-stretchingvibrations of the fundamental modes occurring at these longer wavelengths.Content of organic material or opaque accessories reduce the diagnostic absorptionfeature in the range of 2.3 um.
Two Landsat TM satellite data sets (scenes) are covering the target area (Figure10). The northern scene (path and row 173/037) was taken from the date of22.11.1991 and the southern scene (path and row 173/038) was taken from thedate of 26.10.1993. Data processing was carried out by the Gesellschaft furAngewandte Fernerkundung (GAF, Munchen) and by the BGR (Hannover) in TM-band combinations (7-4-1), (7/1-4-1), (5/7-4-1) color coded red, green and blue. Allhard copies (color photo prints) were carried out by the BGR (Hannover).
The hard copies are in the scales 1 : 100.000, 1 : 250.000, 1 : 500.000 and 1 :1.000.000.
According to image processing the satellite images show a wide range of colors.The colors result from absorption and reflectance properties, image processing andfrom photographic laboratory work. The following colors are typical for the mineralgroups mentioned before:
- Phyllosilicates (e.g. kaolinite, montmorillonite, mica incl. sericite, chlorite; alsocalcite). The color in the image using the red filter in band 7 is blue to green becau-se low reflexion "reduces" the red in the resulting color.
- Iron hidroxides (goethite, limonite). The resulting color using the same red filter isred, because the high reflexion in band 7 intensifies the red in the resulting color.4.1.2 The TM-band combination 7-4-1
According to absorption and reflectance properties the TM-band combination 7-4-1color coded red-blue-green creates an image with characteristic features:
Red colors are displayed by iron-rich rocks or soil which have a low albedo (darkcolored volcanic ash, weathered basalt surface etc.).
The albedo is the ratio of the amount of electromagnetic energy reflected by asurface to the amount of energy incident upon it
Green colors predominantly represent vegetation.
-30-
Blue and cyan colors represent alteration zones, clay minerals, gypsiferous salt andcarbonates which are free of impurities.
The colors representing basaltic material in the basalt area are reddish brown,brown, blueish brown, blackish brown, dark blue, black, dark grey and grey.
The present TM-band combination shows fresh basalt in dark black. Depending onthe different climatic conditions the reflection properties of the basaltic rocks differ.Especially in the western area weathering processes with soil production increasethe reflectance into shorter wavelength due to increasing content of mica and clayminerals (TM-band 1). It results in blueish-blackish and greyish basalt because thered-component (TM-band 7) is over toned. In the eastern area increasing oxidationand precepitation of iron oxides and lower production of clay minerals and soilincreases reflectance in the SWIR-range (TM-band 7). At this stage the basaltsreach more brownish colour.
To the outermost W and SW of the southern scene Cretaceous limestone isexposed near the City of Mafraq and S of Amman (The city of Amman is notdisplayed on the image). Predominantly, the limestone is free of organic impuritieswhich is evident by its whitish color.
South of the basalt field Cenozoic sediments are exposed in brownish, white,yellow, red and cyan colors. The brownish color derives from chert sediments whichcontain some amounts of iron oxides. The white and yellow colors reflect quartz-richeolian and fluviatile sand. The cyan (or blueish-greenish) color which occurs in theWadi Sirhan depression is assumed to be caused by kaolinitic-carbonatic evaporiticsediments with a distinct sodium salt content. The reason for the cyan color arebending-stretching vibrations of OH' anions in evaporites with resulting absorptionof TM-band 7 (red). The trace of cyan colored sediments can be followed upthrough the Wadi Sirhan until the Azraq well field area. Directly in the area of Azraqtwo red colored fields occur. The red color indicates absorption of TM-band 1 andTM-band 4 and reflectance in TM-band 7, due to lack of vegetation and occurrenceof bivalent and/or trivalent iron. Obviously, this area is covered by dead or dryvegetation and plenty of iron oxides.
In an area S of the two Azraq springs the intensity of the blue and the red colors arereduced. A homogenous green field is assumed to be a dry pond of anomalouschemical composition, probably because of absorption in the visible wavelengths,especially in TM-band 1, due to charge transfer of iron-bearing minerals or soils andbecause of absorption in the SWIR-range of TM-band 7, due to bending-stretchingvibrations of OH' anions.
Open water occurrences in the region show different reflection properties. In thewestern part of Jabal Al Arab numerous lakes result from dam projects. Althoughthe LANDSAT TM-scene has been taken during the dry season (22 November
-31-
1991) the lakes reveal large quantities of stored water resources in the western areaof Jabal Al Arab. The image shows black color which results from normal waterabsorption properties. In the eastern part of the basalt area of investigation severalsmall "lakes" are restricted to mud-pans (sabkha). All of them show distinct bluishreflection colors which indicate flat water conditions. On the other hand cyan-bluishcolors are known from salt flats with gypsum content.
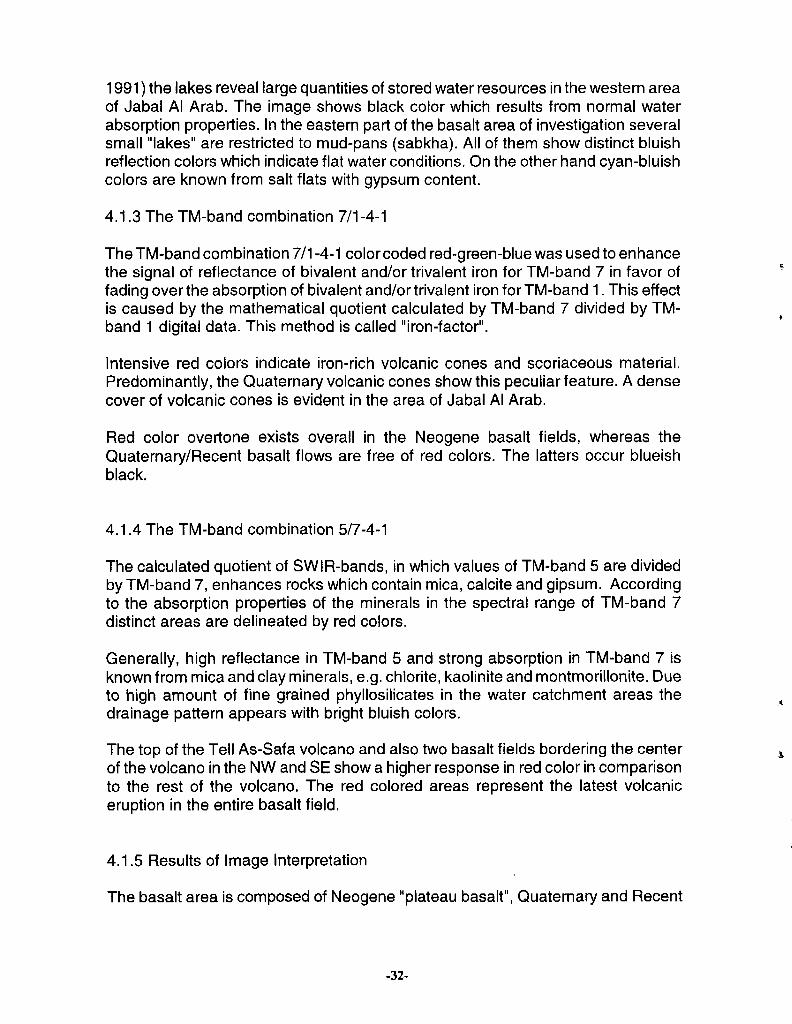
4.1.3 The TM-band combination 7/1-4-1
The TM-band combination 7/1 -4-1 color coded red-green-blue was used to enhancethe signal of reflectance of bivalent and/or trivalent iron for TM-band 7 in favor offading over the absorption of bivalent and/or trivalent iron for TM-band 1. This effectis caused by the mathematical quotient calculated by TM-band 7 divided by TM-band 1 digital data. This method is called "iron-factor".
Intensive red colors indicate iron-rich volcanic cones and scoriaceous material.Predominantly, the Quaternary volcanic cones show this peculiar feature. A densecover of volcanic cones is evident in the area of Jabal Al Arab.
Red color overtone exists overall in the Neogene basalt fields, whereas theQuaternary/Recent basalt flows are free of red colors. The latters occur blueishblack.
4.1.4 The TM-band combination 5/7-4-1
The calculated quotient of SWIR-bands, in which values of TM-band 5 are dividedby TM-band 7, enhances rocks which contain mica, calcite and gipsum. Accordingto the absorption properties of the minerals in the spectral range of TM-band 7distinct areas are delineated by red colors.
Generally, high reflectance in TM-band 5 and strong absorption in TM-band 7 isknown from mica and clay minerals, e.g. chlorite, kaolinite and montmorillonite. Dueto high amount of fine grained phyllosilicates in the water catchment areas thedrainage pattern appears with bright bluish colors.
The top of the Tell As-Safa volcano and also two basalt fields bordering the centerof the volcano in the NW and SE show a higher response in red color in comparisonto the rest of the volcano. The red colored areas represent the latest volcaniceruption in the entire basalt field.
4.1.5 Results of Image Interpretation
The basalt area is composed of Neogene "plateau basalt", Quaternary and Recent
-32-
"basaltic lava flows" and "shield volcanoes".
The following main lithostratigraphic units were defined:Neogene plateau basalt,Neogene basaltic dykes,Quaternary shield basalt,Quaternary valley-filling lava flows,Quaternary cinder and scoria cones,Volcaniclastics and sediments in wadis and morphological depressions.
The central part of the basalt field is occupied by the Jabal Al Arab mountain massifwith elevations between 1300 and 1800 m asl. The western basalt area until JabalAl Arab is influenced by Mediterranean climate with precipitation of, on average, 300- 500 mm during the cold winter season. East and southeast of Jabal Al Arab meanannual precipitation decreases to less than 100 mm per year. Accordingly, mainrenewable groundwater resources occur on the Jabal Al Arab mountain massif andon the foothills and plains west of the mountain.
The top of the Jabal Al Arab is covered by Neogene shield basalts and by thinlayers of Quaternary lava flows or basaltic tuff. The western foothills and plains arecovered prevailingly by Quaternary shield basalt and valley-filling basalt flows.
The following relationships between properties of different types of basalt flows,visible on satellite images, and occurrence of groundwater and groundwaterrecharge are indicated:
Plateau basalts and shield basalts: Poorly developed surface drainage system,relatively favorable conditions for direct recharge, accumulation of low permeabilitylayers of extensive basalt flows.Valley-filling lava flows: Well developed drainage system, surface runoff prevails,limited lateral extent of lava flows, generally no perched groundwater.
The Miocene-Pliocene "plateau basalts" reach thicknesses of several hundreds ofmeters with thin soil and sedimentary interlayers. Deep vertical fractures (coolingcracks as result of contraction) are prominent in these "plateau basalts" and mayprovide favorable conditions for groundwater movement. UnconsolidatedQuaternary tuff and scoria volcanoes and tuff and scoria terrains may haverelatively high infiltration capacities, but are limited in extent.
The differentiated drainage pattern of Quaternary "valley-filling lava flows" andQuaternary weathered tuff terrains indicate rapid surface water runoff intomorphologic depressions: mud pans, sabkhas and major wadis. The mud pans orsabkhas are covered by fine grained sediments (clay material) which reduceinfiltration and recharge into underlying rocks. Due to evaporation the salinity
-33-
increases in the sediment pans. Water collected in the pans is, to a considerableextent, lost by evaporation.
Basaltic dykes crosscutting the entire area can be deeply situated hydraulic barriers.They can separate, on local scale, areas of different groundwater level anddifferentiate the basalt aquifers into compartments with different groundwater flowconditions.
According to the geologic structure of the basalt complex, it can be assumed thatthe deeper subsurface of the Jabal Al Arab mountain massif is occupied by themain feeder zone of the Neogene basalt flows and constitutes a thick sequence ofbasaltic rocks as vertical dykes or in sill-type intrusions into sedimentary rocks. Noextensive deep groundwater circulation is therefore expected in the core of themountain massif.
4.2 Proposals for Satellite Imagery Studies for Hydrogeology in selected areas
4.2.1 Vulnerability of Karst Aquifer in Jordan, Syria, Lebanon and West Bank
The northwestern fringes of the ESCWA region comprises mountain chains andhighlands with sub-humid Mediterranean climate. Outcropping karstified carbonateformations in these mountains and highlands provide productive aquifers with waterresources of major importance in Syria, Lebanon, Jordan and West Bank.
Increasing population density, intensive land use and development of industrialactivities are creating increasing stress on the water resources in these countriesand cause particular hazards of groundwater contamination. Groundwatervulnerability assessment can be used as a tool for setting up strategies andmeasures for protecting groundwater resources against contamination. Theseresults of groundwater vulnerability assessments are presented on maps whichdelineate areas of different vulnerability and sites of main contamination hazards.Hydrogeologic investigations for the vulnerability assessment can be supported byinterpretation of satellite images. Valuable types of information that can be obtainedfor groundwater vulnerability assessment from satellite images are (Vrba andZaporozec 1994):
distribution of high vertical drainage,location of permanently wet areas,existing land use,vegetative cover condition,variations of soil texture,hydrogeologic complexes.
-34-
A preliminary interpretation of satellite images has been made for a selected areain north-western Jordan with a view to the possibilities of using remote sensing datafor a fast and inexpensive definition of features related to aquifer vulnerability andcontamination hazards.
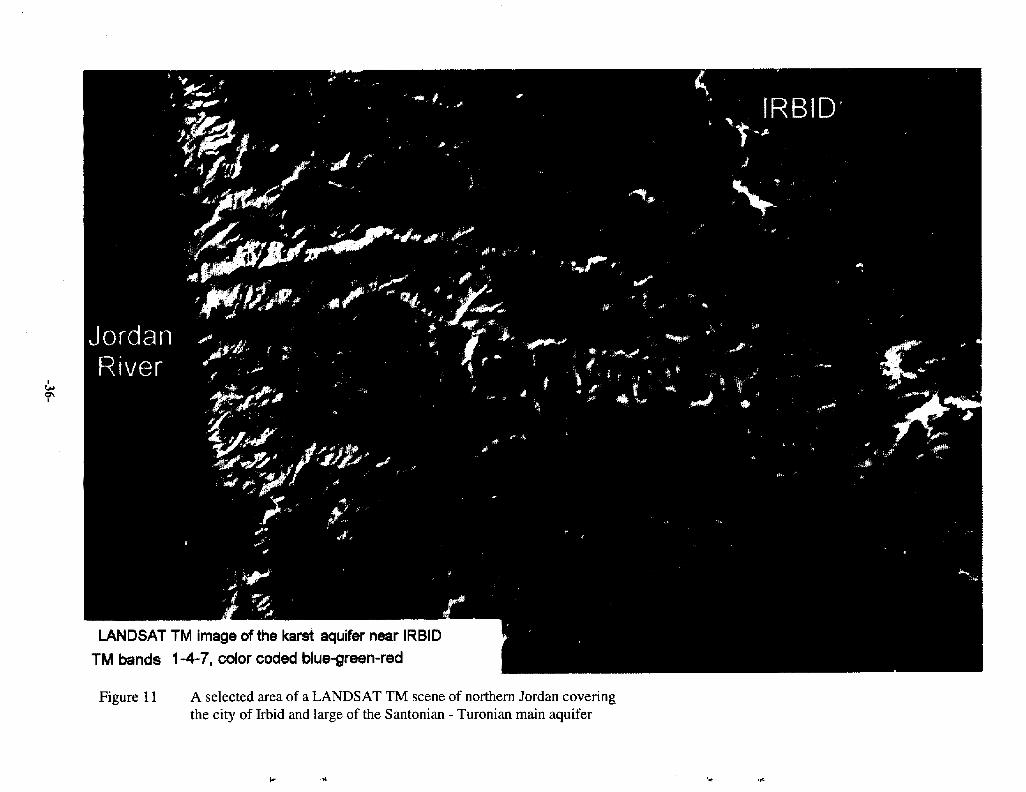
Intensive recent urban and rural development can be delineated by satellite imagerywith the aid of actual LANDSATTM data (Figure 11). Polygon mapping of classifiedareas reveals a rapid increase of settlements and existing agriculture use, which arenot yet delineated on available geographic maps (Figure 12).
The following features can be delineated by simple polygon mapping:Outcrops of Cenomanian-Turonian carbonate aquifer,Aquifer outcrops with thick soil cover,Rainfed agriculture,Irrigation areas,Towns and villages.
Larger industrial areas in greater Amman and greater Damascus areas can beclearly identified from satellite images.
Remote sensing data can significantly support hydrogeologic and land use studiesfor aquifer vulnerability assessment and can, in particular, provide up-to-dateinformation on recent land use developments.
An evaluation of present land cover in the area of extent of major karst aquifers inthe northwestern part of the ESCWA region appears recommendable with aparticular view to hazards caused by intensive land use developments tooutcropping uncovered aquifers.
-35-
JordanRiver
IRBID
LANDSAT TM image of the karst aquifer near IRBID
TM bands 1 -4-7, color coded blue-green-red
Figure 11 A selected area of a LANDSAT TM scene of northern Jordan coveringthe city of Irbid and large of the Santonian - Turonian main aquifer
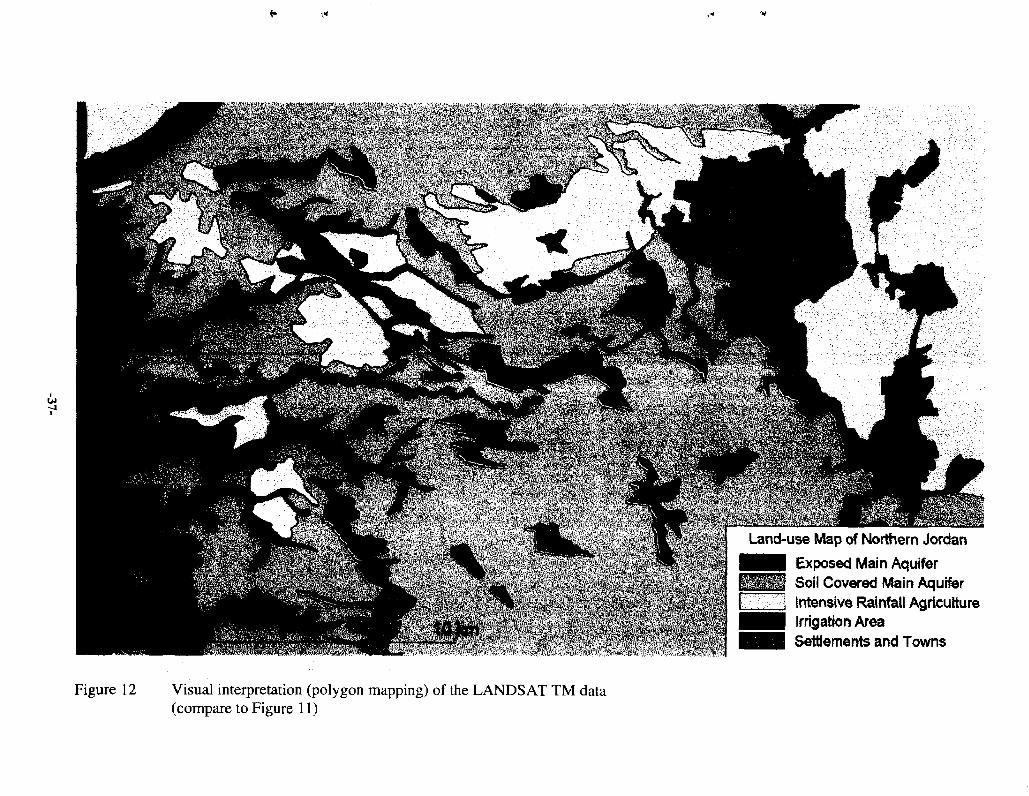
Land-use Map of Northern Jordan
Exposed Main AquiferSoi! Covered Main AquiferIntensive Rainfall AgricultureIrrigation AreaSettlements and Towns
Figure 12 Visual interpretation (polygon mapping) of the LANDSAT TM data(compare to Figure 11)
4.2.2 Karst Aquifer of Northern Oman and United Arab Emirates
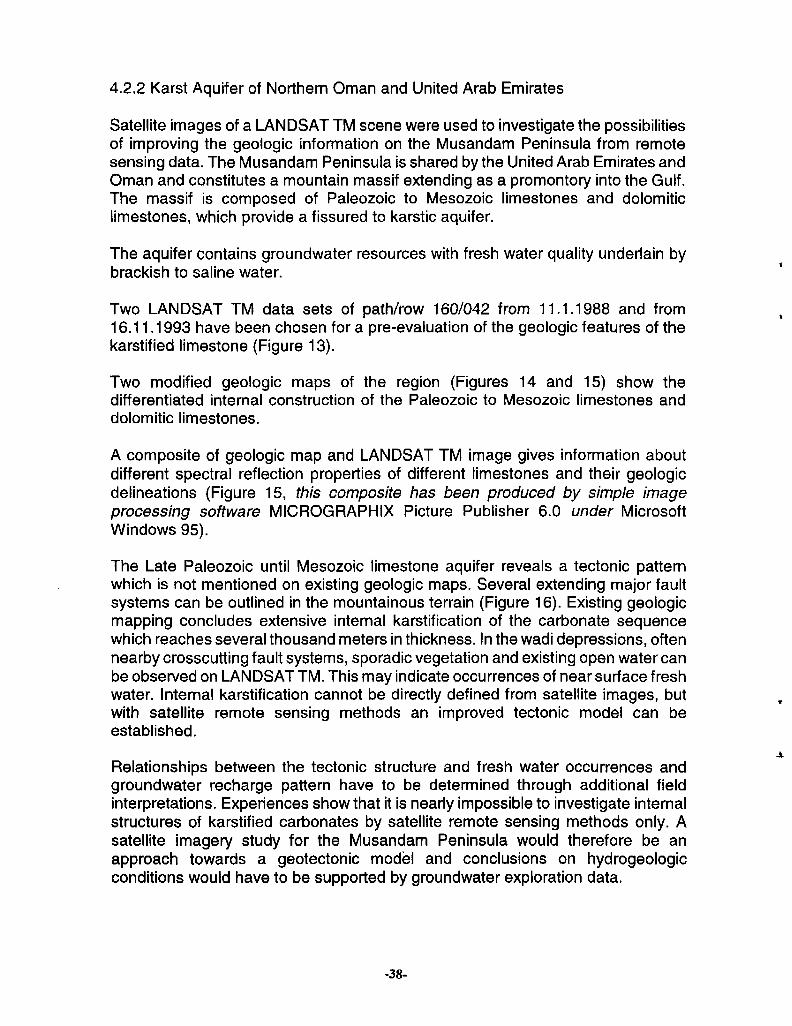
Satellite images of a LANDSAT TM scene were used to investigate the possibilitiesof improving the geologic information on the Musandam Peninsula from remotesensing data. The Musandam Peninsula is shared by the United Arab Emirates andOman and constitutes a mountain massif extending as a promontory into the Gulf.The massif is composed of Paleozoic to Mesozoic limestones and dolomiticlimestones, which provide a fissured to karstic aquifer.
The aquifer contains groundwater resources with fresh water quality underlain bybrackish to saline water.
Two LANDSAT TM data sets of path/row 160/042 from 11.1.1988 and from16.11.1993 have been chosen for a pre-evaluation of the geologic features of thekarstified limestone (Figure 13).
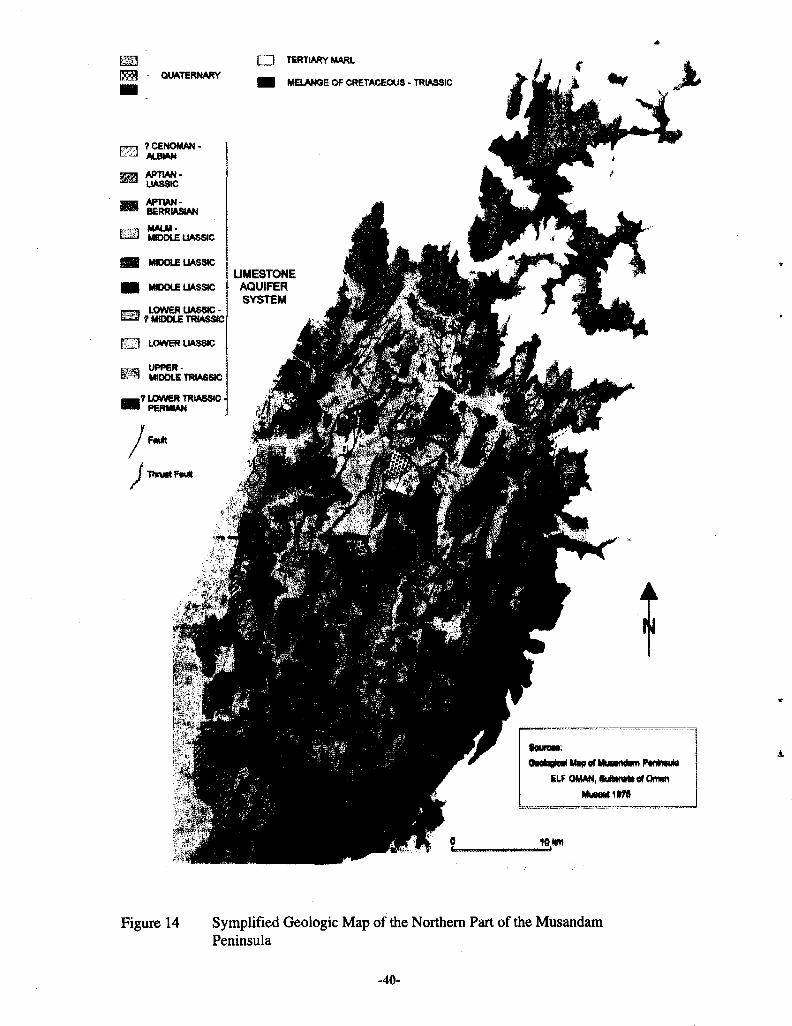
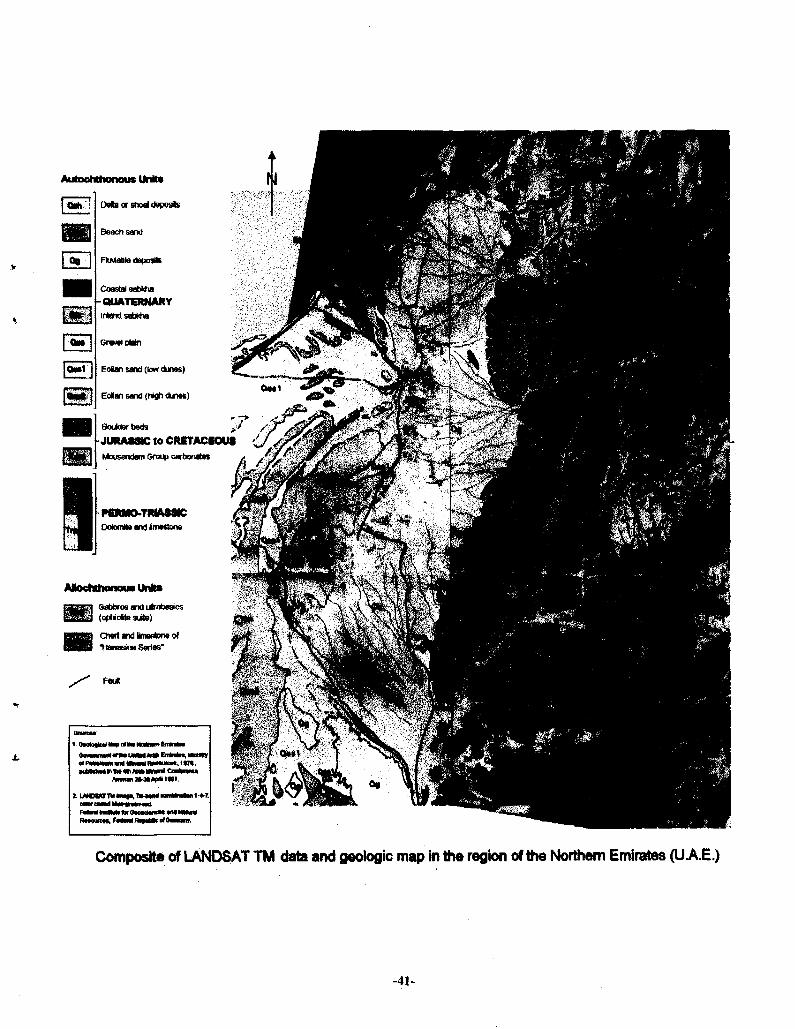
Two modified geologic maps of the region (Figures 14 and 15) show thedifferentiated internal construction of the Paleozoic to Mesozoic limestones anddolomitic limestones.
A composite of geologic map and LANDSAT TM image gives information aboutdifferent spectral reflection properties of different limestones and their geologicdelineations (Figure 15, this composite has been produced by simple imageprocessing software MICROGRAPHIX Picture Publisher 6.0 under MicrosoftWindows 95).
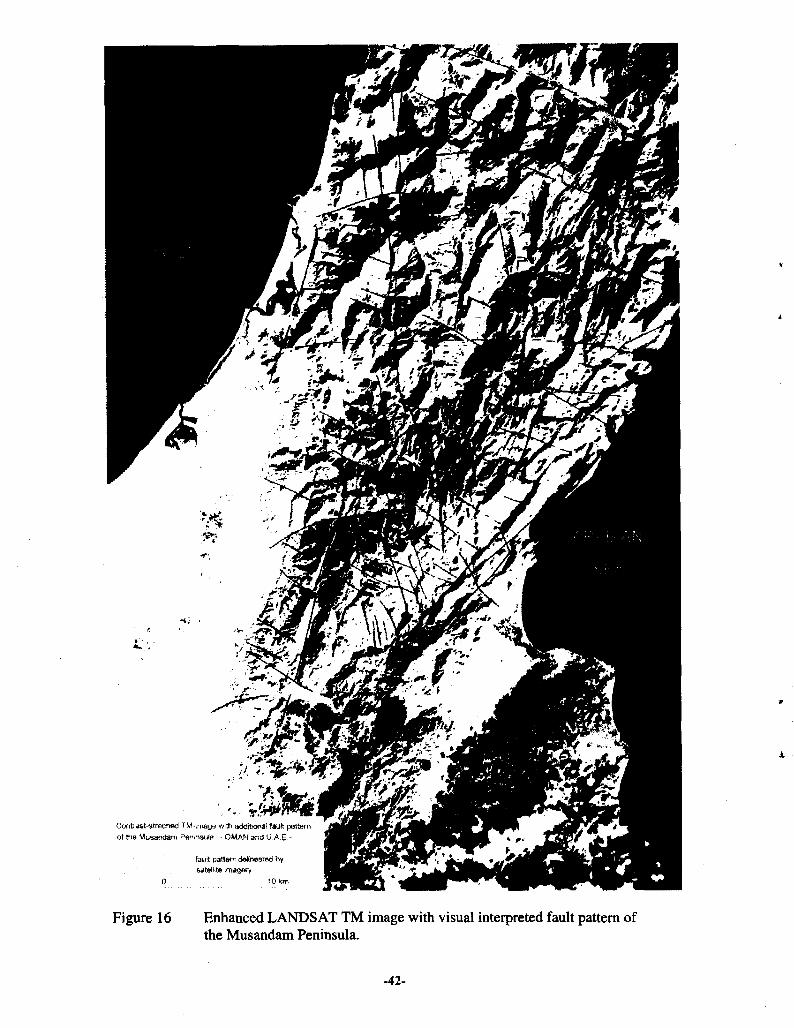
The Late Paleozoic until Mesozoic limestone aquifer reveals a tectonic patternwhich is not mentioned on existing geologic maps. Several extending major faultsystems can be outlined in the mountainous terrain (Figure 16). Existing geologicmapping concludes extensive internal karstification of the carbonate sequencewhich reaches several thousand meters in thickness. In the wadi depressions, oftennearby crosscutting fault systems, sporadic vegetation and existing open water canbe observed on LANDSAT TM. This may indicate occurrences of near surface freshwater. Internal karstification cannot be directly defined from satellite images, butwith satellite remote sensing methods an improved tectonic model can beestablished.
Relationships between the tectonic structure and fresh water occurrences andgroundwater recharge pattern have to be determined through additional fieldinterpretations. Experiences show that it is nearly impossible to investigate internalstructures of karstified carbonates by satellite remote sensing methods only. Asatellite imagery study for the Musandam Peninsula would therefore be anapproach towards a geotectonic model and conclusions on hydrogeologicconditions would have to be supported by groundwater exploration data.
-38-
LANDSAT TM Imags of the Musandam Peninsula of OMAN
and the U A.E.. TM-band combination 1-4-7. color coded
Figure 13 LANDSAT TM-image of the Musandam Peninsula of Oman and theU.A.E.
-39-
QUATERNARY
7CENOMAN-ALBIAN
APTVW-UASSIC
APTIAN-BERRIASIAN
MALM-MIDDLE UASSIC
MIDDLE UASSIC
MIDDLE UASSIC
I LOWER UASSIC -1 ? MIDDLE TRIASSIC
LOWER UASSIC
UPPER-MIDDLE TRIASSIC
.? LOWER TRIASSIC• PERMIAN
TERTIARY MARL
MELANGE OF CRETACEOUS-TRIASSIC
LIMESTONEAQUIFERSYSTEM
Figure 14 Symplified Geologic Map of the Northern Part of the MusandamPeninsula
-40-
Autochthonous Unit*
D e b or shoal deposits
Beach sand
I Owl
HI
Coastal sabkhaQUATERNARY
Eolan sand (tow dunes)
Eodan sand (high dunes)
Boulder bads ,i /
JURASSIC to CRETACEOUS (J,//Mousandam Group carbonates
PERMO-TMASSICDolomite and lm#vtono
( m n Gabbros and latabasics
Chart and imestone of
Ttawsina Series"
Fftut
Composite of LANDSAT TM data and geologic map in the region of the Northern Emirates (U AE.)
-41-
Contiast-stnecfted TM-image «if\ additional fault pattern
ot the Musandam Peninsula - OMAN and U.A.E.-
fqult pattwr-. detinostw) by&ate!fite imagfir^
0 '0 km
Figure 16 Enhanced LANDSAT TM image with visual interpreted fault pattern ofthe Musandam Peninsula.
-42-
4.2.3 Groundwater Discharge in the Umm as Samim Sabkha
The reflection properties of salt covered soils and rocks differ considerably fromother surface phenomena (chapter 4.1.1). It is known that sabkhas of the ArabianPeninsula comprise sandy silt-sized carbonate sediments with certain content ofanhydrite and halite.
Examples of successive evaporation with increasing salt precipitation are given insabkha depressions as it has been demonstrated in the Basalt Aquifer Study(Schaffer, 1994) and in numerous previous published investigations from theESCWA region (e.g. the study of the QATTARA Depression, Study Qattara-Depression, 1979).Satellite images covering the Umm As Samim Sabkha were used to definepossibilities of delineation of groundwater discharge areas and of mapping of thesurface drainage pattern with a view to an assessment of volumes of groundwaterdischarge.
The Umm as Samim Sabkha which is located on the territory of the Sultanate ofOman and in the region of south-eastern Saudi Arabia comprises an area of about10.000 square kilometers (Figure 17). Evaporation from a free water surface in theregion of the central desert area around the Umm as Samim Sabkha is more than3000 mm/a.
The most promising aquifer in the region of the Arabian Peninsula is known as theDammam aquifer. The sabkha which probably is underlain by this aquifer is situatedat the eastern rim of the Rub Al Khali desert (Figure 8).
For a preliminary interpretation one LANDSAT TM scene, path 159 and row 045from 25 Jan 1987, has been chosen in the band combinations 1 -4-7 color codedblue-green-red. This data set has been provided by the GAF in Munich, Germany(as fireplot, scale 1 : 1.000.000) and it was prepared as photo prints, scale 1 :500.000 and 1 . 250.000, in the BGR-Hannover, Germany.
A preliminary satellite interpretation reveals sand-dune covered evaporites north,west and south-west of the central region of the sabkha. To the east and to thenorth-east of the center alluvial gravel plains of the eastern Oman mountains showdrainage patterns (alluvial channels) which give evidence for former surface runoffinto the sabkha.
Nearby the center of the sabkha a paleo-plateau can be delineated (Figure 17).This plateau is covered by evaporites which indicates former water coverageprobably during the humid phase of Late Pleistocene (?) or Early Holocene.Probably, during that time the alluvial channels have been formed. The entire regionof the sabkha originally was filled by water. Due to now existing evaporites and
-43-
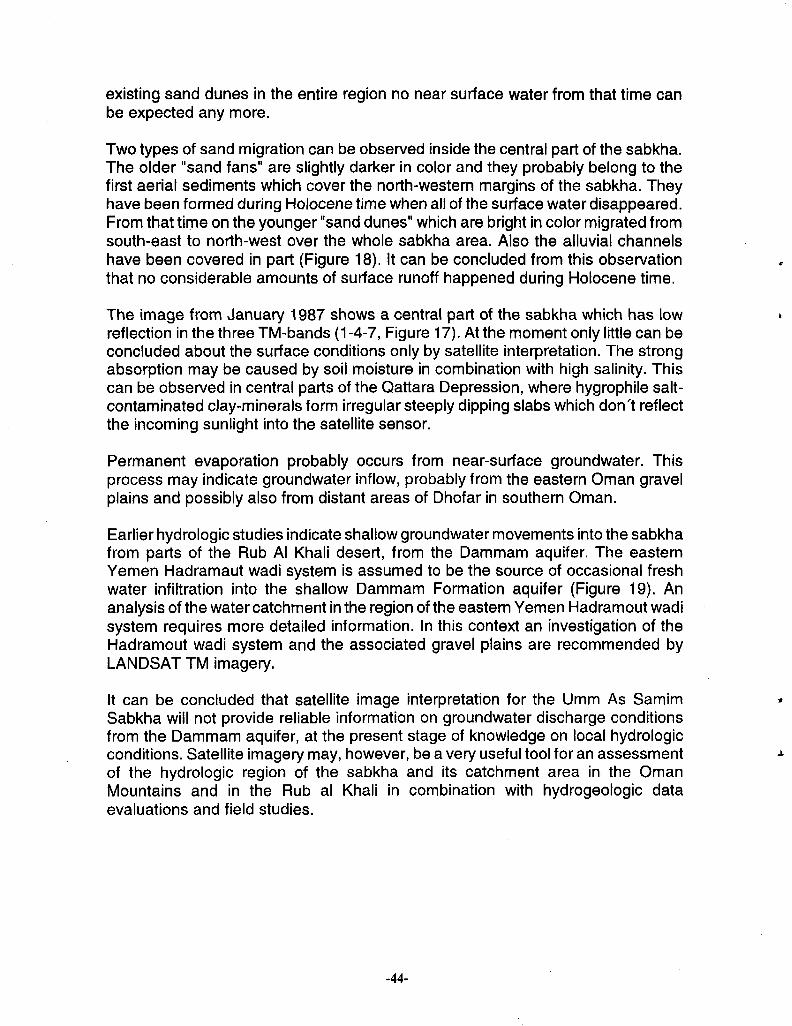
existing sand dunes in the entire region no near surface water from that time canbe expected any more.
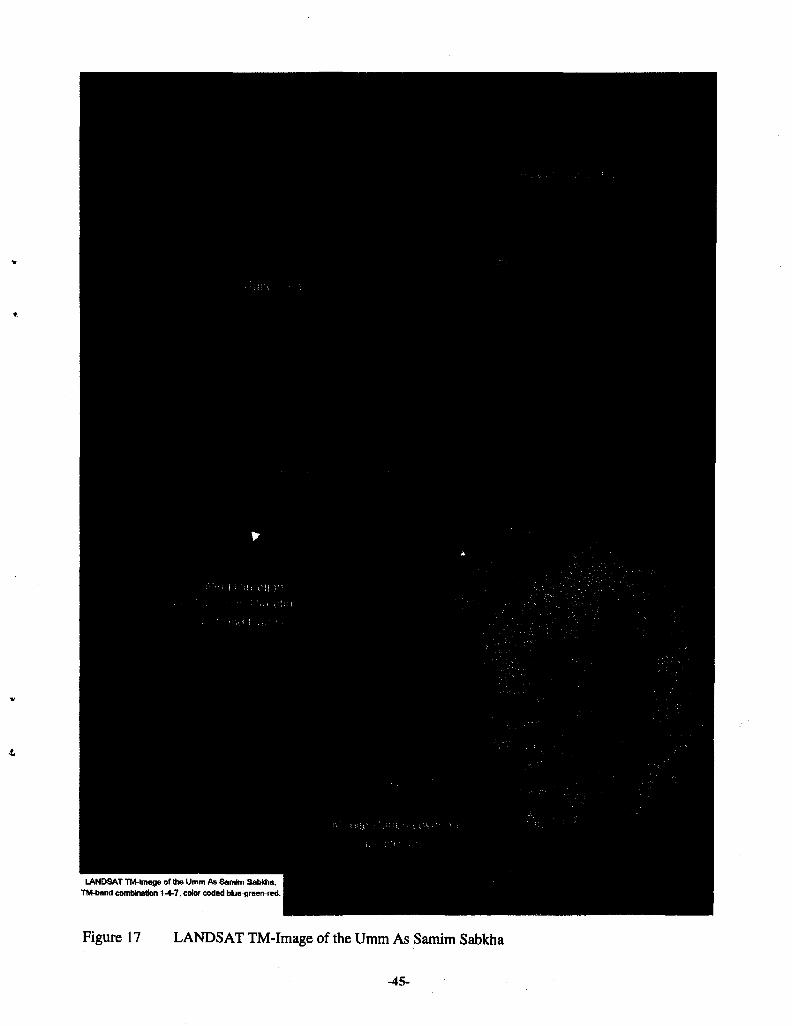
Two types of sand migration can be observed inside the central part of the sabkha.The older "sand fans" are slightly darker in color and they probably belong to thefirst aerial sediments which cover the north-western margins of the sabkha. Theyhave been formed during Holocene time when all of the surface water disappeared.From that time on the younger "sand dunes" which are bright in color migrated fromsouth-east to north-west over the whole sabkha area. Also the alluvial channelshave been covered in part (Figure 18). It can be concluded from this observationthat no considerable amounts of surface runoff happened during Holocene time.
The image from January 1987 shows a central part of the sabkha which has lowreflection in the three TM-bands (1-4-7, Figure 17). At the moment only little can beconcluded about the surface conditions only by satellite interpretation. The strongabsorption may be caused by soil moisture in combination with high salinity. Thiscan be observed in central parts of the Qattara Depression, where hygrophile salt-contaminated clay-minerals form irregular steeply dipping slabs which don't reflectthe incoming sunlight into the satellite sensor.
Permanent evaporation probably occurs from near-surface groundwater. Thisprocess may indicate groundwater inflow, probably from the eastern Oman gravelplains and possibly also from distant areas of Dhofar in southern Oman.
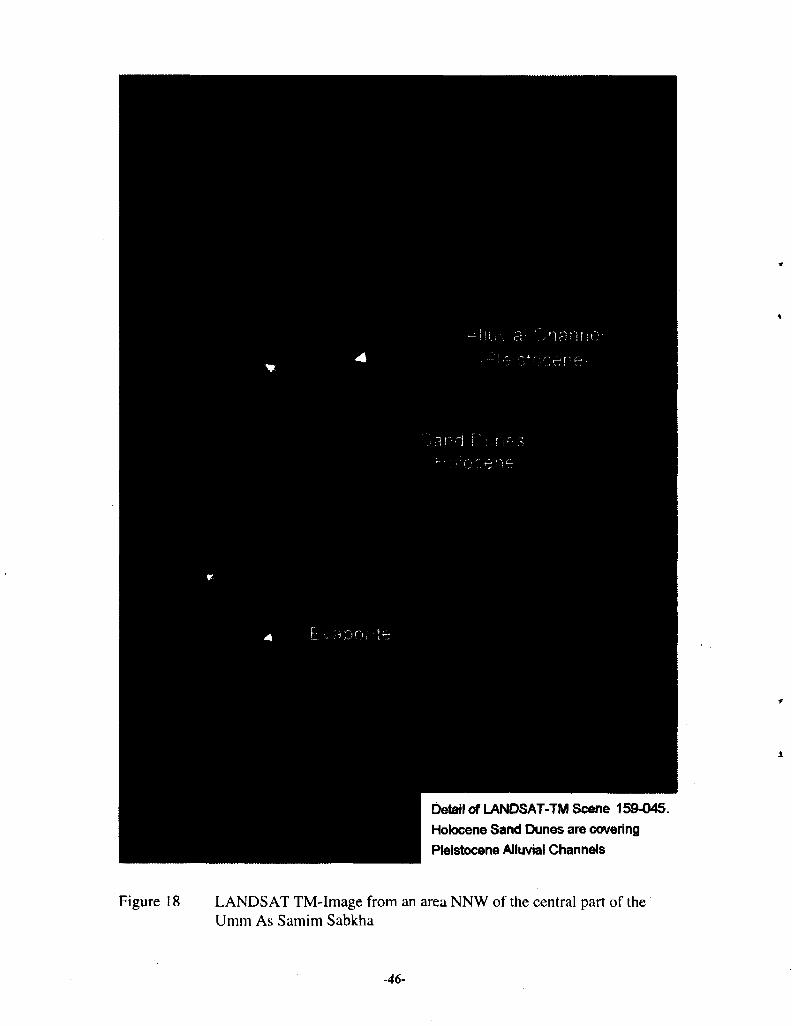
Earlier hydrologic studies indicate shallow groundwater movements into the sabkhafrom parts of the Rub Al Khali desert, from the Dammam aquifer. The easternYemen Hadramaut wadi system is assumed to be the source of occasional freshwater infiltration into the shallow Dammam Formation aquifer (Figure 19). Ananalysis of the water catchment in the region of the eastern Yemen Hadramout wadisystem requires more detailed information. In this context an investigation of theHadramout wadi system and the associated gravel plains are recommended byLANDSAT TM imagery.
It can be concluded that satellite image interpretation for the Umm As SamimSabkha will not provide reliable information on groundwater discharge conditionsfrom the Dammam aquifer, at the present stage of knowledge on local hydrologicconditions. Satellite imagery may, however, be a very useful tool for an assessmentof the hydrologic region of the sabkha and its catchment area in the OmanMountains and in the Rub al Khali in combination with hydrogeologic dataevaluations and field studies.
-44-
LANDSAT TM-Image of the Umm As Samkn Sabkha
Figure 17 LANDSAT TM-Image of the Umm As Samim Sabkha
-45-
Detail of LANDSAT-TM Scene 159-045
Holocene Sand Dunes are covering
Pleistocene Alluvial Channels
Figure 18 LANDSAT TM-Image from an area NNW of the central part of theUmm As Samim Sabkha
-46-
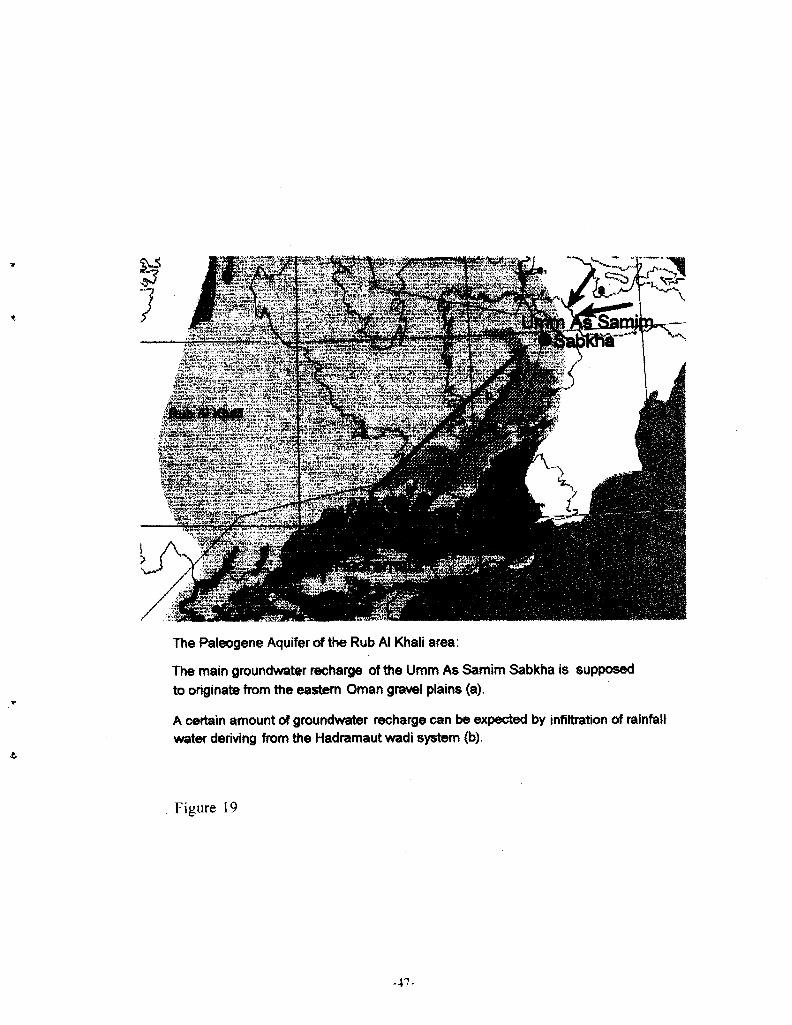
The Paleogene Aquifer of the Rub Al Khali area:
The main groundwater recharge of the Umm As Samim Sabkha is supposed
to originate from the eastern Oman gravel plains (a).
A certain amount of groundwater recharge can be expected by infiltration of rainfallwater deriving from the Hadramaut wadi system (b).
Figure 19
-47-
5. Acquisition and Processing of Satellite Images
In general, nearly all satellite data types can be bought from satellite data suppliers.Numerous world-wide operating governmental and commercial distributers areselling satellite data of different kind. The satellite data originate from groundreceiving stations which are represented by licensed contractors of the satelliteowner. Depending on the different satellite systems they are partly direct read outdata from the satellite which passes the ground-station or they are onboard tape-recorded data which result from one or more orbits (tape-recorded SPOT-lmagedata are currently unavailable, because the on-board tape recorder is out of order).The acquisition data are raw-data or processed data stored on magnetic tapes orcomputer-Disks (CD-Rom). Depending on the image processing system of thecustomer the data type has to be reprocessed by the data distributer or by thecustomer himself. If the customer has no facilities for data processing and/orfacilities for hardcopy production he can order from most of the suppliers readyprocessed hardcopies on photo-paper (satellite images).
The most proper source of satellite data is the existing World-Wide-Web on Internetcommunication. Most distributers offer so called "quicklooks" through the Internetcommunication also to the computer screen of the customer. Predominantly theyare free of charge (except for the Internet and Telephone costs). The archievedquicklooks give an overview of the area of interest and the customer achieves arough overview about the applicability of the offered scene. A comprehensivecollection of available sources of quicklook images and their detailed descriptionsis given in the annexes (chapter 9).
At present time (since 1996) high resolution images from the defense-technologyLANYARD satellite (1963) are archieved by the USGS and for free marketing underthe address: http://edcwww.cr.usgs.gov/dclass/dclass,html
5.1 Satellite Data Types and their Sources
It was mentioned before (chapter 3) that the practical use of different satellite datatypes is directly bound to the thematic questions. With respect to the thematicquestions and the frame of a project, the scale, spatial and spectrometric resolutionand the costs of acquisition have to be taken into consideration. For detailedgeologic/hydrologic studies, scale 1: 250.000 or 1:100.000, at present timeLANDSAT TM, IRS-1A/B/C SPOT Image or JERS data are recommended.
Global or regional vegetation monitoring requires continuous data supply at
-48-
moderate acquisition costs. For that reason the NOAA-AVHRR data arerecommended tools because a swath widths of about 2400 km and a daily coverageis given (annex 10, 10-1, 10-2).
The satellite data can be acquired from Space IMAGING EOSAT, the NationalSatellite Land Remote Sensing Data Archive (NSLRSDA) at the EROS Data Center(EDC), the EURIMAGE directly via EiNet www server (annex 4), and fromInternational Ground Stations. The ESCWA region can be received directly fromground stations in Europe, Arab countries (Riyadh and Cairo) and India. Severalexamples of data acquisition are given in the annexes (chapter 9).
5.1.1 Coverage of Satellite Data with Respect to the ESCWA-Region
Due to the onboard storage of orbital data of most of the operating satellite systemsa nearly world-wide coverage is given. For the ESCWA region direct data read-outs,e.g. SPOT Image, LANDSAT TM and NOAA AVHRR are possible from thereceiving station in Saudi Arabia (King Abdulaziz City for Science and Technology-KACST-, P.O. Box 6086, Riyadh 11442). The south-eastern and the north-westernpart of the ESCWA-region can be directly received from the Indian IRS at groundstations in Germany (Neustrelitz) and India (Shadnagar). The south-western partis not covered (large areas of Saudi Arabia and the western part of the Republic ofYemen). IRS-data of this region are currently unavailable.
The Tracking and Data Relay System (TDRS) is a world-wide operatinggeostationary satellite-borne data relay system which enables the main receivingstations to receive data from every ground of the world.
5.1.2 Resolution Properties and Spectral Features
The optical "passive" sensors of the Japanese JERS give data sets at pixel size of18 m which is sufficient for hydrologic investigations. Spectral properties of thesingle sensor bands are listed in Table 1 and in annex 5.
A particular feature of the JERS Optical Scanner (OPS) is given by thespectrometric resolution intheSWIR-range. JERS bands 6 (2.01 -2.12 urn), 7 (2.13- 2.25) and 8 (2.27 - 2.40 urn) are comparable to LANDSAT TM band 7 (2.08 - 2.35um), but they cover distinct absorption-peaks for differentiation of clay minerals likekaolinite and montmorillonite (2.20 pm) and chlorite, serpentinite and alsocarbonates (2.30 um).
5.1.3 Acquisition of Satellite Data and/or Satellite Images
A comprehensive collection of data- and/or image acquisition sources is given in theannexes (chapter 9). The data can be acquired via www-server or by mail. The most
-49-
important address for nearly all satellite data is the Space IMAGING EOSAT (annex2) and the EROS DATA CENTER (EDC, annex 15), both are based in the U.S.A.Depending on the user defined acquisition date and the area of coverage the datasets have to be ordered from one of the two main distributers (more information islisted in annex 15 -15-1).
Through on-line connections to the digital data catalogues like EURIMAGE (annex4), SPOT IMAGE (annex 6), the German Remote Sensing Data Center-DFD (annex1), the Company for Applied Remote Sensing (GAF, annex 11 and chapter 5.2.1),and to the constantly updated IMAGING EOSAT microfiche catalogue, an on-lineservicercan perform an instant search in these archives, check the availability of scenes andconduct an initial quality control of the data. When a scene is not available from thearchive, or if new images are needed, a special acquisition can be performed byprogramming a satellite to acquire the image needed by the customer.
5.2 Processing Methods of Satellite Data
Due to the specific questions of the application of satellite imagery the dataprocessing has to follow scientific problems. According to hydrological questions,e.g. on a regional scale, 1 :250.000, full or quarter scenes of LANDSAT TM can beprocessed with band combinations 1-4-7, color coded blue-green-red. A geocodedrectification always is recommended. The data distributers offer specific serviceswhich allow all available band combinations and rectifications.
5.2.1 Commercial Processing Services
Most suppliers of satellite data offer processing services and photo prints(hardcopies). The above mentioned Space IMAGING EOSAT and several othergovernmental and commercial distributers offer a wide selection of processingservices. As an example, technical support for image processing can be given byGAF company (annex 11) and by its cooperating hardware-companyGEOSYSTEMS(http://www.geosystems.de/).
Detailed information and a list of companies are given in the annexes (chapter 9).
5.2.2 Costs of Data Acquisition and Processing Services
The costs of data acquisition differ considerably between the different satellitesystems. There are data types which can be received free of charge, e.g. NOAA-AVHRR data through a private receiving station. Others, e.g. LANDSAT TM andSPOT IMAGE cost several thousand US$. Detailed lists of costs are given in the
-50-
annexes (chapter 9).
LANDSAT TM-scenes which have been already previously ordered by the USgovernment and affiliated users (USGAU) from EOSAT for which a copy is in thearchive at Eros Data Center (EDC) are available to UNEP commissionedhydrological remote sensing projects for US$ 150,- per scene (annex 14). UNEPprograms belong to non commercial affiliated users.
6. Recommended Future Earth Observatina Satellite Projects for GroundwaterInvestigations in the ESCWA Region
The future will bring plenty of new satellite and sensor systems which will increasethe possibilities for applied remote sensing techniques assigned to the range ofhydrological questions.
The evolution of new systems and of a wide spectrum of applications is certified(chapter 9).
The data of the active SAR-satellites (Canadian RADARSAT, European ERS SARand the Japanese JERS SAR) and the passive Microwave scanners of severalsatellite systems which have different and wide ranges of spectral bands revealnumerous options in the field of groundwater research activities forthe future. At themoment there is not enough experience with these systems and the futuredevelopment should be observed.
A large area of coverage which is combined with a high repetition rate (so-called"re-visiting") is given for polar orbiting weather satellites. The data of the NOAA-satellites (National Oceanographic and Aeronautic Agency) are currently also usedfor earth-surface observating programs. Onboard the NOAA-satellites the AVHRR-radiometer (Advanced Very High Resolution Radiometer) has a spatial resolution(pixel size) of 1 square kilometer with a spectral resolution from visible red (VIS) tothermal infrared (TIR) in 5 bands. The NOAA-program is planned continuing into thefuture with continuous data supply.
IRS-data (onboard tape-recorded "vegetation index"; the VIS, SWIR and TIRchannels unstored) are distributed by EOSAT and by GAF. Currently the IRS non-recorded data are available only for limited areas of the ESCWA-region (chapter5.1.1). Probably, in the future a total coverage of the entire ESCWA-region will begiven and the application of IRS-data will be a recommended tool for future land-use studies.
Applied remote sensing investigation with respect to hydrologic questions isintensely linked to the identification, classification, and mapping of existingvegetation. LANDSAT TM data (annex 15-1), ERDAS Image Processing (annex21)
-51-
and ARC/INFO-GIS techniques (annex 22) are recommended tools for digitallymapping of existing vegetation and land cover type across large areas in theESCWA-region. A data base layer can be built by integrating multispectralLANDSAT TM data with biophysical data (e.g. vegetation index) in a GIS. Thisprocess contains first manual digitizing and second labeling of polygons, aprocedure used by GIS-working teams in worldwide operating programs, e.g. theEarth Observing System (EOS, annex 20).
The first step of discrimination and classification of vegetation areas can be carriedout as an unsupervised classification of pixels. It uses a specially designedalgorithm to identify spectral groups that simulate the enhanced color composite ofTM-bands 3, 4, and 5. These bands are the most useful for vegetation analysisbecause they generally have the least spectral overlap among other types. In theclassification program, the number of spectral groups is determined by two user-specified criteria:
1. The correlation between a pixel and a reference point in three-dimensional colorspace, and
2. The distance between a pixel and origin (0,0,0) in the color space. The formerseeks to match a pixel's color with the color composite, whereas the latter emulatesits brightness (the farther from the origin, the brighter).
Pixels with similar colors and brightness belong to the same spectral group.
In the first stage, the algoritm employs a two-pass process. The first pass searchesfor pixels that do not meet the above user-specified criteria, defining anotherspectral group whenever either condition is not met. It also randomly selects onepixel to represent each spectral group; with random selection, the probability of agroup being selected is equal to the population size of the group, so none of thelarge groups will be missed. (If a small group is missed, it can be manually addedlater). These randomly-selected "training"-pixels are stored and used in the secondpass to classify pixels into spectral groups. The resulting pixel classification closelyresembles the color composite in appearance. By this method, data are processedmore quickly than with the commonly used ISODATA and MAXIMUM LIKELIHOODclassification methods.
After the second pass, classes are digitally regrouped with some modifications bythe operator (an enormous time saver, because conventional unsupervisedclassification methods require the operator to manually regroup classes). Theclassified image is then smoothened using a filter to remove "salt and pepper"regions. This step improves the physical appearance of the image and greatlyreduces the number of records in the GIS database. The smoothened image thenundergoes an unique merging process to combine small regions with highly similar,larger neighbors, thus creating regions of the desired minimum area.
-52-
The second stage involves classification of regions, rather than individual pixels.The spectral groups are converted into an ARC/INFO GRID file, an attribute tableis built, and attribute values for the different spectral and biophysical variables areassigned to each region. Ground truth data from existing vegetation maps, fieldplots, and aerial photographs are analyzed with spectral and biophysical data(including elevation, slope, aspect, and the other four TM bands) and used for asupervised classification of attributes by a nonparametric method called NEARESTMEMBER of GROUP. The resultant image is labeled according to vegetation covertypes. Because the data are never converted from raster to vector format, many ofthe traditional limitations for building attribute tables are avoided, and large areascan be processed relatively quickly and efficiently.
An approach to monitor salt-affected soils by remote sensing classification methodshas been carried out by Saleh and Saud (1997) in Saudi Arabia with LANDSAT TMdata.
For the future the LANDSAT Program will be continued with the planned LANDSAT7 satellite (currently LANDSAT 5 is operating probably until the Year 2000; annex15 - annex 19).
Several high resolution commercial satellite systems are also planned which willhave pixel sizes less than 1m; e.g. Space Imaging from Locheed MartinCorporation, Quickbird from Earthwatch (Bell Aerospace, Hitachi, NuovaTelespazio) and Orbimage from Orbital Sciences, Saudi Arabia. Future highresolution satellites are planned by France, Israel, Japan, Spain, South-Africa,Russia and the USA.
Nevertheless, as it was mentioned before (chapter 3 and 5.1) the application ofdifferent satellite systems for groundwater studies is limited to the frame of thesingle studies.
The costs of acquisition and the large amount of data are enormous and noteconomical for a general aquifer study, covering an entire area of regional scale;e.g. the "Paleogene Aquifer" which is extending from Syria through the eastern partof Saudi Arabia into the Hadramawt of Yemen, with high resolution satellite data.On the other hand, selected areas should be acquired with future high or moderateresolution data; e.g. LANDSAT TM as it has been practiced in the mentioned casestudies (chapter 4). The entire Paleogene Aquifer of the Arabian Peninsula in totalshould be handled with low resolution data, e.g. with NOAA-AVHRR 1 km pixel size.All these systems are reliable and the future data supply is warranted for severalyears.
-53-
7. Conclusions and Recommendations
In this chapter the results of the present study concerning the applicability of remotesensing methods for groundwater studies and the acquisition properties of remotelysensed data for the member states of the ESCWA-region are summarized.
The countries of the ESCWA region reveal favorable conditions for earthobservation from space. The arid conditions guarrantee low cloud coverage in thedry season and significant vegetation indications during all seasonal periods. Over70% of the region is desert and most parts are lacking sufficient water resourcesand adequate soils to support a settled population.
The application of remote sensing methods in the field of groundwater studies aredemonstrated in an aquifer case study in the basalt region in northern Jordan andsouthern Syria. Based on drainage pattern and the distribution of the Neogenebasalt of the Jabal Al Arab area, groundwater recharge conditions and relationshipsbetween geologic structure and groundwater occurrence at different depth in thebasalt complex,have been delineated by the interpretation of LANDSAT TM-data.
In the area of the Shared Upper Cretaceous Karst Aquifer of Jordan, Syria,Lebanon, and West Bank, intensive urban and rural development can be delineatedby satellite imagery with the aid of actual LANDSAT TM data. Polygon mapping ofclassified areas reveals a rapid increase of settlements and extensive agricultureuse which are as yet not delineated on available geographic maps. Town- andvillage- settlements, rainfall agriculture areas and irrigated areas, soil cover andoutcropping karstified aquifer can be differentiated. This information supports land-use studies with data of the actual situation.
A re-evaluation of the present land cover is recommended for the entire area,because hazards groundwater quality deterioration have to be expected due tointensive land-use nearby the unprotected outcropping aquifer.
On LANDSAT TM image salt covered Paleogene limestone, chalk, marl andevaporite can be observed in the area of the south-eastern desert of Saudi Arabiaand in the Umm as Samim Sabkha of the Sultanate of Oman. Large parts of thesabkha region are covered by recent desert dunes. Where the Paleogene rocks areexposed large salt fields can be delineated. The evaporated area indicates a largeregional depression which was probably covered by water during Pleistocene(?)time. This depression covers large areas of south-east Saudi Arabia. An existingpaleo-coastal line can be interpreted by satellite imagery from a small and flatplateau near the center of the sabkha. The actual situation shows the presentcenter of the depression with indications of moistured soil in combination with highsalinity. Obviously, the hydraulic pressure from saline surface-near groundwatercauses the permanent and successive evaporation. This process may be an
-54-
indicator for a certain fresh groundwater recharge, probably from the eastern Omangravel plains and/or from the far south-western Yemen Hadramaut wadi system(Figure 19). The flat Dammam Formation aquifer is proposed as the most importantaquifer in the region. It is recommended to investigate the Paleogene aquifer rockswhich have been previously delineated in the available geologic maps covering thesurroundings of the present sabkha. Satellite imagery (LANDSAT TM) gives notsufficient information about real existing outcroppings of the Dammam Formation.
Satellite imagery of the North-Oman Mountains (Musandam Peninsula) with its LatePaleozoic until Mesozoic limestone aquifer reveals a tectonic pattern which is notmentioned on existing geologic maps. Two lateral extending major fault systemscan be outlined in the mountainous terrain. Geologic mapping concludes extensiveinternal karstification of the carbonate sequence which reaches several thousandmeters in thickness. In the wadi depressions often nearby crosscutting fault systemssporadic vegetation and existing open water can be observed on LANDSAT TMwhich may indicate certain amounts of near surface fresh water or temporary rainfallrunoffs. Few is known about the internal karstification and the runoff of seasonalrainfall water, but with satellite remote sensing methods a tectonic model can be re-evaluated which might give some hints about the direction of fresh-water runoff (intothe sea or into internal karstified carbonates), or about the rate of groundwaterrecharge. Experiences show that it is nearly impossible to investigate internalstructures of karstified carbonates by satellite remote sensing methods only. Therecommended satellite imagery study is in this context only an approach towardsa geotectonic model and it is recommended to handle any conclusions carefully.
One very important indicator for near surface water is the existing vegetation whichcan be easily distinguished by satellite imagery. Identification and differentiation ofvegetation can be carried out by satellite imagery for the recommended studies ofthe North-Oman mountains, and in the karst aquifer in the region of Jordan, Syria,Lebanon and West Bank
The existing vegetation of the territory of the ESCWA member states reflects theactual situation of desertification and man-made land degradation.
The benefits of remotely sensed data and their thematic applications for hydrologic/-hydrogeologic studies in the ESCWA-region can be summed up as:
-monitoring of vegetation and land-use including crop-estimation,-geologic synoptic overview of a region of interest,-multispectral resolution with selected bands which can be applied for hydrography,
-rapid data access to digital geocoded data files (map-accuracy),-compatibility of digital image data to digital hydrologic thematic data,-large archive of historical data,-cost effective data acquisition.
-55-
This study on Application of Satellite Imagery in ESCWA-states gives hints andrecommendations for problem orientated satellite data acquisitions and application.Regarding the hydrologic questions for monitoring purpose, the spatial and temporalresolution of the available satellite data has to be taken into consideration.
The rules have to be considered,-the higher the resolution the lower the "re-visiting rate" and the higher the costs of
acquisition,- the lower the resolution the higher the "re-visiting rate" and the lower the costs of
acquisition
Due to the facilities and due to the programs of the working groups of the singleESCWA member states the acquisition procedures for satellite data may differ. Thedata can be achieved through mail order from commercial and governmental datacenters or they can be ordered directly via Internet Communication from the maindistributers which are all listed in the annexes (chapter 9). Data characteristics andproper applications, modern simple processing methods, and processing servicesare given.
An archive of satellite images from hydrologic sensitive areas of the ESCWA regionis recommended to be installed at the UN-ESCWA headquarter. Low cost imageprocessing hard- and software is recommended for simple image processing. Apersonal computer which is combined with a f latboard scanner, a color inkjet printerand adequate software enables the hydrologic expert to resemble, to copy and tomodify existing satellite images.
Last information (Space Imaging EOSAT, May/June 1997)
Satellite UpdatesThe Indian IRS-1C, -1B, and P2 satellites are fully functional and downlink data ona regular basis for commercial sale. IRS-1 B and -P2 downlink to Norman, Okla.,and Shadnagar, India, while IRS-1 C data is received at several stations (Seefollowing.)
Space Imaging EOSAT's one- meter remote sensing satellite, the world's firstcommercial satellite with this resolution, is on schedule for launch in late 1997 fromVandenberg Air Force Base, California. It will provide panchromatic imagery withone-meter spatial resolution and 1.5 meter ground accuracy. Resolution will be fourmeters in the multispectral bands.
Landsat 5 continues to collect and transmit data daily to Space Imaging EOSAT'sNorman facility and to 15 ground stations around the world. The satellite is healthyand requires only normal maintenance and operational supervision.
-56-
IRS-1C GroundStation Network GrowingImage data from the three sensors aboard the Indian IRS-1C satellite are beingreceived at ground stations in Norman, Oklahoma, and Shadnagar, India, and atEuromap's Neustrelitz, Germany, facility.
Operators of existing ground stations in Thailand and Taiwan have signedagreements to downlink IRS-IC imagery, and are now preparing their facilities.Ground stations in Japan, South Africa and Australia have agreed in principle toreceive the data and are expected to begin station preparation in early 1997.
Space Imaging EOSAT is in contact with all remaining Landsat ground stations todiscuss downlink arrangements, according to Timothy Puckonus, Space ImagingEOSAT's IRS Program Director.
CARTERRA SamplesEasy To ViewYou don't need an image processing package to view sample CARTERRA imagery.All you need is Windows 95 or Windows 3.1 to display simulated onemeter spaceimagery from the TOPIX CD, now available from Space Imaging EOSAT.
-How to contact Space Imaging EOSAT, annex 13-.
TOPIX is the first in a series of evaluation CDs that enable users to view sampleimage products, plus a host of information about Space Imaging EOSAT, includingthe company's entire Web site (internet connection not required) and corporatevideo.Also on the CD are two viewers: ERDAS IMAGIZER, developed for SpaceImaging EOSAT using functions from ERDAS Inc.'s IMAGINE software, and CityViewer, developed by PADCO Inc. Both IMAGIZER and City Viewer offer the abilityto retrieve images for display, adjust contrast, rescale the image to map coordi-nates, pan and zoom, and measure distances.
Two Transportable Ground Stations Being InstalledSmall ground stations with transportable antennas continue to grow in popularityaround the world.
Terra Systems Inc. of Honolulu, Hawaii, has completed installation of its 5X/Areceiving station at the University of Hawaii in Oahu and has begun tracking anddownlink tests with Landsat 5 and JERS-1. The station has a 5-meter antenna andis capable of receiving data from all current commercial remote sensing satellites.For more information, contact Dick Lunn in Hawaii at 808-539-3745.
-57-
Vexcel Corporation, of Boulder, Colorado, has been contracted by the HiroshimaInstitute of Technology in Japan to provide a complete ground station to receiveremote sensing data from any current commercial satellite. The station will featureVexcel's 3D SAR Processing System and a 7.3-meter antenna. The Institute will usethe station to train the next generation of Japan's environmental researchers inremote sensing techniques.
For information, contact Ron McCoy in Boulder, Colorado, at 303-444-0094.
New Space Imaging EOSAT Online - Browse Fee WaivedSpace Imaging EOSAT's new, integrated Web site is now available atwww.spaceimage.com. The new site includes information about the company afterits merger in November of last year. The Web site also includes enhancedbrowsing capability through the Interactive CARTERRA archive. The new systemis user friendly, rich in size and GROWING. The archive houses approximately225,000 aerially and satellite derived Earth images. Customers are able to accessthe archive FREE OF CHARGE - annual fees have been waived. You can alsoplace product orders directly online.
8. Literature
Abu-Ajamieh, M.M., Bender, F.K., Eicher, R.N., Natural Resources in Jordan,Inventory - Evaluation - Development Program, December 1988, Natural ResourcesAuthority, Amman, Jordan.
ACSAD, Water Resources Map of the Arab Countries, 1 : 1.000.000, The ArabCenter for the Studies of Arid Zones and Dry Lands (ACSAD), Damaskus 1984.
Allison, L.J. and Schnapf, A., Manual of Remote Sensing, 1982.
Al-Naimy, H.M.K., Remote Sensing Techniques for comparative Studies ofWatersheds in selected Basins in the ESCWA Region; in Proceedings of the ExpertGroup Meeting on the Implications of Agenda 21 for Integrated Water Managementin the ESCWA Region, Amman, 2-5 October 1995, 254-297.
Andrews, I.J., Cretaceous and Paleogene Lithostratigraphy in the Subsurface ofJordan, The Hashemite Kingdom of Jordan, Ministry of Energy and MineralResources, Natural Resources Authority, Amman 1992.
Bender, F., Geology of Jordan, Contributions to the Regional Geology of the Earth,Gebr. Borntraeger-Berlin-Stuttgart, 1974.
Bender, F.,On the evolution of the Wadi Araba - Jordan Rift, Geol Jb., B45, 3-20,Hannover 1982.
-58-
Bender, F., Geologic Map of Jordan, 1:500.000 scale, prepared in cooperation withthe Government of Jordan and the Geological Survey of the Federal Republic ofGermany.
Boisvert, J.B., Gwyn, Q.H.L., Chanzy, A., Major, D.J., Brisco, B. and Brown, R.J.,1997, Effect of surface soil moisture gradients on modelling radar backscatteringfrom bare fields, International Journal of Remote Sensing, 18, 1, 153-170.
Boom, G. van den, and Suwwan, O., Report on Geological and Petrological Studiesof the Plateaubasalts in NE-Jordan. Unpublished report, German GeologicalMission in Jordan, Bundesanstaltfur Bodenforschung.ArchivNr. 23715, Hannover,May 1966.
Caselles, V., Delegido, J., Sobrino, J.A. and Hurtado, E., 1992, Evaluation of themaximum evapotranspiration over the La Mancha region, Spain, using NOAAAVHRR data. International Journal of Remote Sensing, 13, 5, 939-946.
De Jong, S.M., Applications of Reflective Remote Sensing for Land DegradationStudies in a Mediterranean Environment. Nederlandse Geografische Studies 177,Utrecht, ISBN 90-6809-191-3.
Dwivedi, R.S., 1996, Monitoring of salt-affected soils of the Indi-Gangetic alluvialplains using principal component analysis, International Journal of Remote Sensing,17,10,1907-1914.
Ehrlich, D., Estes, J.E. and Singh, A., 1994, Applications of NOAA-AVHRR 1kmdata for environmental monitoring. International Journal of Remote Sensing, 15,1,145-161.
El-Baz, F., Utilizing Satellite Images for Ground Water Exploration in Fracture ZoneAquifers, International Conference on Water Resources Management in AridCountries, Muscat, Sultanate of Oman, March 1995, Volume 2, 419-427.
ESCWA, Economic and Social Commission for Western Asia, Water ResourcesAssessment in the ESCWA Region, Using Remote Sensing and GIS Techniques,Final Report, ESCWA, UNEP and IDB, 1996.
Fritz, L.W., 1996, Commercial Earth Observation Satellites (Lockheed MartinCorporation), Ninth United Nations Regional Cartographic Conference for Africa,Addis Ababa, Ethiopia 11-15 November 1996.
Geological Map of the Arabian Peninsula, 1 : 2.000.000, USGS, 1963.
Geologische Karte von Jordanien 1 : 250.000, Blatt Amman, Bundesanstalt furBodenforschung, Hannover 1968.
-59-
Gonzaiez-Alonso, F., Cuevas, J.M., Arbiol, R. and Baulies, X., 1997, RemoteSensing and agricultural statistics: crop area estimation in north-eastern Spainthrough diachronic Landsat TM and ground sample data, International Journal ofRemote Sensing, 18, 2, 467-470.
Gower, J.F.R., 1992, Low cost satellite sensor image reception for NOAA HRPTand other compatible data. International Journal of Remote Sensing, 14, 1,177-181.
Groten, S.M.E., 1993, NDVI-crop monitoring and early yield assessment of BurkinaFaso. International Journal of Remote Sensing, 14, 8, 1495-1515.
Ibrahim, K., The Geological Framework for the Harrat Ash-Shaam Basaltic Super-Group and its Volcanotectonic Evolution, The Hashemite Kingdom of Jordan,Ministry of Energy and Mineral Resources, Natural Resources Authority, Bulletin 25,Amman 1993 (a).
Ibrahim, K., Al Azraq, map sheet 3353I, scale 1 : 50.000. Hashemite Kingdom ofJordan, Narural Resources Authority, National Geol. Map. Project, Amman 1993 (b).
Kramer, H.J., 1991, Earth Observation-Remote Sensing Overview of Missions andSensors, DLR-Bericht, in BGR, Ref. 1.32, Fernerkundung.
Kramer, H.J., 1996, Observation of the Earth and its environment -survey ofmissions and sensors- , ISBN 3-540-60933-4 3rd ed, Springer-Verlag BerlinHeidelberg New York.
A.A. Krasnov, V.G. Kazmin, V.V. Kulakov. Explanatory Notes on the Geological Mapof Syria 1 : 200.000, Syrian Arab Republic, Ministry of Industry. Dept. of Geologicaland Mineral Research, TECHNOEXPORT, USSR, 1966.
Krishnamurthy, J., Kumar, N.V., Jayaraman, V. and Manivel, M., 1996, An approachto demarcate ground water potential zones through remote sensing and ageographical information system, International Journal of Remote Sensing, 17,10,1867-1884.
Kruck, W. and Schaffer, U. (1991): The Geological Map of the Republic of Yemen1:250 000, 8 sheets. - Hannover (Fed. Inst. Geosc. and Nat. Res.).
Maselli, F., Conese, C. and Petkov, V., 1993, Environmental monitoring andcrop forecasting in the Sahel through the use of NOAA NDVI data. A case study:Niger 1986-89. International Journal of Remote Sensing, 14, 18, 3471-3487.
Ponikarov, V.P. et al., The Geology of Syria: Explanatory Notes on the GeologicalMap of Syria 1 : 500.000, Syrian Arab Republic, Ministry of Industry. Dept. of
-60-
Geological and Mineral Research, TECHNOEXPORT, USSR, 1967.
Rizk, Z.S., Alsharan, A.S. and Shindo, S., 1997, Evaluation of GroundwaterResources of United Arab Emirates, in The Third Water Conference, Muscat,Sultanate of Oman, 29 Shawwal-4 Dhol Qada, 1417, 8-13 March, 1997, 95-122.
ROBERTSON RESEARCH GROUP (1990): Republic of Yemen. The NaturalResources Project. Satellite Mapping 1 : 250.000. Technical Report. RobertsonGroup pic, Llandudno, U.K.
Saleh A. Al-Hassoun and Saud A. Taher, A remote sensing approach for monitoringsalt-affected soils: A case study in Saudi Arabia, Civil Engineering Department, KingSaud University, Riyadh, Saudi Arabia, in The Third Gulf Water Conference,Muscat, Sultanate of Oman, 8-13 March, 1997., editor: Water Sciences andTechnology Association, P.O. Box 20018, Manama, Bahrein.
Schaffer, U., 1994, LANDSAT Thematic Mapper Satellite Imagery; the CenozoicVolcanic Field of Jordan and Syria, -a study for the Economic and SocialCommission for Western Asia, ESCWA, Amman, Jordan-, Federal Institute forGeosciences and Natural Resources, Hannover, Germany, unpublished report.
Shimabukuro, Y.E, Carvalho, V.C. and Rudorff, B.F.T., 1997, NOAA-AVHRR dataprocessing for the mapping of vegetation cover, International Journal of RemoteSensing, 18,3,671-678.
Study Qattara-Depression, 1979, Geological Sketch Map of the Egyptian WesternDesert, 1 : 1.000.000, Ministry of Electricity and Energy, Qattara Project Authority,Arab Republic of Egypt.
Tucker, C.J., 1979, Red and photographic infrared linear combinations formonitoring vegetation. Remote sensing Environ., 8, 127.
Vrba, J. and Zaporozec, A., 1994, Guidbook on mapping groundwatervulnerability.International Contributions to Hydrology, 16, Hannover.
Wagner, W. and Kruck, W., Report on Activities and Results in the Field of Geologyand Hydrogeology, 1978 - 1982, Part 11-1, Geology of the Hamad Region,unpublished report of the Federal Institute for Geosciences and Natural Resources,BGR, Hannover; in cooperation with The Arab Center for the Studies of Arid Zonesand Dry Lands -ACSAD-, Damascus, 1982.
Wagner, W., Thematic Mapping for Development and Management of SharedWater Resources in the ESCWA Region, Ninth United Nations RegionalCartographic Conference for Africa, Addis Ababa, 11-15 November 1996.
-61-
Yang, X., Zhou, Q. and Melville, M. 1997, Estimating local sugarcaneevapotranspiration using Landsat TM image and a VITT concept, InternationalJournal of Remote Sensing, 18, 2, 453-460.
9. List of Annexes:
The list of annexes contains information from July 1997 about existing satellitesystems, acquisition forms of satellite data and addresses of governmental andcommercial satellite data suppliers.
9.1 Explanatory Notes
The information which is given in the list of annexes has been collected from anINTERNET research study. Most of the printouts have been directly downloadedform the network.
All satellite data suppliers are present in the worldwide network. They offeracquisition forms and they give hints for applications of satellite remote sensing.The annexes contain the necessary information for an order of satellite data. Theycan be understood as a guideline and an information catalog. As it has beenmentioned before, depending on the specific thematic questions, a satellite systemand a regional or an international data-supplier has to be choosen. If this has beendone, the aquisition form can be ordered by telephone or fax. For this procedure anINTERNET connection is not absolutely necessary.
The reader must be reminded that due to improving technologies it is recommendedhere that the present guideline through the offers and applications of remotelysensed data should be updated continiously.
Annex 1 gives an overview of the German Aerospace Research Establishment(DLR) and its associated members. Although information about the radar satelliteX-SAR and a quicklook are attached.
Annex 2 informs about addresses of the Space Imaging Eosat satellite datadistributer and about selected current satellite constellations.
Annex 3 presents the Earth Watch Incorporated satellite data distributer.
Annex 4 contains information about quicklooks and E-mail addresses of theEurimage satellite data distributer.
Annex 5 gives a comprehensive overview of available satellite data, application,
-62-
technical data, acquisition and prices from the Australian Centre for RemoteSensing (ACRES).
Annex 6 contains data of the French satellite Spot Image and addresses of localsatellite data distributers.
Annex 7 , annex 8 and annex 9 give Internet-addresses and current activities of theEuropean data center Eurimage, the Japanese satellite JERS and the NOAA-AVHRR weather satellite.
Annex 10 is a comprehensive file which contains plenty of data about the AdvancedVery High Resolution Radiometer (AVHRR) and its application.
Annex 11 informs about the German Company for Applied Remote Sensing (GAF),its activities and contact addresses.
Annex 12 gives an example of an archive system which is currently developed atthe German Federal Institute for Geosciences and Natural Resources (BGR,Hannover).
Annex 13 provides information about access to LANDSAT data through contactaddresses of the US EROS Data center and the Space Imaging Eosat company.
Annex 14 informs about the current status of the agreement between LANDSATProgram Management and EOSAT Corporation concerning pricing.
Annex 15 gives general data of the USGS EROS Data Center, programs and itpresents the USGS Global Land Information System (GLIS). GLIS contains a seriesof routinely updated global land information.
Annex 16 describes LANDSAT TM Imagery in general and contact addresses ofsatellite data distributers are given.
Annex 17 describes LANDSAT TM data and its applications. Additionally acomprehensive description about the physical properties of the TM data-structureis given.
Annex 18 presents forms for LANDSAT TM data acquisition and an example ofsearch criteria is attached.
Annex 19 describes the international currently operating ground stations whichreceive LANDSAT TM data.
Annex 20 gives information about the organisation of the worldwide operating EarthObservating System (EOS). The EOS is connected to the entire data archives.
-63-
Annex 21 informs about the most prominent ERDAS Image Processing systemwhich is distributed worldwide. Addresses of local distributers of the ESCWA regionare attached.
Annex 22 informs about the Arc-Info GIS. Addresses of local distributers areattached.
-64-

Annex 1 German Aerospace Research Establishment (DLR)German Remote Sensing Data Center (DFD)X-SAR User KitX-SAR Datatakes, Sorted by Geographical CoordinatesX-SAR Datatakes and Quicklooks, Sorted by Geographical Coordinates185 X-SAR Quicklooks of ESCWA-RegionX-SAR Quicklook Screen-Printout from Azraq spring field of Jordan
Annex 1-1 Information Catalog: DLR
Annex 2 EOSAT- Space ImagingSummary of Current Satellite ConstellationsMapping Alliance Program (MAP)
Annex 2-1 Information Catalog: EOSAT
Annex 3 Earth Watch Incorporated
Annex 4 Ei Net WWW server
Quick Looks (description of quick looks)Eurimage
- on line services: ApplicationsZooming into the ESCWA Region
Annex 5 Australian Centre for Remote Sensing (ACRES)About Remote SensingRemote Sensing Products and ServicesACRES Products and Services IndexACRES Landsat TM Price ListACRES SPOT Price ListSatellite - ERSACRES ERS SAR Price ListSatellite - JERSEOSAT JERS Price ListSatellites - Indian Remote Sensing Satellite (IRS)EOSAT IRS Price List
Annex 6 Commercial Network Organisation SPOT IMAGESystem Exploitation - Receiving StationsLocal Distributors (ESCWA-Region)
Annex 7 Information Catalog: Eurimage
-65-
Annex 8 Information Catalog: JERS
Annex 9 Information Catalog: NOAA and NOAA-AVHRR
Annex 10 AVHRR-data collection:SummaryAttributesData CenterPersonnelReference
Annex 10-1 Advanced Very High Resolution Radiometer (AVHRR)BackgroundExtent of CoverageAcquisition
Processing StepsData Characteristics
Spatial ResolutionTemporal CoverageSpectral Range
Data OrganizationData Availability
Procedures for Obtaining DataProducts and Services
Applications and Related Data SetsReferences
Appendix -data types and selection parameters-
Annex 10-2 Advanced Very High Resolution Radiometer Search Criteria
Annex 11 The Company for Applied Remote Sensing (GAF)Gesellschaft fiir Angewandte Fernerkundung GAF mbHLeonrodstr. 68, D-80636 Miinchen, Tel. 089-1211528-0
Annex 12 Digitales Nachweissystem fiir Satellitenbilddaten (DNS) of theFederal Istitute for Geosciences and Natural Resources (BGR,
Hannover)
- currently the description is available only in German language-
Annex 13 Access to Landsat Data in the USA and from Non-US GroundStations Eros Data Center on-line catalog systemsHow to contact Space Imaging Eosat
-66-
Annex 14 Current Status and Summary of Agreement between LANDSATProgram Management and EOSAT Corporation on Cost andReproduction Rights for LANDSAT 4/5 Thematic Mapper Data
USGAU - US Government and Affiliated Users
Annex 15 The USGS EROS Data Center (USGS EDC)USGS Special Project ImagesUSGS Products and ServicesUSGS Products Available from the USGS EROS Data Center-Global Hydrologic Data-GLIS - USGS EDC Global Land Information System
Annex 15-1 The USGS EROS Data CenterA Brief History of the LANDSAT ProgramCharacteristics of the LANDSAT SystemCharacteristics of LANDSAT DataApplications of LANDSAT Data
Annex 15-2 Information Catalog: EROS DATA CENTER
Annex 16 LANDSAT Thematic Mapper ImagerySummaryAttributesData CenterPersonnelReference
Annex 17 Thematic Mapper Landsat DataBackgroundExtent of CoverageAcquisition
Processing StepsData Characteristics
Spatial ResolutionTemporal CoverageSpectral Range
Data OrganizationData Availability
Procedures for Obtaining DataProducts and Services
Applications and Related Data SetsReferencesAppendix
-67-
Annex 18 USGS Thematic Mapper Landsat Data: Search CriteriaGeographic CoverageAcquisition DatePath/Row SearchCloud Cover
LANDSAT Data Dictionary
Annex 19 LANDSAT Ground Station Operations Working Group(LGSOWG) TM
BackgroundExtent of CoverageAcquisition
Processing StepsData Characteristics
Spatial ResolutionTemporal CoverageSpectral Range
Data OrganizationData Availability
Procedures for Obtaining DataProducts and Services
Applications and Related Data SetsReferencesAppendix
Annex 20 The Earth Observing System (EOS) World Wide Web-Information Server-
The EOS Distributed Active Archive Center (DAAC)
Annex 21 ERDAS IMAGE PROCESSINGERDAS IMAGINE 8.3 Platform Specifications
ERDAS Africa and Middle East Distributers
Annex 22 Arc-Info GIS Techniques
ESRI (Arc-Info Company)ESRI HeadquartersInternational Distributers AfricaInternational Distributers Asia
-68-

Annex 1 Gennan Aerospace Research Establishment (DLR)Gennan Remote Sensing Data Center (DFD)X-SAR User KitX-SAR Datatakes, Sorted by Geographical CoordinatesX-SAR Datatakes and Quicklooks, Sorted By Geographical Coordinates185 X-SAR Quicklooks of the ESCWA RegionX-SAR Quicklook Screen-Printout from Azraq spring field of Jordan
-69-
DeutscheForschungsanstalt
und Raumfahrt "e'.V. German Aerospace Research Establishment
Welcome to DFDThe German Remote Sensing Data Center (Deutsches Fernerkundungsdatenzentrum) DFD acts as a national infrastructure for remote sensing(especially earth observation) and focuses on the tasks acquisition of data, user oriented pre-processing, archiving and data storage, non-commercialdata distribution and promotion of remote sensing applications.
Willkommen im DFDDas Deutsche Fernerkundungsdatenzentrum nimmt die Aufgabe als nationale Infrastruktur fur Femerkundung (insbesondere Erdbeobachtung) wahrund ist mit den Aufgaben Datenbeschaffung, nutzerorientierte Vorprozessierung, Archivierung und Datenspeicherung, nicht-kommerzielleDatenverteilung sowie der Forderung von Fernerkundungsanwendungen betraut.
Deutsche Forschungsanstalt fur Luft- und RaumfahrtDeutsches FernerkundungsdatenzentrumOberpfaffenhofenD-82234 WeBlingFax: +49 (0)8153 28-1137
e-mail: [email protected]
Welcome to the X-SAR User Kit!Edited by Michael Eineder and Hartmut Runge
(c) DLR/DFD, all rights reserved
Figure: The first X-SAR scene ever processed: Kamchatka /Russia
What you get with this X-SAR User Kit
about 5700 geographical maps showing the ground coverage... here is a sampleinstructions how to order the full resolution products at DLRdocuments describing the product types and their qualitymore than 14000 image quicklooks (precision images with reduced resolution)... have a look at one4 full resolution sample products in CEOS format (320 MB, only on CD-ROM Version)
Starting Points into the User Kit
Simply navigate through the User Kit by selecting the blue, underlined references:
• Coverage of both missions (works best with (c) Netscape 2.0 and JAVA)
• Coverage maps of all data takes• Ordering products at DFD• DLR documents concerning products• Sample Products in CEOS Format
Our Motivation
DARA and DLR are promoting the application of X-SAR data. In this User Kit you will find all necessary information about the project, the acquireddata, documents and order forms. Furthermore, you will find a representative selection of images which you are invited to browse through.
However the space on this User Kit is limited and the number of processed images is daily growing. The Intelligent Satellite Information System(ISIS) allows you to access the complete, up-to-date DFD data catalog using advanced query methods.
Additional information:
• X-SAR Related Notes, Documents and Publications• List of Contact Addresses• ISIS, die Intelligent Satellite Information System• The Most Important World Wide Web Locations for the SIR-C/X-SAR Missions
The Data Takes
The SIR-C / X-SAR data have been acquired in units of so called 'data takes' which are named by the major test site like 'Oberpfaffenhofen'. Thedata takes may be thousands of kilometers long and therefore span whole continents. On the other hand the X-SAR swath is quite narrow, typically30km. The test sites have been acquired several times on ascending or descending orbits and with different radar parameters like resolution modes andincidence angles.
The instrument was switched on well before the test site at the so called 'DT start time'. It hit the test site at the so called 'closest approach time'and was switched off at the 'DT stop time'.
On this User Kit we provide you with the complete X-SAR data take coverage plots showing you which areas have been acquired. They are sorted bycoordinates and the by two missions. The latter two are furthermore sorted by the name of the data take, the Site ED and by acquisition time.
The Site IDAll SIR-C / X-SAR test sites have been assigned a three-character Site ID. The first character of the Site ED indicates the primary discipline of theinvestigations:
C - CalibrationE = EcologyG - GeologyH - HydrologyM - Electromagnetic TheoryN - OceanographyT - Targets of Opportunity
The second character of the Site ID is used to designate if the site is a Supersite (S), Backup Supersite (B) or Non-Supersite (any other character). Thethird character of the Site ID is used to distinguish between different site coverages (e.g. ascending or descending orbits).
A good overview about the test sites and the science investigations can be found in the JPL Publication 93-29, Dec. 15,1993, "SIR-C / X-SARMission Overview".
X-SAR Datatakes, Sorted by Geographical CoordinatesAll data of both X-SAR missions is accessible via geographical coordinates. Quicklooks and unprocessed data are presorted in tiles of 10 x 10degrees.
If your browser supports client-side image maps (Netscape 2.0 and Explorer do) you may click directly on a tile in the world map. If your browserdoes not yet support client-side image maps you have to select your tile from a sorted list.
*!
X-SAR Datatakes and Quicklooks, Sorted by GeographicalCoordinatesLongitude : 030 ... 40 deg / Latitude : 030 ... 40 deg
Back to world map I Printable version of this page
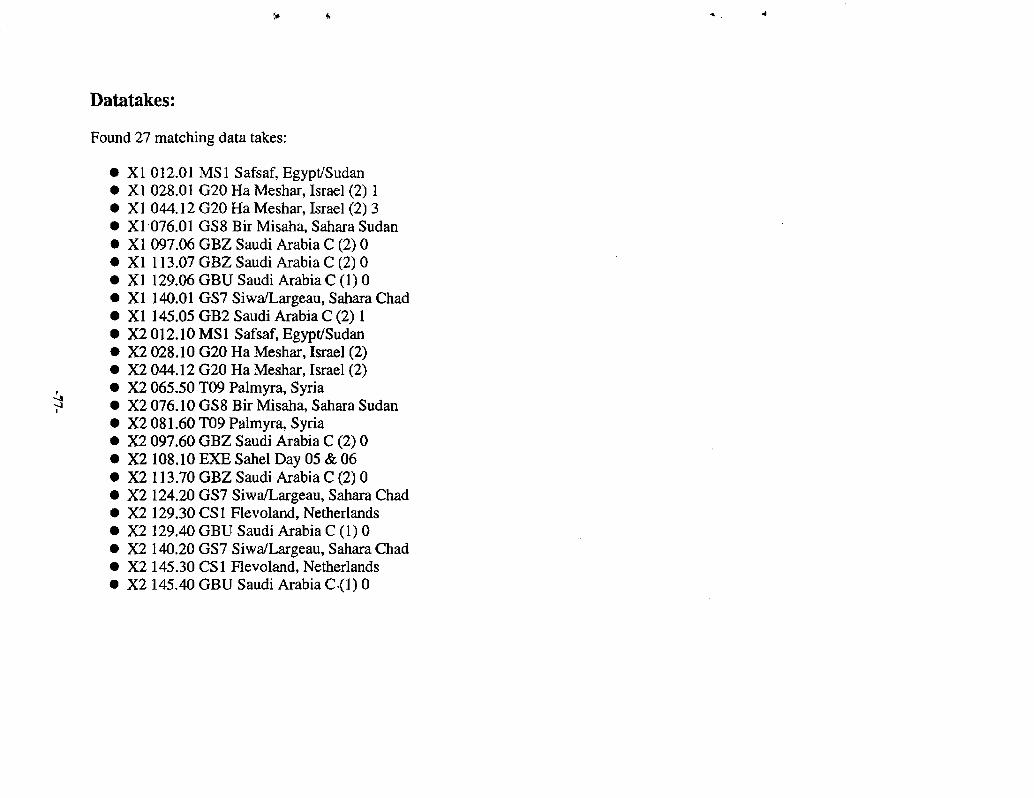
Datatakes:
Found 27 matching data takes:
XI 012.01 MSI Safsaf, Egypt/SudanXI 028.01 G20 Ha Meshar, Israel (2) 1XI 044.12 G20 Ha Meshar, Israel (2) 3XI 076.01 GS8 Bir Misaha, Sahara SudanXI 097.06 GBZ Saudi Arabia C (2) 0XI 113.07 GBZ Saudi Arabia C (2) 0XI 129.06 GBU Saudi Arabia C (1) 0XI 140.01 GS7 Siwa/Largeau, Sahara ChadXI 145.05 GB2 Saudi Arabia C (2) 1X2 012.10 MSI Safsaf, Egypt/SudanX2 028.10 G20 Ha Meshar, Israel (2)X2 044.12 G20 Ha Meshar, Israel (2)X2 065.50 T09 Palmyra, SyriaX2 076.10 GS8 Bir Misaha, Sahara SudanX2 081.60 T09 Palmyra, SyriaX2 097.60 GBZ Saudi Arabia C (2) 0X2 108.10 EXE Sahel Day 05 & 06X2 113.70 GBZ Saudi Arabia C (2) 0X2 124.20 GS7 Siwa/Largeau, Sahara ChadX2 129.30 CS1 Flevoland, NetherlandsX2 129.40 GBU Saudi Arabia C (1) 0X2 140.20 GS7 Siwa/Largeau, Sahara ChadX2 145.30 CS1 Flevoland, NetherlandsX2 145.40 GBU Saudi Arabia C<1) 0
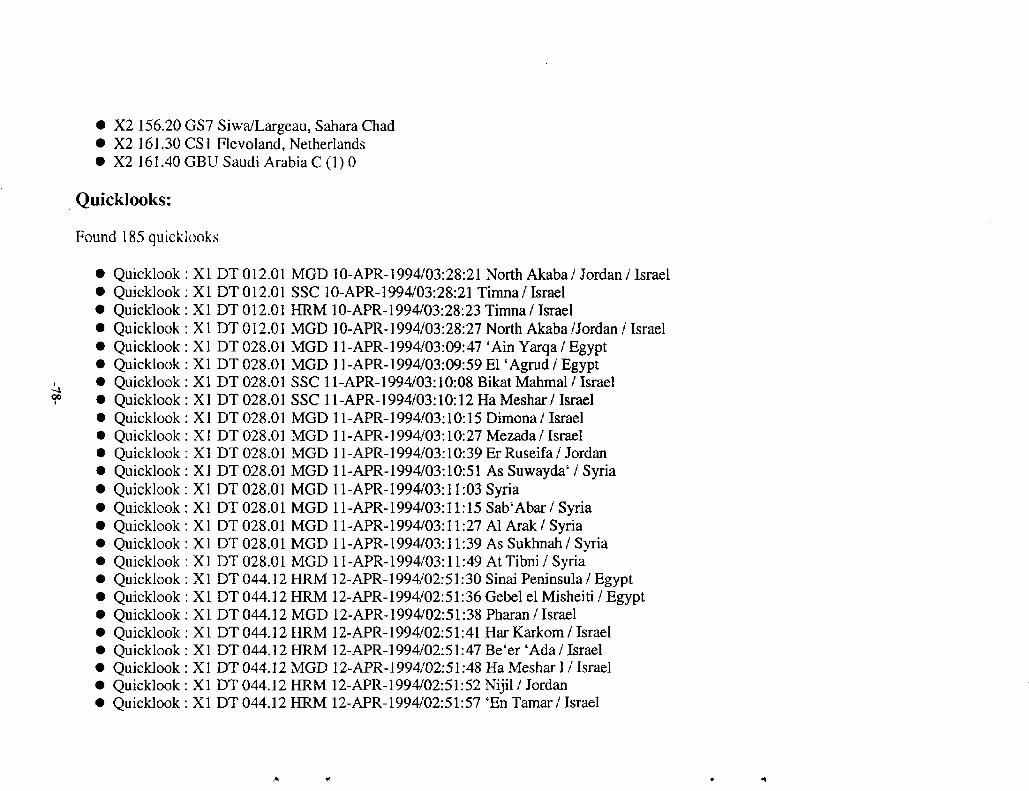
• X2 156.20 GS7 Siwa/Largeau, Sahara Chad• X2 161.30 CS1 Flevoland, Netherlands• X2 16I.40GBU Saudi ArabiaC(l)0
Quicklooks:
Found 185 quicklooks
Quicklook: XI DT 012.01 MGD 10-APR-1994/03:28:21 North Akaba / Jordan / IsraelQuicklook : XI DT 012.01 SSC 10-APR-1994/03:28:21 Timna / IsraelQuicklook : XI DT012.01 HRM 10-APR-1994/03:28:23 Timna/IsraelQuicklook : X1 DT 012.01 MGD 10-APR-1994/03:28:27 North Akaba /Jordan / IsraelQuicklook : XI DT028.01 MGD ll-APR-1994/03:09:47 'Ain Yarqa/EgyptQuicklook : XI DT 028.01 MGD 1 l-APR-1994/03:09:59 El 'Agrud / EgyptQuicklook : XI DT 028.01 SSC 1 l-APR-1994/03:10:08 Bikat Mahmal / IsraelQuicklook : XI DT 028.01 SSC 11-APR-1994/03:10:12 Ha Meshar / IsraelQuicklook: XI DT 028.01 MGD 11-APR-1994/03:10:15 Dimona/IsraelQuicklook : XI DT 028.01 MGD 11-APR-1994/03:10:27 Mezada/ IsraelQuicklook: XI DT028.01 MGD ll-APR-1994/03:10:39ErRuseifa/JordanQuicklook: XI DT 028.01 MGD ll-APR-1994/03:10:51 As Suwayda'/ SyriaQuicklook: XI DT 028.01 MGD 11-APR-1994/03:11:03 SyriaQuicklook: XI DT028.01 MGD ll-APR-1994/03:! 1:15 Sab'Abar/SyriaQuicklook: XI DT 028.01 MGD ll-APR-1994/03:ll:27 AlArak/SyriaQuicklook: XI DT 028.01 MGD ll-APR-1994/03:ll:39 As Sukhnah/SyriaQuicklook: XI DT 028.01 MGD ll-APR-1994/03:ll:49 At Tibni / SyriaQuicklook : X1 DT 044.12 HRM 12-APR-1994/02:51:30 Sinai Peninsula / EgyptQuicklook : XI DT 044.12 HRM 12-APR-1994/02:51:36 Gebel el Misheiti / EgyptQuicklook: XI DT044.12MGD 12-APR-1994/02:51:38 Pharan / IsraelQuicklook: XI DT 044.12 HRM 12-APR-1994/02:51:41 Har Karkom / IsraelQuicklook : XI DT044.12 HRM 12-APR-1994/02:51:47 Be'er 'Ada/.IsraelQuicklook : XI DT 044.12 MGD 12-APR-1994/02:51:48 Ha Meshar I / IsraelQuicklook : XI DT 044.12 HRM 12-APR-1994/02:51:52 Nijil / JordanQuicklook: XI DT044.12HRM 12-APR-1994/02:51:57 'EnTamar/Israel
Quicklook: XI DT044.12MGD 12-APR-1994/02:51:59 Ha Meshar II / IsraelQuicklook : XI DT 044.12 MGD 12-APR-1994/02:51:59 Ha Meshar II / IsraelQuicklook : XI DT044.12HRM 12-APR-1994/02:52:04Samara/JordanQuicklook : XI DT 044.12 HRM 12-APR-1994/02:52:09 Museitiba/ JordanQuicklook : XI DT 044.12 HRM 12-APR-1994/02:52:16 Qasr Mushash/ JordanQuicklook: XI DT 044.12 HRM 12-APR-1994/02:52:21 Syrian Desert / JordanQuicklook : XI DT 044.12 HRM 12-APR-1994/02:52:27 Tell Refa'i / JordanQuicklook : XI DT 044.12 HRM 12-APR-1994/02:52:34 Syrian Desert / SyriaQuicklook : XI DT 044.12 HRM 12-APR-1994/02:52:39 Syrian Desert / SyriaQuicklook : XI DT 044.12 HRM 12-APR-1994/02:52:45 Syrian Desert / SyriaQuicklook : XI DT 044.12 HRM 12-APR-1994/02:52:51 Rummana / SyriaQuicklook: XI DT 044.12 HRM 12-APR-1994/02:52:57 SyriaQuicklook : XI DT 044.12 HRM 12-APR-1994/02:53:03 SyriaQuicklook : XI DT 044.12 HRM 12-APR-1994/02:53:09 Bi'r Hajal / SyriaQuicklook : XI DT 044.12 HRM 12-APR-1994/02:53:15 Bi'r Najib / SyriaQuicklook : XI DT 044.12 HRM 12-APR-1994/02:53:21 Bi'ar Ghabaqhib / SyriaQuicklook : XI DT 044.12 HRM 12-APR-1994/02:53:27 SyriaQuicklook : XI DT 044.12 HRM 12-APR-1994/02:53:33 SyriaQuicklook : XI DT 044.12 HRM 12-APR-1994/02:53:36 Jabal Ma*zah / SyriaQuicklook : XI DT 076.01 MGD 14-APR-1994/02:12:46 Bir Abu Darag/EgyptQuicklook: XI DT 076.01 MGD 14-APR-1994/02:12:58 Bir el Tawil / EgyptQuicklook: XI DT076.01 MGD 14-APR-1994/02:13:10BirRodSalim/EgyptQuicklook: XI DT076.01 MGD 14-APR-l994/02:13:22RafahSta/EgyptQuicklook: XI DT076.01 MGD 14-APR-1994/02:13:26Karmiyya/IsraelQuicklook: XI DT 097.06 MGD 15-APR-1994/09:40:19 South Aleppo/SyriaQuicklook: XI DT 097.06 MGD 15-APR-1994/09:41:05 Al Umchaimin / IraqQuicklook : XI DT 113.07 MGD 16-APR-1994/09:19:38 South Aleppo / SyriaQuicklook : XI DT 113.07 MGD 16-APR-1994/09:19:38 Ar Ruwaydah / SyriaQuicklook : XI DT 113.07 MGD 16-APR-1994/09:19:40 'Uqayribat/ SyriaQuicklook : XI DT 113.07 MGD 16-APR-1994/09:19:52 Tiyas / SyriaQuicklook : XI DT 113.07 MGD 16-APR-1994/09:20:04 Bi'r al Halba/ SyriaQuicklook : XI DT 113.07 MGD 16-APR-1994/09:20:16 SyriaQuicklook : XI DT 113.07 MGD 16-APR-1994/09:20:27 Al-Anbar / Iraq
00
9
Quicklook : XI DT 113.07 MGD 16-APR-1994/09:20:40 Maqar an Na'am/Iraq/Saudi ArabiaQuicklook : XI DT 145.05 MGD 18-APR-1994/08:37:10 LibanonQuicklook : XI DT 145.05 MGD 18-APR-1994/08:37:10 Jbail/ LebanonQuicklook : XI DT 145.05 MGD 18-APR-1994/08:37:12 Harfel el Mreffi / LebanonQuicklook: XI DT 145.05 MGD 18-APR-1994/08:37:18 Damaskus / SyriaQuicklook : XI DT 145.05 MGD 18-APR-1994/08:37:24 Tall at Asfar/SyriaQuicklook: XI DT 145.05 MGD 18-APR-1994/08:37:36 Syrian Desert / SyriaQuicklook : XI DT 145.05 MGD 18-APR-1994/08:37:48 Zatab ash Shamah / Saudi ArabiaQuicklook : XI DT 145.05 MGD 18-APR-1994/08:37:59 'Aqran/ Saudi ArabiaQuicklook: XI DT 145.05 MGD 18-APR-l994/08:38:12 ArRaha/ Saudi ArabiaQuicklook : XI DT 145.05 MGD 18-APR-1994/08:38:24 Ath Thayat / Saudi ArabiaQuicklook : XI DT 145.05 MGD 18-APR-1994/08:38:25 Harrat/ Saudi ArabiaQuicklook : XI DT 145.05 MGD 18-APR-1994/08:38:36 Al Jawf / Saudi ArabiaQuicklook: X2 DT 012.10 HRM 01-OCT-1994/03:39:39 An-Nafud/ Saudi ArabiaQuicklook: X2 DT 012.10 HRM 01-OCT-1994/03:39:45 JordanQuicklook : X2 DT 012.10 HRM 01-OCT-1994/03:39:51 JordanQuicklook : X2 DT 012.10 HRM 01-OCT-1994/03:39:58 Al'Isawiyah / Saudi ArabiaQuicklook : X2 DT 012.10 HRM 01-OCT-1994/03:40:03 An-Nafud / Saudi ArabiaQuicklook : X2 DT 012.10 HRM 01-OCT-1994/03:40:10 An-Nafud / Saudi ArabiaQuicklook: X2 DT 012.10 HRM 01 -OCT-1994/03:40:15 An-Nafud / Saudi ArabiaQuicklook : X2 DT 012.10 HRM 01-OCT-1994/03:40:22 Umm Wa'al / Saudi ArabiaQuicklook : X2 DT 012.10 HRM 01-OCT-1994/03:40:27 An-Nafud / Saudi ArabiaQuicklook : X2 DT 012.10 HRM 01-OCT-1994/03:40:33 Syrian Desert, Al-Anbar / IraqQuicklook : X2 DT 012.10 HRM01-OCT-1994/03:40:39 Al-Anbar / IraqQuicklook: X2 DT 012.10 HRM 01-OCT-1994/03:40:45 Ubaila / IraqQuicklook :X2DT 012.10 HRM 01-OCT-1994/03:40:51 Al-Anbar / IraqQuicklook : X2 DT 028.10 MGD 02-OCT-1994/03:20:53 Gebel Umm Mafrud / EgyptQuicklook : X2 DT 028.10 MGD 02-OCT-1994/03:21:02 Har Gerofit / IsraelQuicklook : X2 DT 028.10 MGD 02-OCT-1994/03:21:05 Gebel Suweiqa / EgyptQuicklook : X2 DT 028.10 MGD 02-OCT-1994/03:21:13 Jebel Mas'uda / JordanQuicklook : X2 DT 028.10 MGD 02-OCT-1994/03:21:21 Jebel el Ata'ita/ JordanQuicklook : X2 DT 028.10 MGD 02-OCT-l994/03:21:33 Jeb.er Ruweifa / JordanQuicklook : X2 DT 028.10 MGD 02-OCT-1994/03:21:45 El Azraq / Jordan
Quicklook : X2 DT028.10 MGD 02-OCT-1994/03:21:57 Tal Misma/ JordanQuicklook : X2 DT 028.10 MGD 02-OCT-1994/03:22:09 Bazounya / LebanonQuicklook: X2DT 028.10 MGD 02-OCT-1994/03:22:21 Badiyat / SyriaQuicklook : X2 DT 028.10 MGD 02-OCT-1994/03:22:33 Bi'r al Marba'ah / SyriaQuicklook : X2 DT 028.10 MGD 02-OCT-l 994/03:22:45 Bi'r Muwaylih / SyriaQuicklook : X2 DT 044.12 MGD 03-OCT-1994/03:02:16 Gebel el Gharra/ EgyptQuicklook : X2 DT 044.12 MGD 03-OCT-1994/03:02:28 Gebel el Saisib/ EgyptQuicklook : X2 DT 044.12 MGD 03-OCT-1994/03:02:33 Holot Agur / Egypt, IsraelQuicklook : X2 DT 044.12 MGD 03-OCT-1994/03:02:36 Nizzana / IsraelQuicklook : X2 DT 044.12 MGD 03-OCT-1994/03:02:42 Mashabbe Sade / IsraelQuicklook : X2 DT 044.12 MGD 03-OCT-1994/03:02:43 Tel Yeshua / IsraelQuicklook : X2 DT 044.12 MGD 03-OCT-1994/03:02:47 Be'er Shera/ IsraelQuicklook : X2 DT 044.12 SSC 03-OCT-1994/03:02:47 Be'er Shera/ IsraelQuicklook : X2 DT 044.12 MGD 03-OCT-1994/03:02:52 Dead Sea / IsraelQuicklook : X2 DT 044.12 MGD 03-OCT-1994/03:02:55 Jericho / JordanQuicklook : X2 DT 044.12 MGD 03-OCT-1994/03:03:07 Burma / JordanQuicklook: X2 DT 044.12 MGD 03-OCT-1994/03:03:19 Shahba' / SyriaQuicklook : X2 DT 044.12 MGD 03-OCT-1994/03:03:28 Golan streaks / SyriaQuicklook : X2 DT 044.12 MGD 03-OCT-1994/03:03:31 SyriaQuicklook : X2 DT044.12 MGD 03-OCT-1994/03:03:43 Sab'Abar / SyriaQuicklook : X2 DT 044.12 MGD 03-OCT-1994/03:03:55 Tadmur / SyriaQuicklook : X2 DT 044.12 MGD 03-OCT-1994/03:04:07 Tall Thulaythawat/ SyriaQuicklook : X2 DT 044.12 MGD 03-OCT-1994/03:04:19 Ma'din Jadid/ SyriaQuicklook : X2 DT 044.12 MGD 03-OCT-1994/03:04:21 'Ayn al Bayda' / SyriaQuicklook : X2 DT 065.50 MGD 04-OCT-1994/10:29:41 Karaca Dag / TurkeyQuicklook : X2 DT 065.50 MGD 04-OCT-1994/10:29:53 HanobasI / TurkeyQuicklook : X2 DT 065.50 MGD 04-OCT-1994/10:30:05 Aksaray, Nigde / TurkeyQuicklook : X2 DT 065.50 MGD 04-OCT-1994/10:30:17 KamlslI / TurkeyQuicklook : X2 DT 065.50 MGD 04-OCT-1994/10:30:29 Ceyhan / TurkeyQuicklook : X2 DT 065.50 MGD 04-OCT-1994/10:30:41 Iskenderun / TurkeyQuicklook : X2 DT 065.50 MGD 04-OCT-1994/10:30:53 Ma'arrat al Ikhwan / SyriaQuicklook : X2 DT 065.50 MGD 04-OCT-1994/10:31:04 Al Andarin / SyriaQuicklook : X2 DT 065.50 MGD 04-OCT-1994/10:31:17 Tadmur / Syria
Quicklook : X2 DT 065.50 MGD 04-OCT-1994/10:31:25 SyriaQuicklook : X2 DT 065.50 MGD 04-OCT-1994/10:31:32 SyriaQuicklook : X2 DT 065.50 MGD 04-OCT-1994/10:31:44 Ghadir al Mulusi / IraqQuicklook : X2 DT 065.50 MGD 04-OCT-1994/10:31:56 Al-Anbar / IraqQuicklook : X2 DT 065.50 MGD 04-OCT-1994/10:32:08 Chayia/ IraqQuicklook : X2 DT 076.10 MGD 05-OCT-1994/02:23:39 Ghurd al Qattantyah / EgyptQuicklook : X2 DT 076.10 HRM 05-OCT-1994/02:23:50 Ashmun / EgyptQuicklook : X2 DT 076.10 MGD 05-OCT-1994/02:23:52 Shibin al Kawn / EgyptQuicklook : X2 DT076.10 HRM 05-OCT-1994/02:24:00 Aja/EgyptQuicklook : X2 DT 076.10 MGD 05-OCT-1994/02:24:05 Dumyat / EgyptQuicklook : X2 DT 076.10 HRM 05-OCT-1994/02:24:09 Dumyat / EgyptQuicklook : X2 DT076.10 HRM05-OCT-1994/02:24:10 Dumyat/EgyptQuicklook: X2 DT 081.60 MGD 05-OCT-1994/10:10:09 Temelli / TurkeyQuicklook :X2DT 081.60 MGD 05-OCT-1994/10:10:11 Dcizce/ TurkeyQuicklook : X2 DT 081.60 MGD 05-OCT-1994/10:10:23 Sereflikochisar/ TurkeyQuicklook: X2 DT 081.60 MGD 05-OCT-1994/10:10:35 Ciftlik / TurkeyQuicklook : X2 DT 081.60 MGD 05-OCT-1994/10:10:47 KamlslI / TurkeyQuicklook : X2 DT 081.60 MGD 05-OCT-1994/10:10:59 Ceyhan / TurkeyQuicklook : X2 DT 081.60 MGD 05-OCT-1994/10:11:10 Iskenderun / TurkeyQuicklook : X2 DT 081.60 MGD 05-OCT-1994/10:11:23 Ma'arrat al Ddiwan / SyriaQuicklook : X2 DT 081.60 MGD 05-OCT-1994/10:11:29 South Aleppo / SyriaQuicklook :X2DT 081.60 MGD 05-OCT-1994/10:11:34 AlAndarin/SyriaQuicklook : X2 DT 081.60 MGD 05-OCT-1994/10:11:47 Tadmur/ SyriaQuicklook : X2 DT 081.60 MGD 05-OCT-1994/10:11:55 SyriaQuicklook : X2 DT 081.60 MGD 05-OCT-1994/10:12:03 SyriaQuicklook : X2 DT 081.60 MGD 05-OCT-1994/10:12:14 Ghadir al Mulusi / IraqQuicklook : X2 DT 081.60 MGD 05-OCT-1994/10:12:27 Al-Anbar / IraqQuicklook : X2 DT081.60 MGD 05-OCT-1994/10:12:39 Chayia/ IraqQuicklook : X2 DT 097.60 HRM 06-OCT-1994/09:51:46 Tripoli / LibanonQuicklook : X2 DT 097.60 HRM 06-OCT-1994/09:51:46 Trablous / LebanonQuicklook : X2 DT 097.60 HRM 06-OCT-1994/09:51:48 LibanonQuicklook : X2 DT 097.60 HRM 06-OCT-1994/09:51:50 LibanonQuicklook : X2 DT 097.60 HRM 06-OCT-1994/09:51:54 Tal'at Musa / Lebanon
Quicklook : X2 DT 097.60 HRM 06-OCT-1994/09:51:Quicklook : X2 DT 097.60 HRM 06-OCT-1994/09:52;Quicklook : X2 DT 097.60 HRM 06-OCT-1994/09:52:Quicklook : X2 DT 097.60 HRM 06-OCT-1994/09:52:Quicklook: X2 DT 097.60 HRM 06-OCT-1994/09:52:Quicklook : X2 DT 097.60 HRM 06-OCT-1994/09:52Quicklook : X2 DT 097.60 HRM 06-OCT-1994/09:52Quicklook : X2 DT 097.60 HRM 06-OCT-1994/09:52Quicklook : X2 DT 097.60 HRM 06-OCT-1994/09:52:Quicklook : X2 DT 097.60 HRM 06-OCT-1994/09:52:Quicklook : X2 DT 097.60 HRM 06-OCT-1994/09:52:Quicklook : X2 DT 097.60 HRM 06-OCT-1994/09:53:Quicklook : X2 DT 097.60 HRM 06-OCT-1994/09:53:Quicklook: X2 DT 097.60 HRM 06-OCT-1994/09:53:Quicklook: X2 DT 097.60 HRM 06-OCT-1994/09:53:Quicklook : X2 DT 108.10 HRM 07-OCT-1994/01:44:Quicklook : X2 DT 129.30 MGD 08-OCT-1994/09:07:Quicklook : X2 DT 129.30 MGD 08-OCT-1994/09:07:Quicklook : X2 DT 129.30 MGD 08-OCT-1994/09:07:Quicklook: X2 DT 129.30 MGD 08-OCT-1994/09:07:Quicklook : X2 DT 145.30 MGD 09-OCT-1994/08:44:Quicklook : X2 DT 145.30 MGD 09-OCT-1994/08:44:Quicklook : X2 DT 145.30 MGD 09-OCT-1994/08:44:Quicklook: X2 DT 145.30 MGD 09-OCT-1994/08:44:Quicklook : X2 DT 161.30 MGD 10-OCT-1994/08:21:Quicklook : X2 DT 161.30 MGD 10-OCT-1994/08:21Quicklook : X2 DT 161.30 MGD 10-OCT-1994/08:22Quicklook : X2 DT 161.30 MGD 10-OCT-1994/08:22
56 Libanon00 Jabal Ma Ma'lula / Syria06 Syria12 Syria18 TalMisma/ Jordan24 Qasr el Burqu / Jordan30 Border / Syria / Jordan36 Border / Jordan / Saudi Arabia42 Qutayfat Tutayf/ Saudi Arabia48 Al-Harrah / Saudi Arabia54 Jabal al 'Amud / Saudi Arabia00 Al-Harrah / Saudi Arabia06 An-Nafud / Saudi Arabia12 Suwayr / Saudi Arabia18 Mubarraz / Saudi Arabia04 Alexandria / Egypt:23Geyve/Turkey:35Beydili/Turkey:47 Guenyuezue / Turkey:49 Goek Dag / Turkey:29Geyve/Turkey:41 Beydili / Turkey:53 Guenyuezue / Turkey:55 Goek Dag / Turkey:36TaraklI/Turkey:48Sivrihisar/ Turkey:00 Guenyuezue / Turkey02 Suelueklue / Turkey
I X-SAR User Kit I X-SAR Coverage I Mail to [email protected] I
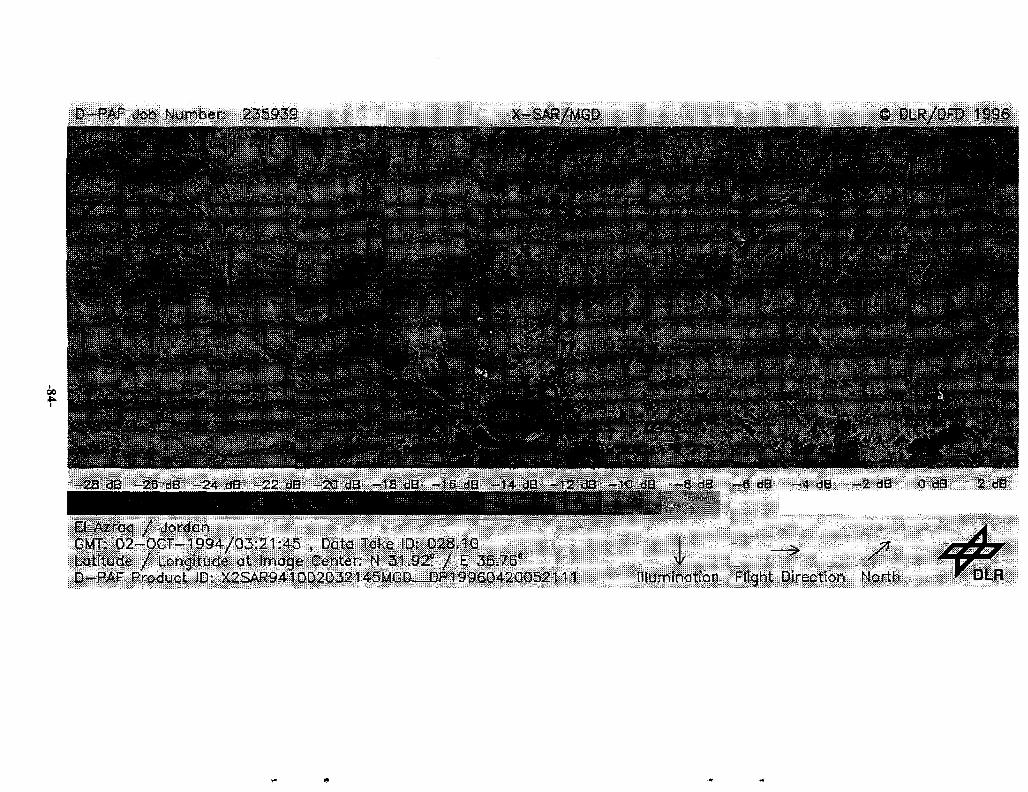
-2B dB -26 dB - 24 .dB - 2 2 dB -

Annex 1-1 Information Catalog: DLR
-85-
DLR - Forschungszentrum Braunschweig
Deutsche Forschungsanstalt fur Luft- und Raumfahrt e.V. DLR Forschungszentrum Braunschweig.Zentrumsleiter: Dr. Heinrich Dissen E-Mail:... httv://www.bs.dlr.de/ - size 2K - 3.Apr.97 - German
DLR - Forschungsanstalt fuer Luft- und Raumfahrt e.V
DLR Homepage in English. Willkommen in der DLR. Luftfahrt. Energietechnik. Raumfahrt.Technologietransfer. DLR Schwarzes Brett. DLR Organisation. DLR. http://www.dlr.de/ - size 2K -12.May.97 - German
DLR WT-DV-IG GSttingen WWW Entry Point
Welcome to the DLR WT-DV-IG Gottingen WorldWideWeb Server. This experimental service ofthe DLR (German Aerospace Research Establishment) department., http://www.rz.zo.dlr,de:8081/ -size 3K-21.May.97-English
DLR
http://rses.anu.edu.au/~iean/HTML Presentation/DLR/DLR.html - size 350 bytes - 12.Nov.96
-86-

Annex 2 EOSAT - Space ImagingSummaiy of Current Satellite ConstellationsMapping Alliance Program (MAP)
-87-

How to Reach Us
00
9351 Grant StreetSuite 500
Thornton, Colorado 80229Phone: +1 303-254-2000
Toll Free (U.S.): +1800-425-2997Fax: +1 303-254-2215
Email: [email protected]
Jump To:
Sales OfficesClient Services
International Business DevelopmentProduct & Application Information
Media Relations
Sales Offices
00so
CENTRAL U.S.
Mindy Brown, Central Regional SalesManager9351 Grant StreetSuite 500Thornton, Colorado 80229Phone: (303) 254-2063Fax:(303)254-2215Email: [email protected]
Tony Palizzi, Manager, Strategic Programs9351 Grant StreetSuite 500Thornton, Colorado 80229Phone: (303)254-2120Fax:(303)254-2215Email: [email protected]
EASTERN U.S.
Ralph Mason, Director of FederalPrograms4300 Forbes BoulevardLanham, Maryland 20707Phone: (301) 552-0558Fax:(301)552-5476Email: [email protected]
Andrew Fisher, Manager, Eastern Region5850 T.G. Lee BoulevardSuite 650Orlando, FL 32822Phone (407) 856-7828Fax (407) 856-9550E-Mail: [email protected]
Tony Shupin, Director, International Sales33 Wood Avenue, SouthSuite 600Iselin,NJ 08830Phone (908) 603-9595Fax (908) 603-8310E-Mail: [email protected]
WESTERN U.S.
Eric Waldman, Western Regional SalesManager50 California Street, Suite 1500San Francisco, CA 94111Phone:(415)439-5345Fax:(415)439-5375Email: [email protected]
Konrad Fry, Manager, Canada & LatinAmerica1 Park Plaza, Suite 600Jamboree CenterIrvine, CA 92714Phone:(714)852-7370Fax (714) 852-7371E-Mail: [email protected]
Susan Sinclair, Director, Distributor Network1 Park Plaza, 6th FloorJamboree CenterIrvine, CA 92714Phone: (714) 852-7373Fax:(714)852-7376Email: [email protected]
Client Services
Dale Richards, Director, Client Services

4300 Forbes Blvd.Lanham, MD 20706Phone: (301)552-0556Fax: (301) 552-3762Email: [email protected]
Vivian Stiggers, Customer Services Manager4300 Forbes Blvd.Lanham, MD 20706Phone:(301)552-0551Fax: (301)552-3762Email: [email protected]
International Business Development
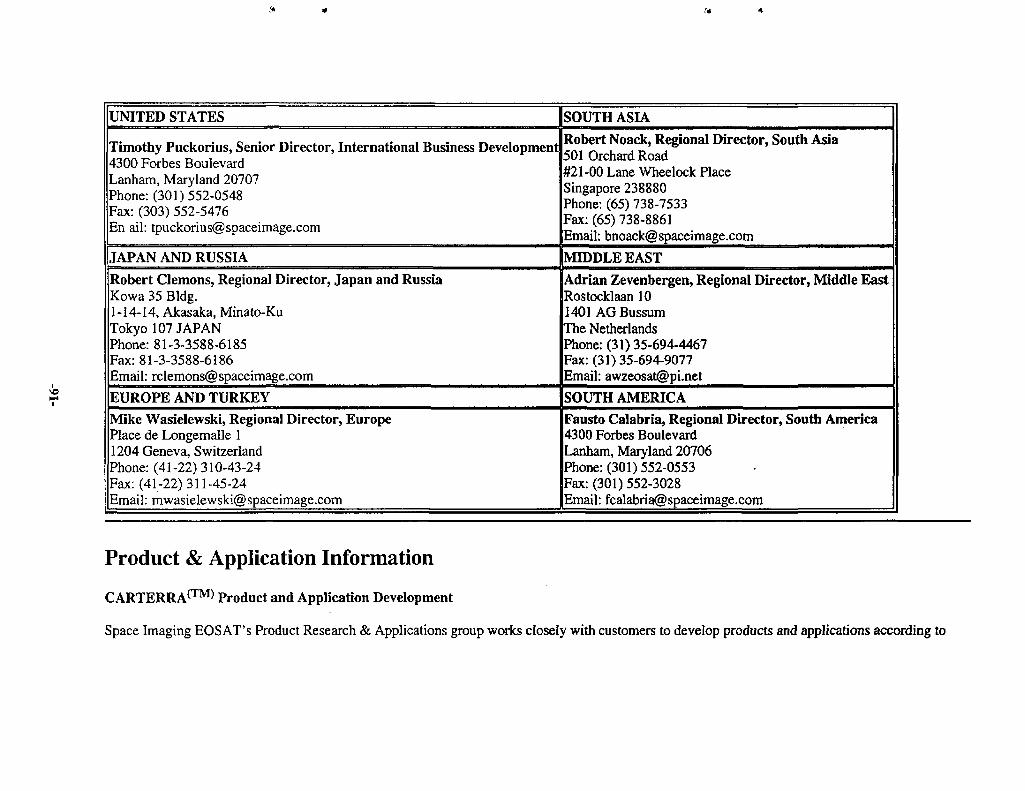
UNITED STATES
Timothy Puckorius, Senior Director, International Business Development4300 Forbes BoulevardLanham, Maryland 20707Phone:(301)552-0548Fax: (303) 552-5476En ail: [email protected]
JAPAN AND RUSSIA
Robert demons, Regional Director, Japan and RussiaKowa35Bldg.1-14-14, Akasaka, Minato-KuTokyo 107 JAPANPhone: 81-3-3588-6185Fax: 81-3-3588-6186Email: [email protected]
EUROPE AND TURKEYMike Wasielewski, Regional Director, EuropePlace de Longemalle 11204 Geneva, SwitzerlandPhone: (41-22) 310-43-24Fax: (41-22) 311-45-24Email: [email protected]
SOUTH ASIA
Robert Noack, Regional Director, South Asia501 Orchard Road#21-00 Lane Wheelock PlaceSingapore 238880Phone: (65) 738-7533Fax: (65)738-8861Email: [email protected]
MEDDLE EAST
Adrian Zevenbergen, Regional Director, Middle EastRostocklaan 101401 AGBussumThe NetherlandsPhone: (31)35-694-4467Fax: (31)35-694-9077Email: [email protected]
SOUTH AMERICA
Fausto Calabria, Regional Director, South America4300 Forbes BoulevardLanham, Maryland 20706Phone: (301) 552-0553Fax: (301) 552-3028Email: [email protected]
Product & Application Information
CARTERRA(TM) Product and Application Development
Space Imaging EOSAT's Product Research & Applications group works closely with customers to develop products and applications according to

markcl specifications. For information about products and applications in the following markets, please contact the noted business administrator.
Cathe Gehret(303) 254-2124
Agriculture
Utilities
Federal/Mapping
Environment
Transportation
Jeff Miller(303) 254-2123
Civil Government
Exploration
Exploitation
Media
Monica Moroney(303)254-2122
Real Estate
Insurance
Telecommunications
Consumer Markets
Media Relations
Brian Webster, Director, Marketing CommunicationsPhone: (303) 254-2104Email: [email protected]
Linda Turner, Communications and Internet CoordinatorPhone:(303)254-2106Email: [email protected]
Fax:(303)254-2215
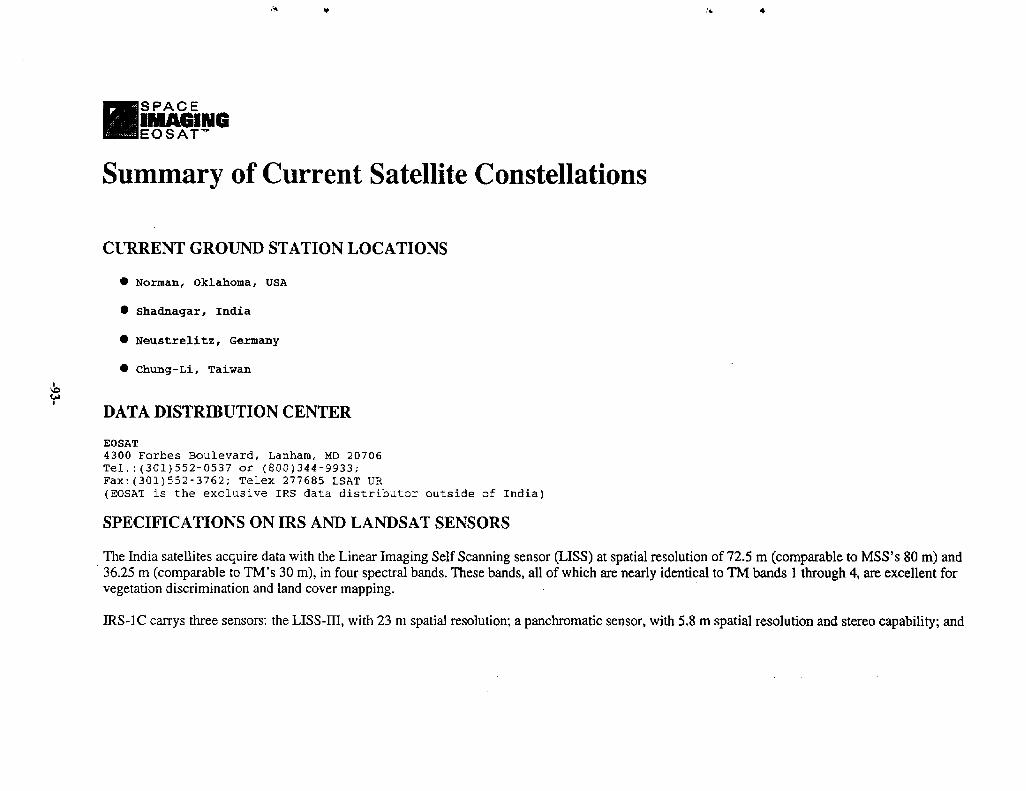
vb
SPACE
IMAGINGEOSAT'
Summary of Current Satellite Constellations
CURRENT GROUND STATION LOCATIONS
• Norman, Oklahoma, USA
• Shadnagar, India
• Neustrelitz, Germany
• Chung-Li, Taiwan
DATA DISTRIBUTION CENTER
EOSAT4300 Forbes Boulevard, Lanham, MD 20706Tel.:(301)552-0537 or (800)344-9933;Fax:(301)552-3762; Telex 277685 LSAT UR(EOSAT is the exclusive IRS data distributor outside of India)
SPECIFICATIONS ON IRS AND LANDSAT SENSORS
The India satellites acquire data with the Linear Imaging Self Scanning sensor (LISS) at spatial resolution of 72.5 m (comparable to MSS's 80 m) and36.25 m (comparable to TM's 30 m), in four spectral bands. These bands, all of which are nearly identical to TM bands 1 through 4, are excellent forvegetation discrimination and land cover mapping.
IRS-1C carrys three sensors: the LISS-III, with 23 m spatial resolution; a panchromatic sensor, with 5.8 m spatial resolution and stereo capability; and
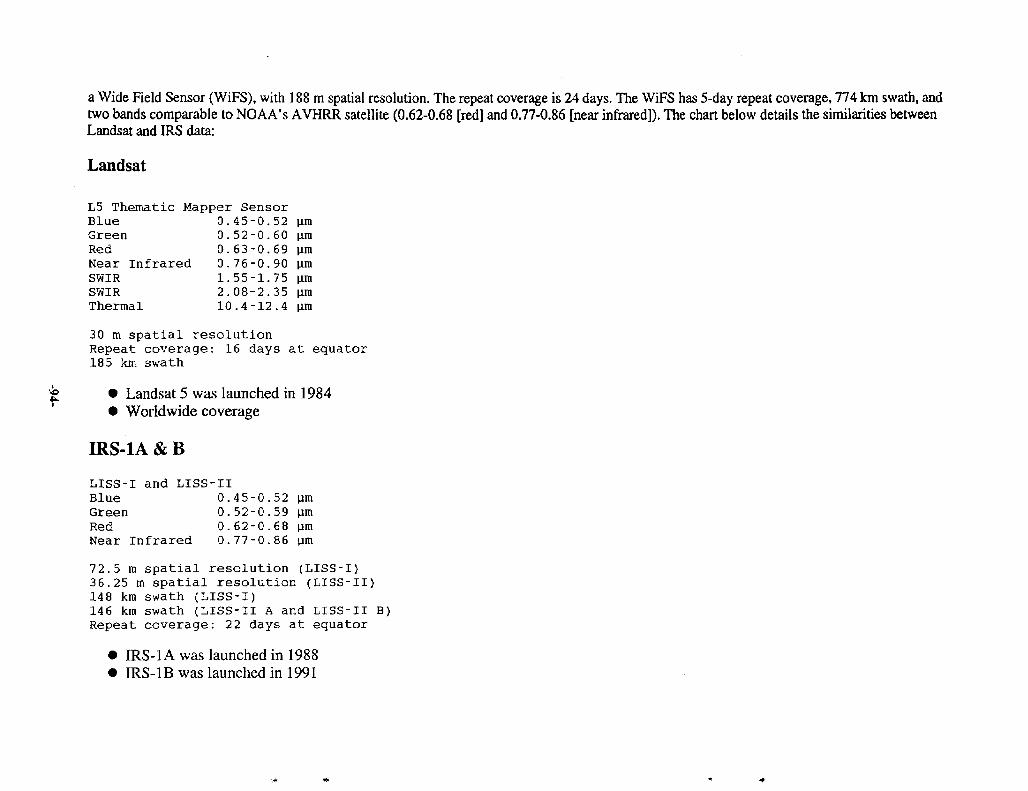
a Wide Field Sensor (WiFS), with 188 m spatial resolution. The repeat coverage is 24 days. The WiFS has 5-day repeat coverage, 774 km swath, andtwo bands comparable to NOAA's AVHRR satellite (0.62-0.68 [red] and 0.77-0.86 [near infrared]). The chart below details the similarities betweenLandsat and IRS data:
Landsat
L5 Thematic Mapper SensorBlueGreenRedNear InfraredSWIRSWIRThermal
0.45-0.520.52-0.600.63-0.690.76-0.901.55-1.752.08-2.3510.4-12.4
urnumumumumumum
30 m spatial resolutionRepeat coverage: 16 days at equator185 km swath
• Landsat 5 was launched in 1984• Worldwide coverage
IRS-1A & B
LISS-I and LISS-IIBlue 0.45-0.52 umGreen 0. 52-0. 59 umRed 0.62-0.68 umNear Infrared 0.77-0.86 um
72.5 m spa t i a l resolut ion (LISS-I)36.25 m spa t i a l resolut ion (LISS-II)14 8 km swath (LISS-I)146 km swath (LISS-II A and LISS-II B)Repeat coverage: 2 2 days a t equator
• IRS-1A was launched in 1988• IRS-IB was launched in 1991
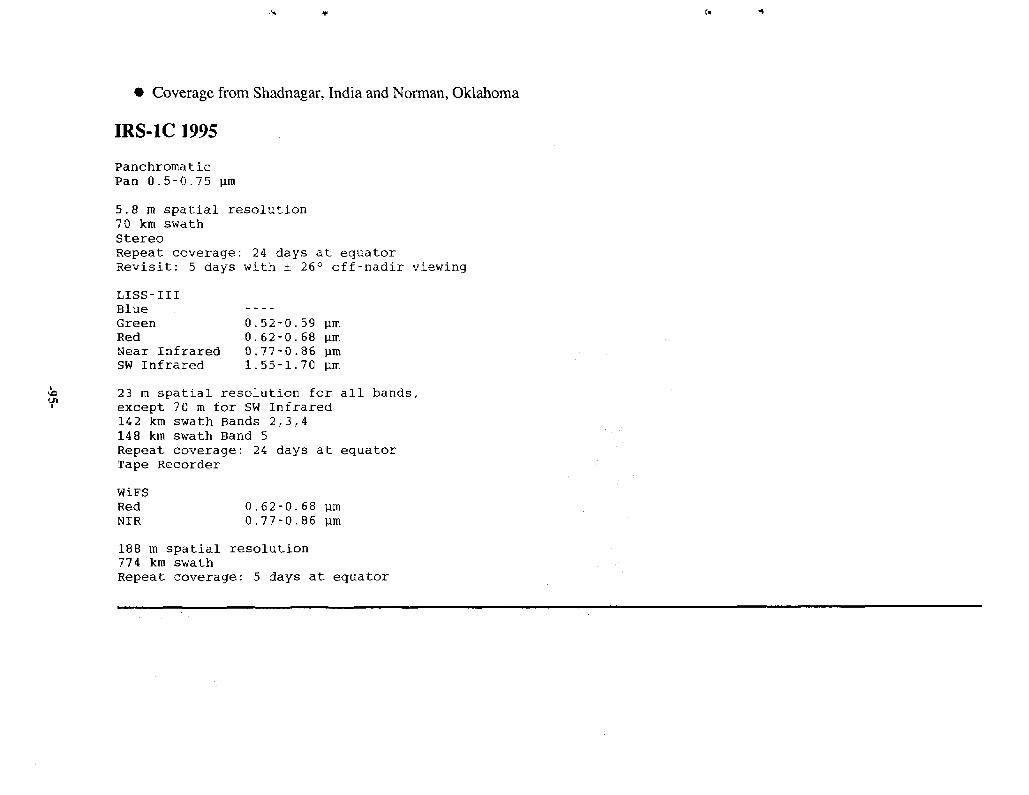
• Coverage from Shadnagar, India and Norman, Oklahoma
IRS-IC 1995
PanchromaticPan 0.5-0.75 urn
5.8 m spatial resolution70 km swathStereoRepeat coverage: 24 days at equatorRevisit: 5 days with ± 26° off-nadir viewing
LISS-IIIBlueGreen 0 . 52-0 . 59 urnRed 0,62-0.68 urnNear Infrared 0.77-0.86 urnSW Infrared 1.55-1.70 urn
23 m spatial resolution for all bands,except 70 m for SW Infrared14 2 km swath Bands 2,3,414 8 km swath Band 5Repeat coverage: 24 days at equatorTape Recorder
WiFSRedNIR
00
. 6 2
. 7 7- 0-0
.68
.86liraurn
188 m spatial resolution774 km swathRepeat coverage: 5 days at equator
SPACE
IMAGIIEOSAT'
The Mapping Alliance Program (MAP) is an innovative program that enables Space Imaging EOSAT to offer a broad array of high-resolution Earthinformation and derivative information products to customers worldwide. MAP combines the expertise and services of several leading aerial servicesand mapping companies in the United States with the unmatched space imagery capabilities of Space Imaging EOSAT in a first-of-its-kind alliance.MAP gives Space Imaging EOSAT and its partners the broadest array of Earth information resources available anywhere today, including aerialphotography and space imagery ranging in resolution from a few centimeters to several meters, mapping services and value-added applications.
Participating firms in MAP are:
Aerial Data Reduction Associates, Inc. (Pennsauke, NJ)
AERO-METRIC, Inc. (Sheboygan, WI)
Analytical Surveys, Inc. (Colorado Springs, CO)
GEONEX Corp. (St. Petersburg, FL)

Annex 2-1 Information Catalog: EOSAT
-97-
LPM/EOSAT AgreementCurrent Status and Summary of Agreement Between Landsat Program Management and EOSATCorporation on Cost and Reproduction Rights for Landsat 4/5 Thematic.http://geo. arc, nasa.gov/sge/landsat/aprl 1.. htm I - size 5K - I.May. 97 - English
EOSAT IRS PricesEOSAT IRS Price List. Last Updated - April 1996 IRS PRODUCTS. ACRES is an EOSATRepresentative for sales of IRS data in Australia. To assist our...http://www.auslizeov.au/acres/prod ser/eoirspri.html - size 5K - 23.Oct.96 - English
Utility to write EOSAT Fast Format B tapes.User's Guide. FSTFMTOUT. Function: Copies a LAS image to an EOSAT fast format B tape.Parameters: IN. Input image. IN may be a single or multi-band image.. http://eoswww. essc. psu.edu/lasdoc/usr/ug/fstfmtout html - size 5K - 26.Apr.94 - FMglish
EOSAT JERS PricesEOSAT JERS Price List. Last Updated - September 1996. ACRES is an EOSAT Representative forsales of (Japanese) JERS data in Australia. To assist our...http://www.auxlig.gov.au/acres/prod ser/eojerpri.html - size 6K - 23.0cL96 - English
Spatial WebBroker. Space Imaging EOSATSpace Imaging EOSAT Interactive Global Archive. Genasys II, Inc have developed in conjunctionwith Space Imaging EOSAT an interactive image browse system..http://www.genasvs.com/homepaze/applications/sie.htmI - size SK - 22.May.97 - English
Development of the EOSAT United States Product PackageUnited States Department of the Interior MRLC Consortium Documentation Manual January, 1994GEOLOGICAL SURVEY EROS Data Center Sioux Falls, South Dakota...http://www. epa. sov/docs/grd/m rlc/sec3let2. htm I - size 2K - 24. Dec. 96 - English
ACRES EOSAT JERS DistributorsACRES Data Distributore for EOSAT JERS Data. Last Updated - May 1997. ACRES is aRepresentative for the Earth Observation Satellite Company (EOSAT), USA,., http ://www.auslig.gov.au/acres/jereodis.html - size 4K - JJ.May.97 - English
OverVue from EOSATReturn to: [Home Page Image Databases 1 EOSAT Products & Info] or go to Overvue: [ ProductInfo 1 Pricing] OverVue. Standard Product Specifications...http://www. coresw. com/Databases/eosat/overvue/overv ue info, htm I - size 2K - ].Aug.96 - English
Prices EOSAT TM
-98-
EOSAT Landsat TM Price List Last Updated - August 1996. ACRES and our Distributors act asagents for the sale of Landsat Thematic Mapper products from...http://www.guslis.sov.au/acres/prod ser/eotmpric.html - size 4K - 23.Oct.96 - English
EOSAT Products and ServicesReturn to: [Home Page / Image Databases] or go to EOSAT: [Background / Products andInformation] EOSAT Products Available from Core Software. The...http://www.coresw.com/Databases/eosat/eosat products.htmI - size 2K - J.A ug.96 - English
ACRES EOSAT Landsat DistributorsACRES Distributors for EOSAT Landsat Data. Last Updated - May 1997. ACRES is aRepresentative for the Earth Observation Satellite Company (EOSAT), USA,...http://w w w. auslis.eov.au/acres/leosdis. htm I - size 4K - JJ.May.97 - English
EOSAT BackgroundReturn to: [Home Page / Image Databases] or go to EOSAT: [Background / Products andInformation] Earth Observation Satellite Corporation. The Earth...http://www .coresw.com/Dafabases/eosat/eosat background.htm I - size 3K - J.A ug.96 - English
Earth Observation Satellite Company (EOSAT)Earth Observation Satellite Company (EOSAT) Customer Services Department 4300 ForbesBlvd.Lanham, MD 20706 USA Fhone: (301)552-0500 Fax: (301)552-3762....http://w w w. techexpo. com/firm s/eosat. htm I - size 1018 bytes - 26Jul.96 - English
Utility to read EOSAT Fast Format tapes (all versions).User's Guide. FSTFMTI1M. Function: Reads Thermatic Mapper (TM) images from EOSAT FastFormat tapes and writes them to LAS image files. All of the bands are.http://eoswww. essc.psu. edu/tasdoc/usr/ug/fstfmtin, html - size 12K - 26.Apr.94 - English
ACRES EOSAT IRS DistributorsACRES Data Distributors for EOSAT IRS Data. Last Updated - May 1997. ACRES is aRepresentative for the Earth Observation Satellite Company (EOSAT), USA,...http://www.auslis sov.au/acres/irseodis.html - size 4K - JJ.May.97 - English
EOSAT Releases Landsat MSS Data to Public Domain DistributionThe Earth Observer - January/February 1993. EOSAT Releases Landsat MSS Data to PublicDomain Distribution. After two years of assisting commercial...http://spso2.gsfc.nasa.sov/eos observ/1 2 93Zp21b.html - size 2K - 27.Apr.94 - English
Keep in touch with Space Imaging EOSATnbsp; Space Imaging EOSAT wants to ensure satisfaction among our end-users, customers,associates, and industry colleagues. To help us learn more about...http://w w w. spaceim use, com/horn e/feedback/ - size I IK - 23.May.97 - English
Space Imaging EOSAT Contact InfoHow to Reach Us. 9351 Grant Street Suite 500 Thornton, Colorado 80229 Phone: ~1 303-254-2000 Toll
-99-
Free (U.S.): +1 800-425-2997 Fax: ~1 303-254-2215 Email:.http://w w w. svaceim age, com/home/overview/contacts, html - size UK - 23. May. 97 - English
IRS-1 - Contact Addresses
Contact Addresses. United States. EOSAT and NRSA have signed an agreement that allowsEOSAT to receive Indian data, and that makes EOSAT the exclusive...http://w w w. belspo. be/telsat/irs/irsd co. htm I - size 2K - ]5.Mw.96 - English
Landsat - Scene Formats
Scene Formats. Products are available in different scene sizes, depending to a certain extent on thesensor (MSS or TM) and the source of the data (ESA or. http://www.belspo. be/telsat/landsat/lapr_SC.html - size IK - 15.Mar.96 - English
IDI - PEDAGeOG Educational Software
LOW COST LANDSAT IMAGES from EOSAT. Remote Sensing educational products for schoolsand individuals."> INTER MOUNTAIN DIGITAL IMAGING, L.C. Scholar Series., http://www.idi-Ut.com/scholar.html - size 5K - 2l.Jan.97 - English
Landsat Satellites: Thematic Mapper Imagery
Landsat Satellites: Thematic Mapper Imagery. Landsat TM: Before the Landsat commercializationcontract was signed between the Department of Commerce and. http://www. uni-sb.de/philfak/fb6/fr66/tpw/rem sens/platform/landsat/landsatx. html - size 12K - 5Jun,95 - English
Research Systems Inc. - ENVI
ENVI Related Sites. EOSAT Web Site. EOSAT is a commercial provider of Landsat and otherdata, remote sensing information, and various services. Site... http://www. rsinc. com/envi/im age, htm I- size 6K - 16.Dec.96 ~ English
Landsat Sample Data
Return to: [Home Page 1 Image Databases 1 EOSAT Products & Info] or go to Landsat: [TechData 1 Samples 1 Pricing] Landsat Samples. Image of...http://www.coresw.com/Databases/eosat/landsat/landsat sampies.html - size IK - 1.Aug.96 - English
No Title
LANDSAT IMAGE DATA FOR GIS SUMMARY OF LANDSAT DATA - Originally anexperimental research project sponsored by the United States government. Now a... http://corpsgeol, usace. arm y.m il/geo/m etadata/sec 7 input/lands at - size 12K - n.Mar.95 - English
Commercial remote sensing data vendors
Commercial remote sensing data vendors. EarthSat. Phone:1-301-231-0660 Fax:1-301-231-5020 WWW: http://www.earthsat.com. EOSAT. Phone: 1(301)552-0500 Fax:http://www.ermapper.com/product/datasrc.html - size 3K - l7.Apr.97 - English
Application Demos
Space Imaging EOSAT is the world's largest supplier of high-resolution Earth information andderivative products and services. The company's globally...
•100-
http://www.spaceimage,com/home/apps/appsdemos.html - size 6K - 22.May.97 English
Dragon Tape/CD Library
Dragon Tape/CD Library. Read satellite data from EOSAT and others on mag tape directly intoDragon/ips. Handles EOSAT TM 8mm Exabyte, Australian Center.http://www.strvicom.es/addlink/scishop/prodsIOOOOO637. html - size 976 bytes - 23.Mar.95 - English
No TitleLandsat Thematic Mapper Imagery. BRIEF. Landsat TM: Before the Landsat commercializationcontract was signed between the Department of Commerce and the.. http://www. uni-sbde/philfak/fb6/fr66/tpw/rem sens/platform/landsat/landsatl .htmI - size 4K - i3.Oct.94 - English
LANDSAT TM and MSS CharacteristicsThe following information is reproduced with the permission of the Australian Surveying and LandInformation Group, Canberra.© COMMONWEALTH OF...http://www.denr.sagov.au/rig/dieimage/landdatahtmmI - size IOK - 7.May.97 - English
Landsat TM - Background
Landsat TM - Background. Before the Landsat commercialization contract was signed between theDepartment of Commerce and the Earth Observation Satellite...http://www. belspo. be/telsat/landsat/tm bg OO1. htm I - size 2K - i5.Mar.96 - English
Landsat - Copyright
Landsat - Copyright. Confidentiality of Satellite Data. The Purechaser acknowledges that SatelliteData is a special, valuable and unique asset of EOSAT,.. http://www.belspo.be/telsat/landsat/laco_OOl.html - size 2K - 15 Mar 96 - English
Landsat Image Data for GIS
Landsat Image Data for CIS. SUMMARY OF LANDSAT DATA. Originally an experimentalresearch project sponsored by the United States government. Now a...http://www. uni-sb.de/philfak/fb6/fr66/tpw/rem sens/platform/landsat/landsat.. htm I. - size UK -5Jun.95 - English
Landsat -References & On-line Guides
Landsat - References & On-line Guides. Books. EOSAT Catalog of Products and Services. EOSATPurchasing Guide (Instructions and Order Forms) On-line Guides.http://www.belspo.be/telsae/landsat/larf OOl.html - size 988 bytes - i5.Mar96 - English
GeoPlace.com Dailv News - November 18. 1996Previous Day's News. Today's News. Next Day's News. News Briefs. Space Imaging Buys EOSAT.November 18, 1996. Space Imaging, Thornton, C~o., agreed to...http :/www. seoplace.com/news/dailv/96H18.html - size 6K - 29.May.97 - English
-101-
Satellite Imagery Available through the Internet
Satellite Imagery Available through the Internet. Advanced Earth Observing Satellite (ADEOS)ADEOS Total Ozone Mapping Spectrometer (TOMS) AVHRR data from.hup://urn be 7. urn be. edu/~-tbenial/freedata. htm I - size SK - 3jan.97 - English
Landsat - Processing StepsProcessing Steps. MSS PROCESSING. Radiometrically corrected (spacecraft and sensor systematicparameters) MSS data were transmitted from the EOSAT data...http.V/www.belspo.be/telsat/landsat/laps OO/.htmI - size 5K - J5.Mar.96 - English
Landsat MS - ProductsLandsat MS - Products. The MSS, which has been in use since 1972, has four spectral bands and aresolution of 80 m. The ESA archive contains MSS data... http://www.belspo.be/telsat/landsat/msvr_OO/.htm I - size 2K - J5.Mar.96 - English
GAF-NEWSProjects, Publications, News, Press Releases. Last Update: 18.02.1996. EOSAT Press releaseFebruary 1996. Germany First to Sign-IRS Ground,.http://206.104.52. VGA F/www.gaf/news/press.html - size 2K - 30.A ug.96 - English
Remote Sensing, GIS. Geographic. Earth Sciences ResourcesRemote Sensing, GIS, Geographic, Earth Sciences and GeoData Resources. Contents. RemoteSensing, GIS, Geographic and Earth Sciences / GeoData.Remote...http://www. ccc. nottingham. ac. uk/~cczdao/seos. htm I - size 17K - 8.NOV.96 - English
Satellites IRSSatellites - Indian Remote Sensing Satellite (IRS) The Indian Space Research Organisation(ISRO) has been responsible for the development and management...http;//www.auslig.sov.aui'acres/prod ser/irsdata.html - size 7K - 23.Oct.96 - English
Landsat - Basic productsBasic Products. Raw data. LANDSAT raw data is available, in a digital format, - for full, quarterand mini scenes for ESA data and. - for full scenes for.. http://www.belspo.be/telsat/landsat/laprbahtml - size IK - l5.Mar.96 - English
TM
U.S. Geological Survey - National Mapping Information - EROS Data Center. Landsat TM DataAvailable From U.S. Geological Survey National Satellite Land...http://edcw w w. cr. usgs. gov/whatsnew/tm. htm I - size 3K - 24.Mar.95 - English
H)I - Indian Remote Sensing SatellitesINTERMOUNTAIN DIGITAL IMAGING, L.C. Indian Remote Sensing. The Republic of India isone of the few countries in the world that has successfully developed,.http;//www. idi-ut.com/irs.html - size 7K - 21jan.97 - English
-102-
Landsat - Processing StepsProcessing Steps. MSS PROCESSING. Radiometrically corrected (spacecraft and sensor systematicparameters) MSS data were transmitted from the EOSAT data...http://w ww. belspo. be/telsat/landsat/laps OO/.htm I - size 5K - J5.Mar.96 - English
Landsat MS - ProductsLandsat MS - Products. The MSS, which has been in use since 1972, has four spectral bands and aresolution of 80 m. The ESA archive contains MSS data... http://www,belspo.be/telsat/landsat/mspr00/.html - size 2K - J5.Mar.96 - English
GAF-NEWSProjects, Publications, News, Press Releases. Last Update: 18.02.1996. EOSAT Press releaseFebruary 1996. Germany First to Sign-IRS Ground..http://206.104.52.VGAF/www eaf/news/press.html - size 2K - SO.Aug96 - English
Remote Sensing, GIS. Geographic. Earth Sciences ResourcesRemote Sensing, GIS, Geographic, Earth Sciences and GeoData Resources. Contents. RemoteSensing, GIS, Geographic and Earth Sciences / GeoData.Remote...http://www. ccc. nottingham. etc. uk/~cczdao/geog. htm I - size 17K - 8.Nov.96 - English
Satellites IRSSatellites - Indian Remote Sensing Satellite (IRS) The Indian Space Research Organisation(ISRO) has been responsible for the development and management...http://w w w. auslig, gov.au/acres/prod_ ser/irsdata. htm I - size 7K - 23.oa.96 - English
Landsat - Basic productsBasic Products. Raw data. LANDSAT raw data is available, in a digital format, - for full, quarterand mini scenes for ESA data and. - for full scenes for.. http;//www.belspo.be/telsat/landsat/laprbahtml - size IK - I5 Mar.96 - English
TM
U.S. Geological Survey - National Mapping Information - EROS Data Center. Landsat TM DataAvailable From U.S. Geological Survey National Satellite Land...http://edcwww.cr.usgs.gov/whatsnew/tm.html - sue 3K - 24.Mar.95 - English
EDI - Indian Remote Sensing SatellitesINTERMOUNTA1N DIGITAL IMAGING, L.C. Indian Remote Sensing. The Republic of India isone of the few countries in the world that has successfully developed,.http://www. idi-ut.com/irs.html - size 7K - 21jan.97 - English
-103-
Imported Products ServiceImported Satellite Data from Overseas Suppliers. Last Updated - July 1996. ACRES and many ofour Distributors act as agents for a variety of satellite... http://www.auslig.sov.aw'acres/prodSer/importS.html - size 3K - 23.Oct.96 - English
Landsat Data Access (USA)ACCESS TO LANDSAT DATA IN THE USA AND FROM NON-US GROUND STATIONS. INTHE USA. Landsat Multispectral Scanner (MSS) and Thematic Mapper (TM) data are...hup://geo.arc.nasa.gov/sge/landsat/daccess.html - size 5K~- I.May.97 - English
The Quick ListLandsat TM -- Collected after September 27, 1985. Status: CORE technologies provides an on-line... http://developers.ivv.nasa.gov/rem_ sen/earth_ sci/landsat_ 2.html - size 2K - 23.May.97 -English
SSC Satellitbild, LANDSAT Satellite StatusLandsat Status. The Landsat 5 satellite is healthy, still delivering data according to EOSAT, U.S.A.
http://rvmd.ssc.se/ssc/sb/satstat/landsat. htm I - size 2K - & May.96 - English
Satellite Imiage Processing SoftwareINTERMOUNTAIN DIGITAL IMAGING, L.C. SATELLITE IMAGE PROCESSINGSOFTWARE. THIS IS YOUR SOURCE... for high quality, satellite image processing softwareand.. http://wWW.idi-ut.com/s-soft.htmI - size 7K - 21.Jan.97 - English
SatelliteslSensors - The best URL'sSatellites/Sensors - The best URL's. ALMAZ. GDS, index search on ALMAZ at the main menulevel. DMSP. IDN, Source (Satellites, Platforms...) Descriptions...http://w w w. be Is po. be/telsat/annexes/anvl se.html - size 8K - ]5.Mar.96 - English
homepageDigital Images. Space ImaginglEOSAT Satellite Images— US - Landsat, TM Indian - IRS induding5 meter IRS-IC (sample available on diskette).http://www.atterbuty.com/page7.html - size 6K - 21.May.97 - English
IDI - Indian Remote Sensing SatellitesINTERMOUNTAIN DIGITAL IMAGING, L.C. Indian Remote Sensing. The Republic of India isone of the few countries in the world that has successfully developed,.http://www, idi-ut. com/Irs, htm I - size 7K - 21jan.97 - English
NASA Landsat Pathfinder Data AcguisitionNASA Landsat Pathfinder Data Acquisition. The project obtains digital Landsat MSS and TM datafrom three sources: (a) the U.S. national archives held at...
-104-
http,:/pathfinder-www.sr. unh, edu/pathfinderl /information/overview/acquisition, html - size 6K -18.Jan.96 - English
GlossaryLANDSAT (formerly ERTS) The Landsat program, first known as the Earth Resources TechnologySatellite (ERTS) Program, is a development of the National...http://edcwww.cr.usss.sov/bin/slossearch/landsat - size IK - 24.May.97 - English
Remote Sensing LinksSatellite Data. AVIRIS - Online Quicklooks. AIRSAR - Information about JPL's AIRSAR sensor.Alaska SAR Facility. Declassified Satellite Imagery. EOSAThttp://wwvf.csr.utexas.edu/proiects/rs/links.htmI - size 4K - 13.Mar.97 - English
-105-


Annex 3 Earth Wateh Incoiporated
-107-
About the,
Our Products]
ImageryApplications
EarthWatch Incorporated (EarthWatch) offers images ofthe Earth's surface archived in the Digital Globe™database, the world's first commercial, multipurposecollection of geographic data products includinghigh-resolution satellite imagery, image maps, digitalterrain models, and digital maps.
DIGITAL GLOBEYour P(*n»t Qn-lin«"
Available now! Colorado Front Range high-resolutionimagery, NEW
Interested in the design of the first U.S. commercialradar satellite? NEW
Launch a career in satellite imaging with EarthWatch.
Checkour job listings.
Check out our multimedia site - with animation and sound(You'll need Shockwave and plenty of bandwidth!)
Contact EarthWatch
©1997 EarthWatch Incorporated. All rights reserved.Please send your Web comments to [email protected].
-108-

Annex 4 Ei Net WWW serverQuick LooksEurimage
-109-
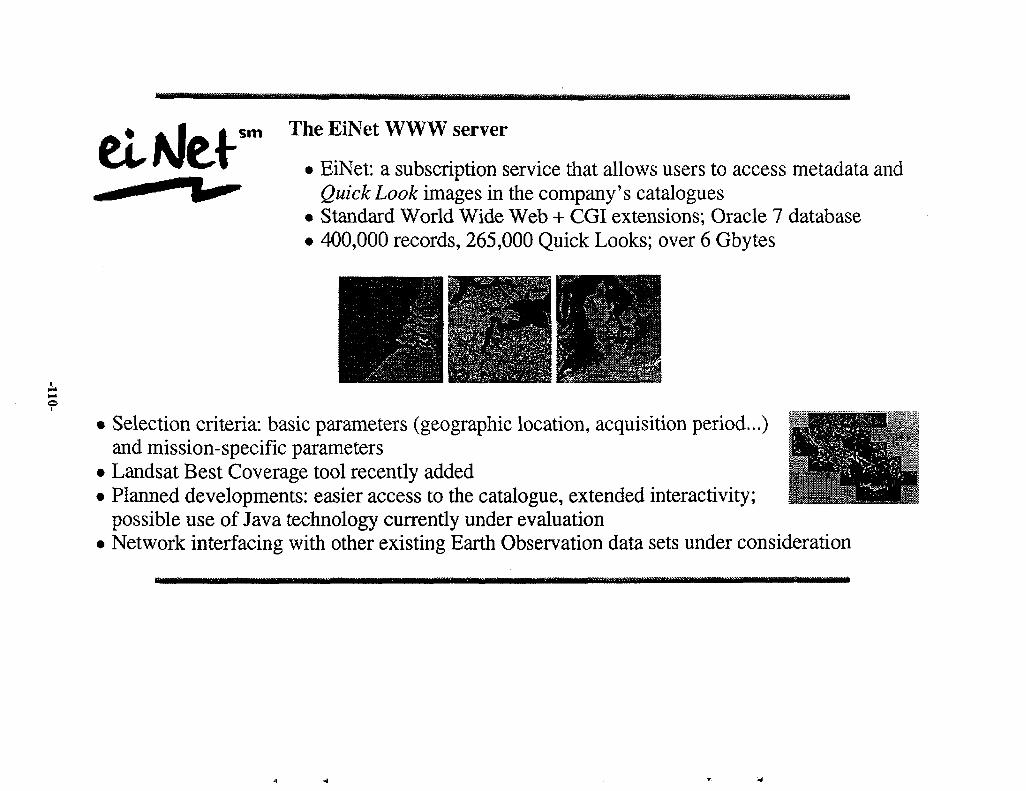
The EiNet WWW server
• EiNet: a subscription service that allows users to access metadata andQuick Look images in the company's catalogues
• Standard World Wide Web + CGI extensions; Oracle 7 database• 400,000 records, 265,000 Quick Looks; over 6 Gbytes
• Selection criteria: basic parameters (geographic location, acquisition period...)and mission-specific parameters
• Landsat Best Coverage tool recently added• Planned developments: easier access to the catalogue, extended interactivity;
possible use of Java technology currently under evaluation• Network interfacing with other existing Earth Observation data sets under consideration
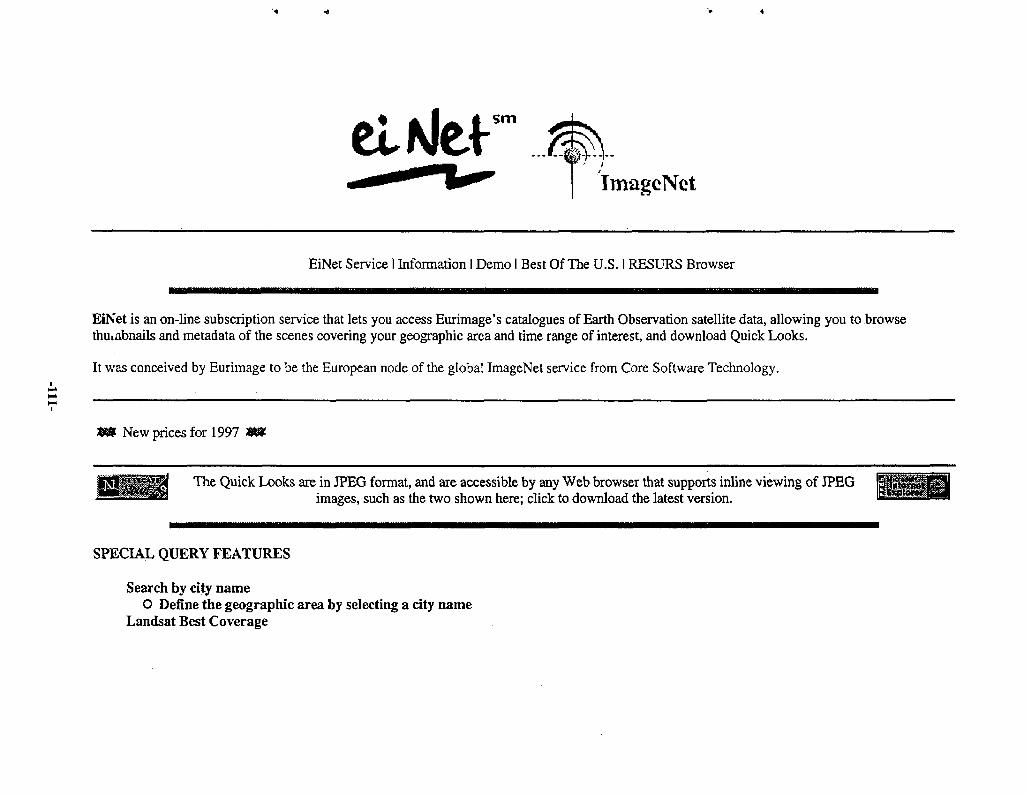
sm
IirmgeNet
EiNet Service I Information I Demo I Best Of The U.S. I RESURS Browser
EiNet is an on-line subscription service that lets you access Eurimage's catalogues of Earth Observation satellite data, allowing you to browsethuuibnails and metadata of the scenes covering your geographic area and time range of interest, and download Quick Looks.
It was conceived by Eurimage to be the European node of the global ImageNet service from Core Software Technology.
New prices for 1997
The Quick Looks are in JPEG format, and are accessible by any Web browser that supports inline viewing of JPEGimages, such as the two shown here; click to download the latest version.
SPECIAL QUERY FEATURES
Search by city nameO Define the geographic area by selecting a city name
Landsat Best Coverage
O Choose the country of interest to obtain only the covering scenesNo output limit
O Results are returned in groups of 20 (previews) or 200 (text only)
What's Available
0 EiNet Service - purchase a subscription to EiNet and gain access to our catalogue and Quick Looks browser of hundreds of thousands of scenesfrom LANDSAT TM, KVR-1000 and RESURS-01 MSU-SK (see below for full details of what's available)
l l Information - includes current prices for the EiNet service
® EiNet Demo - using a pre-defined area of interest and data set® Best Of The U.S. - gives you access to catalogue of cloud-free, high quality Landsat TM images of the United States of America; access to the
catalogue and downloading of the Quick Looks is free of charge
% RESURS Browser - gives you access to a catalogue of images from the RESURS-01 satellite; you use simple criteria to search the catalogueand can then download the corresponding Quick Looks free of charge.
Current Data Sets: (details)
Landsat TM (European Archive)
Landsat TM (Worldwide Archive)
KVR-1000
RESURS-01 MSU-SK (unlimited downloading of Quick Looks - free of charge).
Contact us
Ask for EiNet information and a registration form
Send your comments on EiNet
Up to Welcome Page.
How to contact Eurimage.
Last updated: 21 March 1997
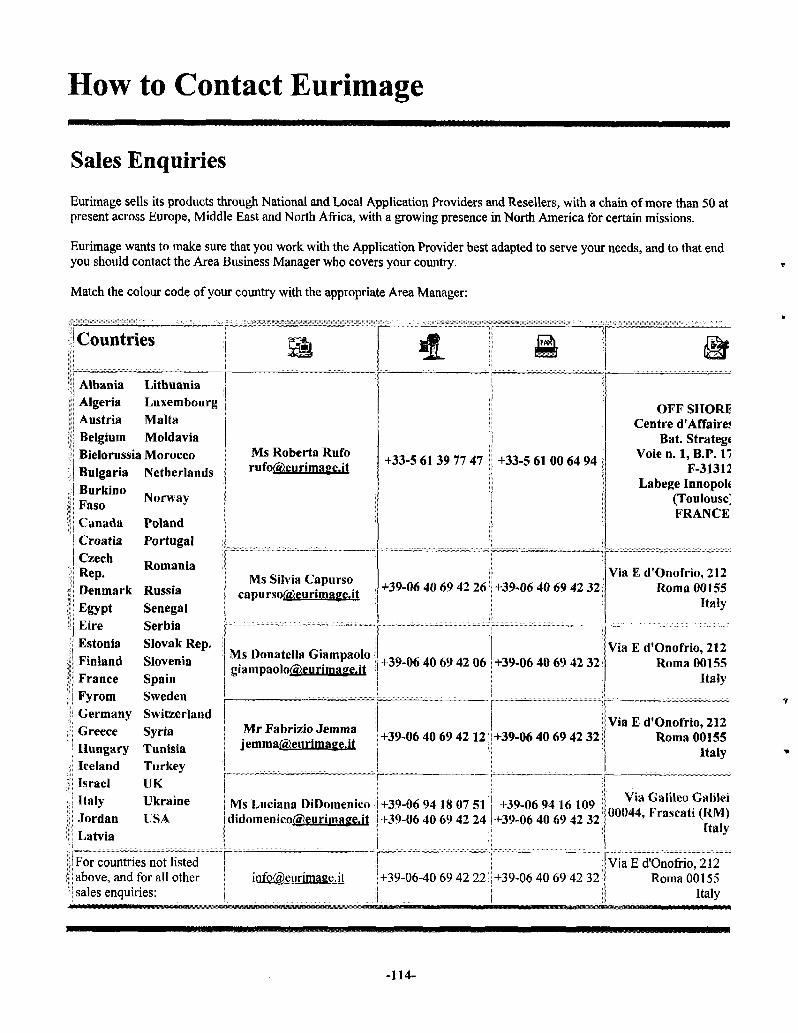
How to Contact Eurimage
Sales Enquiries
Eurimage sells its products through National and Local Application Providers and Resellers, with a chain of more than 50 atpresent across Europe, Middle East and North Africa, with a growing presence in North America for certain missions.
Eurimage wants to make sure that you work with the Application Provider best adapted to serve your needs, and to that endyou should contact the Area Business Manager who covers your country.
Match the colour code of your country with the appropriate Area Manager:
Countries
:p Albania Lithuaniai Algeria Luxembourg| Austria Malta| Belgium Moldavia
i | Bielorussia Morocco| Bulgaria NetherlandsI Burkino
11 Fasoi CanadaCroatia PortugalCzech
(Rep.3: Denmark RussiaH Egypt SenegalI Eire) Estonia
I Finland! France
Fyromi Germany Switzerland: Greece Syriaj Hungary Tunisia1 Iceland Turkey
Ms Roberta Ruforufo(5)eu rimage.it +33-5 61 39 77 47 I +33-5 61 00 64 94 j
Norway
Poland
Romania
SerbiaSlovak Rep.SloveniaSpainSweden
OFF SHORECentre d'Affaire;
Bat. StrategfVoie n. 1, B.P. V,
F-31312Labege Innopolc
(Toulouse^FRANCE
M.s Silvia Capursocapu rsotajeurimage.it +39-06 40 69 42 26)1 +39-06 40 69 42 32
Via E d'Onofrio, 212Roma 00155
Italy
1Ms Donatella Giampaolo
eu rimage.it +39-06 40 69 42 06 +39-06 40 69 42 32Via E d'Onofrio, 212
Roma 00155Italy
Mr Fabrizio Jemmaj emmaiSeu rimage. it
Via E d'Onofrio, 212+39-06 40 69 42 12 +39-06 40 69 42 321 Roma 00155
Italy
Israel! Italy! Jordani Latvia
UKUkraineUSA
Ms Luciana DiDomenicodidoinenico(5),eu rimage.it
+39-06 94 18 07 51+39-06 40 69 42 24
+39-06 94 16 109+39-06 40 69 42 32
Via Galileo Galilei00044, Frascati (RM)
ftaiy
;?|For countries not listedi;i above, and for all other! sales enquiries:
info@,eurimage.itVia E d'Onofrio, 212
+39-06-40 69 42 22;!+39-06 40 69 42 32 j| Roma 00155Italy
-114-
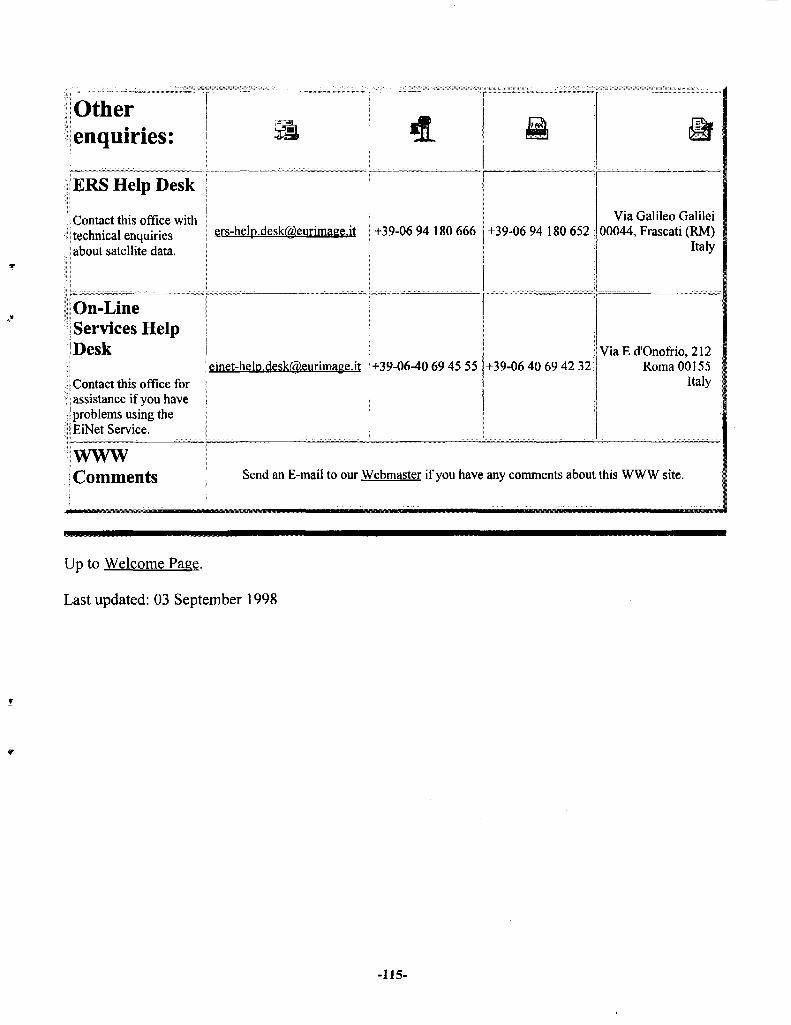
Otherenquiries:
j
ERS Help Desk
1 Contact this office with i 
elNferGeneral
EiNet is a subscription service, proposed in co-operation by Eurimage and Core Software Technology (CST), that allows users to search for metadataand browse Quick Look images from satellite missions such as Landsat, KVR 1000 and RESURS.
The system model is that of a Client / Server:
E • The Server software is running on a dedicated workstation installed and operated by Eurimage at its main offices at Rome, 24 hours a day, 7* days a week
• The Client software can be any public domain World Wide Web (WWW) client available on Unix, PC or Macintosh system platforms. Werecommend a client that shows JPEG images inline such as Netscape since all Quick Look images are stored and transmitted in JPEG format.
Catalogue (inventory)
The dataset for the vast majority of satellite scenes comprises three elements:
o Scene metadata (text)• Quick Look preview (small image)• Quick Look (image)
The exceptions arc sonic earlier LANDSAT images, where no previews or Quick Looks are available.
How it works
When you connect to our the EiNet Service you will be asked for your user name and password. A graphical map interface allows you to zoom intoyour zone of interest and select either a single location or a rectangular area in which the data search is to be performed. Once you are satisfied withyour area definition, an intuitive Query Form is displayed, from which you specify the other search parameters (date range, mission and missiondependent values). The server responds with the Metadata of the scenes that match your search parameters plus associated Quick Look previews. Inthis way you can immediately visualise the results of the query. You can click on a Preview to download the associated Quick Look, which can beeither displayed by your WWW client's in-built image visualisation capability or by its launching a specific image viewing application.
EiNet Demo
If you would like to see what the EiNet service has to offer, select EiNet Demo to perform a search on a pre-defined geographic area and a small fixeddataset (the screens you see are copies of the real screens, but altering the parameters in the demo will not change the results).
Prices
New Prices for 1997
With effect from 1st January 1997 the price of EiNet will be reduced to:
ECU 1001 calendar year
This gives:
• access to EiNet from the date of subscription until the 31st of December of the subscription year
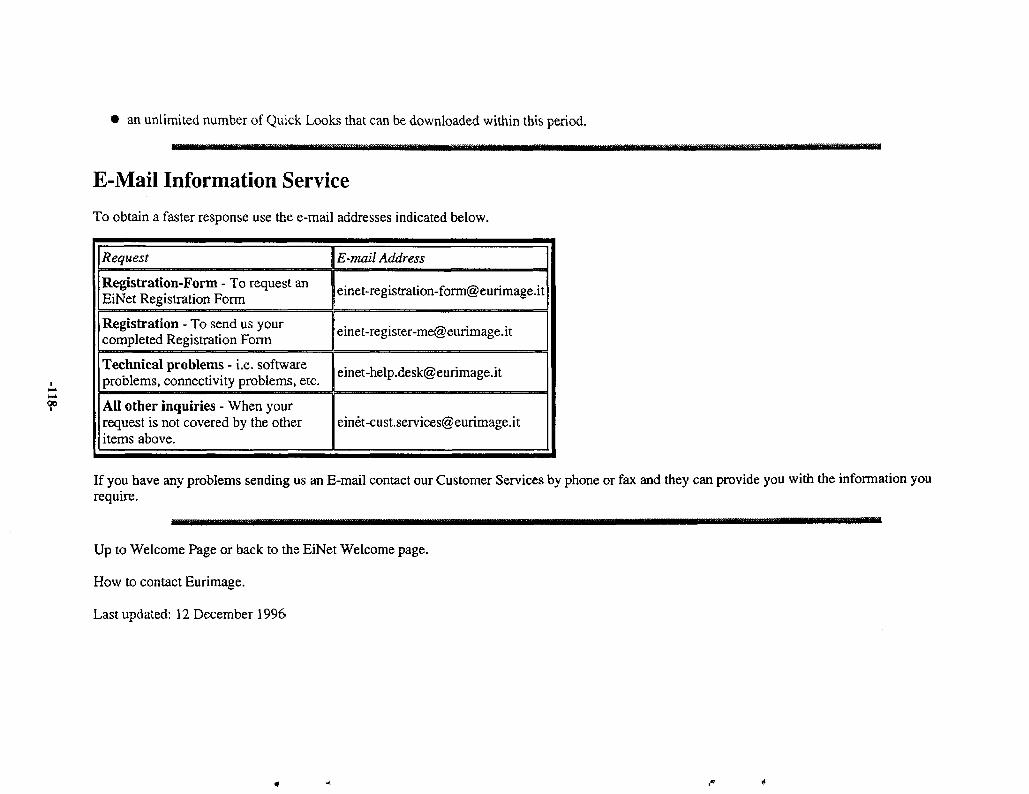
an unlimited number of Quick Looks that can be downloaded within this period.
00
E-Mail Information ServiceTo obtain a faster response use the e-mail addresses indicated below.
Request
Registration-Form - To request anEiNet Registration Form
Registration - To send us yourcompleted Registration Form
Technical problems - i.e. softwareproblems, connectivity problems, etc.
All other inquiries - When yourrequest is not covered by the otheritems above.
E-mail Address
If you have any problems sending us an E-mail contact our Customer Services by phone or fax and they can provide you with the information yourequire.
Up to Welcome Page or back to the EiNet Welcome page.
How to contact Eurimage.
Last updated: 12 December 1996
Quick LooksIf you 're new to the world of Remote Sensing you may be wondering what a Quick Look is. Well, let's take an example of an image from the mostpopular and reliable satellite in the history of Remote Sensing - LANDS AT. The Thematic Mapper (TM) instrument on this satellite measures thereflected solar light from its 185 km swath in an array of 7,020 sensors, each of which is measuring the reflectance of an area of the earth's surfaceabout 26 metres square. The time interval between each successive capture is such that the satellite moves 26 metres along its track between eachcapture, thus neatly covering the surface of the earth without overlap - isn't technology wonderful!
5,760 of these rows of readings go to make a standard LANDSAT scene, giving a total of 40,435,200 readings (normally known as pixels). TheLANDSAT TM sensor takes these readings simultaneously in seven separate bands in the visible and infrared parts of the spectrum, thus giving us agrand total of 283,046,400 pixels.
To create an image from these data we use just three of these bands, and so we have a mere 121,305,600 pixels to deal with. When you consider thateach pixel is stored in one byte you can see that an image created from this data would be about 115.68 Mb (uncompressed) - not a very downloadableproposition on the Internet (1 Mb - 1024 x 1024 bytes).
Thus, we create a Quick Look by sub-sampling the data to give an image of 512 x 512 pixels per band. An RGB colour image of these dimensions isnormally about 768 Kb (1 Kb = 1024 bytes), but with JPEG compression we can get the size down to 9Kb - 31Kb (depending on the image contents),without losing too much image quality.
The LANDSAT Quick Looks are RGB images, using bands seven (mid-infrared), five (near-infrared) and two (visible - green), as RGB, respectively,a combination which above all else helps users to distinguish between clouds and snow, because of their different reflectance in the infrared.
Finally, the images are contrast-stretched with a special algorithm to ensure that the range of reflectance values that was recorded by LANDSAT ineach band (perhaps between 30 and 85) is stretched across the full range of potential values (0 to 255), thus giving a colourful image that makes iteasy to distinguish major features.
For panchromatic sensors, such as the KVR-1000 camera on the COSMOS satellite, the Quick Looks are in black and white.
These Quick Looks are examined by potential users to check the estimates of cloud cover percentages that were made at the time of acquisition at thereceiving station, as well as to decide which product would be most useful for their project.
To Receive Quick Looks
There are two ways to receive Quick Looks from Eurimage:
W Subscribe to EiNet, Eurimage's catalogs and Quick Looks browser
H Subscribe to Eurimage's Quick Looks CD-ROM
ft smPi IUP4-
Up to Welcome Page or back to
How to contact Eurimage.
Last updated: 20 December 1996
Eurimage provides Earth Observation Products and Services in Europe, North Africa and the Middle East, offering remote sensing users a uniquemulti-mission service.
I - visitor count since 1st July 1995.
This site is best viewed with a browser that supports Tables and JPEG images, such as the two shown here; click todownload the latest version.
On-line Services:
W EiNet Quick Looks and catalogue browsing system
H Earth Watching - Eurimage's monitoring service for natural disasters and special events, in conjunction with the European Space Agency.
Information:
Products and product-related services.
Applications for a summary of the applications that use the different data sets offered by Eurimage.
What's New for the latest information about data availability, special offers, technical updates, etc. and to read the Eurimage Newsletters.
Eurimage Summary or Background - more about the Company,
Remote Sensing LinksContents Index
SituationsVacant
Eurimageaddresses
What's new inthese pages
E-Mail your commentsabout this site
Last updated: 12 June 1997
C/ic :̂ anywhere on the map to zoom in.
Note: This server uses JPEG images and requires a WWW Browser that displays inline JPEG images, such as Netscape (tm) from NetscapeCommunications, Inc.
C/i'ci anywhere on the map to zoom in. When you are ready to search, press the button below.
'. may search for any images that include just a location, or for images that contain a minimum area by indicating your choice in the boxes below,V and then selecting a location on the map above
Point Area
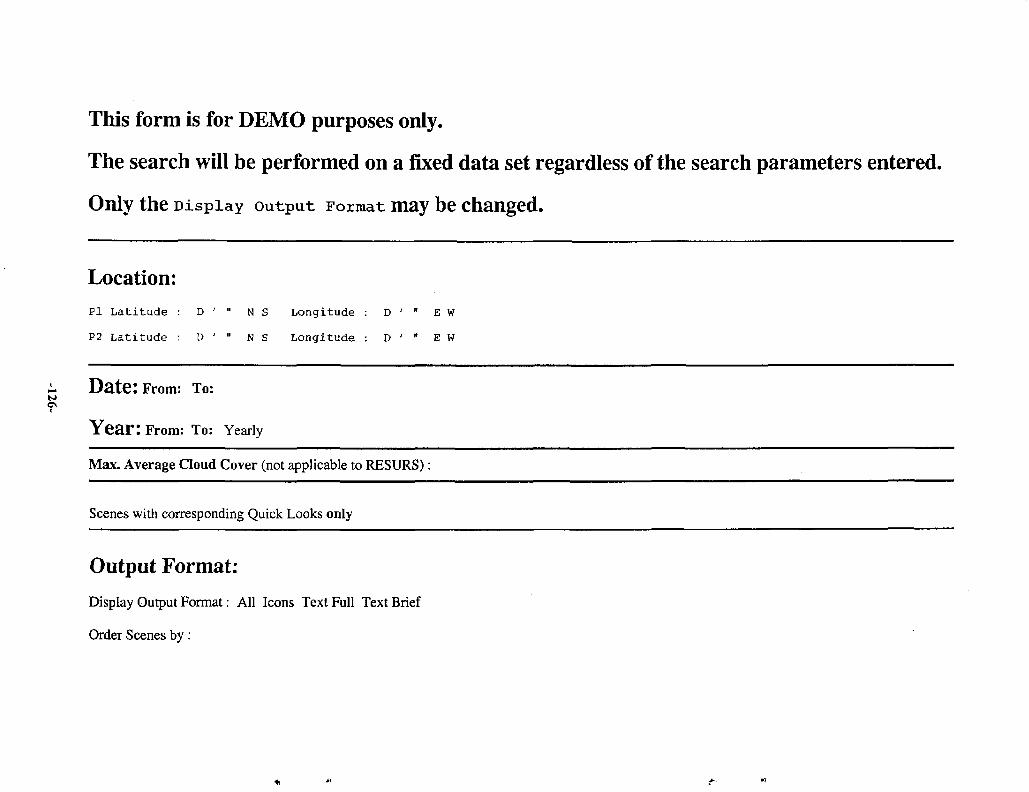
This form is for DEMO purposes only.
The search will be performed on a fixed data set regardless of the search parameters entered.
Only the Display output Format may be changed.
Location:PI Latitude : D ' " N S Longitude : D ' " E W
P2 Latitude : D ' " N S Longitude : D ' " E W
Date: From: To:
Y e a r : From: To: Yearly
Max. Average Cloud Cover (not applicable to RESURS):
Scenes with corresponding Quick Looks only
Output Format:
Display Output Format: All Icons Text Full Text Brief
Order Scenes by:
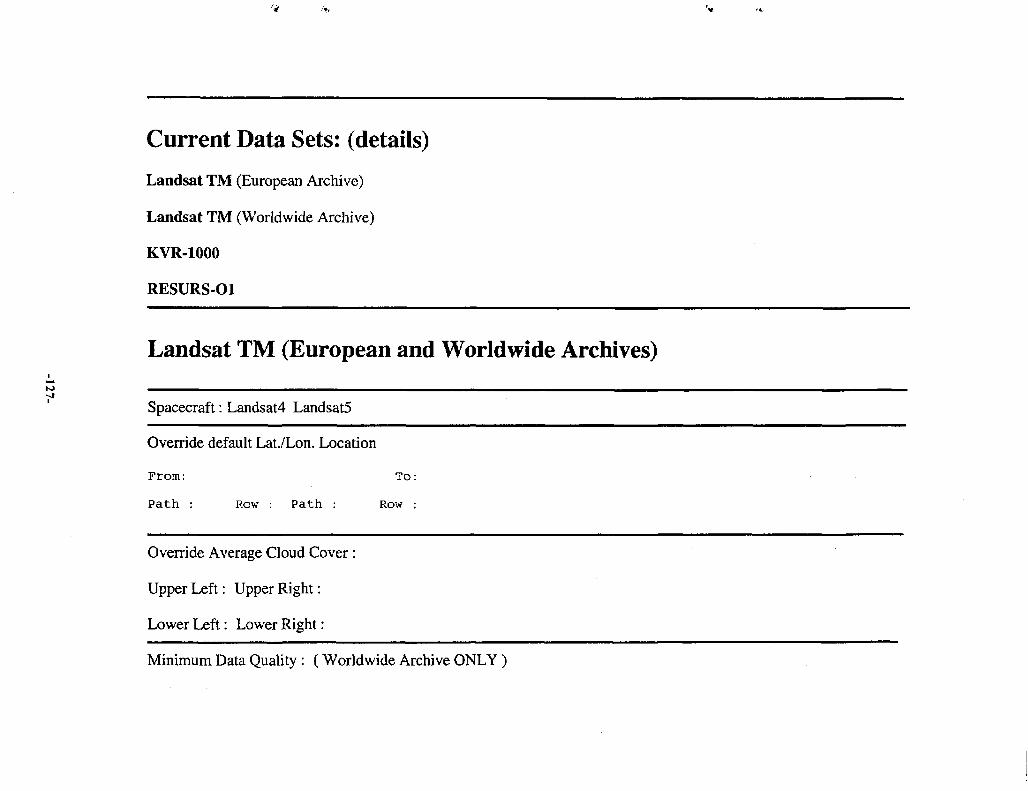
Current Data Sets: (details)
Landsat TM (European Archive)
Landsat TM (Worldwide Archive)
KVR-1000
RESURS-O1
Landsat TM (European and Worldwide Archives)
Spacecraft: Landsat4 Landsat5
Override default Lat./Lon. Location
From: To:
Path : Row : Path : Row :
Override Average Cloud Cover :
Upper Left: Upper Right:
Lower Left: Lower Right:
Minimum Data Quality : (Worldwide Archive ONLY)
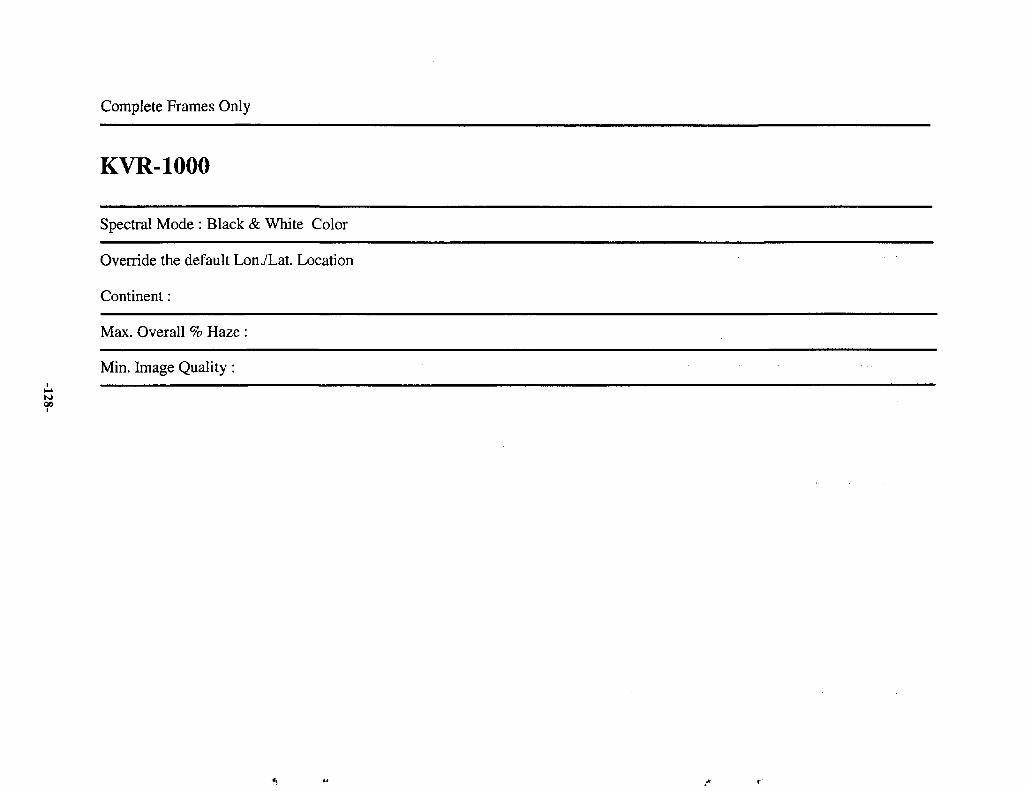
Complete Frames Only
KVR-1000
Spectral Mode : Black & White Color
Override the default Lon./Lat. Location
Continent:
Max. Overall % Haze
Min. Image Quality :
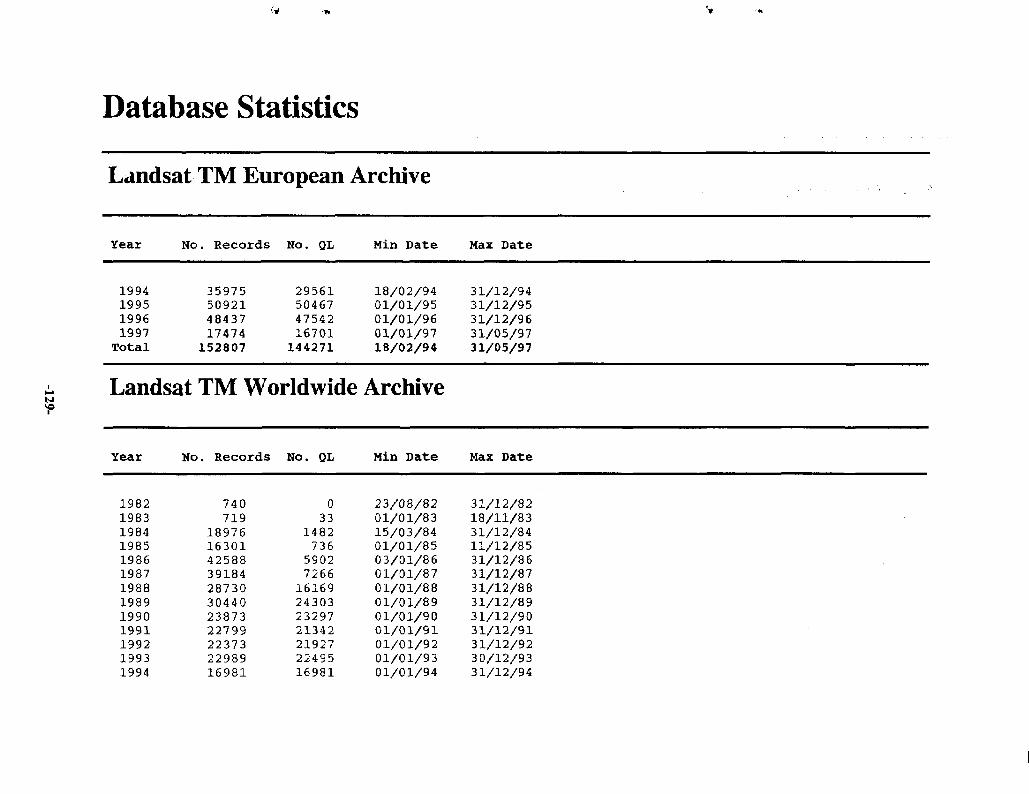
Database Statistics
Landsat TM European Archive
Year No. Records Ho. QL Min Date Max Date
1994199519961997Total
35975509214843717474152807
29561504674754216701144271
18/02/9401/01/9501/01/9601/01/9718/02/94
31/12/9431/12/9531/12/9631/05/9731/05/97
Landsat TM Worldwide Archive
Year No. Records No. QL Min Date Max Date
1982198319841985198619871988198919901991199219931994
740719
1897616301425883918428730304402387322799223732298916981
033
14827365902726616169243032329721342219272249516981
23/08/8201/01/8315/03/8401/01/8503/01/8601/01/8701/01/8801/01/8901/01/9001/01/9101/01/9201/01/9301/01/94
31/12/8218/11/8331/12/8411/12/8531/12/8631/12/8731/12/8831/12/8931/12/9031/12/9131/12/9230/12/9331/12/94
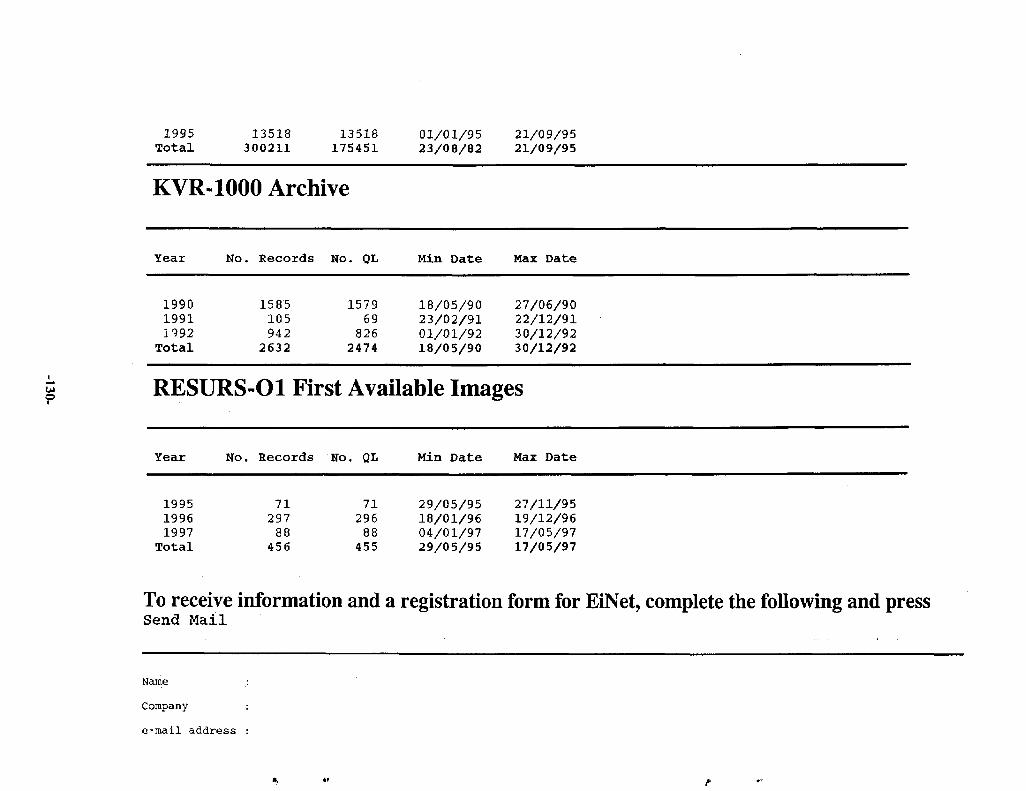
1995 13518 13518 01/01/95 21/09/95Total 300211 175451 23/08/82 21/09/95
KVR-1000 Archive
Year No. Records No. QL Min Date Max Date
199019911192
Total
158510594 2
2632
157969
8262474
18/05/9023/02/9101/01/9218/05/90
27/06/9022/12/9130/12/9230/12/92
g RESURS-01 First Available Images
Year No. Records Ho. QL Min Date Max Date
199519961997
Total
7129788
456
7129688
455
29/05/9518/01/9604/01/9729/05/95
27/11/9519/12/9617/05/9717/05/97
To receive information and a registration form for EiNet, complete the following and pressSend Mail
Name :
Company :
e-mail address :
Annex 5 Australian Centre for Remote Sensing (ACRES)About Remote SensingRemote Sensing Products and ServicesACRES Products and Services IndexACRES Landsat TM Price ListACRES SPOT Price ListSatellite - ERSACRES ERS SAR Price ListSatellite - JERSEOSAT JERS Price ListSatellites - Indian Remote Sensing Satellite (IRS)EOSAT IRS Price List
-131-
AUSTRALIAN CENTREFOR REMOTE SENSING
SAUSUGi
About Remote Sensing
What is Remote Sensing?
Remote sensing is the observation of an object from a distance. Examples are Aerial Photography and the use of satellites to observe the Earth.
Satellite remote sensing involves gathering information about features on the Earth's surface from orbiting satellites. These satellites carry two typesof sensor systems known as "active" and "passive". A "passive" system generally consists of an array of small sensors or detectors which record (asdigital numbers) the amount of electro-magnetic radiation reflected and/or emitted from the Earth's surface. A multispectral scanner is an example ofa passive system. An "active" system propagates its own electro-magnetic radiation and measures (as digital numbers) the intensity of the returnsignal. Synthetic Aperture Radar (SAR) is an example of an active system.
The digital data acquired by the satellites are transmitted to ground stations and can be used to reconstitute an image of the Earth's surface not toodissimilar to an aerial photograph.
Benefits of Remotely Sensed Data from Earth Observation Satellites.
Remotely sensed data acquired by the Earth observation satellites provide a number of benefits for studying the Earth's surface, including:
• continuous acquisition of data• regular revisit capabilities (resulting in up-to-date information)• broad regional coverage• good spectral resolution (including infra-red bands)• good spatial resolution
ability to manipulate/enhance digital dataability to combine satellite digital data with other digital datacost effective datamap-accurate datapossibility of stereo viewinglarge archive of historical data
How are data provided to the end-user?
Data are provided as hard copy photographic data products, or as digital data products which can be viewed and manipulated on a variety of softwaresystems.
Further information is available on ACRES Products and Services.
How are data used?
Satellite data are used to provide timely and detailed information about the Earth's surface, especially in relation to the management of our renewableand non-renewable resources.
Some examples of uses of satellite data are:
assessment and monitoring of vegetation types and their statussoil surveysmineral explorationmap making and revisionproduction of thematic mapswater resources planning and monitoringurban planningagricultural property management planningcrop yield assessmentnatural disaster assessment

t
Some Common Earth Observation Satellites
Common Earth observation satellites include Landsat, SPOT, ERS and JERS.
See ACRES Satellite Facts Page for more information.
More infonnation about Remote Sensing can be obtained by connecting to the WWW pages of the Nottingham University in the United Kingdom.
ACRES Products and Services
About ACRES
N* AUSTRAUAN SURVEYING & LAND INFORMATION GROUP& Scrivener Building, Dunlop Court, Fern Hill Park, Bruce ACT 26171 PO Box 2 Belconnen ACT 2616 Phone: +61 6 201 4201 Fax: +61 6 201 4366
© COMMONWEALTH OF AUSTRALIA 1995
S AUSLIG.AUSTRALIAN CENTREFOR REMOTE SENSING
Remote Sensing Products and ServicesLast Updated • July 1996
The Australian Centre for Remote Sensing (ACRES) is the business unit of AUSLIG responsible for its national remote sensing program. ACRESacquires, archives and processes data from some of the major polar orbiting earth resource satellites. In addition, ACRES provides satellite dataimported from overseas suppliers (ie acquired from other ground stations). Products may be purchased either through one of ACRES speciallyappointed Distributors around Australia (Landsat, SPOT, RADARSAT, ERS and JERS), New Zealand (RADARSAT only), Indonesia (Landsat only)and USA {Landsat only), or directly from the ACRES office in Canberra.
* ACRES has a range of products and services to suit various data analysis applications. Detailed information can be obtained via the ACRES Productsand Services Index.
Following is a brief summary of the various satellite sensors from which ACRES directly receives data:
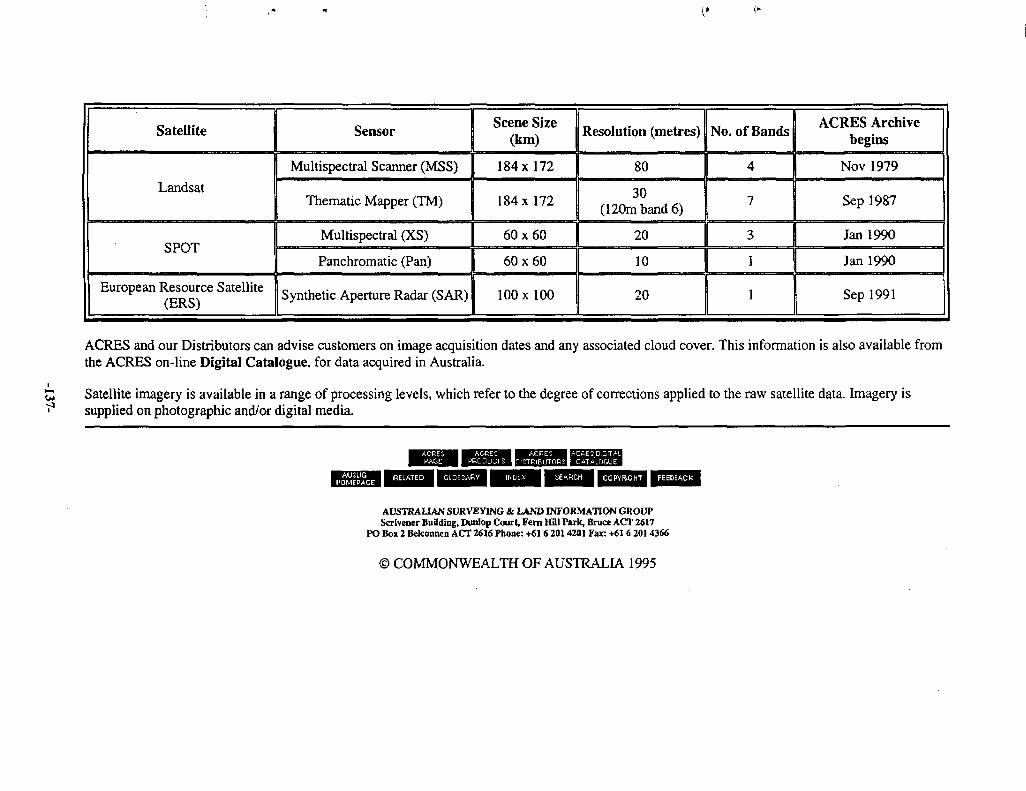
Satellite
Landsat
SPOT
European Resource Satellite(ERS)
Sensor
Multispectral Scanner (MSS)
Thematic Mapper (TM)
Multispectral (XS)
Panchromatic (Pan)
Synthetic Aperture Radar (SAR)
Scene Size(km)
184x172
184x172
60x60
60x60
100 x100
Resolution (metres)
80
30(120m band 6)
20
10
20
No. of Bands
4
7
3
1
1
ACRES Archivebegins
Nov 1979
Sep 1987
Jan 1990
Jan 1990
Sep 1991
ACRES and our Distributors can advise customers on image acquisition dates and any associated cloud cover. This information is also available fromthe ACRES on-line Digital Catalogue, for data acquired in Australia.
Satellite imagery is available in a range of processing levels, which refer to the degree of corrections applied to the raw satellite data. Imagery issupplied on photographic and/or digital media.
AUSTRALIAN SURVEYING & LAND INFORMATION GROUPScrivener Bunding, Dunlop Court, Fern Hfll Park, Bruce ACT 2617
PO Box 2 Belconnen ACT 2616 Phone: +61 6 201 4201 Fax: +616 2014366
© COMMONWEALTH OF AUSTRALIA 1995
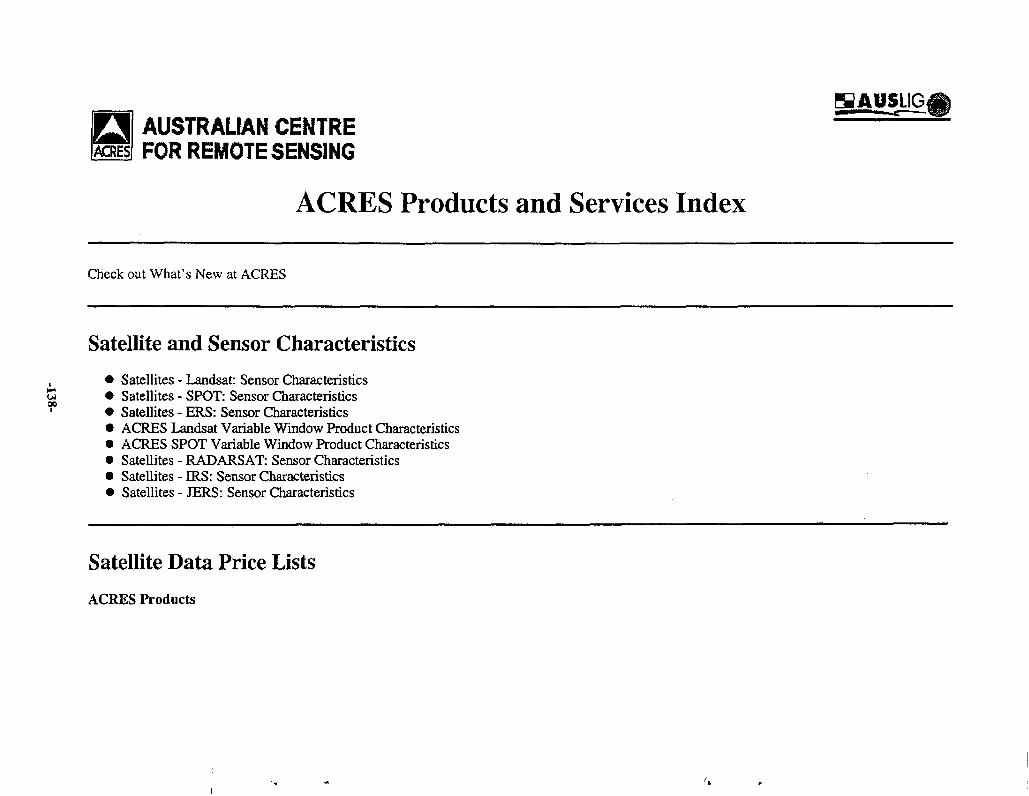
AUSTRALIAN CENTREFOR REMOTE SENSING
ACRES Products and Services Index
Check out What's New at ACRES
00
Satellite and Sensor CharacteristicsSatellites - Landsat: Sensor CharacteristicsSatellites - SPOT: Sensor CharacteristicsSatellites - ERS: Sensor CharacteristicsACRES Landsat Variable Window Product CharacteristicsACRES SPOT Variable Window Product CharacteristicsSatellites - RADARSAT: Sensor CharacteristicsSatellites - ERS: Sensor CharacteristicsSatellites - JERS: Sensor Characteristics
Satellite Data Price ListsACRES Products

• ACRES Landsat Thematic Mapper (TM) Data• ACRES Landsat Multispectral Scanner (MSS) Data• ACRES SPOT Multispectral and Panchromatic Data• ACRES ERS Synthetic Aperture Radar (SAR) Data
Imported Products
RADARSAT SAR ProductsEOSAT Landsat TM ProductsNRCT (Thailand) Landsat TM ProductsEROS Landsat MSS ProductsEOSAT IRS ProductsEOSAT JERS ProductsSSC Satellitbild RESURS Products
ACRES Services
Image Writing ServiceImage Writing Service PricesImported Satellite Data from Overseas SuppliersSatellite Programming ServiceACRES Future Acquisitions for SPOT Imagery - Fee Structure and Details
ACRES Speciality Products
• Customised Sample Product
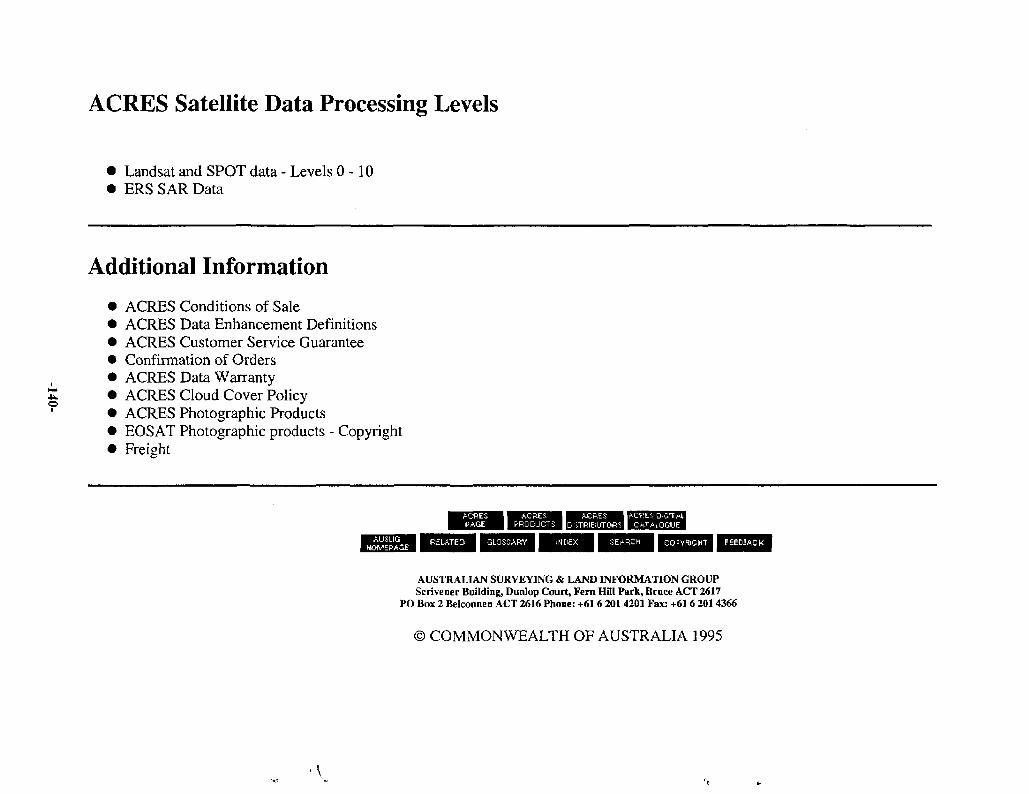
ACRES Satellite Data Processing Levels
• Landsat and SPOT data - Levels 0 - 1 0• ERS SAR Data
Additional Information
ACRES Conditions of SaleACRES Data Enhancement DefinitionsACRES Customer Service GuaranteeConfirmation of OrdersACRES Data WarrantyACRES Cloud Cover PolicyACRES Photographic ProductsEOSAT Photographic products - CopyrightFreight
AUSTRALIAN SURVEYING & LAND INFORMATION GROUPScrivener Building, Dunlop Court, Fern Hill Park, Bruce ACT 2617
PO Box 2 Belconnen ACT 2616 Phone: +616 201 4201 Fax: +61 6 2014366
© COMMONWEALTH OF AUSTRALIA 1995
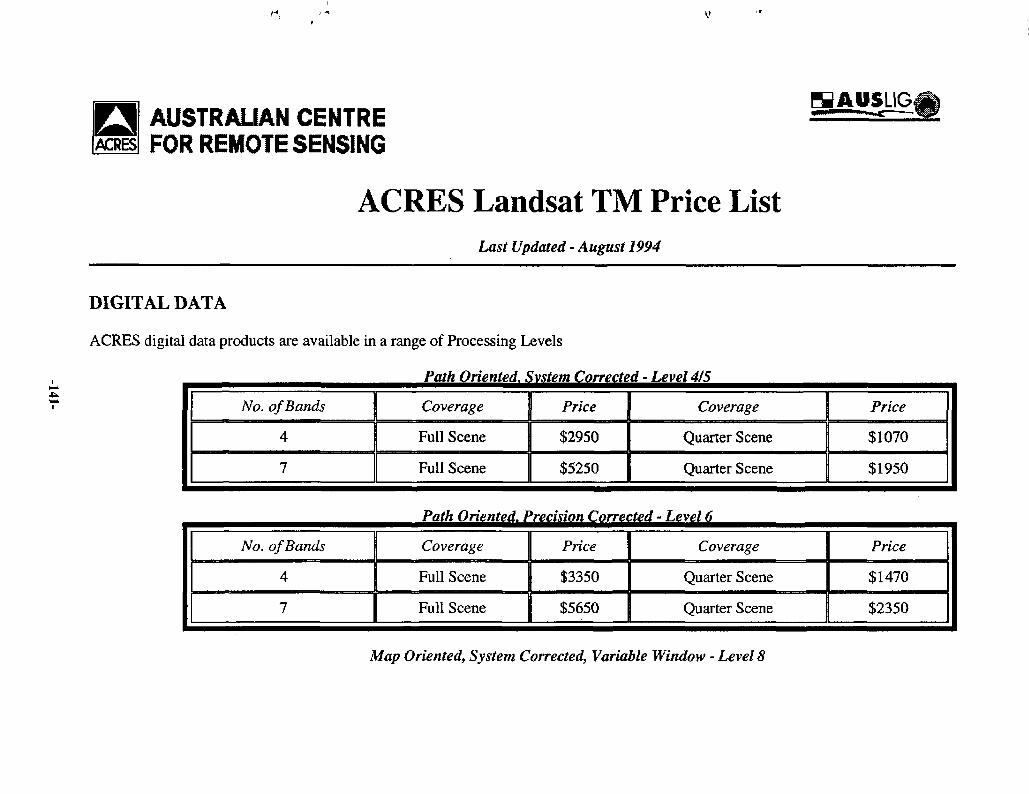
AUSTRALIAN CENTREFOR REMOTE SENSING
%AUSUG
ACRES Landsat TM Price ListLast Updated - August 1994
DIGITAL DATA
ACRES digital data products are available in a range of Processing Levels
Path Oriented. System Corrected - Level 4/5
No. of Bands
4
7
Coverage
Full Scene
Full Scene
Price
$2950
$5250
Coverage
Quarter Scene
Quarter Scene
Price
$1070
$1950
Path Oriented. Precision Corrected - Level 6
No. of Bands
4
7
Coverage
Full Scene
Full Scene
Price
$3350
$5650
Coverage
Quarter Scene
Quarter Scene
Price
$1470
$2350
Map Oriented, System Corrected, Variable Window - Level 8
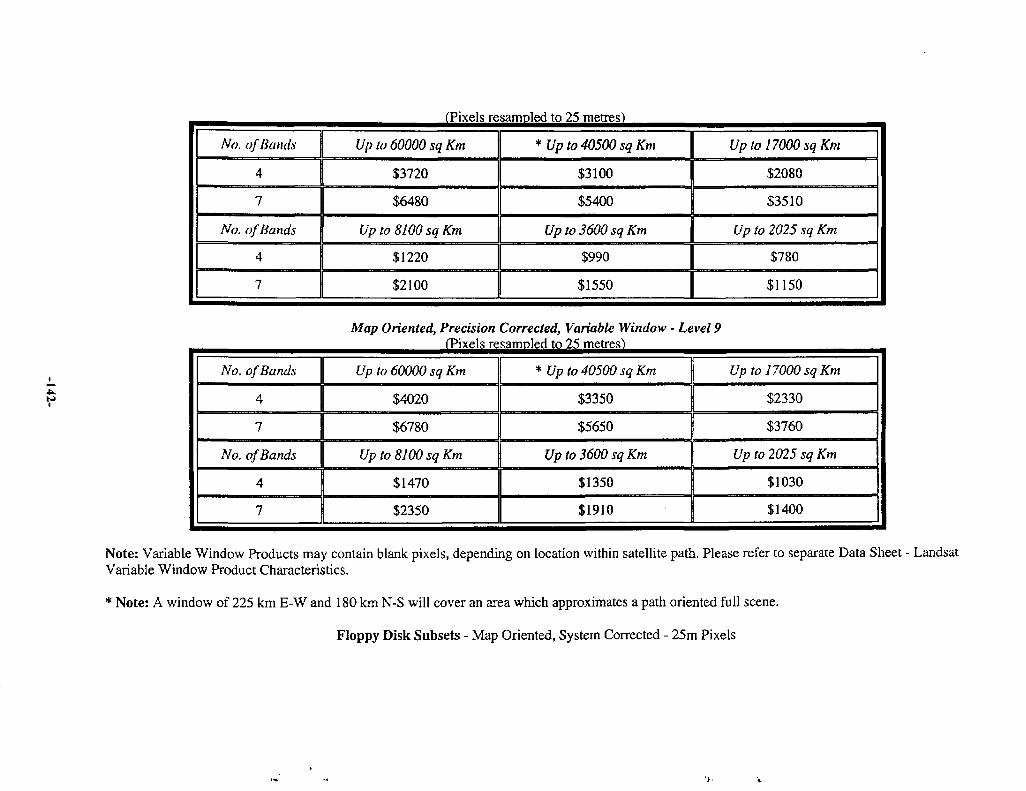
(Pixels resamoled to 25 metres)
No. of Bands
4 17
No. of Bands
4
7
Up to 60000 sq Km
$3720
$6480
Up to 8100 sq Km
$1220
$2100
* Up to 40500 sq Km
$3100
$5400
Up to 3600 sq Km
$990
$1550
Up to 17000 sq Km
$2080
$3510
Up to 2025 sq Km
$780
$1150
Map Oriented, Precision Corrected, Variable Window - Level 9(Pixels resamDled to 25 metres')
No. of Bands
4
7
No. of Bands
4
7
Up to 60000 sq Km
$4020
$6780
Up to 8100 sq Km
$1470
$2350
* Up to 40500 sq Km
$3350
$5650
Up to 3600 sq Km
$1350
$1910
Up to 17000 sq Km
$2330
$3760
Up to 2025 sq Km
$1030
$1400
Note: Variable Window Products may contain blank pixels, depending on location within satellite path. Please refer to separate Data Sheet - LandsatVariable Window Product Characteristics.
* Note: A window of 225 km E-W and 180 km N-S will cover an area which approximates a path oriented full scene.
Floppy Disk Subsets - Map Oriented, System Corrected - 25m Pixels
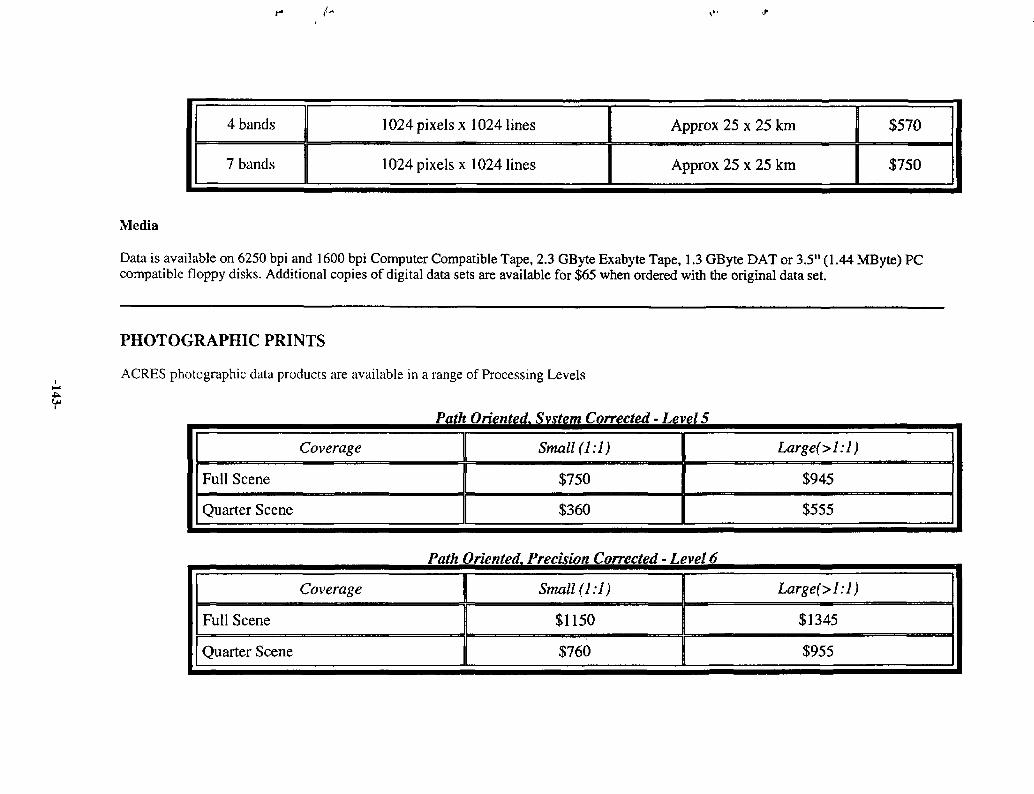
4 bands
7 bands
1024 pixels x 1024 lines
1024 pixels x 1024 lines
Approx 25 x 25 km
Approx 25 x 25 km
$570
$750
Media
Data is available on 6250 bpi and 1600 bpi Computer Compatible Tape, 2.3 GByte Exabyte Tape, 1.3 GByte DAT or 3.5" (1.44 MByte) PCcompatible floppy disks. Additional copies of digital data sets are available for $65 when ordered with the original data set.
PHOTOGRAPHIC PRINTS
ACRES photographic data products are available in a range of Processing Levels
Path Oriented. System Corrected - Level 5
Coverage
Full Scene
Quarter Scene
Coverage
Full Scene
Quarter Scene
Small (1:1)
$750
$360
Path Oriented. Precision Corrected - Level 6
Small (1:1)
$1150
1 $760
Large(>l:l)
$945
$555
Large(>l:l)
$1345
$955
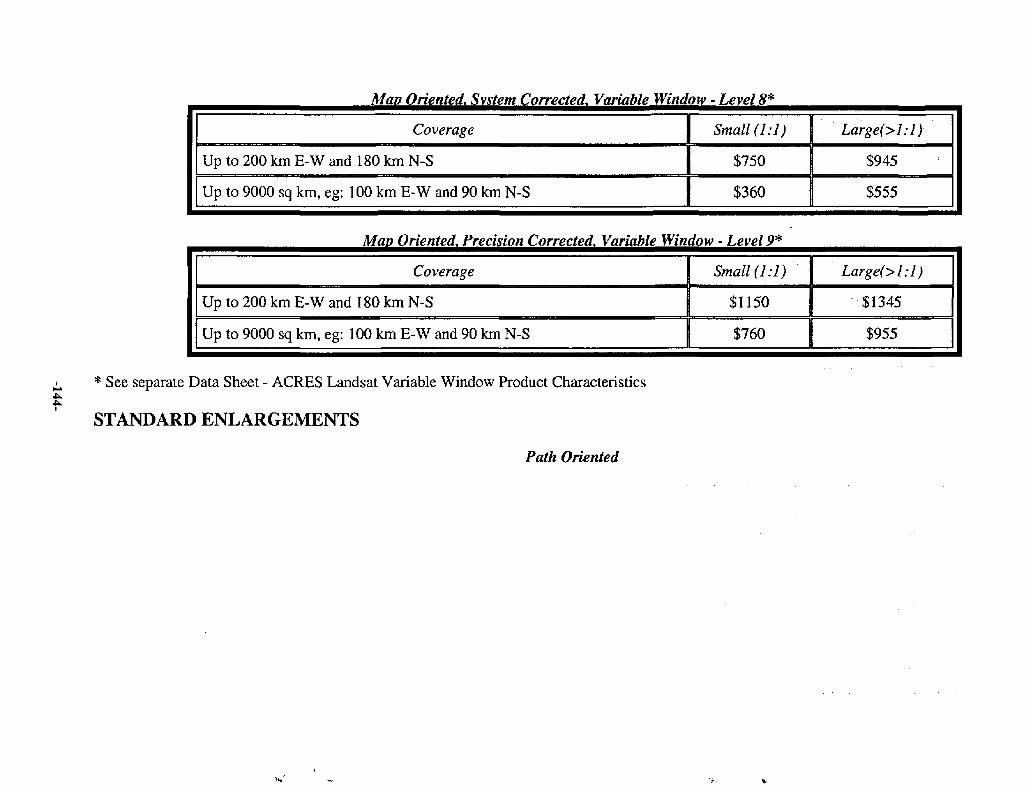
Map Oriented. System Corrected, Variable Window - Level 8*
Coverage
Up to 200 km E-W and 180 km N-S
Up to 9000 sq km, eg: 100 km E-W and 90 km N-S
Small (1:1)
$750
$360
Large(>l:l)
$945
$555
Map Oriented, Precision Corrected. Variable Window - Level 9*
Coverage
Up to 200 km E-W and 180 km N-S
Up to 9000 sq km, eg: 100 km E-W and 90 km N-S
Small (1:1)
$1150
$760
Large(>l:l)
$1345
$955
* See separate Data Sheet - ACRES Landsat Variable Window Product Characteristics
STANDARD ENLARGEMENTS
Path Oriented
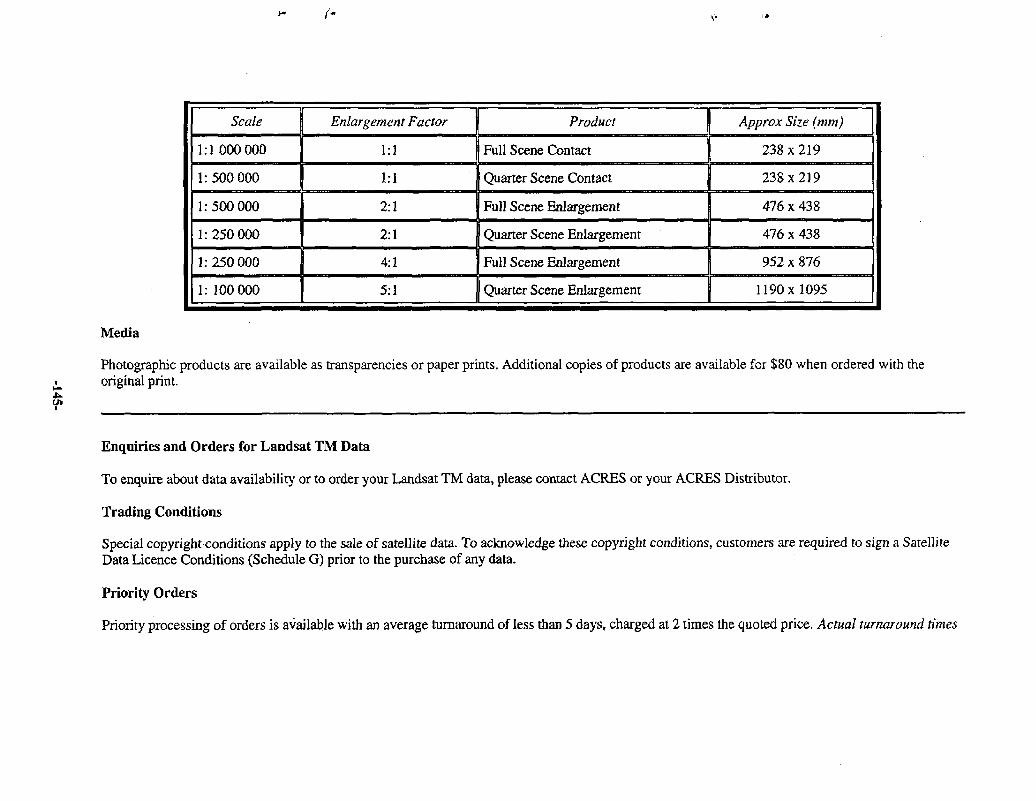
(A
Scale
1:1000 000
1:500 000
1:500 000
1:250 000
1:250 000
1: 100 000
Enlargement Factor
1:1
1:1
2:1
2:1
4:1
5:1
Product
Full Scene Contact
Quarter Scene Contact
Full Scene Enlargement
Quarter Scene Enlargement
Full Scene Enlargement
Quarter Scene Enlargement
Approx Size (mm)
238x219
238x219
476 x 438
476 x 438
952 x 876
1190x1095
Media
Photographic products are available as transparencies or paper prints. Additional copies of products are available for $80 when ordered with theoriginal print.
Enquiries and Orders for Landsat TM Data
To enquire about data availability or to order your Landsat TM data, please contact ACRES or your ACRES Distributor.
Trading Conditions
Special copyright conditions apply to the sale of satellite data. To acknowledge these copyright conditions, customers are required to sign a SatelliteData Licence Conditions (Schedule G) prior to the purchase of any data.
Priority Orders
Priority processing of orders is available with an average turnaround of less than 5 days, charged at 2 times the quoted price. Actual turnaround times
should be discussed with ACRES at time of order.
Delivery Details
ACRES products are dispatched by air freight. The price of data includes freight charges, except for international deliveries. To facilitate delivery ofyour products, please provide both your postal and street address.
All prices are subject to variation without notice and are quoted in Australian Dollars.
- AUSTRALIAN SURVEYING & LAND INFORMATION GROUPScrivener Building, Dunlop Court, Fern HOI Park, Bruce ACT 2617
PO Box 2 Belconoen ACT 2616 Phone: +61 6 2014201 Fax: +61 6 2014366
© COMMONWEALTH OF AUSTRALIA 1995
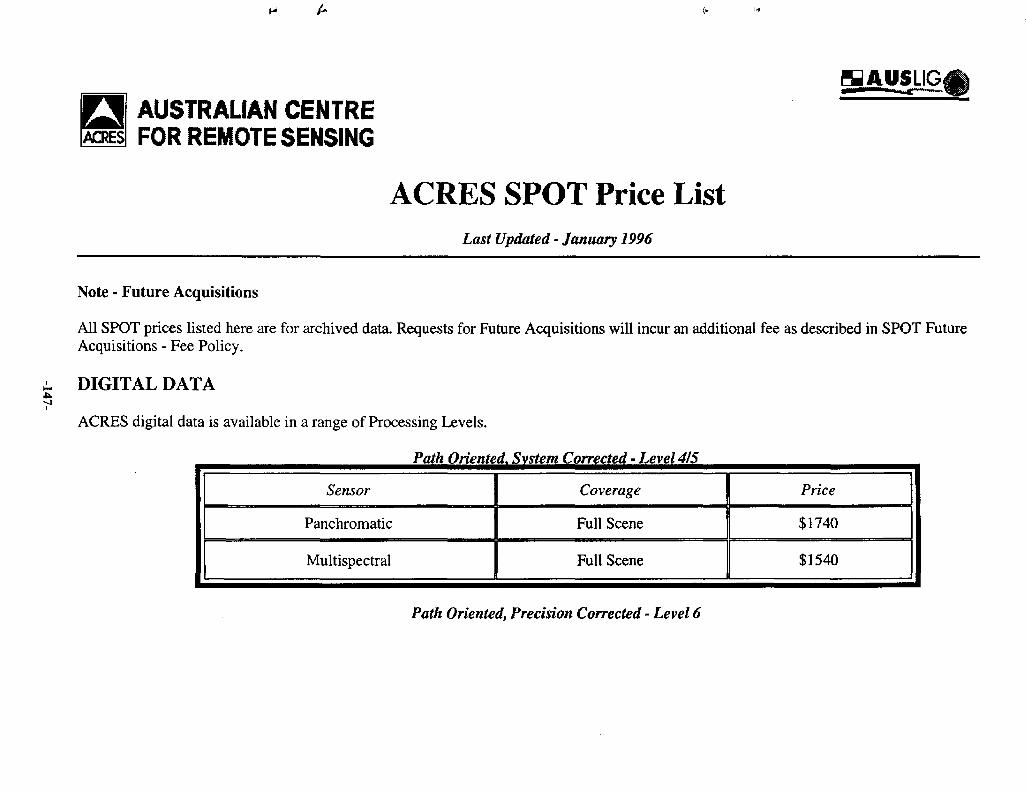
HAU5LIGAUSTRALIAN CENTREFOR REMOTE SENSING
ACRES SPOT Price ListLast Updated - January 1996
Note - Future Acquisitions
All SPOT prices listed here are for archived data. Requests for Future Acquisitions will incur an additional fee as described in SPOT FutureAcquisitions - Fee Policy.
i. DIGITAL DATAi
ACRES digital data is available in a range of Processing Levels.
Path Oriented, System Corrected - Level 4/5
Sensor
Panchromatic
Multispectral
Coverage
Full Scene
Full Scene
Price
$1740
$1540
Path Oriented, Precision Corrected - Level 6
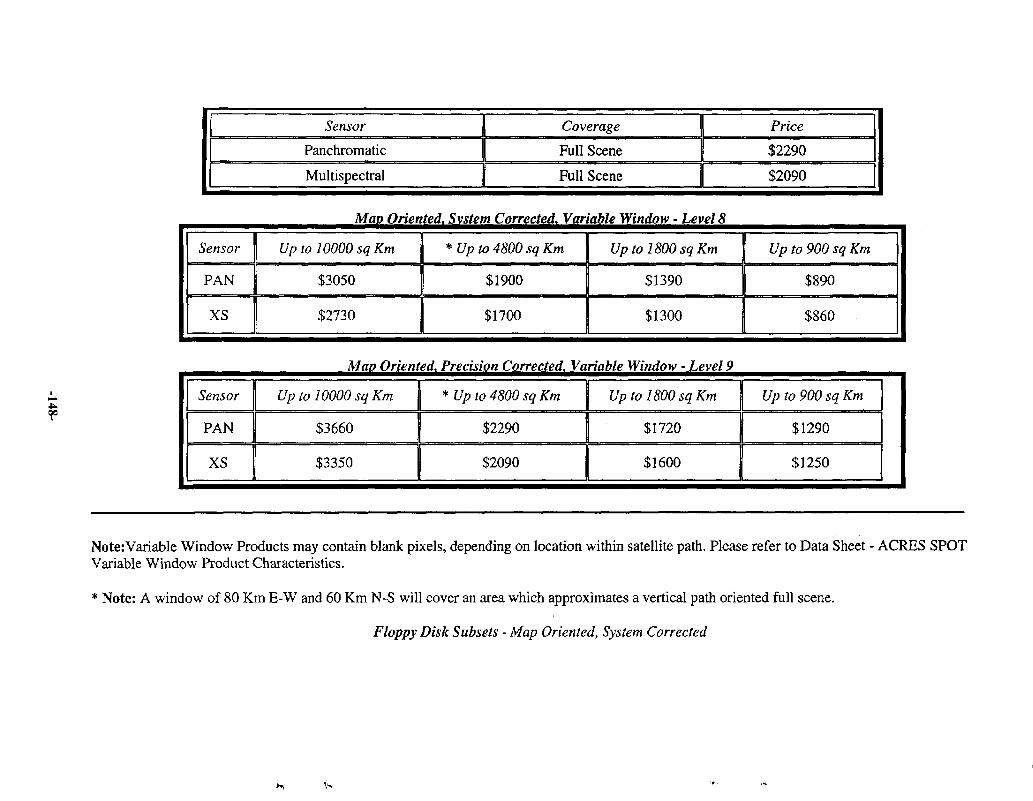
00
Sensor
Panchromatic
Multispectral
j Coverage
1 Full Scene
| Full Scene
1 Price
| $2290
j $2090
Map Oriented. System Corrected. Variable Window - Level 8
Sensor
PAN
XS
Up to 10000 sq Km
$3050
$2730
* Up to 4800 sq Km
$1900
$1700
Up to 1800 sq Km
$1390
$1300
Up to 900 sq Km
$890
$860
Map Oriented. Precision Corrected, Variable Window - Level 9
Sensor
PAN
XS
Up to 10000 sq Km
$3660
$3350
* Up to 4800 sq Km
$2290
$2090
Up to 1800 sq Km
$1720
$1600
Up to 900 sq Km
$1290
$1250
Note:Variable Window Products may contain blank pixels, depending on location within satellite path. Please refer to Data Sheet - ACRES SPOTVariable Window Product Characteristics.
* Note: A window of 80 Km E-W and 60 Km N-S will cover an area which approximates a vertical path oriented full scene.
Floppy Disk Subsets - Map Oriented, System Corrected
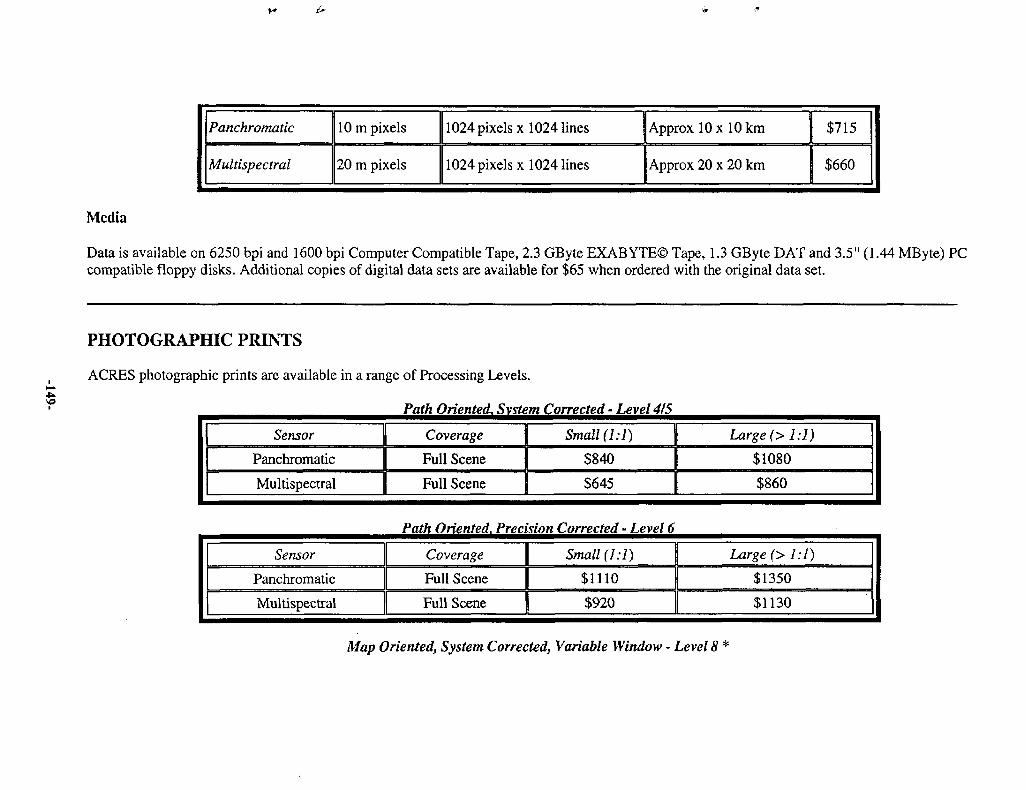
Panchromatic
Multispectral
10 m pixels
20 m pixels
1024pixelsxl0241ines
1024 pixels x 1024 lines
Approx 10 x 10 km
Approx 20 x 20 km
$715
$660
Media
Data is available on 6250 bpi and 1600 bpi Computer Compatible Tape, 2.3 GByte EXABYTE© Tape, 1.3 GByte DAT and 3.5" (1.44 MByte) PCcompatible floppy disks. Additional copies of digital data sets are available for $65 when ordered with the original data set.
PHOTOGRAPHIC PRINTS
ACRES photographic prints are available in a range of Processing Levels.
Path Oriented, System Corrected - Level 415
Sensor
Panchromatic
Multispectral
Coverage
Full Scene
Full Scene
Small (1:1)
$840
$645
Large (> 1:1)
$1080
$860
Path Oriented. Precision Corrected - Level 6
Sensor
Panchromatic
Multispectral
Coverage
Full Scene
Full Scene
Small (1:1)
$1110
$920
Large (> 1:1)
$1350
$1130
Map Oriented, System Corrected, Variable Window - Level 8
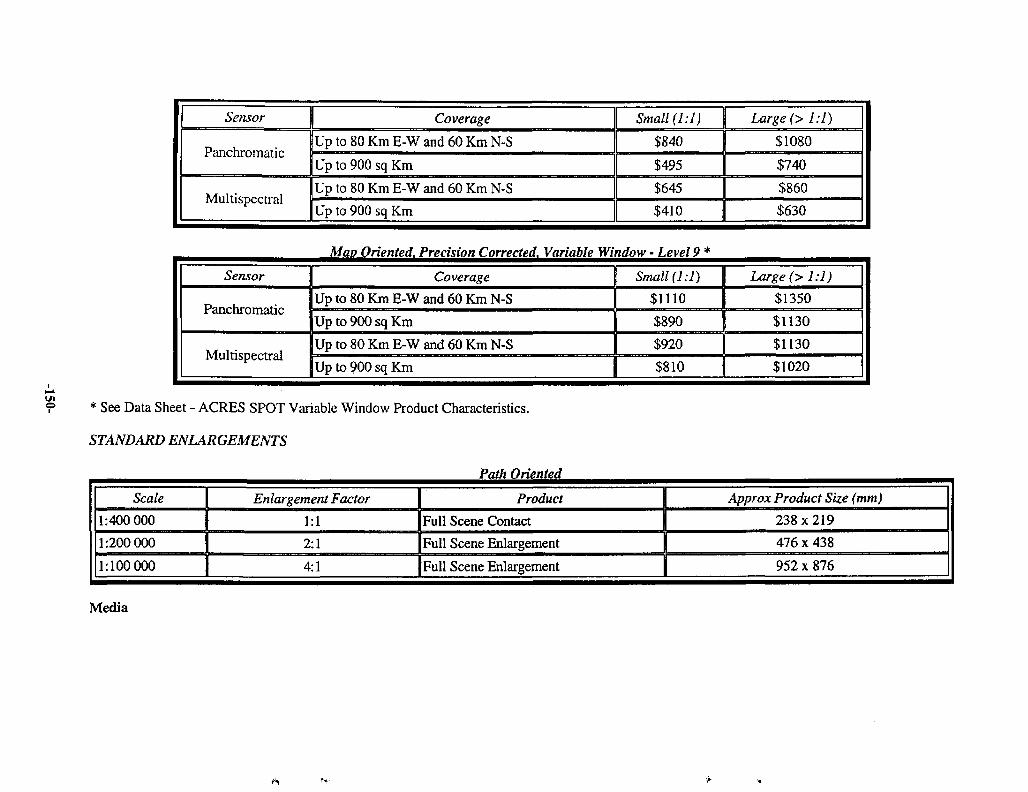
Sensor
Panchromatic
Multispectral
Coverage
Up to 80 Km E-W and 60 Km N-S
Up to 900 sq Km
Up to 80 Km E-W and 60 Km N-S
Up to 900 sq Km
Small (1:1)
$840
$495
$645
$410
Large (> 1:1)
$1080
$740
$860
$630
Map Oriented, Precision Corrected, Variable Window - Level 9 *
Sensor
Panchromatic
Multispectral
Coverage
Up to 80 Km E-W and 60 Km N-S
Up to 900 sq Km
Up to 80 Km E-W and 60 Km N-S
Up to 900 sq Km
Small (1:1)
$1110
$890
$920
$810
Large (> 1:1)
$1350
$1130
$1130
$1020
* See Data Sheet - ACRES SPOT Variable Window Product Characteristics.
STANDARD ENLARGEMENTS
Path Oriented
Scale
1:400 000
1:200 000
1:100 000
Enlargement Factor
1:1
2:1
4:1
Product
Full Scene Contact
Full Scene Enlargement
Full Scene Enlargement
Approx Product Size (mm)
238x219
476 x 438
952 x 876
Media
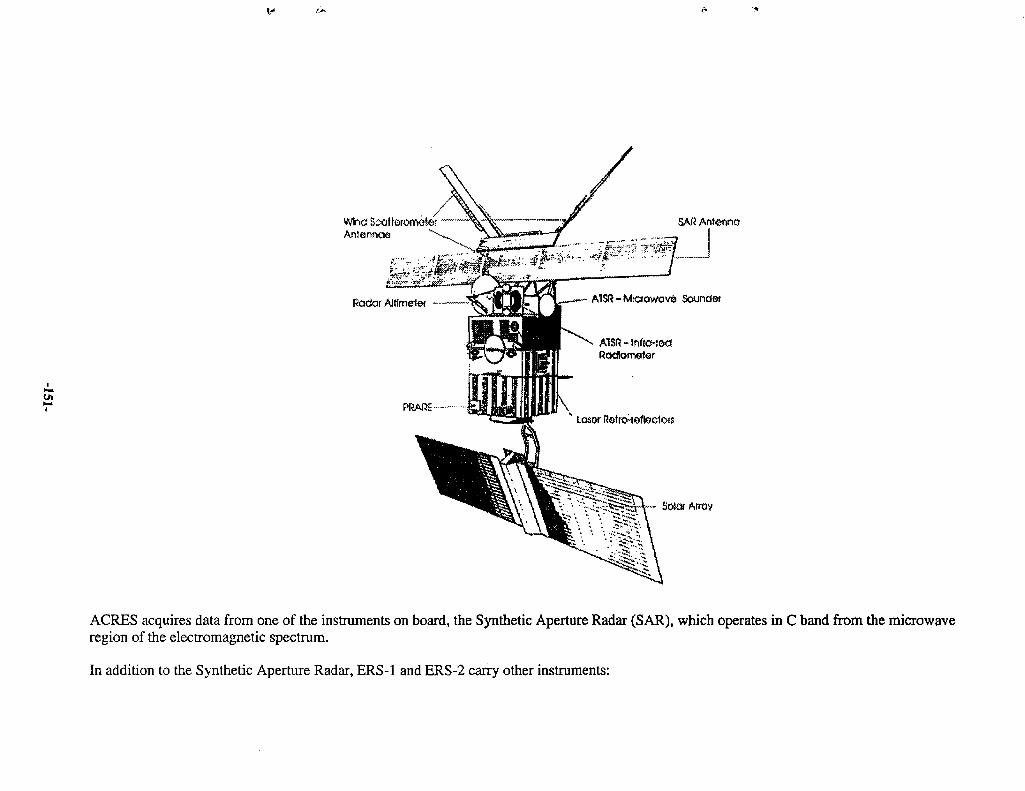
t / l
SAR Antewc
Sc»ar Array
ACRES acquires data from one of the instruments on board, the Synthetic Aperture Radar (SAR), which operates in C band from the microwaveregion of the electromagnetic spectrum.
In addition to the Synthetic Aperture Radar, ERS-1 and ERS-2 carry other instruments:
• The Radar Altimeter• The AIong-Track Scanning Radiometer and Microwave Sounder• The Precise Range and Range Rate Equipment (functional only on ERS-2)• The Wind Scatterometer• The Laser Retro-reflector
SATELLITE DETAILS
SENSOR PARAMETERS - Synthetic Aperture Radar (SAR)
The SAR is an active microwave sensor capable of imaging earth resource targets regardless of time of day, cloud, haze or smoke cover of an area.The instrument is classified "active" as it emits the energy necessary to image the earth's surface. In contrast, "passive" or "optical" sensors rely on thesun's reflected energy to image the earth. More general information on SAR is available through NASA's Jet Propulsion Laboratory: What is ImagingRadar.
ERS SAR Characteristics
Photographic products are available as paper prints. Additional copies of products are available for $80 when ordered with the original print.
ENQUIRIES AND ORDERS FOR SPOT DATA
Enquiries and orders for SPOT data should be submitted to SPOT Imaging Services. Advance programming of the SPOT satellite is available - pleasecontact SPOT Imaging Services for details.
Trading Conditions
Special copyright conditions apply to the sale of satellite data. To acknowledge these copyright conditions, customers are required to sign a SatelliteData Licence Conditions (Schedule G) prior to the purchase of any data.
Priority Orders
Priority processing of orders is available with an average turnaround of less than 5 days, charged at 2 times the quoted price. Actual turnaround timesshould be discussed with ACRES at time of order.
Delivery Details
ACRES products are dispatched by air freight. The price of data includes freight charges except for international deliveries. To facilitate delivery ofyour products, please provide both your postal and street address.
All prices are subject to variation without notice and are quoted in Australian Dollars.
AUSTRALIAN SURVEYING & LAND INFORMATION GROUPScrivener Building, Dunlop Court, Fern HOI Park, Bruce ACT 2617
PO Box 2 Belconnen ACT 2616 Phone: +61 6 201 4201 Fax: +61 6 201 4366
AUSTRALIAN CENTREFOR REMOTE SENSING
Satellites - ERSLast Updated - May 1997
The following is a brief description of the European Space Agency's (ESA) Earth Resource Satellite (ERS). The first satellite in this series, ERS-1was launched on 17 July 1991 and ERS-2 on 20 April 1995. These satellites are designed to gather information about the earth's ocean, ice and landresources using a variety of sensors.
Below is a diagram of the ERS spacecraft.
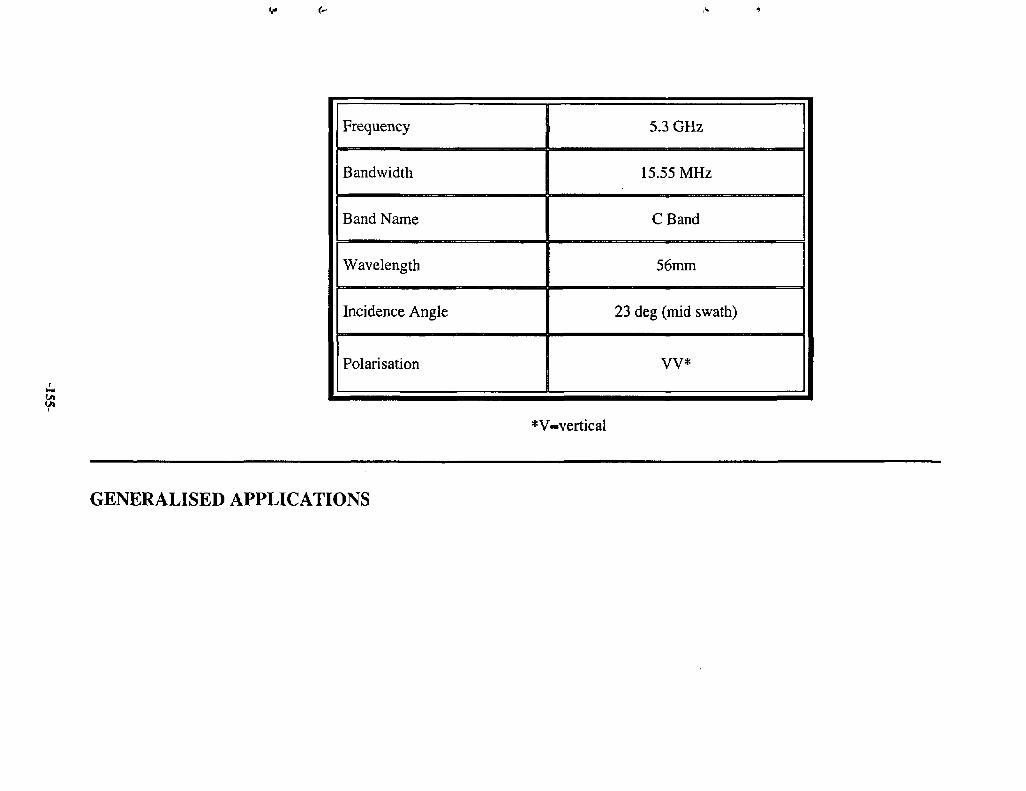
C/l
Frequency
Bandwidth
Band Name
Wavelength
Incidence Angle
Polarisation
5.3 GHz
15.55 MHz
CBand
56mm
23 deg (mid swath)
VV*
*V=vertical
GENERALISED APPLICATIONS
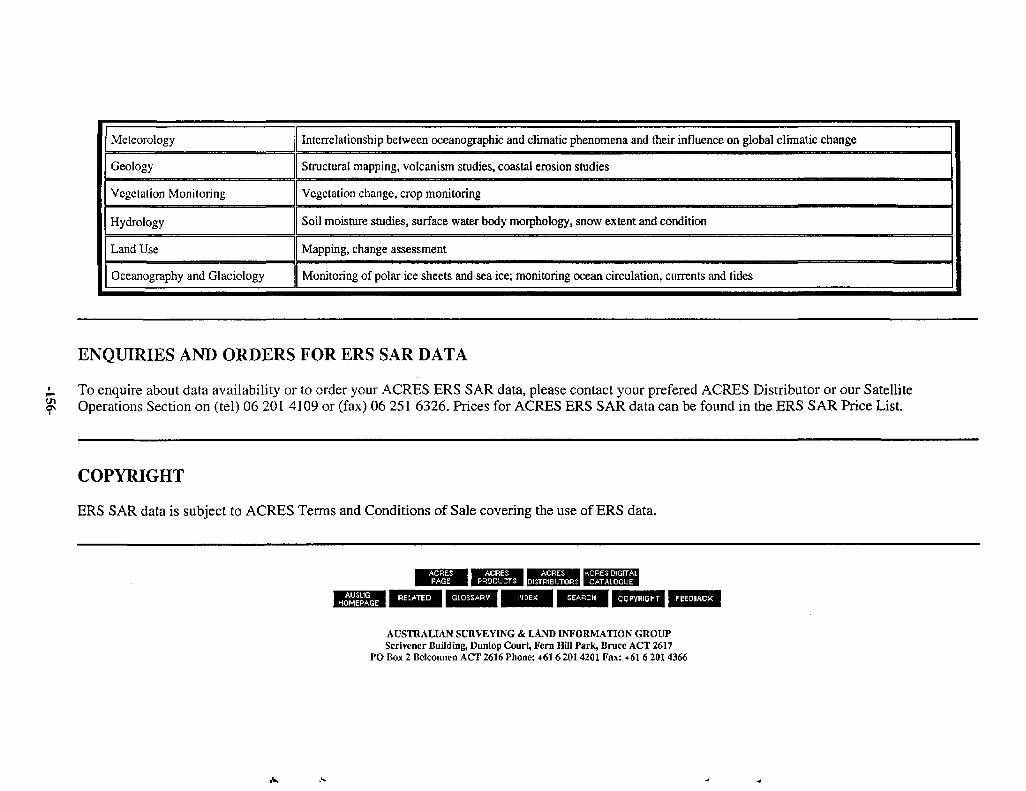
Meteorology
Geology
Vegetation Monitoring
Hydrology
Land Use
Oceanography and Glaciology
Interrelationship between oceanographic and climatic phenomena and their influence on global climatic change
Structural mapping, votcanism studies, coastal erosion studies
Vegetation change, crop monitoring
Soil moisture studies, surface water body morphology, snow extent and condition
Mapping, change assessment
Monitoring of polar ice sheets and sea ice; monitoring ocean circulation, currents and tides
ENQUIRIES AND ORDERS FOR ERS SAR DATA
^ To enquire about data availability or to order your ACRES ERS SAR data, please contact your prefered ACRES Distributor or our Satelliteov Operations Section on (tel) 06 201 4109 or (fax) 06 251 6326. Prices for ACRES ERS SAR data can be found in the ERS SAR Price List.
COPYRIGHT
ERS SAR data is subject to ACRES Terms and Conditions of Sale covering the use of ERS data.
ACRES • ACRES I-.CRES DIGITALPRODUCTS lo iSTRIBUTORSl CATALOGUE
AUSTRALIAN SURVEYING & LAND INFORMATION GROUPScrivener Building, Dunlop Court, Fern Hill Park, Bruce ACT 2617
PO Box 2 Bclconncn ACT 2616 Phone: +61 6 201 4201 Fax: +61 6 201 4366
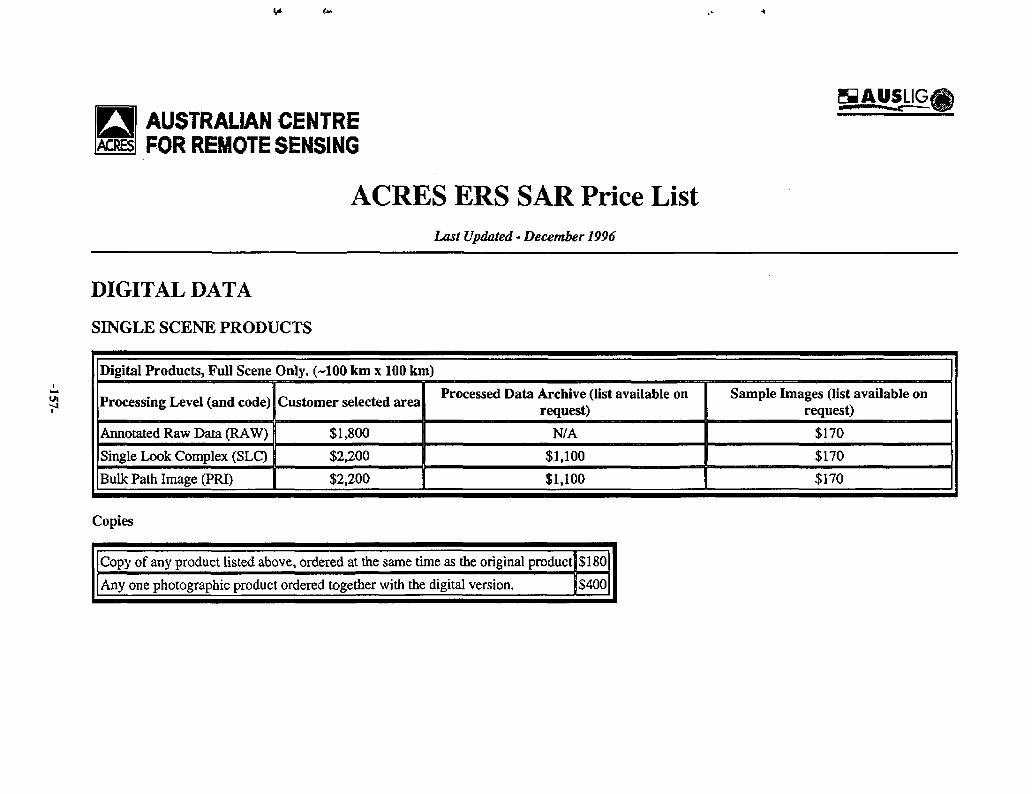
E9AU5LIG<AUSTRALIAN CENTREFOR REMOTE SENSING
ACRES ERS SAR Price ListLast Updated - December 1996
DIGITAL DATA
SINGLE SCENE PRODUCTS
Digital Products, Full Scene Only. (-100 km x 100 km)
Processing Level (and code)
Annotated Raw Data (RAW)
Single Look Complex (SLC)
Bulk Path Image (PRI)
Customer selected area
$1,800
$2,200
$2,200
Processed Data Archive (list available onrequest)
N/A
$1,100
$1,100
Sample Images (list available onrequest)
$170
$170
$170
Copies
Copy of any product listed above, ordered at the same time as the original product
Any one photographic product ordered together with the digital version.
$180
$400
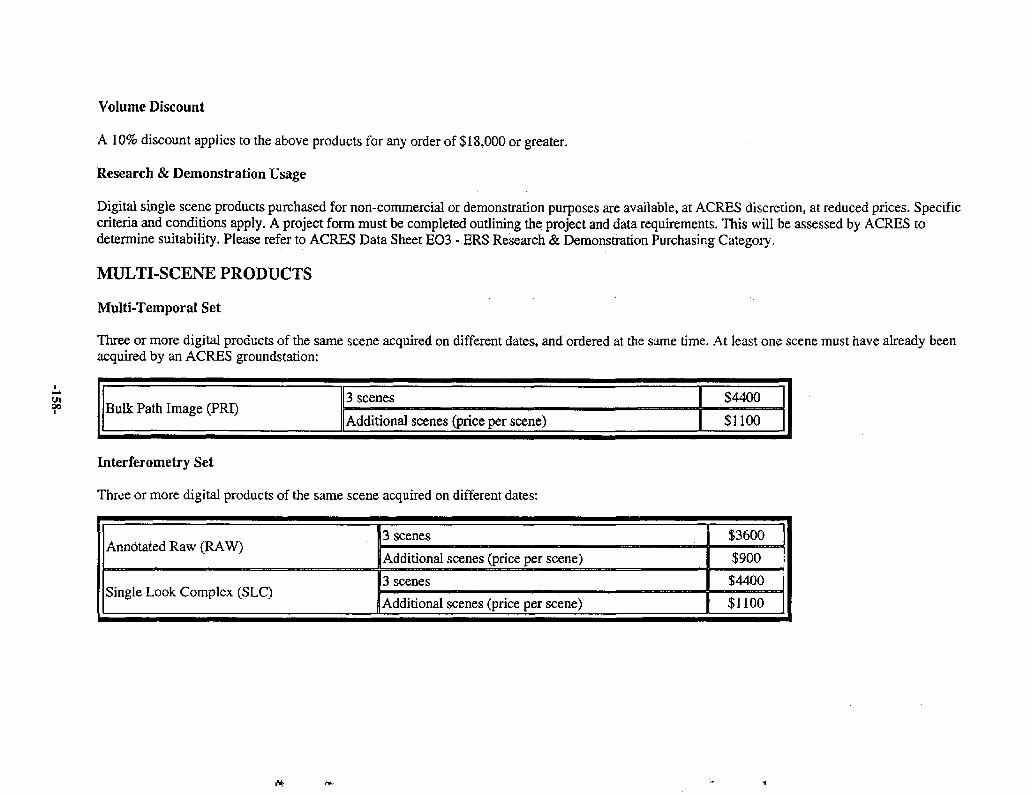
Volume Discount
A 10% discount applies to the above products for any order of $18,000 or greater.
Research & Demonstration Usage
Digital single scene products purchased for non-commercial or demonstration purposes are available, at ACRES discretion, at reduced prices. Specificcriteria and conditions apply. A project form must be completed outlining the project and data requirements. This will be assessed by ACRES todetermine suitability. Please refer to ACRES Data Sheet EO3 - ERS Research & Demonstration Purchasing Category.
MULTI-SCENE PRODUCTS
Multi-Temporal Set
Three or more digital products of the same scene acquired on different dates, and ordered at the same time. At least one scene must have already beenacquired by an ACRES groundstation:
Bulk Path Image (PRI)3 scenes
Additional scenes (price per scene)
$4400
$1100
Interferometry Set
Three or more digital products of the same scene acquired on different dates:
Annotated Raw (RAW)
Single Look Complex (SLC)
3 scenes
Additional scenes (price per scene)
3 scenes
Additional scenes (price per scene)
$3600
$900
$4400
$1100
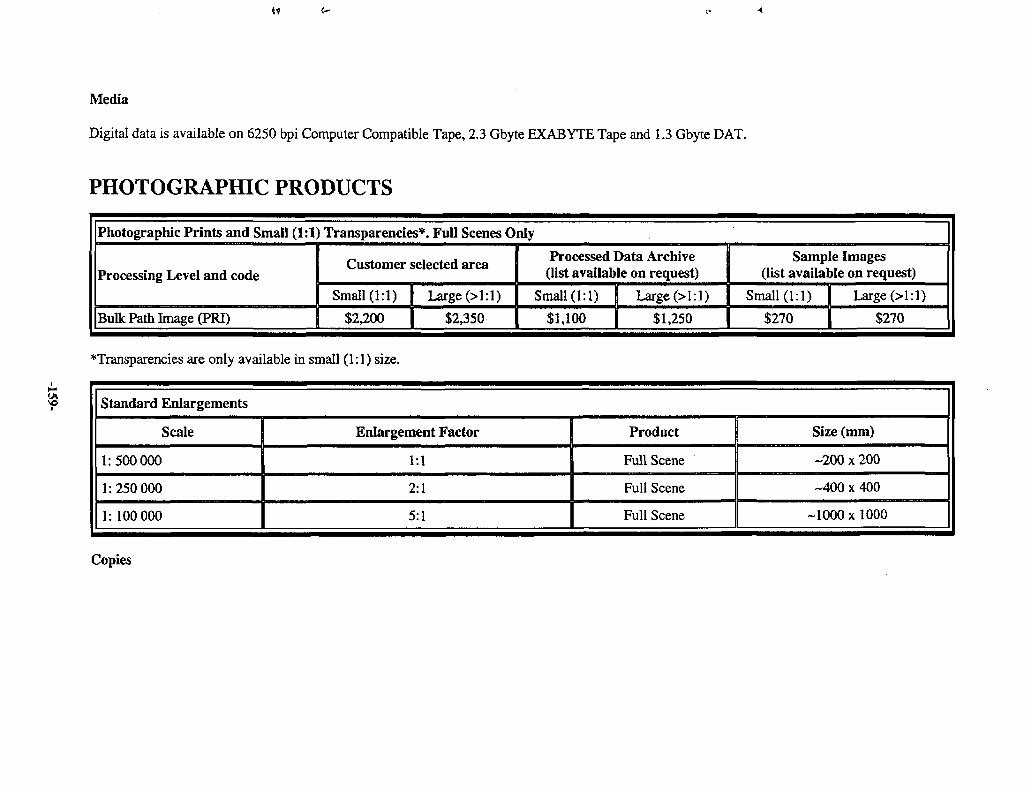
Media
Digital data is available on 6250 bpi Computer Compatible Tape, 2.3 Gbyte EXABYTE Tape and 1.3 Gbyte DAT.
PHOTOGRAPHIC PRODUCTS
Photographic Prints and Small (1:1) Transparencies*. Full Scenes Only
Processing Level and code
Bulk Path Image (PRT)
Customer selected area
Small (1:1)
$2,200
Large (>1:1)
$2,350
Processed Data Archive(list available on request)
Small (1:1)
$1,100
Large (>1:1)
$1,250
Sample Images(list available on request)
Small (1:1)
$270
Large (>1:1)
$270
Transparencies are only available in small (1:1) size.
Standard Enlargements
Scale
1:500 000
1: 250 000
1:100 000
Enlargement Factor
1:1
2:1
5:1
Product
Full Scene
Full Scene
Full Scene
Size (mm)
-200 x 200
-400x400
-1000 x1000
Copies
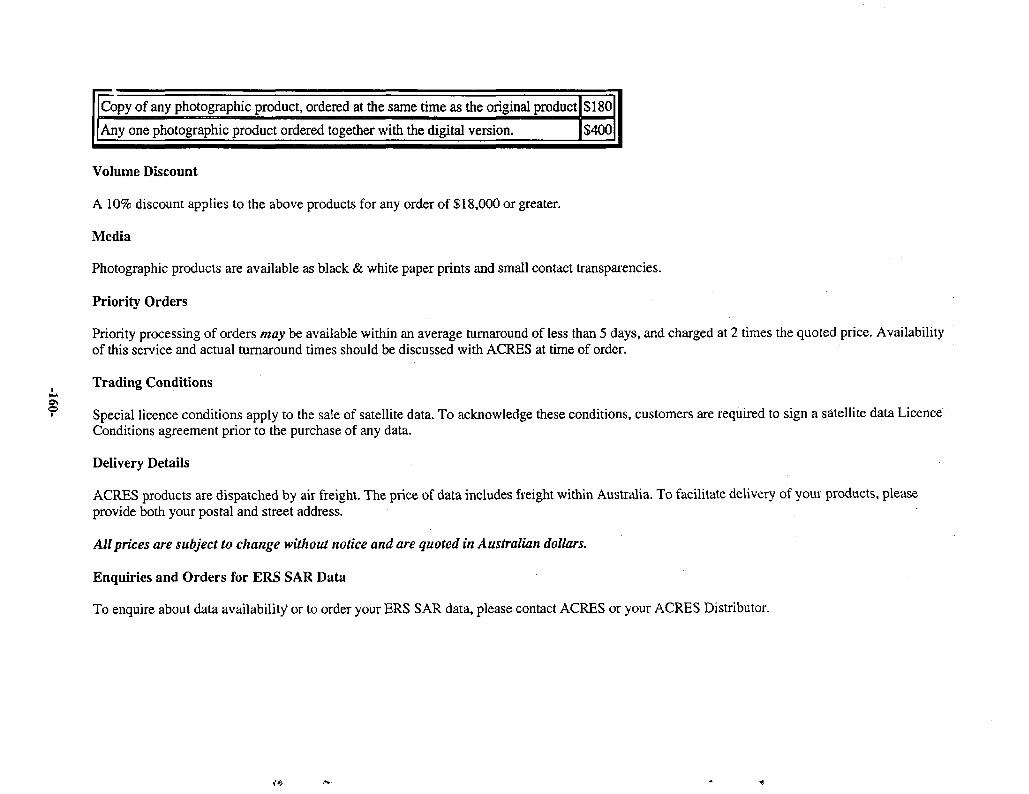
Copy of any photographic product, ordered at the same time as the original product
Any one photographic product ordered together with the digital version.
$180
$400
Volume Discount
A 10% discount applies to the above products for any order of $18,000 or greater.
Media
Photographic products are available as black & white paper prints and small contact transparencies.
Priority Orders
Priority processing of orders may be available within an average turnaround of less than 5 days, and charged at 2 times the quoted price. Availabilityof this service and actual turnaround times should be discussed with ACRES at time of order.
Trading Conditions
Special licence conditions apply to the sale of satellite data. To acknowledge these conditions, customers are required to sign a satellite data LicenceConditions agreement prior to the purchase of any data.
Delivery Details
ACRES products are dispatched by air freight. The price of data includes freight within Australia. To facilitate delivery of your products, pleaseprovide both your postal and street address.
All prices are subject to change without notice and are quoted in Australian dollars.
Enquiries and Orders for ERS SAR Data
To enquire about data availability or to order your ERS SAR data, please contact ACRES or your ACRES Distributor.
HAUSUGjAUSTRALIAN CENTREFOR REMOTE SENSING
Satellites - JERS
The Japanese Earth Resources Satellite-l (JERS-l) is a joint project between the National Space Development Agency of Japan (NASDA) and theMinistry of International Trade and Industry (MITI). NASDA is in charge of the satellite while MITI is responsible for the observation equipment.JERS-l was launched in February 1992 and observes the Earth's surface using optical sensors and a synthetic aperture radar (SAR) sensor. The opticalsensors collect information from eight spectral bands, while the SAR sensor operates in the L-band of the microwave wavelengths.
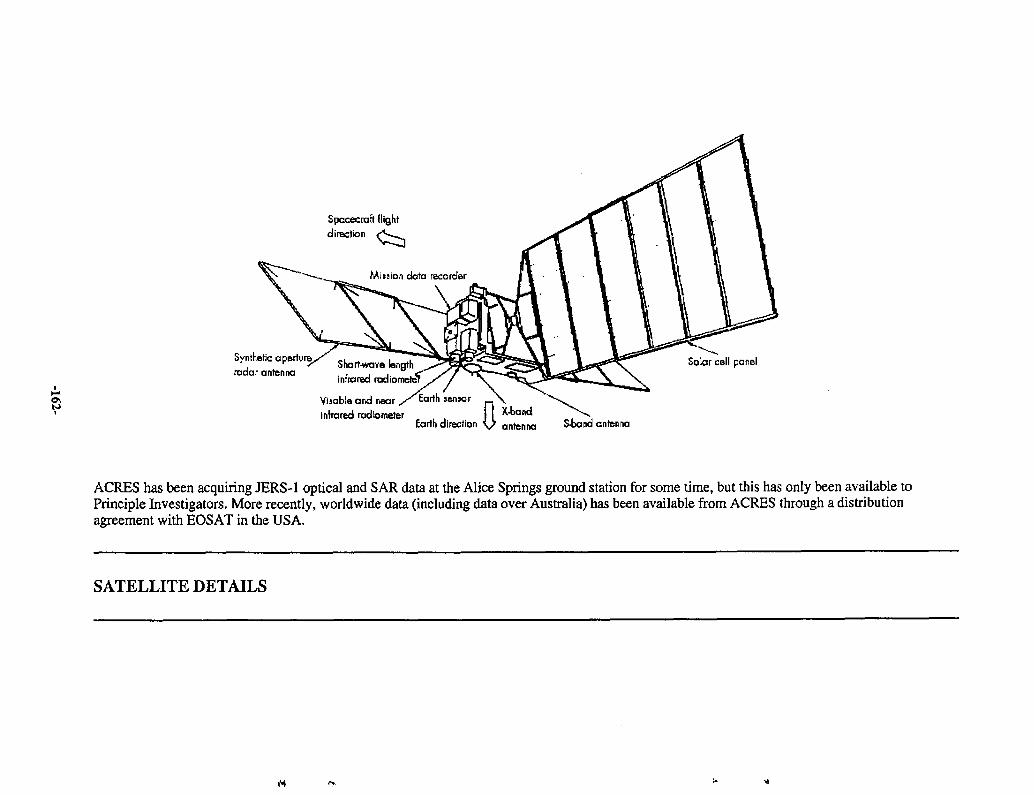
Spacecraft flight
direction
Shart-wave length
infrared radio
Synthetic aperture^
radar antennaSolar cell panel
Yisable and near
infrared radiometer
Earth »nsor
Earth direction Stand antenna
ACRES has been acquiring JERS-1 optical and SAR data at the Alice Springs ground station for some time, but this has only been available toPrinciple Investigators. More recently, worldwide data (including data over Australia) has been available from ACRES through a distributionagreement with EOSAT in the USA.
SATELLITE DETAILS
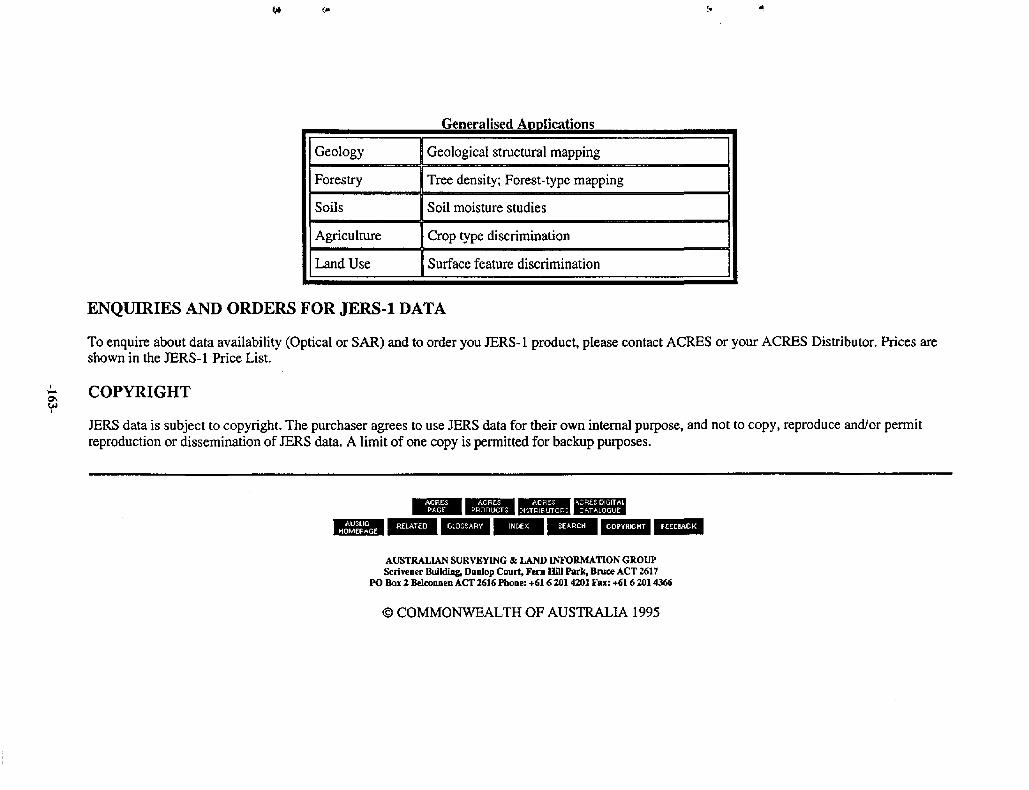
Generalised Applications
Geology
Forestry
Soils
Agriculture
Land Use
Geological structural mapping
Tree density; Forest-type mapping
Soil moisture studies
Crop type discrimination
Surface feature discrimination
ENQUIRIES AND ORDERS FOR JERS-1 DATA
To enquire about data availability (Optical or SAR) and to order you JERS-1 product, please contact ACRES or your ACRES Distributor. Prices areshown in the JERS-1 Price List.
COPYRIGHT
JERS data is subject to copyright. The purchaser agrees to use JERS data for their own internal purpose, and not to copy, reproduce and/or permitreproduction or dissemination of JERS data. A limit of one copy is permitted for backup purposes.
AUSTRALIAN SURVEYING & LAND INFORMATION GROUPScrivener Building, Dunlop Court, Fern HHI Park, Bruce ACT 2617
PO Box 2 Belconnen ACT 2616 Phone: +616 201 4201 Fax: +61 6 2014366
© COMMONWEALTH OF AUSTRALIA 1995
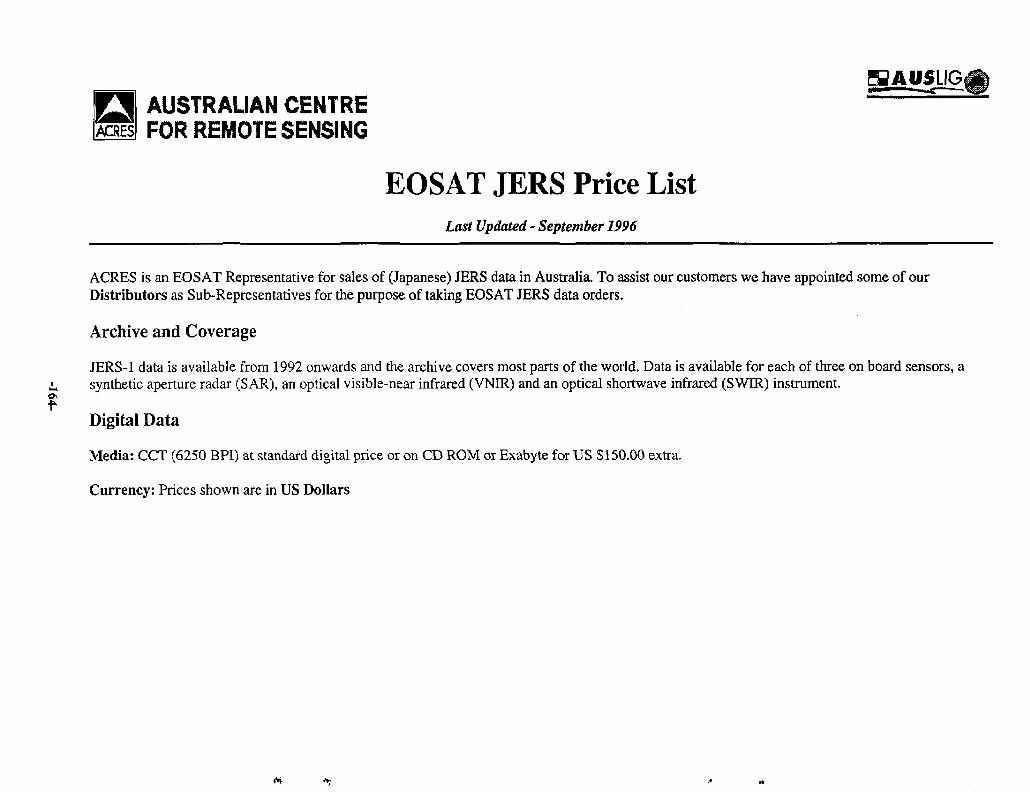
Eg.AUSLIGiJAUSTRALIAN CENTRE
IACRESI FOR REMOTE SENSING
EOSAT JERS Price ListLast Updated - September 1996
ACRES is an EOSAT Representative for sales of (Japanese) JERS data in Australia. To assist our customers we have appointed some of ourDistributors as Sub-Representatives for the purpose of taking EOSAT JERS data orders.
Archive and Coverage
JERS-1 data is available from 1992 onwards and the archive covers most parts of the world. Data is available for each of three on board sensors, asynthetic aperture radar (SAR), an optical visible-near infrared (VNIR) and an optical shortwave infrared (SWIR) instrument.
Digital Data
Media: CCT (6250 BPI) at standard digital price or on CD ROM or Exabyte for US $150.00 extra.
Currency: Prices shown are in US Dollars
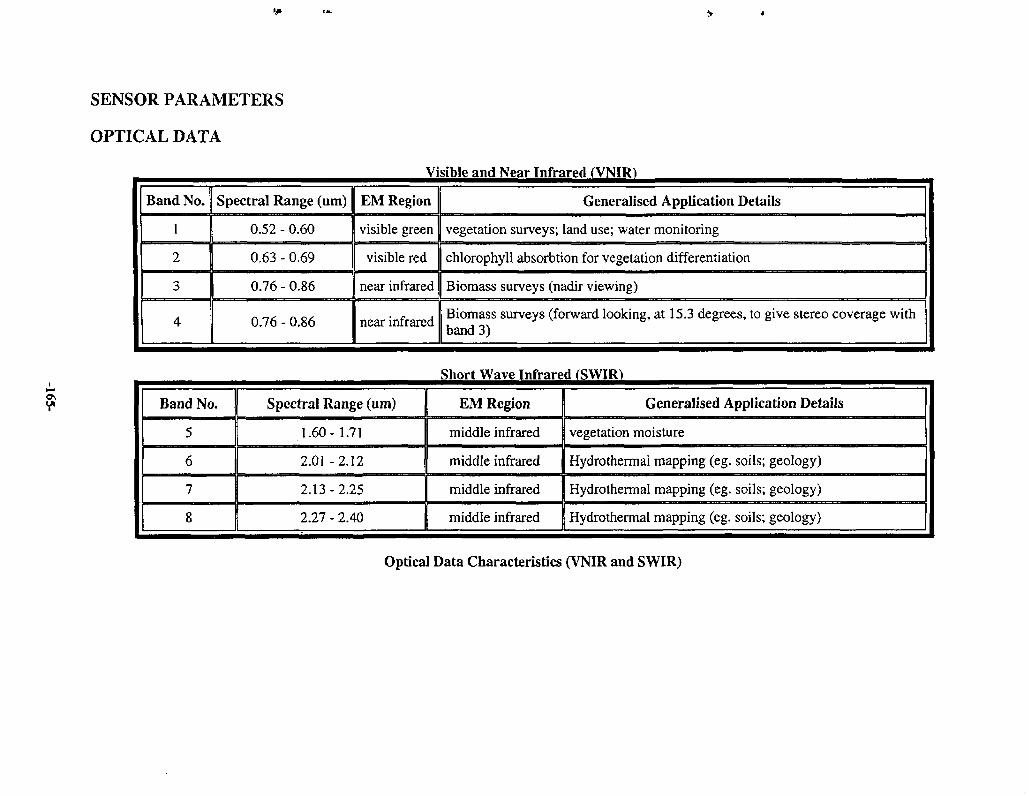
SENSOR PARAMETERS
OPTICAL DATA
Visibie and Near Infrared (\MR)
Band No.
1
2
3
4
Spectral Range (um)
0.52 - 0.60
0.63 - 0.69
0.76 - 0.86
0.76 - 0.86
EM Region
visible green
visible red
near infrared
near infrared
Generalised Application Details
vegetation surveys; land use; water monitoring
chlorophyll absorbtion for vegetation differentiation
Biomass surveys (nadir viewing)
Biomass surveys (forward looking, at 15.3 degrees, to give stereo coverage withband 3)
Short Wave Infrared fSWIR)
Band No.
5
6
7
8
Spectral Range (um)
1.60- 1.71
2.01 -2.12
2.13-2.25
2.27 - 2.40
EM Region
middle infrared
middle infrared
middle infrared
middle infrared
Generalised Application Details
vegetation moisture
Hydrothermal mapping (eg. soils; geology)
Hydrothermal mapping (eg. soils; geology)
Hydrothermal mapping (eg. soils; geology)
Optical Data Characteristics (VNIR and SWIR)
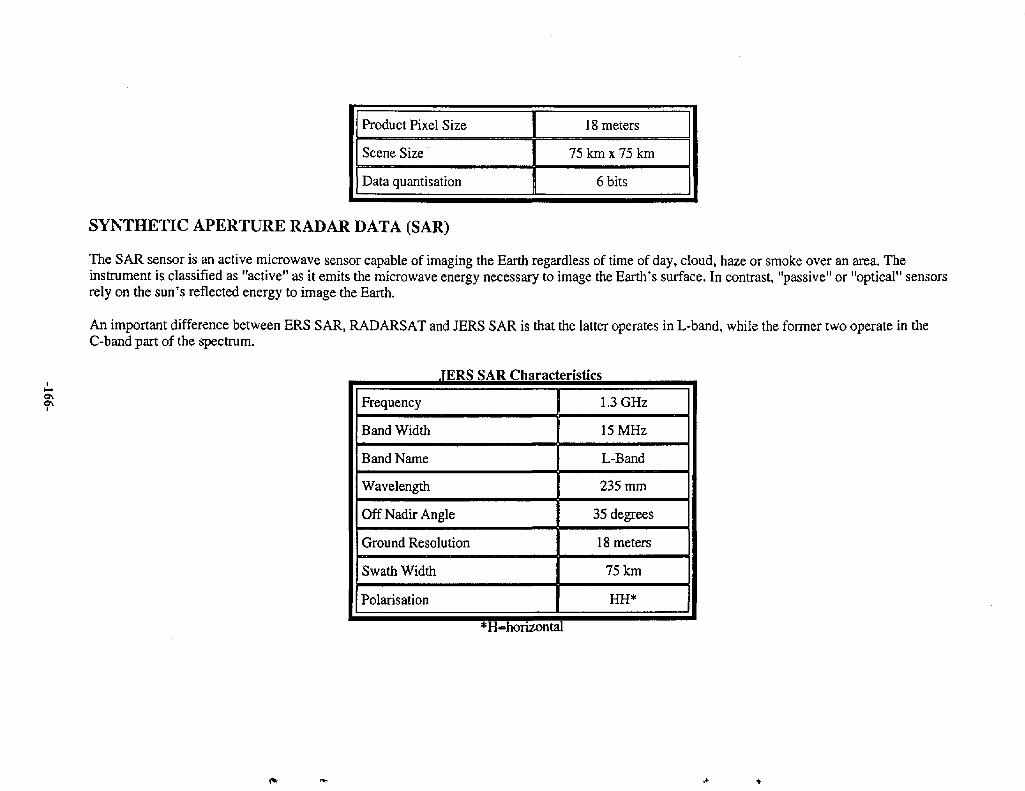
Product Pixel Size
Scene Size
Data quantisation
18 meters
75 km x 75 km
6 bits
SYNTHETIC APERTURE RADAR DATA (SAR)
The SAR sensor is an active microwave sensor capable of imaging the Earth regardless of time of day, cloud, haze or smoke over an area. Theinstrument is classified as "active" as it emits the microwave energy necessary to image the Earth's surface. In contrast, "passive" or "optical" sensorsrely on the sun's reflected energy to image the Earth.
An important difference between ERS SAR, RADARSAT and JERS SAR is that the latter operates in L-band, while the former two operate in theC-band part of the spectrum.
JERS SAR Characteristics
Frequency
Band Width
Band Name
Wavelength
Off Nadir Angle
Ground Resolution
Swath Width
Polarisation
1.3 GHz
15 MHz
L-Band
235 mm
35 degrees
18 meters
75 km
HH*
*H-=horizontal
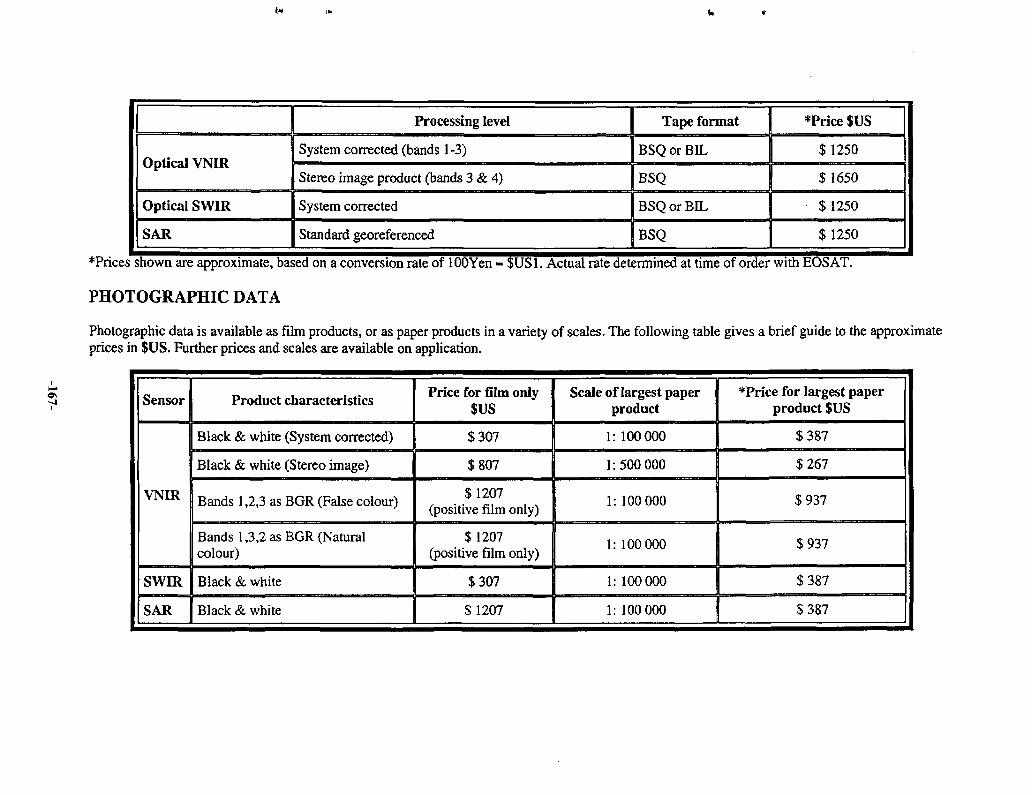
Optical VNIR
Optical SWIR
SAR
Processing level
System corrected (bands 1-3)
Stereo image product (bands 3 & 4)
System corrected
Standard georeferenced
Tape format
BSQ or BIL
BSQ
BSQ or BIL
BSQ
*Price$US
$1250
$1650
$ 1250
$1250
•Prices shown are approximate, based on a conversion rate of lOOYen = $US1. Actual rate determined at time of order with EOSAT.
PHOTOGRAPHIC DATA
Photographic data is available as film products, or as paper products in a variety of scales. The following table gives a brief guide to the approximateprices in $US. Further prices and scales are available on application.
Sensor
VNER
SWIR
SAR
Product characteristics
Black & white (System corrected)
Black & white (Stereo image)
Bands 1,2,3 as BGR (False colour)
Bands 1,3,2 as BGR (Naturalcolour)
Black & white
Black & white
Price for film only$US
$307
$807
$1207(positive film only)
$1207(positive film only)
$307
$1207
Scale of largest paperproduct
1: 100 000
1:500 000
1: 100 000
1: 100 000
1:100 000
1: 100 000
*Price for largest paperproduct $US
$387
$267
$937
$937
$387
$387

*Prices shown are approximate, based on a conversion rate of 1 OOYen = $US 1. Actual rate determined at time of order with EOS AT.
FREIGHT
The cost of freight is extra and will be advised at the time of ordering.
TRADING CONDITIONS
JERS data is subject to copyright. The purchaser agrees to use JERS data for their own internal purpose, and not to copy, reproduce and/or permitreproduction or dissemination of JERS data.
AUSTRALIAN SURVEYING & LAND INFORMATION GROUPScrivener Building, Dunlop Court, Fern mil Park, Bruce ACT 2617
PO Box 2 Relconnen ACT 2616 Phone: +616 2014201 Fax: +616 2014366
• COMMONWEALTH OF AUSTRALIA 1995
AUSTRALIAN CENTREFOR REMOTE SENSING
Satellites - Indian Remote Sensing Satellite (IRS)
The Indian Space Research Organisation (ISRO) has been responsible for the development and management of the IRS (Indian Remote Sensing)series of satellites. These satellites carry a variety of optical sensors to provide both multispectral and panchromatic earth resource information tousers.
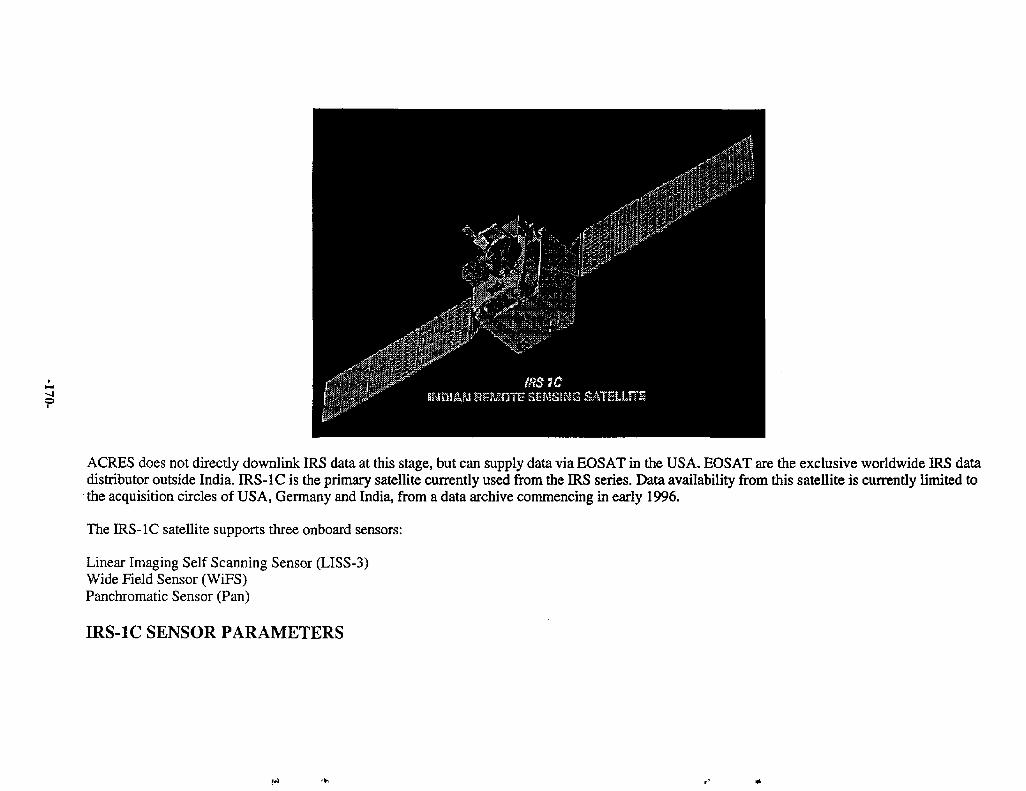
ACRES does not directly downlink IRS data at this stage, but can supply data via EOSAT in the USA. EOSAT are the exclusive worldwide IRS datadistributor outside India. IRS-IC is the primary satellite currently used from the IRS series. Data availability from this satellite is currently limited tothe acquisition circles of USA, Germany and India, from a data archive commencing in early 1996.
The IRS-IC satellite supports three onboard sensors:
Linear Imaging Self Scanning Sensor (LISS-3)Wide Field Sensor (WiFS)Panchromatic Sensor (Pan)
IRS-IC SENSOR PARAMETERS
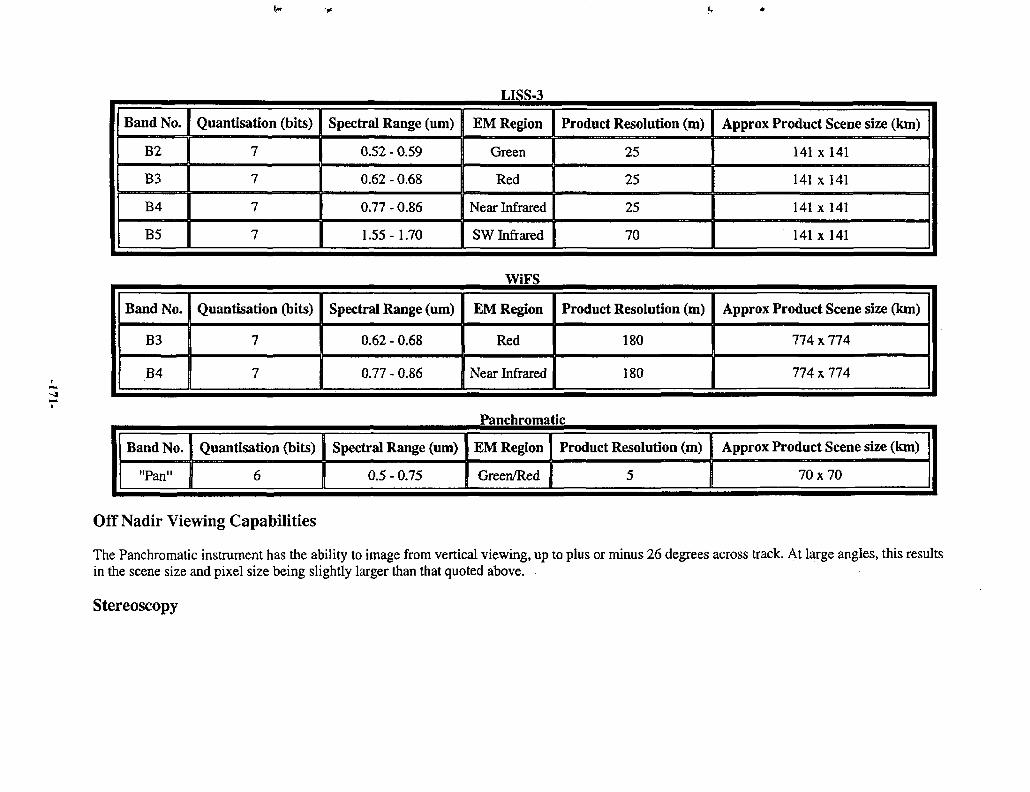
LISS-3
Band No.
B2
B3
B4
B5
Quantisation (bits)
7
7
7
7
Spectral Range (urn)
0.52 - 0.59
0.62 - 0.68
0.77 - 0.86
1.55-1.70
EM Region
Green
Red
Near Infrared
SW Infrared
Product Resolution (m)
25
25
25
70
Approx Product Scene size (km)
141x141
141x141
141x141
141x141
WiFS
Band No.
B3
B4
Quantisation (bits)
7
7
Spectral Range (urn)
0.62 - 0.68
0.77 - 0.86
EM Region
Red
Near Infrared
Product Resolution (m)
180
180
Approx Product Scene size (km)
774 x 774
774 x 774
Panchromatic
Band No.
"Pan"
Quantisation (bits)
6
Spectral Range (um)
0.5 - 0.75
EM Region
Green/Red
Product Resolution (m)
5
Approx Product Scene size (km)
70x70
Off Nadir Viewing Capabilities
The Panchromatic instrument has the ability to image from vertical viewing, up to plus or minus 26 degrees across track. At large angles, this resultsin the scene size and pixel size being slightly larger than that quoted above.
Stereoscopy
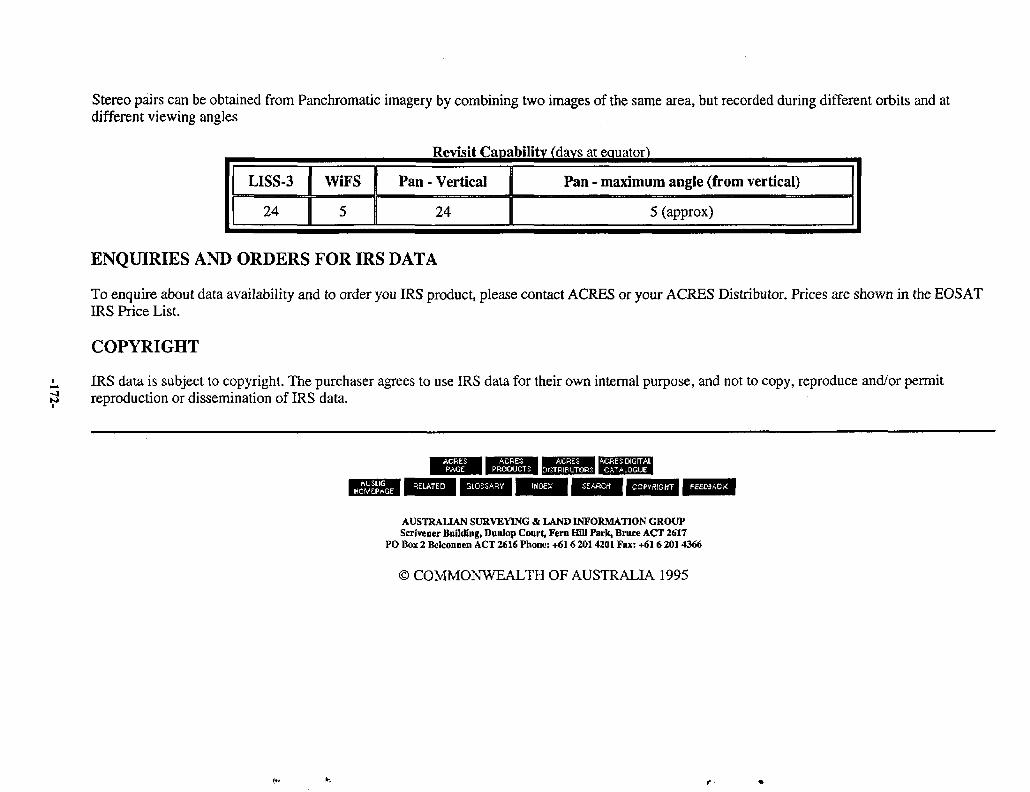
Stereo pairs can be obtained from Panchromatic imagery by combining two images of the same area, but recorded during different orbits and atdifferent viewing angles
LISS-3
24
WiFS
5
Pan
Revisit Capability
- Vertical
24
fdavs at equator)
Pan - maximum angle (from vertical)
5 (approx)
ENQUIRIES AND ORDERS FOR IRS DATA
To enquire about data availability and to order you IRS product, please contact ACRES or your ACRES Distributor. Prices are shown in the EOSATIRS Price List.
COPYRIGHT
IRS data is subject to copyright. The purchaser agrees to use IRS data for their own internal purpose, and not to copy, reproduce and/or permitreproduction or dissemination of IRS data.
AUSTRALIAN SURVEYING & LAND INFORMATION GROUPScrivener Building, Dunlop Court, Fern Hill Park, Bruce ACT 2617
PO Box 2 Bclconnen ACT 2616 Phone: +61 6 201 4201 Fax: +61 6 201 4366
© COMMONWEALTH OF AUSTRALIA 1995
SAUSUGAUSTRALIAN CENTREFOR REMOTE SENSING
EOSAT IRS Price ListLast Updated - April 1996
IRS PRODUCTS
ACRES is an EOSAT Representative for sales of IRS data in Australia. To assist our customers we have appointed some of our Distributors asSub-Representatives for the purpose of taking EOSAT IRS data orders.
ARCHIVE AND COVERAGE
IRS-lCdata is available from early 1996 onwards. The data covers the acquisition circles of USA, Germany and India. Data over Australia iscurrently unavailable.
DIGITAL DATA
Media: CD-ROM, Exabyte or CCT (6250 BPI)
Data Format: Fast Format
Copies: Available for US$250 when ordered with the original product.
Currency: Prices shown are in US Dollars.
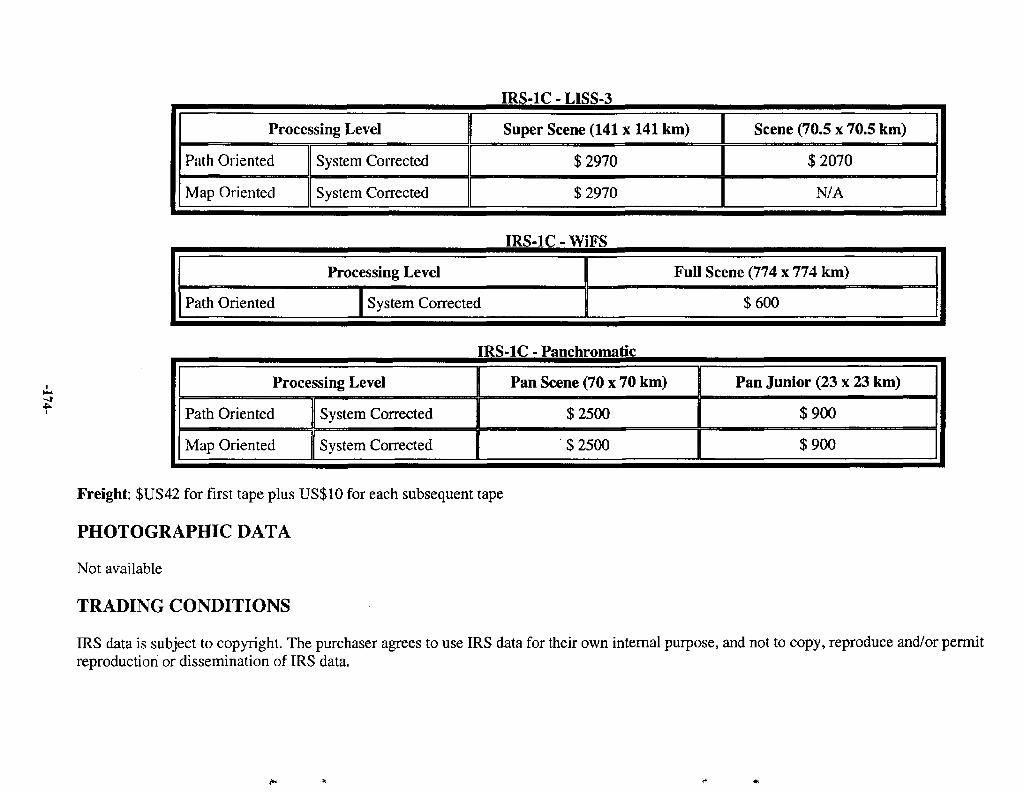
IRS-1C - LISS-3
Processing Level
Path Oriented
Map Oriented
System Corrected
System Corrected
Super Scene (141 x 141 km)
$2970
$2970
Scene (70.5 x 70.5 km)
$2070
N/A
Path Oriented
Processing Level
1 System Corrected
IRS-1C -WiFS
Full Scene (774 x
$600
774 km)
IRS-1C - Panchromatic
Processing Level
Path Oriented
Map Oriented
System Corrected
System Corrected
Pan Scene (70 x 70 km)
$2500
$2500
Pan Junior (23 x 23 km)
$900
$900
Freight: $US42 for first tape plus US$10 for each subsequent tape
PHOTOGRAPHIC DATA
Not available
TRADING CONDITIONS
IRS data is subject to copyright. The purchaser agrees to use IRS data for their own internal purpose, and not to copy, reproduce and/or permitreproduction or dissemination of IRS data.
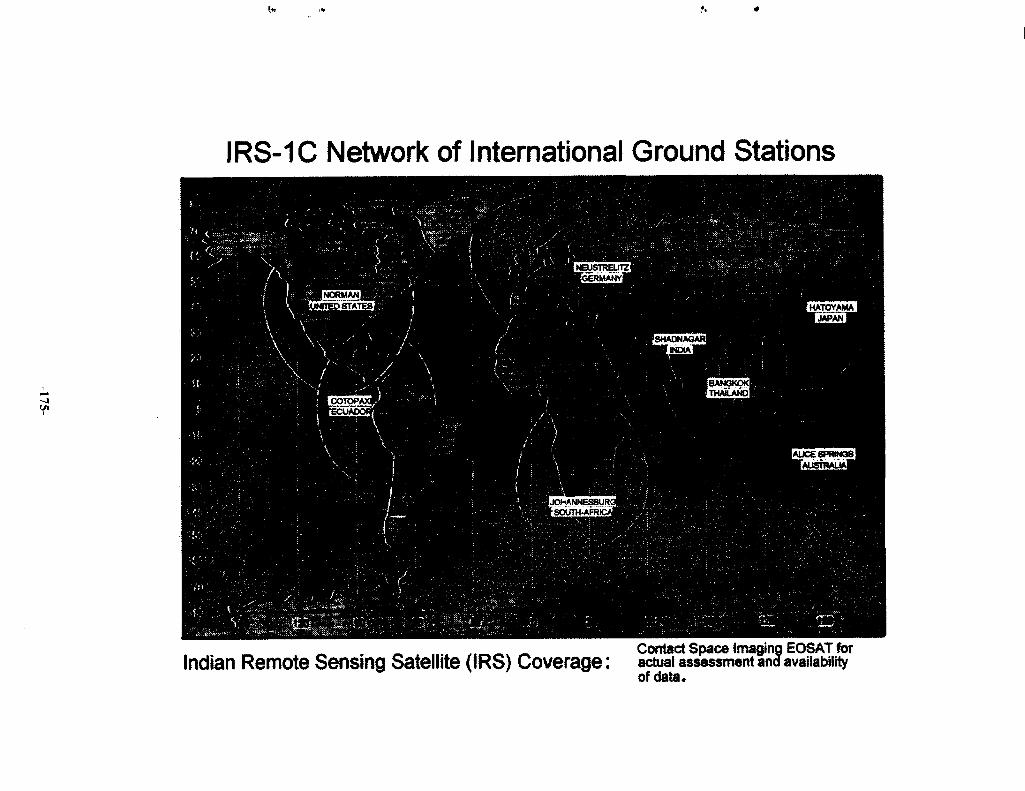
IRS-1C Network of International Ground Stations
_ Contact Space Imaging EOSAT for
Indian Remote Sensing Satellite (IRS) Coverage: actual assessment arofdata.


Annex 6 Commercial Network Organisation SPOT IMAGESystem Exploitation - Receiving StationsLocal Distributors (ESCWA-Region)
-177-
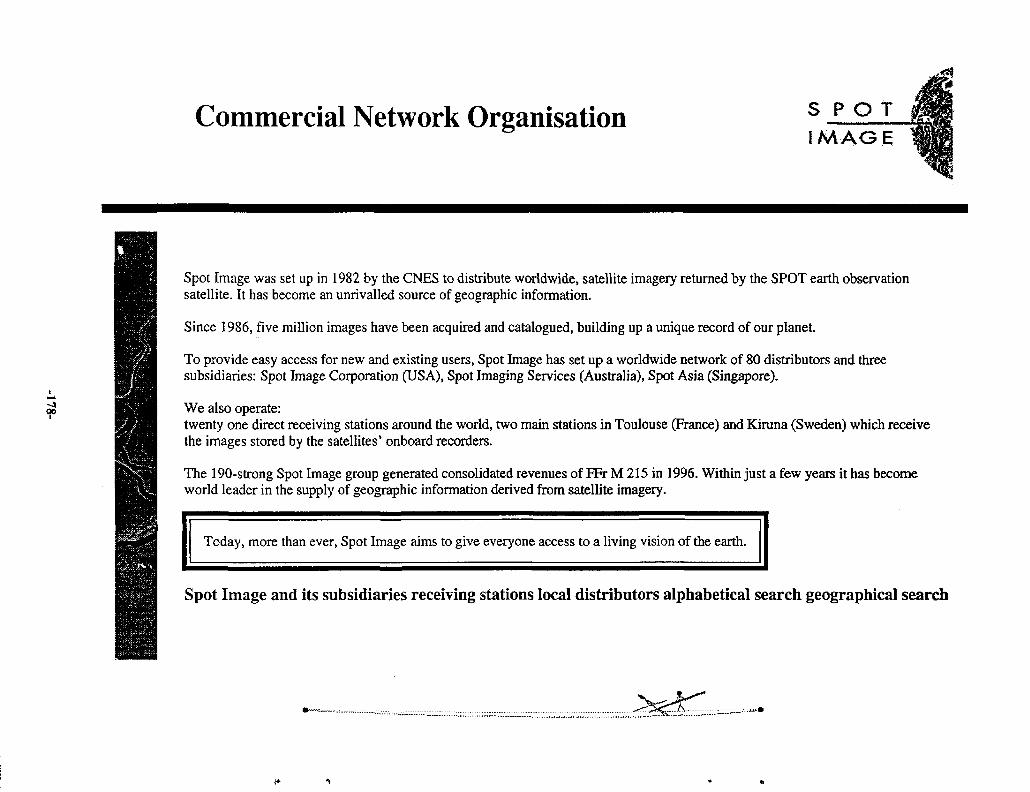
Commercial Network Organisation S P O T1 M A O E
-400
Spot Image was set up in 1982 by the CNES to distribute worldwide, satellite imagery returned by the SPOT earth observationsatellite. It has become an unrivalled source of geographic information.
Since 1986, five million images have been acquired and catalogued, building up a unique record of our planet.
To provide easy access for new and existing users, Spot Image has set up a worldwide network of 80 distributors and threesubsidiaries: Spot Image Corporation (USA), Spot Imaging Services (Australia), Spot Asia (Singapore).
We also operate:twenty one direct receiving stations around the world, two main stations in Toulouse (France) and Kiruna (Sweden) which receivethe images stored by the satellites' onboard recorders.
The 190-strong Spot Image group generated consolidated revenues of FFr M215 in 1996. Within just a few years it has becomeworld leader in the supply of geographic information derived from satellite imagery.
Today, more than ever, Spot Image aims to give everyone access to a living vision of the earth.
Spot Image and its subsidiaries receiving stations local distributors alphabetical search geographical search
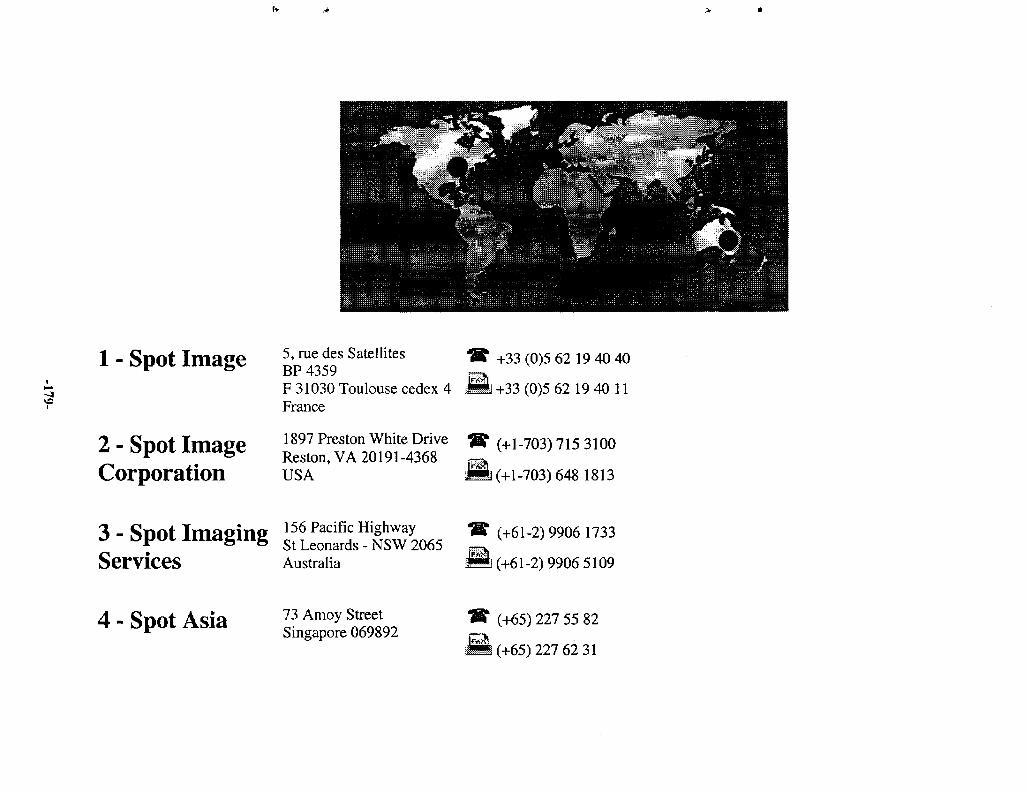
1 - Spot Image
2 - Spot ImageCorporation
5, rue des SatellitesBP 4359F 31030 Toulouse cedex 4France
+33(0)5 62 19 40 40
1+33(0)5 62 19 40 11
1897 Preston White Drive flf (+1-703) 715 3100Reston,VA 20191-4368 fm
USA H I (+1-703) 648 1813
3 - Spot Imaging IffPacifi? ffi&™*r ° & St Leonards - NSW 2065
Services Australia
(+61-2)99061733
(+61-2)9906 5109
4 - Spot Asia 73 Amoy StreetSingapore 069892
(+65) 227 55 82
(+65) 227 62 31
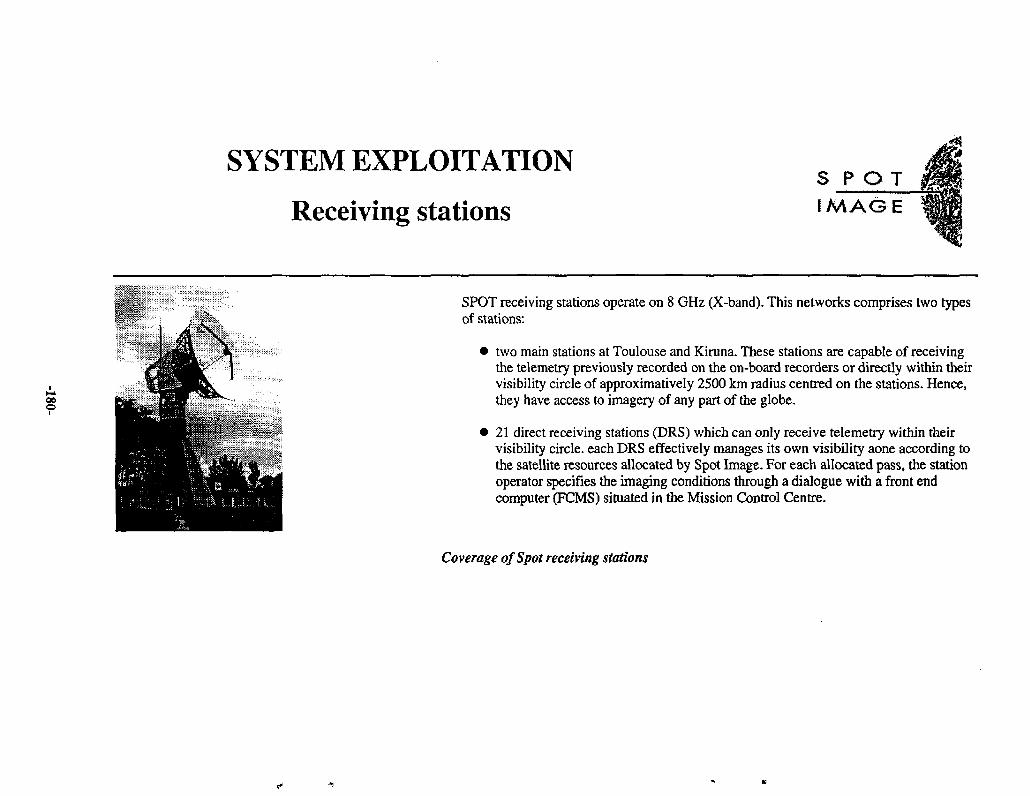
SYSTEM EXPLOITATION
Receiving stationsS P O T
IMAGE
SPOT receiving stations operate on 8 GHz (X-band). This networks comprises two typesof stations:
• two main stations at Toulouse and Kiruna. These stations are capable of receivingthe telemetry previously recorded on the on-board recorders or directly within theirvisibility circle of approximatively 2500 km radius centred on the stations. Hence,they have access to imagery of any part of the globe.
• 21 direct receiving stations (DRS) which can only receive telemetry within theirvisibility circle, each DRS effectively manages its own visibility aone according tothe satellite resources allocated by Spot Image. For each allocated pass, the stationoperator specifies the imaging conditions through a dialogue with a front endcomputer (FCMS) situated in the Mission Control Centre.
Coverage of Spot receiving stations
Local Distributors S PO
I.MAG
T 1E ij1
mm
The A icon means that the distributor also operates a receiving station.
Spot Image and its subsidiaries are marked with the following icon:
oo Algeria INC - National Institute of Cartography123 rue de TripoliBP430Hussein Dey, AlgerAlgeria
(+213) 223 4376
(+213)223 4381
Benin Centre National de Teledetection et de Surveillance du Couvert Forestier (CE.NA.TEL)B.P. 06-711CotonouBenin
(+229) 33 03 80
(+229)33 19 56
Jordan Research & Consulting Services Co. Ltd.P.O. Box 5013AmmanHashemite Kingdom of Jordan
(+962-6) 603 255
(+962-6) 603 420
Kenya Andrews Aeronautical & Allied Equipment Ltd.Kasuku Road, KilimaniP.O. Box 41152NairobiKenya
(+254-2)72 14 33
I (+254-2) 72 16 40
Kuwait COMET International Co.P.O. Box 29606Safat, Code 13157Kuwait
(+965) 244 41 41
(+965)244 4140
Libya Libyan Center for Remote Sensing and Space ScienceP/oBox397TripoliLibya
(+218 21)607 015
Morocco Centre Royal de Teledetection Spatiale
Morocco Centre Koyal de Telcdctcction Spatiale16 bis, avenue de FranceAgdal RabatMorocco
(+212-7) 776305 or 06
I j § .(+212-7) 776300
Mozambique CENACARTA537 Josina Machel Av.P.O. Box 83MaputoMozambique
(+258-1)424 789
I (+258-1) 421 959
Nigeria
8
Information Research Ltd.3, Gerrard Road, IkoyiP.O. Box 53386Ikoyi, LagosNigeria
(+234-1)269 34 21
(+234-1)269 34 19
Oman INTERTEC SYSTEMS L.L.C.P.O. Box 345Postal Code 118Sultanate of Oman
(+968) 595 417 or 418
I (+968) 595 419
Saudi ArabiaA King Abdulaziz City for
Science and Technology (KACST)P.O. Box 6086Riyadh 11442
(+966-1)488 3444
I (+966-1) 481 1154
Kingdom of Saudi Arabia
South AfricaA CSIR
Satellite Applications CenterP.O. Box 395Pretoria 0001South Africa
(27-11)642 46 92
(27-11)642 24 46
Tunisia Centre National de TeledetectionRoute de la MarsaB.P. 2001080 Tunis CedexTunisia
(216-1)761333
(216-1)760 890
Yemen M.A.M. International CorporationP/O Box 525SANA'ARepublic of Yemen
(967-1)272 401
(967-1) 274 141
SPOVSytfem

Annex 7 Information Catalog: Eurimage
-185-
Eurimage Newsletter December, 1996Eurimage Newsletter December, 1996- Dear Colleague, Upcoming ERS-2 products! ESRIN hasfurther improved the ERS SAR data products. The latest improvements.http://www.eurimage.it/Latest_News/NewsLetters/dec96.html - size 6K - 21.May.97 - English
WWW Access to Earth Observation Data - EurimageEurimage profile. Founded in 1989 by four leading companies in EO. Mission: distribution ofworld-wide satellite imagery to a wide range of users. In...http://www.eurimage.it/info/www5/slidel.html - size 914 byres - 21.May.97 - English
Eurimage Newsletter November, 1995Eurimage Newsletter November, 1995. 8th November, 1995. Dear Colleague, Best of Europeseries! in the last issue we gave you a foretaste of this new...http://www.eurimage.it/Latest_News/NewsLetters/Nov95.html - size 7K - 21.May.97 - English
WWW Access to Earth Observation Data - EurimageWww Access to Earth Observation Data. Eurimage Position Paper. Fifth International WorldWide Web Conference. Tile EiNet WWW server. EiNet is a...http://www.eurimage.it/info/www5/einet.html - size 5K - 21,May97 - English
WWW Access to Earth Observation Data - EurimageInteroperability. Eurimage has closely followed the ongoing activities for an EO catalogueinteroperability protocol definition. An IMS gateway was~.~http://www.eurimage.it/info/www5/sHde3.html - size IK - 2J.May.97 - English
Eurimage PricesEurimage Prices. Eurimage sells its Products and Services through a large network of expertdistributors across Europe, North Africa and the Middle East...http://www .eurimage.it/Common/Price _List.html - size IK - 21 .May.97 - English
WWW Access to Earth Observation Date - EurimageThe EiNet WWW server. EiNet: a subscription service that allows users to access metadata andQuick Look images in the company's catalogues. Standard World.httpJ/www.eurimage.it/info/www5/slide2.html - size IK - 22.May.97 - English
Eurimage Newsletter December, 1995Eurimage Newsletter December, 1995. 22nd December, 1995. Dear Colleague, The first imagesfrom this satellite are now available; Quick Looks can be...http://www.eurimage.it/Latest_News/NewsLetters/Dec95.html - size 3K - 22.May.97 - English
How to Contact EurimageHow to Contact Eurimage. Head Office. Contact this office for general enquiries or enquiriesabout invoices. Via E d'Onofrio, 212 Roma 00155 Italy..http://www.eurimage.it/Common/Addresses.html - size 5K - 22.May.97 - English
-186-

Eurimage Newsletter May. 1996Eurimage Newsletter May, 1996. Dear Colleague, New ERS- 1/2 Products. A series of newproducts is being offered for those customers interested in...http://www.eurimage.it/Latest_News/NewsLetters/may96.html - size 5K - 22.May,97 - English
-187-


Annex 8 Information Catalog: JERS
-189-
Classification map using multidate JERS-1/SAR dataRikubetsu. Classification map using multidate JERS-1/SAR data. (180kB) FTP. Data.SAR_classification-2(Hokkaido)/c1assify.tiff. Date: 1992.10.10,...http:// mentor.eorc.nasda.go.jp./Gallery/Japan/Hokkaido/rikubetsu_01.html-size IK-6.Jim, 96-English
DEM data from JERS-1/OPS stereo pair imagesKiso. DEM data from JERS-1/OPS stereo pair images. Data theme: Bird's eye viewimage DEM data. (215kB) FTP. Readme, readme opsdem/readme.Data....http://mentor.eorc.nasda.go.jp/Gallery/Japan/Chubu/kisoJ)l.html - size 2K - 6.Jun.96 -English
JERS-1 COVERAGEJERS-1 observation condition (as of November 1995) Japanese coverage... 42931Bytes. World coverage... 46226 Bytes. This image is a distribution map which is....http://hdsn.eoc.nasda.go.jp/guide/guide/satellite/jl_coverage_e.html - size 1014 bytes -23.Aug.96 - English
ASF's JERS-1 SAR Computer Compatible Signal DataJERS-1 SAR Computer Compatible Signal Data. Summary: One way that lSIASDA'sJERS-1 (the National Aeronautics and Space Development Agency's first Japanese...http://www .asf.alaska.edu/datasetdocuments/jers 1 sar_signal_data.html - size 60K -8.May.97 - English
JERS-1 - Platforms/satellitesJERS-1 - Platforms/satellites. Launch Date Sensors Status JERS-1 11/2/92 OPS, SARmission duration: 2 years. Orbital characteristics. - altitude: 565 km..http://www.belspo.be/telsat/jers/jepl_001.htm-size 970 bytes - 15.Mar.96 - English
ERS-1 vs. JERS-I, White MauntainsERS-1 vs. JERS-1 White Mountains. Copyright 1992, ESA. Comparison: These imagesamples demonstrate the increased foreshortening and layover distortions...http://www.asf.alaska.edu/userserv/mountains.html - size 4K - ll.Oct.96 - English
JERS-1 - Services & DistributoreJERS- 1 - Services & Distributors. Contact addresses. Catalogues. Prices. Products, inboth digital and photographic formats, are available through...hltpJ/www.belspo.be/telsat/jers/jesdJ)01 .htm - size 650 bytes - 15.Mar.96 - English
JERS-1 DataJERS-1 Data. SUMMARY_DESCRIPTION. Digital data from the Japanese SpaceAgency's Earth Resource Satellite JERS-1.TIMECOVERAGE. 0000-00-00, 0000-00-00....http://www.ccrs.emr.ca/linc/ps/digital/remote/djersle.html - size 7K- 1.Oct.96 - English
-190-

Annex 9 Information Catalog: NOAA and NOAA-AVHRR
-191-
USDOC/NOAA/NESDIS/National Geophysical Data CenterThe National Geophysical Data Center (NGDC) manages environmental data in the fields ofmarine geology and geophysics, paleochmatology, solar-terrestnal.http://julius.ngdc.noaa.gov/ - size 8K - 2.May. 97 - English
NOAA AVHRR: MethodologyNOAA AVHRR: Methodology. GIS Methodology. Integrity of the Remotely Sensed Data, whenutilising a temporal series of AVHRR data it is important to...http://www.dwe.csiro.au/local/forest/bbproj/avhnneth.hnn - size 15K - 11.Feb.96 - English
NOAA AVHRR Data User's GuideNOAA AVHRR Data User's Guide. (Version 1.1, December 1995; Introduction. Spatial andTemporal Extent of CCRS AVHRR Archive. AVHRR Sensor Characteristics..http://www.ccrs.nrcan.gc.ca/gcnet/guides/avhrr/avhrr.html - size 3K - 2I.Dec.95- English
Search for NOAA AVHRR Quicklook ImagesSearch for NOAA AVHRR Quicklook Images. Search by Button. Search by Data and [email protected]://www.tkl.iis.u-tokyo.ac.jp/SatIAN/Search/search.html - size 492 bytes - 2.Aug.96 -English
NOAA AVHRR OuicklookN6AA AVHRR Quicklook. Quicklooks stored after December 7th 1994 are showing acombination of AVHRR channels 1-2-4 (r-g-b) for daytime data (minimum sun zenith.http://129.247.162.47/PRODUCTS/D-QL.html - size 2K - 7 Jul95 English
-192-

Annex 10 AVHRR-data collection:SummaryAttributesData CenterPersonnelReference
-193-
Master Directory DIF Display
DIF DisplayIf you have further questions or noticed a need for an update, please contact the GCMD staffscientists!.
EDC-Held AVHRR Data
Data Set Citation
Originator(s): U.S. Geological Survey-Title: EDC-Held AVHRR DataPublication Date: 1980Publication Place: Sioux Falls, South DakotaPublisher: U.S. Geological SurveyData Presentation Form: Remote Sensing Image
SummaryLast Updated: 1997-06-11
The Advanced Very High Resolution Radiometer (AVHRR) data set is comprisedof data collected by the AVHRR sensor and held in the archives of theU.S. Geological Survey's EROS Data Center. Carried aboard the NationalOceanic and Atmospheric Administration's Polar Orbiting EnvironmentalSatellite series, the AVHRR sensor is a broad-band, 4- or 5-channel scanningradiometer, sensing in the visible, near-infrared, and thermal infraredportions of the electromagnetic spectrum.
The EROS Data Center houses AVHRR High Resolution Picture Transmission (HRPT)data and Local Area Coverage (LAC) data. The HRPT data are full resolutionimage data transmitted to a ground station as they are collected, while LACdata (also full resolution data) are recorded with an onboard tape recorderfor subsequent transmission during a station overpass.
The objective of the AVHRR instrument is to provide radiance data forinvestigation of clouds, land-water boundaries, snow and ice extent, ice orsnow melt inception, day and night cloud distribution, temperatures ofradiating surfaces, and sea surface temperature. The AVHRR data collectioneffort also provides opportunities for studying and monitoring vegetationconditions in ecosystems, including forests, tundra, and grasslands withapplications that include agricultural assessment, land cover mapping,production of large-area image maps (e.g., country maps, continental maps,world maps), and evaluation of regional and continental snow cover.
The Global Land Information System (GLIS) and the EOSDIS InformationManagement System (IMS) are interactive query systems providinginformation on this data set and on a variety of other data sets.These systems also support data visualization and ordering services.
-194-
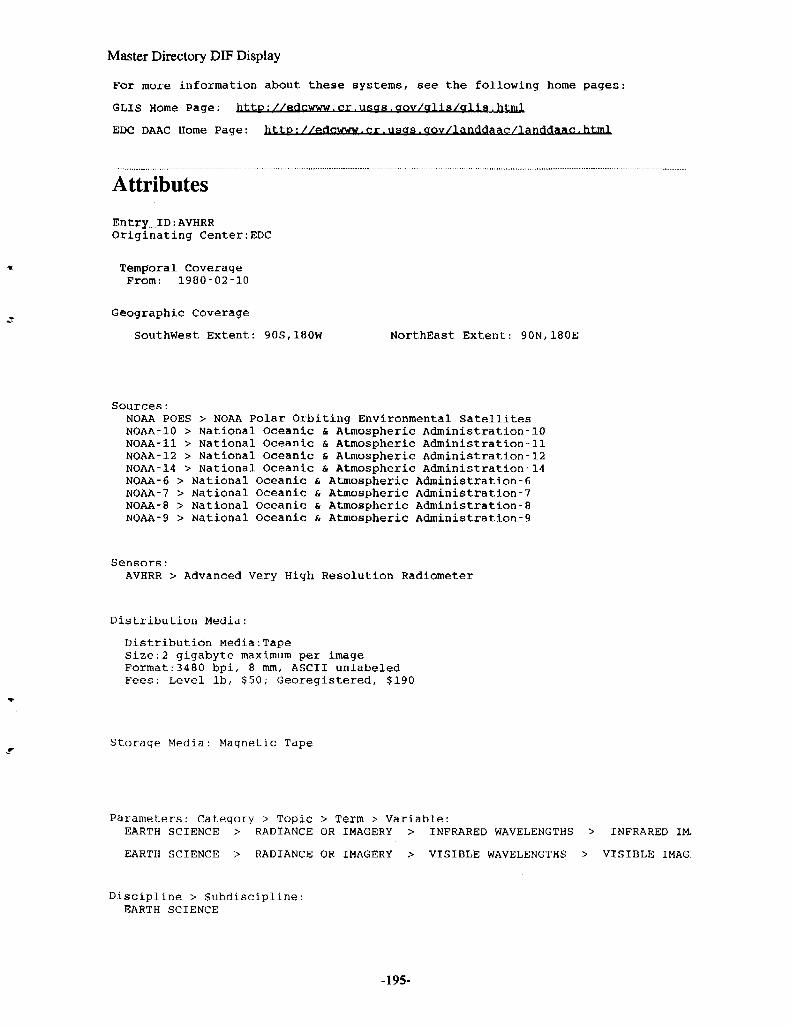
Master Directory DIF Display
For more information about these systems, see the following home pages:
GLIS Home Page: http://a(inwww.cr.usas.aov/qlls/qlls.html
EDC DAAC Home Page: http: //ftrtnwww. cr. uses .aov/landdaac/landdaac:. html
Attributes
Entry_ID:AVHRROriginating Center:EDC
Temporal CoverageFrom: 1980-02-10
Geographic Coverage
Southwest Extent: 90S,180W NorthEast Extent: 90N,180E
Sources:NOAA POES > NOAA Polar Orbiting Environmental SatellitesNOAA-10 > National Oceanic & Atmospheric Administration-10NOAA-11 > National Oceanic & Atmospheric Administration-11NOAA-12 > National Oceanic & Atmospheric Administration-12NOAA-14 > National Oceanic & Atmospheric Administration-14NOAA-6 > National Oceanic & Atmospheric Administration-6NOAA-7 > National Oceanic & Atmospheric Administration-7NOAA-8 > National Oceanic & Atmospheric Administration-8NOAA-9 > National Oceanic & Atmospheric Administration-9
Sensors:AVHRR > Advanced Very High Resolution Radiometer
Distribution Media:
Distribution Media:TapeSize:2 gigabyte maximum per imageFormat:3480 bpi, 8 mm, ASCII unlabeledFees: Level lb, 550; Georegistered, $190
Storage Media: Magnetic Tape
Parameters: Category > Topic > Term > Variable:
EARTH SCIENCE > RADIANCE OR IMAGERY > INFRARED WAVELENGTHS
EARTH SCIENCE > RADIANCE OR IMAGERY > VISIBLE WAVELENGTHS
> INFRARED IM,
> VISIBLE IMAG:
Discipline > Subdiscipline:EARTH SCIENCE
-195-
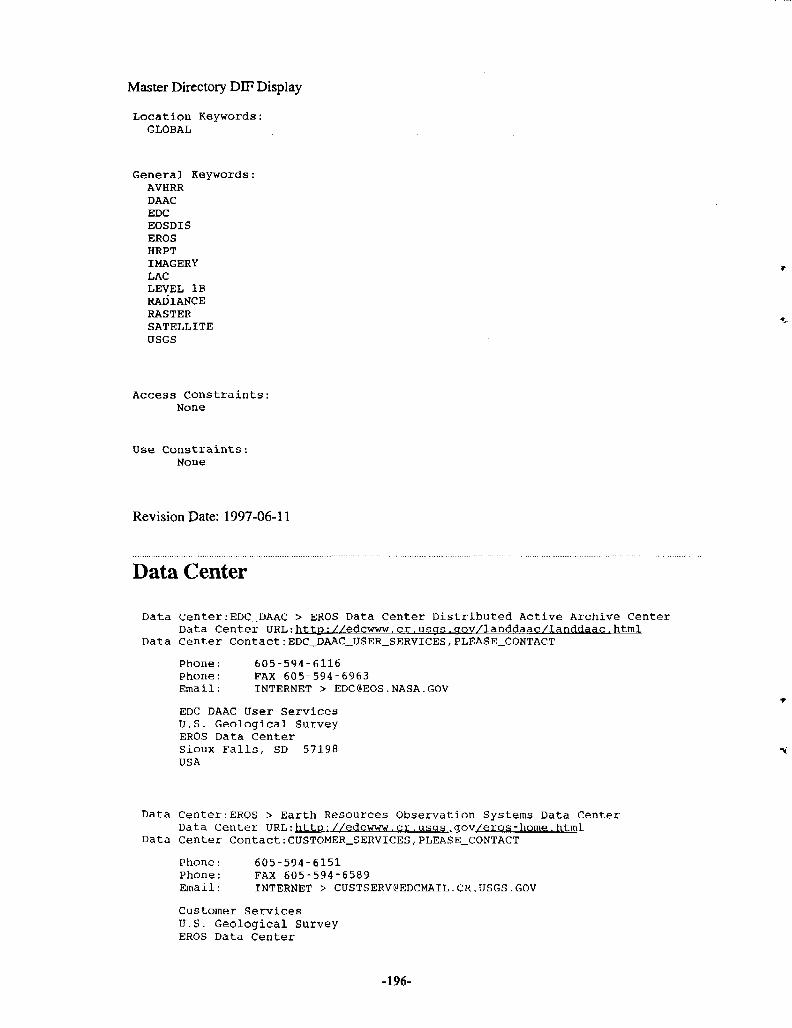
Master Directory DIF Display
Location Keywords:GLOBAL
General Keywords:AVHRRDAACEDCEOSDISEROSHRPTIMAGERYLACLEVEL IBRADIANCERASTERSATELLITEUSGS
Access Constraints:None
Use Constraints:None
Revision Date: 1997-06-11
Data Center
Data Center:EDC_DAAC > EROS Data Center Distributed Active Archive CenterData Center URL: ht.t.p : //edcwww. cr.usas. aov/landdaac/landdaac. html
Data Center Contact:EDC_DAAC_USER_SERVICES,PLEASE_CONTACT
Phone: 605-594-6116Phone: PAX 605-594-6963Email: INTERNET > [email protected]
EDC DAAC User ServicesU.S. Geological SurveyEROS Data CenterSioux Falls, SD 57198USA
Data Center:EROS > Earth Resources Observation Systems Data CenterData Center URL:http;//edcwww.cr•usas.qov/eros-home.html
Data Center Contact:CUSTOMER_SERVICES,PLEASE_CONTACT
Phone: 605-594-6151Phone: FAX 605-594-6589Email: INTERNET > [email protected]
Customer ServicesU.S. Geological SurveyEROS Data Center
-196-
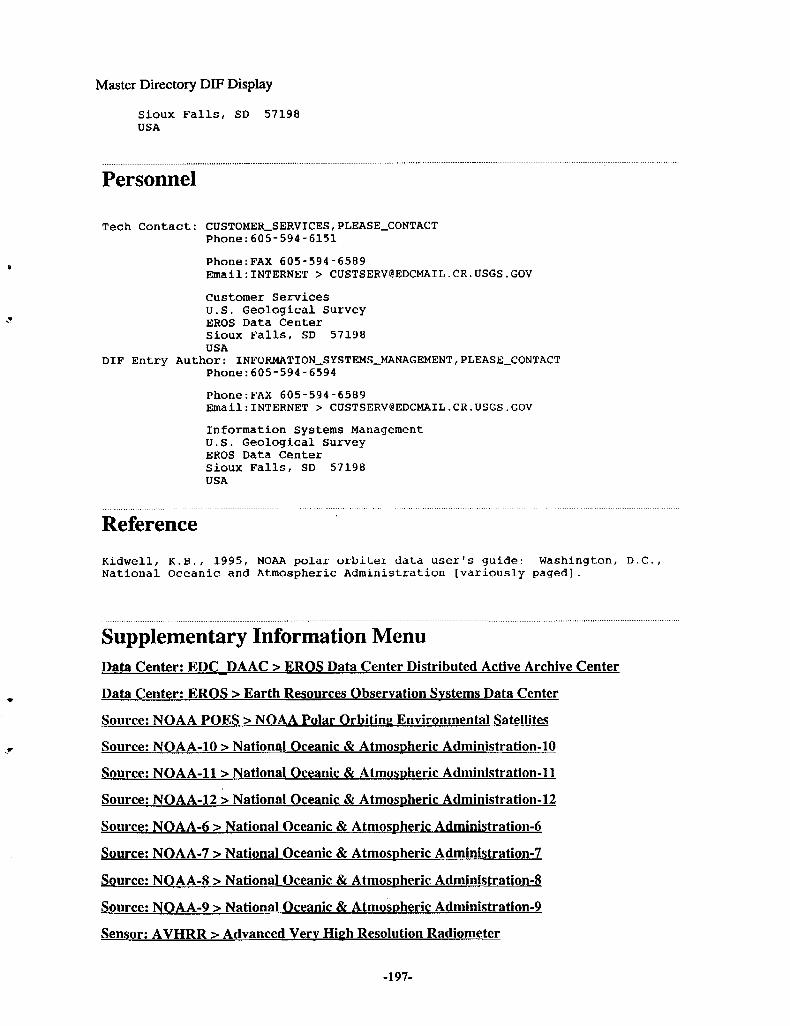
Master Directory DIF Display
Sioux Falls, SD 57198USA
Personnel
Tech Contact: CUSTOMER_SERVICES,PLEASE_CONTACTPhone:605-594-6151
Phone:FAX 605-594-6589Email:INTERNET > [email protected]
Customer ServicesU.S. Geological SurveyEROS Data CenterSioux Falls, SD 57198USA
DIF Entry Author: INFORMATION_SYSTEMS_MANAGEMENT,PLEASE_CONTACTPhone:605-594-6594
Phone:FAX 605-594-6589Email:INTERNET > [email protected]
Information Systems ManagementU.S. Geological SurveyEROS Data CenterSioux Falls, SD 57198USA
ReferenceKidwell, K.B., 1995, NOAA polar orbiter data user's guide: Washington, D.C.National Oceanic and Atmospheric Administration [variously paged].
Supplementary Information MenuData Center; EDCDAAC > EROS Data Center Distributed Active Archive Center
Data Center: EROS > Earth Resources Observation Systems Data Center
Source: NOAA POES > NOAA Polar Orbiting Environmental Satellites
Source: NOAA-10 > National Oceanic & Atmospheric Administration-10
Source: NOAA-11 > National Oceanic & Atmospheric Administration-11
Source: NOAA-12 > National Oceanic & Atmospheric Administration-12
Source: NOAA-6 > National Oceanic fy Atmospheric Administration-6
Source: NOAA-7 > National Oceanic & Atmospheric Administration-7
Source: NOAA-8 > National Oceanic & Atmospheric Administration-8
Source: NOAA-9 > National Oceanic & Atmospheric Administration-9
Sensor: AVHRR > Advanced Very High Resolution Radiometer
-197-

Annex 10-1 Advanced Very High Resolution Radiometer (AVHRR)BackgroundExtent of CoverageAcquisition
Processing StepsData Characteristics
Spatial ResolutionTemporal CoverageSpectral Range
Data OrganizationData Availability
Procedures for Obtaining DataProducts and Services
Applications and Related Data SetsReferencesAppendix -data types and selection parameters-
-199-
AVHRR
Advanced Very High Resolution RadiometerTable of Contents
BackgroundExtent of Coverage
Processing StepsData Characteristics
fipat.ial ResolutionTemporal Coverage;Spectral Range.
Da,ta OrganizationData availability
Procedures for Obtaining DataProducts and Services
Applications and Related Data SetsReferencesAppendix
Background
The Advanced Very High Resolution Radiometer (AVHRR) is a broad-band, four or five channel(depending on the model) scanner, sensing in the visible, near-infrared, and thermal infraredportions of the electromagnetic spectrum. This sensor is carried on NOAA's Polar OrbitingEnvironmental Satellites (POES), beginning with TTROS-N in 1978.
AVHRR data are acquired in three formats:High Resolution Picture Transmission (HRPT)Local Area Coverage (LAC)Global Area Coverage (GAP
HRPT data are full resolution image data transmitted to a ground station as they are collected.LAC are also full resolution data, but recorded with an on-board tape recorder for subsequenttransmission during a station overpass. GAC data provide daily subsampled global coveragerecorded on the tape recorders and then transmitted to a ground station.
Extent of Coverage
The AVHRR sensor provides for global (pole to pole) on board collection of data from all spectralchannels. Each pass of the satellite provides a 2399 km (1491 mi) wide swath. The satellite orbitsthe Earth 14 times each day from 833 km (517 mi) above its surface.
Example swath
Acquisition
AVHRR data are both broadcast continually in direct readout mode and recorded on board thesatellite for later playback. The EROS Data Center (EDO AVHRR Data Acquisition andProcessing System (ADAPS), which began operation in May 1987, receives approximately sixdaytime passes per day of HRPT data over the conterminous United States. Night acquisitions are
-200-
AVHRR
acquired upon request only. As of March 1990, all data received at EDC are permanentlyarchived. Prior to March 1990, approximately 40 percent of the data received were archived.
The EROS Data Center AVHRR Data Acquisition and Processing System was expanded on June15,1990, to acquire LAC and GAC data via a communications satellite for areas recordedthroughout the entire globe. Priority is given to LAC acquisitions of the North American continentnot covered by EDC's direct reception capabilities and other project specific areas.
NOAA/NESDIS receives both world-wide recorded and direct readout AVHRR data from theWallops Island, Virginia, and Gilmore Creek, Alaska, stations. Those stations then redirect thedata via a satellite relay to NOAA/NESDIS in Suitland, Maryland, where the data are processed,archived, and reproduced.
Processing Steps
EDC's ADAPS flow for acquisitions and archiving begins with either direct HRPT reception orre-broadcast DOMSAT LAC/GAC reception. Initial ingest of the data reformatting includesarchiving, and creation of browse quick looks, 9-track tapes, and 3480 cartridge tapes.
The NOAA AVHRR processing flow begins with sensor data receipt by the Command and DataAcquisition (CDA) stations (Wallops Island, Virginia and Gilmore Creek, Alaska) where the dataare re-broadcast via communications satellites, to NOAA/NESDIS in Suitland, Maryland. Theephemeris data are accessed through the Gridded Earth Location and Determination System(GELDS) software on NAS computers for Level lb production.
The EROS ADAPS systematic georegistration process references AVHRR data to the Earth'ssurface. Through modeling the position and attitude of the TIROS satellite platforms and thescanning geometry of the AVHRR sensor, geometric distortions can be minimized. The positionof the satellite is determined by an orbital model updated by ephemeris data received daily fromNAVY Space Surveillance. The AVHRR sensor model characterizes the non-linear scanning ofthe sensor mirror. A refinement to the sensor model accounts for the displacement in longitudedue to the rotation of the Earth under the satellite. All modeling is referenced to the time ofacquisition. As the satellite clock time drifts, a delta time adjustment is applied. Collectively,these models comprise the geometric correction model in ADAPS. The positional accuracy of asystematic georegistration is approximately 5000 m, RMSE.
Precise georegistration positional accuracy of 1000 m RMSE, requires correlation of imagefeatures with accurately registered cartographic or image-based maps. A common practice is touse cartographic sources such as Digital Chart of the World (DCW) or hydrography data to extracteasily identifiable features such as coastlines, water bodies, and rivers and to correlate them withthe matching raw image locations using various techniques. The correlation process determinesspecific adjustments to be applied to the time, roll, and yaw parameters of the orbital model. TheEDC ADAPS uses a variety of techniques depending upon the geographic location of the imageryand the volume of data to be processed.
Data Characteristics
Spatial Resolution
The average instantaneous field-of-view QFOV) of 1.4 milliradians yields a LAC/HRPT groundresolution of approximately 1.1 km at the satellite nadir from the nominal orbit altitude of 833 km(517 mi). The GAC data are derived from an on board sample averaging of the full resolutionAVHRR data. Four out of every five samples along the scan line are used to compute one averagevalue and the data from only every third scan line are processed, yielding 1.1-km by 4-kmresolution at nadir.
Temporal Co\erage
-201-
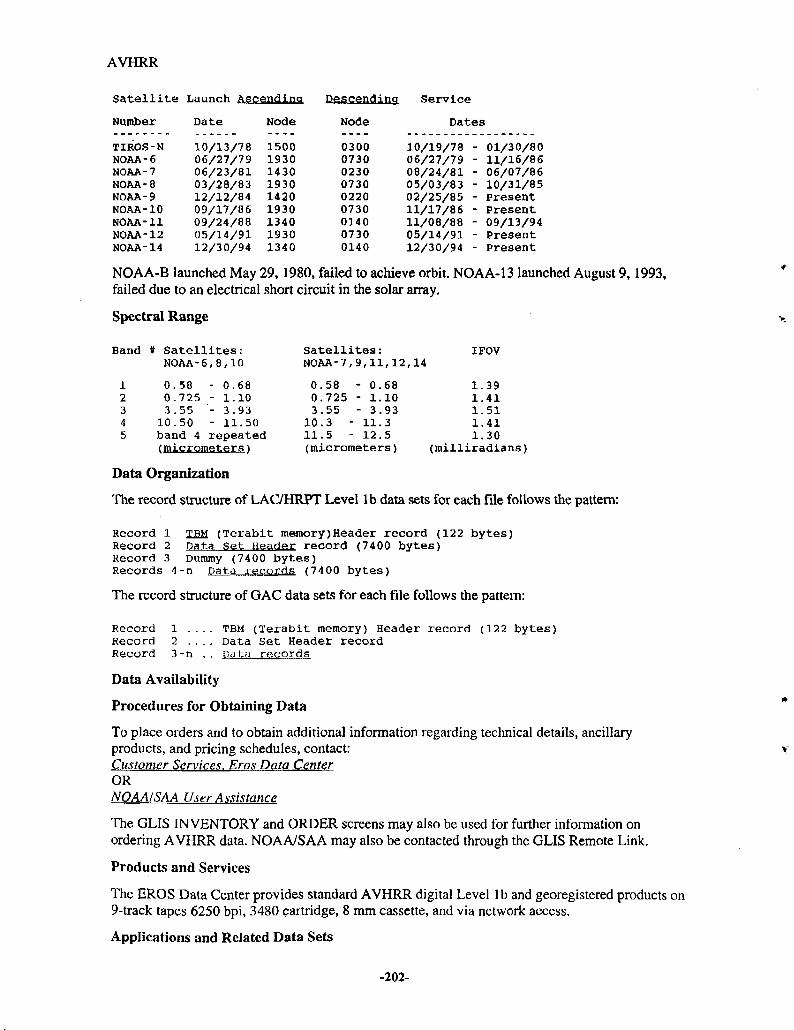
AVHRR
Satellite Launch Ascending Descending Service
Number
TIROS-NNOAA-6NOAA-7NOAA-8NOAA-9NOAA-10NOAA-11NOAA-12NOAA-14
Date
10/13/7806/27/7906/23/8103/28/8312/12/8409/17/8609/24/8805/14/9112/30/94
Node
150019301430193014201930134019301340
Node
030007300230073002200730014007300140
Dates
10/19/78 -06/27/79 -08/24/81 -05/03/83 -02/25/85 -11/17/86 -11/08/88 -05/14/91 -12/30/94 -
01/30/8011/16/8606/07/8610/31/85PresentPresent09/13/94PresentPresent
NOAA-B launched May 29,1980, failed to achieve orbit. NOAA-13 launched August 9,1993,failed due to an electrical short circuit in the solar array.
Spectral Range
Band # Satellites:NOAA-6,8,10
Satellites:NOAA-7,9,11,12,14
IFOV
0.58 - 0.680.725 - 1.103 .55
10.50- 3.93- 11.50
band 4 repeated(micrometers)
0.580.7253.55
10.3 •
11.5 •
• 0.68• 1 . 1 0- 3.9311.312.5
(micrometers)
1.391.411.511.411.30
(milliradians)
Data Organization
The record structure of LAC/HRPT Level lb data sets for each file follows the pattern:
Record 1 TBM (Terabit memory)Header record (122 bytes)Record 2 Data Set Header record (7400 bytes)Record 3 Dummy (7400 bytes)Records 4-n Data records (7400 bytes)
The record structure of GAC data sets for each file follows the pattern:
Record 1 .... TBM (Terabit memory) Header record (122 bytes)Record 2 .... Data Set Header recordRecord 3-n .. Data records
Data Availability
Procedures for Obtaining Data
To place orders and to obtain additional information regarding technical details, ancillaryproducts, and pricing schedules, contact:Customer Services. Eros Data CenterORNOAAISAA User Assistance
The GLIS INVENTORY and ORDER screens may also be used for further information onordering AVHRR data. NOAA/SAA may also be contacted through the GLIS Remote Link.
Products and Services
The EROS Data Center provides standard AVHRR digital Level lb and georegistered products on9-track tapes 6250 bpi, 3480 cartridge, 8 mm cassette, and via network access.
Applications and Related Data Sets
-202-
AVHRR
AVHRR data provide opportunities for studying and monitoring vegetation conditions inecosystems including forests, tundra, and grasslands. Applications include agriculturalassessment, land cover mapping, producing image maps of large areas such as countries orcontinents and tracking regional and continental snow cover. AVHRR data are also used toretrieve various geophysical parameters such as sea surface temperatures and energy budget data.
Additional data sets include the Alaska twice-monthly AVHRR and the U.S. Conterminousbi-weekly composites. These comprehensive time series data sets are calibrated, georegistereddaily observations and twice-monthly maximum NDVI composites for each annual growingseason.
Global Experimental Bi-Weekly Normalized Difference data, computed from Global VegetationIndex (GVT) data, are analyzed to monitor global vegetation as a potential tool in global climaticstudies.
References
Kidwell, Katherine B., comp. and ed., 1991, NOAA polar orbiter data (TIROS-N, NOAA-6,NOAA-7, NOAA-8, NOAA-9, NOAA-10, NOAA-11, and NOAA-12) users guide:Washington, D.C., NOAA/NESDIS.
Kidwell, Katherine B., comp. and ed., May 1990, Global Vegetation Index user's guide:Washington, D.C., NOAA/NESDIS.
Ohring, George, Gallo, K.P., Gruber, Arnold, Planet, Walter, Stowe, Larry, Tarpley, J.D., 1989,Climate and global change: Eos, American Geophysical Union, v. 70, no. 41, October 10, 1989,p. 889, 891,894, 901.
Earth Observation Satellite Company, 1994, Landsat system status report-September 1994:Lanham, Md., Earth Observation Satellite Company, p. 1-11.
National Oceanic and Atmospheric Administration, August 1981, National holdings ofenvironmental satellite data of the National Oceanic and Atmospheric Administration:Washington, D.C., NOAA/NESDIS.
National Oceanic and Atmospheric Administration, 1985, Hydrologic and land sciencesapplications of the National Oceanic and Atmospheric Administration polar-orbiting satellitedata: Washington, D.C., NOAA/NESDIS.
National Oceanic and Atmospheric Administration, March 1994, National Oceanic andAtmospheric Administration Retrospective satellite data price list, satellite products list andordering procedures: Washington, D.C., NOAA/NESDIS.
Appendix
-203-
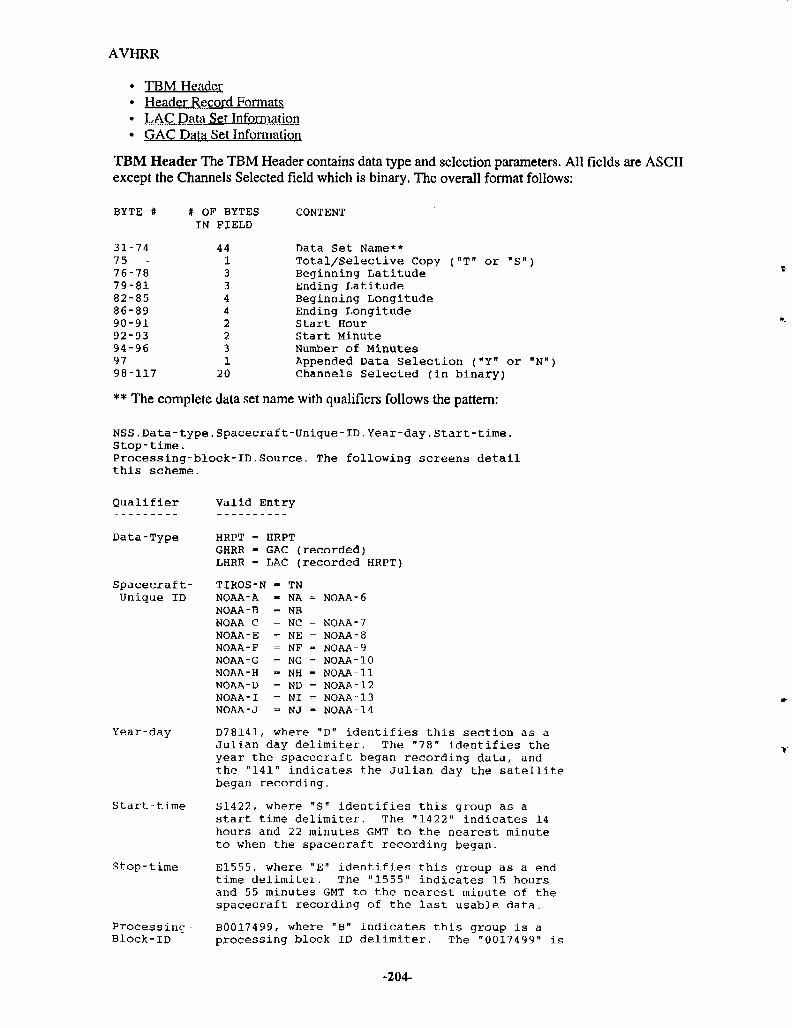
AVHRR
• TBM Header* Header Record Formats* LAC Data Set Information• GAC Data Set Information
TBM Header The TBM Header contains data type and selection parameters. All fields are ASCIIexcept the Channels Selected field which is binary. The overall format follows:
BYTE # # OF BYTES CONTENTIN FIELD
31-74 44 Data Set Name**75 - 1 Total/Selective Copy ("T" or "S")76-78 3 Beginning Latitude79-81 3 Ending Latitude82-85 4 Beginning Longitude86-89 4 Ending Longitude90-91 2 Start Hour92-93 2 Start Minute94-96 3 Number of Minutes97 1 Appended Data Selection ("Y" or "N")98-117 20 Channels Selected (in binary)
** The complete data set name with qualifiers follows the pattern:
NSS.Data-type.Spacecraft-Unique-ID.Year-day.Start-time.Stop-time.Processing-block-lD.Source. The following screens detailthis scheme.
Qualifier
Data-Type
Spacecraft-Unique ID
Valid
HRPT =GHRR -LHRR =
TIROS-NOAA-ANOAA-BNOAA-CNOAA-ENOAA-FNOAA-GNOAA-HNOAA-DNOAA-INOAA-J
Entry
HRPTGAC (recorded)LAC (recorded H
N = TN- NA '= NB= NC =- NE == NF -= NG =- NH •= ND == NI == NJ •
= NOAA-6
= NOAA-7= NOAA-8• NOAA-9= NOAA-10• NOAA-11= NOAA-12= NOAA-13• NOAA-14
Year-day D78141, where "D" identifies this section as aJulian day delimiter. The "78" identifies theyear the spacecraft began recording data, andthe "141" indicates the Julian day the satellitebegan recording.
Start-time S1422, where "S" identifies this group as astart time delimiter. The "1422" indicates 14hours and 22 minutes GMT to the nearest minuteto when the spacecraft recording began.
Stop-time E1555, where "E" identifies this group as a endtime delimiter. The "1555" indicates 15 hoursand 55 minutes GMT to the nearest minute of thespacecraft recording of the last usable data.
Processing B0017499, where "B" indicates this group is aBlock-ID processing block ID delimiter. The "0017499" is
-204-
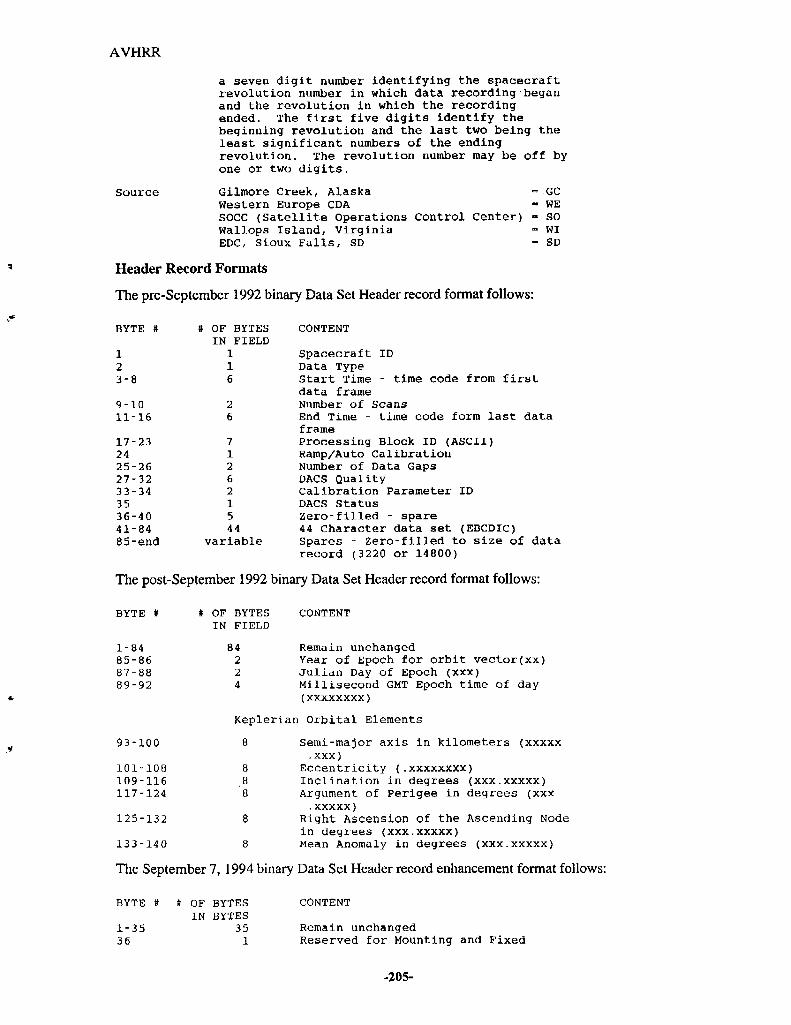
AVHRR
a seven digit number identifying the spacecraftrevolution number in which data recording beganand the revolution in which the recordingended. The first five digits identify thebeginning revolution and the last two being theleast significant numbers of the endingrevolution. The revolution number may be off byone or two digits.
Source Gilmore Creek, Alaska - GCWestern Europe CDA - WESOCC (Satellite Operations Control Center) - SOWallops Island, Virginia - WIEDC, Sioux Falls, SD - SD
Header Record Formats
The pre-September 1992 binary Data Set Header record format follows:
BYTE # # OF BYTES CONTENTIN FIELD
1 1 Spacecraft ID2 1 Data Type3-8 6 Start Time - time code from first
data frame9-10 2 Number of Scans11-16 6 End Time - time code form last data
frame17-23 7 Processing Block ID (ASCII)24 1 Ramp/Auto Calibration25-26 2 Number of Data Gaps27-32 6 DACS Quality33-34 2 Calibration Parameter ID35 1 DACS Status36-40 5 Zero-filled - spare41-84 44 44 character data set (EBCDIC)85-end variable Spares - Zero-filled to size of data
record (3220 or 14800)
The post-September 1992 binary Data Set Header record format follows:
BYTE # # OF BYTES CONTENTIN FIELD
1-84 84 Remain unchanged85-86 2 Year of Epoch for orbit vector(xx)87-88 2 Julian Day of Epoch (xxx)89-92 4 Millisecond GMT Epoch time of day
(xxxxxxxx)
Keplerian Orbital Elements
Semi-major axis in kilometers (xxxxx.xxx)
Eccentricity (.xxxxxxxx)Inclination in degrees (xxx.xxxxx)Argument of Perigee in degrees (xxx.xxxxx)
Right Ascension of the Ascending Nodein degrees (xxx.xxxxx)Mean Anomaly in degrees (xxx.xxxxx)
The September 7, 1994 binary Data Set Header record enhancement format follows:
CONTENT
Remain unchangedReserved for Mounting and Fixed
-205-
93-100
101-108109-116117-124
125-132
133-140
8
CO
C
O
CO
8
8
BYTE *
1-3536
* OFIN
BYTESBYTES
351
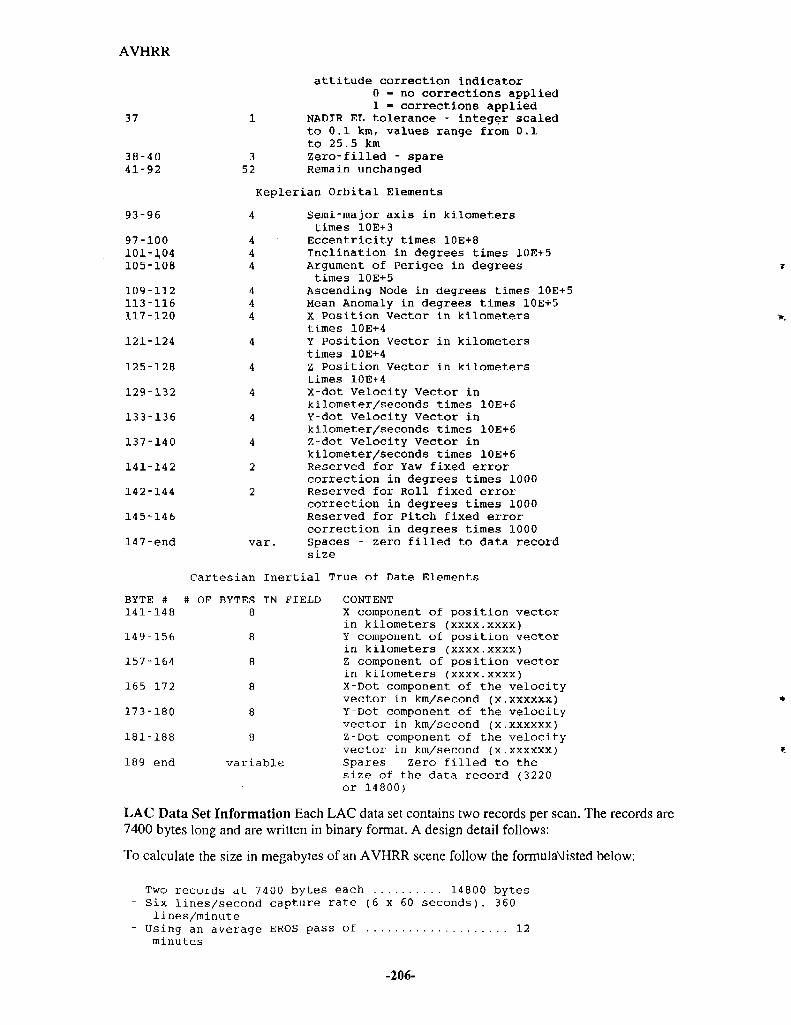
AVHRR
37
38-4041-92
93-96
352
attitude correction indicator0 = no corrections applied1 - corrections applied
NADIR EL tolerance - integer scaledto 0.1 km, values range from 0.1to 25.5 kmZero-filled - spareRemain unchanged
Keplerian Orbital Elements
1 Semi-major axis in kilometerstimes 10E+3Eccentricity times 10E+8Inclination in degrees times 10E+5Argument of Perigee in degreestimes 10E+5
Ascending Node in degrees times 10E+5Mean Anomaly in degrees times 10E+5X Position Vector in kilometerstimes 10E+4Y Position Vector in kilometerstimes 10E+4Z Position Vector in kilometerstimes 10E+4X-dot Velocity Vector inkilometer/seconds times 10E+6Y-dot Velocity Vector inkilometer/seconds times 10E+6Z-dot Velocity Vector inkilometer/seconds times 10E+6Reserved for Yaw fixed errorcorrection in degrees times 1000Reserved for Roll fixed errorcorrection in degrees times 1000Reserved for Pitch fixed errorcorrection in degrees times 1000Spaces - zero filled to data recordsize
Cartesian Inertial True of Date Elements
FIELD CONTENTX component of position vectorin kilometers (xxxx.xxxx)Y component of position vectorin kilometers {xxxx.xxxx)Z component of position vectorin kilometers (xxxx.xxxx)X-Dot component of the velocityvector in km/second (x.xxxxxx)Y-Dot component of the velocityvector in km/second (x.xxxxxx)Z-Dot component of the velocityvector in km/second (x.xxxxxx)Spares - Zero filled to thesize of the data record (3220or 14800)
L A C Data Set Information Each L A C data set contains two records per scan. The records are7400 bytes long and are written in binary format. A design detail follows:
To calculate the size in megabytes of an A V H R R scene follow the formulaMisted below:
- Two records at 7400 bytes each 14800 bytes- Six lines/second capture rate (6 x 60 seconds). 360
lines/minute- Using an average EROS pass of 12
minutes
97-100101-3,04105-108
109-112113-116117-120
121-124
125-128
129-132
133-136
137-140
141-142
142-144
145-146
147-end
444
444
4
4
4
4
4
2
2
V
BYTE #141-148
149-156
157-164
165-172
173-180
181-188
189-end
# OF BYTES IN8
8
8
8
8
8
variable
-206-
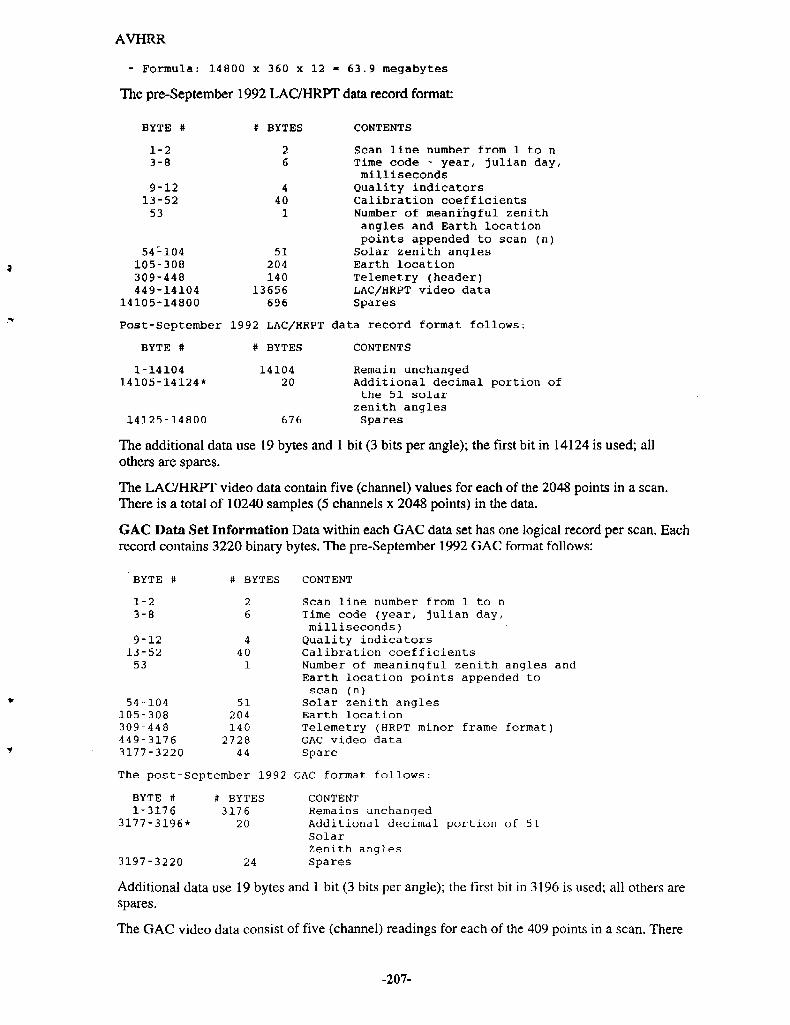
AVHRR
- Formula: 14800 x 360 x 12 - 63.9 megabytes
The pre-September 1992 LAC/HRPT data record format:
BYTE # # BYTES CONTENTS
1-2 2 Scan l i n e number from 1 t o n3-8 6 Time code - yea r , J u l i a n day,
milliseconds9-12 4 Quality indicators
13-52 40 Calibration coefficients53 1 Number of meaningful zenith
angles and Earth locationpoints appended to scan (n)
54-104 51 Solar zeni th angles105-308 204 Earth locat ion309-448 140 Telemetry (header)449-14104 13656 LAC/HRPT video data
14105-14800 696 Spares
Post-September 1992 LAC/HRPT data record format follows;
BYTE # # BYTES CONTENTS
1-1410414105-14124*
14125-14800
1410420
676
Remain unchangedAdditional decimal portion ofthe 51 solarzenith anglesSpares
The additional data use 19 bytes and 1 bit (3 bits per angle); the first bit in 14124 is used; allothers are spares.
The LAC/HRPT video data contain five (channel) values for each of the 2048 points in a scan.There is a total of 10240 samples (5 channels x 2048 points) in the data.
GAC Data Set Information Data within each GAC data set has one logical record per scan. Eachrecord contains 3220 binary bytes. The pre-September 1992 GAC format follows:
BYTE # # BYTES CONTENT
1-2 2 Scan line number from 1 to n3-8 6 Time code (year, Julian day,
milliseconds)9-12 4 Quality indicators
13-52 40 Calibration coefficients53 1 Number of meaningful zenith angles and
Earth location points appended toscan (n)
54-104 51 Solar zenith angles105-308 204 Earth location309-448 140 Telemetry (HRPT minor frame format)449-3176 2728 GAC video data3177-3220 44 Spare
The post-September 1992 GAC format follows:
BYTE # # BYTES CONTENT1-3176 3176 Remains unchanged
3177-3196* 20 Additional decimal portion of 51SolarZenith angles
3197-3220 24 Spares
Additional data use 19 bytes and 1 bit (3 bits per angle); the first bit in 3196 is used; all others arespares.
The GAC video data consist of five (channel) readings for each of the 409 points in a scan. There
-207-
AVHRR
is a total of 2045 samples (5 channels x 409 points) in the data. For TIROS-N, NOAA-6, -8, -10,and -12, there is no sensor for channel 5; therefore, channel 4 data are repeated in the fifth channelposition.
-208-

Annex 10-2 Advanced Very High Resolution Radiometer Search Criteria
-209-
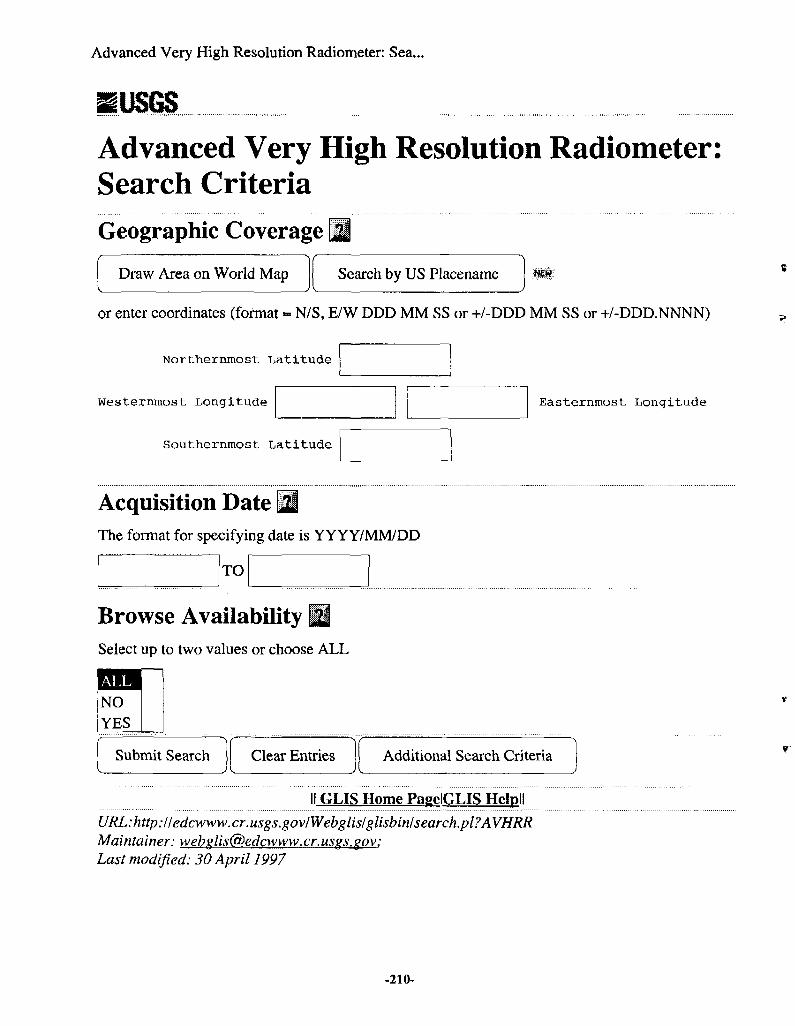
Advanced Very High Resolution Radiometer: Sea...
2USGSAdvanced Very High Resolution Radiometer:Search CriteriaGeographic Coverage
Draw Area on World Map Search by US Placename ffei
or enter coordinates (format - N/S, E/W DDD MM SS or +/-DDD MM SS or +/-DDD.NNNN)
Northernmost Latitude
Westernmost Longitude Easternmost Longitude
Southernmost Latitude
Acquisition Date U!The format for specifying date is YYYY/MM/DD
TO
Browse Availability 61Select up to two values or choose ALL
H I MI NO IYES
Submit Search Clear Entries Additional Search Criteria
IIGLIS Home PagelGLIS Helpll
URL: http://edcwww.cr.usgs.gov/Webglis/glisbin/search.pl7AVHRRMaintainer: webglis&iedcwww.cr.usgs.gov:Last modified: 30 April 1997
-210-

Annex 11 The Company for Applied Remote Sensing (GAF)
-211-
GAF: Company for Applied Remote Sensing and GIS
GAF Gesellschaft fur Angewandte FernerkundungmbH/
Company for Applied Remote Sensing
Celebrating 10 years of leadership in providing innovativesolutions and quality products.
"Satellite Remote Sensing and GIS solutions for professionalmapping and management of the worlds natural resources."
The Company for Applied Remote Sensing (GAF), founded in 1985, is an internationally activeconsultants firm in the fields of satellite remote sensing, digital image processing, andgeographical information systems. GAF, a private sector enterprise located in Munich, is amember of the AHT GROUP Management Services .
Company profile
Remote Sensing & GIS - Areas of Application
Products and Services
mWorld Wide Activities
Satellite Data Distribution
#Selected Projects in detail
#Satellite Image Suppliers & Space Research Agencies
RTA
IRS data reception for Europe Sistemas de Teledeteccion Aplicada
l»ltx
©1996 GAF - Gesellschaft fiir Angewandte Femerkundung mbH / Company for Applied Remote Sensing
-212-
Homepage GAF mbH
A company uniquely committed toexcellence in performance and quality
in products and services.
Introduction to the Company
GAF is a private sector enterprise, founded in 1985 and located in Munich. The shareholdersare Agrar- and Hydrotechnik (AHT) AHT Group Management Services, Essen, JKBVerwaltungsgesellschaft des Wittelsbacher Ausgleichsfond, Munich and Dr.Rupert Haydn,Munich.
The company is a member of the AHT-Group Management Service. GAF has established aQuality Management System (QMS) in 1995 and is fully certified according to InternationalStandard Organisation (ISO) 9001 (Re-certified in 1996).
GAPs services are dedicated to the complete range of value-added services for remotely senseddata and GIS applications in the fields of environmental surveillance, forestry, agriculture, soilmapping, landuse/landcover mapping, hydrology, hydrogeology, exploration, geophysics andcartography. For the present GAF is employing a staff of 30 experts in these fields of earthsciences.
Striving to attain such competence and efficiency is based on GAPs belief that success in therapidly advancing field of remote sensing requires not only a sound technical infrastructure, butalso a profound understanding of the relationship between the fields of application and theavailable technology. GAF also believes that solving problems related to a broad spectrum ofapplications can only be done by interdisciplinary approach and experienced management.
Business structure
9GIS database design, generation, management and analysis for natural resources,environment / Forestry, agriculture
Project planning, implementation and management / GIS, Management Information Systems
9Digital cartography and map production / GIS, training
Satellite data distribution / Official distributor of EOSAT, Eurimage, Spotimage,Sovinformsputnik, Radarsat Int.
9Standard Satellite Data Processing / Laserfilmwriting Services
9Education & training
Affiliations and Owned Companies
EUROMAP GmbH ( a GAF company for IRS Satellite Data acquisition anddistribution), Neustrelitz, Germany
-213-
GAF Links
GAF Satellite Image Suppliers &Space Research Agencies
Satellite Images Suppliers:
EUROMAP. Germany
EURIMAGE. Italy
EOSAT. USA
j SPOT IMAGE. France
Canadian bpace Aqence spaisaleAmncv i RADARSAT - Canadian Space Agency
Instituto Nacional de Pesauisas Esoaciais. Brazil
Space Research Organizations:
Space Agency
The National Aeronautics and Space Administration
German Aerospace Research Stablishment
Centre National d'Etudes Spatiales
Lfm/t
©1996 GAF - Gesellschaft fur Angewandte Femerkundung mbH / Company for Applied Remote SensingFor more information, contact GAF
-214-

GAF Activity
GAFWorld Wide Activities
The Company for Applied Remote Sensing (GAF), founded in 1985, is today an internationallyrecognized consulting firm offering a full range of services specifically related to spaceborneremote sensing. GAF is a privately held company based in Munich, Germany, and a member ofthe Agrar- und Hydrotechnik (AHT) Group, based in Essen, Germany.
World-Wide Activites
As a highly specialised company, GAF is tied into the AHT GROUP of companies which hasthe capacitiy to provide the full spectrum of engineering and management services for thedesign, planning and implementation of agricultural, infra-structural and environmentalprojects world-wide.
GAF is registered at the World Bank, the Asian and African Development Bank, variousunits of the European Union including the PHARE and TACIS programmes and with the FAOin Rome.
Support to the Global Market
Services in satellite remote sensing often need support components from neighboring areassuch as aerial photography, database technology, cartography, thematic mapping, and projectplanning.GAF has developed integrated approaches using best outside expertise to be found inthe international market.
GAF has been a leader in forming international consortia and company-like structures intocompetetive business alliances to disseminate satellite remote sensing information to the globalmarket.
Representatives and Affiliations:
USA. Washington RepresentativeSweden. Scandinavian Representative
Sistemas de Teledeteccion Aplicada
IRS data reception for Europe
©1996 GAF - Gesellschaft fur Angewandte Fernerkundung mbH / Company for Applied Remote SensingFor more information, contact GAF
-215-
Remote Sensing & GIS applications
Remote Sensing & GIS- Areas of application
GAF provides the complete range of technical services related to remote sensing andgeographic information systems (GIS), and associated disciplines, including the following mainsectors:
.988199:
t\223S
Forestry
Agriculture
Regional planning
Environmental monitoring
Hydrology
Geology. Lithologv
Natural hazard monitoring
The diversity of space and airborne sensor systems and potential applications requires a highconceptual and instrumental flexibility. GAF offers a complete range of services and represents aperfect partner for professional activities, ranging from satellite data distribution, imageprocessing and interpretation and image recording on film to database design, GIS analysis anddigital cartography. In addition, software development, consultancy and training are offered.
©1996 GAF - Gesellschaft fiir Angewandte Femerkundung mbH / Company for Applied Remote SensingFor more information, contact GAF
-216-

GAF Products and Services
GAFServices Offered
GAF provides the complete range of technical services related to satellite remote sensing,geographic information systems (GIS), and associated disciplines, including:
Project planning, implementation and management.
1 Image processing and interpretation.
GIS database management and analysis.
Digital cartography and map production.
Education and training.
Application programme development.
GAF & GEOSYSTEMS Image Processing Service
Satellite data distribution.
Research & Development.
tt»fn*7©1996 GAF - Gesellschaft fur Angewandte Femerkundung mbH / Company for Applied Remote Sensing
For more information, contact GAF
-217-
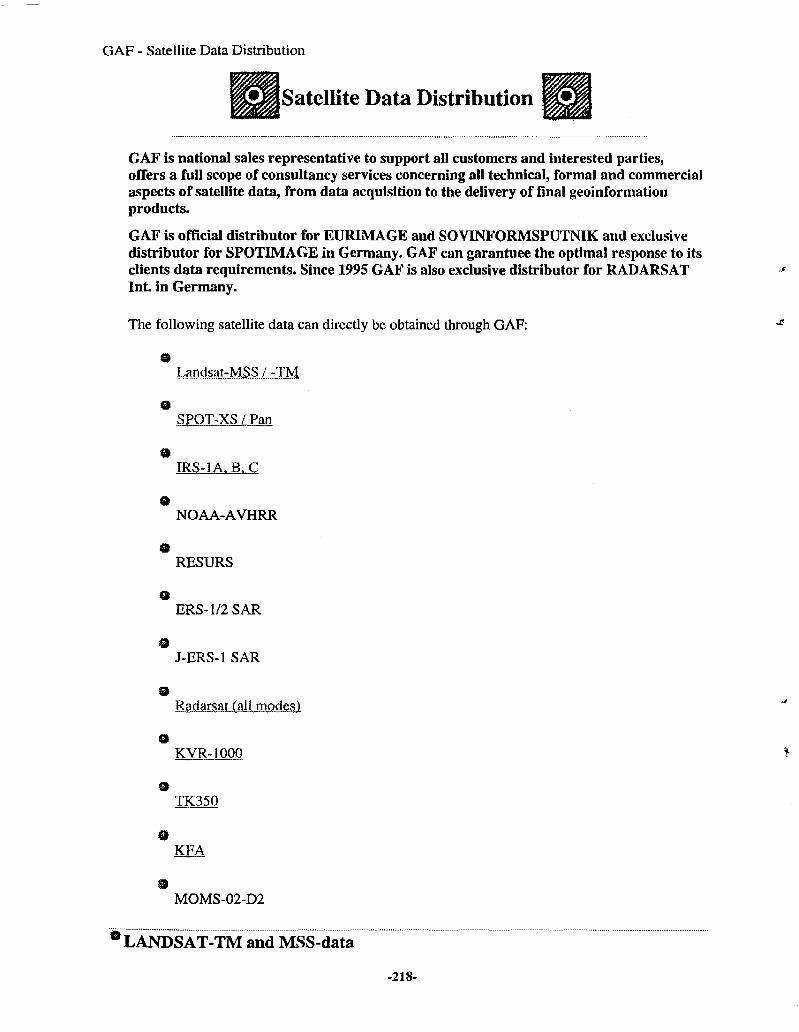
GAF - Satellite Data Distribution
Satellite Data Distribution
GAF is national sales representative to support all customers and interested parties,offers a full scope of consultancy services concerning all technical, formal and commercialaspects of satellite data, from data acquisition to the delivery of final geoinformationproducts.
GAF is official distributor for EURIMAGE and SOVINFORMSPUTNIK and exclusivedistributor for SPOTIMAGE in Germany. GAF can garantuee the optimal response to itsclients data requirements. Since 1995 GAF is also exclusive distributor for RADARSATInt in Germany.
The following satellite data can directly be obtained through GAF:
Landsat-MSS / -TM
i
SPOT-XS / Pan
IRS-1A.B.C
NOAA-AVHRR
RESURS
ERS-1/2 SAR
J-ERS-1 SAR
Radarsat (all modes)
KVR-1000
KFA
MOMS-02-D2
'LANDSAT-TM and MSS-data
-218-
GAF - Satellite Data Distribution
As international sales representative of EURIMAGE, GAF acquires LANDSAT-TM and MSSdata and products from ground receiving stations worldwide, including Frascati (Italy), Kiruna(Sweden) and Maspalomas (Spain) in Europe. Good contacts exist also to receiving stations inSouth Africa, Thailand, Indonesia, Pakistan, Brazil and Australia.
9 Indian Remote Sensing satellite data
GAF is prime contact for the customer support to the recently established europeanwidedistributor network. For more information please refer to EUROMAP
• SPOT data
As official distributor of SPOT IMAGE products, GAF also disseminates satellite dataworldwide.
9 Russian satellite data
GAF, as sales representative of SOVINFORMSPUTNIK handles the acquisition and distributionof KFA-1000 photographs. For some years now, these high resolution space photographs, takenby the Russian satellite series KOSMOS and the space station MIR, have been increasingly usedin the field of environmental monitoring and regional planning.
Q Radar satellite data
Through EURIMAGE all ERS-1/2 SAR and J-ERS-1 SAR data can be ordered directly at GAF.Since 1995 GAF is also exclusive distributor for RADARSAT Int. in Germany.
Customer Support
® GAF distribution personnel and the company's applications specialists are always updated onthe newest developments in the field of remote sensing, geographic information systems (GIS)and related disciplines.
® The company's technical and operational expertise is at the customer's disposal for selecting theappropriate sensor, the preferable spectral resolution and the best possible acquisition dates for hisspecific project needs.
® GAF has special information support for SPOT data users. SPOT newsletters fin German) withdedicated information on products, applications and prices will be send to all interested clients.
Requests for Satellite Imagery
® Through on-line connections to the digital data catalogues like of EURIMAGE and SPOTIMAGE, and access to the constantly updated EOSAT microfiche catalogue, GAF can perform aninstant search in these archives, check the availability of scenes and conduct an initial qualitycontrol of the data.
® When a scene is not available from the archive, or when new images are needed, a specialacquisition can be performed by programming a satellite to acquire the image needed by thecustomer.
-219-
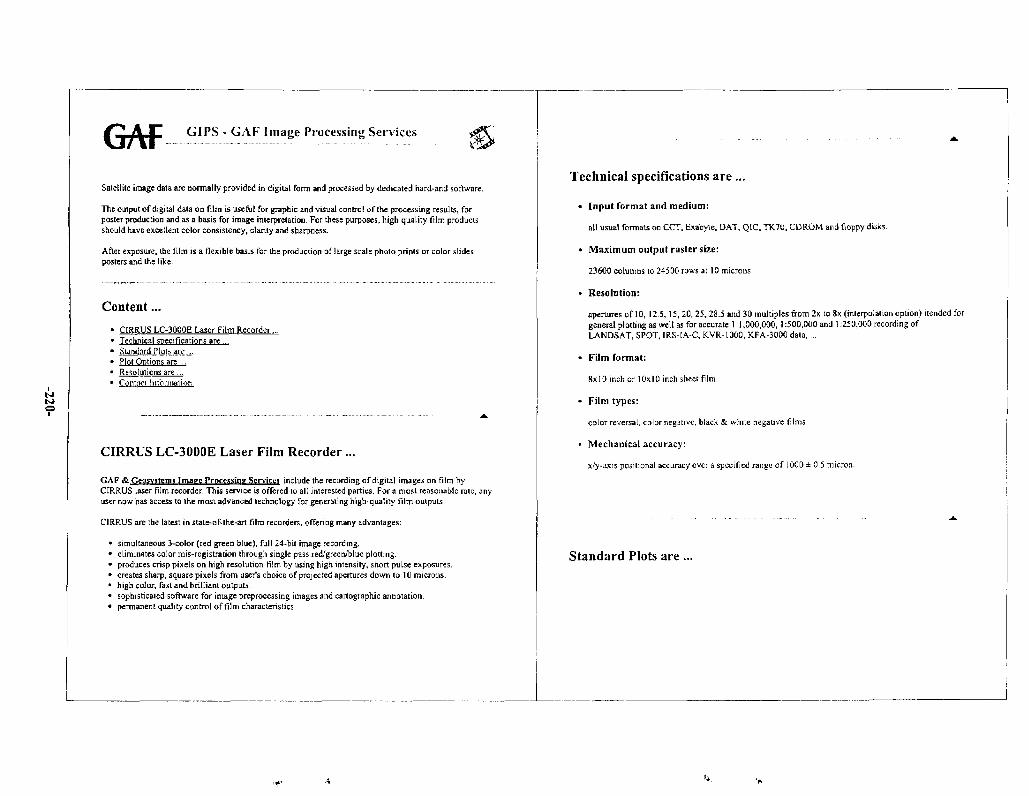
GAF GIPS - GAF Image Processing Services
Satellite image data are normally provided in digital form and processed by dedicated hard-and software.
The output of digital data on film is useful for graphic and visual con iro I of the processing results, forposter production and as a basis for image interpretation. For these purposes, high quality film productsshould have excellent color consistency, clarity and sharpness.
After exposure, the film is a flexible basis for the production of large scale photo prints or color slides,posters and the like.
Content...
• CIRRUS LC-3000E Laser Film Recorder.• Technical specifications are ...• Standard Plots aw ...• Plot Options are ...• Resolutions are ...• Contik'i hybridation
CIRRUS LC-3000E Laser Film Recorder...
CAF & Ceosvsteras Tmape Processing Services include the recording of digital images on film byCIRRUS laser film recorder. This service is offered to all interested parties. For a most reasonable rate, anyuser now has access to the most advanced technology for generating high-quality Him outputs.
CIRRUS are the latest in state-of-the-art film recorders, offering many advantages:
simultaneous 3-color (red green blue), full 24-bit image recording.eliminates color mis-registration through single pass red/green/blue plotting.produces crisp pixels on high resolution film by using high intensity, short pulse exposures.creates sharp, square pixels from user's choice of projected apertures down to 10 microns.high color, fast and brilliant outputssophisticated software for image preprocessing images and cartographic annotation.permanent quality control of film characteristics
Technical specifications are...
• Input format and medium:
all usual formats on CCT, Exabyte, DAT, QIC, TK70, CDROM and floppy disks.
• Maximum output raster size:
23600 columns to 24500 rows at 10 microns.
> Resolution:
apertures of 10, 12.5, 15, 20, 25,2S.5 and 30 multiples from 2x to 8x (interpolation option) itended forgeneral plotting as well as for accurate 1:1,000,000, 1:500,000 and 1:250,000 recording ofLANDSAT, SPOT, [RS-IA-C, KVR-1000, KFA-3000 data, ...
• Film format:
8x10 inch or 10x10 inch sheet film.
• Film types:
color reversal, color negative, black & white negative films.
• Mechanical accuracy:
x/y-axis positional accuracy over a specified range of 1000 ± 0.5 micron.
Standard Plots are...
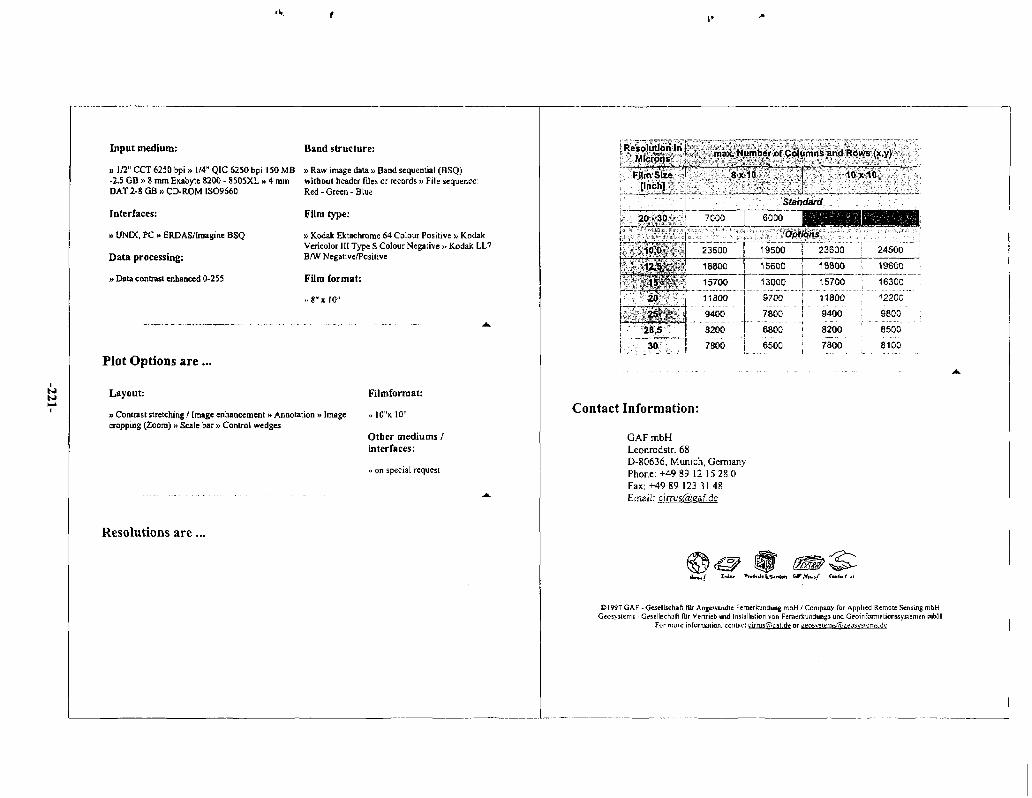
Input medium: Band structure:
» 1/2" CCT 6250 bpi » 1/4" QIC 6250 bpi 150 MB » Raw image data » Band sequential (BSQ)-2.5 GB » t mm Exabyte 8200 - S505XL » 4 mm without header files or records » File sequence:DAT 2-8 GB » CD-ROM [SO9660 Red - Green - Blue
Interfaces: Film type:
» UNIX, PC » ERDAS/Imagine BSQ » Kodak Ektachrome (A Colour Positive » KodakVericolor III Type S Colour Negative » Kodak LL7
Data processing: B/W Negative/Positive
» Data contrast enhanced 0-255 Film format:
.. 8"x 10"
Plot Options are ...
Layout: Fil inform at:
» Contrast stretching / Image enhancement » Annotation »Image » IO"x 10"cropping (Zoom) » Scale bar » Control wedges
Other mediums /interfaces:
» on special request
Resolutions are...
i Resolution in
FltmSiie V
23600 I
Standard
6000~
; •"";•: -Options
19500 | 23600 24500
S 1S600 i 18800
13000 j 15700
9700 | 11800
7800 ! 9400
6800 ] 8200
6500 ! 7800
19600
16300
12200
9800
8500
8100
Contact Information:
GAFmbHLeonrodstr. 68D-80636, Munich, GermanyPhone:+49 89 12 15280Fax: +49 89 123 31 48Email: cirrusfaieaf.de
©1*97 GAF -Gesellichaft fEir Angev '̂andte Fernerkundung mbH / Company for Applied Remote Sensing mbHGeosystems - Oeselischafl fllr Vertrieb und Installation von FemeAujidunys und Geoinfonnationssyslemen mbH
For more informal ion, contact tirnjs^L'af.denr Eensv^lem^p eosvsiems.de


Annex 12 Digitales Nachweissystem ftir Satellitenbilddaten (DNS) of the FederalIstitute for Geosciences and Natural Resources (BGR, Hannover)- currently the description is available only in German language-
-223-
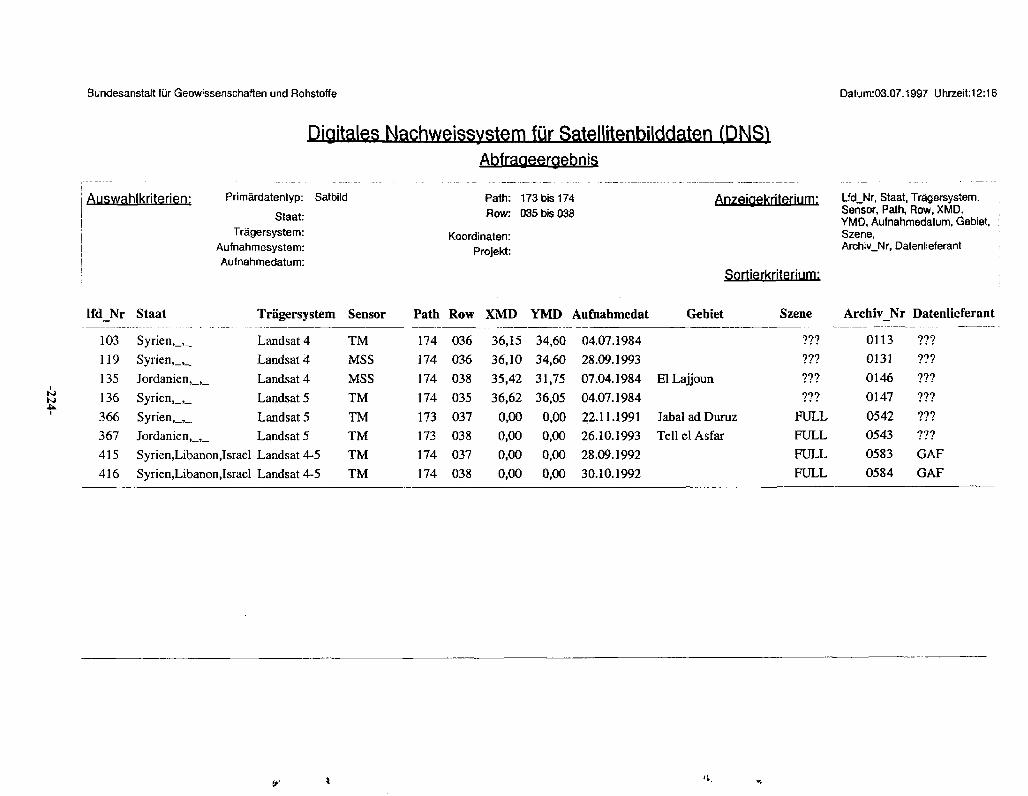
Bundesanstaft fur Geowissenschaften und Rohstoffe Datum:03.07.1997 Uhrzeit:12:16
Digitales Machweissvstem fur Satellitenbilddaten (DNS)
Auswahlkriterien:
l f d N r
103
119
135
136
366
367
415
416
Staat
Syrien,_,_
Syrien,_,_
Primardatentyp: Satbilc
Staat:Tragersystem:
Auinahmesystem:Aufnahmedatum:
Tragersystem
Landsat 4
Landsat 4
Jordanien,_,_ Landsat 4
Syrien,_,_
Syrien,_,_
Landsat 5
Landsat 5Jordanien,_,_ Landsat 5
Syrien,Libanon.Israel Landsat 4-5
Syrien,Libanon,Israel Landsat 4-5
Sensor
TM
MSS
MSS
TM
TM
TM
TM
TM
Path
174
174
174
174
173173
174
174
Abfrapeergebnis
Path: 173bis174Row: 035 bis 038
Koordinaten:Projekt:
Row
036
036
038
035
037
038
037
038
XMD
36,15
36,10
35,42
36,62
0,00
0,00
0,00
0,00
YMD Aufnahmedat
34,60
34,60
31,75
36,05
0,00
0,00
0,00
0,00
04.07.1984
28.09.1993
07.04.1984
04.07.1984
22.11.199126.10.1993
28.09.1992
30.10.1992
Anzeigekriterium:
Sortierkriterium:
Gebiet Szene
111
???
El Lajjoun 111
Ill
Jabal ad Duruz FULLTell el Asfar FULL
FULL
FULL
Lfd_Nr, Staat, Tragersystem,Sensor, Path, Row, XMD,YMD, Aufnahmedatum, Gebiet,Szene,Archiv_Nr, Oaten lief erant
Archiv_Nr Datenlieferant
0113 111
0131 ???
0146 111
0147 111
0542 111
0543 ???
0583 GAF
0584 GAF
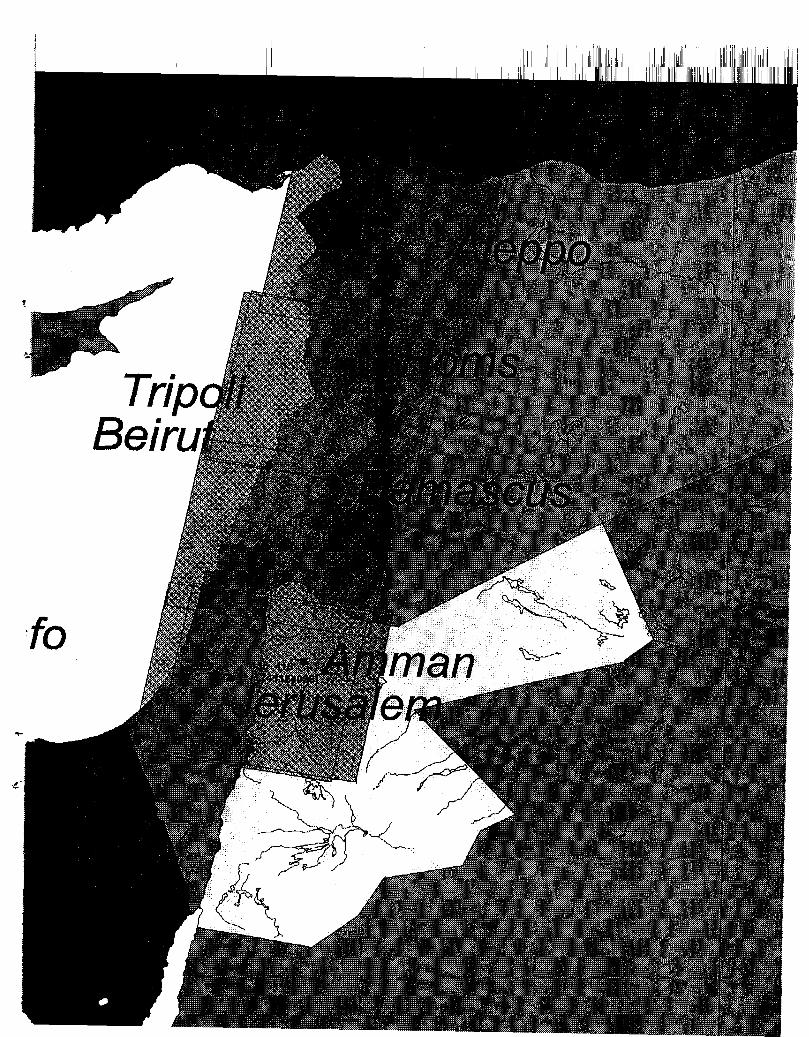
1 11 1I I ,1 IIII illi i i
IliiSmijmBijImi
Is
IBIn
mmOK?
\man
f̂̂
» \


Annex 13 Access to Landsat Data in the USA and from Non-US Ground StationsEros Data Center on-line catalog systemsHow to contact Space Imaging Eosat
-227-
Landsat Data Access (USA)
ACCESS TO LANDSAT DATAIN THE USA AND
FROM NON-US GROUND STATIONS
IN THE USA
Landsat Multispectral Scanner (MSS) and Thematic Mapper (TM) data are available in the UnitedStates through the US Geological Survey's EROS Data Center (EDC) and Space ImagingEQSAT.
Data users interested in IVISS digital data and hardcopy products should direct inquiries to theEDC.
"US Government and Affiliated Users" (USGAU) interested in JM digital data and hardcopyproducts should direct inquiries to the EDC.
Other users of TM data should direct inquiries to the EDC if the data of interest were acquiredprior to October 1992, or to Space Imaging EOS AT for acquisitions more recent than October1992.
How to contact the EROS Data Center:
E-mail: custserv(SmaiI.cr.usgs.gov
Telephone: 605-594-6151Fax: 605-594-6589
By Mail:
Customer ServicesUS Geological Survey
EROS Data Center
Sioux Falls, SD 57198
EDC on-line catalog systems:
Information on Landsat data from the EDC can be obtained over the Internet through the Global^Land Information System (GLIS1. and the "VOIMS."
GLIS is an interactive computer system that provides information on land data sets. GLIScontains references to regional, continental, and global data sets including land use, soils,topography, and data from aircraft and satellites. Direct access to GLIS is also available throughwide area networks and dial-up interfaces.
• WEBGLIS: http://edcwww.cr.usgs.gov/vvebglis• Text terminal access: telnet glis.cf.usgs.gov• Xwindows terminal access: telnet xglis.cr.usgs.gov• PC access dial-up modem: Contact GLIS user assistance to request PC dial-up GLIS
software or download the software over the Internet fromsunl.cr.usgs.gov/pub/software/pcglis
GLIS user assistance:
-228-
Landsat Data Access (USA)
Telephone: 1-800-252-4547
Fax: 605-594-6589
Email: glis(S)glis.cr.usgs.gov
VO IMS is the information management system for the Earth Observation System Data andInformation System (EOSDIS) operated through the Land Processes Distributed Active ArchiveCenter (DAAC) at the EDC. VO IMS contains information on all EOS land data sets includingLandsat. VO IMS is less intuitive to use than GLIS but it contains information on some specialLandsat data sets not currently listed through GLIS.
Note: Because of an agreement between the USG and EOS AT Corporation (now SpaceImaging EOSAT) regarding cost and reproduction rights for Landsat TM data sold to USgovernment and affiliated users, all such users should order Landsat data through the EDCto obtain the lowest price.
How to contact Space Imaging EOSAT:
To serve customers, EOSAT maintains marketing and sales, applications and customer servicesdepartments. EOSAT encourages customers to review product requirements with the EOSATstaff. All customer inquiries and orders are confidential.
E-mail: infofSspaceimage.com
Telephone: 301-552-0537 or toll free 800-344-9933
An online data catalog for EOSAT is also available.
LANDSAT DATA FROM NON-US GROUND STATIONS
Data from Landsat satellites is received and distributed by an international network of groundstations. A table of connections via the Internet to the stations and the on-line catalog systems ofthe stations is available.
Return, or go, to:
homepage
(END)Last modified: 5/1/97
•
Landsat Program summary ; Homenaee Table of Contents* J i j K •
-229-

Annex 14 Current Status and Summary of Agreement between LANDSATProgram Management and EOSAT Corporation on Cost andReproduction Rights for LANDSAT 4/5 Thematic Mapper Data
-231-
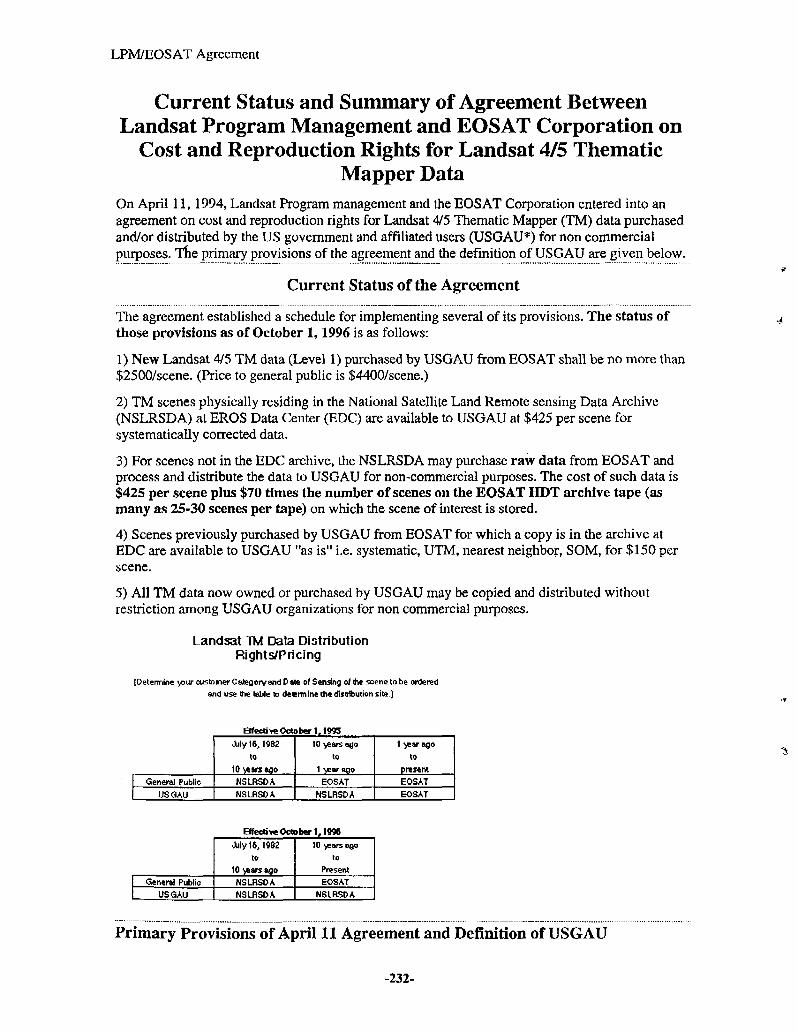
LPM/EOSAT Agreement
Current Status and Summary of Agreement BetweenLandsat Program Management and EOSAT Corporation on
Cost and Reproduction Rights for Landsat 4/5 ThematicMapper Data
On April 11, 1994, Landsat Program management and the EOSAT Corporation entered into anagreement on cost and reproduction rights for Landsat 4/5 Thematic Mapper (TM) data purchasedand/or distributed by the US government and affiliated users (USGAU*) for non commercialpurposes. The primary provisions of the agreement and the definition of USGAU are given below.
Current Status of the Agreement
The agreement established a schedule for implementing several of its provisions. The status ofthose provisions as of October 1,1996 is as follows:
1) New Landsat 4/5 TM data (Level 1) purchased by USGAU from EOSAT shall be no more than$2500/scene. (Price to general public is $4400/scene.)
2) TM scenes physically residing in the National Satellite Land Remote sensing Data Archive(NSLRSDA) at EROS Data Center (EDC) are available to USGAU at $425 per scene forsystematically corrected data.
3) For scenes not in the EDC archive, the NSLRSDA may purchase raw data from EOSAT andprocess and distribute the data to USGAU for non-commercial purposes. The cost of such data is$425 per scene plus $70 times the number of scenes on the EOSAT HDT archive tape (asmany as 25-30 scenes per tape) on which the scene of interest is stored.
4) Scenes previously purchased by USGAU from EOSAT for which a copy is in the archive atEDC are available to USGAU "as is" i.e. systematic, UTM, nearest neighbor, SOM, for $150 perscene.
5) All TM data now owned or purchased by USGAU may be copied and distributed withoutrestriction among USGAU organizations for non commercial purposes.
Landsat TM Data DistributionRights/Pricing
[Determine your customer Category and Date of Sensing of ihe scene to be ordered
and use Ihe table to determine the distribution site.)
.1995
General Public
USGAU
General Public
USGAU
July 16,1982
to
10 Years ago
NSLRSDA
NSLRSDA
10 years ago
to
1 Year ago
EOSAT
NSLRSDA
Effective October 1,1996
July 16,1982
to
10 Years ago
NSLRSDA
NSLRSDA
10 Years ago
to
Present
EOSAT
NSLRSDA
1 Year ago
to
present
EOSAT
EOSAT
Primary Provisions of April 11 Agreement and Definition of USGAU
-232-

LPM/EOSAT Agreement
1. Cost ofLandsat TM data purchased by US government and affiliated users (USGAU)
• $3500 for scenes purchased between 4/11/94 and 12/31 /94.• $2500 for scenes purchased after 12/31/94.• For raw data purchased by the National Satellite Land Remote Sensing Data Archive
(EDC): $70/scene until 5 years after demise of Landsat 4/5 (cost of shipping data thereafter.)
2. USGAU rights to copy data for, and redistribute data among, USGAU for noncommercial use
• Unrestricted rights for TM scenes purchased after 4/11/94.• For data purchased prior to 4/11/94: prior to 10/1/95 - unrestricted rights to data purchased
more than two (2) years previous (moving window); after 10/1/95 - unrestricted rights.
3. USGAU rights to process data from the NSLRSDAfor USGAU for noncommercial use
• Until 9/30/94: restrictions in place at time of purchase apply.• 10/1/94 through 10/1/95: restricted for data sensed more than two (2) years previous
(moving window).• 10/2/95 through 10/1/96: unrestricted for data sensed more than one year previous (moving
window).• After 10/1/96: unrestricted rights
*USGAU is defined as:1. US government agencies2. US government contractors3. Researchers and institutions conducting scientific investigations related to global changefunded by, or defined in agreements with, US CEES member agencies.4. US Global Change Research Program international programs, i.e. global change researchprograms in countries other than the US as well as global change research programs of the WorldMeteorological Organization (WMO), the United Nations Enviroglobal change research programsof the World Meteorological Organization (WMO), the United Nations EnvironmentalProgramme (UNEP), Intergovernmental Oceanographic Commission (IOC)5. Other researchers (individuals or entities conducting scientific investigations, not necessarilyrelated to the Global Change Research Program) that have signed with the US government acooperative agreement involving the use of Landsat data for noncommercial purposes.6. Educational institutions for noncommercial purposes.7. Nonprofit, public interest entities.
Return, or go, to:
• I 51HftCflt i ':
I — I Landsat Program summary ! Access to Landsat data\ homepage ] • ~̂ ;
Comments, questions:Write to esheffnerffbgaia.arc. nasa. gov
END (Last modified 5/1/97)
-233-


Annex 15 The USGS EROS Data CenterUSGS Special Project ImagesUSGS Products and ServicesUSGS Products Available from the USGS EROS Data Center-Global Hydrologic Data-
-235-
EROS home page
EROSHome Page
EROS Data CenterEarth Resources Observation Systems
"We are stewards of land remote sensing and associated data,advancing the availability and applicability of these data forscientific and land management users worldwide."
-- EROS Data Center Vision Statement
Features:Special Projects Images and Earthshots
IIUSGS Home Page II Mapping II
Please read this general DisclaimerURL:http:I'/'edcwww.cr.usgs.gov/'eros-home.htmlMaintainer: edcweb&edcwww.cr.usgs. govLast modified: 16 June 1997.
-236-
satellite data, aerial photographs: EROS Spec...
USGSSpecial Projects ImagesThe EROS Data Center houses millions of images — aerial photographs, mainly for mapping, andvarious kinds of satellite images for scientific study. Among all these pictures, naturally, are somethat are beautiful, some that record events of historic significance, and some that stir theimagination for other reasons.
This page contains a selection of such images, available from EROS Customer Services asphotographic products in sizes up to 40 inches square. Next to each image is the size of thegraphic file in bytes, as an approximate indication of download time.
ITIES of the World
THER
NATURAL HAZARDS
-237-
satellite data, aerial photographs: EROS Spec...
URAL FEATURES
II EROS Home Page
URL:http:l I edcwww.cr.usgs.govlpaolpaol .htmlMaintainer: edcweb@edcwww. cr. usgs.govLast modified: 19 June 1997
-238-
Programs at EROS Data Center
1USGSProducts and ServicesThe USGS EROS Data Center houses millions of aerial photographs of theUnited States, as well as images from several series of satellites covering theentire Earth.
The EDC also is host to the sales data base for digital products of the USGS'sNational Mapping Division, of which it is part. These products, prominentlyincluding Digital Line Graphs and Digital Elevation Models, are knowcollectively as US GeoData. A number of US GeoData files are distributed
T o v e r o u r anonymous Fl'P server at no charge.
ServicesAll of these USGS product lines are described briefly in a List of products . Tolaunch an online search for a specific product go to the GLOBAL LandInformation System, or GLIS .
The EDC also serves as the Land Processes Distributed Active Archive Center,or DAAC . for NASA's Mission to Planet Earth program, serving satellite data"packaged" for various scientific and resource-planning applications.
• On-Line Search For Products (GLIS)fr List, with samples of USGS productsO NASA DAAC products
II EROS Home Page I Contact Customer Servicesll
Please read this general DisclaimerURL:http:lledcwww.cr.usgs.govlcontent_products.htmlMaintainer: edcweb(ifi>edcwww. cr. usgs. govLast modified: 29 May 1997.
-239-
USGS Geospatial Data & Information Products
3IUSGS
CenterProducts Available from the USGS EROS Data
Here are some "quick links" to:[ Map Dealers ] [ Online Data ]
The U.S. Geological Survey provides a variety of cartographic, geographic, earth science, andremotely sensed data, products, and services in support of Federal, State, and public interests.These products and services include information about the Earth's natural and cultural features,base maps and special maps in several scales, digital cartographic data, aerial photographs andother remotely sensed data.
Photographs I Digital Satellite and Aerial Data I Digital Cartographic Data I Digital Elevation Data1 Digital Landuse/Landcover Data I Thematic Regional Data I Digital Climate Data I DigitalGeologic Data I Digital Hvdrolpgic Data I Digital Soils Data
Printed Maps
Productj DescriptionjfechnicaT! Abstract
aps - Indexes, Catalogs, and Lists Iaps Large Scale-Covers small area ]
laps - World and Planets !laps Small Scale-Covers large area I
User FactGuide Sheet
Product AccessSearch 1 FTP Sample
& Order I Download G a l l e r y
Photographs
ProductDescription
Technical! User:T FactAbstract Guide Sheet i& Order
Declassified Intel. Satellite PhotosDigital Orthophoto Quads: County CDDigital Orthophoto Quads: Quarter QuadsU.S. Government Aerial PhotographySkylab, Gemini, and Apollo PhotographyNational Aerial Photography Program HNASA Aerial Photography IScientific Committee/Antarctic Research" jSpace Shuttle Earth ObservationJProgramJ IUS Geological Survey Aerial Photograpnyj SEROS Special Projects Images J
Product AccessSearch I FTP
Download
Sample jGallery
Digital Satellite and Aerial Data
Product
Description
Technical; User FactAbstract {Guide Sheet
Product AccessSearch | p Sample
& 1 , .GalleryOrder P o w » l o a d
-240-
USGS Geospatial Data & Information Products
iComposites[Advanced Very High Resolution
adiometer
fGlobal Experimental Bi-Weekly Norm.
[MultiSpectral Scanner Landsat Data(fhetnatic Mapper Landsat Data|.GSOWG MultiSpectral Scanner; JLandsatjLGSOWG Hematic Mapper Landsat
JC LandsaTTM Bas'icLandsat TM Derivative
,C Landsat TM Geocodedorthem Great Plains 1988 AVHRR
ISahel & NW Africa 14-Day NDVIteomposites^Side-Looking Airborne Radar[SPOT High Resolution Visible Data
Digital Cartographic Data
Product
)igital Line Graphs (DLG)|l:24000-Large Scalejl: 100000-Intermediate Scalell:200000a-Srnall ScaleMgital Raster Graphics (DRG)
^Geographic Names Information Systems
DescriptionTechnicalAbstract
UserGuide
FactSheet
Product AccessSearch
& Order n . .GalleryDownload; JFTP
• Sample
Digital Topgraphic Data
Product
Digital Elevation Models (DEM)|7.5 minute-Large Scale115 minute-Large Scalej2 Arc Second-Intermediate Scalejl-degree-Small Scale
DescriptionTechnicalAbstract
UserGuide
FactProduct Access
Search I FTPSheet & Order j Download
SampleGallery
_
I
Digital Landuse/Landcover Data
ProductDescription Product Access
TechnicalAbstract
Land Use & Land Cover Digital Data
Thematic Regional Data
User \ Fact : SearchGuide i Sheet !& Order
FTPSample
_ , .GalleryDownload;
-241-
USGS Geospatial Data & Information Products
Product
Description I
Technical User I Fact jAbstract Guide Sheet j
Upper Mississippi & Lower Missouri DataBase
Product AccessSearch
&Order
F T p Sample
boWnloadiGaIlery
Digital Climate Data
ProductDescription
Technical 1 UserAbstract I Guide
Product AccessFact
SheetSearch
& OrderFTP
Download
SampleGallery
iOmernik Ecoregions Datalajor World Ecosystems
Digital Geologic Data
Product
jGeophysical DataNational Geochronological Data
| Description| Technical j User i FactI Abstract I Guide Sheet
Product AccessSearch f FTP
& Order
National Uranium Resource Evaluation \
\ Sample
Digital Hydrologic Data
Product
jobai Hydroiogic Data
DescriptionTechnical! User j FactAbstract IGuide Sheet
Product Access ;„ , jSearchH FTP ; S a m P l e !aearcn ; r i r Y;aiiprv!
& Order jDownload; l i e r y |
Digital Soils Data
j Product
pAO-Digital Soil Ma£of tiheJWcdd^State Soil Geographic Data BaseNobler World Soils Date Set
Description Product AccessTechnical
! AbstractUser Fact \ Search
Guide Sheet & Order
Sample^ X i ; .! GalleryDownload
FTP
What's Newl Partners! Publicationsl Products! About EDCI USGS Home Pagel
llPjodiicts and Services Pagell EDC Home PagellURL: http://edcwww.cr.usgs.gov/dsprod/prod.htmlMaintainer: [email protected] modified: 27 June 1997
-242-
GLIS
ZUSGS
USGS EDC Global Land Information System(GLIS)The Global Land Information System (GLIS) is an interactive computer system developed by theU.S. Geological Survey (USGS) for scientists seeking sources of information about the Earth'sland surfaces. GLIS contains metadata that is, descriptive information about data sets. ThroughGLIS, scientists can evaluate data sets, determine their availability, and place online requests forproducts. GLIS is more than a mere list of products. It offers online samples of earth science datathat may be ordered through the system.
Scientists can use GLIS to display outlines of the geographic.areas covered by the data sets. Usingdigital browse functions to manipulate the data, they can determine such information as theamount of cloud coverage or the quality of an image.
Online requests can be placed via GLIS for earth science data. The producing organization willreceive the request and provide the user with price and ordering information.
GLIS contains references to regional, continental, and global land information including land use,land cover, and soils data; cultural and topographic data; and remotely sensed satellite and aircraftdata. GLIS is routinely updated with new data set descriptions, as they are contributed by theglobal change scientific community. GLIS inventories are reviewed daily to assure access to themost current information. The system operates 24 hours a day, 7 days a week for world-wideconnectivity and availability.
Web version of GLIS:Users with a table enabled browser can access Webglis at http://edcwww.cr.usgs.gov/webglis .Webglis supports graphic-based query and browse functions.
X Version of GLIS:Users wishing to perform higher level graphic-based functions can access the X version of GLISusing an X terminal or X terminal emulator package on a PC.
FromINTERNET: TELNET xalis . cr. users . aov
A copy of the xglis client, that you can run locally on a Data General, SUN Solaris, or SiliconGraphics, is available over anonymous FTP (Make sure to read the README file). FurtherInstructions, and the anonymous FTP address, can be found under xglis NEWS .
I EROS Home Page 1URL:http:lI edewww. cr. usgs.gov/glis/glis.htmlMaintainer: edcwebffibedcwww. cr. uses, eov
-243-


Annex 15-1 The USGS EROS DATA CENTERA Brief History of the LANDSAT ProgramCharacteristics of the LANDSAT SystemCharacteristics of LANDSAT DataApplications of LANDSAT Data
-245-
USGS: Customer Service Factsheet for Landsat
U|SG|SU.S. Geological Survey - National Mapping Information - ffROS Data Center
U.S. Department of the InteriorU.S. Geological Survey
EROS Data CenterLandsat Data
A Brief History of the Landsat ProgramThe concept of a civilian Earth resources satellite was conceived in the Department of Interior inthe mid-1960's. The National Aeronautics and Space Administration (NASA) embarked on aninitiative to develop and launch the first Earth monitoring satellite to meet the needs of resourcesmanagers and Earth scientists. The USGS entered into a partnership with NASA in the early1970's to assume responsibility for data archiving and distribution of data products. On July 23,1972, NASA launched the first in a series of satellites designed to provide repetitive globalcoverage of the Earth's land masses. Designated initially as the Earth Resources TechnologySatellite-A (ERTS-A), it used a Nimbus-type platform that was modified to carry sensor systemsand data relay equipment. When operational orbit was achieved, it was designated ERTS-1.
The satellite continued to function beyond its designed life expectancy of 1 year and finally ceasedto operate on January 6,1978, more than 5 years after its launch date. The second in this series ofEarth resources satellites (designated ERTS-B) was launched January 22,1975. It was renamedLandsat 2 by NASA, which also renamed ERTS-1 to Landsat 1. Three additional Landsats werelaunched in 1978,1982 and 1984(Landsat 3, 4 and 5 respectively). Each successive satellitesystem had improved sensor and communications capabilities(table 1).Tablel — — — - —Background information and status of Landsat satellites.
Satellite Launched Decommissioned SensorsLandsat 1 July 23, 1972 January 6,1978 MSS and RBVLandsat 2 January 22,1975February 25, 1982MSS and RBVLandsat 3 March 5, 1978 March 31,1983 MSS and RBVLandsat 4 July 16, 1982 * TM and MSSLandsat 5 March 1,1984 ** TM and MSSLandsat 6 October 5,1993 *** ETMLandsat 7 Fall 1998**** ETR ******
* in stand by mode** operational*** never achieved orbit**** anticipated launch***** T n e s e n s o r onboard Landsat 6 was called the enhanced
thematic mapper (ETM). Landsat 7 will carry theenhanced thematic mapper plus (ETM+)
NASA was responsible for operating the Landsats through the early 1980's. In January 1983,operations of the Landsat system were transferred to the National Oceanic and Atmospheric
-246-
USGS: Customer Service Factsheet for Landsat
Administration (NOAA). In October 1985, the Landsat system was commercialized and the EarthObservation Satellite Company assumed responsibility for its operation. Throughout thesechanges, the EDC retained primary responsibility as the Government archive of Landsat data. TheLand Remote Sensing Policy Act of 1992 (Public Law 102-555) officially authorized the NationalSatellite Land Remote Sensing Data Archive and assigned responsibility to the Department of theInterior. In addition to its Landsat data management responsibility the EDC investigates newmethods of characterizing and studying changes on the land surface with Landsat data.
Characteristics of the Landsat SystemLandsats 1 through 3 operated in a near-polar orbit at an altitude of 920 km with an 18-day repeatcoverage cycle. These satellites circled the Earth every 103 minutes, completing 14 orbits a day.Eighteen day and 251 overlapping orbits were required to provide nearly complete coverage of theEarth's surface with 185 km wide image swaths. The amount of swath overlap or sidelap variesfrom 14 percent at the Equator to a maximum of approximately 85 percent at 81 degrees north orsouth latitude. These satellites carried two sensors: a return beam vidicom (RBV) and a MSS. TheRBV sensor was essentially a television camera and did not achieve the popularity of the MSSsensor. The MSS sensor scanned the Earth's surface from west to east as the satellite moved in itsdescending (north-to-south) orbit over the sunlit side of the Earth. Six detectors for each spectralband provided six scan lines on each active scan. The combination of scanning geometry, satelliteorbit, and Earth rotation produced the global coverage necessary for studying land surface change.The resolution of the MSS sensor was approximately 80 m with radiometric coverage in fourspectral bands from the visible green to the near-infrared(IR) wavelengths. Only the MSS sensoron Laevery 103 minutes, completing 14 orbits a d
Landsats 4 and 5 carry both the MSS and the TM sensors: however, routine collection of MSSdata was terminated in late 1992. They orbit at an altitude of 705 km and provide a 16 day,233-orbit cycle with a swath overlap that varies from 7 percent at the Equator to nearly 84 percentat 81 degrees north or south latitude. These satellites were also designed and operated to collectdata over a 185 km swath. The MSS sensors aboard Landsat 4 and 5 are identical to the ones thatwere carried on Landsat 1 and 2. The MSS and TM sensors primarily detect reflected radiationfrom the Earth in the visible and IR wavelengths, but the TM sensor provides more radiometricinformation than the MSS sensor. The wavelength range for the TM sensor is from the visible(blue), through the mid-IR, into the thermal-IR portion of the electromagnetic spectrum. Sixteendetectors for the visible and mid-IR wavelength bands in the TM sensor provide 16 scan lines oneach active scan. Four detectors for the thermal-IR band provide four scan lines on each activescan. The TM sensor has a spatial resolution of 120 m for the thermal IR band and 30 m for theother six radiometric bands.
All of the Landsats have been in sun-synchronous orbits with equatorial crossing times rangingfrom 8:30 a.m. for Landsat 1 to 9 a.m. for Landsat 2 to the current time of 9:45 a.m. for Landsat 5,and the proposed time of 10 a.m. for Landsat 7.
Characteristics of Landsat DataSince 1972 these satellites have provided repetitive, synoptic, global coverage of high-resolutionmulti spectral imagery. The characteristics of the MSS and TM bands were selected to maximizetheir capabilities for detecting and monitoring different types of Earth's resources. For example,MSS band 1 (band 2 of TM)can detect green reflectance from healthy vegetation, and band 2 ofMSS (band 3 of TM) is designed for detecting chlorophyll absorption in vegetation. MSS bands 3and 4 (TM band 4) are ideal for near-IR reflectance peaks in healthy green vegetation and fordetecting water-MSS and TM bands were selected to maximize their capabilities for detecting andmonitoring different types of Earth's resources. For example, MSS band 1 (band 2 of TM)candetect green reflectance from healthy vegetation, and band 2 of MSS (band 3 of TM) is designedfor detecting chlorophyll absorption in vegetation. MSS bands 3 and 4 (TM band 4) are ideal for
-247-
USGS: Customer Service Factsheet for Landsat
near-IR reflectance peaks in healthy green vegetation and for detecting water-land interfa
Typically, MSS Bands 4, 2, and 1 can be combined to make false-color composite images whereband 4 represents red, band 2, green, and band 1, blue. This band combination makes vegetationappear as shades of red, brighter reds indicating more vigorously growing vegetation. Soils withno or sparse vegetation will range from white (sands) to greens or browns depending onmoistublue. This band combination makes vegetation appear as shades of red, brighter redsindicating more vigorously growing vegetation. Soils with no or sparse vegetation will range fromwhite (sands) to greens or browns depending on moisture and organic matter content. Waterbodies will appear blue. Deep, clear water will be dark blue to black in color, whilesediment-laden or shallow waters will appear lighter in color. Urban areas will appear blue-gray incolor. Clouds a
Applications of Landsat DataLandsat data have been used by government, commercial, industrial, civilian, and educationalcommunities in the U.S. and worldwide. They are being used to support a wide range ofapplications in such areas as global change research, agriculture, forestry, geology, resourcesmanagement, geography, mapping, water quality, and oceanography.
From "Historical Landsat Data Comparisons, Illustrations of the Earth's Changing Surface" U.S.Department of the Interior, U.S. Geological Survey, EROS Data Center, March 1995.
•[Return to Product Table Page g ] Return to EROS Data Center Home Page
<URL:http:lledcwww.cr.usgs.govlfactsheetsllandsatyact.html>
Page owner: < [email protected]>Last modified: 2 May 1997
-248-

Annex 15-2 Information Catalog: EROS DATA CENTER
-249-
EROS Data Center Supports the GLOBE(Global Learning and Observations to Benef)....U.S. Geological Survey —EROS Data Center.EROS Data Center Supports the GLOBE (Global Learning and Observations to Benefit theEnvironment) Program....http://edcwww.cr. usgs.eov/pecora/gacke/abstract. htm I - size 2K - jo.Oct.96 - English
Welcome to the EROS Data Center International WWW ServerThe following WWW Pages are available from this machine... Africa Data DisseminationService. Greater Horn of Africa. Inter-Arnerican Geospstial Data...http://edcintl. cr. uses, eov/ - size 655 bytes - 4.Sep. 96 - English
EROS Data Center LinksEROS Data Center Links... EROS Data Center - the home page. USGS/EROS Data Center.EROS Data Center's Landsat Archive and Pathfinder. EROS Data Center....http://]37.216.192.44/sps/tammyZeros.htm - size IK - 2i.May'.97 - English
Science Highlight: EROS Data CenterScience Highlight: EROS Data Center. A Remote Sensing Based Vegetation ClassificationLogic for Global Land Cover Analysis. Running, S. W., T. Rhttp://w w w -nsidc. Colorado. edu/NA SA /YEA RBOOK 199 4/ems, htm I - size 4K - 28.heb.96 - English
EROS Data CenterThe EROS Data Center. The EROS Data Center (EDC) is home to the EOS-DIS LandProcesses Distributed Active Archive Center (LP-DAAC). The primary role of...http://glcts.maxey.dri.edu/glcts/project/edc.html - size 743 bytes - 10.Jan.96 - English
EROS Data Center Supports the GLOBE (Global Learning and Observations to BenefU.S. Geological Survey —EROS Data Center. GLOBE Project—Savannah, GA. Images ofSavannah. This image is 99K....http://edcw ww.cr. usgs. gov/pecora/gacke/'savannah, htm I - size IK - lO.Oct96 - English
Landsat Pathfinder Processing Support at the EROS Data CenterU.S. Geological Survey —EROS Data Center. HTFIP Project Deliverables. A sample image isshown below. Return to Landsat Pathfinder Processing Title Page.http.V/edcwww. cr.usgs.gov/pecora/larson/htfiproduct.html - size 786 bytes - W.OcL96 - English
EOSDIS DAAC at EROS Data CenterWelcome to the EDC DAAC. The Earth Resources Observation Systems (EROS) Data CenterDistributed Active Archive Center (EDC DAAC) was established as part...http://edcwww.cr.usgs.gov/landdaac/landdaac.html - size 3K - 8.May.97 - English
EROS Data CenterEROS Data Center. The Earth Resources Observation Systems (EROS) Data Center, located inSioux Falls, SD is a data management, systems development, and...http://edcwww.cr.usgs.gov/doc/edc.html - size 2K - i.Apr.96 - Eng/ish
-250-
Landsat Pathfinder Processing Support at the EROS Data CenterU.S. Geological Survey -EROS Data Center. GLCTS Processing Data Layers. To view alarger view of a particular image, click on the labels. 57-meter MSS...httpj/edcwww. cr. uses, eov/pecora/larson/data. htm I - size IK - io.Oa.96 - English
Collected EOS Messages: (fwd) Introducing the EROS Data Center DAACfwd) Introducing the EROS Data Center DAAC. DUNLOP Douglas (ddunlop® ella) Tue, 28Jun 94 17:49:39+0200. Messages sorted by: [date][ thread][ subject...httv://www.eol. ists.calmail-hsts/cos/0005.htinl - size IOK - 22.May.97 - English
About EROS Data CenterEROS Home Page: The Web site for the USGS EROS Data Center.http://edcwww.cr.usgs.gov/content about, html - size 9K - 7.May.97 - English
Information about USGS/EROS Data CenterU.S. Geological Survey(USGS) Earth Resorces Observation Systems(EROS) Data Center.Address: Sioux Falls, SD 57198 USA. The USGS EROS Data Center(EDC) was..http://w ww.goin. nasda. so. jp/GOlN/TRIC/eros. htm I - size IK - 6Jun.9S - Eng/ish
Programs at EROS Data CenterWhat's New Home Page: The Web site for the USGS EROS Data Center.http://edcftp.cr. usgs. sov/content programs, html - size 5K - 7.May.97 - Eng/ish
EROS Data Center Supports the GLOBE (Global Learning and Observations to BenefU.S. Geological Survey --EROS Data Center. EROS Data Center Supports the GLOBE (GlobalLearning and Observations to Benefit the Environment) Program....http://edcwww.cr.usss.sov/pecora/sacke/gacke.html - size 3K - io.Oct.96 • English
EROS Data Center Address pageU.S. Geological Survey National Mapping Division MS 508, Room 2B-312B 12201 RestonParkway Reston, VA 22092 USA USA Tel: 703-648-5781 Fax: 703-648-5939...http://edcwww.cr.uses.gov/landdaac/1KM/edcaddress - size 268 bytes - 2S.Apr.96 - English
Landsat Pathfinder Processing Support at the EROS Data CenterU.S. Geological Survey —EROS Data Center, Landsat Pathfinder Processing Support at theEROS Data Center. Gayla Evans, Kelly Feistner, Charles Larson,...http://edcwww.cr.usgs.gov/Decora/larson/abstract. html - size 2K - iO.Oct.96 - English
Products from the USGS EROS Data CenterU.S. Department of the Interior U.S. Geological Survey. Products from the USGS EROS DataCenter. The Earth Resources Observation Systems Data Center...http://w ww-nmd. usss. gov/m ac/isb/pubs/factsheets/edc prod, htm I - size 5K - 24.May.97 - English
Programs at EROS Data CenterWhat's New Home Page: The Web site for the USGS EROS Data Center.httpj/edcwww.cr. usss.sov'/content products.html - size 4K - 7.May.97 - English
USGS: EROS Data CenterU.S. Geological Survey - National Mapping Information - EROS Data Center. (230KB) EROS
-251-
Data Center--Who We Are and What We Do. The Earth Resources...http://edcwww. cr\ usss.aov/doc/edchome/erosinfo/eros^en/backsround.html - size 3K - i.Mar.96 -English
MAGIC II Quarterly Meeting at the EROS Data CenterMAGIC II Quarterly Meeting Page: The Web site for MAGIC II Quarterly Meeting held at theUSGS EROS Data Center.http://edcissl.cr.usgs.pov/magic/meeting,html - size 4K - 21.May.97 - Eng/ish
The EROS Data Center's Landsat Archive & Landsat PathfinderIntroduction to EROS Data Center's Landsat Archive and Landsat Pathfinder Projecthttp://grid2.cr.uses.sov/landsat/ - size 4K - I.May.97 - Eng/;sh
EROS Data Centers U.S. Geological SurveyEROS Data Center. U.S. Geological Survey. Sioux Falls SD 57198. FAX (605) 594-6589.Contact. Customer Service. (60S) 594-6151. Transfer Media: Internet,...http://www.lmic.state.mn. us/gc/dir/usgseros.htm - size 2K - 20.May.97 - English
EROS Data Center (EDO DAACEROS Data Center (EDC) DAAC. The EDC DAAC is used by Earth and global changescientists to study, characterize, and monitor biologic, geologic,...http://www-nsidc.Colorado. edu/NA SA /Y EA RBOOK 1994/eros2. htm I - size 4K - 2S.Feb.96 - English
EROS Data Center Earthshots: main menuEarthshots: satellite images of environmental change. EROS Data Center, U.S. GeologicalSurvey, U.S. Department of the Interior. The Landsat archive is at.http;//edcwww.cr.usps.pov/Earthshots/ - size 10K - 25.Mar.97 - English
USGS/EROS Data Center (EDC) Landsat 7 Image Assessment System (IAS)USGS/EROS Data Center (EDC) Landsat 7 Image Assessment System (IAS) GeometricAlgorithms. --> Usually Under Construction! --> --> Landsat 7 IAS Geometric.http.Z/edcWWW.Cr.USgS.pov/ias/ ~ size 2K - 14.Mar.97 - Eng/ish
USGS/EROS Data Center (ED) Landsat 7 Image Assessment System (IAS) AlgorithmUSGS/EROS Data Center (EDC) Landsat 7 Image Assessment System (IAS) Note: Thealgorithm descriptions have been superceded by the ATBD. Geometric Levell...http://edcwww.cr.uses.zov/ias/algo.html - size 2K - i.Feb.97 - English
USGS: Landsat Ground Station Operations Working GroupU.S. Geological Survey - National Mapping Information - EROS Data Center. U.S.Department of the Interior U.S. Geological Survey. Landsat Ground Station...httpJ/edcftp. cr. usgs. gov/factsheets/lgsowg. htm I - size 3K - 6.May.97 - English
USGS: World Data Center BackgroundU.S. Geological Survey - National Mapping Information - EROS Data Center. U.S. GeologicalSurvey - National Mapping Information - EROS Data Center. World..htt ://edcwww.cr.us s. ov/doc/edchome/world/worlddaL html - size 9K - is.Mar.97- English
-252-

Annex 16 LANDSAT Thematic Mapper ImagerySummaryAttributesData CenterPersonnelReference
-253-
Master Directory DIF Display
DIF DisplayIf you have further questions or noticed a need for an update, please contact the GCMD staffscientists!.
Landsat Thematic Mapper Imagery
SummaryLast Updated: 1996-05-13
Landsat thematic mapper (TM) data from the Landsat satellite series areavailable from the National Satellite Land Remote Sensing Data Archivelocated at the U.S. Geological Survey's EROS Data Center and from theEarth Observation Satellite Company (EOSAT). These data are distributedin accordance with the Land Remote Sensing Policy Act of 1992,Public Law 102-555, as amended, and related contractual agreements.
Landsat TM data are also collected by a series of foreign receivingstations (i.e., Landsat Ground Stations Working Group (LGSOWG)participants) and are available from several distribution sites includingAustralia, Brazil, Canada, Italy, Japan, Maspalomas, Pakistan, SouthAfrica, and Sweden. Purchasers are subject to individualdistribution site policy and pricing directives.
The Global Land Information System (GLIS) and the EOSDIS InformationManagement System (IMS) are interactive query systems providing informationon a variety of data sets. These systems also support data visualizationand ordering services. For more information about these systems, see thefollowing home pages:
GLIS Home Page: http://edcwww.cr.usgs.gov/qlis/alis.html
EDC DAAC Home Page: http://edcwww.cr.usgs.gov/landdaac/landdaac.html
Attributes
Entry_ID:LANDSAT_TMOriginating Center:EDC
Temporal CoverageFrom: 1982-07-16
Geographic Coverage
-254-
Master Directory DIF Display
Southwest Extent: 81S,180W NorthEast Extent: 81N,180E
Sources:LANDSATLANDSAT-4LANDSAT-5
Sensors:TM > Thematic Mapper
Distribution Media:
Distribution Media:Film
Distribution Media:Magnetic Tapes
Storage Media: Film
Storage Media: Magnetic Tapes
Parameters: Category > Topic > Term > Variable:EARTH SCIENCE > RADIANCE OR IMAGERY > INFRARED WAVELENGTHS > INFRARED IH
EARTH SCIENCE > RADIANCE OR IMAGERY > VISIBLE WAVELENGTHS > VISIBLE IMAG:
Discipline > Subdiscipline:EARTH SCIENCE
Location Keywords:AFRICAANTARCTICASIAAUSTRALIAEUROPEGLOBALNORTH AMERICASOUTH AMERICA
General Keywords:DAACEDCEOSATEOSDISEROSEURASIAIMAGERYLANDSATLGSOWGNLAPSRADIANCEREMOTE SENSINGSATELLITETHEMATIC MAPPER
-255-
Master Directory DIF Display
TMUSGS
Review Date: 1996-04-22Revision Date: 1996-05-13
Data Center
Data Center:EDC_DAAC > EROS Data Center Distributed Active Archive CenterData Center URL:http://edcwww.cr.usqs.aov/landdaac/landriaac.html,
Data Center Contact:EDC_DAAC_USER_SERVICES,PLEASE_CONTACT
Phone: 605-594-6116Phone: FAX 605-594-6963Email: INTERNET > [email protected]
EDC DAAC User ServicesU.S. Geological SurveyEROS Data CenterSioux Falls, SD 57198USA
Data Center:EOSAT > Earth Observation Satellite CompanyData Center Contact:EOSAT,PLEASE CONTACT
Phone: 301-552-0500Phone: 800-344-9933
Customer ServicesEOSAT4 3 00 Forbes BoulevardLanham, MD 20706USA
Data Center:EROS > Earth Resources Observation Systems Data CenterData Center URL:htto://edcwww.cr.usgs.aov/eros-home.html
Data Center Contact:CUSTOMER_SERVICES,PLEASE_CONTACT
Phone: 605-594-6151Phone: FAX 605-594-6589Email: INTERNET > [email protected]
Customer ServicesU.S. Geological SurveyEROS Data CenterSioux Falls, SD 57198USA
-256-
Master Directory DIF Display
Personnel
Tech Contact: CUSTOMER_SERVICES,PLEASE_CONTACTPhone:605-594-6151
Phone:FAX 605-594-6589Email:INTERNET > [email protected]
Customer ServicesU.S. Geological SurveyEROS Data CenterSioux Falls, SD 57198USA
DIF Entry Author: INFORMATION_SYSTEMS_MANAGEMENT,PLEASE_CONTACTPhone:605-594-6594
Phone.FAX 605-594-6589Email:INTERNET > [email protected]
Information Systems ManagementU.S. Geological SurveyEROS Data CenterSioux Falls, SD 57198USA
ReferenceNational Oceanic and Atmospheric Administration, 1984, Landsat data usersnotes: [Sioux Falls, S. Dak.], National Oceanic and AtmosphericAdministration [variously paged].
U.S. Geological Survey and National Oceanic and Atmospheric Administration,1984, Landsat 4 data users handbook: [Washington, D.C.], U.S. GeologicalSurvey and National Oceanic and Atmospheric Administration [variouslypaged].
Supplementary Information MenuData Center: EDCDAAC > EROS Data Center Distributed Active Archive Center
Data Center: EROS > Earth Resources Observation Systems Data Center
Source: LANDSAT
Source: LANDSAT-4
Source: LANDSAT-5
-257-


Annex 17 Thematic Mapper Landsat DataBackgroundExtent of CoverageAcquisition
Processing StepsData Characteristics
Spatial ResolutionTemporal CoverageSpectral Range
Data OrganizationData Availability
Procedures for Obtaining DataProducts and Services
Applications and Related Data SetsReferencesAppendix
-259-
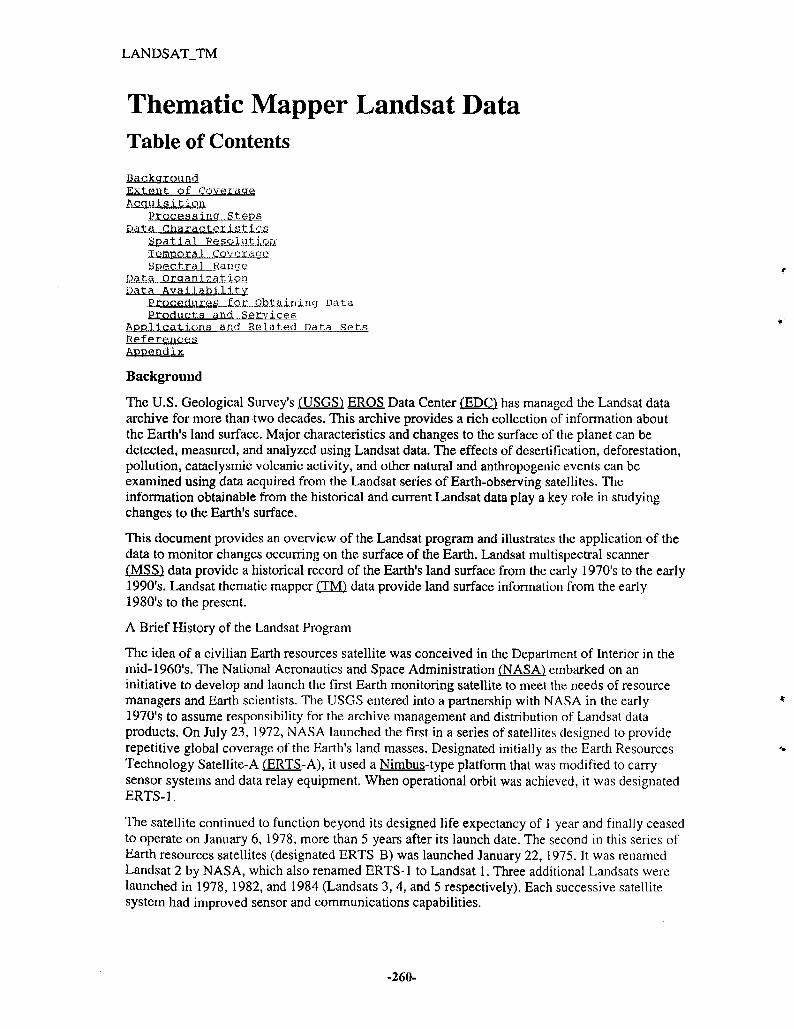
LANDSATJTM
Thematic Mapper Landsat DataTable of Contents
BackgroundExtant of Coverage
Processing Steps
Temporal Coverage
D a t:. a Q j; q a n 1 y, a t IonData Aval la):??. 1. i t y
Prnrlnct.s and ServicesApplications and Related Data So;tsReferencesAppendix.
Background
The U.S. Geological Survey's fUSGS) EROS Data Center (EDO has managed the Landsat dataarchive for more than two decades. This archive provides a rich collection of information aboutthe Earth's land surface. Major characteristics and changes to the surface of the planet can bedetected, measured, and analyzed using Landsat data. The effects of desertification, deforestation,pollution, cataclysmic volcanic activity, and other natural and anthropogenic events can beexamined using data acquired from the Landsat series of Earth-observing satellites. Theinformation obtainable from the historical and current Landsat data play a key role in studyingchanges to the Earth's surface.
This document provides an overview of the Landsat program and illustrates the application of thedata to monitor changes occurring on the surface of the Earth. Landsat multispectral scannerfMSS^ data provide a historical record of the Earth's land surface from the early 1970's to the early1990's. Landsat thematic mapper CTM) data provide land surface information from the early1980's to the present.
A Brief History of the Landsat Program
The idea of a civilian Earth resources satellite was conceived in the Department of Interior in themid-1960's. The National Aeronautics and Space Administration (NASA*) embarked on aninitiative to develop and launch the first Earth monitoring satellite to meet the needs of resourcemanagers and Earth scientists. The USGS entered into a partnership with NASA in the early1970's to assume responsibility for the archive management and distribution of Landsat dataproducts. On July 23, 1972, NASA launched the first in a series of satellites designed to providerepetitive global coverage of the Earth's land masses. Designated initially as the Earth ResourcesTechnology Satellite-A £ERTS-A), it used a Nimbus-type platform that was modified to carrysensor systems and data relay equipment. When operational orbit was achieved, it was designatedERTS-1.
The satellite continued to function beyond its designed life expectancy of 1 year and finally ceasedto operate on January 6, 1978, more than 5 years after its launch date. The second in this series ofEarth resources satellites (designated ERTS-B) was launched January 22, 1975. It was renamedLandsat 2 by NASA, which also renamed ERTS-1 to Landsat 1. Three additional Landsats werelaunched in 1978, 1982, and 1984 (Landsats 3, 4, and 5 respectively). Each successive satellitesystem had improved sensor and communications capabilities.
-260-
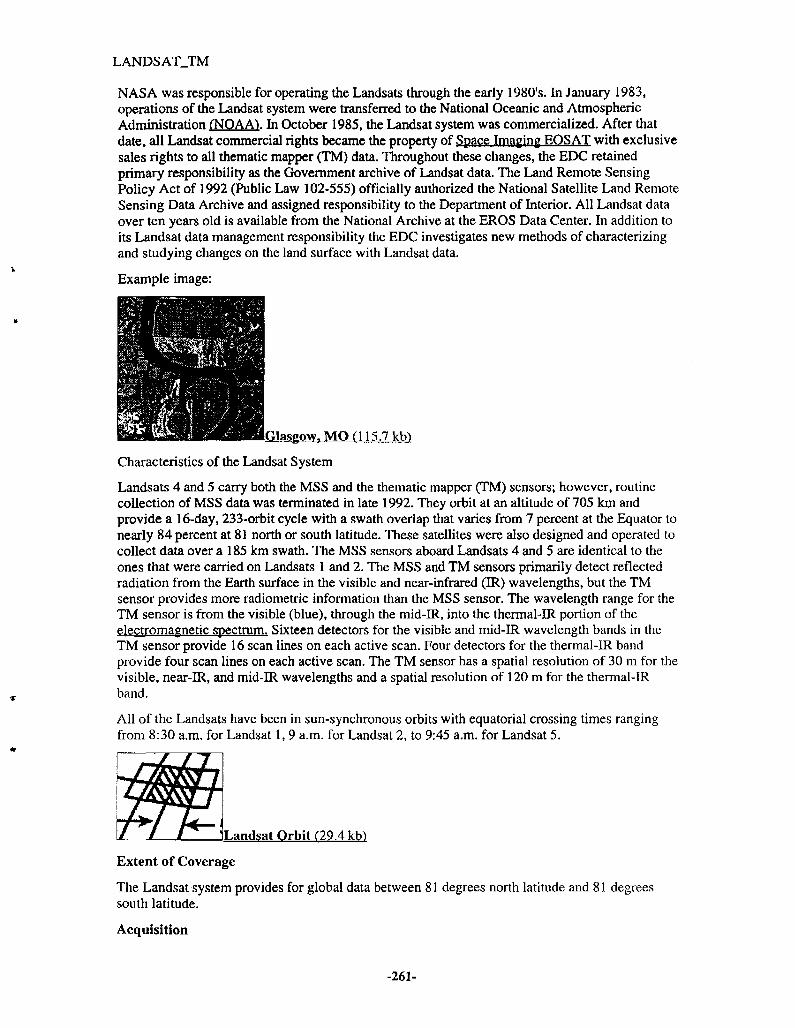
LANDSAT_TM
NASA was responsible for operating the Landsats through the early 1980's. In January 1983,operations of the Landsat system were transferred to the National Oceanic and AtmosphericAdministration CNOAA'). In October 1985, the Landsat system was commercialized. After thatdate, all Landsat commercial rights became the property of Space imaging EOS AT with exclusivesales rights to all thematic mapper (TM) data. Throughout these changes, the EDC retainedprimary responsibility as the Government archive of Landsat data. The Land Remote SensingPolicy Act of 1992 (Public Law 102-555) officially authorized the National Satellite Land RemoteSensing Data Archive and assigned responsibility to the Department of Interior. All Landsat dataover ten years old is available from the National Archive at the EROS Data Center. In addition toits Landsat data management responsibility the EDC investigates new methods of characterizingand studying changes on the land surface with Landsat data.
Example image:
Glasgow. MO (1 15.7 kb)
Characteristics of the Landsat System
Landsats 4 and 5 carry both the MSS and the thematic mapper (TM) sensors; however, routinecollection of MSS data was terminated in late 1992. They orbit at an altitude of 705 km andprovide a 16-day, 233-orbit cycle with a swath overlap that varies from 7 percent at the Equator tonearly 84 percent at 81 north or south latitude. These satellites were also designed and operated tocollect data over a 185 km swath. The MSS sensors aboard Landsats 4 and 5 are identical to theones that were carried on Landsats 1 and 2. The MSS and TM sensors primarily detect reflectedradiation from the Earth surface in the visible and near-infrared (IR) wavelengths, but the TMsensor provides more radiometric information than the MSS sensor. The wavelength range for theTM sensor is from the visible (blue), through the mid-IR, into the thermal-IR portion of theelectromagnetic spectrum. Sixteen detectors for the visible and mid-IR wavelength bands in theTM sensor provide 16 scan lines on each active scan. Four detectors for the thermal-IR bandprovide four scan lines on each active scan. The TM sensor has a spatial resolution of 30 m for thevisible, near-IR, and mid-IR wavelengths and a spatial resolution of 120 m for the thermal-IRband.
All of the Landsats have been in sun-synchronous orbits with equatorial crossing times rangingfrom 8:30 a.m. for Landsat 1, 9 a.m. for Landsat 2, to 9:45 a.m. for Landsat 5.
'Landsat Orbit (29.4 kb1)
Extent of Coverage
The Landsat system provides for global data between 81 degrees north latitude and 81 degreessouth latitude.
Acquisition
-261-
LANDSAT_TM
The Landsat platforms operate from a sun-synchronous, near-polar orbit imaging the same 185km (115 miles) ground swath every 16 days. Thematic mapper (TM) data are received directlyfrom Landsats 4 and 5 by a network of 16 worldwide ground stations. The United States groundstation in Norman, Oklahoma, receives TM downlinks daily, and records them on high densitytapes (HDTS). These HDTs are then sent to Space Imaging EOSAT's Image Processing Facility(IDPF) located in Lanham, Maryland. Also, data are transmitted via a Tracking and Data RelaySatellite (TDRS) to its ground terminal at White Sands, New Mexico, and then relayed via adomestic communications satellite (DOMSAT) to the Space Imaging EOSAT data processingfacility in Norman, Oklahoma.
The TDRS System (TDRSS) satellites are in geosynchronous orbits. This configuration allowedthe acquisition of MSS data for nearly all of the Earth's surface, except for an area between 50degrees north and 67 degrees east by 50 degrees south and 82 degrees east. That area may becovered in part by data recorders at the Thailand and India ground stations.
TDRS Coverage Gap (8.7 kb)
Processing Steps
The Space Imaging EOSAT Image Data Processing Facility in Lanham, Maryland, receives theHDTs from the Norman, Oklahoma, acquisition facility. The newly acquired data are manuallyand automatically screened for cloud cover and data quality through the Preprocessing and DataClassification System (PDCS). HDTs that are required for customer products continue through theimage processing stream. The remaining data are stored locally for approximately six months;after temporary storage, they are permanently archived in Jessup, Maryland. The HDTs are alsoshipped to the EDC where they are copied and the original returned to the Space Imaging EOSAT.
Systematic correction data (SCD) is generated as follows:
- Correcting and validating the mirror scan and payloadcorrection data
- Providing for image framing by generating a series ofscene center parameters
- Synchronizing telemetry data with video data
- Estimating linear motion deviation of scan mirror/scanline corrections
- Generating benchmark correction matrices for specified mapprojections
- Producing along- and across-scan high-frequency line matrices
The Space Imaging EOSAT Image Processing System (EIPS) has the capability to produceprecision-corrected, geocoded, mosaicked, and terrain-corrected products. Insufficient controlpoints in the Control Point Library (CPT) requires a single band (Band 4) tape be produced andprocessed on the Control Point Extraction System (CPES1 for control point (chip) selection. Uponsuccessful completion, the product is reprocessed via the EIPS. Digital elevation model (DEM)
-262-
LANDSAT_TM
and digital terrain model fDTVH data are ingested through EIPS for terrain-corrected and mosaicproducts.
A 3-band digital data tape is provided with each film product request and is used in the FilmProcess Generation System (FPGS). The 3-band digital data are ingested, Look Up Tables (LUTs)are constructed, and the ordered RGB is assigned for output. The latent image is processed using aColorfire-240. Further processing is completed per customer request and tranported via acommercial vendor. These products include: paper print, color positive, transparency, orprocessed negatidata
The Space Imaging EOSAT initiated a Fast Format for TM digital data. The general formattingcriteria follows:
1. Field definitions strictly follow American National Standards Institute fANSD andInternational Organization for Standardization (ISO) standards.
2. Only Band Sequential CBSO') image structure is supported, because data are made available asingle band at a time. Geometric corrections to the data are done one band at a time.
3. Image files consist of a single band of data.4. A digital product is referred to as a volume set. Individual tapes are referred to as volumes. A
volume set may have one or more volumes depending on image size and output tape density.Multi-resolution data sets have a volume set for each resolution.
For further information on the MSS processing systems refer to:
• BROS Digital Image Processing System (EDIPS)• National Landsat Archive Production System fNLAPS)
Data Characteristics
Since 1972 these satellites have provided repetitive, synoptic, global coverage of high-resolutionmultispectral imagery. The characteristics of the MSS and TM bands were selected to maximizetheir capabilities for detecting and monitoring different types of Earth resources. For example, TMband 2 can detect green reflectance from healthy vegetation, and band 3 of TM is designed fordetecting chlorophyll absorption in vegetation. TM band 4 is ideal for near-IR reflectance peaks inhealthy green vegetation and for detecting water-land interfaces. TM band 1 can penetrate waterfor bathymetric mapping along coastal areas and is useful for soil-vegetation differentiation andfor distinguishing forest types. The two mid-IR red bands on TM (bands 5 and 7) are useful forvegetation and soil moisture studies, and discriminating between rock and mineral types. Thethermal-IR band on TM (band 6) is designed to assist in thermal mapping, and for soil moistureand vegetation studies.
Typically, TM Bands 4, 3, and 2 can be combined to make false-color composite images whereband 4 represents red, band 3, green, and band 2, blue. This band combination makes vegetationappear as shades of red, brighter reds indicating more vigorously growing vegetation. Soils withno or sparse vegetation will range from white (sands) to greens or browns depending on moistureand organic matter content. Water bodies will appear blue. Deep, clear water will be dark blue toblack in color, while sediment-laden or shallow waters will appear lighter in color. Urban areaswill appear blue-gray in color. Clouds and snow will be bright white. They are usuallydistinguishable from each other by the shadows associated with the clouds.
Spatial Resolution
A Landsat 4 and 5 TM scene has an instantaneous field of view (IFOV) of 30 square meters inbands 1 through 5 and band 7, band 6 has an IFOV of 120 square meters on the ground.
The resolution for the TM sensor is shown below:
-263-
LANDSATJTM
L a n d s a t s 4 -5
BandBandBandBandBandBandBand
1234567
Resolution(meters)
3030303030
12030
Temporal Coverage
Background information and status of Landsat satellites.
S a t e l l i t e Launched Decommissioned Sensors
Landsat 1 July 23, 1972 January 6, 1978 MSS and £BV_Landsat 2 January 22, 1975 February 25, 1982 MSS and RBVLandsat 3 March 5, 1978 March 31, 1983 MSS and RBVLandsat 4 July 16, 1982 * TM and MSS
Landsat 5 March 1, 1984 ** TM and MSS
* in standby mode used for range and command as of December 14, 1993.
** currently operational
Spectral RangeThe thematic mapper (TM) is an advanced, multispectral scanning, Earth resources sensordesigned to achieve higher image resolution, sharper spectral separation, improved geometricfidelity, and greater radiometric accuracy and resolution than the MSS sensor. TM data arescanned simultaneously in seven spectral bands. Band 6 scans thermal (heat) infrared radiation.
Radiometric range of bands and resolution for the TM sensor (from Landsat 4 Data UsersHandbook, 1984, USGS).
L a n d s a t s 4 -5Band 1Band 2Band 3Band 4Band 5Band 6Band 7
Wavelength(micrometers)
0.45-0.520.52-0.600.63-0.690.76-0.901.55-1.75
10.40-12.502.08-2.35
Micrometers and their relationship to the
Resolution(meters)
3030303030
12030
electromagnetic spectrum
Data Organization
The Space Imaging EOSAT Fast Format volume set contains a header file, image files, and atrailer file.
The first file on each volume, a Read-Me-First file, contains header data. It is in AmericanStandard Code for Information Interchange (ASCII) format and adheres to ANSI and ISOstandards. The header file contains a single 1536-byte ASCII record. All alphanumerics are leftjustified, and all numerics are right justified.
All image files contain only one TM band of image pixels. There are no header records within theimage file, nor are there prefix and/or suffix data in the individual image records. Image data maybe blocked or unblocked.
The blocking factor is a procedure used to minimize the number of digital tapes required to
-264-
LANDSATJTM
accommodate a full-scene seven-band image set. Image data are written to tape in individualrecords and between each record is an inter-record gap (IRG), 0.35 of an inch, separating imagefile records. Unblocked data contain one line of image data per tape record.
The last volume of the Fast Format image set includes a trailer file. The trailer file containsephemeris information to compute the approximate spacecraft position for each pixel in theimage. This file is in ASCII format and adheres to ANSI and ISO standards.
The structure for a single-volume and a multi-volume set are presented below. Each file isfollowed by an End-Of-File (EOF) marker. An End-Of-Volume (EOV) marker consists of threeEOFs.
Single VolumeVolume Set
Header File
EOFBand 1
EOFBand 2
EOFBand 3
EOFBand 4
EOFBand 5EOF
Band 6EOF
Band 7EOFEOV
Trailer File
Data Availability
Procedures for Obtaining
Volume 1
Header File
EOFBand 1
EOFBand 2EOF
Band 3EOF
BAND 4EOFEOV
Trailer File
Data
Multi VolumeVolume Set
Volume 2
Header File
EOFBand 5
EOFBand 6EOF
Band 7EOFEOV
Trailer File
To place orders and to obtain additional information regarding technical details, ancillaryproducts, and pricing schedules, contact:Customer Services, EROS Data Center
The GLIS INVENTORY and ORDER screens also may be used for further information onordering Thematic Mapper data.
Products and Services
The EROS Data Center offers TM digital products on 8 mm cartridge tapes and Compact DiscRecordables, (CDRs).
The following products and prices will be offered by USGS-EDC to U.S. Governmentand itsAffiliated Users (USGAU). This group is comprised of U.S. Government agencies; U.S.Government contractors; researchers involved with the U.S. Global ChaU.S. Governmentagencies; U.S. Government contractors; researchers involved with the U.S. Global ChangeResearch Program and its international counterpart programs; and other researchers andinternational entities that have signed with the U.
All prices listed in the table are based on the TM data physically residing in the National LandRemote Sensing Data Archive (NSLRSDA) at EDC; the HDT access fee does not apply.
-265-
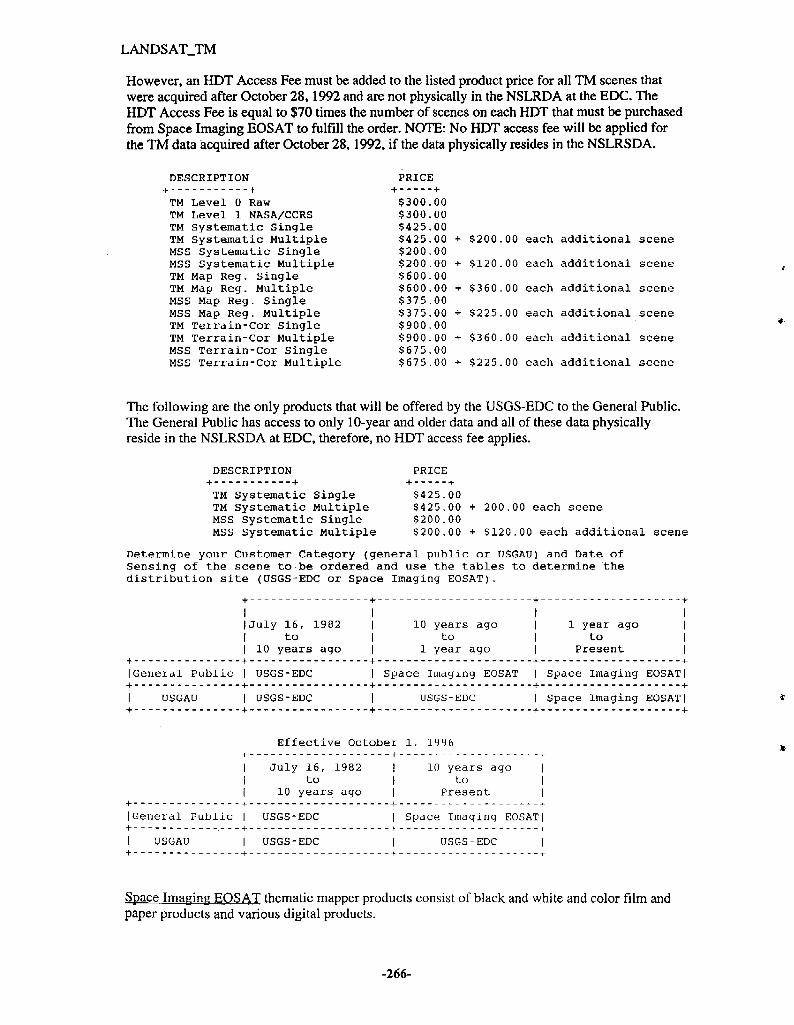
LANDSAT_TM
However, an HDT Access Fee must be added to the listed product price for all TM scenes thatwere acquired after October 28,1992 and are not physically in the NSLRDA at the EDC. TheHDT Access Fee is equal to $70 times the number of scenes on each HDT that must be purchasedfrom Space Imaging EOSAT to fulfill the order. NOTE: No HDT access fee will be applied forthe TM data acquired after October 28,1992, if the data physically resides in the NSLRSDA.
DESCRIPTIONH h
TM Level 0 RawTM Level 1 NASA/CCRSTM Systematic SingleTM Systematic MultipleMSS Systematic SingleMSS Systematic MultipleTM Map Reg. SingleTM Map Reg. MultipleMSS Map Reg. SingleMSS Map Reg. MultipleTM Terrain-Cor SingleTM Terrain-Cor MultipleMSS Terrain-Cor SingleMSS Terrain-Cor Multiple
PRICE+ +$300.00$300.00$425.00$425.00 + $200.00 each additional scene$200.00$200.00 + $120.00 each additional scene$600.00$600.00 + $360.00 each additional scene$375.00$375.00 + $225.00 each additional scene$900.00$900.00 + $360.00 each additional scene$675.00$675.00 + $225.00 each additional scene
The following are the only products that will be offered by the USGS-EDC to the General Public.The General Public has access to only 10-year and older data and all of these data physicallyreside in the NSLRSDA at EDC, therefore, no HDT access fee applies.
DESCRIPTION PRICE
TM Systematic Single $425.00TM Systematic Multiple $425.00 + 200.00 each sceneMSS Systematic Single $200.00MSS Systematic Multiple $200.00 + $120.00 each additional scene
Determine your Customer Category (general public or USGAU) and Date ofSensing of the scene to be ordered and use the tables to determine thedistribution site (USGS-EDC or Space Imaging EOSAT).
I I I I|July 16, 1982 | 10 years ago | 1 year ago |I to | to | to |I 10 years ago | 1 year ago | Present |
+ + h + +I General Public | USGS-EDC | Space Imaging EOSAT | Space Imaging EOSAT|
| USGAU | USGS-EDC | USGS-EDC | Space Imaging EOSAT|+ - — — — •-••- — — - - . . . - - 4 - " " " T " 1 " " " ™ w " 1 " T T " r l l " " ' p l l " + T 1 " 1 " ' " " „ — - ,- — ^ - - . - . - - - - f - _ _ _ . - . _ _ - _ _ - . _ . . w . _ _ _ _ _ _ _ _ _ - | -
Effective October 1, 1996+ + +I July 16, 1982 | 10 years ago |I to | to || 10 years ago | Present |
+ - + + +I General Public | USGS-EDC | Space Imaging EOSAT|+ ., + +
I USGAU | USGS-EDC | USGS-EDC |
Space Imaging EOSAT thematic mapper products consist of black and white and color film andpaper products and various digital products.
-266-
LANDSAT_TM
Applications and Related Data Sets
Landsat data have been used by government, commercial, industrial, civilian, and educationalcommunities in the U.S. and worldwide. They are being used to support a wide range ofapplications in such areas as global change research, agriculture, forestry, geology, resourcesmanagement, geography, mapping, water quality, and oceanography. Landsat data have potentialapplications for monitoring the conditions of the Earth's land surface. The images can be used tomap anthropogenic and natural changes on the Earth over periods of several months to more than15 years. The types of changes that can be identified include agricultural development,deforestation, natural disasters, urbanization, and the development and degradation of waterresources. The Mgg archive has over 630,000 scenes with a data volume of 20 terabytes. The TMarchive has over 300,000 scenes with a data volume of over 50 terabytes.
Scene (59.2 kb)
References
Earth Observation Satellite Company, 1985, User's guide for Landsat thematic mappercomputer-compatible tapes: Lanham, Md., Earth Observation Satellite Company [variouslypaged].
Earth Observation Satellite Company, 1994, Landsat system status report—September 1994:Lanham, Md., Earth Observation Satellite Company, p. 1-11.
National Aeronautics and Space Administration, 1981, Draft Landsat-D worldwide referencesystem (WRS) users guide: [Greenbelt, Md.], National Aeronautics and Space Administration[variously paged].
National Oceanic and Atmospheric Administration, 1983, Landsat data users notes: [SiouxFalls, S. Dak.], National Oceanic and Atmospheric Administration [variously paged]
U.S. Geological Survey and National Oceanic and Atmospheric Administration, 1984, Landsat4 data users handbook: [Washington, D.C.], U.S. Geological Survey and National Oceanic andAtmospheric Administration [variously paged].
Appendix
• Worldwide Reference System CWRS1
-267-

Annex 18 USGS Thematic Mapper Landsat Data: Search CriteriaGeographic CoverageAcquisition DatePath/Row SearchCloud Cover
LANDSAT Data Dictionary
-269-
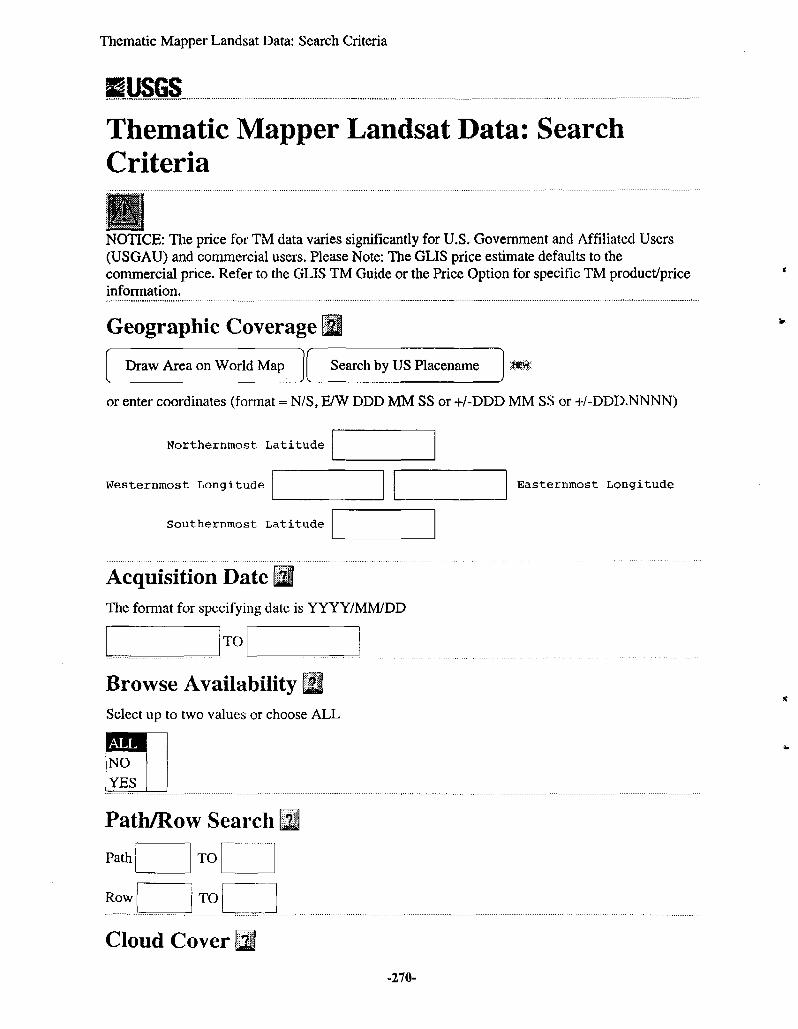
Thematic Mapper Landsat Data: Search Criteria
USGSThemat ic Mapper Landsat Data: SearchCriteria
NOTICE: The price for TM data varies significantly for U.S. Government and Affiliated Users(USGAU) and commercial users. Please Note: The GLIS price estimate defaults to thecommercial price. Refer to the GLIS TM Guide or the Price Option for specific TM product/priceinformation.
Geographic Coverage
Draw Area on World Map Search by US Placename
or enter coordinates (format = N/S, E/W DDD MM SS or +/-DDD MM SS or +/-DDD.NNNN)
Northernmost Latitude
Westernmost Longitude Easternmost Longitude
Southernmost Latitude
Acquisition Date [21The format for specifying date is YYYY/MM/DD
TO
BrowseSelect up to two values or choose ALL
NOYES
Path/Row Search
Path
Row
TO 1
T°P]Cloud Cover
-270-

Thematic Mapper Landsat Data: Search Criteria
TO
Entity Id
DCT AvailabilitySelect up to two values or choose ALL
N DCT's are not availableY DCT's are available
Product Distribution SitSelect up to two values or choose ALL
10 years and older from EDCUSGS-EDC and EOSAT
Submit Search Clear Entries Additional Search Criteria
II GLIS Home PagelGLIS Helpll
URL:http:lledcwww.cr.usgs.govlWebglislglisbinlsearch.pl?LANDSAT_TMMaintainer: webglis&edcwww. cr, usgs. gov:Last modified: 30 April 1997
-271-
USGS: Landsat Thematic Mapper (TM) Data Diet...
1USGS
HELP: Landsat Data DictionaryAcquisition DateArea IndicatorB/W Film AvailabilityBrowse AvailabilityCloud CoverCCT Availability (Full Scene)CCT Availability CScene Quadrangles)ConditionDate of UpdateDCT AvailabilityEntity IDGeographic CoverageMicroframe NumberOverall QualityPath/RowProduct Distribution SiteQuad 1 Cloud CoverQuad 2 Cloud CoverQuad 3 Cloud CoverQuad 4 Cloud CoverRecording TechniqueSatellite NumberSensor CodeWRS Type
Area Indicator
• Field Definition: An indicator to note how well a search area is covered by an inventoryentity.
Valid codes include:P — Partial coverage of the search area within the entity.C = The entity coverage is within the search area.S = The search area is within the entity coverage.
This field only applies to geographic searches. If searching by a non-geographic method (e.g.,entity IDs), this field will be blank.
B/W Film Availability
• Field Definition: A flag to indicate the availability of data products or visual aids. Thisincludes such things as enhanced color composite, black-and-white film, etc.
Valid codes:Y = Yes, B&W photos are available for this scene.
-272-
USGS: Landsat Thematic Mapper (TM) Data Diet...
N - No, Standard photo products are not available.
Browse Availability
• Field Definition: This flag identifies whether or not the entity has a browse image availablewith it. A browse image provides the user with a visual overview of an inventory item. Thisis an on-line digital (raster format) image of an individual scene.
Note: Preview images are resampled from the original data and may not accurately representthe full resolution product. For more information see "Overview of GLIS Preview ImageStrategies".
Cloud Cover
• Field Definition: Cloud Cover is the percentage of the entire image obscured by clouds andtheir shadows. The percentage is displayed in increments of 10%.
Cloud Cover is a subjective call made from interpreting a single band of the image on film. It istherefore, approximate in nature.
Valid Codes include:
0 - 0 % but less than 10%1 - 10% but less than 20%%2 =• 20% but less than 30%3 - 30% but less than 40%4 = 40% but less than 50%5 = 50% but less than 60%6 - 60% but less than 70%7 - 70% but less than 80%8 - 80% but less than 90%9 - 90% up to 100%
CCT Availability (Full Scene)
• Field Definition: A field that indicates the availability of computer compatible tape (CCT)products for an entire scene.
Valid codes:
CCT is not available.
X type CCT is available.
CCT Availability (Scene Quadrangles)
• Field Definition: This field indicates the availability of computer compatible tape(CCT)products.
Valid codes:
-273-
USGS: Landsat Thematic Mapper (TM) Data Diet...
N = No, CCTs are not available for all quads of this scene.U = Radiometrically uncorrected quads exist for this scene.
Condition
• Field Definition: Condition equates to a special image defect or condition in data processingthat affects a scene or group of scenes. The scene may not be downgraded in quality but itscondition is important to note.
Valid codes:• - Not applicable; no special condition evident in this scene.
P = Pre-WRS data. Image data was accepted prior to stabilizing the orbit to its nominal status.Therefore, the data may be geographically off from other WRS scenes of the same path.
R - Radiometric Engineering data. The image was a part of a calibration study for radiometriccorrection.
K - Space Imaging EOSAT supplied nominal center coordinates.
D = Sensor warm-up problem.
N = New scenes generated by TMACS processing.
Q - New TMACS/Post Launch stabilization data.
Acquisition Date
• Field Definition: The date the data was acquired.
Date of Update
• Field Definition: The Date of Update refers to the date the inventory record was added to theinventory, or the date the record was last updated.
DCT Availability
• Field Definition: Indicates availability of image on digital cassette tape.
TM: Y = DCT i s a v a i l a b l eN = DCT i s n o t a v a i l a b l e
Digital Cassette Tape (DCT) availability of yes means that the TM DCT source is in theNational Land Remote Sensing Data Archive (NLRSDA) at the EROS Data Center. Therefore,the High Density Tape (HDT) access fee will not be charged to U.S. Government and AffiliatedUsers (USGAU). Refer to the TM Guide or Price file on the main menu for further information.
Entity ID
-274-
USGS: Landsat Thematic Mapper (TM) Data Diet...
• Field Definition: This field uniquely identifies data which can be ordered in any combinationof unique products.
Example:TM Entity ID: LT5043034008628110
WHERE:L = LandsatT = Thematic Mapper5 = S a t e l l i t e number. This should be v a l i d a t e d
against the s a t e l l i t e field if used exclusively.043 = Path034 = Row00 = WRS row offset (set to 00)86 = Last two digits-year of acquisition
281 - Julian date of acquisition9 = Instrument mode (LS 4/5-TM-l and MSS-9,
LS 7 - 0=night acquisitions1=TM bands 1-7, 2=bands 4,6,7 panchromatic,3-bands 4,5,6 panchromatic
0 = Instrument multiplexor (MUX) on board the spacecraftThis will always be 0 for LS 4/5.LS 7 and beyond will be 1 or 2.
Geographic CoverageThere are three options for entering coordinate information to define the geographic coverage ofinterest.
1. Draw Area on Map: Displays a map of the world in which you select coordinates.
PanClicking within the map redraws the globe to center on that particular point.
Define Zoom BoxSelects a portion of the globe to view by defining a box to zoom in on. To define thezoom box, click on the upper left comer of the area to be zoomed in on. Afterdocument reloads, click on the lower right comer to complete the box.
Define a Point for searchingClick on any point within the map area. The point selected to search on is identifiedwith a crossmark. The coordinate information will be displayed in the text fields afterthe point has been selected.
Define RangeTo define the range, click on the upper left comer of the area to be zoomed in on. Afterdocument reloads, click on the lower right corner to complete the box. The areaselected to search on is identified with a rectangular outline. The coordinateinformation will be displayed in the text fields after the range has been defined.
2. Search by U.S. Place Name: Allows you to enter a feature name to define the geographiccoverage of interest. This is a multi-step process.
Step 1 (Search U.S. Placenames)Name (Required)Enter in the name of the feature you wish to search on. (example: Sioux Falls)
-275-

USGS: Landsat Thematic Mapper (TM) Data Diet...
State: (Required)Enter the two digit code for the state in which the feature resides. (Example: SD)
Feature Type.Select a feature type that corresponds with the feature name you entered.(example:Populated Place, PPL, City, town, village, subdivision)
OK buttonClick on the OK button to submit the place name entry.
Step 2 (Select One or More Placenames.)To select a feature, click on the button next to the feature name. The name you haveselected will be used to search the inventory. You may add additional criteria to yoursearch by scrolling to other fields (such as Acquisition Date or Map name) and byentering the requested information.
Draw Area on World MapClick on the Draw Area on World Map button if you would like to select a feature froma map instead of the list.
Step 3 (World Map)A map will be presented to you showing the area of the features that matched yourplace name entry from the first step. For instructions on how to define an area withinthe map see Geographic Coverage: Draw Area on Map.
Rather than select an area using the map, you may want to use the map to reference thelist of features (matching your entry) listed below the map. Use pan and zoom to getclose to the feature names to determine which feature best matches your area ofinterest. You can then select a feature from the list by clicking on the button next to thefeature name. You may add additional criteria to your search by scrolling to other fields(such as Acquisition Date or Map name) and by entering the requested information.
NOTE:If you define an area on the map and select a feature from the list, the searchwill be executed using the Placename selected. The area defined on the map will beignored.
3. Type in Coordinates:
Point: Type in Northernmost Latitude and Westernmost Longitude.Range (Rectangular box): Allows you to type in four points to define a rectangularsearch area.
(format =* +/-DDD MM SS or +/-DDD.NNNN)The plus (+) sign represents northern latitude and eastern longitude.The minus (-) sign represents southern latitude and western longitude.
Microframe Number
• Field Definition: The location of the browse microfiche or digital file. Identifies thelocation of the microframe image (cassette/fiche and frame number). Prefixes of 1,2 and
-276-
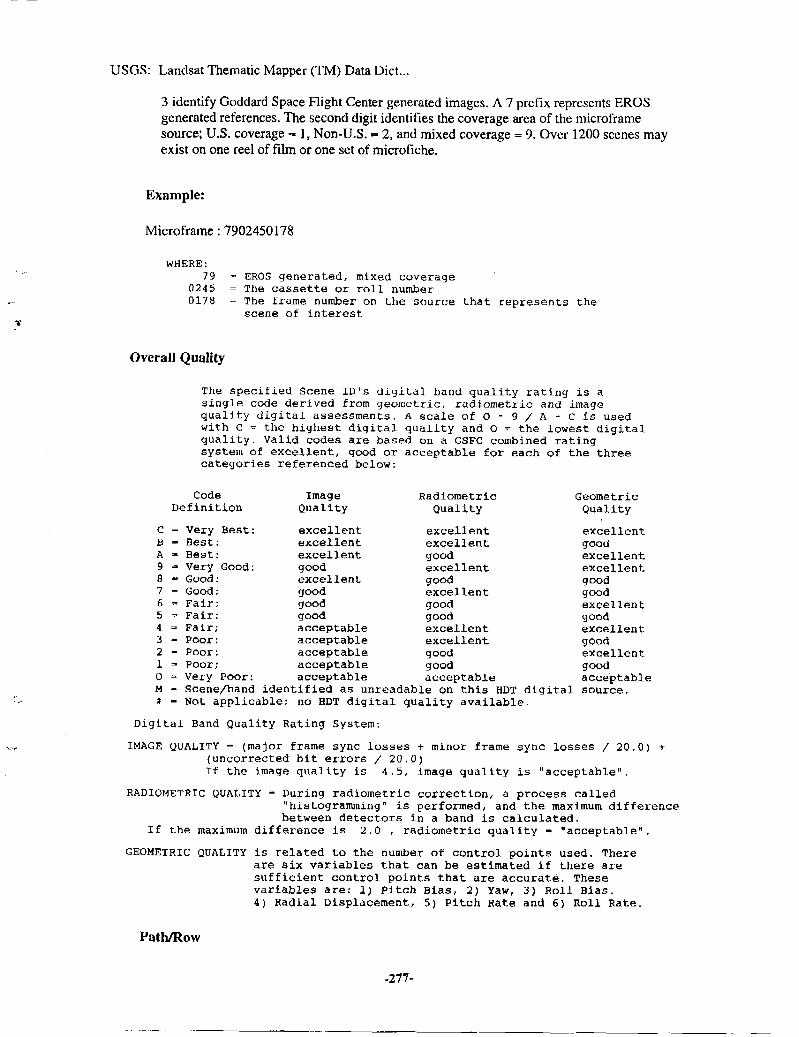
USGS: Landsat Thematic Mapper (TM) Data Diet...
3 identify Goddard Space Flight Center generated images. A 7 prefix represents EROSgenerated references. The second digit identifies the coverage area of the microframesource; U.S. coverage - 1, Non-U.S. = 2, and mixed coverage = 9, Over 1200 scenes mayexist on one reel of film or one set of microfiche.
Example:
Microframe: 7902450178
WHERE:79 - EROS generated, mixed coverage
0245 = The cassette or roll number0178 = The frame number on the source that represents the
scene of interest
Overall Quality
The specified Scene ID'S digital band quality rating is asingle code derived from geometric, radiometric and imagequality digital assessments. A scale o f o - 9 / A - C i s usedwith C = the highest digital quality and O = the lowest digitalquality. Valid codes are based on a GSFC combined ratingsystem of excellent, good or acceptable for each of the threecategories referenced below:
cBA937654321OM#
CodeDefinition
= Very Best:- Best:- Best:=• Very Good:=• Good:= Good:- Fair:= Fair:- Fair;- Poor:- Poor:- Poor;=* Very Poor:- Scene/band— Not acDlif}«
ImageQuality
excellentexcellentexcellentgoodexcellentgoodgoodgoodacceptableacceptableacceptableacceptableacceptable
RadiometricQuality
excellentexcellentgoodexcellentgoodexcellentgoodgoodexcellentexcellentgoodgoodacceptable
identified as unreadable on this HDTible: nn HDT diaital nua'MI-v auailahli
GeometricQuality
excellentgoodexcellentexcellentgoodgoodexcellentgoodexcellentgoodexcellentgoodacceptable
digital source.
Digital Band Quality Rating System:
IMAGE QUALITY = (major frame sync losses + minor frame sync losses / 20.0) +(uncorrected bit errors / 20.0)If the image quality is 4.5, image quality is "acceptable".
RADIOMETRIC QUALITY = During radiometric correction, a process called"histogranuning" is performed, and the maximum differencebetween detectors in a band is calculated.
If the maximum difference is 2.0 , radiometric quality - "acceptable".
GEOMETRIC QUALITY is related to the number of control points used. Thereare six variables that can be estimated if there aresufficient control points that are accurate. Thesevariables are: 1) pitch Bias, 2) Yaw, 3) Roll Bias.4) Radial Displacement, 5) Pitch Rate and 6) Roll Rate.
Path/Row
-277-

Annex 19 LANDSAT Ground Station Operations Working Group(LGSOWG) TM
BackgroundExtent of CoverageAcquisition
Processing StepsData Characteristics
Spatial ResolutionTemporal CoverageSpectral Range
Data OrganizationData Availability
Procedures for Obtaining DataProducts and Services
Applications and Related Data SetsReferencesAppendix
-281-
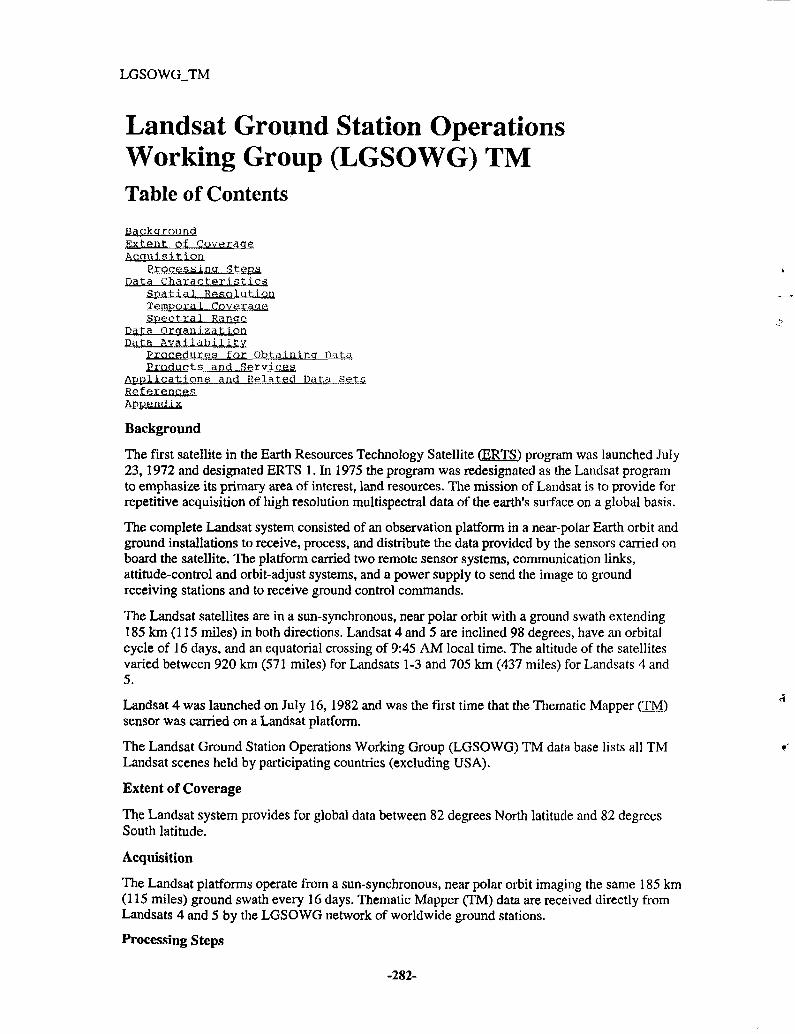
LGSOWG TM
Landsat Ground Station OperationsWorking Group (LGSOWG) TMTable of Contents
BackgroundExtant pfi CoverageAcquisition
Processing gtepsData Characteristics
Soatial ResolutionTemporal CoverageSpectral
Data OrganizationData Aval lability
Procedures for Obtaining DataProducts and Services
Applications and Related Data SetsReferencesAppendix
Background
The first satellite in the Earth Resources Technology Satellite CERTS) program was launched July23,1972 and designated ERTS 1. In 1975 the program was redesignated as the Landsat programto emphasize its primary area of interest, land resources. The mission of Landsat is to provide forrepetitive acquisition of high resolution multispectral data of the earth's surface on a global basis.
The complete Landsat system consisted of an observation platform in a near-polar Earth orbit andground installations to receive, process, and distribute the data provided by the sensors carried onboard the satellite. The platform carried two remote sensor systems, communication links,attitude-control and orbit-adjust systems, and a power supply to send the image to groundreceiving stations and to receive ground control commands.
The Landsat satellites are in a sun-synchronous, near polar orbit with a ground swath extending185 km (115 miles) in both directions. Landsat 4 and 5 are inclined 98 degrees, have an orbitalcycle of 16 days, and an equatorial crossing of 9:45 AM local time. The altitude of the satellitesvaried between 920 km (571 miles) for Landsats 1-3 and 705 km (437 miles) for Landsats 4 and5.
Landsat 4 was launched on July 16, 1982 and was the first time that the Thematic Mapper (TM)sensor was carried on a Landsat platform.
The Landsat Ground Station Operations Working Group (LGSOWG) TM data base lists all TMLandsat scenes held by participating countries (excluding USA).
Extent of Coverage
The Landsat system provides for global data between 82 degrees North latitude and 82 degreesSouth latitude.
Acquisition
The Landsat platforms operate from a sun-synchronous, near polar orbit imaging the same 185 km(115 miles) ground swath every 16 days. Thematic Mapper (TM) data are received directly fromLandsats 4 and 5 by the LGSOWG network of worldwide ground stations.
Processing Steps
-282-
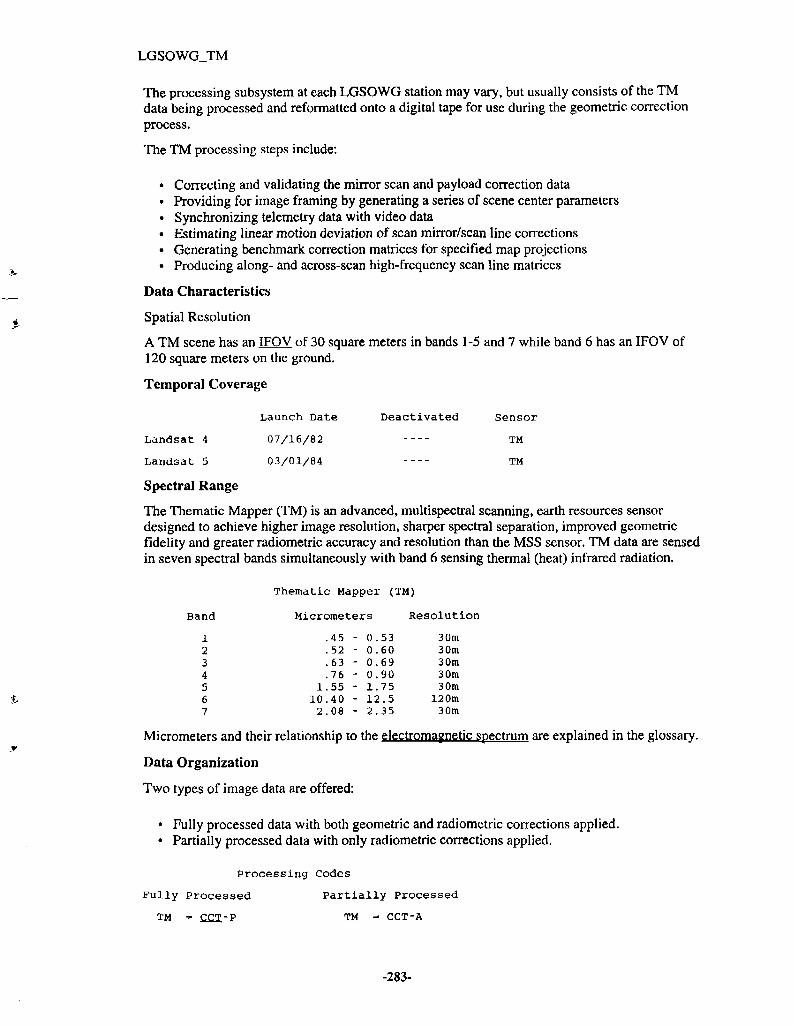
LGSOWG_TM
The processing subsystem at each LGSOWG station may vary, but usually consists of the TMdata being processed and reformatted onto a digital tape for use during the geometric correctionprocess.
The TM processing steps include:
• Correcting and validating the mirror scan and payload correction data• Providing for image framing by generating a series of scene center parameters• Synchronizing telemetry data with video data• Estimating linear motion deviation of scan mirror/scan line corrections• Generating benchmark correction matrices for specified map projections• Producing along- and across-scan high-frequency scan line matrices
Data Characteristics
Spatial Resolution
A TM scene has an IFOV of 30 square meters in bands 1 -5 and 7 while band 6 has an IFOV of120 square meters on the ground.
Temporal Coverage
Launch Date Deactivated Sensor
Landsat 4 07/16/82 TM
Landsat 5 03/01/84 TM
Spectral Range
The Thematic Mapper (TM) is an advanced, multispectral scanning, earth resources sensordesigned to achieve higher image resolution, sharper spectral separation, improved geometricfidelity and greater radiometric accuracy and resolution than the MSS sensor. TM data are sensedin seven spectral bands simultaneously with band 6 sensing thermal (heat) infrared radiation.
Thematic Mapper (TM)
Band Micrometers Resolution
1234567
Micrometers and their relationship to the electromagnetic spectrum are explained in the glossary.
Data Organization
Two types of image data are offered:
• Fully processed data with both geometric and radiometric corrections applied.• Partially processed data with only radiometric corrections applied.
Processing Codes
Fully Processed Partially Processed
TM - CCT-P TM =• CCT-A
-283-
1102
.45 -
. 52 -
.63 -
.76 -
.55 -
.40 -
.08 -
0.530.600.690.901.7512.52.35
30m30m30m30m30m
120m30m
LGSOWG_TM
Both processing levels offer either a Band-Interleaved-by-Line (BIL) or a Band-Sequential CBSO1image data format.
Current CCT's include a comprehensive field location and data description informationsuperstructure. This superstructure consists of:
• A volume directory file which generally describes the data configuration and providespointers to each data file.
• A file descriptor record for each data file which describes the data structure within the fileand provides pointers to certain fields within the file.
The entire superstructure is composed of four records. Three records (volume descriptor, text, filepointer) reside in a volume directory file. The fourth record is the file descriptor record which isthe first record of each data file. The four superstructure records are similar to one another incontent as well as in format. The purpose of these records is to identify, describe and locate datain the data files. Thus, superstructure records primarily supply information about the data on theCCT rather than carrying data themselves.
Data Availability
Procedures for Obtaining Data
To obtain additional LGSOWG TM information regarding other technical details, ancillaryproducts, and pricing schedules contact one of the:LGSOWG Stations
The specific LGSOWG station can be determined from the first two characters of each scene'sEntity ID based upon:
YG - AustraliaYB - BrazilYC - CanadaYD - Italy (via European Space Agency)YJ- JapanYM - Maspalomas (via European Space Agency)YP - PakistanYF - South AfricaYE - Sweden (via European Space Agency)
The GLIS INVENTORY and ORDER screens may also be used for further information onordering Landsat data.
Products and Services
Requests for LGSOWG TM data will be forwarded to the proper LGSOWG center. U.S. Federalusers interested in purchasing data may contact:Customer Services. EROSDafg. Center
Applications and Related Data Sets
Landsat data are used for many varying studies, inventories and analysis. Crop acreageinventories, timber class identifications, soil identification and mapping, range cover and forageproduction analysis, plant stress detection, regional land use classifications, generation ofphoto-maps, mineral and petroleum exploration, pollution monitoring, geological mapping andinterpretation, areal snow extent assessments, and shallow bathymetric measurements are but afew of the applications of Landsat TM data.
-284-
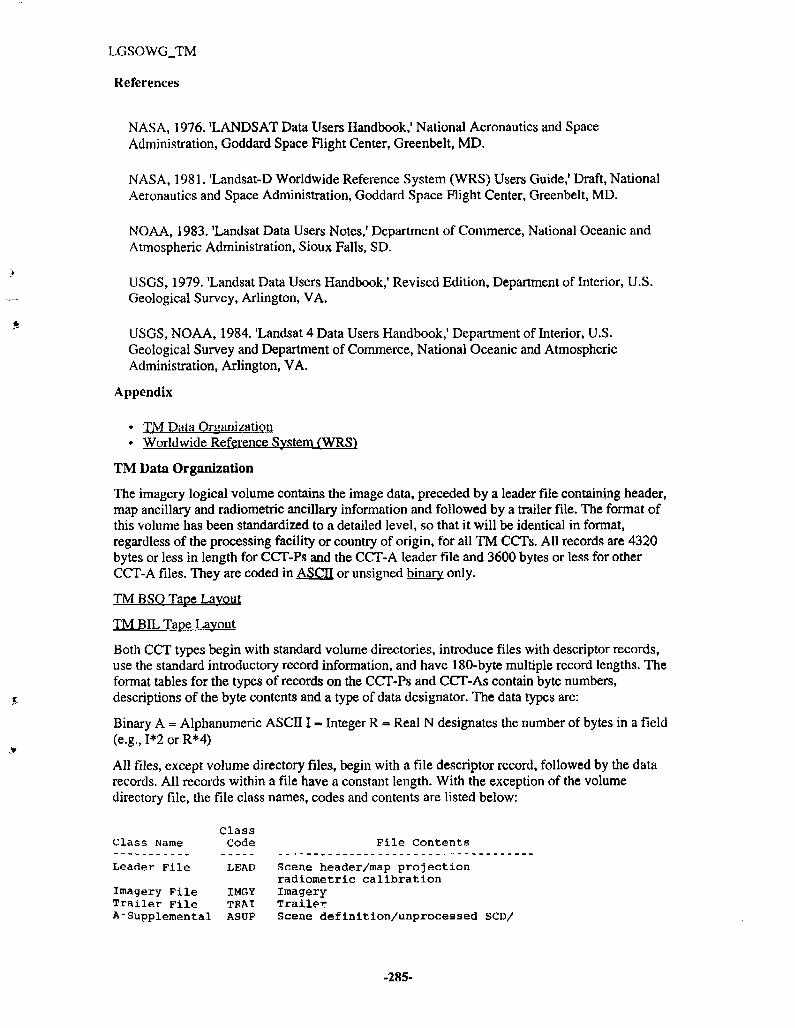
LGSOWGJTM
References
NASA, 1976. 'LANDSAT Data Users Handbook,1 National Aeronautics and SpaceAdministration, Goddard Space Flight Center, Greenbelt, MD.
NASA, 1981. 'Landsat-D Worldwide Reference System (WRS) Users Guide,1 Draft, NationalAeronautics and Space Administration, Goddard Space Flight Center, Greenbelt, MD.
NOAA, 1983. 'Landsat Data Users Notes,1 Department of Commerce, National Oceanic andAtmospheric Administration, Sioux Falls, SD.
USGS, 1979. 'Landsat Data Users Handbook,' Revised Edition, Department of Interior, U.S.Geological Survey, Arlington, VA.
USGS, NOAA, 1984. 'Landsat 4 Data Users Handbook,' Department of Interior, U.S.Geological Survey and Department of Commerce, National Oceanic and AtmosphericAdministration, Arlington, VA.
Appendix
• TM Data Organization• Worldwide Reference System CWRS1
TM Data Organization
The imagery logical volume contains the image data, preceded by a leader file containing header,map ancillary and radiometric ancillary information and followed by a trailer file. The format ofthis volume has been standardized to a detailed level, so that it will be identical in format,regardless of the processing facility or country of origin, for all TM CCTs. All records are 4320bytes or less in length for CCT-Ps and the CCT-A leader file and 3600 bytes or less for otherCCT-A files. They are coded in ASCII or unsigned binary only.
TM BSO Tape Layout
TM BIL Tape Layout
Both CCT types begin with standard volume directories, introduce files with descriptor records,use the standard introductory record information, and have 180-byte multiple record lengths. Theformat tables for the types of records on the CCT-Ps and CCT-As contain byte numbers,descriptions of the byte contents and a type of data designator. The data types are:
Binary A = Alphanumeric ASCII I - Integer R = Real N designates the number of bytes in a field(e.g.,I*2orR*4)
All files, except volume directory files, begin with a file descriptor record, followed by the datarecords. All records within a file have a constant length. With the exception of the volumedirectory file, the file class names, codes and contents are listed below:
Class Name
Leader File
Imagery PileTrailer FileA-Supplemental
ClassCode
LEAD
IMGYTRAIASUP
File Contents
Scene header/map projectionradiometric calibrationImageryTrailerScene definition/unprocessed SCD/
-285-
LGSOWGJTM
control points/geometric modeling/hifrequency matrices/annotation
P-Supplemental PSUP Band quality/annotation
Each of the records in a file contains standard introductory information in the first 12 bytes:record sequence number, record type code (and subtypes) and record length. The record number isin bytes 1 through 4 of each record; its value starts at 1 and increases sequentially in thesubsequent file records. Bytes 5 through 8 contain the type codes and are used to identify the typeof information in the record. The record type is made up of four separate 1 -byte codes: a type codeand three subtype codes.
The type code indicates the basic data type in a record, and the three sub-types are used to furtherclassify the data and format. There are seven data types: superstructure, header, annotation,ancillary, data, trailer and text. Bytes 9 through 12 contain the record length. The three types ofsuperstructure records have the following lengths:
1. Volume Descriptor Record - 3 60 bytes2. File pointer Record 360 bytes3. File Descriptor Record 360 bytes
(if other records in file are variable)
Standard formats are either binary or ASCII encoded. Binary fields are either unsigned integervalues or specified number codes. The most significant bit (MSB) in each field is the MSB of thefirst byte within the field and the least significant bit (LSB) is the LSB of the last byte within afield. For binary fields more than 1 byte (8 bits) long, no DIGITAL VAX inversion effects arepermitted; that is, the first byte of the field must appear first on the tape.
ASCII data are encoded as one 7-bit character per byte. The ASCII character occupies the first 7bits (0-6) and bit 7 is equal to zero. Numeric data represented in ASrepresented in ASCII formatare always right-justified and blank-filled on the left. Character data within a field are alwaysleft-justified and blank-fill
The beginning-of-tape (BOT) and end-of-tape (EOT) markers are small pieces of reflective tapelocated on the non-reading side of the CCT at least 10 feet from the beginning and 14 feet fromthe end of each reel. These markers define the permissible recording area of the CCT.
The identification burst is recorded on tape by the tape drive and begins at least 1.7 inches beforethe trailing edge of the BOT marker. It extends no closer than 0.5 inch from the first data block.An initial gap (a minimum of 3 inches and a maximum of 25 feet) separates the BOT marker fromthe first data block.
Adjacent files are separated by an EOF tape mark preceded by an inter-block gap (IBG) tape markand followed by a standard IBG. Adjacent records within a file are separated by a standard IBG.
-286-
Annex 20 The Earth Observing System (EOS) World Wide Web-Information Server-
The EOS Distributed Active Archive Center (DAAC)
-287-
1Welcome to the
Earth Observing System
World Wide WebInformation Server
The intention of this site is to provide convenient access to program information for thoseinvolved or interested in the EOS program.
(NASA WWW Servers
[Distributed Active Archive Centers (DAACS)
JEOS Project Related WWW Servers
^Servers of Related Interest
^Services
Problems or comments should be sent to [email protected].
Last Modified:Sept 30,1996
Curator:EOS VO Network Support Office,Jhon Honce, Hughes STX,Jhon.Honce(a)(>sfc.nasa.t>ov.
Responsible Organization:EOS Project Office/Code 505 GSFC,Richard desJardins, Network Engineer,Richard.des.]ardins(fhgsfc.nasa.eov.
-288-
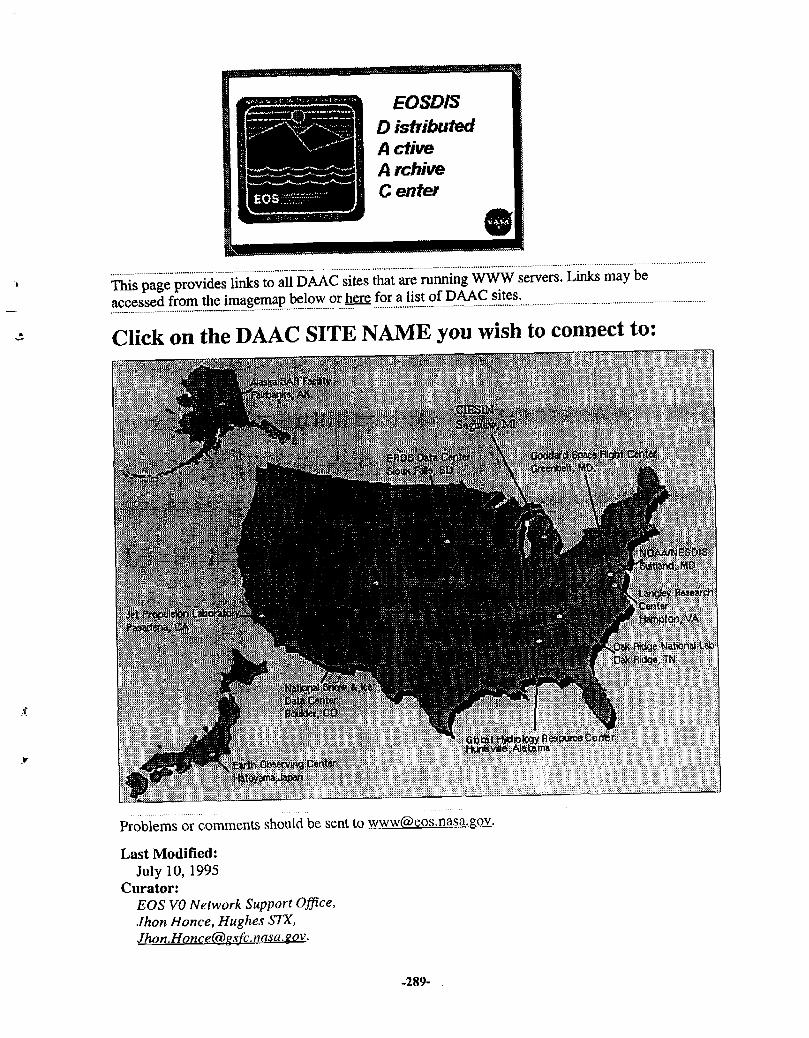
EOSDISD istributedA ctiveA rchiveCenter
^ ^ ^ ^ ^ s ^ are running WWW servers. Links may beaccessedfrom the imagemap below or_tofor.ali8tofDAACsites.
Click on the DAAC SITE NAME you wish to connect to:
Langley ResearchCenterHampton,
Ridge National Lab
Oak Ridge, TN
Gbbeil Hydioicgy ResourceCerfcrHunfeville.Alabama
t Earth Observing Center- Hatoi«ma,Japan
Problems or comments should be sent to www(Seos.nasa.gov.
Last Modified:July 10, 1995
Curator:EOS VO Network Support Office,Jhon Honce, Hughes STX,Jhnn.Hnnce(a)f>sfc. nasa. sov.
-289-

Responsible Organization:EOS Project Office/Code 505 GSFC,Richard desJardins, Network Engineer,Richard.desJardinsC&ssfc.nasa.eov.
-290-
EOSDIS DAAC at EROS Data Center
Welcome to the EDC DAACThe Earth Resources Observation Systems (EROS) Data Center Distributed Active ArchiveCenter (EDC DAAC) was established as part of NASA's Earth Observing System Data andInformation System (EOSDIS) initiative to promote the interdisciplinary study and understandingof the integrated Earth system. Access to land processes data, including satellite- andaircraft-acquired data stored in the EDC DAAC's archives, plays an important role in promotingsuch study and understanding.
Research performed by Earth and global change scientists investigating the conditions andprocesses that affect land-atmosphere and land-ocean interactions is supported by enhanced accessto archived data and data products. Information about and procedures for obtaining these data areprovided through the EOSDIS Information Management System.
NBProducts
BGlobal 1KM AVHRR Data
JJLandsat Pathfinder Data
^•Global 30 Arc-Second Elevation Data Set
-291-
EOSDIS DAAC at EROS Data Center
1SIR-Survey DataPrecision Data InventoryEducational CD-ROM:
Global Land Cover Characterization
i iiServices
Telnet to the EOSDIS Version O IMSEDC DAAC User Services OfficeOther DAAC User Services Offices
• l O t h e r WWW Servers
Connect to the LANDSAT Program pageConnect to NASA EOSDIS home pageConnect to USGS/EROS Data Center home pageConnect to Global Change Master DirectoryConnect to the ECS Science OfficeConnect to VO IMS Wen Gateway
IJIlDAAC User Services Survey
<URL:http://edcwww.cr.usgs.gov/landdaac/landdaac.html>Page owner: <[email protected]>Last modified: 8 May 1997.
-292-
Annex 21 ERDAS IMAGE PROCESSINGERDAS IMAGINE 8.3 Platform Specifications
ERDAS Africa and Middle East Distributers
-293-
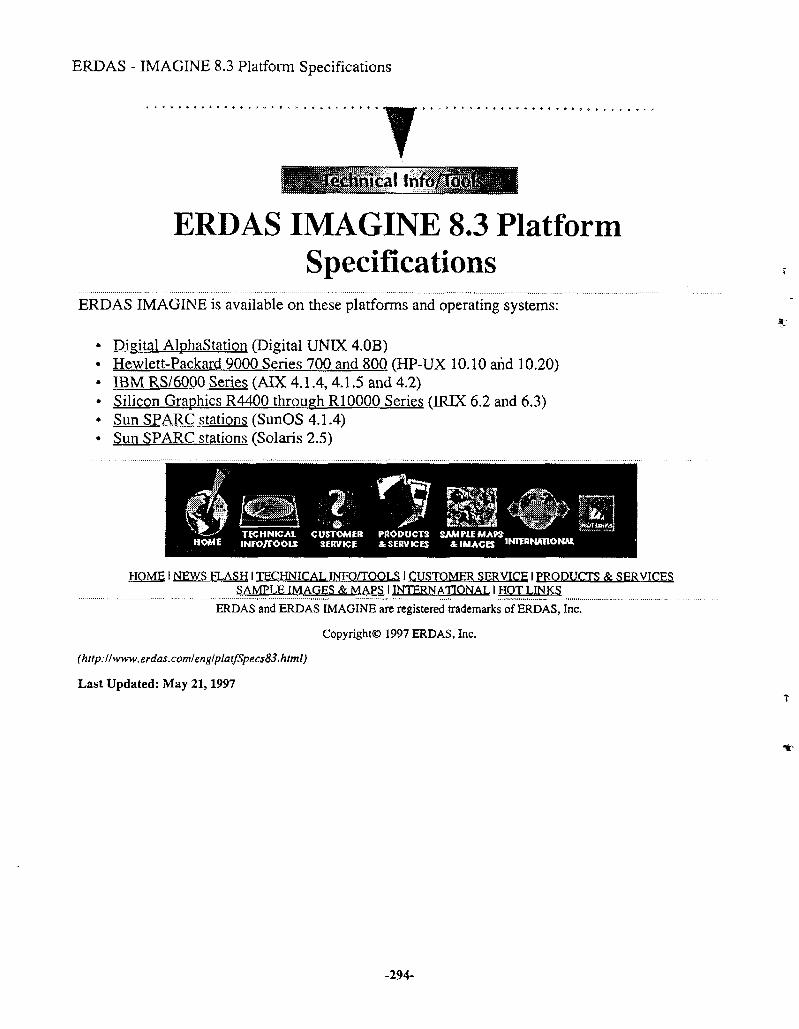
ERDAS - IMAGINE 8.3 Platform Specifications
technical Infoy
ERDAS IMAGINE 8.3 PlatformSpecifications
ERDAS IMAGINE is available on these platforms and operating systems:
• Digital AlphaStation (Digital UNIX 4.0B1• Hewlett-Packard 9000 Series 700 and 800 (HP-UX 10.10 and 10.20)• IBM RS/6000 Series (AIX 4.1.4, 4.1.5 and 4.2)• Silicon Graphics R4400 through RIOOOO Series (TRIX 6.2 and 63)• Sun SPARC stations fSunOS 4.1.4)• Sun SPARC stations (Solaris 2.5)
HOME I NEWS FLASH I TECHNICAL INFO/TOOLS I CUSTOMER SERVICE I PRODUCTS & SERVICESSAMPLE IMAGES & MAPS I INTERNATIONAL, I HOT LINKS
ERDAS and ERDAS IMAGINE are registered trademarks of ERDAS, Inc.
Copyright© 1997 ERDAS, Inc.
(http://www.erdas.com/eng/platfSpecs83.html)
Last Updated: May 21,1997
-294-
Erdas- Products & Services
TNewsletter (Monitor) I User Testimonials I Company Overview I Press Releases
Application Notes I Periodical Listings I Career OpportunitiesTraining Schedule I Sales Territories 1 Ordering Information
Product Information 1 Trade Shows & Conferences
, j hiiSi >:<• ^
: -•-• T E C H N I C A L C U S T O M E R P R O D U C T S SAMPLE M A P SH O M E INFO/TOOLS SERVICE ^SERVICES * IMAGES INTERNATIONAL
HOME I NEWS FLASH I TECHNICAL INFO/TOOLS I CUSTOMER SERVICE I PRODUCTS & SERVICESSAMPLE IMAGES & MAPS I INTERNATIONAL I HOT LINKS
ERDAS and ERDAS IMAGINE arc registered trademarks of ERDAS, Inc.
Copyright© 1996 ERDAS, Inc.
http://www.erdas.com/marcomJindex.html
-295-
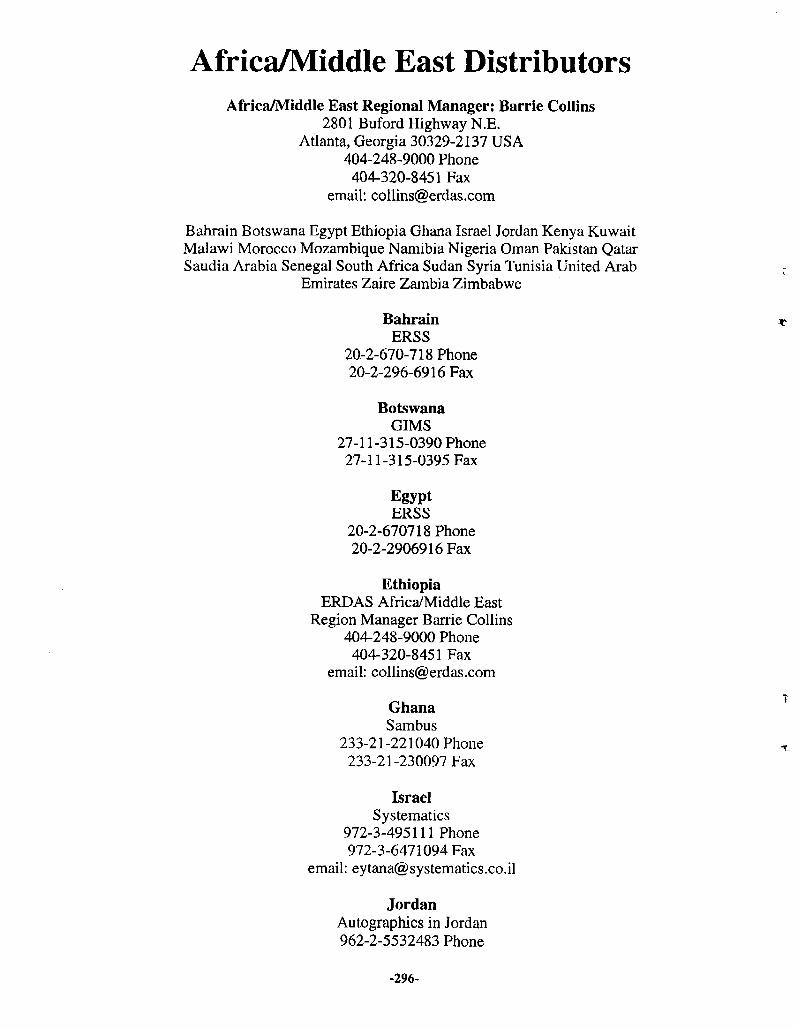
Africa/Middle East DistributorsAfrica/Middle East Regional Manager: Barrie Collins
2801 Buford Highway N.E.Atlanta, Georgia 30329-2137 USA
404-248-9000 Phone404-320-8451 Fax
email: [email protected]
Bahrain Botswana Egypt Ethiopia Ghana Israel Jordan Kenya KuwaitMalawi Morocco Mozambique Namibia Nigeria Oman Pakistan QatarSaudia Arabia Senegal South Africa Sudan Syria Tunisia United Arab
Emirates Zaire Zambia Zimbabwe
BahrainERSS
20-2-670-718 Phone20-2-296-6916 Fax
BotswanaGIMS
27-11-315-0390 Phone27-11-315-0395 Fax
EgyptERSS
20-2-670718 Phone20-2-2906916 Fax
EthiopiaERDAS Africa/Middle East
Region Manager Barrie Collins404-248-9000 Phone
404-320-8451 Faxemail: [email protected]
GhanaSambus
233-21-221040 Phone233-21-230097 Fax
IsraelSystematics
972-3-495111 Phone972-3-6471094 Fax
email: [email protected]
JordanAutographies in Jordan962-2-5532483 Phone
-296-

962-2-5531600 Fax
KenyaRSI Ltd.
254-2-241131 Phone254-2-241131 Fax
KuwaitERDAS Africa/Middle East
Region Manager Barrie Collins404-248-9000 Phone
404-320-8451 Faxemail: [email protected]
MalawiGIMS
27-11-315-0390 Phone27-11-315-0395 Fax
MoroccoGeomatic
2122-20-01-63 Phone2122-22-38-67 Fax
MozambiqueGIMS
27-11-315-0390 Phone27-11-315-0395 Fax
NamibiaGIMS
27-11-315-0390 Phone27-11-315-0395 Fax
NigeriaERDAS Africa/Middle East
Region Manager Barrie Collins404-248-9000 Phone
404-320-8451 Faxemail: [email protected]
OmanGeosystems
971-4-522-500 Phone971-4-522-518 Fax
PakistanBSI
92-21 -568-8514/1089 Phone92-21-568-5592 Fax
-297-
PakistanPRDS
92-21-453-0926 Phone92-21-453-4619 Fax
QatarERSS
20-2-670718 Phone20-2-2906916 Fax
Saudi ArabiaAtallah Systems
966-1-465-22-22 Phone966-1-46243-28 Fax
SenegalERDAS Africa/Middle East
Region Manager Barrie Collins404-248-9000 Phone
404-320-8451 Faxemail: [email protected]
South AfricaGIMS
27-11-315-0390 Phone27-11-315-0395 Fax
SudanERSS
20-2-670-718 Phone20-2-290-6916 Fax
SyriaHI-TECH HOUSE
963-11-543-0799 Phone963-11-542-2832 Fax
TunisiaGRAPHTECH
216-1-767-042 Phone216-1-750-454 Fax
United Arab EmiratesMAPS GEOSYSTEMS971-6-356-411 Phone
971-6-354-057 Fax
ZaireGIMS
27-11-315-0390 Phone27-11-315-0395 Fax
-298-
ZambiaGIMS
27-11-315-0390 Phone27-11-315-0395 Fax
ZimbabweGIMS
27-11-315-0390 Phone27-11-315-0395 Fax
ERDAS International Officesemail: [email protected]
Headquarters United Kingdom2801 Buford Highway, Suite 300 Telford HouseAtlanta, Georgia 30329-2137 Fulboum, Cambridge CB1 5HBUSA United Kingdom404/248-9000 phone 44-1223-881 -774 phone404/320-8451 fax 44-1223-880-160 fax
-299-
Annex 22 Arc-Info GIS Techniques
ESRI (Arc-Info Company)ESRI HeadquartersInternational Distributers AfricaInternational Distributers Asia
-300-
ESRi GIS solutions for everyon*User Support I Shop Online Contact Us 1
>>Contact4Js-Th« World Leod«r tnOIS
Please direct all inquiries regarding software pricing, sales, support, andconsulting services to your local ESRI Office or International Distributoror visit their home page. For other questions or comments, you maycontact ESRI headquarters by e-mail, telephone, fax, or write to us at theaddress below.
Contact Your Local Office
Select your continent from the map tothe right for the correct contactinformation.
ESRI Headquarters:
ESRI380 New York StreetRedlands,CA 92373-8100USA
Many ESRI International Distributors havetheir own web site
Visit the Home Page of Your Local ESRIOffice or International Distributor
E-mail UsFor Help With ESRI Software...Visit our User Support page foranswers to many common questions.For other questions, please contactyour local office.
For ARCVIEW-L and ESRI-L...Here's how to subscribe to orunsubscribe from the ARCVIEW-Land ESRI-L discussion lists.
Regarding This Home Page...To ask questions or makesuggestions about this site, please
For General Information...To ask general questions about ESRIinternational software sales and support,contact [email protected].
Regarding ARC News...To subscribe to our free quarterlynewsletter or change your mailingaddress, [email protected].
To E-mail an ESRI Employee...Compose a separate message, and use thefollowing naming convention: first initial,
-301-
contact [email protected]. last [email protected], for example:[email protected]
Call or Fax Us
Group Telephone Fax
Main Number 909-793-2853 I 909-793-5953
International Division 909-793-2853 Ext. 1-1235 909-307-3070
Home I News I Software I Data I Consulting I Industries I Partners I User Support I Shop Online I ContactUs
Copyright © Environmental Systems Research Institute, Inc.Send your comments to: [email protected]
October 10, 1997
-302-
ESnl GJS solutions for evetyatuNews | Software I Data I Consulting Partners I User Support I Shop Online Contact Us |
m International -Distributors*^GIS Salei and S»rvic» For Your Rtgic
AFRICAFollowing is contact information for authorized ESRI distributors in Africa. To findyour local distributor, either scroll down or click the FIND button above, type in yourcountry name, and press return.
BotswanaSee South Africa
BurundiSee Kenya
DjiboutiSee Kenya
EgyptQuality StandardsMr. Mahmoud Shouman19, Amer StreetDokkiPhone: +20-2-361-2344Fax: 20-2-360-9932Email:qs@ritsecl .com.eg
EritreaSee Kenya
EthiopiaSee Kenya
GhanaSambus Co.Mr. Samuel AboahHouse No. F702/1Kuku Hill, Osu-AccraPhone:+223-21-773883Fax: +233-21-777082Email:[email protected]
-303-
KenyaThunder InternationalMr. Mark NicholsonNo. 10, Devsons FlatsArgwing Kodhek CloseP.O.Box 40874Hurlingham, NairobiPhone: +254-2-718321/721852Fax: +254-2-721852Email: [email protected]
LesothoSee South Africa
MadagascarSee France
MalawiSee South Africa
MoroccoGeomaticMr. Hassan Moussaria30 Residence du NilAvenue Ogbah-AgdaeRabatPhone: +2127-77-0330Fax: +2127-77-0087Email: [email protected]
NamibiaSee South Africa
RwandaSee Kenya
SenegalSee France
South AfricaGIMSMr. Steve HineBlock N, Central Park Corner of Old Pretoria and New RoadsMidrand, 1685Phone:+271-1-3150390Fax: +271-1 -3150395Email: [email protected]: http://www.gims.com
TanzaniaSee Kenya
-304-
TunisiaGRAPHTECHContact: Madgy Gaafar84AvTalobM'hiriBP 76,2078 La MarsaTunis, TUNISIAPhone: +216-1-767042/750454Fax:+216-1-750-454Email: [email protected]
UgandaSee Kenya
ZambiaSee South Africa
ZimbabweSee South Africa
Everywhere elseESRI - RedlandsInternational MarketingPhone: +909-793-2853 ext 1-1235Fax: +909-307-3070Email: [email protected]
-305-
CIS solutions for everyone liJBUlle*Contact Us IIndustrie;
international DistributorsO15 Sales ond Service For Your
ASIAFollowing is contact information for authorized ESRI distributors in Asia. To find yourlocal distributor, either scroll down, or click the FIND button above, type in yourcountry name, and press return.
C
BahrainMicro CenterDr. Ghulum BakiriP.O. Box 1539ManamaPhone: +(973)533887Fax: +(973)232440Email: [email protected]
BangladeshSee Singapore
BruneiSee Singapore
BurmaSee Thailand
ChinaSuper Full Technology Co., Ltd.Mr. Francis HoUnit A, 12/F, Bldg. A, Fuhua MansionNo. 8, North Avenue, Chao Yang MenDong Cheng District, Beijing 10027People's Republic of ChinaPhone: +(86-10)6554-1618-21Fax: +(86-10)6554-4600Email: [email protected]: [email protected]: [email protected]
Hong KongHorizon Technologies
-306-
Mr. John ZhaoMiss Winne TangRoom 601, 113 Argyle StreetMongkok, KowloonHong KongPhone: +(852)2548-8737/9436-6376Fax: +(852)2548-8965Email: [email protected]: [email protected]
IndiaESRI IndiaMr. Dinesh GuptaBalaji Estate8 Sudarshan Munjal MargKalkajiNew Delhi 110 019Phone:+91 11 6203801Fax:+91 11 620 3838Email: dgupta%[email protected]
IndonesiaESRI-South Asia (Jakarta)Mid Plaza ILevel 17Jl. Jenderal Sudirman, Kav. 10-11Jakarta 10220Phone: +(62-21)570-7685Fax: +(62-21)570-7686Email:[email protected]
IranNegareh Computer CompanyMr. Mahmoud MalekanianBldg. No. 57, Shahid Ghandi Ave.Palizi SquareP.O. Box 15875/1414 Tehran 15567Phone: +(98-21)861-711/866-761Fax:+(98-21)860-0967
IsraelSystematics TechnologiesMr. Oded Leventer4 Raoul Wallenberg StreetTel Aviv 69719Phone:+(972-3)649-5111Fax: +(972-3)647-1094Email: [email protected]
JapanPASCO Corporation
-307-

Mr. T. Okuyama1-2, 1-Chome HigashiyamaHigashiyama Bldg, 8FMeguro-kuTokyo 153Phone:+(81-3)3715-1601Fax:+(81-3)3715-1607Email: [email protected]
JordanInfographMr. Munir KawarAbdali, Akorco Building "t
4th Floor, Office #12P.O. Box 911021Amman CPhone: +(962-6)603-546Fax: +(962-6)602-891Email: [email protected]
KoreaCADLANDMr. Jay J. YoonSongnam Building, Suite 3121358-6, Seocho2-dongSeocho-guSeoulPhone: +(82-2)3473-4888Fax: +(82-2)3474-2090Email: [email protected]: http://www.cadland.co.kr
KuwaitDiyar United Trading and Contracting Co.Mr. Indrajit BhowmickDaiyah Area 1, Street 17, Building 14P.O. Box 44240 7
32057 HawalliPhone: +(965)251-5636/252-1269Fax: +(965)252-7919 ?Email: [email protected]
LaosSee Thailand
LebanonKhatib & AlamiMr. Jacques EkmekjiDaoudlarian BuildingCorniche El Mazraa StreetP.O.Box 14-6203
-308-

BeirutPhone: +(9611)300609, 603315, 818861, 867259, 8684Fax:+(9611)603301Email: [email protected]: [email protected]
MalaysiaESRI-South Asia (Malaysia)Level 6B, Menara PKNS-PJ17, Jalan Yong Shook Lin46050 PETALING JAYAPhone: +(60-3)757-9930Fax: +(60-3)757-9679Email: [email protected]
OmanKhatib & Alami Consolidated Engineering Co.Mr. Faisal AlamiP.O. Box 238Muscat, 112Phone: +(968)602-016/602-076Fax: +(968)602-098Email: [email protected]
PakistanPakistan Resources Development Services, Ltd.Ms. Anjla Ashraf29, Block 7&8 D.C.H.S.Sharea FaisalKarachi-75350Phone: +(92-21)453-0926Fax: +(92-21)453-4619Email: [email protected]: [email protected]
PhilippinesGeodata Systems Technologies, Inc.Ms. Francisca Dayrit19th Floor Strata 100 BuildingEmerald Ave., Ortigas CenterPasig City, 1605 PhilippinesPhone: +(63-2)637-4447 to 49Fax: +(63-2)633-6873Email: [email protected]
QatarMannai Trading CompanyMr. K. VenugopalanSalwa Industrial ComplexP.O. Box 76Doha
-309-
Phone: +(974)412-555Fax:+(974)411-982Email: [email protected]
Saudi ArabiaMoammar Information SystemsMr.Khalid Al MoammarP.O.Box 16116Riyadh 11464Phone: +(966-1)463-1270Fax:+(966-1)465-9035Email: [email protected]
SingaporeESRI-South AsiaMr. Jim Durana350 Orchard RoadShaw House, #12-01/03Singapore 0923Phone: +(65)735-8755Fax: +(65)735-5629Email: [email protected]
Sri LankaEMSO LimitedMr. Anil Wijewardene50 Hyde Park CornerP.O. Box 312Colombo 2Phone: +(94-1)435-059Fax: +(94-1)447-881
SyriaHI-TECH HOUSEMr. Samaan AlkouriBab Charki, Tabala RoadKassis BuildingP.O. Box 25982DamascusPhone: +(963-11)543-0799Fax:+(963-11)542-2832Email:
TaiwanHitron Technology Inc.Mr. C.C. WuP.O. Box 17-77Hsin Chuang, TaipeiTaiwanPhone: +(886-2)298-3456Fax: +(886-2)298-2200
-310-
Email: [email protected] http://www.nq.ht.net.tw
ThailandESRI-ThailandMr. Krairop Luang-UthaiCDG House202 Rachada-Nanglinchi RoadChongnonsi, YannawaBangkok 10120Phone: +(66-2)678-0707Fax: +(66-2)678-0321-3Email: [email protected]: [email protected]
United Arab EmiratesGISTECMr. Manoj Kumer Dhall1 Oth Floor, Comiche PlazaP.O. Box 5026SharjahPhone: +(971-6)723636Fax: +(971-6)724490Email: [email protected]
VietnamSee Thailand
YemenNational Trading Company (NATCO)Mr. Mazen AmanMr.WaelZokariP.O.Box 1108Sana'aPhone: +(967)1-267795Fax: +(967)1-267796Email: [email protected]
Everywhere elseESRI - RedlandsInternational MarketingPhone: +(909)793-2853 ext 1-1235Fax: +(909)307-3070Email: [email protected]
Home I News I Software I Data I Consulting I Industries I Partners I User Support I Shop Online I ContactUs
Copyright © Environmental Systems Research Institute, Inc.Send your comments to: [email protected]
-311-