Service Oriented Architecture for Remote Sensing Satellite Telemetry Data Implemented on Cloud...
15
I.J. Information Technology and Computer Science, 2013, 07, 12-26 Published Online June 2013 in MECS (http://www.mecs-press.org/) DOI: 10.5815/ijitcs.2013.07.02 Copyright © 2013 MECS I.J. Information Technology and Computer Science, 2013, 07, 12-26 Service Oriented Architecture for Remote Sensing Satellite Telemetry Data Implemented on Cloud Computing Dr. Abdelfattah El-Sharkawi Al – Azhar University, Cairo, Egypt E-mail: [email protected] Dr. Ahmed Shouman Menoufia University, Cairo, Egypt E-mail: [email protected] Eng. Sayed Lasheen National authority for remote sensing and space science (NARSS), Cairo, Egypt E-mail: [email protected] Abstract— This paper articulates how Service Oriented Architecture (SOA) and cloud computing together can facilitate technology setup in Telemetry (TM) processing with a case study from the Egyptian space program (ESP) and a comparative study with space situational awareness (SSA) program in European space agency (ESA), Moreover, this paper illustrates how cloud computing services and deployment models enable software and hardware decoupling and making flexible TM data analysis possible. The large amount of available computational resources facilitates a shift in approaches to software development, deployment and operations. Index Terms— Cloud Computing, Service Oriented Architecture, Telemetry Data, National Authority for Remote Sensing and Space Science (NARSS) I. Introduction 1.1 Space system Components Any space system can be represented as two components. First is a space segment such as Low Earth Orbit (LEO) satellites [1] [2] Fig. 1: Space system components The second is a ground segment which has two parts first is Data Reception and Transmission Facilities (DRTF) that is responsible to communicate with the space segment and second part is Mission control center (MCC) that is responsible to plan payload missions and receive TM data, analyze them and take in flight control decisions. Figure 1summarizes this structure. 1.2 Low Earth Orbit (LEO) Remote Sensing Satellites Among the important applications of LEO satellites is remote sensing. Satellites are controlled by a Ground Station on earth that sends commands and receives telemetry from satellite to maintain proper operation. LEO satellites could be visible for only a period of time from the point of view of an observer on earth. They can send data to the Ground Station when they pass by a Ground Station zone. Therefore, the Ground station plays a very important role in the communication process with satellites [2] 1.3 Telemetry (TM ) Data Data transmitted from a satellite during satellite’s ground contact involve not only image data but also housekeeping telemetry data including information about satellite health which comprises a set of satellite status indicators and sensors read outs such as electric current of the on-board equipment and temperature etc. [2]
-
Upload
independent -
Category
Documents
-
view
1 -
download
0
Transcript of Service Oriented Architecture for Remote Sensing Satellite Telemetry Data Implemented on Cloud...
I.J. Information Technology and Computer Science, 2013, 07, 12-26 Published Online June 2013 in MECS (http://www.mecs-press.org/)
DOI: 10.5815/ijitcs.2013.07.02
Copyright © 2013 MECS I.J. Information Technology and Computer Science, 2013, 07, 12-26
Service Oriented Architecture for Remote
Sensing Satellite Telemetry Data Implemented on
Cloud Computing
Dr. Abdelfattah El-Sharkawi
Al – Azhar University, Cairo, Egypt
E-mail: [email protected]
Dr. Ahmed Shouman
Menoufia University, Cairo, Egypt
E-mail: [email protected]
Eng. Sayed Lasheen
National authority for remote sensing and space science (NARSS), Cairo, Egypt
E-mail: [email protected]
Abstract— This paper articulates how Service Oriented
Architecture (SOA) and cloud computing together can
facilitate technology setup in Telemetry (TM)
processing with a case study from the Egyptian space
program (ESP) and a comparative study with space
situational awareness (SSA) program in European
space agency (ESA), Moreover, this paper illustrates
how cloud computing services and deployment models
enable software and hardware decoupling and making
flexible TM data analysis possible. The large amount of
available computational resources facilitates a shift in
approaches to software development, deployment and
operations.
Index Terms— Cloud Computing, Service Oriented
Architecture, Telemetry Data, National Authority for
Remote Sensing and Space Science (NARSS)
I. Introduction
1.1 Space system Components
Any space system can be represented as two
components. First is a space segment such as Low
Earth Orbit (LEO) satellites [1] [2]
Fig. 1: Space system components
The second is a ground segment which has two parts
first is Data Reception and Transmission Facilities
(DRTF) that is responsible to communicate with the
space segment and second part is Mission control
center (MCC) that is responsible to plan payload
missions and receive TM data, analyze them and take in
flight control decisions. Figure 1summarizes this
structure.
1.2 Low Earth Orbit (LEO) Remote Sensing
Satellites
Among the important applications of LEO satellites
is remote sensing. Satellites are controlled by a Ground
Station on earth that sends commands and receives
telemetry from satellite to maintain proper operation.
LEO satellites could be visible for only a period of time
from the point of view of an observer on earth. They
can send data to the Ground Station when they pass by
a Ground Station zone. Therefore, the Ground station
plays a very important role in the communication
process with satellites [2]
1.3 Telemetry (TM ) Data
Data transmitted from a satellite during satellite’s
ground contact involve not only image data but also
housekeeping telemetry data including information
about satellite health which comprises a set of satellite
status indicators and sensors read outs such as electric
current of the on-board equipment and temperature etc. [2]

Service Oriented Architecture for Remote Sensing 13
Satellite Telemetry Data Implemented on Cloud Computing
Copyright © 2013 MECS I.J. Information Technology and Computer Science, 2013, 07, 12-26
Fig. 2: MCC decision support mechanism
TM subsystem and Satellite Control Subsystem (SCS)
together are considered as a decision support system in
MCC. If MCC discovers that some mistakes occur
through the quick satellite health checking from TM
report, MCC normally take the suitable decision by
uploading the corresponding commands through SCS.
Figure 2 summarizes this decision support mechanism.
1.4 Service Oriented Architecture (SOA)
In essence, it is a way of designing a software system
to provide services to either end-user applications or
other services through published and discoverable
interfaces. The basic service oriented architecture (SOA)
defines an interaction between software agents as an
exchange of messages between service requesters
(clients) and service providers. [3] [4]
Clients are
software agents that request the execution of a service.
Providers are software agents that provide the service.
Agents can be simultaneously both service clients and
providers. Providers are responsible for publishing a
description of the service(s) they provide. Clients must
be able to find the description(s) of the services they
require and must be able to bind to them. The basic
SOA shown in Figure 3 does not only represent the
architecture for services but also a relationship of three
kinds of participants; namely the service provider, the
service discovery agency, and the service requestor
(client). The interactions involve publish, find and bind
operations.
Fig. 3: basic SOA
1.5 Cloud Computing
Cloud computing is a model for enabling ubiquitous,
convenient, on-demand network access to a shared pool
of configurable computing resources (e.g., networks,
servers, storage, applications, and services) that can be
rapidly provisioned and released with minimal
management effort or service provider interaction. This
cloud model promotes availability and is composed of
five essential characteristics, three service models, and
four deployment models
Essential Characteristics [5] [6] [7] [8] [9] [10]
:
On-demand self-service a consumer can unilaterally
provision computing capabilities, such as server time
and network storage, as needed automatically
without requiring human interaction with each
service’s provider.
Broad network access. Capabilities are available
over the network and accessed through standard
mechanisms that promote use by heterogeneous thin
or thick client platforms (e.g., mobile phones, laptops,
and PDAs).
Resource pooling. The provider’s computing
resources are pooled to serve multiple consumers
using a multi-tenant model, with different physical
and virtual resources dynamically assigned and
reassigned according to consumer demand. There is a
sense of location independence in that the customer
generally has no control or knowledge over the exact
location of the provided resources but may be able to
specify location at a higher level of abstraction (e.g.,
country, state, or datacenter). Examples of resources
include storage, processing, memory, network
bandwidth, and virtual machines.
Rapid elasticity. Capabilities can be rapidly and
elastically provisioned, in some cases automatically,
to quickly scale out, and rapidly released to quickly
scale in. To the consumer, the capabilities available
for provisioning often appear to be unlimited and can
be purchased in any quantity at any time.
Measured Service. Cloud systems automatically
control and optimize resource use by leveraging a
metering capability at some level of abstraction
appropriate to the type of service (e.g., storage,
processing, bandwidth, and active user accounts).
Resource usage can be monitored, controlled, and
reported, providing transparency for both the
provider and consumer of the utilized service.
II. Problem Definition
The first Egyptian remote sensing satellite (Egypt
sat-1) was launched to LEO in 2007 by Egyptian Space
program (ESP). In order to maintain proper satellite
operation, Egyptian Ground control Station was
Established to monitor and control the satellite in its
Orbit via DRTF and MCC. Since LEO satellites are
visible for only a period of time from the point of view
of an observer on earth, they can send TM data to the
Ground stations only when they pass by a DRTF zone
of theses ground stations as shown in Figure (4-a)
Since ESP got only one ground station in Cairo,
Egypt sat-1 could only be seen by DRTF four times per
day. As many countries, if ESP decided to build a

14 Service Oriented Architecture for Remote Sensing
Satellite Telemetry Data Implemented on Cloud Computing
Copyright © 2013 MECS I.J. Information Technology and Computer Science, 2013, 07, 12-26
number of DRTF’s around the country to cover most of
satellite orbits as shown in Figure (4-b). It can monitor
other satellites which belong to other partners
(countries, small organizations, universities) which has
the same satellite series. Moreover, it will use its all
hardware and software resources in the ground segment
to create a new business model as (pay – per - use) to
develop organization assets. According to this proposal,
two problems will appear. First is how to handle the
TM data for other satellites in the same series? Second
is how to design a SOA for TM subsystem to introduce
the TM data analysis service and how to implement it
on cloud computing?
Fig. 4: DRTF zone
This paper focuses on the second problem which
considered as a good case study to implement a huge
data on cloud computing
III. Proposed Solution
Taking the TM packet structure defined by European
cooperation for space standardization (ECSS)[11]
into
consideration, and using modular object oriented
techniques to design TM software this will make
standardization in TM data handling problem and offer
an application programming interface (API), which
enables the software engineers to extend the system and
adapt it to their project requirements.
So the following generic steps [12]
could be
considered to handle TM data
1. Receive the data stream from the satellite
2. Extract the individual TM frames out of the data
stream.
3. Extract the raw value of every single TM data from
the Frame.
4. Apply the calibration routines to retrieve the
engineering value of the TM data.
5. Visualize the values to the clients through some User
Interface.
6. Archive the retrieved TM data.
Based on this generic procedure the system
architecture shown in Figure 5 has been proposed,
which guaranties the highest level of flexibility and
extendibility for different Satellite projects.
Fig. 5: proposed Architecture of MCC and DRTF
MCC collects all telemetry data (TMD) for each
satellite from these DRTF’s and makes them available
to the partners as a service. Therefore, this research
introduces a design of a SOA for TM subsystem to
Introduce the TMD analysis service and to study the
deployment of these services on cloud computing.
3.1 System Components
The system can be divided into the following core
software components:
TM database, which contains the definitions of all
TMD. These definitions consist of information about
the raw format of the data, i.e. the size in Bytes and
Bits, its position in the TM frame, the calibration
method to retrieve the engineering value and
hard/soft limits for valid values, etc.
Data handling engine, which establishes a
connection to the database and DRTF to carry out the
task Nr 3, 4 and 6 of the above procedure. Upon a
satellite pass it receives telemetry packages
sequentially and extracts the telemetry data entities
then apply the calibration and archive TMD into
database (DB).

Service Oriented Architecture for Remote Sensing 15
Satellite Telemetry Data Implemented on Cloud Computing
Copyright © 2013 MECS I.J. Information Technology and Computer Science, 2013, 07, 12-26
Reporting facility for monitoring and visualization
of the extracted telemetry data to telemetry clients
(Task Nr5.).
Orbit determination package to propagate satellites
orbits
3.2 Data Flow between System Components
This following paragraph describes the data flow
between system components as shown in Figure 6
Fig. 6: data flow between TM components
Orbit determination package propagates the satellite
orbits and sends them to MCC database.
Based on the orbit data, DRTF determines the
satellite visibility zones to receive TMD
Data handling engine establishes the connection with
MCC (DB) & DRTF and extract the received TM
packets with parameters’ calibration values then
archive TMD to database.
3.3 The Suggested Techniques
Cloud computing and service oriented technologies
will release the opportunity for collaboration and
innovation in data utilization which will provide
High performance for on-demand services
Fast and easy deployment of services on cloud
computing
Scalability of the system
IV. Service Oriented Architecture (SOA) of TM
System
The design process of a Service-oriented model for
TM system are discussed in the following subsections
4.1 Services Identification Phase Has Two Steps
4.1.1 Functional decomposition
Determination of Satellite orbits or Calculate satellite
orbits using satellite two line elements then Define
the DRTF zone which can track the satellite in a
period of time (session) with defining its start and
end time to receive TM, This function must be
finished by orbit determination subsystem in MCC
before satellite communication session start.
After the previous function, Telemetry system can do
the following functions to provide all proposed
Services:
1. Establish a connection to MCC database and to the
(DRTF)
2. Extract TM packet format for each subsystem on the
satellite
3. Apply the calibration routines to retrieve the
engineering value of the TMD.
4. Archiving TMD on DB during session
5. Authentication management.
4.1.2 Services decomposition
1. Display TM parameters in tabular format.
2. Visualize the values of parameters to the clients
through some User Interface.
3. TMD analysis per defined period of time with graphs
4. TM reporting per period of time

16 Service Oriented Architecture for Remote Sensing
Satellite Telemetry Data Implemented on Cloud Computing
Copyright © 2013 MECS I.J. Information Technology and Computer Science, 2013, 07, 12-26
4.2 Services Specification
From the above discussion, the proposed TM system
services can be summarized as Follows:
packet extraction
data calibration
Archiving
presentation
analysis
Hence, Users or clients can visualize, monitor, and
analysis the extracted telemetry data from reporting
facility component through cloud community. The
process model of all TM functions and services can be
generated using unified modeling language (UML) as
shown in Figure 7.
Fig. 7: UML process model for the TM functional and services decomposition
Fig. 8: UML data model for TM system
4.3 Services Realization
As explained before there are four software
components and this step will recognize the software
that realizes a given services, as follows:
Orbit determination package
o Define the DRTF which can track the satellite in
its zone in a period of time called session with
defining its start and end time to receive TM.
Data handling engine
o Establish a connection to DB and DRTF
o Extract TM packet format from TM stream
o Apply the calibration routines to retrieve the
engineering value of the TM data.
o Archiving TMD on DB during session to make
analysis or statistics

Service Oriented Architecture for Remote Sensing 17
Satellite Telemetry Data Implemented on Cloud Computing
Copyright © 2013 MECS I.J. Information Technology and Computer Science, 2013, 07, 12-26
Monitoring and visualizing (reporting facility)
o Display TM parameters in table format.
o Visualize the values of parameters to the clients
through some User Interface.
o TMD analysis per any period of time with graphs
o Reporting per any period of time
TM Database
This is the main component to realize all previous
services.
The UML class diagram shown in Figure 8 shows
the data model of the TM database schema.
4.4 Dynamics of TM Messaging Interaction
Figure 9 shows the sequence diagram that monitor
messaging interaction flow to get a service in two
modes; namely real time mode and offline time mode.
Fig. 9: UML sequence diagram for getting a service
Sequence of actions of real time mode:
o TMD received from the satellite
o TMD extracted in data handling server
o Calibrate TMD to its engineering values to be
displayed
o Archive TMD into DB
o Search in DB about the user data request to
display
Sequence of actions of offline mode
o Search in DB about the user data request
o Display telemetry data
4.5 Proposed Service Oriented Architecture (SOA)
The proposed architecture has three main blocks
shown in Figure 10 as follows:
TM data processing which will establish the
connection with (DRTF) during satellite
communication session to extract TMD from TM
packets with calibration of parameters values and
archive it into DB
Data center or DB has all TM data for all satellites
which was archived; users can get any TMD through
data administration module. A knowledge base will
be used to generate statistics and reports.
Services provision center this block has users
interface to access any service after authentication.

18 Service Oriented Architecture for Remote Sensing
Satellite Telemetry Data Implemented on Cloud Computing
Copyright © 2013 MECS I.J. Information Technology and Computer Science, 2013, 07, 12-26
Fig. 10: proposed TM (SOA)
V. Proposed Cloud Computing Implementation
5.1 Cloud Framework
The First step to implement TM (SOA) on the cloud
computing is to define the cloud frame work as shown
in table 1
Table 1: cloud frame work
This table shows a community cloud as a deployment
model that has three service models:
Data as a service (Daas), will introduce TM data
analysis and visualization.
Software as a service (Saas), will introduce a TM
software tools to the users.
Infrastructure as a service (Iaas), all ground station
resources will be used to introduce all services to the
users.
5.2 Cloud computing Architecture
The proposed definition of TM cloud computing
architecture shown in Figure 11 is divided into four
layers to provide differentiating capabilities to the TM
system users as follows:
Fig. 11: TM cloud architecture

Service Oriented Architecture for Remote Sensing 19
Satellite Telemetry Data Implemented on Cloud Computing
Copyright © 2013 MECS I.J. Information Technology and Computer Science, 2013, 07, 12-26
Application services layer
Provide a ready to use software applications, in a
SaaS model, such as TMD parameters analysis, TMD
Visualization, TMD graph presentation software.
The users can access the services provided by this
layer through web-portals.
Data services layer
Provide all satellite TM data to authenticated users –
called (Daas).
Platform services layer
Provide all technical and business algorithms to
make data calculation, calibration and processing.
Infrastructure services layer
Deliver computational resources, communication
facilities in communication as a service (Caas) model
and data storage for the layers above – called IaaS.
VI. Cloud Computing Simulation
To provide TM services through cloud computing;
Figure 12 shows the needed tools.
Fig. 12: TM cloud computing simulation components
Data center
Satellite data transmission and receiving facilities
(DRTF)
Networking
Platform (operating system OS)
TM data extractor software
Orbit determination and propagation subsystem
(ODPS)
Web server with domain name system (DNS) to
manage Clients services.
Monitoring workstation to measure quality of
services (QOS)
Data center
This component was simulated using two database
servers working with clustering technique to archive
and manage all TM data as shown in Figure 13.
Fig. 13: clustering technique
The group of nodes of each cluster is managed as a
single system and shares a common namespace.
Monitoring workstation
There are many Cloud Computing Monitoring tools
as PRTG tool [13]
; which has many sensors that can
measure and visualize the performance of all resource
parameters such as CPU load, memory usage, hard disk,
SQL, HTTP etc. as shown in Figure 14
Fig. 14: PRTG network monitoring tool

20 Service Oriented Architecture for Remote Sensing
Satellite Telemetry Data Implemented on Cloud Computing
Copyright © 2013 MECS I.J. Information Technology and Computer Science, 2013, 07, 12-26
6.1 Cloud Computing Network Performance
Parameters Simulation
The main factors which effect network performance
parameters are:
Internetworking devices
Type of data being transferred
Network topology
Number of users on the network
User computer
Server computer
6.1.1 Network protocol
OPNET network simulation tool was used as shown
in Figure 15 to insure that transmission Control
protocol (TCP) is A Reliable, Connection-Oriented, and
Byte-Stream Service
This test for FTP service on server side using
IPcloud32 node model as IP cloud supporting up to32
serial line interfaces at a selectable data rate through
which IP traffic can be modeled. IP packets arriving on
any cloud interface are routed to the appropriate output
interface based on their destination IP address
Choosing Congestion Window Size (bytes) and Sent
Segment Sequence Number Statistics, to compare the
performance of the algorithms through the analysis of
the simulation results
Fig. 15: TCP Simulation
N.B The sent Segment Sequence Number is almost
flat with every drop in the congestion window as shown
in Figure 16. This insures that TCP guarantees the
reliable, in-order delivery of a stream of bytes. It
includes a flow-control mechanism for the byte streams
that allows the receiver to limit how much data the
sender can transmit at a given time. In addition, TCP
implements a highly tuned congestion-control
mechanism.
Fig. 16: TCP sent segment sequence number compare with congestion window size

Service Oriented Architecture for Remote Sensing 21
Satellite Telemetry Data Implemented on Cloud Computing
Copyright © 2013 MECS I.J. Information Technology and Computer Science, 2013, 07, 12-26
6.1.2 Network Throughput
Throughput refers to actual measured bandwidth, at a
specific time of day, using specific Internet routes, and
while a specific set of data is transmitted on the
network. [14] [15]
Bandwidth is the measure of the amount of
information that can move through the network in a
given period of time. Therefore, the amount of
available bandwidth is a critical part of the specification
of the network. A typical LAN might be built to
provide 100 Mbps to every desktop workstation, but
this does not mean that each user is actually able to
move 100 megabits of data through the network for
every second of use. This would be true only under the
most ideal circumstances.
Maximum TCP throughput = TWS/ RTT bps
Where
TWS = TCP window size or receiver buffer size
RTT = round-trip time.
bps = bits per second
Data transfer time calculation,
Theoretical T= S / BW sec && Actual T= S / P sec
Where
T = data Transfer time
S = size of file
BW= theoretical bandwidth
P = actual bandwidth at the moment of transfer
Sec = second
End-to-end delay refers to the time taken for
a packet to be transmitted across a network from source
to destination.
D end-end= N [d Trans + d prop + d proc]
Where
D end-end = end-to-end delay
d Trans = transmission delay
d prop = propagation delay
d proc = processing delay
N= number of links (Number of routers + 1)
Note: neglected queuing delays.
Each router will have its own d Trans, d prop, and d proc
Assume that no TCP window scaling option found,
so TCP window size will be used as 64Kbytes. Then,
Round Trip Time (RTT) is the main factor to
decide TCP throughput between locations.
Table 2: RTT and throughput relation
RTT
ms
TCP throughput
bps
TCP throughput
Mbps
10 52428000 52
20 26214000 26
50 10485600 10
100 5242800 5.2
150 3495200 4.3
200 2621400 2.5
300 1747600 1.7
500 1048560 1
As it clear from table 2 and graph, with the greater
RTT throughput is lower.
6.1.3 Network Utilization
Network utilization is the ratio of current network
traffic to the maximum traffic that the port can handle.
It indicates the bandwidth use in the network. While
high network utilization indicates the network is busy,
low network utilization indicates the network is idle.
6.1.4 Response time
Refers to the time taken to execute a job it depends
on resource characteristics and network utilization this
will clear after simulation for FTP download response
time, web response time and database query response
time. Networks of different types or in different
topology have different theoretical peek value under
general conditions.
6.2 Cloud Computing Services Performance
Parameters Simulation

22 Service Oriented Architecture for Remote Sensing
Satellite Telemetry Data Implemented on Cloud Computing
Copyright © 2013 MECS I.J. Information Technology and Computer Science, 2013, 07, 12-26
Using OPNET network simulation tool the following
Cloud services performance parameters was measured
FTP service which contain TM data and files transfer.
HTTP or web service
Database service
Servers Load
Table 3 contains simulation data which will be
illustrated in Figure 17
Table 3: simulation data
Simulation parameter Value
Protocol TCP
Number of subnets (4) - one for servers and three for clients
Internal subnets links 100 base T
External links PPP-DS3
Cloud IP_cloud32
Number of servers One for data center and the other for HTTP & FTP each one contains single processor
Number of applications Three - (FTP,HTTP and database ) each client can access all applications in serial order
HTTP application Heavy browsing
Database application High access
Fig. 17: main scenario configurations and FTP application parameters table
6.2.1 The relation between link background
utilization and other performance parameters
By modifying PPP_DS3 link background utilization
between server’s subnet and cloud in scenario (2) as
shown in Figure18
Fig. 18: Background utilization
Throughput of the DB server load will be changing
according to utilization as HTTP server performance
load will increase as shown in Figure 19

Service Oriented Architecture for Remote Sensing 23
Satellite Telemetry Data Implemented on Cloud Computing
Copyright © 2013 MECS I.J. Information Technology and Computer Science, 2013, 07, 12-26
Fig. 19: results comparing
6.2.2 The relation between number of clients and
other performance parameters
By increasing the number of clients in each subnet
from three clients in scenario (1) to six clients in each
subnet in scenario (3), each client can access all
applications (FTP, HTTP and database) in serial
operation mode.
Database server and FTP&HTTP server load will
increase as shown in Figure 20
Fig. 20: results comparing
24 Service Oriented Architecture for Remote Sensing
Satellite Telemetry Data Implemented on Cloud Computing
Copyright © 2013 MECS I.J. Information Technology and Computer Science, 2013, 07, 12-26
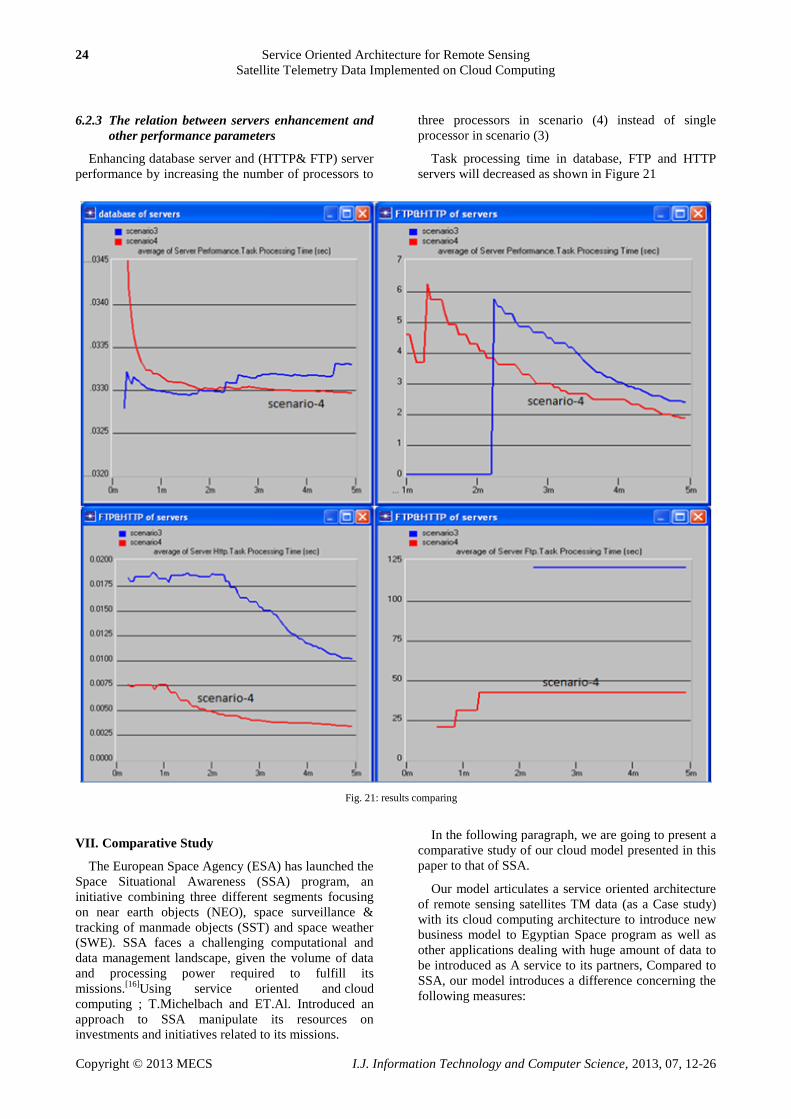
6.2.3 The relation between servers enhancement and
other performance parameters
Enhancing database server and (HTTP& FTP) server
performance by increasing the number of processors to
three processors in scenario (4) instead of single
processor in scenario (3)
Task processing time in database, FTP and HTTP
servers will decreased as shown in Figure 21
Fig. 21: results comparing
VII. Comparative Study
The European Space Agency (ESA) has launched the
Space Situational Awareness (SSA) program, an
initiative combining three different segments focusing
on near earth objects (NEO), space surveillance &
tracking of manmade objects (SST) and space weather
(SWE). SSA faces a challenging computational and
data management landscape, given the volume of data
and processing power required to fulfill its
missions.[16]
Using service oriented and cloud
computing ; T.Michelbach and ET.Al. Introduced an
approach to SSA manipulate its resources on
investments and initiatives related to its missions.
In the following paragraph, we are going to present a
comparative study of our cloud model presented in this
paper to that of SSA.
Our model articulates a service oriented architecture
of remote sensing satellites TM data (as a Case study)
with its cloud computing architecture to introduce new
business model to Egyptian Space program as well as
other applications dealing with huge amount of data to
be introduced as A service to its partners, Compared to
SSA, our model introduces a difference concerning the
following measures:
Service Oriented Architecture for Remote Sensing 25
Satellite Telemetry Data Implemented on Cloud Computing
Copyright © 2013 MECS I.J. Information Technology and Computer Science, 2013, 07, 12-26
Maintainability – Our model increased
maintainability by definition of standardized
requirements
Interoperability – Our model increased
interoperability by standardized service and data
models
SOA – Our model has software components used in
processing with Data flow between software
components (SSA does not)
Cloud architecture – Our model used Data as a
service layer (SSA used Platform as a service).
Our model which offers computation to only in one
layer (rather than in all layers as in SSA model)
VIII. Conclusion
Implementing the proposed service oriented
architecture (SOA) of satellite telemetry data (TMD) on
cloud computing was a very good case study in this
research to illustrate that Cloud computing and SOA
techniques have the ability to deploy large amount of
data as a service to the clients with substantial
scalability and elasticity. We introduced a mathematical
analysis procedure to show how the performance of
cloud would be affected by the Quality of services
(QOS) of the network.
Simulation results were collected using OPNET for
studying the performance of the cloud based on the
network protocol as TCP; the effect of RTT on network
throughput, Network utilization and response time. On
the application level, simulation results that affect cloud
performance were also collected such as link
background utilization, the number of clients and the
number of processors. To show the added values of this
research, a comparative study with a similar work done
by the European space agency (Space Situational
Awareness) was also introduced. Therefore, The
organizations working in fields such as space ,
petroleum, multimedia... etc. which offers a
huge amount of data (to be introduced as a service to its
partners) can use the illustrated procedures in this
research to implement cloud computing facilities with
high (QOS).
References
[1] http://www.fas.org/spp/military/docops/army/ref_t
ext/chap07a.htm
[2] Yu Du , “A Satellite Ground Station Control
System” , Technical University of Denmark ,
Informatics and Mathematical Modeling , Lyngby
21 October 2005 IMM-THESIS-2005-86, pp.
17 ,18,26,27,34
[3] Mike P. Papazoglou, “ Service -Oriented
Computing: Concepts, Characteristics and
Directions“, Proceedings of the Fourth
International Conference on Web Information
Systems Engineering (WISE’03) , PP. 3 , VOL 0-
7695-1999-7/03 $17.00 , 2003 IEEE
[4] AsadullahShaikh, MunibaMemon ,
NasrullahMemon ,Muhammad Misbahuddin ,”
The Role of Service Oriented Architecture in
Telemedicine Healthcare System” , IEEE 2009
[5] Peter Mell ,Timothy Grance , “ The NIST
Definition of Cloud Computing (Draft) “ , NIST ,
PP. 6,7 , Special Publication 800-145 January
2011
[6] Yuri Demchenko , Cees de Laat, ” Defining
Generic Architecture for Cloud Infrastructure as a
Service Model” , The International Symposium on
Grids and Clouds and the Open Grid Forum
Academia Sinica, Taipei, Taiwan , March 19 - 25,
2011
[7] Joe Weinman, “Mathematical Proof of the
Inevitability of Cloud
Computing” ,http://www.JoeWeinman.com/Resou
rces/Joe_Weinman_Inevitability_Of_Cloud.pdf,
2011
[8] Anthony T. Velte ,Toby J. Velte ,Robert
Elsenpeter,“ Cloud Computing A Practical
Approach” , ISBN: 978-0-07-162695-8 ,2010
[9] Minqi Zhou, Rong Zhang, DadanZeng,
WeiningQian , “ Services in the Cloud Computing
Era: A Survey “ , IEEE 2010
[10] Michael Behrendt ,BernardGlasner ,Petra
Kopp ,Robert Dieckmann ,GerdBreiter ,Stefan
pappe ,Heather Kreger, Ali Arsanjani ,
“Introduction and Architecture Overview IBM
Cloud Computing Reference Architecture 2.0 “ ,
IBM , 2011
[11] European cooperation for space standardization
(ECSS) “Ground systems and operations
Telemetry and telecommand packet utilization ” ,
ECSS – E- 70-41A , 30 January 2003
[12] MehranSarkarati, Keplerlaan , Noordwijk ZH, "A
WEB-BASED MODULAR AND FLEXIBLE
DATA ACQUISITION AND TELEMETRY
MONITORING SYSTEMFOR MICRO
SATELLITES “
[13] Paessler AG , “PRTG Network Monitor 9 Getting
Started”, September 2011
[14] http://basicitnetworking.blogspot.com/2009/11/tho
ughput-data-transfer-calculation.html
[15] Andrew Kaczorek, Jason Stowe, “ Maximizing
Data Throughput” ,http://cloudcomputing.sys-
con.com/node/1590356/print ,10/3/2012
[16] T. Michelbach , B. E. Amstutz , T. T. Usrey , G.
Frith , M. Ziegler , C. Tueffers , J. Stogdill , A.
ÁguedaMaté ,”Cloud Computing and Service
26 Service Oriented Architecture for Remote Sensing
Satellite Telemetry Data Implemented on Cloud Computing
Copyright © 2013 MECS I.J. Information Technology and Computer Science, 2013, 07, 12-26
Orientation in the SSA programme Space
Surveillance services and data in the
Cloud” ,European Space Surveillance Conference
2011
Authors’ Profiles
Dr. Abdelfattah El-Sharkawi:
Associate professor , Software
Engineering ,Al –Azhar University,
Egypt; Project Director for the
Development of software of Mission
Control Center at Egyptian National
Agency for Remote Sensing and Space Sciences
(NARSS).
Dr. Ahmed Shouman: Assistant
Professor, Department of Engineering
and Computer Science, Faculty of
Electronic Engineering, Monoufia
University, Egypt.
Eng. Sayed lasheen: Telemetry senior
engineer, in Egyptian ground control
station, Graduate student for master
degree for computer science in
Menoufia University, major in computer
science