A review of the status of satellite remote sensing and image ...
25
Progress in Physical Geography 33(2) (2009) pp. 183–207 DOI: 10.1177/0309133309339563 A review of the status of satellite remote sensing and image processing techniques for mapping natural hazards and disasters Karen E. Joyce, 1 * Stella E. Belliss, 2 Sergey V. Samsonov, 1 Stephen J. McNeill 2 and Phil J. Glassey 1 1 GNS Science, PO Box 30368, Lower Hutt, 5040, New Zealand 2 Landcare Research, PO Box 40, Lincoln 7640, New Zealand Abstract: In the event of a natural disaster, remote sensing is a valuable source of spatial information and its utility has been proven on many occasions around the world. However, there are many different types of hazards experienced worldwide on an annual basis and their remote sensing solutions are equally varied. This paper addresses a number of data types and image processing techniques used to map and monitor earthquakes, faulting, volcanic activity, landslides, flooding, and wildfire, and the damages associated with each. Remote sensing is currently used operationally for some monitoring programs, though there are also difficulties associated with the rapid acquisition of data and provision of a robust product to emergency services as an end-user. The current status of remote sensing as a rapid-response data source is discussed, and some perspectives given on emerging airborne and satellite technologies. Key words: image processing, natural hazards, optical, remote sensing, SAR, thermal. *Author for correspondence. Email: [email protected] © The Author(s), 2009. Reprints and permissions: http://www.sagepub.co.uk/journalsPermissions.nav I Natural hazards and disasters The use of remote sensing within the domain of natural hazards and disasters has become increasingly common, due in part to increased awareness of environmental issues such as climate change, but also to the in- crease in geospatial technologies and the ability to provide up-to-date imagery to the public through the media and internet. As technology is enhanced, demand and expec- tations increase for near-real-time monitoring and visual images to be relayed to emergency services and the public in the event of a natural disaster. Recent improvements to earth monitoring satellites are paving the way to supply the demand. Techniques needed to exploit the available data effectively and rapidly must be developed concurrently, to ensure the best possible intelligence is reaching emergency services and decision- makers in a timely manner. A comprehensive review of remote sensing for some natural hazards was completed by Tralli et al. (2005), and Gillespie et al. (2007) at Universiteit Twente on January 11, 2013 ppg.sagepub.com Downloaded from
-
Upload
khangminh22 -
Category
Documents
-
view
0 -
download
0
Transcript of A review of the status of satellite remote sensing and image ...

Progress in Physical Geography 33(2) (2009) pp. 183–207
DOI: 10.1177/0309133309339563
A review of the status of satellite remote sensing and image processing techniques for mapping natural hazards and disasters
Karen E. Joyce,1* Stella E. Belliss,2 Sergey V. Samsonov,1 Stephen J. McNeill2 and Phil J. Glassey1
1GNS Science, PO Box 30368, Lower Hutt, 5040, New Zealand2Landcare Research, PO Box 40, Lincoln 7640, New Zealand
Abstract: In the event of a natural disaster, remote sensing is a valuable source of spatial information and its utility has been proven on many occasions around the world. However, there are many different types of hazards experienced worldwide on an annual basis and their remote sensing solutions are equally varied. This paper addresses a number of data types and image processing techniques used to map and monitor earthquakes, faulting, volcanic activity, landslides, fl ooding, and wildfi re, and the damages associated with each. Remote sensing is currently used operationally for some monitoring programs, though there are also diffi culties associated with the rapid acquisition of data and provision of a robust product to emergency services as an end-user. The current status of remote sensing as a rapid-response data source is discussed, and some perspectives given on emerging airborne and satellite technologies.
Key words: image processing, natural hazards, optical, remote sensing, SAR, thermal.
�
*Author for correspondence. Email: [email protected]
© The Author(s), 2009. Reprints and permissions:http://www.sagepub.co.uk/journalsPermissions.nav
I Natural hazards and disastersThe use of remote sensing within the domain of natural hazards and disasters has become increasingly common, due in part to increased awareness of environmental issues such as climate change, but also to the in-crease in geospatial technologies and the ability to provide up-to-date imagery to the public through the media and internet. As technology is enhanced, demand and expec-tations increase for near-real-time monitoring and visual images to be relayed to emergency
services and the public in the event of a natural disaster. Recent improvements to earth monitoring satellites are paving the way to supply the demand. Techniques needed to exploit the available data effectively and rapidly must be developed concurrently, to ensure the best possible intelligence is reaching emergency services and decision-makers in a timely manner.
A comprehensive review of remote sensing for some natural hazards was completed by Tralli et al. (2005), and Gillespie et al. (2007)
at Universiteit Twente on January 11, 2013ppg.sagepub.comDownloaded from

184 Progress in Physical Geography 33(2)
reviewed natural hazard prediction and ass-essment by remote sensing, with a focus on the types of sensors available. The research presented in this paper complements these works by directing attention to the manner in which the mapping was achieved with respect to different image processing techni-ques. Further, we also report on the reality of remotely sensed image acquisition and processing requirements with the view that timely intelligence and information extrac-tion is critical in an emergency response to a hazard or disaster situation.
For reference, the details of a number of satellites and sensors that are commonly used or have the potential for hazards mapping are collated in Table 1.
The four phases of the disaster manage-ment cycle include reduction (mitigation), readiness (preparedness), response and recovery (Cartwright, 2005). Remote sensing has a role to play in each of these phases, though this paper focuses primarily on its contribution to the response phase. Several different types of natural hazards and dis-asters are presented in the following sections to determine the commonly used image pro-cessing techniques (summarized in Table 2), their advantages and disadvantages, and to review the reality of applying them in a rapid-response environment.
Through this review it became apparent that many mapping operations are still using manual interpretation techniques to achieve
(Continued)
Table 1 Summary of the characteristics of some sensors used in hazards mapping and monitoring
Satellite Sensor Swath (km) Nadir spatial resolution (m)
Revisit capability
Airborne sensors variable variable > 0.1 Mobilized to orderCASI variable 1–2Hymap 100–225 2–10
Worldview Panchromatic 16.4 0.46 1.1 daysMultispectral 16.4 1.85
Quickbird Panchromatic 16.5 0.6 1.5–3 daysMultispectral 16.5 2.4
Ikonos Panchromatic 11 1 1.5–3 daysMultispectral 11 4
RapidEye^ Multispectral 77 x 1500 6.5 1 dayEO-1 ALI 60 30 Every 16 days
Hyperion 7.5 30Terra ASTER 60 15,30,90 4–16 daysTerra / Aqua MODIS 2300 250, 500, 1000 At least twice daily for
each satelliteALOS PRISM 35 4 Several times per year
as per JAXA acquisition plan
AVNIR 70 10PALSAR (Fine) 40–70 10PALSAR (ScanSAR) 250–350 100
SPOT-4 Panchromatic 60–80 10 11 times every 26 days
Multispectral 60–80 20
at Universiteit Twente on January 11, 2013ppg.sagepub.comDownloaded from

Karen E. Joyce et al.: A review of satellite remote sensing and image processing techniques 185
Satellite Sensor Swath (km) Nadir spatial resolution (m)
Revisit capability
SPOT-5 Panchromatic 60–80 5 11 times every 26 daysMultispectral 60–80 10
Kompsat Panchromatic 15 1 2–3 daysMultispectral 15 1
Landsat-5 TM Multispectral 185 30 Every 16 daysTM Thermal 185 120
Landsat-7* ETM+ Panchromatic 185 15 Every 16 daysETM+ Multispectral 185 30ETM+ Thermal 185 60
NOAA AVHRR 2399 1100 Several times per dayEnvisat MERIS 575 300 2–3 daysRadarsat-2 Ultra-fi ne 20 3 Every few daysRadarsat-1/-2 Fine 50 8Radarsat-2 Quad-pol fi ne 25 8Radarsat-1/-2 Standard 100 25Radarsat-2 Quad-pol standard 25 25Radarsat-1 Wide 150 30
Radarsat-1/-2 ScanSAR narrow 300 50Radarsat-1/-2 ScanSAR wide 500 100Radarsat-1/-2 Extended high 75 25Radarsat-1 Extended low 170 35ERS-2 100 30 35-day repeat cycleEnvisat ASAR standard 100 30 36-day repeat cycle
ASAR ScanSAR 405 1000TerraSAR-X Spotlight 10 1 11-day repeat cycle;
2.5-day revisit capabilityStripmap 30 3ScanSAR 100 18
Cosmo-Skymed^ Spotlight 10 <1 ~37 hours
Stripmap 40 3–15ScanSAR 100-200 30–100
*Landsat-7 nearing the end of its useful life; problems with scan line corrector resulting in data gaps^Figures quoted for one satellite in constellation
Table 1 Continued
high accuracy, but are disadvantaged by speed of reproduction. It is considerably faster and more sustainable to have automatically implemented algorithms for hazard detection and monitoring. Several programs already exist globally for providing near-real-time information to monitor thermal ‘hotspots’ associated with volcanic activity or fi re (for
example, see University of Hawai’i and Geoscience Australia). Ultimately it would be useful to have similar automated methods and algorithms in place for the acquisition and processing of imagery and provision of geospatial information about other hazard events. To achieve this goal, robust techni-ques need to be developed and thoroughly
at Universiteit Twente on January 11, 2013ppg.sagepub.comDownloaded from

186 Progress in Physical Geography 33(2)
tested in an operational environment. The following sections document the testing of various methods for scientifi c and monitoring purposes, while examples of some current operational programs, of the role of remote sensing in rapid response systems, and of emerging developments are given in later parts of the paper.
II Earthquakes and faultingThere are several aspects involved in the de-tection of earthquakes, faulting, and damages associated with each. DInSAR (Differential Interferometric Synthetic Aperture Radar) is generally accepted as the best method for earthquake associated deformation map-ping; LiDAR (Light Detection and Ranging) provides the highest resolution DEM avail-able for fault interpretation; and very high resolution optical data will provide the best imagery for damage assessment of buildings and infrastructure.
1 Optical detection of earthquakes and faultingThe technique of choice in the use of remote sensing for fault mapping with optical data is manual interpretation, regardless of the data source (Fu et al., 2004; 2005; Walker, 2006; Walker et al., 2007). Frequently, the effects of earthquake activity and faulting are not manifested in spectral variations within image data, but in topographical changes. Image interpretation therefore relies on the expertise of the analyst, rather than spectral classifi ers. It is possible that this fi eld could benefit from the use of filters specifically designed to detect linear features. Note that fault detection is more of an exercise in pre-paredness than rapid response.
A number of different techniques have been reported in the literature to map the extent of earthquake damage, particularly in urban areas. Image differencing of multidate spectral ratios demonstrated better results than synthetic aperture radar (SAR) in Turkey and Iran, though a combination of optical and SAR coherence was reported to give the most accurate result (Stramondo et al., 2006). Sertel et al. (2007) used semivariogram
analysis of SPOT panchromatic imagery obtained both before and after the Izmit earthquake in Turkey. This technique demon-strated the possibility of mapping earth-quake severity based on changes in the shape of semivariograms, although further research was suggested before the relationship to a quantifi able amount of damage could be determined. It may also be of use where the spatial resolution of the image data is suf-ficient to detect textural changes, though insuffi cient to detect specifi c damages. See also section IV for details of landslide mapping as a result of earthquake damage.
2 Thermal and microwave detection of earthquakes and faultingAs an alternative to mapping earthquake damage, several studies have sought to char-acterize short-term temperature increases immediately prior to earthquakes. While the detection of thermal anomalies has thus far been conducted retrospectively, refi nement of this technique and routine investigation may hold information key to earthquake prediction and warnings. A ‘normal’ temp-erature for a region can be calculated using a time series of image data and an image of interest compared with this to determine areas of anomaly (Choudhury et al., 2006). This technique, as well as the split-window method, can be used with various multiband thermal sensors. Temperature anomalies have been observed over both land and sea in this manner (Ouzounov et al., 2006).
Recently, attempts were undertaken to measure the microwave signal produced by rock failures during earthquakes with pas-sive microwave sensors such as Advanced Microwave Scanning Radiometer for Earth Observation System (AMSR-E) aboard the satellite Aqua. Some initial results are promising (Takano and Maeda, 2009) but more work needs to be done in this direction.
3 SAR detection of earthquakes and faultingHigh resolution Synthetic Aperture Radar (SAR) intensity data is used for mapping ground changes and infrastructure damages
at Universiteit Twente on January 11, 2013ppg.sagepub.comDownloaded from

Karen E. Joyce et al.: A review of satellite remote sensing and image processing techniques 187
Tab
le 2
R
emot
ely
sens
ed d
ata
type
s an
d im
age
proc
essi
ng t
echn
ique
s fo
r in
form
atio
n ex
trac
tion
abou
t na
tura
l haz
ards
Dat
a ty
peSe
nsor
exa
mpl
esT
echn
ique
App
licat
ion
Adv
anta
ges
Dis
adva
ntag
es
Mul
tispe
ctra
l hi
gh t
o m
oder
ate
reso
lutio
n
Ikon
os,
Qui
ckbi
rd,
SPO
T, A
STE
R,
AL
OS
Man
ual
inte
rpre
tatio
nIn
fras
truc
ture
and
pr
oper
ty d
amag
e du
e to
fl oo
ding
, ea
rthq
uake
s,
land
slid
es, e
tc
Ben
efi t
s fr
om a
naly
st’s
kno
wle
dge
of t
he a
rea
in a
dditi
on t
o ot
her
inte
rpre
tatio
n cu
es s
uch
as c
onte
xt,
site
, ass
ocia
tion,
sha
pe, s
ize;
im
med
iate
vec
tor
outp
ut fi
le
Can
be
subj
ectiv
e, t
ime-
cons
umin
g fo
r w
ides
prea
d ev
ents
, and
non
-re
peat
able
Spec
tral
cl
assi
fi cat
ion
Loc
atio
n an
d ex
tent
of fl
ood
ing,
la
ndsl
ides
, vol
cani
c de
bris
, fi r
e sc
ars
Rel
ativ
ely
rapi
d to
app
ly o
ver
a la
rge
area
Non
-uni
que
spec
tral
res
pons
e va
lues
, may
req
uire
add
ition
al
man
ual e
ditin
g, a
ppro
pria
te
algo
rithm
mus
t be
sel
ecte
d fo
r op
timal
res
ult
Sem
ivar
iogr
am
anal
ysis
and
ot
her
text
ural
cl
assi
fi ers
Dam
age
due
to
eart
hqua
kes;
loca
tion
of la
ndsl
ides
May
be
usef
ul w
hen
spat
ial r
esol
utio
n is
low
er t
han
desi
red
Onl
y re
turn
s re
lativ
e da
mag
e es
timat
es
Imag
e th
resh
oldi
ng
(incl
udin
g ba
nd
ratio
s)
Loc
atio
n an
d ex
tent
of fl
ood
ing,
la
ndsl
ides
, vol
cani
c de
bris
, fi r
e sc
ars
Sim
ple
and
rapi
d to
app
ly, b
and
ratio
s re
duce
illu
min
atio
n va
riabi
lity,
can
be
appl
ied
with
pan
chro
mat
ic d
ata
Det
erm
inat
ion
of t
hres
hold
val
ues
may
be
subj
ectiv
e
Imag
e di
ffer
enci
ngL
ocat
ion
and
exte
nt o
f fl o
odin
g,
land
slid
es, v
olca
nic
debr
is, fi
re
scar
s
Can
be
cond
ucte
d on
pan
chro
mat
ic
data
, ban
d ra
tios
or S
AR
bac
ksca
tter
im
ager
y
Req
uire
s be
fore
and
aft
er im
ager
y th
at is
acc
urat
ely
co-r
egis
tere
d an
d ra
diom
etric
ally
bal
ance
d, o
nly
take
s th
e sp
ectr
al in
form
atio
n fr
om
a si
ngle
ban
d (t
houg
h th
is m
ay b
e a
ratio
com
bina
tion)
, all
chan
ges
will
be
iden
tifi e
d re
gard
less
of t
heir
rele
vanc
e to
the
par
ticul
ar n
atur
al
haza
rd (e
g, c
rop
rota
tions
); s
till
need
to
dete
rmin
e a
thre
shol
d of
ch
ange
(Con
tinue
d)
at Universiteit Twente on January 11, 2013ppg.sagepub.comDownloaded from

188 Progress in Physical Geography 33(2)
Dat
a ty
peSe
nsor
exa
mpl
esT
echn
ique
App
licat
ion
Adv
anta
ges
Dis
adva
ntag
es
Pos
t-cl
assi
fi cat
ion
chan
ge
dete
ctio
n
Loc
atio
n an
d ex
tent
of fl
ood
ing,
la
ndsl
ides
, vol
cani
c de
bris
, fi r
e sc
ars
Doe
s no
t re
quire
rad
iom
etric
ca
libra
tion
betw
een
mul
tiple
imag
esR
equi
res
befo
re a
nd a
fter
imag
ery
that
is a
ccur
atel
y co
-reg
iste
red,
all
chan
ges
will
be
iden
tifi e
d re
gard
less
of
the
ir re
leva
nce
to t
he p
artic
ular
na
tura
l haz
ard
(eg,
cro
p ro
tatio
ns),
re
quire
s cl
assi
fi cat
ion
to a
lso
be
com
plet
ed o
n ‘b
efor
e’ im
age
DE
M
gene
ratio
nD
EM
is u
sed
as
a su
pple
men
tary
in
form
atio
n in
var
iety
of
stu
dies
Pho
togr
amm
etric
met
hods
can
pr
ovid
e ve
ry h
igh
reso
lutio
n D
EM
s in
th
e ab
senc
e of
LiD
AR
Ster
eo im
agin
g is
not
aut
omat
ical
ly
acqu
ired
so m
ay n
ot b
e av
aila
ble;
D
EM
cre
atio
n so
ftw
are
is n
ot
stan
dard
in im
age
proc
essi
ng
pack
ages
– ie
, cos
ts e
xtra
, der
ived
el
evat
ion
is b
ased
on
vege
tatio
n ra
ther
tha
n gr
ound
hei
ght,
no
data
in
clo
udy
area
sSW
IRG
OE
S, T
OM
S,
MO
DIS
, A
STE
R
Split
win
dow
Hei
ght,
ext
ent
and
volu
me
of v
olca
nic
ash
clou
ds
Com
mon
ly u
sed
and
wel
l tes
ted
Rel
ativ
ely
low
spa
tial r
esol
utio
n of
th
erm
al s
enso
rs. U
nabl
e to
der
ive
sub-
pixe
l com
pone
nts
The
rmal
AST
ER
, M
OD
IS,
AV
HR
R
Split
win
dow
Cra
ter
lake
te
mpe
ratu
res,
lava
fl o
w, p
recu
rsor
to
eart
hqua
ke a
ctiv
ity,
tem
pera
ture
and
siz
e of
fi re
hot
spot
s
Com
mon
ly u
sed
and
wel
l tes
ted
Rel
ativ
ely
low
spa
tial r
esol
utio
n of
th
erm
al s
enso
rs. U
nabl
e to
der
ive
subp
ixel
com
pone
nts
Dua
l ban
dC
rate
r la
ke
tem
pera
ture
s, la
va
fl ow
, pre
curs
or t
o ea
rthq
uake
act
ivity
, te
mpe
ratu
re a
nd s
ize
of fi
re h
otsp
ots
Can
der
ive
subp
ixel
com
pone
nts
Ass
umes
onl
y tw
o th
erm
al
com
pone
nts
UV
or
ther
mal
GO
ES,
TO
MS,
M
OD
IS,
AST
ER
Abs
orpt
ion
in
UV
or
TIR
Hei
ght,
ext
ent
and
volu
me
of S
O2 a
nd
othe
r ga
s em
issi
ons
Com
mon
ly u
sed
and
wel
l tes
ted
Low
spa
tial r
esol
utio
n of
ge
osta
tiona
ry s
atel
lites
, req
uire
s ve
ry h
igh
tem
pora
l res
olut
ion
to
mon
itor
chan
ges
Tab
le 2
C
ontin
ued
at Universiteit Twente on January 11, 2013ppg.sagepub.comDownloaded from

Karen E. Joyce et al.: A review of satellite remote sensing and image processing techniques 189
SAR
JER
S-1,
ER
S-1/
2, E
NV
ISA
T,
AL
OS
PA
LSA
R,
Ter
raSA
R-X
, R
adar
sat-
1/2,
C
osm
o-Sk
yMed
Coh
eren
ceC
hang
e de
tect
ion
due
to la
ndsl
idin
g,
fl ood
ing,
fi re
, etc
Pro
vide
s qu
antit
ativ
e es
timat
ion
of
grou
nd c
hang
es
Doe
s no
t w
ork
wel
l in
dens
ely
vege
tate
d re
gion
s, a
ffec
ted
by
seas
onal
cha
nges
, acc
urac
y de
crea
ses
with
tim
e B
acks
catt
er
inte
nsity
Cha
nge
dete
ctio
n du
e to
land
slid
ing,
fl o
odin
g, fi
re, e
tc
Can
be
used
in c
loud
y co
nditi
ons,
si
de-lo
okin
g ac
quis
ition
geo
met
ry is
be
nefi c
ial f
or c
erta
in a
pplic
atio
ns
Qua
ntita
tive
anal
ysis
is c
ompl
icat
ed
and
varie
s si
gnifi
cant
ly fo
r di
ffer
ent
regi
ons,
may
be
diffi
cult
to in
terp
ret
for
non-
expe
rienc
ed e
nd-u
sers
In
terf
erom
etry
/ D
EM
ge
nera
tion
DE
M is
use
d as
su
pple
men
tary
in
form
atio
n in
var
iety
of
stu
dies
Inde
pend
ent
of w
eath
er c
ondi
tions
Acc
urac
y de
pend
s on
acq
uisi
tion
geom
etry
, wav
e-le
ngth
and
co
here
nce,
sid
e-lo
okin
g ac
quis
ition
ge
omet
ry c
reat
es d
isto
rtio
n an
d sh
adow
ed a
reas
Diff
eren
tial
inte
rfer
omet
rySu
rfac
e de
form
atio
n du
e to
vol
cani
c or
te
cton
ic a
ctiv
ity;
velo
city
and
ext
ent
of s
low
mov
ing
land
slid
es
Hig
h pr
ecis
ion,
hig
h re
solu
tion
of
som
e ne
w s
enso
rsD
epen
dent
on
spat
ial b
asel
ine
and
DE
M a
ccur
acy;
can
not
dete
rmin
e di
ffer
ence
bet
wee
n ve
rtic
al a
nd
horiz
onta
l com
pone
nts,
hig
h ac
cura
cy o
nly
avai
labl
e in
are
as
with
out
dens
e ve
geta
tion
Pol
arim
etry
Lan
d-co
ver
clas
sifi c
atio
n an
d ch
ange
det
ectio
n
Abi
lity
to d
etec
t fe
atur
es t
hat
are
not
visi
ble
on o
ptic
al im
ages
, sid
e-lo
okin
g ac
quis
ition
geo
met
ry
Dep
ende
nt o
n ty
pe o
f lan
d co
ver
and
seas
onal
cha
nges
DE
MP
AL
SAR
, L
iDA
R,
Ter
raSA
R-X
DT
M
diff
eren
cing
Vol
ume
of
land
slid
e re
late
d ea
rth
mov
emen
t,
faul
t lo
catio
ns
and
elev
atio
n di
spla
cem
ent
Pro
vide
s qu
antit
ativ
e es
timat
ion
of
volu
met
ric d
epos
ition
s an
d gr
ound
ch
ange
Req
uire
s im
ager
y bo
th b
efor
e an
d af
ter
even
t to
be
accu
rate
ly c
o-re
gist
ered
Ikon
os,
Qui
ckbi
rd,
SPO
T
Pho
togr
amm
etric
met
hods
can
pr
ovid
e ve
ry h
igh
reso
lutio
n D
EM
s in
th
e ab
senc
e of
LiD
AR
Ster
eo im
agin
g is
not
aut
omat
ical
ly
acqu
ired
so m
ay n
ot b
e av
aila
ble;
D
EM
cre
atio
n so
ftw
are
is n
ot
stan
dard
in im
age
proc
essi
ng
pack
ages
– ie
, cos
ts e
xtra
, der
ived
el
evat
ion
is b
ased
on
vege
tatio
n ra
ther
tha
n gr
ound
hei
ght,
no
data
in
clo
udy
area
sA
irbor
ne
LID
AR
sen
sors
, SE
ASA
T
Man
ual
inte
rpre
tatio
n
Ver
y hi
gh h
oriz
onta
l and
ver
tical
re
solu
tion,
can
giv
e ac
cura
te s
urfa
ce
elev
atio
n (r
athe
r th
an t
ree
heig
hts)
Acq
uisi
tion
of L
iDA
R is
exp
ensi
ve
and
take
s a
cons
ider
able
am
ount
of
time
to p
roce
ss
at Universiteit Twente on January 11, 2013ppg.sagepub.comDownloaded from

190 Progress in Physical Geography 33(2)
by calculating a ratio or difference between multitemporal images and then applying supervised or unsupervised classifi cation in the same way as is done with optical data (Matsuoka and Yamazaki, 2005). The main limitation of this approach is a significant variability of backscatter intensity for dif-ferent regions, lack of quantitative estima-tions and dependence on incidence angle.
A few modern SAR satell ites such as TerraSAR-X, Radarsat-2 and ALOS PALSAR are capable of providing data of various polarizations simultaneously. Phase shift and intensity difference between images of various polarizations are dependent on land cover and, therefore, can be success-fully used for its classifi cation (Czuchlewski et al., 2003). For example, due to side-looking acquisition geometry, urban constructions often produce distinct signal caused by the double bounce mechanism (Guillaso et al., 2005) and this pattern changes when build-ings are damaged by an earthquake. For this particular case and many other applications, SAR polarimetry will produce valuable results and complement optical observations.
Differential SAR interferometry is pos-sibly one of the best techniques used for mapping ground deformation produced by earthquakes. Differential interferometry (DInSAR) calculates the phase difference between SAR images acquired before and after an event or some other period when de-formation has occurred (Massonnet and Feigl, 1998; Rosen et al., 2000). The accuracy of this technique depends on data type and its quality: wave-band, perpendicular and temp-oral baselines, ground conditions (such as vegetation and snow coverage), tropospheric and ionospheric noise. In the most favourable conditions it is possible to achieve accuracy better than one quarter of SAR wavelength, about 0.5–1 cm for X-band, 1–2 cm for C-band, and 2–3 cm for L-band. This accuracy is suffi cient for mapping ground deformation of a moderate earthquake (M5 and up) depending on the depth of the epicentre.
The success of DInSAR depends on the degree of phase correlation between the various scenes, which in turn depends on the relative timing and geometry of the vari-ous scenes, as well as decorrelation due to the atmosphere, the relative accuracy of the orbit knowledge, and the precise conditions of image acquisition. Decorrelation occurs when surface conditions are signifi cantly dif-ferent between two acquisitions, or when they appear different in case of large spatial baselines. The effect of decorrelation is less significant for L-band than for C- and X-band. In early SAR satellites, images that might otherwise be suitable for InSAR or DInSAR were sometimes incoherent due to lack of yaw steering, although this is not a sig-nifi cant issue for SAR satellites at the time of writing. Various techniques have been developed in order to minimize atmospheric noise (stacking; Small Baseline Subeset – SBAS; Permanent Scatterers – PS) but usually atmospheric noise is not a problem for earthquake mapping because of a large magnitude of coseismic signal. However, in close proximity to a fault, displacements are too large and interferometric phase cannot be reconstructed due to ambiguity in phase unwrapping (Hanssen, 2001).
4 LiDAR detection of faultingAirborne LiDAR surveys are increasingly useful for mapping surface expressions of faulting. The extremely high vertical and horizontal resolution is ideal for observing previously undetected faults. Cunningham et al. (2006) demonstrated the utility of map-ping active faults after applying a tree removal algorithm to the derived digital elevation model (DEM). Subsequent analysis was com-pleted manually by visual interpretation. Manual interpretation was also used in New Zealand to extend the length of known faults and identify and map new fault scarps (Begg and Mouslpoulou, 2007). Topo-graphical profi les were used to assist analysis and quantify vertical deformations. However,
at Universiteit Twente on January 11, 2013ppg.sagepub.comDownloaded from

Karen E. Joyce et al.: A review of satellite remote sensing and image processing techniques 191
this technique of hazard mapping and monitoring is not appropriate for providing information in a rapid-response emergency situation due to the time it takes to acquire and process the data to a point where it can be manually interpreted.
III Volcanic activityDetection and monitoring of volcanic activity spans a number of different data types and processing methods. Thermal anomalies are commonly detected by comparing a location with its background or average temperature; volcanic deposits are best detected with optical data, often using the normalized difference vegetation index (NDVI) for spectral enhancement; the split-window method is used for detecting ash compos-ition within clouds; and InSAR is best for volcanic deformations.
1 Optical detection of volcanic activityA variety of sensors are available to provide data suitable for debris mapping, with a preference noted towards the higher spatial resolution satellites such as SPOT, Landsat and ASTER (Kerle et al., 2003; Joyce et al., 2008c). The use of additional spatial infor-mation such as pre-event images has been considered important for accurate detection of the deposit and vital for damage assess-ment. Quickbird and IKONOS could be used for this application, dependent on the extent of debris – and fi nancial constraints on the project. Lower spatial resolution satellites such as AVHRR have been found to be in-adequate (Kerle et al., 2003). ASTER has the added advantage of providing data that can be used to develop a DEM of the region, which can be useful in volumetric analysis of debris deposits (Huggel et al., 2008).
Few methods of automatic detection of volcanic debris using remote sensing have been reported in the literature, and it appears that the favoured technique is manual digit-ization. However, the normalized difference vegetation index (NDVI) is commonly used for its ability to enhance the difference be-
tween volcanic deposits and surrounding vegetated areas (Castro and Carranza, 2005; Harris et al., 2006). The NDVI can also be combined with a threshold value to delineate the deposit. Other techniques that have been used to aid visual interpretation of changes due to volcanic activity include a multiband display incorporating different input dates (Calomarde, 1998; Castro and Carranza, 2005), principal components analysis, and image subtraction (Torres et al., 2004).
2 Thermal detection of volcanic activityOf the more common applications, thermal monitoring of crater lake temperatures, lava, and thermal anomalies have been conducted since the 1980s, initially using the thermal sensor on board the Landsat series of sensors (Francis, 1989; Oppenheimer, 1996; Kaneko, 1998; Kaneko and Wooster, 1999; 2005; Donegan and Flynn, 2004; Harris et al., 2004). The number of thermal applications has since increased with the development of more sophisticated techniques such as sub-pixel analysis with multiband thermal sensors like ASTER (Pieri and Abrams, 2004; 2005; Lombardo and Buongiorno, 2006), MODIS (Wright and Flynn, 2003; Wright et al., 2004; 2005) and AVHRR (Mouginis-Mark et al., 1994; Carn and Oppenheimer, 2000; Patrick et al., 2005). The dual-band method is commonly applied to derive subpixel-level thermal anomalies, though is considered an oversimplifi cation of reality as it assumes that only two features of different temperatures exist within a pixel, whereas realistically there may be up to seven components (Wright and Flynn, 2003). Alerts for thermal anomalies observed on a global scale are available freely on the internet, utilizing both MODIS and GOES image data (Wright and Flynn, 2003; Wright et al., 2004; Rothery et al., 2005). These need to be viewed with caution, however, as the alerts are not sensitive to merely warm features (eg, minor crater lake heating), and will also be triggered by other non-volcanic sources of heat such as a bushfi re (Rothery et al., 2005).
at Universiteit Twente on January 11, 2013ppg.sagepub.comDownloaded from

192 Progress in Physical Geography 33(2)
Remote sensing is commonly used to monitor ash clouds and volcanic gaseous emissions (SO2) from both explosive and non explosive eruptions. Large-scale eruptions can eject gases and ash into the stratosphere, which may be monitored using geostationary satellites that measure absorption in the UV, SWIR and TIR wavelengths (eg, TOMS, GOES). However, they often lack the spatial resolution and radiometric sensitivity to monitor smaller fl uctuations in volcanic activity. Such plumes may be monitored with higher resolution using ASTER (Realmuto et al., 1997; Pieri and Abrams, 2004; Pugnaghi et al., 2006), though temporal variability moni-toring is compromised with the less frequent overpasses of this sensor. SO2 is measured using diagnostic absorption features in either the UV or TIR region of the spectrum. Ash composition is commonly measured using the ‘split-window’ technique, and requires subtraction of the refl ectance in one SWIR or TIR band from another (Prata, 1989). This technique allows distinction between vol-canic ash clouds and those of meteorological origin, based on threshold values (Dean et al., 2004; Tupper et al., 2004; Gu et al., 2005). Ash monitoring is considered operational and useful for aviation and warnings to volcanic ash advisory centres (VAACs).
3 SAR detection of volcanic activitySAR has successfully been used for mapping volcanic deformations (Berardino et al., 2002; Kwoun et al., 2006) as well as for monitoring of pyroclastic fl ows and lahars (Terunuma et al., 2005). It is particularly useful in erup-tions where there is a lot of smoke obscuring the target and preventing the effective use of optical data. Three products derived from SAR data are usually used: SAR backscatter intensity, InSAR coherence, and DInSAR interferometry.
Various ground conditions (eg, roughness, soil moisture, slope) affect intensity of refl ec-tion. Therefore, calculating a difference or a ratio of intensity images from before and after the event should produce an image where changes caused by pyroclastic fl ows
or lahars are easily observable. However, Terunuma et al. (2005) showed that changes of intensity signal are not clearly observed for either C- or L-band SAR sensors. But coherence calculated for the pair of images before and after an event was signifi cantly lower in regions where pyroclastic fl ows or lahars had occurred. However, estimation of coherence variation is only possible in regions with a high initial degree of coherence, ie, those not covered by dense vegetation or snow, and not being eroded too quickly.
SAR interferometry can be used to derive DEMs before and after an eruption. By sub-tracting these models it is possible to observe large-scale deformations caused by lahars or pyroclastic fl ows. Alternatively, differential interferometry can estimate deformation with subcentimetre accuracy caused by thermal and pressure sources underlying the surface. By monitoring volcanoes over a long period it is possible to reconstruct temporal patterns of deformation using SBAS (Berardino et al., 2002) or permanent scatterers techniques (Ferreti et al., 2001; Hooper et al., 2004).
IV LandslidesIt is possible to use both SAR and optical data for landslide detection, but it appears that optical data provides better results, most likely due to spatial resolution and sensor look angle. It can, however, suffer from mis-classifi cation with other areas of bare groud. Multitemporal analysis is preferable and spectral enhancement is often required. SAR data would be most useful in the event of storm-induced landsliding, where cloud cover impeded optical acquisition. InSAR could be useful for measuring the rate of slow-moving landslides. Difficulties can arise with SAR data in areas of high slopes due to layover and shadowing effects.
1 Optical detection of landslidesVisual interpretation, with and without on-screen digitizing of both two- and three-dimensional data, has been commonly used in the past and is still an effective method of
at Universiteit Twente on January 11, 2013ppg.sagepub.comDownloaded from

Karen E. Joyce et al.: A review of satellite remote sensing and image processing techniques 193
landslide mapping (Singhroy, 1995; Singhroy et al., 1998; Ostir et al., 2003; Nichol and Wong, 2005a; Kumar et al., 2006; Voigt et al., 2007). Orthophotography in particular has demonstrated its utility for mapping land-slides in detail and IKONOS with pan-sharpening has been suggested to be of equivalent if not superior use (Nichol and Wong, 2005b). Manual techniques benefi t from the analyst’s knowledge of the area, though they cannot be automated, and are impracticably time-consuming when mapping widespread numerous landslides. Some emerging studies are attempting to use more automated extraction techniques, utilizing band ratios (Cheng et al., 2004; Rau et al., 2007) and unsupervised (Dymond et al., 2006) and supervised classifi cation (Nichol and Wong, 2005b; Joyce et al., 2008a; 2008b) to reduce the level of manual interpretation, while still providing reasonably high accuracy levels (up to 80%). In a study to test the most accurate method for mapping landslides with SPOT-5 imagery, it was determined that the spectral angle mapper (SAM) supervised classifi cation and NDVI thresholding were the most accurate semi-automated techni-ques compared with the results achieved with parallelepiped, minimum distance to means, principal components, and multi-temporal image differencing (Joyce et al., 2008a; 2008b). This study also noted that manual digitizing produced a higher accuracy than any of the aforementioned techniques, but was considerably more time-consuming for a widespread event.
Multitemporal image analysis is a valu-able technique that can be used if imagery is available both before and after a landsliding event. This is perhaps the most promising option for rapid response. The process applied then relies on digital change detection – a number of methods of which are available (Singh, 1989; Jensen, 1996). An overall ac-curacy of approximately 70% was achieved using the postclassification comparison technique for landslide detection in Hong Kong (Nichol and Wong, 2005b). While
apparently effective, and commonly used in other areas of interest, this method is not documented frequently in landslide detection literature. An alternative technique requires multidate image differencing, as demon-strated with SPOT imagery in Taiwan (Cheng et al., 2004), using an infrared and red band ratio, image differencing, and thresholding. The results were later confined to slopes greater than 22° to reduce misclassifi cation due to human-induced change. Image dif-ferencing has also proven effective using panchromatic data for landslide mapping in Italy (Hervas et al., 2003; Rosin and Hervas, 2005), though while the authors report suc-cess an accuracy assessment is not given. Less success was reported when using SPOT-5 data in New Zealand, and diffi culties with this technique were associated with cloud cover affecting the radiometric calibration between the two dates (Joyce et al., 2008a; 2008b). This technique is also heavily reliant on accurate co-registration between images.
Unsupervised classification without change detection was used by Dymond et al. (2006) with SPOT-5 data for mapping the combined erosion scar and debris of a land-slide. The classification was restricted to slopes greater than 5° in an effort to reduce misclassifi cation of ‘bright’ pixels that may otherwise be areas of bare ground. While 80% accuracy was reported, only landslides greater than 10 000 m2 were checked, and an independent data set was not used for verification. Given the spatial resolution of SPOT (10 m), it is possible that there were many undetected small landslides that were not represented in this accuracy state-ment. Due to the high contrast of landslides with background features, subpixel iden-tification is possible, though accurate boundary delineation is not (Nichol and Wong, 2005b).
An alternative option to the use of spectral classifiers with optical data is to include textural layers (Whitworth et al., 2005). The image roughness with respect to its surrounds caused by landslide debris and shadow effects
at Universiteit Twente on January 11, 2013ppg.sagepub.comDownloaded from

194 Progress in Physical Geography 33(2)
can add additional information as a layer in a classifi cation. A principal components layer can also be used to assist distinction between land-cover types that appear similar in the textural layer (Whitworth et al., 2005).
The calculation of change in a DEM sur-face is one of the more frequently used techniques for landslide detection and moni-toring using remotely sensed data (Kaab, 2002; Ostir et al., 2003; Singhroy and Molch, 2004; Casson et al., 2005; Chen et al., 2006; Nichol et al., 2006; Tsutsui et al., 2007). This technique is only useful for large landslides with considerable vertical change in the topo-graphy. The stereo viewing capability of sev-eral contemporary sensors (SPOT, Ikonos, Quickbird) makes this a viable technique for acquiring imagery for the use of change detection and potentially for rapid response. In addition, the very high spatial resolution of the panchromatic stereo imagery from the Ikonos and Quickbird satellite sensors pro-duce very detailed elevation models that are considerably more cost-effective than the equivalent areal coverage of airborne LiDAR or SAR. The technique of DEM differencing also allows volumetric calculation of erosion and debris. However, stereo imaging is not automatically acquired with all sensors and may not be available for the specifi c area of interest, especially as rapid response type imagery. In addition, DEM extraction tools do not come as standard with image processing software, thus require separate add-on modules or software to create (eg, Leica photogrammetry suite, DEM extraction tool in ENVI).
2 SAR detection of landslidesAs with optical remote sensing, there is no distinct backscatter signature that can uniquely be associated with the mixed targets in a landslide. Instead, it is necessary to either use expert interpreter knowledge on a single scene, or estimate the backscatter differ-ence from a pre- and post-landslide event, and apply some threshold of change (Belliss et al., 1998).
While detecting backscatter difference is theoretically a straightforward task, there are some complications involved. First, if the images have slightly different viewing positions or different ground local incidence angles, then the scenes will exhibit an apparent change in brightness due to the difference in local incidence angle. This topographic dif-ference can be corrected, provided a good DEM is available (Pairman et al., 1997). Second, the inherent radar brightness of a target depends to a certain extent on sur-face environmental conditions on each date. Therefore, a difference-between-dates backscatter image might still show an overall brightness difference different from zero (ie, false positive). This effect is exacerbated with shorter wavelengths. Finally, unless the pre- and post-landslide images tightly embrace the times of the landslide event, the difference-between-dates backscatter image will tend to falsely detect landslides that are simply due to land-cover change – a problem that is similarly recognized with optical imagery.
Differential interferometry is used to measure velocities and extent of slow-moving landslides. In Rott and Nagler (2006) ERS SAR was used to map a landslide that is moving with 2.4 cm per year velocity. Unfortunately, such a high accuracy is only possible in regions not covered by dense vegetation that are coherent for extended periods of time.
V FloodingFlooding is readily apparent in both optical and SAR data, providing there is knowledge of water body location prior to the event. The use of SAR is preferable due to the likelihood of associated cloud cover. Simple techniques of image thresholding are easy to implement.
1 Optical detection of fl oodingMapping and monitoring water inundation can be a challenging process for passive remote sensing due to the often coincident cloud cover, and the fact that water is generally not
at Universiteit Twente on January 11, 2013ppg.sagepub.comDownloaded from

Karen E. Joyce et al.: A review of satellite remote sensing and image processing techniques 195
visible under a closed vegetation canopy. The utility of high temporal resolution sensors such as AVHRR is realized by Sandholt et al. (2003), who state that although the spatial resolution is coarser than many other satellite sensors the frequent revisit time offers a greater probability of obtaining cloud-free imagery. They used linear spectral un-mixing with thermal imagery to determine inundated areas, but were faced with the difficulty of selecting pure endmembers. Alternatively, they also tested supervised maximum likelihood and ISODATA clus-tering classifi cations with the higher spatial resolution Landsat ETM+, concluding that no technique is necessarily better than the other, rather that each has its advantages and disadvantages depending on the flooding extent, cloud cover and temporal variability.
Manual analysis of MISR imagery was completed to determine quantitative charac-teristics of the 2004 tsunami development along the eastern coast of India (Garay and Diner, 2007). This provided information about wave propagation and behaviour, but was not used to estimate the extent of damage.
Potentially one of the most useful studies for rapid-response flood mapping was conducted to create on-board satellite pro-cessing algorithms for Hyperion imagery (Ip et al., 2006). The algorithm utilizes three narrow spectral bands for a classifi cation and is then compared to a base scene to extract fl ood detail rather than just wet regions (eg, rivers, lakes). However, Hyperion has limited global coverage, and obtains imagery in rela-tively small segments that would be useful for localized fl ooding but not necessarily large events.
The extreme fl ooding events associated with several tropical storms in recent years (Hurricane Katrina, Cyclone Nargis) have been successfully and rapidly mapped using a variety of sensors to take advantage of dif-ferences in spatial and temporal resolution. Geoscience Australia is actively acquiring imagery of fl ooding events in Australia and attempting to develop semi-automated
techniques for extracting inundated areas (Lymburner et al., 2008; Thankappan et al., 2008). Flooding events of 2007 and 2008 were successfully mapped using Landsat-5 TM and ALOS AVNIR-2.
2 SAR detection of fl oodingSAR would appear to be an ideal sensor for the detection of extensive flooded areas, since the backscatter signature of water is so distinctive compared with that of vegetation (Lewis et al., 1998). Spectacular examples of the use of SAR include the April 1997 Red River flood near Winnipeg, Canada (Bonn and Dixon, 2005), and the Mississippi fl ood of 1993 (Nazarenko et al., 1995). The basic underlying assumption in these cases is that the fl oodwater remains visible for a suffi ciently long period of time to allow for acquisition of imagery and subsequent delin-eation of the flood boundary, which was certainly the case in these two major fl ood events.
SAR backscatter intensity and InSAR coherence can be successfully used together for mapping of regions affected by fl ooding. In Oberstadler et al. (1997) it was shown that flooded areas appear darker on ERS SAR intensity images and, therefore, comparing two images before and during fl ooding it is possible to map flooded areas with a high degree of accuracy. By combining SAR with other geospatial data such as DEMs, it is also possible to estimate the depth of water in fl ooded regions. InSAR coherence can also be used for the same purposes (Geudtner et al., 1996). This technique maps coherence of a SAR pair of images acquired before and during fl ooding and comparing it to a pair of SAR images that are both acquired before flooding. Areas affected by flooding have signifi cantly lower coherence than dry areas and by subtracting both coherence maps it is possible to identify these areas easily.
One of the unique features of SAR is the ability to detect areas of fl ooding under closed-canopy vegetation. Areas of fl ooded vegetation show with enhanced backscatter,
at Universiteit Twente on January 11, 2013ppg.sagepub.comDownloaded from

196 Progress in Physical Geography 33(2)
due to the corner-refl ector effect formed from the vegetation and the smooth water surface. The effect is wavelength- and vegetation-dependent, with short-wavelength (X- and C-band) sensitive to fl ooding under grasses (MacDonald et al., 1980), mid-wavelength (S-band) sensitive to flooding under reed and brush vegetation (Lewis et al, 1998), and long-wavelength (L- and P-band) sensitive to fl ooding under trees (Imhoff et al., 1987). This phenomenon has been long known with wavelengths as short as K-band (Waite and MacDonald, 1971), and has been explained by a comprehensive model (Ormsby et al., 1985). As in the case of the SAR detection of landslides above, successful detection of flooded areas under vegetation requires some visual interpretation experience, or the assistance of a scene gathered before the fl ooding in order to make a comparison.
VI Wildfi reMonitoring fi res using remote sensing is done in one of two ways: applications are based on either near-real-time monitoring of the fi re itself and/or smoke, or on mapping the extent and severity of burnt areas. MODIS and AVHRR are the most commonly used data types for this application due to their high temporal resolution. The use of their NIR wavelengths also allows for some penetr-ation through smoke to view the fi re scar.
1 Optical detection of wildfi reMapping and monitoring of fi re scars can use similar methods to those described for land-slides, as the characteristic of these features is cleared vegetation. However, while land-sliding results in exposed soils appearing as brighter features than their surrounds, burnt vegetation and organic matter in soils generally results in optically darker scar features in imagery due to the presence of ash. The degree of difference in refl ectance values between burnt and unburnt surfaces is dependent on the type of vegetation.
Satellite-based remote sensing has been used to extract information about the com-bustion completeness and also the fraction of an area that contains burns, through developing regression models with in situ information (Roy and Landman, 2005). While texture was considered to vary with burn scars in low spatial resolution (1 km) imagery, the isodata spectral classifi er produced higher accuracy levels for detection of scars in savannas. Band ratios and normalized indices are considered to provide better separation between burnt and non-burnt areas than individual spectral bands, particularly when combining wavelengths in the SWIR region of the spectrum (Trigg et al., 2005). Other ratios, such as the normalized difference vegetation index (NDVI) and the normal-ized burn ratio (NBR), were found to be less effective (Trigg et al., 2005; Hoy, 2007). Unsupervised classification has also been successfully used to delineate large scar areas in mosaicked AVHRR imagery. Most recently, the bushfi res in Victoria, Australia (February 2009), have been captured by optical sensors like MODIS, ASTER, Hyperion and ALI. It is too soon to report on automated or semi-automated techniques for extraction of the burn extent.
2 Thermal detection of wildfi reAs with estimating hotspots due to volcanic activity, the MODIS sensor is often used. Two techniques are commonly cited for derivation of surface temperatures and hotspots. The dual-band technique derives the temperature of two components and their portions within a pixel (Dozier, 1981), though problems with the oversimplifi cation of this technique were explored by Giglio and Kendall (2001). As an alternative, the split-window technique has proven useful as a basis for global monitoring of fi res, through detecting changes from a specified back-ground value. However, it is unable to derive subpixel components. These methods are
at Universiteit Twente on January 11, 2013ppg.sagepub.comDownloaded from

Karen E. Joyce et al.: A review of satellite remote sensing and image processing techniques 197
similar to those used for detection of thermal-based volcanic activity. Thermal differences have also been noticed between burnt and unburnt areas, thus temperature can also be used to map and monitor fi re scars.
3 SAR detection of wildfi reSynthetic aperture radar has been success-fully used for identification of burnt areas over the boreal forest of Alaska, Canada (Bourgeau-Chavez and Kasischke, 2002), and Siberia (Ranson et al., 2003) as well as over the tropical rain forest of Indonesia (Siegert et al., 1995) and semi-arid Mediterranean forest (Gimeno and San-Miguel-Ayanz, 2004). In these studies it was shown that the intensity of SAR backscatter signal was noticeably different between predominantly undisturbed and fi re-disturbed forest. This was due to an increase in soil moisture, in-creased surface roughness exposed to the incoming microwave radiation, and damage to the vegetation canopy by fi re.
In Gimeno and San-Miguel-Ayanz (2004), various SAR products with different resolution and various incidence angles were tested and novice incidence-angle normal-ization was introduced. It was also shown that acquisitions with low incidence angle are the most successful in identifi cation of burnt areas in hilly regions. In Couturier et al. (2001) the relationship between SAR backscatter intensity and fi re-related Daily Drought Index (DDI) was investigated over rain forest of Indonesia. A strong correla-tion between these two characteristics was observed, which suggested that SAR data can be successfully used not only for iden-tifi cation of burnt areas but also as a proxy for the susceptibility of forest to burn.
VII Operationally active hazard monitoring programs using remotely sensed imageryVarious programs are becoming available and more accessible for serving both imagery
and information with respect to hazards and disasters. The USGS hosts a Hazards Data Distribution System (HDDS), where it is possible to download pre- and post-event imagery from recent hazard events. It is also possible to retrieve baseline imagery from other areas in the United States through this interface. However, this is not an online operational portal for analysed imagery.
The University of Hawaii operates two websites for near-real-time monitoring of thermal hotspots. The first site contains GOES imagery of selected sites in the Western Hemisphere that is updated every 15 minutes, displaying combinations of visible, mid-infrared and thermal radiation. The second, more interactive site is based on MODIS imagery and displays hotspots as determined by a threshold in thermal values (Wright et al., 2004). The user can select a particular area of interest and retrieve a text fi le containing the location of the hotspot.
Geoscience Australia has a similar hotspot identifying GIS interface based on MODIS and AVHRR thermal imagery. This covers Australia, New Zealand and the South Pacifi c. Again, a threshold is used to identify locations hotter than a ‘background’ value. The University of Maryland hosts a global fi re mapper that is linked to a system to pro-vide email alerts of fi res within a specifi ed area of interest. The option is also available at several of these sites to export the current hotspots to Google Earth for near-real-time viewing by emergency responders. Due to the underlying data, each of these applications experiences diffi culties in detecting hotspots in areas of high cloud and/or smoke.
To ensure safe navigation and monitor possible climatic impact, NOAA records global historical volcanic eruptions, tracks volcanic ash eruptions affecting the United States, issues volcanic ash advisories, and provides ash cloud forecasts. The USGS Volcano Hazards CAP Alert provides daily updates of volcanic activity for sites identifi ed
at Universiteit Twente on January 11, 2013ppg.sagepub.comDownloaded from
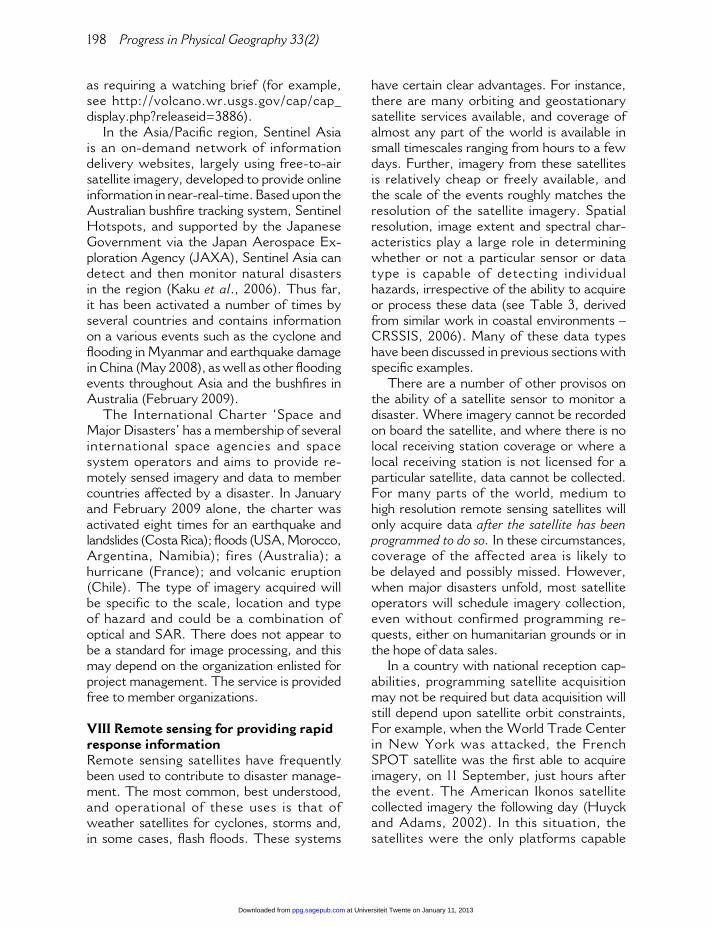
198 Progress in Physical Geography 33(2)
as requiring a watching brief (for example, see http://volcano.wr.usgs.gov/cap/cap_display.php?releaseid=3886).
In the Asia/Pacifi c region, Sentinel Asia is an on-demand network of information delivery websites, largely using free-to-air satellite imagery, developed to provide online information in near-real-time. Based upon the Australian bushfi re tracking system, Sentinel Hotspots, and supported by the Japanese Government via the Japan Aerospace Ex-ploration Agency (JAXA), Sentinel Asia can detect and then monitor natural disasters in the region (Kaku et al., 2006). Thus far, it has been activated a number of times by several countries and contains information on a various events such as the cyclone and fl ooding in Myanmar and earthquake damage in China (May 2008), as well as other fl ooding events throughout Asia and the bushfi res in Australia (February 2009).
The International Charter ‘Space and Major Disasters’ has a membership of several international space agencies and space system operators and aims to provide re-motely sensed imagery and data to member countries affected by a disaster. In January and February 2009 alone, the charter was activated eight times for an earthquake and landslides (Costa Rica); fl oods (USA, Morocco, Argentina, Namibia); fires (Australia); a hurricane (France); and volcanic eruption (Chile). The type of imagery acquired will be specific to the scale, location and type of hazard and could be a combination of optical and SAR. There does not appear to be a standard for image processing, and this may depend on the organization enlisted for project management. The service is provided free to member organizations.
VIII Remote sensing for providing rapid response informationRemote sensing satellites have frequently been used to contribute to disaster manage-ment. The most common, best understood, and operational of these uses is that of weather satellites for cyclones, storms and, in some cases, fl ash fl oods. These systems
have certain clear advantages. For instance, there are many orbiting and geostationary satellite services available, and coverage of almost any part of the world is available in small timescales ranging from hours to a few days. Further, imagery from these satellites is relatively cheap or freely available, and the scale of the events roughly matches the resolution of the satellite imagery. Spatial resolution, image extent and spectral char-acteristics play a large role in determining whether or not a particular sensor or data type is capable of detecting individual hazards, irrespective of the ability to acquire or process these data (see Table 3, derived from similar work in coastal environments – CRSSIS, 2006). Many of these data types have been discussed in previous sections with specifi c examples.
There are a number of other provisos on the ability of a satellite sensor to monitor a disaster. Where imagery cannot be recorded on board the satellite, and where there is no local receiving station coverage or where a local receiving station is not licensed for a particular satellite, data cannot be collected. For many parts of the world, medium to high resolution remote sensing satellites will only acquire data after the satellite has been programmed to do so. In these circumstances, coverage of the affected area is likely to be delayed and possibly missed. However, when major disasters unfold, most satellite operators will schedule imagery collection, even without confirmed programming re-quests, either on humanitarian grounds or in the hope of data sales.
In a country with national reception cap-abilities, programming satellite acquisition may not be required but data acquisition will still depend upon satellite orbit constraints, For example, when the World Trade Center in New York was attacked, the French SPOT satellite was the fi rst able to acquire imagery, on 11 September, just hours after the event. The American Ikonos satellite collected imagery the following day (Huyck and Adams, 2002). In this situation, the satellites were the only platforms capable
at Universiteit Twente on January 11, 2013ppg.sagepub.comDownloaded from

Karen E. Joyce et al.: A review of satellite remote sensing and image processing techniques 199
of acquiring early imagery since there was an air traffi c ban in force over the USA that was not lifted until 13 September. From then on, aircraft-mounted sensors were able to provide daily multispectral imagery, thermal imagery, photographs, hyperspectral imagery, and LiDAR. Some time later, some aerial photographs were converted to three-dimensional information by use of pro-prietary software from Pictometery, which can make all angles of a structure visible and measurable. Such images would have been useful for assessing hazards, eg, overhanging debris, during the clean-up (Huyck and Adams, 2002).
There are still many countries that do not have access to direct reception stations within their territory for medium to high spatial resolution imagery. In an emergency, commercial satellite services can be tasked to collect data. Depending upon the position of the particular satellite within its orbit, the time interval between an urgent data pro-gramming request and the fi rst acquisition attempt could be as short as 24 hours or as long as several days. As a general rule, satellite services more commonly used for emergencies are better at rapid response. A prime example of such a satellite service is Radarsat, which can typically schedule a data acquisition at very short notice and then supply the data to the data requester within hours of a successful acquisition. Other optical commercial satellite services could accept a programming request at similar short notice. Successful data acquisition would then rely predominantly upon orbital constraints plus, for optical satellites, cloud-free conditions over the area of need.
IX Emerging systemsEvery year, more earth observation satellites are launched than go out of commission. Currently, both Radarsat and SPOT have two satellites in orbit, and many other services with one satellite are planning a re-placement and/or a second vehicle. Just as there are constellations of communications satellites to allow continual coverage, a
number of national/international initiatives are in the process of launching constellations of satellites to enable daily or more frequent observation of anywhere in the world. One of the main drivers/justifications of these services is national security and this includes hazard monitoring. Systems that are under way include Cosmo-Skymed, a constellation of two X-band SAR satellites and two optical satellites phased at 90 degrees from one another. Another constellation under way is one developed by Surrey Satellite Technology (SST) and known as the Disaster Monitoring Constellation (DMC). This is a series of micro-satellites carrying multispectral sensors, each of which will be owned by individual countries/partners that will cooperate in data acquisition and distribution in the event of a disaster. When complete, the constellation should enable daily data coverage at the equator and hourly at higher latitudes (da Silva Curiel et al., 2005).
The German sate l l i te TerraSAR-X (launched in June 2007) is capable of acquiring imagery with up to 1 m spatial re-solution. Again the literature on processing and applications of this sensor is limited, but the sensor is expected to be another useful option for disaster monitoring. TanDEM-X is scheduled for launch in 2009 and will fl y in orbit close to TerraSAR-X, allowing the generation of high resolution DEMs that could potentially be used for change analysis, particularly with respect to volumetric analysis of landslide-related earth move-ment. Also German, the RapidEye constel-lation of fi ve satellites launched in August 2008 boasts a daily revisit time with a 6.5 m pixel size. Their online kiosk is also designed for rapid access to data. The combination of high spatial and temporal resolution in optical sensors holds great potential for disaster monitoring.
In addition to satellite platforms, the high level of fl exibility afforded by some airborne platforms is proving to be of real utility for disaster mapping and monitoring. With state of the art GPS and IMU (inertial mea-surement units) on board, it is possible to
at Universiteit Twente on January 11, 2013ppg.sagepub.comDownloaded from

200 Progress in Physical Geography 33(2)
Tab
le 3
U
tility
of v
ario
us d
ata
type
s fo
r pr
ovid
ing
info
rmat
ion
abou
t na
tura
l haz
ards
Spec
tral
Vis
ible
– N
IRSW
IRH
yper
spec
tral
The
rmal
SAR
LiD
AR
Spat
ial (
very
hig
h =
<5
m;
high
= 5
–20
m; m
ediu
m =
20
–250
m; c
oars
e =
>25
0 m
)
Ver
y hi
ghH
igh
Med
ium
Coa
rse
Hig
hM
ediu
mC
oars
eV
ery
high
Med
ium
Coa
rse
Med
ium
Coa
rse
Sing
le
pola
rizat
ion
Pol
arim
etric
DE
M
Sens
or e
xam
ple
Qui
ckbi
rd,
Ikon
osA
STE
R,
SPO
T,
AL
OS
Lan
dsat
MO
DIS
, A
VH
RR
AST
ER
, SP
OT
Lan
dsat
MO
DIS
, A
VH
RR
CA
SI,
Hym
apH
yper
ion
MO
DIS
AST
ER
, L
ands
atM
OD
IS,
AV
HR
RR
adar
sat-
1,
ER
S-1/
2R
adar
sat-
2,
Ter
raSA
R-X
Airb
orne
Se
nsor
Vol
cano
The
rmal
an
omal
y –
< 1
00°C
EE
EE
EE
EE
EE
AA
EE
E
The
rmal
an
omal
y –
>10
0°C
EE
EE
BB
BB
BB
AA
EE
E
The
rmal
an
omal
y –
>10
00°C
BB
BB
BB
BB
BB
AA
EE
E
Lah
arB
AA
EE
EE
BB
EB
EB
DB
Ash
clo
uds
– de
tect
ion
BB
BB
BB
AE
*B
BB
BE
EE
Ash
clo
uds
– qu
antifi
cat
ion
EE
EE
BB
AE
*B
BB
BE
EE
Gas
clo
uds
– de
tect
ion
BB
BB
BB
BE
*B
BB
AE
EE
Gas
clo
uds
– qu
antifi
cat
ion
EE
EE
BB
BE
*B
BB
AE
EE
Def
orm
atio
nE
EE
EE
EE
EE
EE
EA
DA
Deb
risB
BB
CE
EE
BB
CE
EC
DB
Lav
a fl o
wB
BB
CB
BC
BB
CB
BC
DB
Pyr
ocla
stic
fl o
wB
BB
CB
BC
BB
CB
BC
DB
at Universiteit Twente on January 11, 2013ppg.sagepub.comDownloaded from

Karen E. Joyce et al.: A review of satellite remote sensing and image processing techniques 201
Ear
thqu
akes
an
d fa
ultin
g (s
ee a
lso
fi res
, fl o
odin
g an
d la
ndsl
ides
)
Faul
t lo
catio
nB
CC
EC
CE
BC
EE
EB
EA
Def
orm
atio
nE
EE
EE
EE
EE
EE
EA
CA
Aft
erm
ath
– bu
ildin
g an
d pr
oper
ty
dam
age
BB
BC
EE
EB
BC
EE
CC
B
Lan
dslid
esSc
ar +
deb
ris
fl ow
BA
BC
EE
EB
BE
EE
CD
B
Isol
ate
scar
fr
om d
ebris
fl o
wC
CE
EE
EE
CC
EE
EC
DB
Floo
ding
Inun
date
d ar
eaA
AB
CB
BC
BB
CB
CA
AB
Aft
erm
ath
– bu
ildin
g an
d pr
oper
ty
dam
age
AB
BC
CC
EB
BE
EE
CD
C
Wild
fi re
Fire
fron
tB
BB
BB
BA
BB
BB
AE
EE
Aft
erm
ath
– bu
ildin
g an
d pr
oper
ty
dam
age
BB
BC
BB
CB
BC
EE
CD
B
Lan
dsca
pe
scar
sB
AA
CE
EE
BB
CE
EC
AB
A: C
lear
ly d
emon
stra
ted
to w
ork
usin
g st
anda
rd im
age
proc
essi
ng s
yste
ms
and
is o
penl
y av
aila
ble
in t
he li
tera
ture
B: S
how
n to
wor
k w
ith e
xper
imen
tal i
mag
e da
ta s
ets
or o
ver
limite
d ar
eas
with
ver
y sm
all p
ixel
s or
ove
r gl
obal
sca
les
with
larg
e pi
xels
C: I
f ext
ent
is b
igge
r th
an s
ever
al p
ixel
sD
: Not
wid
ely
avai
labl
e in
lite
ratu
re b
ut t
heor
etic
ally
sho
uld
be a
pot
entia
l use
E: N
ot fe
asib
le*
Lis
ted
as n
ot fe
asib
le b
ecau
se o
f airc
raft
res
tric
tions
on
fl yin
g ov
er v
olca
nic
ash/
gas
clou
ds, r
athe
r th
an s
enso
r in
abili
ty
at Universiteit Twente on January 11, 2013ppg.sagepub.comDownloaded from

202 Progress in Physical Geography 33(2)
achieve relatively accurate geopositioning for acquired imagery and to develop auto-mated procedures for orthorectifi cation. On-board processing can also facilitate anomaly detection such as that used in fi re mapping so that a useful product can be served to the end-user as a shapefi le, image, or layer on Google Earth within minutes of capture (Ambrosia and Hinkley, 2008). Systems are being developed for both manned and unmanned vehicles that have the added advantage of being able to fl y under clouds in some areas and can incorporate a variety of sensors including optical and thermal.
X SummaryThe use of remote sensing for mapping and monitoring natural hazards has diversified in recent years owing to an increase in data availability and technological advances in their interpretation. Remote sensing has proven useful for a range of applications in-cluding the detection of earthquakes, faulting, volcanic activity, landslides, fl ooding, wildfi re, and the damages associated with each. A number of options for processing different data types collected in response to each of these hazards have been reviewed, with the commonality being the strong preference for baseline data to be acquired and main-tained pre-event. It has been noted on several occasions that damage assessment is not possible without an understanding of the initial-state environmental characteristics. Automated techniques are well established for identifi cation of fi re and volcanic activity associated with excessive heat, but the operationalization of mapping other hazard and disaster events requires more robust and generic techniques to be developed and implemented.
As the importance of good spatial data is becoming increasingly recognized, remote sensing in the fi eld of hazard assessment and disaster management is likely to grow in the future. New earth observation satellites are continually being launched, recognizing the prospective market in disaster management,
but the provision of acquired image data in a rapid response situation remains a challenge both technically and fi nancially. There is also the potential for increased use of airborne platforms to provide the fi rst level of image data in an emergency situation by acquiring, processing and serving imagery in near-real-time to the end-user.
It is not possible to recommend a single data type or processing solution that will work under all conditions. This is a broad fi eld of applications where some techniques will work better under some circumstances than another. While manual interpretation of many data types for various applications provides a popular mapping solution, this is unlikely to be the way forward for rapid response and emergency events. SAR data and InSAR techniques, for example, are of considerable value for mapping fl ooding extent and earth deformations due to vol-canic or tectonic activity, but are unable to detect thermal anomalies or concentrations of volcanic gaseous emissions. Optical data offers several advantages over SAR, but is inherently affected by cloud cover, smoke or haze at the time of satellite overpass. The fl exibility provided by a multisensor, multi-platform approach is likely to give the most comprehensive coverage of a disaster event.
AcknowledgementsThis work was supported by the New Zealand Foundation for Research, Science and Technology under contract C05X0403. Thank you to anonymous reviewers for helpful comments on the original manuscript.
ReferencesAmbrosia, V.G. and Hinkley, E. 2008: NASA
science serving society: improving capabilities for fi re characterization to effect reduction in disaster losses. IEEE International Geoscience and Remote Sensing Symposium, Boston, MA, 4, IV-628-631.
Begg, J.G. and Mouslpoulou, V. 2007: Rangitaiki Plains: another veil is lifted. New LiDAR data from Bay of Plenty, New Zealand. Geological Society of New Zealand Miscellaneous Publication 123A, 9.
Belliss, S.E., Pairman, D. and McNeill, S.J. 1998: Use of Radarsat data to map Landslide erosion in
at Universiteit Twente on January 11, 2013ppg.sagepub.comDownloaded from

Karen E. Joyce et al.: A review of satellite remote sensing and image processing techniques 203
steep landforms. Application Development and Research Opportunity (ADRO) Final Symposium, 13–15 October, Montreal, Quebec, Canada, Electronic Proceedings.
Berardino, P., Fornaro, G., Lanari, R. and Sansoti, E. 2002: A new algorithm for surface deformation monitoring based on small baseline differential SAR interferometry. IEEE Transactions on Geoscience and Remote Sensing 41, 2375–83.
Bonn, F. and Dixon, R. 2005: Monitoring fl ood extent and forecasting excess runoff risk with Radarsat-1 data. Natural Hazards 35, 377–93.
Bourgeau-Chavez, L. and Kasischke, E. 2002: Mapping fire scars in global boreal forest using imaging radar data. International Journal of Remote Sensing 23, 4211–34.
Calomarde, R. 1998: An application of remote sensing and geographic information system (GIS): a case study in Sto. Tomas-Marela River, Mt Pinatubo, Zambales, Philippines. Asian Conference on Remote Sensing, Manila.
Carn, S.A. and Oppenheimer, C. 2000: Remote monitoring of Indonesian volcanoes using satellite data from the Internet. International Journal of Remote Sensing 21, 873–910.
Cartwright, S. 2005: National Civil Defence Emer-gency Management Plan Order 2005. Published under the authority of the New Zealand Govern-ment, Wellington, New Zealand, 68 pp.
Casson, B., Delacourt, C. and Allemand, P. 2005: Contribution of multi-temporal remote sensing images to characterize landslide slip surface – applic-ation to the La Clapiere landslide (France). Natural Hazards and Earth System Sciences 5, 425–37.
Castro, O.T. and Carranza, E.J.M. 2005: Remote sensing of temporal variations in spatial distributions of lahar and pyroclastic-fl ow deposits, West Mount Pinatubo, Philippines. In Erasmi, S., Cyffka, B. and Kappas, M., editors, Remote sensing and GIS for environmental studies, volume 113, Gottingen: Gottinger Geographische Abhandlungen, 223–29.
Centre for Remote Sensing and Spatial Inform-ation Science (CRSSIS) 2006: Coastal remote sensing mapping capability matrix. Retrieved 17 May 2009 from http://www.gpem.uq.edu.au/CRSSIS/tools/rstoolkit/pdf/Mapping%20capability%20matrix.pdf
Chen, R.F., Chang, K.J., Angelier, J., Chan, Y.C., Deffontaines, B., Lee, C.T. and Lin, M.L. 2006: Topographical changes revealed by high-resolution airborne LiDAR data: the 1999 Tsaoling landslide induced by the Chi-Chi earthquake. Engineering Geology 88, 160–72.
Cheng, K.S., Wei, C. and Chang, S.C. 2004: Locating landslides using multi-temporal satellite images. Advances in Space Research 33, 296–301.
Choudhury, S., Dasgupta, S., Saraf, A.K. and Panda, S. 2006: Remote sensing observations of
pre-earthquake thermal anomalies in Iran. Inter-national Journal of Remote Sensing 27, 4381–96.
Couturier, S., Taylor, D., Siegert, F., Hoffmann, A. and Bao, M. 2001: ERS SAR backscatter. A potential real-time indicator of the proness of modi-fied rainforest to fire. Remote Sensing of Environ-ment 76, 410–17.
Cunningham, D., Grebby, S., Tansey, K., Gosar, A. and Kastelic, V. 2006: Application of airborne LiDAR to mapping seismogenic faults in forested mountainous terrain, southeastern Alps, Slovenia. Geophysical Research Letters 33, L20308, DOI: 10.1029/2006GL027014.
Czuchlewski, K., Weissel, R.J.K. and Kim, Y. 2003: Polarimetric synthetic aperture radar study of the Tsaoling landslide generated by the 1999 Chi-Chi earthquake. Journal of Geophysical Research 108(F1), 6006, DOI: 10.1029/2003JF000037.
da Silva Curiel, A., Boland, L., Cooksley, J., Bekhti, M., Stephens. P., Suna. W. and Sweeting, M. 2005: First results from the disaster monitoring con-stellation (DMC). Acta Astronautica 56, 261–71.
Dean, K., Dehn, J., Papp, K.R., Smith, S., Izbekov, P., Peterson, R., Keamey, C. and Steffke, A. 2004: Integrated satellite observations of the 2001 eruption of Mt Cleveland, Alaska. Journal of Volcanology and Geothermal Research 135, 51–73.
Donegan, S.J. and Flynn, L.P. 2004: Comparison of the response of the Landsat 7 Enhanced Thematic Mapper Plus and the Earth Observing-1 Advanced Land Imager over active lava flows. Journal of Volcanology and Geothermal Research 135, 105–26.
Dozier, J. 1981: A method for satellite identifi cation of surface temperature fi elds of subpixel resolution. Remote Sensing of Environment 11, 221–29.
Dymond, J.R., Ausseil, A.G., Shepherd, J.D. and Buettner, L. 2006: Validation of a region-wide model of landslide susceptibility in the Manawatu-Wanganui region of New Zealand. Geomorphology 74, 70–79.
Ferreti, A., Prati, C. and Rocca, F. 2001: Permanent scatterers in SAR interferometry. IEEE Transactions on Geoscience and Remote Sensing 39, 8–20.
Francis, P.W. 1989: Remote sensing of volcanoes. Advances in Space Research 9, 89–92.
Fu, B., Awata, Y., Du, J., Ninomiya, Y. and He, W. 2005: Complex geometry and segmentation of the surface rupture associated with the 14 November 2001 great Kunlun earthquake, northern Tibet, China. Tectonophysics 407, 43–63.
Fu, B., Ninomiya, Y., Lei, X., Toda, S., and Awata, Y. 2004: Mapping active fault associated with the 2003 Mw 6.6 Bam (SE Iran) earthquake with ASTER 3D images. Remote Sensing of Environ-ment 92, 153–57.
Garay, M.J. and Diner, D.J. 2007: Multi-angle Imaging SpectroRadiometer (MISR) time-lapse imagery of tsunami waves from the 26 December
at Universiteit Twente on January 11, 2013ppg.sagepub.comDownloaded from

204 Progress in Physical Geography 33(2)
assessment of fi re severity in Alaskan black spruce forests. Masters thesis, Department of Geography, University of Maryland. Retrieved 17 May 2009 from http://hdl.handle.net/1903/6960
Huggel, C., Schneider, D., Miranda, P.J., Delgado Granados, H. and Kaab, A. 2008: Evaluation of ASTER and SRTM DEM data for lahar modeling: a case study on lahars from Popocatepetl Volcano, Mexico. Journal of Volcanology and Geothermal Research 170, 99–110.
Huyck, C. and Adams, B. 2002: Emergency response in the wake of the World Trade Center attack: the remote sensing perspective. Engineering and Organ-izational Issues Related to The World Trade Center Terrorist Attack, volume 3, Report MCEER-02-SP05, 58 pp.
Imhoff, M.L., Vermillion, C., Story, M.H., Choudhury, A.M., Gafoor, A. and Polcyn, F. 1987: Monsoon fl ood boundary delineation and damage assessment using space borne imaging radar and Landsat data. Photogrammetric Engineering and Remote Sensing 53, 405–13.
Ip, F., Dohm, J.M., Baker, V.R., Doggett, T., Davies, A.G., Castano, R., Chien, S., Cichy, B., Greeley, R., Sherwood, R., Tran, D. and Rabideau, G. 2006: Flood detection and monitoring with the autonomous sciencecraft experiment onboard EO-1. Remote Sensing of Environment 101, 463–81.
Jensen, J.R. 1996: Introductory digital image processing: a remote sensing perspective. Upper Saddle River, NJ: Prentice-Hall, 316 pp.
Joyce, K.E., Dellow, G.D. and Glassey, P.J. 2008a: Assessing image processing techniques for mapping landslides. Proceedings of IEEE International Geoscience and Remote Sensing Symposium, Boston, MA 2, 1231–34.
— 2008b: Methods for mapping landslides in New Zealand using satellite optical remote sensing. 14th Australasian Remote Sensing and Photogrammetry Conference, Darwin, electronic proceedings.
Joyce, K.E., Samsonov, S., Jongens, R., Lee, J.M. and Glassey, P.J. 2008c: Using remote sensing for mapping the effects of natural hazards in New Zealand. Proceedings of IEEE International Geoscience and Remote Sensing Symposium, Boston, MA 2, 1251–54.
Kaab, A. 2002: Monitoring high-mountain terrain deformation from repeated air- and spaceborne optical data: examples using digital aerial imagery and ASTER data. ISPRS Journal of Photogrammetry and Remote Sensing 57, 39–52.
Kaku, K., Held, A.A., Fukui, H. and Arakida, M. 2006: Sentinel Asia initiative for disaster manage-ment support in the Asia-Pacifi c region. Proceedings of SPIE 6142, 641203, DOI: 10.1117/12.697822.
Kaneko, T. 1998: Thermal observation of the 1986 eruption of Izu-Oshima volcano (Japan) using Landsat TM data. Advances in Space Research 21, 517–20.
2004 Sumatra-Andaman earthquake. Remote Sensing of Environment 107, 256–63.
Geudtner, D., Winter, R. and Vachon, P. 1996: Flood monitoring using ERS-1 SAR interferometry coherence maps. Proceedings of IEEE International Geoscience and Remote Sensing Symposium 2, 966–68.
Giglio, L. and Kendall, J.D. 2001: Application of the Dozier retrieval to wildfi re characterization: a sensitivity analysis. Remote Sensing of Environment 77, 34–49.
Gillespie, T.W., Chu, J., Frankenberg, E. and Thomas, D. 2007: Assessment and prediction of natural hazards from satellite imagery. Progress in Physical Geography 31, 459–70.
Gimeno, M. and San-Miguel-Ayanz, J. 2004: Evaluation of Radarsat-1 data for identifi cation of burnt areas in Southern Europe. Remote Sensing of Environment 92, 370–75.
Gu, Y.X., Rose, W.I., Schneider, D.J., Bluth, G.J.S. and Watson, I.M. 2005: Advantageous GOES IR results for ash mapping at high latitudes: Cleveland eruptions 2001. Geophysical Research Letters 32, L02305, DOI: 02310.01029/02004GL021651.
Guillaso, S., Ferro-Famil, L., Reigber, A. and Pottier, E. 2005: Building characterization using L-band polarimetric interferometric SAR data. IEEE Geoscience and Remote Sensing Letters 2, 347–51.
Hanssen, R.F. 2001: Radar interferometry: data interpretation and error analysis. Dordrecht: Kluwer, 308 pp.
Harris, A.J.L., Flynn, L.P., Matias, O., Rose, W.I. and Cornejo, J. 2004: The evolution of an active silicic lava fl ow fi eld: an ETM+ perspective. Journal of Volcanology and Geothermal Research 135, 147–68.
Harris, A.J.L., Vallance, J.W., Kimberly, P., Rose, W.I., Matias, O., Bunzendahl, E., Flynn, L.P. and Garbeil, H. 2006: Downstream aggradation owing to lava dome extrusion and rainfall runoff at Volcan Santiaguito, Guatemala. In Rose, W.I., Bluth, G.J.S., Carr, M.J., Ewert, J.W., Patino, L.C. and Vallance, J.W., editors, Volcanic hazards in Central America, Geological Society of America, Special Paper 412, 85–104.
Hervas, J., Barredo, J.I., Rosin, P.L., Pasuto, A., Mantovani, F. and Silvano, S. 2003: Monitoring landslides from optical remotely sensed imagery: the case history of Tessina landslide, Italy. Geomorphology 54, 63–75.
Hooper, A., Zebker, H., Segail, P. and Kampes, B. 2004: A new method for measuring deformation on volcanoes and other natural terrains using InSAR persistent scatterers. Geophysical Research Letters 31, L23611, DOI: 23610.21029/22004GL021737.
Hoy, E.E. 2007: Evaluating the potential of the normalized burn ratio and other spectral indices for
at Universiteit Twente on January 11, 2013ppg.sagepub.comDownloaded from

Karen E. Joyce et al.: A review of satellite remote sensing and image processing techniques 205
Kaneko, T. and Wooster, M.J. 1999: Landsat infrared analysis of fumarole activity at Unzen Volcano: time-series comparison with gas and magma fl uxes. Journal of Volcanology and Geothermal Research 89, 57–64.
— 2005: Satellite thermal analysis of the 1986 Izu-Oshima lava flows. Journal of Volcanology and Geothermal Research 148, 355–71.
Kerle, N., Froger, J.L., Oppenheimer, C. and de Vries, B.V. 2003: Remote sensing of the 1998 mudfl ow at Casita volcano, Nicaragua. International Journal of Remote Sensing 24, 4791–816.
Kumar, K.V., Martha, T.R. and Roy, P.S. 2006: Mapping damage in the Jammu and Kashmir caused by 8 October 2005 M-w 7.3 earthquake from the Cartosat-1 and Resourcesat-1 imagery. International Journal of Remote Sensing 27, 4449–59.
Kwoun, O.I., Lu, Z., Neal, K. and Wicks, C. 2006: Quiescent deformation of the Aniakchak Caldera, Alaska, mapped by InSAR. Geology 34, 5–8.
Lewis, A.J., Henderson, F.M. and Holcomb, D.W. 1998: Radar fundamentals: the geoscience perspective. In Henderson, F.M. and Lewis, A.J., editors, Principles and applications of imaging radar, New York: Wiley, 131–81.
Lombardo, V. and Buongiorno, M.F. 2006: Lava fl ow thermal analysis using three infrared bands of remote-sensing imagery: a study case from Mount Etna 2001 eruption. Remote Sensing of Environment 101, 141–49.
Lymburner, L., Mueller, N. and Islam, A. 2008: Assessing the accuracy of fl ood mapping techniques using coincident MODIS and Landsat TM scenes. 14th Australasian Remote Sensing and Photogrammetry Conference, Darwin, electronic proceedings.
MacDonald, H.C., Waite, W.P. and Demarcke, J.S. 1980: Use of Seasat satellite radar imagery for the detection of standing water beneath forest vegetation. Proceedings of the American Society of Photogrammetry Annual Technical Meeting RS-3(B), 1–13.
Massonnet, D. and Feigl, K. 1998: Radar interferometry and its application to changes in the Earth surface. Reviews of Geophysics 36, 441–500.
Matsuoka, M. and Yamazaki, F. 2005: Building damage mapping of the 2003 Bam Iran Earthquake using Envisat/ASAR intensity imagery. Earthquake Spectra 21, S285, DOI: 10.1193/1191.2101027.
Mouginis-Mark, P., Garbeil, H. and Flament, P. 1994: Effects of viewing geometry on AVHRR ob-servations of volcanic thermal anomalies. Remote Sensing of Environment 48, 51–60.
Nazarenko, D.M., Martenson, D., Rossignol, S. and Staples, G. 1995: RADARSAT image char-acteristics and application requirements. Record of the IEEE 1995 International Radar Conference, 351–55, DOI: 10.1109/RADAR.1995.522571.
Nichol, J. and Wong, M.S. 2005a: Detection and interpretation of landslides using satellite images. Land Degradation and Development 16, 243–55.
— 2005b: Satellite remote sensing for detailed landslide inventories using change detection and image fusion. International Journal of Remote Sensing 26, 1913–26.
Nichol, J.E., Shaker, A. and Wong, M.S. 2006: Application of high-resolution stereo satellite images to detailed landslide hazard assessment. Geomorphology 76, 68–75.
Oberstadler, R., Honsch, H. and Hutch, D. 1997: Assessment of the mapping capabilities of ERS-1 SAR data for flood mapping: a case study in Germany. Hydrological Processes 11, 1415–25.
Oppenheimer, C. 1996: Crater lake heat losses esti-mated by remote sensing. Geophysical Research Letters 23, 1793–96.
Ormsby, J.P., Blanchard, B.J. and Blanchard, A.J. 1985: Detection of lowland flooding using active microwave systems. Photogrammetric Engineering and Remote Sensing 51, 317–28.
Ostir, K., Veljanovski, T., Podobnikar, T. and Stancic, Z. 2003: Application of satellite remote sensing in natural hazard management: the Mount Mangart landslide case study. International Journal of Remote Sensing 24, 3983–4002.
Ouzounov, D., Bryant, N., Logan, T., Pulinets, S. and Taylor, P. 2006: Satellite thermal IR pheno-mena associated with some of the major earth-quakes in 1999–2003. Physics and Chemistry of the Earth 31, 154–63.
Pairman, D., Belliss, S.E. and McNeill, S.J. 1997: Terrain influences on SAR backscatter around Mt. Taranaki, New Zealand. IEEE Transactions on Geoscience and Remote Sensing 35, 924–32.
Patrick, M.R., Dehn, J. and Dean, K. 2005: Numerical modelling of lava fl ow cooling applied to the 1997 Okmok eruption: comparison with advanced very high resolution radiometer thermal imagery. Journal of Geophysical Research – Solid Earth 110, B02210, DOI: 02210.01029/02003JB002538.
Pieri, D. and Abrams, M. 2004: ASTER watches the world’s volcanoes: a new paradigm for volcano-logical observations from orbit. Journal of Volcanology and Geothermal Research 135, 13–28.
— 2005: ASTER observations of thermal anomalies preceding the April 2003 eruption of Chikurachki volcano, Kurile Islands, Russia. Remote Sensing of Environment 99, 84–94.
Prata, A.J. 1989: Infrared radiative transfer calculations for volcanic ash clouds. Geophysical Research Letters 16, 1293–96.
Pugnaghi, S., Gangale, G., Corradini, S. and Buongiorno, M.F. 2006: Mt Etna sulfur dioxide fl ux monitoring using ASTER-TIR data and atmospheric observations. Journal of Volcanology and Geothermal Research 74–90.
at Universiteit Twente on January 11, 2013ppg.sagepub.comDownloaded from

206 Progress in Physical Geography 33(2)
Ranson, K., Kovacs, K., Sun, G. and Kharuk, V. 2003: Disturbance recognition in the boreal forest using radar and Landsat-7. Canadian Journal of Remote Sensing 29, 271–85.
Rau, J.Y., Chen, L.C., Liu, J.K. and Wu, T.H. 2007: Dynamics monitoring and disaster assess-ment for watershed management using time-series satellite images. IEEE Transactions on Geoscience and Remote Sensing 45, 1641–49.
Realmuto, V.J., Sutton, A.J. and Elias, T. 1997: Multispectral thermal infrared mapping of sulfur dioxide plumes: a case study from the East Rift Zone of Kilauea Volcano, Hawaii. Journal of Geophysical Research – Solid Earth 102, 15057–72.
Rosen, P., Hensley, P., Joughin, I., Li, F., Madsen, S., Rodriguez, E. and Goldstein, R. 2000: Synthetic aperture radar interferometry. Proceedings of the IEEE 88, 333–82.
Rosin, P.L. and Hervas, J. 2005: Remote sensing image thresholding methods for determining land-slide activity. International Journal of Remote Sensing 26, 1075–92.
Rothery, D.A., Coppola, D. and Saunders, C. 2005: Analysis of volcanic activity patterns using MODIS thermal alerts. Bulletin of Volcanology 67, 539–56.
Rott, H. and Nagler, T. 2006: The contribution of radar interferometry to the assessment of landslide hazards. Advances in Space Research 37, 710–19.
Roy, D.P. and Landman, T. 2005: Characterizing the surface heterogeneity of fi re effects using multi-temporal refl ective wavelength data. International Journal of Remote Sensing 26, 4197–218.
Sandholt, I., Nyborg, L., Fog, B., Lo, M., Bocoum, O. and Rasmussen, K. 2003: Remote sensing techniques for fl ood monitoring in the Senegal River Valley. Danish Journal of Geography 103, 71–81.
Sertel, E., Kaya, S. and Curran, P.J. 2007: Use of semivariograms to identify earthquake damage in an urban area. IEEE Transactions on Geoscience and Remote Sensing 45, 1590–94.
Siegert, F., Kuntz, S., Streck, C. and Bergbauer, B. 1995: Land use planning and monitoring in Indonesia using ERS-1 RADAR data. Proceedings of International Conference on Remote Sensing and GIS for Environmental Resources Management – The Indonesian-European Experience, Jakarta, Indonesia, 110–17.
Singh, A. 1989: Digital change detection techniques using remotely-sensed data. International Journal of Remote Sensing 10, 989–1003.
Singhroy, V. 1995: SAR integrated techniques for geohazard assessment. Advances in Space Research 15, 67–78.
Singhroy, V. and Molch, K. 2004: Characterizing and monitoring rockslides from SAR techniques. Advances in Space Research 33, 290–95.
Singhroy, V., Mattar, K.E. and Gray, A.L. 1998: Landslide characterization in Canada using interferometric SAR and combined SAR and TM images. Advances in Space Research 21, 465–76.
Stramondo, S., Bignami, C., Chini, M., Pierdicca, N. and Tertulliani, A. 2006: Satellite radar and optical remote sensing for earthquake damage detec-tion: results from different case studies. International Journal of Remote Sensing 27, 4433–47.
Takano, T. and Maeda, T. 2009: Experiment and theoretical study of earthquake detection cap-ability by means of microwave passive sensors on a satellite. IEEE Geoscience and Remote Sensing Letters 6, 107–11.
Terunuma, T., Nishida, K., Amada, T., Mizuyama, T., Sato, I. and Urai, M. 2005: Detection of traces of pyroclastic fl ows and lahars with satellite synthetic aperture radars. International Journal of Remote Sensing 26, 1927–42.
Thankappan, M., Reddy, S., Ackerly, S. and Forghani, A. 2008: Sentinel fl oods prototype: a system for rapid dissemination of satellite derived information on fl ooding. 14th Australasian Remote Sensing and Photogrammetry Conference, Darwin, electronic proceedings.
Torres, R., Mouginis-Mark, P., Self, S., Garbeil, H., Kallianpur, K. and Quiambao, R. 2004: Monitoring the evolution of the Pasig-Potrero alluvial fan, Pinatubo Volcano, using a decade of remote sensing data. Journal of Volcanology and Geothermal Research 138, 371–92.
Tralli, D.M., Blom, R.G., Zlotnicki, V., Donnellan, A. and Evans, D.L. 2005: Satellite remote sensing of earthquake, volcano, fl ood, landslide and coastal inundation hazards. ISPRS Journal of Photogrammetry and Remote Sensing 59, 185–98.
Trigg, S.N., Roy, D.P., and Flasse, S. 2005: An in situ study of the effects of surface anisotropy on the remote sensing of burned savannah. International Journal of Remote Sensing 26, 4869–76.
Tsutsui, K., Rokugawa, S., Nakagawa, H., Miyazaki, S., Cheng, C.T., Shiraishi, T. and Yang, S.D. 2007: Detection and volume estimation of large-scale landslides based on elevation-change analysis using DEMs extracted from high-resolution satellite stereo imagery. IEEE Transactions on Geoscience and Remote Sensing 45, 1681–96.
Tupper, A., Carn, S., Davey, J., Kamada, Y., Potts, R., Prata, F. and Tokuno, M. 2004: An evaluation of volcanic cloud detection techniques during recent significant eruptions in the western ‘Ring of Fire’. Remote Sensing of Environment 91, 27–46.
Voigt, S., Kemper, T., Riedlinger, T., Kiefl , R., Scholte, K. and Mehl, H. 2007: Satellite image analysis for disaster and crisis-management support. IEEE Transactions on Geoscience and Remote Sensing 45, 1520–28.
at Universiteit Twente on January 11, 2013ppg.sagepub.comDownloaded from

Karen E. Joyce et al.: A review of satellite remote sensing and image processing techniques 207
Waite, W.P. and MacDonald, H.C. 1971: Vegetation penetration with K-band radars. IEEE Transactions on Geoscience and Remote Sensing GE-9, 147–55.
Walker, R.T. 2006: A remote sensing study of active folding and faulting in southern Kerman province, SE Iran. Journal of Structural Geology 28, 654–68.
Walker, R.T., Nissen, E., Molor, E. and Bayasgalan, A. 2007: Reinterpretation of the active faulting in central Mongolia. Geology 35, 759–62.
Whitworth, M.C.Z., Giles, D.P. and Murphy, W. 2005: Airborne remote sensing for landslide hazard assessment: a case study on the Jurassic escarpment slopes of Worcestershire, UK. Quarterly Journal of Engineering Geology and Hydrogeology 38, 285–300.
Wright, R. and Flynn, L.P. 2003: On the retrieval of lava-fl ow surface temperatures from infrared satellite data. Geology 31, 893–96.
Wright, R., Carn, S. and Flynn, L.P. 2005: A satellite chronology of the May–June 2003 eruption of Anatahan volcano. Journal of Volcanology and Geothermal Research 146, 102–16.
Wright, R., Flynn, L.P., Garbeil, H., Harris, A.J.L. and Pilger, E. 2004: MODVOLC: near-real-time thermal monitoring of global volcanism. Journal of Volcanology and Geothermal Research 135, 29–49.
at Universiteit Twente on January 11, 2013ppg.sagepub.comDownloaded from