Noninvasive Remote Sensing Techniques for Infrastructures Diagnostics
9
Hindawi Publishing Corporation International Journal of Geophysics Volume 2011, Article ID 204976, 9 pages doi:10.1155/2011/204976 Research Article Noninvasive Remote Sensing Techniques for Infrastructures Diagnostics Angelo Palombo, 1 Stefano Pignatti, 1 Angela Perrone, 1 Francesco Soldovieri, 2 Tony Alfredo Stabile, 3 and Simone Pascucci 1 1 Consiglio Nazionale delle Ricerche, Istituto di Metodologie per l’Analisi Ambientale (IMAA), 85050 Tito Scalo, Italy 2 Consiglio Nazionale delle Ricerche, Istituto per il Rilevamento Elettromagnetico dell’Ambiente (IREA), 80127 Naples, Italy 3 Dipartimento di Scienze Fisiche, Universit` a degli Studi di Napoli Federico II, 80126 Naples, Italy Correspondence should be addressed to Angelo Palombo, [email protected] Received 15 February 2011; Revised 15 April 2011; Accepted 25 May 2011 Academic Editor: Nicola Masini Copyright © 2011 Angelo Palombo et al. This is an open access article distributed under the Creative Commons Attribution License, which permits unrestricted use, distribution, and reproduction in any medium, provided the original work is properly cited. The present paper aims at analyzing the potentialities of noninvasive remote sensing techniques used for detecting the conservation status of infrastructures. The applied remote sensing techniques are ground-based microwave radar interferometer and InfraRed Thermography (IRT) to study a particular structure planned and made in the framework of the ISTIMES project (funded by the European Commission in the frame of a joint Call “ICT and Security” of the Seventh Framework Programme). To exploit the effectiveness of the high-resolution remote sensing techniques applied we will use the high-frequency thermal camera to measure the structures oscillations by high-frequency analysis and ground-based microwave radar interferometer to measure the dynamic displacement of several points belonging to a large structure. The paper describes the preliminary research results and discusses on the future applicability and techniques developments for integrating high-frequency time series data of the thermal imagery and ground-based microwave radar interferometer data. 1. Introduction During the last decades, the advances in nondestructive elec- tromagnetic sensing techniques (optical, thermal, and mi- crowave) operating at different spectral, spatial and time scales make a multidepth, multiresolution and multiscale di- agnostics and monitoring activities thus to be used for the status assessment of existing structures [1]. These nondestructive techniques are primarily suited for the detection and characterisation of alterations and defects in the near surface of structures [2] and for the displacement monitoring and verification of the structural integrity of buildings and structures [3, 4]. As regards the sensing techniques used for this study, the thermal camera technology is a non-destructive investigation technique commonly used in different applications and in particular in the infrastructures and architectural heritage diagnostics [5]. Thermal imagery is used to identify sub- surface ununiformities since the heat flow from the surface to the inner structure is affected by the defects and inho- mogeneities present in the structure. The InfraRed Termog- raphy (IRT) analysis allows diagnostic results ranging from qualitative characterization (e.g., detection) to quantitative analysis (e.g., inhomogeneities characterization). It is worth noting that the application of IRT for detecting and charac- terizing defects in construction materials can be quite com- plicated as different physical properties affecting the thermal and optical properties of the structure [6] have to be con- sidered. Among them, the most important are the conduc- tivity, the diffusivity, and the specific heat of the investigated material, whereas the spectral properties such as emissivity, absorption, reflection, and transmission play a key role on the heat distribution in the material. Other properties/ characteristics that influence the thermal behaviour of a material are related to its porosity, volumetric mass, and water content. Furthermore, the use of high-frequency imagery ther- mal camera gives the opportunity of measuring full field
Transcript of Noninvasive Remote Sensing Techniques for Infrastructures Diagnostics
Hindawi Publishing CorporationInternational Journal of GeophysicsVolume 2011, Article ID 204976, 9 pagesdoi:10.1155/2011/204976
Research Article
Noninvasive Remote Sensing Techniques forInfrastructures Diagnostics
Angelo Palombo,1 Stefano Pignatti,1 Angela Perrone,1 Francesco Soldovieri,2
Tony Alfredo Stabile,3 and Simone Pascucci1
1 Consiglio Nazionale delle Ricerche, Istituto di Metodologie per l’Analisi Ambientale (IMAA), 85050 Tito Scalo, Italy2 Consiglio Nazionale delle Ricerche, Istituto per il Rilevamento Elettromagnetico dell’Ambiente (IREA), 80127 Naples, Italy3 Dipartimento di Scienze Fisiche, Universita degli Studi di Napoli Federico II, 80126 Naples, Italy
Correspondence should be addressed to Angelo Palombo, [email protected]
Received 15 February 2011; Revised 15 April 2011; Accepted 25 May 2011
Academic Editor: Nicola Masini
Copyright © 2011 Angelo Palombo et al. This is an open access article distributed under the Creative Commons AttributionLicense, which permits unrestricted use, distribution, and reproduction in any medium, provided the original work is properlycited.
The present paper aims at analyzing the potentialities of noninvasive remote sensing techniques used for detecting the conservationstatus of infrastructures. The applied remote sensing techniques are ground-based microwave radar interferometer and InfraRedThermography (IRT) to study a particular structure planned and made in the framework of the ISTIMES project (funded by theEuropean Commission in the frame of a joint Call “ICT and Security” of the Seventh Framework Programme). To exploit theeffectiveness of the high-resolution remote sensing techniques applied we will use the high-frequency thermal camera to measurethe structures oscillations by high-frequency analysis and ground-based microwave radar interferometer to measure the dynamicdisplacement of several points belonging to a large structure. The paper describes the preliminary research results and discusses onthe future applicability and techniques developments for integrating high-frequency time series data of the thermal imagery andground-based microwave radar interferometer data.
1. Introduction
During the last decades, the advances in nondestructive elec-tromagnetic sensing techniques (optical, thermal, and mi-crowave) operating at different spectral, spatial and timescales make a multidepth, multiresolution and multiscale di-agnostics and monitoring activities thus to be used for thestatus assessment of existing structures [1].
These nondestructive techniques are primarily suited forthe detection and characterisation of alterations and defectsin the near surface of structures [2] and for the displacementmonitoring and verification of the structural integrity ofbuildings and structures [3, 4].
As regards the sensing techniques used for this study, thethermal camera technology is a non-destructive investigationtechnique commonly used in different applications and inparticular in the infrastructures and architectural heritagediagnostics [5]. Thermal imagery is used to identify sub-surface ununiformities since the heat flow from the surface
to the inner structure is affected by the defects and inho-mogeneities present in the structure. The InfraRed Termog-raphy (IRT) analysis allows diagnostic results ranging fromqualitative characterization (e.g., detection) to quantitativeanalysis (e.g., inhomogeneities characterization). It is worthnoting that the application of IRT for detecting and charac-terizing defects in construction materials can be quite com-plicated as different physical properties affecting the thermaland optical properties of the structure [6] have to be con-sidered. Among them, the most important are the conduc-tivity, the diffusivity, and the specific heat of the investigatedmaterial, whereas the spectral properties such as emissivity,absorption, reflection, and transmission play a key role onthe heat distribution in the material. Other properties/characteristics that influence the thermal behaviour of amaterial are related to its porosity, volumetric mass, andwater content.
Furthermore, the use of high-frequency imagery ther-mal camera gives the opportunity of measuring full field
2 International Journal of Geophysics
deformation and vibration characteristics (i.e., frequencyand attenuation). From these measurements different modalparameters of the structure (e.g., natural frequencies, modeshapes, and damping ratios) can be extracted and displayedand used for the definition of a baseline set of dynamiccharacteristics of the structure. This kind of analysis can besubsequently used for the structural health monitoring andthe application of vibration-based damage detection tech-niques (see e.g., [7, 8]).
For the present study, we used high-frequency imagery(HFI) acquisitions for the retrieving of fast displacementsand vibrations in the structure.
On the other hand, concerning the microwave interfer-ometry technology applied in this study, it has proven to be apowerful remote sensing tool for vibration measurement ofstructures [9]. It was recently applied for tracking the vibra-tion of bridges excited by vehicular traffic [8, 10] to monitorthe displacements of heritage architectural structures such asthe two bell towers,
Giotto’s Tower and Arnolfo’s Tower, in Florence [11] orthe Tower of Pisa [12], for deflection measurements on vi-brating stay cables [13], and for in-field dynamic monitoringof engineering structures [4, 14]. All these studies have beencarried out by the use of an innovative noncontact micro-wave interferometer, named IBIS-S (Image By Interfero-metric Survey of Structures), manufactured by the Italiancompany IDS S.p.A. This innovative radar system hasbeen also applied for this study and it is based on theStepped-Frequency Continuous Wave (SF-CW) technique[15] and on the Differential Interferometric technique [16].The former providing the system with a range resolutioncapability and the latter allowing the system to evaluate thedisplacement response of each target detected in the illumi-nated scenario. IBIS-S sensor is fast and easy to be installed,allowing to operate in all weather conditions, both day andnight, even at a significant distance and without the need ofinstalling and wiring sensors. A further advantage obtainedby the IBIS-S instrument is the direct measurement of thedisplacement of a large number of targets simultaneously, inreal-time, and with high accuracy.
In this paper, the application of different sensors andmethodologies to several noninvasive infrastructures nearsurface diagnostics is presented. The analysis of acquired dataon different structures and materials included also time seriesrecorded by the thermal camera and radar on several pointsof a test bed cement beam.
2. Data and Methods
2.1. Test Beds. The data for this study were acquired in Mon-tagnole (French Alpes) site in an innovative facility ownedby LCPC (Laboratoire Central des Ponts et Chaussees), thatis one of the ISTIMES partners.
The Montagnole test site is mainly used to certify metal-lic protection nets that are used in mountains to prevent cat-astrophic rockslides. For ISTIMES project, it was exploitedas a purely research-oriented facility to verify the behaviourof noninvasive sensing techniques during the progressive
damage of an on purpose built concrete beam structure. Inparticular, the experiment has regarded the progressive dam-age, in different stages, of a concrete beam by means of fallingblocks thus allowing the different techniques to be tested inthe presence of hazards.
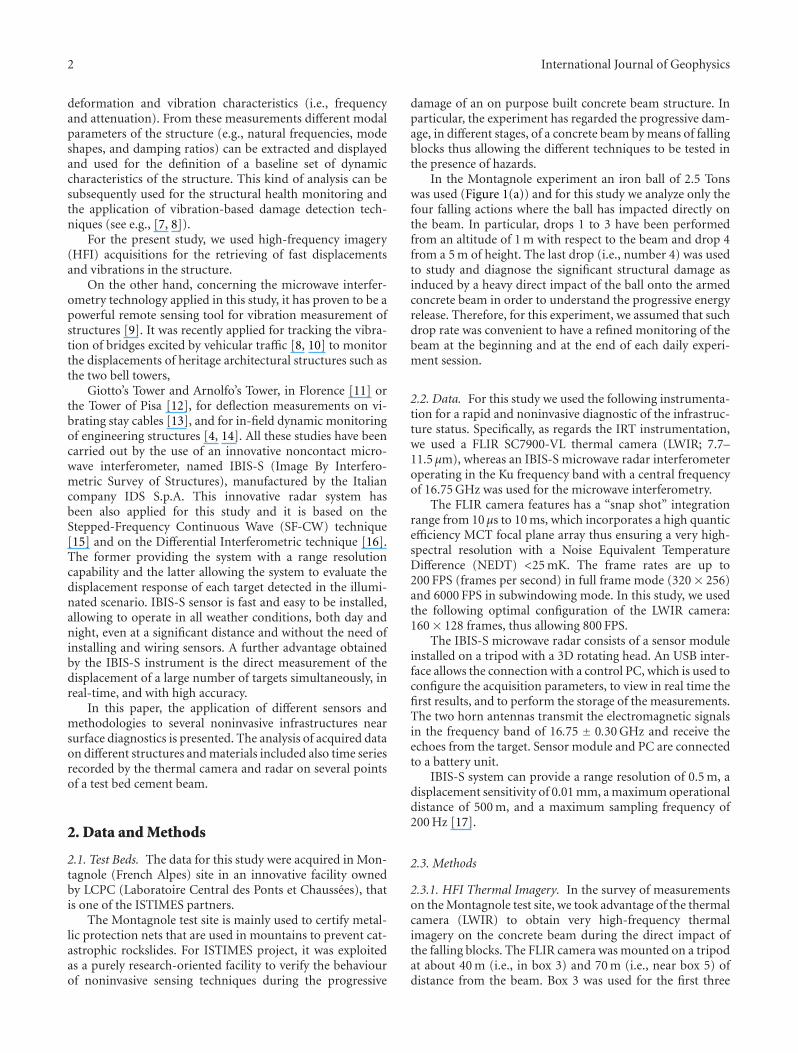
In the Montagnole experiment an iron ball of 2.5 Tonswas used (Figure 1(a)) and for this study we analyze only thefour falling actions where the ball has impacted directly onthe beam. In particular, drops 1 to 3 have been performedfrom an altitude of 1 m with respect to the beam and drop 4from a 5 m of height. The last drop (i.e., number 4) was usedto study and diagnose the significant structural damage asinduced by a heavy direct impact of the ball onto the armedconcrete beam in order to understand the progressive energyrelease. Therefore, for this experiment, we assumed that suchdrop rate was convenient to have a refined monitoring of thebeam at the beginning and at the end of each daily experi-ment session.
2.2. Data. For this study we used the following instrumenta-tion for a rapid and noninvasive diagnostic of the infrastruc-ture status. Specifically, as regards the IRT instrumentation,we used a FLIR SC7900-VL thermal camera (LWIR; 7.7–11.5 μm), whereas an IBIS-S microwave radar interferometeroperating in the Ku frequency band with a central frequencyof 16.75 GHz was used for the microwave interferometry.
The FLIR camera features has a “snap shot” integrationrange from 10 μs to 10 ms, which incorporates a high quanticefficiency MCT focal plane array thus ensuring a very high-spectral resolution with a Noise Equivalent TemperatureDifference (NEDT) <25 mK. The frame rates are up to200 FPS (frames per second) in full frame mode (320× 256)and 6000 FPS in subwindowing mode. In this study, we usedthe following optimal configuration of the LWIR camera:160× 128 frames, thus allowing 800 FPS.
The IBIS-S microwave radar consists of a sensor moduleinstalled on a tripod with a 3D rotating head. An USB inter-face allows the connection with a control PC, which is used toconfigure the acquisition parameters, to view in real time thefirst results, and to perform the storage of the measurements.The two horn antennas transmit the electromagnetic signalsin the frequency band of 16.75 ± 0.30 GHz and receive theechoes from the target. Sensor module and PC are connectedto a battery unit.
IBIS-S system can provide a range resolution of 0.5 m, adisplacement sensitivity of 0.01 mm, a maximum operationaldistance of 500 m, and a maximum sampling frequency of200 Hz [17].
2.3. Methods
2.3.1. HFI Thermal Imagery. In the survey of measurementson the Montagnole test site, we took advantage of the thermalcamera (LWIR) to obtain very high-frequency thermalimagery on the concrete beam during the direct impact ofthe falling blocks. The FLIR camera was mounted on a tripodat about 40 m (i.e., in box 3) and 70 m (i.e., near box 5) ofdistance from the beam. Box 3 was used for the first three
International Journal of Geophysics 3
(a)
Background
Mixedpixels
Beam
(b)
Figure 1: (a) Picture of the experimental site with the heavy load (iron ball) suspended at the height of 1 m over the beam. (b) Exampleof a frame acquired by HFI FLIR camera. The frame depicts the heavy load just before the impact on the concrete beam. The black arrowindicates the mixed pixels (i.e., background and beam) used for calculating the oscillation frequency after the impact.
drops (height of the falling ball of 1 m); for the drop 4 (heightof the falling ball of 5 m), due to safety reasons, the camerawas installed near the box 5 (70 m). For all the drops, theacquisition time was of 46 s for a total of 37000 frames.
The thermal imagery acquisitions were used to calculatethe beam oscillation frequency as derived from the differencebetween the beam temperature and the background temper-ature (see Figure 1(b)).
The method is based on the presence of mixed pixelscomposed by both the beam and the background as shownby the black arrow in Figure 1(b), labelled as i-pixel. The i-pixel temperature measured by the FLIR camera accounts forthe time-varying temperature relative to the beam and thebackground. The following equations were used to retrievethe beam oscillation:
c1Tb + c2Tt = Tm,
c1 + c2 = 1,(1)
where, c1 and Tb are the fraction of the i-pixel occupied bythe background and its temperature, respectively; c2 and Tt
are the fraction of the i-pixel occupied by the beam and itstemperature, respectively. Tm is the temperature measured bythe camera for the i-pixel.
The first equation of (1) represents the linear mixingof the temperatures of the beam and the background, thesecond is the constrain used for the total pixel fraction. TheTb and Tt temperatures, which are unknowns in (1), can beextracted from the temperature values of the neighbouringpixels of the i-pixel. The neighbouring pixels used for calcu-lating Tb and Tt have to be pure pixels (i.e., made up of onlybeam or target).
In (1), c2 represents the oscillation quantity expressed interms of pixel fraction that varies from 0 to 1. Moreover,when c2 oscillation reaches values near to the maximum andminimum, this represents situations in which the amplitudeof oscillation is close to or greater than the maximum meas-urable for a pixel, respectively. In the case that a pixel isnot sufficient to encompass the oscillation, it is possibleto solve the problem by considering, using the sum of
the neighbouring pixels, “equivalent pixels” having a largerdimension compared to the original one.
2.3.2. Ground-Based Microwave Radar Interferometer. IBIS-Sis based on two well-known radar techniques: the Stepped-Frequency Continuous Wave (SF-CW) and the DifferentialInterferometric [12, 18].
The SF-CW technique allows the system to resolve thescenario in the range direction [15, 19], that is, to detect theposition of target surfaces placed at different distances fromthe sensor. It is based on the synthesis and transmission of aburst of N monochromatic pulses equally and incrementallyspaced in frequency (with fixed frequency step ofΔ f ) leadingto a work bandwidth B:
B = (N − 1)Δ f , (2)
The N monochromatic pulses sample the scenario in thefrequency domain similarly to a short pulse with a largebandwidth B. In a SF-CW radar, the signal source dwellsat each frequency fx = f0 + kΔ f (k = 0, 1, 2, . . . ,N-1), thesingle tone signal is sufficiently long to allow the echoesbackscattered by the target to reach the receiver. Hence, theduration of each monochromatic pulse (Tpulse) depends onthe maximum distance (Rmax) to be observed in the scenarioand is given by,
Tpulse ≥ 2Rmax
c, (3)
where c represents the velocity of the light.At each sampled time instant, both I (In-phase) and
Q (Quadrature) components of the received signals areacquired so that the resulting data consist of a vector ofN complex samples, representing the frequency responsemeasured at N discrete frequencies.
By taking the Inverse Discrete Fourier Transform (IDFT)the radar response is reconstructed in the time domain: eachcomplex sample in this domain represents the signal (echo)from a range (distance) interval of length cTpulse/2.
The amplitude range profile of the radar echoes isthen obtained by calculating the magnitude of each bin of
4 International Journal of Geophysics
0.16
0.14
0.12
0.1
0.08
0.06
0.04
0.02
0
−0.020 1 2 3 4 5 6 7 8
Time (s)
Pix
elfr
acti
on
Oscillation drop 3
Pixel fraction shot 3 Dumper oscillator
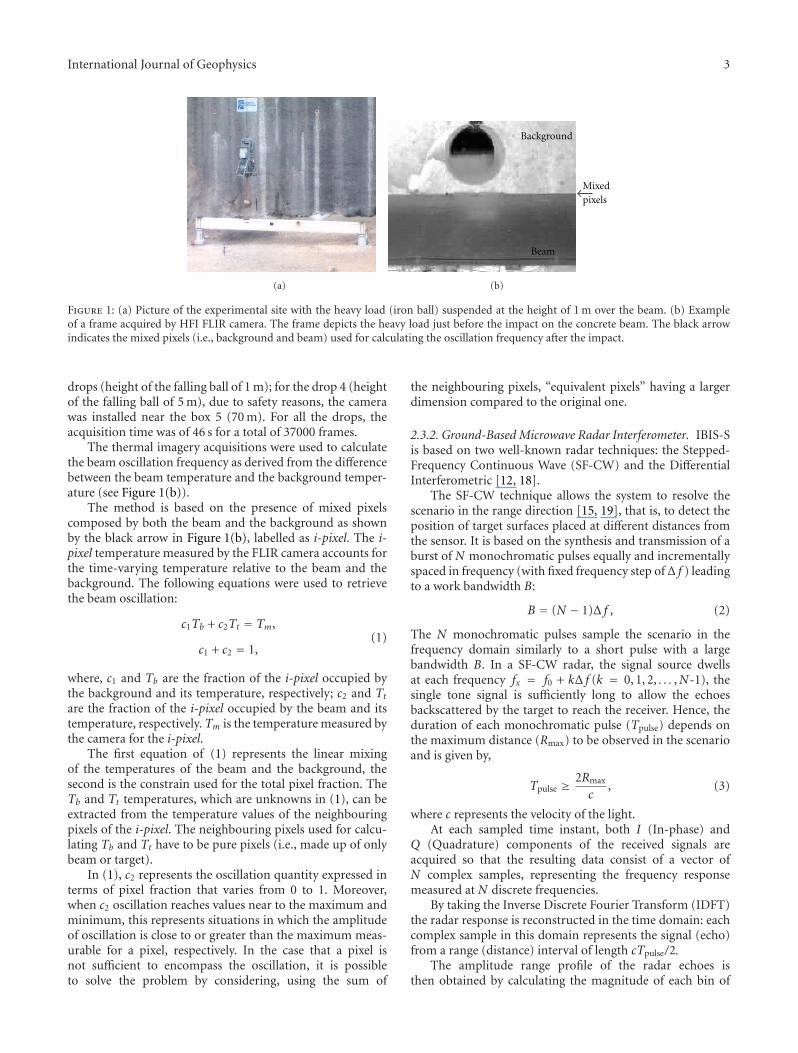
Figure 2: The graph shows the under-dumping decay attained forthe fraction of the i-pixel occupied by the beam (i.e., blue line C2)used for the Montagnole experiment. Red line depicts the theoret-ical dumper oscillator calculated from the parameters of Table 1.
the IDFT of acquired vector samples. This range profile givesa one-dimensional mapping of scattering objects in the “viewspace” as function of their relative distance from the sensor.
The differential interferometric technique allows thesystem to measure the displacements of the structure illumi-nated by the antenna main beam by comparing the phaseinformation of the backscattered electromagnetic wavescollected at different times (see, e.g., [16]).
Generally speaking, when a target surface moves withrespect to the sensor module (emitting and back-receivingthe electromagnetic wave) at least a phase shift arises be-tween the signals reflected by the target surface at differenttimes. Hence, the displacement of the investigated objectis determined from the phase shift measured by the radarsensor at the discrete acquisition times. The radial dis-placement dp (i.e., the displacement along the direction ofwave propagation) and the phase shift Δϕ are linked by thefollowing:
dp ∝ λ
4πΔϕ, (4)
where λ is the wavelength of the probing electromagneticsignal.
The radar emits a series of electromagnetic waves for theentire measurement period and processes phase informationat regular time intervals to find any displacement occurringbetween one emission and the next one. It is worth under-lining that the interferometric technique in (4) provides ameasurement of the displacement along the line of sight forall the range bins of the structure illuminated by the antennabeam; once dp has been evaluated, the vertical displacementd can be easily found by making some geometric projections.
IBIS-S system was applied in both Montagnole andMusmeci test beds. In the first case it was installed on a hill ata height of about 15 m from the ground level and at a distanceof about 70 m from the target. In order to improve the ac-curacy and the signal-to-noise ratio of the measurements,a corner reflector was fixed on the beam. To acquire the
measurements a range sampling frequency of 200 Hz and anacquisition time of about 60 s for each drop were used.
In the Musmeci test bed IBIS-S system was placed justunder the bridge deck with a perpendicular direction at a dis-tance of about 30 m. A sampling frequency of about 100 Hzand an acquisition time of about 5 minutes were applied.
In both cases the use of IBIS-S system allowed the dy-namic monitoring of the investigated target without anycontact between the sensor and the investigated target. Thischaracteristic was very useful in Montagnole test bed wherevery restricted security conditions were required in order tocarry out the experiment.
3. Results and Discussion
3.1. HFI Results. For Montagnole experiment, the drops ofthe heavy iron ball on the beam were used as mechanicalsolicitation to measure the dynamic response of the beam.For this study we used a simple model by considering the be-haviour of the beam as the one of a damped harmonic oscil-lator. The equation describing the oscillation is
z(t) = A0e−σω0t sin
(√1− σω0t + ϕ
), (5)
where A0 is the amplitude and ϕ the phase that dictates theinitial conditions, ω0 is the undamped angular frequencyof the oscillator and ζ is damping ratio that are given,respectively, by:
ω0 =√
k
m,
σ = c
2mω0,
(6)
where k is the elastic constant, m is the mass, and c is theviscous damping coefficient.
The value of ζ determines the behaviour of the system infact, the damped harmonic oscillator can be (a) for ζ > 1,the system is represented by exponentially decays; (b) for ζ =1, the system returns to equilibrium as quickly as possiblewithout oscillating; (c) for ζ < 1, the system is represented byan underdamped harmonic oscillator (Figure 2).
The quantity that describes the beam oscillation is thec2 value represented in (1). This value was calculated forall the frames of each acquisition performed on the beam.Figure 2 depicts the comparison between the quantity c2
(blue line) calculated for the third drop and the theoreticalunderdamped harmonic oscillator (red line) that approxi-mates the c2 oscillations. The parameters used for evaluatingthe underdamped harmonic oscillation, that is, those thatbetter approximates the c2 oscillation, are reported in Table 1.
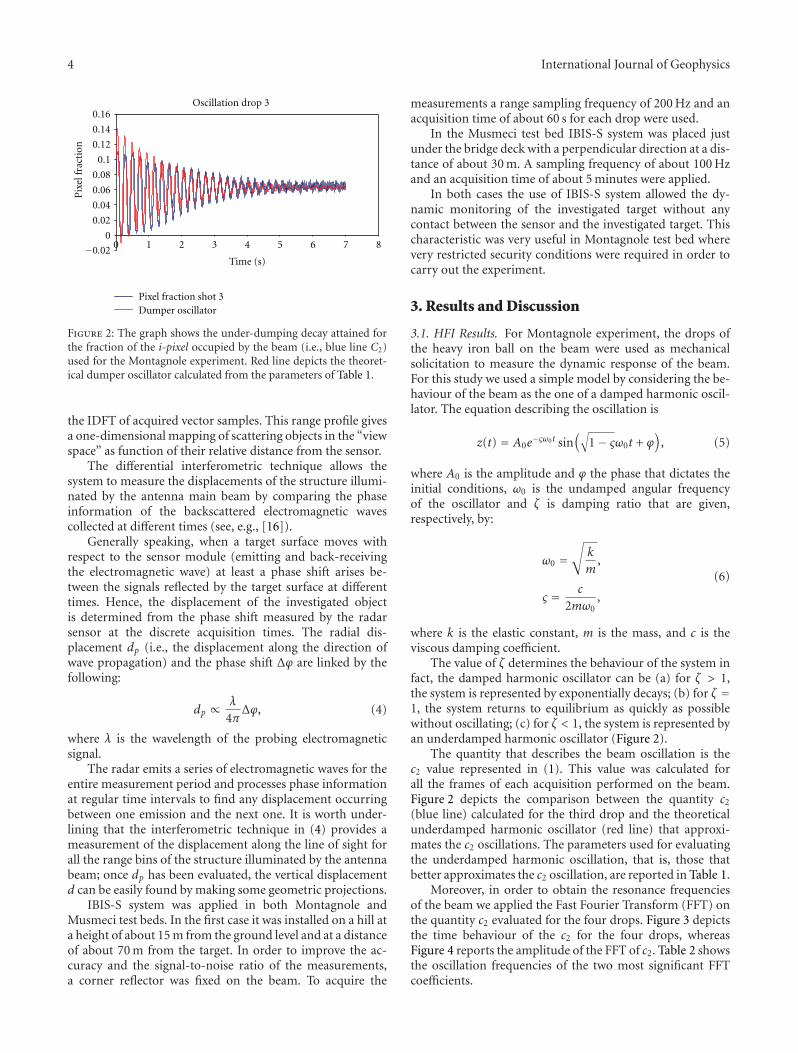
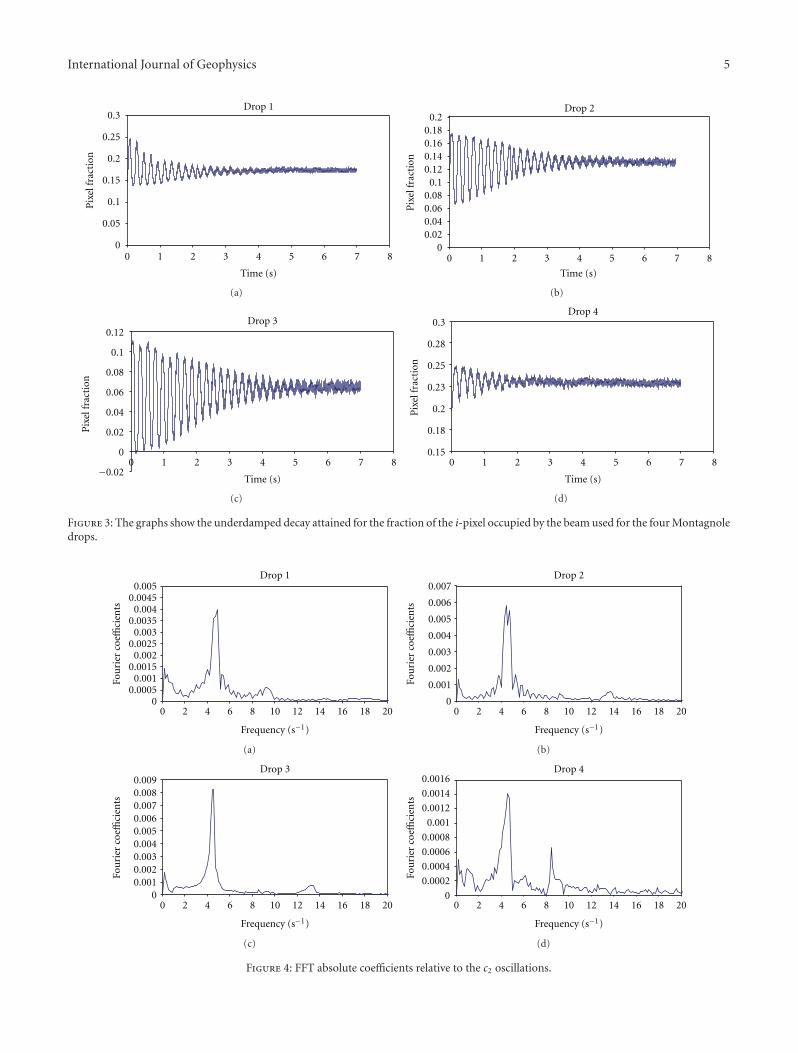
Moreover, in order to obtain the resonance frequenciesof the beam we applied the Fast Fourier Transform (FFT) onthe quantity c2 evaluated for the four drops. Figure 3 depictsthe time behaviour of the c2 for the four drops, whereasFigure 4 reports the amplitude of the FFT of c2. Table 2 showsthe oscillation frequencies of the two most significant FFTcoefficients.
International Journal of Geophysics 5
0.3
0.25
0.2
0.15
0.1
0.05
0
Drop 1
0 1 2 3 4 5 6 7 8
Time (s)
Pix
elfr
acti
on
(a)
0 1 2 3 4 5 6 7 8
Time (s)
Pix
elfr
acti
on
Drop 20.2
0.180.160.140.12
0.10.080.060.040.02
0
(b)
0 1 2 3 4 5 6 7 8
Time (s)
Pix
elfr
acti
on
Drop 30.12
0.1
0.08
0.06
0.04
0.02
0
−0.02
(c)
0 1 2 3 4 5 6 7 8
Time (s)
Pix
elfr
acti
on
Drop 40.3
0.28
0.25
0.23
0.2
0.18
0.15
(d)
Figure 3: The graphs show the underdamped decay attained for the fraction of the i-pixel occupied by the beam used for the four Montagnoledrops.
0.0050.0045
0.0040.0035
0.0030.0025
0.0020.0015
0.0010.0005
00 2 4 6 8 10 12 14 16 18 20
Frequency (s−1)
Fou
rier
coeffi
cien
ts
Drop 1
(a)
0 2 4 6 8 10 12 14 16 18 20
Frequency (s−1)
Fou
rier
coeffi
cien
ts
Drop 20.007
0.006
0.005
0.004
0.003
0.002
0.001
0
(b)
0 2 4 6 8 10 12 14 16 18 20
Frequency (s−1)
Fou
rier
coeffi
cien
ts
Drop 3
0.0070.0060.0050.0040.0030.0020.001
0
0.0090.008
(c)
0 2 4 6 8 10 12 14 16 18 20
Frequency (s−1)
Fou
rier
coeffi
cien
ts
Drop 40.0016
0.0014
0.0012
0.001
0.0008
0.0006
0.0004
0.0002
0
(d)
Figure 4: FFT absolute coefficients relative to the c2 oscillations.
6 International Journal of Geophysics
2
0
−2
136 138 140 142 146 144 148 150 152
Dis
plac
emen
t(m
m)
Time (s)
Drop 1
(a)
Dis
plac
emen
t(m
m)
Time (s)
−1
−2
−3
−4
−5
52 54 56 58 60 62 64 68 70 72
Drop 2
66
(b)
−2
−4
−6
Dis
plac
emen
t(m
m)
86 90 94 98 82 86 90 94 98 102 106
Drop 3
(c)
Dis
plac
emen
t(m
m)
Time (s)
−6
−8
−10
−12
−14
−16
−18
−20178 180 182 184 186 188 190 192 194 196
Drop 4
(d)
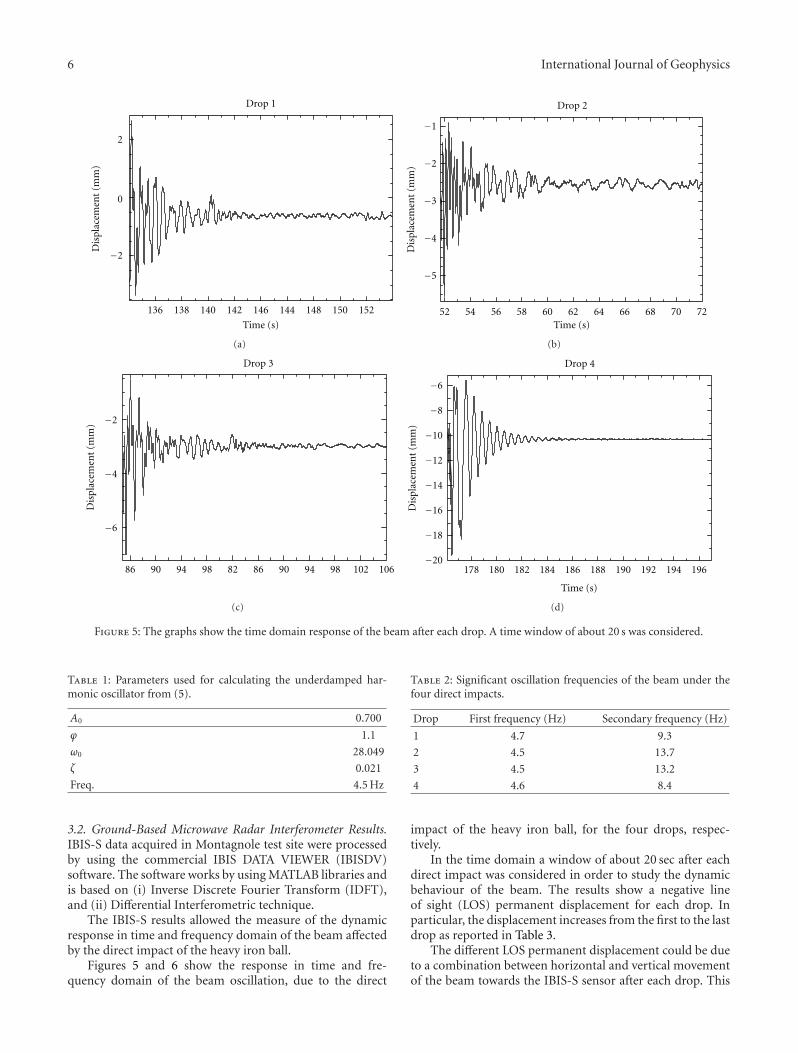
Figure 5: The graphs show the time domain response of the beam after each drop. A time window of about 20 s was considered.
Table 1: Parameters used for calculating the underdamped har-monic oscillator from (5).
A0 0.700
ϕ 1.1
ω0 28.049
ζ 0.021
Freq. 4.5 Hz
3.2. Ground-Based Microwave Radar Interferometer Results.IBIS-S data acquired in Montagnole test site were processedby using the commercial IBIS DATA VIEWER (IBISDV)software. The software works by using MATLAB libraries andis based on (i) Inverse Discrete Fourier Transform (IDFT),and (ii) Differential Interferometric technique.
The IBIS-S results allowed the measure of the dynamicresponse in time and frequency domain of the beam affectedby the direct impact of the heavy iron ball.
Figures 5 and 6 show the response in time and fre-quency domain of the beam oscillation, due to the direct
Table 2: Significant oscillation frequencies of the beam under thefour direct impacts.
Drop First frequency (Hz) Secondary frequency (Hz)
1 4.7 9.3
2 4.5 13.7
3 4.5 13.2
4 4.6 8.4
impact of the heavy iron ball, for the four drops, respec-tively.
In the time domain a window of about 20 sec after eachdirect impact was considered in order to study the dynamicbehaviour of the beam. The results show a negative lineof sight (LOS) permanent displacement for each drop. Inparticular, the displacement increases from the first to the lastdrop as reported in Table 3.
The different LOS permanent displacement could be dueto a combination between horizontal and vertical movementof the beam towards the IBIS-S sensor after each drop. This
International Journal of Geophysics 7
2
1.5
1
0.5
0
0 2 4 6 8 10Frequency (Hz)
Am
plit
ude
Drop 1
(a)
1.2
1
0.8
0.6
0.4
0.2
0
0 2 4 6 8 10Frequency (Hz)
Am
plit
ude
Drop 2
(b)
1.5
1
0.5
00 2 4 6 8 10
Frequency (Hz)
Am
plit
ude
Drop 3
(c)
4
2
00 2 4 6 8 10
Frequency (Hz)
Am
plit
ude
Drop 4
(d)
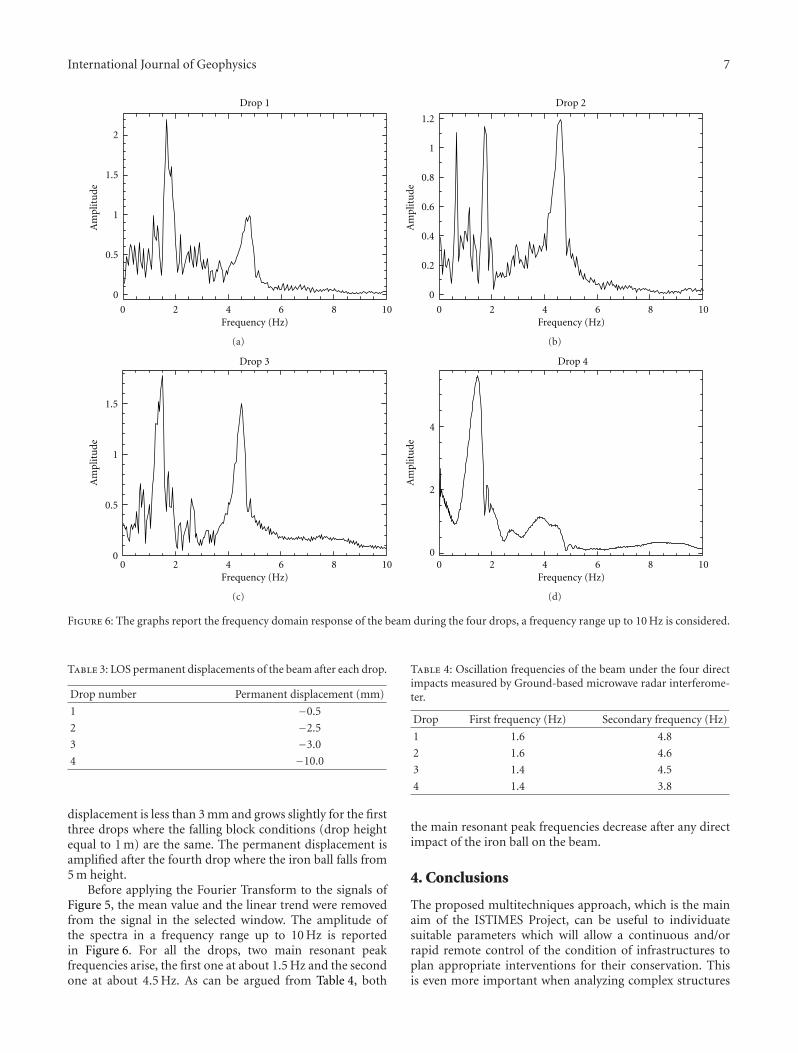
Figure 6: The graphs report the frequency domain response of the beam during the four drops, a frequency range up to 10 Hz is considered.
Table 3: LOS permanent displacements of the beam after each drop.
Drop number Permanent displacement (mm)
1 −0.5
2 −2.5
3 −3.0
4 −10.0
displacement is less than 3 mm and grows slightly for the firstthree drops where the falling block conditions (drop heightequal to 1 m) are the same. The permanent displacement isamplified after the fourth drop where the iron ball falls from5 m height.
Before applying the Fourier Transform to the signals ofFigure 5, the mean value and the linear trend were removedfrom the signal in the selected window. The amplitude ofthe spectra in a frequency range up to 10 Hz is reportedin Figure 6. For all the drops, two main resonant peakfrequencies arise, the first one at about 1.5 Hz and the secondone at about 4.5 Hz. As can be argued from Table 4, both
Table 4: Oscillation frequencies of the beam under the four directimpacts measured by Ground-based microwave radar interferome-ter.
Drop First frequency (Hz) Secondary frequency (Hz)
1 1.6 4.8
2 1.6 4.6
3 1.4 4.5
4 1.4 3.8
the main resonant peak frequencies decrease after any directimpact of the iron ball on the beam.
4. Conclusions
The proposed multitechniques approach, which is the mainaim of the ISTIMES Project, can be useful to individuatesuitable parameters which will allow a continuous and/orrapid remote control of the condition of infrastructures toplan appropriate interventions for their conservation. Thisis even more important when analyzing complex structures
8 International Journal of Geophysics
Table 5: Comparison between the oscillation frequencies measuredby HFI and GB microwave Radar with the relative percentagedifference.
Drop HFI (HZ)GB
microwaveradar (Hz)
Relative percentagedifference
1 4.7 4.8 2.1
2 4.5 4.6 2.2
3 4.5 4.5 0.0
4 4.6 3.8 17.4
where the use of a single diagnostic tool can provide resultsleading to ambiguous interpretations.
However, it is difficult to have at disposal a completesetup of instruments measuring the same parameter, forexample, as in this case where HFI thermal imagery andground-based (G-B) microwave radar were applied to studythe dynamic behaviour of a beam affected by changeablestrains.
G-B microwave radar was applied with the aim of meas-uring the dynamic displacement of the beam. This tech-nique provided good results, giving information about thebehaviour of the target investigated in time and frequencydomains. In particular, it allowed the estimation of the dis-placement affecting the beam after each drops and the meas-urement of the main frequencies characterizing the structure.Two main peaks at different frequencies were highlighted;both the frequencies decrease after the two last drops due tothe increase of the number of severe cracks observed on thebeam. The cracks damaging the beam have induced a loss ofstiffness with a consequent raise of the period of the eigenmodes and a decrease of the eigen-frequencies.
HFI thermal imagery camera was applied with the aimof measuring the structure oscillations by high frequencyanalysis. Also in this case, the results allowed to discriminatetwo main peaks at different frequencies after each drop. Thefirst peak measured by HFI at around 4.5 Hz is comparablewith the second peak measured by G-B radar. However,HFI frequencies do not highlight a decrease after the lastdrop as well as the G-B results (see Table 5). This could beexplained considering the different line of view of the twotechniques; indeed, G-B microwave radar was placed at adifferent height respect to the HFI camera and it observedthe beam by a specific angle. HFI thermal camera was placedat the same height of the beam and it observed the targetperpendicularly. Moreover, the information provided by G-B microwave radar is related to displacement of the beamalong the line of sight, while the information from HFIcamera is related to the displacement of the beam in the planeperpendicular to the sensor. The comparison between HFIand G-B results also suggests that G-B radar better points outthe low peak frequencies, whereas the HFI thermal camerahighlightes the high frequencies.
About the lowest frequencies retrieved by G-B radar (seeTable 4), two possible explanation could be given as: a vibra-tion mode of the beam or the main oscillation frequency ofdropping machinery after each drop.
Future work will be focused on (a) laboratory and fieldmeasurements to better understand the different resultsattained by the HFI and GB microwave Radar (b) a numericalmodelling of the beam to estimate its main frequencies, and(c) the development and analysis of the integration of thedata acquired by different sensor technologies on infrastruc-tures in order to evaluate their effectiveness and suitabilityfor this kind of application.
Acknowledgment
The research leading to these results has received fund-ing from the European Community’s Seventh FrameworkProgramme (FP7/2007–2013) under Grant Agreement no.225663 Joint Call FP7-ICT-SEC-2007-1.
References
[1] C. Kohl, M. Krause, C. Maierhofer, K. Mayer, J. Wostmann,and H. Wiggenhauser, “3D-visualisation of NDT data using adata fusion technique,” Insight, vol. 45, no. 12, pp. 800–804,2003.
[2] Ch. Maierhofer, R. Arndt, M. Rollig et al., “Applicationof impulse-thermography for non-destructive assessment ofconcrete structures,” Cement and Concrete Composites, vol. 28,no. 4, pp. 393–401, 2006.
[3] M. Proto, M. Bavusi, R. Bernini et al., “Transport infrastruc-ture surveillance and monitoring by electromagnetic sensing:the ISTIMES project,” Sensors, vol. 10, no. 12, pp. 10620–10639, 2010.
[4] S. Rodelsperger, G. Laufer, C. Gerstenecker, and M. Becker,“Monitoring of displacements with ground-based microwaveinterferometry: IBIS-S and IBIS-L,” Journal of Applied Geodesy,vol. 4, no. 1, pp. 41–54, 2010.
[5] J. R. Brown and H. R. Hamilton, “Quantitative infraredthermography inspection for FRP applied to concrete usingsingle pixel analysis,” Construction and Building Materials. Inpress.
[6] S. Pascucci, C. Bassani, A. Palombo, M. Poscolieri, and R.Cavalli, “Road asphalt pavements analyzed by airborne ther-mal remote sensing: preliminary results of the venice highway,”Sensors, vol. 8, no. 2, pp. 1278–1296, 2008.
[7] S. W. Doebling, C. R. Farrar, M. B. Prime, and D. Shevitz,Damage identification and health monitoring of structural andmechanical systems from changes in their vibration characteris-tics: a literature review, Los Alamos National Laboratory, 1996.
[8] C. Gentile and G. Bernardini, “Output-only modal identifica-tion of a reinforced concrete bridge from radar-based meas-urements,” NDT and E International, vol. 41, no. 7, pp. 544–553, 2008.
[9] C. R. Farrar, T. W. Darling, A. Migliori, and W. E. Baker,“Microwave interferometers for non-contact vibration mea-surements on large structures,” Mechanical Systems and SignalProcessing, vol. 13, no. 2, pp. 241–253, 1999.
[10] M. Pieraccini, F. Parrini, M. Fratini, C. Atzeni, P. Spinelli, andM. Micheloni, “Static and dynamic testing of bridges throughmicrowave interferometry,” NDT and E International, vol. 40,no. 3, pp. 208–214, 2007.
[11] M. Pieraccini, M. Fratini, D. Dei, and C. Atzeni, “Structuraltesting of Historical Heritage Site Towers by microwave remotesensing,” Journal of Cultural Heritage, vol. 10, no. 2, pp. 174–182, 2009.
International Journal of Geophysics 9
[12] C. Atzeni, A. Bicci, D. Dei, M. Fratini, and M. Pieraccini,“Remote survey of the leaning tower of pisa by interferometricsensing,” IEEE Geoscience and Remote Sensing Letters, vol. 7,no. 1, Article ID 5290014, pp. 185–189, 2010.
[13] C. Gentile, “Application of microwave remote sensing todynamic testing of stay-cables,” Remote Sensing, vol. 2, no. 1,pp. 36–51, 2010.
[14] M. Pieraccini, F. Parrini, M. Fratini, C. Atzeni, and P. Spinelli,“In-service testing of wind turbine towers using a microwavesensor,” Renewable Energy, vol. 33, no. 1, pp. 13–21, 2008.
[15] J. D. Taylor, Ed., Ultra-Wideband Radar Technology, CRCPress, 2001.
[16] F. M. Henderson and A. J. Lewis, Eds., Manual of RemoteSensing. Principles and Applications of Imaging Radar, JohnWiley & Sons, New York, NY, USA, 1998.
[17] C. Gentile and G. Bernardini, “An interferometric radar fornon-contact measurement of deflections on civil engineeringstructures: laboratory and full-scale tests,” Structure andInfrastructure Engineering, vol. 6, no. 5, pp. 521–534, 2010.
[18] G. Bernardini, G. De Pasquale, A. Bicci et al., “Microwaveinterferometer for ambient vibration measurement on civilengineering structures: 1. Principles of the radar techniqueand laboratory tests,” in Experimental Vibration Analysis forCivil Engineering Structures (EVACES ’07), Porto, Portugal,October 2007.
[19] M. Pieraccini, M. Fratini, F. Parrini, G. Macaluso, and C.Atzeni, “High-speed CW step-frequency coherent radar fordynamic monitoring of civil engineering structures,” Electron-ics Letters, vol. 40, no. 14, pp. 907–908, 2004.