BERENBERG DIAGNOSTICS CONFERENCE
34
BERENBERG DIAGNOSTICS CONFERENCE London - May 10, 2022
-
Upload
khangminh22 -
Category
Documents
-
view
4 -
download
0
Transcript of BERENBERG DIAGNOSTICS CONFERENCE

BERENBERG DIAGNOSTICS CONFERENCE
London - May 10, 2022

SAFE HARBOR STATEMENT
Forward-looking statements involve risks.
This company presentation contains various statements concerning the future performance of STRATEC. These statements are based on both assumptions and estimates. Although we are convinced that these forward-looking statements are realistic, we can provide no guarantee of this. This is because our assumptions involve risks and uncertainties which could result in a substantial divergence between actual results and those expected.
It is not planned to update these forward-looking statements.
LONDON - MAY 10, 2022 2

AGENDA
LONDON - MAY 10, 2022
1. OVERVIEW AND BUSINESS MODEL2. THE IVD MARKET3. FINANCIALS4. OUTLOOK AND STRATEGY
3

LONDON - MAY 10, 2022
OVERVIEW AND
BUSINESS MODEL
4

• Leading OEM player for automation solutions for the diagnostics industry and translational research
• Three decades of experience in highly regulated healthcare markets and growing technology pool
• Around 1.400 employees worldwide
Around 50% allocable to R&D
• Production sites in Germany (HQ), Switzerland, Hungary and Austria
• High number of systems installed globally
More than 14,000 medium to high throughput systems
More than 30,000 low throughput systems
• Sales of € 287.3 million in 2021
CAGR sales since IPO in 1998: ~15%
• Dividend payments raised over 17 consecutive years
OVERVIEW AND BUSINESS MODEL
STRATEC AT A GLANCE
LONDON - MAY 10, 2022
SELECTED PRODUCTS
5

OVERVIEW AND BUSINESS MODEL
UNIQUE MARKET POSITION STRATEC IN THE IVD VALUE CHAIN
LONDON - MAY 10, 2022
DiagnosticCompanies
Blood Banks,Laboratories
Patients
STRATEC develops and manufactures fully automated analyzer systems and disposables focusing on the high growth segments in diagnostics
Partners market systems together with reagents and consumables to laboratories, blood banks and hospitals worldwide
Laboratories performing tests and offering service to doctors and patients using reagents from diagnostic companies
Growth drivers:
• Aging population
• Developing healthcare systems worldwide
• Rising prevalence of chronic diseases
• High volume of new tests
6

OVERVIEW AND BUSINESS MODEL
BUSINESS MODEL
LONDON - MAY 10, 2022
STRATEC provides instrumentation, consumables, software and automation solutions
OEM development and manufacturing
More than 10,000 fully automated analyzer systems and modules manufactured annually
Wide range of intellectual property rights
Extensive collaboration with partner during design phase
STRATEC: Engineering / automation, software, QM
Partner: System / reagent / market requirements
Systems have long market lifecycles
Product lifecycles typically in an area of 12 to 15 years
Leads to longstanding partnerships
Expanding installed base of systems
Product enhancement and extension drives value
7

Dev
elopm
ent
and m
arke
t la
unch
of su
cces
sor
pro
duct
OVERVIEW AND BUSINESS MODEL
LONDON - MAY 10, 2022
Long-term agreements with partners Milestone payments during development stage
Operating sales during series production stage
Recurring sales from service parts & consumables sales
Minimum volume commitment Firm purchase orders
STRATEC an integral part of partners’ plans
Reliable partnership Shortened development time
Integration of analyzer system and reagents
Agreed development budget & transfer price
High commitment by both partners
SECURING RETURN ON INVESTMENT
INDICATIVE SALES CHARACTERISTICS OF AN ANALYZER OEM PROJECT
2 to 4 yearsDevelopment
phase
12 to 15 yearsMarketing phase of the analyzer system
Another 5 yearsof service parts & consumables
Service part & consumables
Sale
s
8

THE IVD MARKET
LONDON - MAY 10, 2022 9
THE IVD MARKET
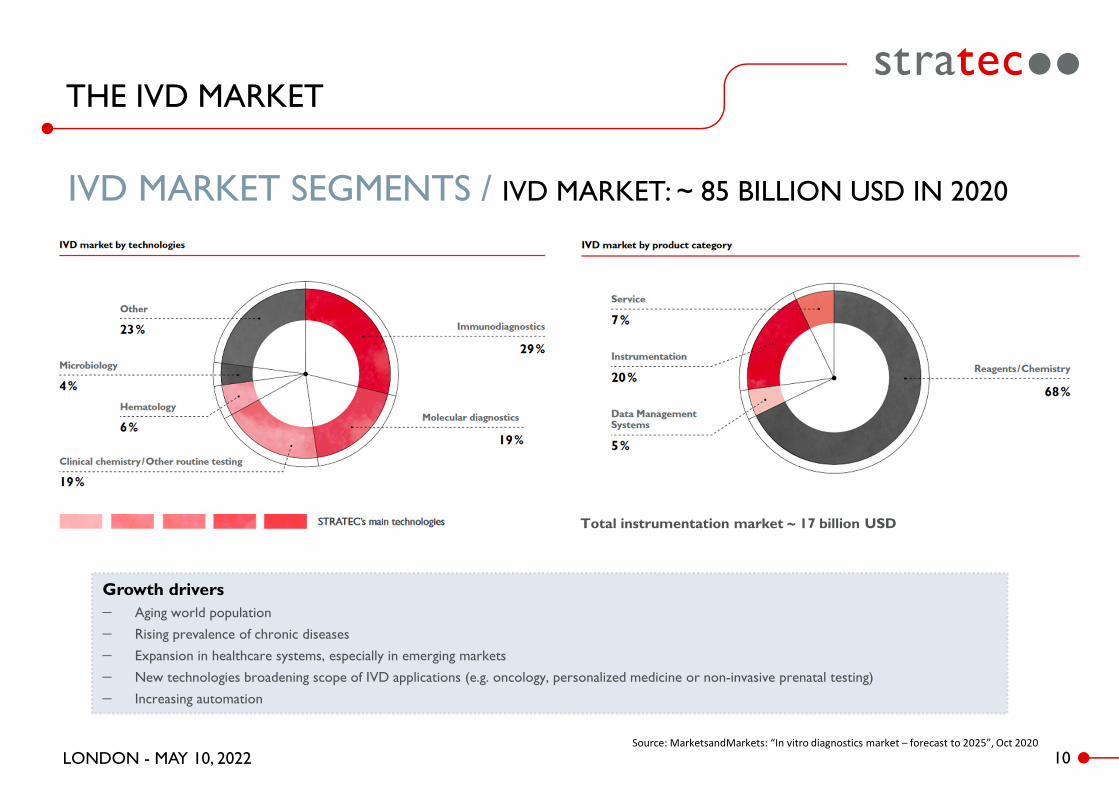
IVD MARKET SEGMENTS / IVD MARKET: ~ 85 BILLION USD IN 2020
LONDON - MAY 10, 2022
Growth drivers
Aging world population
Rising prevalence of chronic diseases
Expansion in healthcare systems, especially in emerging markets
New technologies broadening scope of IVD applications (e.g. oncology, personalized medicine or non-invasive prenatal testing)
Increasing automation
Total instrumentation market ~ 17 billion USD
10Source: MarketsandMarkets: “In vitro diagnostics market – forecast to 2025”, Oct 2020

THE IVD MARKET
OUTSOURCED VS IN HOUSE INSTRUMENTATION MARKET
LONDON - MAY 10, 2022 11
• The majority of instrumentation equipment in the IVD market is still developed in-house by diagnostics companies
• Share of outsourced developments has already increased significantly over the last couple of years
• Trend of outsourcing towards specialized players set to continue, due to:
Engineering of automation solutions often not core competence of diagnostics companies
Shorter development timeframes due to already existent technology pools
Guaranteed project budget and firm transfer prices
Keeping up with regulatory developments easier for specialized players
Structured processes in order to address end customer needs, such as ease of use, user experience, workflow efficiencies, remote access, serviceability and preventive maintenance
PAST FUTURE
PROPORTION OF OUTSOURCED INSTRUMENTION DEVELOPMENTS

THE IVD MARKET
A SELECTION OF STRATEC CUSTOMERS
LONDON - MAY 10, 2022
Source: IVD News / non-public companies estimated / non-reported sector sales estimated
… AND OTHER GAME-CHANGING
COMPANIES
STRATEC customer
Not a STRATEC customer
12
GLOBAL TOP 20 IVD COMPANIES Sales 2021 (USD billion)
1. Roche 19.0
2. Abbott 15.6
3. Danaher 9.8
4. SIEMENS Healthineers 6.6
5. Thermo Fisher 5.7
6. BECTON DICKINSON 4.4
7. HOLOGIC 3.5
8. bioMérieux 3.2
9. Sysmex 3.1
10. PerkinElmer 2.9
11. mindray 2.8
12. Ortho Clinical Diagnostics 2.0
13. illumina 1.8
14. Exact Sciences 1.8
15. QUIDEL 1.7
16. BIO-RAD 1.5
17. werfen 1.4
18. Agilent 1.4
19. DiaSorin 1.3
20. Seegene 1.1

LONDON - MAY 10, 2022
FINANCIALS
13

LONDON - MAY 10, 2022
KEY FIGURES - TRACK RECORD
Sales in € millionCAGR ~9%
Adjusted EBIT in € million1
CAGR ~10%
1 Figures adjusted for comparison; adjusted for depreciation and amortization from purchase price allocation for acquisitions, related integration expenses and other extraordinary effects. Reconciliation to IFRS figures can be found in the respective annual report.
14
FINANCIALS
116.6 122.7 128144.9 146.9
184.9
207.5187.8
214.2
250.0
287.3
0
50
100
150
200
250
300
350
2011 2012 2013 2014 2015 2016 2017 2018 2019 2020 2021
21.8
15.6
19.5
24.126.9
32.3
36.4
26.229.3
41.7
54.3
0.0
10.0
20.0
30.0
40.0
50.0
60.0
2011 2012 2013 2014 2015 2016 2017 2018 2019 2020 2021

FINANCIALS
LONDON - MAY 10, 2022
KEY FIGURES - TRACK RECORD
Adjusted net income in € million1
CAGR ~11%Dividend per share in € CAGR ~6%
1 Figures adjusted for comparison; adjusted for depreciation and amortization from purchase price allocation for acquisitions, related integration expenses and other extraordinary effects. Reconciliation to IFRS figures can be found in the respective annual report.
2 Subject to AGM approval
15
15.312.4
15.5
19.822.1
25.427.9
20.2
24.1
35.2
45.1
0.0
5.0
10.0
15.0
20.0
25.0
30.0
35.0
40.0
45.0
50.0
2011 2012 2013 2014 2015 2016 2017 2018 2019 2020 2021
0.55 0.560.60
0.700.75 0.77
0.80 0.82 0.840.90
0.95
0.00
0.20
0.40
0.60
0.80
1.00
2011 2012 2013 2014 2015 2016 2017 2018 2019 2020 2021
2

FINANCIALS
LONDON - MAY 10, 2022 16
Q1/2022 AT A GLANCE
• Group sales up by 4.7% yoy to € 75.4 million (Q1/2021: € 72.0 million)
Growth of 1.8% at constant currency
• Adjusted EBIT of € 15.0 million moderately below strong prior year level but slightly ahead of budget (Q1/2021: € 16.0 million)
• Significant progress within well-filled development pipeline and several promising negotiations in regard to new projects
Further customer of Smart Consumables segment about to submit for approval: Novel test for the early and fast detection and risk assessment of sepsis (one of the most frequent causes of death worldwide)
High number of incoming customer requests regarding new projects and ongoing feasibility studies
• Several products in ramp-up phase and more launches to come in the next 12 months
Molecular diagnostics system family for one of the market leaders scheduled for launch in mid-2022

Q1/2022 FINANCIALS AT A GLANCE1
FINANCIALS
LONDON - MAY 10, 2022
bps = basis points
1 For comparison purposes, adjusted figures exclude amortization resulting from purchase price allocations in the context of acquisitions.
17
€ 000s Q1/2022 Q1/2021 Change
Sales 75,387 71,995 +4.7%
EBITDA 18,459 18,840 -2.0%
EBITDA margin (%) 24.5 26.2 -170 bps
Adjusted EBIT 15,037 16,045 -6.3%
Adjusted EBIT margin (%) 19.9 22.3 -240 bps
Adjusted consolidated net income 11,948 13,147 -9.1%
Adjusted basic earnings per share (in €) 0.99 1.09 -9.2%
Basic earnings per share IFRS (in €) 0.92 0.95 -3.2%

FINANCIALS
LONDON - MAY 10, 2022
SALES Q1/2022
Q1/2022 sales up 4.7% yoy to € 75.4 million
+1.8% at constant currency
(+) Higher Development & Service sales
(+) Strong Service Parts & Consumables business
(+) Strong call-up numbers for immunohematology systems
(+) New product launches
(-) Lower sales with molecular diagnostic systems due to pandemic related build-up of capacities in the prior year
As of March 31
In € million
18
49.5
39.6
46.6
56.5
72.075.4
0
10
20
30
40
50
60
70
80
Q1/17 Q1/18 Q1/19 Q1/20 Q1/21 Q1/22

FINANCIALS
LONDON - MAY 10, 2022
Q1/2022 adjusted EBIT down by 6.3% yoy to € 15.0 million
Q1/2022 adjusted EBIT margin of 19.9% versus 22.3% in the prior year
(-) Normalization of product mix within Systems sales
(-) Tense supply chain and input cost inflation
(+) Increased share of high margin Service Parts and Consumables sales
(+) Higher-than-usual contribution margin from Development and Services sales
EBIT EBIT margin
EBIT in € million EBIT margin in %
As of March 31
ADJUSTED EBIT AND EBIT MARGIN Q1/2022
19
6.9
4.05.0
7.7
16.015.0
13.9%
10.1%10.7%
13.6%
22.3%
19.9%
8%
12%
16%
20%
24%
28%
32%
0
2
4
6
8
10
12
14
16
18
Q1/17 Q1/18 Q1/19 Q1/20 Q1/21 Q1/22

FINANCIALS
LONDON - MAY 10, 2022
CASH FLOW AND NET DEBT Q1/2022
• Cash flow from operating activities burdened by increased trade receivables position
reporting date effects; significant improvement was already visible at the beginning of Q2/2022
• Investment ratio1 at 5.2% of sales
• Net debt / LTM EBITDA of 0.8x
20
€ 000s Q1/2022 Q1/2021 Change
Cash flow – operating activities 773 14,028 -94.4%
Cash flow – investment activities -3,914 -4,302 n/a
Cash flow – financing activities 5,089 -1,292 n/a
Free cash flow -3,141 9,726 n/a
€ 000s Q1/2022 FY/2021 Change
Cash at end of period 49,564 47,184 +5.0%
Equity ratio (%) 56.2 55.8 +40 bps
Net debt 54,984 52,443 -4.8%
1 Total investments in intangible and tangible assets in % of salesLTM = Last twelve months

FINANCIALS
21LONDON - MAY 10, 2022
SALES BY OPERATING DIVISIONS FY 2021
0
20
40
60
80
100
120
140
160
180
Systems Service Parts &Consumables
Developmentand Services
Others
2020 2021
+18.8%(+20.7% at CER)
-8.3%(-7.9% at CER)
+49.9%(+53,0% at CER)
Sales in € million
11% 9%
32% 33%
57% 58%
0%
10%
20%
30%
40%
50%
60%
70%
80%
90%
100%
2020 2021
Others Development and Services
Service Parts & Consumables Systems
In % of total sales
+16.9%(+18.9 at CER)
As of December 31
CER= Constant exchange rates

FINANCIALS
22LONDON - MAY 10, 2022
SEGMENT PERFORMANCE FY 2021
Instrumentation
€ 000s FY 2021 FY 2020 Change At CER
Sales 201,349 176,517 +14.1% +16.2%
Adj. EBIT 34,296 28.277 +21.3%
Adj. EBIT margin 17.0% 16.0% +100 bps
CER = Constant exchange rates
Smart Consumables
€ 000s FY 2021 FY 2020 Change At CER
Sales 19.076 17,103 +11.5% +13.2%
Adjusted EBIT 525 -1,183 nm
Adj. EBIT margin 2.8% -6.9% +970 bps
Diatron
€ 000s FY 2021 FY 2020 Change At CER
Sales 66,910 56,479 +18.5% +19.4%
Adj. EBIT 19,452 14,619 +33.1%
Adj. EBIT margin 29.1% 25,9% +320 bps
- Strong demand for molecular diagnostics solutions and ramp-up of newly launched products
- Strong growth with haematology (including veterinary) and molecular diagnostics products
- Ramp-up of newly launched products and related improvement of sales mix (shrinking share of recognized development revenues)

LONDON - MAY 10, 2022
OUTLOOK AND STRATEGY
23

OUTLOOK AND STRATEGY
LONDON - MAY 10, 2022
GUIDANCE FOR FISCAL YEAR 2022*
• Sales to match the previous year’s level on a constant-currency basis
– Ramp-up of young product portfolio and additional upcoming launches set to compensate potential declines in COVID-19-related product lines
• Adjusted EBIT margin of around 16.5% to 18.5% (2021: 18.9%)
– Raising input costs and normalization of product mix
• Investments in tangible and intangible assets combined of around 6.0% to 8.0% of sales
* Any assessment of the further course of the pandemic, particularly from the fall onwards, and associated demand for in-vitro diagnostics products is subject to great uncertainties. STRATEC’s budget scenario for the 2022 financial year includes a higher than normal number of assumptions and risk adjustments. Furthermore, the situation in global supply chains also remains tense and increasingly difficult to predict, with this being due not least to the war in Ukraine and renewed lockdowns in Asia.
24

OUTLOOK AND STRATEGY
25
• COVID-19 pandemic has driven 2020 and 2021 market growth rates far above the historical long-term average of around 4-6% p.a.
• High comparison basis due to surge in COVID testing volumes might adversely affect market growth rates in 2022 and 2023
• Return to at least historical market growth rates expected once new baseline is reached
• Further infection waves to be expected with probably steeper ramps but shorter durations
requires higher spare capacity levels to be held by the labs to cover peaks
COVID-19 AND MARKET UPDATE
LONDON - MAY 10, 2022

STRATEC WELL POSITIONED TO OUTPACE EXPECTED MARKET GROWTH
In contrast to the overall market, no negative pricing effects expected
STRATEC customers set to gain further market share once regular approval pathways for COVID-19 tests are established / again required
Overutilization of testing equipment triggers significant replacement potential
Expanded installed base set to drive strong service parts & consumables business
Expanded menus at the customer side and transfer of esoteric tests into screening formats
Pandemic and labor shortages have again highlighted the value of highly automated lab workflows
Several products in ramp up phase
e.g. LIAISON XS, FACSDuet, KleeYa and several new smart consumables
Strong outsourcing trend and launch / development pipeline
e.g. three molecular diagnostic systems
OUTLOOK AND STRATEGY
26LONDON - MAY 10, 2022
SPECIFIC DRIVERS FOR STRATEC

OUTLOOK
LONDON - MAY 10, 2022 27
FOCUS IN 2022 AND BEYOND
• Execute on current development pipeline and launch line-up
Expected launches over the next 12 months include two MDx solution families
Further MDx solution (x-plex) for decentralised testing needs is set to hit the market in 2024
• Execute deal pipeline regarding new development and manufacturing agreements
• Implement measures to address supply chain issues and rising input costs
• M&A remains part of the company’s growth and diversification strategy
• Restore pre-pandemic efficiency levels throughout the company
• Manage additional personnel requirements in view of a well-filled project pipeline

OUTLOOK AND STRATEGY
LONDON - MAY 10, 2022 28
Enable customers and STRATEC to grow above
market averageExpand product/value
offering
• Focus on high growth areas and segments
• Boost expertise and technology portfolio
Expand product/value offering
Increase proportion of recurring revenues Expand product/value
offering
Drive customer diversification
• Utilize tailwind from increasing complexity
• Expand smart consumables business
• Organically and via M&A transactions
• Without entering into competition to partners
• Utilize extended platform offering
• Extend components business
• New markets (e.g. veterinary, translational research)
STRATEGIC PRIORITIES

APPENDIX
LONDON - MAY 10, 2022 29

APPENDIX
KEY FIGURES AT A GLANCE1
1 Figures adjusted for comparison; adjusted for depreciation and amortization from purchase price allocation for acquisitions, related integration expenses and other extraordinary effects. Reconciliation to IFRS figures can be found in the respective annual report.
2 Subject to AGM approval
LONDON - MAY 10, 2022
IFRS (€ million) 2017 2018 2019 2020 2021
Sales 207.5 187.8 214.2 250.1 287.3
Adjusted EBIT 36.4 26.2 29.3 41.7 54.3
Adjusted EBIT margin (%) 17.5 13.9 13.7 16.7 18.9
Adjusted Consolidated net income 28.9 20.2 24.1 35.2 45.1
Adjusted Earnings per share (€) 2.43 1.70 2.01 2.92 3.73
Dividend per share (€) 0.80 0.82 0.84 0.90 0.952
No. of employees 1,086 1,228 1,302 1,319 1,398
Total assets 264 275 299 332 369
Equity ratio (%) 59.8 55.3 53.1 52.0 55.8
Free cash flow 14.4 1.2 -6.4 10.0 43.3
30

APPENDIX
LONDON - MAY 10, 2022
Consolidated net incomeEBIT
ADJUSTMENTS FY/2021
31
€ 000s FY 2021 FY 2020
Adjusted EBIT 54,273 41,713
Adjustments:
PPA amortization -4,874 -8,036
Impairment -1,047 0
Other -175 0
EBIT 48,177 33,677
€ 000s FY 2021 FY 2020
Adjusted consolidated net income 45,122 35,218
Adjusted earnings per share in € (basic)
3.73 2.92
Adjustments:
PPA amortization -4,874 -8,036
Impairment -1,047 0
Other -175 0
Taxes 932 1,253
Consolidated net income 39,958 28,435
Earnings per share in € (basic) 3.30 2.36

APPENDIX
Consolidated net incomeEBIT
ADJUSTMENTS Q1/2022
32
€ 000s Q1/2022 Q1/2021
Adjusted EBIT 15,037 16,045
Adjustments:
PPA amortization -936 -1,917
EBIT 14,101 14,128
€ 000s Q1/2022 Q1/2021
Adjusted consolidated net income 11,948 13,147
Adjusted earnings per share in € (basic)
0.99 1.09
Adjustments:
PPA amortization -936 -1,917
Taxes on income 157 319
Consolidated net income 11,169 11,549
Earnings per share in € (basic) 0.92 0.95
LONDON - MAY 10, 2022

APPENDIX
LONDON - MAY 10, 2022
SHAREHOLDER STRUCTURE(AS OF: DECEMBER 2021)
SHARE
IPO Aug. 1998Number of shares 12,127,995Share price (05/04/2022) € 107.20Market capitalization € 1.3 billion
Fixed and family ownership(incl. their investment companies)
Free float
Institutional investors > 3%:Allianz Global InvestorsAmeriprise FinancialBrown Capital ManagementJuno Investment Partners
40.6%
59.4%
33

STRATEC SEGewerbestr. 3775217 BirkenfeldGermany
Phone +49 7082 7916-0Fax +49 7082 7916-999www.stratec.com
CONTACT
THANK YOU
FOR YOUR
ATTENTION
CONTACT
Jan Keppeler, CFAHead of IR, Sustainability & Corporate Communications
Phone +49 7082 [email protected]
LONDON - MAY 10, 2022 34