Knowledge Bases in Spatial Data Infrastructures - A new Level of Decision Support

Marine Spatial Data Infrastructures
By
TEEMU TARES
A Dissertation
submitted in partial fulfilment of the requirements for the degree of
MASTER OF SCIENCE
(Hydrographic Surveying)
Supervisor: Dr Claire Ellul
Course Director: Dr Jonathan Iliffe
6 September 2013

MARINE SPATIAL DATA INFRASTRUCTURES TEEMU TARES
i
MSc Dissertation Submission
Student Name: TEEMU TARES
Programme: MSc HYDROGRAPHIC SURVEYING
Supervisor: DR CLAIRE ELLUL
Dissertation Title: MARINE SPATIAL DATA INFRASTRUCTURES
DECLARATION OF OWNERSHIP
I confirm that I have read and understood the guidelines on plagiarism, that I
understand the meaning of plagiarism and that I may be penalised for
submitting work that has been plagiarised.
I declare that all material presented in the accompanying work is entirely my
own work except where explicitly and individually indicated and that all sources
used in its preparation and all quotations are clearly cited.
I have submitted an electronic copy of the project report through turnitin.
Should this statement prove to be untrue, I recognise the right of the Board of
Examiners to recommend what action should be taken in line with UCL’s regulations.
Signature: Date 6 September 2013

MARINE SPATIAL DATA INFRASTRUCTURES TEEMU TARES
ii
Abstract
Geographic information have been effectively used in terrestrial Geographic Information
Systems (GIS) for decades, but in relation to the sea and the seafloor, it is not easy partially
due to the three-dimensional and dynamic marine environment and, partially, because
operating and collecting spatial information is quite troublesome underwater in comparison
to the acquisition of, for example, satellite imagery over land.
Today, there are great efforts around the world to implement new systems to e.g. measure,
observe, monitor, manage and improve the marine environmental situation. It has become
evident that the status of the Global Ocean cannot be neglected and something must be
done differently in order to better protect the Ocean against environmental degradation
and harmful changes, which are mainly due to greedy over-exploitation of marine resources
and side-effects of over-population, when wastewaters are still led to the sea.
Marine Spatial Data Infrastructures are being implemented to bring marine information
more available to decision makers, organizations and people responsible for, or dealing
with, marine resources. The rational is that decisions concerning the Global Ocean (or, a
local sea) should be based on understanding instead of cravings.
In this dissertation, components of Marine Spatial Data Infrastructures were identified and
studied, and a simple prototype tested at the Department of Civil, Environmental &
Geomatics Engineering of University College London, UK. The study showed that there are
lots of open marine datasets, although their utilisation is not quite easy for a non-specialist.
This may change in the future thanks to Web Mapping tools being developed at the same
time, when spatial data are being more and more opened to the public.
The main result of this project was to bring together the principles, actors, policies,
technology, metadata, standards, services, data and geo-portals in relation to Marine Spatial
Data Infrastructures.
Keywords: Marine Spatial Data Infrastructure, MSDI, Spatial Data Infrastructure, SDI,
INSPIRE, GeoConnections, Digital Coast, Maritime Spatial Planning, MSP, Integrated Coastal
Zone Management, ICZM, Geographic Information System, GIS, Web Mapping Service, OGC,
Remote Sensing, GMES, Copernicus, GOOS, Marine Environment, Maritime Situational
Awareness, Marine Global Picture, Maritime Surveillance, Environmental Monitoring,
Hydrographic Surveying, Seafloor, Underwater, Sub-Sea, Sea, Ocean.

MARINE SPATIAL DATA INFRASTRUCTURES TEEMU TARES
iii
Acknowledgements
I would like to thank my supervisor, Dr Claire Ellul for entrusting me this project. I had a
feeling that Marine Spatial Data Infrastructures will be a rather wide subject to study, but I
could not imagine how far-reaching, indeed. I am quite grateful for the encouragement and
advices of Dr Ellul at all stages of my work.
I am very grateful too to the director of our course, Dr Jonathan Iliffe, whose personal
teaching and guidance was invaluable during the MSc in Hydrographic Surveying course.
I would also like to extend my appreciation to the University College London members of
staff at CEGE, and, specifically, to Liz Jones, Dr Paul Groves, Prof Marek Ziebart, Prof Richard
Simons and Dietmar Backes.
Last, but not the least, I thank my family for their limitless support and trust in my efforts.

MARINE SPATIAL DATA INFRASTRUCTURES TEEMU TARES
iv
Abbreviations
3D Three-dimensional
API Application Programming Interface
AODC Australian Ocean Data Centre
ASCII American Standard Code for Information Interchange
BODC British Oceanographic Data Centre
CEGE UCL Department of Civil, Environmental & Geomatic Engineering
CBA Cost-Benefit Analysis
CF Climate and Forecast metadata convention
Copernicus Global Monitoring for Environment and Security (GMES)
CORBA Common Object Request Broker Architecture
CMSP Coastal and Marine Spatial Planning
CSDGM FGDC Content Standard for Digital Geospatial Metadata
CSV Comma Separated Value
CSW OGC Catalogue Service for the Web
DBMS Database Management System
DEM Digital Elevation Model
EEA European Environment Agency
EO Earth Observation
EU European Union
FAO Food and Agriculture Organization of the United Nations
FGDC Federal Geographic Data Committee
FOSS Free Open Source Software
FTP File Transfer Protocol
GEBCO General Bathymetric Chart of the Oceans
GeoREL Rights expression language for geographic information

MARINE SPATIAL DATA INFRASTRUCTURES TEEMU TARES
v
GESAMP Scientific Aspects of Marine Environmental Protection
GI Geographic Information
GIS Geographic Information System
GISCO Geographical Information System at the European Commission
GMES Global Monitoring for Environment and Security (Copernicus)
GML OGC Geography Markup Language
GOOS Global Ocean Observing System
GSDI Global Spatial Data Infrastructure
HDF Hierarchical Data Format
HO Hydrographical Office
HTML Hypertext Markup Language
ICZM Integrated Coastal-Zone Management
IEC International Electrotechnical Commission
IHO International Hydrographic Organization
IMO International Maritime Organization
IMP Integrated Maritime Policy
IPSO International Programme on the State of the Ocean
ISO International Standardization Organization
INSPIRE Infrastructure for Spatial Information in Europe
KML Keyhole Markup Language
LADM Land Administration Domain Model
LAT Lowest Astronomical Tide
LCML Land Cover Meta Language
MARPOL Intl Convention for the Prevention of Pollution from Ships
MOOS Monterey Ocean Observing System
MSDI Marine Spatial Data Infrastructure
MSP Maritime Spatial Planning

MARINE SPATIAL DATA INFRASTRUCTURES TEEMU TARES
vi
NetCDF Network Common Data Format
NISO National Information Standards organization
NOAA National Oceanic and Atmospheric Administration
NSDI National Spatial Data Infrastructure
O&M Observation & Measurement
ODN Ordnance Datum Newline
OGC Open Geospatial Consortium
OLE Object Linking and Embedding
OS Operating System
PC Personal Computer
OS Ordnance Survey
PAR Photosynthetically Active Radiation
PI Place Identifier
RS Remote Sensing
SDI Spatial Data Infrastructure
SFS OGC Simple Feature Standard
SOAP Simple Object Access Protocol
SRID Spatial Reference System Identifier
SQL Structured Query Language
SVG Scalable Vector Graphics
SYKE Finnish Environment Institute
OBIS Ocean Biogeographic Information System
TCP/IP Transmission Control Protocol/Internet Protocol
UCL University College London
UI User Interface
UK United Kingdom
UML Universal Markup Language

MARINE SPATIAL DATA INFRASTRUCTURES TEEMU TARES
vii
UN United Nations
UNCLOS United Nations Convention on the Law of the Sea
UNECE United Nations Economic Commission for Europe
UNEP United Nations Environment Programme
UNESCO United Nations Educational, Scientific and Cultural Organization
URL Uniform Resource Locator
UTM Universal Transverse Mercator
VROM Dutch Ministry of Housing
W3C World Wide Web Consortium
WCS OGC Web Coverage Service
WFS OGC Web Feature Service
WMC OGC Web Map Context
WMS OGC Web Map Service
WGS-84 World Geodetic System 1984
WSDL Web Services Description Language
X3D Extensible 3D
XML Extensible Markup Language
WWW World Wide Web

MARINE SPATIAL DATA INFRASTRUCTURES TEEMU TARES
viii
List of Figures
Figure 1. Basic components of SDI (Souza and Delgado, 2012). ..................................................................... 6
Figure 2. The two concrete feet of the human society set to benefit of an SDI. .............................................. 7
Figure 3. Marine spatial data infrastructure themes (Fowler, Smith and Stein, 2011). .................................... 8
Figure 4. A generic MSDI architecture (after IHO, 2011). ............................................................................. 11
Figure 5. Fields of marine applications relying on the elements of SDI. ........................................................ 11
Figure 6. Utilization of spatial data by public sector in Finland (Mäkelä and Hilke, 2010). ............................ 13
Figure 7. Maritime service areas in the EU (GISCO, 2011). ........................................................................... 14
Figure 8. A possible SDI architecture (Steiniger, 2010). ............................................................................... 17
Figure 9. SDI software needs (Steiniger, 2010). ........................................................................................... 18
Figure 10. OBIS platform and architecture (Cleary and Fujioka, 2011). ........................................................ 19
Figure 11. Data inventory diagram of the Walloon Administration (MADAME, 2000). ................................. 21
Figure 12. The three types of ISO 19115 descriptors. .................................................................................. 22
Figure 13. Geospatial standardization (Nebert, 2013). ................................................................................ 23
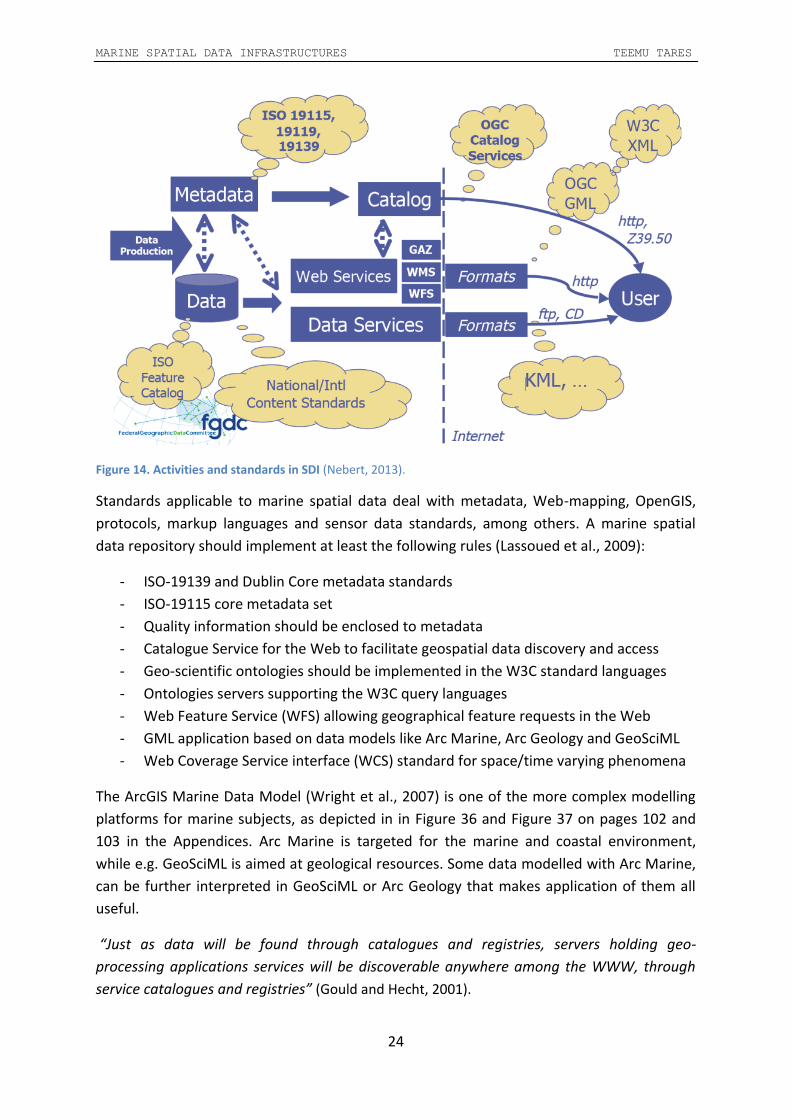
Figure 14. Activities and standards in SDI (Nebert, 2013). ........................................................................... 24
Figure 15. INSPIRE Geo-portal (INSPIRE, 2013). ........................................................................................... 26
Figure 16. OGC Services (GSDI, 2009). ......................................................................................................... 29
Figure 17. Components of coastal and marine ecological classification (Arc Marine, 2013). ......................... 30
Figure 18. Block diagram of the UCL MSDI Prototype together with some remote services (e.g. Oracle). ..... 32
Figure 19. Connection to the UCL VPN. ....................................................................................................... 34
Figure 20. SSH tunnel has been opened to UCL GEGE. ................................................................................. 35
Figure 21. Test: QGIS Desktop GIS Client accessing and displaying data from the UCL GeoServer. ................ 36
Figure 22. Test: QGIS accessing and displaying swamps, rivers, lakes, depth contours etc. in Finland. .......... 37
Figure 23. Test: QGIS accessing and displaying a.o. bathymetry, satellite imagery and ports in Europe. ....... 38
Figure 24. Reverse pyramid effect (Bregt, 2012). ........................................................................................ 55
Figure 25. Cumulative costs and benefits of the NOAA Digital Coast service during a 5 years’ period. .......... 56
Figure 26. Open source SDI software (Steiniger, 2010). ............................................................................... 63
Figure 27. Freemind graphical approach to define a list of metadata elements (Neiswender, 2010). ............ 71
Figure 28. SFML data locator map (left) and download menu (right) (SFML, 2013). ...................................... 90
Figure 29. SeaDataNet user’s portal systems architecture (SeaDataNet, 2013). ........................................... 94
Figure 30. PRIMAR worldwide ENC coverage (on the left) in Finland (PIMAR, 2013).................................... 97
Figure 31. PRIMAR ENC search result from Nauvo (on the right), Finland (PIMAR, 2013). ............................. 97
Figure 32. PRIMAR worldwide ENC coverage around England (PIMAR, 2013). ............................................. 97
Figure 33. The most important waterways of Finland (Liikennevirasto, 2013). ............................................. 99
Figure 34. Pan-European marine metadata services (SeaDataNet, 2013). .................................................. 100
Figure 35. SeaDataNet direct access to data (SeaDataNet, 2013). .............................................................. 101
Figure 36. Arc Marine thematic layers (Wright et al., 2007). Cont. … ........................................................ 102
Figure 37. … Cont. Arc Marine thematic layers (Wright et al., 2007). ........................................................ 103
Figure 38. Ship track lines from 1980-2010 hydrographic surveys (GEBCO, 2011). ...................................... 104
Figure 39. Sea depth contours, lakes, rivers and swamps of South-East Finland highlighted. ...................... 105
Figure 40. CleanTOPO2 - 3D version rendered as an oblique view (Patterson, 2013). ................................. 106
Figure 41. Gravity from satellite altimetry, version 15, Sandwell & Smith, 2006. ....................................... 107

MARINE SPATIAL DATA INFRASTRUCTURES TEEMU TARES
ix
List of Tables
Table 1. Coastal data model features/processes and geospatial data types (after Nyerges et al., 2007). ...... 10
Table 2. Spatial data themes mentioned in the INSPIRE directive, 14 March 2007. ...................................... 25
Table 3. A list of published ISO standards on geographic information. (See also page 74 etc.) ..................... 27
Table 4. Parts of the IHO S-100 standard (IHO, 2009). ................................................................................. 54
Table 5. INSPIRE annual requirements in million € as estimated in 2003. .................................................... 55
Table 6. Priority Commonwealth marine spatial information (Nairn, 2010). ................................................ 60
Table 7. Standards relevant to the OGC Hydrology Domain Working Group. ............................................... 76
Table 8. Topic categories of the Canadian GeoConnections Discovery Portal. .............................................. 91

MARINE SPATIAL DATA INFRASTRUCTURES TEEMU TARES
x
Contents
1 INTRODUCTION .................................................................................................................... 1
1.1 Motivation .................................................................................................................... 1
1.2 Objective ....................................................................................................................... 4
1.3 Outline .......................................................................................................................... 4
2 PRINCIPLES OF SDI ............................................................................................................... 5
3 SETTING UP A MARINE SDI .................................................................................................. 8
4 ACTORS ...............................................................................................................................12
4.1 Stakeholders, Users, Providers and Administrators ..................................................12
5 POLICIES AND ORGANISATIONAL STRATEGIES ..................................................................14
5.1 Cultural, Institutional, Policy and Legal Settings ........................................................15
6 TECHNOLOGY .....................................................................................................................17
7 METADATA .........................................................................................................................20
7.1 Purpose .......................................................................................................................21
7.2 Interoperability ...........................................................................................................22
8 STANDARDS ........................................................................................................................23
8.1 INSPIRE ........................................................................................................................25
8.2 International Organization for Standardization (ISO) ................................................27
9 SERVICES.............................................................................................................................28
10 DATA ...............................................................................................................................30
10.1 Core Datasets of Hydrographic Offices ......................................................................31
11 MSDI PROTOTYPE ...........................................................................................................32
11.1 Data Discovery ............................................................................................................32
11.2 Data Visualization .......................................................................................................33
11.3 Data Access .................................................................................................................33
11.4 Data Processing ..........................................................................................................34
11.5 Evaluation of the Prototype .......................................................................................34
12 DISCUSSION ....................................................................................................................39
12.1 Successes ....................................................................................................................39
MARINE SPATIAL DATA INFRASTRUCTURES TEEMU TARES
xi
12.2 Shortfalls .....................................................................................................................39
13 CONCLUSIONS ................................................................................................................41
14 FURTHER WORK .............................................................................................................43
15 REFERENCES ...................................................................................................................44
16 APPENDICES ....................................................................................................................54
16.1 IHO S-100 Standard ....................................................................................................54
16.2 Cost-Benefit Analysis ..................................................................................................55
16.3 Actors (Cont.) ..............................................................................................................58
16.4 National SDI Monitoring and Assessment .................................................................61
16.5 Free Open Source GIS Software (FOSS GIS) ...............................................................63
16.6 Metadata (Cont.) ........................................................................................................69
16.7 Standards (Cont.) ........................................................................................................72
16.8 Services (Cont.) ...........................................................................................................80
16.9 Data (Cont.) .................................................................................................................82
16.10 Marine Geospatial Portals ......................................................................................89

MARINE SPATIAL DATA INFRASTRUCTURES TEEMU TARES
1
1 INTRODUCTION
1.1 Motivation The socio-economic value of marine areas of the world is huge. And, yet, as Dr James V.
Gardner, Research Professor of the Center for Coastal and Ocean Mapping tells: “We have
better maps of Mars. … We need to map the ocean, because it is totally unmapped. We
don’t know what’s there: Every time we map it, we find something new. It’s our Earth; it’s
where we live. It’s 70% of the surface of the Earth.” (GEBCO, 2011)
Meaden (2013) distinguishes 6 functions with especially broad socio-economic value:
1. Maritime trade and transport
2. Sea-food, nutrition, health and ecosystems services
3. Ocean energy and raw materials
4. Living, working and leisure in coastal regions and at sea
5. Coastal protection and nature development
6. Maritime monitoring and surveillance
Maximising short-term profits as opposed to sustaining exploitation in a long term is
revenging itself: “The whole global ecosystem is under enormous pressure mainly coming
from the increasing human population, which is attempting to extract resources at an
accelerating rate from a planet that is finite” (Meaden, 2013, page xxiv).
Conflicts are starting to emerge in those six functional areas listed above, calling for
Maritime Spatial Planning (MSP) or Coastal and Marine Spatial Planning (CMSP) in many
locations. “There is no doubt that GIS will be the technological basis on which marine spatial
management will best function” (Meaden, 2013, page 380). To be sustainable, marine
planning requires not only political, jurisdictional, socio-economical, technical etc.
information on paper, but people responsible for planning and exploitation must get to
know and understand the ocean, in particular.
The Agenda 21 resolution of the United Nations Conference on Environment and
Development in Rio de Janeiro in 1992 already addressed the need to stop and reverse
environmental deterioration. Spatial information is required for monitoring and making the
right decisions.
The International Programme on the State of the Ocean (IPSO) emphasizes that the Global
Ocean and the life within it are the least understood components on our planet. Subjected
to multiple human induced stressors from over-fishing and pollution, to acidification and
global warming, the Ocean is under the most unprecedented threat in human history, as
IPSO (2013) is pointing out with the following observations:

MARINE SPATIAL DATA INFRASTRUCTURES TEEMU TARES
2
Increased temperatures in the Ocean have been detected down to depths of 3000m.
Since 1978, summer sea-ice in the Arctic has decreased by over 7% per decade.
Carbon dioxide absorption has reduced pH levels in the Ocean, increasing its acidity.
75% of the global fish stocks are fully exploited, over-exploited or depleted.
Iconic marine species such as sharks and corals are disappearing from the Ocean.
Ocean ‘dead zones’ are spreading.
The SDI Cookbook (GSDI, 2009) also mentions increasing pollution, diminishing fish stocks,
toxic waste, crime management, business development, flood mitigation, land-use
assessment, disaster recovery and environmental restoration as examples, where Spatial
Data Infrastructures (SDI) are needed to support discovery, access, acquisition, use and
sharing of spatial information. To do it effectively, common conventions and technical
agreements towards interoperability between the local, regional, national and global Spatial
Data Infrastructures (SDIs) are required. Therefore, SDIs are being developed around the
world (GDI, 2009).
During the last 20 years, substantial progress towards interoperability of software and
datasets has indeed been achieved based on standards and data warehouses. Assimilating
spatial datasets in environmental, ecological, oceanographic, social, commercial, economic,
political, juridical and scientific frameworks is of great socio-economic benefit.
The benefits of a Spatial Data Infrastructure in a marine context enclose (IHO, 2011):
- Interoperability of datasets - Inter- and multi-organisational usage with increased efficiency - Reduced data duplication - Reuse of past datasets - More effective use of public funding - Division of costs - Improved ocean and coastal-zone management - Improved maritime spatial planning - Integrating marine and terrestrial data infrastructures and service providers - Cost savings through increased efficiency - Reduction of risk - Increased opportunities through availability of information - Wider user- and use-base for marine spatial information - Development of new products and services - Growth of new, non-navigational markets
Major application areas benefiting from marine geographic information, are related to
business and governmental mapping, analyses, maritime planning, national and
international development, law enforcement, health care, industry-related transportation,
route selection, vessel tracking, goods distribution, utilities services and management,

MARINE SPATIAL DATA INFRASTRUCTURES TEEMU TARES
3
military training, command, control and intelligence, natural resources inventory, harvest,
business planning, nature and cultural conservation, academic research and education, and
management of living species and environment (Meaden, 2013).
The real challenges confronted by maritime planners include (Seys et al., 2013):
- Increase in the volumes of remotely sensed and other data
- Diversity in data types: physicochemical, geological, meteorological and biological
- Discrepancy between the scales at which data are gathered and at which needed
- Global warming, sea-level rise, depletion of fish stocks, pollution etc.
- Integration of local datasets to support global decision-making
On the other hand, data and information can be exchanged in the internet quickly and at
very low cost, and improving computers and database systems make it possible to analyse
huge datasets and better manage the marine environment. Also international collaboration
and standardization are aiming at interoperable terrestrial and marine data infrastructures.
“While there are thousands of moored and free floating data buoys in the world's oceans,
thousands of land-based environmental stations, and over 50 environmental satellites
orbiting the globe, all providing millions of data sets, most of these technologies do not yet
talk to each other” (USGeo, 2012).
A Spatial Data Infrastructure (SDI) aims at supporting interoperable network discovery and
access to spatial data and services as well as metadata describing them, ancillary
information, software and hardware technologies, norms and standards, organisational,
national, regional and trans-national policies, laws, key actors, stakeholders, data providers
and users (Souza and Delgado, 2012).
Today, SDI appears to be beneficial both financially and environmentally that is motivating
its implementation.

MARINE SPATIAL DATA INFRASTRUCTURES TEEMU TARES
4
1.2 Objective A Spatial Data Infrastructure (SDI) brings together the people, legislation, data, services and
software and hardware systems to permit greater sharing of data within an organization,
regionally, nationally and internationally. Although this concept is relatively well established
in terrestrial GIS, it has perhaps only been recently identified as being relevant also to the
marine spatial framework.
Firstly, this project is to investigate marine-related SDI in relation to the following issues:
1. Scope and purpose for a Marine SDI - who will use it, where and how?
2. What kind of data is available mainly in the European focus?
3. What data standards exist that underpin interoperability for data sharing?
4. What software is available to host the data? Is there any data sharing software that
is already used in the Marine Environment? Is GIS software suitable for the marine?
5. What legislation helps or hinders data sharing in an international, marine context?
Secondly, in the end of this project, the focus is turned to attempt building a prototype
Marine SDI, reviewing and selecting software and marine data based on the earlier research.
1.3 Outline After the previous introduction to the item of Marine Spatial Data Infrastructures,
principles of Spatial Data Infrastructures (SDI) in general, will be described in Chapter 2.
Building on these Principles of SDI, basics of the Marine SDI will then be set up in Chapter 3.
Then, after Setting up a Marine SDI, Chapter 4 attempts to find out stakeholders, users,
providers, administrators, as well as their needs regarding to this setup.
Closely related to these Actors, there are Policies and Organisational Strategies, including
cultural and legal issues, which are studied in Chapter 5.
Chapter 6 is about Technology, having almost concurrent, but somewhat hidden role with
the living actors in today’s computerised world. The last five chapters are in fact an effort to
get deeper in the hardware and software issues, which are so crucial for the operation of
Marine Spatial Data Infrastructures. Therefore, the titles became: Metadata, Standards,
Services, Data and MSDI Prototype.
After the Discussion and Conclusions chapters, several Appendices have been enclosed.
This was done in order not to exceed the maximum length of the main part too much, while
keeping useful information intact.

MARINE SPATIAL DATA INFRASTRUCTURES TEEMU TARES
5
2 PRINCIPLES OF SDI In order to understand how a Marine Spatial Data Infrastructure should be constructed, and
the benefits to be derived from therein, it is first important to understand the fundamental
intent and components of a Spatial Data Infrastructure (SDI) and the stakeholders involved
in its creation and maintenance.
“The term Spatial Data Infrastructure was coined in 1993 by the U.S. National Research
Council to denote a framework of technologies, policies, and institutional arrangements that
together facilitate the creation, exchange, and use of geospatial data and related
information resources across an information-sharing community. Such a framework can be
implemented narrowly to enable the sharing of geospatial information within an
organization or more broadly for use at a national, regional, or global level. In all cases, an
SDI will provide an institutionally sanctioned, automated means for posting, discovering,
evaluating, and exchanging geospatial information by participating information producers
and users. SDI extends a GIS by ensuring geospatial data and standards are used to create
authoritative datasets and policies that support it” (Esri, 2010).
The Spatial Data Infrastructure (SDI) was defined by Kuhn (2005) by stating: “SDI is a
coordinated series of agreements on technology standards, institutional arrangements, and
policies that enable the discovery and use of geospatial information by users and for
purposes other than those it was created for.” The SDI Cookbook (GSDI, 2009), on the other
hand, defines SDI more compactly as “technologies, policies and institutional arrangements
that facilitate the availability of and access to spatial data.”
The objectives of Spatial Data Infrastructure are, following Steiniger (2010):
Distribution of spatial data
Standardization for interoperability
Providing central access point to data with cataloguing
Maintaining data by the original producer
Avoiding duplication of efforts
To spread the utilisation of spatial data, there must be a high-speed network that allows
data to be accessed easily and at low cost, shared effectively, the data itself must be
updated and be of assured quality produced by institutions being responsible for their tasks
(Souza and Delgado, 2012). This way the user can access any data from any source without
needing to worry about its interoperability.

MARINE SPATIAL DATA INFRASTRUCTURES TEEMU TARES
6
The basic five elements of SDI adapted from Souza and Delgado (2012), and Nebert (2013),
as presented in Figure 1, are:
1. Data and Metadata: Fundamental spatial datasets and information
o Maps, measurements, thematic, topological, topographical, statistical, names
2. Technology: Information technology and services
o Hardware, software, firmware, network, database, technical implementation
3. Regulation and standards: Technical agreements
o Data representation, transfer, utilization, interoperability
4. Policies and legislation: Institutional framework and arrangements
o Data sharing, security, privacy, governance, funding
5. Actors: Stakeholders, producers, providers, end-users, people and organisations
o Training, professional development, cooperation, outreach, actual utilisation
Figure 1. Basic components of SDI (Souza and Delgado, 2012).
The primary actors in SDI enclose possibly four levels:
1) engineers and scientists as data and service developers, 2) operational data producers and service providers, 3) coordinating bodies and organizations, and 4) scientists, engineers, decision makers, authorities, organisations and people as end-users.

MARINE SPATIAL DATA INFRASTRUCTURES TEEMU TARES
7
In a wider scope, an SDI may be seen not only as a network of information internal to the
human society, but as a system of feed-back between the nature and the human society,
where the society benefits of the SDI due to more efficient and sustainable use of natural
resources, as shown in Figure 2, where the human society is standing on two concrete ’feet’,
the Ecology and the Economy. And, if either collapses, so will the Society.
Figure 2. The two concrete feet of the human society set to benefit of an SDI.
It must be taken into consideration that, if SDI will be utilised mainly to increase the
exploration of natural resources - as it presumably will - SDI may not only fail to protect the
environment, but it will increase the rate of environmental deterioration through the
increased awareness and exploitation of natural resources.
Spatial Data (SD) are any data referenced to a specific location or geographical area, while
Spatial Services (SS) operate on these data. Services concentrate on discovering (i.e.,
searching, listing, finding), displaying, viewing (i.e., navigating, zooming, panning, overlaying
etc.), uploading, accessing, downloading, transforming (i.e., geocoding, ortho-rectification,
format transformation etc.) and processing (i.e., organising, classifying, calculating,
optimising, assimilating, producing maps etc.) spatial datasets as well as invoking other
interoperable services.
In principal, a Spatial Data Infrastructure (SDI) is based on spatial datasets and services, as
well as on their descriptions called Metadata, which is allowing data and services to be
found by non-native users and systems. In addition, SDI is based on the contributions of
end-users, developers, producers, added-value service providers and coordinating bodies.
Physically, an SDI requires different hardware and software components to work together
that will be introduced in two later chapters, namely Technology and MSDI Prototype,
starting on pages 17 and 32, correspondingly.
---
After these fundamentals of SDI, the next chapter will set up the Marine component of SDI.

MARINE SPATIAL DATA INFRASTRUCTURES TEEMU TARES
8
3 SETTING UP A MARINE SDI “Marine Spatial Data Infrastructure (MSDI) is the component of an SDI that encompasses
marine geographic and business information in its widest sense. This would typically include
seabed topography, geology, marine infrastructure, resources utilisation, administrative and
legal boundaries, areas of conservation, marine habitats and oceanography” (IHO, 2011).
MSDI places emphasis on the unlocking of hydrographic and all the other marine geospatial
information.
It has been estimated that only 10% of the sea floor has been surveyed to produce an
underwater digital elevation model (GEBCO, 2011) somewhat comparable to that available
globally on land. The Global Ocean covers about 72% of the surface of the Earth and holds
97% of the world’s water being an essential component of the Earth System. Moreover, very
little is known under the seafloor and in the deep sea. Therefore, the Ocean should be
investigated more thoroughly.
The need for a specific or integrated Marine Spatial Data Infrastructure comes back to the
United Nations Convention on the Law of the Sea (UN, 1983) under which marine
boundaries are required to be managed and made available by each country. Also Maritime
Spatial Planning (MSP), allocating rights for marine resources, defence, fisheries, monitoring
marine areas, intercepting illegal activities, quick maritime surveillance, legislation covering
oceans and ecosystem health, require detailed knowledge of maritime boundaries and
other marine information
Figure 3. Marine spatial data infrastructure themes (Fowler, Smith and Stein, 2011).
According to Cockburn, Nichols and Monahan (2004) cadastres have long been used on land
to register the boundaries of ownership and “cadastral surveying” and “legal surveying” are
often used interchangeably. Similarly to the land cadastre, a marine cadastre describes
spatial extents, rights, restrictions and responsibilities, as presented in Figure 3.

MARINE SPATIAL DATA INFRASTRUCTURES TEEMU TARES
9
Although the number of basic MSDI themes may currently be smaller than that of SDI, the
number will increase in the future, as MSDI is the main source of information for Maritime
Spatial Planning (MSP). Increasing environmental concerns and the largely unknown marine
environment will require new themes. For example, Integrated Coastal Zone Management
(ICZM) in the USA encompasses at least the following subjects.
- Site selection
- Coastal protection & shoreline management
- Emergency planning & management
- Licensing & consent evaluation
- Aggregates extraction & commercial exploitation
- Survey planning & execution
- Conservation of nature and human health
- Disposal monitoring
- Fisheries regulation
- Habitat mapping & heritage assessment
- Navigational charts, route optimization, vessel location monitoring
- Maritime security and safety of navigation
- Homeland security & defence
- Research, education and other applications of e.g. oceanography, hydrography,
geodesy, geophysics, geology, climatology, meteorology, biology and chemistry
Another example of MSDI themes is presented in Table 1 on the next page. An even more
detailed collection of thematic layers of the Arc Marine (2013) data model initiative is
presented in Figure 36 and Figure 37, respectively, on pages 102 and 103 in the Appendices.
Not only mariners are benefiting of MSDI while navigating, but there are several other even
greater benefits including safer and more effective shipping (that is transporting 90% of the
global trade), maritime spatial planning, coastal zone management, environmental
awareness, sustainable use and exploration of marine resources and national maritime
defence (IHO, 2011). Evidently, MSDI aims at providing data not only for producing
traditional nautical charts, but also for a wider audience with new application areas not yet
even discovered.
In the opinion of the writer, MSDI aims at bringing different geospatial data and services
together and using them to defend and gain the socio-economic values of marine areas of
the world, as already referred to in the very first sentence on page 1.
Societal and economic benefits of MSDI enclose improved Maritime Spatial Planning (MSP),
Ocean and Coastal Zone Management (OCZM), efficiency of maritime operations, maritime
safety, exploration and exploitation of marine resources, and maritime defence. Ecological
benefits of MSDI enclose environmental protection - as far as the negative effects of the
intensified commercial exploitation due to MSDI’s economic benefits don’t override it.

MARINE SPATIAL DATA INFRASTRUCTURES TEEMU TARES
10
Table 1. Coastal data model features/processes and geospatial data types (after Nyerges et al., 2007).
Key
1. Step 1 features are compiled from ArcHydro and Arc Data Model info 2. Step 2 features are compiled from textbook information 3. Step 3 features are compiled from Near-shore Task Force info
Ultimately, an MSDI can support the action to “identify how humankind is changing the
capacity of the Global Ocean to support life and human societies on Earth” (IPSO, 2013).

MARINE SPATIAL DATA INFRASTRUCTURES TEEMU TARES
11
A key principle of the European MSDI - as also in case of SDI - is to create data once and use
it multiple times, in order to limit data transfer and keep it up to date. This is illustrated in
Figure 4, where local Geoportals are accessing both a remote registry and database.
Figure 4. A generic MSDI architecture (after IHO, 2011).
Figure 5. Fields of marine applications relying on the elements of SDI.
Figure 5 is visualising the important elements of a Maritime SDI, which will be discussed
later. The next chapter will answer the question: Who will use MSDI and where?

MARINE SPATIAL DATA INFRASTRUCTURES TEEMU TARES
12
4 ACTORS A working local, regional, national or global MSDI requires governance by the coordinating
public bodies and willingness for cooperation by the participating producers and providers
of data and services. End-users enclose mainly public organizations, but more datasets and
services are being developed and given free access to other organisations and people.
Hydrography forms the base spatial data layer for an MSDI in each state. In this framework,
the national Hydrographic Office (HO) possesses an unparalleled data and knowledge
resource according to the International Hydrographic Organization (IHO, 2010). In
cooperation with stakeholders the utilisation of hydrographic information can be advanced
to a new range and level of applications, enclosing improved decision making and data
management, increased organisational functions and market exposure efficiencies, more
effective use of public investments through cooperation and cost savings, among others.
IHO (2010) states that a HO should identify who are the other data providers, what data
they are providing, how is it complementing to that of the HO, who are the key persons to
get into contact with, what do they wish from the HO, how are they interacting with the
other involved SDI organisations, and what data sharing protocols they are supporting.
Moreover, according to IHO, it important to get to know SDI, how to develop and deliver it,
know the standards of data and metadata, have knowledge of the required Information and
Communications Technology (ICT) services, data base design and GIS software, and to do
team work in line with the SDI goals.
4.1 Stakeholders, Users, Providers and Administrators Public and private sector are in general the main sectors affected and focus is often on
environmental information. Marine spatial data infrastructure key stakeholders are related
to government, industry, coastal tourism, marine resources, transportation, science and the
general public. According to Nairn (2010) and GOOS (2013), they enclose:
- Environmental protection
- Coastal management
- Fisheries management
- Regional marine planning
- Hydrographic offices
- Oceanographic research
- National meteorological and oceanographic agencies
- Offshore oil, gas and minerals exploration and industry
- Other marine and coastal industries
- Transport and post security
- Maritime safety and security
- Parties to international conventions

MARINE SPATIAL DATA INFRASTRUCTURES TEEMU TARES
13
- Submarine cable and pipeline protection
- Indigenous interests
- Policy makers
User organizations involved in the “Users Requirement Definition” of MyOcean (2013):
- EMSA (European Maritime Safety Agency) as a MyOcean key user
- EEA (The European Environment Agency) as a MyOcean key user
- ECMWF (European Centre for Medium-Range Weather Forecasts) as a key user
- ICES (International Council for the Exploitation of the Sea) as a MyOcean key user
- FAO (Food and Agriculture Organization of the United Nations) as MyOcean key user
- HELCOM is working for the protection of the Baltic Sea against pollution.
- OSPAR has fifteen governments working for the protection of North-East Atlantic.
- UNEP/MAP (United Nations’ Environment Programme/Mediterranean Action Plan)
- National maritime safety, environmental and fishery agencies
- National Weather Services
- Climate Research centres
The public sector is the main end-user of geospatial information in Finland. And, according
to Mäkelä and Hilke (2010), the organisations in Figure 6 have had mutual GIS-related
businesses as shown by the connecting lines. The names are unfortunately in Finnish, but an
interested reader is advised to continue reading this subject on page 58, in the Appendices.
Similarly, “Customer Needs” analysis can be found on page 60, in the Appendices.
Figure 6. Utilization of spatial data by public sector in Finland (Mäkelä and Hilke, 2010).
Coastal and maritime activities have a huge socio-economic impact in Europe and
elsewhere, and, consequently, different policies and strategies for information sharing (or,
limiting it) exist. These policies are the subject of the next chapter.

MARINE SPATIAL DATA INFRASTRUCTURES TEEMU TARES
14
5 POLICIES AND ORGANISATIONAL STRATEGIES Policy is related to strategic decisions on dissemination, access rights and distribution
control (Souza and Delgado, 2012) and it is linked to organization’s strategy for sharing
spatial information. For example, in EU the general MSDI policy is defined by the INSPIRE
Directive. In Canada, the corresponding policy is Geoconnections and in USA, Digital Coast.
“Marine SDI developments fit well with national, regional and world-wide initiatives aiming
at supporting environmental policies. Although SDI developments in general are led by land
mapping and cadastral agencies in most countries, the maritime dimension is increasingly
acknowledged as an important element, especially to implement integrated maritime
policies” (Ward, 2013).
The huge impact of coastal and maritime activities on the EU regions is clearly depicted in
Figure 7. It is shows the percentage of population living in areas, where maritime activities
have a socio-economic impact. This was calculated as the reachable areas within a given
time from coastal focal points (GISCO, 2011, page 24).
Figure 7. Maritime service areas in the EU (GISCO, 2011).

MARINE SPATIAL DATA INFRASTRUCTURES TEEMU TARES
15
5.1 Cultural, Institutional, Policy and Legal Settings Important legislation acts cover offshore settlements, seas and submerged lands, shipping,
marine pollution (MARPOL, International Convention for the Prevention of Pollution from
Ships), sea dumping, navigation, indigenous interests, maritime security like defence,
migration, customs and ports security, environmental protection and biodiversity
conservation, fisheries and other living marine resources, offshore minerals, cables and
pipes, and historic shipwrecks (Ward, 2013).
The London Convention (1975) and Protocol (2006) is one of the first conventions to protect
marine environment from human activities. Under the Protocol all dumping is now generally
prohibited, but dumping of the following items may be allowed after thorough impacts
analysis: Dredged material, sewage sludge, fish wastes, vessels and platforms, mining
wastes, organic material of natural origin, bulky items of iron, concrete etc., and carbon
dioxide streams from CCS processes (IMO, 2013). Also ocean fertilization research including
risk management and monitoring may be allowed.
EU legislation to protect the marine environment includes e.g. the Common Fisheries Policy
and the Water Framework Directive. These, however, are protecting the sea only from
specific fragmented pressures. That is why EU adopted two instruments, i.e. the EU
Recommendation on Integrated Coastal Zone Management and the EU Marine Strategy
Framework Directive as a more comprehensive protection of the European marine waters.
Further, the Integrated Maritime Policy (IMP) is the first time a policy has brought together
all the sectors that affect the oceans. The aim of the IMP is no less than to achieve the full
economic potential of the seas in harmony with the marine environment (EC, 2013).
Article 197 of UNCLOS (United Nations Convention on the Law of the Sea, originally adopted
in 1982) provides that states must cooperate for the protection and preservation of the
marine environment. IMO (International Maritime Organization) is cooperating in the
Regional Seas Programme of the United Nations Environment Programme (UNEP), having a
key role in the Scientific Aspects of Marine Environmental Protection programme (GESAMP)
and in combating marine pollution in general (IMO, 2012, page 81).
Articles 200 and 201 of UNCLOS provide for cooperation in promotion of studies, scientific
research programmes and exchange of information and data acquired about pollution of the
marine environment, and in the establishment of scientific criteria for the formulation and
elaboration of rules, standards and recommended practices and procedures for the
prevention, reduction and control of pollution of the marine environment. Articles 204 to
206 of UNCLOS contain provisions on the monitoring of the risks or effects of pollution and
assessment of the potential effects of planned activities under their jurisdiction or control
which may cause substantial pollution of or significant and harmful changes to the marine
environment. According to the article 261 and 262, the use of scientific equipment must not
MARINE SPATIAL DATA INFRASTRUCTURES TEEMU TARES
16
constitute an obstacle to international shipping routes and such installations must bear
internationally agreed warning signals to ensure safety at sea, (IMO, 2012, page 82-85).
By contrast to the natural marine ecological boundaries, the jurisdictional maritime
boundaries either confirm to the exclusive economic zone of 200 nautical miles or to the
agreed boundaries between the neighbouring countries that leads to duality of marine
space division between the ecosystems and political jurisdiction. Without stronger
cooperation between the ecologically neighbouring countries, the ideal applications of MSDI
& GIS are unlikely to ensue (Meaden, 2013). Securing awareness of the importance of
marine spatial planning among higher levels of management or governance appears to have
received not much attention in the past, and, therefore, the underlying importance of
spatial association has not been appreciated enough at strategic planning levels.
At national level existing Information Technology (IT) legislation and policies need to be
reviewed, when establishing organizational data exchange policies also in order to address
privacy, intellectual property and security issues. Some national laws, licensing and
copyrights may be barriers, which cannot be overcome by geospatial SDI standardization.
For example, detailed hydrographic data may be considered as militarily sensitive
information, which therefore cannot be made neither freely nor commercially available.
Similarly, large energy companies and hydrographic surveying companies may tend to treat
“Big Data” acquired for their own purposes as a trade secret. These national or commercial
policies may be seriously hampering as well Maritime Spatial Planning and Integrated
Coastal Zone Management as protection of the unknown marine environment.
Obstacles to integration of marine policies include fragmentation, institutional structures,
divided legal competence, enforcement & compliance and complexity (Long, 2013).
---
The next chapter adds physical hardware and software to our scholarly study so far.

MARINE SPATIAL DATA INFRASTRUCTURES TEEMU TARES
17
6 TECHNOLOGY The SDI technology component includes hardware and software concepts such as web
services, ontologies, geo-portals, catalogues and framework of minimum set of data (Souza
and Delgado, 2012). Technology also includes hardware for data collection, ingesting,
processing, storage, GIS user interface and output, as well as devices and systems for data
transfer (Meaden, 2013). The technology enables the delivery of information for viewing,
transformation and downloading (IHO, 2011). This SDI hardware is shown in Figure 8.
Figure 8. A possible SDI architecture (Steiniger, 2010).
SDI’s basic software components are shown in Figure 9. And, according to Steiniger and
Hunter (2009) they consist of:
1. A software client to display, query, and analyze spatial data (browser or Desktop GIS)
2. A catalogue service for discovering, browsing, and querying the resources
3. A spatial data service allowing the delivery of the data via Internet
4. Processing services such as datum and projection transformations
5. Data repository for storing the data, e.g. in a Spatial database
6. A client or desktop GIS software to create and update spatial data.
Geospatial standards like WMS, WFS, GML, ISO 19115 (which are presented later), data
formats and internet transfer standards defined by the Open Geospatial Consortium (OGC),
International Standardization Organization (ISO) and W3C consortium, are necessary to
allow the interaction between the SDI software components to process vector and raster
data, make maps and transfer data.

MARINE SPATIAL DATA INFRASTRUCTURES TEEMU TARES
18
Figure 9. SDI software needs (Steiniger, 2010).
There are a limited number of large proprietary GIS software packages, which are used for
SDI and they may be suitable also for the Marine SDI. Compared to an SDI, similar type of
vector and raster data - but with different object names and properties - can be used in an
MSDI. The need for handling, visualisation and interpretation not only 2-dimensional, but
also 3D (depth) and 4D (dynamic), multi-dimensional, multi-sensor, multi-source, and,
especially, hyper-temporal data (and data formats such as netCDF), is probably the most
striking difference between SDI and MSDI. In the Global Ocean, there are lots of interrelated
phenomena that require of an MSDI the ability of dealing with very large volumes of data.
The Ocean Biogeographic Information System (OBIS), for example, was using PostgreSQL,
PostGIS, GeoServer, OpenLayers and Amazon Cloud Computing (Cleary and Fujioka, 2011).
This open source philosophy fits particularly well in the university research environment.
The OBIS architecture is graphically presented in Figure 10.
“It has been difficult to integrate spatial information from different systems and to integrate
spatial information into non-spatial information systems, because (McKee, 2003):
1. Different geo-processing systems, including vector/raster GIS, CAD, imaging,
transportation, navigation and management, produce very different types of data.
2. Different geo-processing systems produce data in different formats.
3. Different software libraries with interfaces restrict communication between systems.
4. Different data producers do not name spatial features in the same way.
5. Different data producers do not structure their metadata in a standard way.”

MARINE SPATIAL DATA INFRASTRUCTURES TEEMU TARES
19
Figure 10. OBIS platform and architecture (Cleary and Fujioka, 2011).
Other difficulties in MSDI are due to data being acquired by several kinds of instruments in
different types of surveys and stored in many different ways and data formats, informative
decision making requiring data assimilation not only from these sources, but also from other
sources such as chemical and biological observations. Moreover, metadata may be missing
or not conforming to the standards.
A most noteworthy commercial GIS software company in terms of market share is
Environmental Systems Research Institute (ESRI), whose major product is the ArcGIS
software package with several additional packages, such as Arc Marine and Arc Hydro.
“Performance is one of the key weaknesses of Arc Marine given its complexity and the
number of relationships and join operations needed to answer user requests” (Wright, 2013).
In case of the ocean visualisation, another commercial software i.e. Fledermaus, has
according to the knowledge of the author of this dissertation a long history of being a most
popular software for processing of sonar bathymetric and backscattering data. The new
Fledermaus-ArcGIS integration allows the data processed first in Fledermaus to be exported
to ArcGIS for final production of e.g. maps.
During the last few years there have appeared many quite promising Free Open Source
(FOSS) GIS packages, the most popular of them having large user base that is considered to
improve the quality as well as the functionality, because bugs are noticed and corrected
quickly and more and more new sub-routines implemented. The main advantage of FOSS
GIS is, of course, that it is free of charge and restrictions that was also the main criterion not
to consider any commercial software packages for this dissertation project. FOSS GIS
packages were therefore reviewed, the results of which are utilized in the MSDI Prototype
chapter on page 32. A more complete Free Open Source GIS Software review can be found
on page 63, in the Appendices.

MARINE SPATIAL DATA INFRASTRUCTURES TEEMU TARES
20
7 METADATA Metadata is officially used to describe the geospatial data and services in order to facilitate
searching and finding useful information. Metadata is useful to describe all type of data, i.e.,
not only emphasising the official data, but also anything else that can be useful to know in
the future for example telling about what was done in the project, what are the sources of
references and how good or bad something is (Nebert, 2013).
In EU, the cost of metadata is estimated to be about 20% of the INSPIRE SDI cost. For more
details, please refer to the Cost-Benefit Analysis on page 55.
The NISO guide (2004) states that "metadata is the key to ensure that resources will survive
and continue to be accessible into the future". Consequently, the marine spatial information
of today can in the long run potentially become part of the written human and natural
history, notwithstanding being partially in a machine-readable form. XML (Extensible
Markup Language) and GML (Geography Markup Language) are nowadays commonly used
for geographic data transactions over the internet.
Metadata can apply to data, services and other resource types by 1)providing inventory
documentation of existing internal spatial resources within an organization, 2)allowing
structured search of spatial resource catalogues by others and 3)providing end-users with
adequate information about how to utilize the resource correctly (Nebert, 2013). The
minimum set of SDI metadata should describe data type, extent, quality and the coordinate
reference system in order to facilitate discovery, retrieval and reuse, and to let users know
the basic characteristics for most efficient application (IHO, 2011).
The Geographic Reference System is an important part of the metadata, giving information
on both the horizontal and vertical datum and map projection used, for example: WGS-84
(World Geodetic System 1984) datum, ODN (Ordnance Datum Newline) or LAT (Lowest
Astronomical Tide) local or regional vertical datum, and UTM 30 (Universal Transverse
Mercator, zone 30) map projection. Iliffe and Lott (2008) are describing the datums and map
projections in detail in their book.
From a user perspective, however, everything else than the data and some application-
oriented services of interest may be considered more or less a nuisance especially, if a lot of
extra time and efforts are required in order to use the information. Metadata should
therefore be implemented in an automated process where ever feasible, to make its usage
invisible or at least as transparent as possible so that the human user’s experience will be
nice and work effective. The user needs the data to be certificate, official and of assured
quality that information is part of metadata, too.

MARINE SPATIAL DATA INFRASTRUCTURES TEEMU TARES
21
7.1 Purpose Metadata is very important, because otherwise there would be a great loss of time spent in
manually searching for existing datasets and services, investigating their usability for a
particular purpose and solving issues of incompatible data formats and services. Metadata
makes automation and interoperability of services possible, as described by Hogrefe and
Stocks (2010) by:
“Making data easier to manage without a need to repeatedly answer the same
questions about processing methods, quality etc.
Making data available to others through being able to find and use it.
Promoting readability of data-related information maintained in standard ways.
Fostering collaboration by raising awareness of quality and organizational activities.
Avoiding costly duplication of data or research, because information is easily found.”
Metadata is also used to describe spatial data and services in terms of access and use rights,
conformity with implementing rules, quality, validity, geographic location and responsible
public authorities, for example. A metadata service for managing spatial resources requires
choosing a right metadata standard, structuring the metadata databases for fast searching
and linking them to cartographic products, which are made available for a user through a
marine Web-mapping interface (MADAME, 2000).
Figure 11. Data inventory diagram of the Walloon Administration (MADAME, 2000).

MARINE SPATIAL DATA INFRASTRUCTURES TEEMU TARES
22
7.2 Interoperability The Institute of Electrical and Electronics Engineers (IEEE, 1990) defines interoperability as
the “ability of system components to exchange information and to use the information that
has been exchanged”. Metadata interoperability allows information systems to exchange
and use descriptive metadata about available data.
Neiswender and Montgomery (2009) emphasise as an important aspect that interoperable
metadata can be used by computer systems, in contrast to metadata that is designed to be
read by a person. Interoperable metadata allows, for example, tools such as address books
and drawing systems to easily import remote data, people to move spatial datasets
between various GIS systems, and a dataset to be found through multiple catalogues. To
ensure interoperability, metadata standards must be obeyed. Using standard vocabulary
helps in making metadata interoperable.
The ISO 19115/TS19139 standards provide the de facto standard for metadata and its
encoding (Nebert, 2013). The ISO TC 211 technical committee established the ISO 19115
standard for Geographic Information Metadata in 2003. ISO 19115 is facilitating the
interoperability of metadata services and is recommended to replace its predecessors.
There are eleven headings of which the following four are closely related to spatial
information (Barde et al., 2010): Reference system, spatial representation, content
information, and identification. Three ways of describing geographical extents are available:
(1) Toponyms, i.e. spatial keywords, (2) Cartographic objects with complex limits, and (3)
Cartographic box-like objects.
Figure 12. The three types of ISO 19115 descriptors.
Metadata searches are easier in the cartographic mode, where the user can do metadata
searches without needing to remember and type any text, which is thus recommended. For
ontological relationships developing multilingual thesauri (ISO 1985 for synonyms) can be
done using the ISO 5964 standard. Spatial relationships are based on OGC. In addition,
RDBMS like Oracle Spatial, MySQL Spatial (free) or Postgres/Postgis should be used.

MARINE SPATIAL DATA INFRASTRUCTURES TEEMU TARES
23
8 STANDARDS “Standardization makes an SDI work. Standards touch every SDI activity. Standards include
specifications, formal standards, and documented practices” (Nebert, 2013).
In EU, the cost of Harmonisation of Data is estimated to be about 40% of the INSPIRE SDI
cost. For more details, please refer to the Cost-Benefit Analysis on page 55.
Examples of important international spatial standards enclose ISO 19100 series, IHO S-100
and the OGC standards. The main organizations related to standardization of terrestrial
geospatial information and services nationally or globally (GSDI), are shown in Figure 13.
Figure 13. Geospatial standardization (Nebert, 2013).
Well over 100 standards are relevant to SDI, for example in terms of interoperability, data
format, metadata, thesaurus and vocabulary. These activities are reflected in Figure 14.
Standards define technical data management in order to allow interoperability of data and
services. For example, it is important to use the ISO 19115 standard to ensure
interoperability between the MSDI, GIS, Remote Sensing (RS) and other processing systems.
The Open Geospatial Consortium’s (OGC) work on data content modelling, transport and
web services are critical to developing a robust SDI approach (IHO, 2011).
Framework data should be maintained for common goods and it consists of data layers for
transportation and utilities networks, hydrography, cadastral, administrative boundaries,
elevation, aerial etc. imagery and geodetic control points. ISO TC/211 metadata standard
and ISO/CD 19115 Geographic Information metadata standard provide methods for
describing these framework layers. ISO/CD 19107 Geographic information spatial schema
provides definitions for topology and geometry.
MARINE SPATIAL DATA INFRASTRUCTURES TEEMU TARES
24
Figure 14. Activities and standards in SDI (Nebert, 2013).
Standards applicable to marine spatial data deal with metadata, Web-mapping, OpenGIS,
protocols, markup languages and sensor data standards, among others. A marine spatial
data repository should implement at least the following rules (Lassoued et al., 2009):
- ISO-19139 and Dublin Core metadata standards
- ISO-19115 core metadata set
- Quality information should be enclosed to metadata
- Catalogue Service for the Web to facilitate geospatial data discovery and access
- Geo-scientific ontologies should be implemented in the W3C standard languages
- Ontologies servers supporting the W3C query languages
- Web Feature Service (WFS) allowing geographical feature requests in the Web
- GML application based on data models like Arc Marine, Arc Geology and GeoSciML
- Web Coverage Service interface (WCS) standard for space/time varying phenomena
The ArcGIS Marine Data Model (Wright et al., 2007) is one of the more complex modelling
platforms for marine subjects, as depicted in in Figure 36 and Figure 37 on pages 102 and
103 in the Appendices. Arc Marine is targeted for the marine and coastal environment,
while e.g. GeoSciML is aimed at geological resources. Some data modelled with Arc Marine,
can be further interpreted in GeoSciML or Arc Geology that makes application of them all
useful.
“Just as data will be found through catalogues and registries, servers holding geo-
processing applications services will be discoverable anywhere among the WWW, through
service catalogues and registries” (Gould and Hecht, 2001).

MARINE SPATIAL DATA INFRASTRUCTURES TEEMU TARES
25
8.1 INSPIRE INSPIRE is an EU initiative in order to develop a Spatial Data Infrastructure for Europe to
facilitate interoperable discovery and access to both local and global European levels. This
will be based on distributed databases with common standards. INSPIRE aims to set
common rules for this purpose. Services are needed for production and publication,
discovery, access and use. Also, understanding of geographic information is stressed.
“Making data available according to the INSPIRE standards in 30 countries using 22
languages requires specific skill sets that few public authorities have” (smeSpire, 2013).The
INSPIRE directive (2007) of the European Union defines 34 themes that a national Spatial
Data Infrastructure (SDI) must implement. The data themes are presented in Table 2.
Table 2. Spatial data themes mentioned in the INSPIRE directive, 14 March 2007.
The discovery and viewing services are available to the public free of charge (Official Journal,
1991, Article 14 in INSPIRE). Sharing of spatial data sets and services among public

MARINE SPATIAL DATA INFRASTRUCTURES TEEMU TARES
26
authorities of the EU member states are enabled for tasks, which may have environmental
impacts. In addition, Community bodies of EU are provided with free data and services in
order to fulfil their obligations related to the environment.
“The INSPIRE Directive requires the Commission to establish a geo-portal (shown in Figure
15) and the Member States shall provide access to their infrastructures through the geo-
portal as well as through any access points they decide to operate” (INSPIRE, 2013).
The INSPIRE Directive (2007/2/EC) is targeted for solving environmental problems, directly
or indirectly. It states that “an infrastructure for spatial information in the European
Community should be established” in order to solve the availability, quality, organization,
accessibility and sharing problems related to many kinds of spatial information utilized
across the various levels of public authority. The Infrastructure for Spatial Information in the
European Community was established to assist policy-making that may have environmental
effects. The European Environment Agency and the European Environment Information and
Observation Network are actively contributing to the Inspire directive and providing reliable
environmental information for the EU (Official Journal, 1991).
Figure 15. INSPIRE Geo-portal (INSPIRE, 2013).

MARINE SPATIAL DATA INFRASTRUCTURES TEEMU TARES
27
8.2 International Organization for Standardization (ISO) ISO is the largest and most established developer and publisher of international standards.
It is composed of only national organizations. ISO/TC211 is the ISO technical committee
specialized in Geographic Information with standards specifying data, methods, tools, data
management, acquisition, processing, analysis, accessing, presenting, interoperable
applications, and transferring GI data between users, systems and locations (ISO, 2013).
ISO/TC211 is responsible for the 191XX series of standards for geographic information.
According to Nebert (2013), the standards highlighted below are especially relevant to SDI.
Table 3. A list of published ISO standards on geographic information. (See also page 74 etc.)
More information about standards is available starting on page 72, in the Appendices.

MARINE SPATIAL DATA INFRASTRUCTURES TEEMU TARES
28
9 SERVICES “Networks contain vast amounts of spatial information that are distributed among multiple
databases, stored in many formats and maintained by myriad of individuals and
organizations” (Kottman, 1999). Navigating these complex networks without services is
inefficient and confusing, when looking for information of interest.
In EU, the cost of Network Services is estimated to be about 30% of the INSPIRE SDI cost. For
more details, please refer to the Cost-Benefit Analysis on page 55.
Services are accessible through network interfaces allowing users to evoke behaviours using
standardized protocols. Three types of services are fundamental to SDI: data catalogue
services, on-line mapping services and access services. A broad range of other spatial
services exist. The OGC Service Framework, shown in Figure 16 identifies additional
processing and portrayal services, interfaces and exchange protocols that can be utilized by
any application and also form part of an SDI.
Many fundamental SDI services are related to data management and accessing data (GSDI,
2009) including: discovery and catalogue services, web-mapping, electronic commerce (e.g.,
http://www.commerce.net), authentication, payment confidentiality, public key
infrastructure, delivery and packaging, compression, sub-setting and sub-selection,
container-based delivery systems (e.g. http://www.paradata.com), data subscription, data
and file transport, HTTP, FTP, SMTP/MIME. Higher level services are related to data analysis,
usage and value-adding including: geo-processing, distributed computing, CORBA
(http://www.omg.org), COM, and a multitude of value-added spatial services related,
among others, to environmental, economical, industrial, social, juridical and political
applications and to specific sub-fields like meteorological research or fisheries policy taking
the advantage of spatial information.
The OGC Service Framework (GSDI, 2009) groups spatial services into five categories:
- Application Services, which are for human interaction with spatial information
- Catalogue Services, which are for the management of metadata
- Data Services, which are for the management of spatial data
- Portrayal Services, which are for human interaction with spatial information
- Processing Services, which are for processing of spatial information
A separation between spatial services listed above and IT services is made in ISO 19101.
And, there are six classes of IT services (GSDI, 2009):
- Human interaction services dealing with user interfaces, graphics, multimedia and
presentation of documents
- Model/information management services dealing with development, manipulation,
and storage of metadata, conceptual schemas and datasets

MARINE SPATIAL DATA INFRASTRUCTURES TEEMU TARES
29
- Workflow/task services dealing with specific tasks conducted by humans
- Processing services dealing with computations involving spatial data
- Communication services dealing with data transfer in communications networks
- System management services dealing with management of systems, applications and
networks, including management of user accounts and access rights
- Standard service layers specified in INSPIRE include: CSW, WMS, WMTS, WFS, WPS,
WCTS and Atom
Figure 16. OGC Services (GSDI, 2009).
Important Services include: Atom Syndication Format (Atom), Web Authentication Service,
Catalogue Service (CSW), Web Coordinate Transformation Service (WCTS), NetCDF Climate
and Forecast (CF), Sensor Observation Service (SOS), Web Coverage Service (WCS), Web
Feature Service (WFS), Web Map Print Service (WMPS), Web Map Service (WMS), Web Map
Tile Service (WMTS), Web Perspective View Service (WPVS), Web Processing Service (WPS),
Web Security Service (WSS), Sensor Observation Service (SOS), Sensor Observation Service
(SOS), Symbolization (SLD), Routing Service, and Analysis and Topologic Overlay Service.
Please, view also the “Marine Metadata Standards” starting on page 72.

MARINE SPATIAL DATA INFRASTRUCTURES TEEMU TARES
30
10 DATA The most important MSDI component and of actual interest is the spatial information, i.e.
data, expressed in a consistent coordinate reference system. The two main data layers
enclose (1) the most commonly used spatial reference information and (2) application-
specific information, the latter of which may contain not only information on location, but is
e.g. business-related covering all the marine and maritime application areas.
The reference information enclose sub-layers like buildings, roads, railways, hydrography,
bathymetry, administrative boundaries, geodetic points, elevation, orthoimagery,
population, health, biology, chemistry, land cover, flood areas, economy or any other
spatially defined information. The latter may enclose specific surveillance & exploration
information, oil & gas, mineral extraction, renewable energy, fishing & mariculture,
construction & dredging & disposal, maritime infrastructure, submarine cables, pipelines,
marine recreation, tourism, conservation areas, species habitats, wrecks, coastal defence &
military activities, ports & maritime navigation, tides & currents, winds & waves, sea-ice,
(Green, 2010).
Biogeographic setting or eco-regions are defined by climate, geology and evolutionary
history. Aquatic setting is predominant in zones defined by salinity, coastal proximity and
tidal regime. Biotope is a combination of abiotic (i.e., inorganic) habitat and associated
species. This type of ecological classification is depicted in Figure 17.
Figure 17. Components of coastal and marine ecological classification (Arc Marine, 2013).

MARINE SPATIAL DATA INFRASTRUCTURES TEEMU TARES
31
Ecological processes play a key role in Coastal and Marine Spatial Planning (CMSP), because
they are giving information on for example species diversity and distribution, setting a
foundation for processes happening in the ocean. Where the species are and how
productive they are is heavily influenced by oceanographic processes, which are very spatial
and dynamic. In addition to natural systems, of increasing importance are economic
services, which are giving CMSP information where specific actions are allowed and where
they should be prohibited. Another example is shipping, where the selected shipping routes
are a major use of the oceans having also important economic consequences for the
shipping companies. Political information about regulations and jurisdictional boundaries
are a guiding layer on what can happen and where that is a spatial component to feed in
this planning process. Social patterns (i.e., demographic information) where people are,
what type of people they are, what they are interested in getting from the ocean, how they
interact with each other, what is the social dynamics and social structure, and the network
of communities are all important factors on influencing what will come out of a particular
ocean region as we try to plan and manage it. All these and other spatial-related
information need to be fed in the planning process in the GIS platform (Halpern et al., 2012).
10.1 Core Datasets of Hydrographic Offices Most of the marine spatial datasets are owned or held by local or national hydrographic
offices (HOs). Types of core hydrographic data by theme include (IHO, 2010; NOAA, 2013):
Bathymetry including DEM (i.e., elevation), TIN, grid and points
Tidal information including water levels and tidal streams
Oceanography, e.g. sound velocity profile (SVP), salinity, temperature and currents
Navigational aids including buoys, lights and landmarks
Coastline, maritime borders, administrative limits and traffic separation schemes
Obstructions and wrecks
Hazards and climate
Ocean use
Seabed classification, benthic and land cover, e.g. rocks, sand and mud
Marine animals and habitat
Geographical names for seas, undersea features and charted coastal names
Maritime infrastructure: oil platforms, wind farms, pipelines and submarine cables
Shoreline infrastructure including jetties and tide gauges
Names of maritime spatial objects
To reduce data duplication and to guarantee that the updated data is of consistent quality,
it is important that the original data owner will be responsible for maintaining it.
Note! The reader should also view page 82 and 89, in the Appendices, as well as the
“Marine Metadata Standards”, starting on page 72.

MARINE SPATIAL DATA INFRASTRUCTURES TEEMU TARES
32
11 MSDI PROTOTYPE A Maritime SDI requires network services including metadata and data discovery, view,
access and transform. Due to simplicity, the MSDI compliance requirements on policy, law,
planning, data licensing, digital rights management, pricing and data processing were not
included in our MSDI prototype although they should be enclosed in a real MSDI. So, in
principal, the following 4 criteria for an MSDI prototype were tested: searching for metadata
(Discovery), data visualization (Viewing), download (Access) and use.
The Gulf of Finland was selected as the primary area of interest, but some of the datasets
covered the whole Baltic Sea or even the globe.
Figure 18. Block diagram of the UCL MSDI Prototype together with some remote services (e.g. Oracle).
The following chapters are explaining the configuration and a simple evaluation that was
performed by the author by using the UCL MSDI Prototype, shown above in Figure 18.
11.1 Data Discovery The 1st class of SDI Web services is the Discovery Service, which is typically provided by
national SDI catalogues, which can be accessed through related portals. Discovery requires
common metadata standards to be used to make the information about datasets
discoverable. Now, international standards (ISO 19115 and ISO 19139) exist for this purpose
and have been adopted by most countries. The first task is to make an inventory in general
on who has what data (physical variable) and where (location) of what type (raster, vector)

MARINE SPATIAL DATA INFRASTRUCTURES TEEMU TARES
33
and quality (quality standard). SDI web services can then be utilized to discover the
metadata and incorporated information on data in detail.
11.2 Data Visualization The 2nd class of SDI services allows data to be presented interactively through services such
as WMS (Web Map Service) and WFS (Web Feature Service) using a standard interface over
the internet. Firstly, WMS is used to request and provide maps or their contents
information. Secondly, WFS is used to request and provide the data or search and access
spatial features.
11.3 Data Access The 3rd class of SDI Web services is needed to access raw geo-spatial data (not maps in case
of Web services) by downloading static data files through FTP or via Web Services using
common file formats such as NetCDF, HDF, GeoTIFF, XML and ASCII.
A single client can access multiple service targets. Examples of databases enclose MapServer
& PostgreSQL, Deegree & MS Access, ArcIMS & ArcSDE, Geomedia & AutoCAD, MapExtreme
& Oracle etc.), which are all accessed through the same standard OGC WMS Service layer.
WMS needs to be configured by setting an explicit service URL (Uniform Resource Locator)
defining the host, port and protocol used. In addition, the default data source, coordinate
SRID (Spatial Reference System Identifier), name of the mapping file, coordinate system
EPSG codes, list of layers to include, base map, and an explicit data source should be
specified. WFS service is used for publishing and editing data. All the WFS administration
steps are performed in SQL (Structured Query Language). Configuring the WFS enclose
setting server capabilities information, enabling database schemas, publishing tables as
feature types, register tables for updating, and notifying the WFS server (Godfrind, 2011).
In the opinion of the author, FOSS GIS (Free Open Source Software) is providing the general
interoperability required to be able to use an MSDI. Firstly, as a result of the FOSS GIS
review that is presented on page 63, in the Appendices, Quantum GIS (QGIS) appeared a
best candidate as a Desktop GIS Client not only due to its popularity. Secondly, GeoServer
was a good selection as a Web Map Server, because it is strong in standards, it is as good a
candidate as another strong FOSS server, MapServer, and last but not the least, it is already
in use at the University College London. Thirdly, deegree and GeoNetwork were also
available in UCL and connections were created and tested, as explained on the next page.
These two were not however utilised, because all the data could be well uploaded and
accessed at the UCL GeoServer.
In case of QGIS, the metadata is stored in the system project file and is not available to
other projects or other users of the same datasets. Another drawback in QGIS is that it is not
able to search metadata (Ellul, 2013a). This makes our MSDI prototype rather handicapped,
if connected to a larger data warehouse, although in our case the number of different
vector and raster files was so small (i.e., 17) that there was no need to search metadata.
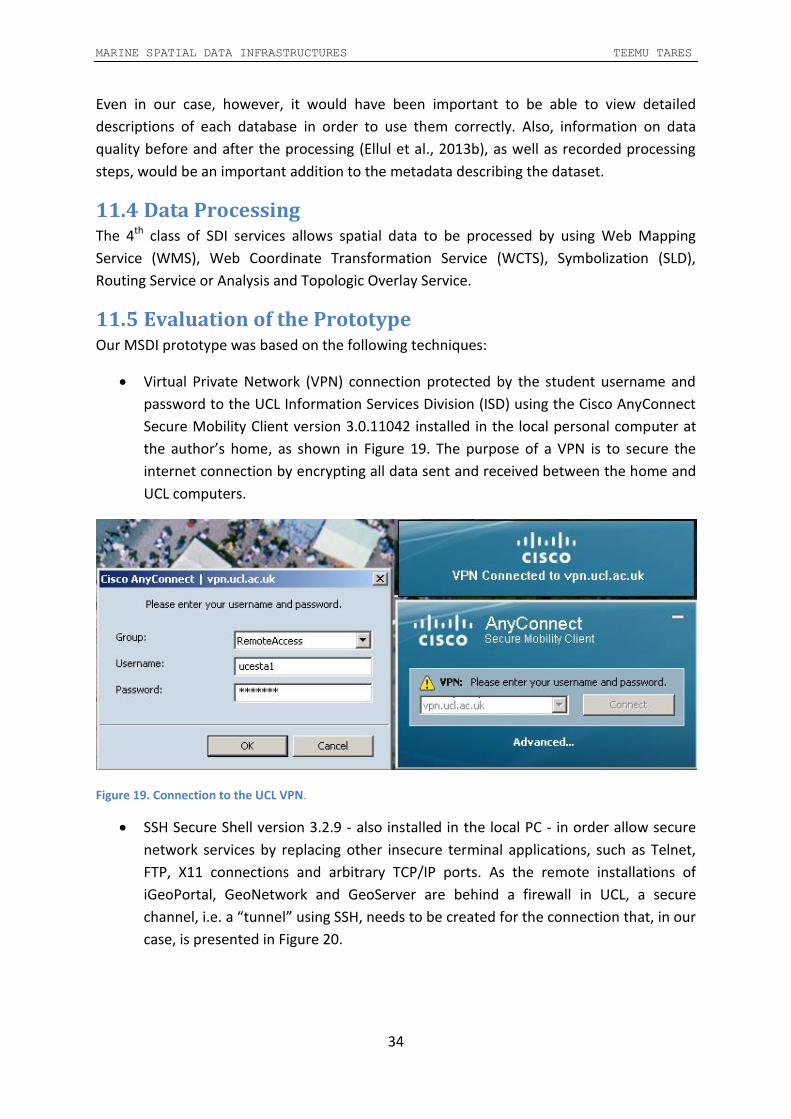
MARINE SPATIAL DATA INFRASTRUCTURES TEEMU TARES
34
Even in our case, however, it would have been important to be able to view detailed
descriptions of each database in order to use them correctly. Also, information on data
quality before and after the processing (Ellul et al., 2013b), as well as recorded processing
steps, would be an important addition to the metadata describing the dataset.
11.4 Data Processing The 4th class of SDI services allows spatial data to be processed by using Web Mapping
Service (WMS), Web Coordinate Transformation Service (WCTS), Symbolization (SLD),
Routing Service or Analysis and Topologic Overlay Service.
11.5 Evaluation of the Prototype Our MSDI prototype was based on the following techniques:
Virtual Private Network (VPN) connection protected by the student username and
password to the UCL Information Services Division (ISD) using the Cisco AnyConnect
Secure Mobility Client version 3.0.11042 installed in the local personal computer at
the author’s home, as shown in Figure 19. The purpose of a VPN is to secure the
internet connection by encrypting all data sent and received between the home and
UCL computers.
Figure 19. Connection to the UCL VPN.
SSH Secure Shell version 3.2.9 - also installed in the local PC - in order allow secure
network services by replacing other insecure terminal applications, such as Telnet,
FTP, X11 connections and arbitrary TCP/IP ports. As the remote installations of
iGeoPortal, GeoNetwork and GeoServer are behind a firewall in UCL, a secure
channel, i.e. a “tunnel” using SSH, needs to be created for the connection that, in our
case, is presented in Figure 20.

MARINE SPATIAL DATA INFRASTRUCTURES TEEMU TARES
35
Figure 20. SSH tunnel has been opened to UCL GEGE.
Of the three applications mentioned above, a Free Open Source (FOSS) GeoServer
application was used, because in addition to being free, it allowed the required WCF,
WFS and WMS services.
Selected raster and vector data files, as explained below, were uploaded to a given
GeoServer folder.
Data was then accessed from the user’s desktop computer using Quantum GIS
(QGIS), which is one of the most popular and advanced FOSS GIS software available.
The uploaded Free and Open Source (FOS) data files included:
Colour-coded depth and relief shading of the ocean bottom, and, cross-blended
hypsometric data with relief, water areas, drainages and ocean bottom raster files
(Natural Earth, 2013), where the bathymetry is derived from the CleanTOPO2 data
(Patterson, 2013, shown in Figure 40), which is originally based on global seafloor
topography measured and estimated from gravity data from satellite altimetry in ca.
20km resolution and from much higher resolution, but unfortunately sparse
shipboard depth soundings derived by Smith and Sandwell (1997). Their original
dataset contains however artefacts, which are corrected in the CleanTOPO2 by
manual editing. It is useful to know that there is a better bathymetric dataset with a
3 kilometres resolution available (see: GEBCO, 2011), but due to some file format
conversion problems, the author of this dissertation could not make it readily
available. Note also that there exists an even much higher resolution (i.e. 45-60m)
dataset from the Shuttle Radar Topography Mission (Farr et al., 2007) measured
over the land surfaces. This digital elevation model (DEM) of all land between about
60° North latitude and 56° South does not reach the latitudes of Finland, however.

MARINE SPATIAL DATA INFRASTRUCTURES TEEMU TARES
36
International shape files used include: 1:10,000,000 collection (Natural Earth, 2013)
of ports and populated places of the world, coastlines of the world, and bathymetric
contour lines for 0, 200, 1000, 2000 and 4000 meters.
National shape files used in 1:1,000,000 scale covering the whole country of Finland
are derived from the National Land Survey of Finland (Koordinates, 2013) containing
all the water-related areas, i.e., coastline, water depth, lakes, rivers and swamps.
QGIS (at author’s home in Finland) was connected to the GeoServer at UCL in London,
UK, and data was effortlessly accessed, as are shown by the next 3 figures below. The
first of them, i.e. Figure 21 shows administrative boundaries, coastline, islands, shaded
relief, water, drainages and bathymetric contours between 200 and 4000 meters.
Figure 21. Test: QGIS Desktop GIS Client accessing and displaying data from the UCL GeoServer.

MARINE SPATIAL DATA INFRASTRUCTURES TEEMU TARES
37
Figure 22. Test: QGIS accessing and displaying swamps, rivers, lakes, depth contours etc. in Finland.
The Figure 39 on page 105, in the Appendices, presents a similar, but zoomed-in image over
southern Finland, where swamp areas, lakes, rivers and islands are well highlighted.

MARINE SPATIAL DATA INFRASTRUCTURES TEEMU TARES
38
Figure 23. Test: QGIS accessing and displaying a.o. bathymetry, satellite imagery and ports in Europe.
This image shows the ports around Europe, in addition to bathymetry and satellite imagery.
All the data on the QGIS Layers menu, on the left above, are actually residing at UCL and
automatically transferred to QGIS through the Web Mapping Services, while the QGIS itself
is being run on author’s PC. I.e., no data is copied, but fetched from the UCL GeoServer.

MARINE SPATIAL DATA INFRASTRUCTURES TEEMU TARES
39
12 DISCUSSION
12.1 Successes In the opinion of the author, GIS is a good tool for educating people and finding out gaps in
the knowledge of e.g. decision makers, if good MSDI data is available for the analysis.
Harmonisation of global datasets will be costly and difficult, if SDI standards are not obeyed.
If data originates from different sources, there will be compatibility issues and even errors,
but working always with the original data will reduce them. This is one of the most
important successes of MSDI, especially under INSPIRE and relatives.
According to cost-benefit analyses, the INSPIRE SDI appears financially quite beneficial.
Moreover, the benefits of the US Digital Coast are estimated to exceed costs by over 400%.
More details about these Cost-Benefit Analyses are available on page 55, in the Appendices.
Although there are special additional requirements in case of an MSDI due to the dynamic
and 3D marine environment, two of the six main types of SDI software tools, i.e., the Spatial
Database Management System and Catalogue/Registry & Metadata System, can most likely
be directly applied to MSDI, if the extremely large storage and dynamic data access
requirements can be fulfilled. This is because these systems can save data in any format, be
it multi-dimensional or not. It then depends on the query language and system performance
to allow multi-dimensional queries and near real-time dynamic access of data. Quantum GIS
worked very well, if some “bugs” are forgotten. Even in that case no data was lost and the
projects could be quickly run again after re-starting QGIS.
According to Halpern et al. (2012), there are at least five areas on the cutting edge of the
scientific work, which can benefit from the development of Marine SDI Tools and we can be
sure that the future GIS will make these kinds of analyses feasible:
Uncertainty: It is inherent to all information and it propagates through the system.
Temporal dynamics: In the ocean, species, people, currents, wind etc. etc. move.
Citizen science: To get more information than is possible by the authorities alone.
Big data integration: MSDI datasets must be assimilated for analysis and solution.
Spatial connectivity of processes: What happens in one place is affecting the others.
12.2 Shortfalls When using the GeoServer, there were often problems for example, when selecting “Layers
– Page 2”, which most of the time did not succeed and was giving an error message: “Sorry,
your session timed out... It looks like you waited too long to make that last change. If this
continues to happen, you should get in touch with your system administrator.” Login out and
in again did not always solve this problem, so there were not a time problem. In the opinion
of the writer, also the response times of GeoServer in the UCL configuration were
frustratingly slow for any efficient working, because clicking almost any item under the Data

MARINE SPATIAL DATA INFRASTRUCTURES TEEMU TARES
40
menu, for example, resulted in waiting times of 2-25 seconds. Clearly, the GeoServer “was
waiting for local host” too often, which is probably not reflecting a problem in the
GeoServer itself, but in the UCL configuration. Due to the connection times, web mapping is
best suited to occasional usage and not so well for a professional or scientific utilization.
Sometimes GIS may give wrong impressions of how much may be done with it alone that
must be accounted. GIS is also not a real-time tool for dynamic monitoring yet. The marine
parameters are often changing rapidly, so mapping on the sea may be considered static only
in respect to land structures like islands, seafloor and bedrock, while for example water
level, temperature, currents, wind, chemical concentrations, species distribution etc. may
change rather in minutes or seconds than in days or years. Marine data repositories thus
need constant updating and the dilemma is that costly data then quickly becomes obsolete,
if not valueless. Still, it should be archived that multiplies the mass storage requirements.
Acquiring databases in the deep sea is difficult, because there isn’t available a technology
similar to Remote Sensing (RS) satellites that could be used to quickly acquire imagery over
large areas with a high-resolution. Currently about 90% of the oceans have still not been
mapped a single time. Even if we could do it once, then the high temporal repeat
requirement in three dimensions is making the task absolutely impossible today in any other
way than in a very low spatial (>km) and temporal (weeks-years) resolutions or in a small
Area of Interest (AOI). This problem may be partly solved by developing models to
interpolate in space and to extrapolate in time, giving useful estimates at least for the most
important Parameters of Interest (POI). An example of this is the prediction of marine
surface currents for shipping route optimisation in order to save fuel over long distances.
In case of INSPIRE SDI, where the data and its metadata are held in separate databases,
automatically updating the metadata, when data has been re-processed, requires the user
to save both of them on the local computer that is violating the philosophy of not making
multiple copies of the data. A software package called ER Mapper is a good example of not
making copies of large processed data files, but saving a script of processing steps that can
then later be repeated. Also, Ellul et al. (2013a) have shown using FOSS GIS software that
metadata and data can be tightly coupled so that modifying data automatically updates the
metadata.
For the integrity of data and metadata, it would be useful to save all the related information
in one file, although the INSPIRE directive appears to require that data and metadata are
saved separately in order to facilitate the data discovery through searching the metadata
that probably makes the data discovery quicker, because the metadata files are small in
comparison to the actual data files. The small file size also makes it easy to keep metadata.
On the other hand, the hardware and software infrastructure gets complicated, because the
different systems must be made to talk with each other instead of just simply downloading
an interesting data set. In the author’s opinion, integrating data and metadata in a single file
would greatly simplify the implementation of any SDI.

MARINE SPATIAL DATA INFRASTRUCTURES TEEMU TARES
41
13 CONCLUSIONS In this project, it soon became evident that the subject of Spatial Data Infrastructures (SDI)
is huge. Moreover, Marine SDI (MSDI) has not yet taken a stance as well as the terrestrial
SDI, because the subject of MSDI is still new. Against these backgrounds, the author feels
that the MSDI Prototype presented in Figure 18 devolved somewhat elusive of necessity.
Nevertheless, a main result of this project was summarizing the principles, actors, policies,
technology, metadata, standards, services, data and geo-portals in Marine Spatial Data
Infrastructures. The study showed that there are lots of marine data the utilisation of which
is however not quite easy for a non-specialist. This may be changing thanks to Web Mapping
tools being developed at the same time, when datasets are being opened to the public.
It is crucial to recognize that while both GIS and Remote Sensing have made it possible to
make decisions based on facts during the last 20 years, it is also true to say that during this
period the overall situation with respect with aquatic environments has not improved
(Meaden, 2013). In fact, there is a high risk that mapping the Global Ocean and
implementing the initially well-meaning MSDIs may trigger a “gold rush” to marine minerals,
energy and the other marine resources with devastating consequences!
In case of the Ocean, four types of SDI software tools, i.e. the Desktop GIS Client, Desktop
Web GIS Development Toolkit, Web Map Server and Web GIS Server, must allow 3D if not
multi-dimensional and near real-time data be analysed as well as the related applications to
be developed and run. I.e., here it is absolutely necessary to keep in mind that the marine
environment is three-dimensional and in constant motion that is in contrast to for example
the land cover ashore.
Other special requirements of MSDI in comparison to SDI, are to be able to handle globally
extremely sparse, multi-resolution and multi-sensor data, where pixel resolutions are
varying from tens of kilometres down to centimetres, and sensors covering underwater
sonar depth and backscatter observations as well as satellite-based optical and microwave
oceanography and a myriad of point-type of observations of water chemical and physical
properties using buoys, for example. I.e., phenomena with largely varying nature are
investigated using many different Observation & Measurement (O&M) methods. Therefore,
MSDI should be able to handle three-dimensional, multi-temporal, multi-resolution and
multi-sensor datasets.
According to FAO (2003 and 2010) the shortest time and space scales are related to e.g.
beach waves, Langmuir waves (i.e., shallow, slow, counter-rotating vortices at the ocean’s
surface) and internal waves with scales ranging from a fraction of second to one day and
from 10cm to 1km, correspondingly. The longest time and space scales, on the other hand,
are related to zoo-plankton, eddies, fronts, adult fish, and ocean gyres with scales ranging
from weeks to over 10 years and from hundreds of meters to thousands of kilometres. I.e.,
very large ranges of temporal and spatial resolutions are required to analyse all kind of

MARINE SPATIAL DATA INFRASTRUCTURES TEEMU TARES
42
dynamic marine information. If we have high-resolution, a lower resolution can always be
down-sampled, but a higher resolution cannot be up-sampled. This means that high
resolution should be the aim, as long as the ways of observation do not harm the animals.
It is of utmost importance to guarantee that the sound-waves required to map the deep
Ocean are not going to be too harmful to marine mammals, fishes and the other marine
animals. The sound is propagating underwater five times faster and over very much longer
distances than in the air, and many marine animals are sensitive to extremely low powers.
Today, the seas are polluted by noise originating from ships, construction and marine
exploration using both extremely low and high frequencies, and strong sounds, if not
explosions, in order to receive echoes deep under the seafloor in locating oil, gas and
minerals. It is quite evident that these and military tests are harmful for marine mammals,
as shown e.g. in the following video http://www.youtube.com/watch?v=O9gDk29Y_YY.
Healthy sane should be used regarding to exploration, experiments and operations at sea!
Because satellites can only acquire bathymetric grids above the sea surface with a very low
resolution (a few km) globally, as presented in Figure 41, on page 107, it will take a long
time before the deep waters have been mapped in detail by using maritime vessels. For the
same reason, the update rate is also much slower under the water than above. Besides
optical observations of a thin sea surface layer (due to visibility ranging from less than 1m to
up to 50m depending on turbidity and swell of the sea) there is no technology similar to the
Earth Observation (EO) satellites that could be used for mapping of large areas of deep
ocean quickly with a better than a few kilometres of resolution. A technological jump like,
for example, a larger number of unmanned, low-noise imaging sub-sea gliders is needed.
Today, dry land - covering less than 30% of the Earth - has been imaged using satellites
several times in a resolution of about 30m, but only 10% of the ocean bottom has been
mapped, in a much lower resolution. Track lines of hydrographic surveys done until 2010
with resolutions of 1 - 200m, depending on depth, are shown in Figure 38.
Currently, the best global map of the ocean depth, GEBCO Digital Atlas, has a resolution of
30 arc-seconds that corresponds to about 1km pixel spacing. It is based on a database of
ship track soundings interpolated (i.e., guessed) between the tracks and earlier bathymetric
grids (GEBCO, 2011). Even though the GEBCO Digital Atlas is a really great achievement
covering the entire globe, it is a quite rough and averaged Digital Elevation Model (DEM) of
the seafloor topography, missing not only most of the details between the 30 arc-seconds,
but all the other than geometric information and most notably, optical photography, when
compared to terrestrial satellite and e.g. Street View (Google Earth, 2013) observations.
The lack of detailed Global Ocean maps is a major limitation for an MSDI currently.
MARINE SPATIAL DATA INFRASTRUCTURES TEEMU TARES
43
14 FURTHER WORK In the opinion of the author, the most important next step would be to develop for QGIS or
Python a procedure in order to try systematically access the most important MSDI
warehouses and to make their data available first internal to UCL, and, then in the Web.
Currently, there are so many Marine Geoportals with so many data types that it can be
daunting to study any more than what is just needed in a quite specific area of science and
geography, of specific data type in a specific research project by an individual researcher.
A Python interface could access multi-dimensional data structures of marine SDI. CF has
grown from NetCDF, HDF etc. formats to make them more inter-operable being on a higher
level. These kinds of data formats should be investigated, if they could provide a working
method to integrate metadata and data, which are held separately in INSPIRE.
Integrating data and metadata in a single file could simplify the implementation of an SDI.
Therefore, it should be evaluated, if the separation is really bringing any advantages or not.
Starting on page 89 in the chapter of “Marine Geospatial Portals”, in the Appendices, there
are mentioned several good attempts to make marine information available, but are they
really interoperable and easy to use, having decision makers in mind, or, are they just large
collections of data, where each individual researcher is in any case required to spend lots of
time in order to understand the data types, formats etc., before being able to use the data?
Another issue for a study could be to investigate how Open Data could allow also Open
Science, where the data used in a research project would always be delivered with the
project report so that anybody could repeat the processes by just calling a script. And, then
being able to try own methods using the same dataset and tools.
MSDIs are bringing marine information available to decision makers, with the rational that
decisions should be based on understanding instead of cravings. But, what information is
important when deciding about the Ocean? Decision makers may not know. So, even if
there are a lot of good data, researchers must still select, analyse, visualise and explain it.
Last but not the least:
Please, explore the Ocean at
http://www.google.com/earth/explore/showcase/ocean.html# and
http://www.youtube.com/watch?v=A-zIiM6uAzE.

MARINE SPATIAL DATA INFRASTRUCTURES TEEMU TARES
44
15 REFERENCES Adkins, J., 2012. Benefits and Costs of the Digital Coast. National Oceanic and Atmospheric
Administration (NOAA) Coastal Services Center, 16 pages. Available from:
http://www.csc.noaa.gov/digitalcoast/_/pdf/Benefits_and_Costs_of_the_Digital_Coast.pdf [Accessed 14
July 2013].
AODC, 2013. ISO 18115 Marine Community Profile (MCP). Australian Ocean Data Centre.
Available from: http://www.aodc.org.au/index.php?id=37 [Accessed 31 August 2013].
Arc Marine, 2013. The ArcGIS Marine Data Model (for the oceans, seas, and coastal regions
of our planet...). Available from: http://dusk.geo.orst.edu/djl/arcgis/ [Accessed 21 July 2013].
Barde, J. et al., 2010. A Metadata Service for Managing Spatial Resources of Coastal Areas.
In: Coastal and Marine Geospatial Technologies. Springer, pages 3-15.
Branton, R., 2009. Eastern Canadian Benthic Macrofauna. Government of Canada, Fisheries
and Oceans Canada, Marine Fish Division. Available from: http://geodiscover.cgdi.ca/wes/RecordSummaryPage.do?uuid=AF9C7B11-28DB-2AB4-137B-
B29B8EBA6006&recordLocale=en_US&view=summary&entryPoint=jsMap&mode=unmappable [Accessed 3
August 2013].
Branton, R., 2010a. Living marine legacy of Gwaii Haanas. I: Marine plant baseline to 1999
and plant-related management issues. Bedford Institute of Oceanography, Nova Scotia,
Canada. Available from: http://geodiscover.cgdi.ca/wes/RecordSummaryPage.do?uuid=5CEF61A5-29F8-
F16C-3D5C-6545B39C34FA&recordLocale=en_US&view=summary&entryPoint=jsMap&mode=unmappable
[Accessed 3 August 2013].
Branton, R., 2010b. Living marine legacy of Gwaii Haanas. II: Marine invertebrate baseline to
2000 and invertebrate-related management issues. Bedford Institute of Oceanography,
Nova Scotia, Canada. Available from: http://geodiscover.cgdi.ca/wes/RecordSummaryPage.do?uuid=39EDD493-7F59-8CA2-79A8-
08F4EEB2CAD2&recordLocale=en_US&view=summary&entryPoint=jsMap&mode=unmappable [Accessed 3
August 2013].
Branton, R., 2010c. EAISSNA - An Electronic Atlas of Ichthyoplankton on the Scotian Shelf of
North America. Government of Canada, Fisheries and Oceans Canada, Marine Fish Division.
Available from: http://www.marinebiodiversity.ca/en/eaissna/eaissna.html [Accessed 3 August 2013].
Bregt, A., 2012. Spatial Data Infrastructures: Cost-Benefit Analysis in Perspective. INSPIRE
Directive Workshop, Ispra, Italy, 15-16 October 2012, 22 pages.
Cascadoss, 2009. Evaluation of Desktop GIS Applications. Available from:
http://www.cascadoss.eu/en/index.php?option=com_content&task=view&id=14&Itemid=14 [Accessed 4
July 2013].
MARINE SPATIAL DATA INFRASTRUCTURES TEEMU TARES
45
Cetl, V., Toth, K., de Lima, V.N., 2012. Cost benefit considerations: INSPIRE Annex II and III
Themes Testing. EC Joint Research Centre, IES, 26 pages.
Chen, D., Shams, S., Carmona-Moreno, C., and Leone, A., 2008. Assessment of open source
GIS software for water resources management in developing countries. EC Joint Research
Centre, Institute for Environment and Sustainability, Italy, 26 pages.
Chen, D., Shams, S., Carmona-Moreno, C., and Leone, A., 2010. Assessment of open source
GIS software for water resources management in developing countries. Journal of Hydro-
Environment Research 4, pages 253-264.
Cleary, J. and Fujioka, E., 2011. Advancing global marine biogeography research with open
source GIS software and cloud computing. FOSS4G2011 video presentation. Available from: http://www.fosslc.org/drupal/content/advancing-global-marine-biogeography-research-open-source-gis-
software-and-cloud-computing [Accessed 29 June 2013].
Cockburn, Nichols and Monahan, 2004. UNCLOS’ potential influence on a marine cadastre:
Depth, breadth, and sovereign rights. University of New Brunswick, 14 pages.
Craglia, M. and Borzacchiello, M.T., 2012. Cost and Benefits of implementing the INSPIRE
Directive Workshop. Ispra, 15-16 October 2012, 10 pages.
Craglia, M., 2012. INSPIRE Impact Assessment: Lesson Learned. EC Joint Research Center,
Digital Earth Unit, 32 pages.
Directive 2007/2/EC of the European Parliament and of the Council of 14 March 2007
establishing an Infrastructure for Spatial Information in the European Community (INSPIRE).
Available from: http://eur-lex.europa.eu/LexUriServ/LexUriServ.do?uri=CELEX:32007L0002:EN:NOT
[Accessed 10 July 2013].
EC, 2013. EU Coastal and Marine Policy. Environment, European Commission. Available
from: http://ec.europa.eu/environment/marine/eu-coast-and-marine-policy [Accessed 3 August 2013].
EEA, 2006. The changing faces of Europe’s coastal areas. EEA Report No 6/2006. European
Environment Agency and Publications Office of the European Union, ISBN 92-9167-842-2,
112 pages. Available from: http://www.eea.europa.eu/publications/eea_report_2006_6 [Accessed 15
August 2013].
EEA, 2010. The European Environment. State and Outlook 2010. Marine and Coastal
Environment. European Environment Agency (EEA), Copenhagen, Denmark. Publications
Office of the European Union, Luxembourg, ISBN 978-92-9213-158-6, 58 pages.
Ellul, C., 2012. Can Free (and Open Source) Software and Data be Used to Underpin a Self-
Paced Tutorial on Spatial Databases? Transactions on GIS, 16(4), pp. 435-454.
MARINE SPATIAL DATA INFRASTRUCTURES TEEMU TARES
46
Ellul, C., Tamash, N., Xian, F., Stuiver, J. and Rickles, P., 2013a. Using Free and Open Source
GIS to Automatically Create Standards-Based Spatial Metadata in Academia – First
Investigations. University College London, UK and University of Wageningen, The
Netherlands. 16 pages.
Ellul, C., Winer, D., Mooney, J., and Foord, J., 2013b. Bridging the Gap between Traditional
Metadata and the Requirements of an Academic SDI for Interdisciplinary Research.
University College London and London Metropolitan University, UK. 21 pages.
Esri, 2010. Spatial Data Infrastructure: A Collaborative Network. Esri, Redlands, California,
USA, 8 pages.
FAO, 2003. The ecosystem approach to fisheries. FAO Technical Guidelines for Responsible
Fisheries No. 4, FAO Fisheries Department, Rome, 112 pages. Also available at
http://www.fao.org/docrep/005/y4470e/y4470e00.HTM.
FAO, 2010. Aquaculture development. 4. Ecosystem approach to aquaculture. FAO Technical
Guidelines for Responsible Fisheries. No. 5, Rome, 53 pages. Also available at
http://www.fao.org/docrep/013/i1750e/i1750e00.htm.
Farr, T. et al., 2007. The Shuttle Radar Topography Mission. Rev. Geophys., 45, 43 pages.
Available from: http://www2.jpl.nasa.gov/srtm/srtmBibliography.html [Accessed 25 August 2013].
FGDC, 2001. Metadata Profile for Shoreline Data. Available from:
http://www.fgdc.gov/standards/projects/FGDC-standards-projects/metadata/shoreline-metadata [Accessed
29 July 2013]
FGDC, 2013. Geospatial Metadata Standards. Available from:
http://www.fgdc.gov/metadata/geospatial-metadata-standards#fgdcendorsedisostandards [Accessed 26
July 2013].
Finlex, 2009. Regulation 1282/2009. Available from:
http://www.finlex.fi/fi/laki/alkup/2009/20091282 [Accessed 25 July 2013].
Fowler, C., Smith, B. and Stein, D. 2011. Building a marine spatial data infrastructure to
support marine spatial planning in U.S. waters. National Oceanic and Atmospheric
Administration (NOAA), Coastal Services Center, 6 pages.
GEBCO, 2011. General Bathymetric Chart of the Oceans. Video. Available from:
https://www.youtube.com/watch?v=A-zIiM6uAzE&feature=player_embedded [Accessed August 2013].
GeoConnections, 2013. Available from: http://geodiscover.cgdi.ca [Accessed 1 August 2013].
GeoGratis, 2011. North American Atlas – Sea Ice. GeoGratis Client Services, Government of
Canada, Natural Resources Canada, Earth Sciences Sector. Available from:

MARINE SPATIAL DATA INFRASTRUCTURES TEEMU TARES
47
http://geodiscover.cgdi.ca/wes/displayExternalLinks.do?identifier=1154E722-C468-4AF2-F8A8-
E765C26D526F&recordLocale=en_US [Accessed 3 August 2013].
GISCO, 2011. Geographical Information System of the Commission. Progress Report 2011.
Eurostat. Available from: http://epp.eurostat.ec.europa.eu/portal/page/portal/gisco_Geographical_information_maps/publications/pro
gress_report [Accessed 10 July 2013].
Godfrind, A., 2011. ORACLE Spatial Web Services. Washington, USA, 85 pp. Available from: http://download.oracle.com/otndocs/products/spatial/pdf/osuc2011_presentations/osuc2011_webserv_godf
rind.pdf [Accessed 1 August2013].
Google Earth, 2013. Google Earth Beginner Tutorials: Street View. Available from:
http://www.google.com/earth/learn/beginner.html#tab=street-view [Accessed 30 August 2013].
GOOS, 2013. Global Ocean Observing System. Available from: http://www.ioc-goos.org/
[Accessed 20 July 2013].
Gould, M. and Hecht, L. Jr. 2001. OGC: A Framework for Geospatial and Statistical
Information Integration. An Open GIS Consortium (OGC) White Paper. Tallinn: Joint
UNECE/Eurostat Work Session on Methodological Issues Involving the Integration of
Statistics and Geography, 9 pages.
GRASS GIS, 2013. GRASS GIS web page: “The world’s leading Free GIS software”. Available
from: http://grass.osgeo.org/ [Accessed 1 July 2013].
Graybeal, J., Neiswender, C., Stocks, K., Bermudez, L., Galbraith, N., Watson, S., Miller, S.P.,
2010. Definition of Metadata. MMI Guide: Navigating the World of Marine Metadata.
Available from: http://marinemetadata.org/guides/mdataintro/mdatadefined [Accessed August 2013].
Grus, L., Crompvoets, J. and Bregt A. K., 2007. Multi-view SDI assessment framework,
International Journal of Spatial Data Infrastructures Research, 2, 33-53.
GSDI, 2009. The SDI Cookbook. Global Spatial Data Infrastructure Association (GSDI).
Available from: http://www.gsdi.org/gsdicookbookindex [Accessed 15 July 2013].
Halpern, B., Wright, D. et al., 2012. Coastal and Marine Spatial Planning. Video
presentations. 2012 Esri Ocean Summit Proceedings. Available from:
http://proceedings.esri.com/library/userconf/oceans12/ [Accessed 12 August 2013].
Herring, J. R. (Ed.), 2011. OpenGIS Implementation Standard for Geographic information -
Simple feature access - Part 1 & 2. Version 1.2.1. Open Geospatial Consortium Inc.
Hogrefe, K., Stocks, K., 2010. The Importance of Metadata. MMI Guide: Navigating the
World of Marine Metadata. Available from:
http://marinemetadata.org/guides/mdataintro/mdataimportance [Accessed 2 August 2013].

MARINE SPATIAL DATA INFRASTRUCTURES TEEMU TARES
48
Hydrology DWG, 2013. OGC Hydrology Domain Working Group web page. Available from:
http://external.opengis.org/twiki_public/HydrologyDWG/WebHome [Accessed 19 July 2013].
IEEE, 1990. IEEE Standard Computer Dictionary: A Compilation of IEEE Standard Computer
Glossaries, Institute of Electrical and Electronics Engineers, New York.
IHO, 2009. IHO Hydrographic Geospatial Standard for Marine Data and Information. v0.0.4,
International Hydrographic Bureau, Monaco. Available from:
http://www.iho.int/mtg_docs/com_wg/TSMAD/TSMAD_Misc/S-100ver0.0.4.pdf [Accessed 27 July 2013].
IHO, 2011. Spatial Data Infrastructures, “The Marine Dimension”, Guidance for
Hydrographic Offices. Edition 1.1. – February 2011, C-17, International Hydrographic
Organization, International Hydrographic Bureau, Monaco, 34 pages.
IHO, 2013. Bathymetry and Ocean Mapping. International Hydrographic Organization (IHO).
Available from: http://www.iho.int/srv1/index.php?option=com_content&view=article&id=300&Itemid=744
[Accessed 12 August 2013].
Iliffe, J. and Lott, R., 2008. Datums and Map Projections. Whittles Publishing, 208 pages.
IMO, 2012. Implications of the United Nations Convention on the Law of the Sea for the
International Maritime Organization. Study by the Secretariat of the International Maritime
Organization (IMO), LEG/MISC.7, 129 pages. Available from:
http://www.imo.org/OurWork/Legal/Documents/Implications%20of%20UNCLOS%20for%20IMO.pdf
[Accessed 19 August 2013].
IMO, 2013. IMO and the Environment. N187E, IMO, London, UK, 12 pages. Available from:
http://www.imo.org/OurWork/Environment/Documents/IMO%20and%20the%20Environm
ent%202011.pdf [Accessed 19 August 2013].
INSPIRE, 2003. Contribution to the extended impact assessment of INSPIRE, Environment
agency for England and Wales. Available from: http://inspire.jrc.it/reports/fds_report.pdf,
[Accessed 3 July 2013].
INSPIRE, 2011. INSPIRE Monitoring Indicators – Guidelines Document. EC Eurostat, 35
pages. Available from: http://inspire.jrc.ec.europa.eu/events/conferences/cost_benefits/INSPIRE_MR_Guidelines_Reporting_2011-
01-18_v_5.0.pdf [Accessed 10 July 2013].
INSPIRE, 2013. INSPIRE Geoportal. Enhancing access to European spatial data. Available
from: http://inspire-geoportal.ec.europa.eu/ [Accessed 20 June 2013].
IPSO, 2008. Implementing the Global State of the Oceans. International Programme on the
State of the Ocean (IPSO), 40 pages. Available from:
http://www.stateoftheocean.org/pdfs/ipso_report_051208web.pdf [Accessed 27 August 2013].

MARINE SPATIAL DATA INFRASTRUCTURES TEEMU TARES
49
IPSO, 2013. International Programme on the State of the Ocean (IPSO). Available from:
http://www.stateoftheocean.org [Accessed 14 August 2013].
ISO/TC 211, 2009. Standards Guide: ISO/TC 211 Geographic Information/Geomatics.
Available from: http://www.isotc211.org/Outreach/ISO_TC_211_Standards_Guide.pdf [Accessed 10
August 2013].
Koordinates, 2013. Available from: http://koordinates.com/ [Accessed 18 August 2013].
Kottman, C., 1999. The OpenGIS Abstract Specification Topic 13: Catalog Services Version 4.
Open GIS Consortium Inc., 39 pages. Available from: http://www.opengeospatial.org/standards/as
[Accessed 14 August 2013].
Kuhn, W., 2005. Introduction to Spatial Data Infrastructures. Institute for Geoinformatics,
University of Münster, 46 pages. Available from: http://www.google.com/url?sa=t&rct=j&q=&esrc=s&frm=1&source=web&cd=4&cad=rja&ved=0CEMQFjAD&u
rl=http%3A%2F%2Fwww.inf.udec.cl%2F~andrea%2Fcursos%2Fwerner%2F2426%2520SDI%2520Intro.ppt&ei=g
1PlUZ3ZEemk4ASC_IHoAQ&usg=AFQjCNGOGoudIfGZwCFbQ-fdLT5GTUt00g&sig2=c7p1R2-
C3ClXIKVqck9w1w&bvm=bv.48705608,d.bGE [Accessed 16 July 2013].
Lassoued, L. (Ed) et al., 2009. Geoscientific Data Integration (GeoDI): Identification of
Standards and Models. Marine Research Sub-Programme, PBA/KI/07/001, Oregon State
University, 30 pages.
Liikennevirasto, 2013. Suomen tärkeimmät vesireitit. Available from:
http://portal.liikennevirasto.fi/sivu/www/f/liikenneverkko/vesivaylat_kanavat [Accessed August 2013].
Lindegaard, M., 2011. The Nordic Open Source Initiative Network. FOSS4G2011 video
presentation. Available from: http://www.fosslc.org/drupal/content/nordic-open-source-initiative-
network [Accessed 29 June 2013].
Long, 2013. EU Maritime Policy. Asia Pacific Alumni Meeting, 23 pages. Available from: http://www.un.org/depts/los/nippon/unnff_programme_home/alumni/tokyo_alumni_presents_files/alum_to
kyo_long.pdf [Accessed 02 September 2013].
MADAME, 2000. Methods for Access Data and Metadata in Europe, Info2000 Project.
Mäkelä, J. and Hilke, K. (Eds.), 2010. Paikkatietojen hyödyntäminen Suomessa (i.e.,
Utilization of spatial information in Finland). Workgroup for Spatial Data Infrastructure,
Finnish Inspire Network, 40 pages. Available from: http://www.paikkatietoikkuna.fi/c/document_library/get_file?uuid=18e702ba-aad8-476d-9867-
cc0c3f2306d6&groupId=108478 [Accessed 11 July 2013].
Manson, 2010. Coastal Environmental Data - Northern and Eastern Canada. Government of
Canada, Natural Resources Canada, Earth Sciences Sector. Available from: http://geodiscover.cgdi.ca/wes/RecordSummaryPage.do?uuid=AE6F9E7B-3C6B-16E2-2993-

MARINE SPATIAL DATA INFRASTRUCTURES TEEMU TARES
50
7713E7F64949&recordLocale=en_US&view=summary&entryPoint=jsMap&mode=unmappable [Accessed
31 July 2013].
Meaden, G.J. (Ed.), 2013. Advances in Geographic Information Systems and Remote Sensing
for Fisheries and Aquaculture. FAO fisheries and aquaculture technical paper no. 552, Food
and Agriculture Organization of the United Nations, Rome, 452 pages. Available from:
http://www.fao.org/docrep/017/i3254e/i3254e.pdf [Accessed 28 August 2013].
MetOcean DWG, 2013. OGC MetOcean Domain Working Group web page. Available from:
http://external.opengeospatial.org/twiki_public/MetOceanDWG/WebHome [Accessed 18 July 2013].
mezoGIS, 2013. mezoGIS web page. Available from: http://www.mezogis.org/ [Accessed 13 July
2013].
Milton, R., 2010. Nova Scotia Wetlands and Coastal Habitats Inventory. Nova Scotia
Department of Natural Resources, Renewable Resources Branch, Wildlife Division, Canada.
Available from: http://www.gov.ns.ca/nse/wetland/ [Accessed 3 August 2013].
MyOcean, 2013. MyOcean web page. Available from: http://www.myocean.eu [Accessed 12
June 2013].
MySQL, 2013. MySQL web page. Available from: http://www.mysql.com/ [Accessed July 2013].
Nairn, A. 2010. The Development of an Australian Marine Spatial Information System
(AMSIS) to Support Australian Government Ocean Policy and Multi-Use Marine Activities. In:
Coastal and Marine Geospatial Technologies. Dordrecht, Heidelberg, London, New York:
Springer, pp. 17-27.
Natural Earth, 2013. Available from: http://www.shadedrelief.com/natural/index.html [Accessed
August 26, 2013].
Nebert, D., 2013. Spatial Data Infrastructure Concepts and Components. Video presentation,
US Federal Geographic Data Committee. Available from: http://www.gsdi.org/SDIvideos
[Accessed 3 August 2013].
Neiswender, C., Isenor, A., Graybeal, J., Hogrefe, K., Bermudez, L., Galbraith, N., Watson, S.,
2011. Metadata Standards. MMI Guides: Navigating the World of Marine Metadata.
Available from: http://marinemetadata.org/guides/mdatastandards Accessed August 31, 2013.
Neiswender, C., Isenor, A., Stocks, K., 2010. Getting Started - How You Can Publish Your
Metadata. MMI Guide: Navigating the World of Marine Metadata. Available from:
http://marinemetadata.org/guides/mdataintro/gettingstarted [Accessed August 2, 2013].
Neiswender, C., Montgomery, E., 2009. Metadata Interoperability - What Is It, and Why Is It
Important? MMI Guides: Navigating the World of Marine Metadata. Available from:
http://marinemetadata.org/guides/mdataintro/mdatainteroperability [Accessed July 31, 2013.]

MARINE SPATIAL DATA INFRASTRUCTURES TEEMU TARES
51
NISO, 2004. Understanding Metadata. National Information Standards Organization (NISO),
20 pages. Available from: http://www.niso.org/publications/press/UnderstandingMetadata.pdf
Nyerges, T. et al. 2007. Constructing a Coastal Data Model for Puget Sound: A Classroom
Experience. Proceedings of Coastal Zone 07, 5 pages.
Official Journal L 120, 11.5.1991. European Parliament and the Council.
OGC, 2013. OpenGIS Catalogue Services Specification, version 2.0.2. Open Geospatial
Consortium Inc., 219 pages. Available from: http://www.opengeospatial.org/standards/cat
[Accessed 12 August 2013].
OpenGeo, 2013. About PostGIS. Available from: http://opengeo.org/ [Accessed 14 July 2013].
Patterson, T., 2013. CleanTOPO2. Available from: http://www.shadedrelief.com/cleantopo2
[Accessed 10 July 2013].
PostGIS, 2013. PostGIS web page. Available from: http://postgis.refractions.net/ [Accessed 12
July 2013].
Rix, J., Fast, S., Masser, I., Salge, F., Vico, F., 2011. Methodology to Describe, Analyse and
Assess Subnational SDIs: Survey, Experiences and Lessons Learnt. International Journal of
Spatial Data Infrastructures Research, Vol.6, 23-52.
Rodier, A., 2010. Assessment and Comparison of Open Source GIS Solutions. Certificate of
specialization in Geomatics. University of Geneva and UNEP/GRID-Europe, 40 pages.
Schlitzer, R., 2010. Ocean Data View. Available from: http://odv.awi.de [Accessed 14 August
2013].
SeaDataNet, 2013. SeaDataNet infrastructure. Available from: http://www.seadatanet.org
[Accessed 9 July 2013].
SeaDataNet, 2013b. SeaDataNet Newsletter, 13 May 2013. Available from:
http://seadatanet.maris2.nl/newsletter.asp?v0=8#82 [Accessed 9 July 2013].
SeaDataNet, 2013c. SeaDataNet architecture. Available from:
http://www.seadatanet.org/Standards-Software/SeaDataNet-architecture [Accessed 30 August 2013].
Seys, J., Mees, J., Pissierssens, P., Vanden Berghe, E., 2013. Marine Data Management: we
can do more, but can we do better? Available from:
http://www.iode.org/index.php?option=com_content&view=article&id=3&Itemid=33 [Accessed 11
August 2013].
Shankaranarayanan, G. and Even, A., 2006. The Metadata Enigma, Communications of the
ACM, Vol. 49, No. 2, pages 88–94.

MARINE SPATIAL DATA INFRASTRUCTURES TEEMU TARES
52
smeSpire, 2013: A European Community of Geo-ICT SMEs. Available from:
http://www.smespire.eu/ [Accessed 9 July 2013].
Smith, A., 2012. Atlantic Submarine Cable and Pipeline Database. Government of Canada,
Fisheries and Oceans Canada, Canadian Hydrographic Service (Atlantic Region). . Available
from: http://geodiscover.cgdi.ca/wes/displayExternalLinks.do?identifier=C8375AA4-465E-A13C-D932-
2DF25E190953&recordLocale=en_US [Accessed 31 July 2013].
Smith, W.H.F. and Sandwell, D.T., 1997. Global Seafloor Topography. Available from:
http://www.ngdc.noaa.gov/mgg/fliers/97mgg03.html [Accessed 20 August 2013].
Souza, F. A. and Delgado, J. P. M., 2012. Evaluation of the Proposal of a Spatial Data
Infrastructure in Bahia, Brazil. 12th International Conference on Computational Science and
Its Applications, pp. 155-158.
Steiniger, S. and Bocher, E., 2009. An overview on current free and open source desktop GIS
developments. International Journal of Geographical Information Science 23, pp.1345-1370.
Steiniger, S. and Hunter, A. J. S., 2009. Free and open source GIS software for building a
spatial data infrastructure. In E. Bocher and M. Neteler (Eds.): Geospatial Free and Open
Source Software in the 21st Century: Proceedings of the first Open Source Geospatial
Research Symposium, 2009, LNG&C, Springer, Heidelberg, pp. 247-261.
Steiniger, S., 2010. Building on Open Source GIS @ COSSFest 2010, presentation. Available
from: http://www.youtube.com/watch?v=-j7PLVJlvfE [Accessed 16 July 2013].
SYKE, 2013. The Baltic Sea Portal. Available from: http://www.itameriportaali.fi/fi/tutkimus/mertutk-
koordinaatio/fi_FI/koordinaatio/ [Accessed 7 August 2013].
UN, 1983. The Law of the Sea. United Nations Convention on the Law of the Sea.
UNESCO, 2008. IOC Workshop Report No. 206. Oostende,, UNESCO, 17 pp. Available from:
http://www.oceandatastandards.org/images/stories/ods_docs/wr206.pdf [Accessed 10 July 2013].
UNESCO, 2011. Ocean Data Standards. IOC Manuals and Guides 54, vol. 2, UNESCO, 19 pp.
UNESCO, 2013. Ocean Data Standards. IOC Manuals and Guides 54, vol. 3, UNESCO, 21 pp.
USGeo, 2012.GEOSS: the Global Earth Observation System of Systems. Group on Earth
Observations, 2 pages. Available from: http://www.masgc.org/pdf/masgp/07-012.pdf [Accessed 29
August 2013].
Vandenbroucke, 2012. Reporting cost/benefits of INSPIRE: Some thoughts from the INSPIRE
State of Play (SoP) and Drafting Team Monitoring & Reporting (DT MR) perspective. Spatial
Applications Division, KU Leuven, 25 pages.

MARINE SPATIAL DATA INFRASTRUCTURES TEEMU TARES
53
VROM, 2008. GIDEON - Key geo-information facility for the Netherlands. Approach and
implementation strategy (2008-2011). Ministry of Housing, Spatial Planning and
Environment (VROM), 56 pages.
Ward, R., 2013. Global Geospatial Information Management and Marine Spatial Data
Infrastructures. Available from: http://www.hydro-international.com/issues/articles/id1451-
Global_Geospatial_Information_Management_and_Marine_Spatial_Data_Infrastructures.html [Accessed 24
July 2013].
Wright, D. (Ed.), 2013. Arc Marine v. 2.0. PPT presentation, Esri, 31 pages.
Wright, D. et al. 2007. Arc Marine. GIS for a Blue Planet. Redlands: ESRI Press, 202 pages.

MARINE SPATIAL DATA INFRASTRUCTURES TEEMU TARES
54
16 APPENDICES
16.1 IHO S-100 Standard This is related to the 8.10 S-100 IHO Geospatial Standard for Hydrographic Data, on page 84.
Table 4. Parts of the IHO S-100 standard (IHO, 2009).

MARINE SPATIAL DATA INFRASTRUCTURES TEEMU TARES
55
16.2 Cost-Benefit Analysis Most governments have started SDI initiatives and in the European Community, for
example, the cost of the Infrastructure for Spatial Information in Europe (INSPIRE) was
estimated in 2003 to be up to €273 million annually during a period of 10 years (INSPIRE,
2003). According to INSPIRE (2003, 2013) and Bregt (2012), the major portion of this cost is
required on a regional/ local level, as presented in Table 5 .
Table 5. INSPIRE annual requirements in million € as estimated in 2003.
EU National organisations Regional or local Total (M€)
2-6 13-27 77-240 92-273
Further according to Bregt (2012), the benefits on the regional/local level are the lowest,
while on the EU level they are the highest (as seen on Table 5). Because of this “reverse
pyramid effect” depicted in Figure 24 (Bregt, 2012, page 14), we may conclude that there is
a strong need to support the regional and local levels from both the EU and national levels.
Figure 24. Reverse pyramid effect (Bregt, 2012).
The INSPIRE costs are estimated to be divided between:
1. Metadata (20%)
2. Harmonisation of data (40%)
3. Network services (30%)
4. Training, learning and practicing (3%)
5. Monitoring & coordination of infrastructure construction (7%)
The percentages shown above are approximated from an early impact analysis and forecast
of INSPIRE costs in Poland between the years of 2009 and 2019 (Vandenbroucke, 2012).
It is, however, extremely difficult to do a reliable Cost-Benefit Analysis (CBA) for INSPIRE due
to the many influencing factors, interconnections and complications in estimating the
benefits that is probably explaining the ranges of variation between the CBA results by
different authors in Table 5. Only a few EU member states are reporting their INSPIRE costs,
the figures being between 10% and 30% depending on the type of the cost, i.e., metadata,
harmonization, network services, coordination and monitoring, as classified by Craglia and
Borzacchiello (2012).

MARINE SPATIAL DATA INFRASTRUCTURES TEEMU TARES
56
Detailed case-studies accomplished in Catalonia 2007 and Lombardy 2008-2009 in any case
show quantitatively “clear benefits”, while CBA in the Netherlands 2009 shows benefits
being around two times the costs. Theoretical CBA studies have shown much higher benefit
to cost factors of up to 8 (Bregt, 2012, page 6). As a conclusion, today SDI appears to be
beneficial both financially and environmentally that is motivating its implementation.
The analysis of the US NOAA Digital Coast estimated benefits exceeding costs by over 400 %
over a 15-year period. Those cumulative costs and benefits accounted until now, i.e. for a
period from 2008 to 2012, are depicted in Figure 25. For example in 2011, the accounted
costs for that year were about $1,200,000 while the annual benefits at the same time were
nearly $5,400,000. “In FY2011 alone, 142000 users downloaded data and tools from the
Digital Coast, resulting in cost-reduction benefits that equal the entire historical investment
in the resource” (Adkins, 2012). Adkins measured efficiency gains in a straightforward way: If
a GIS technician who makes $36 per hour saves one hour of labour thanks to Digital Coast
that is a $36 benefit. And, if that happens tens of thousands of times each year, the
numbers simply add up.
Figure 25. Cumulative costs and benefits of the NOAA Digital Coast service during a 5 years’ period.
Reported benefits of INSPIRE enclose (Craglia and Borzacchiello; Cetl; Mäkelä, 2012):
1. Easier and better access to data and services
2. Data interoperability
3. Availability of new services and businesses
4. Improved data and service quality
5. Avoiding duplication and promoting re-use
6. Improved industrial and research efficiency
7. Removal of sharing barriers between organisations
8. Promoting inter-institutional collaboration
9. Money and time saving for users and authorities

MARINE SPATIAL DATA INFRASTRUCTURES TEEMU TARES
57
10. Improved environmental assessment and decision making
Adkins (2009) considered six types of benefits of the NOAA Digital Coast:
1. Reduced labour costs as users find, download and apply data more rapidly.
2. Reduced technology costs due to smaller number of servers and IT staff members.
3. Avoided development costs, because Digital Coast already provides what is needed.
4. Reduced labour costs due to skills and training acquired through the Digital Coast.
5. Reduced costs as Digital Coast partners share labour skills and other investments.
6. Reduced cost when outreach by any one partner points to the products of others.
Craglia (2012) concludes in his study on INSPIRE Impact Assessment comparing the situation
in the year 2002 to that of 2009 that “in 2002 the most frequent problem was accessing data
and also in 2009 over half of the respondents had access problems”. In addition, data
integration, finding data and information on its quality were considered a problem in 2009.

MARINE SPATIAL DATA INFRASTRUCTURES TEEMU TARES
58
16.3 Actors (Cont.) According to the Finnish national regulation (Finlex, 2009), authorities responsible for
managing spatial data related to the INSPIRE directive enclose the following:
- Agency of Rural Affairs http://www.mavi.fi/en/
- Centre for Economic Development, Transport and Environment http://www.ely-keskus.fi/en
- Finnish Defence Forces http://www.puolustusvoimat.fi/en/
- Finnish Energy Market Authority http://www.energiamarkkinavirasto.fi
- Finnish Environment Institute http://www.syke.fi/en-US
- Finnish Food Safety Authority http://www.evira.fi/portal/en/
- Finnish Forest Centre http://www.metsakeskus.fi/briefly-in-english
- Finnish Meteorological Institute http://en.ilmatieteenlaitos.fi/
- Finnish Museum of Natural History http://www.luomus.fi/english/
- Finnish Safety and Chemicals Agency http://www.tukes.fi/en/
- Finnish Transport Agency http://portal.liikennevirasto.fi/sivu/www/e/
- Finnish Transport Safety Agency http://www.trafi.fi/enLuonnontieteellinen
- Game and Fisheries Research http://www.rktl.fi/english/
- Geological Survey of Finland http://en.gtk.fi/
- National Land Survey of Finland http://www.maanmittauslaitos.fi/en
- METLA http://www.metla.fi/index-en.html
- Metsähallitus http://www.metsa.fi/sivustot/metsa/en
- Ministry of Agriculture and Forestry http://www.mmm.fi/en
- Ministry of Employment and the Economy http://www.tem.fi/en
- MTT https://portal.mtt.fi/portal/page/portal/mtt_en
- Municipalities of Finland http://www.localfinland.fi/en/Pages/default.aspx
- National Board of Antiquities http://www.nba.fi/en/index
- National Institute for Health and Welfare http://www.thl.fi/en_US/web/en
- Population Register Centre http://www.vrk.fi/default.aspx?site=4
- Statistics Finland https://www.tilastokeskus.fi/index_en.html
The highlighted authorities are as well working for the Finnish Marine Research Strategy,
the list of active participants of which is presented on the following page.
Active stakeholders in the Finnish Marine Research Strategy include (SYKE, 2013):
- Baltic Organisations Network for Funding Science http://www.bonusportal.org
- Central Union of Agricultural Producers and Forest Owners http://www.mtk.fi/en_GB/
- Centre for Economic Development, Transport and Environment http://www.ely-keskus.fi/en
- Confederation of Finnish Industries http://www.ek.fi/ek/en
- Finnish Association for Nature Conservation http://www.sll.fi/site-actions/english
- Finnish Environment Institute http://www.syke.fi/en-US
- Finnish Marine Scientist Association http://www.merentutkijat.fi
- Finnish Meteorological Institute http://en.ilmatieteenlaitos.fi/

MARINE SPATIAL DATA INFRASTRUCTURES TEEMU TARES
59
- Finnish Port Association http://www.finnports.com
- Finnish Ship Owners Association http://www.shipowners.fi/en
- Finnish Transport Agency http://portal.liikennevirasto.fi/sivu/www/e/
- Geological Survey of Finland http://en.gtk.fi/
- Meriteollisuusyhdistys http://www.meriteollisuus.fi
- Metsähallitus http://www.metsa.fi/sivustot/metsa/en
- Ministry of Agriculture and Forestry http://www.mmm.fi/en
- Ministry of Defence http://www.defmin.fi/en
- Ministry of Education and Culture http://www.minedu.fi/OPM/?lang=en
- Ministry of Environment http://www.ym.fi/en-US
- Ministry of Foreign Affairs http://formin.finland.fi
- Ministry of Transport and Communications http://www.lvm.fi/web/en
- National Board of Antiquities http://www.nba.fi/en/index
- SCOR Committee http://www.academies.fi/english/committees/oceanic_research.html
- STUK http://www.stuk.fi/en_GB/
- University of Helsinki http://www.helsinki.fi/university/
- University of Oulu http://www.oulu.fi/english/
- University of Turku http://www.utu.fi/en
- VTT Technical Research Centre of Finland http://www.vtt.fi/?lang=en
- WWF Finland http://wwf.fi/en/
- Åbo Akademi University http://www.abo.fi/?lang=en

MARINE SPATIAL DATA INFRASTRUCTURES TEEMU TARES
60
16.3.1 Customer Needs Spatial information is needed in general for policy and decision making, marine planning and
management, GIS, maritime traffic monitoring and applications within defined areas. Table
6 presents the major spatial boundaries defined in the Commonwealth legislation.
Table 6. Priority Commonwealth marine spatial information (Nairn, 2010).
Boundary Type Description Administrative boundaries
Coastal waters, territorial sea, contiguous zone, exclusive economic zone, ext. continental shelf, coral sea limits, baselines, base points, boundaries for treaty, petroleum and submerged land, petroleum lease, offshore mineral, reef, marine park, planning zone, world heritage, marine protected areas, fisheries, indigenous land and agreement, search and rescue, defence exercise, customs port limits, security port limits, immigration zone
Framework data
Shoreline, state borders, island reefs, rocks, cays, shoals, seas
Bathymetry
Bathymetric image, isobaths
Coastal and offshore gazetteer
Cultural locations, land features, marine features
Anthropogenic features
Historic shipwrecks, ocean disposal sites
Transport
Ship reporting locations, derived shipping lanes, ferry routes
Infrastructure
Petroleum wells, platforms pipelines, submarine cables, navigational aids
Geology
Seafloor features, sedimentary basins, tectonic elements
Environmental management
Bioregions, marine planning regions
In particular, customer needs are related to maritime safety, marine resources, coastal and
ocean environment, climate situation and weather forecast.
Frequently requested parameters enclose currents, sea-surface and air temperature, sea-
ice, sea level, surface winds, chlorophyll-dissolved oxygen, nutrients, PAR (light) and salinity
(MyOcean, 2013).
MARINE SPATIAL DATA INFRASTRUCTURES TEEMU TARES
61
16.4 National SDI Monitoring and Assessment MSDI monitoring and reporting is used to provide information on (IHO, 2011):
What datasets complete with metadata are being disseminated
Feedback from users and stakeholders
Definition of data, services and products being offered
A multi-view SDI assessment framework was developed by Grus et al. (2007) and it was
studied for assessing the goals of the Dutch national SDI (GIDEON) approved by the Dutch
government in 2008 (VROM, 2008). Being universal this method can be customised for the
purposes of any national SDI assessment. In general, the multi-view SDI assessment
framework contains the assessment requirements, approach, application and evaluation.
National SDI strategies are monitored while being constructed and used in order to justify
public spending on those SDIs. This can be done by formal progress reports assessing the
fulfilment of their goals related to SDI organizations and clearinghouses. Grus et al. (2007)
presented a chronological goal-oriented SDI assessment as follows:
Identify goals
Identify stakeholders
List indicators
Organise a workshop
Select and match indicators with goals
Formulate and apply the assessment for goal-oriented SDI
Evaluated results and improve earlier steps as needed
The GIDEON SDI policy on the other hand consists of 7 strategies, i.e.:
Giving spatial data a prominent place in the national e-services
Encouraging the use of key geo-registers
Implementing INSPIRE
Supporting standardization and national joint facilities
Stimulating the use of spatial data in crisis management, environmental protection,
mobility and spatial planning
Enabling industry to value-add public data as much as possible
Encouraging collaborative R&D&I to continuously develop the SDI facilities
The goal-oriented SDI assessment was applied to the Dutch GIDEON SDI with 4 goals. 21
Dutch organisations participated in the one-day workshop on goal-oriented SDI assessment
goals (Grus et al. 2007). They were given a rather exhaustive list of 72 indicators (or, suggest
their own) to select five per each GIDEON SDI goal with the following results, indicating the
most important indicators/properties of the national SDI geo-portal selected under each of
the 4 goals:
MARINE SPATIAL DATA INFRASTRUCTURES TEEMU TARES
62
1. Spatial data about any location will be available for public and business users
- Web mapping service
- Map searching
- Number of visitors
- Number of datasets
- SDI searching
- Covering national territory
- Data providers and end-users are participating
2. Businesses can do value-adding to the spatial data provided by the government
- Freedom of geographic information through legislation
- Commercial pricing framework
- Private parties involved in NSDI strategic plan
- Data download service
3. Government will use the data
- Policy for sharing spatial information between public bodies
- SDI searching
- Covering national territory
4. There will be close collaboration between government, universities, institutes and
business in order to improve the SDI
- Public-private partnerships
- Long-term NSDI strategic plan
- Organizations agreeing the plan
- Open source services
- Data providers and end-users are participating
About half of the workshop participants considered the list of indicators be more than 50%
complete and, thus, improvements are needed in terms of the number of indicators and
thematic classification in order to make the selection complete and easier for the SDI
stakeholders. All the studied 72 indicators are listed in Grus et al. (2007, pages 16-18). Rix et
al. (2011) have made a comprehensive survey in Europe involving about 200 sub-national
SDIs from 26 countries.

MARINE SPATIAL DATA INFRASTRUCTURES TEEMU TARES
63
16.5 Free Open Source GIS Software (FOSS GIS) The term Free Open Source Software (FOSS) at the best means not only that it is free of
charge, but also that you’ll get the source code and may modify it as you like. Therefore, the
larger the particular FOSS community using, developing and testing is, the better and
broader the software. An active community is also vital for the future development. Public
domain FOSS belongs to everyone without restrictions, but there are also OSS software
packages with some restrictions, as noticed by Rodier (2010, pp. 6-7), when evaluating a
large number of OSS in his dissertation.
The data formats tested by Rodier (2010) enclosed ShapeFiles (.shp), Drawing Exchange
Format (.dxf), Text (.txt), OpenStreetMap (.osm), Image Disk (.img), ESRI grid, Tagged Image
File (.tif) and ASCII (.asc). Other tested features enclosed: connection to Web services (i.e.,
WMS, WCS, WFS), digitation, snapping, basic geo-processing (i.e., clipping, buffering,
intersecting, merging), connection to databases (i.e., tabular, relational, PostGIS), image
analysis (i.e., histogram, filtering, composition, segmentation), exporting, layout production
and measuring real distances. Most of the available FOSS GIS software packages are listed
on the following web pages:
- http://opensourcegis.org/
- http://freegis.org/
- http://web.sourceforge.com/
- http://www.osgeo.org/
- http://en.giswiki.net/wiki/Category:Software
- http://www.cascadoss.eu/en/index.php
- http://www.cascadoss.eu/en/index.php?option=com_content&task=view&id=14&Itemid=14
- http://en.wikipedia.org/wiki/List_of_GIS_software
- http://freegeographytools.com
- http://freegeographytools.com/2010/giscloud-an-online-geographic-information-system-application
Figure 26. Open source SDI software (Steiniger, 2010).

MARINE SPATIAL DATA INFRASTRUCTURES TEEMU TARES
64
16.5.1 Server Software Web Map Server software standards enclose (Steiniger, 2010):
- WMS for maps
- WSC for vectors
- WCS for raster data
- Proprietary equivalents: ArcServer, ArcIMS, AutoDesk MapGuide etc.
Web Map Server software development projects enclose:
- MapServer www.mapserver.org A strong product on standards.
- GeoServer www.geoserver.org A strong product on standards.
- AutoDesk MapGuide OSS www.mapguide.osgeo.org
- Degree www.wiki.deegree.org
- Quantum GIS web map server
- REST-based approaches
Web GIS Server software standards enclose (Steiniger, 2010):
- OGC WPS
- ISO 19119
- Proprietary equivalents: ArcServer, PCI Geomatics
Web GIS Server software development projects enclose:
- 52north WPS www.52north.or
- PyWPS www.pywps,wald.intevation.org Integrates with GRASS.
- Degree www.wiki.deegree.org
16.5.2 Spatial Database Management Systems SDBMS are mainly for storing spatial data enclosing following standards: (Steiniger, 2010)
- Extensions to existing products
- OGC SFS
- Proprietary equivalents: Oracle Spatial, ArcSDE, DB2 Spatial Extender
Spatial Database Management System development projects enclose:
- PostGIS www.reactions.net Strongest according to Steiniger,
2010.
- MySQL www.mysql.com
- SQLite www.gaia-gis.it/spatiallite
16.5.3 Catalogues/Registry & Metadata Catalogues are storing metadata, allowing discovery, browsing and query of data & services:

MARINE SPATIAL DATA INFRASTRUCTURES TEEMU TARES
65
- ISO 19115: Metadata
- ISO 19119: Geographic Services
- WSC for vectors
Software development projects enclose:
- GeoNetwork www.geonetworkopensource.net Supported by UN Food Agency.
- MDweb www.mdweb-project.org
- deegree www.wiki.deegree.org
16.5.4 Client Software Viewing, querying, creating, updating, analysing and printing.
Desktop GIS
- GRASS www.grass.osgeo.org “Legacy” software.
- gvSIG www.gvsig.org
- Quantum GIS www.qgis.org Developing quickly.
- OpenJUMP www.openjump.org
- MapWindow www.mapwindow.org Windows only software.
- uDig www.refractions.net Good on standards.
- Proprietary software are easier to use: ArcGIS, ArcExplorer, AutoDesk, Intergraph,
Bentley
Web GIS Development Toolkits
- Viewers: OpenLayers (Google Maps), OpenScales (Flex-based)
- Geoportal toolkits: MapBender, deegree
- Web map development toolkits: GeoMajas, GeoExt, GeoMoose, MapFish, SharpMap,
Google Web Toolkit, Google Gears etc.
- No single toolkit does it all, so some efforts required to put them together
- Proprietary software: ArcGIS Web Mapping APIs etc.
16.5.5 Summary Particularly competitive are (Steiniger, 2010):
- GeoServer & MapServer Web Map Server
- PostGIS DBMS
- GeoNetwork OpenSource Catalogue/Registry
- OPenLayers Web Map Viewer
- Web mapping toolkits
- Desktop GIS depends on tasks
- SDIs can be implemented using FOSS successfully

MARINE SPATIAL DATA INFRASTRUCTURES TEEMU TARES
66
In the opinion of the author, FOSS GIS is providing the general interoperability required to
be able to use an MSDI. For example, it is possible to download several GIS file formats
including shapefiles, which is the industry standard vector data format by ESRI/ArcView, you
can extract and reformat the data for loading for example into PostGIS, and then query and
browse metadata using psql or pgaccess, browse data graphically with QGIS and JUMP
analysing the downloaded data with GRASS or R and, finally, produce a high quality map for
publication using GMT.
16.5.6 Selecting FOSS Software 1. Use cases
2. Evaluation Criteria
3. Evaluation
4. Criteria Weighting
5. Selection
MySQL
MySQL is advertised to be “the world’s most popular open source database” and as “an
ideal choice for cloud-based database deployments” (MySQL, 2013). It is popular under
Linux Operating System (OS), but MySQL Database, MySQL Connectors and MySQL
Workbench are also available for Windows OS. For Excel, there is a new MySQL plugin
allowing easy manipulation of MySQL data without any prior MySQL technical knowledge.
For this reason, MySQL might suit very well for those UCL MSc courses using Excel by default
in course works.
Oracle Express
Oracle Express is a simplified version of Oracle Database 10g Release 2 RDBMS with
Oracle’s complete spatial functionality (Ellul, 2012).
PostgreSQL
PostgreSQL is an open source relational database management system (RDBMS) that has
been used by the Department of Civil, Environmental & Geomatic Engineering (CEGE) of the
University College London (UCL) in UK for developing a self-paced spatial database course
for CEGE’s Masters programmes in surveying, hydrographic surveying, remote sensing and
geographical information science (Ellul, 2012) with good results in that purpose. The support
for spatial objects to PostgreSQL is provided by its PostGIS extension.
PostGIS
PostGIS ads support for geographic objects to the PostgreSQL. “In effect, PostGIS spatially
enables the PostgreSQL server, allowing it to be used as a backend spatial database for
geographic information systems (GIS), much like ESRI's SDE or Oracle's Spatial extension”
MARINE SPATIAL DATA INFRASTRUCTURES TEEMU TARES
67
(PostGIS, 2013). It is a spatial database for RS&GIS software enclosing the following software
packages (OpenGeo, 2013):
- Open Source Server: GeoServer, MapServer, Mapnik, DeeGree, SharpMap
- Open Source Desktop: GRASS, QGIS, uDig, gvSIG
- Proprietary Server: ArcServer, Ionic Enterprise, MapDotNet Server
- Proprietary Desktop: ArcGIS, Manifold, Safe FME, CadCorp SIS, MapInfo Professional
mezoGIS
mezoGIS is a graphical interface to query and analyse spatial data operating on external
PostGIS databases. mezoGIS provides a tool for geo-spatial analysis with PostGIS through
SQL queries. “There are other, excellent open source applications that can display PostGIS
datasets (like QGIS and GRASS). Those, however, expect properly indexed tables as an input,
and don't provide a built-in functionality to launch SQL queries. The focus of mezoGIS is to
stay close to the SQL workflow: Spatial queries are launched through manually entered SQL
commands, and results containing geometry are displayed as map layers” (mezoGIS, 2013).
Quantum GIS
Quantum GIS (QGIS) has an interface to GRASS GIS that is giving great technical potential in
the otherwise limited Remote Sensing (RS) and Earth Observation (EO) raster data
processing capabilities (Cascadoss, 2009). Chen et al. (2010) ranked QGIS the highest in their
evaluation (Ellul, 2010). As a dedicated GIS application, the technical potential of QGIS was
rated the best by Cascadoss (2009), although GRASS is even better among all the software
capable to GIS and/or RS. In addition, plug-ins for Python (Ellul, 2012) and an extensive
support for GIS data formats (Rodier, 2010; Steiniger, 2009) are available for QGIS.
Quantum GIS is offering two options for saving metadata: Users can create simple metadata
directly with the properties of each dataset, or, alternatively use metadata editor plug-in
called Metatools, which can access metadata in ISO19115 format (Ellul et al., 2013a).
GRASS GIS
The Geographic Resources Analysis Support System (GRASS) is used in geo-spatial data
management, data analysis, image processing, visualization, modelling and map production.
GRASS is a project of the Open Source Geospatial Foundation (OSGeo) and its development
has already lasted 30 years (GRASS GIS, 2013). According to Rodier (2010) GRASS is however
not quite user-friendly nor an easy to use software. But, it has a large user-base and its
functionality and usability were reported by Cascados (2009) to be clearly the best among
the OSS RS&GIS software packages, the nearest competitors being gvSIG and OSSIM.
uDig
uDig aims at providing a Java solution for a complete desktop GIS with analytical capabilities
being at the same time user-friendly and internet-oriented with geo-spatial web services

MARINE SPATIAL DATA INFRASTRUCTURES TEEMU TARES
68
(incl. WMS, WFS, WCS). It can use GRASS for complex vector operations and also embeds
JGRASS and Sextante plugins for advanced processing. In addition, uDig contains tools for
further plugin creation. Shapefiles, PostGIS, WMS and many other data formats are
supported. It is recommended by both Rodier (2010) and Chen et al. (2008) as a good
openGIS implementation that can sometimes be very slow, however.
SPRING
According to Rodier (2010), SPRING has a substantial set of tools aimed, for example, at
image segmentation, 3D, DEM and hydrological applications.
ILWIS
The Integrated Land and Water Information System (ILWIS) is a Remote Sensing (RS)
application and as such possibly not of immediate interest for GIS users. Its functionality,
usability and efficiency were the best among the dedicated OSS RS software packages
reviewed by Cascadoss (2009), although in terms of reliability, maintainability, portability
and web services it is lacking.
Geospatial Data Abstraction Library
Geospatial Data abstraction library (GDAL) is a programming library allowing manipulation
and format conversion of raster data. OGR comes with GDAL allowing the same for vectors
(Rodier, 2010).
GeoServer
The GeoServer is a full Java (J2EE) implementation of the OpenGIS Consortium's Web
Coverage Server (WCS) specification and Web Feature Server (WFS) specification together
with an integrated Web Map Server (WMS). I.e., there are three Services implemented:
1. Web Coverage Service (WCS) specification 1.0 and 1.1.1. All layers published by this
service are available on WMS also.
2. Web Feature Service (WFS) specification 1.0.0 and WFS 1.1.0, supporting all WFS
operations including Transaction.
3. A compliant implementation of WMS plus most of the SLD dynamic styling
extension. WMS can also generate PDF, SVG, KML and GeoRSS file formats.

MARINE SPATIAL DATA INFRASTRUCTURES TEEMU TARES
69
16.6 Metadata (Cont.) “Those responsible for the geo-processing needs of a governmental, commercial or industrial
organisation will find it useful to know the difference between catalogues and registries;
they will need to know about those catalogues that index their data and about those
registries that define their metadata” (Gould and Hecht, 2001).
Metadata is published in a metadata clearinghouse, also called a registry or repository
(Neiswender, 2010).
16.6.1 Metadata Classification Syntactic metadata describe what the data look like and how they are organized. Syntactic
fields often include the unique variable name, data type (integer, float, etc., including sizes),
file format, and units of measurement. Note that the first and last of these certainly have
semantic meaning, even if their primary use is for labelling or identification (Graybeal et al.
2010).
Semantic metadata describe what they mean. Semantic data are often considered to be
human-oriented rather than machine-usable, but that seems to be an assumption, and not
required by the term itself. Semantic fields are often more descriptive, such as long name,
definition, comments, and copyright. For example, the information that a field labelled
“SST” holds sea surface temperature measurements is semantic metadata. Most semantic
fields would be more widely useful if they followed agreed-upon conventions and
terminology. The increasing use of ontologies will likely push semantic content much more
into a machine-readable realm (Graybeal et al. 2010).
Search metadata, also known as discovery metadata, include information that would help a
person decide if there were things of interest in a data set or which search keywords to use
if they were using a data portal. An observation type such as multi-beam bathymetry is an
example of helpful search metadata, especially when managed by a system of controlled
vocabularies. Search metadata might also be latitude and longitude bounds, so that a
computer or a person could know if the data fell within an area of interest (Graybeal et al.
2010).
Use metadata helps a computer or a person to understand or process the data. Typical use
metadata would be calibration parameters, units, and precision information. Use metadata
often overlap with syntactic metadata, though they are not synonymous. Usage metadata
labels need to be unique to be of value for processing the data, while syntactic data may
not. Based on typical definitions of the terms, the distinction between use and search
metadata can be unclear. Some or all search metadata may be automatable, that is,
represented in ways that are meaningful to the applications processing and used by that
software. Indeed, this will be necessary to facilitate widespread data mining. Furthermore,
some use metadata will be of interest to people searching for data, even though it is more
oriented toward computer applications (Graybeal et al. 2010). When designing a metadata

MARINE SPATIAL DATA INFRASTRUCTURES TEEMU TARES
70
approach, it is important to consider both the terms and characteristics that people or
systems will need to search for and to find your data, and also the details that people and
systems would need to know to use them.
Static metadata are not expected to change much over the life of the data they describe,
even as the data evolve.
Dynamic metadata are conversely a function of the contents of the data, so as a dataset
evolves, dynamic metadata change. In reality, even static metadata may have to be changed
if, for example, incorrect information was captured and the error discovered later.
An interesting special case involves the seeding of metadata prior to the arrival of data
themselves. Metadata captured before data arrival are implicitly static and can be
associated with that data permanently, possibly as part of an automated process embedded
in the data stream. Metadata captured after data arrival imply some other process for
entering that information.
When planning your metadata process, it is worth considering which metadata you expect
to be persistent through time, and which will need to change. And you will need to
determine the processes for updating dynamic metadata, and for handling an unexpected
need to adjust or correct static metadata (Graybeal et al. 2010).
Shankaranarayanan and Even (2006) propose six types of metadata based on their function:
Infrastructure metadata describes the components of the computer systems, such as
hardware, operating systems, networking and database servers. It is primarily used
for system maintenance.
Model metadata (the data dictionary) describes the modeling of data into entities
and their relationships (e.g., tables and column headers). It includes conceptual,
logical, and physical descriptions as well as semantic information, such as terms used
and how they relate to other terminology in the system.
Process metadata provides information on how data are generated and the changes
they undergo from source to target.
Quality metadata includes both a description of the physical size (number of records,
bytes) as well as quality measurements, such as the accuracy and completeness of
the data.
Interface (delivery and reporting) metadata captures how the data is used, such as
where and how much data are delivered (e.g., downloaded from an online system)
and in what formats. It can also include how the data are used in derivative products
like reports.
Administration metadata includes information on users, security, and access
privileges to data and applications.

MARINE SPATIAL DATA INFRASTRUCTURES TEEMU TARES
71
16.6.2 Metadata Template To publish your metadata, a metadata template needs to be designed or filled-in based on
available standards and, then, it is converted into an electronic format suitable for
publishing in the metadata clearinghouse, that is, registry. A comma separated value text
file (CSV ASCII) and Extensible Markup Language (XML) are versatile text-based formats that
many standards are adopting (Neiswender, 2010). It is however not always clear, if
particular information is data or metadata. For example, coordinates could be either data or
metadata. To clarify the separation, Graybeal et al. (2010) have given these three examples:
1. Data: Photo of a newly discovered species of fish
Metadata: Location of discovery (latitude, longitude, depth), other fish in the area,
salinity of the water, quantity discovered (school, single fish or larger number) etc.
2. Data: Meteorological Measurements
Metadata: Location of readings (latitude, longitude, height), instrumentation used to
collect data, units, processing done to measurements etc.
3. Data: Sediment Core Record
Metadata: Location of discovery (latitude, longitude, depth), description of
stratigraphy, length, type of coring device etc.
I.e., there may be some standard fields, like location and date. But, in general, different
dataset require different types of descriptions. For this reason, a metadata template must
be created that fits your particular data. Some standards enclose sample templates
(Neiswender, 2010). In any case, you need to develop a working list of metadata elements
by using an Excel table or a graphical map done with the help of the Freemind software of
which Figure 27 shows an example.
Figure 27. Freemind graphical approach to define a list of metadata elements (Neiswender, 2010).
Examples of how to write good metadata can be accessed at the following web page:
https://marinemetadata.org/guides/mdataintro/mdataexamples.
MARINE SPATIAL DATA INFRASTRUCTURES TEEMU TARES
72
16.7 Standards (Cont.) “Problems related to the existence of scattered data, lack of existing data, outdated data,
formats and different characteristics to storage, among others, hinder the widespread use
and interoperability of SDI” (Souza and Delgado, 2012).
Potential technical problems have been arisen due to immature technical standards, pricing,
access and use licensing, copyright, trade secret, security etc. issues, political consent
regarding e-services, lack of coordination in governance between countries and
organizations, varying data quality. And, all the problems mentioned, are matters of
agreement to be cleared away by standardisation. A true technical problem, however, is
that there are very large white areas in the map of the Ocean in comparison to land maps.
16.7.1 Marine Metadata Standards A metadata standard specifies how to describe a dataset. There are content standards and
format standards. By carefully articulating how the metadata elements are named,
structured, and utilized, metadata standards enable interoperability and allow for the
creation of tools to work with the metadata, such as searchable repositories and metadata
creation templates (Neiswender et al., 2011).
16.7.1.1 Content Standard
Content standards are describing the information to be acquired by giving each metadata
element a label (i.e., a name) and its definition. For example, “vessel” is a label for a
common oceanographic metadata element. The definition could contain the name of the
research vessel possibly appended with the particular item from the ICES list of ship names.
The content standard also requires statements of usage for the metadata elements. For
example, a rule might specify mandatory elements (Neiswender et al., 2011).
16.7.1.2 Format Standard
Format standards express how the information described in content standards will be
represented. Common formats enclose NetCDF, XML, HTML and ASCII text, the purpose of
which is to allow machine readability of metadata. For example, the ISO 19139 contains
both the content and format standards.
16.7.1.3 Marine Community Metadata Profile of ISO 19115
The Marine Community Profile of ISO 19115 standard was developed by the Joint Facility
Australian Oceanographic Data Centre. In addition to all ISO 19115 core and mandatory
metadata elements, it covers the sea-going collection of oceanographic datasets with four
new metadata elements (items 1-4 below) and two new code tables (Neiswender et al.,
2011; AODC, 2013):
1. Revision data of metadata.
2. Sampling frequency: daily, weekly, monthly.
3. Temporal currency of the resource, describing values in the Currency Type Code list.

MARINE SPATIAL DATA INFRASTRUCTURES TEEMU TARES
73
4. Temporal Aggregation of the resource with the Temporal Aggregation Unit Code list.
5. Currency Type Code describing the temporal currency: historical, predicted etc.
6. Temporal Aggregation Unit Code: day, month, multi-month etc.
In addition, an XML encoding schema based on ISO19139 has been developed to describe,
validate and exchange Marine Community Profile metadata (AODC, 2013).
The Marine Community Profile can be downloaded at the following web address:
http://www.aodc.org.au/files/MarineCommunityProfilev1.4.pdf.
16.7.1.4 Metadata Entry and Search Tool
BlueNet (www.bluenet.org.au) has developed the Metadata Entry and Search Tool (MEST) for
marine datasets. The MEST application can be downloaded from the BlueNet wiki at
http://bluenetdev.its.utas.edu.au/download/bluenetmest.html.
16.7.1.5 Ocean Data Standards Pilot Project
IODE (International Oceanographic Data and Information Exchange) and JCOMM (Joint
WMO-IOC Technical Commission for Oceanography and Marine Meteorology) recognized
that there were not agreements on a wide range of matters to allow easy exchange of
collected data. Therefore, the Ocean Data Standards Pilot Project (Intergovernmental
Oceanographic Data and Information Exchange) was established in 2008. There were several
recommendations and improvements including the following (UNESCO, 2008, 2011, 2013):
- ISO 8601 standard as standard representation of date and time
- IODE Quality Flag Standard for oceanographic and meteorological data
- ISO-6709 standard for latitude, longitude and altitude
- ISO-3166 for country codes
- Platforms
- Quality control of temperature, salinity, sea-level, currents, surface waves,
- Projects, institutions, units, instruments, science words, taxa, parameters,
16.7.1.6 FGDC CSDGM Metadata Profile for Shoreline Data
The Shoreline Metadata Profile is an extension to the existing FGDC (US Federal Geographic
Data Committee) Content Standards for Digital Geospatial Metadata (CSDGM). It allows
describing shoreline data for GIS applications including national mapping. Important
application areas include coastal zone management, environmental monitoring, exploration,
resources utilization, legal and jurisdictional issues, ocean and meteorological modeling,
engineering, construction, planning, and many others (FGDC, 2001).
Additional terms and data elements are provided to support shoreline and coastal
metadata. The added elements include tidal (i.e. type and time) and weather (i.e., wind
speed and direction, wave height and barometric pressure) conditions, as well as
environmental events, like hurricanes (AODC, 2013).

MARINE SPATIAL DATA INFRASTRUCTURES TEEMU TARES
74
16.7.2 International Organization for Standardization (ISO) The committee currently has 66 published standards including those listed in the table
below, and, others related to e.g. HTML, XML, SVG, SOAP and WSDL.
Standard Description ISO 6709 Representation of geographic point location by coordinates
ISO 19101 Geographic information reference model
ISO 19103 Conceptual schema language
ISO 19104 Terminology
ISO 19105 Conformance and testing
ISO 19106 Profiles
ISO 19107 Spatial schema
ISO 19108 Temporal schema
ISO 19109 Rules for application schema
ISO 19110 Methodology for feature cataloguing
ISO 19111 Spatial referencing by coordinates
ISO 19112 Spatial referencing by geographic identifiers
ISO 19113 Quality principles
ISO 19114 Quality evaluation procedures
ISO 19115 Metadata
ISO 19116 Positioning services
ISO 19117 Portrayal
ISO 19118 Encoding
ISO 19119 Services
ISO 19120 Functional standards
ISO 19121 Imagery and gridded data
ISO 19122 Qualification and certification of personnel
ISO 19123 Schema for coverage geometry and functions
ISO 19125 Simple feature access
ISO 19126 Feature concept dictionaries and registers
ISO 19127 Geodetic codes and parameters
ISO 19128 Web map server interface
ISO 19129 Imagery, gridded and coverage data framework
ISO 19130 Imagery sensor models for geo-positioning
ISO 19131 Requirements for application schema and feature catalogue
ISO 19132 Reference model
ISO 19133 Tracking and navigation
ISO 19134 Multimodal routing and navigation
ISO 19135 Procedures for item registration
ISO 19136 Geography Markup Language (GML)
ISO 19137 Core profile of the spatial schema
ISO 19138 Data quality measures
ISO 19139 Metadata - XML schema implementation
ISO 19141 Schema for moving features
ISO 19142 Web Feature Service (WFS)
ISO 19143 Filter encoding
ISO 19144 Classification system structure & Land Cover Meta Language (LCML)
ISO 19145 Registry of representations of geographic point location
ISO 19146 Cross-domain vocabularies
MARINE SPATIAL DATA INFRASTRUCTURES TEEMU TARES
75
ISO 19148 Linear referencing
ISO 19149 Rights expression language for geographic information (GeoREL)
ISO 19150 Ontology Framework
ISO 19152 Land Administration Domain Model (LADM)
ISO 19155 Place Identifier (PI) architecture
ISO 19156 Observations and measurements
ISO/IEC 9075 Structured Query Language (SQL)
The official contents of ISO/TC 211 standards on geographic information can be accessed at
http://www.iso.org/iso/iso_catalogue/catalogue_tc/catalogue_tc_browse.htm?commid=54904&pu
blished=on&includesc=true.
The two other relevant geospatial standards, when implementing SDIs are ISO TC 204 and
JTC-1 dealing e.g. with road transportation and catalogues/registries, correspondingly.
16.7.3 Open Geospatial Consortium (OGC) The Open Geospatial Consortium (OGC) develops standards to make spatial data and
services interoperable. The OpenGIS Simple Features Access (SFA) standard is also called ISO
19125. The SFA Part 1 describes the geometry of simple geographic features, like Point,
Curve, Surface and collections of them by using Universal Markup Language (UML). SFA Part
2 defines a Structured Query Language (SQL) supporting, among others, querying of those
simple features, which can have both spatial and non-spatial attributes. In SQL, each feature
is occupying a row in the feature table. Also CORBA (Common Object Request Broker
Architecture) and OLE (Object Linking and Embedding) are used.
The following standards are indispensable for the application of SFA: ISO 1907, ISO 19109,
19111, ISO 19119, ISO 19133, ISO/IEC CD 13249-3:2006 and ISO/IEC 9075 (Herring, 2011).
OGC standards relevant to SDI enclose (Steiniger, 2010) the following, of which the
underlined are the most commonly used (Nebert, 2013):
Data delivery
o OGC Web Map Service (WMS)
o OGC Web Feature Service (WFS)
o OGC Web Coverage Service (WCS)
Data formats
o OGC Simple Feature Standard (SFS)
o OGC Geography Markup Language (GML)
o Keyhole Markup Language (KML)
Data search
o OGC Catalogue Service (CSW)
o Gazetteer Service (WFS-G)
Other purposes

MARINE SPATIAL DATA INFRASTRUCTURES TEEMU TARES
76
o Web Processing Standard (WPS)
o Coordinate Transformation Service (CTS)
o Web Terrain Service (WTS)
o Styled Layer Descriptor (SLD)
o OGC Web Map Context (WMC)
There are over 30 OGC working groups of which those two directly related to Marine SDI are
briefly presented below. All the working groups can be accessed at the follow web page:
http://www.opengeospatial.org/projects/groups/wg
16.7.3.1 Hydrology Working Group
The OGC Hydrology Domain Working Group (DWG) is addressing relationships between
spatial information (features) and observational data (O&M). Relevant ISO and OGC
standards to the Hydrology DWG include:
Table 7. Standards relevant to the OGC Hydrology Domain Working Group.
Standard Description
GML Encoding standards for geospatial and technical data
WFS Interface for hosting and accessing feature data
O&M Observation & Measurement metadata and results
SOS Interface for hosting and accessing observation data
SPS Interface for tasking observational sensors
WCS Interface for hosting and accessing gridded data and time-series
ISO 19115 Metadata for datasets: Description of geographical information and associated services, including contents, spatial-temporal purchases, data quality, access and rights to use.
ISO 19119 Metadata for web services: Supports the description of geo-spatial services including data portals, web mapping applications, data models and online data processing, in conjunction with ISO 19115 (FGDC, 2013).
ISO 19139 Metadata XML schema implementation: Specifies the ISO 19115 metadata record format and general content, description validation and metadata exchange.
In order to apply these OGC and ISO standards to the water resources domain, they need to
be profiled appropriately (Hydrology DWG, 2013).
16.7.3.2 MetOcean Working Group
In order to achieve interoperability in using spatial information, a range of OGC standards
such as WMS, WCS, GML, WFS, as well as data processing and sensor related services need
to be implemented in the applications. Also the following requirements are listed by
MetOcean DWG (2013):
Climate Science Modelling Language (CSML) for encoding climate, atmospheric and
oceanographic data: http://csml.badc.rl.ac.uk/

MARINE SPATIAL DATA INFRASTRUCTURES TEEMU TARES
77
ncML-GML extension of the netCDF Markup Language (ncML) for facilitating
interoperability between the atmospheric and GIS data systems:
http://www.ogcnetwork.net/node/214
Weather Information Exchange Models (AIXM & WXXM):
http://www.wxxm.aero/public/subsite_homepage/homepage.html
Metadata for Climate Models (METAFOR):
http://external.opengeospatial.org/twiki_public/MetOceanDWG/MetaFor
Weather Objects Modelling Language (WOML) for defining meteorological
phenomena by using GML Feature model and the basis of the language:
https://agora.fmi.fi/display/WOML
ISO/DIS 19156 - Observations and Measurements (O&M):
http://www.iso.org/iso/home/store/catalogue_tc/catalogue_detail.htm?csnumber=32574
NetCDF (network Common Data Form) supporting the creation and sharing arrays of
scientific data: http://www.unidata.ucar.edu/software/netcdf/
Climate & Forecast (CF) Metadata Convention for sharing of files created with the
NetCDF API (i.e., Application Programming Interface) : http://cf-pcmdi.llnl.gov/
WMO International Codes: http://www.wmo.int/pages/prog/www/WMOCodes.html
The ISO/DIS 19156 Geographic Information - Observations and Measurements standard is
considered to form the basis of the conceptual model for meteorology and oceanography
(MetOcean DWG, 2013).
16.7.4 S-100 IHO Geospatial Standard for Hydrographic Data The S-100 standard will eventually replace the S-57 IHO Transfer Standard for Digital
Hydrographic Data. Therefore, S-57 is not further discussed in this dissertation.
The S-100 IHO Hydrographic Geospatial Standard for Marine Data and Information is based
on the ISO 19100 and conforms to the ISO TC 211 geographical information standards as far
as possible. S-100 specifies (IHO, 2009):
1. Registers of information related to hydrography
2. Products, feature catalogues and a definition of the feature model
3. Use of data and metadata for hydrographic requirements
The S-100 standard covers items such as: 3D, time-varying data, gridded data, bathymetric
products, inland ENC (Electronic Navigational Chart), nautical publications, MIOs (Marine
Information Overlays), Web Services and next generation S-101 ENC.
S-100 consists of total 16 parts, which are listed on page 54 in the Appendices with
associations to the ISO 19100 standard.

MARINE SPATIAL DATA INFRASTRUCTURES TEEMU TARES
78
16.7.5 INSPIRE The Inspire is being built on the infrastructures established by the EU member states aiming
to make those national SDI systems compatible and usable in co-operation. The data and
services from the Galileo satellite positioning and Global Monitoring for Environment and
Security (GMES) systems should be used. The Inspire directive applies to public authorities,
but also others should take the advantage of it on a voluntary basis.
1. Coordinate reference systems (x,y,z)/(lat,lon,h) coordinates based on geodetic h and v datum.
2. Geographical grid systems Multi-resolution grid with origin, orientation and cell size.
3. Geographical names Area, region, locality, city, town or other feature of interest.
4. Administrative units Local, regional or national governance separated by border.
5. Addresses Road name, house number, postal code etc.
6. Cadastral parcels Area in cadastral register or similar.
7. Transport networks Road, rail, air, water network or related infrastructure.
8. Hydrography Marine area, water body, river basin or related item.
9. Protected sites Area of specific conservation.
10. Elevation DEM of land, ice or ocean surface incl. bathymetry & shoreline.
11. Land cover Natural or artificial cover incl. forest, agriculture, water etc.
12. Ortho-imagery Geo-referenced imagery of the Earth.
13. Geology Structural composition, bedrock, aquifer and geomorphology
14. Statistical units Units described by statistics.
15. Buildings Building location.
16. Soil Depth, structure, content, erosion, slope, water capacity etc.
17. Land use Residential, commercial, recreational, industry, forest, rural etc.
18. Health and safety Pathology/health distribution linked to pollution/environment.
19. Utility and governmental services Sewage, waste management, energy, water, schools, hospitals.
20. Environmental monitoring facilities Measurement of emissions and ecosystem parameters.
21. Production and industrial facilities Industrial sites with pollution prevention, mining, storage etc.
22. Agricultural and aquaculture facilities Farming incl. irrigation system, greenhouse and stable.
23. Population distribution Geographical population characteristics.
24. Area management zones and units Dumping site, drink water, water fairways, mining, ICZM etc.
25. Natural risk zones Atmospheric, hydrologic, seismic, volcanic, fire etc. hazards.
26. Atmospheric conditions Physical atmospheric conditions measured.
27. Meteorological geographical features Weather measurements, rain, temperature, wind etc.
28. Oceanographic geographical features Physical conditions, currents, salinity, temperature, waves etc.
29. Sea regions Sea divided into regions of common physical conditions.
30. Bio-geographical regions Homogeneous ecological conditions regions.
31. Habitats and biotopes Geographical, ecological conditions, abiotic/biotic features etc.
32. Species distribution Geographical of animal or plant species.
33. Energy resources Hydrocarbon, hydropower, bio-energy, solar, wind etc. extent.
34. Mineral resources Metal ores, minerals incl. depth information on the resource.
INSPIRE insists data to be kept up to data by the original data provider or a custodian that is
very useful in order to avoid multiple versions of same data to appear in addition to keeping
the data current. But, when it is further insisted by INSPIRE that the data should be not
duplicated, it has according to the author of this dissertation a counter-productive effect
making the data utilization extremely slow in comparison to accessing a local copy, because
the data must be transferred every time, when starting a new GIS analysis session, for
example. The typical internet transfer rates are currently much slower than the transfer
rates in a local computer or network. Therefore, the data must be copied in order to work

MARINE SPATIAL DATA INFRASTRUCTURES TEEMU TARES
79
with it without needing to wait minutes of WMS accesses time. Secondly, what would
happen, if the network would be down? Then, of course no WMS service or data would be
available to work with.
Each EU member state has usually a public authority as an Inspire contact point. Every three
years starting in 15 May 2013, member states shall report to the European Commission how
their public sector SDI is coordinated, how quality assured, what is authorities’ contribution
to SDI, how SDI is used, what data sharing agreements there are between public authorities,
and what are the costs and benefits of implementing the Inspire directive.
16.7.6 World Wide Web Consortium (W3C) W3C4 is an open international organization whose goal is to lead the World Wide Web to its
full potential by developing common protocols. W3C open standards support the
development of technologies for advancing the Internet by ensuring interoperability, such
as extensible Markup Language (XML) [2], Resource Description Framework (RDF) [3],
Ontology Web Language (OWL) [4], web services [5], etc.
16.7.7 European Committee for Standardization (CEN) CEN aims at developing European Standards and other technical specifications. CEN/TC 287
is specialized in geographic information. CEN/TC 287 developed standards for
interoperability of metadata, services and encoding, among others.
16.7.8 Registries and Repositories Interoperability is achieved by allowing information models and service definitions be
shared. A registry is used to publish these objects. According to ISO 19135, a registry is an
information system, whilst a register is a set of files.
16.7.8.1 ISO 19135
The ISO 19135 standard specifies how to establish registers of uniquely, unambiguously and
permanently assigned to geographic information. The standard specifies what is necessary
to provide identification and meaning to the registered items.
16.7.8.2 IHO Hydrographic Registry
The IHO Geospatial Information Infrastructure is being developed. The core component of
this will be the S-100 Geospatial Standard for Hydrographic Data and its associated
information registry. IHO Feature Dictionary registers: http://195.217.61.120/iho_registry.
16.7.8.3 DGIWG Feature and Attribute Data Registry
The Digital Geospatial Information Working Group (DGIWG) component registers including
the DGIWG Feature Data Dictionary (FDD) Register. FDD contains geographic information
concepts to characterize real world phenomena based on the Feature and Attribute Coding
Catalogue (FACC) which is a component of the Digital Geographic Information Exchange
Standard (DIGEST).

MARINE SPATIAL DATA INFRASTRUCTURES TEEMU TARES
80
16.8 Services (Cont.)
16.8.1 Atom Syndication Format (Atom) Atom is an XML-based list of feeds information composing of entries with a set of related
metadata. The primary use of Atom is to collect Web content such as weblogs and news
headlines to Web sites.
16.8.2 Web Authentication Service (CAS) The Central Authentication Service (CAS) involves a client web browser, web application and
the CAS server, permitting web applications to authenticate the user without getting access
to e.g. user’s password.
16.8.3 Catalogue Service (CSW) The OGC CAT standard provides the ability to publish and search collections of descriptive
information, i.e., metadata, for data, services and related information. Metadata may be
queried by humans or computer (OGC, 2013).
16.8.4 Web Coordinate Transformation Service (WCTS) The OGC Coordinate Transformation (CT) is a standard way of coordinate transformations
with the aim that that all spatial data are defined in the same spatial reference system.
16.8.5 NetCDF Climate and Forecast (CF) The NetCDF library (NetCDF) is intended to access climate, atmosphere, surface, and ocean
data according to well-defined rules. Sufficient metadata should make it self-describing in
the sense that each variable is described in time and space. This convention enables
software to display data and perform operations with minimal user intervention.
16.8.6 Web Coverage Service (WCS) The OGC WCS standard provides access to coverages representing space-varying
phenomena that relate a spatio-temporal domain to a multi-dimensional range of
properties.
16.8.7 Web Feature Service (WFS) The OGC WFS standard provides access to and management of a feature data repository.
Rather than sharing geographic information at the file level using File Transfer Protocol
(FTP), for example, the WFS offers direct access to geospatial information.
16.8.8 Web Map Print Service (WMPS) WMPS is a service for creating high quality map prints.

MARINE SPATIAL DATA INFRASTRUCTURES TEEMU TARES
81
16.8.9 Web Map Service (WMS) The OGC WMS standard provides facilities for the creation and display of map views of
geographic information that is generally rendered in a pictorial format such as PNG, GIF or
JPEG, or in a vector form.
16.8.10 Web Map Tile Service (WMTS) OGC WMTS server applications can serve map tiles of spatially referenced data using tile
images with predefined content, extent and resolution.
16.8.11 Web Perspective View Service (WPVS) WPVS aims at portrayal of 3D geo-information of e.g. virtual city and terrain models.
16.8.12 Web Processing Service (WPS) The OGC WPS interface standard provides input and output rules for geo-spatial processing
services, such as polygon overlay. It also defines an interface that facilitates the publishing
of geo-spatial processes and discovery of those processes.
16.8.13 Web Security Service (WSS) The OASIS WSS specification describes enhancements to SOAP messaging in terms of
integrity and confidentiality allowing a wide variety of data security and encryption.
16.8.14 Sensor Observation Service (SOS) The OGC Sensor Observation Service (SOS) allows sensor data to be managed in an
interoperable way. Querying observations, registering new sensor and inserting new sensor
observations are provided.
16.8.15 Symbolization (SLD) The OGC Styled Layer Descriptor (SLD) allows user-defined symbolization and coloring of
geographic data.

MARINE SPATIAL DATA INFRASTRUCTURES TEEMU TARES
82
16.9 Data (Cont.) National Hydrographic Offices (HO) can be seen as the competent authority to provide
hydrographic data in SDI (IHO, 2011). HO data commonly enclose physical features of the
seabed and coast, as well as general water levels, tides and currents. These data are
provided for the safety of navigation and environmental protection, but also more and more
for maritime spatial planning, engineering of marine infrastructures and exploration of
energy, mineral and other natural resources.
Despite the protection of environment is considered of high importance for example by the
INSPIRE directive, it is quite evident for the time being that the more information there will
be about potential marine resources, the more they will be commercially exploited and the
more will the environment suffer. Therefore, environmental protection will get more
difficult with increasing information on the seabed. No information and no human
interference would of course be the ideal situation for the natural environment – to say it
straight – because, from the human point of view, commercial exploitation of marine
resources weight more than protecting the marine life.
HO data forms the basis for any MSDI comprising of source or raw data including dense
bathymetric and other hydrographic datasets, and product data including Electronic
Navigation Charts (ENC), Digital Elevation Model (DEM), seafloor classification, coastline,
maritime borders, digital nautical documents and data about data, i.e. metadata.
In addition, metadata for data discovery needs to describe the type of data (to enable users
to apply the data correctly), the extent, quality, horizontal and vertical datum and projection
as well as temporal reference. Use of the ISO 19115 standard is applied for interoperability.
Although searching for metadata by type, area and keyword can be simply provided on a
website or even on paper, searching through an SDI/MSDI portal is ideal for efficiency and
automation purposes. In the opinion of this author, searching by area is optimal, when the
geographical Area of Interest (AOI) is specified. But, sometimes the user may want to find
out, if specific type of data is available and where, making the other search types preferable.
After investigating the metadata and finding the right data, the user wants to download it.
Via Web Mapping Services (WMS), automated search and download can be developed. For
the most efficient data processing, the data may be downloaded on the local hard disk,
where it can be accessed immediately, repeatedly and processed much quicker than
through a common web mapping service is possible. Although the data may be copied many
times, the original source of data will always stay the same and will be accessed, when local
data needs to be updated. Mobile web mapping services may be based on visualisation of
readily processed datasets and then the raw data does not need to be copied.
MARINE SPATIAL DATA INFRASTRUCTURES TEEMU TARES
83
16.9.1 Land Use
16.9.2 Surveillance & Exploration
16.9.3 Oil & Gas
16.9.4 Mineral Extraction
16.9.5 Renewable Energy
16.9.6 Fishing & Mariculture
16.9.7 Construction, Dredging & Disposal
16.9.8 Infrastructure & Submarine Cables The primary use of the Atlantic Submarine Cable and Pipeline Database is for reference on
Canadian Hydrographic Service (CHS) products and an effort to track cable positions for the
purposes of stakeholders, marine safety, hazard assessment and project planning. Latitude
and longitude positions for cables pipelines are stored (Smith, 2012).
16.9.9 Marine Recreation & Tourism
16.9.10 Conservation Areas, Species Habitats and Wrecks The purpose of the Nova Scotia Wetlands and Coastal Habitats Inventory in Canada is to
delimit wetland and coastal habitat areas for conservation and sustainable use. Parameters
recorded enclose dominant wetlands and coastal habitats greater than 0.5 hectares
including bogs, fens, deep and shallow marshes, seasonally flooded flats, meadows, shrub
and wooded swamps, lakeshore wetlands, salt marsh, saline ponds, dunes, beaches, cliffs,
and, estuarine and marine flats. These habitats are recognized being ecologically,
economically and socially important ecosystems to support policy and legislation, land use
planning, impact assessment, environmental monitoring, reporting and scientific research
(Milton, 2010).
The Living Marine Legacy of Gwaii Haanas I lists all marine plant species and maps their
distributions from the first records in 1911 to 1999, including 348 seaweed and 4 sea-grass
species from 456 intertidal to shallow sub-tidal locations. The database covers the Haida
Gwaii archipelago and includes all species of the region from any published source (Branton,
2010a).
The Living Marine Legacy of Gwaii Haanas II lists all invertebrate species and their
distributions from the first records in 1880 to 2000 from the intertidal to the deep-sea,
containing 25 000 records of over 2 500 species from 2 900 localities (Branton, 2010b).
The EAISSNA Electronic Atlas of Ichthyoplankton is a georeferenced database on the
distribution of fish eggs and larvae on the Nova Scotian Shelf. 197 scientific publications

MARINE SPATIAL DATA INFRASTRUCTURES TEEMU TARES
84
from 1919 to 2001 were reviewed providing information on 107 taxa of fish and
invertebrates. The information and is useful for environmental managers, oil industry and
fisheries researchers (Branton, 2010c).
The Eastern Canadian Benthic Macrofauna database is to map biomass and productivity of
benthic communities on the continental shelf to support ecosystems research in eastern
North America. Biomass measurements from 1954 to 2000 were georeferenced in the
database (Branton, 2009).
16.9.11 Coastal Defence & Military Activities
16.9.12 Ports & Maritime Navigation
16.9.13 Tides and Currents The Coastal Environmental Data - Northern and Eastern Canada database is necessary for
understanding coastal processes through measuring current, wave, water level and
meteorological data (Manson, 2010).
16.9.14 Wind and Waves
16.9.15 Bathymetry
16.9.16 Sea-Ice The purpose of the 1:10 000 000 North American Atlas for Sea-Ice is to be displayed and
used for the continental level analysis. Basic data layers enclose roads, railroads, populated
places, political boundaries, hydrography, bathymetry, sea ice and glaciers, which have all
been processed to be in correct positions relatively to each other. The data originated from
the Canadian Ice Service and shows the average minimum ice cover over a 30 years’ time in
1969-1999 (GeoGratis, 2011).
16.9.17 Chemistry The EMODNET Chemistry portal can be accessed at:
http://emodnet-chemistry.maris2.nl/v_cdi_v2/intro_cdi.asp
The colour indicates the number of measurement datasets. Clicking on a coloured square
selects a specific variable and marine region, whereby the results are presented. Pointing
the mouse on a coloured square displays the number of available datasets.
16.9.18 Baltic Sea This chapter is based on the MyOcean Catalogue (MyOcean, 2013). See also: http://www.myocean.eu/automne_modules_files/pmedia/public/r124_9_myocean_catalogue_v3.0_23_april_
2013_-_without_view.pdf
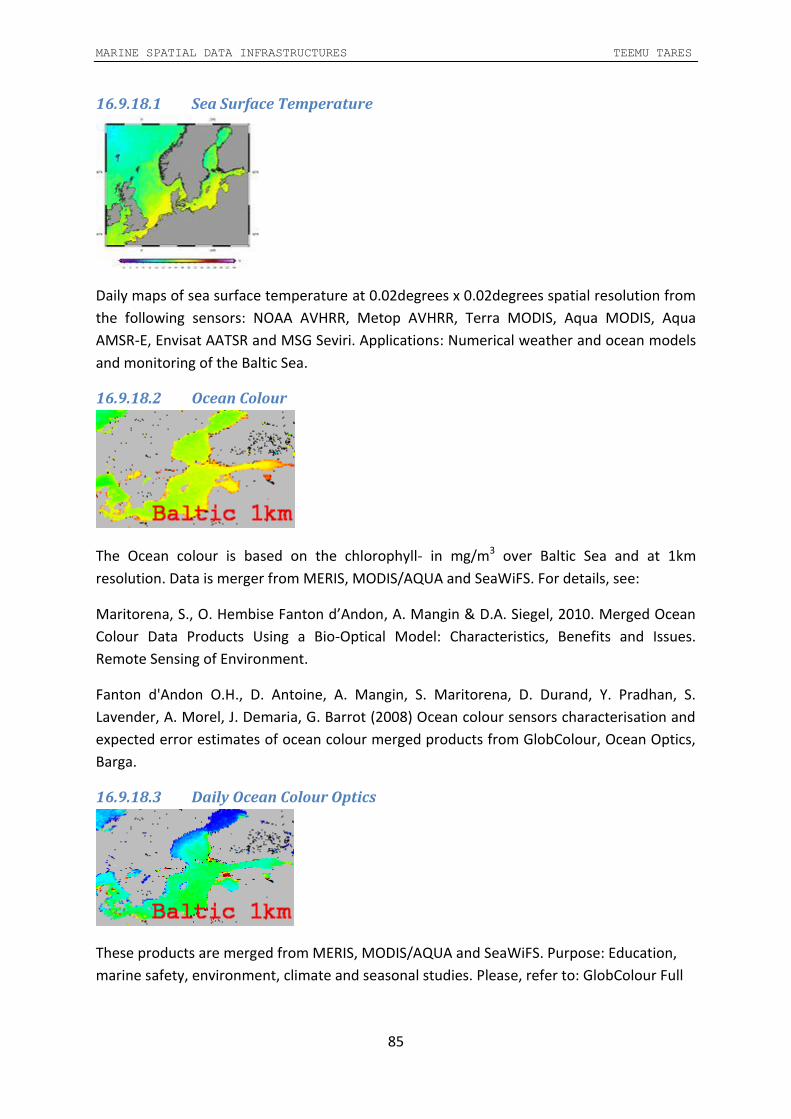
MARINE SPATIAL DATA INFRASTRUCTURES TEEMU TARES
85
16.9.18.1 Sea Surface Temperature
Daily maps of sea surface temperature at 0.02degrees x 0.02degrees spatial resolution from
the following sensors: NOAA AVHRR, Metop AVHRR, Terra MODIS, Aqua MODIS, Aqua
AMSR-E, Envisat AATSR and MSG Seviri. Applications: Numerical weather and ocean models
and monitoring of the Baltic Sea.
16.9.18.2 Ocean Colour
The Ocean colour is based on the chlorophyll- in mg/m3 over Baltic Sea and at 1km
resolution. Data is merger from MERIS, MODIS/AQUA and SeaWiFS. For details, see:
Maritorena, S., O. Hembise Fanton d’Andon, A. Mangin & D.A. Siegel, 2010. Merged Ocean
Colour Data Products Using a Bio-Optical Model: Characteristics, Benefits and Issues.
Remote Sensing of Environment.
Fanton d'Andon O.H., D. Antoine, A. Mangin, S. Maritorena, D. Durand, Y. Pradhan, S.
Lavender, A. Morel, J. Demaria, G. Barrot (2008) Ocean colour sensors characterisation and
expected error estimates of ocean colour merged products from GlobColour, Ocean Optics,
Barga.
16.9.18.3 Daily Ocean Colour Optics
These products are merged from MERIS, MODIS/AQUA and SeaWiFS. Purpose: Education,
marine safety, environment, climate and seasonal studies. Please, refer to: GlobColour Full

MARINE SPATIAL DATA INFRASTRUCTURES TEEMU TARES
86
Validation Report at
http://www.enviport.org/globcolour/validation/report/GlobCOLOUR_FVR_v1.1.pdf.
16.9.18.4 Physical Analysis
The Baltic Sea physical model provides forecasts for the
physical conditions in the Baltic Sea. The product is provided on a grid with horizontal
resolution of 1 nautical mile and in 25 vertical depth levels. Data are available online for the
latest 3 months.
16.9.18.5 Mean Ocean Topography
For the Global Ocean- Mean Dynamic Topography computed on a 7 years period (1993-
1999). More information: Rio, M.-H., Schaeffer, P., Lemoine, J.-M., Hernandez, F.,
Estimation of the ocean Mean Dynamic Topography through the combination of altimetric
data, in-situ measurements and GRACE geoid: From global to regional studies, Proceedings
of the GOCINA international workshop, Luxembourg, 2005.
16.9.18.6 Sea-Ice Concentration and Thickness
Ice thickness chart (ITC), ice drift and ice concentration are derived from Envisat ASAR and
RADARSAT-2, in a 0.1-1km grid. J. Karvonen, M. Similä, SAR-Based Estimation of the Baltic
Sea Ice Motion, Proc. of the International Geoscience and Remote Sensing Symposium 2007
(IGARSS 07), pp. 2605-2608, 2007.
16.9.18.7 Sea Surface Height
The European Ocean (North-West Shelf, Iberic-Biscayan-Ireland Mediterranean Sea, Black
Sea and Baltic Sea): Mono altimeter satellite along-track sea surface heights computed with
respect to a seven-year mean.

MARINE SPATIAL DATA INFRASTRUCTURES TEEMU TARES
87
16.9.18.8 Bio-Geo-Chemistry Analysis
The Baltic Sea biogeochemical product on a grid of 1 nautical mile spatial resolution, and in
25 vertical depth levels. See: Neumann, 2000. Towards a 3d-ecosystem model of the Baltic
Sea. J. Mar. Syst. 25, 405-419.
16.9.18.9 Physics Re-Analysis
Monthly mean fields for the physical conditions in the Baltic Sea based on 20 year reanalysis
simulations for the period January 1990 - December 2009
16.9.18.10 In-Situ near Real-Time Observations
The In Situ Thematic Assembly Centre (INS TAC) collects near real-time in-situ observation
data. These data are collected from the BOOS members. Variables:
- Mass concentration of chlorophyll a
- Moles of oxygen per unit mass
- Sea surface height
- Salinity
- Temperature
- X velocity
- Y velocity
Ocean circulation models need information on the interior of the ocean only available from
in-situ measurements.

MARINE SPATIAL DATA INFRASTRUCTURES TEEMU TARES
88
16.9.18.11 Ocean Wind Observations
Daily gridded sea surface wind observations from the ASCAT scatterometers on board
METOP-A and METOP-B. Resolution: 0.125 or 0.25. IFREMER CERSAT surface wind
climatology Fields for the Global Ocean include wind components, wind module and wind
stress available since April 2007.
16.9.18.12 Baltic Operational Oceanographic System
BOOS aims at integrating marine services to users and policy makers with objectives to
improve the maritime safety, sustainable use of Baltic Sea resources, offshore energy
activities, environmental hazards and pollution avoidance, ocean climate studies, and
federate resources of diverse institutes: http://www.boos.org/

MARINE SPATIAL DATA INFRASTRUCTURES TEEMU TARES
89
16.10 Marine Geospatial Portals This chapter provides a random list of some marine geospatial portals. There are very many
others, because most of the maritime countries are providing their own native services. In
addition, there are several other international portals not mentioned here for a reason.
16.10.1 Copernicus (former GMES) The European Copernicus Marine Monitoring service provides regular information on
temperature, salinity, currents, wind, sea level and sea-ice. The observation infrastructure
consists of several Remote Sensing satellites and in-situ components. In addition, to Marine
Monitoring, Copernicus services cover Land Monitoring, Atmospheric Monitoring,
Emergency Management, Security and Climate Change. There is a very large number (about)
of EU research projects, which can be searched and accessed through the Copernicus
Database of projects. Source: http://copernicus.eu/pages-principales/services/marine-monitoring/
16.10.2 GEBCO Ocean Mapping The General Bathymetric Chart of the Oceans (GEBCO) comprises 18 separate bathymetric
map sheets covering all oceanic areas. The GEBCO chart is produced together with the
UNESCO Intergovernmental Oceanographic Commission (IOC) and IHO. GEBCO can be
accessed through their web page at http://www.gebco.net/.
16.10.3 NOAA Digital Coast The NOAA Coastal Services Center is listing 891 layers of data in 12 themes for all the states
of USA. In addition to data, they also have tools, training and case studies available. The
service is accessible in here: http://www.csc.noaa.gov/digitalcoast/.
16.10.4 US Integrated Ocean Observing System (IOOS) IOOS has currently 2524 observation platforms around the coastal USA. The observing
systems include underwater gliders, coastal radars and animal telemetry. They are
addressing the following information need themes: marine operations (e.g. SAR), coastal
hazards, climate variability, and ecosystems, fisheries and water quality. “Today, U.S. IOOS
has a mandate to "lead the integration of ocean, coastal, and Great Lakes observing
capabilities.” Source: http://www.ioos.noaa.gov/
16.10.5 Seafloor Mapping Lab Data Library SFML data include multi-beam and side scan sonar imagery together with bathymetric
contours, grid analyses, habitat analyses, coastline and other associated datasets with FGDC
metadata. Survey locations are shown on the map in Figure 28. Clicking a square survey
location at the web site (http://seafloor.otterlabs.org/SFMLwebDATA_SURVEYMAP.htm) will open a
menu similar to that shown on the right in Figure 28, where the actual data can be very
easily downloaded and freely used. The multi-beam and side-scan sonar images are in
GeoTIFF format and other data in ArcGIS shape files or in ArcGIS grids (SFML, 2013).

MARINE SPATIAL DATA INFRASTRUCTURES TEEMU TARES
90
Figure 28. SFML data locator map (left) and download menu (right) (SFML, 2013).

MARINE SPATIAL DATA INFRASTRUCTURES TEEMU TARES
91
16.10.6 GeoConnections “The Canadian GeoConnections Discovery Portal is a metadata catalogue that enables GIS
users, developers and data suppliers to find, evaluate, access, visualize and publish Canadian
geospatial and geoscience data products and Web services” (GeoConnections, 2013).
There are 17 topic categories in the GeoConnections Discovery Portal and the number of
databases under each category is shown in Table 8. The databases were further searched by
us using the keywords “ocean”, “marine”, “sea” and “maritime” in order to find out the
number of databases in each category.
And, it was found out that there were 7311 (38%) databases mentioning the word “ocean”,
1269 (6.6%) mentioning “sea”, 434 (2.3%) mentioning “marine”, 343 (1.8%) mentioning
“coast” and 72 mentioning “maritime”. These percentages are shown on the last row of
Table 8. The lowest occurrence of these words was in the following categories:
Atmosphere and Climate, where 52 (5.5%) of the 939 databases mentioned “ocean”
Biology and Ecology, where 57 (5.7%) of 1007 mentioned “ocean”
Environment and Conservation, where 54 (4.5%) of 1204 mentioned “ocean”
Public Health and Disease, where 1 of 15 mentioned “coast”, but none of the other
Table 8. Topic categories of the Canadian GeoConnections Discovery Portal.
Category Number of Databases
Ocean %
Sea %
Marine %
Maritime %
Coast %
Administrative and Political 1688 56.6 9.2 0.8 0.1 0.5
Agriculture and Farming 554 48.7 4.0 2.3 0.7 2.3
Atmosphere and Climate 939 5.5 5.3 2.9 0.2 1.5
Biology and Ecology 1007 5.7 7.0 2.7 0.8 3.9
Business and Economic 1366 25.8 0.3 1.6 0.1 0.4
Cadastral 648 46.9 0.3 0.6 0.3 0.2
Cultural, Society and Demographic 1750 20.1 0.0 1.1 0.2 0.1
Elevation and Derived Products 320 85.3 2.5 4.7 1.6 4.1
Environment and Conservation 1204 4.5 4.7 2.6 0.8 2.2
Geological and Geophysical 392 38.0 18.9 13.5 1.0 13.3
Imagery and Base Maps 1157 50.7 14 2.3 0.8 2.9
Inland Water Resources 1419 47.7 4.2 1.8 0.4 2.5
Locations and Geodetic Networks 1790 36.1 0.0 0.9 0.1 0.2
Oceans and Coasts 1995 55.0 30.1 5.3 0.5 4.4
Public Health and Disease 15 0.0 0.0 0.0 0.0 6.7
Public Safety and Security 13 38.5 23.1 15.4 0.0 30.8
Transportation Networks 1968 39.4 0.1 1.2 0.2 0.2
Utilities and Communication 991 71.0 0.1 0.9 0.2 0.2
Total 19216 38.0 6.6 2.3 0.4 1.8
The total number of databases on the GeoConnections Discovery Portal was 19216 and the
portal opens in the following web address http://geodiscover.cgdi.ca.

MARINE SPATIAL DATA INFRASTRUCTURES TEEMU TARES
92
16.10.7 MyOcean The 7 MyOcean geographical areas include: Global Ocean, Arctic Ocean, Baltic Sea, Atlantic
European North West Shelf Ocean, Atlantic Iberian Biscay Irish Ocean, Mediterranean Sea
and Black Sea. And, the products contain the following parameters: ocean temperature,
ocean salinity, ocean currents, sea-ice, sea-level, winds, ocean optics, ocean chemistry,
ocean biology, ocean chlorophyll. There are 107 products available in the catalogue at
http://www.myocean.eu/.
MyOcean data can be downloaded regularly and automatically by choosing the SUBSET or
the DIRECT download mechanism using a Python script. The data format is Network
Common Data Form (netCDF), which is a set of software libraries and machine-independent
data formats. This is also a community standard for sharing scientific data. A netCDF file
both metadata and data. netCDF programming interfaces are available for C, Java, Fortran,
C++, IDL, MATLAB, Perl, Python, R and Ruby (Unidata, 2013). Some useful netCDF tools
include (See also http://ww.unidata.ucar.edu/software/netcdf):
Decompressors
o WinZip, http://ww.winzip.com
o Bzip2, http://ww.7-zip.org, http://ww.bzip.org
Visualisation tools
o Ncview, http://meteora.ucsd.edu/~pierce/ncview_home_page.html
o Ferret, http://ferret.wrc.noaa.gov/Ferret
o Matplotlib Python library, http://matplotlib.sourceforge.net
o Ncl, http://www.ncl.ucar.edu
o Idv, http://www.unidata.ucar.edu/software/idv (advanced view with 3D animation)
Manipulation tools
o NetCDF software with Fortran, C++ etc. libraries is freely available at
http://www.unidata.ucar.edu/software/netcdf/docs/faq.html#howtoget being the
best tool for processing NetCDF files, enclosing file format conversions.
o The NetCDF Operators (NCO) is a powerful set of tools for extraction,
concatenation or adding attributes: http://nco.sourceforge.net
o Marine Geospatial Ecology Tools at http://code.env.duke.edu/projects/mget is
also an addition to ArcGIS for NetCDF format conversions to ASCI or ArcGrid.
Converting tools from NetCDF to GRIB e.g.
o Ncl: http://www.ncl.ucar.edu
16.10.8 IHO Bathymetry Although 70 % of the Earth surface is covered by ocean, the world´s oceans remain poorly
mapped. Yet only about 10% of the seafloor has been surveyed by echo sounders at a
resolution of around 1 minute or better (IHO, 2013). This is very much in contrast to dry
land, where satellite instruments, like the ENVISAT MERIS or LANDSAT ETM, have ( at least
in theory) been able to acquire imagery with global coverage (i.e., where the cloud-cover is
not hindering the visibility) at resolutions of 1km every 3 days, or 30m every 16 days,
correspondingly. Even much higher resolution imagery (as fine as 50cm resolution from
satellite and near-cm-resolutions from the airplane) is readily available anywhere over the

MARINE SPATIAL DATA INFRASTRUCTURES TEEMU TARES
93
populated land (immediately visible in Google Earth or Bing Maps, for example) or a new
acquisition can be arranged on request by a satellites in weeks with prices not much higher
than 1000 US dollars per 100 km2.
Bathymetric data is important as well for navigation through nautical charts as for Earth
sciences. Knowing, the shape of the ocean basins, ridges and mountains, the flow of sea
water carrying nutrients, pollutants, heat and salt can be modelled. Undersea seismic events
can also be analysed. The IHO Data Centre for Digital Bathymetry (DCDB) collects oceanic
soundings from vessels. Shallow water soundings have been derived from national products
such as Electronic Nautical Charts (ENC).
16.10.9 SeaDataNet “SeaDataNet is a pan-European infrastructure providing harmonised discovery services and
access to ocean and marine environmental data sets managed in distributed data centres.
The partnership is composed of 44 institutions directly involved in the project as partner and
10 other institutions as associate partner, from 35 countries riparian to European seas”
(SeaDataNet, 2013b).
SeaDataNet comprises following services, as depicted in Figure 29 (SeaDataNet, 2013c):
Discovery services = Metadata directories
Viewing services = Visualisation of metadata, data and data products
Delivery services = Data access & downloading of datasets
Product services = Generic and standard products
Security services = Authentication, Authorization & Accounting (AAA)
Monitoring services = Statistics on usage and performance of the system
Maintenance services = Updating of metadata by SeaDataNet partners
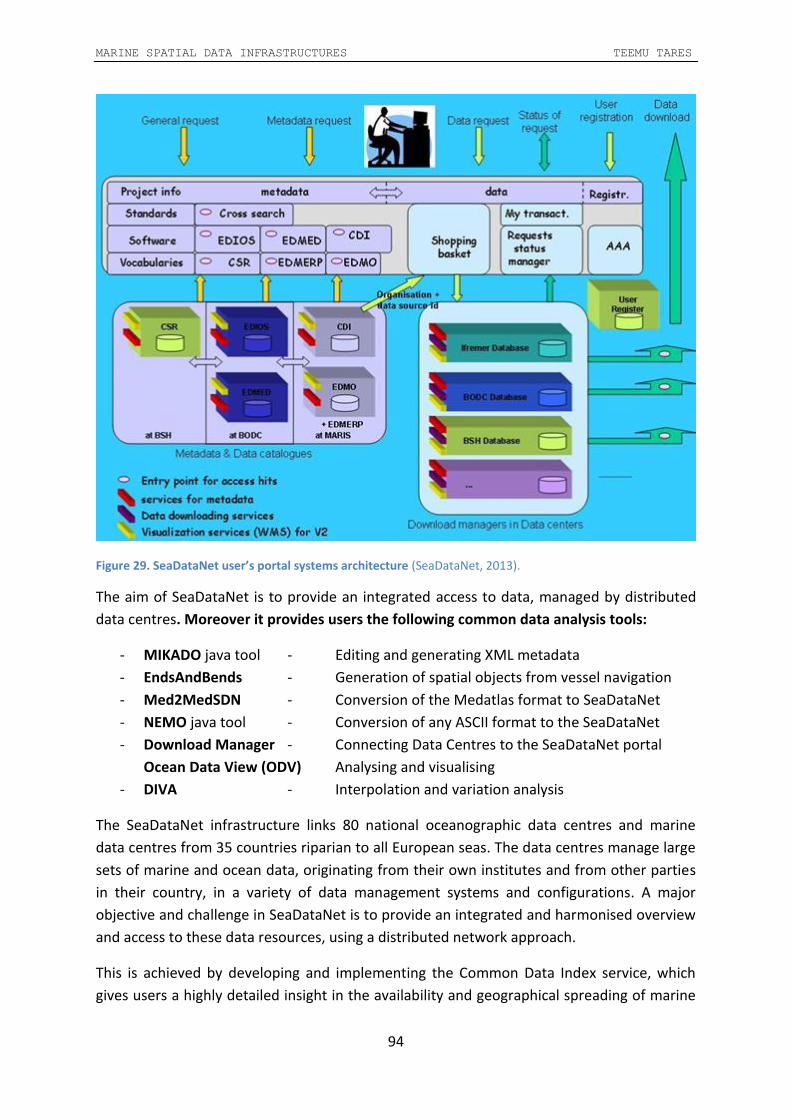
MARINE SPATIAL DATA INFRASTRUCTURES TEEMU TARES
94
Figure 29. SeaDataNet user’s portal systems architecture (SeaDataNet, 2013).
The aim of SeaDataNet is to provide an integrated access to data, managed by distributed
data centres. Moreover it provides users the following common data analysis tools:
- MIKADO java tool - Editing and generating XML metadata
- EndsAndBends - Generation of spatial objects from vessel navigation
- Med2MedSDN - Conversion of the Medatlas format to SeaDataNet
- NEMO java tool - Conversion of any ASCII format to the SeaDataNet
- Download Manager - Connecting Data Centres to the SeaDataNet portal
Ocean Data View (ODV) Analysing and visualising
- DIVA - Interpolation and variation analysis
The SeaDataNet infrastructure links 80 national oceanographic data centres and marine
data centres from 35 countries riparian to all European seas. The data centres manage large
sets of marine and ocean data, originating from their own institutes and from other parties
in their country, in a variety of data management systems and configurations. A major
objective and challenge in SeaDataNet is to provide an integrated and harmonised overview
and access to these data resources, using a distributed network approach.
This is achieved by developing and implementing the Common Data Index service, which
gives users a highly detailed insight in the availability and geographical spreading of marine

MARINE SPATIAL DATA INFRASTRUCTURES TEEMU TARES
95
data across the different data centres across Europe. The CDI provides an ISO19115 based
index (metadatabase) to individual data sets (such as samples, time series, profiles,
trajectories, etc.) and it provides a unique interface to online data access. Data sets are
available in ODV format which can be used directly in the Ocean Data View (ODV) software
package including the Data Interpolating Variation Analysis software tool (DIVA).
16.10.10 Global Ocean Observing System (GOOS) The Global Ocean Observing System (GOOS) is a permanent ocean observation, modelling
and analysis system of marine variables including state of the oceans, living resources and
climate change forecasts. The GOOS is the oceanographic component of the Global Earth
Observation System of Systems (GEOSS ) and it is supported by UN and UNESCO. GOOS aims
at understanding weather and climate, state of the ocean, marine life, improve marine
management, mitigate natural hazards and pollution, protect life and property at the sea,
and enable scientific research (GOOS, 2013). GOOS is collecting data from a multitude of
sources, including near real-time satellite and buoy observations on water and air
temperature, air pressure, air humidity, ocean currents, water salinity, sea-level, sea-ice,
plankton, wave characteristics, coral reefs, voluntary ship observations, biodiversity,
tsunami etc. A complete list with access to these and other data is available at the following
web site: http://gosic.org/goos. Currently, there are 108 programmes related to GOOS: http://www.ioc-goos.org/index.php?option=com_content&view=category&id=36&layout=blog&Itemid=131&lang=en.
16.10.11 Geo-Seas In Geo-Seas there are 26 marine geological and geophysical data centers from 17 European
maritime countries. A major objective and challenge in Geo-Seas is to provide an integrated
and harmonized overview and access to these data resources using the CDI service through
an ISO19115-based index (metadatabase) to individual data sets (such as samples, time
series, profiles, trajectories, etc. All the 26 Geo-Seas data centers are fully operational
delivering data directly through discovery and access services. As a result there are now in
excess 130,000 metadata records. The aims of Geo-Seas are aligned with European
directives and recent large-scale framework programmes on global and European scales,
such as GEOSS and GMES, EMODNET and INSPIRE (Geo-Seas Web page, 2013).
16.10.12 Pan-European Metadata Services This chapter is based on an overview of Pan-European marine research organisations as given at the SeaDataNet internet page and the user-interface are presented in
Figure 34 and
Figure 35 on page 131 and 101, correspondingly. All the services listed below can be
accessed through this web address: http://www.seadatanet.org/Metadata.

MARINE SPATIAL DATA INFRASTRUCTURES TEEMU TARES
96
16.10.12.1 European Directory of Marine Organisations (EDMO)
EDMO contains addresses and activity profiles of research institutes, data holding centres,
monitoring agencies, governmental and private organisations engaged in marine research,
data management or data acquisition. More than 1500 organisations are listed. See above.
16.10.12.2 Directory of Marine Environmental Data (EDMED)
EDMED is a reference to marine datasets of over 700 European research laboratories or
data centres, covering disciplines such as marine meteorology, physical, chemical and
biological oceanography, sedimentology, biology, fisheries, environment, coast, and marine
geology. There are more than 3500 datasets across the Europe. The Web address is above.
16.10.12.3 Directory of Marine Environmental Research (EDMERP)
EDMERP covers over 1800 marine research projects across Europe with subjects as above.
16.10.12.4 Cruise Summary Reports (CSR)
Cruise Summary Reports directory covers cruises from year 1873 till today of more than
2000 research vessels and nearly 40000 cruises, in global oceans and all European waters.
16.10.12.5 Directory of the initial Ocean-observing Systems (EDIOS)
EDIOS is an initiative of EuroGOOS listing ocean measuring systems in Europe, as compiled
from national contributions. As always in the chapter, the web address is given above.
16.10.12.6 Nordic Open Source Initiative Network
GeoNetwork was selected as a starting point for Nordic Geo-Portals project originally in
Denmark, Norway, Finland, Sweden and Scotland and it was developed together further in
order to fulfil the requirements of the INSPIRE directive. Prioritised list of requested
functionality was created (Lindegaard, 2011). Lindegaard reminded of the cooperation that
custom-build solutions are difficult to replace. See:
http://geonetwork-opensource.org/
http://www.geodata-info.dk/Portal/
http://www.geodata.se/
http://www.geodata.no/
http://www.paikkatietoikkuna.fi/web/en

MARINE SPATIAL DATA INFRASTRUCTURES TEEMU TARES
97
16.10.12.7 PRIMAR
Figure 30. PRIMAR worldwide ENC coverage (on the left) in Finland (PIMAR, 2013).
Figure 31. PRIMAR ENC search result from Nauvo (on the right), Finland (PIMAR, 2013).
Figure 32. PRIMAR worldwide ENC coverage around England (PIMAR, 2013).
Source: https://www.primar.org/web/10180/15
16.10.13 UK National Oceanographic Database (NODB) This index provides access to all data series held in our National Oceanographic Database
(NODB), a collection of marine data sets maintained by BODC, originating from a wide range
of organisations. Parameter categories include, for example

MARINE SPATIAL DATA INFRASTRUCTURES TEEMU TARES
98
- Acoustics
- Bathymetry and topography
- Currents - horizontal and vertical velocity, Lagrangian currents and water transport
rates Meteorology - Radiosonde, Meteorological stations and data buoys
- Optical properties - pigments, turbidity, irradiance
- Sea level
- Water column temperature and salinity
- Water column chemistry - nutrients, carbons, oxygen
- Waves - statistics and spectra
The NODB index includes 88129 data series from 148 different organisations.
Source: https://www.primar.org/web/10180/15
16.10.14 Finland Paikkatietoikkuna (www.paikkatietoikkuna.fi) is the finnish SDI. Unfortunately, an MSDI is
not available probably due major organisational changes of breaking down the Finnish
Maritime Administration in to private companies in 2010 and the Finnish Maritime Research
Center between the Finnish Environment Institute and Meteorologial Instutute a few year
earlier. The governmental Traffic Agency has however promised that marine products will
be opened ”little by little” (Traffic Agency web page, 2013). The SDI has in any case been a
success, with over 40,000,000 service requests monthly in 2012 .
Other Finnish portals of spatial information include:
Kansalaisen Karttapaikka www.kansalaisen.karttapaikka.fi
Tampereen kaupunki
PaikkaOppi www.paikkaoppi.fi
Palvelukartta www.suomi.fi/suomifi/suomi/palvelukartta
Museovirasto
Vipu-palvelu www.mavi.fi/fi/index/viljelijatuet/vipu.html
Työ- ja elinkeinoministeriö www.mol.fi, www.eharava.fi, www.lupapiste.fi
Reittiopas www.reittiopas.fi
Pääkaupunkiseudun Palvelukartta www.hel.fi/palvelukartta
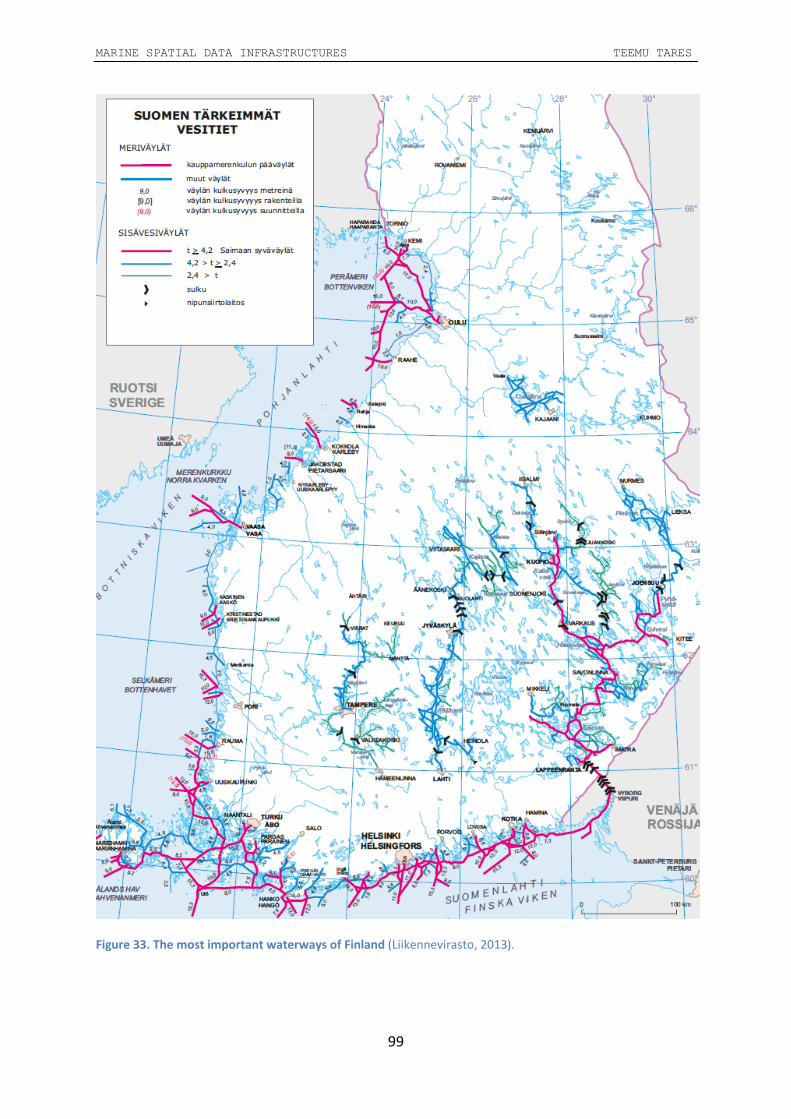
MARINE SPATIAL DATA INFRASTRUCTURES TEEMU TARES
99
Figure 33. The most important waterways of Finland (Liikennevirasto, 2013).

MARINE SPATIAL DATA INFRASTRUCTURES TEEMU TARES
100
Figure 34. Pan-European marine metadata services (SeaDataNet, 2013).

MARINE SPATIAL DATA INFRASTRUCTURES TEEMU TARES
101
Figure 35. SeaDataNet direct access to data (SeaDataNet, 2013).

MARINE SPATIAL DATA INFRASTRUCTURES TEEMU TARES
102
Figure 36. Arc Marine thematic layers (Wright et al., 2007). Cont. …

MARINE SPATIAL DATA INFRASTRUCTURES TEEMU TARES
103
Figure 37. … Cont. Arc Marine thematic layers (Wright et al., 2007).

MARINE SPATIAL DATA INFRASTRUCTURES TEEMU TARES
104
Figure 38. Ship track lines from 1980-2010 hydrographic surveys (GEBCO, 2011).
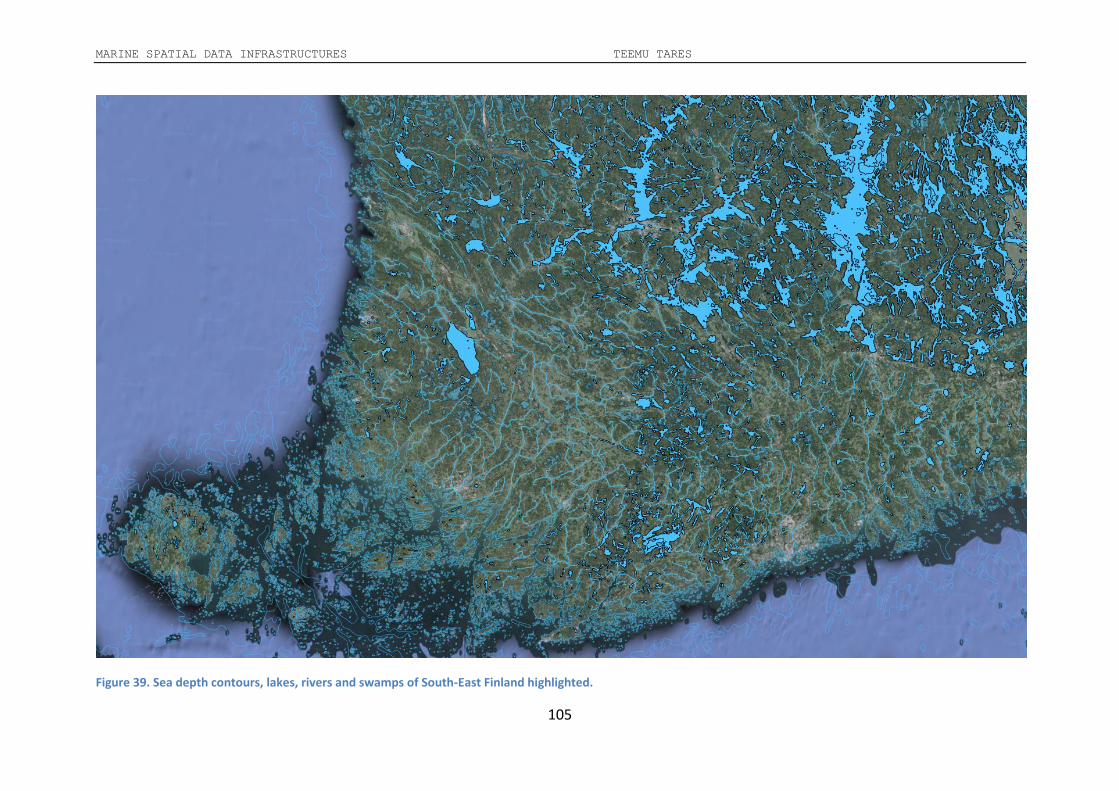
MARINE SPATIAL DATA INFRASTRUCTURES TEEMU TARES
105
Figure 39. Sea depth contours, lakes, rivers and swamps of South-East Finland highlighted.
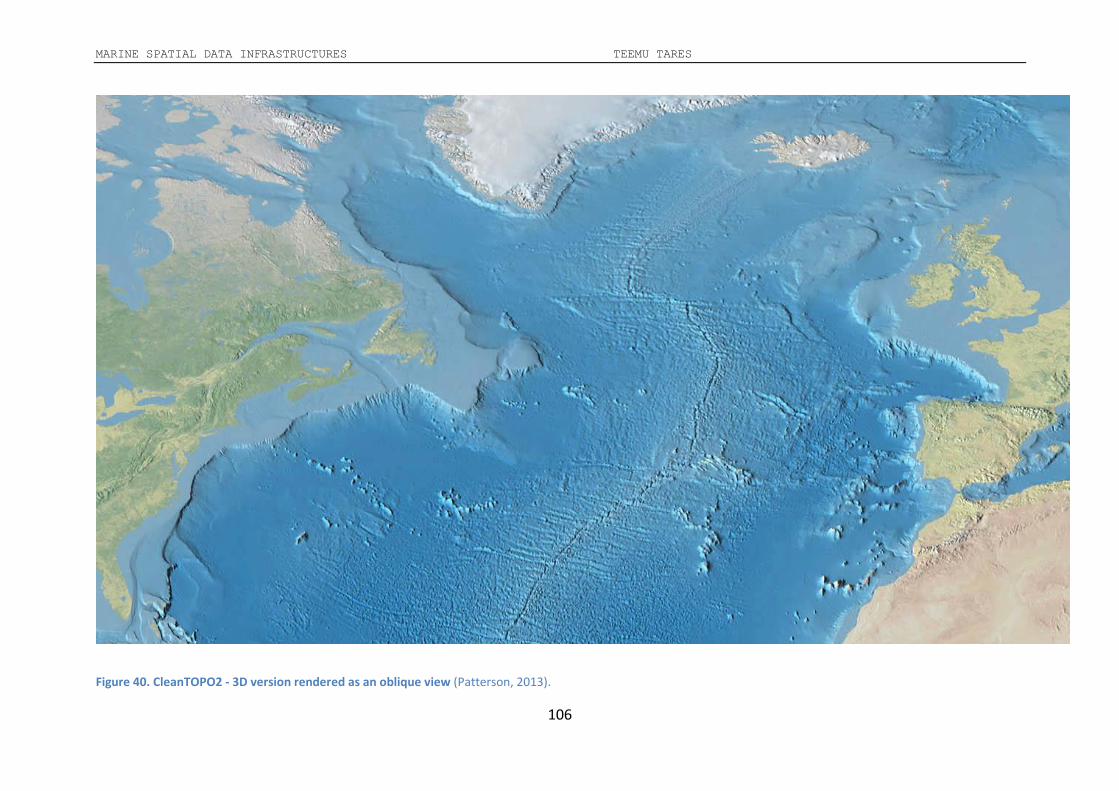
MARINE SPATIAL DATA INFRASTRUCTURES TEEMU TARES
106
Figure 40. CleanTOPO2 - 3D version rendered as an oblique view (Patterson, 2013).

MARINE SPATIAL DATA INFRASTRUCTURES TEEMU TARES
107
Figure 41. Gravity from satellite altimetry, version 15, Sandwell & Smith, 2006.
“Imagine taking one depth measurement every couple of kilometres” (GEBCO, 2011).
Copyright © 2022 FDOKUMEN