
Genus Power Infrastructures Limited Corporate Identity ... - BSE
Upload
khangminh22Category
view
0download
0
The "Essential" collection
Report
National climate
change adaptation plan:
transportation infrastructures
and systems, action 1
Potential impacts of climate change on transportation
infrastructures and systems, on their design,
maintenance and operation standards, and the need for
detailed climate projections
July 2015
Cerema-DTITM report – 2 – May 2016
Authors and main proofreaders
Cerema / DTecEMF
Claire GALIANA
Aldéric HAUCHECORNE
Guirec PRÉVOT
Jean-Jacques TRICHET
Cerema / DTecITM
Anne-Laure BADIN / supervision
Sophie CARIOU
Marie COLIN / supervision
Christian CREMONA
Xavier DELACHE
Marc DI MARTINO / supervision
Linda FEREZ
Fabien PALHOL
Pascal ROSSIGNY
Yannick TARDIVEL
Jean-Marc TARRIEU
Cerema / DTecTV
Marine LERICOLAIS
Cerema / DTerCE
Caroline MAUDUIT
Cerema / DTerNP
Véronique BERCHE
DGITM
Olivier GAVAUD
André LEUXE
IFRECOR
Michel PORCHER
RFF
Anne-Laure GENTY
SNCF
Alexandre KADDOURI
Antoine ROTHEY
STAC:
Catherine BONARI
Aubin LOPEZ
David SMAGGHE
STRMTG
Laurent ROQUES
VNF
Christine BOURBON
Acknowledgments to the numerous experts from Cerema, SNCF, STAC, STRMTG and VNF who contributed to the proofreading of this report and to the listing and analyzing of standards.

PNACC, infrastructures and transport systems, action 1 – Adaptation of infrastructures and transport systems to climate change
3
Contents Foreword ....................................................................................................................................... 7
Introduction ................................................................................................................................... 9
Chapter ........................................................................................................................................ 11
Climate changes expected in France by 2100........................................................................... 11
1 - Methodology ............................................................................................................................................................. 13 1.1 - Emissions scenarios......................................................................................................................... 13 1.2 - Climate simulation models ............................................................................................................... 15 1.3 - Proposed climate indices ................................................................................................................. 16 1.4 - Spatial means and calculation of uncertainties ................................................................................ 18
2 - Tendencies produced by the climate simulations...................................................................................................... 21 2.1 - Temperatures ................................................................................................................................... 21 2.2 - Precipitation ...................................................................................................................................... 22 2.3 - Groundwater levels .......................................................................................................................... 24 2.4 - Wind ................................................................................................................................................. 25 2.5 - Sea level (marine flooding) and change to the swell climate ........................................................... 26 2.6 - Extreme weather events ................................................................................................................... 28 2.7 - Biodiversity ....................................................................................................................................... 31 2.8 - Distinctive features of French overseas territories ........................................................................... 33
3 - Summary of the climate tendencies .......................................................................................................................... 36 Chapter ........................................................................................................................................ 40
Potential impacts of expected climate change on transport infrastructures .......................... 40
4 - Impacts of changes in temperature .......................................................................................................................... 42 4.1 - Highway infrastructures .................................................................................................................... 42 4.2 - Earthworks ....................................................................................................................................... 42 4.3 - Constructions ................................................................................................................................... 44 4.4 - Rail ................................................................................................................................................. 45 4.5 - Rivers ............................................................................................................................................... 49 4.6 - Port and maritime infrastructures ..................................................................................................... 49 4.7 - Airport infrastructures ....................................................................................................................... 49 4.8 - Cable transport systems .................................................................................................................. 50
5 - Impacts of changes in precipitation .......................................................................................................................... 51 5.1 - Highway infrastructures .................................................................................................................... 51 5.2 - Earthworks ....................................................................................................................................... 51 5.3 - Constructions ................................................................................................................................... 52 5.4 - Rail ................................................................................................................................................. 54 5.5 - Rivers ............................................................................................................................................... 56 5.6 - Port and maritime infrastructures ..................................................................................................... 57 5.7 - Airport infrastructures ....................................................................................................................... 57 5.8 - Cable transport systems .................................................................................................................. 58
6 - Impacts of changes in wind ...................................................................................................................................... 59 6.1 - Highway infrastructures .................................................................................................................... 59 6.2 - Earthworks ....................................................................................................................................... 59 6.3 - Constructions ................................................................................................................................... 59 6.4 - Rail ................................................................................................................................................. 60 6.5 - Rivers ............................................................................................................................................... 62 6.6 - Port and maritime infrastructures ..................................................................................................... 62 6.7 - Airport infrastructures ....................................................................................................................... 63 6.8 - Cable transport systems .................................................................................................................. 64
7 - Impacts of changes in the sea level and swell climate ............................................................................................. 65 7.1 - Highway infrastructures .................................................................................................................... 65 7.2 - Earthworks ....................................................................................................................................... 65 7.3 - Constructions ................................................................................................................................... 65 7.4 - Rail ................................................................................................................................................. 66
PNACC, infrastructures and transport systems, action 1 – Adaptation of infrastructures and transport systems to climate change
4
7.5 - Rivers ............................................................................................................................................... 66 7.6 - Port and maritime infrastructures ..................................................................................................... 66 7.7 - Airport infrastructures ....................................................................................................................... 67
8 - Impacts of changes in biodiversity ............................................................................................................................ 68 8.1 - Highway infrastructures .................................................................................................................... 68 8.2 - Earthworks ....................................................................................................................................... 68 8.3 - Constructions ................................................................................................................................... 68 8.4 - Rail ................................................................................................................................................. 68 8.5 - Rivers ............................................................................................................................................... 68 8.6 - Port infrastructures ........................................................................................................................... 68 8.7 - Airport infrastructures ....................................................................................................................... 69
9 - Table summarizing the potential impacts of climate change by type of infrastructure .............................................. 71 Chapter
Technical documentation for the design, operation and maintenance of transport infrastructures that could potentially be impacted by climate change ................................... 76
10 - Methodology for the analysis of technical reference materials ................................................................................. 78 10.1 - General methodology for all forms of transport ................................................................................ 78 10.2 - Identified reference documents ........................................................................................................ 78
Chapter
Climate projections that are necessary to adapt the reference documents ........................... 79
11 - Details of the approach to the subject ...................................................................................................................... 81 11.1 - Spatial or temporal precision? .......................................................................................................... 81 11.2 - Which variables are covered by these demands for clarification? ................................................... 81 11.3 - Changes in meteorological parameters or the indicators calculated using these parameters ........ 81
12 - Clarification for highways .......................................................................................................................................... 82 12.1 - List of variables ................................................................................................................................ 82 12.2 - Summary of the required clarification on the climatic variables used in highways reference documents ................................................................................................................................................. 86
13 - Clarifications for highway constructions .................................................................................................................... 88 13.1 - Temperature ..................................................................................................................................... 88 13.2 - Precipitation ...................................................................................................................................... 88 13.3 - Wind ................................................................................................................................................. 88 13.4 - Summary of the required clarification on the climatic variables used in construction reference documents ................................................................................................................................................. 89
14 - Clarification for railroads ........................................................................................................................................... 91 14.1 - Temperature ..................................................................................................................................... 91 14.2 - Precipitation ...................................................................................................................................... 91 14.3 - Wind ................................................................................................................................................. 91 14.4 - Globally ............................................................................................................................................ 91 14.5 - Summary of the required clarification on the climatic variables used in rail reference documents . 92
15 - Clarification for the river and maritime domains ........................................................................................................ 95 15.1 - Variables based on statistical studies (notion of recurrence intervals) ............................................ 95 15.2 - Variables used as input .................................................................................................................... 96 15.3 - In summary ....................................................................................................................................... 96 15.4 - Summary of the required clarification on the climatic variables used in river and maritime reference documents ................................................................................................................................................. 97
16 - Clarification for airports ............................................................................................................................................. 98 16.1 - Climate typology ............................................................................................................................... 98 16.2 - Airport reference temperature .......................................................................................................... 99 16.3 - Wind ................................................................................................................................................. 99 16.4 - Precipitation .................................................................................................................................... 100 16.5 - In summary ..................................................................................................................................... 100 16.6 - Summary of the required clarification on the climatic variables used in airport reference documents ............................................................................................................................................... 101
17 - Clarification for the domain specific to mechanical lifts and guided transport systems ........................................... 103 17.1 - Main variables ................................................................................................................................ 103 17.2 - Summary of the required clarification on the climatic variables used in reference documents specific to mechanical lifts and guided transport systems ......................................................................... 104
PNACC, infrastructures and transport systems, action 1 – Adaptation of infrastructures and transport systems to climate change
5
18 - Acronyms ................................................................................................................................................................ 110 19 - Bibliography ............................................................................................................................................................ 113
19.1 - Bibliography of the report ................................................................................................................ 113 19.2 - General documents ......................................................................................................................... 116
Annexes ..................................................................................................................................... 117
1 - Methodology used to calculate the climate tendencies and to define the levels of confidence .............................. 117 2 - Detailed methodologies for the analysis of technical reference materials .............................................................. 118
2.1 - Method used to list climate data in the highways reference materials (DTecITM) .......................... 118 2.2 - Method used to list climate data in the reference materials specific to urban constructions ......... 120 2.3 - Method used to list climate data in the highways constructions reference materials .................... 121 2.4 - Method used to list climate data in the reference materials specific to tunnels ............................. 121 2.5 - Method used to list climate data in the rail reference materials ..................................................... 121 2.6 - Method used to list climate data in the maritime and river reference materials ............................. 122 2.7 - Method used to list climate data in the airport reference materials ............................................... 122 2.8 - Method used to list climate data in the reference materials specific to guided transport systems 123
3 - Summary of the methodology and the breakdown of the analysis of the reference material .................................. 124 4 - List of reference documents ................................................................................................................................... 126
4.1 - Document categories ..................................................................................................................... 126 4.2 - Highways reference documents ..................................................................................................... 127 4.3 - Reference materials for urban highways........................................................................................ 140 4.4 - Reference materials for highway constructions ............................................................................. 142 4.5 - Rail reference materials ................................................................................................................. 144 4.6 - Maritime and river reference documents ........................................................................................ 153 4.7 - Airport reference documents .......................................................................................................... 158 4.8 - Reference documents specific to mechanical lifts and guided transport ....................................... 160

PNACC, infrastructures and transport systems, action 1 – Adaptation of infrastructures and transport systems to climate change
6
This page intentionally left blank

PNACC, infrastructures and transport systems, action 1 – Adaptation of infrastructures and transport systems to climate change
7
Foreword The fight against climate change is a national priority. The goal of COP21, also known as the 2015 Paris Climate Conference, is to reach an international agreement to keep global warming below 2°C.
Despite the efforts that have already been made to reduce greenhouse gas emissions, climate changes affecting temperature, the global water cycle, retreating snow and ice, the rise in the global average sea level and the modification of certain climate extremes will affect numerous sectors, including agriculture, forestry, tourism, fishing, biodiversity, urban and country planning, building and transport infrastructures.
In addition to mitigation efforts, it is necessary to prepare for this change. Otherwise the costs and the damage could be much higher than the cost of making the preparations. We must reduce our vulnerability to climate variations right away, if we are to avoid serious environmental, material, financial and human damage.
Adaptation to climate change, the essential complement to the mitigation actions already underway, has become a major issue that demands a nationwide effort. France adopted its national climate change adaptation plan (PNACC) in 2011.
The impacts of climate change on transport networks affect all modes of transport. Adaptation is essential, because transport networks and equipment are used for long periods of time. A number of measures have been identified by the PNACC. These measures are aimed at analyzing the impact of climate change, to prevent the transport systems from becoming vulnerable and to prepare the improvement of the resistance and the resilience of existing and future infrastructures, in order to secure the future and the safety of transport networks.
This report relates to action 1 of the "infrastructure and transport systems" section of the PNACC. The purpose of this report is to examine the potential impacts of climate change on the design, maintenance and operation standards of transportation infrastructures and systems. The technical reference documents can then be revised accordingly, if necessary.
The goal is to make sure that the transportation infrastructures and equipment, which are built to be used for a long time (sometimes a century or more), are capable of satisfactorily withstanding the expected changes due to the average and extreme conditions of climate change.
Directorate general for infrastructure, transport and the sea
May 2015

PNACC, infrastructures and transport systems, action 1 – Adaptation of infrastructures and transport systems to climate change
8
This page intentionally left blank

PNACC, infrastructures and transport systems, action 1 – Adaptation of infrastructures and transport systems to climate change
9
Introduction The National Climate Change Adaptation Plan – PNACC [1] – was built on a collective and shared basis1. It was published on July 20, 2011, and was immediately applicable for five years. It applies to all public policies: health, urban planning, water, biodiversity, research, transport, etc.
The impacts of climate change on transport networks, irrespective of the mode of transport, could worsen in the coming century. These networks must be adapted, due to their importance to society and the economy, and the very long periods for which they remain in use.
A number of actions have been identified in the infrastructure and transport systems section of the PNACC in order to achieve this. These measures will enable us to analyze the impact of climate change, to prevent the transport systems from becoming vulnerable and to prepare the improvement of the resistance and the resilience of existing and future infrastructures, in order to secure the future and the safety of transport networks. These actions are as follows:
action 1: review and adapt the technical standards for the construction, maintenance and operation of transport networks (infrastructures and equipment used to deliver the service) in metropolitan France and overseas territories ;
action 2: study the impact of climate change on transport demand and the consequences for reshaping transport provision ;
action 3: define a harmonized methodology to diagnose the vulnerability of infrastructures and land, sea and air transport systems ;
action 4: establish a statement of vulnerability for land, sea and air transport networks in metropolitan France and overseas territories and prepare appropriate and phased response strategies to local and global climate change issues.
At the request of the Directorate General for Infrastructure, Transport and the Sea (DGITM) and the Ministry of Ecology, Sustainable Development and Energy (MEDDE), a work group was set up in November 2011 to implement these actions. This work group includes representatives from the following technical entities and infrastructure managers: Cerema (through its technical and regional divisions), CETU, STAC, STRMTG, and representatives of IFRECOR, RFF, SNCF and VNF.
The work group met regularly to produce, amongst others, this report, which is intended to respond to action 1 of the infrastructure and transport systems section of the PNACC. More precisely, the purpose of this action is to:
identify all the technical reference documents (guides, etc.), standards and legal texts (circulars, etc.) that are of use for the design, maintenance and operation of transport infrastructures that could be impacted by climate change, because they rely on climate variables ;
identify the climate projections that are necessary to adapt the previously mentioned reference documents ;
adapt these reference documents.
1The inter-ministerial report entitled "Climate change: costs of impacts and lines of adaptation" was published in two stages: a first stage in 2008 [2] and a second in 2009 [3]. In 2010, different discussions were held (nationwide as a Grenelle, regionally, and with citizens), followed by an final round table.

PNACC, infrastructures and transport systems, action 1 – Adaptation of infrastructures and transport systems to climate change
10
Consequently, the work group focused on:
recapping the main climate changes expected by 2100, on the basis of the 2011 [4] and 2012 [5, 6] reports of the analysis supervised by Jean Jouzel2 and the scientific content of the fourth assessment report of the IPCC (International Panel on Climate Change), published in 2007 [7]. Only gradual climate changes were taken into consideration in this report ;
listing the current climate impacts and the potential impacts of climate change on the existing infrastructures. The following infrastructures were covered: highway infrastructures, earthworks, highway constructions, railway, river, maritime, port and airport constructions, mechanical lifts and guided transport systems ;
listing the reference documents (guides, standards, official texts, etc.) that may be impacted by climate change, because they use or mention climate variables. These reference documents were then classified in order of priority of adaptation ;
determining the climate variables for which projections are necessary in order to adapt the technical reference documents.
These activities resulted in the production of a report that is:
consistent, because each contributor's input on their topic was provided according to a common methodology ;
heterogeneous, inasmuch as the descriptions of the current and future climate impacts, the list of technical reference documents and the requests for climate projections, were the result of work that was specific to each type of infrastructure.
The authors are responsible for the parts about the infrastructures that they covered.
2Jean Jouzel is a French climatologist and glaciologist, who is currently the vice-chairman of the IPCC work group 1.

PNACC, infrastructures and transport systems, action 1 – Adaptation of infrastructures and transport systems to climate change
11
Chapter Climate changes expected in
France by 2100
PNACC, infrastructures and transport systems, action 1 – Adaptation of infrastructures and transport systems to climate change
12
Jean Jouzel was appointed to conduct an expert analysis as part of the preparations of the PNACC and for the PNACC itself. The purpose of this mission was to simulate climate change in France. In the present report, the definition of "climate change" is that used in the IPCC special report on managing the risks of extreme events and disasters to advance climate change adaptation [8]:
"A change in the state of the climate that can be identified (e.g., by using statistical tests) by changes in the mean and/or the variability of its properties and that persists for an extended period, typically decades or longer. Climate change may be due to natural internal processes or external forcings, or to persistent anthropogenic changes in the composition of the atmosphere or in land use."
The expert analysis resulted in the publication of reports presenting regional climate simulations for the periods 2020-2050 and 2070-2100, compared with a reference period (1980-1999 or 1970-1999). These results are based on, amongst others, the reports of the IPCC, and in particular the fourth assessment report [7].
The following chapter contains an interpretation of the data in the 2011 and 2012 reports [5, 6] of the analysis supervised by Jean Jouzel and, more generally, in the fourth assessment report of the IPCC [7]. At the instigation of the Directorate General for Energy and Climate (DGEC), this data constitutes the hypotheses of changes in the French climate, according to which the group worked3.
To begin with, the hypotheses and the limits of the expert analysis supervised by Jean Jouzel (scenarios, scale) are outlined. Then, the proposed climate indices are presented and, finally, the expected tendencies of climate change are described.
3The new hypotheses on climate change presented in the fifth assessment report of the IPCC [9] were not taken into consideration in the present report, but the main differences from the fourth assessment report [7] are explained. The work done on action 1 of the infrastructure and transport systems section of the PNACC started in 2011, before the publication of the IPCC's fifth assessment report in 2013.

PNACC, infrastructures and transport systems, action 1 – Adaptation of infrastructures and transport systems to climate change
13
1 - Methodology A set of reference scenarios (chapter 1.1) proposed by the IPCC describes the possible evolution of the emissions and concentrations of greenhouse gases. These scenarios constitute input for the climate simulation models (chapter 1.2) and they can be used to produce projections of the different climate parameters (chapter 1.3), but with uncertainties (chapter 1.4).
1.1 - Emissions scenarios The IPCC scenarios, which describe the possible evolution of greenhouse gas emissions and concentrations, are based on different hypotheses on future economic development and its consequences for the environment. They take the changes in the population, the economy, industrial and agricultural development and, in a rather simplified manner, the chemistry of the atmosphere into consideration. These scenarios – known as SRES4 – are described below.
Scenario A1 describes a future world of very rapid economic growth, global population that peaks in mid-century and declines thereafter, and the rapid introduction of new and more efficient technologies. It also describes convergence among regions, particularly in terms of per capita income. In scenario A1B, technological development respects a balance across all energy sources.
Scenario A2 describes a very heterogeneous world, with economic development that is primarily regionally oriented, a continuously increasing global population and technological change that is slower than in the other storylines.
Scenario B1 describes a convergent world with a global population that peaks in mid-century and declines thereafter, as in the A1 storyline. The emphasis is on global solutions to economic, social and environmental sustainability, including improved equity.
Scenario B2 describes a world in which the emphasis is on local solutions to economic, social and environmental sustainability. It is a world with continuously increasing global population, at a rate lower than A2, intermediate levels of economic development, and less rapid and more diverse technological change than in the A1 and B1 storylines.
Figure 1: Greenhouse gas (CO2 and CH4) and aerosol precursor gas (SO2) emission scenarios. The emissions produced between 1900 and 2000 are shown on the far left. Then, six scenario families are presented. All the scenarios are equally
probable. Source: IPCC, 2007 [7].
4The Special Report on Emissions Scenarios (SRES) [10] presenting these scenarios was published in 2000.
PNACC, infrastructures and transport systems, action 1 – Adaptation of infrastructures and transport systems to climate change
14
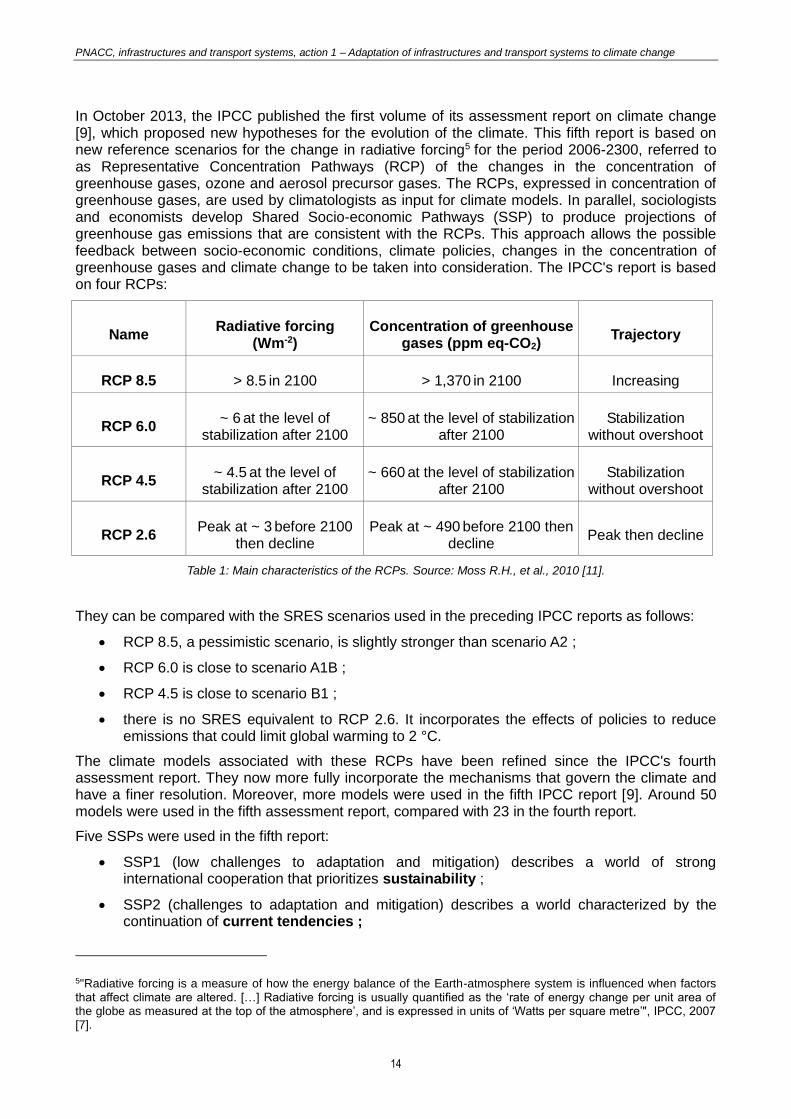
In October 2013, the IPCC published the first volume of its assessment report on climate change [9], which proposed new hypotheses for the evolution of the climate. This fifth report is based on new reference scenarios for the change in radiative forcing5 for the period 2006-2300, referred to as Representative Concentration Pathways (RCP) of the changes in the concentration of greenhouse gases, ozone and aerosol precursor gases. The RCPs, expressed in concentration of greenhouse gases, are used by climatologists as input for climate models. In parallel, sociologists and economists develop Shared Socio-economic Pathways (SSP) to produce projections of greenhouse gas emissions that are consistent with the RCPs. This approach allows the possible feedback between socio-economic conditions, climate policies, changes in the concentration of greenhouse gases and climate change to be taken into consideration. The IPCC's report is based on four RCPs:
Name Radiative forcing
(Wm-2) Concentration of greenhouse
gases (ppm eq-CO2) Trajectory
RCP 8.5 > 8.5 in 2100 > 1,370 in 2100 Increasing
RCP 6.0 ~ 6 at the level of
stabilization after 2100 ~ 850 at the level of stabilization
after 2100
Stabilization without overshoot
RCP 4.5 ~ 4.5 at the level of
stabilization after 2100 ~ 660 at the level of stabilization
after 2100 Stabilization
without overshoot
RCP 2.6 Peak at ~ 3 before 2100
then decline Peak at ~ 490 before 2100 then
decline Peak then decline
Table 1: Main characteristics of the RCPs. Source: Moss R.H., et al., 2010 [11].
They can be compared with the SRES scenarios used in the preceding IPCC reports as follows:
RCP 8.5, a pessimistic scenario, is slightly stronger than scenario A2 ;
RCP 6.0 is close to scenario A1B ;
RCP 4.5 is close to scenario B1 ;
there is no SRES equivalent to RCP 2.6. It incorporates the effects of policies to reduce emissions that could limit global warming to 2 °C.
The climate models associated with these RCPs have been refined since the IPCC's fourth assessment report. They now more fully incorporate the mechanisms that govern the climate and have a finer resolution. Moreover, more models were used in the fifth IPCC report [9]. Around 50 models were used in the fifth assessment report, compared with 23 in the fourth report.
Five SSPs were used in the fifth report:
SSP1 (low challenges to adaptation and mitigation) describes a world of strong international cooperation that prioritizes sustainability ;
SSP2 (challenges to adaptation and mitigation) describes a world characterized by the continuation of current tendencies ;
5"Radiative forcing is a measure of how the energy balance of the Earth-atmosphere system is influenced when factors that affect climate are altered. […] Radiative forcing is usually quantified as the ‘rate of energy change per unit area of the globe as measured at the top of the atmosphere’, and is expressed in units of ‘Watts per square metre’", IPCC, 2007 [7].

PNACC, infrastructures and transport systems, action 1 – Adaptation of infrastructures and transport systems to climate change
15
SSP3 (high challenges to adaptation and mitigation) depicts a fragmented world affected by competition between countries, slow economic growth, security-oriented policies and industrial production that has little regard for the environment ;
SSP4 (high challenges to adaptation, low challenges to mitigation) describes a world marked by significant inequality between and within countries. A minority is responsible for greenhouse gas emissions, a fact that makes mitigation policies easier to implement, while most of the population remains poor and vulnerable to climate change ;
SSP5 (low challenges to adaptation, high challenges to mitigation) describes a world that concentrates on the rapid conventional development of developing countries, based on high energy consumption and carbon-emitting technologies. The rise in living standards increases the capacity for adaptation, thanks in particular to the decline of extreme poverty.
A more detailed summary of the new RCPs and SSPs was written and published in 2013 by the ONERC [12].
The climate change tendencies identified in the fifth IPCC assessment report [9] are on the whole similar to those announced in the fourth assessment report, in terms of their structures and their amplitudes, while taking the different scenarios into account. Before comparing the projections in these two reports in detail, the reference periods should be verified, as they can reduce or increase the changes in the climate.
1.2 - Climate simulation models Climate models are very complex mathematical tools that are capable of projecting changes in the elements that make up the climate system. The principle of climate models is based on the mathematical representation, using a set of equations, of the physical phenomena that determine the evolution of the atmosphere and oceans. These equations are applied to a calculation matrix, with the finest possible mesh, that covers the surface of the globe, the thickness of the atmosphere and the depth of the oceans. The resolution of these equations at the different points of the mesh and the comparison between these results and observed results improves the numerical system and the configuration applied.
On a worldwide scale, the IPCC used 23 AOGCM type models (the most complex) to produce these reports and their climate scenarios. On the scale of France, climate change is simulated using French regional models, such as ARPEGE-Climat and LMDZ, respectively developed by the CNRM-Météo-France (French national meteorological research center) and the IPSL (Institut Pierre-Simon Laplace):
the ARPEGE-Climat model used by Météo-France is derived from the operational short-term forecasting model ;
the LMDz model is also a variable mesh general circulation model ;
the ALADIN-Climat model used by Météo-France is derived from the ALADIN operational short-term forecasting model ;
the MAR model, like ALADIN-Climat, is a model covering a limited-area domain ;
finally, the ANR SCAMPEI6 [13] project provides a more precise answer to the question of climate change in mountainous regions in metropolitan France. It is partly based on simulation models derived from the analysis supervised by Jean Jouzel. Extreme phenomena, snow cover and uncertainties are modeled with a finer mesh (8 km) in order to take account of the topographical complexity.
6<http://www.cnrm.meteo.fr/scampei/>
PNACC, infrastructures and transport systems, action 1 – Adaptation of infrastructures and transport systems to climate change
16
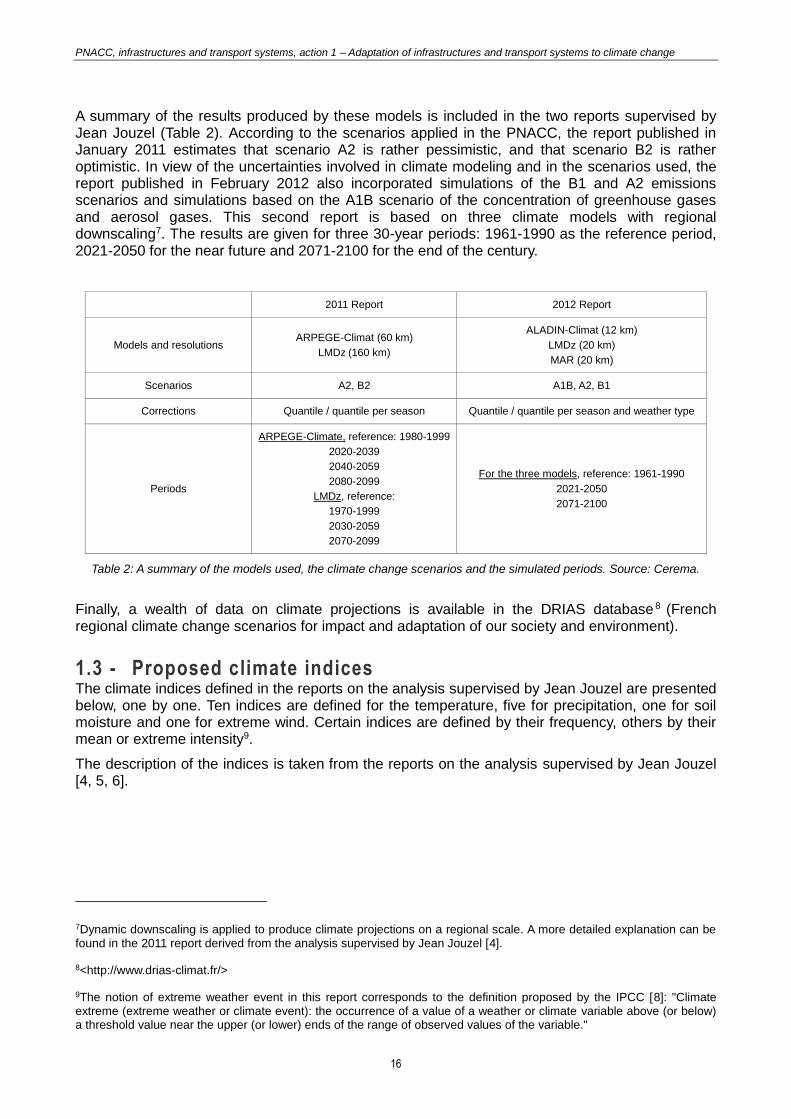
A summary of the results produced by these models is included in the two reports supervised by Jean Jouzel (Table 2). According to the scenarios applied in the PNACC, the report published in January 2011 estimates that scenario A2 is rather pessimistic, and that scenario B2 is rather optimistic. In view of the uncertainties involved in climate modeling and in the scenarios used, the report published in February 2012 also incorporated simulations of the B1 and A2 emissions scenarios and simulations based on the A1B scenario of the concentration of greenhouse gases and aerosol gases. This second report is based on three climate models with regional downscaling7. The results are given for three 30-year periods: 1961-1990 as the reference period, 2021-2050 for the near future and 2071-2100 for the end of the century.
2011 Report 2012 Report
Models and resolutions ARPEGE-Climat (60 km)
LMDz (160 km)
ALADIN-Climat (12 km)
LMDz (20 km)
MAR (20 km)
Scenarios A2, B2 A1B, A2, B1
Corrections Quantile / quantile per season Quantile / quantile per season and weather type
Periods
ARPEGE-Climate, reference: 1980-1999
2020-2039
2040-2059
2080-2099
LMDz, reference:
1970-1999
2030-2059
2070-2099
For the three models, reference: 1961-1990
2021-2050
2071-2100
Table 2: A summary of the models used, the climate change scenarios and the simulated periods. Source: Cerema.
Finally, a wealth of data on climate projections is available in the DRIAS database 8 (French regional climate change scenarios for impact and adaptation of our society and environment).
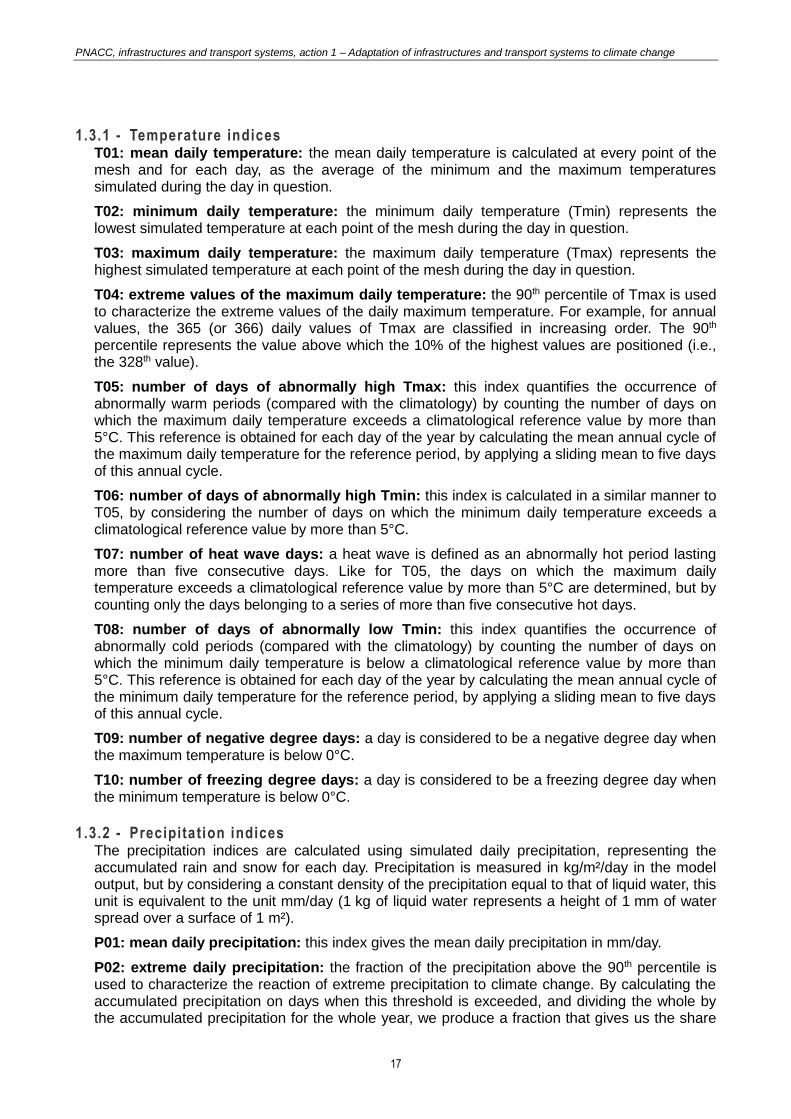
1.3 - Proposed climate indices The climate indices defined in the reports on the analysis supervised by Jean Jouzel are presented below, one by one. Ten indices are defined for the temperature, five for precipitation, one for soil moisture and one for extreme wind. Certain indices are defined by their frequency, others by their mean or extreme intensity9.
The description of the indices is taken from the reports on the analysis supervised by Jean Jouzel [4, 5, 6].
7Dynamic downscaling is applied to produce climate projections on a regional scale. A more detailed explanation can be found in the 2011 report derived from the analysis supervised by Jean Jouzel [4].
8<http://www.drias-climat.fr/>
9The notion of extreme weather event in this report corresponds to the definition proposed by the IPCC [8]: "Climate extreme (extreme weather or climate event): the occurrence of a value of a weather or climate variable above (or below) a threshold value near the upper (or lower) ends of the range of observed values of the variable."
PNACC, infrastructures and transport systems, action 1 – Adaptation of infrastructures and transport systems to climate change
17
1.3.1 - Temperature indices T01: mean daily temperature: the mean daily temperature is calculated at every point of the mesh and for each day, as the average of the minimum and the maximum temperatures simulated during the day in question.
T02: minimum daily temperature: the minimum daily temperature (Tmin) represents the lowest simulated temperature at each point of the mesh during the day in question.
T03: maximum daily temperature: the maximum daily temperature (Tmax) represents the highest simulated temperature at each point of the mesh during the day in question.
T04: extreme values of the maximum daily temperature: the 90th percentile of Tmax is used to characterize the extreme values of the daily maximum temperature. For example, for annual values, the 365 (or 366) daily values of Tmax are classified in increasing order. The 90th percentile represents the value above which the 10% of the highest values are positioned (i.e., the 328th value).
T05: number of days of abnormally high Tmax: this index quantifies the occurrence of abnormally warm periods (compared with the climatology) by counting the number of days on which the maximum daily temperature exceeds a climatological reference value by more than 5°C. This reference is obtained for each day of the year by calculating the mean annual cycle of the maximum daily temperature for the reference period, by applying a sliding mean to five days of this annual cycle.
T06: number of days of abnormally high Tmin: this index is calculated in a similar manner to T05, by considering the number of days on which the minimum daily temperature exceeds a climatological reference value by more than 5°C.
T07: number of heat wave days: a heat wave is defined as an abnormally hot period lasting more than five consecutive days. Like for T05, the days on which the maximum daily temperature exceeds a climatological reference value by more than 5°C are determined, but by counting only the days belonging to a series of more than five consecutive hot days.
T08: number of days of abnormally low Tmin: this index quantifies the occurrence of abnormally cold periods (compared with the climatology) by counting the number of days on which the minimum daily temperature is below a climatological reference value by more than 5°C. This reference is obtained for each day of the year by calculating the mean annual cycle of the minimum daily temperature for the reference period, by applying a sliding mean to five days of this annual cycle.
T09: number of negative degree days: a day is considered to be a negative degree day when the maximum temperature is below 0°C.
T10: number of freezing degree days: a day is considered to be a freezing degree day when the minimum temperature is below 0°C.
1.3.2 - Precipitation indices The precipitation indices are calculated using simulated daily precipitation, representing the accumulated rain and snow for each day. Precipitation is measured in kg/m²/day in the model output, but by considering a constant density of the precipitation equal to that of liquid water, this unit is equivalent to the unit mm/day (1 kg of liquid water represents a height of 1 mm of water spread over a surface of 1 m²).
P01: mean daily precipitation: this index gives the mean daily precipitation in mm/day.
P02: extreme daily precipitation: the fraction of the precipitation above the 90th percentile is used to characterize the reaction of extreme precipitation to climate change. By calculating the accumulated precipitation on days when this threshold is exceeded, and dividing the whole by the accumulated precipitation for the whole year, we produce a fraction that gives us the share

PNACC, infrastructures and transport systems, action 1 – Adaptation of infrastructures and transport systems to climate change
18
of high-precipitation events in the total annual precipitation. This index between 0 and 1 does not have a unit. But it can be multiplied by 100 to express the results as percentages.
P03: number of days of intense precipitation: this index gives the number of days when the daily precipitation exceeds the 20 mm threshold. This threshold is significantly higher than the mean precipitation on rainy days at most of the points of the mesh and is used to isolate intense precipitation events.
P04: periods of severe drought: the definition of a drought is rather complex, because it depends on the domain in question and the adopted point of view. The distinction is made between four main types of drought: meteorological, hydrological, agricultural and socio-economic. A dry event can be considered as a severe drought in one of these domains, but not necessarily in the others (e.g., for farmers, a shortage of precipitation at a given time of year may be harmful, without the ground necessarily being dry enough to constitute a drought from the hydrological perspective). The index calculated here is the maximum number of consecutive dry days and is used to characterize the intensity of droughts from the meteorological perspective. A day is deemed to be dry if the corresponding daily precipitation does not exceed 1 mm.
P05: number of days of snowfall: the most accurate way to determine the number of days of snowfall would consist of analyzing the snow precipitation data in the output produced by the model. However, the SAFRAN (mesoscale atmospheric analysis system for surface variables) atmospheric reanalyses do not provide this parameter, a fact that prevents us from applying the correction method to the reference climate. Another method consists of deducing this parameter from the corrected temperature and precipitation data. In this case, a day is considered to be a day of snowfall when the minimum daily temperature is lower than 0°C and the daily precipitation is not zero. Note that this method tends to overestimate the actual value of the index during the day, because the minus temperatures and the precipitation do not necessarily occur simultaneously.
1.3.3 - Soil moisture index H01: to assess the intensity of droughts from a hydrological perspective, the annual minimum total water content of the soil is given, i.e., contained in the full depth of the soil. This data is not available for the LMDz model, so only the results produced by the ARPEGE-Climat model are shown.
1.3.4 - Wind index V01: annual maximum wind speed values are given to characterize the changes in intensity of the most violent winds. This index is expressed in km/h.
1.4 - Spatial means and calculation of uncertainties The indices in the reports on the analysis supervised by Jean Jouzel are calculated using daily series simulated by ALADIN-Climat, LMDz and MAR. Most of these indices were defined as part of the European STARDEX project (STAtistical and Regional dynamic Downscaling of EXtremes for European regions).
The values of each of these indices are calculated at each point of the mesh (chapter 1.2). Spatial means can then be calculated using these values, either for the whole of France, or by dividing the territory into regions by only taking the points of the mesh in the region of interest into consideration. A value can be calculated for the index for a given year, season, etc. Then, it is possible to calculate the mean of these values for the period of each climate scenario considered. For example, in the 2012 report, in scenario A2, the periods last 30 years: 1961-1990, etc.
PNACC, infrastructures and transport systems, action 1 – Adaptation of infrastructures and transport systems to climate change
19
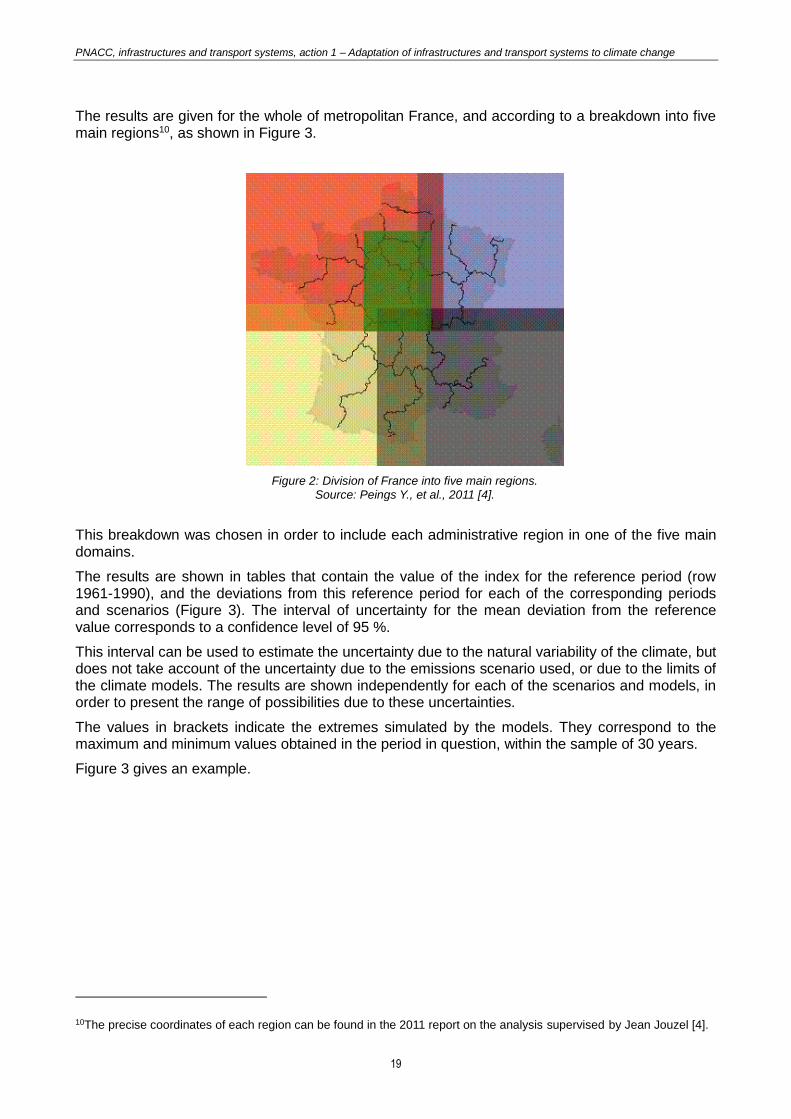
The results are given for the whole of metropolitan France, and according to a breakdown into five main regions10, as shown in Figure 3.
This breakdown was chosen in order to include each administrative region in one of the five main domains.
The results are shown in tables that contain the value of the index for the reference period (row 1961-1990), and the deviations from this reference period for each of the corresponding periods and scenarios (Figure 3). The interval of uncertainty for the mean deviation from the reference value corresponds to a confidence level of 95 %.
This interval can be used to estimate the uncertainty due to the natural variability of the climate, but does not take account of the uncertainty due to the emissions scenario used, or due to the limits of the climate models. The results are shown independently for each of the scenarios and models, in order to present the range of possibilities due to these uncertainties.
The values in brackets indicate the extremes simulated by the models. They correspond to the maximum and minimum values obtained in the period in question, within the sample of 30 years.
Figure 3 gives an example.
10The precise coordinates of each region can be found in the 2011 report on the analysis supervised by Jean Jouzel [4].
Figure 2: Division of France into five main regions. Source: Peings Y., et al., 2011 [4].

PNACC, infrastructures and transport systems, action 1 – Adaptation of infrastructures and transport systems to climate change
20
Figure 3: Table of the indicators and their variation according to the models and scenarios. In this example, the index (the mean daily temperature in this case) is 10.3°C on average in the reference period of ALADIN-Climat and MAR. For
LMDz, the value of the index is 10.2°C. Source: Peings Y., et al., 2012 [5].
In scenario A2, the mean value for the period 2071-2100 is liable to increase by between 3.6 and 4.3 °C (with a confidence level of 95 %) for the ALADIN-Climat model. However, in this period, it is possible that a year may be 2.6 °C warmer than the reference, while the warmest year is 5.0 °C off this same reference.

PNACC, infrastructures and transport systems, action 1 – Adaptation of infrastructures and transport systems to climate change
21
2 - Tendencies produced by the climate simulations All the climate projections presented here are derived from the reports on the analysis supervised
by Jean Jouzel [4, 5, 6], a summary written by the ONERC [14] and the PNACC.
2.1 - Temperatures
2.1.1 - Description In general, mean temperatures will tend to rise throughout the metropolitan territory (Figure 4) and in the overseas territories. According to the most noteworthy results in scenario B2, the mean daily temperature (index T01) in metropolitan France will rise by approximately 2 to 2.5°C between the end of the 20th century and the end of the 21st century. In scenario A2, the increase is approximately 2.5 to 3.5°C. The warming is similar in the two scenarios by 2030 and 2050, at between approximately 0.5 and 1.5°C. However, it is slightly higher for scenario A2 in 2050. The small differences between the scenarios according to these timescales reflects the inertia of the climate system's response to greenhouse gas emissions. It also highlights the importance of the impact of the natural variability of the climate in these timescales, which partly conceals the slow tendency for anthropic warming. After 2050, the gaps between the "optimistic" scenario B2 and the "pessimistic" scenario A2 widen significantly.
2.1.2 - Significant cl imatic tendencies
the mean temperature in the territory tends to rise ;
a significant maximum value of 3.5°C (the "pessimistic" A2 scenario) is taken for the mean temperature increase in one century ;
there are fewer and fewer negative degree days ;
it also appears that the daily thermal amplitudes change.
Figure 4: Index T01. Mean daily temperature as an annual mean for the reference period and deviations of the scenarios from the reference. Unit: °C.
Source: Peings Y., et al., 2011 [4].

PNACC, infrastructures and transport systems, action 1 – Adaptation of infrastructures and transport systems to climate change
22
2.2 - Precipitation
2.2.1 - Description While the evolution of mean daily precipitation (index P01) is relatively uncertain in winter and fall (Figures 7 and 8), the results of the simulations according to the two scenarios show a tendency towards reduced precipitation in spring and summer (Figures 5 and 6). This reduction, which only becomes noticeable at the end of the century in scenario B2, occurs earlier and in a greater amplitude in scenario A2 (about 10% around 2050 and 30% around 2090 for the summer season). Irrespective of the scenario, south-west France is the region most affected by this reduction.
Figure 8: Index P01. Mean daily precipitation in fall. Unit: mm/day. Source: Peings Y., et al., 2011 [4].
Figure 7: Index P01. Mean daily precipitation in winter. Unit: mm/day. Source: Peings Y., et al., 2011 [4].
Figure 5: Index P01. Mean daily precipitation in summer. Unit: mm/day. Source: Peings Y., et al., 2011 [4].
Figure 6: Index P01. Mean daily precipitation in spring. Unit: mm/day. Source: Peings Y., et al., 2011 [4].
PNACC, infrastructures and transport systems, action 1 – Adaptation of infrastructures and transport systems to climate change
23
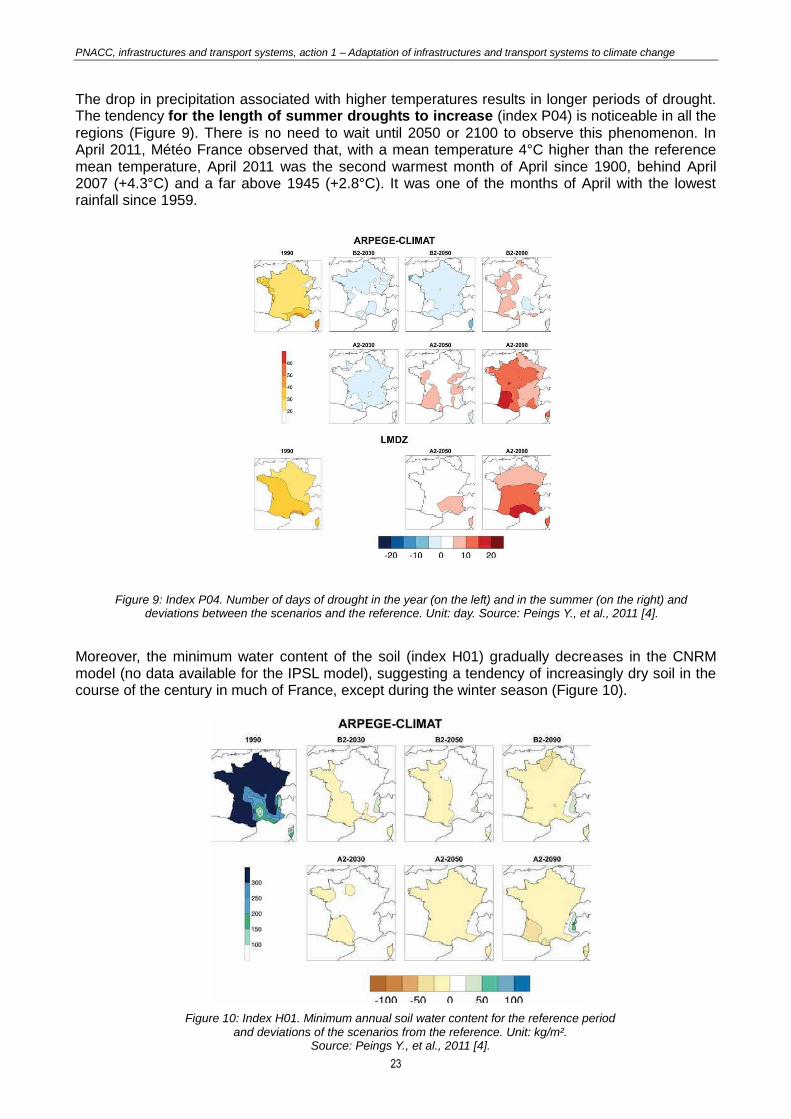
The drop in precipitation associated with higher temperatures results in longer periods of drought. The tendency for the length of summer droughts to increase (index P04) is noticeable in all the regions (Figure 9). There is no need to wait until 2050 or 2100 to observe this phenomenon. In April 2011, Météo France observed that, with a mean temperature 4°C higher than the reference mean temperature, April 2011 was the second warmest month of April since 1900, behind April 2007 (+4.3°C) and a far above 1945 (+2.8°C). It was one of the months of April with the lowest rainfall since 1959.
Moreover, the minimum water content of the soil (index H01) gradually decreases in the CNRM model (no data available for the IPSL model), suggesting a tendency of increasingly dry soil in the course of the century in much of France, except during the winter season (Figure 10).
Figure 10: Index H01. Minimum annual soil water content for the reference period and deviations of the scenarios from the reference. Unit: kg/m².
Source: Peings Y., et al., 2011 [4].
Figure 9: Index P04. Number of days of drought in the year (on the left) and in the summer (on the right) and deviations between the scenarios and the reference. Unit: day. Source: Peings Y., et al., 2011 [4].
PNACC, infrastructures and transport systems, action 1 – Adaptation of infrastructures and transport systems to climate change
24
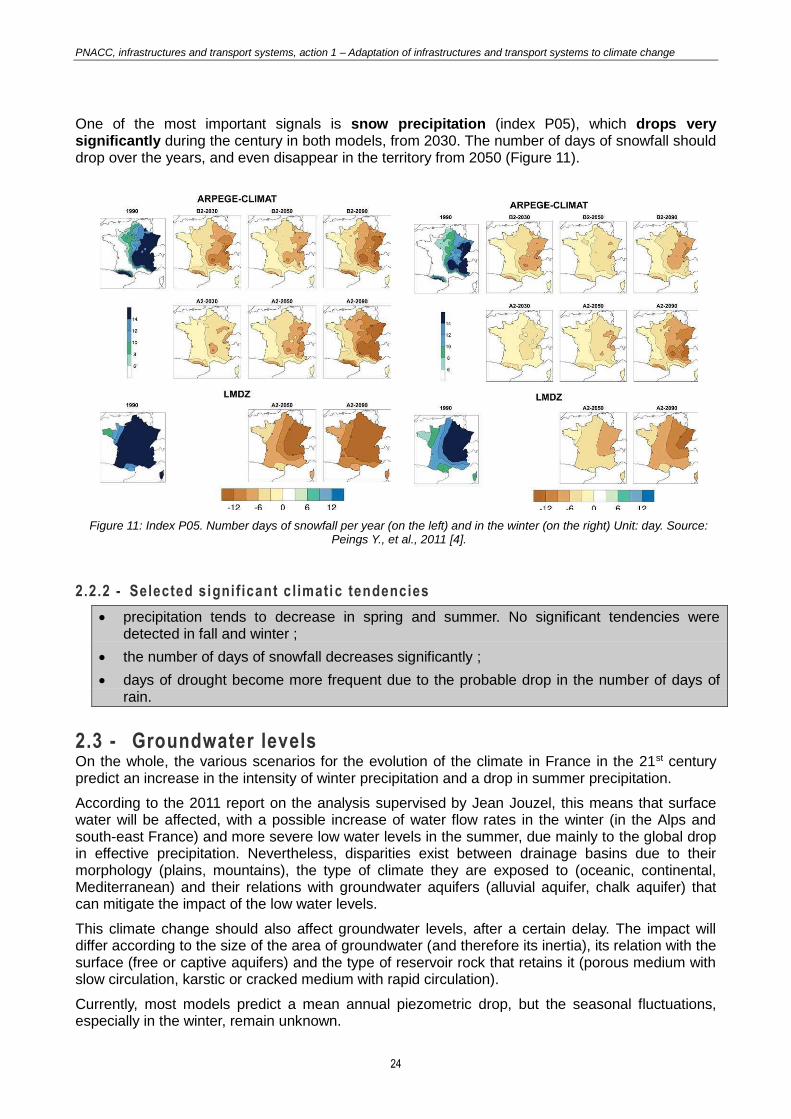
One of the most important signals is snow precipitation (index P05), which drops very significantly during the century in both models, from 2030. The number of days of snowfall should drop over the years, and even disappear in the territory from 2050 (Figure 11).
2.2.2 - Selected significant c l imatic tendencies
precipitation tends to decrease in spring and summer. No significant tendencies were detected in fall and winter ;
the number of days of snowfall decreases significantly ;
days of drought become more frequent due to the probable drop in the number of days of rain.
2.3 - Groundwater levels On the whole, the various scenarios for the evolution of the climate in France in the 21st century predict an increase in the intensity of winter precipitation and a drop in summer precipitation.
According to the 2011 report on the analysis supervised by Jean Jouzel, this means that surface water will be affected, with a possible increase of water flow rates in the winter (in the Alps and south-east France) and more severe low water levels in the summer, due mainly to the global drop in effective precipitation. Nevertheless, disparities exist between drainage basins due to their morphology (plains, mountains), the type of climate they are exposed to (oceanic, continental, Mediterranean) and their relations with groundwater aquifers (alluvial aquifer, chalk aquifer) that can mitigate the impact of the low water levels.
This climate change should also affect groundwater levels, after a certain delay. The impact will differ according to the size of the area of groundwater (and therefore its inertia), its relation with the surface (free or captive aquifers) and the type of reservoir rock that retains it (porous medium with slow circulation, karstic or cracked medium with rapid circulation).
Currently, most models predict a mean annual piezometric drop, but the seasonal fluctuations, especially in the winter, remain unknown.
Figure 11: Index P05. Number days of snowfall per year (on the left) and in the winter (on the right) Unit: day. Source: Peings Y., et al., 2011 [4].

PNACC, infrastructures and transport systems, action 1 – Adaptation of infrastructures and transport systems to climate change
25
On an annual scale, the deficit due to the reduced replenishment at the times of the summer low water levels could be more or less offset by the rise in winter precipitation. Consequently, the main result will be an increase in the scale of seasonal water table fluctuations.
Therefore, the expected impact of climate change on groundwater levels should have both quantitative and qualitative aspects:
in quantitative terms, the natural causes (climate change) will be worsened by certain anthropic behaviors (increase in the volumes taken from the water table) ;
in terms of quality, the water could become more aggressive11, having a harder impact on reservoir rock that is sensitive to dissolution phenomena, such as carbonate terrain (calcareous, chalk) or evaporite terrain (gypsum, salt).
2.3.1 - Selected significant c l imatic tendencies
• Flow volumes of surface water should increase in winter, with more severe low water levels in summer. These tendencies are liable to vary between drainage basins.
• The mean annual piezometric level of groundwater should tend to drop, but little is known about seasonal fluctuations. These variations should be disparate.
2.4 - Wind
2.4.1 - Description The studies and modeling of wind and climate change are very uncertain, and little data exists on the subject. While climate modeling has improved vastly, it remains difficult to precisely forecast the location, intensity and frequency of these phenomena (Figure 12).
There are however some results available, thanks to the modeling done as part of IMFREX, which uses the ARPEGE and LMDz models. A slight increase in the speed of the strongest winds (index V01) is forecast in the northern part of the country, with a slight drop in the south of France.
11The aggressiveness of the water characterizes is aptitude to corrode the materials it comes into contact with, and to dissolve chalk.
Figure 12: Index V01. Maximum annual wind speed for the reference period and deviations of the scenarios from the reference. Unit: km/h. Source: Peings Y., et al., 2011 [4].

PNACC, infrastructures and transport systems, action 1 – Adaptation of infrastructures and transport systems to climate change
26
2.4.2 - Selected significant c l imatic tendencies
• The modeling of changes in the wind systems remains very uncertain.
2.5 - Sea level (marine flooding) and change to the swell climate
2.5.1 - Sea level
De s c r i p t i o n Marine flooding occurs when a coastal zone is covered by the sea. It can occur further to major climate events, such as violent wind, strong swell or storms. These events are temporary and rapid. Permanent marine flooding is also expected, as the sea level rises due to climate change. This is a slow and inexorable phenomenon. It is described in detail below.
The total volume of the oceans can vary due to the melting of continental glaciers, in Greenland and the Antarctic in particular. The volume of the oceans is also a function of their temperature, which is in turn determined by the mean temperature of the atmosphere. As the climate becomes warmer, thermal expansion causes the level of the oceans to rise. This thermal expansion should be the main reason why the mean sea level will rise.
The oceans warm up very slowly and an increase in the mean temperature of the atmosphere results in the expansion of the oceans a few decades later. The thermal inertia of the oceans is much greater than that of the air. The system takes centuries to stabilize. Sea level has been rising since the end of the Little Ice Age in the 18th century. The warming observed in the 20th century will affect the sea level in the 21st century.
The mean observed rise conceals significant local diversity. Local phenomena can be equally important as the mean rise, making it greater or smaller. Climate change can affect the dominant currents and winds that form the relief of oceans of an amplitude greater than the meter. Changes in the system that are unrelated to the rise in the mean level of the oceans are difficult to predict (the disappearance of the Gulf Stream is often evoked) and will be of an amplitude greater than the mean rise. Furthermore, this rise is of the same order as certain local movements of the earth's crust. Therefore, it is preferable to use local studies and to avoid evoking the phenomenon in general terms.
Da t a According to the IPCC's fourth assessment report, the mean level of the sea could rise by a height of between 23 and 51 cm between the end of the 20th century and the end of the 21st century in scenario A2, and between 20 and 43 cm in scenario B2. But these projections are subject to numerous uncertainties, including the uncertainty related to the possible acceleration in the melting of the polar ice caps. The assessments in the fifth IPCC report are significantly higher than those in the fourth report, in which the highest forecast was 0.59 m. The latest report predicts a mean global rise of 0.45 to 0.82 m by 2100 in comparison with the reference period of 1986-2005 in scenario RCP 8.5 (the most pessimistic scenario).
The regional distribution of changes in sea level is very difficult to estimate, because it depends on numerous local parameters. The changes forecast in France are uncertain, especially for the Mediterranean, for which the IPCC did not give a value. The rise in the level of the Mediterranean is difficult to estimate using global models, because they do not take account of the exchange of water between the Mediterranean and the Atlantic in the Straits of Gibraltar.
Several projects using high-resolution models should shed new light on the question in the near future, even if the uncertainties of these evaluations will only be correctly estimated in several years' time.
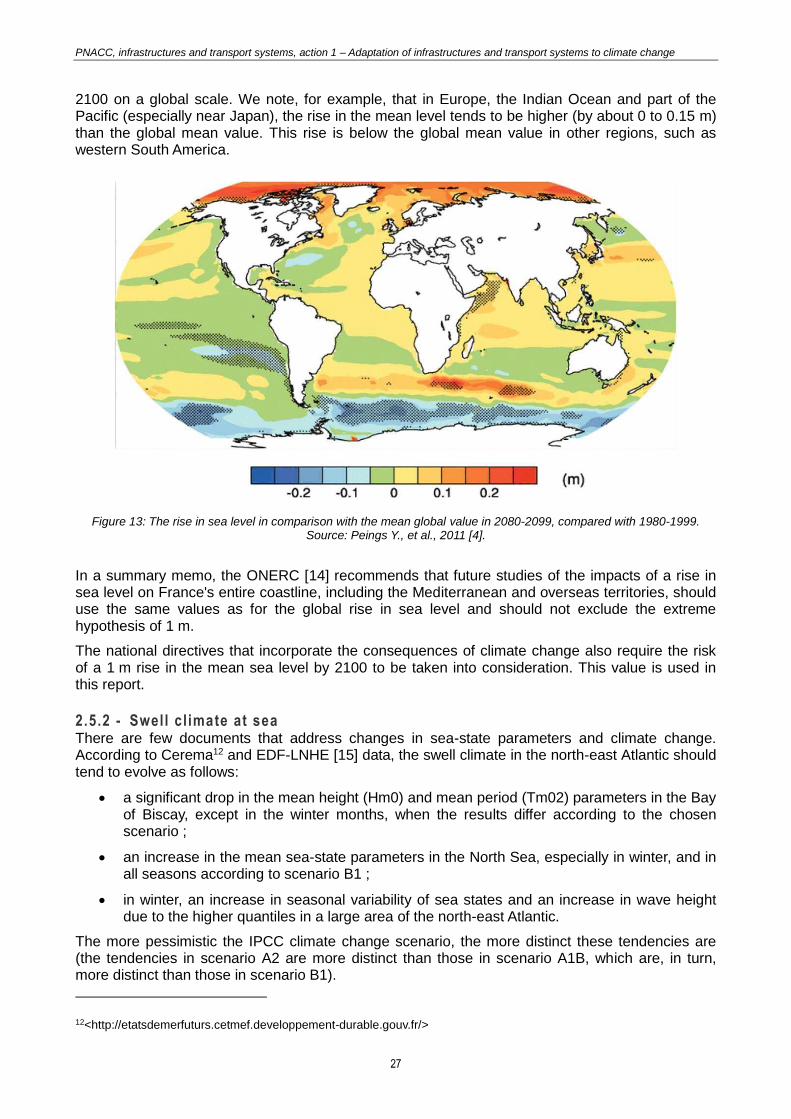
The IPCC report contains a map (Figure 13) showing the distribution of the rise in sea level that takes the influence of density and oceanic circulation into consideration. This map shows the deviation (in meters) of the changes in mean regional levels from the mean values announced for
PNACC, infrastructures and transport systems, action 1 – Adaptation of infrastructures and transport systems to climate change
27
2100 on a global scale. We note, for example, that in Europe, the Indian Ocean and part of the Pacific (especially near Japan), the rise in the mean level tends to be higher (by about 0 to 0.15 m) than the global mean value. This rise is below the global mean value in other regions, such as western South America.
In a summary memo, the ONERC [14] recommends that future studies of the impacts of a rise in sea level on France's entire coastline, including the Mediterranean and overseas territories, should use the same values as for the global rise in sea level and should not exclude the extreme hypothesis of 1 m.
The national directives that incorporate the consequences of climate change also require the risk of a 1 m rise in the mean sea level by 2100 to be taken into consideration. This value is used in this report.
2.5.2 - Swell cl imate at sea There are few documents that address changes in sea-state parameters and climate change. According to Cerema12 and EDF-LNHE [15] data, the swell climate in the north-east Atlantic should tend to evolve as follows:
a significant drop in the mean height (Hm0) and mean period (Tm02) parameters in the Bay of Biscay, except in the winter months, when the results differ according to the chosen scenario ;
an increase in the mean sea-state parameters in the North Sea, especially in winter, and in all seasons according to scenario B1 ;
in winter, an increase in seasonal variability of sea states and an increase in wave height due to the higher quantiles in a large area of the north-east Atlantic.
The more pessimistic the IPCC climate change scenario, the more distinct these tendencies are (the tendencies in scenario A2 are more distinct than those in scenario A1B, which are, in turn, more distinct than those in scenario B1).
12<http://etatsdemerfuturs.cetmef.developpement-durable.gouv.fr/>
Figure 13: The rise in sea level in comparison with the mean global value in 2080-2099, compared with 1980-1999. Source: Peings Y., et al., 2011 [4].

PNACC, infrastructures and transport systems, action 1 – Adaptation of infrastructures and transport systems to climate change
28
This analysis applies to the swell climate at sea. The rise in sea level will reduce the efficiency of the bathymetric filter and, therefore, increase the level of swell on the coast with the same swell climate at sea.
2.5.3 - Selected significant c l imatic tendencies
• Sea level forecasts are uncertain, especially locally, but, on the whole, they predict a rise in the water level.
• In accordance with the recommendations of the ONERC, the hypothesis of a 1 m rise in the sea level by 2100 is applied in this report.
• There is very little documentation about changes in swell climate.
2.6 - Extreme weather events
2.6.1 - Description The IPCC defines an extreme weather event as a rare event according to the statistics of its frequency in a given place [8]. While the definitions of "rare" vary considerably, an extreme weather event should be as rare, if not rarer, than the tenth or the ninetieth percentiles. By definition, the characteristics of "extreme weather conditions" vary from one place to another.
Due to its geographical position and its overseas territories, France is exposed to numerous weather events:
weather events related to temperature: cold waves, heat waves, fog, forest fires ;
extreme weather events related to precipitation: snow storms, heavy rain, violent squalls, flooding, tidal waves ;
extreme weather events related to wind: cyclones, hurricanes, storms, tornadoes, tidal waves.
According to the IPCC [7], the variability of extreme phenomena, such as droughts, tropical cyclones, extreme temperatures or the frequency and intensity of precipitation, is more difficult to analyze and monitor than climatic means, because it demands long chronological series of data with a high spatial and temporal resolution.
This document considers that all the extreme events liable to recur or increase in frequency are known, apart from events related to low temperatures (snow, fog), which tend to decrease according to the different models.
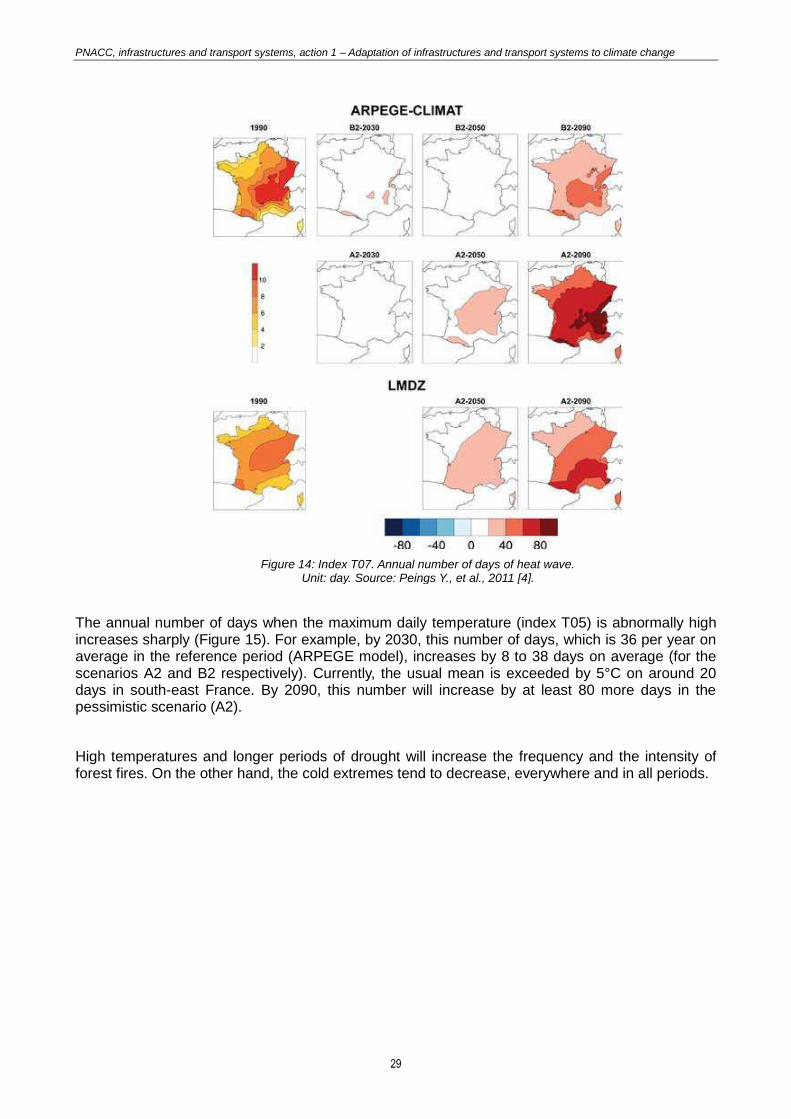
For the indices related to hot extremes, the results of the simulations according to the two scenarios show a tendency for the frequency and the intensity of these extremes to increase. An annual number of heat wave days (index T07) of between 30 and more than 80, depending on the location and the optimistic or pessimistic scenario, is taken, which is an average of 10 times more than at the start of the century (Figure 14).
PNACC, infrastructures and transport systems, action 1 – Adaptation of infrastructures and transport systems to climate change
29
The annual number of days when the maximum daily temperature (index T05) is abnormally high increases sharply (Figure 15). For example, by 2030, this number of days, which is 36 per year on average in the reference period (ARPEGE model), increases by 8 to 38 days on average (for the scenarios A2 and B2 respectively). Currently, the usual mean is exceeded by 5°C on around 20 days in south-east France. By 2090, this number will increase by at least 80 more days in the pessimistic scenario (A2).
High temperatures and longer periods of drought will increase the frequency and the intensity of forest fires. On the other hand, the cold extremes tend to decrease, everywhere and in all periods.
Figure 14: Index T07. Annual number of days of heat wave. Unit: day. Source: Peings Y., et al., 2011 [4].

PNACC, infrastructures and transport systems, action 1 – Adaptation of infrastructures and transport systems to climate change
30
As mentioned in paragraph 22, precipitation will be less frequent but more intense (Figures 16 and 17).
Figure 15: Index T05. The number of days in the year when the Tmax is 5°C higher than the reference for the reference period and the deviations between the scenarios and the reference. Unit: day.
Source: Peings Y., et al., 2011 [4].
Figure 16: Index P02. Percentage of precipitation above the 90th annual percentile for the reference period and deviations between the scenarios and the reference. Source: Peings Y., et al., 2011 [4].

PNACC, infrastructures and transport systems, action 1 – Adaptation of infrastructures and transport systems to climate change
31
Regarding extreme wind, in metropolitan France, a slight tendency to decrease is observed in the south of the country, while the direction of the changes in the north is undetermined (chapter 2.4).
2.6.2 - Selected significant c l imat ic tendencies
• Hot extremes tend to increase in frequency and intensity.
• Extremes related to precipitation tend to decrease in frequency, but increase in intensity.
• The modeling of extremes related to events such as storms, hurricanes, etc., are still very uncertain.
2.7 - Biodiversity This change was taken as a climatic factor, because it indirectly impacts certain domains, and aviation safety in particular.
2.7.1 - Description This section concentrates on the danger of birds, which is an essential issue for aviation safety.
Over the last 30 years, birds in Europe have changed their areas of distribution and their reproductive and migratory calendars, most likely in response to climate change. The most specialized species of birds are disappearing, to the benefit of more opportunistic species, in a trend that contributes to the erosion of biodiversity on a nationwide scale.
Figure 17: Index P03. Number of days with more than 20 mm of precipitation for the reference period and deviations between the scenarios and the reference. Unit: day. Source: Peings Y., et al., 2011 [4].

PNACC, infrastructures and transport systems, action 1 – Adaptation of infrastructures and transport systems to climate change
32
Birds are very special targets of the impact of climate change for several reasons:
they are warm-blooded animals that remain active all year round ;
numerous species of birds change their habitat twice a year, covering several zones of climate and vegetation ;
they have separate phases (reproduction, molting, fall migration, overwintering, spring migration) in their annual cycle and must adapt to variable changes in the climate and their habitat.
2.7.2 - Data Numerous studies have shown that certain changes in the lifestyles of birds have occurred in response to climate change. The clearest evidence is their spring migration, even if the quality of the data and the approaches adopted are very inconsistent [16].
A recent continent-wide analysis on the basis of a database of birds in Europe [17, 18], for the period from 1970 to 2000, highlighted a decline in migratory birds [19]. During this 30-year period, 40 % of afro-palearctic migrant birds (long-distance migrants that nest in Europe and spend the winter in sub-Saharan Africa) showed significant negative tendencies. Long-distance migratory birds seem to be more affected by these declines in population than non-migratory birds (residents and short-distance migrants) nesting in the same habitats in Europe. The studies suggest that they are less capable of adapting to climate change than non-migratory birds due to the reduced size of their brain and their limited problem-solving abilities [20, 21].
Since the 1970s-1980s, migratory bird fauna in Europe and North America has been tending to remain in its breeding territory for longer. The advance of the spring migration is more distinct amongst short-distance migrants. Delayed migration in the fall has also been occasionally observed, probably as the result of the longer period of vegetation. The ringing of migrants in Germany in fall showed that 19 out of 28 species delayed their migration by 5 to 6 days between 1970 and 1990.
Species such as the cuckoo or the nightingale spend the winter in sub-Saharan Africa, where the chronic droughts are having a severe impact on them. By way of example, the dramatic drought in the Sahel in 1968, when annual accumulated precipitation was 70% below the normal level, brought about the death of two thirds of English common whitethroats between 1968 and 1969. If mortality due to migration exceeds that of wintering at breeding grounds, selection will encourage species to become sedentary. Experiments on the blackcap have shown that in 25 generations, or about 40 years, a totally migratory population can become totally sedentary. This certainly explains why several songbirds, such as the blackbird, the robin and the blue tit, which used to migrate, became partially sedentary in central Europe in the course of the 20th century.
The PNACC includes four specific actions that address biodiversity, in order to collect the necessary data and to strengthen the existing monitoring tools so that the effects of climate change on biodiversity can be taken into consideration. Currently, little precise data exists on these changes, but certain studies have confirmed the modifications that are occurring as a result of climate change.
Only the following precise observations can be attributed to climate change:
the early migration of swallows that gather in their hundreds on runways (Montpellier, La Rochelle) ;
an increase in the populations of birds dependent on relatively arid ecosystems (bustards, curlews) ;
high densities of voles ;
low winter mortality of herons, resulting in incidents with these species (gray herons and cattle egrets) ;

PNACC, infrastructures and transport systems, action 1 – Adaptation of infrastructures and transport systems to climate change
33
less noteworthy overwintering of certain partial migrants, such as lapwings, which migrate south in fewer numbers than previously ;
observations of Mediterranean species, such as the grebe and the bee-eater, further north than in the past.
2.7.3 - Selected significant c l imatic tendencies
Changes in the climate can cause bird fauna to change its areas of distribution and breeding and migration dates.
2.8 - Distinctive features of French overseas territories
2.8.1 - Description The French overseas possessions include numerous territories and islands that are remote from metropolitan France. They form a set of atypical territories in comparison with metropolitan France due to their distant geographical location, the distinctive features of their climate, their topography, their volcanic activity, their dispersion and their isolation. The French overseas territories already benefit from a culture of adapting to climatic issues, because they are, on the whole, more exposed than the metropolitan territories.
The French overseas territories represent zones that are too small for global models to simulate climate change in detail. However, one configuration of ARPEGE-Climat was used to conduct high-resolution simulations on the entire globe with a 50 × 50 km² mesh. Two simulations were made in the analysis supervised by Jean Jouzel [4]: one for the reference period from 1961 to 1990, and another for the period from 2041 to 2070 (scenario A2).
2.8.2 - Data
Te m p e ra t u r es an d p rec i p i ta t i on These simulations show that, like on the rest of the planet, the temperature rises are more pronounced on the continents (or on large islands, like Madagascar) than on the oceans. Warming in the overseas territories is expected to be significant, with considerable variations between the geographical zones. The IPCC's fifth assessment report confirms that the most pessimistic temperature values could rise on average by between 2.6 and 4.8°C worldwide (in the most pessimistic scenario: RCP 8.5).
A specific study was conducted for Réunion Island using the results of these simulations [4]. In the vicinity of Réunion, the model forecasts an increase of between 1.4 and 3.0°C by the end of the century, depending on the scenario and the season. The temperature will rise more in the hottest months of the year. On the other hand, the temperature will rise only moderately in June, July and August, which are the coolest months.
The fifth IPCC assessment report forecasts a significant rise in precipitation in the high latitudes, with values in excess of 10 % in the Arctic and the Antarctic. The values fluctuate from one subtropical zone to another and are less significant (Table 3).

PNACC, infrastructures and transport systems, action 1 – Adaptation of infrastructures and transport systems to climate change
34
Region Mean temperature
in °C
Precipitation
as %
Caribbean +2°C (+1.8 to +2.4°C) -12% (-19 to -3%)
Guiana +3.3°C (+2.6 to +3.7°C) +0 % (-3 to +6 %)
Indian Ocean
+2.1 °C (+1.9 to +2.4 °C) +4 % (+3 to +5 %)
South Pacific
+1.8 °C (+1.7 to +2 °C) +3 % (+3 to +6 %)
New Caledonia
+1.9 °C (+1.8 to +2.1 °C) -6.5 % (-5 to -8 %)
Table 3: Climate projections for 2099 of temperature and precipitation in European overseas territories. Scenario A1B – IPCC 2007. The ranges of uncertainty (25/75% quartiles) are given in brackets. Source: UICN, 2008 [22].
More locally, the simulations referred to in the "Description" section were made for the indices related to precipitation on Réunion Island. Most of the climate indices indicate drier conditions in the period 2041-2070. It also seems that the proportion of extreme precipitation in the annual total will be greater in the future climate.
There are no similar analyses for the other overseas territories. Nevertheless, the EXPLORE 207013 project provides data on the projections of watercourse flows and the temperature of surface water for the Antilles, Réunion Island and Guiana.
Cy c l o ne s a n d s t o r ms The climate projections of tropical storms and cyclones remain uncertain. However, several studies forecast an increase in their intensity due to climate change, and a reduction of their frequency. These tendencies must be considered with caution, but they lead us to refrain from underestimating the phenomenon.
In particular, the IPCC forecasts that cyclones will intensify in all the tropical regions, with stronger maximum winds and heavier point precipitation. This intensification is due to the rise in tropical sea temperatures.
S e a le v e l The rise in the sea level in the overseas territories predicted by the IPCC corresponds to the projected rises in most of them, but with variations from one region to another (chapter 2.5).
S w e l l c l i m at e Cerema has ordered a study [15] by the EDF LNHE to determine the future swell climates in the Réunion and Antilles zones. This study will identify the likely changes in the various swell climates (in particular cyclonic) with climate change.
Bi o d i ve r s i ty The rise in sea temperatures and ocean acidification will seriously impact the health and survival of coral reefs. Recent studies on the impact of climate change on the state of health of coral reefs are very pessimistic:
the rise in the temperature of sea water will favor the increase in coral bleaching, which can result in the death of the coral ;
the expected rise in ocean acidification will seriously impede the growth of coral ;
13<http://www.developpement-durable.gouv.fr/Evaluation-des-strategies-d.html>
PNACC, infrastructures and transport systems, action 1 – Adaptation of infrastructures and transport systems to climate change
35
the intensification of cyclones will increase their mechanical destructive effect on the most fragile coral formations.
Coral formations protect the coastline from erosion. A single coral reef can absorb up to 90% of the force of a wave. Consequently, these parameters will have a significant indirect effect on airport or highway infrastructures located on or near the coral platforms.
Moreover, mangroves are also damaged by the mechanical effects of strong cyclonic swells and the chemical effects of hyper-salinity (strong onshore winds carrying salt and the rise in sea level). The deterioration of mangroves could significantly reduce their protective effect on the coastline and the coastal infrastructures located upstream.

PNACC, infrastructures and transport systems, action 1 – Adaptation of infrastructures and transport systems to climate change
36
3 - Summary of the climate tendencies The climate change tendencies were calculated by the work group for the PNACC for the indices defined in the analysis supervised by Jean Jouzel [4, 5]. They are shown in the tables below in the column entitled "average intensity of change" for a given reference period. They were then associated with levels of confidence. The methodology used to calculate the tendencies and to define the levels of confidence can be found in Annex 2.
Tables 4, 5 and 6 summarize the data for the temperature, precipitation and wind indicators, and changes in them.

PNACC, infrastructures and transport systems, action 1 – Adaptation of infrastructures and transport systems to climate change
37
Temperature indices
Average intensity
of the change
for the period 2021 / 2050
(all models and scenarios considered)
Level of confidence in the tendency of the change
for the period 2021 / 2050 on a scale of 4
Average intensity of the change
for the period 2071 / 2100
(all models and scenarios considered)
Level of confidence in the tendency of the change for the
period 2071 / 2100 on a scale of 4
T01 Daily Taverage will rise between 1.4 and 1.9°C 4 will rise between 2.8 and 3.4°C 4
T02 Daily Tmin will rise between 1.2 and 1.7°C 4 will rise between 2.5 and 3.0°C 4
T03 Daily Tmax will rise between 1.4 and 2.2°C 4 will rise between 3.1 and 3.8°C 4
T04 Extreme values of the daily Tmax will rise between 1.7 and 3.0°C 4 will rise between 4.1 and 5.5°C 4
Balance: T01 – T02 – T03 – T04
Tendency to rise
(between 1.2 and 3.0 °C
indices T01 to T04 combined)
High confidence
Tendency to rise
(between 2.5 and 5.5°C
indices T01 to T04 combined)
High confidence
T05 Number of days (d) with abnormally high Tmax
will rise between 35 and 51 d 4 will rise between 84 and 101 d 4
T06 Number of days (d) with abnormally high Tmin
will rise between 26 and 35 d 4 will rise between 67 and 81 d 4
T07 Number of days (d) of heat wave will rise between 14 and 24 d 4 will rise between 48 and 63 d 4
Balance: T05 – T06 – T07
Tendency to rise
(by 14 to 51 d
indices T05 to T07 combined)
High confidence
Tendency to rise
(by 48 to 101 d
indices T05 to T07 combined)
High confidence
T08 Number of days (d) with abnormally low Tmin
will drop between 8 and 16 d 4 will drop between 13 and 20 d 4
T09 Number of days (d) at Tmax < 0 will drop between 3 and 9 d 4 will drop between 6 and 11 d 4
T10 Number of freezing degree days (d) (Tmin < 0)
will drop between 12 and 23 d 4 will drop between 23 and 33 d 4
Balance
Tendency to drop
(between 3 and 23 d
indices T08 to T10 combined)
High confidence
Tendency to drop
(between 6 and 33 d
indices T08 to T10 combined)
High confidence
Table 4: A presentation of the temperature indicator and its tendencies (analysis of the climatic indices presented in the reports of the analysis supervised by Jean Jouzel [5]). The scale varies from 1 to 4, where 4 is the maximum. Source: Cerema.
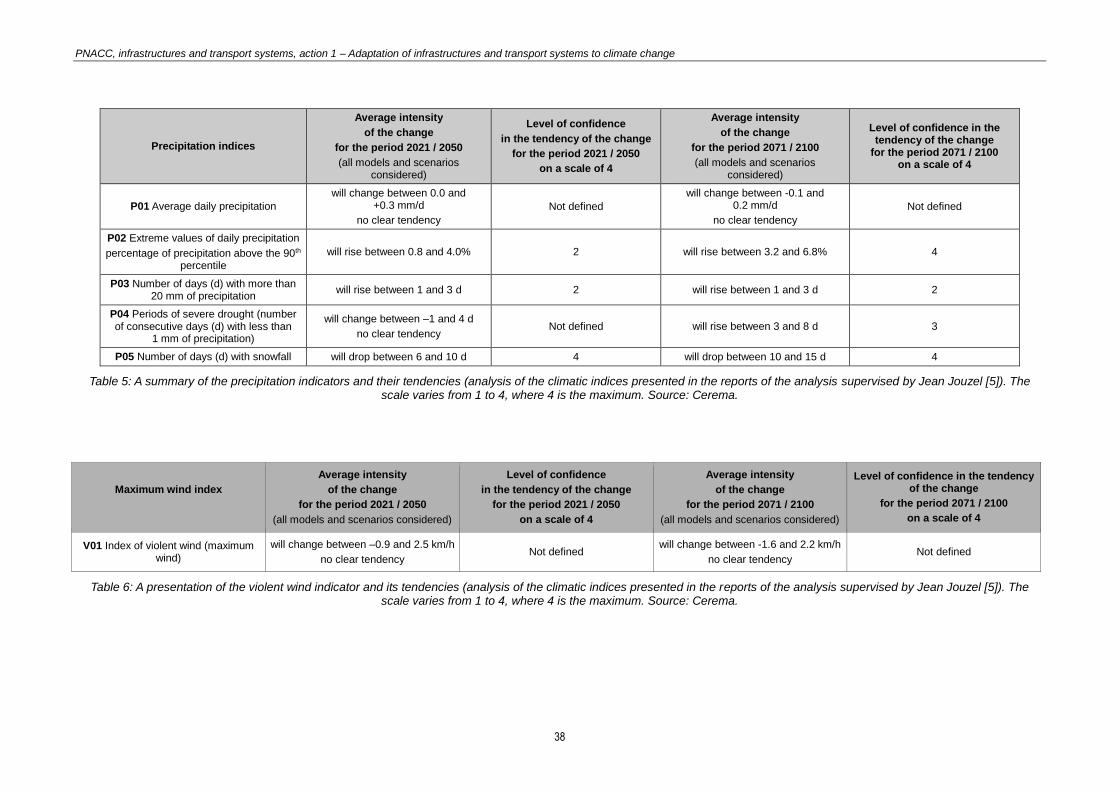
PNACC, infrastructures and transport systems, action 1 – Adaptation of infrastructures and transport systems to climate change
38
Precipitation indices
Average intensity
of the change
for the period 2021 / 2050
(all models and scenarios considered)
Level of confidence
in the tendency of the change
for the period 2021 / 2050
on a scale of 4
Average intensity
of the change
for the period 2071 / 2100
(all models and scenarios considered)
Level of confidence in the tendency of the change
for the period 2071 / 2100 on a scale of 4
P01 Average daily precipitation
will change between 0.0 and +0.3 mm/d
no clear tendency
Not defined
will change between -0.1 and 0.2 mm/d
no clear tendency
Not defined
P02 Extreme values of daily precipitation
percentage of precipitation above the 90th percentile
will rise between 0.8 and 4.0% 2 will rise between 3.2 and 6.8% 4
P03 Number of days (d) with more than 20 mm of precipitation
will rise between 1 and 3 d 2 will rise between 1 and 3 d 2
P04 Periods of severe drought (number of consecutive days (d) with less than
1 mm of precipitation)
will change between –1 and 4 d
no clear tendency Not defined will rise between 3 and 8 d 3
P05 Number of days (d) with snowfall will drop between 6 and 10 d 4 will drop between 10 and 15 d 4
Table 5: A summary of the precipitation indicators and their tendencies (analysis of the climatic indices presented in the reports of the analysis supervised by Jean Jouzel [5]). The scale varies from 1 to 4, where 4 is the maximum. Source: Cerema.
Maximum wind index
Average intensity
of the change
for the period 2021 / 2050
(all models and scenarios considered)
Level of confidence
in the tendency of the change
for the period 2021 / 2050
on a scale of 4
Average intensity
of the change
for the period 2071 / 2100
(all models and scenarios considered)
Level of confidence in the tendency of the change
for the period 2071 / 2100
on a scale of 4
V01 Index of violent wind (maximum wind)
will change between –0.9 and 2.5 km/h
no clear tendency Not defined
will change between -1.6 and 2.2 km/h
no clear tendency Not defined
Table 6: A presentation of the violent wind indicator and its tendencies (analysis of the climatic indices presented in the reports of the analysis supervised by Jean Jouzel [5]). The scale varies from 1 to 4, where 4 is the maximum. Source: Cerema.
PNACC, infrastructures and transport systems, action 1 – Adaptation of infrastructures and transport systems to climate change
39
The soil moisture index is included in the 2011 report on the analysis supervised by Jean Jouzel for three different periods, according to the results of scenarios A2 and B2 for the ARPEGE-Climat model. The tendencies are as follows:
2020-2039: will change by between −9 and +13 kg/m² (level of confidence: not defined) ;
2040-2059: will change by between -13.5 and +7 kg/m² (level of confidence: not defined) ;
2080-2099: will decrease by between 0.5 and 23.5 kg/m² (level of confidence: 2 on a scale of 4).
The report on the analysis supervised by Jean Jouzel does not provide any indices for changes in the swell climate and sea level, but it does contain quantified tendencies (mean values) for the second parameter. The sea level will tend to rise, but significant uncertainties remain, especially with regard to regional aspects. In view of the uncertainties related to the projections and the lack of precision of the cartographic resources, the IPCC report does not distinguish the hypotheses according to the scenarios. Consequently, the following hypotheses apply for 2100:
optimistic hypothesis: 0.40 m ;
pessimistic hypothesis: 0.60 m ;
extreme hypothesis: 1 m.
Regarding swell climate, there are few documents that address changes in sea-state parameters. According to work conducted by Cerema and EDF-LNHE [15], wave height in the Bay of Biscay should decrease (except in winter), and increase in the North Sea. These tendencies and their seasonality are highly dependent on the climate change scenarios. For the time being, no information is available for the Mediterranean and overseas territories. A Cerema study is underway to assess the future swell climates in the Réunion and Antilles zones.
PNACC, infrastructures and transport systems, action 1 – Adaptation of infrastructures and transport systems to climate change
40
Chapter Potential impacts of expected climate change on transport
infrastructures

PNACC, infrastructures and transport systems, action 1 – Adaptation of infrastructures and transport systems to climate change
41
In the course of the study, the work group raised a number of questions about the potential impacts of climate change on existing infrastructures.
This chapter looks at the future of the infrastructures faced with climate change tendencies and goes beyond considerations limited to major changes in the climate. The point was emphasized that the climate must be taken into consideration right from the design phase of the constructions. For example, the topography, the wind rose and exposure to the sun must be taken into consideration when positioning a road, in order to avoid zones where winter conditions could cause problems. Consequently, the idea that "being well adapted to climate change means already being well adapted to current climate variability" becomes more meaningful.
The various impacts of the climate and of climate change are presented as follows: for each climatic parameter – temperature, rainfall, wind, sea level, swell climate and biodiversity – the impacts are described for the following infrastructures and systems: highway infrastructures, earthworks, highway constructions, rail infrastructures, including guided transport systems (subways and secondary and tourist railroads), river, port, maritime and airport infrastructures and cable transport systems. For the rail network, we focused on the national and secondary networks, apart from the exceptions mentioned in the corresponding paragraphs. The potential impacts of the tendencies of the climatic mean values and extremes are grouped together, because it is sometimes difficult to make a distinction between them from the perspective of their values and their impacts on the infrastructures. The impacts expected in metropolitan France and overseas territories are also grouped together, and when these potential impacts are different, specific local characteristics are specified.

PNACC, infrastructures and transport systems, action 1 – Adaptation of infrastructures and transport systems to climate change
42
4 - Impacts of changes in temperature
4.1 - Highway infrastructures Highway infrastructures include road foundations and highway equipment (safety equipment, sanitation facilities).
4.1.1 - Coastal The French approach to the design of roads takes account of the temperatures to which the asphalt is exposed through the notion of equivalent temperature. An increase in the mean temperature will affect the equivalent temperature and, therefore, the design of asphalt road surfaces. The length and intensity of freezing periods are expected to decrease. In this case, the design for current periods of frost would be oversized, especially with regard to the reference index, which is the highest ever since 1951.
An increase in maximum temperatures can also impact the pavements, and in particular the surface layers, which may be deformed. Phenomena of wheel tracking, creep and bleeding in the pavements may be accentuated.
Moreover, an increase in the intensity of extremely high temperatures risks making the choice of bitumens more complex. The bitumens would need to be harder, so that they are less plastic when exposed to high temperatures. But, the harder a bitumen is, the more brittle it becomes when exposed to the cold. Finally, sustained extremely low temperatures combined with an increase in the intensity of hot extremes results in an increase in temperature amplitude. Yet bitumens that respond well to these increased temperature amplitudes are relatively rare.
4.1.2 - Operations The gradual drop in the number of days of glaze ice and snowfall will be accompanied by a reduction in the number of winter highway maintenance interventions by the roads and highways operators. It will tend to facilitate travel on these highways, which will become more reliable.
Droughts could incur the risk of forest fires, making certain exposed highway infrastructures more vulnerable, due to visibility problems for users and road blocks. Moreover, in the event of very hot weather, pollution peaks are more frequent. Traffic restrictions and other preventive and control measures could be taken more frequently.
4.2 - Earthworks Earthworks involve excavation and fill or backfill for land and maritime infrastructures.
Higher temperatures, especially when combined with a period of drought, impact clay soils and may then locally affect the network to different extents:
by increasing mechanical deterioration :
o settling and water losses ;
o occurrence of shrinkage phenomena that can cause the road platforms to crack (Figure 18). This impact is not notable on the pavement layers, in view of the expected renewal cycle under normal operating conditions. The main risk affects the foundation layers. The risk is low on the primary road network, which is robustly designed and well maintained. On the secondary network, repairs of the foundation layers should be expected, especially on low profiles ;

PNACC, infrastructures and transport systems, action 1 – Adaptation of infrastructures and transport systems to climate change
43
o surface instability of the slopes due to shrinkage and reduced grass coverage of the slopes in the event of drought ;
during operations: when applying, difficulties in maintaining the hydrous condition when laying may be encountered, due to intense evaporation. These difficulties could be made worse by more frequent restrictions on the use of water ;
environmental impacts: in the event of high temperatures or drought, restrictions may apply to the watering of the soil to prevent dust generation, and to the possibility of using water when the water content needs to be increased. Therefore, more intense compacting and the production of test plates on these materials in a dry to very dry condition will become more frequent.
The action of a rise in temperature alone only has a weak influence on these phenomena.
Examples of impacts due to drought
Drought causes clay soils to shrink and provokes uneven settling that causes a deterioration of the roads (longitudinal adaptive cracking and roadside settling). This deterioration is particularly dangerous for two-wheelers and can incur high maintenance costs for the operators (about €80 to €100 K per year for a department exposed to these phenomena).
CEREMA is taking part in research operations14 in which it has installed instruments on several sections of damaged roads in the Indre and Loir-et-Cher departments in France. These operations have revealed the seasonal nature of these phenomena, the importance of the lithology of the soil and of the environment in the kinetics and the depth of dessication. On one test section, Cerema recommended the use of a "road encapsulation" type solution. The road is encapsulated by digging a 1 to 1.65 m deep trench and filling it with concrete. This experiment resulted in stable soil water content and a significant reduction in the observed deterioration of the surface.
14 Called ORSI CCLEAR: Impact of climate change on pavements (<http://actions-incitatives.ifsttar.fr/orsi-risques-et-environnement/encours/cclear/>), supplementing ORSI Drought 1 and 2 (<http://actions-incitatives.ifsttar.fr/orsi-risques-et-environnement/encours/secheresse2/>).
Figure 18: Photograph of fill on the RN158 in Macé, France, in which the cracks and settlements became worse after the summer of 2003. Source: Cerema, DTerNC.

PNACC, infrastructures and transport systems, action 1 – Adaptation of infrastructures and transport systems to climate change
44
4.3 - Constructions The temperature parameter acts on the constructions in several ways.
4.3.1 - Use of concrete High temperatures can be one of the causes of cracks in concrete as it sets by natural drying (shrinkage due to dessication). If no precautions are taken in cold weather, the water in the concrete can freeze. The distinction must be made between this risk and the risk due to freeze–thaw cycles. The sharp increase in the hydration speed of the cement also produces differences in temperature between the core of the cast parts and their surface, and/or between the thin and thick sections of the same part, resulting in disrupted deformations and the risk of cracking (thermal shrinkage). Finally, in certain cases, if the temperature of the concrete is too high when it sets, an internal sulfate reaction may take place during the lifespan of the construction. This results in internal swelling and the appearance of cracks in the material. Even if the combination of changing temperatures and extreme phenomena15 does not reduce the quality of the concrete, it can lead to restrictions on use that are detrimental to economic activity and the progress of the works.
4.3.2 - Behavior of steel at low temperatures If the temperature of steel drops below a certain threshold, it becomes fragile and can break without any plastic deformation. This is particularly true of very old steel. Therefore, a rise in the mean temperature would have a beneficial effect on metal structures.
4.3.3 - Structural actions by the thermal expansion of materials All the materials used to build a construction and, therefore the construction itself, are affected by the phenomenon of thermal expansion, irrespective of their type. The variations in temperature cause relative movements of the various parts of the structure, or stress, if these movements are not possible. They can result in an elongation or a shortening of the bearing structure, curves in beams and the appearance of self-induced stress, due to the non-linear distribution of the temperature in the section.
The design and dimensioning rules take this expansion into consideration to avoid any damage that it could cause. These rules have evolved, in particular by adopting more restrictive ranges of temperature variation and extreme values. In general, the impact of a rise in temperature due to climate change on bridges that are designed today can be said to be insignificant. Interventions on the specific equipment in the constructions (expansion joints, support devices) can often significantly reduce or eliminate these impacts. The need to conduct these interventions before replacing this equipment as part of normal operations should be rare, except possibly in the event of long heat waves or periods of severe cold. Such operations are generally not complex.
For bridges that will be built in the coming decades, for projects lasting 100 years, this change in the hypotheses relating to temperature has no impact. The amplitudes and extreme values are such that they will not result in over-dimensioning, except, possibly, for constructions designed without expansion joints for greater ease of maintenance, such as "integrated bridges" or hyperstatic systems.
The same is not true for existing systems. The uneven distribution of temperature in a bridge deck depends on exposure to sunlight, the wind and, in combined bridges, the differences in the capacity and thermal conductivity of the steel and concrete. This uneven distribution exists in the vertical and the transverse directions. They also affect the piles and the walls of the structure in
15To mitigate these risks, extreme events and the mean values are usually integrated in the design and sizing of the reinforcement of constructions or the improvement of their environment as part of the same project, because the same technical options will be adopted. The cost of over-engineering relative to the value of the extreme event is low compared with the global cost of the consequences of the same event.

PNACC, infrastructures and transport systems, action 1 – Adaptation of infrastructures and transport systems to climate change
45
contact with media at different temperatures. These phenomena cause self-induced stress that can be detrimental to the integrity of the concrete, in particular for constructions in which the effect of the temperature was not properly integrated in the dimensioning phase. This is particularly the case of hyperstatic systems. Since the bearing conditions do not allow deformation to occur freely, internal forces are produced.
Amongst existing structures, the oldest constructions are potentially the most sensitive, but, as they may be old and obsolete, they will only face climate changes in the near future and for a short period. Thus, they will be only partly impacted by climate change.
4.3.4 - Action on the durabil i ty of materials Deterioration caused by freeze–thaw cycles mainly affects the parts that are not protected by a waterproof coating and is amplified by the use of deicing salt. The intensity of the deterioration depends on the porosity of the material and its degree of saturation. Salt can cause micro-cracking due to the sudden drop in the temperature of the material when the layer of ice melts as the chlorides penetrate it. The susceptibility of the aggregates to frost damage also has a significant impact on concrete's resistance to low temperatures. A rise in the mean temperature will result in fewer days with frost and, therefore, reduced use of deicing salt. This will have a positive effect on the durability of the materials. But this positive effect could be offset by a rise in freeze–thaw cycles.
The reduction in the quantities of deicing salt should also have a beneficial effect on the risk due to the penetration of chlorides. But this positive effect could also be limited by an increase in wetting-drying cycles. An increase in wetting-drying cycles may also result in a higher risk of carbonation in existing structures. For new constructions, part n°65 of the general technical specifications applicable to public works contracts [23] requires a maximum aggressiveness class of XC4.
For retaining structures, the temperature is not taken into consideration.
For tunnels, the possible consequences of a change in temperature mainly impact ventilation and, therefore, the consumption of electricity. These effects may be positive or not.
4.4 - Rail
4.4.1 - High temperatures Episodes of high temperatures or heat waves in the summer, or significant differences in temperature over a short period, can have impacts on the network. These impacts usually result in the deformation of the tracks, requiring speed limits, or they can cause the overhead lines to become slack, resulting in power cuts.
Ra i l ob j ec t : t r ac ks We know from experience that extreme temperatures (heat waves) can cause the rails to expand. The maximum rail temperature on the national French rail network (RFN) is 60°C. This parameter can be used to determine the maximum stress level in the rail and to dimension the components and associated maintenance rules (rails, attachments, ties, profile and quality of the ballast).
This approach illustrates how climate conditions are taken into consideration in the design of rail infrastructures. Consequently, disruption only occurs when one component part fails or when the construction rules of the railroad are not followed (for example, failure to respect the ballast profiles).
To avoid any deterioration of the track due to climate conditions, inspection cycles are organized to guarantee that the construction rules are obeyed at all times in the railroad's lifespan. These inspection cycles, their subjects and the procedures are described in detail in the French railroad operator's (SNCF) reference material. In accordance with these reference documents, heat patrols are organized as soon as the temperature of the rail is liable to exceed 45°C. These patrols allow any deviations from the installation and maintenance rules of the railroad to be detected and

PNACC, infrastructures and transport systems, action 1 – Adaptation of infrastructures and transport systems to climate change
46
corrected before cold or hot periods. If the detected zones cannot be corrected, specific surveillance is put in place.
While the notion of heat patrols does not exist for trams, inspection cycles are defined in the safety and operations regulations of every network. The content can be adapted in periods of extreme heat in order to detect any potential deterioration at the earliest possible stage.
Above 65°C, speeds are temporarily restricted to 80 km/h and traffic may be suspended on the basis of the observations made by the inspection patrols.
The above-mentioned observations on the national rail network also apply to the secondary networks, excluding the overhead line issue and at reduced speeds. However, it should be noted that long welded rails are not used on difficult profiles, in which case the adjustment of the joints is delicate and must be thoroughly checked by the operators.
Ra i l ob j ec t : s i g na l i ng e q u ip m en t It is important to monitor the systems that regulate the temperature in the computer room. All the computer systems are designed to operate at ambient temperatures of approximately +18°C to +27°C (air-conditioned buildings). Outside this temperature range, operations may be disrupted.
Ra i l ob j ec t : ov e r he a d l i n e s The 1,500°V catenary wires installed on certain lines are of the so-called semi-tensioned type, because only the contact wires are tensioned. This tensioning is calculated for temperatures of between 2.5 and 47.5°C. Above 47.5°C, the contact wire is no longer tensioned and "stretches" proportionally with the rise in the temperature (Figure 19).
The overhead contact lines in tram systems (600 - 750 V power supply) are impacted in a similar manner. The safety and operations regulations include requirements for regular checks by drivers and – where necessary – interventions by the maintenance staff. Overall, there is no negative feedback on the effects of extreme temperatures on trams.

PNACC, infrastructures and transport systems, action 1 – Adaptation of infrastructures and transport systems to climate change
47
Ra i l ob j ec t s : ro l l in g s t o c k The air conditioning can operate up to a temperature of +50°C. But it is only required to perform up to +35°C, above which the power of the air conditioning is shed. Above this temperature, operation at 50% of performance is tolerated, i.e. where one out of two compressors continues to function.
Figure 19: Illustration of the behavior of electric power supply cables at high temperatures. Source: SNCF.

PNACC, infrastructures and transport systems, action 1 – Adaptation of infrastructures and transport systems to climate change
48
The air production unit is designed to keep the ambient exterior temperature at 40°C. Therefore, this requirement does not take account of the classification of the temperature specified at +45°C. In order to mitigate this fact and to protect the air production unit, a load shedding system has been developed. This system switches between the air production units, thereby offloading those that are in danger of overheating.
The cooling generator has two circuits: the high-temperature (HT) circuit and the low-temperature circuit (LT). The HT circuit is designed for temperatures of up to 95°C at the motor outlet, which is considered to be the hottest part of the generator. The LT circuit is designed for a temperature of 50°C and can exceptionally go up to 60°C, before the motor power is derated. The design temperatures of the cooling generator correspond to an exterior ambient temperature of +35°C. Above this temperature, up to 30% of the motor's power is shed.
S p e c ia l ca se o f h i g h -s p e ed l in e s The high-temperature patrols on board a train take place from the third day on which the maximum temperature of the ambient air is liable to reach 34°C, further to temporary single-track sections in the domains in question. The patrols stop as soon as the maximum air temperature drops back below 34°C for at least two consecutive days.
A temporary 80 km/h speed limit is applied to all trains, at least between 1 p.m. and 7 p.m., from the third day when T°air > 34°C:
if the inspections specific to periods of severe heat cannot be made;
in zones that needed to be re-released, if this is not yet the case.
I m p ac t s o n op e r a t i o ns Summer increases in temperature can affect train traffic. Certain rolling stock may suffer from failures due to the heat, causing delays and cancellations that are usually unforeseeable and difficult to explain to users. Heat waves can also impact the comfort, and even the health, of passengers. Finally, track-side fires can cause serious delays due to the time required for the fire fighters to intervene.
4.4.2 - Winter temperatures As a general rule, the increase in the minimum mean temperatures should have a positive impact on railroads.
Ra i l ob j ec t : t r ac ks Regarding the track, the temperature calculated for stress release for the installation of the rails is usually 25°C. The cold increases stress in the rail, and can even result in rupture. Cold season inspection patrols are organized. Defective rails are replaced in the temperature range defined relative to a reference temperature of the long welded rails. Temporary speed limits may apply and traffic may be suspended, depending on the observations made by the inspection patrols.
Ra i l ob j ec t : su b s ta t i on s The HVLV (non-RTE) part of the substations is designed to operate at temperatures of -25°C, and as low as -30°C. Below these temperatures, operations may be disrupted.
Ra i l ob j ec t : o v e r he a d l i n e s The 1,500°V catenary wires installed on certain lines are of the so-called semi-tensioned type, because only the contact wires are tensioned. This tensioning is calculated for temperatures of between 2.5 and 47.5°C. Below 2.5°C, the contact wire is no longer tensioned and "tightens" proportionally with the drop in the temperature.

PNACC, infrastructures and transport systems, action 1 – Adaptation of infrastructures and transport systems to climate change
49
4.5 - Rivers Higher temperatures and the intensification of heat waves could result in the obstruction of navigable waters by the proliferation of algae that acts as a hydraulic brake. The proliferation of algae would also disrupt the water supplies of certain canals, causing the water level to drop. These phenomena were observed in the spring of 2011. Even if no studies have been conducted on this subject, it is probable that extreme increases in temperature would cause malfunctions in the automatic control systems used to control locks and manage the water.
The drop in the number of freezing days should be beneficial for the operation of the network. In periods of severe cold, navigable waterways can freeze over. In such cases, an ice-breaker is necessary to open up the waterway.
4.6 - Port and maritime infrastructures The expected rise in temperature should only have a minor impact on port and maritime infrastructures. The rails of gantry cranes could expand, much like the rails on railroad tracks, in periods of great heat. This would impact loading and unloading operations.
4.7 - Airport infrastructures
4.7.1 - Operations France has already experienced hot summers and abnormally high temperatures, like in 2003, without any impact on aerodrome operations.
A significant rise in mean and extreme temperatures would normally result in longer take-off distances. Certain aircraft would no longer be able to use the airports. But these impacts must be put into perspective:
numerous airports are already adapted, in theory at least, to climate change, because the length of the runways is over-dimensioned. By way of example, the climate conditions in Madrid, Spain are similar to those that may occur in France (and at Charles de Gaulle airport in particular) by the end of the century, with the addition of a strong altimetric constraint (altitude of 610 m). For equivalent types of aircraft traffic (the categories that use the airports), Madrid-Barajas airport has a maximum runway length of 4,350 m, compared with 4,215 m at Roissy Charles-de-Gaulle with an altitude of 119 m.
Moreover, the highly probable advent of new technologies will produce more powerful engines that should solve this problem.
It could also result in the reduced use of glycol, which would have positive environmental impacts.
Certain workstations at airports are directly exposed to climate conditions, and in particular those people at work when the aircraft is moving on the traffic aprons. Heat waves will make this kind of work more arduous, because airports cannot interrupt their activities during the hottest hours of the day.
The impact on buildings would result in a tendency for the number of air conditioning degree days to rise and, therefore, an increase in consumption by cooling systems in the summer. However, this increase is offset by the drop in the need for heating, due to the decrease in cold temperatures.
In addition, droughts caused by the increase in the temperature and periods of severe heat could result in an increase in the number of uncontrolled forest fires. These forest fires could disrupt air traffic due to poor visibility and give rise to the risk of fire on platforms located on the edge of woods and forests.
PNACC, infrastructures and transport systems, action 1 – Adaptation of infrastructures and transport systems to climate change
50
4.7.2 - Coastal Droughts can also result in the rapid wear of taxiways and serious damage to buildings on clay soil.
4.8 - Cable transport systems Given the geographical zones where these systems are located, the impact of very low temperatures is already taken into consideration.
A rise in the extreme temperatures would probably not impact cable-based transport systems, for the same reasons of geographical location (at altitude, the effects of high temperatures are reduced).
But the question could be raised, if systems of this type are developed in urban zones. But current feedback from systems that have already been installed in other counties has not revealed any particular problems.
In certain systems currently in use at high altitude (higher than 2,500 m), the structures are anchored in permafrost, the consistency and thickness of which depends on the temperature. A thaw in these zones could cause landslides and result in damage to the structures. However, these sectors are few in number and are clearly identified. Some of them are already instrumented and monitored.
PNACC, infrastructures and transport systems, action 1 – Adaptation of infrastructures and transport systems to climate change
51
5 - Impacts of changes in precipitation
5.1 - Highway infrastructures
5.1.1 - Precipitation The increase in precipitation could impact road safety by exposing motorists to the risk of aquaplaning in the event of heavy precipitation.
Highway infrastructures risk being threatened by heavy rainfall that destroys the networks (flooded roads, landslides) and makes the roads unusable.
The intensity of rainfall-related events could increase, and in particular the intensity of extreme events. In this case, the highway sanitation infrastructures could prove to be insufficient. These infrastructures are designed to cope with a given occurrence of rainfall (in the national network). The impact of climate change could result in an increase in the number of days when the capacity of the sanitation networks is exceeded.
5.1.2 - Snow The drop in the number of days of snowfall is a favorable parameter for the use of highway networks, because it will tend to reduce the number of operations to guarantee practicability. It will facilitate travel on these highways, which will become more reliable.
5.1.3 - Water table level The rise in water table levels, which was not foreseen in the initial design of the pavement structure, will shorten its lifespan. However, the possibility of water input is taken into consideration in the design of pavements for frost. Therefore, greater security should be taken into consideration for infrastructures close to a water table that is close to the surface, and especially for the thicknesses of the sub-base.
5.2 - Earthworks
5.2.1 - Precipitation The rise in the intensity of extreme values of daily precipitation will tend to increase the risk of more frequent unstable slopes. Natural slopes and artificial structures, such as infill or canal dikes, are particularly affected by these phenomena. The main expected consequences of an increase in intense rainfall – tropical phenomena or flooding due to extreme rainfall – for earthworks are:
the erosion of the base of slopes or infill contiguous with hydraulic constructions or constructions with an insufficient water outlet (Figure 20) ;
instability on a larger scale, resulting in landslides or falling rocks ;
the potential increase in the appearance of underground cavities, such as unblocked shafts or karstic cavities ;
the deterioration of the base materials of infill that is subjected to prolonged water logging or to rapid flooding / flood recessions, due to more frequent flooding. This phenomenon is all the more important when the structures, and in particular hydraulic structures, were designed without any special specifications. One exception is structures built in wetlands, but these structures do not always have dimensions (openings) that correspond to the climate change data.

PNACC, infrastructures and transport systems, action 1 – Adaptation of infrastructures and transport systems to climate change
52
These phenomena can result in the rupture of certain structures (mud slides, embankment slides, underwashing, collapse, falling rocks, etc.), or even in their destruction (major landslides, settling of infill, etc.).
Figure 20: Erosion of a hillside in Brittany following heavy rainfall on 15 January 2008. Source: Olivier Malassingne (Cerema).
5.2.2 - Water table level Seasonal water table fluctuation corresponds to the variation of its level in the course of the year. If precipitation increases in the winter (in which case the table becomes very full) and decreases in the summer (which results in the exhaustion of water resources), then seasonal water table fluctuation is likely to increase. An increase in periods of drought in the summer would tend to accentuate the variations of the water table level. This phenomenon could be accentuated by increased pumping for industrial uses, irrigation, etc.
The variations in the piezometric head of the water tables (seasonal water table fluctuation) would therefore be accentuated. Rocks and soil that were permanently above the level of the water table would then be subject to regular cycles of water coverage and drying. In aquifers that are water-sensitive, such as gypsum or calcareous soil, this will result in phenomena of dissolution and karstification. These phenomena are liable to result in the instability of surface earthworks (settlement, destabilization, collapse).
5.2.3 - Drought Periods of drought can result in deterioration. This deterioration is described in detail in paragraph 42.
5.3 - Constructions
5.3.1 - Precipitation Precipitation can result in floods, a rise in the water table and changes in the hydraulic system of watercourses. Under certain conditions, bridges and retaining structures in wetlands can be exposed to the risk of erosion of watercourse beds and of foundations. The erosion of the foundations of a structure can result in its destruction, which is almost always sudden and brutal.
A survey by the World Road Association (PIARC) [24] shows that the situation is similar in the thirteen countries that took part: "The most serious risk caused by the effects of climate change for

PNACC, infrastructures and transport systems, action 1 – Adaptation of infrastructures and transport systems to climate change
53
bridge structures appears to be the increase in the intensity and the frequency of heavy rain that causes flooding and erosion".
About one quarter of the structures in the national highways network are located in wetlands and are, therefore, potentially vulnerable. Studies are currently underway to assess the risks to these structures. It also appears that the foundations of the oldest constructions are no longer adapted to the current conditions of their environment. Their environment has changed significantly since they were built, in particular due to urban development, other developments and changes in the use of space.
This is an important issue, because there are more than 200,000 bridges in the highways network. The numerous retaining walls and certain infills that are contiguous with the structures should also be taken into consideration, whether they are in low-flow channels or in wetlands. Works to stabilize or protect structures at risk are often difficult and costly.
Predictions of changes in floods or in periods of precipitation would help to assess this risk and its consequences.
There are many potentially vulnerable constructions and the consequences of erosion are significant. The collapse of a bridge on the Saint-Étienne River on Réunion Island is a recent example (Figure 21).
Figure 21: Photos of a bridge on the Saint-Étienne River on Réunion Island, which collapsed on 26 February 2007, when Cyclone Gamede hit Réunion. The cyclone was accompanied by heavy precipitation, which eroded certain piles and
caused several spans to collapse. Source: DDE La Réunion.
The rise in wetting–drying cycles can increase the risk of chemical attack by carbonation or by the penetration of chlorides into existing structures.
5.3.2 - Snow The impact on structures of the sharp drop in the number of days with snow is, like the drop in the number of days with frost, qualitatively favorable. It will limit the use of deicing salt on highways. Salt is a significant cause of corrosion of the materials that make up the structures.
5.3.3 - Drought Climate change is expected to lengthen the periods of insufficient rainfall. When combined with the increase in mean temperatures, this rainfall deficit will result in a reduction in the water content of surface soils. This change in the parameters may result in the shrinkage of the supporting clay soils and increase their potential to swell (chapter 4.2). But this risk remains moderate for the

PNACC, infrastructures and transport systems, action 1 – Adaptation of infrastructures and transport systems to climate change
54
surface foundations of constructions, which are relatively well protected by being buried to sufficient depths, and by their bearing surfaces, which are often large and limit evaporation.
5.4 - Rail
5.4.1 - Frost Frost is liable to disrupt the power supply of rail systems. In zones where frost is frequent, overhead lines are equipped with defrosting circuits (short circuit and Joule effect) that can be remotely controlled from the control center. But in view of the climate projections of the reduction in periods of frost, this impact should be minimal.
5.4.2 - Snow (< 10 cm) or hail Snow and ice can prevent points from being operated if the point heaters are out of order, but the heaters are not sensitive to these climate events. If point heaters are not installed, the operational instructions attempt to favor the most direct route. Trains no longer take diversions, especially in stations, to avoid becoming trapped on a route that is no longer possible. The "snow > 10 cm" event is no different from the "snow < 10 cm" event in terms of its basic impact on the infrastructure.
On urban subway or tram type networks, low temperatures and snow are taken into consideration within the limits of the reasonably foreseeable conditions in conurbations on a plain. The network is deiced by permanently maintaining the traffic and heating the track equipment or the treads of subway trains with tires. If these measures are insufficient, traffic may be disrupted or suspended on overground sections, especially on sloping profiles or due to the possible malfunction of track equipment. These events remain very occasional.
On secondary networks, especially in mountainous regions, the systems are simple and robust (heating operations, telephone blocks). Major snow removals are expected and organized. In the serious episodes in the winter of 2010, the train was the last means of transport that remained operational.
The accentuation of episodes of cold and snow is liable to partially and temporarily paralyze overground urban networks. However, climate forecasts foresee a drop in snowfall, which should have a positive impact on operations.
5.4.3 - Floods
Ra i l r o ad s in ge n e r a l Here, we look at cases where the water level reaches the underside of the ties. In theory, railroads are usable as long as the rails are not underwater and the electric components are in working order. Water eliminates the lubricants of the moving parts of the track and speeds up their aging process. In this case, the components must be greased more frequently. Water also interferes with the workings of track circuits and point motors. In zones with major excavations, the condition of the ground supporting the overhead lines must be checked in the event of landslides.
PNACC, infrastructures and transport systems, action 1 – Adaptation of infrastructures and transport systems to climate change
55
Speed restrictions come into force when:
the water reaches the underside of the ties. Maximum speed of 40 km/h ;
the water reaches the lowest pad of the rails. Maximum speed of 10 km/h ;
the water reaches the top of the lowest rail head or the ballast is entrained. Suspension of traffic.
These speed limits can be raised, depending on the analysis of the local situation.
Examples of impacts due to flooding
On June 18 and 19, 2013, after a sudden rise of the waters of the Gave de Pau river, the line between Lourdes and Pau was flooded, causing the traffic to be interrupted. The river washed away 60 meters of fill, the ballast and a catenary pole.
The Engineering System Projects teams from the Aquitaine division intervened on June 19, with the Rail Traffic Directorate, which operates the infrastructure of the French Rail Network (RFF), and construction contractors. They devised the solution and the methodology to repair the line. The conditions were difficult, because the current in the Gave de Pau remained very strong for several days.
S p e c ia l ca se o f h i g h -s p e ed l in e s Certain exceptional atmospheric situations are liable to endanger rail traffic or to disrupt the workings of the systems (signals, overhead lines, etc.). This is the case in the event of torrential rain, high winds, flooding, heavy snow falls, the formation of glaze ice, severe frost, etc. In periods of extreme weather, the tracks are inspected by patrols, or special rounds made by the service staff. The purpose of these patrols or inspections is to check that there is no danger for the rail traffic and, where necessary, to take protective measures.
The monitoring of the tracks in foul weather is no substitute for preventive measures designed to reduce the risk of incidents. It is necessary to ensure that due care is taken in the preventive measures, and in particular:
the thorough maintenance of zones containing dangerous trees, through regular felling ;
the inspection and improvement of drainage systems ;
the periodical cleaning of drains and intercepting and foot ditche s;
the inspection of the feet of structures in rivers and, if necessary, the adaptation of the frequency of inspections to the frequency of high waters ;
the timely scheduling of works to stabilize cut or fill slopes ;
winter servicing of signaling equipment.
When trains run on snow-covered tracks, snow can accumulate under the body of high-speed trains and turn into ice. Blocks of ice that become detached can damage the track equipment (the surface of the rails, electric equipment, points, etc.). Special patrols are organized whenever the projection of ice is reported. The patrols are organized as soon as possible, covering 5 km either side of the point at which the report was made. The purpose of the patrols is to check for the types of damage listed above. Local measures to be taken to protect the safety of the personnel in the event of projections of ice must be documented in the establishment's reference material.

PNACC, infrastructures and transport systems, action 1 – Adaptation of infrastructures and transport systems to climate change
56
5.4.4 - Water table level The problems resulting from changes in the water table level, as described in chapter 5.2.2, mainly apply to guided transport systems, plus the additional issues mentioned in this section.
For urban guided transport systems, rain, apart from flooding, is not a particular problem, apart from a few rare cases of skidding on steep gradients (e.g., subway tunnel approaches), which can easily be dealt with.
The risk of flooding in conurbations is to be feared:
in underground networks, such as the RATP subway in Paris, which had to be protected against the centennial rise in the level of the Seine by mobile barriers that could be quickly deployed in stations ;
in technical facilities. Severe disruption can occur, depending on the type of facility affected;
On certain secondary railroads and tourist railroads, the risk of flooding occurs when water levels rise suddenly following torrential rain, and can sometimes cause landslides. Several serious events can occur at random and recurrently: collapsed embankments, rails washed away, landslides, falling rocks. The risk of falling rocks (Figure 22) rises when intense phenomena occur more frequently. This type of event can result in serious accidents due to lack of visibility or "direct hit" incidents, as was the case on the rail network in Provence in 2014.
Figure 22: Railroad in Provence, February 2014. Source: STRMTG.
5.5 - Rivers
5.5.1 - Precipitation Changes in water levels impact operations. A sharp rise in the water level requires the rapid deployment of barriers, while increased flooding will cause traffic to be suspended. The maintenance of channels is also modified. Movements of sediment increase in periods of high flow and flooding. Finally, the dimensioning of structures, in particular those that provide protection against erosion and flooding, must also be modified.
5.5.2 - Drought The minimum instream flow of rivers must be respected. Therefore, in periods of drought:
water-saving measures are taken in the reservoirs, ponds and dams that form the summer reserve ;

PNACC, infrastructures and transport systems, action 1 – Adaptation of infrastructures and transport systems to climate change
57
starting in the spring, pleasure craft pass through locks in groups ;
reductions in maximum loaded draft allow the most critical sectors to remain navigable for as long as possible ;
navigation hours and water levels are restricted, resulting in reduced loads ;
regional authorities receive all the information they need to arbitrate between the different uses of water: drinking water for humans and animals, navigation, irrigation, fish farming, maintenance of biotopes.
These measures result in higher operating and transport costs.
Examples of impacts due to drought
In 2011, more than 55 French departments were hit by drought. For example, the flow rate in the Rhine was 50 to 60% below the usual mean values. The water level dropped to below one meter in certain places. This situation caused barge owners to halve their loads, or the draft would have been insufficient. Operators had to make more return trips or charter additional vessels in order to deliver their goods. The price of transport increased by 20 to 60% per transported ton.
5.6 - Port and maritime infrastructures
5.6.1 - Precipitation Heavy rain can saturate the wastewater networks or flood aprons and buildings, causing disruption to traffic and port operations.
5.6.2 - Water table level A rise in the water table level can compromise the stability of retaining structures, or even lead to their collapse.
5.6.3 - Drought Drought should have a minor effect on port infrastructures.
5.7 - Airport infrastructures
5.7.1 - Precipitation The general decline in precipitation should facilitate airport operations. Heavy rain can flood runways and buildings, causing disruption to traffic and airport operations.
5.7.2 - Snow The decrease in the number of days of snowfall should improve aerodrome operations, due to the drop in interruptions in traffic and/or delays due to poor weather. The weather events in the winter of 2010/2011 illustrate the impacts of heavy snowfall. These unforeseeable events severely disrupted airports in Paris, including Roissy-Charles de Gaulle airport.
5.7.3 - Drought On clay soils, periods of drought can cause shrinkage and swelling that is harmful to the structures of buildings (terminals, towers) and the air traffic pavements, resulting in long-term damage (chapter 4.2).

PNACC, infrastructures and transport systems, action 1 – Adaptation of infrastructures and transport systems to climate change
58
5.8 - Cable transport systems Cable transport systems are not very sensitive to precipitation. However, prolonged and/or intense increases in precipitation could extend the zones subject to landslides and, therefore, exposed to the risk of collapse of pylon and terminal type infrastructures. There are no known examples of this happening.

PNACC, infrastructures and transport systems, action 1 – Adaptation of infrastructures and transport systems to climate change
59
6 - Impacts of changes in wind
6.1 - Highway infrastructures Strong wind can threaten traffic management and the dependability and safety of transport on the exposed sections of road. The equipment installed on the highways networks (lighting systems, noise barriers, vertical and dynamic road signs (panels, gantries, masts, etc.)) are vulnerable in the event of strong winds, and also due to fatigue. Wind speed is taken into consideration in their design. A rise in the wind speed could cause them to fall over and cause safety problems.
Nevertheless, they are replaced sufficiently frequently for the gradual changes in the wind parameters to be hardly perceptible in the course of their lifespan. On the other hand, if climate change brings about intense or more frequent extreme phenomena, the risks to user safety will be serious, particularly because so many of these items are present on our highways.
Moreover, the wind can jeopardize the safety of vehicles with large windage (trucks, buses, caravans) and of smaller vehicles such as two-wheelers. The wind can also cause vehicles to drift, cause drivers to lose control of their vehicle and cause accidents.
Finally, strong winds combined with snow can cause operational problems and compromise safety.
6.2 - Earthworks No impacts of changes in the wind system have been identified for earthworks.
6.3 - Constructions
6.3.1 - Potential impacts on structures The structures that are potentially most sensitive to changes in the wind system are suspension bridges and cable-stayed bridges. There are few examples of this type of structure in France. Two phenomena must be taken into consideration for this type of structure: the risk of aeroelastic instability and the risk incurred by a rise in the mean wind speed and turbulence.
The design and calculation rules take account of the force of the wind on bridges and their aerodynamic behavior. With regard to the risk of aerodynamic instability, the critical speeds of instability are very high (above 250 km/h), meaning that a change in the wind system would have little impact. The slight expected rise in maximum wind speeds also has a very limited effect on the dimensioning of assemblies under static loads, excepting perhaps a few structural components, such as cables or suspension lines. Currently, the uncertainty about changes in turbulence prevent its impact from being evaluated.
6.3.2 - Potential impacts on operations Driving conditions are more dangerous in high winds. This situation is more frequent on bridges than on other sections of highways because bridges are usually located in a more open environment. This is particularly true of very large bridges, which are nevertheless equipped with wind-breaking devices and are governed by specific operating rules.
6.3.3 - Impact of extreme events For extreme wind values, the distinction must be made between exceeding a given level and the time for which this level is exceeded. The duration significantly impacts the number of fatigue cycles in certain parts of structures, or results in a loss of comfort (foot bridges).
Extreme tropical phenomena, such as cyclones, are liable to damage structures. Violent wind, and above all heavy precipitation, can have serious effects on, or even destroy, exposed structures.
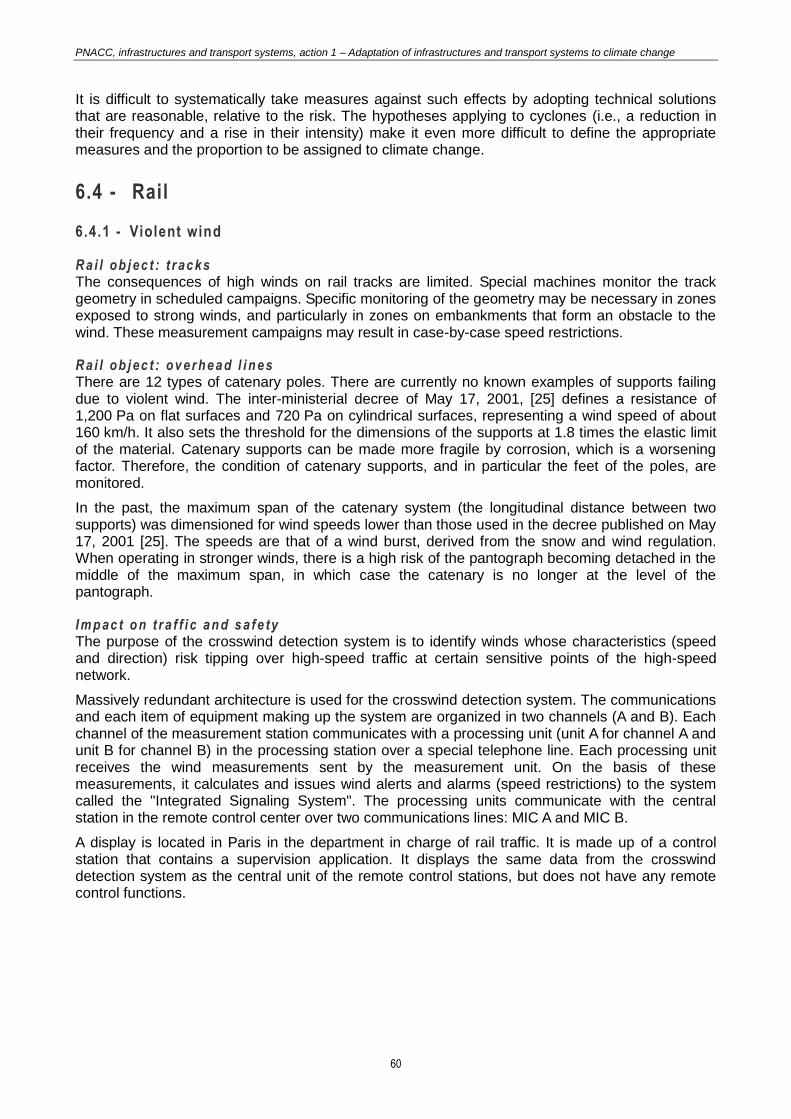
PNACC, infrastructures and transport systems, action 1 – Adaptation of infrastructures and transport systems to climate change
60
It is difficult to systematically take measures against such effects by adopting technical solutions that are reasonable, relative to the risk. The hypotheses applying to cyclones (i.e., a reduction in their frequency and a rise in their intensity) make it even more difficult to define the appropriate measures and the proportion to be assigned to climate change.
6.4 - Rail
6.4.1 - Violent wind
Ra i l ob j ec t : t r ac ks The consequences of high winds on rail tracks are limited. Special machines monitor the track geometry in scheduled campaigns. Specific monitoring of the geometry may be necessary in zones exposed to strong winds, and particularly in zones on embankments that form an obstacle to the wind. These measurement campaigns may result in case-by-case speed restrictions.
Ra i l ob j ec t : ov e r he a d l i n e s There are 12 types of catenary poles. There are currently no known examples of supports failing due to violent wind. The inter-ministerial decree of May 17, 2001, [25] defines a resistance of 1,200 Pa on flat surfaces and 720 Pa on cylindrical surfaces, representing a wind speed of about 160 km/h. It also sets the threshold for the dimensions of the supports at 1.8 times the elastic limit of the material. Catenary supports can be made more fragile by corrosion, which is a worsening factor. Therefore, the condition of catenary supports, and in particular the feet of the poles, are monitored.
In the past, the maximum span of the catenary system (the longitudinal distance between two supports) was dimensioned for wind speeds lower than those used in the decree published on May 17, 2001 [25]. The speeds are that of a wind burst, derived from the snow and wind regulation. When operating in stronger winds, there is a high risk of the pantograph becoming detached in the middle of the maximum span, in which case the catenary is no longer at the level of the pantograph.
I m p ac t o n t r a f f i c a n d s a f e ty The purpose of the crosswind detection system is to identify winds whose characteristics (speed and direction) risk tipping over high-speed traffic at certain sensitive points of the high-speed network.
Massively redundant architecture is used for the crosswind detection system. The communications and each item of equipment making up the system are organized in two channels (A and B). Each channel of the measurement station communicates with a processing unit (unit A for channel A and unit B for channel B) in the processing station over a special telephone line. Each processing unit receives the wind measurements sent by the measurement unit. On the basis of these measurements, it calculates and issues wind alerts and alarms (speed restrictions) to the system called the "Integrated Signaling System". The processing units communicate with the central station in the remote control center over two communications lines: MIC A and MIC B.
A display is located in Paris in the department in charge of rail traffic. It is made up of a control station that contains a supervision application. It displays the same data from the crosswind detection system as the central unit of the remote control stations, but does not have any remote control functions.
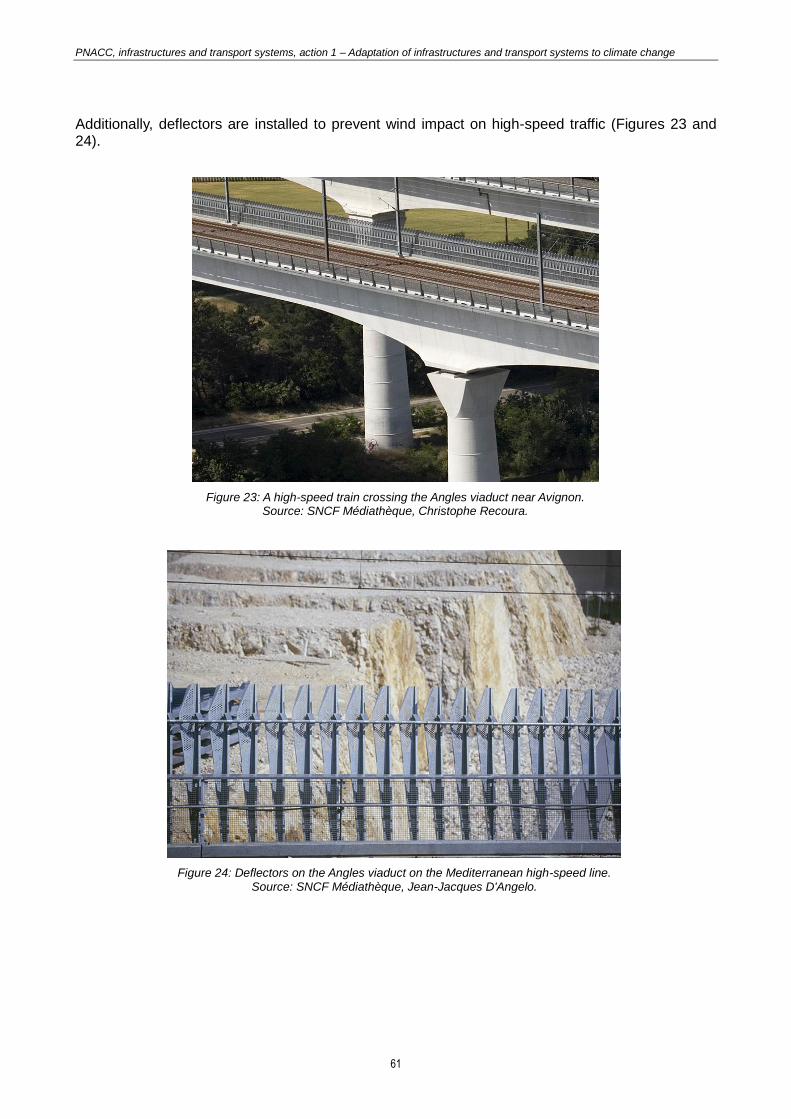
PNACC, infrastructures and transport systems, action 1 – Adaptation of infrastructures and transport systems to climate change
61
Additionally, deflectors are installed to prevent wind impact on high-speed traffic (Figures 23 and 24).
Figure 23: A high-speed train crossing the Angles viaduct near Avignon. Source: SNCF Médiathèque, Christophe Recoura.
Figure 24: Deflectors on the Angles viaduct on the Mediterranean high-speed line. Source: SNCF Médiathèque, Jean-Jacques D'Angelo.
PNACC, infrastructures and transport systems, action 1 – Adaptation of infrastructures and transport systems to climate change
62
Examples of impacts due to violent wind
North-west of Narbonne, the line to Carcassonne crosses the alluvial plain of the Orbieu on an embankment that is up to 6 meters high. During the storm of November 11 to 13, 1999, the fill was washed away, the track was undercut and turned over and the catenary equipment was torn out of the ground. The locomotive of a goods train derailed and the water reached the level of the track on the Orbieu viaduct. Rail traffic was interrupted for 14 days. The same storm resulted in a 1.30-meter rise in the sea level at Port-Vendres and a significant 6-meter swell in Sète [26].
Tr a m s a n d s u bw ay s On tram lines, violent winds can impact the direct urban environment causing branches or the equipment on the platforms to fall. The safety and operating regulations define the acceptable wind limits for operations.
Subway systems are practically insensitive to wind. However, on the overground sections of the network, there is a risk of falling branches or equipment on the platforms, and of objects being displaced by the wind.
6.4.2 - Event: wind carrying saline air
Ra i l ob j ec t : t r ac ks Air loaded with sand slowly pollutes the platform and reduces the overall service life of the track. The ballast needs to be replaced and the track needs to be leveled more frequently. Preventive measures against salt include washing the track using special trains.
Lines equipped with a track circuit are liable to be impacted. Temporary speed limits and measurements of disruption may be put in place.
Ra i l ob j ec t : ov e r he a d l i n e s Electrified lines are equipped with hot-galvanized (NF EN ISO 1461 [27]) or painted supports. Spots of rust may appear that must be monitored over time by special preventive maintenance patrols.
6.5 - Rivers In the event of changes in the direction and the speed of the wind system, wider navigable channels may be required to allow vessels to maneuver in safety. Increased wind speeds can cause the equipment (lighting, vertical signs, etc.) installed along the navigable channels to fall, resulting in safety problems. Finally, navigable channels are often lined with trees, some of which are old, and are vulnerable to a rise in wind speed.
6.6 - Port and maritime infrastructures Changes in the wind system, and in its direction in particular, could disrupt access to ports. Access channels are usually directed according to the prevailing winds to avoid crosswinds and to make it easier for the vessels to maneuver.
An increase in the intensity of the wind can result in greater loads when lowering cargo using gantry cranes on the quay, and, therefore, instability or even the collapse of the quays in extreme cases.
Violent storms disrupt operations, because the port equipment (gantry cranes, other cranes) have to be stopped or operate in degraded mode.

PNACC, infrastructures and transport systems, action 1 – Adaptation of infrastructures and transport systems to climate change
63
6.7 - Airport infrastructures A significant, frequent or definitive change in the prevailing winds could make certain runways unusable, temporarily or definitively, because their orientation is no longer adapted to the new winds.
Landing and takeoff maneuvers become more difficult, or even dangerous, when the ground wind component crossing the axis of the runway (crosswind) exceeds a given value. This value is calculated according to the diagram below (Figure 25), where VT is the maximum permissible value of the crosswind.
Moreover, violent winds and storms can impact aerodrome operations. In the event of storms, certain aerodromes have to be closed. In overseas territories, tropical storms and cyclones can lead to the closure of airports, often cutting the territories off from metropolitan France. Damage to airports and lengthy closures can also delay the arrival of the emergency services.
In windy conditions, the risk of FOD (Foreign Object Debris) is higher on the taxiways and can compromise flight safety.
Figure 25: Calculation of crosswind. Source: STAC.

PNACC, infrastructures and transport systems, action 1 – Adaptation of infrastructures and transport systems to climate change
64
6.8 - Cable transport systems The notion of violent winds has always been incorporated in the design and operation of cable transport systems. Anemometers that send information to the terminal are installed on all cableway systems, which are the most sensitive to violent winds. Specific operating instructions (speed restrictions or stoppages) are applied when thresholds are exceeded.
An increase in the frequency of high winds would probably not affect the safety of these systems, but would have an impact on their availability.
PNACC, infrastructures and transport systems, action 1 – Adaptation of infrastructures and transport systems to climate change
65
7 - Impacts of changes in the sea level and swell climate
7.1 - Highway infrastructures Certain parts of highway infrastructures located at low altitude or in coastal zones could be affected by a risk of marine flooding that limits the lifespan of the infrastructures and makes the network temporarily or definitively unavailable. In 2009, a simplified study was made of the vulnerability of land transport infrastructures to the risk of submersion [28].
Marine flooding requires the infrastructures to be protected or alternative routes to be created.
The report on the costs of the impacts of climate change [29] claims that: "the rise in the overall sea level by 1 meter would represent a cost for the main roads in metropolitan France (excluding motorways and other thoroughfares), and excluding losses due to usage, of up to €2,000 M." This sum excludes the "network" effect. For example, the flooding of a limited section of road can make a much larger section unavailable, but only the value of the submerged section was counted.
7.2 - Earthworks Most of the earthworks above the water line were built at least 20 years ago. The fact that the base of the fill of these earthworks is below sea level was not taken into consideration in their dimensioning and construction, a fact that could result in problems or erosion, collapsing embankments, breaches, etc. These problems can be made worse by the effects of swell and tides.
An increase in the occurrence of submersion will result in ruptures by overflow, a risk against which dikes are almost never protected.
7.3 - Constructions
7.3.1 - Selected significant c l imatic tendencies for constructions A rise in sea level of more than 1 meter will make the issues of the reorganization of the territory and land use extremely important in relation to that of constructions.
7.3.2 - Potential impacts on constructions The rise in sea level will have a number of effects: constructions (bridges and walls) that are currently in rivers will be exposed to brackish water and to changes in the currents around their supports and foundations.
The chlorides in sea water and spray are factors of corrosion of the reinforced concrete in the structures. The changes in the currents will increase erosion, and, therefore, the integrity and the stability of the exposed structures.
Not many highway structures will be affected by the rise in sea level. However, special attention must be paid to sensitive retaining structures.
Finally, the flow section of all bridges will be reduced by the residual height of the rise in sea level around these structures.

PNACC, infrastructures and transport systems, action 1 – Adaptation of infrastructures and transport systems to climate change
66
7.4 - Rail In this case, the phenomenon must be understood in its broadest sense: marine flooding, higher water levels in rivers, etc. The rail network may be exposed to risks of differing natures, but that have close or comparable causes and that sometimes coincide in time and in space. For example, extreme events of continental origin and of marine origin can occur simultaneously.
The impacts of these phenomena depend on the technology used to protect the safety of the structures. Water eliminates the lubricants of the moving parts of the track, speeds up their aging process and interferes with the workings of point motors. In this case, preventive or corrective measures are necessary: increased frequency of the periodical lubrication of the systems, monitoring of the condition of catenary supports in the event of landslides in excavated zones, etc.
A slight rise in the mean sea level can significantly increase the inland penetration of salt water. This will affect the maintenance of the permanent pumps that lower the level of the water table in underground passages along the coast. These systems are designed to pump fresh water. Furthermore, the concrete used in underground structures is not adapted to contact with salty or brackish water.
Additionally, problems may appear in the infrastructure itself.
We can assume that the rise in sea level will result in effects of submersion that will be worsened by the effect of the swell by the sea, and by the simultaneous occurrence of marine and continental storms by inland watercourses and on wetlands.
Due to their geographical position, guided transport systems are less sensitive to the phenomenon of rising sea levels. However, certain sections of the tram network in Montpellier and Nice could be impacted. Green water could damage the platform of the Balagne secondary line in Corsica. Accidents can be avoided by track patrols and speed restrictions. The track subsystem requires special attention in zones exposed to the marine elements.
7.5 - Rivers A rise in the sea level could result in changes in water levels in river estuaries and canals, and, consequently, modifications in the upstream water flows (water line) that will impact operations.
7.6 - Port and maritime infrastructures For port infrastructures, a rise in the sea level would reduce almost every aspect of their operation and performance, due to the behavior of the waters in the port, the availability of the equipment and the stability of the structures.
First, a rise in the sea level would attenuate phenomena of breaking seas and friction on the ocean floor when swell propagates from the high sea towards port zones. These phenomena depend directly on the depth of the waters. The intensity of swell at the entrance to ports and the swell affecting exterior protective structures would therefore increase. This overall increase in the height of swell will be even greater in ports located in shallow waters.
A simultaneous rise in the water level and the height of the waves will result in increased damage to protective structures and in waves crashing over these structures more frequently. When waves flow over these structures, the water behind them becomes rougher. Similarly, when the quayside is positioned directly at the rear of the protective structures, the working conditions on the quay will be seriously affected by the waves that crash over the structure, and the availability of the quay facilities will be reduced.
In addition to increasing the swell at the entrance to the port, a rise in the water level usually diminishes the shelter provided by the infrastructure. Swell inside ports is usually reduced by diffraction around the structures and the interior contours of the port. The level of attenuation
PNACC, infrastructures and transport systems, action 1 – Adaptation of infrastructures and transport systems to climate change
67
depends on the wavelengths of the waves. An increase in depth due to rising sea levels will increase the wavelengths and, therefore, make the diffraction less efficient. This will result in rougher waters inside the port. There are multiple consequences: a drop in the availability of the berths on the quayside, increased loads on moorings, greater movement of the ships, with possible impacts on safety. Moreover, rougher waters inside the port can also affect the stability of the structures exposed to waves (more frequent and more serious damage).
Examples of impacts due to marine flooding
Between February 27 and 28, 2010, storm Xynthia swept through France. It resulted in violent winds and a storm surge that coincided almost simultaneously with spring tides (coefficient: 102) and high tide, causing sudden and severe marine flooding in the Charente-Maritime and Vendée departments. Around 50 people lost their lives. This episode, and in particular the resulting rise in water levels of almost 1.5 meters, gives us an idea of the possible consequences of a rise in sea level: marine flooding, destruction of protective structures, loss of human life, damage in ports and on railroads near the coast.
7.7 - Airport infrastructures Certain airport infrastructures could be vulnerable to a rise in sea level. A rise in sea level would require additional protection or the relocation of certain threatened facilities, especially in the overseas territories that are more exposed. In French Polynesia, most runways are built on coral reefs and are between 2 and 3 meters above the mean sea level.
Potentially vulnerable airports located in high-risk zones must be identified. Studying a few extreme situations on islands could give us an idea of the most critical current situations that are due to climate change. Impacts that have already occurred or are expected to occur in the short term could be catastrophic, especially when existing land disappears due to submersion.
PNACC, infrastructures and transport systems, action 1 – Adaptation of infrastructures and transport systems to climate change
68
8 - Impacts of changes in biodiversity
8.1 - Highway infrastructures In the coming century, changes in biodiversity could result in different or more frequent maintenance of the landscape, especially if operators are faced with a proliferation of invasive species.
Climate change could modify the distribution of species of fauna and flora, thereby displacing ecological corridors. In this case, existing highway infrastructures may have to be adapted. Similarly, these new corridors should be taken into consideration when designing new infrastructures, in order to allow species to migrate.
In the inter-tropical zones of the overseas territories, climate change would have an indirect effect on the structures protecting coastal roads, through the expected damage done to coral reefs and the associated ecosystems, including mangroves in particular. These ecosystems play an important role in the protection of the coastline. They significantly reduce the energy of swell on the coastline. A coral reef can absorb up to 90% of the impact force of a wave. Elsewhere, the mechanical and chemical deterioration of mangroves could cause them to shrink considerably, and reduce their protective effect on the coastline and the coastal infrastructures located upstream. Studies have shown how the roots and branches of mangroves can reduce the energy of a wave by 75% when it crosses 200 meters of mangrove.
8.2 - Earthworks No impacts of changes in biodiversity have been identified for earthworks.
8.3 - Constructions No impacts of changes in biodiversity have been identified for constructions.
8.4 - Rail Studies are currently underway to determine the role of railway verges as a refuge or habitat. This parameter will probably have consequences in the long term on the maintenance of the infrastructure (railway verges, etc.).
8.5 - Rivers Changes in biodiversity could result in more frequent maintenance of navigable waters and their banks, particularly with regard to invasive species. As a result of the displacement of ecological corridors or changes in the distribution of species, ecological continuity structures, such as fish passages, may have to be adapted.
8.6 - Port infrastructures No impacts of changes in biodiversity have been identified for port infrastructures.

PNACC, infrastructures and transport systems, action 1 – Adaptation of infrastructures and transport systems to climate change
69
8.7 - Airport infrastructures
8.7.1 - Impacts In the inter-tropical zones of the overseas territories, just like for the highway infrastructures (chapter 8.1), the expected deterioration of coral reefs and the associated ecosystems can impact airport infrastructures by affecting the structures that protect the coastline. This is particularly the case in French Polynesia, where most of the runways are built on coral reef platforms.
Changes in the populations of certain species of migratory birds, and in particular, the modification of their distribution, as certain species become sedentary, or the drop in winter mortality, could increase the risk of collisions between birds and aircraft near aerodromes.
For example, the rise in numbers of voles has attracted more birds of prey to many airports. This could explain the increase in the number of collisions between aircraft and birds of prey.
Collisions with birds cause material damage, from the simple deformation of the leading edge of a wing to the partial or total destruction of an engine. Collisions also disrupt operations, particularly delays due to accelerations-stops, about turns, detailed inspections of engines, repairs, etc.
When birds are ingested, the most common causes of accidents are engine failures or acceleration-stop followed by a runway excursion.
The damage caused by birds can be serious and very costly (up to several million euros).
Figure 26: Damage caused to an Airbus following a collision with a bird. Source: STAC.

PNACC, infrastructures and transport systems, action 1 – Adaptation of infrastructures and transport systems to climate change
70
Examples of impacts due to marine flooding
Danger caused by animals is a serious issue for airport operators and aircraft. Since 1912, 90 civil aircraft have crashed worldwide, with the loss of more than 300 lives. Of the 765 incidents reported on French airports per year on average, 8.5% are classified as serious and 4.6% result in damage. The goal is to reduce the number of collisions between animals (mainly birds and mammals) and aircraft at airports. The following example illustrates the consequences of the danger from birds. On August 14, 2013, at Montpellier airport, one of the two engines of an Airbus A320 ingested a black-headed gull on take-off (Figure 26), obliging the aircraft to turn back and make an emergency landing with one engine.
Statistics compiled in France over the last two years, covering about 1,000 incidents with birds, shows that diurnal birds of prey are the cause of most collisions with aircraft (33%). Kestrels, buzzards and black kites were involved in 300 incidents during this period. The number of collisions with these birds per 10,000 aircraft movements has doubled over the last 10 years. Gulls and terns come second, accounting for 19% of incidents.
The overall drop in collisions between animals and aircraft in recent years is the result of well adapted scaring actions taken by the teams on airports that are responsible for combating the threat from birds. The proportion of incidents with lapwings depends on how harsh the winter is, varying from 9 to 12%, depending on the year. Even if the proportion of collisions with swallows and house martins remains high at 13%, these incidents do not usually cause any damage to aircraft due to the small size of the birds. On the other hand, one in three collisions with pigeons, partridges and pheasants results in serious damage to the aircraft. These "dense" birds are dangerous. Crows only account for 3% of impacts, mainly in July and August, when the young birds start to fly, and in foggy weather [30].

PNACC, infrastructures and transport systems, action 1 – Adaptation of infrastructures and transport systems to climate change
71
9 - Table summarizing the potential impacts of climate change by type of infrastructure
Temperature Precipitation Rise in sea level and
increase in high swell
Change in the wind system
Drought Biodiversity
Rise in the mean
temperature
Rise in maximum
temperatures
Drop in the number of
freezing days
Freeze–thaw cycles
Number of days of snow
Rise in the intensity of "extreme"
precipitation
Highways
Construction: qualitatively
favorable effect
Deformation of coatings
Deformation of coatings, wheel tracking, creep, bleeding, loss of
grip
Safety problems caused by forest
fires: poor visibility and road
blocks
Reduced winter maintenance
Reduced winter
maintenance
Road safety: risk of aquaplaning
Rise in the number of days
when the capacity of the
sanitation network is exceeded
Network disruption
Risk of destabilizing
rock fill protection and
the road structures
Flooding
Vulnerable highway
equipment
Safety problems for users,
depending on windage
Cracks in the pavements in
clay soil zones
More frequent landscaping
Displacement of ecological corridors
Overseas territories: increased risk of submersion and
damage to coastal infrastructures due
to the probable deterioration of coral
reefs and mangroves

PNACC, infrastructures and transport systems, action 1 – Adaptation of infrastructures and transport systems to climate change
72
Temperature Precipitation Rise in sea level and
increase in high swell
Change in the wind system
Drought Biodiversity
Rise in the mean
temperature
Rise in maximum
temperatures
Drop in the number of
freezing days
Freeze–thaw cycles
Number of days of snow
Rise in the intensity of "extreme"
precipitation
Earthworks
Shrinkage / swelling of clay: cracks and rising pavements
Shrinkage / swelling of clay: cracks and rising
pavements
Increased frequency of
collapsing slopes (erosion, instability,
deterioration)
Collapse, falling rocks,
landslides, mud slides
Erosion of the structures and the lower parts
of infill, and possible
destabilization of the infill
Problems with erosion,
breaches and the collapse of embankments
Increase in ruptures by
overflow due to the increased occurrence of submersion
Shrinkage / swelling
Bridges and walls
Insignificant effects on thermal
expansion (caution
required for integral bridges)
Effects of self-induced stress to be analyzed
for sections exposed to
multiple factors and hyperstatic
sections
Impact on the use made of the
materials (concrete)
Increased risk of older steel
becoming fragile in severe cold
Positive effect on durability
Changes not properly
identified in the scenarios
Positive effect on durability
Increased risk of erosion of bridge foundations and retaining walls
located in wetlands
Higher risk of carbonation or the penetration of chlorides due to the increase
in wetting / drying cycles
Increased exposure to
brackish water, changes in the currents around their supports
Reduced flow section
Absence of any significant
impacts (caution required for certain light structural
elements with regard to extreme transient
phenomena)
Increased risk of settling

PNACC, infrastructures and transport systems, action 1 – Adaptation of infrastructures and transport systems to climate change
73
Temperature Precipitation Rise in sea level and
increase in high swell
Change in the wind system
Drought Biodiversity
Rise in the mean
temperature
Rise in maximum
temperatures
Drop in the number of
freezing days
Freeze–thaw cycles
Number of days of snow
Rise in the intensity of "extreme"
precipitation
Railroad infrastructures
– Rails
Increased stress in the rails: risk of
deformation (heat waves) or
breakage (cold) of the rail
Malfunction of sectioning devices
Risk of cables overheating in heat
waves
Risk of rail breakages
Blocking of track switching gear
Risk of rail breakages
Blocking of track switching gear
Landslides / flooding:
interference with the operation of
electronic devices and track circuits
More rapid rail corrosion
Deformation of the geometry of the
track
Mud slides forming obstacles to traffic
Malfunction of sectioning devices
in rain or exceptionally high
water levels
Deterioration of the structures
Exceptional wind: span
misalignment adapted to the pantographs
Strong wind: risk to outdoor electric
equipment
Salt air storm: possible
disruption of the track circuits
Clay shrinkage
Railroad infrastructures – Overhead
lines
Malfunction of
sectioning devices
Conducting wire wear, insulators
cease to be effective
Flooding (rain or exceptionally high
waters): malfunction of the sectioning devices
Exceptional wind: span
misalignment adapted to the pantographs
Railroad infrastructures – Substations
Risk of cables
overheating in heat waves
Strong wind: risk
to outdoor electric equipment
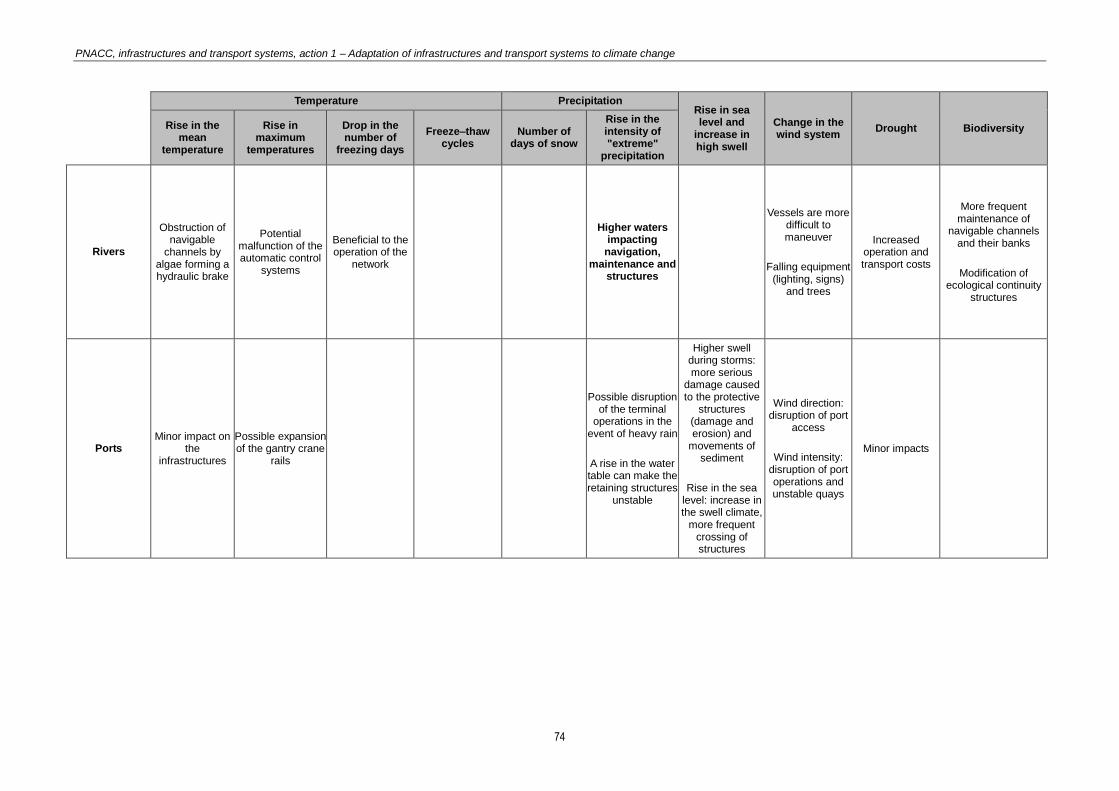
PNACC, infrastructures and transport systems, action 1 – Adaptation of infrastructures and transport systems to climate change
74
Temperature Precipitation Rise in sea level and
increase in high swell
Change in the wind system
Drought Biodiversity
Rise in the mean
temperature
Rise in maximum
temperatures
Drop in the number of
freezing days
Freeze–thaw cycles
Number of days of snow
Rise in the intensity of "extreme"
precipitation
Rivers
Obstruction of navigable
channels by algae forming a hydraulic brake
Potential malfunction of the automatic control
systems
Beneficial to the operation of the
network
Higher waters impacting
navigation, maintenance and
structures
Vessels are more difficult to maneuver
Falling equipment (lighting, signs)
and trees
Increased operation and transport costs
More frequent maintenance of
navigable channels and their banks
Modification of ecological continuity
structures
Ports Minor impact on
the infrastructures
Possible expansion of the gantry crane
rails
Possible disruption of the terminal
operations in the event of heavy rain
A rise in the water table can make the retaining structures
unstable
Higher swell during storms: more serious
damage caused to the protective
structures (damage and erosion) and
movements of sediment
Rise in the sea level: increase in the swell climate,
more frequent crossing of structures
Wind direction: disruption of port
access
Wind intensity: disruption of port operations and unstable quays
Minor impacts

PNACC, infrastructures and transport systems, action 1 – Adaptation of infrastructures and transport systems to climate change
75
Temperature Precipitation Rise in sea level and
increase in high swell
Change in the wind system
Drought Biodiversity
Rise in the mean
temperature
Rise in maximum
temperatures
Drop in the number of
freezing days
Freeze–thaw cycles
Number of days of snow
Rise in the intensity of "extreme"
precipitation
Airports
Longer takeoff distances but in
theory this should not be a
problem
Impact identical to that produced by the rise in mean
temperature
Reduced traffic interruptions and/or delays
Reduced use of glycol (less pollution)
Reduced traffic interruptions and/or delays
Reduced use of glycol (less pollution)
Flooding of runways and
buildings
Higher risk of submersion and deterioration of
the infrastructures
The runways could be rendered
unusable
Violent wind and storms: safety
problems
Impacts of the shrinkage /
swelling of clay
Rise in the number of
uncontrolled forest fires
Changes in the risk of collisions between
birds and aircraft near aerodromes
Overseas territories: increased risk of submersion and
damage to coastal infrastructures due to
the probable deterioration of coral reefs and mangroves
Cable transport systems
Extreme temperatures: disruption of
operations for the sake of the comfort
of users
Higher risk of unstable soil that could result in the deterioration of the
structures
Reduced availability of the
system (stoppages)
Deterioration of
the infrastructure by the most
extreme events
Table 7: Summary of the potential impacts of climate change by type of infrastructure. Source: Cerema.

PNACC, infrastructures and transport systems, action 1 – Adaptation of infrastructures and transport systems to climate change
76
Chapter Technical documentation for the
design, operation and maintenance of transport infrastructures that could potentially be impacted by
climate change

PNACC, infrastructures and transport systems, action 1 – Adaptation of infrastructures and transport systems to climate change
77
The preceding analysis of the potential impacts of climate change on transport infrastructures was made in preparation for the identification of the technical reference materials, standards and official texts that are liable to be impacted by climate change.
This chapter describes the general methodology used to list and analyze these reference documents. The methodologies used to list the documents specific to each type of infrastructure are described in detail in an annex. The lists of reference documents are also included in an annex. They offer a first response to action 1, because they include the reference documents that must be adapted. This response is completed by the last chapter, which addresses the demand for climate projections.

PNACC, infrastructures and transport systems, action 1 – Adaptation of infrastructures and transport systems to climate change
78
10 - Methodology for the analysis of technical reference materials
10.1 - General methodology for all forms of transport In total, several hundred documents (more than 800 for highways alone) were consulted by type of infrastructure, in order to identify the reference documents containing climate-related parameters. The documents were listed using different methodologies, depending on the technical departments involved.
The reference documents for highway infrastructures, highway structures and tunnels were identified by making searches with keywords in the French highways technical documentation database (DTRF). Climatic variables that are liable to change were used as keywords. These same keywords were used for airports, in a set of international, European and French documents. For each domain (highway infrastructures, highway structures, tunnels and airports), the list of reference documents was completed by experts. There are no databases specific to the other types of infrastructures. The corresponding technical departments then listed the documents that they frequently use or have produced. This method applies to rail, maritime and river reference documents, documents specific to urban structures and, finally, documents specific to mechanical lifts and guided transport systems. These lists were completed by searches made in numerous databases (chapter 2). Each technical department then sorted the listed documents on a case-by-case basis, in order to select those reference documents:
containing climatic variables that may or may not influence the design, maintenance or operation of the corresponding infrastructures (highway reference documents, reference documents on maritime and river structures, excepting, in this domain, the operating regulations specific to guided transport systems) ;
containing climatic variables liable to influence the design, maintenance or the operation of the corresponding infrastructures (reference materials specific to tunnels, highway structures or urban constructions, including, for this domain, guides to crisis management that may be subject to change).
It should be noted that the reference documentation produced by the profession, but not from RST, are not included in this document.
10.2 - Identified reference documents The documents identified in the analysis of the reference material were classified in the following three categories:
category 1: technical reference documents that are not impacted by climate change, but that address climatic notions ;
category 2: technical reference documents that are impacted by climate change and that already need to undergo a technical revision (changes to regulations, standardization actions, etc.) ;
category 3: technical reference documents that absolutely require more precise details of climatic variables or parameters in order to determine whether they have to be revised, and how.
The listed documents were then classified according to three major themes corresponding to construction, maintenance and operations. For each listed document, the keywords that they contain are mentioned. These documents can be found in an annex to the report.

PNACC, infrastructures and transport systems, action 1 – Adaptation of infrastructures and transport systems to climate change
79
Chapter Climate projections that are
necessary to adapt the reference documents

PNACC, infrastructures and transport systems, action 1 – Adaptation of infrastructures and transport systems to climate change
80
The purpose of this chapter is, further to the identification of the reference documents liable to be impacted by climate change, to define the climate projections that are necessary in order to adapt the reference material.
First, it presents the different types of climate projections that may be required, then it specifies the required projections for each major infrastructure category and how they can be used to adapt the reference material.
PNACC, infrastructures and transport systems, action 1 – Adaptation of infrastructures and transport systems to climate change
81
11 - Details of the approach to the subject
11.1 - Spatial or temporal precision? There are different orders of clarification required for the climatic variables. The clarification may be spatial, because the data currently used in the reference documents for the design, maintenance and operation of transport infrastructures and systems is not sufficiently detailed for the territory in order to take the heterogeneous nature of the climate in France, today and in the future, into consideration. Temporal clarification may also be necessary, because the existing data on these parameters is not sufficiently available for timescales that can produce useful statistics. Finally, it may be possible to request spatial-temporal clarification, where necessary.
11.2 - Which variables are covered by these demands for clarification? Clarification may be requested for existing variables, for which the spatial and temporal scales, or both, may have to be specified with greater precision, or for new variables, such as those proposed in Jean Jouzel's analysis that are not currently included in the reference documents. By way of example, the daily amplitudes of temperature are not currently integrated in the highways reference documents, despite the fact that they may represent useful additional information.
11.3 - Changes in meteorological parameters or the indicators calculated using these parameters The distinction must be made between the statistics that are demanded for a given climatic parameter, and the definition and the calculation of the indicator that is, or will be, produced by the competent departments in the field, using these statistics. This indicator can be produced from one or several meteorological parameters using a determined calculation formula, or be based on a statistical analysis of one or several parameters.
If we consider the frost indices used to verify the freezing of pavements in the dimensioning process, the calculation of the frost indices can be requested on a finer spatial-temporal scale than the scale that currently exists in the catalog of new pavement type structures (an average of one datum per department). However, with a new database of frost indices it is possible to choose different indicators that will come into play in the dimensioning reference materials:
the exceptional frost index, which is currently defined as the harshest since 1951 ;
the unexceptional harsh frost index, which is currently defined as the index of harshness of frost that occurs once every 10 years ;
etc.
In this case, it is not the meteorological parameter itself that needs to change in the reference documents, but the definition of the indicator that is produced using the completed database. In this way, for example, we may decide that the exceptional frost index is the index that defines the harshest winter on a 30-year sliding scale. With a new database that is spatially more precise, this new definition will allow for the improved dimensioning of infrastructures.
Therefore, for certain parameters, the reference documents are revised in two stages.
The above example also applies if the meteorological parameter is one that is measured directly, rather than a parameter like the frost index, which is the result of a calculation made on a measured parameter, in this case the temperature.

PNACC, infrastructures and transport systems, action 1 – Adaptation of infrastructures and transport systems to climate change
82
The questions addressed in this section apply to the design of infrastructures, but not to their construction. In the latter case, the weather on the building site is what it is and cannot be forecast. Nevertheless, the approach to the construction phase could look into the influence of climate change on current practices. Two situations could arise:
the change in a parameter in the future can produce a change in the quantified value of this parameter in a reference document ;
the change in this parameter in the future can affect the period during which a certain action is possible.
For example, the guide to the treatment of soils (Guide de traitement des sols, GTS) [31] currently states that the minimum temperature for the use of materials treated with hydraulic binders is 5°C. If we consider that the temperature will globally increase in the years to come, it is highly probable that the ranges for the use of these materials will be larger. Consequently, decision-makers are faced with a number of choices:
increase the quantified value of the temperature in the reference documents in order to maintain the quality of the use of these materials, without adding any more constraints to the ones that already exist ;
broaden the ranges in which these products can be used.
12 - Clarification for highways It appears to be useful to improve the reference documents applying to highways and urban thoroughfares (which are equivalent to highways in a first approximation), in view of the impacts of climate change. In recent years, a number of observations tend to illustrate that our knowledge in this domain is insufficient, and that highway pathologies are increasingly linked to surface problems due directly to the climate (the presence of water and variations in the temperature), and to structural problems related to the traffic. Therefore, numerous climatic variables demand greater precision, which is organized in a number of themes in this chapter: pavements, earthworks, sanitation and crisis management in urban environments.
12.1 - List of variables
12.1.1 - Pavements The reference materials applying to the design and construction of pavement layers refer to variables of temperature, precipitation and wind. Many of these variables demand greater precision.
The reference indices of atmospheric freezing are used in the dimensioning of transport infrastructures because the verification of infrastructures with regard to frost is based on the notion of the comparison between the permissible atmospheric frost index of the pavement and the reference frost index, which is calculated according to NF P 98-080-1 (Annex A normative) [32]. The first index depends on the nature of the materials making up the pavement and the platform, and mainly on their thickness. The second index depends on the geographical location of the project. The calculation is based on our knowledge of the mean daily temperature.
Thorough knowledge of regional frost indices is essential in order to adjust the dimensioning of new infrastructures to frost. Current data includes about 95 values for the whole of France, which is not enough to describe the variations in the climate and to take proper account of topography. Recent works with Météo France have drawn up a regional distribution according to a mesh on a scale of 1 km for France, but this new data has not been incorporated in the reference documents. Therefore, this variable needs to be regionalized. The same applies to the revision of the rankings of the indices used as references for dimensioning purposes. Without revising these rankings, the infrastructures will be almost systematically over-dimensioned.

PNACC, infrastructures and transport systems, action 1 – Adaptation of infrastructures and transport systems to climate change
83
Seasonal temperature cycles influence the mechanical characteristics of bituminous materials. They are taken into consideration through the "equivalent temperature" parameter in the dimensioning of pavements made of so-called "black" materials. In France, an equivalent temperature of 15°C is used. Improved spatial knowledge of the mean daily atmospheric temperature would allow the value of the equivalent temperature and, consequently, the dimensioning of the pavements, to be regionally refined. Dividing France up into three "equivalent temperature" zones appears to be sufficient and would prevent the current usage of this parameter from becoming too complex. Taking topography into account would also be useful (on a scale of more than one station per department).
The mean, maximum and minimum daily, monthly and annual temperatures are also taken into consideration in the choice of the nature of the hydrocarbon binders and the hydrocarbon mixes. Consequently, hard grade binders are used in the hottest regions, because they are more resistant to creep. Softer grade binders are used in more severe winter climates, because they are more resistant to thermal cracking. The old guide to the application of standards for asphalts (Application des norms enrobés) [33] and the special technical specifications (Cahier des clauses techniques particulières, CCTP) in document n°27 [34] apply the tables of the main climates encountered in France (oceanic, meridional, continental or mountainous), with the zones of use of certain products, also according to the altitude. The notions of mean daily minimum temperatures in January/February or mean daily maximum temperatures in July/August are also taken into consideration.
A finer spatial knowledge of the amplitudes of annual temperatures (the minimum and maximum pavement surface temperatures) and of the daily amplitudes of the temperature could be used to define the regions where hydrocarbon binders could potentially be used in the future. In particular, improved knowledge of the daily amplitudes would allow for a better understanding of the damage caused to the network. With the current specifications, climate change could be the cause of impacts such as an increase in wheel tracking, bleeding asphalts and of more restrictive conditions applying to the use of concrete, in particular.
The wind figures in numerous special technical specifications, which state that the laying of asphalt should be avoided when the wind speed is higher than 30 km/h. The forced convection caused by the wind tends to cool the material too quickly, and prevents it from achieving the required degree of compactness. Precipitation can also play a major role in the application of materials, which is prohibited for certain materials under certain rainy conditions. It also affects the time taken by the materials to set and to achieve the mechanical performances over time that are defined in the formulation studies. These latter two parameters need to be clarified, because they can influence the length of the projects and the calculation of the number of days of poor weather on the basis of up-to-date statistics for the next century. The special case of the use of concrete needs to be investigated, because several documents contain specifications for its use and also condition its use according to snowfall or H1 climate zones.
12.1.2 - Earthworks The rules applying to the design and construction of earthworks refer to, amongst others, the water content of the material used. Variations in this content affect the bearing capacity, the swelling and the slipperiness of the material and its possible reuse. Therefore, they directly affect the smooth execution of the construction of the earthworks.
The variations in the water content of the materials depend on the weather conditions measured by the climatic variables. In simplified terms, three main sets of variables affect earthworks:
variables in the water input in the materials. Most of the time, this input comes from precipitation. The precipitation, and particularly its frequency and intensity, as observed during the extraction and installation of the material, determine the use of the earthworks materials. Under certain rainfall conditions (storms, etc.), the use of the materials may be prohibited. Finally, precipitation is included in the calculation of the forecasts of the number of days when the work site is shut down, as indicated in the special technical and administrative specifications. An increase in the frequency of heavy rain could make

PNACC, infrastructures and transport systems, action 1 – Adaptation of infrastructures and transport systems to climate change
84
embankments more fragile (landslides, etc.), erode the soil and/or destroy earthworks (settling, etc.) ;
variables in the water losses from the soils. These variables characterize the evaporative capacity of the atmosphere. This capacity is measured in terms of the potential water losses. The potential water losses influence the water content of the material and, therefore, the strategies for the construction and the maintenance of the earthworks. In particular, shrinkage due to water losses can result in cracks in the road platforms or surface instability in the embankments. An increase in settlement may occur on roads with low to moderate traffic that have a thin to averagely thick pavement structure and are built on soils that are sensitive to shrinkage and swelling. The potential water losses are included in the calculation of the forecasts of the number of days when the work site is shut down, as indicated in the special technical and administrative specifications.
Other variables:
o frost (frequency and intensity): this variable can influence the work site schedule and interfere with other activities. For example, in certain periods, frost can prevent grass from being laid and shrubs from being planted ;
o wind: in addition to its evaporating effect, the wind can also inhibit treatment with hydraulic binders, the installation of fine sand infill, etc. ;
o snow: snow can act as a significant wetting agent ;
o fog: fog creates unsafe conditions and can also result in site shutdowns ;
o storms: storms can cause erosion or even destruction of structures.
Precise knowledge with a spatial dispersion relative to the major geographical assemblies:
mean monthly heights in mm :
the number of days when precipitation exceeds a given threshold (1 and 5 mm) per month over the last 30 years ;
accumulated rainfall in excess of 100 mm on a 3-day sliding scale ;
the number of days with rainfall in excess of 10, 25, 50 and 100 mm ;
the mean monthly potential water loss by evaporation over a 10-year period ;
the mean monthly temperature ;
the number of days when the wind exceeds a given threshold (30 km/h) per month over the last 10 years ;
the number of days when the temperatures are below a given threshold (5°C) per month over the last 30 years ;
the intensity and the duration of frost in the last 10 years and the probability of the appearance of the first frost.
would allow for a better understanding of the conditions of use of the earthwork materials and of the work site schedule.
12.1.3 - Sanitation The precipitation intensity parameter influences the dimensioning of highway sanitation structures. The input data is the intensity of the rain over different recurrence intervals, usually between 10 and 100 years. Precipitation data over very short periods of between 6 to 30 minutes is necessary in order to calculate the flow rates that are used to dimension the sanitation structures (platform constructions, storm basins, restoration of the normal flows). According to the current specifications in this field, there is a risk of structures being under-dimensioned, because the frequency of extreme rainfall is liable to increase.

PNACC, infrastructures and transport systems, action 1 – Adaptation of infrastructures and transport systems to climate change
85
12.1.4 - Crisis management in urban environments It could be useful to revise the guides to the management of crises in urban transport. The rise in the frequency of extreme events will probably impact these guides, even if the climatic variables that they use are not included in the formulas.
In an urban context, an extreme weather event can impact large populations, the operation of several modes of transport (passenger cars, public transport, green transport) and the resilience of the city in all its complex aspects (human, economic and strategic). Therefore, the crisis management plans must be capable of guiding large populations, taking the diversity of the users into consideration and restoring the connections that are essential to the human, economic and strategic activities in the city.

PNACC, infrastructures and transport systems, action 1 – Adaptation of infrastructures and transport systems to climate change
86
12.2 - Summary of the required clarification on the climatic variables used in highways reference documents
Variables Observed climate phenomena Sub-variable Requirement for precision
Spatial scale
Requirement for precision
Temporal scale
Jouzel's variables
Frost Reduction throughout France
Intensity and duration of frost: frost indices
Sufficient to produce 25°C/d iso-value maps
At least 30 years (currently 60 years to select the
indicator) To be compared with T08,
T09 and T10 Probability of the appearance of the first frost
To be determined so that changes in decades can be taken
into consideration from the temporal perspective
By decade for example (10-day period sufficient for
work site planning purposes – to be defined)
Precipitation
Possible drop in the number of days of precipitation in spring and summer
Drop in the number of days of snow
Reduced frequency and increased intensity of extreme events
Maximum intensity over a period of 6 min
Minimum, mean and maximum intensity (hourly, daily, monthly, annually)
Number of days of drought
Number of days when precipitation exceeds a given threshold (1 to 5 mm)
Accumulated rainfall in excess of 100 mm on a 3-day sliding scale
Number of days with rainfall in excess of 10, 25, 50 and 100 mm
To be determined. Numerous case-by-case studies on the
scale of the highway drainage basin
30-year statistics and extreme events (centennial
floods, etc.)
To be compared with P01, P02, P03 and P04

PNACC, infrastructures and transport systems, action 1 – Adaptation of infrastructures and transport systems to climate change
87
Variables Observed climate phenomena Sub-variable Requirement for precision
Spatial scale
Requirement for precision
Temporal scale
Jouzel's variables
Temperature
Rise in mean temperatures
Rise in the frequency and intensity of extreme phenomena
Mean monthly maximum and minimum temperatures
Mean monthly temperatures
Abnormally high number of days of Tmax (heat wave)
Number of days when the temperatures are below a given threshold (5°C) per
month over the last 30 years
Scale of the Symposium zones or scale proposed by the weather
models (8 km mesh on the territory), to be defined
30-year statistics and extreme events (heat wave)
T02
T03
T05
Wind
For metropolitan France: a slight downward tendency in the south of
the country and signs of undetermined changes in the north.
Uncertain projections
The number of days when the wind exceeds a given threshold (30 km/h) per
month
To be determined for 10 km/h zoning Measurement mesh to be
defined Over the last 10 years
V01 for extreme winds
Evaporation, exposure to
sunlight
Mean potential monthly water loss due to evaporation
Determine the possible zoning
10-year statistics are sufficient because there is
less dispersion than with the other parameters
Fog Idea of frequency for the
scheduling of works
Table 8: Summary of the required clarification on the climatic variables used in highways reference documents. Source: Cerema.
In more global terms, and as several technical documents already propose, it could be useful to maintain nationwide climate zoning for France, which would combine certain precipitation and temperature parameters to be determined.

PNACC, infrastructures and transport systems, action 1 – Adaptation of infrastructures and transport systems to climate change
88
13 - Clarifications for highway constructions
13.1 - Temperature Clarifications are necessary on the hypotheses to be applied to the number of days of frost and to freeze–thaw cycles. These parameters have a direct influence on the durability of the materials that make up the structures. When combined with the number of days of snow, they can be used to determine the intensity of salt spreading operations on roads. This quantity of salt is used in the aging models of the structures, on which the asset management policy relies in order to optimize maintenance actions. Resistance to frost, to freeze–thaw cycles and to chlorides are essential characteristics of the formulation of concretes used in new structures. They are used to adapt the concrete to the foreseeable environmental conditions in the structure's lifetime (100 years). This data is also essential to assess the vulnerability of existing structures to mechanical and physical-chemical attacks.
13.2 - Precipitation Knowledge of changes in flooding phenomena is important. Rainfall hypotheses used to determine how the frequency of floods, their intensity and their extreme values will change must be found. This input is used to study the risks of erosion of the structures' supports (bridges and retaining walls) and of the access embankments and, therefore, the preventive measures to be taken. The hydraulic transparency of the measures taken for the infrastructures can be verified by applying these hypotheses.
13.3 - Wind The characteristics of extreme winds (in excess of thresholds) are necessary to assess their effects on cable-stayed structures and highway equipment (signage gantries, noise barriers, etc.). However, additional data on the possible modifications of the turbulence systems or the durations for which the wind levels are exceeded is essential in order to assess certain effects of the wind on parts of the structures.

PNACC, infrastructures and transport systems, action 1 – Adaptation of infrastructures and transport systems to climate change
89
13.4 - Summary of the required clarification on the climatic vari ables used in construction reference documents
Variables Observed climate phenomena Sub-variable Requirement for precision
Spatial scale
Requirement for precision
Temporal scale
Jouzel's variables
Temperature
Rise in mean temperatures
Rise in the frequency and intensity of extreme phenomena
Mean annual maximum and minimum temperatures
Abnormally high number of days of Tmax (heat wave)
Annual temperature amplitude
Daily temperature amplitude
Minimum and maximum daily temperatures
Scale proposed by the weather models (8 km mesh on the
territory) Statistics for 30 years
T02
T03
T05
Frost
Reduction throughout France
Intensity and duration of frost: frost indices
Sufficient to produce 25°C/d iso-value maps
At least 30 years (currently 60 years to select the
indicator) To be compared with T08, T09 and
T10 Probability of the appearance of the first frost
To be determined so that changes in decades can be taken into
consideration from the temporal perspective
By decade for example (10-day period sufficient for
work site planning purposes)

PNACC, infrastructures and transport systems, action 1 – Adaptation of infrastructures and transport systems to climate change
90
Variables Observed climate phenomena Sub-variable Requirement for precision
Spatial scale
Requirement for precision
Temporal scale
Jouzel's variables
Precipitation
Possible drop in the number of days of precipitation in spring and summer
Drop in the number of days of snow
Reduced frequency and increased intensity of extreme events
Maximum intensity over a period of 6 min
Minimum, mean and maximum intensity (hourly, daily, monthly, annually)
Number of days of drought
To be determined along a watercourse
Statistics for 50 years
50-year or centennial flow rate
To be compared with P01, P02, P03
and P04
Wind
For metropolitan France: a slight downward tendency in the south of
the country and signs of undetermined changes in the north.
Uncertain projections
Case-by-case for constructions
sensitive to the effects of the wind
Statistics for 50 years
50-year speed
Adjustment of the Gumbel and Weibull laws of the
extreme speeds
Determination of the peak factors
Characteristics of the turbulence
V01
Table 9: Summary of the required clarification on the climatic variables used in construction reference documents. Source: Cerema.
PNACC, infrastructures and transport systems, action 1 – Adaptation of infrastructures and transport systems to climate change
91
14 - Clarification for railroads
14.1 - Temperature It is necessary to know the durations and scale of hot periods in order to optimize the frequency of network maintenance operations and to improve the specifications for the "tropicalization" of the equipment and the rolling stock.
The exploration of zones sensitive to the shrinkage of clay and the stability of the track is essential in order to guarantee traffic safety.
Clarifications are necessary about the number of days of frost and freeze–thaw cycles.
14.2 - Precipitation Knowledge of changes in flooding phenomena is important. Rainfall hypotheses used to determine how the frequency of floods, their intensity and their extreme values will change must be found. Control of the risk of flooding requires reliable regional forecasts with 30-, 100- and 1,000-year recurrence intervals.
To anticipate the preventive measures to be taken, it is necessary to know the quantities of snow for traffic management purposes and to avoid the phenomenon of becoming unaccustomed.
Like for the changes in the temperature, zones sensitive to the swelling of clay and the stability of the track must be explored in order to guarantee traffic safety.
14.3 - Wind The characteristics of extreme winds are necessary to assess the effects on the power supply system and traffic management.
14.4 - Globally The main point here consists of finding the right balance in the investments in infrastructure and equipment required to cope with climate change. We recommend a three-step approach:
first, review the design and inspection standards of the structures and equipment in order to detect in sufficient time any early wear, obsolescence or fragilization phenomena that could result from harsher climate conditions, and to design a more robust means of production ;
second, adapt the maintenance cycles accordingly in order to maintain the service life of the affected assets, as far as this is possible ;
third, as investments in replacements or capacity become necessary, always include aspects containing the criteria of resilience to future climate conditions.
In this way, the reference climate data will be of use in the climate-proofing of the investments. It is also necessary to define the climate governance relating to transport.

PNACC, infrastructures and transport systems, action 1 – Adaptation of infrastructures and transport systems to climate change
92
14.5 - Summary of the required clarification on the climatic v ariables used in rail reference documents
Variables Observed climate phenomena Sub-variable
Requirement for precision
Spatial scale
Requirement for precision
Temporal scale
Jouzel's variables
Temperature
Rise in mean temperatures
Rise in the frequency and intensity of
extreme phenomena
Mean annual maximum and minimum temperatures
Abnormally high number of days of Tmax
(heat wave)
Annual temperature amplitude
Daily temperature amplitude
Minimum and maximum daily temperatures
Scale of the Symposium zones or scale proposed by the weather models (8 km
mesh on the territory)
Changes over 30, 50 and 100 years
T01 T02 T03 T05
Frost Reduction throughout France
Intensity and duration of frost: frost indices Sufficient to establish maps of iso-values on a regional
scale
On a timescale of at least 30 years To be
compared with T04, T08, T09
and T10 Probability of the appearance of the first frost
To be determined so that changes in decades can be
taken into consideration from the temporal perspective
By decade, for example (10-day period sufficient for
work site planning purposes)

PNACC, infrastructures and transport systems, action 1 – Adaptation of infrastructures and transport systems to climate change
93
Variables Observed climate phenomena Sub-variable
Requirement for precision
Spatial scale
Requirement for precision
Temporal scale
Jouzel's variables
Precipitation
Possible drop in the number of days of precipitation in spring and summer
Drop in the number of days of snow
Reduced frequency and increased
intensity of extreme events
Daily rainfall
Maximum annual rainfall lasting 6 min, 30 min, 1 h, 6 h and 24 h
Minimum, mean and maximum rainfall by season or annually (hourly, daily, monthly,
annual)
Accumulated rainfall over 3, 15 and 30 days
Number of days of drought
Number of rain events by season
Mean duration of rain events by season
Map of rainfall and intensities (precise to within a km²)
Regional map of storm
corridors (precise to within a km²)
Data on the scales proposed
by the weather models (certain data is already given
on a km² scale)
Changes over 30, 50 and 100 years
Changes in the recurrence intervals of the rainfall and intensity parameters (for recurrence intervals of 10
and 100 years)
Seasonal distribution of rain and periods of drought
P01 P02 P03 P04 P05
Wind
For metropolitan France: a slight downward tendency in the south of the
country and signs of undetermined changes in the north. Uncertain
projections
Number of days with wind above a threshold (to be determined)
Number of storm type events
Changes over 30, 50 and
100 years V01 for extreme
winds
Evaporation, exposure to
sunlight
10-year statistics are sufficient because there is
less dispersion than with the other parameters
Fog Frequency Idea of frequency for the
scheduling of works
Hail
Storms of mixed rain and hail – worsening factors for run-off and the transportation of solids (plant debris,
mud, etc.)
Location of hail storms
Map of the number of days of precipitation with hail/year (map to within a km² to be cross-referenced with the
map of the storm corridors)
Change over 10 and 30 years
Lightning Location and number of strikes/day Map of lightning strikes
(number/day – number/year) Statistics over 10 and 30
years

PNACC, infrastructures and transport systems, action 1 – Adaptation of infrastructures and transport systems to climate change
94
Variables Observed climate phenomena Sub-variable
Requirement for precision
Spatial scale
Requirement for precision
Temporal scale
Jouzel's variables
Seasonal water table fluctuation
Increase in the scale of seasonal water table fluctuation
Piezometric head
Amplitude of the variations
Regional map (the finest possible data)
Change over 30 years
Change in plant cover
Change in run-off conditions Location of changes in plant cover (seasonal
and multi-year) Map of changes in crops and
natural vegetation Change over 10, 30 and
100 years
Table 10: Summary of the required clarification on the climatic variables used in rail reference documents. Source: Cerema, RFF, SNCF, STRMTG.

PNACC, infrastructures and transport systems, action 1 – Adaptation of infrastructures and transport systems to climate change
95
15 - Clarification for the river and maritime domains An analysis of the reference material shows that two types of climatic variables are used:
variables with values that are determined on the basis of local statistics (the notion of recurrence intervals) ;
variables whose values are defined by documents.
15.1 - Variables based on statistical studies (notion of recurrence intervals)
15.1.1 - Water levels Water levels are included in the design of infrastructures on several levels. For example, the minimum level is necessary to substantiate the stability of constructions, the maximum levels are required to determine the levels of the infrastructures and to dimension them under the maximum hydraulic load, the mean levels are necessary for the operation of mobile dams, etc.
Good knowledge of the water levels is necessary to dimension these infrastructures, because they can influence the geometry and the stability of the constructions. The dimensions of the constructions are also based on the recurrence intervals of the water levels, as defined in the reference material and studied for each construction. Therefore, these levels are defined using statistical methods. The inclusion of the values of projections of rises in sea level in infrastructure projects has created the need for more regionally based values.
The question is also raised of how to take this rise in sea level into consideration. For example, when a construction is designed to last 100 years, which sea level should be used to determine the dimensions (today, in 50 years, in 100 years?). When structures are dimensioned in X years, is the same performance expected of them? Which water level should be used to assess the corrosion of structures and improve their durability?
15.1.2 - Swell Swell is an important dimensioning variable (that is closely linked to the water level in coastal areas) in the design of maritime infrastructures. Like for the quasi-static action of the water level, the representative values and the calculation values of swell are based on statistical data that can be used to define swell projections in order to dimension the constructions. Projections of the amplitude and periods of swell are necessary. Then, it is necessary to look into the inclusion of these projections in the dimensioning process.
Moreover, the pressure fields are also necessary to determine swell at sea. Knowledge of these future pressure fields allows the onshore and the offshore swell climates to be determined. Consequently, this data is essential to determine the swell variable and, therefore, the design of the structures.
15.1.3 - Flow rates For river infrastructures, knowledge of the low-water flow rates, the mean daily, monthly and annual flow rates and the high-water flow rates (annual, decennial, centennial, etc.) is necessary to design and operate the structures. Values based on the recurrence intervals of a phenomenon are still used in order to apply values that are representative of the events. Here again, we must think about the projections of these parameters on a local scale and about how they can be incorporated into the reference materials.
PNACC, infrastructures and transport systems, action 1 – Adaptation of infrastructures and transport systems to climate change
96
15.2 - Variables used as input
15.2.1 - Ice Ice is mentioned as a load that can be exerted on certain parts of hydraulic structures. The values are determined using German regulations.
15.2.2 - Wind Mean wind speeds, wind roses and extreme events are used in the dimensioning process of maritime infrastructures. The wind maps used are included in the Eurocodes.
Operating rules are often linked to these wind conditions, so a change in the occurrence of events can impact port operations.
15.2.3 - Snow Reference is made to the Eurocode maps, with possible updates according to the projections.
15.2.4 - Temperature Reference is made to the Eurocode maps, with possible updates according to the projections.
15.3 - In summary For weather variables demanding specific site studies based on statistical data, it is necessary to know the projections of the values of the variables and to think about their inclusion in the dimensioning process of the infrastructures.
For weather variables given in documents, the question of updates of the reference maps used for dimensioning should be asked, as well the question of how the projections should be incorporated in the dimensioning process or the operating rules.

PNACC, infrastructures and transport systems, action 1 – Adaptation of infrastructures and transport systems to climate change
97
15.4 - Summary of the required clarification on the climatic variables used in river and maritime reference documents
Variables Observed climate phenomena
Sub-variable
Requirement for precision
Spatial scale
Requirement for precision
Temporal scale
Jouzel's variables
Sea level Rise in sea level
Maps of iso-values on a regional scale
Changes over 30, 50 and 100 years
Swell climate at sea
Atlas of swell in the future for metropolitan France and
overseas territories Changes over 30, 50 and 100 years
Precipitation
Possible drop in the number of days of
precipitation in spring and summer
Drop in the number of days of snow
Reduced frequency and increased intensity of
extreme events
High water
Low-water flow
Maps of high waters on a regional scale
Maps of low-water flows on a regional scale
Changes over 30, 50 and 100 years
Table 11: Summary of the required clarification on the climatic variables used in river and maritime reference documents. Source: Cerema, VNF.

PNACC, infrastructures and transport systems, action 1 – Adaptation of infrastructures and transport systems to climate change
98
16 - Clarification for airports According to the analysis of the reference material, the weather variables used in the operation of the infrastructures are variables that constitute input data or calculated mean temperatures. If the climate changes, then the input data changes, but the formulas or the calculations in which it is used are not called into question.
16.1 - Climate typology The standards and recommendations applying to the design of airport pavement infrastructures are based on highway standards and, therefore, follow developments related to highways. The need for clarification mentioned in chapter 12.2 could apply to the design of airport pavements. However, even if airport pavements have usage qualities that are identical to those of highway pavements, the loads applied by the traffic are highly variable, in terms of intensity and number. These characteristics and particularities result in different choices of components of the asphalts and bituminous products and their formulation, and in the adaptation of the modalities of use and control. The guide to the application of standards entitled "Bituminous mixtures and surface dressings for airport pavements" [35] published by the civil aviation technical center of the French civil aviation authority (STAC), proposes the characteristics and formulas used in France for all the hot bituminous mixtures that can be used as surface, binder and base courses, for surface wear coatings and micro-asphalts. The specifications for the choice of products are guided by the notion of the levels of stress that are the result, for a given aerodrome, of the combination of two factors: the class of the traffic and the type of climate. It is this second factor that could potentially change.
Four types of climate have been defined, on the basis of the temperature readings taken by Météo France over many years, of the mean daily maximum temperatures in the hottest two months and the mean daily minimum temperatures in the coldest two months of the year:
Type 1: predominantly oceanic ;
Type 2: predominantly Mediterranean ;
Type 3: predominantly continental or mountainous ;
Type 4: predominantly tropical.
According to climate change data, the climate at certain airports could change, thereby also changing the levels of stress. This means that different products may be chosen.
Mean daily maximum temperature in the two hottest months
T 27°C T > 27°C
Mean daily minimum temperature in the two coldest months
T > 14 °C Type 4: predominantly tropical
0°C ≤ T ≤ 14°C Type 1: predominantly
oceanic Type 2: predominantly
Mediterranean
T < 0°C Type 3: predominantly
continental or mountainous N/A
Table 12: Definition of the type of climate. Source: STAC.
PNACC, infrastructures and transport systems, action 1 – Adaptation of infrastructures and transport systems to climate change
99
More precise details of the mean daily minimum temperatures in the coldest two months and the mean daily maximum temperatures in the hottest two months will allow those airports where the climate is liable to change to be identified.
Moreover, certain airports near the coast are equipped with structures to provide protection against swell and tides. These structures are dimensioned according to the standards and regulations applying to the maritime and river domains. Therefore, the need for clarification mentioned in part 95 also applies to these structures.
16.2 - Airport reference temperature In Volume I (Aerodrome Design and Operations) of Annex 14 to the Convention on International Civil Aviation [36], the ICAO – the International Civil Aviation Organization – recommends that the mean daily maximum temperature in the hottest month of the year (the hottest month being the month in which the mean monthly temperature is the highest) should be considered as the airport's reference temperature. This temperature should be a mean value over several years.
16.3 - Wind Aerodromes must be designed to accept aircraft under most of the normal wind conditions. A tail wind on one runway is a head wind on a runway facing the opposite direction. The length of the runway increases with tail winds, or when the notion of two-way runways is used (i.e., by theoretically using a head wind under all circumstances to establish the length of the runway). It is the zero wind condition that is critical to both takeoffs and landings. However, this requires a change in the direction of use of the runway every time the wind changes, and the runway is not sufficiently long for movements that are made with a tail wind, due to the preferred use of the runway. This problem is made more complicated by the fact that the wind is qualified as "calm" up to a speed of 9.2 km/h (5 kt). The landing performance graphs and tables drawn up by the FAA (Federal Aviation Administration) are ordinarily based on a tail wind of 9.2 km/h (5 kt) that takes the necessary flexibility when landing into consideration. On the other hand, they are drawn up for zero wind. In the documents intended for airport planners that provide the aircraft characteristics, the takeoff performance graphs are drawn up for zero wind and the landing performance graphs are established for zero wind at a height of 15 m (50 ft).
The ICAO [36] recommends the following measures with regard to crosswinds when determining the direction, the position and the number of runways:
it should be assumed that the landing or takeoff of airplanes is, in normal circumstances, precluded when the crosswind component exceeds :
o 37 km/h (20 kt) in the case of airplanes whose reference field length is 1,500 m or over; however when poor runway braking action owing to an insufficient longitudinal coefficient of friction is experienced with some frequency, a crosswind component not exceeding 24 km/h (13 kt) should be assumed ;
o 24 km/h (13 kt) in the case of airplanes whose reference field length is 1,200 m or up to but not including 1,500 m ;
o 19 km/h (10 kt) in the case of airplanes whose reference field length is less than 1,200 m.
Supplement A, Section 1 of Volume I of Annex 14 [36], contains indications on the factors that affect the evaluation of the coefficient of use and on the possible margins to be allowed in order to take the effect of exceptional conditions into consideration.
The selection of data to be used for the calculation of the usability factor should be based on reliable wind distribution statistics that extend over as long a period as possible, preferably of not less than five years. The observations used should be made at least eight times daily and spaced at equal intervals of time. The winds mentioned are mean winds. The need to take gusts into

PNACC, infrastructures and transport systems, action 1 – Adaptation of infrastructures and transport systems to climate change
100
consideration is mentioned in Supplement A, Section 1 of Volume I of Annex 14 [36]. Finally, the airport buildings (terminals, control tower, etc.) are usually designed to withstand winds of 130 to 200 km/h, depending on the location.
16.4 - Precipitation The report on friction on contaminated runways (Rapport Adherence sur pistes contaminées) [37] published by the civil aviation technical center of the French civil aviation authority (STAC), defines climatic zones for French aerodromes.
The climatic zones characterize the harshness of the winters and are defined by the calculation of the index of winter accessibility, as explained in the circular published on October 31, 1996 [38]. They are classified as follows:
TR: very severe winter ;
AR: quite severe winter ;
PR: mild winter ;
C: clement winter ;
OM: overseas territory.
By way of example, the airport of Saint Pierre and Miquelon is classified in the "TR" climate zone.
Certain aerodromes could change categories, depending on the rainfall.
16.4.1 - Marine flooding – Ris ing waters It would be preferable to have more precise data on the projections of the rise in waters in France, and more particularly for the overseas territories, where the airports are often on islands at low altitude. A relatively precise map of the foreseeable level of submersion by 2100, that also takes account of the existing protective structures and the topography around airports by the coast, is necessary.
The maximum swell levels in the event of high tides or storms would also be useful. Without these projections, the maximum rise in the water level of 1 m could apply, but this would make the results of the vulnerability analyses quite alarmist, because certain airports would completely disappear.
16.4.2 - Prevail ing winds The existing climatic projections make little mention of the "prevailing winds" variable. It would be useful to have a projection of the possible change in the direction of the prevailing winds. If any such changes are significant, a map of the new prevailing winds, with the new directions correlated with the annual number of foreseeable days, would also be useful.
16.4.3 - Overseas terri tories In general terms, little data is available for the French overseas territories. Even if the "rising waters" parameter is one of the most important unforeseeable factors for aerodromes, more precise details on the frequency and the intensity of cyclones or tropical storms would also be welcome.
16.5 - In summary The texts related to design use formulas that will continue to apply, irrespective of any changes in the climate.
However, some of the data on mean extreme temperatures or the direction and the strength of the wind would be necessary, as would the variation in swell and the sea level. This data would improve the assessment of the vulnerability of airports to climate change. Other additional data required for a more in-depth analysis are shown in Table 13.

PNACC, infrastructures and transport systems, action 1 – Adaptation of infrastructures and transport systems to climate change
101
16.6 - Summary of the required clarification on the climatic variables used in airport reference documents
Variables Observed climate phenomena Sub-variable Requirement for precision
Spatial scale
Requirement for precision
Temporal scale
Jouzel's variables
Temperature
Rise in mean temperatures
Rise in the frequency and intensity of
extreme phenomena
Mean daily minimum temperatures in the two coldest months (see buildings and earthworks and
pavement maintenance)
Mean daily maximum temperature
See highways domain. As close
as possible to the airports
See highways domain. Changes over 30, 50 and
100 years
T02 T03 T05
Precipitation
Possible drop in the number of days of precipitation in spring and summer
Drop in the number of days of snow
Reduced frequency and increased
intensity of extreme events
See highways domain (formulation of the materials and drainage
basins)
Number of days of drought
See other domains See other domains See highways
domain.
Wind
For metropolitan France: a slight downward tendency in the south of
the country and signs of undetermined changes in the north.
Uncertain projections
Foreseeable change in wind direction
Frequency in days/year of winds in excess of 19, 24 and 37 km/h and
for extreme events
Values of extreme winds (km/h)
Data in the vicinity of airports (within a radius of 10 km)
Changes over 30, 50 and 100 years
V01 for extreme winds

PNACC, infrastructures and transport systems, action 1 – Adaptation of infrastructures and transport systems to climate change
102
Variables Observed climate phenomena Sub-variable Requirement for precision
Spatial scale
Requirement for precision
Temporal scale
Jouzel's variables
Sea level Rise in sea level Foreseeable rise in water levels in
cm Maps of iso-values on a regional
scale (near airports) Changes over 30, 50 and
100 years
Rise in sea level
Swell Maximum swell level and
foreseeable frequency
Atlas of swell in the future for metropolitan France and overseas territories (near
airports)
Changes over 30, 50 and 100 years
Variation in the swell climate
Table 13: Summary of the required clarification on the climatic variables used in airport reference documents. Source: Cerema, STAC.
PNACC, infrastructures and transport systems, action 1 – Adaptation of infrastructures and transport systems to climate change
103
17 - Clarification for the domain specific to mechanical lifts and guided transport systems
17.1 - Main variables Wind and rainfall (snow and precipitation) are the two main variables liable to disrupt cable transport systems and urban guided transport systems. The design and maintenance/operations documents are based on the maps introduced by the Eurocodes.
Periods of intense rain, which may or may not be durable, are the most feared phenomena on secondary or tourist railroads, especially for networks with difficult topography. They can cause sudden damage that can impact the networks.
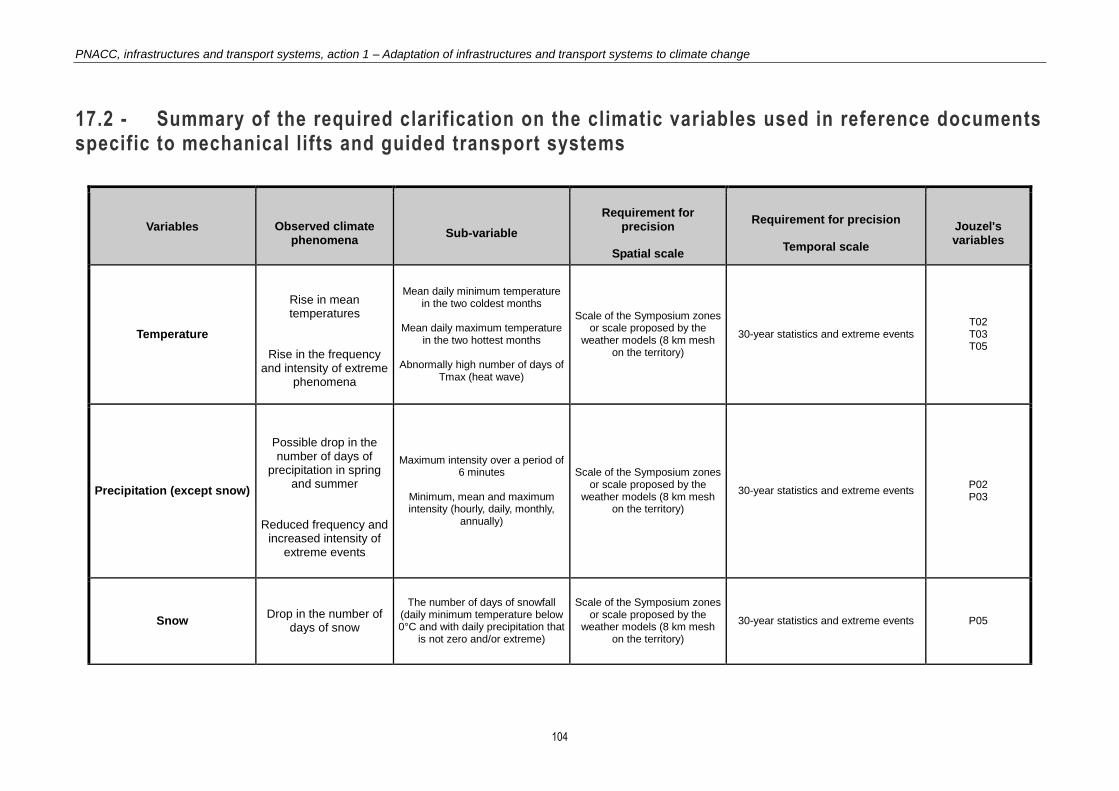
PNACC, infrastructures and transport systems, action 1 – Adaptation of infrastructures and transport systems to climate change
104
17.2 - Summary of the required clarification on the climatic variables used in reference documents specific to mechanical lifts and guided transport systems
Variables Observed climate phenomena
Sub-variable
Requirement for precision
Spatial scale
Requirement for precision
Temporal scale
Jouzel's variables
Temperature
Rise in mean temperatures
Rise in the frequency
and intensity of extreme phenomena
Mean daily minimum temperature in the two coldest months
Mean daily maximum temperature
in the two hottest months
Abnormally high number of days of Tmax (heat wave)
Scale of the Symposium zones or scale proposed by the
weather models (8 km mesh on the territory)
30-year statistics and extreme events T02 T03 T05
Precipitation (except snow)
Possible drop in the number of days of
precipitation in spring and summer
Reduced frequency and
increased intensity of extreme events
Maximum intensity over a period of 6 minutes
Minimum, mean and maximum intensity (hourly, daily, monthly,
annually)
Scale of the Symposium zones or scale proposed by the
weather models (8 km mesh on the territory)
30-year statistics and extreme events P02 P03
Snow Drop in the number of
days of snow
The number of days of snowfall (daily minimum temperature below 0°C and with daily precipitation that
is not zero and/or extreme)
Scale of the Symposium zones or scale proposed by the
weather models (8 km mesh on the territory)
30-year statistics and extreme events P05

PNACC, infrastructures and transport systems, action 1 – Adaptation of infrastructures and transport systems to climate change
105
Variables Observed climate phenomena
Sub-variable
Requirement for precision
Spatial scale
Requirement for precision
Temporal scale
Jouzel's variables
Wind
For metropolitan France: a slight
downward tendency in the south of the country
and signs of undetermined changes in the north. Uncertain
projections
Frequency and direction of extreme winds
Scale of the Symposium zones or scale proposed by the
weather models (8 km mesh on the territory)
30-year statistics and extreme events V01
Table 14: Summary of the required clarification on the climatic variables used in reference documents specific to mechanical lifts and guided transport systems. Source: Cerema, STRMTG.

PNACC, infrastructures and transport systems, action 1 – Adaptation of infrastructures and transport systems to climate change
106
Index of figures
Figure 1: Greenhouse gas (CO2 and CH4) and aerosol precursor gas (SO2) emission scenarios. The emissions produced between 1900 and 2000 are shown on the far left. Then, six scenario families are presented. All the scenarios are equally probable. Source: IPCC, 2007 [7]. .................................................................................................................. 13
Figure 2: Division of France into five main regions. Source: Peings Y., et al., 2011 [4]. ..... 19
Figure 3: Table of the indicators and their variation according to the models and scenarios. In this example, the index (the mean daily temperature in this case) is 10.3°C on average in the reference period of ALADIN-Climat and MAR. For LMDz, the value of the index is 10.2°C. Source: Peings Y., et al., 2012 [5]. ........................................................................ 20
Figure 4: Index T01. Mean daily temperature as an annual mean for the reference period and deviations of the scenarios from the reference. Unit: °C. Source: Peings Y., et al., 2011 [4]. ...................................................................................................................................... 21
Figure 5: Index P01. Mean daily precipitation in summer. Unit: mm/day. Source: Peings Y., et al., 2011 [4]. ................................................................................................................... 22
Figure 6: Index P01. Mean daily precipitation in spring. Unit: mm/day. Source: Peings Y., et al., 2011 [4]. ....................................................................................................................... 22
Figure 7: Index P01. Mean daily precipitation in winter. Unit: mm/day. Source: Peings Y., et al., 2011 [4]. ....................................................................................................................... 22
Figure 8: Index P01. Mean daily precipitation in fall. Unit: mm/day. Source: Peings Y., et al., 2011 [4]. ....................................................................................................................... 22
Figure 9: Index P04. Number of days of drought in the year (on the left) and in the summer (on the right) and deviations between the scenarios and the reference. Unit: day. Source: Peings Y., et al., 2011 [4]. ................................................................................................... 23
Figure 10: Index H01. Minimum annual soil water content for the reference period and deviations of the scenarios from the reference. Unit: kg/m². Source: Peings Y., et al., 2011 [4]. ...................................................................................................................................... 23
Figure 11: Index P05. Number days of snowfall per year (on the left) and in the winter (on the right) Unit: day. Source: Peings Y., et al., 2011 [4]. ...................................................... 24
Figure 12: Index V01. Maximum annual wind speed for the reference period and deviations of the scenarios from the reference. Unit: km/h. Source: Peings Y., et al., 2011 [4]. ...................................................................................................................................... 25
Figure 13: The rise in sea level in comparison with the mean global value in 2080-2099, compared with 1980-1999. Source: Peings Y., et al., 2011 [4]. .......................................... 27
Figure 14: Index T07. Annual number of days of heat wave. Unit: day. Source: Peings Y., et al., 2011 [4]. ................................................................................................................... 29
Figure 15: Index T05. The number of days in the year when the Tmax is 5°C higher than the reference for the reference period and the deviations between the scenarios and the reference. Unit: day. Source: Peings Y., et al., 2011 [4]. .................................................... 30

PNACC, infrastructures and transport systems, action 1 – Adaptation of infrastructures and transport systems to climate change
107
Figure 16: Index P02. Percentage of precipitation above the 90th annual percentile for the reference period and deviations between the scenarios and the reference. Source: Peings Y., et al., 2011 [4]. .................................................................................................................... 30
Figure 17: Index P03. Number of days with more than 20 mm of precipitation for the reference period and deviations between the scenarios and the reference. Unit: day. Source: Peings Y., et al., 2011 [4]. ..................................................................................... 31
Figure 18: Photograph of fill on the RN158 in Macé, France, in which the cracks and settlements became worse after the summer of 2003. Source: Cerema, DTerNC. ............ 43
Figure 19: Illustration of the behavior of electric power supply cables at high temperatures. Source: SNCF. ................................................................................................................... 47
Figure 20: Erosion of a hillside in Brittany following heavy rainfall on 15 January 2008. Source: Olivier Malassingne (Cerema). ............................................................................. 52
Figure 21: Photos of a bridge on the Saint-Étienne River on Réunion Island, which collapsed on 26 February 2007, when Cyclone Gamede hit Réunion. The cyclone was accompanied by heavy precipitation, which eroded certain piles and caused several spans to collapse. Source: DDE La Réunion. ............................................................................... 53
Figure 22: Railroad in Provence, February 2014. Source: STRMTG. ................................ 56
Figure 23: A high-speed train crossing the Angles viaduct near Avignon. Source: SNCF Médiathèque, Christophe Recoura. ................................................................................... 61
Figure 24: Deflectors on the Angles viaduct on the Mediterranean high-speed line. Source: SNCF Médiathèque, Jean-Jacques D'Angelo. ................................................................... 61
Figure 25: Calculation of crosswind. Source: STAC........................................................... 63
Figure 26: Damage caused to an Airbus following a collision with a bird. Source: STAC. . 68
Figure 27: Example of a climatic forecast. Source: Peings Y., et al., 2012 [5].................. 117

PNACC, infrastructures and transport systems, action 1 – Adaptation of infrastructures and transport systems to climate change
108
Index of tables
Table 1: Main characteristics of the RCPs. Source: Moss R.H., et al., 2010 [11]. .............. 14
Table 2: A summary of the models used, the climate change scenarios and the simulated periods. Source: Cerema. .................................................................................................. 16
Table 3: Climate projections for 2099 of temperature and precipitation in European overseas territories. Scenario A1B – IPCC 2007. The ranges of uncertainty (25/75% quartiles) are given in brackets. Source: UICN, 2008 [22]. ................................................ 34
Table 4: A presentation of the temperature indicator and its tendencies (analysis of the climatic indices presented in the reports of the analysis supervised by Jean Jouzel [5]). The scale varies from 1 to 4, where 4 is the maximum. Source: Cerema. ......................... 37
Table 5: A summary of the precipitation indicators and their tendencies (analysis of the climatic indices presented in the reports of the analysis supervised by Jean Jouzel [5]). The scale varies from 1 to 4, where 4 is the maximum. Source: Cerema. ......................... 38
Table 6: A presentation of the violent wind indicator and its tendencies (analysis of the climatic indices presented in the reports of the analysis supervised by Jean Jouzel [5]). The scale varies from 1 to 4, where 4 is the maximum. Source: Cerema. ......................... 38
Table 7: Summary of the potential impacts of climate change by type of infrastructure. Source: Cerema. ................................................................................................................ 74
Table 8: Summary of the required clarification on the climatic variables used in highways reference documents. Source: Cerema. ............................................................................ 86
Table 9: Summary of the required clarification on the climatic variables used in construction reference documents. Source: Cerema. ........................................................ 89
Table 10: Summary of the required clarification on the climatic variables used in rail reference documents. Source: Cerema, RFF, SNCF, STRMTG. ........................................ 93
Table 11: Summary of the required clarification on the climatic variables used in river and maritime reference documents. Source: Cerema, VNF. ..................................................... 96
Table 12: Definition of the type of climate. Source: STAC. ................................................. 97
Table 13: Summary of the required clarification on the climatic variables used in airport reference documents. Source: Cerema, STAC. ............................................................... 102
Table 14: Summary of the required clarification on the climatic variables used in reference documents specific to mechanical lifts and guided transport systems. Source: Cerema, STRMTG. ......................................................................................................................... 105
Table 15: Query in the DTRF of the highways reference material containing climatic variables. Source: Cerema. ............................................................................................. 119
Table 16: The number of references to climatic variables found in the DTRF. Source: Cerema. ........................................................................................................................... 120

PNACC, infrastructures and transport systems, action 1 – Adaptation of infrastructures and transport systems to climate change
109
Table 17: Table summarizing the listing methodologies and the departments involved in the listing of the reference materials and the requests for projections, by type of infrastructure. Source: Cerema. .............................................................................................................. 125
Table 18: Categorized highways reference documents. Source: Cerema. ....................... 137
Table 19: Categorized reference materials for urban highways. Source: Cerema. .......... 139
Table 20: Categorized reference materials for highway constructions. Source: Cerema. 141
Table 21: Categorized rail reference documents. Source: RFF, SNCF............................. 150
Table 22: Categorized maritime, river and port reference documents. Source: Cerema, VNF. ................................................................................................................................. 154
Table 23: Categorized airport reference documents. Source: STAC. ............................... 155
Table 24: Categorized reference documents specific to mechanical lifts and guided transport systems. Source: STRMTG............................................................................... 158
PNACC, infrastructures and transport systems, action 1 – Adaptation of infrastructures and transport systems to climate change
110
18 - Acronyms Al: ministerial decree
ALADIN: limited area, dynamic adaptation, international development
ANR SCAMPEI: French national research agency, climate scenarios for mountain areas: extreme events, snow cover and uncertainties
ARPEGE: small-scale and large-scale research action
BRGM: French geological and mining research bureau
CCAP: specific administrative clauses
CCTP: specific technical clauses
CEN: European Committee for Standardization
Cerema: Center for studies and expertise on risks, environment, mobility, and urban and country planning
CETE: equipment technical research center
CETMEF: maritime and river technical research center
CETU: center for technical research into tunnels
CNRM: Météo-France national meteorological research center
CTCHU: roadways, earthworks, urban roadways
DGAC: French Civil Aviation Authority
DGEC: directorate general for energy and climate
DGITM: directorate general for infrastructure, transport and the sea
DOM-COM: French overseas territories
DS: safety file
DTecEMF: technical division for water, sea and waterways (Cerema, formerly CETMEF)
DTecITM: technical division for transportation infrastructures and materials (Cerema, formerly SETRA)
DTecTV: technical division for territorial development and urban planning (Cerema, formerly CERTU)
DTer: territorial divisions (Cerema, formerly CETE)
DTRF: French road engineering documentation
DVL: crosswind detection systems
EDF-LNHE: Électricité de France – National hydraulic and environmental laboratory
FAA: Federal Aviation Administration
FOD: Foreign Object Debris
GES: greenhouse gases
GTS: guide to the treatment of soils
HT: High Temperature

PNACC, infrastructures and transport systems, action 1 – Adaptation of infrastructures and transport systems to climate change
111
ICAO: International Civil Aviation Organization
IFRECOR: French initiative for coral reefs
IMFREX: impacts of anthropic changes on the frequency of the extreme phenomena of wind, temperature and precipitation
IPCC: Intergovernmental Panel on Climate Change (in French: GIEC)
IPSL: Institut Pierre Simon Laplace
ITAC: technical instruction on civil aerodromes
LGGE: environmental glaciology and geophysics laboratory
LGV: high-speed line
LMDz: zoom climate and meteorology laboratory
LT: Low Temperature
LRS: long welded rail
LTV: temporary speed limit
MAR: regional atmospheric model
MEDDE: Ministry of Ecology, Sustainable Development and Energy
OA: constructions
ORSI: strategic and incentivized research operation
PANS: Procedure for Air Navigation Services
PCI: excellence and innovation center
PIARC: Permanent International Association of Road Congresses
PNACC: national climate change adaptation plan
PPHM: gantries, jib cranes and high masts
RATP: Paris region transport authority
RCP: Representative Concentration Pathways
RFF: French rail network
RFN: National rail network
RM: mechanical lift
RTE: electricity transmission network
SARPS: Standards And Recommended Practices
SETRA: technical department for transport, roads and bridges engineering and road safety
SNCF: French national rail operator
SRES: Special Report on Emissions Scenarios
SSP: Shared Socioeconomic Pathways
STAC: civil aviation technical center of the French civil aviation authority
STARDEX: STAtistical and Regional dynamical Downscaling of EXtremes for European regions
STRMTG: technical department for mechanical lifts and guided transport systems
TSI: Technical Specifications for Interoperability
TG: guided transport system
PNACC, infrastructures and transport systems, action 1 – Adaptation of infrastructures and transport systems to climate change
112
TGV: high-speed train
UIC: international union of railways
UT: processing unit
VH: winter maintenance
VNF: navigable waterways of France
VT: crosswind

PNACC, infrastructures and transport systems, action 1 – Adaptation of infrastructures and transport systems to climate change
113
19 - Bibliography
19.1 - Bibliography of the report [1] Ministry of Ecology, Sustainable Development, Transport and Housing. Plan National d’Adaptation de la France aux effets du Changement Climatique 2011-2015 [online]. 2011, 187 p. [Accessed May 22, 2015]. Available at: <http://www.developpement-durable.gouv.fr/IMG/pdf/ONERC-PNACC-complet.pdf>
[2] Inter-ministerial working group "Impacts of climate change, adaptation and associated costs in France". Impacts du changement climatique, adaptation et coûts associés en France [online]. Interim document. 2008, 247 p. [Accessed May 22, 2015]. Available from: <http://www.developpement-durable.gouv.fr/IMG/pdf/Rapport_complet_0907allegeV2_20-11-08.pdf>
[3] Inter-ministerial working group "Impacts of climate change, adaptation and associated costs in France". Impacts du changement climatique, adaptation et coûts associés en France [online]. Report on the second phase. 2009, 108 p. [Accessed May 22, 2015]. Available from: <http://www.developpement-durable.gouv.fr/IMG/pdf/partie_1_rapport_de_synthese.pdf>
[4] Peings Y., et al. Scénarios régionalisés. Scénarios climatiques : indices sur la France métropolitaine pour les modèles français ALADIN-Climat et LMDz et quelques projections pour les DOM-COM. [online]. Supervised by Jouzel J., 2nd edition. Paris: Ministry of Ecology, Sustainable Development, Transport and Housing, 2011. [Accessed May 22, 2015]. Le climat de la France au XXe siècle, vol. 1, 140 p. Available from: <http://www.developpement-durable.gouv.fr/IMG/pdf/onerc_rapport_misssion_jouzel_25janv2011_complet_V2_Web_VF.pdf>
[5] Peings Y., et al. Scénarios régionalisés. Indices de référence pour la métropole. Scénarios climatiques : indices sur la France métropolitaine pour les modèles français ALADIN-Climat, LMDz et MAR [online]. Supervised by Jouzel J., 1st edition. Paris: Ministry of Ecology, Sustainable Development, Transport and Housing, 2012. [Accessed May 22, 2015]. Le climat de la France au XXe siècle, vol. 2, 303 p. Available from: <http://www.developpement-durable.gouv.fr/IMG/pdf/ONERC_Rapport_scenarios_reference_fevrier_2012_Web_VF.pdf>
[6] Planton S., et al. Évolution du niveau de la mer. Changement climatique et niveau de la mer : de la planète aux côtes françaises [online]. Supervised by Jouzel J., 1st edition. Paris: Ministry of Ecology, Sustainable Development, Transport and Housing, 2012. [Accessed May 22, 2015]. Le climat de la France au XXe siècle, vol. 3, 49 p. Available from: <http://www.developpement-durable.gouv.fr/IMG/pdf/ONERC_Rapport_niveau_de_la_mer_Web_VF.pdf>
[7] IPCC. Climate change 2007: The physical science basis. Contribution of Working Group I to the Fourth Assessment Report of the Intergovernmental Panel on Climate Change [online]. Under the supervision of the editorial team, Solomon, S., et al. Cambridge (UK) and New York (New York state, USA): Cambridge University Press, 2007, 996 p. [Accessed May 22, 2015]. ISBN: 978-0-521-8809-1 (hardback), 978-0-521-70596-7 (paperback). Available from: <www.ipcc.ch/pdf/assessment-report/ar4/wg1/ar4_wg1_full_report.pdf>
[8] IPCC. Special Report on Managing the Risks of Extreme Events and. Disasters to Advance Climate Change Adaptation. Summary for Policymakers. Special Report of the Intergovernmental Panel on Climate Change [online]. Cambridge (UK): Cambridge University Press, 2012, 20 p. [Accessed May 22, 2015]. ISBN 978-92-9169-233-0. Available from: <https://www.ipcc.ch/pdf/special-reports/srex/SREX_Full_Report.pdf>
[9] IPCC. Climate Change 2013: The Physical Science Basis. Contribution of Working Group I to the Fifth Assessment Report of the Intergovernmental Panel on Climate Change [online]. Under the supervision of the editorial team, Stocker T.F., et al. Cambridge (UK) and New York (New York
PNACC, infrastructures and transport systems, action 1 – Adaptation of infrastructures and transport systems to climate change
114
state, USA): Cambridge University Press, 2013, 1535 p. [Accessed May 22, 2015]. ISBN: 978-1-107-05799-1 (hardback), 978-1-107-66-182-0 (paperback). Available from: <https://www.ipcc.ch/pdf/assessment-report/ar5/wg1/WG1AR5_ALL_FINAL.pdf>
[10] IPCC. Emissions Scenarios. A Special Report of Working Group III of the Intergovernmental Panel on Climate Change [online]. Under the supervision of the editorial team, Nakicenovic N., et al. Cambridge (UK) and New York (New York state, USA): Cambridge University Press, 2000, 599 p. [Accessed May 22, 2015]. ISBN: 0-521-80081-1 (hardback), 0-521-80493-0 (paperback). Available from: <https://www.ipcc.ch/ipccreports/sres/emission/emissions_scenarios.pdf>
[11] Moss R.H., et al. The next generation of scenarios for climate change research and assessment [online]. In: Nature, 2010, n°463, pp.747-756. [Accessed May 22, 2015]. DOI: 10.1038. Available from: <http://www.nature.com/nature/journal/v463/n7282/full/nature08823.html>
[12] DGEC / ONERC. Découvrir les nouveaux scénarios RCP et SSP utilisés par le GIEC [online]. Technical summary. 2013, 12 p. [Accessed May 22, 2015]. Available from: <http://www.developpement-durable.gouv.fr/IMG/pdf/ONERC_decouvrir_scenarios_Giec.pdf>
[13] Piazza M., et al., Évaluation du changement climatique sur les zones de montagne en France à partir des méthodes de régionalisation. La Houille Blanche. 2012. In print.
[14] DGEC / ONERC. Synthèse. Prise en compte de l’élévation du niveau de la mer en vue de l’estimation des impacts du changement climatique et des mesures d’adaptation possibles [online]. Technical summary. 2010, 4 p. [Accessed May 22, 2015]. Available from: <http://www.developpement-durable.gouv.fr/IMG/pdf/synth_niveau_mer.pdf>
[15] Laugel, A. Climatologie des états de mer en Atlantique nord-est : analyse du climat actuel et des évolutions futures sous scénarios de changement climatique par descente d’échelle dynamique et statistique [online]. Doctoral thesis: coastal engineering: Paris: Université Paris-Est, 2013, 197 p. [Accessed May 22, 2015]. Available from: <https://tel.archives-ouvertes.fr/file/index/docid/966849/filename/TH2013PEST1120_incomplete.pdf>
[16] Lehikoinen E., et al. Arrival and departure dates [online] In: Advances In Ecological Research, 2004, vol. 35, 31 p. [Accessed May 22, 2015]. Available from: <http://users.utu.fi/karainio/projekti/pdf/Lehikoinen&al_AdvEcolRes2004.pdf>
[17] Tucker, G. M., and Heath, M. F. Birds in Europe: their conservation status. In: BirdLife International, 1994, Conservation Series n° 3. Cambridge (UK).
[18] BirdLife International. State of the world’s birds 2004: indicators for our changing world [online]. Cambridge (UK): BirdLife International, 2004, 73 p. [Accessed May 22, 2015]. ISBN: 0-946888-50-7. Available from: <http://www.birdlife.org/datazone/userfiles/docs/SOWB2004_en.pdf>
[19] Sanderson F.J., et al. Long-term population declines in Afro-Palearctic migrant birds. In: Biological conservation, vol. 131, n° 1, 2006, pp.93-105.
[20] Schultz S., et al. Brain size and resource specialisation predict long-term population trends in British birds. In: Proceedings of the Royal Society of London, 2005, Series B Biological Sciences 272, n° 1578, pp.2305-2311. DOI: 10.1098.
[21] Sol D., et al. Brain size, innovative propensity and migratory behaviour in temperate Palearctic birds. Proceedings of the Royal Society of London, 2005, Series B Biological Sciences 272, n° 1571, pp.1433-1441. DOI: 10.1038.
[22] UICN. Changement climatique et biodiversité dans l’outre-mer européen [online]. Under the supervision of Petit J. and Prudent G. Gland (Switzerland) and Brussels (Belgium): UICN: reprint, 2010, 196 p. [Accessed May 22, 2015]. ISBN: 978-2-8317-1322-9. Available from: <http://www.developpement-durable.gouv.fr/IMG/pdf/ONERC-uicn-juillet2008.pdf>
[23] MEFE / MEEDDAT. Cahier des clauses techniques générales applicables aux marchés publics de travaux. Fascicule n°65. Exécution des ouvrages de génie civil en béton armé ou précontraint [online]. Official text. 2008, 277 p. Available from: <http://www.developpement-durable.gouv.fr/IMG/pdf/F65_2012-05-30.pdf>
PNACC, infrastructures and transport systems, action 1 – Adaptation of infrastructures and transport systems to climate change
115
[24] PIARC, Technical Committee D.3 Road bridges. Adaptation to climate change for bridges. 2011, 68 p. ISBN: 2-84060-241-5.
[25] Ministry of Economy, Finance and Industry. Inter-ministerial decree of May 17, 2001, defining the technical conditions to be met by energy distribution networks. Official text. JORF, n° 134, 2001, pp. 9270.
[26] RFF. Étude complémentaire n°4. Évaluation des incidences du réchauffement climatique sur l’infrastructure ferroviaire existante entre Montpellier et Perpignan [online]. 2008, 98 p. [Accessed May 22, 2015]. Available from: <http://cpdp.debatpublic.fr/cpdp-lnmp/DOCS/ETUDES_C/ETUDE_CO-4.PDF>
[27] AFNOR. NF EN ISO 1461. Hot dip galvanized coatings on fabricated iron and steel articles – Specifications and test methods. Standard. 2009, 16 p.
[28] CETMEF / CETE Méditerranée / CETE de l’Ouest. Vulnérabilité du territoire national aux risques littoraux, France métropolitaine [online]. Report. 2009, 170 p. [Accessed May 22, 2015]. Available from: <http://fr.calameo.com/read/0005873342f81dc9cc928>
[29] ONERC. Évaluation du coût des impacts du changement climatique et de l’adaptation en France – Rapport de la seconde phase – Partie III – Rapports des groupes sectoriels [online]. 2009, 231 p. [Accessed May 22, 2015]. Available from: <http://www.developpement-durable.gouv.fr/IMG/pdf/partie_3_rapports_des_groupes_sectoriels.pdf>
[30] DGAC / STAC. Les oiseaux des aérodromes français. Prévention du péril aviaire [online]. 94 p. [Accessed May 22, 2015]. Available from: <http://www.stac.aviation-civile.gouv.fr/publications/documents/oiseaux_ad_france.pdf>
[31] CFTR. Guide technique. Traitement des sols à la chaux et/ou aux liants hydrauliques. Application à la réalisation des assises de chaussées. Guide technique. Setra, 2007, 76 p.
[32] AFNOR. NF P 98-080-1. Chaussées – Terrassements. Terminologie. Standard. 1992, 14 p.
[33] SETRA, LCPC. Enrobés hydrocarbonés à chaud. Guide d’application des normes pour le réseau routier national. 1994, 162 p.
[34] MELTT. Cahier des clauses techniques générales. Fascicule n°27. Fabrication et mise en œuvre des enrobés hydrocarbonés [online]. Official text. 2012, 145 p. [Accessed May 22, 2015]. Available from: <http://www.developpement-durable.gouv.fr/IMG/pdf/F27_2012-05-30.pdf>
[35] STAC. Bituminous mixtures and surface dressings for airport pavements. Guide to the application of standards [online]. Guide to the application of standards. 2nd Edition. Bonneuil-sur-Marne (France): STAC, 2009, 77 p. [Accessed May 22, 2015]. ISBN: 978-2-11-096931-6. Available from: <http://www.stac.aviation-civile.gouv.fr/publications/documents/gan_apl_norm_2009gb_b.pdf>
[36] ICAO. International Standards and Recommended Practices. Annex 14 to the Convention on International Civil Aviation. Volume I Aerodrome Design and Operations [online]. 5th Edition. Montreal (Canada): International Civil Aviation Organization, 2009, vol. 1, annex 14, 328 p.[Accessed May 22, 2015]. ISBN: 978-92-9231-332-6. Available from: <http://www.bazl.admin.ch/dokumentation/grundlagen/02643/index.html?lang=fr&download=NHzLpZeg7t,lnp6I0NTU042l2Z6ln1ae2IZn4Z2qZpnO2Yuq2Z6gpJCDeoB9g2ym162epYbg2c_JjKbNoKSn6A-->
[37] STAC. Adhérence sur pistes contaminées [online]. Study report. Bonneuil-sur-Marne (France): STAC, 2010, 80 p. [Accessed May 22, 2015]. Available from: <http://www.stac.aviation-civile.gouv.fr/publications/documents/adherence_piste_contaminee.pdf>
[38] Ministry of Public Works. Circular published October 31, 1996, on winter highway maintenance. Official text. 1996, 16 p.
[39] DGAC / STAC. Instruction Technique sur les Aérodromes Civils, ITAC. Guide technique. 2002.

PNACC, infrastructures and transport systems, action 1 – Adaptation of infrastructures and transport systems to climate change
116
[40] AFNOR. NF EN 12929-1. Safety requirements for cableway installations designed to carry persons – General requirements– Part 1: Requirements for all installations. Standard. 2004.
19.2 - General documents GICC. Projet de recherche. Gestion territoriale du changement climatique. Une analyse à partir des politiques régionales. Rapport final [online]. 2007, vol. 1, 64 p. [Accessed May 22, 2015]. Available from: <http://www.gip-ecofor.org/doc/drupal/gicc/Rapport%20Final%20Bertrand%20Larrue%20-%20synthese.pdf>
GICC. Stratégies d’adaptation des ouvrages de protection marine ou des modes d’occupation du littoral vis-à-vis de la montée du niveau des mers et des océans. Projet SAO POLO. Rapport [online]. Under the supervision of Sergent P. 2012, 119 p. [Accessed May 22, 2015]. Available from: <http://www.gip-ecofor.org/doc/drupal/gicc/Sergent_Rapport_RF_2sept2012.pdf>
IPCC. Climate Change 2007: Synthesis Report. Contribution of Working Groups I, II and III to the Fourth Assessment Report of the Intergovernmental Panel on Climate Change [online]. Core Writing Team, Pachauri, R.K. and Reisinger, A. IPCC: Geneva (Switzerland), 2007, 103 p. [Accessed May 22, 2015]. ISBN: 92-9169-222-0. Available from: <https://www.ipcc.ch/pdf/assessment-report/ar4/syr/ar4_syr_full_report.pdf>
IPCC. Summary for Policymakers, Climate Change 2013: The Physical Science Basis. Contribution of Working Group I to the Fifth Assessment Report of the Intergovernmental Panel on Climate Change [online]. Under the supervision of Stocker, T.F., et al. Cambridge (UK) and New York (New York state, USA): Cambridge University Press, 2013, 27 p. [Accessed May 22, 2015]. Available from: <www.climatechange2013.org/images/report/WG1AR5_SPM_FINAL.pdf>
IPCC. Managing the Risks of Extreme Events and Disasters to Advance Climate Change Adaptation. A Special Report of Working Groups I and II of the Intergovernmental Panel on Climate Change [online]. Under the supervision of Field, C.B., et al. Cambridge (UK) and New York (New York state, USA): Cambridge University Press, 2012, 582 p. ISBN: 978-1-107-02506-6 (hardback), 978-1-107-60780-4 (paperback). [Accessed May 22, 2015]. Available from: <http://www.ipcc-wg2.gov/SREX/images/uploads/SREX-All_FINAL.pdf>
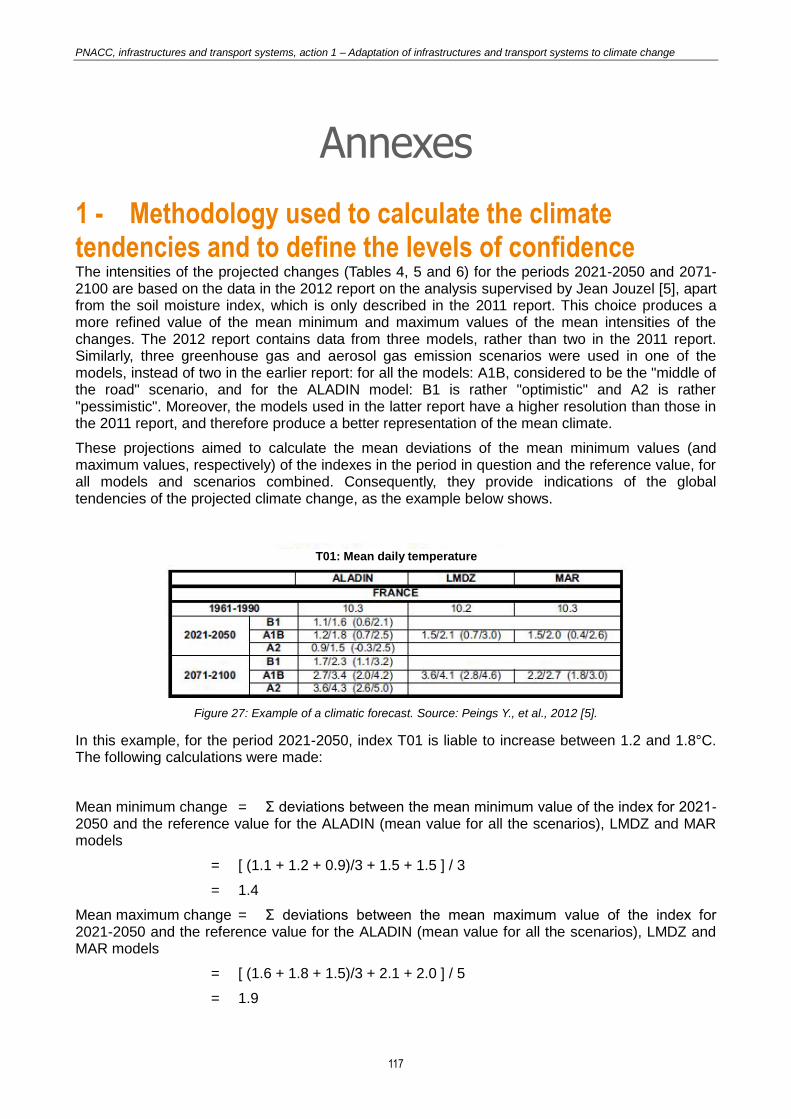
PNACC, infrastructures and transport systems, action 1 – Adaptation of infrastructures and transport systems to climate change
117
Annexes
1 - Methodology used to calculate the climate tendencies and to define the levels of confidence The intensities of the projected changes (Tables 4, 5 and 6) for the periods 2021-2050 and 2071-2100 are based on the data in the 2012 report on the analysis supervised by Jean Jouzel [5], apart from the soil moisture index, which is only described in the 2011 report. This choice produces a more refined value of the mean minimum and maximum values of the mean intensities of the changes. The 2012 report contains data from three models, rather than two in the 2011 report. Similarly, three greenhouse gas and aerosol gas emission scenarios were used in one of the models, instead of two in the earlier report: for all the models: A1B, considered to be the "middle of the road" scenario, and for the ALADIN model: B1 is rather "optimistic" and A2 is rather "pessimistic". Moreover, the models used in the latter report have a higher resolution than those in the 2011 report, and therefore produce a better representation of the mean climate.
These projections aimed to calculate the mean deviations of the mean minimum values (and maximum values, respectively) of the indexes in the period in question and the reference value, for all models and scenarios combined. Consequently, they provide indications of the global tendencies of the projected climate change, as the example below shows.
In this example, for the period 2021-2050, index T01 is liable to increase between 1.2 and 1.8°C. The following calculations were made:
Mean minimum change = Σ deviations between the mean minimum value of the index for 2021-2050 and the reference value for the ALADIN (mean value for all the scenarios), LMDZ and MAR models
= [ (1.1 + 1.2 + 0.9)/3 + 1.5 + 1.5 ] / 3
= 1.4
Mean maximum change = Σ deviations between the mean maximum value of the index for 2021-2050 and the reference value for the ALADIN (mean value for all the scenarios), LMDZ and MAR models
= [ (1.6 + 1.8 + 1.5)/3 + 2.1 + 2.0 ] / 5
= 1.9
Figure 27: Example of a climatic forecast. Source: Peings Y., et al., 2012 [5].
T01: Mean daily temperature

PNACC, infrastructures and transport systems, action 1 – Adaptation of infrastructures and transport systems to climate change
118
In conclusion, the calculations show that, for the period 2021-2050, index T01 will tend to increase between 1.4 and 1.9°C.
Moreover, a level of confidence in the tendency of the change was defined as follows:
for indices with mean minimum and maximum tendencies in opposite directions, the level of confidence cannot be established;
for indices with mean minimum and maximum tendencies with the same sign, the level of confidence in the tendency that increases or decreases was defined as follows: for the mean minimum change (or respectively maximum), two points were awarded if all the mean values of the minimum indices (or respectively maximum) have the same sign; one point was awarded if one of these values does not have the same sign as the others, and zero points were awarded otherwise. The points awarded to the mean minimum and maximum changes were added up and presented in the table.
For example, for the index T01 in the period 2012-2050:
mean minimum change: Aladin B1: 1.1 / Aladin A1B: 1.2 / Aladin A2: 0.9 / LMDZ A1B: 1.5 / MAR A1B: 1.5. All the numbers have the same sign, so two points are awarded for the mean minimum change;
mean maximum change: Aladin B1: 1.6 / Aladin A1B: 1.8 / Aladin A2: 1.5 / LMDZ A1B: 2.1 / MAR A1B: 2.0. All the numbers have the same sign, so two points are awarded for the mean maximum change.
Therefore, the level of confidence is 4/4.
The decision was taken not to weight the points awarded for the calculation of the tendency, because the goal is to produce a level of confidence, and not a range of values. Therefore, all the scenarios were taken into consideration on the same level.
2 - Detailed methodologies for the analysis of technical reference materials
2.1 - Method used to list climate data in the highways reference materials (DTecITM) This method was used by the DTecITM (Cerema).
The reference documents were listed using queries made on the French technical highways documentation (DTRF) portal, with keywords matching the climatic variables that are liable to change.
The following tables show the number of documents found in the DTRF documentary database by searches using keywords in the manuals and in full text. The documents included are official texts, standards and technical documents.
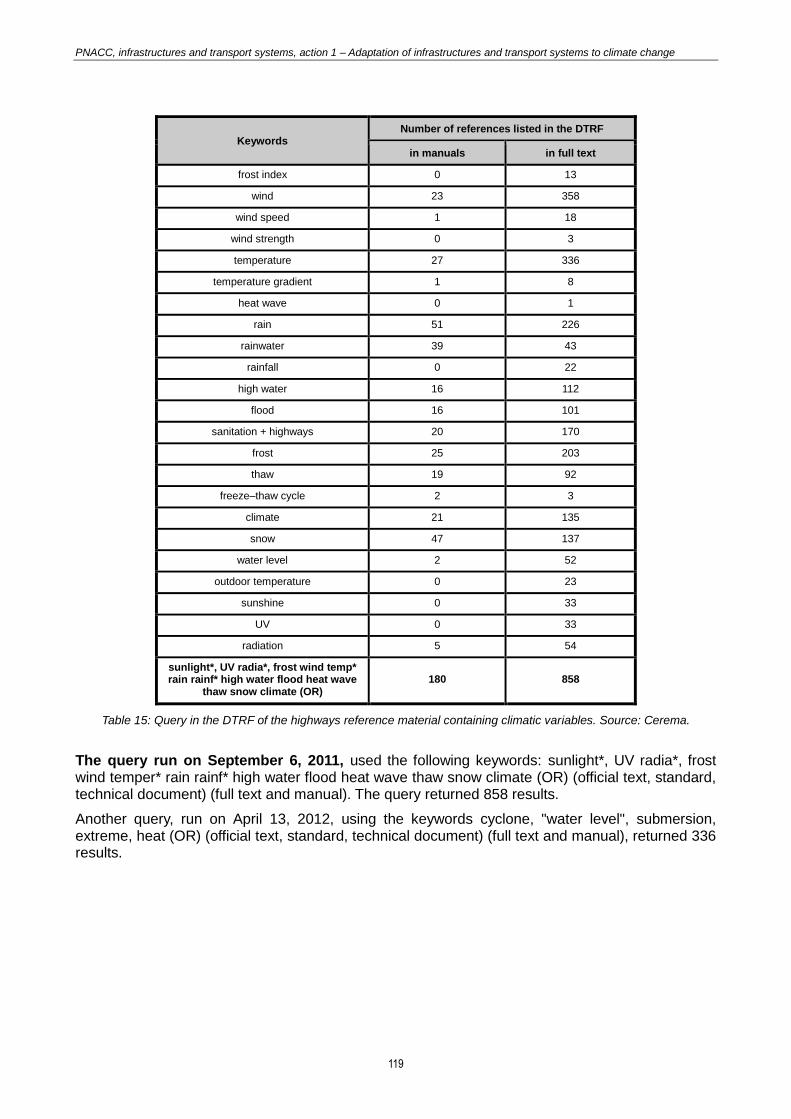
PNACC, infrastructures and transport systems, action 1 – Adaptation of infrastructures and transport systems to climate change
119
Keywords Number of references listed in the DTRF
in manuals in full text
frost index 0 13
wind 23 358
wind speed 1 18
wind strength 0 3
temperature 27 336
temperature gradient 1 8
heat wave 0 1
rain 51 226
rainwater 39 43
rainfall 0 22
high water 16 112
flood 16 101
sanitation + highways 20 170
frost 25 203
thaw 19 92
freeze–thaw cycle 2 3
climate 21 135
snow 47 137
water level 2 52
outdoor temperature 0 23
sunshine 0 33
UV 0 33
radiation 5 54
sunlight*, UV radia*, frost wind temp* rain rainf* high water flood heat wave
thaw snow climate (OR) 180 858
Table 15: Query in the DTRF of the highways reference material containing climatic variables. Source: Cerema.
The query run on September 6, 2011, used the following keywords: sunlight*, UV radia*, frost wind temper* rain rainf* high water flood heat wave thaw snow climate (OR) (official text, standard, technical document) (full text and manual). The query returned 858 results.
Another query, run on April 13, 2012, using the keywords cyclone, "water level", submersion, extreme, heat (OR) (official text, standard, technical document) (full text and manual), returned 336 results.

PNACC, infrastructures and transport systems, action 1 – Adaptation of infrastructures and transport systems to climate change
120
Keywords
Number of references listed in the DTRF
in manuals in full text
Cyclone 9 0
Water level 0 53
Submersion 0 17
Extreme 0 182
Heat 10 87
Cyclone "water level" submersion extreme heat (OR)
10 336
Table 16: The number of references to climatic variables found in the DTRF. Source: Cerema.
The list of reference documents extracted by these queries was completed with the documents that the queries did not find and, when possible, by standards. Technical documents in the course of being updated or that have just been published were added to the various domains. For highway engineering, the technical reference documents were sorted by the Lyon DTer (Caroline Mauduit) as part of a study of the PCI and climate change in the territory.
2.2 - Method used to list climate data in the reference materials specific to urban constructions This method was used by the DTecTV (Cerema).
A search was run in the DTRF database for works published by the DTecTV. This search identified technical guides that are possibly related to the design of urban highways and, more marginally, to operations and maintenance.
The corpus of standards of the CTCHU (urban pavements) should also be added to this inventory.
The DTecTV proceeded as follows:
first, a search was run with the "climate" keywords on all the DTecTV documents. But, even after sorting, it emerged that this type of query was irrelevant. So the decision was taken to make a more pragmatic selection of documents related to the experience of the research engineers ;
the list of reference documents at the DTecTV related to the design, maintenance and operation of urban constructions was compiled. An inventory was created in a spreadsheet in the Highways department of the DTecTV by cross-referencing the data from all the research engineers with the DTRF data, in order to scan all the reference documents in use that could be affected ;
finally, the list of documents was sorted. The documents used to dimension urban infrastructures were selected, if their recommendations could be impacted by climate change. This set of documents was then completed with guides to the management of crises that could be revised in order to take the higher frequency of extreme events into consideration.

PNACC, infrastructures and transport systems, action 1 – Adaptation of infrastructures and transport systems to climate change
121
2.3 - Method used to list climate data in the highways constructions reference materials This method was used by the DTecITM (Cerema).
The reference documents used for highway constructions are European standards. The regulations that apply to the design, the dimensioning and the substantiation of civil engineering works, and the regulations that apply to the use of materials and construction products refer to these standards. Where appropriate, the climatic parameters are specified in the national annexes of these standards.
The maintenance or reinforcement operations for existing constructions are not yet completely covered by up-to-date European standards. Wherever possible, the corresponding projects adopt the climatic actions in the European standards, or in other sources of relevant information, when they differ unfavorably from the values used in the construction.
Documents that are neither standards nor regulations, such as technical guides, do not define any quantified values. Therefore, they are not taken into consideration in the reference documents that may be updated.
2.4 - Method used to list climate data in the reference materials specific to tunnels This method concerns the CETU.
Many of the reference documents for tunnels are common to tunnels and more conventional constructions. In fact, no reference materials specific to tunnels were identified that could raises issues regarding climate change.
2.5 - Method used to list climate data in the rail reference materials This method was used by RFF and SNCF.
In the investment projects managed directly or indirectly by RFF as the principal contracting authority, a number of technical texts apply:
Technical Specifications for Interoperability (TSI) ;
French laws and regulations (plus orders, decrees, inter-ministerial technical instructions and circulars) ;
European standards ;
French standards ;
UIC (international union of railways) data sheets ;
usage recommendations (GEFRA, DTecITM, etc.) ;
texts specific to the French national rail network: design and maintenance reference documents, texts for the infrastructure reference material, mainly type "IN".
The reference documents specific to railroads were listed according to expert advice. For example, the texts relating to constructions fall under the authority of Civil Engineering and require a specific study.

PNACC, infrastructures and transport systems, action 1 – Adaptation of infrastructures and transport systems to climate change
122
2.6 - Method used to list climate data in the maritime and river reference materials This method was used by the DTecEMF (Cerema).
There is no real database similar to the DTRF for the constructions within the scope of responsibility of the DTecEMF (navigation constructions in ports and rivers).
Therefore, the DTecEMF proceeded as follows:
initially, it drew up the list of reference documents used for the design, maintenance and operation of maritime and river constructions. An inventory was created in a spreadsheet in the multimodal department of the DTecEMF by referring to all the infrastructure research engineers, in order to scan all the reference documents in use that could be affected ;
then the listed documents were sorted in order to exclude the reference material that is not impacted by climate change. The documents were sorted by excluding the reference material in which climate variables are not mentioned, or in which the climate variables are mentioned, but do not influence the dimensioning process or the formulated prescriptions.
But this method remains subjective, because only the DTecEMF reference documents or other reference documents that are regularly used by the engineers were selected. Nevertheless, the essential documents recommended or used by the DTecEMF were identified.
2.6.1 - For marit ime constructions A selection of reference documents for maritime constructions was compiled by the DTecEMF in 2004. It was used to create the list of reference standards. The DTecITM reference documents in this selection were excluded from the analysis, because they had already been studied by the DTecITM.
This selection was then completed and updated in order to take account of changes in standards, and in particular the publication of the Eurocodes (the Eurocodes apply to all themes, such as, for example, soil mechanics) and of the national application standards.
2.6.2 - Navigation constructions In the absence of any data repositories, a list was compiled in order to identify the reference documents used by the DTecEMF engineers. Therefore, the final table should be considered as the the most comprehensive list possible, to be used in the deign, maintenance and operation of river navigation constructions.
2.6.3 - Special case of operational regulations Operational regulations may also be impacted by climate change, but in view of the number of operators, the diversity of the regulations and the limited information available on this subject, they have been excluded from this analysis.
2.7 - Method used to list climate data in the airport reference materials This method was used by STAC.
The documents related to climate data for airport constructions were listed by analyzing the relevant international reference material of the International Civil Aviation Organization (ICAO), the European reference standards of the European Committee for Standardization (CEN) and the domestic reference documents of the French Civil Aviation Authority (DGAC). This analysis was conducted by searches using keywords. The same keywords were used as for highways.

PNACC, infrastructures and transport systems, action 1 – Adaptation of infrastructures and transport systems to climate change
123
Amongst the international reference documents, three types of texts were identified:
the Chicago convention;
the annexes of the Convention, made up of:
o standards and recommended practices (SARPS) ;
o supplements (differences notified by States are subject to a particular supplement) ;
o PANS (procedures for air navigation services) ;
indicative information, made up mainly of :
o manuals ;
o circulars.
A list of standards applying to the products used in the design of airport pavements was used to analyze the European reference materials. These standards are listed in the table of airport reference documents, but this list is liable to change in the future.
The analysis of national reference documents was based on the guide to the application of standards on bituminous mixtures and surface dressings for airport pavements (Guide d’application des normes relatif aux enrobés hydrocarbonés et enduits superficiels pour chaussées aéronautiques) [35] and the report on friction on contaminated runways (Rapport Adhérence sur pistes contaminées) [36], published by the civil aviation technical center of the French civil aviation authority, and on the technical instruction on civil aerodromes (Instruction Technique sur les Aérodromes Civils, ITAC) [39].
2.8 - Method used to list climate data in the reference materials specific to guided transport systems This method was used by STRMTG.
The STRMTG does not have a complete and unique database of the technical documents, laws and standards that cover all the systems monitored by the department (mechanical lifts, urban guided transport systems, secondary railroads, tourist railroads / handcars).
An inventory of the technical reference documents compiled by the STRMTG has been completed with the applicable regulatory documents that are directly related to the department's activities.
This inventory has since been extended to include normative documents. This search was made by looking through the documents available on the department's computer network, after having questioned the system managers or their agents. Some of the documents found were excluded, because they are of little use and could incur a risk of errors. The remaining documents were searched using keywords, wherever possible. Documents that could not be searched by keyword, because of their format, were rapidly scanned using the table of contents and by quick browsing. For each document identified as being liable to be affected by changes in a climate variable, the variable in question was identified. The search by keywords was run using the following list: frost, ice, temperature, snow, wind, rain, lightning, floods*, extremes*, and occasionally, collapsing and landslides, depending on the transport system and the document in question.
It should be noted that the systems in the scope of competence of the STRMTG cover fields of activity that are not significantly standardized with regard to their sensitivity to climatic variables. This is true of guided transport systems, but less so for mechanical lifts, for which the technical

PNACC, infrastructures and transport systems, action 1 – Adaptation of infrastructures and transport systems to climate change
124
guides to design, operations and maintenance include thresholds for the climate factors to be taken into consideration (in particular, references to the Eurocodes)16.
The results of the work described above cannot constitute the single benchmark. The climatic variables and their impact on the transport system are mainly taken into consideration in the operations documents and/or the regulatory documents that apply to the construction of the network or the equipment, where appropriate. Examples are:
for urban guided transport systems, with regard to rain and flooding, the safety file defines the lowest points of the network and the maximum acceptable water height before stopping the system, or before introducing instructions for degraded use ;
in order to take account of the wind for mechanical lifts, the manufacturers have agreed to define a maximum speed, above which cable transport systems (X or Y systems) cannot function under acceptable conditions, including the conditions of comfort of the users (70/90/110 km/h, depending on the system). The maximum permissible thresholds, above which the system is shut down, are defined by the operator's regulations, or sometimes simply by practical factors.
3 - Summary of the methodology and the breakdown of the analysis of the reference material The table below (Table 17) summarizes the methodologies used to list the reference documents used by type of infrastructure. It also specifies the department that compiled the list and the requests for climate projections, for a given type of infrastructure.
16The standards are currently being revised, and in particular NF EN 12929-1 "Safety requirements for cableway installations designed to carry persons – General requirements. – Part 1: Requirements for all installations" [40]. Current discussions do not include a revision of the current wind pressure values.

PNACC, infrastructures and transport systems, action 1 – Adaptation of infrastructures and transport systems to climate change
125
Methodology used to list the reference documents
List of reference documents drawn
up by
Requests for climate
projections made by
Search in document databases completed
by expert advice
Research on the advice of
experts
Highways x Cerema Cerema
Urban constructions x Cerema (DTecTV)
Highway constructions x Cerema (DTecITM) Cerema (DTecITM)
Tunnels x CETU CETU
Railways x RFF and SNCF RFF and SNCF, with the STRMTG
River and maritime domain
x Cerema (DTecEMF), VNF
Cerema (DTecEMF), VNF
Airports x STAC STAC
Domain specific to mechanical lifts and
guided transport systems
x STRMTG STRMTG
Table 17: Table summarizing the listing methodologies and the departments involved in the listing of the reference materials and the requests for projections, by type of infrastructure. Source: Cerema.

PNACC, infrastructures and transport systems, action 1 – Adaptation of infrastructures and transport systems to climate change
126
4 - List of reference documents
4.1 - Document categories The documents identified in the analysis of the reference material were classified in the following three categories ("category" column):
category 1: technical reference documents that are not impacted by climate change, but that address climatic notions ;
category 2: technical reference documents that are impacted by climate change and that already need to undergo a technical revision (changes to regulations, standardization actions, etc.) ;
category 3: technical reference documents that absolutely require more precise details of climatic variables or parameters in order to determine whether they have to be revised, and how.
The listed documents were then classified according to three major themes corresponding to construction, maintenance and operations ("themes" column).
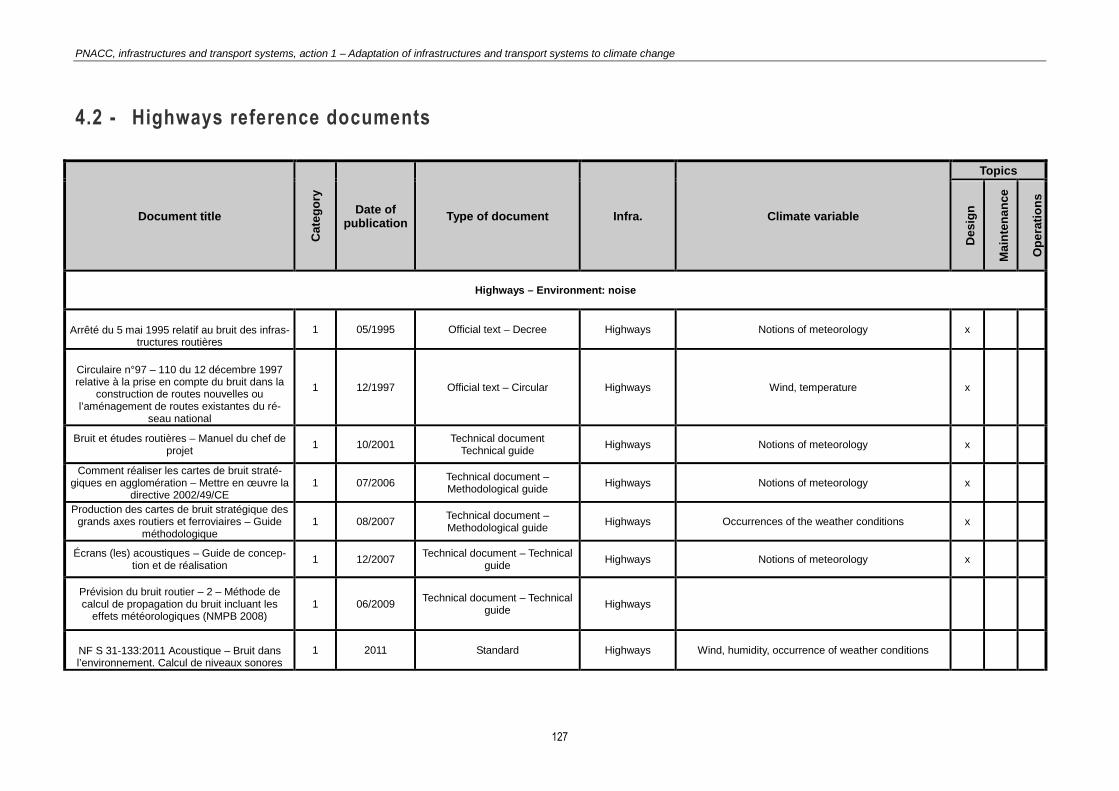
PNACC, infrastructures and transport systems, action 1 – Adaptation of infrastructures and transport systems to climate change
127
4.2 - Highways reference documents
Document title
Cate
go
ry
Date of
publication Type of document Infra. Climate variable
Topics
Des
ign
Ma
inte
na
nce
Op
era
tio
ns
Highways – Environment: noise
Arrêté du 5 mai 1995 relatif au bruit des infras-tructures routières
1 05/1995 Official text – Decree Highways Notions of meteorology x
Circulaire n°97 – 110 du 12 décembre 1997 relative à la prise en compte du bruit dans la
construction de routes nouvelles ou l’aménagement de routes existantes du ré-
seau national
1 12/1997 Official text – Circular Highways Wind, temperature x
Bruit et études routières – Manuel du chef de projet 1 10/2001
Technical document Technical guide
Highways Notions of meteorology x
Comment réaliser les cartes de bruit straté-giques en agglomération – Mettre en œuvre la
directive 2002/49/CE 1 07/2006
Technical document – Methodological guide
Highways Notions of meteorology x
Production des cartes de bruit stratégique des grands axes routiers et ferroviaires – Guide
méthodologique 1 08/2007
Technical document – Methodological guide
Highways Occurrences of the weather conditions x
Écrans (les) acoustiques – Guide de concep-tion et de réalisation 1 12/2007
Technical document – Technical guide
Highways Notions of meteorology x
Prévision du bruit routier – 2 – Méthode de calcul de propagation du bruit incluant les
effets météorologiques (NMPB 2008) 1 06/2009
Technical document – Technical guide
Highways
NF S 31-133:2011 Acoustique – Bruit dans l’environnement. Calcul de niveaux sonores
1 2011 Standard Highways Wind, humidity, occurrence of weather conditions

PNACC, infrastructures and transport systems, action 1 – Adaptation of infrastructures and transport systems to climate change
128
Document title
Cate
go
ry
Date of
publication Type of document Infra. Climate variable
Topics
Des
ign
Ma
inte
na
nce
Op
era
tio
ns
Highways – Environment: landscape
Végétalisation (la) : la végétation, outil d’aménagement – Guide technique 1 03/1994
Technical document Technical guide
Highways Map of bioclimatic zones in France, temperature and frost. Changes in the climate conditions can influence
the type of vegetation x
Cahier des clauses techniques générales – Fascicule 35 – Aménagements paysagers.
Aires de sports et de loisirs de plein air 1 04/1999 Official text – CCTG Highways
Frost, snow, temperature, wind, precipitation, fog, etc. Weather conditions can close down work sites
x
Nouveau (le) fascicule 35 du CCTG. Aménagements paysagers – Aires de sports et
de loisirs de plein air. Apports et conseils d’utilisation
1 07/1999 Technical document –
Information memo and data sheet
Highways Frost, snow, temperature, wind, precipitation, fog, etc.
Weather conditions can close down work sites x
Insertion d’une infrastructure routière – Concilier terrassements et enjeux paysagers 1 06/2008
Technical document – Information memo and data
sheet Highways
Snow The goals of greening an embankment can be linked to the climatic conditions
x
Paysage et infrastructures de transport - Guide méthodologique 1 06/2008
Technical document Technical guide
Highways Climatic conditions are to be taken into consideration for
landscaping purposes x
Insertion d’une infrastructure de transport – Concilier assainissement et enjeux de
paysage 1 09/2009
Technical document – Information memo and data
sheet Highways
Rain. The choice of the type of sanitation structure is determined by the rainfall conditions
x x
Highways – Environment: air quality
Circulaire n° 98-36 du 17 février 1998 relative à l’application de l’article 19 de la loi sur l’air et l’utilisation rationnelle de l’énergie complétant
le contenu des études d’impact des projets d’aménagement
1 2/17/1998 Official text – Application circular Highways Weather conditions influence the dispersion of
pollutants. If they change, the dispersion may change too.
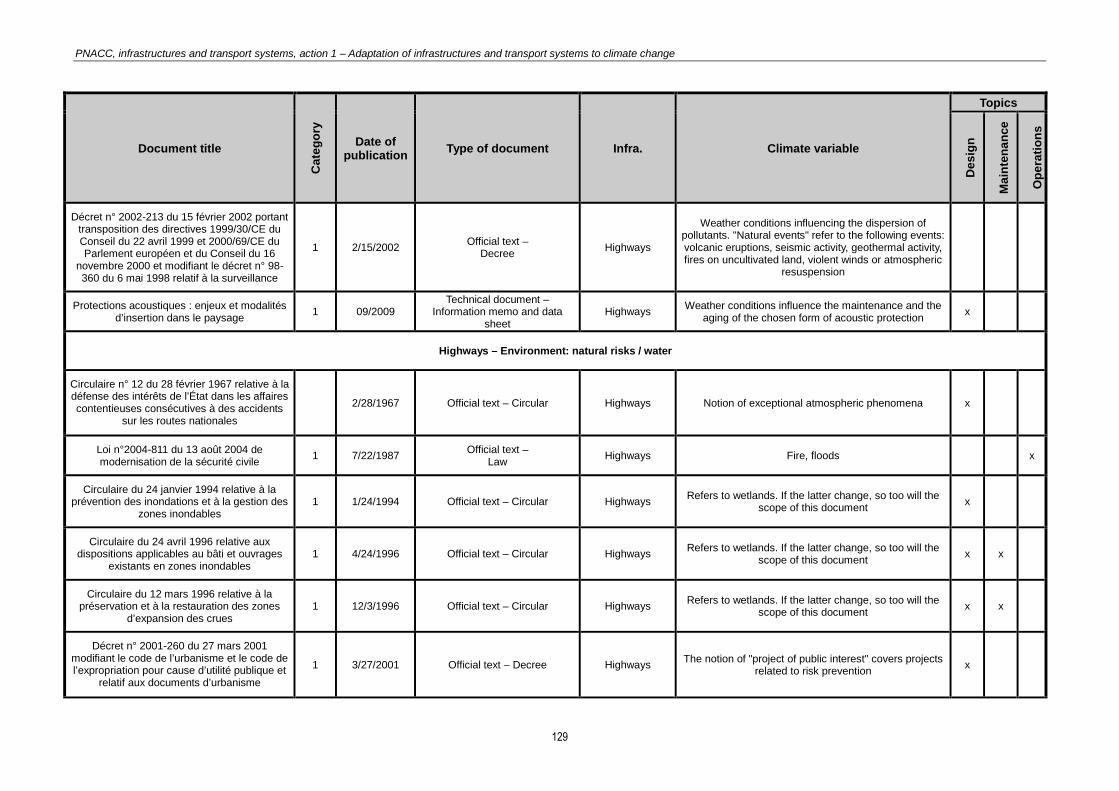
PNACC, infrastructures and transport systems, action 1 – Adaptation of infrastructures and transport systems to climate change
129
Document title
Cate
go
ry
Date of
publication Type of document Infra. Climate variable
Topics
Des
ign
Ma
inte
na
nce
Op
era
tio
ns
Décret n° 2002-213 du 15 février 2002 portant transposition des directives 1999/30/CE du Conseil du 22 avril 1999 et 2000/69/CE du Parlement européen et du Conseil du 16
novembre 2000 et modifiant le décret n° 98-360 du 6 mai 1998 relatif à la surveillance
1 2/15/2002 Official text –
Decree Highways
Weather conditions influencing the dispersion of pollutants. "Natural events" refer to the following events: volcanic eruptions, seismic activity, geothermal activity, fires on uncultivated land, violent winds or atmospheric
resuspension
Protections acoustiques : enjeux et modalités d’insertion dans le paysage 1 09/2009
Technical document – Information memo and data
sheet Highways
Weather conditions influence the maintenance and the aging of the chosen form of acoustic protection
x
Highways – Environment: natural risks / water
Circulaire n° 12 du 28 février 1967 relative à la défense des intérêts de l’État dans les affaires contentieuses consécutives à des accidents
sur les routes nationales 2/28/1967 Official text – Circular Highways Notion of exceptional atmospheric phenomena x
Loi n°2004-811 du 13 août 2004 de modernisation de la sécurité civile 1 7/22/1987
Official text – Law
Highways Fire, floods x
Circulaire du 24 janvier 1994 relative à la prévention des inondations et à la gestion des
zones inondables 1 1/24/1994 Official text – Circular Highways
Refers to wetlands. If the latter change, so too will the scope of this document
x
Circulaire du 24 avril 1996 relative aux dispositions applicables au bâti et ouvrages
existants en zones inondables 1 4/24/1996 Official text – Circular Highways
Refers to wetlands. If the latter change, so too will the scope of this document
x x
Circulaire du 12 mars 1996 relative à la préservation et à la restauration des zones
d’expansion des crues 1 12/3/1996 Official text – Circular Highways
Refers to wetlands. If the latter change, so too will the scope of this document
x x
Décret n° 2001-260 du 27 mars 2001 modifiant le code de l’urbanisme et le code de l’expropriation pour cause d’utilité publique et
relatif aux documents d’urbanisme 1 3/27/2001 Official text – Decree Highways
The notion of "project of public interest" covers projects related to risk prevention
x

PNACC, infrastructures and transport systems, action 1 – Adaptation of infrastructures and transport systems to climate change
130
Document title
Cate
go
ry
Date of
publication Type of document Infra. Climate variable
Topics
Des
ign
Ma
inte
na
nce
Op
era
tio
ns
Décret n° 2002-202 du 13 février 2002 modifiant le décret n° 93-743 du 29 mars 1993
relatif à la nomenclature des opérations soumises à autorisation ou à déclaration en
application de l’article 10 de la loi n° 92-3 du 3 janvier 1992 sur l’eau
1 2/13/2002 Official text –
Decree Highways
Refers to wetlands. If the latter change, so too will the scope of this document
x
Circulaire du 30 avril 2002 relative à la politique de l’État en matière de risques
naturels prévisibles et de gestion des espaces situés derrière les digues de protection contre les inondations et les submersions marines
1 4/30/2002 Official text – Circular Highways
Refers to wetlands. If the latter change, so too will the scope of this document. Refers to the risks of
submersion and levels of submersion taken from the 2010 ONERC memo. To be modified if new submersion
hypotheses are defined for 2100
x
Arrêté du 27 juillet 2006 modifiant l’arrêté du 13 février 2002 fixant les prescriptions
générales applicables aux installations ou ouvrages soumis à déclaration en application
des articles L.214-1 à L.214-6 du code de l’environnement et relevant de la rubrique
2.5.4 (2° et 3°) de la nomenclature annexée au décret n°93-743 du 29 mars 1993 modifié
1 7/27/2002 Official text – Decree Highways Refers to wetlands. If the latter change, so too will the
scope of this document x x
Loi n° 2003-699 du 30 juillet 2003 relative à la prévention des risques technologiques et naturels et à la réparation des dommages
1 7/30/2003 Official text – Law Highways Refers to wetlands. If the latter change, so too will the
scope of this document x
Circulaire du 21 janvier 2004 relative à la maîtrise de l’urbanisme et adaptation des
constructions en zone inondable 1 1/21/2004 Official text – Circular Highways
Refers to wetlands. If the latter change, so too will the scope of this document
x
Instruction jointe à la circulaire du 22 novembre 2004 relative à la concertation entre les services de l’environnement et les services
de l’équipement pour l’élaboration et l’instruction des projets routiers du réseau
national
1 11/22/2004 Official text – Circular Highways Refers to wetlands. If the latter change, so too will the
scope of this document x

PNACC, infrastructures and transport systems, action 1 – Adaptation of infrastructures and transport systems to climate change
131
Document title
Cate
go
ry
Date of
publication Type of document Infra. Climate variable
Topics
Des
ign
Ma
inte
na
nce
Op
era
tio
ns
Décret n° 2006-881 du 17 juillet 2006 modifiant le décret n° 93-743 du 29 mars 1993
relatif à la Nomenclature des opérations soumises à autorisation ou à déclaration en
application de l’article 10 de la loi n° 92-3 du 3 janvier 1992 sur l’eau et le décret
1 7/17/2006 Official text –
Decree Highways
Refers to wetlands. If the latter change, so too will the scope of this document
x
Article R.214-1 du code de l’Environnement 1 7/4/2014 Official text – Law Highways Refers to wetlands. If the latter change, so too will the
scope of this document x
Instruction jointe à la circulaire du 29/04/2014 technique relative aux modalités d’élaboration des opérations d’investissement et de gestion
sur le réseau routier national
1 2/6/2015 Official text – Circular Highways Refers to wetlands and unforeseeable events. If they
change, so too will the scope of this document x
Instruction jointe à la circulaire du 29/04/2014 technique relative aux systèmes de
management de / par la qualité dans les services routiers
1 2/6/2015 Official text – Circular Highways Refers to wetlands and unforeseeable events. If they
change, so too will the scope of this document x
Highways – Pavements: dimensioning
NF P 98-086 : Dimensionnement des structures de chaussées routières.
DOCUMENT EN COURS DE REVISION 2
Standard – Homologated standard
Highways – Pavements
Frost index, temperature x
Conception et dimensionnement des structures de chaussée – Guide technique 1 1994
Technical document – Technical guide
Highways – Pavements
Exposure to sunlight, radiation, freeze–thaw, temperature, rain, rainfall, frost index, drainage,
sanitation x
Lettre-circulaire du 26 octobre 1998 concernant l’application du catalogue des
structures types de chaussées neuves 1 10/26/1998 Official text – Circular
Highways – Pavements
Freeze–thaw index x
Catalogue des structures types de chaussées neuves. Réseau routier national 3 10/1998
Technical document – Technical guide
Highways – Pavements
Freeze–thaw index, temperature x
Chaussées en béton – Guide technique 3 03/2000 Technical document – Technical
guide Highways – Pavements
Drainage, frost index, wind, temperature, rain (intensity in mm/year)
x
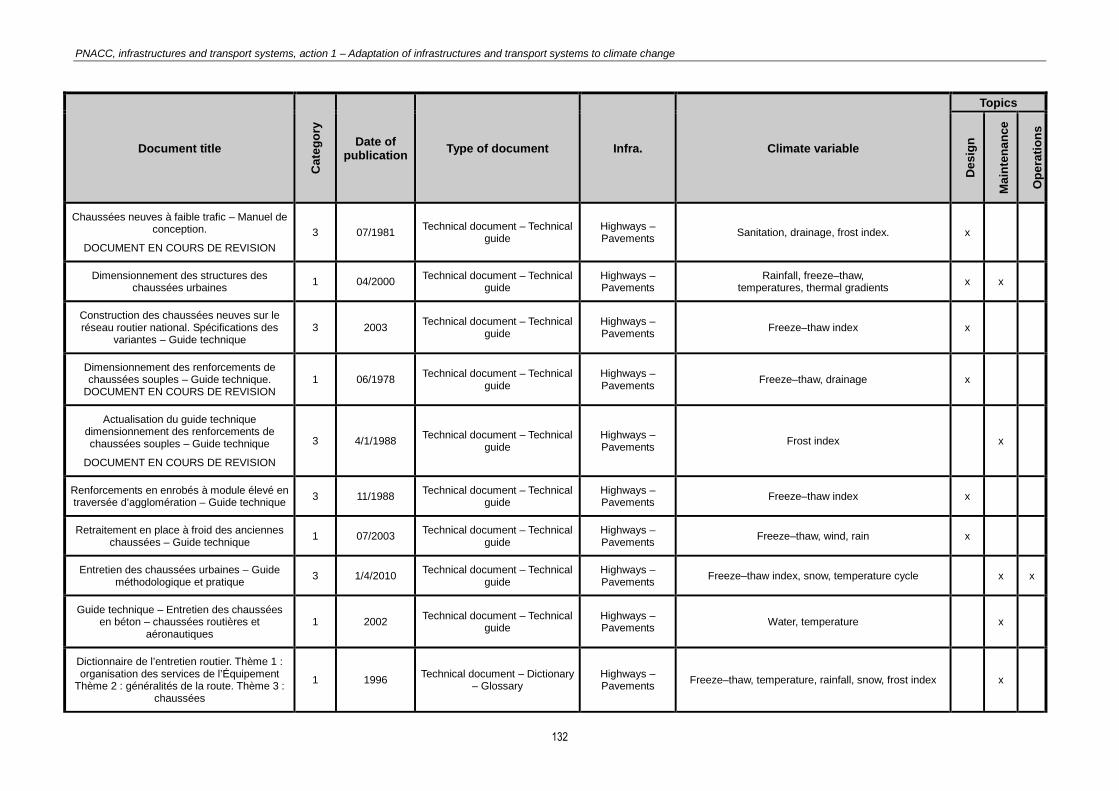
PNACC, infrastructures and transport systems, action 1 – Adaptation of infrastructures and transport systems to climate change
132
Document title
Cate
go
ry
Date of
publication Type of document Infra. Climate variable
Topics
Des
ign
Ma
inte
na
nce
Op
era
tio
ns
Chaussées neuves à faible trafic – Manuel de conception.
DOCUMENT EN COURS DE REVISION 3 07/1981
Technical document – Technical guide
Highways – Pavements
Sanitation, drainage, frost index. x
Dimensionnement des structures des chaussées urbaines 1 04/2000
Technical document – Technical guide
Highways – Pavements
Rainfall, freeze–thaw, temperatures, thermal gradients
x x
Construction des chaussées neuves sur le réseau routier national. Spécifications des
variantes – Guide technique 3 2003
Technical document – Technical guide
Highways – Pavements
Freeze–thaw index x
Dimensionnement des renforcements de chaussées souples – Guide technique.
DOCUMENT EN COURS DE REVISION 1 06/1978
Technical document – Technical guide
Highways – Pavements
Freeze–thaw, drainage x
Actualisation du guide technique dimensionnement des renforcements de chaussées souples – Guide technique
DOCUMENT EN COURS DE REVISION
3 4/1/1988 Technical document – Technical
guide Highways – Pavements
Frost index x
Renforcements en enrobés à module élevé en traversée d’agglomération – Guide technique 3 11/1988
Technical document – Technical guide
Highways – Pavements
Freeze–thaw index x
Retraitement en place à froid des anciennes chaussées – Guide technique 1 07/2003
Technical document – Technical guide
Highways – Pavements
Freeze–thaw, wind, rain x
Entretien des chaussées urbaines – Guide méthodologique et pratique 3 1/4/2010
Technical document – Technical guide
Highways – Pavements
Freeze–thaw index, snow, temperature cycle x x
Guide technique – Entretien des chaussées en béton – chaussées routières et
aéronautiques 1 2002
Technical document – Technical guide
Highways – Pavements
Water, temperature x
Dictionnaire de l’entretien routier. Thème 1 : organisation des services de l’Équipement
Thème 2 : généralités de la route. Thème 3 : chaussées
1 1996 Technical document – Dictionary
– Glossary Highways – Pavements
Freeze–thaw, temperature, rainfall, snow, frost index x

PNACC, infrastructures and transport systems, action 1 – Adaptation of infrastructures and transport systems to climate change
133
Document title
Cate
go
ry
Date of
publication Type of document Infra. Climate variable
Topics
Des
ign
Ma
inte
na
nce
Op
era
tio
ns
Highways – Pavements: materials
Enrobés hydrocarbonés à chaud – guide d’application des normes pour le réseau
routier national 3 12/1994
Technical document – Technical guide
Highways – Pavements
UV, wind, temperature, rain, mean maximum temperatures in July/August, mean minimum
temperatures in January/February. x
Enrobés drainants – Note d’info n°100 3 1997 Technical document –
Information memo and data sheet
Highways – Pavements
Frost, temperature, rain, snow, H1 climate zone x x
Enduits superficiels d’usure – Guide technique 1 05/1995 Technical document – Technical
guide Highways – Pavements
Exposure to sunlight, frost, wind, temperature, rain x x
Aide au choix des techniques d’entretien des couches de surface des chaussées – Guide
technique.
DOCUMENT EN COURS DE REVISION
1
2003
Technical document – Technical guide
Highways – Pavements
Wind, temperature, rainfall, snow x
Cahier des clauses techniques générales – Fascicule 62 – Titre I – Section I – Règles techniques de conception et de calcul des ouvrages et constructions en béton armé
suivant la méthode des états limites – BAEL 91 révisé 99
1 2/15/1999 Official text – CCTG Highways Wind, temperature, snow, climate, climatic loads x
Traitement des sols à la chaux et/ou aux liants hydrauliques – Application à la réalisation des
assises de chaussées – Guide technique 1 2007
Technical document – Technical guide
Highways – Pavements
Frost, rain, climate, temperature, wind x
Application des nouvelles normes assises de chaussées NF EN 14227 – Mélanges traités aux liants hydrauliques – Spécifications. Note
CFTR n°15
1 2007 Technical document –
Information memo and data sheet
Highways – Pavements
Water x
Assises de chaussées en graves non traitées et matériaux traités aux liants hydrauliques et
pouzzolaniques – Guide d’application des normes pour le réseau routier national
3 12/1998 Technical document – Technical
guide Highways – Pavements
Frost index, weather conditions, wind, temperature, rain x
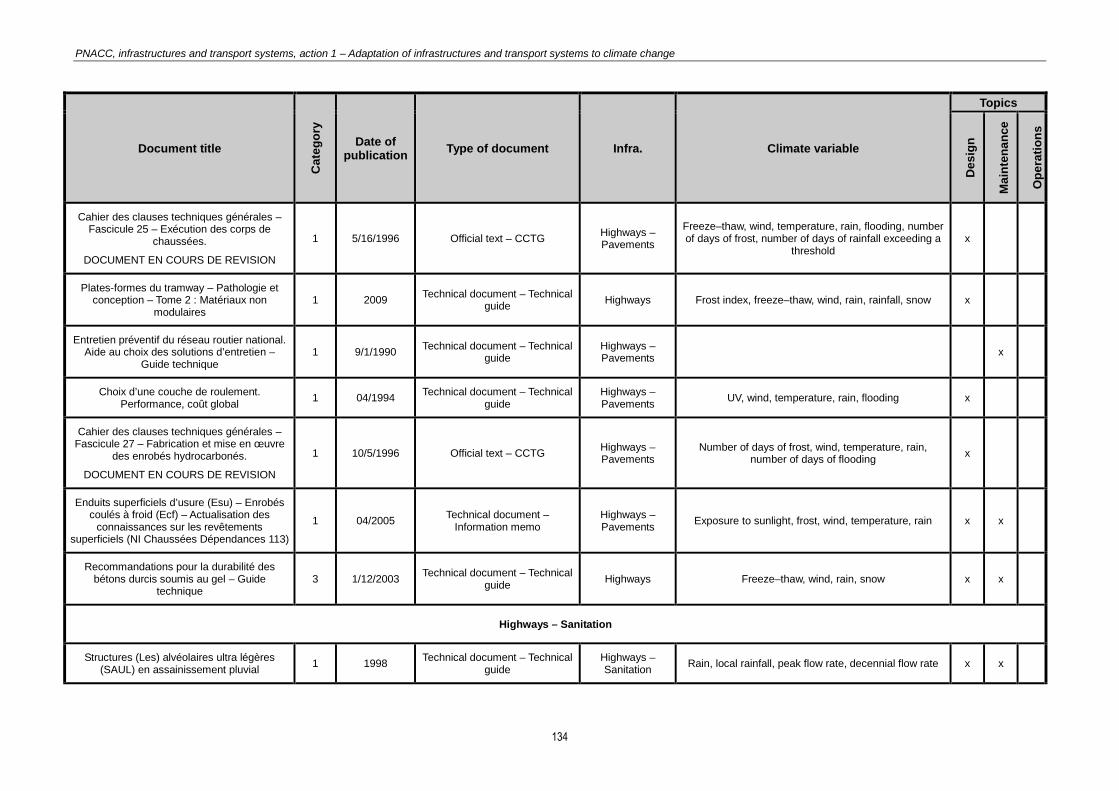
PNACC, infrastructures and transport systems, action 1 – Adaptation of infrastructures and transport systems to climate change
134
Document title
Cate
go
ry
Date of
publication Type of document Infra. Climate variable
Topics
Des
ign
Ma
inte
na
nce
Op
era
tio
ns
Cahier des clauses techniques générales – Fascicule 25 – Exécution des corps de
chaussées.
DOCUMENT EN COURS DE REVISION
1 5/16/1996 Official text – CCTG Highways – Pavements
Freeze–thaw, wind, temperature, rain, flooding, number of days of frost, number of days of rainfall exceeding a
threshold x
Plates-formes du tramway – Pathologie et conception – Tome 2 : Matériaux non
modulaires 1 2009
Technical document – Technical guide
Highways Frost index, freeze–thaw, wind, rain, rainfall, snow x
Entretien préventif du réseau routier national. Aide au choix des solutions d’entretien –
Guide technique 1 9/1/1990
Technical document – Technical guide
Highways – Pavements
x
Choix d’une couche de roulement. Performance, coût global 1 04/1994
Technical document – Technical guide
Highways – Pavements
UV, wind, temperature, rain, flooding x
Cahier des clauses techniques générales – Fascicule 27 – Fabrication et mise en œuvre
des enrobés hydrocarbonés.
DOCUMENT EN COURS DE REVISION
1 10/5/1996 Official text – CCTG Highways – Pavements
Number of days of frost, wind, temperature, rain, number of days of flooding
x
Enduits superficiels d’usure (Esu) – Enrobés coulés à froid (Ecf) – Actualisation des
connaissances sur les revêtements superficiels (NI Chaussées Dépendances 113)
1 04/2005 Technical document –
Information memo Highways – Pavements
Exposure to sunlight, frost, wind, temperature, rain x x
Recommandations pour la durabilité des bétons durcis soumis au gel – Guide
technique 3 1/12/2003
Technical document – Technical guide
Highways Freeze–thaw, wind, rain, snow x x
Highways – Sanitation
Structures (Les) alvéolaires ultra légères (SAUL) en assainissement pluvial 1 1998
Technical document – Technical guide
Highways – Sanitation
Rain, local rainfall, peak flow rate, decennial flow rate x x

PNACC, infrastructures and transport systems, action 1 – Adaptation of infrastructures and transport systems to climate change
135
Document title
Cate
go
ry
Date of
publication Type of document Infra. Climate variable
Topics
Des
ign
Ma
inte
na
nce
Op
era
tio
ns
Ouvrages routiers et inondations 3 1998 Technical document –
Information memo and data sheet
Highways – Sanitation
Reference peak flow rates x
Bilan financier prévu par la circulaire n° 94-56 du 5 mai 1994 définissant les modalités
d’élaboration, d’instruction et d’approbation des opérations d’investissements sur le
réseau routier national non concédé – Guide technique
2 2001 Technical document – Technical
guide Highways – Sanitation
Snow, frost x
Loi n°2006-1772 du 30 décembre 2006 sur l’eau et les milieux aquatiques 2 12/30/2006
Official text Law
Highways – Sanitation
Assainissement routier – Guide technique 3 2006 Technical document – Technical
guide Highways – Sanitation
Flooding, submersion, recurrence interval, exceptional flow rate, water depth, peak flow rate for a given
recurrence interval, mean intensity (mm/h), run-off coefficient, decennial daily rain or for another recurrence
interval, concentration time, climatology
x
Guide technique – Drainage routier 1 2006 Technical document – Technical
guide Highways – Sanitation
Freeze–thaw, wind, temperature, rain, humidity, infiltration coefficient as % of rainfall, height and
duration of precipitation, climate zone x x x
Pollution d’origine routière – Conception des ouvrages de traitement des eaux – Guide
technique 3 2007
Technical document – Technical guide
Highways – Sanitation
Rainfall, rain, recurrence interval, harshness of the winter, rainfall with a 10-year recurrence interval, 2-hour duration, rainfall limited to a 1-year recurrence interval,
2-hour duration. Annex: rainfall in mm of the peak event, mean annual rainfall in m, occurrence and level of centennial high waters (flow rates and frequencies)
x x x
Assainissement (l') pluvial intégré dans l’aménagement – Éléments clés pour le
recours aux techniques alternatives 1 2008
Technical document – Technical guide
Highways – Sanitation
Reference flow rate, frequency of flooding, decennial flow rate, maximum annual rainfall, intensity / duration /
frequency graph x
Highways – Earthworks
Réalisation des remblais et des couches de forme (GTR) – Guide technique 1 1992
Technical document – Technical guide
Highways – Earthworks
Freeze–thaw, wind, rainfall or intensity of rain, rain erosion, meteorology
x

PNACC, infrastructures and transport systems, action 1 – Adaptation of infrastructures and transport systems to climate change
136
Document title
Cate
go
ry
Date of
publication Type of document Infra. Climate variable
Topics
Des
ign
Ma
inte
na
nce
Op
era
tio
ns
Guide technique : Conception et réalisation des terrassements – Fascicule 1 : études et
exécution des travaux – Fascicule 2 : organisation des contrôles – Fascicule 3 :
méthodes d’essais
1 2007 Technical document – Technical
guide Highways – Earthworks
Frost, wind, rain, rainfall, snow, flooding, sun, rain erosion, climate zones, frost index
x
Traitement des sols à la chaux et/ou aux liants hydrauliques (GTS) – Application à la
réalisation des remblais et des couches de forme – Guide technique
3 2000 Technical document – Technical
guide Highways – Earthworks
Freeze–thaw, wind, rain, rainfall, climate temperature x
Météorologie et Terrassement. DOCUMENT EN COURS DE REVISION 3 1986
Technical document – Technical guide
Highways – Earthworks
Evaporation, precipitation, snow, fog, storms, frost, hydrological properties of soil, wind
x
Terrassements – Aide à la rédaction des CCTP – Guide méthodologique. DOCUMENT
EN COURS DE REVISION 3 2006
Technical document – Technical guide
Highways – Earthworks
Frost, wind, flooding, temperature, precipitation x
Cahier des clauses techniques générales. Fascicule 2. Terrassements généraux 1 2003 Official text – CCTG
Highways – Earthworks
Meteorology x
Portance des plates-formes : pertinence du choix d’une méthodologie de mesure 1 In progress Technical document
Highways – Earthworks
Recommandations pour le diagnostic, l’entretien et la réhabilitation des remblais
routiers 1 In progress Technical document
Highways – Earthworks
x x
Étude et réalisation des remblais sur sols compressibles (Sétra et LCPC) 1 2000
Technical document – Technical guide
Highways – Earthworks
Reference to key parameters, such as water flow, water content, drainage, without a direct link with meteorology
/ climatology x
NF P98-080-1 : Chaussées – Terrassement – Terminologie – Partie 1 : terminologie relative au calcul de dimensionnement des chaussées
2 1992 Standard – Homologated
standard Highways – Earthworks
Frost index, temperature x

PNACC, infrastructures and transport systems, action 1 – Adaptation of infrastructures and transport systems to climate change
137
Document title
Cate
go
ry
Date of
publication Type of document Infra. Climate variable
Topics
Des
ign
Ma
inte
na
nce
Op
era
tio
ns
Highways – Vertical signs – Panels, gantries, masts
Norme XP – P 98 – 550 – 1 Signalisation routière verticale – Portiques, potences et
hauts mats – Partie 1 : spécifications de cal-cul, mise en œuvre, contrôle, maintenance,
surveillance
1 08/1996 Standard
Highways – Vertical signs –
Panels, gantries, masts
Wind, snow, temperature. Document linked to the Eurocodes, considered in the field of constructions
x x x
Highways – Winter maintenance
Anticipation des risques routiers hivernaux – Éléments de réflexion 1 09/2006
Technical document – Technical guide
Highways – Winter
maintenance
Climate zoning. Definition of winter service levels. Snow, precipitation and cold
x
Comportement (le) hivernal particulier de certaines surfaces routières 1 04/1991
Technical document – Information memo and data
sheet
Highways – Winter
maintenance No references to climate variables x
Dictionnaire de l’entretien routier. Thème 4 : viabilité hivernale 1 05/1998
Technical document – Dictionary – Glossary
Highways – Winter
maintenance
No references to climate variables. Methodological document. Organization of winter service
x
Dispositions particulières pour l’exploitation hivernale des bétons bitumineux drainants 3 09/2001
Technical document – Information memo and data
sheet
Highways – Winter
maintenance
Weather phenomena on highways. Reference to H1: reference documents to be amended if
the H1 zoning changes x
Élaboration d’une politique routière de maintenance par niveaux de service – Guide
méthodologique 1 11/1994
Technical document – Technical guide
Highways – Winter
maintenance No references to climate variables x
Fondants (les) chimiques : choisir un sel de déneigement 1 06/1989
Technical document – Information memo and data
sheet
Highways – Winter
maintenance
Characteristics, operation, efficiency of deicing agents No references to climate variables
x
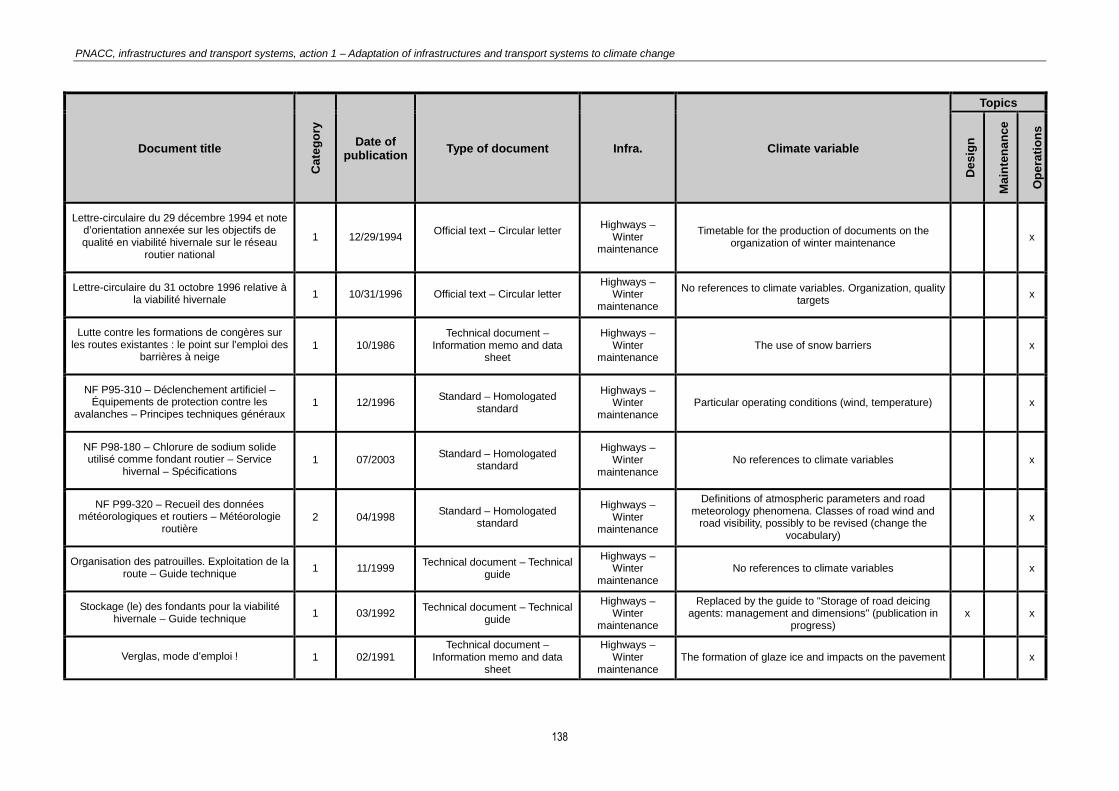
PNACC, infrastructures and transport systems, action 1 – Adaptation of infrastructures and transport systems to climate change
138
Document title
Cate
go
ry
Date of
publication Type of document Infra. Climate variable
Topics
Des
ign
Ma
inte
na
nce
Op
era
tio
ns
Lettre-circulaire du 29 décembre 1994 et note d’orientation annexée sur les objectifs de qualité en viabilité hivernale sur le réseau
routier national 1 12/29/1994
Official text – Circular letter
Highways – Winter
maintenance
Timetable for the production of documents on the organization of winter maintenance
x
Lettre-circulaire du 31 octobre 1996 relative à la viabilité hivernale 1 10/31/1996 Official text – Circular letter
Highways – Winter
maintenance
No references to climate variables. Organization, quality targets
x
Lutte contre les formations de congères sur les routes existantes : le point sur l’emploi des
barrières à neige 1 10/1986
Technical document – Information memo and data
sheet
Highways – Winter
maintenance The use of snow barriers x
NF P95-310 – Déclenchement artificiel – Équipements de protection contre les
avalanches – Principes techniques généraux 1 12/1996
Standard – Homologated standard
Highways – Winter
maintenance Particular operating conditions (wind, temperature) x
NF P98-180 – Chlorure de sodium solide utilisé comme fondant routier – Service
hivernal – Spécifications 1 07/2003
Standard – Homologated standard
Highways – Winter
maintenance No references to climate variables x
NF P99-320 – Recueil des données météorologiques et routiers – Météorologie
routière 2 04/1998
Standard – Homologated standard
Highways – Winter
maintenance
Definitions of atmospheric parameters and road meteorology phenomena. Classes of road wind and
road visibility, possibly to be revised (change the vocabulary)
x
Organisation des patrouilles. Exploitation de la route – Guide technique 1 11/1999
Technical document – Technical guide
Highways – Winter
maintenance No references to climate variables x
Stockage (le) des fondants pour la viabilité hivernale – Guide technique 1 03/1992
Technical document – Technical guide
Highways – Winter
maintenance
Replaced by the guide to "Storage of road deicing agents: management and dimensions" (publication in
progress) x x
Verglas, mode d’emploi ! 1 02/1991 Technical document –
Information memo and data sheet
Highways – Winter
maintenance The formation of glaze ice and impacts on the pavement x
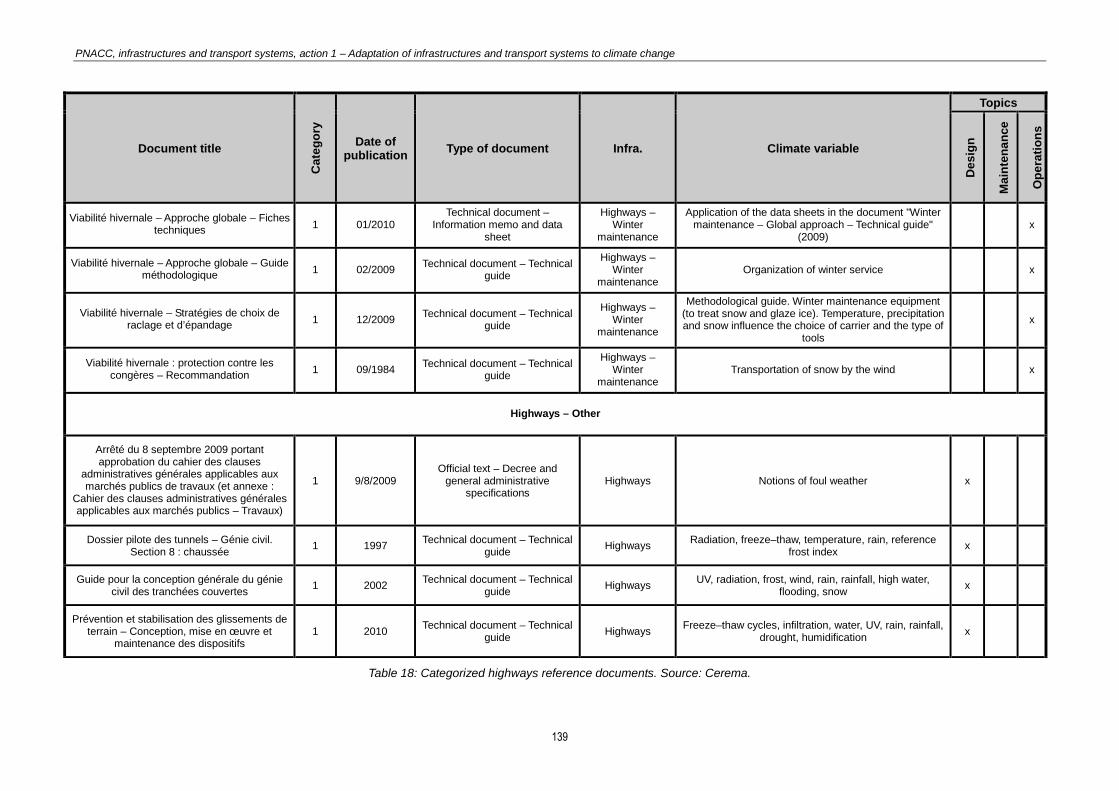
PNACC, infrastructures and transport systems, action 1 – Adaptation of infrastructures and transport systems to climate change
139
Document title
Cate
go
ry
Date of
publication Type of document Infra. Climate variable
Topics
Des
ign
Ma
inte
na
nce
Op
era
tio
ns
Viabilité hivernale – Approche globale – Fiches techniques 1 01/2010
Technical document – Information memo and data
sheet
Highways – Winter
maintenance
Application of the data sheets in the document "Winter maintenance – Global approach – Technical guide"
(2009) x
Viabilité hivernale – Approche globale – Guide méthodologique 1 02/2009
Technical document – Technical guide
Highways – Winter
maintenance Organization of winter service x
Viabilité hivernale – Stratégies de choix de raclage et d’épandage 1 12/2009
Technical document – Technical guide
Highways – Winter
maintenance
Methodological guide. Winter maintenance equipment (to treat snow and glaze ice). Temperature, precipitation and snow influence the choice of carrier and the type of
tools
x
Viabilité hivernale : protection contre les congères – Recommandation 1 09/1984
Technical document – Technical guide
Highways – Winter
maintenance Transportation of snow by the wind x
Highways – Other
Arrêté du 8 septembre 2009 portant approbation du cahier des clauses
administratives générales applicables aux marchés publics de travaux (et annexe :
Cahier des clauses administratives générales applicables aux marchés publics – Travaux)
1 9/8/2009 Official text – Decree and
general administrative specifications
Highways Notions of foul weather x
Dossier pilote des tunnels – Génie civil. Section 8 : chaussée 1 1997
Technical document – Technical guide
Highways Radiation, freeze–thaw, temperature, rain, reference
frost index x
Guide pour la conception générale du génie civil des tranchées couvertes 1 2002
Technical document – Technical guide
Highways UV, radiation, frost, wind, rain, rainfall, high water,
flooding, snow x
Prévention et stabilisation des glissements de terrain – Conception, mise en œuvre et
maintenance des dispositifs 1 2010
Technical document – Technical guide
Highways Freeze–thaw cycles, infiltration, water, UV, rain, rainfall,
drought, humidification x
Table 18: Categorized highways reference documents. Source: Cerema.

PNACC, infrastructures and transport systems, action 1 – Adaptation of infrastructures and transport systems to climate change
140
4.3 - Reference materials for urban highways
Document title Author / Publishe
r
Cate
go
ry
Date of
publication
Type of document
Infra.
Climate variable
Topics
Desig
n
Ma
inte
nan
ce
Op
era
tion
s
STRUCT- URB – Dimensionnement des chaussées neuves CERTU 1 2005 Software
Urban highways
Temperature, snow, precipitation x
Usage des surfaces podotactiles par les personnes aveugles ou malvoyantes
CERTU – DSCR
1 2005 Technical
guide Urban
highways Temperature, snow, precipitation x
Plan de gestion du trafic périurbain – Guide méthodologique
CERTU – DSCR
1 2007 Technical
guide Urban
highways Temperature, snow, precipitation x
Chaussées urbaines démontables – Guide technique 2008
CERTU – LCPC – CIMBET
ON
1 2009 Technical
guide Urban
highways Temperature, snow, precipitation x
Profil en travers, outil du partage des voiries urbaines CERTU 1 2009
Technical guide
Urban highways
Temperature, snow, precipitation x
Instructions sur les conditions techniques d’aménagement des voies rapides urbaines
(ICTAVRU) CERTU 1 2009
Technical guide
Urban highways
Temperature, snow, precipitation x
Guide sur le marquage de la chaussée en agglomération CERTU 1 2004
Technical guide
Urban highways
Temperature, snow, precipitation x

PNACC, infrastructures and transport systems, action 1 – Adaptation of infrastructures and transport systems to climate change
141
Chaussées bus : Choix des matériaux et dimensionnement structurel CERTU 1 2006
Technical guide
Urban highways
Temperature, snow, precipitation x
Entretien des chaussées urbaines – Guide méthodologique et pratique CERTU 1 2010
Technical guide
Urban highways
Temperature, snow, precipitation x
Sols (les) stabilisés en milieu urbain – Conception, choix des matériaux, mise en œuvre et entretien CERTU 1 2009
Technical guide
Urban highways
Temperature, snow, precipitation x x
Recommandations pour les aménagements cyclables – version mise à jour en septembre 2008 CERTU 1 2008
Technical guide
Urban highways
Temperature, snow, precipitation x x
Chaussées poreuses urbaines – Guide technique CERTU 1 1999 Technical
guide Urban
highways Temperature, snow, precipitation x
Dimensionnement des structures des chaussées urbaines CERTU 1 2000
Technical guide
Urban highways
Temperature, snow, precipitation x
Conception des accès sur voies rapides urbaines de type 4 (VRU A) CERTU 1 2003
Technical guide
Urban highways
Temperature, snow, precipitation x
Table 19: Categorized reference materials for urban highways. Source: Cerema.
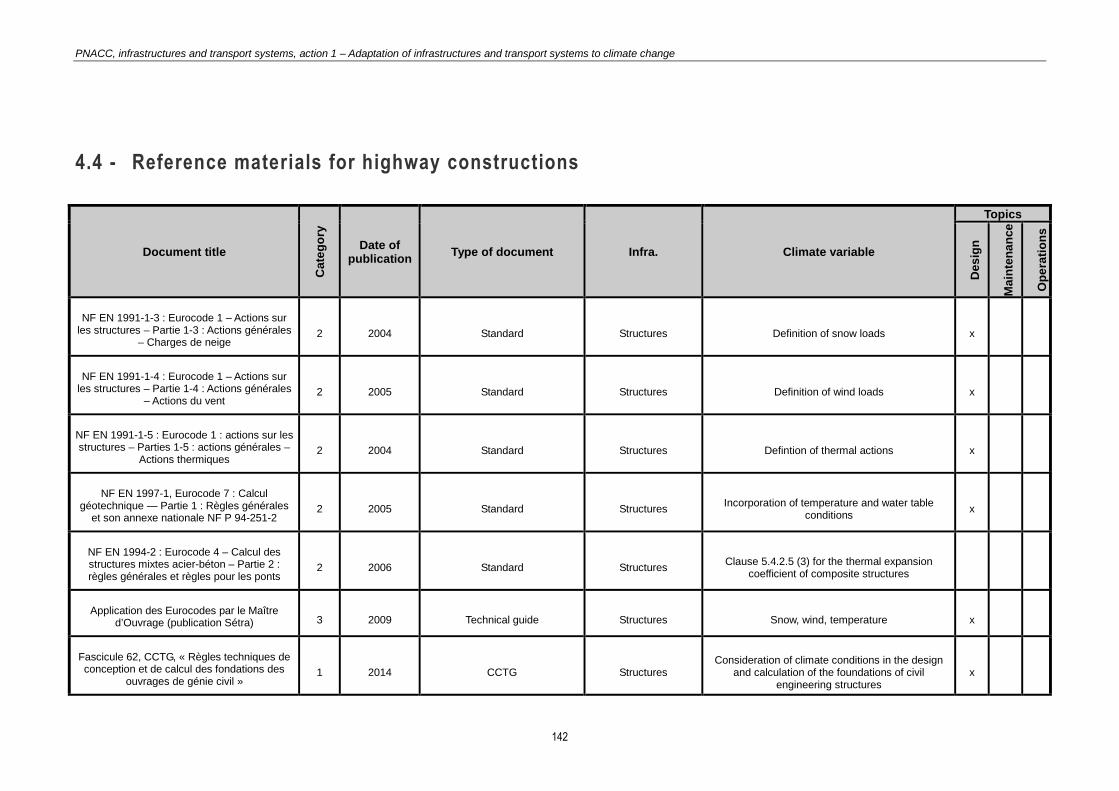
PNACC, infrastructures and transport systems, action 1 – Adaptation of infrastructures and transport systems to climate change
142
4.4 - Reference materials for highway constructions
Document title
Cate
go
ry
Date of
publication Type of document Infra. Climate variable
Topics
Des
ign
Ma
inte
na
nce
Op
era
tio
ns
NF EN 1991-1-3 : Eurocode 1 – Actions sur les structures – Partie 1-3 : Actions générales
– Charges de neige 2 2004 Standard Structures Definition of snow loads x
NF EN 1991-1-4 : Eurocode 1 – Actions sur les structures – Partie 1-4 : Actions générales
– Actions du vent 2 2005 Standard Structures Definition of wind loads x
NF EN 1991-1-5 : Eurocode 1 : actions sur les structures – Parties 1-5 : actions générales –
Actions thermiques 2 2004 Standard Structures Defintion of thermal actions x
NF EN 1997-1, Eurocode 7 : Calcul géotechnique — Partie 1 : Règles générales
et son annexe nationale NF P 94-251-2 2 2005 Standard Structures
Incorporation of temperature and water table conditions
x
NF EN 1994-2 : Eurocode 4 – Calcul des structures mixtes acier-béton – Partie 2 : règles générales et règles pour les ponts
2 2006 Standard Structures Clause 5.4.2.5 (3) for the thermal expansion
coefficient of composite structures
Application des Eurocodes par le Maître d’Ouvrage (publication Sétra) 3 2009 Technical guide Structures Snow, wind, temperature x
Fascicule 62, CCTG, « Règles techniques de conception et de calcul des fondations des
ouvrages de génie civil » 1 2014 CCTG Structures
Consideration of climate conditions in the design and calculation of the foundations of civil
engineering structures x
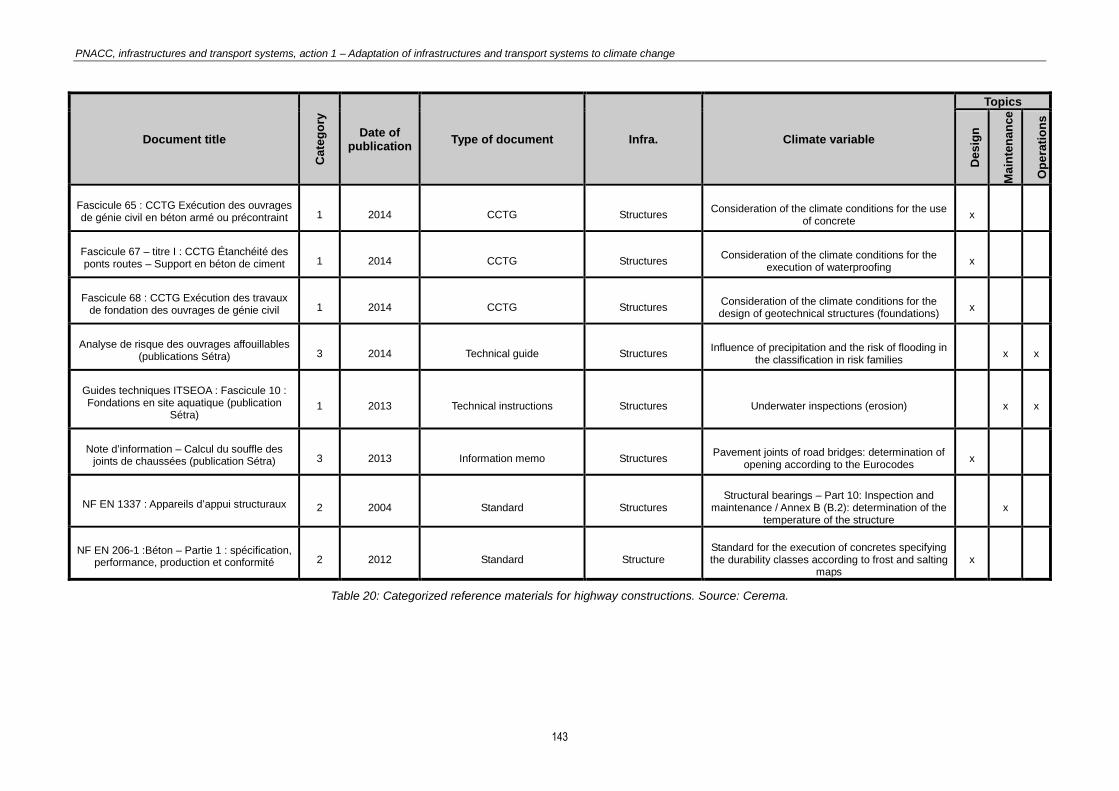
PNACC, infrastructures and transport systems, action 1 – Adaptation of infrastructures and transport systems to climate change
143
Document title
Cate
go
ry
Date of
publication Type of document Infra. Climate variable
Topics
Des
ign
Ma
inte
na
nce
Op
era
tio
ns
Fascicule 65 : CCTG Exécution des ouvrages de génie civil en béton armé ou précontraint 1 2014 CCTG Structures
Consideration of the climate conditions for the use of concrete
x
Fascicule 67 – titre I : CCTG Étanchéité des ponts routes – Support en béton de ciment 1 2014 CCTG Structures
Consideration of the climate conditions for the execution of waterproofing
x
Fascicule 68 : CCTG Exécution des travaux de fondation des ouvrages de génie civil 1 2014 CCTG Structures
Consideration of the climate conditions for the design of geotechnical structures (foundations)
x
Analyse de risque des ouvrages affouillables (publications Sétra) 3 2014 Technical guide Structures
Influence of precipitation and the risk of flooding in the classification in risk families
x x
Guides techniques ITSEOA : Fascicule 10 : Fondations en site aquatique (publication
Sétra) 1 2013 Technical instructions Structures Underwater inspections (erosion) x x
Note d’information – Calcul du souffle des joints de chaussées (publication Sétra) 3 2013 Information memo Structures
Pavement joints of road bridges: determination of opening according to the Eurocodes
x
NF EN 1337 : Appareils d’appui structuraux 2 2004 Standard Structures Structural bearings – Part 10: Inspection and
maintenance / Annex B (B.2): determination of the temperature of the structure
x
NF EN 206-1 :Béton – Partie 1 : spécification, performance, production et conformité 2 2012 Standard Structure
Standard for the execution of concretes specifying the durability classes according to frost and salting
maps x
Table 20: Categorized reference materials for highway constructions. Source: Cerema.
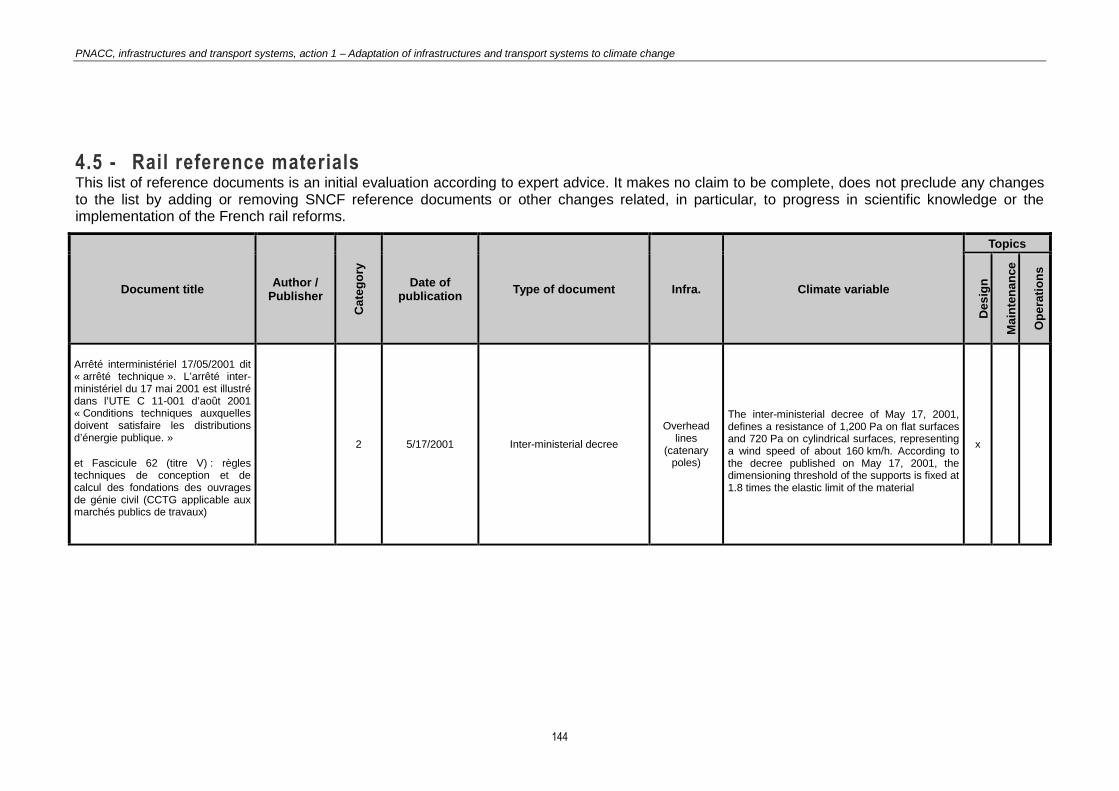
PNACC, infrastructures and transport systems, action 1 – Adaptation of infrastructures and transport systems to climate change
144
4.5 - Rail reference materials This list of reference documents is an initial evaluation according to expert advice. It makes no claim to be complete, does not preclude any changes to the list by adding or removing SNCF reference documents or other changes related, in particular, to progress in scientific knowledge or the implementation of the French rail reforms.
Document title Author /
Publisher
Cate
go
ry
Date of
publication Type of document Infra. Climate variable
Topics
Des
ign
Ma
inte
na
nce
Op
era
tio
ns
Arrêté interministériel 17/05/2001 dit « arrêté technique ». L’arrêté inter-ministériel du 17 mai 2001 est illustré dans l’UTE C 11-001 d’août 2001 « Conditions techniques auxquelles doivent satisfaire les distributions d’énergie publique. »
et Fascicule 62 (titre V) : règles techniques de conception et de calcul des fondations des ouvrages de génie civil (CCTG applicable aux marchés publics de travaux)
2 5/17/2001 Inter-ministerial decree
Overhead lines
(catenary poles)
The inter-ministerial decree of May 17, 2001, defines a resistance of 1,200 Pa on flat surfaces and 720 Pa on cylindrical surfaces, representing a wind speed of about 160 km/h. According to the decree published on May 17, 2001, the dimensioning threshold of the supports is fixed at 1.8 times the elastic limit of the material
x

PNACC, infrastructures and transport systems, action 1 – Adaptation of infrastructures and transport systems to climate change
145
Document title Author /
Publisher
Cate
go
ry
Date of
publication Type of document Infra. Climate variable
Topics
Des
ign
Ma
inte
na
nce
Op
era
tio
ns
NF EN 50125-1 Mai 2012 – Applications ferroviaires – Conditions d’environnement pour le matériel – Partie 1 : équipement embarqué du
matériel roulant
NF EN 50125-2 Mai 2003 – Applications ferroviaires – Conditions d’environnement pour le matériel – Partie 2 : installations électriques
fixes
NF EN 50125-3 Mai 2003 – Applications ferroviaires – Conditions d’environnement pour le matériel –
Partie 3 : équipement pour la signalisation et les
télécommunications
To be checked with the appropri
ate standardization group
2003 / 2012 European Standard
NF
Classification specifying, amongst others, the outdoor ambient temperature, the temperature inside the vehicle compartments, and the temperature in the electronic cabinets
x
Norme NF EN 50123 – Alimentation électrique – installations fixes et
appareillages auxiliaires en courant continu
NF EN 50163 – Tension d’alimentation des réseaux de
traction (alimentation électrique et mise à la terre des équipements de transports publics et appareillage
auxiliaire)
NF EN 50124 – Coordination de l’isolement dans le domaine
ferroviaire ; s’applique aux matériels utilisés en signalisation, matériels
roulants et installations fixes jusqu’à 2000m au-dessus du niveau de la
mer
To be checked with the appropri
ate standardization group
European Standard
NF
More specifically:
– cold (formation of ice, heavy snow, frost): catenary switchgear (NF 501231-1 – EN 50163 and EN 50124)
– wind (storms): meeting the standards with regard to the insulation distances according to the voltage domain, as per EN 50124 for catenary system insulators
x

PNACC, infrastructures and transport systems, action 1 – Adaptation of infrastructures and transport systems to climate change
146
Document title Author /
Publisher
Cate
go
ry
Date of
publication Type of document Infra. Climate variable
Topics
Des
ign
Ma
inte
na
nce
Op
era
tio
ns
IN 0283 – Libération des LRS avec tendeurs hydrauliques ou à
température naturelle SNCF
3 IN Track Temperature (calculated release temperature for the laying of 25°C rails, calculated termination temperature for the laying of 25°C rails)
x
IN 3001 – Principes Généraux applicables à la pose de voie en
Longs Rails Soudés (LRS) SNCF
3 IN Track
The maximum rail temperature on the national French rail network is 60°C. This parameter can be used to determine the maximum stress level in the rail and to dimension the components and associated maintenance rules (rails, attachments, ties, profile and quality of the ballast)
x
IN 2915 – Conditions d’armement et trace pour la création de LRS SNCF
3 IN Track
To make sure that the zone between the heads inside the tunnel will never be subjected to thermal compression loads, the long welded rails must be released at a temperature between 25°C and 32°C, in order to be above the maximum ambient temperature in the tunnel observed between these points.
IN 3002 – Conditions techniques à respecter pour l’entretien des LRS et des appareils incorporés sur Lignes
Classiques et Lignes à Grande Vitesse
SNCF 3 IN Track
Definition of the technical conditions to be met for the maintenance of long welded rails and the incorporated track equipment of the main conventional lines, high-speed lines and lines less than 3 m from the main lines (distance measured between the closest rails), irrespective of the temperature conditions at the time of the effective operations and in the stabilization period, and the measures to be taken in the event of an incident (breakages and defects of the rail, deformation of the track, accidental overheating of the rails)
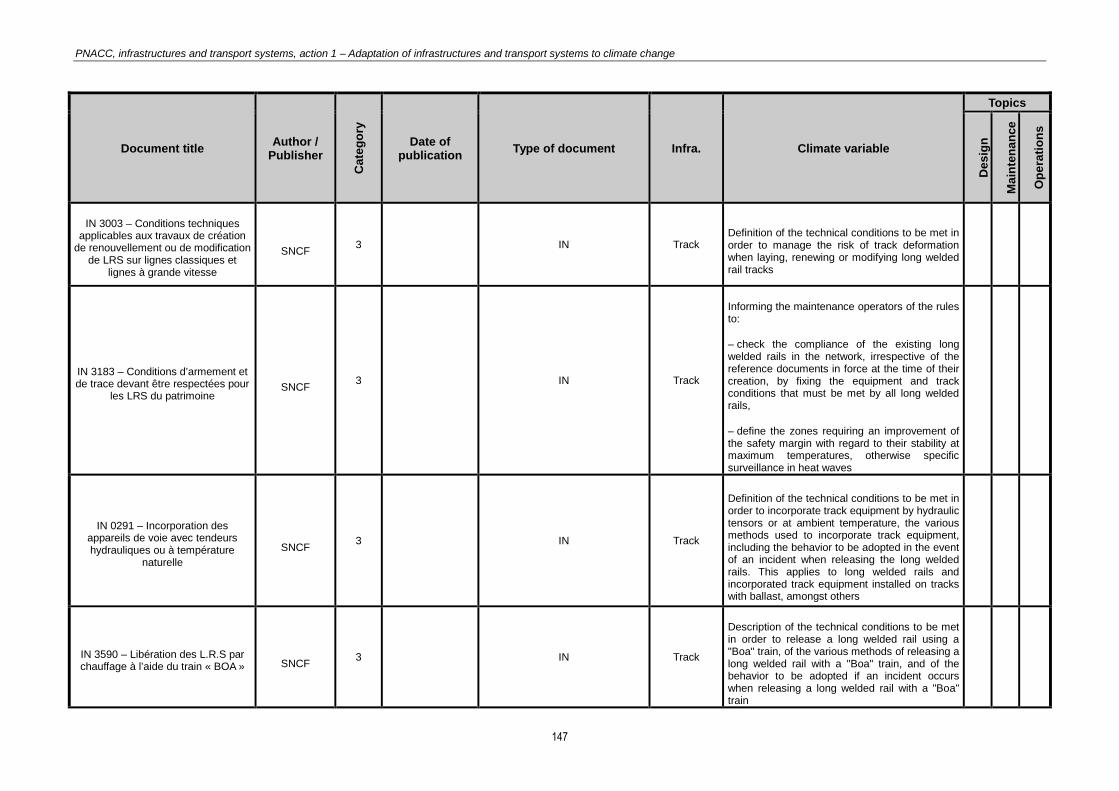
PNACC, infrastructures and transport systems, action 1 – Adaptation of infrastructures and transport systems to climate change
147
Document title Author /
Publisher
Cate
go
ry
Date of
publication Type of document Infra. Climate variable
Topics
Des
ign
Ma
inte
na
nce
Op
era
tio
ns
IN 3003 – Conditions techniques applicables aux travaux de création
de renouvellement ou de modification de LRS sur lignes classiques et
lignes à grande vitesse
SNCF 3 IN Track
Definition of the technical conditions to be met in order to manage the risk of track deformation when laying, renewing or modifying long welded rail tracks
IN 3183 – Conditions d’armement et de trace devant être respectées pour
les LRS du patrimoine SNCF
3 IN Track
Informing the maintenance operators of the rules to:
– check the compliance of the existing long welded rails in the network, irrespective of the reference documents in force at the time of their creation, by fixing the equipment and track conditions that must be met by all long welded rails,
– define the zones requiring an improvement of the safety margin with regard to their stability at maximum temperatures, otherwise specific surveillance in heat waves
IN 0291 – Incorporation des appareils de voie avec tendeurs hydrauliques ou à température
naturelle SNCF
3 IN Track
Definition of the technical conditions to be met in order to incorporate track equipment by hydraulic tensors or at ambient temperature, the various methods used to incorporate track equipment, including the behavior to be adopted in the event of an incident when releasing the long welded rails. This applies to long welded rails and incorporated track equipment installed on tracks with ballast, amongst others
IN 3590 – Libération des L.R.S par chauffage à l’aide du train « BOA » SNCF
3 IN Track
Description of the technical conditions to be met in order to release a long welded rail using a "Boa" train, of the various methods of releasing a long welded rail with a "Boa" train, and of the behavior to be adopted if an incident occurs when releasing a long welded rail with a "Boa" train

PNACC, infrastructures and transport systems, action 1 – Adaptation of infrastructures and transport systems to climate change
148
Document title Author /
Publisher
Cate
go
ry
Date of
publication Type of document Infra. Climate variable
Topics
Des
ign
Ma
inte
na
nce
Op
era
tio
ns
IN 2955 – Remplacement de rails ou de soudures en LRS SNCF
3 IN Track Definition of the procedures to be followed with long welded rails in order to repair the rails or welds that are broken or suffer from a fault that requires the replacement of a section of rail
IN 0259 – Conception réalisation entretien des structures d’assise et des plates-formes, des ouvrages de
drainage et d’écoulement qui les complètent, drainage structure
d’assise, plate-forme, collecteur, tunnel, fosse, assise, sous-couche
SNCF 3 IN Track Provision for the design, construction and
maintenance of drainage and evacuation works
IN 0319 – Surveillance et maintenance de la voie SNCF
3 IN Track
Procedure for the verification of the stability of the ballasted track and measures to be taken when the stability is, or risks being, affected unexpectedly. The rules in this procedure are applicable to tracks equipped with normal rail bars or with long welded rails. They cover the conventional main lines and the high-speed lines
IN 1252 – Petits ouvrages sous voies et à proximité des voies SNCF
3 IN Track
Guide to choosing the most technically and economically appropriate solutions for ongoing projects. Constructions – Metal nozzle – Concrete – Structure under the track – SOLON – Tracks
IN1833 – Maintenance des fossés en terre (qui sera remplacé par IN4488) SNCF
3 IN Track Modalities for the surveillance and maintenance of earth ditches on all the lines in the national network
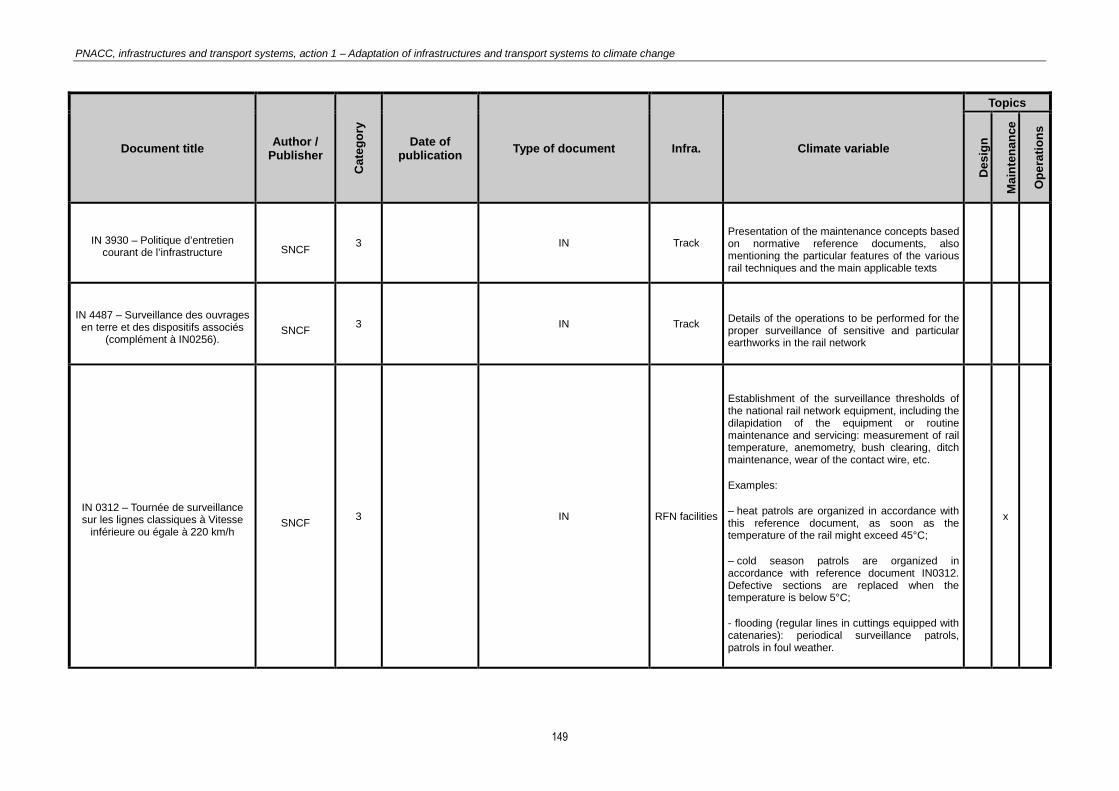
PNACC, infrastructures and transport systems, action 1 – Adaptation of infrastructures and transport systems to climate change
149
Document title Author /
Publisher
Cate
go
ry
Date of
publication Type of document Infra. Climate variable
Topics
Des
ign
Ma
inte
na
nce
Op
era
tio
ns
IN 3930 – Politique d’entretien courant de l’infrastructure SNCF
3 IN Track Presentation of the maintenance concepts based on normative reference documents, also mentioning the particular features of the various rail techniques and the main applicable texts
IN 4487 – Surveillance des ouvrages en terre et des dispositifs associés
(complément à IN0256). SNCF
3 IN Track Details of the operations to be performed for the proper surveillance of sensitive and particular earthworks in the rail network
IN 0312 – Tournée de surveillance sur les lignes classiques à Vitesse
inférieure ou égale à 220 km/h SNCF
3 IN RFN facilities
Establishment of the surveillance thresholds of the national rail network equipment, including the dilapidation of the equipment or routine maintenance and servicing: measurement of rail temperature, anemometry, bush clearing, ditch maintenance, wear of the contact wire, etc.
Examples:
– heat patrols are organized in accordance with this reference document, as soon as the temperature of the rail might exceed 45°C;
– cold season patrols are organized in accordance with reference document IN0312. Defective sections are replaced when the temperature is below 5°C;
- flooding (regular lines in cuttings equipped with catenaries): periodical surveillance patrols, patrols in foul weather.
x
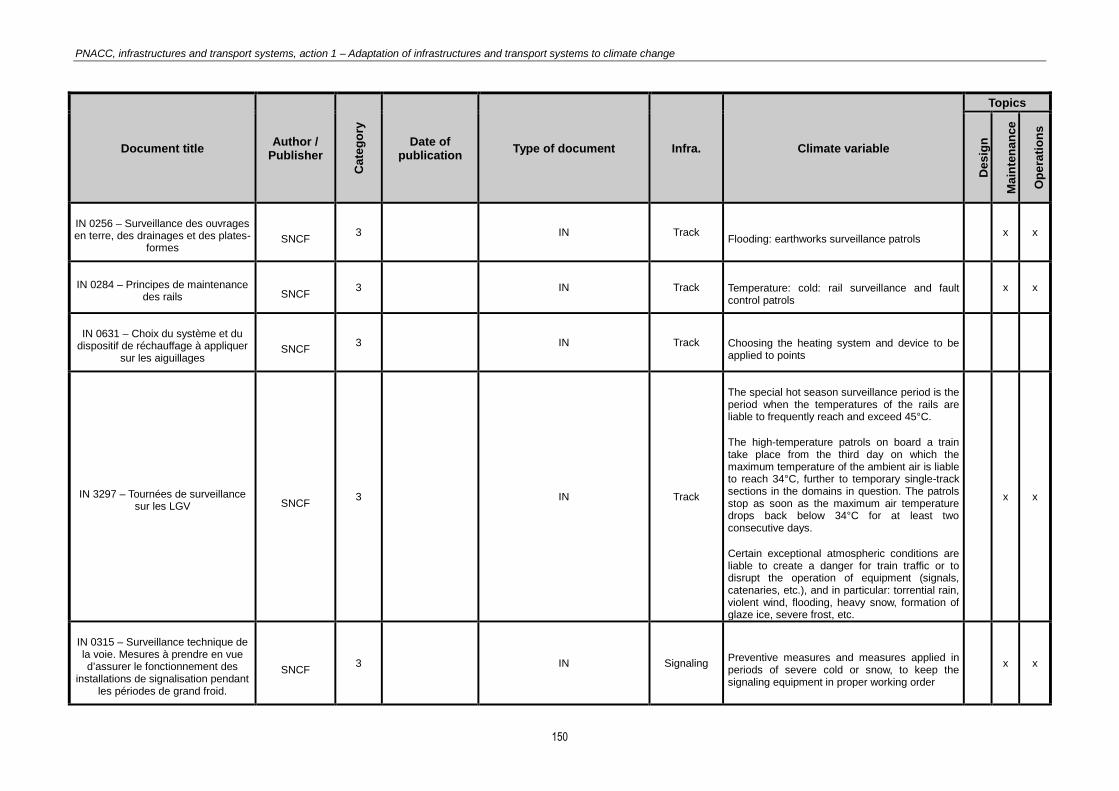
PNACC, infrastructures and transport systems, action 1 – Adaptation of infrastructures and transport systems to climate change
150
Document title Author /
Publisher
Cate
go
ry
Date of
publication Type of document Infra. Climate variable
Topics
Des
ign
Ma
inte
na
nce
Op
era
tio
ns
IN 0256 – Surveillance des ouvrages en terre, des drainages et des plates-
formes SNCF
3 IN Track Flooding: earthworks surveillance patrols
x x
IN 0284 – Principes de maintenance des rails SNCF
3 IN Track Temperature: cold: rail surveillance and fault control patrols
x x
IN 0631 – Choix du système et du dispositif de réchauffage à appliquer
sur les aiguillages SNCF
3 IN Track Choosing the heating system and device to be applied to points
IN 3297 – Tournées de surveillance sur les LGV SNCF
3 IN Track
The special hot season surveillance period is the period when the temperatures of the rails are liable to frequently reach and exceed 45°C.
The high-temperature patrols on board a train take place from the third day on which the maximum temperature of the ambient air is liable to reach 34°C, further to temporary single-track sections in the domains in question. The patrols stop as soon as the maximum air temperature drops back below 34°C for at least two consecutive days.
Certain exceptional atmospheric conditions are liable to create a danger for train traffic or to disrupt the operation of equipment (signals, catenaries, etc.), and in particular: torrential rain, violent wind, flooding, heavy snow, formation of glaze ice, severe frost, etc.
x x
IN 0315 – Surveillance technique de la voie. Mesures à prendre en vue d’assurer le fonctionnement des
installations de signalisation pendant les périodes de grand froid.
SNCF 3 IN Signaling
Preventive measures and measures applied in periods of severe cold or snow, to keep the signaling equipment in proper working order
x x

PNACC, infrastructures and transport systems, action 1 – Adaptation of infrastructures and transport systems to climate change
151
Document title Author /
Publisher
Cate
go
ry
Date of
publication Type of document Infra. Climate variable
Topics
Des
ign
Ma
inte
na
nce
Op
era
tio
ns
IN 2913 – Règles de maintenance – tringlerie des aiguillages SNCF
3 IN Signaling Safety of rail operations
x x
IN 0393 – Systèmes informatiques de signalisation. Règles générales de
maintenance SNCF
3 IN Signaling
Monitoring the systems that regulate the temperature in the computer room. All the computer systems are designed to operate at ambient temperatures of approximately +18°C to +27°C (air-conditioned buildings)
x x x
IN 1817 – Politique de maintenance des installations de traction
électrique des lignes classiques : – à courant continu 1500V – à courant
alternatif 25000V – 50Hz
SNCF 3 IN
Overhead lines
Records of particularities must kept locally:
– condition of zones or installations at a frequency adapted, for technical reasons, to the resistance of branch terminal equipment to loads (does not cover adaptations related to the multi-year distribution of capacity);
– condition of so-called "sensitive" equipment in hot periods;
– condition of critical zones with regard to electric dimensioning or traction return;
– condition of critical zones with regard to the resistance of branch terminal equipment (components for which an adaptation of the surveillance or servicing does not guarantee their mechanical or electrical resistance).
Certain conditions may not be applicable, in which case they are marked "N/A"

PNACC, infrastructures and transport systems, action 1 – Adaptation of infrastructures and transport systems to climate change
152
Document title Author /
Publisher
Cate
go
ry
Date of
publication Type of document Infra. Climate variable
Topics
Des
ign
Ma
inte
na
nce
Op
era
tio
ns
IN 2447 – IFTE – Conduite – Exploitation Dégivrage de la
caténaire – définit les dispositions générales applicables en cas de
prévisions et d’alertes météorologiques « givre »
SNCF 3 IN
Overhead lines
This document defines the parties involved in the process to deice the catenary system and prioritizes the levels of intervention.
It also describes the different methods of combating frost and assesses their efficiency according to the context
x
Principe SNCF 305090 SNCF 3
Overhead lines
(embankments)
Flooding (risk of landslides). The excavations are shaped according to the terrain, as per the principle 305090
x
IN 3278 – Référentiel technique pour la réalisation des LGV – Partie génie
civil (tomes 2 et 3) SNCF
3 IN Civil
engineering
Design and construction of works:
– civil engineering works for high-speed lines (speed higher than or equal to 230 km/h) dedicated to passenger traffic or carrying mixed traffic (passengers and freight)
– lines connecting the high-speed line to the existing rail network and associated constructions (adaptation of the highways network, etc.) concomitant with the construction of the rail infrastructure.
The dimensioning rules applying to earthworks, hydraulic works and constructions are defined. The requirements for access to these constructions and the superstructure for maintenance and the safety of the lines are explained
Table 21: Categorized rail reference documents. Source: RFF, SNCF.
The following tables summarize the texts liable to be impacted by climate change. The hypothesis of current techniques is applied in this document. Only the climate changes, so any possible technological developments are ignored.

PNACC, infrastructures and transport systems, action 1 – Adaptation of infrastructures and transport systems to climate change
153
4.6 - Maritime and river reference documents
Document title Author / Publish
er
Cate
go
ry
Date of
publication
Type of document
Infra.
Climate variable
Topics
Desig
n
Main
ten
an
ce
Op
era
tio
ns
ROSA 2000
(recommandations pour le calcul aux états limites des ouvrages en sites aquatiques)
CETMEF 1 2000 Recommend
ations Port and river infrastructures
Water levels: table introducing the water level to be considered (with the corresponding recurrence interval) in the dimensioning of a
construction + maps of extreme levels Question: which level is taken into consideration to dimension a
construction? The current level, or the level in 100 years' time? Which value of the rise in sea level?
x
ROSA 2000
(recommandations pour le calcul aux états limites des ouvrages en sites aquatiques)
CETMEF 1 2000 Recommend
ations Port and river infrastructures
Current (no values defined, but formulas used to apply the action to constructions)
x
ROSA 2000
(recommandations pour le calcul aux états limites des ouvrages en sites aquatiques)
CETMEF 1 2000 Recommend
ations Port and river infrastructures
Ice: reference to German standards: thickness of ice on river constructions
x
NF EN 1991-1-3 actions générales – charges de neige AFNOR 2 2004
European Standard
Port and river infrastructures
Snow map to be updated? x
ROSA 2000 (recommandations pour le calcul aux états limites des ouvrages en sites aquatiques) CETMEF 1 2000
Recommendations
Port and river infrastructures
Swell (no values defined. Recurrence intervals or statistical values are used)
x
ROSA 2000
(recommandations pour le calcul aux états limites des ouvrages en sites aquatiques)
CETMEF 1 2000 Recommend
ations Port and river infrastructures
Flow rates: high-water and low-water flow rates x
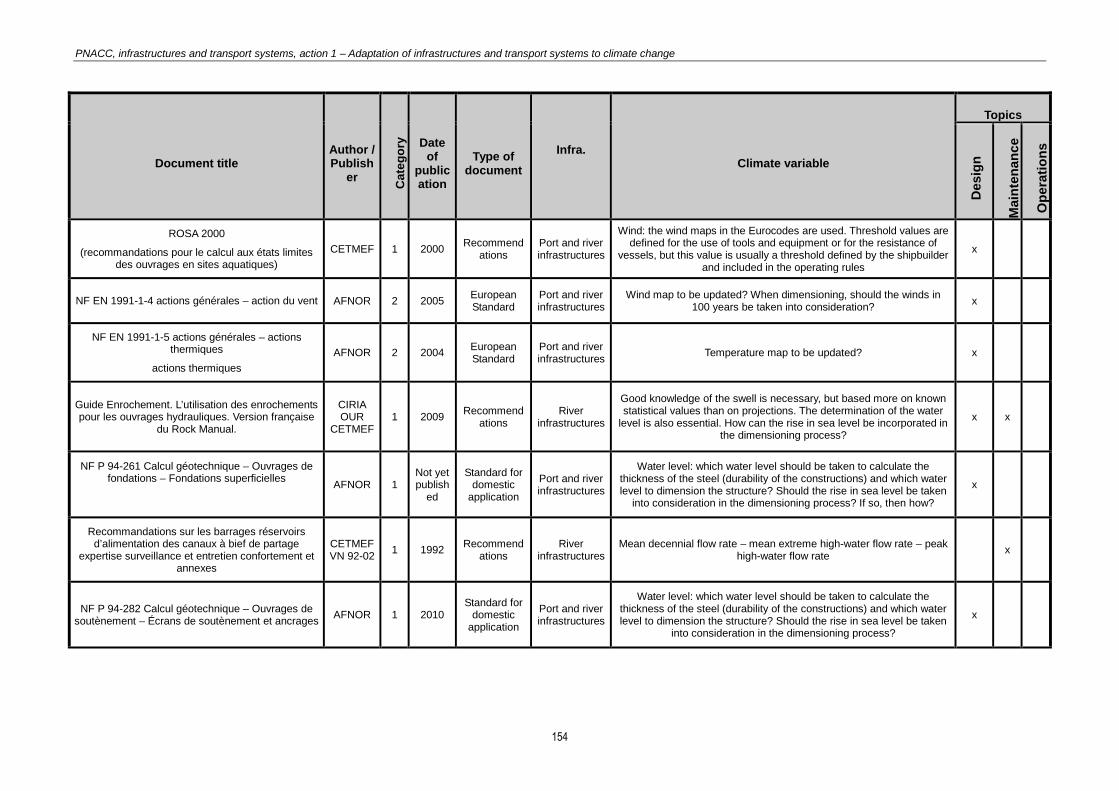
PNACC, infrastructures and transport systems, action 1 – Adaptation of infrastructures and transport systems to climate change
154
Document title Author / Publish
er
Cate
go
ry
Date of
publication
Type of document
Infra.
Climate variable
Topics
Desig
n
Main
ten
an
ce
Op
era
tio
ns
ROSA 2000
(recommandations pour le calcul aux états limites des ouvrages en sites aquatiques)
CETMEF 1 2000 Recommend
ations Port and river infrastructures
Wind: the wind maps in the Eurocodes are used. Threshold values are defined for the use of tools and equipment or for the resistance of
vessels, but this value is usually a threshold defined by the shipbuilder and included in the operating rules
x
NF EN 1991-1-4 actions générales – action du vent AFNOR 2 2005 European Standard
Port and river infrastructures
Wind map to be updated? When dimensioning, should the winds in 100 years be taken into consideration?
x
NF EN 1991-1-5 actions générales – actions thermiques
actions thermiques AFNOR 2 2004
European Standard
Port and river infrastructures
Temperature map to be updated? x
Guide Enrochement. L’utilisation des enrochements pour les ouvrages hydrauliques. Version française
du Rock Manual.
CIRIA OUR
CETMEF 1 2009
Recommendations
River infrastructures
Good knowledge of the swell is necessary, but based more on known statistical values than on projections. The determination of the water
level is also essential. How can the rise in sea level be incorporated in the dimensioning process?
x x
NF P 94-261 Calcul géotechnique – Ouvrages de fondations – Fondations superficielles
AFNOR 1
Not yet publish
ed
Standard for domestic
application
Port and river infrastructures
Water level: which water level should be taken to calculate the thickness of the steel (durability of the constructions) and which water level to dimension the structure? Should the rise in sea level be taken
into consideration in the dimensioning process? If so, then how?
x
Recommandations sur les barrages réservoirs d’alimentation des canaux à bief de partage
expertise surveillance et entretien confortement et annexes
CETMEF VN 92-02
1 1992 Recommend
ations River
infrastructures Mean decennial flow rate – mean extreme high-water flow rate – peak
high-water flow rate x
NF P 94-282 Calcul géotechnique – Ouvrages de soutènement – Écrans de soutènement et ancrages AFNOR 1 2010
Standard for domestic
application
Port and river infrastructures
Water level: which water level should be taken to calculate the thickness of the steel (durability of the constructions) and which water level to dimension the structure? Should the rise in sea level be taken
into consideration in the dimensioning process?
x
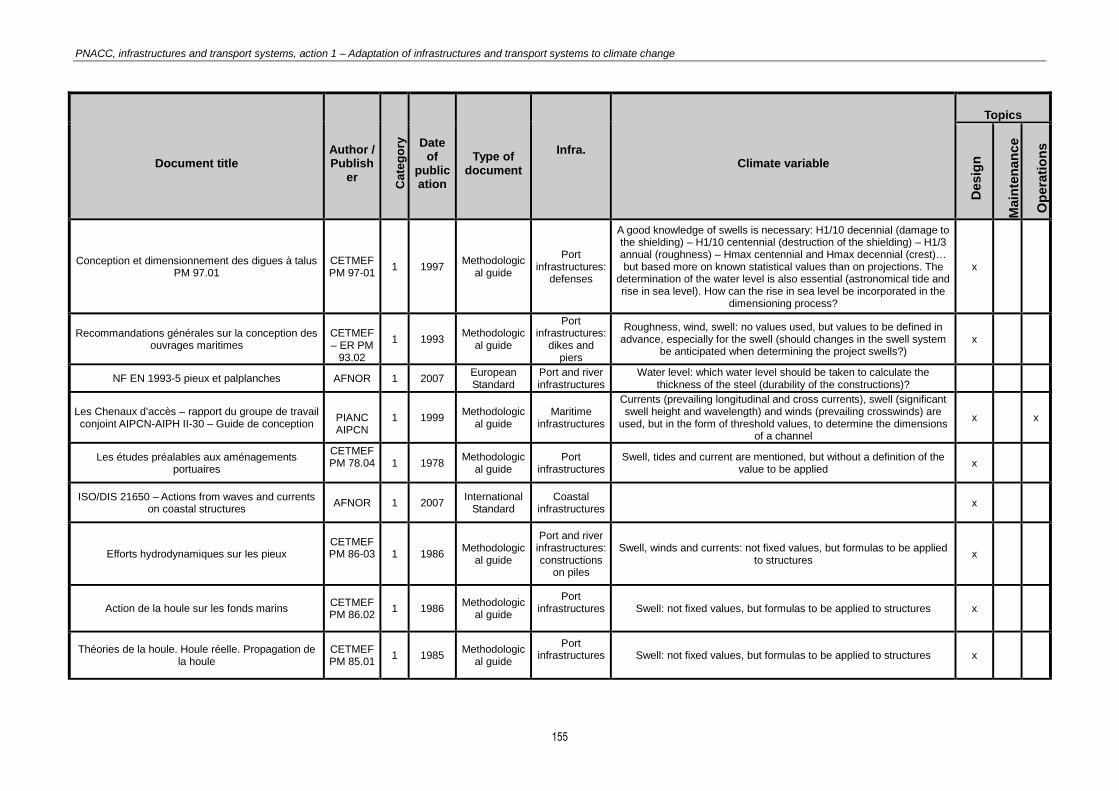
PNACC, infrastructures and transport systems, action 1 – Adaptation of infrastructures and transport systems to climate change
155
Document title Author / Publish
er
Cate
go
ry
Date of
publication
Type of document
Infra.
Climate variable
Topics
Desig
n
Main
ten
an
ce
Op
era
tio
ns
Conception et dimensionnement des digues à talus PM 97.01
CETMEF PM 97-01
1 1997 Methodologic
al guide
Port infrastructures:
defenses
A good knowledge of swells is necessary: H1/10 decennial (damage to the shielding) – H1/10 centennial (destruction of the shielding) – H1/3 annual (roughness) – Hmax centennial and Hmax decennial (crest)… but based more on known statistical values than on projections. The
determination of the water level is also essential (astronomical tide and rise in sea level). How can the rise in sea level be incorporated in the
dimensioning process?
x
Recommandations générales sur la conception des ouvrages maritimes
CETMEF – ER PM
93.02
1 1993 Methodologic
al guide
Port infrastructures:
dikes and piers
Roughness, wind, swell: no values used, but values to be defined in advance, especially for the swell (should changes in the swell system
be anticipated when determining the project swells?) x
NF EN 1993-5 pieux et palplanches AFNOR 1 2007 European Standard
Port and river infrastructures
Water level: which water level should be taken to calculate the thickness of the steel (durability of the constructions)?
Les Chenaux d’accès – rapport du groupe de travail conjoint AIPCN-AIPH II-30 – Guide de conception
PIANC AIPCN
1 1999 Methodologic
al guide Maritime
infrastructures
Currents (prevailing longitudinal and cross currents), swell (significant swell height and wavelength) and winds (prevailing crosswinds) are
used, but in the form of threshold values, to determine the dimensions of a channel
x x
Les études préalables aux aménagements portuaires
CETMEF PM 78.04
1 1978
Methodological guide
Port infrastructures
Swell, tides and current are mentioned, but without a definition of the value to be applied
x
ISO/DIS 21650 – Actions from waves and currents on coastal structures AFNOR 1 2007
International Standard
Coastal infrastructures
x
Efforts hydrodynamiques sur les pieux CETMEF PM 86-03
1 1986
Methodological guide
Port and river infrastructures: constructions
on piles
Swell, winds and currents: not fixed values, but formulas to be applied to structures
x
Action de la houle sur les fonds marins CETMEF PM 86.02
1 1986 Methodologic
al guide
Port infrastructures
Swell: not fixed values, but formulas to be applied to structures x
Théories de la houle. Houle réelle. Propagation de la houle
CETMEF PM 85.01
1 1985 Methodologic
al guide
Port infrastructures
Swell: not fixed values, but formulas to be applied to structures x

PNACC, infrastructures and transport systems, action 1 – Adaptation of infrastructures and transport systems to climate change
156
Document title Author / Publish
er
Cate
go
ry
Date of
publication
Type of document
Infra.
Climate variable
Topics
Desig
n
Main
ten
an
ce
Op
era
tio
ns
Critères régissant les mouvements des navires amarrés dans les ports – guide pratique
PIANC AIPCN
1 1995 Recommend
ations
Port infrastructures
Swell, winds and currents: not fixed values, but formulas to be applied to structures
x
Défenses de berges en enrochements CETMEF VN 96-02
1 1996 Methodologic
al guide River
infrastructures Swell (amplitude)
Recommandations pour le dimensionnement et la construction de revêtements souples incorporant
des géotextiles pour les voies navigables intérieures
PIANC AIPCN
1 1987 Technical
documentation
River infrastructures
Determination of the water level: which water level? Which associated wave?
x
Breakwaters with vertical and inclined concrete walls Marcom GT 28
PIANC AIPCN
1
2003
Technical documentatio
n
Port infrastructures:
defenses
Good knowledge of the swell is necessary, but based more on known statistical values than on projections.
The determination of the water level is also essential (astronomical tide and rise in sea level). How can the rise in sea level be incorporated in
the dimensioning process?
x
Dimensionnement et construction de revêtements souples incorporant des géotextiles en milieu marin
– recommandations – Marcom GT 21
PIANC AIPCN
1 1996
Technical documentatio
n
Port infrastructures:
defenses
A good knowledge of swells is necessary: H1/10 decennial (damage to the shielding) – H1/10 centennial (destruction of the shielding) – H1/3 annual (roughness) – Hmax centennial and Hmax decennial (crest)… but based more on known statistical values than on projections. The
determination of the water level is also essential (astronomical tide and rise in sea level). How can the rise in sea level be incorporated in the
dimensioning process?
x
Analyse des digues à talus en enrochements Marcom GT 12
PIANC AIPCN
1 1996
Technical documentatio
n
Port infrastructures:
defenses
A good knowledge of swells is necessary: H1/10 decennial (damage to the shielding) – H1/10 centennial
(destruction of the shielding) – H1/3 annual (roughness) – Hmax centennial and Hmax decennial (crest)… but based more on known statistical values than on projections. The determination of the water
level is also essential (astronomical tide and rise in sea level). How can the rise in sea level be incorporated in the dimensioning process?
x
Innovation in navigation lock design PIANC AIPCN
1 2009 Technical
documentation
River infrastructures
Notions of waves and current x
Protection contre la corrosion des structures métalliques en site aquatique (2 volumes, dont le
deuxième est en cours de révision)
CETMEF QG 88-02
1 1988
Methodological guide
River infrastructures
Salinity, water temperature and water level are factors that influence the corrosion of metal structures. How can changes in these values be
incorporated in the dimensioning process? x x

PNACC, infrastructures and transport systems, action 1 – Adaptation of infrastructures and transport systems to climate change
157
Document title Author / Publish
er
Cate
go
ry
Date of
publication
Type of document
Infra.
Climate variable
Topics
Desig
n
Main
ten
an
ce
Op
era
tio
ns
Circulaire 76-38 modifiée 95-86 Ministry of Public Works
1 1995 Ministerial
circular River
infrastructures Highest navigable water level x x
Instruction technique, surveillance, entretien et réparation des barrages mobiles en rivière
CETMEF VN 96-01
1 1996 Technical
documentation
Port infrastructures:
defenses River flow rates x x x
L’aménagement des voies navigables par canalisation des rivières
CETMEF VN 78-01
1 1978
Technical documentatio
n
River infrastructures
River flow rates: daily, monthly and annual mean values to dimension the critical loads of dams, operation, etc. – decennial and centennial high water level – water table level – highest navigable water levels,
etc.
x
Les barrages mobiles de navigation : guide du chef de projet
VNF – CETMEF
1 1988
Methodological guide
River infrastructures
Knowledge of flow rates for operations and management – knowledge of high-water levels (using deterministic and/or probabilistic methods). Knowledge of water levels: highest navigable waters... Is it necessary to include the possible increase in these values in the dimensioning
process, and how?
x x
Table 22: Categorized maritime, river and port reference documents. Source: Cerema, VNF.
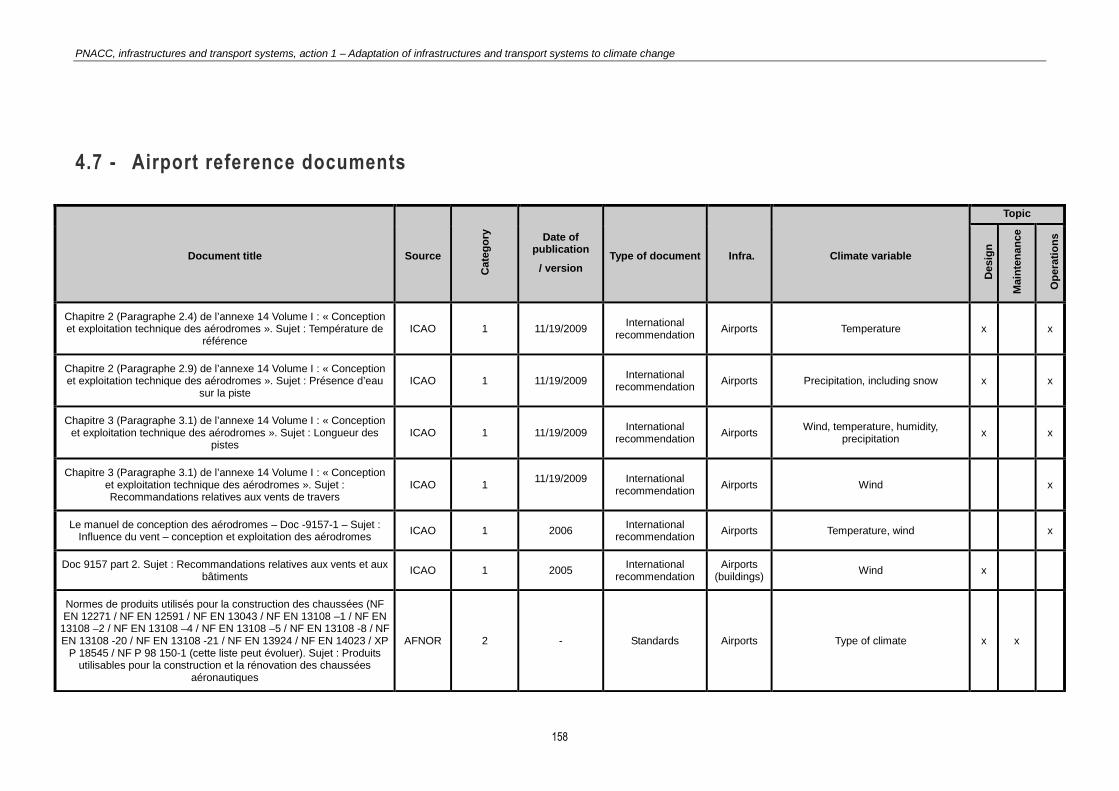
PNACC, infrastructures and transport systems, action 1 – Adaptation of infrastructures and transport systems to climate change
158
4.7 - Airport reference documents
Document title Source
Cate
go
ry
Date of publication
/ version Type of document Infra. Climate variable
Topic
Desig
n
Ma
inte
na
nce
Op
era
tio
ns
Chapitre 2 (Paragraphe 2.4) de l’annexe 14 Volume I : « Conception et exploitation technique des aérodromes ». Sujet : Température de
référence ICAO 1 11/19/2009
International recommendation
Airports Temperature x x
Chapitre 2 (Paragraphe 2.9) de l’annexe 14 Volume I : « Conception et exploitation technique des aérodromes ». Sujet : Présence d’eau
sur la piste ICAO 1 11/19/2009
International recommendation
Airports Precipitation, including snow x x
Chapitre 3 (Paragraphe 3.1) de l’annexe 14 Volume I : « Conception et exploitation technique des aérodromes ». Sujet : Longueur des
pistes ICAO 1 11/19/2009
International recommendation
Airports Wind, temperature, humidity,
precipitation x x
Chapitre 3 (Paragraphe 3.1) de l’annexe 14 Volume I : « Conception et exploitation technique des aérodromes ». Sujet : Recommandations relatives aux vents de travers
ICAO 1 11/19/2009
International
recommendation Airports Wind x
Le manuel de conception des aérodromes – Doc -9157-1 – Sujet : Influence du vent – conception et exploitation des aérodromes ICAO 1 2006
International recommendation
Airports Temperature, wind x
Doc 9157 part 2. Sujet : Recommandations relatives aux vents et aux bâtiments ICAO 1 2005
International recommendation
Airports (buildings)
Wind x
Normes de produits utilisés pour la construction des chaussées (NF EN 12271 / NF EN 12591 / NF EN 13043 / NF EN 13108 –1 / NF EN
13108 –2 / NF EN 13108 –4 / NF EN 13108 –5 / NF EN 13108 -8 / NF EN 13108 -20 / NF EN 13108 -21 / NF EN 13924 / NF EN 14023 / XP
P 18545 / NF P 98 150-1 (cette liste peut évoluer). Sujet : Produits utilisables pour la construction et la rénovation des chaussées
aéronautiques
AFNOR 2 - Standards Airports Type of climate x x
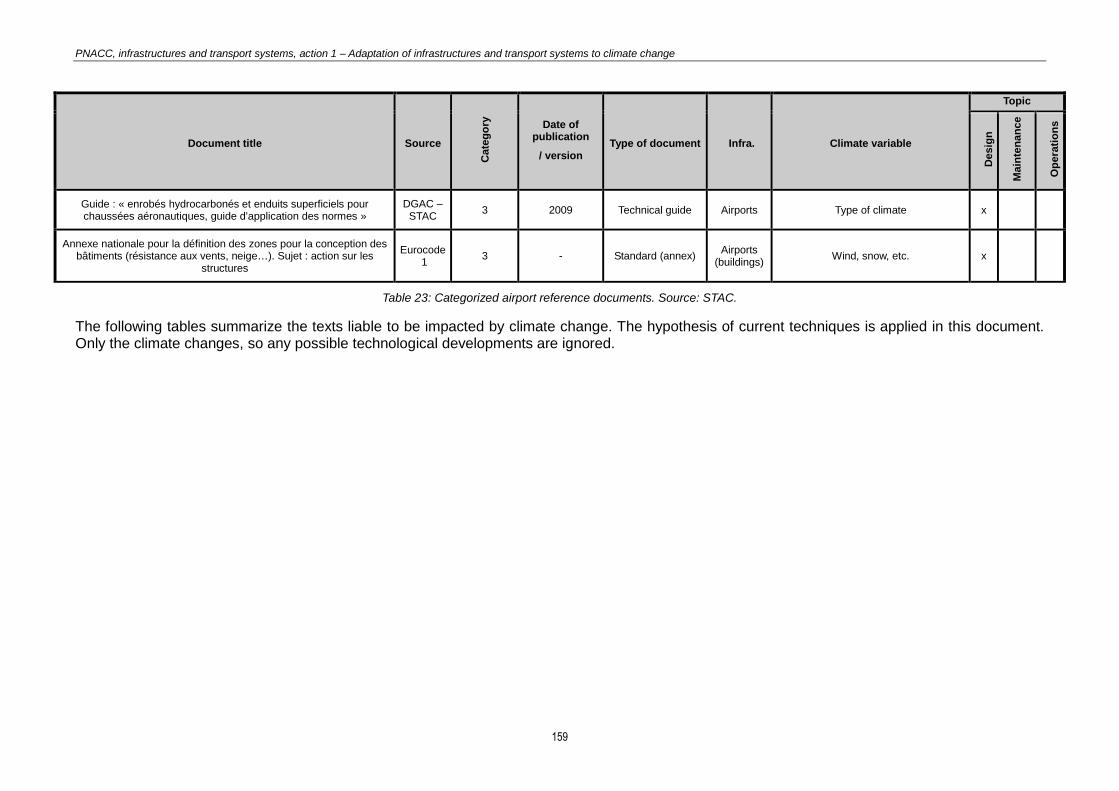
PNACC, infrastructures and transport systems, action 1 – Adaptation of infrastructures and transport systems to climate change
159
Document title Source
Cate
go
ry
Date of publication
/ version Type of document Infra. Climate variable
Topic
Desig
n
Ma
inte
na
nce
Op
era
tio
ns
Guide : « enrobés hydrocarbonés et enduits superficiels pour chaussées aéronautiques, guide d’application des normes »
DGAC – STAC
3 2009 Technical guide Airports Type of climate x
Annexe nationale pour la définition des zones pour la conception des bâtiments (résistance aux vents, neige…). Sujet : action sur les
structures
Eurocode 1
3 - Standard (annex) Airports
(buildings) Wind, snow, etc. x
Table 23: Categorized airport reference documents. Source: STAC.
The following tables summarize the texts liable to be impacted by climate change. The hypothesis of current techniques is applied in this document. Only the climate changes, so any possible technological developments are ignored.
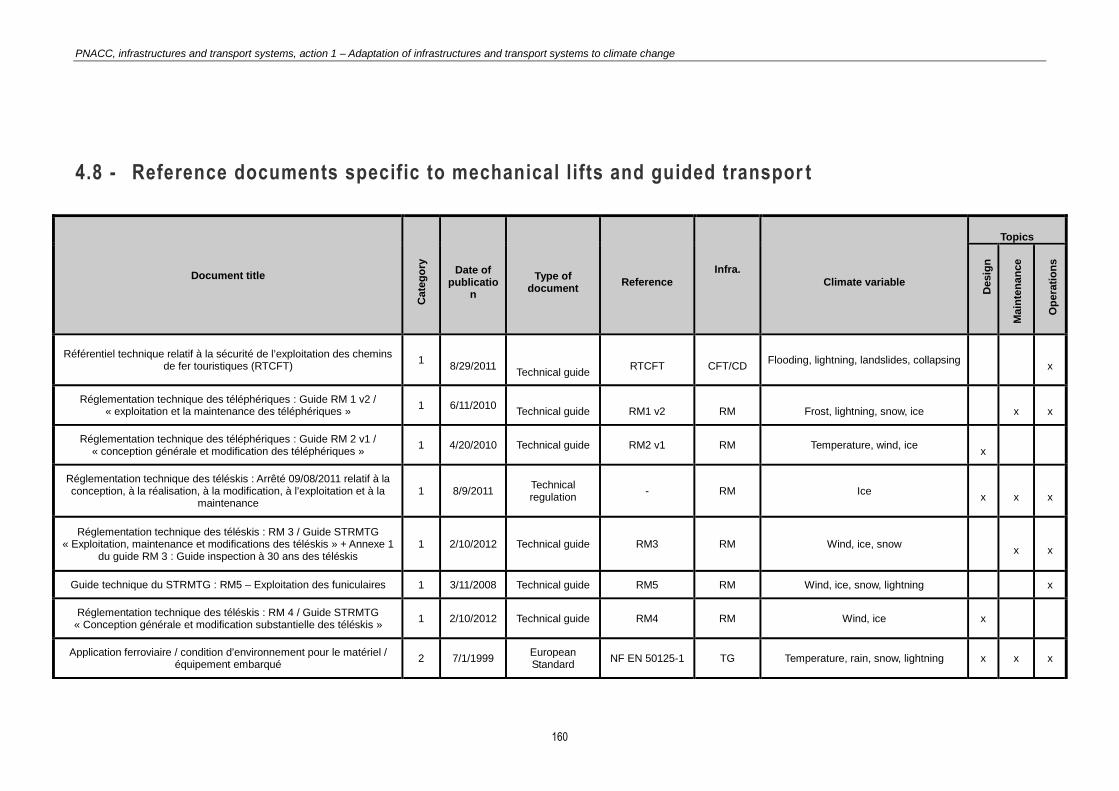
PNACC, infrastructures and transport systems, action 1 – Adaptation of infrastructures and transport systems to climate change
160
4.8 - Reference documents specific to mechanical lifts and guided transpor t
Document title
Cate
go
ry
Date of
publication
Type of document
Reference
Infra.
Climate variable
Topics
Desig
n
Ma
inte
na
nce
Op
era
tio
ns
Référentiel technique relatif à la sécurité de l’exploitation des chemins de fer touristiques (RTCFT) 1
8/29/2011
Technical guide
RTCFT
CFT/CD
Flooding, lightning, landslides, collapsing x
Réglementation technique des téléphériques : Guide RM 1 v2 / « exploitation et la maintenance des téléphériques » 1
6/11/2010
Technical guide
RM1 v2
RM
Frost, lightning, snow, ice
x
x
Réglementation technique des téléphériques : Guide RM 2 v1 / « conception générale et modification des téléphériques » 1 4/20/2010 Technical guide RM2 v1 RM Temperature, wind, ice
x
Réglementation technique des téléskis : Arrêté 09/08/2011 relatif à la conception, à la réalisation, à la modification, à l’exploitation et à la
maintenance 1 8/9/2011
Technical regulation
- RM Ice x
x
x
Réglementation technique des téléskis : RM 3 / Guide STRMTG « Exploitation, maintenance et modifications des téléskis » + Annexe 1
du guide RM 3 : Guide inspection à 30 ans des téléskis 1 2/10/2012 Technical guide RM3 RM Wind, ice, snow
x
x
Guide technique du STRMTG : RM5 – Exploitation des funiculaires 1 3/11/2008 Technical guide RM5 RM Wind, ice, snow, lightning
x
Réglementation technique des téléskis : RM 4 / Guide STRMTG « Conception générale et modification substantielle des téléskis » 1 2/10/2012 Technical guide RM4 RM Wind, ice x
Application ferroviaire / condition d’environnement pour le matériel / équipement embarqué 2 7/1/1999
European Standard
NF EN 50125-1 TG Temperature, rain, snow, lightning x x x

PNACC, infrastructures and transport systems, action 1 – Adaptation of infrastructures and transport systems to climate change
161
Document title
Cate
go
ry
Date of
publication
Type of document
Reference
Infra.
Climate variable
Topics
Desig
n
Ma
inte
na
nce
Op
era
tio
ns
Application ferroviaire / condition d’environnement pour le matériel / installations électriques fixes 2 5/1/2003
European Standard
NF EN 50125-2 TG Temperature, rain, snow, lightning x x x
Application ferroviaire / condition d’environnement pour le matériel / équipement pour la signalisation et les télécommunications 2 5/1/2003
European Standard
NF EN 50125-3 TG Temperature, rain, snow, lightning x x x
Application ferroviaire / Voie – Appareils de voie 1
March 2004 / January
2006 / December
2005 / June 2006
European Standard
NF EN 13232 (1 to 9)
TG Temperature x
Application ferroviaire – Équipements électroniques utilisés sur le matériel roulant 2 12/1/2001
European Standard
NF EN 50155 TG Temperature x x x
Application ferroviaire / Spécification et démonstration de la fiabilité, de la disponibilité, de la maintenabilité et de la sécurité (FDMS) 1 2/1/1999
European Standard
NF EN 50126 TG Temperature, snow, flooding, rain,
landslides x
Applications ferroviaires – Résistance des structures de véhicules ferroviaires 1 7/1/2001
European Standard
NF EN 12663 TG Wind, temperature x
Arrêté du 9 août 2011 relatif à la conception, à la réalisation, à la modification, à l'exploitation et à la maintenance des téléskis 1 8/9/2011
Technical regulation
- RM Ice, storms, lightning x x x
Arrêté du 7 août 2009 relatif à la conception, à la réalisation, à la modification, à l'exploitation et à la maintenance des téléphériques 1 8/7/2009
Technical regulation
- RM Ice, storms, lightning x x x
Sécurité des tapis roulants pour les activités de sports d’hiver ou de loisirs 1 12/1/2011
French standard
NF EN 15700 RM Temperature x x
Arrêté du 17 mai 2001 fixant les conditions techniques auxquelles doivent satisfaire les distributions d’énergie électrique 1 5/17/2001
Technical regulation
- Common Snow, wind, ice, rain x
Règlement neige et vent 1 5/1/2009 Technical regulation
NV65 Common Snow, wind x
Entraînements et autres dispositifs mécaniques 1 12/1/2004 European Standard
NF EN 13223 RM Wind, temperature, ice, rain x x
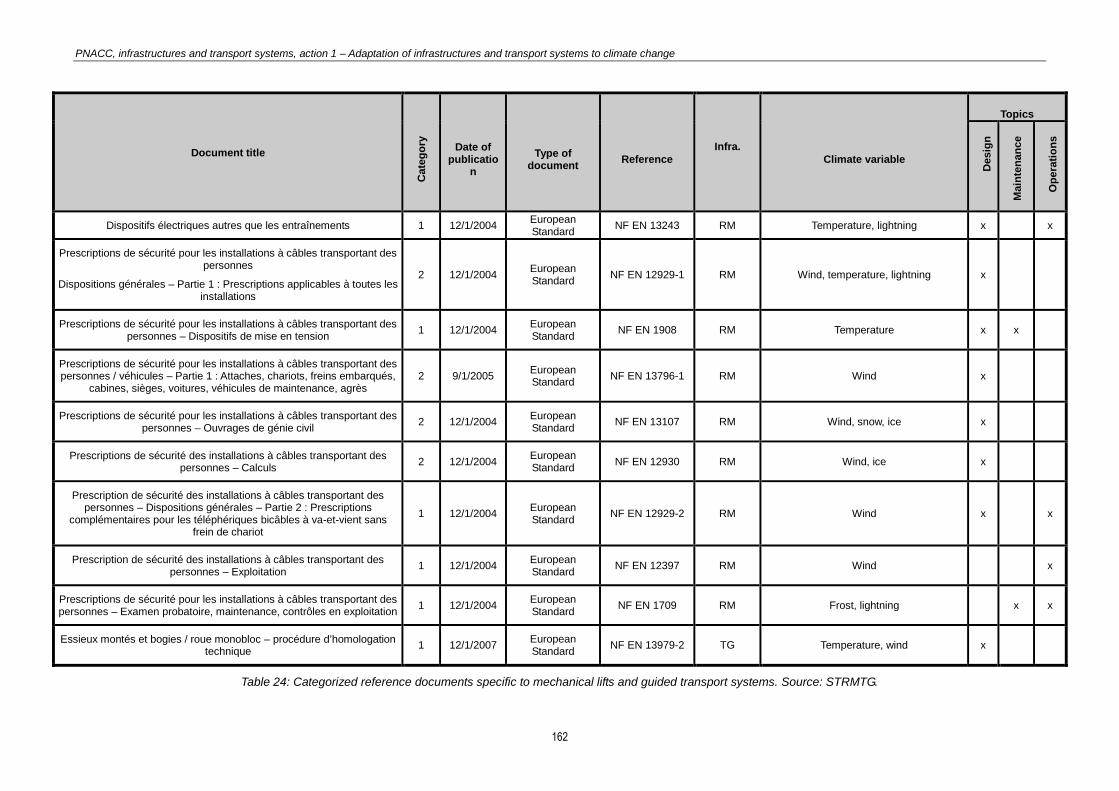
PNACC, infrastructures and transport systems, action 1 – Adaptation of infrastructures and transport systems to climate change
162
Document title
Cate
go
ry
Date of
publication
Type of document
Reference
Infra.
Climate variable
Topics
Desig
n
Ma
inte
na
nce
Op
era
tio
ns
Dispositifs électriques autres que les entraînements 1 12/1/2004 European Standard
NF EN 13243 RM Temperature, lightning x x
Prescriptions de sécurité pour les installations à câbles transportant des personnes
Dispositions générales – Partie 1 : Prescriptions applicables à toutes les installations
2 12/1/2004 European Standard
NF EN 12929-1 RM Wind, temperature, lightning x
Prescriptions de sécurité pour les installations à câbles transportant des personnes – Dispositifs de mise en tension 1 12/1/2004
European Standard
NF EN 1908 RM Temperature x x
Prescriptions de sécurité pour les installations à câbles transportant des personnes / véhicules – Partie 1 : Attaches, chariots, freins embarqués,
cabines, sièges, voitures, véhicules de maintenance, agrès 2 9/1/2005
European Standard
NF EN 13796-1 RM Wind x
Prescriptions de sécurité pour les installations à câbles transportant des personnes – Ouvrages de génie civil 2 12/1/2004
European Standard
NF EN 13107 RM Wind, snow, ice x
Prescriptions de sécurité des installations à câbles transportant des personnes – Calculs 2 12/1/2004
European Standard
NF EN 12930 RM Wind, ice x
Prescription de sécurité des installations à câbles transportant des personnes – Dispositions générales – Partie 2 : Prescriptions
complémentaires pour les téléphériques bicâbles à va-et-vient sans frein de chariot
1 12/1/2004 European Standard
NF EN 12929-2 RM Wind x x
Prescription de sécurité des installations à câbles transportant des personnes – Exploitation 1 12/1/2004
European Standard
NF EN 12397 RM Wind x
Prescriptions de sécurité pour les installations à câbles transportant des personnes – Examen probatoire, maintenance, contrôles en exploitation 1 12/1/2004
European Standard
NF EN 1709 RM Frost, lightning x x
Essieux montés et bogies / roue monobloc – procédure d’homologation technique 1 12/1/2007
European Standard
NF EN 13979-2 TG Temperature, wind x
Table 24: Categorized reference documents specific to mechanical lifts and guided transport systems. Source: STRMTG.

PNACC, infrastructures and transport systems, action 1 – Adaptation of infrastructures and transport systems to climate change
163

Technical division for transportation infrastructures and materials - 110 rue de Paris, 77171 Sourdun, France - Tel: +33 (0)1 60 52 31 31
Headquarters: Cité des Mobilités - 25, avenue François Mitterrand - CS 92 803 - F-69674 Bron Cedex - Tel.: +33 (0)4 72 14 30 30
Public institution - Siret 130 018 310 00016 -
© 2015 – Cerema - Reference: 1511w – ISRN: CEREMA-DTecITM-2015-009 -1-FR
This document cannot be sold. The total reproduction of this document is copyright-free and subject to the conditions of the license
Summary
The impacts of the climate are liable to increase in the coming century. This report responds to action 1 of the national climate change adaptation plan, which aims to allow for the adaptation of these infrastructures to climate change.
Various international and national reports contain projections of climate change: a rise in mean temperatures, changes in precipitation and wind systems, extreme events, rise in the sea level, etc. (IPCC, 2007, 2013; Peings, 2011, 2012; Planton, 2012).
After reviewing the main changes in the climate expected before 2100, this report presents the current impacts of the climate and the potential impacts of the expected changes in the climate on: highway infrastructures (including urban transport structures), earthworks, constructions, rail infrastructures, river, maritime and port infrastructures, airport infrastructures and, finally, transport systems and mechanical drag lifts.
In each of these domains of infrastructures, the technical reference documents for design, maintenance and operation, in which climate variables intervene, are listed and classified in three categories of priority of adaptation. Finally, a list is compiled of the climate projections required to adapt these reference documents.
This subsequent adaptation should allow future changes in the climate to be taken into consideration more effectively.
Copyright © 2022 FDOKUMEN