Greening Information Technology (IT) Infrastructures
217
Greening Information Technology (IT) Infrastructures Designing a green IT assessment methodology that supports IT decision- makers contribute to corporate responsibility strategy Thesis Graduation Report By Johanne Christine Punte Kalsheim PUBLIC VERSION August 2012 Delft University of Technology Faculty of Technology, Policy Analysis and Management
-
Upload
khangminh22 -
Category
Documents
-
view
0 -
download
0
Transcript of Greening Information Technology (IT) Infrastructures

Greening Information Technology (IT) Infrastructures
Designing a green IT assessment methodology that supports IT decision-
makers contribute to corporate responsibility strategy
Thesis Graduation Report
By Johanne Christine Punte Kalsheim
PUBLIC VERSION
August 2012
Delft University of Technology
Faculty of Technology, Policy Analysis and Management

MSc Thesis, J.C.P.Kalsheim: Green Hardware IT Infrastructure (GHITI)
2
Project details
Author: Johanne Christine Punte Kalsheim
Student Number: 1396390
Email: [email protected]
This is the final product of the thesis graduation project for:
Study program: Systems Engineering, Policy Analysis and Management (SEPAM)
Graduation section: Systems Engineering (SE)
University: Delft University of Technology, Faculty of Technology Policy and Management (TPM)
The research is performed by order of:
KPMG, Amstelveen
Department: Sourcing Advisory
Period:
1st
of January 2012- 30th
of August 2012
Graduation Committee:
Chair: Professor Frances Brazier
Section Systems Engineering, Faculty of Technology, Policy and Management.
First supervisor: Dr. Jaco Appelman
Section Systems Engineering, Faculty of Technology, Policy and Management.
Second supervisor: Ir. Lydia Stougie
Section Energy and Industry.
External supervisor: Professor Erik Beulen
Director KPMG Sourcing Advisory.

MSc Thesis, J.C.P.Kalsheim: Green Hardware IT Infrastructure (GHITI)
3
Preface and acknowledgements This research report is the result of a graduation internship at KPMG Sourcing Advisory and also serves as the thesis report for the Master Systems Engineering, Policy Analysis and Management (SEPAM). The aim of this thesis project was to design a new framework to assess the greenness of the hardware IT infrastructure of an organisation as a step towards a comprehensive corporate responsibility (CR) strategy. From a scientific point of view no such framework was found in literature. From a practical point of view this may help IT decision-makers contribute to the CR strategy of an organisation by creating awareness and measuring progression over time. A quick overview of the research can be found in the executive summary on the next page. More insight on the research problem, research question and research design can be found in chapters 1 and 2. For the academic and practical grounding of the framework design, including the designed framework and its initial functional design, see chapters 4 to 8. For insights on strong, weak and improvement points of the framework design and framework design process, see chapter 9. This includes evaluation and reflection on the design. Furthermore, recommendations with regard to the implementation and use of the framework design can be found in chapter 10. In chapter 11 conclusions and recommendations for further research can be found. The appendices provide additional details on literature, design requirements and case study. The organisation investigated in the case study has been entitled BSC Netherlands. At the conclusion of my research I sincerely thank my supervisors from Delft University of Technology for the provided assistance: Jaco Appelman, Lydia Stougie and graduation professor Frances Brazier. They helped me focus on fundamental elements of my research and provided me with the needed support on the topics of life cycle analysis, life cycle thinking, expert panel review and sustainability. During my research I have also received indispensable support and an enjoyable working environment within KPMG. I would like to thank my external supervisor, professor Erik Beulen for his great support and for the many recommendations during the project. Additionally I am very thankful for the support I received from Jonathan Aarnouts and Hans de Bue during the internship at KPMG. I would also like to thank everybody within KPMG and at Delft University of Technology who contributed to my research in the form of interviews, brainstorms and those who showed an interest in my research. Finally, I would like to show my gratitude towards the experts that took part in the expert panels: Freek Bomhof, Wim Hendriksen, Rick van Krevelen, Arnoud Walrecht, Jan Hoogstrate, Jeroen Guinee and Martijn Warnier. I hope you enjoy reading the final results of the thesis project. Johanne Christine Punte Kalsheim Delft, August 2012

MSc Thesis, J.C.P.Kalsheim: Green Hardware IT Infrastructure (GHITI)
4
Executive summary Introduction There are several issues and opportunities with regard to information technology (IT). On the one hand, the IT industry is responsible for a large amount of global GHG emission, water pollution, depletion of scarce materials, growing volumes of e-waste and the largest release of hazardous waste worldwide. On the other hand, IT is an important source of cost efficiency and competitive advantage. Examples of economic opportunities of making IT greener are cost saving, risk reduction, innovation and prevention of resource restriction. Moreover, the social impact of the IT industry is immense. IT might be manufactured from minerals from military conflict zones or produced under derived working conditions. These examples of environmental, economic and social implications of IT illustrate that IT should constitute a significant part of an organisation’s sustainability policy and corporate responsibility (CR) strategy. But how can an IT decision-maker contribute to this? It is expected that a framework providing insights into the greenness of the hardware IT infrastructure of an organisation could support IT decision-makers contribute to the overall CR strategy of organisations. Consequently, the research question of this thesis project has been formulated as follows:
In essence this research addresses environmental and economic aspects of IT, often referred to as green IT. Emphasis is put on environmental sustainability and costs associated with the physical IT infrastructure supporting business applications through processing, transferring or storing computer programs or data. This is referred to as the greening the hardware IT infrastructure. The purpose of this research is to understand how an IT decision-maker can contribute to CR strategy by addressing several environmental issues efficiently. These environmental issues are related to water use, energy use and raw material use, greenhouse gas (GHG) emissions and generation of electronic and electrical waste (WEEE). Research methodology To structure and guide the explorative research of designing a new framework, the design science research by Hevner et al. (2004) is applied. The design science research is an outcome based research methodology that focuses on designing artefacts. Basically this methodology consists of three types of iterations; relevance, rigor and design. To establish rigor and relevance literature was reviewed from the knowledge base (rigor) and design requirements were analysed from stakeholder interviews (relevance). This information constitutes the academic and practical grounding of the new artefact. To design a new framework three design iterations were carried out; two formative validations by expert panels and one operational validation through a case study. Results The outcome of the design process was a new framework that can be used to assess the greenness of an organisation’s hardware IT infrastructure. The framework consists of several viable performance indicators related to energy use, water use, GHG emission and generation of raw material waste at organisational level (see Chapter 7). The operationalization of these can be found in the functional design in Chapter 8. The functional design describes how the performance indicator scores can be estimated and aggregated into assessment criteria scores and an index. The assessment criteria were defined as follows: 1. Water use over the life cycle of hardware IT (m
3)
2. Energy use over the life cycle of hardware IT (MJ) 3. Generation of waste over the life cycle of hardware IT (kg) 4. Greenhouse gas emissions over the life cycle of hardware IT (ton CO2) 5. Costs over the life cycle of hardware IT (euro)
Research question What generic framework based upon environmental and economic life cycle assessment criteria could be developed to assess the relative greenness of the hardware IT infrastructure of an organization as a step towards a comprehensive corporate responsibility strategy?

MSc Thesis, J.C.P.Kalsheim: Green Hardware IT Infrastructure (GHITI)
5
The index is entitled the Hardware IT infrastructure Greenness (HITIG) index. The HITIG index can be determined by applying the weighted sum method. This requires normalization and weighing of assessment criteria. At the moment normalization is not possible as an unbiased reference score cannot be established. Evaluation, reflection and recommendations Although three design iterations were carried out to design the new framework, the framework design process and the artefact have several limitations. First, the expert panel reviews have several limitations. The panels were small and expert opinions about which design requirement constituted “core requirements” differed between the panels. Second, the case study research had several limitations. Data used to estimate some of the performance indicators in the case study was deprived. Moreover, the external validity of the framework is limited as only one case study was executed with a limited number of hardware IT infrastructure units. Third, a limited number of aspects related to sustainability have been incorporated in the new framework. Environmental issues have been limited resource usage (water, energy and raw materials), GHG emission and waste generation and economic aspects have been limited to costs. Social implications of sustainability have not been included at all. Fourth, measuring performance is challenging and using indicators to assess the greenness of hardware IT is a reductionist tool that possibly cannot encapsulate the complexity of sustainability and greenness of IT. Lastly, several experts from KPMG have been involved in the definition of design requirements and the expert panel reviews. This could have biased the framework, but this cannot be completely proven. To deal with the shortcomings of the new framework several things could be done. The external validity of the framework could be enhanced by carrying out additional case studies in which different units of analysis are investigated. The functional design could be improved by incorporating more accurate and up-to-date data. The framework could be further expanded to incorporate additional economic and environmental aspects and social implications of IT. Land use, hazardous waste, quality and working conditions are examples of four aspects that could be incorporated in the framework. Furthermore, the framework could be accompanied with a management process to ensure an organisations’ progress is measured over time. The management process could be based upon the plan-do-check-act (PDCA) cycle. Implementing a new management process or integrating the framework in an already existing environmental management process could require awareness of green and sustainable IT within an organisation as well as a clear governance structure. Conclusion and further research The new framework can be used to determine the greenness of the hardware IT infrastructure of an organisation as a step towards a comprehensive CR strategy when incorporated in a measurement process. The framework supports achieving the desired green IT assessment criteria scores. Organisations can use the outcome of periodical measurements from the framework to, if required, adjust their policies in order to achieve the CR goals as part of their CR strategy. The framework can be used to assess green IT progression related to energy use, water use, generation of raw material waste, GHG emission and costs over the life cycle of hardware IT. Assessing the relative greenness of the hardware IT infrastructure of an organisation would require implementing the framework in a continuous management process. Measuring the hardware IT infrastructure greenness with the purpose of benchmarking results, it is recommended organisations apply the same calculation methodology to ensure consistency and comparability of results. For further research it is recommended to investigate how social aspects can be incorporated in the framework to ensure a more balanced contribution to CR strategy. It is also recommended to improve the quality of certain data used in the functional design and to extend the scope of environmental and economic sustainability aspects in the framework. Furthermore, research should focus on improving the framework through additional refinement cycles. Particularly important are additional case studies to test the general applicability of the framework, further refine the functional design and evaluate the use of the framework over time as part of a continuous management process.

MSc Thesis, J.C.P.Kalsheim: Green Hardware IT Infrastructure (GHITI)
6
Table of Content PREFACE AND ACKNOWLEDGEMENTS ...................................................................................................................... 3
EXECUTIVE SUMMARY ............................................................................................................................................. 4
LIST OF TABLES ........................................................................................................................................................ 10
LIST OF FIGURES ...................................................................................................................................................... 10
LIST OF ABBREVIATIONS .......................................................................................................................................... 12
PART I ...................................................................................................................................................................... 13
1. INTRODUCTION ............................................................................................................................................... 14
1.1 BACKGROUND .................................................................................................................................................... 14 1.2 RESEARCH PROBLEM AND MOTIVATION .................................................................................................................... 15 1.2.1 PROBLEM OWNER AND DILEMMAS ...................................................................................................................... 15 1.2.2 RESEARCH PROBLEM AND MOTIVATION ................................................................................................................ 15 1.3 RESEARCH OBJECTIVES .......................................................................................................................................... 16 1.4 RESEARCH SCOPE ................................................................................................................................................. 17 1.5 RESEARCH QUESTIONS .......................................................................................................................................... 19
2. RESEARCH DESIGN ........................................................................................................................................... 20
2.1 RESEARCH PARADIGM .......................................................................................................................................... 20 2.2 RESEARCH METHODOLOGY .................................................................................................................................... 20 2.3 RESEARCH STRATEGY ............................................................................................................................................ 21 2.4 CONCLUSION ...................................................................................................................................................... 23
3. STRUCTURE OF THE THESIS .............................................................................................................................. 25
PART II ..................................................................................................................................................................... 27
4. THEORETICAL BACKGROUND ON GREEN IT ...................................................................................................... 28
4.1 GREEN IT ........................................................................................................................................................... 28 4.1.1 DEFINITIONS OF GREEN IT ................................................................................................................................. 28 4.1.2 SUSTAINABILITY............................................................................................................................................... 30 4.1.3 ECO-EFFICIENCY .............................................................................................................................................. 32 4.1.4 LIFE CYCLE THINKING ........................................................................................................................................ 32 4.1.5 INFORMATION TECHNOLOGY ............................................................................................................................. 33 4.2 GREEN IT AS PART OF CORPORATE RESPONSIBILITY STRATEGY ....................................................................................... 34 4.2.1 CORPORATE RESPONSIBILITY STRATEGY ................................................................................................................ 34 4.2.2 GREEN IT IN CORPORATE RESPONSIBILITY STRATEGY ............................................................................................... 36 4.3 SUMMARY AND CONCLUSION ................................................................................................................................. 37
5. THEORETICAL BACKGROUND ON ENVIRONMENTAL AND ECONOMIC PERFORMANCE ASSESSMENT .............. 39
5.1 PERFORMANCE ASSESSMENT ................................................................................................................................. 39 5.1.1 PURPOSE OF MEASURING PERFORMANCE ............................................................................................................. 39 5.1.1 RISKS OF REPORTING PERFORMANCE ................................................................................................................... 39 5.2 SUSTAINABILITY ASSESSMENT ................................................................................................................................. 40 5.2.1 CLASSIFICATION OF SUSTAINABILITY ASSESSMENT ................................................................................................... 40 5.2.2 PRODUCT RELATED ASSESSMENT......................................................................................................................... 40 5.2.3 INDICATORS AND INDICES .................................................................................................................................. 42 5.3 ENVIRONMENTAL AND ECONOMIC INDICATORS AND INDICES ........................................................................................ 43 5.3.1 ENVIRONMENTAL AND ECONOMIC SUSTAINABILITY INDICATORS AND INDICES .............................................................. 43 5.3.2 ECO-EFFICIENCY INDICATORS AND INDICES ............................................................................................................ 45 5.3.3 GREEN PERFORMANCE INDICATORS ..................................................................................................................... 45

MSc Thesis, J.C.P.Kalsheim: Green Hardware IT Infrastructure (GHITI)
7
5.4 BUSINESS STANDARDS .......................................................................................................................................... 46 5.4.1 GREENHOUSE GAS (GHG) PROTOCOL .................................................................................................................. 46 5.4.2 WATER FOOTPRINT .......................................................................................................................................... 47 5.4.3 MATERIAL FLOW COST ACCOUNTING ................................................................................................................... 48 5.5 SUMMARY AND CONCLUSION ................................................................................................................................. 48
6. DESIGN REQUIREMENTS .................................................................................................................................. 50
6.1 THEORETICAL FOUNDATION FOR DESIGN REQUIREMENTS PROCESS................................................................................. 50 6.1.1 CRITERIA FOR GOOD REQUIREMENTS ................................................................................................................... 50 6.1.2 CORE ACTIVITIES IN REQUIREMENTS ENGINEERING .................................................................................................. 50 6.1.3 STAKEHOLDERS AND STAKEHOLDER INVOLVEMENT ................................................................................................. 51 6.2 THE REQUIREMENTS ANALYSIS PROCESS ................................................................................................................... 51 6.2.1 REQUIREMENTS ELICITATION .............................................................................................................................. 52 6.2.2 ANALYSING REQUIREMENTS ............................................................................................................................... 53 6.2.3 COMMUNICATING REQUIREMENTS ...................................................................................................................... 54 6.2.4 AGREEING REQUIREMENTS ................................................................................................................................ 54 6.2.5 EVOLVING REQUIREMENTS ................................................................................................................................ 54 6.3 SUMMARY AND CONCLUSION ................................................................................................................................. 54
PART III.................................................................................................................................................................... 57
7. NEW FRAMEWORK DESIGN ............................................................................................................................. 58
7.1 DESIGN PROCESS ................................................................................................................................................. 58 7.2 FRAMEWORK DESIGN ........................................................................................................................................... 59 7.2.1 GOAL OF THE FRAMEWORK................................................................................................................................ 59 7.2.2 FRAMEWORK ENTITY ........................................................................................................................................ 59 7.2.3 UNITS OF ANALYSIS .......................................................................................................................................... 61 7.2.4 FRAMEWORK SCOPE ......................................................................................................................................... 61 7.2.5 GREENING HARDWARE IT INFRASTRUCTURE (GHITI) FRAMEWORK ........................................................................... 61 7.3 CONTENTS OF THE NEW FRAMEWORK ...................................................................................................................... 62 7.3.1 DEPENDENCIES OF INDICATORS .......................................................................................................................... 63 7.3.2 COVERING LITERATURE ..................................................................................................................................... 63
8. FUNCTIONAL DESIGN ....................................................................................................................................... 64
8.1 PROCURE HARDWARE IT ....................................................................................................................................... 64 8.1.1 WATER USE RELATED TO THE EXTRACTION AND PRODUCTION PROCESS OF HARDWARE IT ............................................... 64 8.1.2 ENERGY USE RELATED TO THE EXTRACTION AND PRODUCTION PROCESS OF HARDWARE IT .............................................. 65 8.1.3 AMOUNT OF RECYCLED AND REUSED MATERIALS IN HARDWARE IT PROCURED ............................................................. 66 8.1.4 AMOUNT OF RAW MATERIALS IN HARDWARE IT PROCURED ..................................................................................... 67 8.1.5 AMOUNT OF REFURBISHED AND USED HARDWARE IT PROCURED ............................................................................... 67 8.1.6 GREENHOUSE GAS EMISSION RELATED TO THE EXTRACTION AND PRODUCTION PROCESS OF HARDWARE IT ......................... 68 8.1.7 PROCUREMENT COSTS OF HARDWARE IT .............................................................................................................. 69 8.2 USE HARDWARE IT .............................................................................................................................................. 69 8.2.1 AMOUNT OF WATER USED IN HARDWARE IT OPERATION PER SOURCE ........................................................................ 69 8.2.2 AMOUNT OF ENERGY USE OF HARDWARE IT OPERATION .......................................................................................... 71 8.2.3 THE UTILIZATION OF HARDWARE IT RELATIVE TO UNIT SPECIFIC OPTIMA...................................................................... 72 8.2.4 AMOUNT OF REPLACED SUB-COMPONENTS IN HARDWARE IT ................................................................................... 73 8.2.5 AMOUNT OF REPAIRED SUB-COMPONENTS IN HARDWARE IT .................................................................................... 74 8.2.6 GREENHOUSE GAS EMISSION RELATED TO EXTRACTION AND PRODUCTION OF ENERGY USED IN HARDWARE IT OPERATION .... 74 8.2.7 ENERGY COSTS OF HARDWARE IT OPERATION ........................................................................................................ 75 8.2.8 WATER COSTS OF HARDWARE IT OPERATION ........................................................................................................ 75 8.2.9 COSTS OF CARBON CREDITS FOR THE OPERATION OF HARDWARE IT ........................................................................... 76 8.2.10 MAINTENANCE COSTS OF HARDWARE IT .............................................................................................................. 77 8.3 DISPOSE HARDWARE IT ........................................................................................................................................ 77

MSc Thesis, J.C.P.Kalsheim: Green Hardware IT Infrastructure (GHITI)
8
8.3.1 AMOUNT OF WATER USE RELATED TO HARDWARE IT DISCARD TO LANDFILL ................................................................. 77 8.3.2 AMOUNT OF WATER USE RELATED TO RECYCLING HARDWARE IT ............................................................................... 78 8.3.3 AMOUNT OF WATER USE TO RECOVER ENERGY FROM HARDWARE IT .......................................................................... 79 8.3.4 AMOUNT OF WATER USE RELATED TO REUSE AND REFURBISH HARDWARE IT FOR THIRD PARTY USE ................................. 80 8.3.5 AMOUNT OF ENERGY USE RELATED TO HARDWARE IT DISCARD TO LANDFILL ................................................................ 80 8.3.6 AMOUNT OF ENERGY USE RELATED TO RECYCLING HARDWARE IT .............................................................................. 81 8.3.7 AMOUNT OF ENERGY RECOVERED FROM DISCARDED HARDWARE IT ........................................................................... 82 8.3.8 AMOUNT OF ENERGY USE RELATED TO REUSE AND REFURBISH HARDWARE IT FOR THIRD PARTY USE ................................ 83 8.3.9 AMOUNT OF MATERIALS FROM HARDWARE IT TO LANDFILL ..................................................................................... 83 8.3.10 AMOUNT OF RECYCLED MATERIALS FROM HARDWARE IT ......................................................................................... 84 8.3.11 AMOUNT OF HARDWARE IT DISCARDED FOR ENERGY RECOVERY ................................................................................ 85 8.3.12 AMOUNT OF MATERIALS IN HARDWARE IT REUSED OR REFURBISHED FOR THIRD PARTY USE ............................................ 86 8.3.13 AMOUNT OF GREENHOUSE GAS EMISSION OF RECYCLING HARDWARE IT ..................................................................... 86 8.3.14 AMOUNT OF GREENHOUSE GAS EMISSION OF RECOVERING ENERGY FROM HARDWARE IT ............................................... 87 8.3.15 AMOUNT OF GREENHOUSE GAS EMISSION RELATED TO REUSE AND REFURBISH HARDWARE IT FOR THIRD PARTY USE ............ 87 8.3.16 COSTS OF HARDWARE IT SENT TO LANDFILL .......................................................................................................... 88 8.3.17 COSTS OF RECYCLING HARDWARE IT .................................................................................................................... 88 8.3.18 COSTS OF RECOVERING ENERGY FROM HARDWARE IT ............................................................................................. 89 8.3.19 REVENUES FROM SELLING USED AND REFURBISHED HARDWARE IT TO THIRD PARTIES .................................................... 90 8.4 AGGREGATION OF PERFORMANCE INDICATORS .......................................................................................................... 90 8.4.1 ASSESSMENT CRITERIA SCORES ........................................................................................................................... 91 8.4.2 INDEX VALUE SCORE ......................................................................................................................................... 93 8.5 FUNCTIONAL DESIGN USE ...................................................................................................................................... 93
PART IV ................................................................................................................................................................... 97
9. EVALUATION AND REFLECTION ON FRAMEWORK DESIGN .................................................................................. 98
9.1 EVALUATION OF EVALUATION METHODS .................................................................................................................. 98 9.2 EVALUATION OF DESIGN REQUIREMENTS ................................................................................................................ 101 9.3 REFLECTION ON DESIGN PROCESS .......................................................................................................................... 105 9.4 REFLECTION ON PERFORMANCE ASSESSMENT .......................................................................................................... 107 9.5 REFLECTION ON RESEARCHER’S ROLE ..................................................................................................................... 108 9.6 SUMMARY AND CONCLUSIONS ............................................................................................................................. 108
10. RECOMMENDATIONS FOR FRAMEWORK USE, EVOLVEMENT AND IMPLEMENTATION PATH ................ 111
10.1 APPLIED PRINCIPLES OF FUNCTIONAL DESIGN ........................................................................................................... 111 10.2 VISION ON MANAGEMENT PROCESS AND EVOLVEMENT ............................................................................................. 112 10.3 VISION ON FRAMEWORK IMPLEMENTATION PATH .................................................................................................... 114 10.4 SUMMARY AND CONCLUSION ............................................................................................................................... 115
11. CONCLUSION AND RECOMMENDATIONS ............................................................................................... 117
11.1 RESEARCH DEFINITION ........................................................................................................................................ 117 11.2 RESEARCH APPROACH ......................................................................................................................................... 117 11.3 ANSWERING THE RESEARCH QUESTIONS ................................................................................................................. 118 11.4 RECOMMENDATIONS FOR FURTHER RESEARCH ........................................................................................................ 123
BIBLIOGRAPHY ...................................................................................................................................................... 124
APPENDICES .......................................................................................................................................................... 141
APPENDIX A: SUSTAINABILITY INDICATORS AND INDICES ....................................................................................................... 143 APPENDIX B: GREEN PERFORMANCE INDICATORS (GPI) ....................................................................................................... 149 APPENDIX C: DESIGN REQUIREMENTS ELICITED ................................................................................................................... 154 APPENDIX D: REQUIREMENTS ANALYSIS AND AGREEMENT .................................................................................................... 158 APPENDIX E: CONCEPTUAL FRAMEWORK ........................................................................................................................... 165 APPENDIX F: DESIGN OF EXPERT PANEL REVIEW ................................................................................................................. 167

MSc Thesis, J.C.P.Kalsheim: Green Hardware IT Infrastructure (GHITI)
9
APPENDIX G: OUTCOME EXPERT PANEL REVIEW 1 .............................................................................................................. 171 APPENDIX H: OUTCOME EXPERT PANEL REVIEW 2 .............................................................................................................. 173 APPENDIX I: PERFORMANCE INDICATOR GROUNDING ........................................................................................................... 175 APPENDIX J: DATA ESTIMATES FOR THE FUNCTIONAL DESIGN ................................................................................................ 177 APPENDIX K: CASE STUDY PROTOCOL ................................................................................................................................ 181 APPENDIX L: CASE STUDY DATA ....................................................................................................................................... 184 APPENDIX M: CASE STUDY BSC NETHERLANDS .................................................................................................................. 185 APPENDIX N: SENSITIVITY ANALYSIS CASE STUDY RESULTS .................................................................................................... 194 APPENDIX O: EVALUATION OF PRESENTATION LAYOUTS ....................................................................................................... 215

MSc Thesis, J.C.P.Kalsheim: Green Hardware IT Infrastructure (GHITI)
10
List of Tables TABLE 1: RESEARCH OBJECTIVE, RESEARCH METHODS AND INFORMATION SOURCES WITHIN THE RESEARCH STRATEGY CHOSEN .................. 21 TABLE 2: EXPERT PANEL DEMOGRAPHICS ................................................................................................................................. 23 TABLE 3: TERMS IN THE DEFINITIONS OF GREEN IT ..................................................................................................................... 28 TABLE 4: GENERIC COMPETITIVE ENVIRONMENTAL STRATEGIES (ORSATO, 2009) ............................................................................ 36 TABLE 5: SUMMARY OF KEY GREEN IT CONCEPTS ....................................................................................................................... 37 TABLE 6: INDICATOR SETS FROM LITERATURE(LU, ET AL., 2011)(SINGHA ET AL., 2012) ................................................................... 44 TABLE 7: DESIGN REQUIREMENTS OF A TOOL TO ASSESS THE GREENNESS OF THE HARDWARE IT INFRASTRUCTURE OF AN ORGANISATION .... 55 TABLE 8: AVERAGE POWER DRAWS PER ACTIVITY MODE (LEHMANN & GALLEN, 2007) .................................................................... 72 TABLE 9: WATER SAVING RECYCLING HARDWARE IT UNITS(IVF, 2007) ......................................................................................... 79 TABLE 10: ENERGY SAVING RECYCLING HARDWARE IT UNITS(IVF, 2007) ...................................................................................... 81 TABLE 11: ASSESSMENT CRITERIA SCORES THAT MAY BE USED FOR BENCHMARKING ........................................................................ 102 TABLE 12: DESIGN REQUIREMENTS OF A TOOL TO ASSESS THE GREENNESS OF THE HARDWARE IT INFRASTRUCTURE OF AN ORGANISATION 119
List of Figures FIGURE 1: RESEARCH SCOPE .................................................................................................................................................. 18 FIGURE 2: RESEARCH DESIGN INSPIRED BY THE DESIGN SCIENCE RESEARCH BY HEVNER ET AL. (2004) AND PEFFERS ET AL. (2007) ............ 24 FIGURE 3: STRUCTURE OF THE THESIS REPORT, INSPIRED BY PEFFERS ET AL. (2007) .......................................................................... 25 FIGURE 4: REPRESENTATIONS OF SUSTAINABILITY ADAPTED FROM LOZANO (2008) ......................................................................... 30 FIGURE 5: OBJECT OF ANALYSIS AND POSSIBLE CLASSES OF HARDWARE IT PRODUCTS, ADAPTED FROM WORKGROUP CIO COVENANT, EXPERTS
KPMG IT ADVISORY AND LITERATURE (GURBAXANI, MELVILLE, & KRAEMER, 1998) (UNHELKAR, 2011) (BECCALLI, 2007) (UDDIN
AND RAHNMAN, 2011) ............................................................................................................................................... 34 FIGURE 6: OPERATIONAL SUSTAINABILITY FRAMEWORK BY LABUSCHAGNE ET AL. (2005) .................................................................. 35 FIGURE 7: APPLICATION AREAS OF EIO-LCA, LCA AND HYBRID LCA ADAPTED FROM LAVE & MATTHEWS (2006) ................................ 42 FIGURE 8: OVERVIEW OF GHG PROTOCOL SCOPES AND EMISSIONS ACROSS THE VALUE CHAIN (WBSD & WRI, 2011) ......................... 47 FIGURE 9: REQUIREMENTS ENGINEERING PROCESS APPLIED TO SPECIFY TOOL REQUIREMENTS............................................................. 52 FIGURE 10: INTERVIEWEES AT KPMG NETHERLANDS AND DELFT UNIVERSITY OF TECHNOLOGY ......................................................... 53 FIGURE 11: DESIGN ITERATIONS INCLUDING INPUT AND OUTPUTS ................................................................................................. 58 FIGURE 12: FRAMEWORK ENTITY DESIGN ................................................................................................................................. 60 FIGURE 13: GREEN HARDWARE IT INFRASTRUCTURE (GHITI) FRAMEWORK ................................................................................... 62 FIGURE 14: CALCULATION METHOD PERFORMANCE INDICATOR 1.1.1............................................................................................ 65 FIGURE 15: CALCULATION METHOD PERFORMANCE INDICATOR 2.1.1............................................................................................ 66 FIGURE 16: CALCULATION METHOD PERFORMANCE INDICATOR 3.1.1............................................................................................ 66 FIGURE 17: CALCULATION METHOD PERFORMANCE INDICATOR 3.1.2............................................................................................ 67 FIGURE 18: CALCULATION METHOD PERFORMANCE INDICATOR 3.1.3............................................................................................ 67 FIGURE 19: CALCULATION METHOD PERFORMANCE INDICATOR 4.1.1............................................................................................ 68 FIGURE 20: CALCULATION METHOD PERFORMANCE INDICATOR 5.1.1............................................................................................ 69 FIGURE 21: CALCULATION METHOD PERFORMANCE INDICATOR 1.2.1............................................................................................ 70 FIGURE 22: CALCULATION METHOD PERFORMANCE INDICATOR 2.2.1............................................................................................ 71 FIGURE 23: CALCULATION METHOD PERFORMANCE INDICATOR 2.2.2............................................................................................ 72 FIGURE 24: CALCULATION METHOD PERFORMANCE INDICATOR 3.2.1............................................................................................ 73 FIGURE 25: CALCULATION METHOD PERFORMANCE INDICATOR 4.2.1............................................................................................ 74 FIGURE 26: CALCULATION METHOD PERFORMANCE INDICATOR 5.2.1............................................................................................ 75 FIGURE 27: CALCULATION METHOD PERFORMANCE INDICATOR 5.2.2............................................................................................ 76 FIGURE 28: CALCULATION METHOD PERFORMANCE INDICATOR 5.2.3............................................................................................ 76 FIGURE 29: CALCULATION METHOD PERFORMANCE INDICATOR 5.2.4............................................................................................ 77 FIGURE 30: CALCULATION METHOD PERFORMANCE INDICATOR 1.3.2............................................................................................ 78 FIGURE 31: CALCULATION METHOD PERFORMANCE INDICATOR 1.3.3............................................................................................ 79 FIGURE 32: CALCULATION METHOD PERFORMANCE INDICATOR 1.3.4............................................................................................ 80 FIGURE 33: CALCULATION METHOD PERFORMANCE INDICATOR 2.3.2............................................................................................ 81 FIGURE 34: CALCULATION METHOD PERFORMANCE INDICATOR 2.3.3............................................................................................ 82 FIGURE 35: CALCULATION METHOD PERFORMANCE INDICATOR 2.3.4............................................................................................ 83

MSc Thesis, J.C.P.Kalsheim: Green Hardware IT Infrastructure (GHITI)
11
FIGURE 36: CALCULATION METHOD PERFORMANCE INDICATOR 3.3.1............................................................................................ 84 FIGURE 37: CALCULATION METHOD PERFORMANCE INDICATOR 3.3.2............................................................................................ 85 FIGURE 38: CALCULATION METHOD PERFORMANCE INDICATOR 3.3.3............................................................................................ 85 FIGURE 39: CALCULATION METHOD PERFORMANCE INDICATOR 3.3.4............................................................................................ 86 FIGURE 40: CALCULATION METHOD PERFORMANCE INDICATOR 4.3.1............................................................................................ 86 FIGURE 41: CALCULATION METHOD PERFORMANCE INDICATOR 4.3.2............................................................................................ 87 FIGURE 42: CALCULATION METHOD PERFORMANCE INDICATOR 4.3.3............................................................................................ 88 FIGURE 43: CALCULATION METHOD PERFORMANCE INDICATOR 5.3.1............................................................................................ 88 FIGURE 44: CALCULATION METHOD PERFORMANCE INDICATOR 5.3.2............................................................................................ 89 FIGURE 45: CALCULATION METHOD PERFORMANCE INDICATOR 5.3.1............................................................................................ 90 FIGURE 46: CALCULATION METHOD PERFORMANCE INDICATOR 5.3.4............................................................................................ 90 FIGURE 47: OVERVIEW FUNCTIONAL DESIGN USE ...................................................................................................................... 94 FIGURE 48: CATEGORIES OF UNITS OF ANALYSIS IN THE BSC CASE STUDY ........................................................................................ 99 FIGURE 49: PRESENTATION LAYOUT 1 ................................................................................................................................... 103 FIGURE 50: PRESENTATION LAYOUT 2 ................................................................................................................................... 104 FIGURE 51: PRESENTATION LAYOUT 3 ................................................................................................................................... 104 FIGURE 52: MANAGEMENT PROCESS, ADOPTED FROM ISO 14031AND PDCA CYCLE .................................................................... 112 FIGURE 53: VISION ON IMPLEMENTATION PATH ...................................................................................................................... 115 FIGURE 54: GREEN HARDWARE IT INFRASTRUCTURE (GHITI) FRAMEWORK ................................................................................. 120 FIGURE 55: MANAGEMENT PROCESS, ADOPTED FROM ISO 14031 ............................................................................................ 122

MSc Thesis, J.C.P.Kalsheim: Green Hardware IT Infrastructure (GHITI)
12
List of Abbreviations CIO Chief Information Officer CR Corporate responsibility CS Corporate sustainability responsibility CSR Corporate social responsibility EIO-LCA Economic Input-Output LCA EMAS European Eco-Management and Audit Scheme EPE Environmental Performance Evaluation GHG Greenhouse gas GHITI Greening hardware IT Infrastructure GPIs Green Performance Indicators GRI Global Reporting Initiative HITIG index Hardware IT Infrastructure Greenness Index ICT Information and communication technology ISO International Organisation of Standardisation IT Information Technology LCA Life Cycle Analysis LCC Life Cycle Costing
LCSP Lowell Centre for Sustainable Production PMS Performance measurement system SMART criteria Objectives of good requirements – Specific, measurable, attainable, realizable and traceable TCO Total Cost of Ownership WEEE Waste Eletronical and Electric Equipment WBCSD World Business Council for Sustainable Development WRI World Resource Institute 3BL Triple Bottom Line; People, Planet and Profit or the three pillars of sustainability; economic, social, environmental

Part I Problem analysis and research design
Part II: Academic and practical
grounding Part III: Framework design
Part IV: Framework
evaluation and conclusion
Define design
requirements
(Ch6)
Design
framework (Ch7)
Demonstrate
framework
Define green IT
assessment
(Ch4&5)
Evaluate
framework
(Ch9)
Evaluation,
recommendation
and conclusion on
design (Ch10&11)Business
needs
Refine
Applicable
knowledge
Identify research
problem and
motivation
(Ch1)
Part I: Problem analysis
and research design

MSc Thesis, J.C.P. Kalsheim: Greening Information Technology (IT) Infrastructures
Introduction 14
1. Introduction What would you do if you were a decision-maker striving to meet growing business needs for information technology (IT) along with performing sustainably? This chapter will elaborate on a situation in which several IT decision-makers find themselves; amid the tension of sustainability and IT. From the situation described in the first section, a problem statement (section 1.2), research objectives (1.3) and consequently research questions (1.4) will be derived. The first section will elaborated on the relationship between sustainability and IT (section 1.1).
1.1 Background Sustainability has become one of the greatest challenges of society today. To companies sustainability is essential to the long term successfulness of business operations and is often driven by factors such costs, new market opportunities, ethical responsibility and imago (Dao, Langella, & Carbo, 2011) (Unhelkar B. , 2011) (Porter & Kramer, 2006) (Schaltegger, 2008). A result of this has been a growing emphasison sustainability in several industries. One of these industies is the IT industry. Over the past decade there has been a growing emphasis among researchers and organisations on green and sustainable IT. A research by Symantec in 2009 showed that 86% of large companies’ claim the key driver towards green IT is environmental responsibility (Symantec, 2009). In the consecutive paragraphs issues and opportunities related to the IT industry and sustainability will be discussed. Several environmental issues fall under the responsibility of the IT industry. In 2007 Gartner estimated that the information and communication technology (ICT) industry was responsible for 2% of the global CO2 emissions. This is the same level as the aviation industry (Gartner, 2007). Further, the industry is responsible for water pollution, depletion of scarce materials, growing volumes of e-waste and the largest release of hazardous waste worldwide (Ruth, 2009)(Babin & Nicholson, 2011). These are serious environmental issues that should not go unattended. Despite that IT is a source of serious environmental pollution; it is also an enabler of green and sustainable development. An example of this is the use of videoconferencing, a possible alternative to travelling to a meeting. The use of IT as a service to lower carbon footprints of an organisation is often referred to as greening by IT (Hird, 2010). Next to the environmental impact of IT, IT also has economic benefits. IT is a source of cost efficiency and competitive advantage. Moreover, green IT might create competitive advantage through differentiation (Powell & Dent-Micallef, 1997)(Callon, 1995). Economic opportunities associated with green IT are cost saving, revenue growth, risk reduction, innovation, repositioning and prevention of resource restriction (Accenture, 2009) (Bansal & Roth, 2000) (e-Server-Consortium, 2009) (Harmon & Auseklis, 2009) (Hart. & Milstein, 2003) (Info-Tech, 2009) (Skinner, 2009) (Zarrella, 2008) (Erek, Loeser, Schmidt, Zarnekow, & Kolbe, 2011). By for instance improving the energy efficiency of hardware, operational costs may be reduced significantly within several organisations. Green IT also contributes to the achievement of corporate sustainability targets (Erek, Loeser, Schmidt, Zarnekow, & Kolbe, 2011). IT also has a social dimension that is both internal and external to organisations. From within an organisation, introducing measures to green IT requires the commitment of employees (Hird, 2010). With respect to procurement and disposal, IT should be bought and disposed fairly without harmful consequences to manufacturing workers or communities (Steinweg & Slob, 2009). In the United States the Conflict Mineral Law has been proposed in which electronic companies are required to verify and disclose their sources of the minerals cassiterite, wolframite and tantalum from the Democratic Republic of the Congo or adjoining countries in their products (Society of Manufacturing Engineers, 2011) (Securities and Exchange Commission, 2010). The Conflict Mineral Law is a result of the negative social impact of the electronics industry, which also includes IT. Would you like to have a “blood” laptop? To summarize, looking at IT from a sustainability perspective shows there are several issues and opportunities. These can be found in three dimensions; environmental, economic and social. Issues regarding these dimensions are complex. This often makes solutions unclear to decision-makers. In the next section the problem and motivation that formed the research will be further elaborated on.

MSc Thesis, J.C.P. Kalsheim: Greening Information Technology (IT) Infrastructures
Introduction 15
1.2 Research problem and motivation
Initially in this section, dilemmas decision-makers are confronted with concerning sustainable IT will be discussed. The purpose of this is to understand and define a relevant, important and unsolved business problem. Further, this section describes the business problem from a practical viewpoint and discusses current literature on sustainable and green IT. This is done to underpin the motivation for carrying out the research. This section concludes with a problem statement that is deduced from the problem description.
1.2.1 Problem owner and dilemmas With the current trends and societal concerns regarding sustainability and IT, organisations need to make sustainability a key part of their IT strategies going forward (Dubey & Hefley, 2011). Organisations are in the position to influence issues related to IT. They can also seize the opportunities presented by implementing strategies aimed at improving the sustainability of IT. Within most organisations this is the responsibility of IT decision-makers such as Chief Information Officers (CIOs) and IT managers. This group of actors represent the problem owner in this thesis. The main issue the problem owner is confronted with is how to intertwine IT with sustainability, thereby making a contribution to corporate responsibility (CR). According to Gartner (2008) the main issues related to green IT that IT decision-makers are facing is getting the greenhouse gas (GHG) emissions and IT house in order. However, the more important role is to help the organisation address organisation wide environmental sustainability issues (Gartner, 2008). This might be accomplished through green IT (Gartner, 2008) (Jain, Benbunan-Fich, & Mohan, 2011). But if you were the CIO of a large multinational firm wanting to improve the sustainability of your organisation, what would you decide: spend your budget on procuring more environmentally friendly IT or switch to a green energy supplier producing more sustainable energy than the previous? On what grounds would you make such a decision? What would be the influence of both options on the overall environmental and economic performance of your organisation? Would it even be possible to lower the environmental impact of the IT department when demand for data capacity increases rapidly? These questions represent dilemmas IT decision-makers are faced with when pursuing to green IT.
1.2.2 Research problem and motivation
As suggested in the previous section, CIOs and other IT decision-makers are facing several dilemmas concerning greening an organisation’s IT. Green IT is perceived as a step towards sustainable IT and a strategy that might contribute to the overall sustainability targets as defined in the corporate responsibility (CR) strategy of an organisation (Stenzel, Cokins, & Schubert, 2011). However, organisations that emphasize sustainability may not always extent their environmental efforts to the IT department (Cone, 2006). One of the worries of IT decision-makers concerning sustainable IT is how to contribute to the overall sustainability targets of an organisation. Several IT decision-makers want to contribute to these targets, but find it difficult to determine how to do this effectively while providing necessary IT to support efficient and competitive business operations (CIO Staff, 2008) (Gartner, 2008). Essentially, the practical business problem is how to deal with an increasing demand for new IT products, data centre capacity and related technology, while simultaneously improving the sustainability of IT (Molla & Cooper, 2009). Next to the practical problem situation, research on green and sustainable IT is a relatively new and unexplored scientific research field (Molla, 2009). Frameworks related to green IT have been devoted to understand;
maturity, readiness or motivation of organisations with respect to green IT (Humphrey, 1988)(Molla, 2009)(Molla & Cooper, 2009)(Donnellan, Sheridan, & Curry, 2011)(Bose & Luo, 2011),
the intersection between environmental responsibility and global IT outsourcing (Babin & Nicholson, 2011),
development and justification of energy conservation measures for green IT (Corbett, Webster, Sayili, Zelenika, & Pearce, 2010),
the role of IT resources and their integration with human and supply chain resources (Dao, Langella, & Carbo, 2011),
environmental costs of technological architecture (Cavaleiro, Vasconcelos, & Pedro, 2010),
how to evaluate green ICT using green attributes (Ting-ting, Jing, & Dan, 2012),
green IT assessment using a balanced scorecard (Jain, Benbunan-Fich, & Mohan, 2011),
how to evaluate IT enabled business transformation (Elliot, 2011),

MSc Thesis, J.C.P. Kalsheim: Greening Information Technology (IT) Infrastructures
Introduction 16
sustainable IT service design (Harmon & Auseklis, 2009),
classification of IT hardware products (Carme & Elena, 2009),
life cycle exergy analysis (LCEA) of IT devices (Shah & Meckler, 2011),
improve the energy efficiency of software programs (Naumann, Dick, Kern, & Johann, 2011)(Capra, Francalanci, & Slaughter, 2011) and
green autonomic computing systems (Kephart & Chess, 2003). From the frameworks devoted to assess the greenness of IT, maturity models might be useful to determine a organisation’s IT preparedness to be environmentally responsible and competitive (Molla & Cooper, 2009). This is the most mature framework and has been developed for commercial use by large organisations such as Accenture (Accenture, 2012). Another framework that might provide useful insights to decision-makers on green IT is the balanced scorecard. The balanced score card provides insights into possible green IT initiatives through exploring how IT can contribute to organisation-wide sustainability performance (Jain, Benbunan-Fich, & Mohan, 2011). Although these models can provide useful insights into an organisation’s IT greenness level, they do not provide quantitative information or guidelines on how to measure and improve (1) the current greenness of the IT infrastructure over its entire life cycle, (2) the influence of green IT drivers and improvement measures and (3) the impact of IT on several environmental issues associated with IT (see background, section 1.1). Life cycle exergy analysis (LCEA) and the evaluation system of green ICT products developed by Ting-ting et al. (2012) make use of quantitative information at product level that might provide such insights. However, evaluating a product is not sufficient when the objective is to determine the greenness of the entire IT infrastructure of an organisation for policy making or managerial purposes. This would require a more extensive framework. Furthermore, the framework by Ting-ting et al. (2012) includes a limited number of aspects related to green ICT products. The authors suggest a system balancing greenness and costs would provide better and more meaningful directions for organisations (Ting-ting et al., 2012). Summing up, it remains unclear what framework an IT decision-makers can use to assess the greenness of the IT infrastructure over the entire life cycle effectively as a step towards sustainable IT and a comprehensive CR strategy. Hence, the practical and scientific problem statement can be defined as:
The problem statement forms the essence of this research, and will be used to deduce research objectives.
1.3 Research objectives From the problem statement, research objectives are defined. The objective of this research is threefold:
(1) Design a new framework The purpose of this research is to design a new framework that can be used by IT decision-makers pursuing to contribute to corporate responsibility strategy by greening IT
(2) Validate the new framework design The new framework should be validated through several incremental iterations to ensure a robust design that can contribute to the scientific knowledge base on green and sustainable IT
Practical problem statement IT decision-makers want to contribute to environmental sustainability and corporate responsibility strategy of an organization, but lack a clear assessment tool for this. It is expected that a tool providing insights into the greenness of the hardware IT infrastructure of an organization might be an important step towards a comprehensive CR strategy.
Scientific problem statement It is unclear what framework could be used by an IT decision-maker to measure and assess the greenness of an organization’s IT infrastructure as a step towards sustainable IT and a comprehensive corporate responsibility strategy. This is an important knowledge gap in the field of research that focuses on green and sustainable IT.

MSc Thesis, J.C.P. Kalsheim: Greening Information Technology (IT) Infrastructures
Introduction 17
(3) Identifying the limitations of the new framework and give recommendations for further research At the end of this research limitations should be identified and recommendations for further research should be given
Before defining the research question, the research scope will be elaborated on in the next section to understand within which boundaries the framework will be designed.
1.4 Research scope Green IT is an extensive and broadly interpreted topic in literature. To meet the research objectives defined in the previous section within predefined project constraints it is necessary to limit the research scope. The research scope is shown in Figure 1. In the subsequent paragraphs the research scope will be elaborated on.
First, the research focuses on greening the hardware IT infrastructure of an organisation. This implies that greening by IT fall out of the research scope. Greening by IT can be interpreted as the use of IT services to meet overall
environmental sustainability goals of an organisation (see theoretical foundation, Chapter 4). This research
investigates greening hardware IT infrastructures because it can be seen as a fundamental step in greening business operations. It is recognized that the sustainability enabling effects of IT might be far-reaching. IT as a service can be used to green IT and other aspects of business operations such as transportation.
Second, the research focuses on greening the shared physical IT equipment within an organisation that is used to process, store or transmit computer programs or data supporting business applications (Linberg, 1999). This is defined as the hardware IT infrastructure. In IT research a distinction can be made between technical IT infrastructure, managerial capability infrastructure and the IT human infrastructure. The technical IT infrastructure is defined as the physical IT and communication resources together with the business applications and shared services of an organisation. This encompasses storage, network, data, application assets and network critical physical infrastructures (Byrd & Turner, 2000). The managerial capability is the management of IT acitivities and strategic foresight about changes in the IT, business and the broader environment (Ravichandran & Lertwongsatien, 2005). The IT human infrastructure refers to the competenties, commitments, experience, values and norms of the IT personnel that delivers the IT products and services (Molla, Cooper, & Pittayachawan, 2011)(Byrd & Turner, 2000). In view of these categories of IT infrastructures, the technical IT infrastructure fall within the research scope. As regards the technical IT infrastructure, this includes (Broadbent & Weil, 1997) (McKay & Brockway, 1989) (Duncan, 1995) (Niederman, Brancheau, & Wetherbe, 1991) (Davenport & Prusak, 1998) (Keen, 1991) (Earl, 1989) (Weill, 1993) (Agarwal & Nath, 2011); (1) data, (2) core data processing applications, (3) computer hardware and software, (4) network and communication technologies and (5) shared IT services. This research focuses on the physical assets. This is referred to as hardware. In this research, hardware is defined as physical equipment used to process, store or transmit computer programs or data (Linberg, 1999). Other aspects of IT such as software and IT services are not part of the research scope. Nevertheless, it is acknowledged that software can contribute significantly to energy efficiency by (re)engineering (Capra & Merlo, 2009)(Naumann, Dick, Kern, & Johann, 2011).
Third, the entity, also referred to as the object of analysis, is the hardware IT infrastructure of “an organisation”. The scope of an organisation’s hardware IT infrastructure is outlined in section 7.2.2. Basically, outsourced, leased and owned hardware IT infrastructure units fall within an organisation’s hardware IT infrastructure. It is assumed the influence of entirely or partially owned franchises are insignificant.
Fourth, the research focuses on the life cycle of hardware IT infrastructure products in an organisation from the moment of procurement to end-of-life. When a hardware IT infrastructure asset is manufactured from raw materials, the environmental effects of raw materials extraction and manufacturing are incorporated in the analysis. Further, hardware IT infrastructure units are transported several times between various locations. Although transportation is responsible for approximately 1% of the energy usage in the life cycle of desktops, laptops and thin clients, it is not within the scope (Clevers, 2010)(IVF, 2007) (JEMAI, 2003). Additional aspects that fall outside the scope is design and installation of hardware IT infrastructure units. “Design for disassembly” can contribute to more efficient recycling or refurbishment of units (Shrivastava, 1995). However, this is insignificant if an organisation does not recycle or refurbish units at the end-of-life. Installation time and resources used (i.e. water, energy and raw materials) to install hardware IT infrastructure units are assumed to be insignificant compared to time and resources

MSc Thesis, J.C.P. Kalsheim: Greening Information Technology (IT) Infrastructures
Introduction 18
units use during operations. With regards to hardware IT, installation is understood as the process of preparing a unit that has been delivered by the hardware IT supplier for operation.
Fifth, with regard to the “green” part of the definition of green IT (see theoretical foundation, Chapter 4) the
research focuses on the environmental and economic pillar of sustainability. Particular emphasis is put on the environmental pillar. As regards the economic pillar of sustainability the research focuses on financial implications related to environmental impacts over the life cycle of hardware IT within an organisation. This delineation is based upon definitions of green IT in literature as will be discussed in section 4.1. Social aspects of sustainability are left out of the research scope. This is merely discussed in literature on green IT. Nevertheless, it is acknowledge that the social pillar is essential to achieve sustainability and a comprehensive CR strategy.
The sixth delineation concerns issues addressed in this research. These issues form the fundament for assessment criteria incorporated in the design of a new framework. Literature suggests resource usage (energy, water and raw materials) and GHG emission are important issues related to IT (Murugesan, 2008) (Harmon & Auseklis, 2009) (Molla & Cooper, 2009) (Molla, 2009) (Capra & Merlo, 2009) (Lamb, 2009) (Hird, 2010) (Harmon, Demirkan, Auseklis, & Reinoso, 2010) (Dao, Langella, & Carbo, 2011) (Li & Zhou, 2011 ). Next to environmental issues, costs are also acknowledged to be an important aspect of greening IT (Murugesan, 2008)(Molla, 2009) (Harmon, Demirkan, Auseklis, & Reinoso, 2010)(Li & Zhou, 2011 ) (Harmon & Demirkan, 2011). In essence these issues comprise; energy use, water use, raw material use, generation of Waste of Eletronical and Electric Equipment (WEEE) and GHG emission. Next to these, there are other issues related to IT such as land use and release of hazardous substances. These are not part of the research scope.
Lastly, the use of hardware IT infrastructure units is delineated. In the use phase, the research focuses on resources used by owned, leased and outsourced hardware IT (see framework entity, section 7.2.2). The environmental impact of using internet or other commercial services that are supported by the hardware IT infrastructure of a third party is not part of the research scope. Furthermore, the presence of a rebound-effect is acknowledged when assessing an organisation’s hardware IT infrastructure over time. The rebound-effect is not explicitly incorporated in the research scope because it is difficult, if not impossible to influence. With regard to water and waste, the scope is limited to the amount of water used and the generation of WEEE from disposal of owned hardware IT (see framework entity, section 7.2.2).
The entire research scope can be found in Figure 1. Aspects that will be investigated as well as aspects that fall outside the research scope have been illustrated in this overview.
Green IT
Greening by IT Software Services
Leased
Outsourced
Greening IT
Sc
op
e
Greening
hardware IT Use
hardware IT
Dispose
harwdare IT
Procure
hardware IT
Life cycle stages Central issues
Ou
t of S
co
pe
Energy use
GHG
emission
Water use
Raw material
use
Owned
hardware IT
Hardware IT
infrastructure
(object of analysis)
Franchises
Costs
Economic
sustainability
Environmental
sustainability
Pillars of
sustainability
TransportationOther life cycle
stages
Social
sustainability
Environmental
Economic
Other issues
WEEE
Figure 1: Research scope

MSc Thesis, J.C.P. Kalsheim: Greening Information Technology (IT) Infrastructures
Introduction 19
Next to the scope of the research content, the research focuses on developing a new framework. The first step towards operationalizing the framework is part of the scope. This is limited to one case study research to operationally verify the use and practical relevance of the framework. The purpose is not to develop a generic tool as this an explorative study.
1.5 Research questions Based on the research objectives and scope clarifications in the previous sections, the main question is formulated:
To answer the main question in a structured way several sub-questions are formulated. The sub-questions are in line with the design science research approach chosen to structure and guide the research. To structure the sub-questions these have been divided into three parts which are inspired by the design science research by Hevner et al. (2004). The sub-questions are as follows:
Part 2: Academic and practical grounding 1. What is green IT? 2. To what extent can green IT be part of corporate responsibility strategy? 3. What economic and environmental life cycle assessment criteria can be found in literature to assess the
greenness of the hardware IT infrastructure of an organisation? 4. Which requirements can be defined for a tool to assess the relative greenness of the hardware IT infrastructure
of an organisation?
Part 3: Framework design 5. What framework can be designed incorporating economic and environmental life cycle assessment criteria to
assess the relative greenness of the hardware IT infrastructure of an organisation?
Part 4: Framework evaluation and conclusion 6. How successful is the framework in determining the relative greenness of the hardware IT infrastructure of an
organisation as a step towards a comprehensive corporate responsibility strategy? 7. How can the framework be improved to make it more in line with corporate responsibility strategy? 8. How can the framework be used to determine the relative greenness of the hardware IT infrastructure of an
organisation as a step towards a comprehensive corporate responsibility strategy?
Research question What generic framework based upon environmental and economic life cycle assessment criteria could be developed to assess the relative greenness of the hardware IT infrastructure of an organization as a step towards a comprehensive corporate responsibility strategy?

MSc Thesis, J.C.P. Kalsheim: Greening Information Technology (IT) Infrastructures
Research design 20
2. Research design In the previous chapter the research question has been presented. To answer the research question, a research design needs to be defined. To define a suitable research design it is necessary to understand the research paradigm that shapes the perception of the researcher and guides the process. The research paradigm will be briefly explained in section 2.1. In section 2.2 the research approach chosen within the paradigm will be elaborated on. This section also describes the guiding principles of the research approach. Approaching the research field numerous research strategies can be applied. Research strategies chosen will be discussed in section 2.3. The concluding research design will be presented in section 2.4.
2.1 Research paradigm To be able to translate the research statement into research question and choose an appropriate research methodology, a decision has to be made on the research paradigm. The research paradigm, also known as the knowledge claim, shaped the research questions defined in section 1.5 and also shapes the methodology that is applied to this research. The research paradigm is the set of philosophical mind-set or assumptions that determine the way the world is perceived during the inquiry (Patton, 1990) (Creswell, 2002). This research follows a design approach as the research aims at designing a new framework. In the next section the design approach chosen to guide the research will be elaborated on.
2.2 Research methodology To conduct the research successfully it is necessary to adopt an appropriate research approach to structure and guide the research process. As the objective of the thesis is to design a framework based on scientific literature, the design science research by Hevner et al. (2004) is chosen. The arguments underlying the selection of design approach will be outlined in the following paragraphs. In the last paragraph in this section, guidelines on how to adopt the design science research approach successfully will be presented. These guidelines will be used in Part IV to evaluate the successfulness of the design process. First, the design science research approach supports achieving the objectives of this research as stated in Chapter 1. The objective of the research is to design a framework to assess the relative greenness of an organisation’s hardware IT infrastructure. The design science approach seeks to create new and innovative knowledge based artefacts through building and evaluating artefacts designed to meet the identified business needs (Peffers, Tuunanen, Rothenberger, & Chatterjee, 2007) (Hevner, March, Park, & Ram, 2004). Other generic models that could be used to structure the design process is the meta-model developed by Herder & Stikkelman (2004) and the engineering design process (Herder & Stikkelman, 2004)(Ertas & Jones, 1996). The meta model is a tool to order the complexity of activities that are undertaken in design processes, but lack theoretical foundation (Koppenjan & Groenewegen, 2005). The engineering process is not applied as basic sciences, mathematics and engineering sciences are not used to convert resources optimally to meet research objectives (Ertas & Jones, 1996). Second, the design science research can deal with the wickedness of the research problem. The problem defined in the research is the absence a framework to assess the greenness of the hardware IT infrastructure of an organisation. This is a wicked problem because it does not have an absolute answer (Ritchey, 2007) (Conklin, 2005) (Rittle, Horst, & Webber, 1973). There are for instance several different interpretations of green IT in literature and design requirements for a green IT assessment tool can alternate. Further, sustainable and green IT is a relatively new an unexplored research field that develops rapidly. In order to overcome challenges wicked problems impose, the design science research offers a structured way of analysing problems. The design science research approach starts by defining design requirements (i.e. business needs) and reviewing literature to establish a theoretical foundation (i.e. knowledge base) for a viable artefact (Hevner, March, Park, & Ram, 2004). Third, the design science research approach incorporates several incremental iterations that supports the development of a rigorous and relevant new framework design. The design science research methodology process model by Peffers et al. (2007) consists of a number of steps and incremental iterations. Several design approaches, such as the design science research, design cycle and the spiral model, include an iterative element. Iteration is essential for generating value in design processes (Ballard, 2000) (Hevner, March, Park, & Ram, 2004)(Boehm B. W.,

MSc Thesis, J.C.P. Kalsheim: Greening Information Technology (IT) Infrastructures
Research design 21
1986) (Takeda, Veerkamp, Tomiyama, & Yoshikawa, 1990). The design science research consists of three types of iteration cycles; the rigor, relevance and design cycle. The rigor cycle provides “grounding theories and methods along with domain experience and expertise from the foundations knowledge base into the research and adds the new knowledge generated by the research to the growing knowledge base” (Hevner A. R., 2007: 87). The relevance cycle integrates “the contextual environment into the research and introduces the research artefacts into environmental field testing” (Hevner A. R., 2007: 87). These processes provide input for the design cycle and support the feedback loop to the environment and academic knowledge base. The design cycle “iterates between the construction of an artefact, its evaluation, and subsequent feedback to refine the design further” (Hevner A. R., 2007: 91). Applying this research approach ensures the designed solution is based on both academic rigor and practical relevance. But how can it be applied successfully? A successful adoption of the approach requires the guidelines for design science research by Hevner et al. (2004) are followed. The most important of these is that the research must produce an artefact that addresses a problem (Peffers et al., 2007). Basically the artefact should be relevant to the solution of an important and unsolved business problem. Furthermore, the utility, quality and efficacy of the artefact should be rigorously evaluated. The research should represent a clear and verifiable contribution and rigor should be used in both the development and evaluation of the artefact. Developing an artefact should be a search process that utilise existing theories and knowledge to come up with an effective solution. Lastly, the research should be effectively communicated to both technical and managerial audiences (Hevner et al., 2004)(Peffers et al., 2007). Following these guidelines, the approach could be applied successfully. A well-defined research strategy is also part of this approach.
2.3 Research strategy The next aspect to be determined is the research strategy and the structured set of activities to be performed to answer the research question. Ruan (2005) proposes that “good” research often is pursued on behalf of four basic research objectives: exploration, description, explanation and evaluation. The research objectives defined in section 1.3 suggest the research in its totality has an explorative character, which implies a qualitative research strategy would be suitable (Morse, 1994) (Creswell, 2002). Within the qualitative research domain, various research methods and information sources are available. Yin (2009) suggests an appropriate research method can be determined from the type of question asked. Depending on the type of question asked, there are five types of research strategies: experiment, survey, desk research, history and case study. The type of research method chosen should depend on the form of the research question, the control an investigator has over actual behaviour events and the focus on contemporary instead of historical data (Yin, 2009). For each sub-question defined in section 1.5 the control over actual behaviour events and focus on historical data is low. Inspired by Yin (2009), suitable research methods are chosen and implemented to answer the sub-questions. The sub-questions can be used to answer the main question. The research strategy designed for this research can be found in Table 1.
Table 1: Research objective, research methods and information sources within the research strategy chosen
Research questions Research objective
Research method Information source Desk
research Expert
interview Expert panels
Case study
Liter-ature
Expert opinion
Documents BCS
Interviews BCS
Part 1: Theoretical and environmental foundation
1. What is green IT? Exploration x x
2. To what extent can green IT be part of corporate responsibility strategy?
Exploration x x
3. What economic and environmental life cycle assessment criteria can be found in literature to assess the greenness of the hardware IT infrastructure of an organisation?
Exploration x x
4. Which requirements can be defined for a tool to assess the relative greenness of the hardware IT infrastructure of an organisation?
Exploration, description
x x x x

MSc Thesis, J.C.P. Kalsheim: Greening Information Technology (IT) Infrastructures
Research design 22
Part 2: Framework design
5. What framework can be designed incorporating economic and environmental life cycle assessment criteria to assess the relative greenness of the hardware IT infrastructure of an organisation?
Exploration, Explanation
x x x x
Part 3: Framework evaluation
6. How successful is the framework in determining the relative greenness of the IT infrastructure of an organisation as a step towards a comprehensive corporate responsibility strategy?
Evaluation x x x x x
7. How can the framework be improved to make it more in line with corporate responsibility strategy?
Evaluation x x
8. How can the framework be used to determine the relative greenness of the hardware IT infrastructure of an organisation as a step towards a comprehensive corporate responsibility strategy?
Description x
x
In Table 1 sub-questions are linked to research objectives, research methods and information sources. In the first column the sub-questions are listed. The type of research objective associated with each sub-question is defined in the second column. In the last two columns the research methods and information sources chosen are indicated with a cross. In the next paragraphs the research methods will be outlined in more detail. Desk research Table 1 shows several sub-questions are answered from desk research. Desk research is a form of secondary research that often makes a good starting point for research projects (Courch & Housden, 2003). Scientific search engines were used to review of existing literature in knowledge databases. Knowledge domains from which literature were reviewed comprise the following; life cycle analysis, green and sustainable IT, sustainability, eco-efficiency, green performance indicators for IT data centres and IT service centres, performance assessment, life cycle thinking and requirements engineering. Expert interviews Next to desk research, expert were interviewed. Interviews are efficient and often very simple ways to gather knowledge of field experts. Although criticized for the influence of the type of questions asked and the relationship with interviewer, interviews are still a regularly used method in academic research (Eisenhardt, 1989) (Lenski & Leggett, 1960). Interviews were used to elicit design requirements of an assessment tool. The interviewees were either be experts in a relevant knowledge field or represented a relevant stakeholder. Preliminary to the expert interviews, a brainstorm session was organized with three representative stakeholders to define design requirements. The brainstorm session severed as a create exploration of what an assessment tool would be like. This helped define specific questions for interviews with experts and other stakeholders. Expert panel The third research method used in this research was expert panels. In early development stages, small samples to gain expert feedback to evaluate and support model development can be useful to develop and test explanations (Hakim, 1987)(Beechham, et al., 2005). In this research two expert panels were organized. The aim of the expert panels was to formatively validate the framework design (Tessmer, 1993). An expert panel is a group of experts from a given knowledge field. Experts were carefully selected from a population of experienced practitioners and researchers in various fields related to green IT to ensure different and relevant knowledge fields are represented in the panels as recommended by Lausens & Vinter (2001) and Kitchenham et al. (2002). Given feasibility constraints, only expert from the Netherlands were asked to participate in the expert panels. The experts were allowed to provide feedback to be utilized for design changes to the artefact. The feedback for improvement of design is an essential component of design science research (Hevner et al., 2004)(Hevner, 2007). The design of the expert panels organized including the expert selection can be found in Appendix F. In essence the group of experts selected can be referred to as a stratified sample. The expert demographics can be found in Table 2. Lydia Stougie did not physically

MSc Thesis, J.C.P. Kalsheim: Greening Information Technology (IT) Infrastructures
Research design 23
attend the second expert panel, nevertheless her opinion was used as an input preliminary to the second expert panel review due to her expertise in life cycle exergy analysis and performance assessment. Table 2: Expert panel demographics
Expert panel Expert name Expertize
1
Erik Beulen Outsourcing/sourcing
Freek Bomhof ICT and sustainability
Wim Hendricksen Data centres and IT infrastructures
Rick van Krevelen Computer science and requirements engineering
2
Lydia Stougie Life cycle exergy analysis and performance assessment
Aernoud Walrecht Sustainability and green IT
Jeroen Guinee Life cycle analysis and substance flow analysis
Martijn Warnier Computer science, ICT and energy
Jan Hoogstrate Reuse, refurbishment and recycling of IT and green IT
Case study After the expert panel validation, the framework design was operationally verified in a an explorative case study. A case study helps evaluate benefits of methods and tools in a cost-effective way (Kitchenham, Pickard, & Pfleeger, 1995). A case single, embedded study research is also chosen because of the in-depth character of the investigation, complexity of the research area and explorative character of the research. A case study offers a holistic, multi-perspective investigation of the research object. It has the advantage of describing the real world without influencing or simplifying it (Yin R. K., 2009). An experimental research would not be feasible as there are too many variables in the framework (Verschuren & Doorewaard, 2010) (Feagin, Orum, & Sjoberg, 1991). Due to the exploratory and revelatory character of the research, one explorative case study was considered appropriate(Yin, 2009). The main disadvantage of applying this research method is the restricted generalizability of its results. Hence, the framework will only be operationally verified for the scope of hardware IT investigated. The statement investigated in the case study therefore is: the framework is able to successfully determine the greenness of the hardware IT infrastructure investigated. Various tactics to enhance validity of the single, embedded case study are implemented in the case study. First, construct validity, which is the establishment of correct operational measures for the concepts being studied, is enhanced by using multiple sources of evidence(Yin R. K., 2009). This is also called methodological triangulation. Yin (2009) suggests multiple of the following sources can be used in a case study: documentation, archival records, interviews, direct observation, participatory observation, physical objects. Construct validity is further enhanced by providing a feedback allowing management to verify data collected. Second, a functional design is made and implemented in the case study to ensure internal validity of relationships between data-items, performance indicators and assessment criteria. Third, reliability issafeguarded by creating and using a case study protocol (see Appendix K).The case study protocol serves as a guide when collecting data, but also ensures repeatability(Yin R. K., 2009). It is acknowledged that to assure external validity multiple case studies should be performed to enable case study findings to be generalizable beyond the immediate case study (Yin R. K., 2009). Multiple case studies are not performed due to time constraints.
2.4 Conclusion
In the previous sections the research design has been elaborated on. It is concluded that the design science research approach will be used to structure and guide the research and that desk research, expert interviews, expert panels and case study are research strategies that will be applied within this approach. The final research design is illustrated in Figure 2.

MSc Thesis, J.C.P. Kalsheim: Greening Information Technology (IT) Infrastructures
Research design 24
Part 1: Academic and practical
grounding Part 2: Framework design
Part 3: Framework evaluation and
conclusion
Define tooling
requirements (Q4)
Design
framework (Q5)
Demonstrate
framework
Define green IT
assessment
(Q1,2,3)
Evaluate
framework
(Q6,7)
Recommendation
and conclusion on
design (Q8)Business needs
RefineApplicable
knowledge
Expert interview Expert panel Case study
Desk research
Desk research
Research
strategy
Legend
Research
approach
Figure 2: Research design inspired by the design science research by Hevner et al. (2004) and Peffers et al. (2007)
Before the results of the research design are presented, the structure of the report is outlined in the next chapter. This is based upon the research design shown in Figure 2.

MSc Thesis, J.C.P. Kalsheim: Greening Information Technology (IT) Infrastructures
Structure of the thesis 25
3. Structure of the thesis In the previous two chapters the starting point for this research has been described. Based upon this, the thesis is divided into four consecutive parts: 1) problem analysis and research design, 2) academic and practical grounding, 3) framework design and 4) framework evaluation and conclusion. In each of these parts one or more chapters can be found that address one or more of the sub-questions defined in section 1.5. The structure of the thesis is illustrated in Figure 3.
Part II: Academic and practical
grounding Part III: Framework design
Part IV: Framework
evaluation and conclusion
Define design
requirements
(Ch6)
Design
framework
(Ch7&8)
Demonstrate
framework
Define green IT
assessment
(Ch4&5)
Evaluate
framework
(Ch9)
Recommendation
and conclusion on
design (Ch10&11)Business
needs
Refine
Applicable
knowledge
Identify research
problem and
motivation
(Ch1)
Part I: Problem analysis
and research design
Figure 3: structure of the thesis report, inspired by Peffers et al. (2007)
The research problem and motivation can be found in Chapter 1. In Chapter 2 the research design created to solve the research problem is defined. The research design is based upon literature on research paradigms, methodologies and strategies from the knowledge base. Chapter 1, 2 and 3 constitute the first part of the thesis. In the second part of the thesis the fundament for the design of a new framework is presented. This part starts by reviewing literature to establish an academic foundation for a new framework (applicable knowledge) and defining design requirements for an assessment tool (business needs) (Chapter 4, 5 and 6). The literature review is structured from a top-down approach. This enables defining the overall structure for attaining green IT which subsequently is broken down into performance indicators (Spohn, 2004). The definition of green IT is presented in Chapter 4. The subsequent literature review explores performance indicator related to its “sub-terms”; sustainability, eco-efficiency and green (Chapter 5). In Chapter 6 design requirement of an assessment tool can be found. The new framework design can be found in Chapter 7. In Chapter 8 the first operationalization of the framework is presented as tested in a case study. Evaluation and reflection on the new framework design can be found in Chapter 9. Chapter 10 describes application principles of the functional design, a vision on a management process and an implementation vision of this management process. In the last chapter, Chapter 11, conclusions and recommendations for further research can be found.

MSc Thesis, J.C.P. Kalsheim: Greening Information Technology (IT) Infrastructures

MSc Thesis, J.C.P. Kalsheim: Greening Information Technology (IT) Infrastructures
Part II Academic and practical grounding
Part II: Academic and practical
grounding Part III: Framework design
Part IV: Framework
evaluation and conclusion
Define design
requirements
(Ch6)
Design
framework (Ch7)
Demonstrate
framework
Define green IT
assessment
(Ch4&5)
Evaluate
framework
(Ch9)
Recommendation
and conclusion on
design (Ch10&11)Business
needs
Refine
Applicable
knowledge
Identify research
problem and
motivation
(Ch1)
Part I: Problem analysis
and research design

MSc Thesis, J.C.P. Kalsheim: Greening Information Technology (IT) Infrastructures
Theoretical background on green IT 28
4. Theoretical background on green IT To successfully design a new framework the design science research by Hevner et al. (2004) is chosen to structure and guide the research process. In this and the subsequent chapter, literature will be reviewed to establish a knowledge base for designing an academically rigorous framework. This chapter focuses on defining the overall structure of green IT (section 4.1) and green IT as a step towards a comprehensive CR strategy (section 4.2). This is used as input for the subsequent chapter, which focuses on performance assessment and measuring green IT.
4.1 Green IT To draw a conceptual foundation for a green IT framework it is necessary to have a clear understanding of green IT. The sub-question addressed in this chapter is “what is green IT?” (Q1). In section 4.1.1 various definitions of green IT are outlined. Several concepts found in these definitions are further elaborated on in section 4.1.2-4.1.4. This will be used to gain a more comprehensive understanding of what green IT is. In section 4.1.5 IT will be outlined to further clarify what green IT comprises and what the scope of this research addresses.
4.1.1 Definitions of green IT Green IT has become a catchphrase in IT management even though a common understanding of the scope and coverage of the concept is missing in research and practice (Velte, Velte, & Elsenpeter, 2008). Some researchers also prefer the term green IS as this concept incorporates green IT and comprise a greater variety of possible initiatives to support sustainable business processes beyond IT (Watson, Boudreau, & Chen, 2010). A comprehensive overview of green IT definitions is provided by Molla (2009). From various concepts the author suggests that green IT is: “a systematic application of ecological-sustainability criteria (such as pollution prevention, product stewardship, use of clean technologies) to the creation, sourcing, use and disposal of the IT technical infrastructure as well as within the IT human and managerial components of the IT infrastructure, in order to reduce IT, business process and supply-chain related emissions, waste and water use; improve energy efficiency and generate Green economic rent” (Molla, 2009:757) Molla’s definition suggests that green IT requires a holistic approach that incorporates the entire life cycle of the IT infrastructure (Molla, 2009). That the life cycle of IT is a significant part of green IT is emphasized by several other authors (Murugesan, 2008) (Elliot, 2011)(Molla & Cooper, 2009)(Unhelkar B. , 2011)(Harmon & Demirkan, 2011)(Li & Zhou, 2011 )(Harmon, Demirkan, Auseklis, & Reinoso, 2010)(Harmon & Auseklis, 2009) (Capra & Merlo, 2009) (Hird, 2010)(Dao, Langella, & Carbo, 2011). The definitions of the life cycle of IT differs. For example, Murugesan suggest the life cycle of IT entails design, manufacture, use and disposal. Alternatively, Molla and Coopers (2009) incorporates sourcing, operation, recycling, reuse and disposal. According to the study by Molla (2009) there are several similar terms in green IT definitions such as green, sustainability and eco-efficiency. Frequently reoccurring terms in several recent definitions of green IT could be reduced to the following: environmental sustainability, eco-efficiency (i.e. costs and resource efficiency), life cycle, human and managerial components and greening by IT. Table 3 summarizes these sub-terms. These definitions show it is possible to distinguish between greening IT and greening by IT. Arguably greening IT focuses on greening operations, whereas greening by IT focuses on using IT services to green an organisation’s operations beyond merely IT (Hird, 2010). Both ways could be seen as a first step towards the superior goal of sustainability (Molla, 2009). In the following paragraphs key terms in green IT definitions are outlined in more detail. Table 3: Terms in the definitions of Green IT
Definition by
Terms in Green IT definitions
Environmental sustainability
Costs Resource efficiency
Life cycle Human and managerial
components Greening by
IT
(Elliot, 2011) x x x
(Murugesan, 2008) x x x x
(Harmon & Auseklis, 2009) x x

MSc Thesis, J.C.P. Kalsheim: Greening Information Technology (IT) Infrastructures
Theoretical background on green IT 29
(Molla & Cooper, 2009) x x x
(Molla, 2009) x x x x x
(Capra & Merlo, 2009) x x x
(Lamb, 2009) x
(Hird, 2010) x x x x
(Harmon, Demirkan, Auseklis, & Reinoso, 2010)
x x x x
(Dao, Langella, & Carbo, 2011) x x
(Li & Zhou, 2011 ) x x x x
(Harmon & Demirkan, 2011) x x x
(Unhelkar, 2011) x
First, green IT definitions signify environmental sustainability and incorporate life cycle thinking. Table 3 shows that 11 of the 13 definitions of green IT use the term environmental sustainability. The term life cycle is mentioned in 8 out of 13 definitions. According to Murugesan (2008) environmental sustainability of IT involves green design, manufacturing, use and disposal of IT systems. In this definition of green IT environmental sustainability and life cycle thinking is seen as one comprehensive part (Murugesan, 2008). An organisation could for instance ensure that the hardware IT infrastructure would become more environmental sustainable by reducing CO2 emissions during operation without increasing the emission or use of other resources. This way the direct impact the organisation would have on the environment may decrease and the relative environmental sustainability could increase slightly. Negative impacts on the environment might be lowered, but this does not necessarily mean that the needs of future generations can be met (Harmon & Auseklis, 2009) (Senge, Smith, Kruschwitz, Laur, & Schley, 2008). For example, efficient use of water during operation could not redeem the amount of water used in the production phase. In that sense, green IT needs to stretch beyond organisational boundaries to achieve environmental sustainability. Second, green IT implies eco-efficiency in all life cycle phases of IT. Combining costs and resource efficiency and their influence on environmental sustainability, green IT could be assumed to incorporate eco-efficiency of IT (Huppes & Ishikawa, 2005). Table 3 shows that 10 out of 13 definitions in literature include resource efficiency and 5 out of 13 mention costs of IT. These characteristics are dependent. More efficient use of resources lead to lower operational costs of IT over the life cycle neglecting the presence of a rebound-effects (Harmon, Daim, & Raffo, 2010)(Harmon & Demirkan, 2011)(Babin & Nicholson, 2011). In terms of energy economics the rebound-effect is the behavioural response to energy efficiency measures that lead to a higher energy use (Greeninga, Greeneb, & Difiglio, 2000). Furthermore, resource efficiency of IT influences environmental sustainability of IT. Inefficient use of energy, water and raw materials over the life cycle of IT could contribute to a more rapid depletion of resources if these are not adequately recycled or reused. A rapid depletion of resources is not environmental sustainable, especially when it might hamper availability of such resources to future generations. Third, green IT implies management of environmental sustainability and eco-efficiency of IT and the use of IT services to meet overall environmental sustainability goals of an organisation. The Human and managerial component of IT and greening by IT are two important sub-parts of green IT definitions (Elliot, 2011) (Molla, 2009) (Capra & Merlo, 2009) (Hird, 2010). Basically, from a managerial perspective environmental sustainability criteria related to IT should be incorporated in the management cycle, as well as the responsibility of management in stimulating green behaviour among employees (Elliot, 2011) (Molla, 2009). Greening by IT is a very different concept. It incorporates the use of IT services to reduce the environmental footprint of an organisation beyond physical IT. In doing so, greening by IT may contribute to the overall environmental sustainability goals of an organisation(Molla, 2009) (Capra & Merlo, 2009) (Hird, 2010). IT can also make IT greener. Computing systems that are able to manage themselves autonomically given high-level objectives from administrators is an example of this. An environmenetal benefits of autonomic computers is more efficient computing machines running at peak performance 24/7 (Kephart & Chess, 2003).

MSc Thesis, J.C.P. Kalsheim: Greening Information Technology (IT) Infrastructures
Theoretical background on green IT 30
To summarize, green IT incorporates environmental sustainability, eco-efficiency, management of environmental sustainability, eco-efficiency and the use of IT services to meet environmental sustainability goals of an organisation. Before defining green IT the following terms will be elaborated on; sustainability, environmental sustainability, eco-efficiency, life cycle thinking and IT. The aim of the following literature review is to understand the scope and meaning of these terms, and thereby gain additional insights on green IT.
4.1.2 Sustainability As outlined in the previous section, sustainability is an important aspect of green IT. In the following paragraphs sustainability will be elaborated in order to understand the scope and limitations of green IT in relation to sustainability theory. Sustainable development Sustainability is an often used concept. The Brundtland Commission defined sustainable developed in 1987 as “development that meets the needs of the present world, without compromising the ability of future generations to meet their own needs” (Brundtland, 1987:24). Since the Brundtland Commission, several alternative definitions and interpretations of sustainability have been proposed. Sustainable development often is divided into three pillars as shown in representation A in Figure 4. These pillars comprise the aim to satisfy social, environmental and economic goals, which is also referred to as the triple bottom line (3BL) (Adams, 2006) (Azapagic & Perdan, 2000) (Elkington, 1997) (Mulder, 2006) (Redclift, 1987).
So
cia
l p
rog
res
s
En
vir
on
me
nta
l
pro
tec
tio
n
Ec
on
om
ic g
row
th
Sustainable development
Social Environment
Economic
Economy
Society
Environment
A. Graphical respresentation of sustainability using
the three pillars of sustainable developementC. Graphical respresentation of sustinability using a
non-concentric adjacent circles
B. Graphical representation of sustainability
using a Venn diagram
Eco-efficiency
Socio-economic
Socio-technical
Figure 4: Representations of sustainability adapted from Lozano (2008)
Figure 4 shows there are three different ways of interpreting the 3BL concept of sustainbility. In Figure 4A economic growth, social progress and environmental protection form the pillars of sustainable development. To safeguard sustainable development, all pillars should be represented equally. Figure B and C are based upon the paradigms of “weak” and “strong” sustainability. Economicsts define “weak” sustainability as allowing trade-offs between the different areas of sustainability as long as the overall outcome is positive (Pope, Annandale & Morisson-Saunders, 2004) (Gasparators, El-Haram & Horner, 2008) (Bond & Morisson-Saunders, 2011). Figure 4B shows the relationship between the social, environmental and economic dimensions as three intersecting circles. Although this figure shows that the three areas need to be integrated, it also allows trade-offs (Adams, 2006). This figure is an example of “weak” sustainability. The paradigm of “strong” sustainability states that natural capital cannot be substituted by other forms of capital such as social and human capital (Pope, Annandale & Morisson-Saunders, 2004) (Gasparators, El-Haram & Horner, 2008) (Bond & Morisson-Saunders, 2011). In Figure 5C sustainability is presented by three concentric circles with economy in the centre. The environment forms the remotest dimension encircling both economy and society. This indicates that economy and society is constrained by environmental limits (Cato, 2009). This represents “strong” sustainability. The 3BL interpretation is criticised by several academics for several reasons (Burdge & Vanclay, 1995)(Dale et al., 1997)(Vanclay, 1999)(Lenhtonen, 2004). First, the three-pillar model perpetuates the “economism” and “productivism” of modern society by continuing to distinguish between what is considered “social” and “economic”. This emphaizes the idea that economy can be treated as a separate sphere detached from the social context,

MSc Thesis, J.C.P. Kalsheim: Greening Information Technology (IT) Infrastructures
Theoretical background on green IT 31
whereas this often is impossible. Second, the model does not give any guidance on how to arbitrate between the disagreeing objectives that arise due to separate logic and charateristics of each pillar. Third, there are reasons to suppose that the three dimensions are not qualitatively equal, but occupy different positions in a hierarchy. For example, the social dimension of sustainability is more difficulty to quantify and requires different framework and tools than the economic and environmental sustainability dimensions (Lehtonen, 2004). Researchers have discovered that reporting on social responsibility by organisations always is lagging behind reporting on environmenetal issues (Kolk, 2003)(Adams, 2003). Is would not be sustainable interms of the “strong” sustainability paradigm. Researchers are working on incorporating the social dimension in existing economic and environmental frameworks and tools. Kloepffer (2008) has proposed a sustainability LCA in which a combination of life cycle costing (LCC), LCA and social LCA is incorporated. This shows there is a shift towards a more balanced life cycle evaluation of products, processes and services. Despite development in this field, it remains difficult to quantify social LCA (Kloepffer, 2008). Although the 3BL often is unbalanced, economic, social and environmental sustainability are closely intertwined and in practice often difficult to separate. Research has shown that investments in environmental performance have a positive result on the market performance and competitiveness of organisations (Rao & Holt, 2005). Also, when an organisation is acting more environmentally sustainable the social dimension is influenced positively. For example, when an organisation would prevent the release of certain air pollutants, this could have a positive effect on local air quality. A higher air quality would be positive to local human health, and thereby human well-being. Sustainability measurement Next to the 3BL discussions in literature, another debate can be found in the field of sustainability assessment. This debate concerns the degree of reductionist and holistic approach that should be adopted to assess sustainability. From a reductionist point of view complex processes should be broken down to simple terms or component parts to understand and describe a system. Measuring sustainability performance using indicators in an example of a reductionst tool. Holism describes sustainability as a complex interaction that cannot fully be understood. Therefore, it should not be broken down into sub-compoents as these do not make up the entire system (Gasparators, El-Haram & Horner, 2008)(Bond & Morisson-Saunders, 2011). Further, researchers have argued that it is difficult to defined sustainability in a meaninful way that is sufficiently viable to be operationalized because of the fuzziness of the concept (Pope, Annandale & Morisson-Saunders, 2004). Essentially sustainable development is a contested concept that can be percieved differently by different stakeholders when assessed. This creates a challenge because expectations of assessment goals could differ. A solution to this might be to provide guidance to the pursuit of sustainability as well as a measure of this pursuit for a specific situation (Bond & Morisson-Saunders, 2011) (Gasparators, El-Haram & Horner, 2008). Given the ambiguity of sustainability and its measurement, why should sustainability be assessed? First, measurements help decision-makers defined sustainability goals, link them to clear objectives and targets and assess progress towards meeting those targets. Sustainability measurements can provide an basis for evaluation performance, for determining environmental, economic and social impacts of activities and for attaching past and present activities to attain future goals (Mohanty & Rao, 2004). Furthermore, sustainability assessment can be used to defined contested concepts of sustainability in a benefical way and to facilitate participatory processes in order to build consensus on sustainable development. It can also be used to research and analysis (Parris & Kates, 2003). Sustainability and green IT Next to the challenges of assessing sustainability, measuring the sustainability of IT can be very challenging too. This is due to the fuzziness of the concept and the complexity of the IT supply chain. Take for instance a laptop. The device consists of more than hundred subparts that are delivered to an assembler by several hundred sub-suppliers. How can IT suppliers ensure these are developed sustainably? In the electronic and electrical industry several organisations have implemented a “supplier code of conduct” that promotes industry standards for socially responsible business practices across the global supply chain as a reaction to this (Ladou & Lovegrove, 2008). Intitiave such as this might enhance sustainability in the supply chain, but would also require extensive monitoring of sub-suppliers to ensure sustainability targets are met. Would this even become feasible for organisations?

MSc Thesis, J.C.P. Kalsheim: Greening Information Technology (IT) Infrastructures
Theoretical background on green IT 32
With respect to the 3BL interpretation of sustainability, green IT mainly emphasizes environmental sustainability. According to the paradigm of “strong” sustainability, the environment constaints both the social and economic sustainability dimensions. Hence, green IT could be seen as a step towards sustainable IT, but not as sustainable. This requires a more balanced contribution to sustainability that incorporates the economic and social dimension as well. The economic dimension is incorporated to some extent as green IT comprises costs associated with the efficiency of resources used by IT. This is entitled eco-efficiency and will be outlined in the next section.
4.1.3 Eco-efficiency In the previous section, eco-efficiency was defined as an important element in the definition of green IT. But what is eco-efficiency? According to the World Business Council for Sustainable Development (WBCSD) (2000), eco-efficiency is a “management philosopohy which encourages businesses to search for environmental improvements that yield parallel economic benefits” (p.8). The WBCSD further describes eco-efficiency as a ratio between environmental impact and value of production. This is a general definition describing value creation. According to Huppes and Ishikawa (2005) eco-efficiency defintions in literature focus either on value creation or reduction of costs. The authors further describe four basic variants of eco-efficiency present in literature; environmental productivity, environmental intensity of production, environmental improvement cost and environmental cost-effectiveness. Basically, all variants defines eco-efficiency as economy divided by environment, and vice versa (Huppes & Ishikawa, 2005). How can this be operationalized? Operationalizing eco-efficiency within business the concept comprises the subsequent elements (DeSimone & Popoff, 2000); (1) emphasis on service, (2) focus on needs and quality, (3) limitations to eco-capacity, (4) a process view and (5) the entire life cycle of a product. Energy use per computing power (e.g. floating-point operations per second, or flops) is an example of an eco-efficiency measure that emphasizes service. The second element of eco-efficinecy is the key to improved services; to understand customer needs. This can lead to competitive advantages. According to Orsato (2009) eco-efficiency is a differentiation strategy. This will be further elaborated on in section 4.2.2. The third element means that economic activity must be within eco-capacity. This is in line with the paradigm of “strong” sustainability; the environment imposes constraints on the economy. The fourth element is the processes view. Last, DeSimone & Popoff (2000) state an organisation is never truly eco-efficient. An organisation can move towards eco-efficiency by continuously improving resource efficiency (DeSimon & Popoff, 2000). The last element is concerned with the entire life cycle of products; both upstream and downstream implications of activities. Life cycle thinking will be further elaborated on in the next section.
4.1.4 Life cycle thinking Life cycle thinking is a paradigm that suggests the assessment of alternatives in services, products and technologies by considering environmental impacts along the entire life cycle of a studied system. The paradigm expands the scope of the responsibility of all stakeholders to include environmental impacts over the entire life cycle of a process or product. It has a variety of applications in existing concepts and programs such as CR and environmental performance indicators, and it can be found in decisions made by organisations. Advantages of life cycle thinking are that it promotes long-term decisions, informed selection and awareness that decisions made by organisations are not isolated (Saur, et al., 2003). The extent of these advantages depends on how the life cycle is defined. According to the U.S Environmental Protection Agency (EPA) the life cycle refers to the “major activities in the course of the product’s life-span from its manufacture, use, and maintenance, to its final disposal, including the raw material acquisition required to manufacture the product.” (SAIC, 2006:1). This definition is an example of a life cycle definition in which the boundary is set from cradle-to-grave. This definition does not incorporate recycling. Including recycling as an end-of-life process, the life cycle is referred to as cradle-to-cradle or a closed loop (Trusty, 2010) (Vykoukal, Wolf, & Beck, 2009). A cradle-to-cradle definition on design rejects the assumption that it is unavoidable that the natural world is destroyed by human industry, or that disproportionate demand for services and good is the eventual cause of environmental problems (McDonough & Braungart, 2002). Other ways of defining a life cycle of a product or service is from a cradle-to-gate or gate-to-gate perspective. Cradle-to-gate definitions incorporate the life cycle from production of raw materials until the product premises of a business. Gate-to-gate includes the life cycle within the boundaries of businesses (Hermann, Kroeze, & Jawjit, 2007). This is the most isolated definition of a life cycle.

MSc Thesis, J.C.P. Kalsheim: Greening Information Technology (IT) Infrastructures
Theoretical background on green IT 33
The definitions show there are various ways of defining the life cycle of a product or process. But which parts of the life cycle of hardware IT infrastructure units fall under the responsibility of an organisation? Arguably there is no generally accepted definition. In the ICT sector guidance on how to measure the GHG emission of ICT, World Resource Institute (WRI) and the WBCSD have defined the life cycle of ICT according to the cradle-to-grave definition. The end-of-life is depicted as recycled/reused into another product life cycle or as a feedback to the nature (WBSD & WRI, 2012). The loop is closed as an ICT product enters another organisation through recycling, refurbishment or direct reuse. On the other hand, Liu (2002) suggests in an article on IT infrastructure management that the life cycle of IT includes planning and analysis, procurement, installation, operation, maintenance and disposition. Further, Praeg and Schnabel (2006) state that the life cycle of IT services starts at procurement. These are gate-to-grave definitions. Although the life cycle of a hardware IT infrastructure units stretches beyond the use phase, does this mean that the production and disposal of hardware IT infrastructure units is the responsibility of an IT decision-maker within an organisation merely using these? On the one hand, this lies beyond the sphere of influence of decision-makers. Would it be possible for a CIO to influence the water used during production of hardware IT when this is in the hands of a third party? Some might state their not. On the other hand, a CIO should be conscious of the environmental implications of decisions that he or she makes. Measuring performance beyond the direct organisational boundaries would raise awareness and understanding to inform decision-making (Veleva et al., 2001). Besides this discussion, the next concerns which units should be analysed when aiming at greening IT. In the next section hardware IT infrastructure units will be discussed.
4.1.5 Information Technology Most definitions of IT comprise hardware and software technology for processing and storing information in addition to the communication technology for transmitting information (Cooper & Zmud, 1990) (Martin, Brown, DeHayes, Hoffer, & Perkins, 2009). This research focuses on a certain part IT and the technical IT infrastructure of an organisation (Byrd & Turner, 2000); hardware IT infrastructure units. In this research, a hardware IT infrastructure is defined as physical equipment used to process, store or transmit computer programs or data in an organisation (Linberg, 1999). Ways of categorising the hardware IT infrastructure supporting business applications in organisations will be elaborated on in the subsequent paragraph. Currently there are various ways of categorizing the hardware IT infrastructure of an organisation. Unhelkar (2011) summarizes a range of shared physical IT devices that could be of interest to an organisation in the context of green IT. The hardware IT is categorized into four types; data servers, end-user equipment, mobiles and peripherals. Another way of dividing the hardware IT infrastructure into categories are according to their functionality (Gurbaxani, Melville, & Kraemer, 1998). A microcomputer or personal computer is a single-user system, a minicomputer or middle range computer is a class of multi-user computers and a mainframe is a multi-user system (ITL Eduction Solutions, 2006). Beccalli (2007) defines hardware IT into three categories; commercial systems (central processing unit and peripherals), single user systems (personal computers and workstations) and data communications (wide area network, local area network, modem and digital access) (Beccalli, 2007). Hardware IT could also be defined according to their physical arrangement. A distinction can be made between data centre and workplace hardware. With respect to data centre hardware, Uddin and Rahnman (2011) distinguish between storage
devices and servers. Additional data centre equipment are chillers, generators and other energy consuming utilities (Uddin & Rahman, 2011). A possible way of classifying current hardware IT infrastructure is depicted in Figure 5. This classification is based on discussions with experts participating in the CIO Platform in the Netherlands, literature discussed and two IT infrastructure experts. The classification merely serves as an overview of several possible categories of hardware IT that could be found in organisations today.

MSc Thesis, J.C.P. Kalsheim: Greening Information Technology (IT) Infrastructures
Theoretical background on green IT 34
Copier
Scanner
Facsimile (fax) Machine
Multifunction Device
PrinterMainframe
Servers Peripheral ComputerUnified
communication
Laptop
Desktop computer
Thin client
Tablet
Mobile phone
Video conferencing
StorageDC utilitiesNetwork
equipment
Infrastructure hardware (multi-
user systems)
End-user hardware (Single/multi-user
products)
Hardware IT infrastructure of an
organization
Monitor
Switches
Routers
Intrusion detection system
Modem
Intrustion protection system
Load balancer
Appliances
Storage as network
Direct attached storage
Network attached storage
Cooling
Power generation/distribution
General DC utilities
Blade enclosure
Blade (½,1)
Rackmount
Backup
Disk backup
(Virtual) tape backup
IP telephone
Product
classes
Object of
analysis
Firewall
Figure 5: Object of analysis and possible classes of hardware IT products, adapted from workgroup CIO Covenant, experts KPMG IT Advisory and literature (Gurbaxani, Melville, & Kraemer, 1998) (Unhelkar, 2011) (Beccalli, 2007) (Uddin and Rahnman, 2011)
4.2 Green IT as part of corporate responsibility strategy As part of understanding green IT, this section explores the relationship between the concept and CR strategy. This is used to answer the second sub-question defined in the introduction (Chapter 1); To what extent can green IT be part of corporate responsibility strategy? To understand the potential contribution of green IT to the CR strategy of an organisation, the concepts of CR, corporate social responsibility (CSR), corporate sustainability responsibility (CS) (section 4.2.1) and sustainable IT (section 4.2.2) will be outlined. These concepts are related and often overlap each other in literature.
4.2.1 Corporate responsibility strategy Literature on CR strategy, CSR and CS overlap. To understand the concept of CR strategy it is necessary to understand what CSR and CS entails and how these concepts are related to each other and to CR strategy. In the following paragraphs these concepts will be outlined separately, before their interrelatedness will be described. The paragraphs starts by elaborating on CSR. The concept of CSR has evolved over time. In 1960 Keith Davis stated that social responsibility were business decisions and actions taken for reasons at least partially beyond the firm’s direct technical or economic interest (Davis, 1960). In the 1970s the agency theory perspective on CSR evolved after the first positioning of CSR by Keith Davis. Friedman (1970) stated that engaging in CSR is an indication of an agency problem or a conflict between the

MSc Thesis, J.C.P. Kalsheim: Greening Information Technology (IT) Infrastructures
Theoretical background on green IT 35
interests of shareholders and managers. The agency theory suggested managers were using CSR as a means to supplement their own political, social or career agendas at the cost of shareholders (Friedman, 1970)(McWilliams & Siegel, 2001). In later years, Caroll (1991) stated the total CSR of an organisation could be divided into four kinds of social responsibilities; economic, legal, ethical and philanthropic. The economic concept implies organisations have to be profitable, which is also the fundamental responsibility of most organisations. The second layer of responsibility is the legal responsibilities, which are the laws organisations have to obey. The third layer is the ethical responsibility aimed at avoiding harm and acting rightfully and justly. The fourth, and last layer, are the philanthropic responsibilities. These states an organisation has to be a good citizen by contributing resources to the community and improving quality of life (Caroll, 1991). In recent studies, CSR have been defined as actions that appear “to further some social good, beyond the interests of the firm and that which is required by law” (McWilliams & Siegel, 2001: 117). However, it is often viewed as a form of investment. A way to assess CSR investment is as a mechanism for product differentiation (McWilliams & Siegel, 2001). Porter and Kramer (2006) view CSR as a strategic problem with great potential to unleash new sources of competitive differentiation. The authors suggest that CSR strategy must go beyond best practices as it is about choosing a unique position (Kramer & Porter, 2006). Further, Porter and Linde (1995) claim that efficient use of resources is a new paradigm, uniting environmentalism and competitiveness (Porter & Linde, 1995).
From another viewpoint, CSR could be seen as an intermediate stage where companies try to balance economic, environmental and social aspects of CS with the purpose of creating long-term shareholder value (Wempe & Kaptein, 2002)(Linnanen & Panapanaan, 2002)(Lo & Sheu, 2007). Hence, CS could be seen as the ultimate goal of CSR. Further, research on CS reporting has indicates that various sustainability indicators have been used by organisations in their CR reports (Gallego, 2006) (Skouloudis, Evangelinos, & Kourmousis, 2010) (Roca & Searcy, 2012). To structure CR strategy of organisations, Labuschagne et al. (2005) disaggregates CR into four levels of sub-categories. The first level is entitled “CR strategy” which is defined as sustainable business activities as well as corporate social investments and programs. In the second level a distinction is made between operational and social initiatives. Operational incentives are divided into three pillars of sustainability; economic, environmental and social sustainability (Labuschagne, Brent, & Erck, 2005). This might be referred to as CS responsibility of business operations. The framework by Labuschagne et al. (2005) is depicted in Figure 6.
Corporate
responsbility (CR)
strategy
Operational
initiativesSocietal initiatives
Economic
sustainability
Environmental
sustainability
Social
sustainability
Internal human
resources
External
population
Stakeholder
participation
Macro social
performance
Air resources
Water resources
Land resources
Mineral and
energy resources
Financial health
Economic
performance
Potential financial
benefits
Level 1
Level 2
Level 3
Level 4
Figure 6: operational sustainability framework by Labuschagne et al. (2005)

MSc Thesis, J.C.P. Kalsheim: Greening Information Technology (IT) Infrastructures
Theoretical background on green IT 36
Summarizing, CR strategy as defined by Labuschagne et al. (2005) emphasize the same as CS responsibility, but also goes beyond business operations. Hence, the ultimate goal of CR can be seen as; to balance the 3BL interest beyond an organisation’s economic interests and what is required by law. CR strategy is about choosing a unique position with respect to this balance to unlock shared value and strengthen company competitiveness. The balance between the 3BL can be found in CSR reports. In the next section CR, CS and CSR will be elaborated on with respect to green IT.
4.2.2 Green IT in corporate responsibility strategy Next to green IT a second trend has emerged referred to as sustainable IT. The main driver of this trend is CR. Harmon et al. (2010) suggest this trend focuses on improving alignment with overall CSR efforts. Obtaining sustainable IT requires the implementation of balanced economic, environmental and social responsibility interests beyond economic interests and what is required by law. CSR efforts on the other hand, often are trade-offs and an intermediate stage towards this (Wempe & Kaptein, 2002)(Linnanen & Panapanaan, 2002)(Lo & Sheu, 2007). Hence, CSR could be seen as a means towards sustainable IT, but not as sustainable IT itself. Further, green IT is not able to achieve the balance between the 3BL due to the lack of emphasis on social aspects of sustainability. On the other hand, strategies aimed at green IT could create a unique position in the balance of the 3BL. According to Porter (1996) strategy is always a question of choice, coming along with trade-off decisions. This is also the case for CR strategy as an organisation does not have infinite resources. Literature suggests there are various strategies focusing on aspects related to green IT that organisations could implement when pursuing to contribute to the CR strategy. With regards to environmental sustainability and eco-efficiency, Orsato (2009) suggests there are four types of generic, choice-based competitive environmental strategies that might be relevant. Also when pursuing to green the hardware IT infrastructure of an organisation these might be applicable. The environmental strategies suggested by Orsato (2009) are defined in two dimensions: competitive focus and competitive advantage. The competitive focus is either targeted at internal organisational processes or market oriented products and services, whereas the competitive advantage is either obtained through low-costs or differentiation (Orsato, 2009). The strategies are shown in Table 4.
Table 4: Generic competitive environmental strategies (Orsato, 2009)
Competitive focus
Organisational processes Products and services
Competitive advantage
Low-costs Eco-efficiency Environmental cost leadership
Differentiation Beyond compliance leadership Eco-branding
“Eco-efficiency” strategies aim at minimizing waste, by-products and emissions. This way, production efficiency is enhanced and costs are reduced (Erek, Loeser, Schmidt, Zarnekow, & Kolbe, 2011). Green IT definitions studied in section 4.1 suggest that eco-efficiency is a central part of green IT. However, eco-efficiency does not have the competitive advantage of creating differentiation and does not go beyond immediate economic interests of an organisation due to focus on lowering of costs. This is the same for “Environmental cost leadership”, a strategy striving for radical product innovations through for instance substitution of input materials and business practices (Erek, Loeser, Schmidt, Zarnekow, & Kolbe, 2011). On the contrary, this may contribute to the CR strategy when an organisation substitutes materials that are hazardous or have a “negative social footprint” with more sustainable materials beyond requirements defined in laws and regulations. The strategy may subsequently be entitled “Beyond compliance leadership”. However, “Beyond compliance leadership” focuses on differentiation by pursuing unprofitable instead of profitable environmental initiatives (Erek, Loeser, Schmidt, Zarnekow, & Kolbe, 2011). This is also a strategy that can contribute to the overall CR of an organisation, because it strives to go beyond already established laws and regulations. In the European Union this would require organisations to go beyond requirements stated in the following directives:
Directive 2009/125/EC addressing eco-design requirements of energy-related products (European Parliament and the Council, 2003)
Directive 2002/95/EC on the restriction of the use of certain hazardous substances in electrical and eletronical equipment (European Parliament and the Council of the European Union, 2009)
Directive 2002/96/EC on electrical and electronic equipment (WEEE) (European Parliament and Council of the European Union, 2003)

MSc Thesis, J.C.P. Kalsheim: Greening Information Technology (IT) Infrastructures
Theoretical background on green IT 37
Another environmental strategy defined by Orsato (2009) that might create differentiation is “eco-branding”. “Eco-branding” strives for competitive differentiation through environmental product characteristics that a customer might be willing to pay for (Erek, Loeser, Schmidt, Zarnekow, & Kolbe, 2011). For suppliers of hardware IT this might create competitive advantage, and also forms an opportunity of lowering the environmental footprint of the organisation. “Eco-branding” can contribute to the CR strategy of an organisation when going beyond laws and regulations. Beyond the environmental strategies discussed, literature suggests CR motives influence green IT adoption as seen in Molla’s (2008) “Green IT Adoption Model”. The model is consistent with a study by Molla et al. (2009), which found that 77% of respondents considered environmental considerations one of the main drivers for pursuing to green IT. Besides adopting strategies aimed at green IT as a step towards a comprehensive CR, green IT is also driven by a desire to pursue CR within organisations. Furthermore, Harmon & Demirka (2011) state some organisations are taking green IT to the next level when striving to balance the 3BL. For example, IBM has approached sustainable IT from an enterprise wide corporate sustainability perspective with initiatives addressing energy conservation, increased use of renewable energy and increased supply chain efficiency. Intel on the other hand has set sustainability goals and developed metrics for reducing waste (Harmon & Demirkan, 2011). From these examples it is evident that strategies aimed at greening IT can contribute to CR strategy, and vice versa. On the one hand, when implementing initiatives aimed at enhancing CR, this can also have a positive effect on greening IT. An example of this is the production and subsequent use of renewable energy within an organisation. The renewable energy would be used by the entire range of energy consuming devices, including the hardware IT infrastructure without specifically aiming at greening IT. On the other hand, green IT can contribute to the overall CR strategy of an organisation. An example of this is procuring hardware IT made of recycled materials when the CR strategy of an organisation focuses on reducing raw material use. When an organisation aims at producing renewable energy for its business operations, greening IT could not contribute to this. Nevertheless, IT services could be used to support the efficient distribution of this energy when excess energy is produced (greening by IT). To summarize, the examples illustrated in the previous paragraph show that green IT does not necessarily lead to CR, but can contribute to CR strategies. Whether green IT would contribute to the CR strategy depends on strategic choices made by organisations with the purpose of balancing economic, environmental and social responsibility interest. A comprehensive CR strategy would balance these responsibilities beyond the interests of an organisation.
4.3 Summary and conclusion The previous sections elaborates on various interpretations of green IT and the relationship between green IT and CR strategy. In the following paragraphs the findings will be summarized and a conclusion will be drawn with respect to first two sub-questions. Input for the framework design and the subsequent literature review will be summarized at the end of this section. Sub-question 1: “What is green IT?” Various concepts related to IT, green and green IT have been defined to understand what the concept of green IT entails. These are summarized in Table 5.
Table 5: Summary of key green IT concepts
Concept Definition from literature Relevance for new framework
IT infrastructure
The technical IT- , managerial capability- and IT human infrastructure of an organisation (Molla, Cooper, & Pittayachawan, 2011)
Provides a conceptual foundation of the width of the IT and IT infrastructure within an organisation next to the hardware IT infrastructure scope chosen
Technical IT infrastructure
The tangible IT resources such as communications technologies, shared services and business applications that utilize the shared infrastructure and form the backbone for business applications (Da Silva & Brito E Abreu, 2010) (Broadbent & Weil, 1997) (Duncan, 1995)
Provide a conceptual foundation of the various IT that could be found within an organisation.
Hardware IT infrastructure
The shared physical IT equipment within an organisation that is used to process, store or transmit computer programs or data (Linberg, 1999).
Shows there are several physical IT assets in an organisation that should be taken into account when developing a new framework
Sustainability Development that meets the needs of the present world, without compromising the ability of future
Sustainability provides the conceptual foundation on the role of IT in sustainable development. It also

MSc Thesis, J.C.P. Kalsheim: Greening Information Technology (IT) Infrastructures
Theoretical background on green IT 38
generations to meet their own needs (Brundtland, 1987)
positions a new framework in a larger sustainability context
Life cycle thinking
the major activities in the course of a product’s life-span from raw material acquisition, manufacture, use and maintenance to the final disposal (SAIC, 2006)
The life cycle approach implies that an organisation needs to view green IT in terms of the entire IT lifecycle
Eco-efficiency Value creation or reduction of costs for the environmental improvement investigation (Huppes & Ishikawa, 2005)
Improving the measurability of green IT to support efficiency of setting priorities of measures
As regards the definition of green IT, a common understanding of the scope and coverage of the concept is missing in practice as well as in research (Velte, Velte, & Elsenpeter, 2008). Studying several terms incorporated in the definitions of green IT, the concept might be defined as (Elliot, 2011) (Murugesan, 2008) (Harmon & Auseklis, 2009) (Molla & Cooper, 2009) (Molla, 2009) (Capra & Merlo, 2009) (Lamb, 2009) (Hird, 2010) (Harmon, Demirkan, Auseklis, & Reinoso, 2010) (Dao, Langella, & Carbo, 2011) (Li & Zhou, 2011 ) (Harmon & Demirkan, 2011) (Unhelkar B. , 2011):
This definition of green IT emphasizes the environmental and economic pillar of sustainability with particular focus on the environmental pillar. Green IT might be seen as a step towards sustainable IT. It is not suggested this is a complete definition as not all definitions of green IT from literature have been incorporated in the study. However, the definition incorporates several interpretations of green IT from literature. Sub-question 2: “To what extent is green IT part of corporate responsibility strategy” IT forms the backbone of business applications and is often a central part of business operations. Ensuring this is environmentally and economically sustainable is a step towards sustainable IT and thereby also to a comprehensive CR strategy. Nevertheless, to be entitled sustainable IT would require a more balanced contribution to the 3BL. This would also include the social dimension of sustainability. In the context of the framework by Labuschagne et al. (2005) green IT can be seen as an operational initiative and a bottom-up strategy at the fourth and third level of CR strategy. Alone it does not lead to CR, but may contribute to CR strategies. Whether green IT could contribute to the CR strategy depends on strategic choices made by organisations with the purpose of balancing the 3BL beyond the organisation’s economic and technical interests and what is required by law. Therefore, organisations should look further than within their organisational boundaries when pursuing to green IT as a step towards a comprehensive corporate responsibility strategy. Further, strategies aimed at greening IT could support CR strategy and the overall CR strategy of an organisation could support the process of greening IT. Strategies should go further than “Eco-efficiency” and “Environmental cost leadership” strategies defined by Orsato (2009). Summary on findings The following concepts will be used to develop a framework with the purpose of assessing the greenness of the hardware IT infrastructure of an organisation:
Sustainability. Sustainability literature is a fundamental part of green IT and therefore a central source in developing a new framework. The new framework shall emphasise the environmental and economic pillar of sustainability as these can be found in several green IT definitions
Eco-efficiency. Next to environmental and economic sustainability, eco-efficiency is central in green IT literature. Eco-efficiency literature suggests an alternative way of defining economic and environmental performance indicators relevant for the new framework.
Green. As green is a central term in the definition of green IT, literature on green performance indicators (GPIs) developed for IT systems will be reviewed.
Life cycle thinking. A framework addressing green IT should incorporate several life cycle phases within the organisational boundaries as both upstream and downstream effects of IT are significant according to research. The life cycle scope will be further discussed and delineated in the framework design (Chapter 7).
These concepts will be further elaborated on in the next chapter.
Green IT Management of the environmental sustainability and eco-efficiency over the life cycle of IT (greening IT) and the use of IT services to meet overall environmental sustainability goals of an organization (greening by IT)

MSc Thesis, J.C.P. Kalsheim: Greening Information Technology (IT) Infrastructures
Theoretical background on environmental and economic performance assessment 39
5. Theoretical background on environmental and economic
performance assessment In the previous chapter the overall structure for attaining green IT has been defined. In this chapter economic and environmental performance assessment will be discussed with regard to green IT. The aim of the literature review in this chapter is to answer the third sub-question; “What economic and environmental life cycle assessment criteria can be found in literature to assess the greenness of the hardware IT infrastructure of an organisation?” This is part of the theoretical grounding of the new artefact presented in Chapter 7. To structure the literature review on environmental and economic performance assessment, this chapter will be arranged as follows. First, performance assessment will be elaborated on (section 5.1). Then sustainability assessment will be discussed (s ection 5.2). In section 5.3 environmental and economic indicators and indices will be addressed as found in literature on sustainability, eco-efficiency and green performance indicators. The last section discusses various business standard to get insights into organisational boundaries and the environmental responsibility of business activities.
5.1 Performance assessment The first step in an assessment is to measure performance. As the research objective is to design a framework incorporating assessment criteria to determine the greenness of the hardware IT infrastructure of an organisation, it is essential to understand why performance should be measured. In the first section, section 5.1.1, the purposes of measuring performance will be elaborated on. Literature on risks related to reporting performance will also be elaborated on to understand some of the risks that can arise when reporting on performance measures (section 5.1.2). This section provides insight into performance measurement that can be useful when measuring the greenness of the hardware IT infrastructure of an organisation.
5.1.1 Purpose of measuring performance Performance measurement can be defined as the process of quantifying the efficiency and effectiveness of actions (Neely, Gregory, & Platts, 1995)(Neely, et al., 2000). Measuring performance have five functions (Nicis Institute, 2010); create transparency, learn, compare, evaluate and sanction. Measuring performance initially makes an organisation’s performance transparent to internal and external stakeholders (de Bruijn, 2002). Performance measurement also enables an organisation to learn how to improve performance over time. This is critical for the survival of companies (Veleva, Greiner, & Vrumbley, 2001) (Dossi & Patelli, 2010). By comparing an organisation’s performance with peers opportunities can be found to advance performance. This is often referred to as benchmarking. Benchmarking is a market-based learning process by which organisations seek to identify “best practice that produce superior results in other firms and to replicate these to enhance its own competitive advantage” (Vorhies & Morgan, 2005:81). Further, measuring performance can contribute to the internal evaluation of the organisation on how to improve performance. For example, a set of performance indicators can provide organisations with a tool to measure achievements towards specific goals and targets (Veleva & Ellenbecker, 2001). The last function is sanctioning. Performance measurement rewards outputs and therefore is an incentive for performance (de Bruijn, 2002). The purpose of sectioning is to stimulate positive performance within an organisation (Nicis Institute, 2010). For example, if the relative greenness of the hardware IT infrastructure of a data centre improves significantly over time, a reward might be granted to the team responsible for the positive change.
5.1.1 Risks of reporting performance As can be seen, there are several reasons to measure performance. Reporting performance should be done with care. The relationship between actual and reported performance might decline over time because performance indicators have the tendency to run down over time. This is referred to as the performance paradox (Meyer & Gupta, 1994)(Meyer & O'Shaughnessy, 1993). Performance indicators deteriorate over time due to four main processes (Meyer & Gupta, 1994); positive learning, preserve learning, selection and suppression. Positive learning refers to indicators losing their sensitivity in detecting bad performance as people become good at what they do. Perverse learning takes place when individuals or organisations learn which aspects of performance are measured and use this information to manipulate their assessment. In the third process, selection and replacement of the poor with the better performers takes place. Lastly, suppression refers to ignoring differences in performance (Meyer & Gupta, 1994).

MSc Thesis, J.C.P. Kalsheim: Greening Information Technology (IT) Infrastructures
Theoretical background on environmental and economic performance assessment 40
5.2 Sustainability assessment
Although there are several risks related to reporting on performance, there are several advantages of measuring performance. This section will elaborate on how sustainability can be assessed. Classifications of sustainability assessment will be discussed first (section 5.2.1). From this, product related assessment and indicators and indices will be elaborated on (section 5.2.2 and 5.2.3).
5.2.1 Classification of sustainability assessment Sustainability literature form a basis for constructing performance indicators to assess the greenness of the hardware IT infrastructure of an organisation. However, literature on sustainability is extensive and there are numerous ways to assess sustainability. To approach the field of sustainability in a structured way, sustainability assessment classifications are outlined briefly in this section. Sustainability assessment tools can be classified according to the temporal focus and object of focus (Ness et al., 2007). The temporal focus of a sustainability assessment tool can be classified as either retrospective, prospective or retrospective and prospective. Indicators and indices are examples of retrospective assessment. The object of focus of the sustainability assessment tools is either special or at the product level (Ness et al., 2007). Spatial refers to proposed change in policy, which involves indicators, indices and integrated assessment. An example of an assessment tool at product level is LCA. In the next paragraphs the following three categories of sustainability assessment will be discussed; (1) integrated assessment (2) product related assessment tools and (3) indicators and indices. The first type of sustainability assessment is integrated assessment. Integrated assessment is a collection of tools emphasizing policy implementation and policy change. Integrated assessment tools are used for supporting decisions related to a project in a specific area or a policy. Policy related tools are used for global scale assessment. Project related tools focus on local scale assessment. Both have an ex-ante focus (Ness et al., 2007). Integrated assessment consists of several tools that can be used to manage complex issues (Gough et al., 1998). Examples of such tools are multi-criteria analysis, risk analysis and uncertainty analysis. The second type of sustainability assessment is product-related assessment. This focuses on flows in connection with production and consumption of services and goods. The tools can be used to evaluate resource use and environmental impacts along the production chain or through the life cycle of a product. Tools that fall under this category are both retrospective and prospective (Ness et al., 2007). The third type of sustainability assessment is indicators and indices. Indicators are simple measures. When they are integrated in some manner, the resulting measure is referred to as an index or a composite indicator. A criterion consists of a set of related indicators on which a judgment or decision can be based (lópez-ridaura, Keul, Ittersum, & Leffelaar, 2005) (McDonald & Lane, 2004). Criteria could be aggregated into an index. Indices and indicators can be measured and calculated continuously to track long-term sustainability trends (Ness et al., 2007). These are retrospective in nature, but can be used to provide guidance for decision-making (Gasparatos, El-Haram, & Horner, 2008) (Ness et al., 2007). In the following sections the last two categories of sustainability assessment will be discussed. Product related assessment tools are relevant because of the research scope; hardware IT infrastructure assets. Indicators and indices are the most popular sustainability assessment (Gasparators et al., 2008).
5.2.2 Product related assessment There are three different ways to assess sustainability of products and services; bottom-up, top-down and a combination of the bottom-up and top-down approach entitled a hybrid approach. These approaches have both a retrospective and prospective temporal focus. In the following paragraphs the three approaches will be discussed to understand their advantages and disadvantages. A distinction is made between economic and environmental assessment tools although integrated environmental and economic assessment tools exist. Examples of these are integrated LCA and LCC tools (Klöpffler & Ciroth, 2011) (Deng, Wang, & Wu, 2007) (Norris, 2001).

MSc Thesis, J.C.P. Kalsheim: Greening Information Technology (IT) Infrastructures
Theoretical background on environmental and economic performance assessment 41
The bottom-up approach in environmental sustainability assessment is based upon process analysis and breaks down entire processes into smaller elements until the source of environmental impact is reached. An example of a classic bottom-up approach is LCA. LCA is a standardized way of assessing the environmental impacts associated with the entire life cycle of a product or service from cradle-to-grave (ISO, 1997). The environmental evaluation method provides a comprehensive view of the environmental aspects of a process or a product including impacts not considered in more traditional analyses. It is a tool that supports organisations explore improvements on the environmental performance of products and processes (SAIC, 2006). Despite the very complete analysis of how a process affects the environment, there are several disadvantages of LCA. First, the analysis does not lead to a single quantity that can be used to compare different processes. Secondly, performing a LCA is very time consuming and expensive because large amounts of data need to be collected (Lettieri, Hannemann, Care, & Amip, 2009). Applying LCA to the hardware IT infrastructure of an organisation, the amount of data needed and data availability might be problematic due to the system boundary problem (Wiedmann & Minx, 2008). For example, a laptop consists of components that might be developed by more than five hundred sub-suppliers. Determining the environmental sustainability of these components might be an enduring task if simplifications and exclusions are not made. The incompleteness of systems because of such simplifications and exclusions are referred to as truncation error (Nilsen & Weidema, 2001). To determine the environmental sustainability of the entire hardware IT infrastructure of an organisation from a bottom-up approach would require an unlimited amount of data. Hence, the advantage of this approach is also causing a great disadvantage; it provides very detailed insights, but also requires very detailed inputs (Lettieri, Hannemann, Care, & Amip, 2009). The bottom-up approach in economic assessment breaks down entire economic systems into smaller elements until the economic activity is reached. In IT investment decisions LCC and total cost of ownership (TOC) are recognized bottom-up approaches (Gitzel, Cuske, & Münch, 2011) (Ellram, 1995). LCC is defined as the total cost of ownership over the life cycle of an asset (Riggis, 1982). It includes costs of machinery and equipment, acquisition, operation, maintenance, conversion and decommission (Barringer, 2003). LCC explains the total cost of goods from the point of inception to disposal. The main objective of LCC is to achieve the lowest long-term cost of ownership by ranking different investment alternatives. Disadvantages of this approach are the lacks of available and reliable data, underrating of future environmental costs and the failure of handling irreversible decisions (Glunch & Baumann, 2004). Additionally, pre-transaction costs are not emphasizes sufficiently. Although LCC is similar to TCO, it only represents a subset of the TCO assessment (Ellram, 1995). TCO is a purchasing tool aimed at understanding the cost of buying a specific good or service from a particular supplier. In addition to the cost of buying a good or service, TCO includes elements such as order placement, research and inspection. The main disadvantages of TCO are the lack of a standard approach, its complexity and a general lack of available accounting and costing data in many organisations (Ellram, 1995). A different way to determine the sustainability of a product or a service is from a top-down approach. A well-known example of a top-down approach in environmental and economic sustainability assessment is the economic input-output LCA (EIO-LCA). This is a combination of an economic assessment technique and LCA. EIO-LCA measures material and energy resources required for activities in the economy as well as environmental emissions resulting from these (Green Design Institute, 2006). The EIO-LCA method can be useful as a screening tool to identify which process links need detailed modelling. Compared to LCA, the primary benefit of EIO-LCA is the capability to estimate direct and indirect environmental and economic impact across the supply chain of production in an economy (Hawkins, Drickson, Higgins, & Matthews, 2007). The analysis can also be performed inexpensively and rapidly as arbitrary boundaries can be drawn. The transparency and reproducibility of results are an additional advantage of the EIO-LCA. This allows comparison of systems. Drawbacks of the top-down approach are; the amount of disaggregation can be insufficient for the desired level of analysis and the environmental impact arising from use and disposal cannot be tracked (Hendrickson, Horvath, Joshi, & Lave, 1998) (Lave & Matthews, 2006). Basically, the advantage of the EIO and EIO-LCA methods is also their disadvantage; less data is required, but the level of accuracy and detail is inferior to the bottom-up approach. The hybrid approach offers an alternative to the bottom-up and top-down approaches described. An example of a hybrid approach in environmental sustainability assessment is the hybrid LCA. An example of a hybrid economic assessment is hybrid LCC (Nakamura and Kondon, 2006). Essentially the hybrid LCA approach is a measure that integrates LCA data into a comprehensive input-output model. For example, the hybrid LCA is a combination of a

MSc Thesis, J.C.P. Kalsheim: Greening Information Technology (IT) Infrastructures
Theoretical background on environmental and economic performance assessment 42
bottom-up LCA model that incorporates the required level of detail with a top-down EIO-LCA model to account for processes where data is unavailable (Deng, Babbitt, & Williams, 2011). Figure 7illustrates the relationship and advantages of the hybrid LCA compared to EIO-LCA and LCA.
EIO-LCA LCA H-LCA
Inter
industrial
Products/
systems
Materials/
processes
Inter
industrial
Products/
systems
Materials/
processes
Figure 7: Application areas of EIO-LCA, LCA and hybrid LCA adapted from Lave & Matthews (2006)
Basically the hybrid approach incorporates advantages of the bottom-up and top-down approach and reduces the disadvantages of these two approaches. According to Nielsen and Weidema (2001) the basis of all process-based hybrid analysis methods is the assumption that disadvantages in the top-down approach can be decreased or even avoided by adding process specific information (e.g. bottom-up). The top-down EIO-LCA model solves the boundary problem of LCA and makes a hybrid LCA less time consuming than a LCA. Although several disadvantages are reduced, unresolved issues still remain. First, hybrid LCA does not suffice if the goal is to monitor the effectiveness of strategies over time. For this, a larger framework is required that can be updated over time (Ewing, Thabrew, Perrone, Abkowitz, & Hornberger, 2011). Second, quantitative uncertainty analysis of EIO-LCA is lacking due to unavailable basic uncertainty information for individual input-output elements (Suh & Nakamura, 2007). Third, the truncation error and efficient data collection problems remain although diminished in hybrid LCA (Nilsen & Weidema, 2001). Summarizing, there are three approaches to assess the sustainability of a product or service; bottom-up, top-down and hybrid. Using a bottom-up approach leads to detail data, however might require an infinite amount of data and time unless simplifications and exclusions are made. The top-down approach is easier to apply, but the detail level of output data is deprived. The hybrid approach offers an intermediate solution to the limitations of the bottom-up and top-down approaches; their disadvantages are diminished, but are still present. A different way of assessing sustainability than these approaches will be elaborated on in the next section; indicators and indices.
5.2.3 Indicators and indices A performance indicator can be interpreted as a static quantitative measure of an aspect of a criterion that describe or evaluate a particular system performance or output (Steina, Rileyb, & Halbergc, 2001)(McDonald & Lane, 2004) (Pendlebury, Jones, & Karbhari, 1994). It is a reductionist way of measuring sustainability. According to McCool and Stankey (2004) indicators play three important roles in sustainability assessment. First, indicators facilitate the portrayal of the current condition of systems that are complex, multi-faced and interdependent. Second, indicators facilitate the evaluation of the performance of various management policies and actions implemented to achieve sustainability goals. Indicators alert users to imminent changes in systems (McCool & Stankey, 2004). Third, indicators need to concentrate on the outcomes of management and policy (McCool & Stankey, 2001). It requires substantive stakeholder involvement to define what should be sustained from whom and over what time and spatial scale (McCool & Stankey, 2004). The roles of indicators in sustainability assessment show that indicators are not only simple measurements. According to Vollman (1996) key performance indicator expresses how an organisation describes itself to itself. Four key indicator dimensions have been developed by the Lowell Center of Sustainable Production (LCSP) to promote a better understanding of indicators relative to primary data, parameter, goals and issues in sustainability measurement (Veleva & Ellenbecker, 2001). These are (Veleva & Ellenbecker, 2001):
unit of measurement; the metric used in calculating an indicator
type of measurement; an indicator can measure a total amount or an adjusted amount

MSc Thesis, J.C.P. Kalsheim: Greening Information Technology (IT) Infrastructures
Theoretical background on environmental and economic performance assessment 43
period of measurement; the period for tracking and calculating an indicator
boundaries; how far an organisation wishes to go in measuring the indicators Furthermore, a performance indicator can express data in different ways. From an environmental perspective, expressing indicators in absolute terms is the most meaningful. For comparison, a relation to significant denominators is necessary (Jasch, 2009). Data can be expressed in the following ways (Jasch, 2009) (Jasch C. , 2000):
Absolute figures: Such as emissions in tons, tons of raw materials or tons of waste
Relative figures: An absolute figure is compared to another parameter/variable/denominator. The most common denominators are production volumes, number of employees, production hours and sales (turnover).
Percentages or indexed: An absolute or relative figure is expressed in relation to a baseline such as a percentage with respect to a total or as a percentage to values of previous years.
Aggregated data: Absolute or relative figures of the same units are expressed as a combined value by summing up units over more than one production step or production life cycle.
Weighted evaluation: Data is multiplied by a conversion factor expressing its significance prior to aggregating or averaging.
Indicators might be presented in different ways, but what is a good performance indicator? Literature on criteria for good performance indicators is extensive. In the ISO 14031 standard for environmental performance evaluation (EPE), six principles for the derivation of environmental indicators are laid down. First an indicator ought to be comparable and reflect changes in environmental performance (comparability). On top of that, an environmental indicator must be target oriented, i.e. the indicators selected must act towards goals which are able to be influenced by an organisation. Thirdly, an indicator must reflect environmental performance in a concise way and display problem areas in addition to benefits in a balanced manner (balanced). The indicators must fourthly be derived by the same criteria and be related to each other through corresponding time series and units to ensure compatibility. Fifthly, an indicator must be derived frequently enough to ensure action can be taken in due time (frequency). The last principle is comprehensibility, i.e. indicators must be understandable by the user and correspond to the information needed by the user. Additionally, the system has to be clear and concentrate on the most important figures to ensure sufficient comprehensibility (Jasch C. , 2000) (Jasch, 2009). These principles form the basic criteria for good performance indicators for this research. Inevitably few indicators meet all criteria. Hence, selecting performance indicators implies making compromises. Which environmental and economic indicators and indices could be used to assess the greenness of hardware IT will be further elaborated on in the next section.
5.3 Environmental and economic indicators and indices The use of indicators and indices are the most popular ways of assessing sustainability (Gasparators et al., 2008). In this section indicators and indices will be elaborated. This serves as inspiration to design a new framework. Environmental and economic performance indicators from literature on sustainability and eco-efficiency will be discussed in first two sections. In the last section green performance indicators defined for IT service centres and data centres will be deliberated on.
5.3.1 Environmental and economic sustainability indicators and indices
There is no scientific consensus on a common set of sustainability indicators in literature. To define a set of good indicators, a balance needs to be sought between accuracy of the model used to generate the indicators and the ease at which the indicators are generated. According to Vollman (1996) it is better to measure the right things approximately than the wrong ones precise and accurate. In the following paragraphs environmental and economic indicators and indices from sustainability literature will be discussed. In sustainability literature a large amount of indicators and indices are defined. Researchers from different disciplines are conducting research in the field of sustainability indicators. In several scientific journals such as the Journal of Cleaner Production indicators and indices to measure sustainability can be found. To structure the field of sustainability indicators and indices Feng, Joung & Li (2010) suggest the use of two criteria; technical detail and application level. Table 6 lists various indicators sets and indices found in literature and classifies these according to their application level (Singha et al., 2012)(Lu et al., 2011).

MSc Thesis, J.C.P. Kalsheim: Greening Information Technology (IT) Infrastructures
Theoretical background on environmental and economic performance assessment 44
Table 6: Indicator sets from literature(Lu, et al., 2011)(Singha et al., 2012)
Indicator sets and indices Application level
Ind
icat
or
sets
GRI performance indicators for sustainability Facility and corporation
United Nations CSD indicators of sustainable development Country
EU environmental eco-management and audit scheme Facility
Environmental pressure indicators for the European Union Sector and country
OECD toolkit Facility and product
OECD core set of environmental indicators Country
Lowell Center for Sustainable Production Facility
Eco-indicator 99 Product and process
Environmental policy performance indicator Country
Ind
ice
s
Dow Jones Sustainability Index Corporation and sector
Composite Sustainable Development Index Corporation
Composite Sustainability Performance Index Corporation and sector
ITT Flygt Sustainability Index Corporation
General Motors' metrics for sustainable manufacturing Facility
Environmental performance index Country and world
Two "synthetic environmental indices" Country (municipal)
Ecological footprint Sector and country
Index of environmental friendliness Country
Environmental performance index Country
Ford of Europe's product sustainability index Product
Life cycle index Product and process
ISO 14031 EPE Facility and corporation
The greenness of the hardware IT infrastructure is measured within an organisation. When following the classification by Feng, Joung & Li (2010), indicators and indices that fall under application level corporation, facility and product can be useful to assess the greenness of hardware IT infrastructures within organisations. Hence, several sustainability indicator sets and indices listed in Table 6 that fall under the application level sector, country and world are not part of the scope. The literature study on indicators and indices can be found in Appendix A. The literature study in Appendix A shows that none of the indicators and indices studied can be directly applied to determine the greenness of hardware IT infrastructures. The CSPI, ITT Flygt Sustainability index, General Motor’s metrics for sustainable development and Ford Europe’s production sustainability index are developed for specific manufacturing industries. Moreover, OECD toolkit is a prototype developed for manufacturing companies and the CSDI is based on indicators defined by the GRI. The Eco-indicator 99 has been developed for designers in the search for design alternatives. Further, the Dow Jones Sustainability Group Index assesses the financial and sustainability performance of the top 10% of companies in the Dow Jones Global Total Stock Market Index. The LInX facilities LCA and requires a lot of data. Other indicator sets and indices are generally applicable, but not specific enough to hardware IT infrastructures. Indicators listed in the GRI performance indicators for sustainability, European Union Eco-Management and Audit Scheme (EMAS), LCSP and International Organisation of Standardisation (ISO) 14031 EPE can serve as inspiration, but cannot be directly applied. The GRI, EMAS, LCSP and ISO 14031 indicator sets can serve as inspiration to develop a new assessment framework. These indicator sets fall under the application level facility and/or corporation and are relatively mature. EMAS has been available for participation by companies since 1995 (European Commission, 2012). The ISO 14031 standard was published in 1999 and is recommended by the European Commission as part of the EMAS selection and use of environmental performance indicators (European Commission, 2003). Particularly important are the GRI indicators for sustainability as these are widely used by organisations (Roca & Searcy, 2012). The core indicators suggested by LCSP are developed from widely known indicator sets such as the GRI, ISO 14031, WBCSD and Centre for Waste Reduction Technologies (CWRT) (Veleva & Ellenbecker, 2001) (Veleva & Ellenbecker, 2001) (Veleva & Ellenbecker, 2001). Next to these indicator sets, inspiration can also be drawn from eco-efficiency and green performance indicators and indices. This will be elaborated on in the next two sections.

MSc Thesis, J.C.P. Kalsheim: Greening Information Technology (IT) Infrastructures
Theoretical background on environmental and economic performance assessment 45
5.3.2 Eco-efficiency indicators and indices
Next to separate economic and environmental performance indicators and indices, literature suggests there are performance indicators and indices to assess the greenness of the hardware IT infrastructure of an organisation in an integrated way. Eco-efficiency indicators are examples of this. According to the eco-efficiency manual by the United Nations, eco-efficiency indicators are composed of environmental items divided by a financial item (United Nations, 2004). This way, economic and environmental aspects are integrated in one performance indicator. Examples of eco-efficiency indicators are; water consumption per unit of net value added, energy requirements per unit of net value added and waste generated per unit of net value added (United Nations, 2004). The net added value is expressed in terms of a financial item such as cost reduction and revenues (United Nations, 2004). Next to sustainability, eco-efficiency indicators can be used to assess the greenness of hardware IT infrastructures at organisational level. The eco-efficiency framework developed by the WBCSD provides a foundation for sustainability reporting by organisation (Singh, et al., 2009). In this framework several generally applicable value and environmental influence indicators have been listed. Value indicators are expressed quality and net sales. Indicators listed under “environmental influence” have been divided into categories such as energy consumption, water consumptions and materials consumption. Eco-efficiency is defined as product or service value divided by environmental influence. Indicators like this should be used with care as eco-efficiency might not always lead towards sustainability. Eco-efficiency can increase despite decreasing environmental sustainability due to the relationship between economic and environmental aspects. For instance, if economic values increase faster than the environmental impacts decrease, the development seems more environmentally and economically sustainable whereas this is false (Mickwitzet al., 2006). Due to the negative characteristics of eco-efficiency indicators, reporting on performance could be misinterpreted or manipulated easily by individuals or organisations (perverse effect, see Chapter 4).
5.3.3 Green performance indicators The third way of assessing the greenness of hardware IT could be using Green Performance Indicators (GPIs). In the following paragraphs GPIs that are defined for certain hardware IT infrastructure units will be discussed. GPIs are related to the economic and environmental performance of data centres and IT service centres. These are also referred to as green computing metrics in literature (Kipp et al., 2012). GPIs have been developed with the purpose of understanding and improving an organisation’s computing environment. They can be classified as follows (Kipp et al., 2012):
IT resource usage GPIs: related to the IT usage of applications, e.g. CPU usage, data centre density, etc.
Application lifecycle KPIs: related to the process quality and efforts for designing and maintaining the process, e.g. response time, availability, recoverability, etc.
Energy impact GPIs: related to the impact of IT service centres and applications on the environment considering power supply, emissions, consumed materials and other energy related factors, e.g. power usage effectiveness (PUE), data centre infrastructure efficiency (DCiE), CO2 emission, etc.
Organisational GPIs: energy related metrics that measure organisational factors, e.g. human resource indicator, compliant indicator, carbon credit and return of green investment (RoGI), etc.
Several of the GPIs that fall under these classes are relatively immature compared to indicators discussed in the previous sections. Nevertheless, some of these have been or are being incorporated in international measurement standards such as the ICT sector guidance under development (WBCSD & WRI, 2012). In the Code of Conduct on Data Centres Energy Efficiency Version 1.0 developed by the European Commission, the Data Centre Infrastructure Efficiency (DCiE) metric is defined as a data centre energy efficiency indicator which organisations should measure and report. Additional metrics mentioned in the code of conduct are an IT productivity metric and a total energy productivity metric. The IT productivity metric is a metric providing an indicator on how efficiently the IT equipment provides useful IT services, while the total energy productivity metric relates the useful IT services to the total energy consumption of the facility (European Commission, 2008). Next to the code of conduct, several GPIs are listed in the GHG Protocol’s ICT sector guidance. An example of this is the Power Usage Effectiveness (PUE) which measures the same as the DCiE. Several GPIs including their classification, cluster, definition, advantage and disadvantage can be found in Appendix B.

MSc Thesis, J.C.P. Kalsheim: Greening Information Technology (IT) Infrastructures
Theoretical background on environmental and economic performance assessment 46
The literature study in Appendix B shows there are various ways of assessing the greenness of hardware IT located in data centres or IT service centres. Several metrics have been defined by the Green Grid and the Uptime Institute such as the DCiE and deployed hardware utilization ratio. The deployed hardware utilization ration measures the fraction of the deployment IT equipment that is comatose, i.e. using energy/power while not running any application (Stanley, Brill, & Koomey, 2007). Next to these metrics, the EnergyStar label developed by the US Environmental Protection Agency (EPA) and US Department of Energy (DOE) has been applied to IT systems and workstations. EnergyStar is a threshold criteria that an organisation could apply when purchasing IT assets. EnergyStar certification depends mainly on a systems low-power states and the metric is coarse-grained, i.e. a system is either certified or it is not (Ranganathan, Rivoire, & Moore, 2009). The label has been used in the definition of “green” procurement by the Dutch government (Pianoo, 2012). Indicators listed in Appendix B are relatively immature compared to the performance indicators discussed in the previous sections. Moreover, GPIs only address aspects related to energy and GHG emission in the use phase whereas the field of environmental sustainability of hardware IT is much broader (see Chapter 1). In the next section the scope of business activities incorporated in environmental business standards will be elaborated on.
5.4 Business standards Literature suggests several business standards have been developed to assess various aspects of an organisation’s operations. In section 5.2.2 TCO and LCC have been elaborated on. These are often used methods in IT investment valuation (Ellram, 1995) (Ferrin & Plank, 2002). LCA is also a widespread, standardized method often used by organisations (Zutshi & Sohal, 2004) (ISO 14040, 2006). Next to the sustainability assessment tools at product level, several business standards have been developed to assess the impact of an organisation’s activities. These standards often address one or more environmental issues such as GHG emission or water use. In this section three business standards will be discussed. First, the GHG Protocol will be discussed as it is the most widely used GHG emission standard under organisations today (Kolka, Levyb, & Pinksea, 2008). Second, the water footprint introduced by Hoekstra and Hung (2002) and further developed by Hoekstra and Chapagain (2002) will be outlined as it provides useful insight into organisational water use. Third, ways of accounting for raw materials, energy and solid waste will be discussed briefly as incorporated in the ISO 14051 material flow cost accounting. These standards serve as inspiration to design a new framework.
5.4.1 Greenhouse gas (GHG) protocol The WRI and WBCSD have developed the GHG Protocol. Currently the GHG Protocol is a global accounting tool used by numerous governments and businesses around the world to understand, quantify and manage GHG emission (Kolka, Levyb, & Pinksea, 2008). The GHG Protocol makes a distinction between direct and indirect GHG emission. Direct GHG emission is caused by sources that are owned or controlled by the reporting organisation. Indirect GHG emission are a result of activities that occur at sources owned or controlled by another organisation. In the GHG Protocol the scope of an organisation’s GHG emission is divided into three classes: “direct GHG emission” (scope 1), “electricity indirect GHG emission”(scope 2) and “other indirect GHG emission” (scope 3) (WBSD & WRI, 2012). The scopes and emissions across the value chain as defined in the GHG Protocol are illustrated in Figure 8.

MSc Thesis, J.C.P. Kalsheim: Greening Information Technology (IT) Infrastructures
Theoretical background on environmental and economic performance assessment 47
Figure 8: Overview of GHG Protocol scopes and emissions across the value chain (WBSD & WRI, 2011)
As shown in Figure 9, Scope 1 emissions occur from sources owned or controlled by the organisation, such as furnaces and vehicles. Scope 2 emissions accounts for GHG emission from the generation of purchased electricity used by the reporting organisation. This also includes transmission and distribution losses. Sources not owned or controlled by the reporting organisation fall under scope 3 emissions. These emissions are caused by upstream as well as downstream activities of the reporting organisation. Examples of such emissions are extraction and production of purchased materials and fuels, leased assets, franchises, outsourced activities and waste disposal (WBCS & WRI, 2004). Furthermore, the WRI and WBCSD published the draft version of the “GHG Protocol Product Life Cycle Accounting and Reporting Standard - ICT sector guidance” in March 2012. The protocol builds on the International Standard Organisation (ISO) LCA standards 14040:2006 and 14044:2006 and provides a consistent and pragmatic approach to GHG assessment of ICT products. Although the standard is based upon accepted standards, it is still under development (WBSD & WRI, 2012).
5.4.2 Water footprint Next to GHG emission, IT is responsible for water use. But how can water use be estimated? A water footprint standard has been developed as an analogy to the ecological footprint to determine water use. The water footprint is linked to the virtual water concept which is the volume of water necessary to produce a commodity or service (Hoekstra & Chapagain, 2007). The water footprint of nations developed by Hoekstra and Chapagain (2007) make a distinction between volume of water used from domestic water resources and water used in other countries to produce imported and consumed goods and services. At organisational level, this is different. The water footprint of an organisation is the total volume of fresh water consumed or polluted directly or indirectly as a result of running and supporting the business. This is expressed in water volume per unit of time. The business water footprint consists of two components; the operational water footprint and the supply chain water footprint. Hoekstra et al. (2009) distinguish between three types of waters; green, blue and grey water. Green water includes rainwater evaporated from the soil during the production process of agricultural products. Blue water is the volume of ground water and surface water evaporated during the production process. Grey water is defined as the amount of polluted water as a result of business activities (Hoekstra, Chapagain, Aldaya, & Mekonnen, 2009). The water

MSc Thesis, J.C.P. Kalsheim: Greening Information Technology (IT) Infrastructures
Theoretical background on environmental and economic performance assessment 48
footprint of an organisation could be defined within the same organisational scopes as the GHG emission in the GHG Protocol (Dessens, 2010).
5.4.3 Material flow cost accounting The last business standard discussed in this section is material flow cost accounting. Raw materials in business accounting often focuses on product chains only, whereas an organisation’s supply chain also includes providers of products, processes, technology and services that are not immediate raw materials of an organisation’s core products (Kovács, 2008) (Drury, 2008). As part of organisational decision-making, material flows are often narrowed down to corporate level, incorporating supplier input and customer and disposer outputs (Sygylla, Bierer, & Götze, 2011). In broader view, material flows are defined as the way a material follows from its extraction to its disposal. In organisational accounting standards such as the recently introduced ISO 14051 standard for material flow cost accounting, an approach is implemented that incorporates raw materials and sold waste streams. The flows and stocks of materials within organisations are traced and quantified, and the costs associated with those flows are incorporated in the material flow evaluation. This includes raw materials as an input and solid waste as an output (Jasch, 2011). Similar to eco-efficiency indicators, this standard combines economic and environmental aspects. Economic and ecological objectives are integrated in order to contribute to a reduced or more efficient use of materials. Costs that have been incorporated in this standard are related to materials costs, system costs such as maintenance costs and waste management costs (Sygylla, Bierer, & Götze, 2011) (Wang, Cui, Zhu, & Li, 2010).
5.5 Summary and conclusion In the previous sections economic and environmental performance assessment and performance indicators have been elaborated on. This forms the foundation for the design of a new framework to assess the greenness of the hardware IT infrastructure of an organisation in line with the rigor cycle in the design science research by Hevner et al. (2004). In essence this chapter has addressed the third sub-question defined in the introduction in Chapter 1. In the following paragraphs the findings from the literature review will be summarized and a conclusion will be drawn with regard to the third research question, which is: Sub-question 3: “What economic and environmental life cycle assessment criteria can be found in literature to assess the greenness of the hardware IT infrastructure of an organisation?” Literature shows are several reasons to measuring performance. However, reporting on performance should be done with care due to the risks of positive learning, preserve learning, selection and suppression. There are several ways of measuring performance. Ways of measuring sustainability could be classified as integrated assessment, product related assessment and indicators and indices. At product level, sustainability assessment tools can be used. Here a distinction can be made between bottom-up and top-down measurement approaches. Both have advantages and disadvantages. In the hybrid approach these disadvantages diminish, but are not removed. An enduring problem concerns information detail and effort to collect data when adopting product related assessment tools. Using indicators or indices to assess environmental and economic performance, the appropriate application level should be chosen. The classification by Feng, Joung & Li (2010) suggests indicator sets or indices that fall under the category “corporation”, “facility” or “product” could be useful to evaluate the greenness of the hardware IT infrastructure of an organisation. Exploring several indicators and indices within these application levels show several of these are too specific or generic to be directly applicable. Nevertheless, literature shows there are several environmental and economic performance indicators available that can serve as inspiration to develop a new framework. Examples of such are the GRI indicators for sustainability, EMAS and LCSP and ISO 14031 EPE indicators. There are also indicators defined in eco-efficiency literature that combine economic and environmental performance into one indicator. However, these can be misinterpreted or manipulated deliberately in sustainability reports as they combine economic and environmental performance in one indicator value. Furthermore, GPIs can be used. These indicators describe the energy efficiency, energy use and GHG emission of data centre and IT service centres. A limitation of these indicators are their limited scope. To understand the scope of performance assessment in business standards, the GHG Protocol, water footprint and materials flow cost accounting have been looked into. Essentially, relevant business standards found in literature comprise the following; GHG Protocol, water footprint, material flow cost accounting, LCA, TCO and LCC. The last

MSc Thesis, J.C.P. Kalsheim: Greening Information Technology (IT) Infrastructures
Theoretical background on environmental and economic performance assessment 49
three “standards” are bottom-up approaches used to assess the environmental or economic impact of a product over its life cycle. These suffers from the truncation error; defining a suitable boundary can be difficult without making simplifications and assumptions. The three scopes defined in the GHG Protocol can be relevant for determining organisational boundaries of performance indicators and measurements. Similar to the boundaries set in the GHG Protocol, the water footprint incorporates both the operational water footprint and the supply chain water footprint. In material flow cost accounting flows and stocks of materials from an organisations activities and their costs are incorporated in the analysis. To summarize, the following aspects will be used to design a new framework with the purpose of assessing an organisation’s hardware IT infrastructure greenness in Chapter 7:
Assessment approach with regard to environmental and economic sustainability and the advantages and disadvantages of these: the bottom-up, top-down and hybrid approach
Literature on indicators and indices; definitions, dimensions and criteria for good indicators
Environmental, economic and eco-efficiency performance indicator sets and indices from the application levels “corporation”, “facility” and “product” such as GRI, EMAS, LCSP, ISO 14031
Green performance indicators (GPIs) defined for data centres and IT service centres
Environmental and economic boundaries set in the following standards: GHG Protocol, water footprint, material flow accounting
Literature on performance assessment and assessment approaches will also be used in the functional design in Chapter 8.

MSc Thesis, J.C.P. Kalsheim: Greening Information Technology (IT) Infrastructures
Design requirements 50
6. Design requirements Next to the academic foundation to ensure rigor (Chapter 4 and 5), the design science research methodology also includes an environmental context analysis to ensure practical relevance (Hevner, 2007). The aim of the environmental context analysis elaborated on in this section is to define requirements of a tool to assess the greenness of an organisation’s hardware IT infrastructure. This can answer the fourth sub-question; “Which requirements can be defined for a tool to assess the relative greenness of the hardware IT infrastructure of an organisation?” These requirements are referred to as design requirements. To define design requirements, core activities of requirements engineering were to structure and guide the process. Requirements engineering is applied because it is a structured way of analysing stakeholder requirements from a systems engineering perspective (Kotonya & Sommerville, 1988). This chapter describes the theoretical foundation for the requirements design process (section 6.1), the adopted process (section 6.2) and the resulting design requirements (section 6.3).
6.1 Theoretical foundation for design requirements process There are different ways of defining requirements in literature. In this research, a requirement is defined as a statement of the purpose and functioning of a system and its major components (Sommerville & Swayer, 1997)(ISO, 2000). The statement might be a stakeholder expectation or a need (Bahill & Dean, 1999). But what is a good requirement? In the first section criteria for good requirements will be discussed (section 6.1.1). Next, core activities in requirements engineering will be outlined (section 6.1.2). These are developed for software engineering, but provide insights on how to identify requirements for the assessment tool in an effective, valid and reliable manner. In the last section, stakeholder participation in requirements engineering and in the design processes will be discussed (section 6.1.3). Theories and knowledge outlined in this section form the basis for the requirements analysis process defined and applied in the next section.
6.1.1 Criteria for good requirements What is a good requirement? In literature several criteria for good requirements are defined. The most well-known criteria are the SMART criteria. SMART criteria can be used to support the construction and evaluation of requirements that are technically correct (Shahin & Mahbod, 2007). Besides the SMART requirements, Young (2004) and the IEEE (1998) define several criteria for good requirements such as – necessary, verifiable, unambiguous, complete, consistent, traceable, allocated, concise, implementation free, standards construct, unique identifier, correct, modifiable and ranked for importance and stability. These criteria are used in software engineering. However, they may serve as inspiration to analyse and evaluate the construct of requirements elicited in the requirements analysis process. The theoretical foundation for this process will be outlined in the next section.
6.1.2 Core activities in requirements engineering Requirements engineering is the process of discovering the purposes for which a system is intended through studying user needs to arrive at a definition of systems, software or hardware requirements (IEEE, 1990) (Nuseibeh & Easterbrook, 2000). The process consists of several activities. These activities comprise; elicitating requirements, modelling and analyzing requirements, communicating requirements, agreeing requirements and evolving requirements (Nuseibeh & Easterbrook, 2000)(Saiedian & Dale, 2000). Elicitation is the first activity in the requirements engineering process. It involves identifying the problem that needs to be solved, problem bounaries, relevant stakeholders and objectives a system must meet. This can be identified through the application of elicitation techniques and involvement of stakeholders. Interviews, brainstorming and prototyping are examples of elicitation techniques that can be used in requirements elicitation (Nuseibeh & Easterbrook, 2000). The second activity in requirements engineering is modelling and analyzing requirements. Modelling is an activity that can lead to the operationalization of requirements through the construction of abstract descriptions that are amendable to interpretation (Dardenne, Lamsweerde, & Fickas, 1993). From these models analysis techniques can be applied such as consistency checking and requirements animation (Nuseibeh & Easterbrook, 2000). Requirements analysis aims to identify and eliminate incompleteness, inconsistencies, and ambiguities in requirements specifications (Yu, 1997). The third activity in requirements engineering entails communicating the requirements that have been analyzed. This implies that requirements are documented in a readable and traceable manner (Nuseibeh & Easterbrook, 2000). When the origin of a requirement can be found easily, it is entitled a traceable requirement.

MSc Thesis, J.C.P. Kalsheim: Greening Information Technology (IT) Infrastructures
Design requirements 51
The fourth activity in requirements engineering is defined as agreeing requirements (Nuseibeh & Easterbrook, 2000). This involves maintaining agreement with all stakeholders to ensure the requirements are valid. Nuseibeh and Easterbrook (2000) define validation as the “process of establishing that the requirements and model elicited provide an accurate account of stakeholder requirements” (Nuseibeh & Easterbrook, 2000:42). Validating requirements is difficult for two reasons. The first difficulty concerns the question of truth and what is known, which is philosophical in nature. What is a true requirement? The second difficulty concerns reaching agreement among stakeholders with conflicting goals. This can be solved by identifying the most important requirements stakeholders have and ensuring these requirements are met to promote agreement (Nuseibeh & Easterbrook, 2000). This could be done by allowing stakeholders rate requirements or identify a core set of requirements that everyone can agree to. Further, systems engineering literature suggests that verifying requirements concerns proving that each requirements can be satisfied. Validating requirements involves “ensuring that the (1) set of requirements are correct, complete and consistent, (2) a model can be created satisfying the requirements and (3) real world solutions can be built and tested to prove it satisfies the requirements” (Bahill & Henderson, 2005: 2). In the last activity in requirements engineering, requirements should be added or deleted in accordance with the system evolvement. A system can change due to changing stakeholder requirements, operate changes, changes in the environmental context of the system, etc. The requirements documentation should be kept up-to-date in line with alternating requirements or requirements scrubbing. Requirements can be scrubbed in the development process to forestall costs and schedule overruns (Boehm, 1991).
6.1.3 Stakeholders and stakeholder involvement Before applying the core activities of requirements engineering discussed, stakeholder involvement will be elaborated on. In the requirements analysis process various stakeholders can be involved. According to Freeman (1984) a stakeholder is any individual or group who can affect or is affected by the realization of a system (Freeman, 1984). In requirements engineering a stakeholder is any person or organisation that has an opinion, a responsibility for or who might be affected or influenced by the system (Hull, Dick, & Jackson, 2011). According to the IEEE (1988) stakeholders involved in the requirement engineering process in software engineering can be classified as suppliers or developers, users and customers. A supplier is “the person, or persons, who produce a product for a customer” (IEEE, 1998:3). The supplier is also often referred to as the developer responsible for designing, constructing and maintaining the system (Nuseibeh & Easterbrook, 2000). A user is “the person, or persons, who operate or interact directly with the product” (IEEE, 1998:3). A customer can be defined as “the person, or persons, who pay for the product and usually decide the requirements. (…) the customer and supplier may be members of the same organisation” (IEEE, 1998:3). Studies suggests there is a strong relationship between the success of new product development and the extent of customer involvement in the development process (Awa, 2010)(Souder, Sherman, & Cooper, 1998)(Hull, Dick, & Jackson, 2011)(Alam, 2002). Involving customers in product development can be done in different ways (Kaulio, 1998) Literature suggests customers could be involved in all design stages. However, in idea generation, design and testing/pilot customer involvement is the most important. An organisation may obtain user input through a variety of modes such as interviews, brainstorming and customer observation (Alam, 2002). In the requirements analysis approach that has be used, customer involvement is limited.
6.2 The requirements analysis process In the previous section literature on requirements engineering and stakeholder involvement has been elaborated on. This is used as a basis for designing a requirements analysis process for the specification of design requirements of an assessment tool. Basically, the process involves translating “stakeholder voices” into requirements. In the next paragraphs the requirements engineering process adopted will be elaborated on. The process forms the basis for the relevance cycle in design science research. The requirements analysis process is illustrated in Figure 9. In the subsequent sections each process step indicated in bold in Figure 9 will be outlined; requirements elicitation (6.2.1), requirements analysis (6.2.2), requirements communication (6.2.3), agreeing requirements (6.2.4) and evolving requirements (6.2.5).

MSc Thesis, J.C.P. Kalsheim: Greening Information Technology (IT) Infrastructures
Design requirements 52
(3)
Requirements
communication
Develop
framework and
functional design
Evaluate
framework
Literature study:
functions of
performance
measurement
Brainstorm
session KPMG
Sourcing Advisory
Interviews experts
Delft University of
Technology, ICT
and Sustainability
Interviews experts
KPMG Sustainability,
Sourcing and IT
Advisory
(1) Requirements elicitation
(2)
Requirements
analysis
List of
requirements
Interview IT
decision-maker
KPMG
Netherlands
SMART criteria
(4) Agreeing requirements
Verify content
Validate construct
(5) Evolving requirement
Develop core set
of design
requirements
Expert panel
reviews
Evaluate design
requirements
Figure 9: Requirements engineering process applied to specify tool requirements
6.2.1 Requirements elicitation The first step in the requirement analysis process is requirements elicitation (Nuseibeh & Easterbrook, 2000). The problem that needs to be solved is: what tool could be designed to support IT decision-makers in evaluating the relative greenness of the hardware IT infrastructure of an organisation as a step towards a comprehensive CR strategy? The first stakeholder involved in developing this tool is the customer. The customer is defined as an IT decision-maker and is the most important stakeholder. The second stakeholder is the developer. The developer is the person responsible for constructing the tool, which is the author of this research and the future modifier of the assessment tool. The last stakeholder is the user of the tool which is defined as a green IT advisor. It is assumed the green IT advisor is a consultant with an academic background but with no experience in using the tool. In the next paragraphs, the elicitation of requirements will be outlined from this starting point. Requirements were elicited from the stakeholders defined by means of two elicitation techniques: brainstorming and interviews. These techniques were chosen due to their effectiveness (Lloyd, Rosson, & Arthur, 2002) (Gunda, 2008). Requirements were elicited until similar requirements were repeated in interviews with experts. This way, a complete list of requirements describing the assessment tool are defined at this point in time.

MSc Thesis, J.C.P. Kalsheim: Greening Information Technology (IT) Infrastructures
Design requirements 53
The first elicitation technique used in requirements elicitation was brainstorming. Brainstorming was used to elicit user requirements in a creative and explorative way. To identify these requirements advisors from three different organisational layers within KPMG Netherlands were asked to participate in the brainstorm session. In the brainstorm session, requirements from the perspective of the designer as well as user requirements were identified. An example of such a requirement is augmentability, i.e. the ease of updating the tool. In literature on requirements engineering, augmentability has been stated as an important requirement as well (Boehm, Brown, & Lipow, 1976) (Chung & Leite, 2009). In the interviews open, semi-structured questions were asked to identify a broad range of stakeholder requirements from the perspectives of the stakeholder identified. Questions asked were based on the classification of requirements by Sommerville and Sawyer (1997); non-functional and functional requirements. Experts with different skills, backgrounds and expectations were interviewed to uncover design requirements. Experts were selected due to their knowledge of green IT, sustainability, IT and sourcing. Further, they were chosen from a pool of experts at the Faculty of Technology, Management and Policy analysis at Delft University of Technology and KPMG Netherlands. In total six experts were interviewed. An overview of their background and expertise can be found in Figure 11. For more information about the experts interviewed see Appendix C. During the interviews a drawing of the research scope was used to prompt further information gathering and clarify the scope of the assessment tool (Figure 1).
Expert interviews
KPMG Netherlands
Arjan de Draaijer
(KPMG
Sustainability)
Christiaan Piek
(KPMG IT)
Arnoud Walrecht
(KPMG
Sustainability)
Albert Plugge
(KPMG Sourcing and ICT
section at the Faculty of
Technology, Policy and
Management)
Expert interviews Delft
University of Technology
Renate van Drimmelen
(Technology dynamics and
sustainable development (TD&SD)
section at the Faculty of Technology,
Policy and Management)
Jolien Ubacht
(ICT section at the Faculty
of Technology, Policy and
Management)
Figure 10: Interviewees at KPMG Netherlands and Delft University of Technology
Next to stakeholder requirements, requirements found in literature were incorporated in the elicitation of design requirements because of the possible presence of unknown requirements to stakeholders. Requirements from literature were derived from functions of performance measurement defined in section 5.1.1. Reusing requirements of existing systems is a common method of requirements elicitation that might save time and costs (Robertson & Roberston, 1998) (Kotonya & Sommerville, 1988) (Viller & Sommerville, 1999). All requirements defined in the elicitation process can be found in Appendix C. In the next section, modelling and analysing these requirements will be outlined.
6.2.2 Analysing requirements The second step in the requirements analysis process involves analysing requirements (Nuseibeh & Easterbrook, 2000). Requirements are analysed in two steps. The outcome of these steps can be found in Appendix D. First, requirements were constructed according to the standard construct, inconsistent and related requirements are removed and ambiguous requirements are reconstructed. This way, several criteria for good requirements discussed in section 6.1.1 are applied. Analysis of elicited requirements showed there is one inconsistency; one stakeholder suggested the tool should be independent of medium, whereas a second stakeholder suggested the tool would be constrained by available hardware and software applications. This inconsistency is an example of a “user” constraint (green IT advisor), which does not influence the “client” (IT decision-maker). Due to the “user” constraint, the requirement was defined to satisfy both stakeholders. Second, requirements specified were formulated into “high-level” or “aggregate” requirements as several requirements partly cover each other’s content. In two expert panels the entire range of requirements were evaluated, hence a compressed list of requirements is necessary for the panel meetings as well. The compressed list of requirements was double-checked to ensure consistency and completeness in the step from requirements elicited

MSc Thesis, J.C.P. Kalsheim: Greening Information Technology (IT) Infrastructures
Design requirements 54
to the final list of requirements. A drawback of “aggregating” requirements this way, is the chance of defining less specific requirements. Requirements can also be overlooked.
6.2.3 Communicating requirements The third step in the requirements analysis process involves the communication of requirements (Nuseibeh & Easterbrook, 2000). In this report all documented design requirements can be found in Appendix D. The final list of design requirements can be found at the end of this chapter. This document ensures the origin of each design requirement is traceable. For example, the high level requirement “the tool shall determine one value stating the relative greenness of the hardware IT infrastructure of an organisation” (HR1) can be found to be derived from requirements defined by all stakeholders besides Jolien Ubacht. The origin of this requirement is traceable because each source and requirement aggregation step is given a separate identification (ID) number.
6.2.4 Agreeing requirements The fourth step in the requirements analysis process in Figure 10 is agreeing requirements. This concerns ensuring that requirements are valid (Nuseibeh & Easterbrook, 2000). Agreeing requirements involved a number of activities. First, the content of the requirement was validated. This implies ensuring the requirements are an accurate account of stakeholder requirements (Nuseibeh & Easterbrook, 2000). The requirements elicited were double-checked with the person interviewed. Subsequently, the requirements elicited from the perspective of an IT decision-maker were verified by an IT manager and policy-maker at KPMG Netherlands. The result of this meeting was to change one requirement from “minimal effort of an organisation ”to “flexibility in term of data collection detail” with the rationale that the effort an organisation is willing to put into applying an assessment tool, depends on the conceivable importance of the results. Second, the construct of the set of requirements were validated in two steps. Whether the set of requirements were correct, complete and consistent are validated first (Bahill & Henderson, 2005). Subsequently, two expert panels were asked to state whether the high-level requirements construct meet the SMART criteria for requirements as defined in section 6.1.2. This way the construction validity of the requirements were tested. Third, a calculation model that satisfies core requirements was designed (see functional design, Chapter 8) and tested in a real case (Appendix M) (Bahill & Henderson, 2005). This step constituted an additional verification and validation of the core requirements for an assessment tool. The successfulness of the first implementation and use of the functional design will be further elaborated on in the Evaluation and reflection on framework design (see Chapter 9).
6.2.5 Evolving requirements The last step in the requirements analysis process is a continuous process; managing changes in requirements is essential to ensure the tool evolves successfully over time. In this research the first steps towards creating an assessment tool that is stable in presence of change and flexible enough to be customized and adapted to changing requirements have been made by defining a set of core requirements (Nuseibeh & Easterbrook, 2000). To identify a core set of design requirements, two experts panels were asked to review the list of high-level requirements and define critical requirements for an assessment tool. Each panel was given the same list of requirements. However, the list presented to the second expert panel incorporated the SMART criteria adjustments made by the previous panel due to the explorative character of the study and the formative purpose of the validation. The result of this will be presented in the next section.
6.3 Summary and conclusion In the preceding sections the requirements analysis process adopted has been elaborated on. The purpose of exploring design requirements in line with requirements engineering theory has been to structure and establish a rigorous requirements analysis process leading to relevant design requirements. This is part of the relevance cycle in design science research (Hevner et al., 2004). The outcome of the process will be used to answer the fourth research question, which is:

MSc Thesis, J.C.P. Kalsheim: Greening Information Technology (IT) Infrastructures
Design requirements 55
Sub-question 4: “Which requirements can be defined for a tool to assess the relative greenness of the hardware IT infrastructure of an organisation?” The requirements defined have been designed from the input of relevant stakeholders and literature. Requirements for a tool to assess the greenness of the hardware IT infrastructure of an organisation are defined in Table 7. To develop an assessment tool over time, it is important that the tool meets the set of core requirements. Table 7: Design requirements of a tool to assess the greenness of the hardware IT infrastructure of an organisation
ID Design requirements
Co
re r
eq
uir
em
en
ts
HR1 The tool shall determine one value stating the relative greenness of the hardware IT infrastructure of an organisation
HR2 The tool shall demonstrate trade-offs organisations are confronted with in greening the hardware IT infrastructure
HR3 The tool shall determine the influence of main energy use, water use, raw material use, CO2 emission and cost drivers on the relative greenness of the hardware IT infrastructure of an organisation
HR5 The tool shall support organisations improve the relative greenness of the hardware IT infrastructure over time as part of a continuous management process
HR7 The tool shall produce results that can be compared to peers
HR8 The tool shall be based upon information from accepted standards
HR12 The tool shall communicate the results clearly to IT decision-makers
Ad
dit
ion
al r
eq
uir
em
en
ts
HR4 The tool shall support the analysis of relevant energy use, water use, raw material use and greenhouse gas emission goals that could be embedded in an organisation with respect to greening the hardware IT infrastructure of an organisation
HR6 The tool shall determine the effect of external factors and trends on the relative greenness of the hardware IT infrastructure of an organisation
HR9 The tool shall be constructed based upon valid data sources
HR10 The time a technical software specialist use to encode changes in performance indicators and the reporting format should be minimized (maintainability)
HR11 The tool shall be flexible in terms of detail level of the input data
HR13 The tool shall allow covering the internal mechanisms for other stakeholders than the user

MSc Thesis, J.C.P. Kalsheim: Greening Information Technology (IT) Infrastructures

MSc Thesis, J.C.P. Kalsheim: Greening Information Technology (IT) Infrastructures
Part III Framework design
Part II: Academic and practical
grounding Part III: Framework design
Part IV: Framework
evaluation and conclusion
Define tooling
requirements
(Ch6)
Design
framework
(Ch7&8)
Demonstrate
framework
Define green IT
assessment
(Ch4&5)
Evaluate
Framework
(Ch9)
Recommendation
and conclusion on
design
(Ch9,10&11)Business
needs
Refine
Applicable
knowledge
Identify research
problem and
motivation
(Ch1&Ch2)
Part I: Problem analysis
and research design

MSc Thesis, J.C.P. Kalsheim: Greening Information Technology (IT) Infrastructures
New framework design 58
7. New framework design In the previous chapters literature has been reviewed (Chapter 4 and 5) and design requirements have been specified (Chapter 6). These are the first steps towards a new framework based upon academic rigor as well as practical relevance. This chapter aims at answering the fifth sub-question; “what framework can be designed incorporating economic and environmental life cycle assessment criteria to assess the relative greenness of the hardware IT infrastructure of an organisation?” In this chapter the new framework will be presented that is based upon the outcome of these steps (section 7.2). Before this, the design process will be outlined that resulted in the new framework (section 7.1).The framework content will be discussed in section 7.3. The purpose of this chapter is to answer the fifth sub-question defined in Chapter 1.
7.1 Design process According to Iivari (2007) inspiration for creative design activity can be drawn from different sources. Design is defined as the “iteration between the construction of an artefact, its evaluation and subsequent feedback to refine the design further” (Hevner A. R., 2007: 91). Simon (1996) depicts the nature of the design cycle as generating design alternatives and evaluating these against requirements until an adequate design is realized. To ensure a balance between efforts spent on constructing design alternatives and evaluating these, choices were made to ensure a feasible and effective design process. As the essence of design science lies in the scientific evaluation of artefacts (Iivari, 2007), the design cycle process focuses on formative validation of the new framework. The design process essentially consists of several iterations and is part of the design cycle defined in the design science research by Hevner et al. (2004). The design iterations that are performed to formatively validate the framework design are illustrated in Figure 11.
Expert panel 1
Tooling
requirements
(Chapter 6)
Design
conceptual
framework
Expert panel
design
Green IT
assessment
(Chapter 4&5)
Evaluate
conceptual
framework
Evaluation, reflection
and conclusion on
design
(Chapter 9,10&11)
Business
needs
Applicable
knowledge
Design
framework 0.5
Expert panel
design
Evaluate
framework
Expert panel 2
Design
framework 1.0
(Chapter 7)
Functional design
(Chapter 8)
Evaluate
Framework
Case study
refine
Figure 11: Design iterations including input and outputs

MSc Thesis, J.C.P. Kalsheim: Greening Information Technology (IT) Infrastructures
New framework design 59
In the design process shown in Figure 11 two inputs are used to design a conceptual framework. First, literature related to green IT assessment was used to ground the academic aspects of the conceptual framework. Second, design requirements were used to ensure a relevant framework would be developed. The conceptual framework as well as its theoretical grounding can be found in Appendix E. Subsequent to the conceptual framework design, the new framework was formatively validated by two expert panels. In the first validation round, the expert panel was asked to review the conceptual framework design. In the second validation round, the adapted framework design was reviewed by different a panel of experts. The design of the expert panel sessions can be found in Appendix F. The expert panel validation rounds were organized this way due to the explorative character of the design process which requires an ex-ante, formative validation (Venable, Pries-Heje, & Baskerville, 2012). The outcome of the expert panel sessions can be found in Appendix G and H. In the appendices are summarized how the framework changed accordingly relative to the conceptual design. Next to the expert panels, a case study is performed to test how well the artefact performed when studied in depth in a business environment. The case study including data collected and data uncertainty can be found in Appendix L, M, N. The case study showed that it is possible to estimate the performance indicators and assessment criteria defined in the framework for more than eighty different units of analysis when applying the functional design in Chapter 8. The operationalization could be seen as a first step towards a prototype of an assessment tool. The model that was developed is not a prototype, but a first operational test of the new framework. The test showed the framework is operationally verified.
7.2 Framework design In the previous section the design process has been outlined. The next step is to define the fundament for the new framework design; the goal of the framework (section 7.2.1), framework entity (section 7.2.2), units of analysis (section 7.2.3) and framework scope (section 7.2.4). These fundamental “building blocks” have shaped the framework design as presented at the end of this section. The new framework can be found in section 7.2.5.
7.2.1 Goal of the framework
The main goal of the framework is to provide IT decision-makers with a tool to evaluate the greenness of the hardware IT infrastructure of an organisation as a step towards a comprehensive CR strategy. This is necessary because CR, green IT and the hardware IT infrastructure of most organisations currently are perceived as separate fields, whilst the integration of these fields are expected to become increasingly important in the future. The main goal of the framework has been translated into a set of design requirements for an assessment tool. These can be found in Chapter 6. In the subsequent section the framework entity will be defined. The framework entity defines the boundaries of the object of analysis when applying the assessment tool.
7.2.2 Framework entity The entity, also referred to as the object of analysis, is the hardware IT infrastructure of “an organisation”. The adopted definition of an organisation is “any coherent entity or activity that transfer a set of inputs into one or more outputs” (Hoeksta & Gerbens-Leens, 2008:13). This is based on the business or operation of an organisation, assuming an organisation can be defined by its products (Glenn & Malott, 2004). To assess the relative greenness of the hardware IT infrastructure of an organisation, the organisation has to be delineated from its environment. The framework entity is inspired by the ISO 14031 EPE, life cycle thinking and the GHG Protocol. The next paragraphs describe the integration of these sources into a comprehensive framework entity design that describes the scope of an organisation’s hardware IT infrastructure supporting business applications. First, the object of analysis is inspired by the ISO 14031 EPE and life cycle thinking. In the ISO 14031 standard an organisation is defined according to its operation; consisting of physical facilities and equipment as well as supply and delivery from them (Jasch C. , 2000). The life cycle of hardware IT incorporated in this study is limited to procurement, use and dispose of hardware IT (physical facilities and equipment)with the resulting supply and delivery from life cycle phases. This could be seen as a cradle-to-grave definition. The procurement phase begins when the acquisition process starts and ends when the acquisition process ends. When an organisation is the first buyer of a hardware IT asset, the environmental and economic impacts of the preliminary life cycle stages of the

MSc Thesis, J.C.P. Kalsheim: Greening Information Technology (IT) Infrastructures
New framework design 60
asset fall under the procurement stage and respectively the responsibility of the organisation. Basically this implies that environmental and economic effects of hardware IT from the “cradle” are taken into account when hardware IT infrastructure units are first-handed. For example, in a perfect market the price an organisation pays for an asset expresses preliminary life cycle costs such as manufacturing costs and cost of raw materials extraction. The use phase starts when the consuming organisation takes possession of the product and ends when the product is discarded to a waste treatment location. Disposal or end-of-life phase start when used products are discarded by the organisation and ends when the product is returned to nature or allocated to another product’s life cycle through recycling, refurbishment or reuse (WRI & WBCSD, 2011). The end-of-life phase includes the environmental effects of third-party disposal and treatment of waste generated by the organisation’s owned or controlled operations(WRI & WBSCD, 2011). Further, an organisation is responsible for the environmental and economic effects of the disposal of owned hardware IT assets (WBCS & WRI, 2004). This definition of disposal is in line with the GHG Protocol. Next to life cycle phases of hardware IT, the framework entity is also defined consistently with the GHG Protocol. The entity is based upon the three scopes defined in the GHG Protocol; direct GHG emission (scope 1), electricity indirect GHG emission (scope 2) and other indirect GHG emission (scope 3). In essence, this implies that sources that are not owned or controlled by the organisation are incorporated in the framework entity such as leased assets, franchises, outsourced activities and waste disposal(WBCS & WRI, 2004). According to the organisational boundaries defined in the GHG Protocol, a franchiser with equity rights or operational/financial control should be included in consolidation of GHG emission data (WBCS & WRI, 2004). Hence, down-stream franchises that are partially or wholly owned or controlled by the organisation fall within the scope 3. A franchise is in institutional terms a contractual agreement between franchisor and franchisee that allows the franchisee to use the other firm’s business model in a particular location (Rubin, 1978). Concerning an organisation’s hardware IT infrastructure greenness, the influence of down-stream franchises within an organisation’s scope 3 boundary are assumed to be negligible for two reasons. First, a franchise is usually not under the financial control of a franchisor (WBCS & WRI, 2004). Second, the impact that owned franchises might have on the hardware IT infrastructure greenness is assumed to be diminutive relative to the owned, outsourced and leased hardware IT infrastructure. Further, with regard to leased assets an organisational is only accountable for those that it operates. An additional criterion is that leased assets are treated as an entirely owned assets in financial accounting and recorded as such on an organisation’s balance. An organisation might either own hardware IT infrastructure that is leased (down-stream) or lease hardware IT infrastructure that are owned by a third party (up-stream) (WRI & WBSCD, 2011). Outsourced activities are included when these support an organisation’s business applications, such as an outsourced data centre or IT service centre (WBCS & WRI, 2004). ISO 14031 EPE, life cycle thinking and the GHG Protocol constitute the academic grounding of the framework entity. The framework entity design is depicted in Figure 12. This representation of the framework entity was chosen due to feedback from the first expert panel.
UseProcure Dispose
Owned hardware IT
Leased hardware IT
Outsourced hardware IT
Procured hardware IT Disposed hardware IT
Figure 12: Framework entity design
To sum up, the use of hardware IT consists of the use of owned, outsourced and leased hardware IT infrastructure units. This is in accordance with the GHG Protocol scope 3. Under procure falls hardware IT infrastructure units an organisation procure in the form of an outsourced activity, leasing agreement and/or bought product or service. Disposal is only applicable to discarded hardware IT assets that are owned by an organisation. Further, the life cycle scope has been set in accordance with accepted business standards and the “sphere of influence” of IT decision-

MSc Thesis, J.C.P. Kalsheim: Greening Information Technology (IT) Infrastructures
New framework design 61
makers. It is assumed IT decision-makers can influence procurement, use and disposal policies of hardware IT, but not the impact of specific production or disposal processes.
7.2.3 Units of analysis As discussed in paragraph 4.1.5 there are various ways of classifying hardware IT infrastructure units. A classification made today might be biased tomorrow due to rapid technological innovations in the ICT sector. To ensure the units of analysis incorporated in the framework are mutually exclusive and collectively exhaustive over time, the units of analysis should be defined as individual hardware IT infrastructure assets and not according to their functions. A comprehensive overview of units of analysis should therefore be updated continuously to ensure no relevant hardware IT infrastructure assets are overlooked. For the purpose of this research units of analysis are defined as “physical hardware IT infrastructure products with the ability to process, store and transmit data” that support an organisation’s business applications (Linberg, 1999:179). In the next section, the scope of the framework will be further outlined before the framework will be presented.
7.2.4 Framework scope
Before designing the framework, it is necessary to have a clear understanding of the scope of the new framework that is designed. The scope of the framework incorporates the following aspects:
Procurement, use and disposal of hardware IT infrastructure units as separate assets within the organisational boundaries defined in the framework entity
The three organisational boundaries defined by the GHG Protocol and ISO 14031 EPE excluding franchises Performance related to the environmental and economic pillar of sustainability Performance related to resource usage (energy, water and raw materials), CO2 emissions, WEEE and costs
related to hardware IT infrastructure units within the organisational boundaries defined in the framework entity
It should be notices that transportation, installation and design are not included in the framework as these aspects are not part of the research scope (see Chapter 1).
7.2.5 Greening Hardware IT Infrastructure (GHITI) framework In Figure 13 the new framework entitled greening hardware IT Infrastructure(GHITI) framework is presented.
Assessment criteria
Life cycle phase
Procure Use Dispose
Water use over the life cycle of hardware IT (m
3)
1.1.1 Amount of water use related to the extraction and production process of hardware IT
1.2.1 Amount of water used in hardware IT operation per water source
1.3.1 Amount of water use related to hardware IT discarded to landfill
1.3.2 Amount of water use related to recycling hardware IT
1.3.3 Amount of water use related to recovering energy from hardware IT
1.3.4 Amount of water use related to reuse and refurbish hardware IT for third party use
Energy use over the life cycle of hardware IT (MJ)
2.1.1 Amount of energy use related to the extraction and production process of hardware IT
2.2.1 Amount of energy use of hardware IT operation
2.3.1 Amount of energy use related to hardware IT discarded to landfill
2.2.2 Utilization of hardware IT relative to unit specific optima (%)
2.3.2 Amount of energy use related to recycling hardware IT
2.3.3 Amount of energy recovered from discarded hardware IT
2.3.4 Amount of energy use related to reuse and refurbish hardware IT for third party use
Raw 3.1.1 Amount of recycled and reused materials in hardware IT procured
3.2.1 Amount of replaced sub-components in hardware IT
3.3.1 Amount of materials from hardware IT to landfill

MSc Thesis, J.C.P. Kalsheim: Greening Information Technology (IT) Infrastructures
New framework design 62
material waste generation over the life cycle of hardware IT (kg)
3.1.2 Amount of raw materials in hardware IT procured
3.2.2 Amount of repaired sub-components in hardware IT
3.3.2 Amount of recycled materials from hardware IT
3.1.3 Amount of refurbished or used hardware IT procured
3.3.3 Amount of hardware IT discarded for energy recovery
3.3.4 Amount of materials in hardware IT reused and refurbished for third party use
Greenhouse gas emissions over the life cycle of hardware IT (ton CO2 equivalent)
4.1.1 Amount of greenhouse gas emission related to the extraction and production process of hardware IT
4.2.1 Amount of greenhouse gas emission related to extraction and production of energy used in hardware IT operation
4.3.1 Amount of greenhouse gas emission related to hardware IT discarded to landfill
4.3.2 Amount of greenhouse gas emission related to recycling hardware IT
4.3.3 Amount of greenhouse gas emission related to recovering energy from hardware IT
4.3.4 Amount of greenhouse gas emission related to reuse and refurbish hardware IT for third party use
Costs over the life cycle of hardware IT (euro)
5.1.1 Procurement costs of hardware IT
5.2.1 Energy costs of hardware IT operation
5.3.1 Costs of hardware IT discarded to landfill
5.2.2 Water costs of hardware IT operation
5.3.2 Costs of recycling hardware IT
5.2.3 Costs of carbon credits for the operation of hardware IT
5.3.3 Costs of recovering energy from discarded hardware IT
5.2.4 Maintenance costs of hardware IT
5.3.4 Revenues from selling used and refurbished hardware IT to third parties
Figure 13: Green Hardware IT Infrastructure (GHITI) framework
On the rows of the framework in Figure 14 there are five classes of environmental and economic assessment criteria. Each criterion addresses a generic issue organisations are confronted with when striving to green the hardware IT infrastructure – water use, energy use, raw material waste generation, GHG emission and costs. Assessment criteria are chosen on the vertical axis of the framework because the aggregation of performance indicators that fall under these result in five values that make trade-offs easier to comprehend and communicate to IT decision-makers (see requirements HR2 and HR12). In the columns the life cycle phases can be found. These levels are procure, use and dispose. These levels are chosen because they aim at providing IT decision-makers with insights about the greenness of the hardware IT assets beyond the immediate use phase. For leased and outsourced assets performance indicators under the use phase are applicable. This is in line with boundaries set by an accepted business standards; the GHG Protocol. It is consciously decided to limit the life cycle phases to three. A benefit of additional phases is that performance indicators related to these might be specified more precisely. However, several performance indicators would reappear in several phases and make the new framework unnecessary complex. The five assessment criteria in the rows and the life cycle phases in the columns result in a matrix. In each cell of this matrix one or more performance indicators are defined. The performance indicators are classified by three numbers. The first number refers to the assessment criteria on the horizontal axis. For example, performance indicators related to GHG emission start with the number four. The second number refers to the life cycle phases on the vertical axis, whereas the third number is given to the indicator to separate all performance indicators in this category. For example, procurement costs of hardware IT is given the ID 5.1.1 because the indicator falls under the fifth criteria (5) in the first life cycle phase (5.1). Further, it is the first performance indicator under this matrix (5.1.1). In the next section the content of the framework will be outlined in more detail.
7.3 Contents of the new framework In this section the content of the new framework will be elaborated on. In this section dependencies of the indicators (section 7.3.1) and literature coverage (section 7.3.2) will be discussed. The definition of the individual

MSc Thesis, J.C.P. Kalsheim: Greening Information Technology (IT) Infrastructures
New framework design 63
performance indicators will be provided in the subsequent chapter (Chapter 8), but is also part of the contents of the new framework.
7.3.1 Dependencies of indicators As regards the framework contents, performance indicators listed are not independent of each other. Some indicator improvements deliver positive gains for other indicators, and vice versa. For example, if less unit of analysis would be recycled, less energy and water would be used to recycle hardware IT. Turned the other way around; more recycled units would lead to more energy and water use of recycling hardware IT. Despite interdependencies between performance indicators, improving one indicator does not necessarily imply the overall greenness of the hardware IT infrastructure of an organisation is improved. For example, if more units would be sent to landfill instead of being recycled this would lead to a lower energy and water use of recycling hardware IT. On the other hand, this would lead to a higher generation of raw materials waste. This example shows that a positive effect on one aspect can lead to a negative effect on another. It is the task of an IT decision-maker to make decisions and prioritizing performance indicators that are in line with an organisations CR strategy. This way prioritizations related to greening the hardware IT infrastructure can contribute to organisation specific CR strategies.
7.3.2 Covering literature In Chapter 4 and 5 literature related to green IT has been reviewed. This provides the academic grounding of the new framework defined in paragraph 7.2.5. Literature related to the assessment of organisational IT greenness is relatively limited, but literature related to sub-terms in the definition of green IT such as sustainability is exhaustive. There are more environmental and economic tools, indicators and indices than incorporated in the literature review in Chapter 4 and 5, but these were consciously not used because of time restrictions of the research. For this reasons, total completeness of the framework is not claimed. Additionally, it cannot be said that all environmental assessment tools, indicators and indices are equally present in the new framework. However, relating performance indicator to the literature review suggests all indicators incorporated in the new framework are derived from or can be found in literature (see Appendix I).

MSc Thesis, J.C.P. Kalsheim: Greening Information Technology (IT) Infrastructures
8. Functional design In the previous chapter the new framework has been presented. A first operationalization of performance indicator found in the new framework will be presented in this chapter. This chapter describes how the new framework was operationalized to assess the greenness of the hardware IT infrastructure of an organisation. An explorative case study that was used to refine the functional design. This can be found in Appendix M. The aim of this chapter is to present the operationally verified functions of the new framework and to answer part of the eight sub-question; “How can the framework be used to determine the relative greenness of the hardware IT infrastructure of an organisation as a step towards a comprehensive CR strategy?” In Chapter 10 the use of the framework will be further elaborated on.
To structure the functional design in a clear way, this chapter is split into the life cycle phases incorporated in the new framework; procure, use and dispose. Section 8.1 describes performance indicators that fall under procurement, section 8.2 performance indicators related to use and section 8.3 performance indicators addressing disposal of hardware IT. Assumptions, definitions, calculation methodologies and required input data will be defined per performance indicator. Each calculation methodology presented will be depicted as a figure consisting of several squares with different colours. The colours indicate different data sources. Yellow squares mean data-items can be determined from data collected within the organisation investigated. A red squares implies data can be defined form literature, product specifications or LCA databases. A blue square indicates which performance indicator is calculated and a white square is other performance indicator that are required to calculate the “blue" performance indicator. The calculation methodologies incorporated in the functional design are based upon literature, business standards and information available from product specifications. For example, GHG emission are estimated in line with calculation methodologies defined in the GHG Protocol. Further, this chapter illustrates the aggregation of performance indicators and assessment criteria (section 8.4). In the last chapter the use of the functional design will be elaborated on (section 8.5).
8.1 Procure hardware IT In the following sub-sections, performance indicators that fall under the life cycle phase procurement will be outlined. The section starts with defining performance indicator 1.1.1. Performance indicators in this section describe aspects related to procured hardware IT infrastructure units from the beginning to the end of the acquisition process. When first-hand units are procured, environmental effects from the “cradle” are incorporated in the calculations in this phase. When entire units are second-hand (i.e. not new nor consisting of recycled components) the environmental effects from the “cradle” are not included in this phase. This phase economic and environmental effects of procured hardware IT that is outsourced, leased and owned are incorporated.
8.1.1 Water use related to the extraction and production process of hardware IT Definition: This performance indicator addresses water use related to the extraction of materials for hardware IT as well as the production of hardware IT (“cradle”). This performance indicator can be applied to determine the amount of water use related to procuring a first-hand unit that is either entirely new or fabricated from recycled or reused component materials.
Assumptions: It is assumed refurbished or used hardware IT infrastructure units procured have a raw material content of 0%. Thus, water use related to extraction and production of these units are assumed to be negligible. Further, it is assumed water use related to extraction and production is proportional to the percentage of raw materials in hardware IT procured. This implies that when less raw materials are used, less water is used to extract raw materials for these units. Thereby, it is assumed that the LCA studies presented in Appendix J do not incorporate water use reductions due to the presence of recycled component materials. The amount of water used to extract materials and produce a hardware IT infrastructure unit is assumed to be dependent on the type of hardware IT (e.g. laptop, desktop, telephone, etc.) and weight of unit as can be found in calculations in Appendix J. It is assumed that “non-raw materials” in hardware IT use the same amount of water as materials that are recycled. Hence, the presence of “non-raw materials” in hardware IT reduces water use by approximately 92% relative to water use caused by raw materials. The 92% difference is estimated for performance indicator 1.3.2 (Amount of water use related to recycling

MSc Thesis, J.C.P. Kalsheim: Greening Information Technology (IT) Infrastructures
hardware IT). This figure is based upon estimates from literature. The estimation of this percentage can be found in section 8.3.2. Calculation methodology and input: The calculation method shown in Figure 14is chosen to determine this performance indicator using aggregate data.
Number of units
(unit)
Water use related to
extraction and
production of unit (m^3/
unit)
1.1.1 Water use related to the
extraction and production
process of hardware IT (m^3)
Percentage of raw
materials in
hardware IT
procured (%)
Figure 14: calculation method performance indicator 1.1.1
To calculate this performance indicator the number of units that support an organisation’s business applications should be determined from internal business information. This is multiplied by the amount of water use related to extraction and production of a particular unit. Water use dependents on various conditions such as type and size of a unit. LCA studies under EcoLeaf can be used to determine water use related to materials extraction and production of several categories of hardware IT products. EcoLeaf is an environmental label that evaluates a product from extraction of resources to discarding and recycling in line with the ISO standard for LCA (EcoLeaf, 2012). An overview of water used to extract and produce various types of hardware IT can be found in Appendix J. This is based upon the analysis of various devices as defined in EcoLeaf specifications. This information is used to estimate water use related to extraction and production of several types of units such as printers and projectors. With regard to laptops and desktops, a study by IVF (2007) will be used as this provides more up-to-date information than currently available EcoLeaf data do. Next to this information, water use related to extraction and production per unit depends on the proportion of raw, recycled or reused material components in hardware IT units. The more recycled or used component materials there are in a product, the less water is used to extract raw materials and produce this unit. Summing up, calculating this performance indicator the following calculation formula can be applied:
∑ WATERep
(1)
Where N = number of units (unit) WATERepi = amount fo water used for extraction and production of unit i (m
3/unit)
RawMat = Amount of raw materials in unit i (kg) Rec&ReuMat = Amount of recycled or/and reused materials in unit i (kg) i = unit of analysis
8.1.2 Energy use related to the extraction and production process of hardware IT Definition: This performance indicator focuses on energy used to extract materials for hardware IT and the production of hardware IT (“cradle”). It can be applied to determine the amount of energy use related to procuring a first-hand unit that is either entirely new or fabricated from recycled or reused component materials.
Assumptions: It is assumed that entirely refurbished or used hardware IT infrastructure units have a raw material content of 0%. Thus, energy use related to extraction and production of these units are assumed to be negligible. Further, it is assumed that energy use related to extraction and production of a unit is proportional to the percentage of raw materials in the hardware IT infrastructure unit procured. Hence, when less raw materials are used it is assumed less energy is related to the extraction and production of the units. Thereby, it is assumed LCA studies upon which energy use related to extraction and production of the units are based do not incorporate recycled or reused component materials. The amount of energy used to extract materials and produce a hardware IT infrastructure unit is assumed to be dependent on the type of hardware IT (e.g. laptop, desktop, telephone, etc.) and size of unit as estimated in Appendix J. It is assumed the amount of energy use is proportional to the size of the unit. When recycled or reused component materials are used, energy savings are assumed to be approximately 84% relative to raw material use. This percentage is estimated for performance indicator 2.3.2 (Amount of energy use related to recycling hardware IT). The estimate of this percentage can be found in section 8.3.6.

MSc Thesis, J.C.P. Kalsheim: Greening Information Technology (IT) Infrastructures
Calculation methodology and input: The calculation method shown in Figure 15is chosen to determine this performance indicator using aggregate data.
Number of units
(unit)
Energy use related to
extraction and
production of unit (MJ/
unit)
2.1.1 Energy use related to the
extraction and production
process of hardware IT (MJ)
Percentage of raw
materials in
hardware IT
procured (%)
Figure 15: calculation method performance indicator 2.1.1
To calculate this performance indicator the number of units that support an organisation’s business applications could be determined from internal business documentation. This is multiplied by the amount of energy use related to extraction and production of a unit. An overview energy used to extract and produce various types of hardware IT can be found in Appendix J. This is based upon literature and information from LCA studies by hardware IT suppliers to achieve the EcoLeaf label and a study by IVF (2007) for the European Commission. Besides, energy use related to extraction and production per unit is assumed to be dependent on the proportion of raw, recycled or reused material components in hardware IT units. A possible calculation formula that can be applied is:
∑ ENER ep
(2)
Where N = number of units (unit) ENERGYepi = Energy used for extraction and production of unit i (MJ/unit) RawMat = Amount of raw materials (kg) Rec&ReuMat = Amount of recycled or/and reused materials(kg) i = unit of analysis
8.1.3 Amount of recycled and reused materials in hardware IT procured Definition: This performance indicator emphasizes the amount of recycled and reused component materials used in hardware IT. Examples of such materials are scrap iron and steel.
Assumptions: It is assumed that the percentage recycled and reused materials within a unit is known to the hardware IT supplier and that this information can be obtained from material flow cost accounting schemes. Further, it is assumed units that are entirely refurbished and reused consist of 100% raw materials, although this may not necessarily be the case for those units that are refurbished.
Calculation methodology and input: Given the scope of the explorative case study and the prototype, the calculation methodology shown in Figure 16 is applied.
Number of units
(unit)
Percentage
recycled and/or
reused materials
in unit (%)
3.1.1 Amount of recycled and
reused materials in hardware
IT procured (kg)
Weight of unit (kg)
Figure 16: calculation method performance indicator 3.1.1
First the number of units should be determined. The weight of the unit can be determined from product specification documents or average values of similar units. Subsequently the percentage recycled and/or reused component materials in a unit could be determined. To determine this percentage implies that the amount of recycled and/or reused component materials in a unit would have to be determined for all supplied sub-parts. This is very challenging to determine and requires collaboration with hardware IT suppliers. Nevertheless, to calculate this performance indicator the following formula can be applied:
∑ (
)
(3)
Where

MSc Thesis, J.C.P. Kalsheim: Greening Information Technology (IT) Infrastructures
N = number of units (unit) Weight = Average weight of unit i (kg/unit) RawMat = Amount of raw materials (kg) Rec&ReuMat = Amount of recycled or/and reused materials (kg) i = unit of analysis
8.1.4 Amount of raw materials in hardware IT procured Definition: This performance indicator addresses the amount raw materials that are present in the hardware IT infrastructure units procured by an organisation. Raw materials are materials used for the first time in a product.
Assumptions: The same assumptions are made to determine this performance indicator as for the previous performance indicator (see section 8.1.3).
Calculation methodology and input: To determine this performance indicator the calculation methodology depicted in Figure 17is applied.
Number of units
(unit)
Percentage raw
materials in unit
(%)
3.1.2 Amount of raw materials
in hardware IT procured (kg)Weight of unit (kg)
Figure 17: calculation method performance indicator 3.1.2
The same information is required to determine this performance indicator as the previous performance indicator (see section 8.1.3). Hence, to calculate this performance indicator the subsequent formula can be used:
∑ (
)
(4)
Where N = number of units (unit) Weight = Average weight (kg/unit) RawMat = Amount of raw materials (kg) Rec&ReuMat = Amount of recycled or/and reused materials(kg) i = unit of analysis
8.1.5 Amount of refurbished and used hardware IT procured Definition: This performance indicator concerns the amount of hardware IT infrastructure units an organisation procure that has been used one or more times before (i.e. second-hand units). A refurbished unit is an upgraded hardware IT infrastructure unit that still has some value to a market that is less demanding of technological requirements (Knemeyer, Ponzurick & Logar, 2002). A reused unit is not upgraded, but still has a market value.
Assumptions: It is assumed an organisation is informed about the preliminary “life” of hardware IT infrastructure units procured (i.e. whether they are first-hand or second-hand). It is assumed that all second-hand units are either refurbished or used without additional upgrades.
Calculation methodology and input: This performance indicator can be determined using the approach depicted in Figure 18.
3.1.3 Amount of
refurbished or used
hardware IT
procured (kg)
Amount of used or
refurbished units
procured (unit)
Weight of unit (kg/
unit)
Figure 18: calculation method performance indicator 3.1.3

MSc Thesis, J.C.P. Kalsheim: Greening Information Technology (IT) Infrastructures
First whether or not an organisation procure used or refurbished hardware IT infrastructure units could be determined. This can be determined from interviews with management responsible for procuring IT. According to a survey in 2002 of about 190 IT executives in CIO magazine, 77% of the respondents said they were purchasing second market equipment and 46% expected to increase their spending on refurbished IT equipment in the next years (Berinato, 2002). If used or refurbished hardware IT is procured the amount of units and their weight could be determined. Multiplying these, the performance indicator is calculated. Hence, the subsequent formula can be used to estimate this performance indicator:
∑ (5)
Where Nru= number of units refurbished or used (unit) Weight = Average weight of refurbished or used unit (kg/unit) i = unit of analysis
8.1.6 Greenhouse gas emission related to the extraction and production process of
hardware IT Definition: This performance indicator addresses GHG emission related to extraction of raw materials to production of hardware IT supporting business applications. It can be applied to determine the amount of GHG emission related to procuring a first-hand unit that is either entirely new or fabricated from recycled or reused component materials.
Assumptions: The same assumptions are applicable to determine this performance indicator as defined for performance indicator 2.1.1 (see section 8.1.2). Further, it is assumed energy used to extract and produce hardware IT is the only source of GHG emission. It is assumed 1.8 ton CO2equivalent is released per MJ of electricity used during materials extraction and production(IEA, 2011). Moreover, it is assumed electricity use is the only source of GHG emission in the materials extraction and production phase of hardware IT infrastructure units. Other sources of GHG emission are assumed to be negligible.
Calculation methodology and input: The calculation methodology shown in Figure 19 can be used to determine this performance indicator. This methodology is based on the Tier 1 calculation methodology defined by the Intergovernmental Panel on Climate Change (IPCC) (2006).
4.1.1 Greenhouse gas emission
related to the extraction and
production process of hardware
IT (ton CO2)
2.1.1 Energy use related to
the extraction and production
process of hardware IT (MJ)
Greenhouse gas
emission factor (ton
CO2/MJ)
Figure 19: calculation method performance indicator 4.1.1
To calculate this performance indicator, energy use related to the extraction and production process of hardware IT is used (see performance indicator 2.1.1). Next, GHG emission data can be used to estimate GHG emission associated with this energy use as suggested in the GHG Protocol (2004). The world average GHG emission per kWh from electricity generated was 0.5 kg of CO2equivalent per kWh in 2009. This is the same as 1.8 kg of CO2equivalents per MJ (IEA, 2011). This emission factor can be used to determine GHG emission in subsequent upstream and downstream emission calculations. Hence, to calculate this performance indicator the following calculation formula can be applied:
I H I 1.8 10 (6)
Where PI2.1.1 = energy use related to the extraction and production process of hardware IT (MJ) GHGep = world average GHG emission due to coal based electricity usage (ton CO2/MJ)

MSc Thesis, J.C.P. Kalsheim: Greening Information Technology (IT) Infrastructures
8.1.7 Procurement costs of hardware IT
Definition: This performance indicator addresses all costs associated with procuring a hardware IT infrastructure unit. For several units such as servers and storage this also involves licence costs.
Assumptions: It is assumed depreciation costs or price of procured units reflect procurement costs, and thereby also the economic value of hardware IT infrastructure units. Other aspects related to procuring hardware IT are not incorporated in this functional design. It is acknowledged that additional costs related to procurement might be high. These are assumed to be negligible compared to the price of a procured hardware IT infrastructure unit.
Calculation methodology and input: In Figure 20 the calculation methodology that can be used to determine this performance indicator is shown.
Number of units
(unit)
Annual
depreciation costs
of unit (euro/year/
unit)
5.1.1 Procurement costs of
hardware IT (euro)
Expected lifetime
of unit (year)
Figure 20: calculation method performance indicator 5.1.1
To calculate this performance indicator the number of units, depreciation costs unit and expected lifetime of the units are required data-items. These data-items are determined from information by the organisation investigated as this might vary between various organisation due for instance economies of scale when large batches from hardware IT suppliers are procured. Annual depreciation costs can be determine directly from financial budgets. It should be notices that procurement costs per unit of analysis can be determined directly as well. Hence, to calculate this performance indicator the following calculation formulas can be used:
∑ (7)
or
∑ (8)
Where N = number of units (unit) DepCost = Annual depreciation costs of unit ([euro/year]/unit) ExpLife = Expected lifetime (year) Pro = Price of procured unit i (euro/unit) i = unit of analysis
When an organisation have to pay licence costs, this should be incorporated in the price of procured unit i.
8.2 Use hardware IT In the next sub-sections performance indicators related to the use of hardware IT infrastructure units will be outlined. In this phase outsourced, leased and owned hardware IT infrastructure units should be taken into account when estimating performance. The definition of these classes of units can be found in Chapter 7.
8.2.1 Amount of water used in hardware IT operation per source Definition: This performance indicator focuses on the amount of water used per water source during the operational life time of a hardware IT infrastructure unit. The operational life time of a unit is defined as the time from the unit is procured until it is disposed. In this phase water might be used to cool hardware IT infrastructure units. Additionally, water is used to generate electricity that hardware IT infrastructure units use during operations. Both sources of water use are incorporated in this performance indicator.

MSc Thesis, J.C.P. Kalsheim: Greening Information Technology (IT) Infrastructures
Assumptions: The amount of water used for cooling is assumed to be distributed equally over an entire facility. It is assumed that hardware IT infrastructure units placed in data centres are the only units that are cooled by water. Currently multi-user and single-user hardware IT infrastructure units in offices are cooled by built-in fans. It is assumed cooling of hardware IT infrastructure units in data centres can be determine from the rate of British Thermal Units (BTU) per hour defined in product specifications of hardware IT. Furthermore, 12.000 BTU/hour is assumed to equal 1 ton of cooling water, the energy produced by melting one 'short' ton of ice in 24 hours (Sun Microsystems, 2006). It is assumed 12.000 BTU requires 1 ton of cooling water per hour. 1 BTU/hour is assumed to be equal to 3.41 watts (Sun Microsystems, 2006) (HP, 2008). Furthermore, it is assumed water use caused by electricity production depends on type of energy produced as shown in Appendix J. This water use is part of the water use caused by hardware IT operations.
Calculation methodology and input: The calculation methodology that can be applied to determine this performance indicator is shown in Figure 21.Figure 21 shows there are two separate inputs to this performance indicator; water caused by cooling and energy production.
1.2.1 Amount of water
used in hardware IT
operation per water
source (m^3/source)
Amount of units
cooled by water
(unit)
Amount of cooling
water required per
unit (m^3 per unit)
2.2.1 Amount of energy
use of hardware IT
operation (MJ)
Amount of water
use per energy
source (m^3/MJ of
energy type)
Proportion of each
energy type in energy
mix procured (%/
energy type)
Source of
cooling water
(source)
Source of water
used energy
production (source)
Figure 21: calculation method performance indicator 1.2.1
To calculate this performance indicator, the amount of water extracted per source for cooling hardware IT should be determined. This can be determined from the input of three information sources; amount of units cooled by water, amount of cooling water required per unit and source of cooling water. Amount of units cooled by water cooling systems can be determine from technical specification published by data centres where hardware IT infrastructure units are operated. Further, amount of cooling water required per unit can be determined from product specifications, assuming cooling is required for an amount proportional to energy consumption of a unit (Rasmussen, 2007).
Next to water used to cool hardware IT, water is also used to produce electricity that is used by these units during operation. A study by Fthenakis & Kim(2010) estimate the amount of water withdrawal per unit of electricity produced from various electricity sources over the entire life cycle. Other studies suggest there is a relationship between electricity consumption and water use (Younos, Hill, & Poole, 2009) (Gleick, 1994). In Appendix Jthe amount of water use caused by the production and distribution of various types of electricity are listed. This information is used to calculate the performance indicator. Summarizing, this performance indicator can be estimated when applying the following calculation formula:
∑
∑
(9)
Where CUnit= Amount of unit i cooled with cooling water (unit) Cooling = Amount of cooling required per unit i (BTU/hour) = 3.41 × watt (active mode)
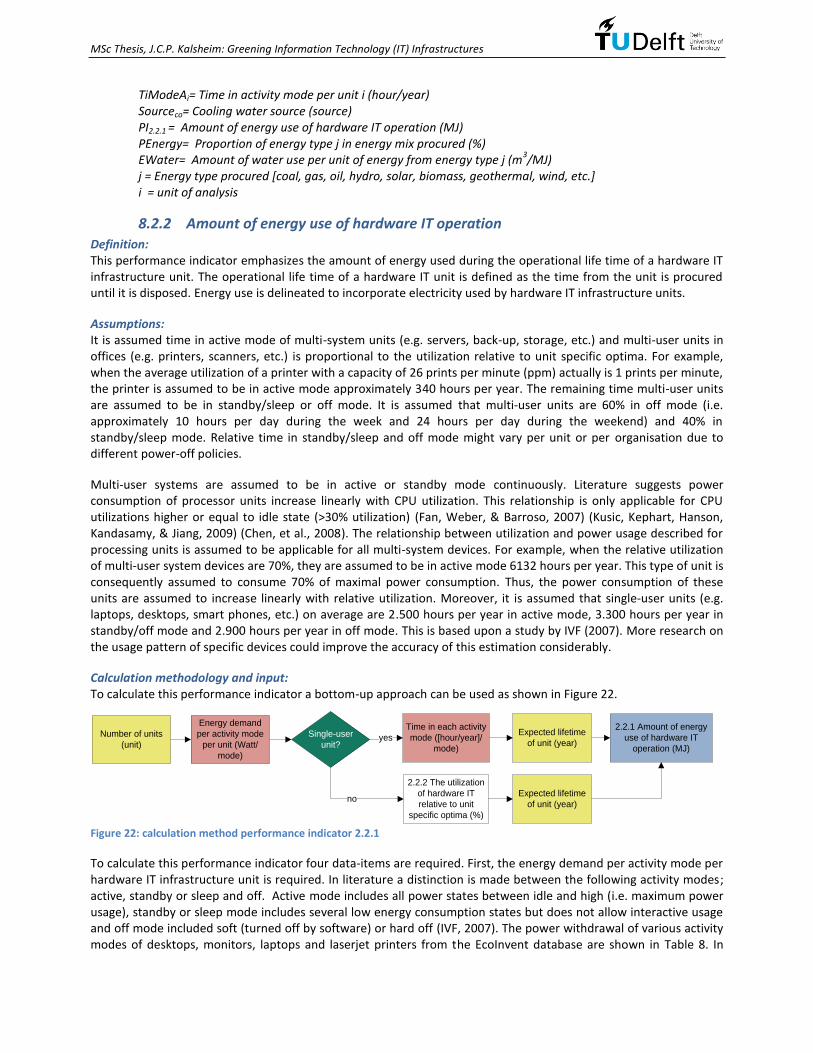
MSc Thesis, J.C.P. Kalsheim: Greening Information Technology (IT) Infrastructures
TiModeAi= Time in activity mode per unit i (hour/year) Sourceco= Cooling water source (source) PI2.2.1 = Amount of energy use of hardware IT operation (MJ) PEnergy= Proportion of energy type j in energy mix procured (%) EWater= Amount of water use per unit of energy from energy type j (m
3/MJ)
j = Energy type procured [coal, gas, oil, hydro, solar, biomass, geothermal, wind, etc.] i = unit of analysis
8.2.2 Amount of energy use of hardware IT operation Definition: This performance indicator emphasizes the amount of energy used during the operational life time of a hardware IT infrastructure unit. The operational life time of a hardware IT unit is defined as the time from the unit is procured until it is disposed. Energy use is delineated to incorporate electricity used by hardware IT infrastructure units.
Assumptions: It is assumed time in active mode of multi-system units (e.g. servers, back-up, storage, etc.) and multi-user units in offices (e.g. printers, scanners, etc.) is proportional to the utilization relative to unit specific optima. For example, when the average utilization of a printer with a capacity of 26 prints per minute (ppm) actually is 1 prints per minute, the printer is assumed to be in active mode approximately 340 hours per year. The remaining time multi-user units are assumed to be in standby/sleep or off mode. It is assumed that multi-user units are 60% in off mode (i.e. approximately 10 hours per day during the week and 24 hours per day during the weekend) and 40% in standby/sleep mode. Relative time in standby/sleep and off mode might vary per unit or per organisation due to different power-off policies.
Multi-user systems are assumed to be in active or standby mode continuously. Literature suggests power consumption of processor units increase linearly with CPU utilization. This relationship is only applicable for CPU utilizations higher or equal to idle state (>30% utilization) (Fan, Weber, & Barroso, 2007) (Kusic, Kephart, Hanson, Kandasamy, & Jiang, 2009) (Chen, et al., 2008). The relationship between utilization and power usage described for processing units is assumed to be applicable for all multi-system devices. For example, when the relative utilization of multi-user system devices are 70%, they are assumed to be in active mode 6132 hours per year. This type of unit is consequently assumed to consume 70% of maximal power consumption. Thus, the power consumption of these units are assumed to increase linearly with relative utilization. Moreover, it is assumed that single-user units (e.g. laptops, desktops, smart phones, etc.) on average are 2.500 hours per year in active mode, 3.300 hours per year in standby/off mode and 2.900 hours per year in off mode. This is based upon a study by IVF (2007). More research on the usage pattern of specific devices could improve the accuracy of this estimation considerably.
Calculation methodology and input: To calculate this performance indicator a bottom-up approach can be used as shown in Figure 22.
Number of units
(unit)
Time in each activity
mode ([hour/year]/
mode)
2.2.1 Amount of energy
use of hardware IT
operation (MJ)
Energy demand
per activity mode
per unit (Watt/
mode)
Expected lifetime
of unit (year)Single-user
unit?
no
yes
2.2.2 The utilization
of hardware IT
relative to unit
specific optima (%)
Expected lifetime
of unit (year)
Figure 22: calculation method performance indicator 2.2.1
To calculate this performance indicator four data-items are required. First, the energy demand per activity mode per hardware IT infrastructure unit is required. In literature a distinction is made between the following activity modes; active, standby or sleep and off. Active mode includes all power states between idle and high (i.e. maximum power usage), standby or sleep mode includes several low energy consumption states but does not allow interactive usage and off mode included soft (turned off by software) or hard off (IVF, 2007). The power withdrawal of various activity modes of desktops, monitors, laptops and laserjet printers from the EcoInvent database are shown in Table 8. In

MSc Thesis, J.C.P. Kalsheim: Greening Information Technology (IT) Infrastructures
product specification documents by hardware IT suppliers more accurate data can be found about the power consumption of units. For example, in product specifications of the HP EliteBook 8460p the power use in active, sleep/standby and off mode were approximately 12 watt, 1.2 watt and 0.56 watt respectively (HP, 2012). This type of information could be used as input data. Information found in LCA literature could be used as well. This is a more reliable information source.
Table 8: Average power draws per activity mode (Lehmann & Gallen, 2007)
Hardware IT type Energy use in activity mode (Watt)
Active Sleep/standby Off Desktop 60 25 2
CRT-monitor 90 20 3
LCD-monitor 25 5 1,5
Laptop 19 4 1.5
Laserjet printer 300 50 1
Second, time spent in each activity mode could be estimated. This depends on the type of unit; whether it is a single-user system or not. This is depicted in the calculation methodology in Figure 22 as a decision element with the shape of a diamond. For single-user systems average data can be found in literature, through estimations or measurements. A study by IVF (2007) illustrate the average computer usage pattern of several types of units. Multi-system units such as servers, switches, etc. and multi-user systems are assumed to be active in mode correspondence with their relative utilization as calculated in performance indicator 2.2.2. Estimating power usage of multi-user equipment is different. Time in active mode of a printer or copier can be determine from the amount of prints that are made. Lastly, the expected lifetime of a unit should to be determined to estimate this performance indicator. Summarizing, the following calculation formula can be applied:
∑ ∑
(10)
Where N = number of units (unit) ExpLife = Expected lifetime (year) EnMode = Energy demand activity mode x per unit i (Watt) TiMode = Time in activity mode x per unit i (hour/year) i = unit of analysis j = activity mode [active, standby/sleep, off]
8.2.3 The utilization of hardware IT relative to unit specific optima Definition: This performance indicator addresses the capacity of a hardware IT infrastructure unit that is used relative to a unit specific optimum. The capacity used is defined as utilization, and the maximum capacity of a unit is defined as the unit specific utilization optimum.
Assumptions: It is assumed that the unit specific utilization optimum of (1) multi-user systems is their maximum capacity in operational mode (e.g. maximum prints per minute for printers and copy machines), (2) multi-system units (server, switch, etc.) is 100% and (3) single-user units is approximately 15%. Additional research should be carried out to defined unit specific utilization optimum values better.
Calculation methodology and input: To determine this performance indicator, the calculation methodology described in Figure 23can beapplied.
Unit specific
utilization optimum
(%)
2.2.2 The utilization of
hardware IT relative to unit
specific optima (%)
Average utilization
of unit (%)
Figure 23: calculation method performance indicator 2.2.2

MSc Thesis, J.C.P. Kalsheim: Greening Information Technology (IT) Infrastructures
To calculate this performance indicator data is needed about the unit specific utilization optimum and the average utilization of a unit. The utilization of a unit is defined as the capacity used. Hence, the optimal utilization is the maximal capacity usage possible. For a tape, sever, back-up, laptop and desktop this is the percentage of the central processing unit (CPU) that is used during operation. To increase the utilization of a severs or other hardware IT infrastructure units that are shared by multiple end-users, these might consolidated using virtualized machines. In server consolidation multiple server applications are deployed onto virtual machines that run on a single, more powerful machine (Marty & Hill, 2007). The unit specific utilization optimum can be found in product specific documentation or literature. For example, a printer with a capacity of 45 prints per minutes has an optimal utilization of 45 prints per minutes. Summarized, to calculate this performance indicator the following calculation formulacan be applied:
∑
∑
(11)
Where Util = Average utilization of unit (%) UtilOp = Unit specific utilization optimum (%) N = number of units (unit) i = unit of analysis
8.2.4 Amount of replaced sub-components in hardware IT Definition: This performance indicator focuses on the amount of replaced sub-components in hardware IT infrastructure units during its operational lifetime. A sub-component of a hardware IT infrastructure unit can be replaced with the purpose of refurbishing the unit. Assumptions: It is assumed that sub-components that are replaced entirely consist of raw materials. Furthermore, it is assumed that the average weight of a sub-component is approximately 0,1 kg. This is about 1/5 of the size of batteries found in laptops by hardware suppliers such as HP and Dell. The effect of this performance indicator on energy use, water use and GHG emission is assumed to be negligible relative to procured hardware IT infrastructure units. It will therefore not be included in additional performance indicator estimates.
Calculation methodology and input: To determine this performance indicator, the calculation methodology described in Figure 24 can be applied.
Number of units
(unit)
Average number of
sub-components
replaced in unit (sub-
component/year)
3.2.1 Amount of replaced
sub-components with raw
materials in hardware IT
(kg)
Expected lifetime
of unit (year)
Average weight of
sub-component
(kg/sub-
component)
Figure 24: calculation method performance indicator 3.2.1
To calculate this performance indicator the following data-items are necessary: (1) number of units and (2) average number of sub-components replaced in unit. Hence, to calculate this performance indicator the following calculation formula can be applied:
∑ ) (12)
Where N = number of units (unit) SubC = average number of sub-components replaced in a unit (sub-component/year) ExpLife = expected lifetime (year) Weightsub = average weight of sub-component (kg/sub-component) i = unit of analysis

MSc Thesis, J.C.P. Kalsheim: Greening Information Technology (IT) Infrastructures
8.2.5 Amount of repaired sub-components in hardware IT
Definition: This performance indicator concerns the amount of repaired sub-components in hardware IT infrastructure units. Repairing units are part of internal maintenance and can extend the lifetime of a unit due to internal reuse.
Assumptions: It is assumed one defective unit requires the reparation of one sub-component. Further, it is assumed that repairing sub-components in hardware IT infrastructure units do not lead to additional raw material use or other environmental effects.
Calculation methodology and input: The same calculation methodology as for performance indicator 3.2.1 in section 8.2.4 can be applied to determine this performance indicator. Instead of average number of sub-components replace in unit, average number of sub-components repaired in unit should be determined. This performance indicator might be determined directly from internal documents and/or from one or more interviews with IT managers in the reporting organisation. The performance indicator can be estimated from the total number of defects that are sent to hardware IT suppliers for reparation.
8.2.6 Greenhouse gas emission related to extraction and production of energy used in
hardware IT operation Definition: This performance indicator emphasizes the GHG emission from the purchased energy that is used tooperate hardware IT infrastructure units. The energy used is limited to electricity consumption. Scope 3 in the GHG Protocol suggests the entire production chain of electricity should be included when GHG emission associated with electricity consumption is calculated.
Assumptions: It is assumed only electricity is used to support hardware IT infrastructure units during operation. It is assumed GHG emission due to electricity consumption depends on the type of electricity used in line with estimates defined in Appendix J.
Calculation methodology and input: To estimate this performance indicator the calculation methodology described in Figure 25can be applied.
4.2.1 Greenhouse gas emission
extraction and production of
purchased energy used in
hardware IT operation (ton CO2)
2.2.1 Amount of
energy use of
hardware IT
operation (MJ)
Greenhouse gas
emission per energy
type (ton CO2/MJ of
energy type)
Proportion of each
energy type in energy
mix procured (%/
energy type)
Figure 25: calculation method performance indicator 4.2.1
Information about the amount of energy use of hardware IT operation and total annual amount of energy procured can be combined to calculate the proportion of energy for hardware IT operation. To estimate this performance indicator the following formula can be used:
∑ (13)
Where PEnergy= proportion of energy type i in energy mix procured (MJ/energy type) GHG = GHG emission per energy type (ton CO2/MJ of energy type)
PI2.2.1= Amount of energy use of hardware IT operation (MJ) i = type of energy source [natural gas, oil, coal, photovoltaic, etc.]

MSc Thesis, J.C.P. Kalsheim: Greening Information Technology (IT) Infrastructures
8.2.7 Energy costs of hardware IT operation
Definition: This performance indicator focuses on the costs associated with operating hardware IT infrastructure units due to energy use. As regards energy use, this is limited to electricity consumption during operations.
Assumptions: It is assumed the average price per unit of electricity is 0,054 euro per MJ for non-renewable and 0,060 euro per MJ for renewable energy. This is based upon an extrapolation of electricity prices paid by European households from 2009 to 2011 (European Commission, 2012). Renewable energy use is defined as “energy used that comes directly from renewable sources” in this research. It is assumed electricity is the only energy source used to operate hardware IT infrastructure units in an organisation.
Calculation methodology and input: To determine this performance indicator, the calculation methodology described in Figure 26 is chosen.
Proportion of
renewable and
conventional energy
(%/energy type)
Energy price
(euro/MJ)
5.2.1 Energy costs
of hardware IT
operation (euro)
2.2.1 Amount of
energy use of
hardware IT
operation (MJ)
Figure 26: calculation method performance indicator 5.2.1
To calculate this performance indicator in line with the calculation methodology in Figure 27 the amount of energy use of hardware IT operation(performance indicator 2.2.1) and the energy price need to be determined. The price an organisation pays per unit of energy is possible to determine from internal documents or average market prices. In 2011 the average price paid for electricity by households in Europe was 0.18 euro per kWh (European Commission, 2012). This is the same as 0,05 euro/MJ. Renewable energy is assumed to be approximately 10% more expensive, hence 0,054 euro per MJ in 2011.This percentage is based upon data from BS Netherlands. Extrapolating this information to 2012, average electricity price in Europe is 0,054 euro per MJ for non-renewable and 0,06 euro per MJ for renewable energy. The description of the extrapolation made to determine these prices can be found in Appendix J. It is recommended to update this information over time for an accurate estimate. To calculate this performance indicator the following formula can be used:
(14)
Where PI2.2.1= Amount of energy use of hardware IT operation (MJ)
EPrice= Energy price (euro/MJ)
8.2.8 Water costs of hardware IT operation Definition: This performance indicator emphasizes the costs associated with operating hardware IT infrastructure units due to water use. This is water used to cool and supply the hardware IT infrastructure units with sufficient electricity to operate. Assumptions: The same assumptions can be made for this performance indicator as for performance indicator 1.2.1 (see section 8.2.1). It is assumed the average price of water is 2.1 euro per m
3. This is based on the average price for drink water
in the Netherlands in 2011 (Vewin, 2011). This is the worst case water price for organisations operating in the Netherlands. It is recommended to further investigate the price of water used by electricity producers and data centres. Calculation methodology and input: To determine this performance indicator the calculation methodology described in Figure 27 can be used.

MSc Thesis, J.C.P. Kalsheim: Greening Information Technology (IT) Infrastructures
Amount of units
cooled by water
(unit)
Amount of cooling
water required per
unit (m^3 per unit)
Source of
cooling water
(source)
Water price
(euro/m^3)
5.2.2 Water costs
of hardware IT
operation (euro)
Figure 27: calculation method performance indicator 5.2.2
To calculate water costs of hardware IT operation in line with the calculation methodology in Figure 28 the amount of water used by hardware IT infrastructure units and the water price need to be determined. The price an organisation pays per unit of water is possible to determine from internal documents or from average market prices. In 2011 the price per m
3 of drinking water in the Netherlands was 2.1 euro (Vewin, 2011). Besides bottled water, this
is possibly the highest water price in the Netherlands. Hence, to calculate this performance indicator following formula can be used:
∑
∑
(15)
Where CUnit= Amount of unit i cooled with cooling water (unit) Cooling = Amount of cooling required per unit i (BTU/hour) = 3.41 × watt (active mode) TiModeAi= Time in activity mode per unit i (hour/year) Waterco = Amount of water for cooling (m3/year per source) WPrice= Water price (euro/m
3) i = unit of analysis
8.2.9 Costs of carbon credits for the operation of hardware IT Definition: This performance indicator focuses on the costs associated with operating hardware IT infrastructure units due to GHG emission caused by electricity usage. The indicator expresses the price organisations often are obliged to pay for carbon credits when non-renewable energy is procured. A carbon credit is a permit or certificate expressing the right to emit one tonne of CO2 or CO2 equivalent.
Assumptions: It is assumed the only source of GHG emission of hardware IT infrastructure units in the operational phase is electricity. Further, it is assumed that an organisation has to pay for GHG emission related to this when buying fossil fuel based electricity. It is assumed the price per tonne of CO2equivalent emitted is 16 euro. This price is based upon the price used by the Dutch Ministry of Economic Affairs, Agriculture & Innovation in 2011 (Ministerie van Economische Zaken, Landbouw & Innovatie, 2011).
Calculation methodology and input: The calculation methodology in Figure 28 can be used to calculate the costs of carbon credits during hardware IT operation.
Price of carbon
credit (euro/ton
CO2)
5.2.3 Costs of
carbon credits for
the operation of
hardware IT (euro)
4.2.1 Greenhouse gas emission
extraction and production of
purchased energy used in
hardware IT operation
Figure 28: calculation method performance indicator 5.2.3
To determine this performance indicator in line with the calculation methodology illustrated Figure 28, the amount of GHG emission due to extraction and production of purchase of electricity for hardware IT needs to be determined first. How this could be estimated can be found in section 8.2.6. Next, the price of carbon credits needs to be determined. The price an organisation pays per unit of CO2 equivalent emitted is possible to determine from financial documents in an organisation or from average market prices. In a report published in 2011, the Dutch Ministry of Economic Affairs, Agriculture & Innovation reported the that market price of carbon credits remained

MSc Thesis, J.C.P. Kalsheim: Greening Information Technology (IT) Infrastructures
around 16 euro per tonne of emitted CO2in 2011 (Ministerie van Economische Zaken, Landbouw & Innovatie, 2011). This value is incorporated in the calculation because it has been measured at the moment of performing the case study. The price of carbon credits should be updated. Summing up, calculating this performance indicator the subsequent formula can be used:
(16)
Where PI4.2.1= Amount of GHG emission of hardware IT operation (ton CO2) Pricecc= Price of carbon credit (euro/ton CO2)
8.2.10 Maintenance costs of hardware IT Definition: This performance indicator emphasizes the costs associated with maintaining hardware IT infrastructure units used by an organisation. These are direct costs an organisation make during the operational lifetime of a unit such as repairmen costs of defective units.
Assumptions: It is assumed the maintenance costs are distributed equally over all classes of hardware IT infrastructure units.
Calculation methodology and input: The calculation methodology in Figure 29 can be used to calculate this performance indicator.
Number of units
(unit)
Expected life time
of unit (year)
5.2.4 Maintenance
costs of hardware IT
(euro)
Annual
maintenance costs
per unit (euro/unit
per year)
Figure 29: calculation method performance indicator 5.2.4
To determine this performance indicator three data-items are needed; number of units, annual maintenance costs per unit and expected life time of a unit. The first data-item can be determined from asset lists found at the IT department of an organisation. The annual maintenance costs per hardware IT infrastructure unit is more difficult to determine. This can be estimated from maintenance budgets or agreements made in contracts with hardware IT suppliers responsible for maintaining units. The expected life time of a unit can be determined from asset lists or procurement policies. Summarizing these data-items, the following formula can be used to estimate this performance indicator:
∑ ) (17)
Where N = number of units (unit) MainCost = annual maintenance costs per unit (euro/unit/year) ExpLife = expected lifetime (year) i = unit of analysis
8.3 Dispose hardware IT In the next sub-sections, performance indicators related to disposal of hardware IT infrastructure units will be outlined. Performance indicators defined in this life cycle phase address owned hardware IT or hardware IT that is controlled by the reporting organisation in line with the organisational boundaries set by the GHG Protocol (WRI & WBSCD, 2011). When hardware IT infrastructure units are sold to third parties at the end-of-life, it is assumed the selling price reflects the value of the end-of-life processes (e.g. recycling, incineration, refurbish, etc.).
8.3.1 Amount of water use related to hardware IT discard to landfill Definition: This performance indicator concerns the amount of water used to discard hardware IT infrastructure units to landfill.

MSc Thesis, J.C.P. Kalsheim: Greening Information Technology (IT) Infrastructures
Assumptions: The amount of water used to discard hardware IT infrastructure units to landfill is assumed to be negligible. It is assumed hardware IT infrastructure units are sent directly to landfill and that the water use related to this process is negligible. Calculation methodology and input: Due to the scope of the research, the amount of water used to discard hardware IT infrastructure units to landfill is assumed to be negligible.
8.3.2 Amount of water use related to recycling hardware IT Definition: This performance indicator addresses the amount of water used when hardware IT infrastructure units are recycled.
Assumptions: It is assumed that an equal amount of water is used for all hardware IT infrastructure unit. Further, it is assumed average water use related to recycling a hardware IT infrastructure unit is 8% ± 6% of water used to extract and produce the units from raw materials. This figure will be further elaborated on in the next paragraphs. Calculation methodology and input: A calculation methodology that can be applied to estimate this performance indicator is shown in Figure 30.
Number of units
for recycling (unit)
Water use related to
extraction and
production of unit
(m^3/unit)
1.3.2 Amount of water
use related to
recycling hardware IT
(m^3)
Relative amount of
water used to
recycle hardware
IT (%)
Figure 30: calculation method performance indicator 1.3.2
Information about the number of units for recycling, relative amount of water used to recycle hardware IT and water use related to extraction and production of unit is needed when estimating this performance indicator in line with the calculation methodology in Figure 31. To determine the relative amount of water used to recycle hardware IT an estimate is made by breaking this data-item into two sub-data-items. For example, the proportion of various categories of materials found in hardware IT can be multiplied with the relative water savings per category of material to estimate this data-item. Another way of estimating this data-item is to use data from earlier LCA studies. In the subsequent paragraphs these estimates will be outlined and combined to an average value describing an estimate of relative amount of water used to recycle hardware IT.
First, the proportion of each type of material found in electronic and hardware IT infrastructure scrap is determined. Of the total amount of electronic scrap about 65-66% consists of metals and 19-20% consists of plastics. The remaining parts are glass (4%), wood (1%) and other (10%) (APME, 1995) (Zhang & Forssberg, 1997) (Balakrishnan, Anand, & Chiya, 2007) (Klatt, 2003) (Dalrymple, et al., 2007). For example, a discarded personal computer with a CRT monitor typically consists of approximately 44% metals, 23% plastics, 17% electronic components and 15% glass (Berkhout & Hertin, 2004). A study by Wath et al. (2011) shown a personal computer (PC) consists of approximately 62% metals, 15% glass and 23% plastics. Using the average of the three data points (electronic scrap, monitor and PC) hardware IT infrastructure units are assumed to consist of 64% metals, 21% plastics and 15% glass or other materials. For each of these categories of components in hardware IT, water use relative to extracting and processing raw materials need to be determined to estimate the relative amount of water used to recycle hardware IT. Recycling various metals such as steel and iron, the water use compared to using virgin materials is expected to decrease by approximately 40%. The reduction in polluted water is 76% (ISRI, 2003) (Cui & Forssberg, 2003). According to the US Environmental Protection Agency (EPA), steel recycling contributes to 76% water reduction (Kumara & Putnam, 2008). Recycling plastics, water use is expected to decrease by approximately 91% (Arena, Mastellone, & Perugini, 2003). Water savings related to recycling glass, wood and other materials in electronic scrap is assumed to result in the same water savings as recycled plastics. For each of the categories of components materials in hardware IT, water reductions relative to extracting and processing materials is assumed to be approximately 76%, 91% and 91% for metals, plastics and glass and other materials respectively. Hence, the average

MSc Thesis, J.C.P. Kalsheim: Greening Information Technology (IT) Infrastructures
water use related to recycling a hardware IT infrastructure units is estimated to be approximately 82% relative to water used to extract and produce the unit from raw materials.
Second, a study by IVF (2007) suggests that recycling laptops, monitors and desktops can result in 92% to 97% less water use than when raw materials are extracted and processed for these devices. The percentages and underlying data from the study are shown in Table 9.
Table 9: Water saving recycling hardware IT units(IVF, 2007)
Hardware IT unit Materials extraction and
processing (litres) Recycling
(litres) Savings water
use (%) Laptop 770 52 0,93
CRT monitor 670 21 0,97
LCD monitor 590 15 0,97
Desktop 1.100 88 0,92
Based on the two estimates it is assumed that recycling hardware IT result in a 92% ± 6% water reductions relative to extracting and processing virgin materials. This value is multiplied by the amount of water use related to extraction and production of hardware IT. In Appendix J water use related to extraction and production of several different hardware IT infrastructure units can be found. Summing up, to calculate this performance indicator the following formula can be applied:
∑ 0.08 (18)
Where NRec = number of units recycled (unit) WATER = amount of water used for extraction and production of unit (m
3/unit)
i = unit of analysis
8.3.3 Amount of water use to recover energy from hardware IT Definition: This performance indicator focuses on the amount of water used when hardware IT infrastructure units are burned or otherwise destroyed to recover energy within the framework entity scope(Menad, Björkman, & Allain, 1998). Although hardware IT infrastructure units might be discarded for incineration without any energy being recovered, this still fall under this performance indicator.
Assumptions: It is assumed hardware IT infrastructure units are burned in a thermoelectric power plant to recover energy. These plants consume on average 220 m
3 per MWh in the worst case (biomass), which is 0.061 m
3 water per MJ
(Fthenakis& Kim, 2010).
Calculation methodology and input: The methodology that can be used to estimate this performance indicator is shown in Figure 31.
1.3.3 Amount of water
use related to burning or
otherwise destroying
hardware IT (m^3)
Amount of water use
to recover energy
from hardware IT
(m^3/MJ)
2.3.3 Amount of
energy recovered from
hardware IT (MJ)
Figure 31: calculation method performance indicator 1.3.3
First, the amount of energy recovered from hardware IT discarded by an organisation should be determined (see performance indicator 2.3.3). Second, the amount of water used to recover energy from hardware IT should be calculated. To determine this performance indicator within the intended scope of the prototype, it is assumed hardware IT units are sent to thermal plants to recover energy. A study by Inhaber (2004) show that water withdrawal for the production of energy from fossil fuels in the US were 73 m
3 per MWh. Other studies suggest
water withdrawal for thermoelectric power plants were between 160-220 m3 per MWh and 40-220 m
3 per MWh
dependent on the type of electricity generation and preliminary processing of materials (Gleick, 1994)(Fthenakis&

MSc Thesis, J.C.P. Kalsheim: Greening Information Technology (IT) Infrastructures
Kim, 2010). Assuming the worst case scenario, recovering energy from hardware IT in thermoelectric power plants costs 220 m
3 water per MWh. This is the same as 0.061 m
3 water per MJ. Hence, the following formula can be used
to determine this performance indicator:
0.061 (19)
Where P2.3.3 = Amount of energy recovered from hardware IT (MJ) BurWater = Water used to burn or otherwise destroy unit (m
3/unit)
i = unit of analysis
8.3.4 Amount of water use related to reuse and refurbish hardware IT for third party
use Definition: This performance indicator addresses the amount of water used when hardware IT infrastructure units are refurbished for third party use within the framework entity scope. Refurbished units are upgraded hardware IT infrastructure units to be used over again.
Assumptions: It is assumed that an equal amount of water is used to refurbish all types of units. It is assumed reusing hardware IT infrastructure units does not cause any water use. Further, it is assumed that the average water use related to refurbishing a hardware IT infrastructure unit is 8% ± 6% of water used to extract and produce the units. Hence, water use related to refurbish a unit is assumed to be the same as recycling a units. This estimate can be found in section 8.3.2. More research should be done to improve the accuracy of this estimation.
Calculation methodology and input: To determine this performance indicator the calculation methodology shown in Figure 32 can be used.
Number of units
refurbished for
third party use
(unit)
Water use related to
extraction and
production of unit
(m^3/unit)
1.3.4 Amount of water
use related to reuse and
refurbish hardware IT
for third party use (m^3)
Relative amount of
water used to
recycle hardware
IT (%)
Figure 32: calculation method performance indicator 1.3.4
The number of units refurbished for third party use is determined from information provided by the organisation. Furthermore, the amount of water use related to refurbish hardware IT for third party use is assumed to be the same as for recycled units. Hence, to calculate this performance indicator the following formula can be applied:
∑ 0.08 (20)
Where NRec = number of units refurbish (unit) RecWater = Water used to refurbish unit (m
3/unit)
WATER = amount of water used for extraction and production of unit (m3/unit)
i = unit of analysis
8.3.5 Amount of energy use related to hardware IT discard to landfill Definition: This performance indicator focuses on the amount of energy used to discard hardware IT infrastructure units to landfill. Assumptions: The amount of energy used to discard hardware IT infrastructure units to landfill is assumed to be negligible. It is assumed that hardware IT infrastructure units are sent directly to landfill and that the energy use of this process is negligible.

MSc Thesis, J.C.P. Kalsheim: Greening Information Technology (IT) Infrastructures
Calculation methodology and input: Due to the scope of the case study and the prototype model, the amount of energy used to discard hardware IT infrastructure units to landfill is assumed to be negligible.
8.3.6 Amount of energy use related to recycling hardware IT Definition: This performance indicator addresses the amount of energy used when hardware IT infrastructure units are recycled within the framework entity scope.
Assumptions: It is assumed that an equal amount of energy is used to recycle all types of units of any materials composition. It is assumed the average energy use related to recycling a hardware IT infrastructure unit is approximately 28% of the energy used to extract and produce the units. This estimate will be elaborated on the next paragraphs.
Calculation methodology and input: The estimate this performance indicator the calculation methodology chosen Figure 33 can be applied.
Number of units
for recycling (unit)
Energy use related
to extraction and
production of unit
(m^3/unit)
2.3.2 Amount of
energy use related to
recycling hardware IT
(MJ)
Relative amount of
energy used to
recycle hardware
IT (%)
Figure 33: calculation method performance indicator 2.3.2
This performance indicator can be estimated with the following data-items; number of units for recycling, relative amount of energy used to recycle hardware IT and energy use related to extraction and production of a unit. The first data-item can be determined from assets lists. Estimates that can be used to determine the last data-item can be found in Appendix J. To determine the relative amount of energy used to recycle hardware IT an estimate is made by breaking the data-item into several sub-data-items as outlined for performance indicator 1.3.2.
First, it is assumed that electronic scrap, monitors and PCs, hardware IT infrastructure units to consist of approximately; 64% metals, 21% plastics and 15% glass or other materials. Second, energy savings due to recycling instead of extracting and processing raw materials need to be determined. Recycling plastics, the energy savings are approximately 80-90% and recycling glass requires 20-34% less energy (ISRI, 2011) (Onusseit, 2006). Recycled metals, energy savings over virgin materials vary between 95% (aluminium) and 60% (zinc) (Cui & Forssberg, 2003) (BMRA, 2010) (Green, 2007) (Onusseit, 2006)(Johnson, Reck, Wang, & Graedel, 2008) (Das & Yin, 2007) (Wright, Jahanshahi, Jorgensen, & Brennan, 2002). Literature suggests that recycling steel energy savings are between 50-74% (Geyer & Jackson, 2004) (Kumara & Putnam, 2008). From these data points it is assumed that energy savings are 85%, 27% and 70% for plastic, glass and other materials and metals respectively when recycling instead of using raw materials. This implies approximately 67% of the energy used to produce these units from raw materials is saved when recycling electronic scrap.
Second, a study by IVF (2007) suggests recycling a laptop, monitor and desktop between 83% to 92% less energy is used than extracting and processing raw materials for these devices. The percentages and underlying data from the study are shown in Table 10. Based on this information it is assumed recycling hardware IT result in a 84% ± 10% energy reductions relative to extracting and processing virgin materials. Table 10: Energy saving recycling hardware IT units(IVF, 2007)
Unit Materials extraction and processing (MJ)
Recycling (MJ) Saving energy use (%)
Laptop 2.300 190 0,92
CRT monitor 960 160 0,83
LCD montor 990 120 0,88
Desktop 1.300 110 0,91
Summarizing, to calculate this performance indicator the following formulacan be applied:

MSc Thesis, J.C.P. Kalsheim: Greening Information Technology (IT) Infrastructures
RecEnergy ∑ 0.16 (21)
Where Nrec = number of units recycled (unit) Energyec = Energy used to recycle unit (m
3/unit)
ENERGY = amount fo energy used for extraction and production of unit (m3/unit)
i = unit of analysis
8.3.7 Amount of energy recovered from discarded hardware IT Definition: This performance indicator emphasizes the amount of energy recovered from hardware IT infrastructure units within the framework entity scope when incinerated. Although hardware IT infrastructure units might be discarded for incineration without recovering any energy, this should be incorporated in this performance indicator. The amount of energy recovered from these units are nil.
Assumptions: It is assumed glass and metals used in hardware IT infrastructure units are not combustible. Further, it is assumed that burning an average hardware IT infrastructure unit leads to the production of approximately 3.8 MJ of energy per kg of waste. The estimate of this value will be outline in the subsequent paragraph. The average calorific value estimated per kg is assumed to be the same for all hardware IT infrastructure units discarded to incineration plants. Moreover, it is assumed all hardware IT infrastructure units discarded to recover energy are burned in waste incinerators although waste might be treated in other systems such as pyrolysis and gasification (Williams, 2005).Units might be discarded for recycling and energy recovery. Assuming the remaining parts of a hardware IT infrastructure units are incinerated after being recycled (see WEEE directive), it is assumed this constitutes the plastics found in electronic waste. Hence, the same calorific value might be assumed as this is an average value, but requires the entire weight to the hardware IT unit to be incorporated in the calculation of performance indicator 3.3.4.
Calculation methodology and input: To determine this performance indicator the approach chosen is shown in Figure 34.
2.3.3 Amount of
energy recovered
from discarded
hardware IT (MJ)
Energy recovered
from hardware IT
(MJ/kg)
3.3.4 Amount of
hardware IT discarded
to recover energy (kg)
Figure 34: calculation method performance indicator 2.3.3
First the amount of hardware IT infrastructure units discarded from which a proportion is used to recover energy should be determined (see performance indicator 3.3.4). Energy recovered from hardware IT can be determined from the average materials content of electronic scrap, monitors and PCs in combination with calorific values of the materials. The average materials content of electronic scrap, monitors and PCs is assumed to be; 64% metals, 21% plastics and 15% glass or other materials. Literature suggests the calorific value of mixed plastics is between 30-40 MJ/kg, whereas for metals and glass this is zero (Scott, 2000) (Panda, Singh, & Mishra, 2010) (Porteous, 2005). Further, research suggests the efficiency of a municipal solid waste (MSW) plant lies between 15-86% (Cheng, Zhang, Meng, & Li, 2007) (Grosso & Rigamonti, 2010). Assuming “15% glass or other materials” entirely consists of materials that are not combustible, energy recovered from incinerated parts in hardware IT is approximately 3.8± 0.5 MJ per kg WEEE when the energy recovery efficiency of the thermoelectric power plant is 51%. To sum up, to calculate this performance indicator the subsequent formula can be applied:
∑ ( 3. 5) (22)
Where Nbur = number of units burned or otherwise destroyed (unit) Waterbur = Water used to burn or otherwise destroy unit (m
3/unit)
Waterep = amount fo water used for extraction and production of unit (m3/unit)
i = unit of analysis

MSc Thesis, J.C.P. Kalsheim: Greening Information Technology (IT) Infrastructures
8.3.8 Amount of energy use related to reuse and refurbish hardware IT for third party
use Definition: This performance indicator emphasizes the amount of energy used when hardware IT infrastructure units are refurbished for third party use within the framework entity scope.
Assumptions: It is assumed an equal amount of energy is used to refurbish all types of unit, independent of material composition. It is assumed reusing hardware IT does not cause any additional energy use. It is assumed the amount energy used to refurbish a unit approximately is approximately 2.8% ± 2.5% of the total amount of energy used to producing a new unit from virgin materials. The estimation of this figure will be outlined in the next paragraph section.
Calculation methodology and input: The calculation methodology shown in Figure 35 can be used to estimate this performance indicator.
2.3.4 Amount of energy
use related to refurbish
hardware IT for third
party use (MJ)
Energy use related
to refurbishing
hardware IT (MJ/
unit)
Number of units for
refurbishment (unit)
Figure 35: calculation method performance indicator 2.3.4
The number of units refurbished and energy used related to refurbishing hardware IT need to be determined to estimate this performance indicator as illustrated in Figure 35. Refurbishment practices have a considerable environmental benefit relative to recycling. It has been reported that the energy saving potential of refurbishing a computer is about 5-20 times greater than recycling it (Williams & Sasaki, 2004) (Hickey & Fitzpatrick, 2008). For instance reusing steel, energy use relative to primary materials and recycling respectively is 83% and 63% (Geyer & Jackson, 2004). Assuming that refurbished hardware IT saves 5-20 times more energy than recycled hardware IT does, the amount energy used to upgrade a unit relative to producing a new unit from recycled materials is approximately 2.8% ± 2.5%. Hence, to calculate this performance indicator the following formula can be used:
RefEnergy ∑ 0.028 ) (23)
Where NRef = number of units refurbished (unit) RefEnergy= energy used to refurbish unit (m
3/unit)
ENERGY = amount fo energy used for extraction and production of unit (m3/unit)
i = unit of analysis
8.3.9 Amount of materials from hardware IT to landfill Definition: This performance indicator addresses the amount of materials from hardware IT that is sent to landfill within the framework entity scope.
Assumptions: It is assumed entire hardware IT infrastructure units are sent to landfill when these are discarded to landfill. It is acknowledged that sub-components of recycled unit or refurbished units might end up at landfills as well. Therefore it is assumed that 75% of the hardware IT infrastructure units that are discarded for recycling actually are recycled. This percentage is used because it is stated in the WEEE directive by the European Union as a minimum value organisation should comply to (European Parliament and Council of the European Union, 2003). Assuming the worst case, the remaining parts of recycled units end up at landfills. Further, from hardware IT infrastructure units discarded to recover energy 79% are assumed to end up at landfills due to incombustible materials in hardware IT infrastructure units.
Calculation methodology and input: To determine this performance indicator the calculation methodology chosen is shown in Figure 36.

MSc Thesis, J.C.P. Kalsheim: Greening Information Technology (IT) Infrastructures
3.3.1 Amount of
materials from
hardware IT to landfill
(kg)
Weight of unit
(kg/unit)
Number of units
sent to landfill
(unit)
Number of units
for recycling (unit)
Percentage of
recycled unit non-
recyclable (%)
Weight of unit
(kg/unit)
Percentage of unit
non-combustible
(%)
3.3.4 Amount of
hardware IT discarded
for energy recovery (kg)
Figure 36: calculation method performance indicator 3.3.1
First, the number of units sent to landfill and the weight of these units should be determined. The volume of the units can be determined from product specification documents, and the number of units sent to landfills can be determine from internal documentation. It is acknowledged that sub-components of recycled units might end up at landfills as they cannot recycle. To estimate this, information about the recyclability of units can be incorporated in the calculation method. The proportion of units recycled varies per organisation. According to Apple, the amount of a unit that is recycled is about 70% when a unit is sent back (Apple, 2012). In an article published by Resource Recycling, it was stated that HP recycled 16% of hardware IT infrastructure units in 2010 (Thomas, 2011). Nevertheless, due to the subjectivity of recyclability the threshold stated in the WEEE directive by the European Union will be applied. The WEEE directive requires 75% of electronic and electrical products are recycled (European Parliament and Council of the European Union, 2003). Assuming organisations in Europe meet this level implies that 25% of a hardware IT infrastructure unit might end up at landfills.
Moreover, the ashes or other residual products from hardware IT infrastructure units discarded for energy recovery often end up at landfills. Fractions of recycled hardware IT infrastructure units or hardware IT infrastructure units discarded to landfill might be sent to incinerations prior to this to reduce the volume prior to landfill or concentrate valuable metals in the residual ash (Stewart & Lemieux, 2003) (USGS, 2001). Assuming non-combustible parts in electronic and electrical waste for energy recovery are sent to landfill, this implies that 79% of these units end up at landfills in the end (APME, 1995) (Zhang & Forssberg, 1997) (Balakrishnan, Anand, & Chiya, 2007) (Klatt, 2003) (Dalrymple, et al., 2007). To summarize, to estimate this performance indicator the following formula can be applied:
∑ Weight ∑ Weight
∑ Weight
(24)
Where NLand = number of unit i sent to landfill (unit) NRec = number of units i recycled (unit) NEng = number of units i discarded to recover energy (unit) Weight= weight of unit (kg/unit) i = unit of analysis
8.3.10 Amount of recycled materials from hardware IT Definition: This performance indicator emphasizes the amount of materials from hardware IT that is recycled at the end-of-life within the framework entity scope.
Assumptions: It is assumed 75% of units discarded for recycling are actually recycled. This assumption is based upon the threshold set in the WEEE Directive by the European Union(European Parliament and Council of the European Union, 2003). The remaining parts are assumed to be sent to landfills or municipal waste incinerators.

MSc Thesis, J.C.P. Kalsheim: Greening Information Technology (IT) Infrastructures
Calculation methodology and input: To determine this performance indicator the calculation methodology in Figure 37 can be used.
Number of units
for recycling (unit)
Percentage of
recycled unit
recyclable (%)
3.3.2 Amount of
recycled materials
from hardware IT (kg)
Weight of unit (kg/
unit)
Figure 37: calculation method performance indicator 3.3.2
First, the number of units that are recycled from the owned hardware IT should be determined. This can be determined from contracts with third parties responsible for the end-of-life of WEEE. Second, the weight of these units can be determined from product specification documents. The proportion of actually recycled hardware IT is assumed to be 75% (European Parliament and Council of the European Union, 2003). Hence, to calculate this performance indicator the following formula can be used:
∑ Weight 0. 5 (25)
Where NRec = number of unit i recycled (unit) Weighti = weight of unit i (kg/unit) i = unit of analysis
8.3.11 Amount of hardware IT discarded for energy recovery Definition: This performance indicator defines the amount of materials from hardware IT that is burned or otherwise destroyed within the framework entity scope with the purpose of recovering energy. Though hardware IT infrastructure units might be discarded for incineration without recovering energy, this is incorporated in the performance indicator.
Assumptions: It is assumed that entire hardware IT infrastructure units are discarded to be burned or otherwise destroyed in municipal waste incinerators. The ashes or other residual products are assumed to be sent to landfill.
Calculation methodology and input: To determine this performance indicator the calculation methodology in Figure 38can be applied.
3.3.3 Amount of
hardware IT
discarded for energy
recovery (kg)
Weight of unit (kg/
unit)
Number of units
destined for
energy recovery
(unit)
Figure 38: calculation method performance indicator 3.3.3
Initially the number of units that are discarded to recover energy is required to determine this performance indicator in line with the methodology shown in Figure 39. This can be determined from internal documents or from interviews with IT managers responsible for end-of-life policies in the reporting organisation. The weight of the various unit can be determined from product specification documents. Hence, to estimate this performance indicator the following formula can be used:
∑ Weight (26)
Where NEng = number of unit i discarded to recover energy (unit) Weighti = weight of unit i (kg/unit) i = unit of analysis

MSc Thesis, J.C.P. Kalsheim: Greening Information Technology (IT) Infrastructures
8.3.12 Amount of materials in hardware IT reused or refurbished for third party use
Definition: This performance indicator focuses on the amount of materials that are reused or refurbished for third party use within the framework entity definition. Materials that are refurbished are upgraded to meet a certain quality requirement. This way the material can be used over again.
Assumptions: It is assumed entire hardware IT infrastructure units are reused or refurbished for third party use.
Calculation methodology and input: To determine this performance indicator the calculation methodology shown in Figure 39 can be used.
3.3.4 Amount of
materials in hardware IT
reused or refurbished for
third party use (kg)
Weight of unit (kg/
unit)
Number of units
reused or
refurbished for third
party use (unit)
Figure 39: calculation method performance indicator 3.3.4
To determine this performance indictor, the number of units that are reused or refurbished for third party use should to be determined from the total amount of units an organisation discard. Next, the weight of these units should be known to estimate the performance indicator. The weight can be determined from product specification documents. Hence, to calculate this performance indicator the following formula can be used:
∑ Weight (27)
Where NRef= number of unit i reused or refurbished for third party use (unit) Weighti = weight of unit i (kg/unit) i = unit of analysis
8.3.13 Amount of greenhouse gas emission of recycling hardware IT Definition: This performance indicator addresses the amount of greenhouse gases emitted when hardware IT infrastructure units are recycled within the framework entity definition.
Assumptions: It is assumed that an equal amount of energy is used for each unit and that the amount of GHG emission associated with each energy type is uniform. The amount of GHG emission is assumed to be 1,8 kg of CO2equivalents per MJ (IEA, 2011).
Calculation methodology and input: To determine this performance indicator the calculation methodology shown in Figure 40 can be applied. Similar to preceding GHG emission calculations, this is based upon the Tier 1 calculation method by the IPCC (2006).
4.3.1 Amount of
greenhouse gas
emission of recycling
hardware IT (ton CO2)
Greenhouse gas
emission factor
(ton CO2/MJ)
2.3.2 Amount of
energy use related to
recycling hardware IT
(MJ)
Figure 40: calculation method performance indicator 4.3.1
To calculate this performance indicator, the amount of energy use of recycling hardware IT is multiplied by an emission factors. The world average CO2 emission per kWh from electricity generated was 0,5 kg CO2equivalent per kWh in 2009. This is the same as 1,8 kg CO2equivalents per MJ (IEA, 2011). Hence, to calculate this performance indicator the following calculation formula can be applied:
1.8 (28)

MSc Thesis, J.C.P. Kalsheim: Greening Information Technology (IT) Infrastructures
Where P2.3.1 = amount of energy use related to recycling hardware IT (MJ) GHG = GHG emission per unit of energy (ton CO2/MJ)
8.3.14 Amount of greenhouse gas emission of recovering energy from hardware IT Definition: This performance indicator focuses on the amount of greenhouse gases emitted when hardware IT infrastructure units are burned or otherwise destroyed to recover energy. Although hardware IT infrastructure units might be discarded for incineration without recovering energy, this still falls under the performance indicator.
Assumptions: It is assumed that an equal amount of energy is used for each hardware IT infrastructure unit incinerated and that the amount of GHG emission linked to each unit of energy is uniform within one energy type. The GHGbur is assumed to be 1,2 kilograms CO2equivalent per kg of burned material. This is the worst case scenario. This is based upon the assumption that only plastics in WEEE are combustible or cause CO2 emission. The estimate will be further outlined in the following paragraphs.
Calculation methodology and input: To calculate this performance indicator, the calculation methodology shown in Figure 41 can be used.
4.3.2 Amount of greenhouse
gas emission of burning or
otherwise destroying
hardware IT (ton CO2)
Greenhouse gas
emission per kg
of burned waste
(CO2/kg)
3.3.4 Amount of
hardware IT
discarded for energy
recovery (kg)
Average
percentage of
units combustable
(%)
Figure 41: calculation method performance indicator 4.3.2
To determine this performance indicator the amount of burned or otherwise destroyed materials from hardware IT need to be calculated first. How this can be calculated can be found in section 8.3.11(performance indicator 3.3.3). The average percentage of units combustible is assumed to be 21%. This percentage is based upon the materials content in electronic scrap (APME, 1995) (Zhang & Forssberg, 1997) (Balakrishnan, Anand, & Chiya, 2007) (Klatt, 2003) (Dalrymple, et al., 2007). Subsequently the GHG emission per kilogram of burned waste in waste incinerators is determined. Literature suggests the incineration of 1 mg of municipal waste is responsible for 0,7 to 1,2 mg of CO2 emission (Johnke, 2006). This estimate is used to calculate the amount of GHG emitted due to incineration of hardware IT infrastructure waste. To summarize, the following formula can be applied:
(29)
Where P3.3.4 = amount of burned or otherwise destroyed materials from hardware IT to recover energy (kg) GHGbur = GHG emission per kg of burned waste (CO2/kg)
8.3.15 Amount of greenhouse gas emission related to reuse and refurbish hardware IT
for third party use Definition: This performance indicator addresses the amount of greenhouse gases emitted when hardware IT infrastructure units are refurbished for third party use within the framework entity definition.
Assumptions: It is assumed that an equal amount of energy is used for each unit and that the amount of GHG emission for each energy unit is uniform. It is assumed reusing hardware IT does not cause any additional CO2 emissions. GHG emission is assumed to be 1,8 kg CO2 per MJ (IEA, 2011).
Calculation methodology and input: To determine this performance indicator the calculation methodology shown in the below figure is chosen.

MSc Thesis, J.C.P. Kalsheim: Greening Information Technology (IT) Infrastructures
4.3.3 Amount of greenhouse
gas emission related to reuse
and refurbish hardware IT for
third party use (ton CO2)
Greenhouse gas
emission factor
(ton CO2/MJ)
2.3.3 Amount of energy
use related to refurbish
hardware IT for third
party use (MJ)
Figure 42: calculation method performance indicator 4.3.3
To calculate this performance indicator, the amount of energy used to refurbish hardware IT is multiplied by an emission factors. The world average CO2 emission per kWh from electricity generated was 0,5 kg CO2 per kWh in 2009. This is the same as 1,8 kg CO2 per MJ (IEA, 2011). Hence, to calculate this performance indicator the following calculation formula can be used:
(30)
Where P2.3.3 = amount of energy use related to refurbishing hardware IT (MJ) GHG = GHG emission of energy used (ton CO2/MJ)
8.3.16 Costs of hardware IT sent to landfill Definition: This performance indicator emphasizes the costs associated with discarding hardware IT to landfill within the framework entity definition.
Assumptions: It is assumed the cost of discarding WEEE to landfills approximately is36 euro per tonne. Tip fees are assumed to be the only cost of discarding hardware IT to landfills. How the estimate of the tip fee is determine will be outlined in the next paragraphs. It is recommended to improve the accuracy of this estimate by carrying out additional research.
Calculation methodology and input: To calculate this performance indicator, the calculation methodology shown in Figure 43 can be applied.
5.3.1 Costs of
hardware IT
discarged to
landfill (euro)
Costs of
discarding
hardware IT to
landfill (euro/kg)
3.3.1 Amount of
materials from
hardware IT to
landfill (kg)
Figure 43: calculation method performance indicator 5.3.1
First, the amount of materials from hardware IT to landfill needs to be determined. How is this calculated can be found in section 8.3.9 (performance indicator 3.3.1). Second, costs of discarding a hardware IT infrastructure unit to landfill should be determined. Discarding hardware IT to landfill, tip fees are assumed to be the only costs. A survey in 2008 in the United States showed the average tip fee of landfills was 44 dollars per tonne discarded (BioCycle, 2010). From 1988 to 2008 the tip fee had an average annual increase of approximately 0,47 dollars per year with a standard deviation of 0,11 (Repa, 2005). Assuming this increase has remained stable until today, the average tip fee of landfills currently are about 46 dollars per tonne of waste. Assuming one dollar is 0.79 euro, this is about 36 euro per ton of waste. Hence, to calculate this performance indicator the following formula can be applied:
36 (31)
Where PI3.3.1 = amount of materials form hardware IT to landfill (kg) CoLand = costs of discarding hardware IT to landfill (euro/kg)
8.3.17 Costs of recycling hardware IT Definition: This performance indicator focuses on the costs of recycling hardware IT infrastructure units within the framework entity definition.

MSc Thesis, J.C.P. Kalsheim: Greening Information Technology (IT) Infrastructures
Assumptions: It is assumed the cost of recycling hardware IT infrastructure units is integrated in the price an organisation pays for a hardware IT infrastructure unit when the hardware IT supplier offers to take back the unit at the end-of-life with the purpose of recycling it. Further, it is assumed the price of recycling hardware IT infrastructure units for several products can be determined from the price list in Appendix J. Research showed the fee charged to customers to accept CRT monitors at a plant in California is 10 dollar per unit (Kang & Schoenung, 2006). This is in line with the price estimated in the list in Appendix J. These figures should be further investigated to ensure a more accurate estimation of this performance indicator.
Calculation methodology and input: To determine this performance indicator the calculation methodology shown in the below figure is applied.
5.3.2 Costs of recycling
hardware IT (euro)
Costs of recyling a
hardware IT unit
(euro/unit)
Number of units for
recycling (unit)
Figure 44: calculation method performance indicator 5.3.2
First the number of units recycled needs to be determined. This can be obtained from the organisation investigated. The costs of recycling hardware IT infrastructure units depends on various factors such as type of device. Recycling a laptop computer costs for example 7-39 euro cents in Germany, Austria or Spain for HP (Lee, 2010). Khetriwal, Kraeuchi, & Widmer (2009) state that recycling costs is a function of sales of electronic and electrical equipment and the costs for collection and recycling of the e-waste generated. In various countries electronic waste recycling fees have been implemented to fund future recycling of WEEE. In California this fee is between 6-10 dollar per electronic device dependent on its size (State Board of Equalization, 2010). In Europe the fee is paid by manufacturers and distributors (European Parliament and Council of the European Union, 2003). It is assumed this fee is incorporated in the recycling costs of hardware IT suppliers such as HP. In Appendix J price estimates by hardware IT supplier HP can be found for 2010. These are recycling cost per unit that can be used to calculate the costs an organisation pays to recycle some types of hardware IT. It is recommended to use more up-to-date and organisation specific information to calculate this performance indicator accurately. Hence, to calculate this performance indicator the following formula can be applied:
∑ CoRec (32)
Where NRec = number unit i recycled (unit) CoRec = average costs of recycling hardware IT unit i (euro/unit) i = unit of analysis
8.3.18 Costs of recovering energy from hardware IT Definition: This performance indicator focuses on the costs associated with recovering energy from hardware IT infrastructure units. Although hardware IT infrastructure units might be discarded for incineration without energy being recovered, this falls under the performance indicator.
Assumptions: It is assumed the cost of discarding WEEE to waste-to-energy plants approximately is55 euro per tonne. The estimation of this price can be found in the following paragraphs. It is recommended to improve this estimate to calculate this performance indicator more accurately.
Calculation methodology and input: To determine this performance indicator the calculation methodology shown in Figure 45 can be used.

MSc Thesis, J.C.P. Kalsheim: Greening Information Technology (IT) Infrastructures
5.3.3 Costs of burning
or otherwise
destroying hardware
IT (euro)
Costs of discarding
hardware IT to waste-to-
energy plants (euro/ton)
3.3.4 Amount of burned or
otherwise destroyed
materials from hardware IT
to recover energy (kg)
Figure 45: calculation method performance indicator 5.3.1
First, the amount hardware IT infrastructure units discarded to recover energy should be calculated. How this could be estimated can be found in section 8.3.12 (performance indicator 3.3.4). Second, costs of recovering energy from hardware IT infrastructure units should be determined. Arguably this can be estimated from information about average tip fees of waste-to-energy plants. A survey in 2008 in the United States showed the average tip fee of waste-to-energy plants were 68 dollars per tonne WEEE discarded. Assuming this has undergone the same increase as tip fees for landfills in the US, this is currently 70 dollar per tonne. This is approximately 55 euro per tonne assuming one dollar is 0.79 euro. Hence, to calculate this performance indicator the following formula can be applied:
CoEng 55 (33)
Where PI3.3.1 = amount of materials form hardware IT to landfill (kg) CoEng costs of discarding hardware IT to waste-to-energy plants
8.3.19 Revenues from selling used and refurbished hardware IT to third parties Definition: This performance indicator focuses on the profits of selling refurbished or used hardware IT infrastructure units. Hardware IT infrastructure units might be sold to third parties when they are no longer needed by the organisation.
Assumptions: It is assumed the profit of selling a hardware IT infrastructure unit depends on the type of unit. It is acknowledged that quality is an important factor as well. An average price per type of unit is assumed to be a sufficient to estimate this performance indicator.
Calculation methodology and input: The profits from sales of used or refurbished hardware IT for third party use can be estimated using the calculation methodology shown in Figure 47.
5.3.4 Revenues from
selling used and/or
refurbished hardware IT
to third parties (euro)
Average profit
from selling unit
(euro/unit)
Number of units
sold (unit)
Figure 46: calculation method performance indicator 5.3.4
This performance indicator can be determine from when the number of units sold to third parties as well as average profit from selling these units is known. The formula that can be used to determine this performance indicator subsequently is:
∑ (unit) ( (34)
Where Nsold = number units sold (unit) ProfSold= average profit per hardware IT infrastructure unit sold (euro/unit) i = unit of analysis
8.4 Aggregation of performance indicators As described in the literature review, criteria consist of several performance indicators. In this section the methodology that bridges performance indicators defined in the previous sections, assessment criteria and the greenness of the hardware IT infrastructure of an organisation will be outlined. This is the last part of the operationalization of the new framework to meet design requirement HR1; the tool shall determine one value

MSc Thesis, J.C.P. Kalsheim: Greening Information Technology (IT) Infrastructures
stating the relative greenness of the hardware IT infrastructure of an organisation. To estimate one value, two aggregation steps need to be carried out. First, performance indicators need to be aggregated into assessment criteria (section 8.4.1). Second, assessment criteria need to be aggregated into an index value (section 8.4.2). How this can be done will be outlined in the following paragraphs.
8.4.1 Assessment criteria scores Performance indicators that fall under the same assessment criteria are added when these have an equal measurement unit. In essence all assessment criteria can be calculated this way. In the subsequent paragraphs the formulas that can be applied to determine assessment criteria scores will be outlined. These formulas have been tested in a case study.
Water use over the life cycle of hardware IT (m3)(A1) can be determine by adding all performance indicators that fall
under this criterion. This requires that all water sources are added in performance indicator 1.1.2. Hence, the following formula can be applied:
∑ (35)
Where PI = performance indicator
PI1.2.1 = amount of water used in hardware IT operation = ∑
s = water source i = identification number
Hence, water use over the life cycle of hardware IT(A1) is the sum of amount of water use related to the extraction and production process of hardware IT (P1.1.1),amount of water used in hardware IT operation per water source(P1.2.1), amount of water use related to hardware IT discarded to landfill(P1.3.1), amount of water use related to recycling hardware IT(P1.3.2), amount of water use related to recovering energy from hardware IT(P1.3.3) and amount of water use related to reuse and refurbish hardware IT for third party use (P1.3.4).
To determine amount of energy use related to the life cycle of hardware IT (A2) performance indicators that fall under this criterion should be added except performance indicator 2.2.2. This indicator shows the efficiency gap in the form of a percentage difference between the current utilization and the optimal utilization of devices. The performance indicator has been defined by the first expert panel with the purpose of providing IT decision-makers with insights about possible improvement areas. Increasing the efficiency of individual devices as well as decreasing the number of devices might lead to reductions in energy use of hardware IT over time (performance indictor 2.2.1). Summarizing, to calculate amount of energy use related to the life cycle of hardware IT (A2) the following formula could be applied:
∑ (36)
Where PI = performance indicator i = identification number i.i ≠ 2.2
Hence, energy use over the life cycle of hardware IT (A2) is the sum of amount of energy use related to the extraction and production process of hardware IT (P2.1.1), amount of energy used in hardware IT operation (P2.1.1), utilization of hardware IT relative to unit specific optima (P2.2.2), amount of energy use related to hardware IT discarded to landfill (P2.3.1), amount of energy use related to recycling hardware IT (P2.3.2), amount of energy use related to recovering energy from hardware IT (P2.3.3) and amount of energy use related to reuse and refurbish hardware IT for third party use (P2.3.4). Aggregating performance indicators under the third assessment criterion (generation of raw material waste over the life cycle of hardware IT (%)) is different from the preceding criteria as performance indicators within the same

MSc Thesis, J.C.P. Kalsheim: Greening Information Technology (IT) Infrastructures
assessment criteria are interrelated under this criterion. It is assumed that (1) 75% of a hardware IT infrastructure unit is recyclable and that the remaining percentage is sent to landfill, and (2) the non-combustible percentage of eletronical and electrical waste in a waste-to-energy incinerators are sent to landfill. Hence, to estimate this assessment criterion the following formula could be used:
(37)
Where PI = performance indicator i = identification number
Hence, generation of raw material waste generation over the life cycle of hardware IT (A3) is the sum of amount of amount of recycled and reused materials in hardware IT procured (P3.1.1) and amount of replaced sub-components in hardware IT(P3.1.1), subtracted by amount of recycled materials from hardware IT (P3.3.2), amount of amount of hardware IT discarded for energy recovery (P3.3.3), amount of materials in hardware IT reused and refurbished for third party use(P3.3.4).
Calculating the GHG emission over the life cycle of hardware IT (A4) from the performance indicators the following formula could be used:
∑ (38)
Where PI = performance indicator i = identification number
Hence, greenhouse gas emissions over the life cycle of hardware IT (A4) is the sum of amount of greenhouse gas emissions related to the extraction and production process of hardware IT (P4.1.1), amount of greenhouse gas emissions related to extraction and production of energy used in hardware IT operation (P4.2.1), amount of greenhouse gas emissions related to hardware IT discarded to landfill (P4.3.1), amount of greenhouse gas emissions related to recycling hardware IT (P4.3.2), amount of greenhouse gas emissions related to recovering energy from hardware IT (P4.3.3) and amount of greenhouse gas emissions related to reuse and refurbish hardware IT for third party use(P4.3.4). To determine the costs over the life cycle of hardware IT (A5) performance indicators addressing costs of hardware IT can be subtracted by the revenues from selling used and refurbished hardware IT to third parties (performance indicator 5.3.4). The formula that can applied to determine this criteria is defined as:
∑ (39)
Where PI = performance indicator i = identification number [5.1.i - 5.3.3] i.i ≠ 3.4
Hence, costs over the life cycle of hardware IT (A5) is the sum of procurement costs of hardware IT (P5.1.1), energy costs of hardware IT (P4.2.1), water costs of hardware IT (P5.2.2), costs of carbon credits for the operation of hardware IT (P5.2.3), maintenance costs of hardware IT (P5.2.4), costs of hardware IT discarded for landfill (P5.3.1), costs of recycling hardware IT (P5.3.4) and costs of recovering energy from discarded hardware IT (P5.3.3), subtracted by revenues from selling used and refurbished hardware IT to third parties (P5.3.4).
In the next section the last aggregation step will be outlined to meet design requirement HR1 (see Chapter 6).

MSc Thesis, J.C.P. Kalsheim: Greening Information Technology (IT) Infrastructures
8.4.2 Index value score
To determine one value that expresses the greenness of the hardware IT infrastructure of an organisation an index is developed. This index is entitled the hardware IT infrastructure greenness (HITIG) index. How this index can be determine from the assessment criteria defined in the previous section will be outlined in the following paragraphs. Various ways of aggregating criteria into one composite index will be discussed as this is an enduring issue in literature. There are various ways of establishing an index. From a mathematical point of view an index entails a weighted linear aggregation rule. In sustainability assessment indices are often established from composite indictors (Munda, 2005). More sophisticated approaches for aggregating multi-attribute data can be found in literature on multi-criteria decision analysis (MCDA) (Rowley & Peters, 2009). Ting-ting et al. (2012) use an MCDA method, the fuzzy analytical hierarchy process (AHP), to develop a greenness index for ICT products. MCDA is a branch of a general class of operations research methods appropriate for addressing complex problems with high uncertainty, conflicting objectives, different forms of data and information and multi-interests and perspectives (Wang, Jing, & Zhang, 2010) (Qureshi, Harrison, & Wegener, 1999) (Munda, Nijkamp, & Rietveld, 1994). Several of these methods could be applied to determine the HITIG index as several of these are able to deal with the incommensurability of the assessment criteria defined in the previous section. A well-established aggregation method should be applied to determine the HITIG index. The Eco-indicator 99 is one of the most widely used impact assessment methods by life cycle assessment practitioners in the world. This approach aggregates damage categories using a weighted sum method (Rowley & Peters, 2009). The weighted sum method is one of the most well-known and the simplest MCDA method. The basic principle underlying this technique is the additive utility assumption. That is, the alternative with the highest cumulative value is the best. Using the weighted sum method means that all data needs to be expressed in the same unit (Triantaphyllou, 2005). For the assessment criteria this implies they need to be normalized. Thus, HITIG index can be defined as follows:
∑ (40)
Where Ci = normalized assessment criteria wi = weight attached to Ci and ∑
i = [1, 2, .., 5] 0 ≤ wi ≥ 1
There are multiple ways of normalizing assessment criteria to make them unitless. According to ISO 2000 the aim of normalizing an indicator is to better understand the magnitude of each indicator of the product system under study (ISO 2000). Commonly used techniques are distance from average, min-max, distance from leader and z-score (Blanc, Friot, Margni, & Jolliet, 2008). A study by Bohringer and Jochem (2007) show various normalization techniques have been adopted to create sustainability indices, however no generally accepted procedure could be found. The Eco-indicator 99 normalize damage categories using a reference (“normal”) value. The reference system might be chosen in several ways (Goedkoop & Spriensma, 2000). To benchmark the HITIG index (HR7), the reference value need to be established in a way that enables comparison of results with peers. As the performance of one organisation is assessed in a case study it is not possible to establish a reference point that enables normalization of data. Normalization would require additional measurements, ideally a pool of scores from which a reference value could be established. Nevertheless, determining the weights of the assessment criteria an option could be to consult experts in an open discussion process (Bohringer & Jochem, 2007). In LCA this is an approach often used to determine relative weights. When the objective is to benchmark results it is recommended to implement constant weights of criteria or compare assessment criteria scores. Uniform weights could also be given to the assessment criteria (Bohringer & Jochem, 2007).
8.5 Functional design use Now that the functional design has been outlined it is important to describe how it can be used to estimate performance. This section subsequently illustrates how performance indicators, assessment criteria and the HITIG index can be calculated by showing four examples related to the case study. The examples show how data can be

MSc Thesis, J.C.P. Kalsheim: Greening Information Technology (IT) Infrastructures
used to estimate performance indicators, performance indicators can be used aggregated into assessment criteria and assessment criteria can be used to determine the HITIG index. The inputs and outputs of applying the model are illustrated in Figure 47.
HITIG INDEX
Water use over the life cycle of
hardware IT (A1)
Performance indicator 1.1.1
Performance indicator 1.2.1
Performance indicator 1.3.1
Performance indicator 5.3.4
….
….
Costs over the life cycle of hardware IT
(A5)
….
0.2
0.2
Data (literature, product
specifications, organization’s
database)0.2
Functional design
GHITI scores (performance
indicator, assessment criteria and HITIG scores)
Input Output
Figure 47: Overview functional design use
Below one example of a calculation will be described per life cycle phase.
WATERep
WATERep
Procurement: Performance indicator 1.1.1 An organization has one Canon imageRunner 3530 (multifunctional printer). It is assumed that this printer is entirely made of raw materials. What is the water use related to the extraction and production process of the hardware IT infrastructure unit (m
3)?
To determine this performance indicator, the following formula can be used;
∑ WATERep
(1)
Where N is number of units (unit), WATERepi is amount of water used for extraction and production of unit i (m
3/unit), RawMat is amount of raw materials in unit i (kg), Rec&ReuMat is amount of recycled or/and reused
materials in unit i (kg) and i is unit of analysis As there is only one printer and the printer is entirely made of raw materials, the formula can be rewritten as follows;
In Appendix J the following formula can be found for the water use related to extraction and production of a printer;
WATERep - α α + 4400 (1.A)
Where α is weight of the printer (kg). In product specification it is stated that a Canon imageRunner 3530 weights approximately 70 kilograms. Filling this number into formula 1.A, the water use related to extraction and production of a Canon imageRunner 3530 is estimated to be approximately 3.200 m
3.

MSc Thesis, J.C.P. Kalsheim: Greening Information Technology (IT) Infrastructures
The examples provided above show how information from product specifications and the reporting organisation can be combined to estimate performance indicator scores. The scores of performance indicators can be aggregated into assessment criteria scores by means of simple summations and subtractions. An example of this will be provided below.
≈ J
Use: Performance indicator 2.2.1 An organization has 1300 HP EliteBook 8460p laptops with an expected lifetime of 3 years. What is the amount of energy use of operating these laptops (m
3)?
To determine this performance indicator, the following formula can be used;
∑ ∑
(10)
Where N is number of units (unit), ExpLife is expected lifetime (year), EnMode is energy demand activity mode j per unit i (Watt), TiMode is time in activity mode x per unit i (hour/year), i is unit of analysis and j is activity mode [active, standby/sleep, off]. As a laptop is a single-user unit, it is assumed these units are on average 2.500 hours per year in active mode, 3.300 hours per year in standby/off mode and 2.900 hours per year in off mode. In the product specifications it is stated that HP EliteBook 8460p laptopsuse 12 watts in active mode, 1,2 watts in standby/sleep mode and 0,6 watts in off mode. Hence, the following can be estimated;
Hence, the amount of energy use of operating all HP EliteBook 8460p laptops over the entire operational lifetime at the organization is approximately 500.000 MJ.
(unit) (
20 + 1300 90) ≈
Disposal: Performance indicator 5.3.4 An organization has 100 OptiPlex 755 desktops from Dell and 1300 HP EliteBook 8460p laptops. These units are sold to a third party after being used by the organization for three years. The organization receives an average price of 20 euro per unit for a desktop and 90 euro per unit for a laptop. What are the incomes from selling the desktops and laptops to third parties? To determine this performance indicator, the following formula can be used;
∑ (unit) ( (34)
Where Nsold is number units sold (unit), ProfSold is average profit per hardware IT infrastructure unit sold (euro/unit) and i is unit of analysis. Filling the information given into the formula the following can be estimated;
Hence, revenues from selling used OptiPlex 755 desktops from Dell and HPEliteBook 8460p laptops to third parties at the end-of-life is approximately 120.000 euro.

MSc Thesis, J.C.P. Kalsheim: Greening Information Technology (IT) Infrastructures
The calculation of assessment criterion A2 shows how energy use over the life cycle of hardware IT can be estimated from performance indicators. The assessment criteria can be further aggregated into a HITIG index by applying the weighted sum method. An example of how to estimate the HITIG index will be described below. This example is not taken from the case study.
Assessment criteria: A2 An organization has the subsequent scores per performance indicator related to energy:
ID Performance indicator Score
2.1.1 Energy use related to the extraction and production process of hardware IT (MJ) 13.000.000
2.2.1 Amount of energy use of hardware IT operation (MJ) 59.000.000
2.2.2 The utilization of hardware IT relative to unit specific optima (%) 0,87
2.3.2 Amount of energy use related to recycling hardware IT (MJ) 340.000
2.3.4 Amount of energy use related to refurbish hardware IT for third party use (MJ) 310.000
What is the total energy use over the life cycle of the hardware IT infrastructure?
To determine this performance indicator, the following formula can be used;
∑ (35)
Where I id performance indicator, i is identification number and i.i ≠ 2.2.
Incorporating the performance indicator scores into the formula, the following can be estimated;
∑ ≈ J
Hence, the total energy use over the life cycle of the hardware IT infrastructure measured is approximately 63.000.000 MJ. This is the same as 63 TJ.
HITIG index An organization has the subsequent scores per performance indicator related to energy:
ID Performance indicator Normalized
score Relative weight
of criterion
A1 Water use over the life cycle of hardware IT (m3) 0,30 0,20
A2 Energy use over the life cycle of hardware IT (MJ) 0,45 0,20
A3 Raw material waste over the life cycle of hardware IT (kg) 0,60 0,20
A4 Greenhouse gas emissions over the life cycle of hardware IT (ton CO2) 0,75 0,20
A5 Costs over the life cycle of hardware IT (euro) 0,80 0,20
What is the total energy use over the life cycle of the hardware IT infrastructure?
To determine this performance indicator, the following formula can be used;
∑ (40)
Where Ciis normalized assessment criterion, wi is weight attached to Ci,∑ , iis [1, 2, .., 5] and 0 ≤ wi ≥ 1.
Filling the information given into the formula the following can be estimated;
∑
The HITIG index score is 0,58 out of 1. Hence, the organization has a relative HITIG score of 58% pertaining to the reference value.

MSc Thesis, J.C.P. Kalsheim: Greening Information Technology (IT) Infrastructures
Part IV Framework evaluation and conclusion
Part II: Academic and practical
grounding Part III: Framework design
Part IV: Framework
evaluation and conclusion
Define tooling
requirements
(Ch6)
Design
framework
(Ch7&8)
Demonstrate
framework
Define green IT
assessment
(Ch4&5)
Evaluate
Framework
(Ch9)
Recommendation
and conclusion on
design
(Ch9,10&11)Business
needs
Refine
Applicable
knowledge
Identify research
problem and
motivation
(Ch1&Ch2)
Part I: Problem analysis
and research design

MSc Thesis, J.C.P. Kalsheim: Greening Information Technology (IT) Infrastructures
Evaluation and reflection on framework design 98
9. Evaluation and reflection on framework design In the previous part of the thesis the new framework and functional design have been presented. As part of the design science research approach, the framework needs to be evaluated. In this chapter a translation is made from design to evaluation of the designed artefact. This chapter aims to answer the sixth and seventh sub-questions; “How successful is the framework in determining the greenness of the hardware IT infrastructure of an organisation as a step towards a comprehensive corporate responsibility strategy?” and “How can the framework be improved to make it more in line with corporate responsibility strategy?”. The evaluation and reflection on framework design elaborated on in this chapter is split into five parts; evaluation of evaluation methods, evaluation of design requirements, reflection on the design process, reflection on performance measurement and reflection on the role of the researcher. The first section will elaborate on the evaluation methods that have been used and possible improvements of these (section 10.1). Second, the design requirements will be evaluated (section 10.2). These will be evaluated with regard to the case study findings. Third, the design process will be reflected on to understand the effectiveness and the successfulness of applying the design science research approach defined in Chapter 2 (section 10.3). Fourth, performance assessment will be reflected on to understand possible limitations of measuring green IT using performance indicators as a “yardstick of progress” (section 10.4). In the last part of the evaluation and reflection, the role of the research will be reflected on as the position of the researcher could have had an impact on the design process (section 10.5). From these evaluation and reflection steps, a conclusion will be drawn with regard to the sixth and seventh sub-questions (see Chapter 1).
9.1 Evaluation of evaluation methods As shown in Figure 11 the evaluation strategy is threefold; two expert panel reviews and one case study. Within the case study, a final evaluation has taken place that resulted in a refinement of the presentation layouts. Each of the methods will be discussed briefly and reflected on in the following paragraphs. Expert panels As outlined in Chapter 7 two expert panels have been organized to evaluate and refine the new framework. The expert panel reviews were divided into two parts; a formative validation of the framework and design requirements. The expert panels were held using the same expert panel design to enhance reliability of the outcome. The expert panel design can be found in Appendix F. The design was refined with the input of two experienced facilitators of expert panels preliminary to the panel sessions to enhance effectiveness and efficiency. A trade-off was made between number of experts and time. First, finding a suitable time for several experts to participate in an expert panels showed to be difficult. Of the many experts approached, eight were able to participate. The experts were selected to ensure a balance between the various sub-parts of green IT such as life cycle thinking, outsourcing, requirements engineering, sustainability, recycling, refurbishment and reuse of hardware IT, energy use and cooling. There were no experts in the expert panels with specific expertise in finance and/or accounting. This could have influenced the quality of the performance indicators related to costs over the life cycle of hardware IT. Nevertheless, experts from KPMG attending the panels had wide experience with accounting. Second, during the expert panels time was limited to one and a half and two hours. In each expert panel there were four experts present. Involving more experts might have slowed down the progress of the validation sessions. Then again, it might have led to a stronger conclusion on consensus among experts. An additional advantage of dividing the expert panel validation into two separate sessions was more design iterations; the first expert panel evaluation was implemented in the framework design evaluated by the second expert panel. This might have enhanced the quality of the designed framework. It is recommended to organize larger expert panels for further evaluation of framework contents. In addition to this, the validations were formative and not summative. Formative validation implies the designed framework has been revised with the input of experts (Tessmer, 1993). The validation is not, and perhaps could never be entitled summative as this would imply the framework would be finished and no longer in need of revision. Due to the dynamic character of organisations, rapid developments in the IT market space and a multitude of expert opinions, it might even be impossible to find one perfect framework that all academics could agree to. Besides this, there was not enough time to review all high level requirements in the first expert panel. Hence, the construct validity of the

MSc Thesis, J.C.P. Kalsheim: Greening Information Technology (IT) Infrastructures
Evaluation and reflection on framework design 99
design requirements can be improved as defined in Chapter 6. The suggested improvements in the construct of the design requirements by the first expert panel were accepted by the second expert panel. Next to evaluating the construct validity of the design requirements, core requirements for an assessment tool were defined by the expert panels. These serve as a statement of evaluation of the framework and therefore will be reflected on in the next section. Nevertheless, the outcome of the expert panels differed twice; the first panel clearly emphasized the importance of maintainability, whereas the second panel did not find this a core requirement. Additionally, the separate feedback from Lydia Stougie emphasized the importance of a requirement that was not considered important by either expert panels. The contradictory outcomes showed a non-consensus among the experts. Therefore, they were not defined as core design requirements. The results of the expert panel reviews can be found in Appendix G and H. Case study Next to the expert panels, a case study was performed to test the viability of the framework and refine the functional design. The case study was performed after the expert panel validations. The case study was performed with the purpose of testing the operational validity of the new framework. It constituted one iteration activity between building the framework and evaluating it in order to provide feedback for future refinement (Hevner, 2007) (Hevner, March, Park, & Ram, 2004). The organisation investigated was BCS Netherlands. In the case study, BSC Netherlands was investigated as a separate entity from BSC international. BSC Netherlands was chosen as “object of analysis” for the case study because it is an organisation with an extensive hardware IT infrastructure supporting business applications. Additionally, there was a sense of urgency from top-down to measure the greenness of hardware IT. The scope of hardware IT infrastructure of BSC Netherlands that was investigated in the case study can be found in Figure 48. It is recognized that this only is a limited part of the hardware IT infrastructure supporting business applications at BSC Netherlands. Nevertheless, it represents a complete picture of multi-system units. For further research and improvement of case study results it is recommended additional end-user hardware such as blackberries and iphones are incorporated in the analysis as well.
Multifunction Device
Private printers
Server Peripheral Computer
Laptop
Desktop computer
StorageNetwork equipment
Infrastructure hardware (multi-user systems)
End-user hardware (Single/multi-user hardware)
Hardware IT Infrastructure BSC Netherlands investigated
Switch
Router
Intrusion protection/detection system
Load balancer
Appliance
Unit
class
Object of
analysis
Firewall
Figure 48: categories of units of analysis in the BSC case study
Reflecting on data quality in line with classifications and definitions by Wang & Strong (1996), the following might be stated about the case study data:

MSc Thesis, J.C.P. Kalsheim: Greening Information Technology (IT) Infrastructures
Evaluation and reflection on framework design 100
Most of the data that retrieved from IT managers and Flection in the case study was relevant. It had an added-value of providing information necessary to determine the greenness of the hardware IT infrastructure defined in Figure 48.
When unable to determine unit specific data, aggregate data per unit class was collected and verified by IT experts. Using aggregate data might have hampered the accuracy of the measurement, but have ensured completeness of data. A sensitivity analysis on variations in data collected showed this has little effect on assessment criteria scores when modelled in line with the functional design in Chapter 8 (see Appendix N).
Literature addressing life cycle impacts related to extraction of materials and production of hardware IT that fall under the class “infrastructure hardware”, “servers” and “storage” in Figure 48 was limited. Therefore, the quality of estimates related to water use, energy use and GHG emission in the procurement phase were of derived quality. A sensitivity analysis of the implemented functional design shows this significantly influences water use related to extraction and production of hardware IT (performance indicator 1.1.1) (Appendix M and N). This makes the estimate of water use over the life cycle of hardware IT (A1) less robust. Furthermore, the content of recycled units that end up at landfills significantly influences generation of raw materials waste over the life cycle of hardware IT (A3).
Aggregated data and assumptions concerning the environmental impact of hardware IT were made because data was inaccessible or not easily and quickly enough to retrieve for the case study. This might be an indication of less well-defined data-items. It is recommended to update the case study protocol with regard to the following data-items;
Procurement costs instead of annual depreciation costs per units of analysis,
A clearer definition of average utilization as this might be interpreted differently by different managers and experts. In the case study the meaning of this was discussed with two experts, before an average utilization was determined. For printers and copiers utilization is defined as rate of prints printed. Often organisations count prints as part of CR strategy, hence the chance of data being available about the utilization of these types of units is high. With regard to other units, average utilization can be defined as CPU usage or relative time in active mode to idle and sleep. This data was more difficult to retrieve.
Questions with regard to units of analysis placed in data centres should be updated as “outsourced hardware IT” does not ask for enough information to determine the greenness of the hardware IT infrastructure of an organisation sufficiently. It is recommended to incorporate the type of outsourcing arrangement as outsourced might be perceived as for instance cloud computing, whereas organisations may partially outsource the operation of their hardware IT (housing). In essence cloud computing is computing as a utility (Armbust, et al., 2010).
“replacement of sub-components” was unclear to IT managers. It is recommended to change this question into “number of defective units replaced” as organisations might keep record of defectives.
The timeliness of the data that was collected is good. Data was collected from up-to-date sources such as the 2011 financial budgets. Timeliness of data constructed from literature varied. This is an improvement point for future evolvement of the operationalization of the framework.
Conceivably subjective statements were verified by asking for additional documentation or by consulting experts to enhance reliability and objectiveness of data. Examples are; average utilization and proportion of recycled and refurbished hardware IT at the end-of-life.
Despite the limitations of the data incorporated in the case study the results show it is possible to assess the greenness of the hardware IT infrastructure listed in Figure 48. Hence, the framework and its functional design is operationally verified for these unit classes. Although calculations with the same units can be carried out, external validity of one case study is limited. The results of the case study can therefore not be generalized to all organisations and hardware IT infrastructure units. Final evaluation The final evaluation consisted of two steps as part of evaluating the efficiency of communicating case study results; presentation layouts were evaluated by two industrial design students and one consultant. The reviews can be found in Appendix O. Essentially the reviews resulted in refined layouts presenting case study results to IT decision-makers. Although the layouts were evaluated and refined, this does not verify that the design is able to communicate the

MSc Thesis, J.C.P. Kalsheim: Greening Information Technology (IT) Infrastructures
Evaluation and reflection on framework design 101
results to IT decision-makers efficiently. This would require further user testing and possibly tailoring by customization of the presentation layouts (Mørch, 1997). In the next section evaluation of the core set of requirements will be presented. The evaluation is based upon the case study results and the final evaluation.
9.2 Evaluation of design requirements As explained in the previous section a set of core requirements have been defined and validated by two expert panels. These requirements serve as a statement of evaluation of an assessment tool and are necessary to develop a tool that is stable in presence of change and flexible enough to be customized and adapted to changing requirement (Nuseibeh & Easterbrook, 2000). The design requirements will be reflected on in the following paragraphs with regard to the case study findings. This is part of understanding the successfulness of the new framework and the further evolvement of a generic assessment tool for greening hardware IT. HR1:The tool shall determine one value stating the relative greenness of the hardware IT infrastructure of an organisation
When it is possible to aggregate all assessment criteria into one index then the tool is able to determine one value stating the relative greenness of the hardware IT infrastructure of an organisation. In the functional design in Chapter 8, the HITIG index has been defined. The index describes how assessment criteria can be aggregated into one value stating the relative greenness of the hardware IT infrastructure of an organisation. For this a reference value for normalization needs to be established. Due to the uniqueness and explorative character of this research, no “reference value” existed. Hence, it can be concluded that the requirement has been meet as it is possible to aggregate assessment criteria into one value in theory, but that this is not viable at the moment. HR2: The tool shall demonstrate trade-offs organisations are confronted with in greening the hardware IT infrastructure A tool showing situations involving the reduction of one aspect of the GHITI scores in return for gaining another aspect is able to demonstrate trade-offs organisations are confronted with in greening the hardware IT infrastructure. The case study shows that trade-offs concerning environmental and economic aspects of green IT can be demonstrated in practice. For example, it shows the effect of procuring more renewable energy to supply the hardware IT infrastructure during operations. This is an economic/environment trade-off; lower GHG emission versus higher energy costs, assuming a stable efficiency level. Energy costs of hardware IT in the use phase increases when renewable energy is procured. Assuming one carbon credit costs 16 euro per tonne, costs in the use phase are nevertheless reduced if renewable energy prices are 10% higher than non-renewable energy prices. Other trade-offs have been found such as; accessibility of printers and copier to employees versus efficient utilization of printers and copiers; energy and CO2 emission reduction in the use phase due to availability of more energy efficient hardware IT versus environmental and economic impact of hardware IT in the procurement phase. Concluding, these examples confirm the possibility of demonstrating trade-offs organisations are confronted with in greening the hardware IT infrastructure when applying the functional design to a business case.
HR3: The tool shall determine the influence of main energy use, water use, raw material use, GHG emission and cost drivers on the relative greenness of the hardware IT infrastructure of an organisation The tool should identify the main drivers causing the size of each assessment criteria. In the case study the main energy use, water use, raw material use, GHG emission and cost drivers were found. Figure 51 shows the main drivers behind the HITIG scores per assessment criteria. Further, case study shows that the following is evident about the main drivers of the assessment criteria scores (Appendix M); the main energy use driver can be found in the use phase and under the device category switch; the main water use driver can be found in the procurement phase and under the device category laptops; the main raw material waste driver can be found in the procurement phase and under the device category printers; the main CO2 emission driver can be found in the use phase and under the device category switch; the main cost drivers can be found in the procurement under the device categories switches and storage and in the use phase under the device categories appliances, multifunctional printers and servers. Hence, the case study suggests it can be concluded that a tool constructed from the functional design can determine main drivers behind the greenness score. This is dependent on the analysis and presentation of findings. It requires determining the impact per device category per life cycle phase for each assessment criteria. It is recommended

MSc Thesis, J.C.P. Kalsheim: Greening Information Technology (IT) Infrastructures
Evaluation and reflection on framework design 102
both the absolute and relative impact on the assessment criteria are determined. How the relative impact of assessment criteria might be expressed will be addressed in the evaluation of design requirement HR7.
HR5: The tool shall support organisations improve the relative greenness of the hardware IT infrastructure over time as part of a continuous management process A tool that supports an organisation improve the relative greenness of the hardware IT infrastructure over time as integral part of a continuous management process meets this requirement. In the previous paragraph it has been concluded that a tool developed from the functional design can determine main drivers behind the assessment criteria scores when results are presented in Figure 52. From the results presented improvement areas can be determined. When an organisation chooses to address these improvement areas, the tool can support improvement over time. This also requires a continuous management process. A tool should be integrated with existing environmental management processes or a new environmental management process should be implemented. That the functional design meets this requirement cannot be concluded as it would require more in-depth research over time after the implementation of measures derived from the tool and implementation of a continuous management process. Therefore, it cannot be concluded that a tool based upon the functional design supports improvements over time as part of a continuous management process. This depends on what an organisation wants on the long term. When an organisation chooses to improve the greenness of hardware IT over time and defines goals and targets to become greener, can the tool possibly support certain improvements.
HR7: The tool shall produce results that can be compared to peers If the results of the tool allow comparison between different organisations it is stated that the results are comparable. The case study shows performance indicators and assessment criteria can be determined in a way that allows comparison with peers. Performance indicators and assessment criteria can be expressed per employee or million euro revenue; two ways of expressing scores in a way that allows comparison of results with other organisations. In Table 11 assessment criteria scores determined in the case study are presented that could be used to benchmark GHITI scores. The same calculation methodology and calculation method need to be used by organisations who’s results are to be compared.
Table 11: assessment criteria scores that may be used for benchmarking
ID Name Benchmarking scores
Score/employee Score/million euro revenue
A1 Water use over the life cycle of hardware IT (m3) 4.900 25.000
A2 Energy use over the life cycle of hardware IT (MJ) 21.000 110.000
A3 Raw material waste over the life cycle of hardware IT (kg) 3 17
A4 Greenhouse gas emissions over the life cycle of hardware IT (ton CO2) 44 230
A5 Costs over the life cycle of hardware IT (euro) 7.500 39.000
Next to the output format, comparison of results requires that the tool is generally applicable to organisations. To determine this it is recommended additional case studies are carried out in different sectors, as the general applicability of the framework and functional design cannot be concluded from a single case study. Summing up, it can be concluded that a tool constructed from the functional design can be used to compare results with peers. This requires consistent use of calculation methodologies. Further research should be performed to test whether the framework is generally applicable to all organisations.
HR8: The tool shall be based upon information from accepted standards A tool that is based upon data, methods and methodologies from widely used standards is based upon information from accepted standards. In Chapter 5 literature has been reviewed with regard to environmental and economic performance indicators. Appendix I shows performance indicators have been derived from accepted business standards for environmental performance assessment such as the GRI, EMAS and ISO 14031. Furthermore, organisational boundaries have been set in line with the GHG Protocol. The GHG Protocol is a business standard that has gained wide acceptance under organisations (Sundin, Brown, Wakefield, & Ranganathan, 2009).

MSc Thesis, J.C.P. Kalsheim: Greening Information Technology (IT) Infrastructures
Evaluation and reflection on framework design 103
In the functional design (chapter 8) and case study (Appendix M) GHG emission have been calculated using emission factors and activity data. This is corresponding to the Tier 1 calculation approach stated in the IPCC methodology of estimating the GHG emission of activities by organisations. It is the most basic estimation level making use of calculated ratios relating emissions to a proxy measure of activity at an emission source (IPCC, 1996). It is also the most commonly used approach (WBCS & WRI, 2004). Other calculation methodologies are based upon available literature and information from product specifications published by hardware IT suppliers. These are verifiable information sources. In the functional design and in the cases study assumptions made are specified and sources are explained. Further, calculations of some performance indicators are based upon LCA data of similar products. This is scientific data that has been collected through the application of an accepted environmental assessment methodology. The framework could be improved by incorporating more up-to-date LCA data and extending the use of LCA data in estimations. Besides environmental sustainability indicators, economic performance indicators in the framework design have been derived from accepted standards; TCO and LCC are often used methods in IT investment valuation (Ellram, 1995) (Ferrin & Plank, 2002). During the case study research data needed to determine economic performance indicators derived from these standards were the most challenging to acquire. This signifies the complexity of financial streams in an organisation and the importance of developing a tool which requires information readily available within organisations. Further, TCO and LCC are criticized because a standard approach is lacking (Ellram, 1995). Summing up, the new framework incorporates several accepted environmental sustainability and IT-valuation approaches. However, this does not imply that information is readily available within organisations as there is no environmental and/or economic sustainability measurement standard that is used by all organisations. HR12: The tool shall communicate the results clearly to IT decision-makers A tool that has an attractive and intuitive output layout that additionally is customizable, could be more successful in communicating the results of assessing the greenness of the hardware IT infrastructure of an organisation to IT decision-makers. To evaluate the intuitiveness and attractiveness of the presentation of the case study results, the presentation layers were refined after the evaluation of two industrial design students and one consultant. During the walk-through the participants were asked to evaluate the attractiveness of the presentation layout and the clarity of the meaning of the results presented in the graphics. The conclusions from the evaluations can be found in Appendix O. The refined presentation layouts can be found in the subsequent three figures.
Figure 49: Presentation layout 1

MSc Thesis, J.C.P. Kalsheim: Greening Information Technology (IT) Infrastructures
Evaluation and reflection on framework design 104
Presentation layout 1 (Figure 49) presents the first layout. In this presentation layout the HITIG index score of the organisation is presented. To prevent confusions, the relative score should be outlined. In the case study normalization was not possible, thus a score relative to a “leader” (best situation) and “laggard” (worst situation) was estimated. What a “leader” and “laggard” is described in the presentation layout (Figure 50). Ideally, the presentation layout would show the relative score to a reference score.
Figure 50: Presentation layout 2
In the second presentation layout (Figure 50) more information is provided about the GHITI scores. In this presentation layout the “spider web” has been used to position the relative score on each assessment criteria. The assessment criteria scores (blue line) are presented together with the relative greenness of the hardware IT infrastructure scores (red line) as presented in the previous presentation layout. Where the red line is above the blue line, the organisation scores below average relative greenness of the hardware IT infrastructure scores, and vice versa.
Figure 51: Presentation layout 3
In the third presentation layout assessment criteria scores are presented separately. Hence, all assessment criteria have a separate presentation layout. In Figure 51 the presentation layout presenting the assessment criterion water

MSc Thesis, J.C.P. Kalsheim: Greening Information Technology (IT) Infrastructures
Evaluation and reflection on framework design 105
use over the life cycle of hardware IT (m3) is illustrated. The difference from other assessment criteria presentation
layouts is merely the colour combinations. In these presentation layouts the score per device category in accordance with the classification made in Figure 48 can be found. Furthermore, the relative score per life cycle phase and total impact per life cycle phase can be found in the layout. The relative scores have been added in the right hand corner of the presentation layout. These scores sever as a reference to ensure IT decision-makers understand the magnitude of the assessment criteria scores. These should be chosen with care to prevent responsibility shifts. Although the presentation layouts have been refined this does not verify the design is able to communicate the results to IT decision-makers effectively. This would require further user testing and possibly tailoring by customization of the presentation layers (Mørch, 1997). Customization is possible when a green IT advisor has experience with working in Microsoft Excel and sufficient client insights. Hence, it might be concluded that a tool developed from the functional design can communicate the results clearly to IT decision-makers. The successfulness of communicating the results depends on the effort spent on tailoring the presentation layouts for an IT decision-maker in an attractive and intuitive manner. To summarize, the case study shows it is more or less possible to meet the core requirements defined for an assessment tool when implementing the functional design. This implies the framework is operationally verified for the hardware IT infrastructure units that are analysed. The functional design could be used as a first step towards a generic assessment tool. In the next section the design process will be reflected on as this can provide additional insights on the successfulness of the framework design in meeting its objectives.
9.3 Reflection on design process In the previous section the new framework has been evaluated by means of the core requirements for an assessment tool. The next step is to reflect on the design process. The research has been guided by the design science research by Hevner et al. (2004). This framework was particularly useful in bringing structure to the research, and has resulted in a rigorous research process. Reviewing the design process using the defined guidelines for design science research, the effectiveness of applying the design science research approach can be evaluated (Hevner et al., 2004). This is important in understanding the successfulness of the framework design and design process. In the next paragraphs the guidelines will be reflected on with regard to the process and its impact on the new artefact. Guideline 1: Design as an Artefact According to the first guideline by Hevner et al. (2004) design science research must produce a viable artefact in the form of a model, a method, a construct or an instantiation. The main design artefact in this research is a framework to support IT decision-makers in greening the hardware IT infrastructure. A first implementation of this artefact has been shown to be successful at BSC Netherlands (Appendix M). Hence, the new framework is viable for hardware IT infrastructure units tested in the case study. Guideline 2: Problem relevance The second guideline state: “the objective of design-science is to develop technology-based solutions to important and relevant business problems” (Hevner, March, Park, & Ram, 2004:83). As outlined in the introduction in Chapter 1 the new framework address a relevant business problem, namely the lack of a tool to support IT decision-makers in green the hardware IT infrastructure as a step towards a comprehensive CR strategy. From an academic viewpoint a relevant problem has been addressed as well. In this research a knowledge gap encountered in recent literature on green and sustainable IT has been filled.
Guideline 3: Design evaluation The third guideline in the design science research emphasizes the importance of design evaluation. The designed artefact must be rigorously demonstrated by means of well-executed methods (Hevner, March, Park, & Ram, 2004). In a case study the new framework has been studied in depth in a business environment. Preliminary to this, the framework has been reviewed by two independent expert panels. The previous section shows that the framework meets several of the core set of design requirements. This shows it is possible to construct a tool to assess the greenness within a certain scope of hardware IT from the functional design. Despite these evaluation steps, the

MSc Thesis, J.C.P. Kalsheim: Greening Information Technology (IT) Infrastructures
Evaluation and reflection on framework design 106
implementation of the design science research could have been improved by adding more refinement cycles of the new framework. Guideline 4: Research contributions The design science research states effective research must provide comprehensible and verifiable contributions in the fields of the design artefact, design foundations and/or design methodologies (Hevner, March, Park, & Ram, 2004). To assess the research contribution the following question can be asked “what are the new and interesting contributions of the research?” Essentially, the contribution of this research is a framework that focuses on assessing the relative greenness the hardware IT infrastructure of an organisation as a step towards a comprehensive CR strategy. The framework can be seen as the academic and practical contribution consistent with the research problems stated in the introduction (see Chapter 1). When comparing the framework to literature on green and sustainable IT, it might be concluded that the new framework is unique compared to existing frameworks, because it categorizes environmental and economic performance indicators according to three boundary elements of “an organisation”– procurement, use and disposal. The framework incorporates performance indicators from literature relevant to sub-terms found in green IT definitions. This might be seen as an extension of the knowledge base on green and sustainable IT at organisation level. The practical contribution for IT decision-makers at BSC Netherlands are insights and awareness of current energy use, water use, raw material waste generation, GHG emission and costs over the life cycle of the investigated hardware IT. Furthermore, the case study has demonstrate the possibility of implementing the new framework in practice. The rigor of the framework will be further elaborated on in the next paragraphs. Guideline 5: Research rigor The fifth design science research guideline suggests the research must rely upon the application of rigorous methods in both construction and evaluation of the artefact (Hevner, March, Park, & Ram, 2004). The designed artefact is based upon an extensive literature review on green IT and related topics, requirements engineering, two expert panels and one case study. However, there are several limitations of the scientific grounding of the new framework. First, it cannot be claimed that the framework is complete because a limited number of issues with regard to IT are addressed. Further, a limited amount of literature addressing green IT and related topics have been taken into account due to time constraints. Second, the framework does not incorporate social aspects of sustainability, although the social dimension of sustainability is inevitable when the purpose is to obtain a comprehensive CR strategy entirely consistent with the definition by Labuschagne et al. (2005). Third, the validity to generalize the results of this research is limited; only one case study was executed to validate the new framework. Then again, the framework was not been developed for one organisation in particular. The framework was designed and validated by two independent expert panels consisting of experts with different backgrounds and expertise (Appendix F). Despite the limited generalizability, performing the case study several tactics were implemented to increase validity. Due to the complexity of the framework and the explorative character of this research, the single case study served as a first operational validation of the new framework. To enhance the validity of the research results it is important that the framework is applied within other organisationsand and to a greater scope of hardware IT infrastructure units. This could enhance the generalizability of the framework. Guideline 6: Design as a search process Guideline 6 of the design science research states that “the search for an effective artifact requires utilizing available means to reach desired ends while satisfying laws in the problem environment” (Hevner, March, Park, & Ram, 2004:83). The framework design is a result of an iterative design process from the start of the research project to the final case study data. Scientific literature as well as expert interviews contributed to this quest by providing better understanding on performance assessment, green IT, CR, sustainability, eco-efficiency, design requirements, etc. Additionally, the case study provided useful insights for the further refinement of a viable functional design for several hardware IT infrastructure units. In this research, generation of design alternatives have been less emphasized than evaluation of the framework design. This has been done deliberately due to time constraints. Although alternative frameworks have not been addressed in the research, design alternatives could be perceived as performance indicators found in literature. These have been selected using criteria for good performance indicators defined by the International organisation for standardization (ISO) and refined by two expert panels. Further, the layout of the framework has been adjusted with the feedback from the first expert panel. Both the academic and practical grounding and case study research have been performed within predefined project time.

MSc Thesis, J.C.P. Kalsheim: Greening Information Technology (IT) Infrastructures
Evaluation and reflection on framework design 107
Guideline 7: Communication of research The last guideline by Hevner et al. (2004) emphasizes the importance of communicating the results to both a technology-oriented as well as management-oriented audience. For technology-oriented audience sufficient details can be found in the framework design, functional design and related appendices to enable the described framework and assessment tool to be designed and used within a proper organisational context. The process towards the new framework can be found in Chapter 2. In combination with suggestions for improvements, this allows practitioners to further extend and evaluate the artefact. As regards the management-oriented audience, the implementation process that will be described in the next chapter in addition to the results of the explorative case study and cases study protocol, provide information that allows managers to determine which organisational resources should be committed to construct and use the framework within their specific organisational context. Summarizing, the guidelines for design science research have been followed. Additional refinement cycles could have been incorporated to enhance the design evaluation and research rigor. Supplementary design alternatives could have been developed and incorporated in the design cycle as well.
9.4 Reflection on performance assessment Next to evaluating and reflecting on the designed artefact and the process towards it, it is important to reflect on the further use of the new framework and its limitations. Hence, in the following paragraphs literature on challenges and limitations of performance assessment will be elaborated. Measuring performance in organisations has been extensively reviewed in literature, however the design and implementation of effective and an efficient Performance Measurement System (PMS) remains a problem in several organisations (Searcy et al., 2008). A PMS is a set of performance indicators used to quantify the efficiency and effectiveness of an action (Neely, Gregory, & Platts, 1995)(Neely, et al., 2000) (Tangen S. , 2004). Searcy et al (2008) divide key challenges and opportunities of performance measurement into three categories: design, implementation and evolution. In the design phase, key challenges in organisational performance measurement are (1) tailoring measures to organisation specific circumstances, (2) developing linkages between the bigger organisational systems and (3) addressing key stakeholder issues in the measurement system (Searcy et al., 2008). Other challenges in the design phase are related to resistance of measurement and top management being discharged (Bourne, Mills, Wilcox, Neely, & Platts, 2000). An example of a challenge that arose in the design phase in the case study was; resistance of measurement due to time constraints. Next to challenges related to design of a measurement system, Searcy et al. (2008) define a number of challenges related to implementation; (1) filling the gap between design to implementation, (2) integrating the measures with already existing infrastructures and (3) determining the influence of the measurement system on organisational performance. These challenges are expected to arise after the first measurement. Further, challenges related to the evolution of performance measurement within an organisation are related to; (1) updating measures in response to changing circumstances, (2) preserving and improving commitment to the measures and (3) establishing a governance structure to ensure continuity of the PMS(Searcy et al., 2008). Hence, when aiming at integrating the new framework into an organisation’s measurement systems, these challenges should be addressed to assure successfulness. Next to the challenges of measuring performance at organisational level, measuring sustainability has often been criticized in literature. Measuring sustainability using indicators is a classic reductionist tool based on quantification with several limitations. It often involves technically complex biological and physical features as well as complex social, economic and political dimensions. Applying sustainability indicators attempt to encapsulate these processes and dimensions in a relatively limited number of simple measures, which is often unsuccessful (McCool & Stankey, 2004)(Bell & Morse, 2008). Furthermore, quantifying certain aspects of sustainability may not be possible when aiming at measuring human experience. Performance measurement has also been criticized for its inter-subjective and negotiated character; as there is a vast amount of sustainability indicators and no clear standards, performance indicators are often a result of a socially constructed political instrument (Astleithner & Hamedinger, 2003). Other drawbacks of performance assessment are related to reporting performance. These have been discussed in chapter 4. Basically, negative effects of performance measurement are related to strategic behaviour (e.g. “perverse effect”), internal bureaucracy, obstructiveness to innovations, ambitions and professionalism, the killing of system responsibilities and punishing of good performance (de Bruijn, 2002).

MSc Thesis, J.C.P. Kalsheim: Greening Information Technology (IT) Infrastructures
Evaluation and reflection on framework design 108
As regards the aggregation of data with the purpose of assessing performance, an important trade-off is made between useful information and facilitation of communication when assessing performance. A sustainability assessment that does not combine its indicators into a small set of indices can be difficult to interpret, whereas those that do communicate findings instantly. Arguably indicators combined to indices can provide a clear picture of the system measures. However, there is a problem with the selection of indicators to be aggregated that could intentionally or unintentionally introduce arbitrary weighting or other distortions (SCOPE, 2007). Due to these limitations of aggregating information, it is recommended the HITIG index is always presented together with assessment criteria scores.
9.5 Reflection on researcher’s role Besides the challenges and limitations of performance assessment described, the research results have several additional limitations. Some of these might be caused by the role of the researcher. The following paragraphs contain a brief personal reflection of the researcher in which these limitations will be addressed. First, the start of the research can be described as a walk in the dark; it was unclear which path to take that eventually could contribute to the academic knowledge base as well as to the practical problem within the prescribed research time. After several discussions with supervisors and a broad literature review, the scope was delineated and shaped. Despite that social aspects of hardware IT consciously have not been incorporated in the research scope, the researcher recognizes the importance of ensuring comprehensive improvements of the current hardware IT industry that also includes aspects related to the well-being of humans. Furthermore, the researcher recognizes the importance of design, transportation and IT services in achieving green IT. It is recommended these aspects are further investigated to determine their separate impact on the greenness of hardware IT. Besides the limited research scope, the research was executed at BSC Netherlands. This might have influenced the results because several BSC employees were; (1) interviewed in order to elicit design requirement (≈60% of interviewees) and (2) participating in the expert panels to validate the framework (≈20% of experts). It can be argued that this could have biased the framework. It is understood that it can never be completely proven that this bias does not exist, however it has been the intention of performing an objective and reliable research independent of any organisation. For example, analysing elicited requirements shows that requirements elicited at BSC, Delft University of Technology and literature partly cover each other. Finally, the research contains several iterations. Especially as the case study progressed, the researcher became more knowledgeable of how to measure several of the performance indicators defined in the framework. This resulted in refinement of several indicators during the analysis. This might have hampered the internal validity of the case study, but when reflecting on the end result also means enhanced quality of the functional design and completeness of case study data.
9.6 Summary and conclusions Summarizing, the new framework design has been evaluated and reflected on from several viewpoints; evaluation of evaluation methods, evaluation of design requirements, reflection on design process, reflection on performance assessment and reflection on the role of the researcher. The aim of these evaluations and reflections have been to determine the successfulness of the framework and understanding of how the framework can be improved. The conclusions from these steps will be used answer sub-question 6 and 7 defined in the introduction in Chapter 1. The answer to sub-question six and seven will be provided in the following paragraphs. Sub-question 6: “How successful is the framework in determining the greenness of the hardware IT infrastructure of an organisation as a step towards a comprehensive corporate responsibility strategy?” The framework designed in Chapter 7 fulfils most of the core design requirements of an assessment tool when implemented in a single cases study. Whether this successfulness can be repeated in other organisations cannot be stated from a single, embedded case study. The case study shows however that;
Performance indicators can be measured and aggregated into one value stating the relative greenness of the hardware IT infrastructure investigated at BSC Netherlands (HR1),

MSc Thesis, J.C.P. Kalsheim: Greening Information Technology (IT) Infrastructures
Evaluation and reflection on framework design 109
Main drivers can be identified that cause the greenness of the hardware IT infrastructure investigated at BSC Netherlands (HR2),
The trade-offs BSC Netherlands are confronted with in greening the hardware IT infrastructure are evident when applying the framework (HR3),
If incorporated in a continuous management process as will be elaborated on in Chapter 10, the framework can support BSC Netherlands improve the relative greenness of the hardware IT infrastructure over time (HR5),
Assessment criteria scores at BSC Netherlands that are defined per employee or million euro revenue may be compared to peers when consistent use of calculation methodology is applied (HR7),
Although new in its sort, the framework is based upon accepted business standard related to environmental sustainability and IT investment evaluation. A case study at BSC Netherlands shows this does not necessarily imply all data are readily available or accessible from within the organisation (HR8),
When presentation layouts are carefully designed and tailor-made for an IT decision-maker, results can be communicated more effectively (HR12)
Hence, evaluating the design requirements shows that implementing the framework design together with the recommended implementation in the next chapter can result in a successful framework use at BSC Netherlands. A conclusion can be drawn for a certain scope of hardware IT at BSC Netherlands, but it cannot be stated the framework is successful in determining the greenness of the hardware IT infrastructure of organisations in general or the total hardware IT infrastructure at BSC Netherlands. For this, further research and additional design iterations are recommended. Nevertheless, the framework is operationally verified for hardware IT infrastructure units incorporated in the case study. Besides being able to meet most of the design requirements fairly well in the case study, the new framework has several limitations. First, performance indicators are defined with the input of a limited number of experts. The two separate expert panels showed the resulting conclusions in some cases were contradicting. In the research, this is interpreted as a non-consensus among experts, and therefore rejected. Arguably involving more experts in one sessions would have resulted in a different, and perhaps more complete framework. However, this does not imply a consensus among academics and practitioners would be possible to attain. Second, measuring performance using performance indicators has several limitations. Literature suggests defining performance indicators often is a result of inter-subjectivity and negotiation between stakeholders. In this research, multiple experts have been involved at different moments in time which could have limited the political and inter-subjective character of the framework design. Further, the design, implementation and evolvement of a PMS that incorporated the new framework is very challenging due to for instance resistance to measurement, a gap between measure and implementation and the difficulty of establishing governance structures. Third, it can be argued that the framework is not able to encapsulate all technically complex biological and physical features as well as complex social, economic and political dimensions of hardware IT at organisation level. Perhaps the integration of more LCA data in the functional design could enhance this? Nevertheless, the new framework should merely be treated as a tool that can be used by IT decision-makers when striving to measure progression towards a greener hardware IT infrastructure. Fourth, information from aggregate data should be used with care as comparing different issues related to greening hardware IT in a meaningful manner might not be possible without being biased. Therefore, it is recommended the HITIG index is used with the assessment criteria scores. Sub-question 7: “How can the framework be improved to make it more in line with corporate responsibility strategy?” As suggested in the previous paragraphs, using the framework over time as part of a continuous management process can contribute to the CR strategy of an organisation. As regards environmental sustainability, the framework addresses several issues; energy use, water use, raw materials, generation of electronic and electrical waste and GHG emission. To improve the framework, it could be extended to incorporate other environmental issues such as land use, biodiversity, water pollution, emission of ozone depletion substances, NOx. SOx, and other air emissions (GRI, 2000). With respect to economic sustainability, the framework is limited to costs. This can be improved by incorporating other economic sustainability aspects related to quality, market presence, indirect economic impacts, openness to stakeholder review and participation in decision-making process(GRI, 2000)(Veleva & Ellenbecker, 2001).

MSc Thesis, J.C.P. Kalsheim: Greening Information Technology (IT) Infrastructures
Evaluation and reflection on framework design 110
Besides extending the scope of both economic and environmental sustainability topics, the main improvement potential of the framework can be found in the social dimension of sustainability. The social dimension of sustainability is not part of the new framework as it was not been incorporated in the research scope. Nevertheless, that economic, social and environmental sustainability are closely intertwined and that in practice they can be difficult to separate is recognized (Rao & Holt, 2005). Thus, environmental and economic aspects incorporated in the framework can have an effect on the social sustainability dimension as well. This does not imply that the framework balances the 3BL. It is recognized that social sustainability is important in obtaining an improved balance of the 3BL and thereby also to a comprehensive CR strategy. Only when all three dimensions of sustainability are addressed in a balanced way and when the needs of the presentdo not comprise the ability of future generations to meet their needs, it may be entitled sustainable development and a step towards comprehensive CR (Brundtland, 1987) (Labuschagne et al., 2005). Summarizing, the new framework presented in chapter 7 and 8 should not be used by an organisation without precaution. The new framework, performance assessment and the framework design, implementation and evolvement have several limitations and challenges. In the next chapter a translation will be made from evaluation and reflection to framework use and evolvement over time. These are recommendations on how to deal with some of the limitations and challenges pinpointed in this chapter.

MSc Thesis, J.C.P. Kalsheim: Greening Information Technology (IT) Infrastructures
Recommendations for framework use, evolvement and implementation path 111
10. Recommendations for framework use, evolvement and implementation path
In the previous chapter the new framework and design process have been evaluated and reflected on. In this chapter a translation is made from design to implementation in the form of a strategy to deploy the framework design as described in Chapter 7 and 8. This entails guidelines for use of the functional design (section 10.1) and a vision on how to manage the process of measuring the greenness of hardware IT (section 10.2). How this process can be implemented over time to address some of the challenges of PMS will be outlined in section 9.3.2. The vision has been based upon insights from the case study as well as literature on EPE as found in accepted business standards. The vision on a management process and implementation path serve as suggestions on how to address the shortcomings of merely using the framework design when striving to measure and improve the greenness of hardware IT over time. Additionally, these recommendations can be used together with the functional design to answer the last sub-question defined in Chapter 1; “How can the framework be used to determine the relative greenness of the hardware IT infrastructure of an organisation as a step towards a comprehensive corporate responsibility strategy?”
10.1 Applied principles of functional design Based on the results from the evaluation in Chapter 9, five guidelines will be stated that should be adhered to when applying the functional design in its current form. In essence these guidelines apply to hardware IT infrastructure units measured in the case study. Aiming at measuring additional units, application guideline 6 should be met to ensure enhanced framework utility.
1. Ensure up to date questions in case study protocol Due to stated limitations of the case study protocol in its current form, it is recommended this is improved to enhance quality of data collected. Despite that it is recommended to improve the case study protocol, it should be used consistently in additional business cases to ensure reliability of data and comparability of results for internal as well as external benchmarking purposes. This way, additional business cases may be successful.
2. Tailor presentation layout to organisation Presentation layouts have been suggested in Chapter 9. However, these should be tailored to its audience. This way the successfulness in communicating results effectively may be enhanced.
3. Use available and accessible data Information needed to perform calculations have to be available and accessible within organisations to perform reliable estimations of performance indicators. This would require passive and active monitoring of data. Mainly data may be found in financial statements. Where data cannot be found in financial statements or assets lists, data might be found through interviews with IT managers or experts, hardware IT suppliers and end-of-life vendors. Data might also be found in literature. Without required data being available, the functional design cannot be applied successfully.
4. Continuously update and improve data quality An extensive amount of data used in the functional design has been based upon relatively old sources or have been constructed from estimates that are based upon old or unspecific data sources. It is recommended several of these are improved or updates where possible to improve data quality. Other, more recent data is also recommended to be updated annually. Examples of such are the average electricity price and costs of carbon credits. Without continuously updating existing data or improving data quality, the functional design may not be successful.
5. User must have basic knowledge of IT and data analysis software It is recommended the user of the framework has basic knowledge of IT and green IT assessment. The framework and functional design provide guidance on how to assess the relative greenness of the hardware IT infrastructure of an organisation, but still requires some level of understanding of the topic by the user. Additionally, the use should be familiar with data analysis software such as Excel. Such software are used to calculate and aggregate performance indicators.

MSc Thesis, J.C.P. Kalsheim: Greening Information Technology (IT) Infrastructures
Recommendations for framework use, evolvement and implementation path 112
6. Extend the hardware IT infrastructure application scope consistently and communicate adjustments It is recommended to extent the scope of hardware IT infrastructure units that can be estimated using the functional design. Possibly the functional design would have to be adjusted for certain, additional units of analysis. When adjustments are made, these should be implemented in the functional design consistently. The changes should furthermore be communicated. This way the framework can improve its utility. Summarizing, the guidelines describe several aspects that need to be taken into account when using the functional design as defined in chapter 8. The subsequent step is to understand the bigger context of the functional design in an organisation. Hence, the next section will describe a vision on how to manage the process of measuring the greenness of hardware IT consistently over time. This is a vision on the further evolvement of an assessment tool as part of a continuous management process.
10.2 Vision on management process and evolvement It is recommended to make the GHITI framework an integral part of an organisation’s environmental performance assessment. This could stimulate an organisation measure progress over time consistently. The ISO 14000 environmental management standard describes a process for measuring environmental performance. This is based upon the Plan-Do-Check-Act (PDCA) business process improvement model. In line with this model and the ISO 14031 standard, a vision on a management cycle to measure and improve the greenness of the hardware IT infrastructure of an organisation over time will be outlined in the following paragraphs. The management process is depicted in Figure 52.
(2) Define data
sources
(3) Determine
data collection
procedure
(4) Data
collection
(5) Data analysis
and evaluation
Data storage
Start/initiation
Framework 2.0(1) Define goals
and scope of
measurement
Report data to
stakeholders
Case study protocol
Functional design
(6) Review and
improve GHITI
evaluation
PL
AN
DO
CH
EC
K
& A
CT
Figure 52: Management process, adopted from ISO 14031and PDCA cycle
Figure 52 shows how an organisation can measure the greenness of the hardware IT infrastructure of an organisation and improve the measurement process over time. Information from this process can also be used to improve performance. Targets and objectives regarding GHITI scores can be set by an organisation. Periodical measurement of progression can help an organisation determine whether targets and objectives are met. When

MSc Thesis, J.C.P. Kalsheim: Greening Information Technology (IT) Infrastructures
Recommendations for framework use, evolvement and implementation path 113
actual performance does not meet defined targets to meet objectives, management can choose to implement measures to steer performance in the desired direction. This way, the management process in Figure 52 can support organisations improve the relative greenness of the hardware IT infrastructure over time. In the following paragraphs the various phases of the management process (Plan, Do, Check and Act) will be elaborated on in more detail. Plan The first phase in the management process is planning. In this phase goals and scope of the measurement are set, data sources are defined and data collection procedures are chosen. It is recommended to involve middle management and employees in the selection of indicators, data sources and data collection procedures to ensure data availability and create commitment to the assessment. This may also hold them accountable at the implementation stage (Veleva & Ellenbecker, 2001). The new framework consists of several performance indicators that can be complicated and time-consuming to measure in a real business case. To overcome this, it is recommended to select relevant performance indicators. In the case study relevant performance indicators were selected with the input of IT managers and a policy maker. They pinpointed which performance indicators would be irrelevant or negligible and where to collect the data. A drawback of this is the risk of selecting performance indicators on which the organisation scores high. It is recommended to think on the long-term and not only choose quick wins. Enforcing this might be difficult. Do In the second phase in the management process, data is collected, analysed and evaluated. The collection of data to estimate performance indicators should be planned carefully to minimize the burden on an organisation, risk of errors that might occur when collecting data and ensure data collected is approved and collected on a consistent basis. Ideally, an organisation would integrate the data collection and reporting process with existing tools and processes (WBCS & WRI, 2004) (Putnam, 2002). A trade-off should be made between detail level of data collected, calculation accuracy, time and budget. It is recommended an organisation applies the most accurate, reliable and verifiable data. Completeness of data is also necessary to ensure a comprehensive analysis of performance. Enforcing data meet all these criteria might be difficult due to time and budget constraints. In the case study the entire data sheet was sent to IT managers for verification. This is recommended as part of data collection procedures to enhance data quality. An external party could verify the reliability of this data as well to further enhance the quality. Next to the importance of high data quality, it is recommended to streamline data collection processes to ensure data is collection efficiently. As regards the analysis of data it is recommended to use the functional design consistently. This way results can be used for internal and external benchmarking. Benchmarking can for instance be used to compare the GHITI performance at BSC Netherlands with BSC units in other countries. Ideally one compares similar units, however legal BSC unit might be different in for example size and hardware IT infrastructure. Further, it is recommended to measure the same classes of units of analysis. This way the resulting scores per unit class can be compared although units of analysis change over time. Evaluation of an organisation’s performance is the last step in this phase. The greenness of the hardware IT infrastructure should be reviewed periodically. A consistent and meaningful comparison of the GHITI scores over time also requires that organisations set a performance datum to compare the current GHITI level. The performance datum can be referred to as the base year (WBCS & WRI, 2004). To consistently tracking the GHITI scores over time, the GHITI scores in the base year might have to be recalculated as organisations undergo significant structural changes such as mergers, acquisitions and divestments and outsourcing or in sourcing of activities influencing the greenness level of the hardware IT. The threshold for recalculating the base year is dependent on the significance of the change (WBCS & WRI, 2004). An organisation could use the base year as a basis for setting and tracking progress towards a “GHITI score” objective at a specific point in time.

MSc Thesis, J.C.P. Kalsheim: Greening Information Technology (IT) Infrastructures
Recommendations for framework use, evolvement and implementation path 114
Check & Act In the last phase of the management process, check & act, measured performance are communicated and the GHITI evaluation is reviewed and improved. It is recommended to communicate the results of the estimate to internal and external stakeholders to create awareness, demonstrate commitment and put information in the hands of actors responsible for improvements (Putnam, 2002). The results might be communicated in the form of a presentation or report. Besides communicating the results, it is essential to improve the GHITI evaluation over time. The indicators used within the GHITI assessment should be evaluated to achieve a continuous improvement of the functional design and the evaluation process (Veleva & Ellenbecker, 2001). Process management (Plan, Do, Check & Act) A successful measurement process is often related to successful process management. Measuring the GHITI scores require the effort of several actors both within as well as outside the organisation investigated. To ensure a good process de Bruijn, Heuvelhof, & Veld (2010) suggest the following aspects should be met: openness, protection of core values, progress and substance. Openness implies an initiator does not take unilateral decisions, but adopts an open attitude (Bruijn, Heuvelhof, & Veld, 2010). In the case study openness was created by discussing the case study at a management meeting in the planning phase. This also ensured progress and substance as the management meeting was heavily staffed with IT managers, which allowed swift decision-making with regard to efforts, responsibilities and content of the measurement process. When addressing external organisations in the data collection process, protection of core values is important. This can be obtained by ensuring confidentiality of corporate information (Bruijn, Heuvelhof, & Veld, 2010). Furthermore, a sense of urgency is recommended among the main stakeholders to assess the greenness of the hardware IT (Bruijn, Heuvelhof, & Veld, 2010). At BSC Netherlands internal sense of urgency was created due to the commitments made by the CIO. Upstream however, data showed to be more challenging to collect; hardware IT suppliers were less reluctant to provide information as there was no sense of urgency. Although there was a sense of urgency to measure the greenness of the hardware IT infrastructure at BSC Netherlands, collecting data required time and effort of several employees. To ensure time and effort is put into the measurement process it is important to create commitment through persuasion or authority. When data was readily available, data collection proceeded smoothly. An example of readily available information within BSC Netherlands was the amount and types of hardware IT supporting business applications. Data about depreciation costs of devices, selling prices, utilization of specific devices and maintenance costs were more difficult to collect. This delayed the data collection process as employees either stated not to have the information or that collecting the information would take too much time. In such situations, data collection can be pushed through by asking for more aggregate data or average data points instead of unit specific data. This hampers the data accuracy, but allows all data to be collected in the end (completeness).
10.3 Vision on framework implementation path The management process described in the previous section is very ambitious and would require a stepwise implementation path. To overcome some of the challenges of implementing a PMS as described in Chapter 9, a vision on a implementation path will be presented in the following paragraphs for BSC Netherlands. The implementation path has been divided into three phases: (1) creating awareness, (2) implementation and benchmark and (3) governance (Figure 54). These will be outlined briefly in the next section.

MSc Thesis, J.C.P. Kalsheim: Greening Information Technology (IT) Infrastructures
Recommendations for framework use, evolvement and implementation path 115
Create
awareness
Implementation
and benchmark
Governance
Implementation path
Effort
Time
1 month
1 year
2 years
Figure 53: Vision on implementation path
Creating awareness (0 to 1 month) The first step in the envisioned implementation path involves creating awareness. Awareness of the environmental, economic and social effects of hardware IT over the entire life cycle of products is critical to get a complete picture of the importance of sustainable IT. As part of developing a sustainable organisational culture at the IT department of an organisation, increasing awareness among employees on issues related to hardware IT is important. Preliminary to this, top-down commitment should be assured and a nil-measurement should be performed. It is important that top-down commitment is sustained throughout all implementation phases to ensure successfulness (Bourne et al., 2000) (Bourne et al., 2002). Data collected in the nil-measurement should be stored in a data base. The nil-measurement could be used as a first test measurement. The results of the nil-measurement could be presented to IT decision-makers, IT managers and to employees at the operational level. The purpose of this would be to; creating bottom-up awareness and commitment within the organisation, bridging the gap from framework design to implementation and determining the impact of the hardware IT infrastructure on organisational performance in terms of CR efforts and targets. Ideally, the effect of this would be awareness of greening hardware IT and the positive effect this could have on CR strategy. This phase should also focus on understanding how to integrate measures with already existing infrastructures. Implementation and benchmark (1 month to 1 year) The second phase in Figure 54 entails consigning lessons learned on how to measure GHITI scores to other organisations. Lessons learned and the framework can be presented at forums focusing on green IT. This could enable other organisations to measure their hardware IT infrastructure greenness as well. On the long term this could have a positive impacts on improvements as a pool of measurements could be established for benchmarking GHITI scores. At organisational level the measurement system could be integrated in existing measurement systems. Further, a second measurement could be performed when top-down commitment is assured. Ideally this measurement could be used for both internal and external benchmarking purposes. Governance (1 to 2 year) The third and last phase in the vision concerns establishing of a governance structure to ensure continuity of the PMS (Searcy, et al., 2008). The purpose of the governance structure could be to provide strategic direction on how to enhance GHITI performance, ensuring GHITI objectives are achieved, maintain commitment to measures and verifying organisational resources are used responsibly (IT Governance Institute, 2003) (Searcy, et al., 2008). Furthermore, deterioration of the performance measurement could be prevented by for example investing in interaction with professionals and limiting the scope of performance measurement by making a strategic selection of hardware IT infrastructure units (de Bruijn, 2002).
10.4 Summary and conclusion In the previous sections three aspects have been addressed with regard to the use of the new framework. First, application guidelines have been presented that address several limitations of the functional design described in chapter 8. Subsequently, a vision of a management process and a vision on how to implemented this over time have been presented. The guidelines including the visions constitute the foundation to answer the last research question.

MSc Thesis, J.C.P. Kalsheim: Greening Information Technology (IT) Infrastructures
Recommendations for framework use, evolvement and implementation path 116
Sub-question 8: “How could the framework be used to determine the relative greenness of the hardware IT infrastructure of an organisation as a step towards a comprehensive corporate responsibility strategy?” The following can be concluded about the use of the new framework;
On the short term, the use of the framework in its current form should; (1)be implemented after the case study protocol questions are improved, (2) tailor presentation layouts to its audience, (3) use accessible and available information within an organisation, (4) continuously update data and improve the quality of several data point and (5) be used by user with basic knowledge of IT and data analysis software. Furthermore, the use of additional units of analysis outside the investigated research scope should be done consistent with the functional design. Necessary changes should be communicated.
On the long term, the new framework should be incorporated in a continuous management process. Figure 52 shows a vision on such a process based upon ISO 14031 EPE. This vision shows how an organisation can measure the greenness of the hardware IT infrastructure of an organisation and improve the measurement process over time. Information from this process can be used to improve performance. Targets and objectives regarding GHITI scores can be set by an organisation. Periodical measurements can help an organisation determine whether objectives and targets are met. When actual performance does not meet the defined objectives and targets, management can choose to implement measures to steer performance in the needed direction. This way, the management process in Figure 52 can support organisations improve the relative greenness of the hardware IT infrastructure over time. The management process should furthermore;
Be planned consistently with existing environmental management systems and data collection processes (PLAN)
Incorporate strategic selection of hardware IT infrastructure units incorporated in the assessment (PLAN)
Incorporate consistent references for normalization, assessment criteria weights and calculation methodologies (PLAN)
Incorporate a data collection procedure that results in data that is accurate, reliable, complete and verifiable (DO)
Incorporate a verification of data by an external party before reporting and publishing (DO)
Incorporate a base year from which relative, internal progress can be measured (CHECK & ACT)
Communicate performance to internal and external stakeholders (CHECK & ACT)
Incorporate feedback mechanism on lessons learned to enhance effectiveness and efficiency of the measurement process over time (CHECK & ACT)
An implementation path towards a meaningful use of the framework can consist of the following phases; (1) creating awareness, (2) first measurement and benchmarking and (3) governance. Creating awareness is important for the organisation to understand the necessity of improving, and thereby monitoring, the greenness of the hardware IT infrastructure of an organisation over time. A first measurement and benchmark is necessary to enhance the use of the framework; enabling measuring and monitoring the relative greenness of hardware IT compared to peers. Governance is important to successfully organize the management process within an organisation. Commitment of management needs to be sustained during all phases for successful implementation.

MSc Thesis, J.C.P. Kalsheim: Greening Information Technology (IT) Infrastructures
Conclusions and recommendations 117
11. Conclusion and recommendations This chapter gives an overview of the results of the thesis, which focused on designing a framework to assess the greenness of the hardware IT infrastructure of an organisation as a step towards a comprehensive CR strategy. In the first two sections the research will be outlined (section 11.1 and 11.2). In the subsequent sections, the results of the research will be presented (11.3). In section 11.4 recommendations for further research will be defined.
11.1 Research definition This research focused on environmental issues related to the use of water, energy and raw materials, GHG emission and WEEE by hardware IT infrastructure units supporting business applications. The aim of this research was to understand how an IT decision-maker can contribute to CR strategy by addressing multiple environmental issues related to the hardware IT infrastructure that supports business applications. It is expected that a tool providing insights about the greenness of the hardware IT infrastructure of an organisation can support IT decision-makers contribute to the CR strategy of an organisation. The research question investigated in the research was:
In literature it is unclear what tool could be used to support IT decision-makers green the hardware IT infrastructure as a step towards a comprehensive CR strategy. The scientific contribution of this research is a new framework to assess the greenness of hardware IT with respect to energy use, water use, GHG emission and WEEE. At organisational level this can be used by IT decision-makers as a “yardstick of progress”. Thus, the research could be seen an extension of existing theory on green IT and its contribution to CR strategy. The practical contribution of the research is a framework and functional design of performance indicators that can support IT decision-makers measure progress and improve certain aspects of the environmental footprint of IT over time. Additionally, this research includes application guidelines of the functional design and a vision on how the greenness of hardware IT can be measured and implemented over time.
11.2 Research approach To structure and guide this explorative research the design science research by Hevner et al. (2004) was applied. The following steps have taken place subsequently;
1. Literature has been reviewed and design requirements have been elicited from expert interviews These initial steps represent the academic grounding and practical relevance shaping the framework. Literature related to green IT, performance assessment, sustainability, eco-efficiency and life cycle thinking was reviewed. Parallel to the literature review, design requirements were analysed applying core activities of requirements engineering. These activities brought structure to the process of defining design requirements of a tool to assess the relative greenness of the hardware IT infrastructure of an organisation. The literature review and the design requirements were used to design a new framework.
2. A new framework has been design and validated Three design cycles took place to refine the framework and its functional design; two expert panels and one case study. The new framework describes several viable performance indicators related to energy use, water use, GHG emission, generation of raw material waste and costs over the life cycle of hardware IT.
3. The new framework has been evaluated and reflected on to understand its limitations and use The evaluation methods were evaluated first. Subsequently, the new framework was evaluated using the core set of design requirements for an assessment tool. The framework design process was evaluated too. Further, performance assessment and the role of the researcher were reflected on.
Research question What generic framework based upon environmental and economic life cycle assessment criteria could be developed to assess the relative greenness of the hardware IT infrastructure of an organization as a step towards a comprehensive corporate responsibility strategy?

MSc Thesis, J.C.P. Kalsheim: Greening Information Technology (IT) Infrastructures
Conclusions and recommendations 118
The above steps resulted in answers to the sub-questions which are necessary to answer the research question. The answers will be presented in the subsequent section.
11.3 Answering the research questions To answer the main question of the research, it is essential to understand the answer to its sub-questions. The next paragraphs will therefore describe these. At the end, the main question will be answered.
Sub-question 1: “What is green IT?” The first sub-question focuses on the definition of green IT. A common understanding of the scope and coverage of the concept is missing in practice as well as in research (Velte, Velte, & Elsenpeter, 2008). Studying several terms incorporated in the definitions of green IT, the concept can be defined as follows (Elliot, 2011) (Murugesan, 2008) (Harmon & Auseklis, 2009) (Molla & Cooper, 2009) (Molla, 2009) (Capra & Merlo, 2009) (Lamb, 2009) (Hird, 2010) (Harmon, Demirkan, Auseklis, & Reinoso, 2010) (Dao, Langella, & Carbo, 2011) (Li & Zhou, 2011 ) (Harmon & Demirkan, 2011) (Unhelkar B. , 2011):
This definition of green IT focuses on the environmental and economic pillar of sustainability with particular emphasis on environmental sustainability. Green IT is a fuzzy concept and a step towards sustainable IT.
Sub-question 2: “To what extent can green IT be part of corporate responsibility strategy” The second sub-question focuses on understand the relationship between green IT and CR strategy. Literature shows that green IT can be seen as a step towards a comprehensive CR strategy. IT form the backbone of business applications and is often a central part of business operations. Ensuring this is environmentally and economically sustainable is a step towards sustainable IT and thereby also to a comprehensive CR strategy. Hence, green IT might be perceived as an integral part of CR. To be entitled sustainable IT would require a more balanced contribution to the 3BL that also includes the social dimension of sustainability. Nevertheless, setting green IT targets could contribute to achieving CR goals. These goals should stretch beyond the interests of firms and what is required by law (McWilliams & Siegel, 2001). Thus, for green IT to constitute to CR requires strategies that go further than “Eco-efficiency” and “Environmental cost leadership” (Orsato, 2009). With respect to the framework by Labuschagne et al. (2005) green IT can be seen as an operational initiative and a bottom-up strategy at the fourth and third level of CR strategy. Alone it does not lead to CR, but may contribute to CR strategies. Furthermore, whether green IT can be a step towards an organisation’s CR strategy has been argued to depend on strategic choice made when trying to balance the 3BL. It has been argued that green IT could be implemented in line with these choices. Strategies aimed at green IT that are in line with CR strategy may contribute to the overall CR efforts of an organisation. Simultaneously, green IT often is a motive or influenced positively by CR strategy. Sub-question 3: “What economic and environmental life cycle assessment criteria can be found in literature to assess the greenness of the hardware IT infrastructure of an organisation?” The third-sub question focuses on economic and environmental life cycle assessment criteria that can be used to assess the relative greenness of the hardware IT infrastructure of an organisation. To define life cycle assessment criteria, literature has been review regarding performance assessment, sustainability assessment, indicators and indices and business standards. Literature shows there are several ways of measuring performance. The use of indicators and indices are the most common way to assess sustainability. Indicators could be aggregated into assessment criteria, and assessment criteria could be aggregated into an index. Using indicators or indices to assess environmental and economic performance, the appropriate application level should be chosen. Indicator sets or indices that fall under the category “corporation”, “facility” or “product” could be useful to evaluate the greenness of the hardware IT infrastructure of an organisation. Exploring several indicators and indices within these application levels show several of these cannot be directly applied because they are either too generic or specific. Indicators need to be tailored. Nevertheless, several environmental and economic performance indicators can serve as inspiration to design a new framework. The GRI indicators for sustainability, EMAS and LCSP and ISO 14031 EPE
Green IT Management of the environmental sustainability and eco-efficiency over the life cycle of IT (greening IT) and the use of IT services to meet overall environmental sustainability goals of an organization (greening by IT)

MSc Thesis, J.C.P. Kalsheim: Greening Information Technology (IT) Infrastructures
Conclusions and recommendations 119
indicators are examples of such indicators. There are also indicators defined in eco-efficiency literature that could be used. However, these can be misinterpreted or manipulated deliberately in sustainability reports as they combine economic and environmental performance in one indicator value. Furthermore, GPIs can serve as inspiration. These indicators describe the energy efficiency, energy use, costs and GHG emission of data centre and IT service centres. A limitation of these indicators are their limited scope. To understand the scope of performance assessment in business standards, the GHG Protocol, water footprint and materials flow cost accounting have been looked into. Business standards found in literature comprise the following; GHG Protocol, water footprint, material flow cost accounting, LCA, TCO and LCC. The last three “standards” are bottom-up approaches used to assess the environmental or economic impact of a product over its life cycle. These suffer from the truncation error; to define a suitable boundary requires simplifications and assumptions. The measurement scopes defined in the GHG Protocol can be used to set organisational boundaries. Similar to these, the water footprint incorporates both the operational water footprint and the supply chain water footprint. In material flow cost accounting flows and stocks of materials and their cost are incorporated in the analysis. Together with the indicators listed in the previous paragraph, this forms the theoretical foundation for assessing the relative greenness of the hardware IT infrastructure of an organisation. Sub-question 4: “Which requirements can be defined for a tool to assess the relative greenness of the hardware IT infrastructure of an organisation??” This sub-question has been concerned with establishing relevance through the application of a process of translating business needs into a set of design requirements. The process applied to define design requirements has been based upon literature on requirements engineering. The design requirements have been designed from the aggregation of stakeholder opinions, literature and expert panel reviews. Design requirements for an assessment tool to assess the relative greenness of the hardware IT infrastructure of an organisation can be found in Table 12. To develop this assessment tool it is essential that it meets the core requirements.
Table 12: Design requirements of a tool to assess the greenness of the hardware IT infrastructure of an organisation
ID Design requirements
Co
re r
equ
ire
men
ts
HR1 The tool shall determine one value stating the relative greenness of the hardware IT infrastructure of an organisation
HR2 The tool shall demonstrate trade-offs organisations are confronted with in greening the hardware IT infrastructure
HR3 The tool shall determine the influence of main energy use, water use, raw material use, CO2 emission and cost drivers on the relative greenness of the hardware IT infrastructure of an organisation
HR5 The tool shall support organisations improve the relative greenness of the hardware IT infrastructure over time as part of a continuous management process
HR7 The tool shall produce results that can be compared to peers
HR8 The tool shall be based upon information from accepted standards
HR12 The tool shall communicate the results clearly to IT decision-makers
Ad
dit
ion
al r
equ
irem
ents
HR4 The tool shall support the analysis of relevant energy use, water use, raw material use and greenhouse gas emission goals that could be embedded in an organisation with respect to greening the hardware IT infrastructure of an organisation
HR6 The tool shall determine the effect of external factors and trends on the relative greenness of the hardware IT infrastructure of an organisation
HR9 The tool shall be constructed based upon valid data sources
HR10 The time a technical software specialist use to encode changes in performance indicators and the reporting format should be minimized (maintainability)
HR11 The tool shall be flexible in terms of detail level of the input data
HR13 The tool shall allow covering the internal mechanisms for other stakeholders than the user
Sub-question 5: “What framework can be designed incorporating economic and environmental life cycle assessment criteria to assess the relative greenness of the hardware IT infrastructure of an organisation?” The preceding sub-questions focus on the academic and practical grounding of the framework to assure rigor and relevance. This question has addressed the design of a new framework to assess the relative greenness of the hardware IT infrastructure of an organisation a step towards a comprehensive CR strategy. In Figure 55 the new framework entitled the greening hardware IT infrastructure (GHITI) is presented.

MSc Thesis, J.C.P. Kalsheim: Greening Information Technology (IT) Infrastructures
Conclusions and recommendations 120
Assessment criteria
Life cycle phase
Procure Use Dispose
Water use over the life cycle of hardware IT (m
3)
1.1.1 Amount of water use related to the extraction and production process of hardware IT
1.2.1 Amount of water used in hardware IT operation per water source
1.3.1 Amount of water use related to hardware IT discarded to landfill
1.3.2 Amount of water use related to recycling hardware IT
1.3.3 Amount of water use related to recovering energy from hardware IT
1.3.4 Amount of water use related to reuse and refurbish hardware IT for third party use
Energy use over the life cycle of hardware IT (MJ)
2.1.1 Amount of energy use related to the extraction and production process of hardware IT
2.2.1 Amount of energy use of hardware IT operation
2.3.1 Amount of energy use related to hardware IT discarded to landfill
2.2.2 Utilization of hardware IT relative to unit specific optima (%)
2.3.2 Amount of energy use related to recycling hardware IT
2.3.3 Amount of energy recovered from discarded hardware IT
2.3.4 Amount of energy use related to reuse and refurbish hardware IT for third party use
Raw material waste over the life cycle of hardware IT (kg)
3.1.1 Amount of recycled and reused materials in hardware IT procured
3.2.1 Amount of replaced sub-components in hardware IT
3.3.1 Amount of materials from hardware IT to landfill
3.1.2 Amount of raw materials in hardware IT procured
3.2.2 Amount of repaired sub-components in hardware IT
3.3.2 Amount of recycled materials from hardware IT
3.1.3 Amount of refurbished or used hardware IT procured
3.3.3 Amount of hardware IT discarded for energy recovery
3.3.4 Amount of materials in hardware IT reused and refurbished for third party use
Greenhouse gas emissions over the life cycle of hardware IT (ton CO2 equivalent)
4.1.1 Amount of greenhouse gas emission related to the extraction and production process of hardware IT
4.2.1 Amount of greenhouse gas emission related to extraction and production of energy used in hardware IT operation
4.3.1 Amount of greenhouse gas emission related to hardware IT discarded to landfill
4.3.2 Amount of greenhouse gas emission related to recycling hardware IT
4.3.3 Amount of greenhouse gas emission related to recovering energy from hardware IT
4.3.4 Amount of greenhouse gas emission related to reuse and refurbish hardware IT for third party use
Costs over the life cycle of hardware IT (euro)
5.1.1 Procurement costs of hardware IT
5.2.1 Energy costs of hardware IT operation
5.3.1 Costs of hardware IT discarded to landfill
5.2.2 Water costs of hardware IT operation
5.3.2 Costs of recycling hardware IT
5.2.3 Costs of carbon credits for the operation of hardware IT
5.3.3 Costs of recovering energy from discarded hardware IT
5.2.4 Maintenance costs of hardware IT
5.3.4 Revenues from selling used and refurbished hardware IT to third parties
Figure 54: Green Hardware IT Infrastructure (GHITI) framework
The object of analysis, entitled the framework entity scope, is delineated to “an organisation” in line with the three scopes in the GHG Protocol; outsourced activities, leased assets and owned assets should be evaluated. Disposal is only relevant for the disposal of owned assets. Units of analysis are defined as physical hardware IT infrastructure products with the ability to process, store and transmit data that support an organisation’s business applications (Linberg, 1999). The HP EliteBook 8460p latop is an example of a unit of analysis.
MSc Thesis, J.C.P. Kalsheim: Greening Information Technology (IT) Infrastructures
Conclusions and recommendations 121
Sub-question 6: “How successful is the framework in determining the relative greenness of the hardware IT infrastructure of an organisation as a step towards a comprehensive corporate responsibility strategy?” This question addressed the operational validity of the framework. The framework designed has shown to fulfil most of the core design requirements of an assessment tool when implemented in a single cases study. This suggests that implementing the framework design has been successful. A conclusion can be drawn for a certain scope of hardware IT, but it may not be stated that the framework is successful in determining the greenness of the hardware IT infrastructure of organisations in general or the entire hardware IT infrastructure at BSC Netherlands. The framework is operationally verified for hardware IT infrastructure units incorporated in the case study. Besides this, the new framework has several other limitations. First, performance indicators are defined with the input of a limited number of experts with different opinions. The two expert panels showed the resulting conclusions in some cases were contradicting. In the research, this is interpreted as a non-consensus among experts, and therefore rejected. Arguably involving more experts in one sessions would have resulted in a different, and perhaps more complete framework. However, this does not imply a consensus among academics and practitioners would be possible to attain. Second, measuring performance using performance indicators has several limitations and faces challenges. Literature suggests defining performance indicators often is a result of inter-subjectivity and negotiation between stakeholders. In this research, multiple experts have been involved at different moments in time which could have limited the political and inter-subjective character of the framework design. Next to this, the framework is a typical reductionist assessment tool and should be treated accordingly when assessing the greenness of hardware IT infrastructures. It should not be expected that the framework is able to encapsulate all technically complex biological and physical features as well as complex economic and political dimensions of hardware IT. Furthermore, designing, implementing and evolving a PMS that incorporates the new framework is very challenging due resistance to measurement, a gap between measure and implementation, the difficulty of establishing governance structures, etc. Fourth, information from the HITIG score should be used with care as comparing different issues related to greening hardware IT in a meaningful manner might not be possible without being biased.
Sub-question 7: “How can the framework be improved to make it more in line with corporate responsibility strategy?” The seventh sub-question focuses on limitations of the framework with respect to its alignment with a comprehensive CR strategy. As suggested in the answer to sub-question two, using the framework over time as part of a continuous management process can contribute to the CR strategy of an organisation. The framework addresses several issues with regard to environmental sustainability; energy use, water use, raw materials, WEEE and GHG emission. To improve the framework, additional issues could be incorporated such as land use, biodiversity, water pollution, emission of ozone depletion substances, NOx. SOx, and other air emissions. Addressing economic sustainability, the framework is narrowed to costs. Economic sustainability can be improved by incorporating other economic sustainability aspects related to quality, market presence, indirect economic impacts, openness to stakeholder review and participation in decision-making process.
Besides extending the scope of both economic and environmental sustainability topics, the main improvement potential of the framework can be found in the social dimension of sustainability. The social dimension of sustainability has not been incorporated in the framework as it has not been part of the research scope. Nevertheless, it is recognized that economic, social and environmental sustainability are closely intertwined and can influence each other in practice. This does not imply the framework balance the 3BL. It is recognized that social sustainability is important in obtaining an improved balance of the 3BL and thereby also to a comprehensive CR strategy. Only when all three dimensions of sustainability are addressed in a balanced way and when the needs of the present do not comprise the ability of future generations to meet their needs, it can be entitled sustainable development and a step towards a comprehensive CR (Brundtland, 1987) (Labuschagne et al., 2005).
Sub-question 8: “How can the framework be used to determine the relative greenness of the hardware IT infrastructure of an organisation as a step towards a comprehensive corporate responsibility strategy?” In the previous sub-questions the framework design has been evaluated an reflected on. When the objective is to assess the relative greenness of hardware IT, it is necessary to understand how the framework may be used. The conclusion to this sub-question suggests both a short and long term approach. On the short term, the use of the framework in its current form should; (1) be implemented after the case study protocol questions are improved, (2) tailor presentation layouts to its audience, (3) use accessible and available

MSc Thesis, J.C.P. Kalsheim: Greening Information Technology (IT) Infrastructures
Conclusions and recommendations 122
information within an organisation, (4) continuously update data and improve the quality of several data point and (5) be used by user with basic knowledge of IT and data analysis software. Furthermore, units of analysis outside the investigated research scope should be estimated consistently with the functional design. Necessary changes should be communicated. On the long term, the new framework should be incorporated in a continuous management process. Figure 55 shows a vision on such a management process. This is based upon ISO 14031 EPE. The vision shows how an organisation can measure the greenness of the hardware IT infrastructure of an organisation and improve the measurement process over time. Information from this process can be used to improve performance. Targets and objectives regarding GHITI scores can be set by an organisation. Periodical measurements can help an organisation determine whether objectives and targets are met. When actual performance does not meet the defined objectives and targets, management can choose to implement measures to steer performance in the needed direction. This way, the management process in Figure 55 can support organisations improve the relative greenness of the hardware IT infrastructure over time. The management process should furthermore;
Be planned consistently with existing environmental management systems and data collection processes (PLAN)
Incorporate strategic selection of hardware IT infrastructure units incorporated in the assessment (PLAN)
Incorporate consistent references for normalization, assessment criteria weights and calculation methodologies (PLAN)
Incorporate a data collection procedure that results in data that is accurate, reliable, complete and verifiable (DO)
Incorporate a verification of data by an external party before reporting and publishing (DO)
Incorporate a base year from which relative, internal progress can be measured (CHECK & ACT)
Communicate performance to internal and external stakeholders (CHECK & ACT)
Incorporate feedback mechanism on lessons learned to enhance effectiveness and efficiency of the measurement process over time (CHECK & ACT)
(2) Define data
sources
(3) Determine
data collection
procedure
(4) Data
collection
(5) Data analysis
and evaluation
Data storage
Start/initiation
Framework 1.0(1) Define goals
and scope of
measurement
Report data to
stakeholders
Case study protocolFunctional design
(6) Review and
improve GHITI
evaluation
PL
AN
DO
CH
EC
K
& A
CT
Figure 55: Management process, adopted from ISO 14031
An implementation path towards a meaningful use of the framework can consist of the following phases; (1) creating awareness, (2) first measurement and benchmarking and (3) governance. Creating awareness is important for the

MSc Thesis, J.C.P. Kalsheim: Greening Information Technology (IT) Infrastructures
Conclusions and recommendations 123
organisation to understand the necessity of improving, and thereby monitoring, the greenness of the hardware IT infrastructure of an organisation over time. A first measurement and benchmark is necessary to enhance the use of the framework; enabling measuring and monitoring the relative greenness of hardware IT compared to peers. Governance is important to successfully organize the management process within an organisation. Commitment of management needs to be sustained during all phases for successful implementation. Research question: “What generic framework based upon environmental and economic life cycle assessment criteria could be developed to assess the relative greenness of the hardware IT infrastructure of an organisation as a step towards a comprehensive corporate responsibility strategy?” Now that all sub-questions have been answered, a conclusion will be drawn with respect to the research question. The framework presented in Figure 54 can be used to determine the greenness of the hardware IT infrastructure of an organisation as a step towards a comprehensive CR strategy when incorporated in a continuous management process (see vision in Figure 56). The framework can support achieving the desired green IT assessment criteria scores. Organisations can use the outcome of periodical measurements from the framework to, if required, adjust their policies in order to achieve the CR goals as part of their CR strategy. The framework can be used to assess green IT progression related to energy use, water use, generation of raw material waste, GHG emission and costs over the life cycle of hardware IT. The framework can be used to determine the greenness of the hardware IT infrastructure units incorporated in the case study performed. A step towards a more balanced, comprehensive CR strategy would require an integration of the social dimension of sustainability.
11.4 Recommendations for further research As outlined in the evaluation and reflection, completeness of the framework is not claimed. To further broaden the framework in terms of sustainability and CR strategy, the framework should also incorporate the social dimension of sustainability. The upcoming research field of social LCA might constitute a valuable foundation for this. Additional environmental and economic issues could be incorporated in an extension of the new framework as well. The framework in Figure 55 has been delineated to include only some of these. Furthermore, it is recommended additional design cycles are implemented to further verify, validate and refine the framework design. It could be particularly useful to perform additional case studies to refine the functional design and test the general applicability of the new framework in terms of units of analysis. The validity of the output of the assessment tool should be tested as well. During the research it was encountered that LCA data often was very limited. No data could be found about the water and energy use related to materials extraction and production of switches, routers, firewalls, servers, storage, appliances, etc. Data could be obtained from hardware IT suppliers, however the reliability of this is questionable unless verified by a third party. Due to this, it is recommended to investigate the environmental impacts of these types of units more in-depth. This could improve data quality and the accuracy of the functional design. It could possibly also fill a knowledge gap in literature on LCA. In Chapter 10 recommendations for implementation and evolvement of the framework over time have been discussed briefly. It is recommended to further investigate the use of the framework over time.
MSc Thesis, J.C.P. Kalsheim: Greening Information Technology (IT) Infrastructures
124
Bibliography
Accenture. (2012). Accenture Green Maturity Model. Retrieved January 18, 2012, from Accenture: http://www.accenture.com/us-en/pages/insight-technology-consulting-green-maturity-model.aspx
Accenture. (2009). Green Technology: Driving Economic and Environmental Benefits from ICT. Geneva: World Economic Forum.
Adams, W. (2006). The future of sustainability: Re-thinking environment and development in the twenty-first. Cambridge: The IUCN Renowned Thinkers Meeting.
ADJUGO. (2011). Going green, an opportunity for improvement. Retrieved January 17, 2011, from Green IT strategy, governance & maturity framework: http://www.green-ict.com/green-it-strategy-and-governance-framework
Agarwal, S., & Nath, A. (2011). Green computing - A new horizon of energy efficiency and electronic waste minimization; A global perspective. Proceedings - 2011 International Conference on Communication Systems and Network Technologies , 688-693.
Alam. (2002). An exploratory investigation of user involvement in new service development. Journal of the academy of marketing science , 250-261.
Anderson, D., Cader, T., Darby, T., Gruendler, N., Hariharan, R., Holler, A., et al. (2008). A Framework for Data Center Energy Productivity. The Green Grid.
APEAL. (2009). Steel: the sustainable packaging solution. Association of European Producers of Steel for Packaging.
APME. (1995). Plastics - a material of choice for the - electronic and electronic industry. Brussels, Belgium: Association of plastics manufacturers in Europe.
Apple. (2012). The story behind Apple's environmental footprint. Retrieved May 15, 2012, from Apple: www.apple.com/environment/
Arena, Mastellone, & Perugini. (2003). Life cycle assessment of a plastic packaging recycling system. International journal of life cycle assessment , 92-98.
Armbust, Fox, Griffith, Joseph, Katz, Konwinski, et al. (2010). A view of cloud computing. Communications of the ACM , 50-58.
Astleithner, & Hamedinger. (2003). The analysis of sustainability indicators as socially constructed policy instruments: benefits and challenges of 'interactive research'. The International Journal of Justice and Sustainability , 627-640.
Awa. (2010). democratizing the new product development process: a new dimension of value creation and marketing concept. International Business Research , 49-59.
Azapagic, A., & Perdan, S. (2000). Indicators of sustainable development for industry: A general framework. Process Safety and Environmental Protection , 243–261.
Babin, & Nicholson. (2011). How green is my outsourcer? Measuring sustainability in global IT outsourcing. Strategic Outsourcing , 47-66.
Bahill, & Dean. (1999). Discovering system requirements. Handbook of systems engineering and management. New York: Wiley.
Bahill, & Henderson. (2005). Requirements development, verification, and validation exhibited in famous failures. Systems engineering , 1-14.
Balakrishnan, R. B., Anand, K. P., & Chiya, A. B. (2007). Electrical and electronic waste: a global environmental problem. Journal of Waste Management and Researc , 307-317.
Ballard, G. (2000). Positive vs negative iteration in design. Paper presented at the International Group for Lean Construction
Bansal, P., & Roth, K. (2000). Why Companies Go Green - A Model of Ecological Responsiveness. Academy of Management Journal , 717-736.
Barringer, H. P. (2003). A Life Cycle Cost Summary . International Conference of Maintenance Societies (ICOMS®-2003) (pp. 1-10). Perth, Western Australia: Maintenance Engineering Society of Australia.
BCME. (2009). Beverage Can Makers Europe. Retrieved May 21, 2012, from www.bcme.org Beccalli. (2007). Does IT investment improve bank performance? Evidence from Europe. Jornal of Banking and
Finance , 2205-2230. Beecham, Hall, Britton, Cottee & Rainer (2005) Using an expert panel to validate a requirements process
improvement model, Journal of systems and software , 251- 275

MSc Thesis, J.C.P. Kalsheim: Greening Information Technology (IT) Infrastructures
125
Beijleveld, R. (2011, November 15). CIO Convenant. Noordwijkerhout: Stichting CIO Academy. Bell, & Morse. (2008). Sustainability indicators: measuring the immeasureable? London, UK: Earthscan. Berinato. (2002, October 15). Good stuff cheap. Retrieved May 14, 2012, from CIO magazine:
www.cio.com/archive/101502/cheap.html Berkhout, F., & Hertin, J. (2004). De-materialising and re-materialising: digital technologies and the
environment. Futures , 903–920. Bholasing, J. (2009). Quantifying the environmental impact of the IT of Shell: the design of key performance
indicators for long term monitoring of the environmental impact of the IT within a multi-national organisation. Delft: Delft University of Technology.
Bhuie, Ogunseitan, Saphores, & Shapiro. (2004). Environmental and economic tradeoffs in consumer eletronic products recycling: a case study of cell phones and computers. Electronics and the environment (pp. 74-79). IEEE.
Big Room. (2012). Eco-Leaf. Retrieved June 8, 2012, from All ecolabels on building products: http://www.ecolabelindex.com/ecolabel/eco-leaf-japanBioCycle. (2010). The state of garbage in America. BioCycle.
Blanc, Friot, Margni, & Jolliet. (2008). Towards a new index for environmental sustainability on a DALY weighting approach. Sustainable developement , 251-260.
BMRA. (2010). British Metal Recycling Association. Retrieved May 23, 2012, from About metal recycling: http://www.recyclemetals.org/about_metal_recycling
Boehm. (1991). Software risk management: principles and practices. IEEE software , 32-41. Boehm, B. W. (1986). A spiral model of software development and enhancement. ACM SIGSOFT Software
engineering notes, 11(4), 21-42. Boehm, Brown, & Lipow. (1976). Quantitative evaluation of software quality. 2nd International conference on
software engineering (pp. 592-605). Los Alamitos: ACM. Bohringer, & Jochem. (2007). Measuring the immeasurable - a survey of sustainability indices. Ecological
economics , 1-8. Bond & Morisson-Saunders (2011) Re-evaluating sustainability assessment - Aligning the vision and practice.
Environmental Impact Assessment Review , 1-7 Bose, & Luo. (2011). Integrative framework for assessing firm's potential to undertake Green IT initiatives via
virtualization - A theoretical perspective. Journal of Strategic Information Systems . Bourne, Mills, Wilcox, Neely, & Platts. (2000). Designing, implementing and updating performance measurement
systems. International journal of operations & production management , 754-771. Bourne, Mills, Wilcox, Neely & Platts (2000) Designing, implementing and updating performance measurement
systems, International Journal of Operations & Production Management, 754 - 771 Bourne, Neely, Platts & Mills (2002) The success and failure of performance measurement initiatives:
Perceptions of participating managers, International Journal of Operations & Production Management, 1288 - 1310 Broadbent, M., & Weil, P. (1997). Management by Maxim: How Business and IT Managers Can Create IT
Infrastructures. Sloan Management Review , 77–92. Bruijn, H. D., Heuvelhof, E. T., & Veld, R. I. (2010). Process management. Delft: Springer. Brundtland, C. (1987). Our Common Future, United Nations World Commission on Environment and
Development. Oxford, UK: Oxford University Press. Burdge & Vanclay (1995) Social impact assessment. in Vanclay and Bronstein: Environmental and social impact
assessment. Jogn Wiley & Sons , Chichester Byrd, & Turner. (2000). Measuring the Flexibility of Information Technology Infrastructure: Exploratory Analysis
of a Construct. Journal of Management Information Systems , 167–208. Callon, J. (1995). Competitive advantage through information technology. McGraw-Hill Higher Education. Capra, E., & Merlo, F. (2009). Green IT: Everything Starts from the Software. European Conference on
Information Systems , 62–73. Capra, Francalanci, & Slaughter. (2011). Is software "green"? Application development environments and energy
efficiency in open source applications. Information and software technology , 60-71. Carme, C. N., & Elena, C. C. (2009). Automated Framework for Green IT Classification Using Software Agents - a
case study on computer laptops. 2nd IEEE International Conference on Computer Science and Information Technology, ICCSIT (pp. 279-283). Beijing: IEEE.
Caroll. (1991). The pyramid of corporate social responsibility: toward the moral management of organisational stakeholders. Business Horizon , 39-48.
Cato, S. (2009). Green economics. In I. i. development, Earthscan (pp. 36-37). London: Earthscan.

MSc Thesis, J.C.P. Kalsheim: Greening Information Technology (IT) Infrastructures
126
Cavaleiro, Vasconcelos, & Pedro. (2010). A framework for estimating the environmental costs of the technological architecture - an approach to reducing the organisational impact on environment. Proceedings of the 12th International Conference on Enterprise Information Systems (pp. 451-455). Inst. Syst. Technol. Inf., Control Commun. (INSTICC).
CBS (2012) Municipal waste; quantities. Retrived 13 June 2012 from http://www.cbs.nl/en-GB/menu/themas/natuur-milieu/methoden/dataverzameling/korte-onderzoeksbeschrijvingen/gemeentelijk-afval-hoeveelheden.htm
Chambers, & Swain. (2006). Quality indicators for progress: a guide to community quality of life assessment. In Sirgy, Rahtz, & Swain, Community Quality of Life Indicators: Best Cases II (pp. 267-322). The Netherlands: Springer.
Chen, He, Liu, Nath, Rigas, Xiao, et al. (2008). Energy-aware server provisioning and load dispatching for conncetion-intensive internet servicesq. Symposium on Networked Systems Design and Implementation (pp. 337-350). USENIX Association.
Cheng, Zhang, Meng, & Li. (2007). Municipal solid waste fueled power generation in China: a case study of waste-to-energy in Changchun City. Environmental Science and Technology , 7509-7515.
Chung, & Leite, S. d. (2009). On on-functional requirements in software engineering. Conceptual modeling: foundations and applications , 363-376.
CIO Staff. (2008, March 17). CIO's Green IT Survey: Cost Cutting, Social Responsibility Drive Environmental Moves. Retrieved January 23, 2012, from CIO: http://www.cio.com/
Clevers, S. (2010). Ketenkaart ICT-gebruik kantoortoepassingen. The Hague: AgentschapNL. CompuMentor. (2003, October 15). Computer recycling and reuse program. Retrieved May 14, 2012, from
CompuMentor: www.compumentor.org/recycle/glossary.html Cone. (2006). The greening of the CIO. CIO insights. Conklin. (2005). Dialogue mapping: building shared understanding of wicked problems. Chichester: John Wiley &
Sons Inc. Connection Research. (2010, April). A Green ICT Framework - Understtandiing and Measuriing Green ICT.
Retrieved January 18, 2012, from A green paper: http://www.computersite.com.au/assets/files/A_Green_ICT_Framework_CR.pdf
Consoli, F., D. Allen, I. B., Fava, J., Franklin, W., Jensen, A., N. de Oude, R. P., et al. (1993). Guidelines for life-cycle assessment. A 'Code of Practice'. Society of Environmental Toxicology and Chemistry (SETAC) , 55.
Cooper, & Zmud. (1990). Information Technology Implementation Research: A Technological Diffusion Approach. Management Science , 123-139 .
Corbett, Webster, Sayili, Zelenika, & Pearce. (2010). Developing and justifying energy conservation measures: Green IT under construction. Americas Conference on Information Systems. Lima, Peru: AIS electronic library.
Courch, S., & Housden, M. (2003). Marketing research for managers, third edition. Oxford: Butterworth-Heinemann Publications.
Creswell. (2002). Research Design: Qualitative, Quantitative, and Mixed Methods Approaches (2nd Edition). London: Sage Publications.
Cui, J., & Forssberg, E. (2003). Mechanical Recycling of Waste Electric and Electronic Equipment: a Review. Journal of Hazardous Materials , 243–263.
Custance, J., & Hillier, H. (2002). Statistical issues in developing indicators of sustainable development. Journal of the Royal Statistical Society: Series A (Statistics in Society) , 281-290.
Da Silva, L., & Brito E Abreu, F. (2010). Reengineering IT infrastructures: A method for topology discovery. 7th International Conference on the Quality of Information and Communications Technology (pp. 331-336). QUATIC.
Dale, Chapman & McDonald (1997) Social impact assessment in Queensland: why practice lags behind legislative opportunity. Impact assessment , 159-179
Dalrymple, Wright, Kellner, Bains, Geraghty, Goosey, et al. (2007). An integrated approach to electronic waste (WEEE) recycling. Circuit World , 52-58.
Daim, T., Justice, J., Krampits, M., Letts, M., Subramanian, G., & Thirumalai, M. (2009). Data center metrics- an energy efficiency model for information technology managers. Management of Environmental Quality , 712-731.
Daniels, & Bahill. (2004). The hybrid process that combines traditional requirements and use cases. Systems engineering , 303-319.
Dao, V., Langella, I., & Carbo, J. (2011). From green to sustainability; information technology and an integrated sustainability framework. Journal of strategic information systems , 63-79.
Daoud. (2008). Beyond Power: IT's roadmap to Sustainable Computing. IDC Whitepaper.

MSc Thesis, J.C.P. Kalsheim: Greening Information Technology (IT) Infrastructures
127
Dardenne, Lamsweerde, & Fickas. (1993). Goal-directed requirements aquisition. Science of computer programming , 3-50.
Das, & Yin. (2007). The worldwide aluminium economy: the current state of the industry. Chemistry and Materials Science , 57-63.
Davenport, & Prusak. (1998). Working knowledge: How organisations manage what they know. Boston: HBS Press.
Davis, K. (1960). Can business afford to ignore its social responsibilities? California Management Review , 70-76. de Bruijn (2002) Performance measurement in the public sector: strategies to cope with the risks of
performance measurement, International Journal of Public Sector Management, 578 - 594 De Keyser, W. (1994). Multicriteria analysis. Some gear and guidelines to climb and explore a huge mountain.
CSOO Working Paper. Deng, L., Babbitt, C. W., & Williams, E. D. (2011). Economic-balance hybrid LCA extended with uncertainty
analysis: case study of a laptop computer. Journal of Cleaner Production , 1198-1206. Deng, Wang, & Wu. (2007). Study on integrated method of life cycle assessment and life cycle costing. Zhongguo
Jixie Gongcheng/China Mechanical Engineering , 1804-1809. Dennis, L., & Shain, M. (2012). Dictionary of Information Technology, 2nd Edition. Macmillan Press. Denzin. (1984). The research act. Englewoord Cliffs: Prentice Hall. DeSimone, L., & Popoff, F. (2000). Eco-efficiency: The business link to sustainable development. The MIT Press. Donnellan, Sheridan, & Curry. (2011). A Capability Maturity Framework for Sustainable Information and
Communication Technology. IT professional , 33-40. Dossi, A., & Patelli, L. (2010). You Learn From What You Measure: Financial and Non-financial Performance
Measures in Multinational Companies. Long Range Planning , 498–526. Dreher, J., Lawler, M., Stewart, J., Strasorier, G., & Thorne, M. (2009). General Motors Metrics for Sustainable
Manufacturing. Boston: LABORATORY FOR SUSTAINABLE BUSINESS. Dubey, S., & Hefley, W. (2011). Green ITIL: Expanding ITIL Lifecycle for Green IT. Technology management in the
energy smart world (PICMET) , 1-8. Duncan, N. B. (1995). Capturing flexibility of information technology infrastructure: A study of resource
characteristics and their measure. Journal of Management Information Systems , 37-57. Earl, M. J. (1989). Management strategies for information technologies. Englewood Cliffs, NJ: Prentice Hall. EcoLeaf. (2012). EcoLeaf Environmental Label. Retrieved May 21, 2012, from EcoLeaf Overview: www.ecoleaf-
jemai.jp/eng/ Einhorn, & Hogarth. (1975). Unit Weighting Schemes for Decision Making. ORGANISATIONAL BEHAVIOR AND
HUMAN PERFORMANCE 1 , 171-192. Eisenhardt, K. M. (1989). Building Theories from case study research. The Acadamy of Management Review ,
532-550. Elkington, J. (1997). Cannibals with Forks: The Triple Bottom Line of 21st Century Business. Oxford: John Wiley
Sons. Elliot. (2011). Transdisciplinary Perspectives on Environmental Sustainability: A Resource Base and Framework
for IT-Enabled Business Transformation. MIS quarterly , 197-236. Ellram, L. (1995). Total cost of ownership An analysis approach for purchasing. International Journal of Physical
Distribution & Logistics , 4-23. Energie-Nederland & Netbeheer Nederland (2011) Energy in the Netherlands 2011. Zwolle EPA. (2002). Guidance on environmental data verification and data validation. Washington: US Environmental
Protection Agency. Erek, Loeser, Schmidt, Zarnekow, & Kolbe. (2011). Green IT strategies: a case study based framework for aligning
green IT with competitive environmental strategies. PACIS 2011 Proceedings (p. Paper 59). Brisbane: Association of Information Systems.
Ertas, A., & Jones, J. (1996). The Engineering Design Process. 2nd ed. New York: John Wiley & Sons, Inc. e-Server-Consortium. (2009). Efficient Servers - Energy and Cost Savings by Energy Efficient Servers - Case
Studies. Wien: e-Server. European Commission. (2003, July 10). Commission Recommendation on guidance for the implementation of
Regulation (EC) No 761/2001 of the European Parliament and the Council allowing volunary participation by organisations in a Community eco-management and audit scheme (EMAS). Official Journal of the European Union .

MSc Thesis, J.C.P. Kalsheim: Greening Information Technology (IT) Infrastructures
128
European Commission. (2008). Code of conduct on data centres energy efficiency. Ispra: Directorate-General Joint Research Centre, Insitute for Energy, Renewable Energies Unit.
European Commission. (2009, November 25). Regulation (EC) NO 1221/2009 of the European Parliament and the Council of 25 November 2009 on the voluntary participation by organisations in a community eco-management and audit scheme (EMAS). Official Journal L 342 , 0001-0045.
European Commission. (2012, April 27). Environment. Retrieved June 4, 2012, from Overview of the take-up of EMAS accross the years: http://ec.europa.eu/environment/emas/documents/articles_en.htm
European Commission. (2012, May 22). EuroStat. Retrieved May 29, 2012, from Half-year electricity and gas prices 2011 s2: http://www.epp.eurostat.eco.europa.eu/statistics_explained
European Commission. (2012, March 9). What is EMAS? Retrieved March 14, 2012, from European Commission Environment: http://ec.europa.eu/environment/emas/index_eng.htm
European Commission. (2012, April 27). Environment. Retrieved June 4, 2012, from Overview of the take-up of EMAS across the years: http://ec.europa.eu/environment/emas/documents/articles_en.htm
European Commission. (2009, November 25). Regulation (EC) NO 1221/2009 of the European Parliament and the Council of 25 November 2009 on the voluntary participation by organisations in a community eco-management and audit scheme (EMAS). Official Journal L 342 , 0001-0045.
European Parliament and Council of the European Union. (2003, January 27). Directive 2002/96/EC of the European Parliament and of the Council of 27 January 2003 on waste electronical and electronic equipment (WEEE). Official Journal of the European Union .
European Parliament and the Council. (2003). Directive 2002/95/EC of the European Parliament and the Council of 27 January 2003 on the restriction of the use of certain hazardous substances in eletrical and electronic equipment. Official Journal of the European Union .
European Parliament and the Council of the European Union. (2009). DIRECTIVE 2009/125/EC OF THE EUROPEAN PARLIAMENT AND OF THE COUNCIL of 21 October 2009 establishing a framework for the setting of ecodesign requirements for energy-related products. Official Journal of the European Union .
EuroStat (2012) Statistics. Retrieved 13 June 2012 from http://epp.eurostat.ec.europa.eu/portal/page/portal/eurostat/home/
Ewing, A., Thabrew, L., Perrone, D., Abkowitz, M., & Hornberger, G. (2011). Insights on the Use of Hybrid Life Cycle Assessment for Environmental Footprinting- A Case Study of an Inland Marine Freight. Journal of Industrial Ecology , 937-950.
Fan, Weber, & Barroso. (2007). Power Provisioning for a Warehouse-size Computer. Proceedings of the 34th annual international symposium on computer architecture (pp. 13-21). San Diego: ACM.
Feagin, Orum, & Sjoberg. (1991). A case for case study. Chapel Hill: University of North Carolina Press. Ferrin, & Plank. (2002). Total cost of ownership models: an exploratory study. Journal of supply chain
management , 18-29. Finan, J., & Hurley, W. (2002). The analytic hierarchy process: can wash criteria be ignored? Computers &
Operations Research , 1025–1030. Flection. (2012). Flection. Retrieved June 13, 2012, from E-waste-treatment:
http://www.flection.com/content/e-waste-treatment Freeman. (1984). Strategic management: a stakeholder approach. Boston: Pitman. Friedman. (1970, September 13). The social responsibility of business is to increase its profits. New York Times ,
122-126. Fthenakis & Kim (2010). Life-cycle uses of water in U.S. electricity generation. Renewable and Sustainable Energy
Reviews , 2039–2048. Fujitsu. (2010, August). GREEN IT: THE GLOBAL BENCHMARK - A REPORT ON SUSTAINABLE IT IN THE USA, UK,
AUSTRALIA AND INDIA. Retrieved April 23, 2012, from ICT Literacy: http://www.ictliteracy.info/rf.pdf/green_IT_global_benchmark.pdf
Gallego, I. (2006). The use of economic, social and environmental indicators as a measure of sustainable development in Spain. Corporate Social Responsibility and Environmental Management , 78-97.
artner. (2008). oing reen: The CIO’s Role in Enterprise-wide Environmental Sustainability. Gartner EXP Premier.
Gartner. (2007, April 26). Press Releases - Gartner Estimates ICT Industry Accounts for 2 Percent of Global CO2 Emissions. Retrieved May 30, 2012, from Gartner: http://www.gartner.com/it/page.jsp?id=503867

MSc Thesis, J.C.P. Kalsheim: Greening Information Technology (IT) Infrastructures
129
Gasparatos, El-Haram, & Horner. (2008). A critical review of reductionist approaches for assessing the progress towards sustainability. Environmental Impact Assessment Review , 286-311.
Geyer, & Blass. (2010). The economics of cell phone reuse and recycling. The international Journal of Advanced Manufacturing Technology , 515-525.
Geyer, & Jackson. (2004). Supply loops and their constraints: the industrial ecology of recycling and reuse. California Management Review , 55-73.
GHG Protocol. (2012). GHG Protocol product life cycle accounting and reporting standard ICT sector guidance. Retrieved June 22, 2012, from Greenhouse gas protocol: www.ghgprocotol.org
Gitzel, R., Cuske, C., & Münch, C. (2011). Preliminary Thought on Cost-based Investment Decisions in IT. Sixth International Conference on Availability, Reliability and Security (pp. 385-389). IEEE Computer Society.
Gleick, P. H. (1994). Water and energy. Annual Review of Energy and Environment , 267–299. Glenn, & Malott. (2004). Complexity and selection: implications for organisational change. Behavior and social
issues , 89-106. Glinz. (2007). On non-functional requirements. International Requirements engineering confereence (pp. 21-26).
Zurich: IEEE. Glunch, & Baumann. (2004). The life cycle costing (LCC) approach: conceptual discussion of its usefulness for
environmental decision making. Building and environment , 571-580. Goedkoop, & Spriensma. (2000). The Eco-indicator 99: a damange oriented method for life cycle impact
assessment. Methodology report, second edition. Amersfoort: PRe Consultants. Goedkoop, M., Heijungs, R., Huijbregts, M., Schryver, A. D., Struijs, J., & Zelm, R. v. (2009). ReCiPe 2008; A life
cycle impact assessment method which comprises harmonised category indicators at the midpoint and the endpoint level. The Hague: Ministry of VROM.
Green. (2007). Aluminium recycling and processing for energy conservation and sustainability. Ohio, United States: AMS International.
Green Design Institute. (2006). About The EIO-LCA Method. Retrieved February 29, 2012, from Economic Input-Output Life Cycle Assessment: http://www.eiolca.net/Method/index.html
GHG Protocol (2012) Calculation tools. Retrived 13 july 2012 form http://www.ghgprotocol.org/calculation-tools/all-tools/
Green Grid. (2010). Carbon Usage Effectiveness (CUE): A Green Grid Data Center Sustainability Metric. Green Grid.
Green Grid. (2011, March 2). Data Center Efficiency Metrics - UE™, artial UE, ERE, DCcE. Retrieved March 3, 2012, from Technical Forum Presentation: www.thegreengrid.org
Green Grid. (2010). ERE: A metric for measuring the benefit of reuse energy from a data center. Green Grid. Green Grid. (2008). Green Grid Data centre power efficiency metrics: PUE and DCiE. Green Grid. Green Grid. (2010). The Green Grid data center compute efficiency: DCcE. Green Grid. Greeninga, L. A., Greeneb, D. L., & Difiglio, C. (2000). Energy efficiency and consumption — the rebound effect
— a survey. Energy Policy , 389–401. GRI (2000) Indicator set environment (EN) version 3.1. Retrieved January 30, 2012, from GRI:
http://www.globalreporting.org GRI (2000a) Indicator set economic (EC) version 3.1. Retrieved January 30, 2012, from GRI:
http://www.globalreporting.org GRI (2000b) Indicator set society (SO) version 3.1. Retrieved January 30, 2012, from GRI:
http://www.globalreporting.org Grosso, & Rigamonti. (2010). Efficiency of energy recovery from waste incineration, in the light of the new
Waste Framework Directive. Waste Management , 1238-1243. Gunda. (2008). Requirements engineering: elicitation techniques. Trollhattan, Sweden: University West. Gurbaxani, Melville, & Kraemer. (1998). Disaggregating the return on investment to IT capital. International
Conference on Computers and Information Systems (pp. 376-380). Atlanta: Association for Information Systems. Hainault, & Smith. (2000). Minnesota's multi-stakeholder approach to managing electronic products at end-of-
life. IEEE International Symposium on electronics and the environment (pp. 310-317). San Francisco: IEEE. Hakim (1987) Research Design: Strategies and Choices in the Design of Social Research, M. Bulmer,
Contemporary Social Research: Routledge, London (1987) Harmon, & Auseklis. (2009). Sustainable IT Services: Assessing the Impact of Green Computing practices.
PICMET , 1707-1717.

MSc Thesis, J.C.P. Kalsheim: Greening Information Technology (IT) Infrastructures
130
Harmon, & Demirkan. (2011). The next wave of sustainable IT. IEEE Computer Society , 19-25. Harmon, Daim, & Raffo. (2010). Roadmapping the future of sustainable IT. Technology Management for Global
Economic Growth , 1-10. Harmon, Demirkan, Auseklis, & Reinoso. (2010). From green computing to sustainable IT: developing a
sustainable service orientation. Proceedings of the 43rd Hawaii International Conference on System Science , 1-10. Hart, S. (1995). A Natural Resource Based View of the Firm. Academy of Management Review , 986– 1014. Hart, S. (1997). Beyond Greening: Strategies for a Sustainable World. Harvard Business Review , 66–76. Hart., & Milstein. (2003). Creating Sustainable Value. Academy of Management Executive , 56-67. Hawkins, Drickson, Higgins, & Matthews. (2007). A Mixed-Unit Input-Output Model for Environmental Life-Cycle
Assessment and Material Flow Analysis. Environmental Science Technology , 1024-1031. Hendrickson, C., Horvath, A., Joshi, S., & Lave, L. (1998). Economic Input-Output Models for Environmental Life-
Cycle Assessment. Environmental Science & Technology , 184A-191A. Hendrickson, Lave, & Matthews. (2006). Environmental life cycle assessment of goods and services. An input
output approach. Washington: Resources for the Future. Herder, & Stikkelman. (2004). Methanol-Based Industrial Cluster Design: A Study of Design Options and the
Design Process. Ind. Eng. Chem. Res. , 3879–3885. Herington. (2011). Tables of Physcial & Chemical Constants. Retrieved May 15, 2012, from National Physical
Laboratory: www.kayelaby.npl.co.uk/chemistry Hermann, Kroeze, & Jawjit. (2007). Assessing environmental performance by combining life cycle assessment,
multi-criteria analysis and environmental performance indicators. Journal of cleaner production , 1787-1796. Hermann, Urbach, & Wendschlag. (2001). Eco-labelling and the Information Technology (IT) Industry. Electronics
and the Environment , 1-3. Hevner. (2007). A three cycle view of design science research. Scandinavian Journal of Information Science , 87-
92. Hevner, A. R. (2007). A Three Cycle View of Design Science Research. Scandinavian Journal of Information
Systems , 87-92. Hevner, March, Park, & Ram. (2004). Design science in information systems research. Management information
systems quarterly , 75-105. Hickey, & Fitzpatrick. (2008). Combating adverse selection in secondary PC markets. Environ. Sci. Technol , 3047-
3052. Hird, G. (2010). Green IT in practice: how one company is approaching the greening of its IT. Cambridgeshire: IT
Governance Ltd. Hischier, Classen, Lehmann, & Scharnhorst. (2007). Life cycle inventories of electric and electronic equipment:
production, use and disposal. Technology & Society Lab, Swiss centre for life cycle inventories. Dubendorf: EcoInvent. Hoeksta, & Gerbens-Leens. (2008). Business water footprint accounting: a tool to assess how production of
goods and services impacts on freshwater resources worldwide. Delft: UNESCO-IHE. Hoekstra, & Chapagain. (2007). Water footprint of nations: water use by people as a function of their
consumption pattern. Water resource manage , 35-48. Hoekstra, Chapagain, Aldaya, & Mekonnen. (2009). The water footprint manual. Enschede: Water footprint
network. Hornberger, G. and R. Spear (1981). An approach to the preliminary analysis of environmental systems. Journal
of Environmental Management, 7–18. HP. (2012, March 15). QuickSpecs. Retrieved May 21, 2012, from HP Elitebook 8460p Notebook PC. HP Elitebook
8560p Notebook PC: http://h18004.www1.hp.com/products/quickspecs/13947_na/13947_na.pdf HP. (2008, June). Technology brief. Retrieved June 22, 2012, from HP modular cooling system generation 2 water
cooling technology: http://h20000.www2.hp.com HP. (2010, October ). Retrieved June 8, 2012, from HP Planet Partners return and recycling program:
http://h30248.www3.hp.com/recycle/hardware/cq.pdf Hull, Dick, & Jackson. (2011). Requirements engineering. London: Springer. Humphrey, W. (1988). Characterizing the software process: A maturity framework. Software management , 73-
79. Huppes, & Ishikawa. (2005). Eco-efficiency and its terminology. Journal of Industrial Ecology , 43-46. ICES. (2001). Report of the ICES Advisory Committee on Ecosystems. ICES Cooperative Research Report. ICT Media. (2011, November 16). Energie-efficient CIO-commitment. Persbericht . Noordwijkerhout.

MSc Thesis, J.C.P. Kalsheim: Greening Information Technology (IT) Infrastructures
131
IEA. (2011). CO2 emissions from fuel combustion - 2011 highlights. Paris, France: International Energy Agency. IEEE. (1998). IEEE recommended practice for software requirements specification. IEEE standard 830-1998. IEEE. (1990). IEEE-610.12 standard glossary of software enegineering technology. IEEE. Iivari, J. (2007). A paradigmatic analysis of information systems as a design science. Scandinavian Journal of IS ,
39–64. Info-Tech. (2009). Green IT: Why Mid-size Companies Are Investing Now. Toronto: Info-Tech Research Group. Inhaber. (2004). Water Use in Renewable and Conventional Electricity Production. Energy Sources , 309-322. IPCC. (1996). Revises IPCC guidelines for national GHG inventories: reference manual. Intergovernmental Panel
on Climate Change. ISO 14040. (1997). Environmental Management – Life Cycle Assessment –Part 1: Principles and Framework.
International Standards Organisation. ISO. (2006). ISO 14044. Environmental management - Life cycle assessment - Requirements and guidelines.
International Organisation for Standardization (ISO). ISO. (2000). ISO 90000 - Quality management systems - fundamentals and vocabulary. Zurich: International
Organisation for Standardization (ISO). ISRI. (2011, July). Institute of scrap recycling industries. Retrieved May 23, 2012, from Scrap recycling industry
fact sheets: www.isri.org ISRI. (2003). Scrap recycling: where tomorrow begins. Washington: Institute of scrap recycling industries. IVF. (2007). Lot 3. Personal Computers (desktops and laptops) and computer Monitors. Draft Final Report (Task
1-7). Brussels. ITL Eduction Solutions. (2006). Introduction to Computer Science. Delhi: Pearson Education. Jack. (2006). Lessons learned from methodological triangulation. Management Research News , 345-357. Jain, Benbunan-Fich, & Mohan. (2011). Assessing Green IT initiatives using the balanced scorecard. IT
professional , 26-32. Jain, R. P., Benbunan-Fich, R., & Mohan, K. (2011). Assessing Green IT Initiatives Using the balanced scorecard. IT
Professional , 26-32. Jasch. (2009). Environmental and material flow cost accounting: principles and procedures. Austria: Springer
Science. Jasch, C. (2000). Environmental performance evaluation and indicators. Journal of Cleaner Production , 79–88. JEMAI. (2003). Japan Environmental Management Association for Industry . Retrieved January 30, 2012, from
Ecoleaf: http://www.jemai.or.jp/english/ecoleaf/ Johnke. (2006). Emissions from waste incineration. Paris: Intergovernmental Panel on Climate Change (IPCC). Johnson, Reck, Wang, & Graedel. (2008). The energy benefit of stainless steel recycling. Energy policy , 181-192. Kang, & Schoenung. (2006). Economic Analysis of electronic waste recycling: modeling the costs and revenue of
a materials recovery facility in California. Environ. Sci. Technol. , 1672-1680. Kaulio. (1998). Customer, consumer and user involvement in product development: a framework and a review
of selected method. Total quality management , 141-149. Kaplan, J.; Forrest, W.; Kindler, N. (2008). Revolutionizing Data Center Energy Efficiency. McKinsey & Company. Keen. (1991). Shaping the future: Business design through information technology. Boston: HBS Press.
Kephart & Chess (2003) The vision of autonomic computing. Computer, 41-50 Khan, F., Sadiq, R., & Veitch, B. (2004). Life cycle iNdeX (LInX): a new indexing procedure for process and product
design and decision-making. Journal of Cleaner Production , 59–76 . Khetriwal, Kraeuchi, & Widmer. (2009). Producer responsibility for e-waste management: key issues for
consideration - learning from the Swiss experience. Journal of Environmental Management , 153-165. Kipp, Jiang, Fugini, & Salomie. (2012). Layered Green Performance Indicators. Future Generation Computer
Systems , 478-489. Kitchenham, B., Pickard, L., & Pfleeger, S. L. (1995). Case studies for method and tool evaluation. IEEE Software ,
52-62. Kitchenham, Pdleeger, Pickard, Jones, Hoaglin, Emam, Rosenberg. (2002) Preliminary guidelines for empirical
research in software engineering. IEEE Transactions in software engineering, 721-734 Klatt. (2003). Recyclling personal computers. Earth and environmental science , 211-229. Knoepfel (2001) Dow Jones Sustainability Group Index: a global benchmark for corporate sustainability.
Corporate Environmental Strategy, 6–15

MSc Thesis, J.C.P. Kalsheim: Greening Information Technology (IT) Infrastructures
132
Kloepffer, W. (2008). Life cycle sustainability assessment of products. The International Journal of Life Cycle Assessment , 89-95.
Klöpffler, W., & Ciroth, A. (2011). Is LCC relevant in a sustainability assessment? International Journal of Life Cycle Assessment , 99-101.
Knauf, Onoyama, Tsuruta, Uehara, & Kurbad. (2004). The power of experience: on the usefulness of validation knowledge. Seventeenth International Florida Arificial Intelligence Research Society Conference (pp. 337-342). Miami Beach: FLAIRS.
Knemeyer, Ponzurick & Logar, (2002) A qualitative examination of factors affecting reverse logistics systems for end-of-life computers, International Journal of Physical Distribution & Logistics Management, 455 - 479
Kolka, A., Levyb, D., & Pinksea, J. (2008). Corporate Responses in an Emerging Climate Regime: The Institutionalization and Commensuration of Carbon Disclosure. European Accounting Review , 719-745.
Koppenjan, & Groenewegen. (2005). Instituational design for complex technological systems. International Journal of Technology, Policy and Management , 240-255.
Kotonya, & Sommerville. (1988). Requirements engineering process and techniques. 8th Edition. John Wiley & Sons.
Krajnc, Damjan & lavič, eter (2003) Indicators of sustainable production. Clean Technologies and Environmental Policy, Springer Berlin / Heidelberg, 279 - 288
Krajnc, D., & lavič, . (2005). A model for integrated assessment of sustainable development. Resources, Conservation and Recycling , 189–208 .
Kramer, & Porter. (2006). strategy and society: the link between competitive advantage and corporate social responsibility. Harvard Business Review , 78-93.
Krotscheck, C., & Narodoslawsky, M. (1996). The Sustainable Process Index a new dimension in ecological evaluation. Ecological Engineering , 241–258.
Kumara, S., & Putnam, V. (2008). Cradle to cradle: Reverse logistics strategies and opportunities across three industry sector. International Journal of Production Economics , 305–315.
Kuo, & Dick. (2009). THE GREENING OF ORGANISATIONAL IT: WHAT MAKES A DIFFERENCE? Australasian Journal of Information Systems , 81-95.
Kurmar, & Putnam. (2008). Cradle to cradle: reverse logistics strategies and opportunities across three industry sectors. International Journal of Production Economics , 305-315.
Kusic, Kephart, Hanson, Kandasamy, & Jiang. (2009). Power and performance management of virtualized computing environments via lookahead control. Cluster comput , 1-15.
Labuschagne, Brent, & Erck, v. (2005). Assessing the sustainability performance of industries. Journal of cleaner production , 373-385.
Ladou & Lovegrove (2008) Export of electronics equipment waste. International Journal of Occupational and Environmental Health, 1-10
Lamb. (2009). The Greening of IT. How companies can make a difference for the environment. Michigan: Pearson.
Lauesen & Vinter (2001) Preventing requirements defects: an experiment in process improvements. Requirements engineering journal, 37-50
Lave, H., & Matthews. (2006). Environmental Life Cycle Assessment of Goods and Services: An Input-Output Approach. Washington: Resources for the future.
Lee. (2010). Don't tweaak your supply chain - rethink it end to end. Hardard Business Review , 1-8. Lee, S. M., & Kim, S.-k. (2010). Relationships Between the Knowledge Management and IT Infrastructure
Services. Management and Service Science (MASS) (pp. 1 - 4). Wuhan: IEEE. Lehmann, & Gallen. (2007). Part IV electronics use. Zurich: Swiss Centre for Life Cylce Inventories. Lehtonen. (2004). The environmental - social interface of sustainable development: capabilities, social capital,
institutions. Ecological Economics , 199-214. Lenski, G. E., & Leggett, J. C. (1960). Caste, Class and Deference in the Research Interview. The American Journal
of Sociology , 463-467. Lettieri, D. J., Hannemann, C. R., Care, V. P., & A. J. (2009). Lifetime exergy consumption as a sustainability metric
for information technologies . Sustainable Systems and Technology , 1-6. Li, Q., & Zhou, M. (2011 ). The Survey and Future Evolution of Green Computing . Green Computing and
Communications (GreenCom) , 230 - 233.

MSc Thesis, J.C.P. Kalsheim: Greening Information Technology (IT) Infrastructures
133
Linberg, K. R. (1999). Software developer perceptions about software project failure: a case study. The Journal of Systems and Softwar , 177-192.
Linnanen, & Panapanaan. (2002). Roadmapping corporate social responsibility in Finnish companies. Helsinki: Helsinki University of Technology.
Liu, S. (2002). A practical framework for discussing IT infrastructure . IT Professional , 14-21. Lloyd, Rosson, & Arthur. (2002). Effectiveness of eclicitation techniques in distributed requirements engineering.
IEEE Joint International Conference on Requirements Engineering (pp. 311-318). IEEE. Lo, & Sheu. (2007). Is corporate sustainability a value inceasing strategy for business? Corporate governance: an
international review , 345-358. lópez-ridaura, Keul, Ittersum, & Leffelaar. (2005). Multiscale Methodological Framework to Derive Criteria and
Indicators for Sustainability Evaluation of Peasant Natural Resource Management Systems . Environment, Development and Sustainability , 51–69.
Lozano, R. (2008). Envisioning sustainability three-dimensionally. Journal of Cleaner Production , 1838–1846. Lu, T., Gupta, A., Jayal, A. D., Badurdeen, F., Feng, S. C., Jr., O. W., et al. (2011). A Framework of Product and
Process Metrics for Sustainable Manufacturing. Advances in Sustainable Manufacturing , 333-338. Lynch. (2004). Islands in the wastestream. San Francisco: CompuMentor. Mannion, M., & Keepence, B. (1995 ). SMART Requirements. ACM Software Engineering Notes , 42-47. Martin, E. W., Brown, C. V., DeHayes, D. W., Hoffer, J. A., & Perkins, W. C. (2009). naging Information
Technology, 6th Edition. Prentice Hall. Marty, & Hill. (2007). Virtual Hierarchies to support server consolidation. ISCA (pp. 46-56). San Diego: ACM. Masanet, & Horvarth. (2007). Assessing the benefits of design for recycling for plastics in electronics: a case
study of computer enclosures. Materials & Design , 1801-1811. McCool, & Stankey. (2001). Representing the future: A framework for evaluating the utility of indicators in the
search for sustainable forest management. In R. J. Raison, A. G. Brown, & D. W. Flinn, Criteria and Indicators for Sustainable Forest Management (pp. 93–109). Wallingford, UK: CAB International.
McCool, S. F., & Stankey, G. H. (2004). Indicators of Sustainability: Challenges and Opportunities at the Interface of Science and Policy. Environmental Management , 294-305.
McDonald, G., & Lane, M. (2004). Converging global indicators for sustainable forest management. Forest Policy and Economics , 63–70.
McDonough, & Braungart. (2002). Design for the triple top line: new tools for sustainable commerce. Corporate environmental strategy , 251-258.
McKay, & Brockway. (1989). Building IT Infrastructure for the 1990s, Stage by Stage. Norland Norton and Company.
McWilliams, & Siegel. (2001). Corporate social responsibility: a theory of the firm perspective. The academy of management review , 117-127.
Menad, N., Björkman, B., & Allain, E. G. (1998). Combustion of plastics contained in electric and electronic scrap. Resources, Conservation and Recycling , 65–85 .
Meyer, M.W. and Gupta, V. (1994). The performance paradox. In Straw, B.M. and Cummings, L.L. (eds), Research in Organisational Behaviour. Greenwich, CT: JAI Press, 309–369.
Meyer, K. and O’Shaughnessy, K. (1993), Organisational design and the performance paradox, in Swedberg, R. (Ed.), Explorations in Economic Sociology, Russel Sage Foundation, New York, 249-79
Mickwitz, P., Melanen, M., Rosenström, U., & Seppälä, J. (2006). Regional eco-efficiencyindicators – a participatory approach. Journal of Cleaner Production , 1603–1611.
Ministerie van Economische Zaken, Landbouw & Innovatie. (2011). Energierapport 2011. The Hague: Rijksoverheid.
Mohanty & Rao (2004) CGG Collected Working Papers: 2003, Volume 1. Centre for Good Governance. Hyderabad.
Mohapatra, S., & Jindal, A. (2010). Green IT framework for small and medium scale Indian IT services companies . International Journal of Green Economics , 245-261.
Molla. (2009). Organisational Motivations for Green IT: Exploring Green IT Matrix and Motival Models. Pacific Asia Conference on Information Systems .
Molla. (2009). The reach and richness of Green IT: a principal component analysis. 20th Australasian Conference on Information Systems , 754-764.

MSc Thesis, J.C.P. Kalsheim: Greening Information Technology (IT) Infrastructures
134
Molla, & Cooper. (2009). Green IT readiness- a framework and preliminary proof of concept. Aystakasian journal of information systems , 5-23.
Molla, A., Cooper, V., & Pittayachawan, S. (2011). The green IT readiness (G-readiness) of organisations: An exploratory analysis of a construct and instrument. Communications of the Association for Information Systems , 67-96.
Moomaw, Yamba, Kamimoto, Maurice, Nyboer, Urama & Weir (2011) Introduction. In IPCC Special Report on Renewable Energy Sources and Climate Change Mitigation. Cambridge University Press, Cambridge, United Kingdom and New York, NY, USA
Mørch. (1997). Three levels of end-user tailoring: customization, integration, and extension. In Kyng, & Mathiassen, Computers and design in context (pp. 51-75). Boston: Massachusetts Institute of Technology.
Moreno, A., Cappellaro, F., Masoni, P., & AmatoData, A. (2011). Application of Product Data Technology Standards to LCA Data. 483-495: Journal of Industrial Ecology.
Morse, J. M. (1994). Designing funded qualitative research. In N. D. Lincoln, Handbook of qualitative research. Thousand Oaks, CA: Sage.
Mulder, K. (2006). Sustainable development for engineers: a handbook and resource guide. Delft: Greenleaf Publishing.
Munda. (2005). Measuring sustainability: a multli-criterion framework. Environment, development and sustainability117-134.
Munda, Nijkamp, & Rietveld. (1994). Qualitative multicriteria evaluation for environmental management. Ecological economics , 97-112.
Murugesan, S. (2008). Harnessing Green IT: Principles and Practices. IEEE Computer Society , 24-33. Nakamura, & Kondo. (2006). Hybrid LCC of appliances with different energy efficiency. International Journal
LCA , 305–314. Naumann, S., Dick, M., Kern, E., & Johann, T. (2011, December). The GREENSOFT Model: A reference model for
green and sustainable software and its engineering. stainable Computing: Informatics and Systems , 294–304. Neely, A., Gregory, M., & Platts, K. (1995). Performance measurement system design: a literature review and
research agenda. International Journal of Operations & Production Managemen , 80-116. Neely, A., Mills, J., latts, K., Richards, A., regory, M., Bourne, M., et al. (2000). ‘ erformance measurement
system design, developing and testing a process based approach. International Journal of Production and Operations Management , 1119–1145.
Ness, Urbel-Piirsalu, Anderberg, & Olsson. (2007). Categorising tools for sustainability assessment. Ecological economics , 498-508.
Nicis Institute. (2010). Handboek prestatiemeting. Den Haag: Nicis Institute and Delft Universtity of Technology. Niederman, F., Brancheau, J. C., & Wetherbe, J. C. (1991). Information systems management issues for the
1990s. MIS Quarterly , 474-500. Nilsen, & Weidema. (2001). Input/output analysis - shortcuts to life cycle data. Environmental Project No. 581
(pp. 49-52). Copenhagen: Miljstyrelsen. Nordbrand. (2009). Out of control: E-waste trade flows from the EU to developing countriees. Stockholm:
SwedWatch. Norris, G. (2001). Inegrating life cycle cost analysis and LCA . The International Journal of Life Cycle Assessment ,
118-120. Nuseibeh, & Easterbrook. (2000). Requirements engineering: a roadmap. ICES (pp. 37-46). New York: ACM. OECD. (2011, May). OECD sustainable manufacturing indicators. Retrieved March 12, 2012, from OECD
Sustainable Manufacturing Toolkit: http://www.oecd.org/document/48/0,3746,en_21571361_47075996_47855728_1_1_1_1,00.html
ECD. (2011, May ). OECD sustainable manufacturing toolkit. Retrieved March 12, 2012, from OECD: http://www.oecd.org/dataoecd/55/60/48704993.pdf
Onusseit. (2006). The influence of adhersives on recycling. Resources, convervation and recycling , 168-181. Orsato. (2009). Sustainability strategy. Hampshire: Palgrave Mcmillan. Panda, Singh, & Mishra. (2010). Thermolysis of waste plastics to liquid fuels: a suitable method for plastic wast
management and manufacture of value added products - a world review. Renewable and sustainable energy reviews , 233-248.
Patton, M. Q. (1990). Qualitative evaluation and research methods, 2nd edition. London: Sage Publication.

MSc Thesis, J.C.P. Kalsheim: Greening Information Technology (IT) Infrastructures
135
Peffers, K., Tuunanen, T., Rothenberger, M. A., & Chatterjee, S. (2007). A design science research methodology for information systems research. Journal of Management Information Systems, 24(3), 45-77.
Pendlebury, M., Jones, R., & Karbhari, Y. (1994). DEVELOPMENTS IN THE ACCOUNTABILITY AND FINANCIAL REPORTING PRACTICES OF EXECUTIVE AGENCIES. Financial Accountability & Management , 33-46.
Phaal, Farrukh, & Probert. (2004). Technology roadmapping - a planning framework for evolution and revolution. Technological forcasting and social change , 5-26.
Pianoo. (2012, February). Pianoo. Retrieved May 8, 2012, from Criteria voor duurzaam inkopen van Hardware versie 1.6: http://www.pianoo.nl/sites/default/files/documents/documents/criteriadocumenthardwarev16.pdf
ohl, E. (2006). TOWARDS COR ORATE SUSTAINABLE DEVELO MENT −The ITT Flygt Sustainability Index. Mälardalen: Mälardalen University Press Licentiate Theses.
Pope, Annandale & Morisson-Saunders (2004) Conceptualising sustainability assessment. Environmental Impact Assessment Review, 595–616
Porteous. (2005). Why energy from waste incineration is an essential component of environmentally responsible waste managment. Waste management , 451-459.
Porter, & Kramer. (2006). Strategy and society: the link between advantage and corporate social responsibility. Harward Business Review , 78-92.
Porter, & Linde. (1995). Green and Competitive - ending the stalemate. Harvard Business Review , 120-134. Powell, T., & Dent-Micallef, A. (1997). Information technology as competitive advantage; the role of human
business, and technology resources. Strategic Management Journal , 375-405. Praeg, & Schnabel. (2006). IT-service cachet - managing IT-service performance and IT-service quality. Annual
Hawaii International Conference on Systems science (pp. 1-10). Hawaii: IEEE. Preez, D. (2010). A model for Green IT strategy: a content analysis approach. Port Elizabeth, South Africa:
NMMU Business School. Putnam (2002) ISO 14031: Environmenetal Performance Evaluation. Confederation of Indian Industry. Qureshi, Harrison, & Wegener. (1999). Validation of multicriteria analysis models. Validation of multicriteria
analysis models , 105-116. Rao, P., & Holt, D. (2005). Do Green Supply Chains Lead to Competitiveness and Economic Performance?
International Journal of Operations and Production Management , 898–916. Rasmussen. (2007). Calculating total cooling requirements for data centers. APC. Rajesh Kumar Singha, H. M. (2012). An overview of sustainability assessment methodologies. Ecological
Indicators , 281–299. Ranganathan, P., Rivoire, S., & Moore, J. (2009). Computer Performance Issues. Advances in Computers , 159-
233. Ravichandran, T., & Lertwongsatien, C. (2005). Effect of Information Systems Resources and Capabilities on Firm
Performance: A Resource-Based Perspective. Journal of Management Information Systems , 237– 276. Redclift, M. (1987). Sustainable development: Exploring the contradictions. Routledge London: Taylor & Francis
ebook collection. Repa, E. (2005). NSWMA's 2005 tip fee survey. Washington: National Solid Waste Management Association
(NSWMA). Riggis. (1982). Engineering economics. New York: McGraw-Hill. Ritchey. (2007). Wicked problems: structuring social messes with morphological analysis. Swedisch
Morphological AnalysisRittle, Horst, & Webber. (1973). Dilemmas in a general theory of planning. Policy science , 135-144.
RIVM. (2012). Ministerie van VROM. Retrieved January 20, 2012, from Algemeen overzicht van LCA databases: http://www.rivm.nl/Onderwerpen/Onderwerpen/L/Life_Cycle_Assessment_LCA/Databases
Rivoire. (2008). MODELS AND METRICS FOR ENERGY-EFFICIENT COMPUTER SYSTEMS. Stanford University. Rivoire, S., Shah, M. A., Ranganathan, P., Kozyrakis, C., & Meza, J. (2007). Models and Metrics to Enable Energy-
Efficiency ptimizations. IEEE Computer Society , 39-48. Robertson, J., & Roberston, S. (1998). Mastering the requirements engineering process. Addison Wesely. Roca, & Searcy. (2012). An analysis of indicators disclosed in corporate social reports. Journal of cleaner
production , 103-118. Roca, L. C., & Searcy, C. (2012). An analysis of indicators disclosed in corporate sustainability reports. Journal of
Cleaner Production , 103-117.

MSc Thesis, J.C.P. Kalsheim: Greening Information Technology (IT) Infrastructures
136
Rodgers, Steinier, & Leonard. (2002). Method and apparatus for forming linked multi-user groups of shared software. United States Patent Application Publication , 1-10.
Rosen & Kishawy (2012). Sustainable Manufacturing and Design: Concepts, Practices and Needs. Sustainability, 154-174
Rowley, & Peters. (2009). Multi-criteria methods for the aggregation of life cycle impacts. 6th Australian conference on life cycle assessment, (pp. 1-11). Melbourne.
Rubin. (1978). The theory of the firm and the structure of the franchise contract. Journal of law and economics , 223-233.
Ruth, S. (2009). Green IT More Than a Three Percent Solution? . Internet Computing, IEEE , 74-78. SAIC. (2006). Life cycle assessment: principle and practices. Cincinnati, Ohio: National Risk Management
Research Laboratory. U.S. ENVIRONMENTAL PROTECTION AGENCY. Saiedian, & Dale. (2000). Requirements engineering: making the connection between the software developer
and customer. Information and software technology , 419-428. Saltelli, A., S. Tarantola, F. Campolongo, and M. Ratto (2004). Sensitivity Analysis in Practice: A Guide to
Assessing Scientific Models. John Wiley and Sons Saur, Donato, Flores, C., Franki, Jensen, A., Kituyi, et al. (2003). UNEP/SETAC life cycle initative - draft final report
of the LCM definition study. Donzdorf, Germany: Life cycle initiative. Schaltegger, S. (2008). Managing the business case fir sustainability. EMAN-EU conference proceeding , 7-9. Schmidt, N.-H., Ere, K., Kolbe, k. M., & Zarnekow, R. (2009). Towards a Procedural Model for Sustainable
Information Systems Management. The 42nd Hawaii International Conference on System Sciences, (pp. 1-10). Hawaii. Schmidt, W.- ., & Taylor, A. (2006). Ford of Europe’s roduct Sustainability Index. Brentwood, UK: Ford of
Europe. Schoeman, & Sanchez. (2009). Green supply chain overview and a South African case study. Southern African
Transportation Conference , 569-576. Scholz, W., Lang, D. J., Wiek, A., Walter, A. I., & Stauffacher, M. (2006). Transdisciplinary case studies as a means
of sustainability learning. Historical framework and theory. International Journal of Sustainability in Higher Education, 7 ( 3), 226-251.
SCOPE. (2007). sustainability indicators: a scientific assessment. (Hak, Moldan, & Dahl, Eds.) Paris, France: Island Press.
Scott. (2000). "Green" polymers. Polymer Degradation and Stability , 1-7. Searcy, Karapetrovic, & McCartey. (2008). Application of a systems approach to sustainable development
performance measurement. International journal of productivity and performance measurement , 182-197. Securities and Exchange Commission. (2010, December 23). Conflict Minerals. Federal Register / Vol. 75, No.
246 . Senge, Smith, Kruschwitz, Laur, & Schley. (2008). The necessary Revolution: How Individuals and Organisations
areWorking to Create a Sustainable World. New York: Double day. Shah, & Meckler. (2011). A generalised exergy-based framework for sustainable design of IT systems.
International journal of exergy , 127-146. Shahin, & Mahbod. (2007). Prioritization of key performance indicators: an integration of analytical hierarch
process and goal setting. International Journal of Productivity and Performance Mangement , 226-240. Singh R.K., Murty H.R., Gupta S.K., Dikshit A.K. (2007) Development of composite sustainability performance
index for steel industry, Ecological Indicators, 565-588 Singh, H., & Reuters, T. (2011). Data centre maturity model. The Green Grid. Singha, R. K., Murtyb, H., Guptac, S., & Dikshitc, A. (2012). Ecological Indicators An overview of sustainability
assessment methodologies. Ecological Indicators , 281–299. Skinner, J. (2009). Emerging Practices for Replacing Inefficient Hardware. . Santa Clara: Climate Savers
Computing. Skouloudis, A., Evangelinos, K., & Kourmousis, F. (2010). Assessing non-financial reports according to the Global
Reporting Initiative guidelines: evidence from Greece. Journal of Cleaner Production , 426-438. Society of Manufacturing Engineers. (2011). What Your Company Should Know About Conflict Minerals - A
MetalMiner Guide to Conflict Minerals Legislation and The Audit Process. Retrieved February 8, 2012, from MetalMiner: http://www.sme.org/uploadedFiles/About_SME/Industry_Focus_Areas/conflict_minerals_guide.pdf
Sommerville, & Swayer. (1997). Requirements engineering - a good practice guide. John Wiley and Sons.

MSc Thesis, J.C.P. Kalsheim: Greening Information Technology (IT) Infrastructures
137
Souder, Sherman, & Cooper. (1998). Environmental uncertainty, organisational integration, and new product development effectiveness: a rest of contingency theory. Journal of Product innovation management , 520-533.
Spohn, O. (2004). Sustainable Development Indicators within the German Water Industry – A Case Study Carried out at Chalmers University of Technology. Sweden: Chalmers University of Technology.
State Board of Equalization. (2010, December 30). CalRecycle. Retrieved May 23, 2012, from Electronic Product Mangement - Electronic waste recycling fee: http://www.calrecycle.ca.gov/electronics/act2003/retailer/fee
Steina, A., Rileyb, J., & Halbergc, N. (2001). Issues of scale for environmental indicators. Agriculture, Ecosystems & Environment , 215–232.
Steinweg, & Slob. (2009). Buy IT Fair. Amsterdam: Stichting Onderzoek Multinationale Ondernemingen (SOMO). Stenzel, J. P., Cokins, G., & Schubert, K. D. (2011). CIO Best Practices: Enabling Strategic Value With Information
Technology. Canada: John Wiley and Sons, Inc. Stewart, & Lemieux. (2003). Emissions from the incineration of electronics industry waste. Electronics and the
environment , 271-275. Somani, A. (2008). ADVANCED THERMAL MANAGEMENT STRATEGIES FOR ENERGY EFFICIENT DATA CENTERS.
Georgia : Georgia Institute of Technology. School of G.W. Woodruff School of Mechanical Engineering. Suh, & Nakamura. (2007). Five years in the area of input-output and hybrid LCA. International Journal of Life
Cycle Assessment , 351–352. Sun Microsystems. (2006). Server Power and Cooling Requirements. Retrieved June 18, 2012, from Site Planning
Guide for Sun Servers: http://docs.oracle.com/cd/E19088-01/v445.srvr/819-5730-10/powcool.html Sundin, H., Brown, D., Wakefield, J., & Ranganathan, J. (2009). Management Control Systems in a Non-Enterprise
Network: The Greenhouse Gas Protocol Initiative. Australian Accounting Review , 93-102. Symantec. (2009, May). Green IT Regional Data - Global Survey Results May 2009. Retrieved January 16, 2012,
from Sumantec: http://www.symantec.com/content/en/us/about/media/GreenIT_2009.pdf Takeda, H., Veerkamp, P., Tomiyama, T., & Yoshikawa, H. (1990). Modeling design process. AI Magazine, 11(4),
37-48. Tangen, S. (2003). An overview of frequently used performance measures. Work Study , 347-54. Tangen, S. (2004). Performance measurement: from philosophy to practice. International Journal of Productivity
and Performance Management , 726-737. Tellis. (1997). Application of a case study methodology. The Qualitative Report . Tessmer. (1993). Planning and conducting formative evaluations: improving the quality of education and
training. Oxon: Routledge. The Green Grid. (2011). About The Green Grid. Retrieved April 23, 2012, from The Green Grid:
http://www.thegreengrid.org/about-the-green-grid.aspx The Green IT Review. (2011, March 7). The Green Grid Introduces the Data Centre Maturity Model. Retrieved
January 2012, 2012, from The Green IT Report: http://www.thegreenitreview.com/2011/03/green-grid-introduces-data-centre.html
Thomas, J. (2011, October 11). Resource recycling. Retrieved May 15, 2012, from HP tops Greenpeace rankings: http://resource-recycling.com
Ting-ting, Z., Jing, Z., & Dan, L. (2012). A Study on the Evaluation System of Green ICT Products. Advanced materials research , 4061-4067.
Triantaphyllou. (2005). The impact of aggregating benefit and cost criteria in four MCDA methods. Engineering management , 213-226.
Triplett, & Bosworth. (2003). Productivity Measurement Issues in Services Industries: Baumol's disease has been cured. Economic Policy Review , 23-33.
Trusty. (2010). An overview of life cycle assessments: part one. International Code of Council Building Safety Journal Online
Uddin, & Rahman. (2011). Virtualization Implementation Model for Cost Effective & Efficient Data Centers. International Journal of Advanced Science and Applications , 69-74.
Unhelkar, B. (2011). Green IT Strategies and Applications. Boca Raton: CRC Press Taylor & Francis Group. United Nations. (2004). A Manual for the Preparers and Users of Eco-efficiency Indicators, Version 1.1. Geneva:
United Nations. USGS. (2001). Fact sheet. Obsolete computers, "gold mine", or high-tech trash? Resource recovery from
recycling. U.S Geological Survey.

MSc Thesis, J.C.P. Kalsheim: Greening Information Technology (IT) Infrastructures
138
Vanclay (1999) Environmental and social impact assessment. in Petts, J.: Handbook of Environmenetal Impact Assessment. Blackwell science: Oxford
Varun, Bhat & Prakash (2009) LCA of renewable energy for electricity generation systems-A review. Renewable and Sustainable Energy Reviews, 1067-1073
Veleva, & Ellenbecker. (2001). A proposal for measuring business sustainability: addressing shortcomings in existing frameworks. Greener management international , 101-120.
Veleva, & Ellenbecker. (2001). A proposal for measuring business sustainability: addressing shortcomings in existing frameworks. Greener management international , 101-120.
Veleva, & Ellenbecker. (2001). Indicators of Sustainable Production: A New Tool for Promoting Business Sustainability. New Solutions , 41 - 62.
Veleva, Greiner, & Vrumbley. (2001). Indicators of sustainable production. Journal of Cleaner production , 447-452.
Veleva, V., & Ellenbecker, M. (2001). Indicators of sustainable production: framework and methodology. Journal of Cleaner Production , 519–549.
Velte, T., Velte, A., & Elsenpeter, R. (2008). Green IT - Reducing your information system's environmental impact. New York: McGraw-Hill.
Verhoef. (2005). Quantifying the value of IT-investments. Science of computer programming , 315-342. Verschuren, P., & Doorewaard, H. (2010). Designing a research project. Utrecht: LEMMA. Vewin. (2011). Tarievenoverzicht drinkwater per 1 januari 2011. Rijswijk: Vewin. Viller, & Sommerville. (1999). Social analysis in the requirements engineering process: from ethnography to
method. 4th international symposium on requirements engineering (pp. 6-13). Limerick, Ireland: IEEE. Vollmann, T. (1996). The transformation imperative: achieving market dominance through radical change.
Boston: Harvard Business School Press. VROM. (2000, October). Eco-indicator 99 Manual for Designers. Retrieved March 12, 2012, from Ministry of
housing, spatial planning and the environment: http://www.pre-sustainability.com/content/impact-assessment-methods
Vykoukal, Wolf, & Beck. (2009). Does Green IT matter? analysis of the relationship between Green IT and Grid Technology from a resource based view perspective. PACIS 2009 Proceedings (p. Paper 51). Hyderabad, India: AIS Electronic Libarary.
Wang, & Strong. (1996). Beyond accuracy: what data quality means to data consumers. Journal of Management Information Systems , 5-34.
Wang, Jing, & Zhang. (2010). Review of multi-criteria decision analysis aid in sustainable energy decision-making. Renewable Sustainable Energy Review , 2263-2278.
Wath, S. B., Dutt, P. S., & Chakrabart, T. (2011). E-waste scenario in India, its management and implications. Earth and Environmental Science , 249-262.
Watson, Boudreau, & Chen. (2010). Information systems and environmentally sustainable development: energy informatics and new directions for the IS community. MIS Quarterly , 22-38.
WBCS, & WRI. (2004). GHG Protocol: A corporate accounting and reporting stanard. Washington: World resource institute and world business council for sustainable development.
WBCSD. (2000). eco-efficiency: creating more value with less impact. World Business Council for Sustainable Development.
WBSD & WRI. (2012). GHG Protocol Product Life Cycle Accounting and Reporting Standard - ICT Sector Guidance. Washington: World Business Council for Sustainable Development and World Resource Institute.
Weill, P. (1993). The role and value of information technology infrastructure: Some empirical observations. In R. D. Banker, R. J., & M. A. Mahmood, Strategic Information Technology Management: Perspectives on Organisational Growth and Competitive. Harrisburg: Idea Group Pub.
Weisser (2007) A guide to life-cycle greenhouse gas (GHG) emissions from electric supply technologies. Energy, 1543-1559.
Wempe, & Kaptein. (2002). The balanced company: a theory of corporate integrity. Oxford: Oxford University Press.
Wiedmann, & Minx. (2008). A definition of "carbon footprint". In Pertsova, Ecological Economics Research Trends: Chaper 1 (pp. 1-11). Hauppauge NY, USA: Nova Science Publishers.
Williams. (2005). Waste Treatment and Disposal. West Sussex, England: John Wiley & Sons.

MSc Thesis, J.C.P. Kalsheim: Greening Information Technology (IT) Infrastructures
139
Williams, & Sasaki. (2004). Computers and the environment understanding and managing their impacts. Berlin: Kluwer Academic Publishers.
WNA (2012) Energy Analysis of Power Systems. Retrived 13 july 2012 form http://www.world-nuclear.org/info/inf11.html
Wooley. (2004). Computational biology for biotechnology: part II: applications of scientific computing in biotechnology. Trends in biotechnology , 126-132.
WRI & WBCSD. (2011). Product Life Cycle Accounting and Reporting Standard. USA: World Resources Institute and World Business Council for Sustainable Development.
WRI & WBSCD. (2011). Corporate Value Chain (Scope 3) Accounting and Reporting Standard. Geneva: World Resource Insitute and World Business Council for Sustainable Development.
Wright, Jahanshahi, Jorgensen, & Brennan. (2002). Is recycling metal sustainable. Proceedings of the international conference on sustainable processing of minerals, Green processing conference. Australia: Australian Insitute of Mining and Metallurgy.
Yin, R. K. (2009). Case study research design and methods. London: Sage Publications. Young. (2004). Criteria of a good requirement. Retrieved March 19, 2012, from
http://ralphyoung.net/artifacts/criteriagoodrequirement.pdf Younos, T., Hill, R., & Poole, H. (2009). Water Dependency of Energy Production and Power Generation Systems.
Beirut, Lebanon: Virginia Water Resources Research Center (VWRRC). Yu, E. (1997). Towards modelling and reasoning support for early-phase requirements engineering. Proceedings
of the Third IEEE International Symposium on Requirements Engineering (pp. 226 - 235). Annapolis: IEEE. Zarrella, E. (2008). Sustainable IT - The Case for Strategic Leadership. Zürich: KPMG. Zhang, Q., & Zhang, L. (2010). The evaluation and application of manufacturing green product based on fuzzy
comprehensive assessment method. FSKD 17th Conference (pp. 1085-1089). Yantai: IEEE. Zhang, S., & Forssberg, E. (1997). Mechanical separation-oriented characterizationof electronic scrap. Resources,
Conservation and Recycling , 247–269.

MSc Thesis, J.C.P. Kalsheim: Greening Information Technology (IT) Infrastructures
140

MSc Thesis, J.C.P. Kalsheim: Greening Information Technology (IT) Infrastructures
141
Appendices

MSc Thesis, J.C.P. Kalsheim: Greening Information Technology (IT) Infrastructures
142

MSc Thesis, J.C.P. Kalsheim: Greening Information Technology (IT) Infrastructures
Appendix A: Sustainability Indicators and Indices 143
Appendix A: Sustainability Indicators and Indices
1. Introduction In this appendix sustainability indicators from literature will be reviewed. The indicators that will be elaborated on can be found in Table 13. The indicator sets are discussed in chronological sequence, starting with the first indicator set. The purpose of this review is to determine which set of indicators might be valuable when designing a new framework to assess an organisation’s hardware IT greenness.
Table 13: Indicator sets from literature
# Indicator sets and indices Application level
1 GRI performance indicators for sustainability Facility and corporation
2 EU environmental management and audit scheme Facility
3 OECD toolkit Facility and product
4 Lowell Center for Sustainable Production Facility
5 Eco-indicator 99 Product and process
6 Dow Jones Sustainability Index Corporation and sector
7 Composite Sustainability Performance Index Corporation and sector
8 Composite Sustainable Development Index Corporation
9 ITT Flygt Sustainability Index Corporation
10 General Motors' metrics for sustainable manufacturing Facility
11 Ford of Europe's product sustainability index Product
12 Life cycle index Product and process
13 ISO 14031 Facility and corporation
2. Global Reporting Initiative (GRI) performance indicators for sustainability The indicators by the GRI are the most widespread set of indicators used by organisations today (Roca & Searcy, 2012). The indicator set consists of two types of indicators: core and additional indicators. Core indicators are considered especially important to measure. The environmental and economic indicators that fall under this initiative are listed in Table 14 and Table 15. A benefit of these indicators is their widespread recognition by businesses.
Table 14: GRI indicators from the Indicator Protocol Set Environment (GRI, 2000)
Type Environmental indicators
Core indicator
Material used by weight or volume (direct materials and non-renewable materials)
Percentage of materials used that are recycled input materials
Direct energy consumption by primary energy source
Indirect energy consumption by primary energy source
Total water withdrawal from source
Total direct and indirect greenhouse gas emissions by weight
Other relevant indirect greenhouse gas emissions by weight
Emission of ozone-depletion substances by weight
NOx, SOx and other significant air emission by type and weight
Total water discharged by quality and destination
Total weight of waste by type and disposal method
Total number and volume of significant spills
Additional indicators
Energy saved due to conservation and efficiency improvements
Initiatives to provide energy-efficient or renewable energy-based products and services, and reductions in energy requirements as a result of these initiatives
Initiatives to reduce indirect energy consumption and reductions achievements
Water sources significantly affected by withdrawal
Percentage and total volume of water recycled and reused
Initiatives to reduce greenhouse gas emissions and reductions achieved
Weight of transported, imported, exported or treated waste deemed hazardous under the terms of Basel Convention Annex I, II, II and VIII, and percentage of transported waste shipped internationally
\

MSc Thesis, J.C.P. Kalsheim: Greening Information Technology (IT) Infrastructures
Appendix A: Sustainability Indicators and Indices 144
Table 15: GRI indicators from the Indicator Protocol Set Economic (GRI, 2011)
Type Economic indicators
Core indicator
Direct economic value generated and distributed, including revenues, operating costs, employee compensation, donations and other community investments, retained earnings, and payments to capital providers and governments
Financial implications and other risks and opportunities for the organisation’s activities due to climate change.
Coverage of the organisation’s defined benefit plan obligations.
Significant financial assistance received from government.
Policy, practices, and proportion of spending on locally-based suppliers at significant locations of operation.
Procedures for local hiring and proportion of senior management hired from the local community at significant locations of operation.
Development and impact of infrastructure investments and services provided primarily for public benefit through commercial, in-kind, or pro bono engagement.
Additional indicators
Range of ratios of standard entry level wage by gender compared to local minimum wage at significant locations of operation.
Understanding and describing significant indirect economic impacts, including the extent of impacts.
3. European Union environmental management and audit scheme (EMAS) The indicators defined in the EMAS are listed in Table 16. The indicators are developed with the purpose of becoming a European assessment standard. A disadvantage of the standard is its varying acceptance in Europe. The standard has been available for participation by companies since 1995, however business acceptance varies in the European Union. In Germany the largest amount of businesses have implemented the standard (around 1348 participatory organisations), whereas countries such as Malta, Luxembourg and Bulgaria approximately no organisation have implemented the standard (European Commission, 2012).
Table 16: EMAS (European Commission, 2009)
Type/class Indicator Measurement unit
Energy efficiency total direct energy use MWh or GJ
total renewable energy use MWh or GJ
Material efficiency annual mass flow of different materials used ton
Water total annual water consumption m^3
Waste total annual generation of waste ton
total annual generation of hazardous waste kg or ton
Biodiversity Land use m^3 of built area
Emissions total annual emission of greenhouse gases (CO2, CH4, N2O, HFCs, PFCs and SF6) ton of CO2 equivalent
total annual air emission (SO2, Nox and PM) kg or ton
4. OECD toolkit The indicators defined in the OECD sustainability manufacturing toolkit are listed in Table 17. The toolkit provides a set of indicators to measure environmental performance at facility level. The purpose of the standard is to accelerate sustainable production by manufacturing industries as a new opportunity for value creation. This entails a means to benchmark products and production processes (OECD, 2011). Indicators incorporated in the toolkit focus on environmental and financial performance, however work is put into broadening economic and social performance.
Table 17: Indicators from the OECD toolkit (OECD, 2011)
Topic Input indicators Operations indicators Product indicators
Material use
Recycled/reused content Residual intensity Recycled/reused content
Restricted substances intensity Recyclability
Non-renewable materials intensity Renewable materials content
Non-renewable materials intensity
Restricted substance content
Water use Water intensity Water intensity
Intensity of pollutant released to surface water Water release intensity
Energy use Renewable portion of energy consumed Renewable portion of energy Energy consumption intensity
Energy intensity Energy intensity
GHGs GHG intensity Greenhouse gas intensity Greenhouse gas emission intensity
Intensity of pollutant releases to air Air release intensity
Land use Proportion of natural land

MSc Thesis, J.C.P. Kalsheim: Greening Information Technology (IT) Infrastructures
Appendix A: Sustainability Indicators and Indices 145
5. Lowell Center for Sustainable Production (LCSP)
The indicators defined in LCSP are listed in Table 18. Indicators related to workers and community are not included in the overview. The levels included in the overview are the following: Level 1: Compliance/conformance Level 2: Facility materials use and performance Level 3: Facility effects Level 4: Supply chain and product The indicators defined by LCSP aim at raising companies awareness and measuring their progress towards sustainable production systems (Veleva & Ellenbecker, 2001). The LCSP defines sustainable production as the creation of goods and services using processes and systems (Krajnc & lavič, 2003). It presents 22 indicators on five levels of scale that can be calculated as totals or per unit of a product. Indicators listed in the LCSP framework are defined from indicators by the GRI, world business council for sustainable development (WBSD), ISO 14031 and centre for waste reduction technologies (CWRT). Common for these measurement standards are that they suggest similar measures for evaluation of business sustainability performance (e.g. water use, energy use, market share, etc.) (Veleva & Ellenbecker, 2001).
Table 18: Core indicators defined in the LCSP (Veleva & Ellenbecker, 2001)
Aspect Framework level Indicator Measurement unit
Energy and materials
2 Fresh water consumption litres
2 Materials used (total and per unit of product) kg
2 Energy use (total and per unit of product) kWh
2 Percentage energy from renewables %
Natural environment
2 Kilograms of waste generated before recycling (emissions, solid and liquid waste) kg
3 Global warming potential tons of CO2
3 Acidification potential tons of SO2
3 kg of PBT chemical used kg
Products
4 Percent of products designed for disassembly, reuse or recycling %
4 Percent of biodegradable packaging %
4 Percent of products with take-back policies in place %
Economic performance
1 Cost associated with EHS compliance Euro
2 Rate of customer complaints and returns #/product sale
2 Openness to stakeholder review and participation in decision-making process number (1-5)
6. Eco-99 Eco-99 is intended to be used by designers and product managers that want to apply the standard eco-indicator values for the assessment of environmental aspects of product systems over the life cycle. Next to this, different design alternatives can be compared using this standard in combination with LCA software. Eco-indicators defined in the Eco-99 manual are numbers that express the total environmental load of a product or process. The environmental effects of products and production systems are defined in terms of three types of damages; human health, ecosystem quality and resources. In essence the tool is developed to be used by designers in the search for more environmentally-friendly design alternatives and is intended for internal use. It is a tool that can be used within companies and sectors (VROM, 2000).
Table 19: Eco-99 indicators (VROM, 2000)
Indicators (endpoint) Measurement unit
Damage to human health Disability Adjusted Life Years (DALY)
Damage to ecosystem quality % vascular plant species* km^2 * year
Damage to resources MJ surplus energy
7. Dow Jones Sustainability Index The Dow Jones Sustainability Group Index (DJSGI) covers the leading sustainability companies; 10% of companies with the best sustainability performance in each of the 64 industry groups are incorporated in this index. The annual DJSGI reassesses companies for their corporate sustainability performance. This consists of; Corporate Sustainability Assessment, Corporate Sustainability Monitoring and component ranking and selection. The corporate sustainability

MSc Thesis, J.C.P. Kalsheim: Greening Information Technology (IT) Infrastructures
Appendix A: Sustainability Indicators and Indices 146
assessment methodology is based on the application of specific assessment criteria and risks deriving from environmental, economic and social dimensions. These assessment criteria consist of generally applicable and industry specific criteria. For each company assessed, the total sustainability score is determined on a scale from 0% to 100% and compared to the industry average score (Knoepfel, 2001).
8. Composite Sustainability Performance Index The Composite Sustainability Performance Index (CSPI) has been developed specifically for the steel industry. The CSPI aims to measure and evaluate sustainable performance of steel industries along the three pillars of sustainability and organisational governance and technical aspects. It consists of a conceptual decision model based on the analytical hierarchy process (AHP) to evaluate the impact of an organisations sustainability performance. In essence, the CSPI is a framework for sustainability indicators as a tool for performance measurement and improvement at sectorial level (Singh, Murty, Gupta & Dikshit, 2007).
9. Composite Sustainability Development Index
The composite sustainability development index (CSDI) is developed as a track integrating information on economic, environmental and social performance of a company using real-time information. The analytical hierarchy process (AHP) is used to aggregate normalized indicators into one index (Rajesh Kumar Singha, 2012). Performance indicators have been constructed from indicators listed by the GRI (Krajnc & lavič, 2005).
10. ITT Flygt Sustainability Index ITT Flygt AB is a manufacturer and supplier of submersible pumps, mixers and fluid handling technology. The indicators defined in the ITT Flygt sustainability index have been developed over a three year period (Pohl, 2006). The index provides a framework to measure how well a company stands up to its policies and commitments regarding sustainable development (Rajesh Kumar Singha, 2012). Further, the index has been developed with the input of five engineering companies (Rajesh Kumar Singha, 2012). Indicators incorporated in this index are specific to this type of organisation. Weight of pumps and ŋ-wheels are examples of indicators emphasizing this (Pohl, 2006).
11. General Motors’ metrics for sustainable manufacturing
General Motors (GM) has developed a set of metrics to assess the sustainability of their manufacturing processes. The environmental indicators are related to specific manufacturing aspects at General Motor (GM) and has been developed based on a review of state-of-the art metrics for sustainable manufacturing. The GM metrics for sustainable manufacturing recommends sustainable manufacturing metrics for implementation by considering approximately 30 metrics in six main areas; environmental impact, energy consumption, personal health,
occupational safety, waste management and manufacturing costs (Rosen & Kishawy, 2012) (Dreher, et al., 2009).
12. Ford of Europe’s production sustainability index Similar to General Motors, Ford has developed an index to assess the sustainability of their production processes. Indicators that fall under this index are developed specifically for the automobile manufacturer Ford. The index includes eight indicators covering environmental, economic and social factors developed by considering LCA, LCC, sustainable materials, safety, mobility capability, noise and other factors (Rosen & Kishawy, 2012).
13. Life cycle index The life cycle index (LInX) has been developed with the purpose of facilitating LCA application in process and product evaluation and decision-making. The LInX consists of four sub-indices or attributes; environment, health and safety, cost, technical feasibility and socio-political factors. Each sub-index contains a number of basic parameters that are aggregated using the analytical hierarchy process. A composite process has been used to determine the overall index (Khan, Sadiq & Veitch, 2004). It is a data intensive method requiring considerable costs and labour (Krotscheck &
Narodoslawsky, 1996).
14. ISO 14031 The ISO 14031 environmental performance evaluation defines three types of indicator levels: operational performance indicators, management performance indicators and environmental condition indicators.

MSc Thesis, J.C.P. Kalsheim: Greening Information Technology (IT) Infrastructures
Appendix A: Sustainability Indicators and Indices 147
Management performance indicators provide information about management efforts to influence the environmental performance of the organisation’s operation. The performance indicators that fall under this category are related to policy, people, practices, procedures, decisions and actions at all levels of an organisation. (Jasch, 2000)
Operational performance indicators provide information about environmental performance of the operations of an organisation. The indicators in this category are related to three aspects of the operations of an organisation: (1) design, operation and maintenance of physical facilities and equipment of an organisation, (2) materials, energy, products, services, wastes and emissions related to the physical facilities and equipment of an organisation and (3) the supply of materials, energy and services to and the delivery of products, services and wastes from the physical facilities and equipment of an organisation. (Jasch, 2000)
Environmental condition indicators provide information about the conditions of the environment. This might be useful for the implementation of environmental performance evaluation within an organisation. (Jasch, 2000)
Examples of environmental and financial performance indicators that fall under this standard are shown in Table 20. ISO 14031 defines environmental performance evaluation as an internal process and management tool designed to provide management with verifiable and reliable information on a continuous basis. This can be used to determine whether an organisation's environmental performance is met in line with criteria set by the management. The basis for environmental performance evaluation is the operational system, corresponding to an input-output analysis of material flows (Jasch, 2000).
Table 20: ISO 14031 environmental performance indicators (Jasch, 2000) (European Commission, 2003)
Type Indicator
Materials
Quality of materials used per unit of product
Quantity of processed, recycled or reused materials
Quality of materials reused in the production process
Quantity of auxiliary materials recycled or reused
Quality of water per unit of product
Quality of water reused
Quantity of hazardous materials used in the production process
Energy
Quantity of energy used per year or per unit of product
Quantity of energy used per service or customer
Quantity of each type of energy used
Quantity of energy generated with by-products or process streams
Quantity of energy saved due to energy conservation programs
Services supporting the organisation's operation
Amount of hazardous materials used by contracted service providers
Amount of cleaning agents used by contracting service provider
Amount of recyclable and reusable materials used by contracted service providers
Amount and type of waste generated by contracted service providers
Products
Number of products introduced in the market with reduced hazardous properties
Number of products which can be recycled or reused
Number of units of by-products generated per unit of product
Percentage of a product's content that can be reused or recycled
Rate of defective products
Number of units of energy consumed during use of product
Number of products with instructions regarding environmental safety use and disposal
Duration of product use
Wastes
Total waste for disposal
Quality of waste converted to reusable materials per year
Quantity of hazardous materials, recycled or reusable waste produced per year
Quantity of waste stored on site
Quantity of waste controlled by permits
Quantity of waste per year per unit of product
Emissions
Quantity of specific emission per year
Quantity of specific emission per unit of product
Quantity of waste energy released to air
Effluent to land or water
Quantity of specific material discharged per year
Quantity of specific material discharged to water per unit of product

MSc Thesis, J.C.P. Kalsheim: Greening Information Technology (IT) Infrastructures
Appendix A: Sustainability Indicators and Indices 148
Quantity of waste energy released to water
Quantity of material sent to landfill per unit of product
Quantity of effluent per service or customer
Financial performance
costs (operational and capital) that are associated with a product's or process environmental aspects
Return on investment for environmental improvement projects
Savings achieved through reductions in resource usage, prevention of pollution or waste recycling
Sales revenue attributable to a new product or a by-product designed to meet environmental performance or design objectives
Research and development funds applied to projects with environmental significance
Environmental liabilities that may have a material impact on the financial status of the organisation
15. Discussion and conclusion None of the indicator sets and indices elaborated on can be directly applied to determine the greenness of hardware IT infrastructures. The CS I, ITT Flygt Sustainability index, eneral Motor’s metrics for sustainable development and Ford Europe’s production sustainability index are developed for specific manufacturing industries. Further, OECD toolkit is a prototype developed for manufacturing companies, the CSDI is based on indicators defined by the GRI and the Eco-indicator 99 has been developed for designers in the search for design alternatives. The Dow Jones Sustainability Group Index assesses the financial and sustainability performance of the top 10% of companies in the Dow Jones Global Total Stock Market Index. The LInX facilities LCA. It is a very data intensive index. Other indicator sets and indices are generally applicable, but not specific enough to hardware IT infrastructures. It can therefore be concluded no indicator sets and indices can be used directly to determine the greenness of an organisation’s hardware IT infrastructure. Indicators listed in the GRI, EMAS, LCSP and ISO 14031 might nevertheless serve as inspiration. These are relatively mature indicators that have been applied by various organisations.

MSc Thesis, J.C.P. Kalsheim: Greening Information Technology (IT) Infrastructures
Appendix B: Green Performance Indicators (GPI) 149
Appendix B: Green Performance indicators (GPI)
1. Introduction In this appendix various green performance indicators (GPIs) will be reviewed. These indicators serve as an inspiration source to designing a new framework to assess the greenness of an organisation’s hardware IT infrastructure.
2. Scope Several green performance indicators (GPI) or metrics are defined with the purpose of evaluating the greenness of the technical hardware IT infrastructure of an organisation. Several metrics aimed at data centres have been defined by the Green Grid and the Uptime Institute. Next to these metrics, the energy star label developed by the US Environmental Protection Agency (EPA) and US Department of Energy (DOE) has been developed as well to label the greenness of IT. Energy star is not a metric, but a threshold criteria that an organisation could apply when purchasing IT assets. Energy star has been included in the overview as it is an accepted standard for electronic devices. The label has for instance been incorporated in green procurement policies by the Dutch government (Pianoo, 2012). Most of the metrics elaborated on in this review are developed by the Green Grid and Uptime Institute. Next to these several GPIs related to IT resource usage are incorporated in the review. The GPIs summarized in Table 21 are classified into four distinct organisational levels: organisation (ORG), facility (FAC), application (APP) and compute node (CN) (Kipp, Jiang, Fugini, & Salomie, 2012). The metrics in Table 21 are also classified according to the type of cluster under which it can be defined (Kipp, Jiang, Fugini, & Salomie, 2012); 1. IT resource usage GPIs: related to the IT usage of applications, e.g. CPU usage, data centre density, etc. 2. Application lifecycle KPIs: related to the process quality and efforts for designing and maintaining the process,
e.g. response time, availability, recoverability, etc. 3. Energy impact GPIs: related to the impact of IT service centres and applications on the environment considering
power supply, emissions, consumed materials and other energy related factors, e.g. power usage effectiveness (PUE), data centre infrastructure efficiency (DCiE), CO2 emission, etc.
4. Organisational GPIs: energy related metrics that measure organisational factors, e.g. human resource indicator, compliant indicator, carbon credit and return of green investment (RoGI), etc.
The overview also incorporates advantages and disadvantages of each metric including origin, publication year, metric definition and notes. In the notes some aspects of the metrics are elaborated on in more detail.

MSc Thesis, J.C.P. Kalsheim: Greening Information Technology (IT) Infrastructures
150
Table 21: Overview of environmental sustainability metrics defined for the technical hardware IT infrastructure
ORIGIN YEAR NAME METRIC DEFINITION LEVEL GPI
CLUSTER ADVANTAGES AND DISADVANTAGES
NOTES G
reen
Gri
d
2008 Power Usage Effectiveness (PUE)
Total Facility Power/IT Equipment Power or (Cooling+ Power+ Lighting+ IT)/IT
FAC Energy
impact GPI
Misleading results when comparing data centres, does not satisfy EPA requirements
This metric seeks to quantify the energy efficiency of a data centre, and can be used on the short term to improve data centre operational efficiency, e.g. repurpose energy for additional IT equipment (Daim, Justice, Krampits, Letts, Subramanian, & Thirumalai, 2009)
2010
Partial Power Usage Effectiveness (pPUE)
Total Facility Power/IT Equipment Component Power
FAC Energy
impact GPI Only applicable when portions of equipment is used, see PUE
The can be useful to highlight some energy intensive component to get better insight into the energy usage of the IT system (Green Grid, 2011)
2008 Data Centre infrastructure Efficiency (DCiE)
1/PUE or IT Equipment Power/ Total Facility Power x 100%
FAC Energy
impact GPI
Should be complemented with another metric when addressing both infrastructure and IT productivity needs, misleading results when comparing data centres
The metric measures the percentage of power that reaches the IT equipment (Green Grid, 2008)
2010 Energy Reuse Efficiency (ERE)
(1-Reuse Energy/Total Energy)× PUE or (Cooling+ Power+ Lighting + IT-Reuse)/IT
FAC Energy
impact GPI
Misleading results when comparing data centres, does not satisfy EPA requirements
The metric should be used according to the reen rid “if the beneficial energy reuse occurs outside the data centre and its support infrastructure” (Green Grid, 2010)
2008 Data Centre performance efficiency (DCPE)
Useful Work/Total Facility Power FAC Energy
impact GPI
Measuring and defining Useful Work as a standard metrics is a relatively complex- and subjective task
The metric can be used to baseline a data centre and compare its productivity on a daily basis (Green Grid, 2008).
2009
Data Centre Energy Productivity (DCeP)
Useful Work Produced / Total Data Centre Energy Consumed Producing this Work
FAC Energy
impact GPI
The metric is applicable to improvements in a single data centre, i.e. not for comparing across data centres
The metric measures the quantity of useful work that a data centre produces based on the amount of energy it expends, i.e. it can be used to track the total work product of a data centre per unit of energy used to produce this work (Green Grid, 2008; Green Grid, 2009).
2007 Compute Power Efficiency (CPE)
IT Equipment Utilization × DCiE or IT Equipment Utilization/PUE or (IT Equipment Utilization × IT Equipment Power)/Total Facility Power
FAC Energy
impact GPI
The definition of utilization that works for all IT equipment is unclear
The purpose of the metric is to quantify the overall efficiency of a data centre while taking all electrical power delivered to the IT equipment into account, i.e. not only useful work. (Green Grid, 2011)
Server compute efficiency
% (proportion of samples that the server is providing primary services over time)
APP IT
resource usage GPI
This is a sub-metric of the data centre compute efficiency (DCcE). Compared to possible alternatives, the metric is easy to implement.
Useful in determining which servers are candidates for virtualization (Green Grid, 2011).

MSc Thesis, J.C.P. Kalsheim: Greening Information Technology (IT) Infrastructures
Appendix B: Green Performance Indicators (GPI) 151
2010 Data Centre Compute Efficiency (DCcE)
Average of the ScE (Server computing efficiency) values from all servers in the data centre during the same time period
FAC Energy
impact GPI The metric cannot be used to compare data centres
According to the Green Grid (2010) the ScE measures “the proportion of time the server spent providing primary services and expressed as a percentage value”. To estimate the DCcE the ScE values from all servers during the same time period is averaged. The purpose of the metric is to help operators discover inefficiencies within a specific data centre and to address these to increase efficiency over time (Green Grid, 2010)
2007 Data Centre Density (DCD)
Power of All Equipment on Raised Floor/ Area of Raised Floor
FAC IT
resource usage GPI
Whether deployment is done efficiently is not captured by the metric
The raised floor is a system that has been developed and implemented with the following functions; (1) Conduits for power cabling, (2) A cold air distribution system for cooling IT equipment, (3) Tracks, conduits, or supports for data cabling, (4) A copper ground grid for grounding of equipment and (5) a location to run chilled water and other utility piping (Rasmussen, 2010)
2010 Carbon Usage Effectiveness (CUE)
Total CO2 Emissions Cause by the Total Data Centre Energy/Energy Equipment IT
FAC Energy
impact GPI
There is no detail description of how the CUE should be determined and how CUE should be measured for mixed buildings
The metric aims at measuring the sustainability of a data centre with respect to the carbon emissions associated with it, and can be used to compare similar data centres. In combination with PUE /DCiE the metric can be used to assess sustainability, compare results and determine if sustainability or energy efficiency improvements need to be made (Green Grid, 2010)
Up
tim
e In
stit
ute
2008
Corporate Average Data centre Efficiency (CADE)
IT efficiency × Facility efficiency FAC IT
resource usage GPI
Compute performance is not defined
The metric is aimed at measuring the individual and combined energy efficiency of, amount other things, data centres across the entire corporate footprint (Kaplan, J.; Forrest, W.; Kindler, N., 2008)
2007
Site Infrastructure Power Overhead Multiplier (SI-POM)
Data Centre Power Consumption/Total Hardware AC Power Consumption at the Plug for all IT Equipment
FAC Energy
impact GPI
Misleading results when comparing data centres, does not satisfy EPA requirements
Measures how much of a data centre's site power is consumed in overhead instead of making it to the critical IT equipment (Stanley, Brill, & Koomey, 2007)
2007
Site Infrastructure Energy Efficiency Ratio (SI-EER)
Net Power Data Centre/Power Consumed by the IT Services
FAC Energy
impact GPI
Misleading results when comparing data centres, does not satisfy EPA requirements
The metric can be used to identify the efficiency of the data centre site infrastructure system, including the power and cooling support systems (Stanley, Brill, & Koomey, 2007)
2007 IT Hardware AC Hardware Load at the Plug/DC CN Energy Does not say anything about the How much of the power input to a piece of

MSc Thesis, J.C.P. Kalsheim: Greening Information Technology (IT) Infrastructures
Appendix B: Green Performance Indicators (GPI) 152
Power Overhead Multiplier (H-POM)
Hardware Compute Load impact GPI data centre efficiency, but rather the power conversion step
hardware is wasted in power supply conversion losses or diverted to internal fans (Stanley, Brill, & Koomey, 2007)
2007
Deployed Hardware Utilization Ratio (DH-UR)
Number of Servers Running Live Applications/Total Number of Servers Actually Deployed or Number of Terabytes of Storage Holding Important, Frequently Accessed Data/Total Terabytes of Storage Actually Deployed
FAC IT
resource usage GPI
The influence of the metric is limited as IT personnel will not turn off devices since it is often impossible
Measures the fraction of the deployment IT equipment that is comatose, i.e. using energy/power while not running any application (Stanley, Brill, & Koomey, 2007).
2007
Deployed Hardware Utilization Efficiency (DH-UE)
Minimum Number of Servers Necessary to Handle Peak Compute Load/Total Number of Servers Deployed
FAC IT
resource usage GPI
That performance and reliability of servers can be lower for higher rates of utilization is not taken into account
Useful the quantification of the opportunity for servers and storage to increase their utilization by virtualizing (Stanley, Brill, & Koomey, 2007)
An
alys
is t
oo
l
Performance per Watt
Performance (e.g. MHz, Bandwith, Capacity, MIPS or IOPS)/Watt
CN Energy
impact GPI Ambiguity of "Performance"
The energy efficiency of a particular computer hardware or a computer architecture that measures the rate of computation that can be delivered by a computer for every watt of power used (Rivoire et al, 2007). The performance can for instance be measured in million instructions per second (MIPS), which is the execution speed of a computer's Central Processing Unit (Rivoire, Shah, Ranganathan, Kozyrakis, & Meza, 2007) (Ranganathan, Rivoire, & Moore, 2009)
Average Watts per Square Foot
Watt/ft2 FAC
IT resource usage GPI
Identifying the correct power going into the data centre and the specific floor area it is distributed over might be ambiguous
This is the ratio of the total power coming into the data centre floor area. Identifying the correct power going into the data centre and the specific floor area it is distributed over might be ambiguous (Somani, 2008)
CPU usage UsedCPU / AllocatedCPU APP
IT resource usage GPI
memory usage UsedMemory / AllocatedMemory APP
IT resource usage GPI
I/O device usage
Number of I/O operations per second / Watt
APP IT
resource usage GPI
Storage usage
UsedDiskSpace / AllocatedDiskSpace
APP IT
resource usage GPI

MSc Thesis, J.C.P. Kalsheim: Greening Information Technology (IT) Infrastructures
Appendix B: Green Performance Indicators (GPI) 153
Watts per Rack Watt/Rack FAC IT
resource usage GPI
Extrapolating the rack efficiency to the data centre level is difficult
The metric is used to estimate the heat load per rack in data centre. The total heat load is the sum of the heat load of all racks (Somani, 2008)
Embedded Micro-
processor Benchmark Consortium
2006 EnergyBench Netmarks/Joule CN IT
resource usage GPI
Attaching the current probes usually requires dissection of the processor board. The metric measures the Throughput per Joule
This metric provides information on the amount of energy a processor uses while running EEMBC's performance benchmarks, and is focused on the embedded domain and on the processor (Rivoire, 2008)
Sun Micro-systems
2005 SWaP Performance/(Space × Watts) FAC IT
resource usage GPI
Ambiguity of "Performance" Performance is the industry standard benchmark, Space is the number rack units and Watts is the watts used by the system.
SPEC 2008 SPECpower_ ssj2008
Operation/Watt Averaged Over All Load
CN IT
resource usage GPI
Is currently only available in Java
The metric is aimed at assessing the energy efficiency of servers under a wide variety of loads, and is the first server power measurement standard (Daim, Justice, Krampits, Letts, Subramanian, & Thirumalai, 2009).
Rivoire et al. (2007)
2007 JouleSort Records Sorted/Joule CN IT
resource usage GPI
The metric does not address all possible energy-related concerns and as technologies improve, scales must be added or deprecated
The metric can contribute with assessing improvements in end-to-end, system-level energy efficiency. It is easy to use and measures the whole system energy efficiency (Rivoire, Shah, Ranganathan, Kozyrakis, & Meza, 2007)
EPA and DOE
2007 Energy Star A system is either certified or not dependent on a stated threshold
APP Energy
impact GPI
The metric does not measure precise values, but rather whether a system is below or above a threshold. The short-term application is limited. A distinction is made between workstations and other IT systems.
EnergyStar certification depends mainly on a systems low-power states and the metric is coarse-grained, i.e. a system is either certified or it is not (Ranganathan, Rivoire, & Moore, 2009).

MSc Thesis, J.C.P. Kalsheim: Greening Information Technology (IT) Infrastructures
Appendix C: Design Requirements Elicited 154
Appendix C: Design Requirements Elicited
1. Introduction To define the requirements of the framework tool, several interviews were conducted with various experts at Delft University of Technology and KPMG Netherlands. This appendix describes the outcome of these interviews. The appendix is constructed as follows. First, the interview questions are outlined. Second, the results of the interviews at KPMG are presented. Third, requirements defined from interviews with experts at Delft University of Technology are outlined. During the interviews semi-structured, open questions were asked with respect to functional and non-functional requirements. In total nine experts from KPMG Netherlands and at the faculty of technology, policy and management at Delft University of Technology were interviewed. The experts were selected from the two organisations due to their work experience and area of expertise related to green IT. The interviews were held in the period 20 January 2012 to 15 March 2012. The exact date, type of requirement elicitation technique applied and participating expert(s) can be found in Table 22.
Table 22: Requirements elicitation steps
Time Type of elicitation Participant(s) 20 February 2012 Brainstorm session Liselore Sauer, Jasper de Gier, Erik Beulen
23 February 2012 Structured interview Jolien Ubacht
28 February 2012 Structured interview Christiaan Piek
2 March 2012 Structured interview Arjan de Draaijer
7 March 2012 Structured interview Albert Plugge
14 March 2012 Structured interview Arnoud Walrecht
15 March 2012 Structured interview Renate van Drimmelen
1.1 Interview questions To ensure a consistent and reliable elicitation of requirements the following questions were used during the interviews with all experts: 1) Which functions should a tool to assess the greenness of an organisations hardware IT infrastructure have? 2) Which qualities should a tool to assess the greenness of an organisations hardware IT infrastructure have? 3) What functions and/or qualities of a tool to assess the greenness of an organisations hardware IT infrastructure
would be meaningful to an IT decision-maker?
2. Requirements elicited from experts at KPMG In this paragraph the requirements obtained from interviewing experts from KPMG will be presented.
15.1 Brainstorm session During the focus group session with Liselore Sauer (senior manager), Erik Beulen (manager) en Jasper de Grier (advisor) from KPMG a list of functional and non-functional requirements were defined. These experts were included in the brainstorm session because they represent the users of the tool with different levels of experience in the consulting field. After the brainstorm session the requirements were defined according to the attributes of good requirements as defined by the IEEE Computer Society. Subsequently they were ranked by the team of experts. The requirements and the ranking can be found in Table 11.
Table 23: Requirements and ranking from the brainstorm session
Functional requirements Ranking 1.1 The tool shall be able to determine the relative greenness of the IT infrastructure of an organisation consistently 3
1.2 The tool shall identify the main drivers of the relative greenness of the IT infrastructure of an organisation 2
1.3 The tool shall be able to determine the effect of a measure or scenario on the relative greenness of the IT infrastructure of an organisation
5
1.4 The tool should incorporate the explanation behind the indicator values 8
1.5 The tool shall produce output that is meaningful to IT decision-makers 1
Non-functional requirements Ranking 1.6 Adjustments in the tool shall be easy to trace 7

MSc Thesis, J.C.P. Kalsheim: Greening Information Technology (IT) Infrastructures
Appendix C: Design Requirements Elicited 155
1.7 The tool shall be usable on a single laptop 11
1.8 The internal mechanisms of the tool shall be covert to other stakeholders than the user due to intellectual property rights of the user
10
1.9 It shall be easy to implement changes in input and output data without alternating the internal mechanisms of the tool 4
1.10 The underlying assumptions of the tool shall be clear 6
1.11
The learning effort of using the tool shall be less than:
9 - 1 month using the tool for the first time
- 1 week (40 hours) using the tool the second time
From the ranking of requirement it is evident the most important requirement is requirement 5. This is independent of ranking functional and non-functional requirements together or separately. The least important requirement is requirement 7. Hence, it is very important that the tool produce outputs that are meaningful to IT decision-makers. It is less important that the tool is usable on a single laptop. In subsequent interviews, experts were therefore asked which qualities and/or functions the tool should have that would be meaningful to IT decision-makers (see section 1.1).
15.2 Interviews Two interviews were conducted with experts from KPMG sustainability advisory and KPMG IT Advisory to uncover requirements from the sustainability and IT perspective of green IT. From KPMG sustainability Arjan de Draaijer was interviewed. He is a senior director with over 15 years of experience in sustainability consulting. Among other things he has written a business briefing on the COP17 talks in Durban. From IT advisory Christiaan Piek was interviewed. He is a senior director with 12 years of experience in the field of IT strategy,- assessment and -governance. The requirements that were found during the two interviews are outlined in the next sub-sections. Additionally Arnoud Walrecht and Albert Plugge were interviewed. Albert Plugge is a senior manager at KPMG Sourcing and researcher at Delft University of Technology. He is an IT sourcing expert with knowledge of outsourcing hardware IT. Arnoud Walrecht is a manager at KPMG sustainability services in the Netherlands. He worked on several projects with regard to green IT and sustainability in the past.
15.2.1 Arjan de Draaijer
The requirements obtained from the interview with Arjan de Draaijer can be found in Table 24.
Table 24: requirements from interview with Arjan de Draaijer
Functional requirements 2.1 The tool shall produce one output value stating the relative greenness of IT infrastructure of an organisation
2.2 At the front-end of the tool, the effort of greening IT within an organisation shall be incorporated
2.3 At the back-end of the tool, the effect of greening IT within an organisation shall be incorporated
2.4 The tool shall identify the main drivers of the relative greenness of the IT infrastructure of an organisation
2.5 The tool shall incorporate existing standards and initiatives at the front-end
2.6 The tool shall be aligned with common practices of measuring sustainability within organisations at the back-end
Non-functional requirements 2.8 The tool shall produce output that is customizable in terms of presentation
2.9 The tool shall be able to integrate with existing (sustainability and finance & control) reporting systems used by organisations
2.10 The tool shall state the origin of the input data
2.11 The tool shall make clear what stakeholder should be involved to improve the relative greenness of the IT infrastructure of an organisation
2.12 The tool shall make use of available hardware and software at KPMG
15.2.2 Christiaan Piek Functional requirements obtained from the interview with Christiaan Piek can be found in Table 25.
Table 25: requirements from interview with Christiaan Piek
Functional requirements
3.1 The tool shall adopt the conceptual model that is based upon scientific literature and theory to assess the relative greenness of IT infrastructure of an organisation
3.2 The tool shall calculate the relative greenness of IT infrastructure of an organisation as defined in the conceptual model
3.3 The tool shall produce valid results

MSc Thesis, J.C.P. Kalsheim: Greening Information Technology (IT) Infrastructures
Appendix C: Design Requirements Elicited 156
3.4 The tool shall make clear what the trade-offs are between the economic and environmental life cycle assessment criteria of greening the IT infrastructure of an organisation
3.5 The tool shall produce one output value that states the relative greenness of IT infrastructure of an organisation
3.6 The tool shall calculate the effect of implementing strategies aimed at greening the IT infrastructure of an organisation
15.2.3 Albert Plugge (KPMG and Delft University of Technology) Functional requirements obtained from the interview with Albert Plugge can be found in Table 26.
Table 26: requirements from interview Albert Plugge
Functional requirements
4.1 The tool shall determine the effect on organisational goals of implementing strategies aimed at greening the technical hardware IT infrastructure of an organisation
4.2 The tool shall make clear what the trade-offs are between the economic and environmental life cycle assessment criteria of greening the IT infrastructure of an organisation
4.3 The tool shall be applicable to all types of organisations
4.4 The tool shall determine the relative greenness of the technical hardware IT infrastructure of an organisation
4.5 The tool shall support a continuous Green IT management process within organisations
Non-functional requirements 4.8 The output of the tool shall be customizable with respect to ecological and economic goals set by organisations
4.9 The tool shall be user friendly
4.10 The tool shall be based on valid information
4.11 The tool shall make clear what and how external factors influence the relative greenness of the technical IT infrastructure of an organisation
4.12 The output shall be intuitive to IT decision makers
4.13 The taxonomy used in the tool should be clear
4.14 The underlying data in the tool shall be traceable
4.15 The underlying data in the tool shall be reliable
4.16 The tool shall be valid
4.17 The tool shall be verifiable
4.18 The internal mechanisms of the tool shall be covert to other stakeholders than the user due to intellectual property rights of the user
15.2.4 Arnoud Walrecht Functional requirements obtained from the interview with Arnoud Walrecht can be found in Table 27.
Table 27: requirements from interview Arnoud Walrecht
Functional requirements
5.1 The tool shall produce one output value that states the relative greenness of IT infrastructure of an organisation
5.2 The tool shall support an organisation formulate relevant objectives aimed at greening the IT infrastructure in an organisation
5.3 The tool shall show the effect on organisational goals of implementing internal and external (e.g. sourcing) strategies aimed at greening the technical hardware IT infrastructure of an organisation
5.4 The tool shall support energy efficiency improvements in an organisation
5.5 The tool shall support a continuous Green IT management process
Non-functional requirements
5.8 The tool shall present the output intuitively to IT decision makers
5.9 The tool shall make clear what Green IT functions an IT decision-maker can directly and indirectly influence
16. Requirements from expert interview at Delft University of Technology In this paragraph the requirements obtained from interviewing two experts from Delft University of Technology are outlined. The experts interviewed is from the Faculty of Technology, Policy and Management (TPM) - Assistant Professor Jolien Ubacht and Lecturer Renate van Drimmelen.
16.1 Jolien Ubacht Jolien Ubacht has worked at the university for 16 years and has experience with green IT and key performance indicators for green IT. The requirements obtained from the interview with Jolien Ubacht can be found in Table 16. These represent requirements from the user and customer perspective.

MSc Thesis, J.C.P. Kalsheim: Greening Information Technology (IT) Infrastructures
Appendix C: Design Requirements Elicited 157
Table 28: requirements and score of requirements according to Jolien Ubacht
Functional requirements
6.1 The tool should be based upon data that is available in an organisation with respect to Green IT as defined in the research scope (input requirement)
6.2 The tool should provide insights about the awareness of Green IT within an organisation
6.3 The tool should make clear what the drivers behind the Green IT score are
6.4 The tool should make use eco-label information with respect to recyclability
6.5 The tool should produce data that could be compared to other organisations (benchmarking)
6.6 The tool should make clear what drives the output score(s) of assessing the relative greenness of the IT infrastructure of an organisation over time
6.7 The tool should make clear what and how external factors and trends influence the relative greenness of the IT infrastructure of an organisation
Non-functional requirements
6.8 The minimal amount of effort should be put on an organisation to collect the data to assess the relative greenness of the IT infrastructure of an organisation
6.9 The tool should make clear what stakeholder groups should be involved to measure and improve the relative greenness of the IT infrastructure of an organisation
6.10 The tool should make clear what management criteria should be embedded in an organisation with respect to Green IT
6.11 The limitations of using the tool should be clear to all stakeholders
16.2 Renate van Drimmelen Renate van Drimmelen works at the department of Technology Dynamics & Sustainable Development. Her specialisations are; sustainable strategies, renewable energy, system innovation and closing material cycles. The requirements obtained from the interview with Renate van Drimmelen can be found in Table 29.
Table 29: functional and non-functional requirements from interview with Renate van Drimmelen
Functional requirements
7.1 The tool shall make clear what the environmental effect of the technical IT infrastructure is relative to the total environmental effect of an organisation
7.2 The tool shall incorporate the environmental effect of the technical IT infrastructure over the life cycle of the technical IT infrastructure devices
7.3 The tool shall make clear what the trade-offs are between environmental improvements and costs of greening the IT infrastructure of an organisation
7.4 The tool shall make clear what environmental improvement potentials for greening the technical IT infrastructure of an organisation there are relative to the best available technology
7.5 The tool shall make clear how to improve the relative greenness of the technical IT infrastructure of an organisation
Non-functional requirements 7.8 The tool shall be independent of medium
7.9 The underlying assumptions of the tool shall be clear
7.10 The output should be standardized
17. Requirements from literature There are several ways of classifying functional and non-functional requirements from literature. Since the purpose of this study is not to perform an extensive study on requirements engineering, the literature study on requirements is limited to performance measurement. According to the Nicis Insitute (2010) a PMS should have the following functions; create transparency, learn, compare, evaluate and sanction. These are based upon de Bruijn (2000). The tool requirements based upon the functions of performance measurement are defined in Table 18.
Table 30: Requirements defined from PMS, adopted from Nicis Insitute (2010)
Functional requirements 8.1 The tool shall make an organisation’s performance transparent to internal and external stakeholders
8.2 The tool shall learn an organisation how to improve performance
8.3 The tool shall allow comparing an organisation’s performance with peers (benchmarking)
8.4 The tool shall contribute to the internal evaluation of the organisation on how to improve performance
8.5 The tool shall allow providing appropriate sanctions

MSc Thesis, J.C.P. Kalsheim: Greening Information Technology (IT) Infrastructures
Appendix D: Requirements Analysis and Agreement 158
Appendix D: Requirements Analysis and Agreement
1. Introduction In this appendix the outcome of the analysis, agreement and evolvement of requirements elicited from interviews and a brainstorm session with experts will be presented. The purpose of the analysis is to define a set of core design requirements.
2. Requirements analysis Analysing requirements elicited a bottom-up approach is used to define an overall set of high-level requirements. First, inconsistent, overlapping and ambiguous requirements were removed or reconstructed. Ambiguous requirements are reconstructed without alternating the original content of the requirement. The results can be found in Table 32. In the first column the origin of the requirements can be found. Each source are given an ID. The ID of sources and the sources can be found in Table 31. Second, a set of high-level requirements were defined as the content of several requirements overlap. In Table 33 these are defined from the requirements in Table 32. The compressed list of requirements was double-checked to ensure consistency and completeness in the step from requirements elicited to the final list of requirements.
Table 31: Requirement origin
Origin Stakeholder(s) interview/brainstorm S1 Liselore Sauer, Jasper de Gier, Erik Beulen
S2 Arjan de Draaijer
S3 Christiaan Piek
S4 Arnoud Walrecht
S5 Jolien Ubacht
S6 Albert Plugge
S7 Rente van Drimmelen
S8 Nicis Insitute
3. Requirements agreement Validating the requirements elicited and analysed from the perspective of an IT decision-maker, an interview was held with Hans de Bue. Hans de Bue has been IT manager at KPMG in the Netherlands for seven years and is currently supporting the CIO at K M Netherlands. In the interview one “customer” requirement was reformulated, HR11. For an IT decision-maker it is important a tool is flexible in terms of effort as some organisation might be willing to put more effort in the measurement than others. Besides validating requirements from the perspective of an IT decision-maker, the construct validity of the requirements were tested. Two expert panels were asked to validate the construct of all high-level requirements by applying the SMART criteria. The SMART criteria are a set of criteria for good requirements often referred to in literature (Shahin & Mahbod, 2007). The SMART criteria for good requirements are (Mannion & Keepence, 1995):
Specific: a requirement should state exactly what is required, i.e. a criterion should be unambiguous, consistent,
simple and have an appropriate level of detail
Measurable: a requirement should be verifiable once the object of design has been constructed. Hence, the
criteria should be quantitatively or qualitatively measurable
Attainable: a requirement should be physically exhibit under given circumstances
Realizable: a requirement should be achieved given what is known about the practical constraints
Traceable: a requirement should be able to trace from its conception through its specification to its subsequent
design, implementation and test
The resulting changes in the requirements after the expert panel validation can be found in Table 34.

MSc Thesis, J.C.P. Kalsheim: Greening Information Technology (IT) Infrastructures
Appendix D: Requirements Analysis and Agreement 159
Table 32: Revised list of requirements
Origin Expert group
Requirement elicited Stakeholder perspective
ID Revised requirements list
S1 KPMG The tool must be able to determine the relative greenness of the IT infrastructure of an organisation consistently
Green IT advisor/ IT decision-maker
R1 The tool shall determine the relative greenness of the IT infrastructure of an organisation incorporating economic and environmental performance indicators consistently
S6 TU Delft/
KPMG The tool must calculate the relative greenness of the technical hardware IT infrastructure of an organisation
S8 Literature The tool shall make an organisation’s performance transparent to internal and external stakeholders
S7 TU Delft The tool must incorporate the environmental effect of the technical IT infrastructure over the life cycle of the technical IT infrastructure devices
S2, S3, S4
KPMG The tool must produce one output value that states the relative greenness of IT infrastructure of an organisation IT decision-maker R2
The tool shall produce one standardized value stating the relative greenness of IT infrastructure of an organisation
S7 TU Delft The output should be standardized
S7, S3 TU Delft/
KPMG
The tool must make clear what the trade-offs are between environmental improvements and costs of greening the IT infrastructure of an organisation
IT decision-maker R3 The tool shall demonstrate trade-offs organisations are confronted with in greening the hardware IT infrastructure
S4 KPMG The tool must make clear what Green IT functions an IT decision-maker can directly and indirectly influence
S6 TU Delft/
KPMG
The tool must make clear what the trade-offs are between the economic and environmental life cycle assessment criteria of greening the IT infrastructure of an organisation
S3 TU Delft/
KPMG The tool must calculate the relative greenness of IT infrastructure of an organisation as defined in the conceptual model Green IT advisor R4
The tool shall determine the relative greenness of the hardware IT infrastructure of an organisation as defined in the conceptual framework consistently S3 KPMG The instrument must adopt the conceptual model
S3 KPMG The instrument must be generally applicable to any type of organisation
Green IT advisor R5 The tool shall be generally applicable to any type of organisation S6
TU Delft/ KPMG
The tool must be applicable to all types of organisation
S3 KPMG The instrument must provide valid results
Green IT advisor/ IT decision-maker
R6 The tool shall provide valid results S6
TU Delft/ KPMG
The tool must be based on valid information
S6 TU Delft/
KPMG The tool must be scientifically valid
S1, S2 KPMG The tool must identify the main drivers of the relative greenness of the IT infrastructure of an organisation
Green IT advisor R7 The tool shall identify the main drivers of the relative greenness of the IT infrastructure of an organisation
S5 TU Delft The tool should make clear what the drivers behind the Green IT score are
S8 Literature The tool shall learn an organisation how to improve performance
S5 TU Delft The tool should make clear what drives the output score(s) of assessing the relative greenness of the IT infrastructure of an organisation over time
S8 Literature The tool shall make an organisation’s performance transparent to internal and external stakeholders IT decision-maker R8
The tool shall determine the absolute and relative influence of the main drivers on the relative greenness of the IT infrastructure of an organisation S7 TU Delft The tool must make clear what the environmental effect (e.g CO2

MSc Thesis, J.C.P. Kalsheim: Greening Information Technology (IT) Infrastructures
Appendix D: Requirements Analysis and Agreement 160
footprint) of the technical IT infrastructure is relative to the total environmental effect (e.g CO2 footprint) of an organisation
S1 KPMG The tool must be able to determine the effect of a measure or scenario
Green IT advisor
R9 The tool shall incorporate external factors and trends influencing the relative greenness of the hardware IT infrastructure of an organisation
S5, S6 TU Delft/
KPMG The tool should make clear what and how external factors and trends influence the relative greenness of the IT infrastructure of an organisation
R10 The tool shall determine the effect of external factors and trends on the relative greenness of the hardware IT infrastructure of an organisation
S1 KPMG The tool must be able to determine the effect of a measure or scenario
IT decision-maker R11 The tool shall determine the effect on organisational goals of implementing measures aimed at greening the hardware IT infrastructure of an organisation
S4 KPMG The tool must support energy efficiency improvements in an organisation
S3 KPMG The tool must calculate the effect of implementing strategies aimed at greening the IT infrastructure of an organisation
S2 KPMG At the back-end of the tool, the effect of greening IT within an organisation must be incorporated
S2 KPMG At the front-end of the tool, the effort of greening IT within an organisation must be incorporated
S4, S6 TU Delft/
KPMG
The tool must show the effect on organisational goals of implementing internal and external strategies aimed at greening het technical hardware IT infrastructure of an organisation
S5 TU Delft The tool should produce data that could be compared to other organisations IT decision-maker R12
The tool shall produce output in a format that enables comparison of results with peers
S8 Literature The tool shall allow comparing an organisation’s performance with peers
S1 KPMG The tool should incorporate the explanation behind the indicator values Green IT advisor R13
The tool shall incorporate the explanation of the sources used to construct the tool S2 KPMG The tool must state the origin of the input data
S6 TU Delft/
KPMG The tool must be based on valid information
Green IT advisor R14 The tool shall be based upon scientific data
S5 TU Delft The tool should make use of eco-label information with respect to recyclability (independence of origin)
S6 TU Delft/
KPMG The data used in the tool must be independent of origin
Green IT advisor R15 The tool shall make use of verifiable information
S6 TU Delft/
KPMG The tool must be traceable in order to control the raw data
S1 KPMG It must be easy to implement changes in input and output data without alternating the internal mechanisms of the tool
Green IT advisor/ designer
R16 The tool shall be easy to adjust
S2 KPMG The tool must incorporate existing standards and initiatives at the front-end
IT decision-maker R17 The tool shall incorporate accepted business standards with respect to sustainability measurement and reporting
S2 KPMG The tool must be able to integrate with existing (sustainability and finance & control) reporting systems used by organisations
S2 KPMG The tool must be aligned with common practices of measuring sustainability within organisations at the back-end
S1, S7 TU Delft/
KPMG The underlying assumptions of the tool must be clear Green IT advisor R18 The tool shall state the underlying assumptions clearly

MSc Thesis, J.C.P. Kalsheim: Greening Information Technology (IT) Infrastructures
Appendix D: Requirements Analysis and Agreement 161
S5 TU Delft The limitations of using the tool should be clear to all stakeholders Green IT advisor R19 The tool shall state the limitations clearly
S5 TU Delft The minimal amount of effort should be put on an organisation to collect the data to assess the relative greenness of the IT infrastructure of an organisation
IT decision-maker R20 The tool shall use readily available data within an organisation
S5 TU Delft The tool should be based upon data that is available in an organisation with respect to Green IT as defined in the research scope (input requirement)
S1 KPMG The learning effort of using the tool must be less than:1 month using the tool the first time and 1 week (40 hours) using the tool the second time
Green IT advisor R21 The duration of applying the tool shall be less than: 1 month using the tool the first time and 1 week (40 hours) using the tool the second time
S2 KPMG The tool must produce output that is customizable in terms of presentation
Green IT advisor R22 The tool shall produce output with a customizable presentation layout
S6 TU Delft/
KPMG The output of the tool must be customizable with respect to environmental and economic goals set by organisations
S4, S6 TU Delft/
KPMG The tool must present the output intuitively to IT decision makers
Green IT advisor/ IT decision-maker
R23 The tool shall have an attractive and intuitive output layout
S2 KPMG The tool must make use of available hardware and software at KPMG Green IT advisor/
designer R24
The tool shall make use of available software at the user organisation (i.e. KPMG) that can be used on a single laptop (hardware)
S7 TU Delft The tool must be independent of medium
S1 KPMG The tool must be usable on a single laptop
S6 KPMG The tool must be easily usable by consultants
Green IT advisor R25 The tool shall be easy to use for non-experts S6
TU Delft/ KPMG
The taxonomy used in the tool should be clear
S1 KPMG Changes in the tool must be easy to trace Green IT advisor/
designer R26 The tool shall support tracing changes made in the tool
S1, S6 TU Delft/
KPMG The internal mechanisms of the tool must be covert to other stakeholders than the user due to intellectual property rights of the user
Green IT advisor R27 The tool shall allow covering the internal mechanisms for other stakeholders than the user
S4, S6 TU Delft/
KPMG The tool must support a continuous Green IT management process
IT decision-maker R28 The tool shall support a continuous management process of greening the hardware IT infrastructure of an organisation
S8 Literature The tool shall allow providing appropriate sanctions
S4 KPMG The tool must support an organisation formulate relevant objectives aimed at greening the IT infrastructure in an organisation
IT decision-maker R29 The tool shall support the analysis of relevant management objectives that could be embedded in an organisation with respect to greening the hardware IT infrastructure of an organisation S6
TU Delft/ KPMG
The tool should make clear what management criteria should be embedded in an organisation with respect to Green IT
S4 KPMG The tool must make clear what Green IT functions an IT decision maker can directly and indirectly influence
IT decision-maker R30 The tool shall support the analysis of the absolute and relative potential for improving the relative greenness of the hardware IT infrastructure of an organisation
S7 TU Delft The tool must make clear how to improve the relative greenness of the technical IT infrastructure of an organisation
S7 TU Delft The tool must make clear what environmental improvement potentials for greening the technical IT infrastructure of an organisation there are relative to the best available technology
S8 Literature The tool shall contribute to the internal evaluation of the organisation on how to improve performance

MSc Thesis, J.C.P. Kalsheim: Greening Information Technology (IT) Infrastructures
Appendix D: Requirements Analysis and Agreement 162
S5 TU Delft The tool should provide insights about the awareness of Green IT within an organisation
S5, S2 TU Delft/
KPMG
The tool should make clear what stakeholder groups should be involved to measure and improve the relative greenness of the IT infrastructure of an organisation
Green IT advisor R31 The tool shall make clear what stakeholders should be involved to measure and improve the relative greenness of the IT infrastructure of an organisation
Table 33: high level requirements
ID Sub-requirements # High-level requirements
R1 The tool shall determine the relative greenness of the IT infrastructure of an organisation incorporating economic and environmental performance indicators consistently
HR1 the tool shall determine one value stating the relative greenness of the hardware IT infrastructure of an organisation
R2 The tool shall produce one standardized value stating the relative greenness of IT infrastructure of an organisation
R4 The tool shall determine the relative greenness of the hardware IT infrastructure of an organisation as defined in the framework consistently
R3 The tool shall demonstrate trade-offs organisations are confronted with in greening the hardware IT infrastructure
HR2 The tool shall demonstrate trade-offs organisations are confronted with in greening the hardware IT infrastructure
R7 The tool shall identify the main drivers of the relative greenness of the IT infrastructure of an organisation
HR3 The tool shall determine the influence of main drivers on the relative greenness of the hardware IT infrastructure of an organisation
R8 The tool shall determine the absolute and relative influence of the main drivers on the relative greenness of the IT infrastructure of an organisation
R11 The tool shall determine the effect on organisational goals of implementing measures aimed at greening the hardware IT infrastructure of an organisation
HR4 The tool shall support the analysis of relevant goals that could be embedded in an organisation with respect to greening of the hardware IT infrastructure
R29 The tool shall support the analysis of relevant management objectives that could be embedded in an organisation with respect to greening the hardware IT infrastructure of an organisation
R30 The tool shall support the analysis of the absolute and relative potential for improving the relative greenness of the hardware IT infrastructure of an organisation
HR5 The tool shall support organisations improve the relative greenness of the hardware IT infrastructure over time as part of a continuous management process R28
The tool shall support a continuous management process of greening the hardware IT infrastructure of an organisation
R9 The tool shall incorporate external factors and trends influencing the relative greenness of the hardware IT infrastructure of an organisation
HR6 The tool shall determine the effect of external factors and trends on the relative greenness of the hardware IT infrastructure of an organisation
R10 The tool shall determine the effect of external factors and trends on the relative greenness of the hardware IT infrastructure of an organisation
R12 The tool shall produce output in a format that enables comparison of results with peers HR7 The tool shall produce results that can be compared to peers
R5 The tool shall be generally applicable to any type of organisation
R15 The tool shall make use of verifiable information
HR8 The tool shall make use of verifiable information R18 The tool shall state the underlying assumptions clearly
R19 The tool shall state the limitations clearly
R6 The tool shall provide valid results
HR9 The tool shall be constructed based upon valid data sources
R14 The tool shall be based upon scientific data
R13 The tool shall incorporate the explanation of the sources used to construct the tool
R17 The tool shall incorporate accepted business standards with respect to sustainability measurement and reporting

MSc Thesis, J.C.P. Kalsheim: Greening Information Technology (IT) Infrastructures
Appendix D: Requirements Analysis and Agreement 163
R16 The tool shall be easy to adjust HR10 The tool shall be easily to maintain
R26 The tool shall support tracing changes made in the tool
R20 The tool shall use readily available data within an organisation
HR11 The tool shall minimize the effort of an organisation in applying the tool
R21 The duration of applying the tool shall be less than: 1 month using the tool the first time and 1 week (40 hours) using the tool the second time
R24 The tool shall make use of available software at the user organisation (i.e. KPMG) that can be used on a single laptop (hardware)
R31 The tool shall make clear what stakeholders should be involved to measure and improve the relative greenness of the IT infrastructure of an organisation
R25 The tool shall be easy to use for non-experts
R22 The tool shall produce output with a customizable presentation layout HR12 The tool shall present the results instinctively to IT decision-makers
R23 The tool shall have an attractive and intuitive output layout
R27 The tool shall allow covering the internal mechanisms for other stakeholders than the user HR13 The tool shall allow covering the internal mechanisms for other stakeholders than the user
Table 34: revised construct of requirements after expert panel review
ID Requirement Revised list of requirements after expert panel 1 Revised list of requirements after expert panel 2
HR1 The tool shall determine one value stating the relative greenness of the hardware IT infrastructure of an organisation
The tool shall determine one value stating the relative greenness of the hardware IT infrastructure of an organisation
The tool shall determine one value stating the relative greenness of the hardware IT infrastructure of an organisation
HR2 The tool shall demonstrate trade-offs organisations are confronted with in greening the hardware IT infrastructure
The tool shall demonstrate trade-offs organisations are confronted with in greening the hardware IT infrastructure
The tool shall demonstrate trade-offs organisations are confronted with in greening the hardware IT infrastructure
HR3 The tool shall determine the influence of main drivers on the relative greenness of the hardware IT infrastructure of an organisation
The tool shall determine the influence of main energy use, water use, raw materials use, CO2 emission and cost drivers on the relative greenness of the hardware IT infrastructure of an organisation
The tool shall determine the influence of main energy use, water use, raw materials use, CO2 emission and cost drivers on the relative greenness of the hardware IT infrastructure of an organisation
HR4 The tool shall support the analysis of relevant goals that could be embedded in an organisation with respect to greening of the hardware IT infrastructure
The tool shall support the analysis of relevant goals that could be embedded in an organisation with respect to greening of the hardware IT infrastructure
The tool shall support the analysis of relevant energy use, water use, raw materials use and greenhouse gas emission goals that could be embedded in an organisation with respect to greening of the hardware IT infrastructure
HR5 The tool shall support organisations improve the relative greenness of the hardware IT infrastructure over time as part of a continuous management process
The tool shall support organisations improve the relative greenness of the hardware IT infrastructure over time as part of a continuous management process
The tool shall support organisations improve the relative greenness of the hardware IT infrastructure over time as part of a continuous management process
HR6 The tool shall determine the effect of external factors and trends on the relative greenness of the hardware IT infrastructure of an organisation
The tool shall determine the effect of external factors and trends on the relative greenness of the hardware IT infrastructure of an organisation
The tool shall determine the effect of external factors and trends on the relative greenness of the hardware IT infrastructure of an organisation
HR7 The tool shall produce results that can be compared to peers
The tool shall produce results that can be compared to peers The tool shall produce results that can be compared to peers
HR8 The tool shall make use of verifiable information The tool shall be based upon information from accepted business standards
The tool shall be based upon information from accepted standards
HR9 The tool shall be constructed based upon valid data sources
The tool shall be constructed based upon valid data sources The tool shall be constructed based upon valid data sources
HR10 The tool shall be easily to maintain The time a technical software specialist use to encode The time a technical software specialist use to encode

MSc Thesis, J.C.P. Kalsheim: Greening Information Technology (IT) Infrastructures
Appendix D: Requirements Analysis and Agreement 164
changes in performance indicators and the reporting format should be minimized
changes in performance indicators and the reporting format should be minimized (maintainability)
HR11 The tool shall be flexible in terms of detail level of the input data
The tool shall be flexible in terms of detail level of the input data
The tool shall be flexible in terms of detail level of the input data
HR12 The tool shall present the results instinctively to IT decision-makers
The tool shall present the results instinctively to IT decision-makers
The tool shall communicate the results clearly to IT decision-makers
HR13 The tool shall allow covering the internal mechanisms for other stakeholders than the user
The tool shall allow covering the internal mechanisms for other stakeholders than the user
The tool shall allow covering the internal mechanisms for other stakeholders than the user

MSc Thesis, J.C.P. Kalsheim: Greening Information Technology (IT) Infrastructures
Appendix E: Conceptual Framework 165
Appendix E: Conceptual Framework
1. Introduction In this appendix the conceptual framework as well as the its literature coverage will be presented. The conceptual framework is constructed within the organisational boundaries defined by the GHG protocol and the ISO 14031 standard for environmental performance evaluation.
2. Conceptual framework Integrating performance indicators from literature into one framework with the objective of assessing the greenness of an organisation’s hardware IT infrastructure, the conceptual framework as illustrated in Figure 56 is designed. The framework consists of performance indicators defined for the procurement, use and disposal phase of hardware IT infrastructure units. Procurement and disposal is only applicable for owned hardware IT infrastructure units.
Use
2.9 Costs of carbon credits for the
operation of IT hardware
Procure Dispose
1.2 Raw materials in hardware IT
procured
1.3 Recyclable and reusable materials
in hardware IT procured
1.1 Recycled and reused materials in
hardware IT procured
2.7 Energy costs of IT hardware
operation
3.1 Raw materials from hardware IT to
landfill
3.2 Recycled raw materials from
hardware IT
3.3 Internally reused and refurbished
raw materials from hardware IT
3.4 Raw materials from hardware IT
donates elsewhere
2.3 Energy use of hardware IT operation
1.4 Procurement costs of hardware IT
3.5 Burnt or otherwise distroyed raw
materials from hardware IT
2.2 Amount of waste heat produced in
the hardware IT operation
2.4 Renewable energy use of hardware
IT operation
2.1 Water use of hardware IT operation
per source
2.5 Greenhouse gas emission
extraction and production of purchased
energy used in hardware IT operation
2.8 Water costs of IT hardware
operation
2.6 Total energy productivity of
hardware IT operation3.6 Disposal costs of hardware IT
3.7 Greenhouse gas emission of
hardware IT disposal
3.8 Energy use of hardware IT
disposal
2.10 Maintenance costs of IT hardware
3.9 Water use of hardware IT disposal
Figure 56: Conceptual framework
3. Covering literature Performance indicators defined in the conceptual framework are based upon economic and environmental indicators defined in literature. The conceptual framework is mainly based upon the Global Reporting Institute (GRI) indicators for sustainability, European Eco-Management and Audit Scheme (EMAS), Lowell Centre for Sustainable Production (LCSP) and to International Organization of Standardization (ISO) 14031 environmental performance

MSc Thesis, J.C.P. Kalsheim: Greening Information Technology (IT) Infrastructures
Appendix E: Conceptual Framework 166
evaluation indicators. Additionally, performance indicators are constructed from literature on Total Cost of Ownership (TCO) and Life Cycle Costing (LCC) and Green Performance Indicators (GPIs) for data centres and IT service centres. The connection between the various performance indicators in the conceptual framework and the sources outlined are shown in Table 35. This shows that the conceptual framework as defined in Figure 56 is entirely based upon existing literature in the field of environmental and economic performance assessment.
Table 35: The literature source of the indicators defined in the framework
ID Performance indicator
Literature
EMAS GRI ISO 14031 LCSP GPI Environmental
standards* TCO/LCC
1.1 Recycled and reused materials in hardware IT procured
x x
x
1.2 Raw materials in hardware IT
x x
x
1.3 Recyclable and reusable materials in hardware IT procured
x
1.4 Procurement costs hardware IT
x x
2.1 Water use hardware IT operation per source x x x x
x
2.2 Amount of waste heat produced in the hardware IT operation
x
x
2.3 Energy use of hardware IT in operation x x x x x x
2.4 Renewable energy use of hardware IT in operation x x x x
2.5 Greenhouse gas emission extraction and production of purchased energy used in hardware IT operation
x x x x x x
2.6 Total energy productivity of hardware IT operation
x
2.7 Energy costs of hardware IT operation
x x
x x
2.8 Water costs of hardware IT operation
x
x x
2.9 Costs of carbon credits for the operation of hardware IT
x
x x x
2.10 Maintenance costs of IT hardware
x x
3.1 Raw materials from hardware IT to landfill x x x x
x
3.2 Recycled raw materials from hardware IT x x x
x
3.3 Internally reused and refurbished raw materials from hardware IT
x x x x
x
3.4 Raw materials from hardware IT donated elsewhere
x
x
3.5 Burnt or otherwise destroyed raw materials from hardware IT
x
x
3.6 Disposal costs of hardware IT
x x
x
3.7 Greenhouse gas emission of hardware IT disposal
x
3.8 Energy use of hardware IT disposal
x
3.9 Water use hardware IT disposal
x *GHG Protocol, Water footprint and materials flow accounting

MSc Thesis, J.C.P. Kalsheim: Greening Information Technology (IT) Infrastructures
Appendix F: Design of Expert Panel Review 167
Appendix F: Design of Expert Panel Review
1. Introduction This appendix describe the design of two expert panel reviews that were organized to validate the framework and requirement specifications. The results of the first panel were implemented in the second panel to ensure a formative review of the framework design and requirements. The same procedure was applied to both expert panels to ensure reliability of the results. Further developing the framework, it is recommended to apply the procedure that
is described in section 4. First the goals of the expert panels are described (section 2) in addition to the experts
involved in the sessions (section 3).
2. Goals of expert panel reviews The separate expert panel sessions were divided into two parts, a formative review of the (1) framework and (2) requirement specifications developed in the requirements analysis process. The purpose of the framework validation was to validate the content and construct of the framework. Hence, the first expert evaluation to improve the conceptual framework design was implemented in the framework design evaluated by the second expert panel (Tessmer, 1993). The main goal of validating the requirements specification was to define and confirm the validity of a set of core requirements specifying an assessment tool from the list of requirements elicited, documented and analysed in the requirements analysis process. The core requirements serve as a statement of evaluation of the tool, and are necessary to develop a tool that is stable in presence of change and flexible enough to be customized and adapted to changing requirements (Nuseibeh & Easterbrook, 2000). Next, the construct of the requirements were evaluated using the SMART criteria of requirements (Mannion & Keepence, 1995).
3. Selection of experts To attain the goals of the expert panel validation, involving experts within appropriate knowledge fields are essential. Given feasibility constraints, only expert from the Netherlands were selected to participate in the expert panels. Experts from different organisations and with different backgrounds and specialization were asked to participate in one of the two expert panels organized. Of the many experts approached, eight were able to participate. In each expert panel there were four experts present. This way, the validation session could be executed within 1.5 and 2 hours. Involving more experts could slow down the progress of the validation session, but would on the other hand lead to a stronger conclusion. The experts were selected to ensure a balance between the various sub-parts of green IT such as life cycle thinking, outsourcing, requirements engineering, sustainability, recycling, refurbishment and reuse of hardware IT, energy use and cooling. In the first expert panel four experts were involved: Erik Beulen, Wim Hendriksen, Rick van Krevelenand Freek Bomhof. Erik Beulen, Freek Bomhof and Wim Hendriksen are involved in a workgroup on sustainable IT. The workgroup is part of a CIO covenant on energy efficiency and IT signed by 16 CIOs in the Netherlands. The workgroup is currently working on defining and measuring green IT as a step towards sustainable IT. The participants in the workshop are chosen due to their expertise related to green IT and personal knowledge field and background. Erik Beulen is professor in sourcing at the University of Tilburg and director at KPMG sourcing advisory. Preliminary to his work at KPMG, he has worked with IT and outsourcing advisory at Accenture and Atos Origin. Hence, with respect to evaluating the framework, he has extensive experience in the field of outsourcing, leasing and purchasing hardware IT. Freek Bomhof currently works as business consultant at the department of innovation management at TNO ICT. TNO, Netherlands Organisation for Applied Scientific Research, is an independent research organisation. One of the specializations of Freeek Bomhof is sustainability and ICT. He is currently working on a scientific paper on measuring sustainability of IT together with Jaco Appelman at Delft University of Technology. With respect to the framework he has extensive experience with performance measurement in IT and ICT & sustainability.

MSc Thesis, J.C.P. Kalsheim: Greening Information Technology (IT) Infrastructures
Appendix F: Design of Expert Panel Review 168
Wim Hendriksen is country manager of American Power Conversion (APC) at Schneider Electric. APC is a manufacturer of uninterruptible power supplies, electronics peripherals and data center products and is a global leader in integrated critical power and cooling services. Through his work Wim Hendriksen has extensive experience with energy efficiency in data centres. Due to his technical background and expertise in energy and water use in data centres, he’s experience is important in the evaluation of the framework. Next to the experts involved in the CIO covenant on energy efficient, Rick van Krevelen is involved in the first expert panel. He is PhD candidate “Agent Organisations for Strategic Decision Making in Business Simulations and ames” at Delft University of Technology and has a review editorship in the International Journal of Social and Organisational Dynamics in Information Technology. His background in both computer science and requirements engineering is fundamental for a comprehensive evaluation of the framework and requirement specifications. Preliminary to the second expert panel, Lydia Stougie was asked to participate in the expert panel. As she could not participate in either expert panels, she was asked to evaluate the framework and requirements. Lydia Stougie is an expert in life cycle exergy analysis, which is an bottom-up approach used to analyse the sustainability of ICT products. She also teaches performance measurement in energy, industry and water systems at the Faculty of Technology, Policy Analysis and Management at Delft University of Technology. Due to her specific background, her expertise is essential to validate the framework. The conclusions from her evaluation were integrated with those of the first expert panel. The reviewed framework and list of requirements were further evaluated in the second expert panel. In the second expert panel four experts were involved: Arnoud Walrecht, Jan Hoogstrate, Jeroen Guinee and Martijn Warnier. Similar to Erik Beulen, Wim Hendriksen and Freek Bomhof, Arnoud Walrecht is part of the workgroup as part of the CIO covenant. Arnoud Walrecht has experience with sustainability and green IT through his work at KPMG and PwC. At PwC he has worked on the development of a framework for sustainable IT and at KPMG he currently works as manager at the sustainability advisory practice. Hence, when it comes to sustainability and green IT Arnoud Walrecht has important expertise. Jan Hoogstrate currently works as interim director at the computer brokers exchange (CBE) where he has worked as director for about 10 years. CBE is an independent business to business marketplace for international trade in quality used and new high-end IT equipment. Players in the field of servers, storage and networking equipment participating in this exchange market. Additionally, he is currently working at Basis bay which is an Asian consulting firm specialized in green IT. Hence, Jan Hoogstrate has extensive experience in green IT and reuse, refurbishment and recycling of hardware IT.
Jeroen Guinee is currently working at the Institute of Environmental Sciences (CML) at Leiden University. His key areas of research are Substance Flow Analysis (SFA) and Life Cycle Assessment (LCA). He received his PhD in LCA methodology, focusing on Life Cycle Impact Assessment and has since then worked as project leader and editor of the update of the LCA Guide and Backgrounds of 1992, which has resulted in the new Dutch "Handbook on life cycle assessment - Operational guide to the ISO standards". Furthermore, he is currently involved in various national and international LCA-related projects as senior researcher and/or project leader, and as expert reviewer of various LCA-projects. As the framework is based upon life cycle thinking, Jeroen Guinee is a cental expert in the evaluation of the framework. Martijn Warnier currently works as an assistant professor at the Faculty of Technology, Policy Analysis and Management at Delft University of Technology. At the moment he is working on a book on “Energy in the ICT Sector” and has extensive experience in computer science through his dissertation work at the Department of Computer Science at Amsterdam University. The expertise of Marijn Wanier is essential due to his knowledge of energy, ICT and requirement specifications in requirements engineering. As outlined in the above sections, a variety of experts have been involved in evaluating the framework and tool requirements. In the next section, the procedure that has been applied in each expert panel session is outlined.

MSc Thesis, J.C.P. Kalsheim: Greening Information Technology (IT) Infrastructures
Appendix F: Design of Expert Panel Review 169
4. Expert panel procedure
In each expert panel the same procedure was followed to ensure reliability of results. The expert panel session was designed by the author with input from Jaco Appelman and Jan Jaap Ensing. Both are experts in collaborative engineering have wide experience with designing or organizing expert panels and other group meetings. The procedure was defined as follows:
(1) Introduction to the framework and requirements and the goals of the expert panel. The goals are defined in
section 2. In the first expert panel the conceptual framework and the list of high-level requirements defined
from interviews were presented. In the second expert panel, the improved framework and list of requirements were presented.
(2) Clarification of “rules of the game”, i.e. the rules on how to evaluate the framework and requirements and when an improvement suggested by one or more of the experts is implemented
(3) Part I: Validation of framework, 3 questions (4) Part II: Validation of requirements, 2 questions
The procedure including explanation and input is outlined in Table 36. The experts were given approximately 15 minutes to reach an agreement on each question asked. To ensure the content and scope of the research was clear to the experts, short questions were asked during the introduction with the purpose of stimulating experts to ask questions regarding ambiguities and to create an open sphere. Moreover, the experts were given an information booklet with instructions, information on framework and requirements in addition to sheets to write on. The information booklet made has not been included in the report as most of its content overlap with this appendix and the next appendices describing the outcomes of the expert panels and design evolvement.
Table 36: Procedure expert panel validation
Steps and instructions Explanation Input
Introduction of the framework, requirements and “rules of the game”
I will shortly outline (1) the objectives of expert panels, (2) the framework structure, research scope and performance indicators incorporated in the framework, (3) the high-level requirements defined by experts within KPMG and TU Delft and (4) the “rules of the game” are…
Beamer and screen
PART I
First question The performance indicators are meant to provide insights that an IT decision-maker within an organisation can understand and use in managing the process of greening hardware IT
Q1. List of performance indicators A4 with req’s
Second question The purpose of this is to ensure the performance indicators themselves provide useful information that is mutually exclusive
Q2. List of performance indicators: marker for each person
Third question The framework is split into three parts. The purpose is to reach a consensus on the position of the performance indicators within the organisational boundaries that are set.
Q3. Sheet with columns and content and marker Show separation procure, use and dispose hardware IT on the overhead
PART II
Fourth question
There are 14 requirements specified. These are… Q4. A-4 with framework and requirements list
Fifth question Show definition of smart criteria on overhead with examples
A requirement is SMART when it is: specific, measurable, realizable and traceable. We will go through the list of requirements and determine whether these are S, M, A, R and T by filling in a table.
Q5. Ppt with SMART definitions as a backdrop Clean A-4 for notes
“Rules of the game” were defined as follows during the expert panels:
The idea of this session is not to brainstorm, but to come to a consensus
I will ask you five questions, which will be discussed in the group of experts
Before each group discussion, you have 1 minute to think though the question and write down notes on the blank paper before you
The first one finished, is the first one to start discussion
For each proposal please indicate why this is an important action that would improve the framework
Everyone must agree to an action before a change is implemented (unanimity rule)

MSc Thesis, J.C.P. Kalsheim: Greening Information Technology (IT) Infrastructures
Appendix F: Design of Expert Panel Review 170
PART I: Validation of framework In the formative expert review the individual performance indicator in the framework were evaluated by experts. The subsequent questions were asked in addition to the below instructions: 1 “Looking closely at the list of performance indicators and the scope of the framework for one minute: are there
any significant performance indicators absent in the framework that must be included?”
Instructions: You have 1 minute to look at the framework. If you miss a performance indicator, please state why it is important that this must be included in the framework. When additional performance indicators are mentioned ask the expert panel whether they all agree this is an essential performance indicator.
2 “Look closely at the list of performance indicators: are there any overlapping or double indicators in the framework?”
Instructions: You have 1 minute to look at the performance indicators. If you find that two or more performance indicator overlap, please state why it is important that these performance indicators must be formulated as one single performance indicator. When performance indicator combinations are mentioned ask the expert panel whether they all agree it is essential to combine the two performance indicators into one.
3 “Look closely at the list of performance indicators within each column: are there any performance indicators that must be placed differently in the framework with respect to the elements in the framework entity?”
Instructions: You have 1 minute to look at the structure. If you find that a performance indicator should be placed somewhere else, please indicate this on the framework structure in the information booklet before you. Please also state why this is important. When performance indicator are suggested to be placed ask the expert panel whether they all agree it is a necessary change in the framework.
PART II: Validation of requirements In the formative expert review the high-level requirements specified for an assessment tool were evaluated by experts. The subsequent questions were asked in addition to the below instructions: 4 “Look closely at the requirements specified: which of these constitute core requirements for an assessment
tool?”
Instructions: You have 1 minute to study the list of requirements. Please write down the top 3 requirements for an assessment tool with the purpose of assessing an organisation’s hardware IT infrastructure greenness. Please indicate on the paper before you why you consider these the top 3.First each expert will mention the top 3 requirements. Write down the requirement number. Then these will be discussed in the group. I will go through the requirements listed chronologically. Subsequently ask everyone whether they agree a requirement is a core requirements. Then ask whether the entire list of requirements constitute the core set of requirements.
5 “Look closely at the list of high-level requirements specified: are these specific, measurable, attainable, realizable and time-sensitive? I have made a table let us walk-through this together”
Instructions: Prepare a 1*1 matrix with S, M, A, R and T on the horizontal axis and requirement number on the horizontal axis. Ask the experts whether the requirements are S, M, A, R and T while displaying the definition of SMART criteria in requirements engineering on a beamer.

MSc Thesis, J.C.P. Kalsheim: Greening Information Technology (IT) Infrastructures
Appendix G: Outcome of Expert Panel Review 1 171
Appendix G: Outcome Expert Panel Review 1
1. Introduction In this appendix the results of the first formative validation by an expert panel will be presented. The appendix is structure as follows. First, basic information about the expert panel will be provided. Second, the outcome of the first part of the expert panel session will be presented. This concerns the validation of the conceptual framework (Appendix D). Third, the outcome of the second part of the panel session will be outlined. This is the construct validation of the requirements and the development of a core set of requirements of an assessment tool. The design of the expert panel can be found in Appendix F.
2. Basic information Datum session: 27 April 2012 Time: 9.00 to 10.30 Place: Faculty of Technology, Policy Analysis and Management (TPM) at Delft University of Technology, Room D1 Participants: Erik Beulen, Wim Hendriksen, Freek Bomhof and Rick van Kevelen Facilitator: Johanne Kalsheim Equipment: Beamer, write board, markers, white papers
3. PART I: Conceptual framework evaluation In this section the conclusions and suggestions regarding the first part of the expert panel design will be summarized per question asked in line with the expert panel design. Expert panel conclusion (question 1):
1. Performance indicators are missing describing the environmental and economic effect of transportation of hardware IT from the organisation to the disposal location. This is important as an organisation might dispose its hardware IT in a far-away country [comment: not part of the research scope]
2. Performance indicators are missing describing the intensity of repairing hardware IT and the replacement of sub-parts of hardware IT as part of maintenance in the use phase
3. Performance indicators are missing describing the type of raw materials. This is essential as raw materials differs with respect to toxicity and relative scarcity
4. Performance indicators are missing describing the utilization of a hardware IT unit relative to a unit specific optimum. This is important as performance indicator 2.6 is ambiguous (i.e. amount of useful work is unclear) and the efficiency of hardware IT is an essential performance indicator
5. Performance indicators are missing from which the optimal lifetime of a hardware IT unit relative to its full carbon footprint might be determined. This is important to incorporate in the framework as the optimum lifetime of individual hardware IT differs, e.g. carbon footprint of server versus laptop
Expert panel improvement suggestions (question 1):
Include quantity or quality statement in performance indicator definition
Make a distinction between two categories of raw materials: toxic/hazardous and scarce raw materials Expert panel conclusion (question 2):
1. 2.4 overlap with 2.5 and 2.9. The conclusion is that performance indicator 2.4 (renewable energy use of hardware IT operation) should be removed.
2. 1.1 and 1.3 are connected and performance indicator 1.3 is subjective. The content of hardware IT that is recyclable and reusable (performance indicator 1.3) is ambiguous, subjective and dependent on what an organisation does at the end of the hardware IT lifetime. Hence, performance indicator 1.3 should be removed.
3. 3.2 and 3.4 are partially overlap due to an unclear definition. The conclusion is to reformulate 3.4 from Raw materials from hardware IT donates elsewhere to Hardware IT donates elsewhere
4. Maintenance (mentioned in performance indicator 2.10) is connected to repair and replacement as discussed in first question.

MSc Thesis, J.C.P. Kalsheim: Greening Information Technology (IT) Infrastructures
Appendix G: Outcome of Expert Panel Review 1 172
5. Utilization (see discussion point 4, first question) and energy productivity overlap. Remove energy productivity due to ambiguity of “useful work” and replace it with utilization indicators specified in point 4, first question
Expert panel conclusion (question 3):
No specific changes performance indicator position Expert panel improvement suggestions (question 3):
For the clarity of the structure classify performance indicators both vertically (procure, use and disposal) and horizontally (energy use, water use, raw materials use, GHG emission and costs)
4. PART II: Requirements validation In this section conclusions and suggestions with regard to the second part of the expert panel will be summarized per question asked in line with the expert panel design. Expert panel conclusion (question 4):
The requirements 3, 8 and 10 constitute the core requirements, but should be slightly reformulated. Expert panel conclusion (question 5):
See table Table 37
Table 37: Expert panel conclusion
Requirements SMART criteria
Specific Measurable Attainable Realizable Time-bound
3 The tool shall determine the influence of main drivers on the relative greenness of the hardware IT infrastructure of an organisation
- +/- + + +
8 The tool shall make use of verifiable information + + + + +
10 The tool shall be easily to maintain - - - + + +
Expert panel improvement suggestions (question 5):
Requirement 3 should be reformulated into: The tool shall determine the influence of main energy use, water use, raw materials use, CO2 emission and cost drivers on the relative greenness of the hardware IT infrastructure of an organisation
Requirement 8 should be reformulated into: The tool shall be based upon information from accepted business standards
Requirement 10 should be reformulated into: The time a technical software specialist use to encode changes in performance indicators and the reporting format should be minimized (maintainability)

MSc Thesis, J.C.P. Kalsheim: Greening Information Technology (IT) Infrastructures
Appendix H: Outcome of Expert Panel Review 2 173
Appendix H: Outcome Expert Panel Review 2
1. Introduction In this appendix the results of the second formative validation by an expert panel will be presented. The appendix is structure as follows. First, basic information about the expert panel will be provided (section 2). Second, the outcome of the first part of the expert panel session will be presented (section 3). This concerns the validation of the framework revised after the first expert panel (see Appendix D). Third, the outcome of the second part of the panel session will be outlined (section 4). This is the construct validation of the requirements and the development of a core set of requirements of an assessment tool. The design of the expert panel can be found in Appendix F.
2. Basic information Datum session: 3 Mei 2012 Time: 14.00 to 16.00 Place: Faculty of Technology, Policy Analysis and Management (TPM) at Delft University of Technology, Room H Participants: Arnoud Walrecht, Jeroen Guinee, Jan Hoogstrate and Martijn Warnier Facilitator: Johanne Kalsheim Equipment: Beamer, write board, markers, white papers
3. PART I: Framework evaluation In the subsequent paragraphs, the outcome of the expert panel in addition to the review by Lydia Stougie will be outlined. The comments by Lydia Stougie were incorporated in the model presented to the expert panel session but is formulated separately for each question.
Expert panel conclusion (first question): 1. Energy use related to the extraction and production process of hardware IT 2. Procurement of used or refurbished hardware IT 3. Amount of raw materials in hardware IT reused or refurbished for third party use 4. Profit from sales of hardware IT reused or refurbished for third party use
Lydia Stougie:
Water use related to the extraction and production process of hardware IT
Energy use related to the extraction and production process of hardware IT
Revenues of reusing hardware IT infrastructure units Expert panel improvement suggestions (first question):
Clarify what is meant by “donates elsewhere” in performance indicator 3.4 in the (conceptual) framework
In the performance indicator Procurement costs of hardware IT, make clear that this also incorporates the license costs of using the hardware IT.
Incorporate “related to” in water, energy and H emission under life cycle phase procure
Lydia Stougie:
Relate costs, energy use, CO2 emission and water use to disposal method defined for raw materials to ensure consistency
Expert panel conclusion (second question): 1. Amount of waste heat produced by hardware IT operation overlap with Amount of energy use of hardware IT
operation. Additionally, these are conflicting performance indicators. Hence, remove Amount of waste heat produced by hardware IT operation
2. Scarce and hazardous materials overlap each other. A material can be both scarce and hazardous. The classification is arbitrary too. Hence, no distinction should be made scarce and hazardous materials.
Expert panel conclusion (third question):
No alternations

MSc Thesis, J.C.P. Kalsheim: Greening Information Technology (IT) Infrastructures
Appendix H: Outcome of Expert Panel Review 2 174
4. PART II: Requirements validation
In this section conclusions and suggestions regarding the second part of the expert panel will be summarized per question asked in line with the expert panel design. Expert panel conclusion (fourth question):
HR1, HR2, HR3, HR5, HR7, HR12, HR8
HR1 accompanied with HR2 and HR3 essential. HR1 alone is not a core requirement.
Relative to the core requirements defined by the previous panel of experts there is only one difference in opinion. HR10 could be seen as part of HR 8. When a tool is based upon accepted standards, this will be easy to maintain over time.
Lydia Stougie:
HR3, HR12 and HR7
Expert panel conclusion (fifth question): Table 38: Expert panel conclusion
Requirements SMART criteria
Specific Measurable Attainable Realizable Traceable
HR1 the tool shall determine one value stating the relative greenness of the hardware IT infrastructure of an organisation
+ + + + +
HR2 The tool shall demonstrate tradeoffs organisations are confronted with in greening the hardware IT infrastructure
+ + + + +
HR3
The tool shall determine the influence of main energy use, water use, raw materials use, CO2 emission and cost drivers on the relative greenness of the hardware IT infrastructure of an organisation
+ + + + +
HR4 The tool shall support the analysis of relevant goals that could be embedded in an organisation with respect to greening of the hardware IT infrastructure
- - +/- +/- +/-
HR5 The tool shall support organisations improve the relative greenness of the hardware IT infrastructure over time as part of a continuous management process
+ + + + +
HR6 The tool shall determine the effect of external factors and trends on the relative greenness of the hardware IT infrastructure of an organisation
- - - - -
HR7 The tool shall produce results that can be compared to peers + + + +/- +
HR8 The tool shall be based upon information from accepted business standards
+ + + + +
HR9 The tool shall be constructed based upon valid data sources - - +/- +/- +/-
HR10 The time a technical software specialist use to encode changes in performance indicators and the reporting format should be minimized (maintainability)
+ +/- +/- +/- +/-
HR11 The tool shall be flexible in terms of detail level of the input data + + + +/- +
HR12 The tool shall present the results instinctively to IT decision-makers + - + + +
HR13 The tool shall allow covering the internal mechanisms for other stakeholders than the user
+ + + + +
Expert panel suggestions:
HR8 reformulate from accepted business standards to accepted standards.
HR12 reformulate to clarify: ease of communication To make HR4 more specific, reformulate relevant goals to relevant energy use, water use, raw materials use and GHG emission goals

MSc Thesis, J.C.P. Kalsheim: Greening Information Technology (IT) Infrastructures
Appendix I: Performance Indicator Grounding 175
Appendix I: Performance Indicator Grounding
1. Introduction In this appendix the underlying sources of all performance indicators incorporated in the new framework will be outlined.
2. Covering literature Performance indicators defined in the conceptual framework are based upon economic and environmental indicators defined in literature and two expert panel reviews. The framework is mainly based upon the Global Reporting Institute (GRI) indicators for sustainability, European Eco-Management and Audit Scheme (EMAS), Lowell Centre for Sustainable Production (LCSP), the International Organization of Standardization (ISO) 14031 environmental performance evaluation indicators, GHG Protocol, Water Footprint and Materials Flow Cost Accounting. Additionally, performance indicators are constructed from literature on Total Cost of Ownership (TCO) and Life Cycle Costing (LCC) and Green Performance Indicators (GPIs) for data centres and IT service centres. The connection between the various performance indicators in the framework and the sources outlined are shown in Table 39.
Table 39: sources used to design performance indicators in the framework
ID Performance indicator
Source
EMAS GRI ISO
14031 LCSP GPI
Environmental standard*
TCO/ LCC
Expert panel 1
Expert panel 2
1.1.1 Water use related to the extraction and production process of hardware IT
x x x
1.2.1 Amount of water used in hardware IT operation per water source
x x x x
1.3.1 Amount of water use related to hardware IT discarded to landfill
x
1.3.2 Amount of water use related to recycling hardware IT
x
1.3.3 Amount of water use related to recovering energy from hardware IT
x
1.3.4 Amount of water use related to refurbish hardware IT for third party use
x
2.1.1 Energy use related to the extraction and production process of hardware IT
x x x x
2.2.1 Amount of energy use of hardware IT operation
x x x x x x
2.2.2 The utilization of hardware IT relative to unit specific optima
x x
2.3.1 Amount of energy use related to hardware IT discarded to landfill
x
2.3.2 Amount of energy use related to recycling hardware IT
x
2.3.3 Amount of energy recovered from discarded hardware IT
x
2.3.4 Amount of energy use related to refurbish hardware IT for third party use
x
3.1.1 Amount of recycled and reused materials in hardware IT procured
x x x
3.1.2 Amount of raw materials in hardware IT procured
x x x
3.1.3 Amount of refurbished or used hardware IT procured
x x x x
3.2.1 Amount of replaced sub-components in hardware IT
x x
3.2.2 Amount of repaired sub-components in x x

MSc Thesis, J.C.P. Kalsheim: Greening Information Technology (IT) Infrastructures
Appendix I: Performance Indicator Grounding 176
hardware IT
3.3.1 Amount of materials from hardware IT to landfill
x x x x x
3.3.2 Amount of recycled materials from hardware IT x x x x x
3.3.3 Amount of hardware IT discarded for energy recovery (kg)
x x x x x
3.3.4 Amount of materials in hardware IT reused or refurbished for third party use
x x x x x
4.1.1 Greenhouse gas emission related to the extraction and production process of hardware IT
x x
4.2.1 Greenhouse gas emission related to extraction and production of energy used in hardware IT operation
x
4.3.1 4.3.1 Amount of greenhouse gas emission related to hardware IT discarded to landfill
x
4.3.2 4.3.2 Amount of greenhouse gas emission related to recycling hardware IT
x
4.3.3 4.3.3 Amount of greenhouse gas emission related to recovering energy from hardware IT
x
4.3.4 4.3.4 Amount of greenhouse gas emission related to reuse and refurbish hardware IT for third party use
x
5.1.1 Procurement and license costs of hardware IT x x x
5.2.1 Energy costs of hardware IT operation x x x
5.2.2 Water costs of hardware IT operation x x x
5.2.3 Costs of carbon credits for the operation of hardware IT
x x x
5.2.4 Maintenance costs of hardware IT x x x
5.3.1 Costs of hardware IT discarded to landfill x x x x
5.3.2 Costs of recycling hardware IT x x x x
5.3.3 Costs of recovering energy from discarded hardware IT
x x x x
5.3.4 Income from selling used and/or refurbished hardware IT to third parties
x
*GHG Protocol, Water footprint and materials flow accounting

MSc Thesis, J.C.P. Kalsheim: Greening Information Technology (IT) Infrastructures
Appendix J: Data Estimates for the Functional Design 177
Appendix J: Data Estimates for the Functional Design
1. Introduction In this appendix the data that were used to estimate performance indicators according to the functional design will be outlined. The functional design is the first operationalization step of the GHITI Framework.
2. Water and energy use related to the extraction and production of unit To determine the amount of water and energy use related to the extraction and production of a hardware IT unit, mainly data from EcoLeaf specifications are used. EcoLeaf is an environmental product declaration based upon LCA consisting of three parts: (1) a product environmental aspects declaration, (2) a product environmental information sheet and (3) the product data sheet (Big Room, 2012). The data sheet is used to determine this data-items for various types of hardware IT infrastructure units. Information in this standard has been verified by a third party and is based upon the ISO standard for life cycle assessment of products (Big Room, 2012). In the below table information about various products can be found. Data from 2009 and onwards is used to determine water and energy use of a product preliminary to procurement. Information can be found in Table 40.
Table 40: EcoLeaf data for various products of various size (Ecoleaf environmental label, 2012)
Product type Weight
(kg) Water use (kg) Energy use (MJ)
Source Extraction and production Extraction and production
Data projector 7,4 6600 1400 Epson, 2010
Data projector 4,2 4400 880 Epson, 2010
Data projector 4,1 4400 870 Epson, 2010
Data projector 7,6 7100 1500 Epson, 2010
Telephone 1,2 1900 310 Panasonic, 2009
Telephone 0,32 700 160 Panasonic, 2009
Telephone 0,39 430 110 Panasonic, 2009
Telephone 0,92 1500 250 Panasonic, 2009
Printer 220 65000 18000 Konica minolta, 2012
Printer 63 27000 6600 Konica minolta, 2012
Printer 28 18000 3600 Brother, 2011
Printer 27 19000 3700 Brother, 2011
Printer 12 9200 1800 Brother, 2011
Printer 7,9 6500 1200 Brother, 2010
Printer 6,9 5800 1100 Brother, 2010
Analysing the data listed in the Table 28 for printers shows that both water and energy use of extraction and production of this type of unit is polynomial to its weight. The relationship is shown in Figure 2. This estimate could be used to calculate water and energy use of printers within the same weight range (interpolating). Extrapolating should be done with care as this is a trend, and not an explicit relationship between two variables.
Figure 57:relationship between weight of printers and water and energy use related to materials extraction and production (Ecoleaf environmental label, 2012)
Interpolating the data resulted in the following relationships in which x represents the weight, in kilograms of the unit:
y = -0,7332x2 + 434,52x + 4376,2 R² = 0,9911
y = -0,1495x2 + 109,69x + 516,67 R² = 0,9984
0
10000
20000
30000
40000
50000
60000
70000
0 50 100 150 200 250
Wat
er/
en
erg
y u
se r
ela
ted
to
ext
ract
ion
an
d
pro
du
ctio
n
Weight (kg)

MSc Thesis, J.C.P. Kalsheim: Greening Information Technology (IT) Infrastructures
Appendix J: Data Estimates for the Functional Design 178
Printers: Water use extraction and production of unit (m
3) = -0,73x
2 + 440x + 4400 (1.A)
Energy use extraction and production of unit (MJ/unit) = -0,15 x2 + 110x + 520 (2.A)
The proportion of variability in the data is approximately 99% for water and energy use of extraction and production. This implies the proportion of response variation “explained” by the repressors is high. Hence, the above fitted models explains most data variability. It should be notices that this relationship is based upon a limited number of devices. Thereby, the reliability of the relationship is questionable and should not be used as a finite, but rather as an assumptive relationship in calculating performance indicators. Performing the same calculations for data projector and telephones the following relationships are found: Data projector: Water use extraction and production of unit (m
3) = 360x
2 – 3400x + 13000 (R
2= 0,99) (1.B)
Energy use extraction and production of unit (MJ/unit) = 53x2 – 440x + 1800 (R
2= 0,99) (2.B)
Telephones: Water use extraction and production of unit (m
3) = 250x
2 + 1200x + 140 (R
2= 0,95) (1.C)
Energy use extraction and production of unit (MJ/unit) = 110x2 + 33x + 110 (R
2= 0,92) (2.C)
These relationships should only be applied to the types of hardware IT listed in Table 40. For laptops and desktops data from a study by IVF for the European Union c be used as input. The data can be found in Table 41.
Table 41:Energy and water use related to extraction and production of laptop and desktop (IVF 2007)
Product type Weight (kg) Energy use related to extraction and
production of unit (MJ/unit) Water use related to extraction and
production of unit (m^3/unit) Laptop 3,8 2300 1200
Desktop 12,8 1300 820
These values might be incorporate in the calculation of energy and water use related to the extraction and production of laptops and desktops. As these data show, energy and water use decrease with increasing size. This is not in line with the above suggested relationship found in other types of IT devices. This suggests the weakness of extrapolating data from EcoLeaf to other types of IT.
Energy consumption related to the production of a kg of switch has been estimated and can be found in the EcoInvent database. This is approximately 6,5 KWh. Producing a hard disk drive of 0.12 kg for a laptop computer, approximately 1.700 KWh of electricity is used. Information about water use of these components/modules is not available (Hischier, Classen, Lehmann, & Scharnhorst, 2007). Hence, energy use related to extraction of materials and production of switches, routers, servers, storage, appliances, IPS/IDS, appliances and firewalls is assumed to be 39 ± 22 MJ/kg. With respect to water use, the relationship between energy and water use related to extraction and production is assumed to be the same for switches, routers, servers, storage, appliances, IPS/IDS, appliances and firewalls as for laptops and desktops. Assuming a linear trend between the two data points in Table 41, the following relationship is assumed to be applicable to calculate the amount of water used: Other devices: Water use extraction and production of unit (m
3) = 0,35*y + 390 (1.D)
Where y is energy use related to extraction and production of a hardware IT unit. The data and calculation models defined in this paragraph are summarized in Table 42. It is acknowledged that the calculation model for switches, routers, servers, storage, appliances, IPS/IDS, appliances and firewalls is less substantiate. It is recommended to improve these estimates to increase the accuracy of measurements and increase reliability of the functional design.
Table 42: summary of energy and water use related to extraction and production of hardware IT units, x = kg
Unit type Energy use related to extraction and production (MJ) Water use related to extraction and production (kg)
Laptop 2300 1200
Desktop 1300 820
Printer - 0,15*x^2 + 110*x + 520 - 0,73*x^2 + 430*x + 4400

MSc Thesis, J.C.P. Kalsheim: Greening Information Technology (IT) Infrastructures
Appendix J: Data Estimates for the Functional Design 179
Switch y = 39*x 0,35*y + 390
Router y = 39*x 0,35*y + 390
Server y = 39*x 0,35*y + 390
Storage y = 39*x 0,35*y + 390
IPS/IDS y = 39*x 0,35*y + 390
Appliances y = 39*x 0,35*y + 390
Load balancer y = 39*x 0,35*y + 390
Firewall y = 39*x 0,35*y + 390
Data projector 53*x2 – 440*x + 1800 360*x2 – 3500*x + 13000
Telephone 110*x2 + 33*x + 110 250*x2 + 1200*x + 140
3. Amount of water use per energy source
In this section data used to calculate performance indicator 1.2.1 will be defined. The data is listed in Table 43.
Table 43: Amount of water use per energy source (Fthenakis & Kim, 2010)
Energy source Liter per 1000 kWh
Average water use (m^3/MJ) Max Min
Coal 96000 2500 0,014
Oil 86000 2300 0,012
Gas 8600 2300 0,012
Nuclear 120000 3900 0,017
Solar PV and thermal 1900 800 0,0004
Wind 230 0,0001
Hydro 80 0,0000
Biomass/ biodiesel 440000 2000 0,061
4. Greenhouse gas emission per energy type In this section the GHG emission per energy type will be defined as used to calculate performance indicator 4.2.1. To determine this, information found in various sources will be used. From these sources the average GHG emission for each energy type specified can be estimated. The sources, including the data and average GHG emission can be found in Table 44.
Table 44: GHG emission per MJ (Weisser, 2007) (Varun, Bhat & Parakash, 2009)(Moomaw et al., 2011)(WNA, 2011) (GHG Protocol, 2012) (IEA, 2009)
GHG emission (kg CO2 equivalent/MJ) Average GHG emission (ton
CO2/MJ) IEA 2009
values GHG Protocol 2008 values
(Weisser, 2007) (Varun, Bhat &
Parakash, 2009) (Moomaw et al.,
2011) (WNA, 2011)
3,2 3,6 -/+ 1,5 3,4 - 6,1 3,5 2,4 - 6,1 3,2-3,8 0,0037
2,4 2,7 -/+ 0,98 1,8 - 4,3 2,7 1,8 - 4,2 2,6 0,0027
1,4 1,7 -/+ 1,2 1,6 - 2,8 2,2 1,0 - 3,4 1,8 0,0019
0,010 - 0,086 0,087 0,004 - 0,79 0,10 0,0002
0,16 - 0,26 0,049 - 0,9 0,018 - 0,78 0,31 0,0003
0,029 - 0,11 0,035 - 0,45 0,007 - 0,29 0,094 0,0001
0,004 - 0,12 0,013 - 0,85 0 - 0,16 0,094 0,0001
0,13 - 0,36 0,2 - 0,64 0 - 0,27 0,16 0,0002
0,022 - 0,28 0,0002
0,007 - 0,08 0,00
5. Electricity price estimation In this section the electricity price as found in statistics from the European Union (EuroStat) will be presented including an extrapolation of data to estimate current electricity prices. The electricity prices are based upon average prices households paid in the period 2009 to 2011. On the long term it is recommended to update this as electricity price trends are very sensitive to modal market trends. The electricity price including the relationship between electricity prices are shown in the below figure. In Figure 58, 1 stands for 2009, 2 for 2010 and 3 for 2011.

MSc Thesis, J.C.P. Kalsheim: Greening Information Technology (IT) Infrastructures
Appendix J: Data Estimates for the Functional Design 180
Figure 58: Electricity price trend in Europe for households (European Commission, 2012)
Extrapolating the electricity price, the following relationship was found:
Electricity price (euro/Kwh) = 0.0035x2 – 0,0065x + 0,17 (R
2= 1) (27.A)
This relationship show a perfect fit between the data points. This does not imply that extrapolating the data might lead to an accurate estimate. Too few data points have been used for this. The data should be used as an indication. It is recommended to use electricity prices and organisation pays for the highest estimation accuracy.
6. Costs of recycling hardware IT In this section the costs of recycling hardware IT as defined by hardware IT supplier HP in October 2010 will be outlined. The costs of various types of hardware IT can be found in Table 45. Table 45: Recycling costs of hardware IT infrastructure units defined by HP (HP, 2010)
HP and non-HP branded product Recycling costs per unit (dollar) Desktop printers 6
Copiers/large multifunction printers 83
External components (drivers, docking stations, speakers) 1
Hard drivers 1
Ink printers (inkjet, dot matrix, desktop plotter) 3
Large format printers (plotters, design jet) 24
Laser printer (laser jet, fax machine) 7
Mainframe (cabinets, storage arrays) 120
Monitors - CRT 9
Monitors - flat panel 3
Network equipment (server hubs, routers) 3
Desktop PCs 4
Laptop PCs 2
Racks 75
Scanners 2
Servers - blades/single servers 10
Smartphone’s and peripherals ( DA, calculator, camera, keyboard, mice) 1
Storage array 150
Storage media (tape, optical disk) 1
Tape library 120
UPS (uninterrupted power supply) 20
y = 0,0035x2 - 0,0065x + 0,166 R² = 1
0,16
0,165
0,17
0,175
0,18
0 0,5 1 1,5 2 2,5 3 3,5
Ele
ctri
city
pri
ce (
eu
ro/K
Wh
)
Year from 2009, 2009 = 1
Electricity price trend 2009-2011

MSc Thesis, J.C.P. Kalsheim: Greening Information Technology (IT) Infrastructures
Appendix K: Case Study Protocol 181
Appendix K: Case study protocol
1. Introduction In this appendix the case study protocol is outlined. The case study protocol is constructed with the intention of guiding the investigator during the case study and increase the reliability of results (Yin, 2003). This Appendix describes how the case study should be executed.
2. Case study approach There are various ways of conducting a case study. The steps shown in Figure 59 are chosen to guide the case study process in a structured and repeatable way. This approach is based upon Yin (2003) and will be followed for the single case study.
(2) Define data
sources
(3) Determine
data collection
procedure
(4) Data
collection
(5) Data analysis
and evaluation
Data storage
Start/initiation
Framework 1.0(1) Define case
study goals and
scope
Report data to
organization
Case study protocolFunctional design
Figure 59: Case study approach
Reporting data to an organisation, a guide for the case study report is provided in the last section of this appendix.
3. Case study questions
The case study questions to be answered are split into three tables. In the first table, Table 46, the IT manager is
asked to define the hardware IT infrastructure units that support business applications. Owned, outsourced and leased hardware IT infrastructure units should be listed by an IT manager. An example of how a hardware IT infrastructure unit should be defined is; H EliteBook 8460p. Owned hardware IT who’s operation is outsourced to a data centre should be stated separately as these operate under different conditions than hardware IT situated in building operated by the organisation.
Table 46: To be filled in to determine the scope of the hardware IT infrastructure of an organisation
Hardware IT unit Position within organisational boundary
Number of units Owned Leased Outsourced
1
2
3
…
n

MSc Thesis, J.C.P. Kalsheim: Greening Information Technology (IT) Infrastructures
Appendix K: Case Study Protocol 182
In the second table, Table 47, questions regarding various performance indicators are listed that are specific for each hardware IT infrastructure unit listed in the previous table. The table is a matrix with questions (including origin) to be filled in per unit on the horizontal axis and the hardware IT infrastructure units to be analyzed on the vertical axis. The empty cells in the matrix should be filled in for all hardware IT infrastructure units listed in Table 46. For example, the average utilization of the HP EliteBook 8460p is 15% (performance indicator 2.2.2). This data might be obtained from other stakeholders than IT managers. If the end-of-life treatment of hardware IT “waste” from the organisation is done by a third party, information about the proportion of hardware IT discarded for recycling,
landfill, reuse/refurbishment and incineration should be obtained from this stakeholder. Table 47: To be filled in to determine the environmental and economic impact of the hardware IT infrastructure of the organisation
Life cycle stage
ID Question
Hardware IT infrastructure unit
1 2 3 .. n
Procure
Q1.1 What was the total amount of recycled or reused component materials in the hardware IT infrastructure units that the organisation procured the past 12 months?
Q1.2 How many refurbished or used hardware IT infrastructure units were procured by the organisation the past 12 months?
Q1.3 What was the expected lifetime (from moment of procurement to discarding) of the hardware IT infrastructure units the past 12 months?
Q1.4 What were the depreciation costs of the hardware IT infrastructure units the past 12 months?
Use
Q2.1 What was the average utilization of hardware IT infrastructure units the past 12 months?
Q2.2 How many sub-components (e.g. batteries) in hardware IT infrastructure units were replaced the past 12 months?
Q2.3 How many sub-components (e.g. batteries) in hardware IT infrastructure units were repaired the past 12 months?
Q2.4 What were the maintenance costs of the hardware IT infrastructure units the past 12 months?
Disposal
Q3.1 How many hardware IT infrastructure units were discarded directly to landfill the past 12 months?
Q3.2 How many hardware IT infrastructure units were discarded for recycling the past 12 months?
Q3.3 How many hardware IT infrastructure units were discarded for third party (re)use the past 12 months?
Q3.4 How many hardware IT infrastructure units were discarded for energy recovery the past 12 months?
Q3.5 How many hardware IT infrastructure units were discarded for refurbishment?
Q3.6 How many hardware IT infrastructure units were sold to third parties the past 12 months?
Q3.7 What was the average profit of selling hardware IT infrastructure units to third parties the past 12 months?
In the third table, Table 48, generic questions are asked that are applicable to the entire hardware IT infrastructure. These are not unit specific. For example, the organisation might procure “green” electricity for its owned and leased hardware IT infrastructure from energy supplier X consisting of 32% wind, 8% hydro and 60% biomass.
Table 48: To be filled in to determine the environmental and economic impact of the hardware IT infrastructure of the organisation
Life cycle stage
Performance indicator
Question
Use
Q2.5 What type of energy was bought for owned and leased hardware IT infrastructure units during operations?
Q2.6 What type of energy was bought for outsourced hardware IT infrastructure units?
Q2.7 How much water was extracted for cooling hardware IT infrastructure units (in data centre(s)) per source the past 12 months (m^3/source)?

MSc Thesis, J.C.P. Kalsheim: Greening Information Technology (IT) Infrastructures
Appendix K: Case Study Protocol 183
Q2.8 What was the average power usage effectiveness (PUE) value of the data centre where the hardware IT infrastructure units are located?
Q2.9 What percentage of the total data centre capacity was used by the organisation’s hardware IT infrastructure units?
4. Data collection procedure There are various ways of collecting data to answer the case study questions. Yin (2009) suggest multiple of the following sources be applied in a case study: documentation, archival records, interviews, direct observation, participatory observation, physical objects. As quantitative information is required, documentations and interviews are recommended data sources. Both sources should be used to ensure data triangulation. Various stakeholders are involved in the data collection procedure. In the organisation data should be collected from interviews with IT managers and from internal documents. Necessary data from outsourcing vendor(s) might be found within the organisation or might need to be collected from interviews or documents provided by the vendor. To ensure data is collected efficiently, data from various stakeholders should be collected simultaneously when possible to streamline the data collection process.
5. Case study report guide The case study report should be based upon the steps in the case study approach as depicted in Figure 59. It is recommended the case study report consists of the following parts: (1) Case study goals and scope (2) Data sources and data collection procedures (3) Data analysis and evaluation (4) Conclusion and recommendations for improvement It is also recommended to perform a sensitivity analysis of the results as several of the parameters in the functional design are estimates with a given uncertainty.

MSc Thesis, J.C.P. Kalsheim: Greening Information Technology (IT) Infrastructures
Appendix L: Case Study Data 184
Appendix L: Case Study Data
1. Introduction In this appendix the data collected including the moments of collecting data will be presented. This is data used to determine the greenness of the hardware IT infrastructure at BSC Netherlands. The information in this appendix has been removed for confidentiality reasons.

MSc Thesis, J.C.P. Kalsheim: Greening Information Technology (IT) Infrastructures
Appendix M: Case Study BSC Netherlands 185
Appendix M: Case Study BSC Netherlands
1. Introduction In this appendix the results from the case study at BSC Netherlands will be presented. These will be outlined in line with the case study protocol (Appendix K).
2. Case study BSC Netherlands In the first sub-section goals and scope of the case study at BSC Netherlands will be presented (section 2.1). subsequently data sources and data collection procedures will be outlined briefly (section 2.3). In section 2.4 the analysis of the collected data. Conclusions and recommendations from the case study findings can be found in section 2.5.
2.2 Background BSC Netherlands The organisation investigated in the case study research is BSC. In the case study BSC Netherlands was investigated as a separate entity from BSC international. BSC Netherlands was chosen for the case study research because it is an organisation with an extensive hardware IT infrastructure supporting business applications. Additionally, top-down there was a sense of urgency to measure the greenness of hardware IT.
2.3 Goal and research scope In the next paragraphs the goal and scope of the case study will be outlined. The case study was executed in the period 24 May 2012 to 25 June 2012. Goals of the case study The main goal of the case study was to thoroughly analyse the greenness of the hardware IT infrastructure at BSC Netherlands to evaluate the practical relevance of the framework designed. The case study studies the framework in depth in a business environment. Organisational scope The scope of the case study was limited to BSC Netherlands. This BSC entity consists of 12 offices in the Netherlands. The hardware IT infrastructure used by the employees at these locations and in data centres supporting these were investigated. The use of hardware IT infrastructure by BSC employees when travelling abroad was not included in the scope. For example, hardware IT utilized at a German BSC unit by Dutch BSC employees visiting a BSC office in Germany was not included in the scope. The underlying assumption of this statement is that; an equal amount of BSC employees from a foreign country make use of the hardware IT infrastructure in the Netherlands as the amount of BSC employees from the Netherlands making use of the hardware IT infrastructure in foreign countries. Parts of the hardware IT infrastructure supporting the business applications at BSC Netherlands are outsourced internationally by BSC global. An example of this is the IT service centre that is outsourced to an organisation in India. At BSC in the Netherlands there are 3.420 employees, whereas internationally there are about 138.000 employees. Hence, it is assumed BSC Netherlands use a negligible fraction of the underlying hardware IT infrastructure provided by BSC globally (≈2.5%). Therefore, outsourced services by BSC globally were not part of the scope. Other BSC business applications that can be found in other countries than the Netherlands were not investigated. Framework entity scope Before determining the required data and data sources, the different elements within the framework entity investigated in the research will be outlined. The elements of the object of analysis that were investigated in the case study was delineated as shown in Figure 5.

MSc Thesis, J.C.P. Kalsheim: Greening Information Technology (IT) Infrastructures
Appendix M: Case Study BSC Netherlands 186
UseProcure Dispose
Owned hardware IT
Leased hardware IT
Outsourced hardware IT
Procured hardware IT Disposed hardware IT
Figure 60: Elements in the framework entity studied for BSC in the Netherlands
It was found that BSC Netherlands does not lease hardware IT. The operation of several hardware IT infrastructure units is outsourced to two data centres in Amsterdam. In one of these data centres, water is used for cooling. At the end-of-life, BSC sells hardware IT infrastructure units to an organisation that manages the transfer of used and obsolete IT equipment. Scope of units of analysis Ideally all owned and outsourced hardware IT supporting business applications would be investigated in the case study to get a comprehensive picture of the relatives greenness of the hardware IT infrastructure. In this research the hardware IT infrastructure units that are listed in the asset list (internal document) were part of the analysis. It is recognized that next to these units, there are additional hardware IT infrastructure units in use at BSC Netherlands. The classification of units of analysis incorporated in the case study can be found in Figure 6. This is based upon the classification of hardware IT infrastructure units discussed in Chapter 4. Within each class of hardware IT, assets are defined such as HP EliteBook 8460p. These constitute the units of analysis.
Multifunction Device
Private printers
Server Peripheral Computer
Laptop
Desktop computer
StorageNetwork equipment
Infrastructure hardware (multi-user systems)
End-user hardware (Single/multi-user hardware)
Hardware IT Infrastructure BSC Netherlands investigated
Switch
Router
Intrusion protection/detection system
Load balancer
Appliance
Unit
class
Object of
analysis
Firewall
Figure 61: categories of units of analysis investigated in the case study
2.4 Data sources and data collection procedure To estimate the greenness of the hardware IT infrastructure within the scope defined in the previous section, various data sources were used; documentation, archival records and interviews. In Appendix L information sources incorporated in the case study is clarified in an overview of personal communications. Basically two IT managers at BSC Netherlands provided information by filling in the questions listed in the case study protocol. For this, different documentations and archival records were used such as the asset list, financial budgets, etc. To ensure methodological and data source triangulation, several interviews were held and documentations were asked for verification of data. The process was streamlined to ensure efficient collection of data. Data was verified by IT managers after all data was summarized in one spread sheet. The results of the analysis of these data will be presented in the next section.

MSc Thesis, J.C.P. Kalsheim: Greening Information Technology (IT) Infrastructures
Appendix M: Case Study BSC Netherlands 187
2.5 Data analysis and evaluation
This section describes the results from applying the functional design in Chapter 8 to the data collected in Appendix L. Before presenting the results, it is important to understand some of the delineations and assumptions made to perform the analysis. First, the case study was limited to performance indicators that fall within the boundaries described in section 2.3. In the functional design the environmental effects (water use, energy use and GHG emission) of discarding hardware IT to landfills was nil under the assumption that no further processing takes place at landfills. Furthermore, the costs of recycling and refurbishing a hardware IT infrastructure unit was assumed to be incorporated in the price BSC receives from Flection. Flection is the third party responsible for discarded hardware IT from BSC Netherlands. Further, it was assumed all hardware IT infrastructure units in the asset list(s) were discarded to Flection at the end-of-life besides multifunctional printers. Information from Flection showed that 85% of hardware IT was refurbished or directly reused and 15% is recycled over the last year (Appendix L). Furthermore, defective hardware IT infrastructure units at BSC Netherlands were assumed to be sent back to suppliers. It was assumed all defects lead to the replacement of a sub-component with an average mass of 0,1 kg as stated in the functional design (Chapter 8). Moreover, performance indicator 5.2.4 (maintenance costs) was often incorporated in procurement contracts. Maintenance costs that fall outside these contracts for the financial year 2011 were incorporated in the case study. The remaining fall under procurement costs. To sum up, the following performance indicators were not included in the further data analysis as they were assumed to be negligible:
1.3.1 Amount of water use related to hardware IT discarded to landfill
2.3.1 Amount of energy use related to hardware IT discarded to landfill
4.3.1 Amount of greenhouse gas emission related to discarding hardware IT to landfill
1.3.3 Amount of water use related to recovering energy from hardware IT
2.3.3 Amount of energy recovered from discarded hardware IT
3.2.2 Amount of repaired sub-components in hardware IT (falls under 3.2.1)
3.3.3 Amount of hardware IT discarded for energy recovery
4.3.3 Amount of greenhouse gas emission related to recovering energy from hardware IT
5.3.1 Costs of hardware IT discarded to landfill
5.3.2 Costs of recycling hardware IT
5.3.3 Costs of recovering energy from discarded hardware IT The remaining performance indicators were assumed to have a significant effect on the greenness of the hardware IT infrastructure of the organisation. The results of analysing this effect will be discussed in the next paragraphs. Results To analyse the data collected, the calculation methodologies defined in the functional design (Chapter 8) were applied. The resulting scores of each performance indicator are presented in Table 42.
Table 49: Performance indicator score BSC Netherlands
ID Performance indicator Total score
1.1.1 Water use related to the extraction and production process of hardware IT (m3) 15.000.000
1.2.1 Amount of water used in hardware IT operation per water source (m3) 940.000
1.3.2 Amount of water use related to recycling hardware IT (m3) 210.000
1.3.4 Amount of water use related to refurbish hardware IT for third party use (m3) 960.000
2.1.1 Energy use related to the extraction and production process of hardware IT (MJ) 13.000.000
2.2.1 Amount of energy use of hardware IT operation (MJ) 59.000.000
2.2.2 The utilization of hardware IT relative to unit specific optima (%) 0,87
2.3.2 Amount of energy use related to recycling hardware IT (MJ) 340.000
2.3.4 Amount of energy use related to refurbish hardware IT for third party use (MJ) 310.000
3.1.1 Amount of recycled and reused materials in hardware IT procured (MJ) 0,00
3.1.2 Amount of raw materials in hardware IT procured (kg) 74.000
3.1.3 Amount of refurbished or used hardware IT procured (kg) 0,00
3.2.1 Amount of replaced sub-components with raw materials in hardware IT (kg) 560
3.3.1 Amount of materials from hardware IT to landfill (kg) 11.000
3.3.2 Amount of recycled materials from hardware IT (kg) 33.000
3.3.4 Amount of materials in hardware IT reused or refurbished for third party use (kg) 31.000

MSc Thesis, J.C.P. Kalsheim: Greening Information Technology (IT) Infrastructures
Appendix M: Case Study BSC Netherlands 188
4.1.1 Greenhouse gas emission related to the extraction and production process of hardware IT (ton CO2 equivalent)
24.000
4.2.1 Greenhouse gas emission related to extraction and production of energy used in hardware IT operation (ton CO2 equivalent)
130.000
4.3.2 Amount of greenhouse gas emission of recycling hardware IT (ton CO2 equivalent) 620
4.3.4 Amount of greenhouse gas emission related to refurbish hardware IT for third party use (ton CO2 equivalent)
560
5.1.1 Procurement and license costs of hardware IT (euro) 16.000.000
5.2.1 Energy costs of hardware IT operation (euro) 3.200.000
5.2.2 Water costs of hardware IT operation (euro) 160.000
5.2.3 Costs of carbon credits for the operation of hardware IT (euro) 2.000.000
5.2.4 Maintenance costs of hardware IT (euro) 5.700.000
5.3.4 Income from selling used and/or refurbished hardware IT to third parties (euro) 860.000
Applying the aggregation formulas for assessment criteria the following scores were obtained.
Table 50: Assessment criteria score BSC Netherlands
ID Assessment criteria Score Score/
employee Score/million euro revenue
A1 Water use over the life cycle of hardware IT (m3) 17.000.000 4.900 25.00
A2 Energy use over the life cycle of hardware IT (MJ) 73.000.000 21.00 110.000
A3 Raw materials waste over the life cycle of hardware IT (kg) 11.000 3 17
A4 Greenhouse gas emissions over the life cycle of hardware IT (ton CO2 equivalent) 150.000 44 230
A5 Costs over the life cycle of hardware IT (euro) 26.000.000 7.500 39.000
Normalizing these assessment criteria using a reference value is not possible as this is the only measurement of its sort. However, to understand the relative greenness of the hardware IT infrastructure, a “best” and “worst” case “greenness level” were constructed. The “best” and “worst” case are entitled “leader” and “laggard” respectively. These were determined using the same units of analysis, literature data and unit specifications. The assumptions that were made for both types can be found in Table 44.
Table 51: Assumption of “best” and “worst” case to determine relative greenness of BSC Netherlands
Leader Laggard Assuming procurement of hardware IT with 100% recycled materials
Assuming procurement of 100% raw materials
Assuming power usage is proportional to % utilization of device, and the possibility of obtaining optimal utilization of devices 24 hours per day, 365 days per year
Assuming hardware IT units are in active or standby mode 24 hours per day, 365 days per week and a relative utilization multi-system units of 10% less than currently is the case
As no raw materials are used, no raw materials are disposed Assuming the use of biomass energy and water cooling for all network equipment, servers and storage
Assuming all hardware IT are used by third party or refurbished for third party use
Assuming all hardware IT is sent to landfill and no effort is put into end-of-life treatment of units
Assuming the actual procurement of hardware IT occurs in a perfect market
Assuming minimal sales price of unit is 0 euro/unit (defective)
Assuming maximum selling price is; laptop=150euro/unit, desktop=75euro/unit, printer=50euro/unit, server=350euro/unit, multifunctional=10euro/unit, other=within same average-maximum range as other units
The results of determining the values of the “leader” and “laggard” and incorporating these in the estimation of relative scores can be found in Table 44. In Table 45 the weights of each assessment criteria are presented as well.
Table 52: Relative score of assessment criteria and weight
ID Name
Best/worst case reference score
Min score (leader)
Max score (laggard)
Relative score
Relative weight
A1 Water use over the life cycle of hardware IT (m3) 1.200.000 20.000.000 0,1 0,2
A2 Energy use over the life cycle of hardware IT (MJ) 37.000.000 83.000.000 0,23 0,2

MSc Thesis, J.C.P. Kalsheim: Greening Information Technology (IT) Infrastructures
Appendix M: Case Study BSC Netherlands 189
A3 Raw material waste over the life cycle of hardware IT (kg) -74.000 75.000 0,43 0,2
A4 Greenhouse gas emissions over the life cycle of hardware IT (ton CO2 equivalent)
5.900 2820000 0,48 0,2
A5 Costs over the life cycle of hardware IT (euro) 23.000.00 27.000.000 0,31 0,2
Aggregating the normalized scores into the HITIG index described in the functional design, it was assumed that the criteria were equally important. Hence, the relative weight of the assessment criteria is 1/5. This resulted in the following HITIG score of BSC Netherlands; 0.32. This implies the hardware IT infrastructure measured at BSC Netherlands is 78% from the “leader” and 32% from the “laggard” as described in Table 44. The presentation of the results will be outlined in the following paragraphs. Presentation of results To communicate the results of the case study research effectively several presentation layouts have been designed. These will be presented in chronological sequence in the subsequent figures.
Figure 62: Presentation layout 1
Figure 62 shows the relative greenness of the hardware IT infrastructure investigated under the assumptions stated in the functional design and with the data collected. The presentation layout also shows what relative score means by explaining assumptions with regard to a “laggard” (a very bad score) and a “leader” (a very good score). This data point should not be presented alone as it may be biased, however it shows the possibility of determining a relative index score as stated in design requirement HR1 (Chapter 6).

MSc Thesis, J.C.P. Kalsheim: Greening Information Technology (IT) Infrastructures
Appendix M: Case Study BSC Netherlands 190
Figure 63: Presentation layout 2
Figure 8 shows the normalized score in a spin-web. From this presentation it is evident that energy use and water use over the life cycle of hardware IT is dragging the index score down. If the score would be normalized with respect to a suitable “reference system” this would imply the organisation should address water use and energy use to enhance performance relative to peers.
Figure 64: Presentation layout 3.1
Figure 64 shows water use over the life cycle of hardware IT per unit type as defined in the classification in Figure 6 and per life cycle phase. It can be seen that laptops are responsible for the largest water use in the production phase. Subsequent switches, servers and appliance in the procurement phase have a relatively large impact on water use. To give IT decision-makers a clearer picture about how much water the hardware IT infrastructure measured uses over its entire life cycle, references scores are used to show how much water this is relative to for instance Dutch households.

MSc Thesis, J.C.P. Kalsheim: Greening Information Technology (IT) Infrastructures
Appendix M: Case Study BSC Netherlands 191
Figure 65: Presentation layout 3.2
Figure 65 shows that energy use over the life cycle of hardware IT related each type of unit defined in the classification in Figure 6 and per life cycle phase. The presentation layout show, switches are responsible for the largest part of energy use in the use phase. In the use phase servers are also responsible for a great proportion of energy use. In the procurement phase, laptops have the greatest influence on energy use.
Figure 66: presentation layout 3.3
Figure 66 shows the generation of raw materials waste over the life cycle of hardware IT related each type of unit defined in the classification in Figure 6 and per life cycle phase. This presentation layout shows that multifunctional devices are responsible for the largest amount of raw materials waste generation. This is due to the uncertainty around their end-of-life. It was assumed none of the units will be refurbished, but rather recycled in accordance with the WEEE Directive in the European Union.

MSc Thesis, J.C.P. Kalsheim: Greening Information Technology (IT) Infrastructures
Appendix M: Case Study BSC Netherlands 192
Figure 67: presentation layout 3.4
Figure 67 shows that GHG emission over the life cycle of hardware IT related each type of unit defined in the classification in Figure 6 and per life cycle phase. GHG emission have been presented as tons of CO2 equivalents. Evident in this presentation layout is a relationship between energy use and GHG emission. This would not have been the case if more renewable energy would have been used by BSC Netherland in the operational phase of these units.
Figure 68: Presentation layout 3.5
Figure 68 shows that costs over the life cycle of hardware IT related each type of unit defined in the classification in Figure 6 and per life cycle phase. This shows costs in the use phase of appliances overrun procurement costs in some cases. The largest use phase costs are related to switches and possibly also appliances and multifunctional printers. For example, maintenance costs in 2011 was assumed to be equally distributed over all network equipment units. As several appliance are very small, this may not be the case. A similar assumption was made regarding multifunctional printers. In the financial budget 2011, “usage” MFP was assumed to be maintenance costs. This might have incorporate other aspects as well. In the procurement phase, storage unit, switches and laptops represent the largest costs. Income from selling hardware IT at end-of-life is minor.
2.6 Conclusion and recommendations
In the previous section data has been analysed for the case study at BSC Netherlands. Under the various assumptions made, the following might be concluded about the hardware IT infrastructure at BSC Netherlands that fall within the research scope:
The hardware IT is responsible for approximately 17.000.000 m3 of water use over the entire life cycle of the
hardware IT

MSc Thesis, J.C.P. Kalsheim: Greening Information Technology (IT) Infrastructures
Appendix M: Case Study BSC Netherlands 193
The hardware IT is responsible for approximately 73.000.000 MJ of energy use over the life cycle of the hardware IT
The hardware IT is responsible for approximately 11.000 kg of raw materials waste generation over the life cycle of the hardware IT
The hardware IT is responsible for approximately 160.000 ton CO2 emissions over the life cycle of the hardware IT
The relative greenness of the hardware IT infrastructure units is approximately 0,33 where 0 is the worst and 1 is the best score under assumptions listed in Table 44 for the same product specifications and literature assumptions.
To improve the assessment criteria scores and respectively the HITIG index score, the following might be recommended to improve GHITI scores within the research scope at BSC Netherlands:
Procure refurbished hardware IT and/or hardware IT made of more recycled materials. Laptops can have the greatest impact under the assumptions in the functional design
Increase utilization of printers and install automatic turn off since some printers might use a great deal of energy in standby mode. Relative to their maximum utilization, between 2.7-0.2% is currently being used assuming the units are used 24 hours per day, 365 days per week
When procuring hardware IT infrastructure units, incorporate energy consumption criteria. This is particularly important when buying switches as these consume the largest amount of energy and have the largest impact on the total life cycle energy use of hardware IT infrastructure units investigated.
Ensure multifunctional printers are properly disposed at end-of-life when discarded by the winner of the upcoming tender. It should be noticed that donating hardware IT to third world countries is not the same as reuse as these often end up at landfills (Nordbrand, 2009).
Ensure the amount of hardware IT infrastructure units that are refurbished or reused at the end-of life is maximized.

MSc Thesis, J.C.P. Kalsheim: Greening Information Technology (IT) Infrastructures
Appendix N: Sensitivity Analysis Case Study Results 194
Appendix N: Sensitivity Analysis Case Study Results
1. Introduction An important way of testing a model is to perform a model sensitivity analysis because most parameters in models are sensitive to uncertainty. Normally sensitivity analysis is performed by changing the parameters by +/-10%. A good sensitivity analysis also checks the influence of combinations of parameters. This appendix explains how a sensitivity analysis is carried out to test the sensitivity due to uncertainties in data. The uncertainties are analysed using Palisade Risk Simulation tools in Excel. Preliminary to presenting the results of the sensitivity analysis, sensitivity analysis will be discussed shortly (section 2). The results of the sensitivity analysis is split into two parts; assumptions made in literature (section 3) and assumptions made in collected data (section 4). At the end of this appendix the findings will be summarized and a conclusion will be drawn with respect to the case study results and robustness of the functional design.
2. Sensitivity analysis There is not a standard sensitivity analysis. The purpose of most sensitivity analyses, as mentioned in the introduction, is to create a better understanding of how the modelled case study reacts to minor changes in parameter values. This information can be used to find out which parameters an data-items influence the assessment criteria scores the most. Performing a sensitivity analysis different choices have to be made. First, the type of sensitivity analysis should be chosen. A Monte Carlo based method is chosen because it can identify which factors are most responsible for generating high/low values of the output. The method identifies regions in the space of the input factors corresponding to particular values of the output (Hornberger & Spear, 1981) (Saltelli et al., 2004). The second choice concerns what parameters should be tested and which performance indicators are set as output. The aim of the analysis is to determine the effect of certain inputs (model parameters and assumptions made in data collected) on the assessment criteria output. The inputs tested can be found in the subsequent two sections. Graphs are used to illustrate how the outputs vary per input or combination of inputs. Third, the input distribution per parameter has to be chosen. In this research a triangular distribution is used. The triangular distribution is used as the relationship between the variables is known (see functional design, Chapter 8), but data is scare. The probability density function of the triangular distribution is defined as follows;
|
{
(41)
With lower limit a, upper limit b and mode c, where a < b and a ≤ c ≤ b. The last decision concerns the number of simulations and iterations per simulation. The maximum number of simulations and iterations possible have been used in each simulation run. In the simulation of individual input, 10 simulations with 10.000 iterations have taken place. In the simulations where all inputs are simulated simultaneously 5 simulations were carried out with the same number of iterations. In the next two sections the results of the sensitivity analysis outlined will be presented.
3. Influence of uncertainty in literature assumptions Several assumptions were made to construct parameters used to determine performance indicators in the GHITI framework. Several of these were constructed from literature review. Several of the assumptions that were made can be found in the functional design. These have been listed in Table 54. Analysing the sensitivity of these and their influence on the assessment criteria scores two steps were made. First the variance in the assumptions were simulated one by one. The results of these simulations can be found in Table 54. Second all variance distributions in listed Table 54 were implemented simultaneously in one test to understand the variance in all assessment criteria score due to uncertainty in model estimates. The result of this can be found in Table 49. The nil-measurement or the starting point for the sensitivity analysis are shown in Table 53. This starting point is also

MSc Thesis, J.C.P. Kalsheim: Greening Information Technology (IT) Infrastructures
Appendix N: Sensitivity Analysis Case Study Results 195
used in the subsequent sensitivity analysis in section 4. The variability estimated in the simulation runs are relative to these initial assessment criteria scores.
Table 53: nil-measurement
ID Assessment criteria Score A1 Water use over the life cycle of hardware IT (m3) 17.000.000
A2 Energy use over the life cycle of hardware IT (MJ) 73.000.000
A3 Raw materials waste over the life cycle of hardware IT (kg) 11.000
A4 Greenhouse gas emissions over the life cycle of hardware IT (ton CO2 equivalent) 160.000
A5 Costs over the life cycle of hardware IT (euro) 24.000.000
Table 54: variability in assumption implemented in the risk simulation
Assumption about Assumption Uncertainty distribution applied to test results
Greenhouse gas emission factor (ton CO2 equivalent/MJ)
0,0018
Triangular with maximum value 0,0037 (CO2 emission of coal based electricity), minimum value 0 (renewable energy) and likely value 0,0018 (world average)
RiskTriang(0;0,0018; 0,0037)
Energy price (euro/MJ): non-renewable
0,054
Triangular with maximum value 0,061 (extrapolating electricity price 2011 Europe households to 20113), minimum value 0,045 (electricity price 2011 Europe, households) and likely value 0,054 (extrapolating electricity price 2011 Europe households to 2012)
RiskTriang(0,045;0,054;0,061)
Energy price (euro/MJ) : renewable
0,060
Triangular with maximum value 0,068 (extrapolating electricity price 2011 Europe households to 20113), minimum value 0,054 (electricity price 2011 Europe, households) and likely value 0,060 (extrapolating electricity price 2011 Europe households to 2012). Energy price renewable is assumed to be 10% higher than non-renewable
RiskTriang(0,054;0,060;0,068)
Water price (euro/m3) 2,1 Triangular with maximum value 2,3 (10% variance), minimum value 1,1; (10% variance) and likely value 2,1
RiskTriang(1,1;2,1;2,3)
Price of carbon credit (euro/ton CO2 equivalent)
16
Triangular with maximum value 8 (CO2 emission of coal based electricity), minimum value 6 (renewable energy) and likely value 7 (world average)
RiskTriang(15;16;17)
Relative water savings of recycling and refurbishing hardware IT (%)
8% Triangular with maximum value 14%, minimum value 2% (renewable energy) and likely value 8%
RiskTriang(2%;8%;14%)
Relative energy savings of recycling hardware IT (%)
16% Triangular with maximum value 26%, minimum value 6% (renewable energy) and likely value 26%
RiskTriang(6%;16%;26%)
Relative energy use reduction of refurbishing hardware IT (%)
2%
Triangular with maximum value 3,2%, minimum value 0,8% and likely value 15% (variation of 50%)
=RiskTriang(0,05;0,1;0,15)
Average weight of replaced sub-component (kg/sub-component)
0,1 Triangular with maximum value 0,2 (100% variance), minimum value 0,05 (100% variance) and likely value 0,1
RiskTriang(0,05;0,1;0,2)
Percentage of hardware IT recycled in accordance with WEEE Directive
75% Triangular with maximum value 85%, minimum value 65% and likely value 75%
RiskTriang(65%;75%;85%)
Energy use related to materials extraction and production of hardware IT – switch, router, server, storage, firewall, appliances, load balancers and IPS/IDS
39 Triangular with maximum value 61, minimum value 39 and likely value 16
RiskTriang(16;39;61)
Time in standby/sleep mode (multifunctional and private printers)
40% Triangular with maximum value 61, minimum value 38,6 and likely value 16,2
RiskTriang(30%;40%; 50%)
Energy use related to extraction and production of laptops
2.300 Triangular with maximum value 2.500, minimum value 2.000 and likely value 2.300 (10% deviation of value stated by IVF (2007))
RiskTriang(2033,1;2259;2484,9)
Energy use related to extraction and production of desktops
1.300
Triangular with maximum value and minimum value with a 10% deviation of value stated by IVF (2007)
RiskTriang(1.200,4; 1.300;1.400)
Water use related to extraction and production of laptops
1.200 Triangular with maximum value and minimum value with a 10% deviation of value stated by IVF (2007)

MSc Thesis, J.C.P. Kalsheim: Greening Information Technology (IT) Infrastructures
Appendix N: Sensitivity Analysis Case Study Results 196
RiskTriang(1.100,5;1.200;1.300)
Water use related to extraction and production of desktops
820 Triangular with maximum value and minimum value with a 10% deviation of value stated by IVF (2007)
RiskTriang(740;820;900)
Optimal utilization of network equipment, servers and storage
100%
Triangular with maximum value 100%, minimum value 80% and likely value 90%
RiskTriang(80%;90%;100%)
Table 55: Output simulating the assumptions one-by-one when 10.000 iterations and 10 simulations were made per test
Assumption tested
Resulting uncertainty distribution
Greenhouse gas emission factor (ton CO2 equivalent/MJ)
Energy price (euro/MJ): non-renewable
Energy price (euro/MJ) : renewable

MSc Thesis, J.C.P. Kalsheim: Greening Information Technology (IT) Infrastructures
Appendix N: Sensitivity Analysis Case Study Results 197
Water price (euro/m3)
Price of carbon credit (euro/ton CO2 equivalent)
Relative water savings of recycling and refurbishing hardware IT (%)
Relative energy savings of recycling hardware IT (%)

MSc Thesis, J.C.P. Kalsheim: Greening Information Technology (IT) Infrastructures
Appendix N: Sensitivity Analysis Case Study Results 198
Relative energy use reduction of refurbishing hardware IT (%)
Average weight of replaced sub-component (kg/sub-component)

MSc Thesis, J.C.P. Kalsheim: Greening Information Technology (IT) Infrastructures
Appendix N: Sensitivity Analysis Case Study Results 199
Percentage of hardware IT recycled in accordance with WEEE Directive (%)
Energy use related to materials extraction and production of hardware IT – switch, router, server, storage, firewall, appliances, load balancers and IPS/IDS (MJ)

MSc Thesis, J.C.P. Kalsheim: Greening Information Technology (IT) Infrastructures
Appendix N: Sensitivity Analysis Case Study Results 200
Time in standby/sleep mode (multifunctional and private printers)

MSc Thesis, J.C.P. Kalsheim: Greening Information Technology (IT) Infrastructures
Appendix N: Sensitivity Analysis Case Study Results 201
Energy use related to extraction and production of laptops (MJ)
Energy use related to extraction and production of desktops (MJ)

MSc Thesis, J.C.P. Kalsheim: Greening Information Technology (IT) Infrastructures
Appendix N: Sensitivity Analysis Case Study Results 202
Water use related to extraction and production of laptops (m3)
Water use related to extraction and production of desktops (m3)
Optimal utilization of network equipment, servers and storage (%)

MSc Thesis, J.C.P. Kalsheim: Greening Information Technology (IT) Infrastructures
Appendix N: Sensitivity Analysis Case Study Results 203
Table 56: Output simulating all assumptions simultaneously with 10.000 iterations and 5 simulations made per test
Assessment criteria
Resulting uncertainty distribution
Water use over the life cycle of hardware IT (m3)
Energy use over the life cycle of hardware IT (MJ)

MSc Thesis, J.C.P. Kalsheim: Greening Information Technology (IT) Infrastructures
Appendix N: Sensitivity Analysis Case Study Results 204
Raw material waste over the life cycle of hardware IT (kg)
Greenhouse gas emissions over the life cycle of hardware IT (ton CO2 equivalent)
Costs over the life cycle of hardware IT (euro)
From these analyses the following has been found regarding the influence of parameters defined as assumptions or from literature:
Uncertainty in assumptions influencing water use over the life cycle of hardware IT is responsible for approximately 11% variability
Uncertainty in assumptions influencing energy use over the life cycle of hardware IT is responsible for approximately 1,5% variability
Uncertainty in assumptions influencing raw material waste generation over the life cycle of hardware IT is responsible for approximately 16% variability
Uncertainty in assumptions influencing GHG emission generation over the life cycle of hardware IT is responsible for approximately 6,5% variability
Uncertainty in assumptions influencing costs over the life cycle of hardware IT is responsible for approximately 0,7% variability
Thus it may be concluded; the influence on costs and energy use is minimal, whereas raw materials waste generation is relatively high. Water use is also quite high. This is mainly due to uncertainty in water consumption of laptops and desktops as these are of major influence.

MSc Thesis, J.C.P. Kalsheim: Greening Information Technology (IT) Infrastructures
Appendix N: Sensitivity Analysis Case Study Results 205
4. Influence of uncertainty in data collected
Several assumptions were made to ensure completeness of collected data at BSC Netherlands. In this section the uncertainty in these data will be presented as tested in several simulations runs. The tested data are summarized in the below table.
Table 57: Data assumptions simulated
Assumption about Uncertainty distribution applied to test results
Average utilization of hardware IT devices (network equipment, servers and storage) (%)
Triangular with maximum value 0,66 (10% variation), minimum value 0,54 (10% variation) and likely value 0,6
RiskTriang(0,54;0,60;0,66)
Selling price to Flection (euro/unit)
Maximum and minimum values have been implemented as stated by Flection director Joep van Loon. Network equipment and storage are assumed to be procured between 10%-20% of the annual depreciation costs of these unit.
Laptops =RiskTriang(25;95;150)
Desktops =RiskTriang(5;20;75)
Network equipment =RiskTriang(0,1;0,15;0,2)* annual depreciation costs
Servers =RiskTriang(25;190;350)
Private printers = RiskTriang(10;30;50)
Maintenance costs of hardware IT (euro/unit/year)
Maintenance costs of all hardware IT as stated in the data have been tested with a 10% variation.
Laptops =RiskTriang(26;28;31)
Desktops =RiskTriang(390;440;480)
Network equipment =RiskTriang(390;440;480)
Servers =RiskTriang(450;500;550)
Disk cabinets =RiskTriang(540;600;660))
Private printers =RiskTriang(2.100;2.300;2.600)
Procurement costs (euro/unit) Procurement costs of all hardware IT as stated in the data have been tested with a 10% variation.
Water cooling in data centres (%)
The proportion of hardware IT in data canters that are cooled with water has been varied by 10%.
RiskTriang(0,47;0,52;0,57)
Raw materials content procured hardware IT (%)
The proportion of hardware IT that consist of raw materials have been adjusted with maximum 100%, minimum 80% and most likely 90%
RiskTriang(0,8;0,9;1)
Average utilization of printers (%)
The average utilization of printers have been varied by 10%
Multifunctional printers =RiskTriang(0,3996;0,444;0,4884)
Private printers =RiskTriang(0,096;0,11;0,12)
Number of subcomponent replaced annually (sub-components/year/unit)
The average number of sub-components replaced annually are varied by 10%
Proportion renewable energy to data centres (%)
The average proportion renewable energy is minimal 0%, most likely 24% and maximal 100% (i.e. assuming green energy is procured for both data centres at BSC)
RiskTriang(0;0,24;1)
Table 58: Output simulating assumptions with 10-50 simulations and 1000 iterations dependent on the maximal capacity possible
Assessment criteria
Resulting uncertainty distribution
Average utilization of hardware IT devices (network equipment, servers and storage) (%)

MSc Thesis, J.C.P. Kalsheim: Greening Information Technology (IT) Infrastructures
Appendix N: Sensitivity Analysis Case Study Results 206
Selling price to Flection (euro/unit)

MSc Thesis, J.C.P. Kalsheim: Greening Information Technology (IT) Infrastructures
Appendix N: Sensitivity Analysis Case Study Results 207
Maintenance costs of hardware IT (euro/unit/year)
Procurement costs hardware IT (euro/unit)
Water cooling in data center (%)

MSc Thesis, J.C.P. Kalsheim: Greening Information Technology (IT) Infrastructures
Appendix N: Sensitivity Analysis Case Study Results 208
Raw materials content procured hardware IT (%)

MSc Thesis, J.C.P. Kalsheim: Greening Information Technology (IT) Infrastructures
Appendix N: Sensitivity Analysis Case Study Results 209
Average utilization of printers (%)

MSc Thesis, J.C.P. Kalsheim: Greening Information Technology (IT) Infrastructures
Appendix N: Sensitivity Analysis Case Study Results 210
Number of replaced sub-components (sub-component/year/unit)

MSc Thesis, J.C.P. Kalsheim: Greening Information Technology (IT) Infrastructures
Appendix N: Sensitivity Analysis Case Study Results 211
Proportion renewable energy in data centers (%)

MSc Thesis, J.C.P. Kalsheim: Greening Information Technology (IT) Infrastructures
Appendix N: Sensitivity Analysis Case Study Results 212
Table 59: Output simulating all uncertain data points simultaneously with 1.000 iterations and 5 simulations per test
Assessment criteria
Resulting uncertainty distribution
Water use over the life cycle of hardware IT (m3)
Energy use over the life cycle of hardware IT (MJ)
Raw material waste over the life cycle of hardware IT (kg)

MSc Thesis, J.C.P. Kalsheim: Greening Information Technology (IT) Infrastructures
Appendix N: Sensitivity Analysis Case Study Results 213
Greenhouse gas emissions over the life cycle of hardware IT (ton CO2 equivalents)
Costs over the life cycle of hardware IT (euro)
From these analyses the following has been found regarding the influence of parameters defined as assumptions or from literature:
Uncertainty in assumptions influencing water use over the life cycle of hardware IT is responsible for approximately 1,3% variability
Uncertainty in assumptions influencing energy use over the life cycle of hardware IT is responsible for approximately 1,2% variability
Uncertainty in assumptions influencing raw material waste generation over the life cycle of hardware IT is responsible for approximately 2,3% variability
Uncertainty in assumptions influencing GHG emission generation over the life cycle of hardware IT is responsible for approximately 1,5% variability
Uncertainty in assumptions influencing costs over the life cycle of hardware IT is responsible for approximately 0,9% variability
Thus it may be concluded that the influence of uncertainties in data is minimal under the data variations tested (see Table 57).
5. Summary and conclusions From the sensitivity analysis executed it is evident that the functional design and the case study results are the most sensitive to variations in its assumptions. Uncertainties in data collected in the case study have little impact on the assessment criteria scores. The assessment criteria scores are the most sensitive to amount of water use related to raw materials extraction and production of network equipment, storage and server and percentage of recycled materials end-up at landfills. As energy and water use related to the raw materials extraction and production of network equipment, storage and servers could not be found in literature for this research, it is evident the largest uncertainty lies here. It is recommended to improve the quality of these data points. Due to uncertainties both related to assumptions based on estimations from literature and uncertainties in data collected in the case study the outcome of some of the case study score are quite uncertain. The results of combining uncertainties in assumptions and collected data can be found in

MSc Thesis, J.C.P. Kalsheim: Greening Information Technology (IT) Infrastructures
Appendix N: Sensitivity Analysis Case Study Results 214
Table 60 for each assessment criteria score.
Table 60: summary of uncertainties in assessment criteria scores due to assumptions from literature and data collected
ID Name Percentage uncertainty in output scores A1 Water use over the life cycle of hardware IT (m3) 12%
A2 Energy use over the life cycle of hardware IT (MJ) 2,7%
A3 Raw material waste over the life cycle of hardware IT (kg) 19%
A4 Greenhouse gas emissions over the life cycle of hardware IT (ton CO2) 8%
A5 Costs over the life cycle of hardware IT (euro) 1,6%
Table 60 shows that the largest uncertainty can be found in assessment criteria A1 and A4. The uncertainty in A4
is mainly driven by the percentage of recycled materials that end up at landfills. In the functional design it has been assumed this is 25%, which implies just meeting the requirement set in the WEEE Directive in the European Union. In the uncertainty analysis this has been varied by 10%, thereby showing the sensitivity of this assessment criteria to this assumption. It is recognized that defining a reliable approximation can be difficult as BSC Netherlands is dependent on the provision of information from a third part. Additionally, this information should be verifiable and reliable. Next to A4, there is a relatively large uncertainty in assessment criteria A1. As outlined before, this is mainly due to limited research with respect to servers, switches, etc. This uncertainty can be reduced by improving LCA data. Uncertainty in other assessment criteria are smaller because the relative magnitude of product specification data have not been incorporated in the sensitivity analysis. Next to showing where the “weak points” of the first implementation of the functional design can be found, the sensitivity analysis also shows where policies would have the most influence. Addressing water use related to extraction and production of hardware IT would have the greatest impact on assessment criteria A1. This is in line with water use recommendations deduced from analysing the assessment criteria scores per life cycle phase (see Appendix M). Further, ensuring recycled materials actually end up being fully recycled may also influence assessment criteria A4 significantly.

MSc Thesis, J.C.P. Kalsheim: Greening Information Technology (IT) Infrastructures
215
Appendix O: Evaluation of Presentation Layouts
1. Introduction This appendix describes the outcome of the evaluation of the presentation layers of the case study results by two industrial design students and two consultants from KPMG Netherlands. The evaluations will be presented in chronological order starting with a presentation of the first presentation layouts presented to the industrial design student including their comments regarding attractiveness and intuitiveness of presentation (section 2). The refined presentation layouts have subsequently been presented to one consultants at KPMG Netherlands (section 3).
2. First evaluation round In the subsequent figures the presentation layouts have been presented as evaluated by the industrial design student are presented. The interviewees did not have prior knowledge of the topic.
Figure 69: : Presentation layout 1
Figure 70: Presentation layout 2
Figure 71: presentation layout 3
The conclusions from the evaluation by the industrial design students are presented in Table 61.
Table 61: results evaluation industrial design students evaluation of presentation layouts

MSc Thesis, J.C.P. Kalsheim: Greening Information Technology (IT) Infrastructures
216
Name Eva Frese Paul Geurts
Year of study 4 5
Conclusion on presentation layouts
- Presentation layout 1 involves a large amount of information, difficult to grasp at first sight. However, this is more insightful information than presentation layout 2. - Presentation layout 2 is clear, but does not tell within which product category the footprint may be found. - Presentation layout 3 is messy, but does show the relative position of the IT with regard to the assessment criteria.
- presentation layout 1 present a lot of information at the same time - presentation layout 2 is unclear and does not sufficient amount of information. Thereby less easy to understand, especially since there are negative values in some of the figures - presentation layout 3 is also unclear.
Suggested improvements
- Include life cycle phase and relative proportion of each product category in one graphic. - Make headings in presentation layout 1 bigger; highlight water, energy, raw materials, costs and CO2 emissions
- highlight conclusion from the graphics in layout 1 for the less visual oriented person - include an explanation of the values presented in presentation layout 3 - include different colours of the data in layout 2, this way it is possible to see the difference between the assessment criteria better
3. Second evaluation round In the subsequent figures the presentation layouts have been refined in line with the comments by the industrial design student are presented.
Figure 72: presentation layout 4
Figure 73: presentation layout 5

MSc Thesis, J.C.P. Kalsheim: Greening Information Technology (IT) Infrastructures
217
Figure 74: presentation layout 6
In conclusion from the evaluation by the industrial design students are presented in Table 62. Table 62: conclusion interview consultant
Name Jonathan Aarnouts
Working experience as consultant (year)
1
Conclusion on presentation layouts
- presentation layout 6 should be presented to the decision maker fist, subsequently layer 5 - layer 6 does not provide much information - lay 5 provides more information, but it is unclear what the average score is and where the organisation scores less well - presentation layout 4 is clear and provide much more information that the previous, but could also be improved. It is not clear in which life cycle phases the unit classes score highest
Suggested improvements
- in presentation layout 5 incorporate an average line, then improvement relative areas are evident. - in presentation layout 5, incorporate per unit class the influence on of each life cycle phase. This is possible using a stack diagram.