
D3.2 Infrastructures monitoring and interoperability adaptation ...
101
Grant Agreement No.: 604590 Instrument: Large scale integrating project (IP) Call Identifier: FP7-2012-ICT-FI eXperimental Infrastructures for the Future Internet D3.2: Infrastructures monitoring and interoperability adaptation components toolkit and API Revision: v.1.1 Work package WP3 Task Task T3.2 Due date 31/12/2013 Submission date 07/02/2014 Deliverable lead Universidad Politecnica de Madrid (UPM) Authors Jose Gonzalez (UPM), Federico Alvarez (UPM), Fernando Garcia (UPM), Pablo Rodriguez (TID), Fernando Lopez (TID), Panos Trakadas (SYN), Andreas Papadakis (SYN), Panos Karkazis (SYN), Silvio Cretti (CNET), Attilio Broglio (CNET), Giuseppe Ricucci (TI) Reviewers Riwal Kerherve (ILB), Paolo Bertolini (TN), Federico Facca (CNET) Abstract This deliverable describes the different XIFI infrastructures monitoring adaptation components following the APIs and open specifications from D3.1 and provides the software (as open source code) with the manuals required to install and use such components. Keywords Future Internet, Adapter, API, Infrastructure, Monitoring, Network, Datacentre, FI-WARE, Generic Enabler, Management, Federation
-
Upload
khangminh22 -
Category
Documents
-
view
1 -
download
0
Transcript of D3.2 Infrastructures monitoring and interoperability adaptation ...
Grant Agreement No.: 604590
Instrument: Large scale integrating project (IP)
Call Identifier: FP7-2012-ICT-FI
eXperimental Infrastructures for the Future Internet
D3.2: Infrastructures monitoring and
interoperability adaptation components
toolkit and API Revision: v.1.1
Work package WP3
Task Task T3.2
Due date 31/12/2013
Submission date 07/02/2014
Deliverable lead Universidad Politecnica de Madrid (UPM)
Authors Jose Gonzalez (UPM), Federico Alvarez (UPM), Fernando Garcia (UPM),
Pablo Rodriguez (TID), Fernando Lopez (TID), Panos Trakadas (SYN),
Andreas Papadakis (SYN), Panos Karkazis (SYN), Silvio Cretti (CNET),
Attilio Broglio (CNET), Giuseppe Ricucci (TI)
Reviewers Riwal Kerherve (ILB), Paolo Bertolini (TN), Federico Facca (CNET)
Abstract This deliverable describes the different XIFI infrastructures monitoring
adaptation components following the APIs and open specifications from
D3.1 and provides the software (as open source code) with the manuals
required to install and use such components.
Keywords Future Internet, Adapter, API, Infrastructure, Monitoring, Network,
Datacentre, FI-WARE, Generic Enabler, Management, Federation

D3.2: Infrastructures monitoring and interoperability adaptation components toolkit and API
© 2013 - 2015 XIFI Consortium Parties Page 2 of 101
Document Revision History
Version Date Description of change List of contributor(s)
V0.1 30.01. 2014 Version ready for internal
review
Jose Gonzalez (UPM), Federico
Alvarez (UPM) et al.
V1.1 07.02.2014 Final revision Jose Gonzalez (UPM), Federico
Alvarez (UPM) et al.
Disclaimer
This report contains material which is the copyright of certain XIFI Consortium Parties and may only
be reproduced or copied with permission in accordance with the XIFI consortium agreement.
All XIFI Consortium Parties have agreed to publication of this report, the content of which is licensed
under a Creative Commons Attribution-NonCommercial-NoDerivs 3.0 Unported License1.
Neither the XIFI Consortium Parties nor the European Union warrant that the information contained in
the report is capable of use, or that use of the information is free from risk, and accept no liability for
loss or damage suffered by any person using the information.
Copyright notice
© 2013 - 2015 XIFI Consortium Parties
1 http://creativecommons.org/licenses/by-nc-nd/3.0/deed.en_US
Project co-funded by the European Commission in the 7th
Framework Programme (2007-2013)
Nature of the Deliverable: P (Prototype)
Dissemination Level
PU Public
PP Restricted to other programme participants (including the Commission Services)
RE Restricted to bodies determined by the XIFI project
CO Confidential to XIFI project and Commission Services

D3.2: Infrastructures monitoring and interoperability adaptation components toolkit and API
© 2013 - 2015 XIFI Consortium Parties Page 3 of 101
EXECUTIVE SUMMARY
This document describes the infrastructure monitoring adaptation components, following the main
outcomes reached with regards to APIs and open specifications in deliverable D3.1 [31].
The adaptation components consist of an abstraction layer which allows the infrastructure nodes to
offer the full capacity of XIFI in a unified manner, and to achieve the necessary degree of
compatibility with FI-WARE technology [13] and the rest of infrastructures of the XIFI pan-European
federation. This standardization process shall ensure the highest possible quality to the end-users.
In this deliverable, we describe one of the infrastructures adaptation components which are part of the
XIFI WP3: the Infrastructure Adaptation components for the monitoring of the infrastructures. These
components will monitor both networks and data centres, at different levels to expose and control the
relevant parameters of the infrastructures to assure the monitoring and control of quality of services in
the federated infrastructures.
In this document we describe the infrastructure monitoring components, which are part of the XIFI
Infrastructure Monitoring Middleware (XIMM):
NGSI Adapter
Network Active Monitoring-NAM Adapter
Network Passive Monitoring-NPM Adapter
Datacentre & Enabler Monitoring-DEM Adapter
OpenStack Data Collector
The components are described in their corresponding sections, offering a description of the needed
elements to install them in the XIFI infrastructures: architecture, installation manual, user manual,
related components, background and, of course, where to find the software.
In addition, this deliverable is prepared to be a base for future joining infrastructures which will need
to integrate such components to run XIFI with full capacity.
D3.2: Infrastructures monitoring and interoperability adaptation components toolkit and API
© 2013 - 2015 XIFI Consortium Parties Page 4 of 101
TABLE OF CONTENTS
EXECUTIVE SUMMARY ....................................................................................................................3
TABLE OF CONTENTS .......................................................................................................................4
LIST OF FIGURES ...............................................................................................................................6
LIST OF TABLES .................................................................................................................................7
ABBREVIATIONS ................................................................................................................................8
1 INTRODUCTION ..................................................................................................................9
1.1 Scope.........................................................................................................................................9
1.2 D3.1- XIFI infrastructure adaptation components API open specification ..............................9
2 COMPONENTS DESCRIPTION .......................................................................................11
2.1 NGSI Adapter .........................................................................................................................11
2.1.1 Summary .................................................................................................................................11
2.1.2 Component Responsible .........................................................................................................12
2.1.3 Motivation ...............................................................................................................................12
2.1.4 User Stories Backlog ..............................................................................................................12
2.1.5 State of the art .........................................................................................................................13
2.1.6 Architecture Design ................................................................................................................13
2.1.7 Release Plan ............................................................................................................................15
2.1.8 Installation Manual .................................................................................................................15
2.1.9 User Manual ............................................................................................................................17
2.2 Network Active Monitoring-NAM Adapter ...........................................................................19
2.2.1 Summary .................................................................................................................................19
2.2.2 Component Responsible .........................................................................................................21
2.2.3 Motivation ...............................................................................................................................21
2.2.4 User Stories Backlog ..............................................................................................................22
2.2.5 State of the art .........................................................................................................................24
2.2.6 Architecture Design ................................................................................................................25
2.2.7 Release Plan ............................................................................................................................31
2.2.8 Installation Manual .................................................................................................................31
2.2.9 User Manual ............................................................................................................................36
2.3 Network Passive Monitoring-NPM Adapter ..........................................................................45
2.3.1 Summary .................................................................................................................................45
2.3.2 Component Responsible .........................................................................................................46
2.3.3 Motivation ...............................................................................................................................46
2.3.4 User Stories Backlog ..............................................................................................................46
2.3.5 State of the art .........................................................................................................................47
D3.2: Infrastructures monitoring and interoperability adaptation components toolkit and API
© 2013 - 2015 XIFI Consortium Parties Page 5 of 101
2.3.6 Architecture Design ................................................................................................................48
2.3.7 Release Plan ............................................................................................................................50
2.3.8 Installation Manual .................................................................................................................50
2.3.9 User Manual ............................................................................................................................53
2.4 Datacentre & Enabler Monitoring-DEM Adapter ..................................................................58
2.4.1 Summary .................................................................................................................................58
2.4.2 Component Responsible .........................................................................................................60
2.4.3 Motivation ...............................................................................................................................61
2.4.4 User Stories Backlog ..............................................................................................................61
2.4.5 State of the art .........................................................................................................................62
2.4.6 Architecture Design ................................................................................................................63
2.4.7 Release Plan ............................................................................................................................64
2.4.8 Installation Manual .................................................................................................................64
2.4.9 User Manual ............................................................................................................................77
2.5 OpenStack Data Collector ......................................................................................................84
2.5.1 Summary .................................................................................................................................84
2.5.2 Component Responsible .........................................................................................................85
2.5.3 Motivation ...............................................................................................................................85
2.5.4 User Stories Backlog ..............................................................................................................86
2.5.5 State of the art .........................................................................................................................86
2.5.6 Architecture Design ................................................................................................................86
2.5.7 Release Plan ............................................................................................................................87
2.5.8 Installation Manual .................................................................................................................87
2.5.9 User Manual ............................................................................................................................88
3 CONCLUSIONS ...................................................................................................................89
REFERENCES .....................................................................................................................................90
APPENDIX A: NGSI ADAPTER TEST CASES ..............................................................................92
APPENDIX B: DEM ADAPTER TEST CASES ...............................................................................94
D3.2: Infrastructures monitoring and interoperability adaptation components toolkit and API
© 2013 - 2015 XIFI Consortium Parties Page 6 of 101
LIST OF FIGURES
Figure 1: NGSI Adapter within the Architecture of a generic XIFI Node .............................................11
Figure 2: NGSI Adapter Architecture and Context ................................................................................14
Figure 3: NGSI Adapter - Sequence Diagram........................................................................................15
Figure 4: NGSI Adapter – Check logs at console ..................................................................................18
Figure 5: NAM Adapter within the Architecture of a generic XIFI Node .............................................20
Figure 6: NAM Adapter - General Context............................................................................................22
Figure 7: Demonstration of how the PerfSONAR services may be linked together ..............................25
Figure 8: XIMM-NAM Architecture and Context .................................................................................26
Figure 9: NAM Measurement Collector - Internal Architecture ............................................................28
Figure 10: Sequence Diagram - Scheduled Test ....................................................................................29
Figure 11: Sequence Diagram - On-demand Test ..................................................................................30
Figure 12: Sequence Diagram - Configuration Scheduled Testing ........................................................30
Figure 13: Request On-demand OWD Test ...........................................................................................40
Figure 14: Response On-demand OWD Test – REST Console .............................................................41
Figure 15: Response On-demand OWD Test – Web Browser ...............................................................41
Figure 16: Request Scheduled BDW Test – REST Console ..................................................................43
Figure 17: Test Latency (OWD) – NAM Adapter GUI .........................................................................44
Figure 18: Test Latency Result – NAM Adapter GUI ...........................................................................44
Figure 19: Nagios monitoring Resources [23] .......................................................................................48
Figure 20: XIMM-NPM Architecture and Context ................................................................................49
Figure 21: DEM Adapter within the Architecture of a generic XIFI Node ...........................................59
Figure 22: XIMM-DEM Architecture and Context ...............................................................................63
Figure 23: DEM Adapter - Sequence Diagram ......................................................................................64
Figure 24: OpenStack Data Collector within the Architecture of a generic XIFI Node ........................84
Figure 25: OpenStack Data Collector Architecture ...............................................................................86
Figure 26: Nagios Web Interface ...........................................................................................................95
D3.2: Infrastructures monitoring and interoperability adaptation components toolkit and API
© 2013 - 2015 XIFI Consortium Parties Page 7 of 101
LIST OF TABLES
Table 1: NGSI Adapter Context Details ................................................................................................12
Table 2: NGSI Adapter Dependencies Summary...................................................................................12
Table 3: NGSI Adapter Reference Details .............................................................................................12
Table 4: NGSI Adapter User Stories Backlog........................................................................................13
Table 5: NGSI Adapter Release Plan .....................................................................................................15
Table 6: NAM Adapter Context Details ................................................................................................21
Table 7: NAM Adapter Dependencies Summary...................................................................................21
Table 8: NAM Adapter Reference Details .............................................................................................21
Table 9: NAM Adapter User Stories Backlog........................................................................................23
Table 10: NAM Adapter Release Plan ...................................................................................................31
Table 11: NPM Adapter Context Details ...............................................................................................45
Table 12: NPM Adapter Dependencies Summary .................................................................................46
Table 13: NPM Adapter Reference Details ............................................................................................46
Table 14: NPM Adapter User Stories Backlog ......................................................................................47
Table 15: NPM Adapter Release Plan ....................................................................................................50
Table 16: DEM Adapter Context Details ...............................................................................................60
Table 17: DEM Adapter Dependencies Summary .................................................................................60
Table 18: DEM Adapter Reference Details ...........................................................................................60
Table 19: DEM Adapter User Stories Backlog ......................................................................................62
Table 20: DEM Adapter Release Plan ...................................................................................................64
Table 21: OpenStack Data Collector Context Details ............................................................................85
Table 22: OpenStack Data Collector Dependencies Summary ..............................................................85
Table 23: OpenStack Data Collector Reference Details ........................................................................85
Table 24: OpenStack Data Collector User Stories Backlog ...................................................................86
Table 25: OpenStack Data Collector Release Plan ................................................................................87
Table 26: NGSI Adapter Test Cases ......................................................................................................93

D3.2: Infrastructures monitoring and interoperability adaptation components toolkit and API
© 2013 - 2015 XIFI Consortium Parties Page 8 of 101
ABBREVIATIONS
API Application Programming Interface
CB Context Broker
DC Data Centre
DEM Datacentre and Enablers Monitoring
FMC Fundamental Modelling Concepts
GE Generic Enabler
GEi Generic Enabler instance
GUI Graphical User Interface
HTTP Hypertext Transfer Protocol
JSON JavaScript Object Notation
KPI Key Performance Indicator
NAM Network Active Monitoring
NGSI Next Generation Service Interfaces
NPM Network Passive Monitoring
QoS Quality of Service
REST REpresentational State Transfer
SLA Service Level Agreement
SNMP Simple Network Management Protocol
URL Uniform Resource Locator
XIMM XIFI Infrastructure Monitoring Middleware
XML eXtensible Markup Language
D3.2: Infrastructures monitoring and interoperability adaptation components toolkit and API
© 2013 - 2015 XIFI Consortium Parties Page 9 of 101
1 INTRODUCTION
1.1 Scope
This deliverable focuses on the description of the components required for supporting infrastructure
monitoring in the XIFI federation. In particular, this deliverable aims to describe the 5 components
which were identified in D3.1 to gather ‘physical appliance’ monitoring data from the infrastructures
in a consistent way, using when required for data gathering some monitoring solutions developed by
FI-WARE.
The deliverable is a software accompanying deliverable. Therefore we offer an explanation of the
components which are part of the monitoring adapters, focusing on the elements which an
infrastructure owner or developer may need for joining the XIFI federation such as a general
description, responsible, motivation, related work, dependencies, licence, architecture design,
installation manual, user manual, and of course, the pointer to the code.
1.2 D3.1- XIFI infrastructure adaptation components API open specification
The XIFI pan-European federation aims to be the community cloud for European FI-PPP developers
enabled by advanced Future Internet (FI) infrastructures in Europe. The FI-PPP Future Internet Public-
Private Partnership (FI-PPP) [14] is an ambitious programme by the European Commission part of the
7th Framework Programme aiming at exploring the potential of a common platform for Future Internet
technologies to establish new business ecosystems. XIFI, through this community cloud, will provide
a market place to access: i) the web-based services offered by FI-PPP (i.e. the Generic Enablers
developed by FI-WARE [13] and the Specific Enablers provided by Use Case Trials), ii) advanced
Future Internet infrastructures that provide capacities, and iii) data to empower the applications
developed by early adopters of FI-PPP technologies.
One of the relevant needed features is the ability to monitor the XIFI infrastructures, both networks
and data centres, with a set of components which have been implemented as open source.
This document contains the description of the infrastructure monitoring adaptation components,
following the APIs and open specifications from D3.1. The adaptation components consist of an
abstraction layer which allows the infrastructures to offer the full capacity of XIFI in a unified manner,
and to achieve the necessary degree of compatibility with FI-WARE and with the rest of
infrastructures of the XIFI pan-European federation, ensuring the highest possible quality to the end-
users.
In this deliverable, we describe one of the infrastructures adaptation components which are part of the
XIFI WP3: the Infrastructure Adaptation components for the monitoring of the infrastructures. These
components will monitor both networks and data centres, at different levels to expose and control the
relevant parameters of the infrastructures to assure the monitoring and control of quality of services in
the federated infrastructures.
In this document we describe the infrastructure monitoring components, which are part of the XIFI
Infrastructure Monitoring Middleware (XIMM):
NGSI Adapter: This component standardizes the raw data gathered by the XIMM
measurement collectors, thus making data suitable for the NGSI format used by Context
Broker Generic Enabler.

D3.2: Infrastructures monitoring and interoperability adaptation components toolkit and API
© 2013 - 2015 XIFI Consortium Parties Page 10 of 101
Network Active Monitoring-NAM Adapter: This component enables to establish end-to-end
communications along a distributed set of points of interest within the XIFI community to
check bandwidth and latency performance tests.
Network Passive Monitoring-NPM Adapter: this component enables the network resource
monitoring along the XIFI community by providing SNMP data collection from the network
resources and the adaptation layer between the monitoring lowest-layer and the XIFI
federation layer.
Datacentre & Enabler Monitoring-DEM Adapter: this component enables the access to
metrics of specific hosts and services which belong to the datacentre of the infrastructure and
hold a meaningful behaviour for XIFI. Since the special interest of the federation lie on the
performance of FI-WARE GEs instances, their monitoring is a duty that is relevant to XIFI.
OpenStack Data Collector: this component aims at collecting information from an
OpenStack installation using OpenStack keystone and nova APIs and/or the command line.
Information collected is capacity data as number of virtual machine deployed, number of cores
available, size of ram and size of disk, number of users/tenders registered.
The components are described in their corresponding sections, offering a description of the needed
elements to install them in the XIFI infrastructures: architecture, installation manual, user manual,
related components, background and, of course, where to find the software.
In addition, this deliverable is prepared to be a base for future joining infrastructures which will need
to integrate such components to run XIFI with full capacity.
D3.2: Infrastructures monitoring and interoperability adaptation components toolkit and API
© 2013 - 2015 XIFI Consortium Parties Page 11 of 101
2 COMPONENTS DESCRIPTION
2.1 NGSI Adapter
2.1.1 Summary
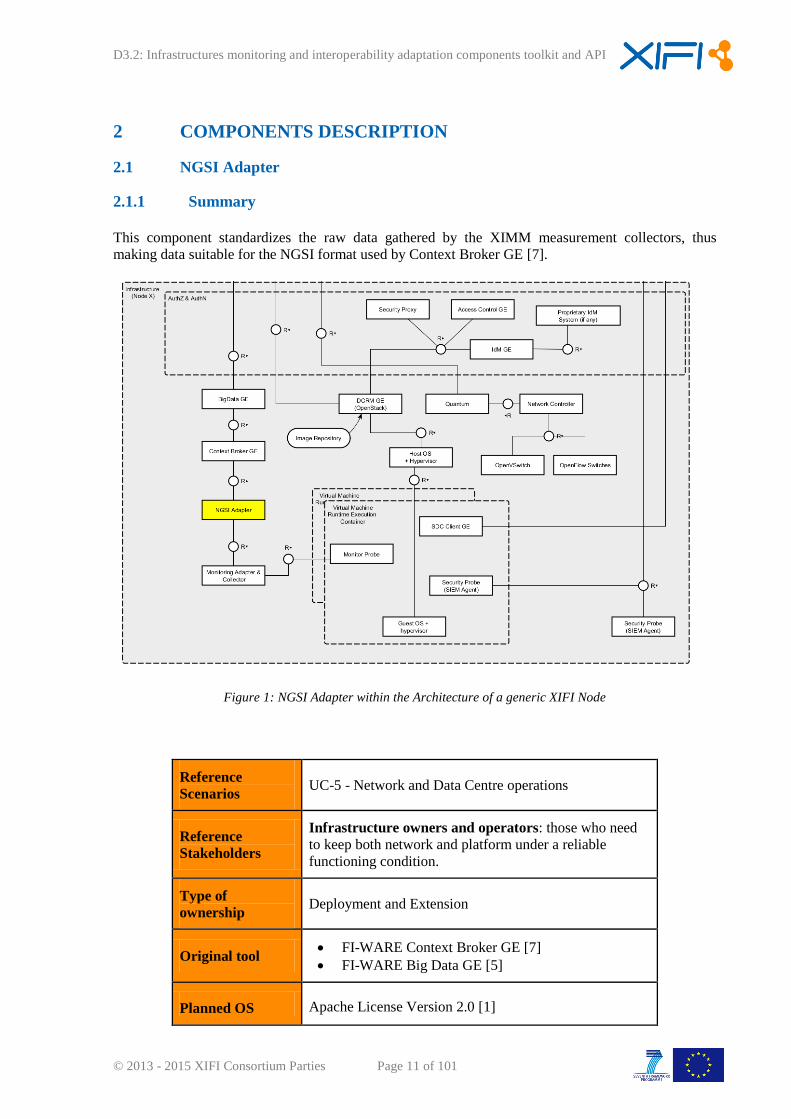
This component standardizes the raw data gathered by the XIMM measurement collectors, thus
making data suitable for the NGSI format used by Context Broker GE [7].
Figure 1: NGSI Adapter within the Architecture of a generic XIFI Node
Reference
Scenarios UC-5 - Network and Data Centre operations
Reference
Stakeholders
Infrastructure owners and operators: those who need
to keep both network and platform under a reliable
functioning condition.
Type of
ownership Deployment and Extension
Original tool FI-WARE Context Broker GE [7]
FI-WARE Big Data GE [5]
Planned OS Apache License Version 2.0 [1]
D3.2: Infrastructures monitoring and interoperability adaptation components toolkit and API
© 2013 - 2015 XIFI Consortium Parties Page 12 of 101
license
Reference OS
community None at the moment
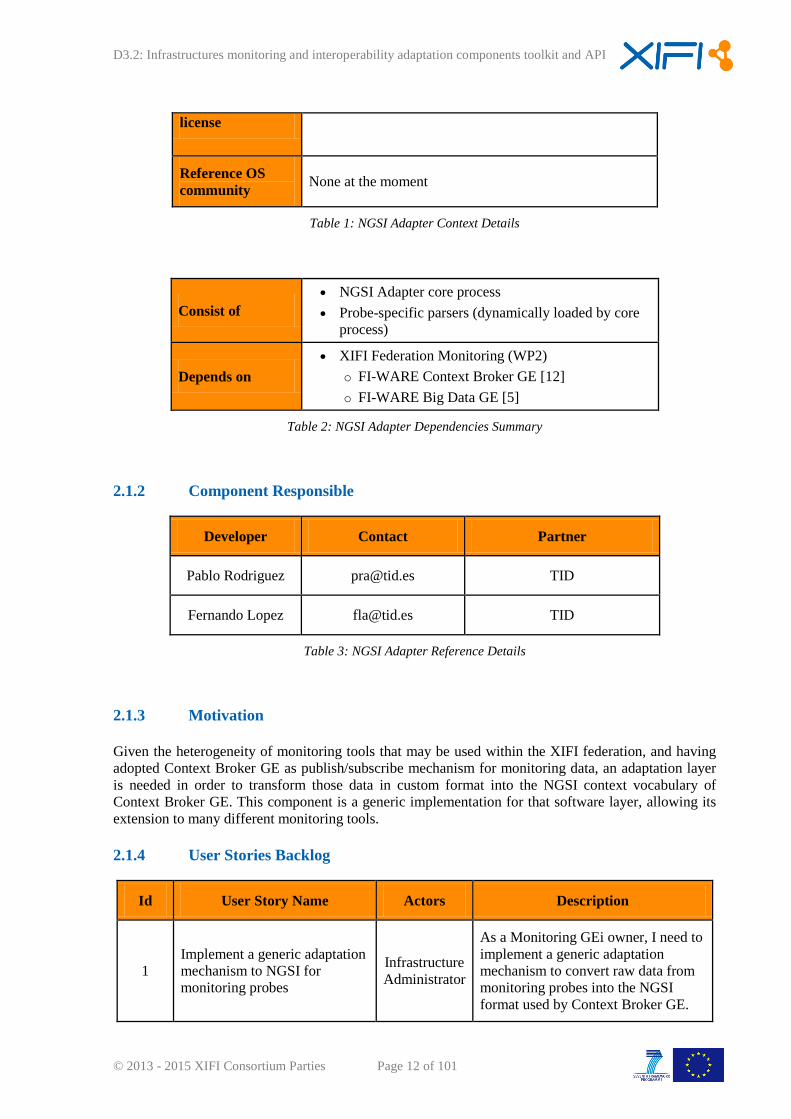
Table 1: NGSI Adapter Context Details
Consist of
NGSI Adapter core process
Probe-specific parsers (dynamically loaded by core
process)
Depends on
XIFI Federation Monitoring (WP2)
o FI-WARE Context Broker GE [12]
o FI-WARE Big Data GE [5]
Table 2: NGSI Adapter Dependencies Summary
2.1.2 Component Responsible
Developer Contact Partner
Pablo Rodriguez [email protected] TID
Fernando Lopez [email protected] TID
Table 3: NGSI Adapter Reference Details
2.1.3 Motivation
Given the heterogeneity of monitoring tools that may be used within the XIFI federation, and having
adopted Context Broker GE as publish/subscribe mechanism for monitoring data, an adaptation layer
is needed in order to transform those data in custom format into the NGSI context vocabulary of
Context Broker GE. This component is a generic implementation for that software layer, allowing its
extension to many different monitoring tools.
2.1.4 User Stories Backlog
Id User Story Name Actors Description
1
Implement a generic adaptation
mechanism to NGSI for
monitoring probes
Infrastructure
Administrator
As a Monitoring GEi owner, I need to
implement a generic adaptation
mechanism to convert raw data from
monitoring probes into the NGSI
format used by Context Broker GE.

D3.2: Infrastructures monitoring and interoperability adaptation components toolkit and API
© 2013 - 2015 XIFI Consortium Parties Page 13 of 101
Id User Story Name Actors Description
2 Specific Nagios adapters to
NGSI
Infrastructure
Administrator
As a Monitoring GEi owner, I need to
implement the specific components of
the Nagios probes for DEM attributes.
3 Analyze perfSONAR-PS
module adaptation to NGSI
Infrastructure
Administrator
As a Monitoring GEi owner, I want to
make an analysis and evaluation of
the perfSONAR-PS adapter
extension.
4 Analyze openNMS module
adaptation to NGSI
Infrastructure
Administrator
As a Monitoring GEi owner, I want to
make an analysis and evaluation of
openNMS adapter extension.
Table 4: NGSI Adapter User Stories Backlog
2.1.5 State of the art
NGSI Adapter is a component originally developed within the FI-WARE Monitoring GEi components
[8] which aim to aggregate data from different monitoring tools that might have been already installed
within the infrastructure owners. This solution shall be capable of providing monitored data through a
standardized format (FI-WARE NGSI-10 API [10]) that unifies developments in FI-PPP projects and
is compatible with the Context Broker [7] and Big Data [5] GEs.
2.1.6 Architecture Design
In order to make the adapter as much independent from other XIMM modules as possible, it shall be
extended by a set of parsers specifically developed for each concrete monitoring probe that is being
used by NAM (section 2.1.9), NPM (section 2.3) and DEM (section 2.4) modules. Therefore, a single
NGSI Adapter might be able to handle any kind of monitoring data coming from the different probes
through the three XIMM measurement collectors. Adaptation from probe-specific format to NGSI
entity attributes is delegated to the NGSI Adapter component and its parsers exclusively (not to the
measurement collectors).
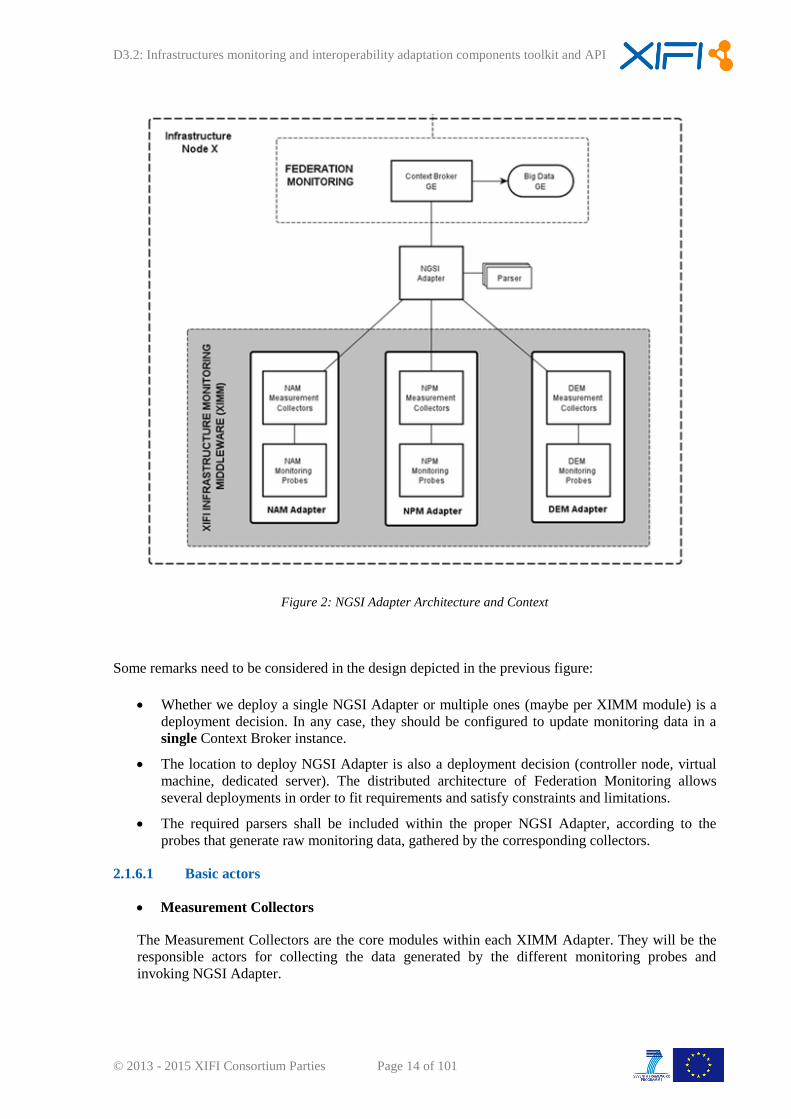
Diagram below (Figure 2) provides a graphical description of the interactions among internal and
surrounding modules of NGSI Adapter.
D3.2: Infrastructures monitoring and interoperability adaptation components toolkit and API
© 2013 - 2015 XIFI Consortium Parties Page 14 of 101
Figure 2: NGSI Adapter Architecture and Context
Some remarks need to be considered in the design depicted in the previous figure:
Whether we deploy a single NGSI Adapter or multiple ones (maybe per XIMM module) is a
deployment decision. In any case, they should be configured to update monitoring data in a
single Context Broker instance.
The location to deploy NGSI Adapter is also a deployment decision (controller node, virtual
machine, dedicated server). The distributed architecture of Federation Monitoring allows
several deployments in order to fit requirements and satisfy constraints and limitations.
The required parsers shall be included within the proper NGSI Adapter, according to the
probes that generate raw monitoring data, gathered by the corresponding collectors.
2.1.6.1 Basic actors
Measurement Collectors
The Measurement Collectors are the core modules within each XIMM Adapter. They will be the
responsible actors for collecting the data generated by the different monitoring probes and
invoking NGSI Adapter.

D3.2: Infrastructures monitoring and interoperability adaptation components toolkit and API
© 2013 - 2015 XIFI Consortium Parties Page 15 of 101
NGSI Adapter Parsers
NGSI Adapter knows nothing about the format of data from monitoring probes, so it should be
augmented with several parsers given as dynamically loadable software modules for each of the
probes. Adapter will select the right parser based on the information from incoming requests, then
will load it and let the parser extract monitoring core information. Then adapter will transform it
into NGSI format.
2.1.6.2 Main interactions
Figure 3: NGSI Adapter - Sequence Diagram
2.1.7 Release Plan
Version ID Milestone User Stories
v1.0 M9 1, 2, 3, 4
Table 5: NGSI Adapter Release Plan
2.1.8 Installation Manual
2.1.8.1 Installation Requirements
NGSI Adapter should work on a variety of operating systems, particularly on the majority of
GNU/Linux distributions (e.g. Debian, Ubuntu, CentOS), as it only requires a V8 JavaScript Engine to
run a Node.js server.
Hardware Requirements:
The minimal requirements are:
RAM: 2 GB
D3.2: Infrastructures monitoring and interoperability adaptation components toolkit and API
© 2013 - 2015 XIFI Consortium Parties Page 16 of 101
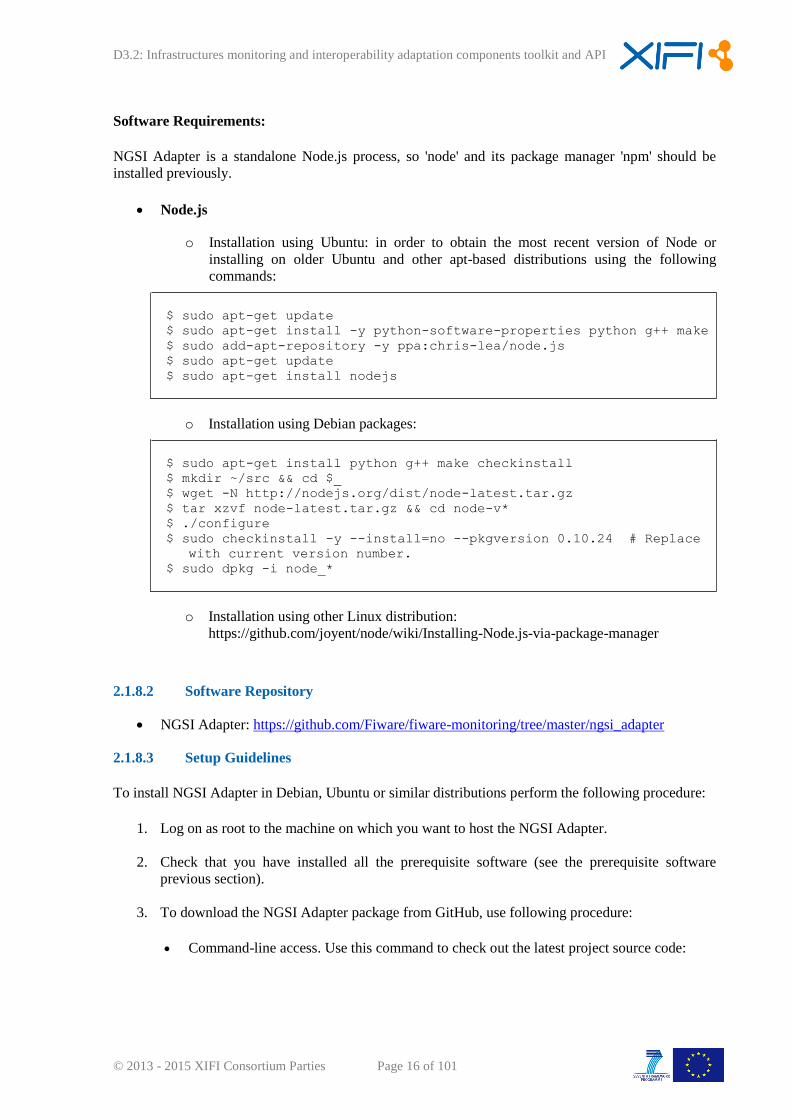
Software Requirements:
NGSI Adapter is a standalone Node.js process, so 'node' and its package manager 'npm' should be
installed previously.
Node.js
o Installation using Ubuntu: in order to obtain the most recent version of Node or
installing on older Ubuntu and other apt-based distributions using the following
commands:
$ sudo apt-get update
$ sudo apt-get install -y python-software-properties python g++ make
$ sudo add-apt-repository -y ppa:chris-lea/node.js
$ sudo apt-get update
$ sudo apt-get install nodejs
o Installation using Debian packages:
$ sudo apt-get install python g++ make checkinstall
$ mkdir ~/src && cd $_
$ wget -N http://nodejs.org/dist/node-latest.tar.gz
$ tar xzvf node-latest.tar.gz && cd node-v*
$ ./configure
$ sudo checkinstall -y --install=no --pkgversion 0.10.24 # Replace
with current version number.
$ sudo dpkg -i node_*
o Installation using other Linux distribution:
https://github.com/joyent/node/wiki/Installing-Node.js-via-package-manager
2.1.8.2 Software Repository
NGSI Adapter: https://github.com/Fiware/fiware-monitoring/tree/master/ngsi_adapter
2.1.8.3 Setup Guidelines
To install NGSI Adapter in Debian, Ubuntu or similar distributions perform the following procedure:
1. Log on as root to the machine on which you want to host the NGSI Adapter.
2. Check that you have installed all the prerequisite software (see the prerequisite software
previous section).
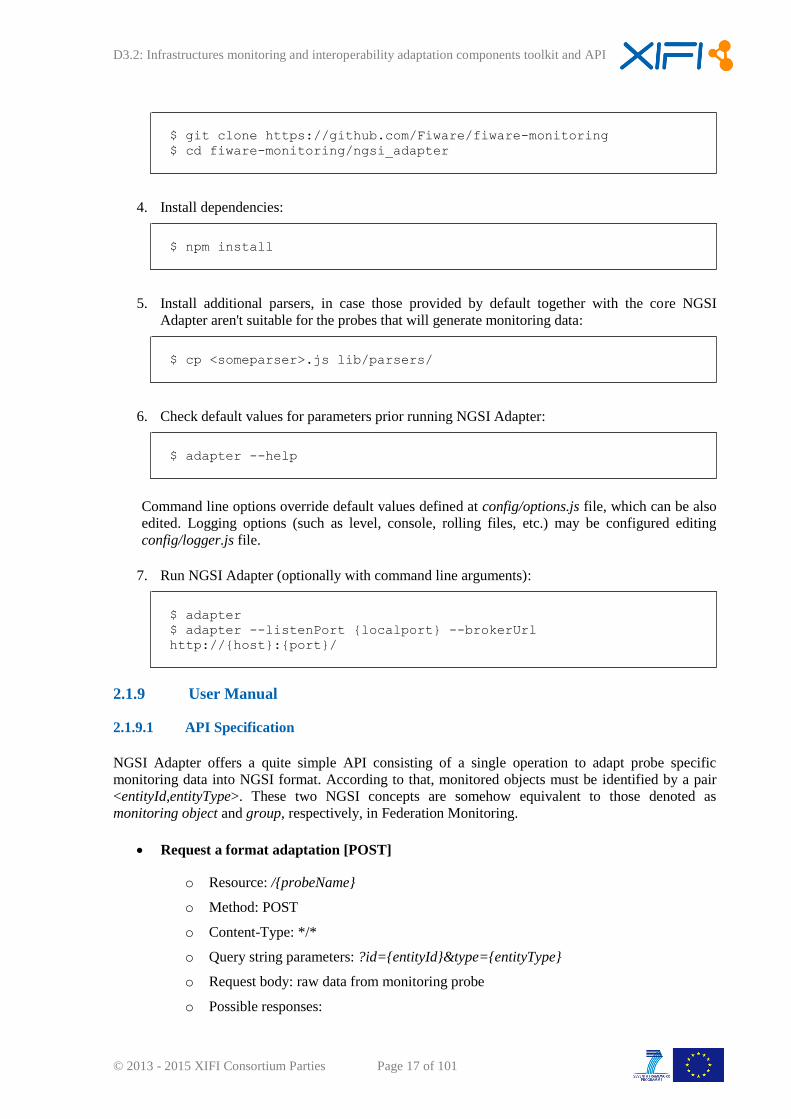
3. To download the NGSI Adapter package from GitHub, use following procedure:
Command-line access. Use this command to check out the latest project source code:
D3.2: Infrastructures monitoring and interoperability adaptation components toolkit and API
© 2013 - 2015 XIFI Consortium Parties Page 17 of 101
$ git clone https://github.com/Fiware/fiware-monitoring
$ cd fiware-monitoring/ngsi_adapter
4. Install dependencies:
$ npm install
5. Install additional parsers, in case those provided by default together with the core NGSI
Adapter aren't suitable for the probes that will generate monitoring data:
$ cp <someparser>.js lib/parsers/
6. Check default values for parameters prior running NGSI Adapter:
$ adapter --help
Command line options override default values defined at config/options.js file, which can be also
edited. Logging options (such as level, console, rolling files, etc.) may be configured editing
config/logger.js file.
7. Run NGSI Adapter (optionally with command line arguments):
$ adapter
$ adapter --listenPort {localport} --brokerUrl
http://{host}:{port}/
2.1.9 User Manual
2.1.9.1 API Specification
NGSI Adapter offers a quite simple API consisting of a single operation to adapt probe specific
monitoring data into NGSI format. According to that, monitored objects must be identified by a pair
<entityId,entityType>. These two NGSI concepts are somehow equivalent to those denoted as
monitoring object and group, respectively, in Federation Monitoring.
Request a format adaptation [POST]
o Resource: /{probeName}
o Method: POST
o Content-Type: */*
o Query string parameters: ?id={entityId}&type={entityType}
o Request body: raw data from monitoring probe
o Possible responses:
D3.2: Infrastructures monitoring and interoperability adaptation components toolkit and API
© 2013 - 2015 XIFI Consortium Parties Page 18 of 101
Code Description Body Content Representation
200 OK none none
404 Not found (*) none none
405 Not allowed (*) none none
(*) Requests are processed asynchronously and always result into a 200 status code,
unless:
the probe is unknown (no valid parser can be found after probe's name): 404
the request method is not POST: 405
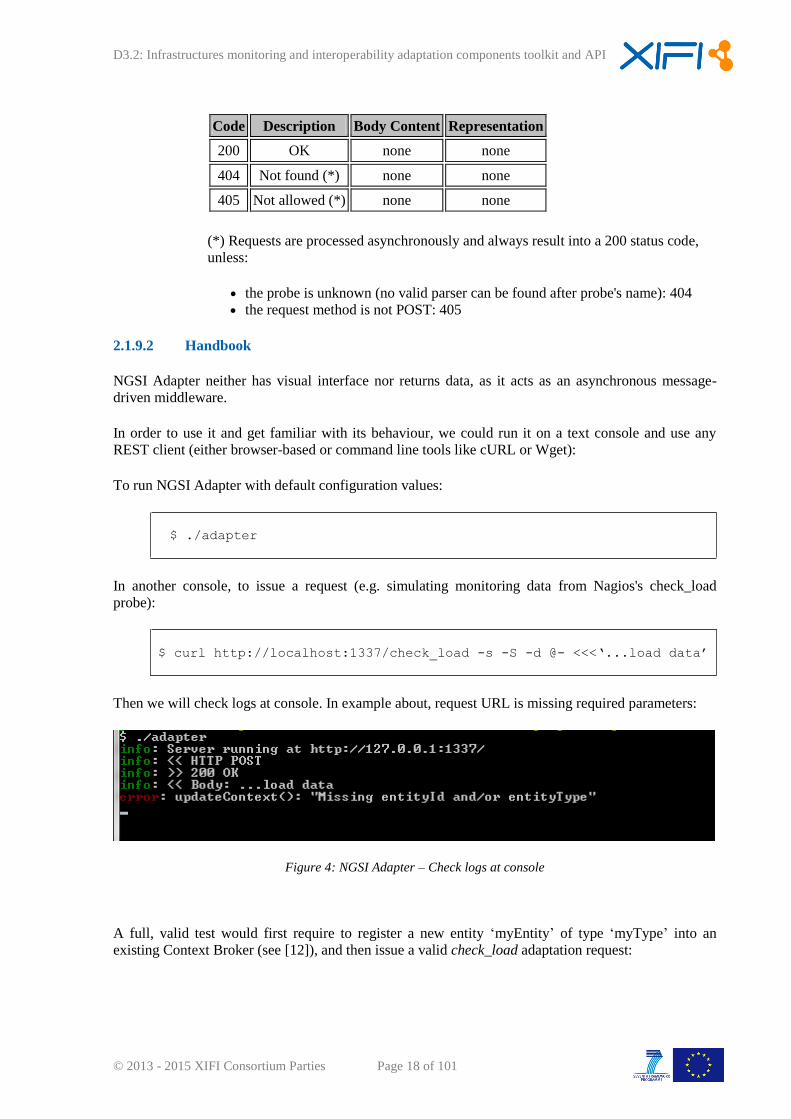
2.1.9.2 Handbook
NGSI Adapter neither has visual interface nor returns data, as it acts as an asynchronous message-
driven middleware.
In order to use it and get familiar with its behaviour, we could run it on a text console and use any
REST client (either browser-based or command line tools like cURL or Wget):
To run NGSI Adapter with default configuration values:
$ ./adapter
In another console, to issue a request (e.g. simulating monitoring data from Nagios's check_load
probe):
$ curl http://localhost:1337/check_load -s -S -d @- <<<‘...load data’
Then we will check logs at console. In example about, request URL is missing required parameters:
Figure 4: NGSI Adapter – Check logs at console
A full, valid test would first require to register a new entity ‘myEntity’ of type ‘myType’ into an
existing Context Broker (see [12]), and then issue a valid check_load adaptation request:
D3.2: Infrastructures monitoring and interoperability adaptation components toolkit and API
© 2013 - 2015 XIFI Consortium Parties Page 19 of 101
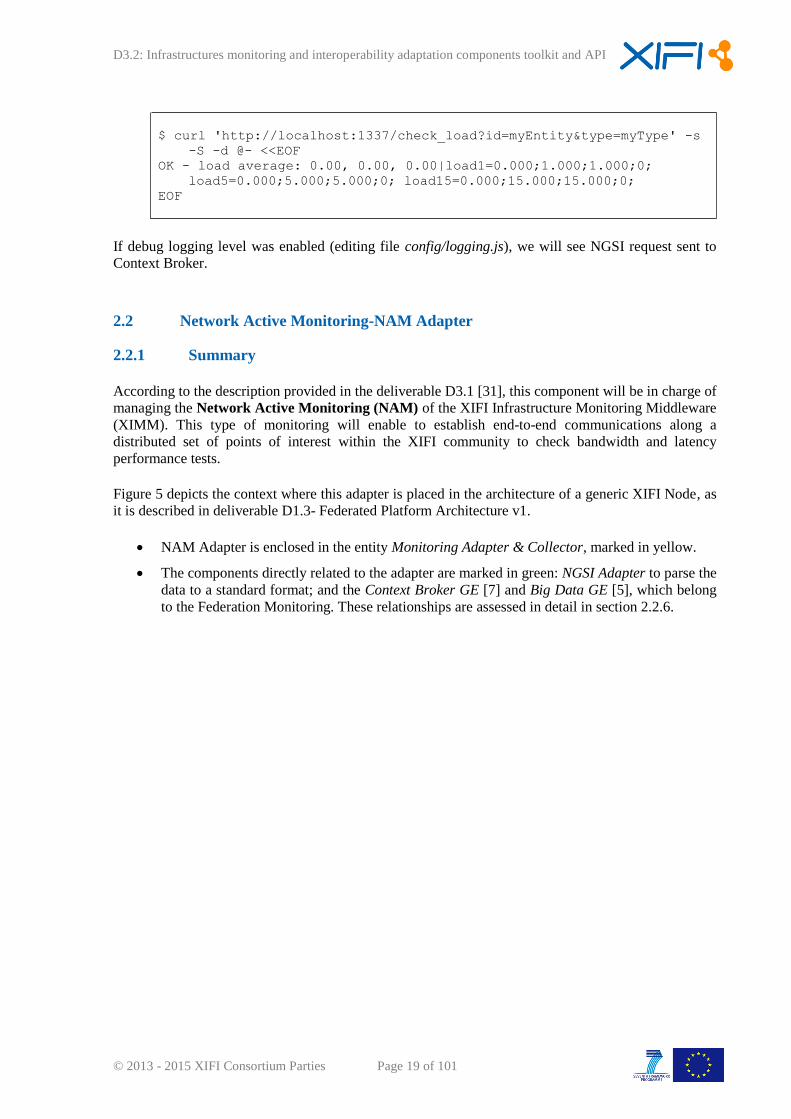
$ curl 'http://localhost:1337/check_load?id=myEntity&type=myType' -s
-S -d @- <<EOF
OK - load average: 0.00, 0.00, 0.00|load1=0.000;1.000;1.000;0;
load5=0.000;5.000;5.000;0; load15=0.000;15.000;15.000;0;
EOF
If debug logging level was enabled (editing file config/logging.js), we will see NGSI request sent to
Context Broker.
2.2 Network Active Monitoring-NAM Adapter
2.2.1 Summary
According to the description provided in the deliverable D3.1 [31], this component will be in charge of
managing the Network Active Monitoring (NAM) of the XIFI Infrastructure Monitoring Middleware
(XIMM). This type of monitoring will enable to establish end-to-end communications along a
distributed set of points of interest within the XIFI community to check bandwidth and latency
performance tests.
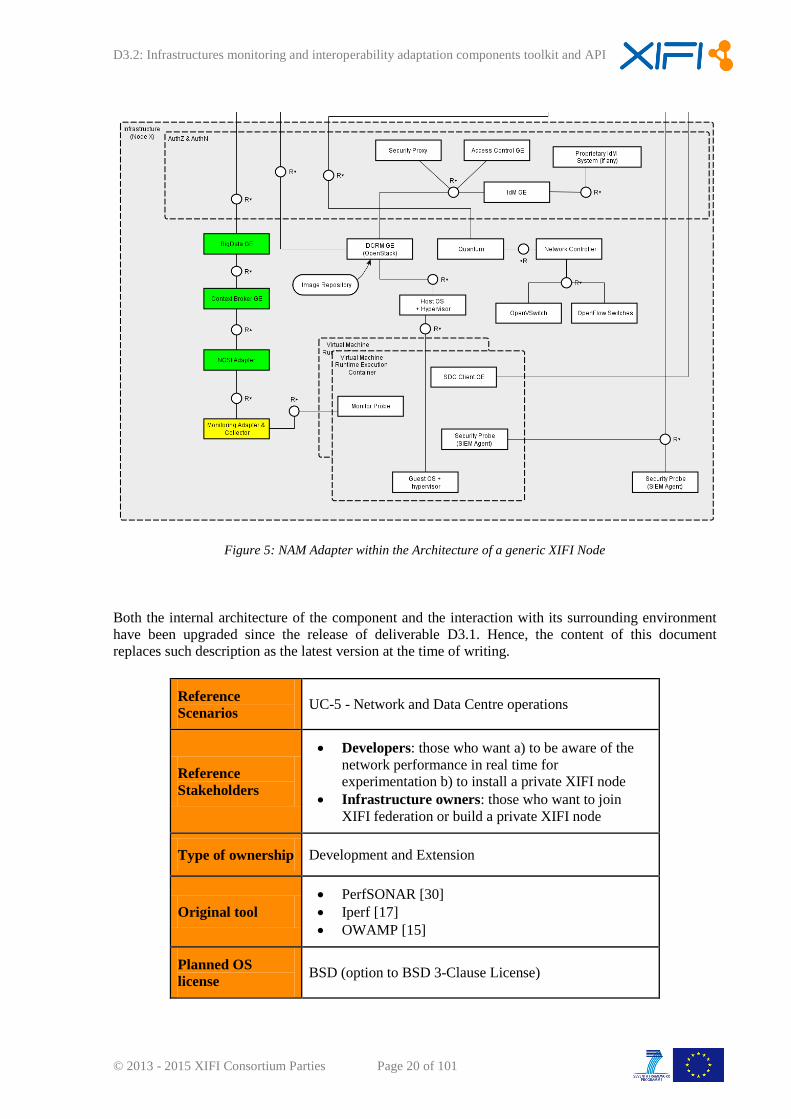
Figure 5 depicts the context where this adapter is placed in the architecture of a generic XIFI Node, as
it is described in deliverable D1.3- Federated Platform Architecture v1.
NAM Adapter is enclosed in the entity Monitoring Adapter & Collector, marked in yellow.
The components directly related to the adapter are marked in green: NGSI Adapter to parse the
data to a standard format; and the Context Broker GE [7] and Big Data GE [5], which belong
to the Federation Monitoring. These relationships are assessed in detail in section 2.2.6.
D3.2: Infrastructures monitoring and interoperability adaptation components toolkit and API
© 2013 - 2015 XIFI Consortium Parties Page 20 of 101
Figure 5: NAM Adapter within the Architecture of a generic XIFI Node
Both the internal architecture of the component and the interaction with its surrounding environment
have been upgraded since the release of deliverable D3.1. Hence, the content of this document
replaces such description as the latest version at the time of writing.
Reference
Scenarios UC-5 - Network and Data Centre operations
Reference
Stakeholders
Developers: those who want a) to be aware of the
network performance in real time for
experimentation b) to install a private XIFI node
Infrastructure owners: those who want to join
XIFI federation or build a private XIFI node
Type of ownership Development and Extension
Original tool
PerfSONAR [30]
Iperf [17]
OWAMP [15]
Planned OS
license BSD (option to BSD 3-Clause License)
D3.2: Infrastructures monitoring and interoperability adaptation components toolkit and API
© 2013 - 2015 XIFI Consortium Parties Page 21 of 101
Reference OS
community PerfSONAR community
Table 6: NAM Adapter Context Details
Consist of
Monitoring Probes
o OWD Monitoring Probe
o BDW Monitoring Probe
Measurement Collectors
o OWD Measurement Collector
o BDW Measurement Collector
Depends on
NGSI Adapter (WP3)
XIFI Federation Monitoring (WP2)
o FI-WARE Context Broker GE [7]
o FI-WARE Big Data GE [5]
XIFI Monitoring Dashboard (WP4)
Table 7: NAM Adapter Dependencies Summary
2.2.2 Component Responsible
Developer Contact Partner
Jose Gonzalez [email protected] UPM
Fernando Garcia [email protected] UPM
Federico Alvarez [email protected] UPM
Table 8: NAM Adapter Reference Details
2.2.3 Motivation
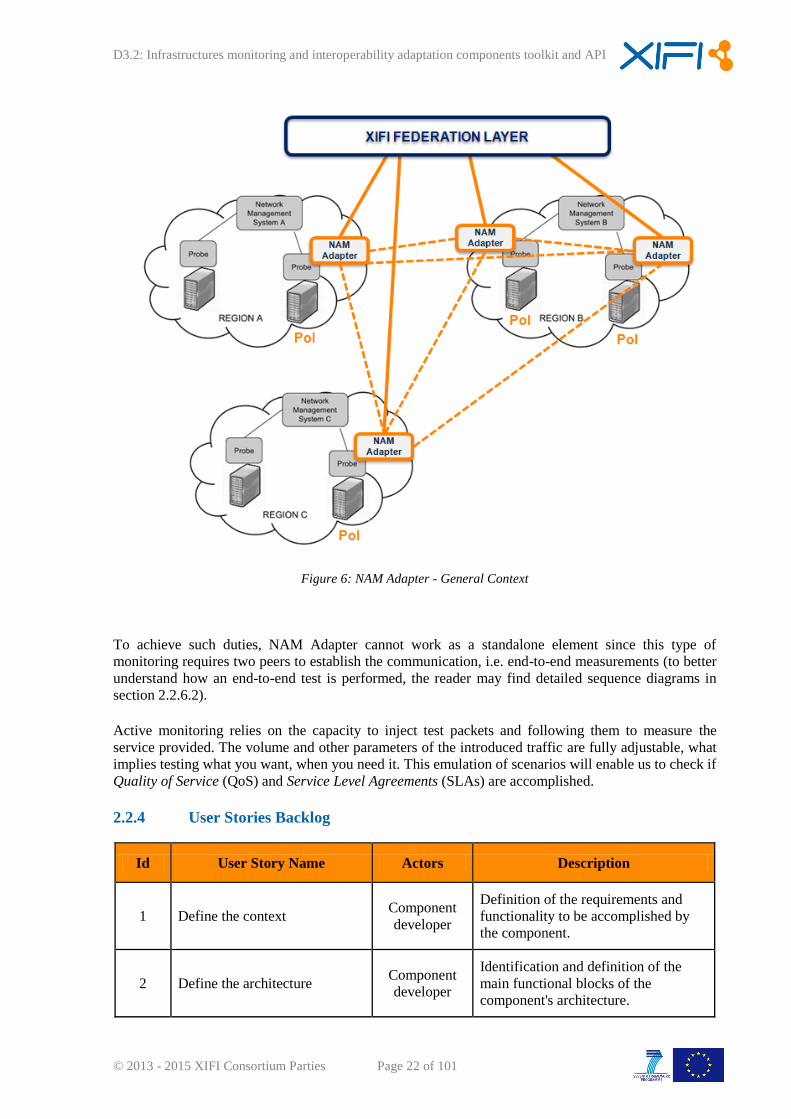
XIMM-NAM Adapters will be distributed in certain points of interest along the XIFI community as
the following picture shows. These components shall accomplish two main tasks:
Provide the adaptation layer between the monitoring tools at the lowest level, and at the XIFI
federation layer.
Provide a distributed monitoring mechanism among infrastructure nodes, being able to trigger
latency and bandwidth-related tests.
D3.2: Infrastructures monitoring and interoperability adaptation components toolkit and API
© 2013 - 2015 XIFI Consortium Parties Page 22 of 101
Figure 6: NAM Adapter - General Context
To achieve such duties, NAM Adapter cannot work as a standalone element since this type of
monitoring requires two peers to establish the communication, i.e. end-to-end measurements (to better
understand how an end-to-end test is performed, the reader may find detailed sequence diagrams in
section 2.2.6.2).
Active monitoring relies on the capacity to inject test packets and following them to measure the
service provided. The volume and other parameters of the introduced traffic are fully adjustable, what
implies testing what you want, when you need it. This emulation of scenarios will enable us to check if
Quality of Service (QoS) and Service Level Agreements (SLAs) are accomplished.
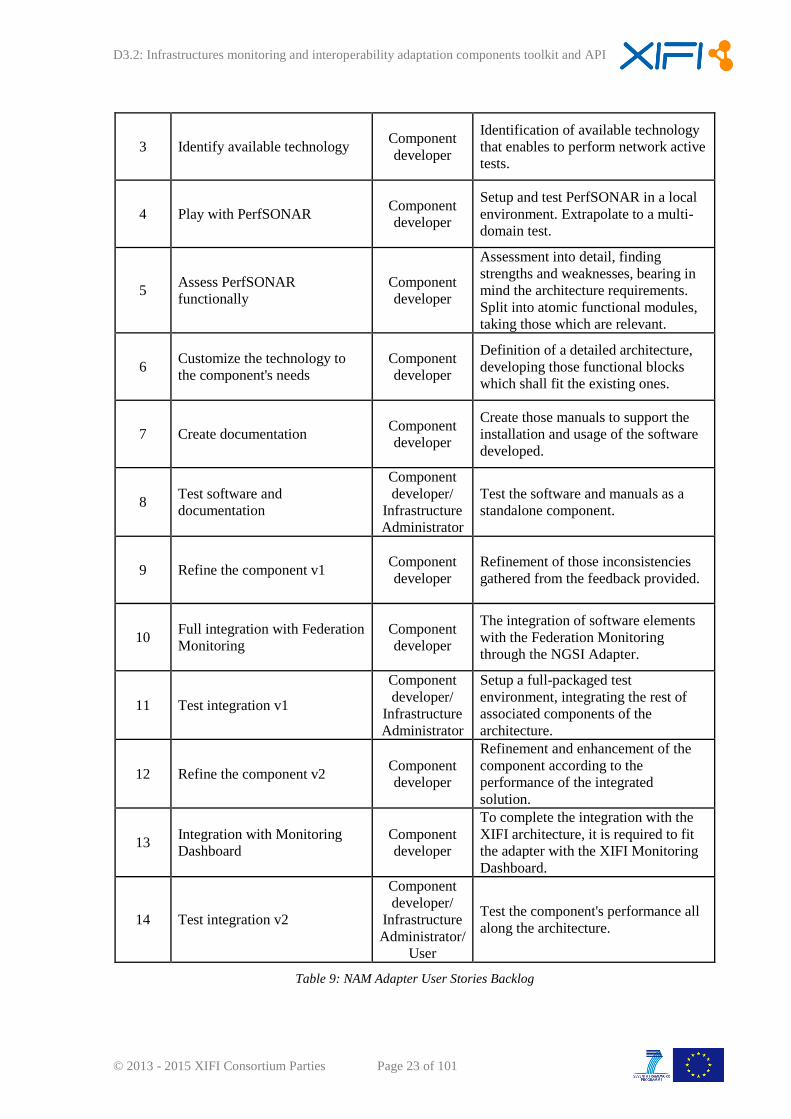
2.2.4 User Stories Backlog
Id User Story Name Actors Description
1 Define the context Component
developer
Definition of the requirements and
functionality to be accomplished by
the component.
2 Define the architecture Component
developer
Identification and definition of the
main functional blocks of the
component's architecture.
D3.2: Infrastructures monitoring and interoperability adaptation components toolkit and API
© 2013 - 2015 XIFI Consortium Parties Page 23 of 101
3 Identify available technology Component
developer
Identification of available technology
that enables to perform network active
tests.
4 Play with PerfSONAR Component
developer
Setup and test PerfSONAR in a local
environment. Extrapolate to a multi-
domain test.
5 Assess PerfSONAR
functionally
Component
developer
Assessment into detail, finding
strengths and weaknesses, bearing in
mind the architecture requirements.
Split into atomic functional modules,
taking those which are relevant.
6 Customize the technology to
the component's needs
Component
developer
Definition of a detailed architecture,
developing those functional blocks
which shall fit the existing ones.
7 Create documentation Component
developer
Create those manuals to support the
installation and usage of the software
developed.
8 Test software and
documentation
Component
developer/
Infrastructure
Administrator
Test the software and manuals as a
standalone component.
9 Refine the component v1 Component
developer
Refinement of those inconsistencies
gathered from the feedback provided.
10 Full integration with Federation
Monitoring
Component
developer
The integration of software elements
with the Federation Monitoring
through the NGSI Adapter.
11 Test integration v1
Component
developer/
Infrastructure
Administrator
Setup a full-packaged test
environment, integrating the rest of
associated components of the
architecture.
12 Refine the component v2 Component
developer
Refinement and enhancement of the
component according to the
performance of the integrated
solution.
13 Integration with Monitoring
Dashboard
Component
developer
To complete the integration with the
XIFI architecture, it is required to fit
the adapter with the XIFI Monitoring
Dashboard.
14 Test integration v2
Component
developer/
Infrastructure
Administrator/
User
Test the component's performance all
along the architecture.
Table 9: NAM Adapter User Stories Backlog
D3.2: Infrastructures monitoring and interoperability adaptation components toolkit and API
© 2013 - 2015 XIFI Consortium Parties Page 24 of 101
2.2.5 State of the art
2.2.5.1 PerfSONAR
With the increase of distributed computing over multiple administrative domains came the
requirement to measure network performance characteristics and share this information between the
users and service providers. This was addressed by the Open Grid Forum Network Measurement and
Network Measurement and Control working groups [26], which defines a set of protocols standards
for sharing data between measurement and monitoring systems, often called the NMWG protocol.
PerfSONAR (PERFormance focused Service Oriented Network monitoring Architecture) [30] is a
framework that implements these protocols for both regular periodic observations, useful for forming
historical records, and for making on-demand measurements to aid problem solving and resolution.
The web service-based infrastructure presented in PerfSONAR was developed with the purpose of
providing network administrators and research users with an easy access to cross-domain performance
information and facilitating the management of advanced networks. This framework is made up of
several services including:
The Measurement Point (MP) services that provide measurement data. This may be done
either by initiating active measurement tests or querying passive measurement devices or
existing database.
Measurement Archive (MA) services are used to record and publish historical monitoring data
which are stored in an archive.
The Lookup Service (LS) enables users to discover other services (e.g. MP and MA) and, in
particular, the tools, capabilities or data offered by those services.
User Interface (UI) provides several methods of visualizing the measured network
characteristics in tabular and graphical forms as well as providing the interface for making on-
demand measurements.
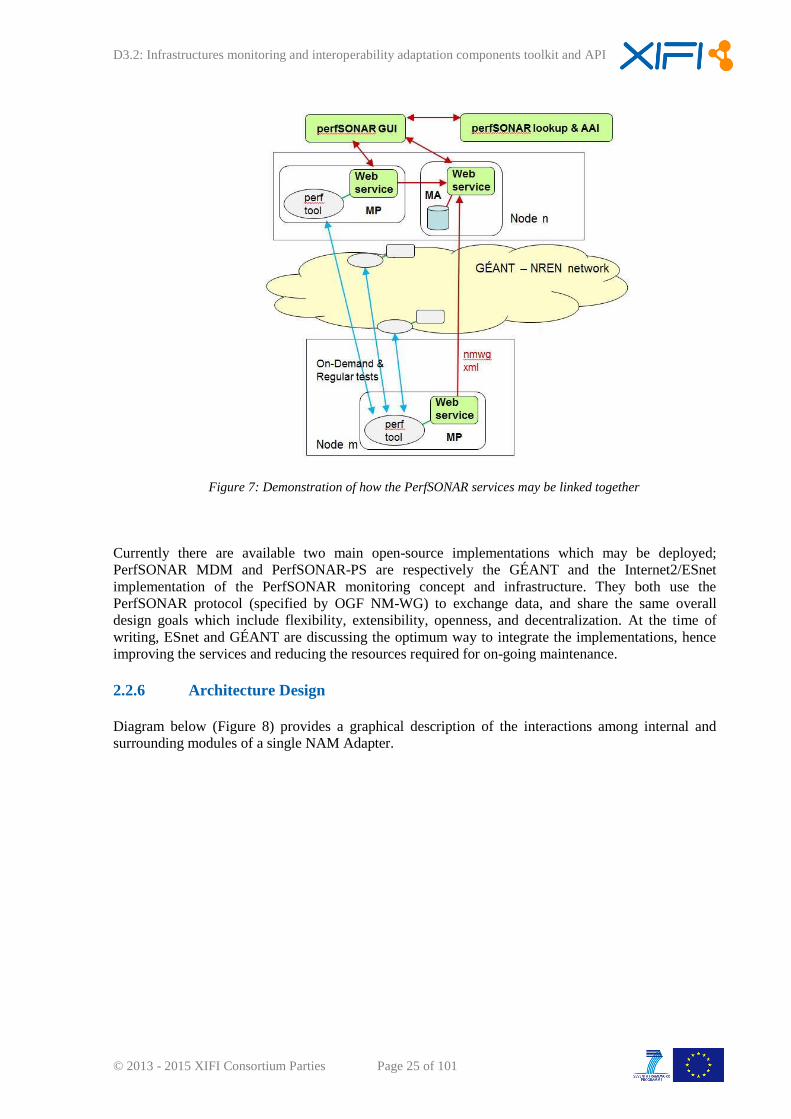
Each PerfSONAR MP uses specific network measurement tools to perform the measurement of the
network characteristic between the selected end points. For example, Iperf [17] is used by the BWCTL
service to fulfil TCP or UDP achievable throughput measurements; and the owping tool is used to
retrieve one-way delay, jitter and packet loss measurements by the OWAMP service. The blue lines in
Figure 7 represent the measurement observations made between MPs by Iperf or owping tools. The
MPs and MAs are ‘controlled’ by a web service layer using the OGF NMWG protocols discussed
above. The interactions between the MP, MA and UI PerfSONAR services are indicated by the red
lines in Figure 7.
D3.2: Infrastructures monitoring and interoperability adaptation components toolkit and API
© 2013 - 2015 XIFI Consortium Parties Page 25 of 101
Figure 7: Demonstration of how the PerfSONAR services may be linked together
Currently there are available two main open-source implementations which may be deployed;
PerfSONAR MDM and PerfSONAR-PS are respectively the GÉANT and the Internet2/ESnet
implementation of the PerfSONAR monitoring concept and infrastructure. They both use the
PerfSONAR protocol (specified by OGF NM-WG) to exchange data, and share the same overall
design goals which include flexibility, extensibility, openness, and decentralization. At the time of
writing, ESnet and GÉANT are discussing the optimum way to integrate the implementations, hence
improving the services and reducing the resources required for on-going maintenance.
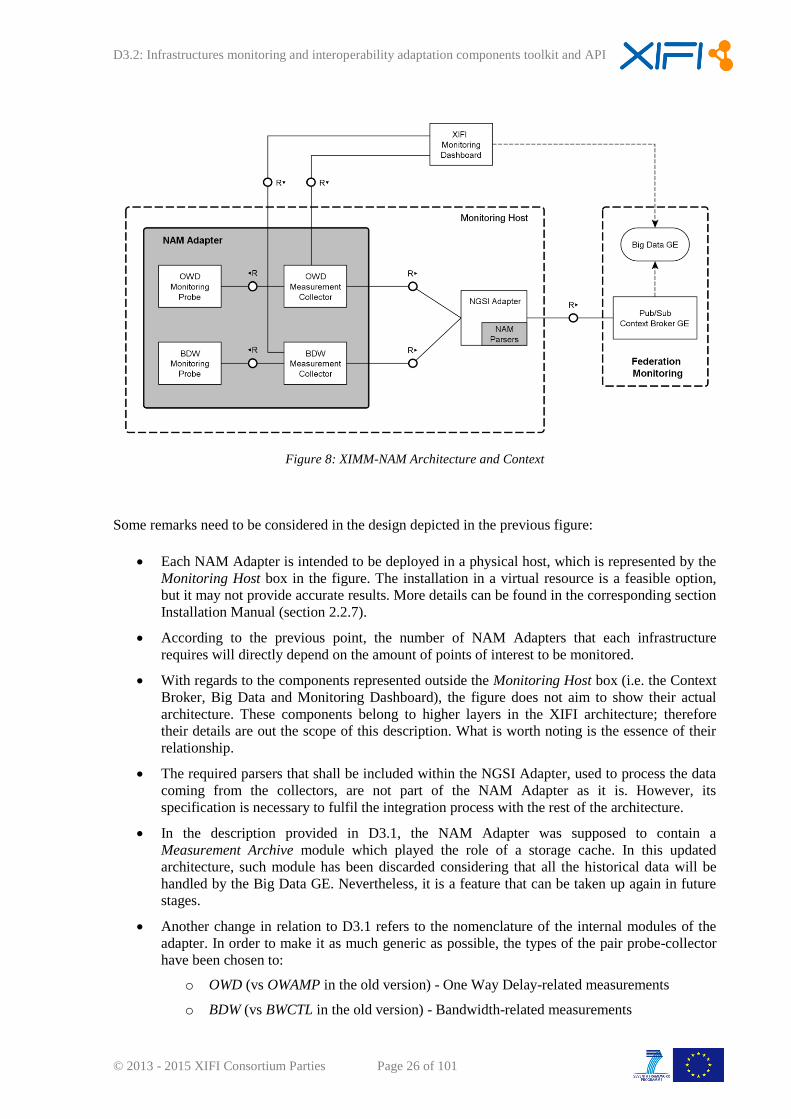
2.2.6 Architecture Design
Diagram below (Figure 8) provides a graphical description of the interactions among internal and
surrounding modules of a single NAM Adapter.
D3.2: Infrastructures monitoring and interoperability adaptation components toolkit and API
© 2013 - 2015 XIFI Consortium Parties Page 26 of 101
Figure 8: XIMM-NAM Architecture and Context
Some remarks need to be considered in the design depicted in the previous figure:
Each NAM Adapter is intended to be deployed in a physical host, which is represented by the
Monitoring Host box in the figure. The installation in a virtual resource is a feasible option,
but it may not provide accurate results. More details can be found in the corresponding section
Installation Manual (section 2.2.7).
According to the previous point, the number of NAM Adapters that each infrastructure
requires will directly depend on the amount of points of interest to be monitored.
With regards to the components represented outside the Monitoring Host box (i.e. the Context
Broker, Big Data and Monitoring Dashboard), the figure does not aim to show their actual
architecture. These components belong to higher layers in the XIFI architecture; therefore
their details are out the scope of this description. What is worth noting is the essence of their
relationship.
The required parsers that shall be included within the NGSI Adapter, used to process the data
coming from the collectors, are not part of the NAM Adapter as it is. However, its
specification is necessary to fulfil the integration process with the rest of the architecture.
In the description provided in D3.1, the NAM Adapter was supposed to contain a
Measurement Archive module which played the role of a storage cache. In this updated
architecture, such module has been discarded considering that all the historical data will be
handled by the Big Data GE. Nevertheless, it is a feature that can be taken up again in future
stages.
Another change in relation to D3.1 refers to the nomenclature of the internal modules of the
adapter. In order to make it as much generic as possible, the types of the pair probe-collector
have been chosen to:
o OWD (vs OWAMP in the old version) - One Way Delay-related measurements
o BDW (vs BWCTL in the old version) - Bandwidth-related measurements

D3.2: Infrastructures monitoring and interoperability adaptation components toolkit and API
© 2013 - 2015 XIFI Consortium Parties Page 27 of 101
2.2.6.1 Basic actors
Monitoring Probes
The Monitoring Probes are those tools used to actually perform the measurement tests between
given hosts of interest. They shall play the role of servers providing the clients with the network
active monitoring data. The interface to interact with these tools is command line-based.
Technically speaking, these probes should not been taken as a part of the adapter by definition.
However, monitoring systems, such as the case of Nagios, do not usually include this kind of
tools. Furthermore, even if they were considered, their functionality cannot be considered in a
distributed multi-region framework. Therefore, NAM's technical solution will require including a
couple of probes by default to enable tests:
o OWD Monitoring Probe: it is in charge of handling one-way delay tests. In deliverable
D3.1 the probe considered as a standard was OWAMP [15]. However, after assessing
in detail this tool provided by Internet 2, it presented some functional requirements
which in terms of efficiency are not feasible (for instance, it requires opening a
dedicated port for each test in progress). Therefore, with regards to the OWD probe, it
has been redefined as a customized solution to enhance the operability.
o BDW Monitoring Probe: According to Internet 2's PerfSONAR distribution with
regards to bandwidth tests [2], three throughput testing tools are considered: Iperf,
Thrulay and Nuttcp. The recommended choice to include within the NAM Adapter
package is Iperf [16], according to reliability test results.
Measurement Collectors
The Measurement Collectors are the core modules within the adapter. They will be the responsible
actors for collecting the data generated by the previously described probes (by playing the role of
clients), processing and forwarding it to the NGSI Adapter. Same as the probes, there are two
types of them, OWD and BDW (see Figure 8), according to the data they deal with.
At this point, it is worth noting that this so-called Measurement Collector is based on the original
model of the Measurement Point taken from the PerfSONAR terminology [30]. The element has
been redefined in order to ease the integration with the rest of the XIFI monitoring architecture. At
the time of writing, the contact with GÉANT is still in progress in order to reach a common
approach in future stages since PerfSONAR distribution is also under development, and DANTE
is part of the XIFI partners.
Diagram below provides a detailed view of the internal architecture of the adapter, focusing on the
elements composing the collector.
D3.2: Infrastructures monitoring and interoperability adaptation components toolkit and API
© 2013 - 2015 XIFI Consortium Parties Page 28 of 101
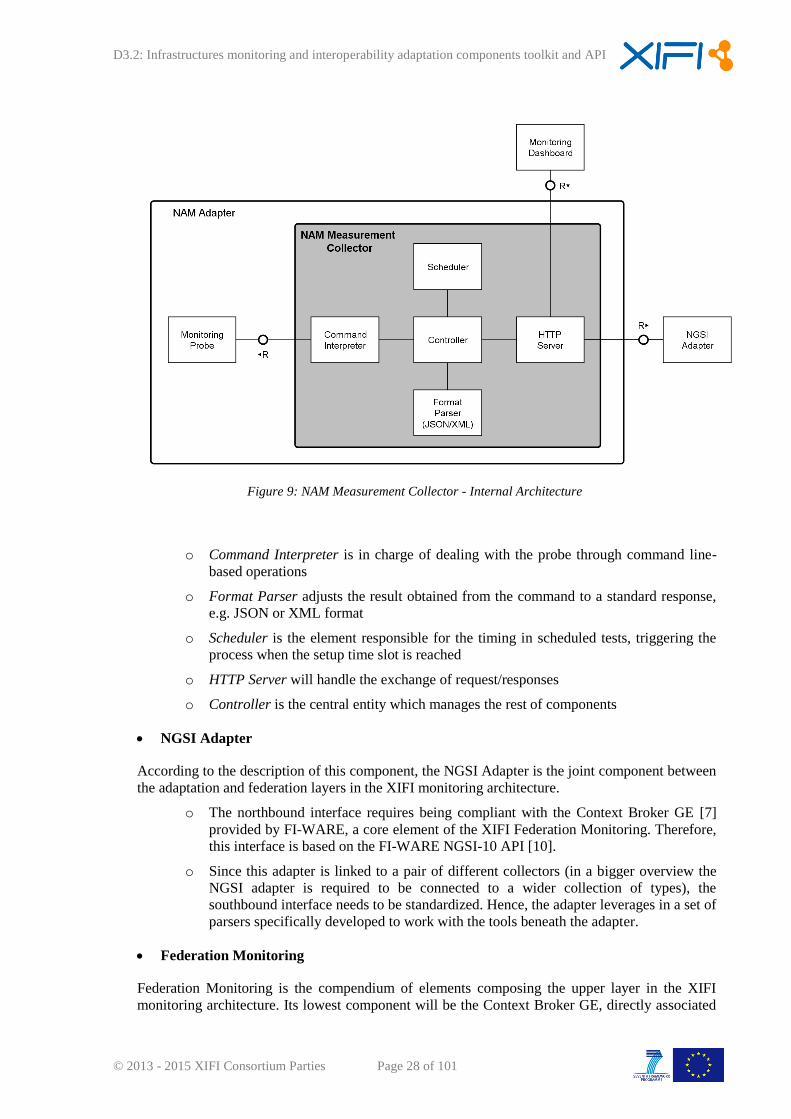
Figure 9: NAM Measurement Collector - Internal Architecture
o Command Interpreter is in charge of dealing with the probe through command line-
based operations
o Format Parser adjusts the result obtained from the command to a standard response,
e.g. JSON or XML format
o Scheduler is the element responsible for the timing in scheduled tests, triggering the
process when the setup time slot is reached
o HTTP Server will handle the exchange of request/responses
o Controller is the central entity which manages the rest of components
NGSI Adapter
According to the description of this component, the NGSI Adapter is the joint component between
the adaptation and federation layers in the XIFI monitoring architecture.
o The northbound interface requires being compliant with the Context Broker GE [7]
provided by FI-WARE, a core element of the XIFI Federation Monitoring. Therefore,
this interface is based on the FI-WARE NGSI-10 API [10].
o Since this adapter is linked to a pair of different collectors (in a bigger overview the
NGSI adapter is required to be connected to a wider collection of types), the
southbound interface needs to be standardized. Hence, the adapter leverages in a set of
parsers specifically developed to work with the tools beneath the adapter.
Federation Monitoring
Federation Monitoring is the compendium of elements composing the upper layer in the XIFI
monitoring architecture. Its lowest component will be the Context Broker GE, directly associated
D3.2: Infrastructures monitoring and interoperability adaptation components toolkit and API
© 2013 - 2015 XIFI Consortium Parties Page 29 of 101
to the NGSI Adapter.
Monitoring Dashboard
Monitoring Dashboard is the place where end users access and manage monitoring data provided
by the XIFI monitoring framework. This Graphical User Interface (GUI) shall be able to request
directly to specific NAM Adapters in order to trigger on-demand tests and configure the
parameters associated to scheduled measurements.
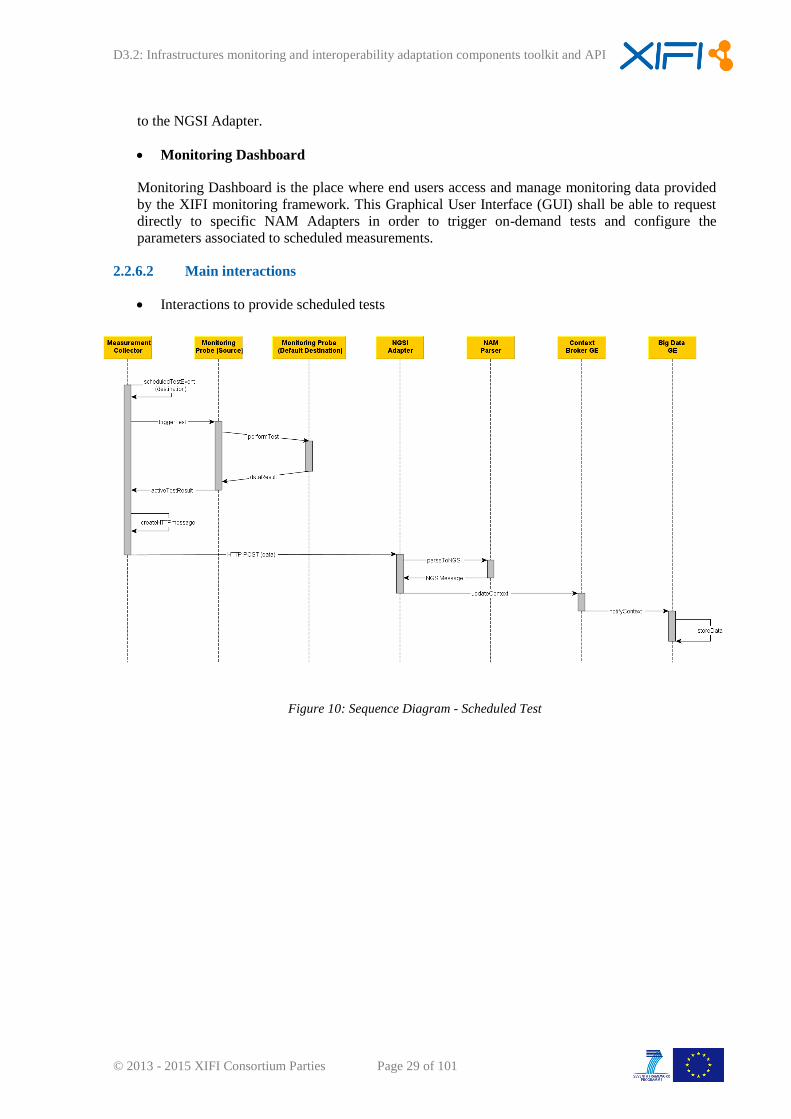
2.2.6.2 Main interactions
Interactions to provide scheduled tests
Figure 10: Sequence Diagram - Scheduled Test
D3.2: Infrastructures monitoring and interoperability adaptation components toolkit and API
© 2013 - 2015 XIFI Consortium Parties Page 30 of 101
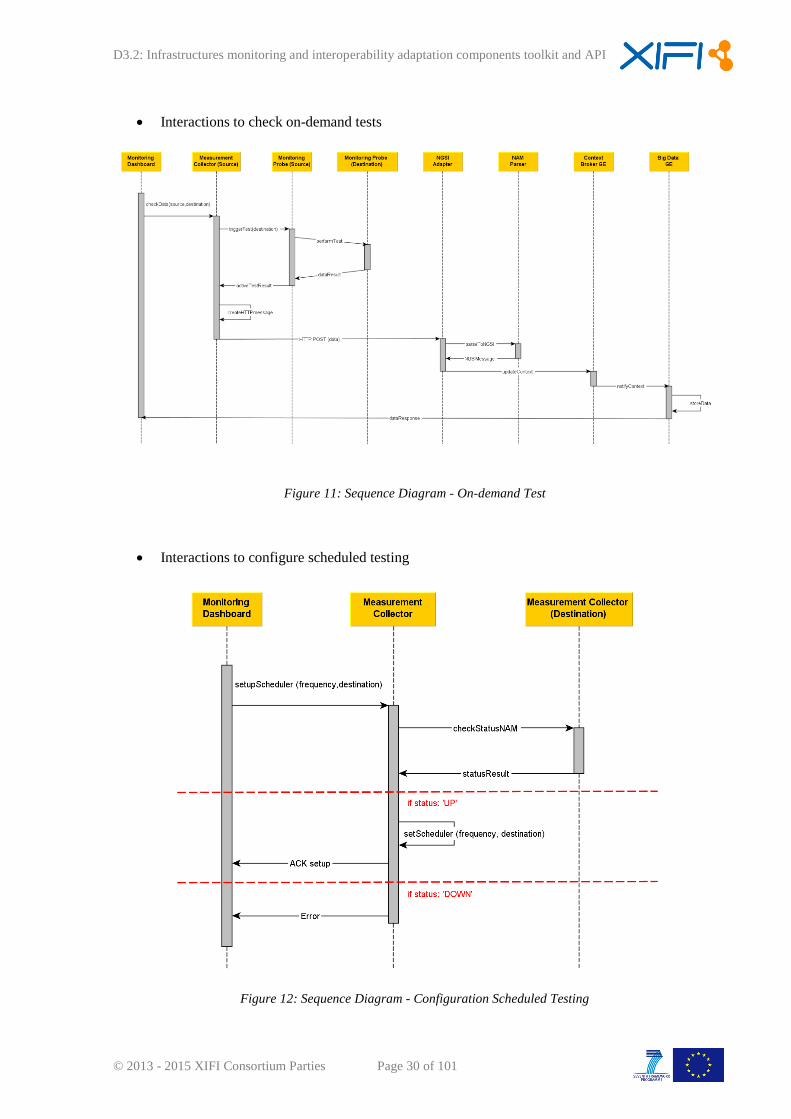
Interactions to check on-demand tests
Figure 11: Sequence Diagram - On-demand Test
Interactions to configure scheduled testing
Figure 12: Sequence Diagram - Configuration Scheduled Testing

D3.2: Infrastructures monitoring and interoperability adaptation components toolkit and API
© 2013 - 2015 XIFI Consortium Parties Page 31 of 101
2.2.7 Release Plan
Version ID Milestone User Stories
v0.1 M3 1, 2, 3
v1.0 M6 4, 5
v2.0 M9 6, 7
v2.1 M12 8, 9
v3.0 M15 10, 11, 12
v3.1 M18 13, 14
Table 10: NAM Adapter Release Plan
2.2.8 Installation Manual
This section aims to guide the reader through the properly configuration of the NAM Adapter.
2.2.8.1 Installation Requirements
The main recommendation to install the NAM Adapter is to deploy the software package on a host
with Ubuntu/ Debian running as Operating System. If this was not the case, it would be necessary to
check how to install additional packages that are required. NAM's software repository has been
successfully tested with versions 12.10 and 13.10 of Ubuntu, and version 7.3 of Debian. No major
issues are expected for upcoming versions.
It is worth noting that this adapter might be installed in a virtual machine. Although this alternative is
feasible, the reader should bear in mind that this configuration may carry accuracy and stability
problems with the measurements that will take place.
Hardware Requirements:
The minimal requirements are:
Hard Disk: 2 GB free capacity
RAM: 2 GB
Software Requirements:
The adapter requires working properly the following set of software elements:
Node.js
o Installation using Ubuntu: in order to obtain the most recent version of Node or
D3.2: Infrastructures monitoring and interoperability adaptation components toolkit and API
© 2013 - 2015 XIFI Consortium Parties Page 32 of 101
installing on older Ubuntu and other apt-based distributions using the following
commands:
$ sudo apt-get update
$ sudo apt-get install -y python-software-properties python g++ make
$ sudo add-apt-repository -y ppa:chris-lea/node.js
$ sudo apt-get update
$ sudo apt-get install nodejs>
o Installation using Debian packages:
$ sudo apt-get install python g++ make checkinstall
$ mkdir ~/src && cd $_
$ wget -N http://nodejs.org/dist/node-latest.tar.gz
$ tar xzvf node-latest.tar.gz && cd node-v*
$ ./configure
$ sudo checkinstall -y --install=no --pkgversion 0.10.24 # Replace
with current version number.
$sudo dpkg -i node_*
o Installation using other Linux distribution:
https://github.com/joyent/node/wiki/Installing-Node.js-via-package-manager
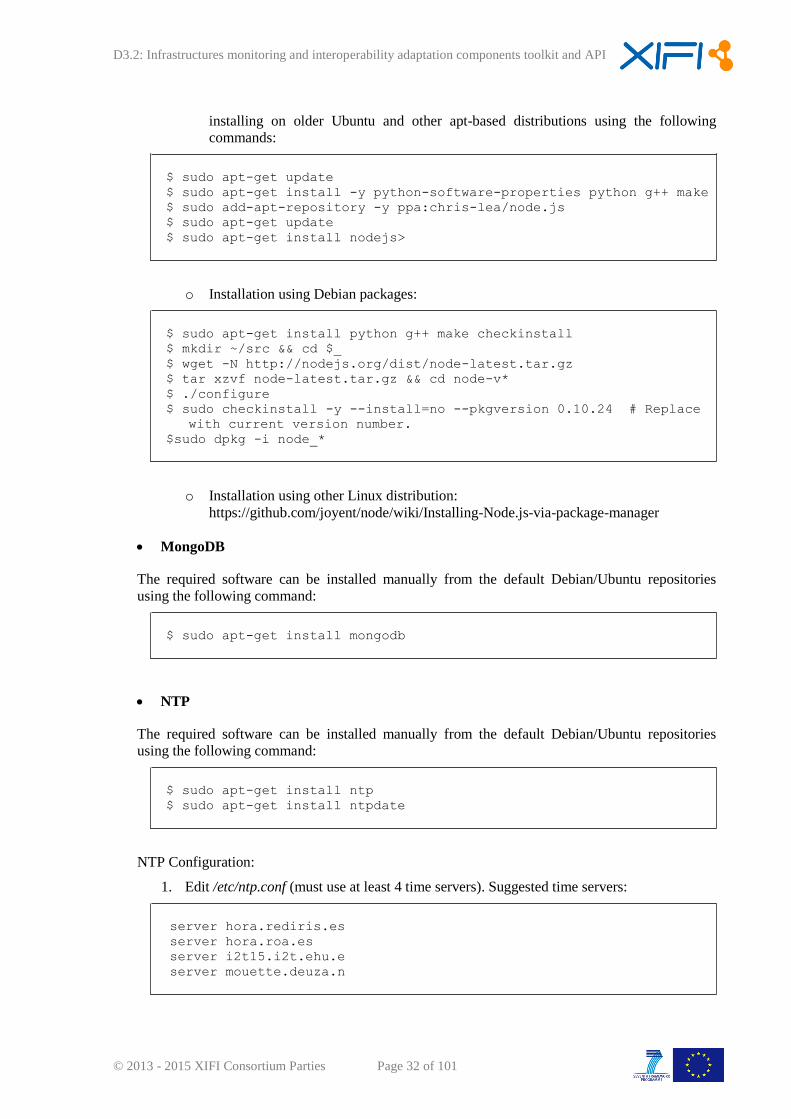
MongoDB
The required software can be installed manually from the default Debian/Ubuntu repositories
using the following command:
$ sudo apt-get install mongodb
NTP
The required software can be installed manually from the default Debian/Ubuntu repositories
using the following command:
$ sudo apt-get install ntp
$ sudo apt-get install ntpdate
NTP Configuration:
1. Edit /etc/ntp.conf (must use at least 4 time servers). Suggested time servers:
server hora.rediris.es
server hora.roa.es
server i2t15.i2t.ehu.e
server mouette.deuza.n
D3.2: Infrastructures monitoring and interoperability adaptation components toolkit and API
© 2013 - 2015 XIFI Consortium Parties Page 33 of 101
2. Check ntp sync:
$ ntpq –p
3. Check current time zone:
$ date
4. Check time zone available in your OS:
$ ls /usr/share/zoneinfo
5. Backup current time zone:
$ sudo mv /etc/localtime /etc/localtime-old
6. Change time zone:
$ sudo ln –sf /usr/share/zoneinfo/Europe/Madrid /etc/localtime
7. Checking for changes:
$ date
Iperf
The required software can be installed manually from the default Debian/Ubuntu repositories
using the following command:
$ sudo apt-get install iperf
2.2.8.2 Software Repository
NAM Adapter: https://xifisvn.res.eng.it/wp3/software/NAM_Adapter/
NGSI Adapter: https://github.com/Fiware/fiware-monitoring/tree/master/ngsi_adapter
Orion Context Broker: http://catalogue.fi-ware.eu/enablers/publishsubscribe-context-broker-
orion-context-broker/downloads
Cosmos BigData: http://catalogue.fi-ware.eu/enablers/downloads-11
D3.2: Infrastructures monitoring and interoperability adaptation components toolkit and API
© 2013 - 2015 XIFI Consortium Parties Page 34 of 101
2.2.8.3 Setup Guidelines
To install the NAM Adapter in Debian, Ubuntu or similar distributions, it is necessary to proceed with
the following steps:
1. Log in as root to the host on which you want to deploy the NAM Adapter software
2. Check that all the required software has been installed (see previous section)
3. The NAM Adapter package can be downloaded by:
Command-line access: use this command to check out the latest version of the source
code:
$ ntpq –p
$ mkdir NAM_Adapter
$ cd NAM_Adapter
$ svn checkout
https://xifisvn.res.eng.it/wp3/software/NAM_Adapter/Trunk/
$ cd Trunk
Non-members may check out a read-only working copy anonymously over HTTP.
$ svn checkout
https://xifisvn.res.eng.it/wp3/software/NAM_Adapter/Trunk/ read-
only
$ cd Trunk
GUI and IDE access. The repository may be fetched by using different client programs
and plugins. See your client's documentation for more information:
http://subversion.apache.org/packages.html
4. Install dependencies. It is important to assure that Node.js is installed, and then run:
$ npm install
5. NAM Adapter Configuration
Copy the config file:
$ cp config/config.js.example config/config.js
Before running the adapter, open config.js file with your text editor. Check all parameters
and edit the file according to the host you are installing. Important fields are:
D3.2: Infrastructures monitoring and interoperability adaptation components toolkit and API
© 2013 - 2015 XIFI Consortium Parties Page 35 of 101
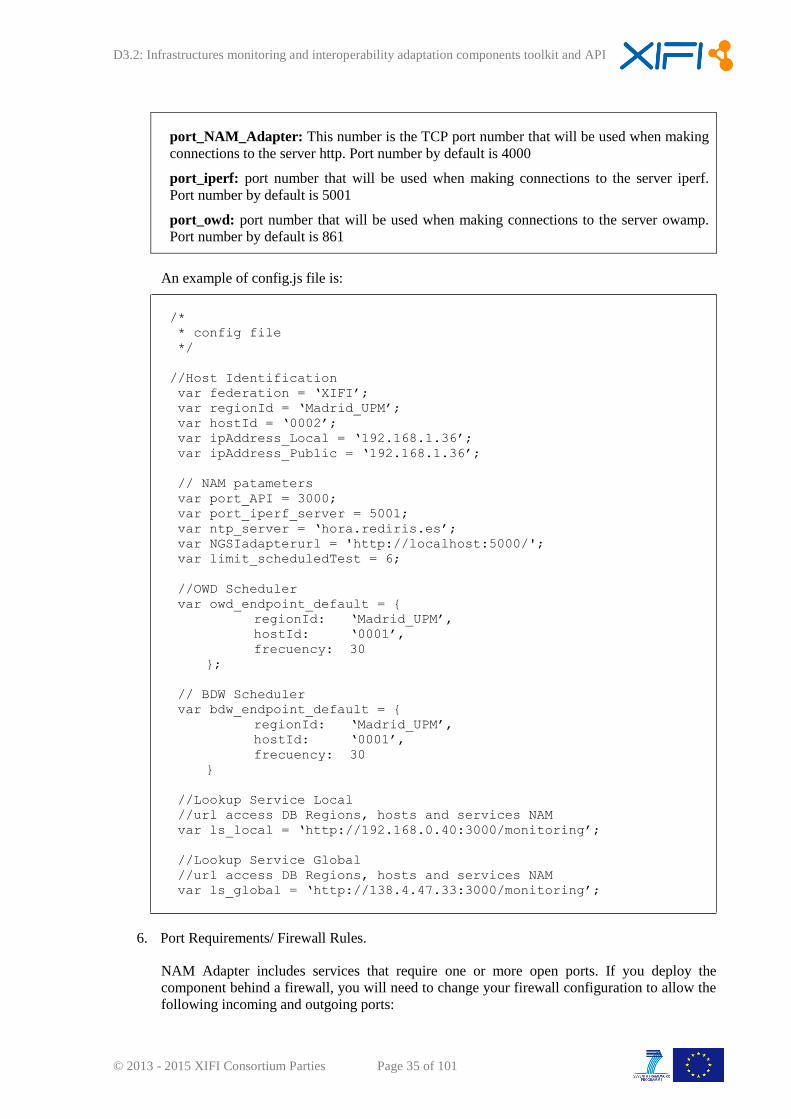
port_NAM_Adapter: This number is the TCP port number that will be used when making
connections to the server http. Port number by default is 4000
port_iperf: port number that will be used when making connections to the server iperf.
Port number by default is 5001
port_owd: port number that will be used when making connections to the server owamp.
Port number by default is 861
An example of config.js file is:
/*
* config file
*/
//Host Identification
var federation = ‘XIFI’;
var regionId = ‘Madrid_UPM’;
var hostId = ‘0002’;
var ipAddress_Local = ‘192.168.1.36’;
var ipAddress_Public = ‘192.168.1.36’;
// NAM patameters
var port_API = 3000;
var port_iperf_server = 5001;
var ntp_server = ‘hora.rediris.es’;
var NGSIadapterurl = 'http://localhost:5000/';
var limit_scheduledTest = 6;
//OWD Scheduler
var owd_endpoint_default = {
regionId: ‘Madrid_UPM’,
hostId: ‘0001’,
frecuency: 30
};
// BDW Scheduler
var bdw_endpoint_default = {
regionId: ‘Madrid_UPM’,
hostId: ‘0001’,
frecuency: 30
}
//Lookup Service Local
//url access DB Regions, hosts and services NAM
var ls_local = ‘http://192.168.0.40:3000/monitoring’;
//Lookup Service Global
//url access DB Regions, hosts and services NAM
var ls_global = ‘http://138.4.47.33:3000/monitoring’;
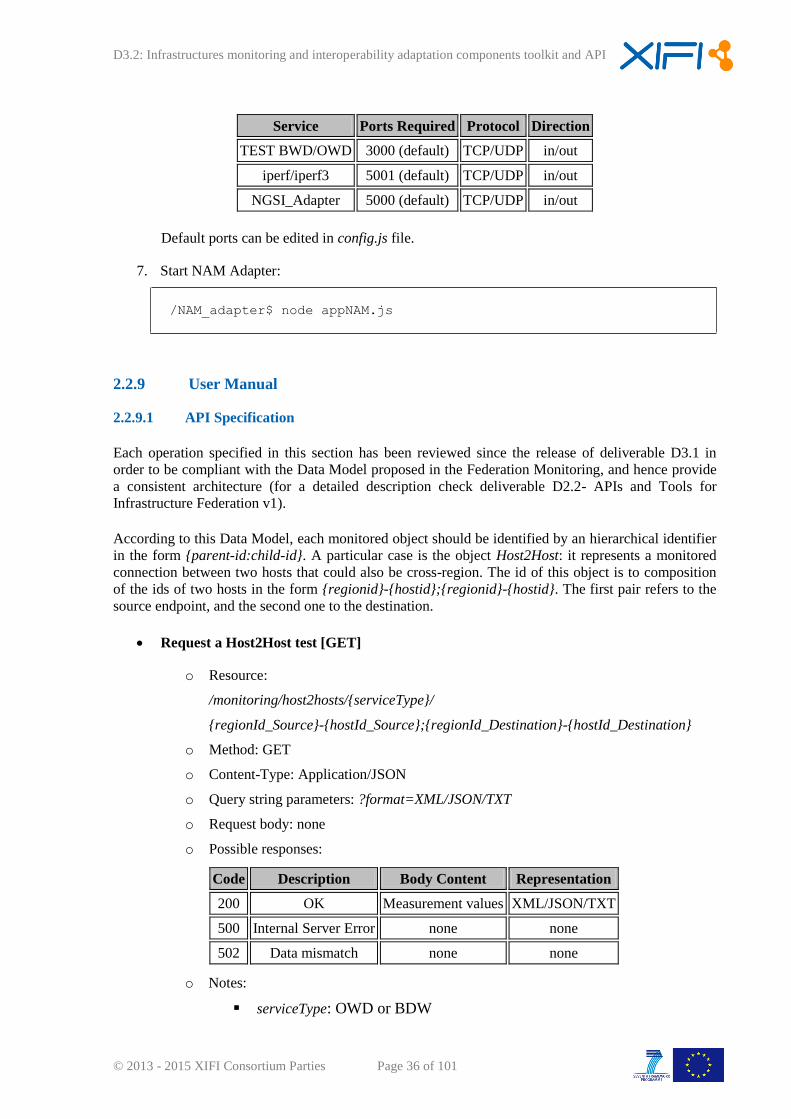
6. Port Requirements/ Firewall Rules.
NAM Adapter includes services that require one or more open ports. If you deploy the
component behind a firewall, you will need to change your firewall configuration to allow the
following incoming and outgoing ports:
D3.2: Infrastructures monitoring and interoperability adaptation components toolkit and API
© 2013 - 2015 XIFI Consortium Parties Page 36 of 101
Service Ports Required Protocol Direction
TEST BWD/OWD 3000 (default) TCP/UDP in/out
iperf/iperf3 5001 (default) TCP/UDP in/out
NGSI_Adapter 5000 (default) TCP/UDP in/out
Default ports can be edited in config.js file.
7. Start NAM Adapter:
/NAM_adapter$ node appNAM.js
2.2.9 User Manual
2.2.9.1 API Specification
Each operation specified in this section has been reviewed since the release of deliverable D3.1 in
order to be compliant with the Data Model proposed in the Federation Monitoring, and hence provide
a consistent architecture (for a detailed description check deliverable D2.2- APIs and Tools for
Infrastructure Federation v1).
According to this Data Model, each monitored object should be identified by an hierarchical identifier
in the form {parent-id:child-id}. A particular case is the object Host2Host: it represents a monitored
connection between two hosts that could also be cross-region. The id of this object is to composition
of the ids of two hosts in the form {regionid}-{hostid};{regionid}-{hostid}. The first pair refers to the
source endpoint, and the second one to the destination.
Request a Host2Host test [GET]
o Resource:
/monitoring/host2hosts/{serviceType}/
{regionId_Source}-{hostId_Source};{regionId_Destination}-{hostId_Destination}
o Method: GET
o Content-Type: Application/JSON
o Query string parameters: ?format=XML/JSON/TXT
o Request body: none
o Possible responses:
Code Description Body Content Representation
200 OK Measurement values XML/JSON/TXT
500 Internal Server Error none none
502 Data mismatch none none
o Notes:
serviceType: OWD or BDW
D3.2: Infrastructures monitoring and interoperability adaptation components toolkit and API
© 2013 - 2015 XIFI Consortium Parties Page 37 of 101
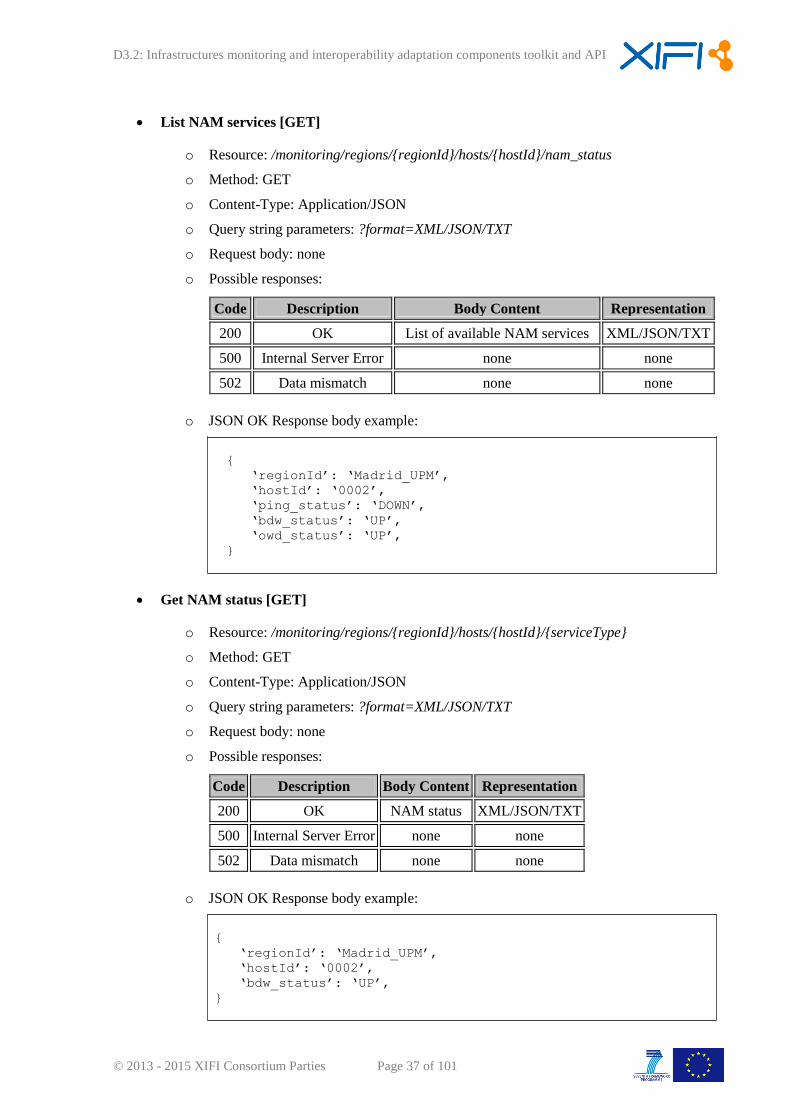
List NAM services [GET]
o Resource: /monitoring/regions/{regionId}/hosts/{hostId}/nam_status
o Method: GET
o Content-Type: Application/JSON
o Query string parameters: ?format=XML/JSON/TXT
o Request body: none
o Possible responses:
Code Description Body Content Representation
200 OK List of available NAM services XML/JSON/TXT
500 Internal Server Error none none
502 Data mismatch none none
o JSON OK Response body example:
{
‘regionId’: ‘Madrid_UPM’,
‘hostId’: ‘0002’,
‘ping_status’: ‘DOWN’,
‘bdw_status’: ‘UP’,
‘owd_status’: ‘UP’,
}
Get NAM status [GET]
o Resource: /monitoring/regions/{regionId}/hosts/{hostId}/{serviceType}
o Method: GET
o Content-Type: Application/JSON
o Query string parameters: ?format=XML/JSON/TXT
o Request body: none
o Possible responses:
Code Description Body Content Representation
200 OK NAM status XML/JSON/TXT
500 Internal Server Error none none
502 Data mismatch none none
o JSON OK Response body example:
{
‘regionId’: ‘Madrid_UPM’,
‘hostId’: ‘0002’,
‘bdw_status’: ‘UP’,
}
D3.2: Infrastructures monitoring and interoperability adaptation components toolkit and API
© 2013 - 2015 XIFI Consortium Parties Page 38 of 101
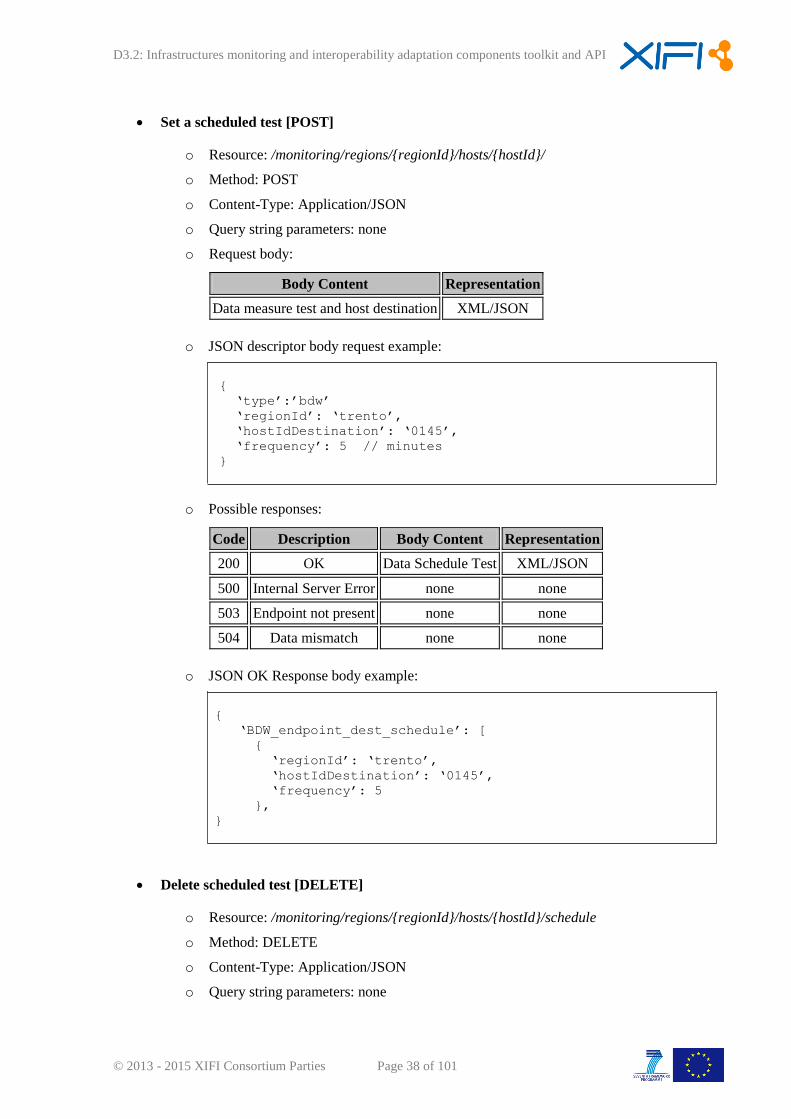
Set a scheduled test [POST]
o Resource: /monitoring/regions/{regionId}/hosts/{hostId}/
o Method: POST
o Content-Type: Application/JSON
o Query string parameters: none
o Request body:
Body Content Representation
Data measure test and host destination XML/JSON
o JSON descriptor body request example:
{
‘type’:’bdw’
‘regionId’: ‘trento’,
‘hostIdDestination’: ‘0145’,
‘frequency’: 5 // minutes
}
o Possible responses:
Code Description Body Content Representation
200 OK Data Schedule Test XML/JSON
500 Internal Server Error none none
503 Endpoint not present none none
504 Data mismatch none none
o JSON OK Response body example:
{
‘BDW_endpoint_dest_schedule’: [
{
‘regionId’: ‘trento’,
‘hostIdDestination’: ‘0145’,
‘frequency’: 5
},
}
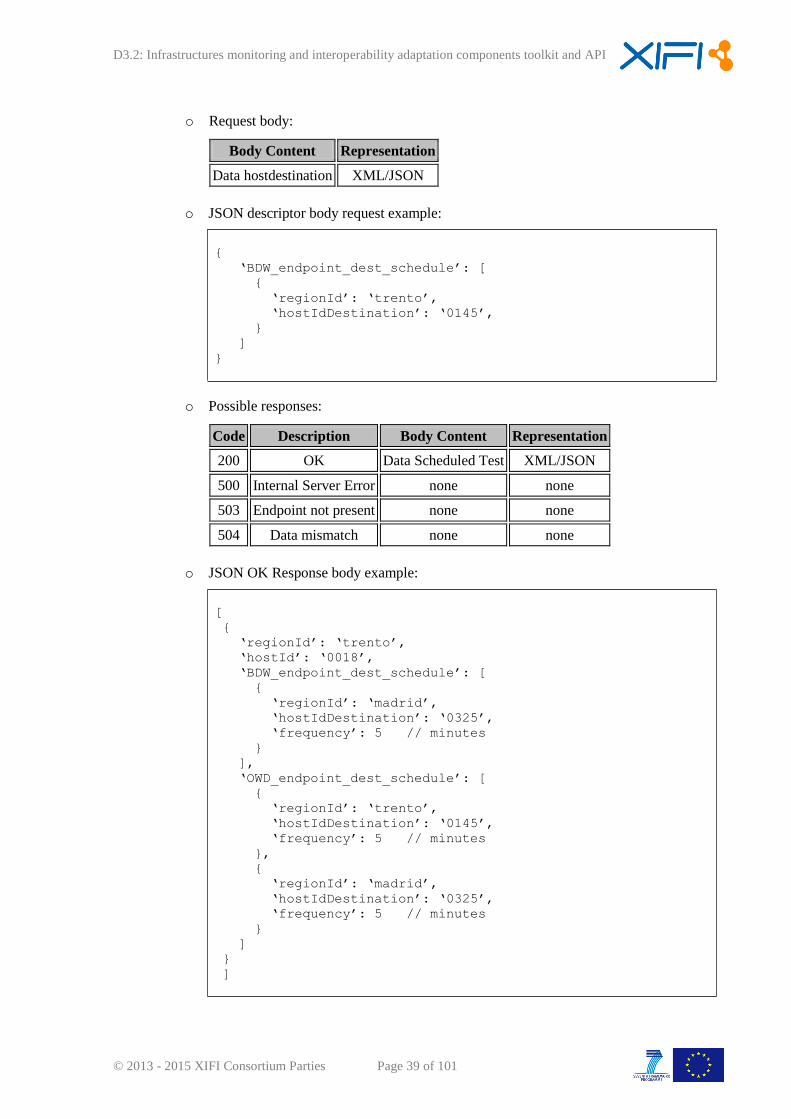
Delete scheduled test [DELETE]
o Resource: /monitoring/regions/{regionId}/hosts/{hostId}/schedule
o Method: DELETE
o Content-Type: Application/JSON
o Query string parameters: none
D3.2: Infrastructures monitoring and interoperability adaptation components toolkit and API
© 2013 - 2015 XIFI Consortium Parties Page 39 of 101
o Request body:
Body Content Representation
Data hostdestination XML/JSON
o JSON descriptor body request example:
{
‘BDW_endpoint_dest_schedule’: [
{
‘regionId’: ‘trento’,
‘hostIdDestination’: ‘0145’,
}
]
}
o Possible responses:
Code Description Body Content Representation
200 OK Data Scheduled Test XML/JSON
500 Internal Server Error none none
503 Endpoint not present none none
504 Data mismatch none none
o JSON OK Response body example:
[
{
‘regionId’: ‘trento’,
‘hostId’: ‘0018’,
‘BDW_endpoint_dest_schedule’: [
{
‘regionId’: ‘madrid’,
‘hostIdDestination’: ‘0325’,
‘frequency’: 5 // minutes
}
],
‘OWD_endpoint_dest_schedule’: [
{
‘regionId’: ‘trento’,
‘hostIdDestination’: ‘0145’,
‘frequency’: 5 // minutes
},
{
‘regionId’: ‘madrid’,
‘hostIdDestination’: ‘0325’,
‘frequency’: 5 // minutes
}
]
}
]
D3.2: Infrastructures monitoring and interoperability adaptation components toolkit and API
© 2013 - 2015 XIFI Consortium Parties Page 40 of 101
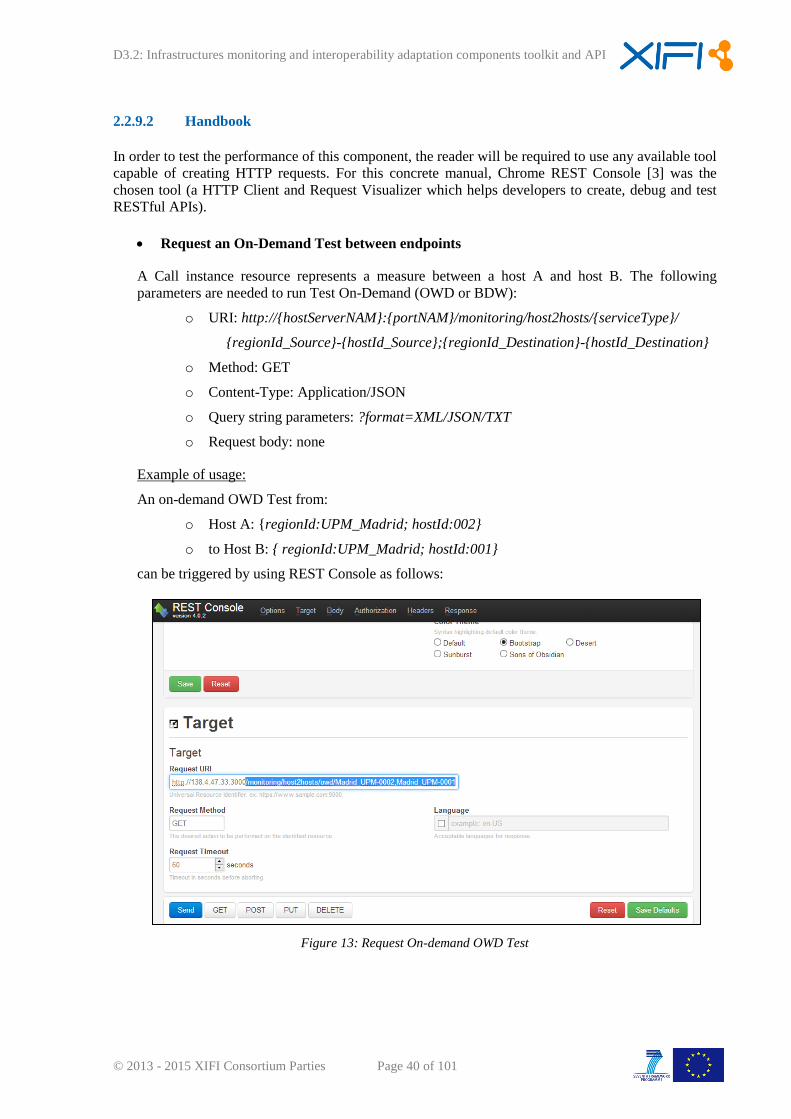
2.2.9.2 Handbook
In order to test the performance of this component, the reader will be required to use any available tool
capable of creating HTTP requests. For this concrete manual, Chrome REST Console [3] was the
chosen tool (a HTTP Client and Request Visualizer which helps developers to create, debug and test
RESTful APIs).
Request an On-Demand Test between endpoints
A Call instance resource represents a measure between a host A and host B. The following
parameters are needed to run Test On-Demand (OWD or BDW):
o URI: http://{hostServerNAM}:{portNAM}/monitoring/host2hosts/{serviceType}/
{regionId_Source}-{hostId_Source};{regionId_Destination}-{hostId_Destination}
o Method: GET
o Content-Type: Application/JSON
o Query string parameters: ?format=XML/JSON/TXT
o Request body: none
Example of usage:
An on-demand OWD Test from:
o Host A: {regionId:UPM_Madrid; hostId:002}
o to Host B: { regionId:UPM_Madrid; hostId:001}
can be triggered by using REST Console as follows:
Figure 13: Request On-demand OWD Test
D3.2: Infrastructures monitoring and interoperability adaptation components toolkit and API
© 2013 - 2015 XIFI Consortium Parties Page 41 of 101
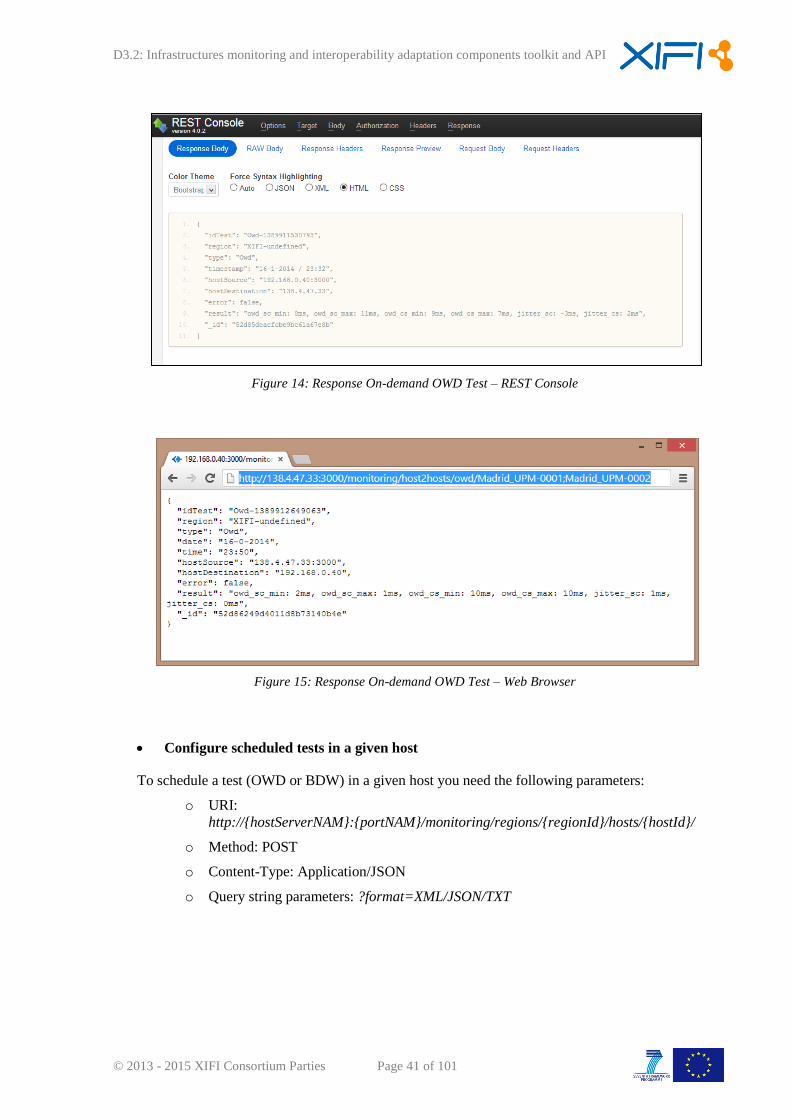
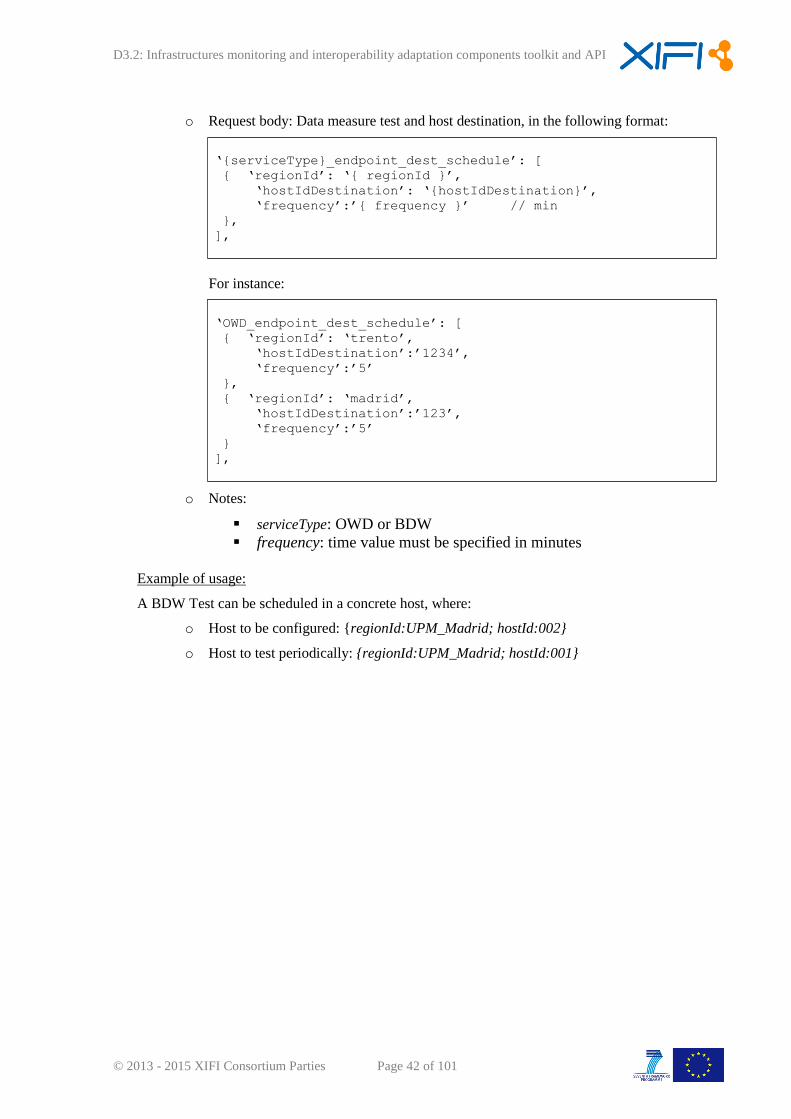
Figure 14: Response On-demand OWD Test – REST Console
Figure 15: Response On-demand OWD Test – Web Browser
Configure scheduled tests in a given host
To schedule a test (OWD or BDW) in a given host you need the following parameters:
o URI:
http://{hostServerNAM}:{portNAM}/monitoring/regions/{regionId}/hosts/{hostId}/
o Method: POST
o Content-Type: Application/JSON
o Query string parameters: ?format=XML/JSON/TXT
D3.2: Infrastructures monitoring and interoperability adaptation components toolkit and API
© 2013 - 2015 XIFI Consortium Parties Page 42 of 101
o Request body: Data measure test and host destination, in the following format:
‘{serviceType}_endpoint_dest_schedule’: [
{ ‘regionId’: ‘{ regionId }’,
‘hostIdDestination’: ‘{hostIdDestination}’,
‘frequency’:’{ frequency }’ // min
},
],
For instance:
‘OWD_endpoint_dest_schedule’: [
{ ‘regionId’: ‘trento’,
‘hostIdDestination’:’1234’,
‘frequency’:’5’
},
{ ‘regionId’: ‘madrid’,
‘hostIdDestination’:’123’,
‘frequency’:’5’
}
],
o Notes:
serviceType: OWD or BDW
frequency: time value must be specified in minutes
Example of usage:
A BDW Test can be scheduled in a concrete host, where:
o Host to be configured: {regionId:UPM_Madrid; hostId:002}
o Host to test periodically: {regionId:UPM_Madrid; hostId:001}
D3.2: Infrastructures monitoring and interoperability adaptation components toolkit and API
© 2013 - 2015 XIFI Consortium Parties Page 43 of 101
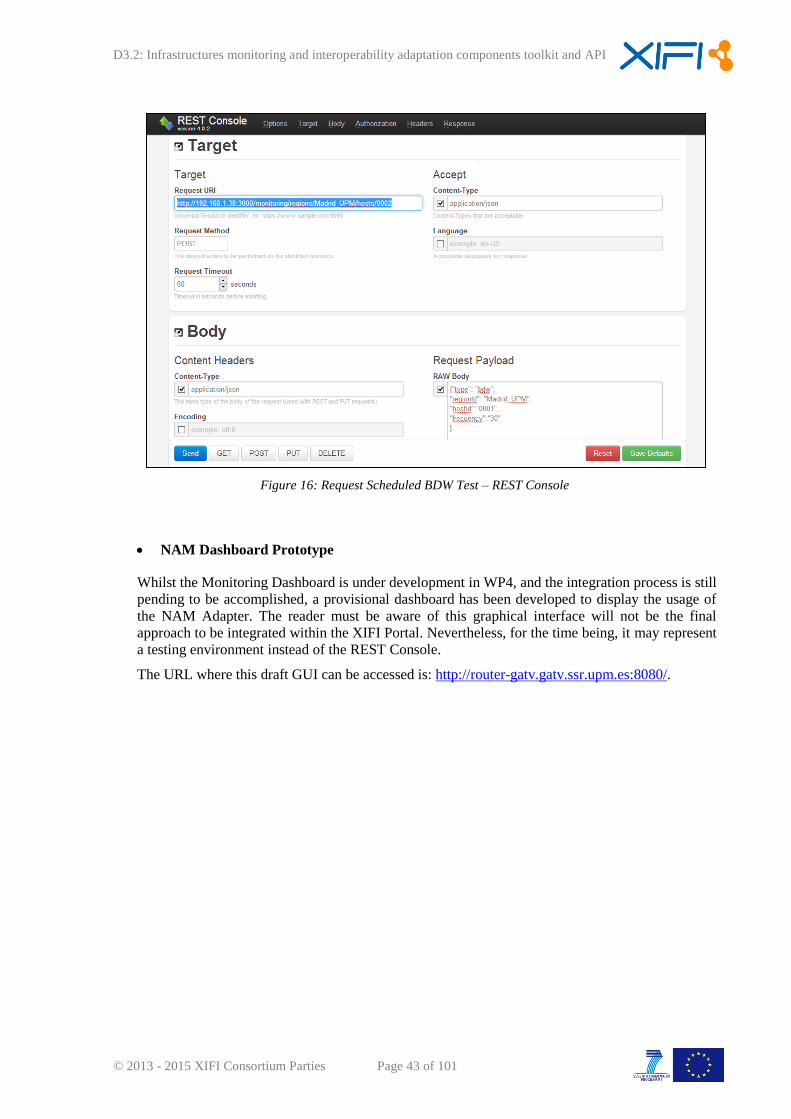
Figure 16: Request Scheduled BDW Test – REST Console
NAM Dashboard Prototype
Whilst the Monitoring Dashboard is under development in WP4, and the integration process is still
pending to be accomplished, a provisional dashboard has been developed to display the usage of
the NAM Adapter. The reader must be aware of this graphical interface will not be the final
approach to be integrated within the XIFI Portal. Nevertheless, for the time being, it may represent
a testing environment instead of the REST Console.
The URL where this draft GUI can be accessed is: http://router-gatv.gatv.ssr.upm.es:8080/.
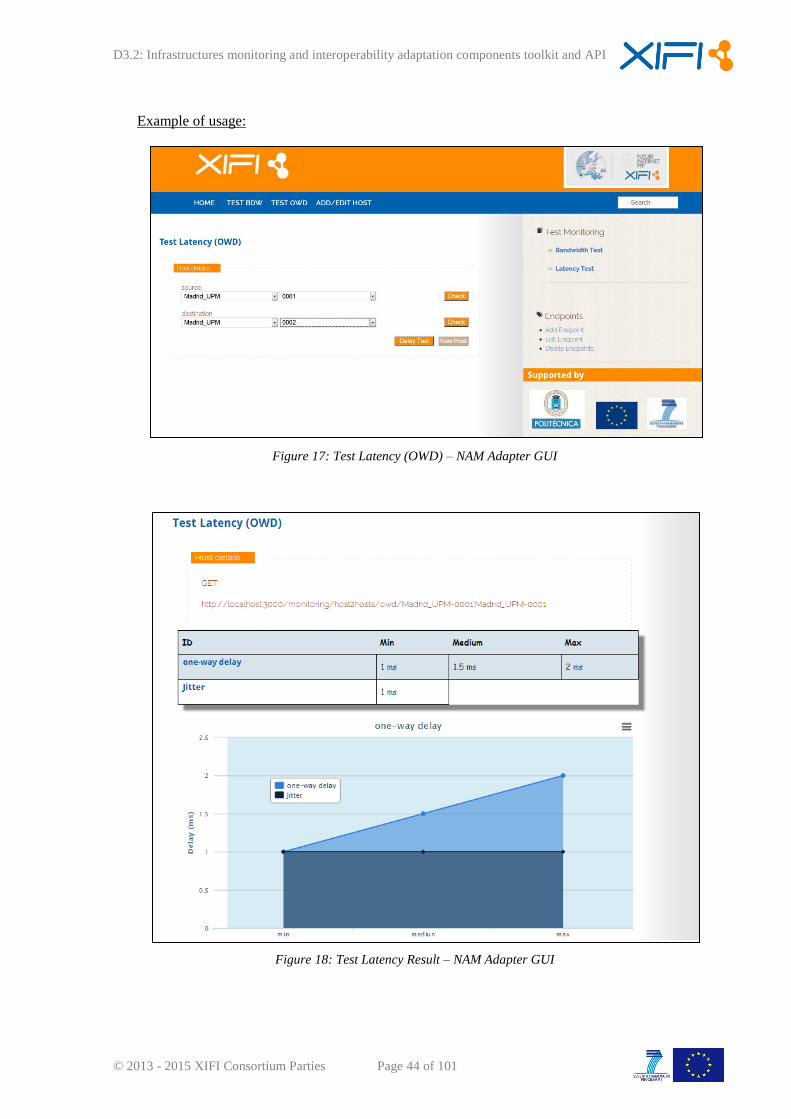
D3.2: Infrastructures monitoring and interoperability adaptation components toolkit and API
© 2013 - 2015 XIFI Consortium Parties Page 44 of 101
Example of usage:
Figure 17: Test Latency (OWD) – NAM Adapter GUI
Figure 18: Test Latency Result – NAM Adapter GUI
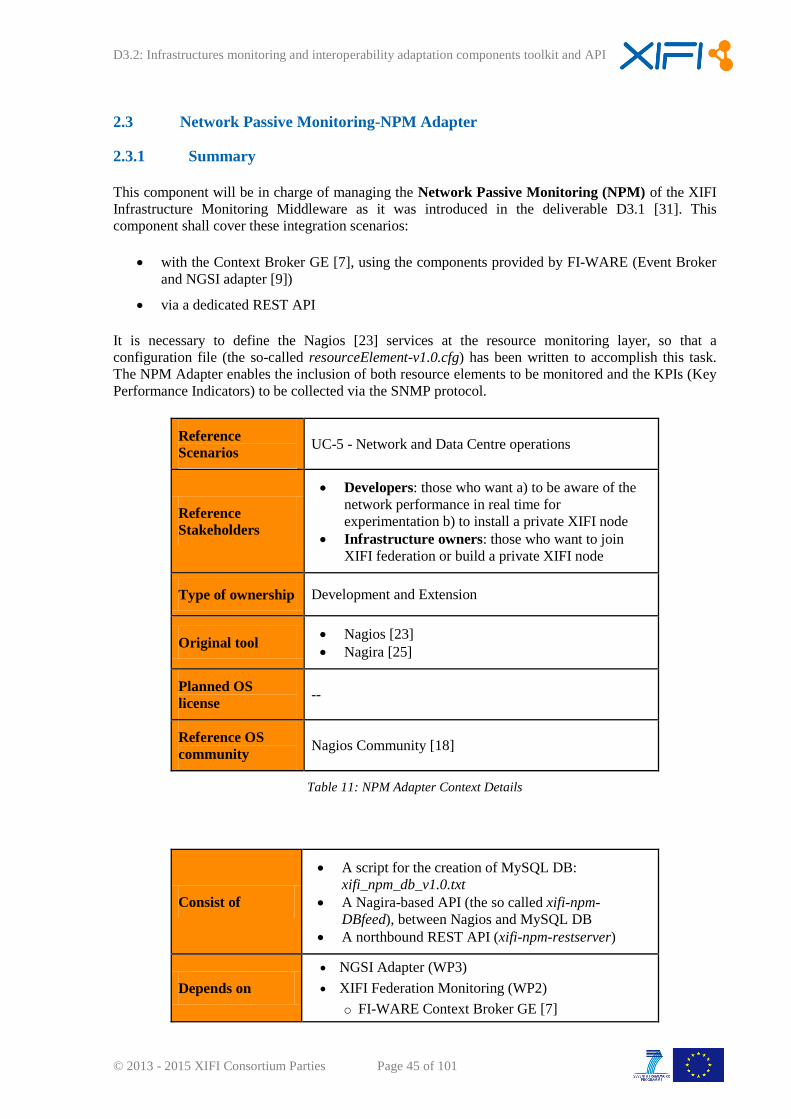
D3.2: Infrastructures monitoring and interoperability adaptation components toolkit and API
© 2013 - 2015 XIFI Consortium Parties Page 45 of 101
2.3 Network Passive Monitoring-NPM Adapter
2.3.1 Summary
This component will be in charge of managing the Network Passive Monitoring (NPM) of the XIFI
Infrastructure Monitoring Middleware as it was introduced in the deliverable D3.1 [31]. This
component shall cover these integration scenarios:
with the Context Broker GE [7], using the components provided by FI-WARE (Event Broker
and NGSI adapter [9])
via a dedicated REST API
It is necessary to define the Nagios [23] services at the resource monitoring layer, so that a
configuration file (the so-called resourceElement-v1.0.cfg) has been written to accomplish this task.
The NPM Adapter enables the inclusion of both resource elements to be monitored and the KPIs (Key
Performance Indicators) to be collected via the SNMP protocol.
Reference
Scenarios UC-5 - Network and Data Centre operations
Reference
Stakeholders
Developers: those who want a) to be aware of the
network performance in real time for
experimentation b) to install a private XIFI node
Infrastructure owners: those who want to join
XIFI federation or build a private XIFI node
Type of ownership Development and Extension
Original tool Nagios [23]
Nagira [25]
Planned OS
license --
Reference OS
community Nagios Community [18]
Table 11: NPM Adapter Context Details
Consist of
A script for the creation of MySQL DB:
xifi_npm_db_v1.0.txt
A Nagira-based API (the so called xifi-npm-
DBfeed), between Nagios and MySQL DB
A northbound REST API (xifi-npm-restserver)
Depends on
NGSI Adapter (WP3)
XIFI Federation Monitoring (WP2)
o FI-WARE Context Broker GE [7]
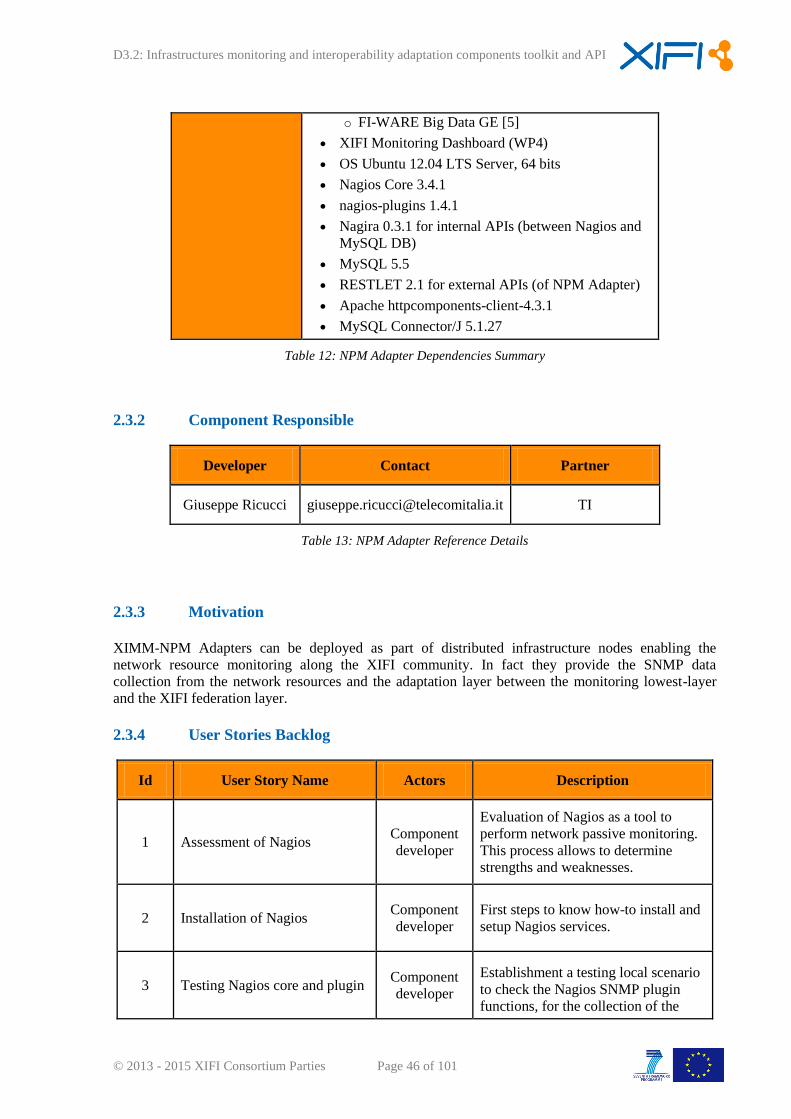
D3.2: Infrastructures monitoring and interoperability adaptation components toolkit and API
© 2013 - 2015 XIFI Consortium Parties Page 46 of 101
o FI-WARE Big Data GE [5]
XIFI Monitoring Dashboard (WP4)
OS Ubuntu 12.04 LTS Server, 64 bits
Nagios Core 3.4.1
nagios-plugins 1.4.1
Nagira 0.3.1 for internal APIs (between Nagios and
MySQL DB)
MySQL 5.5
RESTLET 2.1 for external APIs (of NPM Adapter)
Apache httpcomponents-client-4.3.1
MySQL Connector/J 5.1.27
Table 12: NPM Adapter Dependencies Summary
2.3.2 Component Responsible
Developer Contact Partner
Giuseppe Ricucci [email protected] TI
Table 13: NPM Adapter Reference Details
2.3.3 Motivation
XIMM-NPM Adapters can be deployed as part of distributed infrastructure nodes enabling the
network resource monitoring along the XIFI community. In fact they provide the SNMP data
collection from the network resources and the adaptation layer between the monitoring lowest-layer
and the XIFI federation layer.
2.3.4 User Stories Backlog
Id User Story Name Actors Description
1 Assessment of Nagios Component
developer
Evaluation of Nagios as a tool to
perform network passive monitoring.
This process allows to determine
strengths and weaknesses.
2 Installation of Nagios Component
developer
First steps to know how-to install and
setup Nagios services.
3 Testing Nagios core and plugin Component
developer
Establishment a testing local scenario
to check the Nagios SNMP plugin
functions, for the collection of the
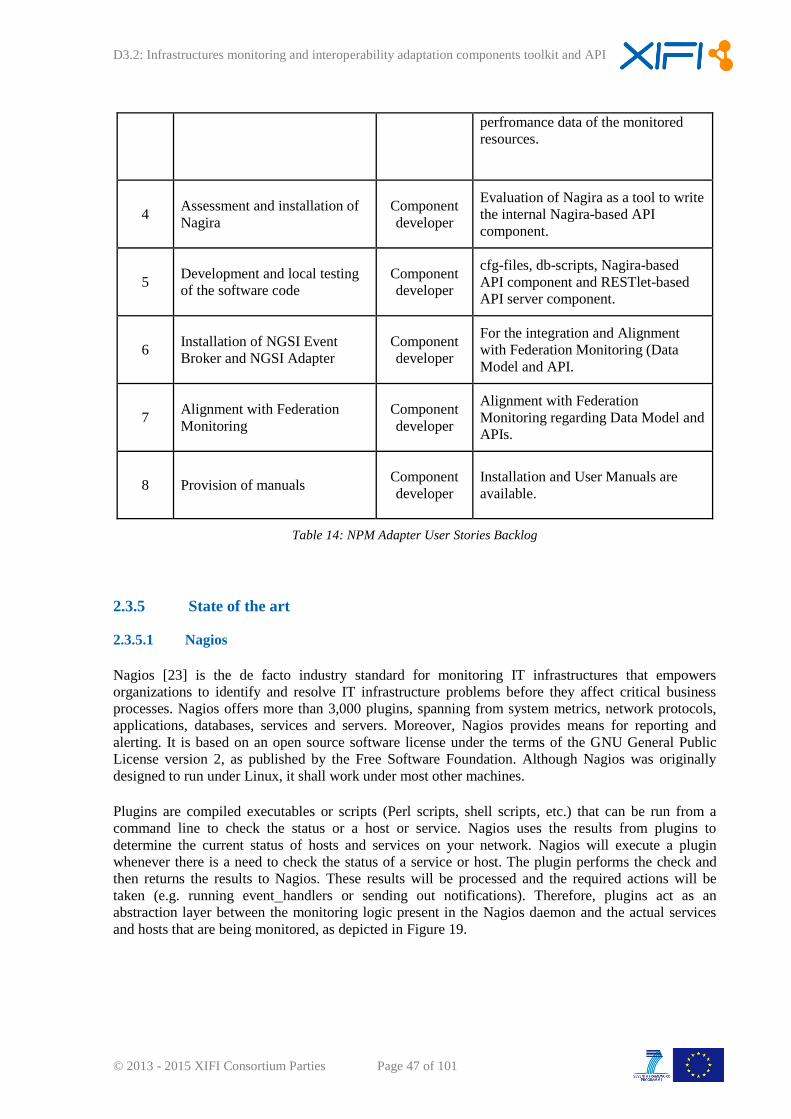
D3.2: Infrastructures monitoring and interoperability adaptation components toolkit and API
© 2013 - 2015 XIFI Consortium Parties Page 47 of 101
perfromance data of the monitored
resources.
4 Assessment and installation of
Nagira
Component
developer
Evaluation of Nagira as a tool to write
the internal Nagira-based API
component.
5 Development and local testing
of the software code
Component
developer
cfg-files, db-scripts, Nagira-based
API component and RESTlet-based
API server component.
6 Installation of NGSI Event
Broker and NGSI Adapter
Component
developer
For the integration and Alignment
with Federation Monitoring (Data
Model and API.
7 Alignment with Federation
Monitoring
Component
developer
Alignment with Federation
Monitoring regarding Data Model and
APIs.
8 Provision of manuals Component
developer
Installation and User Manuals are
available.
Table 14: NPM Adapter User Stories Backlog
2.3.5 State of the art
2.3.5.1 Nagios
Nagios [23] is the de facto industry standard for monitoring IT infrastructures that empowers
organizations to identify and resolve IT infrastructure problems before they affect critical business
processes. Nagios offers more than 3,000 plugins, spanning from system metrics, network protocols,
applications, databases, services and servers. Moreover, Nagios provides means for reporting and
alerting. It is based on an open source software license under the terms of the GNU General Public
License version 2, as published by the Free Software Foundation. Although Nagios was originally
designed to run under Linux, it shall work under most other machines.
Plugins are compiled executables or scripts (Perl scripts, shell scripts, etc.) that can be run from a
command line to check the status or a host or service. Nagios uses the results from plugins to
determine the current status of hosts and services on your network. Nagios will execute a plugin
whenever there is a need to check the status of a service or host. The plugin performs the check and
then returns the results to Nagios. These results will be processed and the required actions will be
taken (e.g. running event handlers or sending out notifications). Therefore, plugins act as an
abstraction layer between the monitoring logic present in the Nagios daemon and the actual services
and hosts that are being monitored, as depicted in Figure 19.
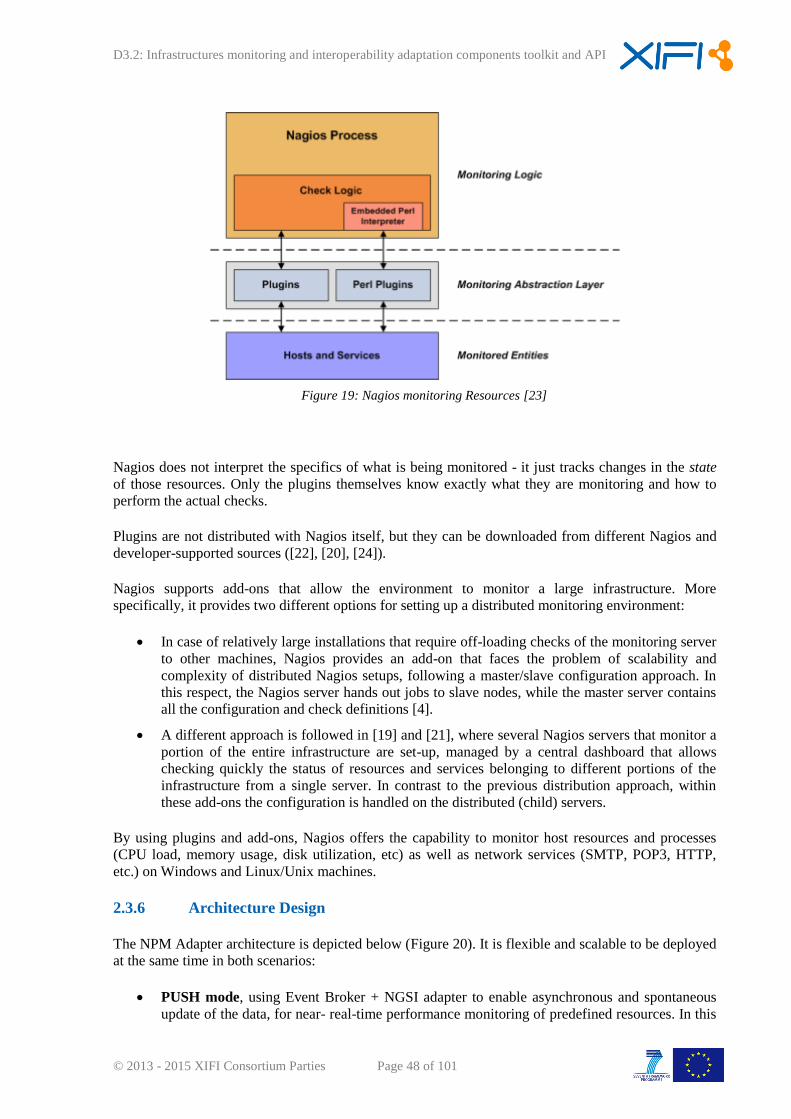
D3.2: Infrastructures monitoring and interoperability adaptation components toolkit and API
© 2013 - 2015 XIFI Consortium Parties Page 48 of 101
Figure 19: Nagios monitoring Resources [23]
Nagios does not interpret the specifics of what is being monitored - it just tracks changes in the state
of those resources. Only the plugins themselves know exactly what they are monitoring and how to
perform the actual checks.
Plugins are not distributed with Nagios itself, but they can be downloaded from different Nagios and
developer-supported sources ([22], [20], [24]).
Nagios supports add-ons that allow the environment to monitor a large infrastructure. More
specifically, it provides two different options for setting up a distributed monitoring environment:
In case of relatively large installations that require off-loading checks of the monitoring server
to other machines, Nagios provides an add-on that faces the problem of scalability and
complexity of distributed Nagios setups, following a master/slave configuration approach. In
this respect, the Nagios server hands out jobs to slave nodes, while the master server contains
all the configuration and check definitions [4].
A different approach is followed in [19] and [21], where several Nagios servers that monitor a
portion of the entire infrastructure are set-up, managed by a central dashboard that allows
checking quickly the status of resources and services belonging to different portions of the
infrastructure from a single server. In contrast to the previous distribution approach, within
these add-ons the configuration is handled on the distributed (child) servers.
By using plugins and add-ons, Nagios offers the capability to monitor host resources and processes
(CPU load, memory usage, disk utilization, etc) as well as network services (SMTP, POP3, HTTP,
etc.) on Windows and Linux/Unix machines.
2.3.6 Architecture Design
The NPM Adapter architecture is depicted below (Figure 20). It is flexible and scalable to be deployed
at the same time in both scenarios:
PUSH mode, using Event Broker + NGSI adapter to enable asynchronous and spontaneous
update of the data, for near- real-time performance monitoring of predefined resources. In this
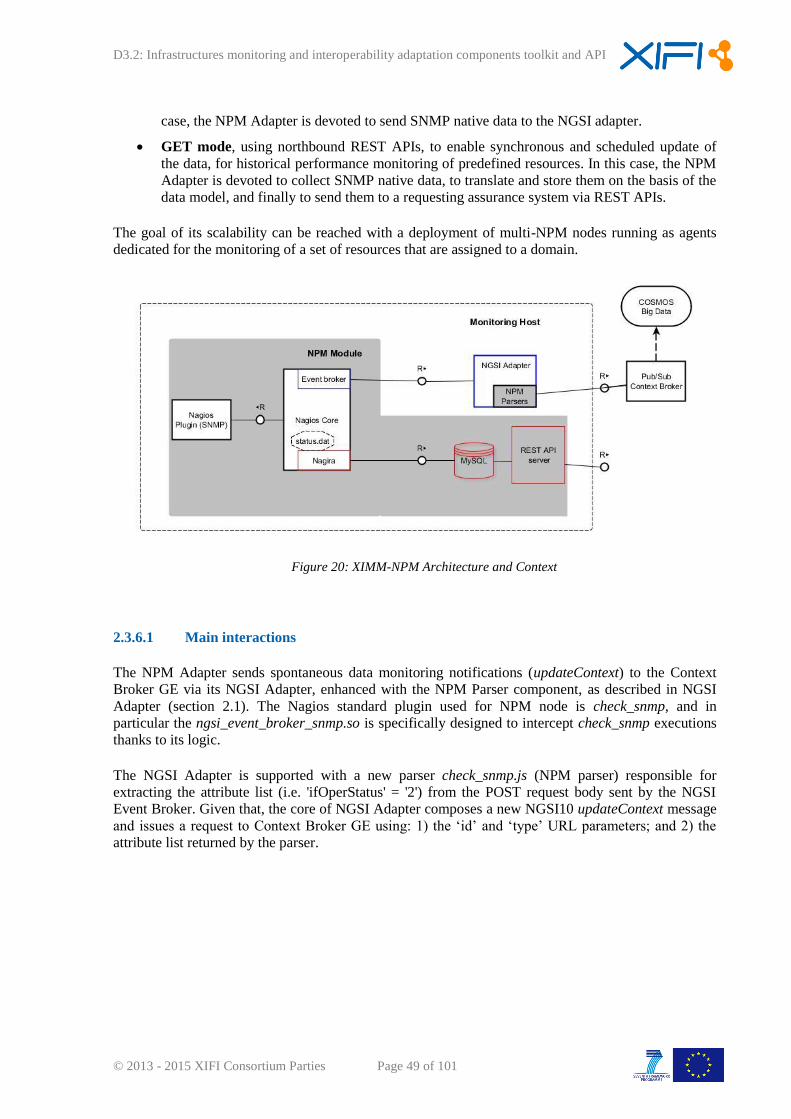
D3.2: Infrastructures monitoring and interoperability adaptation components toolkit and API
© 2013 - 2015 XIFI Consortium Parties Page 49 of 101
case, the NPM Adapter is devoted to send SNMP native data to the NGSI adapter.
GET mode, using northbound REST APIs, to enable synchronous and scheduled update of
the data, for historical performance monitoring of predefined resources. In this case, the NPM
Adapter is devoted to collect SNMP native data, to translate and store them on the basis of the
data model, and finally to send them to a requesting assurance system via REST APIs.
The goal of its scalability can be reached with a deployment of multi-NPM nodes running as agents
dedicated for the monitoring of a set of resources that are assigned to a domain.
Figure 20: XIMM-NPM Architecture and Context
2.3.6.1 Main interactions
The NPM Adapter sends spontaneous data monitoring notifications (updateContext) to the Context
Broker GE via its NGSI Adapter, enhanced with the NPM Parser component, as described in NGSI
Adapter (section 2.1). The Nagios standard plugin used for NPM node is check_snmp, and in
particular the ngsi_event_broker_snmp.so is specifically designed to intercept check_snmp executions
thanks to its logic.
The NGSI Adapter is supported with a new parser check_snmp.js (NPM parser) responsible for
extracting the attribute list (i.e. 'ifOperStatus' = '2') from the POST request body sent by the NGSI
Event Broker. Given that, the core of NGSI Adapter composes a new NGSI10 updateContext message
and issues a request to Context Broker GE using: 1) the ‘id’ and ‘type’ URL parameters; and 2) the
attribute list returned by the parser.
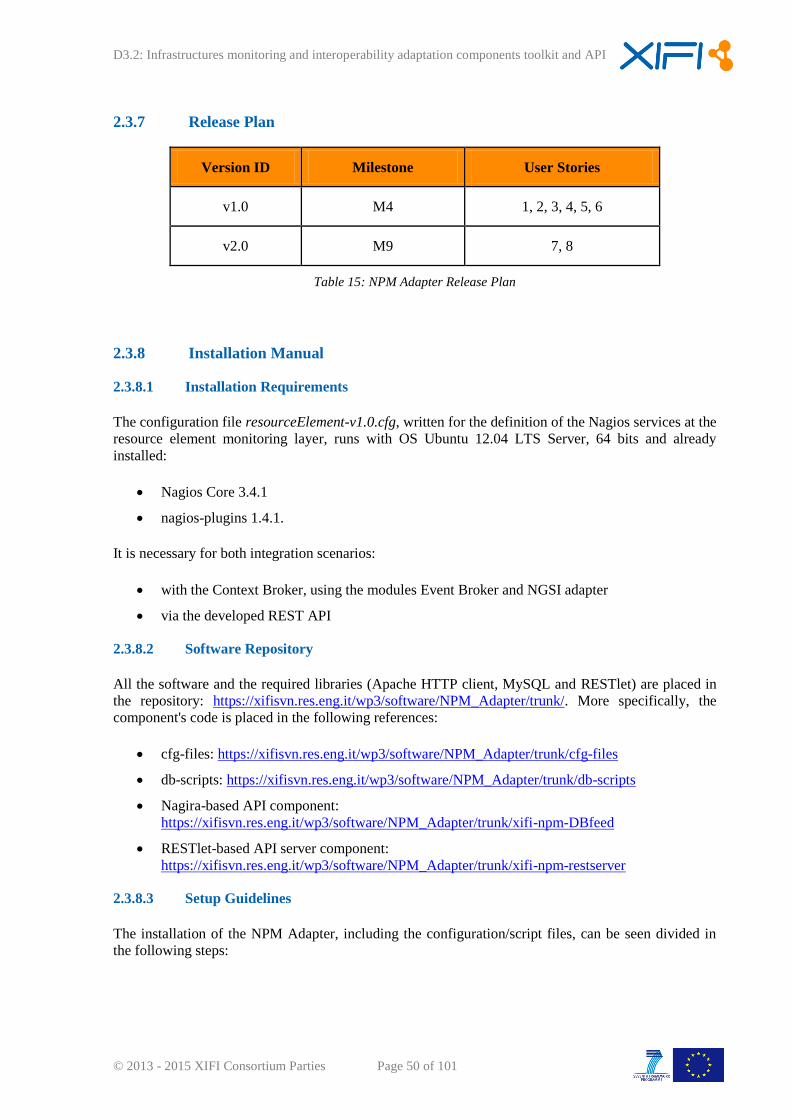
D3.2: Infrastructures monitoring and interoperability adaptation components toolkit and API
© 2013 - 2015 XIFI Consortium Parties Page 50 of 101
2.3.7 Release Plan
Version ID Milestone User Stories
v1.0 M4 1, 2, 3, 4, 5, 6
v2.0 M9 7, 8
Table 15: NPM Adapter Release Plan
2.3.8 Installation Manual
2.3.8.1 Installation Requirements
The configuration file resourceElement-v1.0.cfg, written for the definition of the Nagios services at the
resource element monitoring layer, runs with OS Ubuntu 12.04 LTS Server, 64 bits and already
installed:
Nagios Core 3.4.1
nagios-plugins 1.4.1.
It is necessary for both integration scenarios:
with the Context Broker, using the modules Event Broker and NGSI adapter
via the developed REST API
2.3.8.2 Software Repository
All the software and the required libraries (Apache HTTP client, MySQL and RESTlet) are placed in
the repository: https://xifisvn.res.eng.it/wp3/software/NPM_Adapter/trunk/. More specifically, the
component's code is placed in the following references:
cfg-files: https://xifisvn.res.eng.it/wp3/software/NPM_Adapter/trunk/cfg-files
db-scripts: https://xifisvn.res.eng.it/wp3/software/NPM_Adapter/trunk/db-scripts
Nagira-based API component:
https://xifisvn.res.eng.it/wp3/software/NPM_Adapter/trunk/xifi-npm-DBfeed
RESTlet-based API server component:
https://xifisvn.res.eng.it/wp3/software/NPM_Adapter/trunk/xifi-npm-restserver
2.3.8.3 Setup Guidelines
The installation of the NPM Adapter, including the configuration/script files, can be seen divided in
the following steps:
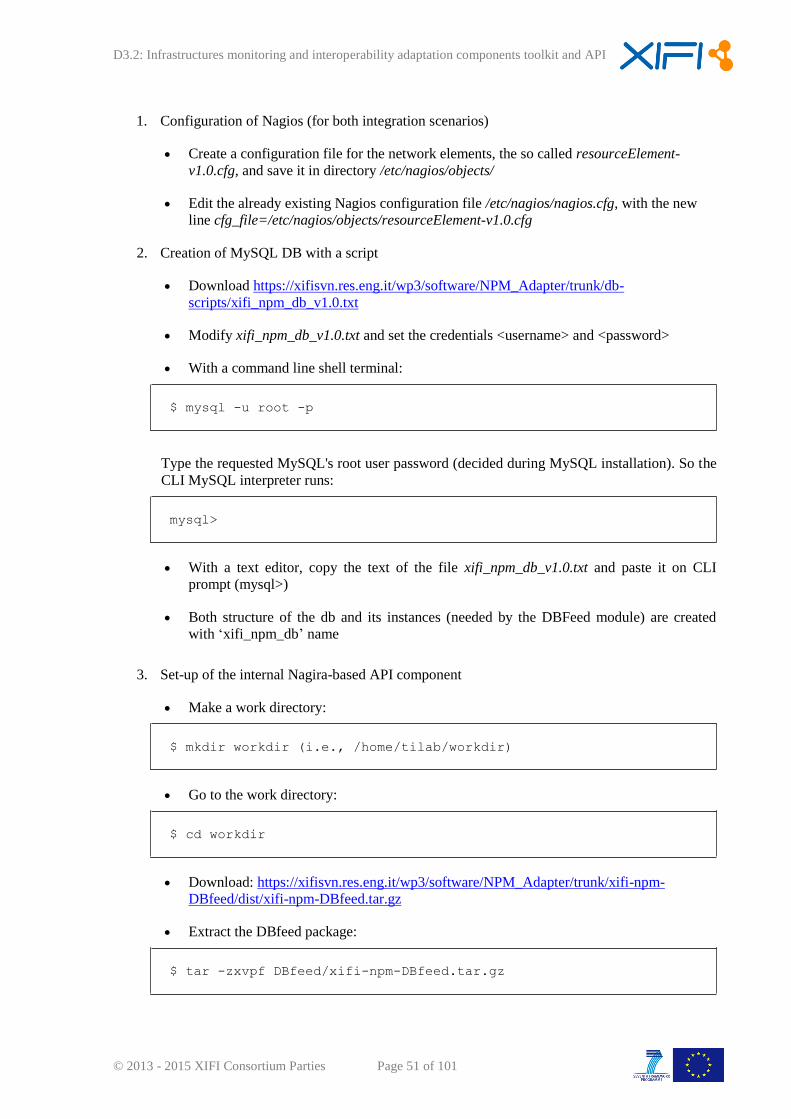
D3.2: Infrastructures monitoring and interoperability adaptation components toolkit and API
© 2013 - 2015 XIFI Consortium Parties Page 51 of 101
1. Configuration of Nagios (for both integration scenarios)
Create a configuration file for the network elements, the so called resourceElement-
v1.0.cfg, and save it in directory /etc/nagios/objects/
Edit the already existing Nagios configuration file /etc/nagios/nagios.cfg, with the new
line cfg_file=/etc/nagios/objects/resourceElement-v1.0.cfg
2. Creation of MySQL DB with a script
Download https://xifisvn.res.eng.it/wp3/software/NPM_Adapter/trunk/db-
scripts/xifi_npm_db_v1.0.txt
Modify xifi_npm_db_v1.0.txt and set the credentials <username> and <password>
With a command line shell terminal:
$ mysql -u root -p
Type the requested MySQL's root user password (decided during MySQL installation). So the
CLI MySQL interpreter runs:
mysql>
With a text editor, copy the text of the file xifi_npm_db_v1.0.txt and paste it on CLI
prompt (mysql>)
Both structure of the db and its instances (needed by the DBFeed module) are created
with ‘xifi_npm_db’ name
3. Set-up of the internal Nagira-based API component
Make a work directory:
$ mkdir workdir (i.e., /home/tilab/workdir)
Go to the work directory:
$ cd workdir
Download: https://xifisvn.res.eng.it/wp3/software/NPM_Adapter/trunk/xifi-npm-
DBfeed/dist/xifi-npm-DBfeed.tar.gz
Extract the DBfeed package:
$ tar -zxvpf DBfeed/xifi-npm-DBfeed.tar.gz
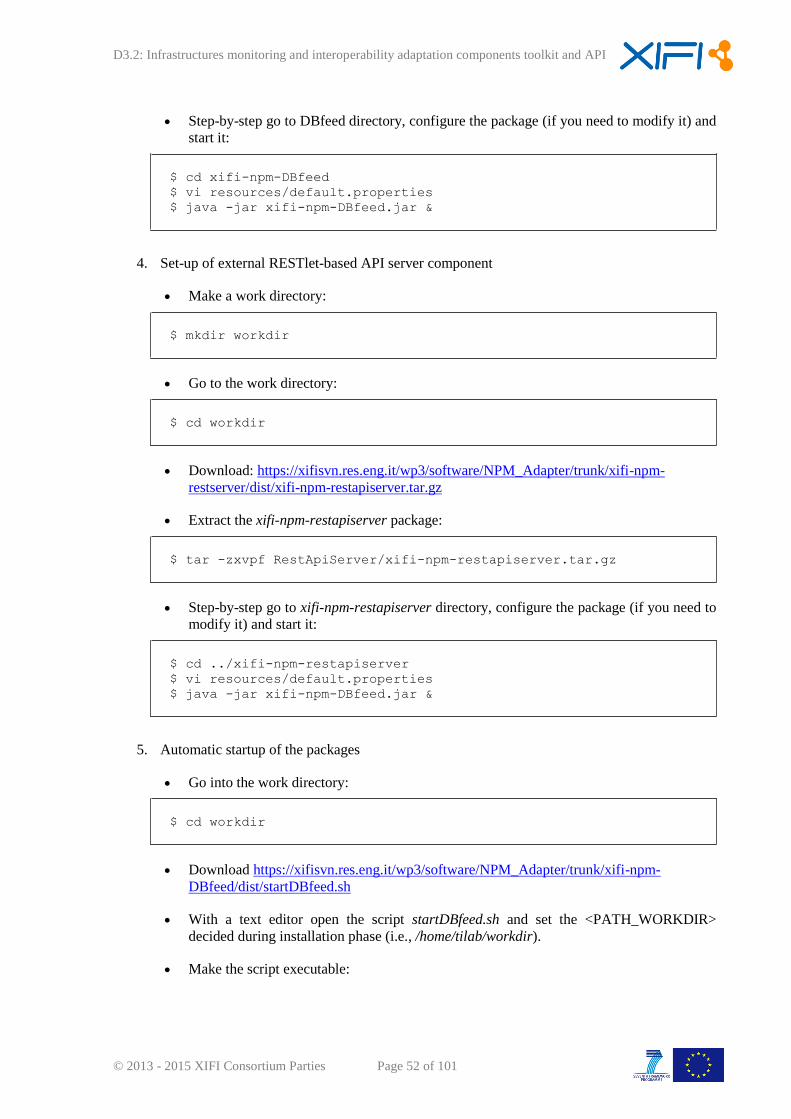
D3.2: Infrastructures monitoring and interoperability adaptation components toolkit and API
© 2013 - 2015 XIFI Consortium Parties Page 52 of 101
Step-by-step go to DBfeed directory, configure the package (if you need to modify it) and
start it:
$ cd xifi-npm-DBfeed
$ vi resources/default.properties
$ java -jar xifi-npm-DBfeed.jar &
4. Set-up of external RESTlet-based API server component
Make a work directory:
$ mkdir workdir
Go to the work directory:
$ cd workdir
Download: https://xifisvn.res.eng.it/wp3/software/NPM_Adapter/trunk/xifi-npm-
restserver/dist/xifi-npm-restapiserver.tar.gz
Extract the xifi-npm-restapiserver package:
$ tar -zxvpf RestApiServer/xifi-npm-restapiserver.tar.gz
Step-by-step go to xifi-npm-restapiserver directory, configure the package (if you need to
modify it) and start it:
$ cd ../xifi-npm-restapiserver
$ vi resources/default.properties
$ java -jar xifi-npm-DBfeed.jar &
5. Automatic startup of the packages
Go into the work directory:
$ cd workdir
Download https://xifisvn.res.eng.it/wp3/software/NPM_Adapter/trunk/xifi-npm-
DBfeed/dist/startDBfeed.sh
With a text editor open the script startDBfeed.sh and set the <PATH_WORKDIR>
decided during installation phase (i.e., /home/tilab/workdir).
Make the script executable:
D3.2: Infrastructures monitoring and interoperability adaptation components toolkit and API
© 2013 - 2015 XIFI Consortium Parties Page 53 of 101
$ chmod 744 startDBfeed.sh
Download https://xifisvn.res.eng.it/wp3/software/NPM_Adapter/trunk/xifi-npm-
restserver/dist/startrestapiserver.sh
With a text editor open the script startrestapiserver.sh and set the <PATH_WORKDIR>
decided during installation phase (i.e., /home/tilab/workdir).
Make the script executable:
$ chmod 744 startrestapiserver.sh
Add @reboot tag to crontab. For that edit the crontab file, launching this command:
$ crontab -e
So a file editor is open for adding the following line:
$ @reboot <PATH_WORKDIR>/startrestapiserver.sh ;
<PATH_WORKDIR>/startDBfeed.sh
Save the file. Please note to set <PATH_WORKDIR> (in the file) decided during
installation phase (i.e., /home/tilab/workdir).
2.3.9 User Manual
2.3.9.1 API Specification
This section defines the northbound APIs of the XIMM-NPM Adapter in the area of resource
performance monitoring. In particular, these APIs cover two retrieval functions:
Resource discovery, in order to construct the map of the monitored resources (i.e. a port of a
network element) of the XIMM-NPM node;
Data monitoring information (KPIs), in order to collect the status/performance data associated
to the monitored resources and stored on the XIMM-NPM’s database.
This specification is defined in a neutral manner to the set of the KPIs (Key Performance Indicators)
and to the nature of the resources.
Resource Discovery [GET]
Through the northbound XIMM-NPM APIs, the resource discovery function allows to retrieve all
the information about the monitored resources of a specified domain and/or resource element. This
information is enough to be used for the data monitoring collection.
This function is a GET operation, here called GetResourceDiscovery, and can be seen as
GetResourceDiscoveryRequest/Response with syntax and notation according to the following
conventions:
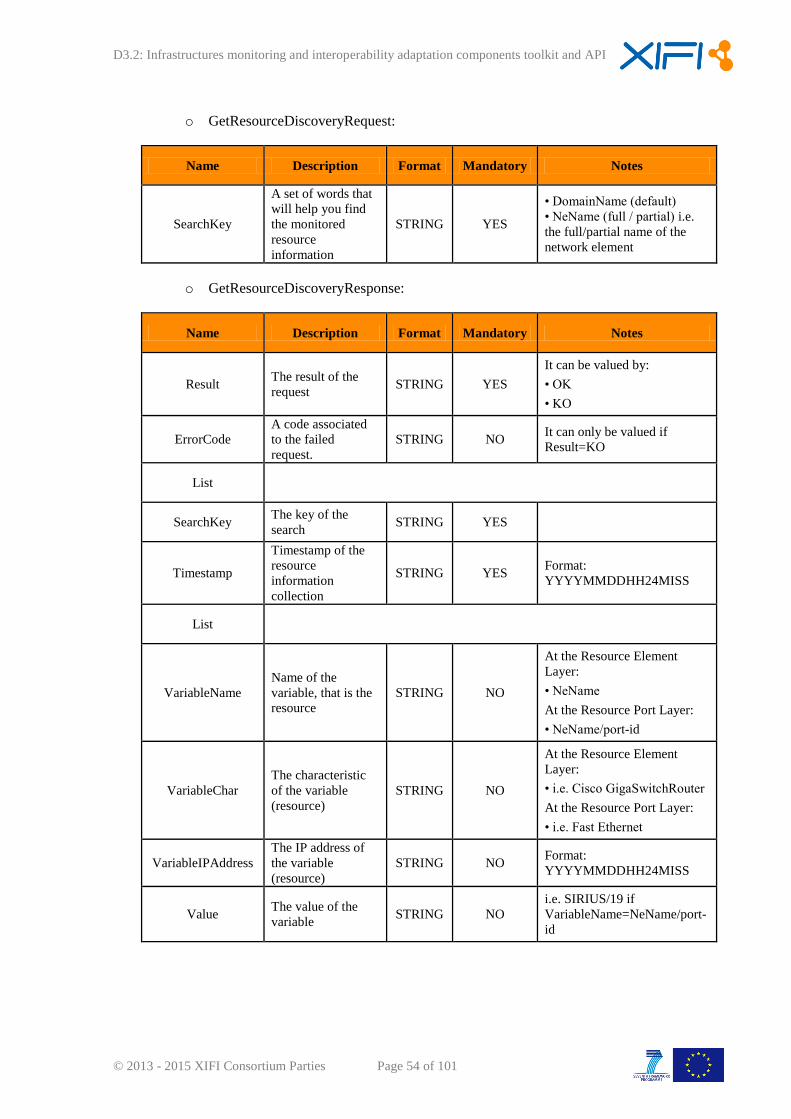
D3.2: Infrastructures monitoring and interoperability adaptation components toolkit and API
© 2013 - 2015 XIFI Consortium Parties Page 54 of 101
o GetResourceDiscoveryRequest:
Name Description Format Mandatory Notes
SearchKey
A set of words that
will help you find
the monitored
resource
information
STRING YES
• DomainName (default)
• NeName (full / partial) i.e.
the full/partial name of the
network element
o GetResourceDiscoveryResponse:
Name Description Format Mandatory Notes
Result The result of the
request STRING YES
It can be valued by:
• OK
• KO
ErrorCode
A code associated
to the failed
request.
STRING NO It can only be valued if
Result=KO
List
SearchKey The key of the
search STRING YES
Timestamp
Timestamp of the
resource
information
collection
STRING YES Format:
YYYYMMDDHH24MISS
List
VariableName
Name of the
variable, that is the
resource
STRING NO
At the Resource Element
Layer:
• NeName
At the Resource Port Layer:
• NeName/port-id
VariableChar
The characteristic
of the variable
(resource)
STRING NO
At the Resource Element
Layer:
• i.e. Cisco GigaSwitchRouter
At the Resource Port Layer:
• i.e. Fast Ethernet
VariableIPAddress
The IP address of
the variable
(resource)
STRING NO Format:
YYYYMMDDHH24MISS
Value The value of the
variable STRING NO
i.e. SIRIUS/19 if
VariableName=NeName/port-
id
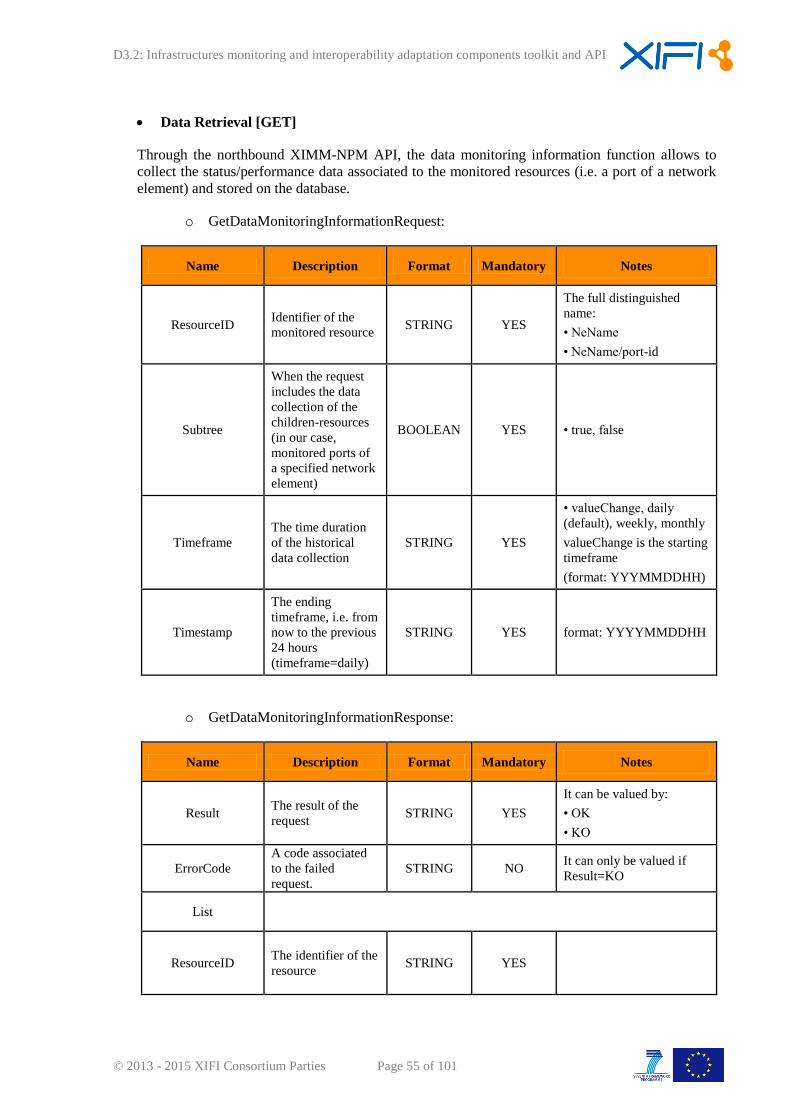
D3.2: Infrastructures monitoring and interoperability adaptation components toolkit and API
© 2013 - 2015 XIFI Consortium Parties Page 55 of 101
Data Retrieval [GET]
Through the northbound XIMM-NPM API, the data monitoring information function allows to
collect the status/performance data associated to the monitored resources (i.e. a port of a network
element) and stored on the database.
o GetDataMonitoringInformationRequest:
Name Description Format Mandatory Notes
ResourceID Identifier of the
monitored resource STRING YES
The full distinguished
name:
• NeName
• NeName/port-id
Subtree
When the request
includes the data
collection of the
children-resources
(in our case,
monitored ports of
a specified network
element)
BOOLEAN YES • true, false
Timeframe
The time duration
of the historical
data collection
STRING YES
• valueChange, daily
(default), weekly, monthly
valueChange is the starting
timeframe
(format: YYYMMDDHH)
Timestamp
The ending
timeframe, i.e. from
now to the previous
24 hours
(timeframe=daily)
STRING YES format: YYYYMMDDHH
o GetDataMonitoringInformationResponse:
Name Description Format Mandatory Notes
Result The result of the
request STRING YES
It can be valued by:
• OK
• KO
ErrorCode
A code associated
to the failed
request.
STRING NO It can only be valued if
Result=KO
List
ResourceID The identifier of the
resource STRING YES
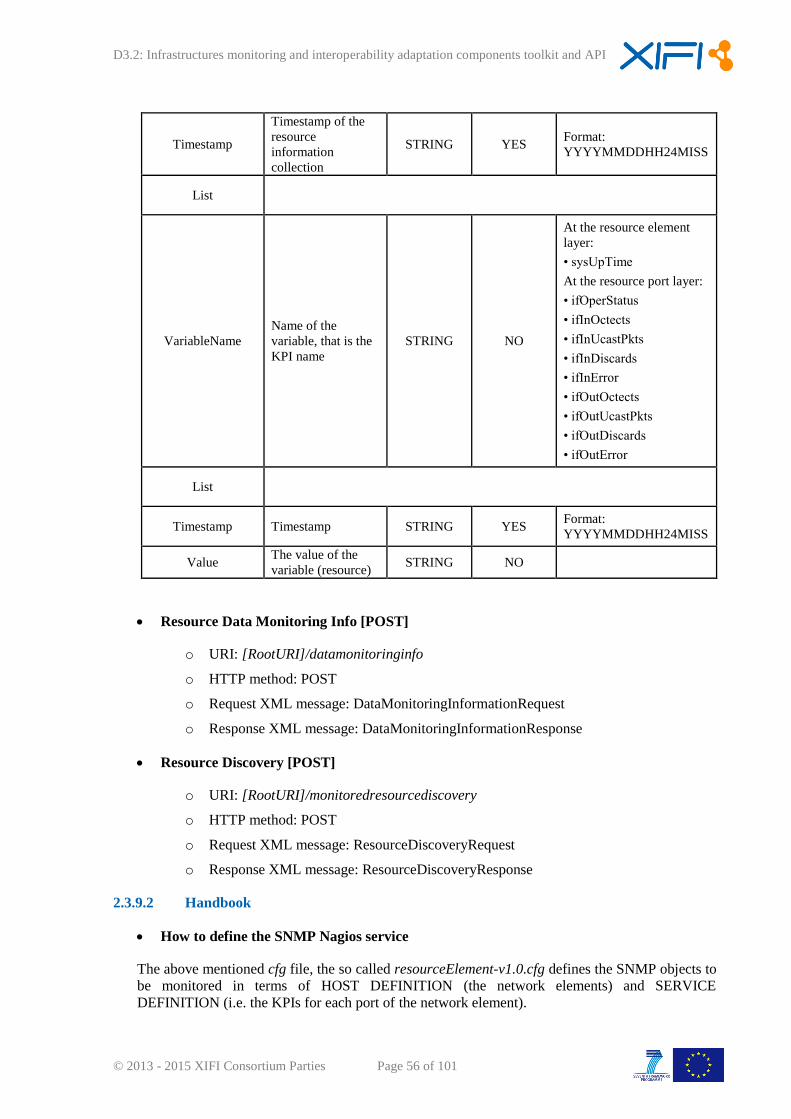
D3.2: Infrastructures monitoring and interoperability adaptation components toolkit and API
© 2013 - 2015 XIFI Consortium Parties Page 56 of 101
Timestamp
Timestamp of the
resource
information
collection
STRING YES Format:
YYYYMMDDHH24MISS
List
VariableName
Name of the
variable, that is the
KPI name
STRING NO
At the resource element
layer:
• sysUpTime
At the resource port layer:
• ifOperStatus
• ifInOctects
• ifInUcastPkts
• ifInDiscards
• ifInError
• ifOutOctects
• ifOutUcastPkts
• ifOutDiscards
• ifOutError
List
Timestamp Timestamp STRING YES Format:
YYYYMMDDHH24MISS
Value The value of the
variable (resource) STRING NO
Resource Data Monitoring Info [POST]
o URI: [RootURI]/datamonitoringinfo
o HTTP method: POST
o Request XML message: DataMonitoringInformationRequest
o Response XML message: DataMonitoringInformationResponse
Resource Discovery [POST]
o URI: [RootURI]/monitoredresourcediscovery
o HTTP method: POST
o Request XML message: ResourceDiscoveryRequest
o Response XML message: ResourceDiscoveryResponse
2.3.9.2 Handbook
How to define the SNMP Nagios service
The above mentioned cfg file, the so called resourceElement-v1.0.cfg defines the SNMP objects to
be monitored in terms of HOST DEFINITION (the network elements) and SERVICE
DEFINITION (i.e. the KPIs for each port of the network element).
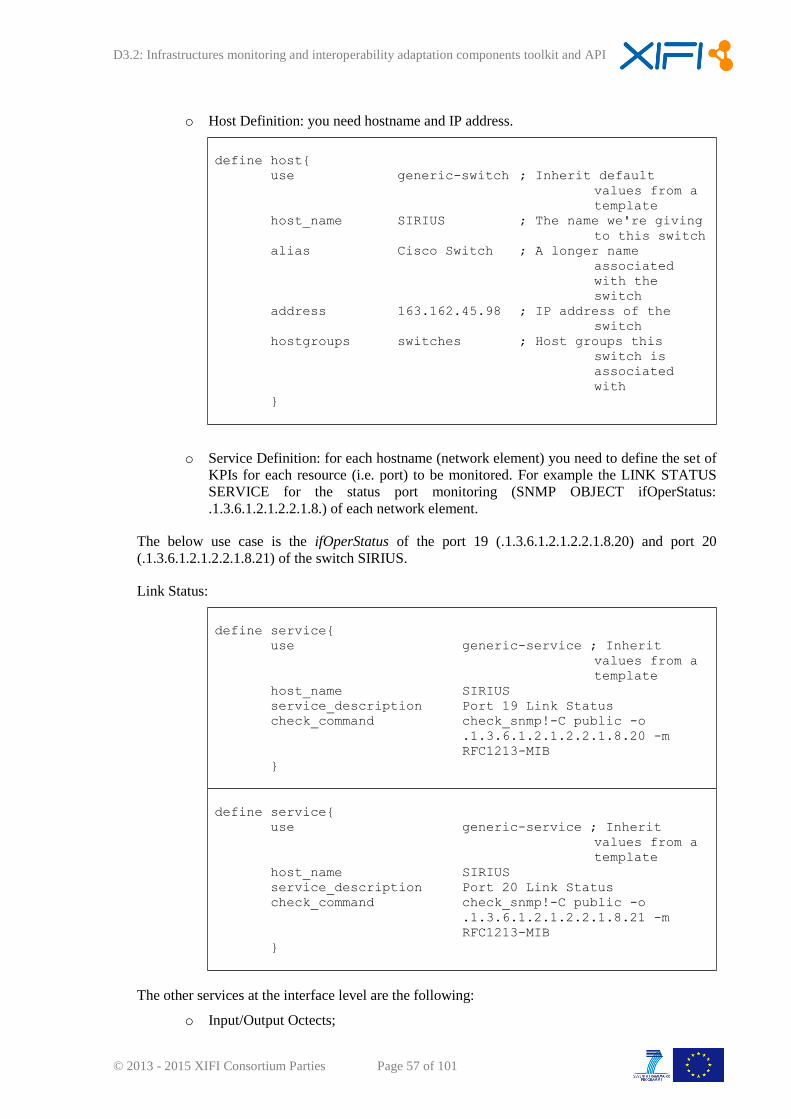
D3.2: Infrastructures monitoring and interoperability adaptation components toolkit and API
© 2013 - 2015 XIFI Consortium Parties Page 57 of 101
o Host Definition: you need hostname and IP address.
define host{
use generic-switch ; Inherit default
values from a
template
host_name SIRIUS ; The name we're giving
to this switch
alias Cisco Switch ; A longer name
associated
with the
switch
address 163.162.45.98 ; IP address of the
switch
hostgroups switches ; Host groups this
switch is
associated
with
}
o Service Definition: for each hostname (network element) you need to define the set of
KPIs for each resource (i.e. port) to be monitored. For example the LINK STATUS
SERVICE for the status port monitoring (SNMP OBJECT ifOperStatus:
.1.3.6.1.2.1.2.2.1.8.) of each network element.
The below use case is the ifOperStatus of the port 19 (.1.3.6.1.2.1.2.2.1.8.20) and port 20
(.1.3.6.1.2.1.2.2.1.8.21) of the switch SIRIUS.
Link Status:
define service{
use generic-service ; Inherit
values from a
template
host_name SIRIUS
service_description Port 19 Link Status
check_command check_snmp!-C public -o
.1.3.6.1.2.1.2.2.1.8.20 -m
RFC1213-MIB
}
define service{
use generic-service ; Inherit
values from a
template
host_name SIRIUS
service_description Port 20 Link Status
check_command check_snmp!-C public -o
.1.3.6.1.2.1.2.2.1.8.21 -m
RFC1213-MIB
}
The other services at the interface level are the following:
o Input/Output Octects;
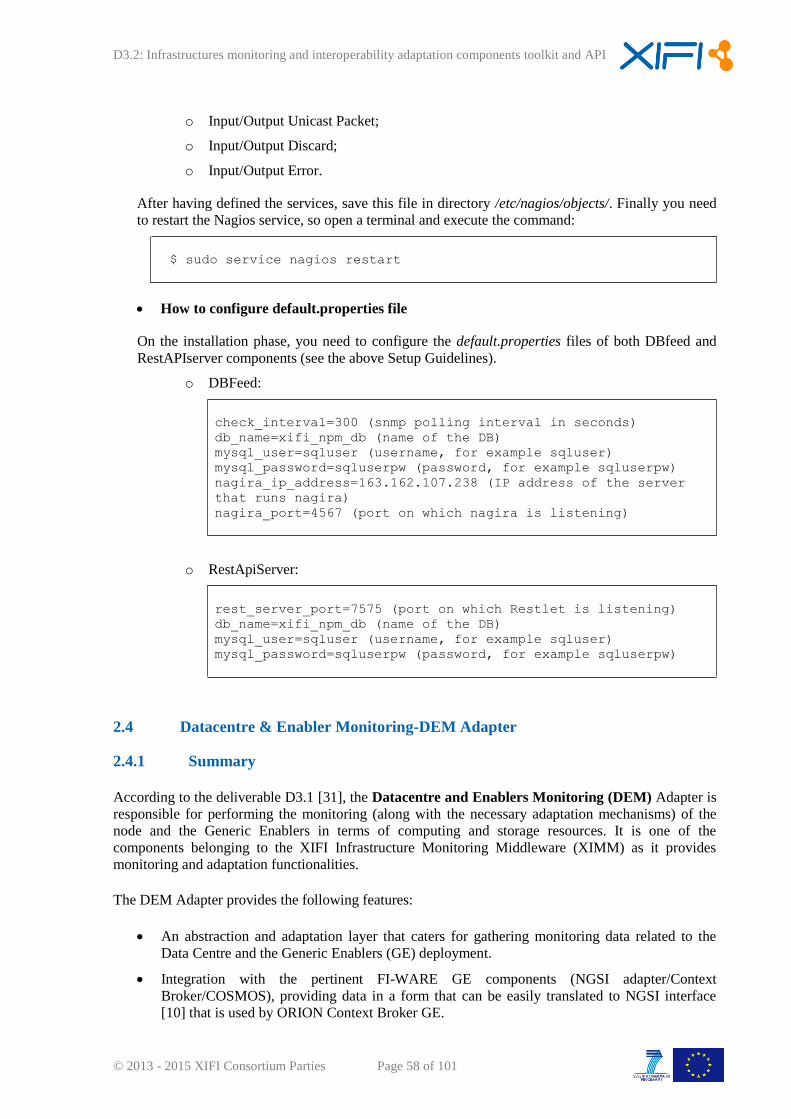
D3.2: Infrastructures monitoring and interoperability adaptation components toolkit and API
© 2013 - 2015 XIFI Consortium Parties Page 58 of 101
o Input/Output Unicast Packet;
o Input/Output Discard;
o Input/Output Error.
After having defined the services, save this file in directory /etc/nagios/objects/. Finally you need
to restart the Nagios service, so open a terminal and execute the command:
$ sudo service nagios restart
How to configure default.properties file
On the installation phase, you need to configure the default.properties files of both DBfeed and
RestAPIserver components (see the above Setup Guidelines).
o DBFeed:
check_interval=300 (snmp polling interval in seconds)
db_name=xifi_npm_db (name of the DB)
mysql_user=sqluser (username, for example sqluser)
mysql_password=sqluserpw (password, for example sqluserpw)
nagira_ip_address=163.162.107.238 (IP address of the server
that runs nagira)
nagira_port=4567 (port on which nagira is listening)
o RestApiServer:
rest_server_port=7575 (port on which Restlet is listening)
db_name=xifi_npm_db (name of the DB)
mysql_user=sqluser (username, for example sqluser)
mysql_password=sqluserpw (password, for example sqluserpw)
2.4 Datacentre & Enabler Monitoring-DEM Adapter
2.4.1 Summary
According to the deliverable D3.1 [31], the Datacentre and Enablers Monitoring (DEM) Adapter is
responsible for performing the monitoring (along with the necessary adaptation mechanisms) of the
node and the Generic Enablers in terms of computing and storage resources. It is one of the
components belonging to the XIFI Infrastructure Monitoring Middleware (XIMM) as it provides
monitoring and adaptation functionalities.
The DEM Adapter provides the following features:
An abstraction and adaptation layer that caters for gathering monitoring data related to the
Data Centre and the Generic Enablers (GE) deployment.
Integration with the pertinent FI-WARE GE components (NGSI adapter/Context
Broker/COSMOS), providing data in a form that can be easily translated to NGSI interface
[10] that is used by ORION Context Broker GE.
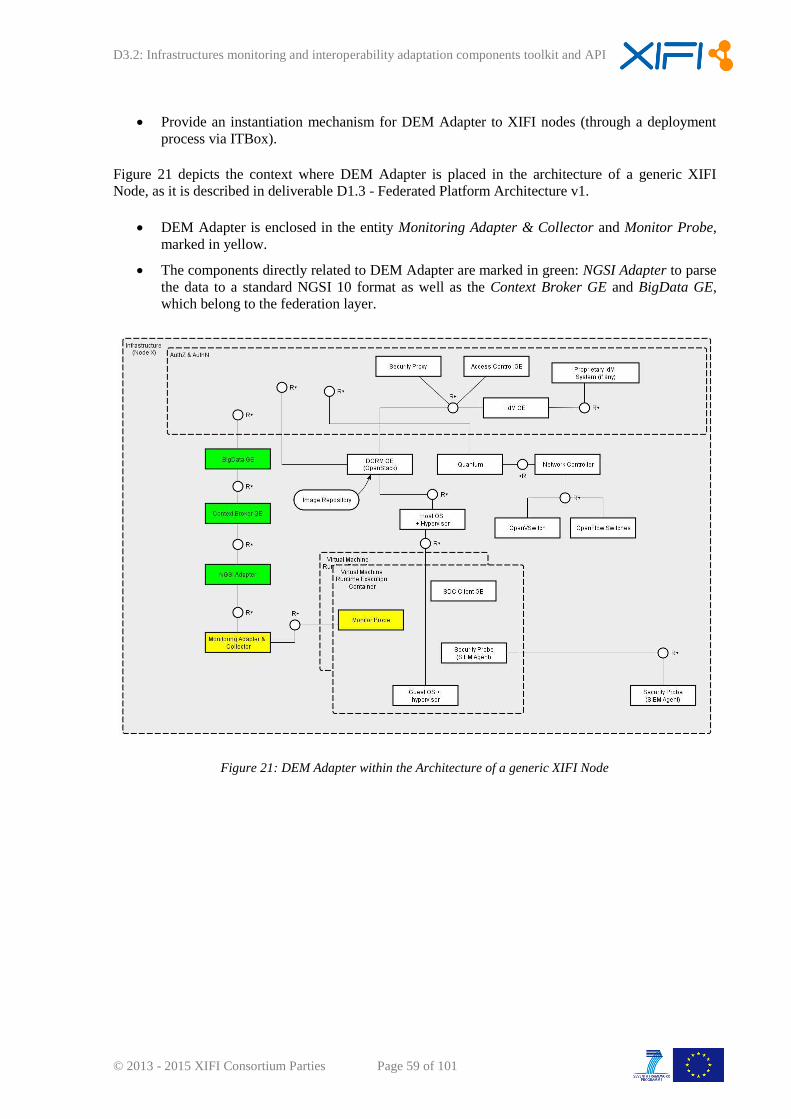
D3.2: Infrastructures monitoring and interoperability adaptation components toolkit and API
© 2013 - 2015 XIFI Consortium Parties Page 59 of 101
Provide an instantiation mechanism for DEM Adapter to XIFI nodes (through a deployment
process via ITBox).
Figure 21 depicts the context where DEM Adapter is placed in the architecture of a generic XIFI
Node, as it is described in deliverable D1.3 - Federated Platform Architecture v1.
DEM Adapter is enclosed in the entity Monitoring Adapter & Collector and Monitor Probe,
marked in yellow.
The components directly related to DEM Adapter are marked in green: NGSI Adapter to parse
the data to a standard NGSI 10 format as well as the Context Broker GE and BigData GE,
which belong to the federation layer.
Figure 21: DEM Adapter within the Architecture of a generic XIFI Node
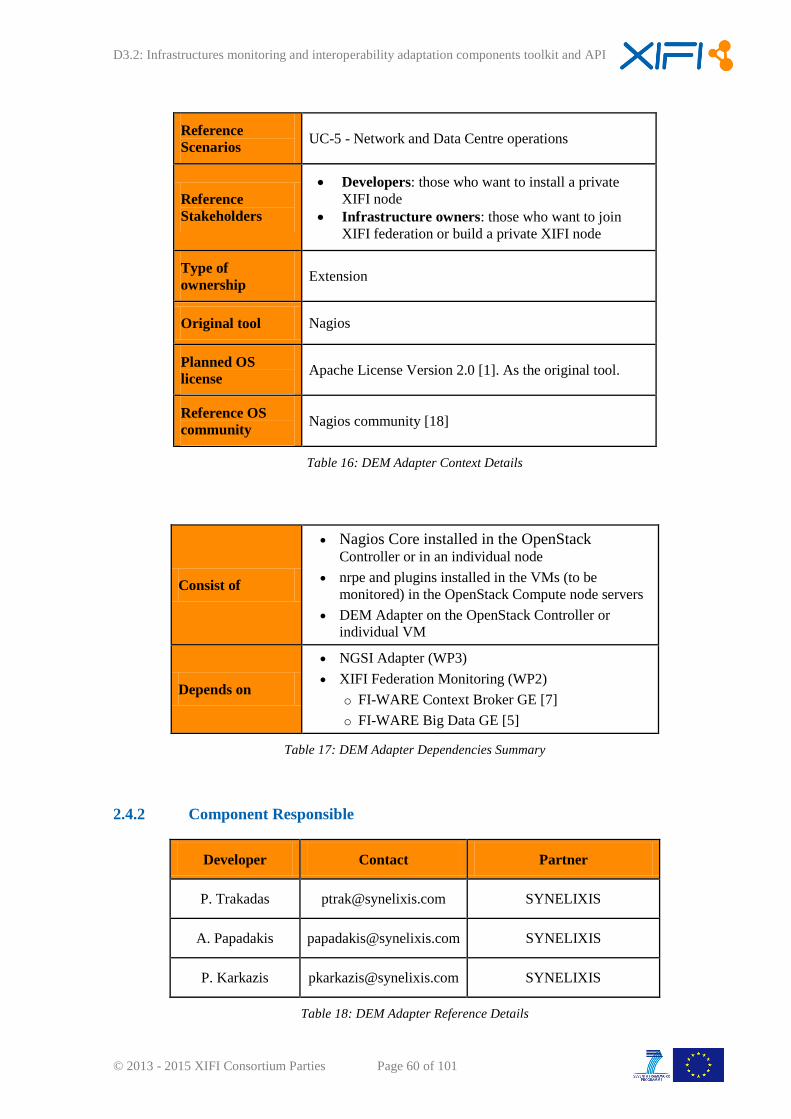
D3.2: Infrastructures monitoring and interoperability adaptation components toolkit and API
© 2013 - 2015 XIFI Consortium Parties Page 60 of 101
Reference
Scenarios UC-5 - Network and Data Centre operations
Reference
Stakeholders
Developers: those who want to install a private
XIFI node
Infrastructure owners: those who want to join
XIFI federation or build a private XIFI node
Type of
ownership Extension
Original tool Nagios
Planned OS
license Apache License Version 2.0 [1]. As the original tool.
Reference OS
community Nagios community [18]
Table 16: DEM Adapter Context Details
Consist of
Nagios Core installed in the OpenStack Controller or in an individual node
nrpe and plugins installed in the VMs (to be
monitored) in the OpenStack Compute node servers
DEM Adapter on the OpenStack Controller or
individual VM
Depends on
NGSI Adapter (WP3)
XIFI Federation Monitoring (WP2)
o FI-WARE Context Broker GE [7]
o FI-WARE Big Data GE [5]
Table 17: DEM Adapter Dependencies Summary
2.4.2 Component Responsible
Developer Contact Partner
P. Trakadas [email protected] SYNELIXIS
A. Papadakis [email protected] SYNELIXIS
P. Karkazis [email protected] SYNELIXIS
Table 18: DEM Adapter Reference Details
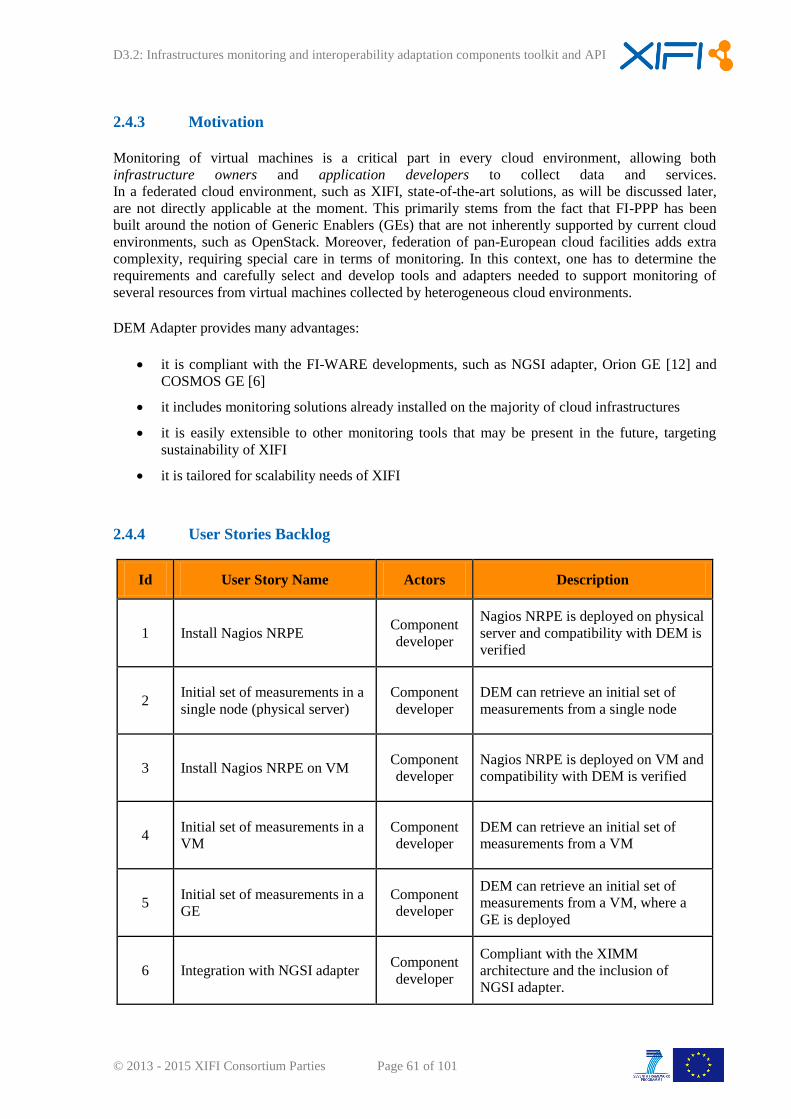
D3.2: Infrastructures monitoring and interoperability adaptation components toolkit and API
© 2013 - 2015 XIFI Consortium Parties Page 61 of 101
2.4.3 Motivation
Monitoring of virtual machines is a critical part in every cloud environment, allowing both
infrastructure owners and application developers to collect data and services.
In a federated cloud environment, such as XIFI, state-of-the-art solutions, as will be discussed later,
are not directly applicable at the moment. This primarily stems from the fact that FI-PPP has been
built around the notion of Generic Enablers (GEs) that are not inherently supported by current cloud
environments, such as OpenStack. Moreover, federation of pan-European cloud facilities adds extra
complexity, requiring special care in terms of monitoring. In this context, one has to determine the
requirements and carefully select and develop tools and adapters needed to support monitoring of
several resources from virtual machines collected by heterogeneous cloud environments.
DEM Adapter provides many advantages:
it is compliant with the FI-WARE developments, such as NGSI adapter, Orion GE [12] and
COSMOS GE [6]
it includes monitoring solutions already installed on the majority of cloud infrastructures
it is easily extensible to other monitoring tools that may be present in the future, targeting
sustainability of XIFI
it is tailored for scalability needs of XIFI
2.4.4 User Stories Backlog
Id User Story Name Actors Description
1 Install Nagios NRPE Component
developer
Nagios NRPE is deployed on physical
server and compatibility with DEM is
verified
2 Initial set of measurements in a
single node (physical server)
Component
developer
DEM can retrieve an initial set of
measurements from a single node
3 Install Nagios NRPE on VM Component
developer
Nagios NRPE is deployed on VM and
compatibility with DEM is verified
4 Initial set of measurements in a
VM
Component
developer
DEM can retrieve an initial set of
measurements from a VM
5 Initial set of measurements in a
GE
Component
developer
DEM can retrieve an initial set of
measurements from a VM, where a
GE is deployed
6 Integration with NGSI adapter Component
developer
Compliant with the XIMM
architecture and the inclusion of
NGSI adapter.
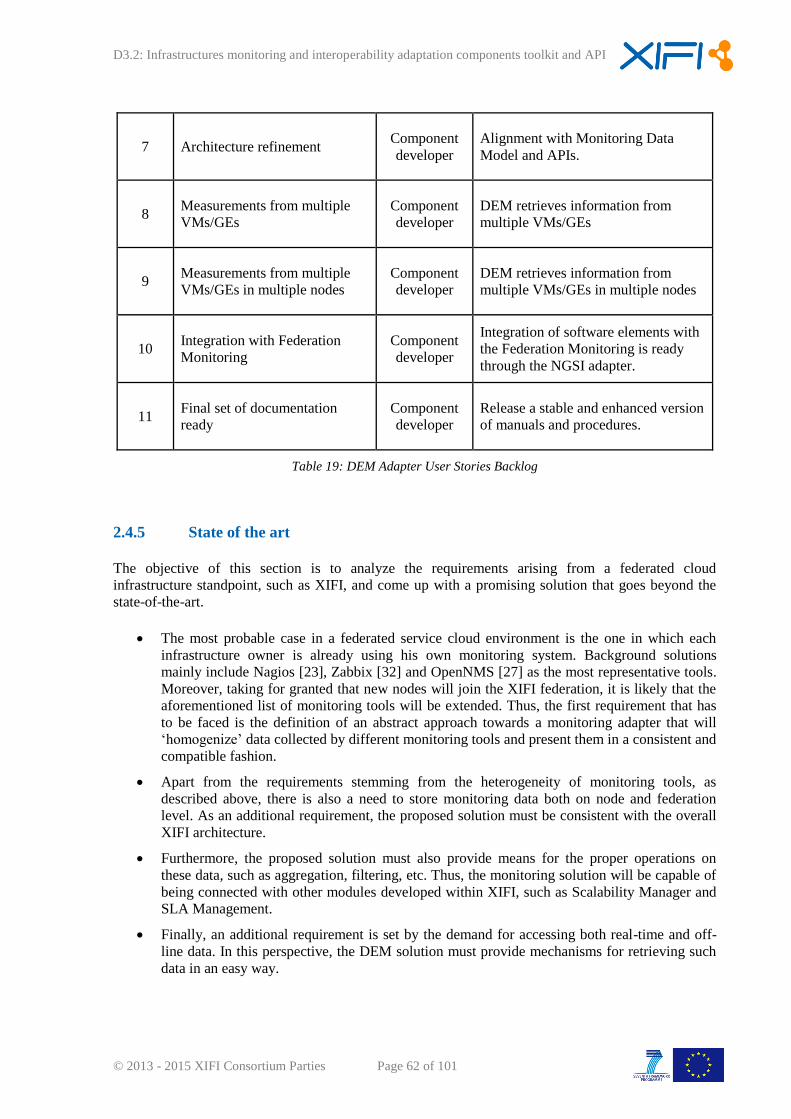
D3.2: Infrastructures monitoring and interoperability adaptation components toolkit and API
© 2013 - 2015 XIFI Consortium Parties Page 62 of 101
7 Architecture refinement Component
developer
Alignment with Monitoring Data
Model and APIs.
8 Measurements from multiple
VMs/GEs
Component
developer
DEM retrieves information from
multiple VMs/GEs
9 Measurements from multiple
VMs/GEs in multiple nodes
Component
developer
DEM retrieves information from
multiple VMs/GEs in multiple nodes
10 Integration with Federation
Monitoring
Component
developer
Integration of software elements with
the Federation Monitoring is ready
through the NGSI adapter.
11 Final set of documentation
ready
Component
developer
Release a stable and enhanced version
of manuals and procedures.
Table 19: DEM Adapter User Stories Backlog
2.4.5 State of the art
The objective of this section is to analyze the requirements arising from a federated cloud
infrastructure standpoint, such as XIFI, and come up with a promising solution that goes beyond the
state-of-the-art.
The most probable case in a federated service cloud environment is the one in which each
infrastructure owner is already using his own monitoring system. Background solutions
mainly include Nagios [23], Zabbix [32] and OpenNMS [27] as the most representative tools.
Moreover, taking for granted that new nodes will join the XIFI federation, it is likely that the
aforementioned list of monitoring tools will be extended. Thus, the first requirement that has
to be faced is the definition of an abstract approach towards a monitoring adapter that will
‘homogenize’ data collected by different monitoring tools and present them in a consistent and
compatible fashion.
Apart from the requirements stemming from the heterogeneity of monitoring tools, as
described above, there is also a need to store monitoring data both on node and federation
level. As an additional requirement, the proposed solution must be consistent with the overall
XIFI architecture.
Furthermore, the proposed solution must also provide means for the proper operations on
these data, such as aggregation, filtering, etc. Thus, the monitoring solution will be capable of
being connected with other modules developed within XIFI, such as Scalability Manager and
SLA Management.
Finally, an additional requirement is set by the demand for accessing both real-time and off-
line data. In this perspective, the DEM solution must provide mechanisms for retrieving such
data in an easy way.
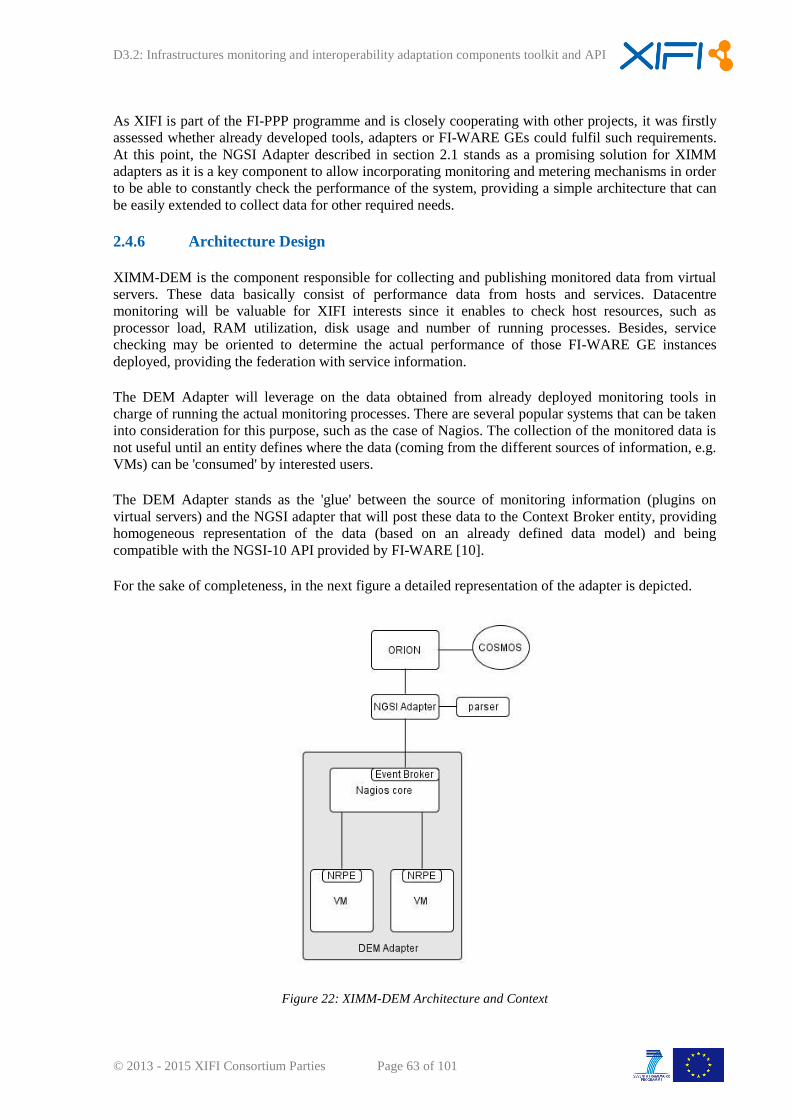
D3.2: Infrastructures monitoring and interoperability adaptation components toolkit and API
© 2013 - 2015 XIFI Consortium Parties Page 63 of 101
As XIFI is part of the FI-PPP programme and is closely cooperating with other projects, it was firstly
assessed whether already developed tools, adapters or FI-WARE GEs could fulfil such requirements.
At this point, the NGSI Adapter described in section 2.1 stands as a promising solution for XIMM
adapters as it is a key component to allow incorporating monitoring and metering mechanisms in order
to be able to constantly check the performance of the system, providing a simple architecture that can
be easily extended to collect data for other required needs.
2.4.6 Architecture Design
XIMM-DEM is the component responsible for collecting and publishing monitored data from virtual
servers. These data basically consist of performance data from hosts and services. Datacentre
monitoring will be valuable for XIFI interests since it enables to check host resources, such as
processor load, RAM utilization, disk usage and number of running processes. Besides, service
checking may be oriented to determine the actual performance of those FI-WARE GE instances
deployed, providing the federation with service information.
The DEM Adapter will leverage on the data obtained from already deployed monitoring tools in
charge of running the actual monitoring processes. There are several popular systems that can be taken
into consideration for this purpose, such as the case of Nagios. The collection of the monitored data is
not useful until an entity defines where the data (coming from the different sources of information, e.g.
VMs) can be 'consumed' by interested users.
The DEM Adapter stands as the 'glue' between the source of monitoring information (plugins on
virtual servers) and the NGSI adapter that will post these data to the Context Broker entity, providing
homogeneous representation of the data (based on an already defined data model) and being
compatible with the NGSI-10 API provided by FI-WARE [10].
For the sake of completeness, in the next figure a detailed representation of the adapter is depicted.
Figure 22: XIMM-DEM Architecture and Context
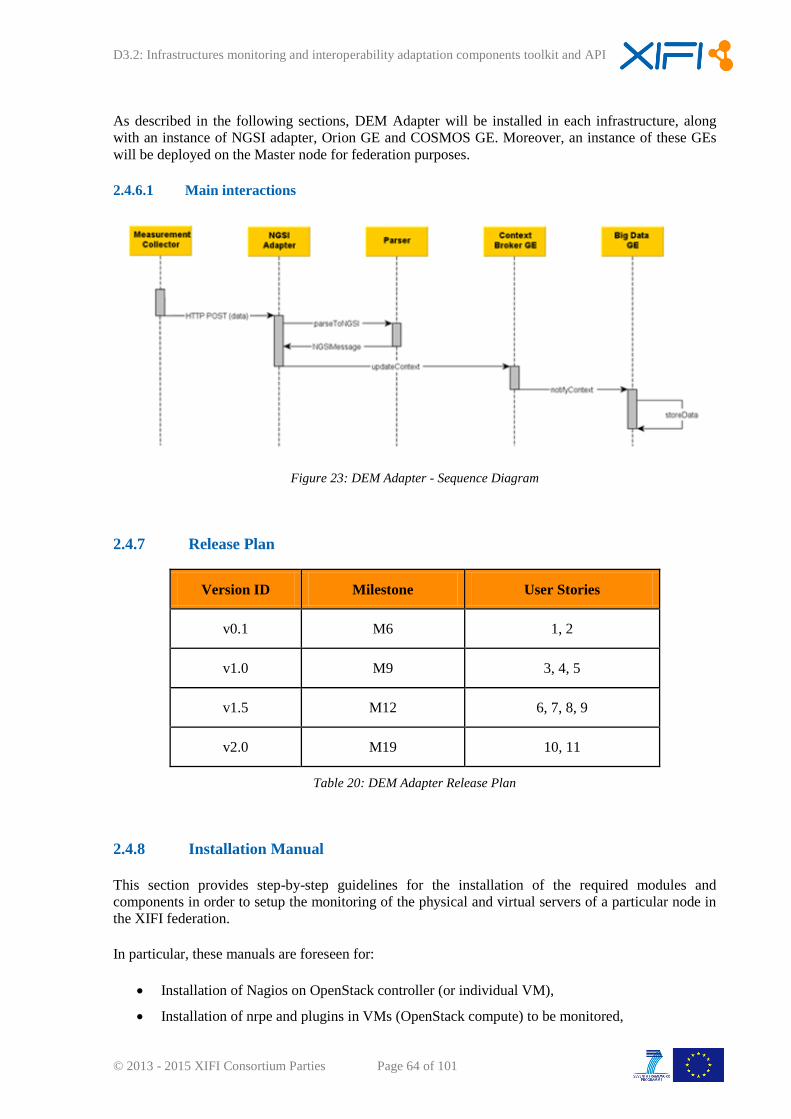
D3.2: Infrastructures monitoring and interoperability adaptation components toolkit and API
© 2013 - 2015 XIFI Consortium Parties Page 64 of 101
As described in the following sections, DEM Adapter will be installed in each infrastructure, along
with an instance of NGSI adapter, Orion GE and COSMOS GE. Moreover, an instance of these GEs
will be deployed on the Master node for federation purposes.
2.4.6.1 Main interactions
Figure 23: DEM Adapter - Sequence Diagram
2.4.7 Release Plan
Version ID Milestone User Stories
v0.1 M6 1, 2
v1.0 M9 3, 4, 5
v1.5 M12 6, 7, 8, 9
v2.0 M19 10, 11
Table 20: DEM Adapter Release Plan
2.4.8 Installation Manual
This section provides step-by-step guidelines for the installation of the required modules and
components in order to setup the monitoring of the physical and virtual servers of a particular node in
the XIFI federation.
In particular, these manuals are foreseen for:
Installation of Nagios on OpenStack controller (or individual VM),
Installation of nrpe and plugins in VMs (OpenStack compute) to be monitored,
D3.2: Infrastructures monitoring and interoperability adaptation components toolkit and API
© 2013 - 2015 XIFI Consortium Parties Page 65 of 101
Installation of the DEM Adapter (Nagios Core NGSI 9/10 Context Broker),
Installation of Orion Context Broker on the XIFI node (including Master node).
2.4.8.1 Installation Requirements
DEM Adapter only requires the latest version of Java (version 7) to be installed.
2.4.8.2 Software Repository
The source code can be downloaded from the following repository:
https://xifisvn.res.eng.it/wp3/software/DEM_Adapter/
Please download the latest version of DEM Adapter.
Also, the source code is also available at: http://synelixis.com/xifi. The required credentials are:
username: xifi
password: xifi#2013#
2.4.8.3 Setup Guidelines
Installation Nagios Core
This section describes the steps to install Nagios on the Monitoring node. In our case, the
monitoring node is considered to be the controller node of the OpenStack Cloud but any other PC
can be used. These steps require administrator privileges.
Prerequisites
o Ubuntu 12.04 LTS is already installed.
o OpenStack (Grizzly) is already installed.
Installation steps:
1. Requirements
In monitoring host must be already installed the following packages Apache 2,PHP,GCC
compiler and development libraries, GD development libraries.
sudo apt-get install apache2
sudo apt-get install libapache2-mod-php5
sudo apt-get install build-essential
sudo apt-get install libgd2-xpm-dev sudo
apt-get install libssl-dev
2. Create Nagios Account:
sudo -s
/usr/sbin/useradd -m -s /bin/bash nagios
passwd nagios
Create a new nagcmd group for allowing external commands to be submitted through the web
interface. Add both the Nagios user and the apache user to the group.
D3.2: Infrastructures monitoring and interoperability adaptation components toolkit and API
© 2013 - 2015 XIFI Consortium Parties Page 66 of 101
/usr/sbin/groupadd nagcmd
/usr/sbin/usermod -a -G nagcmd nagios
/usr/sbin/usermod -a -G nagcmd www-data
3. Download Nagios Packages:
mkdir ~/downloads
cd ~/downloads
wget http://prdownloads.sourceforge.net/sourceforge/nagios/nagios-
3.4.1.tar.gz
wget https://www.nagios-plugins.org/download/nagios-plugins-
1.4.16.tar.gz
wget http://sourceforge.net/projects/nagios/files/nrpe-2.x/nrpe-
2.15/nrpe-2.15.tar.gz
cd ~/downloads
tar xzf nagios-3.4.1.tar.gz
tar xzf nagios-plugins-1.4.16.tar.gz
tar xzf nrpe-2.15.tar.gz
4. Nagios Core installation
Compile and installation of nagios-3.4.1 package:
cd nagios
./configure --with-command-group=nagcmd
make all
make install
make install-init
make install-config
make install-commandmode
Configure Web Interface. Install the Nagios web config file in the Apache conf.d directory:
make install-webconf
Create a nagiosadmin account for logging into the Nagios web interface. Remember the
password you assign to this account – you will need it later.
htpasswd -c /usr/local/nagios/etc/htpasswd.users nagiosadmin
Restart Apache to make the new settings take effect:
/etc/init.d/apache2 reload
D3.2: Infrastructures monitoring and interoperability adaptation components toolkit and API
© 2013 - 2015 XIFI Consortium Parties Page 67 of 101
5. Nagios plugins installation:
cd ~/downloads/nagios-plugins-1.4.16
./configure --with-nagios-user=nagios --with-nagios-group=nagios
make
make install
6. Start Nagios
Configure Nagios to automatically start when the system boots:
ln -s /etc/init.d/nagios /etc/rcS.d/S99nagios
Verify the sample Nagios configuration files:
/usr/local/nagios/bin/nagios -v /usr/local/nagios/etc/nagios.cfg
If there are no errors, start Nagios:
/etc/init.d/nagios start
7. Login to the Web Interface
You should now be able to access the Nagios web interface at the URL below.
You will be prompted for the username (nagiosadmin) and password you specified above.
http://localhost/nagios/
8. Install check_nrpe plugin:
cd ~/downloads/nrpe-2.15.tar.gz
./configure
make all
make install-plugin
Note: If configuration process cannot find ssl libs…
checking for type of socket size... size_t
checking for SSL headers... SSL headers found in /usr
checking for SSL libraries... configure: error: Cannot find ssl
libraries
D3.2: Infrastructures monitoring and interoperability adaptation components toolkit and API
© 2013 - 2015 XIFI Consortium Parties Page 68 of 101
They shall be found manually:
apt-file search libssl | grep libssl-dev
libssl-dev: /usr/lib/x86_64-linux-gnu/libssl.a
libssl-dev: /usr/lib/x86_64-linux-gnu/libssl.so
libssl-dev: /usr/lib/x86_64-linux-gnu/pkgconfig/libssl.pc
libssl-dev: /usr/share/doc/libssl-dev/changelog.Debian.gz
libssl-dev: /usr/share/doc/libssl-dev/changelog.gz
libssl-dev: /usr/share/doc/libssl-dev/copyright
Reconfigure the plugin and continue with the compilation/installation:
./configure --with-ssl=/usr/bin/openssl --with-ssl-
lib=/usr/lib/x86_64-linux-gnu<br />
9. Create a Nagios Command definition for using the check_nrpe plugin
In order Nagios Core to use the check_nrpe plugin a command definition must be created in
Nagios object configuration files. To do so, open commands.cfg file and add the following
definition: (/usr/local/nagios/etc/objects/commands.cfg)
define command {
command_name check_nrpe
command_line $USER1$/check_nrpe -H $HOSTADDRESS$ -C $ARG1$
}
10. Create host and service definitions
At this point, we must define the remote host and its services to Nagios Core. It is strongly
recommended that these definitions are to be placed in a separate configuration file per host.
Create a new file (e.g. miniUbuntu-0.cfg) with the following content:
define host{
use linux-server
host_name miniUbuntu-0
alias Ubuntu 12.04
address 192.168.1.244
}
define service{
use generic-service
host_name miniUbuntu-0
service_description CPU Load
check_command check_nrpe!check_load
}
define service{
use generic-service
host_name miniUbuntu-0
service_description Current Users
check_command check_nrpe!check_users
}
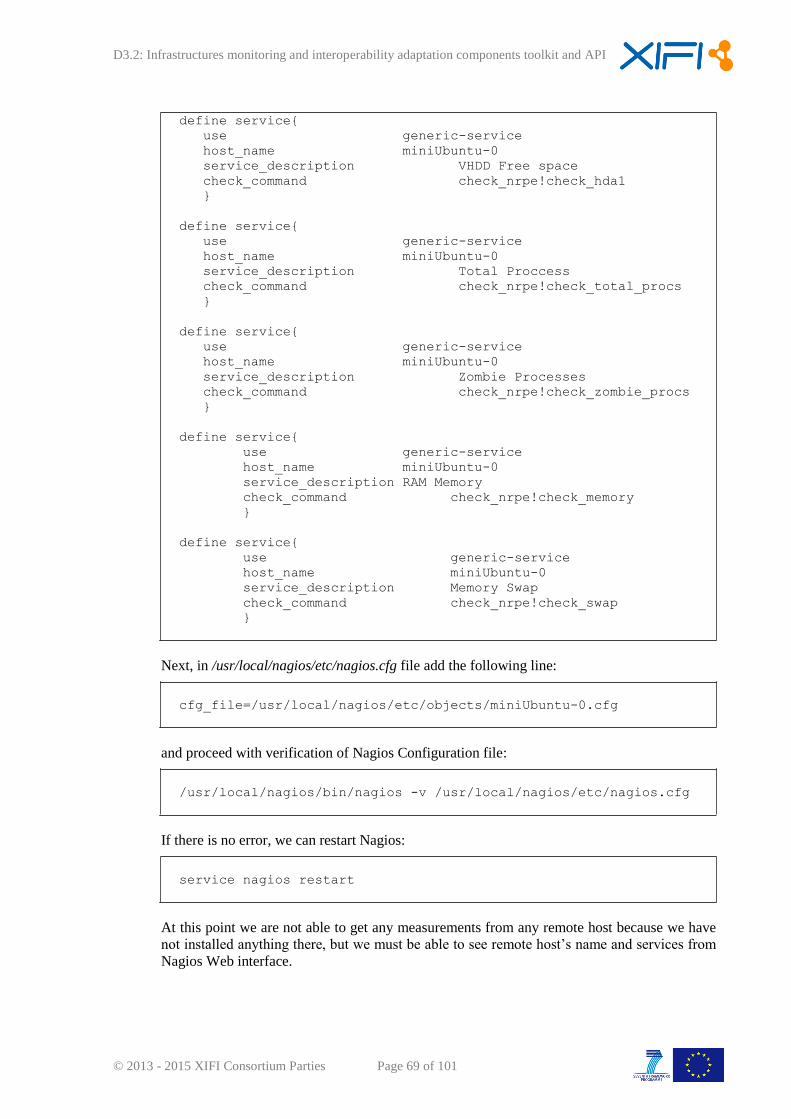
D3.2: Infrastructures monitoring and interoperability adaptation components toolkit and API
© 2013 - 2015 XIFI Consortium Parties Page 69 of 101
define service{
use generic-service
host_name miniUbuntu-0
service_description VHDD Free space
check_command check_nrpe!check_hda1
}
define service{
use generic-service
host_name miniUbuntu-0
service_description Total Proccess
check_command check_nrpe!check_total_procs
}
define service{
use generic-service
host_name miniUbuntu-0
service_description Zombie Processes
check_command check_nrpe!check_zombie_procs
}
define service{
use generic-service
host_name miniUbuntu-0
service_description RAM Memory
check_command check_nrpe!check_memory
}
define service{
use generic-service
host_name miniUbuntu-0
service_description Memory Swap
check_command check_nrpe!check_swap
}
Next, in /usr/local/nagios/etc/nagios.cfg file add the following line:
cfg_file=/usr/local/nagios/etc/objects/miniUbuntu-0.cfg
and proceed with verification of Nagios Configuration file:
/usr/local/nagios/bin/nagios -v /usr/local/nagios/etc/nagios.cfg
If there is no error, we can restart Nagios:
service nagios restart
At this point we are not able to get any measurements from any remote host because we have
not installed anything there, but we must be able to see remote host’s name and services from
Nagios Web interface.
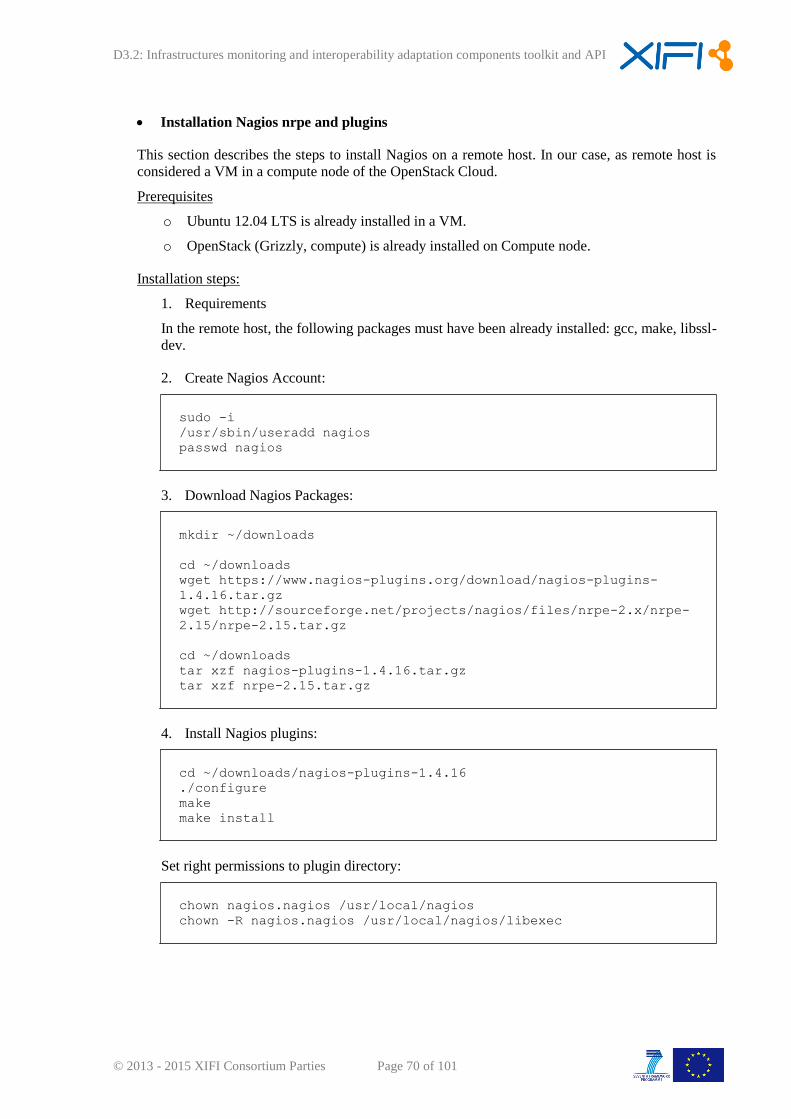
D3.2: Infrastructures monitoring and interoperability adaptation components toolkit and API
© 2013 - 2015 XIFI Consortium Parties Page 70 of 101
Installation Nagios nrpe and plugins
This section describes the steps to install Nagios on a remote host. In our case, as remote host is
considered a VM in a compute node of the OpenStack Cloud.
Prerequisites
o Ubuntu 12.04 LTS is already installed in a VM.
o OpenStack (Grizzly, compute) is already installed on Compute node.
Installation steps:
1. Requirements
In the remote host, the following packages must have been already installed: gcc, make, libssl-
dev.
2. Create Nagios Account:
sudo -i
/usr/sbin/useradd nagios
passwd nagios
3. Download Nagios Packages:
mkdir ~/downloads
cd ~/downloads
wget https://www.nagios-plugins.org/download/nagios-plugins-
1.4.16.tar.gz
wget http://sourceforge.net/projects/nagios/files/nrpe-2.x/nrpe-
2.15/nrpe-2.15.tar.gz
cd ~/downloads
tar xzf nagios-plugins-1.4.16.tar.gz
tar xzf nrpe-2.15.tar.gz
4. Install Nagios plugins:
cd ~/downloads/nagios-plugins-1.4.16
./configure
make
make install
Set right permissions to plugin directory:
chown nagios.nagios /usr/local/nagios
chown -R nagios.nagios /usr/local/nagios/libexec
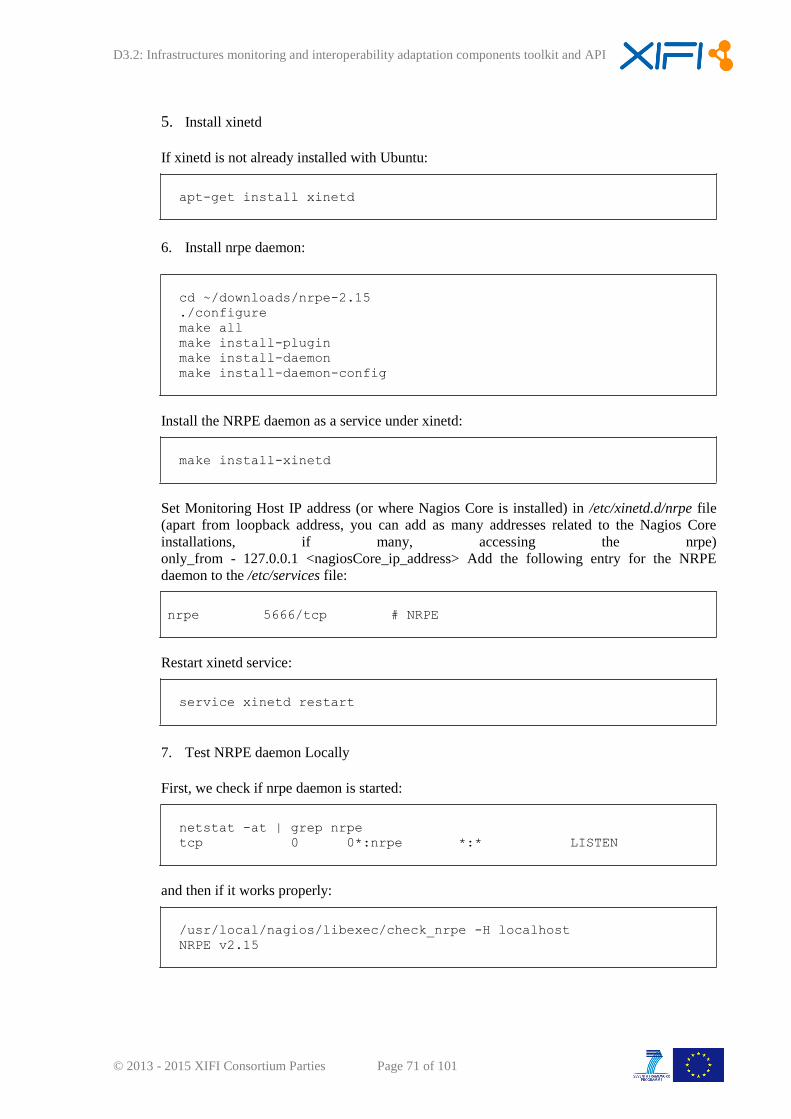
D3.2: Infrastructures monitoring and interoperability adaptation components toolkit and API
© 2013 - 2015 XIFI Consortium Parties Page 71 of 101
5. Install xinetd
If xinetd is not already installed with Ubuntu:
apt-get install xinetd
6. Install nrpe daemon:
cd ~/downloads/nrpe-2.15
./configure
make all
make install-plugin
make install-daemon
make install-daemon-config
Install the NRPE daemon as a service under xinetd:
make install-xinetd
Set Monitoring Host IP address (or where Nagios Core is installed) in /etc/xinetd.d/nrpe file
(apart from loopback address, you can add as many addresses related to the Nagios Core
installations, if many, accessing the nrpe)
only_from - 127.0.0.1 <nagiosCore_ip_address> Add the following entry for the NRPE
daemon to the /etc/services file:
nrpe 5666/tcp # NRPE
Restart xinetd service:
service xinetd restart
7. Test NRPE daemon Locally
First, we check if nrpe daemon is started:
netstat -at | grep nrpe
tcp 0 0*:nrpe *:* LISTEN
and then if it works properly:
/usr/local/nagios/libexec/check_nrpe -H localhost
NRPE v2.15
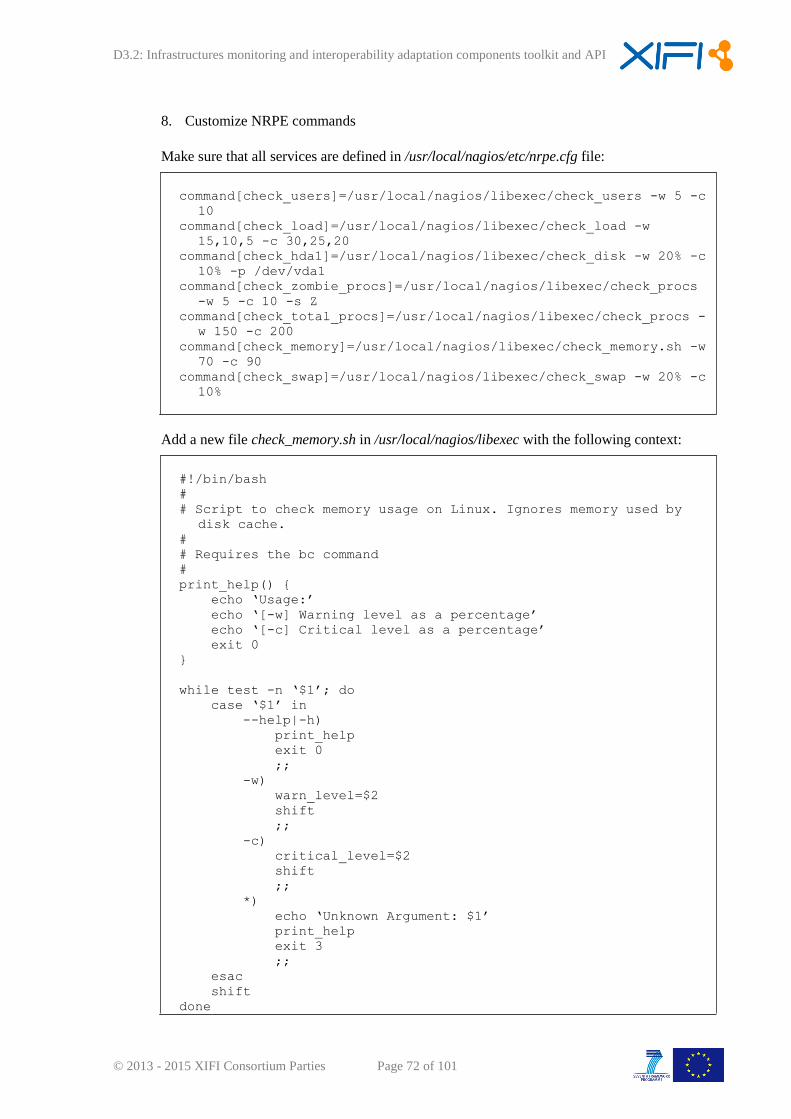
D3.2: Infrastructures monitoring and interoperability adaptation components toolkit and API
© 2013 - 2015 XIFI Consortium Parties Page 72 of 101
8. Customize NRPE commands
Make sure that all services are defined in /usr/local/nagios/etc/nrpe.cfg file:
command[check_users]=/usr/local/nagios/libexec/check_users -w 5 -c
10
command[check_load]=/usr/local/nagios/libexec/check_load -w
15,10,5 -c 30,25,20
command[check_hda1]=/usr/local/nagios/libexec/check_disk -w 20% -c
10% -p /dev/vda1
command[check_zombie_procs]=/usr/local/nagios/libexec/check_procs
-w 5 -c 10 -s Z
command[check_total_procs]=/usr/local/nagios/libexec/check_procs -
w 150 -c 200
command[check_memory]=/usr/local/nagios/libexec/check_memory.sh -w
70 -c 90
command[check_swap]=/usr/local/nagios/libexec/check_swap -w 20% -c
10%
Add a new file check_memory.sh in /usr/local/nagios/libexec with the following context:
#!/bin/bash
#
# Script to check memory usage on Linux. Ignores memory used by
disk cache.
#
# Requires the bc command
#
print_help() {
echo ‘Usage:’
echo ‘[-w] Warning level as a percentage’
echo ‘[-c] Critical level as a percentage’
exit 0
}
while test -n ‘$1’; do
case ‘$1’ in
--help|-h)
print_help
exit 0
;;
-w)
warn_level=$2
shift
;;
-c)
critical_level=$2
shift
;;
*)
echo ‘Unknown Argument: $1’
print_help
exit 3
;;
esac
shift
done
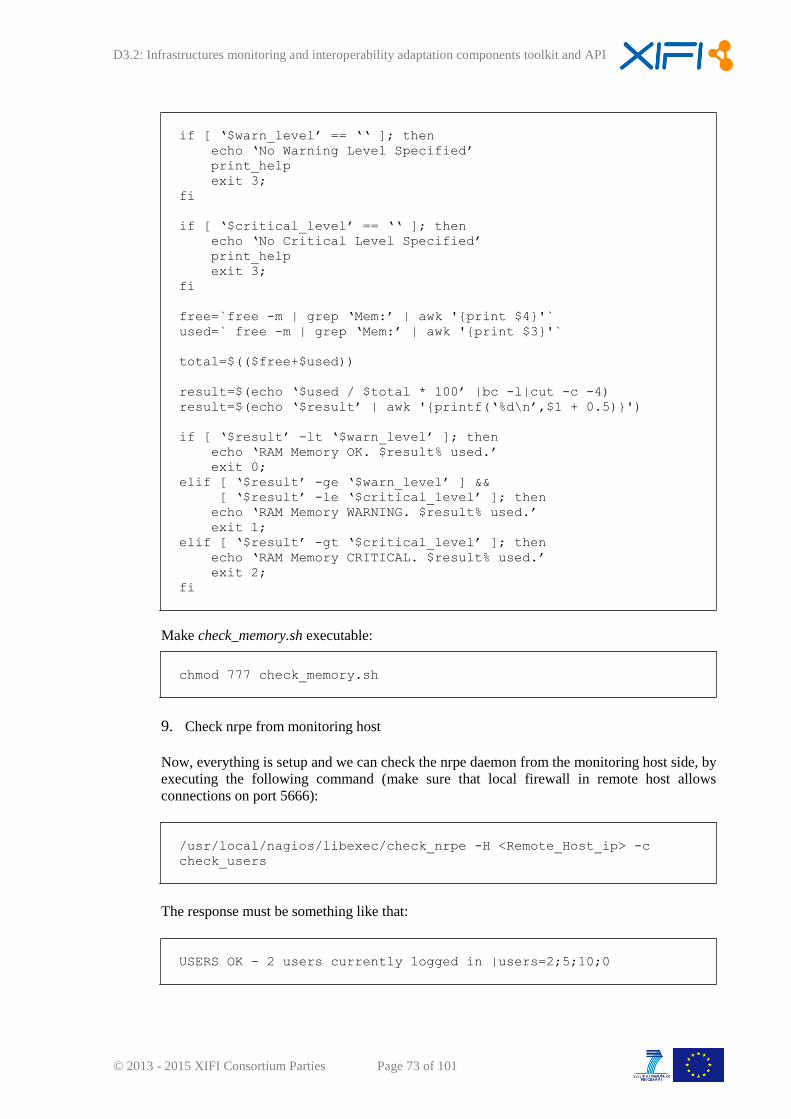
D3.2: Infrastructures monitoring and interoperability adaptation components toolkit and API
© 2013 - 2015 XIFI Consortium Parties Page 73 of 101
if [ ‘$warn_level’ == ‘‘ ]; then
echo ‘No Warning Level Specified’
print_help
exit 3;
fi
if [ ‘$critical_level’ == ‘‘ ]; then
echo ‘No Critical Level Specified’
print_help
exit 3;
fi
free=`free -m | grep ‘Mem:’ | awk '{print $4}'`
used=` free -m | grep ‘Mem:’ | awk '{print $3}'`
total=$(($free+$used))
result=$(echo ‘$used / $total * 100’ |bc -l|cut -c -4)
result=$(echo ‘$result’ | awk '{printf(‘%d\n’,$1 + 0.5)}')
if [ ‘$result’ -lt ‘$warn_level’ ]; then
echo ‘RAM Memory OK. $result% used.’
exit 0;
elif [ ‘$result’ -ge ‘$warn_level’ ] &&
[ ‘$result’ -le ‘$critical_level’ ]; then
echo ‘RAM Memory WARNING. $result% used.’
exit 1;
elif [ ‘$result’ -gt ‘$critical_level’ ]; then
echo ‘RAM Memory CRITICAL. $result% used.’
exit 2;
fi
Make check_memory.sh executable:
chmod 777 check_memory.sh
9. Check nrpe from monitoring host
Now, everything is setup and we can check the nrpe daemon from the monitoring host side, by
executing the following command (make sure that local firewall in remote host allows
connections on port 5666):
/usr/local/nagios/libexec/check_nrpe -H <Remote_Host_ip> -c
check_users
The response must be something like that:
USERS OK - 2 users currently logged in |users=2;5;10;0
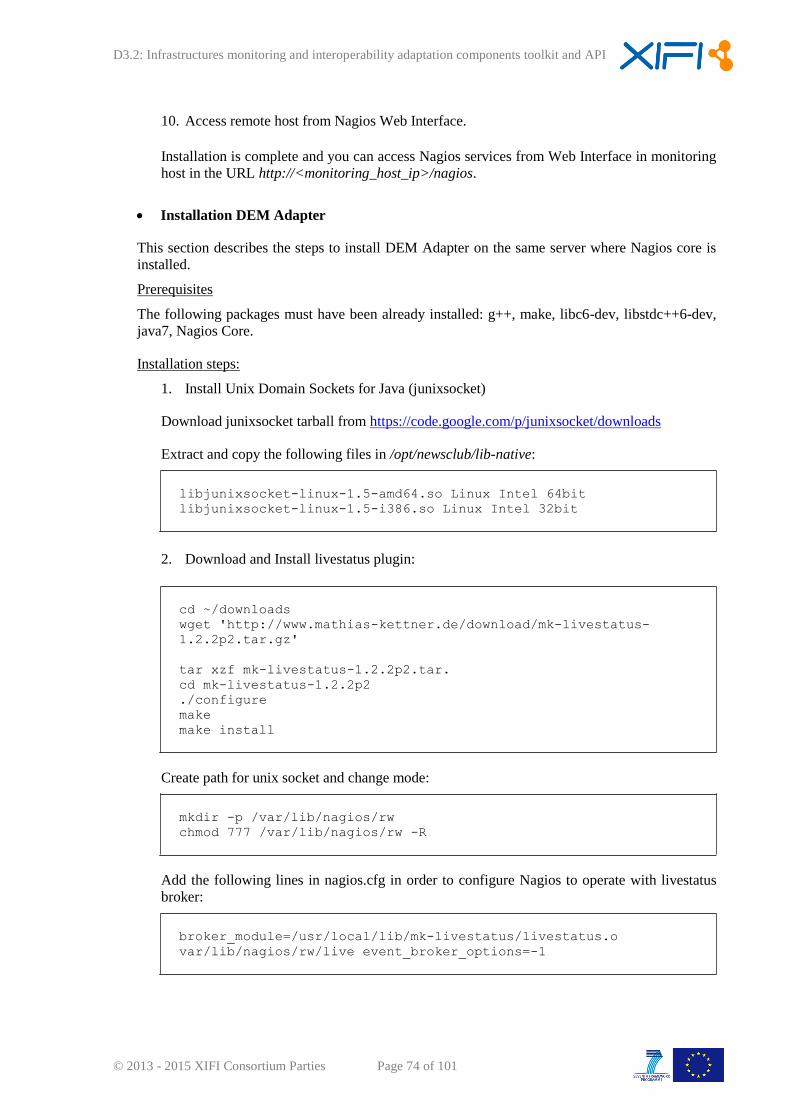
D3.2: Infrastructures monitoring and interoperability adaptation components toolkit and API
© 2013 - 2015 XIFI Consortium Parties Page 74 of 101
10. Access remote host from Nagios Web Interface.
Installation is complete and you can access Nagios services from Web Interface in monitoring
host in the URL http://<monitoring_host_ip>/nagios.
Installation DEM Adapter
This section describes the steps to install DEM Adapter on the same server where Nagios core is
installed.
Prerequisites
The following packages must have been already installed: g++, make, libc6-dev, libstdc++6-dev,
java7, Nagios Core.
Installation steps:
1. Install Unix Domain Sockets for Java (junixsocket)
Download junixsocket tarball from https://code.google.com/p/junixsocket/downloads
Extract and copy the following files in /opt/newsclub/lib-native:
libjunixsocket-linux-1.5-amd64.so Linux Intel 64bit
libjunixsocket-linux-1.5-i386.so Linux Intel 32bit
2. Download and Install livestatus plugin:
cd ~/downloads
wget 'http://www.mathias-kettner.de/download/mk-livestatus-
1.2.2p2.tar.gz'
tar xzf mk-livestatus-1.2.2p2.tar.
cd mk-livestatus-1.2.2p2
./configure
make
make install
Create path for unix socket and change mode:
mkdir -p /var/lib/nagios/rw
chmod 777 /var/lib/nagios/rw -R
Add the following lines in nagios.cfg in order to configure Nagios to operate with livestatus
broker:
broker_module=/usr/local/lib/mk-livestatus/livestatus.o
var/lib/nagios/rw/live event_broker_options=-1
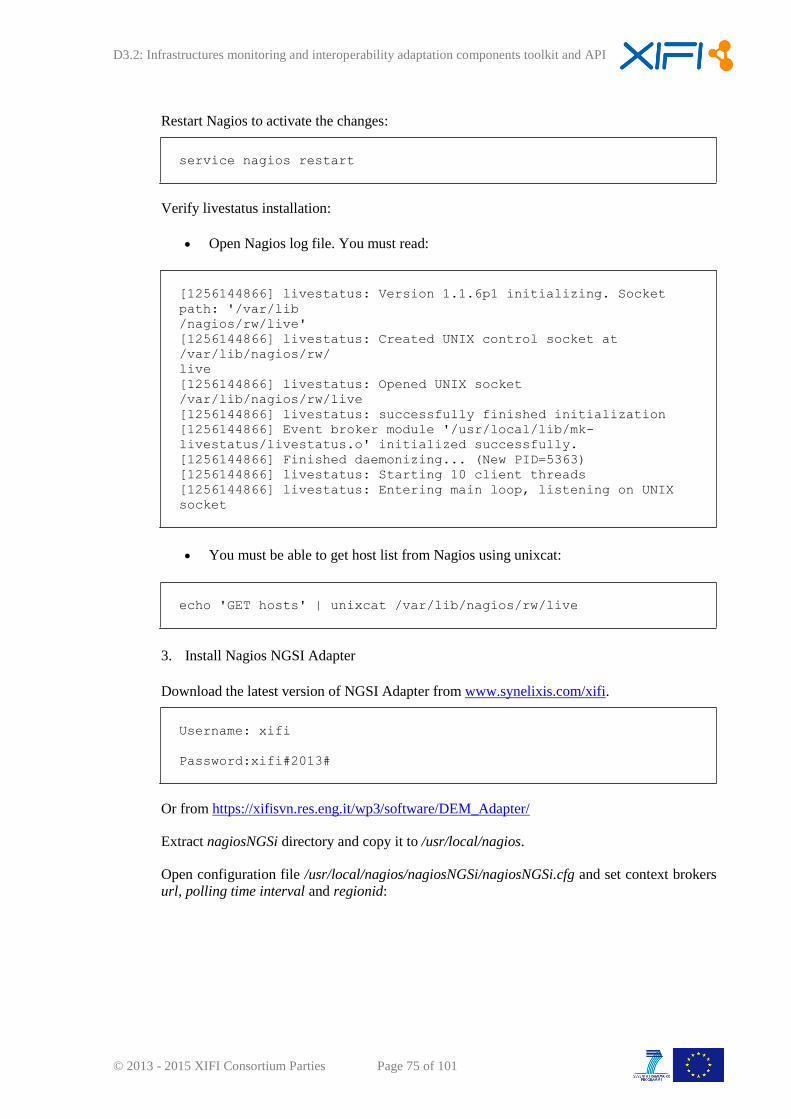
D3.2: Infrastructures monitoring and interoperability adaptation components toolkit and API
© 2013 - 2015 XIFI Consortium Parties Page 75 of 101
Restart Nagios to activate the changes:
service nagios restart
Verify livestatus installation:
Open Nagios log file. You must read:
[1256144866] livestatus: Version 1.1.6p1 initializing. Socket
path: '/var/lib
/nagios/rw/live'
[1256144866] livestatus: Created UNIX control socket at
/var/lib/nagios/rw/
live
[1256144866] livestatus: Opened UNIX socket
/var/lib/nagios/rw/live
[1256144866] livestatus: successfully finished initialization
[1256144866] Event broker module '/usr/local/lib/mk-
livestatus/livestatus.o' initialized successfully.
[1256144866] Finished daemonizing... (New PID=5363)
[1256144866] livestatus: Starting 10 client threads
[1256144866] livestatus: Entering main loop, listening on UNIX
socket
You must be able to get host list from Nagios using unixcat:
echo 'GET hosts' | unixcat /var/lib/nagios/rw/live
3. Install Nagios NGSI Adapter
Download the latest version of NGSI Adapter from www.synelixis.com/xifi.
Username: xifi
Password:xifi#2013#
Or from https://xifisvn.res.eng.it/wp3/software/DEM_Adapter/
Extract nagiosNGSi directory and copy it to /usr/local/nagios.
Open configuration file /usr/local/nagios/nagiosNGSi/nagiosNGSi.cfg and set context brokers
url, polling time interval and regionid:
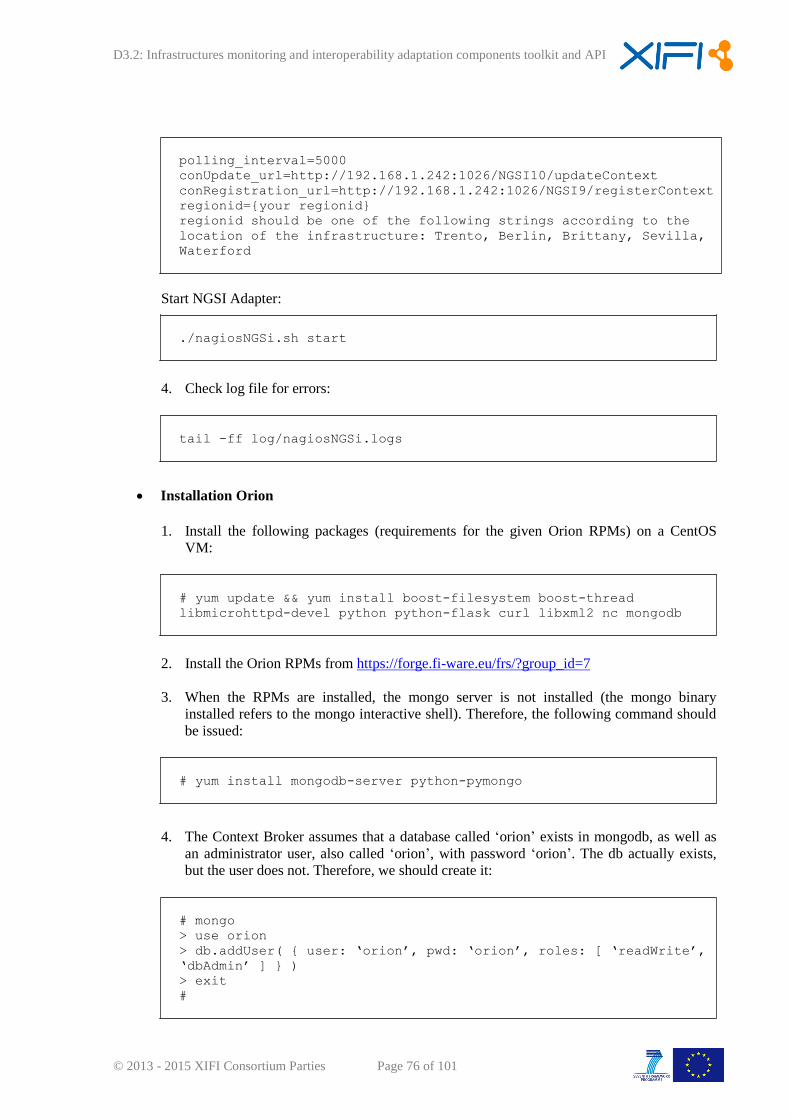
D3.2: Infrastructures monitoring and interoperability adaptation components toolkit and API
© 2013 - 2015 XIFI Consortium Parties Page 76 of 101
polling_interval=5000
conUpdate_url=http://192.168.1.242:1026/NGSI10/updateContext
conRegistration_url=http://192.168.1.242:1026/NGSI9/registerContext
regionid={your regionid}
regionid should be one of the following strings according to the
location of the infrastructure: Trento, Berlin, Brittany, Sevilla,
Waterford
Start NGSI Adapter:
./nagiosNGSi.sh start
4. Check log file for errors:
tail -ff log/nagiosNGSi.logs
Installation Orion
1. Install the following packages (requirements for the given Orion RPMs) on a CentOS
VM:
# yum update && yum install boost-filesystem boost-thread
libmicrohttpd-devel python python-flask curl libxml2 nc mongodb
2. Install the Orion RPMs from https://forge.fi-ware.eu/frs/?group_id=7
3. When the RPMs are installed, the mongo server is not installed (the mongo binary
installed refers to the mongo interactive shell). Therefore, the following command should
be issued:
# yum install mongodb-server python-pymongo
4. The Context Broker assumes that a database called ‘orion’ exists in mongodb, as well as
an administrator user, also called ‘orion’, with password ‘orion’. The db actually exists,
but the user does not. Therefore, we should create it:
# mongo
> use orion
> db.addUser( { user: ‘orion’, pwd: ‘orion’, roles: [ ‘readWrite’,
‘dbAdmin’ ] } )
> exit
#
D3.2: Infrastructures monitoring and interoperability adaptation components toolkit and API
© 2013 - 2015 XIFI Consortium Parties Page 77 of 101
5. Since iptables is blocking access to port 1026 (default for contextBroker), we should open
it through the iptables conf file /etc/sysconfig/iptables
Add the line -A INPUT -m state --state NEW -m tcp -p tcp --dport 1026 -j ACCEPT in
iptables conf file, right below the line enabling port 22 (-A INPUT -m state --state NEW -m
tcp -p tcp --dport 22 -j ACCEPT)
Restart iptables:
# service iptables restart
2.4.9 User Manual
2.4.9.1 API Specification
Each operation specified here is based on the Data Model proposed in the Federation Monitoring
(check deliverable D2.2- APIs and Tools for Infrastructure Federation v1), in order to provide a
consistent architecture.
On the other hand, DEM Adapter provides the methods described in NGSI-9/10 specifications ([10],
[11]), to be compliant with Orion and COSMOS GEs.
2.4.9.2 Handbook
The primary objective of DEM Adapter is to retrieve monitoring data from Nagios, adapt them to
NGSI-9/10 API and post them to a Context Broker. In each execution cycle, DEM Adapter performs
the following steps:
Collects data from Nagios Core, regarding all monitored hosts and their respective services.
Processes information per node and per service.
Builds a ContextUpdate xml for each host, based in NGSI 10 API.
Posts the ContextUpdate xmls to Context Broker
In case where a host or a service is not registered in the Context Broker, DEM builds an
appropriate Registration xml (NGSI-9) and sends it to the Context Broker.
This document guides the user to configure and properly set up the DEM Adapter.
System Configuration
DEM configuration procedure is organized in two main parts. First, we must define DEM settings
for the communication between Nagios monitoring system and Context Broker. Second, we
describe the configuration procedure in order to add/remove nodes or monitored services.
First, we must define DEM settings for the communication between Nagios monitoring system
and Context Broker.
Service Settings
All DEM’s service settings are defined in nagiosNGSi.cfg file. These settings are:
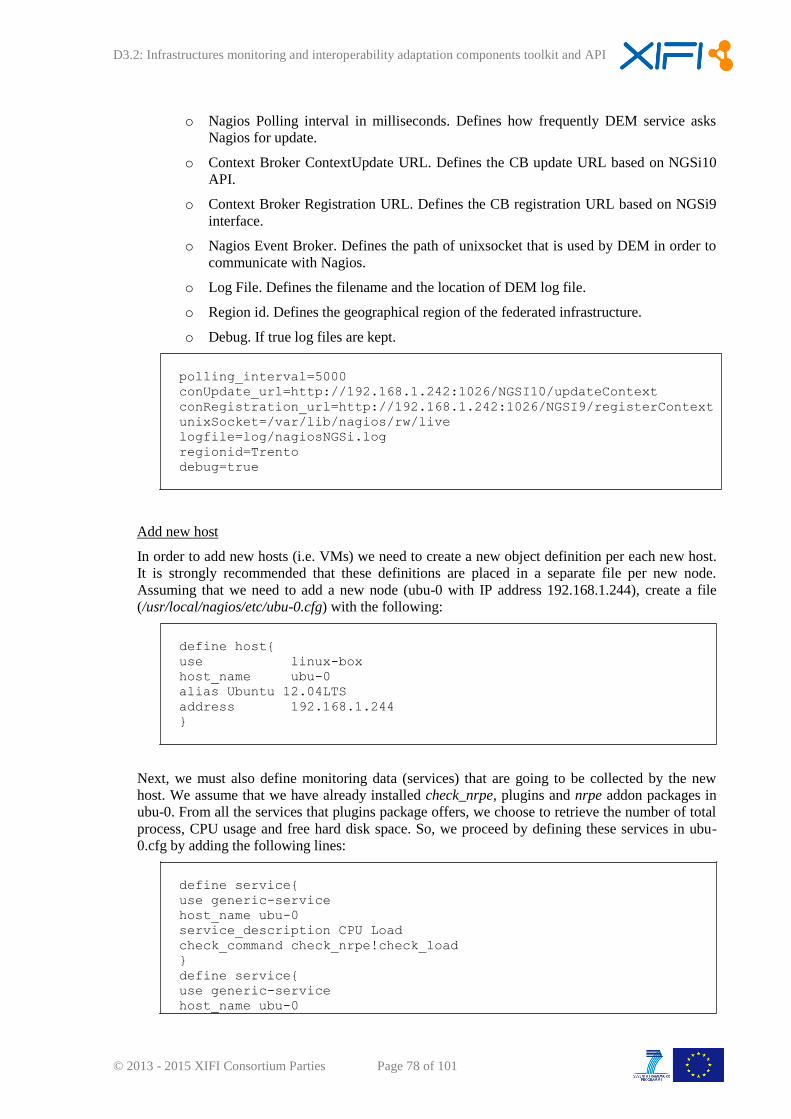
D3.2: Infrastructures monitoring and interoperability adaptation components toolkit and API
© 2013 - 2015 XIFI Consortium Parties Page 78 of 101
o Nagios Polling interval in milliseconds. Defines how frequently DEM service asks
Nagios for update.
o Context Broker ContextUpdate URL. Defines the CB update URL based on NGSi10
API.
o Context Broker Registration URL. Defines the CB registration URL based on NGSi9
interface.
o Nagios Event Broker. Defines the path of unixsocket that is used by DEM in order to
communicate with Nagios.
o Log File. Defines the filename and the location of DEM log file.
o Region id. Defines the geographical region of the federated infrastructure.
o Debug. If true log files are kept.
polling_interval=5000
conUpdate_url=http://192.168.1.242:1026/NGSI10/updateContext
conRegistration_url=http://192.168.1.242:1026/NGSI9/registerContext
unixSocket=/var/lib/nagios/rw/live
logfile=log/nagiosNGSi.log
regionid=Trento
debug=true
Add new host
In order to add new hosts (i.e. VMs) we need to create a new object definition per each new host.
It is strongly recommended that these definitions are placed in a separate file per new node.
Assuming that we need to add a new node (ubu-0 with IP address 192.168.1.244), create a file
(/usr/local/nagios/etc/ubu-0.cfg) with the following:
define host{
use linux-box
host_name ubu-0
alias Ubuntu 12.04LTS
address 192.168.1.244
}
Next, we must also define monitoring data (services) that are going to be collected by the new
host. We assume that we have already installed check_nrpe, plugins and nrpe addon packages in
ubu-0. From all the services that plugins package offers, we choose to retrieve the number of total
process, CPU usage and free hard disk space. So, we proceed by defining these services in ubu-
0.cfg by adding the following lines:
define service{
use generic-service
host_name ubu-0
service_description CPU Load
check_command check_nrpe!check_load
}
define service{
use generic-service
host_name ubu-0
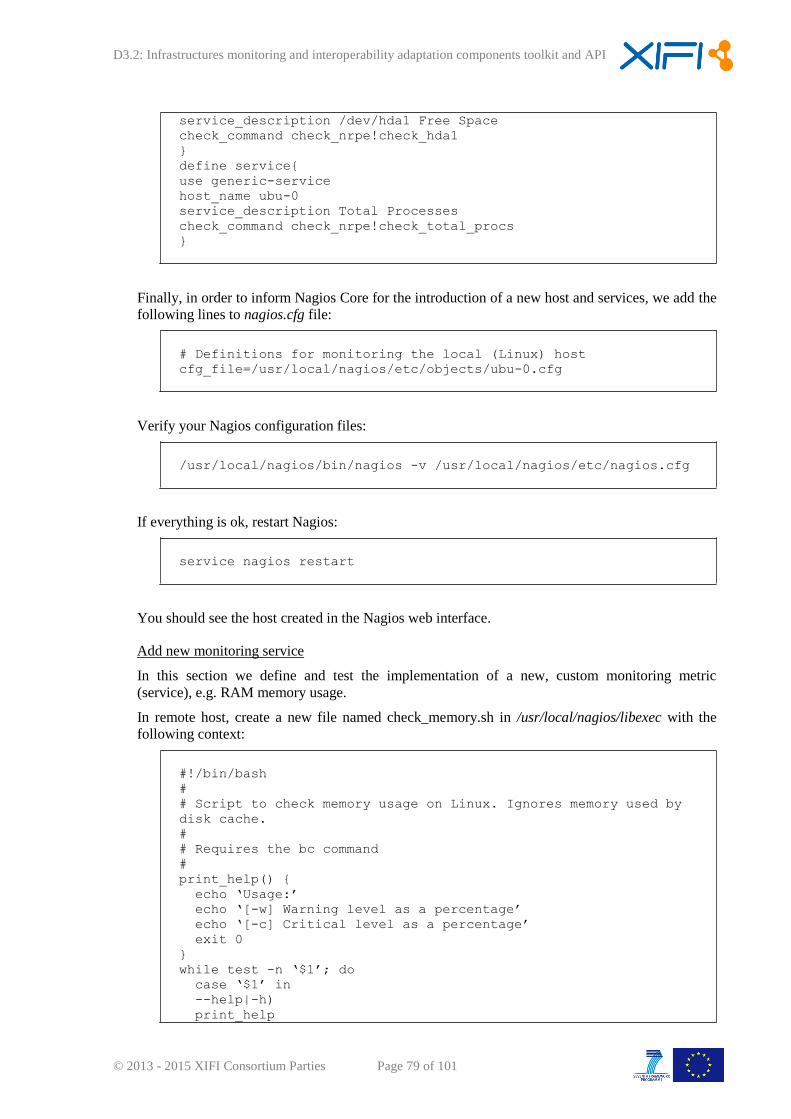
D3.2: Infrastructures monitoring and interoperability adaptation components toolkit and API
© 2013 - 2015 XIFI Consortium Parties Page 79 of 101
service_description /dev/hda1 Free Space
check_command check_nrpe!check_hda1
}
define service{
use generic-service
host_name ubu-0
service_description Total Processes
check_command check_nrpe!check_total_procs
}
Finally, in order to inform Nagios Core for the introduction of a new host and services, we add the
following lines to nagios.cfg file:
# Definitions for monitoring the local (Linux) host
cfg_file=/usr/local/nagios/etc/objects/ubu-0.cfg
Verify your Nagios configuration files:
/usr/local/nagios/bin/nagios -v /usr/local/nagios/etc/nagios.cfg
If everything is ok, restart Nagios:
service nagios restart
You should see the host created in the Nagios web interface.
Add new monitoring service
In this section we define and test the implementation of a new, custom monitoring metric
(service), e.g. RAM memory usage.
In remote host, create a new file named check_memory.sh in /usr/local/nagios/libexec with the
following context:
#!/bin/bash
#
# Script to check memory usage on Linux. Ignores memory used by
disk cache.
#
# Requires the bc command
#
print_help() {
echo ‘Usage:’
echo ‘[-w] Warning level as a percentage’
echo ‘[-c] Critical level as a percentage’
exit 0
}
while test -n ‘$1’; do
case ‘$1’ in
--help|-h)
print_help
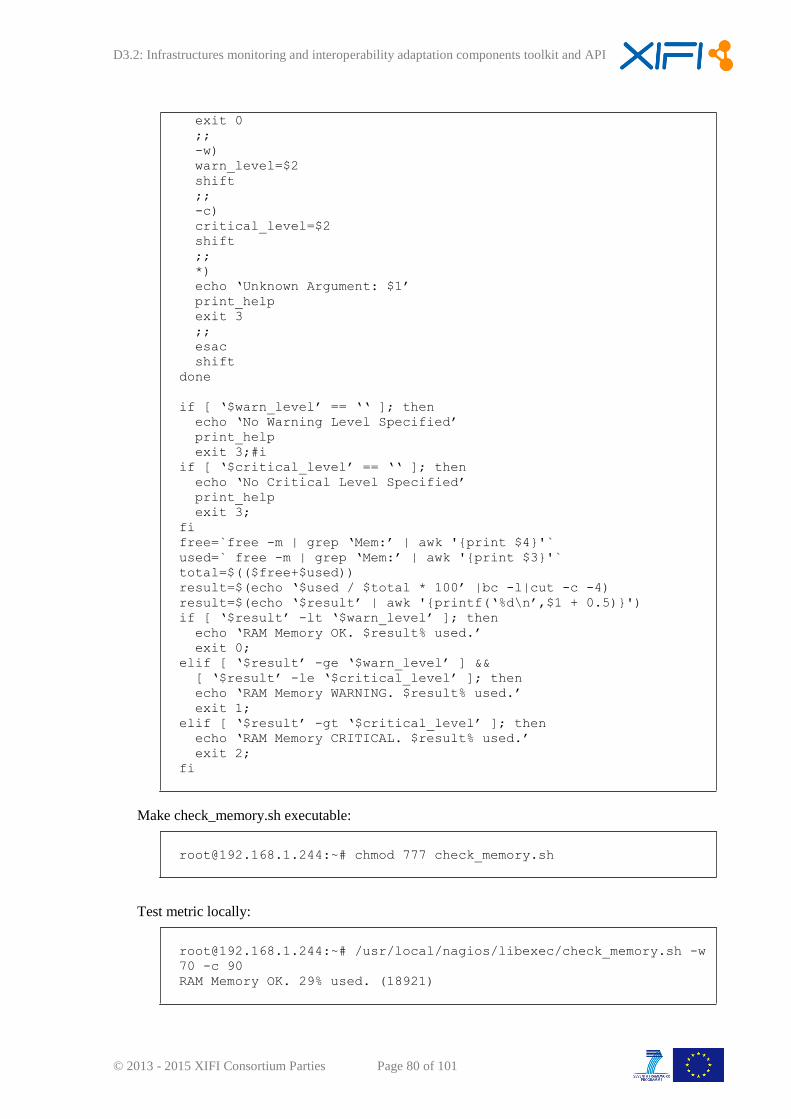
D3.2: Infrastructures monitoring and interoperability adaptation components toolkit and API
© 2013 - 2015 XIFI Consortium Parties Page 80 of 101
exit 0
;;
-w)
warn_level=$2
shift
;;
-c)
critical_level=$2
shift
;;
*)
echo ‘Unknown Argument: $1’
print_help
exit 3
;;
esac
shift
done
if [ ‘$warn_level’ == ‘‘ ]; then
echo ‘No Warning Level Specified’
print_help
exit 3;#i
if [ ‘$critical_level’ == ‘‘ ]; then
echo ‘No Critical Level Specified’
print_help
exit 3;
fi
free=`free -m | grep ‘Mem:’ | awk '{print $4}'`
used=` free -m | grep ‘Mem:’ | awk '{print $3}'`
total=$(($free+$used))
result=$(echo ‘$used / $total * 100’ |bc -l|cut -c -4)
result=$(echo ‘$result’ | awk '{printf(‘%d\n’,$1 + 0.5)}')
if [ ‘$result’ -lt ‘$warn_level’ ]; then
echo ‘RAM Memory OK. $result% used.’
exit 0;
elif [ ‘$result’ -ge ‘$warn_level’ ] &&
[ ‘$result’ -le ‘$critical_level’ ]; then
echo ‘RAM Memory WARNING. $result% used.’
exit 1;
elif [ ‘$result’ -gt ‘$critical_level’ ]; then
echo ‘RAM Memory CRITICAL. $result% used.’
exit 2;
fi
Make check_memory.sh executable:
[email protected]:~# chmod 777 check_memory.sh
Test metric locally:
[email protected]:~# /usr/local/nagios/libexec/check_memory.sh -w
70 -c 90
RAM Memory OK. 29% used. (18921)
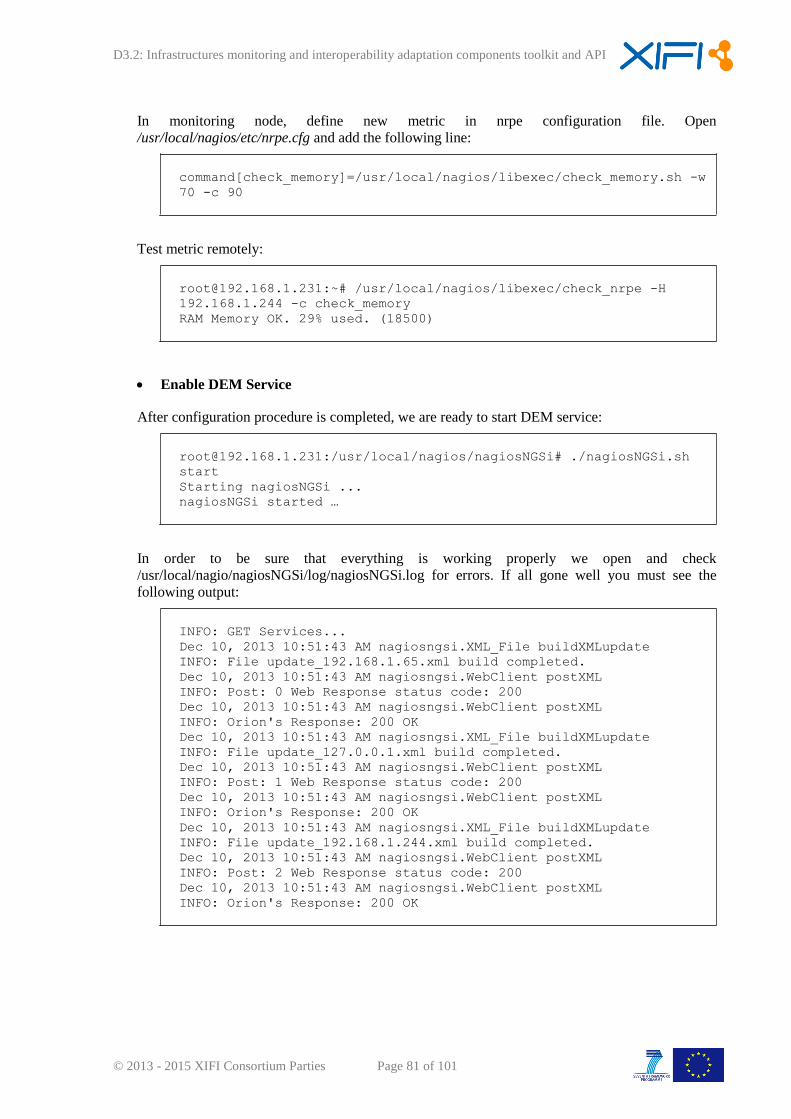
D3.2: Infrastructures monitoring and interoperability adaptation components toolkit and API
© 2013 - 2015 XIFI Consortium Parties Page 81 of 101
In monitoring node, define new metric in nrpe configuration file. Open
/usr/local/nagios/etc/nrpe.cfg and add the following line:
command[check_memory]=/usr/local/nagios/libexec/check_memory.sh -w
70 -c 90
Test metric remotely:
[email protected]:~# /usr/local/nagios/libexec/check_nrpe -H
192.168.1.244 -c check_memory
RAM Memory OK. 29% used. (18500)
Enable DEM Service
After configuration procedure is completed, we are ready to start DEM service:
[email protected]:/usr/local/nagios/nagiosNGSi# ./nagiosNGSi.sh
start
Starting nagiosNGSi ...
nagiosNGSi started …
In order to be sure that everything is working properly we open and check
/usr/local/nagio/nagiosNGSi/log/nagiosNGSi.log for errors. If all gone well you must see the
following output:
INFO: GET Services...
Dec 10, 2013 10:51:43 AM nagiosngsi.XML_File buildXMLupdate
INFO: File update_192.168.1.65.xml build completed.
Dec 10, 2013 10:51:43 AM nagiosngsi.WebClient postXML
INFO: Post: 0 Web Response status code: 200
Dec 10, 2013 10:51:43 AM nagiosngsi.WebClient postXML
INFO: Orion's Response: 200 OK
Dec 10, 2013 10:51:43 AM nagiosngsi.XML_File buildXMLupdate
INFO: File update_127.0.0.1.xml build completed.
Dec 10, 2013 10:51:43 AM nagiosngsi.WebClient postXML
INFO: Post: 1 Web Response status code: 200
Dec 10, 2013 10:51:43 AM nagiosngsi.WebClient postXML
INFO: Orion's Response: 200 OK
Dec 10, 2013 10:51:43 AM nagiosngsi.XML_File buildXMLupdate
INFO: File update_192.168.1.244.xml build completed.
Dec 10, 2013 10:51:43 AM nagiosngsi.WebClient postXML
INFO: Post: 2 Web Response status code: 200
Dec 10, 2013 10:51:43 AM nagiosngsi.WebClient postXML
INFO: Orion's Response: 200 OK
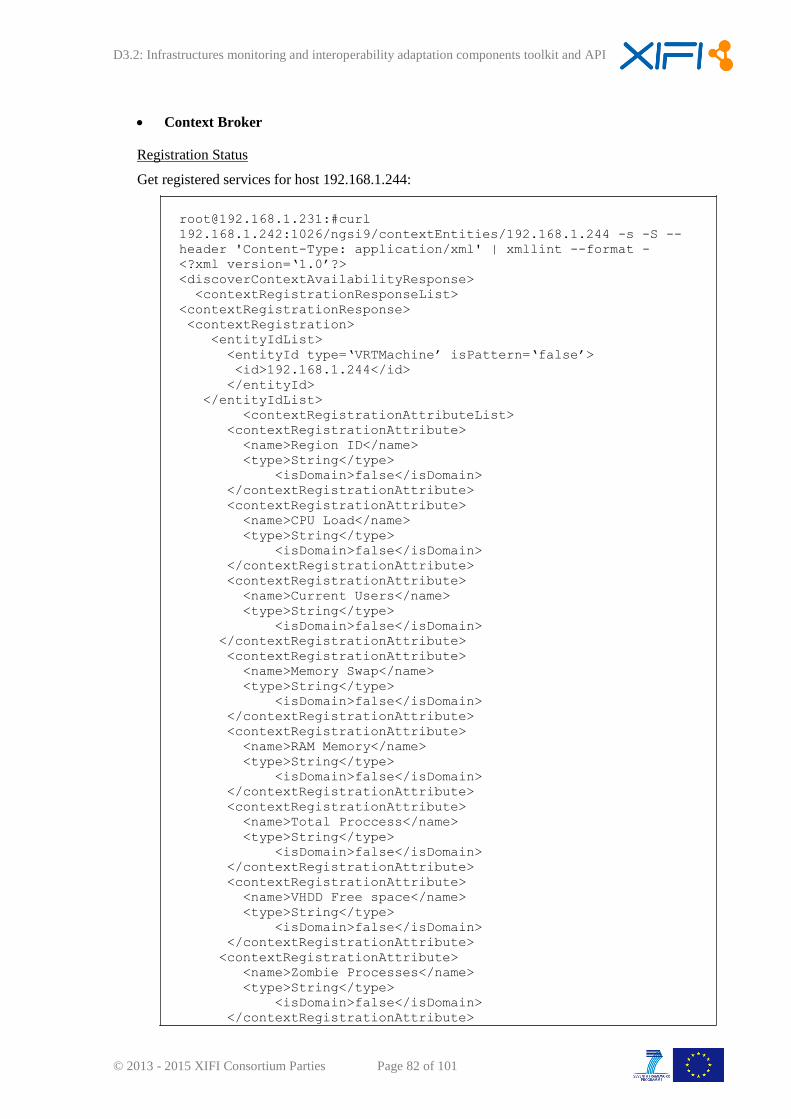
D3.2: Infrastructures monitoring and interoperability adaptation components toolkit and API
© 2013 - 2015 XIFI Consortium Parties Page 82 of 101
Context Broker
Registration Status
Get registered services for host 192.168.1.244:
[email protected]:#curl
192.168.1.242:1026/ngsi9/contextEntities/192.168.1.244 -s -S --
header 'Content-Type: application/xml' | xmllint --format -
<?xml version=‘1.0’?>
<discoverContextAvailabilityResponse>
<contextRegistrationResponseList>
<contextRegistrationResponse>
<contextRegistration>
<entityIdList>
<entityId type=‘VRTMachine’ isPattern=‘false’>
<id>192.168.1.244</id>
</entityId>
</entityIdList>
<contextRegistrationAttributeList>
<contextRegistrationAttribute>
<name>Region ID</name>
<type>String</type>
<isDomain>false</isDomain>
</contextRegistrationAttribute>
<contextRegistrationAttribute>
<name>CPU Load</name>
<type>String</type>
<isDomain>false</isDomain>
</contextRegistrationAttribute>
<contextRegistrationAttribute>
<name>Current Users</name>
<type>String</type>
<isDomain>false</isDomain>
</contextRegistrationAttribute>
<contextRegistrationAttribute>
<name>Memory Swap</name>
<type>String</type>
<isDomain>false</isDomain>
</contextRegistrationAttribute>
<contextRegistrationAttribute>
<name>RAM Memory</name>
<type>String</type>
<isDomain>false</isDomain>
</contextRegistrationAttribute>
<contextRegistrationAttribute>
<name>Total Proccess</name>
<type>String</type>
<isDomain>false</isDomain>
</contextRegistrationAttribute>
<contextRegistrationAttribute>
<name>VHDD Free space</name>
<type>String</type>
<isDomain>false</isDomain>
</contextRegistrationAttribute>
<contextRegistrationAttribute>
<name>Zombie Processes</name>
<type>String</type>
<isDomain>false</isDomain>
</contextRegistrationAttribute>
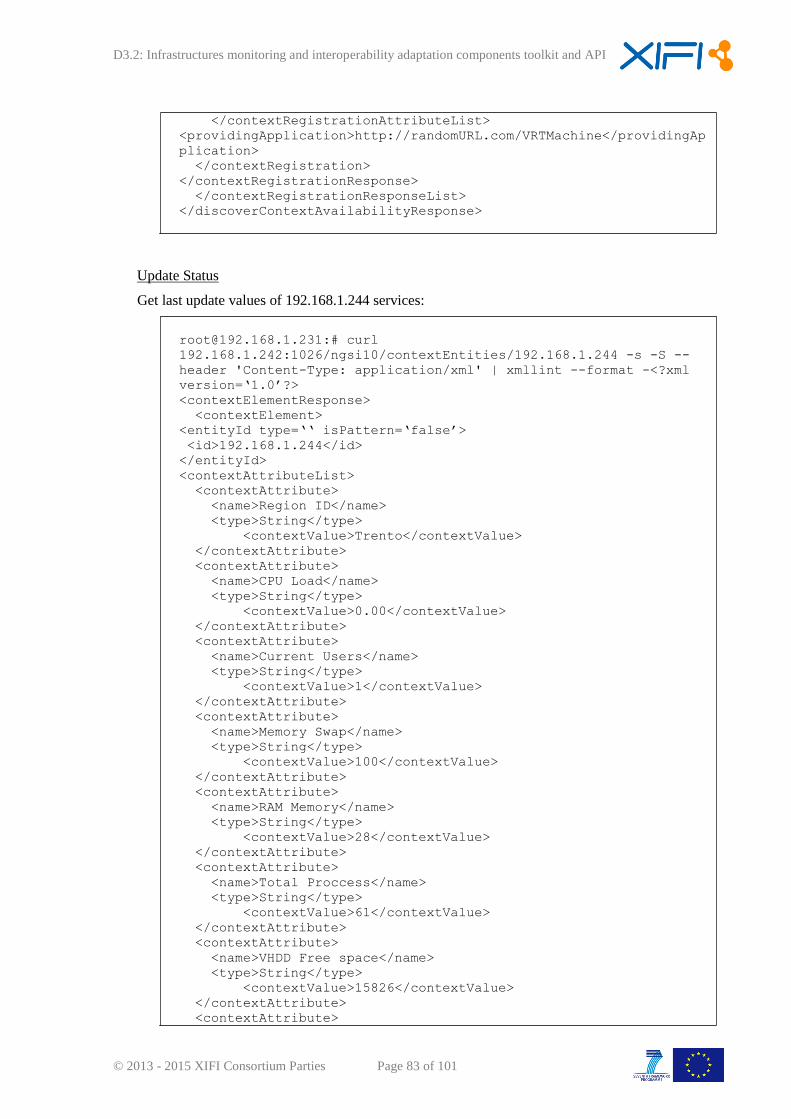
D3.2: Infrastructures monitoring and interoperability adaptation components toolkit and API
© 2013 - 2015 XIFI Consortium Parties Page 83 of 101
</contextRegistrationAttributeList>
<providingApplication>http://randomURL.com/VRTMachine</providingAp
plication>
</contextRegistration>
</contextRegistrationResponse>
</contextRegistrationResponseList>
</discoverContextAvailabilityResponse>
Update Status
Get last update values of 192.168.1.244 services:
[email protected]:# curl
192.168.1.242:1026/ngsi10/contextEntities/192.168.1.244 -s -S --
header 'Content-Type: application/xml' | xmllint --format -<?xml
version=‘1.0’?>
<contextElementResponse>
<contextElement>
<entityId type=‘‘ isPattern=‘false’>
<id>192.168.1.244</id>
</entityId>
<contextAttributeList>
<contextAttribute>
<name>Region ID</name>
<type>String</type>
<contextValue>Trento</contextValue>
</contextAttribute>
<contextAttribute>
<name>CPU Load</name>
<type>String</type>
<contextValue>0.00</contextValue>
</contextAttribute>
<contextAttribute>
<name>Current Users</name>
<type>String</type>
<contextValue>1</contextValue>
</contextAttribute>
<contextAttribute>
<name>Memory Swap</name>
<type>String</type>
<contextValue>100</contextValue>
</contextAttribute>
<contextAttribute>
<name>RAM Memory</name>
<type>String</type>
<contextValue>28</contextValue>
</contextAttribute>
<contextAttribute>
<name>Total Proccess</name>
<type>String</type>
<contextValue>61</contextValue>
</contextAttribute>
<contextAttribute>
<name>VHDD Free space</name>
<type>String</type>
<contextValue>15826</contextValue>
</contextAttribute>
<contextAttribute>
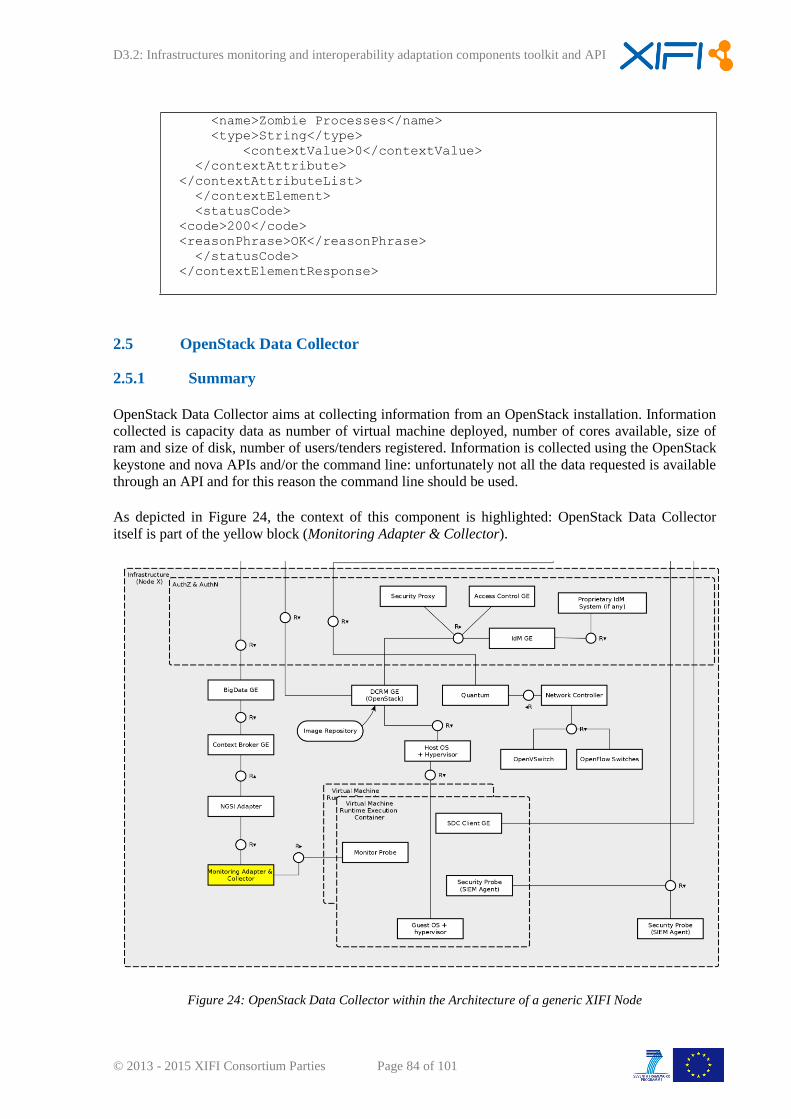
D3.2: Infrastructures monitoring and interoperability adaptation components toolkit and API
© 2013 - 2015 XIFI Consortium Parties Page 84 of 101
<name>Zombie Processes</name>
<type>String</type>
<contextValue>0</contextValue>
</contextAttribute>
</contextAttributeList>
</contextElement>
<statusCode>
<code>200</code>
<reasonPhrase>OK</reasonPhrase>
</statusCode>
</contextElementResponse>
2.5 OpenStack Data Collector
2.5.1 Summary
OpenStack Data Collector aims at collecting information from an OpenStack installation. Information
collected is capacity data as number of virtual machine deployed, number of cores available, size of
ram and size of disk, number of users/tenders registered. Information is collected using the OpenStack
keystone and nova APIs and/or the command line: unfortunately not all the data requested is available
through an API and for this reason the command line should be used.
As depicted in Figure 24, the context of this component is highlighted: OpenStack Data Collector
itself is part of the yellow block (Monitoring Adapter & Collector).
Figure 24: OpenStack Data Collector within the Architecture of a generic XIFI Node
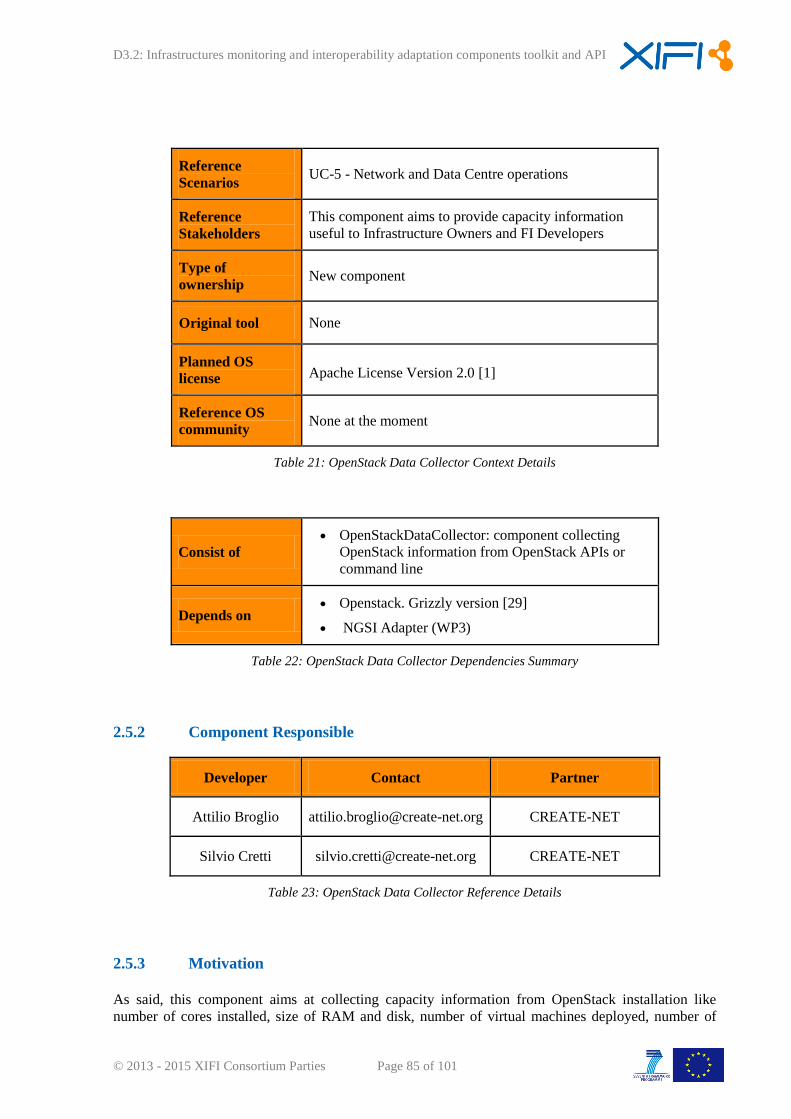
D3.2: Infrastructures monitoring and interoperability adaptation components toolkit and API
© 2013 - 2015 XIFI Consortium Parties Page 85 of 101
Reference
Scenarios UC-5 - Network and Data Centre operations
Reference
Stakeholders
This component aims to provide capacity information
useful to Infrastructure Owners and FI Developers
Type of
ownership New component
Original tool None
Planned OS
license Apache License Version 2.0 [1]
Reference OS
community None at the moment
Table 21: OpenStack Data Collector Context Details
Consist of
OpenStackDataCollector: component collecting
OpenStack information from OpenStack APIs or
command line
Depends on Openstack. Grizzly version [29]
NGSI Adapter (WP3)
Table 22: OpenStack Data Collector Dependencies Summary
2.5.2 Component Responsible
Developer Contact Partner
Attilio Broglio [email protected] CREATE-NET
Silvio Cretti [email protected] CREATE-NET
Table 23: OpenStack Data Collector Reference Details
2.5.3 Motivation
As said, this component aims at collecting capacity information from OpenStack installation like
number of cores installed, size of RAM and disk, number of virtual machines deployed, number of
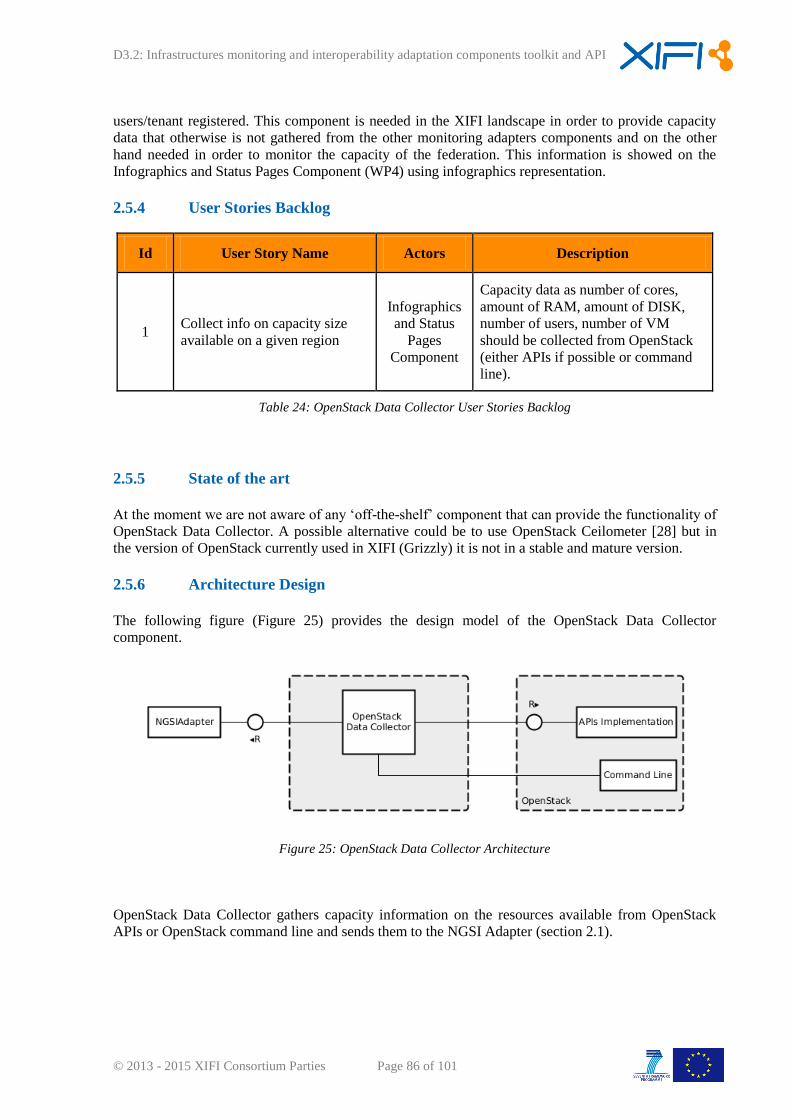
D3.2: Infrastructures monitoring and interoperability adaptation components toolkit and API
© 2013 - 2015 XIFI Consortium Parties Page 86 of 101
users/tenant registered. This component is needed in the XIFI landscape in order to provide capacity
data that otherwise is not gathered from the other monitoring adapters components and on the other
hand needed in order to monitor the capacity of the federation. This information is showed on the
Infographics and Status Pages Component (WP4) using infographics representation.
2.5.4 User Stories Backlog
Id User Story Name Actors Description
1 Collect info on capacity size
available on a given region
Infographics
and Status
Pages
Component
Capacity data as number of cores,
amount of RAM, amount of DISK,
number of users, number of VM
should be collected from OpenStack
(either APIs if possible or command
line).
Table 24: OpenStack Data Collector User Stories Backlog
2.5.5 State of the art
At the moment we are not aware of any ‘off-the-shelf’ component that can provide the functionality of
OpenStack Data Collector. A possible alternative could be to use OpenStack Ceilometer [28] but in
the version of OpenStack currently used in XIFI (Grizzly) it is not in a stable and mature version.
2.5.6 Architecture Design
The following figure (Figure 25) provides the design model of the OpenStack Data Collector
component.
Figure 25: OpenStack Data Collector Architecture
OpenStack Data Collector gathers capacity information on the resources available from OpenStack
APIs or OpenStack command line and sends them to the NGSI Adapter (section 2.1).
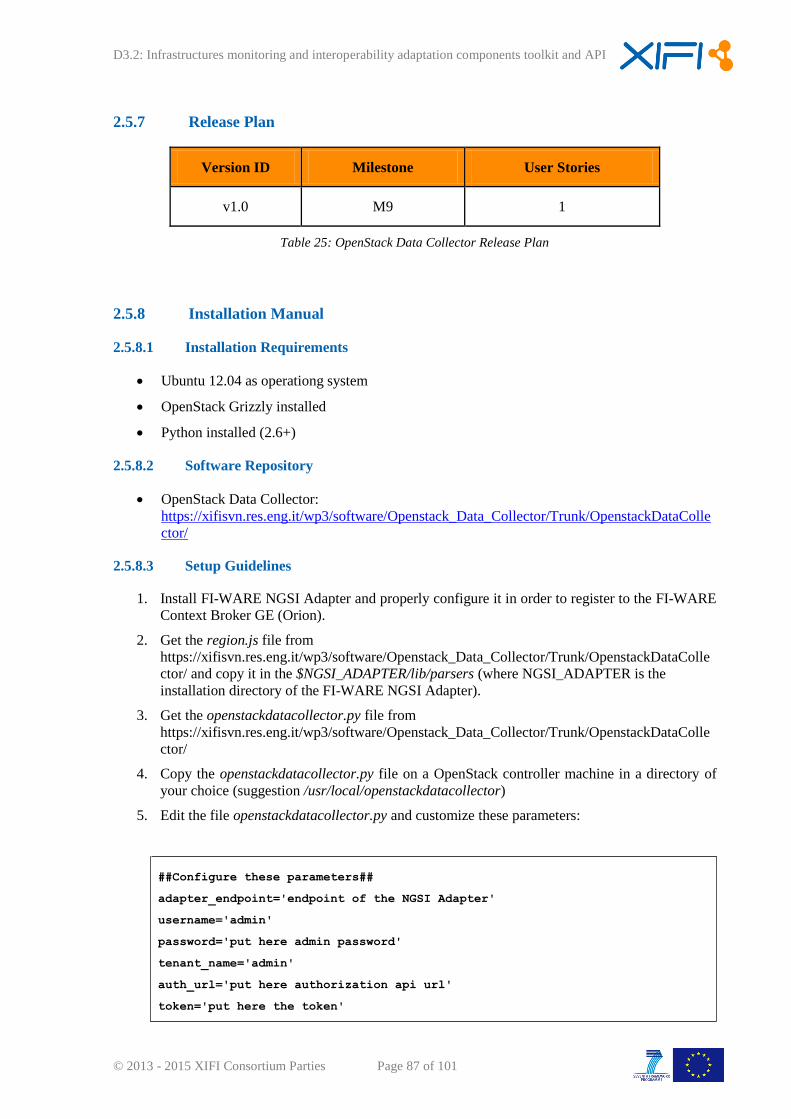
D3.2: Infrastructures monitoring and interoperability adaptation components toolkit and API
© 2013 - 2015 XIFI Consortium Parties Page 87 of 101
2.5.7 Release Plan
Version ID Milestone User Stories
v1.0 M9 1
Table 25: OpenStack Data Collector Release Plan
2.5.8 Installation Manual
2.5.8.1 Installation Requirements
Ubuntu 12.04 as operationg system
OpenStack Grizzly installed
Python installed (2.6+)
2.5.8.2 Software Repository
OpenStack Data Collector:
https://xifisvn.res.eng.it/wp3/software/Openstack_Data_Collector/Trunk/OpenstackDataColle
ctor/
2.5.8.3 Setup Guidelines
1. Install FI-WARE NGSI Adapter and properly configure it in order to register to the FI-WARE
Context Broker GE (Orion).
2. Get the region.js file from
https://xifisvn.res.eng.it/wp3/software/Openstack_Data_Collector/Trunk/OpenstackDataColle
ctor/ and copy it in the $NGSI_ADAPTER/lib/parsers (where NGSI_ADAPTER is the
installation directory of the FI-WARE NGSI Adapter).
3. Get the openstackdatacollector.py file from
https://xifisvn.res.eng.it/wp3/software/Openstack_Data_Collector/Trunk/OpenstackDataColle
ctor/
4. Copy the openstackdatacollector.py file on a OpenStack controller machine in a directory of
your choice (suggestion /usr/local/openstackdatacollector)
5. Edit the file openstackdatacollector.py and customize these parameters:
##Configure these parameters##
adapter_endpoint='endpoint of the NGSI Adapter'
username='admin'
password='put here admin password'
tenant_name='admin'
auth_url='put here authorization api url'
token='put here the token'

D3.2: Infrastructures monitoring and interoperability adaptation components toolkit and API
© 2013 - 2015 XIFI Consortium Parties Page 88 of 101
regionId='put here the region id'
regionName='put here the region name'
country='put here the two letters of the country'
latitude='put here GPS latitude'
longitude='put here GPS longitude'
2.5.9 User Manual
2.5.9.1 Handbook
In order to run the component:
Run NGSI Adapter
Open a terminal on the machine where the component has been installed
Go to the directory where the component has been installed
Run: python openstackdatacollector.py (you can also consider to run it as a daemon)

D3.2: Infrastructures monitoring and interoperability adaptation components toolkit and API
© 2013 - 2015 XIFI Consortium Parties Page 89 of 101
3 CONCLUSIONS
In this deliverable we described the different components required for the monitoring of the
infrastructure nodes within the XIFI community framework. With the descriptions provided, the
manuals and the software, an infrastructure owner shall be capable of integrating the 5 components
needed for a full inter and intra-infrastructure monitoring.
The components described are offering the ways to monitor both networks and data centres, at
different levels, to expose and control the relevant parameters of the infrastructures. On the one hand,
they will be used and presented in the dashboards addressed in WP4, for example to enable the
application developer to select the most suitable infrastructure, or the infrastructure resources; on the
other hand, to understand the XIFI community cloud and its connectivity performance.
The monitoring adapters presented assure the relevant interoperability between the networks data and
the data processing elements, allowing a smooth and seamless operation of the full infrastructures
federation.
Another meaningful aspect of the followed approach is the fact of presenting an innovative proposal
for a more standardized management interface, thus abstracting from the specific management tool,
and keeping updated information on the network and data centre status in a standardized and unified
manner.
Since the licences are open source and the code can be downloaded from the different repositories,
XIFI is targeting different open source communities, assuring the public availability of the solutions
developed.
The outcomes of this deliverable represent the first release of the XIFI monitoring adapters, which will
be installed and tested by the XIFI infrastructures in upcoming stages. This integration process will
reveal further actions to address in terms of the day-by-day feedback from the operations in the
infrastructures. This assessment will benefit the new infrastructure nodes selected in the XIFI Open
Call since they will be required to install the adaptation components.
Future releases of the adapters will incorporate more advanced features, coming from the requirements
identified in the XIFI lifecycle, and to perform with improved capabilities. The work will be reflected
in upcoming XIFI deliverable in year 2.
We prepared the base for future joining infrastructures and to run XIFI with full capacity on the
monitoring and infrastructures operation side.
D3.2: Infrastructures monitoring and interoperability adaptation components toolkit and API
© 2013 - 2015 XIFI Consortium Parties Page 90 of 101
REFERENCES
[1] Apache License, Version 2.0. http://www.apache.org/licenses/LICENSE-2.0.html
[2] Bandwidth Test Controller (BWCTL) Details. http://software.internet2.edu/bwctl/
[3] Chrome REST Console. https://chrome.google.com/webstore/detail/rest-console/
[4] Distributed Nagios eXecutor.
http://library.nagios.com/library/products/nagiosxi/documentation/308-using-dnx-with-nagios
[5] FI-WARE Big Data GE Architecture Description. https://forge.fi-
ware.eu/plugins/mediawiki/wiki/fiware/index.php/FIWARE.ArchitectureDescription.Data.BigD
ata
[6] FI-WARE BigData COSMOS. http://catalogue.fi-ware.eu/enablers/bigdata-analysis-cosmos
[7] FI-WARE Context Broker GE Architecture Description. http://forge.fi-
ware.eu/plugins/mediawiki/wiki/fiware/index.php/FIWARE.ArchitectureDescription.Data.PubS
ub
[8] FI-WARE Monitoring GEi components. https://github.com/Fiware/fiware-monitoring
[9] FI-WARE NGSI Adapter. https://github.com/Fiware/fiware-
monitoring/tree/master/ngsi_adapter
[10] FI-WARE NGSI-10 Open RESTful API Specification. http://forge.fi-
ware.eu/plugins/mediawiki/wiki/fiware/index.php/FI-WARE_NGSI-
10_Open_RESTful_API_Specification
[11] FI-WARE NGSI-9 Open RESTful API Specification. http://forge.fi-
ware.eu/plugins/mediawiki/wiki/fiware/index.php/FI-WARE_NGSI-
9_Open_RESTful_API_Specification
[12] FI-WARE Orion Context Broker - User and Programmers Guide. https://forge.fi-
ware.eu/plugins/mediawiki/wiki/fiware/index.php/Publish/Subscribe_Broker_-
_Orion_Context_Broker_-_User_and_Programmers_Guide
[13] FI-WARE. http://www.fi-ware.eu/
[14] Future Internet Public-Private Partnership (FI-PPP). http://www.fi-ppp.eu/
[15] Internet 2 One-Way Ping (OWAMP). http://software.internet2.edu/owamp/
[16] Iperf measurement tool. http://code.google.com/p/iperf/
[17] Iperf. http://sourceforge.net/projects/Iperf/
[18] Nagios Community. http://community.nagios.org/
[19] Nagios Distributed Monitoring. http://exchange.nagios.org/directory/Addons/Distributed-
Monitoring
[20] Nagios Downloads Page: http://www.nagios.org/download/
[21] Nagios Fusion. http://www.nagios.com/products/nagiosfusion
[22] Nagios Plugins Project: http://nagiosplug.sourceforge.net/
[23] Nagios. http://www.nagios.org/
[24] NagiosExchange.org: http://www.nagiosexchange.org/
[25] Nagira - Nagios RESTful API. http://exchange.nagios.org/directory/Addons/APIs/Nagira--2D-
Nagios-RESTful-API/details

D3.2: Infrastructures monitoring and interoperability adaptation components toolkit and API
© 2013 - 2015 XIFI Consortium Parties Page 91 of 101
[26] Open Grid Forum. http://www.ogf.org/
[27] OpenNMS. http://www.opennms.org/
[28] OpenStack Ceilometer. https://wiki.openstack.org/wiki/Ceilometer
[29] OpenStack. http://www.openstack.org
[30] PerfSONAR. http://www.PerfSONAR.net/
[31] XIFI Deliverable D3.1. http://wiki.fi-xifi.eu/Public:D3.1
[32] Zabbix. http://www.zabbix.com/
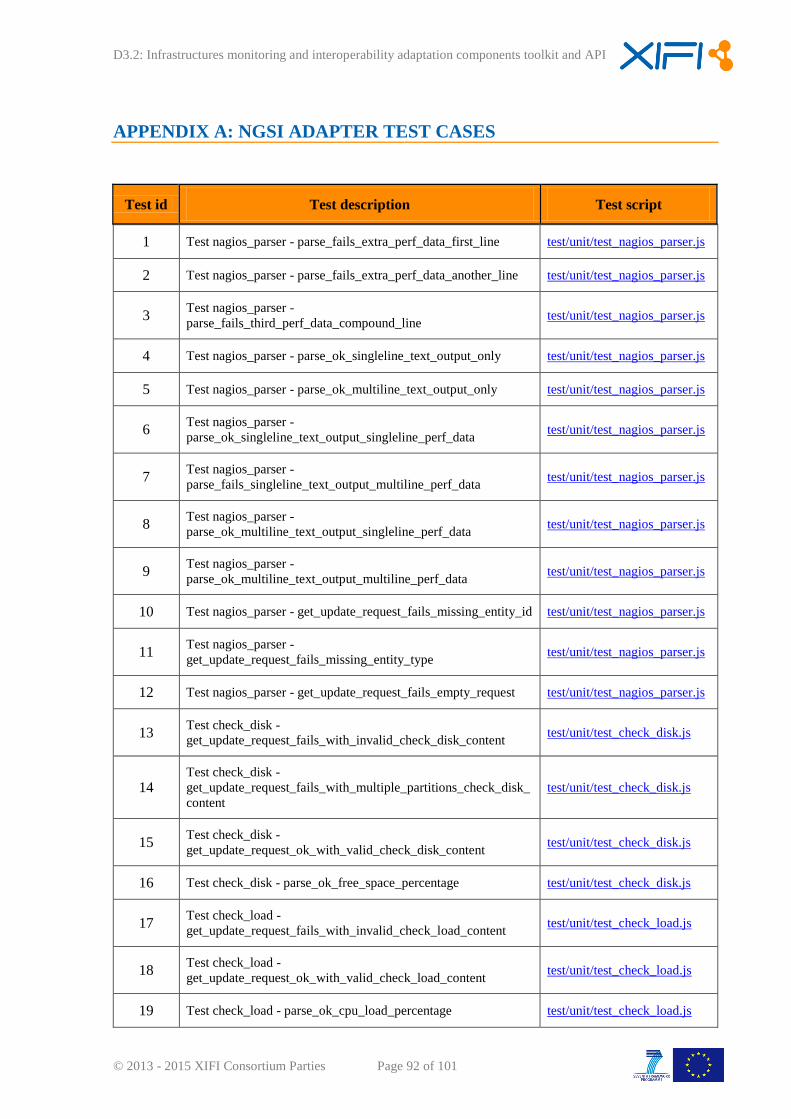
D3.2: Infrastructures monitoring and interoperability adaptation components toolkit and API
© 2013 - 2015 XIFI Consortium Parties Page 92 of 101
APPENDIX A: NGSI ADAPTER TEST CASES
Test id Test description Test script
1 Test nagios_parser - parse_fails_extra_perf_data_first_line test/unit/test_nagios_parser.js
2 Test nagios_parser - parse_fails_extra_perf_data_another_line test/unit/test_nagios_parser.js
3 Test nagios_parser -
parse_fails_third_perf_data_compound_line test/unit/test_nagios_parser.js
4 Test nagios_parser - parse_ok_singleline_text_output_only test/unit/test_nagios_parser.js
5 Test nagios_parser - parse_ok_multiline_text_output_only test/unit/test_nagios_parser.js
6 Test nagios_parser -
parse_ok_singleline_text_output_singleline_perf_data test/unit/test_nagios_parser.js
7 Test nagios_parser -
parse_fails_singleline_text_output_multiline_perf_data test/unit/test_nagios_parser.js
8 Test nagios_parser -
parse_ok_multiline_text_output_singleline_perf_data test/unit/test_nagios_parser.js
9 Test nagios_parser -
parse_ok_multiline_text_output_multiline_perf_data test/unit/test_nagios_parser.js
10 Test nagios_parser - get_update_request_fails_missing_entity_id test/unit/test_nagios_parser.js
11 Test nagios_parser -
get_update_request_fails_missing_entity_type test/unit/test_nagios_parser.js
12 Test nagios_parser - get_update_request_fails_empty_request test/unit/test_nagios_parser.js
13 Test check_disk -
get_update_request_fails_with_invalid_check_disk_content test/unit/test_check_disk.js
14 Test check_disk -
get_update_request_fails_with_multiple_partitions_check_disk_
content
test/unit/test_check_disk.js
15 Test check_disk -
get_update_request_ok_with_valid_check_disk_content test/unit/test_check_disk.js
16 Test check_disk - parse_ok_free_space_percentage test/unit/test_check_disk.js
17 Test check_load -
get_update_request_fails_with_invalid_check_load_content test/unit/test_check_load.js
18 Test check_load -
get_update_request_ok_with_valid_check_load_content test/unit/test_check_load.js
19 Test check_load - parse_ok_cpu_load_percentage test/unit/test_check_load.js
https://github.com/Fiware/fiware-monitoring/blob/master/ngsi_adapter/test/unit/test_nagios_parser.js
https://github.com/Fiware/fiware-monitoring/blob/master/ngsi_adapter/test/unit/test_nagios_parser.js
https://github.com/Fiware/fiware-monitoring/blob/master/ngsi_adapter/test/unit/test_nagios_parser.js
https://github.com/Fiware/fiware-monitoring/blob/master/ngsi_adapter/test/unit/test_nagios_parser.js
https://github.com/Fiware/fiware-monitoring/blob/master/ngsi_adapter/test/unit/test_nagios_parser.js
https://github.com/Fiware/fiware-monitoring/blob/master/ngsi_adapter/test/unit/test_nagios_parser.js
https://github.com/Fiware/fiware-monitoring/blob/master/ngsi_adapter/test/unit/test_nagios_parser.js
https://github.com/Fiware/fiware-monitoring/blob/master/ngsi_adapter/test/unit/test_nagios_parser.js
https://github.com/Fiware/fiware-monitoring/blob/master/ngsi_adapter/test/unit/test_nagios_parser.js
https://github.com/Fiware/fiware-monitoring/blob/master/ngsi_adapter/test/unit/test_nagios_parser.js
https://github.com/Fiware/fiware-monitoring/blob/master/ngsi_adapter/test/unit/test_nagios_parser.js
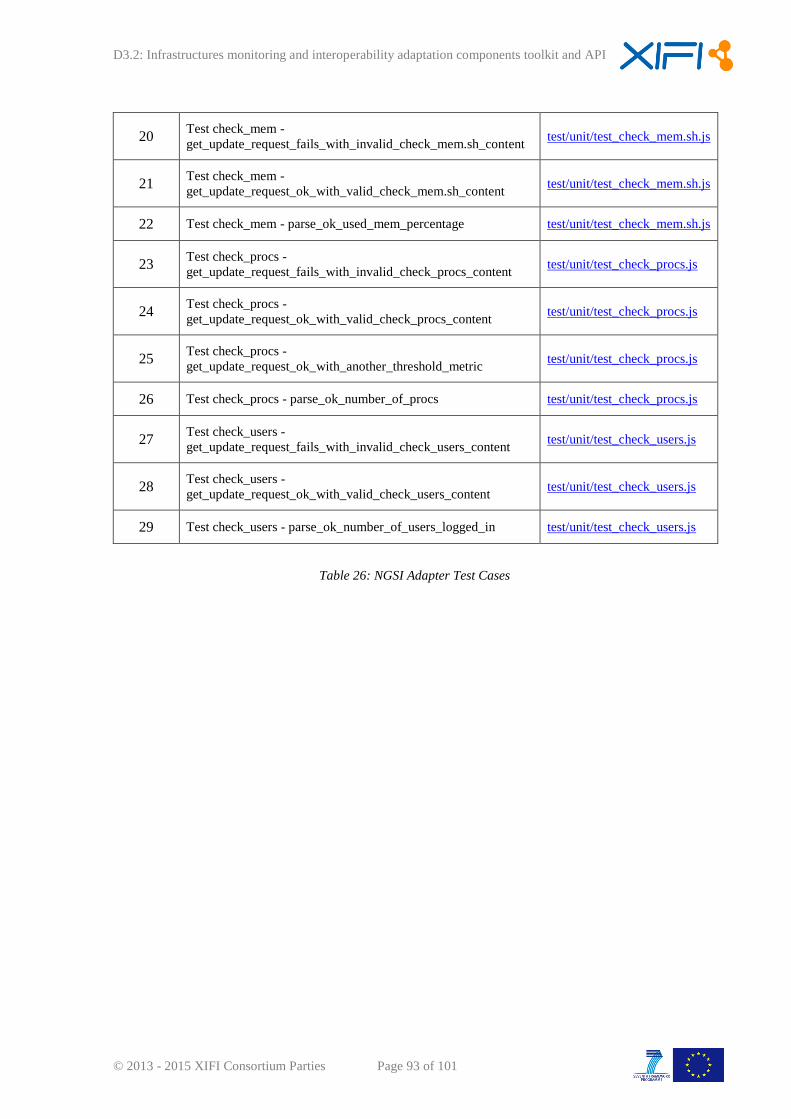
D3.2: Infrastructures monitoring and interoperability adaptation components toolkit and API
© 2013 - 2015 XIFI Consortium Parties Page 93 of 101
20 Test check_mem -
get_update_request_fails_with_invalid_check_mem.sh_content test/unit/test_check_mem.sh.js
21 Test check_mem -
get_update_request_ok_with_valid_check_mem.sh_content test/unit/test_check_mem.sh.js
22 Test check_mem - parse_ok_used_mem_percentage test/unit/test_check_mem.sh.js
23 Test check_procs -
get_update_request_fails_with_invalid_check_procs_content test/unit/test_check_procs.js
24 Test check_procs -
get_update_request_ok_with_valid_check_procs_content test/unit/test_check_procs.js
25 Test check_procs -
get_update_request_ok_with_another_threshold_metric test/unit/test_check_procs.js
26 Test check_procs - parse_ok_number_of_procs test/unit/test_check_procs.js
27 Test check_users -
get_update_request_fails_with_invalid_check_users_content test/unit/test_check_users.js
28 Test check_users -
get_update_request_ok_with_valid_check_users_content test/unit/test_check_users.js
29 Test check_users - parse_ok_number_of_users_logged_in test/unit/test_check_users.js
Table 26: NGSI Adapter Test Cases
D3.2: Infrastructures monitoring and interoperability adaptation components toolkit and API
© 2013 - 2015 XIFI Consortium Parties Page 94 of 101
APPENDIX B: DEM ADAPTER TEST CASES
UNIT TEST 1 – Verification of Nagios Core installation
Description
Nagios Core is responsible for gathering monitoring data from remote hosts (VMs and physical)
through already installed nrpe daemon. In this test, we assume that Nagios core is installed and
running in a server named NCoreSrv and we are going to check the status of two services: Apache
server and Nagios Core.
Procedure
1. Check Apache service In order to check that Apache server is running, type the following.
The second line indicates the response.
root@NCoreSrv:~# ps aux | grep apache2
root 5125 0.0 0.2 24860 6880 ? Ss 19:09 0:00
/usr/sbin/apache2 -k start
If there is no response, this means that Apache server is not running and you must start
the service manually by typing:
root@NCoreSrv:~# service apache2 start''
2. Check Nagios Core service:
root@NCoreSrv:~# ps aux | grep nagios
nagios 32758 0.0 0.0 832824 2008 ? Ssl Nov14 30:11
/usr/local/nagios/bin/nagios -d
/usr/local/nagios/etc/nagios.cfg
If there is no response this means that Nagios Core is not running and you must start the
service manually:
root@NCoreSrv:~# service nagios start
3. Check Nagios Web interface. While the two aforementioned services are up and running,
we must be able to access the Nagios web interface at NCoreSrv URL
(http://localhost/nagios/)
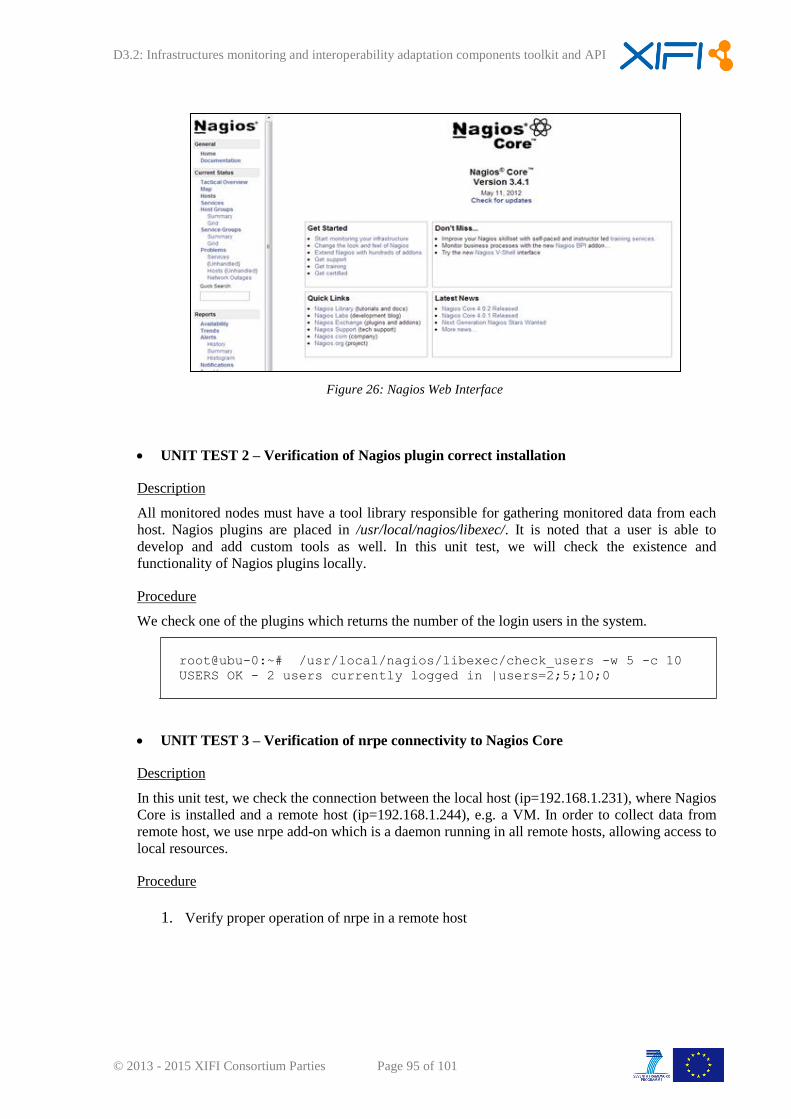
D3.2: Infrastructures monitoring and interoperability adaptation components toolkit and API
© 2013 - 2015 XIFI Consortium Parties Page 95 of 101
Figure 26: Nagios Web Interface
UNIT TEST 2 – Verification of Nagios plugin correct installation
Description
All monitored nodes must have a tool library responsible for gathering monitored data from each
host. Nagios plugins are placed in /usr/local/nagios/libexec/. It is noted that a user is able to
develop and add custom tools as well. In this unit test, we will check the existence and
functionality of Nagios plugins locally.
Procedure
We check one of the plugins which returns the number of the login users in the system.
root@ubu-0:~# /usr/local/nagios/libexec/check_users -w 5 -c 10
USERS OK - 2 users currently logged in |users=2;5;10;0
UNIT TEST 3 – Verification of nrpe connectivity to Nagios Core
Description
In this unit test, we check the connection between the local host (ip=192.168.1.231), where Nagios
Core is installed and a remote host (ip=192.168.1.244), e.g. a VM. In order to collect data from
remote host, we use nrpe add-on which is a daemon running in all remote hosts, allowing access to
local resources.
Procedure
1. Verify proper operation of nrpe in a remote host
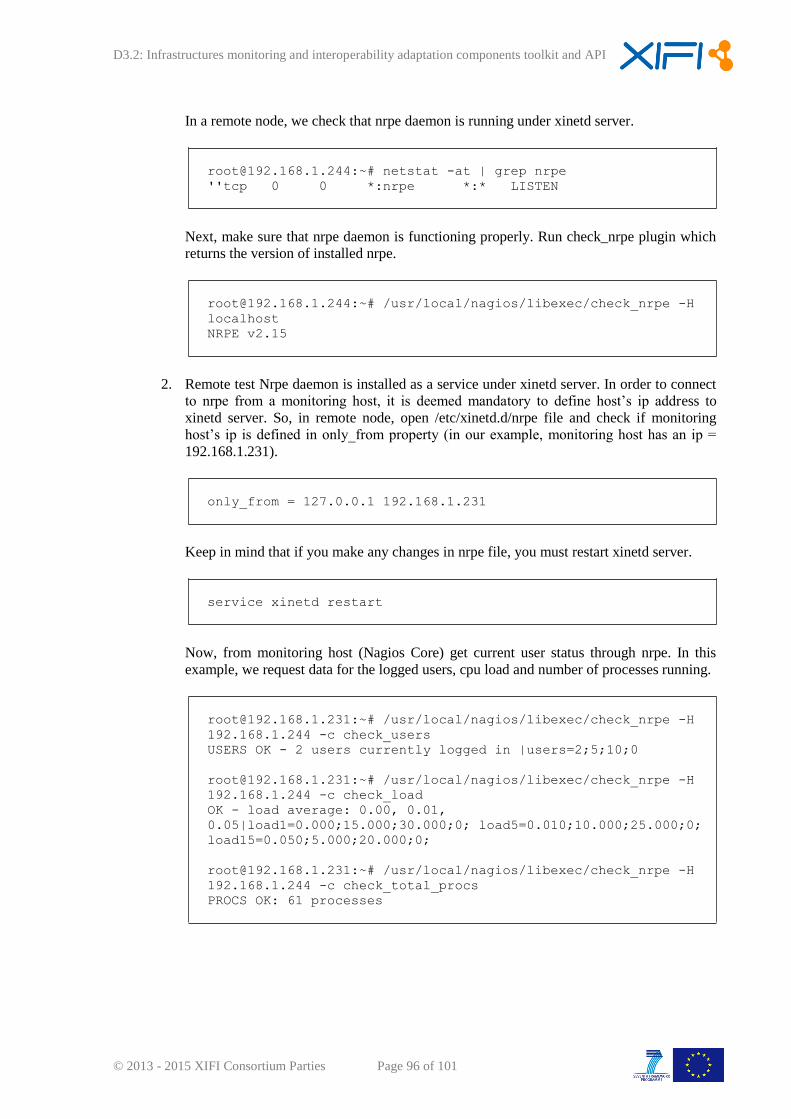
D3.2: Infrastructures monitoring and interoperability adaptation components toolkit and API
© 2013 - 2015 XIFI Consortium Parties Page 96 of 101
In a remote node, we check that nrpe daemon is running under xinetd server.
[email protected]:~# netstat -at | grep nrpe
''tcp 0 0 *:nrpe *:* LISTEN
Next, make sure that nrpe daemon is functioning properly. Run check_nrpe plugin which
returns the version of installed nrpe.
[email protected]:~# /usr/local/nagios/libexec/check_nrpe -H
localhost
NRPE v2.15
2. Remote test Nrpe daemon is installed as a service under xinetd server. In order to connect
to nrpe from a monitoring host, it is deemed mandatory to define host’s ip address to
xinetd server. So, in remote node, open /etc/xinetd.d/nrpe file and check if monitoring
host’s ip is defined in only_from property (in our example, monitoring host has an ip =
192.168.1.231).
only_from = 127.0.0.1 192.168.1.231
Keep in mind that if you make any changes in nrpe file, you must restart xinetd server.
service xinetd restart
Now, from monitoring host (Nagios Core) get current user status through nrpe. In this
example, we request data for the logged users, cpu load and number of processes running.
[email protected]:~# /usr/local/nagios/libexec/check_nrpe -H
192.168.1.244 -c check_users
USERS OK - 2 users currently logged in |users=2;5;10;0
[email protected]:~# /usr/local/nagios/libexec/check_nrpe -H
192.168.1.244 -c check_load
OK - load average: 0.00, 0.01,
0.05|load1=0.000;15.000;30.000;0; load5=0.010;10.000;25.000;0;
load15=0.050;5.000;20.000;0;
[email protected]:~# /usr/local/nagios/libexec/check_nrpe -H
192.168.1.244 -c check_total_procs
PROCS OK: 61 processes
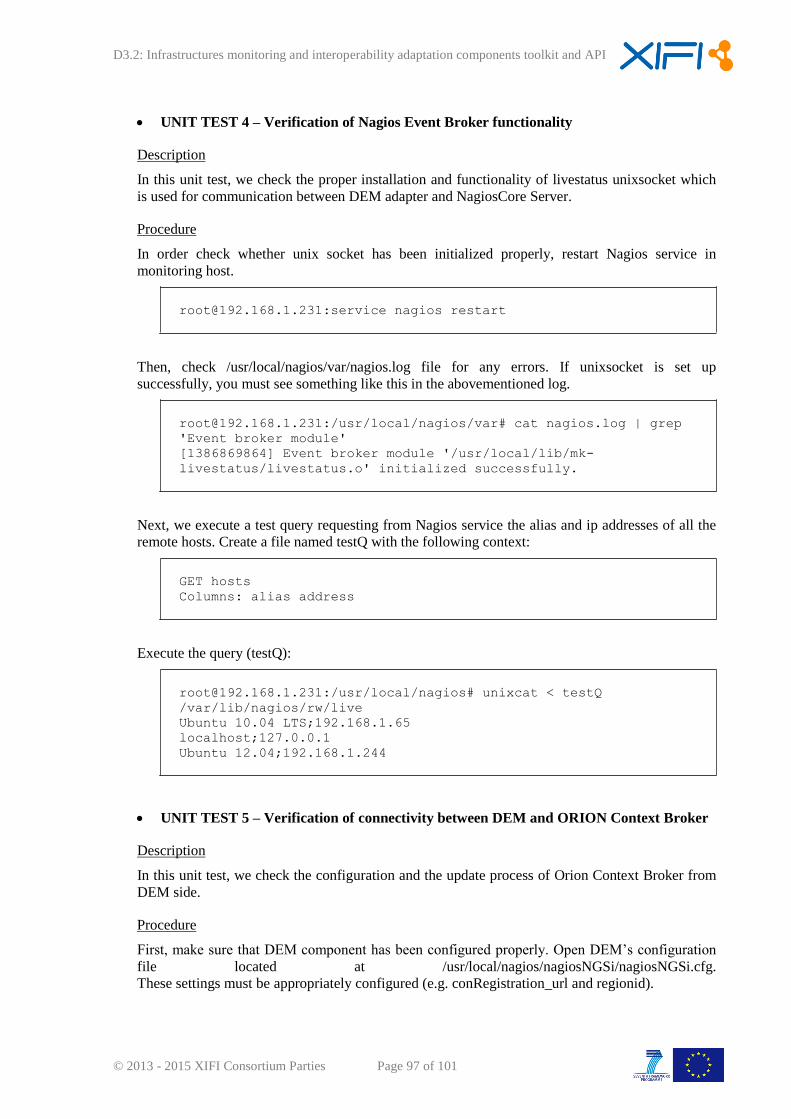
D3.2: Infrastructures monitoring and interoperability adaptation components toolkit and API
© 2013 - 2015 XIFI Consortium Parties Page 97 of 101
UNIT TEST 4 – Verification of Nagios Event Broker functionality
Description
In this unit test, we check the proper installation and functionality of livestatus unixsocket which
is used for communication between DEM adapter and NagiosCore Server.
Procedure
In order check whether unix socket has been initialized properly, restart Nagios service in
monitoring host.
[email protected]:service nagios restart
Then, check /usr/local/nagios/var/nagios.log file for any errors. If unixsocket is set up
successfully, you must see something like this in the abovementioned log.
[email protected]:/usr/local/nagios/var# cat nagios.log | grep
'Event broker module'
[1386869864] Event broker module '/usr/local/lib/mk-
livestatus/livestatus.o' initialized successfully.
Next, we execute a test query requesting from Nagios service the alias and ip addresses of all the
remote hosts. Create a file named testQ with the following context:
GET hosts
Columns: alias address
Execute the query (testQ):
[email protected]:/usr/local/nagios# unixcat < testQ
/var/lib/nagios/rw/live
Ubuntu 10.04 LTS;192.168.1.65
localhost;127.0.0.1
Ubuntu 12.04;192.168.1.244
UNIT TEST 5 – Verification of connectivity between DEM and ORION Context Broker
Description
In this unit test, we check the configuration and the update process of Orion Context Broker from
DEM side.
Procedure
First, make sure that DEM component has been configured properly. Open DEM’s configuration
file located at /usr/local/nagios/nagiosNGSi/nagiosNGSi.cfg.
These settings must be appropriately configured (e.g. conRegistration_url and regionid).
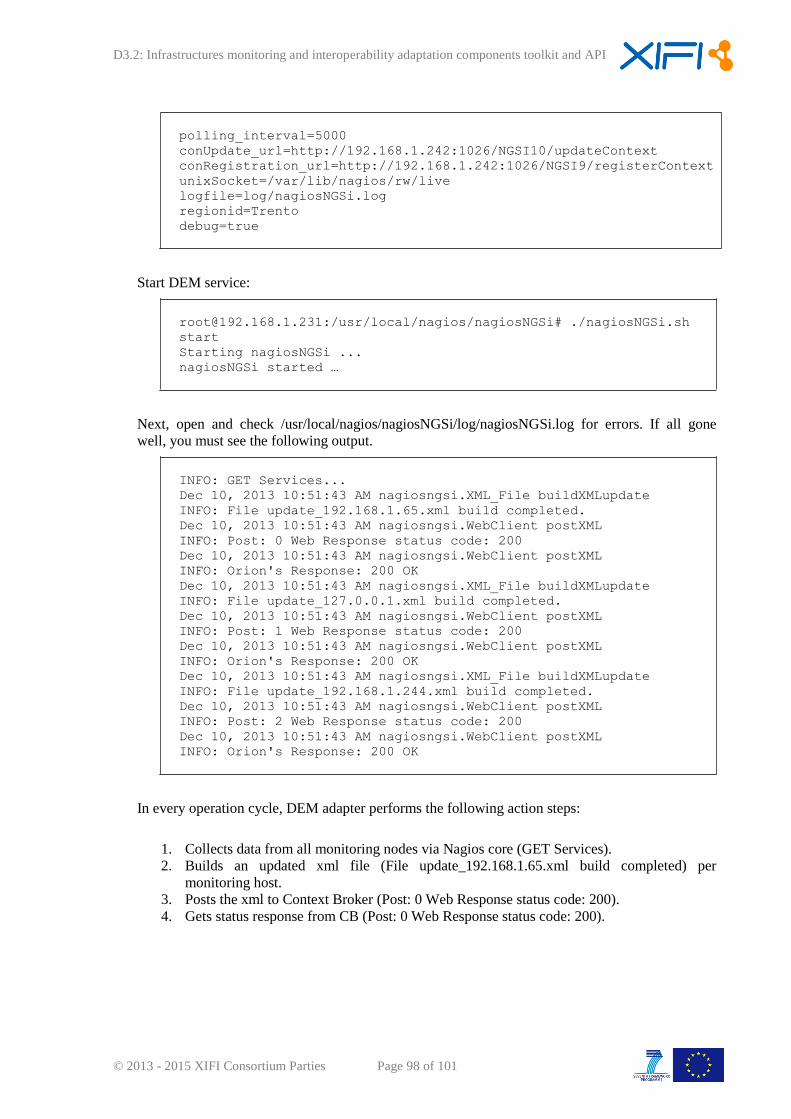
D3.2: Infrastructures monitoring and interoperability adaptation components toolkit and API
© 2013 - 2015 XIFI Consortium Parties Page 98 of 101
polling_interval=5000
conUpdate_url=http://192.168.1.242:1026/NGSI10/updateContext
conRegistration_url=http://192.168.1.242:1026/NGSI9/registerContext
unixSocket=/var/lib/nagios/rw/live
logfile=log/nagiosNGSi.log
regionid=Trento
debug=true
Start DEM service:
[email protected]:/usr/local/nagios/nagiosNGSi# ./nagiosNGSi.sh
start
Starting nagiosNGSi ...
nagiosNGSi started …
Next, open and check /usr/local/nagios/nagiosNGSi/log/nagiosNGSi.log for errors. If all gone
well, you must see the following output.
INFO: GET Services...
Dec 10, 2013 10:51:43 AM nagiosngsi.XML_File buildXMLupdate
INFO: File update_192.168.1.65.xml build completed.
Dec 10, 2013 10:51:43 AM nagiosngsi.WebClient postXML
INFO: Post: 0 Web Response status code: 200
Dec 10, 2013 10:51:43 AM nagiosngsi.WebClient postXML
INFO: Orion's Response: 200 OK
Dec 10, 2013 10:51:43 AM nagiosngsi.XML_File buildXMLupdate
INFO: File update_127.0.0.1.xml build completed.
Dec 10, 2013 10:51:43 AM nagiosngsi.WebClient postXML
INFO: Post: 1 Web Response status code: 200
Dec 10, 2013 10:51:43 AM nagiosngsi.WebClient postXML
INFO: Orion's Response: 200 OK
Dec 10, 2013 10:51:43 AM nagiosngsi.XML_File buildXMLupdate
INFO: File update_192.168.1.244.xml build completed.
Dec 10, 2013 10:51:43 AM nagiosngsi.WebClient postXML
INFO: Post: 2 Web Response status code: 200
Dec 10, 2013 10:51:43 AM nagiosngsi.WebClient postXML
INFO: Orion's Response: 200 OK
In every operation cycle, DEM adapter performs the following action steps:
1. Collects data from all monitoring nodes via Nagios core (GET Services).
2. Builds an updated xml file (File update_192.168.1.65.xml build completed) per
monitoring host.
3. Posts the xml to Context Broker (Post: 0 Web Response status code: 200).
4. Gets status response from CB (Post: 0 Web Response status code: 200).
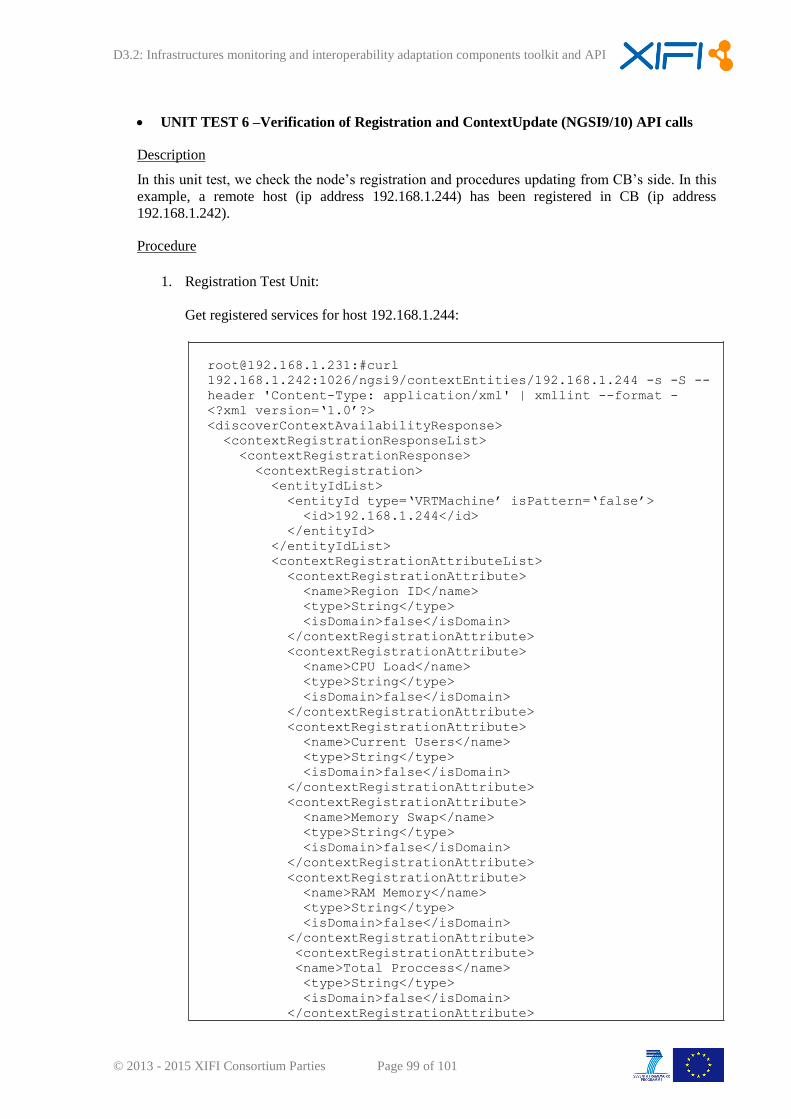
D3.2: Infrastructures monitoring and interoperability adaptation components toolkit and API
© 2013 - 2015 XIFI Consortium Parties Page 99 of 101
UNIT TEST 6 –Verification of Registration and ContextUpdate (NGSI9/10) API calls
Description
In this unit test, we check the node’s registration and procedures updating from CB’s side. In this
example, a remote host (ip address 192.168.1.244) has been registered in CB (ip address
192.168.1.242).
Procedure
1. Registration Test Unit:
Get registered services for host 192.168.1.244:
[email protected]:#curl
192.168.1.242:1026/ngsi9/contextEntities/192.168.1.244 -s -S --
header 'Content-Type: application/xml' | xmllint --format -
<?xml version=‘1.0’?>
<discoverContextAvailabilityResponse>
<contextRegistrationResponseList>
<contextRegistrationResponse>
<contextRegistration>
<entityIdList>
<entityId type=‘VRTMachine’ isPattern=‘false’>
<id>192.168.1.244</id>
</entityId>
</entityIdList>
<contextRegistrationAttributeList>
<contextRegistrationAttribute>
<name>Region ID</name>
<type>String</type>
<isDomain>false</isDomain>
</contextRegistrationAttribute>
<contextRegistrationAttribute>
<name>CPU Load</name>
<type>String</type>
<isDomain>false</isDomain>
</contextRegistrationAttribute>
<contextRegistrationAttribute>
<name>Current Users</name>
<type>String</type>
<isDomain>false</isDomain>
</contextRegistrationAttribute>
<contextRegistrationAttribute>
<name>Memory Swap</name>
<type>String</type>
<isDomain>false</isDomain>
</contextRegistrationAttribute>
<contextRegistrationAttribute>
<name>RAM Memory</name>
<type>String</type>
<isDomain>false</isDomain>
</contextRegistrationAttribute>
<contextRegistrationAttribute>
<name>Total Proccess</name>
<type>String</type>
<isDomain>false</isDomain>
</contextRegistrationAttribute>
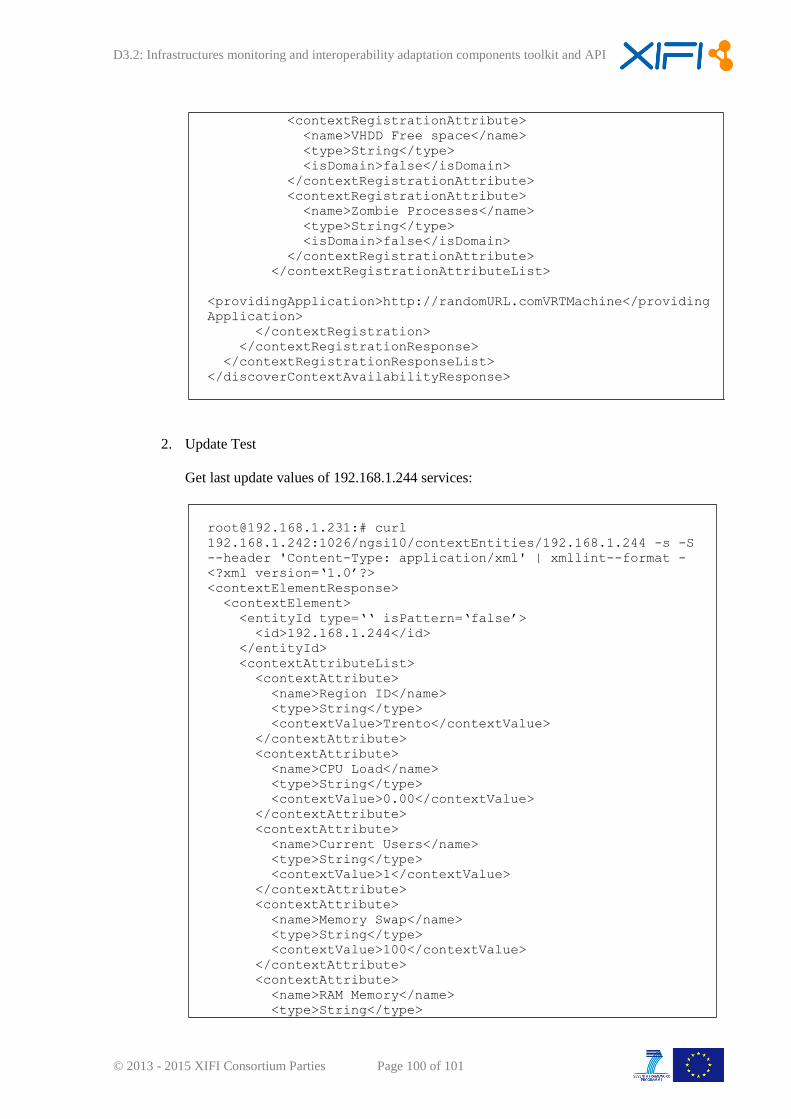
D3.2: Infrastructures monitoring and interoperability adaptation components toolkit and API
© 2013 - 2015 XIFI Consortium Parties Page 100 of 101
<contextRegistrationAttribute>
<name>VHDD Free space</name>
<type>String</type>
<isDomain>false</isDomain>
</contextRegistrationAttribute>
<contextRegistrationAttribute>
<name>Zombie Processes</name>
<type>String</type>
<isDomain>false</isDomain>
</contextRegistrationAttribute>
</contextRegistrationAttributeList>
<providingApplication>http://randomURL.comVRTMachine</providing
Application>
</contextRegistration>
</contextRegistrationResponse>
</contextRegistrationResponseList>
</discoverContextAvailabilityResponse>
2. Update Test
Get last update values of 192.168.1.244 services:
[email protected]:# curl
192.168.1.242:1026/ngsi10/contextEntities/192.168.1.244 -s -S
--header 'Content-Type: application/xml' | xmllint--format -
<?xml version=‘1.0’?>
<contextElementResponse>
<contextElement>
<entityId type=‘‘ isPattern=‘false’>
<id>192.168.1.244</id>
</entityId>
<contextAttributeList>
<contextAttribute>
<name>Region ID</name>
<type>String</type>
<contextValue>Trento</contextValue>
</contextAttribute>
<contextAttribute>
<name>CPU Load</name>
<type>String</type>
<contextValue>0.00</contextValue>
</contextAttribute>
<contextAttribute>
<name>Current Users</name>
<type>String</type>
<contextValue>1</contextValue>
</contextAttribute>
<contextAttribute>
<name>Memory Swap</name>
<type>String</type>
<contextValue>100</contextValue>
</contextAttribute>
<contextAttribute>
<name>RAM Memory</name>
<type>String</type>
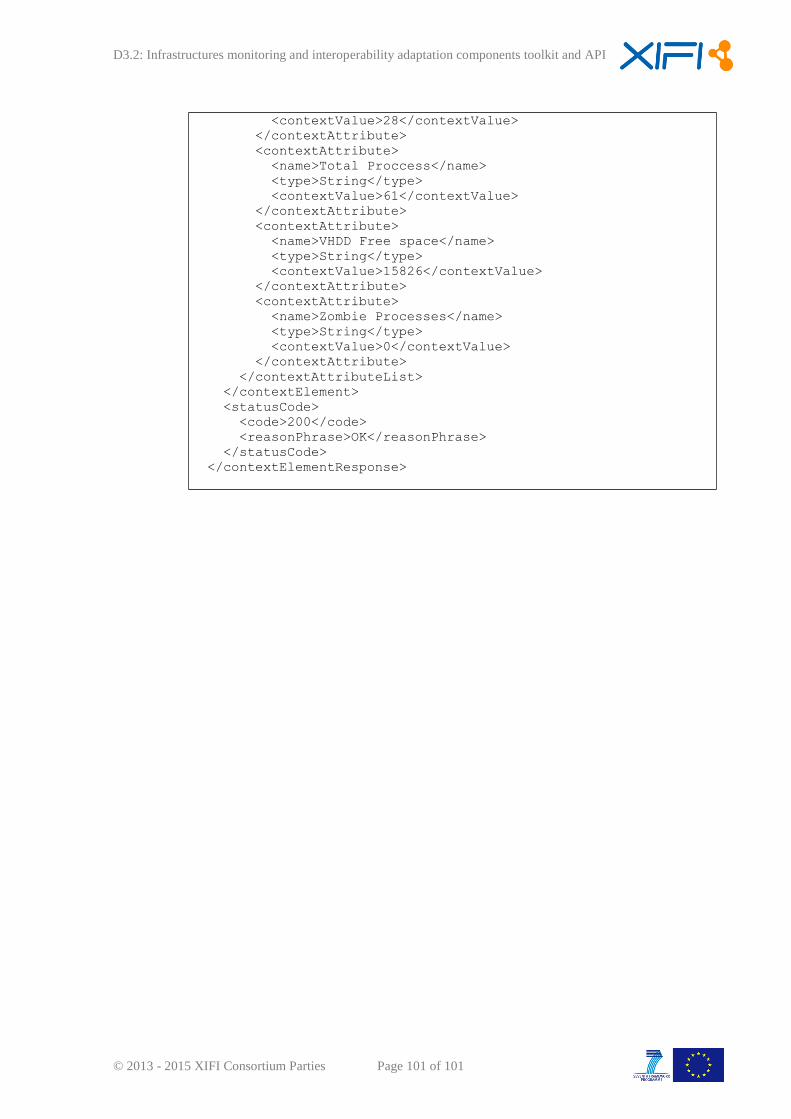
D3.2: Infrastructures monitoring and interoperability adaptation components toolkit and API
© 2013 - 2015 XIFI Consortium Parties Page 101 of 101
<contextValue>28</contextValue>
</contextAttribute>
<contextAttribute>
<name>Total Proccess</name>
<type>String</type>
<contextValue>61</contextValue>
</contextAttribute>
<contextAttribute>
<name>VHDD Free space</name>
<type>String</type>
<contextValue>15826</contextValue>
</contextAttribute>
<contextAttribute>
<name>Zombie Processes</name>
<type>String</type>
<contextValue>0</contextValue>
</contextAttribute>
</contextAttributeList>
</contextElement>
<statusCode>
<code>200</code>
<reasonPhrase>OK</reasonPhrase>
</statusCode>
</contextElementResponse>