Changes in ammonoid fauna and palaeoceanographic environment ...

80
ID # (2786)Received: 02/ 12/ 2013In-revised: 19/01/2014Correspondent Author:Thamer Salim Ali E-mail: [email protected]
ABSTRACT
KEYWORDSInfauna; spatial and temporal variations; multivariate analysis; influential factor; abiotic factors; Bahrain.
Spatial and Temporal Variations of Marine Benthic In-fauna Community inNorthern and Southern Areas of the Kingdom of Bahrain
Thamer Salim Ali Environmental Sciences and Natural Resources Program
College of Graduate Studies, Arabian Gulf UniversityKingdom of Bahrain
The in-fauna community inhabiting the surface sediments in the Bahrain waters during 2007-2008 was investigated to describe the spatial and temporal variations between and within Northern and Southern areas. Using a 0.05 m2 van veen grab, samples were collected from 12 sampling stations: 6 stations at each Northern and Southern waters. The samples were collected during Summer and Winter to compare the in-fauna species composition on seasonal basis at each area. In situ water analysis (temperature, salinity, turbidity, pH, dissolved oxygen and depth) and the sediment grain size analysis were carried out at same stations of in-faunal samples in order to identify potential environmental key factors causing temporal and spatial variations of in-fauna assemblage. Based on species composition, in-fauna community patterns were identified and evaluated by multivariate analysis Multidimensional Scaling (MDS) using PRIMER V6. A total of 5075 specimens represented by 186 taxon were collected during the study period. Generally, the in-fauna abundance and number of species in the Northern area was higher than the Southern area and seasonally the samples collected in Summer were relatively more abundant than those collected in Winter. The BIO-ENV results revealed that the water depth and turbidity are the most influential parameters causing spatial variations of in-fauna community within Northern and Southern areas. On temporal basis, temperature found to be the factor determining major part of the temporal variations within stations associated with Southern area, however turbidity was the influential parameter of temporal variations for stations within the Northern area. On the other hand, the salinity found to be the influential factor affecting the majority of spatial variation between Northern and Southern in-fauna species composition. The present study provides a database on part of marine biodiversity representing a background on benthic community in Bahrain that can be used as a biological indicator to evaluate potential environmental impacts pertaining to developmental projects particularly dredging and reclamation works in coastal and offshore regions.
AGJSR 32 (1) 2014: 80-92 Thamer Salim Ali

81
رقم المسودة: (2786)تاريخ استالم المسودة: 2013/12/02
تاريخ المسودة الُمَعَدلة: 2014/01/19الباحث الُمَراِسل: ثامر سالم علي
بريد الكتروني:[email protected]
االختالفات المكانية والزمانية لمجتمع الكائنات الحيوانية القاعية البحرية في شمال وجنوب مملكة البحرين
ثامر سالم عليبرنامج علوم البيئة والموارد الطبيعية
كلية الدراسات العليا، جامعة الخليج العربيمملكة البحرين
الُمستلخص
الكلمات الدالة
تناول البحث مجتمع الكائنات الحيوانية القاعية في شمال وجنوب البحرين خالل الفترة (-20072008) لوصف االختالفات على أساس المكان والزمان بين مواقع الدراسة في كل منطقة وبين (Van veen) من نوع (Grab sampler) المنطقتين. جمعت عينات الرواسب باستخدام الكباشمساحته السطحية الداخلية م2 من (12) موقع؛ ستة في المنطقة الشمالية وستة في المنطقة الجنوبية. جمعت العينات في موسمي الصيف والشتاء في كل منطقة لمقارنة التغيرات الموسمية في تركيب تجمع األحياء. وتم إجراء قياسات لبعض العوامل البيئية لنوعية المياه شملت الحرارة والملوحة والعكارة واألس الهيدروجيني واألوكسجين المذاب والعمق باإلضافة الى تحليل الحجم الحبيبي القاعية لتحديد أثر هذه العوامل على التوزيع المكاني للرواسب من نفس مواقع جمع األحياء والزماني. تم تحليل عالقة وفرة األحياء القاعية بالعوامل البيئية بطريقة التحليل متعدد التباين (Multidimensional Scaling) األبعاد متعدد التحليل باستخدام (Multivariate analysis)في برنامج (PRIMER V6). تم جمع(5075) نموذج من الكائنات الحيوانية القاعية تمثل (186) نوع خالل فترة الدراسة. وبشكل عام لوحظ أن وفرة األحياء القاعية وعدد أنواعها في المنطقة الشمالية أكبر مما هو عليه في المنطقة الجنوبية، وعلى أساس التغيرات الموسمية وجد أنها كانت في موسم الصيف أكبر نسبياً من الشتاء. وبينت نتائج تحليل (BIO-ENV) أن العمق وعكارة المياه كانت العوامل األكثر تأثيراً في التباين المكاني لألحياء القاعية بين مواقع الدراسة سواء في المنطقة الشمالية أو الجنوبية. وعلى أساس التباين الموسمي، وجد أن الحرارة كانت العامل األكثر تأثيراً في وفرة وعدد أنواع األحياء القاعية بين موسمي الصيف والشتاء في المنطقة الجنوبية بينما كانت عكارة المياه العامل األكثر تأثيراً في التباين الموسمي بين مواقع الدراسة في المنطقة الشمالية. ومن جهة أخرى وجد أن الملوحة هي العامل األبرز الذي يتحكم في الجزء األكبر من التباين في وفرة وعدد أنواع األحياء القاعية بين المنطقتين الشمالية والجنوبية. إن الدراسة الحالية توفر بيانات تعد جزءاً من التنوع الحيوي للحياة البحرية حول مجتمع الكائنات الحيوانية القاعية في البحرين يمكن أن تعتمد كدليل حيوي لتقييم اآلثار البيئية التي تنجم عن المشاريع التنموية
وخصوصاً فيما يتعلق بأعمال الحفر والردم في المناطق الساحلية والبحرية.
كائنات حيوانية قاعية، االختالفات المكانية، االختالفات الزمانية، التحليل متعدد التباين،
العامل المؤثر، العوامل البيئية، البحرين
IntroductionMarine benthic ecosystems comprise a mosaic of biological assemblages existing under differing environmental conditions, and it is conceptually difficult to address the functional role of all biotic components of benthic systems simultaneously (Bremner et al., 2006). From a monitoring perspective, benthos offers three positive attributes: a) relatively sedentary and long-lived, b) occupy an important intermediate trophic position and c) respond differentially to varying environmental conditions (Reish, 1972).
In-fauna represents organisms that live inside the top layers of the sediment, which can be used as a biological indicator to evaluate environmental
stresses. Any physical impacts due to an alteration of the bottom topography and sediment composition may directly or indirectly reflect on in-fauna species composition. In benthic systems, invertebrate species distributions and assemblage composition are strongly influenced by the physico-chemical environment over a range of scales (Hall et al., 1994).
The in-fauna species composition is linked to different factors structuring the assemblage; e.g., temperature, water movement, depth and seabed as found by (Rees et al., 1999); (Thrush et al., 2001); (Sanvicente-Anorve et al., 2002) and (Barros et al., 2004). The situation will be more complex under potential impacts of anthropogenic disturbances resulted from coastal and/or offshore development
AGJSR 32 (1) 2014: 80-92 Thamer Salim Ali

82
activities, which may interact with natural seasonality modifying assemblage composition. Consequently, the assessment of the structure and dynamics of biotic / environmental interactions is of great importance to provide a background on biological and ecological processes, on which explanations could be sorted for any possible man-made contributions. Due to its geographical location, the Summer temperatures in Bahrain regularly exceed 50○C and drop to 14○C-18○C in Winter (Price and Vousden, 1985). Water temperatures and salinities are found to be closely related as a direct result of the climate and the shallowness and partially land-locked nature of this region (Vousden et al., 1985).
The marine environment in Bahrain was ecologically surveyed twice; the first was carried out by the Environmental Protection Committee during the period 1985-1988 (Vousden, 1988). The second was conducted by Bahrain Centre for Studies and Researches during 1998-1999 (Sims & Zainal, 2000). Recently, under marine GIS, projects (MARGIS I & MARGIS II) initiated by Bahrain Centre for Studies and Research, concerned with extensive survey on marine habitat, substrates and marine animals was carried out (Geomatec, 2006). Many key species, which are very important for global, regional and local environment, are present in the Bahrain marine benthic environment (Al-Zayani, 2003). Some of these species have been first recorded in the Arabian Gulf as reported by (Basson et al., 1989 and (Monniot & Monniot, 1997). Several studies discussed the environmental impacts of dredging / infilling activities, which have been going on for a long time in Bahrain (Al-Alawi, 1982); (UNEP, 1985); (Madany et al., 1988); (Vousden, 1988) ); (Madany et al., 1991); and (Vousden, 1995). The study undertaken by (Al-Wedaei, 2007) seems to be the only work concerning with in-fauna associated with Bahrain waters in relation to environmental variables. That study focused on macrobenthic fauna associated with seagrass beds in the Western and Eastern areas of the Kingdom of Bahrain.
The objectives of the present study are to identify the spatial and temporal variations of in-fauna species composition and to find out the influential abiotic factors regulating the in-fauna community in the Bahrain waters using multivariate analyses.
Materials and Methods(1) Study AreaThe Kingdom of Bahrain is composed of 36 islands. The main island is known Bahrain and the other major islands are Muharraq (at North), Sitra (at North East), Um Nasan (at West) and Hawar (at South East) in addition to many small islands scattered within the territorial Bahraini waters. This archipelago is lying at latitudes between 25○ 32’ and 26○ 20’ North and longitude between 50○ 20’ and 50○ 50’ East.
The present study was designed to characterize the in-fauna community in the Northern and Southern waters of Kingdom of Bahrain. The former situated North to the Al-Muharraq Island and the second associated with the area South to Durrat Al-Bahrain Resort (Figure 1). A total of 12 stations have been selected; six monitoring locations at each Northern and Southern area. The samples were collected during Summer and Winter 2007-2008.
(2) Environmental DataIn situ water analysis and sediment grain size analysis were carried out at same stations of in-faunal samples in order to determine the relationships between the environmental factors and the in-faunal community composition. A Laser monitoring multi-sonde water quality meter was used to assess a number of in situ water quality parameters at each station within the study area. At each location, water quality was assessed at the mid-water depth. The parameters that were measured by the meter were temperature (C°), salinity (ppt), turbidity (NTU), pH, dissolved oxygen (mg/l) and depth (m).
The determination of the particle size is essential for the assessment of the availability of substances for the flora and fauna, which may affect the in-fauna assemblage. Samples of sediment were taken for particle size analysis. The material was sieved over the range 20 millimeters down to 0.063 millimeters. Results were expressed using conventional Wentworth Classification to give percentage composition of each particle size. These data were then used as an input to similarity analysis of sediment composition in the survey area using multivariate techniques.
AGJSR 32 (1) 2014: 80-92 Thamer Salim Ali

83
Figure 1: Location Map of Sampling Stations
(3) In-fauna DataTriplicate samples at each location were collected using a Van Veen grab and taken back to the laboratory for analysis. As soon as the samples were received from the field, they were preserved in a solution of dilute formalin (5%) with Rose Bengal prior to the normal sorting process which separates specimens from the sediment with the help of hand magnifier when it is needed. The specimens of each sample were kept then in a small container to be examined under the microscope. The identification setup is made of 10x4.5 Stereo Zoom Microscope (Radical) fitted with digital Camera (Carton) and connected to a desktop computer.
(4) Data AnalysesOnce the identification had been completed the data were then subjected to the following data processing. The objectives of the analysis of data arising from the monitoring are focused on identification of spatial and
temporal patterns of the in-faunal species abundance under investigation and to assess their relationship to environmental parameters.(5) Multivariate AnalysisThe software package PRIMER V6 (Plymouth Routines In Multivariate Ecological Research) developed by Plymouth Marine Laboratory (Clarke and Warwick, 2001; Clarke and Gorley, 2006) was applied. This package is widely employed as a tool for analyzing benthic datasets. Prior to carrying out multivariate analyses, a Bray-Curtis similarity matrix was calculated from the transformed data matrix; the Bray-Curtis coefficient utilized in this procedure is the most the commonly used for biological assemblage data. The Bray-Curtis similarity matrix displays the similarities between all possible pair wise combinations of sample stations based on a scale of 0-100, where 0 represents complete dissimilarity and 100 equals complete similarity between pairs of stations.
AGJSR 32 (1) 2014: 80-92 Thamer Salim Ali

84
(5.1) Non-metric Multidimensional Scaling (MDS) This non-parametric ordination technique represents samples as points in a low dimensional space (usually a 2D plot). All points are in the same rank order as the relative dissimilarities or distances of the samples, as derived from the similarity matrix. The 2D MDS plot is therefore easy to interpret; the closer the points are together, the more similar the community composition of the samples in question and vice versa. The stress value of the MDS plot provides an indication of the ‘goodness-of-fit’ of the plot in relation to the similarity matrix. The species that account for the similarity and differences between the in-faunal groups were identified using the SIMPER sub-routine within the PRIMER software.(5.2) Biological and Environmental Data Relationship (BIO-ENV) BIO-ENV identifies subsets of variables from one dataset that show the best match with patterns from a second dataset (Clarke and Ainsworth, 1993). In present paper this routine simply calculates a measure of agreement between the in-fauna abundance and environmental variables, to explore the subset of environmental parameters, which best ‘matches’ the biological patterns observed between the stations investigated. For each survey area, the Bray-Curtis similarity matrix of square root-transformed in-fauna data was compared against the normalized Euclidean distance (dissimilarity) matrix of untransformed environmental
data. Spearman rank correlation coefficients quantify the match between the biotic and abiotic matrices, and choose the subset of environmental variables which maximize the correlation coefficient, which elucidate the extent to which environmental data is related to or ‘explains’ the observed biological pattern (Clarke and Warwick, 2001).
Results(1) Abiotic Factors Data on in situ water analysis (temperature, salinity, turbidity, pH, DO and depth, and sediment Median Particle Size (MPS) for North and South stations are summarized in Tables 1 and 2, respectively.
At North area, the temperatures were apparently different between Winter and Summer readings. The minimum was 16.5 ○C in Winter (average 18.7 ○C), however the maximum in Summer was 32.7○C (average 31.4○C). The salinity was ranged between 39.9% to 44.1% in Winter and from 39.6% to 44.0% in Summer. The turbidity in Winter showed a wide range varied between 0.1 NTU at N3 and 26.5 NTU at N6, however in Summer the turbidity found at lowest level (0.1 NTU) in the studied stations. The results revealed that pH readings in Winter (average 8.5) were slightly higher than Summer readings (average 8.0).
Table 1: Some Abiotic Factors at Northern Stations during Winter (W) and Summer (S)Station Temperature
(°C)Salinity (ppt) Turbidity (NTU) pH DO (mg/l) Depth (m) MPS (mm)
W S W S W S W S W S W S W SN1 18.3 32.2 41.3 40.8 6.2 0.1 9.0 8.0 4.1 6.4 7.3 7.0 0.31 0.41N2 16.5 32.0 43.0 44.0 0.3 0.1 9.0 7.9 5.0 6.3 5.5 5.3 0.38 0.30N3 17.2 29.2 44.1 42.0 0.1 0.1 9.0 8.0 5.3 6.3 8.8 8.5 0.35 0.42N4 19.8 32.2 41.1 41.4 6.1 0.1 8.0 8.2 5.6 5.7 10.1 10.0 0.55 0.50N5 20.2 32.7 41.1 39.6 26.5 0.1 8.1 8.0 5.7 5.6 9.0 9.0 0.11 0.18N6 20.2 29.8 39.9 40.7 10.9 0.1 8.1 8.0 5.5 6.1 3.5 3.0 0.48 0.57
Table 2: Some Abiotic Factors at Southern Stations during Winter (W) and Summer (S)Station Temperature
(°C)Salinity (ppt) Turbidity
(NTU)pH DO (mg/l) Depth (m) MPS (mm)
W S W S W S W S W S W S W SS1 19.5 34.1 49.9 53.6 0.1 10.6 7.9 8.2 5.5 5.7 7.0 7.3 0.09 0.06S2 19.6 34.2 49.4 53.1 0.1 10.6 8.0 8.2 5.7 5.8 6.0 6.4 0.11 0.06S3 19.5 34.0 50.4 57.2 0.1 10.1 7.9 8.1 5.4 5.5 13.2 13.4 0.063 0.06S4 19.8 35.1 50.0 54.5 13.3 10.4 8.0 8.2 5.7 6.1 1.2 1.4 0.38 0.35S5 19.7 34.0 49.6 56.8 0.2 12.6 8.0 8.1 6.0 5.6 3.6 3.9 0.40 0.47S6 20.0 35.1 50.7 54.7 0.1 9.5 8.0 8.3 5.8 6.0 2.5 2.7 0.43 0.50
AGJSR 32 (1) 2014: 80-92 Thamer Salim Ali

85
The dissolved oxygen results showed well oxygenated condition where the levels mostly over 4 mg/l ranging from 4.1 mg/l to 6.4 mg/l. The depths at all stations were over 3.0 m; the shallowest depth (3.0 m) at station N6 and the deepest (10 m) at station N4. For MPS, the results indicated that station N5 characterized by finer sediment gradient (0.11 – 0.18 mm). The coarser sediment gradients found at stations N4 (0.50 – 0.55 mm) and N6 (0.48 – 0.57 mm).
At South area, the minimum water temperature recorded in Winter was 19.5 ○C (average 19.7○C) and the maximum was 35.1○C recorded in Summer (average 34.4 ○C). In Summer, the average of salinity (55%) ND turbidity (10.6 NTU), were higher than averages obtained in Winter (salinity = 50%), (turbidity = 2.3 NTU) indicating that the Southern water mass in Summer seems to be more saline and characterized by less transparency water column. Generally, the pH readings tend to be more alkaline in Summer showing slight seasonal variations where the average in Summer was (8.2) and in Winter was (8.0). As observed in North area, the water mass in the South is also well oxygenated where the levels ranging from 5.4 mg/l to 6.1 mg/l. The shallowest depth was at station S4 ((1.2 – 1.4 m) and the deepest at station S3 (13.2 – 13.4 m). The MPS at stations S1, S2 and S3 indicated finer grain size of sediments in such locations in comparison with the other 3 locations (S4, S5 and S6) where the grain size average was ranged between 0.35 mm to 0.50 mm.
One-way factorial analysis of variance (ANOVA) was run on the in situ water analysis parameters to test whether there are significant differences between the Winter and Summer sets at each area (Table 3). The statistical analysis indicated that in situ water analysis showed significant differences (P < 0.05) between Summer and Winter readings except for salinity in the Northern area and dissolved oxygen in the Southern area.
Table 3: Significant (●) and Non Significant (○) Differences of in situ Water Analysis between Winter-Summer at Northern and Southern Stations
Parameters Temperature Salinity Turbidity pH DO
North ● ○ ● ● ●South ● ● ● ● ○
(2) In-faunaA shown in Figures (2 and 3), a total of 186 taxon represented by 5075 specimens were collected during the study period. The number of species and individuals collected at Northern area were higher than those collected at Southern area. The number of species collected in Summer (105) was higher than those collected in Winter (85) at Northern area; however no difference found in number of species between Winter (59) and Summer (58) at Southern area. The number of individuals collected in Summer (2237) was largely higher than Winter (959) for North area. Similarly, in the Southern area, the number of individuals collected in Summer (1298) considerably higher than those collected in Winter (581).
Figure 2: Number of In-fauna Species in the Northern and Southern Stations during Winter and Summer.
Figure 3: Number of In-fauna Individuals in the Northern and Southern Stations during Winter and Summer
The highest number of species in the Northern area was 55 collected from station N4 and the lowest was 24 at station N5 (Table 4). However, the
AGJSR 32 (1) 2014: 80-92 Thamer Salim Ali

86
highest number of species in the Southern area was 34 collected from station S6 and the lowest was 17 at stations S2 and S4 (Table 4). The maximum number of individuals collected from the Northern area was 602 at station N4 and the lowest was 80 at station N2. In the Southern area, the highest number of individuals was 396 collected from station S2 and the lowest was 55 from station S5. The number of taxon and individuals at all stations (except S4 and S5 for number of species) showed increasing pattern toward warm season.
Table 4. Number of Species and Number of Individuals of In-fauna in The Northern and Southern Stations During Winter (W) and Summer (S)
NorthernStations
No. Species
No. Indi-viduals Southern
Stations
No. Species
No. Indi-viduals
W S W S W S W S
N1 43 44 148 278 S1 29 30 110 299
N2 27 48 80 279 S2 17 30 62 396
N3 28 34 160 232 S3 21 22 60 85
N4 28 55 88 602 S4 18 17 124 166
N5 24 49 107 379 S5 29 22 55 256
N6 30 47 304 501 S6 28 34 149 160
(3) MDS AnalysisThe stations located within one contour in the MDS ordination at 50% similarity level represent no real difference between species composition. (3.1) Northern AreaThe MDS plot for Winter samples presented in the first plot in figure (4) showed four groups; three are represented by single station (N1, N2 and N6) and the fourth includes the other three stations (N3, N4 and N5). In Summer, the MDS ordination showed some differences in stations scattering in comparison with Winter plot. The results illustrate that the stations are categorized into three groups as shown in the second MDS plot in figure (4). The first represented by single location (N3), the second includes two locations (N1 and N2). However, the three other locations (N4, N5 and N6) are gathered into one contour. The third MDS plot in figure (4) represents the stations as overall for Winter and Summer sampling stations. No overlap noticed between Winter and Summer. The stations scattered with similar contours as in first and second MDS plots; i.e. seven groups can be identified.
Figure 4: MDS of In-fauna Species Composition at Northern Stations
Figure 5: MDS of In-fauna Species Composition at Southern Stations
(3.2) Southern AreaThe Winter samples as presented in the first MDS plot in (see fig, 5) can be divided into four groups. Two of
AGJSR 32 (1) 2014: 80-92 Thamer Salim Ali

87
them are represented by single station (S4 and S5); however each of the other two group comprised of two locations; the first represents S1 and S6 and the second represents S2 and S3. The MDS ordination for Summer sampling stations mostly differ from the Winter plot showing three groups. Two of them are represented by single location (S3 and S4), however the other four locations are clumped into one contour as shown in the second plot in figure (5). The combination of both Winter and Summer sampling locations has been analyzed in overall. The MDS analysis as illustrated in the third plot in figure (5) revealed that the Winter and Summer stations are clearly separated indicating that the in-fauna community in these two periods seem to characterized by different species composition. (3.3) Northern and Southern WatersThe MDS analyses run on the four in-fauna datasets; Winter and Summer for both Northern and Southern areas. The results illustrated in figure 6 showed three main groups. The first group on the left, represents the Northern stations sampled in Winter and Summer with marginal separation. The second group on the right represents the Southern stations sampled in Winter. The third group at the mid lower part of the plot represents Northern stations sampled in Summer. The SW4 contour in the upper right corner and SS3 contour separated from the third group represent in-fauna sample collected at high turbid water in these stations. Such results indicate that the in-fauna species composition spatially categorized into two main groups; Northern and Southern areas. On temporal variations, the species composition can be seasonally separated into Winter and Summer only in Southern area; however in Northern area marginal variations observed between Winter and Summer samples.
Figure 6: MDS of In-fauna Species Composition at Northern and Southern Stations during Winter and Summer
(3.4) BIO-ENV AnalysisThe relationships between in-fauna species composition and the environmental variables were investigated. The correlations calculated by BIO-ENV are given in figure 7. In the BIO-ENV analysis of the transformed matrix of 7 environmental parameters, the single abiotic factor which is highly associated with the in-fauna species distribution was the water depth in the Northern area for both Winter and Summer and in the South area for Summer period as well. Turbidity found as an influential factor regulating the in-fauna species composition for the overall data (combination of Winter and Summer) in the Northern area and also for Winter period of Southern area. The results indicated that temperature was the influential factor determine the in-fauna species abundance of the overall data (combination of Winter and Summer) in the Southern area, however salinity was the main limiting factor determine the spatial variations between the Northern and Southern in-fauna species composition.
The best correlations between the abiotic and biotic matrices are presented in Table 5. Following to the contribution of factors have highest correlation; depth accounted 76.1%, 61.6% and 100% of the best correlations for North Winter, North Summer and South Summer datasets, respectively. Turbidity accounted 88.9% of the best correlation for North (combination Winter and Summer) and 100% for South Winter. Temperature contributed to 89.3% of the best correlation for the overall data (combination Winter and Summer) of South area. Finally, salinity gradient controlled 98.8% of the best correlation for the spatial variation between North and South in-fauna species composition. Basing on 5% significance level, the temporal variations between Winter and Summer in-fauna species composition in both North and South areas showed significant correlation (P<0.05). Moreover, the spatial variation between North and South in-fauna datasets also showed significant correlation (P<0.05). However, for other cases within each area (North Winter, North Summer, South Winter and South Summer) have no significant correlations with the seven a biotic factors investigated.
AGJSR 32 (1) 2014: 80-92 Thamer Salim Ali

88
Figure 7: Correlations between Environmental Variables and In-fauna Species Composition Based on BIO-ENV Routine
Table 5: Influential A biotic Factors Determine In-fauna Species Abundance in the Northern and Southern StationArea and Periods Influential Parameters
(Highest r with single pa-rameter)
r Value Influential Parameters (Best correlations)
r Value
North (Winter) Depth 0.424 Temperature, DO & Depth 0.557North (Summer) Depth 0.165 Temperature& Depth 0.268
North (Winter & Summer) Turbidity 0.434Temperature, Turbidity, Do, Depth & MPS
0.488
South (Winter) Turbidity 0.677 Turbidity 0.677South (Summer) Depth 0.715 Depth 0.715South (Winter & Summer) Temperature 0.684 Temperature & Turbidity. 0.766North & South Salinity 0.479 Salinity & Depth 0.485
The best correlations between the abiotic and biotic matrices are presented in Table 5. Following to the contribution of factors have highest correlation; depth accounted 76.1%, 61.6% and 100% of the best correlations for North Winter, North Summer and South Summer datasets, respectively. Turbidity accounted 88.9% of the best correlation for North (combination Winter and Summer) and 100% for South Winter. Temperature contributed
to 89.3% of the best correlation for the overall data (combination Winter and Summer) of South area. Finally, salinity gradient controlled 98.8% of the best correlation for the spatial variation between North and South in-fauna species composition. Basing on 5% significance level, the temporal variations between Winter and Summer in-fauna species composition in both North and South areas showed significant correlation (P<0.05). Moreover,
AGJSR 32 (1) 2014: 80-92 Thamer Salim Ali
89
the spatial variation between North and South in-fauna datasets also showed significant correlation (P<0.05). However, for other cases within each area (North Winter, North Summer, South Winter and South Summer) have no significant correlations with the seven a biotic factors investigated.
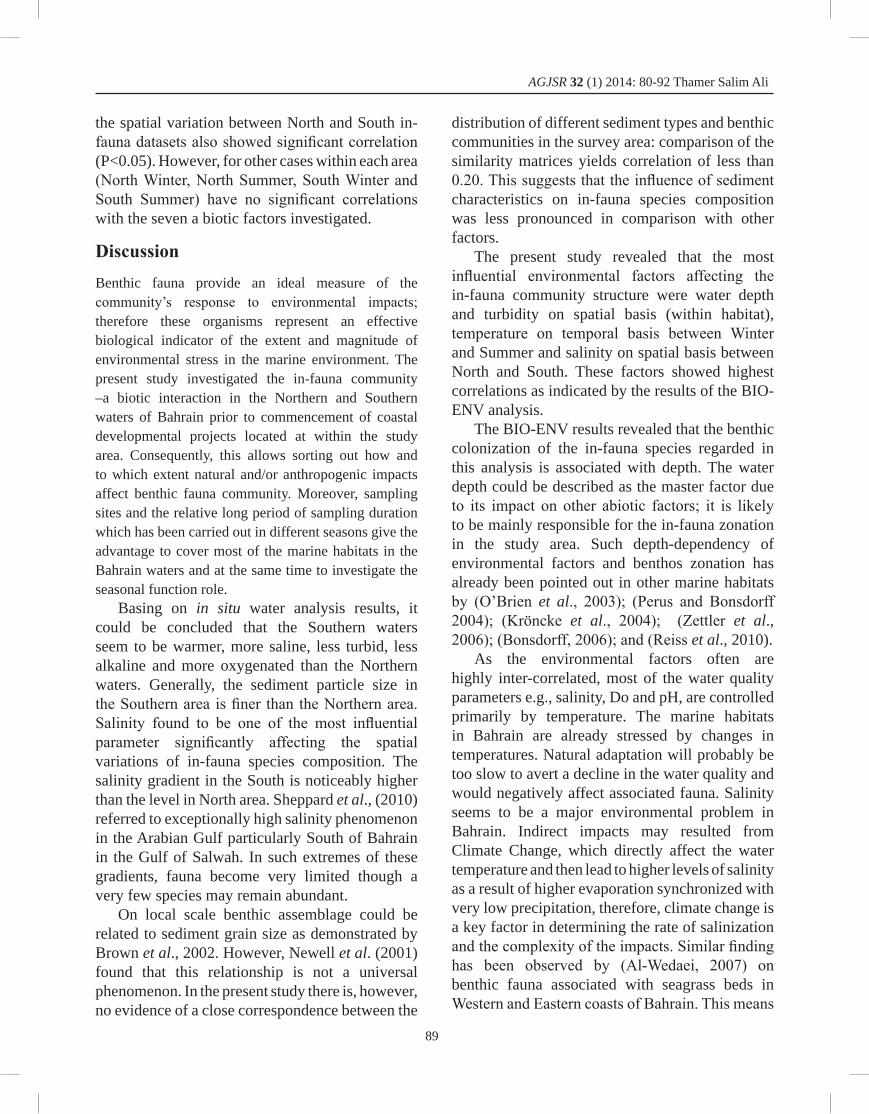
DiscussionBenthic fauna provide an ideal measure of the community’s response to environmental impacts; therefore these organisms represent an effective biological indicator of the extent and magnitude of environmental stress in the marine environment. The present study investigated the in-fauna community –a biotic interaction in the Northern and Southern waters of Bahrain prior to commencement of coastal developmental projects located at within the study area. Consequently, this allows sorting out how and to which extent natural and/or anthropogenic impacts affect benthic fauna community. Moreover, sampling sites and the relative long period of sampling duration which has been carried out in different seasons give the advantage to cover most of the marine habitats in the Bahrain waters and at the same time to investigate the seasonal function role.
Basing on in situ water analysis results, it could be concluded that the Southern waters seem to be warmer, more saline, less turbid, less alkaline and more oxygenated than the Northern waters. Generally, the sediment particle size in the Southern area is finer than the Northern area. Salinity found to be one of the most influential parameter significantly affecting the spatial variations of in-fauna species composition. The salinity gradient in the South is noticeably higher than the level in North area. Sheppard et al., (2010) referred to exceptionally high salinity phenomenon in the Arabian Gulf particularly South of Bahrain in the Gulf of Salwah. In such extremes of these gradients, fauna become very limited though a very few species may remain abundant.
On local scale benthic assemblage could be related to sediment grain size as demonstrated by Brown et al., 2002. However, Newell et al. (2001) found that this relationship is not a universal phenomenon. In the present study there is, however, no evidence of a close correspondence between the
distribution of different sediment types and benthic communities in the survey area: comparison of the similarity matrices yields correlation of less than 0.20. This suggests that the influence of sediment characteristics on in-fauna species composition was less pronounced in comparison with other factors.
The present study revealed that the most influential environmental factors affecting the in-fauna community structure were water depth and turbidity on spatial basis (within habitat), temperature on temporal basis between Winter and Summer and salinity on spatial basis between North and South. These factors showed highest correlations as indicated by the results of the BIO-ENV analysis.
The BIO-ENV results revealed that the benthic colonization of the in-fauna species regarded in this analysis is associated with depth. The water depth could be described as the master factor due to its impact on other abiotic factors; it is likely to be mainly responsible for the in-fauna zonation in the study area. Such depth-dependency of environmental factors and benthos zonation has already been pointed out in other marine habitats by (O’Brien et al., 2003); (Perus and Bonsdorff 2004); (Kröncke et al., 2004); (Zettler et al., 2006); (Bonsdorff, 2006); and (Reiss et al., 2010).
As the environmental factors often are highly inter-correlated, most of the water quality parameters e.g., salinity, Do and pH, are controlled primarily by temperature. The marine habitats in Bahrain are already stressed by changes in temperatures. Natural adaptation will probably be too slow to avert a decline in the water quality and would negatively affect associated fauna. Salinity seems to be a major environmental problem in Bahrain. Indirect impacts may resulted from Climate Change, which directly affect the water temperature and then lead to higher levels of salinity as a result of higher evaporation synchronized with very low precipitation, therefore, climate change is a key factor in determining the rate of salinization and the complexity of the impacts. Similar finding has been observed by (Al-Wedaei, 2007) on benthic fauna associated with seagrass beds in Western and Eastern coasts of Bahrain. This means
AGJSR 32 (1) 2014: 80-92 Thamer Salim Ali

90
that the abundant in-fauna species can be classified as stenohaline species, which make the apparent influence of salinity as a main predictor on the benthic assemblage becomes significant.
The present study provides a background on in-faunal community in the Northern and Southern waters of Bahrain that can be used to evaluate potential environmental impacts which could be resulted due to coastal and offshore developmental constructions. As a result of several coastal and offshore projects either constructed or under construction / planning phase, further investigations are required on in-fauna assemblages as a biological indicator to evaluate the impacts of dredging and infilling works on benthic community.
Acknowledgements The author wish to express his gratitude to the URS Corporation (Previously Scott Wilson Ltd.) / Bahrain office for the opportunity provided to undertake the present study, which is part of environmental impact assessment study for developmental projects designed and supervised by Bahrain office. Appreciation is extended to Mr. Craig Thackray (country manager URS Corp) for his support. Thanks are also due to Lauren van der Merwe (environmental specialist at URS Corp) for reading the MS.
References
Al-Alawi ZS (1982) Dredging and Reclamation Activities along Bahrain Coasts. Technical Circular No. 12. Directorate of Fisheries Bahrain, Manama, Kingdom of Bahrain.
Al-Wedaei KAH (2007) Ecology of Macrobenthic Fauna Associated with the Seagrass Beds Located on Western and Eastern Coasts of Bahrain. University of Bahrain, Manama, Kingdom of Bahrain. pp1-128. (Unpublished MSc Thesis).
Al-Zayani AK (2003) The Selection of Marine Protected Areas (MPAs): A Model for the Kingdom of Bahrain. Environmental Sciences, University of Southampton, UK, pp1- 268p. (Unpublished PhD Thesis).
Barros F; Underwood AJ; and Archambault P (2004) The Influence of Troughs and Crests of Ripple Marks on the Structure of Sub-tidal Benthic
Assemblages around Rocky Reefs. Estuarine Coastal and Shelf Science, 60 (4): 781-790.
Available at: http://www.sciencedirect.com/science/article/pii/S0272771404000034
Basson PW; Burchard JE; Hardy JT; and Price ARG (1977) Biotopes of the Western Arabian Gulf: Marine Life and Environments of Saudi Arabia. ARAMCO, Dhahran, Kingdom of Saudi Arabia.
Basson PW; Mohamed SA; and Arora DK (1989) A Survey of the Benthic Marine Algae in Bahrain. Botanica Marina, 32: 27-40.
Available at: http://www.degruyter.com/view/j/botm.1989.32.issue-
Bonsdorff E (2006) Zoobenthic Diversity Gradients in the Baltic Sea: Continuous Post Glacial Succession in a Stressed Ecosystem. Journal of Experimental Marine Biology and Ecology, 330 (1): 383-391.
Available at: http://www.sciencedirect.com/science/article/pii/S002209810500626X
Bremner J; Rogers SI; and Frid CLJ (2006) Matching Biological Traits to Environmental Conditions in Marine Benthic Ecosystems. Journal of Marine Systems, 60 (3/4): 302–316.
Available at: http://www.sciencedirect.com/science/article/pii/S0924796306000480
Brown CJ; Cooper KM; Meadows WJ; Limpenny DS; and Rees EIS (2002) Small Scale Mapping of Sea-bed Assemblages in the Eastern English Channel using Sidescan Sonar and Remote Sampling Techniques. Estuarine Coastal and Shelf Science, 54 (2): 263-278.
Available at: http://www.sciencedirect.com/science/article/pii/S0272771401908418
Clarke KR; and Ainsworth M (1993) A Method of Linking Multivariate Community Structure to Environmental Variables. Marine Ecology Progress Series, 92 (3): 205-219.
Available at: http://www.int-res.com/articles/meps/92/m092p205
Clarke KR; and Gorley RN (2006) PRIMER v6: User Manual / Tutorial. PRIMER- E Ltd, Plymouth Marine Laboratory, UK, pp1-190.
Clarke KR; and Warwick R (2001) Change in Marine Communities: An Approach to Statistical Analysis and Interpretation 2nd edition. PRIMER-E Ltd,
AGJSR 32 (1) 2014: 80-92 Thamer Salim Ali

91
Plymouth Marine Laboratory, UK. pp1-167. Available at: http://www.researchgate.net/
publication/221962838_Change_Geomatec (2006) Marine Environmental Geographic
Information System (MARGISII) Final Report Bahrain Geomatec. Bahrain Center for studies and research, Manama, Kingdom of Bahrain, pp1-72.
Hall JA; Raffaelli DG; and Thrush SF (1994) Patchiness and Disturbance in Shallow Water Benthic Assemblages. In: Giller P; Hildrew A; Raffaelli D. (eds.) Aquatic Ecology: Scale Pattern and Process. Blackwell Science Oxford, UK.
Available at: https://getinfo.de/app/Patchiness-and-disturbance-in-shallow-water-
Jacobson PT (2000) Evaluation of Multi-metric Bioassessment as an Approach for Assessing Impacts of Entrainment and Impingement under Section 316(b) of the Clean Water Act. Environmental Science and Policy, 3 (Sup. 1): S107-S115.
Available at: http://www.sciencedirect.com/science/article/pii/S1462901100000320
Jones DA Price ARG; and Hughes RN (1978) Ecology of the High Saline Lagoons Dawhat as Sayh Arabian Gulf Saudi Arabia. Estuarine Coastal Marine Science, 6 (3): 253-262.
Available at: http://www.adsabs.harvard.edu/abs/1978ECMS....6..253J
Kröncke I; Stoeck T; Wieking G; and Palojärvi A (2004) Relationship between Structural And Functional Aspects of Microbial and Macrofaunal Communities in Different Areas of the North Sea. Marine Ecology Progress Series, 282 (1): 13–31.
Available at: http://www.int-res.com/articles/meps2004/282/m282p013.pdf
Madany IM; Ali SM; and Akhter MS (1988) A Review of Dredging and Land Reclamation activities in bahran. in: proccedings of the regional organization for the protection of the Marine Environment ROPME Workshop on Coastal Area Development. UNEP Regional Seas Reports and Studies No. 90, ROPME Publication No. GC-5/006, UNEP & ROPME , pp 199-214.
Available at: http://www.unep.org/regionalsea s/publications/reports/.pdf
Madany IM; Mohamed AA; and Anwar SEA
(1991) Coastal Zone Management in Bahrain: An Analysis of Social Economic and Environmental Impacts of Dredging and Reclamation. Journal of Environmental Management, 32 (4):335-348.
Available at: http://www.sciencedirect.com/science/article/pii/S0301479705800702
Monniot C; and Monniot F (1997) Records of Ascidians from Bahrain Arabian Gulf with Three New Species. Journal of Natural History, 31 (11): 1623-1643.
Available at: http://www.tandfonline.com/doi/abs/10.1080/00222939700770871
Newell RC; Seiderer LJ; and Hitchcock DR (1998) The Impact of Dredging Works in Coastal Waters: A Review of the Sensitivity to Disturbance and Subsequent Recovery of Biological Resources on the Sea Bed. In: Ansell AD; Gibson RN, and Barnes M (eds), Oceanography and Marine Biology: An Annual Review, vol.36, 1st ed., Universty College London UCL Press Limited, London. UK . p 127-178.
Available at: http://books.google.com.bh/books?id=7i7PbS8Q_QoC&pg=PP1&lpg=
Newell RC; Seiderer LJ; and Robinson JE (2001) Animal: Sediment Relationships in Coastal Deposits of the Eastern English Channel. Journal of the Marine Biological Association of the UK, 81 (1): 1-9.
Available at: http://journals.cambridge.org/action/displayAbstract?fromPage=
O’Brien K; Hänninen J; Kanerva T; Metsärinne L; and Vuorinen I (2003) Macrobenthic Zonation in Relation to Major Environmental Factors Across the Archipelago Sea Northern Baltic Sea. Boreal Environment Research, 8 (23): 159–170.
Available at: http://www.researchgate.net/publication/228908599_Macrozoobenthic_
Pavlikakis GE and Tsihrintzis VA (2000) Ecosystem management: A Review of A New Concept and Methodology. Water Resources Management, 14 (4): 257-283.
Available at: http://www.link.springer.com/article/10.1023/A%3A1008139011867
Perus J; and Bonsdorff E (2004) LongTerm Changes in Macrozoobenthos in the Aaland Archipelago Northern Baltic Sea. Journal of Sea Research, 52 (1): 45–56.
AGJSR 32 (1) 2014: 80-92 Thamer Salim Ali

92
Price A; and Vousden DH (1985) An Ecological Study of Sites on the Coast of Bahrain. UNEP & Regional Seas Reports and Studies RSRS No. 72, UNEP& RSRS, pp1-13.
Available at: http://www.unep.org/regionalsea s/publications/reports/.pdf
Rees HL; Pendle MA; Waldock R; Limpenny DS; and Boyd SE (1999) A Comparison of Benthic Biodiversity in the North Sea English Channel and Celtic Seas. ICES Journal of Marine Science 56 (2): 228–246.
Available at: http://www.icesjms.oxfordjourna ls.org/content/56/2/228.full.pdf
Reish DJ (1972) The Use of Marine Invertebrates as Indicators of Varying Degree of Marine Pollution. In: Ruiver M (ed), Marine Pollution and Sea Life, Fish News Books, London, UK, pp 203-207.
Available at: http://www.cityu.edu.hk/ap/nru/pub_j166.pdf
Reiss H; Degraer S; Duineveld GCA; Kroncke I; Aldridge J; Craeymeersch JA; Eggleton JD; Hillewaert H; Lavaleye MSS; Moll A; Pohlmann T; Rachor E; Robertson M; Berghe EV; Hoey GV; and Rees HL (2010) Spatial Patterns of In-fauna Epifauna and Demersal Fish Communities in the North Sea. ICES Journal of Marine Science 67 (2): 278–293.
Available at: http://www.web.b.ebscohost.com/ehost/detail?sid=dcca841b-e7d8-
Available at: http://www.icesjms.oxfordjournals.org/content/67/2/278.abstract
Sanvicente-Anorve L; Lepretre A; and Davoult D (2002) Diversity of Benthic Macrofauna in the Eastern English Channel: Comparison among and within Communities. Biodiversity and Conservation, 11 (2): 265-282.
Available at: http://link.springer.com/article/10Sheppard C; Al-Husiani M; Al-Jamali F; Al-
Yamani F; Baldwin R; Bishop J; Benzoni F; Dutrieux E; Dulvy NK; Durvasula SRV; Jones DA; Loughland R; Medio D; Nithyanandan M; Pillingm GM; Polikarpov I; Price ARG; Purkis S; Riegl B; Saburova M; Namin KS; Taylor O; Wilson S; and Zainal K (2010) The Gulf: A young Sea in Decline. Marine Pollution Bulletin 60 (1):13–38.
Available at: http://www.sciencedirect.com/scien
ce/article/pii/S0025326X09004585Sims R; and Zainal AJM (2000) Marine Environment
Geographic Information System (MARGIS). Bahrain Centre for Studies and Researches, Manama, Kingdom of Bahrain.
Thrush SF; Hewitt JE; Funnell G; Cummings VJ; Ellis JI; Schultz D; Talley D; and Norkko A (2001) Fishing Disturbance and Marine Biodiversity: The Role of Habitat Structure in Simple Soft Sediment Systems. Marine Ecology Progress Series, 221: 255–264.
Available at: http://www.int-res.com/articles/meps/221/m221p255-264.pdf
UNEP (1985) An Ecological Study of Sites on the Coast of Bahrain. UNEP Regional Seas Reports and Studies No. 72. Prepared in cooperation with IUCN and ROPME Nairobi, Kenya, pp1-13.
Available at: http://www.unep.org/regionalseas/publications/reports/.pdf
Vousden DH (1995) Bahrain Marine Habitats and some Environmental Effects on Seagrass Beds : A Study of the Marine Habitats of Bahrain with Particular Reference to the Effects of Water Temperature, Depth and Salinity on Seagrass Biomass and Distribution. University of Wales Bangor UK. (Unpublished PhD Thesis).
Available at: http://www.ethos.bl.uk/OrderDetails.do?uin=uk.bl.ethos.364124
Vousden DH (1988) The Bahrain Marine Habitat Survey. A Study of the Marine Habitats in the Waters of Bahrain and their Relationship to Physical Chemical Biological and Anthropogenic Influences. Volume 2 The Habitat Maps: the Distribution of Intertidal and Sub-tidal Habitat Types around Bahrain Including Areas of Scientific and Commercial Importance and Areas Recommended for Protection Conservation and Management. Environmental Protection Technical Secretariat, Manama, Kingdom of Bahrain.
Vousden DH (1985) The Bahrain Marine Habitat Survey. vol. I, the Technical Report. Environmental Protection Technical Secretariat, Manama, Kingdom of Bahrain.
Zettler ML; Röhner M; and Frankowski J (2006) Long Term Changes of Macrozoobenthos in the Arkona Basin (Baltic Sea). Boreal Environment Research, 11 (4): 247–260.
AGJSR 32 (1) 2014: 80-92 Thamer Salim Ali
Copyright © 2022 FDOKUMEN