Lecture 2: RADAR Remote Sensing - Basics
58
Lecture 2: RADAR Remote Sensing - Basics
-
Upload
khangminh22 -
Category
Documents
-
view
3 -
download
0
Transcript of Lecture 2: RADAR Remote Sensing - Basics
Lecture 2:RADAR Remote Sensing - Basics

Electromagnetic Spectrum
Image source: earthguide.ucsd.edu/eoc/special_topics/teach/sp_climate_change/p_emspectrum.html
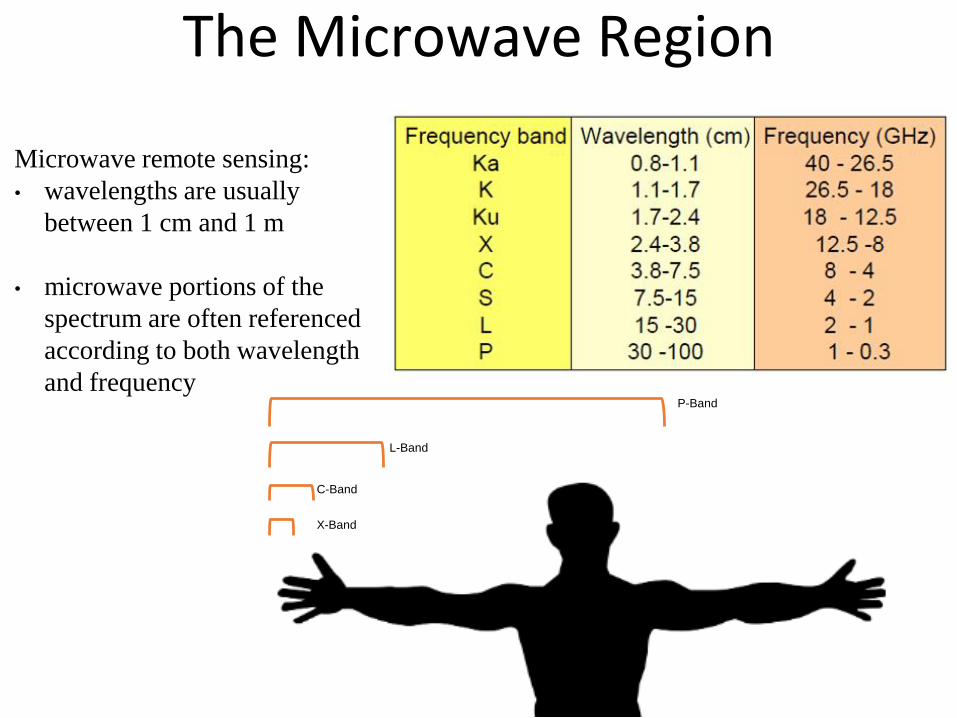
The Microwave Region
Microwave remote sensing:
• wavelengths are usually
between 1 cm and 1 m
• microwave portions of the
spectrum are often referenced
according to both wavelength
and frequencyP-Band
C-Band
L-Band
X-Band
RADAR Trivia (1)
Frequency bands in the microwave range of the electromagnetic spectrum are designated by letters.
What is the origin of this convention?
RADAR Trivia (1)
This convention began in World
War II. Radar bands were given
code words so that military
engineers could talk about them
without divulging their actual
frequency.
They were deliberately non-
sequential in order to confuse the
enemy!
Information source: www.nasa.gov/directorates/heo/scan/communications/outreach/funfacts/txt_band_designators.html
RADAR Trivia (2)Clinton is a small farming town located in southwestern Ontario.
Canadian Forces Base Clinton (CFB Clinton) played a special role during WWII with respect to radar?
Why is CFB Clinton an important part of Canadian radar history?
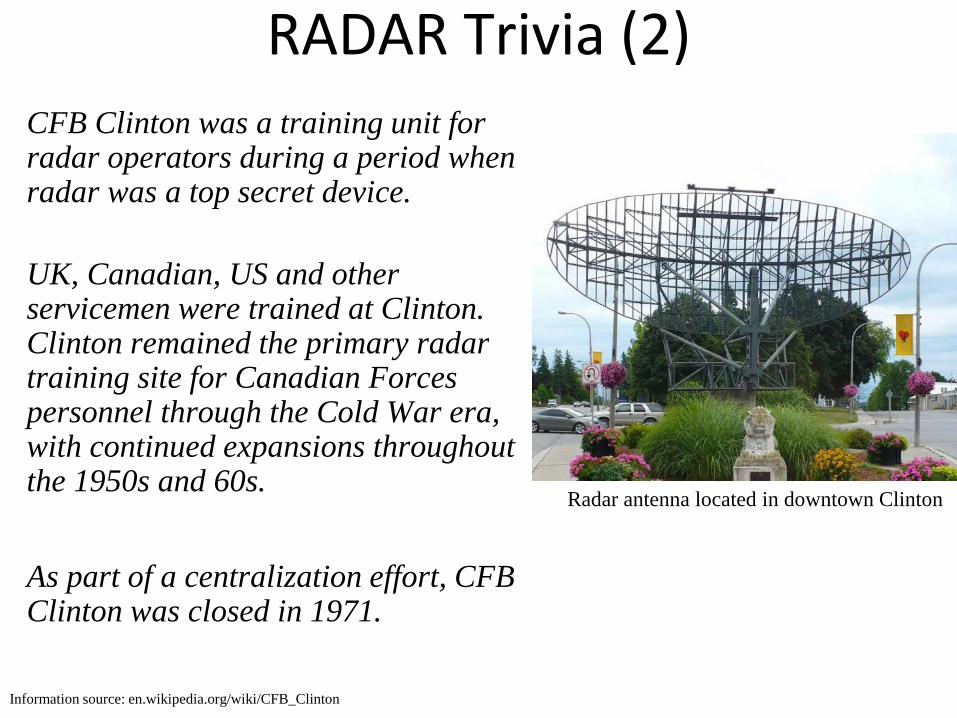
RADAR Trivia (2)CFB Clinton was a training unit for radar operators during a period when radar was a top secret device.
UK, Canadian, US and other servicemen were trained at Clinton. Clinton remained the primary radar training site for Canadian Forces personnel through the Cold War era, with continued expansions throughout the 1950s and 60s.
As part of a centralization effort, CFB Clinton was closed in 1971.
Radar antenna located in downtown Clinton
Information source: en.wikipedia.org/wiki/CFB_Clinton
RADAR Trivia (3)
RADAR is actually an acronym. Deciphering this
acronym reveals the two very important primary roles of
RADAR.
Can you unravel the acronym and the secret of RADAR?
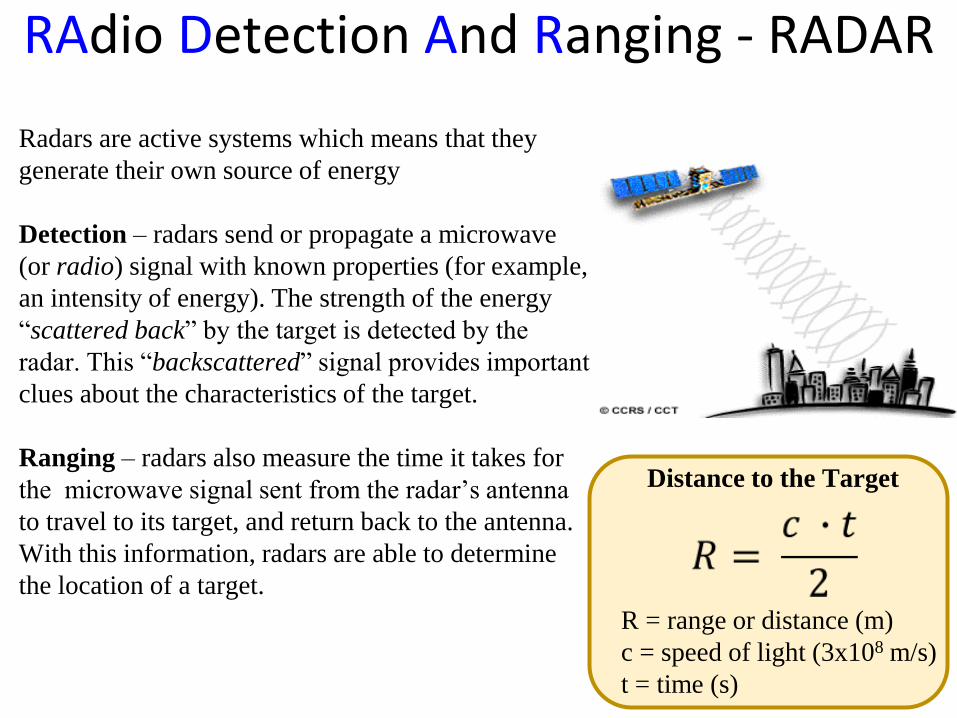
Radars are active systems which means that they
generate their own source of energy
Detection – radars send or propagate a microwave
(or radio) signal with known properties (for example,
an intensity of energy). The strength of the energy
“scattered back” by the target is detected by the
radar. This “backscattered” signal provides important
clues about the characteristics of the target.
Ranging – radars also measure the time it takes for
the microwave signal sent from the radar’s antenna
to travel to its target, and return back to the antenna.
With this information, radars are able to determine
the location of a target.
R = range or distance (m)
c = speed of light (3x10⁸ m/s)
t = time (s)
Distance to the Target
RAdio Detection And Ranging - RADAR
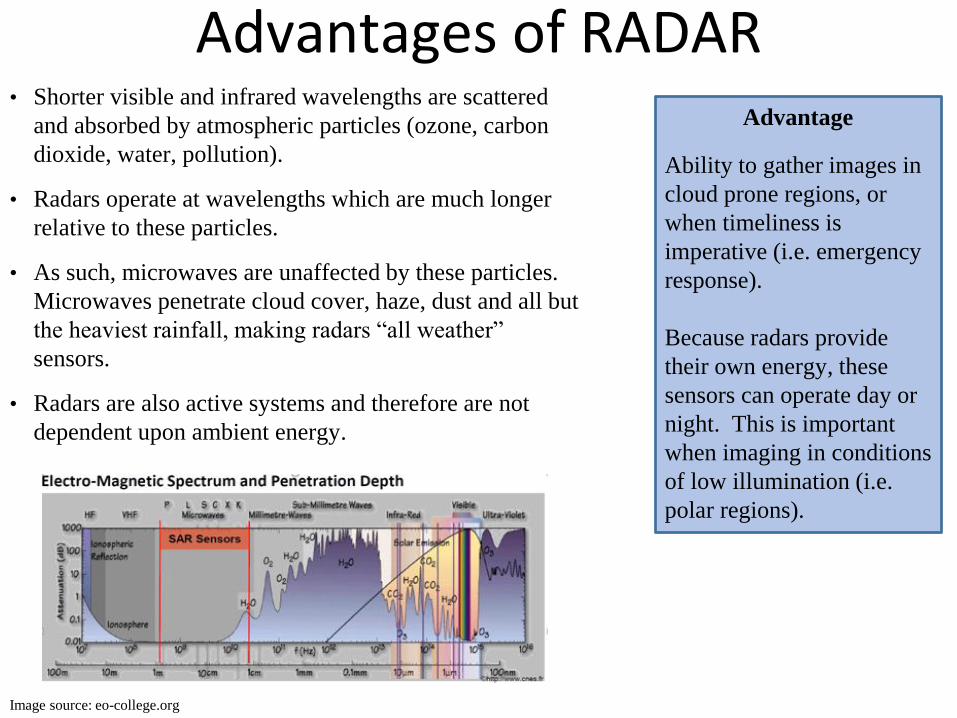
Advantages of RADAR• Shorter visible and infrared wavelengths are scattered
and absorbed by atmospheric particles (ozone, carbon
dioxide, water, pollution).
• Radars operate at wavelengths which are much longer
relative to these particles.
• As such, microwaves are unaffected by these particles.
Microwaves penetrate cloud cover, haze, dust and all but
the heaviest rainfall, making radars “all weather”
sensors.
• Radars are also active systems and therefore are not
dependent upon ambient energy.
Advantage
Ability to gather images in
cloud prone regions, or
when timeliness is
imperative (i.e. emergency
response).
Because radars provide
their own energy, these
sensors can operate day or
night. This is important
when imaging in conditions
of low illumination (i.e.
polar regions).
Image source: eo-college.org
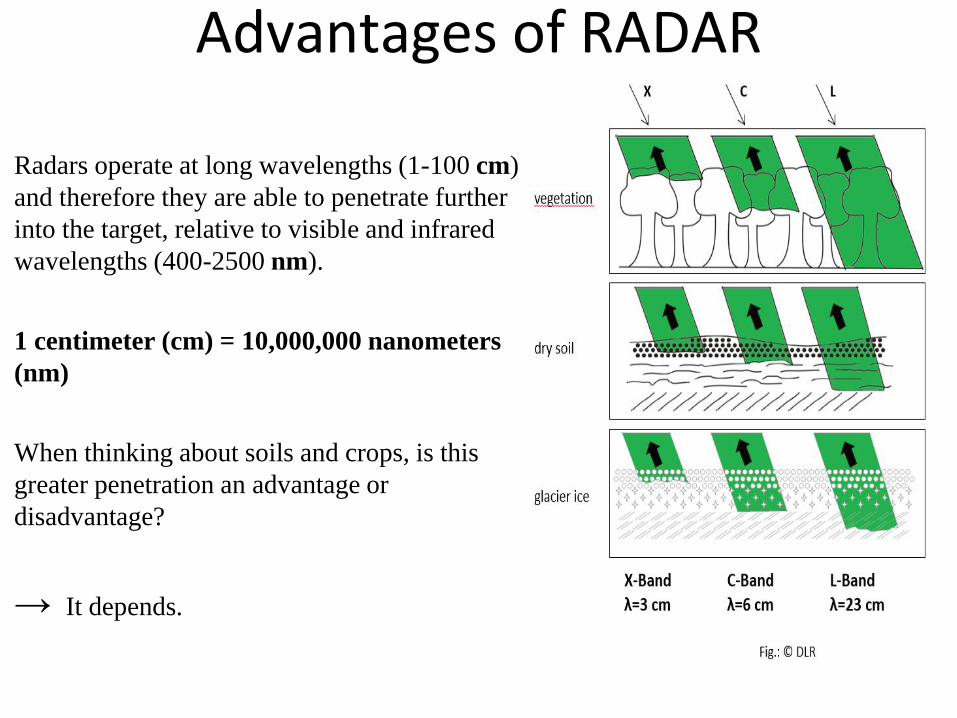
Advantages of RADAR
Radars operate at long wavelengths (1-100 cm)
and therefore they are able to penetrate further
into the target, relative to visible and infrared
wavelengths (400-2500 nm).
1 centimeter (cm) = 10,000,000 nanometers
(nm)
When thinking about soils and crops, is this
greater penetration an advantage or
disadvantage?
→ It depends.
What Defines a SAR?
• Frequency
• Polarization
• Incidence angle
How the signal propagates
What it measures: intensity and phase
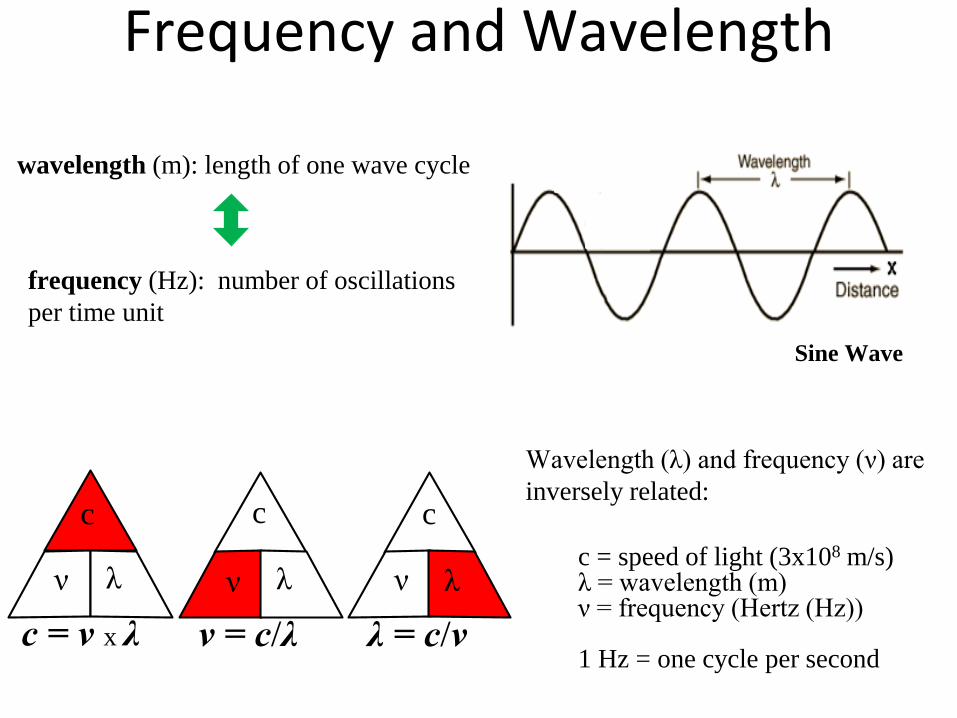
Frequency and Wavelength
Wavelength (λ) and frequency (ν) are
inversely related:
c = speed of light (3x10⁸ m/s)λ = wavelength (m)ν = frequency (Hertz (Hz))
1 Hz = one cycle per second
wavelength (m): length of one wave cycle
frequency (Hz): number of oscillations
per time unit
Sine Wave
ν
c
λ
c = ν x λ
ν
c
λ
ν = c/λ
ν
c
λ
λ = c/ν
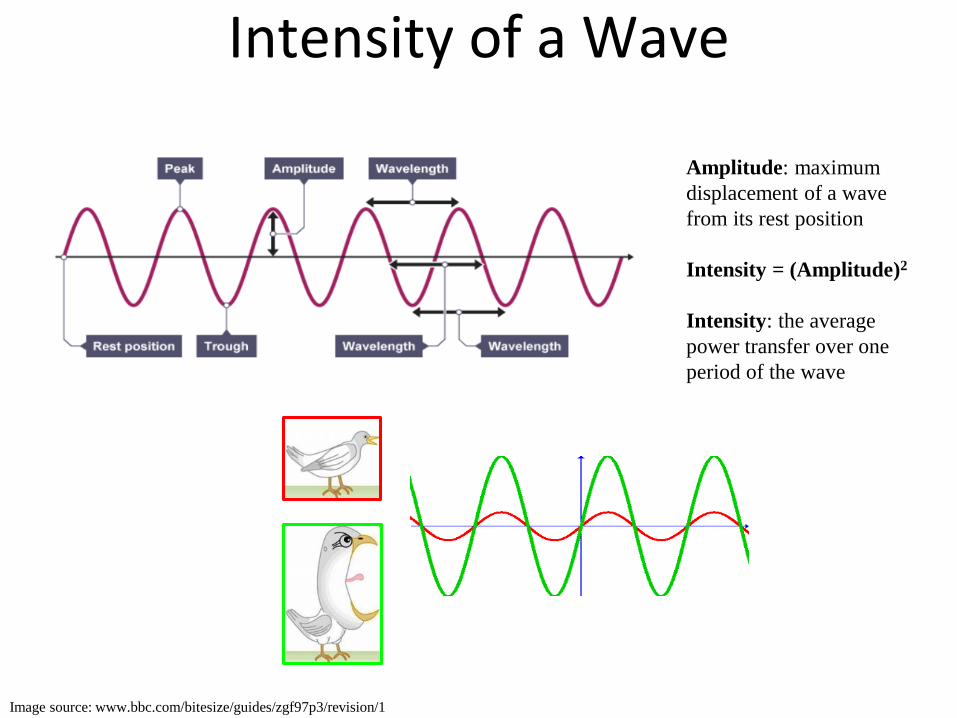
Intensity of a Wave
Amplitude: maximum
displacement of a wave
from its rest position
Intensity = (Amplitude)2
Intensity: the average
power transfer over one
period of the wave
Image source: www.bbc.com/bitesize/guides/zgf97p3/revision/1
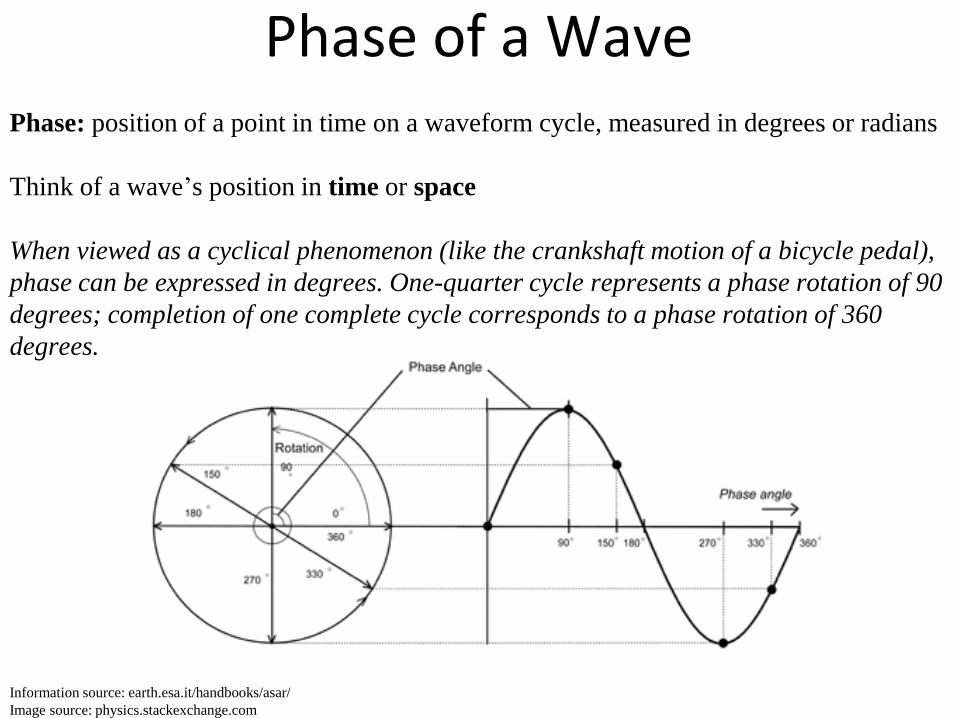
Phase of a Wave Phase: position of a point in time on a waveform cycle, measured in degrees or radians
Think of a wave’s position in time or space
When viewed as a cyclical phenomenon (like the crankshaft motion of a bicycle pedal),
phase can be expressed in degrees. One-quarter cycle represents a phase rotation of 90
degrees; completion of one complete cycle corresponds to a phase rotation of 360
degrees.
Information source: earth.esa.it/handbooks/asar/
Image source: physics.stackexchange.com
Why is this important?
• precise knowledge of phase properties in radar
signal data is a key element in interferometric as
well as in polarimetric SAR
• measured phase difference tells us something
about the structure of the target
• during wave generation, phase offsets determine
how a wave propagates
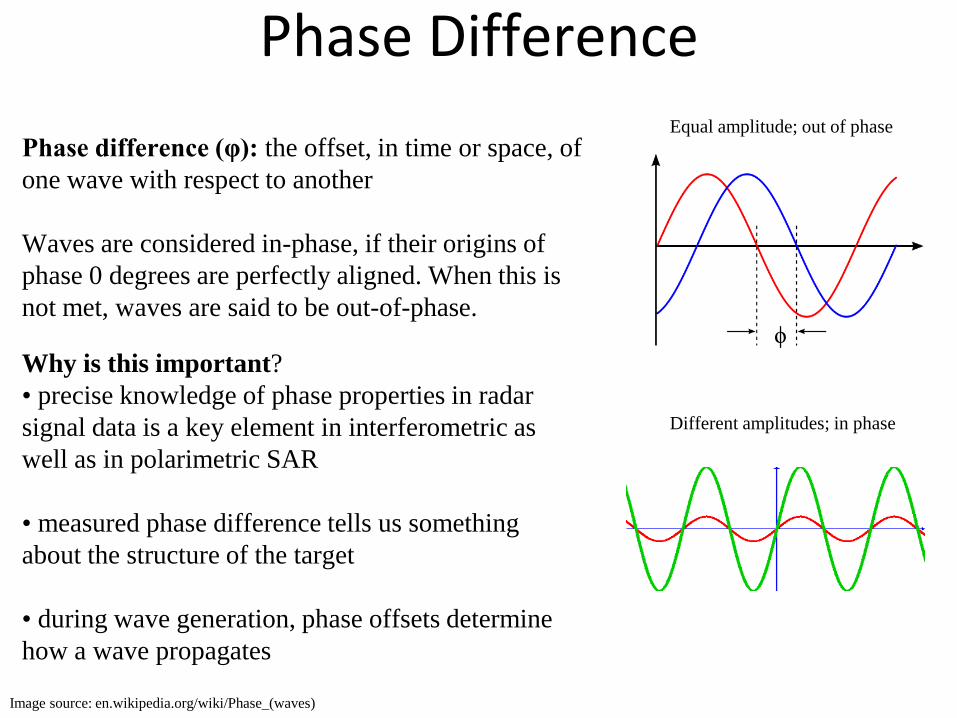
Phase Difference
Phase difference (φ): the offset, in time or space, of
one wave with respect to another
Waves are considered in-phase, if their origins of
phase 0 degrees are perfectly aligned. When this is
not met, waves are said to be out-of-phase. ϕ
Image source: en.wikipedia.org/wiki/Phase_(waves)
Equal amplitude; out of phase
Different amplitudes; in phase
17
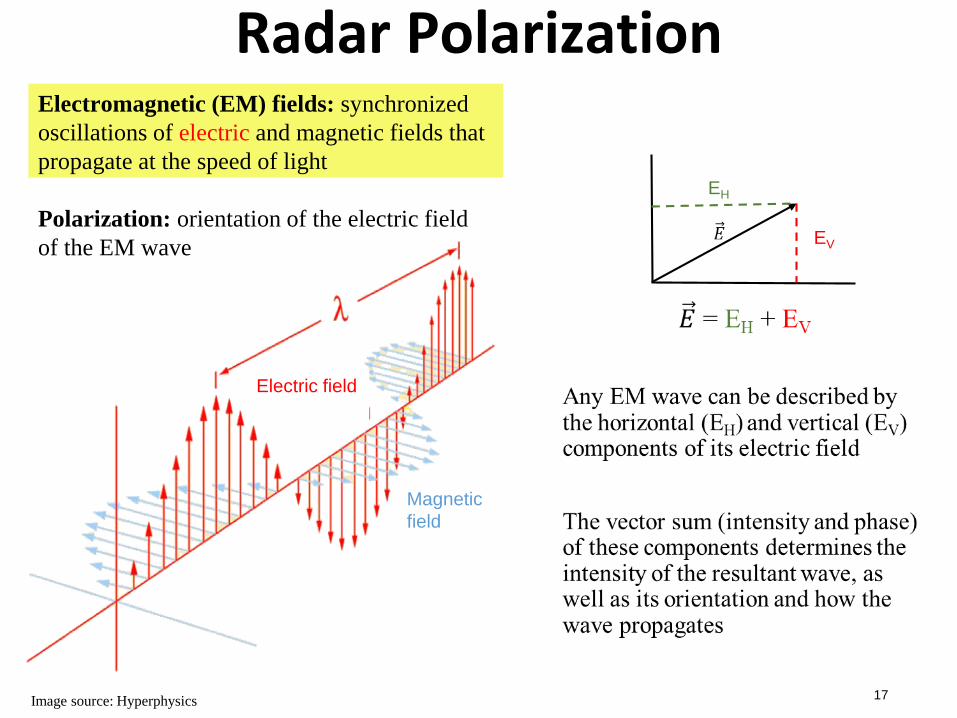
Electromagnetic (EM) fields: synchronized
oscillations of electric and magnetic fields that
propagate at the speed of light
Polarization: orientation of the electric field
of the EM wave
Radar Polarization
Image source: Hyperphysics
Electric field
Magnetic
field
EH
EV

Propa-What?
Propagation: Any of the ways in which a wave travels
Transverse waves: when the E and H field vectors are in a direction perpendicular to (or transverse to) the direction of wave propagation
Electromagnetic (EM) waves: synchronized oscillations of electric and
magnetic fields that propagate at the speed of light
Direction of propagation
How do Waves Propagate?
It’s all about phase offset!
• Linear (most commonly used by SAR sensors)
• Circular (available on some new SAR sensors)
• Elliptical (actually, the most common way that waves propagate)
• Visualize how the tip of the E vector moves – in a plane or does it rotate as it propagates
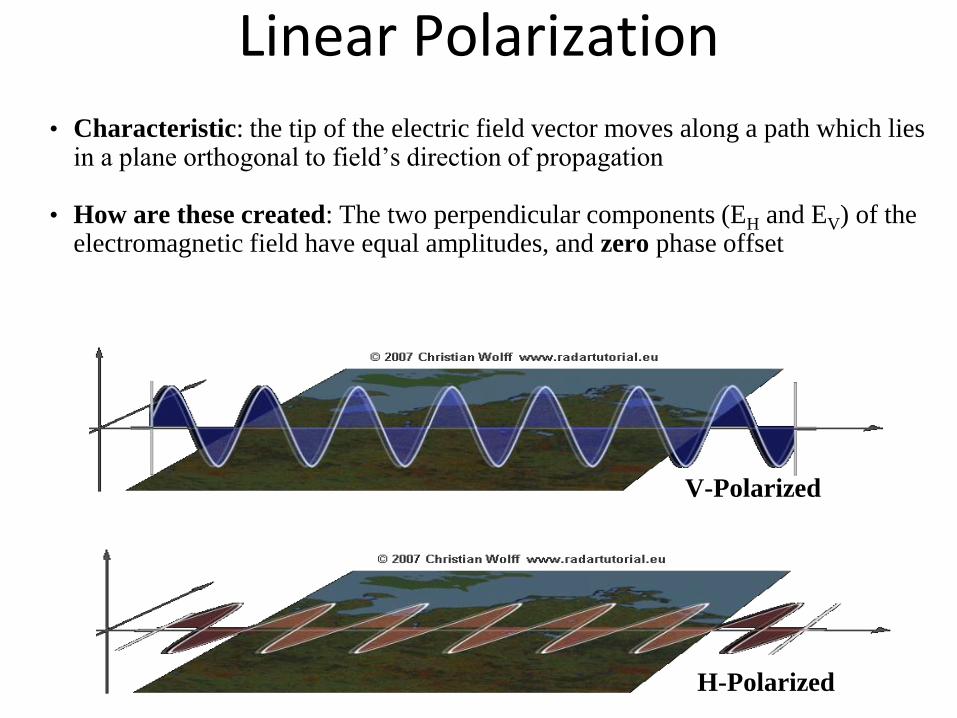
Linear Polarization
• Characteristic: the tip of the electric field vector moves along a path which lies in a plane orthogonal to field’s direction of propagation
• How are these created: The two perpendicular components (EH and EV) of the electromagnetic field have equal amplitudes, and zero phase offset
V-Polarized
H-Polarized
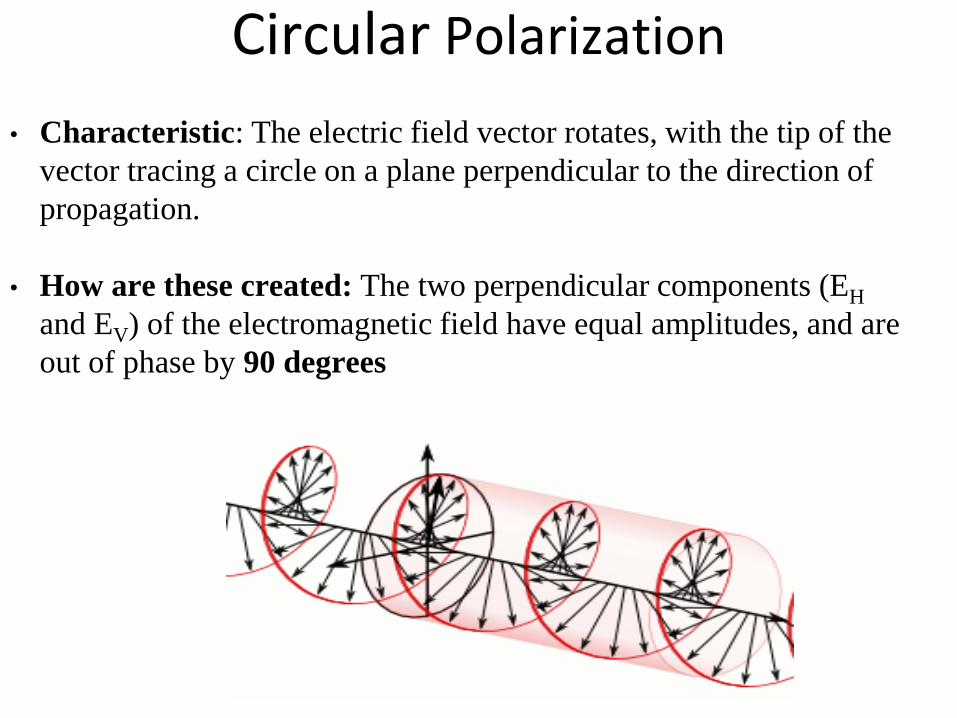
Circular Polarization
• Characteristic: The electric field vector rotates, with the tip of the
vector tracing a circle on a plane perpendicular to the direction of
propagation.
• How are these created: The two perpendicular components (EH
and EV) of the electromagnetic field have equal amplitudes, and are
out of phase by 90 degrees
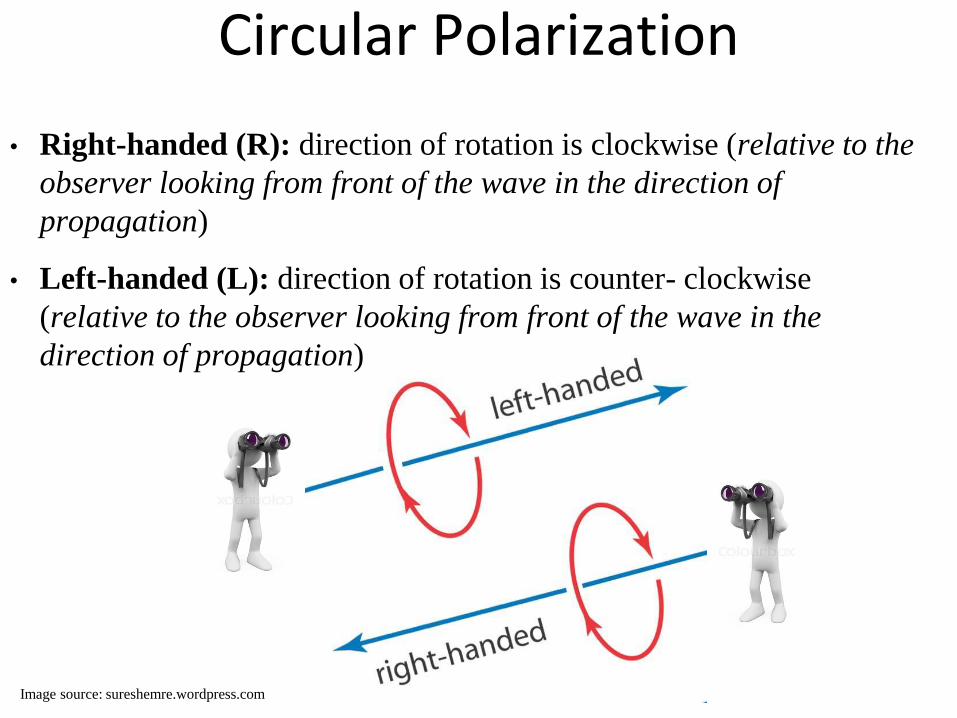
Circular Polarization
• Right-handed (R): direction of rotation is clockwise (relative to the
observer looking from front of the wave in the direction of
propagation)
• Left-handed (L): direction of rotation is counter- clockwise
(relative to the observer looking from front of the wave in the
direction of propagation)
Image source: sureshemre.wordpress.com
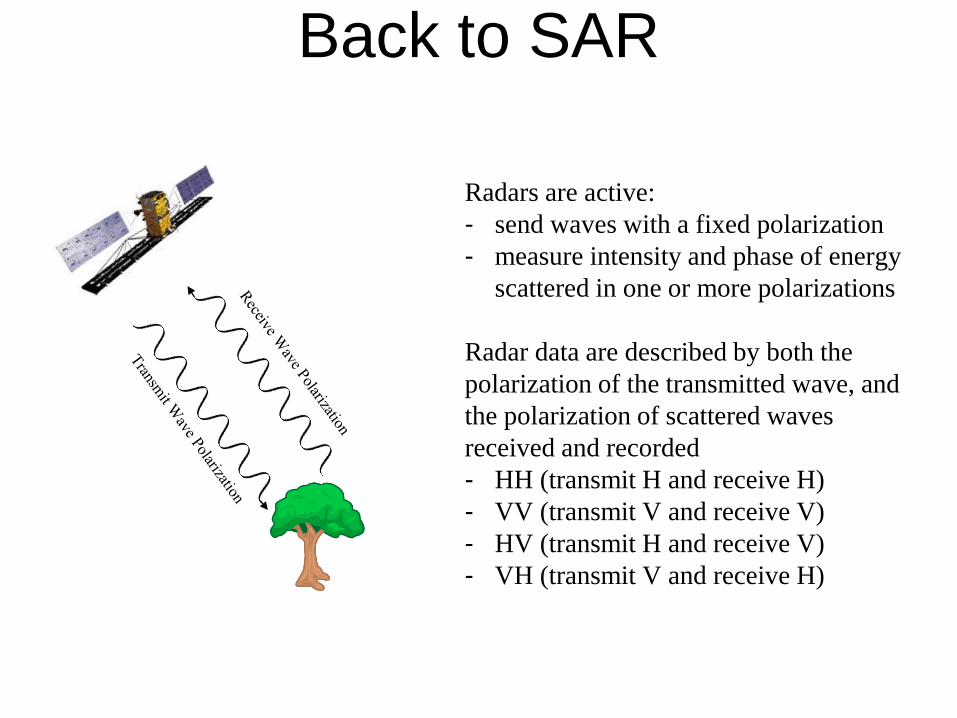
Back to SAR
Radars are active:
- send waves with a fixed polarization
- measure intensity and phase of energy
scattered in one or more polarizations
Radar data are described by both the
polarization of the transmitted wave, and
the polarization of scattered waves
received and recorded
- HH (transmit H and receive H)
- VV (transmit V and receive V)
- HV (transmit H and receive V)
- VH (transmit V and receive H)
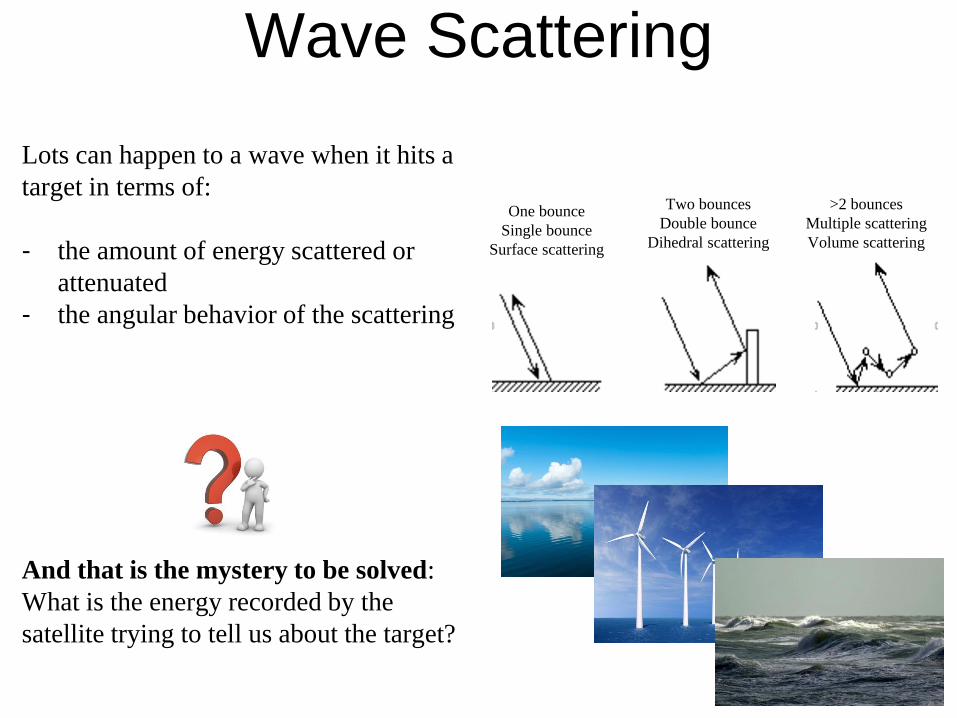
Wave Scattering
Lots can happen to a wave when it hits a
target in terms of:
- the amount of energy scattered or
attenuated
- the angular behavior of the scattering
And that is the mystery to be solved:
What is the energy recorded by the
satellite trying to tell us about the target?
One bounce
Single bounce
Surface scattering
Two bounces
Double bounce
Dihedral scattering
>2 bounces
Multiple scattering
Volume scattering
Radar Geometry
• Azimuth versus range
• Slant versus ground range
• Real Aperture Radar versus Synthetic Aperture Radar
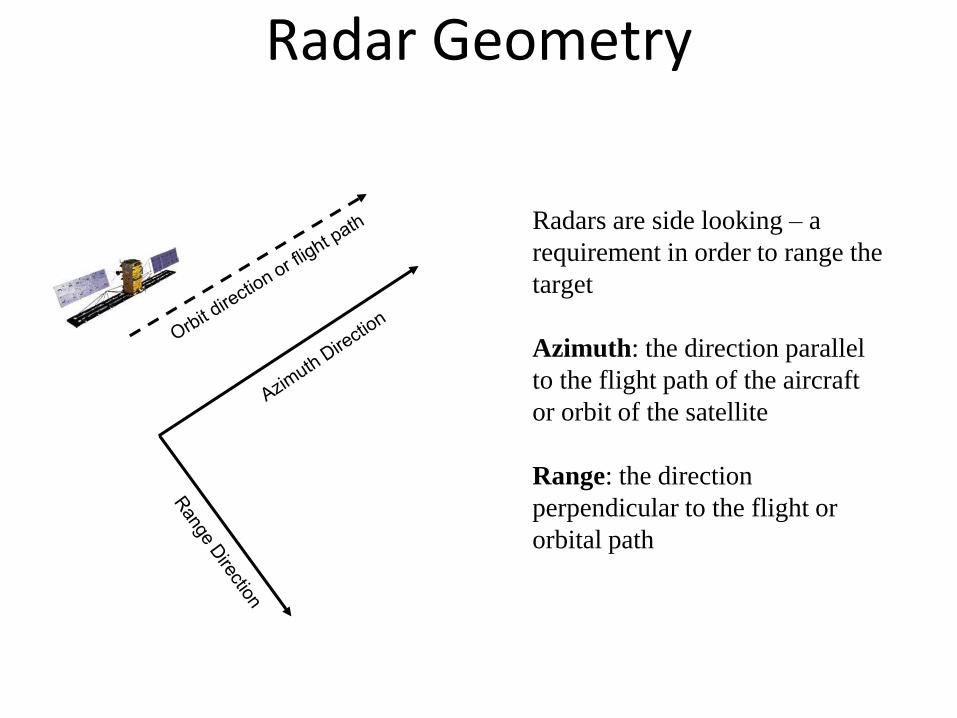
Radar Geometry
Radars are side looking – a
requirement in order to range the
target
Azimuth: the direction parallel
to the flight path of the aircraft
or orbit of the satellite
Range: the direction
perpendicular to the flight or
orbital path
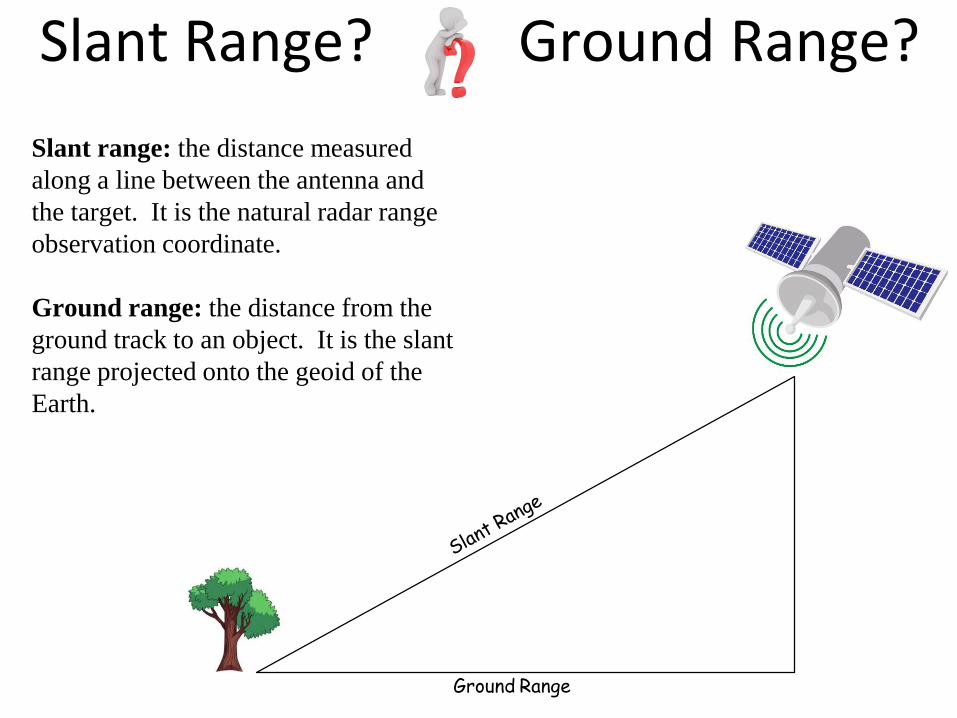
Slant Range? Ground Range?
Slant range: the distance measured
along a line between the antenna and
the target. It is the natural radar range
observation coordinate.
Ground range: the distance from the
ground track to an object. It is the slant
range projected onto the geoid of the
Earth.
Ground Range
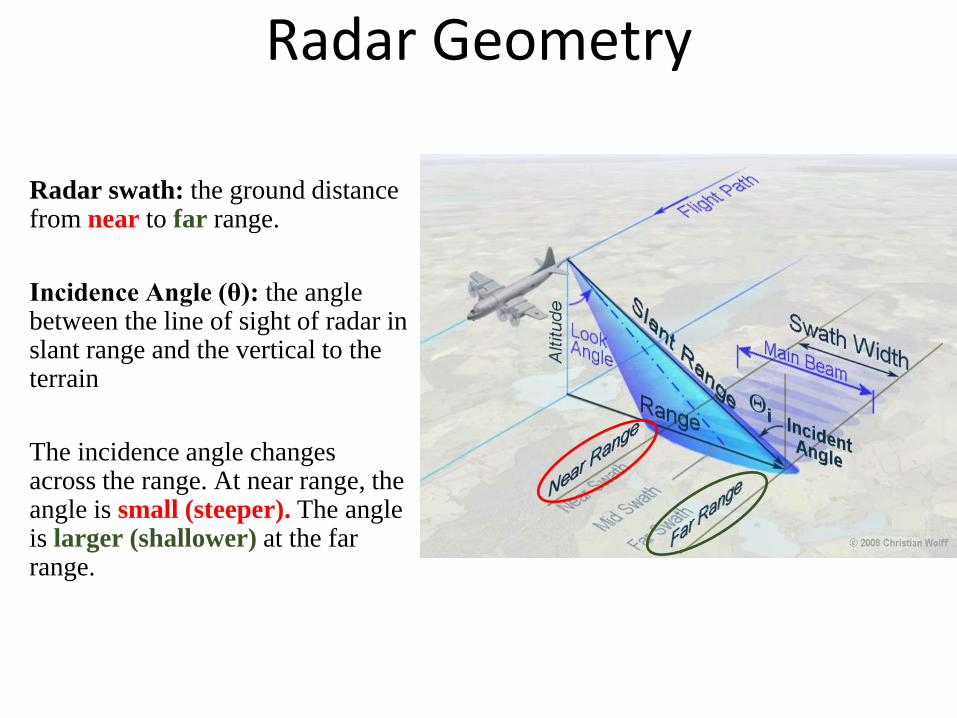
Radar swath: the ground distance from near to far range.
Incidence Angle (θ): the angle between the line of sight of radar in slant range and the vertical to the terrain
The incidence angle changes across the range. At near range, the angle is small (steeper). The angle is larger (shallower) at the far range.
Radar Geometry
Radar Geometry
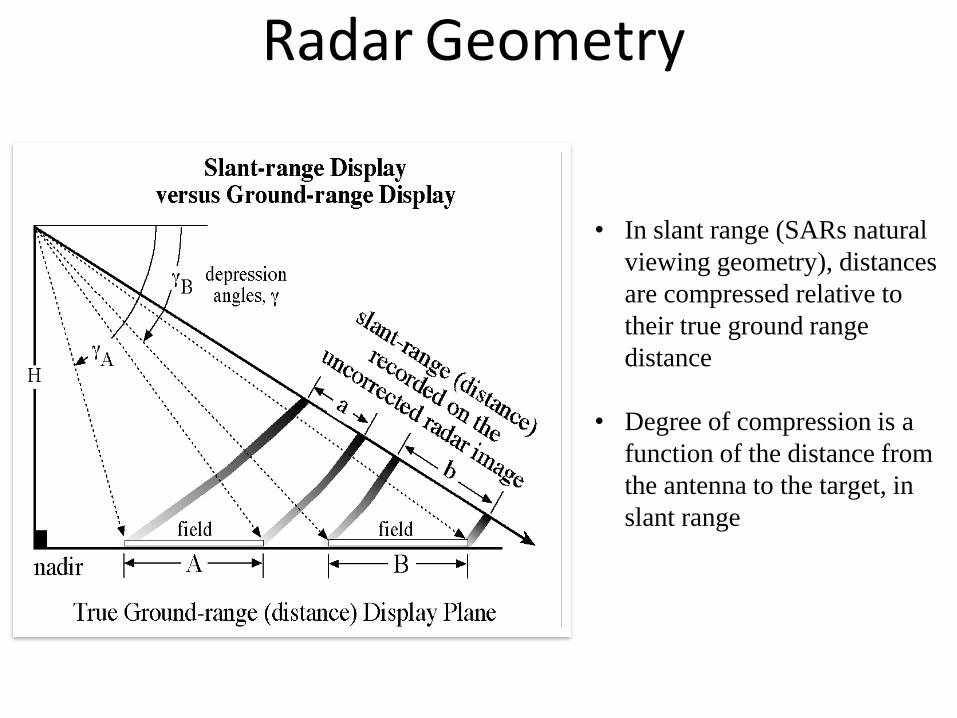
• In slant range (SARs natural
viewing geometry), distances
are compressed relative to
their true ground range
distance
• Degree of compression is a
function of the distance from
the antenna to the target, in
slant range
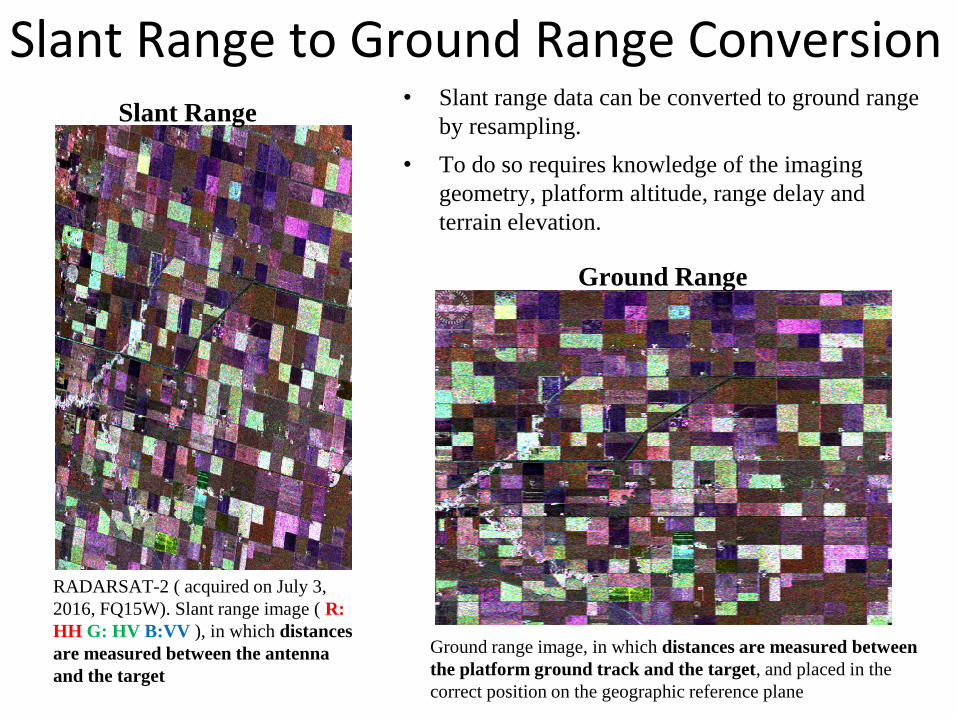
Ground range image, in which distances are measured between
the platform ground track and the target, and placed in the
correct position on the geographic reference plane
Slant Range to Ground Range Conversion• Slant range data can be converted to ground range
by resampling.
• To do so requires knowledge of the imaging
geometry, platform altitude, range delay and
terrain elevation.
RADARSAT-2 ( acquired on July 3,
2016, FQ15W). Slant range image ( R:
HH G: HV B:VV ), in which distances
are measured between the antenna
and the target
Slant Range
Ground Range
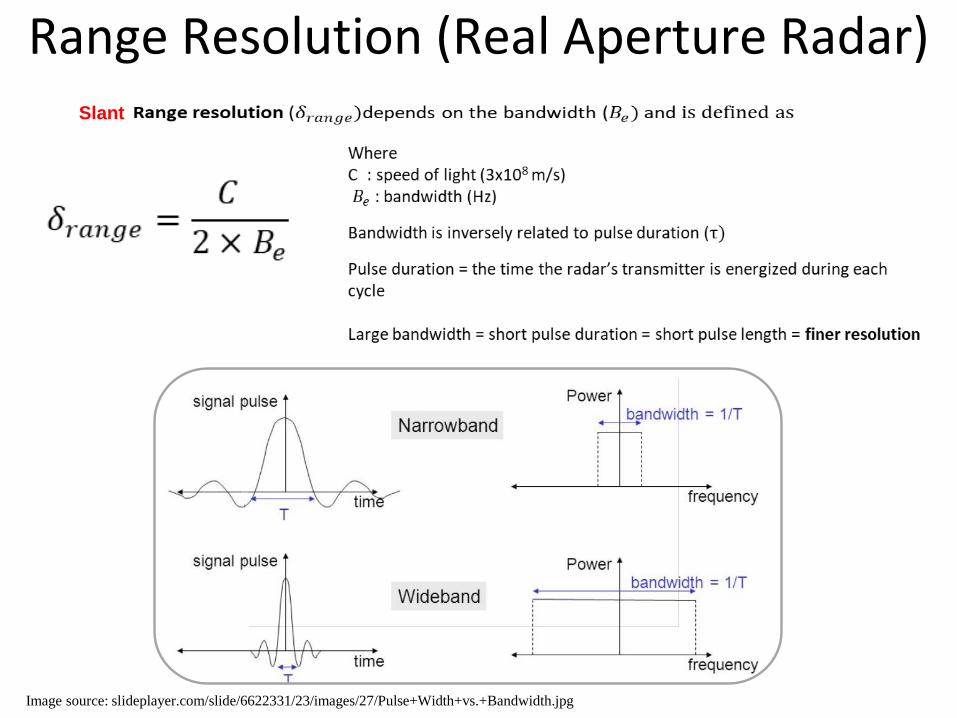
Range Resolution (Real Aperture Radar) Slant
Image source: slideplayer.com/slide/6622331/23/images/27/Pulse+Width+vs.+Bandwidth.jpg
• The range resolution can be improved by increasing the bandwidth (reducing the length or duration of
the pulse) of the radar. Shorter wavelengths will enable higher bandwidth.
• Pulse compression is a signal processing technique commonly used to improve range resolution
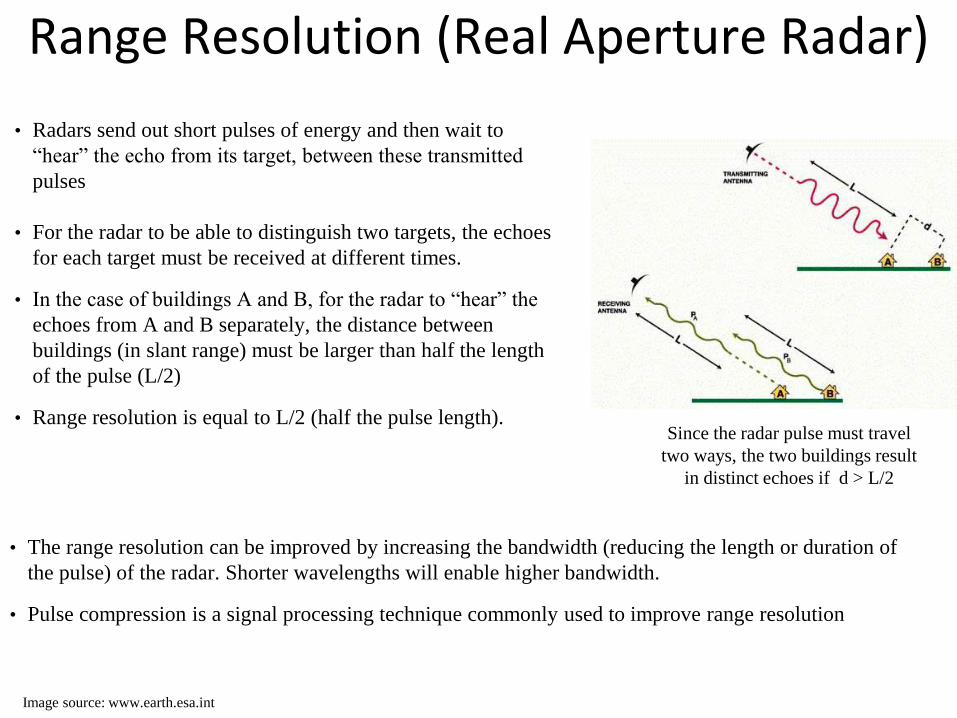
Range Resolution (Real Aperture Radar)
• Radars send out short pulses of energy and then wait to
“hear” the echo from its target, between these transmitted
pulses
• For the radar to be able to distinguish two targets, the echoes
for each target must be received at different times.
• In the case of buildings A and B, for the radar to “hear” the
echoes from A and B separately, the distance between
buildings (in slant range) must be larger than half the length
of the pulse (L/2)
• Range resolution is equal to L/2 (half the pulse length).
Image source: www.earth.esa.int
Since the radar pulse must travel
two ways, the two buildings result
in distinct echoes if d > L/2
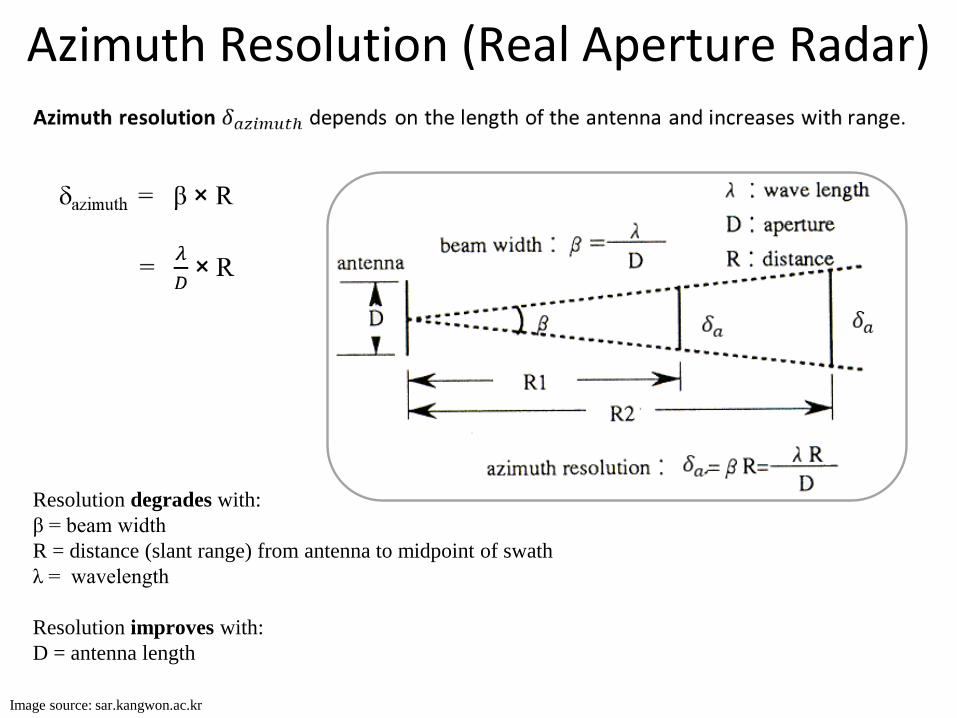
Azimuth Resolution (Real Aperture Radar)
Resolution degrades with:
β = beam width
R = distance (slant range) from antenna to midpoint of swath
λ = wavelength
Resolution improves with:
D = antenna length
Image source: sar.kangwon.ac.kr
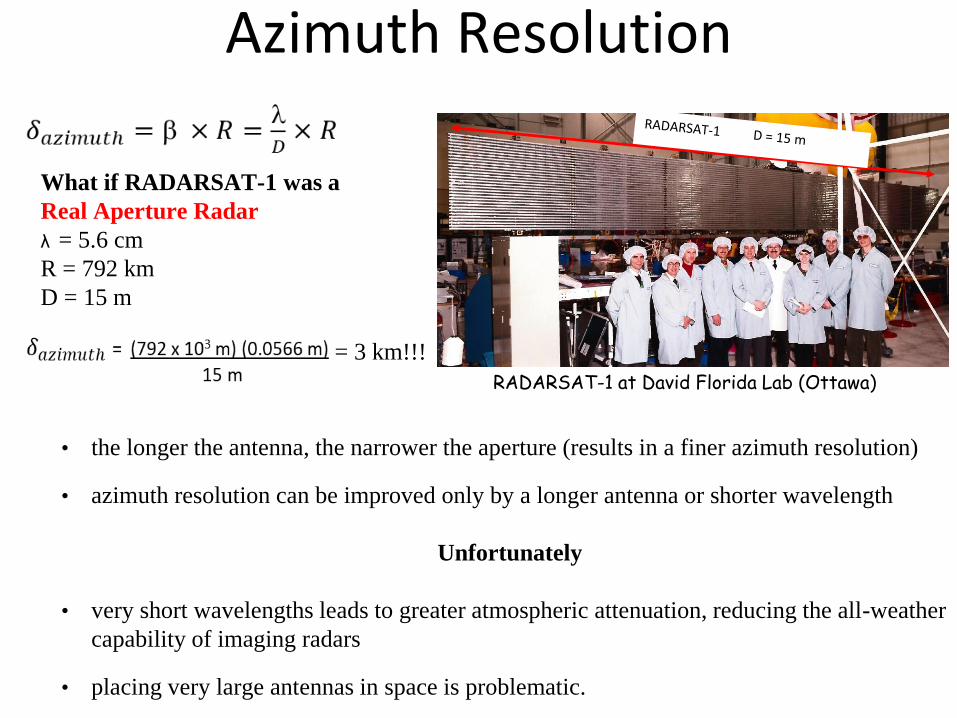
Azimuth Resolution
• the longer the antenna, the narrower the aperture (results in a finer azimuth resolution)
• azimuth resolution can be improved only by a longer antenna or shorter wavelength
Unfortunately
• very short wavelengths leads to greater atmospheric attenuation, reducing the all-weather
capability of imaging radars
• placing very large antennas in space is problematic.
What if RADARSAT-1 was a
Real Aperture Radar
λ = 5.6 cm
R = 792 km
D = 15 m
= 3 km!!!
RADARSAT-1 at David Florida Lab (Ottawa)
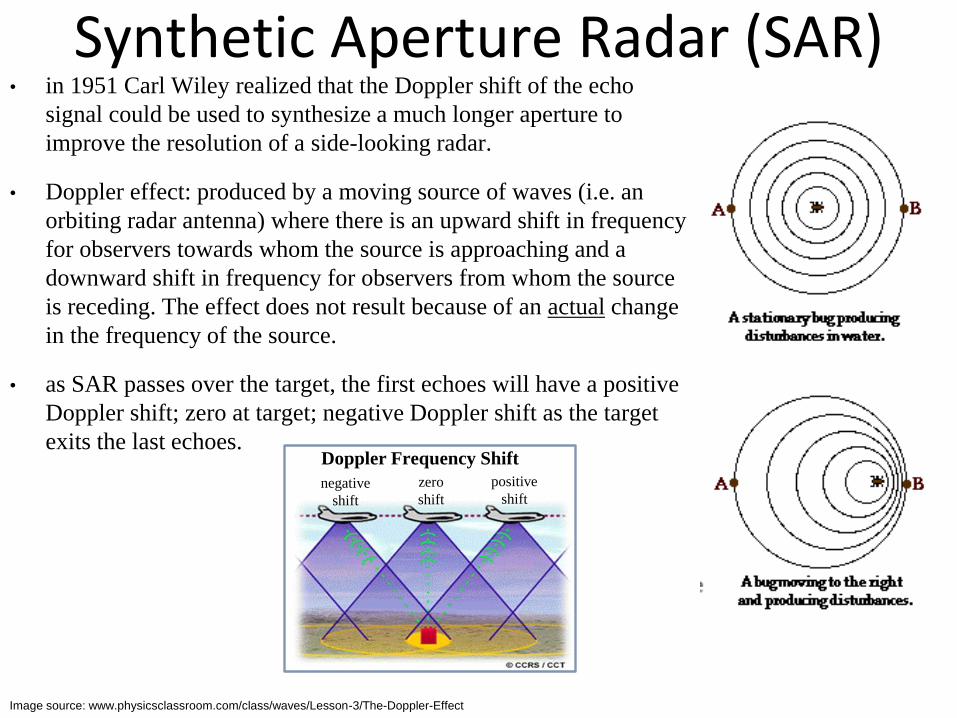
Synthetic Aperture Radar (SAR) • in 1951 Carl Wiley realized that the Doppler shift of the echo
signal could be used to synthesize a much longer aperture to
improve the resolution of a side-looking radar.
• Doppler effect: produced by a moving source of waves (i.e. an
orbiting radar antenna) where there is an upward shift in frequency
for observers towards whom the source is approaching and a
downward shift in frequency for observers from whom the source
is receding. The effect does not result because of an actual change
in the frequency of the source.
• as SAR passes over the target, the first echoes will have a positive
Doppler shift; zero at target; negative Doppler shift as the target
exits the last echoes.
Image source: www.physicsclassroom.com/class/waves/Lesson-3/The-Doppler-Effect
positive
shift
zero
shiftnegative
shift
Doppler Frequency Shift

Synthetic Aperture Radar (SAR) • SAR processor stores all the radar returned signals for the time period T from position A to D (have
different Doppler shifts)
• this is used to reconstruct the signal which would have been obtained by an antenna of length v · T, where v
is the platform speed
• making T large makes the “synthetic aperture” large and hence a higher resolution can be achieved
• in effect, by processing these shorter looks at the target together, the physical (short) antenna “sees” any
point on the ground for a longer period of time, which is equivalent to a longer virtual antenna and thus
higher azimuth resolution
• the achievable azimuth resolution of a SAR is approximately equal to one-half the length of the actual
(real) antenna
Information source: Moreira et al., 2013

RAR and SARThe size of the antenna (D) is the same, but with much different results!
SAR Radiometry
• The Radar Equation
• An eloquent way to express microwave propagation and response
• Reflectivity nomenclature
• Beta, Gamma and Sigma Nought
• Noise and noise suppression
• SAR calibration
• Image artifacts
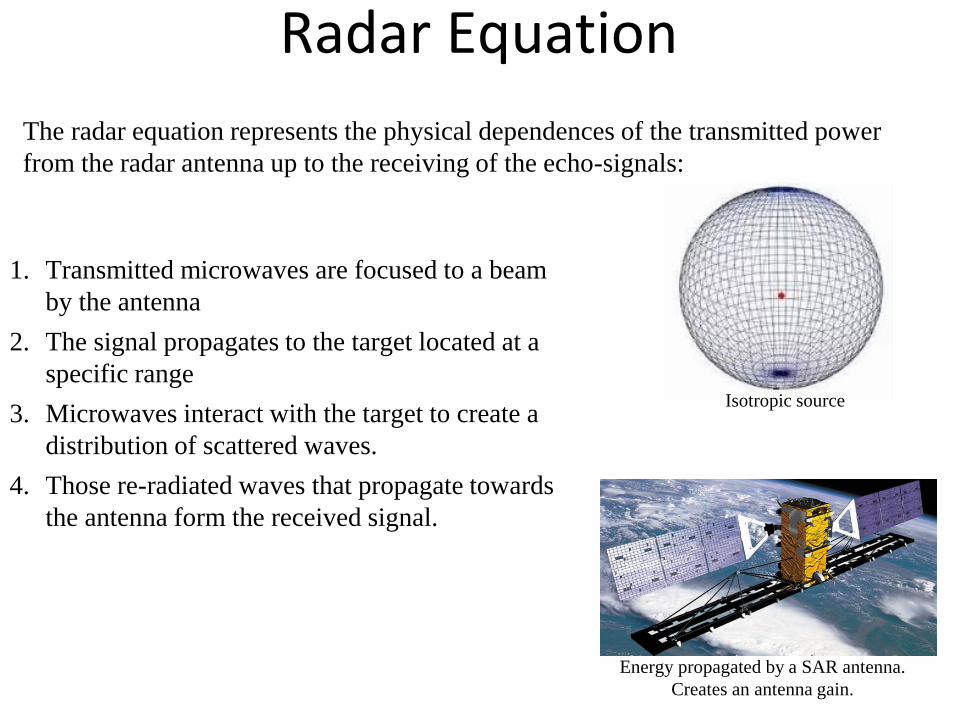
Radar Equation
1. Transmitted microwaves are focused to a beam
by the antenna
2. The signal propagates to the target located at a
specific range
3. Microwaves interact with the target to create a
distribution of scattered waves.
4. Those re-radiated waves that propagate towards
the antenna form the received signal.
The radar equation represents the physical dependences of the transmitted power
from the radar antenna up to the receiving of the echo-signals:
Isotropic source
Energy propagated by a SAR antenna.
Creates an antenna gain.
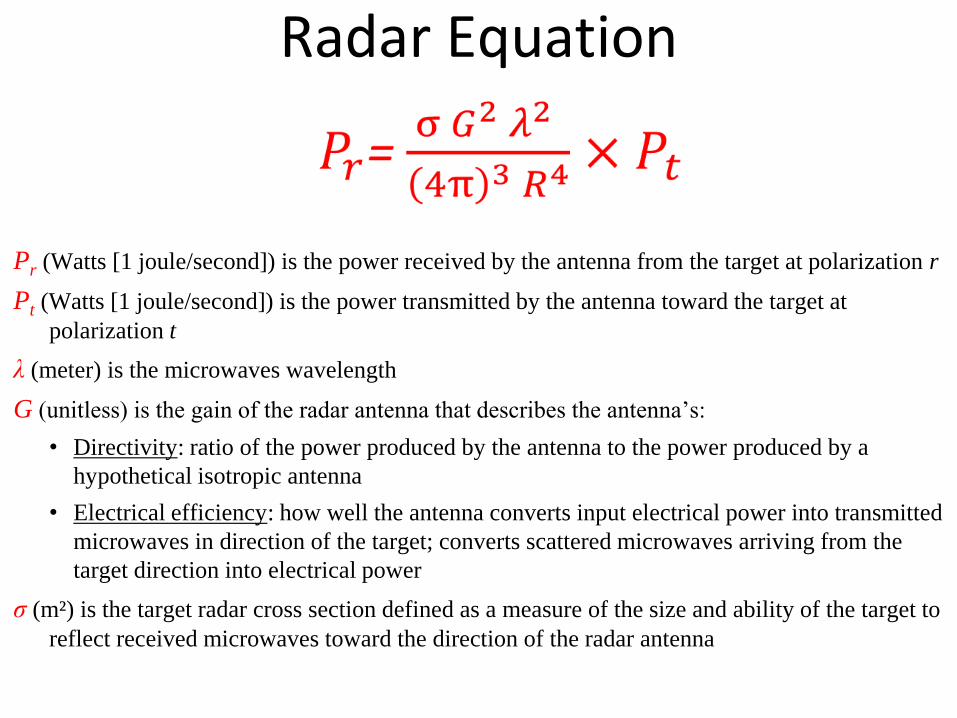
Radar Equation
Pr (Watts [1 joule/second]) is the power received by the antenna from the target at polarization r
Pt (Watts [1 joule/second]) is the power transmitted by the antenna toward the target at
polarization t
λ (meter) is the microwaves wavelength
G (unitless) is the gain of the radar antenna that describes the antenna’s:
• Directivity: ratio of the power produced by the antenna to the power produced by a
hypothetical isotropic antenna
• Electrical efficiency: how well the antenna converts input electrical power into transmitted
microwaves in direction of the target; converts scattered microwaves arriving from the
target direction into electrical power
σ (m²) is the target radar cross section defined as a measure of the size and ability of the target to
reflect received microwaves toward the direction of the radar antenna

Radar Equation
is the spreading loss – the reduction in power density associated with
spreading of the power over a sphere of radius R surrounding the
antenna
R (m) is the range distance from the antenna to the target

SAR Reflectivity - Important Nomenclature
Image source: Small (2011)
Information source: Shimada and Otaki (2010)
Beta Nought (β °)
• reflectivity per unit area in slant plane (Aβ )
• the default radiometric observable of a radar
• does not require knowledge of the local incidence
angle
Gamma Nought (γ ° )
• normalized reflectivity with respect to the
equivalent illuminated area Aγ in the orthogonal
to the slant plane
• plots of γ ° as a function of incident angle tend to be
more constant than comparable plots using σ °
• gamma nought can reduce the incidence angle
dependency of the radar backscatter
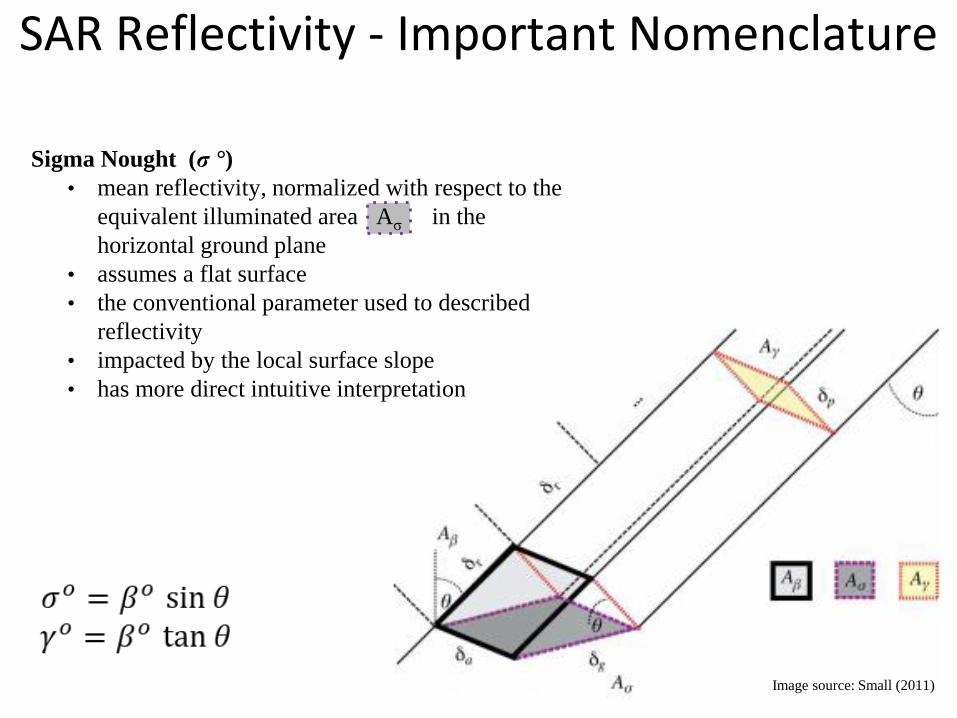
Sigma Nought (σ °)
• mean reflectivity, normalized with respect to the
equivalent illuminated area Aσ in the
horizontal ground plane
• assumes a flat surface
• the conventional parameter used to described
reflectivity
• impacted by the local surface slope
• has more direct intuitive interpretation
SAR Reflectivity - Important Nomenclature
Image source: Small (2011)
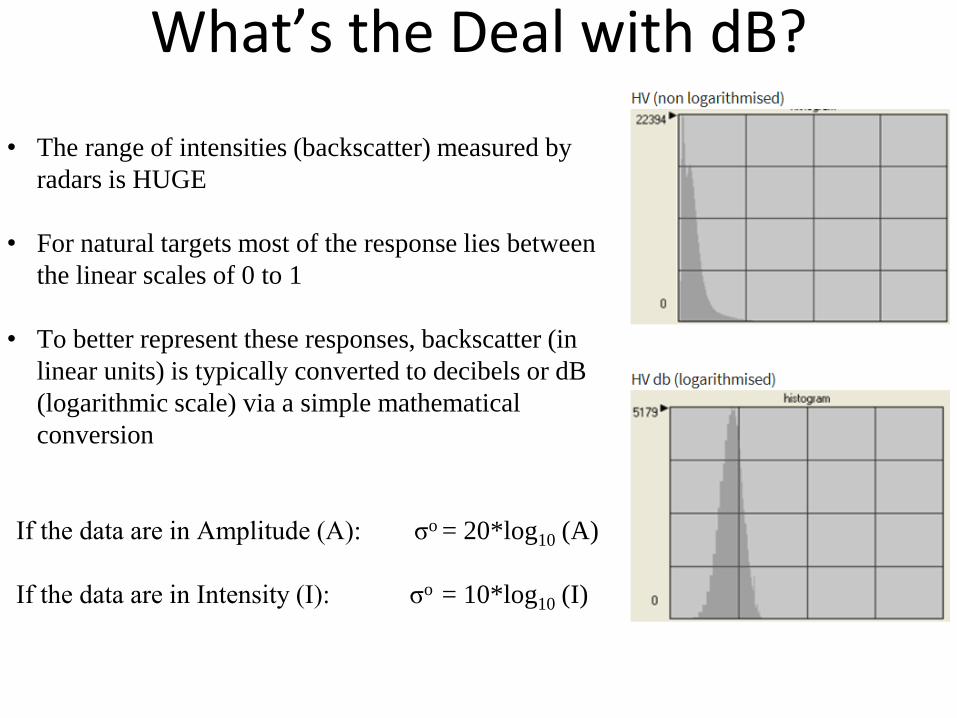
• The range of intensities (backscatter) measured by
radars is HUGE
• For natural targets most of the response lies between
the linear scales of 0 to 1
• To better represent these responses, backscatter (in
linear units) is typically converted to decibels or dB
(logarithmic scale) via a simple mathematical
conversion
If the data are in Amplitude (A): σo = 20*log10 (A)
If the data are in Intensity (I): σo = 10*log10 (I)
What’s the Deal with dB?
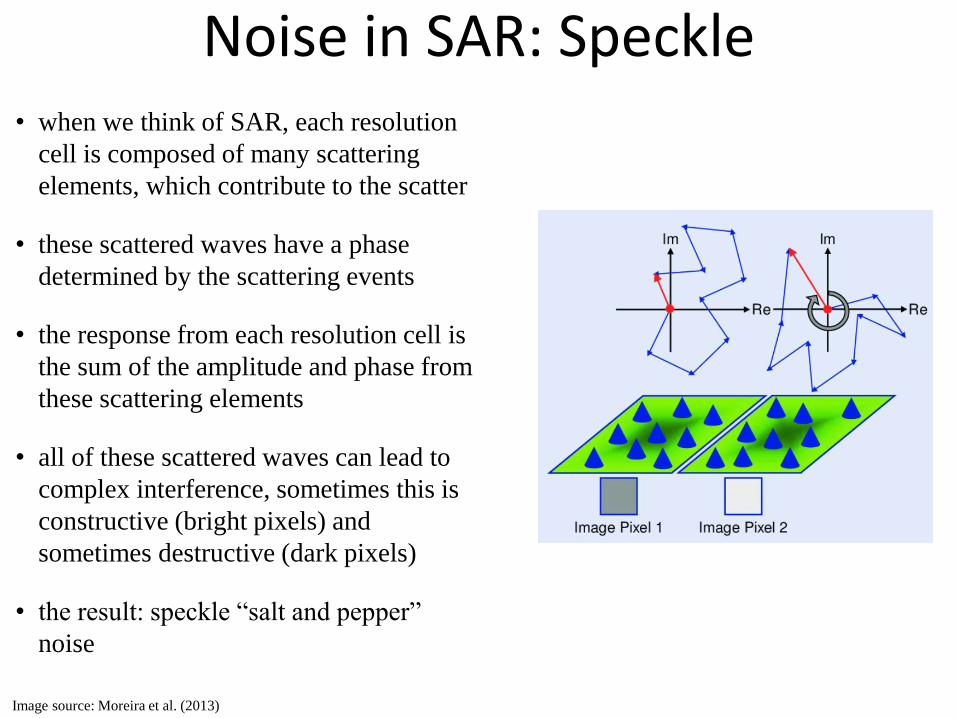
Noise in SAR: Speckle• when we think of SAR, each resolution
cell is composed of many scattering
elements, which contribute to the scatter
• these scattered waves have a phase
determined by the scattering events
• the response from each resolution cell is
the sum of the amplitude and phase from
these scattering elements
• all of these scattered waves can lead to
complex interference, sometimes this is
constructive (bright pixels) and
sometimes destructive (dark pixels)
• the result: speckle “salt and pepper”
noise
Image source: Moreira et al. (2013)
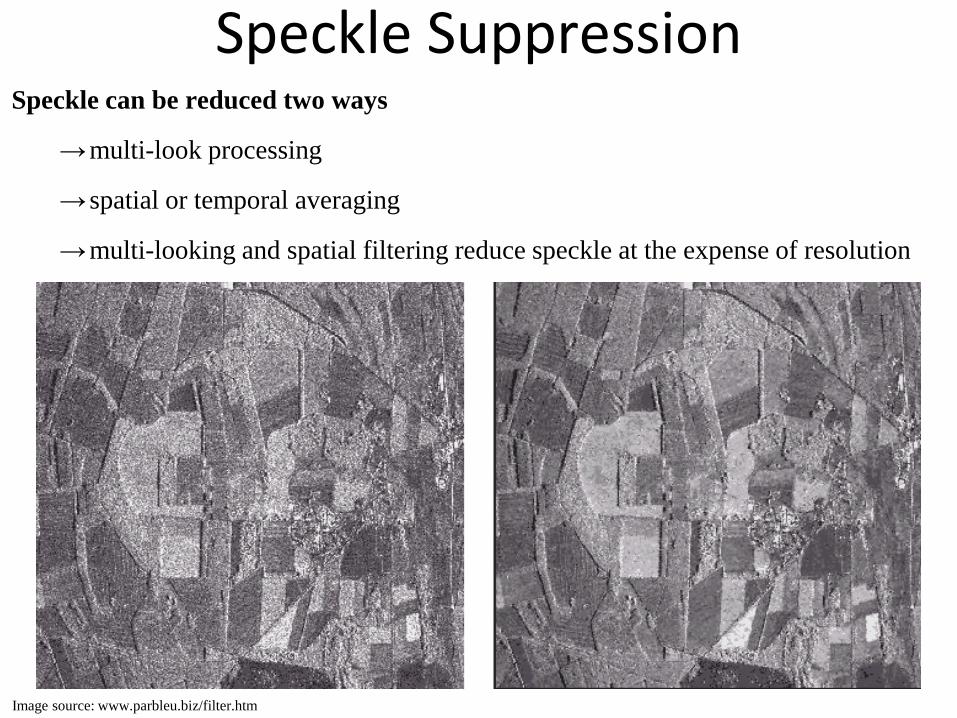
Speckle SuppressionSpeckle can be reduced two ways
→multi-look processing
→ spatial or temporal averaging
→multi-looking and spatial filtering reduce speckle at the expense of resolution
Data: ERS ©ESA
Image source: www.parbleu.biz/filter.htm
Multi-looking
• single look image: uses all signal return from a target to create a single image
• image may have speckle, but has the highest achievable resolution
• independent images of the same area can be formed in the digital processing of SAR
by using sub-sets of the signal returns
• each of the subsets forms a separate image (i.e. a “look”) each of which views a
given point from a slightly different angle
• splitting the synthetic aperture (D) into L non-overlapping sections means that each
has an effective aperture of length D/L; the resolution is degraded by a factor of L
• multi-look image: independent images are averaged to create a multi-look image
• resulting multi-look image has lower resolution, but reduced speckle
Information source: Oliver and Quegan (1998)
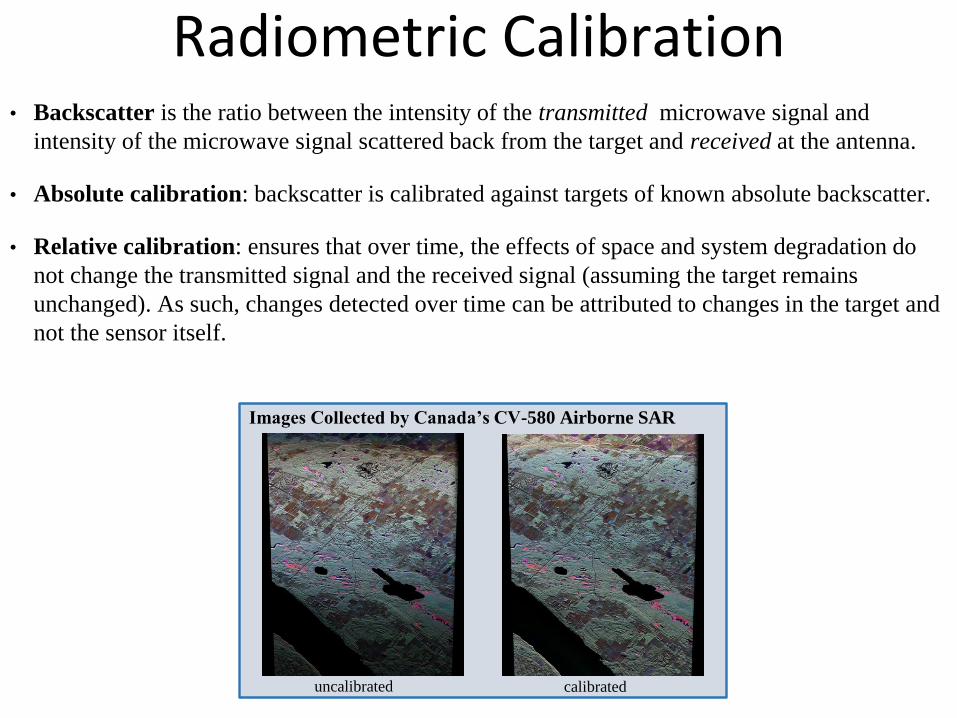
Radiometric Calibration• Backscatter is the ratio between the intensity of the transmitted microwave signal and
intensity of the microwave signal scattered back from the target and received at the antenna.
• Absolute calibration: backscatter is calibrated against targets of known absolute backscatter.
• Relative calibration: ensures that over time, the effects of space and system degradation do
not change the transmitted signal and the received signal (assuming the target remains
unchanged). As such, changes detected over time can be attributed to changes in the target and
not the sensor itself.
uncalibrated calibrated
Images Collected by Canada’s CV-580 Airborne SAR

Relative Calibration• corrects for known variations in radar antenna and system responses to ensure
uniform, repeatable measurements over time
• Amazon rainforest is often used as a relative calibration target. Higher frequency
microwaves do not significantly penetrate its canopy and thus from the perspective of
the SAR, the rainforest is spatially and temporally uniform. The rainforest looks “flat”
to the SAR. Any changes in backscatter over time are considered to be caused by drift
in the SAR electronics, requiring corrections to be made.
• this process allows relative comparisons among targets within one scene or from
scene to scene
Image source: directory.eoportal.org/web/eoportal/satellite-missions/content/-/article/risat1
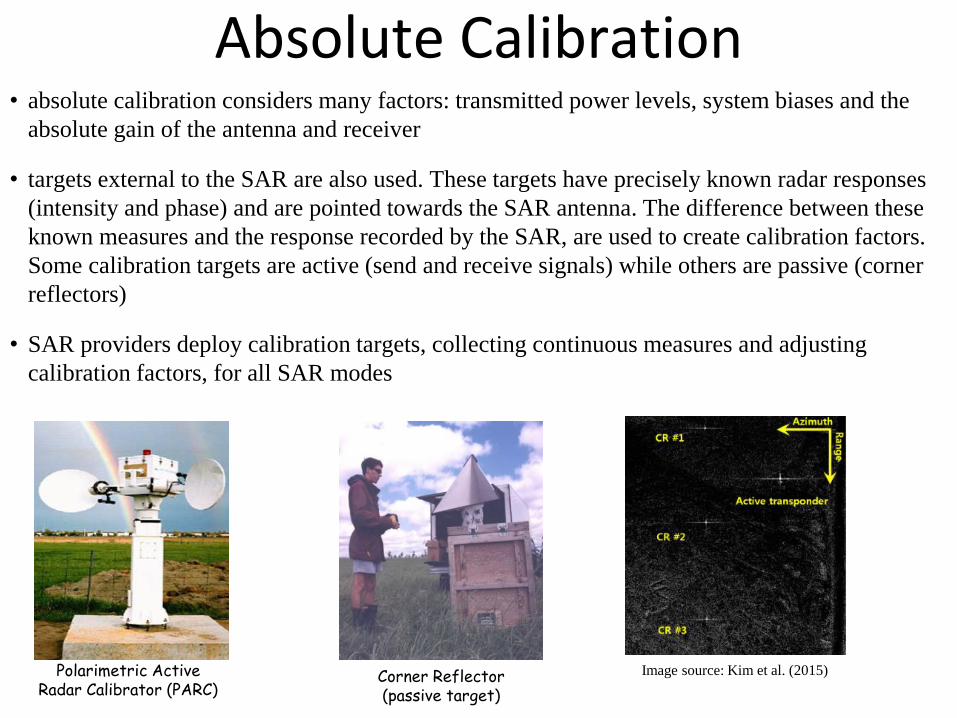
Absolute Calibration• absolute calibration considers many factors: transmitted power levels, system biases and the
absolute gain of the antenna and receiver
• targets external to the SAR are also used. These targets have precisely known radar responses
(intensity and phase) and are pointed towards the SAR antenna. The difference between these
known measures and the response recorded by the SAR, are used to create calibration factors.
Some calibration targets are active (send and receive signals) while others are passive (corner
reflectors)
• SAR providers deploy calibration targets, collecting continuous measures and adjusting
calibration factors, for all SAR modes
Polarimetric Active Radar Calibrator (PARC)
Corner Reflector (passive target)
Image source: Kim et al. (2015)
• SAR image artifacts can occur due to platform, sensor, and/or processing problems
• SAR image radiometry and geometry can be affected and reprocessing can mitigate
these effects in some cases. Sometimes these artifacts cannot be removed.
• Most important radiometric artifacts for land applications:
• Ambiguities that appear as ground objects duplication along azimuth and
range directions → SAR processors don’t correct these effects.
• Scalloping that appears as repeating weak stripes across the scene → can be
compensated.
• Insufficient range antenna pattern compensation that appears in a form of
patches with different brightness → can be corrected using an accurate
correctly applied antenna pattern. Regular calibration of SAR antenna pattern
can help reduce this effect.
SAR Imagery Radiometric Artifacts
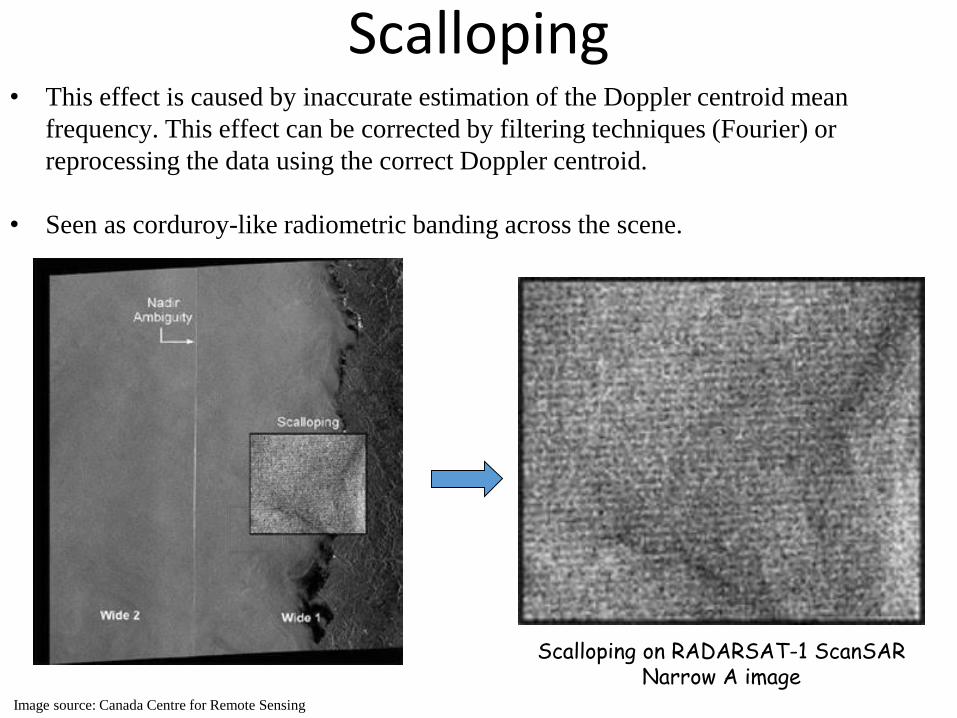
Scalloping• This effect is caused by inaccurate estimation of the Doppler centroid mean
frequency. This effect can be corrected by filtering techniques (Fourier) or
reprocessing the data using the correct Doppler centroid.
• Seen as corduroy-like radiometric banding across the scene.
Scalloping on RADARSAT-1 ScanSARNarrow A image
Image source: Canada Centre for Remote Sensing
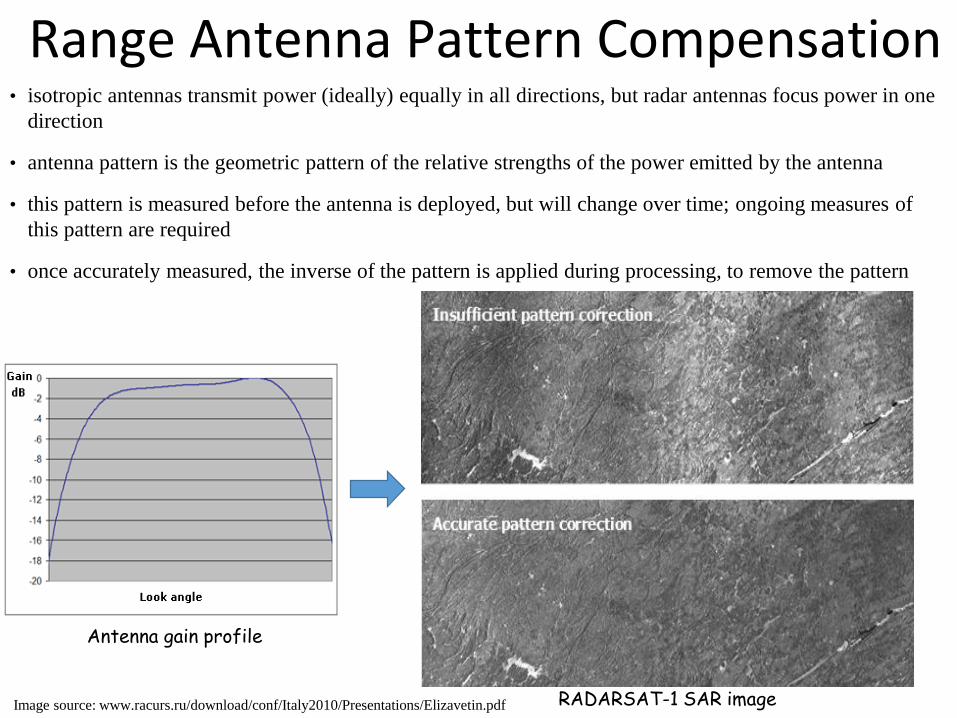
Range Antenna Pattern Compensation• isotropic antennas transmit power (ideally) equally in all directions, but radar antennas focus power in one
direction
• antenna pattern is the geometric pattern of the relative strengths of the power emitted by the antenna
• this pattern is measured before the antenna is deployed, but will change over time; ongoing measures of
this pattern are required
• once accurately measured, the inverse of the pattern is applied during processing, to remove the pattern
RADARSAT-1 SAR image
Antenna gain profile
Image source: www.racurs.ru/download/conf/Italy2010/Presentations/Elizavetin.pdf
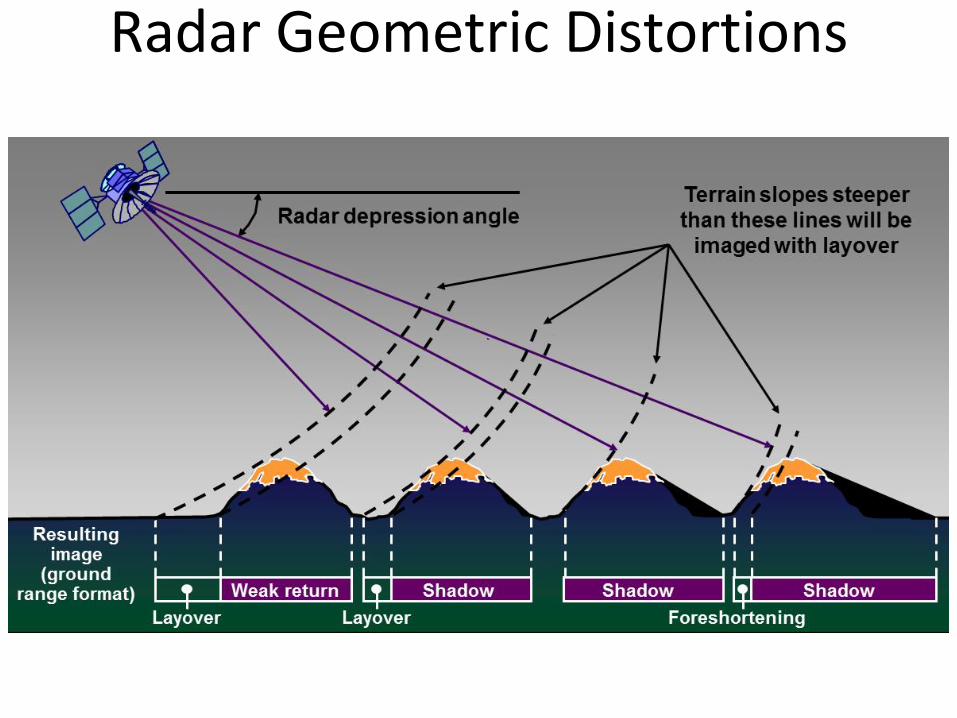
Radar Geometric Distortions
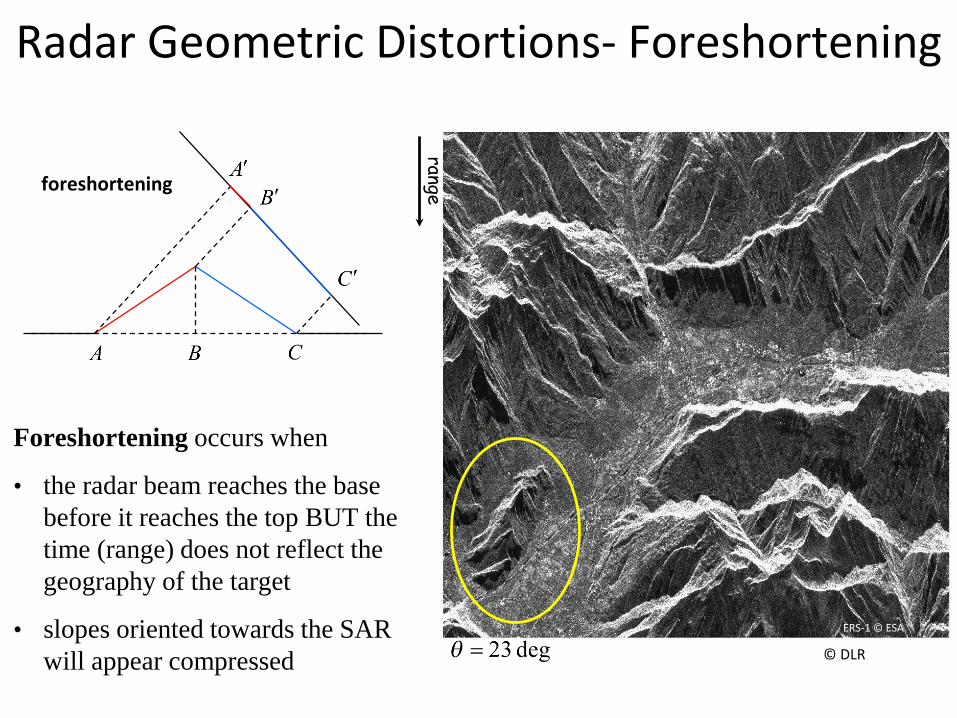
Radar Geometric Distortions- Foreshortening
foreshortening
range
Foreshortening occurs when
• the radar beam reaches the base
before it reaches the top BUT the
time (range) does not reflect the
geography of the target
• slopes oriented towards the SAR
will appear compressed © DLR
ERS-1 © ESA

Radar geometric distortions- Layover
© DLR
layover
ERS-1 © ESA
Layover occurs when
• the radar beam reaches the top of the
feature before it reaches the base
• the signal from the top is received
first by the antenna
• leads to ghost features where slopes
appear to “fall or layover” towards
the SAR
range
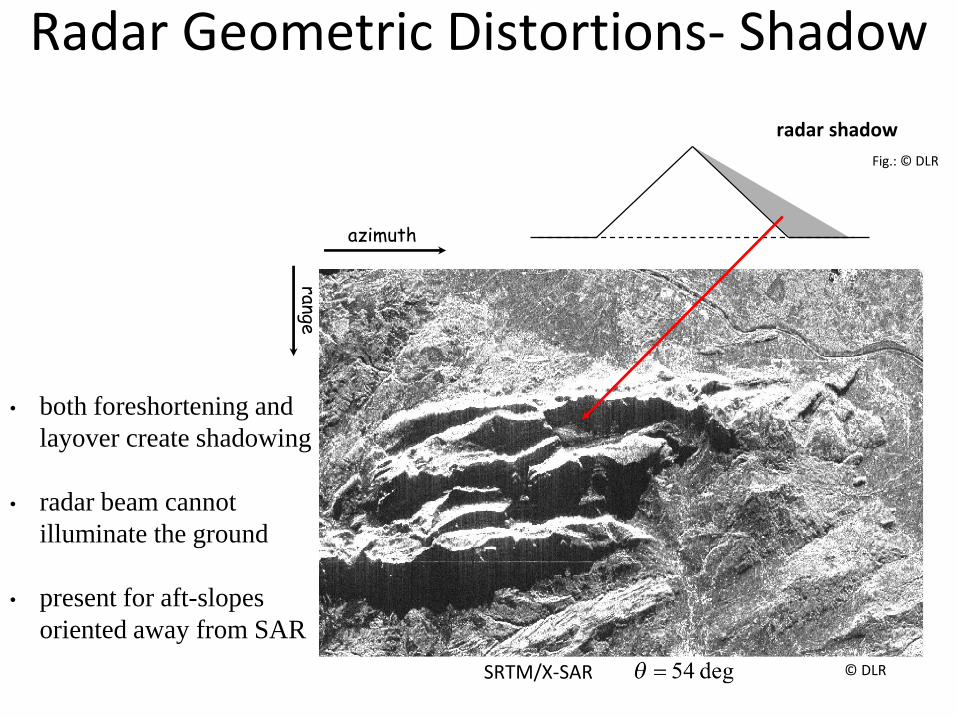
Radar Geometric Distortions- Shadow
© DLR
radar shadow
SRTM/X-SAR
Fig.: © DLR
• both foreshortening and
layover create shadowing
• radar beam cannot
illuminate the ground
• present for aft-slopes
oriented away from SARrange
azimuth
Kim, D.-J.; Jung, J.; Kang, K.-M.; Kim, S.H.; Xu, Z.; Hensley, S.; Swan, A.; Duersch, M. Development of
a Cost-Effective Airborne Remote Sensing System for Coastal Monitoring. Sensors 2015, 15, 25366-
25384.
David Small. Flattening Gamma: Radiometric Terrain Correction for SAR Imagery. IEEE Transactions On
Geoscience And Remote Sensing, Vol. 49, No. 8, August 2011
Shimada, M., and Otaki, T. (2010). Generating continent-scale high-quality SAR mosaic datasets:
Application to PALSAR data for global monitoring. IEEE Journal of Selected Topics in Applied Earth
Observations and Remote Sensing, 3, 637–656.)
Oliver and Quegan. Understanding Synthetic Aperture Radar Images; Artech House: Boston, MA, USA,
1998; p. 479.
Moreira, Alberto & Prats-Iraola, Pau & Younis, Marwan & Krieger, Gerhard & Hajnsek, Irena &
Papathanassiou, Konstantinos. (2013). A Tutorial on Synthetic Aperture Radar.