Remote sensing image fusion using the curvelet transform
14
Remote sensing image fusion using the curvelet transform Filippo Nencini a , Andrea Garzelli a , Stefano Baronti b , Luciano Alparone c, * a DII: Department of Information Engineering, University of Siena, Via Roma, 56, 53100 Siena, Italy b IFAC-CNR: Institute of Applied Physics ‘‘Nello Carrara,’’ National Research Council, Via Madonna del Piano, 10, 50019 S.to Fiorentino (FI), Italy c DET: Department of Electronics and Telecommunications, University of Florence, Via Santa Marta, 3, 50139 Florence, Italy Received 16 March 2005; received in revised form 1 February 2006; accepted 27 February 2006 Available online 2 May 2006 Abstract This paper presents an image fusion method suitable for pan-sharpening of multispectral (MS) bands, based on nonseparable multi- resolution analysis (MRA). The low-resolution MS bands are resampled to the fine scale of the panchromatic (Pan) image and sharpened by injecting highpass directional details extracted from the high-resolution Pan image by means of the curvelet transform (CT). CT is a nonseparable MRA, whose basis functions are directional edges with progressively increasing resolution. The advantage of CT with respect to conventional separable MRA, either decimated or not, is twofold. Firstly, directional detail coefficients matching image edges may be preliminarily soft-thresholded to achieve a noise reduction that is better than that obtained in the separable wavelet domain. Secondly, modeling of the relationships between high-resolution detail coefficients of the MS bands and of the Pan image is more fitting, being accomplished in the directional multiresolution domain. Experiments are carried out on very-high-resolution MS + Pan images acquired by the QuickBird and Ikonos satellite systems. Fusion simulations on spatially degraded data, whose original MS bands are available for reference, show that the proposed curvelet-based fusion method performs slightly better than the state-of-the art. Fusion tests at the full scale reveal that an accurate and reliable Pan-sharpening, little affected by local inaccuracies even in the presence of com- plex and detailed urban landscapes, is achieved by the proposed method. Ó 2006 Elsevier B.V. All rights reserved. Keywords: ‘‘A ` trous’’ wavelet transform; Curvelet transform; Image fusion; Interband structure modeling (IBSM); Multispectral imagery; Multiresolution analysis; Pan-sharpening; Satellite remote sensing; Ridgelet transform 1. Introduction Remote sensing image fusion aims at integrating the information conveyed by data acquired with different spatial and spectral resolutions, for purposes of photo- analysis, feature extraction, modeling, and classification [1]. A notable application is the fusion of multispectral (MS) and panchromatic (Pan) images collected from space. Image fusion techniques take advantage of the complemen- tary spatial/spectral resolution characteristics for produc- ing spatially enhanced MS observations. This specific aspect of fusion is often referred to as band-sharpening [2]. More specifically, Pan-sharpened MS data are available as a commercial product, in which the higher-resolution Pan image has been used to sharpen the lower-resolution MS bands. In fact, the former is usually acquired with the maximum resolution allowed by the imaging sensor and by the data link throughput; the MS data are acquired with coarser resolution, typically, two or four times lower, because of SNR constraints and the transmission bottle- neck. After being received at ground stations, the MS image may be fused with the Pan image to enhance the spa- tial resolution of the former. Image fusion methods based on injecting high frequency components taken from the Pan image into resampled versions of the MS data have demonstrated a superior capability of translating the spectral information of the coarse-scale MS data to the finer scale of the Pan image 1566-2535/$ - see front matter Ó 2006 Elsevier B.V. All rights reserved. doi:10.1016/j.inffus.2006.02.001 * Corresponding author. Tel.: +39 055 4796 563/380 (off./lab.); fax: +39 055 494569. E-mail address: [email protected]fi.it (L. Alparone). www.elsevier.com/locate/inffus Information Fusion 8 (2007) 143–156
Transcript of Remote sensing image fusion using the curvelet transform
www.elsevier.com/locate/inffus
Information Fusion 8 (2007) 143–156
Remote sensing image fusion using the curvelet transform
Filippo Nencini a, Andrea Garzelli a, Stefano Baronti b, Luciano Alparone c,*
a DII: Department of Information Engineering, University of Siena, Via Roma, 56, 53100 Siena, Italyb IFAC-CNR: Institute of Applied Physics ‘‘Nello Carrara,’’ National Research Council, Via Madonna del Piano, 10, 50019 S.to Fiorentino (FI), Italy
c DET: Department of Electronics and Telecommunications, University of Florence, Via Santa Marta, 3, 50139 Florence, Italy
Received 16 March 2005; received in revised form 1 February 2006; accepted 27 February 2006Available online 2 May 2006
Abstract
This paper presents an image fusion method suitable for pan-sharpening of multispectral (MS) bands, based on nonseparable multi-resolution analysis (MRA). The low-resolution MS bands are resampled to the fine scale of the panchromatic (Pan) image and sharpenedby injecting highpass directional details extracted from the high-resolution Pan image by means of the curvelet transform (CT). CT is anonseparable MRA, whose basis functions are directional edges with progressively increasing resolution. The advantage of CT withrespect to conventional separable MRA, either decimated or not, is twofold. Firstly, directional detail coefficients matching image edgesmay be preliminarily soft-thresholded to achieve a noise reduction that is better than that obtained in the separable wavelet domain.Secondly, modeling of the relationships between high-resolution detail coefficients of the MS bands and of the Pan image is more fitting,being accomplished in the directional multiresolution domain. Experiments are carried out on very-high-resolution MS + Pan imagesacquired by the QuickBird and Ikonos satellite systems. Fusion simulations on spatially degraded data, whose original MS bands areavailable for reference, show that the proposed curvelet-based fusion method performs slightly better than the state-of-the art. Fusiontests at the full scale reveal that an accurate and reliable Pan-sharpening, little affected by local inaccuracies even in the presence of com-plex and detailed urban landscapes, is achieved by the proposed method.� 2006 Elsevier B.V. All rights reserved.
Keywords: ‘‘A trous’’ wavelet transform; Curvelet transform; Image fusion; Interband structure modeling (IBSM); Multispectral imagery; Multiresolutionanalysis; Pan-sharpening; Satellite remote sensing; Ridgelet transform
1. Introduction
Remote sensing image fusion aims at integrating theinformation conveyed by data acquired with differentspatial and spectral resolutions, for purposes of photo-analysis, feature extraction, modeling, and classification[1]. A notable application is the fusion of multispectral(MS) and panchromatic (Pan) images collected from space.Image fusion techniques take advantage of the complemen-tary spatial/spectral resolution characteristics for produc-ing spatially enhanced MS observations. This specificaspect of fusion is often referred to as band-sharpening
1566-2535/$ - see front matter � 2006 Elsevier B.V. All rights reserved.
doi:10.1016/j.inffus.2006.02.001
* Corresponding author. Tel.: +39 055 4796 563/380 (off./lab.); fax: +39055 494569.
E-mail address: [email protected] (L. Alparone).
[2]. More specifically, Pan-sharpened MS data are availableas a commercial product, in which the higher-resolutionPan image has been used to sharpen the lower-resolutionMS bands. In fact, the former is usually acquired withthe maximum resolution allowed by the imaging sensorand by the data link throughput; the MS data are acquiredwith coarser resolution, typically, two or four times lower,because of SNR constraints and the transmission bottle-neck. After being received at ground stations, the MSimage may be fused with the Pan image to enhance the spa-tial resolution of the former.
Image fusion methods based on injecting high frequencycomponents taken from the Pan image into resampledversions of the MS data have demonstrated a superiorcapability of translating the spectral information of thecoarse-scale MS data to the finer scale of the Pan image
144 F. Nencini et al. / Information Fusion 8 (2007) 143–156
with minimal introduction of spectral distortions [3]. Mul-tiresolution analysis (MRA) based on wavelets [4], filterbanks [5], and Laplacian pyramids [6], has been recognizedas one of the most efficient tools to implement fusion ofimages at different resolutions [7,8].
Redundant multiresolution structures, like the general-ized Laplacian pyramid (GLP) [9] matching even fractionalscale ratios between the images to be fused, the undeci-mated discrete wavelet transform (UDWT) [10], and the‘‘a trous’’ wavelet transform (ATWT) [11] have been foundto be particularly suitable for image fusion thanks to theirtranslation-invariance property (not strictly possessed byGLP). Such decompositions do not require sharp, i.e., fre-quency selective, digital filters and are not critically sub-sampled. Therefore, typical injection artifacts appearingas impairments in images fused by means of conventionalwavelet analysis, like ringing (Gibbs) effects and canvas-likepatterns originated by aliasing, are missing when imagesare fused by using redundant MRA. This topic has beenfirstly addressed in [12] and recently developed in a coupleof papers [9,13], where spatial details injected by fusionmethods using either decimated or undecimated waveletanalysis are visually compared.
In recent years, nonseparable MRA has been proposedfor image processing. In particular, the curvelet transform,originally proposed for image denoising [14], has beenfound to be an invaluable tool for image enhancement[15]. The curvelet transform is obtained by applying theridgelet transform [16] to square blocks of detail framesof an undecimated wavelet decomposition. Since the ridg-elet transform possesses basis functions matching direc-tional straight lines, the curvelet transform is capable ofrepresenting piecewise linear contours on multiple scalesthrough few significant coefficients. This property leadsto a better separation between geometric details and back-ground noise, which may be easily reduced by threshold-ing curvelet coefficients before they are used for fusion[14].
Image fusion based on MRA, however, requires the def-inition of a model establishing how the missing highpassinformation to be injected into the resampled MS bandsis extracted from the Pan image. The goal is to make thefused bands as similar as possible to what the narrow-bandMS sensor would image if it had the same spatial resolutionas the broad-band one, by which the Pan band is captured.This model is referred to in the literature [17–19] as aninterband structure model (IBSM); it deals with the radio-metric transformation (gain and offset) of spatial structures(edges and textures) when they are passed from Pan to MSimages. The model is usually space-varying; it is calculatedat a coarser resolution and inferred to the finer resolution.However, to increase its specificity, it would be desirable tocalculate such a model in a different domain, in which lin-ear structures that are injected are represented by fewsparse coefficients [20–22].
In this work, we propose an image fusion method forPan-sharpening of very-high-resolution MS images, which
operates in the nonseparable transformed domain of thecurvelet transform. The algorithm is defined for eitherQuickBird or Ikonos imagery, having scale ratio betweenPan and MS equal to 4, but may be easily extended to otherscale ratios that are powers of two. A thorough perfor-mance comparison on both QuickBird and Ikonos datasetsis carried out among a number of advanced methodsdescribed in the literature. Results highlight the benefitsof the proposed method for Pan-sharpening of satelliteremote sensing imagery.
2. Image fusion based on the curvelet transform
In this section, a novel MRA-based scheme withimproved geometrical adaptivity and suitable for imagedata fusion is described. The reader is referred to [9] fora concise, yet comprehensive, review of multiresolutionwavelet analysis in the case of separable processing andoctave frequency subbands. After reviewing the ‘‘a trous’’wavelet transform, which represents the starting point ofthe curvelet transform, the ridgelet transform, from whichthe curvelet transform is derived, is introduced. A discreteimplementation of the curvelet transform is briefly out-lined. The main feature of the curvelet transform is thatit is sensitive to directional edges and capable of represent-ing the highpass details of object contours at differentscales through few sparse nonzero coefficients. Then theflowchart of a scheme based on the curvelet transformand suitable for Pan-sharpening of MS images is presented;problems occurring in developing an IBSM in the curveletdomain are also discussed.
2.1. ‘‘A trous’’ wavelet transform
The ‘‘a trous’’ wavelet transform (ATWT) is a nonor-thogonal multiresolution decomposition defined by a filterbank {hn} and {gn = dn � hn}, with the Kronecker operatordn denoting an allpass filter. The filter bank does not allowperfect reconstruction to be achieved if the output isdecimated. In the absence of decimation, the lowpass filter isupsampled by 2j�1, before processing the jth level; hence thename ‘‘a trous’’ which means ‘‘with holes’’. In two dimen-sions, the filter bank becomes {hmhn} and {dmdn � hmhn},which means that the 2-D detail signal is given by the pixeldifference between two successive approximations.
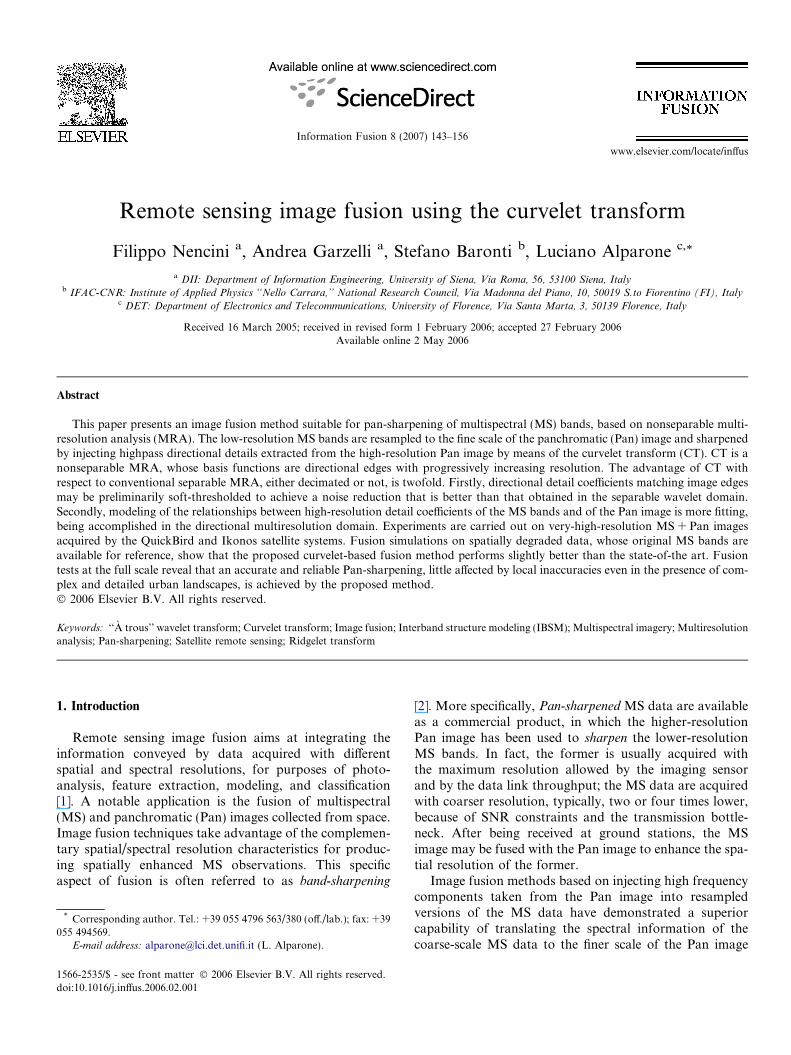
The prototype 1-D lowpass filter h must be strictly zero-phase and symmetric. The frequency responses of theequivalent 1-D analysis filters are shown in Fig. 1(a) and(b), for two different lowpass filters h: the 23-taps GLP fil-ter [9] and the Gaussian-like filter derived by Starck andMurtagh [23] from a cubic spline scaling function andwidely used for image fusion [11,24,25]. Apart from thelowpass filter (leftmost), all the other filters are bandpasswith bandwidths roughly halved as j increases by one.The spline filter, however, does not yield octave subbands,since the prototype exhibits cutoff at approximately one
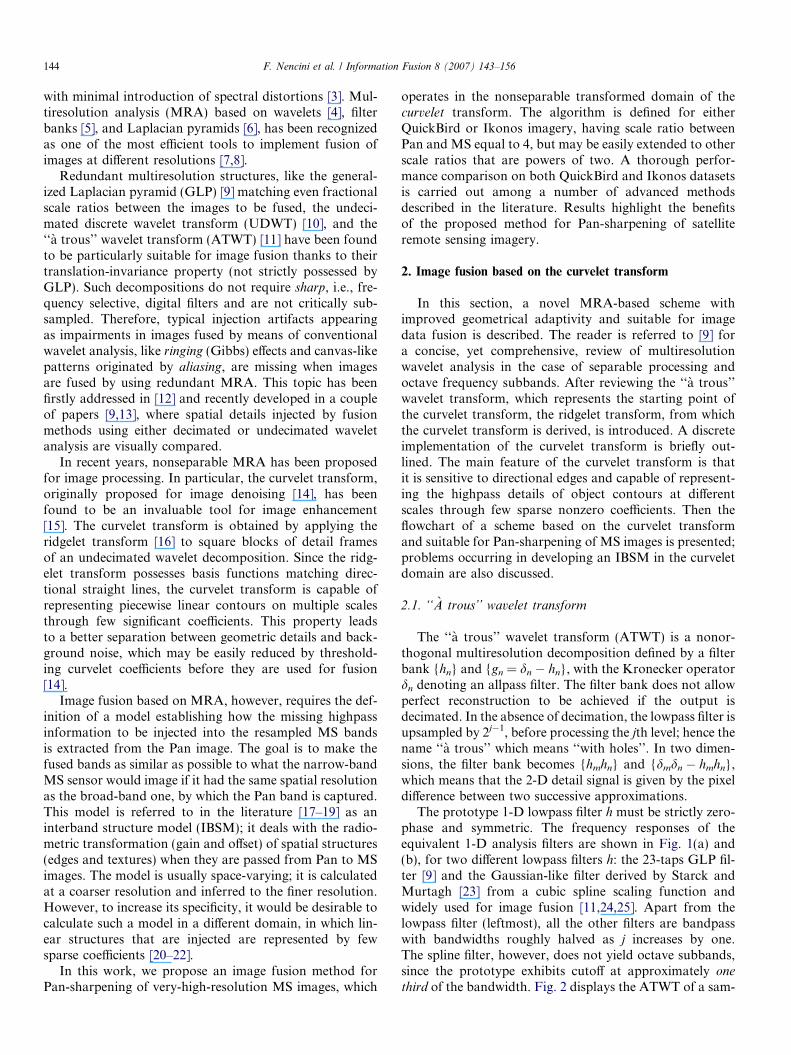
third of the bandwidth. Fig. 2 displays the ATWT of a sam-
0 0.1 0.2 0.3 0.4 0.50
0.2
0.4
0.6
0.8
1
Normalized frequency
Mag
nitu
de
(a)
0 0.1 0.2 0.3 0.4 0.50
0.2
0.4
0.6
0.8
1
Normalized frequency
Mag
nitu
de
(b)
Fig. 1. Frequency responses of equivalent filter bank of an octave ATWT, for J = 3 achieved by (a) 23-taps half-band filter and (b) 5-taps Starck andMurtagh’s Gaussian-like filter.
Fig. 2. ‘‘A trous’’ wavelet transform of Lenna, achieved by the filter bank in Fig. 1(a).
F. Nencini et al. / Information Fusion 8 (2007) 143–156 145
ple image. The levels of ATWT are obtained by separablefiltering of the original image with the equivalent filtersshown in Fig. 1(a).
For a J-level decomposition, the ATWT exhibits a num-ber of coefficients J + 1 times greater than the number ofpixels. Due to the absence of decimation, the synthesis issimply obtained by summing details levels to theapproximation:
f ðm; nÞ ¼ cJ ðm; nÞ þXJ
j¼1
djðm; nÞ ð1Þ
in which cJ(m,n) and dj(m,n), j = 1, . . . ,J are obtainedthrough 2-D separable linear convolution with the equiva-lent lowpass and highpass filters, respectively.
2.2. Ridgelet transform
The next step is finding a transformation capable of rep-resenting straight edges with different slopes and orienta-tions. A possible solution is the ridgelet transform [16],which may be interpreted as the 1-D wavelet transformof the Radon transform of f. This is the basic idea behindthe digital implementation of the ridgelet transform.
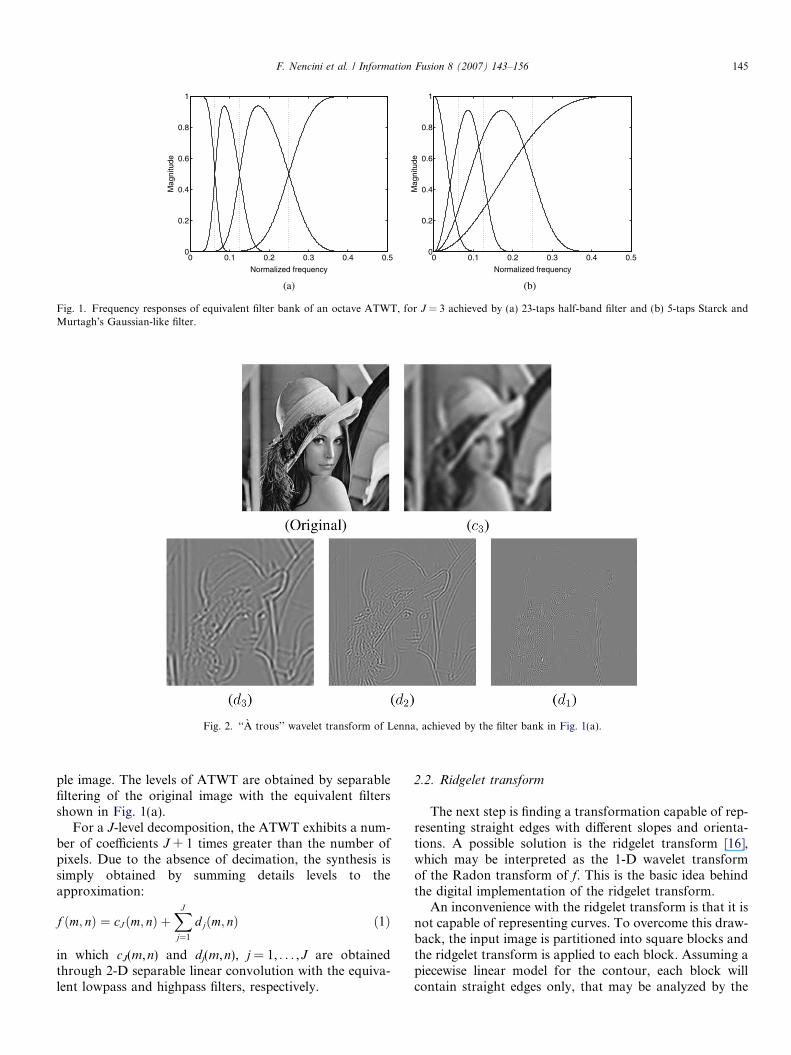
An inconvenience with the ridgelet transform is that it isnot capable of representing curves. To overcome this draw-back, the input image is partitioned into square blocks andthe ridgelet transform is applied to each block. Assuming apiecewise linear model for the contour, each block willcontain straight edges only, that may be analyzed by the
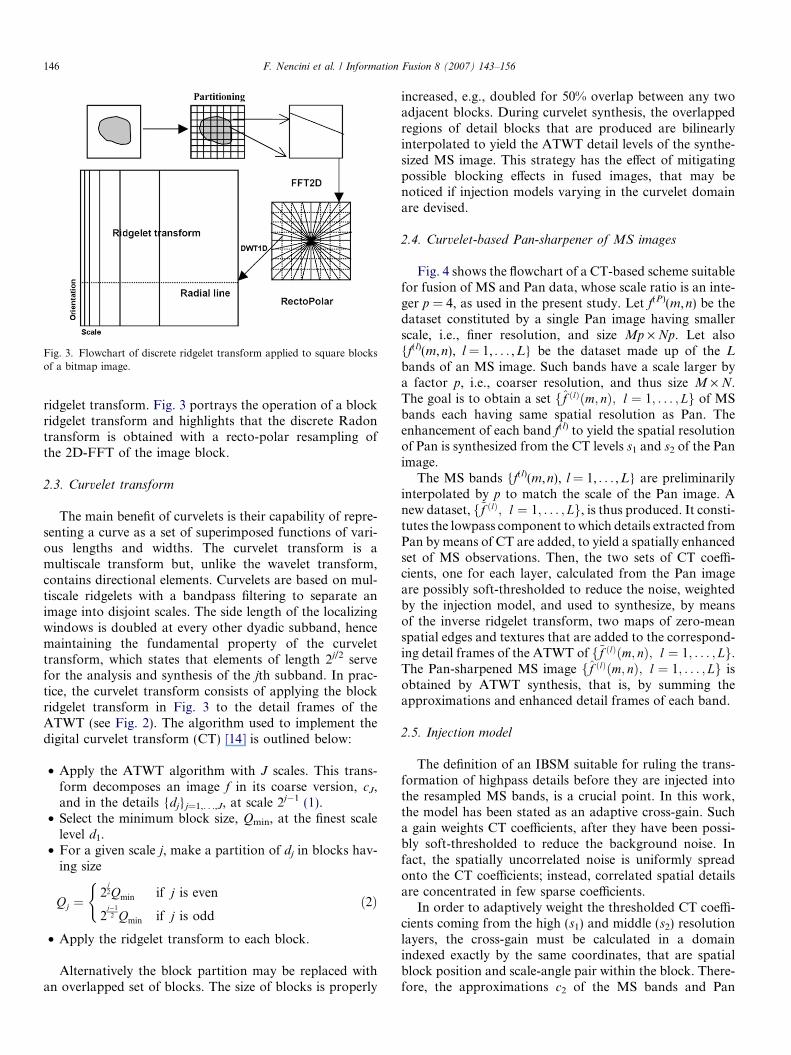
Fig. 3. Flowchart of discrete ridgelet transform applied to square blocksof a bitmap image.
146 F. Nencini et al. / Information Fusion 8 (2007) 143–156
ridgelet transform. Fig. 3 portrays the operation of a blockridgelet transform and highlights that the discrete Radontransform is obtained with a recto-polar resampling ofthe 2D-FFT of the image block.
2.3. Curvelet transform
The main benefit of curvelets is their capability of repre-senting a curve as a set of superimposed functions of vari-ous lengths and widths. The curvelet transform is amultiscale transform but, unlike the wavelet transform,contains directional elements. Curvelets are based on mul-tiscale ridgelets with a bandpass filtering to separate animage into disjoint scales. The side length of the localizingwindows is doubled at every other dyadic subband, hencemaintaining the fundamental property of the curvelettransform, which states that elements of length 2j/2 servefor the analysis and synthesis of the jth subband. In prac-tice, the curvelet transform consists of applying the blockridgelet transform in Fig. 3 to the detail frames of theATWT (see Fig. 2). The algorithm used to implement thedigital curvelet transform (CT) [14] is outlined below:
• Apply the ATWT algorithm with J scales. This trans-form decomposes an image f in its coarse version, cJ,and in the details {dj}j=1,. . .,J, at scale 2j�1 (1).
• Select the minimum block size, Qmin, at the finest scalelevel d1.
• For a given scale j, make a partition of dj in blocks hav-ing size
Qj ¼2
j2Qmin if j is even
2j�1
2 Qmin if j is odd
(ð2Þ
• Apply the ridgelet transform to each block.
Alternatively the block partition may be replaced withan overlapped set of blocks. The size of blocks is properly
increased, e.g., doubled for 50% overlap between any twoadjacent blocks. During curvelet synthesis, the overlappedregions of detail blocks that are produced are bilinearlyinterpolated to yield the ATWT detail levels of the synthe-sized MS image. This strategy has the effect of mitigatingpossible blocking effects in fused images, that may benoticed if injection models varying in the curvelet domainare devised.
2.4. Curvelet-based Pan-sharpener of MS images
Fig. 4 shows the flowchart of a CT-based scheme suitablefor fusion of MS and Pan data, whose scale ratio is an inte-ger p = 4, as used in the present study. Let f(P)(m,n) be thedataset constituted by a single Pan image having smallerscale, i.e., finer resolution, and size Mp · Np. Let also{f(l)(m,n), l = 1, . . . ,L} be the dataset made up of the L
bands of an MS image. Such bands have a scale larger bya factor p, i.e., coarser resolution, and thus size M · N.The goal is to obtain a set ff ðlÞðm; nÞ; l ¼ 1; . . . ; Lg of MSbands each having same spatial resolution as Pan. Theenhancement of each band f(l) to yield the spatial resolutionof Pan is synthesized from the CT levels s1 and s2 of the Panimage.
The MS bands {f(l)(m,n), l = 1, . . . ,L} are preliminarilyinterpolated by p to match the scale of the Pan image. Anew dataset, f~f ðlÞ; l ¼ 1; . . . ; Lg, is thus produced. It consti-tutes the lowpass component to which details extracted fromPan by means of CT are added, to yield a spatially enhancedset of MS observations. Then, the two sets of CT coeffi-cients, one for each layer, calculated from the Pan imageare possibly soft-thresholded to reduce the noise, weightedby the injection model, and used to synthesize, by meansof the inverse ridgelet transform, two maps of zero-meanspatial edges and textures that are added to the correspond-ing detail frames of the ATWT of f~f ðlÞðm; nÞ; l ¼ 1; . . . ; Lg.The Pan-sharpened MS image ff ðlÞðm; nÞ; l ¼ 1; . . . ; Lg isobtained by ATWT synthesis, that is, by summing theapproximations and enhanced detail frames of each band.
2.5. Injection model
The definition of an IBSM suitable for ruling the trans-formation of highpass details before they are injected intothe resampled MS bands, is a crucial point. In this work,the model has been stated as an adaptive cross-gain. Sucha gain weights CT coefficients, after they have been possi-bly soft-thresholded to reduce the background noise. Infact, the spatially uncorrelated noise is uniformly spreadonto the CT coefficients; instead, correlated spatial detailsare concentrated in few sparse coefficients.
In order to adaptively weight the thresholded CT coeffi-cients coming from the high (s1) and middle (s2) resolutionlayers, the cross-gain must be calculated in a domainindexed exactly by the same coordinates, that are spatialblock position and scale-angle pair within the block. There-fore, the approximations c2 of the MS bands and Pan

Softthresholding
Applicationof IBSM
Calculationof IBSM
Applicationof IBSM
Softthresholding
Curvelet TransformATW Transform
MultispectralBands resampled to
Pan scale
Panchromaticd1 c2 s2 s1c2 d2
d1c2 d2
ATW Synthesis
Denoising
Equalization
High-resolutionMultispectral
Bands
Inverse RidgeletTransform
Inverse RidgeletTransform
Fig. 4. Flowchart of curvelet-based fusion of MS and Pan data with 4:1 scale ratio.
Fig. 5. Flowchart of cross-gain calculation in a block-wise directionaldomain.
F. Nencini et al. / Information Fusion 8 (2007) 143–156 147
image are further analyzed with a block ridgelet transform,as shown in Fig. 3.
As two block sizes exist for fine and coarse details, i.e., s1
and s2, respectively, the ridgelet transform is applied to tworeplicas of c2 from MS and Pan, with two different blocksizes. In this way, there is a 1:1 correspondence betweencross-gain map and CT coefficients from Pan on both lay-ers s1 and s2. A simple IBSM is given by the ratio of localstandard deviations of ridgelet coefficients calculated fromthe approximations (c2) of an MS band and of the Panimage, respectively. Fig. 5 summarizes the calculation thecross-gain map at the finer resolution level s1. Analogously,the map of s2 is calculated with a coarser partition.
3. Experimental results and comparisons
3.1. Quality assessment of fusion products
The quality assessment of Pan-sharpened MS images isa difficult task [26,3,27]. Even when spatially degradedMS images are processed for Pan-sharpening, and there-fore reference MS images are available for comparisons,assessment of fidelity to the reference requires computationof several indexes. Examples are the band-to-band correla-tion coefficient (CC), bias in the mean, and root meansquare error (RMSE).
Given two spectral vectors v and v both having L com-ponents, in which v = {v1,v2, . . . ,vL} is the original spectral
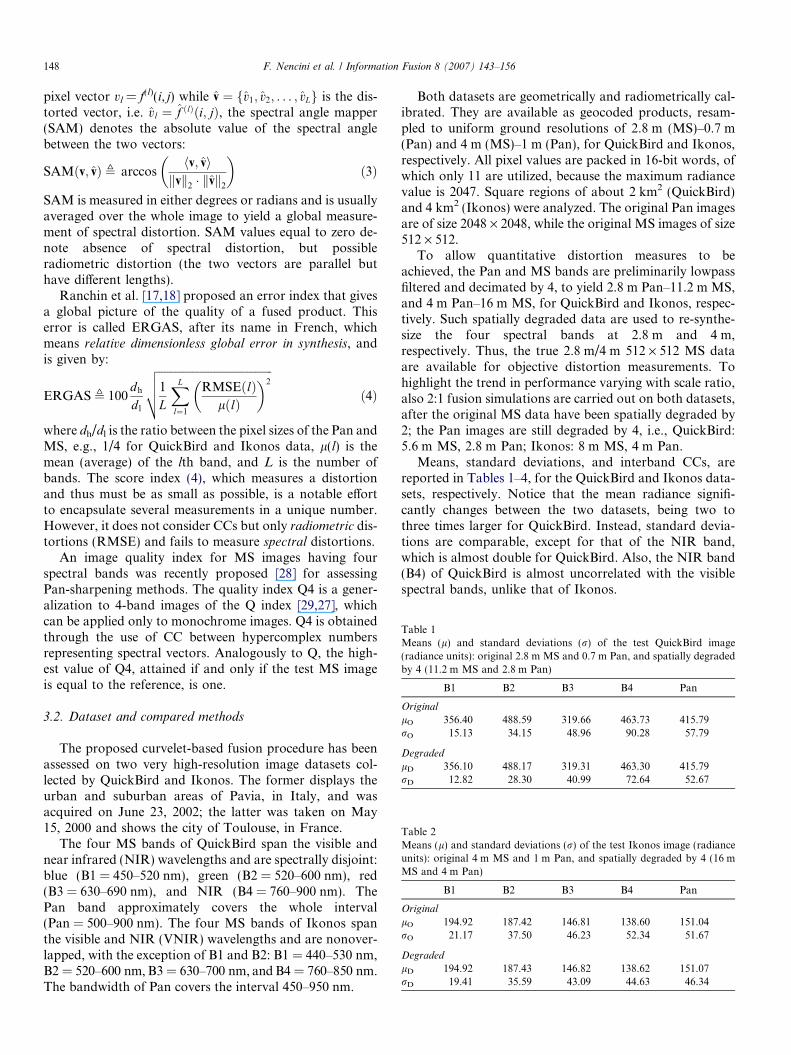
Table 1Means (l) and standard deviations (r) of the test QuickBird image(radiance units): original 2.8 m MS and 0.7 m Pan, and spatially degradedby 4 (11.2 m MS and 2.8 m Pan)
B1 B2 B3 B4 Pan
Original
lO 356.40 488.59 319.66 463.73 415.79rO 15.13 34.15 48.96 90.28 57.79
Degraded
lD 356.10 488.17 319.31 463.30 415.79rD 12.82 28.30 40.99 72.64 52.67
Table 2Means (l) and standard deviations (r) of the test Ikonos image (radianceunits): original 4 m MS and 1 m Pan, and spatially degraded by 4 (16 mMS and 4 m Pan)
B1 B2 B3 B4 Pan
Original
lO 194.92 187.42 146.81 138.60 151.04rO 21.17 37.50 46.23 52.34 51.67
Degraded
lD 194.92 187.43 146.82 138.62 151.07rD 19.41 35.59 43.09 44.63 46.34
148 F. Nencini et al. / Information Fusion 8 (2007) 143–156
pixel vector vl = f(l)(i, j) while v ¼ fv1; v2; . . . ; vLg is the dis-torted vector, i.e. vl ¼ f ðlÞði; jÞ, the spectral angle mapper(SAM) denotes the absolute value of the spectral anglebetween the two vectors:
SAMðv; vÞ , arccoshv; vi
kvk2 � kvk2
� �ð3Þ
SAM is measured in either degrees or radians and is usuallyaveraged over the whole image to yield a global measure-ment of spectral distortion. SAM values equal to zero de-note absence of spectral distortion, but possibleradiometric distortion (the two vectors are parallel buthave different lengths).
Ranchin et al. [17,18] proposed an error index that givesa global picture of the quality of a fused product. Thiserror is called ERGAS, after its name in French, whichmeans relative dimensionless global error in synthesis, andis given by:
ERGAS , 100dh
d l
ffiffiffiffiffiffiffiffiffiffiffiffiffiffiffiffiffiffiffiffiffiffiffiffiffiffiffiffiffiffiffiffiffiffiffiffiffiffiffiffiffi1
L
XL
l¼1
RMSEðlÞlðlÞ
� �2
vuut ð4Þ
where dh/dl is the ratio between the pixel sizes of the Pan andMS, e.g., 1/4 for QuickBird and Ikonos data, l(l) is themean (average) of the lth band, and L is the number ofbands. The score index (4), which measures a distortionand thus must be as small as possible, is a notable effortto encapsulate several measurements in a unique number.However, it does not consider CCs but only radiometric dis-tortions (RMSE) and fails to measure spectral distortions.
An image quality index for MS images having fourspectral bands was recently proposed [28] for assessingPan-sharpening methods. The quality index Q4 is a gener-alization to 4-band images of the Q index [29,27], whichcan be applied only to monochrome images. Q4 is obtainedthrough the use of CC between hypercomplex numbersrepresenting spectral vectors. Analogously to Q, the high-est value of Q4, attained if and only if the test MS imageis equal to the reference, is one.
3.2. Dataset and compared methods
The proposed curvelet-based fusion procedure has beenassessed on two very high-resolution image datasets col-lected by QuickBird and Ikonos. The former displays theurban and suburban areas of Pavia, in Italy, and wasacquired on June 23, 2002; the latter was taken on May15, 2000 and shows the city of Toulouse, in France.
The four MS bands of QuickBird span the visible andnear infrared (NIR) wavelengths and are spectrally disjoint:blue (B1 = 450–520 nm), green (B2 = 520–600 nm), red(B3 = 630–690 nm), and NIR (B4 = 760–900 nm). ThePan band approximately covers the whole interval(Pan = 500–900 nm). The four MS bands of Ikonos spanthe visible and NIR (VNIR) wavelengths and are nonover-lapped, with the exception of B1 and B2: B1 = 440–530 nm,B2 = 520–600 nm, B3 = 630–700 nm, and B4 = 760–850 nm.The bandwidth of Pan covers the interval 450–950 nm.
Both datasets are geometrically and radiometrically cal-ibrated. They are available as geocoded products, resam-pled to uniform ground resolutions of 2.8 m (MS)–0.7 m(Pan) and 4 m (MS)–1 m (Pan), for QuickBird and Ikonos,respectively. All pixel values are packed in 16-bit words, ofwhich only 11 are utilized, because the maximum radiancevalue is 2047. Square regions of about 2 km2 (QuickBird)and 4 km2 (Ikonos) were analyzed. The original Pan imagesare of size 2048 · 2048, while the original MS images of size512 · 512.
To allow quantitative distortion measures to beachieved, the Pan and MS bands are preliminarily lowpassfiltered and decimated by 4, to yield 2.8 m Pan–11.2 m MS,and 4 m Pan–16 m MS, for QuickBird and Ikonos, respec-tively. Such spatially degraded data are used to re-synthe-size the four spectral bands at 2.8 m and 4 m,respectively. Thus, the true 2.8 m/4 m 512 · 512 MS dataare available for objective distortion measurements. Tohighlight the trend in performance varying with scale ratio,also 2:1 fusion simulations are carried out on both datasets,after the original MS data have been spatially degraded by2; the Pan images are still degraded by 4, i.e., QuickBird:5.6 m MS, 2.8 m Pan; Ikonos: 8 m MS, 4 m Pan.
Means, standard deviations, and interband CCs, arereported in Tables 1–4, for the QuickBird and Ikonos data-sets, respectively. Notice that the mean radiance signifi-cantly changes between the two datasets, being two tothree times larger for QuickBird. Instead, standard devia-tions are comparable, except for that of the NIR band,which is almost double for QuickBird. Also, the NIR band(B4) of QuickBird is almost uncorrelated with the visiblespectral bands, unlike that of Ikonos.

Table 3QuickBird: CCs between original 2.8 m MS and Pan image degraded tosame the pixel size
B1 B2 B3 B4 Pan
B1 1.0 0.950 0.823 0.060 0.505B2 0.950 1.0 0.911 0.182 0.625B3 0.823 0.911 1.0 0.192 0.650B4 0.060 0.182 0.192 1.0 0.798Pan 0.505 0.625 0.650 0.798 1.0
Table 4Ikonos: CCs between original 4 m MS and Pan image degraded to samethe pixel size
B1 B2 B3 B4 Pan
B1 1.0 0.959 0.903 0.614 0.784B2 0.959 1.0 0.965 0.662 0.827B3 0.903 0.965 1.0 0.701 0.856B4 0.614 0.662 0.701 1.0 0.854Pan 0.784 0.827 0.856 0.854 1.0
Fig. 6. Detail of fused QuickBird MS image (256 · 256): (a) resampled 11.2 mHPF fusion, (g) GS fusion, (h) AWL fusion and (i) true 2.8 m MS.
F. Nencini et al. / Information Fusion 8 (2007) 143–156 149
True-color composites (bands 3–2–1) of 11.2 m and2.8 m MS data, are reported in Fig. 6(a) and (i), and inFig. 8(a) and (i), for QuickBird and Ikonos, respectively.Local misalignments between MS and degraded Pan, thatare likely to affect fusion results, are introduced by carto-graphic resampling and are hardly noticeable.
A thorough performance comparison was carried outbetween the novel method and a number of state-of-the-art image fusion methods, which are listed in the following.
• Multiresolution IHS [11] with additive model (AWL),based on ATWT.
• ATWT-based method with spectral distortion minimiz-ing (SDM) model [19].
• ATWT-based method with Ranchin–Wald–Mangolini(RWM) model [18].
• ATWT-based method with context-based decision(CBD) model [9].
• Gram–Schmidt spectral sharpening method [30] (GS), asimplemented in ENVI [31].
MS, (b) CT fusion, (c) SDM fusion, (d) RWM fusion, (e) CBD fusion, (f)

150 F. Nencini et al. / Information Fusion 8 (2007) 143–156
• High-pass filtering (HPF) [26]: 3 · 3 and 5 · 5 box filtersfor 2:1 and 4:1 fusion.
Also the case in which the MS data are simply resam-pled (through the 23-taps filter) and no details are added,is presented (under the label EXP) to discuss the behaviorof the different fusion methods.
3.3. Performance comparison on QuickBird data
Mean bias (Dl) and root mean squared error (RMSE)between each pair of fused and original MS bands arereported in Tables 5 and 6, respectively. Mean biases arepractically zero for all entries, as expected, since all methodsactually perform injection of zero-mean edges and texturesinto the resampled MS data. What immediately stands outby looking at the values in Table 6 is that, for 2:1 fusion,only few methods are capable of providing average RMSE
Table 5Mean bias (Dl) between 2.8 m originals and fused MS bands obtainedfrom 11.2 m MS through 4:1 fusion with 2.8 m Pan and from 5.6 m MSthrough 2:1 fusion with 2.8 m Pan
EXP CT AWL SDM RWM CBD GS HPF
4:1
B1 0.002 �0.054 �0.002 �0.234 �0.080 �0.027 0.002 �0.005B2 0.007 �0.032 �0.002 �0.310 �0.127 �0.058 0.007 �0.001B3 0.011 �0.045 �0.007 �0.134 �0.118 �0.117 0.011 �0.004B4 0.027 �0.077 �0.025 �0.097 �0.024 �0.204 0.028 �0.020
Avg. 0.012 �0.052 �0.009 �0.194 �0.087 �0.101 0.012 �0.007
2:1
B1 0.000 �0.023 �0.002 �0.197 �0.028 �0.000 0.000 �0.005B2 0.001 �0.004 �0.000 �0.245 �0.046 �0.002 0.001 �0.003B3 0.001 �0.001 �0.000 �0.122 �0.089 0.006 0.001 �0.003B4 0.007 0.068 0.005 �0.103 �0.013 0.001 0.007 0.002
Avg. 0.002 �0.010 �0.001 �0.167 �0.044 �0.001 0.002 �0.002
Table 6RMSE between original 2.8 m MS bands and fusion products obtainedfrom 11.2 m MS through 4:1 fusion with 2.8 m Pan and from 5.6 m MSthrough 2:1 fusion with 2.8 m Pan
EXP CT AWL SDM RWM CBD GS HPF
4:1
B1 7.31 6.61 15.85 25.51 9.78 7.45 6.35 31.97B2 17.51 13.67 15.74 31.03 19.98 16.48 14.05 27.57B3 25.12 18.93 20.74 20.06 29.66 23.70 19.55 26.24B4 50.83 35.65 44.85 32.76 40.12 36.26 36.66 34.12
Avg. 29.89 21.56 27.11 27.79 27.31 23.47 22.16 30.15
2:1
B1 4.57 4.30 13.54 14.95 4.92 4.71 4.24 22.89B2 10.47 9.23 12.81 19.08 10.33 10.34 9.26 21.05B3 13.93 12.20 14.44 13.39 13.65 14.21 12.47 20.47B4 29.07 23.72 28.86 22.80 25.01 25.18 24.83 24.13
Avg. 17.10 14.28 18.63 17.94 15.35 15.53 14.80 22.18
Avg. ¼ffiffiffiffiffiffiffiffiffiffiffiffiffiffiffiffiffiffiffiffiffiAvg.MSE
p.
values lower than those obtained by plain resampling of MSbands (EXP). In this sense the best algorithms are the curv-elet one (CT), strictly followed by Gram–Schmidt (GS)sharpening, and ATWT with the CBD model (CBD). Themultiresolution IHS (AWL), and the RWM model, bothexploiting ATWT as well, are comparable with plain resam-pling, even if slightly superior. The ATWT-SDM algorithm,devised to optimize the spectral error with respect to theresampled MS bands, and especially HPF, yield larger aver-age errors, mostly concentrated in the blue band. The mainreason for that is the absence of a space-varying model(IBSM) varying with bands: all details are injected, therebyleading to over-enhancement. We also can see that RMSE isdirectly related to the square root of variance of the originalband and inversely related to the correlation with Pan. Twothings can be noticed: RMSE is approximately reduced by afactor equal to
ffiffiffi2p
when the scale ratio is halved, i.e., whenpassing from 4:1 to 2:1 fusion; for the resampled MS bands(EXP), it holds that r2
OðBlÞ � r2DðBlÞ þRMSE2ðBlÞ (see
Table 1).Table 7 reports CCs between fused products and refer-
ence original MS bands. From a general view, the bluewavelengths band (B1) is most difficult to synthesize, whilethe NIR band (B4) is the easiest. The simple explanation isthat the enhancing Pan is weakly correlated with B1 andstrongly with B4 (see Table 3). For 4:1 fusion, CT, GS,and CBD yield average CCs greater than that of the resam-pled bands (EXP). For 2:1 fusion, also RWM outperformsEXP.
Practically, all schemes can adequately enhance B4, butonly CT, GS and CBD provide acceptable enhancement ofB1 for 4:1 fusion (also RWM for 2:1). The best averagescores in terms of CCs between true and fused products fol-low similar trends as for RMSE, GS now being the best for4:1, closely followed by CT; HPF being the poorest. Obvi-ously, the correlation loss of the resampled data is propor-tional to the amount of detail possessed by each band.
Table 7CC between 2.8 m originals and fused MS bands obtained from 11.2 mMS through 4:1 fusion with 2.8 m Pan and from 5.6 m MS through 2:1fusion with 2.8 m Pan
EXP CT AWL SDM RWM CBD GS HPF
4:1
B1 0.860 0.887 0.706 0.598 0.794 0.860 0.899 0.588B2 0.843 0.907 0.876 0.771 0.829 0.870 0.907 0.812B3 0.852 0.918 0.904 0.912 0.837 0.878 0.919 0.833B4 0.819 0.916 0.879 0.929 0.898 0.912 0.921 0.922
Avg. 0.843 0.907 0.841 0.803 0.840 0.880 0.911 0.789
2:1
B1 0.947 0.953 0.761 0.713 0.939 0.944 0.955 0.655B2 0.946 0.958 0.923 0.866 0.948 0.958 0.959 0.874B3 0.957 0.967 0.953 0.961 0.958 0.955 0.966 0.931B4 0.944 0.963 0.950 0.966 0.959 0.958 0.960 0.964
Avg. 0.948 0.960 0.897 0.877 0.951 0.954 0.960 0.856
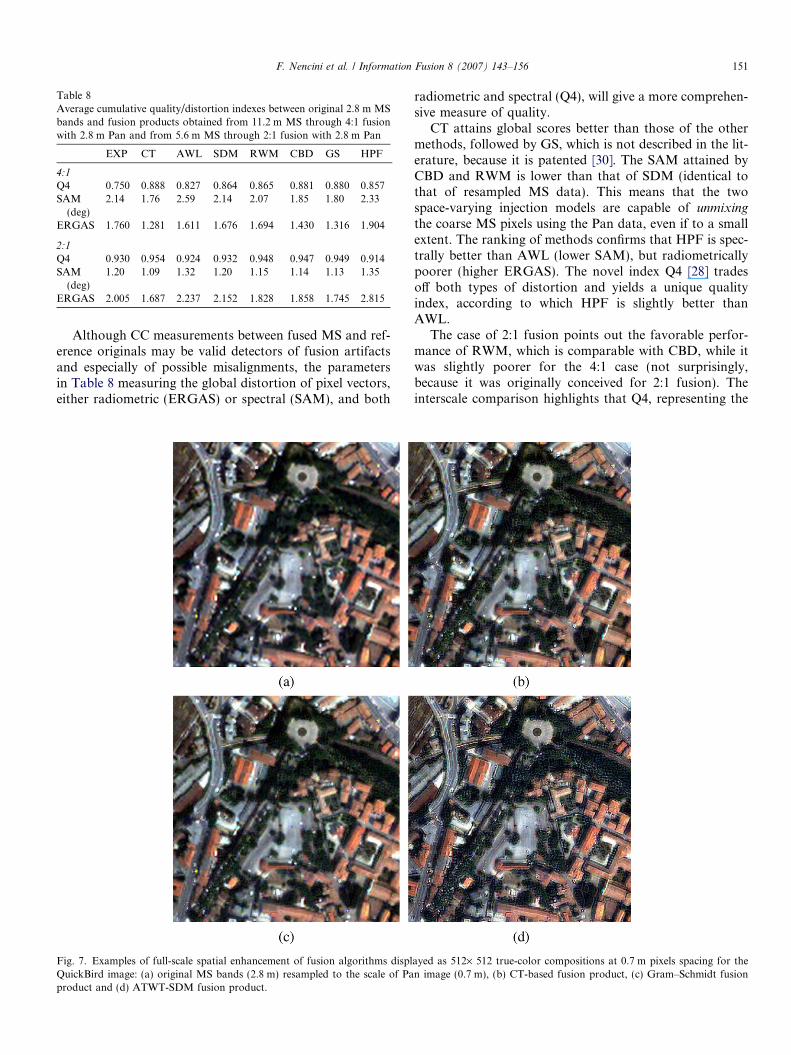
Table 8Average cumulative quality/distortion indexes between original 2.8 m MSbands and fusion products obtained from 11.2 m MS through 4:1 fusionwith 2.8 m Pan and from 5.6 m MS through 2:1 fusion with 2.8 m Pan
EXP CT AWL SDM RWM CBD GS HPF
4:1
Q4 0.750 0.888 0.827 0.864 0.865 0.881 0.880 0.857SAM
(deg)2.14 1.76 2.59 2.14 2.07 1.85 1.80 2.33
ERGAS 1.760 1.281 1.611 1.676 1.694 1.430 1.316 1.904
2:1
Q4 0.930 0.954 0.924 0.932 0.948 0.947 0.949 0.914SAM
(deg)1.20 1.09 1.32 1.20 1.15 1.14 1.13 1.35
ERGAS 2.005 1.687 2.237 2.152 1.828 1.858 1.745 2.815
F. Nencini et al. / Information Fusion 8 (2007) 143–156 151
Although CC measurements between fused MS and ref-erence originals may be valid detectors of fusion artifactsand especially of possible misalignments, the parametersin Table 8 measuring the global distortion of pixel vectors,either radiometric (ERGAS) or spectral (SAM), and both
Fig. 7. Examples of full-scale spatial enhancement of fusion algorithms displQuickBird image: (a) original MS bands (2.8 m) resampled to the scale of Paproduct and (d) ATWT-SDM fusion product.
radiometric and spectral (Q4), will give a more comprehen-sive measure of quality.
CT attains global scores better than those of the othermethods, followed by GS, which is not described in the lit-erature, because it is patented [30]. The SAM attained byCBD and RWM is lower than that of SDM (identical tothat of resampled MS data). This means that the twospace-varying injection models are capable of unmixing
the coarse MS pixels using the Pan data, even if to a smallextent. The ranking of methods confirms that HPF is spec-trally better than AWL (lower SAM), but radiometricallypoorer (higher ERGAS). The novel index Q4 [28] tradesoff both types of distortion and yields a unique qualityindex, according to which HPF is slightly better thanAWL.
The case of 2:1 fusion points out the favorable perfor-mance of RWM, which is comparable with CBD, while itwas slightly poorer for the 4:1 case (not surprisingly,because it was originally conceived for 2:1 fusion). Theinterscale comparison highlights that Q4, representing the
ayed as 512· 512 true-color compositions at 0.7 m pixels spacing for then image (0.7 m), (b) CT-based fusion product, (c) Gram–Schmidt fusion
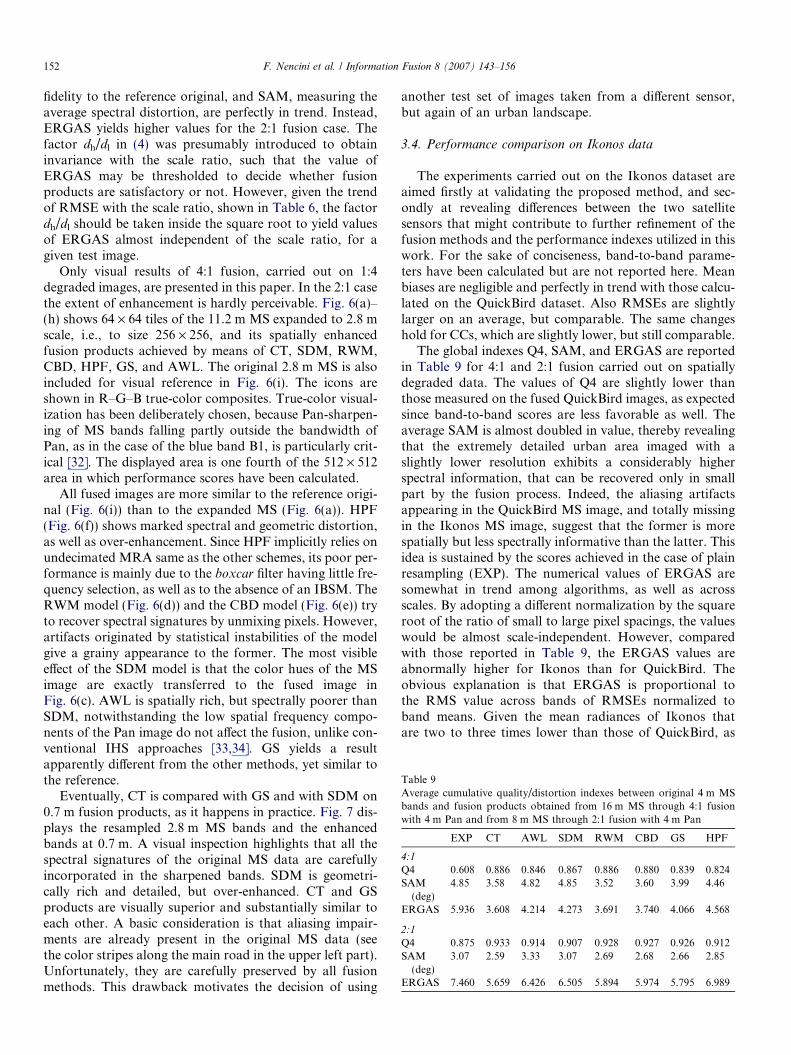
Table 9Average cumulative quality/distortion indexes between original 4 m MSbands and fusion products obtained from 16 m MS through 4:1 fusionwith 4 m Pan and from 8 m MS through 2:1 fusion with 4 m Pan
EXP CT AWL SDM RWM CBD GS HPF
4:1
Q4 0.608 0.886 0.846 0.867 0.886 0.880 0.839 0.824SAM
(deg)4.85 3.58 4.82 4.85 3.52 3.60 3.99 4.46
ERGAS 5.936 3.608 4.214 4.273 3.691 3.740 4.066 4.568
2:1
Q4 0.875 0.933 0.914 0.907 0.928 0.927 0.926 0.912SAM
(deg)3.07 2.59 3.33 3.07 2.69 2.68 2.66 2.85
ERGAS 7.460 5.659 6.426 6.505 5.894 5.974 5.795 6.989
152 F. Nencini et al. / Information Fusion 8 (2007) 143–156
fidelity to the reference original, and SAM, measuring theaverage spectral distortion, are perfectly in trend. Instead,ERGAS yields higher values for the 2:1 fusion case. Thefactor dh/dl in (4) was presumably introduced to obtaininvariance with the scale ratio, such that the value ofERGAS may be thresholded to decide whether fusionproducts are satisfactory or not. However, given the trendof RMSE with the scale ratio, shown in Table 6, the factordh/dl should be taken inside the square root to yield valuesof ERGAS almost independent of the scale ratio, for agiven test image.
Only visual results of 4:1 fusion, carried out on 1:4degraded images, are presented in this paper. In the 2:1 casethe extent of enhancement is hardly perceivable. Fig. 6(a)–(h) shows 64 · 64 tiles of the 11.2 m MS expanded to 2.8 mscale, i.e., to size 256 · 256, and its spatially enhancedfusion products achieved by means of CT, SDM, RWM,CBD, HPF, GS, and AWL. The original 2.8 m MS is alsoincluded for visual reference in Fig. 6(i). The icons areshown in R–G–B true-color composites. True-color visual-ization has been deliberately chosen, because Pan-sharpen-ing of MS bands falling partly outside the bandwidth ofPan, as in the case of the blue band B1, is particularly crit-ical [32]. The displayed area is one fourth of the 512 · 512area in which performance scores have been calculated.
All fused images are more similar to the reference origi-nal (Fig. 6(i)) than to the expanded MS (Fig. 6(a)). HPF(Fig. 6(f)) shows marked spectral and geometric distortion,as well as over-enhancement. Since HPF implicitly relies onundecimated MRA same as the other schemes, its poor per-formance is mainly due to the boxcar filter having little fre-quency selection, as well as to the absence of an IBSM. TheRWM model (Fig. 6(d)) and the CBD model (Fig. 6(e)) tryto recover spectral signatures by unmixing pixels. However,artifacts originated by statistical instabilities of the modelgive a grainy appearance to the former. The most visibleeffect of the SDM model is that the color hues of the MSimage are exactly transferred to the fused image inFig. 6(c). AWL is spatially rich, but spectrally poorer thanSDM, notwithstanding the low spatial frequency compo-nents of the Pan image do not affect the fusion, unlike con-ventional IHS approaches [33,34]. GS yields a resultapparently different from the other methods, yet similar tothe reference.
Eventually, CT is compared with GS and with SDM on0.7 m fusion products, as it happens in practice. Fig. 7 dis-plays the resampled 2.8 m MS bands and the enhancedbands at 0.7 m. A visual inspection highlights that all thespectral signatures of the original MS data are carefullyincorporated in the sharpened bands. SDM is geometri-cally rich and detailed, but over-enhanced. CT and GSproducts are visually superior and substantially similar toeach other. A basic consideration is that aliasing impair-ments are already present in the original MS data (seethe color stripes along the main road in the upper left part).Unfortunately, they are carefully preserved by all fusionmethods. This drawback motivates the decision of using
another test set of images taken from a different sensor,but again of an urban landscape.
3.4. Performance comparison on Ikonos data
The experiments carried out on the Ikonos dataset areaimed firstly at validating the proposed method, and sec-ondly at revealing differences between the two satellitesensors that might contribute to further refinement of thefusion methods and the performance indexes utilized in thiswork. For the sake of conciseness, band-to-band parame-ters have been calculated but are not reported here. Meanbiases are negligible and perfectly in trend with those calcu-lated on the QuickBird dataset. Also RMSEs are slightlylarger on an average, but comparable. The same changeshold for CCs, which are slightly lower, but still comparable.
The global indexes Q4, SAM, and ERGAS are reportedin Table 9 for 4:1 and 2:1 fusion carried out on spatiallydegraded data. The values of Q4 are slightly lower thanthose measured on the fused QuickBird images, as expectedsince band-to-band scores are less favorable as well. Theaverage SAM is almost doubled in value, thereby revealingthat the extremely detailed urban area imaged with aslightly lower resolution exhibits a considerably higherspectral information, that can be recovered only in smallpart by the fusion process. Indeed, the aliasing artifactsappearing in the QuickBird MS image, and totally missingin the Ikonos MS image, suggest that the former is morespatially but less spectrally informative than the latter. Thisidea is sustained by the scores achieved in the case of plainresampling (EXP). The numerical values of ERGAS aresomewhat in trend among algorithms, as well as acrossscales. By adopting a different normalization by the squareroot of the ratio of small to large pixel spacings, the valueswould be almost scale-independent. However, comparedwith those reported in Table 9, the ERGAS values areabnormally higher for Ikonos than for QuickBird. Theobvious explanation is that ERGAS is proportional tothe RMS value across bands of RMSEs normalized toband means. Given the mean radiances of Ikonos thatare two to three times lower than those of QuickBird, as
F. Nencini et al. / Information Fusion 8 (2007) 143–156 153
shown in Tables 1 and 2, it is not surprising that in practicethe interval of ERGAS values is strictly sensor-dependent.No conclusions about which values are suitable to guaran-tee the quality of fusion products can be inferred from oneMS scanner to another. While the change in values with thescale ratio can be easily modeled and hence predicted, thereis no way to overcome the problem stemming from the dif-ference in mean value across sensors, given the intrinsicdefinition of ERGAS. Conversely, the Q4 index is steadybetween the two datasets. The values of Q4 reveal theimproved performance of RWM, which is comparable withthe curvelet method on the Ikonos dataset.
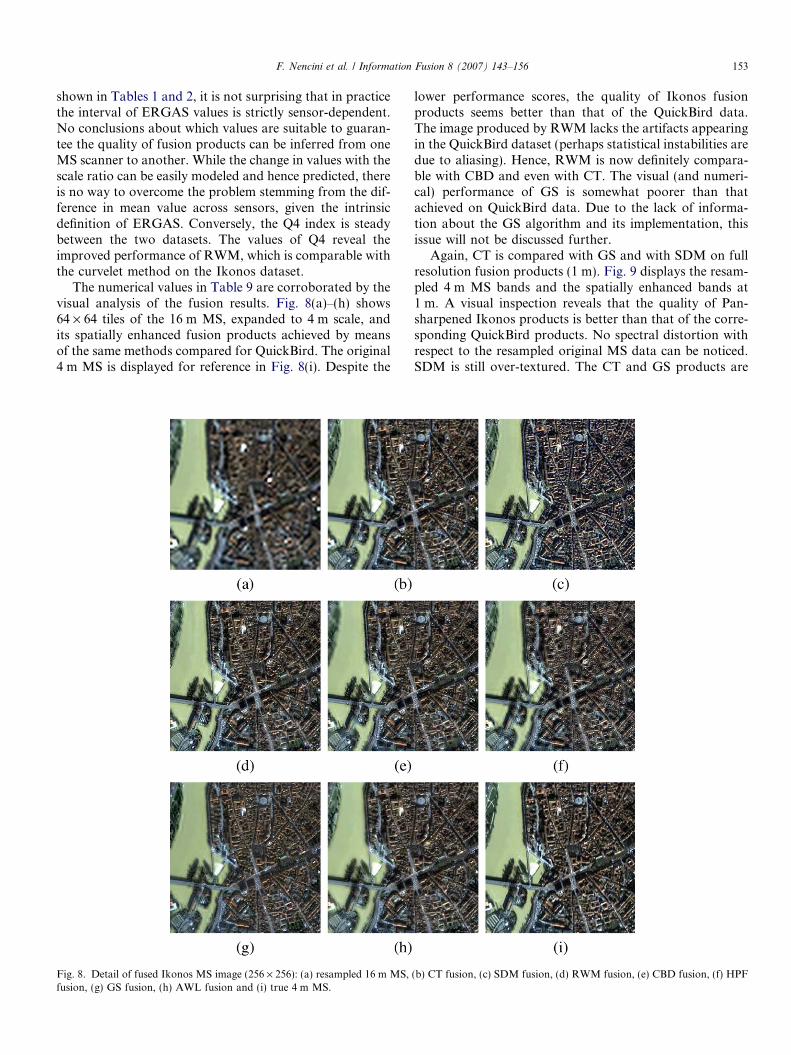
The numerical values in Table 9 are corroborated by thevisual analysis of the fusion results. Fig. 8(a)–(h) shows64 · 64 tiles of the 16 m MS, expanded to 4 m scale, andits spatially enhanced fusion products achieved by meansof the same methods compared for QuickBird. The original4 m MS is displayed for reference in Fig. 8(i). Despite the
Fig. 8. Detail of fused Ikonos MS image (256 · 256): (a) resampled 16 m MS,fusion, (g) GS fusion, (h) AWL fusion and (i) true 4 m MS.
lower performance scores, the quality of Ikonos fusionproducts seems better than that of the QuickBird data.The image produced by RWM lacks the artifacts appearingin the QuickBird dataset (perhaps statistical instabilities aredue to aliasing). Hence, RWM is now definitely compara-ble with CBD and even with CT. The visual (and numeri-cal) performance of GS is somewhat poorer than thatachieved on QuickBird data. Due to the lack of informa-tion about the GS algorithm and its implementation, thisissue will not be discussed further.
Again, CT is compared with GS and with SDM on fullresolution fusion products (1 m). Fig. 9 displays the resam-pled 4 m MS bands and the spatially enhanced bands at1 m. A visual inspection reveals that the quality of Pan-sharpened Ikonos products is better than that of the corre-sponding QuickBird products. No spectral distortion withrespect to the resampled original MS data can be noticed.SDM is still over-textured. The CT and GS products are
(b) CT fusion, (c) SDM fusion, (d) RWM fusion, (e) CBD fusion, (f) HPF
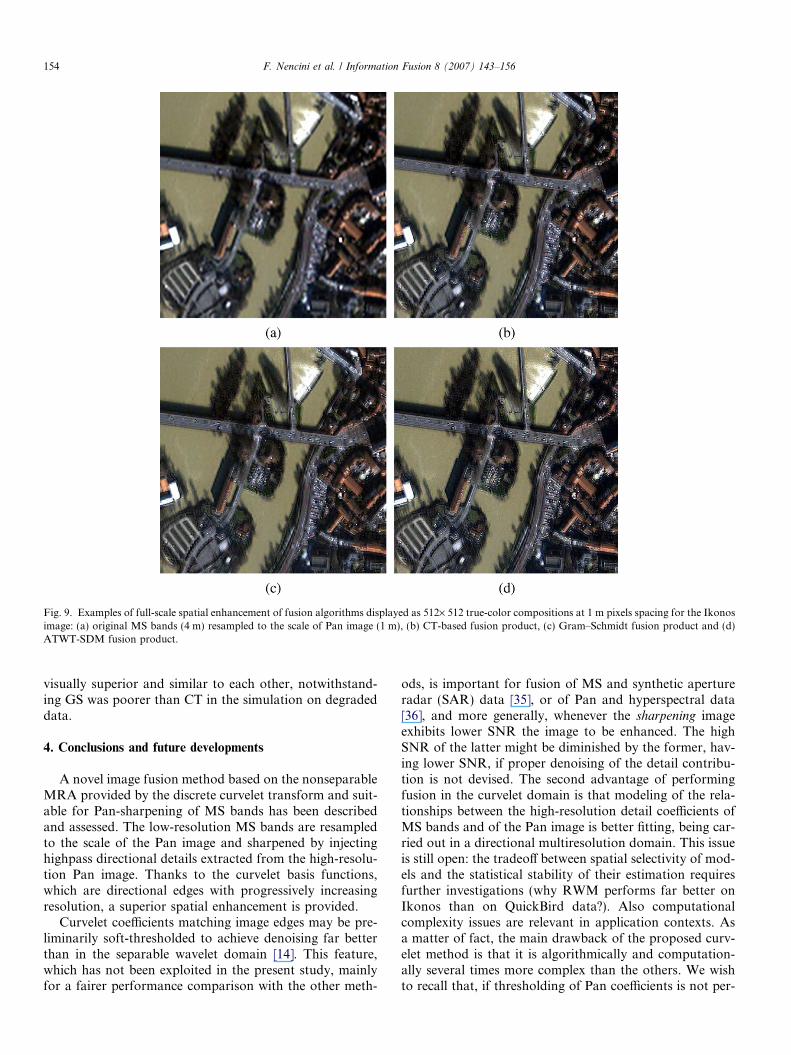
Fig. 9. Examples of full-scale spatial enhancement of fusion algorithms displayed as 512· 512 true-color compositions at 1 m pixels spacing for the Ikonosimage: (a) original MS bands (4 m) resampled to the scale of Pan image (1 m), (b) CT-based fusion product, (c) Gram–Schmidt fusion product and (d)ATWT-SDM fusion product.
154 F. Nencini et al. / Information Fusion 8 (2007) 143–156
visually superior and similar to each other, notwithstand-ing GS was poorer than CT in the simulation on degradeddata.
4. Conclusions and future developments
A novel image fusion method based on the nonseparableMRA provided by the discrete curvelet transform and suit-able for Pan-sharpening of MS bands has been describedand assessed. The low-resolution MS bands are resampledto the scale of the Pan image and sharpened by injectinghighpass directional details extracted from the high-resolu-tion Pan image. Thanks to the curvelet basis functions,which are directional edges with progressively increasingresolution, a superior spatial enhancement is provided.
Curvelet coefficients matching image edges may be pre-liminarily soft-thresholded to achieve denoising far betterthan in the separable wavelet domain [14]. This feature,which has not been exploited in the present study, mainlyfor a fairer performance comparison with the other meth-
ods, is important for fusion of MS and synthetic apertureradar (SAR) data [35], or of Pan and hyperspectral data[36], and more generally, whenever the sharpening imageexhibits lower SNR the image to be enhanced. The highSNR of the latter might be diminished by the former, hav-ing lower SNR, if proper denoising of the detail contribu-tion is not devised. The second advantage of performingfusion in the curvelet domain is that modeling of the rela-tionships between the high-resolution detail coefficients ofMS bands and of the Pan image is better fitting, being car-ried out in a directional multiresolution domain. This issueis still open: the tradeoff between spatial selectivity of mod-els and the statistical stability of their estimation requiresfurther investigations (why RWM performs far better onIkonos than on QuickBird data?). Also computationalcomplexity issues are relevant in application contexts. Asa matter of fact, the main drawback of the proposed curv-elet method is that it is algorithmically and computation-ally several times more complex than the others. We wishto recall that, if thresholding of Pan coefficients is not per-

F. Nencini et al. / Information Fusion 8 (2007) 143–156 155
formed and the IBSM is nonadaptive (a global gain, orgain–offset pair, different for each band but not for eachcoefficient) there is no advantage whatsoever in using thecurvelet transform, rather than the ATWT, for imagefusion. This property may be easily verified if one refersto the flowchart in Fig. 4.
Experiments carried out on very-high-resolution Quick-Bird and Ikonos images have shown that the proposedcurvelet method is quantitatively comparable with state-of-the art image fusion methods. Depending on the data-sets, however, the performance ranking of fusion methodsmay be different. In particular, on the Ikonos dataset theproposed method outperforms the Gram–Schmidt spectralsharpening method, which is implemented in the softwarepackage ENVI and constitutes the baseline algorithm fromwhich commercial Pan-sharpened products are achieved.The different origin of the two algorithms (GS exploits anorthogonal component substitution, CT a nonseparableMRA) and the fact that the GS algorithm is likely to havebeen strongly optimized for commercial exploitation leadus to the conclusion that the novel CT fusion methodmay be useful for Pan-sharpening of MS imagery.
For the sake of completeness, it is worth noting that theidea of using the curvelet transform for image fusion wasindependently carried out by Choi et al. [20], who imple-mented the RWM injection model in the curvelet domain.Unfortunately, due to several factors in their paper (lack ofa flowchart of the algorithm, different dataset, i.e., Landsat7 ETM+ MS and Pan, use of ERGAS as global perfor-mance index), it was not possible to attempt any compari-sons with an otherwise valuable counterpart.
Acknowledgments
The authors are grateful to Bruno Aiazzi of IFAC-CNRfor the computer simulations and to Centre Nationale
d’Etudes Spatiales (CNES) for providing the Ikonos data-set. This work has been supported in part by the ItalianMinistry of Research under PRIN 2005.
References
[1] C. Pohl, J.L. van Genderen, Multisensor image fusion in remotesensing: concepts, methods, and applications, International Journalof Remote Sensing 19 (5) (1998) 823–854.
[2] A.S. Kumar, B. Kartikeyan, K.L. Majumdar, Band sharpening ofIRS-multispectral imagery by cubic spline wavelets, InternationalJournal of Remote Sensing 21 (3) (2000) 581–594.
[3] L. Wald, T. Ranchin, M. Mangolini, Fusion of satellite images ofdifferent spatial resolutions: assessing the quality of resulting images,Photogrammetric Engineering and Remote Sensing 63 (6) (1997) 691–699.
[4] S.G. Mallat, A Wavelet Tour of Signal Processing, second ed.,Academic Press, New York, 1999.
[5] F. Argenti, L. Alparone, Filterbanks design for multisensor datafusion, IEEE Signal Processing Letters 7 (5) (2000) 100–103.
[6] B. Aiazzi, L. Alparone, S. Baronti, F. Lotti, Lossless image compres-sion by quantization feedback in a content-driven enhanced Laplacianpyramid, IEEE Transactions on Image Processing 6 (6) (1997) 831–843.
[7] P. Blanc, T. Blu, T. Ranchin, L. Wald, R. Aloisi, Using iteratedrational filter banks within the ARSIS concept for producing 10 mLandsat multispectral images, International Journal of RemoteSensing 19 (12) (1998) 2331–2343.
[8] G. Piella, A general framework for multiresolution image fusion:from pixels to regions, Information Fusion 4 (4) (2003) 259–280.
[9] B. Aiazzi, L. Alparone, S. Baronti, A. Garzelli, Context-driven fusionof high spatial and spectral resolution data based on oversampledmultiresolution analysis, IEEE Transactions on Geoscience andRemote Sensing 40 (10) (2002) 2300–2312.
[10] S. Li, J.T. Kwok, Y. Wang, Using the discrete wavelet frametransform to merge Landsat TM and SPOT panchromatic images,Information Fusion 3 (1) (2002) 17–23.
[11] J. Nunez, X. Otazu, O. Fors, A. Prades, V. Pala, R. Arbiol,Multiresolution-based image fusion with additive wavelet decompo-sition, IEEE Transactions on Geoscience and Remote Sensing 37 (3)(1999) 1204–1211.
[12] D.A. Yocky, Artifacts in wavelet image merging, Optical Engineering35 (7) (1996) 2094–2101.
[13] M. Gonzales Audıcana, J.L. Saleta, R. Garcıa Catalan, R. Garcıa,Fusion of multispectral and panchromatic images using improvedIHS and PCA mergers based on wavelet decomposition, IEEETransactions on Geoscience and Remote Sensing 42 (6) (2004) 1291–1299.
[14] J.L. Starck, E.J. Candes, D.L. Donoho, The curvelet transform forimage denoising, IEEE Transactions on Image Processing 11 (6)(2002) 670–684.
[15] J.L. Starck, F. Murtagh, E.J. Candes, D.L. Donoho, Gray and colorimage contrast enhancement by the curvelet transform, IEEETransactions on Image Processing 12 (6) (2003) 706–717.
[16] M.N. Do, M. Vetterli, The finite ridgelet transform for imagerepresentation, IEEE Transactions on Image Processing 12 (1) (2003)16–28.
[17] T. Ranchin, L. Wald, Fusion of high spatial and spectral resolutionimages: the ARSIS concept and its implementation, PhotogrammetricEngineering and Remote Sensing 66 (1) (2000) 49–61.
[18] T. Ranchin, B. Aiazzi, L. Alparone, S. Baronti, L. Wald, Imagefusion—the ARSIS concept and some successful implementationschemes, ISPRS Journal Photogrammetry and Remote Sensing 58 (1–2) (2003) 4–18.
[19] A. Garzelli, F. Nencini, Interband structure modeling for Pan-sharpening of very high resolution multispectral images, InformationFusion 6 (3) (2005) 213–224.
[20] M. Choi, R.Y. Kim, M.-R. Nam, H.O. Kim, Fusion of multispectraland panchromatic satellite images using the curvelet transform, IEEEGeoscience and Remote Sensing Letters 2 (2) (2005) 136–140.
[21] A. Garzelli, F. Nencini, L. Alparone, S. Baronti, Multiresolutionfusion of multispectral and panchromatic images through the curvelettransform, in: Proceedings of the IEEE International Geoscience andRemote Sensing Symposium, 2005, pp. 2838–2841.
[22] L. Alparone, S. Baronti, A. Garzelli, F. Nencini, The curvelettransform for fusion of very-high resolution multi-spectral andpanchromatic images, in: Proceedings of the 25th EARSeL Sympo-sium, Porto, Portugal, Millpress Science Publishers, The Netherlands,2006.
[23] J.L. Starck, F. Murtagh, Image restoration with noise suppressionusing the wavelet transform, Astronomy and Astrophysics 288 (1994)342–350.
[24] Y. Chibani, A. Houacine, The joint use of IHS transform andredundant wavelet decomposition for fusing multispectral and pan-chromatic images, International Journal of Remote Sensing 23 (18)(2002) 3821–3833.
[25] S. Teggi, R. Cecchi, F. Serafini, TM and IRS-1C-PAN data fusionusing multiresolution decomposition methods based on the ‘‘a trous’’algorithm, International Journal of Remote Sensing 24 (6) (2003)1287–1301.
[26] P.S. Chavez Jr., S.C. Sides, J.A. Anderson, Comparison of threedifferent methods to merge multiresolution and multispectral data:

156 F. Nencini et al. / Information Fusion 8 (2007) 143–156
Landsat TM and SPOT panchromatic, Photogrammetric Engineeringand Remote Sensing 57 (3) (1991) 295–303.
[27] G. Piella, H. Heijmans, A new quality metric for image fusion, in:Proceedings of the IEEE International Conference on Image Pro-cessing, vol. III/IV, 2003, pp. 173–176.
[28] L. Alparone, S. Baronti, A. Garzelli, F. Nencini, A global qualitymeasurement of Pan-sharpened multispectral imagery, IEEE Geosci-ence and Remote Sensing Letters 1 (4) (2004) 313–317.
[29] Z. Wang, A.C. Bovik, A universal image quality index, IEEE SignalProcessing Letters 9 (3) (2002) 81–84.
[30] C.A. Laben, B.V. Brower, Process for enhancing the spatial resolu-tion of multispectral imagery using pan-sharpening, Eastman KodakCompany, 2000, US Patent # 6,011,875.
[31] ENVI� Version 4.1 User Manual, Research Systems Inc., 2004.[32] Y. Zhang, Understanding image fusion, Photogrammetric Engineer-
ing and Remote Sensing 70 (6) (2004) 657–661.
[33] T.-M. Tu, S.-C. Su, H.-C. Shyu, P.S. Huang, A new look at IHS-like image fusion methods, Information Fusion 2 (3) (2001) 177–186.
[34] T.-M. Tu, P.S. Huang, C.-L. Hung, C.-P. Chang, A fast Intensity-Hue-Saturation fusion technique with spectral adjustment for IKO-NOS imagery, IEEE Geoscience and Remote Sensing Letters 1 (4)(2004) 309–312.
[35] L. Alparone, S. Baronti, A. Garzelli, F. Nencini, Landsat ETM+ andSAR image fusion based on generalized intensity modulation, IEEETransactions on Geoscience and Remote Sensing 42 (12) (2004) 2832–2839.
[36] M.T. Eismann, R.C. Hardie, Hyperspectral resolution enhancementusing high-resolution multispectral imagery with arbitrary responsefunctions, IEEE Transactions on Geoscience and Remote Sensing 43(3) (2005) 455–465.