Audited Annual Report - Fundsquare
324
Audited Annual Report Standard Life Investments Global SICAV Société d'Investissement à Capital Variable Audited Annual Report as at 31 December 2017 No subscription can be received on the basis of financial reports. Subscriptions are only valid if made on the basis of the current prospectus accompanied by the latest annual and the most recent semi-annual report, if published thereafter. R.C.S. Luxembourg B 78.797
-
Upload
khangminh22 -
Category
Documents
-
view
0 -
download
0
Transcript of Audited Annual Report - Fundsquare
Audited Annual Report Standard Life Investments Global SICAV Société d'Investissement à Capital Variable Audited Annual Report as at 31 December 2017
No subscription can be received on the basis of financial reports. Subscriptions are only valid if made on the basis of the current prospectus accompanied by the latest annual and the most recent semi-annual report, if published thereafter. R.C.S. Luxembourg B 78.797
Standard Life Investments Global SICAV
Société d'Investissement à Capital Variable
Registered Office 2-4, rue Eugène Ruppert L-2453 Luxembourg Grand Duchy of Luxembourg
Board of Directors
Members Mr Alan Stephen Acheson Chairman Global Head of Insurance Aberdeen Standard Investments 1 George Street Edinburgh EH2 2LL Scotland
Mr Michael McKenna Managing Director - Ireland Standard Life Employee Services Limited 90 St Stephen’s Green Dublin 2 Ireland
Mr Manuel Hauser (until 15 November 2017)*** Independent Director 11, rue Beaumont L-1219 Luxembourg Grand Duchy of Luxembourg
Ms Jennifer Richards Head of Distribution, Ireland 90 St Stephen’s Green Dublin 2 Ireland
Mr Stephen Campbell (until 4 December 2017)*** Director, Product Management and Governance Aberdeen Standard Investments 1 George Street Edinburgh EH2 2LL Scotland
Mr Robert Curtis (from 4 May 2017)*** Investment Director Fund Governance Aberdeen Standard Investments 1 George Street Edinburgh EH2 2LL Scotland
Mr Ian Boyland (from 4 May 2017)*** Independent Director 25, rue du Schlamestee L-5770 Weiler-la-Tour Luxembourg
Administration and Advisors
Registrar, Transfer Agent, Corporate and Domiciliary Agent, Central Administrator, Depositary Agent The Bank of New York Mellon SA/NV** 2-4, rue Eugène Ruppert L-2453 Luxembourg Grand Duchy of Luxembourg
*Sumitomo Mitsui Trust Bank Limited is the Sub-Investment Manager
for the Japanese Equities Fund only.
**Effective 1 April 2017, BNY Mellon has merged its legal entity The Bank of New York Mellon (Luxembourg) S.A., including its Milan branch, into The Bank of New York Mellon SA/NV.
***Refer to note 11 for details.
Investment Manager Aberdeen Standard Investments 1 George Street Edinburgh EH2 2LL Scotland
Management Company Standard Life Investments (Mutual Funds) Limited 1 George Street Edinburgh EH2 2LL Scotland
Auditor*** KPMG Luxembourg Société coopérative 39, Avenue John F. Kennedy L-1855 Luxembourg Grand Duchy of Luxembourg
Legal Advisor Clifford Chance 10, Boulevard G.D. Charlotte L-1011 Luxembourg Grand Duchy of Luxembourg
Sub-Investment Manager Standard Life Investments (USA) Limited Registered office: 1 George Street Edinburgh EH2 2LL Scotland
Principal place of business: One Beacon Street 34th Floor Boston MA 02108-3106 United States of America
Sumitomo Mitsui Trust Bank Limited* 1-4-1 Marunouchi Chiyoda-ku Tokyo 100-8233 Japan
Principal Distributor Aberdeen Standard Investments 1 George Street Edinburgh EH2 2LL Scotland
Standard Life Investments Global SICAV
Société d'Investissement à Capital Variable
1
Contents Page
Report of the Board of Directors ................................................................................................................................................................ 2
General Information ................................................................................................................................................................................. 3
Audit Report ............................................................................................................................................................................................ 4
Investment Markets Overview ................................................................................................................................................................... 6
Statement of Net Assets............................................................................................................................................................................ 8
Statement of Operations and Changes in Net Assets ................................................................................................................................. 17
Statistics ................................................................................................................................................................................................ 26
Notes to the Financial Statements ............................................................................................................................................................ 38
Remuneration Policy (unaudited) ............................................................................................................................................................. 52
Appendix 1: Share classes issued in the Sub-funds ................................................................................................................................... 53
Appendix 2: SFTR Disclosure (unaudited) ................................................................................................................................................ 55
Sub-fund Objective and Investment Policy
Sub-fund Performance Review and Outlook
Schedule of Investments
Global Equities Fund ................................................................................................................................................... 64
Asian Equities Fund ..................................................................................................................................................... 69
China Equities Fund .................................................................................................................................................... 73
Japanese Equities Fund^ ............................................................................................................................................. 76
Japanese Equity High Alpha Fund^ .............................................................................................................................. 81
European Equities Fund ............................................................................................................................................... 87
Global REIT Focus Fund .............................................................................................................................................. 90
European Smaller Companies Fund .............................................................................................................................. 94
Indian Equity Midcap Opportunities Fund ...................................................................................................................... 98
European Equity Unconstrained Fund ......................................................................................................................... 102
Global Emerging Markets Equity Unconstrained Fund^ ................................................................................................ 105
Enhanced Diversification Global Emerging Markets Equities Fund^ ............................................................................... 109
Continental European Equity Income Fund^ ............................................................................................................... 118
Global Equity Unconstrained Fund^............................................................................................................................ 123
American Equity Unconstrained Fund^ ....................................................................................................................... 127
Global Emerging Markets Equities Fund^ .................................................................................................................... 131
Global Bond Fund ..................................................................................................................................................... 136
Global Inflation-Linked Bond Fund .............................................................................................................................. 143
European High Yield Bond Fund ................................................................................................................................. 151
European Corporate Bond Fund ................................................................................................................................. 157
Euro Government All Stocks Fund^ ............................................................................................................................ 169
Emerging Market Debt Fund^ .................................................................................................................................... 173
Emerging Market Local Currency Debt Fund^ ............................................................................................................. 178
Global High Yield Bond Fund^ ................................................................................................................................... 183
Global Corporate Bond Fund^ .................................................................................................................................... 192
European Corporate Bond Sustainable and Responsible Investment Fund^ ................................................................... 208
Emerging Market Corporate Bond Fund^ .................................................................................................................... 219
Total Return Credit Fund^ ......................................................................................................................................... 226
Emerging Market Debt Unconstrained Fund^ .............................................................................................................. 236
Global Absolute Return Strategies Fund^ .................................................................................................................... 243
Global Focused Strategies Fund^ ............................................................................................................................... 289
Absolute Return Global Bond Strategies Fund^ ........................................................................................................... 307
^This Sub-fund is not authorised in Hong Kong and is not available to Hong Kong residents.
Standard Life Investments Global SICAV
Société d'Investissement à Capital Variable
2
Report of the Board of Directors
As at 31 December 2017, the total net assets of Standard Life Investments Global SICAV (the “Company”) stood at USD 29,174,632,063. The Company's objective is to provide the shareholder with a choice of professionally managed sub-funds (the “Sub-funds”) investing in a wide range of transferable securities in order to achieve an optimum return from capital invested, while reducing investment risk through diversification.
The Board of Directors adheres to the Association of the Luxembourg Fund Industry (“ALFI”) code of conduct for Luxembourg investment funds (revised June 2013). The code of conduct sets a framework of high-level principles and best practice recommendations for the governance of Luxembourg investment funds. The Board of Directors Luxembourg, 27 April 2018 The figures stated in this report are historical and not necessarily indicative of future performance.
Standard Life Investments Global SICAV
Société d'Investissement à Capital Variable
3
General Information
Standard Life Investments Global SICAV (the “Company”) was incorporated on 23 November 2000 under Luxembourg law as “société d'investissement à capital variable” (SICAV). The Company’s articles of incorporation have also been deposited with the Luxembourg Trade and Companies Register and have been published in the Registre de Commerce et des Sociétés on 1 June 2016. The Company has been registered under number B 78.797 with the Luxembourg Trade and Companies Register. The Company has appointed Standard Life Investments (Mutual Funds) Limited, incorporated in Scotland under the Companies Acts (registered number SC123322), to act as its management company with effect as of 1 July 2013. The Company's articles of incorporation may be amended from time to time by a meeting of shareholders, subject to the quorum and majority requirements provided by Luxembourg law. Any amendment to the terms and conditions of the Company, which has, as an effect, a decrease of the rights or guarantees of the shareholders or which imposes on them additional costs, shall only come into force after a period of three months starting at the date the amendment is approved at the general shareholders' meeting. Any amendment to the articles shall be published at the Registre de Commerce et des Societes, in a Luxembourg daily newspaper and, if necessary, in the official publications specified for the respective countries in which Company shares are sold. Any amendments affecting the rights of the holders of shares of any class vis-à-vis those of any other class shall be subject further to the said quorum and majority requirements in respect of each relevant class. The Company is a single legal entity. However, each Sub-fund is regarded as being separate from the others and is liable for all of its own obligations, unless other terms have been specifically agreed with its creditors. The first annual general meeting of shareholders was held at the registered office of the Company on the first Thursday in May 2002 and will be held on the same day each year thereafter (unless such date falls on a legal bank holiday, in which case on the next Luxembourg business day) at midday (Luxembourg time). Notices of all general meetings are sent by mail to all registered shareholders at their registered address at least 8 days prior to each such meeting. Such notice will indicate the time and place of such meeting and the conditions of admission thereto, will contain the agenda and will refer to the requirements of Luxembourg law with regard to the necessary quorum and majorities at such meeting. To the extent required by Luxembourg law, further notices will be published in the Registre de Commerce et des Societes and in one Luxembourg newspaper. Audited annual reports and unaudited semi-annual reports will be made available on the Standard Life Investments Website (www.standardlifeinvestments.com) and at the registered office of the Company. The Company’s financial year ends on 31 December of each year. The net asset value per share and the issue and redemption price can be obtained from the registered office of the Company.
Statement of Changes in Portfolio
A statement giving the changes in the Schedule of Investments for the year ended 31 December 2017 can be obtained free of charge from the registered office of the Company.
Standard Life Investments Global SICAV
Société d'Investissement à Capital Variable
4
Audit Report To the Shareholders of Standard Life Investments Global SICAV 2-4, rue Eugène Ruppert L-2453 Luxembourg Grand Duchy of Luxembourg
REPORT OF THE REVISEUR D’ENTREPRISES AGREE
Report on the audit of the financial statements
Opinion We have audited the accompanying financial statements of Standard Life Investments Global SICAV and each of its sub-funds (“the Fund”), which comprise the statement of net assets and the schedule of investments as at December 31, 2017 and the statement of operations and changes in net assets for the year then ended, and notes to the financial statements, including a summary of significant accounting policies. In our opinion, the accompanying financial statements give a true and fair view of the financial position of Standard Life Investments Global SICAV and each of its sub-funds as at December 31, 2017, and of the results of their operations and changes in their net assets for the year then ended in accordance with Luxembourg legal and regulatory requirements relating to the preparation and presentation of the financial statements. Basis for opinion We conducted our audit in accordance with the Law of 23 July 2016 on the audit profession (“Law of 23 July 2016”) and with International Standards on Auditing (“ISAs”) as adopted for Luxembourg by the Commission de Surveillance du Secteur Financier (“CSSF”). Our responsibilities under the Law of 23 July 2016 and ISAs are further described in the « Responsibilities of “Réviseur d’Entreprises agréé” for the Audit of the Financial Statements » section of our report. We are also independent of the Fund in accordance with the International Ethics Standards Board for Accountants’ Code of Ethics for Professional Accountants (“IESBA Code”) as adopted for Luxembourg by the CSSF together with the ethical requirements that are relevant to our audit of the financial statements, and have fulfilled our other ethical responsibilities under those ethical requirements. We believe that the audit evidence we have obtained is sufficient and appropriate to provide a basis for our opinion. Other information The Board of Directors of the Fund is responsible for the other information. The other information comprises the information stated in the annual report but does not include the financial statements and our report of “Réviseur d’Entreprises agréé” thereon. Our opinion on the financial statements does not cover the other information and we do not express any form of assurance conclusion thereon. In connection with our audit of the financial statements, our responsibility is to read the other information and, in doing so, consider whether the other information is materially inconsistent with the financial statements or our knowledge obtained in the audit or otherwise appears to be materially misstated. If, based on the work we have performed, we conclude that there is a material misstatement of this other information, we are required to report this fact. We have nothing to report in this regard. Responsibilities of the Board of Directors of the Fund for the financial statements The Board of Directors of the Fund is responsible for the preparation and fair presentation of these financial statements in accordance with Luxembourg legal and regulatory requirements relating to the preparation and presentation of the financial statements, and for such internal control as the Board of Directors of the Fund determines is necessary to enable the preparation of financial statements that are free from material misstatement, whether due to fraud or error. In preparing the financial statements, the Board of Directors of the Fund is responsible for assessing the Fund’s ability to continue as a going concern, disclosing, as applicable, matters related to going concern and using the going concern basis of accounting unless the Board of Directors of the Fund either intends to liquidate the Fund or to cease operations, or has no realistic alternative but to do so. Responsibilities of the “Réviseur d’Entreprises agréé” for the audit of the financial statements The objectives of our audit are to obtain reasonable assurance about whether the financial statements as a whole are free from material misstatement, whether due to fraud or error, and to issue a report of “Réviseur d’Entreprises agréé” that includes our opinion. Reasonable assurance is a high level of assurance, but is not a guarantee that an audit conducted in accordance with the Law of 23 July 2016 and with ISAs as adopted for Luxembourg by the CSSF will always detect a material misstatement when it exists. Misstatements can arise from fraud or error and are considered material if, individually or in the aggregate, they could reasonably be expected to influence the economic decisions of users taken on the basis of these financial statements. As part of an audit in accordance with the Law of 23 July 2016 and with ISAs as adopted for Luxembourg by the CSSF, we exercise professional judgment and maintain professional skepticism throughout the audit. We also:
— Identify and assess the risks of material misstatement of the financial statements, whether due to fraud or error, design and perform audit procedures responsive to those risks, and obtain audit evidence that is sufficient and appropriate to provide a basis for our opinion. The risk of not detecting a material misstatement resulting from fraud is higher than for one resulting from error, as fraud may involve collusion, forgery, intentional omissions, misrepresentations, or the override of internal control.
— Obtain an understanding of internal control relevant to the audit in order to design audit procedures that are appropriate in the circumstances, but not for the purpose of expressing an opinion on the effectiveness of the Fund’s internal control.
— Evaluate the appropriateness of accounting policies used and the reasonableness of accounting estimates and related disclosures made by the Board of Directors of the Fund.
Standard Life Investments Global SICAV Societe d'Investissement a Capital Variable
Audit Report ( continued)
Conclude on the appropriateness of the Board of Directors of the Fund's use of the going concern basis of accounting and, based on the audit evidence obtained, whether a material uncertainty exists related to events or conditions that may cast significant doubt on the Fund's ability to continue as a going concern. If we conclude that a material uncertainty exists, we are required to draw attention in our report of "Reviseur d'Entreprises agree" to the related disclosures in the financial statements or, if such disclosures are inadequate, to modify our opinion. Our conclusions are based on the audit evidence obtained up to the date of our report of "Reviseur d'Entreprises agree". However, future events or conditions may cause the Fund to cease to continue as a going concern.
Evaluate the overall presentation, structure and content of the financial statements, including the disclosures, and whether the financial statements represent the underlying transactions and events in a manner that achieves fair presentation.
We communicate with those charged with governance regarding, among other matters, the planned scope and timing of the audit and significant audit findings, including any significant deficiencies in internal control that we identify during our audit.
Luxembourg, April 30, 2018
5
KPMG Luxembourg, Societe cooperative Cabinet de revision agree 39 Avenue John F. Kennedy L-1855 Luxembourg Grand Du of Luxembourg
Standard Life Investments Global SICAV
Société d'Investissement à Capital Variable
6
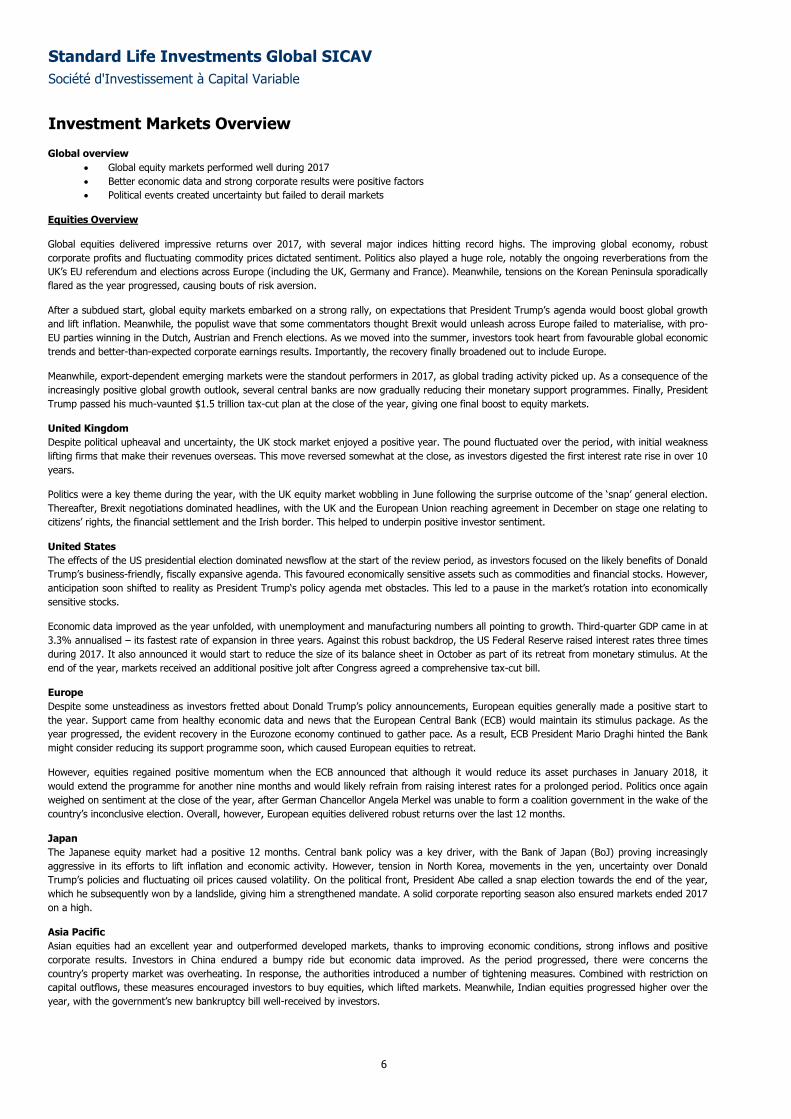
Investment Markets Overview Global overview
Global equity markets performed well during 2017
Better economic data and strong corporate results were positive factors
Political events created uncertainty but failed to derail markets
Equities Overview
Global equities delivered impressive returns over 2017, with several major indices hitting record highs. The improving global economy, robust
corporate profits and fluctuating commodity prices dictated sentiment. Politics also played a huge role, notably the ongoing reverberations from the
UK’s EU referendum and elections across Europe (including the UK, Germany and France). Meanwhile, tensions on the Korean Peninsula sporadically
flared as the year progressed, causing bouts of risk aversion.
After a subdued start, global equity markets embarked on a strong rally, on expectations that President Trump’s agenda would boost global growth
and lift inflation. Meanwhile, the populist wave that some commentators thought Brexit would unleash across Europe failed to materialise, with pro-
EU parties winning in the Dutch, Austrian and French elections. As we moved into the summer, investors took heart from favourable global economic
trends and better-than-expected corporate earnings results. Importantly, the recovery finally broadened out to include Europe.
Meanwhile, export-dependent emerging markets were the standout performers in 2017, as global trading activity picked up. As a consequence of the
increasingly positive global growth outlook, several central banks are now gradually reducing their monetary support programmes. Finally, President
Trump passed his much-vaunted $1.5 trillion tax-cut plan at the close of the year, giving one final boost to equity markets.
United Kingdom
Despite political upheaval and uncertainty, the UK stock market enjoyed a positive year. The pound fluctuated over the period, with initial weakness
lifting firms that make their revenues overseas. This move reversed somewhat at the close, as investors digested the first interest rate rise in over 10
years.
Politics were a key theme during the year, with the UK equity market wobbling in June following the surprise outcome of the ‘snap’ general election.
Thereafter, Brexit negotiations dominated headlines, with the UK and the European Union reaching agreement in December on stage one relating to
citizens’ rights, the financial settlement and the Irish border. This helped to underpin positive investor sentiment.
United States
The effects of the US presidential election dominated newsflow at the start of the review period, as investors focused on the likely benefits of Donald
Trump’s business-friendly, fiscally expansive agenda. This favoured economically sensitive assets such as commodities and financial stocks. However,
anticipation soon shifted to reality as President Trump‘s policy agenda met obstacles. This led to a pause in the market’s rotation into economically
sensitive stocks.
Economic data improved as the year unfolded, with unemployment and manufacturing numbers all pointing to growth. Third-quarter GDP came in at
3.3% annualised – its fastest rate of expansion in three years. Against this robust backdrop, the US Federal Reserve raised interest rates three times
during 2017. It also announced it would start to reduce the size of its balance sheet in October as part of its retreat from monetary stimulus. At the
end of the year, markets received an additional positive jolt after Congress agreed a comprehensive tax-cut bill.
Europe
Despite some unsteadiness as investors fretted about Donald Trump’s policy announcements, European equities generally made a positive start to
the year. Support came from healthy economic data and news that the European Central Bank (ECB) would maintain its stimulus package. As the
year progressed, the evident recovery in the Eurozone economy continued to gather pace. As a result, ECB President Mario Draghi hinted the Bank
might consider reducing its support programme soon, which caused European equities to retreat.
However, equities regained positive momentum when the ECB announced that although it would reduce its asset purchases in January 2018, it
would extend the programme for another nine months and would likely refrain from raising interest rates for a prolonged period. Politics once again
weighed on sentiment at the close of the year, after German Chancellor Angela Merkel was unable to form a coalition government in the wake of the
country’s inconclusive election. Overall, however, European equities delivered robust returns over the last 12 months.
Japan
The Japanese equity market had a positive 12 months. Central bank policy was a key driver, with the Bank of Japan (BoJ) proving increasingly
aggressive in its efforts to lift inflation and economic activity. However, tension in North Korea, movements in the yen, uncertainty over Donald
Trump’s policies and fluctuating oil prices caused volatility. On the political front, President Abe called a snap election towards the end of the year,
which he subsequently won by a landslide, giving him a strengthened mandate. A solid corporate reporting season also ensured markets ended 2017
on a high.
Asia Pacific
Asian equities had an excellent year and outperformed developed markets, thanks to improving economic conditions, strong inflows and positive
corporate results. Investors in China endured a bumpy ride but economic data improved. As the period progressed, there were concerns the
country’s property market was overheating. In response, the authorities introduced a number of tightening measures. Combined with restriction on
capital outflows, these measures encouraged investors to buy equities, which lifted markets. Meanwhile, Indian equities progressed higher over the
year, with the government’s new bankruptcy bill well-received by investors.
Standard Life Investments Global SICAV
Société d'Investissement à Capital Variable
7
Investment Markets Overview (continued) Bonds Overview
Government Bonds
The commitment of central banks to stimulate economic growth, alongside increased geopolitical risks, provided some support for government
bonds. However, there were increasing signs that central bankers were prepared to take a pre-emptive stance on inflation and review ultra-
accommodative monetary policy sooner than many investors had anticipated.
Corporate Bonds
Corporate bonds enjoyed a positive 12 months and outperformed government bonds. Political risks caused some volatility during the period, notably
elections in the US and Europe. However, later in the period, it was central banks and the prospects for changes in monetary policy that preoccupied
investors, with policymakers in the US, Europe and the UK pointing to a tightening of monetary policy.

Standard Life Investments Global SICAV
Société d'Investissement à Capital Variable
Statement of Net Assets As at 31 December 2017
8
Global Equities
Fund
Asian Equities
Fund
China Equities
Fund
Japanese Equities
Fund^ (USD) (USD) (USD) (JPY)
Assets
Investments in securities at market value (note 2b) 251,338,316 28,762,815 186,337,441 28,178,231,700
Acquisition cost: 208,859,513 21,831,156 140,090,621 23,352,473,881
Cash and cash equivalents 6,009,955 909,902 2,864,620 196,950,565
Cash collateral (note 9) – – – –
Margin account – – – –
Interest and dividends receivable, net 142,214 32,440 – 25,650,409
Receivables resulting from sale of securities 115,992 – – 156,977,909
Receivables resulting from subscriptions 23,974 – 260,874 –
Receivable from Investment Manager (note 3e) – 15,763 – –
Other receivables 3,157 – – –
Unrealised appreciation on:
Open forward foreign exchange contracts (note 2f) – 1,105 – –
Open exchange traded futures contracts (note 2h) – – – –
Swap contracts at market value (note 2g) – – – –
Option/swaption contracts at market value (note 2i) – – – –
Total assets 257,633,608 29,722,025 189,462,935 28,557,810,583
Liabilities
Bank overdraft – 3 – 71,539
Cash collateral (note 9) – – – –
Margin account – – – –
Payables resulting from purchases of securities 122,045 – – 88,555,510
Payables resulting from redemptions 35,338 197,763 – 154,516,626
Fees payable 86,413 68,332 163,000 15,604,158
Unrealised depreciation on:
Open forward foreign exchange contracts (note 2f) 1,069 – 1,615 –
Open exchange traded futures contracts (note 2h) – – – –
Swap contracts at market value (note 2g) – – – –
Option/swaption contracts at market value (note 2i) – – – –
Total liabilities 244,865 266,098 164,615 258,747,833
Total net assets prior to swing adjustment 257,388,743 29,455,927 189,298,320 28,299,062,750
Adjustment due to swing pricing (note 8) (566,255) (126,660) – (42,448,594)
Total net assets after swing adjustment 256,822,488 29,329,267 189,298,320 28,256,614,156
^This Sub-fund is not authorised in Hong Kong and is not available to Hong Kong residents.
The accompanying notes form an integral part of these financial statements.
Standard Life Investments Global SICAV
Société d'Investissement à Capital Variable
Statement of Net Assets (continued) As at 31 December 2017
9
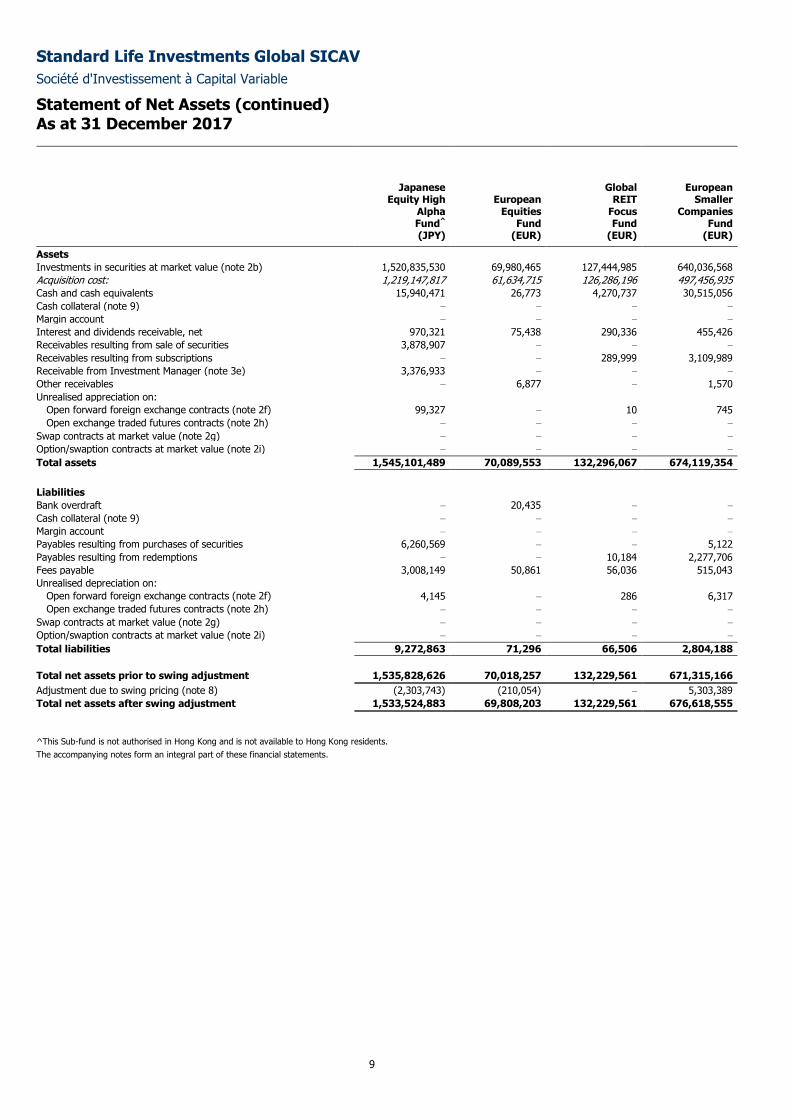
Japanese Equity High
Alpha Fund^
European Equities
Fund
Global REIT
Focus Fund
European Smaller
Companies Fund
(JPY) (EUR) (EUR) (EUR)
Assets
Investments in securities at market value (note 2b) 1,520,835,530 69,980,465 127,444,985 640,036,568
Acquisition cost: 1,219,147,817 61,634,715 126,286,196 497,456,935
Cash and cash equivalents 15,940,471 26,773 4,270,737 30,515,056
Cash collateral (note 9) – – – –
Margin account – – – –
Interest and dividends receivable, net 970,321 75,438 290,336 455,426
Receivables resulting from sale of securities 3,878,907 – – –
Receivables resulting from subscriptions – – 289,999 3,109,989
Receivable from Investment Manager (note 3e) 3,376,933 – – –
Other receivables – 6,877 – 1,570
Unrealised appreciation on:
Open forward foreign exchange contracts (note 2f) 99,327 – 10 745
Open exchange traded futures contracts (note 2h) – – – –
Swap contracts at market value (note 2g) – – – –
Option/swaption contracts at market value (note 2i) – – – –
Total assets 1,545,101,489 70,089,553 132,296,067 674,119,354
Liabilities
Bank overdraft – 20,435 – –
Cash collateral (note 9) – – – –
Margin account – – – –
Payables resulting from purchases of securities 6,260,569 – – 5,122
Payables resulting from redemptions – – 10,184 2,277,706
Fees payable 3,008,149 50,861 56,036 515,043
Unrealised depreciation on:
Open forward foreign exchange contracts (note 2f) 4,145 – 286 6,317
Open exchange traded futures contracts (note 2h) – – – –
Swap contracts at market value (note 2g) – – – –
Option/swaption contracts at market value (note 2i) – – – –
Total liabilities 9,272,863 71,296 66,506 2,804,188
Total net assets prior to swing adjustment 1,535,828,626 70,018,257 132,229,561 671,315,166
Adjustment due to swing pricing (note 8) (2,303,743) (210,054) – 5,303,389
Total net assets after swing adjustment 1,533,524,883 69,808,203 132,229,561 676,618,555
^This Sub-fund is not authorised in Hong Kong and is not available to Hong Kong residents.
The accompanying notes form an integral part of these financial statements.
Standard Life Investments Global SICAV
Société d'Investissement à Capital Variable
Statement of Net Assets (continued) As at 31 December 2017
10
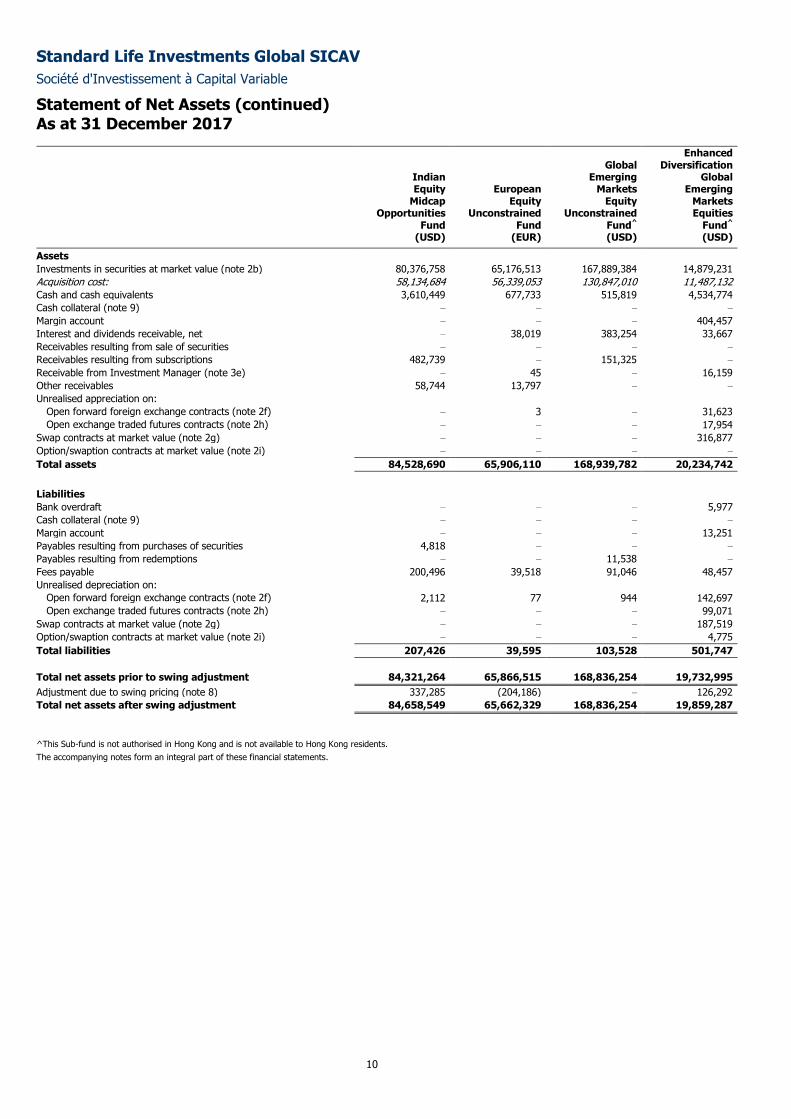
Indian Equity
Midcap Opportunities
Fund
European Equity
Unconstrained Fund
Global Emerging
Markets Equity
Unconstrained Fund^
Enhanced Diversification
Global Emerging
Markets Equities
Fund^ (USD) (EUR) (USD) (USD)
Assets
Investments in securities at market value (note 2b) 80,376,758 65,176,513 167,889,384 14,879,231
Acquisition cost: 58,134,684 56,339,053 130,847,010 11,487,132
Cash and cash equivalents 3,610,449 677,733 515,819 4,534,774
Cash collateral (note 9) – – – –
Margin account – – – 404,457
Interest and dividends receivable, net – 38,019 383,254 33,667
Receivables resulting from sale of securities – – – –
Receivables resulting from subscriptions 482,739 – 151,325 –
Receivable from Investment Manager (note 3e) – 45 – 16,159
Other receivables 58,744 13,797 – –
Unrealised appreciation on:
Open forward foreign exchange contracts (note 2f) – 3 – 31,623
Open exchange traded futures contracts (note 2h) – – – 17,954
Swap contracts at market value (note 2g) – – – 316,877
Option/swaption contracts at market value (note 2i) – – – –
Total assets 84,528,690 65,906,110 168,939,782 20,234,742
Liabilities
Bank overdraft – – – 5,977
Cash collateral (note 9) – – – –
Margin account – – – 13,251
Payables resulting from purchases of securities 4,818 – – –
Payables resulting from redemptions – – 11,538 –
Fees payable 200,496 39,518 91,046 48,457
Unrealised depreciation on:
Open forward foreign exchange contracts (note 2f) 2,112 77 944 142,697
Open exchange traded futures contracts (note 2h) – – – 99,071
Swap contracts at market value (note 2g) – – – 187,519
Option/swaption contracts at market value (note 2i) – – – 4,775
Total liabilities 207,426 39,595 103,528 501,747
Total net assets prior to swing adjustment 84,321,264 65,866,515 168,836,254 19,732,995
Adjustment due to swing pricing (note 8) 337,285 (204,186) – 126,292
Total net assets after swing adjustment 84,658,549 65,662,329 168,836,254 19,859,287
^This Sub-fund is not authorised in Hong Kong and is not available to Hong Kong residents.
The accompanying notes form an integral part of these financial statements.
Standard Life Investments Global SICAV
Société d'Investissement à Capital Variable
Statement of Net Assets (continued) As at 31 December 2017
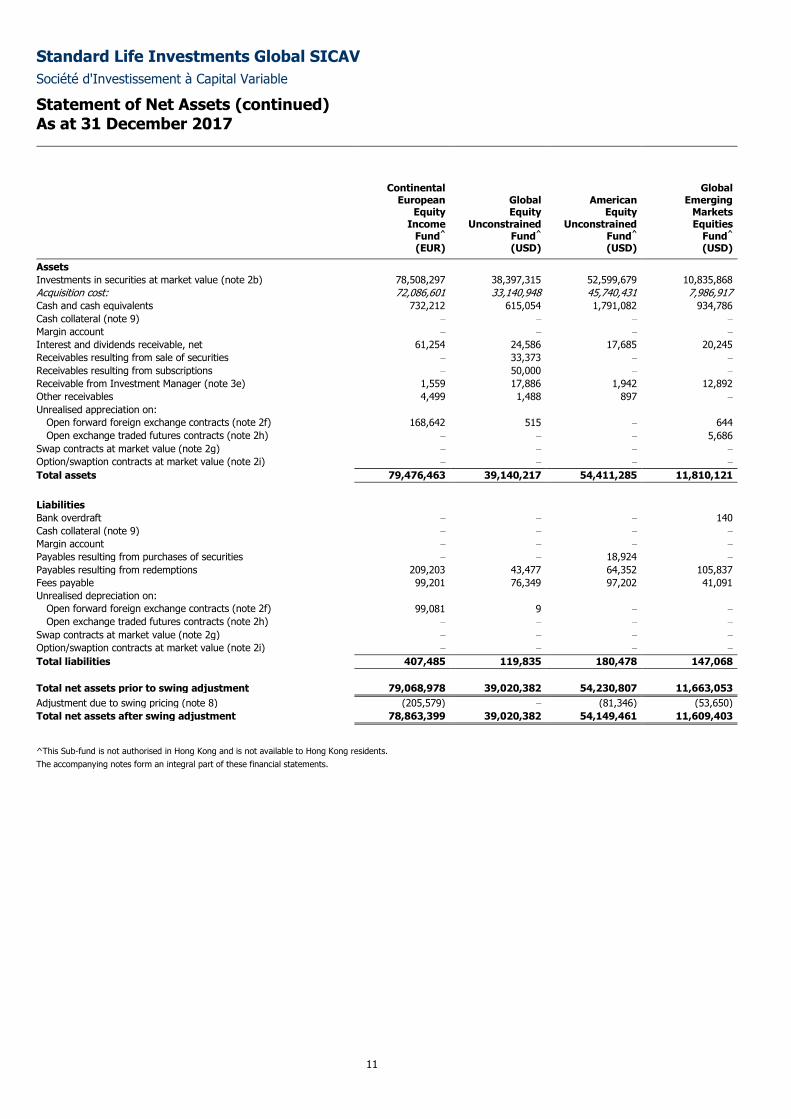
11
Continental European
Equity Income
Fund^
Global Equity
Unconstrained Fund^
American Equity
Unconstrained Fund^
Global
Emerging Markets Equities
Fund^ (EUR) (USD) (USD) (USD)
Assets
Investments in securities at market value (note 2b) 78,508,297 38,397,315 52,599,679 10,835,868
Acquisition cost: 72,086,601 33,140,948 45,740,431 7,986,917
Cash and cash equivalents 732,212 615,054 1,791,082 934,786
Cash collateral (note 9) – – – –
Margin account – – – –
Interest and dividends receivable, net 61,254 24,586 17,685 20,245
Receivables resulting from sale of securities – 33,373 – –
Receivables resulting from subscriptions – 50,000 – –
Receivable from Investment Manager (note 3e) 1,559 17,886 1,942 12,892
Other receivables 4,499 1,488 897 –
Unrealised appreciation on:
Open forward foreign exchange contracts (note 2f) 168,642 515 – 644
Open exchange traded futures contracts (note 2h) – – – 5,686
Swap contracts at market value (note 2g) – – – –
Option/swaption contracts at market value (note 2i) – – – –
Total assets 79,476,463 39,140,217 54,411,285 11,810,121
Liabilities
Bank overdraft – – – 140
Cash collateral (note 9) – – – –
Margin account – – – –
Payables resulting from purchases of securities – – 18,924 –
Payables resulting from redemptions 209,203 43,477 64,352 105,837
Fees payable 99,201 76,349 97,202 41,091
Unrealised depreciation on:
Open forward foreign exchange contracts (note 2f) 99,081 9 – –
Open exchange traded futures contracts (note 2h) – – – –
Swap contracts at market value (note 2g) – – – –
Option/swaption contracts at market value (note 2i) – – – –
Total liabilities 407,485 119,835 180,478 147,068
Total net assets prior to swing adjustment 79,068,978 39,020,382 54,230,807 11,663,053
Adjustment due to swing pricing (note 8) (205,579) – (81,346) (53,650)
Total net assets after swing adjustment 78,863,399 39,020,382 54,149,461 11,609,403
^This Sub-fund is not authorised in Hong Kong and is not available to Hong Kong residents.
The accompanying notes form an integral part of these financial statements.
Standard Life Investments Global SICAV
Société d'Investissement à Capital Variable
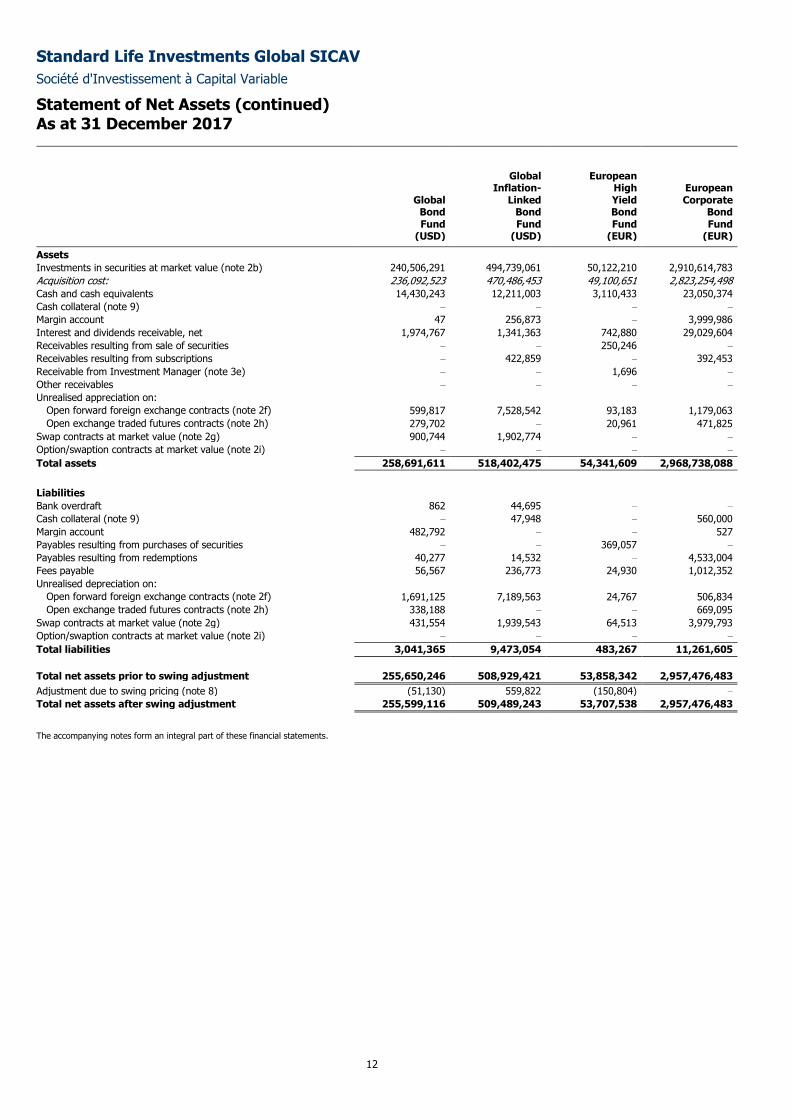
Statement of Net Assets (continued) As at 31 December 2017
12
Global Bond Fund
Global Inflation-
Linked Bond Fund
European High Yield Bond Fund
European Corporate
Bond Fund
(USD) (USD) (EUR) (EUR)
Assets
Investments in securities at market value (note 2b) 240,506,291 494,739,061 50,122,210 2,910,614,783
Acquisition cost: 236,092,523 470,486,453 49,100,651 2,823,254,498
Cash and cash equivalents 14,430,243 12,211,003 3,110,433 23,050,374
Cash collateral (note 9) – – – –
Margin account 47 256,873 – 3,999,986
Interest and dividends receivable, net 1,974,767 1,341,363 742,880 29,029,604
Receivables resulting from sale of securities – – 250,246 –
Receivables resulting from subscriptions – 422,859 – 392,453
Receivable from Investment Manager (note 3e) – – 1,696 –
Other receivables – – – –
Unrealised appreciation on:
Open forward foreign exchange contracts (note 2f) 599,817 7,528,542 93,183 1,179,063
Open exchange traded futures contracts (note 2h) 279,702 – 20,961 471,825
Swap contracts at market value (note 2g) 900,744 1,902,774 – –
Option/swaption contracts at market value (note 2i) – – – –
Total assets 258,691,611 518,402,475 54,341,609 2,968,738,088
Liabilities
Bank overdraft 862 44,695 – –
Cash collateral (note 9) – 47,948 – 560,000
Margin account 482,792 – – 527
Payables resulting from purchases of securities – – 369,057 –
Payables resulting from redemptions 40,277 14,532 – 4,533,004
Fees payable 56,567 236,773 24,930 1,012,352
Unrealised depreciation on:
Open forward foreign exchange contracts (note 2f) 1,691,125 7,189,563 24,767 506,834
Open exchange traded futures contracts (note 2h) 338,188 – – 669,095
Swap contracts at market value (note 2g) 431,554 1,939,543 64,513 3,979,793
Option/swaption contracts at market value (note 2i) – – – –
Total liabilities 3,041,365 9,473,054 483,267 11,261,605
Total net assets prior to swing adjustment 255,650,246 508,929,421 53,858,342 2,957,476,483
Adjustment due to swing pricing (note 8) (51,130) 559,822 (150,804) –
Total net assets after swing adjustment 255,599,116 509,489,243 53,707,538 2,957,476,483
The accompanying notes form an integral part of these financial statements.

Standard Life Investments Global SICAV
Société d'Investissement à Capital Variable
Statement of Net Assets (continued) As at 31 December 2017
13
Euro Government
All Stocks Fund^
Emerging Market
Debt Fund^
Emerging Market
Local Currency
Debt Fund^
Global High Yield Bond
Fund^ (EUR) (USD) (USD) (USD)
Assets
Investments in securities at market value (note 2b) 2,778,699,263 57,948,490 401,607,015 1,068,644,631
Acquisition cost: 2,651,346,586 56,482,492 395,690,425 1,043,534,848
Cash and cash equivalents 86,875,682 4,141,341 11,238,570 56,648,588
Cash collateral (note 9) – – 667,000 1,094,000
Margin account – – 1,819,331 –
Interest and dividends receivable, net 30,542,685 779,937 6,224,461 16,690,330
Receivables resulting from sale of securities – – – –
Receivables resulting from subscriptions – – 404,266 284,046
Receivable from Investment Manager (note 3e) – 6,451 – –
Other receivables – – 33,262 –
Unrealised appreciation on:
Open forward foreign exchange contracts (note 2f) 89,400 569,428 937,528 21,984,281
Open exchange traded futures contracts (note 2h) 1,990,057 – – –
Swap contracts at market value (note 2g) – – 283,020 –
Option/swaption contracts at market value (note 2i) – – – –
Total assets 2,898,197,087 63,445,647 423,214,453 1,165,345,876
Liabilities
Bank overdraft 42 – 2,179,883 9,169
Cash collateral (note 9) 150,000 – 585,124 443,000
Margin account – – 6,734 –
Payables resulting from purchases of securities – – – 1,170,185
Payables resulting from redemptions – – 90,293 –
Fees payable 282,600 40,032 283,917 282,841
Unrealised depreciation on:
Open forward foreign exchange contracts (note 2f) 89 52,442 924,166 5,448,522
Open exchange traded futures contracts (note 2h) 5,575,287 – – –
Swap contracts at market value (note 2g) – – 171,430 –
Option/swaption contracts at market value (note 2i) – – – –
Total liabilities 6,008,018 92,474 4,241,547 7,353,717
Total net assets prior to swing adjustment 2,892,189,069 63,353,173 418,972,906 1,157,992,159
Adjustment due to swing pricing (note 8) – (164,718) 544,665 3,473,977
Total net assets after swing adjustment 2,892,189,069 63,188,455 419,517,571 1,161,466,136
^This Sub-fund is not authorised in Hong Kong and is not available to Hong Kong residents.
The accompanying notes form an integral part of these financial statements.
Standard Life Investments Global SICAV
Société d'Investissement à Capital Variable
Statement of Net Assets (continued) As at 31 December 2017
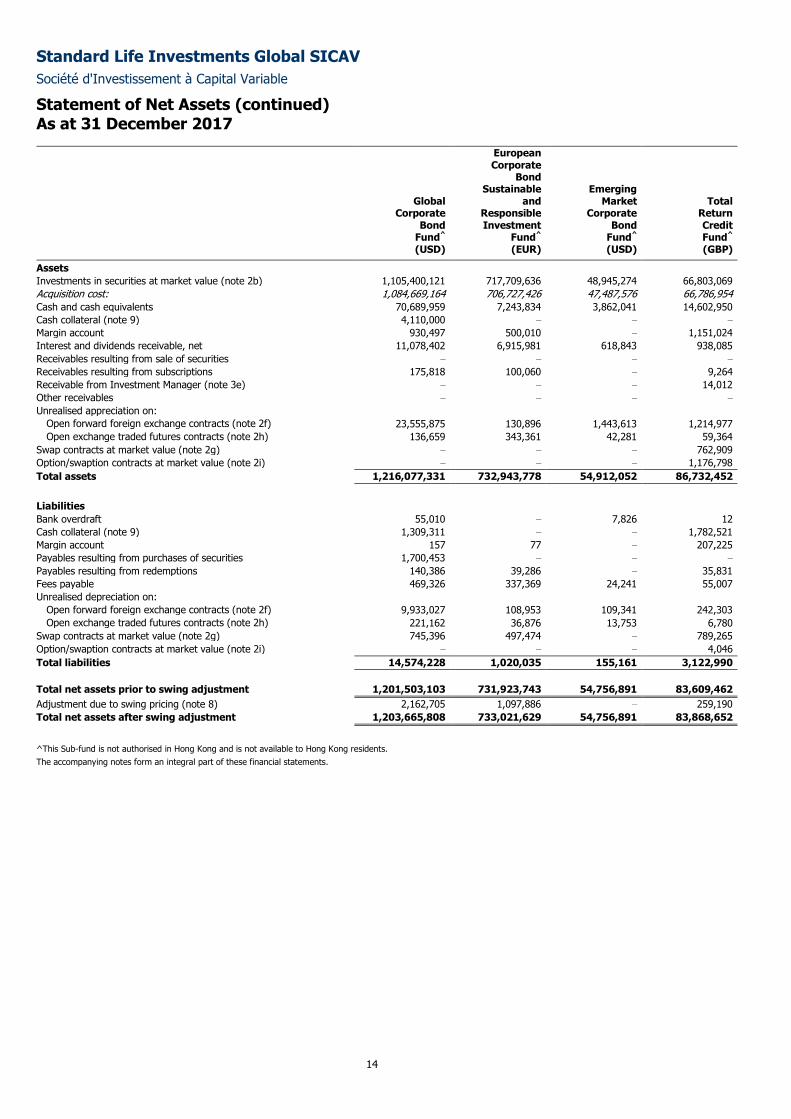
14
Global Corporate
Bond Fund^
European Corporate
Bond Sustainable
and Responsible Investment
Fund^
Emerging Market
Corporate Bond
Fund^
Total Return Credit Fund^
(USD) (EUR) (USD) (GBP)
Assets
Investments in securities at market value (note 2b) 1,105,400,121 717,709,636 48,945,274 66,803,069
Acquisition cost: 1,084,669,164 706,727,426 47,487,576 66,786,954
Cash and cash equivalents 70,689,959 7,243,834 3,862,041 14,602,950
Cash collateral (note 9) 4,110,000 – – –
Margin account 930,497 500,010 – 1,151,024
Interest and dividends receivable, net 11,078,402 6,915,981 618,843 938,085
Receivables resulting from sale of securities – – – –
Receivables resulting from subscriptions 175,818 100,060 – 9,264
Receivable from Investment Manager (note 3e) – – – 14,012
Other receivables – – – –
Unrealised appreciation on:
Open forward foreign exchange contracts (note 2f) 23,555,875 130,896 1,443,613 1,214,977
Open exchange traded futures contracts (note 2h) 136,659 343,361 42,281 59,364
Swap contracts at market value (note 2g) – – – 762,909
Option/swaption contracts at market value (note 2i) – – – 1,176,798
Total assets 1,216,077,331 732,943,778 54,912,052 86,732,452
Liabilities
Bank overdraft 55,010 – 7,826 12
Cash collateral (note 9) 1,309,311 – – 1,782,521
Margin account 157 77 – 207,225
Payables resulting from purchases of securities 1,700,453 – – –
Payables resulting from redemptions 140,386 39,286 – 35,831
Fees payable 469,326 337,369 24,241 55,007
Unrealised depreciation on:
Open forward foreign exchange contracts (note 2f) 9,933,027 108,953 109,341 242,303
Open exchange traded futures contracts (note 2h) 221,162 36,876 13,753 6,780
Swap contracts at market value (note 2g) 745,396 497,474 – 789,265
Option/swaption contracts at market value (note 2i) – – – 4,046
Total liabilities 14,574,228 1,020,035 155,161 3,122,990
Total net assets prior to swing adjustment 1,201,503,103 731,923,743 54,756,891 83,609,462
Adjustment due to swing pricing (note 8) 2,162,705 1,097,886 – 259,190
Total net assets after swing adjustment 1,203,665,808 733,021,629 54,756,891 83,868,652
^This Sub-fund is not authorised in Hong Kong and is not available to Hong Kong residents.
The accompanying notes form an integral part of these financial statements.
Standard Life Investments Global SICAV
Société d'Investissement à Capital Variable
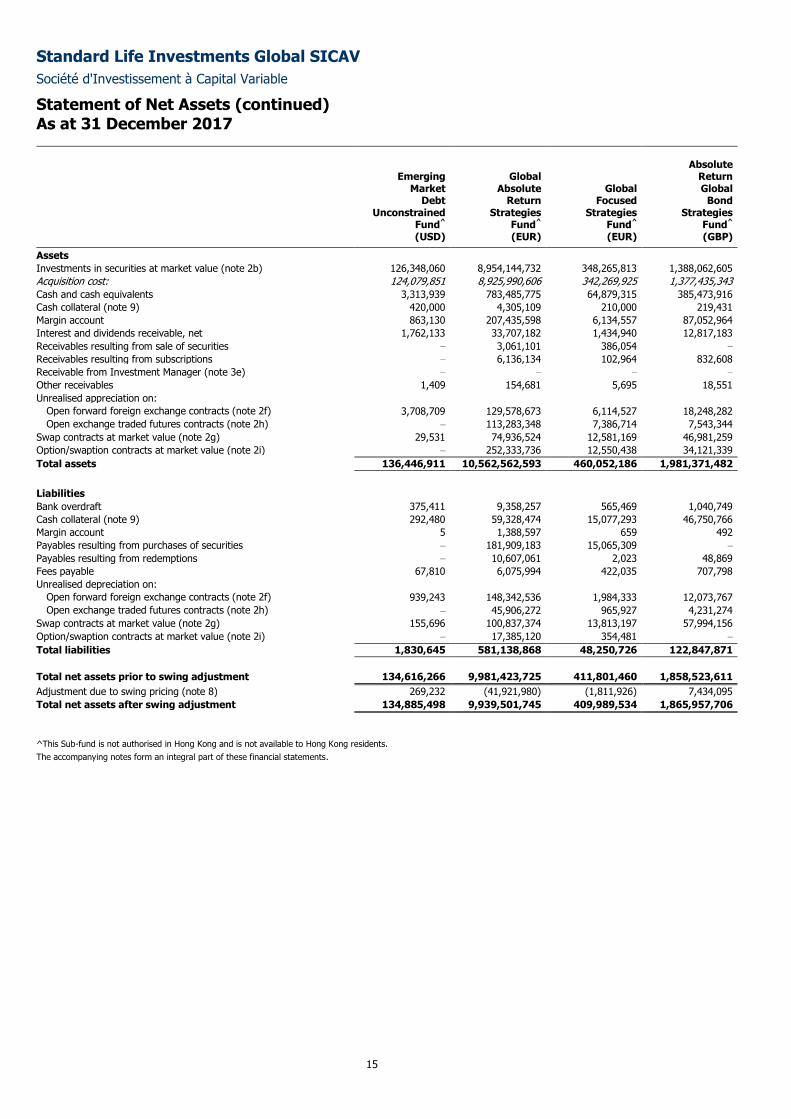
Statement of Net Assets (continued) As at 31 December 2017
15
Emerging Market
Debt Unconstrained
Fund^
Global Absolute
Return Strategies
Fund^
Global Focused
Strategies Fund^
Absolute Return Global
Bond Strategies
Fund^ (USD) (EUR) (EUR) (GBP)
Assets
Investments in securities at market value (note 2b) 126,348,060 8,954,144,732 348,265,813 1,388,062,605
Acquisition cost: 124,079,851 8,925,990,606 342,269,925 1,377,435,343
Cash and cash equivalents 3,313,939 783,485,775 64,879,315 385,473,916
Cash collateral (note 9) 420,000 4,305,109 210,000 219,431
Margin account 863,130 207,435,598 6,134,557 87,052,964
Interest and dividends receivable, net 1,762,133 33,707,182 1,434,940 12,817,183
Receivables resulting from sale of securities – 3,061,101 386,054 –
Receivables resulting from subscriptions – 6,136,134 102,964 832,608
Receivable from Investment Manager (note 3e) – – – –
Other receivables 1,409 154,681 5,695 18,551
Unrealised appreciation on:
Open forward foreign exchange contracts (note 2f) 3,708,709 129,578,673 6,114,527 18,248,282
Open exchange traded futures contracts (note 2h) – 113,283,348 7,386,714 7,543,344
Swap contracts at market value (note 2g) 29,531 74,936,524 12,581,169 46,981,259
Option/swaption contracts at market value (note 2i) – 252,333,736 12,550,438 34,121,339
Total assets 136,446,911 10,562,562,593 460,052,186 1,981,371,482
Liabilities
Bank overdraft 375,411 9,358,257 565,469 1,040,749
Cash collateral (note 9) 292,480 59,328,474 15,077,293 46,750,766
Margin account 5 1,388,597 659 492
Payables resulting from purchases of securities – 181,909,183 15,065,309 –
Payables resulting from redemptions – 10,607,061 2,023 48,869
Fees payable 67,810 6,075,994 422,035 707,798
Unrealised depreciation on:
Open forward foreign exchange contracts (note 2f) 939,243 148,342,536 1,984,333 12,073,767
Open exchange traded futures contracts (note 2h) – 45,906,272 965,927 4,231,274
Swap contracts at market value (note 2g) 155,696 100,837,374 13,813,197 57,994,156
Option/swaption contracts at market value (note 2i) – 17,385,120 354,481 –
Total liabilities 1,830,645 581,138,868 48,250,726 122,847,871
Total net assets prior to swing adjustment 134,616,266 9,981,423,725 411,801,460 1,858,523,611
Adjustment due to swing pricing (note 8) 269,232 (41,921,980) (1,811,926) 7,434,095
Total net assets after swing adjustment 134,885,498 9,939,501,745 409,989,534 1,865,957,706
^This Sub-fund is not authorised in Hong Kong and is not available to Hong Kong residents.
The accompanying notes form an integral part of these financial statements.
Standard Life Investments Global SICAV
Société d'Investissement à Capital Variable
Statement of Net Assets (continued) As at 31 December 2017
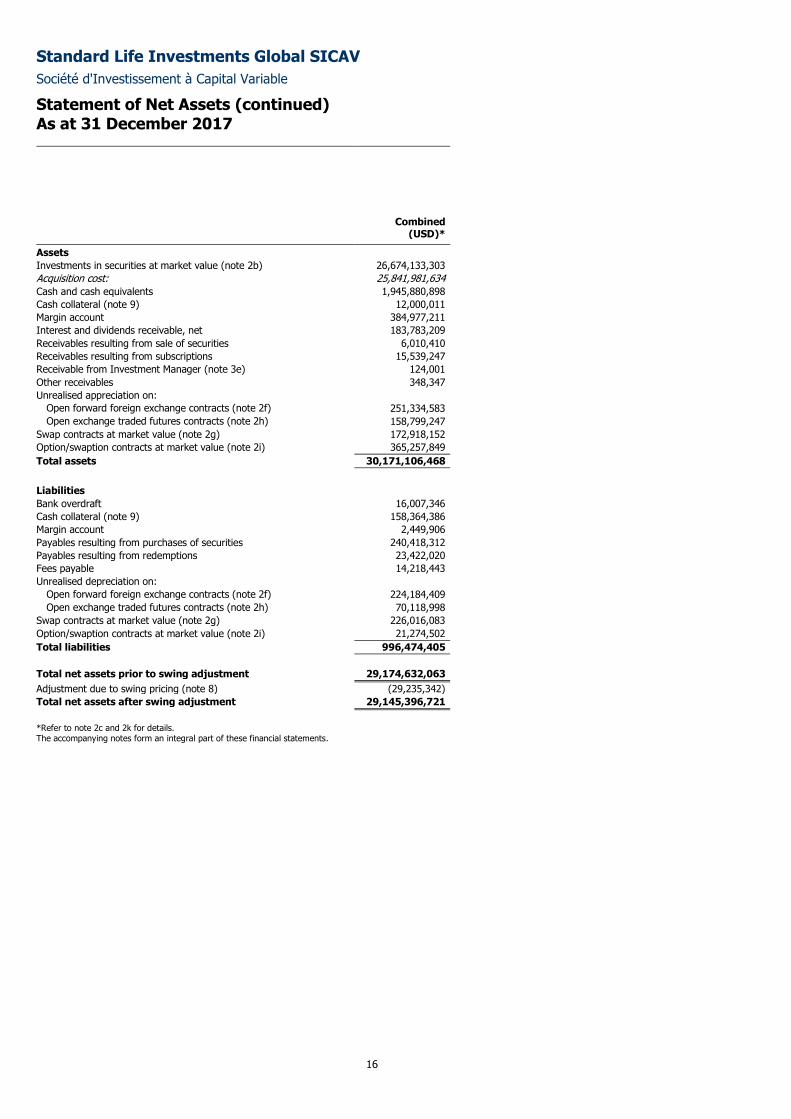
16
Combined (USD)*
Assets
Investments in securities at market value (note 2b) 26,674,133,303
Acquisition cost: 25,841,981,634
Cash and cash equivalents 1,945,880,898
Cash collateral (note 9) 12,000,011
Margin account 384,977,211
Interest and dividends receivable, net 183,783,209
Receivables resulting from sale of securities 6,010,410
Receivables resulting from subscriptions 15,539,247
Receivable from Investment Manager (note 3e) 124,001
Other receivables 348,347
Unrealised appreciation on:
Open forward foreign exchange contracts (note 2f) 251,334,583
Open exchange traded futures contracts (note 2h) 158,799,247
Swap contracts at market value (note 2g) 172,918,152
Option/swaption contracts at market value (note 2i) 365,257,849
Total assets 30,171,106,468
Liabilities
Bank overdraft 16,007,346
Cash collateral (note 9) 158,364,386
Margin account 2,449,906
Payables resulting from purchases of securities 240,418,312
Payables resulting from redemptions 23,422,020
Fees payable 14,218,443
Unrealised depreciation on:
Open forward foreign exchange contracts (note 2f) 224,184,409
Open exchange traded futures contracts (note 2h) 70,118,998
Swap contracts at market value (note 2g) 226,016,083
Option/swaption contracts at market value (note 2i) 21,274,502
Total liabilities 996,474,405
Total net assets prior to swing adjustment 29,174,632,063
Adjustment due to swing pricing (note 8) (29,235,342)
Total net assets after swing adjustment 29,145,396,721
*Refer to note 2c and 2k for details. The accompanying notes form an integral part of these financial statements.
Standard Life Investments Global SICAV
Société d'Investissement à Capital Variable
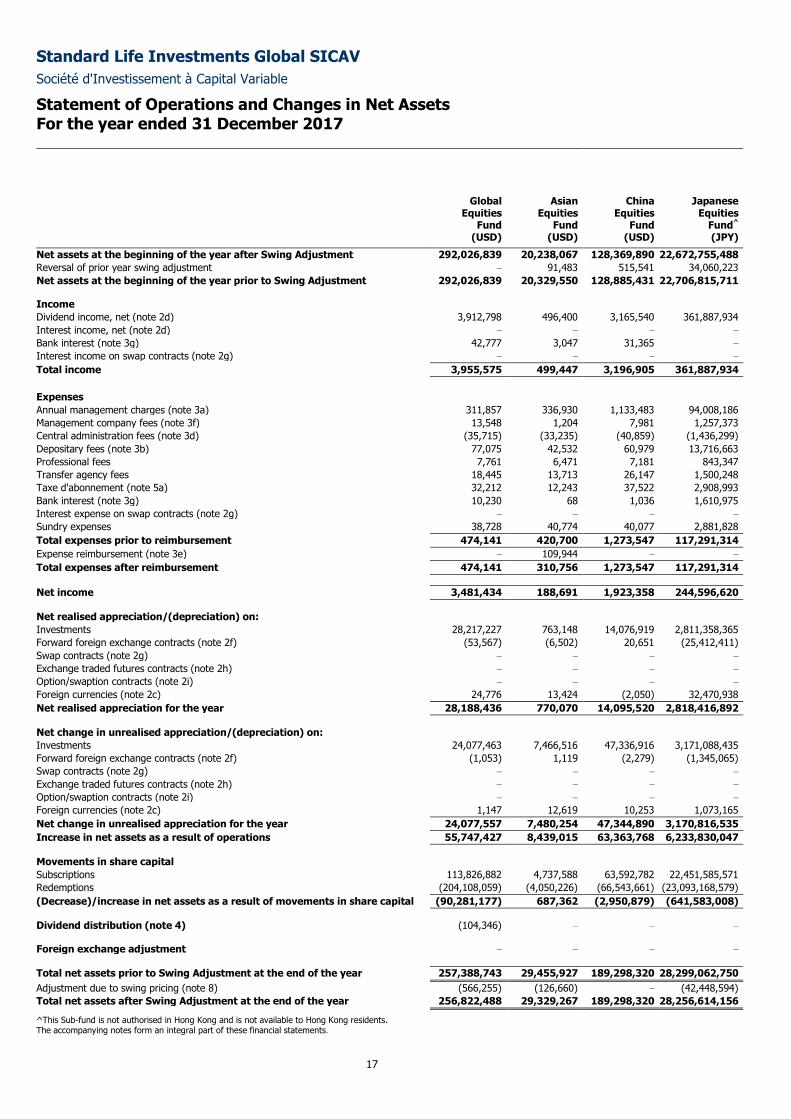
Statement of Operations and Changes in Net Assets For the year ended 31 December 2017
17
Global Equities
Fund
Asian Equities
Fund
China Equities
Fund
Japanese Equities
Fund^ (USD) (USD) (USD) (JPY)
Net assets at the beginning of the year after Swing Adjustment 292,026,839 20,238,067 128,369,890 22,672,755,488
Reversal of prior year swing adjustment – 91,483 515,541 34,060,223
Net assets at the beginning of the year prior to Swing Adjustment 292,026,839 20,329,550 128,885,431 22,706,815,711
Income
Dividend income, net (note 2d) 3,912,798 496,400 3,165,540 361,887,934
Interest income, net (note 2d) – – – –
Bank interest (note 3g) 42,777 3,047 31,365 –
Interest income on swap contracts (note 2g) – – – –
Total income 3,955,575 499,447 3,196,905 361,887,934
Expenses
Annual management charges (note 3a) 311,857 336,930 1,133,483 94,008,186
Management company fees (note 3f) 13,548 1,204 7,981 1,257,373
Central administration fees (note 3d) (35,715) (33,235) (40,859) (1,436,299)
Depositary fees (note 3b) 77,075 42,532 60,979 13,716,663
Professional fees 7,761 6,471 7,181 843,347
Transfer agency fees 18,445 13,713 26,147 1,500,248
Taxe d'abonnement (note 5a) 32,212 12,243 37,522 2,908,993
Bank interest (note 3g) 10,230 68 1,036 1,610,975
Interest expense on swap contracts (note 2g) – – – –
Sundry expenses 38,728 40,774 40,077 2,881,828
Total expenses prior to reimbursement 474,141 420,700 1,273,547 117,291,314
Expense reimbursement (note 3e) – 109,944 – –
Total expenses after reimbursement 474,141 310,756 1,273,547 117,291,314
Net income 3,481,434 188,691 1,923,358 244,596,620
Net realised appreciation/(depreciation) on:
Investments 28,217,227 763,148 14,076,919 2,811,358,365
Forward foreign exchange contracts (note 2f) (53,567) (6,502) 20,651 (25,412,411)
Swap contracts (note 2g) – – – –
Exchange traded futures contracts (note 2h) – – – –
Option/swaption contracts (note 2i) – – – –
Foreign currencies (note 2c) 24,776 13,424 (2,050) 32,470,938
Net realised appreciation for the year 28,188,436 770,070 14,095,520 2,818,416,892
Net change in unrealised appreciation/(depreciation) on:
Investments 24,077,463 7,466,516 47,336,916 3,171,088,435
Forward foreign exchange contracts (note 2f) (1,053) 1,119 (2,279) (1,345,065)
Swap contracts (note 2g) – – – –
Exchange traded futures contracts (note 2h) – – – –
Option/swaption contracts (note 2i) – – – –
Foreign currencies (note 2c) 1,147 12,619 10,253 1,073,165
Net change in unrealised appreciation for the year 24,077,557 7,480,254 47,344,890 3,170,816,535
Increase in net assets as a result of operations 55,747,427 8,439,015 63,363,768 6,233,830,047
Movements in share capital
Subscriptions 113,826,882 4,737,588 63,592,782 22,451,585,571
Redemptions (204,108,059) (4,050,226) (66,543,661) (23,093,168,579)
(Decrease)/increase in net assets as a result of movements in share capital (90,281,177) 687,362 (2,950,879) (641,583,008)
Dividend distribution (note 4) (104,346) – – –
Foreign exchange adjustment – – – –
Total net assets prior to Swing Adjustment at the end of the year 257,388,743 29,455,927 189,298,320 28,299,062,750
Adjustment due to swing pricing (note 8) (566,255) (126,660) – (42,448,594)
Total net assets after Swing Adjustment at the end of the year 256,822,488 29,329,267 189,298,320 28,256,614,156
^This Sub-fund is not authorised in Hong Kong and is not available to Hong Kong residents. The accompanying notes form an integral part of these financial statements.
Standard Life Investments Global SICAV
Société d'Investissement à Capital Variable
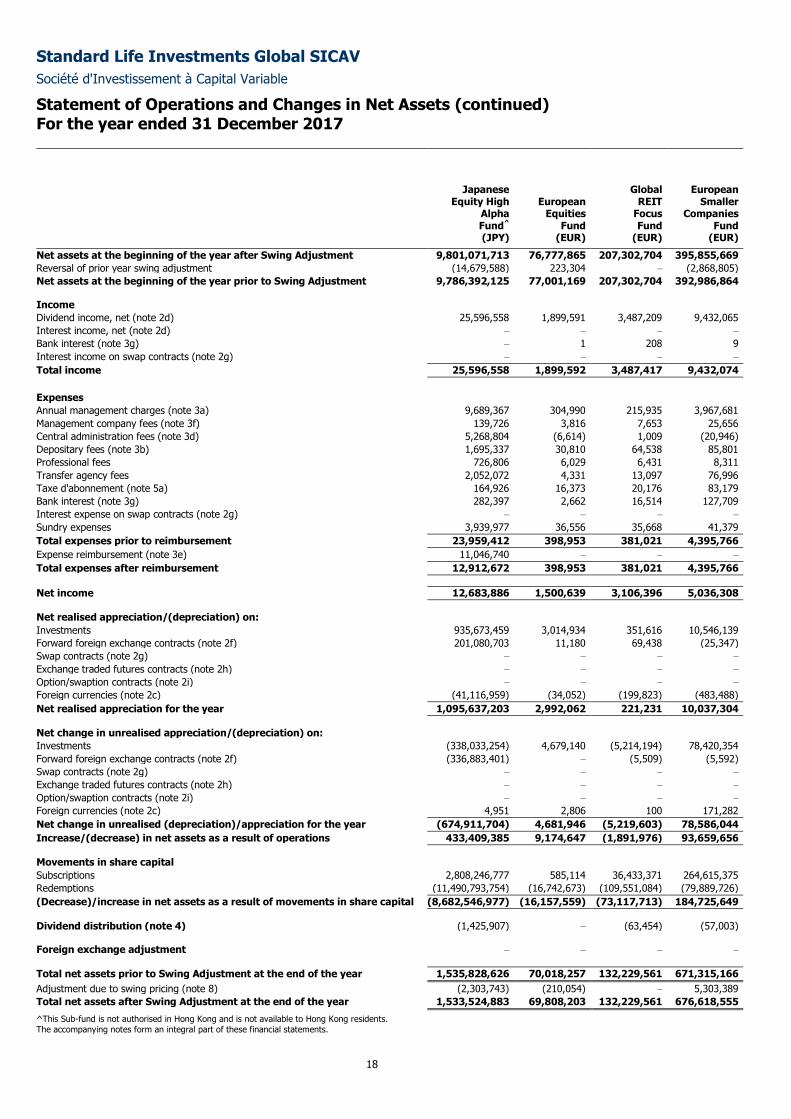
Statement of Operations and Changes in Net Assets (continued) For the year ended 31 December 2017
18
Japanese Equity High
Alpha Fund^
European Equities
Fund
Global REIT
Focus Fund
European Smaller
Companies Fund
(JPY) (EUR) (EUR) (EUR)
Net assets at the beginning of the year after Swing Adjustment 9,801,071,713 76,777,865 207,302,704 395,855,669
Reversal of prior year swing adjustment (14,679,588) 223,304 – (2,868,805)
Net assets at the beginning of the year prior to Swing Adjustment 9,786,392,125 77,001,169 207,302,704 392,986,864
Income
Dividend income, net (note 2d) 25,596,558 1,899,591 3,487,209 9,432,065
Interest income, net (note 2d) – – – –
Bank interest (note 3g) – 1 208 9
Interest income on swap contracts (note 2g) – – – –
Total income 25,596,558 1,899,592 3,487,417 9,432,074
Expenses
Annual management charges (note 3a) 9,689,367 304,990 215,935 3,967,681
Management company fees (note 3f) 139,726 3,816 7,653 25,656
Central administration fees (note 3d) 5,268,804 (6,614) 1,009 (20,946)
Depositary fees (note 3b) 1,695,337 30,810 64,538 85,801
Professional fees 726,806 6,029 6,431 8,311
Transfer agency fees 2,052,072 4,331 13,097 76,996
Taxe d'abonnement (note 5a) 164,926 16,373 20,176 83,179
Bank interest (note 3g) 282,397 2,662 16,514 127,709
Interest expense on swap contracts (note 2g) – – – –
Sundry expenses 3,939,977 36,556 35,668 41,379
Total expenses prior to reimbursement 23,959,412 398,953 381,021 4,395,766
Expense reimbursement (note 3e) 11,046,740 – – –
Total expenses after reimbursement 12,912,672 398,953 381,021 4,395,766
Net income 12,683,886 1,500,639 3,106,396 5,036,308
Net realised appreciation/(depreciation) on:
Investments 935,673,459 3,014,934 351,616 10,546,139
Forward foreign exchange contracts (note 2f) 201,080,703 11,180 69,438 (25,347)
Swap contracts (note 2g) – – – –
Exchange traded futures contracts (note 2h) – – – –
Option/swaption contracts (note 2i) – – – –
Foreign currencies (note 2c) (41,116,959) (34,052) (199,823) (483,488)
Net realised appreciation for the year 1,095,637,203 2,992,062 221,231 10,037,304
Net change in unrealised appreciation/(depreciation) on:
Investments (338,033,254) 4,679,140 (5,214,194) 78,420,354
Forward foreign exchange contracts (note 2f) (336,883,401) – (5,509) (5,592)
Swap contracts (note 2g) – – – –
Exchange traded futures contracts (note 2h) – – – –
Option/swaption contracts (note 2i) – – – –
Foreign currencies (note 2c) 4,951 2,806 100 171,282
Net change in unrealised (depreciation)/appreciation for the year (674,911,704) 4,681,946 (5,219,603) 78,586,044
Increase/(decrease) in net assets as a result of operations 433,409,385 9,174,647 (1,891,976) 93,659,656
Movements in share capital
Subscriptions 2,808,246,777 585,114 36,433,371 264,615,375
Redemptions (11,490,793,754) (16,742,673) (109,551,084) (79,889,726)
(Decrease)/increase in net assets as a result of movements in share capital (8,682,546,977) (16,157,559) (73,117,713) 184,725,649
Dividend distribution (note 4) (1,425,907) – (63,454) (57,003)
Foreign exchange adjustment – – – –
Total net assets prior to Swing Adjustment at the end of the year 1,535,828,626 70,018,257 132,229,561 671,315,166
Adjustment due to swing pricing (note 8) (2,303,743) (210,054) – 5,303,389
Total net assets after Swing Adjustment at the end of the year 1,533,524,883 69,808,203 132,229,561 676,618,555
^This Sub-fund is not authorised in Hong Kong and is not available to Hong Kong residents.
The accompanying notes form an integral part of these financial statements.
Standard Life Investments Global SICAV
Société d'Investissement à Capital Variable
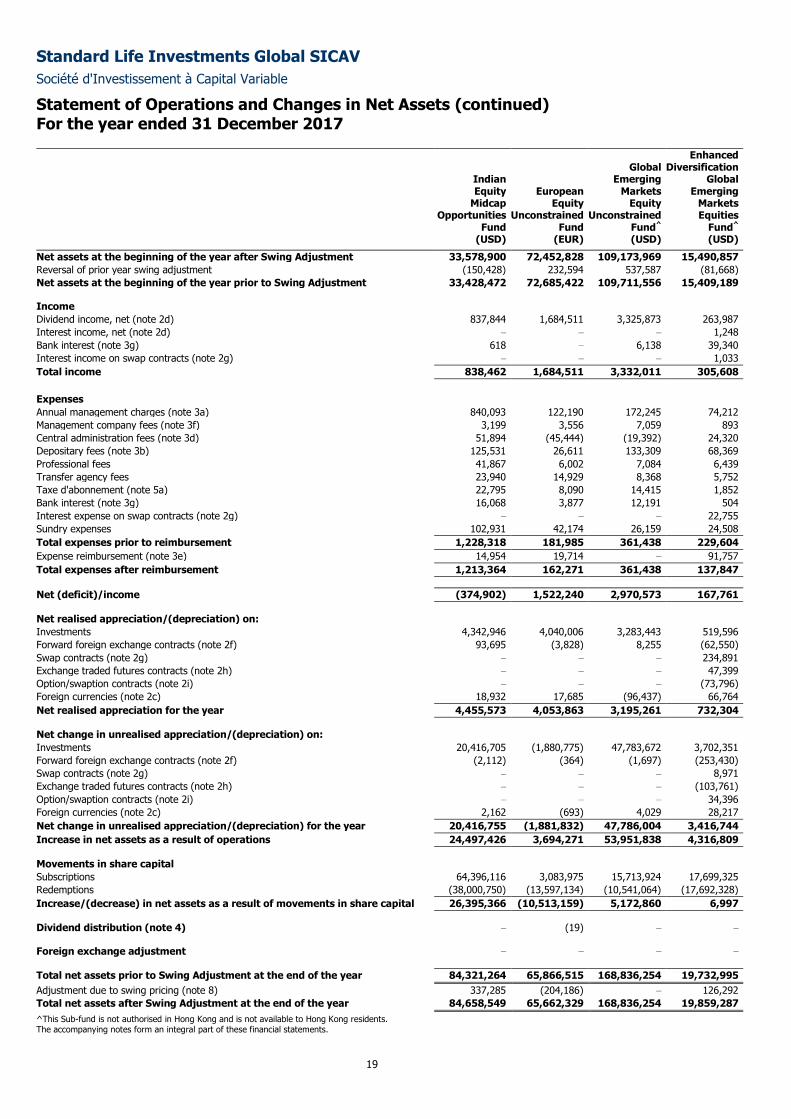
Statement of Operations and Changes in Net Assets (continued) For the year ended 31 December 2017
19
Indian Equity
Midcap Opportunities
Fund
European Equity
Unconstrained Fund
Global Emerging
Markets Equity
Unconstrained Fund^
Enhanced Diversification
Global Emerging
Markets Equities
Fund^ (USD) (EUR) (USD) (USD)
Net assets at the beginning of the year after Swing Adjustment 33,578,900 72,452,828 109,173,969 15,490,857
Reversal of prior year swing adjustment (150,428) 232,594 537,587 (81,668)
Net assets at the beginning of the year prior to Swing Adjustment 33,428,472 72,685,422 109,711,556 15,409,189
Income
Dividend income, net (note 2d) 837,844 1,684,511 3,325,873 263,987
Interest income, net (note 2d) – – – 1,248
Bank interest (note 3g) 618 – 6,138 39,340
Interest income on swap contracts (note 2g) – – – 1,033
Total income 838,462 1,684,511 3,332,011 305,608
Expenses
Annual management charges (note 3a) 840,093 122,190 172,245 74,212
Management company fees (note 3f) 3,199 3,556 7,059 893
Central administration fees (note 3d) 51,894 (45,444) (19,392) 24,320
Depositary fees (note 3b) 125,531 26,611 133,309 68,369
Professional fees 41,867 6,002 7,084 6,439
Transfer agency fees 23,940 14,929 8,368 5,752
Taxe d'abonnement (note 5a) 22,795 8,090 14,415 1,852
Bank interest (note 3g) 16,068 3,877 12,191 504
Interest expense on swap contracts (note 2g) – – – 22,755
Sundry expenses 102,931 42,174 26,159 24,508
Total expenses prior to reimbursement 1,228,318 181,985 361,438 229,604
Expense reimbursement (note 3e) 14,954 19,714 – 91,757
Total expenses after reimbursement 1,213,364 162,271 361,438 137,847
Net (deficit)/income (374,902) 1,522,240 2,970,573 167,761
Net realised appreciation/(depreciation) on:
Investments 4,342,946 4,040,006 3,283,443 519,596
Forward foreign exchange contracts (note 2f) 93,695 (3,828) 8,255 (62,550)
Swap contracts (note 2g) – – – 234,891
Exchange traded futures contracts (note 2h) – – – 47,399
Option/swaption contracts (note 2i) – – – (73,796)
Foreign currencies (note 2c) 18,932 17,685 (96,437) 66,764
Net realised appreciation for the year 4,455,573 4,053,863 3,195,261 732,304
Net change in unrealised appreciation/(depreciation) on:
Investments 20,416,705 (1,880,775) 47,783,672 3,702,351
Forward foreign exchange contracts (note 2f) (2,112) (364) (1,697) (253,430)
Swap contracts (note 2g) – – – 8,971
Exchange traded futures contracts (note 2h) – – – (103,761)
Option/swaption contracts (note 2i) – – – 34,396
Foreign currencies (note 2c) 2,162 (693) 4,029 28,217
Net change in unrealised appreciation/(depreciation) for the year 20,416,755 (1,881,832) 47,786,004 3,416,744
Increase in net assets as a result of operations 24,497,426 3,694,271 53,951,838 4,316,809
Movements in share capital
Subscriptions 64,396,116 3,083,975 15,713,924 17,699,325
Redemptions (38,000,750) (13,597,134) (10,541,064) (17,692,328)
Increase/(decrease) in net assets as a result of movements in share capital 26,395,366 (10,513,159) 5,172,860 6,997
Dividend distribution (note 4) – (19) – –
Foreign exchange adjustment – – – –
Total net assets prior to Swing Adjustment at the end of the year 84,321,264 65,866,515 168,836,254 19,732,995
Adjustment due to swing pricing (note 8) 337,285 (204,186) – 126,292
Total net assets after Swing Adjustment at the end of the year 84,658,549 65,662,329 168,836,254 19,859,287
^This Sub-fund is not authorised in Hong Kong and is not available to Hong Kong residents. The accompanying notes form an integral part of these financial statements.
Standard Life Investments Global SICAV
Société d'Investissement à Capital Variable
Statement of Operations and Changes in Net Assets (continued) For the year ended 31 December 2017
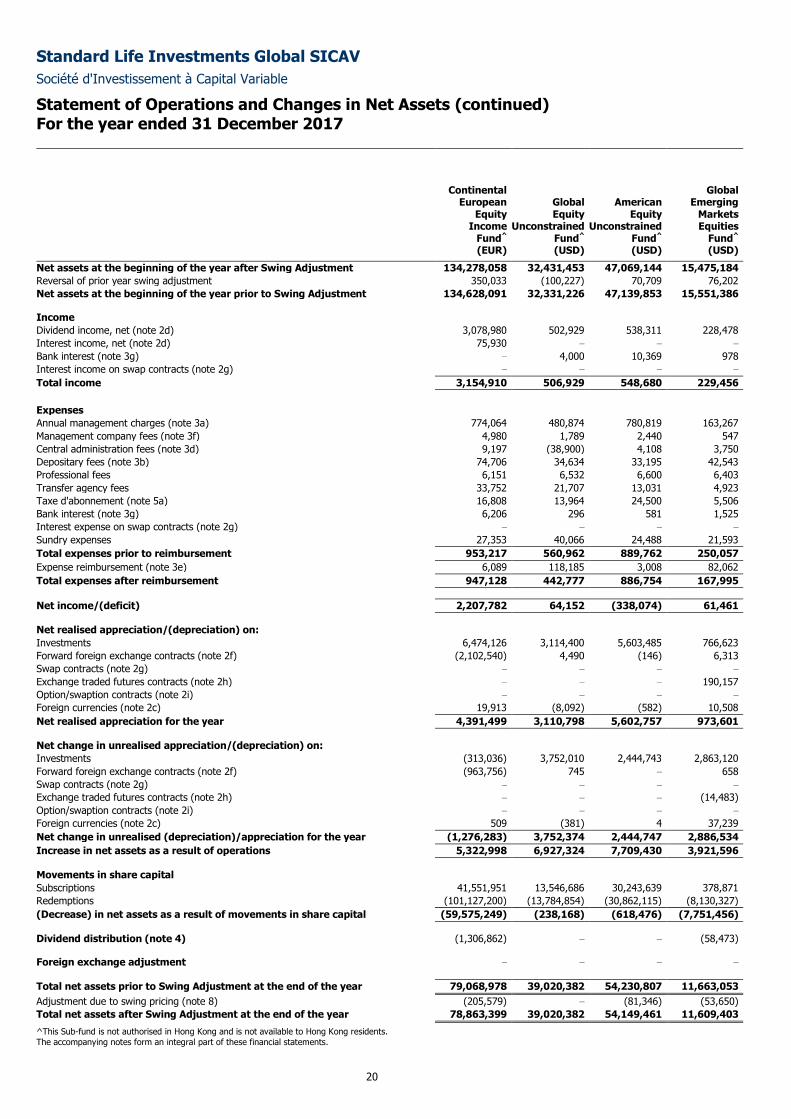
20
Continental European
Equity Income
Fund^
Global Equity
Unconstrained Fund^
American Equity
Unconstrained Fund^
Global Emerging
Markets Equities
Fund^ (EUR) (USD) (USD) (USD)
Net assets at the beginning of the year after Swing Adjustment 134,278,058 32,431,453 47,069,144 15,475,184
Reversal of prior year swing adjustment 350,033 (100,227) 70,709 76,202
Net assets at the beginning of the year prior to Swing Adjustment 134,628,091 32,331,226 47,139,853 15,551,386
Income
Dividend income, net (note 2d) 3,078,980 502,929 538,311 228,478
Interest income, net (note 2d) 75,930 – – –
Bank interest (note 3g) – 4,000 10,369 978
Interest income on swap contracts (note 2g) – – – –
Total income 3,154,910 506,929 548,680 229,456
Expenses
Annual management charges (note 3a) 774,064 480,874 780,819 163,267
Management company fees (note 3f) 4,980 1,789 2,440 547
Central administration fees (note 3d) 9,197 (38,900) 4,108 3,750
Depositary fees (note 3b) 74,706 34,634 33,195 42,543
Professional fees 6,151 6,532 6,600 6,403
Transfer agency fees 33,752 21,707 13,031 4,923
Taxe d'abonnement (note 5a) 16,808 13,964 24,500 5,506
Bank interest (note 3g) 6,206 296 581 1,525
Interest expense on swap contracts (note 2g) – – – –
Sundry expenses 27,353 40,066 24,488 21,593
Total expenses prior to reimbursement 953,217 560,962 889,762 250,057
Expense reimbursement (note 3e) 6,089 118,185 3,008 82,062
Total expenses after reimbursement 947,128 442,777 886,754 167,995
Net income/(deficit) 2,207,782 64,152 (338,074) 61,461
Net realised appreciation/(depreciation) on:
Investments 6,474,126 3,114,400 5,603,485 766,623
Forward foreign exchange contracts (note 2f) (2,102,540) 4,490 (146) 6,313
Swap contracts (note 2g) – – – –
Exchange traded futures contracts (note 2h) – – – 190,157
Option/swaption contracts (note 2i) – – – –
Foreign currencies (note 2c) 19,913 (8,092) (582) 10,508
Net realised appreciation for the year 4,391,499 3,110,798 5,602,757 973,601
Net change in unrealised appreciation/(depreciation) on:
Investments (313,036) 3,752,010 2,444,743 2,863,120
Forward foreign exchange contracts (note 2f) (963,756) 745 – 658
Swap contracts (note 2g) – – – –
Exchange traded futures contracts (note 2h) – – – (14,483)
Option/swaption contracts (note 2i) – – – –
Foreign currencies (note 2c) 509 (381) 4 37,239
Net change in unrealised (depreciation)/appreciation for the year (1,276,283) 3,752,374 2,444,747 2,886,534
Increase in net assets as a result of operations 5,322,998 6,927,324 7,709,430 3,921,596
Movements in share capital
Subscriptions 41,551,951 13,546,686 30,243,639 378,871
Redemptions (101,127,200) (13,784,854) (30,862,115) (8,130,327)
(Decrease) in net assets as a result of movements in share capital (59,575,249) (238,168) (618,476) (7,751,456)
Dividend distribution (note 4) (1,306,862) – – (58,473)
Foreign exchange adjustment – – – –
Total net assets prior to Swing Adjustment at the end of the year 79,068,978 39,020,382 54,230,807 11,663,053
Adjustment due to swing pricing (note 8) (205,579) – (81,346) (53,650)
Total net assets after Swing Adjustment at the end of the year 78,863,399 39,020,382 54,149,461 11,609,403
^This Sub-fund is not authorised in Hong Kong and is not available to Hong Kong residents.
The accompanying notes form an integral part of these financial statements.
Standard Life Investments Global SICAV
Société d'Investissement à Capital Variable
Statement of Operations and Changes in Net Assets (continued) For the year ended 31 December 2017
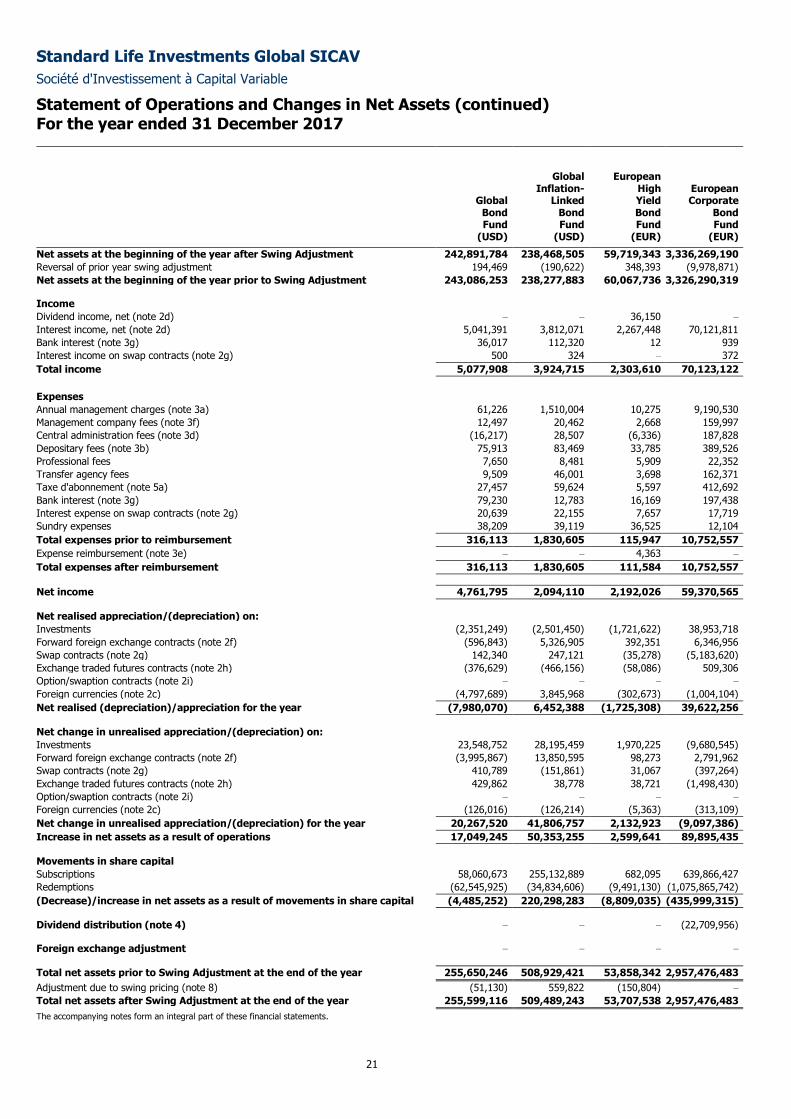
21
Global Bond Fund
Global Inflation-
Linked Bond Fund
European High Yield Bond Fund
European Corporate
Bond Fund
(USD) (USD) (EUR) (EUR)
Net assets at the beginning of the year after Swing Adjustment 242,891,784 238,468,505 59,719,343 3,336,269,190
Reversal of prior year swing adjustment 194,469 (190,622) 348,393 (9,978,871)
Net assets at the beginning of the year prior to Swing Adjustment 243,086,253 238,277,883 60,067,736 3,326,290,319
Income
Dividend income, net (note 2d) – – 36,150 –
Interest income, net (note 2d) 5,041,391 3,812,071 2,267,448 70,121,811
Bank interest (note 3g) 36,017 112,320 12 939
Interest income on swap contracts (note 2g) 500 324 – 372
Total income 5,077,908 3,924,715 2,303,610 70,123,122
Expenses
Annual management charges (note 3a) 61,226 1,510,004 10,275 9,190,530
Management company fees (note 3f) 12,497 20,462 2,668 159,997
Central administration fees (note 3d) (16,217) 28,507 (6,336) 187,828
Depositary fees (note 3b) 75,913 83,469 33,785 389,526
Professional fees 7,650 8,481 5,909 22,352
Transfer agency fees 9,509 46,001 3,698 162,371
Taxe d'abonnement (note 5a) 27,457 59,624 5,597 412,692
Bank interest (note 3g) 79,230 12,783 16,169 197,438
Interest expense on swap contracts (note 2g) 20,639 22,155 7,657 17,719
Sundry expenses 38,209 39,119 36,525 12,104
Total expenses prior to reimbursement 316,113 1,830,605 115,947 10,752,557
Expense reimbursement (note 3e) – – 4,363 –
Total expenses after reimbursement 316,113 1,830,605 111,584 10,752,557
Net income 4,761,795 2,094,110 2,192,026 59,370,565
Net realised appreciation/(depreciation) on:
Investments (2,351,249) (2,501,450) (1,721,622) 38,953,718
Forward foreign exchange contracts (note 2f) (596,843) 5,326,905 392,351 6,346,956
Swap contracts (note 2g) 142,340 247,121 (35,278) (5,183,620)
Exchange traded futures contracts (note 2h) (376,629) (466,156) (58,086) 509,306
Option/swaption contracts (note 2i) – – – –
Foreign currencies (note 2c) (4,797,689) 3,845,968 (302,673) (1,004,104)
Net realised (depreciation)/appreciation for the year (7,980,070) 6,452,388 (1,725,308) 39,622,256
Net change in unrealised appreciation/(depreciation) on:
Investments 23,548,752 28,195,459 1,970,225 (9,680,545)
Forward foreign exchange contracts (note 2f) (3,995,867) 13,850,595 98,273 2,791,962
Swap contracts (note 2g) 410,789 (151,861) 31,067 (397,264)
Exchange traded futures contracts (note 2h) 429,862 38,778 38,721 (1,498,430)
Option/swaption contracts (note 2i) – – – –
Foreign currencies (note 2c) (126,016) (126,214) (5,363) (313,109)
Net change in unrealised appreciation/(depreciation) for the year 20,267,520 41,806,757 2,132,923 (9,097,386)
Increase in net assets as a result of operations 17,049,245 50,353,255 2,599,641 89,895,435
Movements in share capital
Subscriptions 58,060,673 255,132,889 682,095 639,866,427
Redemptions (62,545,925) (34,834,606) (9,491,130) (1,075,865,742)
(Decrease)/increase in net assets as a result of movements in share capital (4,485,252) 220,298,283 (8,809,035) (435,999,315)
Dividend distribution (note 4) – – – (22,709,956)
Foreign exchange adjustment – – – –
Total net assets prior to Swing Adjustment at the end of the year 255,650,246 508,929,421 53,858,342 2,957,476,483
Adjustment due to swing pricing (note 8) (51,130) 559,822 (150,804) –
Total net assets after Swing Adjustment at the end of the year 255,599,116 509,489,243 53,707,538 2,957,476,483
The accompanying notes form an integral part of these financial statements.
Standard Life Investments Global SICAV
Société d'Investissement à Capital Variable
Statement of Operations and Changes in Net Assets (continued) For the year ended 31 December 2017
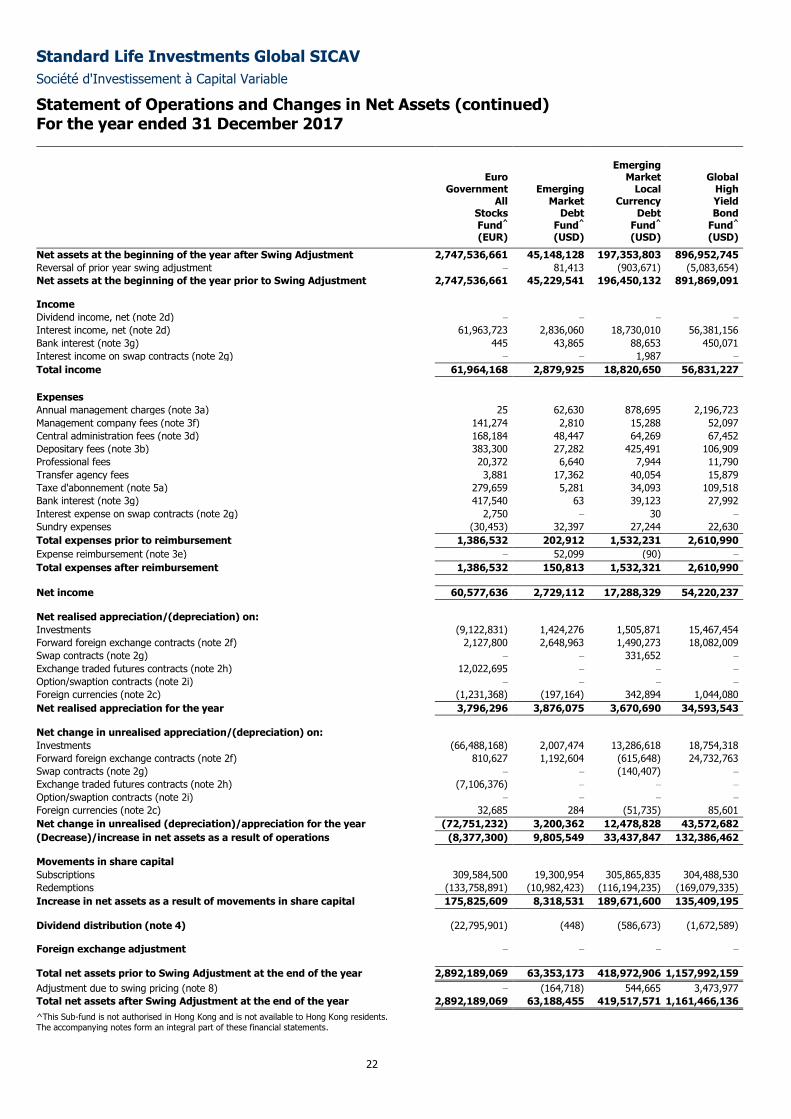
22
Euro Government
All Stocks Fund^
Emerging Market
Debt Fund^
Emerging Market
Local Currency
Debt Fund^
Global High Yield Bond
Fund^ (EUR) (USD) (USD) (USD)
Net assets at the beginning of the year after Swing Adjustment 2,747,536,661 45,148,128 197,353,803 896,952,745
Reversal of prior year swing adjustment – 81,413 (903,671) (5,083,654)
Net assets at the beginning of the year prior to Swing Adjustment 2,747,536,661 45,229,541 196,450,132 891,869,091
Income
Dividend income, net (note 2d) – – – –
Interest income, net (note 2d) 61,963,723 2,836,060 18,730,010 56,381,156
Bank interest (note 3g) 445 43,865 88,653 450,071
Interest income on swap contracts (note 2g) – – 1,987 –
Total income 61,964,168 2,879,925 18,820,650 56,831,227
Expenses
Annual management charges (note 3a) 25 62,630 878,695 2,196,723
Management company fees (note 3f) 141,274 2,810 15,288 52,097
Central administration fees (note 3d) 168,184 48,447 64,269 67,452
Depositary fees (note 3b) 383,300 27,282 425,491 106,909
Professional fees 20,372 6,640 7,944 11,790
Transfer agency fees 3,881 17,362 40,054 15,879
Taxe d'abonnement (note 5a) 279,659 5,281 34,093 109,518
Bank interest (note 3g) 417,540 63 39,123 27,992
Interest expense on swap contracts (note 2g) 2,750 – 30 –
Sundry expenses (30,453) 32,397 27,244 22,630
Total expenses prior to reimbursement 1,386,532 202,912 1,532,231 2,610,990
Expense reimbursement (note 3e) – 52,099 (90) –
Total expenses after reimbursement 1,386,532 150,813 1,532,321 2,610,990
Net income 60,577,636 2,729,112 17,288,329 54,220,237
Net realised appreciation/(depreciation) on:
Investments (9,122,831) 1,424,276 1,505,871 15,467,454
Forward foreign exchange contracts (note 2f) 2,127,800 2,648,963 1,490,273 18,082,009
Swap contracts (note 2g) – – 331,652 –
Exchange traded futures contracts (note 2h) 12,022,695 – – –
Option/swaption contracts (note 2i) – – – –
Foreign currencies (note 2c) (1,231,368) (197,164) 342,894 1,044,080
Net realised appreciation for the year 3,796,296 3,876,075 3,670,690 34,593,543
Net change in unrealised appreciation/(depreciation) on:
Investments (66,488,168) 2,007,474 13,286,618 18,754,318
Forward foreign exchange contracts (note 2f) 810,627 1,192,604 (615,648) 24,732,763
Swap contracts (note 2g) – – (140,407) –
Exchange traded futures contracts (note 2h) (7,106,376) – – –
Option/swaption contracts (note 2i) – – – –
Foreign currencies (note 2c) 32,685 284 (51,735) 85,601
Net change in unrealised (depreciation)/appreciation for the year (72,751,232) 3,200,362 12,478,828 43,572,682
(Decrease)/increase in net assets as a result of operations (8,377,300) 9,805,549 33,437,847 132,386,462
Movements in share capital
Subscriptions 309,584,500 19,300,954 305,865,835 304,488,530
Redemptions (133,758,891) (10,982,423) (116,194,235) (169,079,335)
Increase in net assets as a result of movements in share capital 175,825,609 8,318,531 189,671,600 135,409,195
Dividend distribution (note 4) (22,795,901) (448) (586,673) (1,672,589)
Foreign exchange adjustment – – – –
Total net assets prior to Swing Adjustment at the end of the year 2,892,189,069 63,353,173 418,972,906 1,157,992,159
Adjustment due to swing pricing (note 8) – (164,718) 544,665 3,473,977
Total net assets after Swing Adjustment at the end of the year 2,892,189,069 63,188,455 419,517,571 1,161,466,136
^This Sub-fund is not authorised in Hong Kong and is not available to Hong Kong residents.
The accompanying notes form an integral part of these financial statements.
Standard Life Investments Global SICAV
Société d'Investissement à Capital Variable
Statement of Operations and Changes in Net Assets (continued) For the year ended 31 December 2017
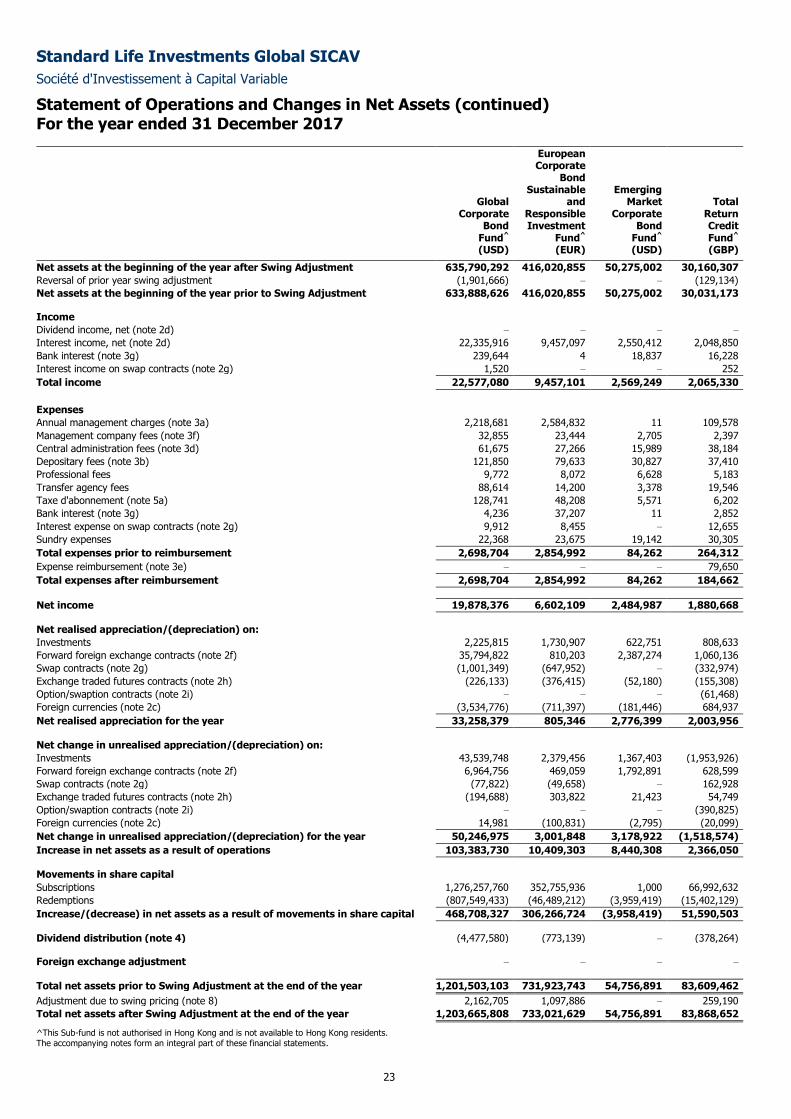
23
Global Corporate
Bond Fund^
European Corporate
Bond Sustainable
and Responsible Investment
Fund^
Emerging Market
Corporate Bond
Fund^
Total Return Credit Fund^
(USD) (EUR) (USD) (GBP)
Net assets at the beginning of the year after Swing Adjustment 635,790,292 416,020,855 50,275,002 30,160,307
Reversal of prior year swing adjustment (1,901,666) – – (129,134)
Net assets at the beginning of the year prior to Swing Adjustment 633,888,626 416,020,855 50,275,002 30,031,173
Income
Dividend income, net (note 2d) – – – –
Interest income, net (note 2d) 22,335,916 9,457,097 2,550,412 2,048,850
Bank interest (note 3g) 239,644 4 18,837 16,228
Interest income on swap contracts (note 2g) 1,520 – – 252
Total income 22,577,080 9,457,101 2,569,249 2,065,330
Expenses
Annual management charges (note 3a) 2,218,681 2,584,832 11 109,578
Management company fees (note 3f) 32,855 23,444 2,705 2,397
Central administration fees (note 3d) 61,675 27,266 15,989 38,184
Depositary fees (note 3b) 121,850 79,633 30,827 37,410
Professional fees 9,772 8,072 6,628 5,183
Transfer agency fees 88,614 14,200 3,378 19,546
Taxe d'abonnement (note 5a) 128,741 48,208 5,571 6,202
Bank interest (note 3g) 4,236 37,207 11 2,852
Interest expense on swap contracts (note 2g) 9,912 8,455 – 12,655
Sundry expenses 22,368 23,675 19,142 30,305
Total expenses prior to reimbursement 2,698,704 2,854,992 84,262 264,312
Expense reimbursement (note 3e) – – – 79,650
Total expenses after reimbursement 2,698,704 2,854,992 84,262 184,662
Net income 19,878,376 6,602,109 2,484,987 1,880,668
Net realised appreciation/(depreciation) on:
Investments 2,225,815 1,730,907 622,751 808,633
Forward foreign exchange contracts (note 2f) 35,794,822 810,203 2,387,274 1,060,136
Swap contracts (note 2g) (1,001,349) (647,952) – (332,974)
Exchange traded futures contracts (note 2h) (226,133) (376,415) (52,180) (155,308)
Option/swaption contracts (note 2i) – – – (61,468)
Foreign currencies (note 2c) (3,534,776) (711,397) (181,446) 684,937
Net realised appreciation for the year 33,258,379 805,346 2,776,399 2,003,956
Net change in unrealised appreciation/(depreciation) on:
Investments 43,539,748 2,379,456 1,367,403 (1,953,926)
Forward foreign exchange contracts (note 2f) 6,964,756 469,059 1,792,891 628,599
Swap contracts (note 2g) (77,822) (49,658) – 162,928
Exchange traded futures contracts (note 2h) (194,688) 303,822 21,423 54,749
Option/swaption contracts (note 2i) – – – (390,825)
Foreign currencies (note 2c) 14,981 (100,831) (2,795) (20,099)
Net change in unrealised appreciation/(depreciation) for the year 50,246,975 3,001,848 3,178,922 (1,518,574)
Increase in net assets as a result of operations 103,383,730 10,409,303 8,440,308 2,366,050
Movements in share capital
Subscriptions 1,276,257,760 352,755,936 1,000 66,992,632
Redemptions (807,549,433) (46,489,212) (3,959,419) (15,402,129)
Increase/(decrease) in net assets as a result of movements in share capital 468,708,327 306,266,724 (3,958,419) 51,590,503
Dividend distribution (note 4) (4,477,580) (773,139) – (378,264)
Foreign exchange adjustment – – – –
Total net assets prior to Swing Adjustment at the end of the year 1,201,503,103 731,923,743 54,756,891 83,609,462
Adjustment due to swing pricing (note 8) 2,162,705 1,097,886 – 259,190
Total net assets after Swing Adjustment at the end of the year 1,203,665,808 733,021,629 54,756,891 83,868,652
^This Sub-fund is not authorised in Hong Kong and is not available to Hong Kong residents. The accompanying notes form an integral part of these financial statements.
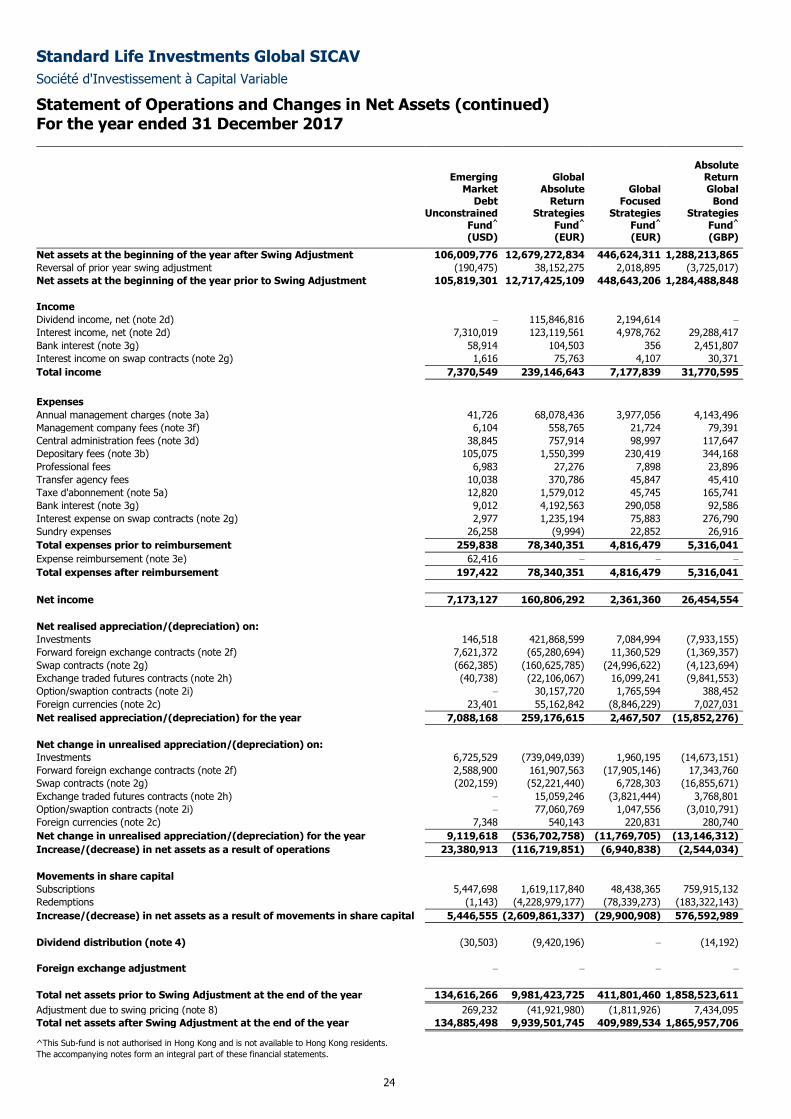
Standard Life Investments Global SICAV
Société d'Investissement à Capital Variable
Statement of Operations and Changes in Net Assets (continued) For the year ended 31 December 2017
24
Emerging Market
Debt Unconstrained
Fund^
Global Absolute
Return Strategies
Fund^
Global Focused
Strategies Fund^
Absolute Return Global
Bond Strategies
Fund^ (USD) (EUR) (EUR) (GBP)
Net assets at the beginning of the year after Swing Adjustment 106,009,776 12,679,272,834 446,624,311 1,288,213,865
Reversal of prior year swing adjustment (190,475) 38,152,275 2,018,895 (3,725,017)
Net assets at the beginning of the year prior to Swing Adjustment 105,819,301 12,717,425,109 448,643,206 1,284,488,848
Income
Dividend income, net (note 2d) – 115,846,816 2,194,614 –
Interest income, net (note 2d) 7,310,019 123,119,561 4,978,762 29,288,417
Bank interest (note 3g) 58,914 104,503 356 2,451,807
Interest income on swap contracts (note 2g) 1,616 75,763 4,107 30,371
Total income 7,370,549 239,146,643 7,177,839 31,770,595
Expenses
Annual management charges (note 3a) 41,726 68,078,436 3,977,056 4,143,496
Management company fees (note 3f) 6,104 558,765 21,724 79,391
Central administration fees (note 3d) 38,845 757,914 98,997 117,647
Depositary fees (note 3b) 105,075 1,550,399 230,419 344,168
Professional fees 6,983 27,276 7,898 23,896
Transfer agency fees 10,038 370,786 45,847 45,410
Taxe d'abonnement (note 5a) 12,820 1,579,012 45,745 165,741
Bank interest (note 3g) 9,012 4,192,563 290,058 92,586
Interest expense on swap contracts (note 2g) 2,977 1,235,194 75,883 276,790
Sundry expenses 26,258 (9,994) 22,852 26,916
Total expenses prior to reimbursement 259,838 78,340,351 4,816,479 5,316,041
Expense reimbursement (note 3e) 62,416 – – –
Total expenses after reimbursement 197,422 78,340,351 4,816,479 5,316,041
Net income 7,173,127 160,806,292 2,361,360 26,454,554
Net realised appreciation/(depreciation) on:
Investments 146,518 421,868,599 7,084,994 (7,933,155)
Forward foreign exchange contracts (note 2f) 7,621,372 (65,280,694) 11,360,529 (1,369,357)
Swap contracts (note 2g) (662,385) (160,625,785) (24,996,622) (4,123,694)
Exchange traded futures contracts (note 2h) (40,738) (22,106,067) 16,099,241 (9,841,553)
Option/swaption contracts (note 2i) – 30,157,720 1,765,594 388,452
Foreign currencies (note 2c) 23,401 55,162,842 (8,846,229) 7,027,031
Net realised appreciation/(depreciation) for the year 7,088,168 259,176,615 2,467,507 (15,852,276)
Net change in unrealised appreciation/(depreciation) on:
Investments 6,725,529 (739,049,039) 1,960,195 (14,673,151)
Forward foreign exchange contracts (note 2f) 2,588,900 161,907,563 (17,905,146) 17,343,760
Swap contracts (note 2g) (202,159) (52,221,440) 6,728,303 (16,855,671)
Exchange traded futures contracts (note 2h) – 15,059,246 (3,821,444) 3,768,801
Option/swaption contracts (note 2i) – 77,060,769 1,047,556 (3,010,791)
Foreign currencies (note 2c) 7,348 540,143 220,831 280,740
Net change in unrealised appreciation/(depreciation) for the year 9,119,618 (536,702,758) (11,769,705) (13,146,312)
Increase/(decrease) in net assets as a result of operations 23,380,913 (116,719,851) (6,940,838) (2,544,034)
Movements in share capital
Subscriptions 5,447,698 1,619,117,840 48,438,365 759,915,132
Redemptions (1,143) (4,228,979,177) (78,339,273) (183,322,143)
Increase/(decrease) in net assets as a result of movements in share capital 5,446,555 (2,609,861,337) (29,900,908) 576,592,989
Dividend distribution (note 4) (30,503) (9,420,196) – (14,192)
Foreign exchange adjustment – – – –
Total net assets prior to Swing Adjustment at the end of the year 134,616,266 9,981,423,725 411,801,460 1,858,523,611
Adjustment due to swing pricing (note 8) 269,232 (41,921,980) (1,811,926) 7,434,095
Total net assets after Swing Adjustment at the end of the year 134,885,498 9,939,501,745 409,989,534 1,865,957,706
^This Sub-fund is not authorised in Hong Kong and is not available to Hong Kong residents.
The accompanying notes form an integral part of these financial statements.
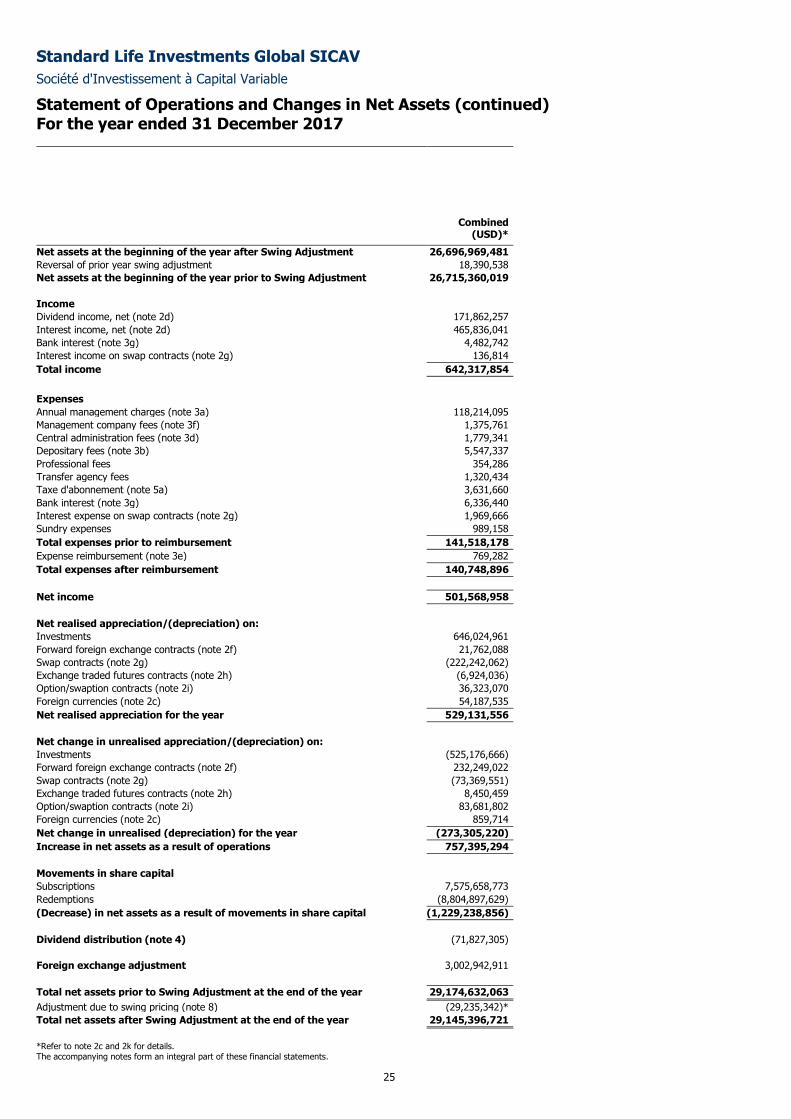
Standard Life Investments Global SICAV
Société d'Investissement à Capital Variable
Statement of Operations and Changes in Net Assets (continued) For the year ended 31 December 2017
25
Combined (USD)*
Net assets at the beginning of the year after Swing Adjustment 26,696,969,481
Reversal of prior year swing adjustment 18,390,538
Net assets at the beginning of the year prior to Swing Adjustment 26,715,360,019
Income
Dividend income, net (note 2d) 171,862,257
Interest income, net (note 2d) 465,836,041
Bank interest (note 3g) 4,482,742
Interest income on swap contracts (note 2g) 136,814
Total income 642,317,854
Expenses
Annual management charges (note 3a) 118,214,095
Management company fees (note 3f) 1,375,761
Central administration fees (note 3d) 1,779,341
Depositary fees (note 3b) 5,547,337
Professional fees 354,286
Transfer agency fees 1,320,434
Taxe d'abonnement (note 5a) 3,631,660
Bank interest (note 3g) 6,336,440
Interest expense on swap contracts (note 2g) 1,969,666
Sundry expenses 989,158
Total expenses prior to reimbursement 141,518,178
Expense reimbursement (note 3e) 769,282
Total expenses after reimbursement 140,748,896
Net income 501,568,958
Net realised appreciation/(depreciation) on:
Investments 646,024,961
Forward foreign exchange contracts (note 2f) 21,762,088
Swap contracts (note 2g) (222,242,062)
Exchange traded futures contracts (note 2h) (6,924,036)
Option/swaption contracts (note 2i) 36,323,070
Foreign currencies (note 2c) 54,187,535
Net realised appreciation for the year 529,131,556
Net change in unrealised appreciation/(depreciation) on:
Investments (525,176,666)
Forward foreign exchange contracts (note 2f) 232,249,022
Swap contracts (note 2g) (73,369,551)
Exchange traded futures contracts (note 2h) 8,450,459
Option/swaption contracts (note 2i) 83,681,802
Foreign currencies (note 2c) 859,714
Net change in unrealised (depreciation) for the year (273,305,220)
Increase in net assets as a result of operations 757,395,294
Movements in share capital
Subscriptions 7,575,658,773
Redemptions (8,804,897,629)
(Decrease) in net assets as a result of movements in share capital (1,229,238,856)
Dividend distribution (note 4) (71,827,305)
Foreign exchange adjustment 3,002,942,911
Total net assets prior to Swing Adjustment at the end of the year 29,174,632,063
Adjustment due to swing pricing (note 8) (29,235,342)*
Total net assets after Swing Adjustment at the end of the year 29,145,396,721
*Refer to note 2c and 2k for details. The accompanying notes form an integral part of these financial statements.
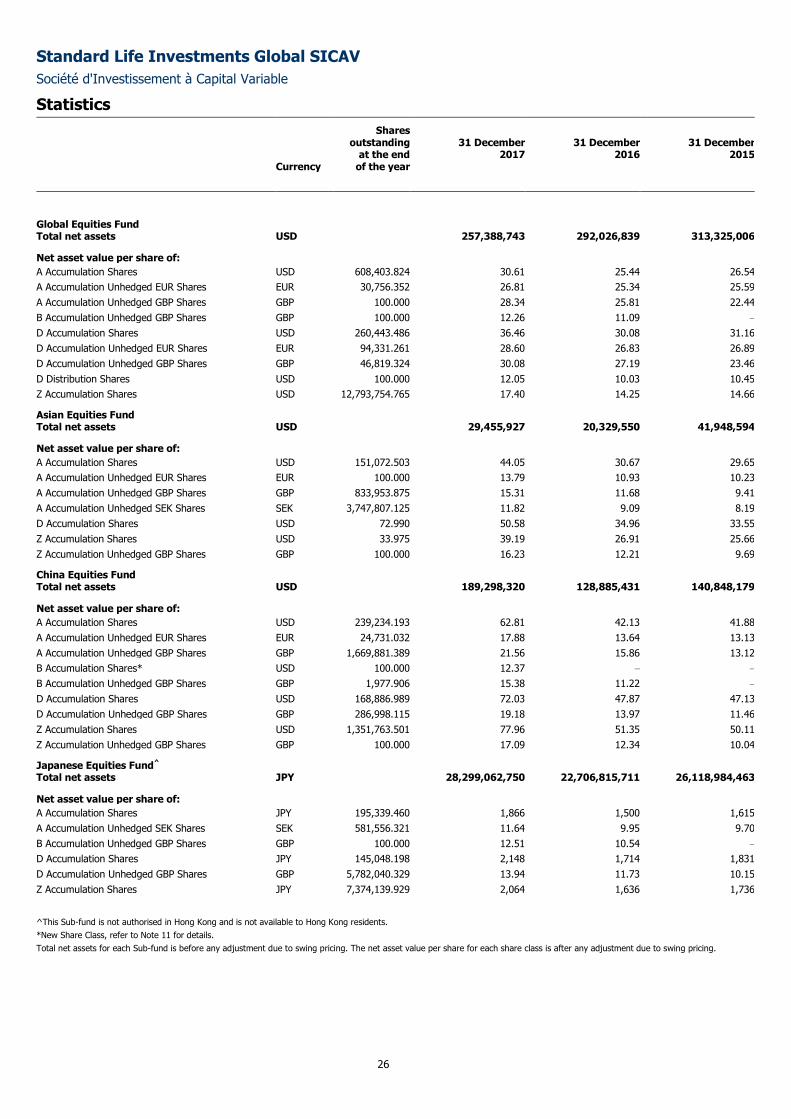
Standard Life Investments Global SICAV
Société d'Investissement à Capital Variable
Statistics
26
Nagp[
Currency
Shares outstanding
at the end of the year
31 December 2017
31 December 2016
31 December 2015
Global Equities Fund Total net assets USD 257,388,743 292,026,839 313,325,006
Net asset value per share of:
A Accumulation Shares USD 608,403.824 30.61 25.44 26.54
A Accumulation Unhedged EUR Shares EUR 30,756.352 26.81 25.34 25.59
A Accumulation Unhedged GBP Shares GBP 100.000 28.34 25.81 22.44
B Accumulation Unhedged GBP Shares GBP 100.000 12.26 11.09 –
D Accumulation Shares USD 260,443.486 36.46 30.08 31.16
D Accumulation Unhedged EUR Shares EUR 94,331.261 28.60 26.83 26.89
D Accumulation Unhedged GBP Shares GBP 46,819.324 30.08 27.19 23.46
D Distribution Shares USD 100.000 12.05 10.03 10.45
Z Accumulation Shares USD 12,793,754.765 17.40 14.25 14.66
Asian Equities Fund Total net assets USD 29,455,927 20,329,550 41,948,594
Net asset value per share of:
A Accumulation Shares USD 151,072.503 44.05 30.67 29.65
A Accumulation Unhedged EUR Shares EUR 100.000 13.79 10.93 10.23
A Accumulation Unhedged GBP Shares GBP 833,953.875 15.31 11.68 9.41
A Accumulation Unhedged SEK Shares SEK 3,747,807.125 11.82 9.09 8.19
D Accumulation Shares USD 72.990 50.58 34.96 33.55
Z Accumulation Shares USD 33.975 39.19 26.91 25.66
Z Accumulation Unhedged GBP Shares GBP 100.000 16.23 12.21 9.69
China Equities Fund Total net assets USD 189,298,320 128,885,431 140,848,179
Net asset value per share of:
A Accumulation Shares USD 239,234.193 62.81 42.13 41.88
A Accumulation Unhedged EUR Shares EUR 24,731.032 17.88 13.64 13.13
A Accumulation Unhedged GBP Shares GBP 1,669,881.389 21.56 15.86 13.12
B Accumulation Shares* USD 100.000 12.37 – –
B Accumulation Unhedged GBP Shares GBP 1,977.906 15.38 11.22 –
D Accumulation Shares USD 168,886.989 72.03 47.87 47.13
D Accumulation Unhedged GBP Shares GBP 286,998.115 19.18 13.97 11.46
Z Accumulation Shares USD 1,351,763.501 77.96 51.35 50.11
Z Accumulation Unhedged GBP Shares GBP 100.000 17.09 12.34 10.04
Japanese Equities Fund^ Total net assets JPY 28,299,062,750 22,706,815,711 26,118,984,463
Net asset value per share of:
A Accumulation Shares JPY 195,339.460 1,866 1,500 1,615
A Accumulation Unhedged SEK Shares SEK 581,556.321 11.64 9.95 9.70
B Accumulation Unhedged GBP Shares GBP 100.000 12.51 10.54 –
D Accumulation Shares JPY 145,048.198 2,148 1,714 1,831
D Accumulation Unhedged GBP Shares GBP 5,782,040.329 13.94 11.73 10.15
Z Accumulation Shares JPY 7,374,139.929 2,064 1,636 1,736
^This Sub-fund is not authorised in Hong Kong and is not available to Hong Kong residents.
*New Share Class, refer to Note 11 for details.
Total net assets for each Sub-fund is before any adjustment due to swing pricing. The net asset value per share for each share class is after any adjustment due to swing pricing.
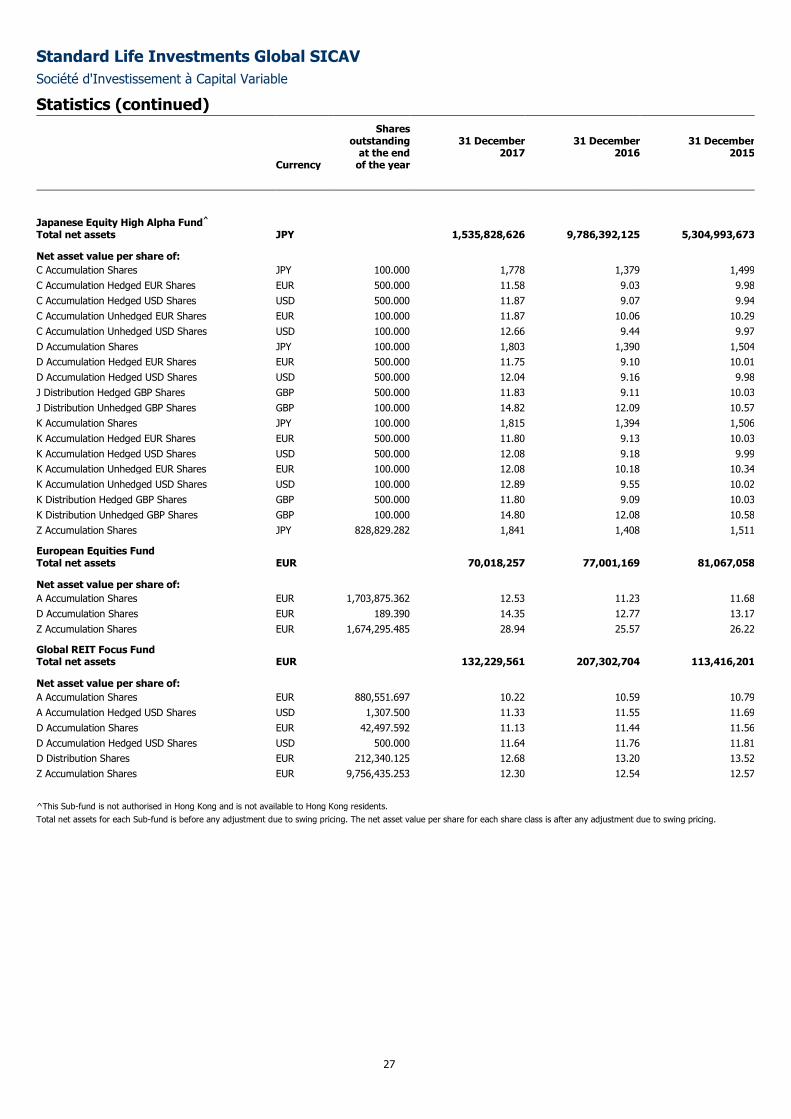
Standard Life Investments Global SICAV
Société d'Investissement à Capital Variable
Statistics (continued)
27
Currency
Shares outstanding
at the end of the year
31 December 2017
31 December 2016
31 December 2015
Japanese Equity High Alpha Fund^1 Total net assets JPY 1,535,828,626 9,786,392,125 5,304,993,673
Net asset value per share of:
C Accumulation Shares JPY 100.000 1,778 1,379 1,499
C Accumulation Hedged EUR Shares EUR 500.000 11.58 9.03 9.98
C Accumulation Hedged USD Shares USD 500.000 11.87 9.07 9.94
C Accumulation Unhedged EUR Shares EUR 100.000 11.87 10.06 10.29
C Accumulation Unhedged USD Shares USD 100.000 12.66 9.44 9.97
D Accumulation Shares JPY 100.000 1,803 1,390 1,504
D Accumulation Hedged EUR Shares EUR 500.000 11.75 9.10 10.01
D Accumulation Hedged USD Shares USD 500.000 12.04 9.16 9.98
J Distribution Hedged GBP Shares GBP 500.000 11.83 9.11 10.03
J Distribution Unhedged GBP Shares GBP 100.000 14.82 12.09 10.57
K Accumulation Shares JPY 100.000 1,815 1,394 1,506
K Accumulation Hedged EUR Shares EUR 500.000 11.80 9.13 10.03
K Accumulation Hedged USD Shares USD 500.000 12.08 9.18 9.99
K Accumulation Unhedged EUR Shares EUR 100.000 12.08 10.18 10.34
K Accumulation Unhedged USD Shares USD 100.000 12.89 9.55 10.02
K Distribution Hedged GBP Shares GBP 500.000 11.80 9.09 10.03
K Distribution Unhedged GBP Shares GBP 100.000 14.80 12.08 10.58
Z Accumulation Shares JPY 828,829.282 1,841 1,408 1,511
European Equities Fund Total net assets EUR 70,018,257 77,001,169 81,067,058
Net asset value per share of:
A Accumulation Shares EUR 1,703,875.362 12.53 11.23 11.68
D Accumulation Shares EUR 189.390 14.35 12.77 13.17
Z Accumulation Shares EUR 1,674,295.485 28.94 25.57 26.22
Global REIT Focus Fund Total net assets EUR 132,229,561 207,302,704 113,416,201
Net asset value per share of:
A Accumulation Shares EUR 880,551.697 10.22 10.59 10.79
A Accumulation Hedged USD Shares USD 1,307.500 11.33 11.55 11.69
D Accumulation Shares EUR 42,497.592 11.13 11.44 11.56
D Accumulation Hedged USD Shares USD 500.000 11.64 11.76 11.81
D Distribution Shares EUR 212,340.125 12.68 13.20 13.52
Z Accumulation Shares EUR 9,756,435.253 12.30 12.54 12.57
^This Sub-fund is not authorised in Hong Kong and is not available to Hong Kong residents.
Total net assets for each Sub-fund is before any adjustment due to swing pricing. The net asset value per share for each share class is after any adjustment due to swing pricing.
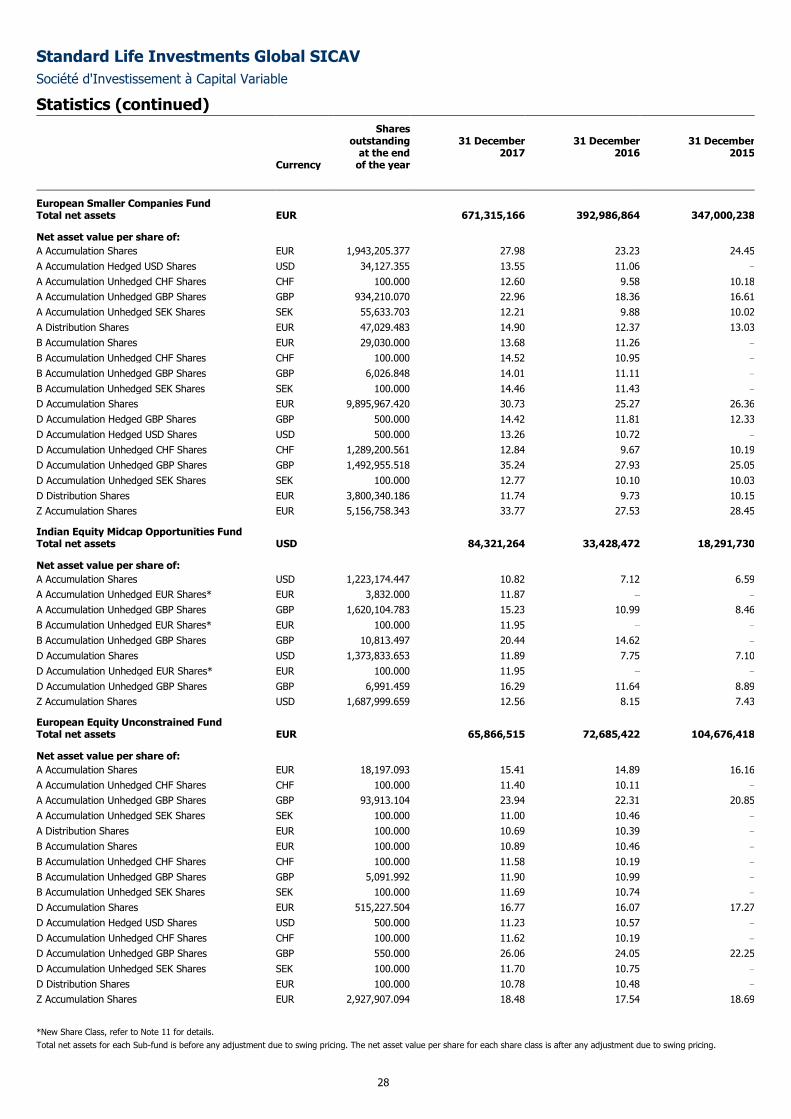
Standard Life Investments Global SICAV
Société d'Investissement à Capital Variable
Statistics (continued)
28
Currency
Shares outstanding
at the end of the year
31 December 2017
31 December 2016
31 December 2015
European Smaller Companies Fund Total net assets EUR 671,315,166 392,986,864 347,000,238
Net asset value per share of:
A Accumulation Shares EUR 1,943,205.377 27.98 23.23 24.45
A Accumulation Hedged USD Shares USD 34,127.355 13.55 11.06 –
A Accumulation Unhedged CHF Shares CHF 100.000 12.60 9.58 10.18
A Accumulation Unhedged GBP Shares GBP 934,210.070 22.96 18.36 16.61
A Accumulation Unhedged SEK Shares SEK 55,633.703 12.21 9.88 10.02
A Distribution Shares EUR 47,029.483 14.90 12.37 13.03
B Accumulation Shares EUR 29,030.000 13.68 11.26 –
B Accumulation Unhedged CHF Shares CHF 100.000 14.52 10.95 –
B Accumulation Unhedged GBP Shares GBP 6,026.848 14.01 11.11 –
B Accumulation Unhedged SEK Shares SEK 100.000 14.46 11.43 –
D Accumulation Shares EUR 9,895,967.420 30.73 25.27 26.36
D Accumulation Hedged GBP Shares GBP 500.000 14.42 11.81 12.33
D Accumulation Hedged USD Shares USD 500.000 13.26 10.72 –
D Accumulation Unhedged CHF Shares CHF 1,289,200.561 12.84 9.67 10.19
D Accumulation Unhedged GBP Shares GBP 1,492,955.518 35.24 27.93 25.05
D Accumulation Unhedged SEK Shares SEK 100.000 12.77 10.10 10.03
D Distribution Shares EUR 3,800,340.186 11.74 9.73 10.15
Z Accumulation Shares EUR 5,156,758.343 33.77 27.53 28.45
Indian Equity Midcap Opportunities Fund2 Total net assets USD 84,321,264 33,428,472 18,291,730
Net asset value per share of:
A Accumulation Shares USD 1,223,174.447 10.82 7.12 6.59
A Accumulation Unhedged EUR Shares* EUR 3,832.000 11.87 – –
A Accumulation Unhedged GBP Shares GBP 1,620,104.783 15.23 10.99 8.46
B Accumulation Unhedged EUR Shares* EUR 100.000 11.95 – –
B Accumulation Unhedged GBP Shares GBP 10,813.497 20.44 14.62 –
D Accumulation Shares USD 1,373,833.653 11.89 7.75 7.10
D Accumulation Unhedged EUR Shares* EUR 100.000 11.95 – –
D Accumulation Unhedged GBP Shares GBP 6,991.459 16.29 11.64 8.89
Z Accumulation Shares USD 1,687,999.659 12.56 8.15 7.43
European Equity Unconstrained Fund Total net assets EUR 65,866,515 72,685,422 104,676,418
Net asset value per share of:
A Accumulation Shares EUR 18,197.093 15.41 14.89 16.16
A Accumulation Unhedged CHF Shares CHF 100.000 11.40 10.11 –
A Accumulation Unhedged GBP Shares GBP 93,913.104 23.94 22.31 20.85
A Accumulation Unhedged SEK Shares SEK 100.000 11.00 10.46 –
A Distribution Shares EUR 100.000 10.69 10.39 –
B Accumulation Shares EUR 100.000 10.89 10.46 –
B Accumulation Unhedged CHF Shares CHF 100.000 11.58 10.19 –
B Accumulation Unhedged GBP Shares GBP 5,091.992 11.90 10.99 –
B Accumulation Unhedged SEK Shares SEK 100.000 11.69 10.74 –
D Accumulation Shares EUR 515,227.504 16.77 16.07 17.27
D Accumulation Hedged USD Shares USD 500.000 11.23 10.57 –
D Accumulation Unhedged CHF Shares CHF 100.000 11.62 10.19 –
D Accumulation Unhedged GBP Shares GBP 550.000 26.06 24.05 22.25
D Accumulation Unhedged SEK Shares SEK 100.000 11.70 10.75 –
D Distribution Shares EUR 100.000 10.78 10.48 –
Z Accumulation Shares EUR 2,927,907.094 18.48 17.54 18.69
*New Share Class, refer to Note 11 for details.
Total net assets for each Sub-fund is before any adjustment due to swing pricing. The net asset value per share for each share class is after any adjustment due to swing pricing.
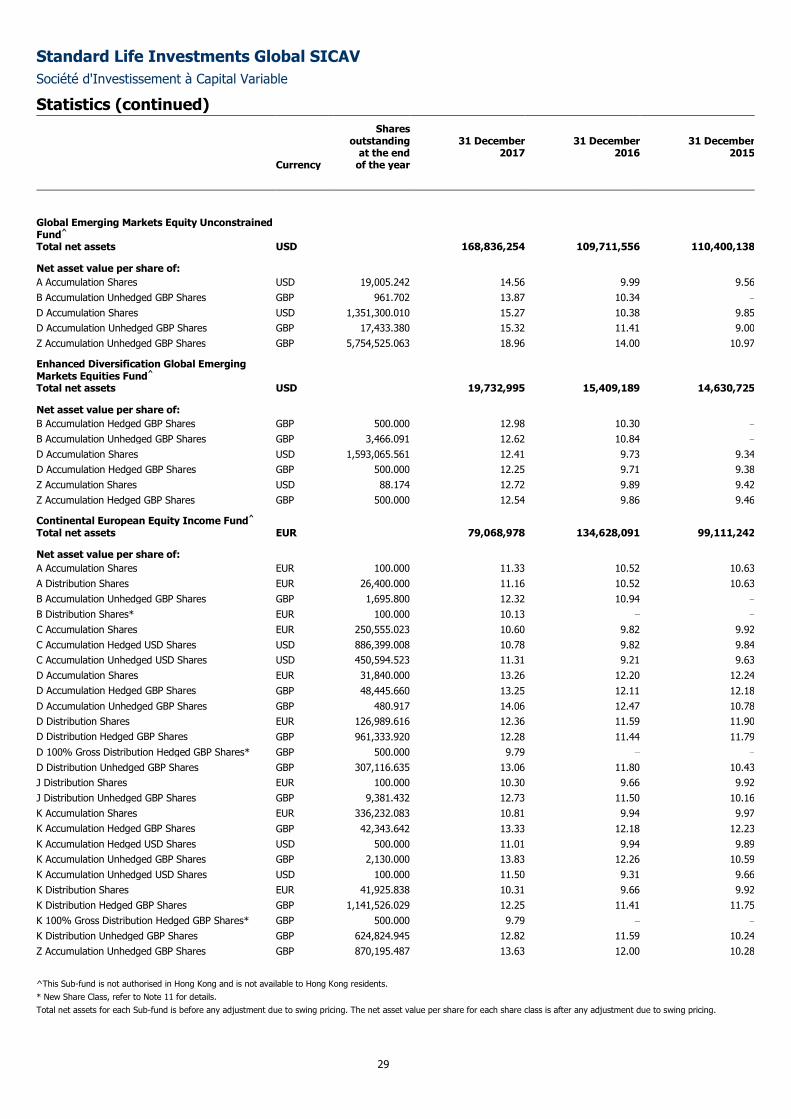
Standard Life Investments Global SICAV
Société d'Investissement à Capital Variable
Statistics (continued)
29
Currency
Shares outstanding
at the end of the year
31 December 2017
31 December 2016
31 December 2015
Global Emerging Markets Equity Unconstrained Fund^ Total net assets USD 168,836,254 109,711,556 110,400,138
Net asset value per share of:
A Accumulation Shares USD 19,005.242 14.56 9.99 9.56
B Accumulation Unhedged GBP Shares GBP 961.702 13.87 10.34 –
D Accumulation Shares USD 1,351,300.010 15.27 10.38 9.85
D Accumulation Unhedged GBP Shares GBP 17,433.380 15.32 11.41 9.00
Z Accumulation Unhedged GBP Shares GBP 5,754,525.063 18.96 14.00 10.97
Enhanced Diversification Global Emerging Markets Equities Fund^ Total net assets USD 19,732,995 15,409,189 14,630,725
Net asset value per share of:
B Accumulation Hedged GBP Shares GBP 500.000 12.98 10.30 –
B Accumulation Unhedged GBP Shares GBP 3,466.091 12.62 10.84 –
D Accumulation Shares USD 1,593,065.561 12.41 9.73 9.34
D Accumulation Hedged GBP Shares GBP 500.000 12.25 9.71 9.38
Z Accumulation Shares USD 88.174 12.72 9.89 9.42
Z Accumulation Hedged GBP Shares GBP 500.000 12.54 9.86 9.46
Continental European Equity Income Fund^ Total net assets EUR 79,068,978 134,628,091 99,111,242
Net asset value per share of:
A Accumulation Shares EUR 100.000 11.33 10.52 10.63
A Distribution Shares EUR 26,400.000 11.16 10.52 10.63
B Accumulation Unhedged GBP Shares GBP 1,695.800 12.32 10.94 –
B Distribution Shares* EUR 100.000 10.13 – –
C Accumulation Shares EUR 250,555.023 10.60 9.82 9.92
C Accumulation Hedged USD Shares USD 886,399.008 10.78 9.82 9.84
C Accumulation Unhedged USD Shares USD 450,594.523 11.31 9.21 9.63
D Accumulation Shares EUR 31,840.000 13.26 12.20 12.24
D Accumulation Hedged GBP Shares GBP 48,445.660 13.25 12.11 12.18
D Accumulation Unhedged GBP Shares GBP 480.917 14.06 12.47 10.78
D Distribution Shares EUR 126,989.616 12.36 11.59 11.90
D Distribution Hedged GBP Shares GBP 961,333.920 12.28 11.44 11.79
D 100% Gross Distribution Hedged GBP Shares* GBP 500.000 9.79 – –
D Distribution Unhedged GBP Shares GBP 307,116.635 13.06 11.80 10.43
J Distribution Shares EUR 100.000 10.30 9.66 9.92
J Distribution Unhedged GBP Shares GBP 9,381.432 12.73 11.50 10.16
K Accumulation Shares EUR 336,232.083 10.81 9.94 9.97
K Accumulation Hedged GBP Shares GBP 42,343.642 13.33 12.18 12.23
K Accumulation Hedged USD Shares USD 500.000 11.01 9.94 9.89
K Accumulation Unhedged GBP Shares GBP 2,130.000 13.83 12.26 10.59
K Accumulation Unhedged USD Shares USD 100.000 11.50 9.31 9.66
K Distribution Shares EUR 41,925.838 10.31 9.66 9.92
K Distribution Hedged GBP Shares GBP 1,141,526.029 12.25 11.41 11.75
K 100% Gross Distribution Hedged GBP Shares* GBP 500.000 9.79 – –
K Distribution Unhedged GBP Shares GBP 624,824.945 12.82 11.59 10.24
Z Accumulation Unhedged GBP Shares GBP 870,195.487 13.63 12.00 10.28
^This Sub-fund is not authorised in Hong Kong and is not available to Hong Kong residents.
* New Share Class, refer to Note 11 for details.
Total net assets for each Sub-fund is before any adjustment due to swing pricing. The net asset value per share for each share class is after any adjustment due to swing pricing.
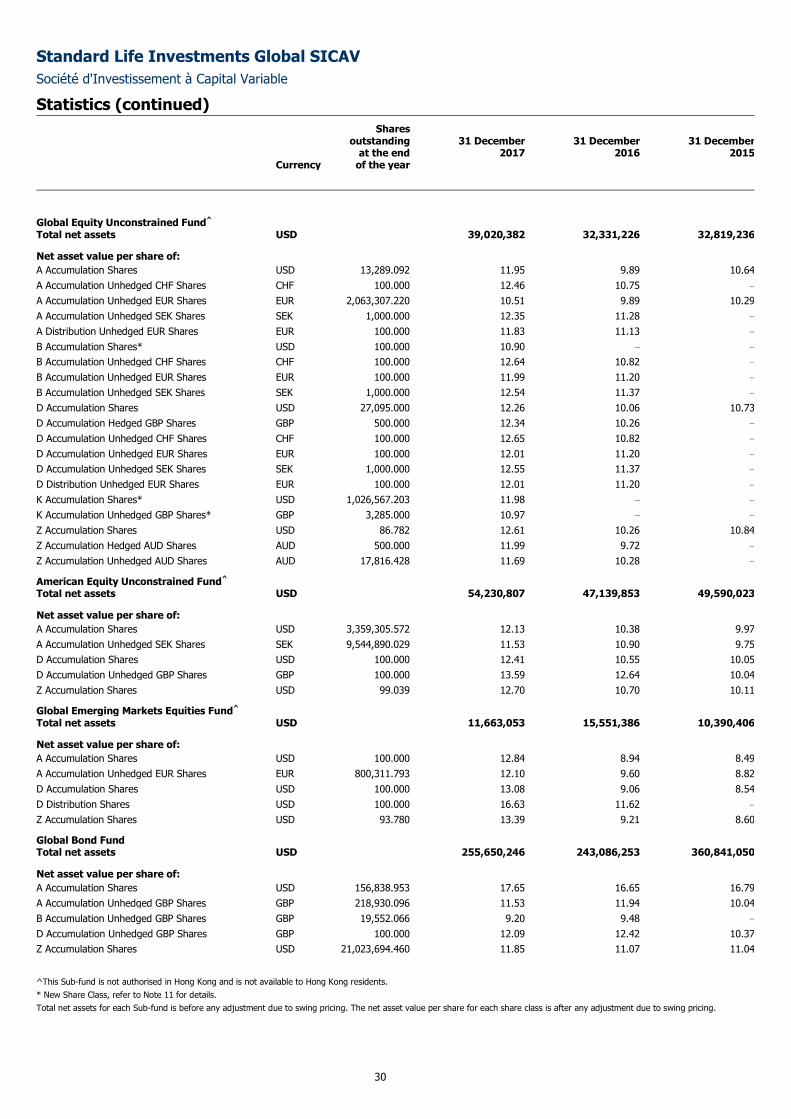
Standard Life Investments Global SICAV
Société d'Investissement à Capital Variable
Statistics (continued)
30
Currency
Shares outstanding
at the end of the year
31 December 2017
31 December 2016
31 December 2015
Global Equity Unconstrained Fund^ Total net assets USD 39,020,382 32,331,226 32,819,236
Net asset value per share of:
A Accumulation Shares USD 13,289.092 11.95 9.89 10.64
A Accumulation Unhedged CHF Shares CHF 100.000 12.46 10.75 –
A Accumulation Unhedged EUR Shares EUR 2,063,307.220 10.51 9.89 10.29
A Accumulation Unhedged SEK Shares SEK 1,000.000 12.35 11.28 –
A Distribution Unhedged EUR Shares EUR 100.000 11.83 11.13 –
B Accumulation Shares* USD 100.000 10.90 – –
B Accumulation Unhedged CHF Shares CHF 100.000 12.64 10.82 –
B Accumulation Unhedged EUR Shares EUR 100.000 11.99 11.20 –
B Accumulation Unhedged SEK Shares SEK 1,000.000 12.54 11.37 –
D Accumulation Shares USD 27,095.000 12.26 10.06 10.73
D Accumulation Hedged GBP Shares GBP 500.000 12.34 10.26 –
D Accumulation Unhedged CHF Shares CHF 100.000 12.65 10.82 –
D Accumulation Unhedged EUR Shares EUR 100.000 12.01 11.20 –
D Accumulation Unhedged SEK Shares SEK 1,000.000 12.55 11.37 –
D Distribution Unhedged EUR Shares EUR 100.000 12.01 11.20 –
K Accumulation Shares* USD 1,026,567.203 11.98 – –
K Accumulation Unhedged GBP Shares* GBP 3,285.000 10.97 – –
Z Accumulation Shares USD 86.782 12.61 10.26 10.84
Z Accumulation Hedged AUD Shares AUD 500.000 11.99 9.72 –
Z Accumulation Unhedged AUD Shares AUD 17,816.428 11.69 10.28 –
American Equity Unconstrained Fund^3 Total net assets USD 54,230,807 47,139,853 49,590,023
Net asset value per share of:
A Accumulation Shares USD 3,359,305.572 12.13 10.38 9.97
A Accumulation Unhedged SEK Shares SEK 9,544,890.029 11.53 10.90 9.75
D Accumulation Shares USD 100.000 12.41 10.55 10.05
D Accumulation Unhedged GBP Shares GBP 100.000 13.59 12.64 10.04
Z Accumulation Shares USD 99.039 12.70 10.70 10.11
Global Emerging Markets Equities Fund^3 Total net assets USD 11,663,053 15,551,386 10,390,406
Net asset value per share of:
A Accumulation Shares USD 100.000 12.84 8.94 8.49
A Accumulation Unhedged EUR Shares EUR 800,311.793 12.10 9.60 8.82
D Accumulation Shares USD 100.000 13.08 9.06 8.54
D Distribution Shares USD 100.000 16.63 11.62 –
Z Accumulation Shares USD 93.780 13.39 9.21 8.60
Global Bond Fund Total net assets USD 255,650,246 243,086,253 360,841,050
Net asset value per share of:
A Accumulation Shares USD 156,838.953 17.65 16.65 16.79
A Accumulation Unhedged GBP Shares GBP 218,930.096 11.53 11.94 10.04
B Accumulation Unhedged GBP Shares GBP 19,552.066 9.20 9.48 –
D Accumulation Unhedged GBP Shares GBP 100.000 12.09 12.42 10.37
Z Accumulation Shares USD 21,023,694.460 11.85 11.07 11.04
^This Sub-fund is not authorised in Hong Kong and is not available to Hong Kong residents.
* New Share Class, refer to Note 11 for details.
Total net assets for each Sub-fund is before any adjustment due to swing pricing. The net asset value per share for each share class is after any adjustment due to swing pricing.
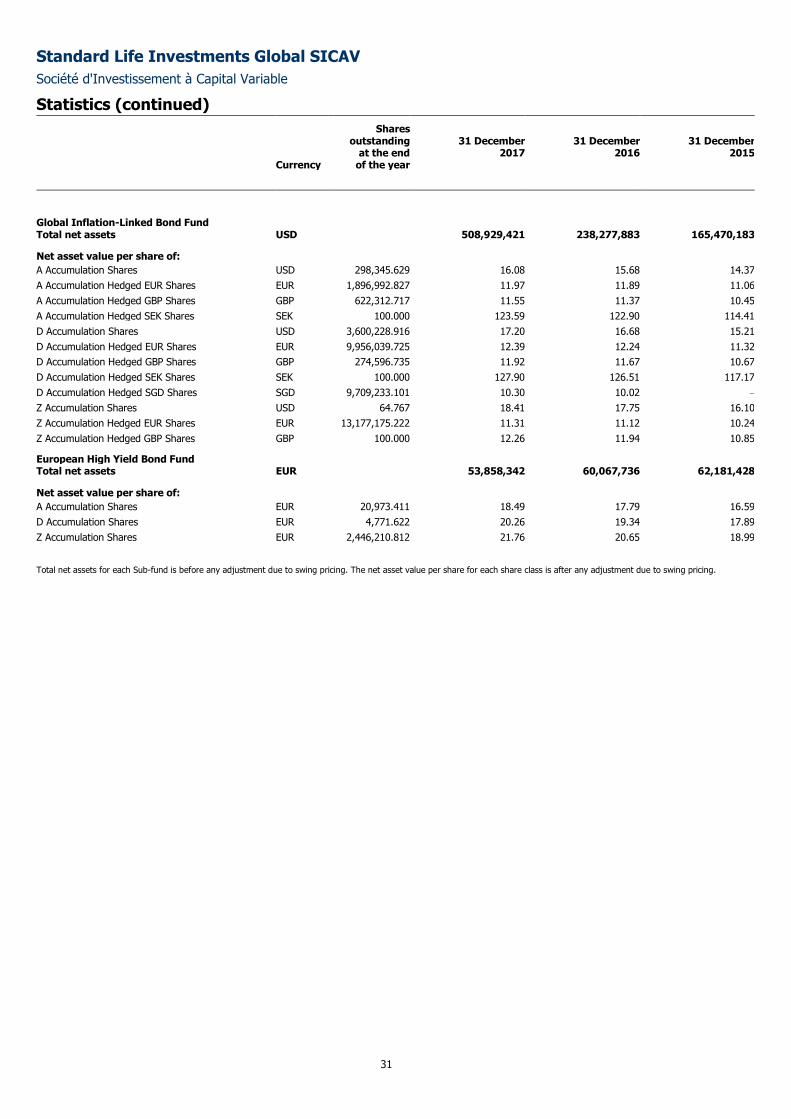
Standard Life Investments Global SICAV
Société d'Investissement à Capital Variable
Statistics (continued)
31
Currency
Shares outstanding
at the end of the year
31 December 2017
31 December 2016
31 December 2015
Global Inflation-Linked Bond Fund Total net assets USD 508,929,421 238,277,883 165,470,183
Net asset value per share of:
A Accumulation Shares USD 298,345.629 16.08 15.68 14.37
A Accumulation Hedged EUR Shares EUR 1,896,992.827 11.97 11.89 11.06
A Accumulation Hedged GBP Shares GBP 622,312.717 11.55 11.37 10.45
A Accumulation Hedged SEK Shares SEK 100.000 123.59 122.90 114.41
D Accumulation Shares USD 3,600,228.916 17.20 16.68 15.21
D Accumulation Hedged EUR Shares EUR 9,956,039.725 12.39 12.24 11.32
D Accumulation Hedged GBP Shares GBP 274,596.735 11.92 11.67 10.67
D Accumulation Hedged SEK Shares SEK 100.000 127.90 126.51 117.17
D Accumulation Hedged SGD Shares SGD 9,709,233.101 10.30 10.02 –
Z Accumulation Shares USD 64.767 18.41 17.75 16.10
Z Accumulation Hedged EUR Shares EUR 13,177,175.222 11.31 11.12 10.24
Z Accumulation Hedged GBP Shares GBP 100.000 12.26 11.94 10.85
European High Yield Bond Fund Total net assets EUR 53,858,342 60,067,736 62,181,428
Net asset value per share of:
A Accumulation Shares EUR 20,973.411 18.49 17.79 16.59
D Accumulation Shares EUR 4,771.622 20.26 19.34 17.89
Z Accumulation Shares EUR 2,446,210.812 21.76 20.65 18.99
Total net assets for each Sub-fund is before any adjustment due to swing pricing. The net asset value per share for each share class is after any adjustment due to swing pricing.
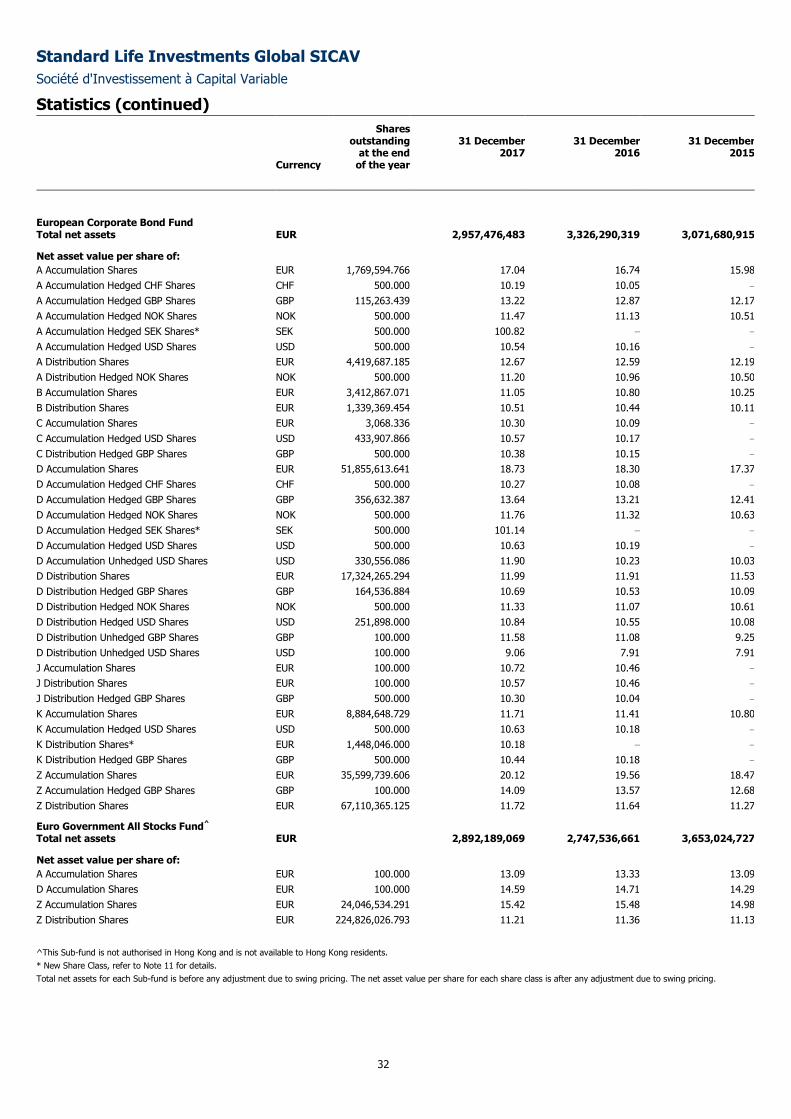
Standard Life Investments Global SICAV
Société d'Investissement à Capital Variable
Statistics (continued)
32
Currency
Shares outstanding
at the end of the year
31 December 2017
31 December 2016
31 December 2015
European Corporate Bond Fund Total net assets EUR 2,957,476,483 3,326,290,319 3,071,680,915
Net asset value per share of:
A Accumulation Shares EUR 1,769,594.766 17.04 16.74 15.98
A Accumulation Hedged CHF Shares CHF 500.000 10.19 10.05 –
A Accumulation Hedged GBP Shares GBP 115,263.439 13.22 12.87 12.17
A Accumulation Hedged NOK Shares NOK 500.000 11.47 11.13 10.51
A Accumulation Hedged SEK Shares* SEK 500.000 100.82 – –
A Accumulation Hedged USD Shares USD 500.000 10.54 10.16 –
A Distribution Shares EUR 4,419,687.185 12.67 12.59 12.19
A Distribution Hedged NOK Shares NOK 500.000 11.20 10.96 10.50
B Accumulation Shares EUR 3,412,867.071 11.05 10.80 10.25
B Distribution Shares EUR 1,339,369.454 10.51 10.44 10.11
C Accumulation Shares EUR 3,068.336 10.30 10.09 –
C Accumulation Hedged USD Shares USD 433,907.866 10.57 10.17 –
C Distribution Hedged GBP Shares GBP 500.000 10.38 10.15 –
D Accumulation Shares EUR 51,855,613.641 18.73 18.30 17.37
D Accumulation Hedged CHF Shares CHF 500.000 10.27 10.08 –
D Accumulation Hedged GBP Shares GBP 356,632.387 13.64 13.21 12.41
D Accumulation Hedged NOK Shares NOK 500.000 11.76 11.32 10.63
D Accumulation Hedged SEK Shares* SEK 500.000 101.14 – –
D Accumulation Hedged USD Shares USD 500.000 10.63 10.19 –
D Accumulation Unhedged USD Shares USD 330,556.086 11.90 10.23 10.03
D Distribution Shares EUR 17,324,265.294 11.99 11.91 11.53
D Distribution Hedged GBP Shares GBP 164,536.884 10.69 10.53 10.09
D Distribution Hedged NOK Shares NOK 500.000 11.33 11.07 10.61
D Distribution Hedged USD Shares USD 251,898.000 10.84 10.55 10.08
D Distribution Unhedged GBP Shares GBP 100.000 11.58 11.08 9.25
D Distribution Unhedged USD Shares USD 100.000 9.06 7.91 7.91
J Accumulation Shares EUR 100.000 10.72 10.46 –
J Distribution Shares EUR 100.000 10.57 10.46 –
J Distribution Hedged GBP Shares GBP 500.000 10.30 10.04 –
K Accumulation Shares EUR 8,884,648.729 11.71 11.41 10.80
K Accumulation Hedged USD Shares USD 500.000 10.63 10.18 –
K Distribution Shares* EUR 1,448,046.000 10.18 – –
K Distribution Hedged GBP Shares GBP 500.000 10.44 10.18 –
Z Accumulation Shares EUR 35,599,739.606 20.12 19.56 18.47
Z Accumulation Hedged GBP Shares GBP 100.000 14.09 13.57 12.68
Z Distribution Shares EUR 67,110,365.125 11.72 11.64 11.27
Euro Government All Stocks Fund^ Total net assets EUR 2,892,189,069 2,747,536,661 3,653,024,727
Net asset value per share of:
A Accumulation Shares EUR 100.000 13.09 13.33 13.09
D Accumulation Shares EUR 100.000 14.59 14.71 14.29
Z Accumulation Shares EUR 24,046,534.291 15.42 15.48 14.98
Z Distribution Shares EUR 224,826,026.793 11.21 11.36 11.13
^This Sub-fund is not authorised in Hong Kong and is not available to Hong Kong residents.
* New Share Class, refer to Note 11 for details.
Total net assets for each Sub-fund is before any adjustment due to swing pricing. The net asset value per share for each share class is after any adjustment due to swing pricing.
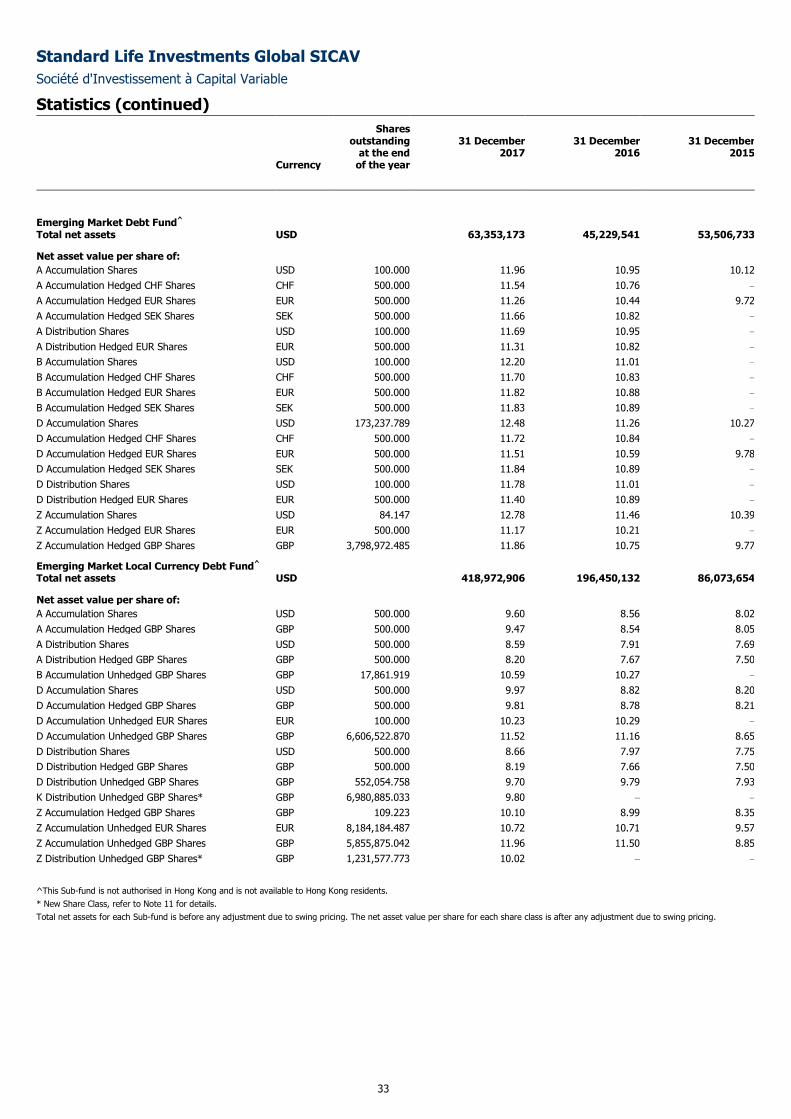
Standard Life Investments Global SICAV
Société d'Investissement à Capital Variable
Statistics (continued)
33
Currency
Shares outstanding
at the end of the year
31 December 2017
31 December 2016
31 December 2015
Emerging Market Debt Fund^ Total net assets USD 63,353,173 45,229,541 53,506,733
Net asset value per share of:
A Accumulation Shares USD 100.000 11.96 10.95 10.12
A Accumulation Hedged CHF Shares CHF 500.000 11.54 10.76 –
A Accumulation Hedged EUR Shares EUR 500.000 11.26 10.44 9.72
A Accumulation Hedged SEK Shares SEK 500.000 11.66 10.82 –
A Distribution Shares USD 100.000 11.69 10.95 –
A Distribution Hedged EUR Shares EUR 500.000 11.31 10.82 –
B Accumulation Shares USD 100.000 12.20 11.01 –
B Accumulation Hedged CHF Shares CHF 500.000 11.70 10.83 –
B Accumulation Hedged EUR Shares EUR 500.000 11.82 10.88 –
B Accumulation Hedged SEK Shares SEK 500.000 11.83 10.89 –
D Accumulation Shares USD 173,237.789 12.48 11.26 10.27
D Accumulation Hedged CHF Shares CHF 500.000 11.72 10.84 –
D Accumulation Hedged EUR Shares EUR 500.000 11.51 10.59 9.78
D Accumulation Hedged SEK Shares SEK 500.000 11.84 10.89 –
D Distribution Shares USD 100.000 11.78 11.01 –
D Distribution Hedged EUR Shares EUR 500.000 11.40 10.89 –
Z Accumulation Shares USD 84.147 12.78 11.46 10.39
Z Accumulation Hedged EUR Shares EUR 500.000 11.17 10.21 –
Z Accumulation Hedged GBP Shares GBP 3,798,972.485 11.86 10.75 9.77
Emerging Market Local Currency Debt Fund^ Total net assets USD 418,972,906 196,450,132 86,073,654
Net asset value per share of:
A Accumulation Shares USD 500.000 9.60 8.56 8.02
A Accumulation Hedged GBP Shares GBP 500.000 9.47 8.54 8.05
A Distribution Shares USD 500.000 8.59 7.91 7.69
A Distribution Hedged GBP Shares GBP 500.000 8.20 7.67 7.50
B Accumulation Unhedged GBP Shares GBP 17,861.919 10.59 10.27 –
D Accumulation Shares USD 500.000 9.97 8.82 8.20
D Accumulation Hedged GBP Shares GBP 500.000 9.81 8.78 8.21
D Accumulation Unhedged EUR Shares EUR 100.000 10.23 10.29 –
D Accumulation Unhedged GBP Shares GBP 6,606,522.870 11.52 11.16 8.65
D Distribution Shares USD 500.000 8.66 7.97 7.75
D Distribution Hedged GBP Shares GBP 500.000 8.19 7.66 7.50
D Distribution Unhedged GBP Shares GBP 552,054.758 9.70 9.79 7.93
K Distribution Unhedged GBP Shares* GBP 6,980,885.033 9.80 – –
Z Accumulation Hedged GBP Shares GBP 109.223 10.10 8.99 8.35
Z Accumulation Unhedged EUR Shares EUR 8,184,184.487 10.72 10.71 9.57
Z Accumulation Unhedged GBP Shares GBP 5,855,875.042 11.96 11.50 8.85
Z Distribution Unhedged GBP Shares* GBP 1,231,577.773 10.02 – –
^This Sub-fund is not authorised in Hong Kong and is not available to Hong Kong residents.
* New Share Class, refer to Note 11 for details.
Total net assets for each Sub-fund is before any adjustment due to swing pricing. The net asset value per share for each share class is after any adjustment due to swing pricing.
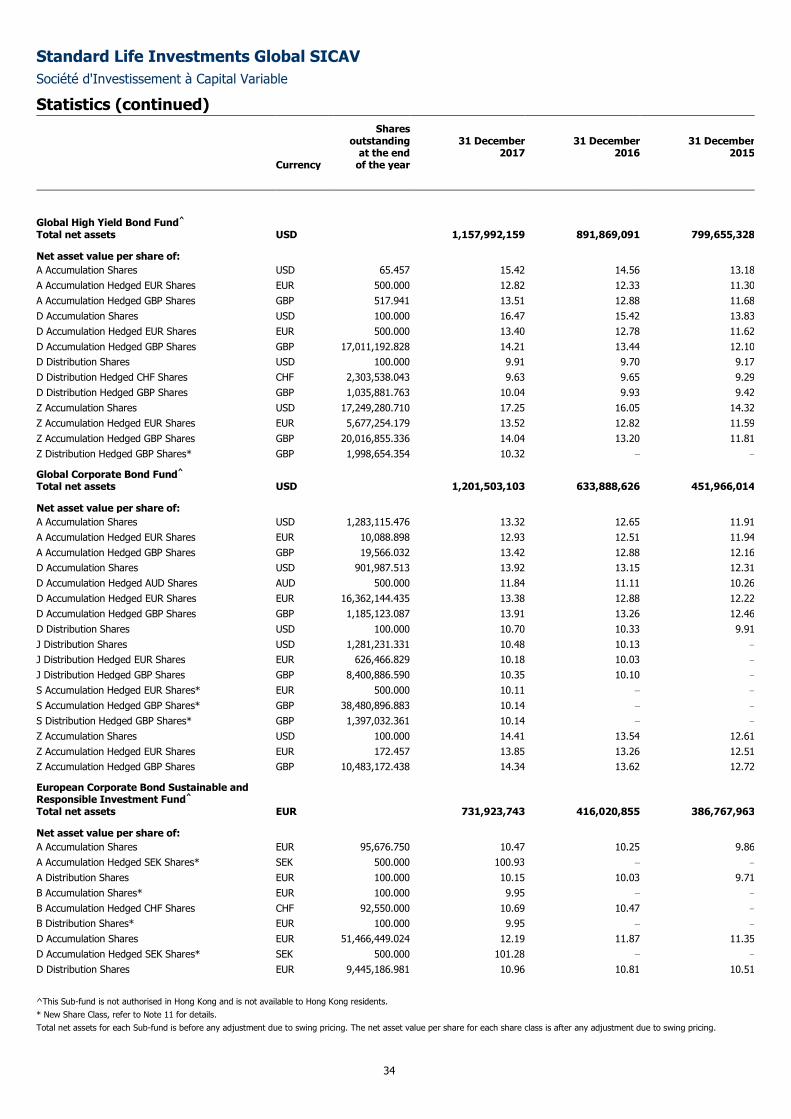
Standard Life Investments Global SICAV
Société d'Investissement à Capital Variable
Statistics (continued)
34
Currency
Shares outstanding
at the end of the year
31 December 2017
31 December 2016
31 December 2015
Global High Yield Bond Fund^ Total net assets USD 1,157,992,159 891,869,091 799,655,328
Net asset value per share of:
A Accumulation Shares USD 65.457 15.42 14.56 13.18
A Accumulation Hedged EUR Shares EUR 500.000 12.82 12.33 11.30
A Accumulation Hedged GBP Shares GBP 517.941 13.51 12.88 11.68
D Accumulation Shares USD 100.000 16.47 15.42 13.83
D Accumulation Hedged EUR Shares EUR 500.000 13.40 12.78 11.62
D Accumulation Hedged GBP Shares GBP 17,011,192.828 14.21 13.44 12.10
D Distribution Shares USD 100.000 9.91 9.70 9.17
D Distribution Hedged CHF Shares CHF 2,303,538.043 9.63 9.65 9.29
D Distribution Hedged GBP Shares GBP 1,035,881.763 10.04 9.93 9.42
Z Accumulation Shares USD 17,249,280.710 17.25 16.05 14.32
Z Accumulation Hedged EUR Shares EUR 5,677,254.179 13.52 12.82 11.59
Z Accumulation Hedged GBP Shares GBP 20,016,855.336 14.04 13.20 11.81
Z Distribution Hedged GBP Shares* GBP 1,998,654.354 10.32 – –
Global Corporate Bond Fund^ Total net assets USD 1,201,503,103 633,888,626 451,966,014
Net asset value per share of:
A Accumulation Shares USD 1,283,115.476 13.32 12.65 11.91
A Accumulation Hedged EUR Shares EUR 10,088.898 12.93 12.51 11.94
A Accumulation Hedged GBP Shares GBP 19,566.032 13.42 12.88 12.16
D Accumulation Shares USD 901,987.513 13.92 13.15 12.31
D Accumulation Hedged AUD Shares AUD 500.000 11.84 11.11 10.26
D Accumulation Hedged EUR Shares EUR 16,362,144.435 13.38 12.88 12.22
D Accumulation Hedged GBP Shares GBP 1,185,123.087 13.91 13.26 12.46
D Distribution Shares USD 100.000 10.70 10.33 9.91
J Distribution Shares USD 1,281,231.331 10.48 10.13 –
J Distribution Hedged EUR Shares EUR 626,466.829 10.18 10.03 –
J Distribution Hedged GBP Shares GBP 8,400,886.590 10.35 10.10 –
S Accumulation Hedged EUR Shares* EUR 500.000 10.11 – –
S Accumulation Hedged GBP Shares* GBP 38,480,896.883 10.14 – –
S Distribution Hedged GBP Shares* GBP 1,397,032.361 10.14 – –
Z Accumulation Shares USD 100.000 14.41 13.54 12.61
Z Accumulation Hedged EUR Shares EUR 172.457 13.85 13.26 12.51
Z Accumulation Hedged GBP Shares GBP 10,483,172.438 14.34 13.62 12.72
European Corporate Bond Sustainable and Responsible Investment Fund^ Total net assets EUR 731,923,743 416,020,855 386,767,963
Net asset value per share of:
A Accumulation Shares EUR 95,676.750 10.47 10.25 9.86
A Accumulation Hedged SEK Shares* SEK 500.000 100.93 – –
A Distribution Shares EUR 100.000 10.15 10.03 9.71
B Accumulation Shares* EUR 100.000 9.95 – –
B Accumulation Hedged CHF Shares CHF 92,550.000 10.69 10.47 –
B Distribution Shares* EUR 100.000 9.95 – –
D Accumulation Shares EUR 51,466,449.024 12.19 11.87 11.35
D Accumulation Hedged SEK Shares* SEK 500.000 101.28 – –
D Distribution Shares EUR 9,445,186.981 10.96 10.81 10.51
^This Sub-fund is not authorised in Hong Kong and is not available to Hong Kong residents.
* New Share Class, refer to Note 11 for details.
Total net assets for each Sub-fund is before any adjustment due to swing pricing. The net asset value per share for each share class is after any adjustment due to swing pricing.
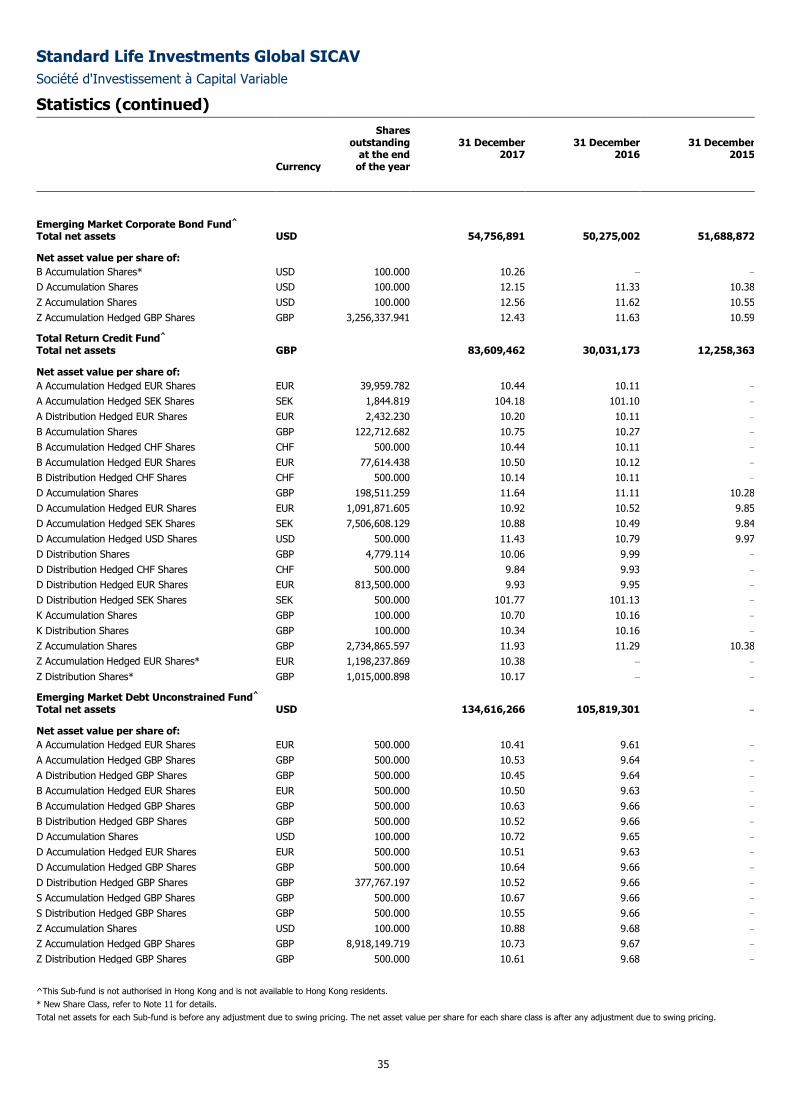
Standard Life Investments Global SICAV
Société d'Investissement à Capital Variable
Statistics (continued)
35
Currency
Shares outstanding
at the end of the year
31 December 2017
31 December 2016
31 December 2015
Emerging Market Corporate Bond Fund^ Total net assets USD 54,756,891 50,275,002 51,688,872
Net asset value per share of:
B Accumulation Shares* USD 100.000 10.26 – –
D Accumulation Shares USD 100.000 12.15 11.33 10.38
Z Accumulation Shares USD 100.000 12.56 11.62 10.55
Z Accumulation Hedged GBP Shares GBP 3,256,337.941 12.43 11.63 10.59
Total Return Credit Fund^ Total net assets GBP 83,609,462 30,031,173 12,258,363
Net asset value per share of:
A Accumulation Hedged EUR Shares EUR 39,959.782 10.44 10.11 –
A Accumulation Hedged SEK Shares SEK 1,844.819 104.18 101.10 –
A Distribution Hedged EUR Shares EUR 2,432.230 10.20 10.11 –
B Accumulation Shares GBP 122,712.682 10.75 10.27 –
B Accumulation Hedged CHF Shares CHF 500.000 10.44 10.11 –
B Accumulation Hedged EUR Shares EUR 77,614.438 10.50 10.12 –
B Distribution Hedged CHF Shares CHF 500.000 10.14 10.11 –
D Accumulation Shares GBP 198,511.259 11.64 11.11 10.28
D Accumulation Hedged EUR Shares EUR 1,091,871.605 10.92 10.52 9.85
D Accumulation Hedged SEK Shares SEK 7,506,608.129 10.88 10.49 9.84
D Accumulation Hedged USD Shares USD 500.000 11.43 10.79 9.97
D Distribution Shares GBP 4,779.114 10.06 9.99 –
D Distribution Hedged CHF Shares CHF 500.000 9.84 9.93 –
D Distribution Hedged EUR Shares EUR 813,500.000 9.93 9.95 –
D Distribution Hedged SEK Shares SEK 500.000 101.77 101.13 –
K Accumulation Shares GBP 100.000 10.70 10.16 –
K Distribution Shares GBP 100.000 10.34 10.16 –
Z Accumulation Shares GBP 2,734,865.597 11.93 11.29 10.38
Z Accumulation Hedged EUR Shares* EUR 1,198,237.869 10.38 – –
Z Distribution Shares* GBP 1,015,000.898 10.17 – –
Emerging Market Debt Unconstrained Fund^4 Total net assets USD 134,616,266 105,819,301 –
Net asset value per share of:
A Accumulation Hedged EUR Shares EUR 500.000 10.41 9.61 –
A Accumulation Hedged GBP Shares GBP 500.000 10.53 9.64 –
A Distribution Hedged GBP Shares GBP 500.000 10.45 9.64 –
B Accumulation Hedged EUR Shares EUR 500.000 10.50 9.63 –
B Accumulation Hedged GBP Shares GBP 500.000 10.63 9.66 –
B Distribution Hedged GBP Shares GBP 500.000 10.52 9.66 –
D Accumulation Shares USD 100.000 10.72 9.65 –
D Accumulation Hedged EUR Shares EUR 500.000 10.51 9.63 –
D Accumulation Hedged GBP Shares GBP 500.000 10.64 9.66 –
D Distribution Hedged GBP Shares GBP 377,767.197 10.52 9.66 –
S Accumulation Hedged GBP Shares GBP 500.000 10.67 9.66 –
S Distribution Hedged GBP Shares GBP 500.000 10.55 9.66 –
Z Accumulation Shares USD 100.000 10.88 9.68 –
Z Accumulation Hedged GBP Shares GBP 8,918,149.719 10.73 9.67 –
Z Distribution Hedged GBP Shares GBP 500.000 10.61 9.68 –
^This Sub-fund is not authorised in Hong Kong and is not available to Hong Kong residents.
* New Share Class, refer to Note 11 for details.
Total net assets for each Sub-fund is before any adjustment due to swing pricing. The net asset value per share for each share class is after any adjustment due to swing pricing.
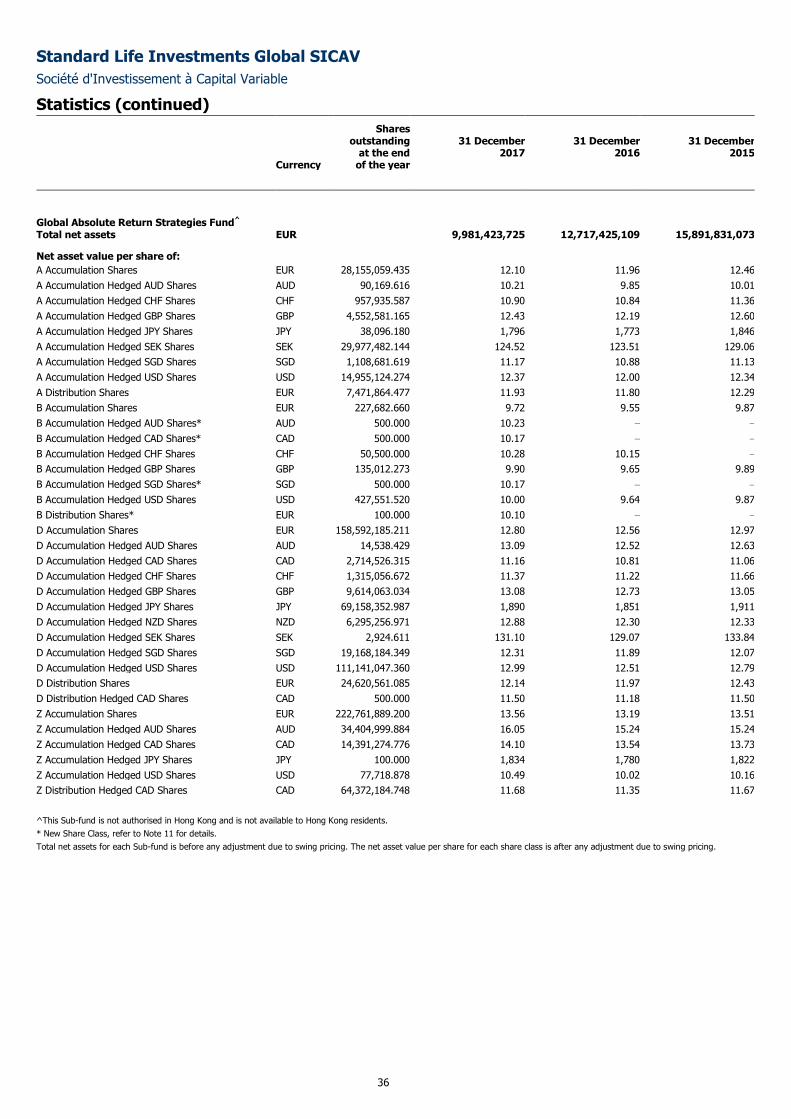
Standard Life Investments Global SICAV
Société d'Investissement à Capital Variable
Statistics (continued)
36
Currency
Shares outstanding
at the end of the year
31 December 2017
31 December 2016
31 December 2015
Global Absolute Return Strategies Fund^ Total net assets EUR 9,981,423,725 12,717,425,109 15,891,831,073
Net asset value per share of:
A Accumulation Shares EUR 28,155,059.435 12.10 11.96 12.46
A Accumulation Hedged AUD Shares AUD 90,169.616 10.21 9.85 10.01
A Accumulation Hedged CHF Shares CHF 957,935.587 10.90 10.84 11.36
A Accumulation Hedged GBP Shares GBP 4,552,581.165 12.43 12.19 12.60
A Accumulation Hedged JPY Shares JPY 38,096.180 1,796 1,773 1,846
A Accumulation Hedged SEK Shares SEK 29,977,482.144 124.52 123.51 129.06
A Accumulation Hedged SGD Shares SGD 1,108,681.619 11.17 10.88 11.13
A Accumulation Hedged USD Shares USD 14,955,124.274 12.37 12.00 12.34
A Distribution Shares EUR 7,471,864.477 11.93 11.80 12.29
B Accumulation Shares EUR 227,682.660 9.72 9.55 9.87
B Accumulation Hedged AUD Shares* AUD 500.000 10.23 – –
B Accumulation Hedged CAD Shares* CAD 500.000 10.17 – –
B Accumulation Hedged CHF Shares CHF 50,500.000 10.28 10.15 –
B Accumulation Hedged GBP Shares GBP 135,012.273 9.90 9.65 9.89
B Accumulation Hedged SGD Shares* SGD 500.000 10.17 – –
B Accumulation Hedged USD Shares USD 427,551.520 10.00 9.64 9.87
B Distribution Shares* EUR 100.000 10.10 – –
D Accumulation Shares EUR 158,592,185.211 12.80 12.56 12.97
D Accumulation Hedged AUD Shares AUD 14,538.429 13.09 12.52 12.63
D Accumulation Hedged CAD Shares CAD 2,714,526.315 11.16 10.81 11.06
D Accumulation Hedged CHF Shares CHF 1,315,056.672 11.37 11.22 11.66
D Accumulation Hedged GBP Shares GBP 9,614,063.034 13.08 12.73 13.05
D Accumulation Hedged JPY Shares JPY 69,158,352.987 1,890 1,851 1,911
D Accumulation Hedged NZD Shares NZD 6,295,256.971 12.88 12.30 12.33
D Accumulation Hedged SEK Shares SEK 2,924.611 131.10 129.07 133.84
D Accumulation Hedged SGD Shares SGD 19,168,184.349 12.31 11.89 12.07
D Accumulation Hedged USD Shares USD 111,141,047.360 12.99 12.51 12.79
D Distribution Shares EUR 24,620,561.085 12.14 11.97 12.43
D Distribution Hedged CAD Shares CAD 500.000 11.50 11.18 11.50
Z Accumulation Shares EUR 222,761,889.200 13.56 13.19 13.51
Z Accumulation Hedged AUD Shares AUD 34,404,999.884 16.05 15.24 15.24
Z Accumulation Hedged CAD Shares CAD 14,391,274.776 14.10 13.54 13.73
Z Accumulation Hedged JPY Shares JPY 100.000 1,834 1,780 1,822
Z Accumulation Hedged USD Shares USD 77,718.878 10.49 10.02 10.16
Z Distribution Hedged CAD Shares CAD 64,372,184.748 11.68 11.35 11.67
^This Sub-fund is not authorised in Hong Kong and is not available to Hong Kong residents.
* New Share Class, refer to Note 11 for details.
Total net assets for each Sub-fund is before any adjustment due to swing pricing. The net asset value per share for each share class is after any adjustment due to swing pricing.
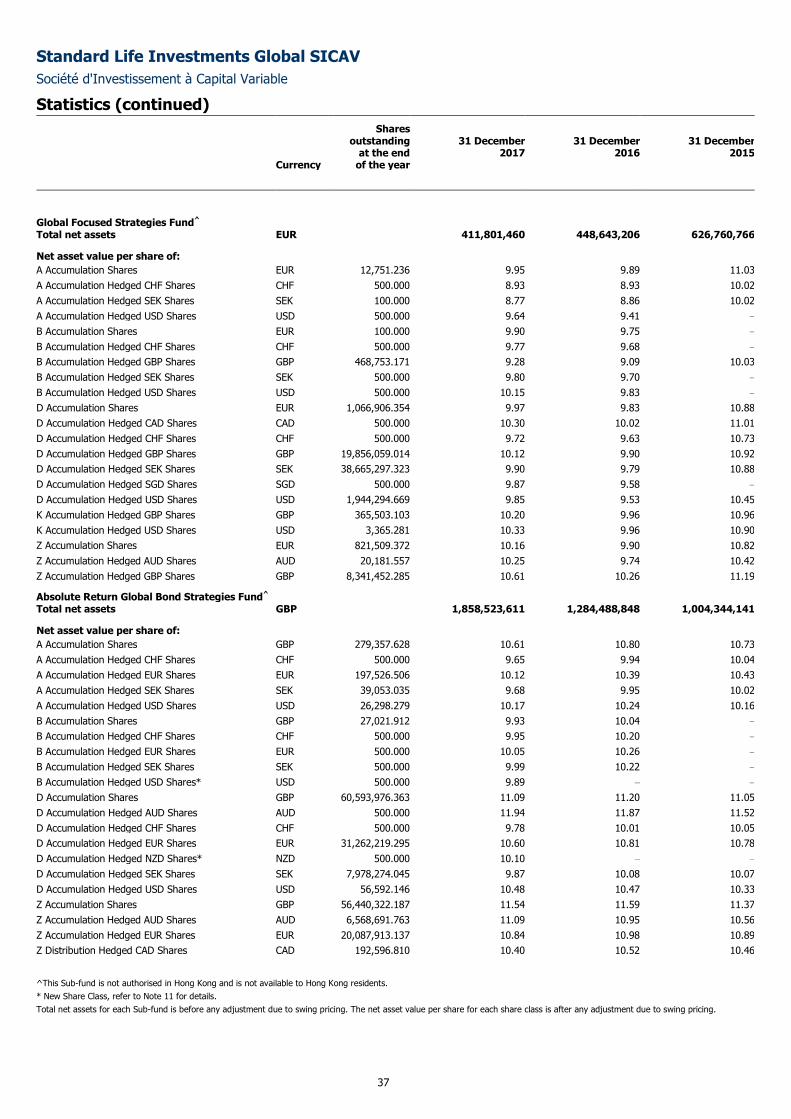
Standard Life Investments Global SICAV
Société d'Investissement à Capital Variable
Statistics (continued)
37
Currency
Shares outstanding
at the end of the year
31 December 2017
31 December 2016
31 December 2015
Global Focused Strategies Fund^ Total net assets EUR 411,801,460 448,643,206 626,760,766
Net asset value per share of:
A Accumulation Shares EUR 12,751.236 9.95 9.89 11.03
A Accumulation Hedged CHF Shares CHF 500.000 8.93 8.93 10.02
A Accumulation Hedged SEK Shares SEK 100.000 8.77 8.86 10.02
A Accumulation Hedged USD Shares USD 500.000 9.64 9.41 –
B Accumulation Shares EUR 100.000 9.90 9.75 –
B Accumulation Hedged CHF Shares CHF 500.000 9.77 9.68 –
B Accumulation Hedged GBP Shares GBP 468,753.171 9.28 9.09 10.03
B Accumulation Hedged SEK Shares SEK 500.000 9.80 9.70 –
B Accumulation Hedged USD Shares USD 500.000 10.15 9.83 –
D Accumulation Shares EUR 1,066,906.354 9.97 9.83 10.88
D Accumulation Hedged CAD Shares CAD 500.000 10.30 10.02 11.01
D Accumulation Hedged CHF Shares CHF 500.000 9.72 9.63 10.73
D Accumulation Hedged GBP Shares GBP 19,856,059.014 10.12 9.90 10.92
D Accumulation Hedged SEK Shares SEK 38,665,297.323 9.90 9.79 10.88
D Accumulation Hedged SGD Shares SGD 500.000 9.87 9.58 –
D Accumulation Hedged USD Shares USD 1,944,294.669 9.85 9.53 10.45
K Accumulation Hedged GBP Shares GBP 365,503.103 10.20 9.96 10.96
K Accumulation Hedged USD Shares USD 3,365.281 10.33 9.96 10.90
Z Accumulation Shares EUR 821,509.372 10.16 9.90 10.82
Z Accumulation Hedged AUD Shares AUD 20,181.557 10.25 9.74 10.42
Z Accumulation Hedged GBP Shares GBP 8,341,452.285 10.61 10.26 11.19
Absolute Return Global Bond Strategies Fund^ Total net assets GBP 1,858,523,611 1,284,488,848 1,004,344,141
Net asset value per share of:
A Accumulation Shares GBP 279,357.628 10.61 10.80 10.73
A Accumulation Hedged CHF Shares CHF 500.000 9.65 9.94 10.04
A Accumulation Hedged EUR Shares EUR 197,526.506 10.12 10.39 10.43
A Accumulation Hedged SEK Shares SEK 39,053.035 9.68 9.95 10.02
A Accumulation Hedged USD Shares USD 26,298.279 10.17 10.24 10.16
B Accumulation Shares GBP 27,021.912 9.93 10.04 –
B Accumulation Hedged CHF Shares CHF 500.000 9.95 10.20 –
B Accumulation Hedged EUR Shares EUR 500.000 10.05 10.26 –
B Accumulation Hedged SEK Shares SEK 500.000 9.99 10.22 –
B Accumulation Hedged USD Shares* USD 500.000 9.89 – –
D Accumulation Shares GBP 60,593,976.363 11.09 11.20 11.05
D Accumulation Hedged AUD Shares AUD 500.000 11.94 11.87 11.52
D Accumulation Hedged CHF Shares CHF 500.000 9.78 10.01 10.05
D Accumulation Hedged EUR Shares EUR 31,262,219.295 10.60 10.81 10.78
D Accumulation Hedged NZD Shares* NZD 500.000 10.10 – –
D Accumulation Hedged SEK Shares SEK 7,978,274.045 9.87 10.08 10.07
D Accumulation Hedged USD Shares USD 56,592.146 10.48 10.47 10.33
Z Accumulation Shares GBP 56,440,322.187 11.54 11.59 11.37
Z Accumulation Hedged AUD Shares AUD 6,568,691.763 11.09 10.95 10.56
Z Accumulation Hedged EUR Shares EUR 20,087,913.137 10.84 10.98 10.89
Z Distribution Hedged CAD Shares CAD 192,596.810 10.40 10.52 10.46
^This Sub-fund is not authorised in Hong Kong and is not available to Hong Kong residents.
* New Share Class, refer to Note 11 for details.
Total net assets for each Sub-fund is before any adjustment due to swing pricing. The net asset value per share for each share class is after any adjustment due to swing pricing.
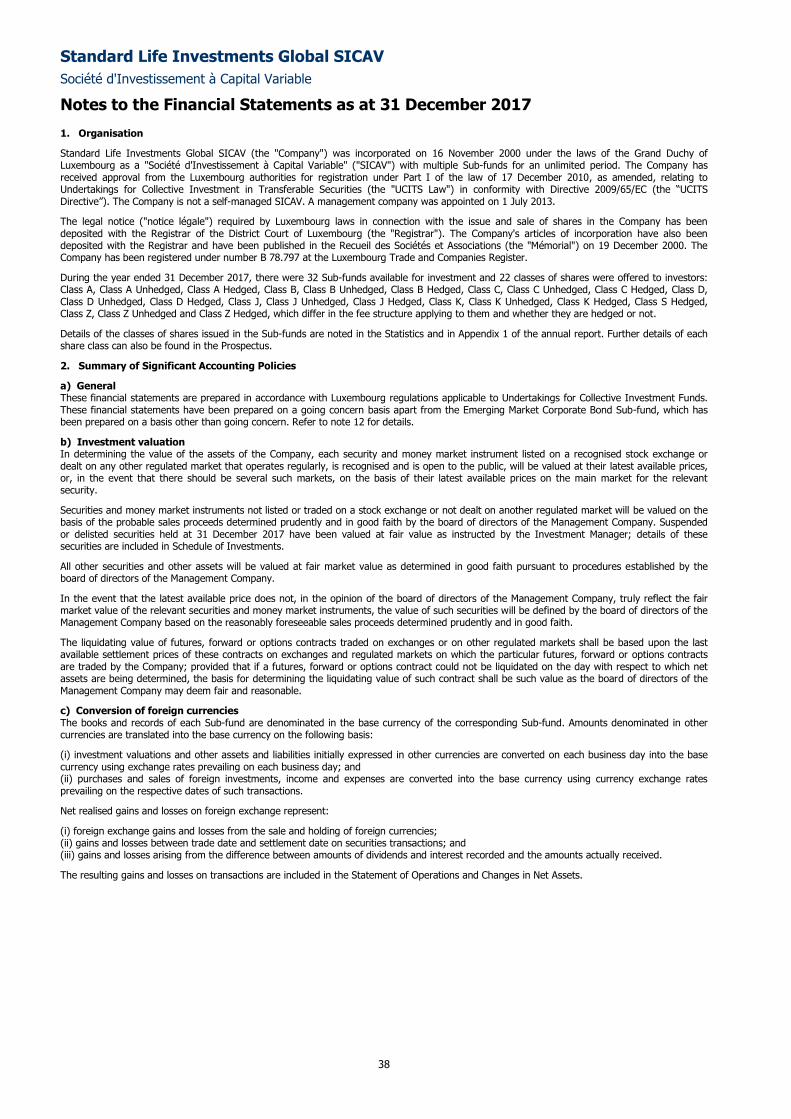
Standard Life Investments Global SICAV
Société d'Investissement à Capital Variable
Notes to the Financial Statements as at 31 December 2017
38
1. Organisation
Standard Life Investments Global SICAV (the "Company") was incorporated on 16 November 2000 under the laws of the Grand Duchy of Luxembourg as a "Société d'Investissement à Capital Variable" ("SICAV") with multiple Sub-funds for an unlimited period. The Company has received approval from the Luxembourg authorities for registration under Part I of the law of 17 December 2010, as amended, relating to Undertakings for Collective Investment in Transferable Securities (the "UCITS Law") in conformity with Directive 2009/65/EC (the “UCITS Directive”). The Company is not a self-managed SICAV. A management company was appointed on 1 July 2013.
The legal notice ("notice légale") required by Luxembourg laws in connection with the issue and sale of shares in the Company has been deposited with the Registrar of the District Court of Luxembourg (the "Registrar"). The Company's articles of incorporation have also been deposited with the Registrar and have been published in the Recueil des Sociétés et Associations (the "Mémorial") on 19 December 2000. The Company has been registered under number B 78.797 at the Luxembourg Trade and Companies Register.
During the year ended 31 December 2017, there were 32 Sub-funds available for investment and 22 classes of shares were offered to investors: Class A, Class A Unhedged, Class A Hedged, Class B, Class B Unhedged, Class B Hedged, Class C, Class C Unhedged, Class C Hedged, Class D, Class D Unhedged, Class D Hedged, Class J, Class J Unhedged, Class J Hedged, Class K, Class K Unhedged, Class K Hedged, Class S Hedged, Class Z, Class Z Unhedged and Class Z Hedged, which differ in the fee structure applying to them and whether they are hedged or not.
Details of the classes of shares issued in the Sub-funds are noted in the Statistics and in Appendix 1 of the annual report. Further details of each share class can also be found in the Prospectus.
2. Summary of Significant Accounting Policies
a) General These financial statements are prepared in accordance with Luxembourg regulations applicable to Undertakings for Collective Investment Funds. These financial statements have been prepared on a going concern basis apart from the Emerging Market Corporate Bond Sub-fund, which has been prepared on a basis other than going concern. Refer to note 12 for details.
b) Investment valuation In determining the value of the assets of the Company, each security and money market instrument listed on a recognised stock exchange or dealt on any other regulated market that operates regularly, is recognised and is open to the public, will be valued at their latest available prices, or, in the event that there should be several such markets, on the basis of their latest available prices on the main market for the relevant security.
Securities and money market instruments not listed or traded on a stock exchange or not dealt on another regulated market will be valued on the basis of the probable sales proceeds determined prudently and in good faith by the board of directors of the Management Company. Suspended or delisted securities held at 31 December 2017 have been valued at fair value as instructed by the Investment Manager; details of these securities are included in Schedule of Investments.
All other securities and other assets will be valued at fair market value as determined in good faith pursuant to procedures established by the board of directors of the Management Company.
In the event that the latest available price does not, in the opinion of the board of directors of the Management Company, truly reflect the fair market value of the relevant securities and money market instruments, the value of such securities will be defined by the board of directors of the Management Company based on the reasonably foreseeable sales proceeds determined prudently and in good faith.
The liquidating value of futures, forward or options contracts traded on exchanges or on other regulated markets shall be based upon the last available settlement prices of these contracts on exchanges and regulated markets on which the particular futures, forward or options contracts are traded by the Company; provided that if a futures, forward or options contract could not be liquidated on the day with respect to which net assets are being determined, the basis for determining the liquidating value of such contract shall be such value as the board of directors of the Management Company may deem fair and reasonable.
c) Conversion of foreign currencies The books and records of each Sub-fund are denominated in the base currency of the corresponding Sub-fund. Amounts denominated in other currencies are translated into the base currency on the following basis:
(i) investment valuations and other assets and liabilities initially expressed in other currencies are converted on each business day into the base currency using exchange rates prevailing on each business day; and (ii) purchases and sales of foreign investments, income and expenses are converted into the base currency using currency exchange rates prevailing on the respective dates of such transactions.
Net realised gains and losses on foreign exchange represent:
(i) foreign exchange gains and losses from the sale and holding of foreign currencies; (ii) gains and losses between trade date and settlement date on securities transactions; and (iii) gains and losses arising from the difference between amounts of dividends and interest recorded and the amounts actually received.
The resulting gains and losses on transactions are included in the Statement of Operations and Changes in Net Assets.
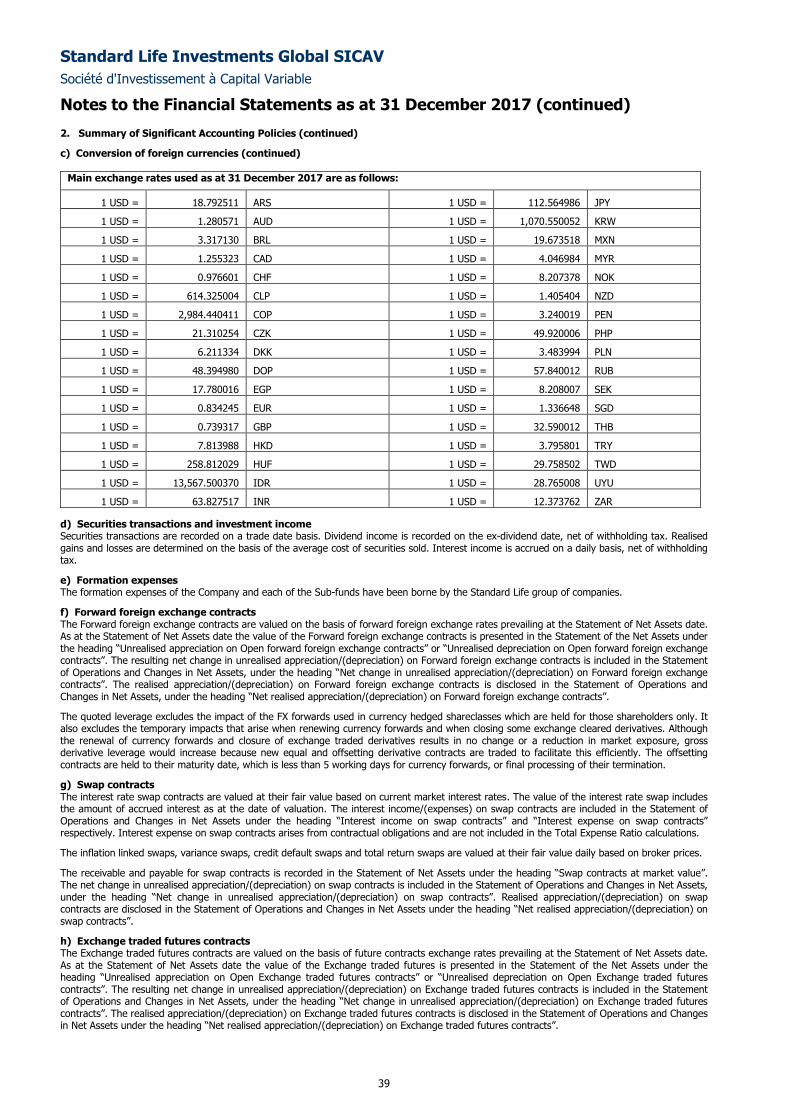
Standard Life Investments Global SICAV
Société d'Investissement à Capital Variable
Notes to the Financial Statements as at 31 December 2017 (continued)
39
2. Summary of Significant Accounting Policies (continued)
c) Conversion of foreign currencies (continued)
Main exchange rates used as at 31 December 2017 are as follows:
1 USD = 18.792511 ARS 1 USD = 112.564986 JPY
1 USD = 1.280571 AUD 1 USD = 1,070.550052 KRW
1 USD = 3.317130 BRL 1 USD = 19.673518 MXN
1 USD = 1.255323 CAD 1 USD = 4.046984 MYR
1 USD = 0.976601 CHF 1 USD = 8.207378 NOK
1 USD = 614.325004 CLP 1 USD = 1.405404 NZD
1 USD = 2,984.440411 COP 1 USD = 3.240019 PEN
1 USD = 21.310254 CZK 1 USD = 49.920006 PHP
1 USD = 6.211334 DKK 1 USD = 3.483994 PLN
1 USD = 48.394980 DOP 1 USD = 57.840012 RUB
1 USD = 17.780016 EGP 1 USD = 8.208007 SEK
1 USD = 0.834245 EUR 1 USD = 1.336648 SGD
1 USD = 0.739317 GBP 1 USD = 32.590012 THB
1 USD = 7.813988 HKD 1 USD = 3.795801 TRY
1 USD = 258.812029 HUF 1 USD = 29.758502 TWD
1 USD = 13,567.500370 IDR 1 USD = 28.765008 UYU
1 USD = 63.827517 INR 1 USD = 12.373762 ZAR
d) Securities transactions and investment income . Securities transactions are recorded on a trade date basis. Dividend income is recorded on the ex-dividend date, net of withholding tax. Realised gains and losses are determined on the basis of the average cost of securities sold. Interest income is accrued on a daily basis, net of withholding tax.
e) Formation expenses The formation expenses of the Company and each of the Sub-funds have been borne by the Standard Life group of companies.
f) Forward foreign exchange contracts The Forward foreign exchange contracts are valued on the basis of forward foreign exchange rates prevailing at the Statement of Net Assets date. As at the Statement of Net Assets date the value of the Forward foreign exchange contracts is presented in the Statement of the Net Assets under the heading “Unrealised appreciation on Open forward foreign exchange contracts” or “Unrealised depreciation on Open forward foreign exchange contracts”. The resulting net change in unrealised appreciation/(depreciation) on Forward foreign exchange contracts is included in the Statement of Operations and Changes in Net Assets, under the heading “Net change in unrealised appreciation/(depreciation) on Forward foreign exchange contracts”. The realised appreciation/(depreciation) on Forward foreign exchange contracts is disclosed in the Statement of Operations and Changes in Net Assets, under the heading “Net realised appreciation/(depreciation) on Forward foreign exchange contracts”.
The quoted leverage excludes the impact of the FX forwards used in currency hedged shareclasses which are held for those shareholders only. It also excludes the temporary impacts that arise when renewing currency forwards and when closing some exchange cleared derivatives. Although the renewal of currency forwards and closure of exchange traded derivatives results in no change or a reduction in market exposure, gross derivative leverage would increase because new equal and offsetting derivative contracts are traded to facilitate this efficiently. The offsetting contracts are held to their maturity date, which is less than 5 working days for currency forwards, or final processing of their termination.
g) Swap contracts The interest rate swap contracts are valued at their fair value based on current market interest rates. The value of the interest rate swap includes the amount of accrued interest as at the date of valuation. The interest income/(expenses) on swap contracts are included in the Statement of Operations and Changes in Net Assets under the heading “Interest income on swap contracts” and “Interest expense on swap contracts” respectively. Interest expense on swap contracts arises from contractual obligations and are not included in the Total Expense Ratio calculations.
The inflation linked swaps, variance swaps, credit default swaps and total return swaps are valued at their fair value daily based on broker prices.
The receivable and payable for swap contracts is recorded in the Statement of Net Assets under the heading “Swap contracts at market value”. The net change in unrealised appreciation/(depreciation) on swap contracts is included in the Statement of Operations and Changes in Net Assets, under the heading “Net change in unrealised appreciation/(depreciation) on swap contracts”. Realised appreciation/(depreciation) on swap contracts are disclosed in the Statement of Operations and Changes in Net Assets under the heading “Net realised appreciation/(depreciation) on swap contracts”.
h) Exchange traded futures contracts The Exchange traded futures contracts are valued on the basis of future contracts exchange rates prevailing at the Statement of Net Assets date. As at the Statement of Net Assets date the value of the Exchange traded futures is presented in the Statement of the Net Assets under the heading “Unrealised appreciation on Open Exchange traded futures contracts” or “Unrealised depreciation on Open Exchange traded futures contracts”. The resulting net change in unrealised appreciation/(depreciation) on Exchange traded futures contracts is included in the Statement of Operations and Changes in Net Assets, under the heading “Net change in unrealised appreciation/(depreciation) on Exchange traded futures contracts”. The realised appreciation/(depreciation) on Exchange traded futures contracts is disclosed in the Statement of Operations and Changes in Net Assets under the heading “Net realised appreciation/(depreciation) on Exchange traded futures contracts”.
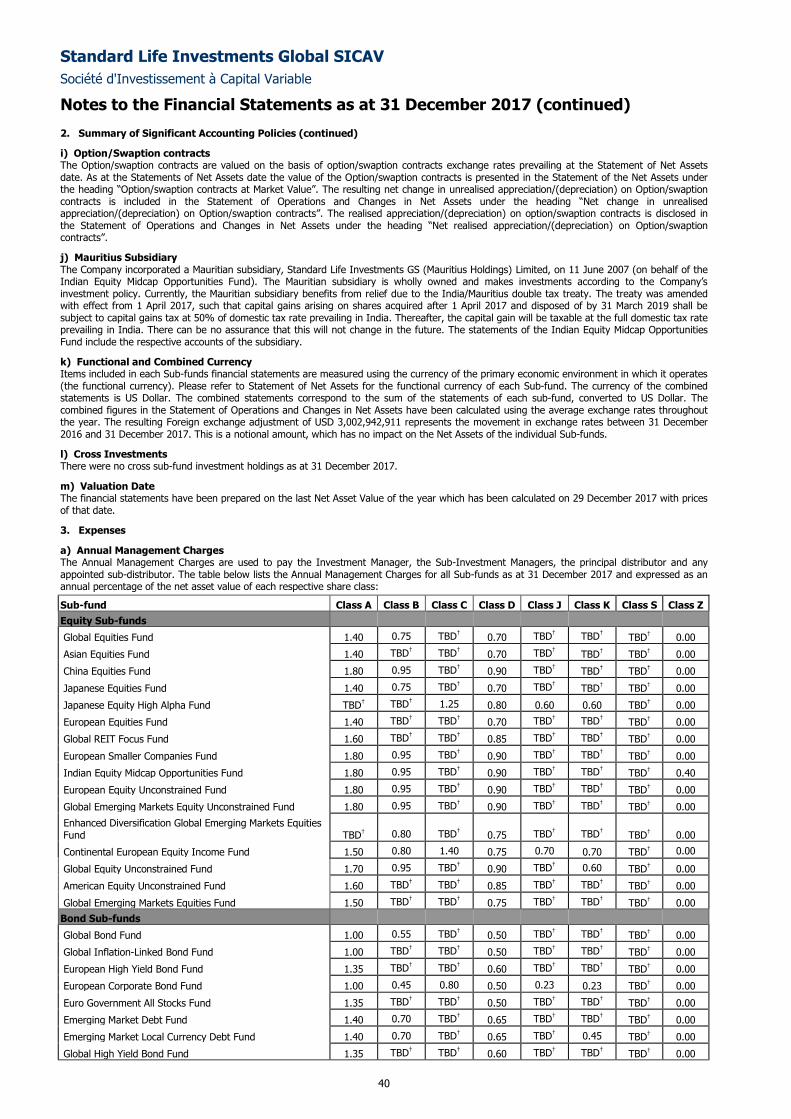
Standard Life Investments Global SICAV
Société d'Investissement à Capital Variable
Notes to the Financial Statements as at 31 December 2017 (continued)
40
2. Summary of Significant Accounting Policies (continued)
i) Option/Swaption contracts The Option/swaption contracts are valued on the basis of option/swaption contracts exchange rates prevailing at the Statement of Net Assets date. As at the Statements of Net Assets date the value of the Option/swaption contracts is presented in the Statement of the Net Assets under the heading “Option/swaption contracts at Market Value”. The resulting net change in unrealised appreciation/(depreciation) on Option/swaption contracts is included in the Statement of Operations and Changes in Net Assets under the heading “Net change in unrealised appreciation/(depreciation) on Option/swaption contracts”. The realised appreciation/(depreciation) on option/swaption contracts is disclosed in the Statement of Operations and Changes in Net Assets under the heading “Net realised appreciation/(depreciation) on Option/swaption contracts”.
j) Mauritius Subsidiary The Company incorporated a Mauritian subsidiary, Standard Life Investments GS (Mauritius Holdings) Limited, on 11 June 2007 (on behalf of the Indian Equity Midcap Opportunities Fund). The Mauritian subsidiary is wholly owned and makes investments according to the Company’s investment policy. Currently, the Mauritian subsidiary benefits from relief due to the India/Mauritius double tax treaty. The treaty was amended with effect from 1 April 2017, such that capital gains arising on shares acquired after 1 April 2017 and disposed of by 31 March 2019 shall be subject to capital gains tax at 50% of domestic tax rate prevailing in India. Thereafter, the capital gain will be taxable at the full domestic tax rate prevailing in India. There can be no assurance that this will not change in the future. The statements of the Indian Equity Midcap Opportunities Fund include the respective accounts of the subsidiary.
k) Functional and Combined Currency Items included in each Sub-funds financial statements are measured using the currency of the primary economic environment in which it operates (the functional currency). Please refer to Statement of Net Assets for the functional currency of each Sub-fund. The currency of the combined statements is US Dollar. The combined statements correspond to the sum of the statements of each sub-fund, converted to US Dollar. The combined figures in the Statement of Operations and Changes in Net Assets have been calculated using the average exchange rates throughout the year. The resulting Foreign exchange adjustment of USD 3,002,942,911 represents the movement in exchange rates between 31 December 2016 and 31 December 2017. This is a notional amount, which has no impact on the Net Assets of the individual Sub-funds.
l) Cross Investments There were no cross sub-fund investment holdings as at 31 December 2017.
m) Valuation Date The financial statements have been prepared on the last Net Asset Value of the year which has been calculated on 29 December 2017 with prices of that date.
3. Expenses
a) Annual Management Charges The Annual Management Charges are used to pay the Investment Manager, the Sub-Investment Managers, the principal distributor and any appointed sub-distributor. The table below lists the Annual Management Charges for all Sub-funds as at 31 December 2017 and expressed as an annual percentage of the net asset value of each respective share class:
Sub-fund Class A Class B Class C Class D Class J Class K Class S Class Z
Equity Sub-funds
Global Equities Fund 1.40 0.75 TBD† 0.70 TBD† TBD† TBD† 0.00
Asian Equities Fund 1.40 TBD† TBD† 0.70 TBD† TBD† TBD† 0.00 China Equities Fund 1.80 0.95 TBD† 0.90 TBD† TBD† TBD† 0.00 Japanese Equities Fund 1.40 0.75 TBD† 0.70 TBD† TBD† TBD† 0.00 Japanese Equity High Alpha Fund TBD† TBD† 1.25 0.80 0.60 0.60 TBD† 0.00 European Equities Fund 1.40 TBD† TBD† 0.70 TBD† TBD† TBD† 0.00 Global REIT Focus Fund 1.60 TBD† TBD† 0.85 TBD† TBD† TBD† 0.00 European Smaller Companies Fund 1.80 0.95 TBD† 0.90 TBD† TBD† TBD† 0.00 Indian Equity Midcap Opportunities Fund 1.80 0.95 TBD† 0.90 TBD† TBD† TBD† 0.40 European Equity Unconstrained Fund 1.80 0.95 TBD† 0.90 TBD† TBD† TBD† 0.00 Global Emerging Markets Equity Unconstrained Fund 1.80 0.95 TBD† 0.90 TBD† TBD† TBD† 0.00 Enhanced Diversification Global Emerging Markets Equities .Fund TBD† 0.80 TBD† 0.75 TBD† TBD† TBD† 0.00 Continental European Equity Income Fund 1.50 0.80 1.40 0.75 0.70 0.70 TBD† 0.00 Global Equity Unconstrained Fund 1.70 0.95 TBD† 0.90 TBD† 0.60 TBD† 0.00 American Equity Unconstrained Fund 1.60 TBD† TBD† 0.85 TBD† TBD† TBD† 0.00 Global Emerging Markets Equities Fund 1.50 TBD† TBD† 0.75 TBD† TBD† TBD† 0.00 Bond Sub-funds
Global Bond Fund 1.00 0.55 TBD† 0.50 TBD† TBD† TBD† 0.00 Global Inflation-Linked Bond Fund 1.00 TBD† TBD† 0.50 TBD† TBD† TBD† 0.00 European High Yield Bond Fund 1.35 TBD† TBD† 0.60 TBD† TBD† TBD† 0.00 European Corporate Bond Fund 1.00 0.45 0.80 0.50 0.23 0.23 TBD† 0.00 Euro Government All Stocks Fund 1.35 TBD† TBD† 0.50 TBD† TBD† TBD† 0.00 Emerging Market Debt Fund 1.40 0.70 TBD† 0.65 TBD† TBD† TBD† 0.00 Emerging Market Local Currency Debt Fund 1.40 0.70 TBD† 0.65 TBD† 0.45 TBD† 0.00 Global High Yield Bond Fund 1.35 TBD† TBD† 0.60 TBD† TBD† TBD† 0.00
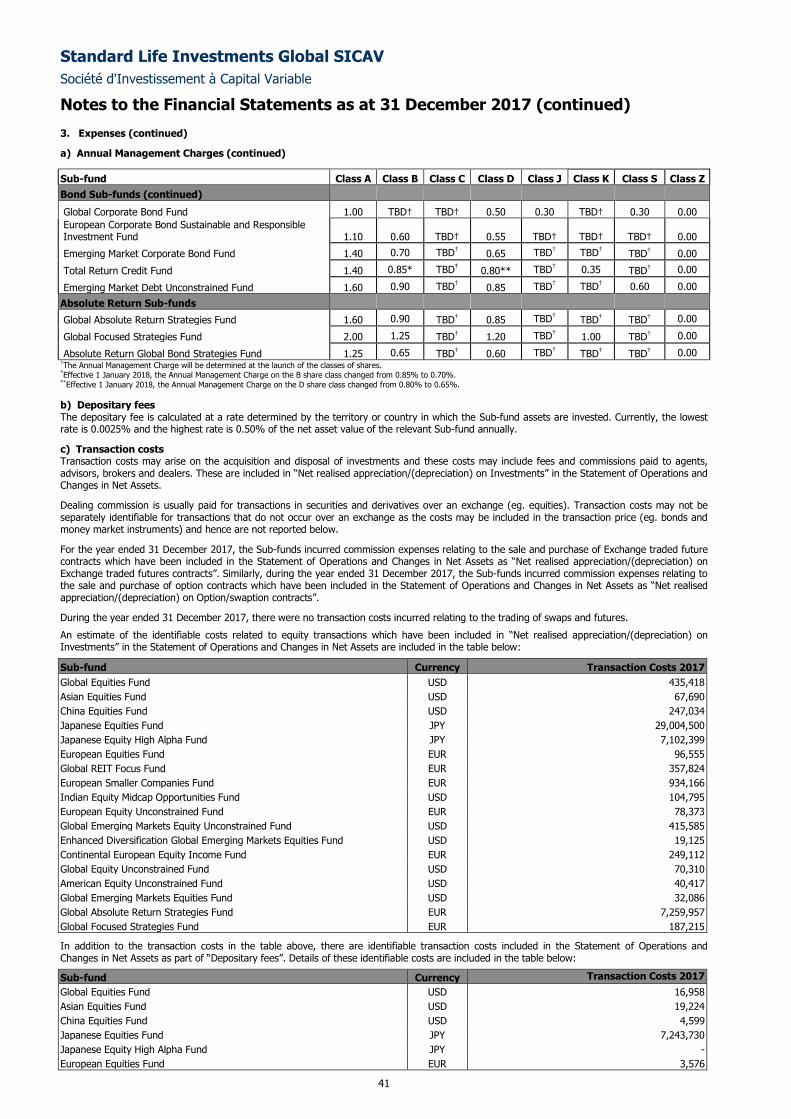
Standard Life Investments Global SICAV
Société d'Investissement à Capital Variable
Notes to the Financial Statements as at 31 December 2017 (continued)
41
3. Expenses (continued)
a) Annual Management Charges (continued)
Sub-fund Class A Class B Class C Class D Class J Class K Class S Class Z
Bond Sub-funds (continued)
Global Corporate Bond Fund 1.00 TBD† TBD† 0.50
0.30 TBD†
0.30 0.00
European Corporate Bond Sustainable and Responsible .Investment Fund 1.10 0.60 TBD† 0.55 TBD† TBD† TBD† 0.00
Emerging Market Corporate Bond Fund 1.40 0.70 TBD† 0.65 TBD† TBD† TBD† 0.00 Total Return Credit Fund 1.40 0.85* TBD† 0.80** TBD† 0.35 TBD† 0.00 Emerging Market Debt Unconstrained Fund 1.60 0.90 TBD† 0.85 TBD† TBD† 0.60 0.00
Absolute Return Sub-funds
Global Absolute Return Strategies Fund 1.60 0.90 TBD† 0.85 TBD† TBD† TBD† 0.00 Global Focused Strategies Fund 2.00 1.25 TBD† 1.20 TBD† 1.00 TBD† 0.00 Absolute Return Global Bond Strategies Fund 1.25 0.65 TBD† 0.60 TBD† TBD† TBD† 0.00 †The Annual Management Charge will be determined at the launch of the classes of shares. *Effective 1 January 2018, the Annual Management Charge on the B share class changed from 0.85% to 0.70%. **Effective 1 January 2018, the Annual Management Charge on the D share class changed from 0.80% to 0.65%.
b) Depositary fees The depositary fee is calculated at a rate determined by the territory or country in which the Sub-fund assets are invested. Currently, the lowest rate is 0.0025% and the highest rate is 0.50% of the net asset value of the relevant Sub-fund annually.
c) Transaction costs Transaction costs may arise on the acquisition and disposal of investments and these costs may include fees and commissions paid to agents, advisors, brokers and dealers. These are included in “Net realised appreciation/(depreciation) on Investments” in the Statement of Operations and Changes in Net Assets.
Dealing commission is usually paid for transactions in securities and derivatives over an exchange (eg. equities). Transaction costs may not be separately identifiable for transactions that do not occur over an exchange as the costs may be included in the transaction price (eg. bonds and money market instruments) and hence are not reported below.
For the year ended 31 December 2017, the Sub-funds incurred commission expenses relating to the sale and purchase of Exchange traded future contracts which have been included in the Statement of Operations and Changes in Net Assets as “Net realised appreciation/(depreciation) on Exchange traded futures contracts”. Similarly, during the year ended 31 December 2017, the Sub-funds incurred commission expenses relating to the sale and purchase of option contracts which have been included in the Statement of Operations and Changes in Net Assets as “Net realised appreciation/(depreciation) on Option/swaption contracts”.
During the year ended 31 December 2017, there were no transaction costs incurred relating to the trading of swaps and futures.
An estimate of the identifiable costs related to equity transactions which have been included in “Net realised appreciation/(depreciation) on Investments” in the Statement of Operations and Changes in Net Assets are included in the table below:
Sub-fund Currency Transaction Costs 2017
Global Equities Fund USD 435,418
Asian Equities Fund USD 67,690
China Equities Fund USD 247,034
Japanese Equities Fund JPY 29,004,500
Japanese Equity High Alpha Fund JPY 7,102,399
European Equities Fund EUR 96,555
Global REIT Focus Fund EUR 357,824
European Smaller Companies Fund EUR 934,166
Indian Equity Midcap Opportunities Fund USD 104,795
European Equity Unconstrained Fund EUR 78,373
Global Emerging Markets Equity Unconstrained Fund USD 415,585
Enhanced Diversification Global Emerging Markets Equities Fund USD 19,125
Continental European Equity Income Fund EUR 249,112
Global Equity Unconstrained Fund USD 70,310
American Equity Unconstrained Fund USD 40,417
Global Emerging Markets Equities Fund USD 32,086
Global Absolute Return Strategies Fund EUR 7,259,957
Global Focused Strategies Fund EUR 187,215
In addition to the transaction costs in the table above, there are identifiable transaction costs included in the Statement of Operations and Changes in Net Assets as part of “Depositary fees”. Details of these identifiable costs are included in the table below:
Sub-fund Currency Transaction Costs 2017 2015 Global Equities Fund USD 16,958
Asian Equities Fund USD 19,224
China Equities Fund USD 4,599
Japanese Equities Fund JPY 7,243,730
Japanese Equity High Alpha Fund JPY -
European Equities Fund EUR 3,576
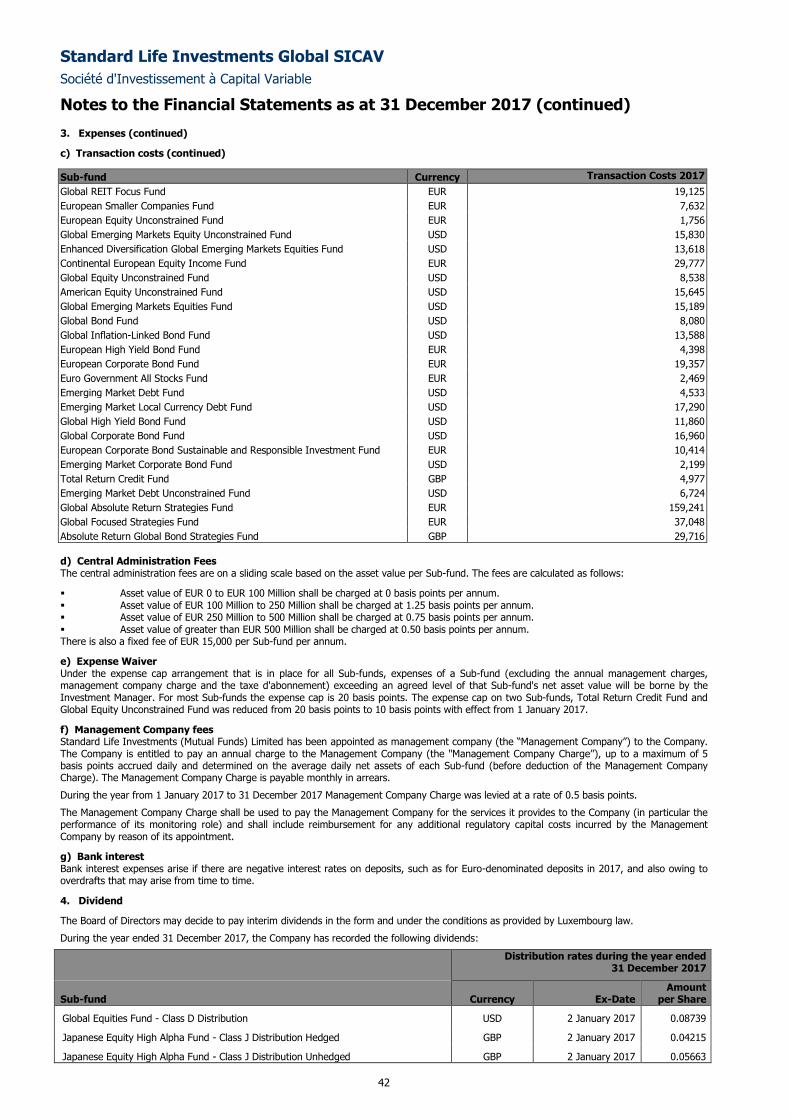
Standard Life Investments Global SICAV
Société d'Investissement à Capital Variable
Notes to the Financial Statements as at 31 December 2017 (continued)
42
3. Expenses (continued)
c) Transaction costs (continued)
Sub-fund Currency Transaction Costs 2017 2015 Global REIT Focus Fund EUR 19,125
European Smaller Companies Fund EUR 7,632
European Equity Unconstrained Fund EUR 1,756
Global Emerging Markets Equity Unconstrained Fund USD 15,830
Enhanced Diversification Global Emerging Markets Equities Fund USD 13,618
Continental European Equity Income Fund EUR 29,777
Global Equity Unconstrained Fund USD 8,538
American Equity Unconstrained Fund USD 15,645
Global Emerging Markets Equities Fund USD 15,189
Global Bond Fund USD 8,080
Global Inflation-Linked Bond Fund USD 13,588
European High Yield Bond Fund EUR 4,398
European Corporate Bond Fund EUR 19,357
Euro Government All Stocks Fund EUR 2,469
Emerging Market Debt Fund USD 4,533
Emerging Market Local Currency Debt Fund USD 17,290
Global High Yield Bond Fund USD 11,860
Global Corporate Bond Fund USD 16,960
European Corporate Bond Sustainable and Responsible Investment Fund EUR 10,414
Emerging Market Corporate Bond Fund USD 2,199
Total Return Credit Fund GBP 4,977
Emerging Market Debt Unconstrained Fund USD 6,724
Global Absolute Return Strategies Fund EUR 159,241
Global Focused Strategies Fund EUR 37,048
Absolute Return Global Bond Strategies Fund GBP 29,716
d) Central Administration Fees The central administration fees are on a sliding scale based on the asset value per Sub-fund. The fees are calculated as follows:
Asset value of EUR 0 to EUR 100 Million shall be charged at 0 basis points per annum. Asset value of EUR 100 Million to 250 Million shall be charged at 1.25 basis points per annum. Asset value of EUR 250 Million to 500 Million shall be charged at 0.75 basis points per annum. Asset value of greater than EUR 500 Million shall be charged at 0.50 basis points per annum. There is also a fixed fee of EUR 15,000 per Sub-fund per annum.
e) Expense Waiver Under the expense cap arrangement that is in place for all Sub-funds, expenses of a Sub-fund (excluding the annual management charges, management company charge and the taxe d'abonnement) exceeding an agreed level of that Sub-fund's net asset value will be borne by the Investment Manager. For most Sub-funds the expense cap is 20 basis points. The expense cap on two Sub-funds, Total Return Credit Fund and Global Equity Unconstrained Fund was reduced from 20 basis points to 10 basis points with effect from 1 January 2017.
f) Management Company fees Standard Life Investments (Mutual Funds) Limited has been appointed as management company (the “Management Company”) to the Company. The Company is entitled to pay an annual charge to the Management Company (the "Management Company Charge’’), up to a maximum of 5 basis points accrued daily and determined on the average daily net assets of each Sub-fund (before deduction of the Management Company Charge). The Management Company Charge is payable monthly in arrears.
During the year from 1 January 2017 to 31 December 2017 Management Company Charge was levied at a rate of 0.5 basis points.
The Management Company Charge shall be used to pay the Management Company for the services it provides to the Company (in particular the performance of its monitoring role) and shall include reimbursement for any additional regulatory capital costs incurred by the Management Company by reason of its appointment.
g) Bank interest Bank interest expenses arise if there are negative interest rates on deposits, such as for Euro-denominated deposits in 2017, and also owing to overdrafts that may arise from time to time.
4. Dividend
The Board of Directors may decide to pay interim dividends in the form and under the conditions as provided by Luxembourg law.
During the year ended 31 December 2017, the Company has recorded the following dividends:
Distribution rates during the year ended 31 December 2017
Sub-fund Currency Ex-Date Amount
per Share
Global Equities Fund - Class D Distribution USD 2 January 2017 0.08739
Japanese Equity High Alpha Fund - Class J Distribution Hedged GBP 2 January 2017 0.04215
Japanese Equity High Alpha Fund - Class J Distribution Unhedged GBP 2 January 2017 0.05663
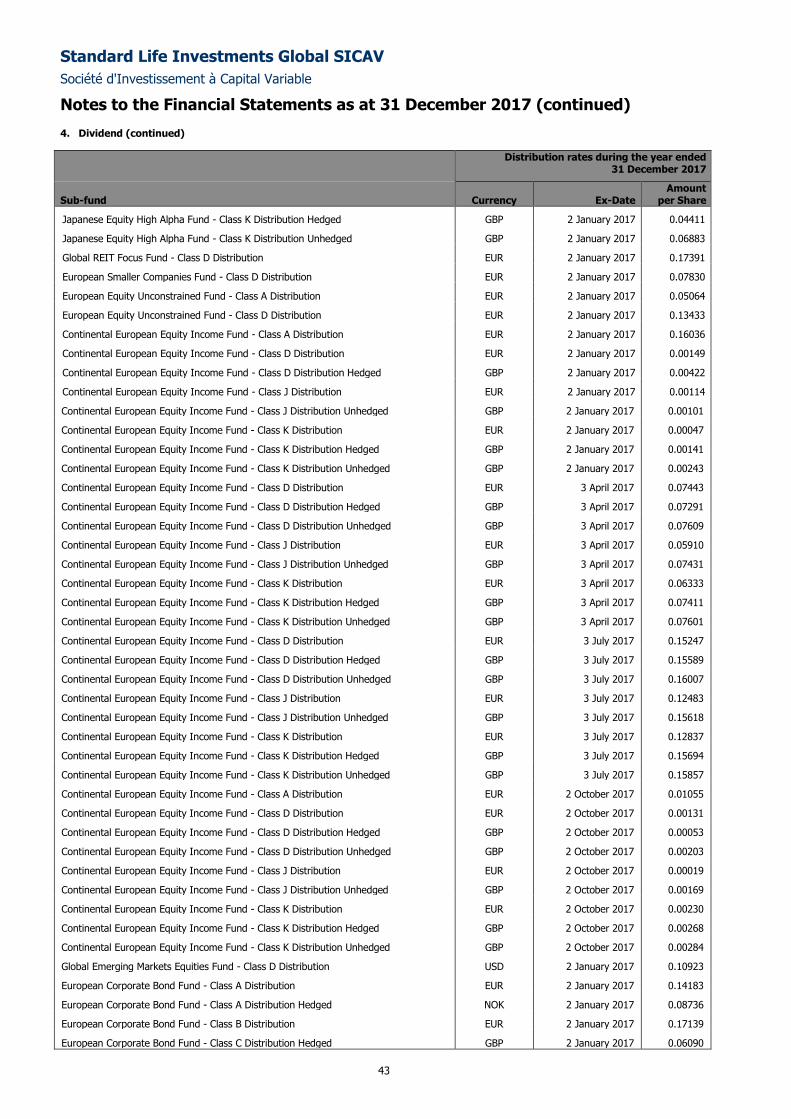
Standard Life Investments Global SICAV
Société d'Investissement à Capital Variable
Notes to the Financial Statements as at 31 December 2017 (continued)
43
4. Dividend (continued)
Distribution rates during the year ended 31 December 2017
Sub-fund Currency Ex-Date Amount
per Share
Japanese Equity High Alpha Fund - Class K Distribution Hedged GBP 2 January 2017 0.04411
Japanese Equity High Alpha Fund - Class K Distribution Unhedged GBP 2 January 2017 0.06883
Global REIT Focus Fund - Class D Distribution EUR 2 January 2017 0.17391
European Smaller Companies Fund - Class D Distribution EUR 2 January 2017 0.07830
European Equity Unconstrained Fund - Class A Distribution EUR 2 January 2017 0.05064
European Equity Unconstrained Fund - Class D Distribution EUR 2 January 2017 0.13433
Continental European Equity Income Fund - Class A Distribution EUR 2 January 2017 0.16036
Continental European Equity Income Fund - Class D Distribution EUR 2 January 2017 0.00149
Continental European Equity Income Fund - Class D Distribution Hedged GBP 2 January 2017 0.00422
Continental European Equity Income Fund - Class J Distribution EUR 2 January 2017 0.00114
Continental European Equity Income Fund - Class J Distribution Unhedged GBP 2 January 2017 0.00101
Continental European Equity Income Fund - Class K Distribution EUR 2 January 2017 0.00047
Continental European Equity Income Fund - Class K Distribution Hedged GBP 2 January 2017 0.00141
Continental European Equity Income Fund - Class K Distribution Unhedged GBP 2 January 2017 0.00243
Continental European Equity Income Fund - Class D Distribution EUR 3 April 2017 0.07443
Continental European Equity Income Fund - Class D Distribution Hedged GBP 3 April 2017 0.07291
Continental European Equity Income Fund - Class D Distribution Unhedged GBP 3 April 2017 0.07609
Continental European Equity Income Fund - Class J Distribution EUR 3 April 2017 0.05910
Continental European Equity Income Fund - Class J Distribution Unhedged GBP 3 April 2017 0.07431
Continental European Equity Income Fund - Class K Distribution EUR 3 April 2017 0.06333
Continental European Equity Income Fund - Class K Distribution Hedged GBP 3 April 2017 0.07411
Continental European Equity Income Fund - Class K Distribution Unhedged GBP 3 April 2017 0.07601
Continental European Equity Income Fund - Class D Distribution EUR 3 July 2017 0.15247
Continental European Equity Income Fund - Class D Distribution Hedged GBP 3 July 2017 0.15589
Continental European Equity Income Fund - Class D Distribution Unhedged GBP 3 July 2017 0.16007
Continental European Equity Income Fund - Class J Distribution EUR 3 July 2017 0.12483
Continental European Equity Income Fund - Class J Distribution Unhedged GBP 3 July 2017 0.15618
Continental European Equity Income Fund - Class K Distribution EUR 3 July 2017 0.12837
Continental European Equity Income Fund - Class K Distribution Hedged GBP 3 July 2017 0.15694
Continental European Equity Income Fund - Class K Distribution Unhedged GBP 3 July 2017 0.15857
Continental European Equity Income Fund - Class A Distribution EUR 2 October 2017 0.01055
Continental European Equity Income Fund - Class D Distribution EUR 2 October 2017 0.00131
Continental European Equity Income Fund - Class D Distribution Hedged GBP 2 October 2017 0.00053
Continental European Equity Income Fund - Class D Distribution Unhedged GBP 2 October 2017 0.00203
Continental European Equity Income Fund - Class J Distribution EUR 2 October 2017 0.00019
Continental European Equity Income Fund - Class J Distribution Unhedged GBP 2 October 2017 0.00169
Continental European Equity Income Fund - Class K Distribution EUR 2 October 2017 0.00230
Continental European Equity Income Fund - Class K Distribution Hedged GBP 2 October 2017 0.00268
Continental European Equity Income Fund - Class K Distribution Unhedged GBP 2 October 2017 0.00284
Global Emerging Markets Equities Fund - Class D Distribution USD 2 January 2017 0.10923
European Corporate Bond Fund - Class A Distribution EUR 2 January 2017 0.14183
European Corporate Bond Fund - Class A Distribution Hedged NOK 2 January 2017 0.08736
European Corporate Bond Fund - Class B Distribution EUR 2 January 2017 0.17139
European Corporate Bond Fund - Class C Distribution Hedged GBP 2 January 2017 0.06090
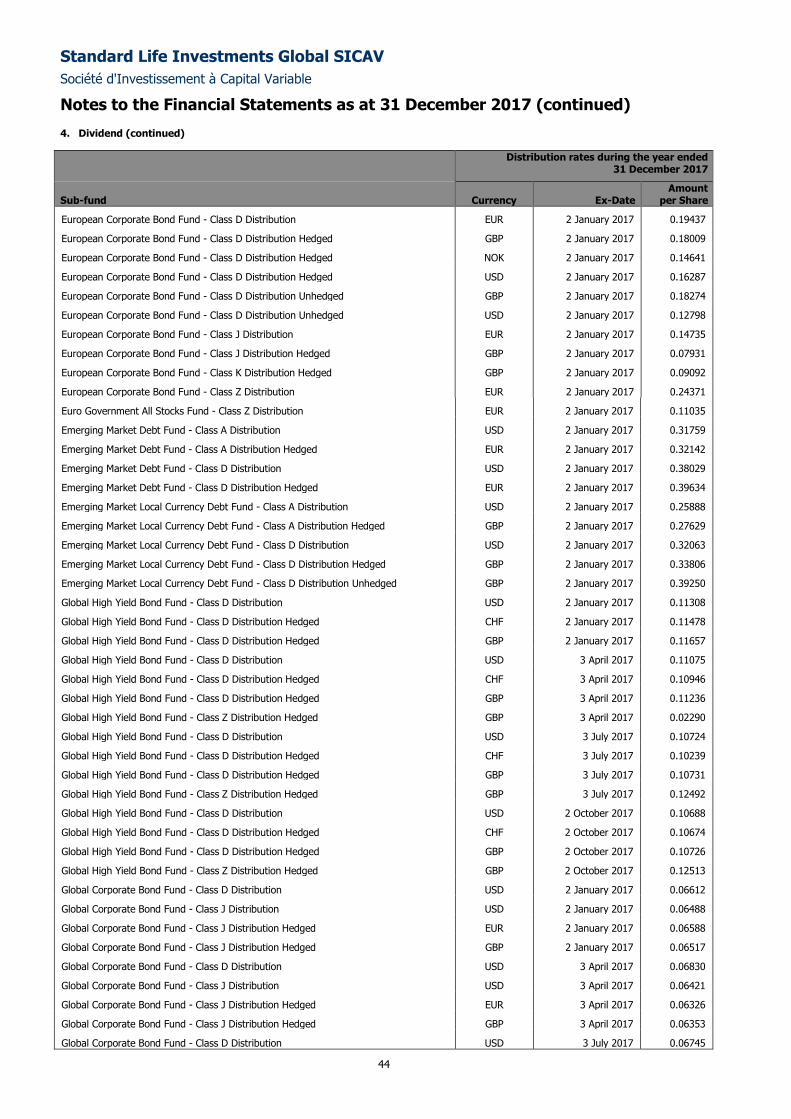
Standard Life Investments Global SICAV
Société d'Investissement à Capital Variable
Notes to the Financial Statements as at 31 December 2017 (continued)
44
4. Dividend (continued)
Distribution rates during the year ended 31 December 2017
Sub-fund Currency Ex-Date Amount
per Share
European Corporate Bond Fund - Class D Distribution EUR 2 January 2017 0.19437
European Corporate Bond Fund - Class D Distribution Hedged GBP 2 January 2017 0.18009
European Corporate Bond Fund - Class D Distribution Hedged NOK 2 January 2017 0.14641
European Corporate Bond Fund - Class D Distribution Hedged USD 2 January 2017 0.16287
European Corporate Bond Fund - Class D Distribution Unhedged GBP 2 January 2017 0.18274
European Corporate Bond Fund - Class D Distribution Unhedged USD 2 January 2017 0.12798
European Corporate Bond Fund - Class J Distribution EUR 2 January 2017 0.14735
European Corporate Bond Fund - Class J Distribution Hedged GBP 2 January 2017 0.07931
European Corporate Bond Fund - Class K Distribution Hedged GBP 2 January 2017 0.09092
European Corporate Bond Fund - Class Z Distribution EUR 2 January 2017 0.24371
Euro Government All Stocks Fund - Class Z Distribution EUR 2 January 2017 0.11035
Emerging Market Debt Fund - Class A Distribution USD 2 January 2017 0.31759
Emerging Market Debt Fund - Class A Distribution Hedged EUR 2 January 2017 0.32142
Emerging Market Debt Fund - Class D Distribution USD 2 January 2017 0.38029
Emerging Market Debt Fund - Class D Distribution Hedged EUR 2 January 2017 0.39634
Emerging Market Local Currency Debt Fund - Class A Distribution USD 2 January 2017 0.25888
Emerging Market Local Currency Debt Fund - Class A Distribution Hedged GBP 2 January 2017 0.27629
Emerging Market Local Currency Debt Fund - Class D Distribution USD 2 January 2017 0.32063
Emerging Market Local Currency Debt Fund - Class D Distribution Hedged GBP 2 January 2017 0.33806
Emerging Market Local Currency Debt Fund - Class D Distribution Unhedged GBP 2 January 2017 0.39250
Global High Yield Bond Fund - Class D Distribution USD 2 January 2017 0.11308
Global High Yield Bond Fund - Class D Distribution Hedged CHF 2 January 2017 0.11478
Global High Yield Bond Fund - Class D Distribution Hedged GBP 2 January 2017 0.11657
Global High Yield Bond Fund - Class D Distribution USD 3 April 2017 0.11075
Global High Yield Bond Fund - Class D Distribution Hedged CHF 3 April 2017 0.10946
Global High Yield Bond Fund - Class D Distribution Hedged GBP 3 April 2017 0.11236
Global High Yield Bond Fund - Class Z Distribution Hedged GBP 3 April 2017 0.02290
Global High Yield Bond Fund - Class D Distribution USD 3 July 2017 0.10724
Global High Yield Bond Fund - Class D Distribution Hedged CHF 3 July 2017 0.10239
Global High Yield Bond Fund - Class D Distribution Hedged GBP 3 July 2017 0.10731
Global High Yield Bond Fund - Class Z Distribution Hedged GBP 3 July 2017 0.12492
Global High Yield Bond Fund - Class D Distribution USD 2 October 2017 0.10688
Global High Yield Bond Fund - Class D Distribution Hedged CHF 2 October 2017 0.10674
Global High Yield Bond Fund - Class D Distribution Hedged GBP 2 October 2017 0.10726
Global High Yield Bond Fund - Class Z Distribution Hedged GBP 2 October 2017 0.12513
Global Corporate Bond Fund - Class D Distribution USD 2 January 2017 0.06612
Global Corporate Bond Fund - Class J Distribution USD 2 January 2017 0.06488
Global Corporate Bond Fund - Class J Distribution Hedged EUR 2 January 2017 0.06588
Global Corporate Bond Fund - Class J Distribution Hedged GBP 2 January 2017 0.06517
Global Corporate Bond Fund - Class D Distribution USD 3 April 2017 0.06830
Global Corporate Bond Fund - Class J Distribution USD 3 April 2017 0.06421
Global Corporate Bond Fund - Class J Distribution Hedged EUR 3 April 2017 0.06326
Global Corporate Bond Fund - Class J Distribution Hedged GBP 3 April 2017 0.06353
Global Corporate Bond Fund - Class D Distribution USD 3 July 2017 0.06745
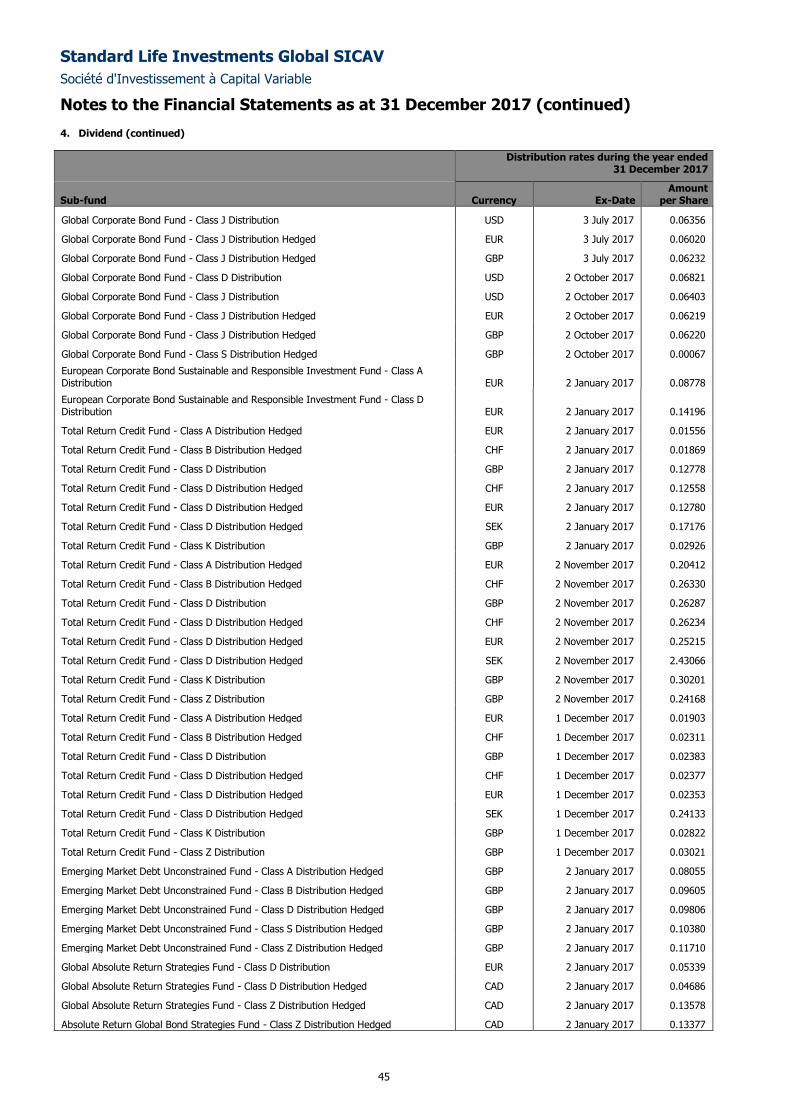
Standard Life Investments Global SICAV
Société d'Investissement à Capital Variable
Notes to the Financial Statements as at 31 December 2017 (continued)
45
4. Dividend (continued)
Distribution rates during the year ended 31 December 2017
Sub-fund Currency Ex-Date Amount
per Share
Global Corporate Bond Fund - Class J Distribution USD 3 July 2017 0.06356
Global Corporate Bond Fund - Class J Distribution Hedged EUR 3 July 2017 0.06020
Global Corporate Bond Fund - Class J Distribution Hedged GBP 3 July 2017 0.06232
Global Corporate Bond Fund - Class D Distribution USD 2 October 2017 0.06821
Global Corporate Bond Fund - Class J Distribution USD 2 October 2017 0.06403
Global Corporate Bond Fund - Class J Distribution Hedged EUR 2 October 2017 0.06219
Global Corporate Bond Fund - Class J Distribution Hedged GBP 2 October 2017 0.06220
Global Corporate Bond Fund - Class S Distribution Hedged GBP 2 October 2017 0.00067
European Corporate Bond Sustainable and Responsible Investment Fund - Class A Distribution EUR 2 January 2017 0.08778
European Corporate Bond Sustainable and Responsible Investment Fund - Class D Distribution EUR 2 January 2017 0.14196
Total Return Credit Fund - Class A Distribution Hedged EUR 2 January 2017 0.01556
Total Return Credit Fund - Class B Distribution Hedged CHF 2 January 2017 0.01869
Total Return Credit Fund - Class D Distribution GBP 2 January 2017 0.12778
Total Return Credit Fund - Class D Distribution Hedged CHF 2 January 2017 0.12558
Total Return Credit Fund - Class D Distribution Hedged EUR 2 January 2017 0.12780
Total Return Credit Fund - Class D Distribution Hedged SEK 2 January 2017 0.17176
Total Return Credit Fund - Class K Distribution GBP 2 January 2017 0.02926
Total Return Credit Fund - Class A Distribution Hedged EUR 2 November 2017 0.20412
Total Return Credit Fund - Class B Distribution Hedged CHF 2 November 2017 0.26330
Total Return Credit Fund - Class D Distribution GBP 2 November 2017 0.26287
Total Return Credit Fund - Class D Distribution Hedged CHF 2 November 2017 0.26234
Total Return Credit Fund - Class D Distribution Hedged EUR 2 November 2017 0.25215
Total Return Credit Fund - Class D Distribution Hedged SEK 2 November 2017 2.43066
Total Return Credit Fund - Class K Distribution GBP 2 November 2017 0.30201
Total Return Credit Fund - Class Z Distribution GBP 2 November 2017 0.24168
Total Return Credit Fund - Class A Distribution Hedged EUR 1 December 2017 0.01903
Total Return Credit Fund - Class B Distribution Hedged CHF 1 December 2017 0.02311
Total Return Credit Fund - Class D Distribution GBP 1 December 2017 0.02383
Total Return Credit Fund - Class D Distribution Hedged CHF 1 December 2017 0.02377
Total Return Credit Fund - Class D Distribution Hedged EUR 1 December 2017 0.02353
Total Return Credit Fund - Class D Distribution Hedged SEK 1 December 2017 0.24133
Total Return Credit Fund - Class K Distribution GBP 1 December 2017 0.02822
Total Return Credit Fund - Class Z Distribution GBP 1 December 2017 0.03021
Emerging Market Debt Unconstrained Fund - Class A Distribution Hedged GBP 2 January 2017 0.08055
Emerging Market Debt Unconstrained Fund - Class B Distribution Hedged GBP 2 January 2017 0.09605
Emerging Market Debt Unconstrained Fund - Class D Distribution Hedged GBP 2 January 2017 0.09806
Emerging Market Debt Unconstrained Fund - Class S Distribution Hedged GBP 2 January 2017 0.10380
Emerging Market Debt Unconstrained Fund - Class Z Distribution Hedged GBP 2 January 2017 0.11710
Global Absolute Return Strategies Fund - Class D Distribution EUR 2 January 2017 0.05339
Global Absolute Return Strategies Fund - Class D Distribution Hedged CAD 2 January 2017 0.04686
Global Absolute Return Strategies Fund - Class Z Distribution Hedged CAD 2 January 2017 0.13578
Absolute Return Global Bond Strategies Fund - Class Z Distribution Hedged CAD 2 January 2017 0.13377
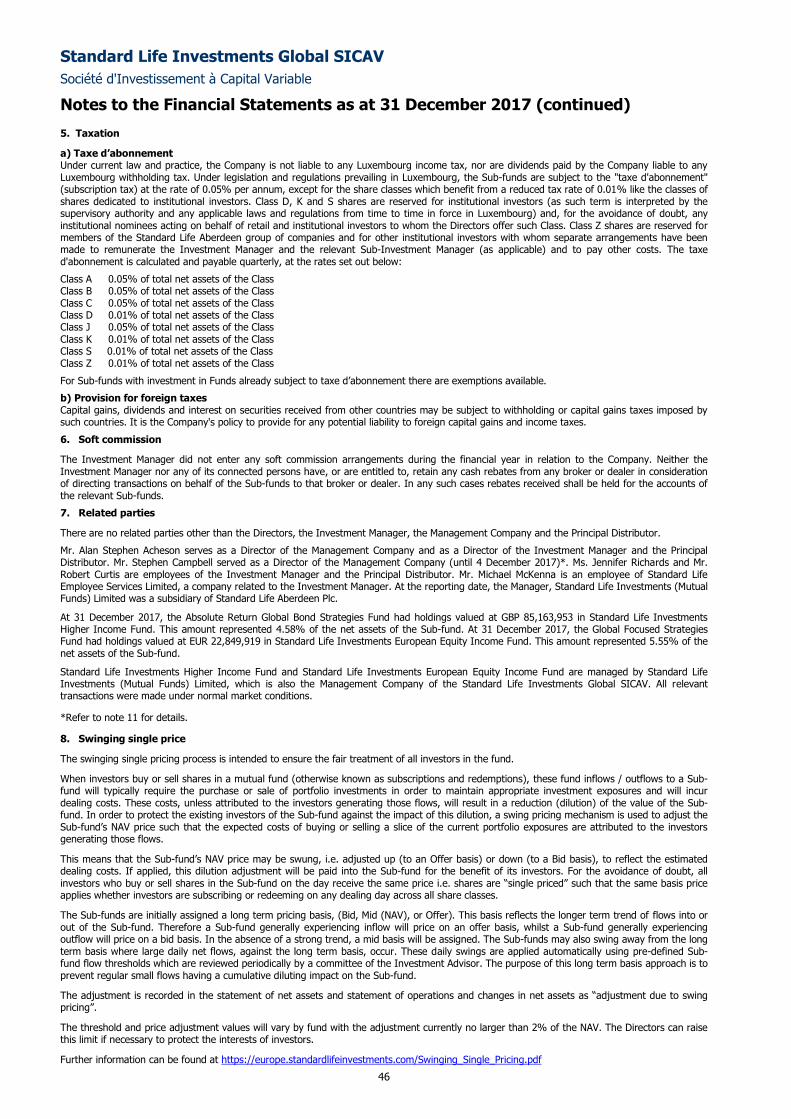
Standard Life Investments Global SICAV
Société d'Investissement à Capital Variable
Notes to the Financial Statements as at 31 December 2017 (continued)
46
5. Taxation
a) Taxe d’abonnement Under current law and practice, the Company is not liable to any Luxembourg income tax, nor are dividends paid by the Company liable to any Luxembourg withholding tax. Under legislation and regulations prevailing in Luxembourg, the Sub-funds are subject to the "taxe d'abonnement" (subscription tax) at the rate of 0.05% per annum, except for the share classes which benefit from a reduced tax rate of 0.01% like the classes of shares dedicated to institutional investors. Class D, K and S shares are reserved for institutional investors (as such term is interpreted by the supervisory authority and any applicable laws and regulations from time to time in force in Luxembourg) and, for the avoidance of doubt, any institutional nominees acting on behalf of retail and institutional investors to whom the Directors offer such Class. Class Z shares are reserved for members of the Standard Life Aberdeen group of companies and for other institutional investors with whom separate arrangements have been made to remunerate the Investment Manager and the relevant Sub-Investment Manager (as applicable) and to pay other costs. The taxe d'abonnement is calculated and payable quarterly, at the rates set out below:
Class A 0.05% of total net assets of the Class Class B 0.05% of total net assets of the Class Class C 0.05% of total net assets of the Class Class D 0.01% of total net assets of the Class Class J 0.05% of total net assets of the Class Class K 0.01% of total net assets of the Class Class S 0.01% of total net assets of the Class Class Z 0.01% of total net assets of the Class
For Sub-funds with investment in Funds already subject to taxe d’abonnement there are exemptions available.
b) Provision for foreign taxes Capital gains, dividends and interest on securities received from other countries may be subject to withholding or capital gains taxes imposed by such countries. It is the Company's policy to provide for any potential liability to foreign capital gains and income taxes.
6. Soft commission
The Investment Manager did not enter any soft commission arrangements during the financial year in relation to the Company. Neither the Investment Manager nor any of its connected persons have, or are entitled to, retain any cash rebates from any broker or dealer in consideration of directing transactions on behalf of the Sub-funds to that broker or dealer. In any such cases rebates received shall be held for the accounts of the relevant Sub-funds.
7. Related parties
There are no related parties other than the Directors, the Investment Manager, the Management Company and the Principal Distributor.
Mr. Alan Stephen Acheson serves as a Director of the Management Company and as a Director of the Investment Manager and the Principal Distributor. Mr. Stephen Campbell served as a Director of the Management Company (until 4 December 2017)*. Ms. Jennifer Richards and Mr. Robert Curtis are employees of the Investment Manager and the Principal Distributor. Mr. Michael McKenna is an employee of Standard Life Employee Services Limited, a company related to the Investment Manager. At the reporting date, the Manager, Standard Life Investments (Mutual Funds) Limited was a subsidiary of Standard Life Aberdeen Plc.
At 31 December 2017, the Absolute Return Global Bond Strategies Fund had holdings valued at GBP 85,163,953 in Standard Life Investments Higher Income Fund. This amount represented 4.58% of the net assets of the Sub-fund. At 31 December 2017, the Global Focused Strategies Fund had holdings valued at EUR 22,849,919 in Standard Life Investments European Equity Income Fund. This amount represented 5.55% of the net assets of the Sub-fund.
Standard Life Investments Higher Income Fund and Standard Life Investments European Equity Income Fund are managed by Standard Life Investments (Mutual Funds) Limited, which is also the Management Company of the Standard Life Investments Global SICAV. All relevant transactions were made under normal market conditions.
*Refer to note 11 for details.
8. Swinging single price
The swinging single pricing process is intended to ensure the fair treatment of all investors in the fund.
When investors buy or sell shares in a mutual fund (otherwise known as subscriptions and redemptions), these fund inflows / outflows to a Sub-fund will typically require the purchase or sale of portfolio investments in order to maintain appropriate investment exposures and will incur dealing costs. These costs, unless attributed to the investors generating those flows, will result in a reduction (dilution) of the value of the Sub-fund. In order to protect the existing investors of the Sub-fund against the impact of this dilution, a swing pricing mechanism is used to adjust the Sub-fund’s NAV price such that the expected costs of buying or selling a slice of the current portfolio exposures are attributed to the investors generating those flows.
This means that the Sub-fund’s NAV price may be swung, i.e. adjusted up (to an Offer basis) or down (to a Bid basis), to reflect the estimated dealing costs. If applied, this dilution adjustment will be paid into the Sub-fund for the benefit of its investors. For the avoidance of doubt, all investors who buy or sell shares in the Sub-fund on the day receive the same price i.e. shares are “single priced” such that the same basis price applies whether investors are subscribing or redeeming on any dealing day across all share classes.
The Sub-funds are initially assigned a long term pricing basis, (Bid, Mid (NAV), or Offer). This basis reflects the longer term trend of flows into or out of the Sub-fund. Therefore a Sub-fund generally experiencing inflow will price on an offer basis, whilst a Sub-fund generally experiencing outflow will price on a bid basis. In the absence of a strong trend, a mid basis will be assigned. The Sub-funds may also swing away from the long term basis where large daily net flows, against the long term basis, occur. These daily swings are applied automatically using pre-defined Sub-fund flow thresholds which are reviewed periodically by a committee of the Investment Advisor. The purpose of this long term basis approach is to prevent regular small flows having a cumulative diluting impact on the Sub-fund.
The adjustment is recorded in the statement of net assets and statement of operations and changes in net assets as “adjustment due to swing pricing”.
The threshold and price adjustment values will vary by fund with the adjustment currently no larger than 2% of the NAV. The Directors can raise this limit if necessary to protect the interests of investors.
Further information can be found at https://europe.standardlifeinvestments.com/Swinging_Single_Pricing.pdf
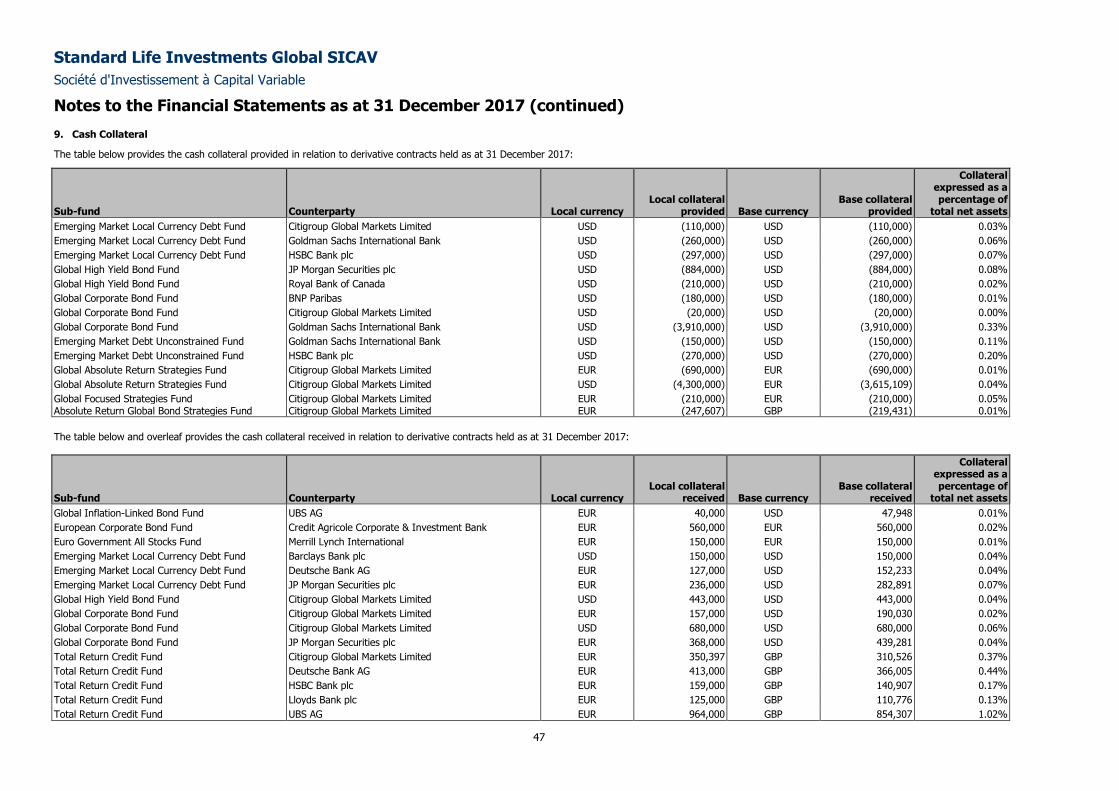
Standard Life Investments Global SICAV
Société d'Investissement à Capital Variable
Notes to the Financial Statements as at 31 December 2017 (continued)
47
9. Cash Collateral
The table below provides the cash collateral provided in relation to derivative contracts held as at 31 December 2017:
Sub-fund Counterparty Local currency Local collateral
provided Base currency Base collateral
provided
Collateral expressed as a percentage of
total net assets
Emerging Market Local Currency Debt Fund Citigroup Global Markets Limited USD (110,000) USD (110,000) 0.03%
Emerging Market Local Currency Debt Fund Goldman Sachs International Bank USD (260,000) USD (260,000) 0.06%
Emerging Market Local Currency Debt Fund HSBC Bank plc USD (297,000) USD (297,000) 0.07%
Global High Yield Bond Fund JP Morgan Securities plc USD (884,000) USD (884,000) 0.08%
Global High Yield Bond Fund Royal Bank of Canada USD (210,000) USD (210,000) 0.02%
Global Corporate Bond Fund BNP Paribas USD (180,000) USD (180,000) 0.01%
Global Corporate Bond Fund Citigroup Global Markets Limited USD (20,000) USD (20,000) 0.00%
Global Corporate Bond Fund Goldman Sachs International Bank USD (3,910,000) USD (3,910,000) 0.33%
Emerging Market Debt Unconstrained Fund Goldman Sachs International Bank USD (150,000) USD (150,000) 0.11%
Emerging Market Debt Unconstrained Fund HSBC Bank plc USD (270,000) USD (270,000) 0.20%
Global Absolute Return Strategies Fund Citigroup Global Markets Limited EUR (690,000) EUR (690,000) 0.01%
Global Absolute Return Strategies Fund Citigroup Global Markets Limited USD (4,300,000) EUR (3,615,109) 0.04%
Global Focused Strategies Fund Citigroup Global Markets Limited EUR (210,000) EUR (210,000) 0.05% Absolute Return Global Bond Strategies Fund Citigroup Global Markets Limited EUR (247,607) GBP (219,431) 0.01%
The table below and overleaf provides the cash collateral received in relation to derivative contracts held as at 31 December 2017:
Sub-fund Counterparty Local currency Local collateral
received Base currency Base collateral
received
Collateral expressed as a percentage of
total net assets
Global Inflation-Linked Bond Fund UBS AG EUR 40,000 USD 47,948 0.01%
European Corporate Bond Fund Credit Agricole Corporate & Investment Bank EUR 560,000 EUR 560,000 0.02%
Euro Government All Stocks Fund Merrill Lynch International EUR 150,000 EUR 150,000 0.01%
Emerging Market Local Currency Debt Fund Barclays Bank plc USD 150,000 USD 150,000 0.04%
Emerging Market Local Currency Debt Fund Deutsche Bank AG EUR 127,000 USD 152,233 0.04%
Emerging Market Local Currency Debt Fund JP Morgan Securities plc EUR 236,000 USD 282,891 0.07%
Global High Yield Bond Fund Citigroup Global Markets Limited USD 443,000 USD 443,000 0.04%
Global Corporate Bond Fund Citigroup Global Markets Limited EUR 157,000 USD 190,030 0.02%
Global Corporate Bond Fund Citigroup Global Markets Limited USD 680,000 USD 680,000 0.06%
Global Corporate Bond Fund JP Morgan Securities plc EUR 368,000 USD 439,281 0.04%
Total Return Credit Fund Citigroup Global Markets Limited EUR 350,397 GBP 310,526 0.37%
Total Return Credit Fund Deutsche Bank AG EUR 413,000 GBP 366,005 0.44%
Total Return Credit Fund HSBC Bank plc EUR 159,000 GBP 140,907 0.17%
Total Return Credit Fund Lloyds Bank plc EUR 125,000 GBP 110,776 0.13%
Total Return Credit Fund UBS AG EUR 964,000 GBP 854,307 1.02%
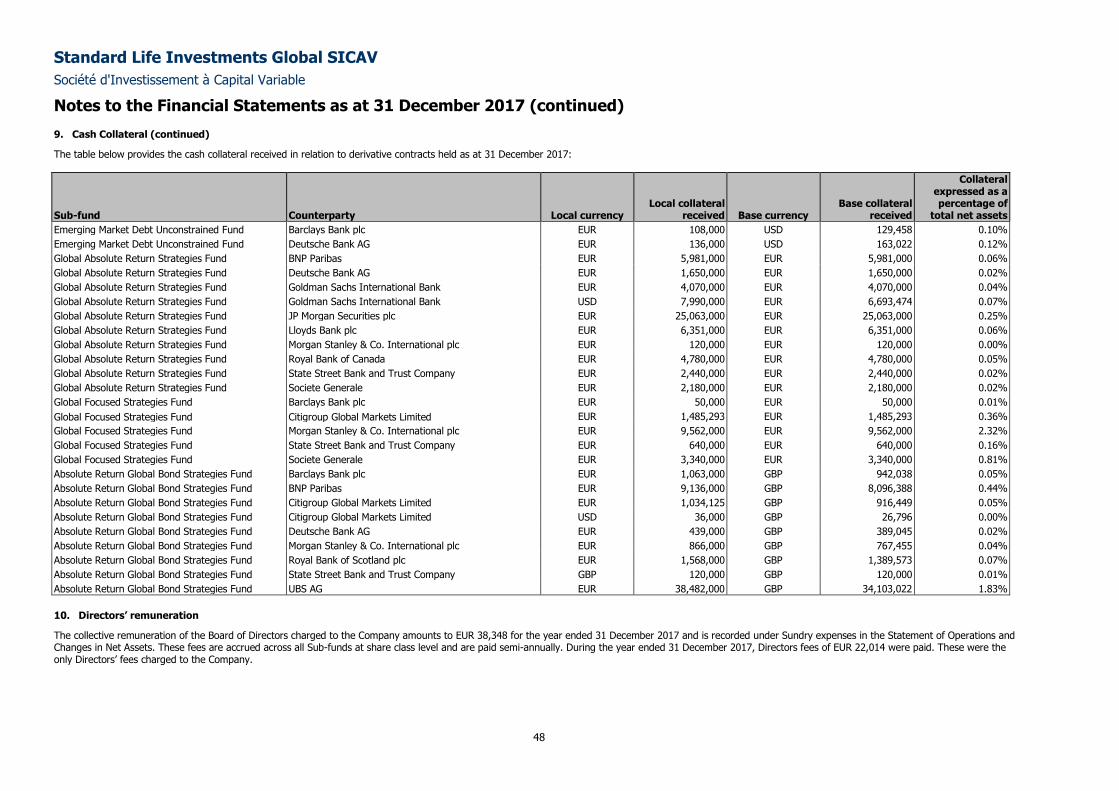
Standard Life Investments Global SICAV
Société d'Investissement à Capital Variable
Notes to the Financial Statements as at 31 December 2017 (continued)
48
9. Cash Collateral (continued)
The table below provides the cash collateral received in relation to derivative contracts held as at 31 December 2017:
Sub-fund Counterparty Local currency Local collateral
received Base currency Base collateral
received
Collateral expressed as a percentage of
total net assets
Emerging Market Debt Unconstrained Fund Barclays Bank plc EUR 108,000 USD 129,458 0.10%
Emerging Market Debt Unconstrained Fund Deutsche Bank AG EUR 136,000 USD 163,022 0.12%
Global Absolute Return Strategies Fund BNP Paribas EUR 5,981,000 EUR 5,981,000 0.06%
Global Absolute Return Strategies Fund Deutsche Bank AG EUR 1,650,000 EUR 1,650,000 0.02%
Global Absolute Return Strategies Fund Goldman Sachs International Bank EUR 4,070,000 EUR 4,070,000 0.04%
Global Absolute Return Strategies Fund Goldman Sachs International Bank USD 7,990,000 EUR 6,693,474 0.07%
Global Absolute Return Strategies Fund JP Morgan Securities plc EUR 25,063,000 EUR 25,063,000 0.25%
Global Absolute Return Strategies Fund Lloyds Bank plc EUR 6,351,000 EUR 6,351,000 0.06%
Global Absolute Return Strategies Fund Morgan Stanley & Co. International plc EUR 120,000 EUR 120,000 0.00%
Global Absolute Return Strategies Fund Royal Bank of Canada EUR 4,780,000 EUR 4,780,000 0.05%
Global Absolute Return Strategies Fund State Street Bank and Trust Company EUR 2,440,000 EUR 2,440,000 0.02%
Global Absolute Return Strategies Fund Societe Generale EUR 2,180,000 EUR 2,180,000 0.02%
Global Focused Strategies Fund Barclays Bank plc EUR 50,000 EUR 50,000 0.01%
Global Focused Strategies Fund Citigroup Global Markets Limited EUR 1,485,293 EUR 1,485,293 0.36%
Global Focused Strategies Fund Morgan Stanley & Co. International plc EUR 9,562,000 EUR 9,562,000 2.32%
Global Focused Strategies Fund State Street Bank and Trust Company EUR 640,000 EUR 640,000 0.16%
Global Focused Strategies Fund Societe Generale EUR 3,340,000 EUR 3,340,000 0.81%
Absolute Return Global Bond Strategies Fund Barclays Bank plc EUR 1,063,000 GBP 942,038 0.05%
Absolute Return Global Bond Strategies Fund BNP Paribas EUR 9,136,000 GBP 8,096,388 0.44%
Absolute Return Global Bond Strategies Fund Citigroup Global Markets Limited EUR 1,034,125 GBP 916,449 0.05%
Absolute Return Global Bond Strategies Fund Citigroup Global Markets Limited USD 36,000 GBP 26,796 0.00%
Absolute Return Global Bond Strategies Fund Deutsche Bank AG EUR 439,000 GBP 389,045 0.02%
Absolute Return Global Bond Strategies Fund Morgan Stanley & Co. International plc EUR 866,000 GBP 767,455 0.04%
Absolute Return Global Bond Strategies Fund Royal Bank of Scotland plc EUR 1,568,000 GBP 1,389,573 0.07%
Absolute Return Global Bond Strategies Fund State Street Bank and Trust Company GBP 120,000 GBP 120,000 0.01%
Absolute Return Global Bond Strategies Fund UBS AG EUR 38,482,000 GBP 34,103,022 1.83%
10. Directors’ remuneration.
The collective remuneration of the Board of Directors charged to the Company amounts to EUR 38,348 for the year ended 31 December 2017 and is recorded under Sundry expenses in the Statement of Operations and Changes in Net Assets. These fees are accrued across all Sub-funds at share class level and are paid semi-annually. During the year ended 31 December 2017, Directors fees of EUR 22,014 were paid. These were the only Directors’ fees charged to the Company.
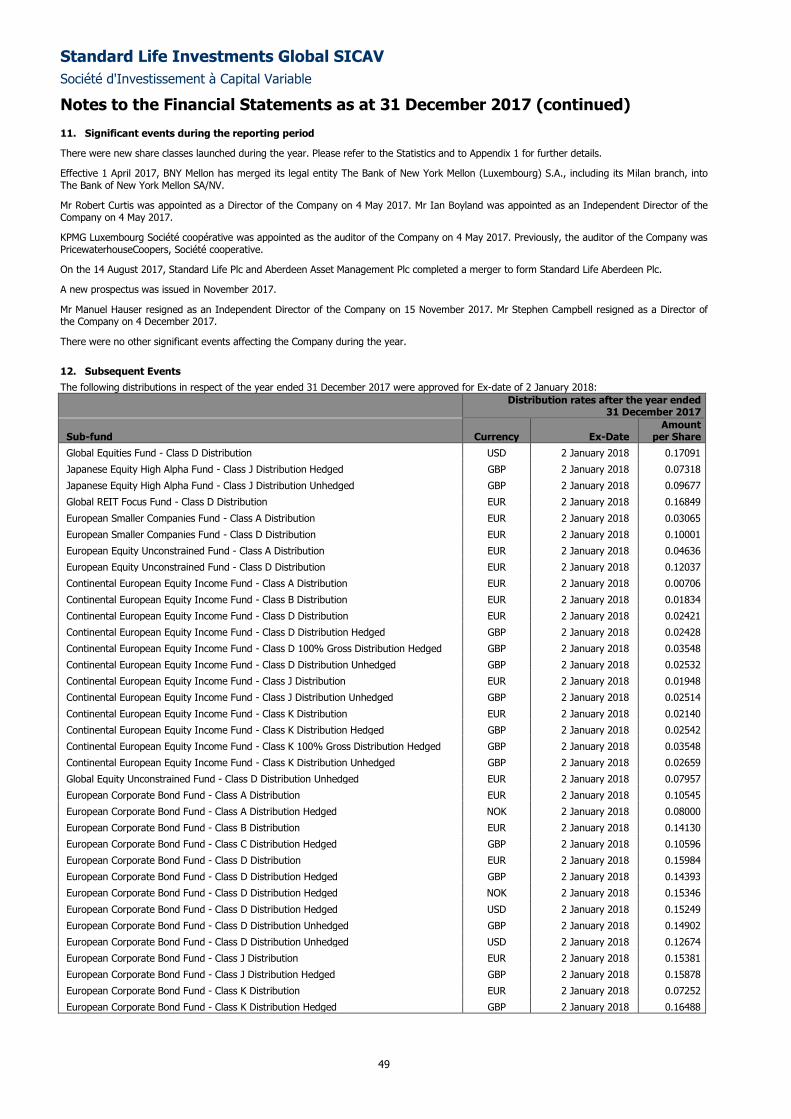
Standard Life Investments Global SICAV
Société d'Investissement à Capital Variable
Notes to the Financial Statements as at 31 December 2017 (continued)
49
11. Significant events during the reporting period
There were new share classes launched during the year. Please refer to the Statistics and to Appendix 1 for further details.
Effective 1 April 2017, BNY Mellon has merged its legal entity The Bank of New York Mellon (Luxembourg) S.A., including its Milan branch, into The Bank of New York Mellon SA/NV.
Mr Robert Curtis was appointed as a Director of the Company on 4 May 2017. Mr Ian Boyland was appointed as an Independent Director of the Company on 4 May 2017.
KPMG Luxembourg Société coopérative was appointed as the auditor of the Company on 4 May 2017. Previously, the auditor of the Company was PricewaterhouseCoopers, Société cooperative.
On the 14 August 2017, Standard Life Plc and Aberdeen Asset Management Plc completed a merger to form Standard Life Aberdeen Plc.
A new prospectus was issued in November 2017.
Mr Manuel Hauser resigned as an Independent Director of the Company on 15 November 2017. Mr Stephen Campbell resigned as a Director of the Company on 4 December 2017.
There were no other significant events affecting the Company during the year.
12. Subsequent Events
The following distributions in respect of the year ended 31 December 2017 were approved for Ex-date of 2 January 2018:
Distribution rates after the year ended 31 December 2017
Sub-fund Currency Ex-Date Amount
per Share
Global Equities Fund - Class D Distribution USD 2 January 2018 0.17091
Japanese Equity High Alpha Fund - Class J Distribution Hedged GBP 2 January 2018 0.07318 Japanese Equity High Alpha Fund - Class J Distribution Unhedged GBP 2 January 2018 0.09677 Global REIT Focus Fund - Class D Distribution EUR 2 January 2018 0.16849
European Smaller Companies Fund - Class A Distribution EUR 2 January 2018 0.03065
European Smaller Companies Fund - Class D Distribution EUR 2 January 2018 0.10001
European Equity Unconstrained Fund - Class A Distribution EUR 2 January 2018 0.04636
European Equity Unconstrained Fund - Class D Distribution EUR 2 January 2018 0.12037
Continental European Equity Income Fund - Class A Distribution EUR 2 January 2018 0.00706 Continental European Equity Income Fund - Class B Distribution EUR 2 January 2018 0.01834
Continental European Equity Income Fund - Class D Distribution EUR 2 January 2018 0.02421
Continental European Equity Income Fund - Class D Distribution Hedged GBP 2 January 2018 0.02428
Continental European Equity Income Fund - Class D 100% Gross Distribution Hedged GBP 2 January 2018 0.03548
Continental European Equity Income Fund - Class D Distribution Unhedged GBP 2 January 2018 0.02532
Continental European Equity Income Fund - Class J Distribution EUR 2 January 2018 0.01948
Continental European Equity Income Fund - Class J Distribution Unhedged GBP 2 January 2018 0.02514
Continental European Equity Income Fund - Class K Distribution EUR 2 January 2018 0.02140
Continental European Equity Income Fund - Class K Distribution Hedged GBP 2 January 2018 0.02542
Continental European Equity Income Fund - Class K 100% Gross Distribution Hedged GBP 2 January 2018 0.03548
Continental European Equity Income Fund - Class K Distribution Unhedged GBP 2 January 2018 0.02659
Global Equity Unconstrained Fund - Class D Distribution Unhedged EUR 2 January 2018 0.07957
European Corporate Bond Fund - Class A Distribution EUR 2 January 2018 0.10545 European Corporate Bond Fund - Class A Distribution Hedged NOK 2 January 2018 0.08000 European Corporate Bond Fund - Class B Distribution EUR 2 January 2018 0.14130 European Corporate Bond Fund - Class C Distribution Hedged GBP 2 January 2018 0.10596 European Corporate Bond Fund - Class D Distribution EUR 2 January 2018 0.15984 European Corporate Bond Fund - Class D Distribution Hedged GBP 2 January 2018 0.14393
European Corporate Bond Fund - Class D Distribution Hedged NOK 2 January 2018 0.15346
European Corporate Bond Fund - Class D Distribution Hedged USD 2 January 2018 0.15249
European Corporate Bond Fund - Class D Distribution Unhedged GBP 2 January 2018 0.14902
European Corporate Bond Fund - Class D Distribution Unhedged USD 2 January 2018 0.12674
European Corporate Bond Fund - Class J Distribution EUR 2 January 2018 0.15381
European Corporate Bond Fund - Class J Distribution Hedged GBP 2 January 2018 0.15878
European Corporate Bond Fund - Class K Distribution EUR 2 January 2018 0.07252
European Corporate Bond Fund - Class K Distribution Hedged GBP 2 January 2018 0.16488
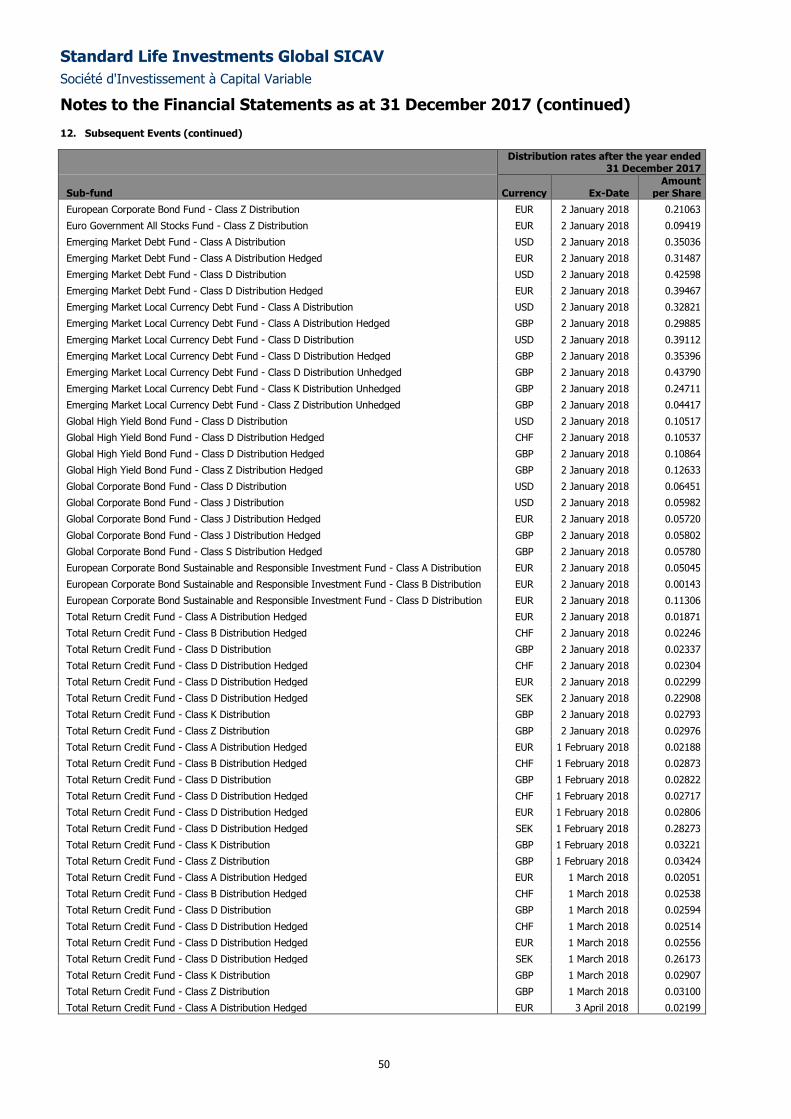
Standard Life Investments Global SICAV
Société d'Investissement à Capital Variable
Notes to the Financial Statements as at 31 December 2017 (continued)
50
12. Subsequent Events (continued)
Distribution rates after the year ended 31 December 2017
Sub-fund Currency Ex-Date Amount
per Share
European Corporate Bond Fund - Class Z Distribution EUR 2 January 2018 0.21063
Euro Government All Stocks Fund - Class Z Distribution EUR 2 January 2018 0.09419
Emerging Market Debt Fund - Class A Distribution USD 2 January 2018 0.35036
Emerging Market Debt Fund - Class A Distribution Hedged EUR 2 January 2018 0.31487
Emerging Market Debt Fund - Class D Distribution USD 2 January 2018 0.42598
Emerging Market Debt Fund - Class D Distribution Hedged EUR 2 January 2018 0.39467
Emerging Market Local Currency Debt Fund - Class A Distribution USD 2 January 2018 0.32821
Emerging Market Local Currency Debt Fund - Class A Distribution Hedged GBP 2 January 2018 0.29885
Emerging Market Local Currency Debt Fund - Class D Distribution USD 2 January 2018 0.39112
Emerging Market Local Currency Debt Fund - Class D Distribution Hedged GBP 2 January 2018 0.35396
Emerging Market Local Currency Debt Fund - Class D Distribution Unhedged GBP 2 January 2018 0.43790
Emerging Market Local Currency Debt Fund - Class K Distribution Unhedged GBP 2 January 2018 0.24711
Emerging Market Local Currency Debt Fund - Class Z Distribution Unhedged GBP 2 January 2018 0.04417
Global High Yield Bond Fund - Class D Distribution USD 2 January 2018 0.10517
Global High Yield Bond Fund - Class D Distribution Hedged CHF 2 January 2018 0.10537
Global High Yield Bond Fund - Class D Distribution Hedged GBP 2 January 2018 0.10864
Global High Yield Bond Fund - Class Z Distribution Hedged GBP 2 January 2018 0.12633
Global Corporate Bond Fund - Class D Distribution USD 2 January 2018 0.06451
Global Corporate Bond Fund - Class J Distribution USD 2 January 2018 0.05982
Global Corporate Bond Fund - Class J Distribution Hedged EUR 2 January 2018 0.05720
Global Corporate Bond Fund - Class J Distribution Hedged GBP 2 January 2018 0.05802
Global Corporate Bond Fund - Class S Distribution Hedged GBP 2 January 2018 0.05780
European Corporate Bond Sustainable and Responsible Investment Fund - Class A Distribution EUR 2 January 2018 0.05045
European Corporate Bond Sustainable and Responsible Investment Fund - Class B Distribution EUR 2 January 2018 0.00143
European Corporate Bond Sustainable and Responsible Investment Fund - Class D Distribution EUR 2 January 2018 0.11306
Total Return Credit Fund - Class A Distribution Hedged EUR 2 January 2018 0.01871
Total Return Credit Fund - Class B Distribution Hedged CHF 2 January 2018 0.02246
Total Return Credit Fund - Class D Distribution GBP 2 January 2018 0.02337
Total Return Credit Fund - Class D Distribution Hedged CHF 2 January 2018 0.02304
Total Return Credit Fund - Class D Distribution Hedged EUR 2 January 2018 0.02299
Total Return Credit Fund - Class D Distribution Hedged SEK 2 January 2018 0.22908
Total Return Credit Fund - Class K Distribution GBP 2 January 2018 0.02793
Total Return Credit Fund - Class Z Distribution GBP 2 January 2018 0.02976
Total Return Credit Fund - Class A Distribution Hedged EUR 1 February 2018 0.02188
Total Return Credit Fund - Class B Distribution Hedged CHF 1 February 2018 0.02873
Total Return Credit Fund - Class D Distribution GBP 1 February 2018 0.02822
Total Return Credit Fund - Class D Distribution Hedged CHF 1 February 2018 0.02717
Total Return Credit Fund - Class D Distribution Hedged EUR 1 February 2018 0.02806
Total Return Credit Fund - Class D Distribution Hedged SEK 1 February 2018 0.28273
Total Return Credit Fund - Class K Distribution GBP 1 February 2018 0.03221
Total Return Credit Fund - Class Z Distribution GBP 1 February 2018 0.03424
Total Return Credit Fund - Class A Distribution Hedged EUR 1 March 2018 0.02051
Total Return Credit Fund - Class B Distribution Hedged CHF 1 March 2018 0.02538
Total Return Credit Fund - Class D Distribution GBP 1 March 2018 0.02594
Total Return Credit Fund - Class D Distribution Hedged CHF 1 March 2018 0.02514
Total Return Credit Fund - Class D Distribution Hedged EUR 1 March 2018 0.02556
Total Return Credit Fund - Class D Distribution Hedged SEK 1 March 2018 0.26173
Total Return Credit Fund - Class K Distribution GBP 1 March 2018 0.02907
Total Return Credit Fund - Class Z Distribution GBP 1 March 2018 0.03100
Total Return Credit Fund - Class A Distribution Hedged EUR 3 April 2018 0.02199
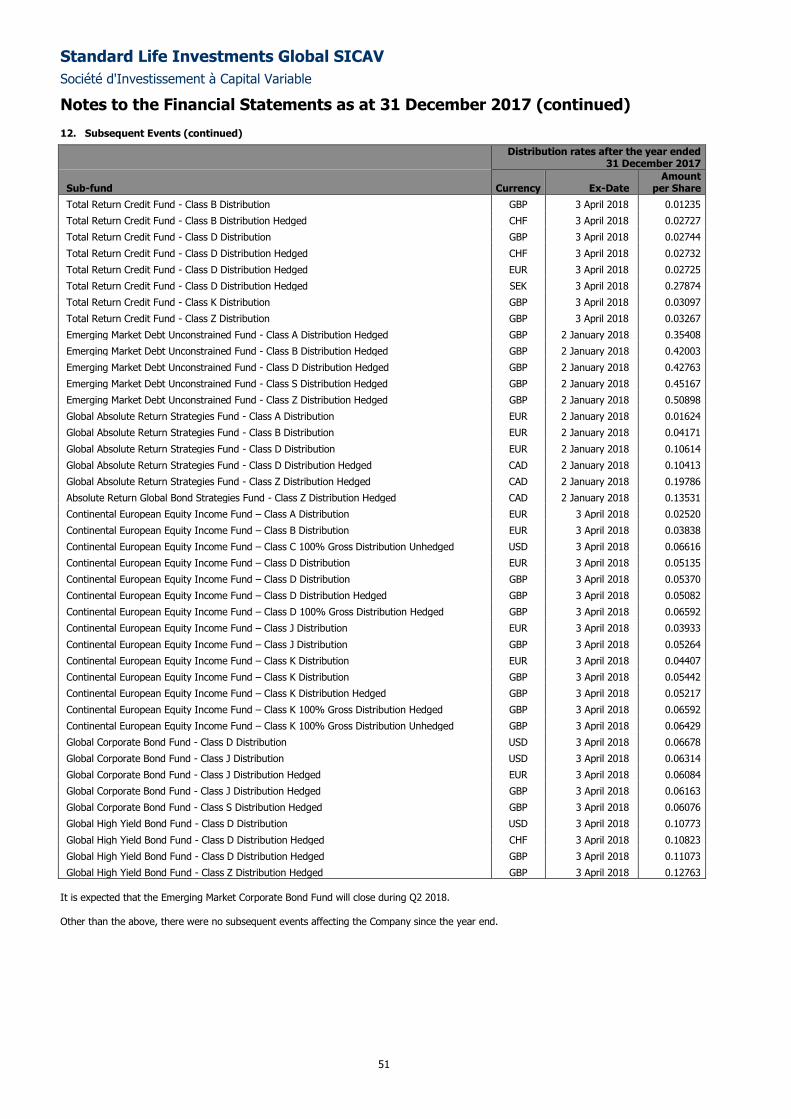
Standard Life Investments Global SICAV
Société d'Investissement à Capital Variable
Notes to the Financial Statements as at 31 December 2017 (continued)
51
12. Subsequent Events (continued)
Distribution rates after the year ended 31 December 2017
Sub-fund Currency Ex-Date Amount
per Share
Total Return Credit Fund - Class B Distribution GBP 3 April 2018 0.01235
Total Return Credit Fund - Class B Distribution Hedged CHF 3 April 2018 0.02727
Total Return Credit Fund - Class D Distribution GBP 3 April 2018 0.02744
Total Return Credit Fund - Class D Distribution Hedged CHF 3 April 2018 0.02732
Total Return Credit Fund - Class D Distribution Hedged EUR 3 April 2018 0.02725
Total Return Credit Fund - Class D Distribution Hedged SEK 3 April 2018 0.27874
Total Return Credit Fund - Class K Distribution GBP 3 April 2018 0.03097
Total Return Credit Fund - Class Z Distribution GBP 3 April 2018 0.03267
Emerging Market Debt Unconstrained Fund - Class A Distribution Hedged GBP 2 January 2018 0.35408
Emerging Market Debt Unconstrained Fund - Class B Distribution Hedged GBP 2 January 2018 0.42003
Emerging Market Debt Unconstrained Fund - Class D Distribution Hedged GBP 2 January 2018 0.42763
Emerging Market Debt Unconstrained Fund - Class S Distribution Hedged GBP 2 January 2018 0.45167
Emerging Market Debt Unconstrained Fund - Class Z Distribution Hedged GBP 2 January 2018 0.50898
Global Absolute Return Strategies Fund - Class A Distribution EUR 2 January 2018 0.01624
Global Absolute Return Strategies Fund - Class B Distribution EUR 2 January 2018 0.04171
Global Absolute Return Strategies Fund - Class D Distribution EUR 2 January 2018 0.10614
Global Absolute Return Strategies Fund - Class D Distribution Hedged CAD 2 January 2018 0.10413
Global Absolute Return Strategies Fund - Class Z Distribution Hedged CAD 2 January 2018 0.19786
Absolute Return Global Bond Strategies Fund - Class Z Distribution Hedged CAD 2 January 2018 0.13531
Continental European Equity Income Fund – Class A Distribution EUR 3 April 2018 0.02520
Continental European Equity Income Fund – Class B Distribution EUR 3 April 2018 0.03838
Continental European Equity Income Fund – Class C 100% Gross Distribution Unhedged USD 3 April 2018 0.06616
Continental European Equity Income Fund – Class D Distribution EUR 3 April 2018 0.05135
Continental European Equity Income Fund – Class D Distribution GBP 3 April 2018 0.05370
Continental European Equity Income Fund – Class D Distribution Hedged GBP 3 April 2018 0.05082
Continental European Equity Income Fund – Class D 100% Gross Distribution Hedged GBP 3 April 2018 0.06592
Continental European Equity Income Fund – Class J Distribution EUR 3 April 2018 0.03933
Continental European Equity Income Fund – Class J Distribution GBP 3 April 2018 0.05264
Continental European Equity Income Fund – Class K Distribution EUR 3 April 2018 0.04407
Continental European Equity Income Fund – Class K Distribution GBP 3 April 2018 0.05442
Continental European Equity Income Fund – Class K Distribution Hedged GBP 3 April 2018 0.05217
Continental European Equity Income Fund – Class K 100% Gross Distribution Hedged GBP 3 April 2018 0.06592
Continental European Equity Income Fund – Class K 100% Gross Distribution Unhedged GBP 3 April 2018 0.06429
Global Corporate Bond Fund - Class D Distribution USD 3 April 2018 0.06678
Global Corporate Bond Fund - Class J Distribution USD 3 April 2018 0.06314
Global Corporate Bond Fund - Class J Distribution Hedged EUR 3 April 2018 0.06084
Global Corporate Bond Fund - Class J Distribution Hedged GBP 3 April 2018 0.06163 Global Corporate Bond Fund - Class S Distribution Hedged GBP 3 April 2018 0.06076 Global High Yield Bond Fund - Class D Distribution USD 3 April 2018 0.10773 Global High Yield Bond Fund - Class D Distribution Hedged CHF 3 April 2018 0.10823 Global High Yield Bond Fund - Class D Distribution Hedged GBP 3 April 2018 0.11073 Global High Yield Bond Fund - Class Z Distribution Hedged GBP 3 April 2018 0.12763
It is expected that the Emerging Market Corporate Bond Fund will close during Q2 2018. Other than the above, there were no subsequent events affecting the Company since the year end.
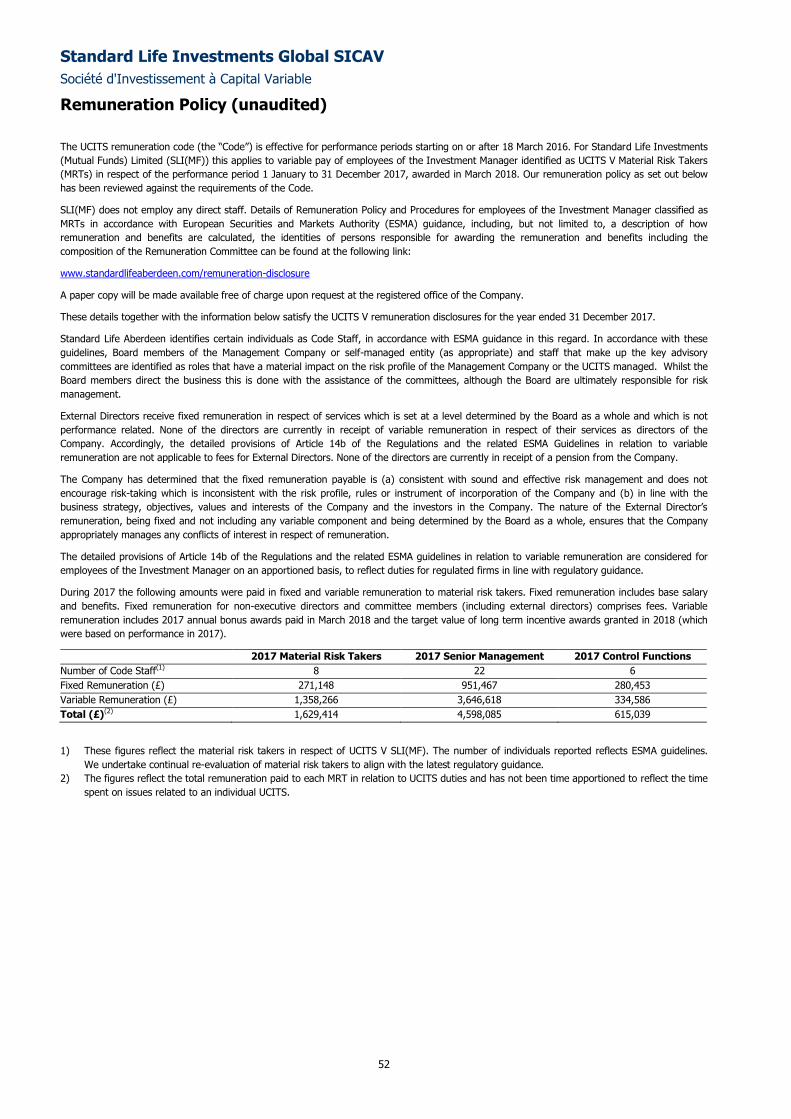
Standard Life Investments Global SICAV
Société d'Investissement à Capital Variable
Remuneration Policy (unaudited)
52
The UCITS remuneration code (the “Code”) is effective for performance periods starting on or after 18 March 2016. For Standard Life Investments
(Mutual Funds) Limited (SLI(MF)) this applies to variable pay of employees of the Investment Manager identified as UCITS V Material Risk Takers
(MRTs) in respect of the performance period 1 January to 31 December 2017, awarded in March 2018. Our remuneration policy as set out below
has been reviewed against the requirements of the Code.
SLI(MF) does not employ any direct staff. Details of Remuneration Policy and Procedures for employees of the Investment Manager classified as
MRTs in accordance with European Securities and Markets Authority (ESMA) guidance, including, but not limited to, a description of how
remuneration and benefits are calculated, the identities of persons responsible for awarding the remuneration and benefits including the
composition of the Remuneration Committee can be found at the following link:
www.standardlifeaberdeen.com/remuneration-disclosure
A paper copy will be made available free of charge upon request at the registered office of the Company.
These details together with the information below satisfy the UCITS V remuneration disclosures for the year ended 31 December 2017.
Standard Life Aberdeen identifies certain individuals as Code Staff, in accordance with ESMA guidance in this regard. In accordance with these
guidelines, Board members of the Management Company or self-managed entity (as appropriate) and staff that make up the key advisory
committees are identified as roles that have a material impact on the risk profile of the Management Company or the UCITS managed. Whilst the
Board members direct the business this is done with the assistance of the committees, although the Board are ultimately responsible for risk
management.
External Directors receive fixed remuneration in respect of services which is set at a level determined by the Board as a whole and which is not
performance related. None of the directors are currently in receipt of variable remuneration in respect of their services as directors of the
Company. Accordingly, the detailed provisions of Article 14b of the Regulations and the related ESMA Guidelines in relation to variable
remuneration are not applicable to fees for External Directors. None of the directors are currently in receipt of a pension from the Company.
The Company has determined that the fixed remuneration payable is (a) consistent with sound and effective risk management and does not
encourage risk-taking which is inconsistent with the risk profile, rules or instrument of incorporation of the Company and (b) in line with the
business strategy, objectives, values and interests of the Company and the investors in the Company. The nature of the External Director’s
remuneration, being fixed and not including any variable component and being determined by the Board as a whole, ensures that the Company
appropriately manages any conflicts of interest in respect of remuneration.
The detailed provisions of Article 14b of the Regulations and the related ESMA guidelines in relation to variable remuneration are considered for
employees of the Investment Manager on an apportioned basis, to reflect duties for regulated firms in line with regulatory guidance.
During 2017 the following amounts were paid in fixed and variable remuneration to material risk takers. Fixed remuneration includes base salary
and benefits. Fixed remuneration for non-executive directors and committee members (including external directors) comprises fees. Variable
remuneration includes 2017 annual bonus awards paid in March 2018 and the target value of long term incentive awards granted in 2018 (which
were based on performance in 2017).
2017 Material Risk Takers 2017 Senior Management 2017 Control Functions
Number of Code Staff(1) 8 22 6
Fixed Remuneration (£) 271,148 951,467 280,453
Variable Remuneration (£) 1,358,266 3,646,618 334,586
Total (£)(2) 1,629,414 4,598,085 615,039
1) These figures reflect the material risk takers in respect of UCITS V SLI(MF). The number of individuals reported reflects ESMA guidelines.
We undertake continual re-evaluation of material risk takers to align with the latest regulatory guidance.
2) The figures reflect the total remuneration paid to each MRT in relation to UCITS duties and has not been time apportioned to reflect the time
spent on issues related to an individual UCITS.
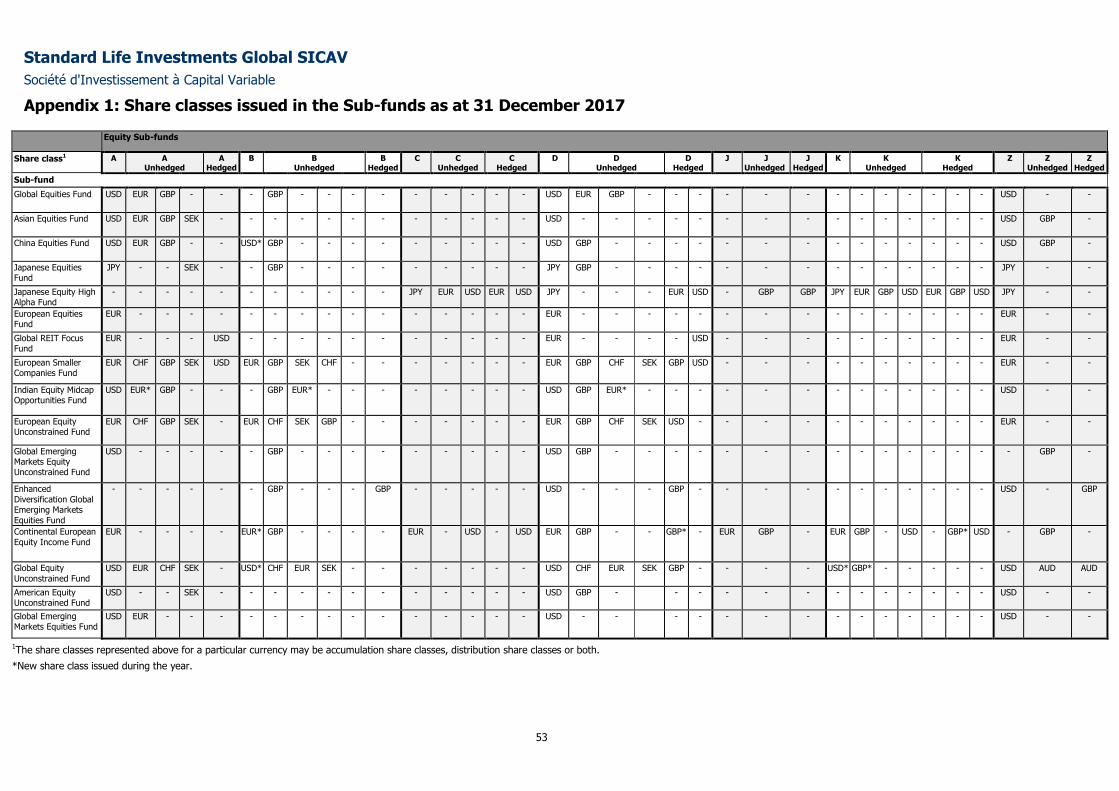
Standard Life Investments Global SICAV
Société d'Investissement à Capital Variable
Appendix 1: Share classes issued in the Sub-funds as at 31 December 2017
53
Equity Sub-funds
Share class1 A A Unhedged
A Hedged
B B Unhedged
B Hedged
C C Unhedged
C Hedged
D D Unhedged
D Hedged
J J Unhedged
J Hedged
K K Unhedged
K Hedged
Z Z Unhedged
Z Hedged
Sub-fund
Global Equities Fund USD EUR GBP - - - GBP - - - - - - - - - USD EUR GBP - - - - - - - - - - - - - USD - -
Asian Equities Fund USD EUR GBP SEK - - - - - - - - - - - - USD - - - - - - - - - - - - - - - USD GBP -
China Equities Fund USD EUR GBP - - USD* GBP - - - - - - - - - USD GBP - - - - - - - - - - - - - - USD GBP -
Japanese Equities Fund
JPY - - SEK - - GBP - - - - - - - - - JPY GBP - - - - - - - - - - - - - - JPY - -
Japanese Equity High Alpha Fund
- - - - - - - - - - - JPY EUR USD EUR USD JPY - - - EUR USD - GBP GBP JPY EUR GBP USD EUR GBP USD JPY - -
European Equities Fund
EUR - - - - - - - - - - - - - - - EUR - - - - - - - - - - - - - - - EUR - -
Global REIT Focus Fund
EUR - - - USD - - - - - - - - - - - EUR - - - - USD - - - - - - - - - - EUR - -
European Smaller Companies Fund
EUR CHF GBP SEK USD EUR GBP SEK CHF - - - - - - - EUR GBP CHF SEK GBP USD - - - - - - - - - - EUR - -
Indian Equity Midcap Opportunities Fund
USD EUR* GBP - - - GBP EUR* - - - - - - - - USD GBP EUR* - - - - - - - - - - - - - USD - -
European Equity Unconstrained Fund
EUR CHF GBP SEK - EUR CHF SEK GBP - - - - - - - EUR GBP CHF SEK USD - - - - - - - - - - - EUR - -
Global Emerging Markets Equity Unconstrained Fund
USD - - - - - GBP - - - - - - - - - USD GBP - - - - - - - - - - - - - - - GBP -
Enhanced
Diversification Global Emerging Markets
Equities Fund
- - - - - - GBP - - - GBP - - - - - USD - - - GBP - - - - - - - - - - - USD - GBP
Continental European
Equity Income Fund
EUR - - - - EUR* GBP - - - - EUR - USD - USD EUR GBP - - GBP* - EUR GBP - EUR GBP - USD - GBP* USD - GBP -
Global Equity
Unconstrained Fund
USD EUR CHF SEK - USD* CHF EUR SEK - - - - - - - USD CHF EUR SEK GBP - - - - USD* GBP* - - - - - USD AUD AUD
American Equity Unconstrained Fund
USD - - SEK - - - - - - - - - - - - USD GBP - - - - - - - - - - - - - USD - -
Global Emerging Markets Equities Fund
USD EUR - - - - - - - - - - - - - - USD - - - - - - - - - - - - - - USD - -
1The share classes represented above for a particular currency may be accumulation share classes, distribution share classes or both.
*New share class issued during the year.
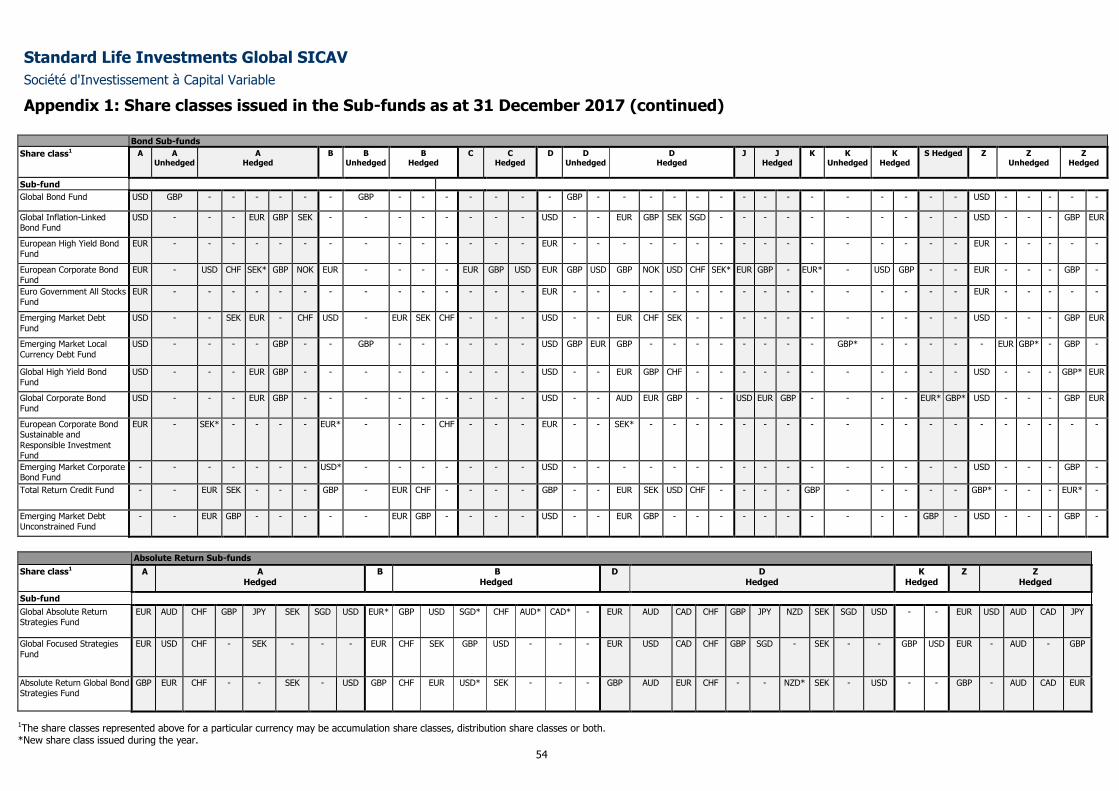
Standard Life Investments Global SICAV
Société d'Investissement à Capital Variable
Appendix 1: Share classes issued in the Sub-funds as at 31 December 2017 (continued)
54
Bond Sub-funds
Share class1 A A Unhedged
A Hedged
B B Unhedged
B Hedged
C C Hedged
D D Unhedged
D Hedged
J J Hedged
K K Unhedged
K Hedged
S Hedged Z Z Unhedged
Z Hedged
Sub-fund
Global Bond Fund USD GBP - - - - - - GBP - - - - - - - GBP - - - - - - - - - - - - - - - USD - - - - -
Global Inflation-Linked Bond Fund
USD - - - EUR GBP SEK - - - - - - - - USD - - EUR GBP SEK SGD - - - - - - - - - - USD - - - GBP EUR
European High Yield Bond Fund
EUR - - - - - - - - - - - - - - EUR - - - - - - - - - - - - - - - - EUR - - - - -
European Corporate Bond Fund
EUR - USD CHF SEK* GBP NOK EUR - - - - EUR GBP USD EUR GBP USD GBP NOK USD CHF SEK* EUR GBP - EUR* - USD GBP - - EUR - - - GBP -
Euro Government All Stocks Fund
EUR - - - - - - - - - - - - - - EUR - - - - - - - - - - - - - - - - EUR - - - - -
Emerging Market Debt
Fund
USD - - SEK EUR - CHF USD - EUR SEK CHF - - - USD - - EUR CHF SEK - - - - - - - - - - - USD - - - GBP EUR
Emerging Market Local
Currency Debt Fund
USD - - - - GBP - - GBP - - - - - - USD GBP EUR GBP - - - - - - - - GBP* - - - - - EUR GBP* - GBP -
Global High Yield Bond Fund
USD - - - EUR GBP - - - - - - - - - USD - - EUR GBP CHF - - - - - - - - - - - USD - - - GBP* EUR
Global Corporate Bond Fund
USD - - - EUR GBP - - - - - - - - - USD - - AUD EUR GBP - - USD EUR GBP - - - - EUR* GBP* USD - - - GBP EUR
European Corporate Bond Sustainable and
Responsible Investment Fund
EUR - SEK* - - - - EUR* - - - CHF - - - EUR - - SEK* - - - - - - - - - - - - - - - - - - -
Emerging Market Corporate Bond Fund
- - - - - - - USD* - - - - - - - USD - - - - - - - - - - - - - - - - USD - - - GBP -
Total Return Credit Fund - - EUR SEK - - - GBP - EUR CHF - - - - GBP - - EUR SEK USD CHF - - - - GBP - - - - - GBP* - - - EUR* -
Emerging Market Debt Unconstrained Fund
- - EUR GBP - - - - - EUR GBP - - - - USD - - EUR GBP - - - - - - - - - - GBP - USD - - - GBP -
Absolute Return Sub-funds
Share class1 A A
Hedged B B
Hedged
D D
Hedged K
Hedged
Z Z
Hedged
Sub-fund
Global Absolute Return Strategies Fund
EUR AUD CHF GBP JPY SEK SGD USD EUR* GBP USD SGD* CHF AUD* CAD* - EUR AUD CAD CHF GBP JPY NZD SEK SGD USD - - EUR USD AUD CAD JPY
Global Focused Strategies
Fund
EUR USD CHF - SEK - - - EUR CHF SEK GBP USD - - - EUR USD CAD CHF GBP SGD - SEK - - GBP USD EUR - AUD - GBP
Absolute Return Global Bond Strategies Fund
GBP EUR CHF - - SEK - USD GBP CHF EUR USD* SEK - - - GBP AUD EUR CHF - - NZD* SEK - USD - - GBP - AUD CAD EUR
1The share classes represented above for a particular currency may be accumulation share classes, distribution share classes or both. *New share class issued during the year.
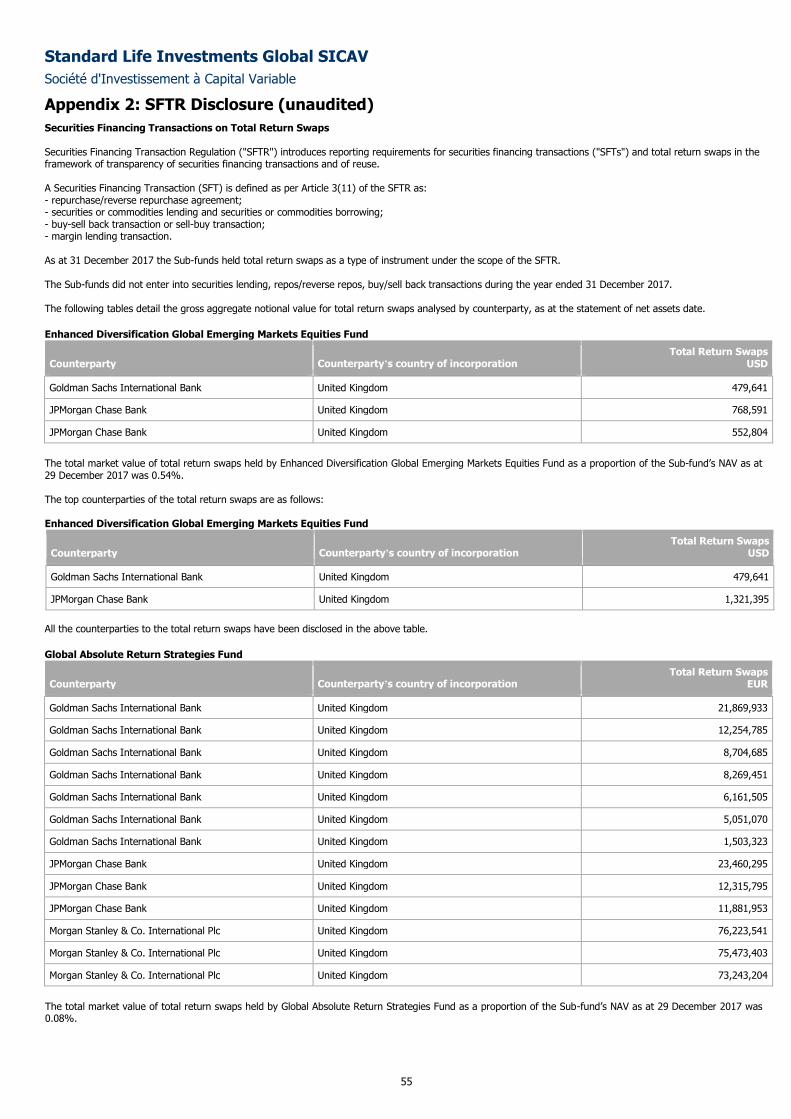
Standard Life Investments Global SICAV
Société d'Investissement à Capital Variable
Appendix 2: SFTR Disclosure (unaudited)
55
Securities Financing Transactions on Total Return Swaps
Securities Financing Transaction Regulation ("SFTR") introduces reporting requirements for securities financing transactions ("SFTs") and total return swaps in the framework of transparency of securities financing transactions and of reuse. A Securities Financing Transaction (SFT) is defined as per Article 3(11) of the SFTR as: - repurchase/reverse repurchase agreement; - securities or commodities lending and securities or commodities borrowing; - buy-sell back transaction or sell-buy transaction; - margin lending transaction. As at 31 December 2017 the Sub-funds held total return swaps as a type of instrument under the scope of the SFTR. The Sub-funds did not enter into securities lending, repos/reverse repos, buy/sell back transactions during the year ended 31 December 2017. The following tables detail the gross aggregate notional value for total return swaps analysed by counterparty, as at the statement of net assets date.
Enhanced Diversification Global Emerging Markets Equities Fund
Counterparty Counterparty’s country of incorporation Total Return Swaps
USD
Goldman Sachs International Bank United Kingdom 479,641
JPMorgan Chase Bank United Kingdom 768,591
JPMorgan Chase Bank United Kingdom 552,804
The total market value of total return swaps held by Enhanced Diversification Global Emerging Markets Equities Fund as a proportion of the Sub-fund’s NAV as at 29 December 2017 was 0.54%. The top counterparties of the total return swaps are as follows: Enhanced Diversification Global Emerging Markets Equities Fund
Counterparty Counterparty’s country of incorporation Total Return Swaps
USD
Goldman Sachs International Bank United Kingdom 479,641
JPMorgan Chase Bank United Kingdom 1,321,395
All the counterparties to the total return swaps have been disclosed in the above table.
Global Absolute Return Strategies Fund
Counterparty Counterparty’s country of incorporation Total Return Swaps
EUR
Goldman Sachs International Bank United Kingdom 21,869,933
Goldman Sachs International Bank United Kingdom 12,254,785
Goldman Sachs International Bank United Kingdom 8,704,685
Goldman Sachs International Bank United Kingdom 8,269,451
Goldman Sachs International Bank United Kingdom 6,161,505
Goldman Sachs International Bank United Kingdom 5,051,070
Goldman Sachs International Bank United Kingdom 1,503,323
JPMorgan Chase Bank United Kingdom 23,460,295
JPMorgan Chase Bank United Kingdom 12,315,795
JPMorgan Chase Bank United Kingdom 11,881,953
Morgan Stanley & Co. International Plc United Kingdom 76,223,541
Morgan Stanley & Co. International Plc United Kingdom 75,473,403
Morgan Stanley & Co. International Plc United Kingdom 73,243,204
The total market value of total return swaps held by Global Absolute Return Strategies Fund as a proportion of the Sub-fund’s NAV as at 29 December 2017 was 0.08%.
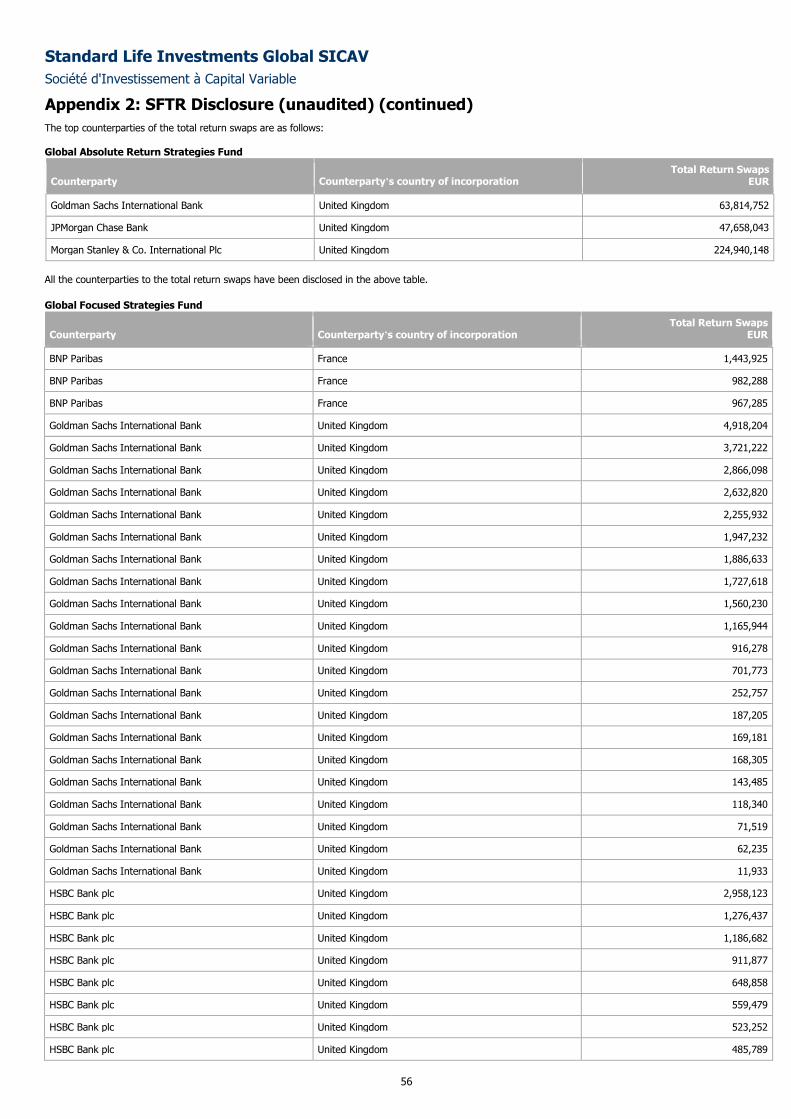
Standard Life Investments Global SICAV
Société d'Investissement à Capital Variable
Appendix 2: SFTR Disclosure (unaudited) (continued)
56
The top counterparties of the total return swaps are as follows: Global Absolute Return Strategies Fund
Counterparty Counterparty’s country of incorporation Total Return Swaps
EUR
Goldman Sachs International Bank United Kingdom 63,814,752
JPMorgan Chase Bank United Kingdom 47,658,043
Morgan Stanley & Co. International Plc United Kingdom 224,940,148
All the counterparties to the total return swaps have been disclosed in the above table.
Global Focused Strategies Fund
Counterparty Counterparty’s country of incorporation Total Return Swaps
EUR
BNP Paribas France 1,443,925
BNP Paribas France 982,288
BNP Paribas France 967,285
Goldman Sachs International Bank United Kingdom 4,918,204
Goldman Sachs International Bank United Kingdom 3,721,222
Goldman Sachs International Bank United Kingdom 2,866,098
Goldman Sachs International Bank United Kingdom 2,632,820
Goldman Sachs International Bank United Kingdom 2,255,932
Goldman Sachs International Bank United Kingdom 1,947,232
Goldman Sachs International Bank United Kingdom 1,886,633
Goldman Sachs International Bank United Kingdom 1,727,618
Goldman Sachs International Bank United Kingdom 1,560,230
Goldman Sachs International Bank United Kingdom 1,165,944
Goldman Sachs International Bank United Kingdom 916,278
Goldman Sachs International Bank United Kingdom 701,773
Goldman Sachs International Bank United Kingdom 252,757
Goldman Sachs International Bank United Kingdom 187,205
Goldman Sachs International Bank United Kingdom 169,181
Goldman Sachs International Bank United Kingdom 168,305
Goldman Sachs International Bank United Kingdom 143,485
Goldman Sachs International Bank United Kingdom 118,340
Goldman Sachs International Bank United Kingdom 71,519
Goldman Sachs International Bank United Kingdom 62,235
Goldman Sachs International Bank United Kingdom 11,933
HSBC Bank plc United Kingdom 2,958,123
HSBC Bank plc United Kingdom 1,276,437
HSBC Bank plc United Kingdom 1,186,682
HSBC Bank plc United Kingdom 911,877
HSBC Bank plc United Kingdom 648,858
HSBC Bank plc United Kingdom 559,479
HSBC Bank plc United Kingdom 523,252
HSBC Bank plc United Kingdom 485,789
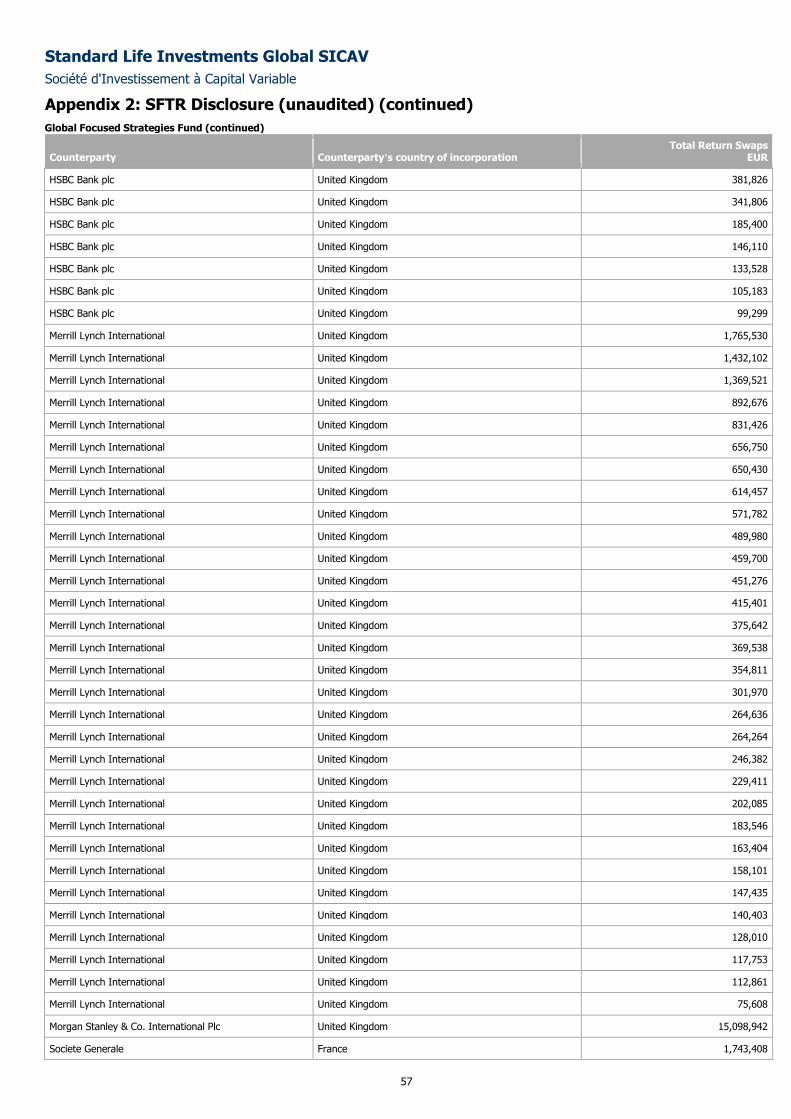
Standard Life Investments Global SICAV
Société d'Investissement à Capital Variable
Appendix 2: SFTR Disclosure (unaudited) (continued)
57
Global Focused Strategies Fund (continued)
Counterparty Counterparty’s country of incorporation Total Return Swaps
EUR
HSBC Bank plc United Kingdom 381,826
HSBC Bank plc United Kingdom 341,806
HSBC Bank plc United Kingdom 185,400
HSBC Bank plc United Kingdom 146,110
HSBC Bank plc United Kingdom 133,528
HSBC Bank plc United Kingdom 105,183
HSBC Bank plc United Kingdom 99,299
Merrill Lynch International United Kingdom 1,765,530
Merrill Lynch International United Kingdom 1,432,102
Merrill Lynch International United Kingdom 1,369,521
Merrill Lynch International United Kingdom 892,676
Merrill Lynch International United Kingdom 831,426
Merrill Lynch International United Kingdom 656,750
Merrill Lynch International United Kingdom 650,430
Merrill Lynch International United Kingdom 614,457
Merrill Lynch International United Kingdom 571,782
Merrill Lynch International United Kingdom 489,980
Merrill Lynch International United Kingdom 459,700
Merrill Lynch International United Kingdom 451,276
Merrill Lynch International United Kingdom 415,401
Merrill Lynch International United Kingdom 375,642
Merrill Lynch International United Kingdom 369,538
Merrill Lynch International United Kingdom 354,811
Merrill Lynch International United Kingdom 301,970
Merrill Lynch International United Kingdom 264,636
Merrill Lynch International United Kingdom 264,264
Merrill Lynch International United Kingdom 246,382
Merrill Lynch International United Kingdom 229,411
Merrill Lynch International United Kingdom 202,085
Merrill Lynch International United Kingdom 183,546
Merrill Lynch International United Kingdom 163,404
Merrill Lynch International United Kingdom 158,101
Merrill Lynch International United Kingdom 147,435
Merrill Lynch International United Kingdom 140,403
Merrill Lynch International United Kingdom 128,010
Merrill Lynch International United Kingdom 117,753
Merrill Lynch International United Kingdom 112,861
Merrill Lynch International United Kingdom 75,608
Morgan Stanley & Co. International Plc United Kingdom 15,098,942
Societe Generale France 1,743,408
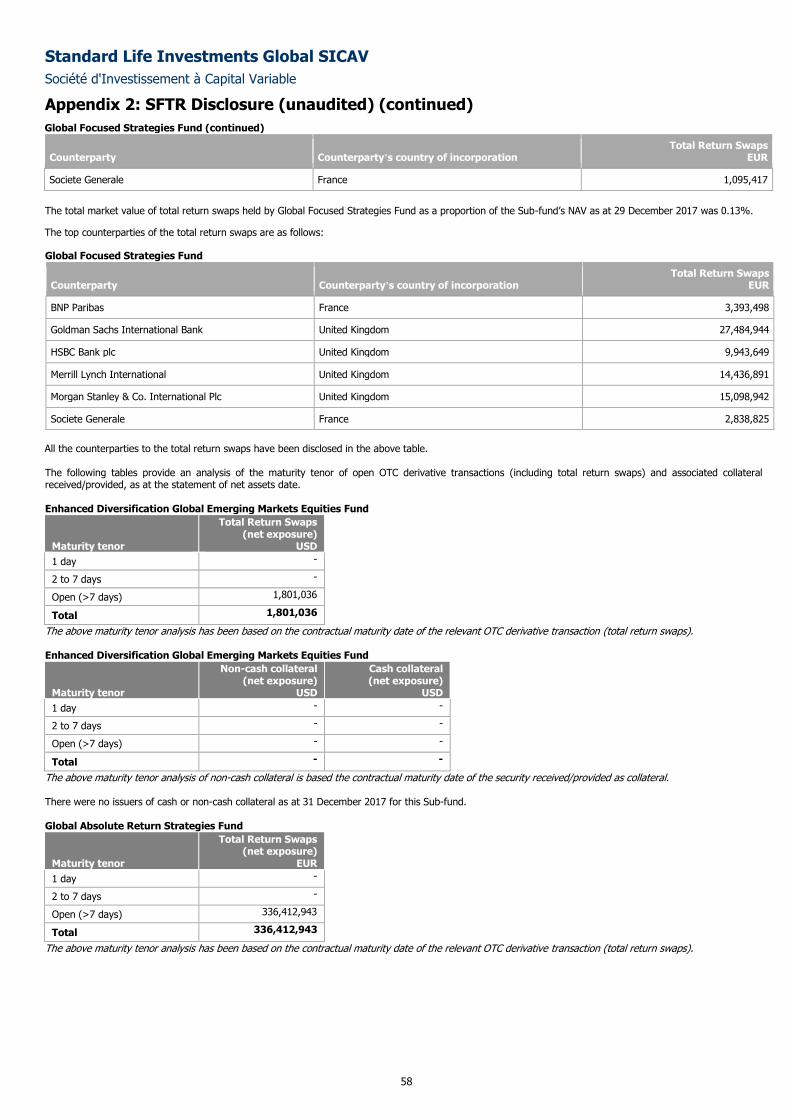
Standard Life Investments Global SICAV
Société d'Investissement à Capital Variable
Appendix 2: SFTR Disclosure (unaudited) (continued)
58
Global Focused Strategies Fund (continued)
Counterparty Counterparty’s country of incorporation Total Return Swaps
EUR
Societe Generale France 1,095,417
The total market value of total return swaps held by Global Focused Strategies Fund as a proportion of the Sub-fund’s NAV as at 29 December 2017 was 0.13%.
The top counterparties of the total return swaps are as follows:
Global Focused Strategies Fund
Counterparty Counterparty’s country of incorporation Total Return Swaps
EUR
BNP Paribas France 3,393,498
Goldman Sachs International Bank United Kingdom 27,484,944
HSBC Bank plc United Kingdom 9,943,649
Merrill Lynch International United Kingdom 14,436,891
Morgan Stanley & Co. International Plc United Kingdom 15,098,942
Societe Generale France 2,838,825
All the counterparties to the total return swaps have been disclosed in the above table.
The following tables provide an analysis of the maturity tenor of open OTC derivative transactions (including total return swaps) and associated collateral received/provided, as at the statement of net assets date. Enhanced Diversification Global Emerging Markets Equities Fund
Maturity tenor
Total Return Swaps (net exposure)
USD
1 day -
2 to 7 days -
Open (>7 days) 1,801,036
Total 1,801,036
The above maturity tenor analysis has been based on the contractual maturity date of the relevant OTC derivative transaction (total return swaps). Enhanced Diversification Global Emerging Markets Equities Fund
Maturity tenor
Non-cash collateral (net exposure)
USD
Cash collateral (net exposure)
USD
1 day - -
2 to 7 days - -
Open (>7 days) - -
Total - -
The above maturity tenor analysis of non-cash collateral is based the contractual maturity date of the security received/provided as collateral.
There were no issuers of cash or non-cash collateral as at 31 December 2017 for this Sub-fund. Global Absolute Return Strategies Fund
Maturity tenor
Total Return Swaps (net exposure)
EUR
1 day -
2 to 7 days -
Open (>7 days) 336,412,943
Total 336,412,943
The above maturity tenor analysis has been based on the contractual maturity date of the relevant OTC derivative transaction (total return swaps).
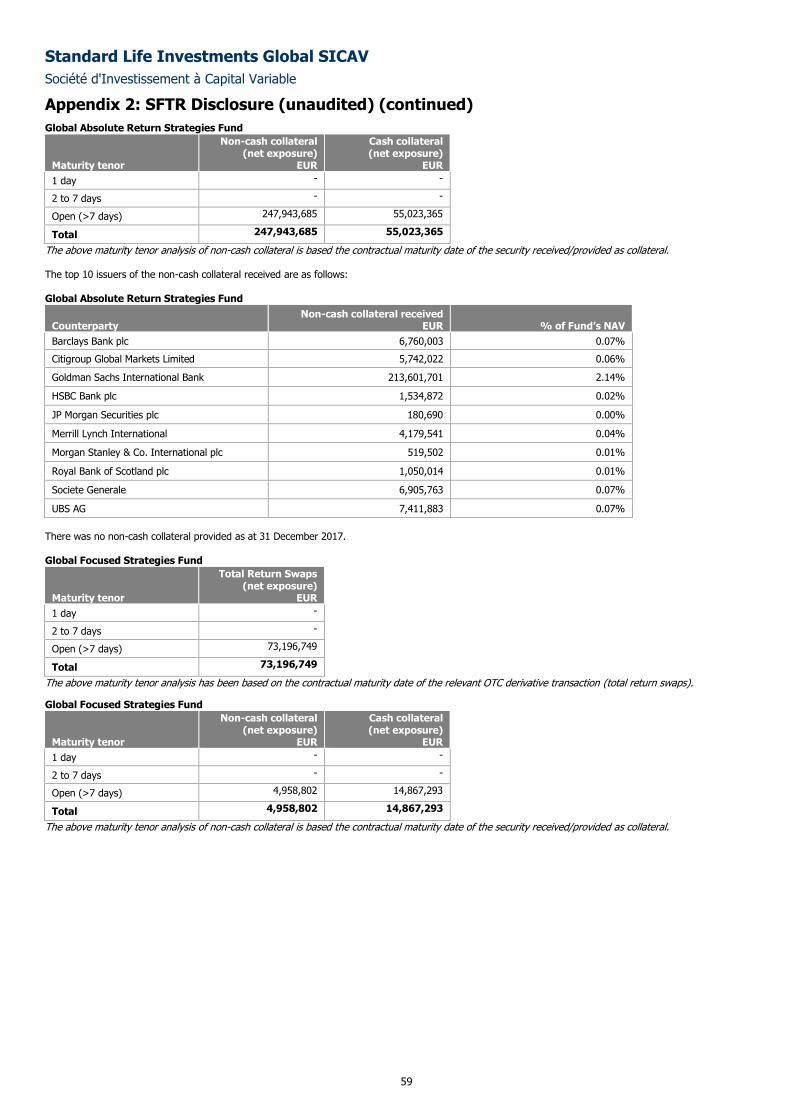
Standard Life Investments Global SICAV
Société d'Investissement à Capital Variable
Appendix 2: SFTR Disclosure (unaudited) (continued)
59
Global Absolute Return Strategies Fund
Maturity tenor
Non-cash collateral (net exposure)
EUR
Cash collateral (net exposure)
EUR
1 day - -
2 to 7 days - -
Open (>7 days) 247,943,685 55,023,365
Total 247,943,685 55,023,365
The above maturity tenor analysis of non-cash collateral is based the contractual maturity date of the security received/provided as collateral. The top 10 issuers of the non-cash collateral received are as follows: Global Absolute Return Strategies Fund
Counterparty Non-cash collateral received
EUR % of Fund’s NAV
Barclays Bank plc 6,760,003 0.07%
Citigroup Global Markets Limited 5,742,022 0.06%
Goldman Sachs International Bank 213,601,701 2.14%
HSBC Bank plc 1,534,872 0.02%
JP Morgan Securities plc 180,690 0.00%
Merrill Lynch International 4,179,541 0.04%
Morgan Stanley & Co. International plc 519,502 0.01%
Royal Bank of Scotland plc 1,050,014 0.01%
Societe Generale 6,905,763 0.07%
UBS AG 7,411,883 0.07%
There was no non-cash collateral provided as at 31 December 2017.
Global Focused Strategies Fund
Maturity tenor
Total Return Swaps (net exposure)
EUR
1 day -
2 to 7 days -
Open (>7 days) 73,196,749
Total 73,196,749
The above maturity tenor analysis has been based on the contractual maturity date of the relevant OTC derivative transaction (total return swaps).
Global Focused Strategies Fund
Maturity tenor
Non-cash collateral (net exposure)
EUR
Cash collateral (net exposure)
EUR
1 day - -
2 to 7 days - -
Open (>7 days) 4,958,802 14,867,293
Total 4,958,802 14,867,293
The above maturity tenor analysis of non-cash collateral is based the contractual maturity date of the security received/provided as collateral.
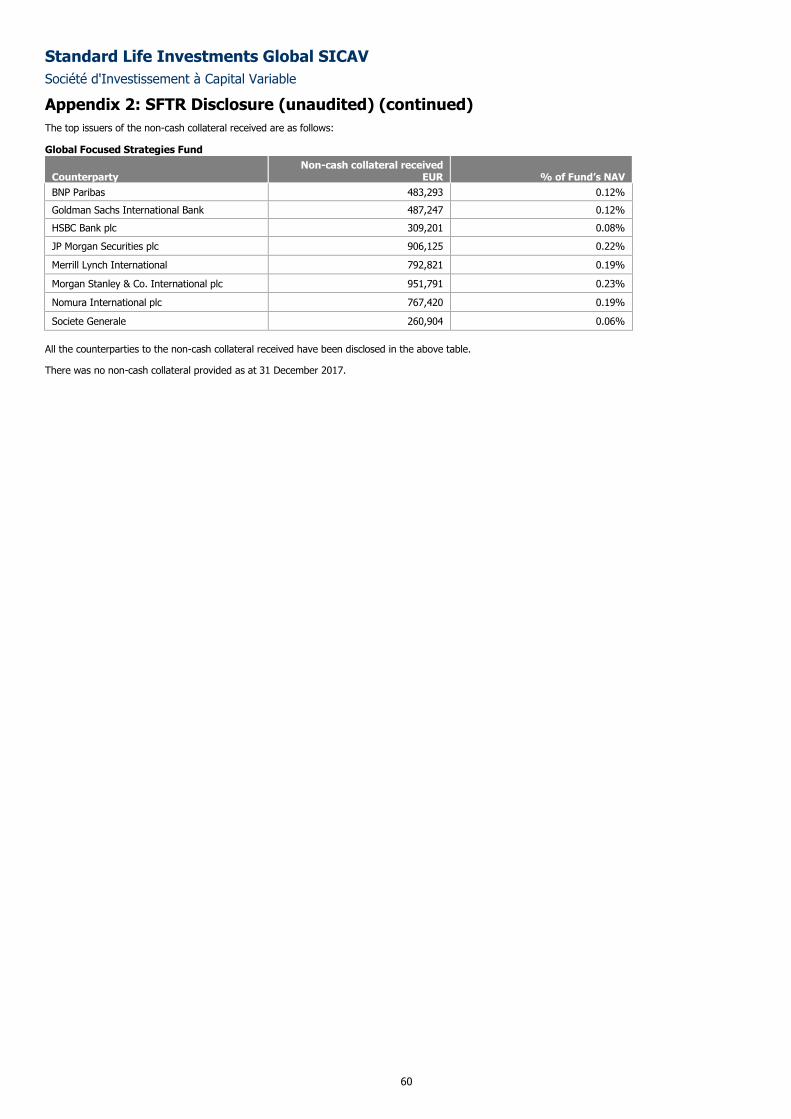
Standard Life Investments Global SICAV
Société d'Investissement à Capital Variable
Appendix 2: SFTR Disclosure (unaudited) (continued)
60
The top issuers of the non-cash collateral received are as follows:
Global Focused Strategies Fund
Counterparty Non-cash collateral received
EUR % of Fund’s NAV
BNP Paribas 483,293 0.12%
Goldman Sachs International Bank 487,247 0.12%
HSBC Bank plc 309,201 0.08%
JP Morgan Securities plc 906,125 0.22%
Merrill Lynch International 792,821 0.19%
Morgan Stanley & Co. International plc 951,791 0.23%
Nomura International plc 767,420 0.19%
Societe Generale 260,904 0.06%
All the counterparties to the non-cash collateral received have been disclosed in the above table.
There was no non-cash collateral provided as at 31 December 2017.
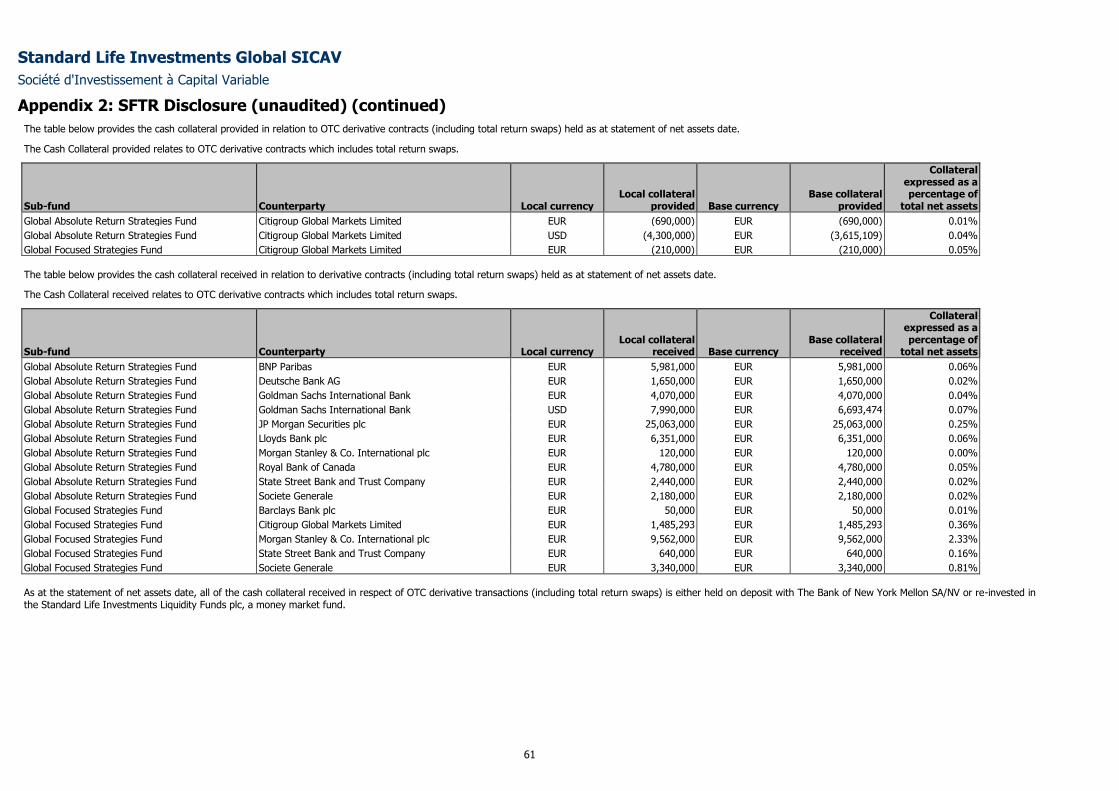
Standard Life Investments Global SICAV
Société d'Investissement à Capital Variable
Appendix 2: SFTR Disclosure (unaudited) (continued)
61
The table below provides the cash collateral provided in relation to OTC derivative contracts (including total return swaps) held as at statement of net assets date.
The Cash Collateral provided relates to OTC derivative contracts which includes total return swaps.
Sub-fund Counterparty Local currency Local collateral
provided Base currency Base collateral
provided
Collateral expressed as a percentage of
total net assets
Global Absolute Return Strategies Fund Citigroup Global Markets Limited EUR (690,000) EUR (690,000) 0.01%
Global Absolute Return Strategies Fund Citigroup Global Markets Limited USD (4,300,000) EUR (3,615,109) 0.04%
Global Focused Strategies Fund Citigroup Global Markets Limited EUR (210,000) EUR (210,000) 0.05%
The table below provides the cash collateral received in relation to derivative contracts (including total return swaps) held as at statement of net assets date.
The Cash Collateral received relates to OTC derivative contracts which includes total return swaps.
Sub-fund Counterparty Local currency Local collateral
received Base currency Base collateral
received
Collateral expressed as a percentage of
total net assets
Global Absolute Return Strategies Fund BNP Paribas EUR 5,981,000 EUR 5,981,000 0.06%
Global Absolute Return Strategies Fund Deutsche Bank AG EUR 1,650,000 EUR 1,650,000 0.02%
Global Absolute Return Strategies Fund Goldman Sachs International Bank EUR 4,070,000 EUR 4,070,000 0.04%
Global Absolute Return Strategies Fund Goldman Sachs International Bank USD 7,990,000 EUR 6,693,474 0.07%
Global Absolute Return Strategies Fund JP Morgan Securities plc EUR 25,063,000 EUR 25,063,000 0.25%
Global Absolute Return Strategies Fund Lloyds Bank plc EUR 6,351,000 EUR 6,351,000 0.06%
Global Absolute Return Strategies Fund Morgan Stanley & Co. International plc EUR 120,000 EUR 120,000 0.00%
Global Absolute Return Strategies Fund Royal Bank of Canada EUR 4,780,000 EUR 4,780,000 0.05%
Global Absolute Return Strategies Fund State Street Bank and Trust Company EUR 2,440,000 EUR 2,440,000 0.02%
Global Absolute Return Strategies Fund Societe Generale EUR 2,180,000 EUR 2,180,000 0.02%
Global Focused Strategies Fund Barclays Bank plc EUR 50,000 EUR 50,000 0.01%
Global Focused Strategies Fund Citigroup Global Markets Limited EUR 1,485,293 EUR 1,485,293 0.36%
Global Focused Strategies Fund Morgan Stanley & Co. International plc EUR 9,562,000 EUR 9,562,000 2.33%
Global Focused Strategies Fund State Street Bank and Trust Company EUR 640,000 EUR 640,000 0.16%
Global Focused Strategies Fund Societe Generale EUR 3,340,000 EUR 3,340,000 0.81%
As at the statement of net assets date, all of the cash collateral received in respect of OTC derivative transactions (including total return swaps) is either held on deposit with The Bank of New York Mellon SA/NV or re-invested in the Standard Life Investments Liquidity Funds plc, a money market fund.
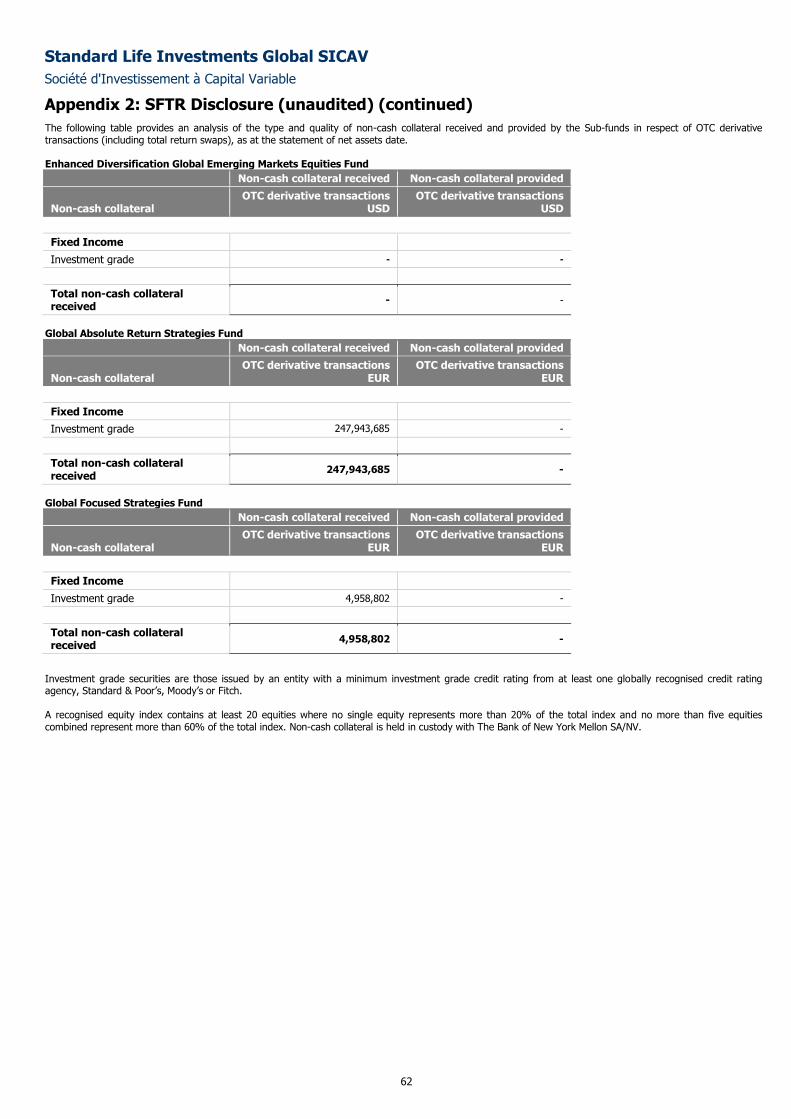
Standard Life Investments Global SICAV
Société d'Investissement à Capital Variable
Appendix 2: SFTR Disclosure (unaudited) (continued)
62
The following table provides an analysis of the type and quality of non-cash collateral received and provided by the Sub-funds in respect of OTC derivative transactions (including total return swaps), as at the statement of net assets date.
Enhanced Diversification Global Emerging Markets Equities Fund
Non-cash collateral received Non-cash collateral provided
Non-cash collateral OTC derivative transactions
USD OTC derivative transactions
USD
Fixed Income
Investment grade - -
Total non-cash collateral received
- -
Global Absolute Return Strategies Fund
Non-cash collateral received Non-cash collateral provided
Non-cash collateral OTC derivative transactions
EUR OTC derivative transactions
EUR
Fixed Income
Investment grade 247,943,685 -
Total non-cash collateral received
247,943,685 -
Global Focused Strategies Fund
Non-cash collateral received Non-cash collateral provided
Non-cash collateral OTC derivative transactions
EUR OTC derivative transactions
EUR
Fixed Income
Investment grade 4,958,802 -
Total non-cash collateral received
4,958,802 -
Investment grade securities are those issued by an entity with a minimum investment grade credit rating from at least one globally recognised credit rating agency, Standard & Poor’s, Moody’s or Fitch. A recognised equity index contains at least 20 equities where no single equity represents more than 20% of the total index and no more than five equities combined represent more than 60% of the total index. Non-cash collateral is held in custody with The Bank of New York Mellon SA/NV.
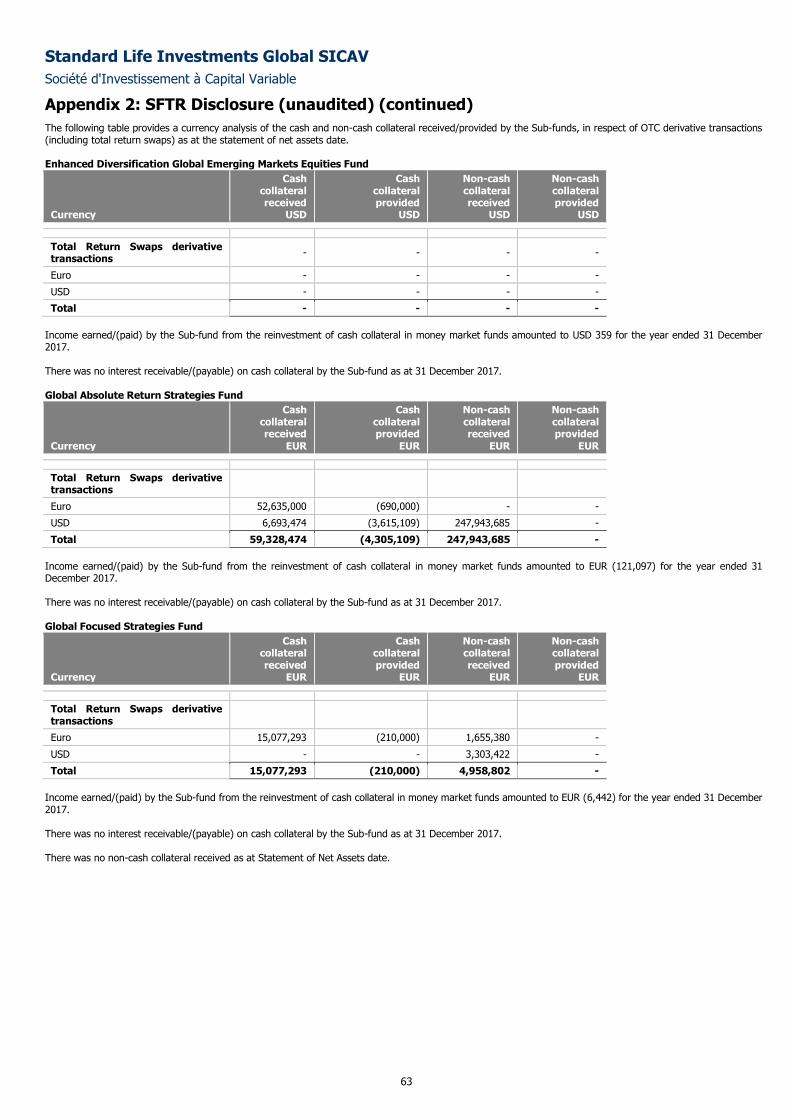
Standard Life Investments Global SICAV
Société d'Investissement à Capital Variable
Appendix 2: SFTR Disclosure (unaudited) (continued)
63
The following table provides a currency analysis of the cash and non-cash collateral received/provided by the Sub-funds, in respect of OTC derivative transactions (including total return swaps) as at the statement of net assets date.
Enhanced Diversification Global Emerging Markets Equities Fund
Currency
Cash collateral received
USD
Cash collateral provided
USD
Non-cash collateral received
USD
Non-cash collateral provided
USD
Total Return Swaps derivative transactions
- - - -
Euro - - - - USD - - - - Total - - - -
Income earned/(paid) by the Sub-fund from the reinvestment of cash collateral in money market funds amounted to USD 359 for the year ended 31 December 2017. There was no interest receivable/(payable) on cash collateral by the Sub-fund as at 31 December 2017.
Global Absolute Return Strategies Fund
Currency
Cash collateral received
EUR
Cash collateral provided
EUR
Non-cash collateral received
EUR
Non-cash collateral provided
EUR
Total Return Swaps derivative transactions
Euro 52,635,000 (690,000) - -
USD 6,693,474 (3,615,109) 247,943,685 -
Total 59,328,474 (4,305,109) 247,943,685 -
Income earned/(paid) by the Sub-fund from the reinvestment of cash collateral in money market funds amounted to EUR (121,097) for the year ended 31 December 2017. There was no interest receivable/(payable) on cash collateral by the Sub-fund as at 31 December 2017.
Global Focused Strategies Fund
Currency
Cash collateral received
EUR
Cash collateral provided
EUR
Non-cash collateral received
EUR
Non-cash collateral provided
EUR
Total Return Swaps derivative transactions
Euro 15,077,293 (210,000) 1,655,380 -
USD - - 3,303,422 -
Total 15,077,293 (210,000) 4,958,802 -
Income earned/(paid) by the Sub-fund from the reinvestment of cash collateral in money market funds amounted to EUR (6,442) for the year ended 31 December 2017.
There was no interest receivable/(payable) on cash collateral by the Sub-fund as at 31 December 2017.
There was no non-cash collateral received as at Statement of Net Assets date.
Standard Life Investments Global SICAV
Société d'Investissement à Capital Variable
64
Global Equities Fund
Sub-fund Objective and Investment Policy
The objective of the Sub-fund is to achieve long-term growth in the share price through capital appreciation of the underlying equity portfolio. It will achieve
this objective primarily through investment in equities and equity related securities of corporations registered on recognized stock exchanges.
Performance Review
The Sub-fund returned 21.20% over the review period, compared to the MSCI AC World Index, which was up 24.62%.*
Looking at the positives first, Hotel operator China Lodging continued to excel and was our top contributor, with consensus earnings estimates revised up
further on the back of rising occupancy rates and revenues per available room. The company is demonstrating its ability to add value through hotel chain
acquisitions and we think there is further scope for margin expansion thanks to operational gearing. US video games maker Activision Blizzard had an
excellent year as it continued to deliver forecast-beating results. This was driven by digital downloads and micro transactions (in-game purchases of various
pieces of kit that are designed to enhance the playing experience). However, the digital distribution investment angle is now better understood by investors,
and the once-marginal eSports offering is now perceived as a clear positive. We therefore took profits ahead of a more competitive year in 2018, which will
see the launch of numerous ‘triple-A’ game titles. Additional highlights included Visteon, Samsung Electronics and Worldpay.
By contrast, shares in US consumer staple group Newell Brands fell after it released disappointing results. This was largely due to weak ‘back-to-school’
demand and an inventory correction at one of Newell’s larger customers. The company consequently reduced guidance for the year and also stepped back
from its longer-term revenue projections. Given this new data, we are currently reassessing our investment case. Pandora, a global manufacturer and
retailer of jewellery, had a challenging year. However, we think the market is focusing too much on the problems Pandora had when it was just a charm
company. Indeed, we feel the rising sales of non-charm products means that Pandora is a different business in this cycle and so we have added to the
position. Positions in Acuity Brands, Halliburton and Element Fleet Management also disappointed.
*Sub-fund performance has been calculated over the stated period on the share price performance basis, based on the institutional share class (D
Accumulation) and net of fees. Please note the index return is quoted gross and contains no adjustment for fees. The sub-fund performance will also be
impacted by any pricing basis changes, made under our single swinging price policy. More information on our swinging price approach can be found in note
8 of the Financial Statements.
Outlook
Global markets enter 2018 on a sound footing. The world economy is growing at a robust rate, which is feeding into healthy corporate profits. Central banks
have started to withdraw monetary stimulus, although any future moves have been signalled as measured and data-dependent. Challenges remain, notably
around geopolitics, the US debt ceiling and potential policy missteps. China could also slow more sharply than expected. Nonetheless, in our view the overall
outlook is encouraging.
Please note that the commitment approach has been used for risk measurement and calculation of global exposure for this Sub-fund.
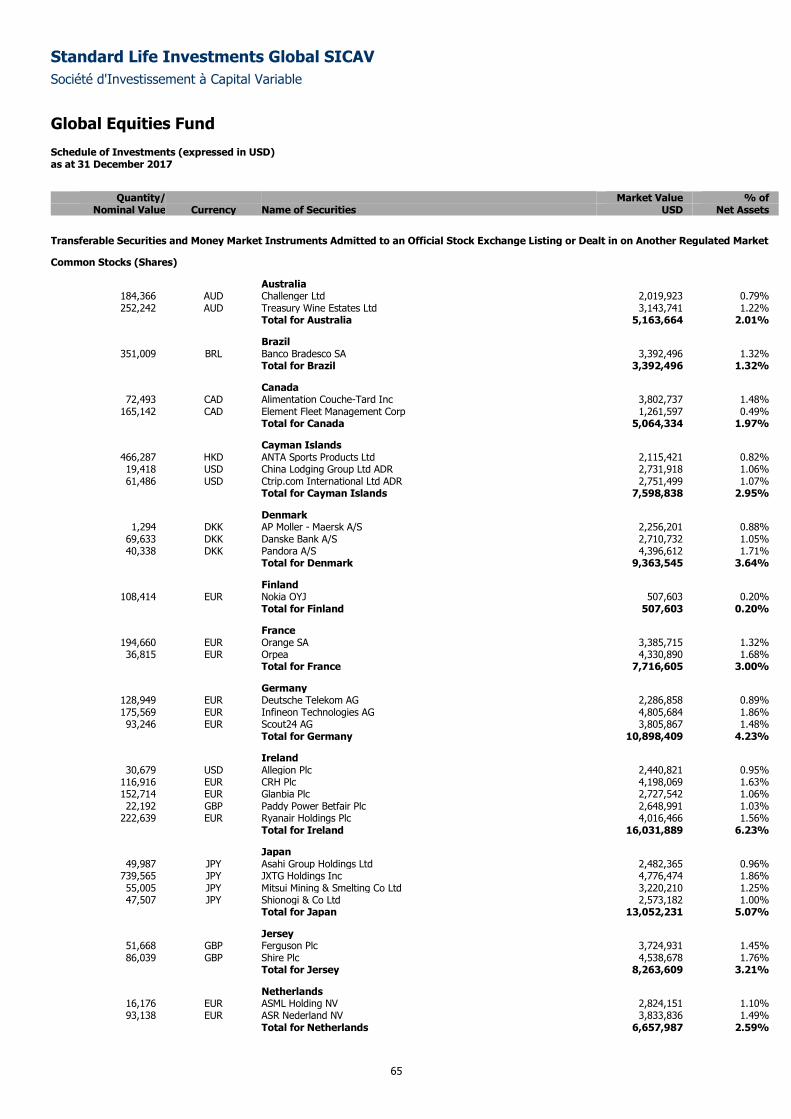
Standard Life Investments Global SICAV
Société d'Investissement à Capital Variable
Global Equities Fund
Schedule of Investments (expressed in USD) as at 31 December 2017
65
Quantity/ Market Value % of
Nominal Value Currency Name of Securities USD Net Assets
Transferable Securities and Money Market Instruments Admitted to an Official Stock Exchange Listing or Dealt in on Another Regulated Market
Common Stocks (Shares)
Australia 184,366 AUD Challenger Ltd 2,019,923 0.79% 252,242 AUD Treasury Wine Estates Ltd 3,143,741 1.22%
Total for Australia 5,163,664 2.01%
Brazil 351,009 BRL Banco Bradesco SA 3,392,496 1.32%
Total for Brazil 3,392,496 1.32%
Canada 72,493 CAD Alimentation Couche-Tard Inc 3,802,737 1.48%
165,142 CAD Element Fleet Management Corp 1,261,597 0.49% Total for Canada 5,064,334 1.97%
Cayman Islands 466,287 HKD ANTA Sports Products Ltd 2,115,421 0.82% 19,418 USD China Lodging Group Ltd ADR 2,731,918 1.06% 61,486 USD Ctrip.com International Ltd ADR 2,751,499 1.07%
Total for Cayman Islands 7,598,838 2.95%
Denmark 1,294 DKK AP Moller - Maersk A/S 2,256,201 0.88%
69,633 DKK Danske Bank A/S 2,710,732 1.05% 40,338 DKK Pandora A/S 4,396,612 1.71%
Total for Denmark 9,363,545 3.64%
Finland 108,414 EUR Nokia OYJ 507,603 0.20%
Total for Finland 507,603 0.20%
France 194,660 EUR Orange SA 3,385,715 1.32% 36,815 EUR Orpea 4,330,890 1.68%
Total for France 7,716,605 3.00%
Germany 128,949 EUR Deutsche Telekom AG 2,286,858 0.89% 175,569 EUR Infineon Technologies AG 4,805,684 1.86% 93,246 EUR Scout24 AG 3,805,867 1.48%
Total for Germany 10,898,409 4.23%
Ireland 30,679 USD Allegion Plc 2,440,821 0.95%
116,916 EUR CRH Plc 4,198,069 1.63% 152,714 EUR Glanbia Plc 2,727,542 1.06% 22,192 GBP Paddy Power Betfair Plc 2,648,991 1.03%
222,639 EUR Ryanair Holdings Plc 4,016,466 1.56% Total for Ireland 16,031,889 6.23%
Japan 49,987 JPY Asahi Group Holdings Ltd 2,482,365 0.96%
739,565 JPY JXTG Holdings Inc 4,776,474 1.86% 55,005 JPY Mitsui Mining & Smelting Co Ltd 3,220,210 1.25% 47,507 JPY Shionogi & Co Ltd 2,573,182 1.00%
Total for Japan 13,052,231 5.07%
Jersey 51,668 GBP Ferguson Plc 3,724,931 1.45% 86,039 GBP Shire Plc 4,538,678 1.76%
Total for Jersey 8,263,609 3.21%
Netherlands 16,176 EUR ASML Holding NV 2,824,151 1.10% 93,138 EUR ASR Nederland NV 3,833,836 1.49%
Total for Netherlands 6,657,987 2.59%
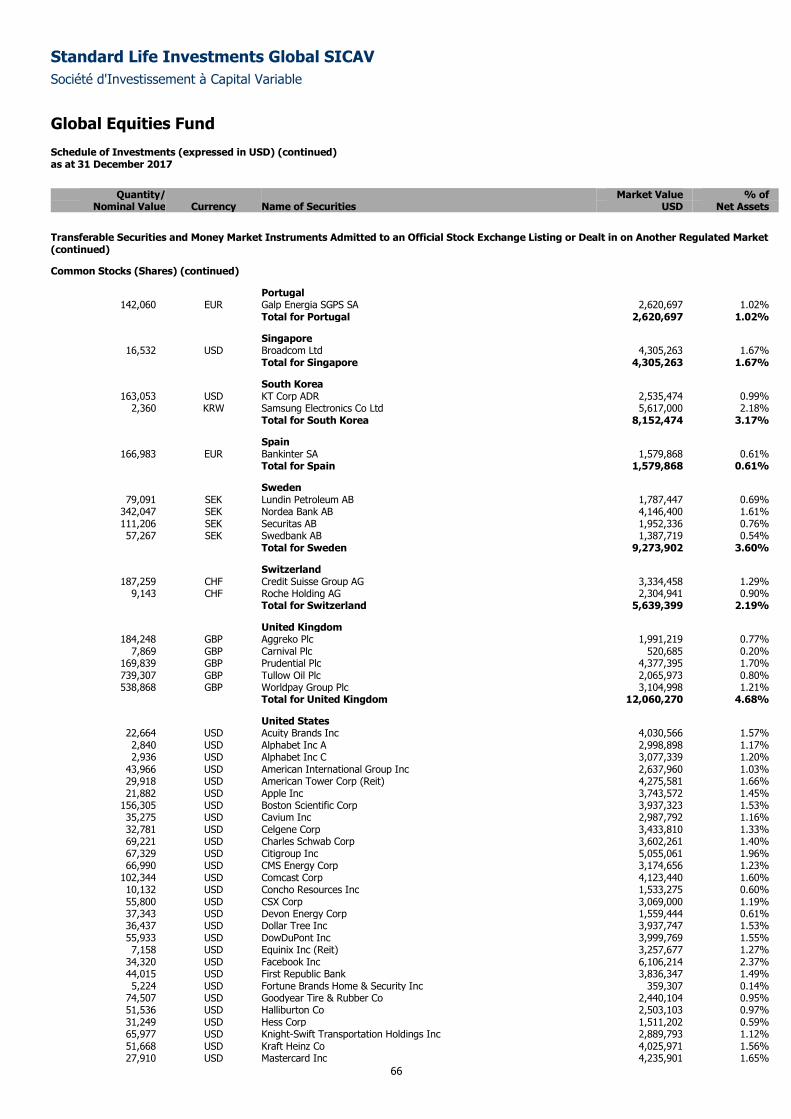
Standard Life Investments Global SICAV
Société d'Investissement à Capital Variable
Global Equities Fund
Schedule of Investments (expressed in USD) (continued) as at 31 December 2017
66
Quantity/ Market Value % of
Nominal Value Currency Name of Securities USD Net Assets
Transferable Securities and Money Market Instruments Admitted to an Official Stock Exchange Listing or Dealt in on Another Regulated Market (continued)
Common Stocks (Shares) (continued)
Portugal 142,060 EUR Galp Energia SGPS SA 2,620,697 1.02%
Total for Portugal 2,620,697 1.02%
Singapore 16,532 USD Broadcom Ltd 4,305,263 1.67%
Total for Singapore 4,305,263 1.67%
South Korea 163,053 USD KT Corp ADR 2,535,474 0.99%
2,360 KRW Samsung Electronics Co Ltd 5,617,000 2.18% Total for South Korea 8,152,474 3.17%
Spain 166,983 EUR Bankinter SA 1,579,868 0.61%
Total for Spain 1,579,868 0.61%
Sweden 79,091 SEK Lundin Petroleum AB 1,787,447 0.69%
342,047 SEK Nordea Bank AB 4,146,400 1.61% 111,206 SEK Securitas AB 1,952,336 0.76% 57,267 SEK Swedbank AB 1,387,719 0.54%
Total for Sweden 9,273,902 3.60%
Switzerland 187,259 CHF Credit Suisse Group AG 3,334,458 1.29%
9,143 CHF Roche Holding AG 2,304,941 0.90% Total for Switzerland 5,639,399 2.19%
United Kingdom 184,248 GBP Aggreko Plc 1,991,219 0.77%
7,869 GBP Carnival Plc 520,685 0.20% 169,839 GBP Prudential Plc 4,377,395 1.70% 739,307 GBP Tullow Oil Plc 2,065,973 0.80% 538,868 GBP Worldpay Group Plc 3,104,998 1.21%
Total for United Kingdom 12,060,270 4.68%
United States 22,664 USD Acuity Brands Inc 4,030,566 1.57% 2,840 USD Alphabet Inc A 2,998,898 1.17% 2,936 USD Alphabet Inc C 3,077,339 1.20%
43,966 USD American International Group Inc 2,637,960 1.03% 29,918 USD American Tower Corp (Reit) 4,275,581 1.66% 21,882 USD Apple Inc 3,743,572 1.45%
156,305 USD Boston Scientific Corp 3,937,323 1.53% 35,275 USD Cavium Inc 2,987,792 1.16% 32,781 USD Celgene Corp 3,433,810 1.33% 69,221 USD Charles Schwab Corp 3,602,261 1.40% 67,329 USD Citigroup Inc 5,055,061 1.96% 66,990 USD CMS Energy Corp 3,174,656 1.23%
102,344 USD Comcast Corp 4,123,440 1.60% 10,132 USD Concho Resources Inc 1,533,275 0.60% 55,800 USD CSX Corp 3,069,000 1.19% 37,343 USD Devon Energy Corp 1,559,444 0.61% 36,437 USD Dollar Tree Inc 3,937,747 1.53% 55,933 USD DowDuPont Inc 3,999,769 1.55% 7,158 USD Equinix Inc (Reit) 3,257,677 1.27%
34,320 USD Facebook Inc 6,106,214 2.37% 44,015 USD First Republic Bank 3,836,347 1.49% 5,224 USD Fortune Brands Home & Security Inc 359,307 0.14%
74,507 USD Goodyear Tire & Rubber Co 2,440,104 0.95% 51,536 USD Halliburton Co 2,503,103 0.97% 31,249 USD Hess Corp 1,511,202 0.59% 65,977 USD Knight-Swift Transportation Holdings Inc 2,889,793 1.12% 51,668 USD Kraft Heinz Co 4,025,971 1.56% 27,910 USD Mastercard Inc 4,235,901 1.65%
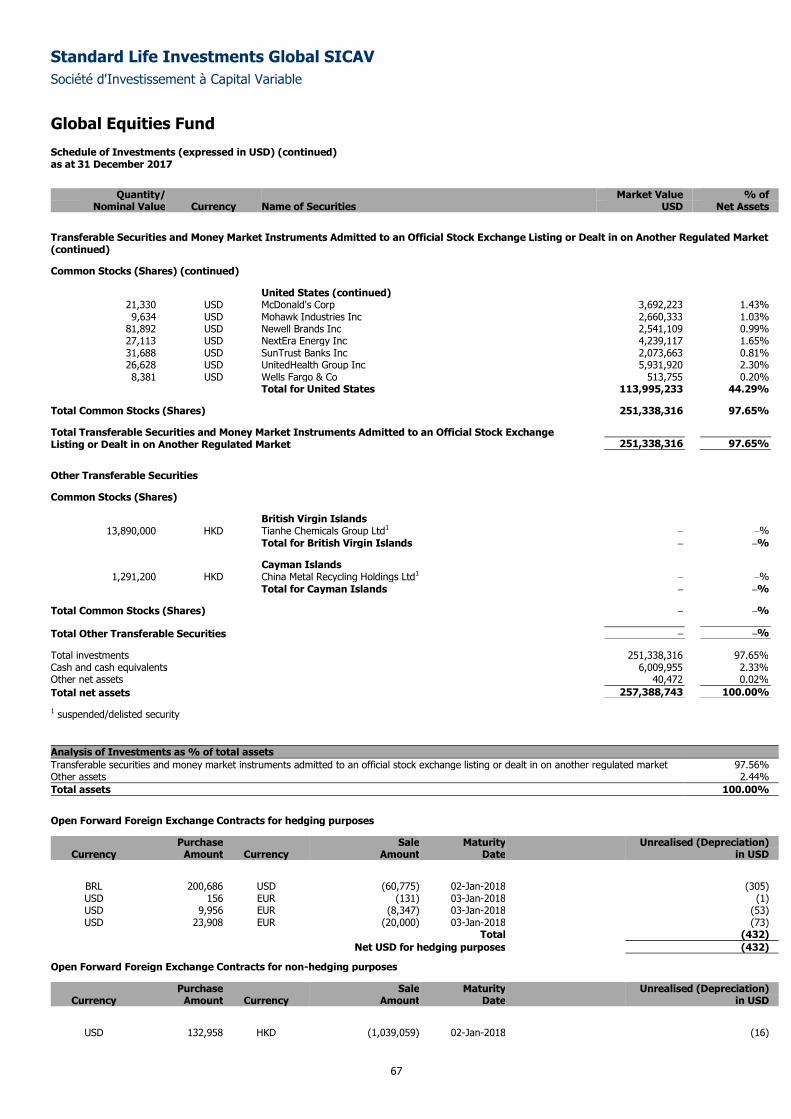
Standard Life Investments Global SICAV
Société d'Investissement à Capital Variable
Global Equities Fund
Schedule of Investments (expressed in USD) (continued) as at 31 December 2017
67
Quantity/ Market Value % of
Nominal Value Currency Name of Securities USD Net Assets
Transferable Securities and Money Market Instruments Admitted to an Official Stock Exchange Listing or Dealt in on Another Regulated Market (continued)
Common Stocks (Shares) (continued)
United States (continued) 21,330 USD McDonald's Corp 3,692,223 1.43% 9,634 USD Mohawk Industries Inc 2,660,333 1.03%
81,892 USD Newell Brands Inc 2,541,109 0.99% 27,113 USD NextEra Energy Inc 4,239,117 1.65% 31,688 USD SunTrust Banks Inc 2,073,663 0.81% 26,628 USD UnitedHealth Group Inc 5,931,920 2.30% 8,381 USD Wells Fargo & Co 513,755 0.20%
Total for United States 113,995,233 44.29%
Total Common Stocks (Shares) 251,338,316 97.65%
Total Transferable Securities and Money Market Instruments Admitted to an Official Stock Exchange Listing or Dealt in on Another Regulated Market 251,338,316 97.65%
Other Transferable Securities
Common Stocks (Shares)
British Virgin Islands 13,890,000 HKD Tianhe Chemicals Group Ltd1 – –%
Total for British Virgin Islands – –%
Cayman Islands 1,291,200 HKD China Metal Recycling Holdings Ltd1 – –%
Total for Cayman Islands – –%
Total Common Stocks (Shares) – –%
Total Other Transferable Securities – –%
Total investments 251,338,316 97.65%
Cash and cash equivalents 6,009,955 2.33%
Other net assets 40,472 0.02%
Total net assets 257,388,743 100.00%
1 suspended/delisted security
Analysis of Investments as % of total assets
Transferable securities and money market instruments admitted to an official stock exchange listing or dealt in on another regulated market 97.56% Other assets 2.44%
Total assets 100.00%
Open Forward Foreign Exchange Contracts for hedging purposes
Purchase Sale Maturity Unrealised (Depreciation) Currency Amount Currency Amount Date in USD
BRL 200,686 USD (60,775) 02-Jan-2018 (305) USD 156 EUR (131) 03-Jan-2018 (1) USD 9,956 EUR (8,347) 03-Jan-2018 (53) USD 23,908 EUR (20,000) 03-Jan-2018 (73)
Total (432)
Net USD for hedging purposes (432)
Open Forward Foreign Exchange Contracts for non-hedging purposes
Purchase Sale Maturity Unrealised (Depreciation) Currency Amount Currency Amount Date in USD
USD 132,958 HKD (1,039,059) 02-Jan-2018 (16)
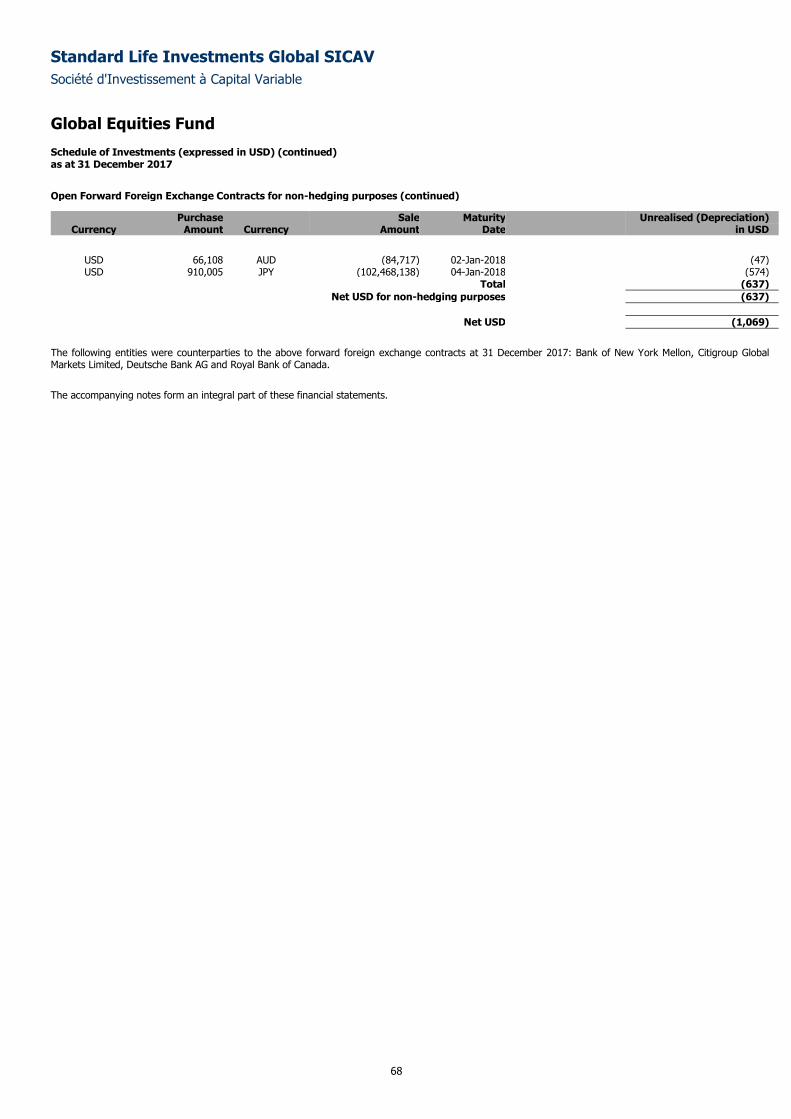
Standard Life Investments Global SICAV
Société d'Investissement à Capital Variable
Global Equities Fund
Schedule of Investments (expressed in USD) (continued) as at 31 December 2017
68
Open Forward Foreign Exchange Contracts for non-hedging purposes (continued)
Purchase Sale Maturity Unrealised (Depreciation) Currency Amount Currency Amount Date in USD
USD 66,108 AUD (84,717) 02-Jan-2018 (47) USD 910,005 JPY (102,468,138) 04-Jan-2018 (574)
Total (637)
Net USD for non-hedging purposes (637)
Net USD (1,069)
The following entities were counterparties to the above forward foreign exchange contracts at 31 December 2017: Bank of New York Mellon, Citigroup Global Markets Limited, Deutsche Bank AG and Royal Bank of Canada.
The accompanying notes form an integral part of these financial statements.
Standard Life Investments Global SICAV
Société d'Investissement à Capital Variable
69
Asian Equities Fund
Sub-fund Objective and Investment Policy The objective of the Sub-fund is to achieve long-term growth in the share price through capital appreciation of the underlying equity portfolio. It will achieve
this objective primarily through investment in equities and equity related securities of corporations domiciled in Asia, or companies that derive a significant
proportion of their revenues or profits from Asian operations or have a significant proportion of their assets there.
Performance Review The Asian Equities Fund rose by 44.68% over the period, compared with a 42.56% return for the MSCI Far East Free Ex-Japan Index.*
Value came from our holding in China’s Ping An Insurance. A combination of higher stock markets and a more favourable investor view of new-business
opportunities heightened expectations for the company’s future profitability. China Lodging was also beneficial, as its business environment continued to
improve, with rising occupancy and room rates. Elsewhere, Chinese snack food and beverage company Dali Foods demonstrated strong product innovation,
with a healthy market share that led to profit outlook upgrades. IT firm SK Hynix was another highlight, due to rising memory chip prices thanks to better
industry management of supply against demand. Finally, Chinese auto part manufacturer Minth Group reported positive results with unexpectedly good
sales and gross margins because of market-share gains.
On the downside, Chinese pharmaceuticals business Dawnrays declined on a lack of newsflow, its small-cap nature and an underwhelming drug pipeline
versus its larger peers. In Macau, property-focused conglomerate Shun Tak gave back some of the healthy outperformance it enjoyed over the summer.
Most notably, there was little stock or sector news during the period. Taiwanese contact lens manufacturer Ginko saw its share price weaken when its sales
numbers suggested competitive pressures in China and challenges from e-commerce channels. Lastly, Korean tyre manufacturer Nexen underperformed
amid concerns about the impact of rising raw material costs.
*Sub-fund performance has been calculated over the stated period on the share price performance basis, based on the institutional share class (D
Accumulation) and net of fees. Please note the index return is quoted gross and contains no adjustment for fees. The sub-fund performance will also be
impacted by any pricing basis changes, made under our single swinging price policy. More information on our swinging price approach can be found in note
8 of the Financial Statements.
Outlook As we enter 2018, the extent to which regional and global economic growth can support the ongoing improvement in corporate earnings in Asia will remain
in focus. As ever, China is key in this narrative from both an economic and policy perspective. Following robust market performance in 2017, earnings
expectations will likely require further positive revisions for these strong returns to continue. From a longer-term perspective, we continue to believe that
Asia is firmly positioned, with compelling demographics and the ongoing re-orientation of economic growth away from exports and more towards domestic
consumption.
Please note that the commitment approach has been used for risk measurement and calculation of global exposure for this Sub-fund.
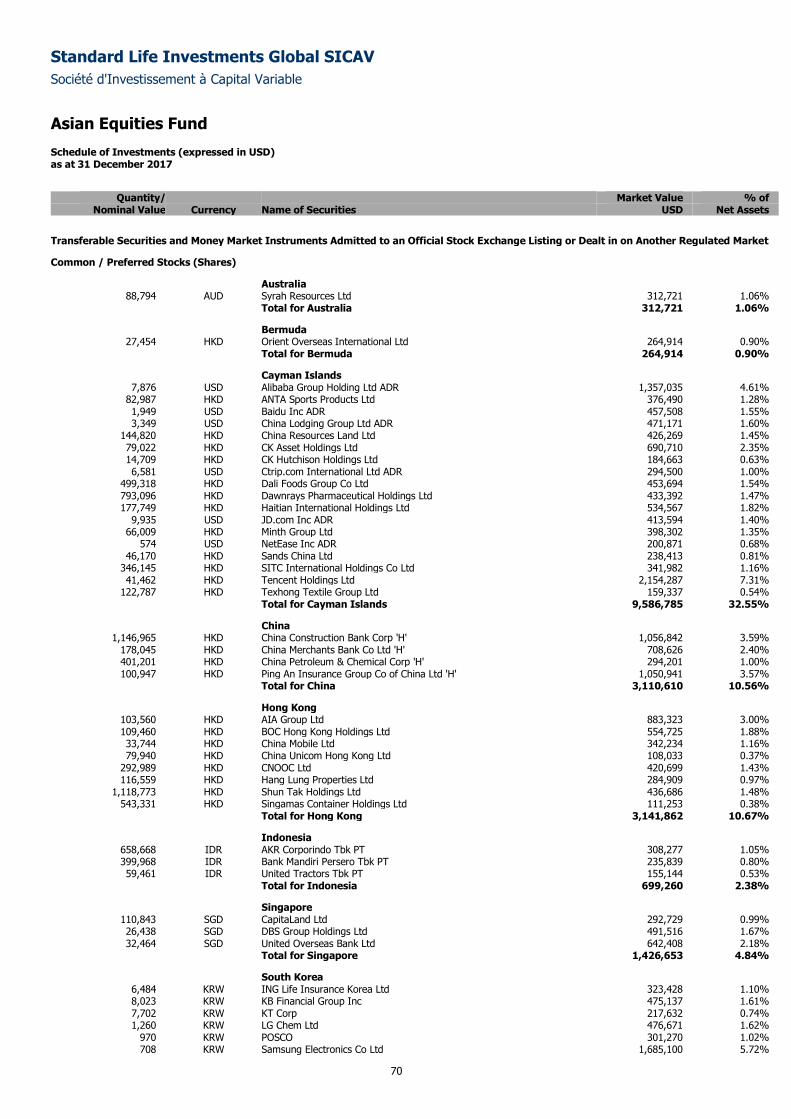
Standard Life Investments Global SICAV
Société d'Investissement à Capital Variable
Asian Equities Fund
Schedule of Investments (expressed in USD) as at 31 December 2017
70
Quantity/ Market Value % of
Nominal Value Currency Name of Securities USD Net Assets
Transferable Securities and Money Market Instruments Admitted to an Official Stock Exchange Listing or Dealt in on Another Regulated Market
Common / Preferred Stocks (Shares)
Australia 88,794 AUD Syrah Resources Ltd 312,721 1.06%
Total for Australia 312,721 1.06%
Bermuda 27,454 HKD Orient Overseas International Ltd 264,914 0.90%
Total for Bermuda 264,914 0.90%
Cayman Islands 7,876 USD Alibaba Group Holding Ltd ADR 1,357,035 4.61%
82,987 HKD ANTA Sports Products Ltd 376,490 1.28% 1,949 USD Baidu Inc ADR 457,508 1.55% 3,349 USD China Lodging Group Ltd ADR 471,171 1.60%
144,820 HKD China Resources Land Ltd 426,269 1.45% 79,022 HKD CK Asset Holdings Ltd 690,710 2.35% 14,709 HKD CK Hutchison Holdings Ltd 184,663 0.63% 6,581 USD Ctrip.com International Ltd ADR 294,500 1.00%
499,318 HKD Dali Foods Group Co Ltd 453,694 1.54% 793,096 HKD Dawnrays Pharmaceutical Holdings Ltd 433,392 1.47% 177,749 HKD Haitian International Holdings Ltd 534,567 1.82%
9,935 USD JD.com Inc ADR 413,594 1.40% 66,009 HKD Minth Group Ltd 398,302 1.35%
574 USD NetEase Inc ADR 200,871 0.68% 46,170 HKD Sands China Ltd 238,413 0.81%
346,145 HKD SITC International Holdings Co Ltd 341,982 1.16% 41,462 HKD Tencent Holdings Ltd 2,154,287 7.31%
122,787 HKD Texhong Textile Group Ltd 159,337 0.54% Total for Cayman Islands 9,586,785 32.55%
China 1,146,965 HKD China Construction Bank Corp 'H' 1,056,842 3.59%
178,045 HKD China Merchants Bank Co Ltd 'H' 708,626 2.40% 401,201 HKD China Petroleum & Chemical Corp 'H' 294,201 1.00% 100,947 HKD Ping An Insurance Group Co of China Ltd 'H' 1,050,941 3.57%
Total for China 3,110,610 10.56%
Hong Kong 103,560 HKD AIA Group Ltd 883,323 3.00% 109,460 HKD BOC Hong Kong Holdings Ltd 554,725 1.88% 33,744 HKD China Mobile Ltd 342,234 1.16% 79,940 HKD China Unicom Hong Kong Ltd 108,033 0.37%
292,989 HKD CNOOC Ltd 420,699 1.43% 116,559 HKD Hang Lung Properties Ltd 284,909 0.97%
1,118,773 HKD Shun Tak Holdings Ltd 436,686 1.48% 543,331 HKD Singamas Container Holdings Ltd 111,253 0.38%
Total for Hong Kong 3,141,862 10.67%
Indonesia 658,668 IDR AKR Corporindo Tbk PT 308,277 1.05% 399,968 IDR Bank Mandiri Persero Tbk PT 235,839 0.80% 59,461 IDR United Tractors Tbk PT 155,144 0.53%
Total for Indonesia 699,260 2.38%
Singapore 110,843 SGD CapitaLand Ltd 292,729 0.99% 26,438 SGD DBS Group Holdings Ltd 491,516 1.67% 32,464 SGD United Overseas Bank Ltd 642,408 2.18%
Total for Singapore 1,426,653 4.84%
South Korea 6,484 KRW ING Life Insurance Korea Ltd 323,428 1.10% 8,023 KRW KB Financial Group Inc 475,137 1.61% 7,702 KRW KT Corp 217,632 0.74% 1,260 KRW LG Chem Ltd 476,671 1.62%
970 KRW POSCO 301,270 1.02% 708 KRW Samsung Electronics Co Ltd 1,685,100 5.72%
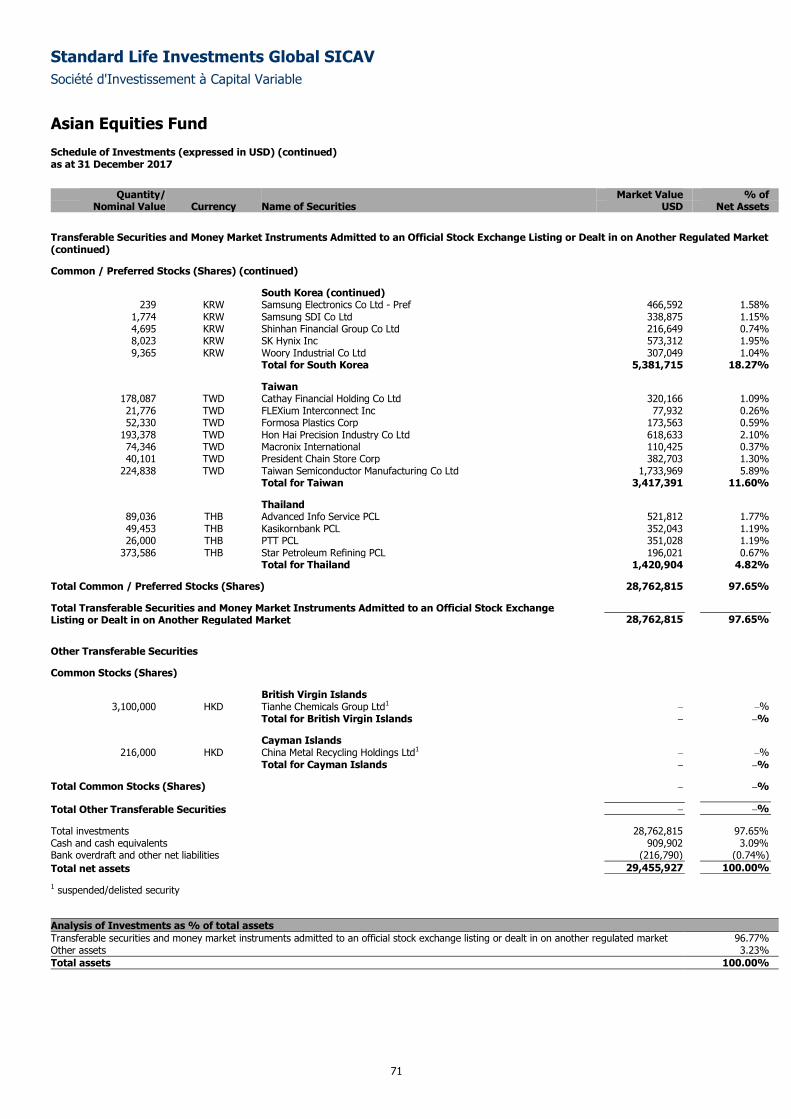
Standard Life Investments Global SICAV
Société d'Investissement à Capital Variable
Asian Equities Fund
Schedule of Investments (expressed in USD) (continued) as at 31 December 2017
71
Quantity/ Market Value % of
Nominal Value Currency Name of Securities USD Net Assets
Transferable Securities and Money Market Instruments Admitted to an Official Stock Exchange Listing or Dealt in on Another Regulated Market (continued)
Common / Preferred Stocks (Shares) (continued)
South Korea (continued) 239 KRW Samsung Electronics Co Ltd - Pref 466,592 1.58%
1,774 KRW Samsung SDI Co Ltd 338,875 1.15% 4,695 KRW Shinhan Financial Group Co Ltd 216,649 0.74% 8,023 KRW SK Hynix Inc 573,312 1.95% 9,365 KRW Woory Industrial Co Ltd 307,049 1.04%
Total for South Korea 5,381,715 18.27%
Taiwan 178,087 TWD Cathay Financial Holding Co Ltd 320,166 1.09% 21,776 TWD FLEXium Interconnect Inc 77,932 0.26% 52,330 TWD Formosa Plastics Corp 173,563 0.59%
193,378 TWD Hon Hai Precision Industry Co Ltd 618,633 2.10% 74,346 TWD Macronix International 110,425 0.37% 40,101 TWD President Chain Store Corp 382,703 1.30%
224,838 TWD Taiwan Semiconductor Manufacturing Co Ltd 1,733,969 5.89% Total for Taiwan 3,417,391 11.60%
Thailand 89,036 THB Advanced Info Service PCL 521,812 1.77% 49,453 THB Kasikornbank PCL 352,043 1.19% 26,000 THB PTT PCL 351,028 1.19%
373,586 THB Star Petroleum Refining PCL 196,021 0.67% Total for Thailand 1,420,904 4.82%
Total Common / Preferred Stocks (Shares) 28,762,815 97.65%
Total Transferable Securities and Money Market Instruments Admitted to an Official Stock Exchange Listing or Dealt in on Another Regulated Market 28,762,815 97.65%
Other Transferable Securities
Common Stocks (Shares)
British Virgin Islands 3,100,000 HKD Tianhe Chemicals Group Ltd1 – –%
Total for British Virgin Islands – –%
Cayman Islands 216,000 HKD China Metal Recycling Holdings Ltd1 – –%
Total for Cayman Islands – –%
Total Common Stocks (Shares) – –%
Total Other Transferable Securities – –%
Total investments 28,762,815 97.65%
Cash and cash equivalents 909,902 3.09%
Bank overdraft and other net liabilities (216,790) (0.74% )
Total net assets 29,455,927 100.00%
1 suspended/delisted security
Analysis of Investments as % of total assets
Transferable securities and money market instruments admitted to an official stock exchange listing or dealt in on another regulated market 96.77% Other assets 3.23%
Total assets 100.00%
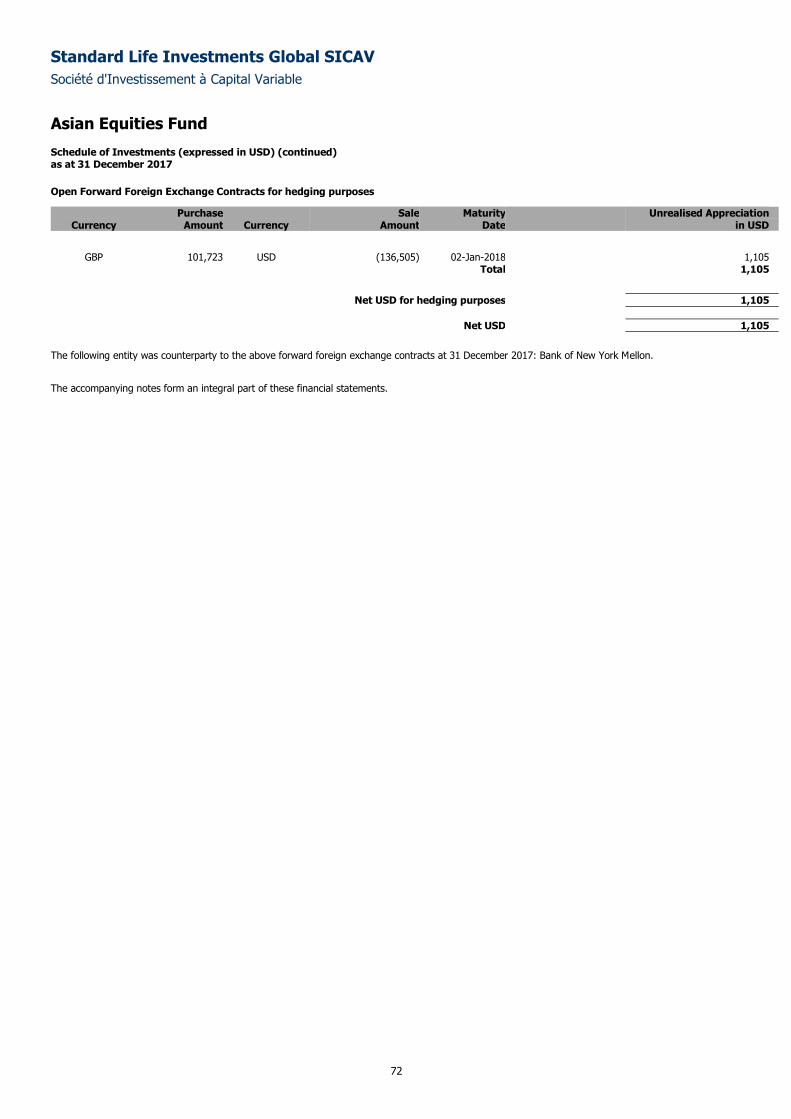
Standard Life Investments Global SICAV
Société d'Investissement à Capital Variable
Asian Equities Fund
Schedule of Investments (expressed in USD) (continued) as at 31 December 2017
72
Open Forward Foreign Exchange Contracts for hedging purposes
Purchase Sale Maturity Unrealised Appreciation Currency Amount Currency Amount Date in USD
GBP 101,723 USD (136,505) 02-Jan-2018 1,105 Total 1,105
Net USD for hedging purposes 1,105
Net USD 1,105
The following entity was counterparty to the above forward foreign exchange contracts at 31 December 2017: Bank of New York Mellon.
The accompanying notes form an integral part of these financial statements.
Standard Life Investments Global SICAV
Société d'Investissement à Capital Variable
73
China Equities Fund
Sub-fund Objective and Investment Policy
The objective of the Sub-fund is to achieve long-term growth in the share price through capital appreciation of the underlying equity portfolio. It will achieve
this objective primarily through investment in equities and equity related securities of corporations domiciled in the People’s Republic of China or companies
that derive a significant proportion of their revenues or profits from Chinese operations or have a significant proportion of their assets there.
Performance Review
The Sub-fund returned 50.46% over the review period in dollar terms, compared to the MSCI China Index, which was up 54.33%.*
Looking at the positives first, Hotel operator China Lodging continued to excel and was our top contributor, with consensus earnings estimates revised up
further on the back of rising occupancy rates and revenues per available room. The company is demonstrating its ability to add value through hotel chain
acquisitions and we think there is further scope for margin expansion thanks to operational gearing. Upbeat Q3 results, which marked the bottom of the
earnings cycle, lifted Sino Biopharmaceutical. Its hepatitis franchise is growing, while cost controls are coming in better than expected. Investors are also
anticipating the launch of extremely profitable drugs this year and next. Additional positives included Cnooc, TK Group and Ping An Insurance.
Elsewhere, our technical underweight in internet giant Tencent (we can only hold so much of the stock within the Fund) hurt relative returns as the
company continued to go from strength to strength. Online travel agent Ctrip.com suffered downgrades as it continued to remove bundled products such as
travel insurance from its site. We view this as a temporary adjustment to Ctrip’s earnings base rather than a slowdown in medium-term growth and are
keeping faith in the company. Positions in China Biologic, Geely and China Evergrande also disappointed.
*Sub-fund performance has been calculated over the stated period on the share price performance basis, based on the institutional share class (D
Accumulation) in euro and net of fees. Please note the index return is quoted gross and contains no adjustment for fees. The sub-fund performance will also
be impacted by any pricing basis changes, made under our single swinging price policy. More information on our swinging price approach can be found in
note 8 of the Financial Statements.
Outlook
Chinese leaders recently gathered in Beijing for the 19th Party Congress, a 5-yearly plenum that sees the leadership of the Communist Party outline future
policy. As expected, Xi Jinping greatly strengthened his leadership position. The Party Congress also confirmed the transition of the Chinese economy from
pursuing rapid growth to ‘better quality’ of living, with stronger party participation in all aspects of corporate and individual lives. There could also be a rise
of ‘state corporatism’, as government directs the economy through strong state-owned enterprises/companies. The aim, as reiterated at the Congress and
the Central Economic Work Conference in mid-December, is to prevent risk in the system, reduce poverty and increase environmental protection.
Interestingly, in the same month People’s Bank of China Governor Zhou repeatedly warned of systemic risk in China’s financial system. As for President Xi, it
is too early to gauge how he will use his enhanced powers, although the push for greater efficiency and quality across the economy is high on his agenda.
Despite a potential cyclical downturn, there are plenty of opportunities to invest in companies that are improving profitability, opening up new markets and
moving up the value chain. The valuation of the MSCI China Index is less compelling at the moment, as the price-to-book and prospective price/earnings
ratios are towards the upper end of historical ranges. However, as quality of growth improves, investors will surely be willing to pay a much higher multiple
for an emerging market growth story that proves the entrepreneurial spirit in China is very much alive.
Please note that the commitment approach has been used for risk measurement and calculation of global exposure for this Sub-fund.
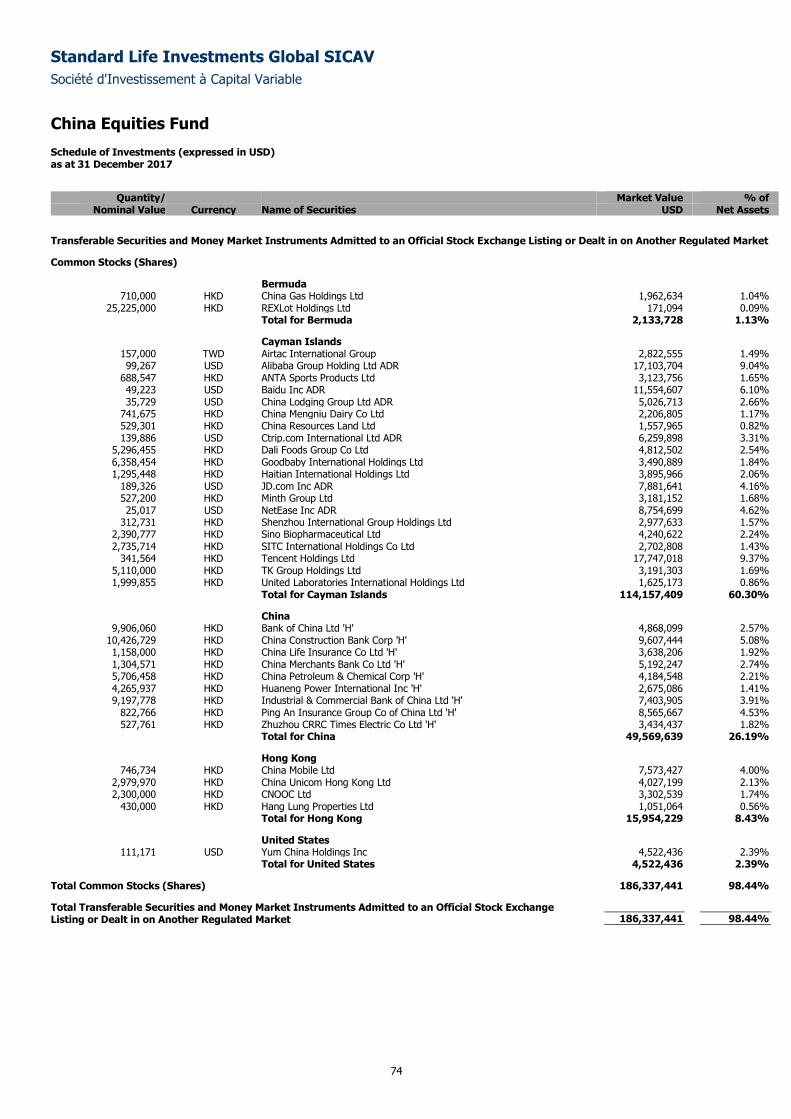
Standard Life Investments Global SICAV
Société d'Investissement à Capital Variable
China Equities Fund
Schedule of Investments (expressed in USD) as at 31 December 2017
74
Quantity/ Market Value % of
Nominal Value Currency Name of Securities USD Net Assets
Transferable Securities and Money Market Instruments Admitted to an Official Stock Exchange Listing or Dealt in on Another Regulated Market
Common Stocks (Shares)
Bermuda 710,000 HKD China Gas Holdings Ltd 1,962,634 1.04%
25,225,000 HKD REXLot Holdings Ltd 171,094 0.09% Total for Bermuda 2,133,728 1.13%
Cayman Islands 157,000 TWD Airtac International Group 2,822,555 1.49% 99,267 USD Alibaba Group Holding Ltd ADR 17,103,704 9.04%
688,547 HKD ANTA Sports Products Ltd 3,123,756 1.65% 49,223 USD Baidu Inc ADR 11,554,607 6.10% 35,729 USD China Lodging Group Ltd ADR 5,026,713 2.66%
741,675 HKD China Mengniu Dairy Co Ltd 2,206,805 1.17% 529,301 HKD China Resources Land Ltd 1,557,965 0.82% 139,886 USD Ctrip.com International Ltd ADR 6,259,898 3.31%
5,296,455 HKD Dali Foods Group Co Ltd 4,812,502 2.54% 6,358,454 HKD Goodbaby International Holdings Ltd 3,490,889 1.84% 1,295,448 HKD Haitian International Holdings Ltd 3,895,966 2.06%
189,326 USD JD.com Inc ADR 7,881,641 4.16% 527,200 HKD Minth Group Ltd 3,181,152 1.68% 25,017 USD NetEase Inc ADR 8,754,699 4.62%
312,731 HKD Shenzhou International Group Holdings Ltd 2,977,633 1.57% 2,390,777 HKD Sino Biopharmaceutical Ltd 4,240,622 2.24% 2,735,714 HKD SITC International Holdings Co Ltd 2,702,808 1.43%
341,564 HKD Tencent Holdings Ltd 17,747,018 9.37% 5,110,000 HKD TK Group Holdings Ltd 3,191,303 1.69% 1,999,855 HKD United Laboratories International Holdings Ltd 1,625,173 0.86%
Total for Cayman Islands 114,157,409 60.30%
China 9,906,060 HKD Bank of China Ltd 'H' 4,868,099 2.57%
10,426,729 HKD China Construction Bank Corp 'H' 9,607,444 5.08% 1,158,000 HKD China Life Insurance Co Ltd 'H' 3,638,206 1.92% 1,304,571 HKD China Merchants Bank Co Ltd 'H' 5,192,247 2.74% 5,706,458 HKD China Petroleum & Chemical Corp 'H' 4,184,548 2.21% 4,265,937 HKD Huaneng Power International Inc 'H' 2,675,086 1.41% 9,197,778 HKD Industrial & Commercial Bank of China Ltd 'H' 7,403,905 3.91%
822,766 HKD Ping An Insurance Group Co of China Ltd 'H' 8,565,667 4.53% 527,761 HKD Zhuzhou CRRC Times Electric Co Ltd 'H' 3,434,437 1.82%
Total for China 49,569,639 26.19%
Hong Kong 746,734 HKD China Mobile Ltd 7,573,427 4.00%
2,979,970 HKD China Unicom Hong Kong Ltd 4,027,199 2.13% 2,300,000 HKD CNOOC Ltd 3,302,539 1.74%
430,000 HKD Hang Lung Properties Ltd 1,051,064 0.56% Total for Hong Kong 15,954,229 8.43%
United States 111,171 USD Yum China Holdings Inc 4,522,436 2.39%
Total for United States 4,522,436 2.39%
Total Common Stocks (Shares) 186,337,441 98.44%
Total Transferable Securities and Money Market Instruments Admitted to an Official Stock Exchange Listing or Dealt in on Another Regulated Market 186,337,441 98.44%
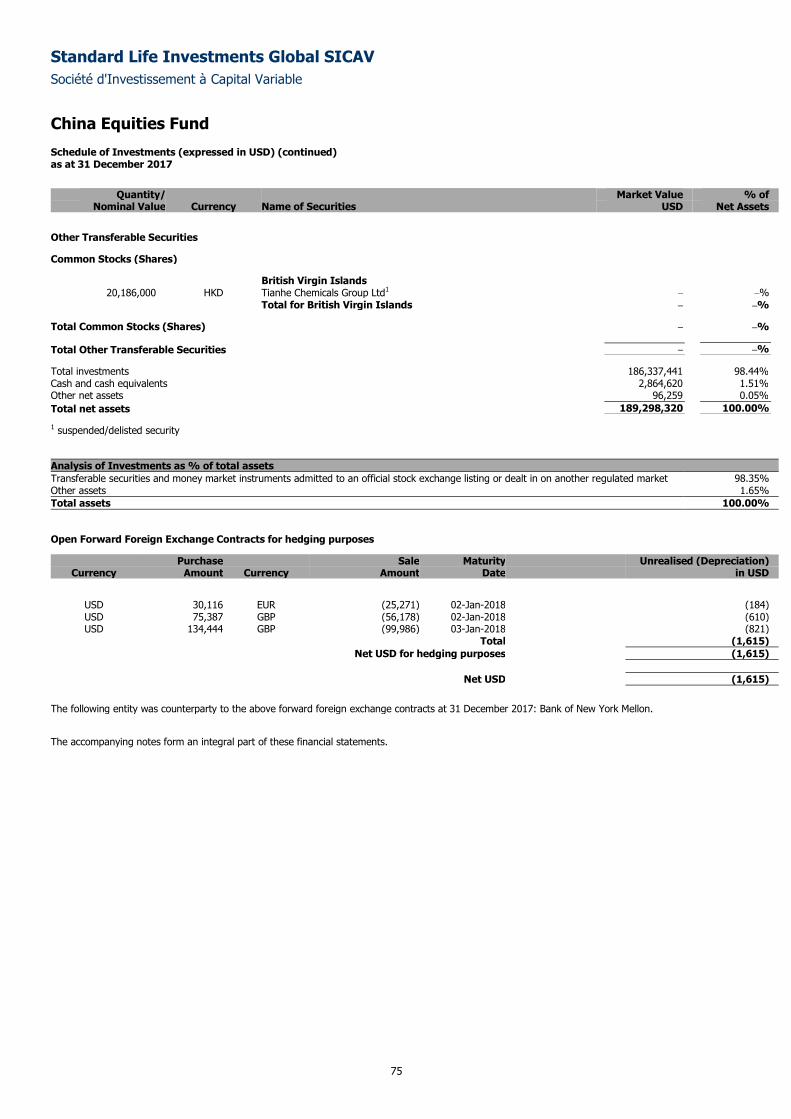
Standard Life Investments Global SICAV
Société d'Investissement à Capital Variable
China Equities Fund
Schedule of Investments (expressed in USD) (continued) as at 31 December 2017
75
Quantity/ Market Value % of
Nominal Value Currency Name of Securities USD Net Assets
Other Transferable Securities
Common Stocks (Shares)
British Virgin Islands 20,186,000 HKD Tianhe Chemicals Group Ltd1 – –%
Total for British Virgin Islands – –%
Total Common Stocks (Shares) – –%
Total Other Transferable Securities – –%
Total investments 186,337,441 98.44%
Cash and cash equivalents 2,864,620 1.51%
Other net assets 96,259 0.05%
Total net assets 189,298,320 100.00%
1 suspended/delisted security
Analysis of Investments as % of total assets
Transferable securities and money market instruments admitted to an official stock exchange listing or dealt in on another regulated market 98.35% Other assets 1.65%
Total assets 100.00%
Open Forward Foreign Exchange Contracts for hedging purposes
Purchase Sale Maturity Unrealised (Depreciation) Currency Amount Currency Amount Date in USD
USD 30,116 EUR (25,271) 02-Jan-2018 (184) USD 75,387 GBP (56,178) 02-Jan-2018 (610) USD 134,444 GBP (99,986) 03-Jan-2018 (821)
Total (1,615)
Net USD for hedging purposes (1,615)
Net USD (1,615)
The following entity was counterparty to the above forward foreign exchange contracts at 31 December 2017: Bank of New York Mellon.
The accompanying notes form an integral part of these financial statements.
Standard Life Investments Global SICAV
Société d'Investissement à Capital Variable
76
Japanese Equities Fund
Sub-fund Objective and Investment Policy The objective of the Sub-fund is to achieve long-term growth in the share price through capital appreciation of the underlying equity portfolio. It will achieve
this objective primarily through investment in equities and equity related securities of corporations domiciled in Japan, or companies that derive a significant
proportion of their revenues or profits from Japanese operations or have a significant proportion of their assets there.
The Sub-fund will be actively managed and aims to outperform the Japanese equity market over the medium to long term. The Sub-fund is considered to be
a core Japanese equity offering and the holdings will be subject to constraints versus the current reference index commensurate with this aim. The
constraints may vary over time.
Performance Review The Japanese Equity Fund returned 25.32% over the period compared with a 20.14% return for the MSCI Japan Index.*
Recruit Holdings made the largest contribution towards performance. It reported better-than-expected earnings, underpinned by domestic revenue growth
and the expansion of its global HR technology businesses. Mitsui Mining and Smelting was another leading contributor during the period. Investors looked
favourably on its micro-thin, copper foil for high-end smartphones, as well as the recovery of the copper mining business of its partner Caserones.
Elsewhere, Komatsu added value, as investors appreciated the upward revision of its earnings guidance, which was based on greater demand for its
machines, including construction machinery in Asia and mining equipment.
Less positively, Mitsui Fudosan underperformed following a decline in expectations for domestic prices and inflation, despite its business operation achieving
substantial earnings growth. Subaru also declined on a weaker auto-market environment in the US and China, as well as news that the firm had carried out
improper vehicle inspections. Finally, Murata Manufacturing detracted from relative returns due to production problems that are expected to impact
earnings.
*Sub-fund performance has been calculated over the stated period on the share price performance basis, based on the institutional share class (D Accumulation) and net of fees. Please note the index return is quoted gross and contains no adjustment for fees. The sub-fund performance will also be impacted by any pricing basis changes, made under our single swinging price policy. More information on our swinging price approach can be found in note 8 of the Financial Statements. Outlook Growth in structural demand has increased the potential for higher earnings, and the favourable global economic cycle means that opportunities exist across
multiple industrial sectors. We will focus on how the wealth generated by the corporate sector will be passed on to the consumer sector, as we believe this
will be important for Japan to enter a robust growth cycle.
At the same time, we are aware of possible downside risks. A rising number of market participants have become optimistic about the global recovery, with
low inflation and interest rates helping to keep volatility at historically low levels. However, the unwinding operations of global monetary policy could lead to
unforeseen market volatility. What’s more, political factors, such as tension from North Korea and the instability of the US government, could knock market
optimism. In addition, any unexpected levels of inflation could trigger a significant shift of money flows.
Please note that the commitment approach has been used for risk measurement and calculation of global exposure for this Sub-fund.
This Sub-fund is not authorised in Hong Kong and is not available to Hong Kong residents.
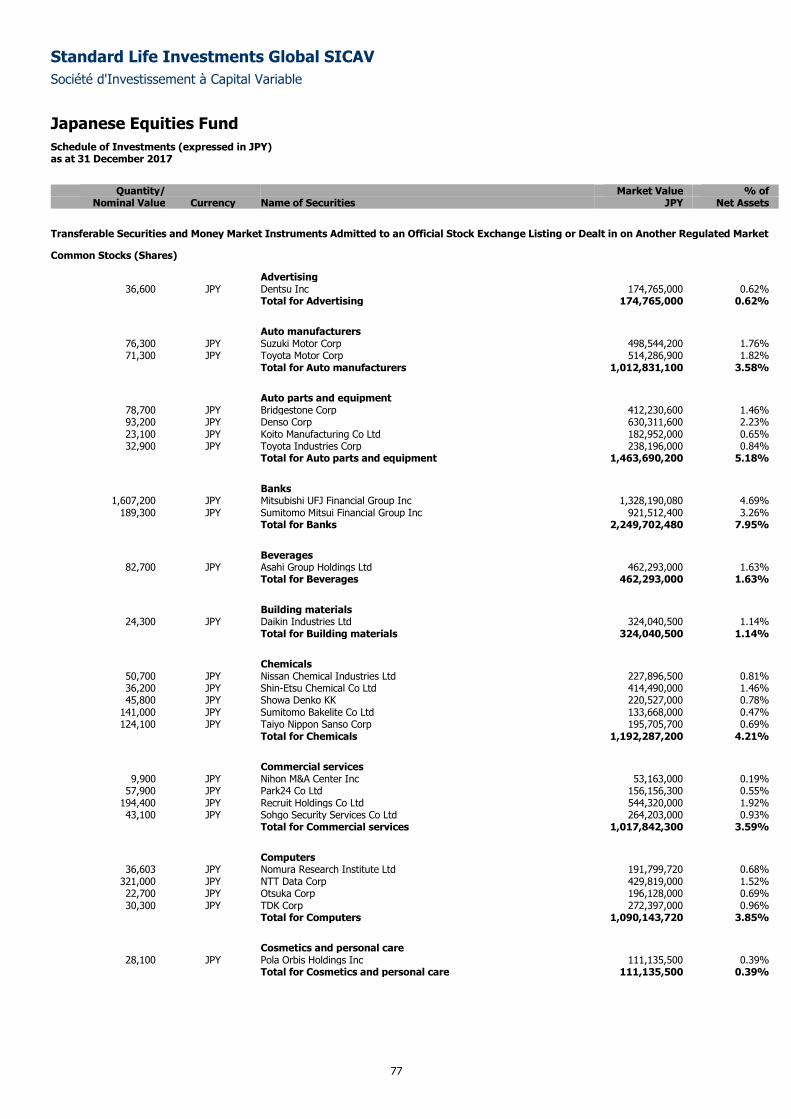
Standard Life Investments Global SICAV
Société d'Investissement à Capital Variable
Japanese Equities Fund
Schedule of Investments (expressed in JPY) as at 31 December 2017
77
Quantity/ Market Value % of
Nominal Value Currency Name of Securities JPY Net Assets
Transferable Securities and Money Market Instruments Admitted to an Official Stock Exchange Listing or Dealt in on Another Regulated Market
Common Stocks (Shares)
Advertising 36,600 JPY Dentsu Inc 174,765,000 0.62%
Total for Advertising 174,765,000 0.62%
Auto manufacturers
76,300 JPY Suzuki Motor Corp 498,544,200 1.76% 71,300 JPY Toyota Motor Corp 514,286,900 1.82%
Total for Auto manufacturers 1,012,831,100 3.58%
Auto parts and equipment
78,700 JPY Bridgestone Corp 412,230,600 1.46% 93,200 JPY Denso Corp 630,311,600 2.23% 23,100 JPY Koito Manufacturing Co Ltd 182,952,000 0.65% 32,900 JPY Toyota Industries Corp 238,196,000 0.84%
Total for Auto parts and equipment 1,463,690,200 5.18%
Banks
1,607,200 JPY Mitsubishi UFJ Financial Group Inc 1,328,190,080 4.69% 189,300 JPY Sumitomo Mitsui Financial Group Inc 921,512,400 3.26%
Total for Banks 2,249,702,480 7.95%
Beverages
82,700 JPY Asahi Group Holdings Ltd 462,293,000 1.63% Total for Beverages 462,293,000 1.63%
Building materials
24,300 JPY Daikin Industries Ltd 324,040,500 1.14% Total for Building materials 324,040,500 1.14%
Chemicals
50,700 JPY Nissan Chemical Industries Ltd 227,896,500 0.81% 36,200 JPY Shin-Etsu Chemical Co Ltd 414,490,000 1.46% 45,800 JPY Showa Denko KK 220,527,000 0.78%
141,000 JPY Sumitomo Bakelite Co Ltd 133,668,000 0.47% 124,100 JPY Taiyo Nippon Sanso Corp 195,705,700 0.69%
Total for Chemicals 1,192,287,200 4.21%
Commercial services
9,900 JPY Nihon M&A Center Inc 53,163,000 0.19% 57,900 JPY Park24 Co Ltd 156,156,300 0.55%
194,400 JPY Recruit Holdings Co Ltd 544,320,000 1.92% 43,100 JPY Sohgo Security Services Co Ltd 264,203,000 0.93%
Total for Commercial services 1,017,842,300 3.59%
Computers
36,603 JPY Nomura Research Institute Ltd 191,799,720 0.68% 321,000 JPY NTT Data Corp 429,819,000 1.52% 22,700 JPY Otsuka Corp 196,128,000 0.69% 30,300 JPY TDK Corp 272,397,000 0.96%
Total for Computers 1,090,143,720 3.85%
Cosmetics and personal care
28,100 JPY Pola Orbis Holdings Inc 111,135,500 0.39% Total for Cosmetics and personal care 111,135,500 0.39%
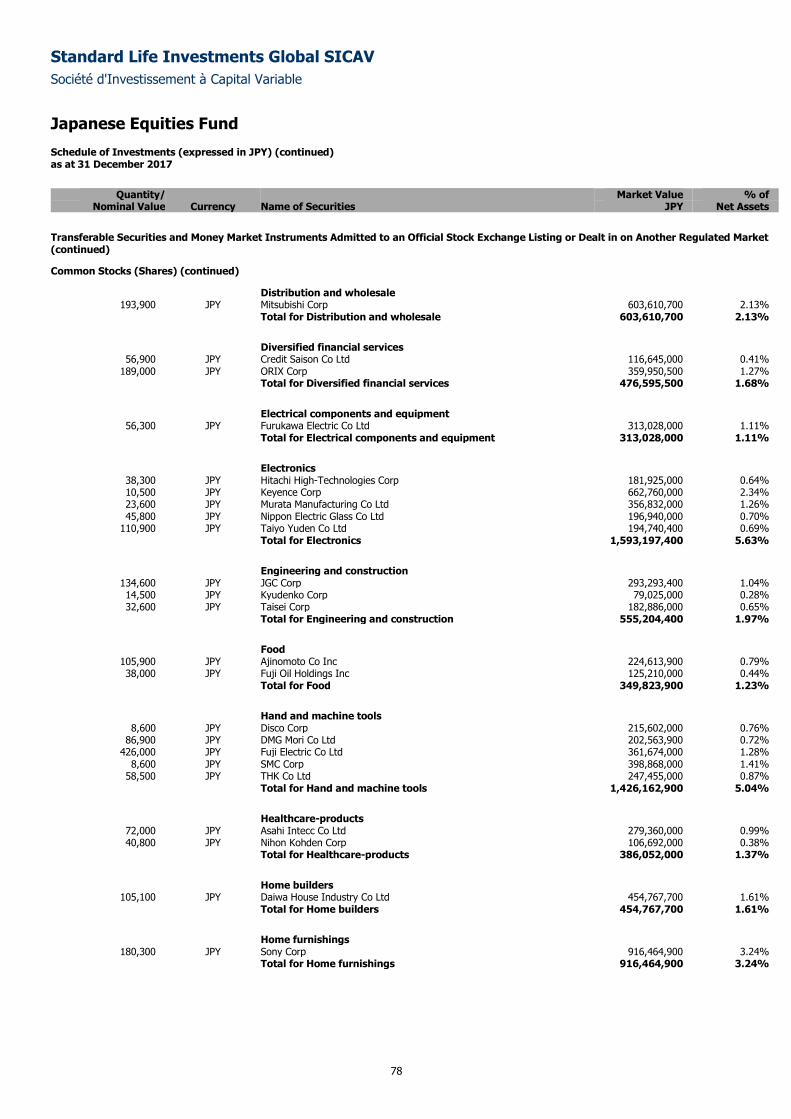
Standard Life Investments Global SICAV
Société d'Investissement à Capital Variable
Japanese Equities Fund
Schedule of Investments (expressed in JPY) (continued) as at 31 December 2017
78
Quantity/ Market Value % of
Nominal Value Currency Name of Securities JPY Net Assets
Transferable Securities and Money Market Instruments Admitted to an Official Stock Exchange Listing or Dealt in on Another Regulated Market (continued)
Common Stocks (Shares) (continued)
Distribution and wholesale 193,900 JPY Mitsubishi Corp 603,610,700 2.13%
Total for Distribution and wholesale 603,610,700 2.13%
Diversified financial services
56,900 JPY Credit Saison Co Ltd 116,645,000 0.41% 189,000 JPY ORIX Corp 359,950,500 1.27%
Total for Diversified financial services 476,595,500 1.68%
Electrical components and equipment
56,300 JPY Furukawa Electric Co Ltd 313,028,000 1.11% Total for Electrical components and equipment 313,028,000 1.11%
Electronics
38,300 JPY Hitachi High-Technologies Corp 181,925,000 0.64% 10,500 JPY Keyence Corp 662,760,000 2.34% 23,600 JPY Murata Manufacturing Co Ltd 356,832,000 1.26% 45,800 JPY Nippon Electric Glass Co Ltd 196,940,000 0.70%
110,900 JPY Taiyo Yuden Co Ltd 194,740,400 0.69% Total for Electronics 1,593,197,400 5.63%
Engineering and construction
134,600 JPY JGC Corp 293,293,400 1.04% 14,500 JPY Kyudenko Corp 79,025,000 0.28% 32,600 JPY Taisei Corp 182,886,000 0.65%
Total for Engineering and construction 555,204,400 1.97%
Food
105,900 JPY Ajinomoto Co Inc 224,613,900 0.79% 38,000 JPY Fuji Oil Holdings Inc 125,210,000 0.44%
Total for Food 349,823,900 1.23%
Hand and machine tools
8,600 JPY Disco Corp 215,602,000 0.76% 86,900 JPY DMG Mori Co Ltd 202,563,900 0.72%
426,000 JPY Fuji Electric Co Ltd 361,674,000 1.28% 8,600 JPY SMC Corp 398,868,000 1.41%
58,500 JPY THK Co Ltd 247,455,000 0.87% Total for Hand and machine tools 1,426,162,900 5.04%
Healthcare-products
72,000 JPY Asahi Intecc Co Ltd 279,360,000 0.99% 40,800 JPY Nihon Kohden Corp 106,692,000 0.38%
Total for Healthcare-products 386,052,000 1.37%
Home builders
105,100 JPY Daiwa House Industry Co Ltd 454,767,700 1.61% Total for Home builders 454,767,700 1.61%
Home furnishings
180,300 JPY Sony Corp 916,464,900 3.24% Total for Home furnishings 916,464,900 3.24%
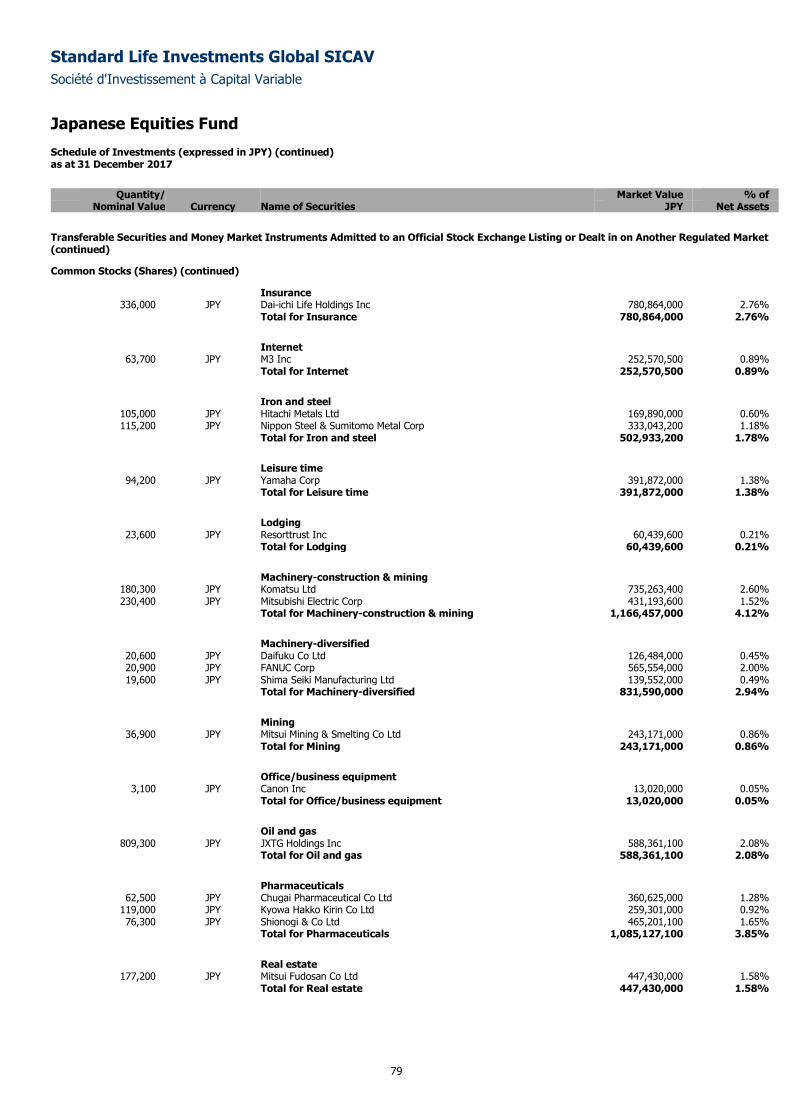
Standard Life Investments Global SICAV
Société d'Investissement à Capital Variable
Japanese Equities Fund
Schedule of Investments (expressed in JPY) (continued) as at 31 December 2017
79
Quantity/ Market Value % of
Nominal Value Currency Name of Securities JPY Net Assets
Transferable Securities and Money Market Instruments Admitted to an Official Stock Exchange Listing or Dealt in on Another Regulated Market (continued)
Common Stocks (Shares) (continued)
Insurance 336,000 JPY Dai-ichi Life Holdings Inc 780,864,000 2.76%
Total for Insurance 780,864,000 2.76%
Internet
63,700 JPY M3 Inc 252,570,500 0.89% Total for Internet 252,570,500 0.89%
Iron and steel
105,000 JPY Hitachi Metals Ltd 169,890,000 0.60% 115,200 JPY Nippon Steel & Sumitomo Metal Corp 333,043,200 1.18%
Total for Iron and steel 502,933,200 1.78%
Leisure time
94,200 JPY Yamaha Corp 391,872,000 1.38% Total for Leisure time 391,872,000 1.38%
Lodging
23,600 JPY Resorttrust Inc 60,439,600 0.21% Total for Lodging 60,439,600 0.21%
Machinery-construction & mining
180,300 JPY Komatsu Ltd 735,263,400 2.60% 230,400 JPY Mitsubishi Electric Corp 431,193,600 1.52%
Total for Machinery-construction & mining 1,166,457,000 4.12%
Machinery-diversified
20,600 JPY Daifuku Co Ltd 126,484,000 0.45% 20,900 JPY FANUC Corp 565,554,000 2.00% 19,600 JPY Shima Seiki Manufacturing Ltd 139,552,000 0.49%
Total for Machinery-diversified 831,590,000 2.94%
Mining
36,900 JPY Mitsui Mining & Smelting Co Ltd 243,171,000 0.86% Total for Mining 243,171,000 0.86%
Office/business equipment
3,100 JPY Canon Inc 13,020,000 0.05% Total for Office/business equipment 13,020,000 0.05%
Oil and gas
809,300 JPY JXTG Holdings Inc 588,361,100 2.08% Total for Oil and gas 588,361,100 2.08%
Pharmaceuticals
62,500 JPY Chugai Pharmaceutical Co Ltd 360,625,000 1.28% 119,000 JPY Kyowa Hakko Kirin Co Ltd 259,301,000 0.92% 76,300 JPY Shionogi & Co Ltd 465,201,100 1.65%
Total for Pharmaceuticals 1,085,127,100 3.85%
Real estate
177,200 JPY Mitsui Fudosan Co Ltd 447,430,000 1.58% Total for Real estate 447,430,000 1.58%
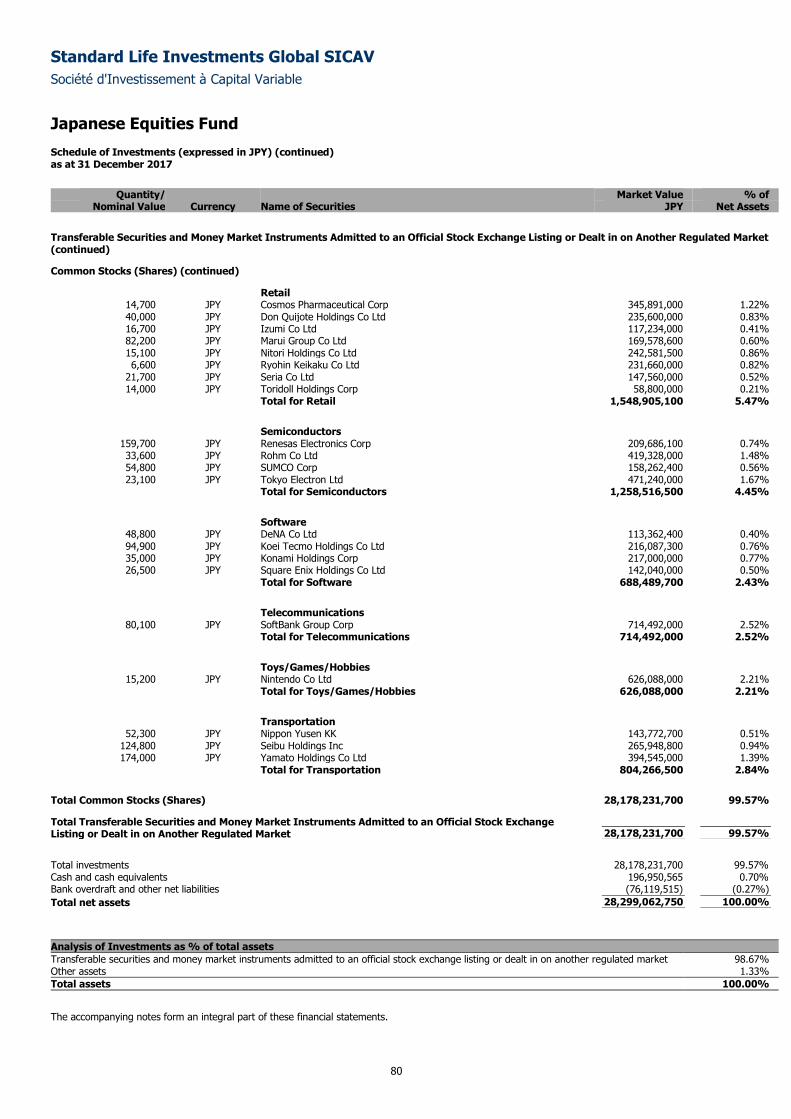
Standard Life Investments Global SICAV
Société d'Investissement à Capital Variable
Japanese Equities Fund
Schedule of Investments (expressed in JPY) (continued) as at 31 December 2017
80
Quantity/ Market Value % of
Nominal Value Currency Name of Securities JPY Net Assets
Transferable Securities and Money Market Instruments Admitted to an Official Stock Exchange Listing or Dealt in on Another Regulated Market (continued)
Common Stocks (Shares) (continued)
Retail 14,700 JPY Cosmos Pharmaceutical Corp 345,891,000 1.22% 40,000 JPY Don Quijote Holdings Co Ltd 235,600,000 0.83% 16,700 JPY Izumi Co Ltd 117,234,000 0.41% 82,200 JPY Marui Group Co Ltd 169,578,600 0.60% 15,100 JPY Nitori Holdings Co Ltd 242,581,500 0.86% 6,600 JPY Ryohin Keikaku Co Ltd 231,660,000 0.82%
21,700 JPY Seria Co Ltd 147,560,000 0.52% 14,000 JPY Toridoll Holdings Corp 58,800,000 0.21%
Total for Retail 1,548,905,100 5.47%
Semiconductors
159,700 JPY Renesas Electronics Corp 209,686,100 0.74% 33,600 JPY Rohm Co Ltd 419,328,000 1.48% 54,800 JPY SUMCO Corp 158,262,400 0.56% 23,100 JPY Tokyo Electron Ltd 471,240,000 1.67%
Total for Semiconductors 1,258,516,500 4.45%
Software
48,800 JPY DeNA Co Ltd 113,362,400 0.40% 94,900 JPY Koei Tecmo Holdings Co Ltd 216,087,300 0.76% 35,000 JPY Konami Holdings Corp 217,000,000 0.77% 26,500 JPY Square Enix Holdings Co Ltd 142,040,000 0.50%
Total for Software 688,489,700 2.43%
Telecommunications
80,100 JPY SoftBank Group Corp 714,492,000 2.52% Total for Telecommunications 714,492,000 2.52%
Toys/Games/Hobbies
15,200 JPY Nintendo Co Ltd 626,088,000 2.21% Total for Toys/Games/Hobbies 626,088,000 2.21%
Transportation
52,300 JPY Nippon Yusen KK 143,772,700 0.51% 124,800 JPY Seibu Holdings Inc 265,948,800 0.94% 174,000 JPY Yamato Holdings Co Ltd 394,545,000 1.39%
Total for Transportation 804,266,500 2.84%
Total Common Stocks (Shares) 28,178,231,700 99.57%
Total Transferable Securities and Money Market Instruments Admitted to an Official Stock Exchange Listing or Dealt in on Another Regulated Market 28,178,231,700 99.57%
Total investments 28,178,231,700 99.57%
Cash and cash equivalents 196,950,565 0.70%
Bank overdraft and other net liabilities (76,119,515) (0.27% )
Total net assets 28,299,062,750 100.00%
Analysis of Investments as % of total assets
Transferable securities and money market instruments admitted to an official stock exchange listing or dealt in on another regulated market 98.67% Other assets 1.33%
Total assets 100.00%
The accompanying notes form an integral part of these financial statements.
Standard Life Investments Global SICAV
Société d'Investissement à Capital Variable
81
Japanese Equity High Alpha Fund
Sub-fund Objective and Investment Policy The objective of the Sub-fund is to achieve long-term growth in the share price through capital appreciation of the underlying equity portfolio. It will achieve
this objective primarily through investment in equities and equity related securities of corporations domiciled in Japan, or companies that derive a significant
proportion of their revenues or profits from Japanese operations or have a significant proportion of their assets there.
The Sub-fund will be actively managed and aims to outperform the Japanese equity market over the medium to long term. The Sub-fund holdings will be
subject to less restrictive constraints versus the current reference index and be managed with a higher performance or "alpha" in mind than a typical core
Japanese equity offering. The constraints and alpha generation target may vary over time.
Performance Review Over the period, the Fund rose 29.71% compared with a 20.14% return for the MSCI Japan Index.*
Mitsui Mining and Smelting was a leading contributor during the period. Investors looked favourably on its micro-thin, copper foil for high-end smartphones,
as well as the recovery of the copper mining business of its partner Caserones. Elsewhere, Komatsu added value as investors appreciated the upward
revision of its earnings guidance, which was based on greater demand for its machines, including construction machinery in Asia and mining equipment.
Rohm also proved positive when an improvement in the mid-term outlook for semiconductor demand in the auto industry raised expectations for the
company’s future growth potential. Lastly, JXTG Holdings received a ratings upgrade from brokers, which projected further margin improvement in its
domestic refinery industry.
On the downside, Subaru underperformed on a weaker auto-market environment in the US and China, as well as news that the firm had carried out
improper vehicle inspections. Murata Manufacturing also detracted from relative returns due to production problems expected to impact earnings. Mitsui
Fudosan declined following a decline in expectations for domestic prices and inflation, despite its business operation achieving substantial earnings growth.
Finally, weaker-than-expected earnings hindered discount chain store Don Quijote Holdings, as did an increase in cheaper product sales that deteriorated
profit margins.
*Sub-fund performance has been calculated over the stated period on the share price performance basis, based on the institutional share class (D
Accumulation) and net of fees. Please note the index return is quoted gross and contains no adjustment for fees. The sub-fund performance will also be
impacted by any pricing basis changes, made under our single swinging price policy. More information on our swinging price approach can be found in note
8 of the Financial Statements.
Outlook
Please note that the commitment approach has been used for risk measurement and calculation of global exposure for this Sub-fund.
This Sub-fund is not authorised in Hong Kong and is not available to Hong Kong residents.
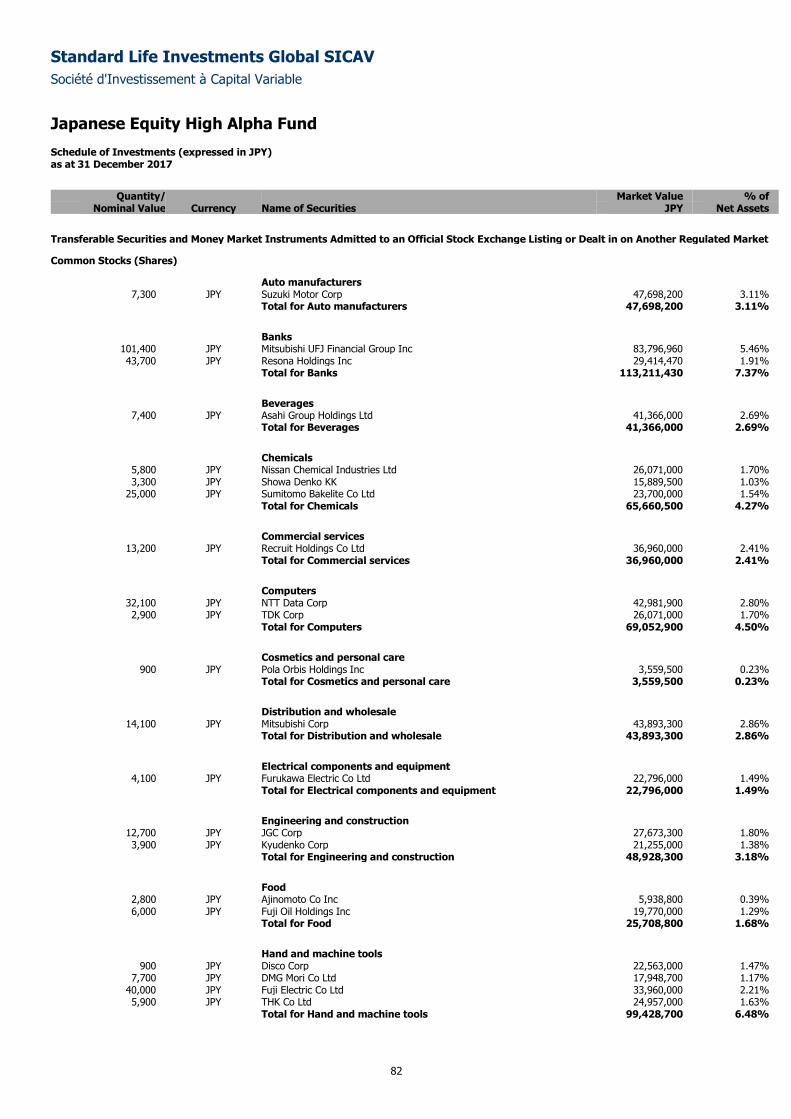
Standard Life Investments Global SICAV
Société d'Investissement à Capital Variable
Japanese Equity High Alpha Fund
Schedule of Investments (expressed in JPY) as at 31 December 2017
82
Quantity/ Market Value % of
Nominal Value Currency Name of Securities JPY Net Assets
Transferable Securities and Money Market Instruments Admitted to an Official Stock Exchange Listing or Dealt in on Another Regulated Market
Common Stocks (Shares)
Auto manufacturers 7,300 JPY Suzuki Motor Corp 47,698,200 3.11%
Total for Auto manufacturers 47,698,200 3.11%
Banks
101,400 JPY Mitsubishi UFJ Financial Group Inc 83,796,960 5.46% 43,700 JPY Resona Holdings Inc 29,414,470 1.91%
Total for Banks 113,211,430 7.37%
Beverages
7,400 JPY Asahi Group Holdings Ltd 41,366,000 2.69% Total for Beverages 41,366,000 2.69%
Chemicals
5,800 JPY Nissan Chemical Industries Ltd 26,071,000 1.70% 3,300 JPY Showa Denko KK 15,889,500 1.03%
25,000 JPY Sumitomo Bakelite Co Ltd 23,700,000 1.54% Total for Chemicals 65,660,500 4.27%
Commercial services
13,200 JPY Recruit Holdings Co Ltd 36,960,000 2.41% Total for Commercial services 36,960,000 2.41%
Computers
32,100 JPY NTT Data Corp 42,981,900 2.80% 2,900 JPY TDK Corp 26,071,000 1.70%
Total for Computers 69,052,900 4.50%
Cosmetics and personal care
900 JPY Pola Orbis Holdings Inc 3,559,500 0.23% Total for Cosmetics and personal care 3,559,500 0.23%
Distribution and wholesale
14,100 JPY Mitsubishi Corp 43,893,300 2.86% Total for Distribution and wholesale 43,893,300 2.86%
Electrical components and equipment
4,100 JPY Furukawa Electric Co Ltd 22,796,000 1.49% Total for Electrical components and equipment 22,796,000 1.49%
Engineering and construction
12,700 JPY JGC Corp 27,673,300 1.80% 3,900 JPY Kyudenko Corp 21,255,000 1.38%
Total for Engineering and construction 48,928,300 3.18%
Food
2,800 JPY Ajinomoto Co Inc 5,938,800 0.39% 6,000 JPY Fuji Oil Holdings Inc 19,770,000 1.29%
Total for Food 25,708,800 1.68%
Hand and machine tools
900 JPY Disco Corp 22,563,000 1.47% 7,700 JPY DMG Mori Co Ltd 17,948,700 1.17%
40,000 JPY Fuji Electric Co Ltd 33,960,000 2.21% 5,900 JPY THK Co Ltd 24,957,000 1.63%
Total for Hand and machine tools 99,428,700 6.48%
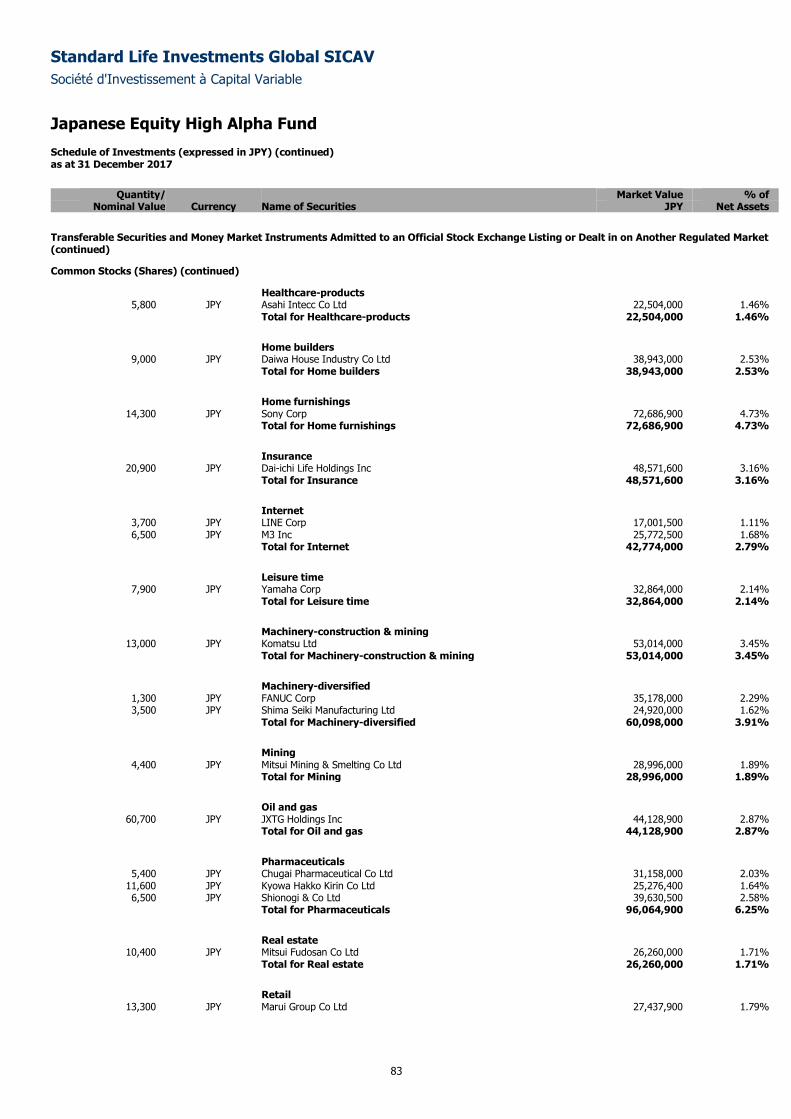
Standard Life Investments Global SICAV
Société d'Investissement à Capital Variable
Japanese Equity High Alpha Fund
Schedule of Investments (expressed in JPY) (continued) as at 31 December 2017
83
Quantity/ Market Value % of
Nominal Value Currency Name of Securities JPY Net Assets
Transferable Securities and Money Market Instruments Admitted to an Official Stock Exchange Listing or Dealt in on Another Regulated Market (continued)
Common Stocks (Shares) (continued)
Healthcare-products 5,800 JPY Asahi Intecc Co Ltd 22,504,000 1.46%
Total for Healthcare-products 22,504,000 1.46%
Home builders
9,000 JPY Daiwa House Industry Co Ltd 38,943,000 2.53% Total for Home builders 38,943,000 2.53%
Home furnishings
14,300 JPY Sony Corp 72,686,900 4.73% Total for Home furnishings 72,686,900 4.73%
Insurance
20,900 JPY Dai-ichi Life Holdings Inc 48,571,600 3.16% Total for Insurance 48,571,600 3.16%
Internet
3,700 JPY LINE Corp 17,001,500 1.11% 6,500 JPY M3 Inc 25,772,500 1.68%
Total for Internet 42,774,000 2.79%
Leisure time
7,900 JPY Yamaha Corp 32,864,000 2.14% Total for Leisure time 32,864,000 2.14%
Machinery-construction & mining
13,000 JPY Komatsu Ltd 53,014,000 3.45% Total for Machinery-construction & mining 53,014,000 3.45%
Machinery-diversified
1,300 JPY FANUC Corp 35,178,000 2.29% 3,500 JPY Shima Seiki Manufacturing Ltd 24,920,000 1.62%
Total for Machinery-diversified 60,098,000 3.91%
Mining
4,400 JPY Mitsui Mining & Smelting Co Ltd 28,996,000 1.89% Total for Mining 28,996,000 1.89%
Oil and gas
60,700 JPY JXTG Holdings Inc 44,128,900 2.87% Total for Oil and gas 44,128,900 2.87%
Pharmaceuticals
5,400 JPY Chugai Pharmaceutical Co Ltd 31,158,000 2.03% 11,600 JPY Kyowa Hakko Kirin Co Ltd 25,276,400 1.64% 6,500 JPY Shionogi & Co Ltd 39,630,500 2.58%
Total for Pharmaceuticals 96,064,900 6.25%
Real estate
10,400 JPY Mitsui Fudosan Co Ltd 26,260,000 1.71% Total for Real estate 26,260,000 1.71%
Retail
13,300 JPY Marui Group Co Ltd 27,437,900 1.79%
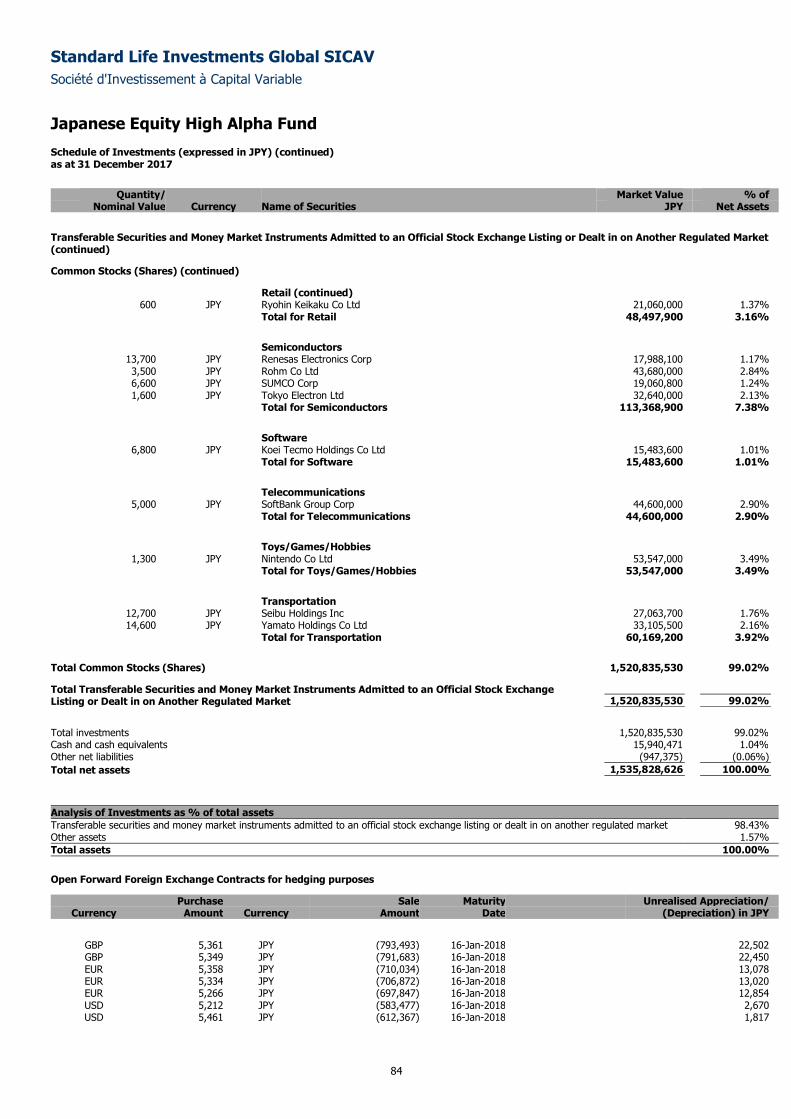
Standard Life Investments Global SICAV
Société d'Investissement à Capital Variable
Japanese Equity High Alpha Fund
Schedule of Investments (expressed in JPY) (continued) as at 31 December 2017
84
Quantity/ Market Value % of
Nominal Value Currency Name of Securities JPY Net Assets
Transferable Securities and Money Market Instruments Admitted to an Official Stock Exchange Listing or Dealt in on Another Regulated Market (continued)
Common Stocks (Shares) (continued)
Retail (continued) 600 JPY Ryohin Keikaku Co Ltd 21,060,000 1.37%
Total for Retail 48,497,900 3.16%
Semiconductors
13,700 JPY Renesas Electronics Corp 17,988,100 1.17% 3,500 JPY Rohm Co Ltd 43,680,000 2.84% 6,600 JPY SUMCO Corp 19,060,800 1.24% 1,600 JPY Tokyo Electron Ltd 32,640,000 2.13%
Total for Semiconductors 113,368,900 7.38%
Software
6,800 JPY Koei Tecmo Holdings Co Ltd 15,483,600 1.01% Total for Software 15,483,600 1.01%
Telecommunications
5,000 JPY SoftBank Group Corp 44,600,000 2.90% Total for Telecommunications 44,600,000 2.90%
Toys/Games/Hobbies
1,300 JPY Nintendo Co Ltd 53,547,000 3.49% Total for Toys/Games/Hobbies 53,547,000 3.49%
Transportation
12,700 JPY Seibu Holdings Inc 27,063,700 1.76% 14,600 JPY Yamato Holdings Co Ltd 33,105,500 2.16%
Total for Transportation 60,169,200 3.92%
Total Common Stocks (Shares) 1,520,835,530 99.02%
Total Transferable Securities and Money Market Instruments Admitted to an Official Stock Exchange Listing or Dealt in on Another Regulated Market 1,520,835,530 99.02%
Total investments 1,520,835,530 99.02%
Cash and cash equivalents 15,940,471 1.04%
Other net liabilities (947,375) (0.06% )
Total net assets 1,535,828,626 100.00%
Analysis of Investments as % of total assets
Transferable securities and money market instruments admitted to an official stock exchange listing or dealt in on another regulated market 98.43% Other assets 1.57%
Total assets 100.00%
Open Forward Foreign Exchange Contracts for hedging purposes
Purchase Sale Maturity Unrealised Appreciation/ Currency Amount Currency Amount Date (Depreciation) in JPY
GBP 5,361 JPY (793,493) 16-Jan-2018 22,502 GBP 5,349 JPY (791,683) 16-Jan-2018 22,450 EUR 5,358 JPY (710,034) 16-Jan-2018 13,078 EUR 5,334 JPY (706,872) 16-Jan-2018 13,020 EUR 5,266 JPY (697,847) 16-Jan-2018 12,854 USD 5,212 JPY (583,477) 16-Jan-2018 2,670 USD 5,461 JPY (612,367) 16-Jan-2018 1,817
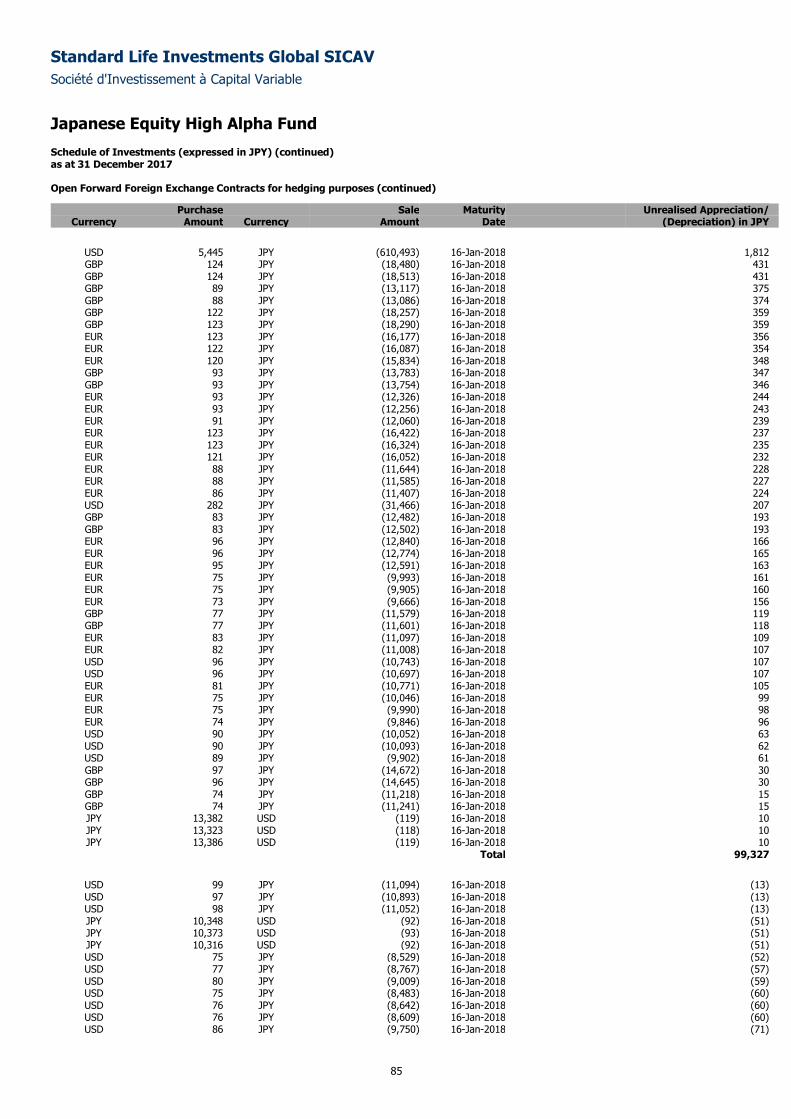
Standard Life Investments Global SICAV
Société d'Investissement à Capital Variable
Japanese Equity High Alpha Fund
Schedule of Investments (expressed in JPY) (continued) as at 31 December 2017
85
Open Forward Foreign Exchange Contracts for hedging purposes (continued)
Purchase Sale Maturity Unrealised Appreciation/ Currency Amount Currency Amount Date (Depreciation) in JPY
USD 5,445 JPY (610,493) 16-Jan-2018 1,812 GBP 124 JPY (18,480) 16-Jan-2018 431 GBP 124 JPY (18,513) 16-Jan-2018 431 GBP 89 JPY (13,117) 16-Jan-2018 375 GBP 88 JPY (13,086) 16-Jan-2018 374 GBP 122 JPY (18,257) 16-Jan-2018 359 GBP 123 JPY (18,290) 16-Jan-2018 359 EUR 123 JPY (16,177) 16-Jan-2018 356 EUR 122 JPY (16,087) 16-Jan-2018 354 EUR 120 JPY (15,834) 16-Jan-2018 348 GBP 93 JPY (13,783) 16-Jan-2018 347 GBP 93 JPY (13,754) 16-Jan-2018 346 EUR 93 JPY (12,326) 16-Jan-2018 244 EUR 93 JPY (12,256) 16-Jan-2018 243 EUR 91 JPY (12,060) 16-Jan-2018 239 EUR 123 JPY (16,422) 16-Jan-2018 237 EUR 123 JPY (16,324) 16-Jan-2018 235 EUR 121 JPY (16,052) 16-Jan-2018 232 EUR 88 JPY (11,644) 16-Jan-2018 228 EUR 88 JPY (11,585) 16-Jan-2018 227 EUR 86 JPY (11,407) 16-Jan-2018 224 USD 282 JPY (31,466) 16-Jan-2018 207 GBP 83 JPY (12,482) 16-Jan-2018 193 GBP 83 JPY (12,502) 16-Jan-2018 193 EUR 96 JPY (12,840) 16-Jan-2018 166 EUR 96 JPY (12,774) 16-Jan-2018 165 EUR 95 JPY (12,591) 16-Jan-2018 163 EUR 75 JPY (9,993) 16-Jan-2018 161 EUR 75 JPY (9,905) 16-Jan-2018 160 EUR 73 JPY (9,666) 16-Jan-2018 156 GBP 77 JPY (11,579) 16-Jan-2018 119 GBP 77 JPY (11,601) 16-Jan-2018 118 EUR 83 JPY (11,097) 16-Jan-2018 109 EUR 82 JPY (11,008) 16-Jan-2018 107 USD 96 JPY (10,743) 16-Jan-2018 107 USD 96 JPY (10,697) 16-Jan-2018 107 EUR 81 JPY (10,771) 16-Jan-2018 105 EUR 75 JPY (10,046) 16-Jan-2018 99 EUR 75 JPY (9,990) 16-Jan-2018 98 EUR 74 JPY (9,846) 16-Jan-2018 96 USD 90 JPY (10,052) 16-Jan-2018 63 USD 90 JPY (10,093) 16-Jan-2018 62 USD 89 JPY (9,902) 16-Jan-2018 61 GBP 97 JPY (14,672) 16-Jan-2018 30 GBP 96 JPY (14,645) 16-Jan-2018 30 GBP 74 JPY (11,218) 16-Jan-2018 15 GBP 74 JPY (11,241) 16-Jan-2018 15 JPY 13,382 USD (119) 16-Jan-2018 10 JPY 13,323 USD (118) 16-Jan-2018 10 JPY 13,386 USD (119) 16-Jan-2018 10
Total 99,327
USD 99 JPY (11,094) 16-Jan-2018 (13) USD 97 JPY (10,893) 16-Jan-2018 (13) USD 98 JPY (11,052) 16-Jan-2018 (13) JPY 10,348 USD (92) 16-Jan-2018 (51) JPY 10,373 USD (93) 16-Jan-2018 (51) JPY 10,316 USD (92) 16-Jan-2018 (51) USD 75 JPY (8,529) 16-Jan-2018 (52) USD 77 JPY (8,767) 16-Jan-2018 (57) USD 80 JPY (9,009) 16-Jan-2018 (59) USD 75 JPY (8,483) 16-Jan-2018 (60) USD 76 JPY (8,642) 16-Jan-2018 (60) USD 76 JPY (8,609) 16-Jan-2018 (60) USD 86 JPY (9,750) 16-Jan-2018 (71)
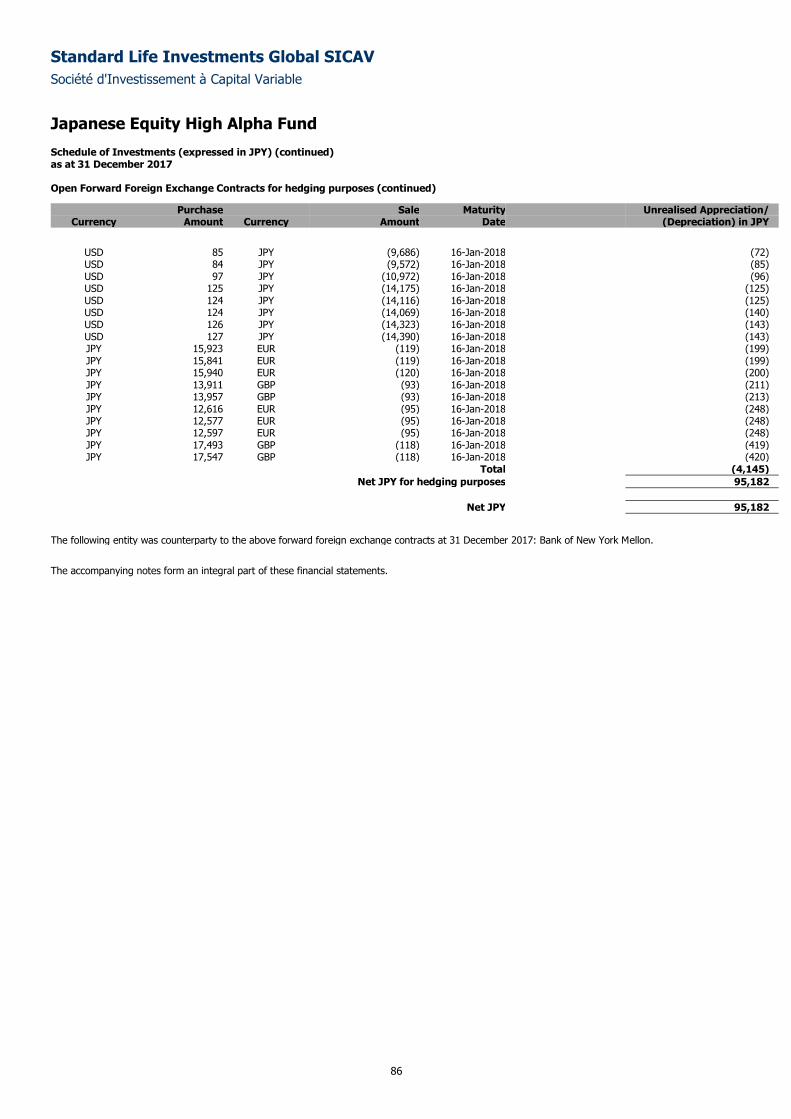
Standard Life Investments Global SICAV
Société d'Investissement à Capital Variable
Japanese Equity High Alpha Fund
Schedule of Investments (expressed in JPY) (continued) as at 31 December 2017
86
Open Forward Foreign Exchange Contracts for hedging purposes (continued)
Purchase Sale Maturity Unrealised Appreciation/ Currency Amount Currency Amount Date (Depreciation) in JPY
USD 85 JPY (9,686) 16-Jan-2018 (72) USD 84 JPY (9,572) 16-Jan-2018 (85) USD 97 JPY (10,972) 16-Jan-2018 (96) USD 125 JPY (14,175) 16-Jan-2018 (125) USD 124 JPY (14,116) 16-Jan-2018 (125) USD 124 JPY (14,069) 16-Jan-2018 (140) USD 126 JPY (14,323) 16-Jan-2018 (143) USD 127 JPY (14,390) 16-Jan-2018 (143) JPY 15,923 EUR (119) 16-Jan-2018 (199) JPY 15,841 EUR (119) 16-Jan-2018 (199) JPY 15,940 EUR (120) 16-Jan-2018 (200) JPY 13,911 GBP (93) 16-Jan-2018 (211) JPY 13,957 GBP (93) 16-Jan-2018 (213) JPY 12,616 EUR (95) 16-Jan-2018 (248) JPY 12,577 EUR (95) 16-Jan-2018 (248) JPY 12,597 EUR (95) 16-Jan-2018 (248) JPY 17,493 GBP (118) 16-Jan-2018 (419) JPY 17,547 GBP (118) 16-Jan-2018 (420)
Total (4,145)
Net JPY for hedging purposes 95,182
Net JPY 95,182
The following entity was counterparty to the above forward foreign exchange contracts at 31 December 2017: Bank of New York Mellon.
The accompanying notes form an integral part of these financial statements.
Standard Life Investments Global SICAV
Société d'Investissement à Capital Variable
87
European Equities Fund
Sub-fund Objective and Investment Policy The objective of the Sub-fund is to achieve long-term growth in the share price through capital appreciation of the underlying equity portfolio. It will achieve
this objective primarily through investment in equities and equity related securities of corporations domiciled in European countries (which might include
emerging markets of Europe), or companies that derive a significant proportion of their revenues or profits from European operations or have a significant
proportion of their assets there.
Performance Review The Fund rose 12.41% over the review period, compared to the MSCI Europe Index, which returned 10.88%.*
Holding shares in luxury goods company Kering, owner of the Gucci brand, supported Fund performance. The firm enjoyed significant growth and pricing
power, which translated into more profitable sales. This pace of expansion will, at some point, slow but there is longevity to the company’s actions. Value
also came from Ambu, which makes disposable equipment for medical procedures. The company saw demand for its products rise during the period. In
other developments, travel company TUI demonstrated strength in its hotels and cruise businesses; and online payment processing specialist Wirecard
continued to deliver growth that was faster than expected in its end markets.
Less positively, the Fund’s pharmaceutical exposure weighed on performance. This was chiefly due to Shire, which experienced earlier-than-expected
generic competition. Broadcast company ProSiebenSat.1 was another underperformer, as its share of the core German TV market declined more than
expected, despite its digital commerce business delivering a strong diversification strategy. Among banking stocks, Virgin Money was impacted by concerns
about loan growth and quality. Elsewhere, Assa Abloy, the global leader in locks and security solutions, has been through a difficult period. Firstly, it had to
explain its credentials following underperformance in China; then its CEO announced that he was retiring. However, we retain a positive view and believe
that the company’s fundamentals remain intact.
*Sub-fund performance has been calculated over the stated period on the share price performance basis, based on the institutional share class (D
Accumulation) in euro and net of fees. Please note the index return is quoted gross and contains no adjustment for fees. The sub-fund performance will also
be impacted by any pricing basis changes, made under our single swinging price policy. More information on our swinging price approach can be found in
note 8 of the Financial Statements.
Outlook European monetary policy is still accommodative (although the extent of this may have peaked) despite recent tightening in the US and the UK. The political environment has been less favourable, however, with a government coalition still to be formed in Germany, elections in Italy, a regional poll in Catalonia and continuing uncertainty over Brexit. We are mindful that political events can drive volatility in equity markets in the short term. Inflation is increasing, and the gradually rising yield environment should be supportive for equity valuations, provided growth continues to improve. Therefore, we expect that cyclicals will remain in focus but are mindful of expectations relative to valuation. Please note that the commitment approach has been used for risk measurement and calculation of global exposure for this Sub-fund.
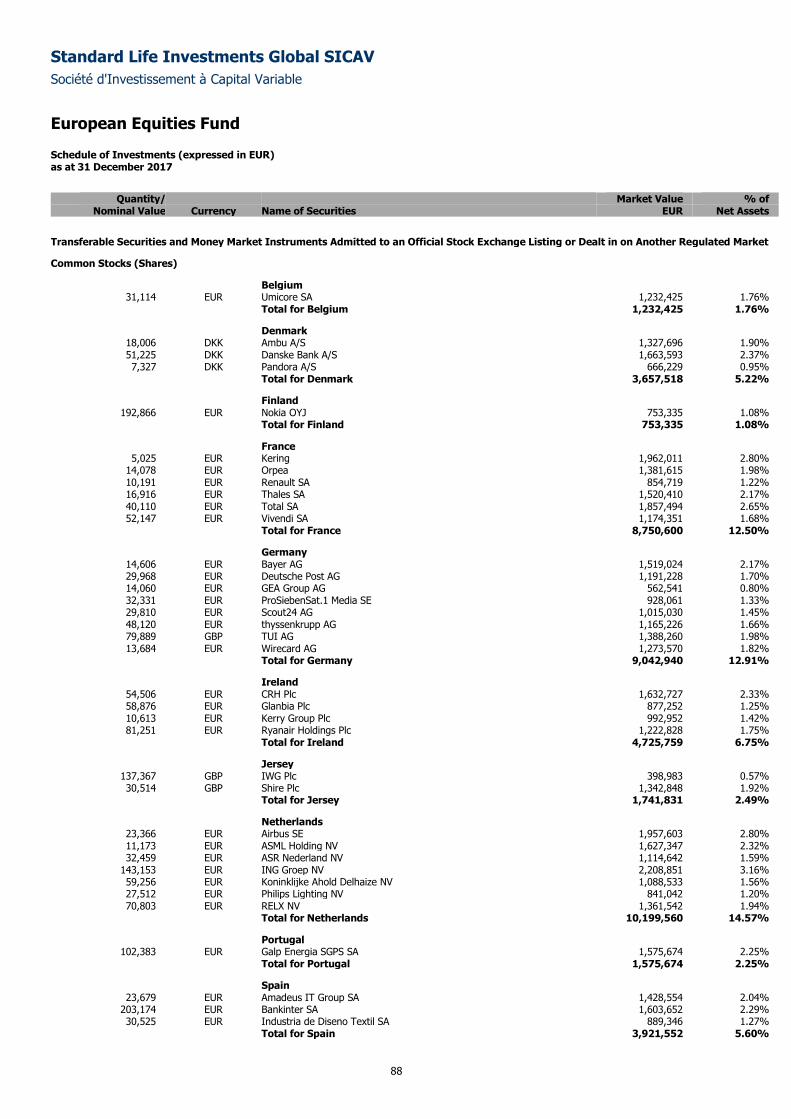
Standard Life Investments Global SICAV
Société d'Investissement à Capital Variable
European Equities Fund Schedule of Investments (expressed in EUR) as at 31 December 2017
88
Quantity/ Market Value % of
Nominal Value Currency Name of Securities EUR Net Assets
Transferable Securities and Money Market Instruments Admitted to an Official Stock Exchange Listing or Dealt in on Another Regulated Market
Common Stocks (Shares)
Belgium 31,114 EUR Umicore SA 1,232,425 1.76%
Total for Belgium 1,232,425 1.76%
Denmark 18,006 DKK Ambu A/S 1,327,696 1.90% 51,225 DKK Danske Bank A/S 1,663,593 2.37% 7,327 DKK Pandora A/S 666,229 0.95%
Total for Denmark 3,657,518 5.22%
Finland 192,866 EUR Nokia OYJ 753,335 1.08%
Total for Finland 753,335 1.08%
France 5,025 EUR Kering 1,962,011 2.80%
14,078 EUR Orpea 1,381,615 1.98% 10,191 EUR Renault SA 854,719 1.22% 16,916 EUR Thales SA 1,520,410 2.17% 40,110 EUR Total SA 1,857,494 2.65% 52,147 EUR Vivendi SA 1,174,351 1.68%
Total for France 8,750,600 12.50%
Germany 14,606 EUR Bayer AG 1,519,024 2.17% 29,968 EUR Deutsche Post AG 1,191,228 1.70% 14,060 EUR GEA Group AG 562,541 0.80% 32,331 EUR ProSiebenSat.1 Media SE 928,061 1.33% 29,810 EUR Scout24 AG 1,015,030 1.45% 48,120 EUR thyssenkrupp AG 1,165,226 1.66% 79,889 GBP TUI AG 1,388,260 1.98% 13,684 EUR Wirecard AG 1,273,570 1.82%
Total for Germany 9,042,940 12.91%
Ireland 54,506 EUR CRH Plc 1,632,727 2.33% 58,876 EUR Glanbia Plc 877,252 1.25% 10,613 EUR Kerry Group Plc 992,952 1.42% 81,251 EUR Ryanair Holdings Plc 1,222,828 1.75%
Total for Ireland 4,725,759 6.75%
Jersey 137,367 GBP IWG Plc 398,983 0.57% 30,514 GBP Shire Plc 1,342,848 1.92%
Total for Jersey 1,741,831 2.49%
Netherlands 23,366 EUR Airbus SE 1,957,603 2.80% 11,173 EUR ASML Holding NV 1,627,347 2.32% 32,459 EUR ASR Nederland NV 1,114,642 1.59%
143,153 EUR ING Groep NV 2,208,851 3.16% 59,256 EUR Koninklijke Ahold Delhaize NV 1,088,533 1.56% 27,512 EUR Philips Lighting NV 841,042 1.20% 70,803 EUR RELX NV 1,361,542 1.94%
Total for Netherlands 10,199,560 14.57%
Portugal 102,383 EUR Galp Energia SGPS SA 1,575,674 2.25%
Total for Portugal 1,575,674 2.25%
Spain 23,679 EUR Amadeus IT Group SA 1,428,554 2.04%
203,174 EUR Bankinter SA 1,603,652 2.29% 30,525 EUR Industria de Diseno Textil SA 889,346 1.27%
Total for Spain 3,921,552 5.60%
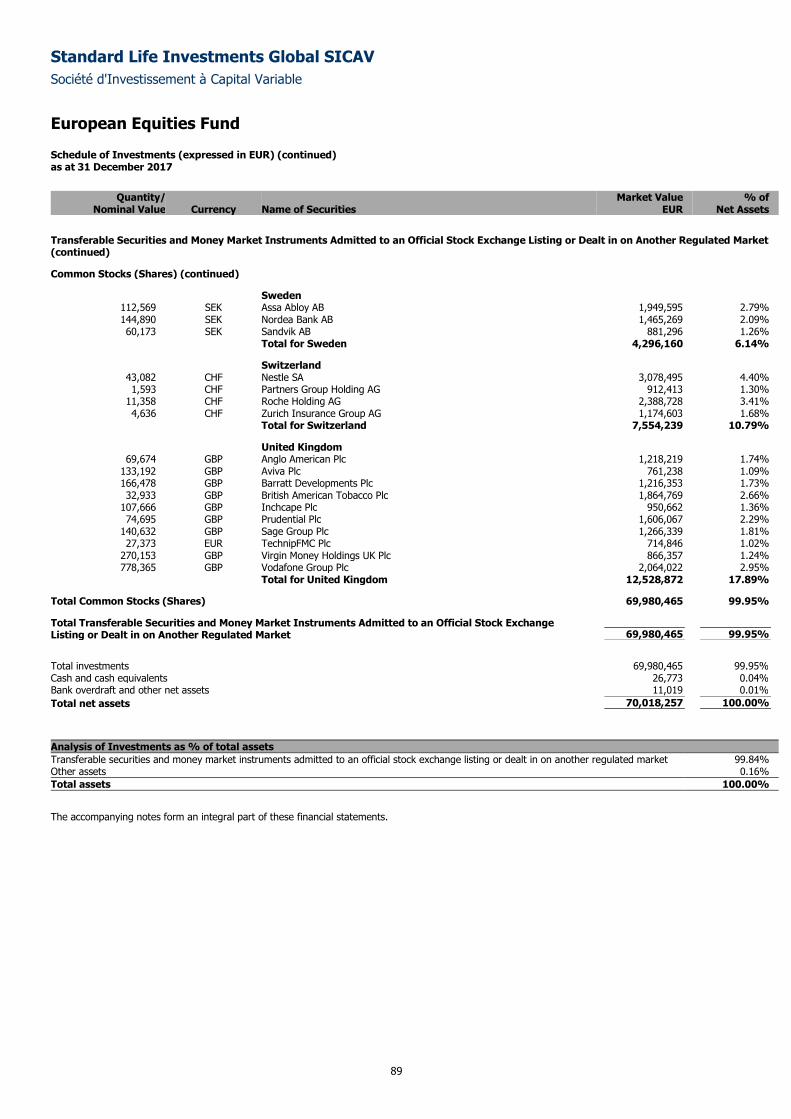
Standard Life Investments Global SICAV
Société d'Investissement à Capital Variable
European Equities Fund Schedule of Investments (expressed in EUR) (continued) as at 31 December 2017
89
Quantity/ Market Value % of
Nominal Value Currency Name of Securities EUR Net Assets
Transferable Securities and Money Market Instruments Admitted to an Official Stock Exchange Listing or Dealt in on Another Regulated Market (continued)
Common Stocks (Shares) (continued)
Sweden 112,569 SEK Assa Abloy AB 1,949,595 2.79% 144,890 SEK Nordea Bank AB 1,465,269 2.09% 60,173 SEK Sandvik AB 881,296 1.26%
Total for Sweden 4,296,160 6.14%
Switzerland 43,082 CHF Nestle SA 3,078,495 4.40% 1,593 CHF Partners Group Holding AG 912,413 1.30%
11,358 CHF Roche Holding AG 2,388,728 3.41% 4,636 CHF Zurich Insurance Group AG 1,174,603 1.68%
Total for Switzerland 7,554,239 10.79%
United Kingdom 69,674 GBP Anglo American Plc 1,218,219 1.74%
133,192 GBP Aviva Plc 761,238 1.09% 166,478 GBP Barratt Developments Plc 1,216,353 1.73% 32,933 GBP British American Tobacco Plc 1,864,769 2.66%
107,666 GBP Inchcape Plc 950,662 1.36% 74,695 GBP Prudential Plc 1,606,067 2.29%
140,632 GBP Sage Group Plc 1,266,339 1.81% 27,373 EUR TechnipFMC Plc 714,846 1.02%
270,153 GBP Virgin Money Holdings UK Plc 866,357 1.24% 778,365 GBP Vodafone Group Plc 2,064,022 2.95%
Total for United Kingdom 12,528,872 17.89%
Total Common Stocks (Shares) 69,980,465 99.95%
Total Transferable Securities and Money Market Instruments Admitted to an Official Stock Exchange Listing or Dealt in on Another Regulated Market 69,980,465 99.95%
Total investments 69,980,465 99.95%
Cash and cash equivalents 26,773 0.04%
Bank overdraft and other net assets 11,019 0.01%
Total net assets 70,018,257 100.00%
Analysis of Investments as % of total assets
Transferable securities and money market instruments admitted to an official stock exchange listing or dealt in on another regulated market 99.84% Other assets 0.16%
Total assets 100.00%
The accompanying notes form an integral part of these financial statements.
Standard Life Investments Global SICAV
Société d'Investissement à Capital Variable
90
Global REIT Focus Fund
Sub-fund Objective and Investment Policy
The investment objective of the Sub-fund is to maximise total return from income and capital appreciation by investing primarily in listed closed ended real
estate investment trusts (“REITs”) or securities and companies principally engaged in real estate activities on a global basis.
A REIT is a company usually listed on a stock exchange that owns and manages predominantly income-producing property, either commercial or residential.
Most of its taxable income is distributed to shareholders through dividends, in return for which the company is largely exempt from corporation tax. REITs
are designed to offer investors income and capital appreciation from rented property assets in a tax-efficient way, with a return over the time more closely
aligned with direct property investment. This is achieved by taking away the “double taxation” (corporation tax plus the tax on dividends) of real estate
funds. REITs allow investors to invest in property as an asset class by creating a more liquid and tax-efficient vehicle than solely investing in the direct
property markets.
Performance Review
The Sub-fund returned -2.72% over the period, compared to a total return of -2.13% from the FTSE EPRA NAREIT Developed Index (euro terms).*
Stock selection in Japan detracted from performance, as small-cap holdings Takara Leben and Ichigo failed to react to the positive news from result
releases. An underweight allocation (relative to the benchmark) in Hong Kong was also negative, with the country outperforming despite our fears that
prices for residential real estate remain unsustainably high. Finally, a general market rotation out of technology stocks at the end of the year was
detrimental for our data centre holdings Equinix and Digital Realty.
On the upside, an off-benchmark holding in US C Corp hotels made a positive contribution towards performance, as Marriott Hotels outperformed steadily
during the year. Our marginally overweight position in Continental Europe was enhanced by strong stock selection, with robust performance from our
Spanish holdings Hispania and Axiare Patrimono. In the UK, our holding in Segro generated strong performance, as UK logistics generated significant
underlying value gains.
*Sub-fund performance has been calculated over the stated period on the share price performance basis, based on the institutional share class (D
Accumulation) and net of fees. Please note the index return is quoted gross and contains no adjustment for fees. The sub-fund performance will also be
impacted by any pricing basis changes, made under our single swinging price policy. More information on our swinging price approach can be found in note
8 of the Financial Statements.
Outlook
We continue to focus on companies that should benefit from strong real estate fundamentals and earnings. As interest rates begin to rise, investors are no
longer paying extra for yield. Therefore, higher-quality, lower-yielding stocks should outperform. At this stage in the capital cycle, we are looking for
markets with rental growth and expect a benign but rising interest rate environment.
In the US, our focus is on the industrial and digital communications (data centres and cell tower) REIT sectors. We are overweight in Continental Europe,
focused on Spain, where the pace of economic recovery remains strong. Elsewhere, we have an underweight position in the UK, where we favour exposure
to the industrial sector. We maintain an underweight position in Hong Kong and Japan, given weak economic fundamentals. We also hold selective positions
in Singapore and Australia, where we see stock-specific outperformance opportunities.
Please note that the commitment approach has been used for risk measurement and calculation of global exposure for this Sub-fund.
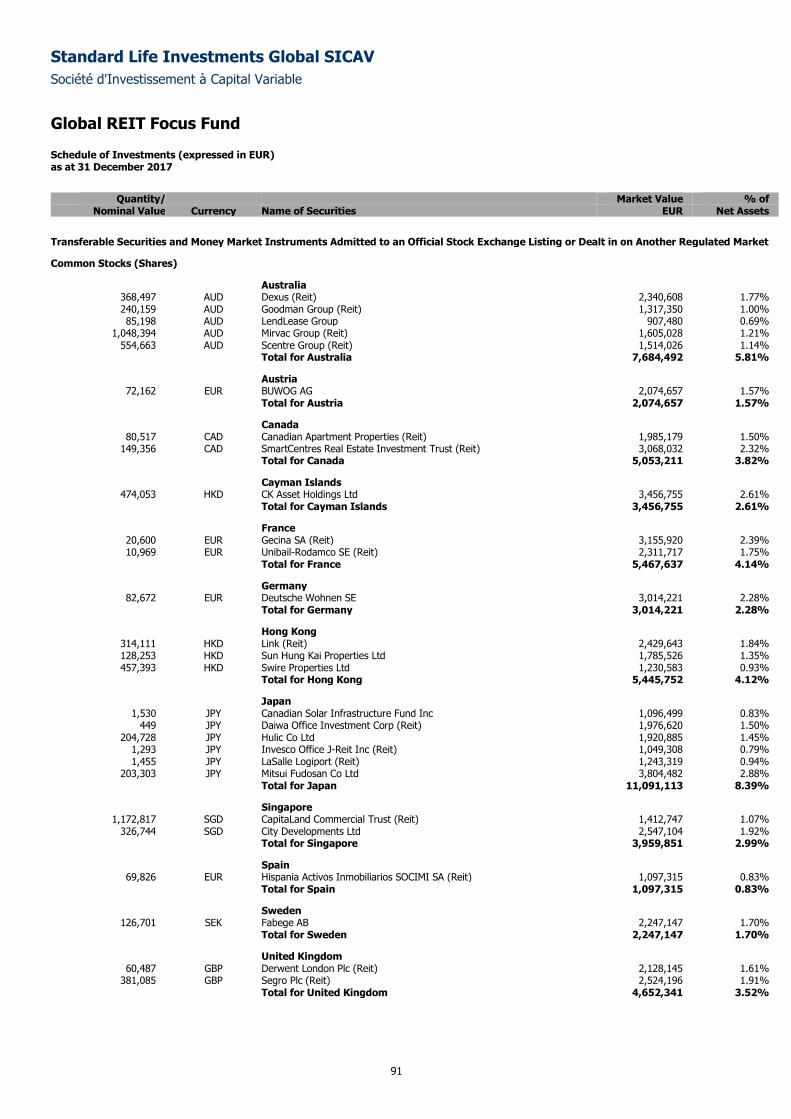
Standard Life Investments Global SICAV
Société d'Investissement à Capital Variable
Global REIT Focus Fund
Schedule of Investments (expressed in EUR) as at 31 December 2017
91
Quantity/ Market Value % of
Nominal Value Currency Name of Securities EUR Net Assets
Transferable Securities and Money Market Instruments Admitted to an Official Stock Exchange Listing or Dealt in on Another Regulated Market
Common Stocks (Shares)
Australia 368,497 AUD Dexus (Reit) 2,340,608 1.77% 240,159 AUD Goodman Group (Reit) 1,317,350 1.00% 85,198 AUD LendLease Group 907,480 0.69%
1,048,394 AUD Mirvac Group (Reit) 1,605,028 1.21% 554,663 AUD Scentre Group (Reit) 1,514,026 1.14%
Total for Australia 7,684,492 5.81%
Austria 72,162 EUR BUWOG AG 2,074,657 1.57%
Total for Austria 2,074,657 1.57%
Canada 80,517 CAD Canadian Apartment Properties (Reit) 1,985,179 1.50%
149,356 CAD SmartCentres Real Estate Investment Trust (Reit) 3,068,032 2.32% Total for Canada 5,053,211 3.82%
Cayman Islands 474,053 HKD CK Asset Holdings Ltd 3,456,755 2.61%
Total for Cayman Islands 3,456,755 2.61%
France 20,600 EUR Gecina SA (Reit) 3,155,920 2.39% 10,969 EUR Unibail-Rodamco SE (Reit) 2,311,717 1.75%
Total for France 5,467,637 4.14%
Germany 82,672 EUR Deutsche Wohnen SE 3,014,221 2.28%
Total for Germany 3,014,221 2.28%
Hong Kong 314,111 HKD Link (Reit) 2,429,643 1.84% 128,253 HKD Sun Hung Kai Properties Ltd 1,785,526 1.35% 457,393 HKD Swire Properties Ltd 1,230,583 0.93%
Total for Hong Kong 5,445,752 4.12%
Japan 1,530 JPY Canadian Solar Infrastructure Fund Inc 1,096,499 0.83%
449 JPY Daiwa Office Investment Corp (Reit) 1,976,620 1.50% 204,728 JPY Hulic Co Ltd 1,920,885 1.45%
1,293 JPY Invesco Office J-Reit Inc (Reit) 1,049,308 0.79% 1,455 JPY LaSalle Logiport (Reit) 1,243,319 0.94%
203,303 JPY Mitsui Fudosan Co Ltd 3,804,482 2.88% Total for Japan 11,091,113 8.39%
Singapore 1,172,817 SGD CapitaLand Commercial Trust (Reit) 1,412,747 1.07%
326,744 SGD City Developments Ltd 2,547,104 1.92% Total for Singapore 3,959,851 2.99%
Spain 69,826 EUR Hispania Activos Inmobiliarios SOCIMI SA (Reit) 1,097,315 0.83%
Total for Spain 1,097,315 0.83%
Sweden 126,701 SEK Fabege AB 2,247,147 1.70%
Total for Sweden 2,247,147 1.70%
United Kingdom 60,487 GBP Derwent London Plc (Reit) 2,128,145 1.61%
381,085 GBP Segro Plc (Reit) 2,524,196 1.91% Total for United Kingdom 4,652,341 3.52%
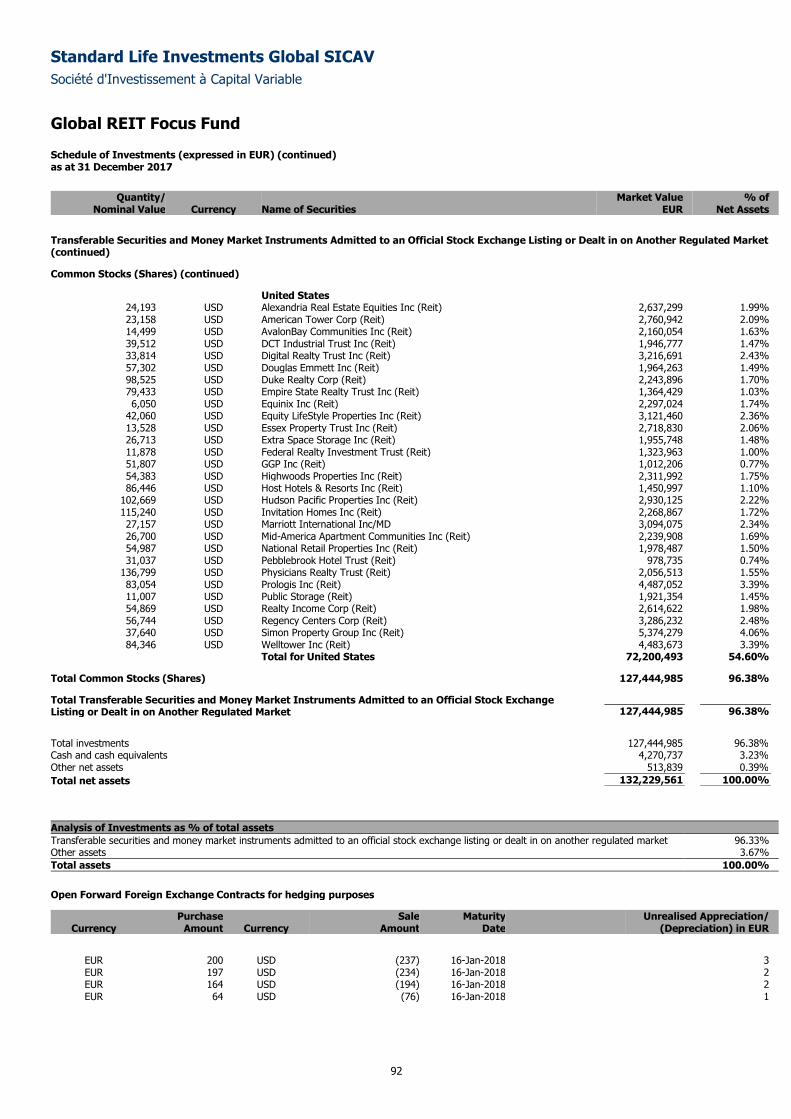
Standard Life Investments Global SICAV
Société d'Investissement à Capital Variable
Global REIT Focus Fund
Schedule of Investments (expressed in EUR) (continued) as at 31 December 2017
92
Quantity/ Market Value % of
Nominal Value Currency Name of Securities EUR Net Assets
Transferable Securities and Money Market Instruments Admitted to an Official Stock Exchange Listing or Dealt in on Another Regulated Market (continued)
Common Stocks (Shares) (continued)
United States 24,193 USD Alexandria Real Estate Equities Inc (Reit) 2,637,299 1.99% 23,158 USD American Tower Corp (Reit) 2,760,942 2.09% 14,499 USD AvalonBay Communities Inc (Reit) 2,160,054 1.63% 39,512 USD DCT Industrial Trust Inc (Reit) 1,946,777 1.47% 33,814 USD Digital Realty Trust Inc (Reit) 3,216,691 2.43% 57,302 USD Douglas Emmett Inc (Reit) 1,964,263 1.49% 98,525 USD Duke Realty Corp (Reit) 2,243,896 1.70% 79,433 USD Empire State Realty Trust Inc (Reit) 1,364,429 1.03% 6,050 USD Equinix Inc (Reit) 2,297,024 1.74%
42,060 USD Equity LifeStyle Properties Inc (Reit) 3,121,460 2.36% 13,528 USD Essex Property Trust Inc (Reit) 2,718,830 2.06% 26,713 USD Extra Space Storage Inc (Reit) 1,955,748 1.48% 11,878 USD Federal Realty Investment Trust (Reit) 1,323,963 1.00% 51,807 USD GGP Inc (Reit) 1,012,206 0.77% 54,383 USD Highwoods Properties Inc (Reit) 2,311,992 1.75% 86,446 USD Host Hotels & Resorts Inc (Reit) 1,450,997 1.10%
102,669 USD Hudson Pacific Properties Inc (Reit) 2,930,125 2.22% 115,240 USD Invitation Homes Inc (Reit) 2,268,867 1.72% 27,157 USD Marriott International Inc/MD 3,094,075 2.34% 26,700 USD Mid-America Apartment Communities Inc (Reit) 2,239,908 1.69% 54,987 USD National Retail Properties Inc (Reit) 1,978,487 1.50% 31,037 USD Pebblebrook Hotel Trust (Reit) 978,735 0.74%
136,799 USD Physicians Realty Trust (Reit) 2,056,513 1.55% 83,054 USD Prologis Inc (Reit) 4,487,052 3.39% 11,007 USD Public Storage (Reit) 1,921,354 1.45% 54,869 USD Realty Income Corp (Reit) 2,614,622 1.98% 56,744 USD Regency Centers Corp (Reit) 3,286,232 2.48% 37,640 USD Simon Property Group Inc (Reit) 5,374,279 4.06% 84,346 USD Welltower Inc (Reit) 4,483,673 3.39%
Total for United States 72,200,493 54.60%
Total Common Stocks (Shares) 127,444,985 96.38%
Total Transferable Securities and Money Market Instruments Admitted to an Official Stock Exchange Listing or Dealt in on Another Regulated Market 127,444,985 96.38%
Total investments 127,444,985 96.38%
Cash and cash equivalents 4,270,737 3.23%
Other net assets 513,839 0.39%
Total net assets 132,229,561 100.00%
Analysis of Investments as % of total assets
Transferable securities and money market instruments admitted to an official stock exchange listing or dealt in on another regulated market 96.33% Other assets 3.67%
Total assets 100.00%
Open Forward Foreign Exchange Contracts for hedging purposes
Purchase Sale Maturity Unrealised Appreciation/ Currency Amount Currency Amount Date (Depreciation) in EUR
EUR 200 USD (237) 16-Jan-2018 3 EUR 197 USD (234) 16-Jan-2018 2 EUR 164 USD (194) 16-Jan-2018 2 EUR 64 USD (76) 16-Jan-2018 1
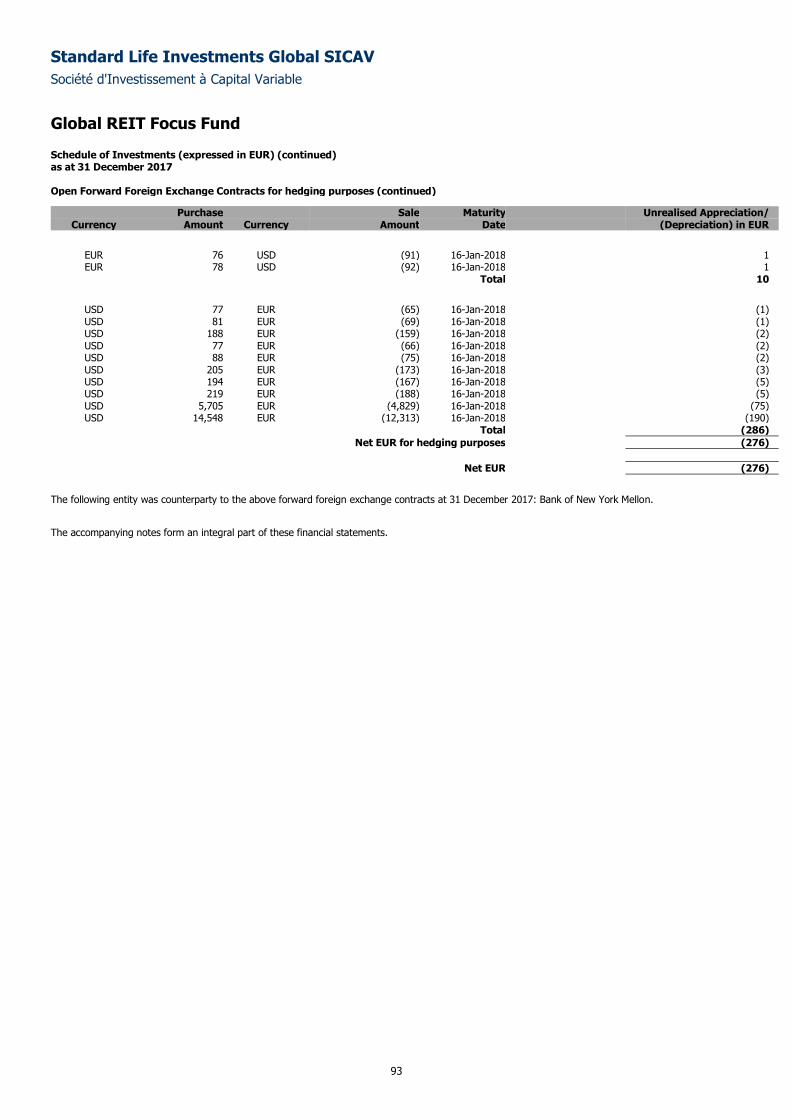
Standard Life Investments Global SICAV
Société d'Investissement à Capital Variable
Global REIT Focus Fund
Schedule of Investments (expressed in EUR) (continued) as at 31 December 2017
93
Open Forward Foreign Exchange Contracts for hedging purposes (continued)
Purchase Sale Maturity Unrealised Appreciation/ Currency Amount Currency Amount Date (Depreciation) in EUR
EUR 76 USD (91) 16-Jan-2018 1 EUR 78 USD (92) 16-Jan-2018 1
Total 10
USD 77 EUR (65) 16-Jan-2018 (1) USD 81 EUR (69) 16-Jan-2018 (1) USD 188 EUR (159) 16-Jan-2018 (2) USD 77 EUR (66) 16-Jan-2018 (2) USD 88 EUR (75) 16-Jan-2018 (2) USD 205 EUR (173) 16-Jan-2018 (3) USD 194 EUR (167) 16-Jan-2018 (5) USD 219 EUR (188) 16-Jan-2018 (5) USD 5,705 EUR (4,829) 16-Jan-2018 (75) USD 14,548 EUR (12,313) 16-Jan-2018 (190)
Total (286)
Net EUR for hedging purposes (276)
Net EUR (276)
The following entity was counterparty to the above forward foreign exchange contracts at 31 December 2017: Bank of New York Mellon.
The accompanying notes form an integral part of these financial statements.
Standard Life Investments Global SICAV
Société d'Investissement à Capital Variable
94
European Smaller Companies Fund
Sub-fund Objective and Investment Policy The investment objective of the Sub-fund is to achieve long-term growth in the share price through capital appreciation of the underlying portfolio. It will
achieve this objective primarily through investment in small cap European equities and equity related securities of corporations domiciled or listed in
European countries (which include the UK and the emerging markets of Europe) or companies that derive a significant proportion of their revenues or profits
from European operations or have a significant proportion of their assets there.
Performance Review The Fund was up by 21.61% over the review period, compared to the FTSE Small Cap Developed Europe Index, which returned 17.73%.*
Our holding in drinks company Fever-Tree performed well during the period. The business announced robust results, which were substantially ahead of
consensus expectations. This resulted in material upgrades to forecasts for the remainder of this year and next. In addition, the company continued to
benefit from growth in the specialty gins market and a strong brand position both in the UK and internationally. Forklift truck manufacturer Jungheinrich was
also strong, given healthy demand from the warehouse market and the rising trend towards warehouse automation. We retain our view that the company
should be able to exceed its stated 2020 targets. Intermediate Capital was another solid performer. This followed a positive set of results that confirmed a
strong period of fundraising and a further move in its business mix towards better-quality asset management earnings.
Less positively, funeral services provider Dignity detracted from relative returns. The company announced an adjustment to its longer-term expected growth
rate, which overshadowed good results. Borregaard was relatively weak following results that indicated difficulties within the European concrete market. The
company is allocating volume to other areas in order to compensate, and we believe that its problems are short term in nature. The longer-term investment
case remains intact, with the firm looking to increase capacity over the next three years. Finally, investment company Melrose proved disappointing. That
said, we maintain our holding, as we believe that the better-than-expected progress made following the acquisition of Nortek is likely to continue.
*Sub-fund performance has been calculated over the stated period on the share price performance basis, based on the institutional share class (D
Accumulation) in euro and net of fees. Please note the index return is quoted gross and contains no adjustment for fees. The sub-fund performance will also
be impacted by any pricing basis changes, made under our single swinging price policy. More information on our swinging price approach can be found in
note 8 of the Financial Statements.
Outlook Economic data in Europe remained strong in the final three months of 2017, with a recent Eurozone manufacturing PMI the highest on record. In turn, this helped equities to climb higher. European monetary policy is still accommodative (although the extent of this may have peaked) despite recent tightening in the US and the UK. The political environment has been less favourable, however, with a government coalition still to be formed in Germany, elections in Italy, a regional poll in Catalonia and continuing uncertainty over Brexit. We are mindful that political events can drive volatility in equity markets in the short term. From a Fund perspective, we remain focused on individual company investment cases, and continue to seek high-quality companies with good growth prospects and positive operating momentum. Please note that the commitment approach has been used for risk measurement and calculation of global exposure for this Sub-fund.
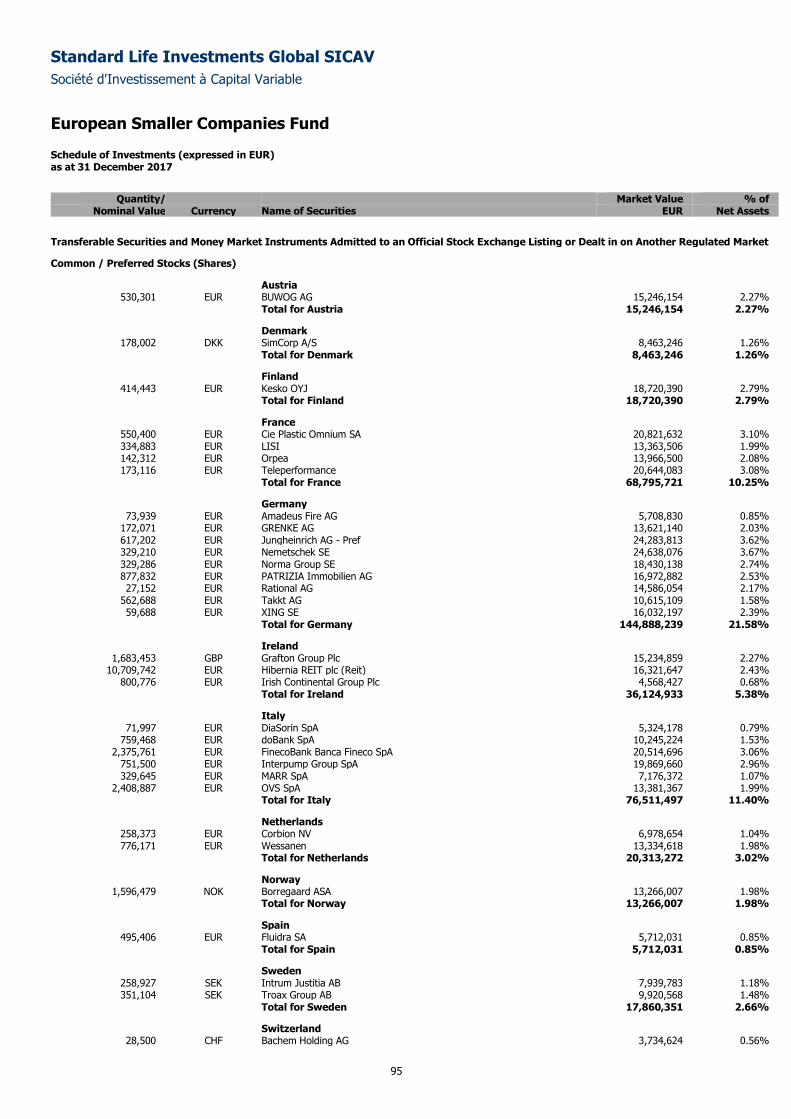
Standard Life Investments Global SICAV
Société d'Investissement à Capital Variable
European Smaller Companies Fund
Schedule of Investments (expressed in EUR) as at 31 December 2017
95
Quantity/ Market Value % of
Nominal Value Currency Name of Securities EUR Net Assets
Transferable Securities and Money Market Instruments Admitted to an Official Stock Exchange Listing or Dealt in on Another Regulated Market
Common / Preferred Stocks (Shares)
Austria 530,301 EUR BUWOG AG 15,246,154 2.27%
Total for Austria 15,246,154 2.27%
Denmark 178,002 DKK SimCorp A/S 8,463,246 1.26%
Total for Denmark 8,463,246 1.26%
Finland 414,443 EUR Kesko OYJ 18,720,390 2.79%
Total for Finland 18,720,390 2.79%
France 550,400 EUR Cie Plastic Omnium SA 20,821,632 3.10% 334,883 EUR LISI 13,363,506 1.99% 142,312 EUR Orpea 13,966,500 2.08% 173,116 EUR Teleperformance 20,644,083 3.08%
Total for France 68,795,721 10.25%
Germany 73,939 EUR Amadeus Fire AG 5,708,830 0.85%
172,071 EUR GRENKE AG 13,621,140 2.03% 617,202 EUR Jungheinrich AG - Pref 24,283,813 3.62% 329,210 EUR Nemetschek SE 24,638,076 3.67% 329,286 EUR Norma Group SE 18,430,138 2.74% 877,832 EUR PATRIZIA Immobilien AG 16,972,882 2.53% 27,152 EUR Rational AG 14,586,054 2.17%
562,688 EUR Takkt AG 10,615,109 1.58% 59,688 EUR XING SE 16,032,197 2.39%
Total for Germany 144,888,239 21.58%
Ireland 1,683,453 GBP Grafton Group Plc 15,234,859 2.27%
10,709,742 EUR Hibernia REIT plc (Reit) 16,321,647 2.43% 800,776 EUR Irish Continental Group Plc 4,568,427 0.68%
Total for Ireland 36,124,933 5.38%
Italy 71,997 EUR DiaSorin SpA 5,324,178 0.79%
759,468 EUR doBank SpA 10,245,224 1.53% 2,375,761 EUR FinecoBank Banca Fineco SpA 20,514,696 3.06%
751,500 EUR Interpump Group SpA 19,869,660 2.96% 329,645 EUR MARR SpA 7,176,372 1.07%
2,408,887 EUR OVS SpA 13,381,367 1.99% Total for Italy 76,511,497 11.40%
Netherlands 258,373 EUR Corbion NV 6,978,654 1.04% 776,171 EUR Wessanen 13,334,618 1.98%
Total for Netherlands 20,313,272 3.02%
Norway 1,596,479 NOK Borregaard ASA 13,266,007 1.98%
Total for Norway 13,266,007 1.98%
Spain 495,406 EUR Fluidra SA 5,712,031 0.85%
Total for Spain 5,712,031 0.85%
Sweden 258,927 SEK Intrum Justitia AB 7,939,783 1.18% 351,104 SEK Troax Group AB 9,920,568 1.48%
Total for Sweden 17,860,351 2.66%
Switzerland 28,500 CHF Bachem Holding AG 3,734,624 0.56%
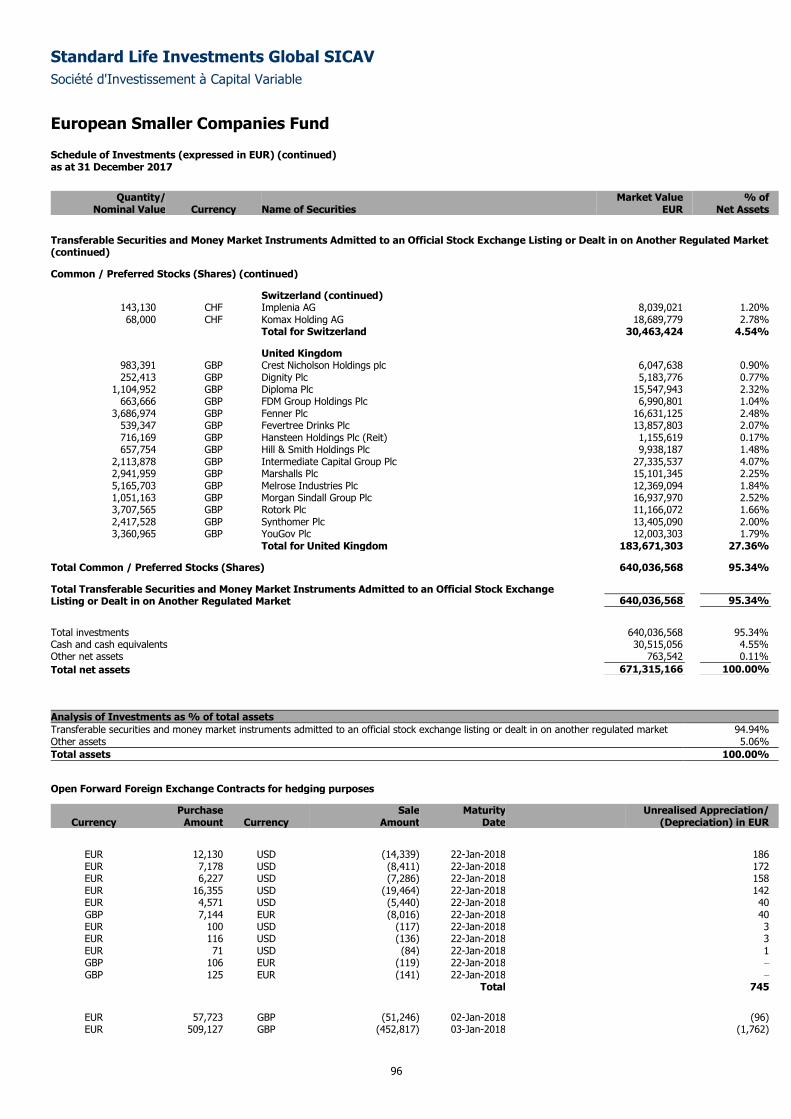
Standard Life Investments Global SICAV
Société d'Investissement à Capital Variable
European Smaller Companies Fund
Schedule of Investments (expressed in EUR) (continued) as at 31 December 2017
96
Quantity/ Market Value % of
Nominal Value Currency Name of Securities EUR Net Assets
Transferable Securities and Money Market Instruments Admitted to an Official Stock Exchange Listing or Dealt in on Another Regulated Market (continued)
Common / Preferred Stocks (Shares) (continued)
Switzerland (continued) 143,130 CHF Implenia AG 8,039,021 1.20% 68,000 CHF Komax Holding AG 18,689,779 2.78%
Total for Switzerland 30,463,424 4.54%
United Kingdom 983,391 GBP Crest Nicholson Holdings plc 6,047,638 0.90% 252,413 GBP Dignity Plc 5,183,776 0.77%
1,104,952 GBP Diploma Plc 15,547,943 2.32% 663,666 GBP FDM Group Holdings Plc 6,990,801 1.04%
3,686,974 GBP Fenner Plc 16,631,125 2.48% 539,347 GBP Fevertree Drinks Plc 13,857,803 2.07% 716,169 GBP Hansteen Holdings Plc (Reit) 1,155,619 0.17% 657,754 GBP Hill & Smith Holdings Plc 9,938,187 1.48%
2,113,878 GBP Intermediate Capital Group Plc 27,335,537 4.07% 2,941,959 GBP Marshalls Plc 15,101,345 2.25% 5,165,703 GBP Melrose Industries Plc 12,369,094 1.84% 1,051,163 GBP Morgan Sindall Group Plc 16,937,970 2.52% 3,707,565 GBP Rotork Plc 11,166,072 1.66% 2,417,528 GBP Synthomer Plc 13,405,090 2.00% 3,360,965 GBP YouGov Plc 12,003,303 1.79%
Total for United Kingdom 183,671,303 27.36%
Total Common / Preferred Stocks (Shares) 640,036,568 95.34%
Total Transferable Securities and Money Market Instruments Admitted to an Official Stock Exchange Listing or Dealt in on Another Regulated Market 640,036,568 95.34%
Total investments 640,036,568 95.34%
Cash and cash equivalents 30,515,056 4.55%
Other net assets 763,542 0.11%
Total net assets 671,315,166 100.00%
Analysis of Investments as % of total assets
Transferable securities and money market instruments admitted to an official stock exchange listing or dealt in on another regulated market 94.94% Other assets 5.06%
Total assets 100.00%
Open Forward Foreign Exchange Contracts for hedging purposes
Purchase Sale Maturity Unrealised Appreciation/ Currency Amount Currency Amount Date (Depreciation) in EUR
EUR 12,130 USD (14,339) 22-Jan-2018 186 EUR 7,178 USD (8,411) 22-Jan-2018 172 EUR 6,227 USD (7,286) 22-Jan-2018 158 EUR 16,355 USD (19,464) 22-Jan-2018 142 EUR 4,571 USD (5,440) 22-Jan-2018 40 GBP 7,144 EUR (8,016) 22-Jan-2018 40 EUR 100 USD (117) 22-Jan-2018 3 EUR 116 USD (136) 22-Jan-2018 3 EUR 71 USD (84) 22-Jan-2018 1 GBP 106 EUR (119) 22-Jan-2018 –
GBP 125 EUR (141) 22-Jan-2018 –
Total 745
EUR 57,723 GBP (51,246) 02-Jan-2018 (96) EUR 509,127 GBP (452,817) 03-Jan-2018 (1,762)
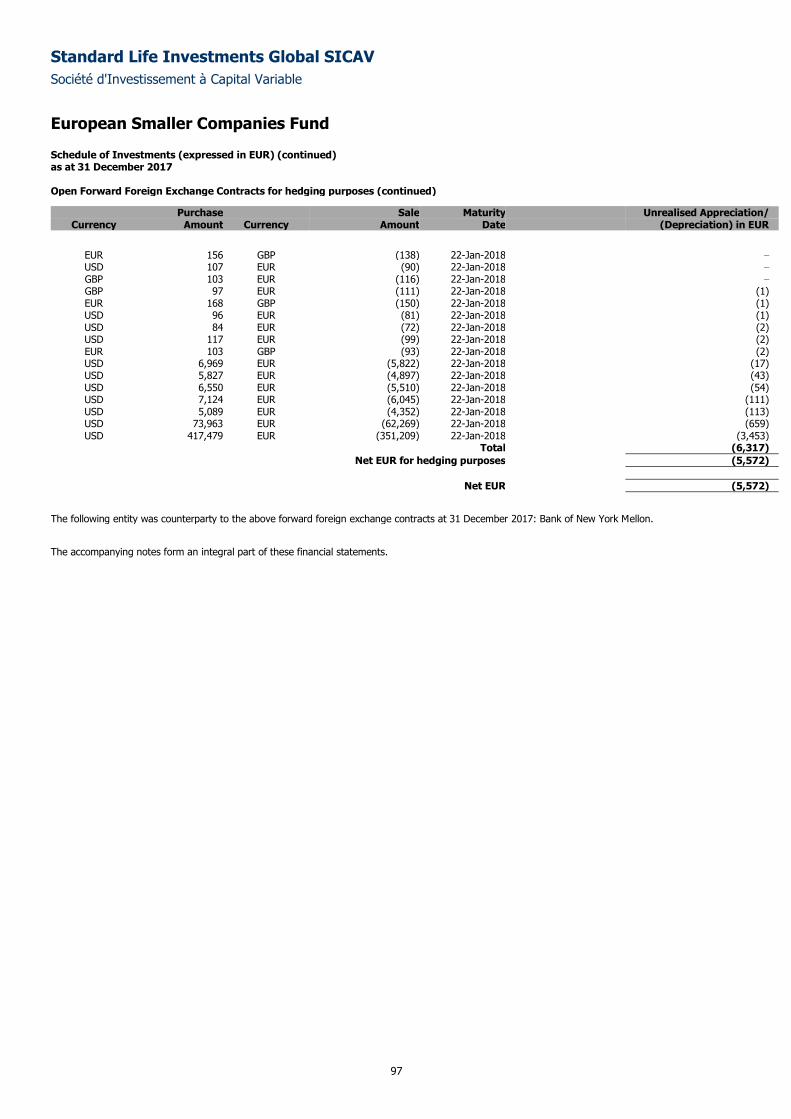
Standard Life Investments Global SICAV
Société d'Investissement à Capital Variable
European Smaller Companies Fund
Schedule of Investments (expressed in EUR) (continued) as at 31 December 2017
97
Open Forward Foreign Exchange Contracts for hedging purposes (continued)
Purchase Sale Maturity Unrealised Appreciation/ Currency Amount Currency Amount Date (Depreciation) in EUR
EUR 156 GBP (138) 22-Jan-2018 –
USD 107 EUR (90) 22-Jan-2018 –
GBP 103 EUR (116) 22-Jan-2018 –
GBP 97 EUR (111) 22-Jan-2018 (1) EUR 168 GBP (150) 22-Jan-2018 (1) USD 96 EUR (81) 22-Jan-2018 (1) USD 84 EUR (72) 22-Jan-2018 (2) USD 117 EUR (99) 22-Jan-2018 (2) EUR 103 GBP (93) 22-Jan-2018 (2) USD 6,969 EUR (5,822) 22-Jan-2018 (17) USD 5,827 EUR (4,897) 22-Jan-2018 (43) USD 6,550 EUR (5,510) 22-Jan-2018 (54) USD 7,124 EUR (6,045) 22-Jan-2018 (111) USD 5,089 EUR (4,352) 22-Jan-2018 (113) USD 73,963 EUR (62,269) 22-Jan-2018 (659) USD 417,479 EUR (351,209) 22-Jan-2018 (3,453)
Total (6,317)
Net EUR for hedging purposes (5,572)
Net EUR (5,572)
The following entity was counterparty to the above forward foreign exchange contracts at 31 December 2017: Bank of New York Mellon.
The accompanying notes form an integral part of these financial statements.
Standard Life Investments Global SICAV
Société d'Investissement à Capital Variable
98
Indian Equity Midcap Opportunities Fund
Sub-fund Objective and Investment Policy The objective of the Sub-fund (the “Indian Equity Midcap Opportunities Fund”) is to achieve long-term growth in the share price through capital
appreciation.
It aims to achieve this objective mainly through investment in mid-capitalisation equities (i.e. equity of companies that have a market capitalisation within
the range of the market capitalisation in the Nifty Midcap 100 Index) and equity related securities of corporations domiciled or listed in India or companies
that derive a significant proportion of their revenues or profits from Indian operations or have a significant proportion of their assets there. The Sub-fund
intends to invest part or all of its assets in Standard Life Investments GS (Mauritius Holdings) Limited (the “Subsidiary”). The Subsidiary is wholly owned by
the Company and is incorporated as a private limited company under the laws of Mauritius. The sole object of the Subsidiary is to carry out investment
activities on behalf of the Sub-fund, and the Subsidiary will apply the investment powers and restrictions of the Company as set out in Appendix A of the
Prospectus.
The Sub-fund will be actively managed by selecting stocks based on a number of fundamental factors which may include, but are not limited to, a
company's earnings growth, valuations and quality of management, and aims to outperform the mid-capitalisation segment of the Indian equity market over
the medium to long term. The Sub-fund invests in no prescribed industry sector. Due to the market capitalisation focus of the Sub-fund which mainly invests
in mid-capitalisation companies, the performance of the Sub-fund may be expected to deviate from the general Indian equity market, more than a portfolio
that is constructed relative to the composition of the overall Indian equity market would deviate from the general Indian equity market.
Performance Review
The Fund returned 53.32% over the review period in dollar terms, compared to the NIFTY Midcap 100 Index, was up 58.74%.
Looking at the positives first, Sundram Fasteners, which manufactures high-tensile fasteners, and motor vehicle parts and accessories performed well after
reporting positive profit numbers. Meanwhile, Voltas’s numbers were significantly ahead of consensus expectations thanks to strong demand in the domestic
air conditioner market and improved margins from its commercial business. Additional highlights Included Baja Finance, Baja Electricals and Apollo
Hospitals.
On the downside, Bank of Baroda’s shares fell after it announced a mixed set of results with higher-than-expected loan slippages. That said, the recent
interest rate cut, ongoing retail loan growth and its attractive valuation mean we maintain our faith in the stock.
*Sub-fund performance has been calculated over the stated period on the share price performance basis, based on the institutional share class (D
Accumulation) and net of fees. Please note the index return is quoted gross and contains no adjustment for fees. The sub-fund performance will also be
impacted by any pricing basis changes, made under our single swinging price policy. More information on our swinging price approach can be found in note
8 of the Financial Statements.
Outlook
We are relatively optimistic about the outlook for India. The economy is in good shape, while monetary policy is supportive. Prime Minister Modi has shown
that his reform agenda was more than just campaign rhetoric. His demonetisation move (whereby 86% of the money in circulation ceased to be legal tender
at the stroke of midnight) was certainly controversial, but should bear fruit in the long run. Meanwhile, the recently implemented Goods and Sales Tax is an
important step in overhauling the country’s tax regime. Against this backdrop, we continue to see numerous exciting opportunities from across the business
world.
Please note that the commitment approach has been used for risk measurement and calculation of global exposure for this Sub-fund.
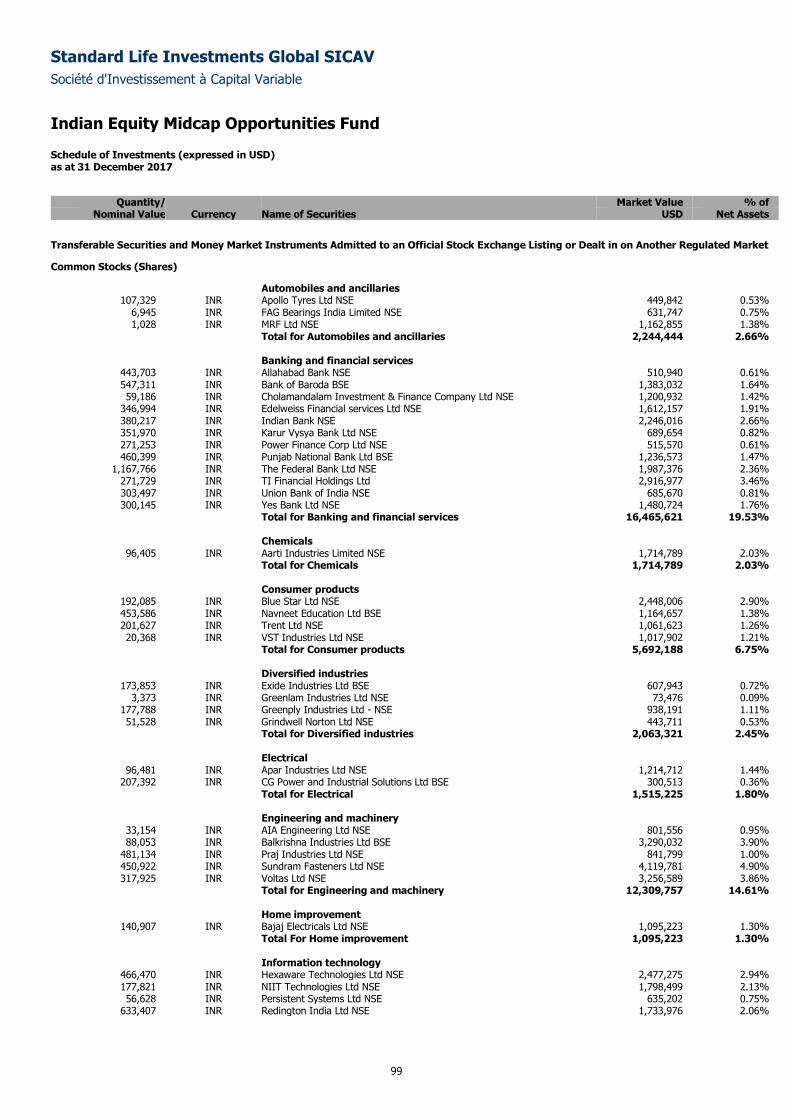
Standard Life Investments Global SICAV
Société d'Investissement à Capital Variable
Indian Equity Midcap Opportunities Fund
Schedule of Investments (expressed in USD) as at 31 December 2017
99
Quantity/ Market Value % of
Nominal Value Currency Name of Securities USD Net Assets
Transferable Securities and Money Market Instruments Admitted to an Official Stock Exchange Listing or Dealt in on Another Regulated Market
Common Stocks (Shares)
Automobiles and ancillaries 107,329 INR Apollo Tyres Ltd NSE 449,842 0.53%
6,945 INR FAG Bearings India Limited NSE 631,747 0.75% 1,028 INR MRF Ltd NSE 1,162,855 1.38%
Total for Automobiles and ancillaries 2,244,444 2.66% Banking and financial services
443,703 INR Allahabad Bank NSE 510,940 0.61% 547,311 INR Bank of Baroda BSE 1,383,032 1.64% 59,186 INR Cholamandalam Investment & Finance Company Ltd NSE 1,200,932 1.42%
346,994 INR Edelweiss Financial services Ltd NSE 1,612,157 1.91% 380,217 INR Indian Bank NSE 2,246,016 2.66% 351,970 INR Karur Vysya Bank Ltd NSE 689,654 0.82% 271,253 INR Power Finance Corp Ltd NSE 515,570 0.61% 460,399 INR Punjab National Bank Ltd BSE 1,236,573 1.47%
1,167,766 INR The Federal Bank Ltd NSE 1,987,376 2.36% 271,729 INR TI Financial Holdings Ltd 2,916,977 3.46% 303,497 INR Union Bank of India NSE 685,670 0.81% 300,145 INR Yes Bank Ltd NSE 1,480,724 1.76%
Total for Banking and financial services 16,465,621 19.53% Chemicals
96,405 INR Aarti Industries Limited NSE 1,714,789 2.03% Total for Chemicals 1,714,789 2.03% Consumer products
192,085 INR Blue Star Ltd NSE 2,448,006 2.90% 453,586 INR Navneet Education Ltd BSE 1,164,657 1.38% 201,627 INR Trent Ltd NSE 1,061,623 1.26% 20,368 INR VST Industries Ltd NSE 1,017,902 1.21%
Total for Consumer products 5,692,188 6.75%
Diversified industries 173,853 INR Exide Industries Ltd BSE 607,943 0.72%
3,373 INR Greenlam Industries Ltd NSE 73,476 0.09% 177,788 INR Greenply Industries Ltd - NSE 938,191 1.11% 51,528 INR Grindwell Norton Ltd NSE 443,711 0.53%
Total for Diversified industries 2,063,321 2.45% Electrical
96,481 INR Apar Industries Ltd NSE 1,214,712 1.44% 207,392 INR CG Power and Industrial Solutions Ltd BSE 300,513 0.36%
Total for Electrical 1,515,225 1.80% Engineering and machinery
33,154 INR AIA Engineering Ltd NSE 801,556 0.95% 88,053 INR Balkrishna Industries Ltd BSE 3,290,032 3.90%
481,134 INR Praj Industries Ltd NSE 841,799 1.00% 450,922 INR Sundram Fasteners Ltd NSE 4,119,781 4.90% 317,925 INR Voltas Ltd NSE 3,256,589 3.86%
Total for Engineering and machinery 12,309,757 14.61% Home improvement
140,907 INR Bajaj Electricals Ltd NSE 1,095,223 1.30% Total For Home improvement 1,095,223 1.30% Information technology
466,470 INR Hexaware Technologies Ltd NSE 2,477,275 2.94% 177,821 INR NIIT Technologies Ltd NSE 1,798,499 2.13% 56,628 INR Persistent Systems Ltd NSE 635,202 0.75%
633,407 INR Redington India Ltd NSE 1,733,976 2.06%
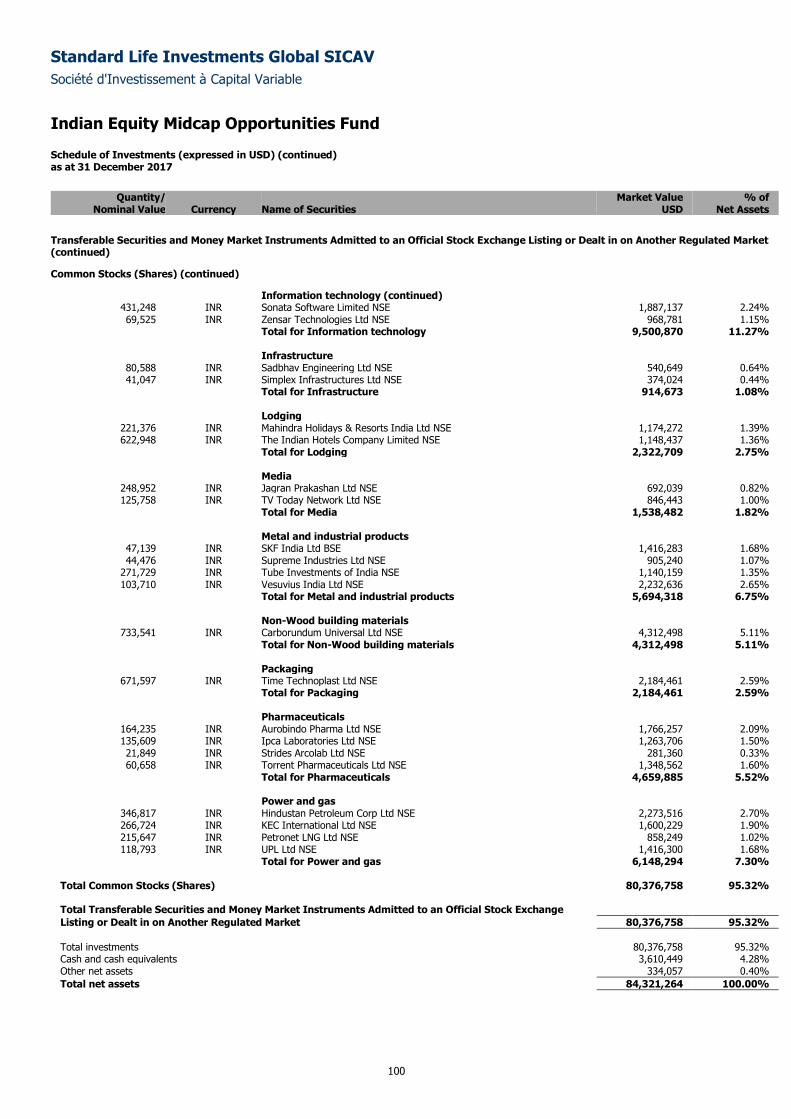
Standard Life Investments Global SICAV
Société d'Investissement à Capital Variable
Indian Equity Midcap Opportunities Fund
Schedule of Investments (expressed in USD) (continued) as at 31 December 2017
100
Quantity/ Market Value % of
Nominal Value Currency Name of Securities USD Net Assets
Transferable Securities and Money Market Instruments Admitted to an Official Stock Exchange Listing or Dealt in on Another Regulated Market (continued)
Common Stocks (Shares) (continued)
Information technology (continued) 431,248 INR Sonata Software Limited NSE 1,887,137 2.24% 69,525 INR Zensar Technologies Ltd NSE 968,781 1.15%
Total for Information technology 9,500,870 11.27% Infrastructure
80,588 INR Sadbhav Engineering Ltd NSE 540,649 0.64% 41,047 INR Simplex Infrastructures Ltd NSE 374,024 0.44%
Total for Infrastructure 914,673 1.08% Lodging
221,376 INR Mahindra Holidays & Resorts India Ltd NSE 1,174,272 1.39% 622,948 INR The Indian Hotels Company Limited NSE 1,148,437 1.36%
Total for Lodging 2,322,709 2.75% Media
248,952 INR Jagran Prakashan Ltd NSE 692,039 0.82% 125,758 INR TV Today Network Ltd NSE 846,443 1.00%
Total for Media 1,538,482 1.82% Metal and industrial products
47,139 INR SKF India Ltd BSE 1,416,283 1.68% 44,476 INR Supreme Industries Ltd NSE 905,240 1.07%
271,729 INR Tube Investments of India NSE 1,140,159 1.35% 103,710 INR Vesuvius India Ltd NSE 2,232,636 2.65%
Total for Metal and industrial products 5,694,318 6.75% Non-Wood building materials
733,541 INR Carborundum Universal Ltd NSE 4,312,498 5.11% Total for Non-Wood building materials 4,312,498 5.11% Packaging
671,597 INR Time Technoplast Ltd NSE 2,184,461 2.59% Total for Packaging 2,184,461 2.59%
Pharmaceuticals
164,235 INR Aurobindo Pharma Ltd NSE 1,766,257 2.09% 135,609 INR Ipca Laboratories Ltd NSE 1,263,706 1.50% 21,849 INR Strides Arcolab Ltd NSE 281,360 0.33% 60,658 INR Torrent Pharmaceuticals Ltd NSE 1,348,562 1.60%
Total for Pharmaceuticals 4,659,885 5.52%
Power and gas 346,817 INR Hindustan Petroleum Corp Ltd NSE 2,273,516 2.70% 266,724 INR KEC International Ltd NSE 1,600,229 1.90% 215,647 INR Petronet LNG Ltd NSE 858,249 1.02% 118,793 INR UPL Ltd NSE 1,416,300 1.68%
Total for Power and gas 6,148,294 7.30%
Total Common Stocks (Shares) 80,376,758 95.32% Total Transferable Securities and Money Market Instruments Admitted to an Official Stock Exchange
Listing or Dealt in on Another Regulated Market 80,376,758 95.32%
Total investments 80,376,758 95.32% Cash and cash equivalents 3,610,449 4.28% Other net assets 334,057 0.40%
Total net assets 84,321,264 100.00%
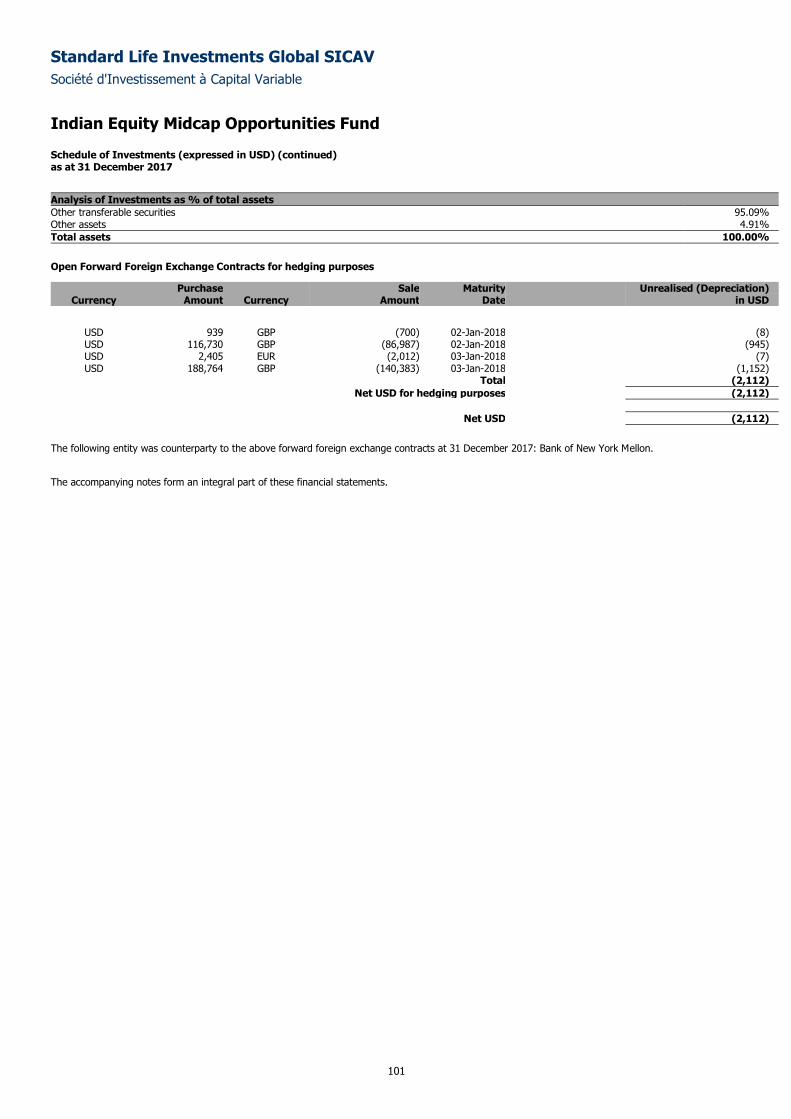
Standard Life Investments Global SICAV
Société d'Investissement à Capital Variable
Indian Equity Midcap Opportunities Fund
Schedule of Investments (expressed in USD) (continued) as at 31 December 2017
101
Analysis of Investments as % of total assets
Other transferable securities 95.09% Other assets 4.91%
Total assets 100.00%
Open Forward Foreign Exchange Contracts for hedging purposes
Purchase Sale Maturity Unrealised (Depreciation) Currency Amount Currency Amount Date in USD
USD 939 GBP (700) 02-Jan-2018 (8) USD 116,730 GBP (86,987) 02-Jan-2018 (945) USD 2,405 EUR (2,012) 03-Jan-2018 (7) USD 188,764 GBP (140,383) 03-Jan-2018 (1,152)
Total (2,112)
Net USD for hedging purposes (2,112)
Net USD (2,112)
The following entity was counterparty to the above forward foreign exchange contracts at 31 December 2017: Bank of New York Mellon.
The accompanying notes form an integral part of these financial statements.
Standard Life Investments Global SICAV
Société d'Investissement à Capital Variable
102
European Equity Unconstrained Fund
Sub-fund Objective and Investment Policy The objective of the Sub-fund is to achieve long-term growth in the share price through capital appreciation of the underlying equity portfolio. It will achieve
this objective primarily through investment in equities and equity related securities of corporations domiciled in European countries (which might include
emerging markets of Europe) or companies that derive a significant proportion of their revenues or profits from European operations or have a significant
proportion of their assets there. The Sub-fund will not be restricted by index weightings, sector constraints or company size.
The Sub-fund may invest in equity related securities, which may include preference shares, debt securities convertible into common shares, warrants on
transferable securities and other equity linked securities.
Performance Review The Fund rose by 4.40% over the review period, compared to the MSCI Europe Index, which returned 10.88%.* A position in temporary office space provider IWG disappointed. An increase in supply and depressed pricing in the sector placed pressure on the company, and it consequently issued a profit warning. We no longer hold the stock. Building materials company CRH also underperformed, as it faced poor weather in the US, dollar exposure and questions around its M&A policy. Pandora, a global manufacturer and retailer of jewellery, had a challenging year. However, we think the market is focusing too much on the problems Pandora had when it was just a charm company. Indeed, we feel the rising sales of non-charm products means that Pandora is a different business in this cycle and so we retain the holding. Positions in Shire, Svenska Handelsbanken and Inditex also disappointed. On a more positive note, Kering reported substantial organic growth that was driven by the continued recovery of its Gucci brand and general improvements in the luxury sector. In Germany, Deutsche Post gained from growth in parcel delivery, evidence of margin progression and improved return to shareholders. Finally, Anglo American found its shares in demand after it reinstated its dividend, with the improving outlook for commodities further driving performance. *Sub-fund performance has been calculated over the stated period on the share price performance basis, based on the institutional share class (D
Accumulation) in euro and net of fees. Please note the index return is quoted gross and contains no adjustment for fees. The sub-fund performance will also
be impacted by any pricing basis changes, made under our single swinging price policy. More information on our swinging price approach can be found in
note 8 of the Financial Statements.
Outlook We remain cautiously optimistic about the prospects for European equities. The outlook for earnings is reasonably positive and is supported by the current reporting season. Earnings upgrades have continued for the first time in years and support the attractiveness of European equities relative to other regions. There is considerable uncertainty surrounding major political events, notably in upcoming elections and Brexit negotiations. However, the outcomes of the Dutch and French elections have been more benign than some had feared. We would argue that the market is now much more aware of these risks than it was last year. That said, recent events in Spain mean investors will need to remain alert to dramatic changes in the political environment. Please note that the commitment approach has been used for risk measurement and calculation of global exposure for this Sub-fund.
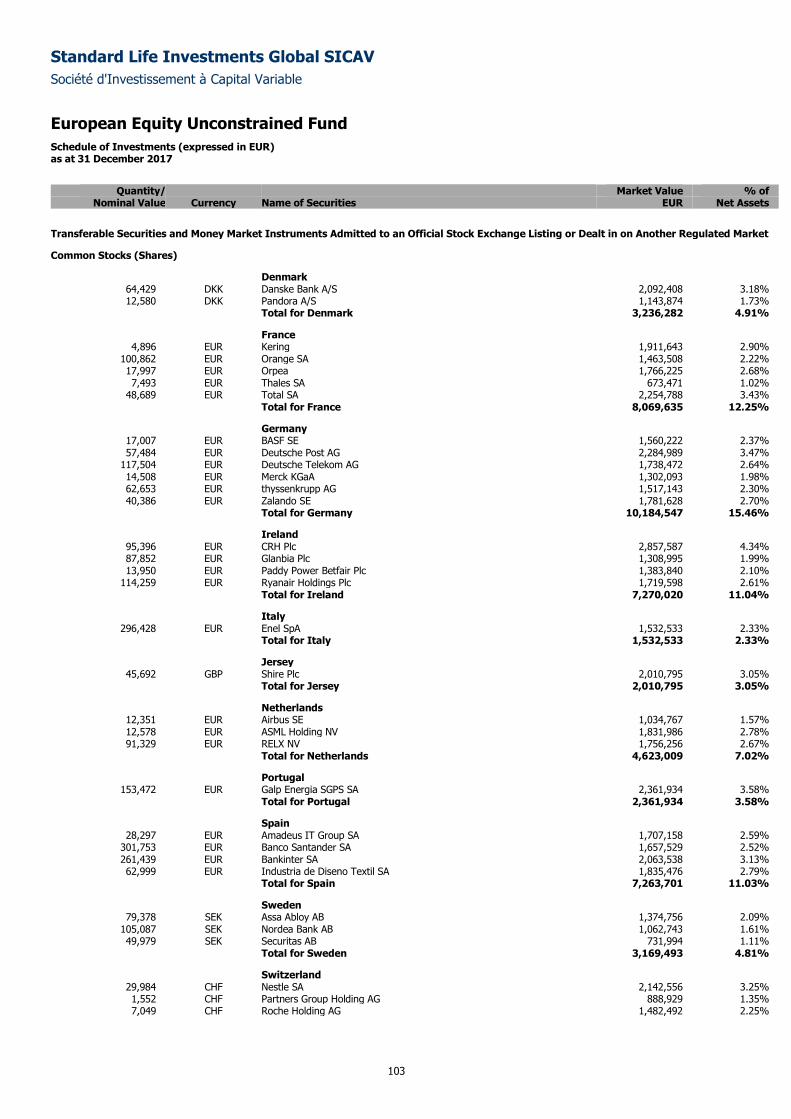
Standard Life Investments Global SICAV
Société d'Investissement à Capital Variable
European Equity Unconstrained Fund
Schedule of Investments (expressed in EUR) as at 31 December 2017
103
Quantity/ Market Value % of
Nominal Value Currency Name of Securities EUR Net Assets
Transferable Securities and Money Market Instruments Admitted to an Official Stock Exchange Listing or Dealt in on Another Regulated Market
Common Stocks (Shares)
Denmark 64,429 DKK Danske Bank A/S 2,092,408 3.18% 12,580 DKK Pandora A/S 1,143,874 1.73%
Total for Denmark 3,236,282 4.91%
France 4,896 EUR Kering 1,911,643 2.90%
100,862 EUR Orange SA 1,463,508 2.22% 17,997 EUR Orpea 1,766,225 2.68% 7,493 EUR Thales SA 673,471 1.02%
48,689 EUR Total SA 2,254,788 3.43% Total for France 8,069,635 12.25%
Germany 17,007 EUR BASF SE 1,560,222 2.37% 57,484 EUR Deutsche Post AG 2,284,989 3.47%
117,504 EUR Deutsche Telekom AG 1,738,472 2.64% 14,508 EUR Merck KGaA 1,302,093 1.98% 62,653 EUR thyssenkrupp AG 1,517,143 2.30% 40,386 EUR Zalando SE 1,781,628 2.70%
Total for Germany 10,184,547 15.46%
Ireland 95,396 EUR CRH Plc 2,857,587 4.34% 87,852 EUR Glanbia Plc 1,308,995 1.99% 13,950 EUR Paddy Power Betfair Plc 1,383,840 2.10%
114,259 EUR Ryanair Holdings Plc 1,719,598 2.61% Total for Ireland 7,270,020 11.04%
Italy 296,428 EUR Enel SpA 1,532,533 2.33%
Total for Italy 1,532,533 2.33%
Jersey 45,692 GBP Shire Plc 2,010,795 3.05%
Total for Jersey 2,010,795 3.05%
Netherlands 12,351 EUR Airbus SE 1,034,767 1.57% 12,578 EUR ASML Holding NV 1,831,986 2.78% 91,329 EUR RELX NV 1,756,256 2.67%
Total for Netherlands 4,623,009 7.02%
Portugal 153,472 EUR Galp Energia SGPS SA 2,361,934 3.58%
Total for Portugal 2,361,934 3.58%
Spain 28,297 EUR Amadeus IT Group SA 1,707,158 2.59%
301,753 EUR Banco Santander SA 1,657,529 2.52% 261,439 EUR Bankinter SA 2,063,538 3.13% 62,999 EUR Industria de Diseno Textil SA 1,835,476 2.79%
Total for Spain 7,263,701 11.03%
Sweden 79,378 SEK Assa Abloy AB 1,374,756 2.09%
105,087 SEK Nordea Bank AB 1,062,743 1.61% 49,979 SEK Securitas AB 731,994 1.11%
Total for Sweden 3,169,493 4.81%
Switzerland 29,984 CHF Nestle SA 2,142,556 3.25% 1,552 CHF Partners Group Holding AG 888,929 1.35% 7,049 CHF Roche Holding AG 1,482,492 2.25%
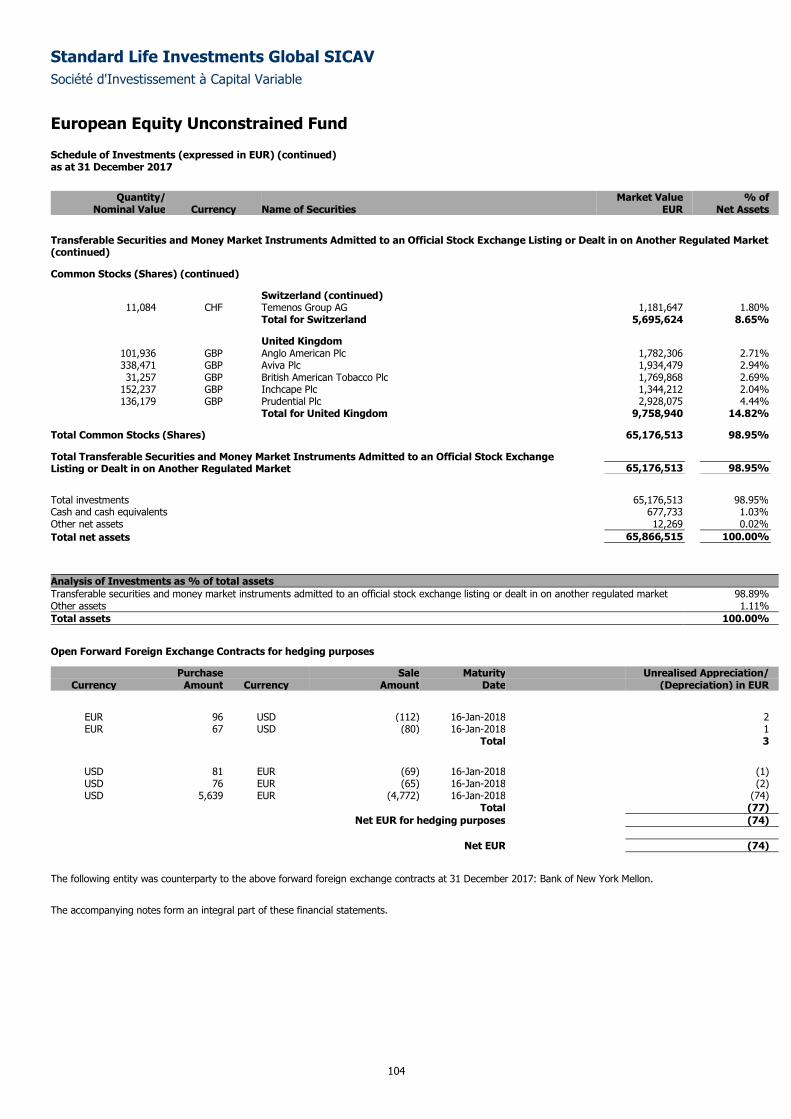
Standard Life Investments Global SICAV
Société d'Investissement à Capital Variable
European Equity Unconstrained Fund
Schedule of Investments (expressed in EUR) (continued) as at 31 December 2017
104
Quantity/ Market Value % of
Nominal Value Currency Name of Securities EUR Net Assets
Transferable Securities and Money Market Instruments Admitted to an Official Stock Exchange Listing or Dealt in on Another Regulated Market (continued)
Common Stocks (Shares) (continued)
Switzerland (continued) 11,084 CHF Temenos Group AG 1,181,647 1.80%
Total for Switzerland 5,695,624 8.65%
United Kingdom 101,936 GBP Anglo American Plc 1,782,306 2.71% 338,471 GBP Aviva Plc 1,934,479 2.94% 31,257 GBP British American Tobacco Plc 1,769,868 2.69%
152,237 GBP Inchcape Plc 1,344,212 2.04% 136,179 GBP Prudential Plc 2,928,075 4.44%
Total for United Kingdom 9,758,940 14.82%
Total Common Stocks (Shares) 65,176,513 98.95%
Total Transferable Securities and Money Market Instruments Admitted to an Official Stock Exchange Listing or Dealt in on Another Regulated Market 65,176,513 98.95%
Total investments 65,176,513 98.95%
Cash and cash equivalents 677,733 1.03%
Other net assets 12,269 0.02%
Total net assets 65,866,515 100.00%
Analysis of Investments as % of total assets
Transferable securities and money market instruments admitted to an official stock exchange listing or dealt in on another regulated market 98.89% Other assets 1.11%
Total assets 100.00%
Open Forward Foreign Exchange Contracts for hedging purposes
Purchase Sale Maturity Unrealised Appreciation/ Currency Amount Currency Amount Date (Depreciation) in EUR
EUR 96 USD (112) 16-Jan-2018 2 EUR 67 USD (80) 16-Jan-2018 1
Total 3
USD 81 EUR (69) 16-Jan-2018 (1) USD 76 EUR (65) 16-Jan-2018 (2) USD 5,639 EUR (4,772) 16-Jan-2018 (74)
Total (77)
Net EUR for hedging purposes (74)
Net EUR (74)
The following entity was counterparty to the above forward foreign exchange contracts at 31 December 2017: Bank of New York Mellon.
The accompanying notes form an integral part of these financial statements.
Standard Life Investments Global SICAV
Société d'Investissement à Capital Variable
105
Global Emerging Markets Equity Unconstrained Fund
Sub-fund Objective and Investment Policy
The objective of the Sub-fund is to achieve long-term growth in the share price through capital appreciation of the underlying equity portfolio. It will achieve
this objective primarily through investment in equities and equity related securities of corporations domiciled in emerging markets or companies that derive
a significant proportion of their revenues and profits from Asian, Eastern European, Middle Eastern, African or Latin American operations or have a
significant proportion of their assets there. The Sub-fund will not be restricted by index weightings, sector constraints or company size.
Performance Review
The Sub-fund returned 47.04% over the review period (in USD, its base currency), compared to the MSCI Emerging Markets Free Index, which was up
37.75%.*
Hotel operator China Lodging continued to excel and was our top contributor, with consensus earnings estimates revised up further on the back of rising
occupancy rates and revenues per available room. The company is demonstrating its ability to add value through hotel chain acquisitions and we think there
is further scope for margin expansion thanks to operational gearing. Elsewhere, Tejas Networks, a leading Indian telecoms optical network equipment
supplier, performed well on the back of growing optimism around operator and government telecommunications investments. Indeed, the prospect for fibre
and optical equipment investment over the next five years is among the most exciting globally and we believe Tejas will be a significant beneficiary due to
its compelling product offering and cost structure. Additional positives included SK Hynix, Sberbank and Voltas
On the downside, software firm Luxoft struggled. The development of new digital customer contracts is weighing on its overall profit levels, although we
view it as a precursor to future profitability. China Biologics, a leading plasma collection and therapeutics producer in China, performed poorly despite
announcing reasonable earnings results. Investors were worried about future prices following the opening of a series of new collection centres. We no
longer hold the stock. Positions in PT AKR Corporindo, Nexen Tire and lack of exposure to Tencent also disappointed.
*Sub-fund performance has been calculated over the stated period on the share price performance basis, based on the institutional share class (D
Accumulation) and net of fees. Please note the index return is quoted gross and contains no adjustment for fees. The sub-fund performance will also be
impacted by any pricing basis changes, made under our single swinging price policy. More information on our swinging price approach can be found in note
8 of the Financial Statements.
Outlook
Looking ahead, we believe the primary driver of global emerging market equity performance remains the global economy. Indeed, we are seeing
synchronous growth acceleration among both developed and emerging countries, with measured monetary policy and limited inflation pressures. This is
feeding accelerating earnings growth at the company level across emerging markets, and we are seeing a lot of upgrades among our holdings. Earnings are
particularly strong in the information technology sector, which now accounts for 28% of the benchmark index, reflecting the significant structural changes in
emerging markets over the last few years.
Please note that the commitment approach has been used for risk measurement and calculation of global exposure for this Sub-fund.
This Sub-fund is not authorised in Hong Kong and is not available to Hong Kong residents.
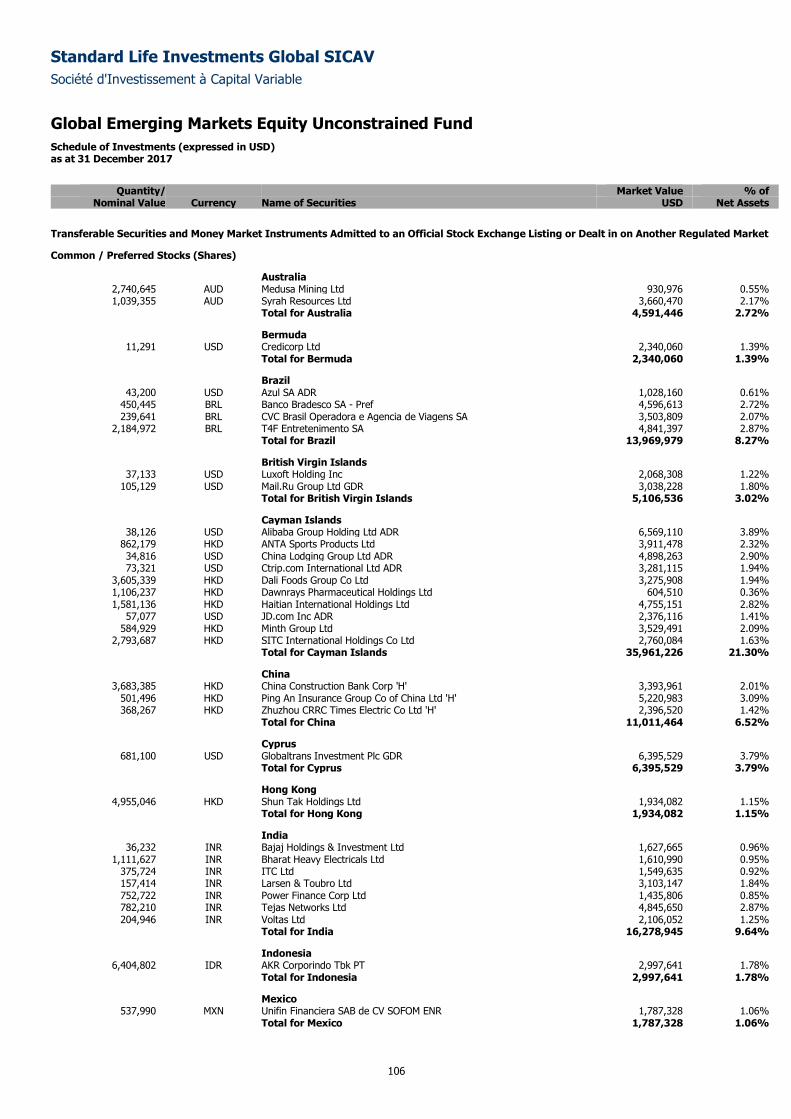
Standard Life Investments Global SICAV
Société d'Investissement à Capital Variable
Global Emerging Markets Equity Unconstrained Fund
Schedule of Investments (expressed in USD) as at 31 December 2017
106
Quantity/ Market Value % of
Nominal Value Currency Name of Securities USD Net Assets
Transferable Securities and Money Market Instruments Admitted to an Official Stock Exchange Listing or Dealt in on Another Regulated Market
Common / Preferred Stocks (Shares)
Australia 2,740,645 AUD Medusa Mining Ltd 930,976 0.55% 1,039,355 AUD Syrah Resources Ltd 3,660,470 2.17%
Total for Australia 4,591,446 2.72%
Bermuda 11,291 USD Credicorp Ltd 2,340,060 1.39%
Total for Bermuda 2,340,060 1.39%
Brazil 43,200 USD Azul SA ADR 1,028,160 0.61%
450,445 BRL Banco Bradesco SA - Pref 4,596,613 2.72% 239,641 BRL CVC Brasil Operadora e Agencia de Viagens SA 3,503,809 2.07%
2,184,972 BRL T4F Entretenimento SA 4,841,397 2.87% Total for Brazil 13,969,979 8.27%
British Virgin Islands 37,133 USD Luxoft Holding Inc 2,068,308 1.22%
105,129 USD Mail.Ru Group Ltd GDR 3,038,228 1.80% Total for British Virgin Islands 5,106,536 3.02%
Cayman Islands 38,126 USD Alibaba Group Holding Ltd ADR 6,569,110 3.89%
862,179 HKD ANTA Sports Products Ltd 3,911,478 2.32% 34,816 USD China Lodging Group Ltd ADR 4,898,263 2.90% 73,321 USD Ctrip.com International Ltd ADR 3,281,115 1.94%
3,605,339 HKD Dali Foods Group Co Ltd 3,275,908 1.94% 1,106,237 HKD Dawnrays Pharmaceutical Holdings Ltd 604,510 0.36% 1,581,136 HKD Haitian International Holdings Ltd 4,755,151 2.82%
57,077 USD JD.com Inc ADR 2,376,116 1.41% 584,929 HKD Minth Group Ltd 3,529,491 2.09%
2,793,687 HKD SITC International Holdings Co Ltd 2,760,084 1.63% Total for Cayman Islands 35,961,226 21.30%
China 3,683,385 HKD China Construction Bank Corp 'H' 3,393,961 2.01%
501,496 HKD Ping An Insurance Group Co of China Ltd 'H' 5,220,983 3.09% 368,267 HKD Zhuzhou CRRC Times Electric Co Ltd 'H' 2,396,520 1.42%
Total for China 11,011,464 6.52%
Cyprus 681,100 USD Globaltrans Investment Plc GDR 6,395,529 3.79%
Total for Cyprus 6,395,529 3.79%
Hong Kong 4,955,046 HKD Shun Tak Holdings Ltd 1,934,082 1.15%
Total for Hong Kong 1,934,082 1.15%
India 36,232 INR Bajaj Holdings & Investment Ltd 1,627,665 0.96%
1,111,627 INR Bharat Heavy Electricals Ltd 1,610,990 0.95% 375,724 INR ITC Ltd 1,549,635 0.92% 157,414 INR Larsen & Toubro Ltd 3,103,147 1.84% 752,722 INR Power Finance Corp Ltd 1,435,806 0.85% 782,210 INR Tejas Networks Ltd 4,845,650 2.87% 204,946 INR Voltas Ltd 2,106,052 1.25%
Total for India 16,278,945 9.64%
Indonesia 6,404,802 IDR AKR Corporindo Tbk PT 2,997,641 1.78%
Total for Indonesia 2,997,641 1.78%
Mexico 537,990 MXN Unifin Financiera SAB de CV SOFOM ENR 1,787,328 1.06%
Total for Mexico 1,787,328 1.06%
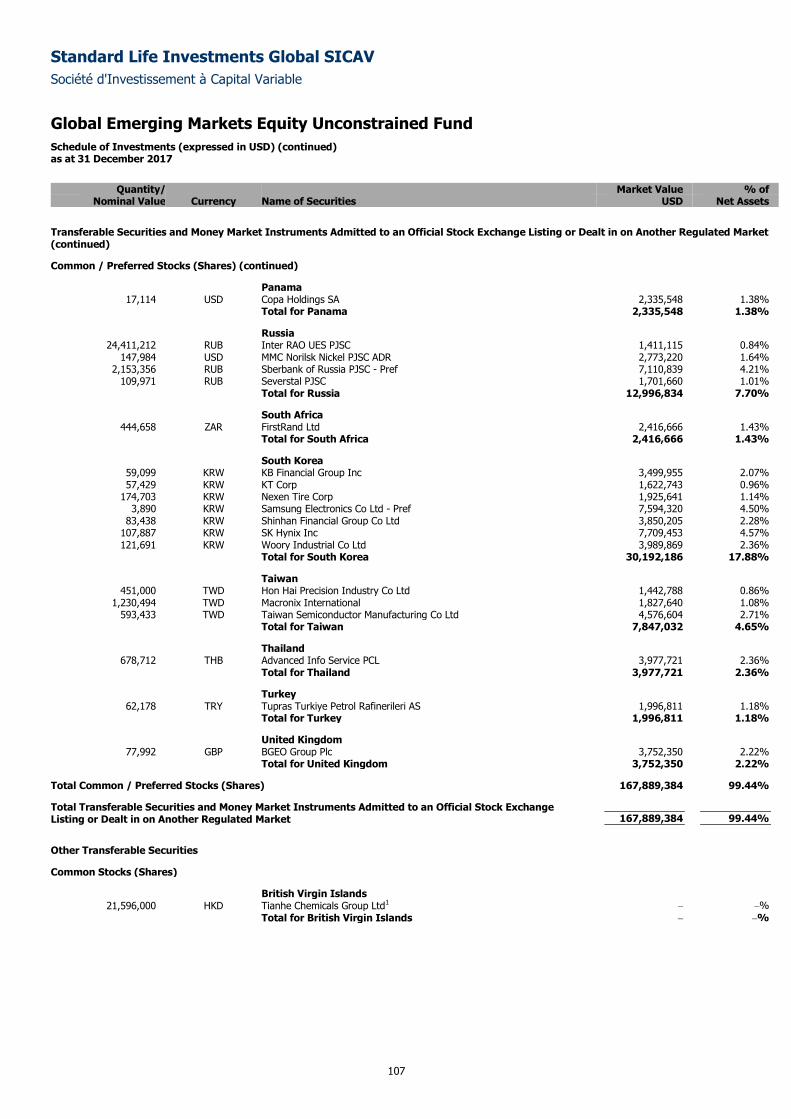
Standard Life Investments Global SICAV
Société d'Investissement à Capital Variable
Global Emerging Markets Equity Unconstrained Fund
Schedule of Investments (expressed in USD) (continued) as at 31 December 2017
107
Quantity/ Market Value % of
Nominal Value Currency Name of Securities USD Net Assets
Transferable Securities and Money Market Instruments Admitted to an Official Stock Exchange Listing or Dealt in on Another Regulated Market (continued)
Common / Preferred Stocks (Shares) (continued)
Panama 17,114 USD Copa Holdings SA 2,335,548 1.38%
Total for Panama 2,335,548 1.38%
Russia 24,411,212 RUB Inter RAO UES PJSC 1,411,115 0.84%
147,984 USD MMC Norilsk Nickel PJSC ADR 2,773,220 1.64% 2,153,356 RUB Sberbank of Russia PJSC - Pref 7,110,839 4.21%
109,971 RUB Severstal PJSC 1,701,660 1.01% Total for Russia 12,996,834 7.70%
South Africa 444,658 ZAR FirstRand Ltd 2,416,666 1.43%
Total for South Africa 2,416,666 1.43%
South Korea 59,099 KRW KB Financial Group Inc 3,499,955 2.07% 57,429 KRW KT Corp 1,622,743 0.96%
174,703 KRW Nexen Tire Corp 1,925,641 1.14% 3,890 KRW Samsung Electronics Co Ltd - Pref 7,594,320 4.50%
83,438 KRW Shinhan Financial Group Co Ltd 3,850,205 2.28% 107,887 KRW SK Hynix Inc 7,709,453 4.57% 121,691 KRW Woory Industrial Co Ltd 3,989,869 2.36%
Total for South Korea 30,192,186 17.88%
Taiwan 451,000 TWD Hon Hai Precision Industry Co Ltd 1,442,788 0.86%
1,230,494 TWD Macronix International 1,827,640 1.08% 593,433 TWD Taiwan Semiconductor Manufacturing Co Ltd 4,576,604 2.71%
Total for Taiwan 7,847,032 4.65%
Thailand 678,712 THB Advanced Info Service PCL 3,977,721 2.36%
Total for Thailand 3,977,721 2.36%
Turkey 62,178 TRY Tupras Turkiye Petrol Rafinerileri AS 1,996,811 1.18%
Total for Turkey 1,996,811 1.18%
United Kingdom 77,992 GBP BGEO Group Plc 3,752,350 2.22%
Total for United Kingdom 3,752,350 2.22%
Total Common / Preferred Stocks (Shares) 167,889,384 99.44%
Total Transferable Securities and Money Market Instruments Admitted to an Official Stock Exchange Listing or Dealt in on Another Regulated Market 167,889,384 99.44%
Other Transferable Securities
Common Stocks (Shares)
British Virgin Islands 21,596,000 HKD Tianhe Chemicals Group Ltd1 – –%
Total for British Virgin Islands – –%
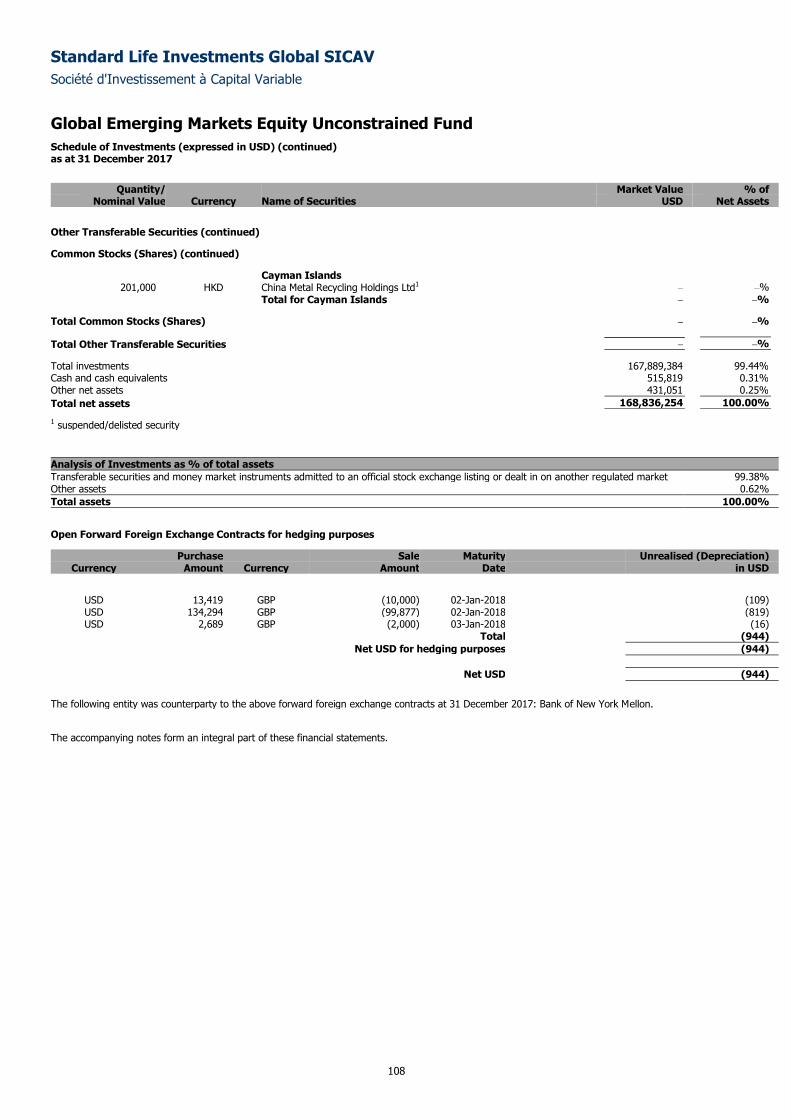
Standard Life Investments Global SICAV
Société d'Investissement à Capital Variable
Global Emerging Markets Equity Unconstrained Fund
Schedule of Investments (expressed in USD) (continued) as at 31 December 2017
108
Quantity/ Market Value % of
Nominal Value Currency Name of Securities USD Net Assets
Other Transferable Securities (continued)
Common Stocks (Shares) (continued)
Cayman Islands 201,000 HKD China Metal Recycling Holdings Ltd1 – –%
Total for Cayman Islands – –%
Total Common Stocks (Shares) – –%
Total Other Transferable Securities – –%
Total investments 167,889,384 99.44%
Cash and cash equivalents 515,819 0.31%
Other net assets 431,051 0.25%
Total net assets 168,836,254 100.00%
1 suspended/delisted security
Analysis of Investments as % of total assets
Transferable securities and money market instruments admitted to an official stock exchange listing or dealt in on another regulated market 99.38% Other assets 0.62%
Total assets 100.00%
Open Forward Foreign Exchange Contracts for hedging purposes
Purchase Sale Maturity Unrealised (Depreciation) Currency Amount Currency Amount Date in USD
USD 13,419 GBP (10,000) 02-Jan-2018 (109) USD 134,294 GBP (99,877) 02-Jan-2018 (819) USD 2,689 GBP (2,000) 03-Jan-2018 (16)
Total (944)
Net USD for hedging purposes (944)
Net USD (944)
The following entity was counterparty to the above forward foreign exchange contracts at 31 December 2017: Bank of New York Mellon.
The accompanying notes form an integral part of these financial statements.
Standard Life Investments Global SICAV
Société d'Investissement à Capital Variable
109
Enhanced Diversification Global Emerging Markets Equities Fund
Sub-fund Objective and Investment Policy The objective of the Sub-fund is to achieve a long term total return consistent with emerging market equities (as compared to the performance benchmark MSCI Emerging Markets) while producing a lower volatility of returns (comparable to the volatility of a blend of 70% MSCI Emerging Markets/30% Cash (defined as 1 month US LIBID)). Returns from the Sub-fund will be both through the reinvestment of income and from capital gains.
The fund typically holds a portfolio of equities and equity related securities of corporations domiciled in global emerging markets or companies that derive a significant proportion of their revenues and profits from global emerging markets (including Asian, Eastern European, Middle Eastern, African or Latin American operations) or have a significant proportion of their assets there. This portfolio is complemented with an active allocation to a highly diverse range of market positions, which utilise a combination of traditional assets (such as equities and bonds) and investment strategies based on advanced derivative techniques with the aim of reducing the fund's overall volatility and generating additional returns. Investors should note that this allocation is likely to result in the fund gaining exposure to non-emerging market opportunities and risks. This means that performance may deviate from emerging market equities over short- and medium-term periods. The fund can take long and short positions in markets, securities and groups of securities through derivative contracts. Leverage in the fund arises as a result of the use of derivatives.
Examples of strategies that may be used at any time may include:
- An assessment of the value of one equity market, region or industry relative to another. Rather than investing in physical securities, the strategy could be implemented through the use of derivatives in the form of futures contracts.
- An assessment of the value of one currency relative to another. The strategy could involve the sale of the currency considered overvalued and purchase of the currency considered undervalued. Derivatives, in the form of forward foreign exchange contracts, could be used to implement the strategy.
- An assessment of the direction of interest rates. Derivatives, in the form of interest rate swaps, could be used to position the portfolio such that it could benefit from the future direction of interest rates.
The fund will invest in equities and equity related securities and a diversified portfolio of permitted derivative contracts (including futures, options, swaps, forward currency contracts and other derivatives) as well as traditional assets (such as equities and bonds) located anywhere in the world. Additionally the Sub-fund may invest in other forms of eligible transferable securities, deposits, money market instruments and undertakings for collective investment. The Sub-fund may, subject to and in accordance with the UCI Law and applicable CSSF circulars, take long and short positions in markets, securities and groups of securities through derivative contracts. Performance Review The Fund rose by 27.62%* over the period, compared with a 37.75% return for the MSCI Emerging Markets Free Index. Looking at stock selection within our GEM equity exposure, China Lodging Group was among the year’s top performers, as improving occupancy and room rates drove earnings upgrades and a re-rating of the shares. Korean battery manufacturer Samsung SDI performed well amid increasingly positive sentiment towards the Tesla vehicle supply chain. In addition, Samsung SDI’s subsidiary is seeing surging demand for small OLEDs for Apple’s iPhone8. Tour operator CVC Brasil made a robust contribution to returns on the back of solid results and a series of accretive acquisitions. Other positives included SK Hynix, Minth Group and Sberbank of Russia. Among the largest detractors from performance were Chinese travel agent Ctrip.com, as regulation around the bundling of online travel products took its toll on revenues. Despite positive results, Korea’s Woori struggled as investors mulled over the likely impact of regulatory change on banks’ profitability. Elsewhere, Australia’s Syrah Resources dragged on performance on fears of imminent capital-raising. Turning to enhanced-diversifiers, our opportunistic, interest rate and inflation strategies contributed positively, while our currency and relative-value equity positions delivered negative returns. Given the strong performance of equity markets in 2017, our opportunistic exposures to Japanese equity and global ex-US small-cap stocks were rewarded. Our exposures to high-yield credit and US investment grade credit also gained, boosted by improving global growth prospects, favourable corporate earnings results and persistent demand for yield. Among our interest rate strategies, those relating to Australian rates were positive. Similarly, European interest rate expectations moved in favour of our European long-end steepener strategy. Also positive was our short UK inflation position. Investors moderated their views on the UK’s medium-term inflation prospects as Brexit negotiations got underway. Our currency pairs taking a negative stance towards the Korean won were penalised. The won strengthened towards year-end, boosted by robust, export-led economic growth and an easing of political tensions on the Korean Peninsula. Our preference for the Japanese yen over the Canadian dollar also struggled. An unexpected rate hike in September from the Bank of Canada and the ongoing recovery in commodity prices drove up the value of the resource-sensitive Canadian dollar. *Sub-fund performance has been calculated over the stated period on the share price performance basis, based on the institutional share class (D Accumulation) and net of fees. Please note the index return is quoted gross and contains no adjustment for fees. The sub-fund performance will also be impacted by any pricing basis changes, made under our single swinging price policy. More information on our swinging price approach can be found in note 8 of the Financial Statements. Outlook In December 2017, the portfolio passed its three-year anniversary, meeting its objective of delivering equity-like returns with less than 70% of emerging equity market volatility. Our outlook is unchanged for 2018, and we believe the primary driver of global emerging market equity performance remains the global economy. Indeed, we are seeing synchronous growth acceleration among both developed and emerging countries, with measured monetary policy and limited inflation pressures. This is feeding accelerating earnings growth at the company level across emerging markets, and we are seeing a lot of upgrades among our holdings. The Fund is a distinctive, blended combination of stock-picking expertise and diversifying multi-asset strategies. Our resulting portfolio targets GEM equity market-like returns with lower volatility, culminating in superior risk-adjusted performance.
Standard Life Investments Global SICAV
Société d'Investissement à Capital Variable
110
Enhanced Diversification Global Emerging Markets Equities Fund Outlook (continued) Please note that the relative Value at Risk (“VaR”) approach has been used for risk measurement and calculation of global exposure for this Sub-fund. Measurement of 1 month 99% VaR is based on a parametric calculation with an additional upwards scaling factor applied. Parametric risk model uses 180 weeks of equally weighted data with which to forecast risk. On the above basis the VaR has been as follows: Highest: 15.09% Average: 12.35% Lowest: 6.98% Leverage is calculated as the sum of the notionals of the derivatives used. The level of leverage employed during the relevant period was 533.70%. The quoted leverage excludes the impact of the FX forwards used in currency hedged shareclasses which are held for those shareholders only. It also excludes the temporary impacts that arise when renewing currency forwards and when closing some exchange cleared derivatives. Although the renewal of currency forwards and closure of exchange traded derivatives results in no change in or a reduction in market exposure, gross derivative leverage would increase because new equal and offsetting derivative contracts are traded to facilitate this efficiently. The offsetting contracts are held to their maturity date, which is less than 5 working days for currency forwards, or final processing of their termination. This Sub-fund is not authorized in Hong Kong and is not available to Hong Kong residents.
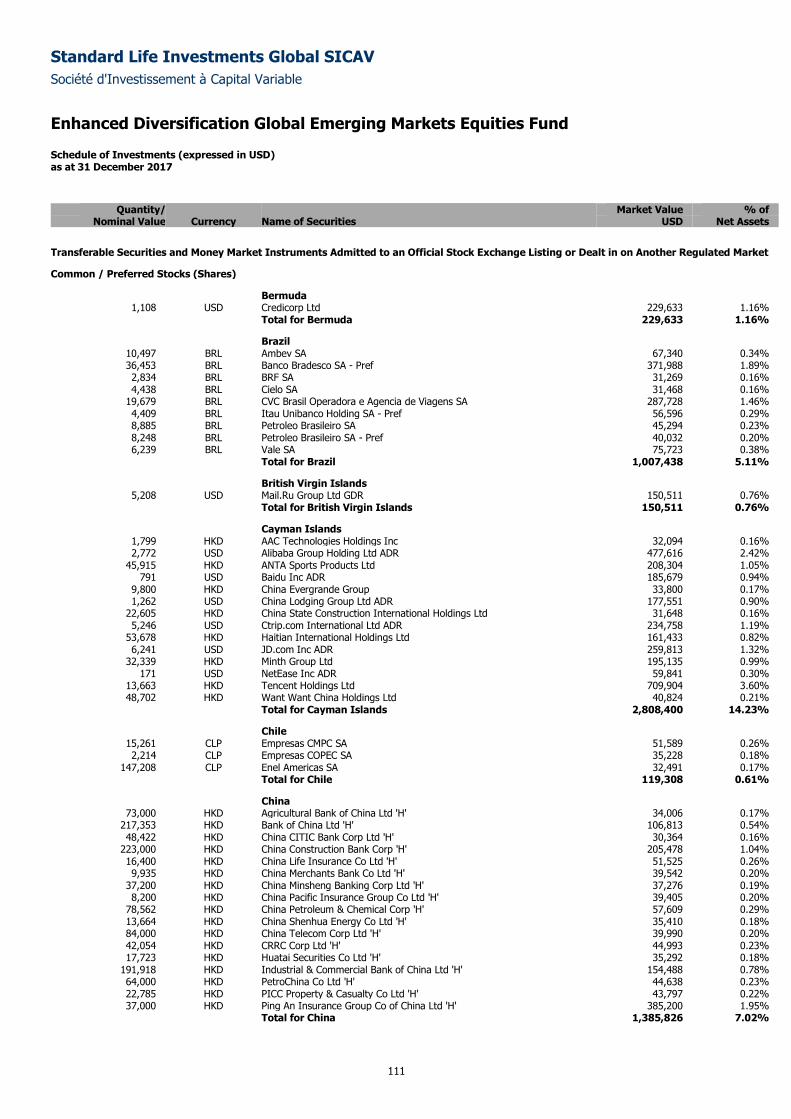
Standard Life Investments Global SICAV
Société d'Investissement à Capital Variable
Enhanced Diversification Global Emerging Markets Equities Fund Schedule of Investments (expressed in USD) as at 31 December 2017
111
Quantity/ Market Value % of
Nominal Value Currency Name of Securities USD Net Assets
Transferable Securities and Money Market Instruments Admitted to an Official Stock Exchange Listing or Dealt in on Another Regulated Market
Common / Preferred Stocks (Shares)
Bermuda 1,108 USD Credicorp Ltd 229,633 1.16%
Total for Bermuda 229,633 1.16%
Brazil 10,497 BRL Ambev SA 67,340 0.34% 36,453 BRL Banco Bradesco SA - Pref 371,988 1.89% 2,834 BRL BRF SA 31,269 0.16% 4,438 BRL Cielo SA 31,468 0.16%
19,679 BRL CVC Brasil Operadora e Agencia de Viagens SA 287,728 1.46% 4,409 BRL Itau Unibanco Holding SA - Pref 56,596 0.29% 8,885 BRL Petroleo Brasileiro SA 45,294 0.23% 8,248 BRL Petroleo Brasileiro SA - Pref 40,032 0.20% 6,239 BRL Vale SA 75,723 0.38%
Total for Brazil 1,007,438 5.11%
British Virgin Islands 5,208 USD Mail.Ru Group Ltd GDR 150,511 0.76%
Total for British Virgin Islands 150,511 0.76%
Cayman Islands 1,799 HKD AAC Technologies Holdings Inc 32,094 0.16% 2,772 USD Alibaba Group Holding Ltd ADR 477,616 2.42%
45,915 HKD ANTA Sports Products Ltd 208,304 1.05% 791 USD Baidu Inc ADR 185,679 0.94%
9,800 HKD China Evergrande Group 33,800 0.17% 1,262 USD China Lodging Group Ltd ADR 177,551 0.90%
22,605 HKD China State Construction International Holdings Ltd 31,648 0.16% 5,246 USD Ctrip.com International Ltd ADR 234,758 1.19%
53,678 HKD Haitian International Holdings Ltd 161,433 0.82% 6,241 USD JD.com Inc ADR 259,813 1.32%
32,339 HKD Minth Group Ltd 195,135 0.99% 171 USD NetEase Inc ADR 59,841 0.30%
13,663 HKD Tencent Holdings Ltd 709,904 3.60% 48,702 HKD Want Want China Holdings Ltd 40,824 0.21%
Total for Cayman Islands 2,808,400 14.23%
Chile 15,261 CLP Empresas CMPC SA 51,589 0.26% 2,214 CLP Empresas COPEC SA 35,228 0.18%
147,208 CLP Enel Americas SA 32,491 0.17% Total for Chile 119,308 0.61%
China 73,000 HKD Agricultural Bank of China Ltd 'H' 34,006 0.17%
217,353 HKD Bank of China Ltd 'H' 106,813 0.54% 48,422 HKD China CITIC Bank Corp Ltd 'H' 30,364 0.16%
223,000 HKD China Construction Bank Corp 'H' 205,478 1.04% 16,400 HKD China Life Insurance Co Ltd 'H' 51,525 0.26% 9,935 HKD China Merchants Bank Co Ltd 'H' 39,542 0.20%
37,200 HKD China Minsheng Banking Corp Ltd 'H' 37,276 0.19% 8,200 HKD China Pacific Insurance Group Co Ltd 'H' 39,405 0.20%
78,562 HKD China Petroleum & Chemical Corp 'H' 57,609 0.29% 13,664 HKD China Shenhua Energy Co Ltd 'H' 35,410 0.18% 84,000 HKD China Telecom Corp Ltd 'H' 39,990 0.20% 42,054 HKD CRRC Corp Ltd 'H' 44,993 0.23% 17,723 HKD Huatai Securities Co Ltd 'H' 35,292 0.18%
191,918 HKD Industrial & Commercial Bank of China Ltd 'H' 154,488 0.78% 64,000 HKD PetroChina Co Ltd 'H' 44,638 0.23% 22,785 HKD PICC Property & Casualty Co Ltd 'H' 43,797 0.22% 37,000 HKD Ping An Insurance Group Co of China Ltd 'H' 385,200 1.95%
Total for China 1,385,826 7.02%
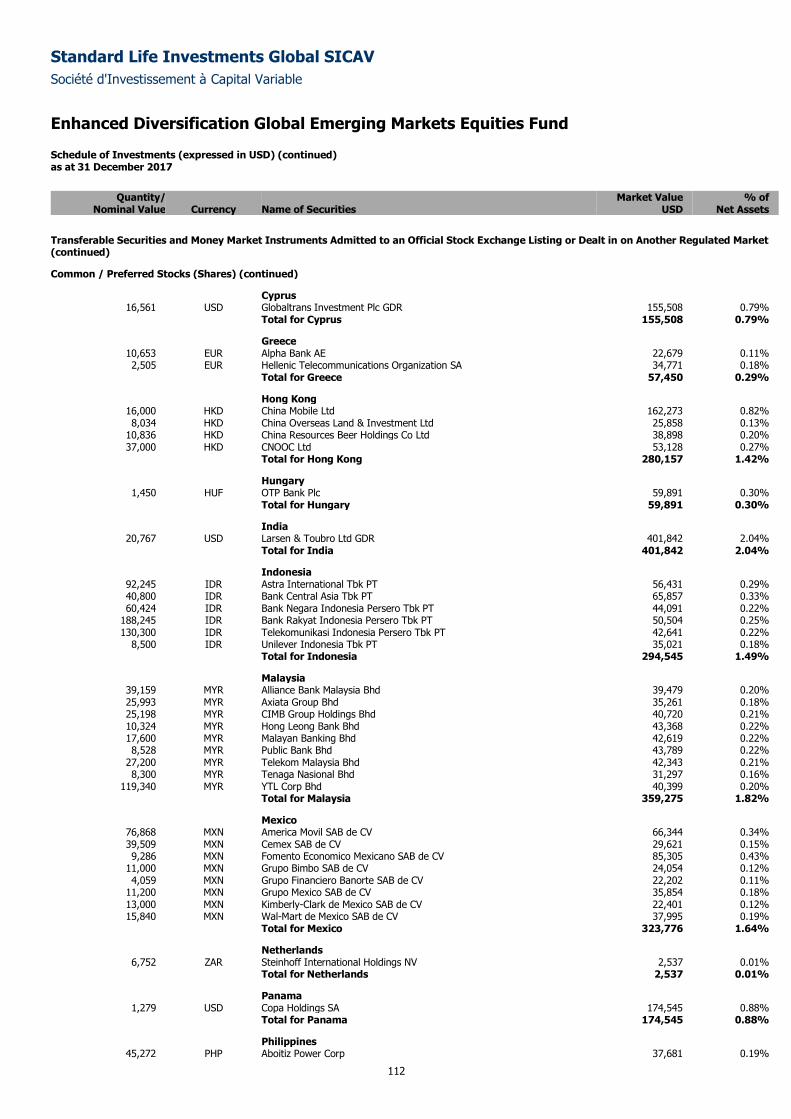
Standard Life Investments Global SICAV
Société d'Investissement à Capital Variable
Enhanced Diversification Global Emerging Markets Equities Fund Schedule of Investments (expressed in USD) (continued) as at 31 December 2017
112
Quantity/ Market Value % of
Nominal Value Currency Name of Securities USD Net Assets
Transferable Securities and Money Market Instruments Admitted to an Official Stock Exchange Listing or Dealt in on Another Regulated Market (continued)
Common / Preferred Stocks (Shares) (continued)
Cyprus 16,561 USD Globaltrans Investment Plc GDR 155,508 0.79%
Total for Cyprus 155,508 0.79%
Greece 10,653 EUR Alpha Bank AE 22,679 0.11% 2,505 EUR Hellenic Telecommunications Organization SA 34,771 0.18%
Total for Greece 57,450 0.29%
Hong Kong 16,000 HKD China Mobile Ltd 162,273 0.82% 8,034 HKD China Overseas Land & Investment Ltd 25,858 0.13%
10,836 HKD China Resources Beer Holdings Co Ltd 38,898 0.20% 37,000 HKD CNOOC Ltd 53,128 0.27%
Total for Hong Kong 280,157 1.42%
Hungary 1,450 HUF OTP Bank Plc 59,891 0.30%
Total for Hungary 59,891 0.30%
India 20,767 USD Larsen & Toubro Ltd GDR 401,842 2.04%
Total for India 401,842 2.04%
Indonesia 92,245 IDR Astra International Tbk PT 56,431 0.29% 40,800 IDR Bank Central Asia Tbk PT 65,857 0.33% 60,424 IDR Bank Negara Indonesia Persero Tbk PT 44,091 0.22%
188,245 IDR Bank Rakyat Indonesia Persero Tbk PT 50,504 0.25% 130,300 IDR Telekomunikasi Indonesia Persero Tbk PT 42,641 0.22%
8,500 IDR Unilever Indonesia Tbk PT 35,021 0.18% Total for Indonesia 294,545 1.49%
Malaysia 39,159 MYR Alliance Bank Malaysia Bhd 39,479 0.20% 25,993 MYR Axiata Group Bhd 35,261 0.18% 25,198 MYR CIMB Group Holdings Bhd 40,720 0.21% 10,324 MYR Hong Leong Bank Bhd 43,368 0.22% 17,600 MYR Malayan Banking Bhd 42,619 0.22% 8,528 MYR Public Bank Bhd 43,789 0.22%
27,200 MYR Telekom Malaysia Bhd 42,343 0.21% 8,300 MYR Tenaga Nasional Bhd 31,297 0.16%
119,340 MYR YTL Corp Bhd 40,399 0.20% Total for Malaysia 359,275 1.82%
Mexico 76,868 MXN America Movil SAB de CV 66,344 0.34% 39,509 MXN Cemex SAB de CV 29,621 0.15% 9,286 MXN Fomento Economico Mexicano SAB de CV 85,305 0.43%
11,000 MXN Grupo Bimbo SAB de CV 24,054 0.12% 4,059 MXN Grupo Financiero Banorte SAB de CV 22,202 0.11%
11,200 MXN Grupo Mexico SAB de CV 35,854 0.18% 13,000 MXN Kimberly-Clark de Mexico SAB de CV 22,401 0.12% 15,840 MXN Wal-Mart de Mexico SAB de CV 37,995 0.19%
Total for Mexico 323,776 1.64%
Netherlands 6,752 ZAR Steinhoff International Holdings NV 2,537 0.01%
Total for Netherlands 2,537 0.01%
Panama 1,279 USD Copa Holdings SA 174,545 0.88%
Total for Panama 174,545 0.88%
Philippines 45,272 PHP Aboitiz Power Corp 37,681 0.19%
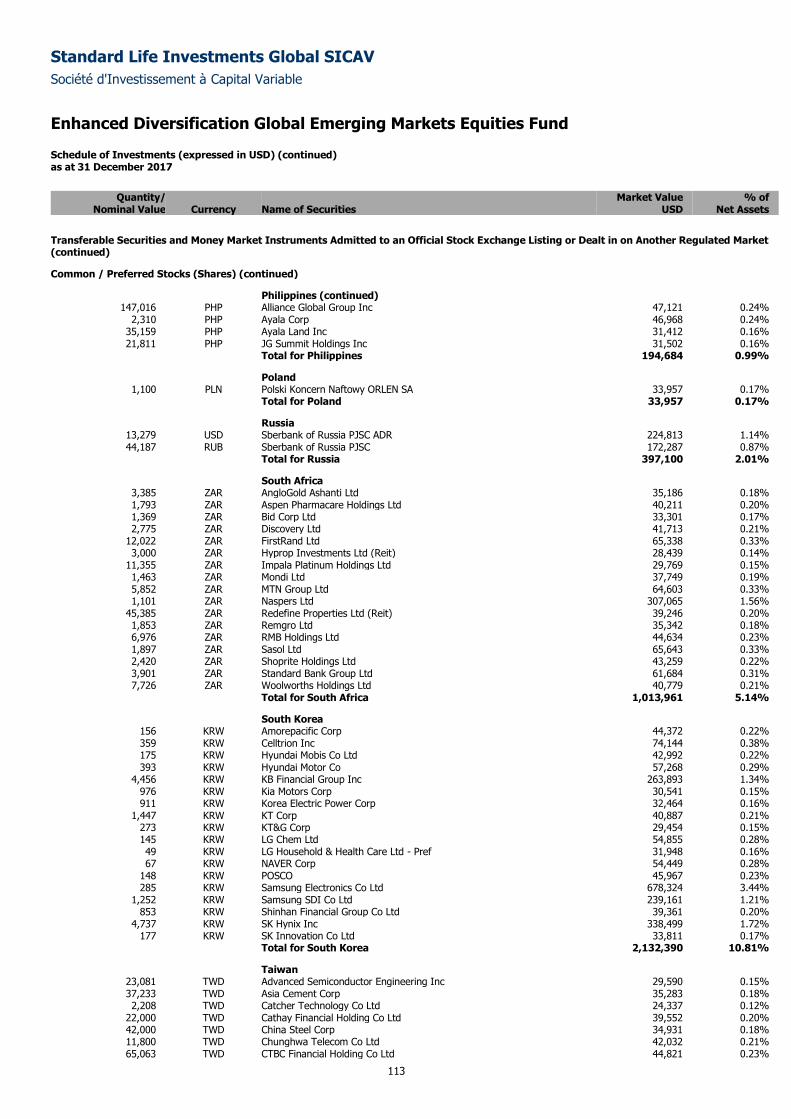
Standard Life Investments Global SICAV
Société d'Investissement à Capital Variable
Enhanced Diversification Global Emerging Markets Equities Fund Schedule of Investments (expressed in USD) (continued) as at 31 December 2017
113
Quantity/ Market Value % of
Nominal Value Currency Name of Securities USD Net Assets
Transferable Securities and Money Market Instruments Admitted to an Official Stock Exchange Listing or Dealt in on Another Regulated Market (continued)
Common / Preferred Stocks (Shares) (continued)
Philippines (continued) 147,016 PHP Alliance Global Group Inc 47,121 0.24%
2,310 PHP Ayala Corp 46,968 0.24% 35,159 PHP Ayala Land Inc 31,412 0.16% 21,811 PHP JG Summit Holdings Inc 31,502 0.16%
Total for Philippines 194,684 0.99%
Poland 1,100 PLN Polski Koncern Naftowy ORLEN SA 33,957 0.17%
Total for Poland 33,957 0.17%
Russia 13,279 USD Sberbank of Russia PJSC ADR 224,813 1.14% 44,187 RUB Sberbank of Russia PJSC 172,287 0.87%
Total for Russia 397,100 2.01%
South Africa 3,385 ZAR AngloGold Ashanti Ltd 35,186 0.18% 1,793 ZAR Aspen Pharmacare Holdings Ltd 40,211 0.20% 1,369 ZAR Bid Corp Ltd 33,301 0.17% 2,775 ZAR Discovery Ltd 41,713 0.21%
12,022 ZAR FirstRand Ltd 65,338 0.33% 3,000 ZAR Hyprop Investments Ltd (Reit) 28,439 0.14%
11,355 ZAR Impala Platinum Holdings Ltd 29,769 0.15% 1,463 ZAR Mondi Ltd 37,749 0.19% 5,852 ZAR MTN Group Ltd 64,603 0.33% 1,101 ZAR Naspers Ltd 307,065 1.56%
45,385 ZAR Redefine Properties Ltd (Reit) 39,246 0.20% 1,853 ZAR Remgro Ltd 35,342 0.18% 6,976 ZAR RMB Holdings Ltd 44,634 0.23% 1,897 ZAR Sasol Ltd 65,643 0.33% 2,420 ZAR Shoprite Holdings Ltd 43,259 0.22% 3,901 ZAR Standard Bank Group Ltd 61,684 0.31% 7,726 ZAR Woolworths Holdings Ltd 40,779 0.21%
Total for South Africa 1,013,961 5.14%
South Korea 156 KRW Amorepacific Corp 44,372 0.22% 359 KRW Celltrion Inc 74,144 0.38% 175 KRW Hyundai Mobis Co Ltd 42,992 0.22% 393 KRW Hyundai Motor Co 57,268 0.29%
4,456 KRW KB Financial Group Inc 263,893 1.34% 976 KRW Kia Motors Corp 30,541 0.15% 911 KRW Korea Electric Power Corp 32,464 0.16%
1,447 KRW KT Corp 40,887 0.21% 273 KRW KT&G Corp 29,454 0.15% 145 KRW LG Chem Ltd 54,855 0.28% 49 KRW LG Household & Health Care Ltd - Pref 31,948 0.16% 67 KRW NAVER Corp 54,449 0.28%
148 KRW POSCO 45,967 0.23% 285 KRW Samsung Electronics Co Ltd 678,324 3.44%
1,252 KRW Samsung SDI Co Ltd 239,161 1.21% 853 KRW Shinhan Financial Group Co Ltd 39,361 0.20%
4,737 KRW SK Hynix Inc 338,499 1.72% 177 KRW SK Innovation Co Ltd 33,811 0.17%
Total for South Korea 2,132,390 10.81%
Taiwan 23,081 TWD Advanced Semiconductor Engineering Inc 29,590 0.15% 37,233 TWD Asia Cement Corp 35,283 0.18% 2,208 TWD Catcher Technology Co Ltd 24,337 0.12%
22,000 TWD Cathay Financial Holding Co Ltd 39,552 0.20% 42,000 TWD China Steel Corp 34,931 0.18% 11,800 TWD Chunghwa Telecom Co Ltd 42,032 0.21% 65,063 TWD CTBC Financial Holding Co Ltd 44,821 0.23%
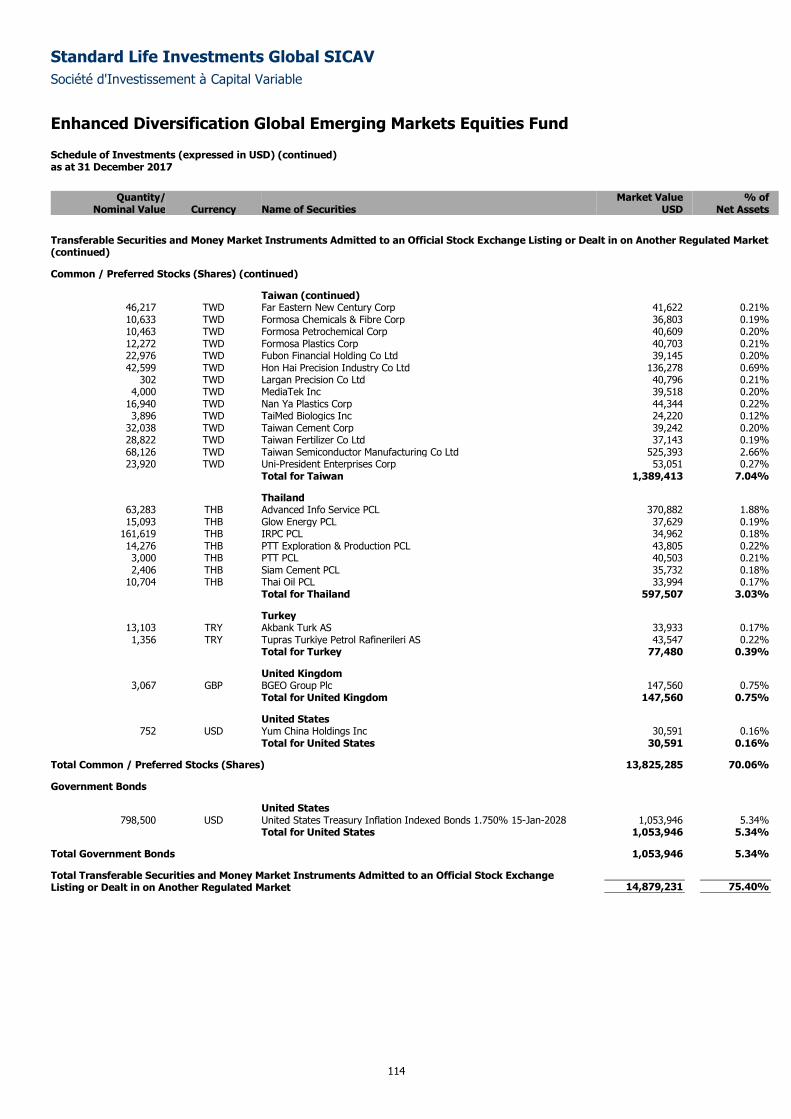
Standard Life Investments Global SICAV
Société d'Investissement à Capital Variable
Enhanced Diversification Global Emerging Markets Equities Fund Schedule of Investments (expressed in USD) (continued) as at 31 December 2017
114
Quantity/ Market Value % of
Nominal Value Currency Name of Securities USD Net Assets
Transferable Securities and Money Market Instruments Admitted to an Official Stock Exchange Listing or Dealt in on Another Regulated Market (continued)
Common / Preferred Stocks (Shares) (continued)
Taiwan (continued) 46,217 TWD Far Eastern New Century Corp 41,622 0.21% 10,633 TWD Formosa Chemicals & Fibre Corp 36,803 0.19% 10,463 TWD Formosa Petrochemical Corp 40,609 0.20% 12,272 TWD Formosa Plastics Corp 40,703 0.21% 22,976 TWD Fubon Financial Holding Co Ltd 39,145 0.20% 42,599 TWD Hon Hai Precision Industry Co Ltd 136,278 0.69%
302 TWD Largan Precision Co Ltd 40,796 0.21% 4,000 TWD MediaTek Inc 39,518 0.20%
16,940 TWD Nan Ya Plastics Corp 44,344 0.22% 3,896 TWD TaiMed Biologics Inc 24,220 0.12%
32,038 TWD Taiwan Cement Corp 39,242 0.20% 28,822 TWD Taiwan Fertilizer Co Ltd 37,143 0.19% 68,126 TWD Taiwan Semiconductor Manufacturing Co Ltd 525,393 2.66% 23,920 TWD Uni-President Enterprises Corp 53,051 0.27%
Total for Taiwan 1,389,413 7.04%
Thailand 63,283 THB Advanced Info Service PCL 370,882 1.88% 15,093 THB Glow Energy PCL 37,629 0.19%
161,619 THB IRPC PCL 34,962 0.18% 14,276 THB PTT Exploration & Production PCL 43,805 0.22% 3,000 THB PTT PCL 40,503 0.21% 2,406 THB Siam Cement PCL 35,732 0.18%
10,704 THB Thai Oil PCL 33,994 0.17% Total for Thailand 597,507 3.03%
Turkey 13,103 TRY Akbank Turk AS 33,933 0.17% 1,356 TRY Tupras Turkiye Petrol Rafinerileri AS 43,547 0.22%
Total for Turkey 77,480 0.39%
United Kingdom 3,067 GBP BGEO Group Plc 147,560 0.75%
Total for United Kingdom 147,560 0.75%
United States 752 USD Yum China Holdings Inc 30,591 0.16%
Total for United States 30,591 0.16%
Total Common / Preferred Stocks (Shares) 13,825,285 70.06%
Government Bonds
United States 798,500 USD United States Treasury Inflation Indexed Bonds 1.750% 15-Jan-2028 1,053,946 5.34%
Total for United States 1,053,946 5.34%
Total Government Bonds 1,053,946 5.34%
Total Transferable Securities and Money Market Instruments Admitted to an Official Stock Exchange Listing or Dealt in on Another Regulated Market 14,879,231 75.40%
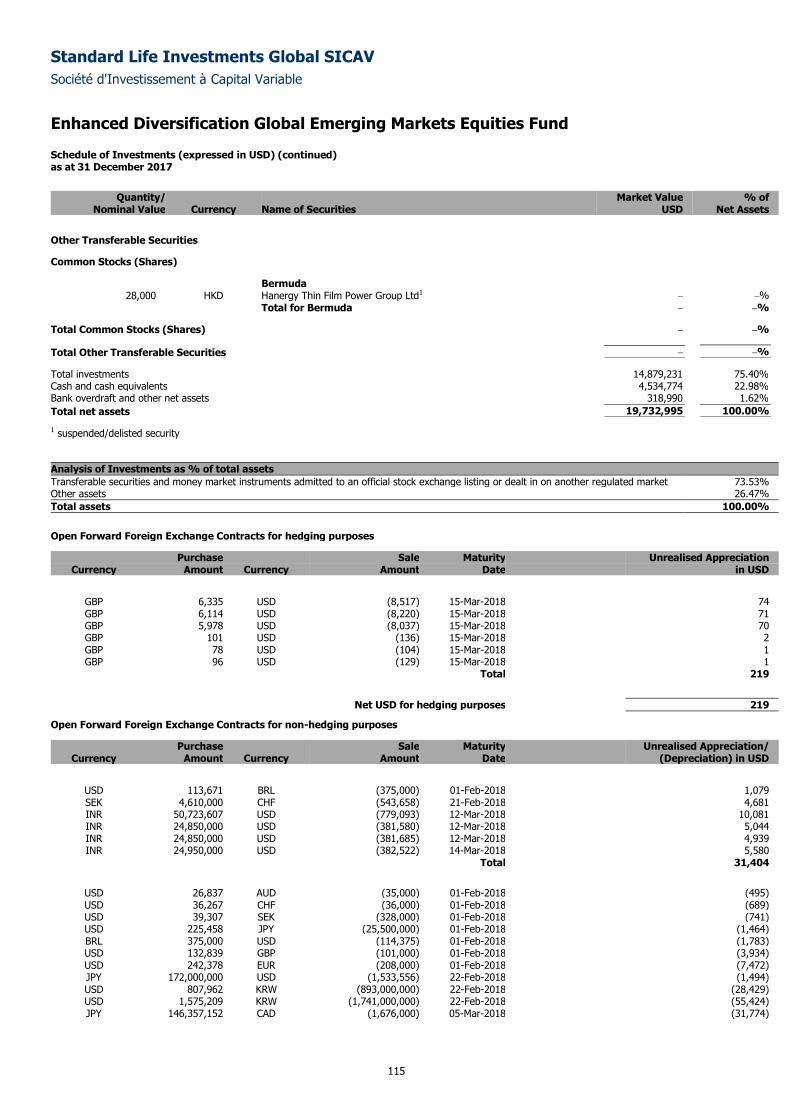
Standard Life Investments Global SICAV
Société d'Investissement à Capital Variable
Enhanced Diversification Global Emerging Markets Equities Fund Schedule of Investments (expressed in USD) (continued) as at 31 December 2017
115
Quantity/ Market Value % of
Nominal Value Currency Name of Securities USD Net Assets
Other Transferable Securities
Common Stocks (Shares)
Bermuda 28,000 HKD Hanergy Thin Film Power Group Ltd1 – –%
Total for Bermuda – –%
Total Common Stocks (Shares) – –%
Total Other Transferable Securities – –%
Total investments 14,879,231 75.40%
Cash and cash equivalents 4,534,774 22.98%
Bank overdraft and other net assets 318,990 1.62%
Total net assets 19,732,995 100.00%
1 suspended/delisted security
Analysis of Investments as % of total assets
Transferable securities and money market instruments admitted to an official stock exchange listing or dealt in on another regulated market 73.53% Other assets 26.47%
Total assets 100.00%
Open Forward Foreign Exchange Contracts for hedging purposes
Purchase Sale Maturity Unrealised Appreciation Currency Amount Currency Amount Date in USD
GBP 6,335 USD (8,517) 15-Mar-2018 74 GBP 6,114 USD (8,220) 15-Mar-2018 71 GBP 5,978 USD (8,037) 15-Mar-2018 70 GBP 101 USD (136) 15-Mar-2018 2 GBP 78 USD (104) 15-Mar-2018 1 GBP 96 USD (129) 15-Mar-2018 1
Total 219
Net USD for hedging purposes 219
Open Forward Foreign Exchange Contracts for non-hedging purposes
Purchase Sale Maturity Unrealised Appreciation/ Currency Amount Currency Amount Date (Depreciation) in USD
USD 113,671 BRL (375,000) 01-Feb-2018 1,079 SEK 4,610,000 CHF (543,658) 21-Feb-2018 4,681 INR 50,723,607 USD (779,093) 12-Mar-2018 10,081 INR 24,850,000 USD (381,580) 12-Mar-2018 5,044 INR 24,850,000 USD (381,685) 12-Mar-2018 4,939 INR 24,950,000 USD (382,522) 14-Mar-2018 5,580
Total 31,404
USD 26,837 AUD (35,000) 01-Feb-2018 (495) USD 36,267 CHF (36,000) 01-Feb-2018 (689) USD 39,307 SEK (328,000) 01-Feb-2018 (741) USD 225,458 JPY (25,500,000) 01-Feb-2018 (1,464) BRL 375,000 USD (114,375) 01-Feb-2018 (1,783) USD 132,839 GBP (101,000) 01-Feb-2018 (3,934) USD 242,378 EUR (208,000) 01-Feb-2018 (7,472) JPY 172,000,000 USD (1,533,556) 22-Feb-2018 (1,494) USD 807,962 KRW (893,000,000) 22-Feb-2018 (28,429) USD 1,575,209 KRW (1,741,000,000) 22-Feb-2018 (55,424) JPY 146,357,152 CAD (1,676,000) 05-Mar-2018 (31,774)
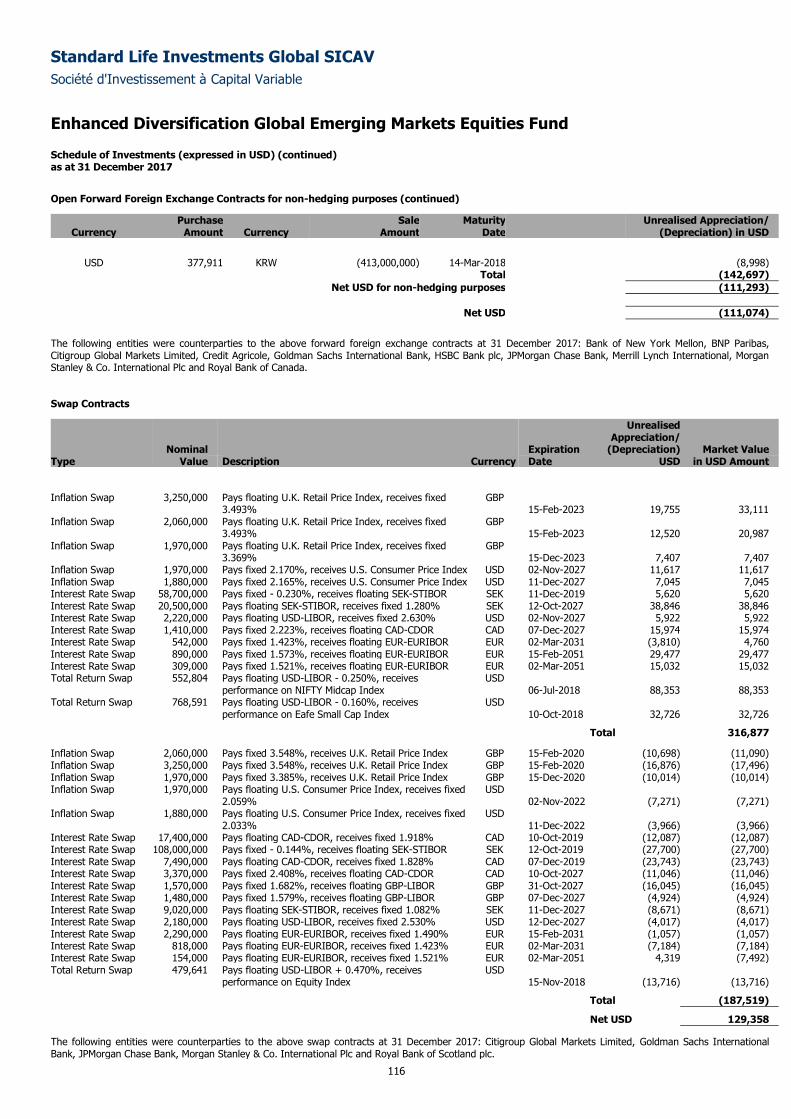
Standard Life Investments Global SICAV
Société d'Investissement à Capital Variable
Enhanced Diversification Global Emerging Markets Equities Fund Schedule of Investments (expressed in USD) (continued) as at 31 December 2017
116
Open Forward Foreign Exchange Contracts for non-hedging purposes (continued)
Purchase Sale Maturity Unrealised Appreciation/ Currency Amount Currency Amount Date (Depreciation) in USD
USD 377,911 KRW (413,000,000) 14-Mar-2018 (8,998)
Total (142,697)
Net USD for non-hedging purposes (111,293)
Net USD (111,074)
The following entities were counterparties to the above forward foreign exchange contracts at 31 December 2017: Bank of New York Mellon, BNP Paribas, Citigroup Global Markets Limited, Credit Agricole, Goldman Sachs International Bank, HSBC Bank plc, JPMorgan Chase Bank, Merrill Lynch International, Morgan Stanley & Co. International Plc and Royal Bank of Canada.
Swap Contracts
Unrealised Appreciation/ Nominal Expiration (Depreciation) Market Value Type Value Description Currency Date USD in USD Amount
Inflation Swap 3,250,000 Pays floating U.K. Retail Price Index, receives fixed 3.493%
GBP 15-Feb-2023 19,755 33,111
Inflation Swap 2,060,000 Pays floating U.K. Retail Price Index, receives fixed 3.493%
GBP 15-Feb-2023 12,520 20,987
Inflation Swap 1,970,000 Pays floating U.K. Retail Price Index, receives fixed 3.369%
GBP 15-Dec-2023 7,407 7,407
Inflation Swap 1,970,000 Pays fixed 2.170%, receives U.S. Consumer Price Index USD 02-Nov-2027 11,617 11,617 Inflation Swap 1,880,000 Pays fixed 2.165%, receives U.S. Consumer Price Index USD 11-Dec-2027 7,045 7,045 Interest Rate Swap 58,700,000 Pays fixed - 0.230%, receives floating SEK-STIBOR SEK 11-Dec-2019 5,620 5,620 Interest Rate Swap 20,500,000 Pays floating SEK-STIBOR, receives fixed 1.280% SEK 12-Oct-2027 38,846 38,846 Interest Rate Swap 2,220,000 Pays floating USD-LIBOR, receives fixed 2.630% USD 02-Nov-2027 5,922 5,922 Interest Rate Swap 1,410,000 Pays fixed 2.223%, receives floating CAD-CDOR CAD 07-Dec-2027 15,974 15,974 Interest Rate Swap 542,000 Pays fixed 1.423%, receives floating EUR-EURIBOR EUR 02-Mar-2031 (3,810) 4,760 Interest Rate Swap 890,000 Pays fixed 1.573%, receives floating EUR-EURIBOR EUR 15-Feb-2051 29,477 29,477 Interest Rate Swap 309,000 Pays fixed 1.521%, receives floating EUR-EURIBOR EUR 02-Mar-2051 15,032 15,032 Total Return Swap 552,804 Pays floating USD-LIBOR - 0.250%, receives
performance on NIFTY Midcap Index USD
06-Jul-2018 88,353 88,353 Total Return Swap 768,591 Pays floating USD-LIBOR - 0.160%, receives
performance on Eafe Small Cap Index USD
10-Oct-2018 32,726 32,726
Total 316,877
Inflation Swap 2,060,000 Pays fixed 3.548%, receives U.K. Retail Price Index GBP 15-Feb-2020 (10,698) (11,090) Inflation Swap 3,250,000 Pays fixed 3.548%, receives U.K. Retail Price Index GBP 15-Feb-2020 (16,876) (17,496) Inflation Swap 1,970,000 Pays fixed 3.385%, receives U.K. Retail Price Index GBP 15-Dec-2020 (10,014) (10,014) Inflation Swap 1,970,000 Pays floating U.S. Consumer Price Index, receives fixed
2.059% USD
02-Nov-2022 (7,271) (7,271) Inflation Swap 1,880,000 Pays floating U.S. Consumer Price Index, receives fixed
2.033% USD
11-Dec-2022 (3,966) (3,966) Interest Rate Swap 17,400,000 Pays floating CAD-CDOR, receives fixed 1.918% CAD 10-Oct-2019 (12,087) (12,087) Interest Rate Swap 108,000,000 Pays fixed - 0.144%, receives floating SEK-STIBOR SEK 12-Oct-2019 (27,700) (27,700) Interest Rate Swap 7,490,000 Pays floating CAD-CDOR, receives fixed 1.828% CAD 07-Dec-2019 (23,743) (23,743) Interest Rate Swap 3,370,000 Pays fixed 2.408%, receives floating CAD-CDOR CAD 10-Oct-2027 (11,046) (11,046) Interest Rate Swap 1,570,000 Pays fixed 1.682%, receives floating GBP-LIBOR GBP 31-Oct-2027 (16,045) (16,045) Interest Rate Swap 1,480,000 Pays fixed 1.579%, receives floating GBP-LIBOR GBP 07-Dec-2027 (4,924) (4,924) Interest Rate Swap 9,020,000 Pays floating SEK-STIBOR, receives fixed 1.082% SEK 11-Dec-2027 (8,671) (8,671) Interest Rate Swap 2,180,000 Pays floating USD-LIBOR, receives fixed 2.530% USD 12-Dec-2027 (4,017) (4,017) Interest Rate Swap 2,290,000 Pays floating EUR-EURIBOR, receives fixed 1.490% EUR 15-Feb-2031 (1,057) (1,057) Interest Rate Swap 818,000 Pays floating EUR-EURIBOR, receives fixed 1.423% EUR 02-Mar-2031 (7,184) (7,184) Interest Rate Swap 154,000 Pays floating EUR-EURIBOR, receives fixed 1.521% EUR 02-Mar-2051 4,319 (7,492) Total Return Swap 479,641 Pays floating USD-LIBOR + 0.470%, receives
performance on Equity Index USD
15-Nov-2018 (13,716) (13,716)
Total (187,519)
Net USD 129,358
The following entities were counterparties to the above swap contracts at 31 December 2017: Citigroup Global Markets Limited, Goldman Sachs International Bank, JPMorgan Chase Bank, Morgan Stanley & Co. International Plc and Royal Bank of Scotland plc.
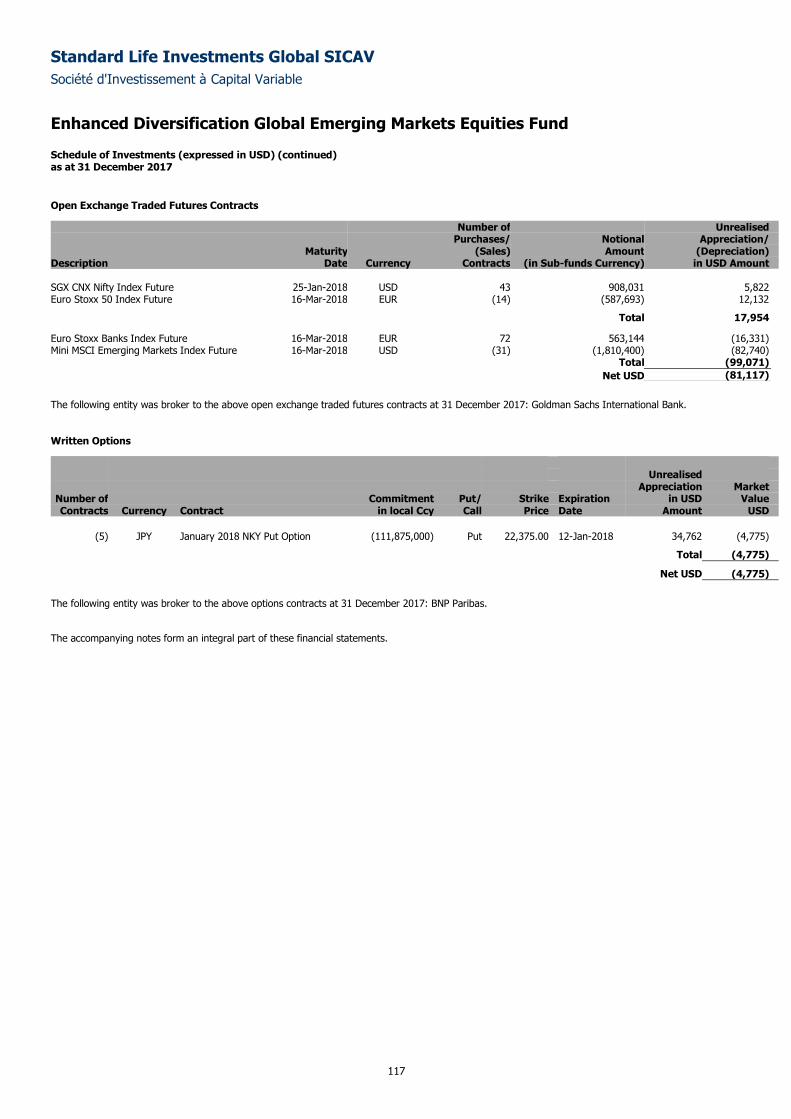
Standard Life Investments Global SICAV
Société d'Investissement à Capital Variable
Enhanced Diversification Global Emerging Markets Equities Fund Schedule of Investments (expressed in USD) (continued) as at 31 December 2017
117
Open Exchange Traded Futures Contracts
Number of Unrealised Purchases/ Notional Appreciation/ Maturity (Sales) Amount (Depreciation) Description Date Currency Contracts (in Sub-funds Currency) in USD Amount SGX CNX Nifty Index Future 25-Jan-2018 USD 43 908,031 5,822 Euro Stoxx 50 Index Future 16-Mar-2018 EUR (14) (587,693) 12,132
Total 17,954
Euro Stoxx Banks Index Future 16-Mar-2018 EUR 72 563,144 (16,331) Mini MSCI Emerging Markets Index Future 16-Mar-2018 USD (31) (1,810,400) (82,740) Total (99,071)
Net USD (81,117)
The following entity was broker to the above open exchange traded futures contracts at 31 December 2017: Goldman Sachs International Bank.
Written Options
Unrealised Appreciation Market
Number of Commitment Put/ Strike Expiration in USD Value Contracts Currency Contract in local Ccy Call Price Date Amount USD
(5) JPY January 2018 NKY Put Option (111,875,000) Put 22,375.00 12-Jan-2018 34,762 (4,775)
Total (4,775)
Net USD (4,775)
The following entity was broker to the above options contracts at 31 December 2017: BNP Paribas.
The accompanying notes form an integral part of these financial statements.
Standard Life Investments Global SICAV
Société d'Investissement à Capital Variable
118
Continental European Equity Income Fund
Sub-fund Objective and Investment Policy The objective of the Sub-fund is to provide a high level of income with some capital appreciation over the longer term.
It will achieve this objective primarily through investment in high yielding equities and equity related securities of corporations domiciled in European
countries (which might include emerging markets of Europe), excluding the UK, or companies that derive a significant proportion of their revenues or profits
from European operations or have a significant proportion of their assets there. A significant proportion may be invested in fixed interest securities.
Performance Review Over the period, the Continental European Equity Income Fund returned 8.67%, compared with the FTSE World Europe ex UK Index return of 13.01%.* Danish wind turbine company Vestas detracted from returns during the period, largely driven by concerns about the US regulatory environment and more intense pricing pressure. Scandinavian banks, such as Nordea & Swedbank, were also negative given worries about the health of the Swedish housing market. In other developments, Nokia declined in the wake of downbeat results, with network performance particularly weak. Jewellery group Pandora also fell when investors became worried about the effect weak mall traffic in the US would have on the company’s core product offerings. Our holding in Umicore boosted performance, as investors began to appreciate its solid position in the electric vehicle supply chain. IT hardware company ASML also made a positive contribution, as it delivered better-than-expected results and provided evidence of stronger product demand and new-product momentum. Elsewhere, asset manager Amundi rose amid healthy inflows and the upside potential from its Pioneer acquisition. Finally, Partners Group, the global private markets management firm, was robust on the back of improving business momentum and a positive surprise on performance fees. *Sub-fund performance has been calculated over the stated period on the share price performance basis, based on the institutional share class (D
Accumulation) in euro and net of fees. Please note the index return is quoted gross and contains no adjustment for fees. The sub-fund performance will also
be impacted by any pricing basis changes, made under our single swinging price policy. More information on our swinging price approach can be found in
note 8 of the Financial Statements.
Outlook European monetary policy is still accommodative (although the extent of this may have peaked) despite recent tightening in the US and the UK. The political environment has been less favourable, however, with a government coalition still to be formed in Germany, elections in Italy, a regional poll in Catalonia and continuing uncertainty over Brexit. We are mindful that political events can drive volatility in equity markets in the short term. Inflation is increasing and the gradually rising yield environment should be supportive for equity valuations, provided growth continues to improve. Therefore, we expect that cyclicals will remain in focus but we are mindful of expectations relative to valuation. Please note that the commitment approach has been used for risk measurement and calculation of global exposure for this Sub-fund. This Sub-fund is not authorised in Hong Kong and is not available to Hong Kong residents.
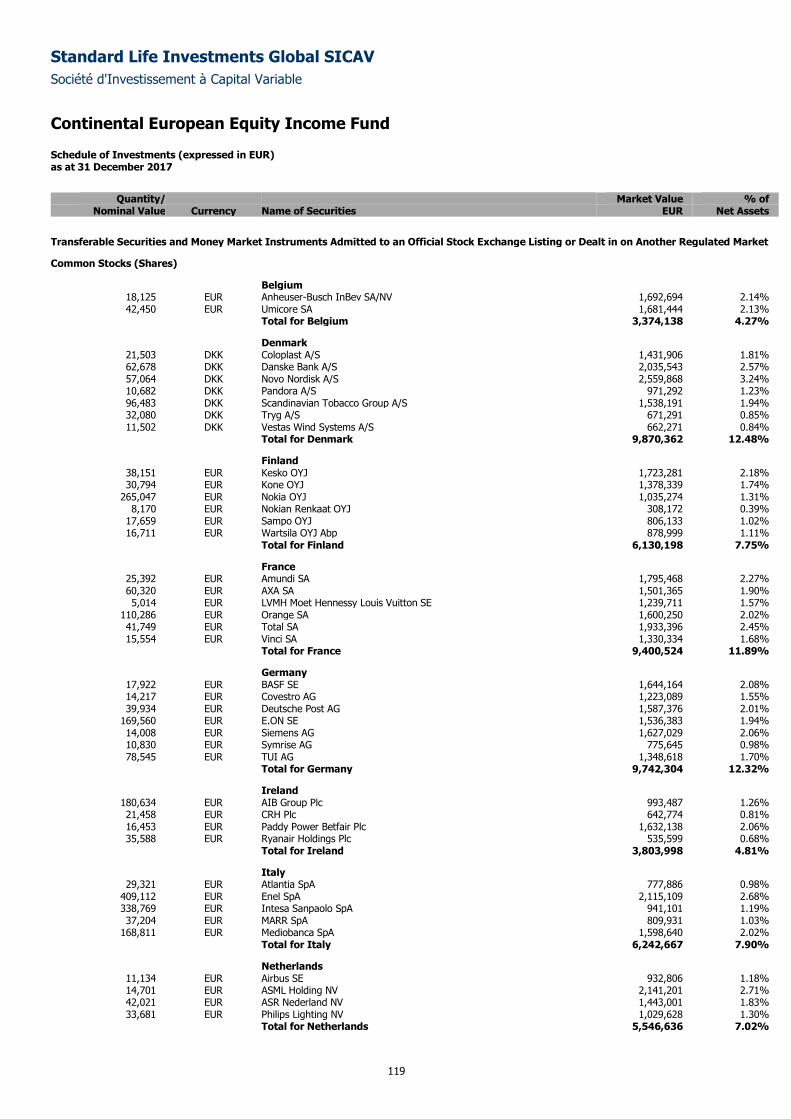
Standard Life Investments Global SICAV
Société d'Investissement à Capital Variable
Continental European Equity Income Fund
Schedule of Investments (expressed in EUR) as at 31 December 2017
119
Quantity/ Market Value % of
Nominal Value Currency Name of Securities EUR Net Assets
Transferable Securities and Money Market Instruments Admitted to an Official Stock Exchange Listing or Dealt in on Another Regulated Market
Common Stocks (Shares)
Belgium 18,125 EUR Anheuser-Busch InBev SA/NV 1,692,694 2.14% 42,450 EUR Umicore SA 1,681,444 2.13%
Total for Belgium 3,374,138 4.27%
Denmark 21,503 DKK Coloplast A/S 1,431,906 1.81% 62,678 DKK Danske Bank A/S 2,035,543 2.57% 57,064 DKK Novo Nordisk A/S 2,559,868 3.24% 10,682 DKK Pandora A/S 971,292 1.23% 96,483 DKK Scandinavian Tobacco Group A/S 1,538,191 1.94% 32,080 DKK Tryg A/S 671,291 0.85% 11,502 DKK Vestas Wind Systems A/S 662,271 0.84%
Total for Denmark 9,870,362 12.48%
Finland 38,151 EUR Kesko OYJ 1,723,281 2.18% 30,794 EUR Kone OYJ 1,378,339 1.74%
265,047 EUR Nokia OYJ 1,035,274 1.31% 8,170 EUR Nokian Renkaat OYJ 308,172 0.39%
17,659 EUR Sampo OYJ 806,133 1.02% 16,711 EUR Wartsila OYJ Abp 878,999 1.11%
Total for Finland 6,130,198 7.75%
France 25,392 EUR Amundi SA 1,795,468 2.27% 60,320 EUR AXA SA 1,501,365 1.90% 5,014 EUR LVMH Moet Hennessy Louis Vuitton SE 1,239,711 1.57%
110,286 EUR Orange SA 1,600,250 2.02% 41,749 EUR Total SA 1,933,396 2.45% 15,554 EUR Vinci SA 1,330,334 1.68%
Total for France 9,400,524 11.89%
Germany 17,922 EUR BASF SE 1,644,164 2.08% 14,217 EUR Covestro AG 1,223,089 1.55% 39,934 EUR Deutsche Post AG 1,587,376 2.01%
169,560 EUR E.ON SE 1,536,383 1.94% 14,008 EUR Siemens AG 1,627,029 2.06% 10,830 EUR Symrise AG 775,645 0.98% 78,545 EUR TUI AG 1,348,618 1.70%
Total for Germany 9,742,304 12.32%
Ireland 180,634 EUR AIB Group Plc 993,487 1.26% 21,458 EUR CRH Plc 642,774 0.81% 16,453 EUR Paddy Power Betfair Plc 1,632,138 2.06% 35,588 EUR Ryanair Holdings Plc 535,599 0.68%
Total for Ireland 3,803,998 4.81%
Italy 29,321 EUR Atlantia SpA 777,886 0.98%
409,112 EUR Enel SpA 2,115,109 2.68% 338,769 EUR Intesa Sanpaolo SpA 941,101 1.19% 37,204 EUR MARR SpA 809,931 1.03%
168,811 EUR Mediobanca SpA 1,598,640 2.02% Total for Italy 6,242,667 7.90%
Netherlands 11,134 EUR Airbus SE 932,806 1.18% 14,701 EUR ASML Holding NV 2,141,201 2.71% 42,021 EUR ASR Nederland NV 1,443,001 1.83% 33,681 EUR Philips Lighting NV 1,029,628 1.30%
Total for Netherlands 5,546,636 7.02%
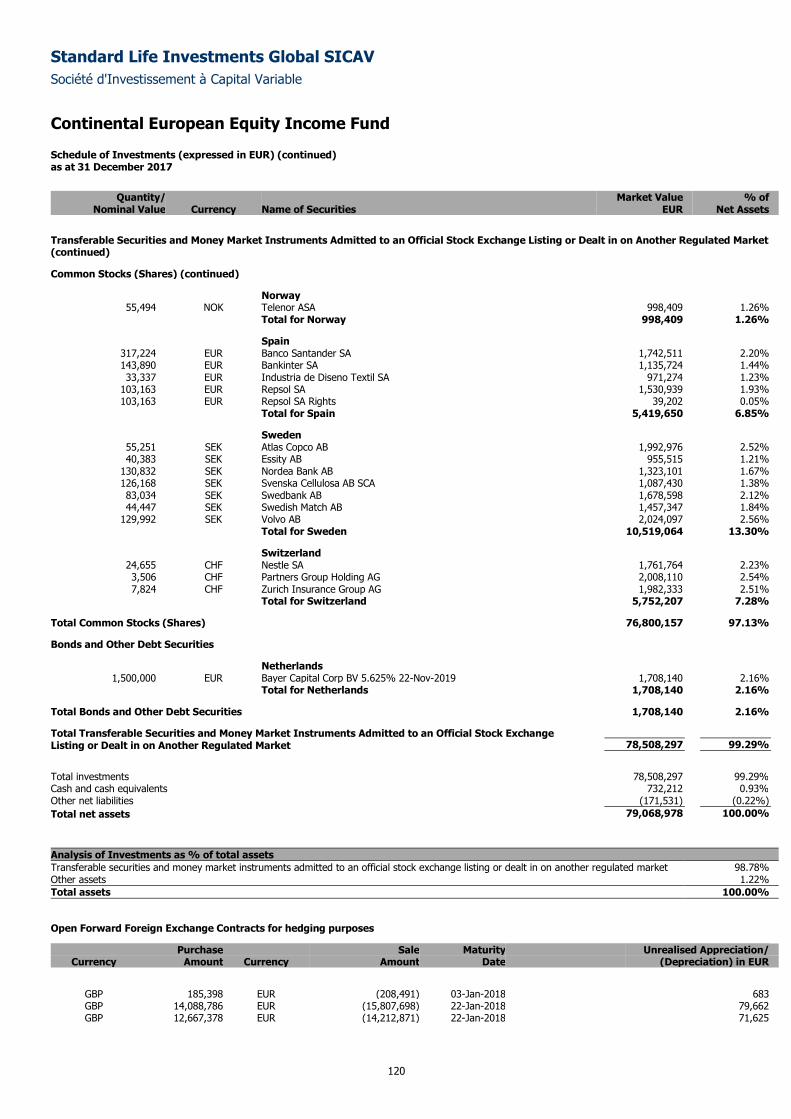
Standard Life Investments Global SICAV
Société d'Investissement à Capital Variable
Continental European Equity Income Fund
Schedule of Investments (expressed in EUR) (continued) as at 31 December 2017
120
Quantity/ Market Value % of
Nominal Value Currency Name of Securities EUR Net Assets
Transferable Securities and Money Market Instruments Admitted to an Official Stock Exchange Listing or Dealt in on Another Regulated Market (continued)
Common Stocks (Shares) (continued)
Norway 55,494 NOK Telenor ASA 998,409 1.26%
Total for Norway 998,409 1.26%
Spain 317,224 EUR Banco Santander SA 1,742,511 2.20% 143,890 EUR Bankinter SA 1,135,724 1.44% 33,337 EUR Industria de Diseno Textil SA 971,274 1.23%
103,163 EUR Repsol SA 1,530,939 1.93% 103,163 EUR Repsol SA Rights 39,202 0.05%
Total for Spain 5,419,650 6.85%
Sweden 55,251 SEK Atlas Copco AB 1,992,976 2.52% 40,383 SEK Essity AB 955,515 1.21%
130,832 SEK Nordea Bank AB 1,323,101 1.67% 126,168 SEK Svenska Cellulosa AB SCA 1,087,430 1.38% 83,034 SEK Swedbank AB 1,678,598 2.12% 44,447 SEK Swedish Match AB 1,457,347 1.84%
129,992 SEK Volvo AB 2,024,097 2.56% Total for Sweden 10,519,064 13.30%
Switzerland 24,655 CHF Nestle SA 1,761,764 2.23% 3,506 CHF Partners Group Holding AG 2,008,110 2.54% 7,824 CHF Zurich Insurance Group AG 1,982,333 2.51%
Total for Switzerland 5,752,207 7.28%
Total Common Stocks (Shares) 76,800,157 97.13%
Bonds and Other Debt Securities
Netherlands 1,500,000 EUR Bayer Capital Corp BV 5.625% 22-Nov-2019 1,708,140 2.16%
Total for Netherlands 1,708,140 2.16%
Total Bonds and Other Debt Securities 1,708,140 2.16%
Total Transferable Securities and Money Market Instruments Admitted to an Official Stock Exchange Listing or Dealt in on Another Regulated Market 78,508,297 99.29%
Total investments 78,508,297 99.29%
Cash and cash equivalents 732,212 0.93%
Other net liabilities (171,531) (0.22% )
Total net assets 79,068,978 100.00%
Analysis of Investments as % of total assets
Transferable securities and money market instruments admitted to an official stock exchange listing or dealt in on another regulated market 98.78% Other assets 1.22%
Total assets 100.00%
Open Forward Foreign Exchange Contracts for hedging purposes
Purchase Sale Maturity Unrealised Appreciation/ Currency Amount Currency Amount Date (Depreciation) in EUR
GBP 185,398 EUR (208,491) 03-Jan-2018 683 GBP 14,088,786 EUR (15,807,698) 22-Jan-2018 79,662 GBP 12,667,378 EUR (14,212,871) 22-Jan-2018 71,625
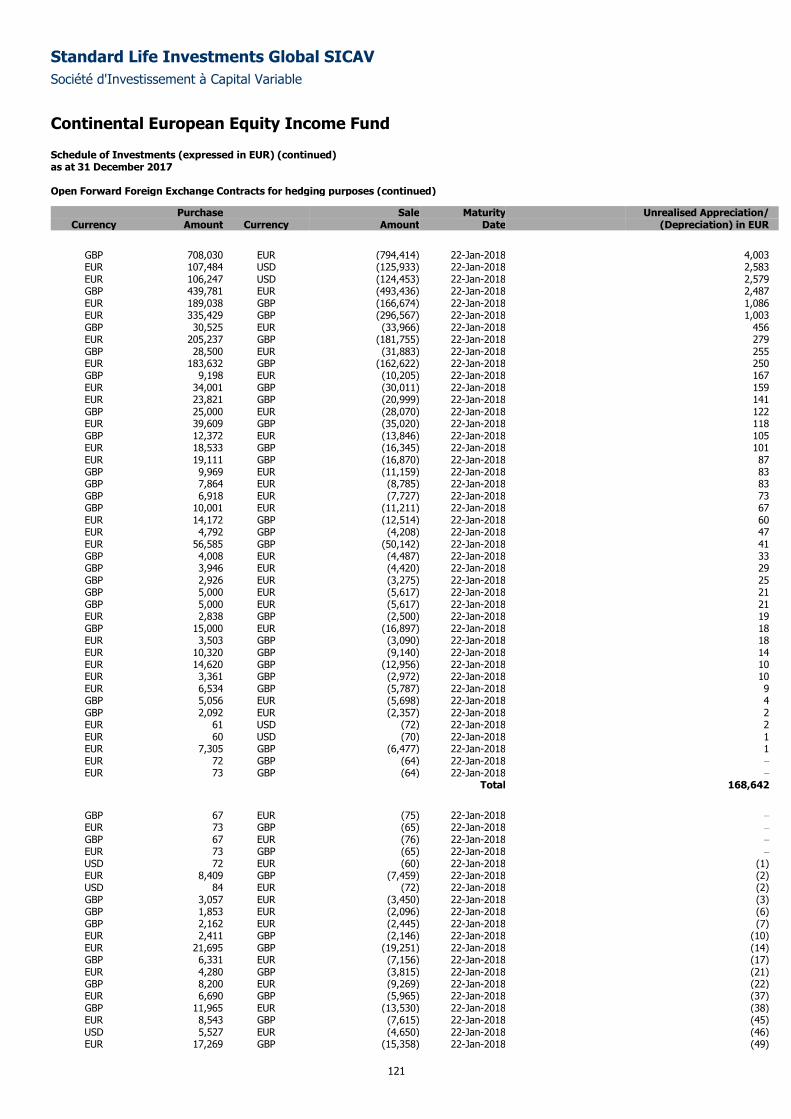
Standard Life Investments Global SICAV
Société d'Investissement à Capital Variable
Continental European Equity Income Fund
Schedule of Investments (expressed in EUR) (continued) as at 31 December 2017
121
Open Forward Foreign Exchange Contracts for hedging purposes (continued)
Purchase Sale Maturity Unrealised Appreciation/ Currency Amount Currency Amount Date (Depreciation) in EUR
GBP 708,030 EUR (794,414) 22-Jan-2018 4,003 EUR 107,484 USD (125,933) 22-Jan-2018 2,583 EUR 106,247 USD (124,453) 22-Jan-2018 2,579 GBP 439,781 EUR (493,436) 22-Jan-2018 2,487 EUR 189,038 GBP (166,674) 22-Jan-2018 1,086 EUR 335,429 GBP (296,567) 22-Jan-2018 1,003 GBP 30,525 EUR (33,966) 22-Jan-2018 456 EUR 205,237 GBP (181,755) 22-Jan-2018 279 GBP 28,500 EUR (31,883) 22-Jan-2018 255 EUR 183,632 GBP (162,622) 22-Jan-2018 250 GBP 9,198 EUR (10,205) 22-Jan-2018 167 EUR 34,001 GBP (30,011) 22-Jan-2018 159 EUR 23,821 GBP (20,999) 22-Jan-2018 141 GBP 25,000 EUR (28,070) 22-Jan-2018 122 EUR 39,609 GBP (35,020) 22-Jan-2018 118 GBP 12,372 EUR (13,846) 22-Jan-2018 105 EUR 18,533 GBP (16,345) 22-Jan-2018 101 EUR 19,111 GBP (16,870) 22-Jan-2018 87 GBP 9,969 EUR (11,159) 22-Jan-2018 83 GBP 7,864 EUR (8,785) 22-Jan-2018 83 GBP 6,918 EUR (7,727) 22-Jan-2018 73 GBP 10,001 EUR (11,211) 22-Jan-2018 67 EUR 14,172 GBP (12,514) 22-Jan-2018 60 EUR 4,792 GBP (4,208) 22-Jan-2018 47 EUR 56,585 GBP (50,142) 22-Jan-2018 41 GBP 4,008 EUR (4,487) 22-Jan-2018 33 GBP 3,946 EUR (4,420) 22-Jan-2018 29 GBP 2,926 EUR (3,275) 22-Jan-2018 25 GBP 5,000 EUR (5,617) 22-Jan-2018 21 GBP 5,000 EUR (5,617) 22-Jan-2018 21 EUR 2,838 GBP (2,500) 22-Jan-2018 19 GBP 15,000 EUR (16,897) 22-Jan-2018 18 EUR 3,503 GBP (3,090) 22-Jan-2018 18 EUR 10,320 GBP (9,140) 22-Jan-2018 14 EUR 14,620 GBP (12,956) 22-Jan-2018 10 EUR 3,361 GBP (2,972) 22-Jan-2018 10 EUR 6,534 GBP (5,787) 22-Jan-2018 9 GBP 5,056 EUR (5,698) 22-Jan-2018 4 GBP 2,092 EUR (2,357) 22-Jan-2018 2 EUR 61 USD (72) 22-Jan-2018 2 EUR 60 USD (70) 22-Jan-2018 1 EUR 7,305 GBP (6,477) 22-Jan-2018 1 EUR 72 GBP (64) 22-Jan-2018 –
EUR 73 GBP (64) 22-Jan-2018 –
Total 168,642
GBP 67 EUR (75) 22-Jan-2018 –
EUR 73 GBP (65) 22-Jan-2018 –
GBP 67 EUR (76) 22-Jan-2018 –
EUR 73 GBP (65) 22-Jan-2018 –
USD 72 EUR (60) 22-Jan-2018 (1) EUR 8,409 GBP (7,459) 22-Jan-2018 (2) USD 84 EUR (72) 22-Jan-2018 (2) GBP 3,057 EUR (3,450) 22-Jan-2018 (3) GBP 1,853 EUR (2,096) 22-Jan-2018 (6) GBP 2,162 EUR (2,445) 22-Jan-2018 (7) EUR 2,411 GBP (2,146) 22-Jan-2018 (10) EUR 21,695 GBP (19,251) 22-Jan-2018 (14) GBP 6,331 EUR (7,156) 22-Jan-2018 (17) EUR 4,280 GBP (3,815) 22-Jan-2018 (21) GBP 8,200 EUR (9,269) 22-Jan-2018 (22) EUR 6,690 GBP (5,965) 22-Jan-2018 (37) GBP 11,965 EUR (13,530) 22-Jan-2018 (38) EUR 8,543 GBP (7,615) 22-Jan-2018 (45) USD 5,527 EUR (4,650) 22-Jan-2018 (46) EUR 17,269 GBP (15,358) 22-Jan-2018 (49)
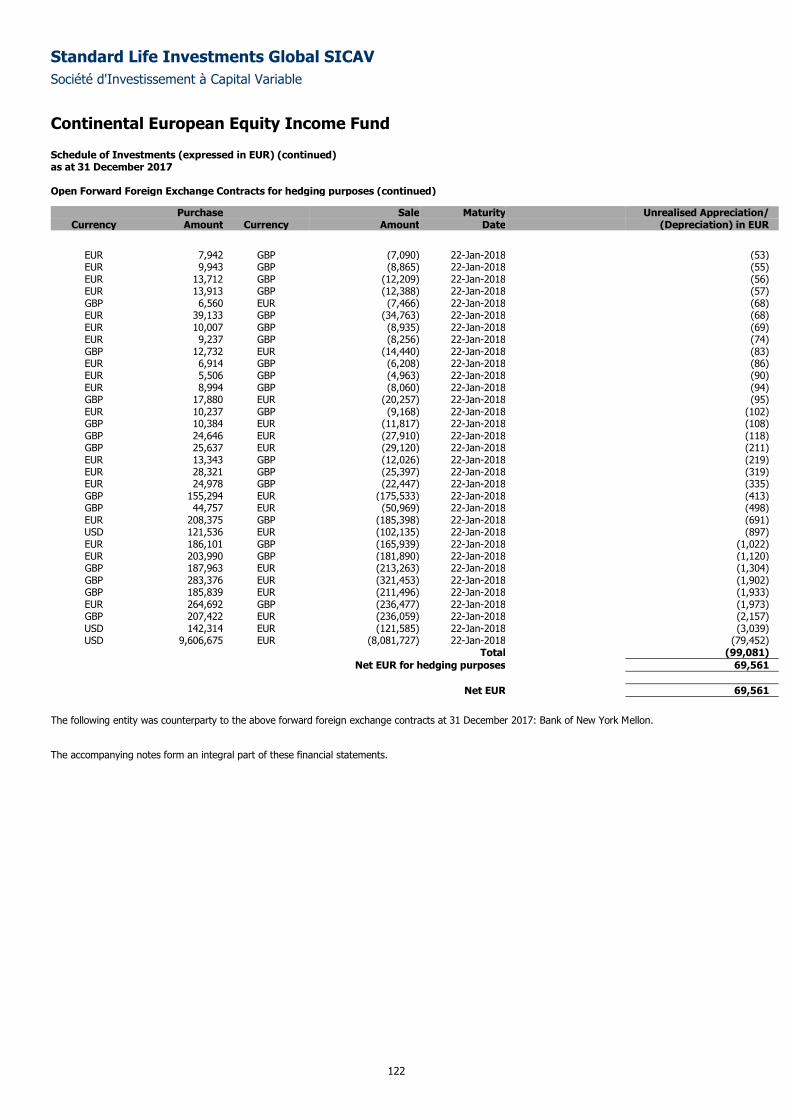
Standard Life Investments Global SICAV
Société d'Investissement à Capital Variable
Continental European Equity Income Fund
Schedule of Investments (expressed in EUR) (continued) as at 31 December 2017
122
Open Forward Foreign Exchange Contracts for hedging purposes (continued)
Purchase Sale Maturity Unrealised Appreciation/ Currency Amount Currency Amount Date (Depreciation) in EUR
EUR 7,942 GBP (7,090) 22-Jan-2018 (53) EUR 9,943 GBP (8,865) 22-Jan-2018 (55) EUR 13,712 GBP (12,209) 22-Jan-2018 (56) EUR 13,913 GBP (12,388) 22-Jan-2018 (57) GBP 6,560 EUR (7,466) 22-Jan-2018 (68) EUR 39,133 GBP (34,763) 22-Jan-2018 (68) EUR 10,007 GBP (8,935) 22-Jan-2018 (69) EUR 9,237 GBP (8,256) 22-Jan-2018 (74) GBP 12,732 EUR (14,440) 22-Jan-2018 (83) EUR 6,914 GBP (6,208) 22-Jan-2018 (86) EUR 5,506 GBP (4,963) 22-Jan-2018 (90) EUR 8,994 GBP (8,060) 22-Jan-2018 (94) GBP 17,880 EUR (20,257) 22-Jan-2018 (95) EUR 10,237 GBP (9,168) 22-Jan-2018 (102) GBP 10,384 EUR (11,817) 22-Jan-2018 (108) GBP 24,646 EUR (27,910) 22-Jan-2018 (118) GBP 25,637 EUR (29,120) 22-Jan-2018 (211) EUR 13,343 GBP (12,026) 22-Jan-2018 (219) EUR 28,321 GBP (25,397) 22-Jan-2018 (319) EUR 24,978 GBP (22,447) 22-Jan-2018 (335) GBP 155,294 EUR (175,533) 22-Jan-2018 (413) GBP 44,757 EUR (50,969) 22-Jan-2018 (498) EUR 208,375 GBP (185,398) 22-Jan-2018 (691) USD 121,536 EUR (102,135) 22-Jan-2018 (897) EUR 186,101 GBP (165,939) 22-Jan-2018 (1,022) EUR 203,990 GBP (181,890) 22-Jan-2018 (1,120) GBP 187,963 EUR (213,263) 22-Jan-2018 (1,304) GBP 283,376 EUR (321,453) 22-Jan-2018 (1,902) GBP 185,839 EUR (211,496) 22-Jan-2018 (1,933) EUR 264,692 GBP (236,477) 22-Jan-2018 (1,973) GBP 207,422 EUR (236,059) 22-Jan-2018 (2,157) USD 142,314 EUR (121,585) 22-Jan-2018 (3,039) USD 9,606,675 EUR (8,081,727) 22-Jan-2018 (79,452)
Total (99,081)
Net EUR for hedging purposes 69,561
Net EUR 69,561
The following entity was counterparty to the above forward foreign exchange contracts at 31 December 2017: Bank of New York Mellon.
The accompanying notes form an integral part of these financial statements.
Standard Life Investments Global SICAV
Société d'Investissement à Capital Variable
123
Global Equity Unconstrained Fund Sub-fund Objective and Investment Policy
The objective of the Sub-fund is to achieve long-term growth in the share price through capital appreciation of the underlying equity portfolio.
It will achieve this objective primarily through investment in equities and equity related securities of corporations registered on recognised stock exchanges.
The Sub-fund will not be restricted by index weightings, sector constraints or company size.
Performance Review
The Sub-fund returned 21.82% over the review period in dollar terms, compared to the MSCI AC World Index, which was up 24.62%.*
Looking at the positives first, US video games maker Activision Blizzard had an excellent year as it continued to deliver forecast-beating results. This was
driven by digital downloads and micro transactions (in-game purchases of various pieces of kit that are designed to enhance the playing experience). That
said, the digital distribution investment angle is now better understood by investors, and the once-marginal eSports offering is now perceived as a clear
positive. We therefore took profits ahead of a more competitive year in 2018, which will see the launch of numerous ‘triple-A’ game titles. A position in
technology conglomerate Samsung Electronics also boosted Fund returns after the company announced strong results, with record profitability in its
memory business. Samsung also pledged to double the dividend payout next year. These results are in-line with our investment thesis. Additional highlights
included Visteon, JXTG Holdings and Worldpay.
By contrast, shares in US consumer staple group Newell Brands fell after it released disappointing results. This was largely due to weak ‘back-to-school’
demand and an inventory correction at one of Newell’s larger customers. The company consequently reduced guidance for the year and also stepped back
from its longer-term revenue projections. Given this new data, we are currently reassessing our investment case. Pandora, a global manufacturer and
retailer of jewellery, had a challenging year. However, we think the market is focusing too much on the problems Pandora had when it was just a charm
company. Indeed, we feel the rising sales of non-charm products means that Pandora is a different business in this cycle and so we have added to the
position. Positions in Acuity Brands, First Republic Bank and Hess Corporation also disappointed.
*Sub-fund performance has been calculated over the stated period on the share price performance basis, based on the institutional share class (D
Accumulation) and net of fees. Please note the index return is quoted gross and contains no adjustment for fees. The sub-fund performance will also be
impacted by any pricing basis changes, made under our single swinging price policy. More information on our swinging price approach can be found in note
8 of the Financial Statements.
Outlook
Global markets enter 2018 on a sound footing. The world economy is growing at a robust rate, which is feeding into healthy corporate profits. Central banks
have started to withdraw monetary stimulus, although any future moves have been signalled as measured and data-dependent. Challenges remain, notably
around geopolitics, the US debt ceiling and potential policy missteps. China could also slow more sharply than expected. Nonetheless, in our view the overall
outlook is encouraging.
Please note that the commitment approach has been used for risk measurement and calculation of global exposure for this Sub-fund.
This Sub-fund is not authorized in Hong Kong and is not available to Hong Kong residents.
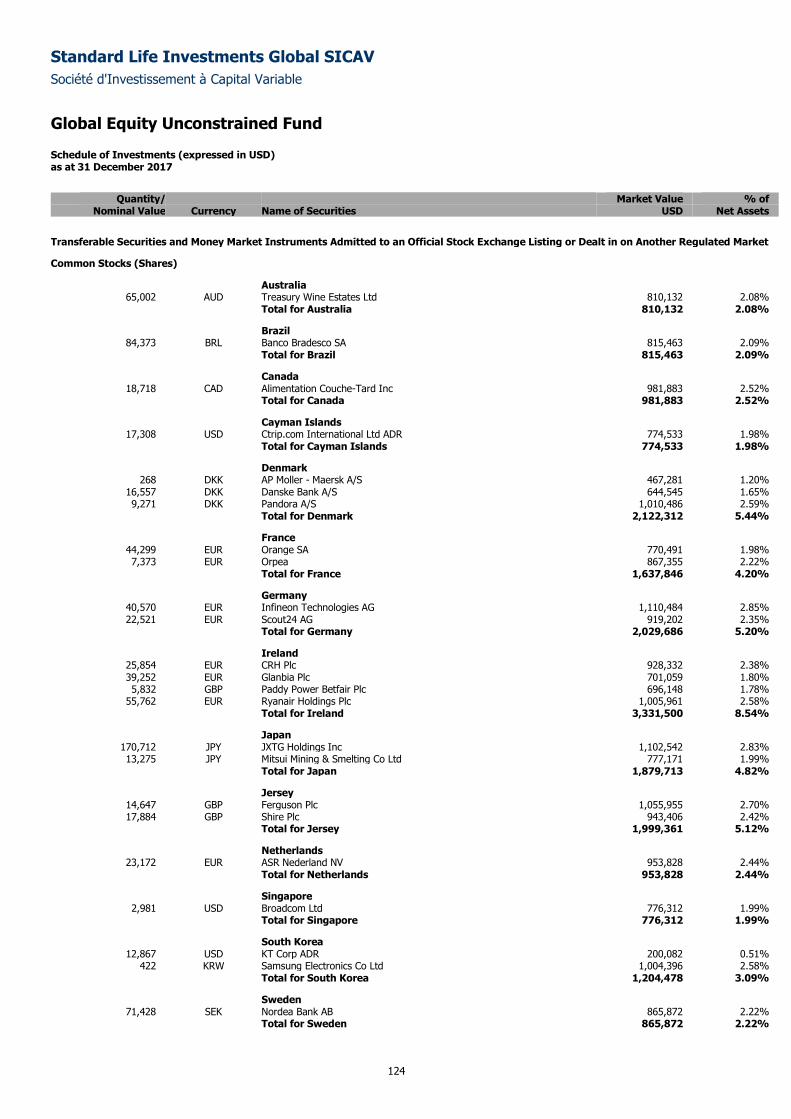
Standard Life Investments Global SICAV
Société d'Investissement à Capital Variable
Global Equity Unconstrained Fund
Schedule of Investments (expressed in USD) as at 31 December 2017
124
Quantity/ Market Value % of
Nominal Value Currency Name of Securities USD Net Assets
Transferable Securities and Money Market Instruments Admitted to an Official Stock Exchange Listing or Dealt in on Another Regulated Market
Common Stocks (Shares)
Australia 65,002 AUD Treasury Wine Estates Ltd 810,132 2.08%
Total for Australia 810,132 2.08%
Brazil 84,373 BRL Banco Bradesco SA 815,463 2.09%
Total for Brazil 815,463 2.09%
Canada 18,718 CAD Alimentation Couche-Tard Inc 981,883 2.52%
Total for Canada 981,883 2.52%
Cayman Islands 17,308 USD Ctrip.com International Ltd ADR 774,533 1.98%
Total for Cayman Islands 774,533 1.98%
Denmark 268 DKK AP Moller - Maersk A/S 467,281 1.20%
16,557 DKK Danske Bank A/S 644,545 1.65% 9,271 DKK Pandora A/S 1,010,486 2.59%
Total for Denmark 2,122,312 5.44%
France 44,299 EUR Orange SA 770,491 1.98% 7,373 EUR Orpea 867,355 2.22%
Total for France 1,637,846 4.20%
Germany 40,570 EUR Infineon Technologies AG 1,110,484 2.85% 22,521 EUR Scout24 AG 919,202 2.35%
Total for Germany 2,029,686 5.20%
Ireland 25,854 EUR CRH Plc 928,332 2.38% 39,252 EUR Glanbia Plc 701,059 1.80% 5,832 GBP Paddy Power Betfair Plc 696,148 1.78%
55,762 EUR Ryanair Holdings Plc 1,005,961 2.58% Total for Ireland 3,331,500 8.54%
Japan 170,712 JPY JXTG Holdings Inc 1,102,542 2.83% 13,275 JPY Mitsui Mining & Smelting Co Ltd 777,171 1.99%
Total for Japan 1,879,713 4.82%
Jersey 14,647 GBP Ferguson Plc 1,055,955 2.70% 17,884 GBP Shire Plc 943,406 2.42%
Total for Jersey 1,999,361 5.12%
Netherlands 23,172 EUR ASR Nederland NV 953,828 2.44%
Total for Netherlands 953,828 2.44%
Singapore 2,981 USD Broadcom Ltd 776,312 1.99%
Total for Singapore 776,312 1.99%
South Korea 12,867 USD KT Corp ADR 200,082 0.51%
422 KRW Samsung Electronics Co Ltd 1,004,396 2.58% Total for South Korea 1,204,478 3.09%
Sweden 71,428 SEK Nordea Bank AB 865,872 2.22%
Total for Sweden 865,872 2.22%
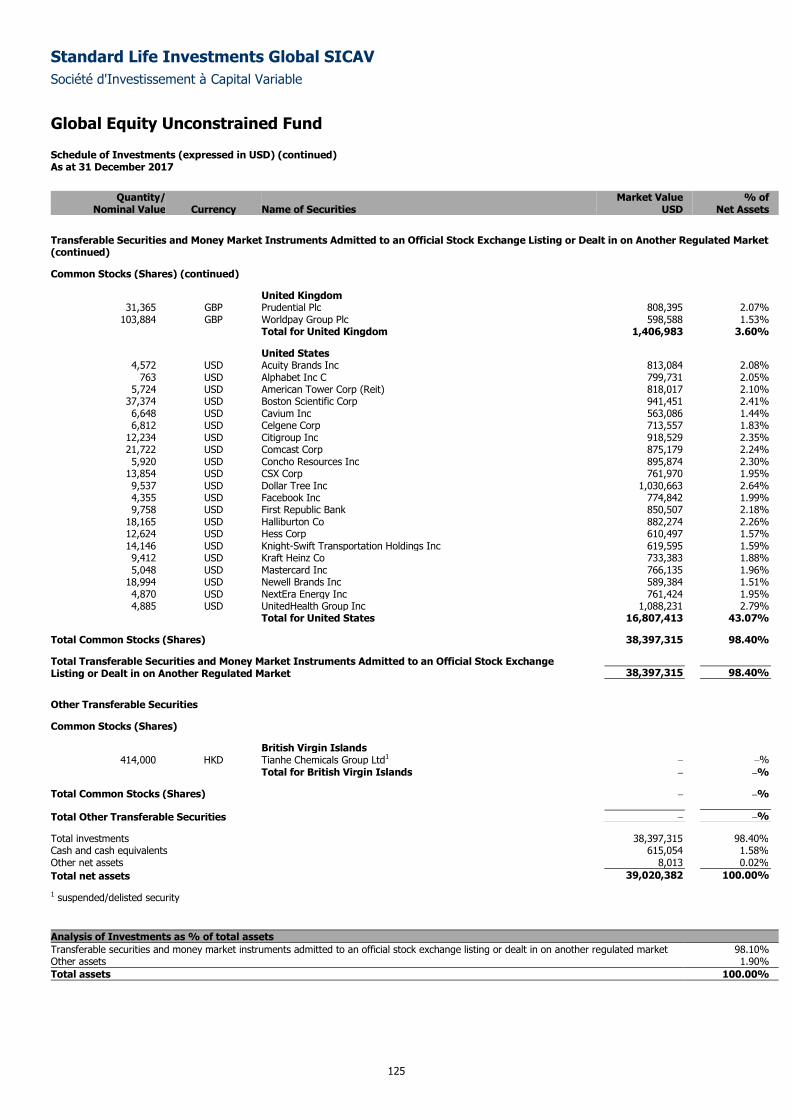
Standard Life Investments Global SICAV
Société d'Investissement à Capital Variable
Global Equity Unconstrained Fund
Schedule of Investments (expressed in USD) (continued) As at 31 December 2017
125
Quantity/ Market Value % of
Nominal Value Currency Name of Securities USD Net Assets
Transferable Securities and Money Market Instruments Admitted to an Official Stock Exchange Listing or Dealt in on Another Regulated Market (continued)
Common Stocks (Shares) (continued)
United Kingdom 31,365 GBP Prudential Plc 808,395 2.07%
103,884 GBP Worldpay Group Plc 598,588 1.53% Total for United Kingdom 1,406,983 3.60%
United States 4,572 USD Acuity Brands Inc 813,084 2.08%
763 USD Alphabet Inc C 799,731 2.05% 5,724 USD American Tower Corp (Reit) 818,017 2.10%
37,374 USD Boston Scientific Corp 941,451 2.41% 6,648 USD Cavium Inc 563,086 1.44% 6,812 USD Celgene Corp 713,557 1.83%
12,234 USD Citigroup Inc 918,529 2.35% 21,722 USD Comcast Corp 875,179 2.24% 5,920 USD Concho Resources Inc 895,874 2.30%
13,854 USD CSX Corp 761,970 1.95% 9,537 USD Dollar Tree Inc 1,030,663 2.64% 4,355 USD Facebook Inc 774,842 1.99% 9,758 USD First Republic Bank 850,507 2.18%
18,165 USD Halliburton Co 882,274 2.26% 12,624 USD Hess Corp 610,497 1.57% 14,146 USD Knight-Swift Transportation Holdings Inc 619,595 1.59% 9,412 USD Kraft Heinz Co 733,383 1.88% 5,048 USD Mastercard Inc 766,135 1.96%
18,994 USD Newell Brands Inc 589,384 1.51% 4,870 USD NextEra Energy Inc 761,424 1.95% 4,885 USD UnitedHealth Group Inc 1,088,231 2.79%
Total for United States 16,807,413 43.07%
Total Common Stocks (Shares) 38,397,315 98.40%
Total Transferable Securities and Money Market Instruments Admitted to an Official Stock Exchange Listing or Dealt in on Another Regulated Market 38,397,315 98.40%
Other Transferable Securities
Common Stocks (Shares)
British Virgin Islands 414,000 HKD Tianhe Chemicals Group Ltd1 – –%
Total for British Virgin Islands – –%
Total Common Stocks (Shares) – –%
Total Other Transferable Securities – –%
Total investments 38,397,315 98.40%
Cash and cash equivalents 615,054 1.58%
Other net assets 8,013 0.02%
Total net assets 39,020,382 100.00%
1 suspended/delisted security
Analysis of Investments as % of total assets
Transferable securities and money market instruments admitted to an official stock exchange listing or dealt in on another regulated market 98.10% Other assets 1.90%
Total assets 100.00%
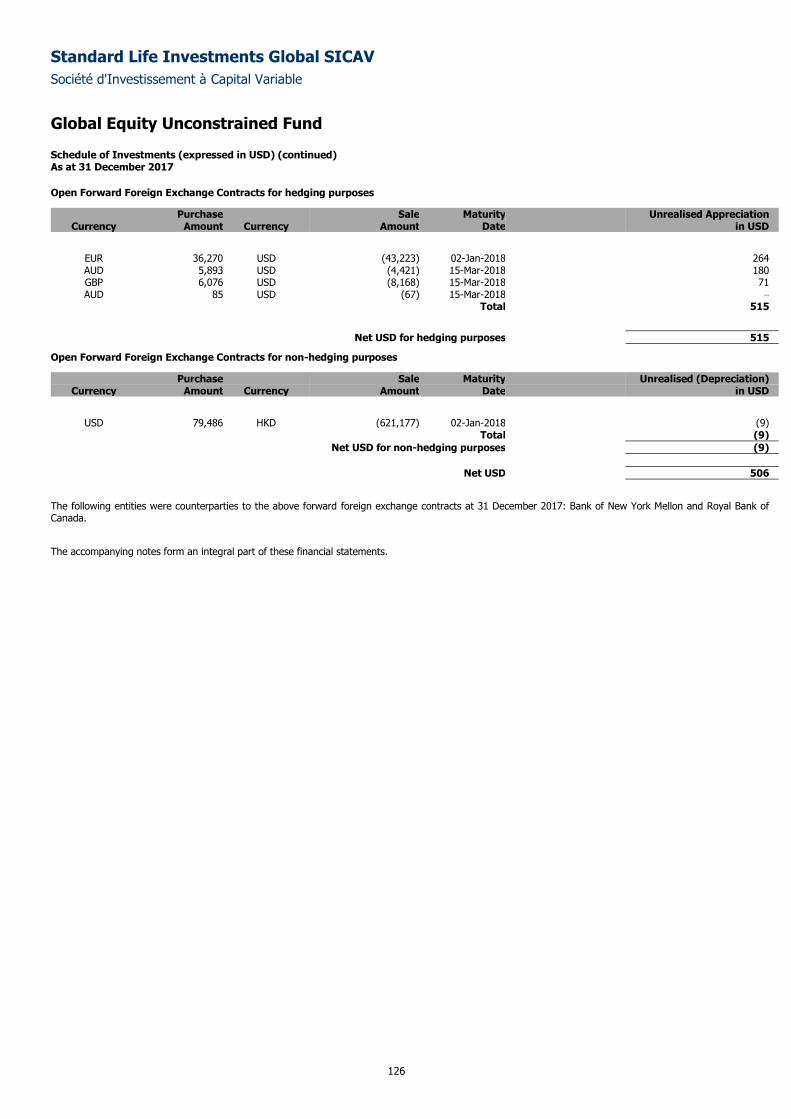
Standard Life Investments Global SICAV
Société d'Investissement à Capital Variable
Global Equity Unconstrained Fund
Schedule of Investments (expressed in USD) (continued) As at 31 December 2017
126
Open Forward Foreign Exchange Contracts for hedging purposes
Purchase Sale Maturity Unrealised Appreciation Currency Amount Currency Amount Date in USD
EUR 36,270 USD (43,223) 02-Jan-2018 264 AUD 5,893 USD (4,421) 15-Mar-2018 180 GBP 6,076 USD (8,168) 15-Mar-2018 71 AUD 85 USD (67) 15-Mar-2018 –
Total 515
Net USD for hedging purposes 515
Open Forward Foreign Exchange Contracts for non-hedging purposes
Purchase Sale Maturity Unrealised (Depreciation) Currency Amount Currency Amount Date in USD
USD 79,486 HKD (621,177) 02-Jan-2018 (9) Total (9)
Net USD for non-hedging purposes (9)
Net USD 506
The following entities were counterparties to the above forward foreign exchange contracts at 31 December 2017: Bank of New York Mellon and Royal Bank of Canada.
The accompanying notes form an integral part of these financial statements.
Standard Life Investments Global SICAV
Société d'Investissement à Capital Variable
127
American Equity Unconstrained Fund Sub-fund Objective and Investment Policy The objective of the Sub-fund is to achieve long-term growth in the share price through capital appreciation of the underlying equity portfolio.
It will achieve this objective primarily through investment in equities and equity related securities of corporations domiciled in the US, or companies that
derive a significant proportion of their revenues or profits from US operations or have a significant proportion of their assets there. The Sub-fund will not be
restricted by index weightings, sector constraints or company size.
Performance Review The Fund rose 17.63% over the review period, compared to the S&P 500 Index, which returned 21.83%.*
The Fund’s position in Newell Brands had a negative impact on performance, as sales and earnings fell short of expectations. This was due, in part, to
significant retail de-stocking within its writing instruments business. First Republic Bank also proved disappointing when management announced that
expenses would rise by more than previously expected. Elsewhere, Kraft Heinz’s share price fell amid concerns about the impact of the Amazon/Wholefoods
link-up on the packaged foods sector. There were also doubts as to whether the company can find a willing acquisition target. Lastly, insurer American
International Group declined when a reserve charge eroded confidence in its management and reserve adequacy.
More positively, discount chain Dollar Tree reported solid results that convinced investors the firm’s turnaround is gaining real traction. Aircraft parts maker
Rockwell Collins also rose when the company received a takeover bid from United Technologies. Elsewhere, semiconductor company Broadcom Limited was
positive for Fund performance. The potential for attractive free cashflow and dividend growth drove investor enthusiasm. A robust earnings report and an
assured outlook supported this. Elsewhere, security solutions provider Allegion added value, as the organic growth rate of its industrial product range is
notably strong and stable interest rates underpin continued expansion in construction end markets.
*Sub-fund performance has been calculated over the stated period on the share price performance basis, based on the institutional share class (D
Accumulation) and net of fees. Please note the index return is quoted gross and contains no adjustment for fees. The sub-fund performance will also be
impacted by any pricing basis changes, made under our single swinging price policy. More information on our swinging price approach can be found in note
8 of the Financial Statements.
Outlook Overall, we are positive on US equities and the economy. The improving global outlook, both for developed and emerging markets, is also presenting
numerous opportunities. Meanwhile, estimates suggest that President Trump’s tax reform bill could boost US GDP growth by about 1% and lift S&P 500
earnings by about 6%. Risks, however, remain. Higher interest rates, for example, could put pressure on earnings multiples and weigh on economic growth.
Geopolitics, the US debt ceiling and the potential for a monetary policy misstep will also be present as we progress through 2018. Nonetheless, the market
remains supportive, with conditions favourable for bottom-up stock-pickers such as ourselves.
Please note that the commitment approach has been used for risk measurement and calculation of global exposure for this Sub-fund.
This Sub-fund is not authorized in Hong Kong and is not available to Hong Kong residents.
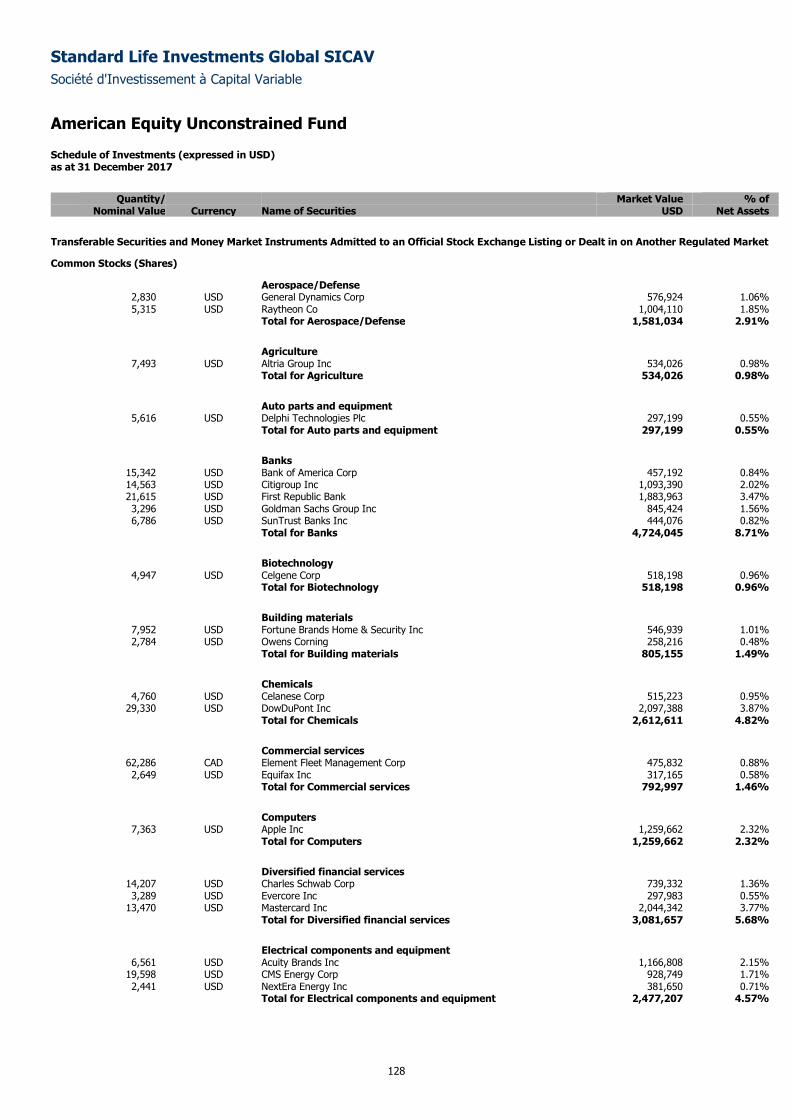
Standard Life Investments Global SICAV
Société d'Investissement à Capital Variable
American Equity Unconstrained Fund
Schedule of Investments (expressed in USD) as at 31 December 2017
128
Quantity/ Market Value % of
Nominal Value Currency Name of Securities USD Net Assets
Transferable Securities and Money Market Instruments Admitted to an Official Stock Exchange Listing or Dealt in on Another Regulated Market
Common Stocks (Shares)
Aerospace/Defense 2,830 USD General Dynamics Corp 576,924 1.06% 5,315 USD Raytheon Co 1,004,110 1.85%
Total for Aerospace/Defense 1,581,034 2.91%
Agriculture
7,493 USD Altria Group Inc 534,026 0.98% Total for Agriculture 534,026 0.98%
Auto parts and equipment
5,616 USD Delphi Technologies Plc 297,199 0.55% Total for Auto parts and equipment 297,199 0.55%
Banks
15,342 USD Bank of America Corp 457,192 0.84% 14,563 USD Citigroup Inc 1,093,390 2.02% 21,615 USD First Republic Bank 1,883,963 3.47% 3,296 USD Goldman Sachs Group Inc 845,424 1.56% 6,786 USD SunTrust Banks Inc 444,076 0.82%
Total for Banks 4,724,045 8.71%
Biotechnology
4,947 USD Celgene Corp 518,198 0.96% Total for Biotechnology 518,198 0.96%
Building materials
7,952 USD Fortune Brands Home & Security Inc 546,939 1.01% 2,784 USD Owens Corning 258,216 0.48%
Total for Building materials 805,155 1.49%
Chemicals
4,760 USD Celanese Corp 515,223 0.95% 29,330 USD DowDuPont Inc 2,097,388 3.87%
Total for Chemicals 2,612,611 4.82%
Commercial services
62,286 CAD Element Fleet Management Corp 475,832 0.88% 2,649 USD Equifax Inc 317,165 0.58%
Total for Commercial services 792,997 1.46%
Computers
7,363 USD Apple Inc 1,259,662 2.32% Total for Computers 1,259,662 2.32%
Diversified financial services
14,207 USD Charles Schwab Corp 739,332 1.36% 3,289 USD Evercore Inc 297,983 0.55%
13,470 USD Mastercard Inc 2,044,342 3.77% Total for Diversified financial services 3,081,657 5.68%
Electrical components and equipment
6,561 USD Acuity Brands Inc 1,166,808 2.15% 19,598 USD CMS Energy Corp 928,749 1.71% 2,441 USD NextEra Energy Inc 381,650 0.71%
Total for Electrical components and equipment 2,477,207 4.57%
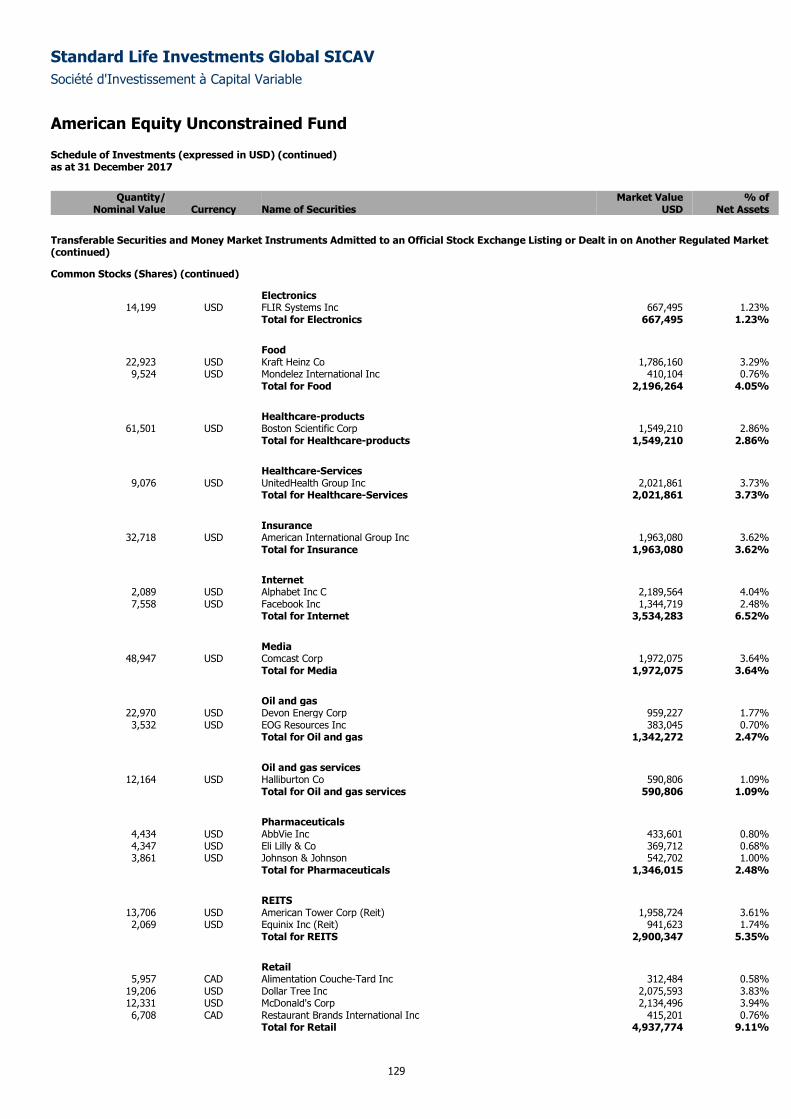
Standard Life Investments Global SICAV
Société d'Investissement à Capital Variable
American Equity Unconstrained Fund
Schedule of Investments (expressed in USD) (continued) as at 31 December 2017
129
Quantity/ Market Value % of
Nominal Value Currency Name of Securities USD Net Assets
Transferable Securities and Money Market Instruments Admitted to an Official Stock Exchange Listing or Dealt in on Another Regulated Market (continued)
Common Stocks (Shares) (continued)
Electronics 14,199 USD FLIR Systems Inc 667,495 1.23%
Total for Electronics 667,495 1.23%
Food
22,923 USD Kraft Heinz Co 1,786,160 3.29% 9,524 USD Mondelez International Inc 410,104 0.76%
Total for Food 2,196,264 4.05%
Healthcare-products
61,501 USD Boston Scientific Corp 1,549,210 2.86% Total for Healthcare-products 1,549,210 2.86%
Healthcare-Services
9,076 USD UnitedHealth Group Inc 2,021,861 3.73% Total for Healthcare-Services 2,021,861 3.73%
Insurance
32,718 USD American International Group Inc 1,963,080 3.62% Total for Insurance 1,963,080 3.62%
Internet
2,089 USD Alphabet Inc C 2,189,564 4.04% 7,558 USD Facebook Inc 1,344,719 2.48%
Total for Internet 3,534,283 6.52%
Media
48,947 USD Comcast Corp 1,972,075 3.64% Total for Media 1,972,075 3.64%
Oil and gas
22,970 USD Devon Energy Corp 959,227 1.77% 3,532 USD EOG Resources Inc 383,045 0.70%
Total for Oil and gas 1,342,272 2.47%
Oil and gas services
12,164 USD Halliburton Co 590,806 1.09% Total for Oil and gas services 590,806 1.09%
Pharmaceuticals
4,434 USD AbbVie Inc 433,601 0.80% 4,347 USD Eli Lilly & Co 369,712 0.68% 3,861 USD Johnson & Johnson 542,702 1.00%
Total for Pharmaceuticals 1,346,015 2.48%
REITS
13,706 USD American Tower Corp (Reit) 1,958,724 3.61% 2,069 USD Equinix Inc (Reit) 941,623 1.74%
Total for REITS 2,900,347 5.35%
Retail
5,957 CAD Alimentation Couche-Tard Inc 312,484 0.58% 19,206 USD Dollar Tree Inc 2,075,593 3.83% 12,331 USD McDonald's Corp 2,134,496 3.94% 6,708 CAD Restaurant Brands International Inc 415,201 0.76%
Total for Retail 4,937,774 9.11%
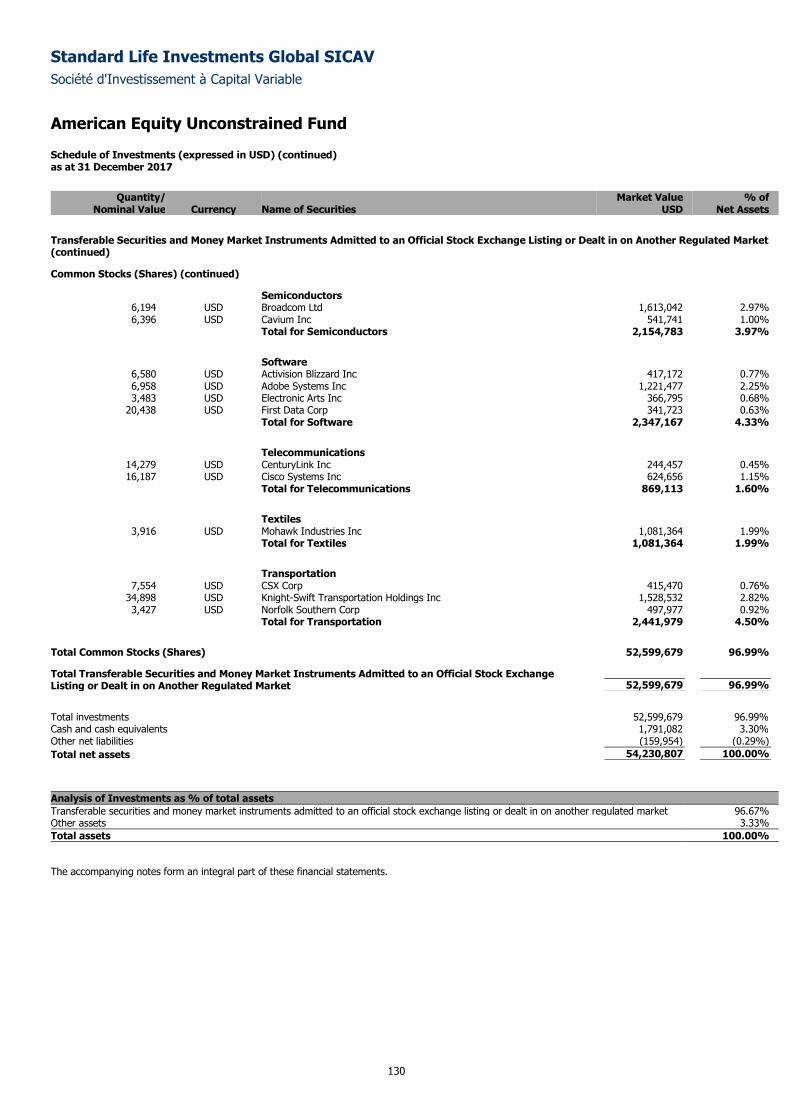
Standard Life Investments Global SICAV
Société d'Investissement à Capital Variable
American Equity Unconstrained Fund
Schedule of Investments (expressed in USD) (continued) as at 31 December 2017
130
Quantity/ Market Value % of
Nominal Value Currency Name of Securities USD Net Assets
Transferable Securities and Money Market Instruments Admitted to an Official Stock Exchange Listing or Dealt in on Another Regulated Market (continued)
Common Stocks (Shares) (continued)
Semiconductors 6,194 USD Broadcom Ltd 1,613,042 2.97% 6,396 USD Cavium Inc 541,741 1.00%
Total for Semiconductors 2,154,783 3.97%
Software
6,580 USD Activision Blizzard Inc 417,172 0.77% 6,958 USD Adobe Systems Inc 1,221,477 2.25% 3,483 USD Electronic Arts Inc 366,795 0.68%
20,438 USD First Data Corp 341,723 0.63% Total for Software 2,347,167 4.33%
Telecommunications
14,279 USD CenturyLink Inc 244,457 0.45% 16,187 USD Cisco Systems Inc 624,656 1.15%
Total for Telecommunications 869,113 1.60%
Textiles
3,916 USD Mohawk Industries Inc 1,081,364 1.99% Total for Textiles 1,081,364 1.99%
Transportation
7,554 USD CSX Corp 415,470 0.76% 34,898 USD Knight-Swift Transportation Holdings Inc 1,528,532 2.82% 3,427 USD Norfolk Southern Corp 497,977 0.92%
Total for Transportation 2,441,979 4.50%
Total Common Stocks (Shares) 52,599,679 96.99%
Total Transferable Securities and Money Market Instruments Admitted to an Official Stock Exchange Listing or Dealt in on Another Regulated Market 52,599,679 96.99%
Total investments 52,599,679 96.99%
Cash and cash equivalents 1,791,082 3.30%
Other net liabilities (159,954) (0.29% )
Total net assets 54,230,807 100.00%
Analysis of Investments as % of total assets
Transferable securities and money market instruments admitted to an official stock exchange listing or dealt in on another regulated market 96.67% Other assets 3.33%
Total assets 100.00%
The accompanying notes form an integral part of these financial statements.
Standard Life Investments Global SICAV
Société d'Investissement à Capital Variable
131
Global Emerging Markets Equities Fund Sub-fund Objective and Investment Policy
The objective of the Sub-fund is to achieve long term growth in the share price through capital appreciation of the underlying equity portfolio.
It will achieve this objective primarily through investment in equities and equity related securities of corporations domiciled in emerging markets or
companies that derive a significant proportion of their revenues or profits from Asian, Eastern European, Middle Eastern, African or Latin American
operations or have a significant proportion of their assets there. The Sub-fund will take positions with reference to index weightings.
Performance Review
The Sub-fund returned 44.36% over the review period, compared to the MSCI Emerging Markets Free Index, which was up 37.75%.*
Hotel operator China Lodging continued to excel and was our top contributor, with consensus earnings estimates revised up further on the back of rising
occupancy rates and revenues per available room. The company is demonstrating its ability to add value through hotel chain acquisitions and we think there
is further scope for margin expansion thanks to operational gearing. Elsewhere, Globaltrans, the Russian rail freight forwarder, announced Q2 earnings well
in excess of consensus thanks to much stronger gondola car pricing. The company has also increased its payout ratio, implying a current dividend yield of
around 8%. Additional positives included Minth, Sunny Optical and ING Life.
Among the negative contributors was Indonesian TV operator Media Nusantara, with the overall ad budget less vibrant than we had hoped and some
volatility in market share. Our conviction is falling in this stock. Meanwhile, a position in travel services firm Ctrip.com weighed on relative performance. The
China Aviation Authority recently said the practice of bundling auxiliary services like airport lounges and car parking with air-ticket sales should be stopped.
Ctrip.com generates 6-7% of its revenues from such practices. However, we believe Ctrip.com will adopt international standards (i.e. selling these services
separately) and that this is therefore a short-term issue. As such, our investment thesis remains in place. Holdings in Ginko, Nexen Tire and JBS also
disappointed.
*Sub-fund performance has been calculated over the stated period on the share price performance basis, based on the institutional share class (D
Accumulation) and net of fees. Please note the index return is quoted gross and contains no adjustment for fees. The sub-fund performance will also be
impacted by any pricing basis changes, made under our single swinging price policy. More information on our swinging price approach can be found in note
8 of the Financial Statements.
Outlook
Looking ahead, we believe the primary driver of global emerging market equity performance remains the global economy. Indeed, we are seeing
synchronous growth acceleration among both developed and emerging countries, with measured monetary policy and limited inflation pressures. This is
feeding accelerating earnings growth at the company level across emerging markets, and we are seeing a lot of upgrades among our holdings. Earnings are
particularly strong in the information technology sector, which now accounts for around 28% of the benchmark index, reflecting the significant structural
changes in emerging markets over the last few years.
Please note that the commitment approach has been used for risk measurement and calculation of global exposure for this Sub-fund.
This Sub-fund is not authorized in Hong Kong and is not available to Hong Kong residents.
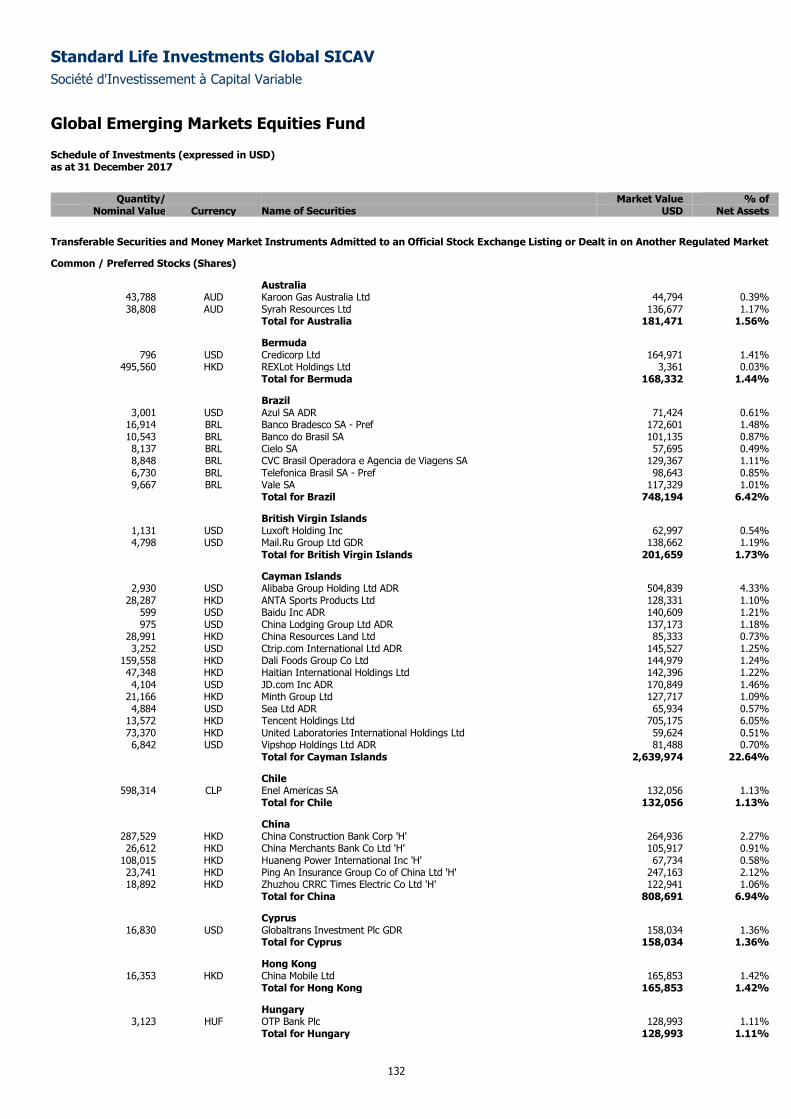
Standard Life Investments Global SICAV
Société d'Investissement à Capital Variable
Global Emerging Markets Equities Fund
Schedule of Investments (expressed in USD) as at 31 December 2017
132
Quantity/ Market Value % of
Nominal Value Currency Name of Securities USD Net Assets
Transferable Securities and Money Market Instruments Admitted to an Official Stock Exchange Listing or Dealt in on Another Regulated Market
Common / Preferred Stocks (Shares)
Australia 43,788 AUD Karoon Gas Australia Ltd 44,794 0.39% 38,808 AUD Syrah Resources Ltd 136,677 1.17%
Total for Australia 181,471 1.56%
Bermuda 796 USD Credicorp Ltd 164,971 1.41%
495,560 HKD REXLot Holdings Ltd 3,361 0.03% Total for Bermuda 168,332 1.44%
Brazil 3,001 USD Azul SA ADR 71,424 0.61%
16,914 BRL Banco Bradesco SA - Pref 172,601 1.48% 10,543 BRL Banco do Brasil SA 101,135 0.87% 8,137 BRL Cielo SA 57,695 0.49% 8,848 BRL CVC Brasil Operadora e Agencia de Viagens SA 129,367 1.11% 6,730 BRL Telefonica Brasil SA - Pref 98,643 0.85% 9,667 BRL Vale SA 117,329 1.01%
Total for Brazil 748,194 6.42%
British Virgin Islands 1,131 USD Luxoft Holding Inc 62,997 0.54% 4,798 USD Mail.Ru Group Ltd GDR 138,662 1.19%
Total for British Virgin Islands 201,659 1.73%
Cayman Islands 2,930 USD Alibaba Group Holding Ltd ADR 504,839 4.33%
28,287 HKD ANTA Sports Products Ltd 128,331 1.10% 599 USD Baidu Inc ADR 140,609 1.21% 975 USD China Lodging Group Ltd ADR 137,173 1.18%
28,991 HKD China Resources Land Ltd 85,333 0.73% 3,252 USD Ctrip.com International Ltd ADR 145,527 1.25%
159,558 HKD Dali Foods Group Co Ltd 144,979 1.24% 47,348 HKD Haitian International Holdings Ltd 142,396 1.22% 4,104 USD JD.com Inc ADR 170,849 1.46%
21,166 HKD Minth Group Ltd 127,717 1.09% 4,884 USD Sea Ltd ADR 65,934 0.57%
13,572 HKD Tencent Holdings Ltd 705,175 6.05% 73,370 HKD United Laboratories International Holdings Ltd 59,624 0.51% 6,842 USD Vipshop Holdings Ltd ADR 81,488 0.70%
Total for Cayman Islands 2,639,974 22.64%
Chile 598,314 CLP Enel Americas SA 132,056 1.13%
Total for Chile 132,056 1.13%
China 287,529 HKD China Construction Bank Corp 'H' 264,936 2.27% 26,612 HKD China Merchants Bank Co Ltd 'H' 105,917 0.91%
108,015 HKD Huaneng Power International Inc 'H' 67,734 0.58% 23,741 HKD Ping An Insurance Group Co of China Ltd 'H' 247,163 2.12% 18,892 HKD Zhuzhou CRRC Times Electric Co Ltd 'H' 122,941 1.06%
Total for China 808,691 6.94%
Cyprus 16,830 USD Globaltrans Investment Plc GDR 158,034 1.36%
Total for Cyprus 158,034 1.36%
Hong Kong 16,353 HKD China Mobile Ltd 165,853 1.42%
Total for Hong Kong 165,853 1.42%
Hungary 3,123 HUF OTP Bank Plc 128,993 1.11%
Total for Hungary 128,993 1.11%
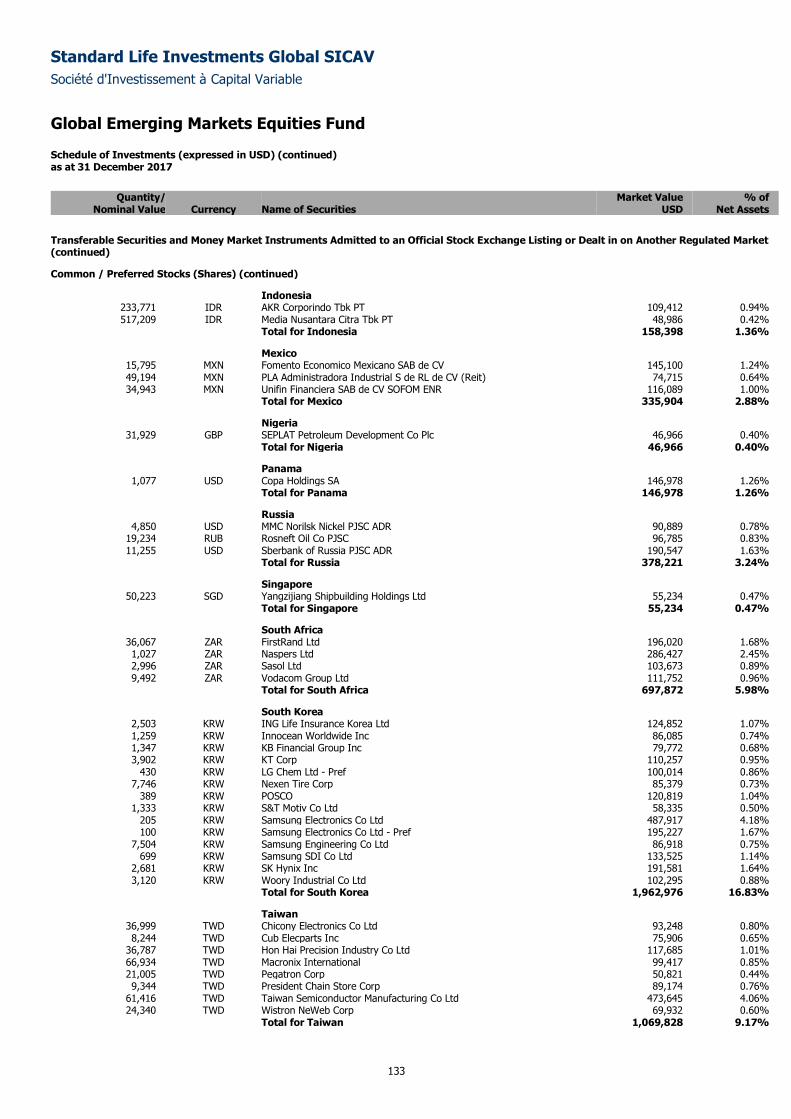
Standard Life Investments Global SICAV
Société d'Investissement à Capital Variable
Global Emerging Markets Equities Fund
Schedule of Investments (expressed in USD) (continued) as at 31 December 2017
133
Quantity/ Market Value % of
Nominal Value Currency Name of Securities USD Net Assets
Transferable Securities and Money Market Instruments Admitted to an Official Stock Exchange Listing or Dealt in on Another Regulated Market (continued)
Common / Preferred Stocks (Shares) (continued)
Indonesia 233,771 IDR AKR Corporindo Tbk PT 109,412 0.94% 517,209 IDR Media Nusantara Citra Tbk PT 48,986 0.42%
Total for Indonesia 158,398 1.36%
Mexico 15,795 MXN Fomento Economico Mexicano SAB de CV 145,100 1.24% 49,194 MXN PLA Administradora Industrial S de RL de CV (Reit) 74,715 0.64% 34,943 MXN Unifin Financiera SAB de CV SOFOM ENR 116,089 1.00%
Total for Mexico 335,904 2.88%
Nigeria 31,929 GBP SEPLAT Petroleum Development Co Plc 46,966 0.40%
Total for Nigeria 46,966 0.40%
Panama 1,077 USD Copa Holdings SA 146,978 1.26%
Total for Panama 146,978 1.26%
Russia 4,850 USD MMC Norilsk Nickel PJSC ADR 90,889 0.78%
19,234 RUB Rosneft Oil Co PJSC 96,785 0.83% 11,255 USD Sberbank of Russia PJSC ADR 190,547 1.63%
Total for Russia 378,221 3.24%
Singapore 50,223 SGD Yangzijiang Shipbuilding Holdings Ltd 55,234 0.47%
Total for Singapore 55,234 0.47%
South Africa 36,067 ZAR FirstRand Ltd 196,020 1.68% 1,027 ZAR Naspers Ltd 286,427 2.45% 2,996 ZAR Sasol Ltd 103,673 0.89% 9,492 ZAR Vodacom Group Ltd 111,752 0.96%
Total for South Africa 697,872 5.98%
South Korea 2,503 KRW ING Life Insurance Korea Ltd 124,852 1.07% 1,259 KRW Innocean Worldwide Inc 86,085 0.74% 1,347 KRW KB Financial Group Inc 79,772 0.68% 3,902 KRW KT Corp 110,257 0.95%
430 KRW LG Chem Ltd - Pref 100,014 0.86% 7,746 KRW Nexen Tire Corp 85,379 0.73%
389 KRW POSCO 120,819 1.04% 1,333 KRW S&T Motiv Co Ltd 58,335 0.50%
205 KRW Samsung Electronics Co Ltd 487,917 4.18% 100 KRW Samsung Electronics Co Ltd - Pref 195,227 1.67%
7,504 KRW Samsung Engineering Co Ltd 86,918 0.75% 699 KRW Samsung SDI Co Ltd 133,525 1.14%
2,681 KRW SK Hynix Inc 191,581 1.64% 3,120 KRW Woory Industrial Co Ltd 102,295 0.88%
Total for South Korea 1,962,976 16.83%
Taiwan 36,999 TWD Chicony Electronics Co Ltd 93,248 0.80% 8,244 TWD Cub Elecparts Inc 75,906 0.65%
36,787 TWD Hon Hai Precision Industry Co Ltd 117,685 1.01% 66,934 TWD Macronix International 99,417 0.85% 21,005 TWD Pegatron Corp 50,821 0.44% 9,344 TWD President Chain Store Corp 89,174 0.76%
61,416 TWD Taiwan Semiconductor Manufacturing Co Ltd 473,645 4.06% 24,340 TWD Wistron NeWeb Corp 69,932 0.60%
Total for Taiwan 1,069,828 9.17%
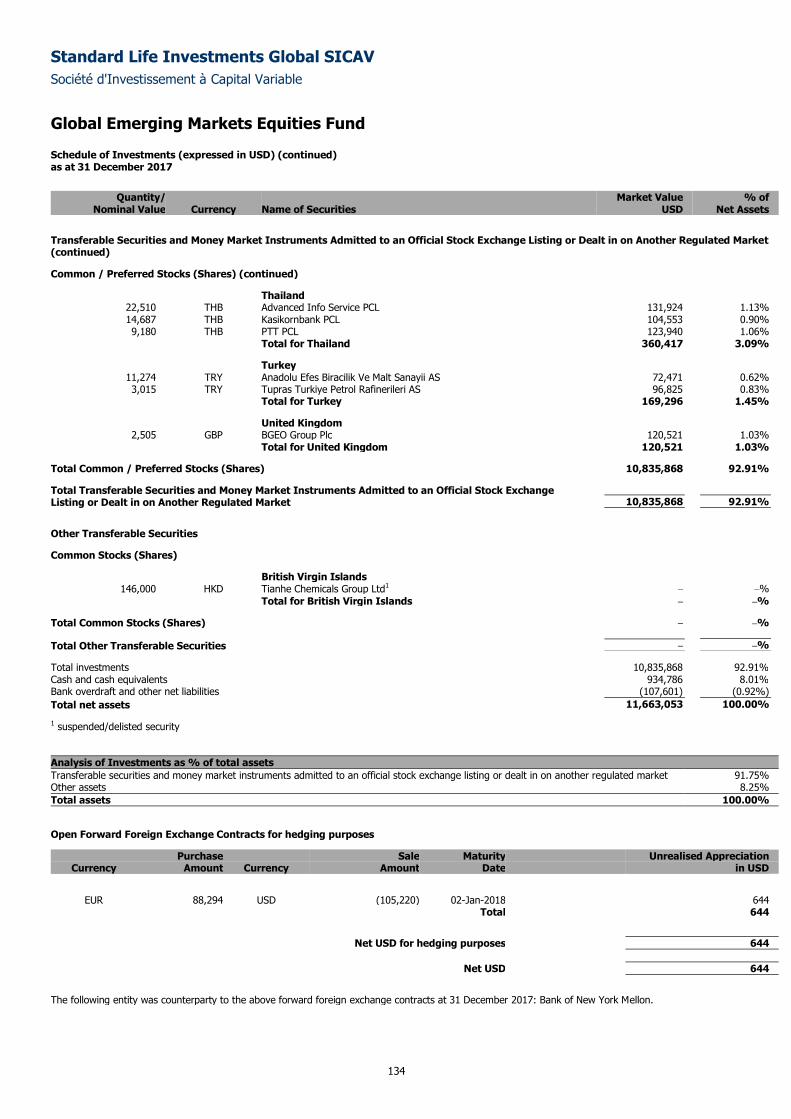
Standard Life Investments Global SICAV
Société d'Investissement à Capital Variable
Global Emerging Markets Equities Fund
Schedule of Investments (expressed in USD) (continued) as at 31 December 2017
134
Quantity/ Market Value % of
Nominal Value Currency Name of Securities USD Net Assets
Transferable Securities and Money Market Instruments Admitted to an Official Stock Exchange Listing or Dealt in on Another Regulated Market (continued)
Common / Preferred Stocks (Shares) (continued)
Thailand 22,510 THB Advanced Info Service PCL 131,924 1.13% 14,687 THB Kasikornbank PCL 104,553 0.90% 9,180 THB PTT PCL 123,940 1.06%
Total for Thailand 360,417 3.09%
Turkey 11,274 TRY Anadolu Efes Biracilik Ve Malt Sanayii AS 72,471 0.62% 3,015 TRY Tupras Turkiye Petrol Rafinerileri AS 96,825 0.83%
Total for Turkey 169,296 1.45%
United Kingdom 2,505 GBP BGEO Group Plc 120,521 1.03%
Total for United Kingdom 120,521 1.03%
Total Common / Preferred Stocks (Shares) 10,835,868 92.91%
Total Transferable Securities and Money Market Instruments Admitted to an Official Stock Exchange Listing or Dealt in on Another Regulated Market 10,835,868 92.91%
Other Transferable Securities
Common Stocks (Shares)
British Virgin Islands 146,000 HKD Tianhe Chemicals Group Ltd1 – –%
Total for British Virgin Islands – –%
Total Common Stocks (Shares) – –%
Total Other Transferable Securities – –%
Total investments 10,835,868 92.91%
Cash and cash equivalents 934,786 8.01%
Bank overdraft and other net liabilities (107,601) (0.92% )
Total net assets 11,663,053 100.00%
1 suspended/delisted security
Analysis of Investments as % of total assets
Transferable securities and money market instruments admitted to an official stock exchange listing or dealt in on another regulated market 91.75% Other assets 8.25%
Total assets 100.00%
Open Forward Foreign Exchange Contracts for hedging purposes
Purchase Sale Maturity Unrealised Appreciation Currency Amount Currency Amount Date in USD
EUR 88,294 USD (105,220) 02-Jan-2018 644 Total 644
Net USD for hedging purposes 644
Net USD 644
The following entity was counterparty to the above forward foreign exchange contracts at 31 December 2017: Bank of New York Mellon.
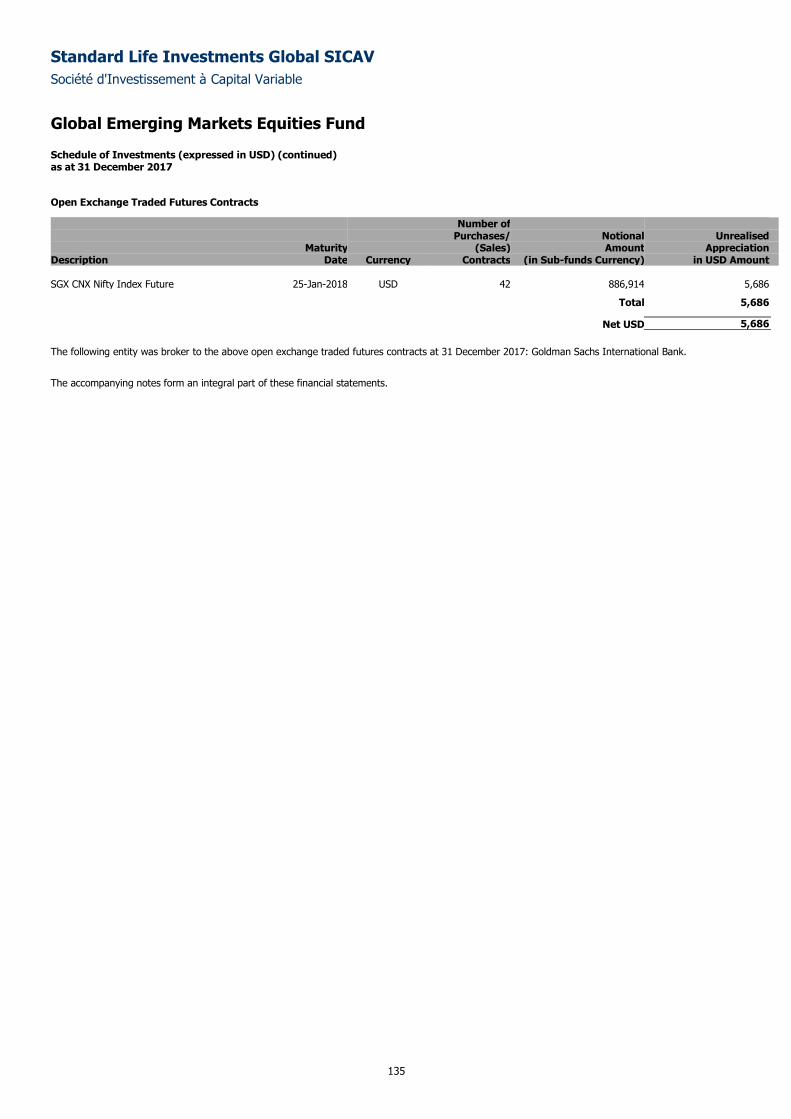
Standard Life Investments Global SICAV
Société d'Investissement à Capital Variable
Global Emerging Markets Equities Fund
Schedule of Investments (expressed in USD) (continued) as at 31 December 2017
135
Open Exchange Traded Futures Contracts
Number of Purchases/ Notional Unrealised Maturity (Sales) Amount Appreciation Description Date Currency Contracts (in Sub-funds Currency) in USD Amount SGX CNX Nifty Index Future 25-Jan-2018 USD 42 886,914 5,686
Total 5,686
Net USD 5,686
The following entity was broker to the above open exchange traded futures contracts at 31 December 2017: Goldman Sachs International Bank.
The accompanying notes form an integral part of these financial statements.
Standard Life Investments Global SICAV
Société d'Investissement à Capital Variable
136
Global Bond Fund
Sub-fund Objective and Investment Policy
The objective of the Sub-fund is to achieve long-term growth in the share price through investing in debt securities issued by sovereign and non-
governmental agencies and corporate transferable debt securities in OECD member countries. Holdings will principally be of investment grade bonds.
Returns on the Sub-fund will be both through the reinvestment of income and from capital gains.
Performance Review
The Sub-fund returned 5.97% over the period, compared to the Citigroup World Government Bond Index return of 7.49%.*
Over the first quarter, underweight positions in Italy and France produced relative gains versus the benchmark amid continuing uncertainty over
forthcoming elections. A steepening position between 10-year and 30-year rates on the European curve also contributed positively. On the downside, being
underweight US duration through 5-year and 7-year Treasury bonds hampered performance. Overall short duration positioning detracted from performance
in the second quarter. Long positions in Japanese yen also struggled as the Bank of Japan is the least willing developed market central bank to embark on a
tightening policy. Long positions in Australian and Swedish debt contributed positively. Demand for these bonds, at still relatively elevated yields, remained
strong.
Our strategic overweight in the US dollar versus the euro underperformed over the third quarter. Stronger economic data in the Eurozone and further talk of
QE tapering enabled the euro to remain firm. Long relative value positioning in Australia versus short duration positioning through markets such as the US
and France also detracted from overall returns. However, the portfolio’s duration and relative value positioning proved beneficial towards the end of the
quarter. The policy normalisation theme resurfaced, prompted by statements from ECB President Mario Draghi and Fed Chair Janet Yellen. Key positive
contributors over the final quarter were the overweight duration strategy in Australia and relative-value views adopted in Europe. In particular, an
overweight in peripheral European bonds added to returns in a period when the market consensus was stubbornly negative. Our view was that a
combination of central bank support and positive Eurozone growth should help peripheral European debt to perform strongly. The long-established
underweight in Japanese government bonds gave a fairly neutral contribution.
*Sub-fund performance has been calculated over the stated period on the share price performance basis, based on the retail share class (A Accumulation)
and net of fees. Please note the index return is quoted gross and contains no adjustment for fees. The sub-fund performance will also be impacted by any
pricing basis changes, made under our single swinging price policy. More information on our swinging price approach can be found in note 8 of the Financial
Statements.
Outlook
Bond markets continue to ignore much of the bond negative news, which ranges from more optimistic economic growth signals to the ongoing retreat of
central banks from emergency policy settings. At the heart of this is the lack (so far) of demand-led inflationary signals and the continued addictive effect of
ongoing quantitative easing in Japan and Europe. Risk premia within bonds remain extremely low and we are wary of current valuation levels, particularly as
higher inflation is not the only necessary condition to monetary tightening.
We remain underweight duration and short of German bunds, which are still at the highly expensive end of their valuation scale. We have taken a more
neutral stance towards the US, albeit the risks do point to higher yields. For peripheral Europe, we remain largely overweight, but this positioning is
nuanced. We are overweight Italy rather than Spain, given the heightened political risks from Catalonia. Our positioning in Japanese rates remains
unchanged.
Please note that the commitment approach has been used for risk measurement and calculation of global exposure for this Sub-fund.
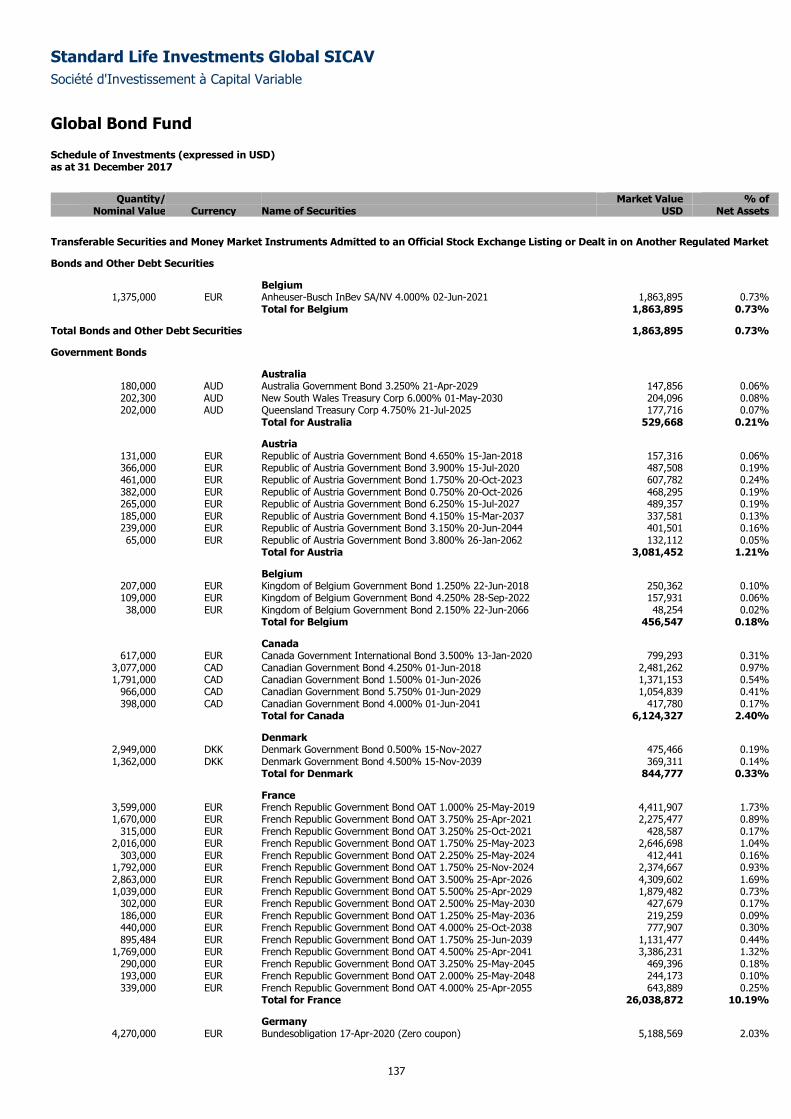
Standard Life Investments Global SICAV
Société d'Investissement à Capital Variable
Global Bond Fund
Schedule of Investments (expressed in USD) as at 31 December 2017
137
Quantity/ Market Value % of
Nominal Value Currency Name of Securities USD Net Assets
Transferable Securities and Money Market Instruments Admitted to an Official Stock Exchange Listing or Dealt in on Another Regulated Market
Bonds and Other Debt Securities
Belgium 1,375,000 EUR Anheuser-Busch InBev SA/NV 4.000% 02-Jun-2021 1,863,895 0.73%
Total for Belgium 1,863,895 0.73%
Total Bonds and Other Debt Securities 1,863,895 0.73%
Government Bonds
Australia 180,000 AUD Australia Government Bond 3.250% 21-Apr-2029 147,856 0.06% 202,300 AUD New South Wales Treasury Corp 6.000% 01-May-2030 204,096 0.08% 202,000 AUD Queensland Treasury Corp 4.750% 21-Jul-2025 177,716 0.07%
Total for Australia 529,668 0.21%
Austria 131,000 EUR Republic of Austria Government Bond 4.650% 15-Jan-2018 157,316 0.06% 366,000 EUR Republic of Austria Government Bond 3.900% 15-Jul-2020 487,508 0.19% 461,000 EUR Republic of Austria Government Bond 1.750% 20-Oct-2023 607,782 0.24% 382,000 EUR Republic of Austria Government Bond 0.750% 20-Oct-2026 468,295 0.19% 265,000 EUR Republic of Austria Government Bond 6.250% 15-Jul-2027 489,357 0.19% 185,000 EUR Republic of Austria Government Bond 4.150% 15-Mar-2037 337,581 0.13% 239,000 EUR Republic of Austria Government Bond 3.150% 20-Jun-2044 401,501 0.16% 65,000 EUR Republic of Austria Government Bond 3.800% 26-Jan-2062 132,112 0.05%
Total for Austria 3,081,452 1.21%
Belgium 207,000 EUR Kingdom of Belgium Government Bond 1.250% 22-Jun-2018 250,362 0.10% 109,000 EUR Kingdom of Belgium Government Bond 4.250% 28-Sep-2022 157,931 0.06% 38,000 EUR Kingdom of Belgium Government Bond 2.150% 22-Jun-2066 48,254 0.02%
Total for Belgium 456,547 0.18%
Canada 617,000 EUR Canada Government International Bond 3.500% 13-Jan-2020 799,293 0.31%
3,077,000 CAD Canadian Government Bond 4.250% 01-Jun-2018 2,481,262 0.97% 1,791,000 CAD Canadian Government Bond 1.500% 01-Jun-2026 1,371,153 0.54%
966,000 CAD Canadian Government Bond 5.750% 01-Jun-2029 1,054,839 0.41% 398,000 CAD Canadian Government Bond 4.000% 01-Jun-2041 417,780 0.17%
Total for Canada 6,124,327 2.40%
Denmark 2,949,000 DKK Denmark Government Bond 0.500% 15-Nov-2027 475,466 0.19% 1,362,000 DKK Denmark Government Bond 4.500% 15-Nov-2039 369,311 0.14%
Total for Denmark 844,777 0.33%
France 3,599,000 EUR French Republic Government Bond OAT 1.000% 25-May-2019 4,411,907 1.73% 1,670,000 EUR French Republic Government Bond OAT 3.750% 25-Apr-2021 2,275,477 0.89%
315,000 EUR French Republic Government Bond OAT 3.250% 25-Oct-2021 428,587 0.17% 2,016,000 EUR French Republic Government Bond OAT 1.750% 25-May-2023 2,646,698 1.04%
303,000 EUR French Republic Government Bond OAT 2.250% 25-May-2024 412,441 0.16% 1,792,000 EUR French Republic Government Bond OAT 1.750% 25-Nov-2024 2,374,667 0.93% 2,863,000 EUR French Republic Government Bond OAT 3.500% 25-Apr-2026 4,309,602 1.69% 1,039,000 EUR French Republic Government Bond OAT 5.500% 25-Apr-2029 1,879,482 0.73%
302,000 EUR French Republic Government Bond OAT 2.500% 25-May-2030 427,679 0.17% 186,000 EUR French Republic Government Bond OAT 1.250% 25-May-2036 219,259 0.09% 440,000 EUR French Republic Government Bond OAT 4.000% 25-Oct-2038 777,907 0.30% 895,484 EUR French Republic Government Bond OAT 1.750% 25-Jun-2039 1,131,477 0.44%
1,769,000 EUR French Republic Government Bond OAT 4.500% 25-Apr-2041 3,386,231 1.32% 290,000 EUR French Republic Government Bond OAT 3.250% 25-May-2045 469,396 0.18% 193,000 EUR French Republic Government Bond OAT 2.000% 25-May-2048 244,173 0.10% 339,000 EUR French Republic Government Bond OAT 4.000% 25-Apr-2055 643,889 0.25%
Total for France 26,038,872 10.19%
Germany 4,270,000 EUR Bundesobligation 17-Apr-2020 (Zero coupon) 5,188,569 2.03%
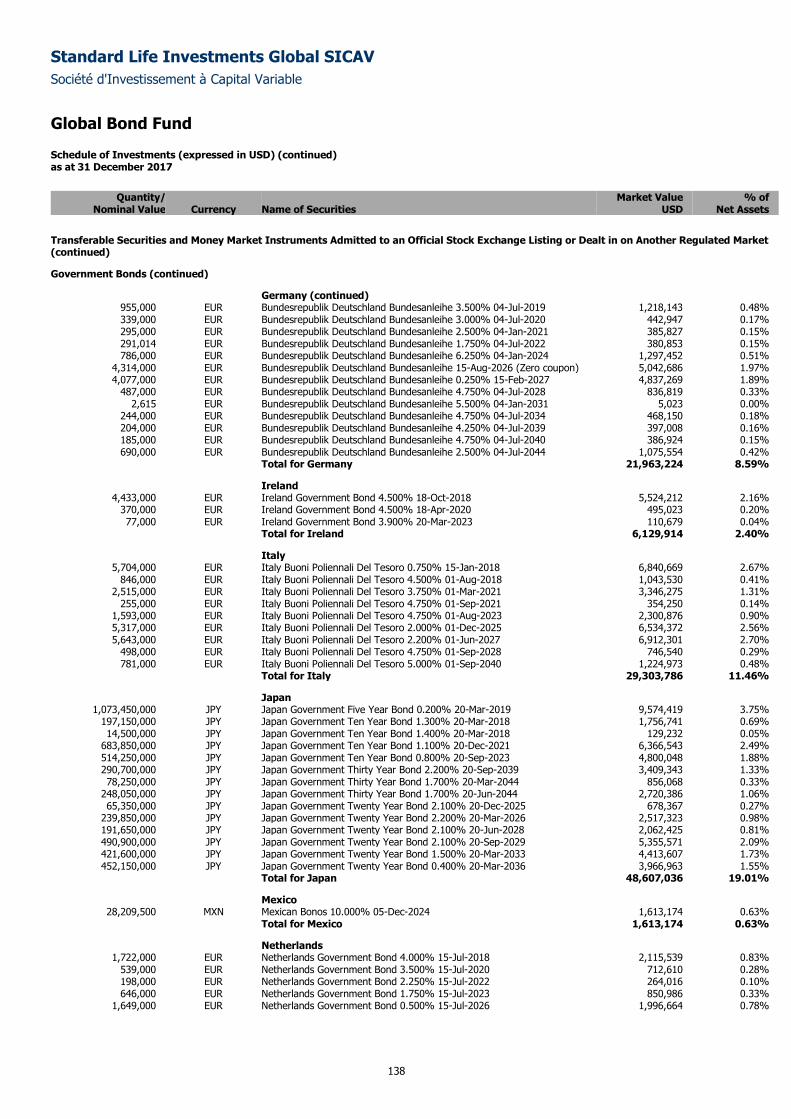
Standard Life Investments Global SICAV
Société d'Investissement à Capital Variable
Global Bond Fund
Schedule of Investments (expressed in USD) (continued) as at 31 December 2017
138
Quantity/ Market Value % of
Nominal Value Currency Name of Securities USD Net Assets
Transferable Securities and Money Market Instruments Admitted to an Official Stock Exchange Listing or Dealt in on Another Regulated Market (continued)
Government Bonds (continued)
Germany (continued) 955,000 EUR Bundesrepublik Deutschland Bundesanleihe 3.500% 04-Jul-2019 1,218,143 0.48% 339,000 EUR Bundesrepublik Deutschland Bundesanleihe 3.000% 04-Jul-2020 442,947 0.17% 295,000 EUR Bundesrepublik Deutschland Bundesanleihe 2.500% 04-Jan-2021 385,827 0.15% 291,014 EUR Bundesrepublik Deutschland Bundesanleihe 1.750% 04-Jul-2022 380,853 0.15% 786,000 EUR Bundesrepublik Deutschland Bundesanleihe 6.250% 04-Jan-2024 1,297,452 0.51%
4,314,000 EUR Bundesrepublik Deutschland Bundesanleihe 15-Aug-2026 (Zero coupon) 5,042,686 1.97% 4,077,000 EUR Bundesrepublik Deutschland Bundesanleihe 0.250% 15-Feb-2027 4,837,269 1.89%
487,000 EUR Bundesrepublik Deutschland Bundesanleihe 4.750% 04-Jul-2028 836,819 0.33% 2,615 EUR Bundesrepublik Deutschland Bundesanleihe 5.500% 04-Jan-2031 5,023 0.00%
244,000 EUR Bundesrepublik Deutschland Bundesanleihe 4.750% 04-Jul-2034 468,150 0.18% 204,000 EUR Bundesrepublik Deutschland Bundesanleihe 4.250% 04-Jul-2039 397,008 0.16% 185,000 EUR Bundesrepublik Deutschland Bundesanleihe 4.750% 04-Jul-2040 386,924 0.15% 690,000 EUR Bundesrepublik Deutschland Bundesanleihe 2.500% 04-Jul-2044 1,075,554 0.42%
Total for Germany 21,963,224 8.59%
Ireland 4,433,000 EUR Ireland Government Bond 4.500% 18-Oct-2018 5,524,212 2.16%
370,000 EUR Ireland Government Bond 4.500% 18-Apr-2020 495,023 0.20% 77,000 EUR Ireland Government Bond 3.900% 20-Mar-2023 110,679 0.04%
Total for Ireland 6,129,914 2.40%
Italy 5,704,000 EUR Italy Buoni Poliennali Del Tesoro 0.750% 15-Jan-2018 6,840,669 2.67%
846,000 EUR Italy Buoni Poliennali Del Tesoro 4.500% 01-Aug-2018 1,043,530 0.41% 2,515,000 EUR Italy Buoni Poliennali Del Tesoro 3.750% 01-Mar-2021 3,346,275 1.31%
255,000 EUR Italy Buoni Poliennali Del Tesoro 4.750% 01-Sep-2021 354,250 0.14% 1,593,000 EUR Italy Buoni Poliennali Del Tesoro 4.750% 01-Aug-2023 2,300,876 0.90% 5,317,000 EUR Italy Buoni Poliennali Del Tesoro 2.000% 01-Dec-2025 6,534,372 2.56% 5,643,000 EUR Italy Buoni Poliennali Del Tesoro 2.200% 01-Jun-2027 6,912,301 2.70%
498,000 EUR Italy Buoni Poliennali Del Tesoro 4.750% 01-Sep-2028 746,540 0.29% 781,000 EUR Italy Buoni Poliennali Del Tesoro 5.000% 01-Sep-2040 1,224,973 0.48%
Total for Italy 29,303,786 11.46%
Japan 1,073,450,000 JPY Japan Government Five Year Bond 0.200% 20-Mar-2019 9,574,419 3.75%
197,150,000 JPY Japan Government Ten Year Bond 1.300% 20-Mar-2018 1,756,741 0.69% 14,500,000 JPY Japan Government Ten Year Bond 1.400% 20-Mar-2018 129,232 0.05%
683,850,000 JPY Japan Government Ten Year Bond 1.100% 20-Dec-2021 6,366,543 2.49% 514,250,000 JPY Japan Government Ten Year Bond 0.800% 20-Sep-2023 4,800,048 1.88% 290,700,000 JPY Japan Government Thirty Year Bond 2.200% 20-Sep-2039 3,409,343 1.33% 78,250,000 JPY Japan Government Thirty Year Bond 1.700% 20-Mar-2044 856,068 0.33%
248,050,000 JPY Japan Government Thirty Year Bond 1.700% 20-Jun-2044 2,720,386 1.06% 65,350,000 JPY Japan Government Twenty Year Bond 2.100% 20-Dec-2025 678,367 0.27%
239,850,000 JPY Japan Government Twenty Year Bond 2.200% 20-Mar-2026 2,517,323 0.98% 191,650,000 JPY Japan Government Twenty Year Bond 2.100% 20-Jun-2028 2,062,425 0.81% 490,900,000 JPY Japan Government Twenty Year Bond 2.100% 20-Sep-2029 5,355,571 2.09% 421,600,000 JPY Japan Government Twenty Year Bond 1.500% 20-Mar-2033 4,413,607 1.73% 452,150,000 JPY Japan Government Twenty Year Bond 0.400% 20-Mar-2036 3,966,963 1.55%
Total for Japan 48,607,036 19.01%
Mexico 28,209,500 MXN Mexican Bonos 10.000% 05-Dec-2024 1,613,174 0.63%
Total for Mexico 1,613,174 0.63%
Netherlands 1,722,000 EUR Netherlands Government Bond 4.000% 15-Jul-2018 2,115,539 0.83%
539,000 EUR Netherlands Government Bond 3.500% 15-Jul-2020 712,610 0.28% 198,000 EUR Netherlands Government Bond 2.250% 15-Jul-2022 264,016 0.10% 646,000 EUR Netherlands Government Bond 1.750% 15-Jul-2023 850,986 0.33%
1,649,000 EUR Netherlands Government Bond 0.500% 15-Jul-2026 1,996,664 0.78%
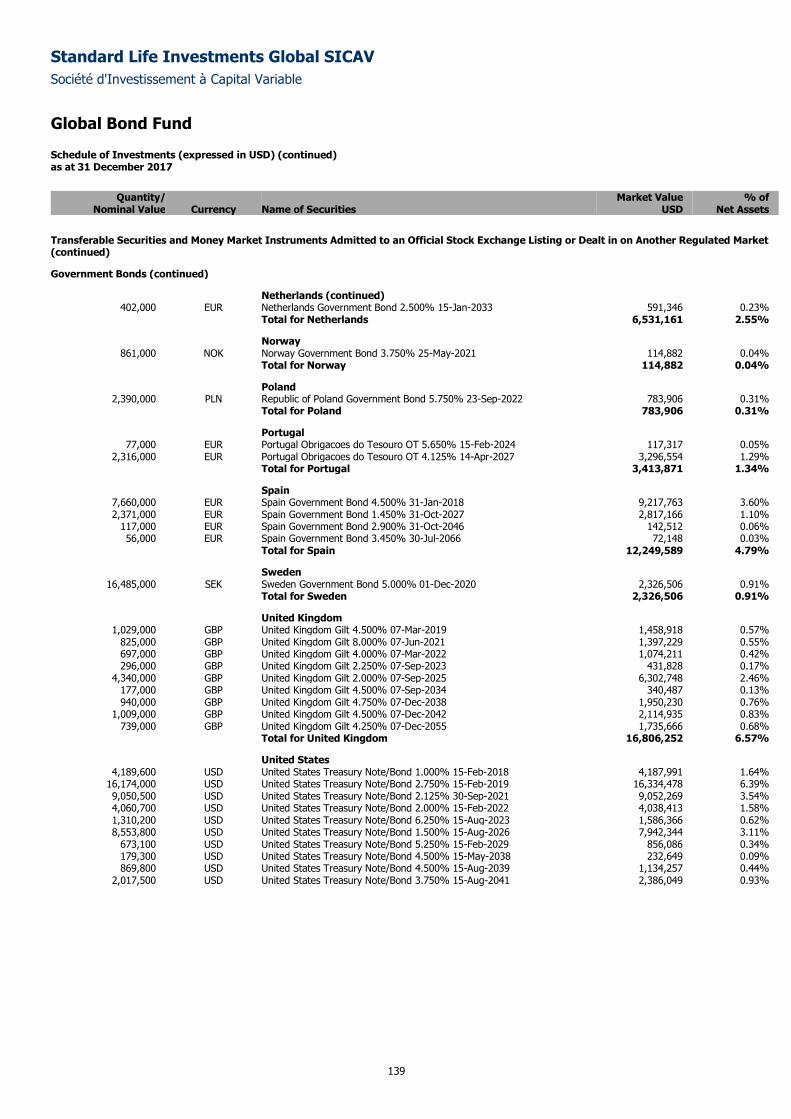
Standard Life Investments Global SICAV
Société d'Investissement à Capital Variable
Global Bond Fund
Schedule of Investments (expressed in USD) (continued) as at 31 December 2017
139
Quantity/ Market Value % of
Nominal Value Currency Name of Securities USD Net Assets
Transferable Securities and Money Market Instruments Admitted to an Official Stock Exchange Listing or Dealt in on Another Regulated Market (continued)
Government Bonds (continued)
Netherlands (continued) 402,000 EUR Netherlands Government Bond 2.500% 15-Jan-2033 591,346 0.23%
Total for Netherlands 6,531,161 2.55%
Norway 861,000 NOK Norway Government Bond 3.750% 25-May-2021 114,882 0.04%
Total for Norway 114,882 0.04%
Poland 2,390,000 PLN Republic of Poland Government Bond 5.750% 23-Sep-2022 783,906 0.31%
Total for Poland 783,906 0.31%
Portugal 77,000 EUR Portugal Obrigacoes do Tesouro OT 5.650% 15-Feb-2024 117,317 0.05%
2,316,000 EUR Portugal Obrigacoes do Tesouro OT 4.125% 14-Apr-2027 3,296,554 1.29% Total for Portugal 3,413,871 1.34%
Spain 7,660,000 EUR Spain Government Bond 4.500% 31-Jan-2018 9,217,763 3.60% 2,371,000 EUR Spain Government Bond 1.450% 31-Oct-2027 2,817,166 1.10%
117,000 EUR Spain Government Bond 2.900% 31-Oct-2046 142,512 0.06% 56,000 EUR Spain Government Bond 3.450% 30-Jul-2066 72,148 0.03%
Total for Spain 12,249,589 4.79%
Sweden 16,485,000 SEK Sweden Government Bond 5.000% 01-Dec-2020 2,326,506 0.91%
Total for Sweden 2,326,506 0.91%
United Kingdom 1,029,000 GBP United Kingdom Gilt 4.500% 07-Mar-2019 1,458,918 0.57%
825,000 GBP United Kingdom Gilt 8.000% 07-Jun-2021 1,397,229 0.55% 697,000 GBP United Kingdom Gilt 4.000% 07-Mar-2022 1,074,211 0.42% 296,000 GBP United Kingdom Gilt 2.250% 07-Sep-2023 431,828 0.17%
4,340,000 GBP United Kingdom Gilt 2.000% 07-Sep-2025 6,302,748 2.46% 177,000 GBP United Kingdom Gilt 4.500% 07-Sep-2034 340,487 0.13% 940,000 GBP United Kingdom Gilt 4.750% 07-Dec-2038 1,950,230 0.76%
1,009,000 GBP United Kingdom Gilt 4.500% 07-Dec-2042 2,114,935 0.83% 739,000 GBP United Kingdom Gilt 4.250% 07-Dec-2055 1,735,666 0.68%
Total for United Kingdom 16,806,252 6.57%
United States 4,189,600 USD United States Treasury Note/Bond 1.000% 15-Feb-2018 4,187,991 1.64%
16,174,000 USD United States Treasury Note/Bond 2.750% 15-Feb-2019 16,334,478 6.39% 9,050,500 USD United States Treasury Note/Bond 2.125% 30-Sep-2021 9,052,269 3.54% 4,060,700 USD United States Treasury Note/Bond 2.000% 15-Feb-2022 4,038,413 1.58% 1,310,200 USD United States Treasury Note/Bond 6.250% 15-Aug-2023 1,586,366 0.62% 8,553,800 USD United States Treasury Note/Bond 1.500% 15-Aug-2026 7,942,344 3.11%
673,100 USD United States Treasury Note/Bond 5.250% 15-Feb-2029 856,086 0.34% 179,300 USD United States Treasury Note/Bond 4.500% 15-May-2038 232,649 0.09% 869,800 USD United States Treasury Note/Bond 4.500% 15-Aug-2039 1,134,257 0.44%
2,017,500 USD United States Treasury Note/Bond 3.750% 15-Aug-2041 2,386,049 0.93%
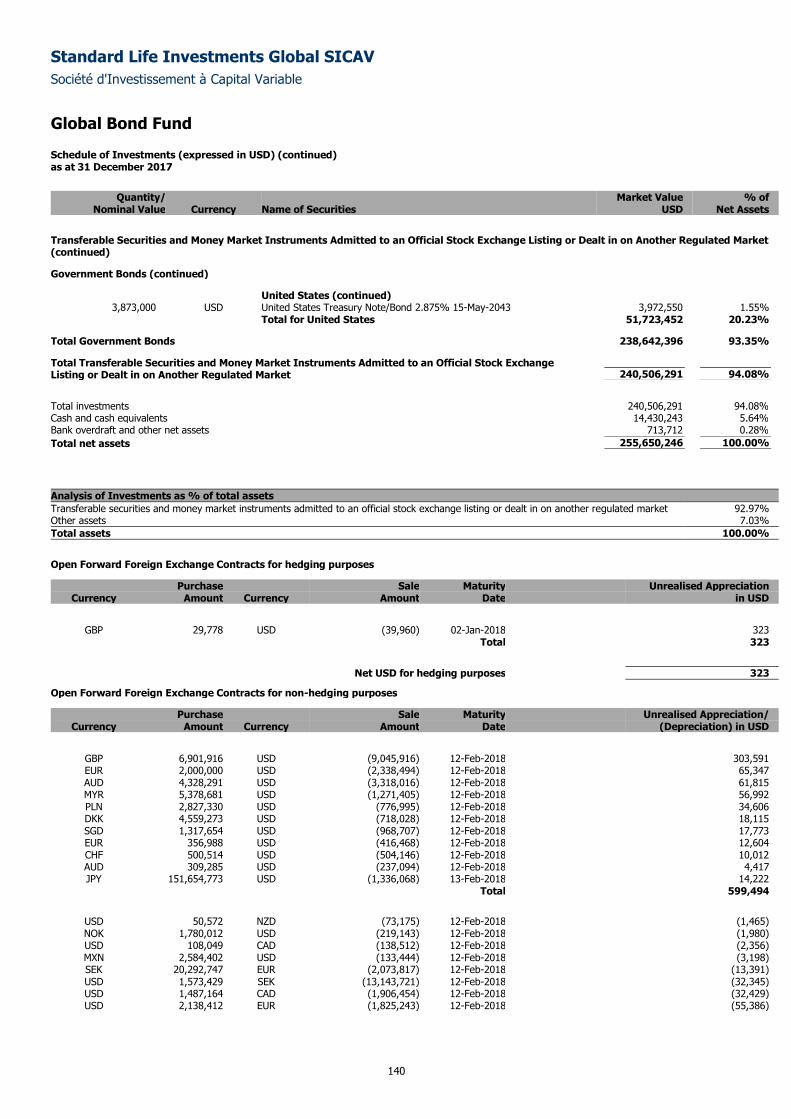
Standard Life Investments Global SICAV
Société d'Investissement à Capital Variable
Global Bond Fund
Schedule of Investments (expressed in USD) (continued) as at 31 December 2017
140
Quantity/ Market Value % of
Nominal Value Currency Name of Securities USD Net Assets
Transferable Securities and Money Market Instruments Admitted to an Official Stock Exchange Listing or Dealt in on Another Regulated Market (continued)
Government Bonds (continued)
United States (continued) 3,873,000 USD United States Treasury Note/Bond 2.875% 15-May-2043 3,972,550 1.55%
Total for United States 51,723,452 20.23%
Total Government Bonds 238,642,396 93.35%
Total Transferable Securities and Money Market Instruments Admitted to an Official Stock Exchange Listing or Dealt in on Another Regulated Market 240,506,291 94.08%
Total investments 240,506,291 94.08%
Cash and cash equivalents 14,430,243 5.64%
Bank overdraft and other net assets 713,712 0.28%
Total net assets 255,650,246 100.00%
Analysis of Investments as % of total assets
Transferable securities and money market instruments admitted to an official stock exchange listing or dealt in on another regulated market 92.97% Other assets 7.03%
Total assets 100.00%
Open Forward Foreign Exchange Contracts for hedging purposes
Purchase Sale Maturity Unrealised Appreciation Currency Amount Currency Amount Date in USD
GBP 29,778 USD (39,960) 02-Jan-2018 323 Total 323
Net USD for hedging purposes 323
Open Forward Foreign Exchange Contracts for non-hedging purposes
Purchase Sale Maturity Unrealised Appreciation/ Currency Amount Currency Amount Date (Depreciation) in USD
GBP 6,901,916 USD (9,045,916) 12-Feb-2018 303,591 EUR 2,000,000 USD (2,338,494) 12-Feb-2018 65,347 AUD 4,328,291 USD (3,318,016) 12-Feb-2018 61,815 MYR 5,378,681 USD (1,271,405) 12-Feb-2018 56,992 PLN 2,827,330 USD (776,995) 12-Feb-2018 34,606 DKK 4,559,273 USD (718,028) 12-Feb-2018 18,115 SGD 1,317,654 USD (968,707) 12-Feb-2018 17,773 EUR 356,988 USD (416,468) 12-Feb-2018 12,604 CHF 500,514 USD (504,146) 12-Feb-2018 10,012 AUD 309,285 USD (237,094) 12-Feb-2018 4,417 JPY 151,654,773 USD (1,336,068) 13-Feb-2018 14,222
Total 599,494
USD 50,572 NZD (73,175) 12-Feb-2018 (1,465) NOK 1,780,012 USD (219,143) 12-Feb-2018 (1,980) USD 108,049 CAD (138,512) 12-Feb-2018 (2,356) MXN 2,584,402 USD (133,444) 12-Feb-2018 (3,198) SEK 20,292,747 EUR (2,073,817) 12-Feb-2018 (13,391) USD 1,573,429 SEK (13,143,721) 12-Feb-2018 (32,345) USD 1,487,164 CAD (1,906,454) 12-Feb-2018 (32,429) USD 2,138,412 EUR (1,825,243) 12-Feb-2018 (55,386)
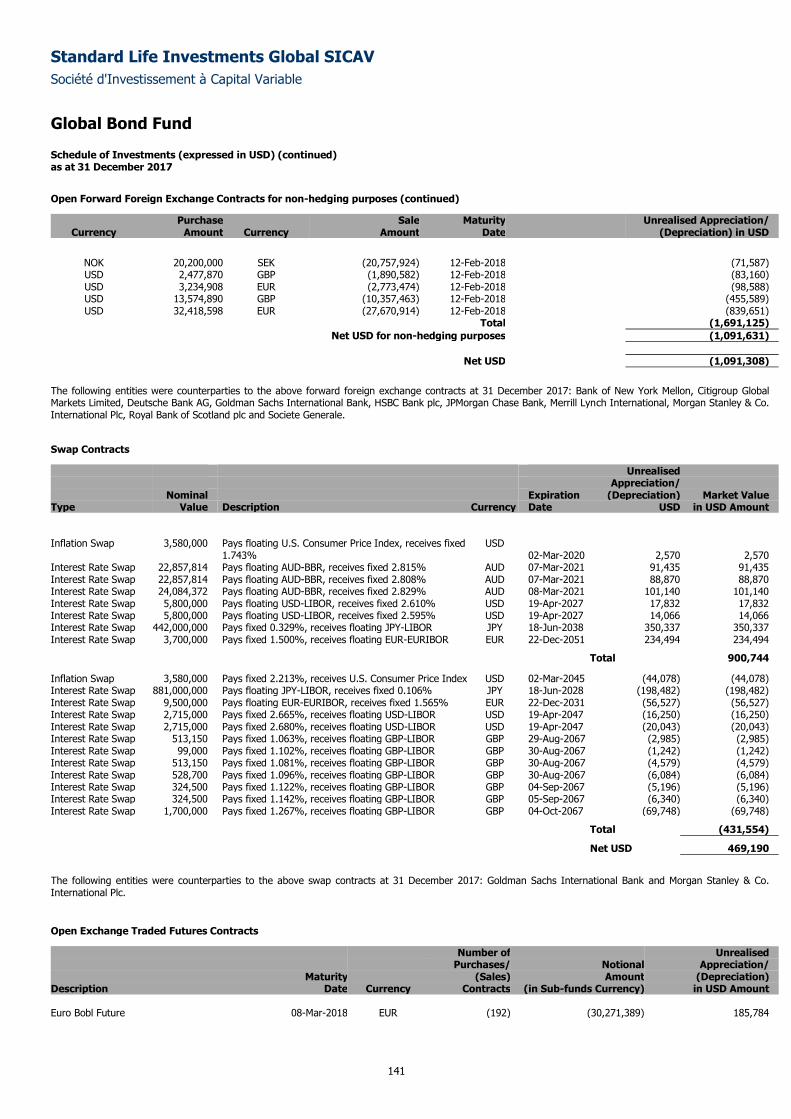
Standard Life Investments Global SICAV
Société d'Investissement à Capital Variable
Global Bond Fund
Schedule of Investments (expressed in USD) (continued) as at 31 December 2017
141
Open Forward Foreign Exchange Contracts for non-hedging purposes (continued)
Purchase Sale Maturity Unrealised Appreciation/ Currency Amount Currency Amount Date (Depreciation) in USD
NOK 20,200,000 SEK (20,757,924) 12-Feb-2018 (71,587) USD 2,477,870 GBP (1,890,582) 12-Feb-2018 (83,160) USD 3,234,908 EUR (2,773,474) 12-Feb-2018 (98,588) USD 13,574,890 GBP (10,357,463) 12-Feb-2018 (455,589) USD 32,418,598 EUR (27,670,914) 12-Feb-2018 (839,651)
Total (1,691,125)
Net USD for non-hedging purposes (1,091,631)
Net USD (1,091,308)
The following entities were counterparties to the above forward foreign exchange contracts at 31 December 2017: Bank of New York Mellon, Citigroup Global Markets Limited, Deutsche Bank AG, Goldman Sachs International Bank, HSBC Bank plc, JPMorgan Chase Bank, Merrill Lynch International, Morgan Stanley & Co. International Plc, Royal Bank of Scotland plc and Societe Generale.
Swap Contracts
Unrealised Appreciation/ Nominal Expiration (Depreciation) Market Value Type Value Description Currency Date USD in USD Amount
Inflation Swap 3,580,000 Pays floating U.S. Consumer Price Index, receives fixed 1.743%
USD 02-Mar-2020 2,570 2,570
Interest Rate Swap 22,857,814 Pays floating AUD-BBR, receives fixed 2.815% AUD 07-Mar-2021 91,435 91,435 Interest Rate Swap 22,857,814 Pays floating AUD-BBR, receives fixed 2.808% AUD 07-Mar-2021 88,870 88,870 Interest Rate Swap 24,084,372 Pays floating AUD-BBR, receives fixed 2.829% AUD 08-Mar-2021 101,140 101,140 Interest Rate Swap 5,800,000 Pays floating USD-LIBOR, receives fixed 2.610% USD 19-Apr-2027 17,832 17,832 Interest Rate Swap 5,800,000 Pays floating USD-LIBOR, receives fixed 2.595% USD 19-Apr-2027 14,066 14,066 Interest Rate Swap 442,000,000 Pays fixed 0.329%, receives floating JPY-LIBOR JPY 18-Jun-2038 350,337 350,337 Interest Rate Swap 3,700,000 Pays fixed 1.500%, receives floating EUR-EURIBOR EUR 22-Dec-2051 234,494 234,494
Total 900,744
Inflation Swap 3,580,000 Pays fixed 2.213%, receives U.S. Consumer Price Index USD 02-Mar-2045 (44,078) (44,078) Interest Rate Swap 881,000,000 Pays floating JPY-LIBOR, receives fixed 0.106% JPY 18-Jun-2028 (198,482) (198,482) Interest Rate Swap 9,500,000 Pays floating EUR-EURIBOR, receives fixed 1.565% EUR 22-Dec-2031 (56,527) (56,527) Interest Rate Swap 2,715,000 Pays fixed 2.665%, receives floating USD-LIBOR USD 19-Apr-2047 (16,250) (16,250) Interest Rate Swap 2,715,000 Pays fixed 2.680%, receives floating USD-LIBOR USD 19-Apr-2047 (20,043) (20,043) Interest Rate Swap 513,150 Pays fixed 1.063%, receives floating GBP-LIBOR GBP 29-Aug-2067 (2,985) (2,985) Interest Rate Swap 99,000 Pays fixed 1.102%, receives floating GBP-LIBOR GBP 30-Aug-2067 (1,242) (1,242) Interest Rate Swap 513,150 Pays fixed 1.081%, receives floating GBP-LIBOR GBP 30-Aug-2067 (4,579) (4,579) Interest Rate Swap 528,700 Pays fixed 1.096%, receives floating GBP-LIBOR GBP 30-Aug-2067 (6,084) (6,084) Interest Rate Swap 324,500 Pays fixed 1.122%, receives floating GBP-LIBOR GBP 04-Sep-2067 (5,196) (5,196) Interest Rate Swap 324,500 Pays fixed 1.142%, receives floating GBP-LIBOR GBP 05-Sep-2067 (6,340) (6,340) Interest Rate Swap 1,700,000 Pays fixed 1.267%, receives floating GBP-LIBOR GBP 04-Oct-2067 (69,748) (69,748)
Total (431,554)
Net USD 469,190
The following entities were counterparties to the above swap contracts at 31 December 2017: Goldman Sachs International Bank and Morgan Stanley & Co. International Plc.
Open Exchange Traded Futures Contracts
Number of Unrealised Purchases/ Notional Appreciation/ Maturity (Sales) Amount (Depreciation) Description Date Currency Contracts (in Sub-funds Currency) in USD Amount Euro Bobl Future 08-Mar-2018 EUR (192) (30,271,389) 185,784
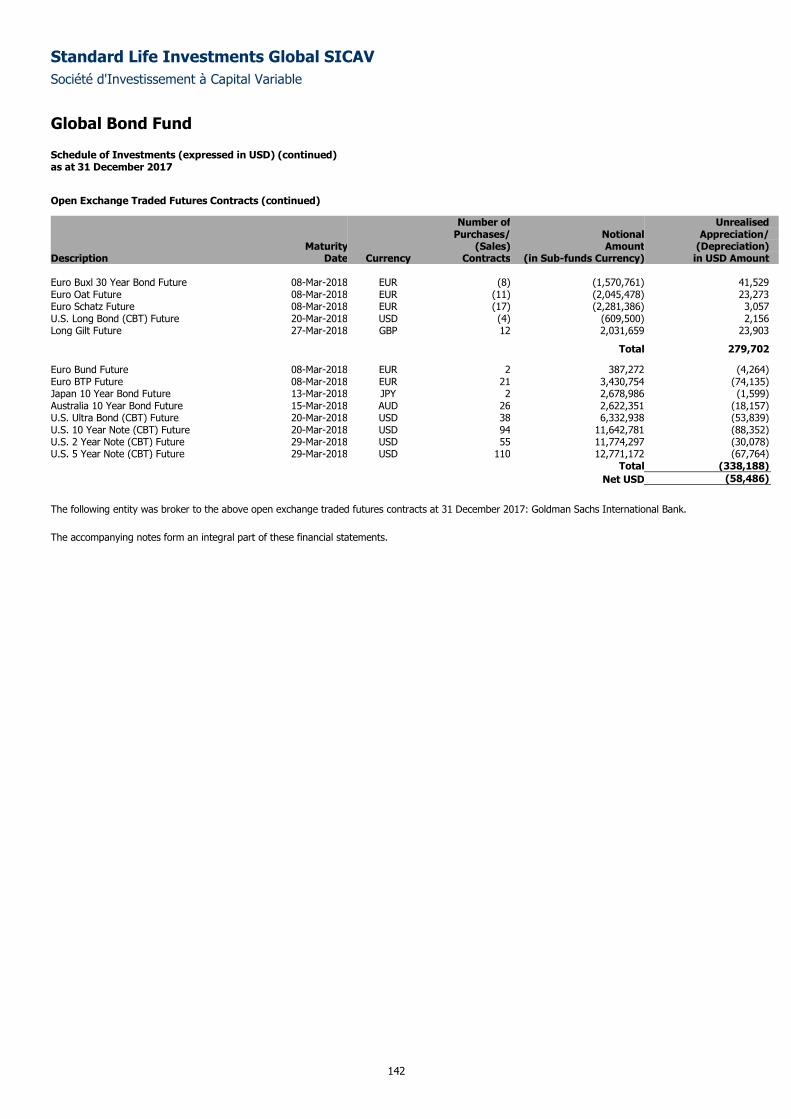
Standard Life Investments Global SICAV
Société d'Investissement à Capital Variable
Global Bond Fund
Schedule of Investments (expressed in USD) (continued) as at 31 December 2017
142
Open Exchange Traded Futures Contracts (continued)
Number of Unrealised Purchases/ Notional Appreciation/ Maturity (Sales) Amount (Depreciation) Description Date Currency Contracts (in Sub-funds Currency) in USD Amount Euro Buxl 30 Year Bond Future 08-Mar-2018 EUR (8) (1,570,761) 41,529 Euro Oat Future 08-Mar-2018 EUR (11) (2,045,478) 23,273 Euro Schatz Future 08-Mar-2018 EUR (17) (2,281,386) 3,057 U.S. Long Bond (CBT) Future 20-Mar-2018 USD (4) (609,500) 2,156 Long Gilt Future 27-Mar-2018 GBP 12 2,031,659 23,903
Total 279,702
Euro Bund Future 08-Mar-2018 EUR 2 387,272 (4,264) Euro BTP Future 08-Mar-2018 EUR 21 3,430,754 (74,135) Japan 10 Year Bond Future 13-Mar-2018 JPY 2 2,678,986 (1,599) Australia 10 Year Bond Future 15-Mar-2018 AUD 26 2,622,351 (18,157) U.S. Ultra Bond (CBT) Future 20-Mar-2018 USD 38 6,332,938 (53,839) U.S. 10 Year Note (CBT) Future 20-Mar-2018 USD 94 11,642,781 (88,352) U.S. 2 Year Note (CBT) Future 29-Mar-2018 USD 55 11,774,297 (30,078) U.S. 5 Year Note (CBT) Future 29-Mar-2018 USD 110 12,771,172 (67,764) Total (338,188)
Net USD (58,486)
The following entity was broker to the above open exchange traded futures contracts at 31 December 2017: Goldman Sachs International Bank.
The accompanying notes form an integral part of these financial statements.
Standard Life Investments Global SICAV
Société d'Investissement à Capital Variable
143
Global Inflation-Linked Bond Fund
Sub-fund Objective and Investment Policy
The objective of the Sub-fund is to provide a real return in US$ over longer time periods. It will do this by investing primarily in sovereign issued and
corporate inflation linked debt. The Sub-fund may also invest in conventional government bonds, investment grade corporate entities, and other interest
bearing securities issued anywhere in the world. On an ancillary basis, the Sub-fund may hold cash and invest in other forms of transferable securities, in
collective investment schemes, short term debt instruments, regularly traded money market instruments the residual maturity of which does not exceed 12
months.
Performance Review
The Sub-fund returned 3.15% over the period, compared to the Barclays World Government Inflation-Linked Bond Index return of 3.32%.*
Early in the year, with sterling starting to stabilise as the triggering of Article 50 approached, investors took a more negative view on the outlook for
medium-term UK inflation. This was beneficial for our UK RPI inflation swaps trade. Having underweight exposure to French and Italian real yields was also
a positive contributor to performance. A position aimed at benefiting from falling interest rates in Sweden underperformed, as interest rate expectations
were impacted by rising inflationary threats. An overweight position in New Zealand index-linked bonds versus an underweight in UK equivalents added to
returns in the second quarter. The spread between the two tightened significantly as New Zealand bonds continued to recover. With inflation expectations in
the US undermined by expectations for higher rates as well as the decline in the oil price, our short position in US 5-year inflation expectations was also
positive for performance. However, a more pessimistic view of President Trump’s ability to deliver on his fiscal policy agenda led to the outperformance of
10-year Treasuries, which hampered our curve steepening strategy on the 2-year to 10-year area of the US curve.
A short position in 3-year UK RPI, 3-years forward contributed positively in the third quarter, as valuations at this part of the inflation curve fell by around 10
basis points over the quarter. Our European curve steepening position between 10-year and 30-year rates also added value as the market began to
anticipate that the ECB would taper its quantitative easing programme. On the downside, a position in 3-year Australian bond futures proved detrimental as
Australian bonds sold off following a hawkish shift in rhetoric from the RBA. In the fourth quarter, our overweight position in New Zealand inflation-linked
bonds versus their UK equivalents performed well as the former rallied following national government elections, signs of fragility in economic data and
dovish rhetoric from the central bank. Another positive for the Fund was our overweight in Canadian real yields. The market continued to recover from the
sharp sell-off that followed Bank of Canada rate hikes in July and September. However, our short position in French and German real yields detracted from
performance as investors chose to focus on Mario Draghi’s dovish messaging on Eurozone inflation rather than the ECB’s comments on QE tapering.
*Sub-fund performance has been calculated over the stated period on the share price performance basis, based on the institutional share class (D
Accumulation) and net of fees. Please note the index return is quoted gross and contains no adjustment for fees. The sub-fund performance will also be
impacted by any pricing basis changes, made under our single swinging price policy. More information on our swinging price approach can be found in note
8 of the Financial Statements.
Outlook
In the US, upside risks to current inflation pricing are emerging, with tax reforms and increasingly tight labour markets beginning to garner more attention.
Market pricing of the inflation risk premium at the long-dated end of the US curve remains very low. Meanwhile in Europe, the ECB is slowing its bond
purchase programme and pointing to the improved growth data and reduction in employment. Against this, core inflation is now back below 1% and we
remain sceptical of an imminent inflationary threat in Europe. The outlook for the UK remains uncertain, as the ongoing Brexit negotiations ebb and flow.
We see little risk of continued interest rate hikes given the uncertain outcome of Brexit talks.
On a strategic horizon, we are currently positioned for the long-dated end of the US inflation market to outperform as we expect positive US inflation
developments over the year ahead. Core European bonds have been well supported by the ECB’s QE programme. Given upcoming tapering of bond
purchases we see threats to bonds trading at artificially expensive levels and choose to hold underweights in German and French real yields. We maintain
our view that UK inflation will fall back over the next year. Given the market is currently pricing in a much more persistent inflationary trend, we retain our
short position in 3-year 3-years forward RPI as a means of opposing this view.
Please note that the commitment approach has been used for risk measurement and calculation of global exposure for this Sub-fund.
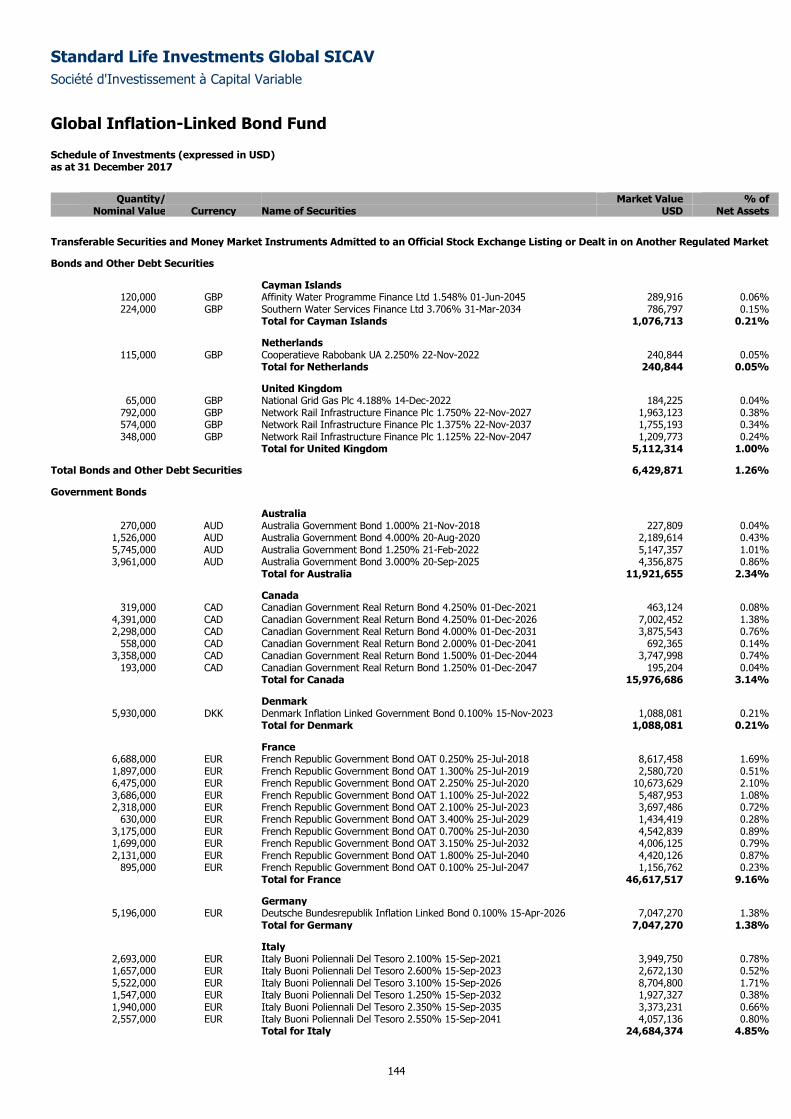
Standard Life Investments Global SICAV
Société d'Investissement à Capital Variable
Global Inflation-Linked Bond Fund
Schedule of Investments (expressed in USD) as at 31 December 2017
144
Quantity/ Market Value % of
Nominal Value Currency Name of Securities USD Net Assets
Transferable Securities and Money Market Instruments Admitted to an Official Stock Exchange Listing or Dealt in on Another Regulated Market
Bonds and Other Debt Securities
Cayman Islands 120,000 GBP Affinity Water Programme Finance Ltd 1.548% 01-Jun-2045 289,916 0.06% 224,000 GBP Southern Water Services Finance Ltd 3.706% 31-Mar-2034 786,797 0.15%
Total for Cayman Islands 1,076,713 0.21%
Netherlands 115,000 GBP Cooperatieve Rabobank UA 2.250% 22-Nov-2022 240,844 0.05%
Total for Netherlands 240,844 0.05%
United Kingdom 65,000 GBP National Grid Gas Plc 4.188% 14-Dec-2022 184,225 0.04%
792,000 GBP Network Rail Infrastructure Finance Plc 1.750% 22-Nov-2027 1,963,123 0.38% 574,000 GBP Network Rail Infrastructure Finance Plc 1.375% 22-Nov-2037 1,755,193 0.34% 348,000 GBP Network Rail Infrastructure Finance Plc 1.125% 22-Nov-2047 1,209,773 0.24%
Total for United Kingdom 5,112,314 1.00%
Total Bonds and Other Debt Securities 6,429,871 1.26%
Government Bonds
Australia 270,000 AUD Australia Government Bond 1.000% 21-Nov-2018 227,809 0.04%
1,526,000 AUD Australia Government Bond 4.000% 20-Aug-2020 2,189,614 0.43% 5,745,000 AUD Australia Government Bond 1.250% 21-Feb-2022 5,147,357 1.01% 3,961,000 AUD Australia Government Bond 3.000% 20-Sep-2025 4,356,875 0.86%
Total for Australia 11,921,655 2.34%
Canada 319,000 CAD Canadian Government Real Return Bond 4.250% 01-Dec-2021 463,124 0.08%
4,391,000 CAD Canadian Government Real Return Bond 4.250% 01-Dec-2026 7,002,452 1.38% 2,298,000 CAD Canadian Government Real Return Bond 4.000% 01-Dec-2031 3,875,543 0.76%
558,000 CAD Canadian Government Real Return Bond 2.000% 01-Dec-2041 692,365 0.14% 3,358,000 CAD Canadian Government Real Return Bond 1.500% 01-Dec-2044 3,747,998 0.74%
193,000 CAD Canadian Government Real Return Bond 1.250% 01-Dec-2047 195,204 0.04% Total for Canada 15,976,686 3.14%
Denmark 5,930,000 DKK Denmark Inflation Linked Government Bond 0.100% 15-Nov-2023 1,088,081 0.21%
Total for Denmark 1,088,081 0.21%
France 6,688,000 EUR French Republic Government Bond OAT 0.250% 25-Jul-2018 8,617,458 1.69% 1,897,000 EUR French Republic Government Bond OAT 1.300% 25-Jul-2019 2,580,720 0.51% 6,475,000 EUR French Republic Government Bond OAT 2.250% 25-Jul-2020 10,673,629 2.10% 3,686,000 EUR French Republic Government Bond OAT 1.100% 25-Jul-2022 5,487,953 1.08% 2,318,000 EUR French Republic Government Bond OAT 2.100% 25-Jul-2023 3,697,486 0.72%
630,000 EUR French Republic Government Bond OAT 3.400% 25-Jul-2029 1,434,419 0.28% 3,175,000 EUR French Republic Government Bond OAT 0.700% 25-Jul-2030 4,542,839 0.89% 1,699,000 EUR French Republic Government Bond OAT 3.150% 25-Jul-2032 4,006,125 0.79% 2,131,000 EUR French Republic Government Bond OAT 1.800% 25-Jul-2040 4,420,126 0.87%
895,000 EUR French Republic Government Bond OAT 0.100% 25-Jul-2047 1,156,762 0.23% Total for France 46,617,517 9.16%
Germany 5,196,000 EUR Deutsche Bundesrepublik Inflation Linked Bond 0.100% 15-Apr-2026 7,047,270 1.38%
Total for Germany 7,047,270 1.38%
Italy 2,693,000 EUR Italy Buoni Poliennali Del Tesoro 2.100% 15-Sep-2021 3,949,750 0.78% 1,657,000 EUR Italy Buoni Poliennali Del Tesoro 2.600% 15-Sep-2023 2,672,130 0.52% 5,522,000 EUR Italy Buoni Poliennali Del Tesoro 3.100% 15-Sep-2026 8,704,800 1.71% 1,547,000 EUR Italy Buoni Poliennali Del Tesoro 1.250% 15-Sep-2032 1,927,327 0.38% 1,940,000 EUR Italy Buoni Poliennali Del Tesoro 2.350% 15-Sep-2035 3,373,231 0.66% 2,557,000 EUR Italy Buoni Poliennali Del Tesoro 2.550% 15-Sep-2041 4,057,136 0.80%
Total for Italy 24,684,374 4.85%
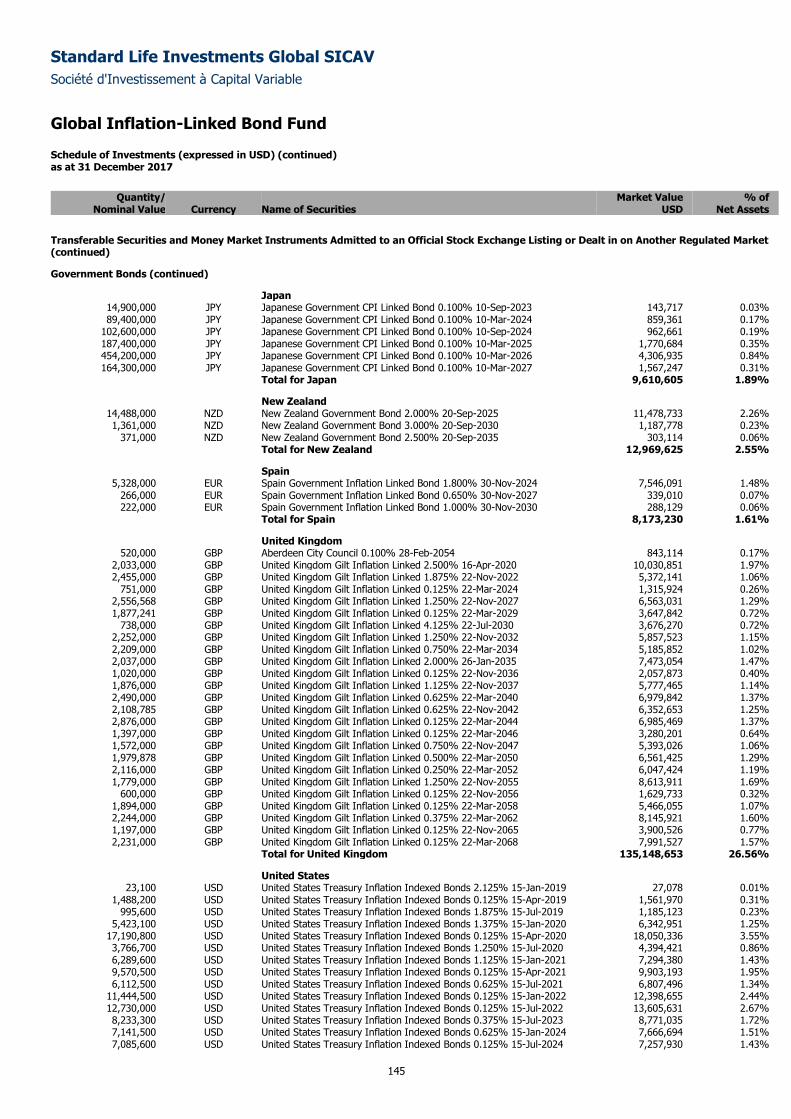
Standard Life Investments Global SICAV
Société d'Investissement à Capital Variable
Global Inflation-Linked Bond Fund
Schedule of Investments (expressed in USD) (continued) as at 31 December 2017
145
Quantity/ Market Value % of
Nominal Value Currency Name of Securities USD Net Assets
Transferable Securities and Money Market Instruments Admitted to an Official Stock Exchange Listing or Dealt in on Another Regulated Market (continued)
Government Bonds (continued)
Japan 14,900,000 JPY Japanese Government CPI Linked Bond 0.100% 10-Sep-2023 143,717 0.03% 89,400,000 JPY Japanese Government CPI Linked Bond 0.100% 10-Mar-2024 859,361 0.17%
102,600,000 JPY Japanese Government CPI Linked Bond 0.100% 10-Sep-2024 962,661 0.19% 187,400,000 JPY Japanese Government CPI Linked Bond 0.100% 10-Mar-2025 1,770,684 0.35% 454,200,000 JPY Japanese Government CPI Linked Bond 0.100% 10-Mar-2026 4,306,935 0.84% 164,300,000 JPY Japanese Government CPI Linked Bond 0.100% 10-Mar-2027 1,567,247 0.31%
Total for Japan 9,610,605 1.89%
New Zealand 14,488,000 NZD New Zealand Government Bond 2.000% 20-Sep-2025 11,478,733 2.26% 1,361,000 NZD New Zealand Government Bond 3.000% 20-Sep-2030 1,187,778 0.23%
371,000 NZD New Zealand Government Bond 2.500% 20-Sep-2035 303,114 0.06% Total for New Zealand 12,969,625 2.55%
Spain 5,328,000 EUR Spain Government Inflation Linked Bond 1.800% 30-Nov-2024 7,546,091 1.48%
266,000 EUR Spain Government Inflation Linked Bond 0.650% 30-Nov-2027 339,010 0.07% 222,000 EUR Spain Government Inflation Linked Bond 1.000% 30-Nov-2030 288,129 0.06%
Total for Spain 8,173,230 1.61%
United Kingdom 520,000 GBP Aberdeen City Council 0.100% 28-Feb-2054 843,114 0.17%
2,033,000 GBP United Kingdom Gilt Inflation Linked 2.500% 16-Apr-2020 10,030,851 1.97% 2,455,000 GBP United Kingdom Gilt Inflation Linked 1.875% 22-Nov-2022 5,372,141 1.06%
751,000 GBP United Kingdom Gilt Inflation Linked 0.125% 22-Mar-2024 1,315,924 0.26% 2,556,568 GBP United Kingdom Gilt Inflation Linked 1.250% 22-Nov-2027 6,563,031 1.29% 1,877,241 GBP United Kingdom Gilt Inflation Linked 0.125% 22-Mar-2029 3,647,842 0.72%
738,000 GBP United Kingdom Gilt Inflation Linked 4.125% 22-Jul-2030 3,676,270 0.72% 2,252,000 GBP United Kingdom Gilt Inflation Linked 1.250% 22-Nov-2032 5,857,523 1.15% 2,209,000 GBP United Kingdom Gilt Inflation Linked 0.750% 22-Mar-2034 5,185,852 1.02% 2,037,000 GBP United Kingdom Gilt Inflation Linked 2.000% 26-Jan-2035 7,473,054 1.47% 1,020,000 GBP United Kingdom Gilt Inflation Linked 0.125% 22-Nov-2036 2,057,873 0.40% 1,876,000 GBP United Kingdom Gilt Inflation Linked 1.125% 22-Nov-2037 5,777,465 1.14% 2,490,000 GBP United Kingdom Gilt Inflation Linked 0.625% 22-Mar-2040 6,979,842 1.37% 2,108,785 GBP United Kingdom Gilt Inflation Linked 0.625% 22-Nov-2042 6,352,653 1.25% 2,876,000 GBP United Kingdom Gilt Inflation Linked 0.125% 22-Mar-2044 6,985,469 1.37% 1,397,000 GBP United Kingdom Gilt Inflation Linked 0.125% 22-Mar-2046 3,280,201 0.64% 1,572,000 GBP United Kingdom Gilt Inflation Linked 0.750% 22-Nov-2047 5,393,026 1.06% 1,979,878 GBP United Kingdom Gilt Inflation Linked 0.500% 22-Mar-2050 6,561,425 1.29% 2,116,000 GBP United Kingdom Gilt Inflation Linked 0.250% 22-Mar-2052 6,047,424 1.19% 1,779,000 GBP United Kingdom Gilt Inflation Linked 1.250% 22-Nov-2055 8,613,911 1.69%
600,000 GBP United Kingdom Gilt Inflation Linked 0.125% 22-Nov-2056 1,629,733 0.32% 1,894,000 GBP United Kingdom Gilt Inflation Linked 0.125% 22-Mar-2058 5,466,055 1.07% 2,244,000 GBP United Kingdom Gilt Inflation Linked 0.375% 22-Mar-2062 8,145,921 1.60% 1,197,000 GBP United Kingdom Gilt Inflation Linked 0.125% 22-Nov-2065 3,900,526 0.77% 2,231,000 GBP United Kingdom Gilt Inflation Linked 0.125% 22-Mar-2068 7,991,527 1.57%
Total for United Kingdom 135,148,653 26.56%
United States 23,100 USD United States Treasury Inflation Indexed Bonds 2.125% 15-Jan-2019 27,078 0.01%
1,488,200 USD United States Treasury Inflation Indexed Bonds 0.125% 15-Apr-2019 1,561,970 0.31% 995,600 USD United States Treasury Inflation Indexed Bonds 1.875% 15-Jul-2019 1,185,123 0.23%
5,423,100 USD United States Treasury Inflation Indexed Bonds 1.375% 15-Jan-2020 6,342,951 1.25% 17,190,800 USD United States Treasury Inflation Indexed Bonds 0.125% 15-Apr-2020 18,050,336 3.55% 3,766,700 USD United States Treasury Inflation Indexed Bonds 1.250% 15-Jul-2020 4,394,421 0.86% 6,289,600 USD United States Treasury Inflation Indexed Bonds 1.125% 15-Jan-2021 7,294,380 1.43% 9,570,500 USD United States Treasury Inflation Indexed Bonds 0.125% 15-Apr-2021 9,903,193 1.95% 6,112,500 USD United States Treasury Inflation Indexed Bonds 0.625% 15-Jul-2021 6,807,496 1.34%
11,444,500 USD United States Treasury Inflation Indexed Bonds 0.125% 15-Jan-2022 12,398,655 2.44% 12,730,000 USD United States Treasury Inflation Indexed Bonds 0.125% 15-Jul-2022 13,605,631 2.67% 8,233,300 USD United States Treasury Inflation Indexed Bonds 0.375% 15-Jul-2023 8,771,035 1.72% 7,141,500 USD United States Treasury Inflation Indexed Bonds 0.625% 15-Jan-2024 7,666,694 1.51% 7,085,600 USD United States Treasury Inflation Indexed Bonds 0.125% 15-Jul-2024 7,257,930 1.43%
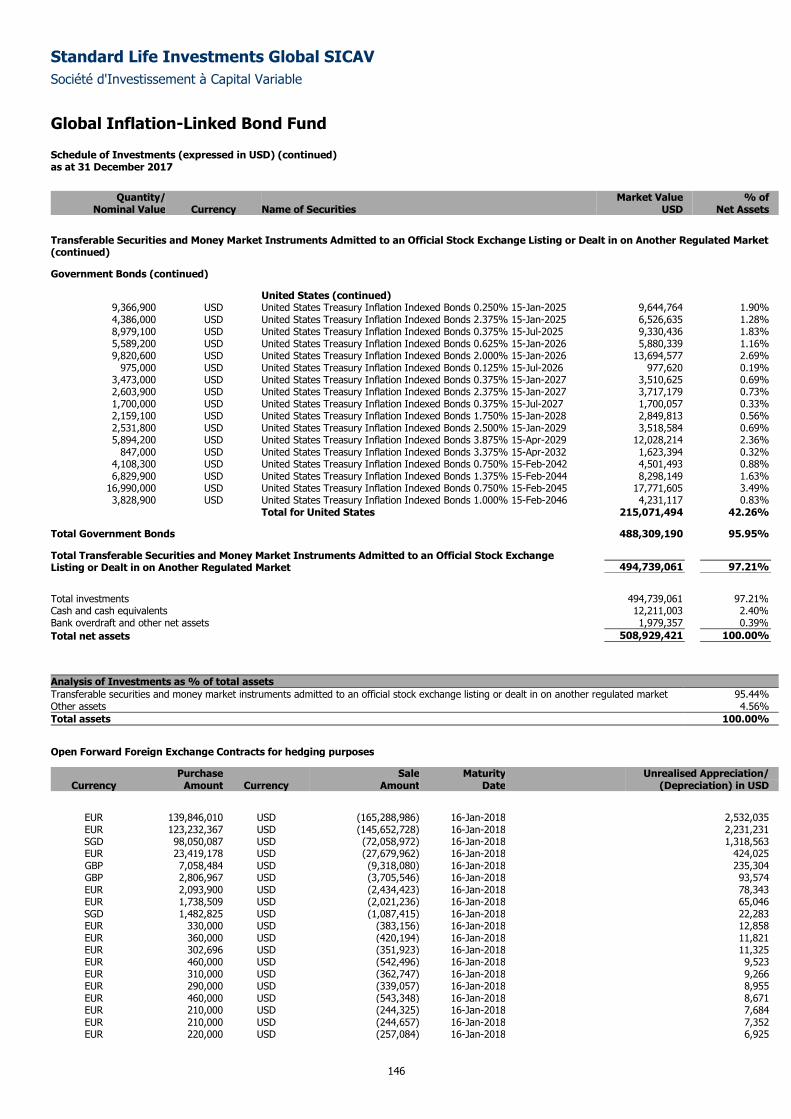
Standard Life Investments Global SICAV
Société d'Investissement à Capital Variable
Global Inflation-Linked Bond Fund
Schedule of Investments (expressed in USD) (continued) as at 31 December 2017
146
Quantity/ Market Value % of
Nominal Value Currency Name of Securities USD Net Assets
Transferable Securities and Money Market Instruments Admitted to an Official Stock Exchange Listing or Dealt in on Another Regulated Market (continued)
Government Bonds (continued)
United States (continued) 9,366,900 USD United States Treasury Inflation Indexed Bonds 0.250% 15-Jan-2025 9,644,764 1.90% 4,386,000 USD United States Treasury Inflation Indexed Bonds 2.375% 15-Jan-2025 6,526,635 1.28% 8,979,100 USD United States Treasury Inflation Indexed Bonds 0.375% 15-Jul-2025 9,330,436 1.83% 5,589,200 USD United States Treasury Inflation Indexed Bonds 0.625% 15-Jan-2026 5,880,339 1.16% 9,820,600 USD United States Treasury Inflation Indexed Bonds 2.000% 15-Jan-2026 13,694,577 2.69%
975,000 USD United States Treasury Inflation Indexed Bonds 0.125% 15-Jul-2026 977,620 0.19% 3,473,000 USD United States Treasury Inflation Indexed Bonds 0.375% 15-Jan-2027 3,510,625 0.69% 2,603,900 USD United States Treasury Inflation Indexed Bonds 2.375% 15-Jan-2027 3,717,179 0.73% 1,700,000 USD United States Treasury Inflation Indexed Bonds 0.375% 15-Jul-2027 1,700,057 0.33% 2,159,100 USD United States Treasury Inflation Indexed Bonds 1.750% 15-Jan-2028 2,849,813 0.56% 2,531,800 USD United States Treasury Inflation Indexed Bonds 2.500% 15-Jan-2029 3,518,584 0.69% 5,894,200 USD United States Treasury Inflation Indexed Bonds 3.875% 15-Apr-2029 12,028,214 2.36%
847,000 USD United States Treasury Inflation Indexed Bonds 3.375% 15-Apr-2032 1,623,394 0.32% 4,108,300 USD United States Treasury Inflation Indexed Bonds 0.750% 15-Feb-2042 4,501,493 0.88% 6,829,900 USD United States Treasury Inflation Indexed Bonds 1.375% 15-Feb-2044 8,298,149 1.63%
16,990,000 USD United States Treasury Inflation Indexed Bonds 0.750% 15-Feb-2045 17,771,605 3.49% 3,828,900 USD United States Treasury Inflation Indexed Bonds 1.000% 15-Feb-2046 4,231,117 0.83%
Total for United States 215,071,494 42.26%
Total Government Bonds 488,309,190 95.95%
Total Transferable Securities and Money Market Instruments Admitted to an Official Stock Exchange Listing or Dealt in on Another Regulated Market 494,739,061 97.21%
Total investments 494,739,061 97.21%
Cash and cash equivalents 12,211,003 2.40%
Bank overdraft and other net assets 1,979,357 0.39%
Total net assets 508,929,421 100.00%
Analysis of Investments as % of total assets
Transferable securities and money market instruments admitted to an official stock exchange listing or dealt in on another regulated market 95.44% Other assets 4.56%
Total assets 100.00%
Open Forward Foreign Exchange Contracts for hedging purposes
Purchase Sale Maturity Unrealised Appreciation/ Currency Amount Currency Amount Date (Depreciation) in USD
EUR 139,846,010 USD (165,288,986) 16-Jan-2018 2,532,035 EUR 123,232,367 USD (145,652,728) 16-Jan-2018 2,231,231 SGD 98,050,087 USD (72,058,972) 16-Jan-2018 1,318,563 EUR 23,419,178 USD (27,679,962) 16-Jan-2018 424,025 GBP 7,058,484 USD (9,318,080) 16-Jan-2018 235,304 GBP 2,806,967 USD (3,705,546) 16-Jan-2018 93,574 EUR 2,093,900 USD (2,434,423) 16-Jan-2018 78,343 EUR 1,738,509 USD (2,021,236) 16-Jan-2018 65,046 SGD 1,482,825 USD (1,087,415) 16-Jan-2018 22,283 EUR 330,000 USD (383,156) 16-Jan-2018 12,858 EUR 360,000 USD (420,194) 16-Jan-2018 11,821 EUR 302,696 USD (351,923) 16-Jan-2018 11,325 EUR 460,000 USD (542,496) 16-Jan-2018 9,523 EUR 310,000 USD (362,747) 16-Jan-2018 9,266 EUR 290,000 USD (339,057) 16-Jan-2018 8,955 EUR 460,000 USD (543,348) 16-Jan-2018 8,671 EUR 210,000 USD (244,325) 16-Jan-2018 7,684 EUR 210,000 USD (244,657) 16-Jan-2018 7,352 EUR 220,000 USD (257,084) 16-Jan-2018 6,925
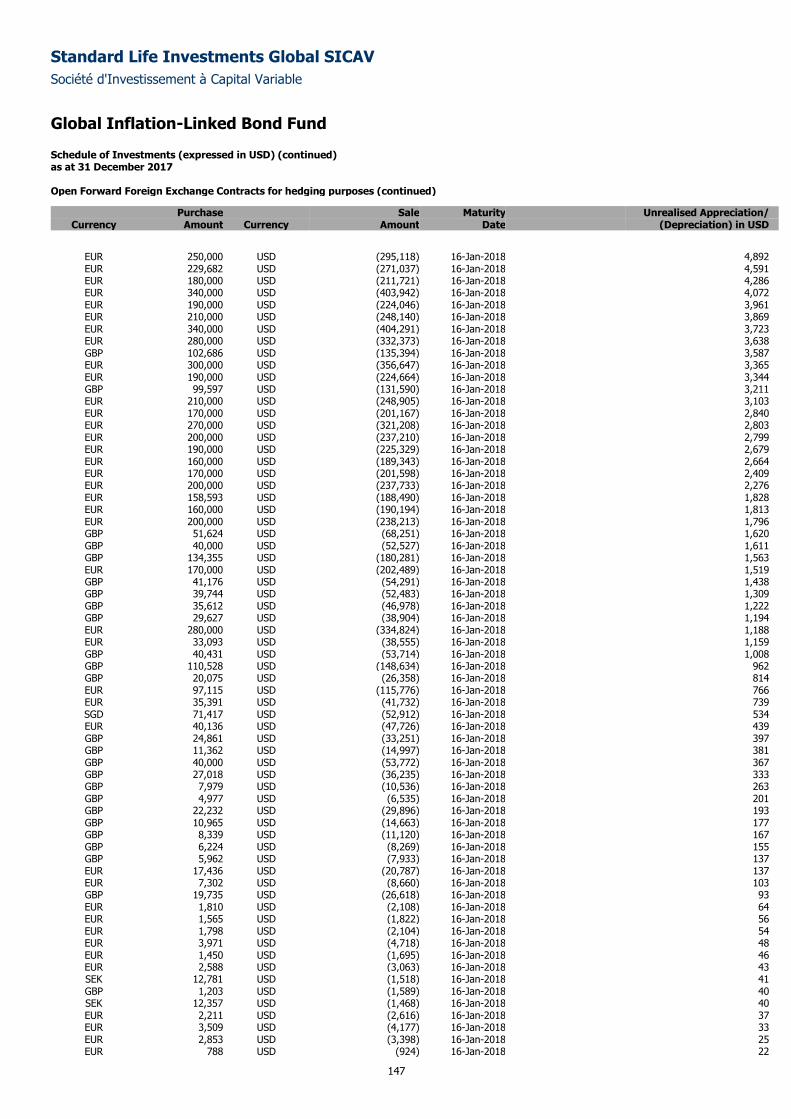
Standard Life Investments Global SICAV
Société d'Investissement à Capital Variable
Global Inflation-Linked Bond Fund
Schedule of Investments (expressed in USD) (continued) as at 31 December 2017
147
Open Forward Foreign Exchange Contracts for hedging purposes (continued)
Purchase Sale Maturity Unrealised Appreciation/ Currency Amount Currency Amount Date (Depreciation) in USD
EUR 250,000 USD (295,118) 16-Jan-2018 4,892 EUR 229,682 USD (271,037) 16-Jan-2018 4,591 EUR 180,000 USD (211,721) 16-Jan-2018 4,286 EUR 340,000 USD (403,942) 16-Jan-2018 4,072 EUR 190,000 USD (224,046) 16-Jan-2018 3,961 EUR 210,000 USD (248,140) 16-Jan-2018 3,869 EUR 340,000 USD (404,291) 16-Jan-2018 3,723 EUR 280,000 USD (332,373) 16-Jan-2018 3,638 GBP 102,686 USD (135,394) 16-Jan-2018 3,587 EUR 300,000 USD (356,647) 16-Jan-2018 3,365 EUR 190,000 USD (224,664) 16-Jan-2018 3,344 GBP 99,597 USD (131,590) 16-Jan-2018 3,211 EUR 210,000 USD (248,905) 16-Jan-2018 3,103 EUR 170,000 USD (201,167) 16-Jan-2018 2,840 EUR 270,000 USD (321,208) 16-Jan-2018 2,803 EUR 200,000 USD (237,210) 16-Jan-2018 2,799 EUR 190,000 USD (225,329) 16-Jan-2018 2,679 EUR 160,000 USD (189,343) 16-Jan-2018 2,664 EUR 170,000 USD (201,598) 16-Jan-2018 2,409 EUR 200,000 USD (237,733) 16-Jan-2018 2,276 EUR 158,593 USD (188,490) 16-Jan-2018 1,828 EUR 160,000 USD (190,194) 16-Jan-2018 1,813 EUR 200,000 USD (238,213) 16-Jan-2018 1,796 GBP 51,624 USD (68,251) 16-Jan-2018 1,620 GBP 40,000 USD (52,527) 16-Jan-2018 1,611 GBP 134,355 USD (180,281) 16-Jan-2018 1,563 EUR 170,000 USD (202,489) 16-Jan-2018 1,519 GBP 41,176 USD (54,291) 16-Jan-2018 1,438 GBP 39,744 USD (52,483) 16-Jan-2018 1,309 GBP 35,612 USD (46,978) 16-Jan-2018 1,222 GBP 29,627 USD (38,904) 16-Jan-2018 1,194 EUR 280,000 USD (334,824) 16-Jan-2018 1,188 EUR 33,093 USD (38,555) 16-Jan-2018 1,159 GBP 40,431 USD (53,714) 16-Jan-2018 1,008 GBP 110,528 USD (148,634) 16-Jan-2018 962 GBP 20,075 USD (26,358) 16-Jan-2018 814 EUR 97,115 USD (115,776) 16-Jan-2018 766 EUR 35,391 USD (41,732) 16-Jan-2018 739 SGD 71,417 USD (52,912) 16-Jan-2018 534 EUR 40,136 USD (47,726) 16-Jan-2018 439 GBP 24,861 USD (33,251) 16-Jan-2018 397 GBP 11,362 USD (14,997) 16-Jan-2018 381 GBP 40,000 USD (53,772) 16-Jan-2018 367 GBP 27,018 USD (36,235) 16-Jan-2018 333 GBP 7,979 USD (10,536) 16-Jan-2018 263 GBP 4,977 USD (6,535) 16-Jan-2018 201 GBP 22,232 USD (29,896) 16-Jan-2018 193 GBP 10,965 USD (14,663) 16-Jan-2018 177 GBP 8,339 USD (11,120) 16-Jan-2018 167 GBP 6,224 USD (8,269) 16-Jan-2018 155 GBP 5,962 USD (7,933) 16-Jan-2018 137 EUR 17,436 USD (20,787) 16-Jan-2018 137 EUR 7,302 USD (8,660) 16-Jan-2018 103 GBP 19,735 USD (26,618) 16-Jan-2018 93 EUR 1,810 USD (2,108) 16-Jan-2018 64 EUR 1,565 USD (1,822) 16-Jan-2018 56 EUR 1,798 USD (2,104) 16-Jan-2018 54 EUR 3,971 USD (4,718) 16-Jan-2018 48 EUR 1,450 USD (1,695) 16-Jan-2018 46 EUR 2,588 USD (3,063) 16-Jan-2018 43 SEK 12,781 USD (1,518) 16-Jan-2018 41 GBP 1,203 USD (1,589) 16-Jan-2018 40 SEK 12,357 USD (1,468) 16-Jan-2018 40 EUR 2,211 USD (2,616) 16-Jan-2018 37 EUR 3,509 USD (4,177) 16-Jan-2018 33 EUR 2,853 USD (3,398) 16-Jan-2018 25 EUR 788 USD (924) 16-Jan-2018 22
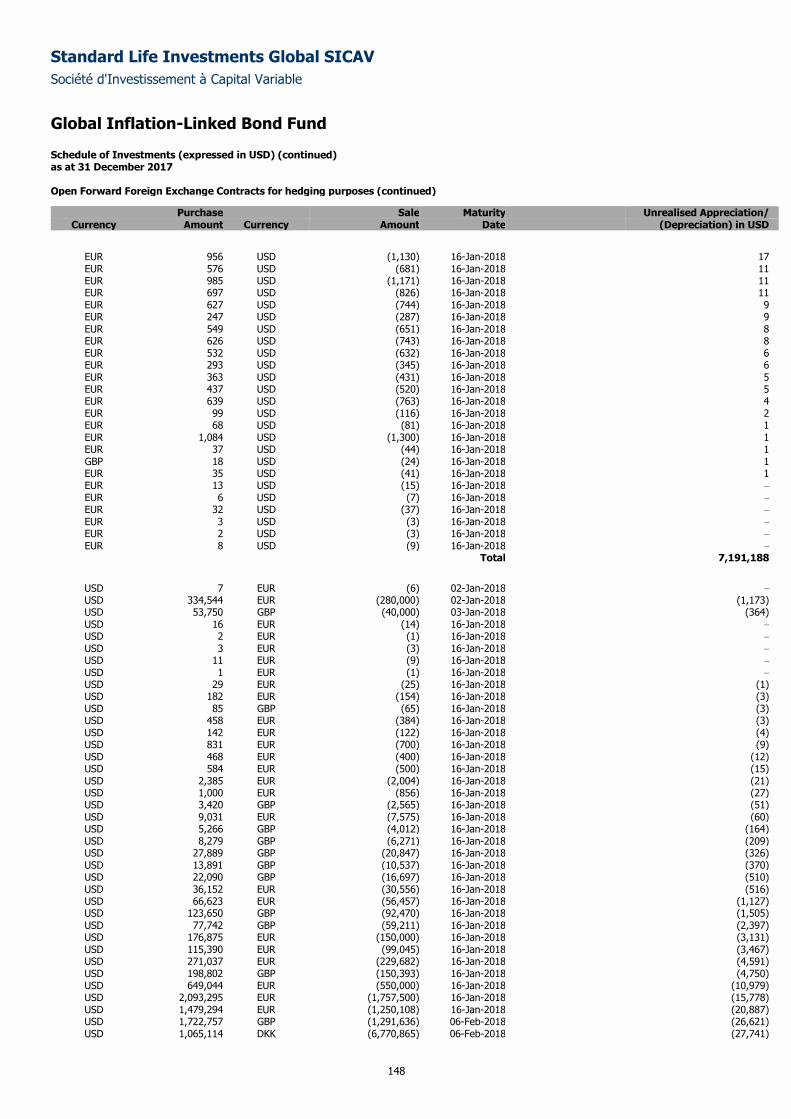
Standard Life Investments Global SICAV
Société d'Investissement à Capital Variable
Global Inflation-Linked Bond Fund
Schedule of Investments (expressed in USD) (continued) as at 31 December 2017
148
Open Forward Foreign Exchange Contracts for hedging purposes (continued)
Purchase Sale Maturity Unrealised Appreciation/ Currency Amount Currency Amount Date (Depreciation) in USD
EUR 956 USD (1,130) 16-Jan-2018 17 EUR 576 USD (681) 16-Jan-2018 11 EUR 985 USD (1,171) 16-Jan-2018 11 EUR 697 USD (826) 16-Jan-2018 11 EUR 627 USD (744) 16-Jan-2018 9 EUR 247 USD (287) 16-Jan-2018 9 EUR 549 USD (651) 16-Jan-2018 8 EUR 626 USD (743) 16-Jan-2018 8 EUR 532 USD (632) 16-Jan-2018 6 EUR 293 USD (345) 16-Jan-2018 6 EUR 363 USD (431) 16-Jan-2018 5 EUR 437 USD (520) 16-Jan-2018 5 EUR 639 USD (763) 16-Jan-2018 4 EUR 99 USD (116) 16-Jan-2018 2 EUR 68 USD (81) 16-Jan-2018 1 EUR 1,084 USD (1,300) 16-Jan-2018 1 EUR 37 USD (44) 16-Jan-2018 1 GBP 18 USD (24) 16-Jan-2018 1 EUR 35 USD (41) 16-Jan-2018 1 EUR 13 USD (15) 16-Jan-2018 –
EUR 6 USD (7) 16-Jan-2018 –
EUR 32 USD (37) 16-Jan-2018 –
EUR 3 USD (3) 16-Jan-2018 –
EUR 2 USD (3) 16-Jan-2018 –
EUR 8 USD (9) 16-Jan-2018 –
Total 7,191,188
USD 7 EUR (6) 02-Jan-2018 –
USD 334,544 EUR (280,000) 02-Jan-2018 (1,173) USD 53,750 GBP (40,000) 03-Jan-2018 (364) USD 16 EUR (14) 16-Jan-2018 –
USD 2 EUR (1) 16-Jan-2018 –
USD 3 EUR (3) 16-Jan-2018 –
USD 11 EUR (9) 16-Jan-2018 –
USD 1 EUR (1) 16-Jan-2018 –
USD 29 EUR (25) 16-Jan-2018 (1) USD 182 EUR (154) 16-Jan-2018 (3) USD 85 GBP (65) 16-Jan-2018 (3) USD 458 EUR (384) 16-Jan-2018 (3) USD 142 EUR (122) 16-Jan-2018 (4) USD 831 EUR (700) 16-Jan-2018 (9) USD 468 EUR (400) 16-Jan-2018 (12) USD 584 EUR (500) 16-Jan-2018 (15) USD 2,385 EUR (2,004) 16-Jan-2018 (21) USD 1,000 EUR (856) 16-Jan-2018 (27) USD 3,420 GBP (2,565) 16-Jan-2018 (51) USD 9,031 EUR (7,575) 16-Jan-2018 (60) USD 5,266 GBP (4,012) 16-Jan-2018 (164) USD 8,279 GBP (6,271) 16-Jan-2018 (209) USD 27,889 GBP (20,847) 16-Jan-2018 (326) USD 13,891 GBP (10,537) 16-Jan-2018 (370) USD 22,090 GBP (16,697) 16-Jan-2018 (510) USD 36,152 EUR (30,556) 16-Jan-2018 (516) USD 66,623 EUR (56,457) 16-Jan-2018 (1,127) USD 123,650 GBP (92,470) 16-Jan-2018 (1,505) USD 77,742 GBP (59,211) 16-Jan-2018 (2,397) USD 176,875 EUR (150,000) 16-Jan-2018 (3,131) USD 115,390 EUR (99,045) 16-Jan-2018 (3,467) USD 271,037 EUR (229,682) 16-Jan-2018 (4,591) USD 198,802 GBP (150,393) 16-Jan-2018 (4,750) USD 649,044 EUR (550,000) 16-Jan-2018 (10,979) USD 2,093,295 EUR (1,757,500) 16-Jan-2018 (15,778) USD 1,479,294 EUR (1,250,108) 16-Jan-2018 (20,887) USD 1,722,757 GBP (1,291,636) 06-Feb-2018 (26,621) USD 1,065,114 DKK (6,770,865) 06-Feb-2018 (27,741)
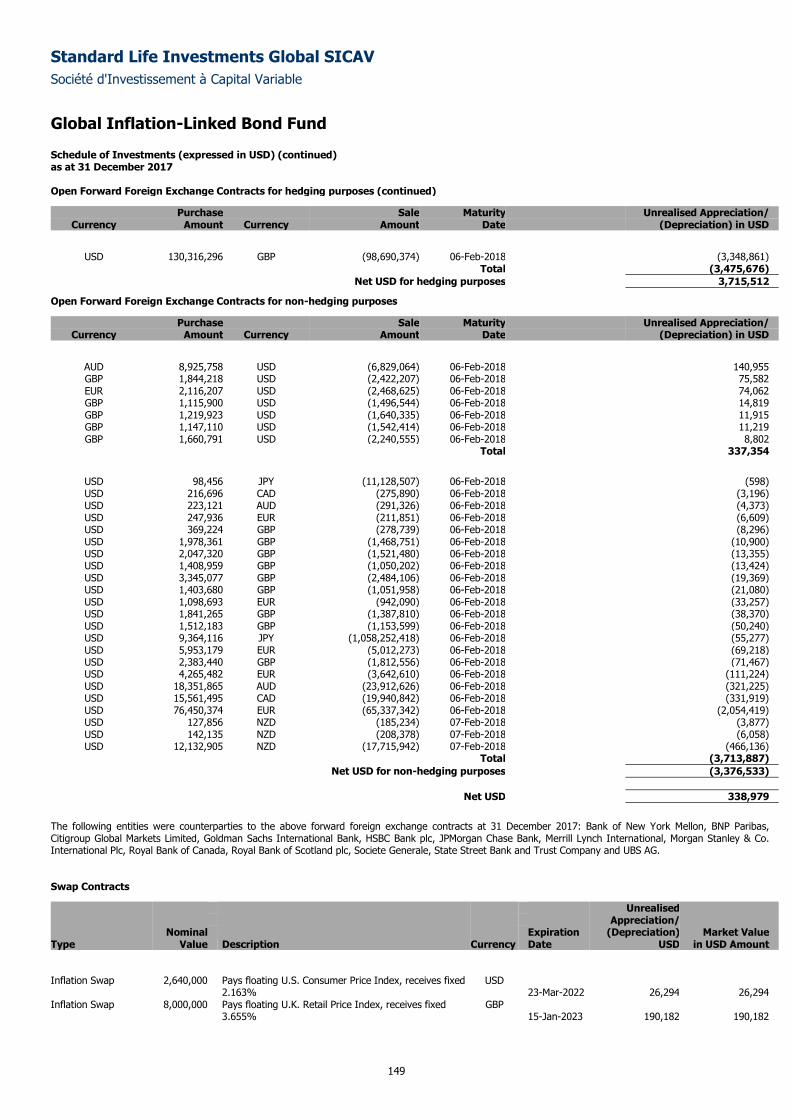
Standard Life Investments Global SICAV
Société d'Investissement à Capital Variable
Global Inflation-Linked Bond Fund
Schedule of Investments (expressed in USD) (continued) as at 31 December 2017
149
Open Forward Foreign Exchange Contracts for hedging purposes (continued)
Purchase Sale Maturity Unrealised Appreciation/ Currency Amount Currency Amount Date (Depreciation) in USD
USD 130,316,296 GBP (98,690,374) 06-Feb-2018 (3,348,861) Total (3,475,676)
Net USD for hedging purposes 3,715,512
Open Forward Foreign Exchange Contracts for non-hedging purposes
Purchase Sale Maturity Unrealised Appreciation/ Currency Amount Currency Amount Date (Depreciation) in USD
AUD 8,925,758 USD (6,829,064) 06-Feb-2018 140,955 GBP 1,844,218 USD (2,422,207) 06-Feb-2018 75,582 EUR 2,116,207 USD (2,468,625) 06-Feb-2018 74,062 GBP 1,115,900 USD (1,496,544) 06-Feb-2018 14,819 GBP 1,219,923 USD (1,640,335) 06-Feb-2018 11,915 GBP 1,147,110 USD (1,542,414) 06-Feb-2018 11,219 GBP 1,660,791 USD (2,240,555) 06-Feb-2018 8,802
Total 337,354
USD 98,456 JPY (11,128,507) 06-Feb-2018 (598) USD 216,696 CAD (275,890) 06-Feb-2018 (3,196) USD 223,121 AUD (291,326) 06-Feb-2018 (4,373) USD 247,936 EUR (211,851) 06-Feb-2018 (6,609) USD 369,224 GBP (278,739) 06-Feb-2018 (8,296) USD 1,978,361 GBP (1,468,751) 06-Feb-2018 (10,900) USD 2,047,320 GBP (1,521,480) 06-Feb-2018 (13,355) USD 1,408,959 GBP (1,050,202) 06-Feb-2018 (13,424) USD 3,345,077 GBP (2,484,106) 06-Feb-2018 (19,369) USD 1,403,680 GBP (1,051,958) 06-Feb-2018 (21,080) USD 1,098,693 EUR (942,090) 06-Feb-2018 (33,257) USD 1,841,265 GBP (1,387,810) 06-Feb-2018 (38,370) USD 1,512,183 GBP (1,153,599) 06-Feb-2018 (50,240) USD 9,364,116 JPY (1,058,252,418) 06-Feb-2018 (55,277) USD 5,953,179 EUR (5,012,273) 06-Feb-2018 (69,218) USD 2,383,440 GBP (1,812,556) 06-Feb-2018 (71,467) USD 4,265,482 EUR (3,642,610) 06-Feb-2018 (111,224) USD 18,351,865 AUD (23,912,626) 06-Feb-2018 (321,225) USD 15,561,495 CAD (19,940,842) 06-Feb-2018 (331,919) USD 76,450,374 EUR (65,337,342) 06-Feb-2018 (2,054,419) USD 127,856 NZD (185,234) 07-Feb-2018 (3,877) USD 142,135 NZD (208,378) 07-Feb-2018 (6,058) USD 12,132,905 NZD (17,715,942) 07-Feb-2018 (466,136)
Total (3,713,887)
Net USD for non-hedging purposes (3,376,533)
Net USD 338,979
The following entities were counterparties to the above forward foreign exchange contracts at 31 December 2017: Bank of New York Mellon, BNP Paribas, Citigroup Global Markets Limited, Goldman Sachs International Bank, HSBC Bank plc, JPMorgan Chase Bank, Merrill Lynch International, Morgan Stanley & Co. International Plc, Royal Bank of Canada, Royal Bank of Scotland plc, Societe Generale, State Street Bank and Trust Company and UBS AG.
Swap Contracts
Unrealised Appreciation/ Nominal Expiration (Depreciation) Market Value Type Value Description Currency Date USD in USD Amount
Inflation Swap 2,640,000 Pays floating U.S. Consumer Price Index, receives fixed 2.163%
USD 23-Mar-2022 26,294 26,294
Inflation Swap 8,000,000 Pays floating U.K. Retail Price Index, receives fixed 3.655%
GBP 15-Jan-2023 190,182 190,182
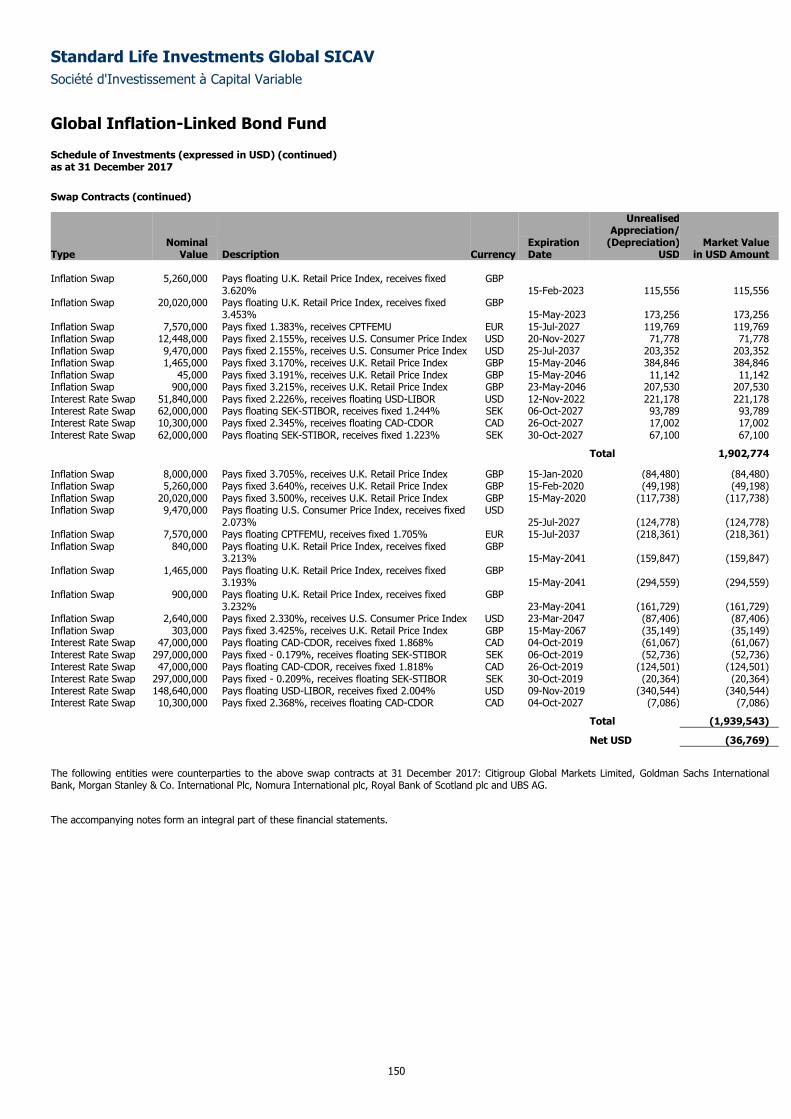
Standard Life Investments Global SICAV
Société d'Investissement à Capital Variable
Global Inflation-Linked Bond Fund
Schedule of Investments (expressed in USD) (continued) as at 31 December 2017
150
Swap Contracts (continued)
Unrealised Appreciation/ Nominal Expiration (Depreciation) Market Value Type Value Description Currency Date USD in USD Amount Inflation Swap 5,260,000 Pays floating U.K. Retail Price Index, receives fixed
3.620% GBP
15-Feb-2023 115,556 115,556 Inflation Swap 20,020,000 Pays floating U.K. Retail Price Index, receives fixed
3.453% GBP
15-May-2023 173,256 173,256 Inflation Swap 7,570,000 Pays fixed 1.383%, receives CPTFEMU EUR 15-Jul-2027 119,769 119,769 Inflation Swap 12,448,000 Pays fixed 2.155%, receives U.S. Consumer Price Index USD 20-Nov-2027 71,778 71,778 Inflation Swap 9,470,000 Pays fixed 2.155%, receives U.S. Consumer Price Index USD 25-Jul-2037 203,352 203,352 Inflation Swap 1,465,000 Pays fixed 3.170%, receives U.K. Retail Price Index GBP 15-May-2046 384,846 384,846 Inflation Swap 45,000 Pays fixed 3.191%, receives U.K. Retail Price Index GBP 15-May-2046 11,142 11,142 Inflation Swap 900,000 Pays fixed 3.215%, receives U.K. Retail Price Index GBP 23-May-2046 207,530 207,530 Interest Rate Swap 51,840,000 Pays fixed 2.226%, receives floating USD-LIBOR USD 12-Nov-2022 221,178 221,178 Interest Rate Swap 62,000,000 Pays floating SEK-STIBOR, receives fixed 1.244% SEK 06-Oct-2027 93,789 93,789 Interest Rate Swap 10,300,000 Pays fixed 2.345%, receives floating CAD-CDOR CAD 26-Oct-2027 17,002 17,002 Interest Rate Swap 62,000,000 Pays floating SEK-STIBOR, receives fixed 1.223% SEK 30-Oct-2027 67,100 67,100
Total 1,902,774
Inflation Swap 8,000,000 Pays fixed 3.705%, receives U.K. Retail Price Index GBP 15-Jan-2020 (84,480) (84,480) Inflation Swap 5,260,000 Pays fixed 3.640%, receives U.K. Retail Price Index GBP 15-Feb-2020 (49,198) (49,198) Inflation Swap 20,020,000 Pays fixed 3.500%, receives U.K. Retail Price Index GBP 15-May-2020 (117,738) (117,738) Inflation Swap 9,470,000 Pays floating U.S. Consumer Price Index, receives fixed
2.073% USD
25-Jul-2027 (124,778) (124,778) Inflation Swap 7,570,000 Pays floating CPTFEMU, receives fixed 1.705% EUR 15-Jul-2037 (218,361) (218,361) Inflation Swap 840,000 Pays floating U.K. Retail Price Index, receives fixed
3.213% GBP
15-May-2041 (159,847) (159,847) Inflation Swap 1,465,000 Pays floating U.K. Retail Price Index, receives fixed
3.193% GBP
15-May-2041 (294,559) (294,559) Inflation Swap 900,000 Pays floating U.K. Retail Price Index, receives fixed
3.232% GBP
23-May-2041 (161,729) (161,729) Inflation Swap 2,640,000 Pays fixed 2.330%, receives U.S. Consumer Price Index USD 23-Mar-2047 (87,406) (87,406) Inflation Swap 303,000 Pays fixed 3.425%, receives U.K. Retail Price Index GBP 15-May-2067 (35,149) (35,149) Interest Rate Swap 47,000,000 Pays floating CAD-CDOR, receives fixed 1.868% CAD 04-Oct-2019 (61,067) (61,067) Interest Rate Swap 297,000,000 Pays fixed - 0.179%, receives floating SEK-STIBOR SEK 06-Oct-2019 (52,736) (52,736) Interest Rate Swap 47,000,000 Pays floating CAD-CDOR, receives fixed 1.818% CAD 26-Oct-2019 (124,501) (124,501) Interest Rate Swap 297,000,000 Pays fixed - 0.209%, receives floating SEK-STIBOR SEK 30-Oct-2019 (20,364) (20,364) Interest Rate Swap 148,640,000 Pays floating USD-LIBOR, receives fixed 2.004% USD 09-Nov-2019 (340,544) (340,544) Interest Rate Swap 10,300,000 Pays fixed 2.368%, receives floating CAD-CDOR CAD 04-Oct-2027 (7,086) (7,086)
Total (1,939,543)
Net USD (36,769)
The following entities were counterparties to the above swap contracts at 31 December 2017: Citigroup Global Markets Limited, Goldman Sachs International Bank, Morgan Stanley & Co. International Plc, Nomura International plc, Royal Bank of Scotland plc and UBS AG.
The accompanying notes form an integral part of these financial statements.
Standard Life Investments Global SICAV
Société d'Investissement à Capital Variable
151
European High Yield Bond Fund
Sub-fund Objective and Investment Policy
The objective of the Sub-fund is to achieve long-term growth in the share price of the Sub-fund. The Sub-fund will invest primarily in Euro-denominated
high yielding debt securities, but may also invest in corporate bonds, government bonds and other interest bearing securities issued anywhere in the world.
The Sub-fund may invest in both investment grade and sub-investment grade corporate entities. Returns of the Sub-fund will be both through the
reinvestment of income and from capital gains.
Performance Review
The Sub-fund returned 4.76%, compared to the Bank of America Merrill Lynch Euro Non-Financials HY Constrained Index return of 6.14%.*
Having no exposure to the troubled Croatian supermarket chain Agrokor was beneficial as its bonds continued to slide and advisers were appointed to
restructure the business. We also had a zero weighting in the Italian construction company Astaldi, which fell markedly on liquidity concerns. Meanwhile, our
off-benchmark holding in legacy financial issuer Credit Logement added to returns as the company tendered for the bonds we held. One other positive
contributor to note was our underweight position in Altice and its associated issuers, which weakened in response to disappointing results.
However, an overweight holding in Liberty Global was a significant drag on returns. Our underweight position in Petrobras also lagged given its bonds rallied
along with the oil price. At a ratings level, an underweight exposure to CCC rated issuers weighed on performance.
*Sub-fund performance has been calculated over the stated period on the share price performance basis, based on the institutional share class (D
Accumulation) and net of fees. Please note the index return is quoted gross and contains no adjustment for fees. The sub-fund performance will also be
impacted by any pricing basis changes, made under our single swinging price policy. More information on our swinging price approach can be found in note
8 of the Financial Statements.
Outlook
The strong performance of European high yield in 2017 was driven by a number of supporting factors; the improving macroeconomic backdrop in Europe
led to solid fundamentals for European high-yield companies, and these companies continue to exhibit strong and stable credit metrics (with a few specific
exceptions, such as UK consumer discretionary). For now, there are no signs of the stretched credit metrics seen in a number of US high yield sectors.
There is also technical support from benign fund flows, and default rates that remain at relatively low levels and which are largely limited to specific sectors
and regions.
However, in our view, the single biggest driver of performance has been the European Central Bank’s corporate bond purchase programme (CSPP). While
the effectiveness or otherwise of this programme is subject to much debate, what cannot be denied is that there is currently a sizeable, largely price-
insensitive, buyer operating in the European corporate credit market. In our view it is inevitable that this programme, coupled with the global ‘grab for yield’
is leading to some fundamental mispricing of risk in credit markets, and some areas of Euro high yield are arguably experiencing the greatest distortions.
We are of the view that many investors are currently underestimating the threat from the potential removal of the CSPP.
With peak QE seemingly behind us, the tapering of central bank stimulus is likely to result in European high-yield credit spreads trading at wider levels over
the coming years, with the path to these wider levels likely to be volatile. As such, we believe that it is a time to be prudent in the high-yield market by
avoiding companies exhibiting higher levels of stress and also focusing on shorter-maturity debt, which will be less sensitive to any removal of the technical
support the CSPP is providing. Given this view, we are firmly defensively positioned in the Fund and will continue to take a prudent approach to risk in the
quarters ahead. We will do this both through holdings and through running increased cash levels.
Please note that the commitment approach has been used for risk measurement and calculation of global exposure for this Sub-fund.
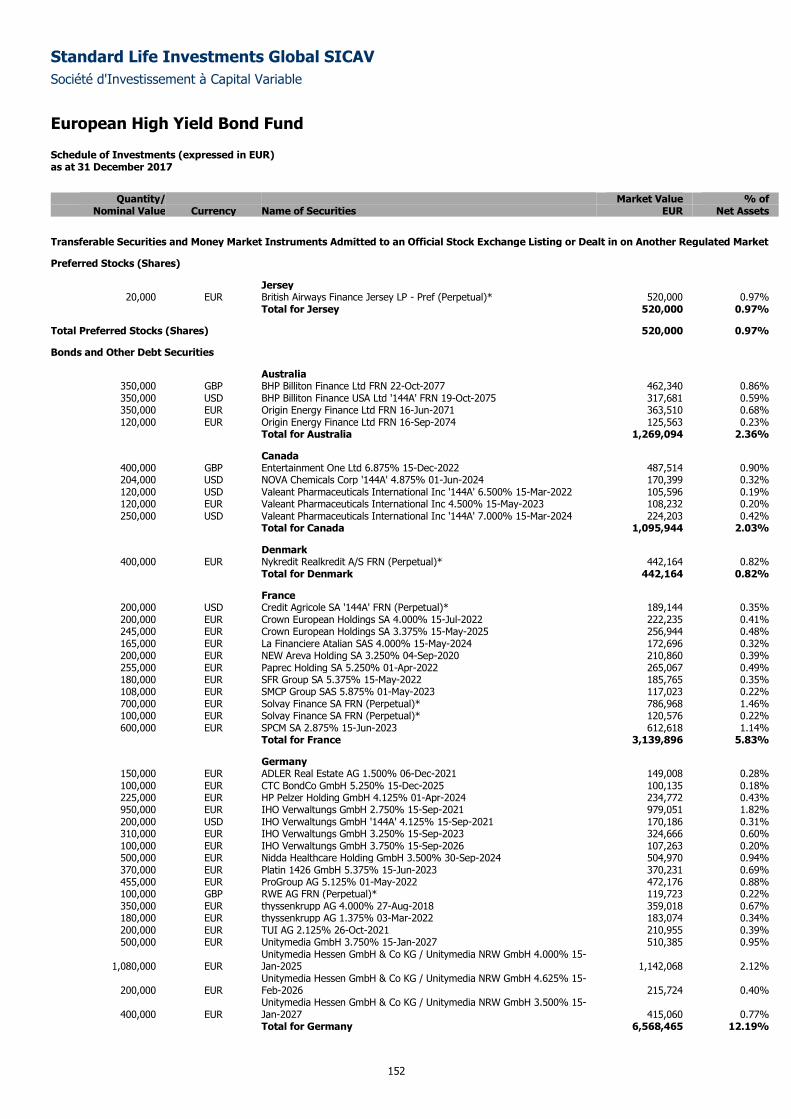
Standard Life Investments Global SICAV
Société d'Investissement à Capital Variable
European High Yield Bond Fund
Schedule of Investments (expressed in EUR) as at 31 December 2017
152
Quantity/ Market Value % of
Nominal Value Currency Name of Securities EUR Net Assets
Transferable Securities and Money Market Instruments Admitted to an Official Stock Exchange Listing or Dealt in on Another Regulated Market
Preferred Stocks (Shares)
Jersey 20,000 EUR British Airways Finance Jersey LP - Pref (Perpetual)* 520,000 0.97%
Total for Jersey 520,000 0.97%
Total Preferred Stocks (Shares) 520,000 0.97%
Bonds and Other Debt Securities
Australia 350,000 GBP BHP Billiton Finance Ltd FRN 22-Oct-2077 462,340 0.86% 350,000 USD BHP Billiton Finance USA Ltd '144A' FRN 19-Oct-2075 317,681 0.59% 350,000 EUR Origin Energy Finance Ltd FRN 16-Jun-2071 363,510 0.68% 120,000 EUR Origin Energy Finance Ltd FRN 16-Sep-2074 125,563 0.23%
Total for Australia 1,269,094 2.36%
Canada 400,000 GBP Entertainment One Ltd 6.875% 15-Dec-2022 487,514 0.90% 204,000 USD NOVA Chemicals Corp '144A' 4.875% 01-Jun-2024 170,399 0.32% 120,000 USD Valeant Pharmaceuticals International Inc '144A' 6.500% 15-Mar-2022 105,596 0.19% 120,000 EUR Valeant Pharmaceuticals International Inc 4.500% 15-May-2023 108,232 0.20% 250,000 USD Valeant Pharmaceuticals International Inc '144A' 7.000% 15-Mar-2024 224,203 0.42%
Total for Canada 1,095,944 2.03%
Denmark 400,000 EUR Nykredit Realkredit A/S FRN (Perpetual)* 442,164 0.82%
Total for Denmark 442,164 0.82%
France 200,000 USD Credit Agricole SA '144A' FRN (Perpetual)* 189,144 0.35% 200,000 EUR Crown European Holdings SA 4.000% 15-Jul-2022 222,235 0.41% 245,000 EUR Crown European Holdings SA 3.375% 15-May-2025 256,944 0.48% 165,000 EUR La Financiere Atalian SAS 4.000% 15-May-2024 172,696 0.32% 200,000 EUR NEW Areva Holding SA 3.250% 04-Sep-2020 210,860 0.39% 255,000 EUR Paprec Holding SA 5.250% 01-Apr-2022 265,067 0.49% 180,000 EUR SFR Group SA 5.375% 15-May-2022 185,765 0.35% 108,000 EUR SMCP Group SAS 5.875% 01-May-2023 117,023 0.22% 700,000 EUR Solvay Finance SA FRN (Perpetual)* 786,968 1.46% 100,000 EUR Solvay Finance SA FRN (Perpetual)* 120,576 0.22% 600,000 EUR SPCM SA 2.875% 15-Jun-2023 612,618 1.14%
Total for France 3,139,896 5.83%
Germany 150,000 EUR ADLER Real Estate AG 1.500% 06-Dec-2021 149,008 0.28% 100,000 EUR CTC BondCo GmbH 5.250% 15-Dec-2025 100,135 0.18% 225,000 EUR HP Pelzer Holding GmbH 4.125% 01-Apr-2024 234,772 0.43% 950,000 EUR IHO Verwaltungs GmbH 2.750% 15-Sep-2021 979,051 1.82% 200,000 USD IHO Verwaltungs GmbH '144A' 4.125% 15-Sep-2021 170,186 0.31% 310,000 EUR IHO Verwaltungs GmbH 3.250% 15-Sep-2023 324,666 0.60% 100,000 EUR IHO Verwaltungs GmbH 3.750% 15-Sep-2026 107,263 0.20% 500,000 EUR Nidda Healthcare Holding GmbH 3.500% 30-Sep-2024 504,970 0.94% 370,000 EUR Platin 1426 GmbH 5.375% 15-Jun-2023 370,231 0.69% 455,000 EUR ProGroup AG 5.125% 01-May-2022 472,176 0.88% 100,000 GBP RWE AG FRN (Perpetual)* 119,723 0.22% 350,000 EUR thyssenkrupp AG 4.000% 27-Aug-2018 359,018 0.67% 180,000 EUR thyssenkrupp AG 1.375% 03-Mar-2022 183,074 0.34% 200,000 EUR TUI AG 2.125% 26-Oct-2021 210,955 0.39% 500,000 EUR Unitymedia GmbH 3.750% 15-Jan-2027 510,385 0.95%
1,080,000 EUR Unitymedia Hessen GmbH & Co KG / Unitymedia NRW GmbH 4.000% 15-Jan-2025 1,142,068 2.12%
200,000 EUR Unitymedia Hessen GmbH & Co KG / Unitymedia NRW GmbH 4.625% 15-Feb-2026 215,724 0.40%
400,000 EUR Unitymedia Hessen GmbH & Co KG / Unitymedia NRW GmbH 3.500% 15-Jan-2027 415,060 0.77%
Total for Germany 6,568,465 12.19%
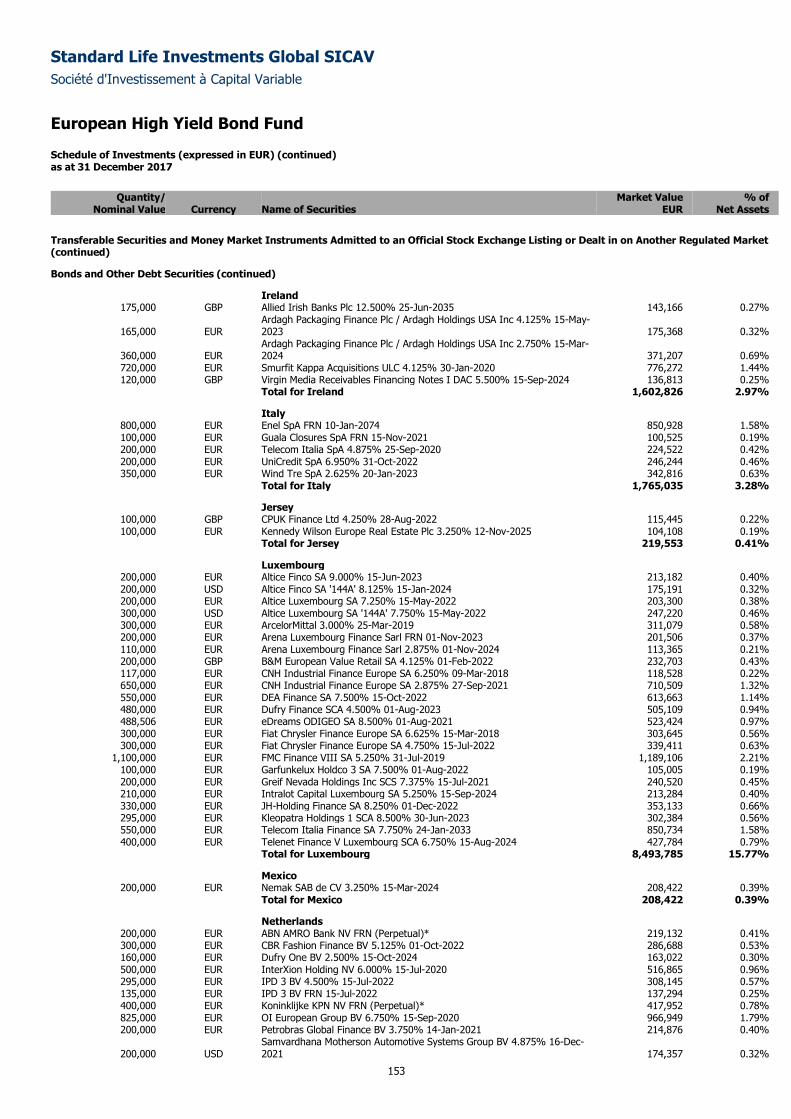
Standard Life Investments Global SICAV
Société d'Investissement à Capital Variable
European High Yield Bond Fund
Schedule of Investments (expressed in EUR) (continued) as at 31 December 2017
153
Quantity/ Market Value % of
Nominal Value Currency Name of Securities EUR Net Assets
Transferable Securities and Money Market Instruments Admitted to an Official Stock Exchange Listing or Dealt in on Another Regulated Market (continued)
Bonds and Other Debt Securities (continued)
Ireland 175,000 GBP Allied Irish Banks Plc 12.500% 25-Jun-2035 143,166 0.27%
165,000 EUR Ardagh Packaging Finance Plc / Ardagh Holdings USA Inc 4.125% 15-May-2023 175,368 0.32%
360,000 EUR Ardagh Packaging Finance Plc / Ardagh Holdings USA Inc 2.750% 15-Mar-2024 371,207 0.69%
720,000 EUR Smurfit Kappa Acquisitions ULC 4.125% 30-Jan-2020 776,272 1.44% 120,000 GBP Virgin Media Receivables Financing Notes I DAC 5.500% 15-Sep-2024 136,813 0.25%
Total for Ireland 1,602,826 2.97%
Italy 800,000 EUR Enel SpA FRN 10-Jan-2074 850,928 1.58% 100,000 EUR Guala Closures SpA FRN 15-Nov-2021 100,525 0.19% 200,000 EUR Telecom Italia SpA 4.875% 25-Sep-2020 224,522 0.42% 200,000 EUR UniCredit SpA 6.950% 31-Oct-2022 246,244 0.46% 350,000 EUR Wind Tre SpA 2.625% 20-Jan-2023 342,816 0.63%
Total for Italy 1,765,035 3.28%
Jersey 100,000 GBP CPUK Finance Ltd 4.250% 28-Aug-2022 115,445 0.22% 100,000 EUR Kennedy Wilson Europe Real Estate Plc 3.250% 12-Nov-2025 104,108 0.19%
Total for Jersey 219,553 0.41%
Luxembourg 200,000 EUR Altice Finco SA 9.000% 15-Jun-2023 213,182 0.40% 200,000 USD Altice Finco SA '144A' 8.125% 15-Jan-2024 175,191 0.32% 200,000 EUR Altice Luxembourg SA 7.250% 15-May-2022 203,300 0.38% 300,000 USD Altice Luxembourg SA '144A' 7.750% 15-May-2022 247,220 0.46% 300,000 EUR ArcelorMittal 3.000% 25-Mar-2019 311,079 0.58% 200,000 EUR Arena Luxembourg Finance Sarl FRN 01-Nov-2023 201,506 0.37% 110,000 EUR Arena Luxembourg Finance Sarl 2.875% 01-Nov-2024 113,365 0.21% 200,000 GBP B&M European Value Retail SA 4.125% 01-Feb-2022 232,703 0.43% 117,000 EUR CNH Industrial Finance Europe SA 6.250% 09-Mar-2018 118,528 0.22% 650,000 EUR CNH Industrial Finance Europe SA 2.875% 27-Sep-2021 710,509 1.32% 550,000 EUR DEA Finance SA 7.500% 15-Oct-2022 613,663 1.14% 480,000 EUR Dufry Finance SCA 4.500% 01-Aug-2023 505,109 0.94% 488,506 EUR eDreams ODIGEO SA 8.500% 01-Aug-2021 523,424 0.97% 300,000 EUR Fiat Chrysler Finance Europe SA 6.625% 15-Mar-2018 303,645 0.56% 300,000 EUR Fiat Chrysler Finance Europe SA 4.750% 15-Jul-2022 339,411 0.63%
1,100,000 EUR FMC Finance VIII SA 5.250% 31-Jul-2019 1,189,106 2.21% 100,000 EUR Garfunkelux Holdco 3 SA 7.500% 01-Aug-2022 105,005 0.19% 200,000 EUR Greif Nevada Holdings Inc SCS 7.375% 15-Jul-2021 240,520 0.45% 210,000 EUR Intralot Capital Luxembourg SA 5.250% 15-Sep-2024 213,284 0.40% 330,000 EUR JH-Holding Finance SA 8.250% 01-Dec-2022 353,133 0.66% 295,000 EUR Kleopatra Holdings 1 SCA 8.500% 30-Jun-2023 302,384 0.56% 550,000 EUR Telecom Italia Finance SA 7.750% 24-Jan-2033 850,734 1.58% 400,000 EUR Telenet Finance V Luxembourg SCA 6.750% 15-Aug-2024 427,784 0.79%
Total for Luxembourg 8,493,785 15.77%
Mexico 200,000 EUR Nemak SAB de CV 3.250% 15-Mar-2024 208,422 0.39%
Total for Mexico 208,422 0.39%
Netherlands 200,000 EUR ABN AMRO Bank NV FRN (Perpetual)* 219,132 0.41% 300,000 EUR CBR Fashion Finance BV 5.125% 01-Oct-2022 286,688 0.53% 160,000 EUR Dufry One BV 2.500% 15-Oct-2024 163,022 0.30% 500,000 EUR InterXion Holding NV 6.000% 15-Jul-2020 516,865 0.96% 295,000 EUR IPD 3 BV 4.500% 15-Jul-2022 308,145 0.57% 135,000 EUR IPD 3 BV FRN 15-Jul-2022 137,294 0.25% 400,000 EUR Koninklijke KPN NV FRN (Perpetual)* 417,952 0.78% 825,000 EUR OI European Group BV 6.750% 15-Sep-2020 966,949 1.79% 200,000 EUR Petrobras Global Finance BV 3.750% 14-Jan-2021 214,876 0.40%
200,000 USD Samvardhana Motherson Automotive Systems Group BV 4.875% 16-Dec-2021 174,357 0.32%
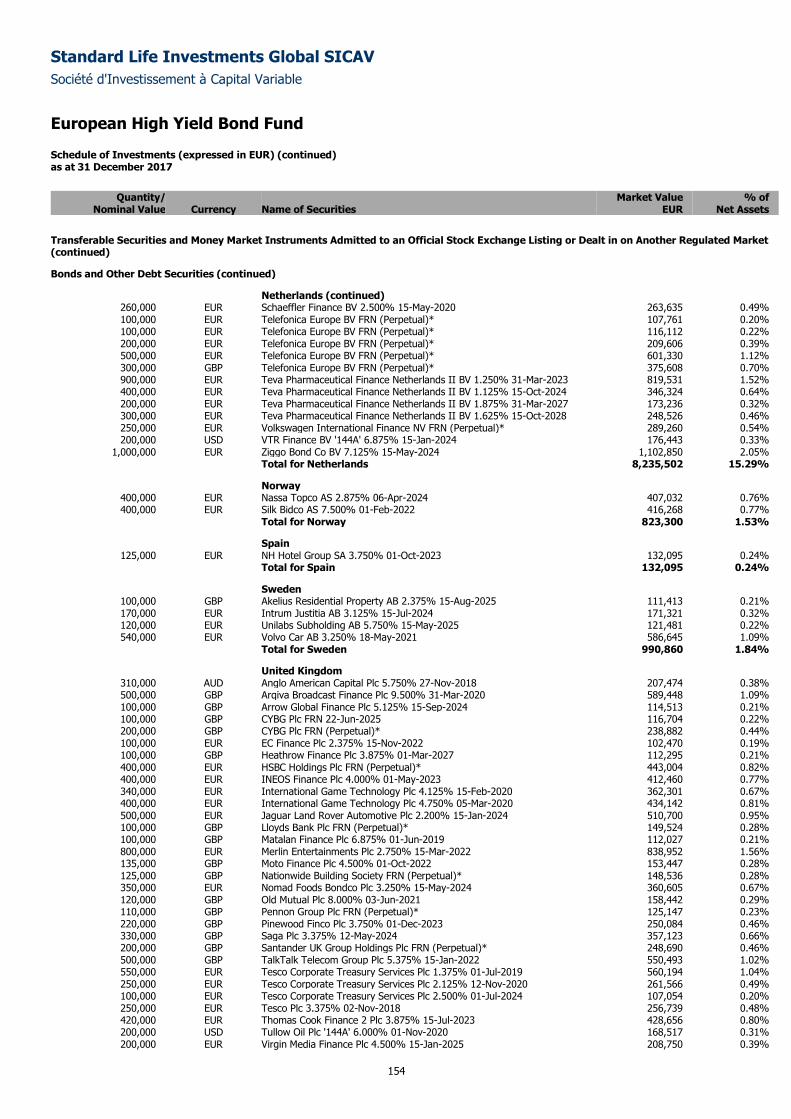
Standard Life Investments Global SICAV
Société d'Investissement à Capital Variable
European High Yield Bond Fund
Schedule of Investments (expressed in EUR) (continued) as at 31 December 2017
154
Quantity/ Market Value % of
Nominal Value Currency Name of Securities EUR Net Assets
Transferable Securities and Money Market Instruments Admitted to an Official Stock Exchange Listing or Dealt in on Another Regulated Market (continued)
Bonds and Other Debt Securities (continued)
Netherlands (continued) 260,000 EUR Schaeffler Finance BV 2.500% 15-May-2020 263,635 0.49% 100,000 EUR Telefonica Europe BV FRN (Perpetual)* 107,761 0.20% 100,000 EUR Telefonica Europe BV FRN (Perpetual)* 116,112 0.22% 200,000 EUR Telefonica Europe BV FRN (Perpetual)* 209,606 0.39% 500,000 EUR Telefonica Europe BV FRN (Perpetual)* 601,330 1.12% 300,000 GBP Telefonica Europe BV FRN (Perpetual)* 375,608 0.70% 900,000 EUR Teva Pharmaceutical Finance Netherlands II BV 1.250% 31-Mar-2023 819,531 1.52% 400,000 EUR Teva Pharmaceutical Finance Netherlands II BV 1.125% 15-Oct-2024 346,324 0.64% 200,000 EUR Teva Pharmaceutical Finance Netherlands II BV 1.875% 31-Mar-2027 173,236 0.32% 300,000 EUR Teva Pharmaceutical Finance Netherlands II BV 1.625% 15-Oct-2028 248,526 0.46% 250,000 EUR Volkswagen International Finance NV FRN (Perpetual)* 289,260 0.54% 200,000 USD VTR Finance BV '144A' 6.875% 15-Jan-2024 176,443 0.33%
1,000,000 EUR Ziggo Bond Co BV 7.125% 15-May-2024 1,102,850 2.05% Total for Netherlands 8,235,502 15.29%
Norway 400,000 EUR Nassa Topco AS 2.875% 06-Apr-2024 407,032 0.76% 400,000 EUR Silk Bidco AS 7.500% 01-Feb-2022 416,268 0.77%
Total for Norway 823,300 1.53%
Spain 125,000 EUR NH Hotel Group SA 3.750% 01-Oct-2023 132,095 0.24%
Total for Spain 132,095 0.24%
Sweden 100,000 GBP Akelius Residential Property AB 2.375% 15-Aug-2025 111,413 0.21% 170,000 EUR Intrum Justitia AB 3.125% 15-Jul-2024 171,321 0.32% 120,000 EUR Unilabs Subholding AB 5.750% 15-May-2025 121,481 0.22% 540,000 EUR Volvo Car AB 3.250% 18-May-2021 586,645 1.09%
Total for Sweden 990,860 1.84%
United Kingdom 310,000 AUD Anglo American Capital Plc 5.750% 27-Nov-2018 207,474 0.38% 500,000 GBP Arqiva Broadcast Finance Plc 9.500% 31-Mar-2020 589,448 1.09% 100,000 GBP Arrow Global Finance Plc 5.125% 15-Sep-2024 114,513 0.21% 100,000 GBP CYBG Plc FRN 22-Jun-2025 116,704 0.22% 200,000 GBP CYBG Plc FRN (Perpetual)* 238,882 0.44% 100,000 EUR EC Finance Plc 2.375% 15-Nov-2022 102,470 0.19% 100,000 GBP Heathrow Finance Plc 3.875% 01-Mar-2027 112,295 0.21% 400,000 EUR HSBC Holdings Plc FRN (Perpetual)* 443,004 0.82% 400,000 EUR INEOS Finance Plc 4.000% 01-May-2023 412,460 0.77% 340,000 EUR International Game Technology Plc 4.125% 15-Feb-2020 362,301 0.67% 400,000 EUR International Game Technology Plc 4.750% 05-Mar-2020 434,142 0.81% 500,000 EUR Jaguar Land Rover Automotive Plc 2.200% 15-Jan-2024 510,700 0.95% 100,000 GBP Lloyds Bank Plc FRN (Perpetual)* 149,524 0.28% 100,000 GBP Matalan Finance Plc 6.875% 01-Jun-2019 112,027 0.21% 800,000 EUR Merlin Entertainments Plc 2.750% 15-Mar-2022 838,952 1.56% 135,000 GBP Moto Finance Plc 4.500% 01-Oct-2022 153,447 0.28% 125,000 GBP Nationwide Building Society FRN (Perpetual)* 148,536 0.28% 350,000 EUR Nomad Foods Bondco Plc 3.250% 15-May-2024 360,605 0.67% 120,000 GBP Old Mutual Plc 8.000% 03-Jun-2021 158,442 0.29% 110,000 GBP Pennon Group Plc FRN (Perpetual)* 125,147 0.23% 220,000 GBP Pinewood Finco Plc 3.750% 01-Dec-2023 250,084 0.46% 330,000 GBP Saga Plc 3.375% 12-May-2024 357,123 0.66% 200,000 GBP Santander UK Group Holdings Plc FRN (Perpetual)* 248,690 0.46% 500,000 GBP TalkTalk Telecom Group Plc 5.375% 15-Jan-2022 550,493 1.02% 550,000 EUR Tesco Corporate Treasury Services Plc 1.375% 01-Jul-2019 560,194 1.04% 250,000 EUR Tesco Corporate Treasury Services Plc 2.125% 12-Nov-2020 261,566 0.49% 100,000 EUR Tesco Corporate Treasury Services Plc 2.500% 01-Jul-2024 107,054 0.20% 250,000 EUR Tesco Plc 3.375% 02-Nov-2018 256,739 0.48% 420,000 EUR Thomas Cook Finance 2 Plc 3.875% 15-Jul-2023 428,656 0.80% 200,000 USD Tullow Oil Plc '144A' 6.000% 01-Nov-2020 168,517 0.31% 200,000 EUR Virgin Media Finance Plc 4.500% 15-Jan-2025 208,750 0.39%
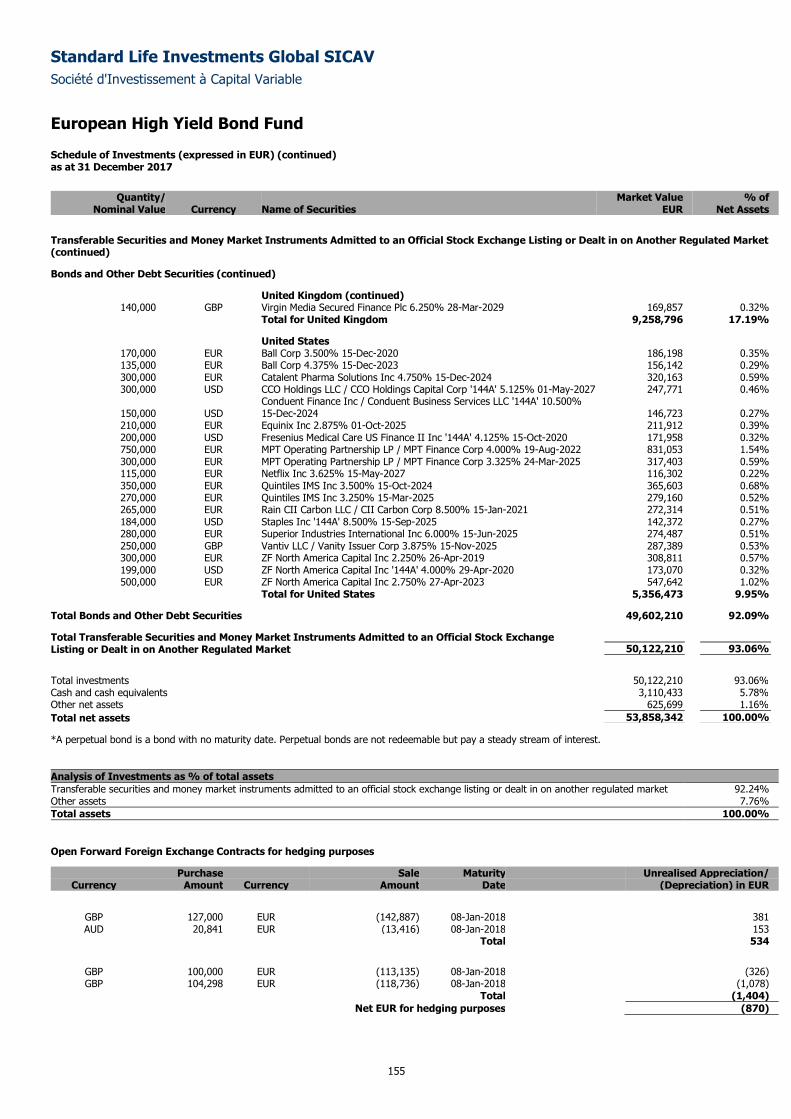
Standard Life Investments Global SICAV
Société d'Investissement à Capital Variable
European High Yield Bond Fund
Schedule of Investments (expressed in EUR) (continued) as at 31 December 2017
155
Quantity/ Market Value % of
Nominal Value Currency Name of Securities EUR Net Assets
Transferable Securities and Money Market Instruments Admitted to an Official Stock Exchange Listing or Dealt in on Another Regulated Market (continued)
Bonds and Other Debt Securities (continued)
United Kingdom (continued) 140,000 GBP Virgin Media Secured Finance Plc 6.250% 28-Mar-2029 169,857 0.32%
Total for United Kingdom 9,258,796 17.19%
United States 170,000 EUR Ball Corp 3.500% 15-Dec-2020 186,198 0.35% 135,000 EUR Ball Corp 4.375% 15-Dec-2023 156,142 0.29% 300,000 EUR Catalent Pharma Solutions Inc 4.750% 15-Dec-2024 320,163 0.59% 300,000 USD CCO Holdings LLC / CCO Holdings Capital Corp '144A' 5.125% 01-May-2027 247,771 0.46%
150,000 USD Conduent Finance Inc / Conduent Business Services LLC '144A' 10.500% 15-Dec-2024 146,723 0.27%
210,000 EUR Equinix Inc 2.875% 01-Oct-2025 211,912 0.39% 200,000 USD Fresenius Medical Care US Finance II Inc '144A' 4.125% 15-Oct-2020 171,958 0.32% 750,000 EUR MPT Operating Partnership LP / MPT Finance Corp 4.000% 19-Aug-2022 831,053 1.54% 300,000 EUR MPT Operating Partnership LP / MPT Finance Corp 3.325% 24-Mar-2025 317,403 0.59% 115,000 EUR Netflix Inc 3.625% 15-May-2027 116,302 0.22% 350,000 EUR Quintiles IMS Inc 3.500% 15-Oct-2024 365,603 0.68% 270,000 EUR Quintiles IMS Inc 3.250% 15-Mar-2025 279,160 0.52% 265,000 EUR Rain CII Carbon LLC / CII Carbon Corp 8.500% 15-Jan-2021 272,314 0.51% 184,000 USD Staples Inc '144A' 8.500% 15-Sep-2025 142,372 0.27% 280,000 EUR Superior Industries International Inc 6.000% 15-Jun-2025 274,487 0.51% 250,000 GBP Vantiv LLC / Vanity Issuer Corp 3.875% 15-Nov-2025 287,389 0.53% 300,000 EUR ZF North America Capital Inc 2.250% 26-Apr-2019 308,811 0.57% 199,000 USD ZF North America Capital Inc '144A' 4.000% 29-Apr-2020 173,070 0.32% 500,000 EUR ZF North America Capital Inc 2.750% 27-Apr-2023 547,642 1.02%
Total for United States 5,356,473 9.95%
Total Bonds and Other Debt Securities 49,602,210 92.09%
Total Transferable Securities and Money Market Instruments Admitted to an Official Stock Exchange Listing or Dealt in on Another Regulated Market 50,122,210 93.06%
Total investments 50,122,210 93.06%
Cash and cash equivalents 3,110,433 5.78%
Other net assets 625,699 1.16%
Total net assets 53,858,342 100.00%
*A perpetual bond is a bond with no maturity date. Perpetual bonds are not redeemable but pay a steady stream of interest.
Analysis of Investments as % of total assets
Transferable securities and money market instruments admitted to an official stock exchange listing or dealt in on another regulated market 92.24% Other assets 7.76%
Total assets 100.00%
Open Forward Foreign Exchange Contracts for hedging purposes
Purchase Sale Maturity Unrealised Appreciation/ Currency Amount Currency Amount Date (Depreciation) in EUR
GBP 127,000 EUR (142,887) 08-Jan-2018 381 AUD 20,841 EUR (13,416) 08-Jan-2018 153
Total 534
GBP 100,000 EUR (113,135) 08-Jan-2018 (326) GBP 104,298 EUR (118,736) 08-Jan-2018 (1,078)
Total (1,404)
Net EUR for hedging purposes (870)
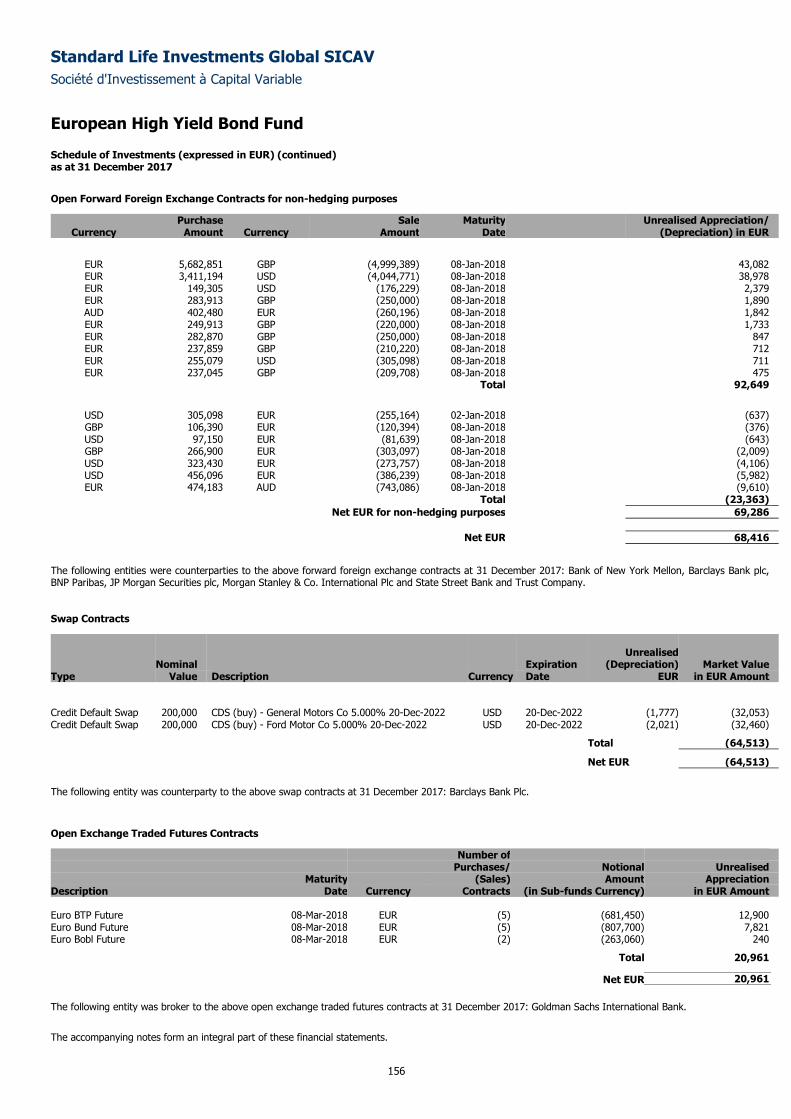
Standard Life Investments Global SICAV
Société d'Investissement à Capital Variable
European High Yield Bond Fund
Schedule of Investments (expressed in EUR) (continued) as at 31 December 2017
156
Open Forward Foreign Exchange Contracts for non-hedging purposes
Purchase Sale Maturity Unrealised Appreciation/ Currency Amount Currency Amount Date (Depreciation) in EUR
EUR 5,682,851 GBP (4,999,389) 08-Jan-2018 43,082 EUR 3,411,194 USD (4,044,771) 08-Jan-2018 38,978 EUR 149,305 USD (176,229) 08-Jan-2018 2,379 EUR 283,913 GBP (250,000) 08-Jan-2018 1,890 AUD 402,480 EUR (260,196) 08-Jan-2018 1,842 EUR 249,913 GBP (220,000) 08-Jan-2018 1,733 EUR 282,870 GBP (250,000) 08-Jan-2018 847 EUR 237,859 GBP (210,220) 08-Jan-2018 712 EUR 255,079 USD (305,098) 08-Jan-2018 711 EUR 237,045 GBP (209,708) 08-Jan-2018 475
Total 92,649
USD 305,098 EUR (255,164) 02-Jan-2018 (637) GBP 106,390 EUR (120,394) 08-Jan-2018 (376) USD 97,150 EUR (81,639) 08-Jan-2018 (643) GBP 266,900 EUR (303,097) 08-Jan-2018 (2,009) USD 323,430 EUR (273,757) 08-Jan-2018 (4,106) USD 456,096 EUR (386,239) 08-Jan-2018 (5,982) EUR 474,183 AUD (743,086) 08-Jan-2018 (9,610)
Total (23,363)
Net EUR for non-hedging purposes 69,286
Net EUR 68,416
The following entities were counterparties to the above forward foreign exchange contracts at 31 December 2017: Bank of New York Mellon, Barclays Bank plc, BNP Paribas, JP Morgan Securities plc, Morgan Stanley & Co. International Plc and State Street Bank and Trust Company.
Swap Contracts
Unrealised Nominal Expiration (Depreciation) Market Value Type Value Description Currency Date EUR in EUR Amount
Credit Default Swap 200,000 CDS (buy) - General Motors Co 5.000% 20-Dec-2022 USD 20-Dec-2022 (1,777) (32,053) Credit Default Swap 200,000 CDS (buy) - Ford Motor Co 5.000% 20-Dec-2022 USD 20-Dec-2022 (2,021) (32,460)
Total (64,513)
Net EUR (64,513)
The following entity was counterparty to the above swap contracts at 31 December 2017: Barclays Bank Plc.
Open Exchange Traded Futures Contracts
Number of Purchases/ Notional Unrealised Maturity (Sales) Amount Appreciation Description Date Currency Contracts (in Sub-funds Currency) in EUR Amount Euro BTP Future 08-Mar-2018 EUR (5) (681,450) 12,900 Euro Bund Future 08-Mar-2018 EUR (5) (807,700) 7,821 Euro Bobl Future 08-Mar-2018 EUR (2) (263,060) 240
Total 20,961
Net EUR 20,961
The following entity was broker to the above open exchange traded futures contracts at 31 December 2017: Goldman Sachs International Bank.
The accompanying notes form an integral part of these financial statements.
Standard Life Investments Global SICAV
Société d'Investissement à Capital Variable
157
European Corporate Bond Fund
Sub-fund Objective and Investment Policy
The objective of the Sub-fund is to achieve long-term growth in the share price through investing substantially in debt securities issued by corporations and
agencies domiciled in European countries or whose securities are quoted on European stock exchanges. Holdings will principally be of investment grade
bonds. The Sub-fund may also invest in government bonds, sub-investment grade debt and other interest bearing securities issued anywhere in the world.
Non-Euro denominated issues will generally be hedged back into that currency. Return on the Sub-fund will be both through the reinvestment of income and
from capital gains.
Performance Review
The Sub-fund returned 2.34% over the period, compared to the iBoxx Euro Corporate Bond Index return of 2.38%.*
Security selection was a positive contributor to performance. Within ratings, our off-benchmark exposure to high yield debt also added to returns. Financials
featured among the leading contributors to performance over the year. However, holdings in German bunds detracted from performance in what was
generally a positive period for risk.
At an individual security level, our overweight position in CTE, the holding company created for Electricite de France’s stake in the grid operator RTE,
benefited performance. We purchased CTE’s bonds at issue in June and they went on to perform well in the secondary market. Overweight positions in a
number of banks, including HSBC, UBS and Rabobank, made a strong contribution to relative returns. Our overweight exposure to a number of corporate
hybrids also proved positive with bonds from Volkswagen, Orsted and Total all performing well. The insurance sector made good progress over the year
which meant overweight positions in NN Group and Aviva added to relative performance.
On the downside, an off-benchmark exposure to AAA rated German development bank KfW was negative for returns as higher-quality debt underperformed
due to rising bond yields. Teva Pharmaceutical was also a significant negative contributor. Not only did the company post weak quarterly results but it was
downgraded by two notches to BB from BBB- by Fitch. This means the bonds will drop out of most investment-grade indices given its average rating is now
BB+. This led to forced selling into an already weak market by investors who cannot hold high yield-rated bonds.
*Sub-fund performance has been calculated over the stated period on the share price performance basis, based on the institutional share class (D
Accumulation) and net of fees. Please note the index return is quoted gross and contains no adjustment for fees. The sub-fund performance will also be
impacted by any pricing basis changes, made under our single swinging price policy. More information on our swinging price approach can be found in note
8 of the Financial Statements.
Outlook
We retain a constructive view of credit markets entering 2018. Globally, economic data has been strong and inflation remains low, which is keeping the
European Central Bank’s (ECB) policy fairly loose. The passage of the US tax reforms provides a stimulus for US companies and the broader economy.
Progress has also been made in the Brexit negotiations, which has lifted some of the uncertainty hanging over the UK. However, political risk remains on the
agenda with the Italian elections in March 2018 creating a potential roadblock in Europe. This is one area in which we are defensively positioned.
We continue to like subordinated bank debt and corporate hybrid bonds, as we see further spread tightening potential. Overall, we think market valuations
already reflect a very benign technical and fundamental scenario but that there is still some room for spreads to tighten. We expect the first half of the year
to be more supportive for credit spreads and underlying rates, given investors will start to focus on the run-off of the ECB’s purchasing programme closer to
2019.
Please note that the commitment approach has been used for risk measurement and calculation of global exposure for this Sub-fund.
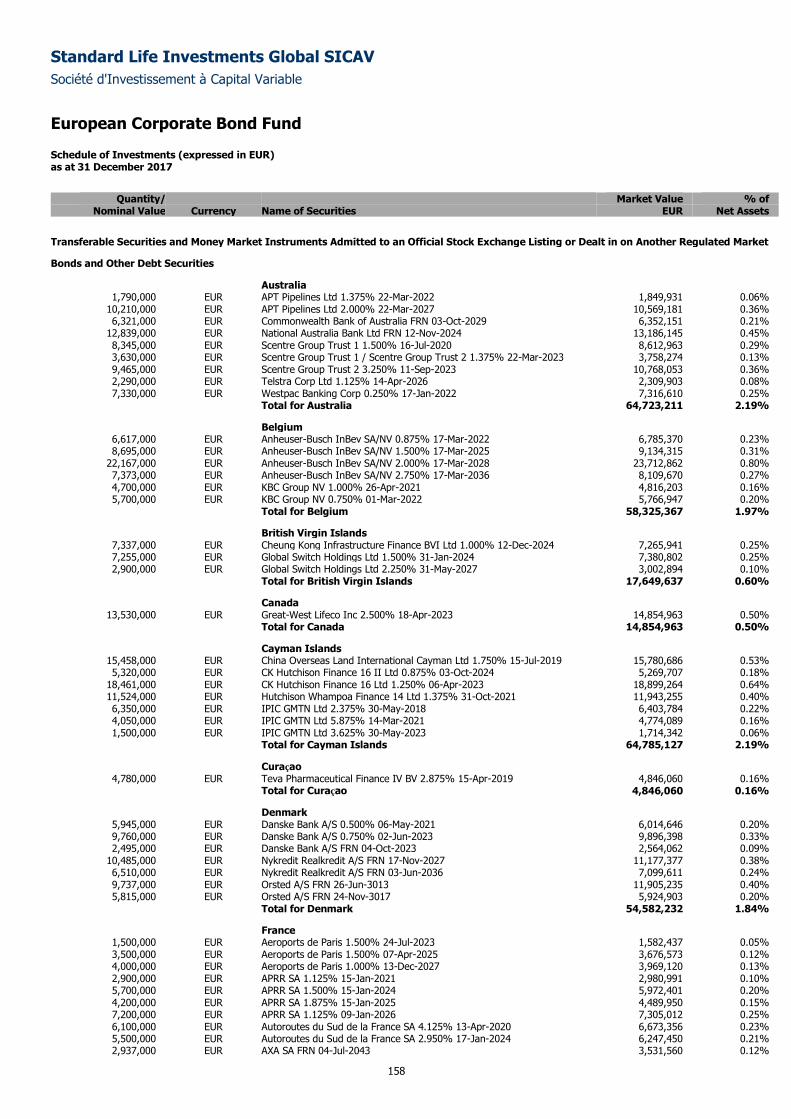
Standard Life Investments Global SICAV
Société d'Investissement à Capital Variable
European Corporate Bond Fund
Schedule of Investments (expressed in EUR) as at 31 December 2017
158
Quantity/ Market Value % of
Nominal Value Currency Name of Securities EUR Net Assets
Transferable Securities and Money Market Instruments Admitted to an Official Stock Exchange Listing or Dealt in on Another Regulated Market
Bonds and Other Debt Securities
Australia 1,790,000 EUR APT Pipelines Ltd 1.375% 22-Mar-2022 1,849,931 0.06%
10,210,000 EUR APT Pipelines Ltd 2.000% 22-Mar-2027 10,569,181 0.36% 6,321,000 EUR Commonwealth Bank of Australia FRN 03-Oct-2029 6,352,151 0.21%
12,839,000 EUR National Australia Bank Ltd FRN 12-Nov-2024 13,186,145 0.45% 8,345,000 EUR Scentre Group Trust 1 1.500% 16-Jul-2020 8,612,963 0.29% 3,630,000 EUR Scentre Group Trust 1 / Scentre Group Trust 2 1.375% 22-Mar-2023 3,758,274 0.13% 9,465,000 EUR Scentre Group Trust 2 3.250% 11-Sep-2023 10,768,053 0.36% 2,290,000 EUR Telstra Corp Ltd 1.125% 14-Apr-2026 2,309,903 0.08% 7,330,000 EUR Westpac Banking Corp 0.250% 17-Jan-2022 7,316,610 0.25%
Total for Australia 64,723,211 2.19%
Belgium 6,617,000 EUR Anheuser-Busch InBev SA/NV 0.875% 17-Mar-2022 6,785,370 0.23% 8,695,000 EUR Anheuser-Busch InBev SA/NV 1.500% 17-Mar-2025 9,134,315 0.31%
22,167,000 EUR Anheuser-Busch InBev SA/NV 2.000% 17-Mar-2028 23,712,862 0.80% 7,373,000 EUR Anheuser-Busch InBev SA/NV 2.750% 17-Mar-2036 8,109,670 0.27% 4,700,000 EUR KBC Group NV 1.000% 26-Apr-2021 4,816,203 0.16% 5,700,000 EUR KBC Group NV 0.750% 01-Mar-2022 5,766,947 0.20%
Total for Belgium 58,325,367 1.97%
British Virgin Islands 7,337,000 EUR Cheung Kong Infrastructure Finance BVI Ltd 1.000% 12-Dec-2024 7,265,941 0.25% 7,255,000 EUR Global Switch Holdings Ltd 1.500% 31-Jan-2024 7,380,802 0.25% 2,900,000 EUR Global Switch Holdings Ltd 2.250% 31-May-2027 3,002,894 0.10%
Total for British Virgin Islands 17,649,637 0.60%
Canada 13,530,000 EUR Great-West Lifeco Inc 2.500% 18-Apr-2023 14,854,963 0.50%
Total for Canada 14,854,963 0.50%
Cayman Islands 15,458,000 EUR China Overseas Land International Cayman Ltd 1.750% 15-Jul-2019 15,780,686 0.53% 5,320,000 EUR CK Hutchison Finance 16 II Ltd 0.875% 03-Oct-2024 5,269,707 0.18%
18,461,000 EUR CK Hutchison Finance 16 Ltd 1.250% 06-Apr-2023 18,899,264 0.64% 11,524,000 EUR Hutchison Whampoa Finance 14 Ltd 1.375% 31-Oct-2021 11,943,255 0.40% 6,350,000 EUR IPIC GMTN Ltd 2.375% 30-May-2018 6,403,784 0.22% 4,050,000 EUR IPIC GMTN Ltd 5.875% 14-Mar-2021 4,774,089 0.16% 1,500,000 EUR IPIC GMTN Ltd 3.625% 30-May-2023 1,714,342 0.06%
Total for Cayman Islands 64,785,127 2.19%
Curaçao 4,780,000 EUR Teva Pharmaceutical Finance IV BV 2.875% 15-Apr-2019 4,846,060 0.16%
Total for Curaçao 4,846,060 0.16%
Denmark 5,945,000 EUR Danske Bank A/S 0.500% 06-May-2021 6,014,646 0.20% 9,760,000 EUR Danske Bank A/S 0.750% 02-Jun-2023 9,896,398 0.33% 2,495,000 EUR Danske Bank A/S FRN 04-Oct-2023 2,564,062 0.09%
10,485,000 EUR Nykredit Realkredit A/S FRN 17-Nov-2027 11,177,377 0.38% 6,510,000 EUR Nykredit Realkredit A/S FRN 03-Jun-2036 7,099,611 0.24% 9,737,000 EUR Orsted A/S FRN 26-Jun-3013 11,905,235 0.40% 5,815,000 EUR Orsted A/S FRN 24-Nov-3017 5,924,903 0.20%
Total for Denmark 54,582,232 1.84%
France 1,500,000 EUR Aeroports de Paris 1.500% 24-Jul-2023 1,582,437 0.05% 3,500,000 EUR Aeroports de Paris 1.500% 07-Apr-2025 3,676,573 0.12% 4,000,000 EUR Aeroports de Paris 1.000% 13-Dec-2027 3,969,120 0.13% 2,900,000 EUR APRR SA 1.125% 15-Jan-2021 2,980,991 0.10% 5,700,000 EUR APRR SA 1.500% 15-Jan-2024 5,972,401 0.20% 4,200,000 EUR APRR SA 1.875% 15-Jan-2025 4,489,950 0.15% 7,200,000 EUR APRR SA 1.125% 09-Jan-2026 7,305,012 0.25% 6,100,000 EUR Autoroutes du Sud de la France SA 4.125% 13-Apr-2020 6,673,356 0.23% 5,500,000 EUR Autoroutes du Sud de la France SA 2.950% 17-Jan-2024 6,247,450 0.21% 2,937,000 EUR AXA SA FRN 04-Jul-2043 3,531,560 0.12%
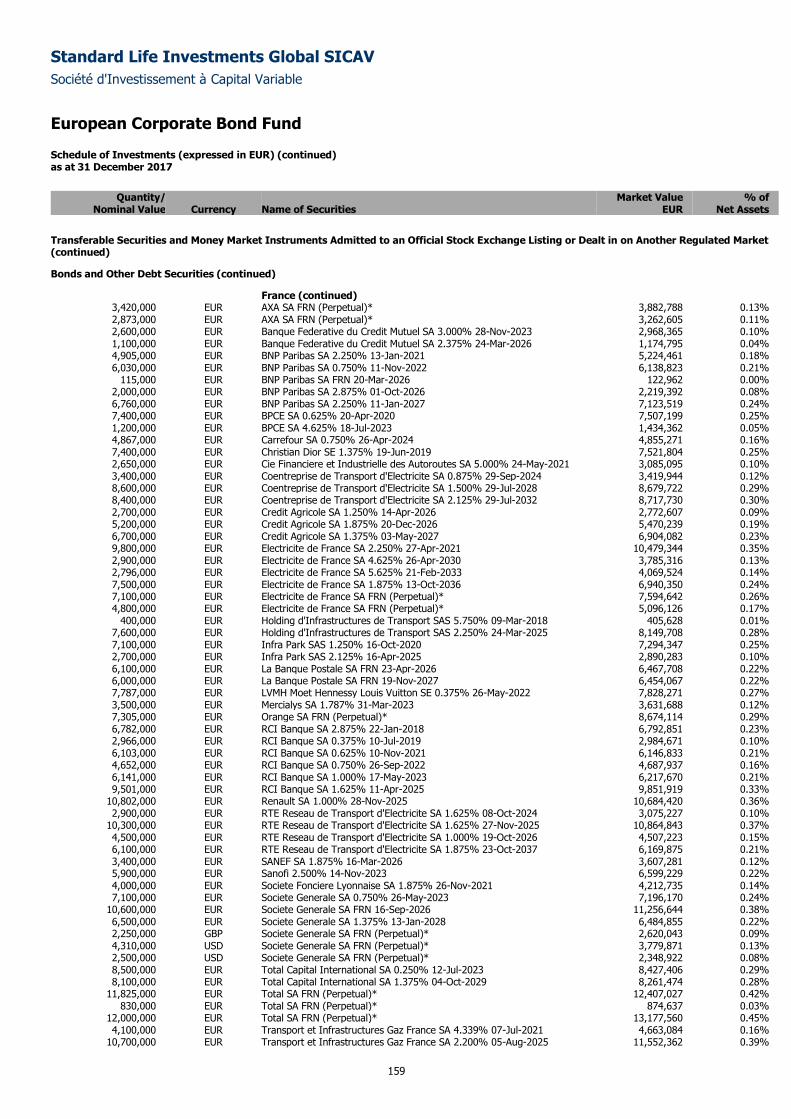
Standard Life Investments Global SICAV
Société d'Investissement à Capital Variable
European Corporate Bond Fund
Schedule of Investments (expressed in EUR) (continued) as at 31 December 2017
159
Quantity/ Market Value % of
Nominal Value Currency Name of Securities EUR Net Assets
Transferable Securities and Money Market Instruments Admitted to an Official Stock Exchange Listing or Dealt in on Another Regulated Market (continued)
Bonds and Other Debt Securities (continued)
France (continued) 3,420,000 EUR AXA SA FRN (Perpetual)* 3,882,788 0.13% 2,873,000 EUR AXA SA FRN (Perpetual)* 3,262,605 0.11% 2,600,000 EUR Banque Federative du Credit Mutuel SA 3.000% 28-Nov-2023 2,968,365 0.10% 1,100,000 EUR Banque Federative du Credit Mutuel SA 2.375% 24-Mar-2026 1,174,795 0.04% 4,905,000 EUR BNP Paribas SA 2.250% 13-Jan-2021 5,224,461 0.18% 6,030,000 EUR BNP Paribas SA 0.750% 11-Nov-2022 6,138,823 0.21%
115,000 EUR BNP Paribas SA FRN 20-Mar-2026 122,962 0.00% 2,000,000 EUR BNP Paribas SA 2.875% 01-Oct-2026 2,219,392 0.08% 6,760,000 EUR BNP Paribas SA 2.250% 11-Jan-2027 7,123,519 0.24% 7,400,000 EUR BPCE SA 0.625% 20-Apr-2020 7,507,199 0.25% 1,200,000 EUR BPCE SA 4.625% 18-Jul-2023 1,434,362 0.05% 4,867,000 EUR Carrefour SA 0.750% 26-Apr-2024 4,855,271 0.16% 7,400,000 EUR Christian Dior SE 1.375% 19-Jun-2019 7,521,804 0.25% 2,650,000 EUR Cie Financiere et Industrielle des Autoroutes SA 5.000% 24-May-2021 3,085,095 0.10% 3,400,000 EUR Coentreprise de Transport d'Electricite SA 0.875% 29-Sep-2024 3,419,944 0.12% 8,600,000 EUR Coentreprise de Transport d'Electricite SA 1.500% 29-Jul-2028 8,679,722 0.29% 8,400,000 EUR Coentreprise de Transport d'Electricite SA 2.125% 29-Jul-2032 8,717,730 0.30% 2,700,000 EUR Credit Agricole SA 1.250% 14-Apr-2026 2,772,607 0.09% 5,200,000 EUR Credit Agricole SA 1.875% 20-Dec-2026 5,470,239 0.19% 6,700,000 EUR Credit Agricole SA 1.375% 03-May-2027 6,904,082 0.23% 9,800,000 EUR Electricite de France SA 2.250% 27-Apr-2021 10,479,344 0.35% 2,900,000 EUR Electricite de France SA 4.625% 26-Apr-2030 3,785,316 0.13% 2,796,000 EUR Electricite de France SA 5.625% 21-Feb-2033 4,069,524 0.14% 7,500,000 EUR Electricite de France SA 1.875% 13-Oct-2036 6,940,350 0.24% 7,100,000 EUR Electricite de France SA FRN (Perpetual)* 7,594,642 0.26% 4,800,000 EUR Electricite de France SA FRN (Perpetual)* 5,096,126 0.17%
400,000 EUR Holding d'Infrastructures de Transport SAS 5.750% 09-Mar-2018 405,628 0.01% 7,600,000 EUR Holding d'Infrastructures de Transport SAS 2.250% 24-Mar-2025 8,149,708 0.28% 7,100,000 EUR Infra Park SAS 1.250% 16-Oct-2020 7,294,347 0.25% 2,700,000 EUR Infra Park SAS 2.125% 16-Apr-2025 2,890,283 0.10% 6,100,000 EUR La Banque Postale SA FRN 23-Apr-2026 6,467,708 0.22% 6,000,000 EUR La Banque Postale SA FRN 19-Nov-2027 6,454,067 0.22% 7,787,000 EUR LVMH Moet Hennessy Louis Vuitton SE 0.375% 26-May-2022 7,828,271 0.27% 3,500,000 EUR Mercialys SA 1.787% 31-Mar-2023 3,631,688 0.12% 7,305,000 EUR Orange SA FRN (Perpetual)* 8,674,114 0.29% 6,782,000 EUR RCI Banque SA 2.875% 22-Jan-2018 6,792,851 0.23% 2,966,000 EUR RCI Banque SA 0.375% 10-Jul-2019 2,984,671 0.10% 6,103,000 EUR RCI Banque SA 0.625% 10-Nov-2021 6,146,833 0.21% 4,652,000 EUR RCI Banque SA 0.750% 26-Sep-2022 4,687,937 0.16% 6,141,000 EUR RCI Banque SA 1.000% 17-May-2023 6,217,670 0.21% 9,501,000 EUR RCI Banque SA 1.625% 11-Apr-2025 9,851,919 0.33%
10,802,000 EUR Renault SA 1.000% 28-Nov-2025 10,684,420 0.36% 2,900,000 EUR RTE Reseau de Transport d'Electricite SA 1.625% 08-Oct-2024 3,075,227 0.10%
10,300,000 EUR RTE Reseau de Transport d'Electricite SA 1.625% 27-Nov-2025 10,864,843 0.37% 4,500,000 EUR RTE Reseau de Transport d'Electricite SA 1.000% 19-Oct-2026 4,507,223 0.15% 6,100,000 EUR RTE Reseau de Transport d'Electricite SA 1.875% 23-Oct-2037 6,169,875 0.21% 3,400,000 EUR SANEF SA 1.875% 16-Mar-2026 3,607,281 0.12% 5,900,000 EUR Sanofi 2.500% 14-Nov-2023 6,599,229 0.22% 4,000,000 EUR Societe Fonciere Lyonnaise SA 1.875% 26-Nov-2021 4,212,735 0.14% 7,100,000 EUR Societe Generale SA 0.750% 26-May-2023 7,196,170 0.24%
10,600,000 EUR Societe Generale SA FRN 16-Sep-2026 11,256,644 0.38% 6,500,000 EUR Societe Generale SA 1.375% 13-Jan-2028 6,484,855 0.22% 2,250,000 GBP Societe Generale SA FRN (Perpetual)* 2,620,043 0.09% 4,310,000 USD Societe Generale SA FRN (Perpetual)* 3,779,871 0.13% 2,500,000 USD Societe Generale SA FRN (Perpetual)* 2,348,922 0.08% 8,500,000 EUR Total Capital International SA 0.250% 12-Jul-2023 8,427,406 0.29% 8,100,000 EUR Total Capital International SA 1.375% 04-Oct-2029 8,261,474 0.28%
11,825,000 EUR Total SA FRN (Perpetual)* 12,407,027 0.42% 830,000 EUR Total SA FRN (Perpetual)* 874,637 0.03%
12,000,000 EUR Total SA FRN (Perpetual)* 13,177,560 0.45% 4,100,000 EUR Transport et Infrastructures Gaz France SA 4.339% 07-Jul-2021 4,663,084 0.16%
10,700,000 EUR Transport et Infrastructures Gaz France SA 2.200% 05-Aug-2025 11,552,362 0.39%
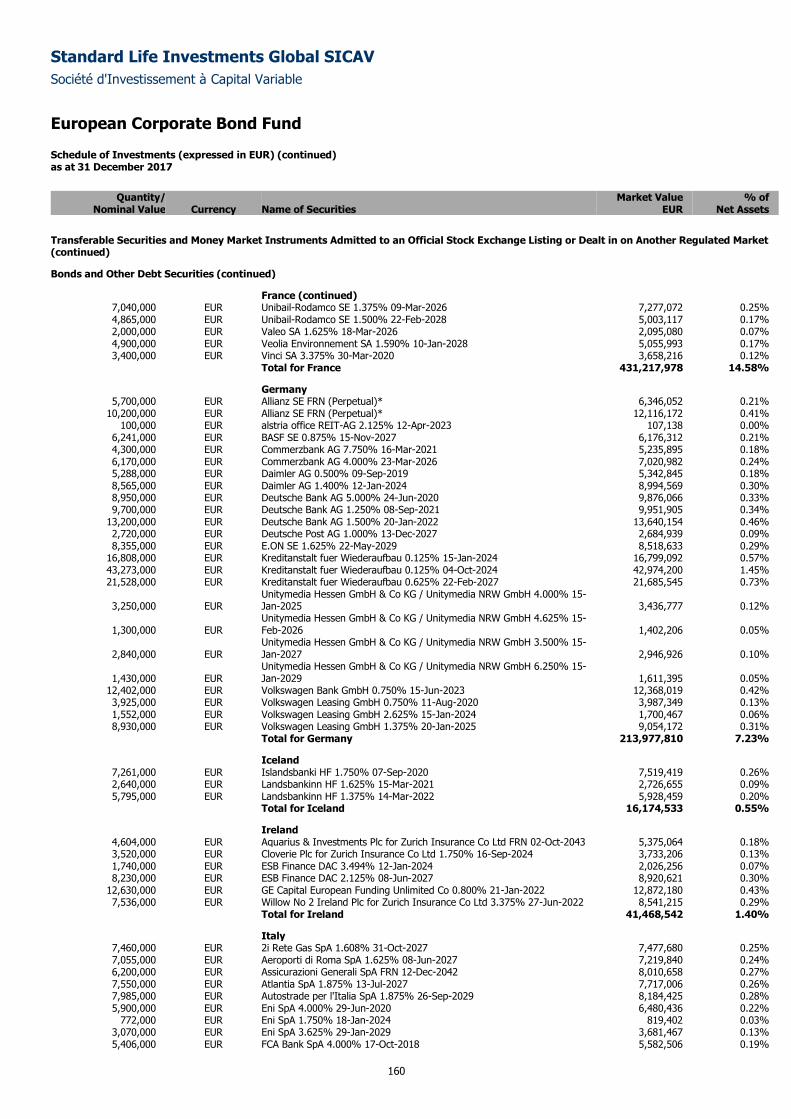
Standard Life Investments Global SICAV
Société d'Investissement à Capital Variable
European Corporate Bond Fund
Schedule of Investments (expressed in EUR) (continued) as at 31 December 2017
160
Quantity/ Market Value % of
Nominal Value Currency Name of Securities EUR Net Assets
Transferable Securities and Money Market Instruments Admitted to an Official Stock Exchange Listing or Dealt in on Another Regulated Market (continued)
Bonds and Other Debt Securities (continued)
France (continued) 7,040,000 EUR Unibail-Rodamco SE 1.375% 09-Mar-2026 7,277,072 0.25% 4,865,000 EUR Unibail-Rodamco SE 1.500% 22-Feb-2028 5,003,117 0.17% 2,000,000 EUR Valeo SA 1.625% 18-Mar-2026 2,095,080 0.07% 4,900,000 EUR Veolia Environnement SA 1.590% 10-Jan-2028 5,055,993 0.17% 3,400,000 EUR Vinci SA 3.375% 30-Mar-2020 3,658,216 0.12%
Total for France 431,217,978 14.58%
Germany 5,700,000 EUR Allianz SE FRN (Perpetual)* 6,346,052 0.21%
10,200,000 EUR Allianz SE FRN (Perpetual)* 12,116,172 0.41% 100,000 EUR alstria office REIT-AG 2.125% 12-Apr-2023 107,138 0.00%
6,241,000 EUR BASF SE 0.875% 15-Nov-2027 6,176,312 0.21% 4,300,000 EUR Commerzbank AG 7.750% 16-Mar-2021 5,235,895 0.18% 6,170,000 EUR Commerzbank AG 4.000% 23-Mar-2026 7,020,982 0.24% 5,288,000 EUR Daimler AG 0.500% 09-Sep-2019 5,342,845 0.18% 8,565,000 EUR Daimler AG 1.400% 12-Jan-2024 8,994,569 0.30% 8,950,000 EUR Deutsche Bank AG 5.000% 24-Jun-2020 9,876,066 0.33% 9,700,000 EUR Deutsche Bank AG 1.250% 08-Sep-2021 9,951,905 0.34%
13,200,000 EUR Deutsche Bank AG 1.500% 20-Jan-2022 13,640,154 0.46% 2,720,000 EUR Deutsche Post AG 1.000% 13-Dec-2027 2,684,939 0.09% 8,355,000 EUR E.ON SE 1.625% 22-May-2029 8,518,633 0.29%
16,808,000 EUR Kreditanstalt fuer Wiederaufbau 0.125% 15-Jan-2024 16,799,092 0.57% 43,273,000 EUR Kreditanstalt fuer Wiederaufbau 0.125% 04-Oct-2024 42,974,200 1.45% 21,528,000 EUR Kreditanstalt fuer Wiederaufbau 0.625% 22-Feb-2027 21,685,545 0.73%
3,250,000 EUR Unitymedia Hessen GmbH & Co KG / Unitymedia NRW GmbH 4.000% 15-Jan-2025 3,436,777 0.12%
1,300,000 EUR Unitymedia Hessen GmbH & Co KG / Unitymedia NRW GmbH 4.625% 15-Feb-2026 1,402,206 0.05%
2,840,000 EUR Unitymedia Hessen GmbH & Co KG / Unitymedia NRW GmbH 3.500% 15-Jan-2027 2,946,926 0.10%
1,430,000 EUR Unitymedia Hessen GmbH & Co KG / Unitymedia NRW GmbH 6.250% 15-Jan-2029 1,611,395 0.05%
12,402,000 EUR Volkswagen Bank GmbH 0.750% 15-Jun-2023 12,368,019 0.42% 3,925,000 EUR Volkswagen Leasing GmbH 0.750% 11-Aug-2020 3,987,349 0.13% 1,552,000 EUR Volkswagen Leasing GmbH 2.625% 15-Jan-2024 1,700,467 0.06% 8,930,000 EUR Volkswagen Leasing GmbH 1.375% 20-Jan-2025 9,054,172 0.31%
Total for Germany 213,977,810 7.23%
Iceland 7,261,000 EUR Islandsbanki HF 1.750% 07-Sep-2020 7,519,419 0.26% 2,640,000 EUR Landsbankinn HF 1.625% 15-Mar-2021 2,726,655 0.09% 5,795,000 EUR Landsbankinn HF 1.375% 14-Mar-2022 5,928,459 0.20%
Total for Iceland 16,174,533 0.55%
Ireland 4,604,000 EUR Aquarius & Investments Plc for Zurich Insurance Co Ltd FRN 02-Oct-2043 5,375,064 0.18% 3,520,000 EUR Cloverie Plc for Zurich Insurance Co Ltd 1.750% 16-Sep-2024 3,733,206 0.13% 1,740,000 EUR ESB Finance DAC 3.494% 12-Jan-2024 2,026,256 0.07% 8,230,000 EUR ESB Finance DAC 2.125% 08-Jun-2027 8,920,621 0.30%
12,630,000 EUR GE Capital European Funding Unlimited Co 0.800% 21-Jan-2022 12,872,180 0.43% 7,536,000 EUR Willow No 2 Ireland Plc for Zurich Insurance Co Ltd 3.375% 27-Jun-2022 8,541,215 0.29%
Total for Ireland 41,468,542 1.40%
Italy 7,460,000 EUR 2i Rete Gas SpA 1.608% 31-Oct-2027 7,477,680 0.25% 7,055,000 EUR Aeroporti di Roma SpA 1.625% 08-Jun-2027 7,219,840 0.24% 6,200,000 EUR Assicurazioni Generali SpA FRN 12-Dec-2042 8,010,658 0.27% 7,550,000 EUR Atlantia SpA 1.875% 13-Jul-2027 7,717,006 0.26% 7,985,000 EUR Autostrade per l'Italia SpA 1.875% 26-Sep-2029 8,184,425 0.28% 5,900,000 EUR Eni SpA 4.000% 29-Jun-2020 6,480,436 0.22%
772,000 EUR Eni SpA 1.750% 18-Jan-2024 819,402 0.03% 3,070,000 EUR Eni SpA 3.625% 29-Jan-2029 3,681,467 0.13% 5,406,000 EUR FCA Bank SpA 4.000% 17-Oct-2018 5,582,506 0.19%
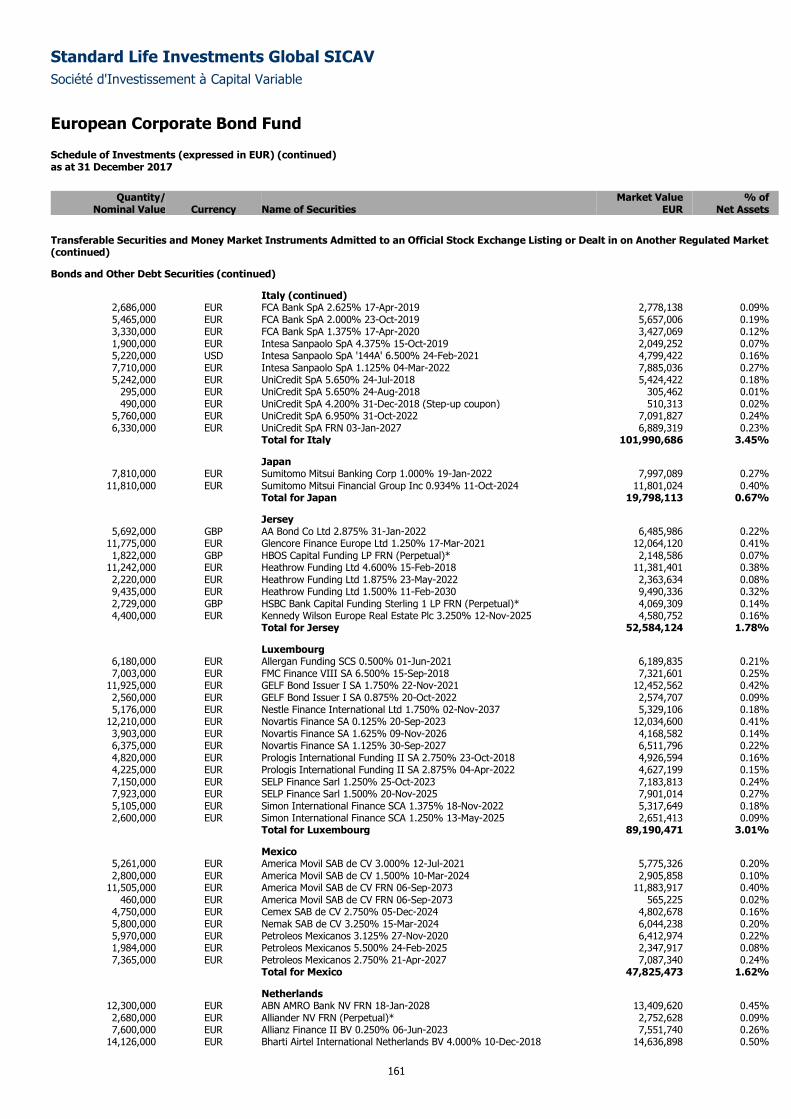
Standard Life Investments Global SICAV
Société d'Investissement à Capital Variable
European Corporate Bond Fund
Schedule of Investments (expressed in EUR) (continued) as at 31 December 2017
161
Quantity/ Market Value % of
Nominal Value Currency Name of Securities EUR Net Assets
Transferable Securities and Money Market Instruments Admitted to an Official Stock Exchange Listing or Dealt in on Another Regulated Market (continued)
Bonds and Other Debt Securities (continued)
Italy (continued) 2,686,000 EUR FCA Bank SpA 2.625% 17-Apr-2019 2,778,138 0.09% 5,465,000 EUR FCA Bank SpA 2.000% 23-Oct-2019 5,657,006 0.19% 3,330,000 EUR FCA Bank SpA 1.375% 17-Apr-2020 3,427,069 0.12% 1,900,000 EUR Intesa Sanpaolo SpA 4.375% 15-Oct-2019 2,049,252 0.07% 5,220,000 USD Intesa Sanpaolo SpA '144A' 6.500% 24-Feb-2021 4,799,422 0.16% 7,710,000 EUR Intesa Sanpaolo SpA 1.125% 04-Mar-2022 7,885,036 0.27% 5,242,000 EUR UniCredit SpA 5.650% 24-Jul-2018 5,424,422 0.18%
295,000 EUR UniCredit SpA 5.650% 24-Aug-2018 305,462 0.01% 490,000 EUR UniCredit SpA 4.200% 31-Dec-2018 (Step-up coupon) 510,313 0.02%
5,760,000 EUR UniCredit SpA 6.950% 31-Oct-2022 7,091,827 0.24% 6,330,000 EUR UniCredit SpA FRN 03-Jan-2027 6,889,319 0.23%
Total for Italy 101,990,686 3.45%
Japan 7,810,000 EUR Sumitomo Mitsui Banking Corp 1.000% 19-Jan-2022 7,997,089 0.27%
11,810,000 EUR Sumitomo Mitsui Financial Group Inc 0.934% 11-Oct-2024 11,801,024 0.40% Total for Japan 19,798,113 0.67%
Jersey 5,692,000 GBP AA Bond Co Ltd 2.875% 31-Jan-2022 6,485,986 0.22%
11,775,000 EUR Glencore Finance Europe Ltd 1.250% 17-Mar-2021 12,064,120 0.41% 1,822,000 GBP HBOS Capital Funding LP FRN (Perpetual)* 2,148,586 0.07%
11,242,000 EUR Heathrow Funding Ltd 4.600% 15-Feb-2018 11,381,401 0.38% 2,220,000 EUR Heathrow Funding Ltd 1.875% 23-May-2022 2,363,634 0.08% 9,435,000 EUR Heathrow Funding Ltd 1.500% 11-Feb-2030 9,490,336 0.32% 2,729,000 GBP HSBC Bank Capital Funding Sterling 1 LP FRN (Perpetual)* 4,069,309 0.14% 4,400,000 EUR Kennedy Wilson Europe Real Estate Plc 3.250% 12-Nov-2025 4,580,752 0.16%
Total for Jersey 52,584,124 1.78%
Luxembourg 6,180,000 EUR Allergan Funding SCS 0.500% 01-Jun-2021 6,189,835 0.21% 7,003,000 EUR FMC Finance VIII SA 6.500% 15-Sep-2018 7,321,601 0.25%
11,925,000 EUR GELF Bond Issuer I SA 1.750% 22-Nov-2021 12,452,562 0.42% 2,560,000 EUR GELF Bond Issuer I SA 0.875% 20-Oct-2022 2,574,707 0.09% 5,176,000 EUR Nestle Finance International Ltd 1.750% 02-Nov-2037 5,329,106 0.18%
12,210,000 EUR Novartis Finance SA 0.125% 20-Sep-2023 12,034,600 0.41% 3,903,000 EUR Novartis Finance SA 1.625% 09-Nov-2026 4,168,582 0.14% 6,375,000 EUR Novartis Finance SA 1.125% 30-Sep-2027 6,511,796 0.22% 4,820,000 EUR Prologis International Funding II SA 2.750% 23-Oct-2018 4,926,594 0.16% 4,225,000 EUR Prologis International Funding II SA 2.875% 04-Apr-2022 4,627,199 0.15% 7,150,000 EUR SELP Finance Sarl 1.250% 25-Oct-2023 7,183,813 0.24% 7,923,000 EUR SELP Finance Sarl 1.500% 20-Nov-2025 7,901,014 0.27% 5,105,000 EUR Simon International Finance SCA 1.375% 18-Nov-2022 5,317,649 0.18% 2,600,000 EUR Simon International Finance SCA 1.250% 13-May-2025 2,651,413 0.09%
Total for Luxembourg 89,190,471 3.01%
Mexico 5,261,000 EUR America Movil SAB de CV 3.000% 12-Jul-2021 5,775,326 0.20% 2,800,000 EUR America Movil SAB de CV 1.500% 10-Mar-2024 2,905,858 0.10%
11,505,000 EUR America Movil SAB de CV FRN 06-Sep-2073 11,883,917 0.40% 460,000 EUR America Movil SAB de CV FRN 06-Sep-2073 565,225 0.02%
4,750,000 EUR Cemex SAB de CV 2.750% 05-Dec-2024 4,802,678 0.16% 5,800,000 EUR Nemak SAB de CV 3.250% 15-Mar-2024 6,044,238 0.20% 5,970,000 EUR Petroleos Mexicanos 3.125% 27-Nov-2020 6,412,974 0.22% 1,984,000 EUR Petroleos Mexicanos 5.500% 24-Feb-2025 2,347,917 0.08% 7,365,000 EUR Petroleos Mexicanos 2.750% 21-Apr-2027 7,087,340 0.24%
Total for Mexico 47,825,473 1.62%
Netherlands 12,300,000 EUR ABN AMRO Bank NV FRN 18-Jan-2028 13,409,620 0.45% 2,680,000 EUR Alliander NV FRN (Perpetual)* 2,752,628 0.09% 7,600,000 EUR Allianz Finance II BV 0.250% 06-Jun-2023 7,551,740 0.26%
14,126,000 EUR Bharti Airtel International Netherlands BV 4.000% 10-Dec-2018 14,636,898 0.50%
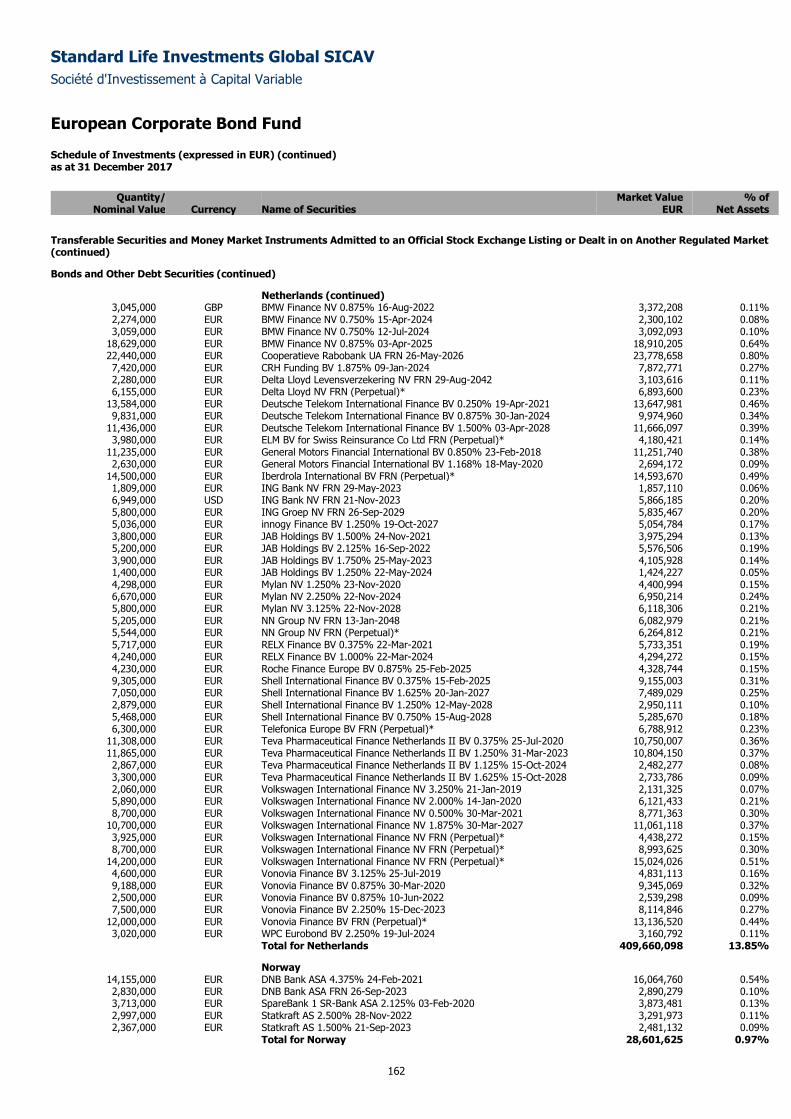
Standard Life Investments Global SICAV
Société d'Investissement à Capital Variable
European Corporate Bond Fund
Schedule of Investments (expressed in EUR) (continued) as at 31 December 2017
162
Quantity/ Market Value % of
Nominal Value Currency Name of Securities EUR Net Assets
Transferable Securities and Money Market Instruments Admitted to an Official Stock Exchange Listing or Dealt in on Another Regulated Market (continued)
Bonds and Other Debt Securities (continued)
Netherlands (continued) 3,045,000 GBP BMW Finance NV 0.875% 16-Aug-2022 3,372,208 0.11% 2,274,000 EUR BMW Finance NV 0.750% 15-Apr-2024 2,300,102 0.08% 3,059,000 EUR BMW Finance NV 0.750% 12-Jul-2024 3,092,093 0.10%
18,629,000 EUR BMW Finance NV 0.875% 03-Apr-2025 18,910,205 0.64% 22,440,000 EUR Cooperatieve Rabobank UA FRN 26-May-2026 23,778,658 0.80% 7,420,000 EUR CRH Funding BV 1.875% 09-Jan-2024 7,872,771 0.27% 2,280,000 EUR Delta Lloyd Levensverzekering NV FRN 29-Aug-2042 3,103,616 0.11% 6,155,000 EUR Delta Lloyd NV FRN (Perpetual)* 6,893,600 0.23%
13,584,000 EUR Deutsche Telekom International Finance BV 0.250% 19-Apr-2021 13,647,981 0.46% 9,831,000 EUR Deutsche Telekom International Finance BV 0.875% 30-Jan-2024 9,974,960 0.34%
11,436,000 EUR Deutsche Telekom International Finance BV 1.500% 03-Apr-2028 11,666,097 0.39% 3,980,000 EUR ELM BV for Swiss Reinsurance Co Ltd FRN (Perpetual)* 4,180,421 0.14%
11,235,000 EUR General Motors Financial International BV 0.850% 23-Feb-2018 11,251,740 0.38% 2,630,000 EUR General Motors Financial International BV 1.168% 18-May-2020 2,694,172 0.09%
14,500,000 EUR Iberdrola International BV FRN (Perpetual)* 14,593,670 0.49% 1,809,000 EUR ING Bank NV FRN 29-May-2023 1,857,110 0.06% 6,949,000 USD ING Bank NV FRN 21-Nov-2023 5,866,185 0.20% 5,800,000 EUR ING Groep NV FRN 26-Sep-2029 5,835,467 0.20% 5,036,000 EUR innogy Finance BV 1.250% 19-Oct-2027 5,054,784 0.17% 3,800,000 EUR JAB Holdings BV 1.500% 24-Nov-2021 3,975,294 0.13% 5,200,000 EUR JAB Holdings BV 2.125% 16-Sep-2022 5,576,506 0.19% 3,900,000 EUR JAB Holdings BV 1.750% 25-May-2023 4,105,928 0.14% 1,400,000 EUR JAB Holdings BV 1.250% 22-May-2024 1,424,227 0.05% 4,298,000 EUR Mylan NV 1.250% 23-Nov-2020 4,400,994 0.15% 6,670,000 EUR Mylan NV 2.250% 22-Nov-2024 6,950,214 0.24% 5,800,000 EUR Mylan NV 3.125% 22-Nov-2028 6,118,306 0.21% 5,205,000 EUR NN Group NV FRN 13-Jan-2048 6,082,979 0.21% 5,544,000 EUR NN Group NV FRN (Perpetual)* 6,264,812 0.21% 5,717,000 EUR RELX Finance BV 0.375% 22-Mar-2021 5,733,351 0.19% 4,240,000 EUR RELX Finance BV 1.000% 22-Mar-2024 4,294,272 0.15% 4,230,000 EUR Roche Finance Europe BV 0.875% 25-Feb-2025 4,328,744 0.15% 9,305,000 EUR Shell International Finance BV 0.375% 15-Feb-2025 9,155,003 0.31% 7,050,000 EUR Shell International Finance BV 1.625% 20-Jan-2027 7,489,029 0.25% 2,879,000 EUR Shell International Finance BV 1.250% 12-May-2028 2,950,111 0.10% 5,468,000 EUR Shell International Finance BV 0.750% 15-Aug-2028 5,285,670 0.18% 6,300,000 EUR Telefonica Europe BV FRN (Perpetual)* 6,788,912 0.23%
11,308,000 EUR Teva Pharmaceutical Finance Netherlands II BV 0.375% 25-Jul-2020 10,750,007 0.36% 11,865,000 EUR Teva Pharmaceutical Finance Netherlands II BV 1.250% 31-Mar-2023 10,804,150 0.37% 2,867,000 EUR Teva Pharmaceutical Finance Netherlands II BV 1.125% 15-Oct-2024 2,482,277 0.08% 3,300,000 EUR Teva Pharmaceutical Finance Netherlands II BV 1.625% 15-Oct-2028 2,733,786 0.09% 2,060,000 EUR Volkswagen International Finance NV 3.250% 21-Jan-2019 2,131,325 0.07% 5,890,000 EUR Volkswagen International Finance NV 2.000% 14-Jan-2020 6,121,433 0.21% 8,700,000 EUR Volkswagen International Finance NV 0.500% 30-Mar-2021 8,771,363 0.30%
10,700,000 EUR Volkswagen International Finance NV 1.875% 30-Mar-2027 11,061,118 0.37% 3,925,000 EUR Volkswagen International Finance NV FRN (Perpetual)* 4,438,272 0.15% 8,700,000 EUR Volkswagen International Finance NV FRN (Perpetual)* 8,993,625 0.30%
14,200,000 EUR Volkswagen International Finance NV FRN (Perpetual)* 15,024,026 0.51% 4,600,000 EUR Vonovia Finance BV 3.125% 25-Jul-2019 4,831,113 0.16% 9,188,000 EUR Vonovia Finance BV 0.875% 30-Mar-2020 9,345,069 0.32% 2,500,000 EUR Vonovia Finance BV 0.875% 10-Jun-2022 2,539,298 0.09% 7,500,000 EUR Vonovia Finance BV 2.250% 15-Dec-2023 8,114,846 0.27%
12,000,000 EUR Vonovia Finance BV FRN (Perpetual)* 13,136,520 0.44% 3,020,000 EUR WPC Eurobond BV 2.250% 19-Jul-2024 3,160,792 0.11%
Total for Netherlands 409,660,098 13.85%
Norway 14,155,000 EUR DNB Bank ASA 4.375% 24-Feb-2021 16,064,760 0.54% 2,830,000 EUR DNB Bank ASA FRN 26-Sep-2023 2,890,279 0.10% 3,713,000 EUR SpareBank 1 SR-Bank ASA 2.125% 03-Feb-2020 3,873,481 0.13% 2,997,000 EUR Statkraft AS 2.500% 28-Nov-2022 3,291,973 0.11% 2,367,000 EUR Statkraft AS 1.500% 21-Sep-2023 2,481,132 0.09%
Total for Norway 28,601,625 0.97%
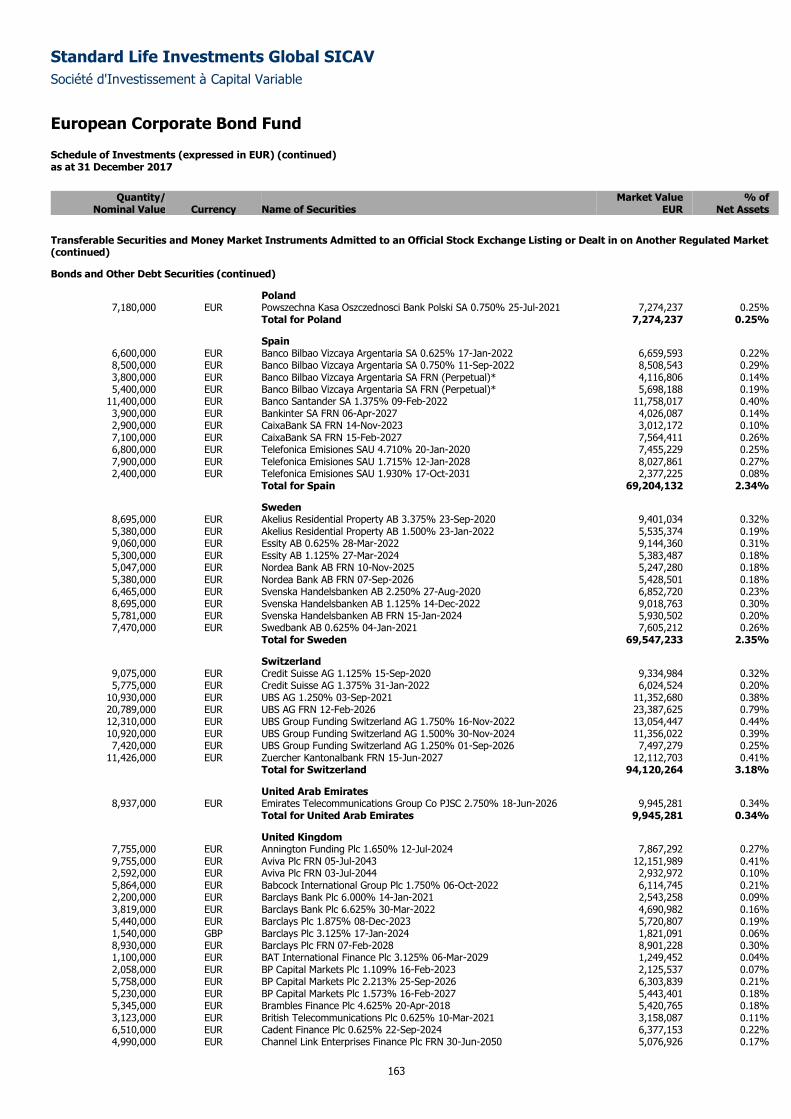
Standard Life Investments Global SICAV
Société d'Investissement à Capital Variable
European Corporate Bond Fund
Schedule of Investments (expressed in EUR) (continued) as at 31 December 2017
163
Quantity/ Market Value % of
Nominal Value Currency Name of Securities EUR Net Assets
Transferable Securities and Money Market Instruments Admitted to an Official Stock Exchange Listing or Dealt in on Another Regulated Market (continued)
Bonds and Other Debt Securities (continued)
Poland 7,180,000 EUR Powszechna Kasa Oszczednosci Bank Polski SA 0.750% 25-Jul-2021 7,274,237 0.25%
Total for Poland 7,274,237 0.25%
Spain 6,600,000 EUR Banco Bilbao Vizcaya Argentaria SA 0.625% 17-Jan-2022 6,659,593 0.22% 8,500,000 EUR Banco Bilbao Vizcaya Argentaria SA 0.750% 11-Sep-2022 8,508,543 0.29% 3,800,000 EUR Banco Bilbao Vizcaya Argentaria SA FRN (Perpetual)* 4,116,806 0.14% 5,400,000 EUR Banco Bilbao Vizcaya Argentaria SA FRN (Perpetual)* 5,698,188 0.19%
11,400,000 EUR Banco Santander SA 1.375% 09-Feb-2022 11,758,017 0.40% 3,900,000 EUR Bankinter SA FRN 06-Apr-2027 4,026,087 0.14% 2,900,000 EUR CaixaBank SA FRN 14-Nov-2023 3,012,172 0.10% 7,100,000 EUR CaixaBank SA FRN 15-Feb-2027 7,564,411 0.26% 6,800,000 EUR Telefonica Emisiones SAU 4.710% 20-Jan-2020 7,455,229 0.25% 7,900,000 EUR Telefonica Emisiones SAU 1.715% 12-Jan-2028 8,027,861 0.27% 2,400,000 EUR Telefonica Emisiones SAU 1.930% 17-Oct-2031 2,377,225 0.08%
Total for Spain 69,204,132 2.34%
Sweden 8,695,000 EUR Akelius Residential Property AB 3.375% 23-Sep-2020 9,401,034 0.32% 5,380,000 EUR Akelius Residential Property AB 1.500% 23-Jan-2022 5,535,374 0.19% 9,060,000 EUR Essity AB 0.625% 28-Mar-2022 9,144,360 0.31% 5,300,000 EUR Essity AB 1.125% 27-Mar-2024 5,383,487 0.18% 5,047,000 EUR Nordea Bank AB FRN 10-Nov-2025 5,247,280 0.18% 5,380,000 EUR Nordea Bank AB FRN 07-Sep-2026 5,428,501 0.18% 6,465,000 EUR Svenska Handelsbanken AB 2.250% 27-Aug-2020 6,852,720 0.23% 8,695,000 EUR Svenska Handelsbanken AB 1.125% 14-Dec-2022 9,018,763 0.30% 5,781,000 EUR Svenska Handelsbanken AB FRN 15-Jan-2024 5,930,502 0.20% 7,470,000 EUR Swedbank AB 0.625% 04-Jan-2021 7,605,212 0.26%
Total for Sweden 69,547,233 2.35%
Switzerland 9,075,000 EUR Credit Suisse AG 1.125% 15-Sep-2020 9,334,984 0.32% 5,775,000 EUR Credit Suisse AG 1.375% 31-Jan-2022 6,024,524 0.20%
10,930,000 EUR UBS AG 1.250% 03-Sep-2021 11,352,680 0.38% 20,789,000 EUR UBS AG FRN 12-Feb-2026 23,387,625 0.79% 12,310,000 EUR UBS Group Funding Switzerland AG 1.750% 16-Nov-2022 13,054,447 0.44% 10,920,000 EUR UBS Group Funding Switzerland AG 1.500% 30-Nov-2024 11,356,022 0.39% 7,420,000 EUR UBS Group Funding Switzerland AG 1.250% 01-Sep-2026 7,497,279 0.25%
11,426,000 EUR Zuercher Kantonalbank FRN 15-Jun-2027 12,112,703 0.41% Total for Switzerland 94,120,264 3.18%
United Arab Emirates 8,937,000 EUR Emirates Telecommunications Group Co PJSC 2.750% 18-Jun-2026 9,945,281 0.34%
Total for United Arab Emirates 9,945,281 0.34%
United Kingdom 7,755,000 EUR Annington Funding Plc 1.650% 12-Jul-2024 7,867,292 0.27% 9,755,000 EUR Aviva Plc FRN 05-Jul-2043 12,151,989 0.41% 2,592,000 EUR Aviva Plc FRN 03-Jul-2044 2,932,972 0.10% 5,864,000 EUR Babcock International Group Plc 1.750% 06-Oct-2022 6,114,745 0.21% 2,200,000 EUR Barclays Bank Plc 6.000% 14-Jan-2021 2,543,258 0.09% 3,819,000 EUR Barclays Bank Plc 6.625% 30-Mar-2022 4,690,982 0.16% 5,440,000 EUR Barclays Plc 1.875% 08-Dec-2023 5,720,807 0.19% 1,540,000 GBP Barclays Plc 3.125% 17-Jan-2024 1,821,091 0.06% 8,930,000 EUR Barclays Plc FRN 07-Feb-2028 8,901,228 0.30% 1,100,000 EUR BAT International Finance Plc 3.125% 06-Mar-2029 1,249,452 0.04% 2,058,000 EUR BP Capital Markets Plc 1.109% 16-Feb-2023 2,125,537 0.07% 5,758,000 EUR BP Capital Markets Plc 2.213% 25-Sep-2026 6,303,839 0.21% 5,230,000 EUR BP Capital Markets Plc 1.573% 16-Feb-2027 5,443,401 0.18% 5,345,000 EUR Brambles Finance Plc 4.625% 20-Apr-2018 5,420,765 0.18% 3,123,000 EUR British Telecommunications Plc 0.625% 10-Mar-2021 3,158,087 0.11% 6,510,000 EUR Cadent Finance Plc 0.625% 22-Sep-2024 6,377,153 0.22% 4,990,000 EUR Channel Link Enterprises Finance Plc FRN 30-Jun-2050 5,076,926 0.17%

Standard Life Investments Global SICAV
Société d'Investissement à Capital Variable
European Corporate Bond Fund
Schedule of Investments (expressed in EUR) (continued) as at 31 December 2017
164
Quantity/ Market Value % of
Nominal Value Currency Name of Securities EUR Net Assets
Transferable Securities and Money Market Instruments Admitted to an Official Stock Exchange Listing or Dealt in on Another Regulated Market (continued)
Bonds and Other Debt Securities (continued)
United Kingdom (continued) 5,968,000 EUR Coventry Building Society 2.500% 18-Nov-2020 6,367,111 0.22% 6,115,000 EUR Experian Finance Plc 4.750% 04-Feb-2020 6,716,414 0.23% 3,280,000 EUR FCE Bank Plc 1.528% 09-Nov-2020 3,409,515 0.11% 3,508,000 EUR FCE Bank Plc 1.875% 24-Jun-2021 3,688,557 0.12% 7,563,000 EUR G4S International Finance Plc 2.625% 06-Dec-2018 7,750,791 0.26% 5,870,000 EUR GlaxoSmithKline Capital Plc 1.375% 12-Sep-2029 5,947,631 0.20% 3,340,000 EUR HSBC Holdings Plc 1.500% 15-Mar-2022 3,500,921 0.12%
12,355,000 EUR HSBC Holdings Plc 0.875% 06-Sep-2024 12,427,833 0.42% 10,655,000 USD HSBC Holdings Plc FRN (Perpetual)* 9,366,660 0.32% 9,630,000 EUR HSBC Holdings Plc FRN (Perpetual)* 10,257,009 0.35% 5,580,000 EUR Imperial Brands Finance Plc 4.500% 05-Jul-2018 5,713,529 0.19% 4,100,000 EUR Imperial Brands Finance Plc 2.250% 26-Feb-2021 4,342,187 0.15% 3,630,000 GBP Jaguar Land Rover Automotive Plc 3.875% 01-Mar-2023 4,254,406 0.14% 1,720,000 EUR Jaguar Land Rover Automotive Plc 2.200% 15-Jan-2024 1,756,808 0.06% 2,225,000 EUR Leeds Building Society 2.625% 01-Apr-2021 2,379,047 0.08% 5,484,000 EUR Leeds Building Society 1.375% 05-May-2022 5,641,418 0.19% 3,615,000 EUR Lloyds Bank Plc FRN 12-Feb-2024 4,054,259 0.14%
11,392,000 GBP Lloyds Bank Plc FRN 09-Jul-2025 14,106,311 0.48% 5,268,000 EUR Lloyds Banking Group Plc 1.000% 09-Nov-2023 5,321,107 0.18%
10,125,000 EUR Lloyds Banking Group Plc 1.500% 12-Sep-2027 10,187,319 0.34% 6,150,000 EUR Mondi Finance Plc 3.375% 28-Sep-2020 6,676,593 0.23% 6,084,000 EUR Nationwide Building Society FRN 20-Mar-2023 6,146,696 0.21% 2,695,000 EUR Nationwide Building Society 0.625% 19-Apr-2023 2,694,890 0.09%
12,405,000 EUR Nationwide Building Society FRN 25-Jul-2029 12,610,985 0.43% 3,923,000 EUR NGG Finance Plc FRN 18-Jun-2076 4,266,655 0.14% 5,814,000 EUR Rentokil Initial Plc 3.250% 07-Oct-2021 6,396,418 0.22% 2,480,000 EUR Royal Bank of Scotland Group Plc FRN 08-Mar-2023 2,607,605 0.09%
12,715,000 EUR Royal Bank of Scotland Group Plc FRN 25-Mar-2024 13,132,433 0.44% 9,780,000 EUR Royal Bank of Scotland Plc 5.375% 30-Sep-2019 10,705,583 0.36% 7,635,000 EUR Santander UK Group Holdings Plc 1.125% 08-Sep-2023 7,728,872 0.26% 2,840,000 EUR Santander UK Plc 2.625% 16-Jul-2020 3,021,593 0.10% 2,012,000 EUR Tesco Corporate Treasury Services Plc 1.375% 01-Jul-2019 2,049,292 0.07% 2,231,000 EUR Tesco Plc 3.375% 02-Nov-2018 2,291,137 0.08% 9,700,000 EUR Vodafone Group Plc 0.375% 22-Nov-2021 9,713,095 0.33%
12,000,000 EUR Vodafone Group Plc 1.600% 29-Jul-2031 11,333,153 0.38% 500,000 EUR Vodafone Group Plc 2.750% 01-Dec-2034 511,353 0.02%
5,088,000 EUR Yorkshire Building Society 2.125% 18-Mar-2019 5,224,310 0.18% Total for United Kingdom 322,199,020 10.90%
United States 5,880,000 EUR AbbVie Inc 1.375% 17-May-2024 6,008,917 0.20% 6,955,000 EUR American International Group Inc 1.875% 21-Jun-2027 7,120,286 0.24% 2,050,000 EUR American International Group Inc FRN 15-Mar-2067 1,939,812 0.07% 4,199,000 USD Apple Inc 2.900% 12-Sep-2027 3,463,765 0.12% 7,985,000 EUR AT&T Inc 2.650% 17-Dec-2021 8,660,692 0.29%
11,468,000 EUR AT&T Inc 1.450% 01-Jun-2022 11,933,486 0.40% 10,495,000 EUR AT&T Inc 2.750% 19-May-2023 11,608,047 0.39% 5,865,000 EUR AT&T Inc 1.800% 04-Sep-2026 5,931,048 0.20% 4,430,000 EUR AT&T Inc 3.550% 17-Dec-2032 4,979,587 0.17% 5,520,000 EUR AT&T Inc 2.450% 15-Mar-2035 5,286,601 0.18% 4,780,000 EUR AT&T Inc 3.150% 04-Sep-2036 4,909,125 0.17% 4,330,000 EUR Bank of America Corp 2.500% 27-Jul-2020 4,599,478 0.16%
36,515,000 EUR Bank of America Corp FRN 07-Feb-2022 37,074,045 1.25% 6,585,000 EUR Bank of America Corp 1.625% 14-Sep-2022 6,940,628 0.23% 9,460,000 EUR Bank of America Corp 0.750% 26-Jul-2023 9,507,648 0.32%
11,712,000 EUR Bank of America Corp FRN 04-May-2027 12,228,877 0.41% 10,640,000 EUR BAT Capital Corp 1.125% 16-Nov-2023 10,811,410 0.37% 3,022,000 EUR Citigroup Inc FRN 10-Feb-2019 3,028,784 0.10% 1,964,000 EUR Citigroup Inc 7.375% 04-Sep-2019 2,209,932 0.08% 5,260,000 EUR Citigroup Inc 1.375% 27-Oct-2021 5,483,296 0.19%
12,765,000 EUR Citigroup Inc 0.750% 26-Oct-2023 12,804,227 0.43% 3,280,000 EUR Citigroup Inc 1.750% 28-Jan-2025 3,451,998 0.12% 3,400,000 GBP Digital Stout Holding LLC 2.750% 19-Jul-2024 3,927,314 0.13%
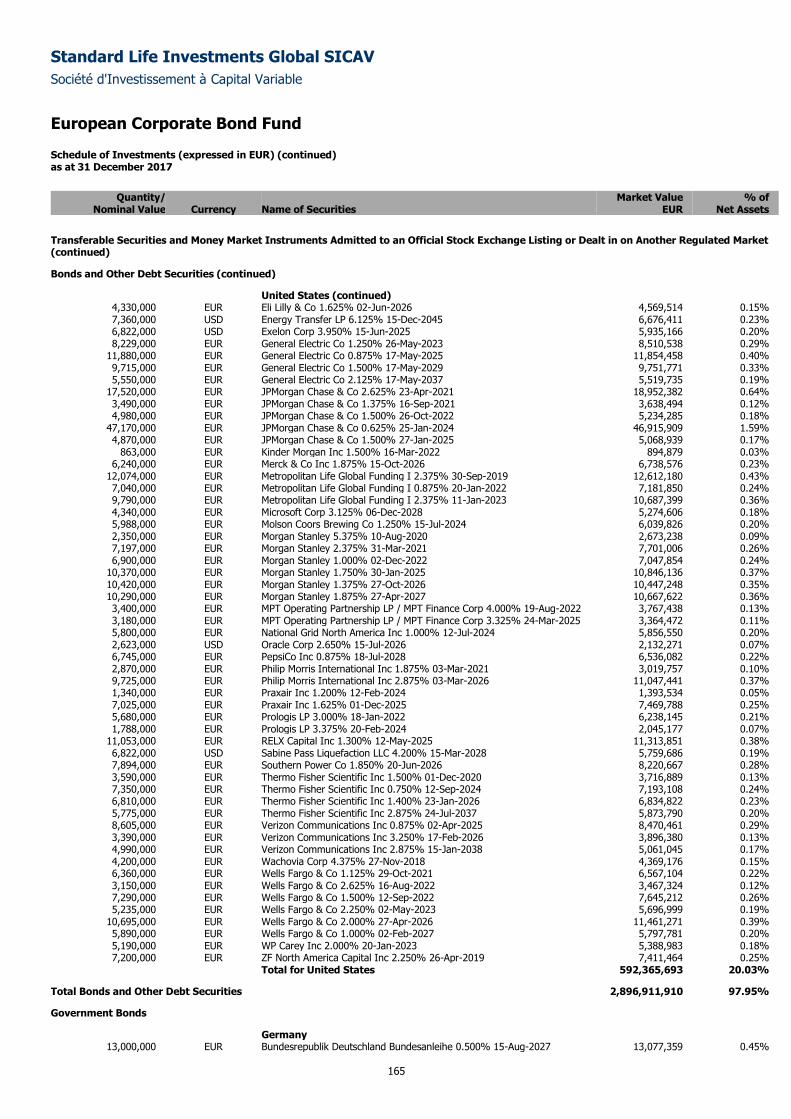
Standard Life Investments Global SICAV
Société d'Investissement à Capital Variable
European Corporate Bond Fund
Schedule of Investments (expressed in EUR) (continued) as at 31 December 2017
165
Quantity/ Market Value % of
Nominal Value Currency Name of Securities EUR Net Assets
Transferable Securities and Money Market Instruments Admitted to an Official Stock Exchange Listing or Dealt in on Another Regulated Market (continued)
Bonds and Other Debt Securities (continued)
United States (continued) 4,330,000 EUR Eli Lilly & Co 1.625% 02-Jun-2026 4,569,514 0.15% 7,360,000 USD Energy Transfer LP 6.125% 15-Dec-2045 6,676,411 0.23% 6,822,000 USD Exelon Corp 3.950% 15-Jun-2025 5,935,166 0.20% 8,229,000 EUR General Electric Co 1.250% 26-May-2023 8,510,538 0.29%
11,880,000 EUR General Electric Co 0.875% 17-May-2025 11,854,458 0.40% 9,715,000 EUR General Electric Co 1.500% 17-May-2029 9,751,771 0.33% 5,550,000 EUR General Electric Co 2.125% 17-May-2037 5,519,735 0.19%
17,520,000 EUR JPMorgan Chase & Co 2.625% 23-Apr-2021 18,952,382 0.64% 3,490,000 EUR JPMorgan Chase & Co 1.375% 16-Sep-2021 3,638,494 0.12% 4,980,000 EUR JPMorgan Chase & Co 1.500% 26-Oct-2022 5,234,285 0.18%
47,170,000 EUR JPMorgan Chase & Co 0.625% 25-Jan-2024 46,915,909 1.59% 4,870,000 EUR JPMorgan Chase & Co 1.500% 27-Jan-2025 5,068,939 0.17%
863,000 EUR Kinder Morgan Inc 1.500% 16-Mar-2022 894,879 0.03% 6,240,000 EUR Merck & Co Inc 1.875% 15-Oct-2026 6,738,576 0.23%
12,074,000 EUR Metropolitan Life Global Funding I 2.375% 30-Sep-2019 12,612,180 0.43% 7,040,000 EUR Metropolitan Life Global Funding I 0.875% 20-Jan-2022 7,181,850 0.24% 9,790,000 EUR Metropolitan Life Global Funding I 2.375% 11-Jan-2023 10,687,399 0.36% 4,340,000 EUR Microsoft Corp 3.125% 06-Dec-2028 5,274,606 0.18% 5,988,000 EUR Molson Coors Brewing Co 1.250% 15-Jul-2024 6,039,826 0.20% 2,350,000 EUR Morgan Stanley 5.375% 10-Aug-2020 2,673,238 0.09% 7,197,000 EUR Morgan Stanley 2.375% 31-Mar-2021 7,701,006 0.26% 6,900,000 EUR Morgan Stanley 1.000% 02-Dec-2022 7,047,854 0.24%
10,370,000 EUR Morgan Stanley 1.750% 30-Jan-2025 10,846,136 0.37% 10,420,000 EUR Morgan Stanley 1.375% 27-Oct-2026 10,447,248 0.35% 10,290,000 EUR Morgan Stanley 1.875% 27-Apr-2027 10,667,622 0.36% 3,400,000 EUR MPT Operating Partnership LP / MPT Finance Corp 4.000% 19-Aug-2022 3,767,438 0.13% 3,180,000 EUR MPT Operating Partnership LP / MPT Finance Corp 3.325% 24-Mar-2025 3,364,472 0.11% 5,800,000 EUR National Grid North America Inc 1.000% 12-Jul-2024 5,856,550 0.20% 2,623,000 USD Oracle Corp 2.650% 15-Jul-2026 2,132,271 0.07% 6,745,000 EUR PepsiCo Inc 0.875% 18-Jul-2028 6,536,082 0.22% 2,870,000 EUR Philip Morris International Inc 1.875% 03-Mar-2021 3,019,757 0.10% 9,725,000 EUR Philip Morris International Inc 2.875% 03-Mar-2026 11,047,441 0.37% 1,340,000 EUR Praxair Inc 1.200% 12-Feb-2024 1,393,534 0.05% 7,025,000 EUR Praxair Inc 1.625% 01-Dec-2025 7,469,788 0.25% 5,680,000 EUR Prologis LP 3.000% 18-Jan-2022 6,238,145 0.21% 1,788,000 EUR Prologis LP 3.375% 20-Feb-2024 2,045,177 0.07%
11,053,000 EUR RELX Capital Inc 1.300% 12-May-2025 11,313,851 0.38% 6,822,000 USD Sabine Pass Liquefaction LLC 4.200% 15-Mar-2028 5,759,686 0.19% 7,894,000 EUR Southern Power Co 1.850% 20-Jun-2026 8,220,667 0.28% 3,590,000 EUR Thermo Fisher Scientific Inc 1.500% 01-Dec-2020 3,716,889 0.13% 7,350,000 EUR Thermo Fisher Scientific Inc 0.750% 12-Sep-2024 7,193,108 0.24% 6,810,000 EUR Thermo Fisher Scientific Inc 1.400% 23-Jan-2026 6,834,822 0.23% 5,775,000 EUR Thermo Fisher Scientific Inc 2.875% 24-Jul-2037 5,873,790 0.20% 8,605,000 EUR Verizon Communications Inc 0.875% 02-Apr-2025 8,470,461 0.29% 3,390,000 EUR Verizon Communications Inc 3.250% 17-Feb-2026 3,896,380 0.13% 4,990,000 EUR Verizon Communications Inc 2.875% 15-Jan-2038 5,061,045 0.17% 4,200,000 EUR Wachovia Corp 4.375% 27-Nov-2018 4,369,176 0.15% 6,360,000 EUR Wells Fargo & Co 1.125% 29-Oct-2021 6,567,104 0.22% 3,150,000 EUR Wells Fargo & Co 2.625% 16-Aug-2022 3,467,324 0.12% 7,290,000 EUR Wells Fargo & Co 1.500% 12-Sep-2022 7,645,212 0.26% 5,235,000 EUR Wells Fargo & Co 2.250% 02-May-2023 5,696,999 0.19%
10,695,000 EUR Wells Fargo & Co 2.000% 27-Apr-2026 11,461,271 0.39% 5,890,000 EUR Wells Fargo & Co 1.000% 02-Feb-2027 5,797,781 0.20% 5,190,000 EUR WP Carey Inc 2.000% 20-Jan-2023 5,388,983 0.18% 7,200,000 EUR ZF North America Capital Inc 2.250% 26-Apr-2019 7,411,464 0.25%
Total for United States 592,365,693 20.03%
Total Bonds and Other Debt Securities 2,896,911,910 97.95%
Government Bonds
Germany 13,000,000 EUR Bundesrepublik Deutschland Bundesanleihe 0.500% 15-Aug-2027 13,077,359 0.45%
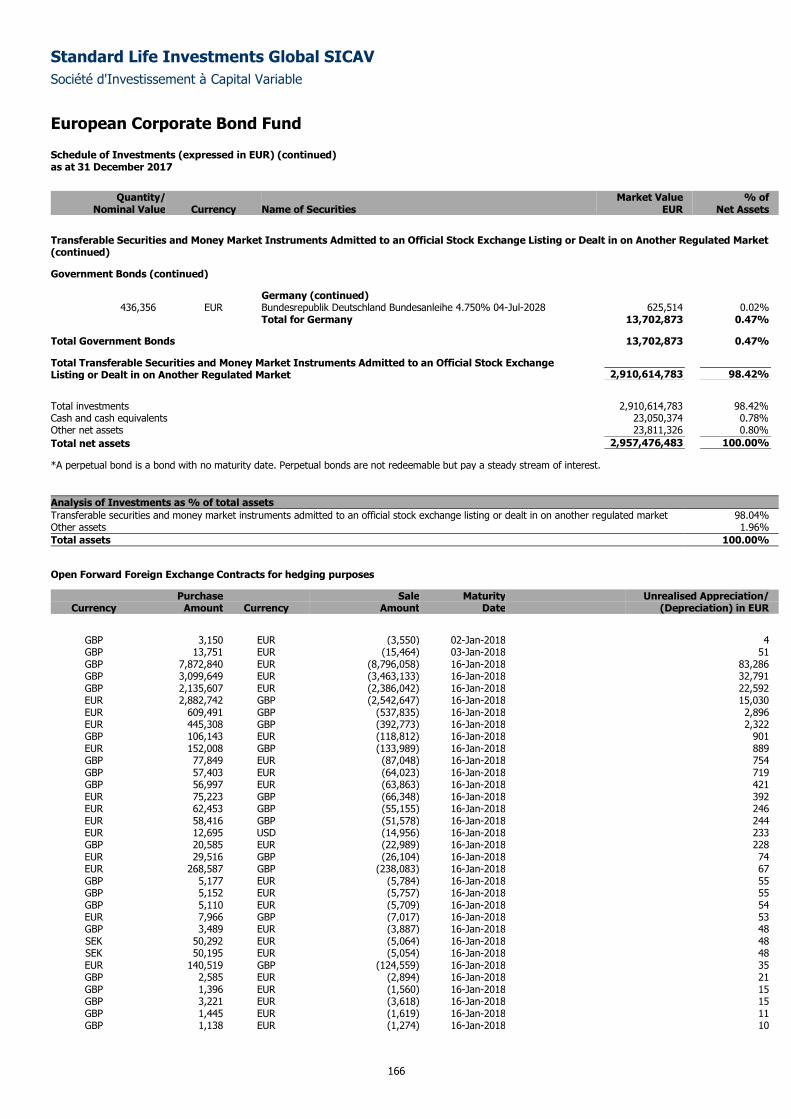
Standard Life Investments Global SICAV
Société d'Investissement à Capital Variable
European Corporate Bond Fund
Schedule of Investments (expressed in EUR) (continued) as at 31 December 2017
166
Quantity/ Market Value % of
Nominal Value Currency Name of Securities EUR Net Assets
Transferable Securities and Money Market Instruments Admitted to an Official Stock Exchange Listing or Dealt in on Another Regulated Market (continued)
Government Bonds (continued)
Germany (continued) 436,356 EUR Bundesrepublik Deutschland Bundesanleihe 4.750% 04-Jul-2028 625,514 0.02%
Total for Germany 13,702,873 0.47%
Total Government Bonds 13,702,873 0.47%
Total Transferable Securities and Money Market Instruments Admitted to an Official Stock Exchange Listing or Dealt in on Another Regulated Market 2,910,614,783 98.42%
Total investments 2,910,614,783 98.42%
Cash and cash equivalents 23,050,374 0.78%
Other net assets 23,811,326 0.80%
Total net assets 2,957,476,483 100.00%
*A perpetual bond is a bond with no maturity date. Perpetual bonds are not redeemable but pay a steady stream of interest.
Analysis of Investments as % of total assets
Transferable securities and money market instruments admitted to an official stock exchange listing or dealt in on another regulated market 98.04% Other assets 1.96%
Total assets 100.00%
Open Forward Foreign Exchange Contracts for hedging purposes
Purchase Sale Maturity Unrealised Appreciation/ Currency Amount Currency Amount Date (Depreciation) in EUR
GBP 3,150 EUR (3,550) 02-Jan-2018 4 GBP 13,751 EUR (15,464) 03-Jan-2018 51 GBP 7,872,840 EUR (8,796,058) 16-Jan-2018 83,286 GBP 3,099,649 EUR (3,463,133) 16-Jan-2018 32,791 GBP 2,135,607 EUR (2,386,042) 16-Jan-2018 22,592 EUR 2,882,742 GBP (2,542,647) 16-Jan-2018 15,030 EUR 609,491 GBP (537,835) 16-Jan-2018 2,896 EUR 445,308 GBP (392,773) 16-Jan-2018 2,322 GBP 106,143 EUR (118,812) 16-Jan-2018 901 EUR 152,008 GBP (133,989) 16-Jan-2018 889 GBP 77,849 EUR (87,048) 16-Jan-2018 754 GBP 57,403 EUR (64,023) 16-Jan-2018 719 GBP 56,997 EUR (63,863) 16-Jan-2018 421 EUR 75,223 GBP (66,348) 16-Jan-2018 392 EUR 62,453 GBP (55,155) 16-Jan-2018 246 EUR 58,416 GBP (51,578) 16-Jan-2018 244 EUR 12,695 USD (14,956) 16-Jan-2018 233 GBP 20,585 EUR (22,989) 16-Jan-2018 228 EUR 29,516 GBP (26,104) 16-Jan-2018 74 EUR 268,587 GBP (238,083) 16-Jan-2018 67 GBP 5,177 EUR (5,784) 16-Jan-2018 55 GBP 5,152 EUR (5,757) 16-Jan-2018 55 GBP 5,110 EUR (5,709) 16-Jan-2018 54 EUR 7,966 GBP (7,017) 16-Jan-2018 53 GBP 3,489 EUR (3,887) 16-Jan-2018 48 SEK 50,292 EUR (5,064) 16-Jan-2018 48 SEK 50,195 EUR (5,054) 16-Jan-2018 48 EUR 140,519 GBP (124,559) 16-Jan-2018 35 GBP 2,585 EUR (2,894) 16-Jan-2018 21 GBP 1,396 EUR (1,560) 16-Jan-2018 15 GBP 3,221 EUR (3,618) 16-Jan-2018 15 GBP 1,445 EUR (1,619) 16-Jan-2018 11 GBP 1,138 EUR (1,274) 16-Jan-2018 10
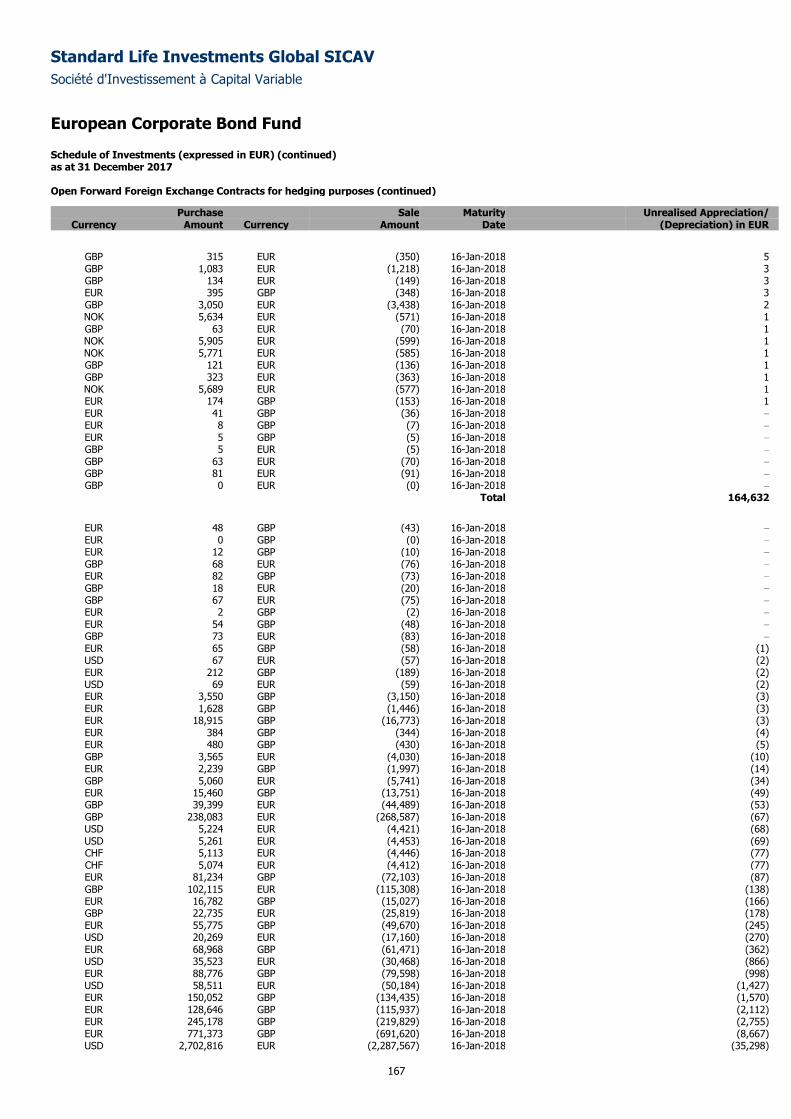
Standard Life Investments Global SICAV
Société d'Investissement à Capital Variable
European Corporate Bond Fund
Schedule of Investments (expressed in EUR) (continued) as at 31 December 2017
167
Open Forward Foreign Exchange Contracts for hedging purposes (continued)
Purchase Sale Maturity Unrealised Appreciation/ Currency Amount Currency Amount Date (Depreciation) in EUR
GBP 315 EUR (350) 16-Jan-2018 5 GBP 1,083 EUR (1,218) 16-Jan-2018 3 GBP 134 EUR (149) 16-Jan-2018 3 EUR 395 GBP (348) 16-Jan-2018 3 GBP 3,050 EUR (3,438) 16-Jan-2018 2 NOK 5,634 EUR (571) 16-Jan-2018 1 GBP 63 EUR (70) 16-Jan-2018 1 NOK 5,905 EUR (599) 16-Jan-2018 1 NOK 5,771 EUR (585) 16-Jan-2018 1 GBP 121 EUR (136) 16-Jan-2018 1 GBP 323 EUR (363) 16-Jan-2018 1 NOK 5,689 EUR (577) 16-Jan-2018 1 EUR 174 GBP (153) 16-Jan-2018 1 EUR 41 GBP (36) 16-Jan-2018 –
EUR 8 GBP (7) 16-Jan-2018 –
EUR 5 GBP (5) 16-Jan-2018 –
GBP 5 EUR (5) 16-Jan-2018 –
GBP 63 EUR (70) 16-Jan-2018 –
GBP 81 EUR (91) 16-Jan-2018 –
GBP 0 EUR (0) 16-Jan-2018 –
Total 164,632
EUR 48 GBP (43) 16-Jan-2018 –
EUR 0 GBP (0) 16-Jan-2018 –
EUR 12 GBP (10) 16-Jan-2018 –
GBP 68 EUR (76) 16-Jan-2018 –
EUR 82 GBP (73) 16-Jan-2018 –
GBP 18 EUR (20) 16-Jan-2018 –
GBP 67 EUR (75) 16-Jan-2018 –
EUR 2 GBP (2) 16-Jan-2018 –
EUR 54 GBP (48) 16-Jan-2018 –
GBP 73 EUR (83) 16-Jan-2018 –
EUR 65 GBP (58) 16-Jan-2018 (1) USD 67 EUR (57) 16-Jan-2018 (2) EUR 212 GBP (189) 16-Jan-2018 (2) USD 69 EUR (59) 16-Jan-2018 (2) EUR 3,550 GBP (3,150) 16-Jan-2018 (3) EUR 1,628 GBP (1,446) 16-Jan-2018 (3) EUR 18,915 GBP (16,773) 16-Jan-2018 (3) EUR 384 GBP (344) 16-Jan-2018 (4) EUR 480 GBP (430) 16-Jan-2018 (5) GBP 3,565 EUR (4,030) 16-Jan-2018 (10) EUR 2,239 GBP (1,997) 16-Jan-2018 (14) GBP 5,060 EUR (5,741) 16-Jan-2018 (34) EUR 15,460 GBP (13,751) 16-Jan-2018 (49) GBP 39,399 EUR (44,489) 16-Jan-2018 (53) GBP 238,083 EUR (268,587) 16-Jan-2018 (67) USD 5,224 EUR (4,421) 16-Jan-2018 (68) USD 5,261 EUR (4,453) 16-Jan-2018 (69) CHF 5,113 EUR (4,446) 16-Jan-2018 (77) CHF 5,074 EUR (4,412) 16-Jan-2018 (77) EUR 81,234 GBP (72,103) 16-Jan-2018 (87) GBP 102,115 EUR (115,308) 16-Jan-2018 (138) EUR 16,782 GBP (15,027) 16-Jan-2018 (166) GBP 22,735 EUR (25,819) 16-Jan-2018 (178) EUR 55,775 GBP (49,670) 16-Jan-2018 (245) USD 20,269 EUR (17,160) 16-Jan-2018 (270) EUR 68,968 GBP (61,471) 16-Jan-2018 (362) USD 35,523 EUR (30,468) 16-Jan-2018 (866) EUR 88,776 GBP (79,598) 16-Jan-2018 (998) USD 58,511 EUR (50,184) 16-Jan-2018 (1,427) EUR 150,052 GBP (134,435) 16-Jan-2018 (1,570) EUR 128,646 GBP (115,937) 16-Jan-2018 (2,112) EUR 245,178 GBP (219,829) 16-Jan-2018 (2,755) EUR 771,373 GBP (691,620) 16-Jan-2018 (8,667) USD 2,702,816 EUR (2,287,567) 16-Jan-2018 (35,298)
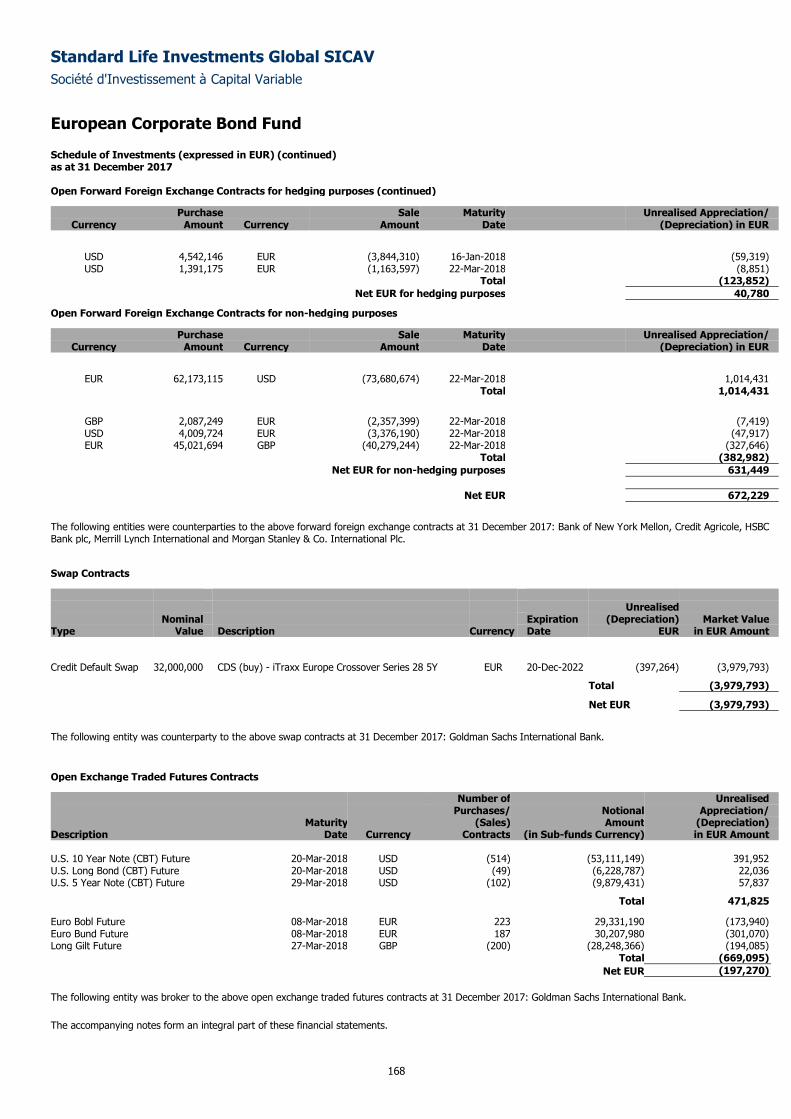
Standard Life Investments Global SICAV
Société d'Investissement à Capital Variable
European Corporate Bond Fund
Schedule of Investments (expressed in EUR) (continued) as at 31 December 2017
168
Open Forward Foreign Exchange Contracts for hedging purposes (continued)
Purchase Sale Maturity Unrealised Appreciation/ Currency Amount Currency Amount Date (Depreciation) in EUR
USD 4,542,146 EUR (3,844,310) 16-Jan-2018 (59,319) USD 1,391,175 EUR (1,163,597) 22-Mar-2018 (8,851)
Total (123,852)
Net EUR for hedging purposes 40,780
Open Forward Foreign Exchange Contracts for non-hedging purposes
Purchase Sale Maturity Unrealised Appreciation/ Currency Amount Currency Amount Date (Depreciation) in EUR
EUR 62,173,115 USD (73,680,674) 22-Mar-2018 1,014,431 Total 1,014,431
GBP 2,087,249 EUR (2,357,399) 22-Mar-2018 (7,419) USD 4,009,724 EUR (3,376,190) 22-Mar-2018 (47,917) EUR 45,021,694 GBP (40,279,244) 22-Mar-2018 (327,646)
Total (382,982)
Net EUR for non-hedging purposes 631,449
Net EUR 672,229
The following entities were counterparties to the above forward foreign exchange contracts at 31 December 2017: Bank of New York Mellon, Credit Agricole, HSBC Bank plc, Merrill Lynch International and Morgan Stanley & Co. International Plc.
Swap Contracts
Unrealised Nominal Expiration (Depreciation) Market Value Type Value Description Currency Date EUR in EUR Amount
Credit Default Swap 32,000,000 CDS (buy) - iTraxx Europe Crossover Series 28 5Y EUR 20-Dec-2022 (397,264) (3,979,793)
Total (3,979,793)
Net EUR (3,979,793)
The following entity was counterparty to the above swap contracts at 31 December 2017: Goldman Sachs International Bank.
Open Exchange Traded Futures Contracts
Number of Unrealised Purchases/ Notional Appreciation/ Maturity (Sales) Amount (Depreciation) Description Date Currency Contracts (in Sub-funds Currency) in EUR Amount U.S. 10 Year Note (CBT) Future 20-Mar-2018 USD (514) (53,111,149) 391,952 U.S. Long Bond (CBT) Future 20-Mar-2018 USD (49) (6,228,787) 22,036 U.S. 5 Year Note (CBT) Future 29-Mar-2018 USD (102) (9,879,431) 57,837
Total 471,825
Euro Bobl Future 08-Mar-2018 EUR 223 29,331,190 (173,940) Euro Bund Future 08-Mar-2018 EUR 187 30,207,980 (301,070) Long Gilt Future 27-Mar-2018 GBP (200) (28,248,366) (194,085) Total (669,095)
Net EUR (197,270)
The following entity was broker to the above open exchange traded futures contracts at 31 December 2017: Goldman Sachs International Bank.
The accompanying notes form an integral part of these financial statements.
Standard Life Investments Global SICAV
Société d'Investissement à Capital Variable
169
Euro Government All Stocks Fund
Sub-fund Objective and Investment Policy
The objective of the Sub-fund is to achieve long term growth in the share price through investing primarily in sovereign, debt securities denominated in
Euros. Returns from the Sub-fund will be both through the reinvestment of income and from capital gains.
Performance Review
The Sub-fund returned -1.80% over the period, compared to the Merrill Lynch EMU Direct Government AA-AAA Index return of -0.39%.*
In the first quarter, underweight positions in French government bonds produced relative gains versus the benchmark. These bonds looked mispriced not
just on yield, as outright economic fundamentals improved, but also on spread as political uncertainty remained. On the downside, being underweight US
duration through 5-year and 7-year Treasury bonds hampered performance over the quarter. Geopolitical risks increased and the market also began to
question the Trump administration’s ability to push through any radical legislation. Overall short-duration positioning, through markets such as France and
the US, detracted from performance in the second quarter. Long positions in Australian and Swedish debt contributed positively. Demand for these bonds,
at still relatively elevated yields, remained strong.
Long relative-value positioning in Australia versus short-duration positioning through markets such as the US and France initially detracted from overall
returns in the third quarter. However, the portfolio’s duration and relative-value positioning proved beneficial towards the end of the quarter. The policy
normalisation theme resurfaced, prompted by statements from ECB President Mario Draghi and Fed Chair Janet Yellen. Key positive contributors over the
final quarter were the overweight duration strategy in Australia and relative-value views adopted in Europe. In particular, an overweight in peripheral
European bonds added to returns in a period when the market consensus was stubbornly negative. Our view was that a combination of central bank support
and positive Eurozone growth should help peripheral European debt to perform strongly.
*Sub-fund performance has been calculated over the stated period on the share price performance basis, based on the retail share class (A Accumulation)
and net of fees. Please note the index return is quoted gross and contains no adjustment for fees. The sub-fund performance will also be impacted by any
pricing basis changes, made under our single swinging price policy. More information on our swinging price approach can be found in note 8 of the Financial
Statements.
Outlook
The combination of low inflation and monetary stimulus is hampering the usual reaction of bonds, which is to sell off when faced with a stronger economic
backdrop. However, the current messaging from central banks is that they are ready to proceed with unwinding ultra-accommodative monetary policy even
if inflation does not fully materialise. This point is important as bonds have begun to accept quantitative easing ad infinitum as the new normal.
We remain solidly underweight duration through German bunds, which are still at the highly expensive end of their valuation scale. We have taken a more
neutral stance towards the US, albeit the risks do point to higher yields, preferring to take underweight duration positions in core European debt. For
peripheral Europe, we remain largely overweight, but this positioning is nuanced. We are overweight Italy rather than Spain, given the heightened political
risks from Catalonia. Elsewhere, we remain overweight Portugal as a sovereign issuer currently in ratings upgrade mode.
Please note that the commitment approach has been used for risk measurement and calculation of global exposure for this Sub-fund.
This Sub-fund is not authorised in Hong Kong and is not available to Hong Kong residents.
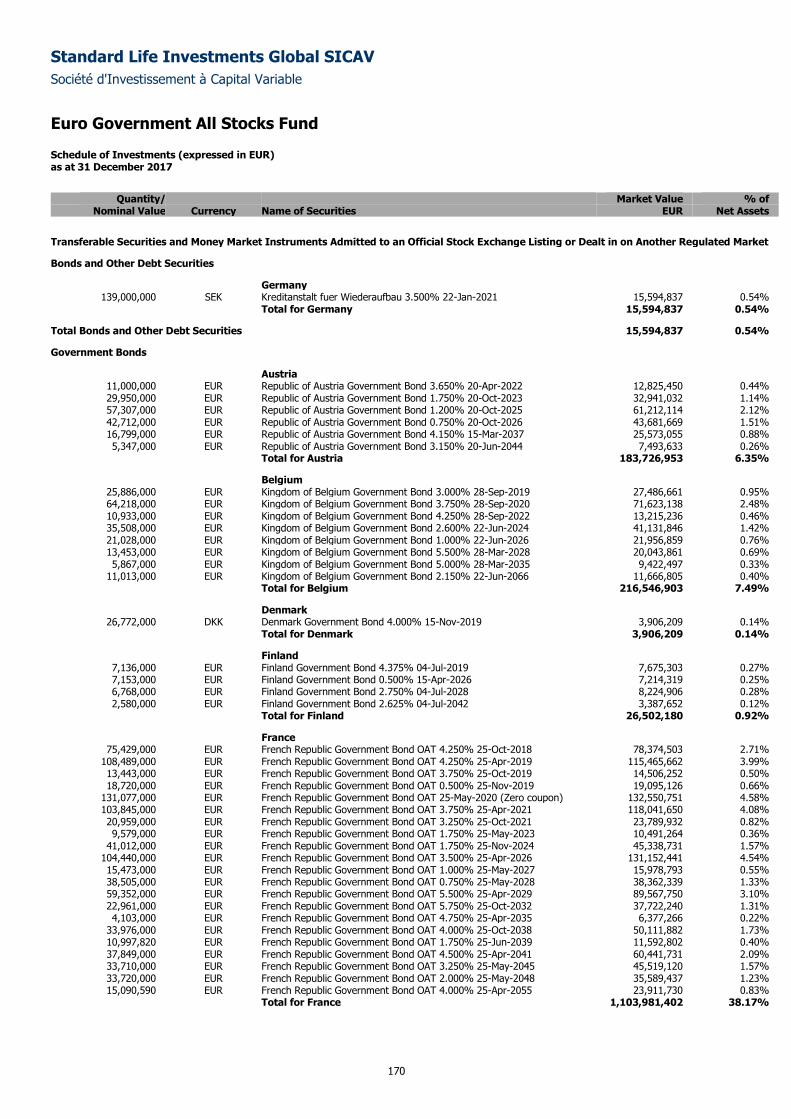
Standard Life Investments Global SICAV
Société d'Investissement à Capital Variable
Euro Government All Stocks Fund
Schedule of Investments (expressed in EUR) as at 31 December 2017
170
Quantity/ Market Value % of
Nominal Value Currency Name of Securities EUR Net Assets
Transferable Securities and Money Market Instruments Admitted to an Official Stock Exchange Listing or Dealt in on Another Regulated Market
Bonds and Other Debt Securities
Germany 139,000,000 SEK Kreditanstalt fuer Wiederaufbau 3.500% 22-Jan-2021 15,594,837 0.54%
Total for Germany 15,594,837 0.54%
Total Bonds and Other Debt Securities 15,594,837 0.54%
Government Bonds
Austria 11,000,000 EUR Republic of Austria Government Bond 3.650% 20-Apr-2022 12,825,450 0.44% 29,950,000 EUR Republic of Austria Government Bond 1.750% 20-Oct-2023 32,941,032 1.14% 57,307,000 EUR Republic of Austria Government Bond 1.200% 20-Oct-2025 61,212,114 2.12% 42,712,000 EUR Republic of Austria Government Bond 0.750% 20-Oct-2026 43,681,669 1.51% 16,799,000 EUR Republic of Austria Government Bond 4.150% 15-Mar-2037 25,573,055 0.88% 5,347,000 EUR Republic of Austria Government Bond 3.150% 20-Jun-2044 7,493,633 0.26%
Total for Austria 183,726,953 6.35%
Belgium 25,886,000 EUR Kingdom of Belgium Government Bond 3.000% 28-Sep-2019 27,486,661 0.95% 64,218,000 EUR Kingdom of Belgium Government Bond 3.750% 28-Sep-2020 71,623,138 2.48% 10,933,000 EUR Kingdom of Belgium Government Bond 4.250% 28-Sep-2022 13,215,236 0.46% 35,508,000 EUR Kingdom of Belgium Government Bond 2.600% 22-Jun-2024 41,131,846 1.42% 21,028,000 EUR Kingdom of Belgium Government Bond 1.000% 22-Jun-2026 21,956,859 0.76% 13,453,000 EUR Kingdom of Belgium Government Bond 5.500% 28-Mar-2028 20,043,861 0.69% 5,867,000 EUR Kingdom of Belgium Government Bond 5.000% 28-Mar-2035 9,422,497 0.33%
11,013,000 EUR Kingdom of Belgium Government Bond 2.150% 22-Jun-2066 11,666,805 0.40% Total for Belgium 216,546,903 7.49%
Denmark 26,772,000 DKK Denmark Government Bond 4.000% 15-Nov-2019 3,906,209 0.14%
Total for Denmark 3,906,209 0.14%
Finland 7,136,000 EUR Finland Government Bond 4.375% 04-Jul-2019 7,675,303 0.27% 7,153,000 EUR Finland Government Bond 0.500% 15-Apr-2026 7,214,319 0.25% 6,768,000 EUR Finland Government Bond 2.750% 04-Jul-2028 8,224,906 0.28% 2,580,000 EUR Finland Government Bond 2.625% 04-Jul-2042 3,387,652 0.12%
Total for Finland 26,502,180 0.92%
France 75,429,000 EUR French Republic Government Bond OAT 4.250% 25-Oct-2018 78,374,503 2.71%
108,489,000 EUR French Republic Government Bond OAT 4.250% 25-Apr-2019 115,465,662 3.99% 13,443,000 EUR French Republic Government Bond OAT 3.750% 25-Oct-2019 14,506,252 0.50% 18,720,000 EUR French Republic Government Bond OAT 0.500% 25-Nov-2019 19,095,126 0.66%
131,077,000 EUR French Republic Government Bond OAT 25-May-2020 (Zero coupon) 132,550,751 4.58% 103,845,000 EUR French Republic Government Bond OAT 3.750% 25-Apr-2021 118,041,650 4.08% 20,959,000 EUR French Republic Government Bond OAT 3.250% 25-Oct-2021 23,789,932 0.82% 9,579,000 EUR French Republic Government Bond OAT 1.750% 25-May-2023 10,491,264 0.36%
41,012,000 EUR French Republic Government Bond OAT 1.750% 25-Nov-2024 45,338,731 1.57% 104,440,000 EUR French Republic Government Bond OAT 3.500% 25-Apr-2026 131,152,441 4.54% 15,473,000 EUR French Republic Government Bond OAT 1.000% 25-May-2027 15,978,793 0.55% 38,505,000 EUR French Republic Government Bond OAT 0.750% 25-May-2028 38,362,339 1.33% 59,352,000 EUR French Republic Government Bond OAT 5.500% 25-Apr-2029 89,567,750 3.10% 22,961,000 EUR French Republic Government Bond OAT 5.750% 25-Oct-2032 37,722,240 1.31% 4,103,000 EUR French Republic Government Bond OAT 4.750% 25-Apr-2035 6,377,266 0.22%
33,976,000 EUR French Republic Government Bond OAT 4.000% 25-Oct-2038 50,111,882 1.73% 10,997,820 EUR French Republic Government Bond OAT 1.750% 25-Jun-2039 11,592,802 0.40% 37,849,000 EUR French Republic Government Bond OAT 4.500% 25-Apr-2041 60,441,731 2.09% 33,710,000 EUR French Republic Government Bond OAT 3.250% 25-May-2045 45,519,120 1.57% 33,720,000 EUR French Republic Government Bond OAT 2.000% 25-May-2048 35,589,437 1.23% 15,090,590 EUR French Republic Government Bond OAT 4.000% 25-Apr-2055 23,911,730 0.83%
Total for France 1,103,981,402 38.17%
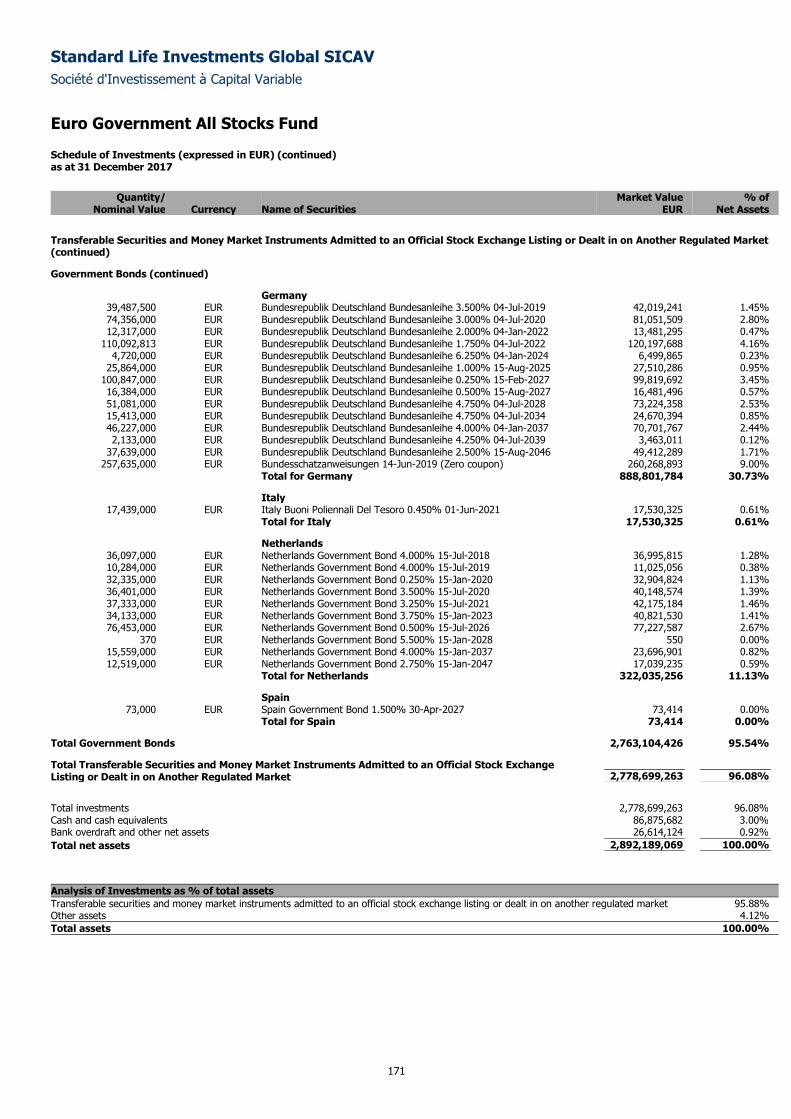
Standard Life Investments Global SICAV
Société d'Investissement à Capital Variable
Euro Government All Stocks Fund
Schedule of Investments (expressed in EUR) (continued) as at 31 December 2017
171
Quantity/ Market Value % of
Nominal Value Currency Name of Securities EUR Net Assets
Transferable Securities and Money Market Instruments Admitted to an Official Stock Exchange Listing or Dealt in on Another Regulated Market (continued)
Government Bonds (continued)
Germany 39,487,500 EUR Bundesrepublik Deutschland Bundesanleihe 3.500% 04-Jul-2019 42,019,241 1.45% 74,356,000 EUR Bundesrepublik Deutschland Bundesanleihe 3.000% 04-Jul-2020 81,051,509 2.80% 12,317,000 EUR Bundesrepublik Deutschland Bundesanleihe 2.000% 04-Jan-2022 13,481,295 0.47%
110,092,813 EUR Bundesrepublik Deutschland Bundesanleihe 1.750% 04-Jul-2022 120,197,688 4.16% 4,720,000 EUR Bundesrepublik Deutschland Bundesanleihe 6.250% 04-Jan-2024 6,499,865 0.23%
25,864,000 EUR Bundesrepublik Deutschland Bundesanleihe 1.000% 15-Aug-2025 27,510,286 0.95% 100,847,000 EUR Bundesrepublik Deutschland Bundesanleihe 0.250% 15-Feb-2027 99,819,692 3.45% 16,384,000 EUR Bundesrepublik Deutschland Bundesanleihe 0.500% 15-Aug-2027 16,481,496 0.57% 51,081,000 EUR Bundesrepublik Deutschland Bundesanleihe 4.750% 04-Jul-2028 73,224,358 2.53% 15,413,000 EUR Bundesrepublik Deutschland Bundesanleihe 4.750% 04-Jul-2034 24,670,394 0.85% 46,227,000 EUR Bundesrepublik Deutschland Bundesanleihe 4.000% 04-Jan-2037 70,701,767 2.44% 2,133,000 EUR Bundesrepublik Deutschland Bundesanleihe 4.250% 04-Jul-2039 3,463,011 0.12%
37,639,000 EUR Bundesrepublik Deutschland Bundesanleihe 2.500% 15-Aug-2046 49,412,289 1.71% 257,635,000 EUR Bundesschatzanweisungen 14-Jun-2019 (Zero coupon) 260,268,893 9.00%
Total for Germany 888,801,784 30.73%
Italy 17,439,000 EUR Italy Buoni Poliennali Del Tesoro 0.450% 01-Jun-2021 17,530,325 0.61%
Total for Italy 17,530,325 0.61%
Netherlands 36,097,000 EUR Netherlands Government Bond 4.000% 15-Jul-2018 36,995,815 1.28% 10,284,000 EUR Netherlands Government Bond 4.000% 15-Jul-2019 11,025,056 0.38% 32,335,000 EUR Netherlands Government Bond 0.250% 15-Jan-2020 32,904,824 1.13% 36,401,000 EUR Netherlands Government Bond 3.500% 15-Jul-2020 40,148,574 1.39% 37,333,000 EUR Netherlands Government Bond 3.250% 15-Jul-2021 42,175,184 1.46% 34,133,000 EUR Netherlands Government Bond 3.750% 15-Jan-2023 40,821,530 1.41% 76,453,000 EUR Netherlands Government Bond 0.500% 15-Jul-2026 77,227,587 2.67%
370 EUR Netherlands Government Bond 5.500% 15-Jan-2028 550 0.00% 15,559,000 EUR Netherlands Government Bond 4.000% 15-Jan-2037 23,696,901 0.82% 12,519,000 EUR Netherlands Government Bond 2.750% 15-Jan-2047 17,039,235 0.59%
Total for Netherlands 322,035,256 11.13%
Spain 73,000 EUR Spain Government Bond 1.500% 30-Apr-2027 73,414 0.00%
Total for Spain 73,414 0.00%
Total Government Bonds 2,763,104,426 95.54%
Total Transferable Securities and Money Market Instruments Admitted to an Official Stock Exchange Listing or Dealt in on Another Regulated Market 2,778,699,263 96.08%
Total investments 2,778,699,263 96.08%
Cash and cash equivalents 86,875,682 3.00%
Bank overdraft and other net assets 26,614,124 0.92%
Total net assets 2,892,189,069 100.00%
Analysis of Investments as % of total assets
Transferable securities and money market instruments admitted to an official stock exchange listing or dealt in on another regulated market 95.88% Other assets 4.12%
Total assets 100.00%
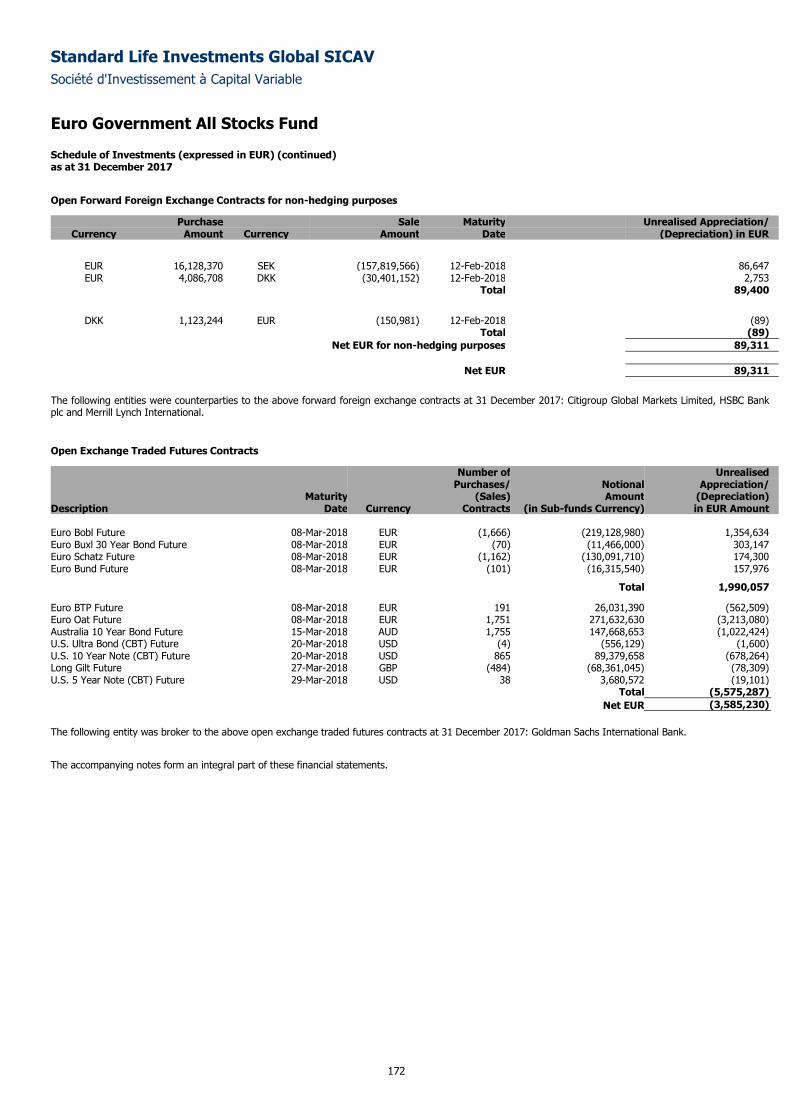
Standard Life Investments Global SICAV
Société d'Investissement à Capital Variable
Euro Government All Stocks Fund
Schedule of Investments (expressed in EUR) (continued) as at 31 December 2017
172
Open Forward Foreign Exchange Contracts for non-hedging purposes
Purchase Sale Maturity Unrealised Appreciation/ Currency Amount Currency Amount Date (Depreciation) in EUR
EUR 16,128,370 SEK (157,819,566) 12-Feb-2018 86,647 EUR 4,086,708 DKK (30,401,152) 12-Feb-2018 2,753
Total 89,400
DKK 1,123,244 EUR (150,981) 12-Feb-2018 (89)
Total (89)
Net EUR for non-hedging purposes 89,311
Net EUR 89,311
The following entities were counterparties to the above forward foreign exchange contracts at 31 December 2017: Citigroup Global Markets Limited, HSBC Bank plc and Merrill Lynch International.
Open Exchange Traded Futures Contracts
Number of Unrealised Purchases/ Notional Appreciation/ Maturity (Sales) Amount (Depreciation) Description Date Currency Contracts (in Sub-funds Currency) in EUR Amount Euro Bobl Future 08-Mar-2018 EUR (1,666) (219,128,980) 1,354,634 Euro Buxl 30 Year Bond Future 08-Mar-2018 EUR (70) (11,466,000) 303,147 Euro Schatz Future 08-Mar-2018 EUR (1,162) (130,091,710) 174,300 Euro Bund Future 08-Mar-2018 EUR (101) (16,315,540) 157,976
Total 1,990,057
Euro BTP Future 08-Mar-2018 EUR 191 26,031,390 (562,509) Euro Oat Future 08-Mar-2018 EUR 1,751 271,632,630 (3,213,080) Australia 10 Year Bond Future 15-Mar-2018 AUD 1,755 147,668,653 (1,022,424) U.S. Ultra Bond (CBT) Future 20-Mar-2018 USD (4) (556,129) (1,600) U.S. 10 Year Note (CBT) Future 20-Mar-2018 USD 865 89,379,658 (678,264) Long Gilt Future 27-Mar-2018 GBP (484) (68,361,045) (78,309) U.S. 5 Year Note (CBT) Future 29-Mar-2018 USD 38 3,680,572 (19,101) Total (5,575,287)
Net EUR (3,585,230)
The following entity was broker to the above open exchange traded futures contracts at 31 December 2017: Goldman Sachs International Bank.
The accompanying notes form an integral part of these financial statements.
Standard Life Investments Global SICAV
Société d'Investissement à Capital Variable
173
Emerging Market Debt Fund
Sub-fund Objective and Investment Policy
The objective of the Sub-fund is to provide a return from both capital appreciation and income. It will do this by primarily investing in bond securities issued
by Emerging Market countries and companies listed on an emerging market stock exchange or which carry out a substantial part of the operations in
Emerging Market countries. An "Emerging Market" is one which is typically outside the OECD but is progressing to becoming advanced as shown by some
liquidity in local debt and equity markets and the existence of some form of market exchange and regulatory body. Such markets are likely to exhibit higher
levels of risk (for example political instability, weak regulation and low liquidity) than developed markets. The Sub-fund may also invest in other transferable
securities, money-market instruments, deposits, cash and near cash, derivatives (including currency forwards, interest rate and credit default swaps) and
collective investment schemes. The Sub-fund may, subject to and in accordance with the UCI Law and applicable CSSF circulars, use derivative contracts for
the purpose of meeting its investment objective and for efficient portfolio management (including hedging).
Performance Review
The Sub-fund returned 10.80% over the period, compared to the JP Morgan EMBI Global Diversified index return of 10.26%*.
Country allocation was strongly positive over the year. Overweight positions in Brazil and Egypt added notably to returns. Both countries have shown an
appetite to enact positive reforms and in the case of Brazil the economy looks as though it is finally through the worst. Our overweight positioning in Nigeria
also contributed strongly. Having an underweight position in Venezuela benefited performance and we continue to avoid this significantly deteriorating
credit. Not holding Russia was another positive contributor to relative returns.
On the downside, our underweight positioning in Mexico detracted from returns. Not holding Ecuador also proved detrimental to performance, as the
country was a beneficiary of the rising price of oil.
*Sub-fund performance has been calculated over the stated period on the share price performance basis, based on the institutional share class (D
Accumulation) and net of fees. Please note the index return is quoted gross and contains no adjustment for fees. The sub-fund performance will also be
impacted by any pricing basis changes, made under our single swinging price policy. More information on our swinging price approach can be found in note
8 of the Financial Statements.
Outlook
Emerging markets (EMs) have started 2018 on a strong footing. A weak US dollar, strong commodity prices and robust global macroeconomic data continue
to buoy sentiment toward EM assets. The global manufacturing cycle remains strong and the cyclical recovery looks set to continue in the period ahead.
These factors are likely to continue to support in EM exports.
This positive external environment is conducive to a recovery in EM investment spending and should support domestic consumption. Inflation pressures are
beginning to appear at the margin in a handful of countries, which could elicit responses from central banks later in the year. 2018 is set to present
challenges in terms of US economic policy, elections and geopolitics. We suspect that NAFTA renegotiations will ultimately conclude in an acceptable manner
for Mexico but that there will likely be some bumps along the way. Mexico will also experience an important election in 2018 and we will be watchful of the
populist forces emerging there. Major elections will also be held in Brazil, Malaysia and Pakistan, among other countries. Geopolitics in the Middle East and
Korea will remain ever-present risks, with periods of escalation and de-escalation likely. Investors are already pricing in some of these risks.
Looking ahead, we remain positive on the asset class. Our base case is for incremental spread tightening as core rates are likely to move higher in 2018.
This would be consistent with the path of spreads during past Federal Reserve hiking cycles of the late 1990s and mid-2000s, when higher global growth
underpinned demand for risk assets.
Please note that the commitment approach has been used for risk measurement and calculation of global exposure for this Sub-fund.
This Sub-fund is not authorized in Hong Kong and is not available to Hong Kong residents.
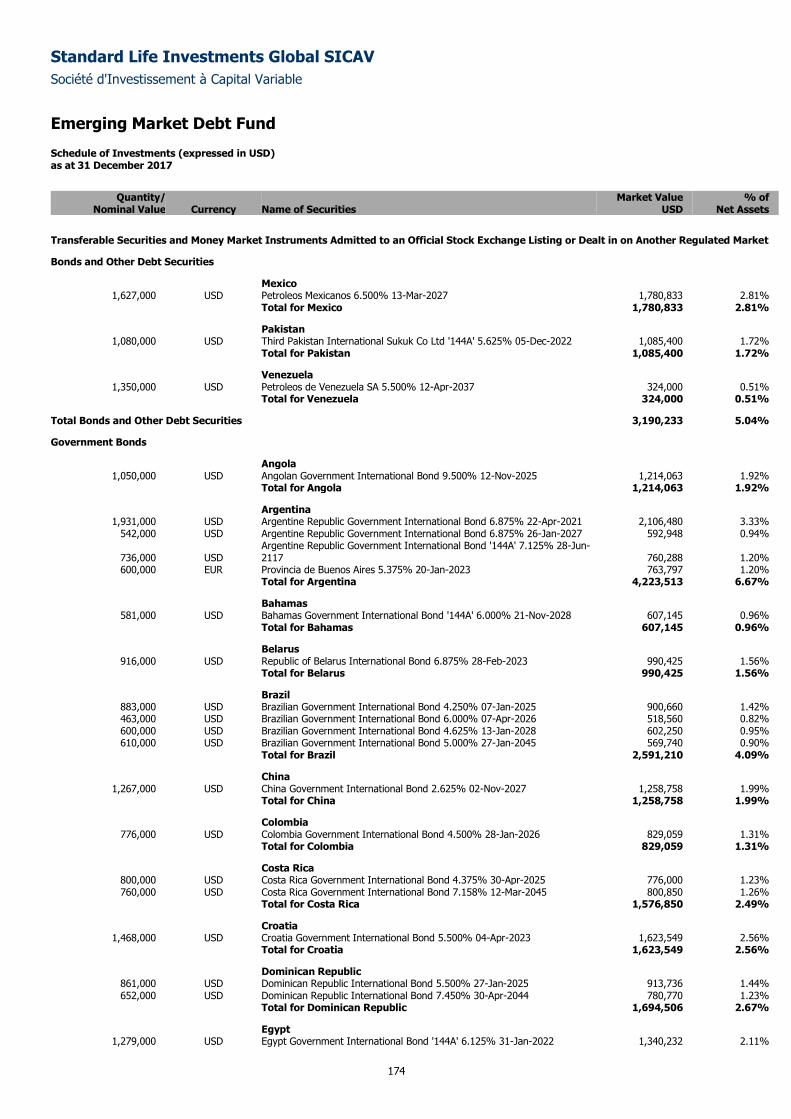
Standard Life Investments Global SICAV
Société d'Investissement à Capital Variable
Emerging Market Debt Fund Schedule of Investments (expressed in USD) as at 31 December 2017
174
Quantity/ Market Value % of
Nominal Value Currency Name of Securities USD Net Assets
Transferable Securities and Money Market Instruments Admitted to an Official Stock Exchange Listing or Dealt in on Another Regulated Market
Bonds and Other Debt Securities
Mexico 1,627,000 USD Petroleos Mexicanos 6.500% 13-Mar-2027 1,780,833 2.81%
Total for Mexico 1,780,833 2.81%
Pakistan 1,080,000 USD Third Pakistan International Sukuk Co Ltd '144A' 5.625% 05-Dec-2022 1,085,400 1.72%
Total for Pakistan 1,085,400 1.72%
Venezuela 1,350,000 USD Petroleos de Venezuela SA 5.500% 12-Apr-2037 324,000 0.51%
Total for Venezuela 324,000 0.51%
Total Bonds and Other Debt Securities 3,190,233 5.04%
Government Bonds
Angola 1,050,000 USD Angolan Government International Bond 9.500% 12-Nov-2025 1,214,063 1.92%
Total for Angola 1,214,063 1.92%
Argentina 1,931,000 USD Argentine Republic Government International Bond 6.875% 22-Apr-2021 2,106,480 3.33%
542,000 USD Argentine Republic Government International Bond 6.875% 26-Jan-2027 592,948 0.94%
736,000 USD Argentine Republic Government International Bond '144A' 7.125% 28-Jun-2117 760,288 1.20%
600,000 EUR Provincia de Buenos Aires 5.375% 20-Jan-2023 763,797 1.20% Total for Argentina 4,223,513 6.67%
Bahamas 581,000 USD Bahamas Government International Bond '144A' 6.000% 21-Nov-2028 607,145 0.96%
Total for Bahamas 607,145 0.96%
Belarus 916,000 USD Republic of Belarus International Bond 6.875% 28-Feb-2023 990,425 1.56%
Total for Belarus 990,425 1.56%
Brazil 883,000 USD Brazilian Government International Bond 4.250% 07-Jan-2025 900,660 1.42% 463,000 USD Brazilian Government International Bond 6.000% 07-Apr-2026 518,560 0.82% 600,000 USD Brazilian Government International Bond 4.625% 13-Jan-2028 602,250 0.95% 610,000 USD Brazilian Government International Bond 5.000% 27-Jan-2045 569,740 0.90%
Total for Brazil 2,591,210 4.09%
China 1,267,000 USD China Government International Bond 2.625% 02-Nov-2027 1,258,758 1.99%
Total for China 1,258,758 1.99%
Colombia 776,000 USD Colombia Government International Bond 4.500% 28-Jan-2026 829,059 1.31%
Total for Colombia 829,059 1.31%
Costa Rica 800,000 USD Costa Rica Government International Bond 4.375% 30-Apr-2025 776,000 1.23% 760,000 USD Costa Rica Government International Bond 7.158% 12-Mar-2045 800,850 1.26%
Total for Costa Rica 1,576,850 2.49%
Croatia 1,468,000 USD Croatia Government International Bond 5.500% 04-Apr-2023 1,623,549 2.56%
Total for Croatia 1,623,549 2.56%
Dominican Republic 861,000 USD Dominican Republic International Bond 5.500% 27-Jan-2025 913,736 1.44% 652,000 USD Dominican Republic International Bond 7.450% 30-Apr-2044 780,770 1.23%
Total for Dominican Republic 1,694,506 2.67%
Egypt 1,279,000 USD Egypt Government International Bond '144A' 6.125% 31-Jan-2022 1,340,232 2.11%
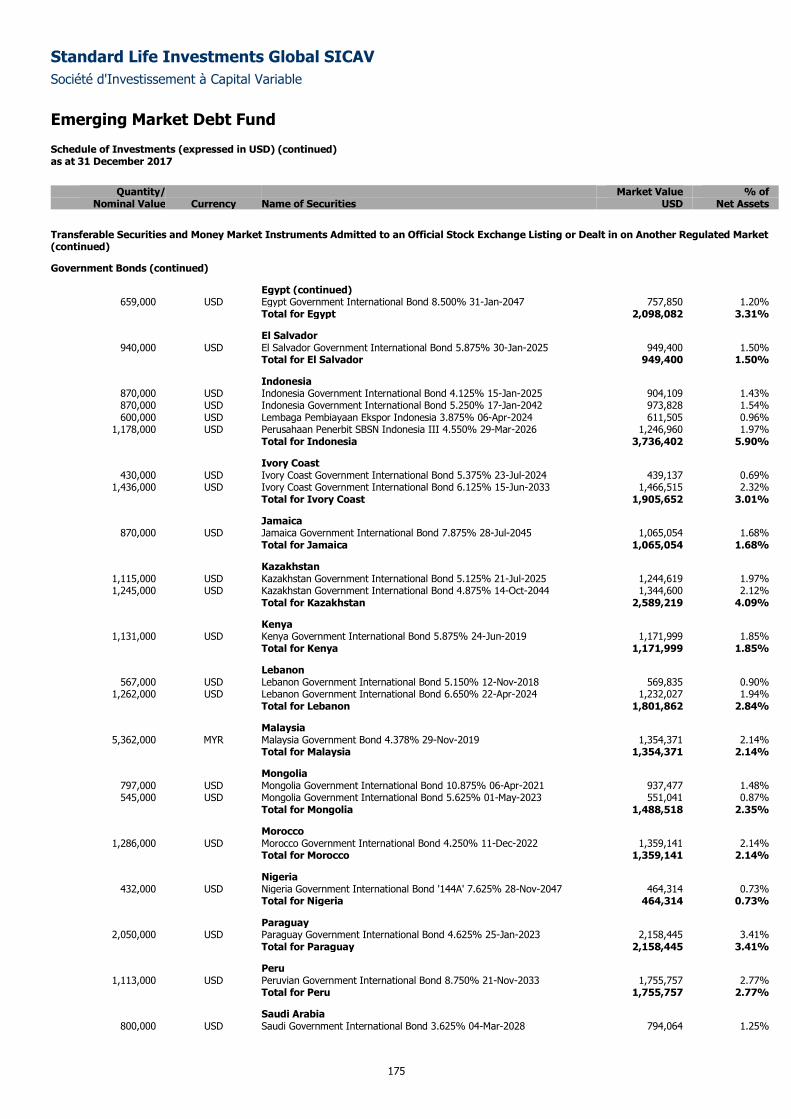
Standard Life Investments Global SICAV
Société d'Investissement à Capital Variable
Emerging Market Debt Fund Schedule of Investments (expressed in USD) (continued) as at 31 December 2017
175
Quantity/ Market Value % of
Nominal Value Currency Name of Securities USD Net Assets
Transferable Securities and Money Market Instruments Admitted to an Official Stock Exchange Listing or Dealt in on Another Regulated Market (continued)
Government Bonds (continued)
Egypt (continued) 659,000 USD Egypt Government International Bond 8.500% 31-Jan-2047 757,850 1.20%
Total for Egypt 2,098,082 3.31%
El Salvador 940,000 USD El Salvador Government International Bond 5.875% 30-Jan-2025 949,400 1.50%
Total for El Salvador 949,400 1.50%
Indonesia 870,000 USD Indonesia Government International Bond 4.125% 15-Jan-2025 904,109 1.43% 870,000 USD Indonesia Government International Bond 5.250% 17-Jan-2042 973,828 1.54% 600,000 USD Lembaga Pembiayaan Ekspor Indonesia 3.875% 06-Apr-2024 611,505 0.96%
1,178,000 USD Perusahaan Penerbit SBSN Indonesia III 4.550% 29-Mar-2026 1,246,960 1.97% Total for Indonesia 3,736,402 5.90%
Ivory Coast 430,000 USD Ivory Coast Government International Bond 5.375% 23-Jul-2024 439,137 0.69%
1,436,000 USD Ivory Coast Government International Bond 6.125% 15-Jun-2033 1,466,515 2.32% Total for Ivory Coast 1,905,652 3.01%
Jamaica 870,000 USD Jamaica Government International Bond 7.875% 28-Jul-2045 1,065,054 1.68%
Total for Jamaica 1,065,054 1.68%
Kazakhstan 1,115,000 USD Kazakhstan Government International Bond 5.125% 21-Jul-2025 1,244,619 1.97% 1,245,000 USD Kazakhstan Government International Bond 4.875% 14-Oct-2044 1,344,600 2.12%
Total for Kazakhstan 2,589,219 4.09%
Kenya 1,131,000 USD Kenya Government International Bond 5.875% 24-Jun-2019 1,171,999 1.85%
Total for Kenya 1,171,999 1.85%
Lebanon 567,000 USD Lebanon Government International Bond 5.150% 12-Nov-2018 569,835 0.90%
1,262,000 USD Lebanon Government International Bond 6.650% 22-Apr-2024 1,232,027 1.94% Total for Lebanon 1,801,862 2.84%
Malaysia 5,362,000 MYR Malaysia Government Bond 4.378% 29-Nov-2019 1,354,371 2.14%
Total for Malaysia 1,354,371 2.14%
Mongolia 797,000 USD Mongolia Government International Bond 10.875% 06-Apr-2021 937,477 1.48% 545,000 USD Mongolia Government International Bond 5.625% 01-May-2023 551,041 0.87%
Total for Mongolia 1,488,518 2.35%
Morocco 1,286,000 USD Morocco Government International Bond 4.250% 11-Dec-2022 1,359,141 2.14%
Total for Morocco 1,359,141 2.14%
Nigeria 432,000 USD Nigeria Government International Bond '144A' 7.625% 28-Nov-2047 464,314 0.73%
Total for Nigeria 464,314 0.73%
Paraguay 2,050,000 USD Paraguay Government International Bond 4.625% 25-Jan-2023 2,158,445 3.41%
Total for Paraguay 2,158,445 3.41%
Peru 1,113,000 USD Peruvian Government International Bond 8.750% 21-Nov-2033 1,755,757 2.77%
Total for Peru 1,755,757 2.77%
Saudi Arabia 800,000 USD Saudi Government International Bond 3.625% 04-Mar-2028 794,064 1.25%
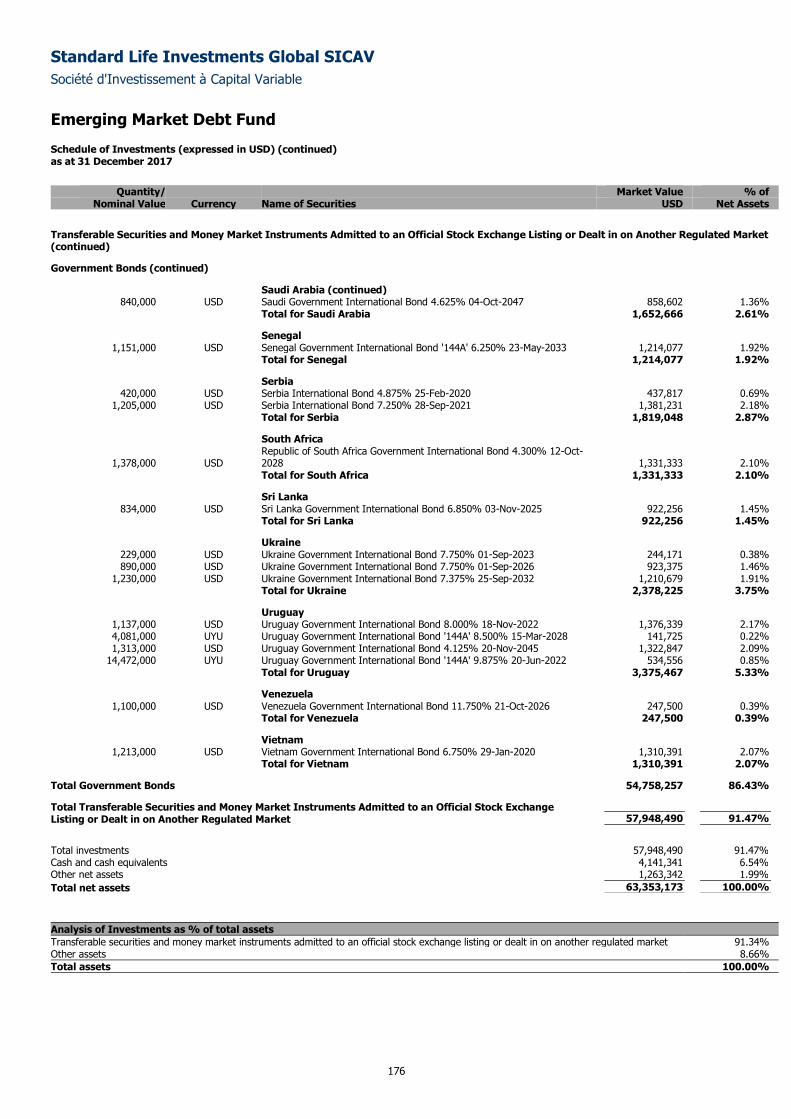
Standard Life Investments Global SICAV
Société d'Investissement à Capital Variable
Emerging Market Debt Fund Schedule of Investments (expressed in USD) (continued) as at 31 December 2017
176
Quantity/ Market Value % of
Nominal Value Currency Name of Securities USD Net Assets
Transferable Securities and Money Market Instruments Admitted to an Official Stock Exchange Listing or Dealt in on Another Regulated Market (continued)
Government Bonds (continued)
Saudi Arabia (continued) 840,000 USD Saudi Government International Bond 4.625% 04-Oct-2047 858,602 1.36%
Total for Saudi Arabia 1,652,666 2.61%
Senegal 1,151,000 USD Senegal Government International Bond '144A' 6.250% 23-May-2033 1,214,077 1.92%
Total for Senegal 1,214,077 1.92%
Serbia 420,000 USD Serbia International Bond 4.875% 25-Feb-2020 437,817 0.69%
1,205,000 USD Serbia International Bond 7.250% 28-Sep-2021 1,381,231 2.18% Total for Serbia 1,819,048 2.87%
South Africa
1,378,000 USD Republic of South Africa Government International Bond 4.300% 12-Oct-2028 1,331,333 2.10%
Total for South Africa 1,331,333 2.10%
Sri Lanka 834,000 USD Sri Lanka Government International Bond 6.850% 03-Nov-2025 922,256 1.45%
Total for Sri Lanka 922,256 1.45%
Ukraine 229,000 USD Ukraine Government International Bond 7.750% 01-Sep-2023 244,171 0.38% 890,000 USD Ukraine Government International Bond 7.750% 01-Sep-2026 923,375 1.46%
1,230,000 USD Ukraine Government International Bond 7.375% 25-Sep-2032 1,210,679 1.91% Total for Ukraine 2,378,225 3.75%
Uruguay 1,137,000 USD Uruguay Government International Bond 8.000% 18-Nov-2022 1,376,339 2.17% 4,081,000 UYU Uruguay Government International Bond '144A' 8.500% 15-Mar-2028 141,725 0.22% 1,313,000 USD Uruguay Government International Bond 4.125% 20-Nov-2045 1,322,847 2.09%
14,472,000 UYU Uruguay Government International Bond '144A' 9.875% 20-Jun-2022 534,556 0.85% Total for Uruguay 3,375,467 5.33%
Venezuela 1,100,000 USD Venezuela Government International Bond 11.750% 21-Oct-2026 247,500 0.39%
Total for Venezuela 247,500 0.39%
Vietnam 1,213,000 USD Vietnam Government International Bond 6.750% 29-Jan-2020 1,310,391 2.07%
Total for Vietnam 1,310,391 2.07%
Total Government Bonds 54,758,257 86.43%
Total Transferable Securities and Money Market Instruments Admitted to an Official Stock Exchange Listing or Dealt in on Another Regulated Market 57,948,490 91.47%
Total investments 57,948,490 91.47%
Cash and cash equivalents 4,141,341 6.54%
Other net assets 1,263,342 1.99%
Total net assets 63,353,173 100.00%
Analysis of Investments as % of total assets
Transferable securities and money market instruments admitted to an official stock exchange listing or dealt in on another regulated market 91.34% Other assets 8.66%
Total assets 100.00%
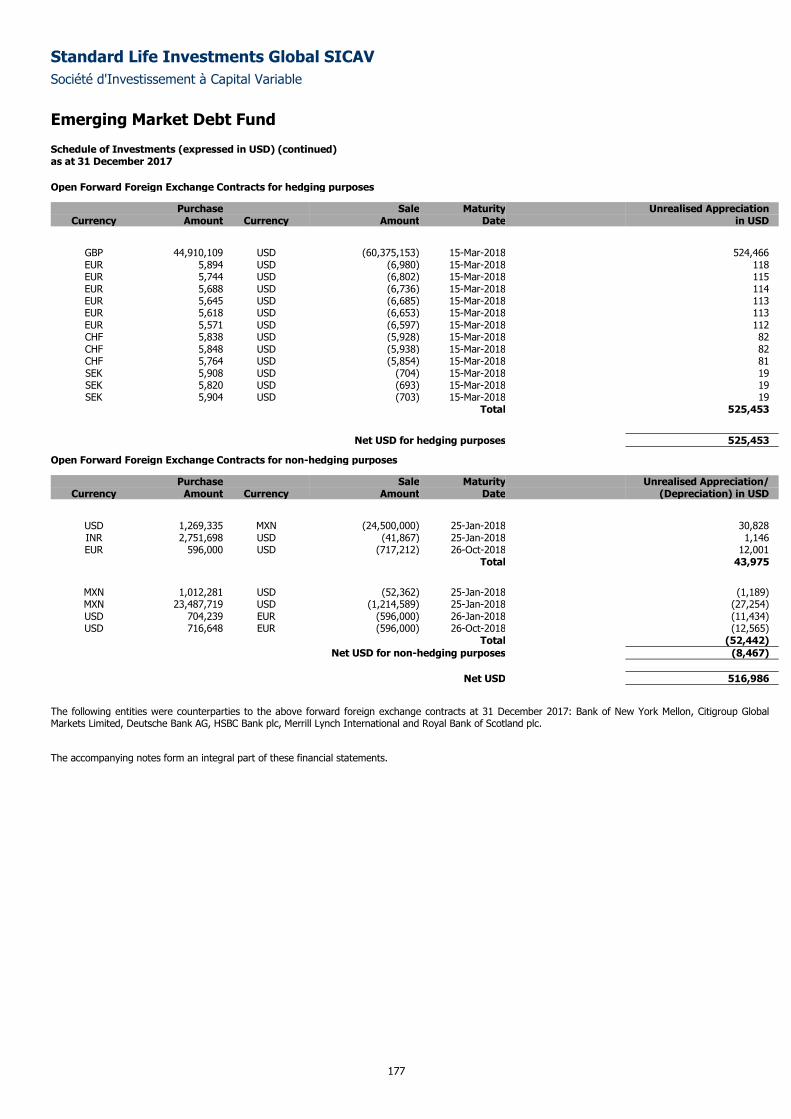
Standard Life Investments Global SICAV
Société d'Investissement à Capital Variable
Emerging Market Debt Fund Schedule of Investments (expressed in USD) (continued) as at 31 December 2017
177
Open Forward Foreign Exchange Contracts for hedging purposes
Purchase Sale Maturity Unrealised Appreciation Currency Amount Currency Amount Date in USD
GBP 44,910,109 USD (60,375,153) 15-Mar-2018 524,466 EUR 5,894 USD (6,980) 15-Mar-2018 118 EUR 5,744 USD (6,802) 15-Mar-2018 115 EUR 5,688 USD (6,736) 15-Mar-2018 114 EUR 5,645 USD (6,685) 15-Mar-2018 113 EUR 5,618 USD (6,653) 15-Mar-2018 113 EUR 5,571 USD (6,597) 15-Mar-2018 112 CHF 5,838 USD (5,928) 15-Mar-2018 82 CHF 5,848 USD (5,938) 15-Mar-2018 82 CHF 5,764 USD (5,854) 15-Mar-2018 81 SEK 5,908 USD (704) 15-Mar-2018 19 SEK 5,820 USD (693) 15-Mar-2018 19 SEK 5,904 USD (703) 15-Mar-2018 19
Total 525,453
Net USD for hedging purposes 525,453
Open Forward Foreign Exchange Contracts for non-hedging purposes
Purchase Sale Maturity Unrealised Appreciation/ Currency Amount Currency Amount Date (Depreciation) in USD
USD 1,269,335 MXN (24,500,000) 25-Jan-2018 30,828 INR 2,751,698 USD (41,867) 25-Jan-2018 1,146 EUR 596,000 USD (717,212) 26-Oct-2018 12,001
Total 43,975
MXN 1,012,281 USD (52,362) 25-Jan-2018 (1,189) MXN 23,487,719 USD (1,214,589) 25-Jan-2018 (27,254) USD 704,239 EUR (596,000) 26-Jan-2018 (11,434) USD 716,648 EUR (596,000) 26-Oct-2018 (12,565)
Total (52,442)
Net USD for non-hedging purposes (8,467)
Net USD 516,986
The following entities were counterparties to the above forward foreign exchange contracts at 31 December 2017: Bank of New York Mellon, Citigroup Global Markets Limited, Deutsche Bank AG, HSBC Bank plc, Merrill Lynch International and Royal Bank of Scotland plc.
The accompanying notes form an integral part of these financial statements.
Standard Life Investments Global SICAV
Société d'Investissement à Capital Variable
178
Emerging Market Local Currency Debt Fund
Sub-fund Objective and Investment Policy
The objective of the Sub-fund is to provide a return from capital appreciation, emerging market foreign currency appreciation and income. The Sub-fund will
achieve this through primarily investing in emerging market foreign currency and bond securities issued by Emerging Market countries and companies listed
on an emerging market stock exchange or which carry out a substantial part of the operations in emerging market countries, denominated in local currency.
The Sub-fund may also invest in other transferable securities, money-market instruments, deposits, cash and near cash, derivatives (including currency
forwards, interest rate and credit default swaps) and collective investment schemes. The Sub-fund may, subject to and in accordance with the UCI Law and
applicable CSSF circulars, use derivative contracts for the purpose of meeting its investment objective and for efficient portfolio management (including
hedging).
Performance Review
The Sub-fund returned 13.11% over the period compared to the JP Morgan GBI-EM Global Diversified Composite index return of 15.21%.*
The single biggest contributor to performance was our zero-weighting in Turkey. The country remains on a moderately deteriorating trajectory according to
our fundamental analysis, while political risk remains very much to the fore. An overweight position in Indonesia also proved beneficial, while our long
exposure to India made a sizeable relative contribution.
Less positive was an overweight position in Mexico. Investors have been focusing heavily on the dangers surrounding NAFTA negotiations; however, we
believe there are positive economic trends at play in the country and that its local bonds and the peso offer value. Our underweight exposure to South
Africa also cost performance, particularly towards the end of the reporting period when investors welcomed the appointment of Cyril Ramaphosa as leader
of the ANC. Security selection in Argentina was also a negative contributor. While we hold an overweight position in Argentina’s sovereign bonds our
exposure is concentrated at the short end of the yield curve, which underperformed relative to the long end.
*Sub-fund performance has been calculated over the stated period on the share price performance basis, based on the institutional share class (D
Accumulation) and net of fees. Please note the index return is quoted gross and contains no adjustment for fees. The sub-fund performance will also be
impacted by any pricing basis changes, made under our single swinging price policy. More information on our swinging price approach can be found in note
8 of the Financial Statements.
Outlook
We retain our view that the outlook is positive for emerging market (EM) local currency assets in 2018. Inflation remains under control in EM, and output
gaps remain large enough in many places that, even though growth is beginning to recover, rate hikes should not be required. There remain honourable
exceptions to this rule, and we think monetary policy changes in Eastern Europe are likely, although currency strength could give attractive returns to
investors in this region. Real yields in EM remain high (far higher than in developed markets) so, as a group, yields should be able to withstand some rises
in core rates as long as the economic environment remains positive.
Please note that the commitment approach has been used for risk measurement and calculation of global exposure for this Sub-fund.
This Sub-fund is not authorised in Hong Kong and is not available to Hong Kong residents.
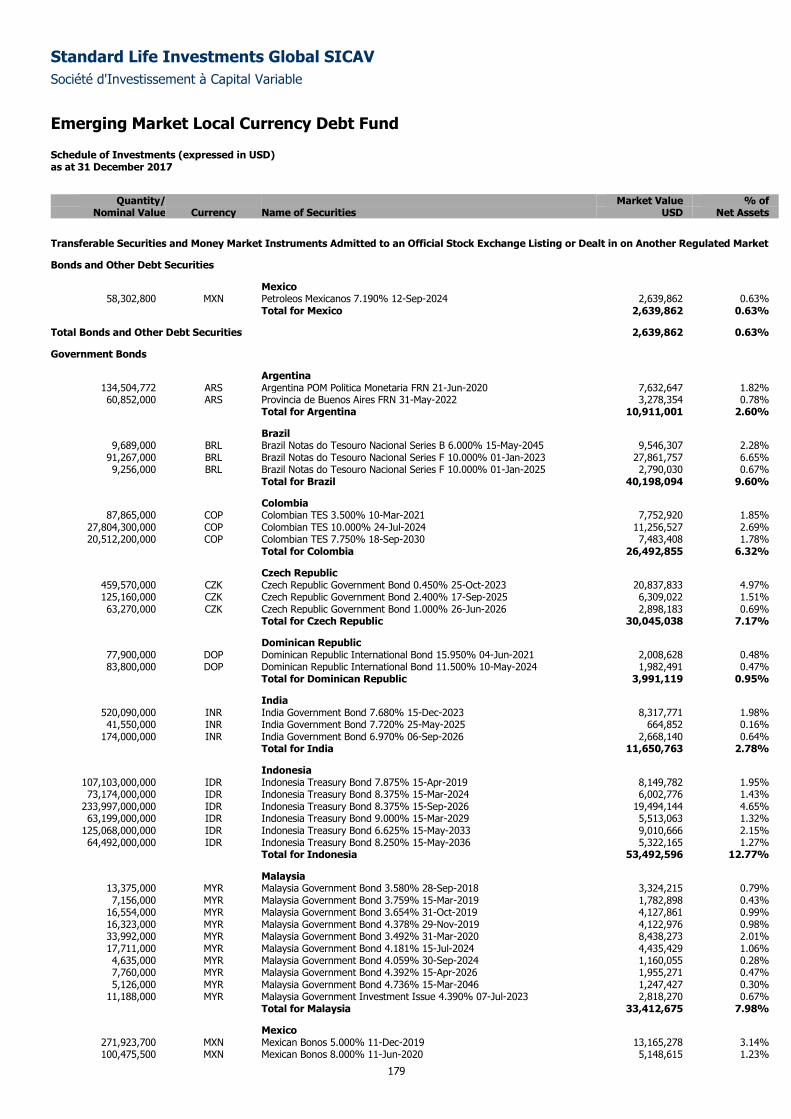
Standard Life Investments Global SICAV
Société d'Investissement à Capital Variable
Emerging Market Local Currency Debt Fund
Schedule of Investments (expressed in USD) as at 31 December 2017
179
Quantity/ Market Value % of
Nominal Value Currency Name of Securities USD Net Assets
Transferable Securities and Money Market Instruments Admitted to an Official Stock Exchange Listing or Dealt in on Another Regulated Market
Bonds and Other Debt Securities
Mexico 58,302,800 MXN Petroleos Mexicanos 7.190% 12-Sep-2024 2,639,862 0.63%
Total for Mexico 2,639,862 0.63%
Total Bonds and Other Debt Securities 2,639,862 0.63%
Government Bonds
Argentina 134,504,772 ARS Argentina POM Politica Monetaria FRN 21-Jun-2020 7,632,647 1.82% 60,852,000 ARS Provincia de Buenos Aires FRN 31-May-2022 3,278,354 0.78%
Total for Argentina 10,911,001 2.60%
Brazil 9,689,000 BRL Brazil Notas do Tesouro Nacional Series B 6.000% 15-May-2045 9,546,307 2.28%
91,267,000 BRL Brazil Notas do Tesouro Nacional Series F 10.000% 01-Jan-2023 27,861,757 6.65% 9,256,000 BRL Brazil Notas do Tesouro Nacional Series F 10.000% 01-Jan-2025 2,790,030 0.67%
Total for Brazil 40,198,094 9.60%
Colombia 87,865,000 COP Colombian TES 3.500% 10-Mar-2021 7,752,920 1.85%
27,804,300,000 COP Colombian TES 10.000% 24-Jul-2024 11,256,527 2.69% 20,512,200,000 COP Colombian TES 7.750% 18-Sep-2030 7,483,408 1.78%
Total for Colombia 26,492,855 6.32%
Czech Republic 459,570,000 CZK Czech Republic Government Bond 0.450% 25-Oct-2023 20,837,833 4.97% 125,160,000 CZK Czech Republic Government Bond 2.400% 17-Sep-2025 6,309,022 1.51% 63,270,000 CZK Czech Republic Government Bond 1.000% 26-Jun-2026 2,898,183 0.69%
Total for Czech Republic 30,045,038 7.17%
Dominican Republic 77,900,000 DOP Dominican Republic International Bond 15.950% 04-Jun-2021 2,008,628 0.48% 83,800,000 DOP Dominican Republic International Bond 11.500% 10-May-2024 1,982,491 0.47%
Total for Dominican Republic 3,991,119 0.95%
India 520,090,000 INR India Government Bond 7.680% 15-Dec-2023 8,317,771 1.98% 41,550,000 INR India Government Bond 7.720% 25-May-2025 664,852 0.16%
174,000,000 INR India Government Bond 6.970% 06-Sep-2026 2,668,140 0.64% Total for India 11,650,763 2.78%
Indonesia 107,103,000,000 IDR Indonesia Treasury Bond 7.875% 15-Apr-2019 8,149,782 1.95% 73,174,000,000 IDR Indonesia Treasury Bond 8.375% 15-Mar-2024 6,002,776 1.43%
233,997,000,000 IDR Indonesia Treasury Bond 8.375% 15-Sep-2026 19,494,144 4.65% 63,199,000,000 IDR Indonesia Treasury Bond 9.000% 15-Mar-2029 5,513,063 1.32%
125,068,000,000 IDR Indonesia Treasury Bond 6.625% 15-May-2033 9,010,666 2.15% 64,492,000,000 IDR Indonesia Treasury Bond 8.250% 15-May-2036 5,322,165 1.27%
Total for Indonesia 53,492,596 12.77%
Malaysia 13,375,000 MYR Malaysia Government Bond 3.580% 28-Sep-2018 3,324,215 0.79% 7,156,000 MYR Malaysia Government Bond 3.759% 15-Mar-2019 1,782,898 0.43%
16,554,000 MYR Malaysia Government Bond 3.654% 31-Oct-2019 4,127,861 0.99% 16,323,000 MYR Malaysia Government Bond 4.378% 29-Nov-2019 4,122,976 0.98% 33,992,000 MYR Malaysia Government Bond 3.492% 31-Mar-2020 8,438,273 2.01% 17,711,000 MYR Malaysia Government Bond 4.181% 15-Jul-2024 4,435,429 1.06% 4,635,000 MYR Malaysia Government Bond 4.059% 30-Sep-2024 1,160,055 0.28% 7,760,000 MYR Malaysia Government Bond 4.392% 15-Apr-2026 1,955,271 0.47% 5,126,000 MYR Malaysia Government Bond 4.736% 15-Mar-2046 1,247,427 0.30%
11,188,000 MYR Malaysia Government Investment Issue 4.390% 07-Jul-2023 2,818,270 0.67% Total for Malaysia 33,412,675 7.98%
Mexico 271,923,700 MXN Mexican Bonos 5.000% 11-Dec-2019 13,165,278 3.14% 100,475,500 MXN Mexican Bonos 8.000% 11-Jun-2020 5,148,615 1.23%
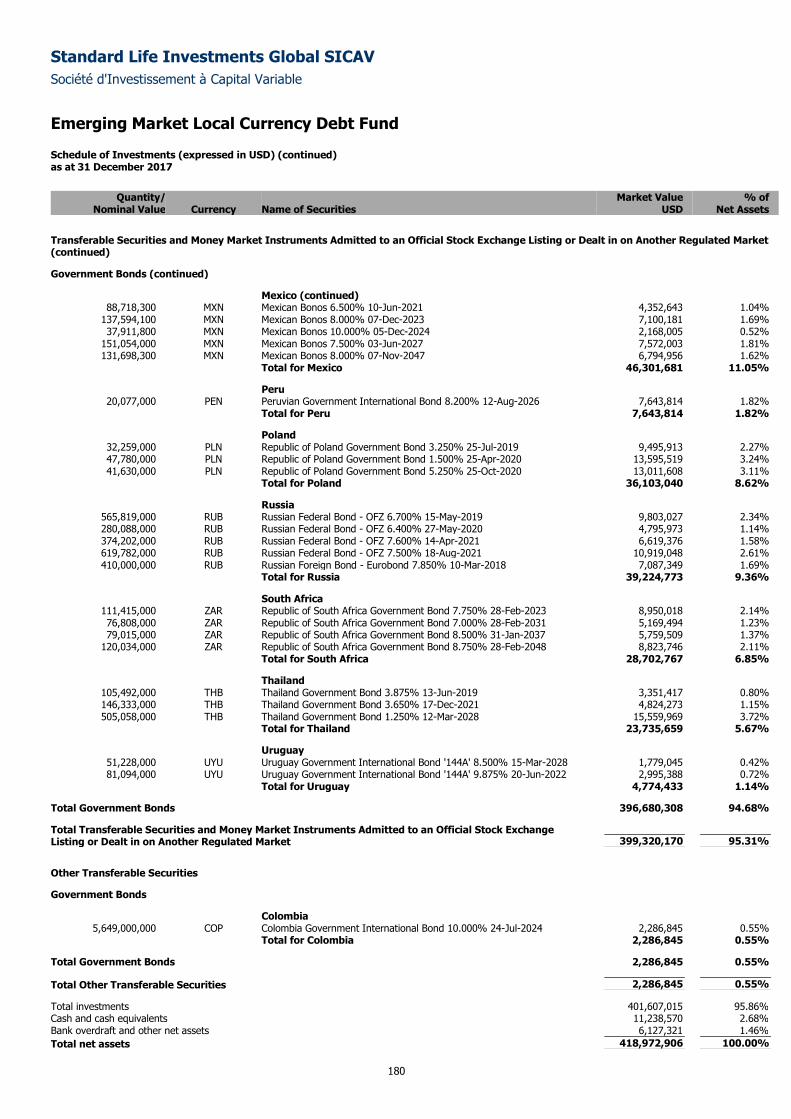
Standard Life Investments Global SICAV
Société d'Investissement à Capital Variable
Emerging Market Local Currency Debt Fund
Schedule of Investments (expressed in USD) (continued) as at 31 December 2017
180
Quantity/ Market Value % of
Nominal Value Currency Name of Securities USD Net Assets
Transferable Securities and Money Market Instruments Admitted to an Official Stock Exchange Listing or Dealt in on Another Regulated Market (continued)
Government Bonds (continued)
Mexico (continued) 88,718,300 MXN Mexican Bonos 6.500% 10-Jun-2021 4,352,643 1.04%
137,594,100 MXN Mexican Bonos 8.000% 07-Dec-2023 7,100,181 1.69% 37,911,800 MXN Mexican Bonos 10.000% 05-Dec-2024 2,168,005 0.52%
151,054,000 MXN Mexican Bonos 7.500% 03-Jun-2027 7,572,003 1.81% 131,698,300 MXN Mexican Bonos 8.000% 07-Nov-2047 6,794,956 1.62%
Total for Mexico 46,301,681 11.05%
Peru 20,077,000 PEN Peruvian Government International Bond 8.200% 12-Aug-2026 7,643,814 1.82%
Total for Peru 7,643,814 1.82%
Poland 32,259,000 PLN Republic of Poland Government Bond 3.250% 25-Jul-2019 9,495,913 2.27% 47,780,000 PLN Republic of Poland Government Bond 1.500% 25-Apr-2020 13,595,519 3.24% 41,630,000 PLN Republic of Poland Government Bond 5.250% 25-Oct-2020 13,011,608 3.11%
Total for Poland 36,103,040 8.62%
Russia 565,819,000 RUB Russian Federal Bond - OFZ 6.700% 15-May-2019 9,803,027 2.34% 280,088,000 RUB Russian Federal Bond - OFZ 6.400% 27-May-2020 4,795,973 1.14% 374,202,000 RUB Russian Federal Bond - OFZ 7.600% 14-Apr-2021 6,619,376 1.58% 619,782,000 RUB Russian Federal Bond - OFZ 7.500% 18-Aug-2021 10,919,048 2.61% 410,000,000 RUB Russian Foreign Bond - Eurobond 7.850% 10-Mar-2018 7,087,349 1.69%
Total for Russia 39,224,773 9.36%
South Africa 111,415,000 ZAR Republic of South Africa Government Bond 7.750% 28-Feb-2023 8,950,018 2.14% 76,808,000 ZAR Republic of South Africa Government Bond 7.000% 28-Feb-2031 5,169,494 1.23% 79,015,000 ZAR Republic of South Africa Government Bond 8.500% 31-Jan-2037 5,759,509 1.37%
120,034,000 ZAR Republic of South Africa Government Bond 8.750% 28-Feb-2048 8,823,746 2.11% Total for South Africa 28,702,767 6.85%
Thailand 105,492,000 THB Thailand Government Bond 3.875% 13-Jun-2019 3,351,417 0.80% 146,333,000 THB Thailand Government Bond 3.650% 17-Dec-2021 4,824,273 1.15% 505,058,000 THB Thailand Government Bond 1.250% 12-Mar-2028 15,559,969 3.72%
Total for Thailand 23,735,659 5.67%
Uruguay 51,228,000 UYU Uruguay Government International Bond '144A' 8.500% 15-Mar-2028 1,779,045 0.42% 81,094,000 UYU Uruguay Government International Bond '144A' 9.875% 20-Jun-2022 2,995,388 0.72%
Total for Uruguay 4,774,433 1.14%
Total Government Bonds 396,680,308 94.68%
Total Transferable Securities and Money Market Instruments Admitted to an Official Stock Exchange Listing or Dealt in on Another Regulated Market 399,320,170 95.31%
Other Transferable Securities
Government Bonds
Colombia 5,649,000,000 COP Colombia Government International Bond 10.000% 24-Jul-2024 2,286,845 0.55%
Total for Colombia 2,286,845 0.55%
Total Government Bonds 2,286,845 0.55%
Total Other Transferable Securities 2,286,845 0.55%
Total investments 401,607,015 95.86%
Cash and cash equivalents 11,238,570 2.68%
Bank overdraft and other net assets 6,127,321 1.46%
Total net assets 418,972,906 100.00%
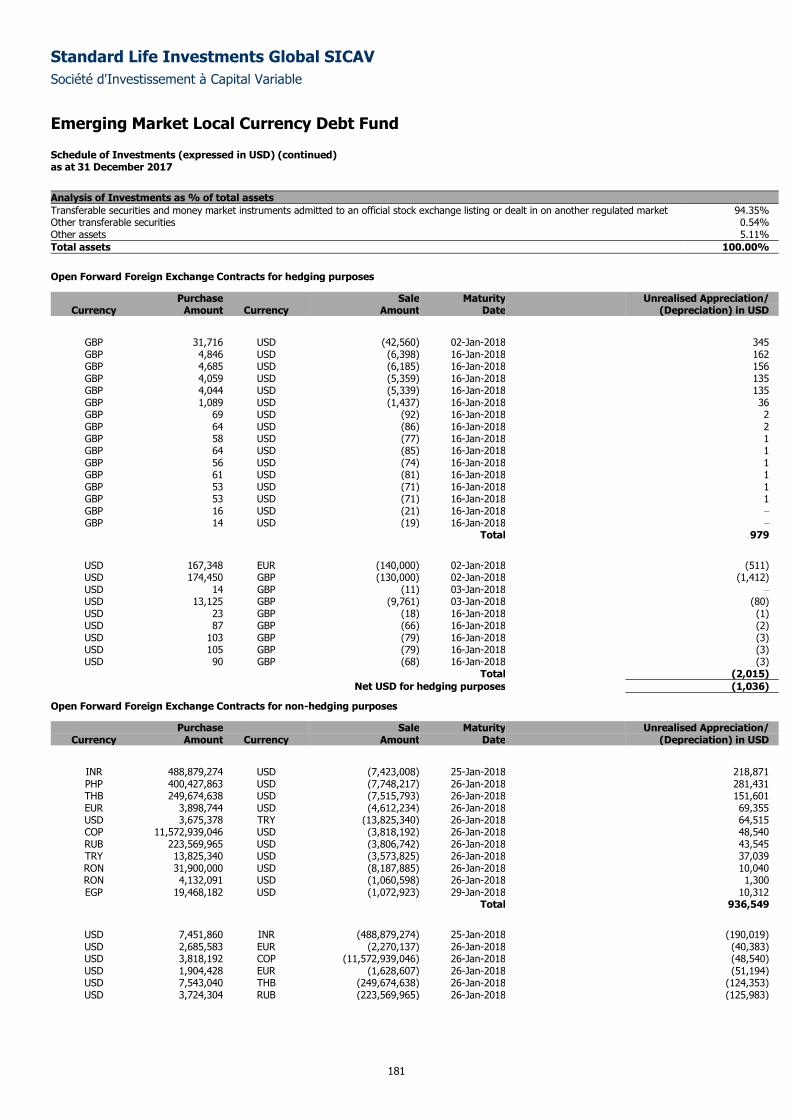
Standard Life Investments Global SICAV
Société d'Investissement à Capital Variable
Emerging Market Local Currency Debt Fund
Schedule of Investments (expressed in USD) (continued) as at 31 December 2017
181
Analysis of Investments as % of total assets
Transferable securities and money market instruments admitted to an official stock exchange listing or dealt in on another regulated market 94.35% Other transferable securities 0.54% Other assets 5.11%
Total assets 100.00%
Open Forward Foreign Exchange Contracts for hedging purposes
Purchase Sale Maturity Unrealised Appreciation/ Currency Amount Currency Amount Date (Depreciation) in USD
GBP 31,716 USD (42,560) 02-Jan-2018 345 GBP 4,846 USD (6,398) 16-Jan-2018 162 GBP 4,685 USD (6,185) 16-Jan-2018 156 GBP 4,059 USD (5,359) 16-Jan-2018 135 GBP 4,044 USD (5,339) 16-Jan-2018 135 GBP 1,089 USD (1,437) 16-Jan-2018 36 GBP 69 USD (92) 16-Jan-2018 2 GBP 64 USD (86) 16-Jan-2018 2 GBP 58 USD (77) 16-Jan-2018 1 GBP 64 USD (85) 16-Jan-2018 1 GBP 56 USD (74) 16-Jan-2018 1 GBP 61 USD (81) 16-Jan-2018 1 GBP 53 USD (71) 16-Jan-2018 1 GBP 53 USD (71) 16-Jan-2018 1 GBP 16 USD (21) 16-Jan-2018 –
GBP 14 USD (19) 16-Jan-2018 –
Total 979
USD 167,348 EUR (140,000) 02-Jan-2018 (511) USD 174,450 GBP (130,000) 02-Jan-2018 (1,412) USD 14 GBP (11) 03-Jan-2018 –
USD 13,125 GBP (9,761) 03-Jan-2018 (80) USD 23 GBP (18) 16-Jan-2018 (1) USD 87 GBP (66) 16-Jan-2018 (2) USD 103 GBP (79) 16-Jan-2018 (3) USD 105 GBP (79) 16-Jan-2018 (3) USD 90 GBP (68) 16-Jan-2018 (3)
Total (2,015)
Net USD for hedging purposes (1,036)
Open Forward Foreign Exchange Contracts for non-hedging purposes
Purchase Sale Maturity Unrealised Appreciation/ Currency Amount Currency Amount Date (Depreciation) in USD
INR 488,879,274 USD (7,423,008) 25-Jan-2018 218,871 PHP 400,427,863 USD (7,748,217) 26-Jan-2018 281,431 THB 249,674,638 USD (7,515,793) 26-Jan-2018 151,601 EUR 3,898,744 USD (4,612,234) 26-Jan-2018 69,355 USD 3,675,378 TRY (13,825,340) 26-Jan-2018 64,515 COP 11,572,939,046 USD (3,818,192) 26-Jan-2018 48,540 RUB 223,569,965 USD (3,806,742) 26-Jan-2018 43,545 TRY 13,825,340 USD (3,573,825) 26-Jan-2018 37,039 RON 31,900,000 USD (8,187,885) 26-Jan-2018 10,040 RON 4,132,091 USD (1,060,598) 26-Jan-2018 1,300 EGP 19,468,182 USD (1,072,923) 29-Jan-2018 10,312
Total 936,549
USD 7,451,860 INR (488,879,274) 25-Jan-2018 (190,019) USD 2,685,583 EUR (2,270,137) 26-Jan-2018 (40,383) USD 3,818,192 COP (11,572,939,046) 26-Jan-2018 (48,540) USD 1,904,428 EUR (1,628,607) 26-Jan-2018 (51,194) USD 7,543,040 THB (249,674,638) 26-Jan-2018 (124,353) USD 3,724,304 RUB (223,569,965) 26-Jan-2018 (125,983)
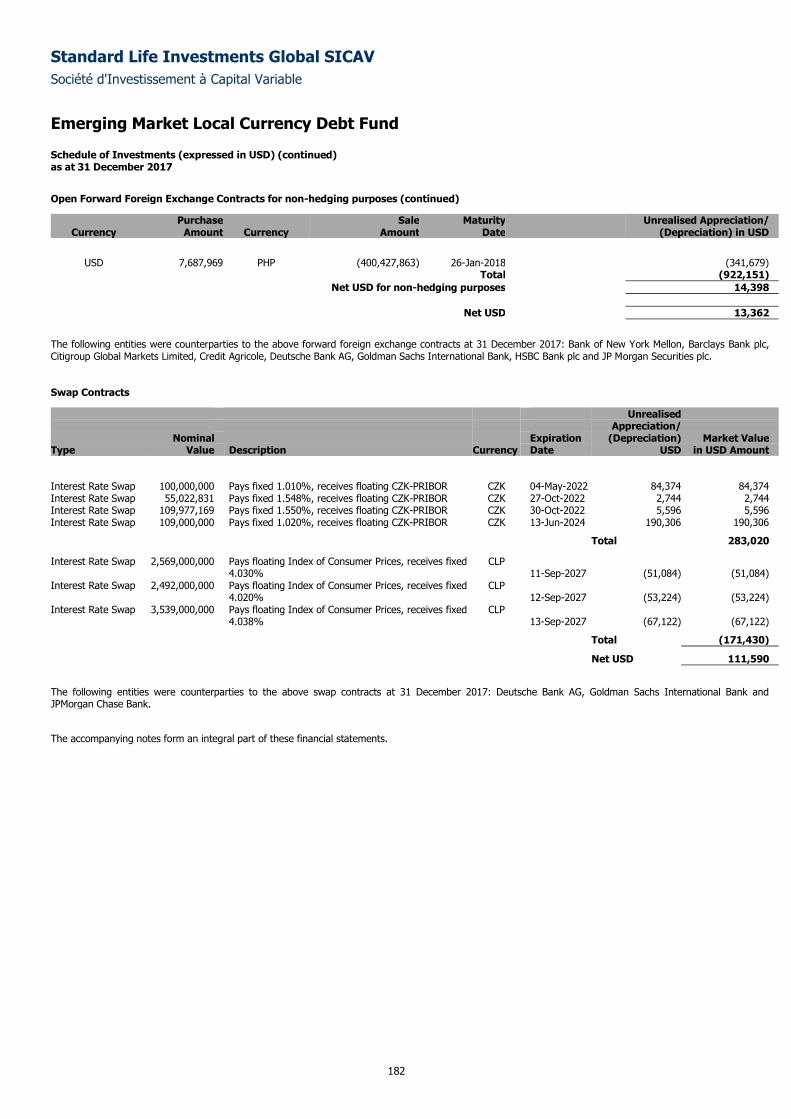
Standard Life Investments Global SICAV
Société d'Investissement à Capital Variable
Emerging Market Local Currency Debt Fund
Schedule of Investments (expressed in USD) (continued) as at 31 December 2017
182
Open Forward Foreign Exchange Contracts for non-hedging purposes (continued)
Purchase Sale Maturity Unrealised Appreciation/ Currency Amount Currency Amount Date (Depreciation) in USD
USD 7,687,969 PHP (400,427,863) 26-Jan-2018 (341,679)
Total (922,151)
Net USD for non-hedging purposes 14,398
Net USD 13,362
The following entities were counterparties to the above forward foreign exchange contracts at 31 December 2017: Bank of New York Mellon, Barclays Bank plc, Citigroup Global Markets Limited, Credit Agricole, Deutsche Bank AG, Goldman Sachs International Bank, HSBC Bank plc and JP Morgan Securities plc.
Swap Contracts
Unrealised Appreciation/ Nominal Expiration (Depreciation) Market Value Type Value Description Currency Date USD in USD Amount
Interest Rate Swap 100,000,000 Pays fixed 1.010%, receives floating CZK-PRIBOR CZK 04-May-2022 84,374 84,374 Interest Rate Swap 55,022,831 Pays fixed 1.548%, receives floating CZK-PRIBOR CZK 27-Oct-2022 2,744 2,744 Interest Rate Swap 109,977,169 Pays fixed 1.550%, receives floating CZK-PRIBOR CZK 30-Oct-2022 5,596 5,596 Interest Rate Swap 109,000,000 Pays fixed 1.020%, receives floating CZK-PRIBOR CZK 13-Jun-2024 190,306 190,306
Total 283,020
Interest Rate Swap 2,569,000,000 Pays floating Index of Consumer Prices, receives fixed 4.030%
CLP 11-Sep-2027 (51,084) (51,084)
Interest Rate Swap 2,492,000,000 Pays floating Index of Consumer Prices, receives fixed 4.020%
CLP 12-Sep-2027 (53,224) (53,224)
Interest Rate Swap 3,539,000,000 Pays floating Index of Consumer Prices, receives fixed 4.038%
CLP 13-Sep-2027 (67,122) (67,122)
Total (171,430)
Net USD 111,590
The following entities were counterparties to the above swap contracts at 31 December 2017: Deutsche Bank AG, Goldman Sachs International Bank and JPMorgan Chase Bank.
The accompanying notes form an integral part of these financial statements.
Standard Life Investments Global SICAV
Société d'Investissement à Capital Variable
183
Global High Yield Bond Fund
Sub-fund Objective and Investment Policy
The objective of the Sub-fund is to achieve long-term growth in the share price of the Sub-fund. The Sub-fund will invest primarily in global high yielding
debt securities, but may also invest in corporate bonds, government bonds and other interest bearing securities issued anywhere in the world. The Sub-fund
may invest in both investment grade and sub-investment grade corporate entities. Returns of the Sub-fund will be both through the reinvestment of income
and from capital gains.
Performance Review
The Sub-fund returned 6.82% over the period, compared with the Barclays Capital Global HY Corp Index ex-Fin with 2% Issuer Cap return of 7.97%*.
Over the year, our slightly defensive positioning relative to the benchmark detracted from returns. This positioning was primarily composed of a high cash
allocation and an underweight exposure to CCC rated bonds.
At an individual security level, a position in Time was a positive contributor due to the proposed acquisition of the company by Meredith Corporation. In
conjunction with its announcement, Meredith announced that it would refinance Time’s existing debt, which caused the price of the Time 2025 bonds to rise
sharply. Not holding PetSmart benefited performance after the company reported earnings that came in well below expectations. An overweight position in
First Quantum Minerals added to returns after copper prices improved which boosted the entire sector. Our overweight position in HCA Healthcare also
contributed positively to Fund performance.
On the downside, a holding in Frontier Communications Corporation lost ground. There were continued concerns around revenue pressures and a
disappointing merger and acquisition integration update. Despite this, we believe that creditors are well-protected as management has access to ample
balance sheet resources, and short-term liquidity remains strong. A position in Consolidated Communications also underperformed. We view Consolidated as
a differentiated wireline company. Its management team has a strong track record on asset integration and recently acquired FairPoint. Consolidated should
be able to invest in the network and drive longer-term earnings’ stability. A large underweight holding in Telecom Italia detracted from returns. This wireline
company regained ground along with the sector as a whole and Telecom Italia represents a significant position in the index.
*Sub-fund performance has been calculated over the stated period on the share price performance basis, based on the institutional share class (D
Accumulation) and net of fees. Please note the index return is quoted gross and contains no adjustment for fees. The sub-fund performance will also be
impacted by any pricing basis changes, made under our single swinging price policy. More information on our swinging price approach can be found in note
8 of the Financial Statements.
Outlook
While we believe that issuer default risk should remain contained for the time being, companies continue to struggle with lower commodity prices, weaker
global demand and elevated levels of inventory. From a risk perspective, we have reduced the Fund’s underweight in BB rated bonds, and have a
concentrated focus on identifying single B rated issuers with improving credit profiles. Furthermore, a few BBB rated bonds that offer attractive risk/return
profiles have been added to the Fund.
We have upgraded the quality of the holdings exposed to energy and have reduced our underweight in this sector. Exposure to companies that will be
challenged in a ‘lower for longer’ commodity price environment has also been reduced. We remain cautious on the lower quality part of the market. We
have selectively added to higher-quality bonds, focusing on upgrade candidates where spreads do not reflect the potential tightening. As always, we seek to
generate returns through individual credit selection and portfolio construction and aim to minimise the impact of duration on performance.
Please note that the commitment approach has been used for risk measurement and calculation of global exposure for this Sub-fund.
This Sub-fund is not authorised in Hong Kong and is not available to Hong Kong residents.
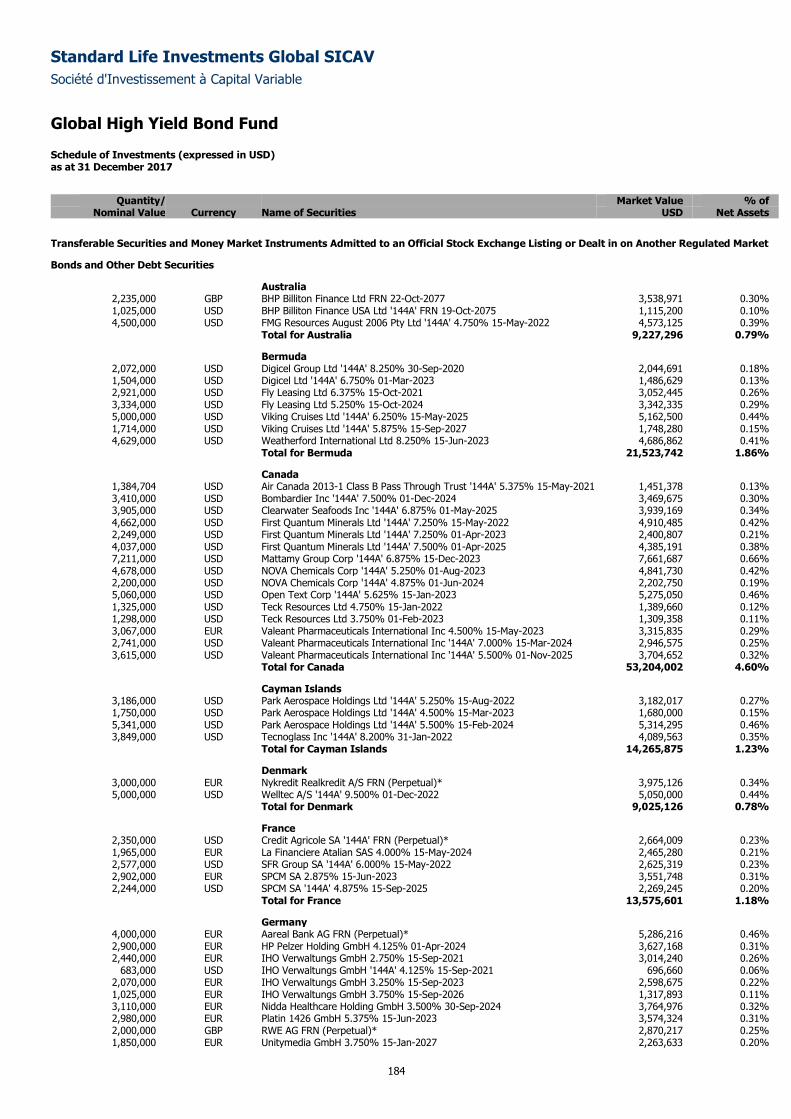
Standard Life Investments Global SICAV
Société d'Investissement à Capital Variable
Global High Yield Bond Fund
Schedule of Investments (expressed in USD) as at 31 December 2017
184
Quantity/ Market Value % of
Nominal Value Currency Name of Securities USD Net Assets
Transferable Securities and Money Market Instruments Admitted to an Official Stock Exchange Listing or Dealt in on Another Regulated Market
Bonds and Other Debt Securities
Australia 2,235,000 GBP BHP Billiton Finance Ltd FRN 22-Oct-2077 3,538,971 0.30% 1,025,000 USD BHP Billiton Finance USA Ltd '144A' FRN 19-Oct-2075 1,115,200 0.10% 4,500,000 USD FMG Resources August 2006 Pty Ltd '144A' 4.750% 15-May-2022 4,573,125 0.39%
Total for Australia 9,227,296 0.79%
Bermuda 2,072,000 USD Digicel Group Ltd '144A' 8.250% 30-Sep-2020 2,044,691 0.18% 1,504,000 USD Digicel Ltd '144A' 6.750% 01-Mar-2023 1,486,629 0.13% 2,921,000 USD Fly Leasing Ltd 6.375% 15-Oct-2021 3,052,445 0.26% 3,334,000 USD Fly Leasing Ltd 5.250% 15-Oct-2024 3,342,335 0.29% 5,000,000 USD Viking Cruises Ltd '144A' 6.250% 15-May-2025 5,162,500 0.44% 1,714,000 USD Viking Cruises Ltd '144A' 5.875% 15-Sep-2027 1,748,280 0.15% 4,629,000 USD Weatherford International Ltd 8.250% 15-Jun-2023 4,686,862 0.41%
Total for Bermuda 21,523,742 1.86%
Canada 1,384,704 USD Air Canada 2013-1 Class B Pass Through Trust '144A' 5.375% 15-May-2021 1,451,378 0.13% 3,410,000 USD Bombardier Inc '144A' 7.500% 01-Dec-2024 3,469,675 0.30% 3,905,000 USD Clearwater Seafoods Inc '144A' 6.875% 01-May-2025 3,939,169 0.34% 4,662,000 USD First Quantum Minerals Ltd '144A' 7.250% 15-May-2022 4,910,485 0.42% 2,249,000 USD First Quantum Minerals Ltd '144A' 7.250% 01-Apr-2023 2,400,807 0.21% 4,037,000 USD First Quantum Minerals Ltd '144A' 7.500% 01-Apr-2025 4,385,191 0.38% 7,211,000 USD Mattamy Group Corp '144A' 6.875% 15-Dec-2023 7,661,687 0.66% 4,678,000 USD NOVA Chemicals Corp '144A' 5.250% 01-Aug-2023 4,841,730 0.42% 2,200,000 USD NOVA Chemicals Corp '144A' 4.875% 01-Jun-2024 2,202,750 0.19% 5,060,000 USD Open Text Corp '144A' 5.625% 15-Jan-2023 5,275,050 0.46% 1,325,000 USD Teck Resources Ltd 4.750% 15-Jan-2022 1,389,660 0.12% 1,298,000 USD Teck Resources Ltd 3.750% 01-Feb-2023 1,309,358 0.11% 3,067,000 EUR Valeant Pharmaceuticals International Inc 4.500% 15-May-2023 3,315,835 0.29% 2,741,000 USD Valeant Pharmaceuticals International Inc '144A' 7.000% 15-Mar-2024 2,946,575 0.25% 3,615,000 USD Valeant Pharmaceuticals International Inc '144A' 5.500% 01-Nov-2025 3,704,652 0.32%
Total for Canada 53,204,002 4.60%
Cayman Islands 3,186,000 USD Park Aerospace Holdings Ltd '144A' 5.250% 15-Aug-2022 3,182,017 0.27% 1,750,000 USD Park Aerospace Holdings Ltd '144A' 4.500% 15-Mar-2023 1,680,000 0.15% 5,341,000 USD Park Aerospace Holdings Ltd '144A' 5.500% 15-Feb-2024 5,314,295 0.46% 3,849,000 USD Tecnoglass Inc '144A' 8.200% 31-Jan-2022 4,089,563 0.35%
Total for Cayman Islands 14,265,875 1.23%
Denmark 3,000,000 EUR Nykredit Realkredit A/S FRN (Perpetual)* 3,975,126 0.34% 5,000,000 USD Welltec A/S '144A' 9.500% 01-Dec-2022 5,050,000 0.44%
Total for Denmark 9,025,126 0.78%
France 2,350,000 USD Credit Agricole SA '144A' FRN (Perpetual)* 2,664,009 0.23% 1,965,000 EUR La Financiere Atalian SAS 4.000% 15-May-2024 2,465,280 0.21% 2,577,000 USD SFR Group SA '144A' 6.000% 15-May-2022 2,625,319 0.23% 2,902,000 EUR SPCM SA 2.875% 15-Jun-2023 3,551,748 0.31% 2,244,000 USD SPCM SA '144A' 4.875% 15-Sep-2025 2,269,245 0.20%
Total for France 13,575,601 1.18%
Germany 4,000,000 EUR Aareal Bank AG FRN (Perpetual)* 5,286,216 0.46% 2,900,000 EUR HP Pelzer Holding GmbH 4.125% 01-Apr-2024 3,627,168 0.31% 2,440,000 EUR IHO Verwaltungs GmbH 2.750% 15-Sep-2021 3,014,240 0.26%
683,000 USD IHO Verwaltungs GmbH '144A' 4.125% 15-Sep-2021 696,660 0.06% 2,070,000 EUR IHO Verwaltungs GmbH 3.250% 15-Sep-2023 2,598,675 0.22% 1,025,000 EUR IHO Verwaltungs GmbH 3.750% 15-Sep-2026 1,317,893 0.11% 3,110,000 EUR Nidda Healthcare Holding GmbH 3.500% 30-Sep-2024 3,764,976 0.32% 2,980,000 EUR Platin 1426 GmbH 5.375% 15-Jun-2023 3,574,324 0.31% 2,000,000 GBP RWE AG FRN (Perpetual)* 2,870,217 0.25% 1,850,000 EUR Unitymedia GmbH 3.750% 15-Jan-2027 2,263,633 0.20%
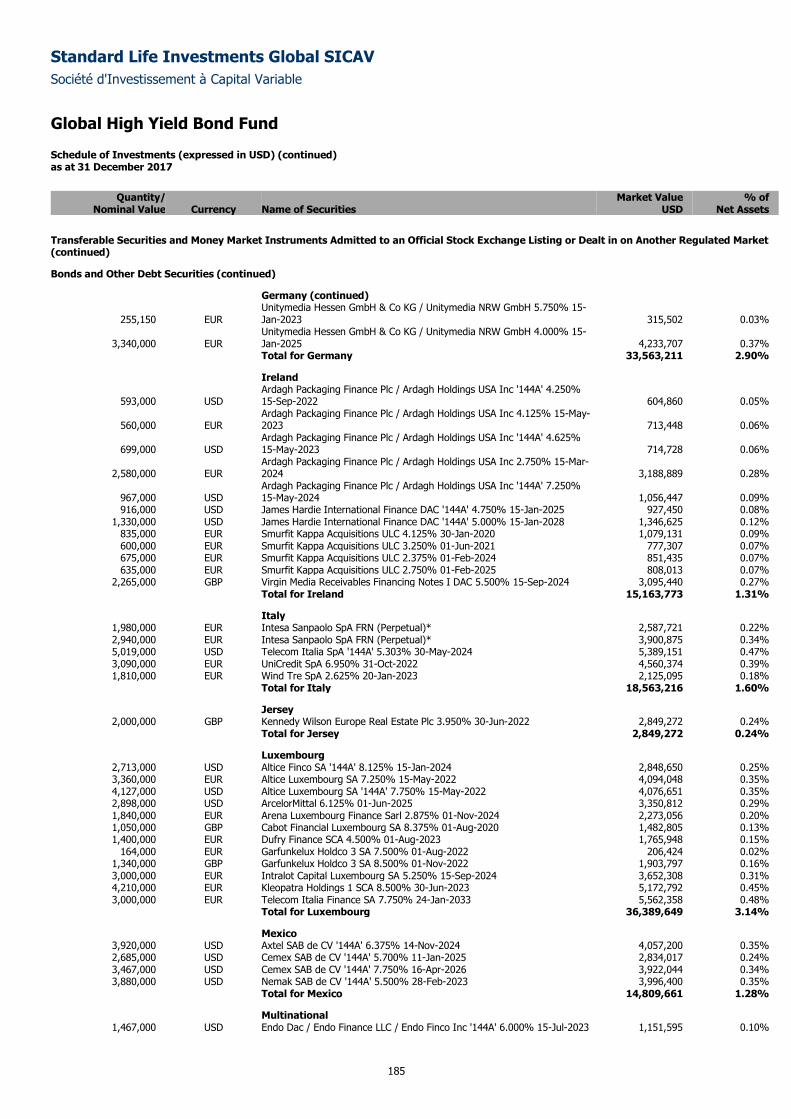
Standard Life Investments Global SICAV
Société d'Investissement à Capital Variable
Global High Yield Bond Fund
Schedule of Investments (expressed in USD) (continued) as at 31 December 2017
185
Quantity/ Market Value % of
Nominal Value Currency Name of Securities USD Net Assets
Transferable Securities and Money Market Instruments Admitted to an Official Stock Exchange Listing or Dealt in on Another Regulated Market (continued)
Bonds and Other Debt Securities (continued)
Germany (continued)
255,150 EUR Unitymedia Hessen GmbH & Co KG / Unitymedia NRW GmbH 5.750% 15-Jan-2023 315,502 0.03%
3,340,000 EUR Unitymedia Hessen GmbH & Co KG / Unitymedia NRW GmbH 4.000% 15-Jan-2025 4,233,707 0.37%
Total for Germany 33,563,211 2.90%
Ireland
593,000 USD Ardagh Packaging Finance Plc / Ardagh Holdings USA Inc '144A' 4.250% 15-Sep-2022 604,860 0.05%
560,000 EUR Ardagh Packaging Finance Plc / Ardagh Holdings USA Inc 4.125% 15-May-2023 713,448 0.06%
699,000 USD Ardagh Packaging Finance Plc / Ardagh Holdings USA Inc '144A' 4.625% 15-May-2023 714,728 0.06%
2,580,000 EUR Ardagh Packaging Finance Plc / Ardagh Holdings USA Inc 2.750% 15-Mar-2024 3,188,889 0.28%
967,000 USD Ardagh Packaging Finance Plc / Ardagh Holdings USA Inc '144A' 7.250% 15-May-2024 1,056,447 0.09%
916,000 USD James Hardie International Finance DAC '144A' 4.750% 15-Jan-2025 927,450 0.08% 1,330,000 USD James Hardie International Finance DAC '144A' 5.000% 15-Jan-2028 1,346,625 0.12%
835,000 EUR Smurfit Kappa Acquisitions ULC 4.125% 30-Jan-2020 1,079,131 0.09% 600,000 EUR Smurfit Kappa Acquisitions ULC 3.250% 01-Jun-2021 777,307 0.07% 675,000 EUR Smurfit Kappa Acquisitions ULC 2.375% 01-Feb-2024 851,435 0.07% 635,000 EUR Smurfit Kappa Acquisitions ULC 2.750% 01-Feb-2025 808,013 0.07%
2,265,000 GBP Virgin Media Receivables Financing Notes I DAC 5.500% 15-Sep-2024 3,095,440 0.27% Total for Ireland 15,163,773 1.31%
Italy 1,980,000 EUR Intesa Sanpaolo SpA FRN (Perpetual)* 2,587,721 0.22% 2,940,000 EUR Intesa Sanpaolo SpA FRN (Perpetual)* 3,900,875 0.34% 5,019,000 USD Telecom Italia SpA '144A' 5.303% 30-May-2024 5,389,151 0.47% 3,090,000 EUR UniCredit SpA 6.950% 31-Oct-2022 4,560,374 0.39% 1,810,000 EUR Wind Tre SpA 2.625% 20-Jan-2023 2,125,095 0.18%
Total for Italy 18,563,216 1.60%
Jersey 2,000,000 GBP Kennedy Wilson Europe Real Estate Plc 3.950% 30-Jun-2022 2,849,272 0.24%
Total for Jersey 2,849,272 0.24%
Luxembourg 2,713,000 USD Altice Finco SA '144A' 8.125% 15-Jan-2024 2,848,650 0.25% 3,360,000 EUR Altice Luxembourg SA 7.250% 15-May-2022 4,094,048 0.35% 4,127,000 USD Altice Luxembourg SA '144A' 7.750% 15-May-2022 4,076,651 0.35% 2,898,000 USD ArcelorMittal 6.125% 01-Jun-2025 3,350,812 0.29% 1,840,000 EUR Arena Luxembourg Finance Sarl 2.875% 01-Nov-2024 2,273,056 0.20% 1,050,000 GBP Cabot Financial Luxembourg SA 8.375% 01-Aug-2020 1,482,805 0.13% 1,400,000 EUR Dufry Finance SCA 4.500% 01-Aug-2023 1,765,948 0.15%
164,000 EUR Garfunkelux Holdco 3 SA 7.500% 01-Aug-2022 206,424 0.02% 1,340,000 GBP Garfunkelux Holdco 3 SA 8.500% 01-Nov-2022 1,903,797 0.16% 3,000,000 EUR Intralot Capital Luxembourg SA 5.250% 15-Sep-2024 3,652,308 0.31% 4,210,000 EUR Kleopatra Holdings 1 SCA 8.500% 30-Jun-2023 5,172,792 0.45% 3,000,000 EUR Telecom Italia Finance SA 7.750% 24-Jan-2033 5,562,358 0.48%
Total for Luxembourg 36,389,649 3.14%
Mexico 3,920,000 USD Axtel SAB de CV '144A' 6.375% 14-Nov-2024 4,057,200 0.35% 2,685,000 USD Cemex SAB de CV '144A' 5.700% 11-Jan-2025 2,834,017 0.24% 3,467,000 USD Cemex SAB de CV '144A' 7.750% 16-Apr-2026 3,922,044 0.34% 3,880,000 USD Nemak SAB de CV '144A' 5.500% 28-Feb-2023 3,996,400 0.35%
Total for Mexico 14,809,661 1.28%
Multinational 1,467,000 USD Endo Dac / Endo Finance LLC / Endo Finco Inc '144A' 6.000% 15-Jul-2023 1,151,595 0.10%
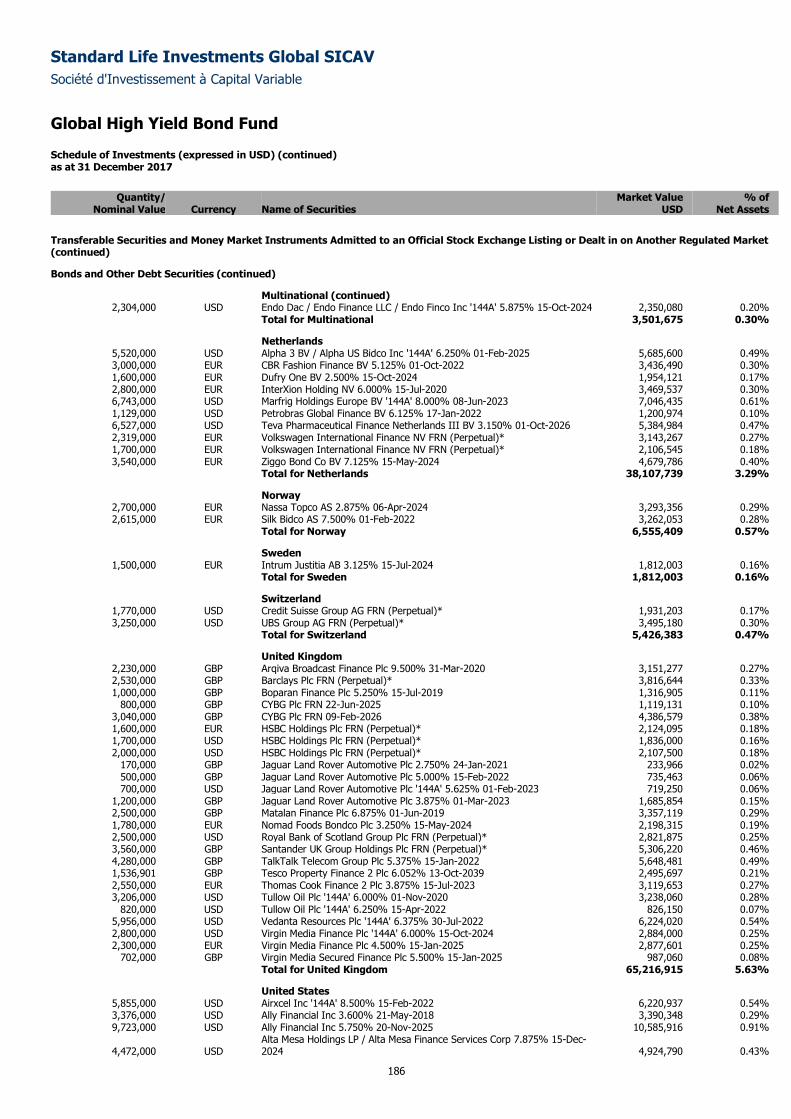
Standard Life Investments Global SICAV
Société d'Investissement à Capital Variable
Global High Yield Bond Fund
Schedule of Investments (expressed in USD) (continued) as at 31 December 2017
186
Quantity/ Market Value % of
Nominal Value Currency Name of Securities USD Net Assets
Transferable Securities and Money Market Instruments Admitted to an Official Stock Exchange Listing or Dealt in on Another Regulated Market (continued)
Bonds and Other Debt Securities (continued)
Multinational (continued) 2,304,000 USD Endo Dac / Endo Finance LLC / Endo Finco Inc '144A' 5.875% 15-Oct-2024 2,350,080 0.20%
Total for Multinational 3,501,675 0.30%
Netherlands 5,520,000 USD Alpha 3 BV / Alpha US Bidco Inc '144A' 6.250% 01-Feb-2025 5,685,600 0.49% 3,000,000 EUR CBR Fashion Finance BV 5.125% 01-Oct-2022 3,436,490 0.30% 1,600,000 EUR Dufry One BV 2.500% 15-Oct-2024 1,954,121 0.17% 2,800,000 EUR InterXion Holding NV 6.000% 15-Jul-2020 3,469,537 0.30% 6,743,000 USD Marfrig Holdings Europe BV '144A' 8.000% 08-Jun-2023 7,046,435 0.61% 1,129,000 USD Petrobras Global Finance BV 6.125% 17-Jan-2022 1,200,974 0.10% 6,527,000 USD Teva Pharmaceutical Finance Netherlands III BV 3.150% 01-Oct-2026 5,384,984 0.47% 2,319,000 EUR Volkswagen International Finance NV FRN (Perpetual)* 3,143,267 0.27% 1,700,000 EUR Volkswagen International Finance NV FRN (Perpetual)* 2,106,545 0.18% 3,540,000 EUR Ziggo Bond Co BV 7.125% 15-May-2024 4,679,786 0.40%
Total for Netherlands 38,107,739 3.29%
Norway 2,700,000 EUR Nassa Topco AS 2.875% 06-Apr-2024 3,293,356 0.29% 2,615,000 EUR Silk Bidco AS 7.500% 01-Feb-2022 3,262,053 0.28%
Total for Norway 6,555,409 0.57%
Sweden 1,500,000 EUR Intrum Justitia AB 3.125% 15-Jul-2024 1,812,003 0.16%
Total for Sweden 1,812,003 0.16%
Switzerland 1,770,000 USD Credit Suisse Group AG FRN (Perpetual)* 1,931,203 0.17% 3,250,000 USD UBS Group AG FRN (Perpetual)* 3,495,180 0.30%
Total for Switzerland 5,426,383 0.47%
United Kingdom 2,230,000 GBP Arqiva Broadcast Finance Plc 9.500% 31-Mar-2020 3,151,277 0.27% 2,530,000 GBP Barclays Plc FRN (Perpetual)* 3,816,644 0.33% 1,000,000 GBP Boparan Finance Plc 5.250% 15-Jul-2019 1,316,905 0.11%
800,000 GBP CYBG Plc FRN 22-Jun-2025 1,119,131 0.10% 3,040,000 GBP CYBG Plc FRN 09-Feb-2026 4,386,579 0.38% 1,600,000 EUR HSBC Holdings Plc FRN (Perpetual)* 2,124,095 0.18% 1,700,000 USD HSBC Holdings Plc FRN (Perpetual)* 1,836,000 0.16% 2,000,000 USD HSBC Holdings Plc FRN (Perpetual)* 2,107,500 0.18%
170,000 GBP Jaguar Land Rover Automotive Plc 2.750% 24-Jan-2021 233,966 0.02% 500,000 GBP Jaguar Land Rover Automotive Plc 5.000% 15-Feb-2022 735,463 0.06% 700,000 USD Jaguar Land Rover Automotive Plc '144A' 5.625% 01-Feb-2023 719,250 0.06%
1,200,000 GBP Jaguar Land Rover Automotive Plc 3.875% 01-Mar-2023 1,685,854 0.15% 2,500,000 GBP Matalan Finance Plc 6.875% 01-Jun-2019 3,357,119 0.29% 1,780,000 EUR Nomad Foods Bondco Plc 3.250% 15-May-2024 2,198,315 0.19% 2,500,000 USD Royal Bank of Scotland Group Plc FRN (Perpetual)* 2,821,875 0.25% 3,560,000 GBP Santander UK Group Holdings Plc FRN (Perpetual)* 5,306,220 0.46% 4,280,000 GBP TalkTalk Telecom Group Plc 5.375% 15-Jan-2022 5,648,481 0.49% 1,536,901 GBP Tesco Property Finance 2 Plc 6.052% 13-Oct-2039 2,495,697 0.21% 2,550,000 EUR Thomas Cook Finance 2 Plc 3.875% 15-Jul-2023 3,119,653 0.27% 3,206,000 USD Tullow Oil Plc '144A' 6.000% 01-Nov-2020 3,238,060 0.28%
820,000 USD Tullow Oil Plc '144A' 6.250% 15-Apr-2022 826,150 0.07% 5,956,000 USD Vedanta Resources Plc '144A' 6.375% 30-Jul-2022 6,224,020 0.54% 2,800,000 USD Virgin Media Finance Plc '144A' 6.000% 15-Oct-2024 2,884,000 0.25% 2,300,000 EUR Virgin Media Finance Plc 4.500% 15-Jan-2025 2,877,601 0.25%
702,000 GBP Virgin Media Secured Finance Plc 5.500% 15-Jan-2025 987,060 0.08% Total for United Kingdom 65,216,915 5.63%
United States 5,855,000 USD Airxcel Inc '144A' 8.500% 15-Feb-2022 6,220,937 0.54% 3,376,000 USD Ally Financial Inc 3.600% 21-May-2018 3,390,348 0.29% 9,723,000 USD Ally Financial Inc 5.750% 20-Nov-2025 10,585,916 0.91%
4,472,000 USD Alta Mesa Holdings LP / Alta Mesa Finance Services Corp 7.875% 15-Dec-2024 4,924,790 0.43%
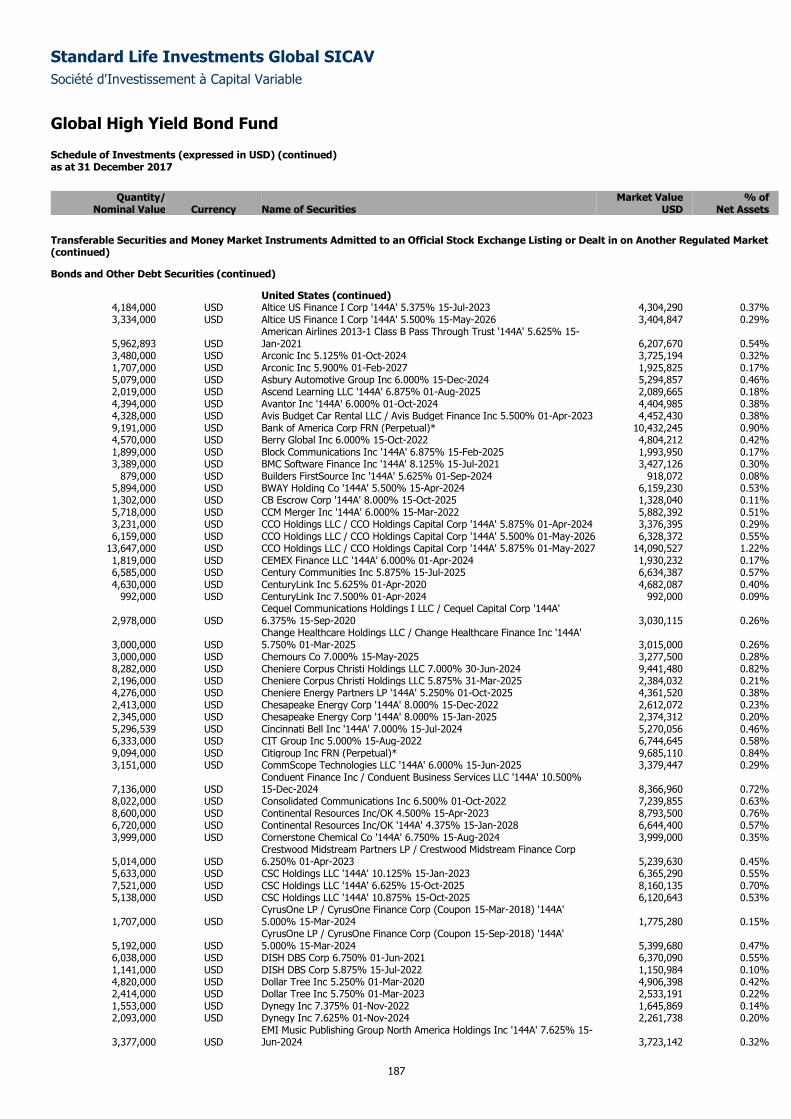
Standard Life Investments Global SICAV
Société d'Investissement à Capital Variable
Global High Yield Bond Fund
Schedule of Investments (expressed in USD) (continued) as at 31 December 2017
187
Quantity/ Market Value % of
Nominal Value Currency Name of Securities USD Net Assets
Transferable Securities and Money Market Instruments Admitted to an Official Stock Exchange Listing or Dealt in on Another Regulated Market (continued)
Bonds and Other Debt Securities (continued)
United States (continued) 4,184,000 USD Altice US Finance I Corp '144A' 5.375% 15-Jul-2023 4,304,290 0.37% 3,334,000 USD Altice US Finance I Corp '144A' 5.500% 15-May-2026 3,404,847 0.29%
5,962,893 USD American Airlines 2013-1 Class B Pass Through Trust '144A' 5.625% 15-Jan-2021 6,207,670 0.54%
3,480,000 USD Arconic Inc 5.125% 01-Oct-2024 3,725,194 0.32% 1,707,000 USD Arconic Inc 5.900% 01-Feb-2027 1,925,825 0.17% 5,079,000 USD Asbury Automotive Group Inc 6.000% 15-Dec-2024 5,294,857 0.46% 2,019,000 USD Ascend Learning LLC '144A' 6.875% 01-Aug-2025 2,089,665 0.18% 4,394,000 USD Avantor Inc '144A' 6.000% 01-Oct-2024 4,404,985 0.38% 4,328,000 USD Avis Budget Car Rental LLC / Avis Budget Finance Inc 5.500% 01-Apr-2023 4,452,430 0.38% 9,191,000 USD Bank of America Corp FRN (Perpetual)* 10,432,245 0.90% 4,570,000 USD Berry Global Inc 6.000% 15-Oct-2022 4,804,212 0.42% 1,899,000 USD Block Communications Inc '144A' 6.875% 15-Feb-2025 1,993,950 0.17% 3,389,000 USD BMC Software Finance Inc '144A' 8.125% 15-Jul-2021 3,427,126 0.30%
879,000 USD Builders FirstSource Inc '144A' 5.625% 01-Sep-2024 918,072 0.08% 5,894,000 USD BWAY Holding Co '144A' 5.500% 15-Apr-2024 6,159,230 0.53% 1,302,000 USD CB Escrow Corp '144A' 8.000% 15-Oct-2025 1,328,040 0.11% 5,718,000 USD CCM Merger Inc '144A' 6.000% 15-Mar-2022 5,882,392 0.51% 3,231,000 USD CCO Holdings LLC / CCO Holdings Capital Corp '144A' 5.875% 01-Apr-2024 3,376,395 0.29% 6,159,000 USD CCO Holdings LLC / CCO Holdings Capital Corp '144A' 5.500% 01-May-2026 6,328,372 0.55%
13,647,000 USD CCO Holdings LLC / CCO Holdings Capital Corp '144A' 5.875% 01-May-2027 14,090,527 1.22% 1,819,000 USD CEMEX Finance LLC '144A' 6.000% 01-Apr-2024 1,930,232 0.17% 6,585,000 USD Century Communities Inc 5.875% 15-Jul-2025 6,634,387 0.57% 4,630,000 USD CenturyLink Inc 5.625% 01-Apr-2020 4,682,087 0.40%
992,000 USD CenturyLink Inc 7.500% 01-Apr-2024 992,000 0.09%
2,978,000 USD Cequel Communications Holdings I LLC / Cequel Capital Corp '144A' 6.375% 15-Sep-2020 3,030,115 0.26%
3,000,000 USD Change Healthcare Holdings LLC / Change Healthcare Finance Inc '144A' 5.750% 01-Mar-2025 3,015,000 0.26%
3,000,000 USD Chemours Co 7.000% 15-May-2025 3,277,500 0.28% 8,282,000 USD Cheniere Corpus Christi Holdings LLC 7.000% 30-Jun-2024 9,441,480 0.82% 2,196,000 USD Cheniere Corpus Christi Holdings LLC 5.875% 31-Mar-2025 2,384,032 0.21% 4,276,000 USD Cheniere Energy Partners LP '144A' 5.250% 01-Oct-2025 4,361,520 0.38% 2,413,000 USD Chesapeake Energy Corp '144A' 8.000% 15-Dec-2022 2,612,072 0.23% 2,345,000 USD Chesapeake Energy Corp '144A' 8.000% 15-Jan-2025 2,374,312 0.20% 5,296,539 USD Cincinnati Bell Inc '144A' 7.000% 15-Jul-2024 5,270,056 0.46% 6,333,000 USD CIT Group Inc 5.000% 15-Aug-2022 6,744,645 0.58% 9,094,000 USD Citigroup Inc FRN (Perpetual)* 9,685,110 0.84% 3,151,000 USD CommScope Technologies LLC '144A' 6.000% 15-Jun-2025 3,379,447 0.29%
7,136,000 USD Conduent Finance Inc / Conduent Business Services LLC '144A' 10.500% 15-Dec-2024 8,366,960 0.72%
8,022,000 USD Consolidated Communications Inc 6.500% 01-Oct-2022 7,239,855 0.63% 8,600,000 USD Continental Resources Inc/OK 4.500% 15-Apr-2023 8,793,500 0.76% 6,720,000 USD Continental Resources Inc/OK '144A' 4.375% 15-Jan-2028 6,644,400 0.57% 3,999,000 USD Cornerstone Chemical Co '144A' 6.750% 15-Aug-2024 3,999,000 0.35%
5,014,000 USD Crestwood Midstream Partners LP / Crestwood Midstream Finance Corp 6.250% 01-Apr-2023 5,239,630 0.45%
5,633,000 USD CSC Holdings LLC '144A' 10.125% 15-Jan-2023 6,365,290 0.55% 7,521,000 USD CSC Holdings LLC '144A' 6.625% 15-Oct-2025 8,160,135 0.70% 5,138,000 USD CSC Holdings LLC '144A' 10.875% 15-Oct-2025 6,120,643 0.53%
1,707,000 USD CyrusOne LP / CyrusOne Finance Corp (Coupon 15-Mar-2018) '144A' 5.000% 15-Mar-2024 1,775,280 0.15%
5,192,000 USD CyrusOne LP / CyrusOne Finance Corp (Coupon 15-Sep-2018) '144A' 5.000% 15-Mar-2024 5,399,680 0.47%
6,038,000 USD DISH DBS Corp 6.750% 01-Jun-2021 6,370,090 0.55% 1,141,000 USD DISH DBS Corp 5.875% 15-Jul-2022 1,150,984 0.10% 4,820,000 USD Dollar Tree Inc 5.250% 01-Mar-2020 4,906,398 0.42% 2,414,000 USD Dollar Tree Inc 5.750% 01-Mar-2023 2,533,191 0.22% 1,553,000 USD Dynegy Inc 7.375% 01-Nov-2022 1,645,869 0.14% 2,093,000 USD Dynegy Inc 7.625% 01-Nov-2024 2,261,738 0.20%
3,377,000 USD EMI Music Publishing Group North America Holdings Inc '144A' 7.625% 15-Jun-2024 3,723,142 0.32%
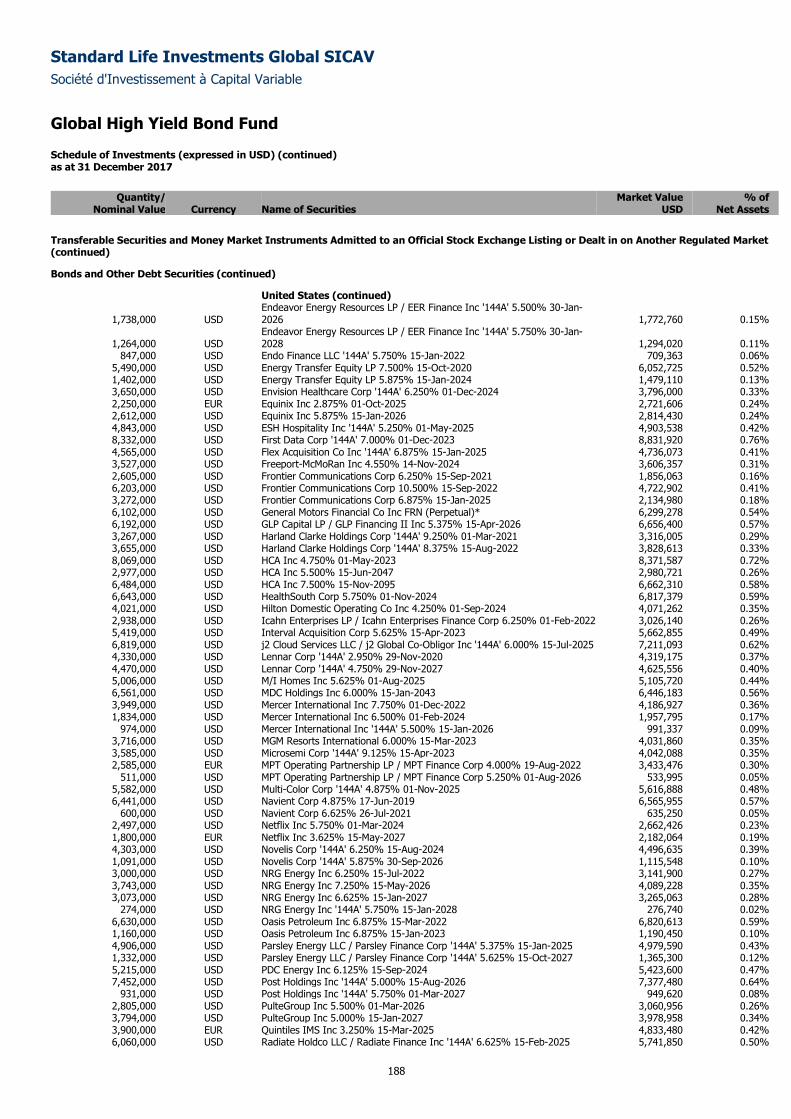
Standard Life Investments Global SICAV
Société d'Investissement à Capital Variable
Global High Yield Bond Fund
Schedule of Investments (expressed in USD) (continued) as at 31 December 2017
188
Quantity/ Market Value % of
Nominal Value Currency Name of Securities USD Net Assets
Transferable Securities and Money Market Instruments Admitted to an Official Stock Exchange Listing or Dealt in on Another Regulated Market (continued)
Bonds and Other Debt Securities (continued)
United States (continued)
1,738,000 USD Endeavor Energy Resources LP / EER Finance Inc '144A' 5.500% 30-Jan-2026 1,772,760 0.15%
1,264,000 USD Endeavor Energy Resources LP / EER Finance Inc '144A' 5.750% 30-Jan-2028 1,294,020 0.11%
847,000 USD Endo Finance LLC '144A' 5.750% 15-Jan-2022 709,363 0.06% 5,490,000 USD Energy Transfer Equity LP 7.500% 15-Oct-2020 6,052,725 0.52% 1,402,000 USD Energy Transfer Equity LP 5.875% 15-Jan-2024 1,479,110 0.13% 3,650,000 USD Envision Healthcare Corp '144A' 6.250% 01-Dec-2024 3,796,000 0.33% 2,250,000 EUR Equinix Inc 2.875% 01-Oct-2025 2,721,606 0.24% 2,612,000 USD Equinix Inc 5.875% 15-Jan-2026 2,814,430 0.24% 4,843,000 USD ESH Hospitality Inc '144A' 5.250% 01-May-2025 4,903,538 0.42% 8,332,000 USD First Data Corp '144A' 7.000% 01-Dec-2023 8,831,920 0.76% 4,565,000 USD Flex Acquisition Co Inc '144A' 6.875% 15-Jan-2025 4,736,073 0.41% 3,527,000 USD Freeport-McMoRan Inc 4.550% 14-Nov-2024 3,606,357 0.31% 2,605,000 USD Frontier Communications Corp 6.250% 15-Sep-2021 1,856,063 0.16% 6,203,000 USD Frontier Communications Corp 10.500% 15-Sep-2022 4,722,902 0.41% 3,272,000 USD Frontier Communications Corp 6.875% 15-Jan-2025 2,134,980 0.18% 6,102,000 USD General Motors Financial Co Inc FRN (Perpetual)* 6,299,278 0.54% 6,192,000 USD GLP Capital LP / GLP Financing II Inc 5.375% 15-Apr-2026 6,656,400 0.57% 3,267,000 USD Harland Clarke Holdings Corp '144A' 9.250% 01-Mar-2021 3,316,005 0.29% 3,655,000 USD Harland Clarke Holdings Corp '144A' 8.375% 15-Aug-2022 3,828,613 0.33% 8,069,000 USD HCA Inc 4.750% 01-May-2023 8,371,587 0.72% 2,977,000 USD HCA Inc 5.500% 15-Jun-2047 2,980,721 0.26% 6,484,000 USD HCA Inc 7.500% 15-Nov-2095 6,662,310 0.58% 6,643,000 USD HealthSouth Corp 5.750% 01-Nov-2024 6,817,379 0.59% 4,021,000 USD Hilton Domestic Operating Co Inc 4.250% 01-Sep-2024 4,071,262 0.35% 2,938,000 USD Icahn Enterprises LP / Icahn Enterprises Finance Corp 6.250% 01-Feb-2022 3,026,140 0.26% 5,419,000 USD Interval Acquisition Corp 5.625% 15-Apr-2023 5,662,855 0.49% 6,819,000 USD j2 Cloud Services LLC / j2 Global Co-Obligor Inc '144A' 6.000% 15-Jul-2025 7,211,093 0.62% 4,330,000 USD Lennar Corp '144A' 2.950% 29-Nov-2020 4,319,175 0.37% 4,470,000 USD Lennar Corp '144A' 4.750% 29-Nov-2027 4,625,556 0.40% 5,006,000 USD M/I Homes Inc 5.625% 01-Aug-2025 5,105,720 0.44% 6,561,000 USD MDC Holdings Inc 6.000% 15-Jan-2043 6,446,183 0.56% 3,949,000 USD Mercer International Inc 7.750% 01-Dec-2022 4,186,927 0.36% 1,834,000 USD Mercer International Inc 6.500% 01-Feb-2024 1,957,795 0.17%
974,000 USD Mercer International Inc '144A' 5.500% 15-Jan-2026 991,337 0.09% 3,716,000 USD MGM Resorts International 6.000% 15-Mar-2023 4,031,860 0.35% 3,585,000 USD Microsemi Corp '144A' 9.125% 15-Apr-2023 4,042,088 0.35% 2,585,000 EUR MPT Operating Partnership LP / MPT Finance Corp 4.000% 19-Aug-2022 3,433,476 0.30%
511,000 USD MPT Operating Partnership LP / MPT Finance Corp 5.250% 01-Aug-2026 533,995 0.05% 5,582,000 USD Multi-Color Corp '144A' 4.875% 01-Nov-2025 5,616,888 0.48% 6,441,000 USD Navient Corp 4.875% 17-Jun-2019 6,565,955 0.57%
600,000 USD Navient Corp 6.625% 26-Jul-2021 635,250 0.05% 2,497,000 USD Netflix Inc 5.750% 01-Mar-2024 2,662,426 0.23% 1,800,000 EUR Netflix Inc 3.625% 15-May-2027 2,182,064 0.19% 4,303,000 USD Novelis Corp '144A' 6.250% 15-Aug-2024 4,496,635 0.39% 1,091,000 USD Novelis Corp '144A' 5.875% 30-Sep-2026 1,115,548 0.10% 3,000,000 USD NRG Energy Inc 6.250% 15-Jul-2022 3,141,900 0.27% 3,743,000 USD NRG Energy Inc 7.250% 15-May-2026 4,089,228 0.35% 3,073,000 USD NRG Energy Inc 6.625% 15-Jan-2027 3,265,063 0.28%
274,000 USD NRG Energy Inc '144A' 5.750% 15-Jan-2028 276,740 0.02% 6,630,000 USD Oasis Petroleum Inc 6.875% 15-Mar-2022 6,820,613 0.59% 1,160,000 USD Oasis Petroleum Inc 6.875% 15-Jan-2023 1,190,450 0.10% 4,906,000 USD Parsley Energy LLC / Parsley Finance Corp '144A' 5.375% 15-Jan-2025 4,979,590 0.43% 1,332,000 USD Parsley Energy LLC / Parsley Finance Corp '144A' 5.625% 15-Oct-2027 1,365,300 0.12% 5,215,000 USD PDC Energy Inc 6.125% 15-Sep-2024 5,423,600 0.47% 7,452,000 USD Post Holdings Inc '144A' 5.000% 15-Aug-2026 7,377,480 0.64%
931,000 USD Post Holdings Inc '144A' 5.750% 01-Mar-2027 949,620 0.08% 2,805,000 USD PulteGroup Inc 5.500% 01-Mar-2026 3,060,956 0.26% 3,794,000 USD PulteGroup Inc 5.000% 15-Jan-2027 3,978,958 0.34% 3,900,000 EUR Quintiles IMS Inc 3.250% 15-Mar-2025 4,833,480 0.42% 6,060,000 USD Radiate Holdco LLC / Radiate Finance Inc '144A' 6.625% 15-Feb-2025 5,741,850 0.50%
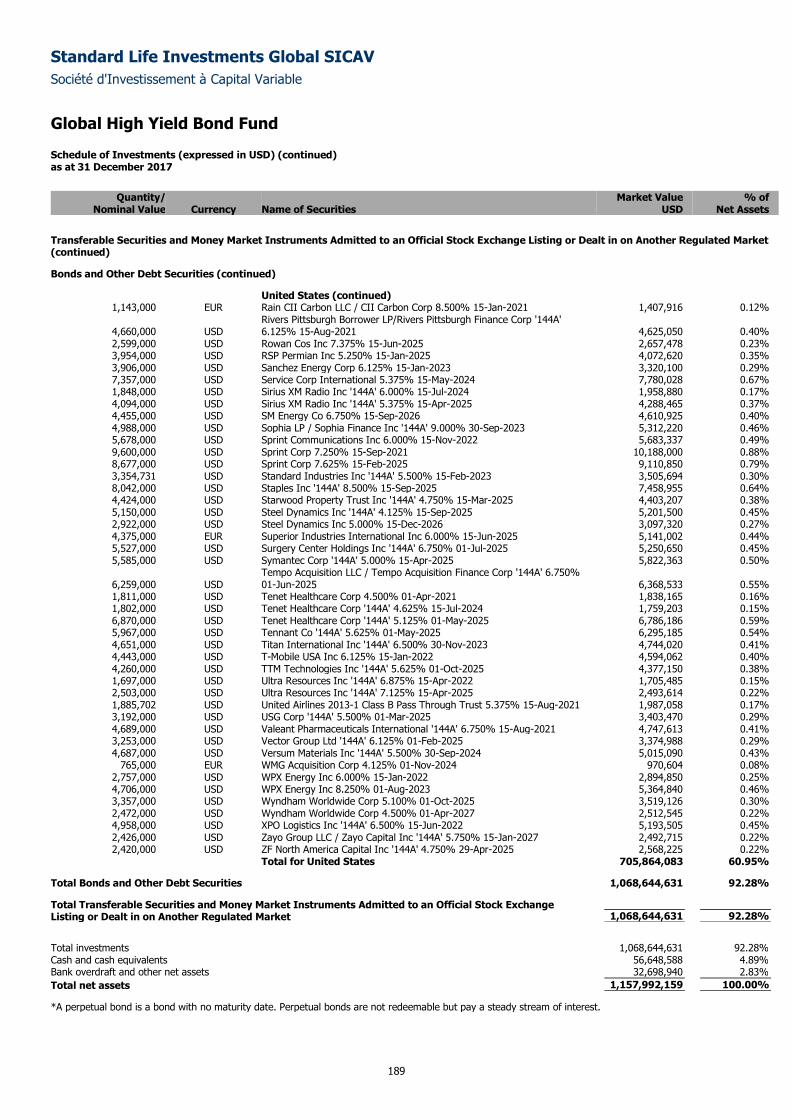
Standard Life Investments Global SICAV
Société d'Investissement à Capital Variable
Global High Yield Bond Fund
Schedule of Investments (expressed in USD) (continued) as at 31 December 2017
189
Quantity/ Market Value % of
Nominal Value Currency Name of Securities USD Net Assets
Transferable Securities and Money Market Instruments Admitted to an Official Stock Exchange Listing or Dealt in on Another Regulated Market (continued)
Bonds and Other Debt Securities (continued)
United States (continued) 1,143,000 EUR Rain CII Carbon LLC / CII Carbon Corp 8.500% 15-Jan-2021 1,407,916 0.12%
4,660,000 USD Rivers Pittsburgh Borrower LP/Rivers Pittsburgh Finance Corp '144A' 6.125% 15-Aug-2021 4,625,050 0.40%
2,599,000 USD Rowan Cos Inc 7.375% 15-Jun-2025 2,657,478 0.23% 3,954,000 USD RSP Permian Inc 5.250% 15-Jan-2025 4,072,620 0.35% 3,906,000 USD Sanchez Energy Corp 6.125% 15-Jan-2023 3,320,100 0.29% 7,357,000 USD Service Corp International 5.375% 15-May-2024 7,780,028 0.67% 1,848,000 USD Sirius XM Radio Inc '144A' 6.000% 15-Jul-2024 1,958,880 0.17% 4,094,000 USD Sirius XM Radio Inc '144A' 5.375% 15-Apr-2025 4,288,465 0.37% 4,455,000 USD SM Energy Co 6.750% 15-Sep-2026 4,610,925 0.40% 4,988,000 USD Sophia LP / Sophia Finance Inc '144A' 9.000% 30-Sep-2023 5,312,220 0.46% 5,678,000 USD Sprint Communications Inc 6.000% 15-Nov-2022 5,683,337 0.49% 9,600,000 USD Sprint Corp 7.250% 15-Sep-2021 10,188,000 0.88% 8,677,000 USD Sprint Corp 7.625% 15-Feb-2025 9,110,850 0.79% 3,354,731 USD Standard Industries Inc '144A' 5.500% 15-Feb-2023 3,505,694 0.30% 8,042,000 USD Staples Inc '144A' 8.500% 15-Sep-2025 7,458,955 0.64% 4,424,000 USD Starwood Property Trust Inc '144A' 4.750% 15-Mar-2025 4,403,207 0.38% 5,150,000 USD Steel Dynamics Inc '144A' 4.125% 15-Sep-2025 5,201,500 0.45% 2,922,000 USD Steel Dynamics Inc 5.000% 15-Dec-2026 3,097,320 0.27% 4,375,000 EUR Superior Industries International Inc 6.000% 15-Jun-2025 5,141,002 0.44% 5,527,000 USD Surgery Center Holdings Inc '144A' 6.750% 01-Jul-2025 5,250,650 0.45% 5,585,000 USD Symantec Corp '144A' 5.000% 15-Apr-2025 5,822,363 0.50%
6,259,000 USD Tempo Acquisition LLC / Tempo Acquisition Finance Corp '144A' 6.750% 01-Jun-2025 6,368,533 0.55%
1,811,000 USD Tenet Healthcare Corp 4.500% 01-Apr-2021 1,838,165 0.16% 1,802,000 USD Tenet Healthcare Corp '144A' 4.625% 15-Jul-2024 1,759,203 0.15% 6,870,000 USD Tenet Healthcare Corp '144A' 5.125% 01-May-2025 6,786,186 0.59% 5,967,000 USD Tennant Co '144A' 5.625% 01-May-2025 6,295,185 0.54% 4,651,000 USD Titan International Inc '144A' 6.500% 30-Nov-2023 4,744,020 0.41% 4,443,000 USD T-Mobile USA Inc 6.125% 15-Jan-2022 4,594,062 0.40% 4,260,000 USD TTM Technologies Inc '144A' 5.625% 01-Oct-2025 4,377,150 0.38% 1,697,000 USD Ultra Resources Inc '144A' 6.875% 15-Apr-2022 1,705,485 0.15% 2,503,000 USD Ultra Resources Inc '144A' 7.125% 15-Apr-2025 2,493,614 0.22% 1,885,702 USD United Airlines 2013-1 Class B Pass Through Trust 5.375% 15-Aug-2021 1,987,058 0.17% 3,192,000 USD USG Corp '144A' 5.500% 01-Mar-2025 3,403,470 0.29% 4,689,000 USD Valeant Pharmaceuticals International '144A' 6.750% 15-Aug-2021 4,747,613 0.41% 3,253,000 USD Vector Group Ltd '144A' 6.125% 01-Feb-2025 3,374,988 0.29% 4,687,000 USD Versum Materials Inc '144A' 5.500% 30-Sep-2024 5,015,090 0.43%
765,000 EUR WMG Acquisition Corp 4.125% 01-Nov-2024 970,604 0.08% 2,757,000 USD WPX Energy Inc 6.000% 15-Jan-2022 2,894,850 0.25% 4,706,000 USD WPX Energy Inc 8.250% 01-Aug-2023 5,364,840 0.46% 3,357,000 USD Wyndham Worldwide Corp 5.100% 01-Oct-2025 3,519,126 0.30% 2,472,000 USD Wyndham Worldwide Corp 4.500% 01-Apr-2027 2,512,545 0.22% 4,958,000 USD XPO Logistics Inc '144A' 6.500% 15-Jun-2022 5,193,505 0.45% 2,426,000 USD Zayo Group LLC / Zayo Capital Inc '144A' 5.750% 15-Jan-2027 2,492,715 0.22% 2,420,000 USD ZF North America Capital Inc '144A' 4.750% 29-Apr-2025 2,568,225 0.22%
Total for United States 705,864,083 60.95%
Total Bonds and Other Debt Securities 1,068,644,631 92.28%
Total Transferable Securities and Money Market Instruments Admitted to an Official Stock Exchange Listing or Dealt in on Another Regulated Market 1,068,644,631 92.28%
Total investments 1,068,644,631 92.28%
Cash and cash equivalents 56,648,588 4.89%
Bank overdraft and other net assets 32,698,940 2.83%
Total net assets 1,157,992,159 100.00%
*A perpetual bond is a bond with no maturity date. Perpetual bonds are not redeemable but pay a steady stream of interest.
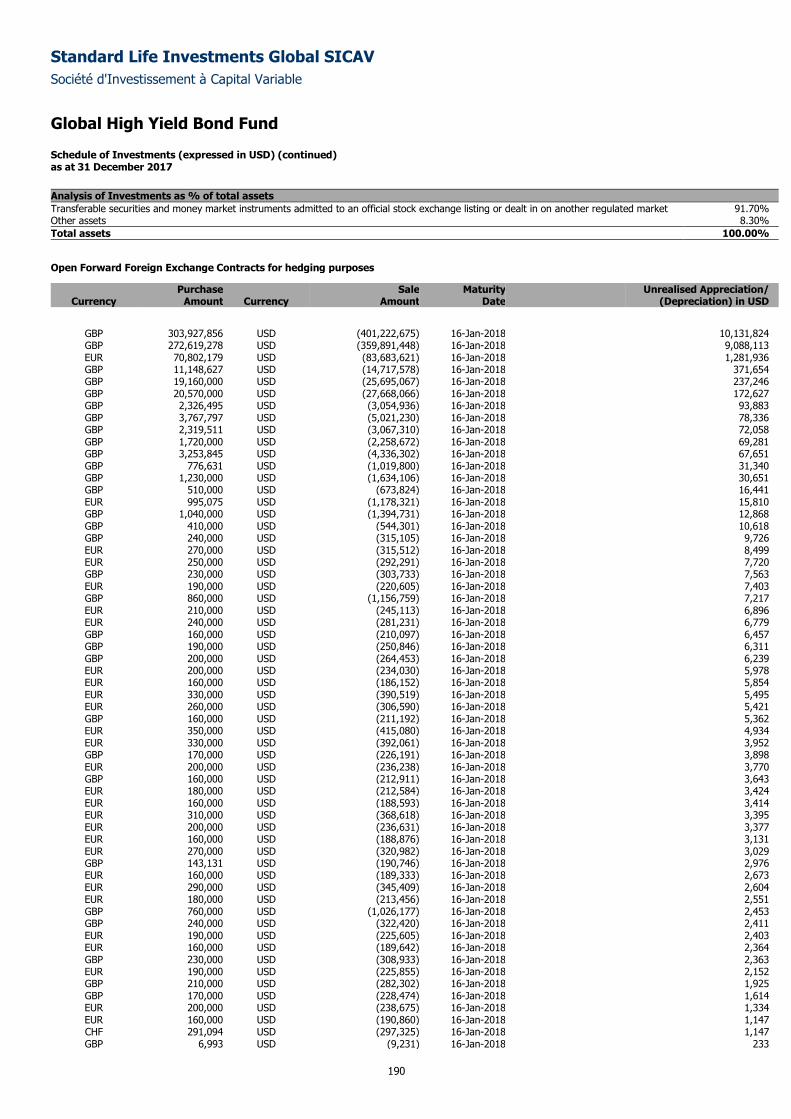
Standard Life Investments Global SICAV
Société d'Investissement à Capital Variable
Global High Yield Bond Fund
Schedule of Investments (expressed in USD) (continued) as at 31 December 2017
190
Analysis of Investments as % of total assets
Transferable securities and money market instruments admitted to an official stock exchange listing or dealt in on another regulated market 91.70% Other assets 8.30%
Total assets 100.00%
Open Forward Foreign Exchange Contracts for hedging purposes
Purchase Sale Maturity Unrealised Appreciation/ Currency Amount Currency Amount Date (Depreciation) in USD
GBP 303,927,856 USD (401,222,675) 16-Jan-2018 10,131,824 GBP 272,619,278 USD (359,891,448) 16-Jan-2018 9,088,113 EUR 70,802,179 USD (83,683,621) 16-Jan-2018 1,281,936 GBP 11,148,627 USD (14,717,578) 16-Jan-2018 371,654 GBP 19,160,000 USD (25,695,067) 16-Jan-2018 237,246 GBP 20,570,000 USD (27,668,066) 16-Jan-2018 172,627 GBP 2,326,495 USD (3,054,936) 16-Jan-2018 93,883 GBP 3,767,797 USD (5,021,230) 16-Jan-2018 78,336 GBP 2,319,511 USD (3,067,310) 16-Jan-2018 72,058 GBP 1,720,000 USD (2,258,672) 16-Jan-2018 69,281 GBP 3,253,845 USD (4,336,302) 16-Jan-2018 67,651 GBP 776,631 USD (1,019,800) 16-Jan-2018 31,340 GBP 1,230,000 USD (1,634,106) 16-Jan-2018 30,651 GBP 510,000 USD (673,824) 16-Jan-2018 16,441 EUR 995,075 USD (1,178,321) 16-Jan-2018 15,810 GBP 1,040,000 USD (1,394,731) 16-Jan-2018 12,868 GBP 410,000 USD (544,301) 16-Jan-2018 10,618 GBP 240,000 USD (315,105) 16-Jan-2018 9,726 EUR 270,000 USD (315,512) 16-Jan-2018 8,499 EUR 250,000 USD (292,291) 16-Jan-2018 7,720 GBP 230,000 USD (303,733) 16-Jan-2018 7,563 EUR 190,000 USD (220,605) 16-Jan-2018 7,403 GBP 860,000 USD (1,156,759) 16-Jan-2018 7,217 EUR 210,000 USD (245,113) 16-Jan-2018 6,896 EUR 240,000 USD (281,231) 16-Jan-2018 6,779 GBP 160,000 USD (210,097) 16-Jan-2018 6,457 GBP 190,000 USD (250,846) 16-Jan-2018 6,311 GBP 200,000 USD (264,453) 16-Jan-2018 6,239 EUR 200,000 USD (234,030) 16-Jan-2018 5,978 EUR 160,000 USD (186,152) 16-Jan-2018 5,854 EUR 330,000 USD (390,519) 16-Jan-2018 5,495 EUR 260,000 USD (306,590) 16-Jan-2018 5,421 GBP 160,000 USD (211,192) 16-Jan-2018 5,362 EUR 350,000 USD (415,080) 16-Jan-2018 4,934 EUR 330,000 USD (392,061) 16-Jan-2018 3,952 GBP 170,000 USD (226,191) 16-Jan-2018 3,898 EUR 200,000 USD (236,238) 16-Jan-2018 3,770 GBP 160,000 USD (212,911) 16-Jan-2018 3,643 EUR 180,000 USD (212,584) 16-Jan-2018 3,424 EUR 160,000 USD (188,593) 16-Jan-2018 3,414 EUR 310,000 USD (368,618) 16-Jan-2018 3,395 EUR 200,000 USD (236,631) 16-Jan-2018 3,377 EUR 160,000 USD (188,876) 16-Jan-2018 3,131 EUR 270,000 USD (320,982) 16-Jan-2018 3,029 GBP 143,131 USD (190,746) 16-Jan-2018 2,976 EUR 160,000 USD (189,333) 16-Jan-2018 2,673 EUR 290,000 USD (345,409) 16-Jan-2018 2,604 EUR 180,000 USD (213,456) 16-Jan-2018 2,551 GBP 760,000 USD (1,026,177) 16-Jan-2018 2,453 GBP 240,000 USD (322,420) 16-Jan-2018 2,411 EUR 190,000 USD (225,605) 16-Jan-2018 2,403 EUR 160,000 USD (189,642) 16-Jan-2018 2,364 GBP 230,000 USD (308,933) 16-Jan-2018 2,363 EUR 190,000 USD (225,855) 16-Jan-2018 2,152 GBP 210,000 USD (282,302) 16-Jan-2018 1,925 GBP 170,000 USD (228,474) 16-Jan-2018 1,614 EUR 200,000 USD (238,675) 16-Jan-2018 1,334 EUR 160,000 USD (190,860) 16-Jan-2018 1,147 CHF 291,094 USD (297,325) 16-Jan-2018 1,147 GBP 6,993 USD (9,231) 16-Jan-2018 233
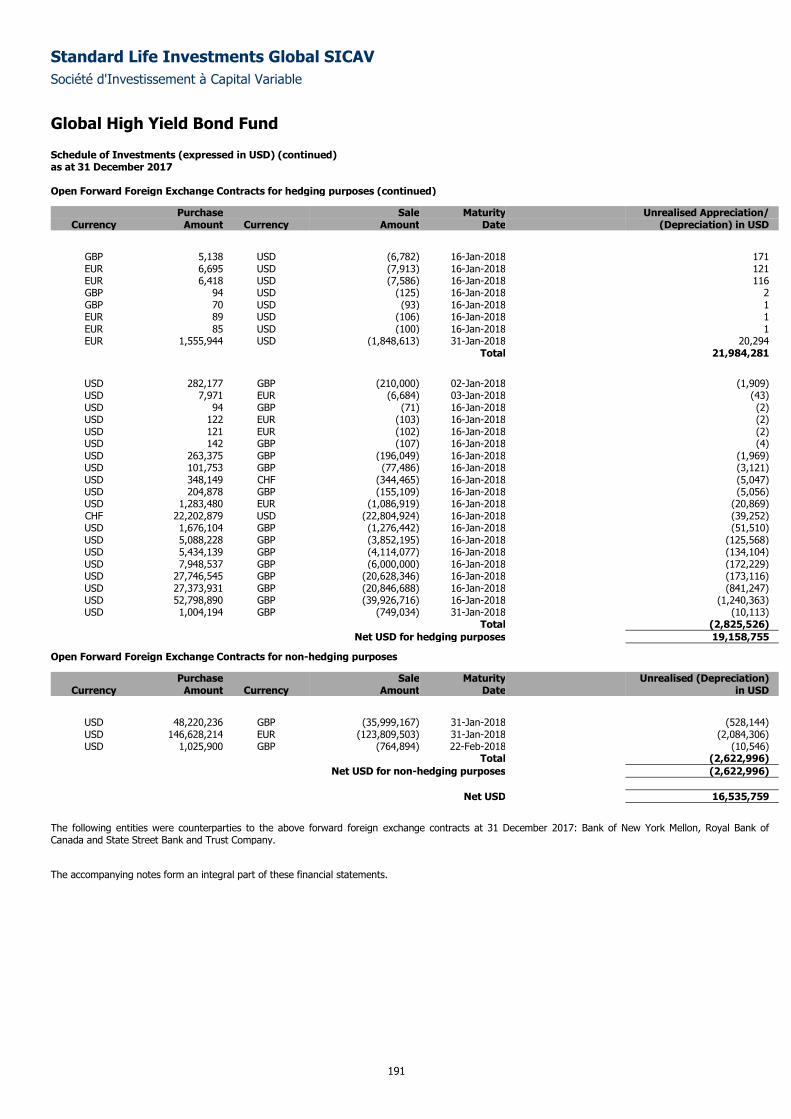
Standard Life Investments Global SICAV
Société d'Investissement à Capital Variable
Global High Yield Bond Fund
Schedule of Investments (expressed in USD) (continued) as at 31 December 2017
191
Open Forward Foreign Exchange Contracts for hedging purposes (continued)
Purchase Sale Maturity Unrealised Appreciation/ Currency Amount Currency Amount Date (Depreciation) in USD
GBP 5,138 USD (6,782) 16-Jan-2018 171 EUR 6,695 USD (7,913) 16-Jan-2018 121 EUR 6,418 USD (7,586) 16-Jan-2018 116 GBP 94 USD (125) 16-Jan-2018 2 GBP 70 USD (93) 16-Jan-2018 1 EUR 89 USD (106) 16-Jan-2018 1 EUR 85 USD (100) 16-Jan-2018 1 EUR 1,555,944 USD (1,848,613) 31-Jan-2018 20,294
Total 21,984,281
USD 282,177 GBP (210,000) 02-Jan-2018 (1,909) USD 7,971 EUR (6,684) 03-Jan-2018 (43) USD 94 GBP (71) 16-Jan-2018 (2) USD 122 EUR (103) 16-Jan-2018 (2) USD 121 EUR (102) 16-Jan-2018 (2) USD 142 GBP (107) 16-Jan-2018 (4) USD 263,375 GBP (196,049) 16-Jan-2018 (1,969) USD 101,753 GBP (77,486) 16-Jan-2018 (3,121) USD 348,149 CHF (344,465) 16-Jan-2018 (5,047) USD 204,878 GBP (155,109) 16-Jan-2018 (5,056) USD 1,283,480 EUR (1,086,919) 16-Jan-2018 (20,869) CHF 22,202,879 USD (22,804,924) 16-Jan-2018 (39,252) USD 1,676,104 GBP (1,276,442) 16-Jan-2018 (51,510) USD 5,088,228 GBP (3,852,195) 16-Jan-2018 (125,568) USD 5,434,139 GBP (4,114,077) 16-Jan-2018 (134,104) USD 7,948,537 GBP (6,000,000) 16-Jan-2018 (172,229) USD 27,746,545 GBP (20,628,346) 16-Jan-2018 (173,116) USD 27,373,931 GBP (20,846,688) 16-Jan-2018 (841,247) USD 52,798,890 GBP (39,926,716) 16-Jan-2018 (1,240,363) USD 1,004,194 GBP (749,034) 31-Jan-2018 (10,113)
Total (2,825,526)
Net USD for hedging purposes 19,158,755
Open Forward Foreign Exchange Contracts for non-hedging purposes
Purchase Sale Maturity Unrealised (Depreciation) Currency Amount Currency Amount Date in USD
USD 48,220,236 GBP (35,999,167) 31-Jan-2018 (528,144) USD 146,628,214 EUR (123,809,503) 31-Jan-2018 (2,084,306) USD 1,025,900 GBP (764,894) 22-Feb-2018 (10,546)
Total (2,622,996)
Net USD for non-hedging purposes (2,622,996)
Net USD 16,535,759
The following entities were counterparties to the above forward foreign exchange contracts at 31 December 2017: Bank of New York Mellon, Royal Bank of Canada and State Street Bank and Trust Company.
The accompanying notes form an integral part of these financial statements.
Standard Life Investments Global SICAV
Société d'Investissement à Capital Variable
192
Global Corporate Bond Fund
Sub-fund Objective and Investment Policy
The objective of the Sub-fund is to achieve long-term growth in the share price of the Sub-fund. The Sub-fund will invest primarily in global debt securities.
Holdings will principally be of investment grade bonds. The Sub-fund may also invest in government bonds, sub-investment grade debt and other interest
bearing securities issued anywhere in the world. Returns of the Sub-fund will be both through the reinvestment of income and from capital gains.
Performance Review
The Sub-fund returned 5.88% compared to the Barclays Global Aggregate Corporates (Hedged to USD) Index which returned 5.70%*.
Over the year, security selection was a significant positive for performance. There was also a positive contribution from sector allocation. Within ratings, our
off-benchmark exposure to high yield debt added to returns.
Our off-benchmark exposure to Tesco performed strongly, driven by positive valuations, improving company results within a difficult UK consumer
environment, and tenders for existing debt. Financials featured heavily in the top ten contributors to performance over the year, with positions in Bank of
America, Societe Generale, Citigroup and Intesa Sanpaolo all adding to returns. In insurance, we benefited from a tender by Prudential for one of the long-
dated bonds held in the portfolio. Our overweight exposure to a number of corporate hybrids also proved positive with bonds from Orsted and Total
performing well.
On the downside, our holding in Teva Pharmaceutical was a significant negative contributor. Not only did the company post weak quarterly results but it
was downgraded by two notches to BB from BBB- by Fitch. This means the bonds will drop out of most investment-grade indices given its average rating is
now BB+. This led to forced selling into an already weak market by investors who cannot hold high yield-rated bonds. An overweight position in Broadcom
also hurt performance as continued speculation around a bid for rival Qualcomm weighed on its bonds.
*Sub-fund performance has been calculated over the stated period on the share price performance basis, based on the institutional share class (D
Accumulation) and net of fees. Please note the index return is quoted gross and contains no adjustment for fees. The sub-fund performance will also be
impacted by any pricing basis changes, made under our single swinging price policy. More information on our swinging price approach can be found in note
8 of the Financial Statements.
Outlook
We retain a constructive view of credit markets entering 2018. Globally, economic data has been strong and inflation remains low, which is keeping the
European Central Bank’s (ECB) policy fairly loose. The passage of US tax reforms provides a stimulus for US companies and the broader economy. Progress
has also been made in the Brexit negotiations, which has lifted some of the uncertainty hanging over the UK. However, political risk remains on the agenda
with the Italian elections in March 2018 creating a potential roadblock in Europe. This is one area in which we are defensively positioned.
We continue to like subordinated bank debt and corporate hybrid bonds, as we see further spread tightening potential. Overall, we think market valuations
already reflect a very benign technical and fundamental scenario but that there is still some room for spreads to tighten. We expect the first half of the year
to be more supportive for credit spreads and underlying rates, given investors will start to focus on the run-off of the ECB’s purchasing programme closer to
2019.
Please note that the commitment approach has been used for risk measurement and calculation of global exposure for this Sub-fund.
This Sub-fund is not authorised in Hong Kong and is not available to Hong Kong residents.
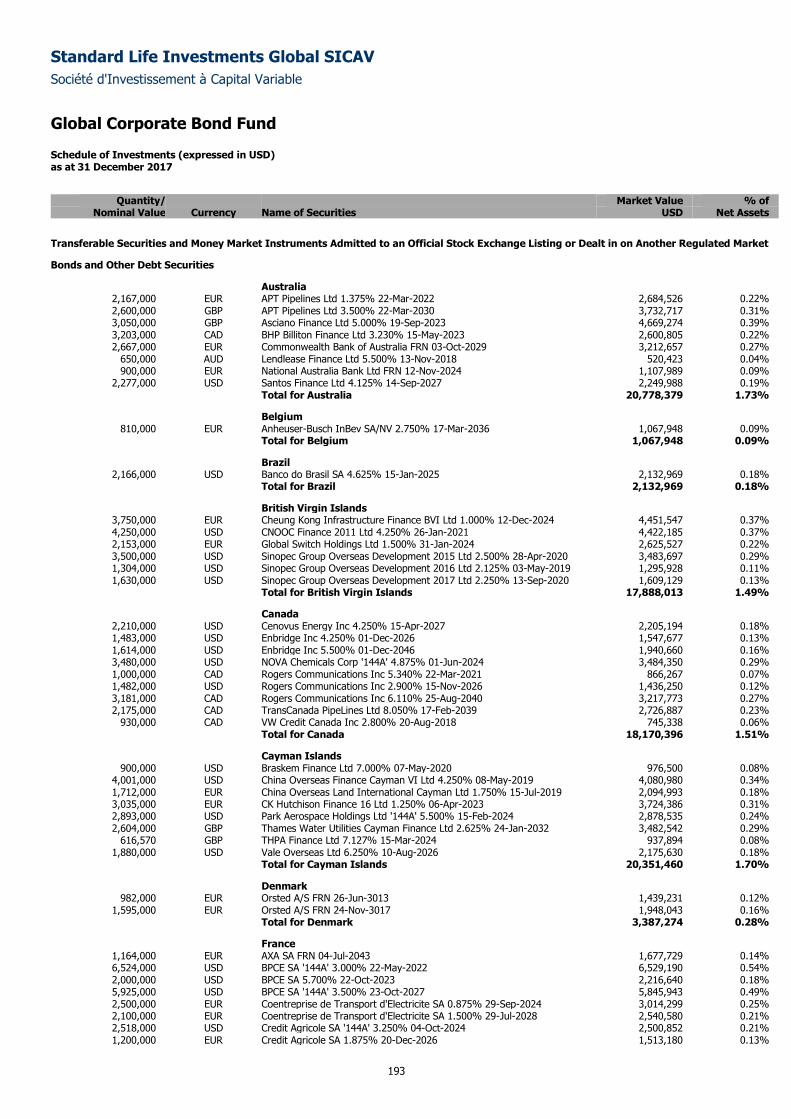
Standard Life Investments Global SICAV
Société d'Investissement à Capital Variable
Global Corporate Bond Fund
Schedule of Investments (expressed in USD) as at 31 December 2017
193
Quantity/ Market Value % of
Nominal Value Currency Name of Securities USD Net Assets
Transferable Securities and Money Market Instruments Admitted to an Official Stock Exchange Listing or Dealt in on Another Regulated Market
Bonds and Other Debt Securities
Australia 2,167,000 EUR APT Pipelines Ltd 1.375% 22-Mar-2022 2,684,526 0.22% 2,600,000 GBP APT Pipelines Ltd 3.500% 22-Mar-2030 3,732,717 0.31% 3,050,000 GBP Asciano Finance Ltd 5.000% 19-Sep-2023 4,669,274 0.39% 3,203,000 CAD BHP Billiton Finance Ltd 3.230% 15-May-2023 2,600,805 0.22% 2,667,000 EUR Commonwealth Bank of Australia FRN 03-Oct-2029 3,212,657 0.27%
650,000 AUD Lendlease Finance Ltd 5.500% 13-Nov-2018 520,423 0.04% 900,000 EUR National Australia Bank Ltd FRN 12-Nov-2024 1,107,989 0.09%
2,277,000 USD Santos Finance Ltd 4.125% 14-Sep-2027 2,249,988 0.19% Total for Australia 20,778,379 1.73%
Belgium 810,000 EUR Anheuser-Busch InBev SA/NV 2.750% 17-Mar-2036 1,067,948 0.09%
Total for Belgium 1,067,948 0.09%
Brazil 2,166,000 USD Banco do Brasil SA 4.625% 15-Jan-2025 2,132,969 0.18%
Total for Brazil 2,132,969 0.18%
British Virgin Islands 3,750,000 EUR Cheung Kong Infrastructure Finance BVI Ltd 1.000% 12-Dec-2024 4,451,547 0.37% 4,250,000 USD CNOOC Finance 2011 Ltd 4.250% 26-Jan-2021 4,422,185 0.37% 2,153,000 EUR Global Switch Holdings Ltd 1.500% 31-Jan-2024 2,625,527 0.22% 3,500,000 USD Sinopec Group Overseas Development 2015 Ltd 2.500% 28-Apr-2020 3,483,697 0.29% 1,304,000 USD Sinopec Group Overseas Development 2016 Ltd 2.125% 03-May-2019 1,295,928 0.11% 1,630,000 USD Sinopec Group Overseas Development 2017 Ltd 2.250% 13-Sep-2020 1,609,129 0.13%
Total for British Virgin Islands 17,888,013 1.49%
Canada 2,210,000 USD Cenovus Energy Inc 4.250% 15-Apr-2027 2,205,194 0.18% 1,483,000 USD Enbridge Inc 4.250% 01-Dec-2026 1,547,677 0.13% 1,614,000 USD Enbridge Inc 5.500% 01-Dec-2046 1,940,660 0.16% 3,480,000 USD NOVA Chemicals Corp '144A' 4.875% 01-Jun-2024 3,484,350 0.29% 1,000,000 CAD Rogers Communications Inc 5.340% 22-Mar-2021 866,267 0.07% 1,482,000 USD Rogers Communications Inc 2.900% 15-Nov-2026 1,436,250 0.12% 3,181,000 CAD Rogers Communications Inc 6.110% 25-Aug-2040 3,217,773 0.27% 2,175,000 CAD TransCanada PipeLines Ltd 8.050% 17-Feb-2039 2,726,887 0.23%
930,000 CAD VW Credit Canada Inc 2.800% 20-Aug-2018 745,338 0.06% Total for Canada 18,170,396 1.51%
Cayman Islands 900,000 USD Braskem Finance Ltd 7.000% 07-May-2020 976,500 0.08%
4,001,000 USD China Overseas Finance Cayman VI Ltd 4.250% 08-May-2019 4,080,980 0.34% 1,712,000 EUR China Overseas Land International Cayman Ltd 1.750% 15-Jul-2019 2,094,993 0.18% 3,035,000 EUR CK Hutchison Finance 16 Ltd 1.250% 06-Apr-2023 3,724,386 0.31% 2,893,000 USD Park Aerospace Holdings Ltd '144A' 5.500% 15-Feb-2024 2,878,535 0.24% 2,604,000 GBP Thames Water Utilities Cayman Finance Ltd 2.625% 24-Jan-2032 3,482,542 0.29%
616,570 GBP THPA Finance Ltd 7.127% 15-Mar-2024 937,894 0.08% 1,880,000 USD Vale Overseas Ltd 6.250% 10-Aug-2026 2,175,630 0.18%
Total for Cayman Islands 20,351,460 1.70%
Denmark 982,000 EUR Orsted A/S FRN 26-Jun-3013 1,439,231 0.12%
1,595,000 EUR Orsted A/S FRN 24-Nov-3017 1,948,043 0.16% Total for Denmark 3,387,274 0.28%
France 1,164,000 EUR AXA SA FRN 04-Jul-2043 1,677,729 0.14% 6,524,000 USD BPCE SA '144A' 3.000% 22-May-2022 6,529,190 0.54% 2,000,000 USD BPCE SA 5.700% 22-Oct-2023 2,216,640 0.18% 5,925,000 USD BPCE SA '144A' 3.500% 23-Oct-2027 5,845,943 0.49% 2,500,000 EUR Coentreprise de Transport d'Electricite SA 0.875% 29-Sep-2024 3,014,299 0.25% 2,100,000 EUR Coentreprise de Transport d'Electricite SA 1.500% 29-Jul-2028 2,540,580 0.21% 2,518,000 USD Credit Agricole SA '144A' 3.250% 04-Oct-2024 2,500,852 0.21% 1,200,000 EUR Credit Agricole SA 1.875% 20-Dec-2026 1,513,180 0.13%
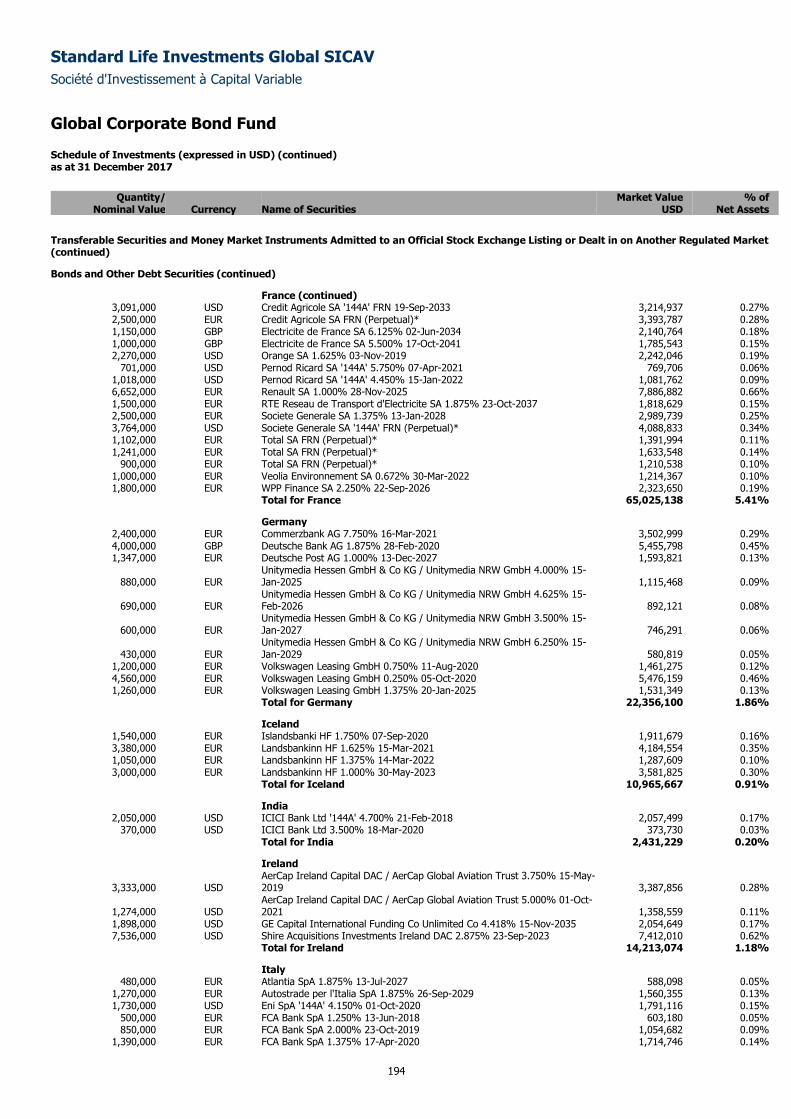
Standard Life Investments Global SICAV
Société d'Investissement à Capital Variable
Global Corporate Bond Fund
Schedule of Investments (expressed in USD) (continued) as at 31 December 2017
194
Quantity/ Market Value % of
Nominal Value Currency Name of Securities USD Net Assets
Transferable Securities and Money Market Instruments Admitted to an Official Stock Exchange Listing or Dealt in on Another Regulated Market (continued)
Bonds and Other Debt Securities (continued)
France (continued) 3,091,000 USD Credit Agricole SA '144A' FRN 19-Sep-2033 3,214,937 0.27% 2,500,000 EUR Credit Agricole SA FRN (Perpetual)* 3,393,787 0.28% 1,150,000 GBP Electricite de France SA 6.125% 02-Jun-2034 2,140,764 0.18% 1,000,000 GBP Electricite de France SA 5.500% 17-Oct-2041 1,785,543 0.15% 2,270,000 USD Orange SA 1.625% 03-Nov-2019 2,242,046 0.19%
701,000 USD Pernod Ricard SA '144A' 5.750% 07-Apr-2021 769,706 0.06% 1,018,000 USD Pernod Ricard SA '144A' 4.450% 15-Jan-2022 1,081,762 0.09% 6,652,000 EUR Renault SA 1.000% 28-Nov-2025 7,886,882 0.66% 1,500,000 EUR RTE Reseau de Transport d'Electricite SA 1.875% 23-Oct-2037 1,818,629 0.15% 2,500,000 EUR Societe Generale SA 1.375% 13-Jan-2028 2,989,739 0.25% 3,764,000 USD Societe Generale SA '144A' FRN (Perpetual)* 4,088,833 0.34% 1,102,000 EUR Total SA FRN (Perpetual)* 1,391,994 0.11% 1,241,000 EUR Total SA FRN (Perpetual)* 1,633,548 0.14%
900,000 EUR Total SA FRN (Perpetual)* 1,210,538 0.10% 1,000,000 EUR Veolia Environnement SA 0.672% 30-Mar-2022 1,214,367 0.10% 1,800,000 EUR WPP Finance SA 2.250% 22-Sep-2026 2,323,650 0.19%
Total for France 65,025,138 5.41%
Germany 2,400,000 EUR Commerzbank AG 7.750% 16-Mar-2021 3,502,999 0.29% 4,000,000 GBP Deutsche Bank AG 1.875% 28-Feb-2020 5,455,798 0.45% 1,347,000 EUR Deutsche Post AG 1.000% 13-Dec-2027 1,593,821 0.13%
880,000 EUR Unitymedia Hessen GmbH & Co KG / Unitymedia NRW GmbH 4.000% 15-Jan-2025 1,115,468 0.09%
690,000 EUR Unitymedia Hessen GmbH & Co KG / Unitymedia NRW GmbH 4.625% 15-Feb-2026 892,121 0.08%
600,000 EUR Unitymedia Hessen GmbH & Co KG / Unitymedia NRW GmbH 3.500% 15-Jan-2027 746,291 0.06%
430,000 EUR Unitymedia Hessen GmbH & Co KG / Unitymedia NRW GmbH 6.250% 15-Jan-2029 580,819 0.05%
1,200,000 EUR Volkswagen Leasing GmbH 0.750% 11-Aug-2020 1,461,275 0.12% 4,560,000 EUR Volkswagen Leasing GmbH 0.250% 05-Oct-2020 5,476,159 0.46% 1,260,000 EUR Volkswagen Leasing GmbH 1.375% 20-Jan-2025 1,531,349 0.13%
Total for Germany 22,356,100 1.86%
Iceland 1,540,000 EUR Islandsbanki HF 1.750% 07-Sep-2020 1,911,679 0.16% 3,380,000 EUR Landsbankinn HF 1.625% 15-Mar-2021 4,184,554 0.35% 1,050,000 EUR Landsbankinn HF 1.375% 14-Mar-2022 1,287,609 0.10% 3,000,000 EUR Landsbankinn HF 1.000% 30-May-2023 3,581,825 0.30%
Total for Iceland 10,965,667 0.91%
India 2,050,000 USD ICICI Bank Ltd '144A' 4.700% 21-Feb-2018 2,057,499 0.17%
370,000 USD ICICI Bank Ltd 3.500% 18-Mar-2020 373,730 0.03% Total for India 2,431,229 0.20%
Ireland
3,333,000 USD AerCap Ireland Capital DAC / AerCap Global Aviation Trust 3.750% 15-May-2019 3,387,856 0.28%
1,274,000 USD AerCap Ireland Capital DAC / AerCap Global Aviation Trust 5.000% 01-Oct-2021 1,358,559 0.11%
1,898,000 USD GE Capital International Funding Co Unlimited Co 4.418% 15-Nov-2035 2,054,649 0.17% 7,536,000 USD Shire Acquisitions Investments Ireland DAC 2.875% 23-Sep-2023 7,412,010 0.62%
Total for Ireland 14,213,074 1.18%
Italy 480,000 EUR Atlantia SpA 1.875% 13-Jul-2027 588,098 0.05%
1,270,000 EUR Autostrade per l'Italia SpA 1.875% 26-Sep-2029 1,560,355 0.13% 1,730,000 USD Eni SpA '144A' 4.150% 01-Oct-2020 1,791,116 0.15%
500,000 EUR FCA Bank SpA 1.250% 13-Jun-2018 603,180 0.05% 850,000 EUR FCA Bank SpA 2.000% 23-Oct-2019 1,054,682 0.09%
1,390,000 EUR FCA Bank SpA 1.375% 17-Apr-2020 1,714,746 0.14%
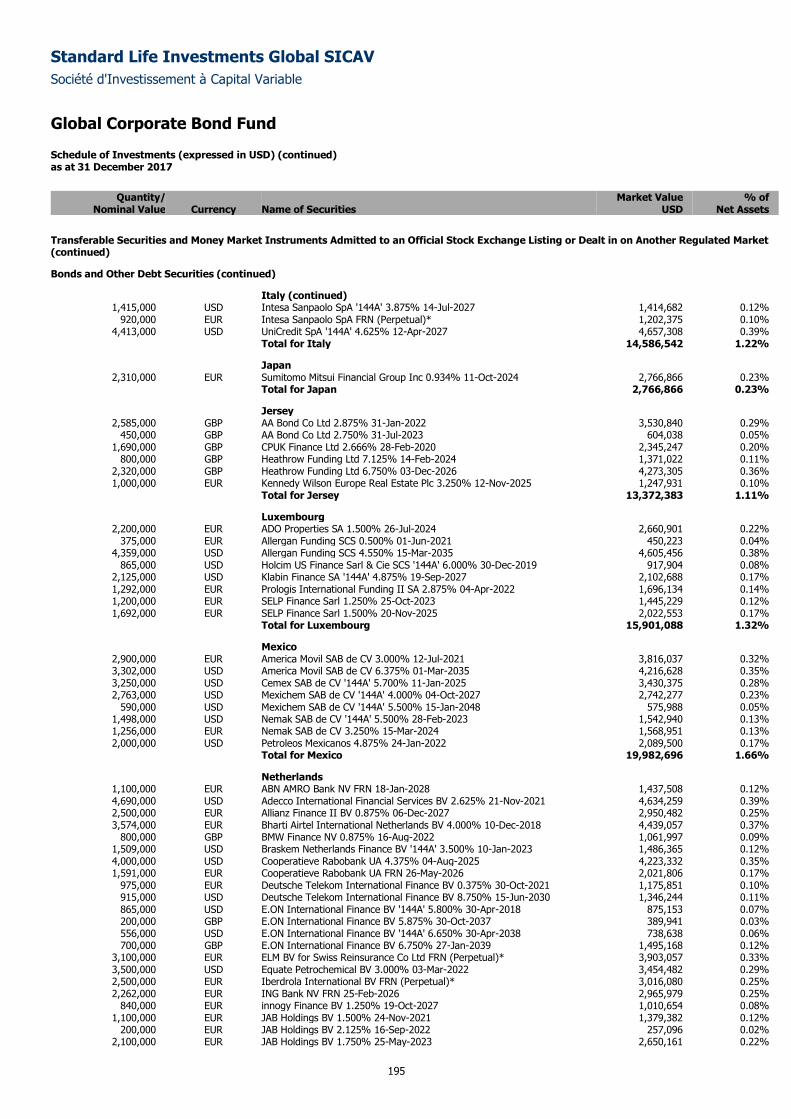
Standard Life Investments Global SICAV
Société d'Investissement à Capital Variable
Global Corporate Bond Fund
Schedule of Investments (expressed in USD) (continued) as at 31 December 2017
195
Quantity/ Market Value % of
Nominal Value Currency Name of Securities USD Net Assets
Transferable Securities and Money Market Instruments Admitted to an Official Stock Exchange Listing or Dealt in on Another Regulated Market (continued)
Bonds and Other Debt Securities (continued)
Italy (continued) 1,415,000 USD Intesa Sanpaolo SpA '144A' 3.875% 14-Jul-2027 1,414,682 0.12%
920,000 EUR Intesa Sanpaolo SpA FRN (Perpetual)* 1,202,375 0.10% 4,413,000 USD UniCredit SpA '144A' 4.625% 12-Apr-2027 4,657,308 0.39%
Total for Italy 14,586,542 1.22%
Japan 2,310,000 EUR Sumitomo Mitsui Financial Group Inc 0.934% 11-Oct-2024 2,766,866 0.23%
Total for Japan 2,766,866 0.23%
Jersey 2,585,000 GBP AA Bond Co Ltd 2.875% 31-Jan-2022 3,530,840 0.29%
450,000 GBP AA Bond Co Ltd 2.750% 31-Jul-2023 604,038 0.05% 1,690,000 GBP CPUK Finance Ltd 2.666% 28-Feb-2020 2,345,247 0.20%
800,000 GBP Heathrow Funding Ltd 7.125% 14-Feb-2024 1,371,022 0.11% 2,320,000 GBP Heathrow Funding Ltd 6.750% 03-Dec-2026 4,273,305 0.36% 1,000,000 EUR Kennedy Wilson Europe Real Estate Plc 3.250% 12-Nov-2025 1,247,931 0.10%
Total for Jersey 13,372,383 1.11%
Luxembourg 2,200,000 EUR ADO Properties SA 1.500% 26-Jul-2024 2,660,901 0.22%
375,000 EUR Allergan Funding SCS 0.500% 01-Jun-2021 450,223 0.04% 4,359,000 USD Allergan Funding SCS 4.550% 15-Mar-2035 4,605,456 0.38%
865,000 USD Holcim US Finance Sarl & Cie SCS '144A' 6.000% 30-Dec-2019 917,904 0.08% 2,125,000 USD Klabin Finance SA '144A' 4.875% 19-Sep-2027 2,102,688 0.17% 1,292,000 EUR Prologis International Funding II SA 2.875% 04-Apr-2022 1,696,134 0.14% 1,200,000 EUR SELP Finance Sarl 1.250% 25-Oct-2023 1,445,229 0.12% 1,692,000 EUR SELP Finance Sarl 1.500% 20-Nov-2025 2,022,553 0.17%
Total for Luxembourg 15,901,088 1.32%
Mexico 2,900,000 EUR America Movil SAB de CV 3.000% 12-Jul-2021 3,816,037 0.32% 3,302,000 USD America Movil SAB de CV 6.375% 01-Mar-2035 4,216,628 0.35% 3,250,000 USD Cemex SAB de CV '144A' 5.700% 11-Jan-2025 3,430,375 0.28% 2,763,000 USD Mexichem SAB de CV '144A' 4.000% 04-Oct-2027 2,742,277 0.23%
590,000 USD Mexichem SAB de CV '144A' 5.500% 15-Jan-2048 575,988 0.05% 1,498,000 USD Nemak SAB de CV '144A' 5.500% 28-Feb-2023 1,542,940 0.13% 1,256,000 EUR Nemak SAB de CV 3.250% 15-Mar-2024 1,568,951 0.13% 2,000,000 USD Petroleos Mexicanos 4.875% 24-Jan-2022 2,089,500 0.17%
Total for Mexico 19,982,696 1.66%
Netherlands 1,100,000 EUR ABN AMRO Bank NV FRN 18-Jan-2028 1,437,508 0.12% 4,690,000 USD Adecco International Financial Services BV 2.625% 21-Nov-2021 4,634,259 0.39% 2,500,000 EUR Allianz Finance II BV 0.875% 06-Dec-2027 2,950,482 0.25% 3,574,000 EUR Bharti Airtel International Netherlands BV 4.000% 10-Dec-2018 4,439,057 0.37%
800,000 GBP BMW Finance NV 0.875% 16-Aug-2022 1,061,997 0.09% 1,509,000 USD Braskem Netherlands Finance BV '144A' 3.500% 10-Jan-2023 1,486,365 0.12% 4,000,000 USD Cooperatieve Rabobank UA 4.375% 04-Aug-2025 4,223,332 0.35% 1,591,000 EUR Cooperatieve Rabobank UA FRN 26-May-2026 2,021,806 0.17%
975,000 EUR Deutsche Telekom International Finance BV 0.375% 30-Oct-2021 1,175,851 0.10% 915,000 USD Deutsche Telekom International Finance BV 8.750% 15-Jun-2030 1,346,244 0.11% 865,000 USD E.ON International Finance BV '144A' 5.800% 30-Apr-2018 875,153 0.07% 200,000 GBP E.ON International Finance BV 5.875% 30-Oct-2037 389,941 0.03% 556,000 USD E.ON International Finance BV '144A' 6.650% 30-Apr-2038 738,638 0.06% 700,000 GBP E.ON International Finance BV 6.750% 27-Jan-2039 1,495,168 0.12%
3,100,000 EUR ELM BV for Swiss Reinsurance Co Ltd FRN (Perpetual)* 3,903,057 0.33% 3,500,000 USD Equate Petrochemical BV 3.000% 03-Mar-2022 3,454,482 0.29% 2,500,000 EUR Iberdrola International BV FRN (Perpetual)* 3,016,080 0.25% 2,262,000 EUR ING Bank NV FRN 25-Feb-2026 2,965,979 0.25%
840,000 EUR innogy Finance BV 1.250% 19-Oct-2027 1,010,654 0.08% 1,100,000 EUR JAB Holdings BV 1.500% 24-Nov-2021 1,379,382 0.12%
200,000 EUR JAB Holdings BV 2.125% 16-Sep-2022 257,096 0.02% 2,100,000 EUR JAB Holdings BV 1.750% 25-May-2023 2,650,161 0.22%
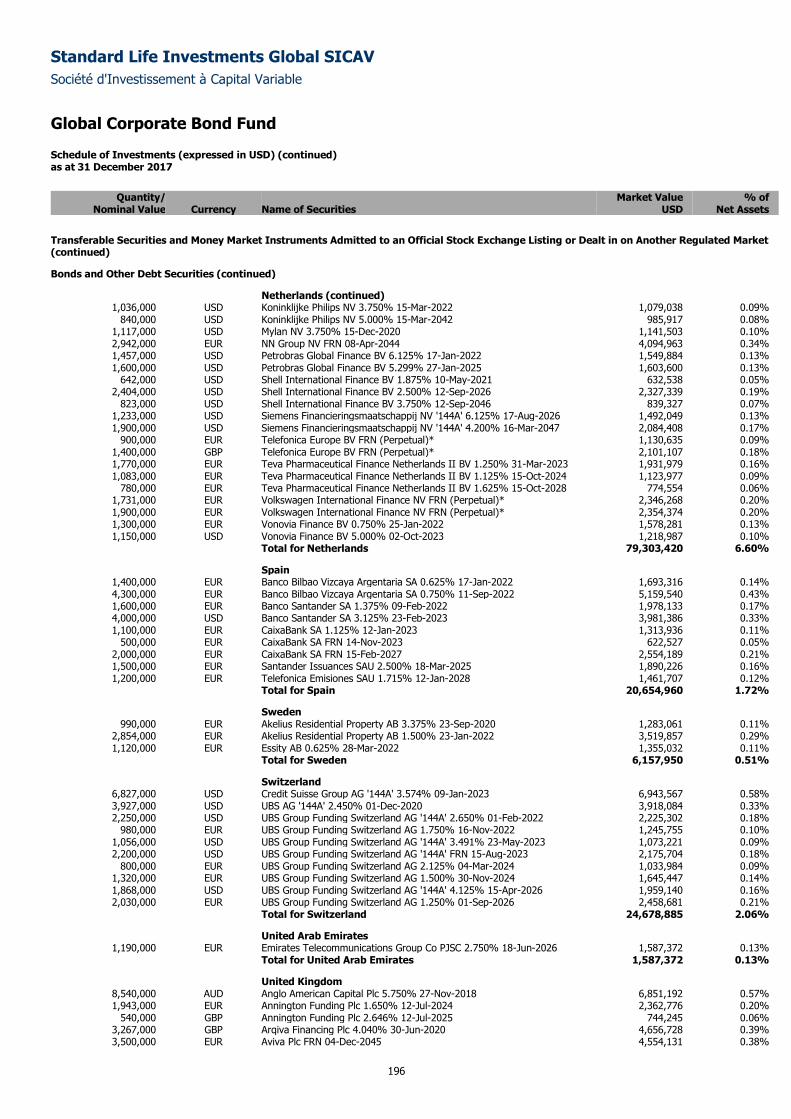
Standard Life Investments Global SICAV
Société d'Investissement à Capital Variable
Global Corporate Bond Fund
Schedule of Investments (expressed in USD) (continued) as at 31 December 2017
196
Quantity/ Market Value % of
Nominal Value Currency Name of Securities USD Net Assets
Transferable Securities and Money Market Instruments Admitted to an Official Stock Exchange Listing or Dealt in on Another Regulated Market (continued)
Bonds and Other Debt Securities (continued)
Netherlands (continued) 1,036,000 USD Koninklijke Philips NV 3.750% 15-Mar-2022 1,079,038 0.09%
840,000 USD Koninklijke Philips NV 5.000% 15-Mar-2042 985,917 0.08% 1,117,000 USD Mylan NV 3.750% 15-Dec-2020 1,141,503 0.10% 2,942,000 EUR NN Group NV FRN 08-Apr-2044 4,094,963 0.34% 1,457,000 USD Petrobras Global Finance BV 6.125% 17-Jan-2022 1,549,884 0.13% 1,600,000 USD Petrobras Global Finance BV 5.299% 27-Jan-2025 1,603,600 0.13%
642,000 USD Shell International Finance BV 1.875% 10-May-2021 632,538 0.05% 2,404,000 USD Shell International Finance BV 2.500% 12-Sep-2026 2,327,339 0.19%
823,000 USD Shell International Finance BV 3.750% 12-Sep-2046 839,327 0.07% 1,233,000 USD Siemens Financieringsmaatschappij NV '144A' 6.125% 17-Aug-2026 1,492,049 0.13% 1,900,000 USD Siemens Financieringsmaatschappij NV '144A' 4.200% 16-Mar-2047 2,084,408 0.17%
900,000 EUR Telefonica Europe BV FRN (Perpetual)* 1,130,635 0.09% 1,400,000 GBP Telefonica Europe BV FRN (Perpetual)* 2,101,107 0.18% 1,770,000 EUR Teva Pharmaceutical Finance Netherlands II BV 1.250% 31-Mar-2023 1,931,979 0.16% 1,083,000 EUR Teva Pharmaceutical Finance Netherlands II BV 1.125% 15-Oct-2024 1,123,977 0.09%
780,000 EUR Teva Pharmaceutical Finance Netherlands II BV 1.625% 15-Oct-2028 774,554 0.06% 1,731,000 EUR Volkswagen International Finance NV FRN (Perpetual)* 2,346,268 0.20% 1,900,000 EUR Volkswagen International Finance NV FRN (Perpetual)* 2,354,374 0.20% 1,300,000 EUR Vonovia Finance BV 0.750% 25-Jan-2022 1,578,281 0.13% 1,150,000 USD Vonovia Finance BV 5.000% 02-Oct-2023 1,218,987 0.10%
Total for Netherlands 79,303,420 6.60%
Spain 1,400,000 EUR Banco Bilbao Vizcaya Argentaria SA 0.625% 17-Jan-2022 1,693,316 0.14% 4,300,000 EUR Banco Bilbao Vizcaya Argentaria SA 0.750% 11-Sep-2022 5,159,540 0.43% 1,600,000 EUR Banco Santander SA 1.375% 09-Feb-2022 1,978,133 0.17% 4,000,000 USD Banco Santander SA 3.125% 23-Feb-2023 3,981,386 0.33% 1,100,000 EUR CaixaBank SA 1.125% 12-Jan-2023 1,313,936 0.11%
500,000 EUR CaixaBank SA FRN 14-Nov-2023 622,527 0.05% 2,000,000 EUR CaixaBank SA FRN 15-Feb-2027 2,554,189 0.21% 1,500,000 EUR Santander Issuances SAU 2.500% 18-Mar-2025 1,890,226 0.16% 1,200,000 EUR Telefonica Emisiones SAU 1.715% 12-Jan-2028 1,461,707 0.12%
Total for Spain 20,654,960 1.72%
Sweden 990,000 EUR Akelius Residential Property AB 3.375% 23-Sep-2020 1,283,061 0.11%
2,854,000 EUR Akelius Residential Property AB 1.500% 23-Jan-2022 3,519,857 0.29% 1,120,000 EUR Essity AB 0.625% 28-Mar-2022 1,355,032 0.11%
Total for Sweden 6,157,950 0.51%
Switzerland 6,827,000 USD Credit Suisse Group AG '144A' 3.574% 09-Jan-2023 6,943,567 0.58% 3,927,000 USD UBS AG '144A' 2.450% 01-Dec-2020 3,918,084 0.33% 2,250,000 USD UBS Group Funding Switzerland AG '144A' 2.650% 01-Feb-2022 2,225,302 0.18%
980,000 EUR UBS Group Funding Switzerland AG 1.750% 16-Nov-2022 1,245,755 0.10% 1,056,000 USD UBS Group Funding Switzerland AG '144A' 3.491% 23-May-2023 1,073,221 0.09% 2,200,000 USD UBS Group Funding Switzerland AG '144A' FRN 15-Aug-2023 2,175,704 0.18%
800,000 EUR UBS Group Funding Switzerland AG 2.125% 04-Mar-2024 1,033,984 0.09% 1,320,000 EUR UBS Group Funding Switzerland AG 1.500% 30-Nov-2024 1,645,447 0.14% 1,868,000 USD UBS Group Funding Switzerland AG '144A' 4.125% 15-Apr-2026 1,959,140 0.16% 2,030,000 EUR UBS Group Funding Switzerland AG 1.250% 01-Sep-2026 2,458,681 0.21%
Total for Switzerland 24,678,885 2.06%
United Arab Emirates 1,190,000 EUR Emirates Telecommunications Group Co PJSC 2.750% 18-Jun-2026 1,587,372 0.13%
Total for United Arab Emirates 1,587,372 0.13%
United Kingdom 8,540,000 AUD Anglo American Capital Plc 5.750% 27-Nov-2018 6,851,192 0.57% 1,943,000 EUR Annington Funding Plc 1.650% 12-Jul-2024 2,362,776 0.20%
540,000 GBP Annington Funding Plc 2.646% 12-Jul-2025 744,245 0.06% 3,267,000 GBP Arqiva Financing Plc 4.040% 30-Jun-2020 4,656,728 0.39% 3,500,000 EUR Aviva Plc FRN 04-Dec-2045 4,554,131 0.38%
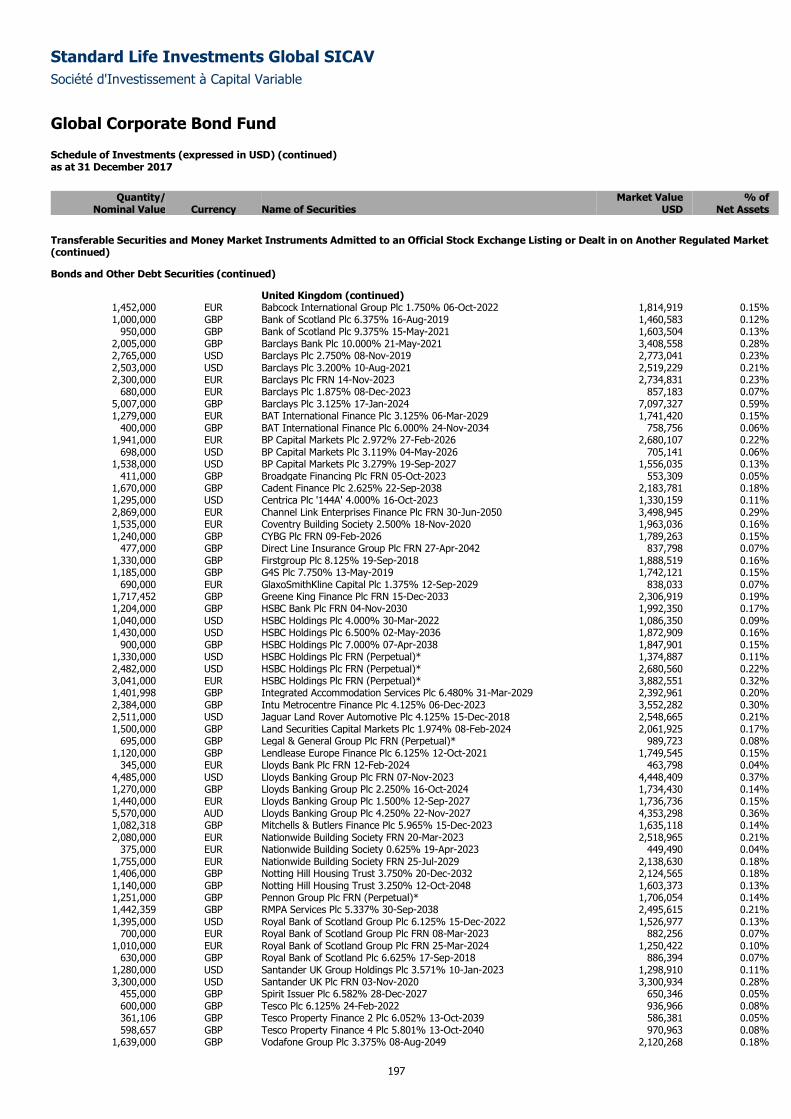
Standard Life Investments Global SICAV
Société d'Investissement à Capital Variable
Global Corporate Bond Fund
Schedule of Investments (expressed in USD) (continued) as at 31 December 2017
197
Quantity/ Market Value % of
Nominal Value Currency Name of Securities USD Net Assets
Transferable Securities and Money Market Instruments Admitted to an Official Stock Exchange Listing or Dealt in on Another Regulated Market (continued)
Bonds and Other Debt Securities (continued)
United Kingdom (continued) 1,452,000 EUR Babcock International Group Plc 1.750% 06-Oct-2022 1,814,919 0.15% 1,000,000 GBP Bank of Scotland Plc 6.375% 16-Aug-2019 1,460,583 0.12%
950,000 GBP Bank of Scotland Plc 9.375% 15-May-2021 1,603,504 0.13% 2,005,000 GBP Barclays Bank Plc 10.000% 21-May-2021 3,408,558 0.28% 2,765,000 USD Barclays Plc 2.750% 08-Nov-2019 2,773,041 0.23% 2,503,000 USD Barclays Plc 3.200% 10-Aug-2021 2,519,229 0.21% 2,300,000 EUR Barclays Plc FRN 14-Nov-2023 2,734,831 0.23%
680,000 EUR Barclays Plc 1.875% 08-Dec-2023 857,183 0.07% 5,007,000 GBP Barclays Plc 3.125% 17-Jan-2024 7,097,327 0.59% 1,279,000 EUR BAT International Finance Plc 3.125% 06-Mar-2029 1,741,420 0.15%
400,000 GBP BAT International Finance Plc 6.000% 24-Nov-2034 758,756 0.06% 1,941,000 EUR BP Capital Markets Plc 2.972% 27-Feb-2026 2,680,107 0.22%
698,000 USD BP Capital Markets Plc 3.119% 04-May-2026 705,141 0.06% 1,538,000 USD BP Capital Markets Plc 3.279% 19-Sep-2027 1,556,035 0.13%
411,000 GBP Broadgate Financing Plc FRN 05-Oct-2023 553,309 0.05% 1,670,000 GBP Cadent Finance Plc 2.625% 22-Sep-2038 2,183,781 0.18% 1,295,000 USD Centrica Plc '144A' 4.000% 16-Oct-2023 1,330,159 0.11% 2,869,000 EUR Channel Link Enterprises Finance Plc FRN 30-Jun-2050 3,498,945 0.29% 1,535,000 EUR Coventry Building Society 2.500% 18-Nov-2020 1,963,036 0.16% 1,240,000 GBP CYBG Plc FRN 09-Feb-2026 1,789,263 0.15%
477,000 GBP Direct Line Insurance Group Plc FRN 27-Apr-2042 837,798 0.07% 1,330,000 GBP Firstgroup Plc 8.125% 19-Sep-2018 1,888,519 0.16% 1,185,000 GBP G4S Plc 7.750% 13-May-2019 1,742,121 0.15%
690,000 EUR GlaxoSmithKline Capital Plc 1.375% 12-Sep-2029 838,033 0.07% 1,717,452 GBP Greene King Finance Plc FRN 15-Dec-2033 2,306,919 0.19% 1,204,000 GBP HSBC Bank Plc FRN 04-Nov-2030 1,992,350 0.17% 1,040,000 USD HSBC Holdings Plc 4.000% 30-Mar-2022 1,086,350 0.09% 1,430,000 USD HSBC Holdings Plc 6.500% 02-May-2036 1,872,909 0.16%
900,000 GBP HSBC Holdings Plc 7.000% 07-Apr-2038 1,847,901 0.15% 1,330,000 USD HSBC Holdings Plc FRN (Perpetual)* 1,374,887 0.11% 2,482,000 USD HSBC Holdings Plc FRN (Perpetual)* 2,680,560 0.22% 3,041,000 EUR HSBC Holdings Plc FRN (Perpetual)* 3,882,551 0.32% 1,401,998 GBP Integrated Accommodation Services Plc 6.480% 31-Mar-2029 2,392,961 0.20% 2,384,000 GBP Intu Metrocentre Finance Plc 4.125% 06-Dec-2023 3,552,282 0.30% 2,511,000 USD Jaguar Land Rover Automotive Plc 4.125% 15-Dec-2018 2,548,665 0.21% 1,500,000 GBP Land Securities Capital Markets Plc 1.974% 08-Feb-2024 2,061,925 0.17%
695,000 GBP Legal & General Group Plc FRN (Perpetual)* 989,723 0.08% 1,120,000 GBP Lendlease Europe Finance Plc 6.125% 12-Oct-2021 1,749,545 0.15%
345,000 EUR Lloyds Bank Plc FRN 12-Feb-2024 463,798 0.04% 4,485,000 USD Lloyds Banking Group Plc FRN 07-Nov-2023 4,448,409 0.37% 1,270,000 GBP Lloyds Banking Group Plc 2.250% 16-Oct-2024 1,734,430 0.14% 1,440,000 EUR Lloyds Banking Group Plc 1.500% 12-Sep-2027 1,736,736 0.15% 5,570,000 AUD Lloyds Banking Group Plc 4.250% 22-Nov-2027 4,353,298 0.36% 1,082,318 GBP Mitchells & Butlers Finance Plc 5.965% 15-Dec-2023 1,635,118 0.14% 2,080,000 EUR Nationwide Building Society FRN 20-Mar-2023 2,518,965 0.21%
375,000 EUR Nationwide Building Society 0.625% 19-Apr-2023 449,490 0.04% 1,755,000 EUR Nationwide Building Society FRN 25-Jul-2029 2,138,630 0.18% 1,406,000 GBP Notting Hill Housing Trust 3.750% 20-Dec-2032 2,124,565 0.18% 1,140,000 GBP Notting Hill Housing Trust 3.250% 12-Oct-2048 1,603,373 0.13% 1,251,000 GBP Pennon Group Plc FRN (Perpetual)* 1,706,054 0.14% 1,442,359 GBP RMPA Services Plc 5.337% 30-Sep-2038 2,495,615 0.21% 1,395,000 USD Royal Bank of Scotland Group Plc 6.125% 15-Dec-2022 1,526,977 0.13%
700,000 EUR Royal Bank of Scotland Group Plc FRN 08-Mar-2023 882,256 0.07% 1,010,000 EUR Royal Bank of Scotland Group Plc FRN 25-Mar-2024 1,250,422 0.10%
630,000 GBP Royal Bank of Scotland Plc 6.625% 17-Sep-2018 886,394 0.07% 1,280,000 USD Santander UK Group Holdings Plc 3.571% 10-Jan-2023 1,298,910 0.11% 3,300,000 USD Santander UK Plc FRN 03-Nov-2020 3,300,934 0.28%
455,000 GBP Spirit Issuer Plc 6.582% 28-Dec-2027 650,346 0.05% 600,000 GBP Tesco Plc 6.125% 24-Feb-2022 936,966 0.08% 361,106 GBP Tesco Property Finance 2 Plc 6.052% 13-Oct-2039 586,381 0.05% 598,657 GBP Tesco Property Finance 4 Plc 5.801% 13-Oct-2040 970,963 0.08%
1,639,000 GBP Vodafone Group Plc 3.375% 08-Aug-2049 2,120,268 0.18%
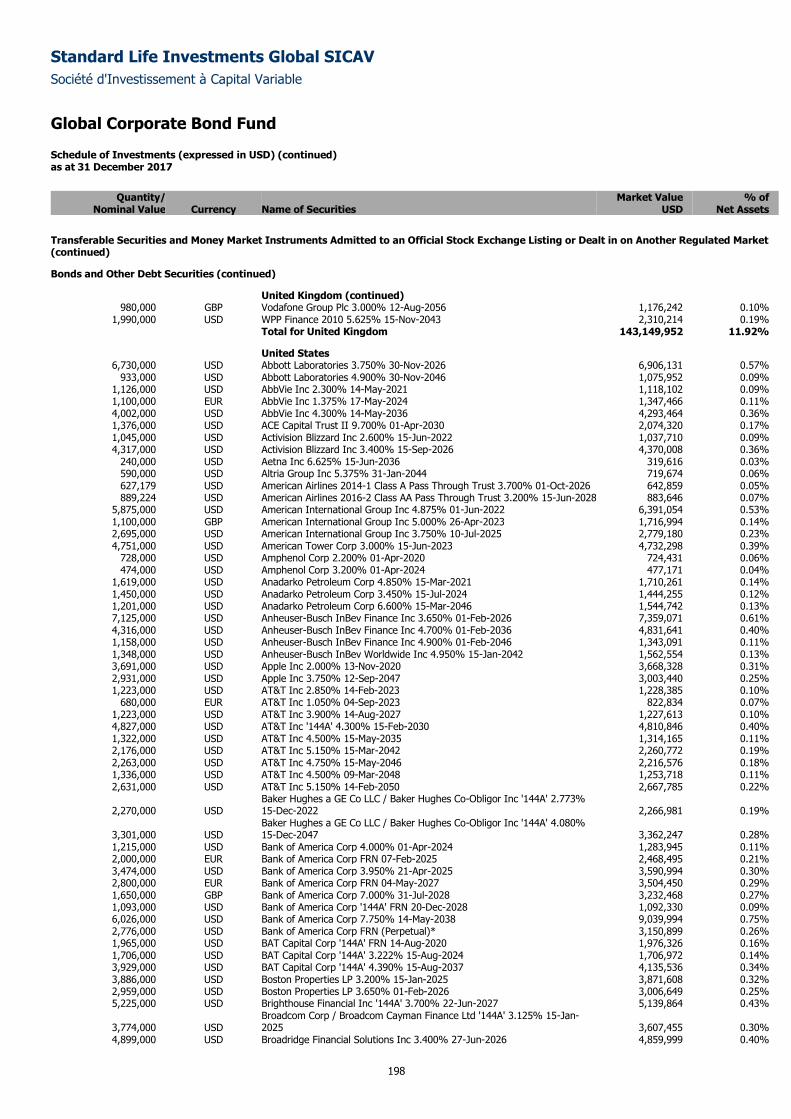
Standard Life Investments Global SICAV
Société d'Investissement à Capital Variable
Global Corporate Bond Fund
Schedule of Investments (expressed in USD) (continued) as at 31 December 2017
198
Quantity/ Market Value % of
Nominal Value Currency Name of Securities USD Net Assets
Transferable Securities and Money Market Instruments Admitted to an Official Stock Exchange Listing or Dealt in on Another Regulated Market (continued)
Bonds and Other Debt Securities (continued)
United Kingdom (continued) 980,000 GBP Vodafone Group Plc 3.000% 12-Aug-2056 1,176,242 0.10%
1,990,000 USD WPP Finance 2010 5.625% 15-Nov-2043 2,310,214 0.19% Total for United Kingdom 143,149,952 11.92%
United States 6,730,000 USD Abbott Laboratories 3.750% 30-Nov-2026 6,906,131 0.57%
933,000 USD Abbott Laboratories 4.900% 30-Nov-2046 1,075,952 0.09% 1,126,000 USD AbbVie Inc 2.300% 14-May-2021 1,118,102 0.09% 1,100,000 EUR AbbVie Inc 1.375% 17-May-2024 1,347,466 0.11% 4,002,000 USD AbbVie Inc 4.300% 14-May-2036 4,293,464 0.36% 1,376,000 USD ACE Capital Trust II 9.700% 01-Apr-2030 2,074,320 0.17% 1,045,000 USD Activision Blizzard Inc 2.600% 15-Jun-2022 1,037,710 0.09% 4,317,000 USD Activision Blizzard Inc 3.400% 15-Sep-2026 4,370,008 0.36%
240,000 USD Aetna Inc 6.625% 15-Jun-2036 319,616 0.03% 590,000 USD Altria Group Inc 5.375% 31-Jan-2044 719,674 0.06% 627,179 USD American Airlines 2014-1 Class A Pass Through Trust 3.700% 01-Oct-2026 642,859 0.05% 889,224 USD American Airlines 2016-2 Class AA Pass Through Trust 3.200% 15-Jun-2028 883,646 0.07%
5,875,000 USD American International Group Inc 4.875% 01-Jun-2022 6,391,054 0.53% 1,100,000 GBP American International Group Inc 5.000% 26-Apr-2023 1,716,994 0.14% 2,695,000 USD American International Group Inc 3.750% 10-Jul-2025 2,779,180 0.23% 4,751,000 USD American Tower Corp 3.000% 15-Jun-2023 4,732,298 0.39%
728,000 USD Amphenol Corp 2.200% 01-Apr-2020 724,431 0.06% 474,000 USD Amphenol Corp 3.200% 01-Apr-2024 477,171 0.04%
1,619,000 USD Anadarko Petroleum Corp 4.850% 15-Mar-2021 1,710,261 0.14% 1,450,000 USD Anadarko Petroleum Corp 3.450% 15-Jul-2024 1,444,255 0.12% 1,201,000 USD Anadarko Petroleum Corp 6.600% 15-Mar-2046 1,544,742 0.13% 7,125,000 USD Anheuser-Busch InBev Finance Inc 3.650% 01-Feb-2026 7,359,071 0.61% 4,316,000 USD Anheuser-Busch InBev Finance Inc 4.700% 01-Feb-2036 4,831,641 0.40% 1,158,000 USD Anheuser-Busch InBev Finance Inc 4.900% 01-Feb-2046 1,343,091 0.11% 1,348,000 USD Anheuser-Busch InBev Worldwide Inc 4.950% 15-Jan-2042 1,562,554 0.13% 3,691,000 USD Apple Inc 2.000% 13-Nov-2020 3,668,328 0.31% 2,931,000 USD Apple Inc 3.750% 12-Sep-2047 3,003,440 0.25% 1,223,000 USD AT&T Inc 2.850% 14-Feb-2023 1,228,385 0.10%
680,000 EUR AT&T Inc 1.050% 04-Sep-2023 822,834 0.07% 1,223,000 USD AT&T Inc 3.900% 14-Aug-2027 1,227,613 0.10% 4,827,000 USD AT&T Inc '144A' 4.300% 15-Feb-2030 4,810,846 0.40% 1,322,000 USD AT&T Inc 4.500% 15-May-2035 1,314,165 0.11% 2,176,000 USD AT&T Inc 5.150% 15-Mar-2042 2,260,772 0.19% 2,263,000 USD AT&T Inc 4.750% 15-May-2046 2,216,576 0.18% 1,336,000 USD AT&T Inc 4.500% 09-Mar-2048 1,253,718 0.11% 2,631,000 USD AT&T Inc 5.150% 14-Feb-2050 2,667,785 0.22%
2,270,000 USD Baker Hughes a GE Co LLC / Baker Hughes Co-Obligor Inc '144A' 2.773% 15-Dec-2022 2,266,981 0.19%
3,301,000 USD Baker Hughes a GE Co LLC / Baker Hughes Co-Obligor Inc '144A' 4.080% 15-Dec-2047 3,362,247 0.28%
1,215,000 USD Bank of America Corp 4.000% 01-Apr-2024 1,283,945 0.11% 2,000,000 EUR Bank of America Corp FRN 07-Feb-2025 2,468,495 0.21% 3,474,000 USD Bank of America Corp 3.950% 21-Apr-2025 3,590,994 0.30% 2,800,000 EUR Bank of America Corp FRN 04-May-2027 3,504,450 0.29% 1,650,000 GBP Bank of America Corp 7.000% 31-Jul-2028 3,232,468 0.27% 1,093,000 USD Bank of America Corp '144A' FRN 20-Dec-2028 1,092,330 0.09% 6,026,000 USD Bank of America Corp 7.750% 14-May-2038 9,039,994 0.75% 2,776,000 USD Bank of America Corp FRN (Perpetual)* 3,150,899 0.26% 1,965,000 USD BAT Capital Corp '144A' FRN 14-Aug-2020 1,976,326 0.16% 1,706,000 USD BAT Capital Corp '144A' 3.222% 15-Aug-2024 1,706,972 0.14% 3,929,000 USD BAT Capital Corp '144A' 4.390% 15-Aug-2037 4,135,536 0.34% 3,886,000 USD Boston Properties LP 3.200% 15-Jan-2025 3,871,608 0.32% 2,959,000 USD Boston Properties LP 3.650% 01-Feb-2026 3,006,649 0.25% 5,225,000 USD Brighthouse Financial Inc '144A' 3.700% 22-Jun-2027 5,139,864 0.43%
3,774,000 USD Broadcom Corp / Broadcom Cayman Finance Ltd '144A' 3.125% 15-Jan-2025 3,607,455 0.30%
4,899,000 USD Broadridge Financial Solutions Inc 3.400% 27-Jun-2026 4,859,999 0.40%
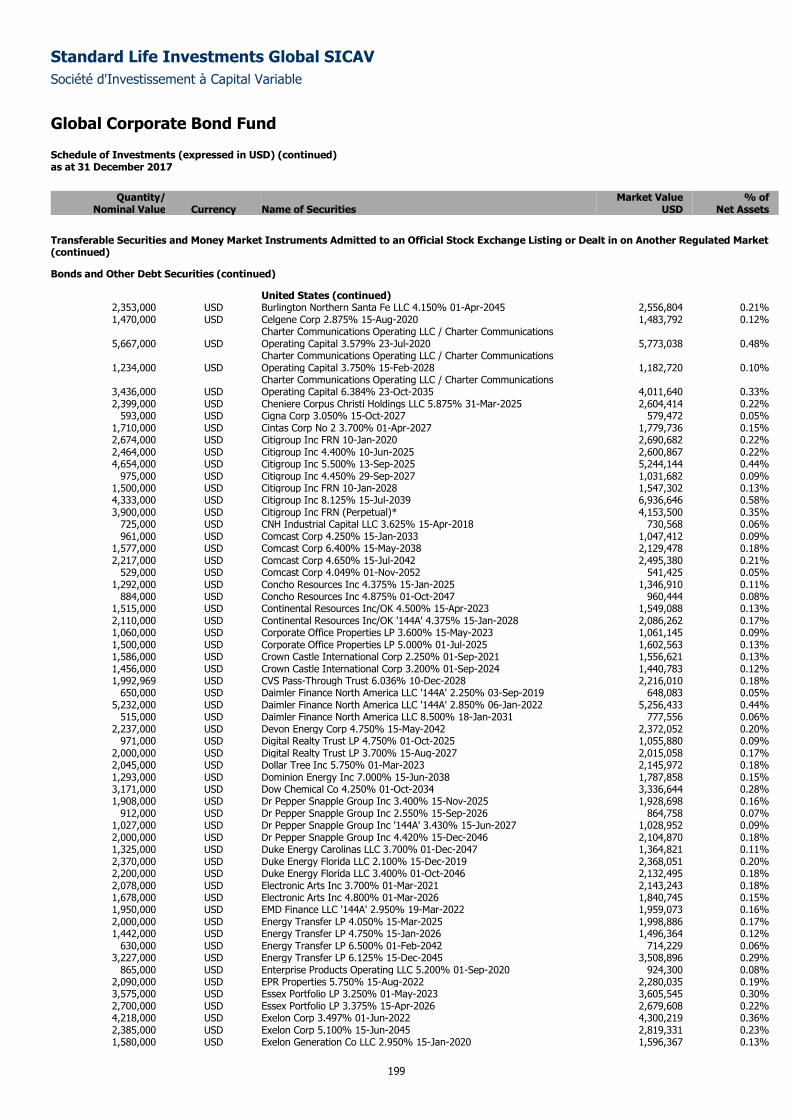
Standard Life Investments Global SICAV
Société d'Investissement à Capital Variable
Global Corporate Bond Fund
Schedule of Investments (expressed in USD) (continued) as at 31 December 2017
199
Quantity/ Market Value % of
Nominal Value Currency Name of Securities USD Net Assets
Transferable Securities and Money Market Instruments Admitted to an Official Stock Exchange Listing or Dealt in on Another Regulated Market (continued)
Bonds and Other Debt Securities (continued)
United States (continued) 2,353,000 USD Burlington Northern Santa Fe LLC 4.150% 01-Apr-2045 2,556,804 0.21% 1,470,000 USD Celgene Corp 2.875% 15-Aug-2020 1,483,792 0.12%
5,667,000 USD Charter Communications Operating LLC / Charter Communications Operating Capital 3.579% 23-Jul-2020 5,773,038 0.48%
1,234,000 USD Charter Communications Operating LLC / Charter Communications Operating Capital 3.750% 15-Feb-2028 1,182,720 0.10%
3,436,000 USD Charter Communications Operating LLC / Charter Communications Operating Capital 6.384% 23-Oct-2035 4,011,640 0.33%
2,399,000 USD Cheniere Corpus Christi Holdings LLC 5.875% 31-Mar-2025 2,604,414 0.22% 593,000 USD Cigna Corp 3.050% 15-Oct-2027 579,472 0.05%
1,710,000 USD Cintas Corp No 2 3.700% 01-Apr-2027 1,779,736 0.15% 2,674,000 USD Citigroup Inc FRN 10-Jan-2020 2,690,682 0.22% 2,464,000 USD Citigroup Inc 4.400% 10-Jun-2025 2,600,867 0.22% 4,654,000 USD Citigroup Inc 5.500% 13-Sep-2025 5,244,144 0.44%
975,000 USD Citigroup Inc 4.450% 29-Sep-2027 1,031,682 0.09% 1,500,000 USD Citigroup Inc FRN 10-Jan-2028 1,547,302 0.13% 4,333,000 USD Citigroup Inc 8.125% 15-Jul-2039 6,936,646 0.58% 3,900,000 USD Citigroup Inc FRN (Perpetual)* 4,153,500 0.35%
725,000 USD CNH Industrial Capital LLC 3.625% 15-Apr-2018 730,568 0.06% 961,000 USD Comcast Corp 4.250% 15-Jan-2033 1,047,412 0.09%
1,577,000 USD Comcast Corp 6.400% 15-May-2038 2,129,478 0.18% 2,217,000 USD Comcast Corp 4.650% 15-Jul-2042 2,495,380 0.21%
529,000 USD Comcast Corp 4.049% 01-Nov-2052 541,425 0.05% 1,292,000 USD Concho Resources Inc 4.375% 15-Jan-2025 1,346,910 0.11%
884,000 USD Concho Resources Inc 4.875% 01-Oct-2047 960,444 0.08% 1,515,000 USD Continental Resources Inc/OK 4.500% 15-Apr-2023 1,549,088 0.13% 2,110,000 USD Continental Resources Inc/OK '144A' 4.375% 15-Jan-2028 2,086,262 0.17% 1,060,000 USD Corporate Office Properties LP 3.600% 15-May-2023 1,061,145 0.09% 1,500,000 USD Corporate Office Properties LP 5.000% 01-Jul-2025 1,602,563 0.13% 1,586,000 USD Crown Castle International Corp 2.250% 01-Sep-2021 1,556,621 0.13% 1,456,000 USD Crown Castle International Corp 3.200% 01-Sep-2024 1,440,783 0.12% 1,992,969 USD CVS Pass-Through Trust 6.036% 10-Dec-2028 2,216,010 0.18%
650,000 USD Daimler Finance North America LLC '144A' 2.250% 03-Sep-2019 648,083 0.05% 5,232,000 USD Daimler Finance North America LLC '144A' 2.850% 06-Jan-2022 5,256,433 0.44%
515,000 USD Daimler Finance North America LLC 8.500% 18-Jan-2031 777,556 0.06% 2,237,000 USD Devon Energy Corp 4.750% 15-May-2042 2,372,052 0.20%
971,000 USD Digital Realty Trust LP 4.750% 01-Oct-2025 1,055,880 0.09% 2,000,000 USD Digital Realty Trust LP 3.700% 15-Aug-2027 2,015,058 0.17% 2,045,000 USD Dollar Tree Inc 5.750% 01-Mar-2023 2,145,972 0.18% 1,293,000 USD Dominion Energy Inc 7.000% 15-Jun-2038 1,787,858 0.15% 3,171,000 USD Dow Chemical Co 4.250% 01-Oct-2034 3,336,644 0.28% 1,908,000 USD Dr Pepper Snapple Group Inc 3.400% 15-Nov-2025 1,928,698 0.16%
912,000 USD Dr Pepper Snapple Group Inc 2.550% 15-Sep-2026 864,758 0.07% 1,027,000 USD Dr Pepper Snapple Group Inc '144A' 3.430% 15-Jun-2027 1,028,952 0.09% 2,000,000 USD Dr Pepper Snapple Group Inc 4.420% 15-Dec-2046 2,104,870 0.18% 1,325,000 USD Duke Energy Carolinas LLC 3.700% 01-Dec-2047 1,364,821 0.11% 2,370,000 USD Duke Energy Florida LLC 2.100% 15-Dec-2019 2,368,051 0.20% 2,200,000 USD Duke Energy Florida LLC 3.400% 01-Oct-2046 2,132,495 0.18% 2,078,000 USD Electronic Arts Inc 3.700% 01-Mar-2021 2,143,243 0.18% 1,678,000 USD Electronic Arts Inc 4.800% 01-Mar-2026 1,840,745 0.15% 1,950,000 USD EMD Finance LLC '144A' 2.950% 19-Mar-2022 1,959,073 0.16% 2,000,000 USD Energy Transfer LP 4.050% 15-Mar-2025 1,998,886 0.17% 1,442,000 USD Energy Transfer LP 4.750% 15-Jan-2026 1,496,364 0.12%
630,000 USD Energy Transfer LP 6.500% 01-Feb-2042 714,229 0.06% 3,227,000 USD Energy Transfer LP 6.125% 15-Dec-2045 3,508,896 0.29%
865,000 USD Enterprise Products Operating LLC 5.200% 01-Sep-2020 924,300 0.08% 2,090,000 USD EPR Properties 5.750% 15-Aug-2022 2,280,035 0.19% 3,575,000 USD Essex Portfolio LP 3.250% 01-May-2023 3,605,545 0.30% 2,700,000 USD Essex Portfolio LP 3.375% 15-Apr-2026 2,679,608 0.22% 4,218,000 USD Exelon Corp 3.497% 01-Jun-2022 4,300,219 0.36% 2,385,000 USD Exelon Corp 5.100% 15-Jun-2045 2,819,331 0.23% 1,580,000 USD Exelon Generation Co LLC 2.950% 15-Jan-2020 1,596,367 0.13%
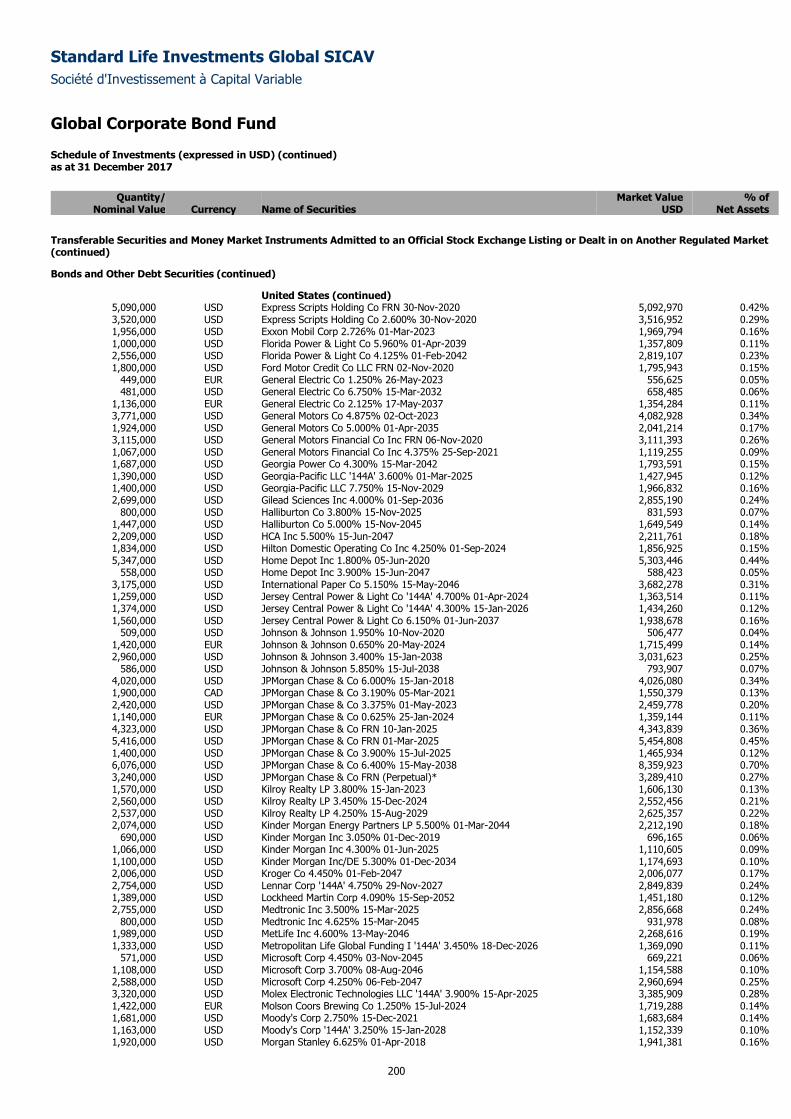
Standard Life Investments Global SICAV
Société d'Investissement à Capital Variable
Global Corporate Bond Fund
Schedule of Investments (expressed in USD) (continued) as at 31 December 2017
200
Quantity/ Market Value % of
Nominal Value Currency Name of Securities USD Net Assets
Transferable Securities and Money Market Instruments Admitted to an Official Stock Exchange Listing or Dealt in on Another Regulated Market (continued)
Bonds and Other Debt Securities (continued)
United States (continued) 5,090,000 USD Express Scripts Holding Co FRN 30-Nov-2020 5,092,970 0.42% 3,520,000 USD Express Scripts Holding Co 2.600% 30-Nov-2020 3,516,952 0.29% 1,956,000 USD Exxon Mobil Corp 2.726% 01-Mar-2023 1,969,794 0.16% 1,000,000 USD Florida Power & Light Co 5.960% 01-Apr-2039 1,357,809 0.11% 2,556,000 USD Florida Power & Light Co 4.125% 01-Feb-2042 2,819,107 0.23% 1,800,000 USD Ford Motor Credit Co LLC FRN 02-Nov-2020 1,795,943 0.15%
449,000 EUR General Electric Co 1.250% 26-May-2023 556,625 0.05% 481,000 USD General Electric Co 6.750% 15-Mar-2032 658,485 0.06%
1,136,000 EUR General Electric Co 2.125% 17-May-2037 1,354,284 0.11% 3,771,000 USD General Motors Co 4.875% 02-Oct-2023 4,082,928 0.34% 1,924,000 USD General Motors Co 5.000% 01-Apr-2035 2,041,214 0.17% 3,115,000 USD General Motors Financial Co Inc FRN 06-Nov-2020 3,111,393 0.26% 1,067,000 USD General Motors Financial Co Inc 4.375% 25-Sep-2021 1,119,255 0.09% 1,687,000 USD Georgia Power Co 4.300% 15-Mar-2042 1,793,591 0.15% 1,390,000 USD Georgia-Pacific LLC '144A' 3.600% 01-Mar-2025 1,427,945 0.12% 1,400,000 USD Georgia-Pacific LLC 7.750% 15-Nov-2029 1,966,832 0.16% 2,699,000 USD Gilead Sciences Inc 4.000% 01-Sep-2036 2,855,190 0.24%
800,000 USD Halliburton Co 3.800% 15-Nov-2025 831,593 0.07% 1,447,000 USD Halliburton Co 5.000% 15-Nov-2045 1,649,549 0.14% 2,209,000 USD HCA Inc 5.500% 15-Jun-2047 2,211,761 0.18% 1,834,000 USD Hilton Domestic Operating Co Inc 4.250% 01-Sep-2024 1,856,925 0.15% 5,347,000 USD Home Depot Inc 1.800% 05-Jun-2020 5,303,446 0.44%
558,000 USD Home Depot Inc 3.900% 15-Jun-2047 588,423 0.05% 3,175,000 USD International Paper Co 5.150% 15-May-2046 3,682,278 0.31% 1,259,000 USD Jersey Central Power & Light Co '144A' 4.700% 01-Apr-2024 1,363,514 0.11% 1,374,000 USD Jersey Central Power & Light Co '144A' 4.300% 15-Jan-2026 1,434,260 0.12% 1,560,000 USD Jersey Central Power & Light Co 6.150% 01-Jun-2037 1,938,678 0.16%
509,000 USD Johnson & Johnson 1.950% 10-Nov-2020 506,477 0.04% 1,420,000 EUR Johnson & Johnson 0.650% 20-May-2024 1,715,499 0.14% 2,960,000 USD Johnson & Johnson 3.400% 15-Jan-2038 3,031,623 0.25%
586,000 USD Johnson & Johnson 5.850% 15-Jul-2038 793,907 0.07% 4,020,000 USD JPMorgan Chase & Co 6.000% 15-Jan-2018 4,026,080 0.34% 1,900,000 CAD JPMorgan Chase & Co 3.190% 05-Mar-2021 1,550,379 0.13% 2,420,000 USD JPMorgan Chase & Co 3.375% 01-May-2023 2,459,778 0.20% 1,140,000 EUR JPMorgan Chase & Co 0.625% 25-Jan-2024 1,359,144 0.11% 4,323,000 USD JPMorgan Chase & Co FRN 10-Jan-2025 4,343,839 0.36% 5,416,000 USD JPMorgan Chase & Co FRN 01-Mar-2025 5,454,808 0.45% 1,400,000 USD JPMorgan Chase & Co 3.900% 15-Jul-2025 1,465,934 0.12% 6,076,000 USD JPMorgan Chase & Co 6.400% 15-May-2038 8,359,923 0.70% 3,240,000 USD JPMorgan Chase & Co FRN (Perpetual)* 3,289,410 0.27% 1,570,000 USD Kilroy Realty LP 3.800% 15-Jan-2023 1,606,130 0.13% 2,560,000 USD Kilroy Realty LP 3.450% 15-Dec-2024 2,552,456 0.21% 2,537,000 USD Kilroy Realty LP 4.250% 15-Aug-2029 2,625,357 0.22% 2,074,000 USD Kinder Morgan Energy Partners LP 5.500% 01-Mar-2044 2,212,190 0.18%
690,000 USD Kinder Morgan Inc 3.050% 01-Dec-2019 696,165 0.06% 1,066,000 USD Kinder Morgan Inc 4.300% 01-Jun-2025 1,110,605 0.09% 1,100,000 USD Kinder Morgan Inc/DE 5.300% 01-Dec-2034 1,174,693 0.10% 2,006,000 USD Kroger Co 4.450% 01-Feb-2047 2,006,077 0.17% 2,754,000 USD Lennar Corp '144A' 4.750% 29-Nov-2027 2,849,839 0.24% 1,389,000 USD Lockheed Martin Corp 4.090% 15-Sep-2052 1,451,180 0.12% 2,755,000 USD Medtronic Inc 3.500% 15-Mar-2025 2,856,668 0.24%
800,000 USD Medtronic Inc 4.625% 15-Mar-2045 931,978 0.08% 1,989,000 USD MetLife Inc 4.600% 13-May-2046 2,268,616 0.19% 1,333,000 USD Metropolitan Life Global Funding I '144A' 3.450% 18-Dec-2026 1,369,090 0.11%
571,000 USD Microsoft Corp 4.450% 03-Nov-2045 669,221 0.06% 1,108,000 USD Microsoft Corp 3.700% 08-Aug-2046 1,154,588 0.10% 2,588,000 USD Microsoft Corp 4.250% 06-Feb-2047 2,960,694 0.25% 3,320,000 USD Molex Electronic Technologies LLC '144A' 3.900% 15-Apr-2025 3,385,909 0.28% 1,422,000 EUR Molson Coors Brewing Co 1.250% 15-Jul-2024 1,719,288 0.14% 1,681,000 USD Moody's Corp 2.750% 15-Dec-2021 1,683,684 0.14% 1,163,000 USD Moody's Corp '144A' 3.250% 15-Jan-2028 1,152,339 0.10% 1,920,000 USD Morgan Stanley 6.625% 01-Apr-2018 1,941,381 0.16%
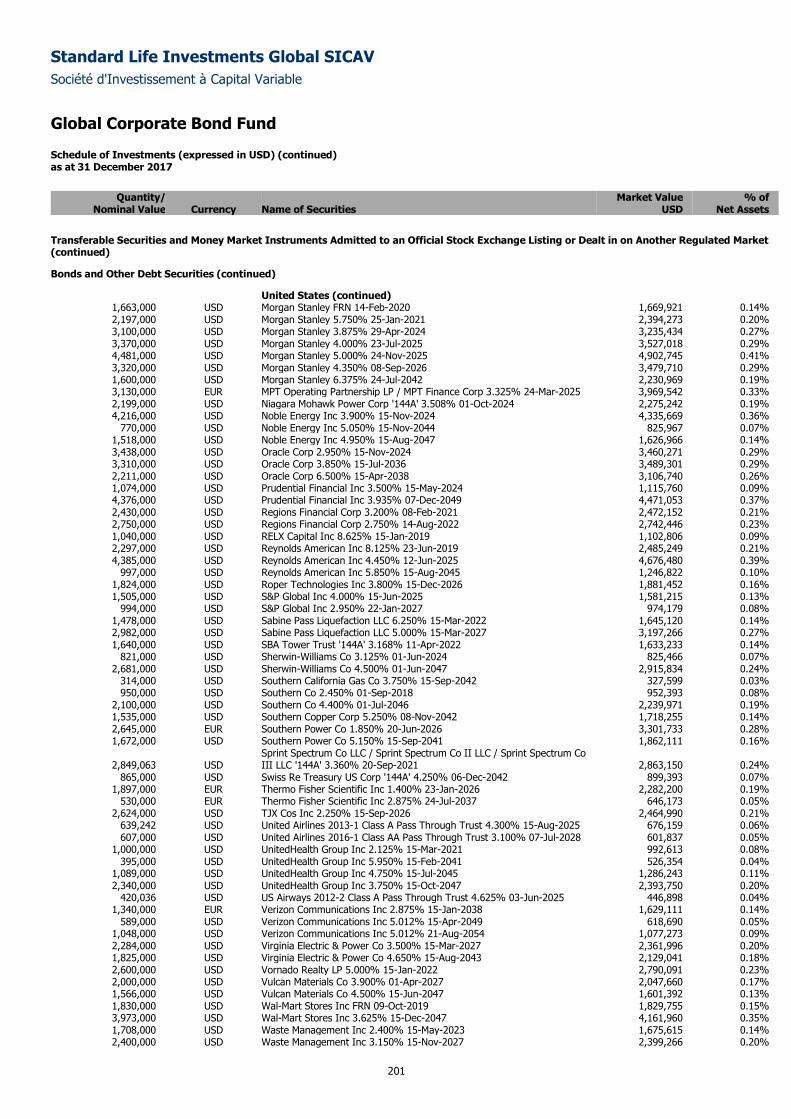
Standard Life Investments Global SICAV
Société d'Investissement à Capital Variable
Global Corporate Bond Fund
Schedule of Investments (expressed in USD) (continued) as at 31 December 2017
201
Quantity/ Market Value % of
Nominal Value Currency Name of Securities USD Net Assets
Transferable Securities and Money Market Instruments Admitted to an Official Stock Exchange Listing or Dealt in on Another Regulated Market (continued)
Bonds and Other Debt Securities (continued)
United States (continued) 1,663,000 USD Morgan Stanley FRN 14-Feb-2020 1,669,921 0.14% 2,197,000 USD Morgan Stanley 5.750% 25-Jan-2021 2,394,273 0.20% 3,100,000 USD Morgan Stanley 3.875% 29-Apr-2024 3,235,434 0.27% 3,370,000 USD Morgan Stanley 4.000% 23-Jul-2025 3,527,018 0.29% 4,481,000 USD Morgan Stanley 5.000% 24-Nov-2025 4,902,745 0.41% 3,320,000 USD Morgan Stanley 4.350% 08-Sep-2026 3,479,710 0.29% 1,600,000 USD Morgan Stanley 6.375% 24-Jul-2042 2,230,969 0.19% 3,130,000 EUR MPT Operating Partnership LP / MPT Finance Corp 3.325% 24-Mar-2025 3,969,542 0.33% 2,199,000 USD Niagara Mohawk Power Corp '144A' 3.508% 01-Oct-2024 2,275,242 0.19% 4,216,000 USD Noble Energy Inc 3.900% 15-Nov-2024 4,335,669 0.36%
770,000 USD Noble Energy Inc 5.050% 15-Nov-2044 825,967 0.07% 1,518,000 USD Noble Energy Inc 4.950% 15-Aug-2047 1,626,966 0.14% 3,438,000 USD Oracle Corp 2.950% 15-Nov-2024 3,460,271 0.29% 3,310,000 USD Oracle Corp 3.850% 15-Jul-2036 3,489,301 0.29% 2,211,000 USD Oracle Corp 6.500% 15-Apr-2038 3,106,740 0.26% 1,074,000 USD Prudential Financial Inc 3.500% 15-May-2024 1,115,760 0.09% 4,376,000 USD Prudential Financial Inc 3.935% 07-Dec-2049 4,471,053 0.37% 2,430,000 USD Regions Financial Corp 3.200% 08-Feb-2021 2,472,152 0.21% 2,750,000 USD Regions Financial Corp 2.750% 14-Aug-2022 2,742,446 0.23% 1,040,000 USD RELX Capital Inc 8.625% 15-Jan-2019 1,102,806 0.09% 2,297,000 USD Reynolds American Inc 8.125% 23-Jun-2019 2,485,249 0.21% 4,385,000 USD Reynolds American Inc 4.450% 12-Jun-2025 4,676,480 0.39%
997,000 USD Reynolds American Inc 5.850% 15-Aug-2045 1,246,822 0.10% 1,824,000 USD Roper Technologies Inc 3.800% 15-Dec-2026 1,881,452 0.16% 1,505,000 USD S&P Global Inc 4.000% 15-Jun-2025 1,581,215 0.13%
994,000 USD S&P Global Inc 2.950% 22-Jan-2027 974,179 0.08% 1,478,000 USD Sabine Pass Liquefaction LLC 6.250% 15-Mar-2022 1,645,120 0.14% 2,982,000 USD Sabine Pass Liquefaction LLC 5.000% 15-Mar-2027 3,197,266 0.27% 1,640,000 USD SBA Tower Trust '144A' 3.168% 11-Apr-2022 1,633,233 0.14%
821,000 USD Sherwin-Williams Co 3.125% 01-Jun-2024 825,466 0.07% 2,681,000 USD Sherwin-Williams Co 4.500% 01-Jun-2047 2,915,834 0.24%
314,000 USD Southern California Gas Co 3.750% 15-Sep-2042 327,599 0.03% 950,000 USD Southern Co 2.450% 01-Sep-2018 952,393 0.08%
2,100,000 USD Southern Co 4.400% 01-Jul-2046 2,239,971 0.19% 1,535,000 USD Southern Copper Corp 5.250% 08-Nov-2042 1,718,255 0.14% 2,645,000 EUR Southern Power Co 1.850% 20-Jun-2026 3,301,733 0.28% 1,672,000 USD Southern Power Co 5.150% 15-Sep-2041 1,862,111 0.16%
2,849,063 USD Sprint Spectrum Co LLC / Sprint Spectrum Co II LLC / Sprint Spectrum Co III LLC '144A' 3.360% 20-Sep-2021 2,863,150 0.24%
865,000 USD Swiss Re Treasury US Corp '144A' 4.250% 06-Dec-2042 899,393 0.07% 1,897,000 EUR Thermo Fisher Scientific Inc 1.400% 23-Jan-2026 2,282,200 0.19%
530,000 EUR Thermo Fisher Scientific Inc 2.875% 24-Jul-2037 646,173 0.05% 2,624,000 USD TJX Cos Inc 2.250% 15-Sep-2026 2,464,990 0.21%
639,242 USD United Airlines 2013-1 Class A Pass Through Trust 4.300% 15-Aug-2025 676,159 0.06% 607,000 USD United Airlines 2016-1 Class AA Pass Through Trust 3.100% 07-Jul-2028 601,837 0.05%
1,000,000 USD UnitedHealth Group Inc 2.125% 15-Mar-2021 992,613 0.08% 395,000 USD UnitedHealth Group Inc 5.950% 15-Feb-2041 526,354 0.04%
1,089,000 USD UnitedHealth Group Inc 4.750% 15-Jul-2045 1,286,243 0.11% 2,340,000 USD UnitedHealth Group Inc 3.750% 15-Oct-2047 2,393,750 0.20%
420,036 USD US Airways 2012-2 Class A Pass Through Trust 4.625% 03-Jun-2025 446,898 0.04% 1,340,000 EUR Verizon Communications Inc 2.875% 15-Jan-2038 1,629,111 0.14%
589,000 USD Verizon Communications Inc 5.012% 15-Apr-2049 618,690 0.05% 1,048,000 USD Verizon Communications Inc 5.012% 21-Aug-2054 1,077,273 0.09% 2,284,000 USD Virginia Electric & Power Co 3.500% 15-Mar-2027 2,361,996 0.20% 1,825,000 USD Virginia Electric & Power Co 4.650% 15-Aug-2043 2,129,041 0.18% 2,600,000 USD Vornado Realty LP 5.000% 15-Jan-2022 2,790,091 0.23% 2,000,000 USD Vulcan Materials Co 3.900% 01-Apr-2027 2,047,660 0.17% 1,566,000 USD Vulcan Materials Co 4.500% 15-Jun-2047 1,601,392 0.13% 1,830,000 USD Wal-Mart Stores Inc FRN 09-Oct-2019 1,829,755 0.15% 3,973,000 USD Wal-Mart Stores Inc 3.625% 15-Dec-2047 4,161,960 0.35% 1,708,000 USD Waste Management Inc 2.400% 15-May-2023 1,675,615 0.14% 2,400,000 USD Waste Management Inc 3.150% 15-Nov-2027 2,399,266 0.20%
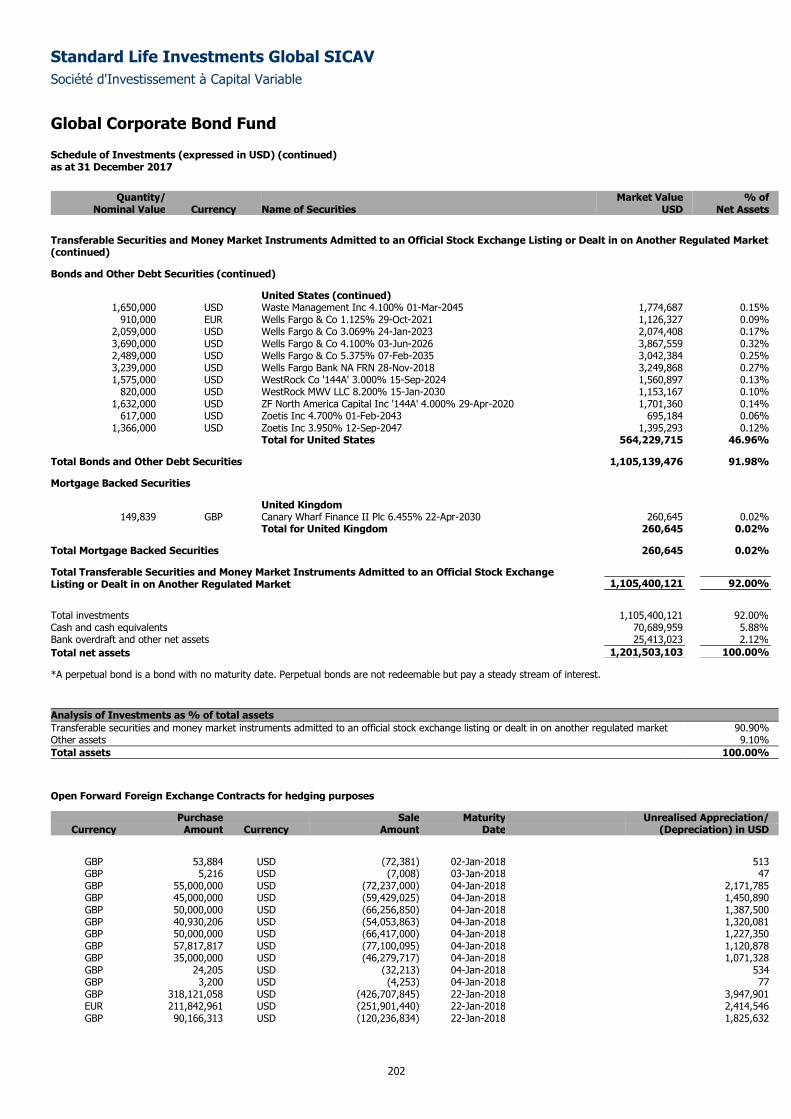
Standard Life Investments Global SICAV
Société d'Investissement à Capital Variable
Global Corporate Bond Fund
Schedule of Investments (expressed in USD) (continued) as at 31 December 2017
202
Quantity/ Market Value % of
Nominal Value Currency Name of Securities USD Net Assets
Transferable Securities and Money Market Instruments Admitted to an Official Stock Exchange Listing or Dealt in on Another Regulated Market (continued)
Bonds and Other Debt Securities (continued)
United States (continued) 1,650,000 USD Waste Management Inc 4.100% 01-Mar-2045 1,774,687 0.15%
910,000 EUR Wells Fargo & Co 1.125% 29-Oct-2021 1,126,327 0.09% 2,059,000 USD Wells Fargo & Co 3.069% 24-Jan-2023 2,074,408 0.17% 3,690,000 USD Wells Fargo & Co 4.100% 03-Jun-2026 3,867,559 0.32% 2,489,000 USD Wells Fargo & Co 5.375% 07-Feb-2035 3,042,384 0.25% 3,239,000 USD Wells Fargo Bank NA FRN 28-Nov-2018 3,249,868 0.27% 1,575,000 USD WestRock Co '144A' 3.000% 15-Sep-2024 1,560,897 0.13%
820,000 USD WestRock MWV LLC 8.200% 15-Jan-2030 1,153,167 0.10% 1,632,000 USD ZF North America Capital Inc '144A' 4.000% 29-Apr-2020 1,701,360 0.14%
617,000 USD Zoetis Inc 4.700% 01-Feb-2043 695,184 0.06% 1,366,000 USD Zoetis Inc 3.950% 12-Sep-2047 1,395,293 0.12%
Total for United States 564,229,715 46.96%
Total Bonds and Other Debt Securities 1,105,139,476 91.98%
Mortgage Backed Securities
United Kingdom 149,839 GBP Canary Wharf Finance II Plc 6.455% 22-Apr-2030 260,645 0.02%
Total for United Kingdom 260,645 0.02%
Total Mortgage Backed Securities 260,645 0.02%
Total Transferable Securities and Money Market Instruments Admitted to an Official Stock Exchange Listing or Dealt in on Another Regulated Market 1,105,400,121 92.00%
Total investments 1,105,400,121 92.00%
Cash and cash equivalents 70,689,959 5.88%
Bank overdraft and other net assets 25,413,023 2.12%
Total net assets 1,201,503,103 100.00%
*A perpetual bond is a bond with no maturity date. Perpetual bonds are not redeemable but pay a steady stream of interest.
Analysis of Investments as % of total assets
Transferable securities and money market instruments admitted to an official stock exchange listing or dealt in on another regulated market 90.90% Other assets 9.10%
Total assets 100.00%
Open Forward Foreign Exchange Contracts for hedging purposes
Purchase Sale Maturity Unrealised Appreciation/ Currency Amount Currency Amount Date (Depreciation) in USD
GBP 53,884 USD (72,381) 02-Jan-2018 513 GBP 5,216 USD (7,008) 03-Jan-2018 47 GBP 55,000,000 USD (72,237,000) 04-Jan-2018 2,171,785 GBP 45,000,000 USD (59,429,025) 04-Jan-2018 1,450,890 GBP 50,000,000 USD (66,256,850) 04-Jan-2018 1,387,500 GBP 40,930,206 USD (54,053,863) 04-Jan-2018 1,320,081 GBP 50,000,000 USD (66,417,000) 04-Jan-2018 1,227,350 GBP 57,817,817 USD (77,100,095) 04-Jan-2018 1,120,878 GBP 35,000,000 USD (46,279,717) 04-Jan-2018 1,071,328 GBP 24,205 USD (32,213) 04-Jan-2018 534 GBP 3,200 USD (4,253) 04-Jan-2018 77 GBP 318,121,058 USD (426,707,845) 22-Jan-2018 3,947,901 EUR 211,842,961 USD (251,901,440) 22-Jan-2018 2,414,546 GBP 90,166,313 USD (120,236,834) 22-Jan-2018 1,825,632
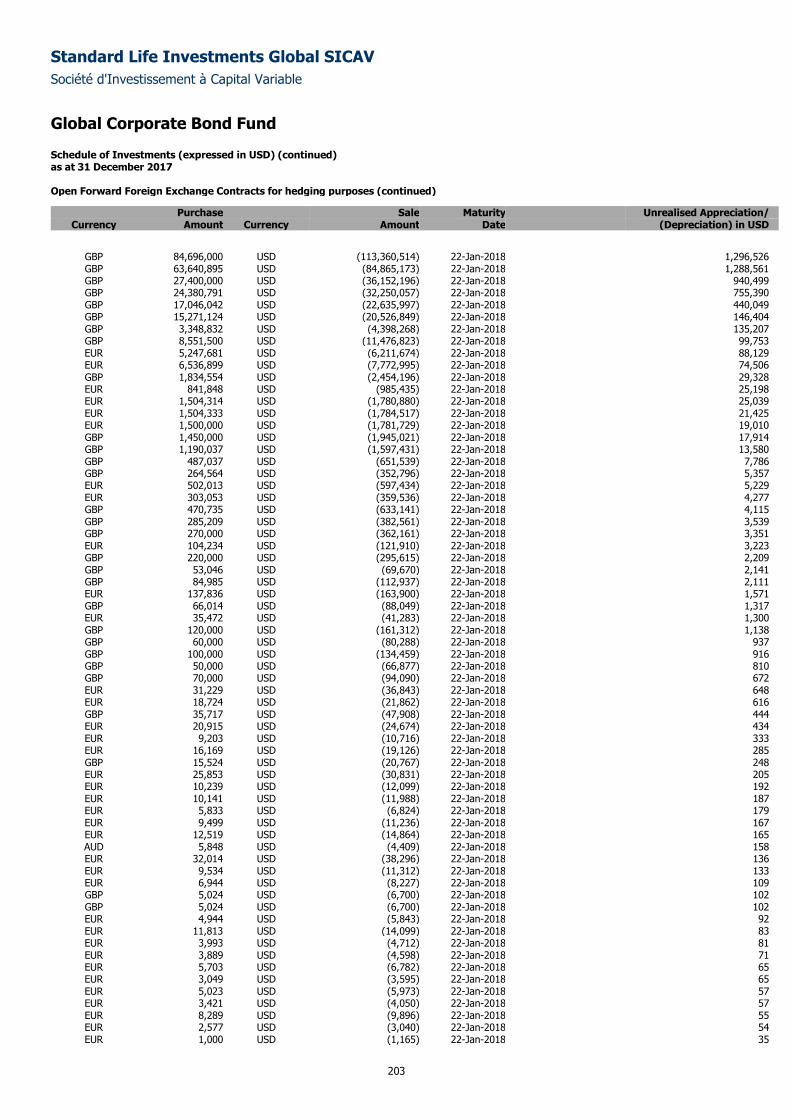
Standard Life Investments Global SICAV
Société d'Investissement à Capital Variable
Global Corporate Bond Fund
Schedule of Investments (expressed in USD) (continued) as at 31 December 2017
203
Open Forward Foreign Exchange Contracts for hedging purposes (continued)
Purchase Sale Maturity Unrealised Appreciation/ Currency Amount Currency Amount Date (Depreciation) in USD
GBP 84,696,000 USD (113,360,514) 22-Jan-2018 1,296,526 GBP 63,640,895 USD (84,865,173) 22-Jan-2018 1,288,561 GBP 27,400,000 USD (36,152,196) 22-Jan-2018 940,499 GBP 24,380,791 USD (32,250,057) 22-Jan-2018 755,390 GBP 17,046,042 USD (22,635,997) 22-Jan-2018 440,049 GBP 15,271,124 USD (20,526,849) 22-Jan-2018 146,404 GBP 3,348,832 USD (4,398,268) 22-Jan-2018 135,207 GBP 8,551,500 USD (11,476,823) 22-Jan-2018 99,753 EUR 5,247,681 USD (6,211,674) 22-Jan-2018 88,129 EUR 6,536,899 USD (7,772,995) 22-Jan-2018 74,506 GBP 1,834,554 USD (2,454,196) 22-Jan-2018 29,328 EUR 841,848 USD (985,435) 22-Jan-2018 25,198 EUR 1,504,314 USD (1,780,880) 22-Jan-2018 25,039 EUR 1,504,333 USD (1,784,517) 22-Jan-2018 21,425 EUR 1,500,000 USD (1,781,729) 22-Jan-2018 19,010 GBP 1,450,000 USD (1,945,021) 22-Jan-2018 17,914 GBP 1,190,037 USD (1,597,431) 22-Jan-2018 13,580 GBP 487,037 USD (651,539) 22-Jan-2018 7,786 GBP 264,564 USD (352,796) 22-Jan-2018 5,357 EUR 502,013 USD (597,434) 22-Jan-2018 5,229 EUR 303,053 USD (359,536) 22-Jan-2018 4,277 GBP 470,735 USD (633,141) 22-Jan-2018 4,115 GBP 285,209 USD (382,561) 22-Jan-2018 3,539 GBP 270,000 USD (362,161) 22-Jan-2018 3,351 EUR 104,234 USD (121,910) 22-Jan-2018 3,223 GBP 220,000 USD (295,615) 22-Jan-2018 2,209 GBP 53,046 USD (69,670) 22-Jan-2018 2,141 GBP 84,985 USD (112,937) 22-Jan-2018 2,111 EUR 137,836 USD (163,900) 22-Jan-2018 1,571 GBP 66,014 USD (88,049) 22-Jan-2018 1,317 EUR 35,472 USD (41,283) 22-Jan-2018 1,300 GBP 120,000 USD (161,312) 22-Jan-2018 1,138 GBP 60,000 USD (80,288) 22-Jan-2018 937 GBP 100,000 USD (134,459) 22-Jan-2018 916 GBP 50,000 USD (66,877) 22-Jan-2018 810 GBP 70,000 USD (94,090) 22-Jan-2018 672 EUR 31,229 USD (36,843) 22-Jan-2018 648 EUR 18,724 USD (21,862) 22-Jan-2018 616 GBP 35,717 USD (47,908) 22-Jan-2018 444 EUR 20,915 USD (24,674) 22-Jan-2018 434 EUR 9,203 USD (10,716) 22-Jan-2018 333 EUR 16,169 USD (19,126) 22-Jan-2018 285 GBP 15,524 USD (20,767) 22-Jan-2018 248 EUR 25,853 USD (30,831) 22-Jan-2018 205 EUR 10,239 USD (12,099) 22-Jan-2018 192 EUR 10,141 USD (11,988) 22-Jan-2018 187 EUR 5,833 USD (6,824) 22-Jan-2018 179 EUR 9,499 USD (11,236) 22-Jan-2018 167 EUR 12,519 USD (14,864) 22-Jan-2018 165 AUD 5,848 USD (4,409) 22-Jan-2018 158 EUR 32,014 USD (38,296) 22-Jan-2018 136 EUR 9,534 USD (11,312) 22-Jan-2018 133 EUR 6,944 USD (8,227) 22-Jan-2018 109 GBP 5,024 USD (6,700) 22-Jan-2018 102 GBP 5,024 USD (6,700) 22-Jan-2018 102 EUR 4,944 USD (5,843) 22-Jan-2018 92 EUR 11,813 USD (14,099) 22-Jan-2018 83 EUR 3,993 USD (4,712) 22-Jan-2018 81 EUR 3,889 USD (4,598) 22-Jan-2018 71 EUR 5,703 USD (6,782) 22-Jan-2018 65 EUR 3,049 USD (3,595) 22-Jan-2018 65 EUR 5,023 USD (5,973) 22-Jan-2018 57 EUR 3,421 USD (4,050) 22-Jan-2018 57 EUR 8,289 USD (9,896) 22-Jan-2018 55 EUR 2,577 USD (3,040) 22-Jan-2018 54 EUR 1,000 USD (1,165) 22-Jan-2018 35
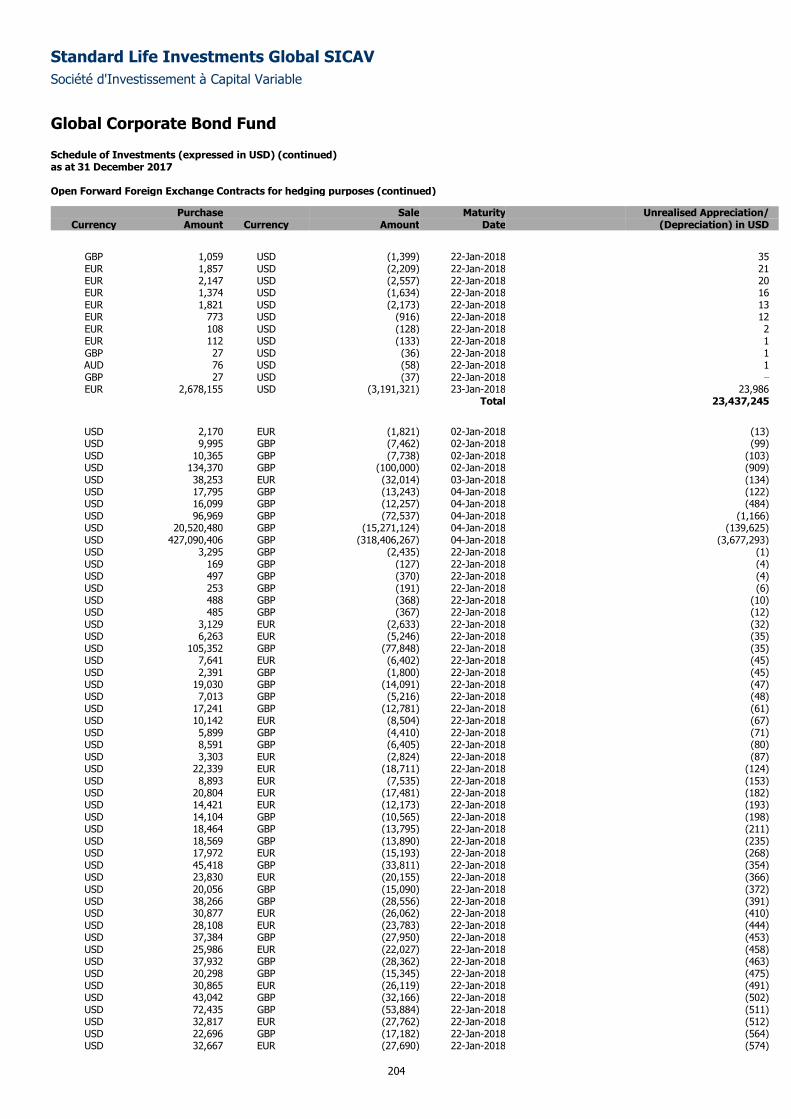
Standard Life Investments Global SICAV
Société d'Investissement à Capital Variable
Global Corporate Bond Fund
Schedule of Investments (expressed in USD) (continued) as at 31 December 2017
204
Open Forward Foreign Exchange Contracts for hedging purposes (continued)
Purchase Sale Maturity Unrealised Appreciation/ Currency Amount Currency Amount Date (Depreciation) in USD
GBP 1,059 USD (1,399) 22-Jan-2018 35 EUR 1,857 USD (2,209) 22-Jan-2018 21 EUR 2,147 USD (2,557) 22-Jan-2018 20 EUR 1,374 USD (1,634) 22-Jan-2018 16 EUR 1,821 USD (2,173) 22-Jan-2018 13 EUR 773 USD (916) 22-Jan-2018 12 EUR 108 USD (128) 22-Jan-2018 2 EUR 112 USD (133) 22-Jan-2018 1 GBP 27 USD (36) 22-Jan-2018 1 AUD 76 USD (58) 22-Jan-2018 1 GBP 27 USD (37) 22-Jan-2018 –
EUR 2,678,155 USD (3,191,321) 23-Jan-2018 23,986 Total 23,437,245
USD 2,170 EUR (1,821) 02-Jan-2018 (13) USD 9,995 GBP (7,462) 02-Jan-2018 (99) USD 10,365 GBP (7,738) 02-Jan-2018 (103) USD 134,370 GBP (100,000) 02-Jan-2018 (909) USD 38,253 EUR (32,014) 03-Jan-2018 (134) USD 17,795 GBP (13,243) 04-Jan-2018 (122) USD 16,099 GBP (12,257) 04-Jan-2018 (484) USD 96,969 GBP (72,537) 04-Jan-2018 (1,166) USD 20,520,480 GBP (15,271,124) 04-Jan-2018 (139,625) USD 427,090,406 GBP (318,406,267) 04-Jan-2018 (3,677,293) USD 3,295 GBP (2,435) 22-Jan-2018 (1) USD 169 GBP (127) 22-Jan-2018 (4) USD 497 GBP (370) 22-Jan-2018 (4) USD 253 GBP (191) 22-Jan-2018 (6) USD 488 GBP (368) 22-Jan-2018 (10) USD 485 GBP (367) 22-Jan-2018 (12) USD 3,129 EUR (2,633) 22-Jan-2018 (32) USD 6,263 EUR (5,246) 22-Jan-2018 (35) USD 105,352 GBP (77,848) 22-Jan-2018 (35) USD 7,641 EUR (6,402) 22-Jan-2018 (45) USD 2,391 GBP (1,800) 22-Jan-2018 (45) USD 19,030 GBP (14,091) 22-Jan-2018 (47) USD 7,013 GBP (5,216) 22-Jan-2018 (48) USD 17,241 GBP (12,781) 22-Jan-2018 (61) USD 10,142 EUR (8,504) 22-Jan-2018 (67) USD 5,899 GBP (4,410) 22-Jan-2018 (71) USD 8,591 GBP (6,405) 22-Jan-2018 (80) USD 3,303 EUR (2,824) 22-Jan-2018 (87) USD 22,339 EUR (18,711) 22-Jan-2018 (124) USD 8,893 EUR (7,535) 22-Jan-2018 (153) USD 20,804 EUR (17,481) 22-Jan-2018 (182) USD 14,421 EUR (12,173) 22-Jan-2018 (193) USD 14,104 GBP (10,565) 22-Jan-2018 (198) USD 18,464 GBP (13,795) 22-Jan-2018 (211) USD 18,569 GBP (13,890) 22-Jan-2018 (235) USD 17,972 EUR (15,193) 22-Jan-2018 (268) USD 45,418 GBP (33,811) 22-Jan-2018 (354) USD 23,830 EUR (20,155) 22-Jan-2018 (366) USD 20,056 GBP (15,090) 22-Jan-2018 (372) USD 38,266 GBP (28,556) 22-Jan-2018 (391) USD 30,877 EUR (26,062) 22-Jan-2018 (410) USD 28,108 EUR (23,783) 22-Jan-2018 (444) USD 37,384 GBP (27,950) 22-Jan-2018 (453) USD 25,986 EUR (22,027) 22-Jan-2018 (458) USD 37,932 GBP (28,362) 22-Jan-2018 (463) USD 20,298 GBP (15,345) 22-Jan-2018 (475) USD 30,865 EUR (26,119) 22-Jan-2018 (491) USD 43,042 GBP (32,166) 22-Jan-2018 (502) USD 72,435 GBP (53,884) 22-Jan-2018 (511) USD 32,817 EUR (27,762) 22-Jan-2018 (512) USD 22,696 GBP (17,182) 22-Jan-2018 (564) USD 32,667 EUR (27,690) 22-Jan-2018 (574)
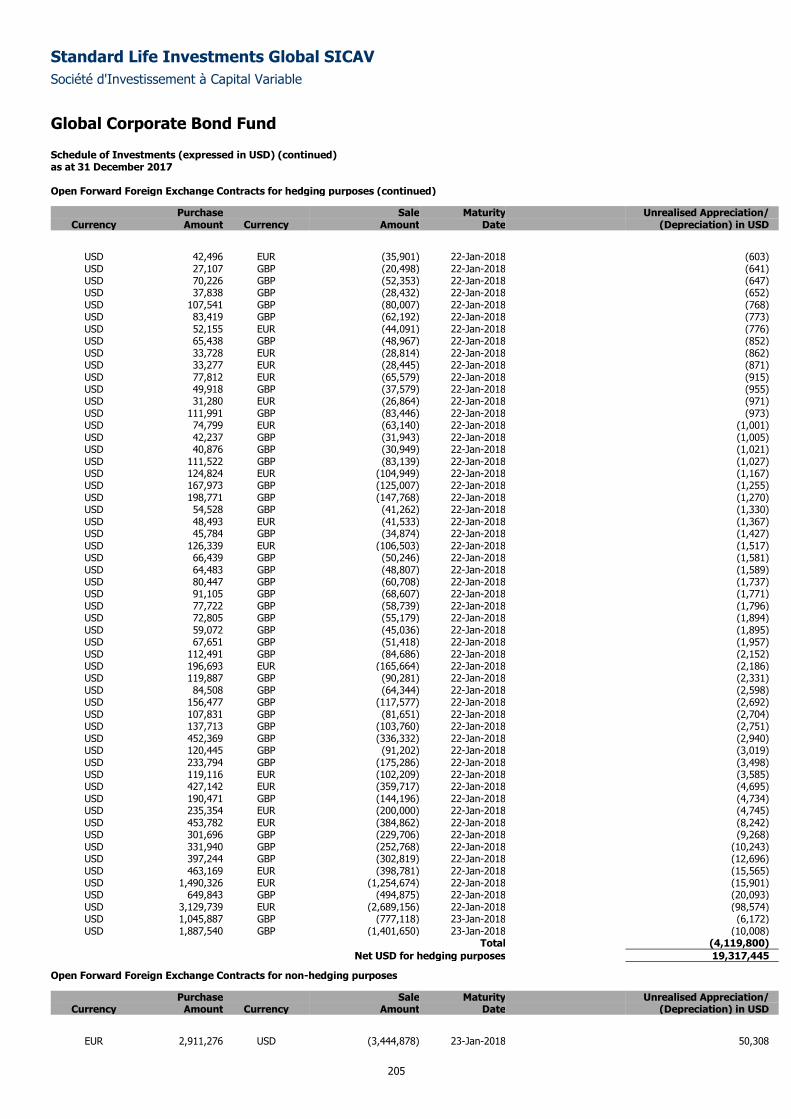
Standard Life Investments Global SICAV
Société d'Investissement à Capital Variable
Global Corporate Bond Fund
Schedule of Investments (expressed in USD) (continued) as at 31 December 2017
205
Open Forward Foreign Exchange Contracts for hedging purposes (continued)
Purchase Sale Maturity Unrealised Appreciation/ Currency Amount Currency Amount Date (Depreciation) in USD
USD 42,496 EUR (35,901) 22-Jan-2018 (603) USD 27,107 GBP (20,498) 22-Jan-2018 (641) USD 70,226 GBP (52,353) 22-Jan-2018 (647) USD 37,838 GBP (28,432) 22-Jan-2018 (652) USD 107,541 GBP (80,007) 22-Jan-2018 (768) USD 83,419 GBP (62,192) 22-Jan-2018 (773) USD 52,155 EUR (44,091) 22-Jan-2018 (776) USD 65,438 GBP (48,967) 22-Jan-2018 (852) USD 33,728 EUR (28,814) 22-Jan-2018 (862) USD 33,277 EUR (28,445) 22-Jan-2018 (871) USD 77,812 EUR (65,579) 22-Jan-2018 (915) USD 49,918 GBP (37,579) 22-Jan-2018 (955) USD 31,280 EUR (26,864) 22-Jan-2018 (971) USD 111,991 GBP (83,446) 22-Jan-2018 (973) USD 74,799 EUR (63,140) 22-Jan-2018 (1,001) USD 42,237 GBP (31,943) 22-Jan-2018 (1,005) USD 40,876 GBP (30,949) 22-Jan-2018 (1,021) USD 111,522 GBP (83,139) 22-Jan-2018 (1,027) USD 124,824 EUR (104,949) 22-Jan-2018 (1,167) USD 167,973 GBP (125,007) 22-Jan-2018 (1,255) USD 198,771 GBP (147,768) 22-Jan-2018 (1,270) USD 54,528 GBP (41,262) 22-Jan-2018 (1,330) USD 48,493 EUR (41,533) 22-Jan-2018 (1,367) USD 45,784 GBP (34,874) 22-Jan-2018 (1,427) USD 126,339 EUR (106,503) 22-Jan-2018 (1,517) USD 66,439 GBP (50,246) 22-Jan-2018 (1,581) USD 64,483 GBP (48,807) 22-Jan-2018 (1,589) USD 80,447 GBP (60,708) 22-Jan-2018 (1,737) USD 91,105 GBP (68,607) 22-Jan-2018 (1,771) USD 77,722 GBP (58,739) 22-Jan-2018 (1,796) USD 72,805 GBP (55,179) 22-Jan-2018 (1,894) USD 59,072 GBP (45,036) 22-Jan-2018 (1,895) USD 67,651 GBP (51,418) 22-Jan-2018 (1,957) USD 112,491 GBP (84,686) 22-Jan-2018 (2,152) USD 196,693 EUR (165,664) 22-Jan-2018 (2,186) USD 119,887 GBP (90,281) 22-Jan-2018 (2,331) USD 84,508 GBP (64,344) 22-Jan-2018 (2,598) USD 156,477 GBP (117,577) 22-Jan-2018 (2,692) USD 107,831 GBP (81,651) 22-Jan-2018 (2,704) USD 137,713 GBP (103,760) 22-Jan-2018 (2,751) USD 452,369 GBP (336,332) 22-Jan-2018 (2,940) USD 120,445 GBP (91,202) 22-Jan-2018 (3,019) USD 233,794 GBP (175,286) 22-Jan-2018 (3,498) USD 119,116 EUR (102,209) 22-Jan-2018 (3,585) USD 427,142 EUR (359,717) 22-Jan-2018 (4,695) USD 190,471 GBP (144,196) 22-Jan-2018 (4,734) USD 235,354 EUR (200,000) 22-Jan-2018 (4,745) USD 453,782 EUR (384,862) 22-Jan-2018 (8,242) USD 301,696 GBP (229,706) 22-Jan-2018 (9,268) USD 331,940 GBP (252,768) 22-Jan-2018 (10,243) USD 397,244 GBP (302,819) 22-Jan-2018 (12,696) USD 463,169 EUR (398,781) 22-Jan-2018 (15,565) USD 1,490,326 EUR (1,254,674) 22-Jan-2018 (15,901) USD 649,843 GBP (494,875) 22-Jan-2018 (20,093) USD 3,129,739 EUR (2,689,156) 22-Jan-2018 (98,574) USD 1,045,887 GBP (777,118) 23-Jan-2018 (6,172) USD 1,887,540 GBP (1,401,650) 23-Jan-2018 (10,008)
Total (4,119,800)
Net USD for hedging purposes 19,317,445
Open Forward Foreign Exchange Contracts for non-hedging purposes
Purchase Sale Maturity Unrealised Appreciation/ Currency Amount Currency Amount Date (Depreciation) in USD
EUR 2,911,276 USD (3,444,878) 23-Jan-2018 50,308
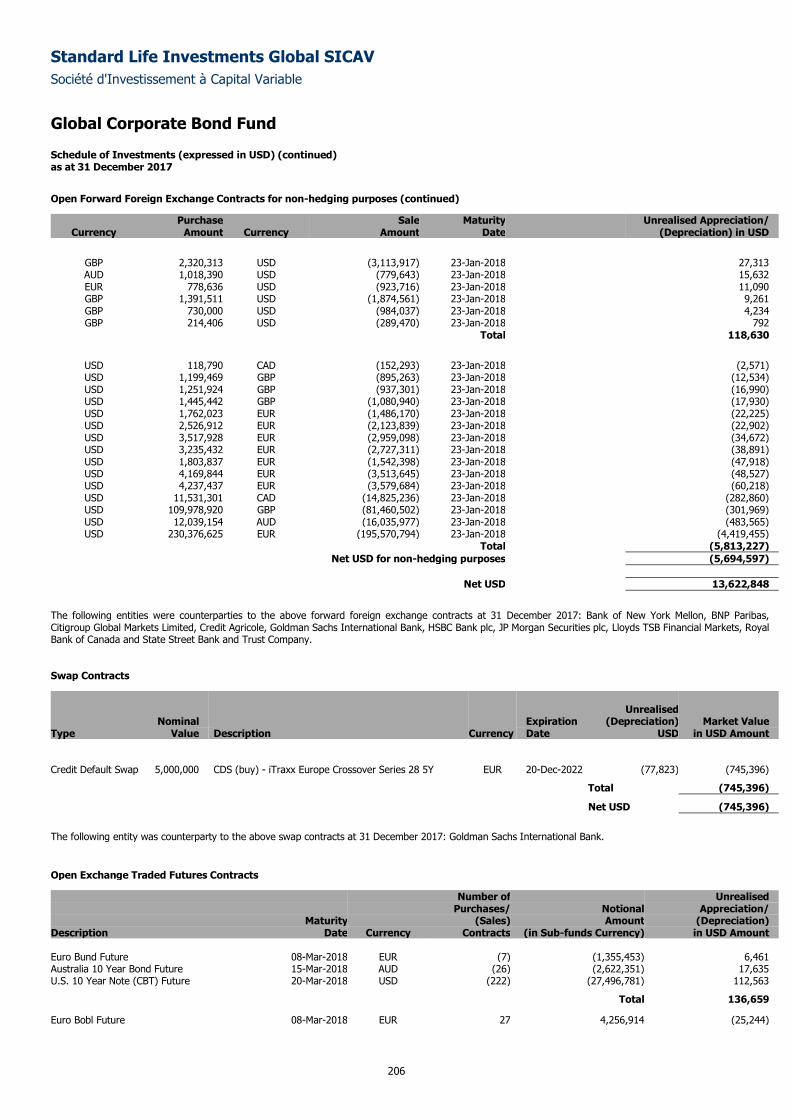
Standard Life Investments Global SICAV
Société d'Investissement à Capital Variable
Global Corporate Bond Fund
Schedule of Investments (expressed in USD) (continued) as at 31 December 2017
206
Open Forward Foreign Exchange Contracts for non-hedging purposes (continued)
Purchase Sale Maturity Unrealised Appreciation/ Currency Amount Currency Amount Date (Depreciation) in USD
GBP 2,320,313 USD (3,113,917) 23-Jan-2018 27,313 AUD 1,018,390 USD (779,643) 23-Jan-2018 15,632 EUR 778,636 USD (923,716) 23-Jan-2018 11,090 GBP 1,391,511 USD (1,874,561) 23-Jan-2018 9,261 GBP 730,000 USD (984,037) 23-Jan-2018 4,234 GBP 214,406 USD (289,470) 23-Jan-2018 792
Total 118,630
USD 118,790 CAD (152,293) 23-Jan-2018 (2,571) USD 1,199,469 GBP (895,263) 23-Jan-2018 (12,534) USD 1,251,924 GBP (937,301) 23-Jan-2018 (16,990) USD 1,445,442 GBP (1,080,940) 23-Jan-2018 (17,930) USD 1,762,023 EUR (1,486,170) 23-Jan-2018 (22,225) USD 2,526,912 EUR (2,123,839) 23-Jan-2018 (22,902) USD 3,517,928 EUR (2,959,098) 23-Jan-2018 (34,672) USD 3,235,432 EUR (2,727,311) 23-Jan-2018 (38,891) USD 1,803,837 EUR (1,542,398) 23-Jan-2018 (47,918) USD 4,169,844 EUR (3,513,645) 23-Jan-2018 (48,527) USD 4,237,437 EUR (3,579,684) 23-Jan-2018 (60,218) USD 11,531,301 CAD (14,825,236) 23-Jan-2018 (282,860) USD 109,978,920 GBP (81,460,502) 23-Jan-2018 (301,969) USD 12,039,154 AUD (16,035,977) 23-Jan-2018 (483,565) USD 230,376,625 EUR (195,570,794) 23-Jan-2018 (4,419,455)
Total (5,813,227)
Net USD for non-hedging purposes (5,694,597)
Net USD 13,622,848
The following entities were counterparties to the above forward foreign exchange contracts at 31 December 2017: Bank of New York Mellon, BNP Paribas, Citigroup Global Markets Limited, Credit Agricole, Goldman Sachs International Bank, HSBC Bank plc, JP Morgan Securities plc, Lloyds TSB Financial Markets, Royal Bank of Canada and State Street Bank and Trust Company.
Swap Contracts
Unrealised Nominal Expiration (Depreciation) Market Value Type Value Description Currency Date USD in USD Amount
Credit Default Swap 5,000,000 CDS (buy) - iTraxx Europe Crossover Series 28 5Y EUR 20-Dec-2022 (77,823) (745,396)
Total (745,396)
Net USD (745,396)
The following entity was counterparty to the above swap contracts at 31 December 2017: Goldman Sachs International Bank.
Open Exchange Traded Futures Contracts
Number of Unrealised Purchases/ Notional Appreciation/ Maturity (Sales) Amount (Depreciation) Description Date Currency Contracts (in Sub-funds Currency) in USD Amount Euro Bund Future 08-Mar-2018 EUR (7) (1,355,453) 6,461 Australia 10 Year Bond Future 15-Mar-2018 AUD (26) (2,622,351) 17,635 U.S. 10 Year Note (CBT) Future 20-Mar-2018 USD (222) (27,496,781) 112,563
Total 136,659
Euro Bobl Future 08-Mar-2018 EUR 27 4,256,914 (25,244)
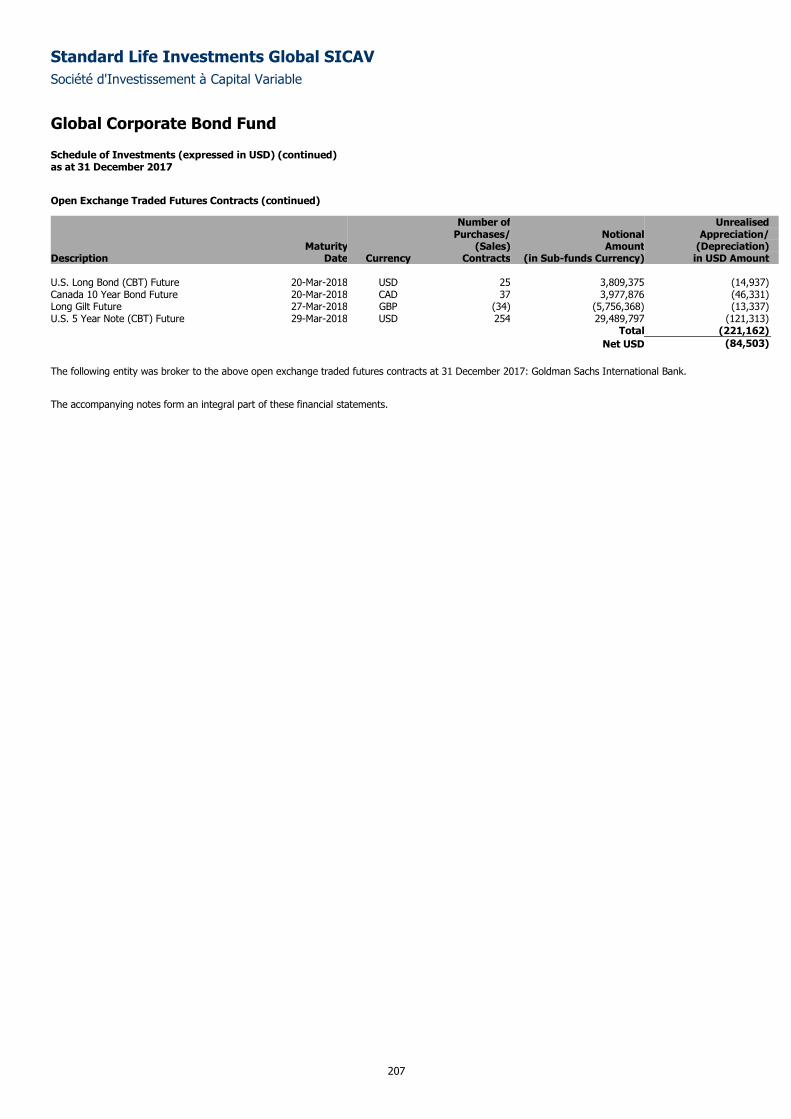
Standard Life Investments Global SICAV
Société d'Investissement à Capital Variable
Global Corporate Bond Fund
Schedule of Investments (expressed in USD) (continued) as at 31 December 2017
207
Open Exchange Traded Futures Contracts (continued)
Number of Unrealised Purchases/ Notional Appreciation/ Maturity (Sales) Amount (Depreciation) Description Date Currency Contracts (in Sub-funds Currency) in USD Amount U.S. Long Bond (CBT) Future 20-Mar-2018 USD 25 3,809,375 (14,937) Canada 10 Year Bond Future 20-Mar-2018 CAD 37 3,977,876 (46,331) Long Gilt Future 27-Mar-2018 GBP (34) (5,756,368) (13,337) U.S. 5 Year Note (CBT) Future 29-Mar-2018 USD 254 29,489,797 (121,313) Total (221,162)
Net USD (84,503)
The following entity was broker to the above open exchange traded futures contracts at 31 December 2017: Goldman Sachs International Bank.
The accompanying notes form an integral part of these financial statements.
Standard Life Investments Global SICAV
Société d'Investissement à Capital Variable
208
European Corporate Bond Sustainable and Responsible Investment Fund
Sub-fund Objective and Investment Policy
The objective of the Sub-fund is to achieve long-term growth in the share price through investing substantially in debt securities issued by corporations and
agencies domiciled in European countries or whose securities are quoted on European stock exchanges. Holdings will principally be of investment grade
bonds. The Sub-fund may also invest in government bonds, sub-investment grade debt and other interest bearing securities issued anywhere in the world.
All investments will need to meet our sustainable and responsible criteria. This means that the Sub-fund will exclude companies that do not comply with any
of the principles set out in the United Nations Global Compact (for more information on these principles, please refer to
http://www.unglobalcompact.org/AboutTheGC/TheTenPrinciples/index.html). An external research provider will be used to determine non-compliance with
any of these principles. Furthermore, the Sub-fund will also exclude companies having direct involvement in the development and production of
controversial weapons.
Non-Euro denominated issues will generally be hedged back into that currency. Return on the Sub-fund will be both through the reinvestment of income and
from capital gains.
Performance Review
The Sub-fund returned 2.73% over the period, compared to the iBoxx Euro Corporate Bond Index which returned 2.38%.*
The biggest positive contributor to relative performance was security selection. Within ratings, our off-benchmark exposure to high yield debt also added to
returns. However, holdings in AAA rated German bunds detracted from performance in what was generally a positive year for risk.
At an individual security level, our overweight position in CTE, the holding company created for Electricite de France’s stake in the grid operator RTE,
benefited performance. We purchased CTE’s bonds at issue in June and they went on to perform well in the secondary market. Overweight positions in a
number of banks, including HSBC, UBS and Rabobank, made a strong contribution to relative returns. Our overweight exposure to a number of corporate
hybrids also proved positive with bonds from Orsted and Total performing well. The insurance sector made good progress over the year which meant
overweight positions in NN Group and Aviva added to relative performance.
On the downside, an off-benchmark exposure to AAA rated German development bank KfW was negative for returns as higher-quality debt underperformed
due to rising bond yields. Teva Pharmaceutical was also a significant negative contributor. Not only did the company post weak quarterly results but it was
downgraded by two notches to BB from BBB- by Fitch. This means the bonds will drop out of most investment-grade indices given its average rating is now
BB+. This led to forced selling into an already weak market by investors who cannot hold high yield-rated bonds.
*Sub-fund performance has been calculated over the stated period on the share price performance basis, based on the institutional share class (D
Accumulation) and net of fees. Please note the index return is quoted gross and contains no adjustment for fees. The sub-fund performance will also be
impacted by any pricing basis changes, made under our single swinging price policy. More information on our swinging price approach can be found in note
8 of the Financial Statements.
Outlook
We retain a constructive view of credit markets entering 2018. Globally, economic data has been strong and inflation remains low, which is keeping the
European Central Bank’s (ECB) policy fairly loose. The passage of the US tax reforms provides a stimulus for US companies and the broader economy.
Progress has also been made in the Brexit negotiations, which has lifted some of the uncertainty hanging over the UK. However, political risk remains on the
agenda with the Italian elections in March 2018 creating a potential roadblock in Europe. This is one area in which we are defensively positioned.
We continue to like subordinated bank debt and corporate hybrid bonds, as we see further spread tightening potential. Overall, we think market valuations
already reflect a very benign technical and fundamental scenario but that there is still some room for spreads to tighten. We expect the first half of the year
to be more supportive for credit spreads and underlying rates, given investors will start to focus on the run-off of the ECB’s purchasing programme closer to
2019.
Please note that the commitment approach has been used for risk measurement and calculation of global exposure for this Sub-fund.
This Sub-fund is not authorised in Hong Kong and is not available to Hong Kong residents.
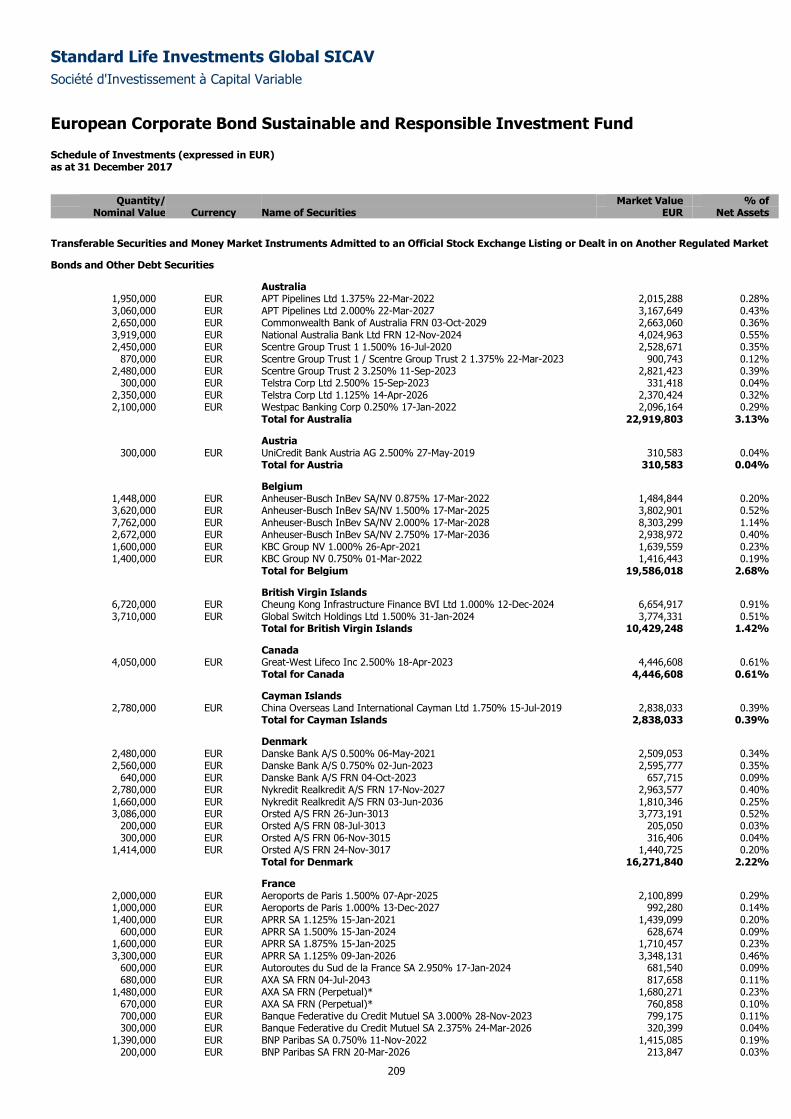
Standard Life Investments Global SICAV
Société d'Investissement à Capital Variable
European Corporate Bond Sustainable and Responsible Investment Fund
Schedule of Investments (expressed in EUR) as at 31 December 2017
209
Quantity/ Market Value % of
Nominal Value Currency Name of Securities EUR Net Assets
Transferable Securities and Money Market Instruments Admitted to an Official Stock Exchange Listing or Dealt in on Another Regulated Market
Bonds and Other Debt Securities
Australia 1,950,000 EUR APT Pipelines Ltd 1.375% 22-Mar-2022 2,015,288 0.28% 3,060,000 EUR APT Pipelines Ltd 2.000% 22-Mar-2027 3,167,649 0.43% 2,650,000 EUR Commonwealth Bank of Australia FRN 03-Oct-2029 2,663,060 0.36% 3,919,000 EUR National Australia Bank Ltd FRN 12-Nov-2024 4,024,963 0.55% 2,450,000 EUR Scentre Group Trust 1 1.500% 16-Jul-2020 2,528,671 0.35%
870,000 EUR Scentre Group Trust 1 / Scentre Group Trust 2 1.375% 22-Mar-2023 900,743 0.12% 2,480,000 EUR Scentre Group Trust 2 3.250% 11-Sep-2023 2,821,423 0.39%
300,000 EUR Telstra Corp Ltd 2.500% 15-Sep-2023 331,418 0.04% 2,350,000 EUR Telstra Corp Ltd 1.125% 14-Apr-2026 2,370,424 0.32% 2,100,000 EUR Westpac Banking Corp 0.250% 17-Jan-2022 2,096,164 0.29%
Total for Australia 22,919,803 3.13%
Austria 300,000 EUR UniCredit Bank Austria AG 2.500% 27-May-2019 310,583 0.04%
Total for Austria 310,583 0.04%
Belgium 1,448,000 EUR Anheuser-Busch InBev SA/NV 0.875% 17-Mar-2022 1,484,844 0.20% 3,620,000 EUR Anheuser-Busch InBev SA/NV 1.500% 17-Mar-2025 3,802,901 0.52% 7,762,000 EUR Anheuser-Busch InBev SA/NV 2.000% 17-Mar-2028 8,303,299 1.14% 2,672,000 EUR Anheuser-Busch InBev SA/NV 2.750% 17-Mar-2036 2,938,972 0.40% 1,600,000 EUR KBC Group NV 1.000% 26-Apr-2021 1,639,559 0.23% 1,400,000 EUR KBC Group NV 0.750% 01-Mar-2022 1,416,443 0.19%
Total for Belgium 19,586,018 2.68%
British Virgin Islands 6,720,000 EUR Cheung Kong Infrastructure Finance BVI Ltd 1.000% 12-Dec-2024 6,654,917 0.91% 3,710,000 EUR Global Switch Holdings Ltd 1.500% 31-Jan-2024 3,774,331 0.51%
Total for British Virgin Islands 10,429,248 1.42%
Canada 4,050,000 EUR Great-West Lifeco Inc 2.500% 18-Apr-2023 4,446,608 0.61%
Total for Canada 4,446,608 0.61%
Cayman Islands 2,780,000 EUR China Overseas Land International Cayman Ltd 1.750% 15-Jul-2019 2,838,033 0.39%
Total for Cayman Islands 2,838,033 0.39%
Denmark 2,480,000 EUR Danske Bank A/S 0.500% 06-May-2021 2,509,053 0.34% 2,560,000 EUR Danske Bank A/S 0.750% 02-Jun-2023 2,595,777 0.35%
640,000 EUR Danske Bank A/S FRN 04-Oct-2023 657,715 0.09% 2,780,000 EUR Nykredit Realkredit A/S FRN 17-Nov-2027 2,963,577 0.40% 1,660,000 EUR Nykredit Realkredit A/S FRN 03-Jun-2036 1,810,346 0.25% 3,086,000 EUR Orsted A/S FRN 26-Jun-3013 3,773,191 0.52%
200,000 EUR Orsted A/S FRN 08-Jul-3013 205,050 0.03% 300,000 EUR Orsted A/S FRN 06-Nov-3015 316,406 0.04%
1,414,000 EUR Orsted A/S FRN 24-Nov-3017 1,440,725 0.20% Total for Denmark 16,271,840 2.22%
France 2,000,000 EUR Aeroports de Paris 1.500% 07-Apr-2025 2,100,899 0.29% 1,000,000 EUR Aeroports de Paris 1.000% 13-Dec-2027 992,280 0.14% 1,400,000 EUR APRR SA 1.125% 15-Jan-2021 1,439,099 0.20%
600,000 EUR APRR SA 1.500% 15-Jan-2024 628,674 0.09% 1,600,000 EUR APRR SA 1.875% 15-Jan-2025 1,710,457 0.23% 3,300,000 EUR APRR SA 1.125% 09-Jan-2026 3,348,131 0.46%
600,000 EUR Autoroutes du Sud de la France SA 2.950% 17-Jan-2024 681,540 0.09% 680,000 EUR AXA SA FRN 04-Jul-2043 817,658 0.11%
1,480,000 EUR AXA SA FRN (Perpetual)* 1,680,271 0.23% 670,000 EUR AXA SA FRN (Perpetual)* 760,858 0.10% 700,000 EUR Banque Federative du Credit Mutuel SA 3.000% 28-Nov-2023 799,175 0.11% 300,000 EUR Banque Federative du Credit Mutuel SA 2.375% 24-Mar-2026 320,399 0.04%
1,390,000 EUR BNP Paribas SA 0.750% 11-Nov-2022 1,415,085 0.19% 200,000 EUR BNP Paribas SA FRN 20-Mar-2026 213,847 0.03%
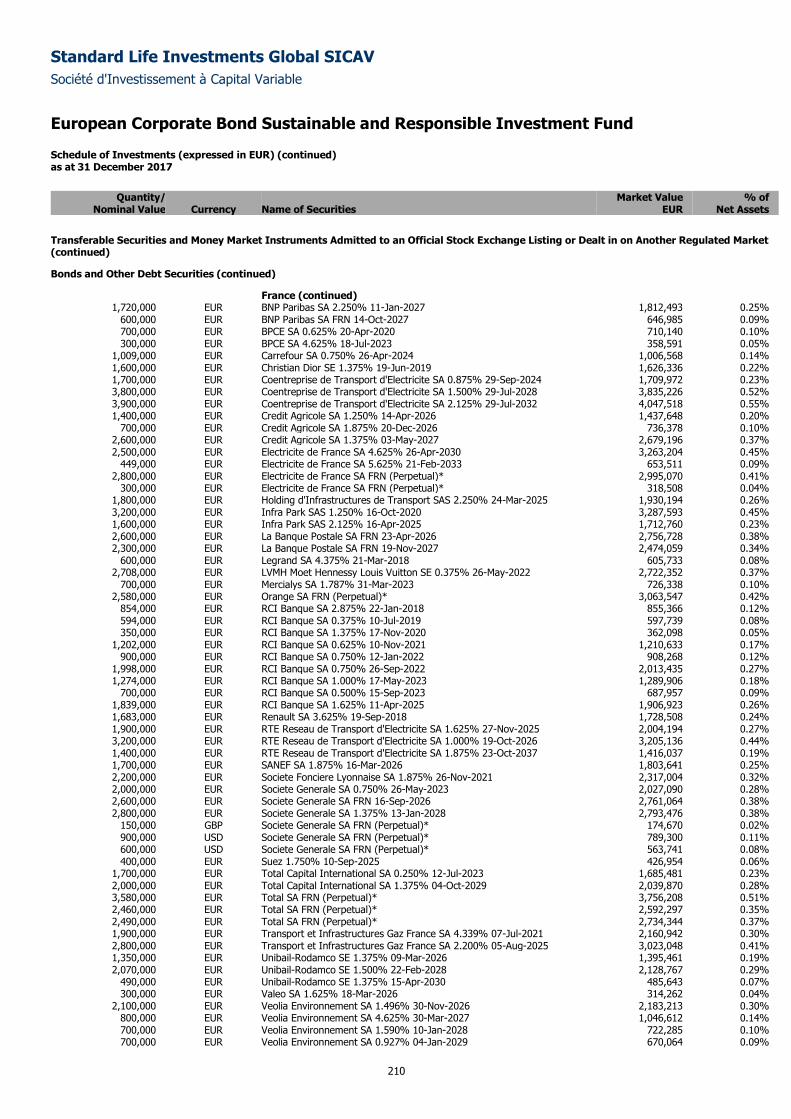
Standard Life Investments Global SICAV
Société d'Investissement à Capital Variable
European Corporate Bond Sustainable and Responsible Investment Fund
Schedule of Investments (expressed in EUR) (continued) as at 31 December 2017
210
Quantity/ Market Value % of
Nominal Value Currency Name of Securities EUR Net Assets
Transferable Securities and Money Market Instruments Admitted to an Official Stock Exchange Listing or Dealt in on Another Regulated Market (continued)
Bonds and Other Debt Securities (continued)
France (continued) 1,720,000 EUR BNP Paribas SA 2.250% 11-Jan-2027 1,812,493 0.25%
600,000 EUR BNP Paribas SA FRN 14-Oct-2027 646,985 0.09% 700,000 EUR BPCE SA 0.625% 20-Apr-2020 710,140 0.10% 300,000 EUR BPCE SA 4.625% 18-Jul-2023 358,591 0.05%
1,009,000 EUR Carrefour SA 0.750% 26-Apr-2024 1,006,568 0.14% 1,600,000 EUR Christian Dior SE 1.375% 19-Jun-2019 1,626,336 0.22% 1,700,000 EUR Coentreprise de Transport d'Electricite SA 0.875% 29-Sep-2024 1,709,972 0.23% 3,800,000 EUR Coentreprise de Transport d'Electricite SA 1.500% 29-Jul-2028 3,835,226 0.52% 3,900,000 EUR Coentreprise de Transport d'Electricite SA 2.125% 29-Jul-2032 4,047,518 0.55% 1,400,000 EUR Credit Agricole SA 1.250% 14-Apr-2026 1,437,648 0.20%
700,000 EUR Credit Agricole SA 1.875% 20-Dec-2026 736,378 0.10% 2,600,000 EUR Credit Agricole SA 1.375% 03-May-2027 2,679,196 0.37% 2,500,000 EUR Electricite de France SA 4.625% 26-Apr-2030 3,263,204 0.45%
449,000 EUR Electricite de France SA 5.625% 21-Feb-2033 653,511 0.09% 2,800,000 EUR Electricite de France SA FRN (Perpetual)* 2,995,070 0.41%
300,000 EUR Electricite de France SA FRN (Perpetual)* 318,508 0.04% 1,800,000 EUR Holding d'Infrastructures de Transport SAS 2.250% 24-Mar-2025 1,930,194 0.26% 3,200,000 EUR Infra Park SAS 1.250% 16-Oct-2020 3,287,593 0.45% 1,600,000 EUR Infra Park SAS 2.125% 16-Apr-2025 1,712,760 0.23% 2,600,000 EUR La Banque Postale SA FRN 23-Apr-2026 2,756,728 0.38% 2,300,000 EUR La Banque Postale SA FRN 19-Nov-2027 2,474,059 0.34%
600,000 EUR Legrand SA 4.375% 21-Mar-2018 605,733 0.08% 2,708,000 EUR LVMH Moet Hennessy Louis Vuitton SE 0.375% 26-May-2022 2,722,352 0.37%
700,000 EUR Mercialys SA 1.787% 31-Mar-2023 726,338 0.10% 2,580,000 EUR Orange SA FRN (Perpetual)* 3,063,547 0.42%
854,000 EUR RCI Banque SA 2.875% 22-Jan-2018 855,366 0.12% 594,000 EUR RCI Banque SA 0.375% 10-Jul-2019 597,739 0.08% 350,000 EUR RCI Banque SA 1.375% 17-Nov-2020 362,098 0.05%
1,202,000 EUR RCI Banque SA 0.625% 10-Nov-2021 1,210,633 0.17% 900,000 EUR RCI Banque SA 0.750% 12-Jan-2022 908,268 0.12%
1,998,000 EUR RCI Banque SA 0.750% 26-Sep-2022 2,013,435 0.27% 1,274,000 EUR RCI Banque SA 1.000% 17-May-2023 1,289,906 0.18%
700,000 EUR RCI Banque SA 0.500% 15-Sep-2023 687,957 0.09% 1,839,000 EUR RCI Banque SA 1.625% 11-Apr-2025 1,906,923 0.26% 1,683,000 EUR Renault SA 3.625% 19-Sep-2018 1,728,508 0.24% 1,900,000 EUR RTE Reseau de Transport d'Electricite SA 1.625% 27-Nov-2025 2,004,194 0.27% 3,200,000 EUR RTE Reseau de Transport d'Electricite SA 1.000% 19-Oct-2026 3,205,136 0.44% 1,400,000 EUR RTE Reseau de Transport d'Electricite SA 1.875% 23-Oct-2037 1,416,037 0.19% 1,700,000 EUR SANEF SA 1.875% 16-Mar-2026 1,803,641 0.25% 2,200,000 EUR Societe Fonciere Lyonnaise SA 1.875% 26-Nov-2021 2,317,004 0.32% 2,000,000 EUR Societe Generale SA 0.750% 26-May-2023 2,027,090 0.28% 2,600,000 EUR Societe Generale SA FRN 16-Sep-2026 2,761,064 0.38% 2,800,000 EUR Societe Generale SA 1.375% 13-Jan-2028 2,793,476 0.38%
150,000 GBP Societe Generale SA FRN (Perpetual)* 174,670 0.02% 900,000 USD Societe Generale SA FRN (Perpetual)* 789,300 0.11% 600,000 USD Societe Generale SA FRN (Perpetual)* 563,741 0.08% 400,000 EUR Suez 1.750% 10-Sep-2025 426,954 0.06%
1,700,000 EUR Total Capital International SA 0.250% 12-Jul-2023 1,685,481 0.23% 2,000,000 EUR Total Capital International SA 1.375% 04-Oct-2029 2,039,870 0.28% 3,580,000 EUR Total SA FRN (Perpetual)* 3,756,208 0.51% 2,460,000 EUR Total SA FRN (Perpetual)* 2,592,297 0.35% 2,490,000 EUR Total SA FRN (Perpetual)* 2,734,344 0.37% 1,900,000 EUR Transport et Infrastructures Gaz France SA 4.339% 07-Jul-2021 2,160,942 0.30% 2,800,000 EUR Transport et Infrastructures Gaz France SA 2.200% 05-Aug-2025 3,023,048 0.41% 1,350,000 EUR Unibail-Rodamco SE 1.375% 09-Mar-2026 1,395,461 0.19% 2,070,000 EUR Unibail-Rodamco SE 1.500% 22-Feb-2028 2,128,767 0.29%
490,000 EUR Unibail-Rodamco SE 1.375% 15-Apr-2030 485,643 0.07% 300,000 EUR Valeo SA 1.625% 18-Mar-2026 314,262 0.04%
2,100,000 EUR Veolia Environnement SA 1.496% 30-Nov-2026 2,183,213 0.30% 800,000 EUR Veolia Environnement SA 4.625% 30-Mar-2027 1,046,612 0.14% 700,000 EUR Veolia Environnement SA 1.590% 10-Jan-2028 722,285 0.10% 700,000 EUR Veolia Environnement SA 0.927% 04-Jan-2029 670,064 0.09%
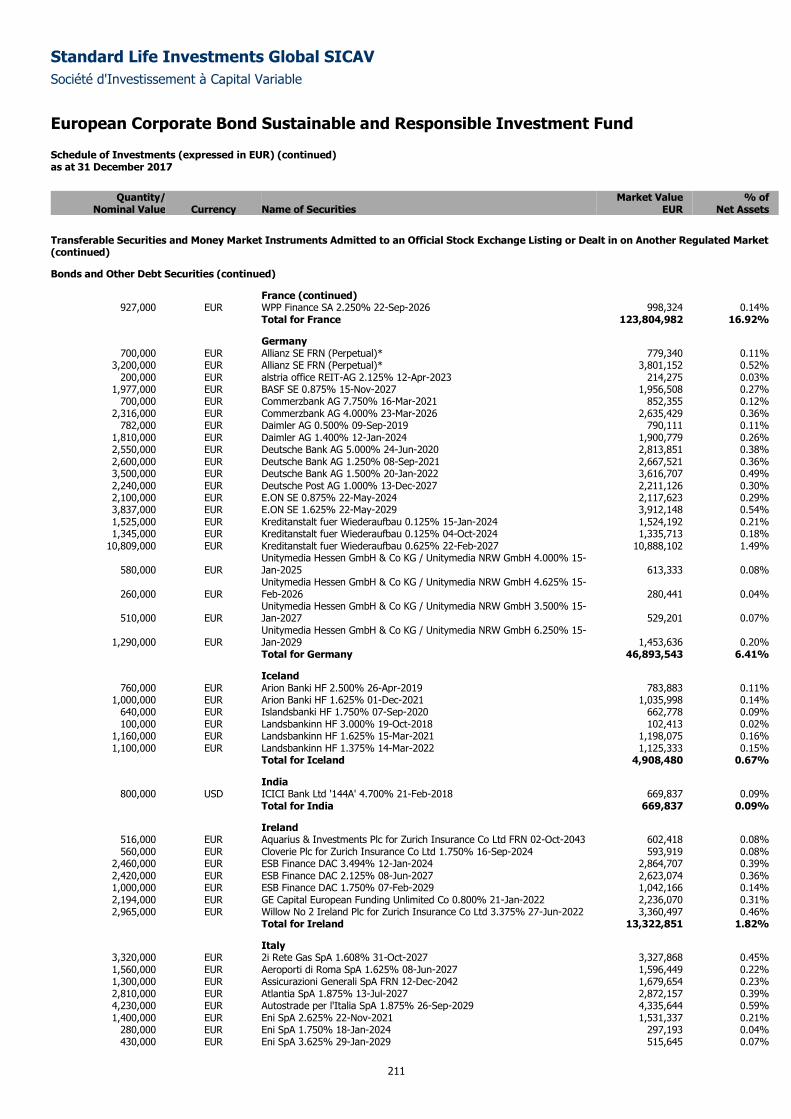
Standard Life Investments Global SICAV
Société d'Investissement à Capital Variable
European Corporate Bond Sustainable and Responsible Investment Fund
Schedule of Investments (expressed in EUR) (continued) as at 31 December 2017
211
Quantity/ Market Value % of
Nominal Value Currency Name of Securities EUR Net Assets
Transferable Securities and Money Market Instruments Admitted to an Official Stock Exchange Listing or Dealt in on Another Regulated Market (continued)
Bonds and Other Debt Securities (continued)
France (continued) 927,000 EUR WPP Finance SA 2.250% 22-Sep-2026 998,324 0.14%
Total for France 123,804,982 16.92%
Germany 700,000 EUR Allianz SE FRN (Perpetual)* 779,340 0.11%
3,200,000 EUR Allianz SE FRN (Perpetual)* 3,801,152 0.52% 200,000 EUR alstria office REIT-AG 2.125% 12-Apr-2023 214,275 0.03%
1,977,000 EUR BASF SE 0.875% 15-Nov-2027 1,956,508 0.27% 700,000 EUR Commerzbank AG 7.750% 16-Mar-2021 852,355 0.12%
2,316,000 EUR Commerzbank AG 4.000% 23-Mar-2026 2,635,429 0.36% 782,000 EUR Daimler AG 0.500% 09-Sep-2019 790,111 0.11%
1,810,000 EUR Daimler AG 1.400% 12-Jan-2024 1,900,779 0.26% 2,550,000 EUR Deutsche Bank AG 5.000% 24-Jun-2020 2,813,851 0.38% 2,600,000 EUR Deutsche Bank AG 1.250% 08-Sep-2021 2,667,521 0.36% 3,500,000 EUR Deutsche Bank AG 1.500% 20-Jan-2022 3,616,707 0.49% 2,240,000 EUR Deutsche Post AG 1.000% 13-Dec-2027 2,211,126 0.30% 2,100,000 EUR E.ON SE 0.875% 22-May-2024 2,117,623 0.29% 3,837,000 EUR E.ON SE 1.625% 22-May-2029 3,912,148 0.54% 1,525,000 EUR Kreditanstalt fuer Wiederaufbau 0.125% 15-Jan-2024 1,524,192 0.21% 1,345,000 EUR Kreditanstalt fuer Wiederaufbau 0.125% 04-Oct-2024 1,335,713 0.18%
10,809,000 EUR Kreditanstalt fuer Wiederaufbau 0.625% 22-Feb-2027 10,888,102 1.49%
580,000 EUR Unitymedia Hessen GmbH & Co KG / Unitymedia NRW GmbH 4.000% 15-Jan-2025 613,333 0.08%
260,000 EUR Unitymedia Hessen GmbH & Co KG / Unitymedia NRW GmbH 4.625% 15-Feb-2026 280,441 0.04%
510,000 EUR Unitymedia Hessen GmbH & Co KG / Unitymedia NRW GmbH 3.500% 15-Jan-2027 529,201 0.07%
1,290,000 EUR Unitymedia Hessen GmbH & Co KG / Unitymedia NRW GmbH 6.250% 15-Jan-2029 1,453,636 0.20%
Total for Germany 46,893,543 6.41%
Iceland 760,000 EUR Arion Banki HF 2.500% 26-Apr-2019 783,883 0.11%
1,000,000 EUR Arion Banki HF 1.625% 01-Dec-2021 1,035,998 0.14% 640,000 EUR Islandsbanki HF 1.750% 07-Sep-2020 662,778 0.09% 100,000 EUR Landsbankinn HF 3.000% 19-Oct-2018 102,413 0.02%
1,160,000 EUR Landsbankinn HF 1.625% 15-Mar-2021 1,198,075 0.16% 1,100,000 EUR Landsbankinn HF 1.375% 14-Mar-2022 1,125,333 0.15%
Total for Iceland 4,908,480 0.67%
India 800,000 USD ICICI Bank Ltd '144A' 4.700% 21-Feb-2018 669,837 0.09%
Total for India 669,837 0.09%
Ireland 516,000 EUR Aquarius & Investments Plc for Zurich Insurance Co Ltd FRN 02-Oct-2043 602,418 0.08% 560,000 EUR Cloverie Plc for Zurich Insurance Co Ltd 1.750% 16-Sep-2024 593,919 0.08%
2,460,000 EUR ESB Finance DAC 3.494% 12-Jan-2024 2,864,707 0.39% 2,420,000 EUR ESB Finance DAC 2.125% 08-Jun-2027 2,623,074 0.36% 1,000,000 EUR ESB Finance DAC 1.750% 07-Feb-2029 1,042,166 0.14% 2,194,000 EUR GE Capital European Funding Unlimited Co 0.800% 21-Jan-2022 2,236,070 0.31% 2,965,000 EUR Willow No 2 Ireland Plc for Zurich Insurance Co Ltd 3.375% 27-Jun-2022 3,360,497 0.46%
Total for Ireland 13,322,851 1.82%
Italy 3,320,000 EUR 2i Rete Gas SpA 1.608% 31-Oct-2027 3,327,868 0.45% 1,560,000 EUR Aeroporti di Roma SpA 1.625% 08-Jun-2027 1,596,449 0.22% 1,300,000 EUR Assicurazioni Generali SpA FRN 12-Dec-2042 1,679,654 0.23% 2,810,000 EUR Atlantia SpA 1.875% 13-Jul-2027 2,872,157 0.39% 4,230,000 EUR Autostrade per l'Italia SpA 1.875% 26-Sep-2029 4,335,644 0.59% 1,400,000 EUR Eni SpA 2.625% 22-Nov-2021 1,531,337 0.21%
280,000 EUR Eni SpA 1.750% 18-Jan-2024 297,193 0.04% 430,000 EUR Eni SpA 3.625% 29-Jan-2029 515,645 0.07%
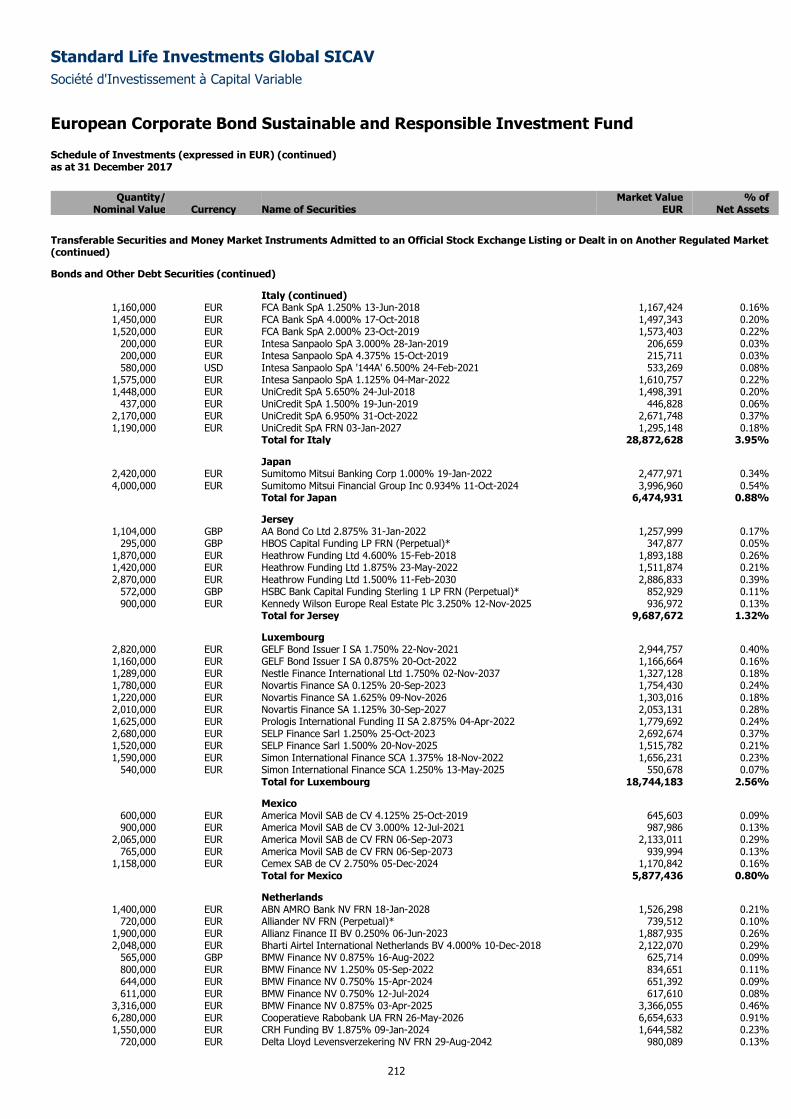
Standard Life Investments Global SICAV
Société d'Investissement à Capital Variable
European Corporate Bond Sustainable and Responsible Investment Fund
Schedule of Investments (expressed in EUR) (continued) as at 31 December 2017
212
Quantity/ Market Value % of
Nominal Value Currency Name of Securities EUR Net Assets
Transferable Securities and Money Market Instruments Admitted to an Official Stock Exchange Listing or Dealt in on Another Regulated Market (continued)
Bonds and Other Debt Securities (continued)
Italy (continued) 1,160,000 EUR FCA Bank SpA 1.250% 13-Jun-2018 1,167,424 0.16% 1,450,000 EUR FCA Bank SpA 4.000% 17-Oct-2018 1,497,343 0.20% 1,520,000 EUR FCA Bank SpA 2.000% 23-Oct-2019 1,573,403 0.22%
200,000 EUR Intesa Sanpaolo SpA 3.000% 28-Jan-2019 206,659 0.03% 200,000 EUR Intesa Sanpaolo SpA 4.375% 15-Oct-2019 215,711 0.03% 580,000 USD Intesa Sanpaolo SpA '144A' 6.500% 24-Feb-2021 533,269 0.08%
1,575,000 EUR Intesa Sanpaolo SpA 1.125% 04-Mar-2022 1,610,757 0.22% 1,448,000 EUR UniCredit SpA 5.650% 24-Jul-2018 1,498,391 0.20%
437,000 EUR UniCredit SpA 1.500% 19-Jun-2019 446,828 0.06% 2,170,000 EUR UniCredit SpA 6.950% 31-Oct-2022 2,671,748 0.37% 1,190,000 EUR UniCredit SpA FRN 03-Jan-2027 1,295,148 0.18%
Total for Italy 28,872,628 3.95%
Japan 2,420,000 EUR Sumitomo Mitsui Banking Corp 1.000% 19-Jan-2022 2,477,971 0.34% 4,000,000 EUR Sumitomo Mitsui Financial Group Inc 0.934% 11-Oct-2024 3,996,960 0.54%
Total for Japan 6,474,931 0.88%
Jersey 1,104,000 GBP AA Bond Co Ltd 2.875% 31-Jan-2022 1,257,999 0.17%
295,000 GBP HBOS Capital Funding LP FRN (Perpetual)* 347,877 0.05% 1,870,000 EUR Heathrow Funding Ltd 4.600% 15-Feb-2018 1,893,188 0.26% 1,420,000 EUR Heathrow Funding Ltd 1.875% 23-May-2022 1,511,874 0.21% 2,870,000 EUR Heathrow Funding Ltd 1.500% 11-Feb-2030 2,886,833 0.39%
572,000 GBP HSBC Bank Capital Funding Sterling 1 LP FRN (Perpetual)* 852,929 0.11% 900,000 EUR Kennedy Wilson Europe Real Estate Plc 3.250% 12-Nov-2025 936,972 0.13%
Total for Jersey 9,687,672 1.32%
Luxembourg 2,820,000 EUR GELF Bond Issuer I SA 1.750% 22-Nov-2021 2,944,757 0.40% 1,160,000 EUR GELF Bond Issuer I SA 0.875% 20-Oct-2022 1,166,664 0.16% 1,289,000 EUR Nestle Finance International Ltd 1.750% 02-Nov-2037 1,327,128 0.18% 1,780,000 EUR Novartis Finance SA 0.125% 20-Sep-2023 1,754,430 0.24% 1,220,000 EUR Novartis Finance SA 1.625% 09-Nov-2026 1,303,016 0.18% 2,010,000 EUR Novartis Finance SA 1.125% 30-Sep-2027 2,053,131 0.28% 1,625,000 EUR Prologis International Funding II SA 2.875% 04-Apr-2022 1,779,692 0.24% 2,680,000 EUR SELP Finance Sarl 1.250% 25-Oct-2023 2,692,674 0.37% 1,520,000 EUR SELP Finance Sarl 1.500% 20-Nov-2025 1,515,782 0.21% 1,590,000 EUR Simon International Finance SCA 1.375% 18-Nov-2022 1,656,231 0.23%
540,000 EUR Simon International Finance SCA 1.250% 13-May-2025 550,678 0.07% Total for Luxembourg 18,744,183 2.56%
Mexico 600,000 EUR America Movil SAB de CV 4.125% 25-Oct-2019 645,603 0.09% 900,000 EUR America Movil SAB de CV 3.000% 12-Jul-2021 987,986 0.13%
2,065,000 EUR America Movil SAB de CV FRN 06-Sep-2073 2,133,011 0.29% 765,000 EUR America Movil SAB de CV FRN 06-Sep-2073 939,994 0.13%
1,158,000 EUR Cemex SAB de CV 2.750% 05-Dec-2024 1,170,842 0.16% Total for Mexico 5,877,436 0.80%
Netherlands 1,400,000 EUR ABN AMRO Bank NV FRN 18-Jan-2028 1,526,298 0.21%
720,000 EUR Alliander NV FRN (Perpetual)* 739,512 0.10% 1,900,000 EUR Allianz Finance II BV 0.250% 06-Jun-2023 1,887,935 0.26% 2,048,000 EUR Bharti Airtel International Netherlands BV 4.000% 10-Dec-2018 2,122,070 0.29%
565,000 GBP BMW Finance NV 0.875% 16-Aug-2022 625,714 0.09% 800,000 EUR BMW Finance NV 1.250% 05-Sep-2022 834,651 0.11% 644,000 EUR BMW Finance NV 0.750% 15-Apr-2024 651,392 0.09% 611,000 EUR BMW Finance NV 0.750% 12-Jul-2024 617,610 0.08%
3,316,000 EUR BMW Finance NV 0.875% 03-Apr-2025 3,366,055 0.46% 6,280,000 EUR Cooperatieve Rabobank UA FRN 26-May-2026 6,654,633 0.91% 1,550,000 EUR CRH Funding BV 1.875% 09-Jan-2024 1,644,582 0.23%
720,000 EUR Delta Lloyd Levensverzekering NV FRN 29-Aug-2042 980,089 0.13%
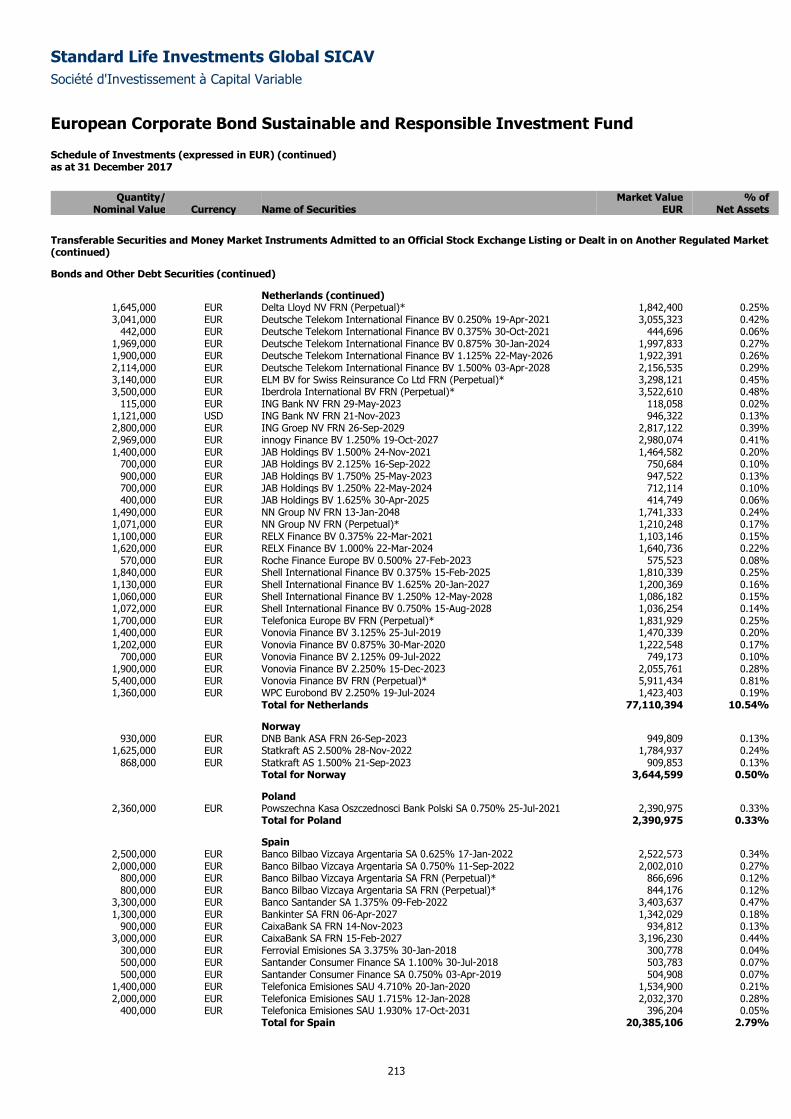
Standard Life Investments Global SICAV
Société d'Investissement à Capital Variable
European Corporate Bond Sustainable and Responsible Investment Fund
Schedule of Investments (expressed in EUR) (continued) as at 31 December 2017
213
Quantity/ Market Value % of
Nominal Value Currency Name of Securities EUR Net Assets
Transferable Securities and Money Market Instruments Admitted to an Official Stock Exchange Listing or Dealt in on Another Regulated Market (continued)
Bonds and Other Debt Securities (continued)
Netherlands (continued) 1,645,000 EUR Delta Lloyd NV FRN (Perpetual)* 1,842,400 0.25% 3,041,000 EUR Deutsche Telekom International Finance BV 0.250% 19-Apr-2021 3,055,323 0.42%
442,000 EUR Deutsche Telekom International Finance BV 0.375% 30-Oct-2021 444,696 0.06% 1,969,000 EUR Deutsche Telekom International Finance BV 0.875% 30-Jan-2024 1,997,833 0.27% 1,900,000 EUR Deutsche Telekom International Finance BV 1.125% 22-May-2026 1,922,391 0.26% 2,114,000 EUR Deutsche Telekom International Finance BV 1.500% 03-Apr-2028 2,156,535 0.29% 3,140,000 EUR ELM BV for Swiss Reinsurance Co Ltd FRN (Perpetual)* 3,298,121 0.45% 3,500,000 EUR Iberdrola International BV FRN (Perpetual)* 3,522,610 0.48%
115,000 EUR ING Bank NV FRN 29-May-2023 118,058 0.02% 1,121,000 USD ING Bank NV FRN 21-Nov-2023 946,322 0.13% 2,800,000 EUR ING Groep NV FRN 26-Sep-2029 2,817,122 0.39% 2,969,000 EUR innogy Finance BV 1.250% 19-Oct-2027 2,980,074 0.41% 1,400,000 EUR JAB Holdings BV 1.500% 24-Nov-2021 1,464,582 0.20%
700,000 EUR JAB Holdings BV 2.125% 16-Sep-2022 750,684 0.10% 900,000 EUR JAB Holdings BV 1.750% 25-May-2023 947,522 0.13% 700,000 EUR JAB Holdings BV 1.250% 22-May-2024 712,114 0.10% 400,000 EUR JAB Holdings BV 1.625% 30-Apr-2025 414,749 0.06%
1,490,000 EUR NN Group NV FRN 13-Jan-2048 1,741,333 0.24% 1,071,000 EUR NN Group NV FRN (Perpetual)* 1,210,248 0.17% 1,100,000 EUR RELX Finance BV 0.375% 22-Mar-2021 1,103,146 0.15% 1,620,000 EUR RELX Finance BV 1.000% 22-Mar-2024 1,640,736 0.22%
570,000 EUR Roche Finance Europe BV 0.500% 27-Feb-2023 575,523 0.08% 1,840,000 EUR Shell International Finance BV 0.375% 15-Feb-2025 1,810,339 0.25% 1,130,000 EUR Shell International Finance BV 1.625% 20-Jan-2027 1,200,369 0.16% 1,060,000 EUR Shell International Finance BV 1.250% 12-May-2028 1,086,182 0.15% 1,072,000 EUR Shell International Finance BV 0.750% 15-Aug-2028 1,036,254 0.14% 1,700,000 EUR Telefonica Europe BV FRN (Perpetual)* 1,831,929 0.25% 1,400,000 EUR Vonovia Finance BV 3.125% 25-Jul-2019 1,470,339 0.20% 1,202,000 EUR Vonovia Finance BV 0.875% 30-Mar-2020 1,222,548 0.17%
700,000 EUR Vonovia Finance BV 2.125% 09-Jul-2022 749,173 0.10% 1,900,000 EUR Vonovia Finance BV 2.250% 15-Dec-2023 2,055,761 0.28% 5,400,000 EUR Vonovia Finance BV FRN (Perpetual)* 5,911,434 0.81% 1,360,000 EUR WPC Eurobond BV 2.250% 19-Jul-2024 1,423,403 0.19%
Total for Netherlands 77,110,394 10.54%
Norway 930,000 EUR DNB Bank ASA FRN 26-Sep-2023 949,809 0.13%
1,625,000 EUR Statkraft AS 2.500% 28-Nov-2022 1,784,937 0.24% 868,000 EUR Statkraft AS 1.500% 21-Sep-2023 909,853 0.13%
Total for Norway 3,644,599 0.50%
Poland 2,360,000 EUR Powszechna Kasa Oszczednosci Bank Polski SA 0.750% 25-Jul-2021 2,390,975 0.33%
Total for Poland 2,390,975 0.33%
Spain 2,500,000 EUR Banco Bilbao Vizcaya Argentaria SA 0.625% 17-Jan-2022 2,522,573 0.34% 2,000,000 EUR Banco Bilbao Vizcaya Argentaria SA 0.750% 11-Sep-2022 2,002,010 0.27%
800,000 EUR Banco Bilbao Vizcaya Argentaria SA FRN (Perpetual)* 866,696 0.12% 800,000 EUR Banco Bilbao Vizcaya Argentaria SA FRN (Perpetual)* 844,176 0.12%
3,300,000 EUR Banco Santander SA 1.375% 09-Feb-2022 3,403,637 0.47% 1,300,000 EUR Bankinter SA FRN 06-Apr-2027 1,342,029 0.18%
900,000 EUR CaixaBank SA FRN 14-Nov-2023 934,812 0.13% 3,000,000 EUR CaixaBank SA FRN 15-Feb-2027 3,196,230 0.44%
300,000 EUR Ferrovial Emisiones SA 3.375% 30-Jan-2018 300,778 0.04% 500,000 EUR Santander Consumer Finance SA 1.100% 30-Jul-2018 503,783 0.07% 500,000 EUR Santander Consumer Finance SA 0.750% 03-Apr-2019 504,908 0.07%
1,400,000 EUR Telefonica Emisiones SAU 4.710% 20-Jan-2020 1,534,900 0.21% 2,000,000 EUR Telefonica Emisiones SAU 1.715% 12-Jan-2028 2,032,370 0.28%
400,000 EUR Telefonica Emisiones SAU 1.930% 17-Oct-2031 396,204 0.05% Total for Spain 20,385,106 2.79%
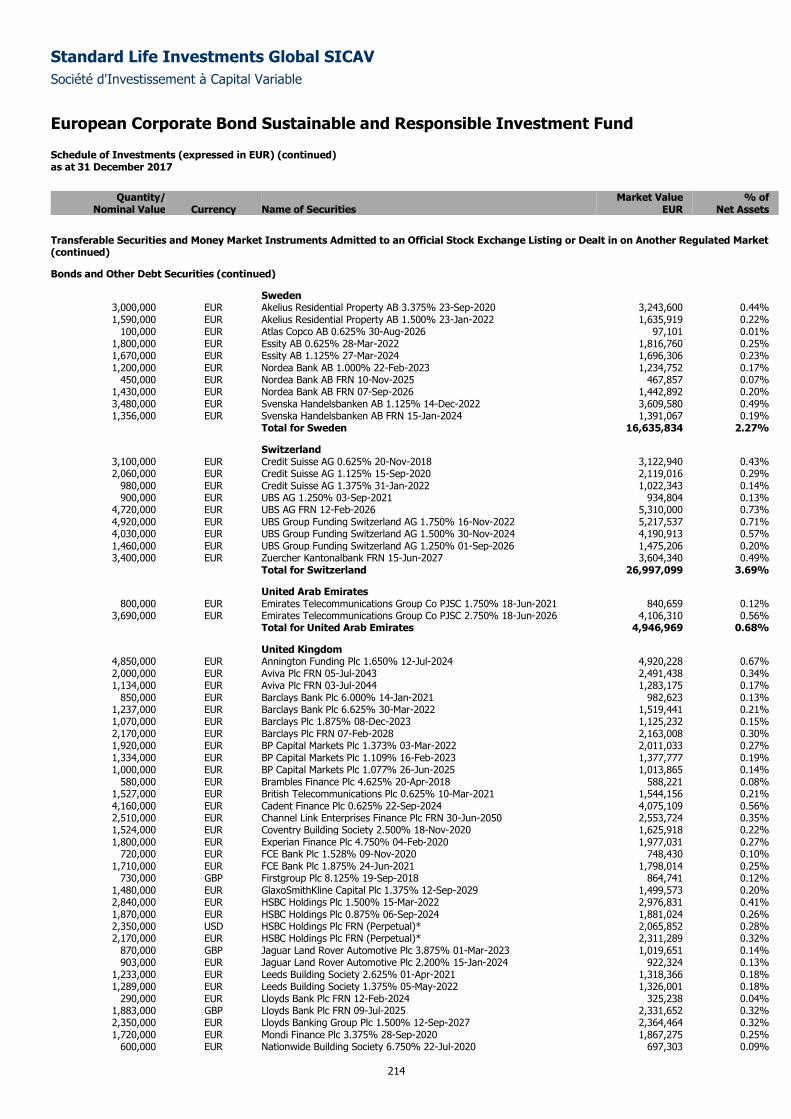
Standard Life Investments Global SICAV
Société d'Investissement à Capital Variable
European Corporate Bond Sustainable and Responsible Investment Fund
Schedule of Investments (expressed in EUR) (continued) as at 31 December 2017
214
Quantity/ Market Value % of
Nominal Value Currency Name of Securities EUR Net Assets
Transferable Securities and Money Market Instruments Admitted to an Official Stock Exchange Listing or Dealt in on Another Regulated Market (continued)
Bonds and Other Debt Securities (continued)
Sweden 3,000,000 EUR Akelius Residential Property AB 3.375% 23-Sep-2020 3,243,600 0.44% 1,590,000 EUR Akelius Residential Property AB 1.500% 23-Jan-2022 1,635,919 0.22%
100,000 EUR Atlas Copco AB 0.625% 30-Aug-2026 97,101 0.01% 1,800,000 EUR Essity AB 0.625% 28-Mar-2022 1,816,760 0.25% 1,670,000 EUR Essity AB 1.125% 27-Mar-2024 1,696,306 0.23% 1,200,000 EUR Nordea Bank AB 1.000% 22-Feb-2023 1,234,752 0.17%
450,000 EUR Nordea Bank AB FRN 10-Nov-2025 467,857 0.07% 1,430,000 EUR Nordea Bank AB FRN 07-Sep-2026 1,442,892 0.20% 3,480,000 EUR Svenska Handelsbanken AB 1.125% 14-Dec-2022 3,609,580 0.49% 1,356,000 EUR Svenska Handelsbanken AB FRN 15-Jan-2024 1,391,067 0.19%
Total for Sweden 16,635,834 2.27%
Switzerland 3,100,000 EUR Credit Suisse AG 0.625% 20-Nov-2018 3,122,940 0.43% 2,060,000 EUR Credit Suisse AG 1.125% 15-Sep-2020 2,119,016 0.29%
980,000 EUR Credit Suisse AG 1.375% 31-Jan-2022 1,022,343 0.14% 900,000 EUR UBS AG 1.250% 03-Sep-2021 934,804 0.13%
4,720,000 EUR UBS AG FRN 12-Feb-2026 5,310,000 0.73% 4,920,000 EUR UBS Group Funding Switzerland AG 1.750% 16-Nov-2022 5,217,537 0.71% 4,030,000 EUR UBS Group Funding Switzerland AG 1.500% 30-Nov-2024 4,190,913 0.57% 1,460,000 EUR UBS Group Funding Switzerland AG 1.250% 01-Sep-2026 1,475,206 0.20% 3,400,000 EUR Zuercher Kantonalbank FRN 15-Jun-2027 3,604,340 0.49%
Total for Switzerland 26,997,099 3.69%
United Arab Emirates 800,000 EUR Emirates Telecommunications Group Co PJSC 1.750% 18-Jun-2021 840,659 0.12%
3,690,000 EUR Emirates Telecommunications Group Co PJSC 2.750% 18-Jun-2026 4,106,310 0.56% Total for United Arab Emirates 4,946,969 0.68%
United Kingdom 4,850,000 EUR Annington Funding Plc 1.650% 12-Jul-2024 4,920,228 0.67% 2,000,000 EUR Aviva Plc FRN 05-Jul-2043 2,491,438 0.34% 1,134,000 EUR Aviva Plc FRN 03-Jul-2044 1,283,175 0.17%
850,000 EUR Barclays Bank Plc 6.000% 14-Jan-2021 982,623 0.13% 1,237,000 EUR Barclays Bank Plc 6.625% 30-Mar-2022 1,519,441 0.21% 1,070,000 EUR Barclays Plc 1.875% 08-Dec-2023 1,125,232 0.15% 2,170,000 EUR Barclays Plc FRN 07-Feb-2028 2,163,008 0.30% 1,920,000 EUR BP Capital Markets Plc 1.373% 03-Mar-2022 2,011,033 0.27% 1,334,000 EUR BP Capital Markets Plc 1.109% 16-Feb-2023 1,377,777 0.19% 1,000,000 EUR BP Capital Markets Plc 1.077% 26-Jun-2025 1,013,865 0.14%
580,000 EUR Brambles Finance Plc 4.625% 20-Apr-2018 588,221 0.08% 1,527,000 EUR British Telecommunications Plc 0.625% 10-Mar-2021 1,544,156 0.21% 4,160,000 EUR Cadent Finance Plc 0.625% 22-Sep-2024 4,075,109 0.56% 2,510,000 EUR Channel Link Enterprises Finance Plc FRN 30-Jun-2050 2,553,724 0.35% 1,524,000 EUR Coventry Building Society 2.500% 18-Nov-2020 1,625,918 0.22% 1,800,000 EUR Experian Finance Plc 4.750% 04-Feb-2020 1,977,031 0.27%
720,000 EUR FCE Bank Plc 1.528% 09-Nov-2020 748,430 0.10% 1,710,000 EUR FCE Bank Plc 1.875% 24-Jun-2021 1,798,014 0.25%
730,000 GBP Firstgroup Plc 8.125% 19-Sep-2018 864,741 0.12% 1,480,000 EUR GlaxoSmithKline Capital Plc 1.375% 12-Sep-2029 1,499,573 0.20% 2,840,000 EUR HSBC Holdings Plc 1.500% 15-Mar-2022 2,976,831 0.41% 1,870,000 EUR HSBC Holdings Plc 0.875% 06-Sep-2024 1,881,024 0.26% 2,350,000 USD HSBC Holdings Plc FRN (Perpetual)* 2,065,852 0.28% 2,170,000 EUR HSBC Holdings Plc FRN (Perpetual)* 2,311,289 0.32%
870,000 GBP Jaguar Land Rover Automotive Plc 3.875% 01-Mar-2023 1,019,651 0.14% 903,000 EUR Jaguar Land Rover Automotive Plc 2.200% 15-Jan-2024 922,324 0.13%
1,233,000 EUR Leeds Building Society 2.625% 01-Apr-2021 1,318,366 0.18% 1,289,000 EUR Leeds Building Society 1.375% 05-May-2022 1,326,001 0.18%
290,000 EUR Lloyds Bank Plc FRN 12-Feb-2024 325,238 0.04% 1,883,000 GBP Lloyds Bank Plc FRN 09-Jul-2025 2,331,652 0.32% 2,350,000 EUR Lloyds Banking Group Plc 1.500% 12-Sep-2027 2,364,464 0.32% 1,720,000 EUR Mondi Finance Plc 3.375% 28-Sep-2020 1,867,275 0.25%
600,000 EUR Nationwide Building Society 6.750% 22-Jul-2020 697,303 0.09%
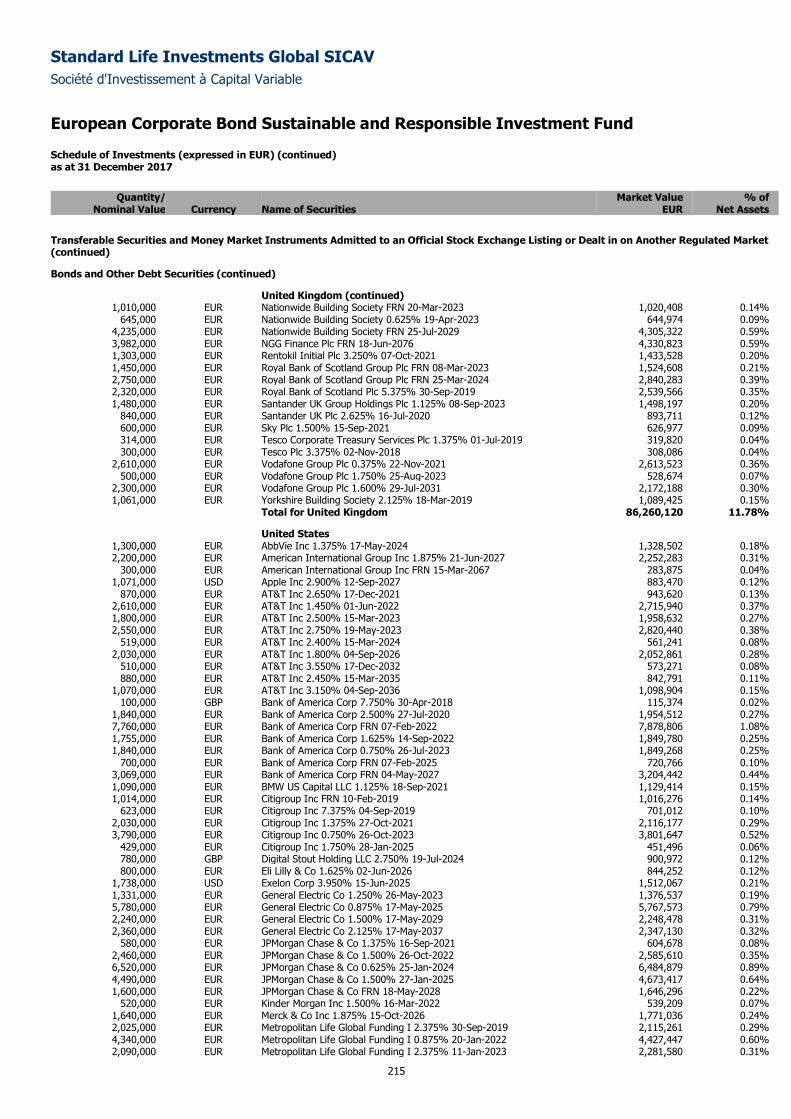
Standard Life Investments Global SICAV
Société d'Investissement à Capital Variable
European Corporate Bond Sustainable and Responsible Investment Fund
Schedule of Investments (expressed in EUR) (continued) as at 31 December 2017
215
Quantity/ Market Value % of
Nominal Value Currency Name of Securities EUR Net Assets
Transferable Securities and Money Market Instruments Admitted to an Official Stock Exchange Listing or Dealt in on Another Regulated Market (continued)
Bonds and Other Debt Securities (continued)
United Kingdom (continued) 1,010,000 EUR Nationwide Building Society FRN 20-Mar-2023 1,020,408 0.14%
645,000 EUR Nationwide Building Society 0.625% 19-Apr-2023 644,974 0.09% 4,235,000 EUR Nationwide Building Society FRN 25-Jul-2029 4,305,322 0.59% 3,982,000 EUR NGG Finance Plc FRN 18-Jun-2076 4,330,823 0.59% 1,303,000 EUR Rentokil Initial Plc 3.250% 07-Oct-2021 1,433,528 0.20% 1,450,000 EUR Royal Bank of Scotland Group Plc FRN 08-Mar-2023 1,524,608 0.21% 2,750,000 EUR Royal Bank of Scotland Group Plc FRN 25-Mar-2024 2,840,283 0.39% 2,320,000 EUR Royal Bank of Scotland Plc 5.375% 30-Sep-2019 2,539,566 0.35% 1,480,000 EUR Santander UK Group Holdings Plc 1.125% 08-Sep-2023 1,498,197 0.20%
840,000 EUR Santander UK Plc 2.625% 16-Jul-2020 893,711 0.12% 600,000 EUR Sky Plc 1.500% 15-Sep-2021 626,977 0.09% 314,000 EUR Tesco Corporate Treasury Services Plc 1.375% 01-Jul-2019 319,820 0.04% 300,000 EUR Tesco Plc 3.375% 02-Nov-2018 308,086 0.04%
2,610,000 EUR Vodafone Group Plc 0.375% 22-Nov-2021 2,613,523 0.36% 500,000 EUR Vodafone Group Plc 1.750% 25-Aug-2023 528,674 0.07%
2,300,000 EUR Vodafone Group Plc 1.600% 29-Jul-2031 2,172,188 0.30% 1,061,000 EUR Yorkshire Building Society 2.125% 18-Mar-2019 1,089,425 0.15%
Total for United Kingdom 86,260,120 11.78%
United States 1,300,000 EUR AbbVie Inc 1.375% 17-May-2024 1,328,502 0.18% 2,200,000 EUR American International Group Inc 1.875% 21-Jun-2027 2,252,283 0.31%
300,000 EUR American International Group Inc FRN 15-Mar-2067 283,875 0.04% 1,071,000 USD Apple Inc 2.900% 12-Sep-2027 883,470 0.12%
870,000 EUR AT&T Inc 2.650% 17-Dec-2021 943,620 0.13% 2,610,000 EUR AT&T Inc 1.450% 01-Jun-2022 2,715,940 0.37% 1,800,000 EUR AT&T Inc 2.500% 15-Mar-2023 1,958,632 0.27% 2,550,000 EUR AT&T Inc 2.750% 19-May-2023 2,820,440 0.38%
519,000 EUR AT&T Inc 2.400% 15-Mar-2024 561,241 0.08% 2,030,000 EUR AT&T Inc 1.800% 04-Sep-2026 2,052,861 0.28%
510,000 EUR AT&T Inc 3.550% 17-Dec-2032 573,271 0.08% 880,000 EUR AT&T Inc 2.450% 15-Mar-2035 842,791 0.11%
1,070,000 EUR AT&T Inc 3.150% 04-Sep-2036 1,098,904 0.15% 100,000 GBP Bank of America Corp 7.750% 30-Apr-2018 115,374 0.02%
1,840,000 EUR Bank of America Corp 2.500% 27-Jul-2020 1,954,512 0.27% 7,760,000 EUR Bank of America Corp FRN 07-Feb-2022 7,878,806 1.08% 1,755,000 EUR Bank of America Corp 1.625% 14-Sep-2022 1,849,780 0.25% 1,840,000 EUR Bank of America Corp 0.750% 26-Jul-2023 1,849,268 0.25%
700,000 EUR Bank of America Corp FRN 07-Feb-2025 720,766 0.10% 3,069,000 EUR Bank of America Corp FRN 04-May-2027 3,204,442 0.44% 1,090,000 EUR BMW US Capital LLC 1.125% 18-Sep-2021 1,129,414 0.15% 1,014,000 EUR Citigroup Inc FRN 10-Feb-2019 1,016,276 0.14%
623,000 EUR Citigroup Inc 7.375% 04-Sep-2019 701,012 0.10% 2,030,000 EUR Citigroup Inc 1.375% 27-Oct-2021 2,116,177 0.29% 3,790,000 EUR Citigroup Inc 0.750% 26-Oct-2023 3,801,647 0.52%
429,000 EUR Citigroup Inc 1.750% 28-Jan-2025 451,496 0.06% 780,000 GBP Digital Stout Holding LLC 2.750% 19-Jul-2024 900,972 0.12% 800,000 EUR Eli Lilly & Co 1.625% 02-Jun-2026 844,252 0.12%
1,738,000 USD Exelon Corp 3.950% 15-Jun-2025 1,512,067 0.21% 1,331,000 EUR General Electric Co 1.250% 26-May-2023 1,376,537 0.19% 5,780,000 EUR General Electric Co 0.875% 17-May-2025 5,767,573 0.79% 2,240,000 EUR General Electric Co 1.500% 17-May-2029 2,248,478 0.31% 2,360,000 EUR General Electric Co 2.125% 17-May-2037 2,347,130 0.32%
580,000 EUR JPMorgan Chase & Co 1.375% 16-Sep-2021 604,678 0.08% 2,460,000 EUR JPMorgan Chase & Co 1.500% 26-Oct-2022 2,585,610 0.35% 6,520,000 EUR JPMorgan Chase & Co 0.625% 25-Jan-2024 6,484,879 0.89% 4,490,000 EUR JPMorgan Chase & Co 1.500% 27-Jan-2025 4,673,417 0.64% 1,600,000 EUR JPMorgan Chase & Co FRN 18-May-2028 1,646,296 0.22%
520,000 EUR Kinder Morgan Inc 1.500% 16-Mar-2022 539,209 0.07% 1,640,000 EUR Merck & Co Inc 1.875% 15-Oct-2026 1,771,036 0.24% 2,025,000 EUR Metropolitan Life Global Funding I 2.375% 30-Sep-2019 2,115,261 0.29% 4,340,000 EUR Metropolitan Life Global Funding I 0.875% 20-Jan-2022 4,427,447 0.60% 2,090,000 EUR Metropolitan Life Global Funding I 2.375% 11-Jan-2023 2,281,580 0.31%
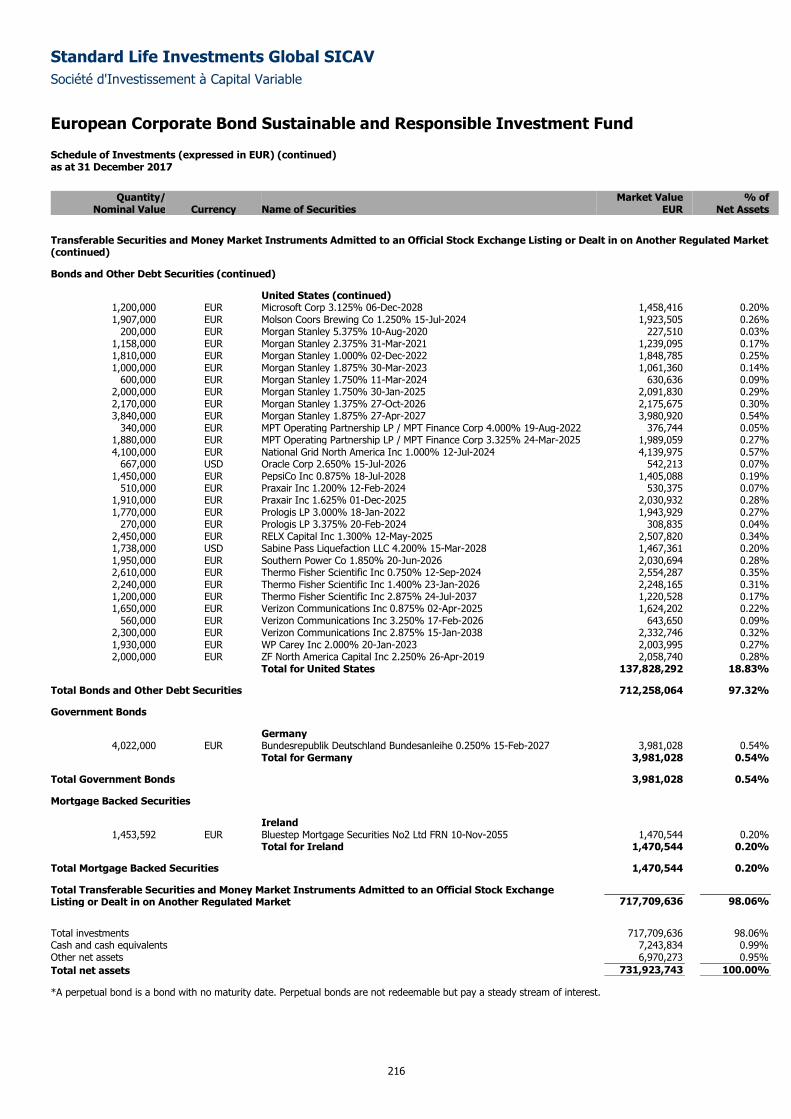
Standard Life Investments Global SICAV
Société d'Investissement à Capital Variable
European Corporate Bond Sustainable and Responsible Investment Fund
Schedule of Investments (expressed in EUR) (continued) as at 31 December 2017
216
Quantity/ Market Value % of
Nominal Value Currency Name of Securities EUR Net Assets
Transferable Securities and Money Market Instruments Admitted to an Official Stock Exchange Listing or Dealt in on Another Regulated Market (continued)
Bonds and Other Debt Securities (continued)
United States (continued) 1,200,000 EUR Microsoft Corp 3.125% 06-Dec-2028 1,458,416 0.20% 1,907,000 EUR Molson Coors Brewing Co 1.250% 15-Jul-2024 1,923,505 0.26%
200,000 EUR Morgan Stanley 5.375% 10-Aug-2020 227,510 0.03% 1,158,000 EUR Morgan Stanley 2.375% 31-Mar-2021 1,239,095 0.17% 1,810,000 EUR Morgan Stanley 1.000% 02-Dec-2022 1,848,785 0.25% 1,000,000 EUR Morgan Stanley 1.875% 30-Mar-2023 1,061,360 0.14%
600,000 EUR Morgan Stanley 1.750% 11-Mar-2024 630,636 0.09% 2,000,000 EUR Morgan Stanley 1.750% 30-Jan-2025 2,091,830 0.29% 2,170,000 EUR Morgan Stanley 1.375% 27-Oct-2026 2,175,675 0.30% 3,840,000 EUR Morgan Stanley 1.875% 27-Apr-2027 3,980,920 0.54%
340,000 EUR MPT Operating Partnership LP / MPT Finance Corp 4.000% 19-Aug-2022 376,744 0.05% 1,880,000 EUR MPT Operating Partnership LP / MPT Finance Corp 3.325% 24-Mar-2025 1,989,059 0.27% 4,100,000 EUR National Grid North America Inc 1.000% 12-Jul-2024 4,139,975 0.57%
667,000 USD Oracle Corp 2.650% 15-Jul-2026 542,213 0.07% 1,450,000 EUR PepsiCo Inc 0.875% 18-Jul-2028 1,405,088 0.19%
510,000 EUR Praxair Inc 1.200% 12-Feb-2024 530,375 0.07% 1,910,000 EUR Praxair Inc 1.625% 01-Dec-2025 2,030,932 0.28% 1,770,000 EUR Prologis LP 3.000% 18-Jan-2022 1,943,929 0.27%
270,000 EUR Prologis LP 3.375% 20-Feb-2024 308,835 0.04% 2,450,000 EUR RELX Capital Inc 1.300% 12-May-2025 2,507,820 0.34% 1,738,000 USD Sabine Pass Liquefaction LLC 4.200% 15-Mar-2028 1,467,361 0.20% 1,950,000 EUR Southern Power Co 1.850% 20-Jun-2026 2,030,694 0.28% 2,610,000 EUR Thermo Fisher Scientific Inc 0.750% 12-Sep-2024 2,554,287 0.35% 2,240,000 EUR Thermo Fisher Scientific Inc 1.400% 23-Jan-2026 2,248,165 0.31% 1,200,000 EUR Thermo Fisher Scientific Inc 2.875% 24-Jul-2037 1,220,528 0.17% 1,650,000 EUR Verizon Communications Inc 0.875% 02-Apr-2025 1,624,202 0.22%
560,000 EUR Verizon Communications Inc 3.250% 17-Feb-2026 643,650 0.09% 2,300,000 EUR Verizon Communications Inc 2.875% 15-Jan-2038 2,332,746 0.32% 1,930,000 EUR WP Carey Inc 2.000% 20-Jan-2023 2,003,995 0.27% 2,000,000 EUR ZF North America Capital Inc 2.250% 26-Apr-2019 2,058,740 0.28%
Total for United States 137,828,292 18.83%
Total Bonds and Other Debt Securities 712,258,064 97.32%
Government Bonds
Germany 4,022,000 EUR Bundesrepublik Deutschland Bundesanleihe 0.250% 15-Feb-2027 3,981,028 0.54%
Total for Germany 3,981,028 0.54%
Total Government Bonds 3,981,028 0.54%
Mortgage Backed Securities
Ireland 1,453,592 EUR Bluestep Mortgage Securities No2 Ltd FRN 10-Nov-2055 1,470,544 0.20%
Total for Ireland 1,470,544 0.20%
Total Mortgage Backed Securities 1,470,544 0.20%
Total Transferable Securities and Money Market Instruments Admitted to an Official Stock Exchange Listing or Dealt in on Another Regulated Market 717,709,636 98.06%
Total investments 717,709,636 98.06%
Cash and cash equivalents 7,243,834 0.99%
Other net assets 6,970,273 0.95%
Total net assets 731,923,743 100.00%
*A perpetual bond is a bond with no maturity date. Perpetual bonds are not redeemable but pay a steady stream of interest.
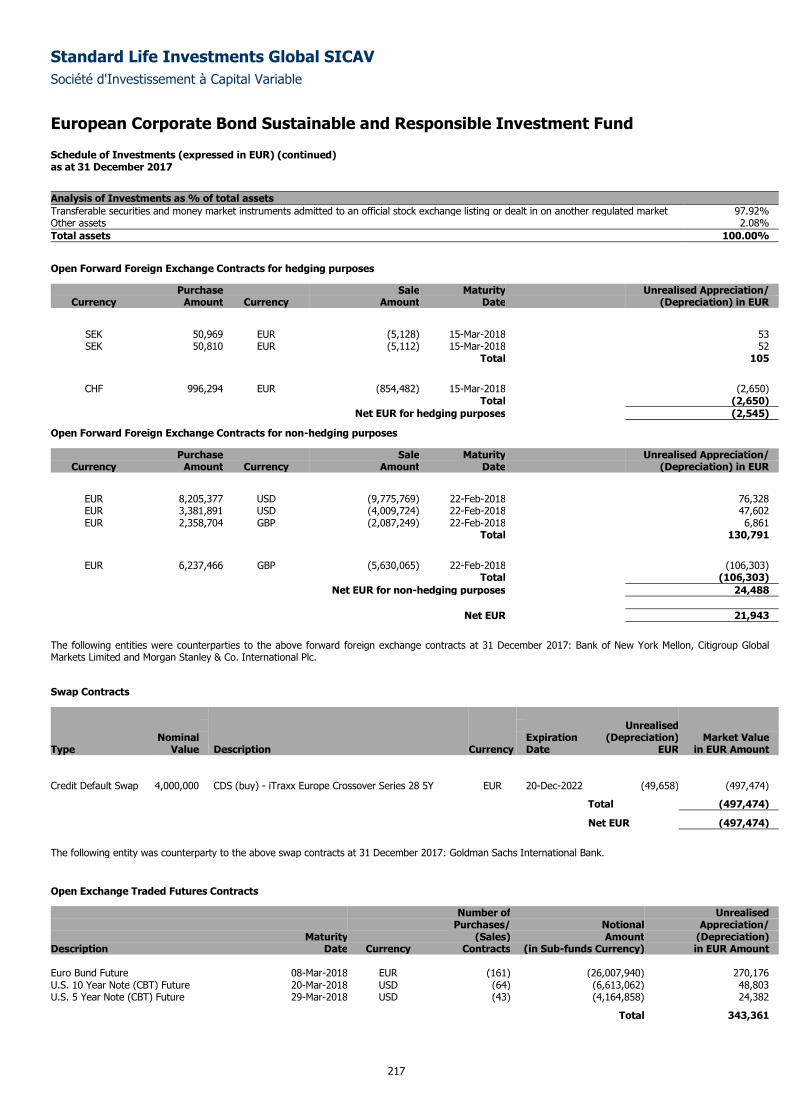
Standard Life Investments Global SICAV
Société d'Investissement à Capital Variable
European Corporate Bond Sustainable and Responsible Investment Fund
Schedule of Investments (expressed in EUR) (continued) as at 31 December 2017
217
Analysis of Investments as % of total assets
Transferable securities and money market instruments admitted to an official stock exchange listing or dealt in on another regulated market 97.92% Other assets 2.08%
Total assets 100.00%
Open Forward Foreign Exchange Contracts for hedging purposes
Purchase Sale Maturity Unrealised Appreciation/ Currency Amount Currency Amount Date (Depreciation) in EUR
SEK 50,969 EUR (5,128) 15-Mar-2018 53 SEK 50,810 EUR (5,112) 15-Mar-2018 52
Total 105
CHF 996,294 EUR (854,482) 15-Mar-2018 (2,650)
Total (2,650)
Net EUR for hedging purposes (2,545)
Open Forward Foreign Exchange Contracts for non-hedging purposes
Purchase Sale Maturity Unrealised Appreciation/ Currency Amount Currency Amount Date (Depreciation) in EUR
EUR 8,205,377 USD (9,775,769) 22-Feb-2018 76,328 EUR 3,381,891 USD (4,009,724) 22-Feb-2018 47,602 EUR 2,358,704 GBP (2,087,249) 22-Feb-2018 6,861
Total 130,791
EUR 6,237,466 GBP (5,630,065) 22-Feb-2018 (106,303)
Total (106,303)
Net EUR for non-hedging purposes 24,488
Net EUR 21,943
The following entities were counterparties to the above forward foreign exchange contracts at 31 December 2017: Bank of New York Mellon, Citigroup Global Markets Limited and Morgan Stanley & Co. International Plc.
Swap Contracts
Unrealised Nominal Expiration (Depreciation) Market Value Type Value Description Currency Date EUR in EUR Amount
Credit Default Swap 4,000,000 CDS (buy) - iTraxx Europe Crossover Series 28 5Y EUR 20-Dec-2022 (49,658) (497,474)
Total (497,474)
Net EUR (497,474)
The following entity was counterparty to the above swap contracts at 31 December 2017: Goldman Sachs International Bank.
Open Exchange Traded Futures Contracts
Number of Unrealised Purchases/ Notional Appreciation/ Maturity (Sales) Amount (Depreciation) Description Date Currency Contracts (in Sub-funds Currency) in EUR Amount Euro Bund Future 08-Mar-2018 EUR (161) (26,007,940) 270,176 U.S. 10 Year Note (CBT) Future 20-Mar-2018 USD (64) (6,613,062) 48,803 U.S. 5 Year Note (CBT) Future 29-Mar-2018 USD (43) (4,164,858) 24,382
Total 343,361
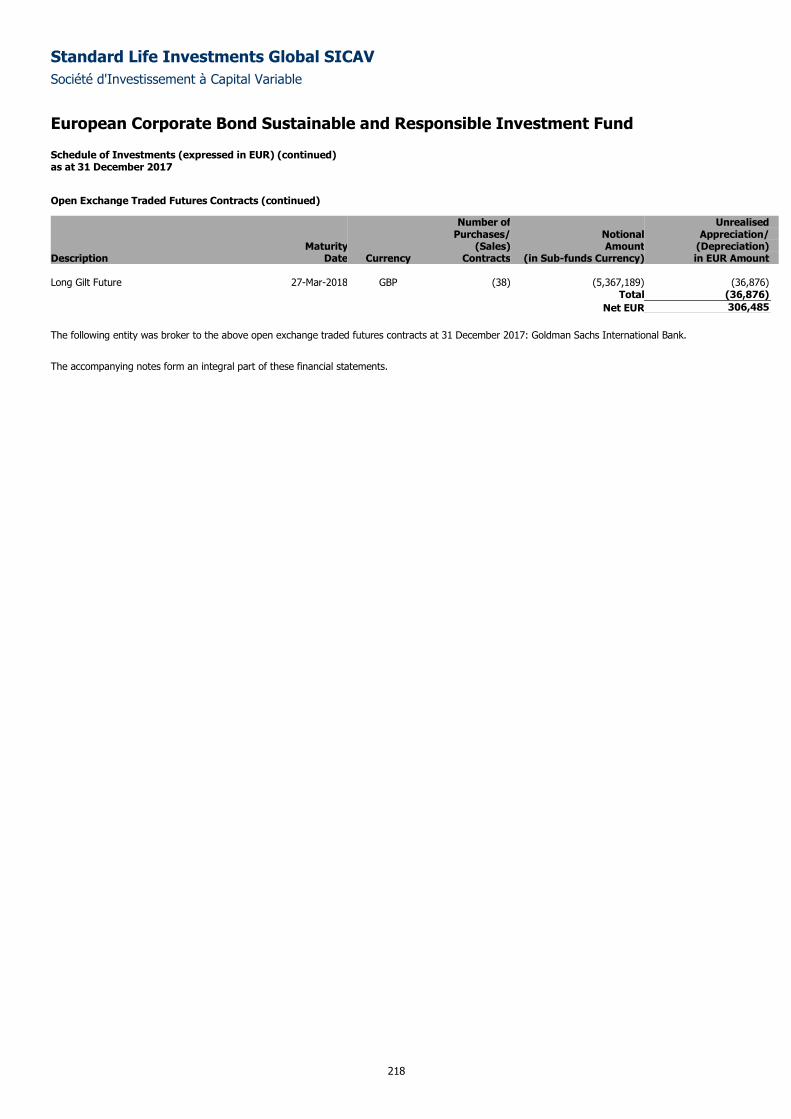
Standard Life Investments Global SICAV
Société d'Investissement à Capital Variable
European Corporate Bond Sustainable and Responsible Investment Fund
Schedule of Investments (expressed in EUR) (continued) as at 31 December 2017
218
Open Exchange Traded Futures Contracts (continued)
Number of Unrealised Purchases/ Notional Appreciation/ Maturity (Sales) Amount (Depreciation) Description Date Currency Contracts (in Sub-funds Currency) in EUR Amount Long Gilt Future 27-Mar-2018 GBP (38) (5,367,189) (36,876) Total (36,876)
Net EUR 306,485
The following entity was broker to the above open exchange traded futures contracts at 31 December 2017: Goldman Sachs International Bank.
The accompanying notes form an integral part of these financial statements.
Standard Life Investments Global SICAV
Société d'Investissement à Capital Variable
219
Emerging Market Corporate Bond Fund
Sub-fund Objective and Investment Policy
The objective of the Sub-fund is to provide a return from capital appreciation and income.
The Sub-fund will achieve this through mainly investing in bonds issued by financial institutions or companies in emerging markets. The majority of the Sub-
fund be invested in bonds denominated in US Dollars. The Sub-fund may also invest in other transferable securities, money-market instruments, deposits,
cash and near cash, derivatives (including currency forwards, interest rate and credit default swaps) and collective investment schemes. The Sub-fund may
not invest more than 5% of net assets in collective investment schemes. The Sub-fund may, subject to and in accordance with the UCI Law and applicable
CSSF circulars, use derivative contracts for the purpose of meeting its investment objective and for efficient portfolio management (including hedging).
Performance Review
The Sub-fund returned 7.21% compared to the JP Morgan CEMBI Broad Diversified index return of 7.96%.*
Holding an off-benchmark position in Frontier Communications was detrimental to returns. The company’s credit profile has been under pressure, especially
since its 2016 purchase of Verizon’s landline operations in California, Texas and Florida, and it suffered multiple credit rating downgrades in 2017. Another
position that proved detrimental to performance was our zero weighting in Colombia’s largest petroleum company, Ecopetrol, as oil-related issuers rallied in
line with the recovering oil price. Meanwhile, our off-benchmark exposure to US Treasuries weighed on returns given the year saw the US risk-free rate rise
in response to higher inflation expectations and interest rate hikes.
More positive was our off-benchmark exposure to Argentina’s recently issued ‘century’ bond. The 100-year bond performed well as investors grew
increasingly positive on the reform-focused presidency of Mauricio Macri. Better sentiment around Argentinian assets was also reflected in the
outperformance of our holding in AES Argentina Generacion, a subsidiary of the US power company AES. Finally, we benefited from an overweight position
in Petrobras given the strong rally in the price of oil.
*Sub-fund performance has been calculated over the stated period on the share price performance basis, based on the institutional share class (D
Accumulation) and net of fees. Please note the index return is quoted gross and contains no adjustment for fees. The sub-fund performance will also be
impacted by any pricing basis changes, made under our single swinging price policy. More information on our swinging price approach can be found in note
8 of the Financial Statements.
Outlook
In markets characterised by low volatility and compressed spreads, the key questions on investors and clients minds alike going into 2018 are - where are
the key risks and is there room for further spread tightening? We have started each of the past few years by warning that a more aggressive hiking cycle
than widely expected will be negative for all fixed income markets. The FOMC vote in December was perhaps an indication that confidence in inflation
trends is not yet high enough for this scenario to play out, but as the effects of tax reform start to ripple through the US economy in 2018 we may see a
more directional view emerge among the key decision-makers.
As always, we highlight the short duration of the asset class, which will continue to support the outperformance of emerging market (EM) corporates
throughout the hiking cycle. There is potential for heightened political risks in Latin America where elections are looming in the key index heavyweights –
Brazil, Mexico, and Colombia. While it is still early days, it is safe to say there are some market-unfriendly candidates already rallying the crowds, and
security selection will be key if we are to outperform through unfavourable election results.
We are aware current valuations are close to post-financial crisis tights but would strongly emphasise the futility in comparing the EM corporates asset class
today with that of 2008 given the structural shift in investor base towards local institutions, and the growth and sophistication of issuers. We believe EM
corporates will continue to benefit from solid global growth in 2018, which is supporting persistent flows into the asset class. We expect strong primary
markets to continue in2018, but for liability management to remain a key priority of EM corporates. This will allow net issuance to be easily absorbed by the
market. Given this, we do not believe a further spread tightening is a far-fetched scenario.
Please note that the commitment approach has been used for risk measurement and calculation of global exposure for this Sub-fund.
This Sub-fund is not authorised in Hong Kong and is not available to Hong Kong residents.
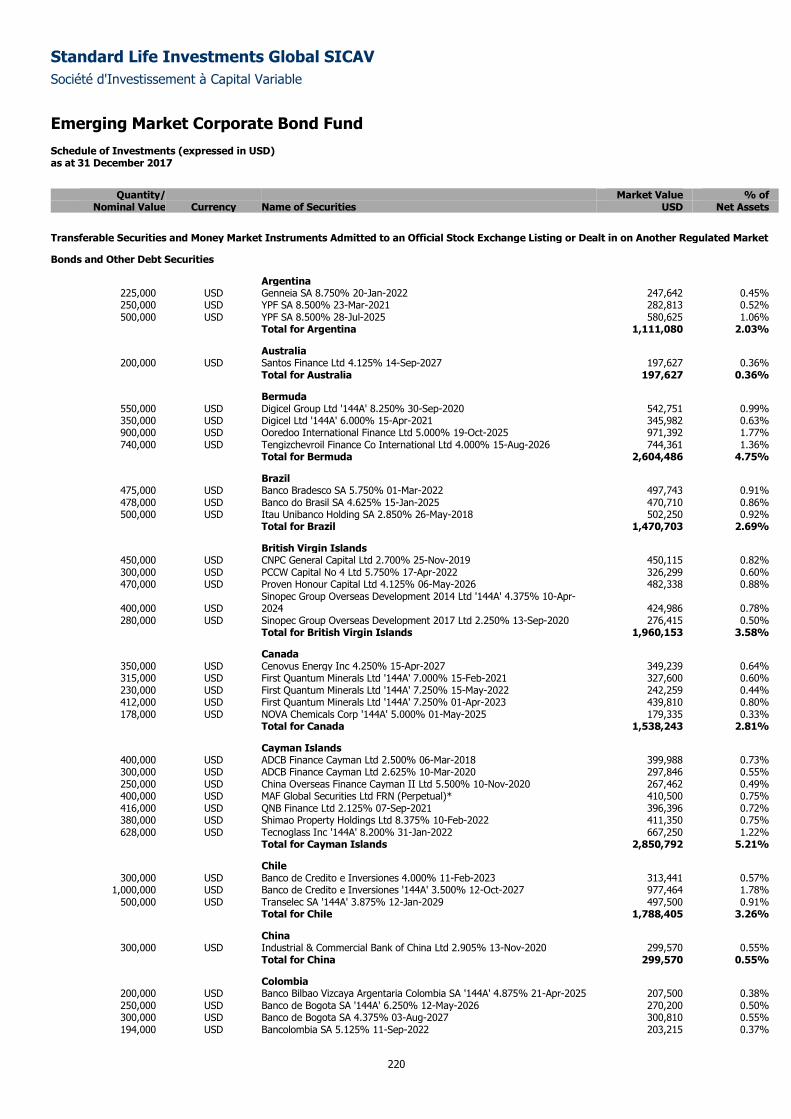
Standard Life Investments Global SICAV
Société d'Investissement à Capital Variable
Emerging Market Corporate Bond Fund Schedule of Investments (expressed in USD) as at 31 December 2017
220
Quantity/ Market Value % of
Nominal Value Currency Name of Securities USD Net Assets
Transferable Securities and Money Market Instruments Admitted to an Official Stock Exchange Listing or Dealt in on Another Regulated Market
Bonds and Other Debt Securities
Argentina 225,000 USD Genneia SA 8.750% 20-Jan-2022 247,642 0.45% 250,000 USD YPF SA 8.500% 23-Mar-2021 282,813 0.52% 500,000 USD YPF SA 8.500% 28-Jul-2025 580,625 1.06%
Total for Argentina 1,111,080 2.03%
Australia 200,000 USD Santos Finance Ltd 4.125% 14-Sep-2027 197,627 0.36%
Total for Australia 197,627 0.36%
Bermuda 550,000 USD Digicel Group Ltd '144A' 8.250% 30-Sep-2020 542,751 0.99% 350,000 USD Digicel Ltd '144A' 6.000% 15-Apr-2021 345,982 0.63% 900,000 USD Ooredoo International Finance Ltd 5.000% 19-Oct-2025 971,392 1.77% 740,000 USD Tengizchevroil Finance Co International Ltd 4.000% 15-Aug-2026 744,361 1.36%
Total for Bermuda 2,604,486 4.75%
Brazil 475,000 USD Banco Bradesco SA 5.750% 01-Mar-2022 497,743 0.91% 478,000 USD Banco do Brasil SA 4.625% 15-Jan-2025 470,710 0.86% 500,000 USD Itau Unibanco Holding SA 2.850% 26-May-2018 502,250 0.92%
Total for Brazil 1,470,703 2.69%
British Virgin Islands 450,000 USD CNPC General Capital Ltd 2.700% 25-Nov-2019 450,115 0.82% 300,000 USD PCCW Capital No 4 Ltd 5.750% 17-Apr-2022 326,299 0.60% 470,000 USD Proven Honour Capital Ltd 4.125% 06-May-2026 482,338 0.88%
400,000 USD Sinopec Group Overseas Development 2014 Ltd '144A' 4.375% 10-Apr-2024 424,986 0.78%
280,000 USD Sinopec Group Overseas Development 2017 Ltd 2.250% 13-Sep-2020 276,415 0.50% Total for British Virgin Islands 1,960,153 3.58%
Canada 350,000 USD Cenovus Energy Inc 4.250% 15-Apr-2027 349,239 0.64% 315,000 USD First Quantum Minerals Ltd '144A' 7.000% 15-Feb-2021 327,600 0.60% 230,000 USD First Quantum Minerals Ltd '144A' 7.250% 15-May-2022 242,259 0.44% 412,000 USD First Quantum Minerals Ltd '144A' 7.250% 01-Apr-2023 439,810 0.80% 178,000 USD NOVA Chemicals Corp '144A' 5.000% 01-May-2025 179,335 0.33%
Total for Canada 1,538,243 2.81%
Cayman Islands 400,000 USD ADCB Finance Cayman Ltd 2.500% 06-Mar-2018 399,988 0.73% 300,000 USD ADCB Finance Cayman Ltd 2.625% 10-Mar-2020 297,846 0.55% 250,000 USD China Overseas Finance Cayman II Ltd 5.500% 10-Nov-2020 267,462 0.49% 400,000 USD MAF Global Securities Ltd FRN (Perpetual)* 410,500 0.75% 416,000 USD QNB Finance Ltd 2.125% 07-Sep-2021 396,396 0.72% 380,000 USD Shimao Property Holdings Ltd 8.375% 10-Feb-2022 411,350 0.75% 628,000 USD Tecnoglass Inc '144A' 8.200% 31-Jan-2022 667,250 1.22%
Total for Cayman Islands 2,850,792 5.21%
Chile 300,000 USD Banco de Credito e Inversiones 4.000% 11-Feb-2023 313,441 0.57%
1,000,000 USD Banco de Credito e Inversiones '144A' 3.500% 12-Oct-2027 977,464 1.78% 500,000 USD Transelec SA '144A' 3.875% 12-Jan-2029 497,500 0.91%
Total for Chile 1,788,405 3.26%
China 300,000 USD Industrial & Commercial Bank of China Ltd 2.905% 13-Nov-2020 299,570 0.55%
Total for China 299,570 0.55%
Colombia 200,000 USD Banco Bilbao Vizcaya Argentaria Colombia SA '144A' 4.875% 21-Apr-2025 207,500 0.38% 250,000 USD Banco de Bogota SA '144A' 6.250% 12-May-2026 270,200 0.50% 300,000 USD Banco de Bogota SA 4.375% 03-Aug-2027 300,810 0.55% 194,000 USD Bancolombia SA 5.125% 11-Sep-2022 203,215 0.37%
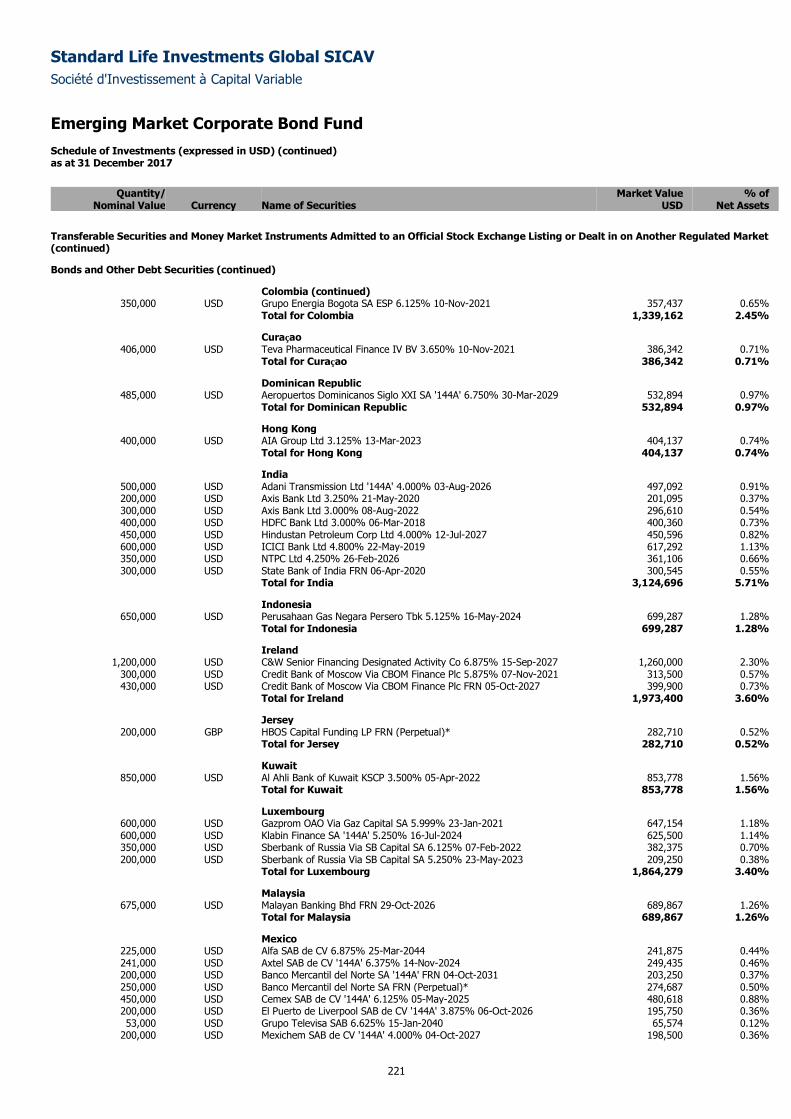
Standard Life Investments Global SICAV
Société d'Investissement à Capital Variable
Emerging Market Corporate Bond Fund Schedule of Investments (expressed in USD) (continued) as at 31 December 2017
221
Quantity/ Market Value % of
Nominal Value Currency Name of Securities USD Net Assets
Transferable Securities and Money Market Instruments Admitted to an Official Stock Exchange Listing or Dealt in on Another Regulated Market (continued)
Bonds and Other Debt Securities (continued)
Colombia (continued) 350,000 USD Grupo Energia Bogota SA ESP 6.125% 10-Nov-2021 357,437 0.65%
Total for Colombia 1,339,162 2.45%
Curaçao 406,000 USD Teva Pharmaceutical Finance IV BV 3.650% 10-Nov-2021 386,342 0.71%
Total for Curaçao 386,342 0.71%
Dominican Republic 485,000 USD Aeropuertos Dominicanos Siglo XXI SA '144A' 6.750% 30-Mar-2029 532,894 0.97%
Total for Dominican Republic 532,894 0.97%
Hong Kong 400,000 USD AIA Group Ltd 3.125% 13-Mar-2023 404,137 0.74%
Total for Hong Kong 404,137 0.74%
India 500,000 USD Adani Transmission Ltd '144A' 4.000% 03-Aug-2026 497,092 0.91% 200,000 USD Axis Bank Ltd 3.250% 21-May-2020 201,095 0.37% 300,000 USD Axis Bank Ltd 3.000% 08-Aug-2022 296,610 0.54% 400,000 USD HDFC Bank Ltd 3.000% 06-Mar-2018 400,360 0.73% 450,000 USD Hindustan Petroleum Corp Ltd 4.000% 12-Jul-2027 450,596 0.82% 600,000 USD ICICI Bank Ltd 4.800% 22-May-2019 617,292 1.13% 350,000 USD NTPC Ltd 4.250% 26-Feb-2026 361,106 0.66% 300,000 USD State Bank of India FRN 06-Apr-2020 300,545 0.55%
Total for India 3,124,696 5.71%
Indonesia 650,000 USD Perusahaan Gas Negara Persero Tbk 5.125% 16-May-2024 699,287 1.28%
Total for Indonesia 699,287 1.28%
Ireland 1,200,000 USD C&W Senior Financing Designated Activity Co 6.875% 15-Sep-2027 1,260,000 2.30%
300,000 USD Credit Bank of Moscow Via CBOM Finance Plc 5.875% 07-Nov-2021 313,500 0.57% 430,000 USD Credit Bank of Moscow Via CBOM Finance Plc FRN 05-Oct-2027 399,900 0.73%
Total for Ireland 1,973,400 3.60%
Jersey 200,000 GBP HBOS Capital Funding LP FRN (Perpetual)* 282,710 0.52%
Total for Jersey 282,710 0.52%
Kuwait 850,000 USD Al Ahli Bank of Kuwait KSCP 3.500% 05-Apr-2022 853,778 1.56%
Total for Kuwait 853,778 1.56%
Luxembourg 600,000 USD Gazprom OAO Via Gaz Capital SA 5.999% 23-Jan-2021 647,154 1.18% 600,000 USD Klabin Finance SA '144A' 5.250% 16-Jul-2024 625,500 1.14% 350,000 USD Sberbank of Russia Via SB Capital SA 6.125% 07-Feb-2022 382,375 0.70% 200,000 USD Sberbank of Russia Via SB Capital SA 5.250% 23-May-2023 209,250 0.38%
Total for Luxembourg 1,864,279 3.40%
Malaysia 675,000 USD Malayan Banking Bhd FRN 29-Oct-2026 689,867 1.26%
Total for Malaysia 689,867 1.26%
Mexico 225,000 USD Alfa SAB de CV 6.875% 25-Mar-2044 241,875 0.44% 241,000 USD Axtel SAB de CV '144A' 6.375% 14-Nov-2024 249,435 0.46% 200,000 USD Banco Mercantil del Norte SA '144A' FRN 04-Oct-2031 203,250 0.37% 250,000 USD Banco Mercantil del Norte SA FRN (Perpetual)* 274,687 0.50% 450,000 USD Cemex SAB de CV '144A' 6.125% 05-May-2025 480,618 0.88% 200,000 USD El Puerto de Liverpool SAB de CV '144A' 3.875% 06-Oct-2026 195,750 0.36% 53,000 USD Grupo Televisa SAB 6.625% 15-Jan-2040 65,574 0.12%
200,000 USD Mexichem SAB de CV '144A' 4.000% 04-Oct-2027 198,500 0.36%
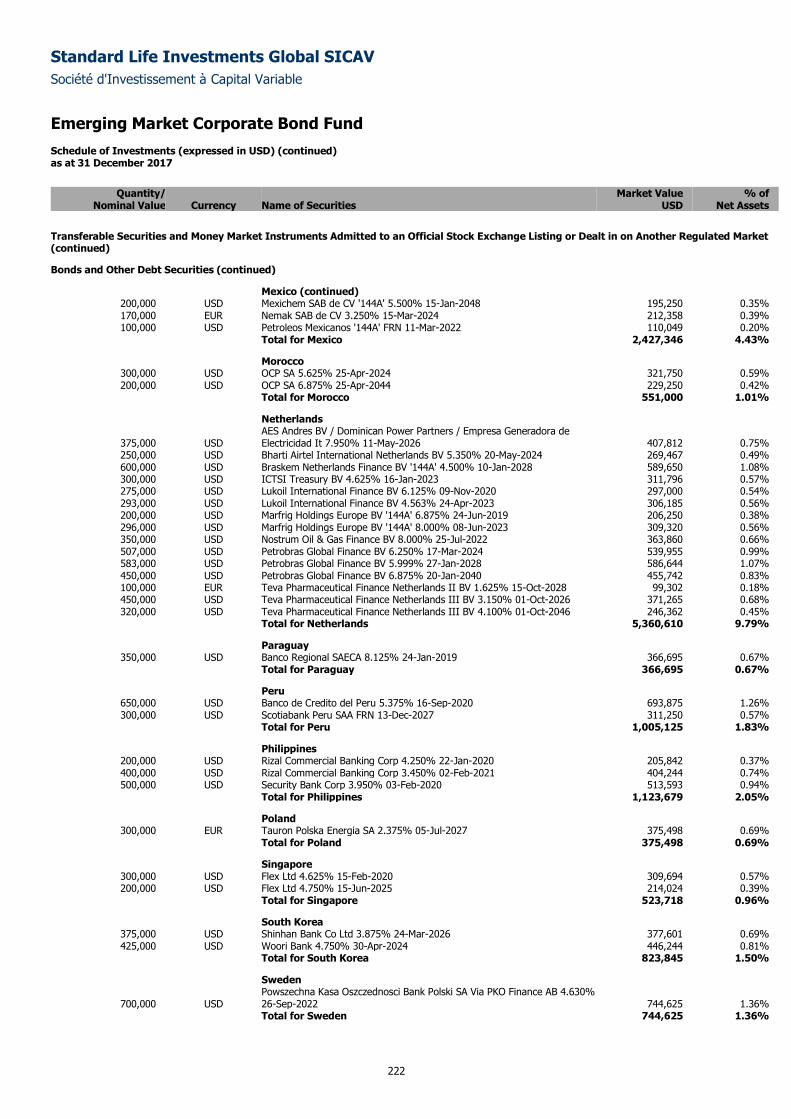
Standard Life Investments Global SICAV
Société d'Investissement à Capital Variable
Emerging Market Corporate Bond Fund Schedule of Investments (expressed in USD) (continued) as at 31 December 2017
222
Quantity/ Market Value % of
Nominal Value Currency Name of Securities USD Net Assets
Transferable Securities and Money Market Instruments Admitted to an Official Stock Exchange Listing or Dealt in on Another Regulated Market (continued)
Bonds and Other Debt Securities (continued)
Mexico (continued) 200,000 USD Mexichem SAB de CV '144A' 5.500% 15-Jan-2048 195,250 0.35% 170,000 EUR Nemak SAB de CV 3.250% 15-Mar-2024 212,358 0.39% 100,000 USD Petroleos Mexicanos '144A' FRN 11-Mar-2022 110,049 0.20%
Total for Mexico 2,427,346 4.43%
Morocco 300,000 USD OCP SA 5.625% 25-Apr-2024 321,750 0.59% 200,000 USD OCP SA 6.875% 25-Apr-2044 229,250 0.42%
Total for Morocco 551,000 1.01%
Netherlands
375,000 USD AES Andres BV / Dominican Power Partners / Empresa Generadora de Electricidad It 7.950% 11-May-2026 407,812 0.75%
250,000 USD Bharti Airtel International Netherlands BV 5.350% 20-May-2024 269,467 0.49% 600,000 USD Braskem Netherlands Finance BV '144A' 4.500% 10-Jan-2028 589,650 1.08% 300,000 USD ICTSI Treasury BV 4.625% 16-Jan-2023 311,796 0.57% 275,000 USD Lukoil International Finance BV 6.125% 09-Nov-2020 297,000 0.54% 293,000 USD Lukoil International Finance BV 4.563% 24-Apr-2023 306,185 0.56% 200,000 USD Marfrig Holdings Europe BV '144A' 6.875% 24-Jun-2019 206,250 0.38% 296,000 USD Marfrig Holdings Europe BV '144A' 8.000% 08-Jun-2023 309,320 0.56% 350,000 USD Nostrum Oil & Gas Finance BV 8.000% 25-Jul-2022 363,860 0.66% 507,000 USD Petrobras Global Finance BV 6.250% 17-Mar-2024 539,955 0.99% 583,000 USD Petrobras Global Finance BV 5.999% 27-Jan-2028 586,644 1.07% 450,000 USD Petrobras Global Finance BV 6.875% 20-Jan-2040 455,742 0.83% 100,000 EUR Teva Pharmaceutical Finance Netherlands II BV 1.625% 15-Oct-2028 99,302 0.18% 450,000 USD Teva Pharmaceutical Finance Netherlands III BV 3.150% 01-Oct-2026 371,265 0.68% 320,000 USD Teva Pharmaceutical Finance Netherlands III BV 4.100% 01-Oct-2046 246,362 0.45%
Total for Netherlands 5,360,610 9.79%
Paraguay 350,000 USD Banco Regional SAECA 8.125% 24-Jan-2019 366,695 0.67%
Total for Paraguay 366,695 0.67%
Peru 650,000 USD Banco de Credito del Peru 5.375% 16-Sep-2020 693,875 1.26% 300,000 USD Scotiabank Peru SAA FRN 13-Dec-2027 311,250 0.57%
Total for Peru 1,005,125 1.83%
Philippines 200,000 USD Rizal Commercial Banking Corp 4.250% 22-Jan-2020 205,842 0.37% 400,000 USD Rizal Commercial Banking Corp 3.450% 02-Feb-2021 404,244 0.74% 500,000 USD Security Bank Corp 3.950% 03-Feb-2020 513,593 0.94%
Total for Philippines 1,123,679 2.05%
Poland 300,000 EUR Tauron Polska Energia SA 2.375% 05-Jul-2027 375,498 0.69%
Total for Poland 375,498 0.69%
Singapore 300,000 USD Flex Ltd 4.625% 15-Feb-2020 309,694 0.57% 200,000 USD Flex Ltd 4.750% 15-Jun-2025 214,024 0.39%
Total for Singapore 523,718 0.96%
South Korea 375,000 USD Shinhan Bank Co Ltd 3.875% 24-Mar-2026 377,601 0.69% 425,000 USD Woori Bank 4.750% 30-Apr-2024 446,244 0.81%
Total for South Korea 823,845 1.50%
Sweden
700,000 USD Powszechna Kasa Oszczednosci Bank Polski SA Via PKO Finance AB 4.630% 26-Sep-2022 744,625 1.36%
Total for Sweden 744,625 1.36%
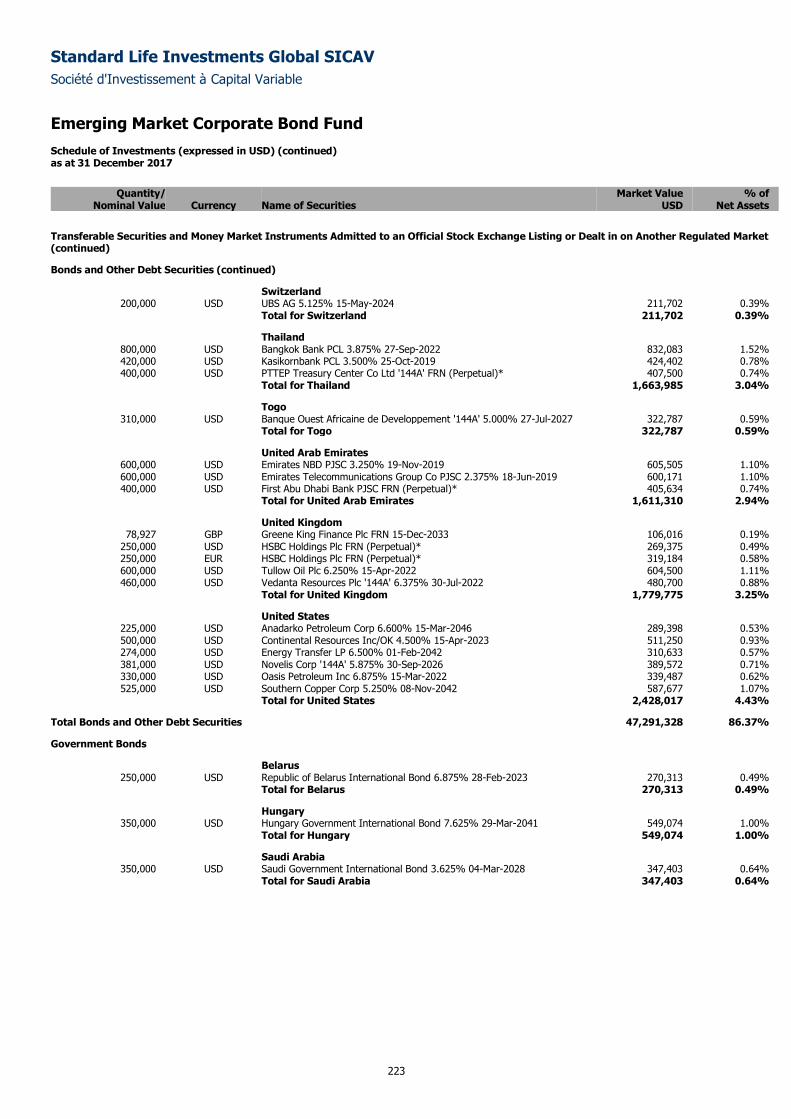
Standard Life Investments Global SICAV
Société d'Investissement à Capital Variable
Emerging Market Corporate Bond Fund Schedule of Investments (expressed in USD) (continued) as at 31 December 2017
223
Quantity/ Market Value % of
Nominal Value Currency Name of Securities USD Net Assets
Transferable Securities and Money Market Instruments Admitted to an Official Stock Exchange Listing or Dealt in on Another Regulated Market (continued)
Bonds and Other Debt Securities (continued)
Switzerland 200,000 USD UBS AG 5.125% 15-May-2024 211,702 0.39%
Total for Switzerland 211,702 0.39%
Thailand 800,000 USD Bangkok Bank PCL 3.875% 27-Sep-2022 832,083 1.52% 420,000 USD Kasikornbank PCL 3.500% 25-Oct-2019 424,402 0.78% 400,000 USD PTTEP Treasury Center Co Ltd '144A' FRN (Perpetual)* 407,500 0.74%
Total for Thailand 1,663,985 3.04%
Togo 310,000 USD Banque Ouest Africaine de Developpement '144A' 5.000% 27-Jul-2027 322,787 0.59%
Total for Togo 322,787 0.59%
United Arab Emirates 600,000 USD Emirates NBD PJSC 3.250% 19-Nov-2019 605,505 1.10% 600,000 USD Emirates Telecommunications Group Co PJSC 2.375% 18-Jun-2019 600,171 1.10% 400,000 USD First Abu Dhabi Bank PJSC FRN (Perpetual)* 405,634 0.74%
Total for United Arab Emirates 1,611,310 2.94%
United Kingdom 78,927 GBP Greene King Finance Plc FRN 15-Dec-2033 106,016 0.19%
250,000 USD HSBC Holdings Plc FRN (Perpetual)* 269,375 0.49% 250,000 EUR HSBC Holdings Plc FRN (Perpetual)* 319,184 0.58% 600,000 USD Tullow Oil Plc 6.250% 15-Apr-2022 604,500 1.11% 460,000 USD Vedanta Resources Plc '144A' 6.375% 30-Jul-2022 480,700 0.88%
Total for United Kingdom 1,779,775 3.25%
United States 225,000 USD Anadarko Petroleum Corp 6.600% 15-Mar-2046 289,398 0.53% 500,000 USD Continental Resources Inc/OK 4.500% 15-Apr-2023 511,250 0.93% 274,000 USD Energy Transfer LP 6.500% 01-Feb-2042 310,633 0.57% 381,000 USD Novelis Corp '144A' 5.875% 30-Sep-2026 389,572 0.71% 330,000 USD Oasis Petroleum Inc 6.875% 15-Mar-2022 339,487 0.62% 525,000 USD Southern Copper Corp 5.250% 08-Nov-2042 587,677 1.07%
Total for United States 2,428,017 4.43%
Total Bonds and Other Debt Securities 47,291,328 86.37%
Government Bonds
Belarus 250,000 USD Republic of Belarus International Bond 6.875% 28-Feb-2023 270,313 0.49%
Total for Belarus 270,313 0.49%
Hungary 350,000 USD Hungary Government International Bond 7.625% 29-Mar-2041 549,074 1.00%
Total for Hungary 549,074 1.00%
Saudi Arabia 350,000 USD Saudi Government International Bond 3.625% 04-Mar-2028 347,403 0.64%
Total for Saudi Arabia 347,403 0.64%
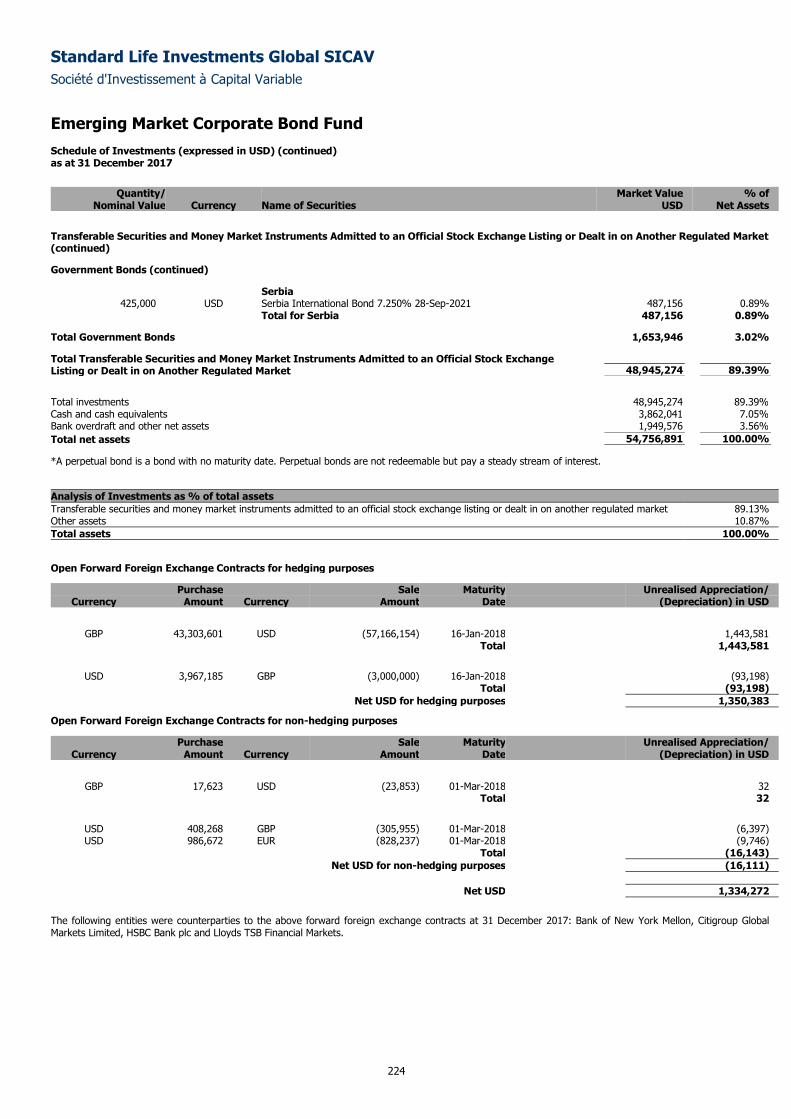
Standard Life Investments Global SICAV
Société d'Investissement à Capital Variable
Emerging Market Corporate Bond Fund Schedule of Investments (expressed in USD) (continued) as at 31 December 2017
224
Quantity/ Market Value % of
Nominal Value Currency Name of Securities USD Net Assets
Transferable Securities and Money Market Instruments Admitted to an Official Stock Exchange Listing or Dealt in on Another Regulated Market (continued)
Government Bonds (continued)
Serbia 425,000 USD Serbia International Bond 7.250% 28-Sep-2021 487,156 0.89%
Total for Serbia 487,156 0.89%
Total Government Bonds 1,653,946 3.02%
Total Transferable Securities and Money Market Instruments Admitted to an Official Stock Exchange Listing or Dealt in on Another Regulated Market 48,945,274 89.39%
Total investments 48,945,274 89.39%
Cash and cash equivalents 3,862,041 7.05%
Bank overdraft and other net assets 1,949,576 3.56%
Total net assets 54,756,891 100.00%
*A perpetual bond is a bond with no maturity date. Perpetual bonds are not redeemable but pay a steady stream of interest.
Analysis of Investments as % of total assets
Transferable securities and money market instruments admitted to an official stock exchange listing or dealt in on another regulated market 89.13% Other assets 10.87%
Total assets 100.00%
Open Forward Foreign Exchange Contracts for hedging purposes
Purchase Sale Maturity Unrealised Appreciation/ Currency Amount Currency Amount Date (Depreciation) in USD
GBP 43,303,601 USD (57,166,154) 16-Jan-2018 1,443,581 Total 1,443,581
USD 3,967,185 GBP (3,000,000) 16-Jan-2018 (93,198)
Total (93,198)
Net USD for hedging purposes 1,350,383
Open Forward Foreign Exchange Contracts for non-hedging purposes
Purchase Sale Maturity Unrealised Appreciation/ Currency Amount Currency Amount Date (Depreciation) in USD
GBP 17,623 USD (23,853) 01-Mar-2018 32 Total 32
USD 408,268 GBP (305,955) 01-Mar-2018 (6,397) USD 986,672 EUR (828,237) 01-Mar-2018 (9,746)
Total (16,143)
Net USD for non-hedging purposes (16,111)
Net USD 1,334,272
The following entities were counterparties to the above forward foreign exchange contracts at 31 December 2017: Bank of New York Mellon, Citigroup Global Markets Limited, HSBC Bank plc and Lloyds TSB Financial Markets.
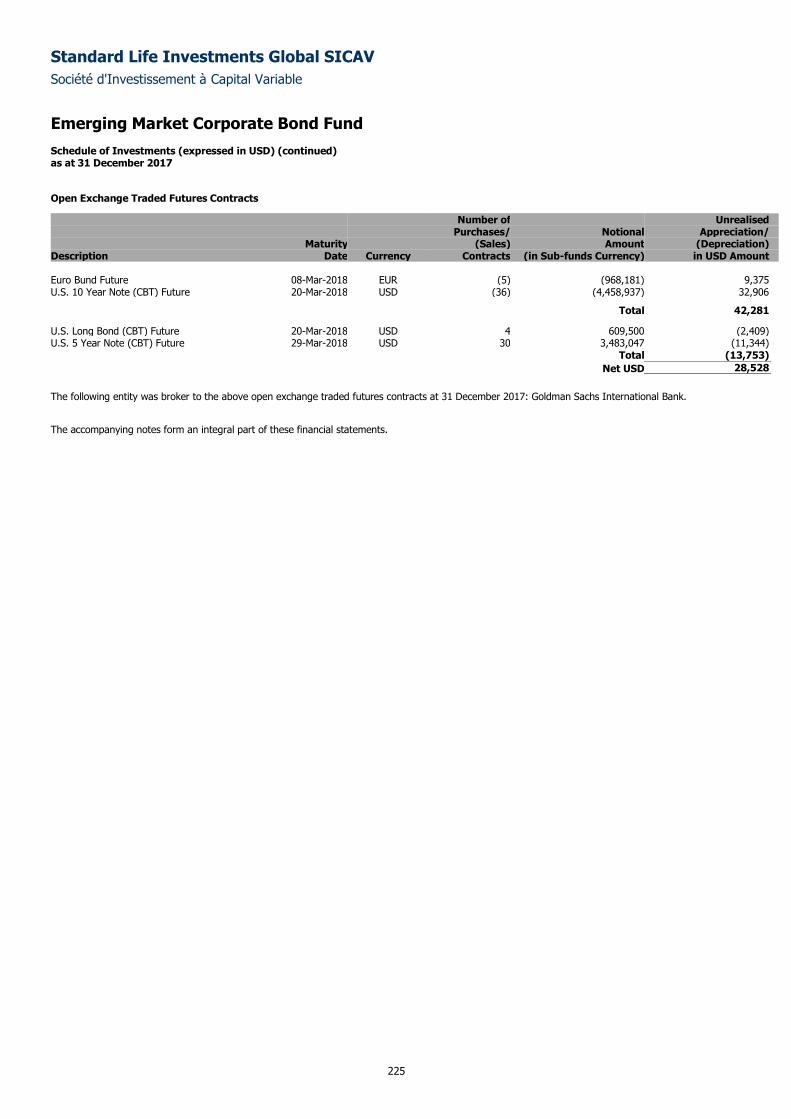
Standard Life Investments Global SICAV
Société d'Investissement à Capital Variable
Emerging Market Corporate Bond Fund Schedule of Investments (expressed in USD) (continued) as at 31 December 2017
225
Open Exchange Traded Futures Contracts
Number of Unrealised Purchases/ Notional Appreciation/ Maturity (Sales) Amount (Depreciation) Description Date Currency Contracts (in Sub-funds Currency) in USD Amount Euro Bund Future 08-Mar-2018 EUR (5) (968,181) 9,375 U.S. 10 Year Note (CBT) Future 20-Mar-2018 USD (36) (4,458,937) 32,906
Total 42,281
U.S. Long Bond (CBT) Future 20-Mar-2018 USD 4 609,500 (2,409) U.S. 5 Year Note (CBT) Future 29-Mar-2018 USD 30 3,483,047 (11,344) Total (13,753)
Net USD 28,528
The following entity was broker to the above open exchange traded futures contracts at 31 December 2017: Goldman Sachs International Bank.
The accompanying notes form an integral part of these financial statements.
Standard Life Investments Global SICAV
Société d'Investissement à Capital Variable
226
Total Return Credit Fund
Sub-fund Objective and Investment Policy
The objective of the Sub-fund is to provide a return from capital appreciation and income. The Sub-fund will achieve this through investing mainly in higher
yielding debt securities. The fund is actively managed by our investment team, who will select securities without reference to an index weight or size to try
to take advantage of opportunities they have identified. The portfolio is complemented with an active allocation to a range of market positions, which utilise
a combination of traditional assets and investment strategies based on advanced derivative techniques with the aim of reducing the fund's overall volatility
and generating additional returns. Investors should note that this allocation is likely to result in the fund gaining exposure to non-bond market opportunities
and risks. This means that performance may deviate from bonds over short and medium-term periods. The fund can take long and short positions in
markets, securities and groups of securities through derivative contracts. Leverage in the fund arises as a result of the use of derivatives.
The Sub-fund seeks investment opportunities from across the bond universe investing mainly in higher yielding debt securities while aiming to reduce the
volatility. The portfolio is complemented with an active macro overlay to a range of market positions that will aim to dampen the volatility of the fund over
the long term as well as provide some downside protection.
Examples of strategies that may be used at any time may include:
- An assessment of the value of one currency relative to another. The strategy could involve the sale of a currency considered overvalued and purchase of a
currency considered undervalued. Derivatives, in the form of forward foreign exchange contracts, could be used to implement the strategy.
- An assessment of the direction of interest rates. Derivatives, in the form of interest rate swaps, could be used to position the portfolio such that it could
benefit from the future direction of interest rates.
- An assessment of the direction of inflation rates. Derivatives, in the form of inflation-indexed (breakeven) swaps, could be used to position the portfolio
such that it could benefit from the future direction of inflation rates.
The fund will invest in a portfolio mainly in higher yielding debt securities, including government and corporate bonds, asset backed securities, sub
investment grade bonds and inflation linked bonds, that are listed or traded in either developed or emerging markets. The Sub-fund may also invest in other
transferable securities, floating rate notes, money-market instruments, deposits, cash and near cash, derivatives (including currency forwards, interest rate
and credit default swaps) and collective investment schemes. In combination it will seek to reduce the volatility of these assets and generate additional
returns by investing in a portfolio of permitted derivative contracts (including futures, options, swaps, forward currency contracts and other derivatives) as
well as traditional assets located anywhere in the world. Investors should note that this allocation is likely to result in the Sub-fund gaining exposure to non-
bond market opportunities and risks. This means that performance may deviate from bonds over short and medium-term periods. In addition, the Sub-fund
will not invest more than 20% of net assets in asset backed securities. The Sub-fund may, subject to and in accordance with the UCI Law and applicable
CSSF circulars, take long and short positions in markets, securities and groups of securities through derivative contracts.
Performance Review
The Sub-fund returned 4.83% over the period.*
Tesco was among the top performers early in the year, as it made further progress towards recovery. Bank of America tier one US$ bonds also performed
well, benefiting from the stabilisation in Treasury yields and strong earnings momentum. Performance detractors included US wireline company Frontier
after disappointing results led to fears of a dividend cut. Turning to our drawdown protection strategies, the best performer was our short position in Italian
government bonds, as mounting political risk in Europe caused yields to rise. The Fund produced a positive total return in the second quarter, building on
the strong start to the year. In a period when volatility remained extremely low, our best credit ideas were strongly positive. Tesco continued to perform
well as a good set of results maintained the recent positive trend. Subordinated financials was the top performing market segment in the Fund, with
Generali, Barclays and Direct Line all notably strong. However, the holding in Frontier’s bonds remained a drag on returns. Our volatility strategies cost 10
basis points over the second quarter, as market volatility had largely evaporated. Finally, our strategy of being long inflation in the US versus short inflation
in Europe was a small positive.
In the third quarter, September was especially pleasing given the Fund performed well in terms of returns despite the quite sizable move higher in global
government bond yields. Our high-conviction credit ideas performed well over the period; however, as investors remained generally relaxed and volatility
very low our portfolio dampening strategies (designed to help performance in adverse market conditions and reduce drawdowns) were a small drag on
performance. From an individual security perspective, long-dated US dollar-denominated bonds from ArcelorMittal, Pulte and Pertamina performed well. A
detractor from performance was our position in Teva Pharmaceutical. The company reported a poor set of second-quarter earnings, with the continued
pressure on generic drug pricing a key driver. In the final quarter, the standout performer was the owner of Time magazine and Sports Illustrated, Time Inc.
This was a new dollar-denominated high-yield issue that we purchased in October. By the end of November Time Inc had been acquired by Meredith, which
subsequently made known its intention to redeem the bonds in full, well above the issuance level. On the downside, our holding in Saga underperformed
when the spreads on its bonds widened in response to a profit warning at its insurance-broking business. For our drawdown protection strategies, it was not
an easy environment given realised volatility had largely evaporated. Strategies designed to benefit when volatility rises had a negative impact over the
fourth quarter. However, our long US dollar and short the Canadian dollar trade recovered well.
*Sub-fund performance has been calculated over the stated period on the share price performance basis, based on the institutional share class (D
Accumulation) and net of fees. Please note the index return is quoted gross and contains no adjustment for fees. The sub-fund performance will also be
impacted by any pricing basis changes, made under our single swinging price policy. More information on our swinging price approach can be found in note
8 of the Financial Statements.
Standard Life Investments Global SICAV
Société d'Investissement à Capital Variable
227
Total Return Credit Fund
Outlook
The many positive drivers of credit markets in 2017 will remain in place in early 2018 but almost all will moderate, whether global economic growth,
company earnings or central bank stimulus. However, valuations are clearly more stretched than they were this time last year and while we believe there is
room for further spread compression in early 2018, there is little cushion in spreads for general volatility. The Fund finished the year with broadly 60%
invested in high yield-rated debt. This has not changed dramatically over the last quarter, but we have moved up in quality, with less than 40% of the Fund
invested in bonds rated below BB-. On top of the cash we hold to fund our drawdown protection strategies, we continue to run with an additional cash
balance of up to 5%. This represents both an element of derisking but also the opportunity to take advantage of any bouts of volatility. We remain positive
on subordinated financial bonds and emerging markets and have close to 30% of the Fund allocated to these areas.
As we move through 2018 and this market rally matures, our strategies designed to reduce drawdowns in more adverse market conditions for risk assets
will be increasingly important. We will look to benefit through a combination of trades in FX, inflation, targeted duration and specific option-based strategies.
However, there will always be individual credit opportunities to take advantage of even when valuations appear stretched.
Please note that the absolute Value at Risk (“VaR”) approach has been used for risk measurement and calculation of global exposure for this Sub-fund.
Measurement of 1 month 99% VaR is based on a parametric calculation with an additional upwards scaling factor applied. Parametric risk model uses 180 weeks of equally weighted data with which to forecast risk. On the above basis the VaR has been as follows: Highest: 3.41% Average: 2.77% Lowest: 2.26% Leverage is calculated as the sum of the notionals of the derivatives used. The level of leverage employed during the relevant period was 224.20%.
The quoted leverage excludes the impact of the FX forwards used in currency hedged shareclasses which are held for those shareholders only. It also
excludes the temporary impacts that arise when renewing currency forwards and when closing some exchange cleared derivatives. Although the renewal of
currency forwards and closure of exchange traded derivatives results in no change in or a reduction in market exposure, gross derivative leverage would
increase because new equal and offsetting derivative contracts are traded to facilitate this efficiently. The offsetting contracts are held to their maturity
date, which is less than 5 working days for currency forwards, or final processing of their termination.
This Sub-fund is not authorized in Hong Kong and is not available to Hong Kong residents.
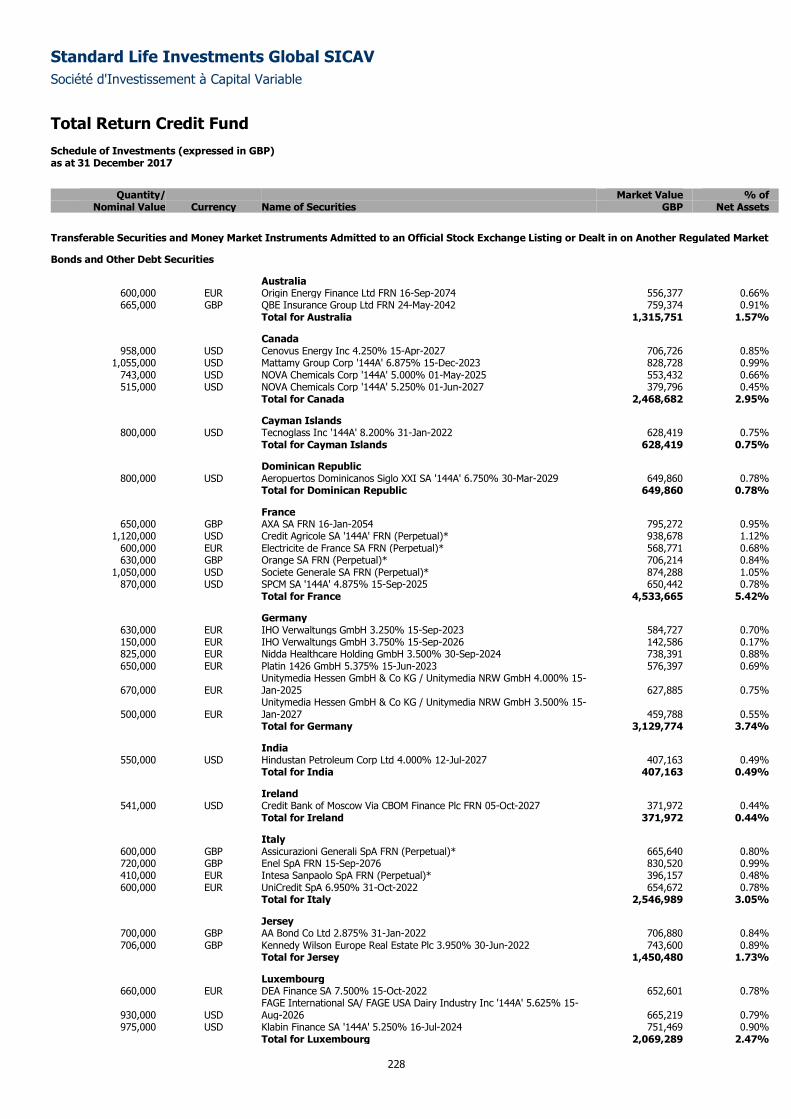
Standard Life Investments Global SICAV
Société d'Investissement à Capital Variable
Total Return Credit Fund Schedule of Investments (expressed in GBP) as at 31 December 2017
228
Quantity/ Market Value % of
Nominal Value Currency Name of Securities GBP Net Assets
Transferable Securities and Money Market Instruments Admitted to an Official Stock Exchange Listing or Dealt in on Another Regulated Market
Bonds and Other Debt Securities
Australia 600,000 EUR Origin Energy Finance Ltd FRN 16-Sep-2074 556,377 0.66% 665,000 GBP QBE Insurance Group Ltd FRN 24-May-2042 759,374 0.91%
Total for Australia 1,315,751 1.57%
Canada 958,000 USD Cenovus Energy Inc 4.250% 15-Apr-2027 706,726 0.85%
1,055,000 USD Mattamy Group Corp '144A' 6.875% 15-Dec-2023 828,728 0.99% 743,000 USD NOVA Chemicals Corp '144A' 5.000% 01-May-2025 553,432 0.66% 515,000 USD NOVA Chemicals Corp '144A' 5.250% 01-Jun-2027 379,796 0.45%
Total for Canada 2,468,682 2.95%
Cayman Islands 800,000 USD Tecnoglass Inc '144A' 8.200% 31-Jan-2022 628,419 0.75%
Total for Cayman Islands 628,419 0.75%
Dominican Republic 800,000 USD Aeropuertos Dominicanos Siglo XXI SA '144A' 6.750% 30-Mar-2029 649,860 0.78%
Total for Dominican Republic 649,860 0.78%
France 650,000 GBP AXA SA FRN 16-Jan-2054 795,272 0.95%
1,120,000 USD Credit Agricole SA '144A' FRN (Perpetual)* 938,678 1.12% 600,000 EUR Electricite de France SA FRN (Perpetual)* 568,771 0.68% 630,000 GBP Orange SA FRN (Perpetual)* 706,214 0.84%
1,050,000 USD Societe Generale SA FRN (Perpetual)* 874,288 1.05% 870,000 USD SPCM SA '144A' 4.875% 15-Sep-2025 650,442 0.78%
Total for France 4,533,665 5.42%
Germany 630,000 EUR IHO Verwaltungs GmbH 3.250% 15-Sep-2023 584,727 0.70% 150,000 EUR IHO Verwaltungs GmbH 3.750% 15-Sep-2026 142,586 0.17% 825,000 EUR Nidda Healthcare Holding GmbH 3.500% 30-Sep-2024 738,391 0.88% 650,000 EUR Platin 1426 GmbH 5.375% 15-Jun-2023 576,397 0.69%
670,000 EUR Unitymedia Hessen GmbH & Co KG / Unitymedia NRW GmbH 4.000% 15-Jan-2025 627,885 0.75%
500,000 EUR Unitymedia Hessen GmbH & Co KG / Unitymedia NRW GmbH 3.500% 15-Jan-2027 459,788 0.55%
Total for Germany 3,129,774 3.74%
India 550,000 USD Hindustan Petroleum Corp Ltd 4.000% 12-Jul-2027 407,163 0.49%
Total for India 407,163 0.49%
Ireland 541,000 USD Credit Bank of Moscow Via CBOM Finance Plc FRN 05-Oct-2027 371,972 0.44%
Total for Ireland 371,972 0.44%
Italy 600,000 GBP Assicurazioni Generali SpA FRN (Perpetual)* 665,640 0.80% 720,000 GBP Enel SpA FRN 15-Sep-2076 830,520 0.99% 410,000 EUR Intesa Sanpaolo SpA FRN (Perpetual)* 396,157 0.48% 600,000 EUR UniCredit SpA 6.950% 31-Oct-2022 654,672 0.78%
Total for Italy 2,546,989 3.05%
Jersey 700,000 GBP AA Bond Co Ltd 2.875% 31-Jan-2022 706,880 0.84% 706,000 GBP Kennedy Wilson Europe Real Estate Plc 3.950% 30-Jun-2022 743,600 0.89%
Total for Jersey 1,450,480 1.73%
Luxembourg 660,000 EUR DEA Finance SA 7.500% 15-Oct-2022 652,601 0.78%
930,000 USD FAGE International SA/ FAGE USA Dairy Industry Inc '144A' 5.625% 15-Aug-2026 665,219 0.79%
975,000 USD Klabin Finance SA '144A' 5.250% 16-Jul-2024 751,469 0.90% Total for Luxembourg 2,069,289 2.47%
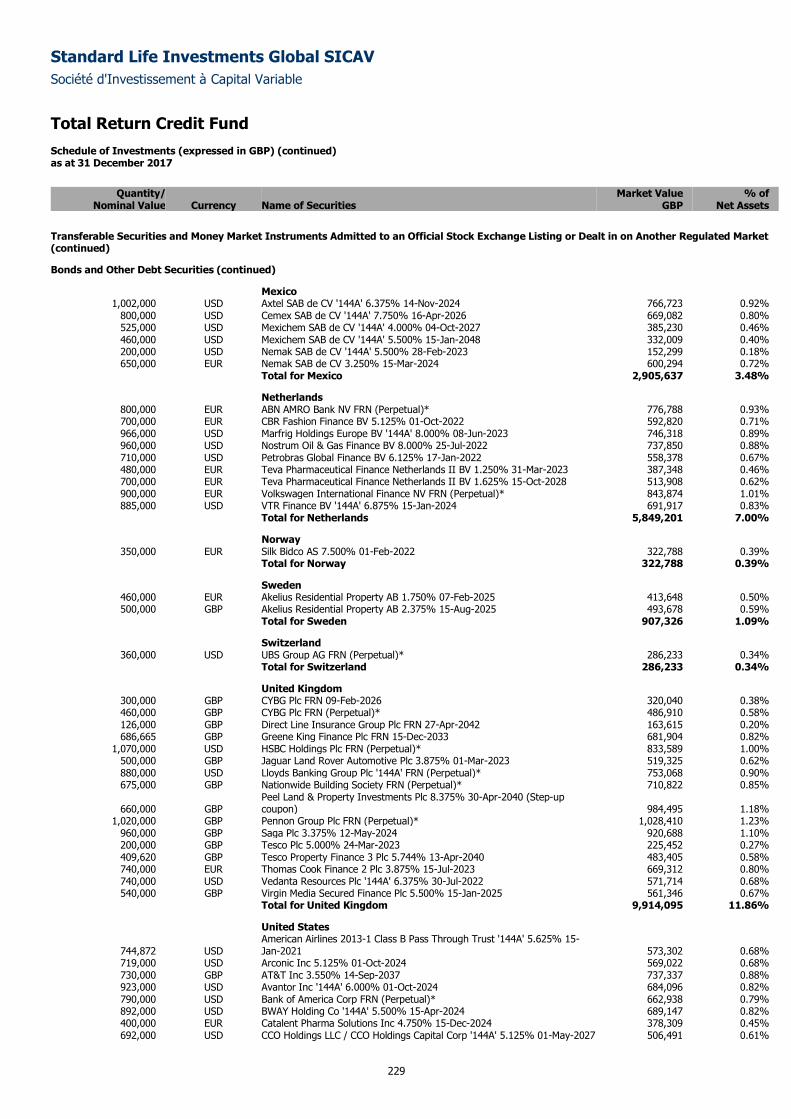
Standard Life Investments Global SICAV
Société d'Investissement à Capital Variable
Total Return Credit Fund Schedule of Investments (expressed in GBP) (continued) as at 31 December 2017
229
Quantity/ Market Value % of
Nominal Value Currency Name of Securities GBP Net Assets
Transferable Securities and Money Market Instruments Admitted to an Official Stock Exchange Listing or Dealt in on Another Regulated Market (continued)
Bonds and Other Debt Securities (continued)
Mexico 1,002,000 USD Axtel SAB de CV '144A' 6.375% 14-Nov-2024 766,723 0.92%
800,000 USD Cemex SAB de CV '144A' 7.750% 16-Apr-2026 669,082 0.80% 525,000 USD Mexichem SAB de CV '144A' 4.000% 04-Oct-2027 385,230 0.46% 460,000 USD Mexichem SAB de CV '144A' 5.500% 15-Jan-2048 332,009 0.40% 200,000 USD Nemak SAB de CV '144A' 5.500% 28-Feb-2023 152,299 0.18% 650,000 EUR Nemak SAB de CV 3.250% 15-Mar-2024 600,294 0.72%
Total for Mexico 2,905,637 3.48%
Netherlands 800,000 EUR ABN AMRO Bank NV FRN (Perpetual)* 776,788 0.93% 700,000 EUR CBR Fashion Finance BV 5.125% 01-Oct-2022 592,820 0.71% 966,000 USD Marfrig Holdings Europe BV '144A' 8.000% 08-Jun-2023 746,318 0.89% 960,000 USD Nostrum Oil & Gas Finance BV 8.000% 25-Jul-2022 737,850 0.88% 710,000 USD Petrobras Global Finance BV 6.125% 17-Jan-2022 558,378 0.67% 480,000 EUR Teva Pharmaceutical Finance Netherlands II BV 1.250% 31-Mar-2023 387,348 0.46% 700,000 EUR Teva Pharmaceutical Finance Netherlands II BV 1.625% 15-Oct-2028 513,908 0.62% 900,000 EUR Volkswagen International Finance NV FRN (Perpetual)* 843,874 1.01% 885,000 USD VTR Finance BV '144A' 6.875% 15-Jan-2024 691,917 0.83%
Total for Netherlands 5,849,201 7.00%
Norway 350,000 EUR Silk Bidco AS 7.500% 01-Feb-2022 322,788 0.39%
Total for Norway 322,788 0.39%
Sweden 460,000 EUR Akelius Residential Property AB 1.750% 07-Feb-2025 413,648 0.50% 500,000 GBP Akelius Residential Property AB 2.375% 15-Aug-2025 493,678 0.59%
Total for Sweden 907,326 1.09%
Switzerland 360,000 USD UBS Group AG FRN (Perpetual)* 286,233 0.34%
Total for Switzerland 286,233 0.34%
United Kingdom 300,000 GBP CYBG Plc FRN 09-Feb-2026 320,040 0.38% 460,000 GBP CYBG Plc FRN (Perpetual)* 486,910 0.58% 126,000 GBP Direct Line Insurance Group Plc FRN 27-Apr-2042 163,615 0.20% 686,665 GBP Greene King Finance Plc FRN 15-Dec-2033 681,904 0.82%
1,070,000 USD HSBC Holdings Plc FRN (Perpetual)* 833,589 1.00% 500,000 GBP Jaguar Land Rover Automotive Plc 3.875% 01-Mar-2023 519,325 0.62% 880,000 USD Lloyds Banking Group Plc '144A' FRN (Perpetual)* 753,068 0.90% 675,000 GBP Nationwide Building Society FRN (Perpetual)* 710,822 0.85%
660,000 GBP Peel Land & Property Investments Plc 8.375% 30-Apr-2040 (Step-up coupon) 984,495 1.18%
1,020,000 GBP Pennon Group Plc FRN (Perpetual)* 1,028,410 1.23% 960,000 GBP Saga Plc 3.375% 12-May-2024 920,688 1.10% 200,000 GBP Tesco Plc 5.000% 24-Mar-2023 225,452 0.27% 409,620 GBP Tesco Property Finance 3 Plc 5.744% 13-Apr-2040 483,405 0.58% 740,000 EUR Thomas Cook Finance 2 Plc 3.875% 15-Jul-2023 669,312 0.80% 740,000 USD Vedanta Resources Plc '144A' 6.375% 30-Jul-2022 571,714 0.68% 540,000 GBP Virgin Media Secured Finance Plc 5.500% 15-Jan-2025 561,346 0.67%
Total for United Kingdom 9,914,095 11.86%
United States
744,872 USD American Airlines 2013-1 Class B Pass Through Trust '144A' 5.625% 15-Jan-2021 573,302 0.68%
719,000 USD Arconic Inc 5.125% 01-Oct-2024 569,022 0.68% 730,000 GBP AT&T Inc 3.550% 14-Sep-2037 737,337 0.88% 923,000 USD Avantor Inc '144A' 6.000% 01-Oct-2024 684,096 0.82% 790,000 USD Bank of America Corp FRN (Perpetual)* 662,938 0.79% 892,000 USD BWAY Holding Co '144A' 5.500% 15-Apr-2024 689,147 0.82% 400,000 EUR Catalent Pharma Solutions Inc 4.750% 15-Dec-2024 378,309 0.45% 692,000 USD CCO Holdings LLC / CCO Holdings Capital Corp '144A' 5.125% 01-May-2027 506,491 0.61%
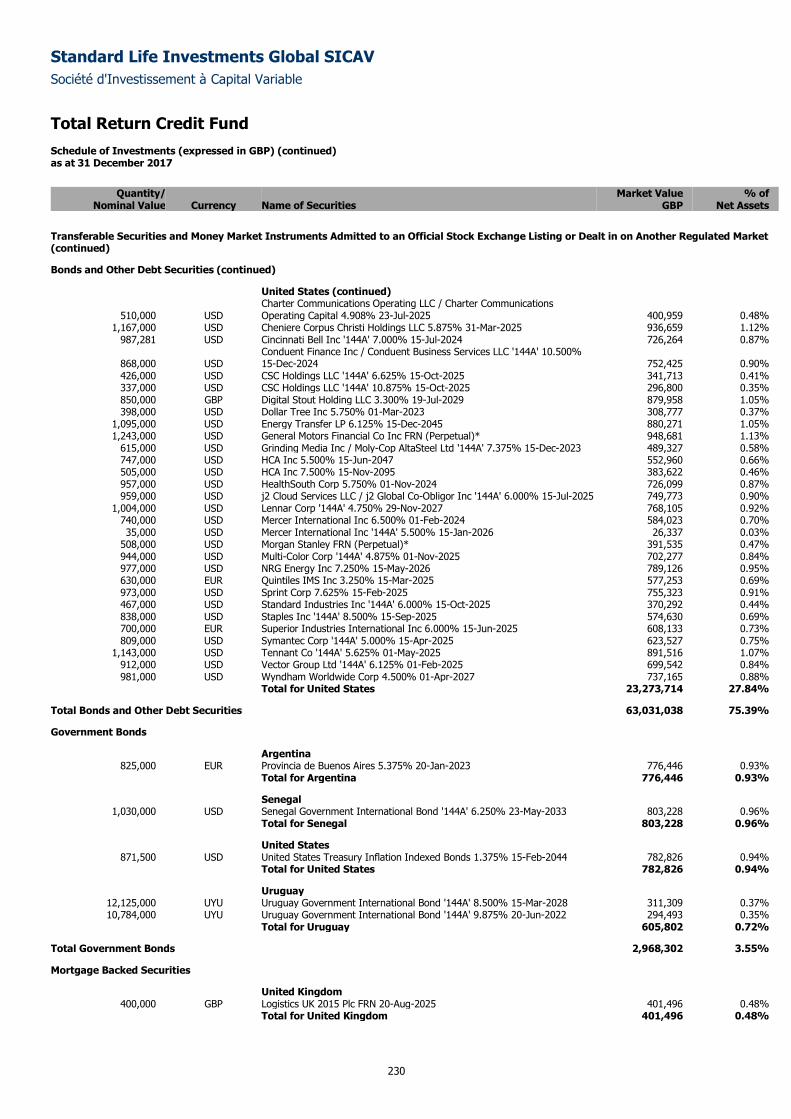
Standard Life Investments Global SICAV
Société d'Investissement à Capital Variable
Total Return Credit Fund Schedule of Investments (expressed in GBP) (continued) as at 31 December 2017
230
Quantity/ Market Value % of
Nominal Value Currency Name of Securities GBP Net Assets
Transferable Securities and Money Market Instruments Admitted to an Official Stock Exchange Listing or Dealt in on Another Regulated Market (continued)
Bonds and Other Debt Securities (continued)
United States (continued)
510,000 USD Charter Communications Operating LLC / Charter Communications Operating Capital 4.908% 23-Jul-2025 400,959 0.48%
1,167,000 USD Cheniere Corpus Christi Holdings LLC 5.875% 31-Mar-2025 936,659 1.12% 987,281 USD Cincinnati Bell Inc '144A' 7.000% 15-Jul-2024 726,264 0.87%
868,000 USD Conduent Finance Inc / Conduent Business Services LLC '144A' 10.500% 15-Dec-2024 752,425 0.90%
426,000 USD CSC Holdings LLC '144A' 6.625% 15-Oct-2025 341,713 0.41% 337,000 USD CSC Holdings LLC '144A' 10.875% 15-Oct-2025 296,800 0.35% 850,000 GBP Digital Stout Holding LLC 3.300% 19-Jul-2029 879,958 1.05% 398,000 USD Dollar Tree Inc 5.750% 01-Mar-2023 308,777 0.37%
1,095,000 USD Energy Transfer LP 6.125% 15-Dec-2045 880,271 1.05% 1,243,000 USD General Motors Financial Co Inc FRN (Perpetual)* 948,681 1.13%
615,000 USD Grinding Media Inc / Moly-Cop AltaSteel Ltd '144A' 7.375% 15-Dec-2023 489,327 0.58% 747,000 USD HCA Inc 5.500% 15-Jun-2047 552,960 0.66% 505,000 USD HCA Inc 7.500% 15-Nov-2095 383,622 0.46% 957,000 USD HealthSouth Corp 5.750% 01-Nov-2024 726,099 0.87% 959,000 USD j2 Cloud Services LLC / j2 Global Co-Obligor Inc '144A' 6.000% 15-Jul-2025 749,773 0.90%
1,004,000 USD Lennar Corp '144A' 4.750% 29-Nov-2027 768,105 0.92% 740,000 USD Mercer International Inc 6.500% 01-Feb-2024 584,023 0.70% 35,000 USD Mercer International Inc '144A' 5.500% 15-Jan-2026 26,337 0.03%
508,000 USD Morgan Stanley FRN (Perpetual)* 391,535 0.47% 944,000 USD Multi-Color Corp '144A' 4.875% 01-Nov-2025 702,277 0.84% 977,000 USD NRG Energy Inc 7.250% 15-May-2026 789,126 0.95% 630,000 EUR Quintiles IMS Inc 3.250% 15-Mar-2025 577,253 0.69% 973,000 USD Sprint Corp 7.625% 15-Feb-2025 755,323 0.91% 467,000 USD Standard Industries Inc '144A' 6.000% 15-Oct-2025 370,292 0.44% 838,000 USD Staples Inc '144A' 8.500% 15-Sep-2025 574,630 0.69% 700,000 EUR Superior Industries International Inc 6.000% 15-Jun-2025 608,133 0.73% 809,000 USD Symantec Corp '144A' 5.000% 15-Apr-2025 623,527 0.75%
1,143,000 USD Tennant Co '144A' 5.625% 01-May-2025 891,516 1.07% 912,000 USD Vector Group Ltd '144A' 6.125% 01-Feb-2025 699,542 0.84% 981,000 USD Wyndham Worldwide Corp 4.500% 01-Apr-2027 737,165 0.88%
Total for United States 23,273,714 27.84%
Total Bonds and Other Debt Securities 63,031,038 75.39%
Government Bonds
Argentina 825,000 EUR Provincia de Buenos Aires 5.375% 20-Jan-2023 776,446 0.93%
Total for Argentina 776,446 0.93%
Senegal 1,030,000 USD Senegal Government International Bond '144A' 6.250% 23-May-2033 803,228 0.96%
Total for Senegal 803,228 0.96%
United States 871,500 USD United States Treasury Inflation Indexed Bonds 1.375% 15-Feb-2044 782,826 0.94%
Total for United States 782,826 0.94%
Uruguay 12,125,000 UYU Uruguay Government International Bond '144A' 8.500% 15-Mar-2028 311,309 0.37% 10,784,000 UYU Uruguay Government International Bond '144A' 9.875% 20-Jun-2022 294,493 0.35%
Total for Uruguay 605,802 0.72%
Total Government Bonds 2,968,302 3.55%
Mortgage Backed Securities
United Kingdom 400,000 GBP Logistics UK 2015 Plc FRN 20-Aug-2025 401,496 0.48%
Total for United Kingdom 401,496 0.48%
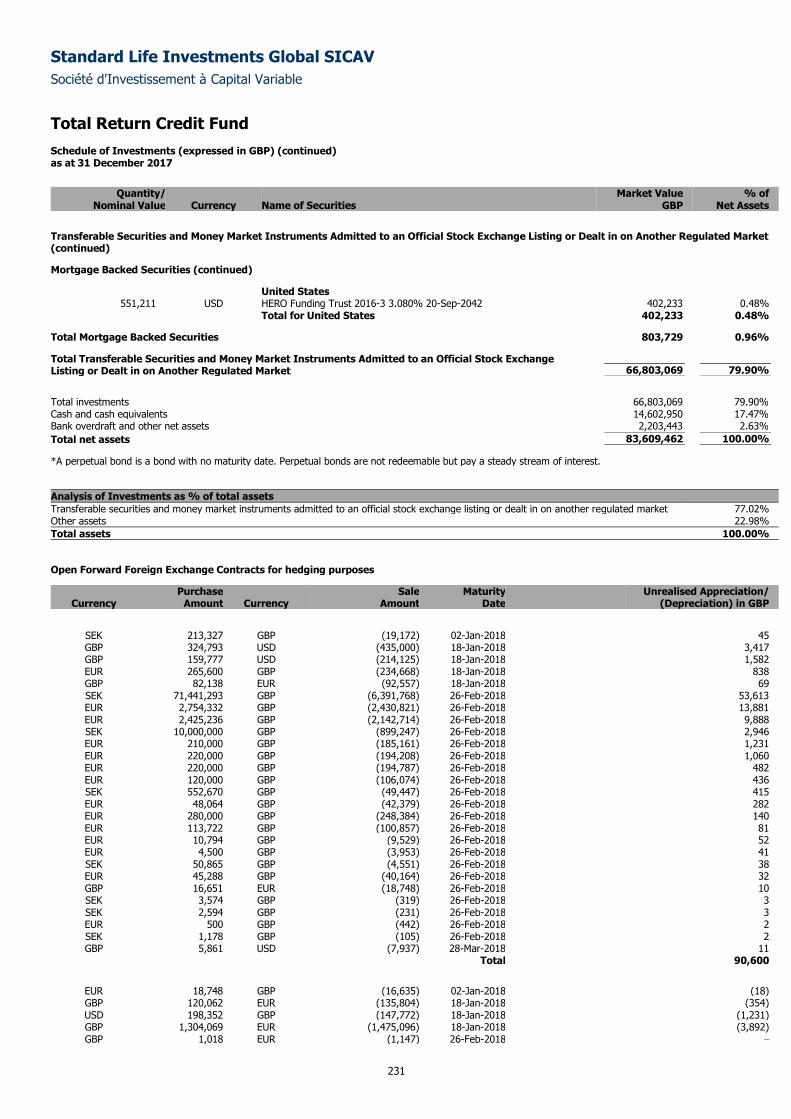
Standard Life Investments Global SICAV
Société d'Investissement à Capital Variable
Total Return Credit Fund Schedule of Investments (expressed in GBP) (continued) as at 31 December 2017
231
Quantity/ Market Value % of
Nominal Value Currency Name of Securities GBP Net Assets
Transferable Securities and Money Market Instruments Admitted to an Official Stock Exchange Listing or Dealt in on Another Regulated Market (continued)
Mortgage Backed Securities (continued)
United States 551,211 USD HERO Funding Trust 2016-3 3.080% 20-Sep-2042 402,233 0.48%
Total for United States 402,233 0.48%
Total Mortgage Backed Securities 803,729 0.96%
Total Transferable Securities and Money Market Instruments Admitted to an Official Stock Exchange Listing or Dealt in on Another Regulated Market 66,803,069 79.90%
Total investments 66,803,069 79.90%
Cash and cash equivalents 14,602,950 17.47%
Bank overdraft and other net assets 2,203,443 2.63%
Total net assets 83,609,462 100.00%
*A perpetual bond is a bond with no maturity date. Perpetual bonds are not redeemable but pay a steady stream of interest.
Analysis of Investments as % of total assets
Transferable securities and money market instruments admitted to an official stock exchange listing or dealt in on another regulated market 77.02% Other assets 22.98%
Total assets 100.00%
Open Forward Foreign Exchange Contracts for hedging purposes
Purchase Sale Maturity Unrealised Appreciation/ Currency Amount Currency Amount Date (Depreciation) in GBP
SEK 213,327 GBP (19,172) 02-Jan-2018 45 GBP 324,793 USD (435,000) 18-Jan-2018 3,417 GBP 159,777 USD (214,125) 18-Jan-2018 1,582 EUR 265,600 GBP (234,668) 18-Jan-2018 838 GBP 82,138 EUR (92,557) 18-Jan-2018 69 SEK 71,441,293 GBP (6,391,768) 26-Feb-2018 53,613 EUR 2,754,332 GBP (2,430,821) 26-Feb-2018 13,881 EUR 2,425,236 GBP (2,142,714) 26-Feb-2018 9,888 SEK 10,000,000 GBP (899,247) 26-Feb-2018 2,946 EUR 210,000 GBP (185,161) 26-Feb-2018 1,231 EUR 220,000 GBP (194,208) 26-Feb-2018 1,060 EUR 220,000 GBP (194,787) 26-Feb-2018 482 EUR 120,000 GBP (106,074) 26-Feb-2018 436 SEK 552,670 GBP (49,447) 26-Feb-2018 415 EUR 48,064 GBP (42,379) 26-Feb-2018 282 EUR 280,000 GBP (248,384) 26-Feb-2018 140 EUR 113,722 GBP (100,857) 26-Feb-2018 81 EUR 10,794 GBP (9,529) 26-Feb-2018 52 EUR 4,500 GBP (3,953) 26-Feb-2018 41 SEK 50,865 GBP (4,551) 26-Feb-2018 38 EUR 45,288 GBP (40,164) 26-Feb-2018 32 GBP 16,651 EUR (18,748) 26-Feb-2018 10 SEK 3,574 GBP (319) 26-Feb-2018 3 SEK 2,594 GBP (231) 26-Feb-2018 3 EUR 500 GBP (442) 26-Feb-2018 2 SEK 1,178 GBP (105) 26-Feb-2018 2 GBP 5,861 USD (7,937) 28-Mar-2018 11
Total 90,600
EUR 18,748 GBP (16,635) 02-Jan-2018 (18) GBP 120,062 EUR (135,804) 18-Jan-2018 (354) USD 198,352 GBP (147,772) 18-Jan-2018 (1,231) GBP 1,304,069 EUR (1,475,096) 18-Jan-2018 (3,892) GBP 1,018 EUR (1,147) 26-Feb-2018 –
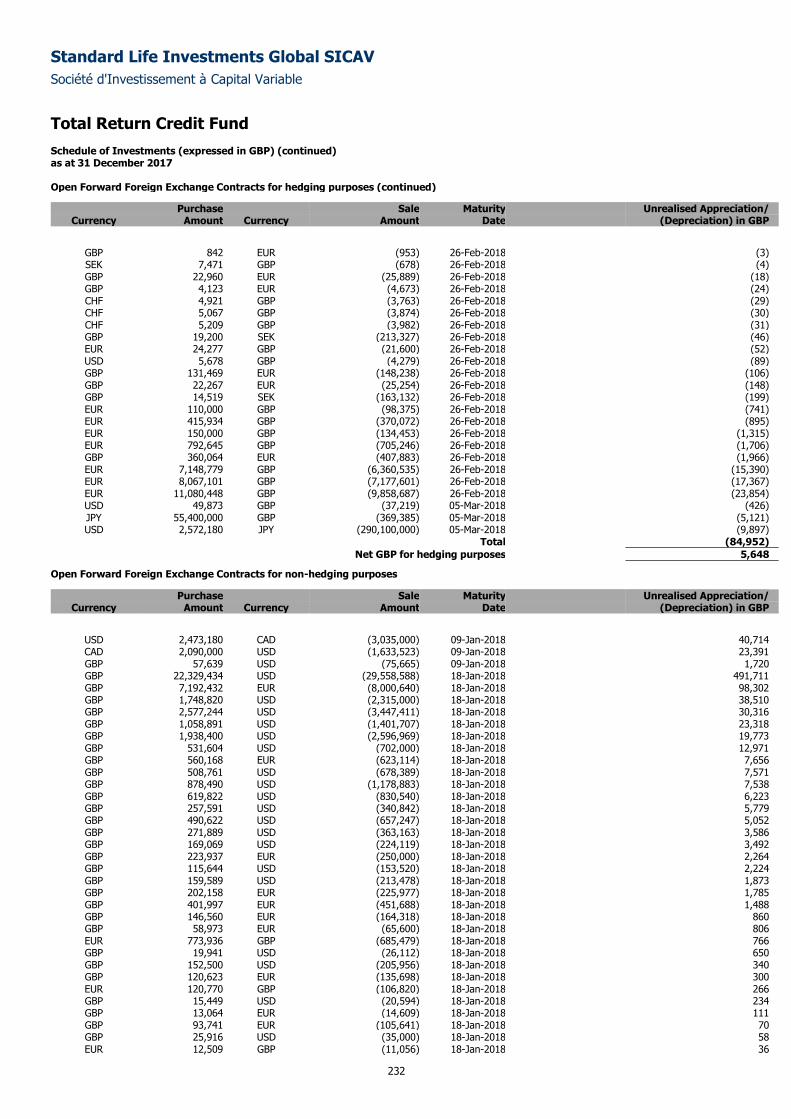
Standard Life Investments Global SICAV
Société d'Investissement à Capital Variable
Total Return Credit Fund Schedule of Investments (expressed in GBP) (continued) as at 31 December 2017
232
Open Forward Foreign Exchange Contracts for hedging purposes (continued)
Purchase Sale Maturity Unrealised Appreciation/ Currency Amount Currency Amount Date (Depreciation) in GBP
GBP 842 EUR (953) 26-Feb-2018 (3) SEK 7,471 GBP (678) 26-Feb-2018 (4) GBP 22,960 EUR (25,889) 26-Feb-2018 (18) GBP 4,123 EUR (4,673) 26-Feb-2018 (24) CHF 4,921 GBP (3,763) 26-Feb-2018 (29) CHF 5,067 GBP (3,874) 26-Feb-2018 (30) CHF 5,209 GBP (3,982) 26-Feb-2018 (31) GBP 19,200 SEK (213,327) 26-Feb-2018 (46) EUR 24,277 GBP (21,600) 26-Feb-2018 (52) USD 5,678 GBP (4,279) 26-Feb-2018 (89) GBP 131,469 EUR (148,238) 26-Feb-2018 (106) GBP 22,267 EUR (25,254) 26-Feb-2018 (148) GBP 14,519 SEK (163,132) 26-Feb-2018 (199) EUR 110,000 GBP (98,375) 26-Feb-2018 (741) EUR 415,934 GBP (370,072) 26-Feb-2018 (895) EUR 150,000 GBP (134,453) 26-Feb-2018 (1,315) EUR 792,645 GBP (705,246) 26-Feb-2018 (1,706) GBP 360,064 EUR (407,883) 26-Feb-2018 (1,966) EUR 7,148,779 GBP (6,360,535) 26-Feb-2018 (15,390) EUR 8,067,101 GBP (7,177,601) 26-Feb-2018 (17,367) EUR 11,080,448 GBP (9,858,687) 26-Feb-2018 (23,854) USD 49,873 GBP (37,219) 05-Mar-2018 (426) JPY 55,400,000 GBP (369,385) 05-Mar-2018 (5,121) USD 2,572,180 JPY (290,100,000) 05-Mar-2018 (9,897)
Total (84,952)
Net GBP for hedging purposes 5,648
Open Forward Foreign Exchange Contracts for non-hedging purposes
Purchase Sale Maturity Unrealised Appreciation/ Currency Amount Currency Amount Date (Depreciation) in GBP
USD 2,473,180 CAD (3,035,000) 09-Jan-2018 40,714 CAD 2,090,000 USD (1,633,523) 09-Jan-2018 23,391 GBP 57,639 USD (75,665) 09-Jan-2018 1,720 GBP 22,329,434 USD (29,558,588) 18-Jan-2018 491,711 GBP 7,192,432 EUR (8,000,640) 18-Jan-2018 98,302 GBP 1,748,820 USD (2,315,000) 18-Jan-2018 38,510 GBP 2,577,244 USD (3,447,411) 18-Jan-2018 30,316 GBP 1,058,891 USD (1,401,707) 18-Jan-2018 23,318 GBP 1,938,400 USD (2,596,969) 18-Jan-2018 19,773 GBP 531,604 USD (702,000) 18-Jan-2018 12,971 GBP 560,168 EUR (623,114) 18-Jan-2018 7,656 GBP 508,761 USD (678,389) 18-Jan-2018 7,571 GBP 878,490 USD (1,178,883) 18-Jan-2018 7,538 GBP 619,822 USD (830,540) 18-Jan-2018 6,223 GBP 257,591 USD (340,842) 18-Jan-2018 5,779 GBP 490,622 USD (657,247) 18-Jan-2018 5,052 GBP 271,889 USD (363,163) 18-Jan-2018 3,586 GBP 169,069 USD (224,119) 18-Jan-2018 3,492 GBP 223,937 EUR (250,000) 18-Jan-2018 2,264 GBP 115,644 USD (153,520) 18-Jan-2018 2,224 GBP 159,589 USD (213,478) 18-Jan-2018 1,873 GBP 202,158 EUR (225,977) 18-Jan-2018 1,785 GBP 401,997 EUR (451,688) 18-Jan-2018 1,488 GBP 146,560 EUR (164,318) 18-Jan-2018 860 GBP 58,973 EUR (65,600) 18-Jan-2018 806 EUR 773,936 GBP (685,479) 18-Jan-2018 766 GBP 19,941 USD (26,112) 18-Jan-2018 650 GBP 152,500 USD (205,956) 18-Jan-2018 340 GBP 120,623 EUR (135,698) 18-Jan-2018 300 EUR 120,770 GBP (106,820) 18-Jan-2018 266 GBP 15,449 USD (20,594) 18-Jan-2018 234 GBP 13,064 EUR (14,609) 18-Jan-2018 111 GBP 93,741 EUR (105,641) 18-Jan-2018 70 GBP 25,916 USD (35,000) 18-Jan-2018 58 EUR 12,509 GBP (11,056) 18-Jan-2018 36
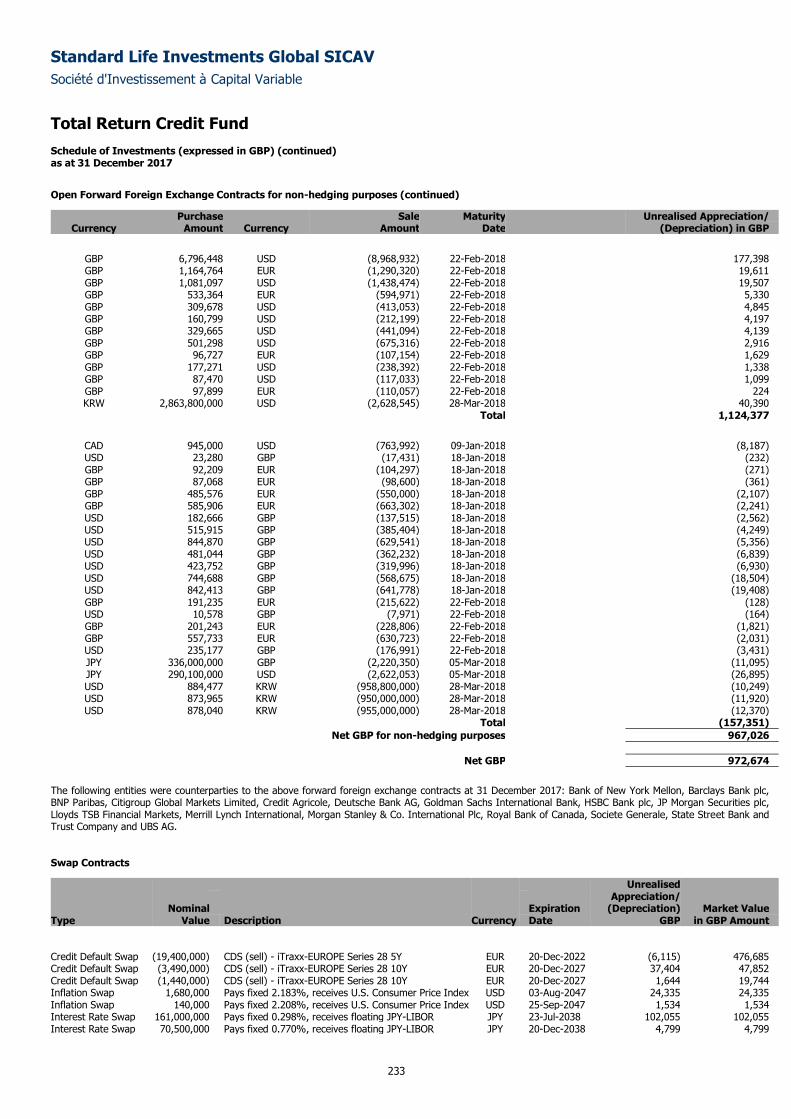
Standard Life Investments Global SICAV
Société d'Investissement à Capital Variable
Total Return Credit Fund Schedule of Investments (expressed in GBP) (continued) as at 31 December 2017
233
Open Forward Foreign Exchange Contracts for non-hedging purposes (continued)
Purchase Sale Maturity Unrealised Appreciation/ Currency Amount Currency Amount Date (Depreciation) in GBP
GBP 6,796,448 USD (8,968,932) 22-Feb-2018 177,398 GBP 1,164,764 EUR (1,290,320) 22-Feb-2018 19,611 GBP 1,081,097 USD (1,438,474) 22-Feb-2018 19,507 GBP 533,364 EUR (594,971) 22-Feb-2018 5,330 GBP 309,678 USD (413,053) 22-Feb-2018 4,845 GBP 160,799 USD (212,199) 22-Feb-2018 4,197 GBP 329,665 USD (441,094) 22-Feb-2018 4,139 GBP 501,298 USD (675,316) 22-Feb-2018 2,916 GBP 96,727 EUR (107,154) 22-Feb-2018 1,629 GBP 177,271 USD (238,392) 22-Feb-2018 1,338 GBP 87,470 USD (117,033) 22-Feb-2018 1,099 GBP 97,899 EUR (110,057) 22-Feb-2018 224 KRW 2,863,800,000 USD (2,628,545) 28-Mar-2018 40,390
Total 1,124,377
CAD 945,000 USD (763,992) 09-Jan-2018 (8,187) USD 23,280 GBP (17,431) 18-Jan-2018 (232) GBP 92,209 EUR (104,297) 18-Jan-2018 (271) GBP 87,068 EUR (98,600) 18-Jan-2018 (361) GBP 485,576 EUR (550,000) 18-Jan-2018 (2,107) GBP 585,906 EUR (663,302) 18-Jan-2018 (2,241) USD 182,666 GBP (137,515) 18-Jan-2018 (2,562) USD 515,915 GBP (385,404) 18-Jan-2018 (4,249) USD 844,870 GBP (629,541) 18-Jan-2018 (5,356) USD 481,044 GBP (362,232) 18-Jan-2018 (6,839) USD 423,752 GBP (319,996) 18-Jan-2018 (6,930) USD 744,688 GBP (568,675) 18-Jan-2018 (18,504) USD 842,413 GBP (641,778) 18-Jan-2018 (19,408) GBP 191,235 EUR (215,622) 22-Feb-2018 (128) USD 10,578 GBP (7,971) 22-Feb-2018 (164) GBP 201,243 EUR (228,806) 22-Feb-2018 (1,821) GBP 557,733 EUR (630,723) 22-Feb-2018 (2,031) USD 235,177 GBP (176,991) 22-Feb-2018 (3,431) JPY 336,000,000 GBP (2,220,350) 05-Mar-2018 (11,095) JPY 290,100,000 USD (2,622,053) 05-Mar-2018 (26,895) USD 884,477 KRW (958,800,000) 28-Mar-2018 (10,249) USD 873,965 KRW (950,000,000) 28-Mar-2018 (11,920) USD 878,040 KRW (955,000,000) 28-Mar-2018 (12,370)
Total (157,351)
Net GBP for non-hedging purposes 967,026
Net GBP 972,674
The following entities were counterparties to the above forward foreign exchange contracts at 31 December 2017: Bank of New York Mellon, Barclays Bank plc, BNP Paribas, Citigroup Global Markets Limited, Credit Agricole, Deutsche Bank AG, Goldman Sachs International Bank, HSBC Bank plc, JP Morgan Securities plc, Lloyds TSB Financial Markets, Merrill Lynch International, Morgan Stanley & Co. International Plc, Royal Bank of Canada, Societe Generale, State Street Bank and Trust Company and UBS AG.
Swap Contracts
Unrealised Appreciation/ Nominal Expiration (Depreciation) Market Value Type Value Description Currency Date GBP in GBP Amount
Credit Default Swap (19,400,000) CDS (sell) - iTraxx-EUROPE Series 28 5Y EUR 20-Dec-2022 (6,115) 476,685 Credit Default Swap (3,490,000) CDS (sell) - iTraxx-EUROPE Series 28 10Y EUR 20-Dec-2027 37,404 47,852 Credit Default Swap (1,440,000) CDS (sell) - iTraxx-EUROPE Series 28 10Y EUR 20-Dec-2027 1,644 19,744 Inflation Swap 1,680,000 Pays fixed 2.183%, receives U.S. Consumer Price Index USD 03-Aug-2047 24,335 24,335 Inflation Swap 140,000 Pays fixed 2.208%, receives U.S. Consumer Price Index USD 25-Sep-2047 1,534 1,534 Interest Rate Swap 161,000,000 Pays fixed 0.298%, receives floating JPY-LIBOR JPY 23-Jul-2038 102,055 102,055 Interest Rate Swap 70,500,000 Pays fixed 0.770%, receives floating JPY-LIBOR JPY 20-Dec-2038 4,799 4,799
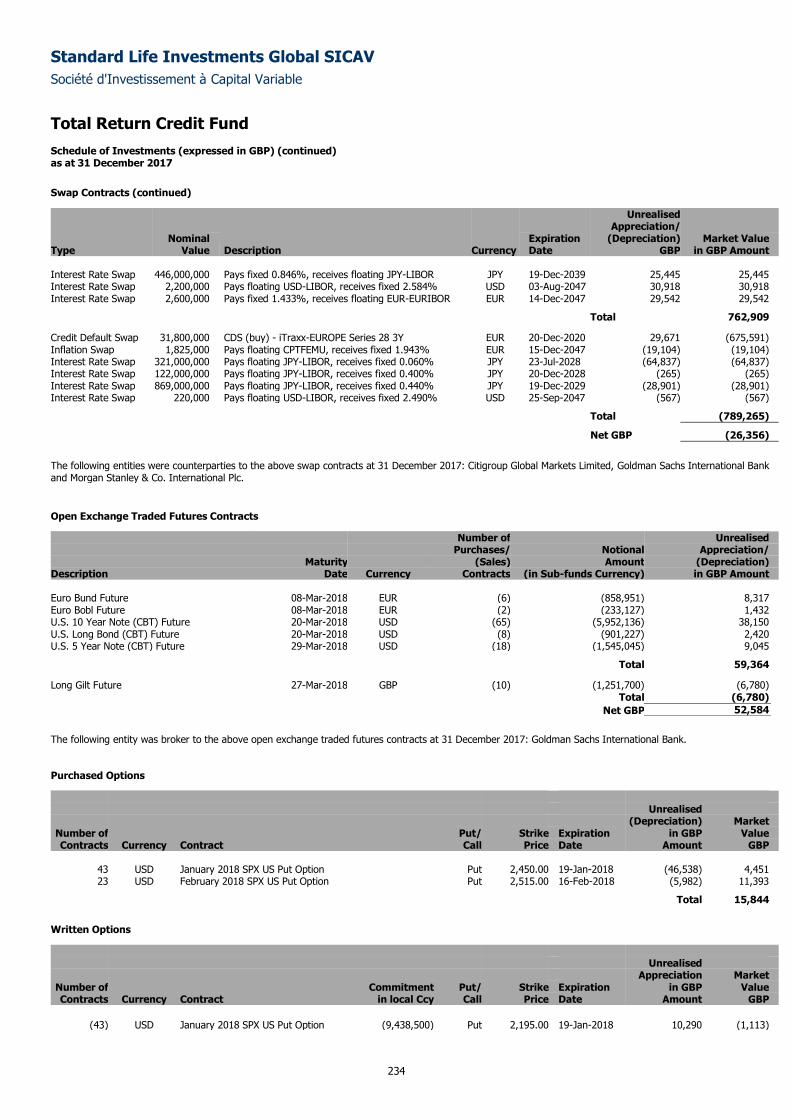
Standard Life Investments Global SICAV
Société d'Investissement à Capital Variable
Total Return Credit Fund Schedule of Investments (expressed in GBP) (continued) as at 31 December 2017
234
Swap Contracts (continued)
Unrealised Appreciation/ Nominal Expiration (Depreciation) Market Value Type Value Description Currency Date GBP in GBP Amount Interest Rate Swap 446,000,000 Pays fixed 0.846%, receives floating JPY-LIBOR JPY 19-Dec-2039 25,445 25,445 Interest Rate Swap 2,200,000 Pays floating USD-LIBOR, receives fixed 2.584% USD 03-Aug-2047 30,918 30,918 Interest Rate Swap 2,600,000 Pays fixed 1.433%, receives floating EUR-EURIBOR EUR 14-Dec-2047 29,542 29,542
Total 762,909
Credit Default Swap 31,800,000 CDS (buy) - iTraxx-EUROPE Series 28 3Y EUR 20-Dec-2020 29,671 (675,591) Inflation Swap 1,825,000 Pays floating CPTFEMU, receives fixed 1.943% EUR 15-Dec-2047 (19,104) (19,104) Interest Rate Swap 321,000,000 Pays floating JPY-LIBOR, receives fixed 0.060% JPY 23-Jul-2028 (64,837) (64,837) Interest Rate Swap 122,000,000 Pays floating JPY-LIBOR, receives fixed 0.400% JPY 20-Dec-2028 (265) (265) Interest Rate Swap 869,000,000 Pays floating JPY-LIBOR, receives fixed 0.440% JPY 19-Dec-2029 (28,901) (28,901) Interest Rate Swap 220,000 Pays floating USD-LIBOR, receives fixed 2.490% USD 25-Sep-2047 (567) (567)
Total (789,265)
Net GBP (26,356)
The following entities were counterparties to the above swap contracts at 31 December 2017: Citigroup Global Markets Limited, Goldman Sachs International Bank and Morgan Stanley & Co. International Plc.
Open Exchange Traded Futures Contracts
Number of Unrealised Purchases/ Notional Appreciation/ Maturity (Sales) Amount (Depreciation) Description Date Currency Contracts (in Sub-funds Currency) in GBP Amount Euro Bund Future 08-Mar-2018 EUR (6) (858,951) 8,317 Euro Bobl Future 08-Mar-2018 EUR (2) (233,127) 1,432 U.S. 10 Year Note (CBT) Future 20-Mar-2018 USD (65) (5,952,136) 38,150 U.S. Long Bond (CBT) Future 20-Mar-2018 USD (8) (901,227) 2,420 U.S. 5 Year Note (CBT) Future 29-Mar-2018 USD (18) (1,545,045) 9,045
Total 59,364
Long Gilt Future 27-Mar-2018 GBP (10) (1,251,700) (6,780) Total (6,780)
Net GBP 52,584
The following entity was broker to the above open exchange traded futures contracts at 31 December 2017: Goldman Sachs International Bank.
Purchased Options
Unrealised (Depreciation) Market
Number of Put/ Strike Expiration in GBP Value Contracts Currency Contract Call Price Date Amount GBP
43 USD January 2018 SPX US Put Option Put 2,450.00 19-Jan-2018 (46,538) 4,451 23 USD February 2018 SPX US Put Option Put 2,515.00 16-Feb-2018 (5,982) 11,393
Total 15,844
Written Options
Unrealised Appreciation Market
Number of Commitment Put/ Strike Expiration in GBP Value Contracts Currency Contract in local Ccy Call Price Date Amount GBP
(43) USD January 2018 SPX US Put Option (9,438,500) Put 2,195.00 19-Jan-2018 10,290 (1,113)
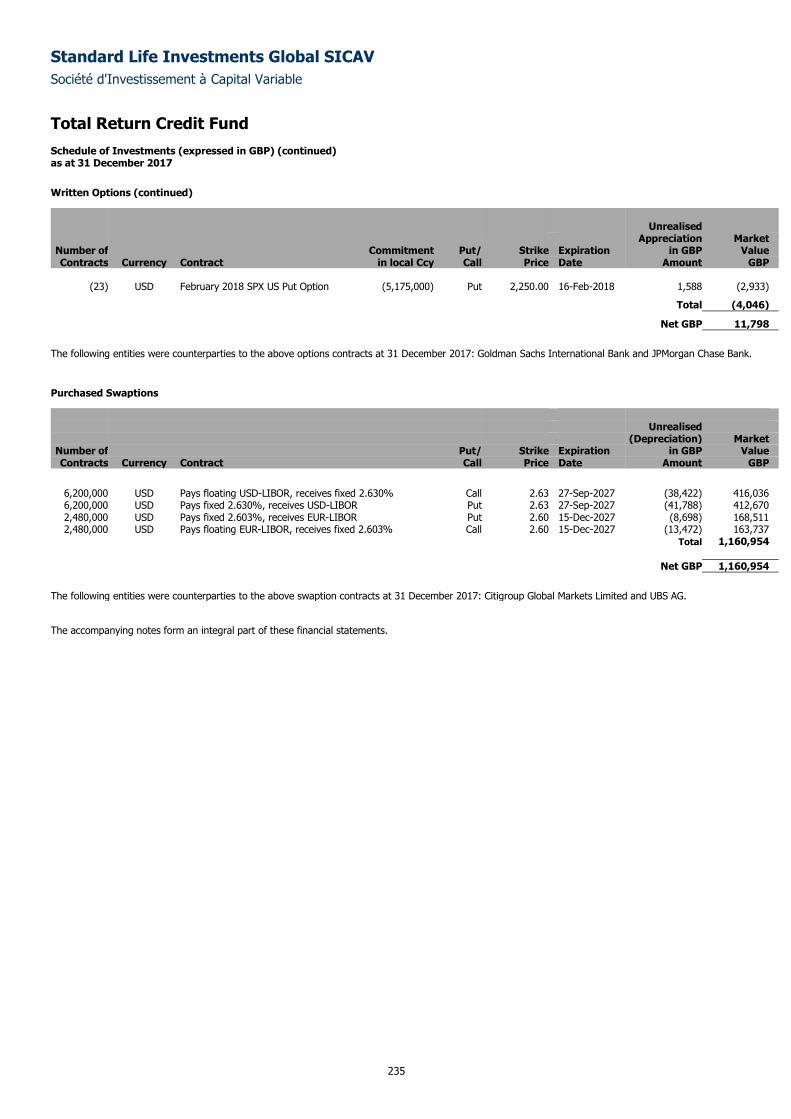
Standard Life Investments Global SICAV
Société d'Investissement à Capital Variable
Total Return Credit Fund Schedule of Investments (expressed in GBP) (continued) as at 31 December 2017
235
Written Options (continued)
Unrealised Appreciation Market
Number of Commitment Put/ Strike Expiration in GBP Value Contracts Currency Contract in local Ccy Call Price Date Amount GBP
(23) USD February 2018 SPX US Put Option (5,175,000) Put 2,250.00 16-Feb-2018 1,588 (2,933)
Total (4,046)
Net GBP 11,798
The following entities were counterparties to the above options contracts at 31 December 2017: Goldman Sachs International Bank and JPMorgan Chase Bank.
Purchased Swaptions
Unrealised (Depreciation) Market
Number of Put/ Strike Expiration in GBP Value Contracts Currency Contract Call Price Date Amount GBP
6,200,000 USD Pays floating USD-LIBOR, receives fixed 2.630% Call 2.63 27-Sep-2027 (38,422) 416,036 6,200,000 USD Pays fixed 2.630%, receives USD-LIBOR Put 2.63 27-Sep-2027 (41,788) 412,670 2,480,000 USD Pays fixed 2.603%, receives EUR-LIBOR Put 2.60 15-Dec-2027 (8,698) 168,511 2,480,000 USD Pays floating EUR-LIBOR, receives fixed 2.603% Call 2.60 15-Dec-2027 (13,472) 163,737
Total 1,160,954
Net GBP 1,160,954
The following entities were counterparties to the above swaption contracts at 31 December 2017: Citigroup Global Markets Limited and UBS AG.
The accompanying notes form an integral part of these financial statements.
Standard Life Investments Global SICAV
Société d'Investissement à Capital Variable
236
Emerging Market Debt Unconstrained Fund
Sub-fund Objective and Investment Policy
The objective of the sub-fund is to provide a return from capital appreciation, emerging market foreign currency movements and income. The sub-fund is
actively managed, investing mainly in bonds that are issued by governments, quasi-government entities or corporations in emerging markets countries and
in emerging market currencies. The fund targets a level of return over rolling three-year periods above the reference index (50% JPM EMBI Global
Diversified (US$), 50% JPM GBI-EM Global Diversified (US$)) plus two and a quarter per-cent per year, gross of fees.
The sub-fund may also invest in other transferable securities, money-market instruments, deposits, cash and near cash, derivatives (including currency
forwards, options and swaps) and collective investment schemes. The fund can take long and short positions in markets, securities and groups of securities
through derivative contracts. Leverage in the fund arises as a result of the use of derivatives.
Examples of some strategies where derivatives are used that may be used at any time may include:
- An assessment of the direction of interest rates. Derivatives, in the form of interest rate swaps, could be used to position the portfolio such that it could
benefit from the expected future direction of interest rates.
- An assessment of the value of one currency relative to another. The strategy could involve the sale of the emerging market currency considered
overvalued and purchase of the emerging market currency considered undervalued. Derivatives, in the form of forward foreign exchange contracts, could be
used to implement the strategy.
- An assessment of the direction of inflation rates. Derivatives, in the form of inflation-indexed (breakeven) swaps, could be used to position the portfolio
such that it could benefit from the expected future direction of inflation rates.
The Sub-fund may, subject to and in accordance with the UCI Law and applicable CSSF circulars, take long and short positions in markets, securities and
groups of securities through derivative contracts.
Performance Review The Emerging Market Debt Unconstrained Fund returned 11.10% over the period, compared to the 50% JP Morgan EMBI Global Diversified/50% JPM GBI-EM Global Diversified index return of 12.76%.* One of the single biggest contributors to performance was our underweight in Turkey. The country remains on a moderately deteriorating trajectory according to our fundamental analysis, while political risk remains very much to the fore. Our overweight positions in Angola and Ivory Coast also made a positive contribution as they were boosted by the rising oil price. Less positive was an overweight position in Mexico. Investors have been focusing heavily on the dangers surrounding NAFTA negotiations; however, we believe there are positive economic trends at play in the country and that its local bonds and the peso offer value. Our underweight exposure to South Africa also cost performance, particularly towards the end of the reporting period when investors welcomed the appointment of Cyril Ramaphosa as leader of the ANC. Security selection in Argentina was also a negative contributor. While we hold an overweight position in Argentina’s sovereign bonds our exposure is concentrated at the short end of the yield curve, which underperformed relative to the long end. *Sub-fund performance has been calculated over the stated period on the share price performance basis, based on the institutional share class (D
Accumulation) and net of fees. Please note the index return is quoted gross and contains no adjustment for fees. The sub-fund performance will also be
impacted by any pricing basis changes, made under our single swinging price policy. More information on our swinging price approach can be found in note
8 of the Financial Statements.
Outlook The outlook for EM assets remains positive. Global activity continues to be relatively robust, with particular strength in Central Europe and stability in Chinese growth rates. Revisions higher in growth expectations are a positive for trade growth and should help EM. We expect the policy response from core-market central banks to be modest this year, even as the Federal Reserve continues to tighten rates. This will make the higher bond yields on offer in EM attractive. The valuation of EM US dollar-denominated bonds compared to developed market credit should also help drive returns. Please note that the relative Value at Risk (“VaR”) approach has been used for risk measurement and calculation of global exposure for this Sub-fund. Measurement of 1 month 99% VaR is based on a parametric calculation with an additional upwards scaling factor applied. Parametric risk model uses 180 weeks of equally weighted data with which to forecast risk. On the above basis the VaR has been as follows: Highest: 5.19% Average: 4.49% Lowest: 3.42% Leverage is calculated as the sum of the notionals of the derivatives used. The level of leverage employed during the relevant period was 81.13%. The quoted leverage excludes the impact of the FX forwards used in currency hedged shareclasses which are held for those shareholders only. It also excludes the temporary impacts that arise when renewing currency forwards and when closing some exchange cleared derivatives. Although the renewal of currency forwards and closure of exchange traded derivatives results in no change in or a reduction in market exposure, gross derivative leverage would increase because new equal and offsetting derivative contracts are traded to facilitate this efficiently. The offsetting contracts are held to their maturity date, which is less than 5 working days for currency forwards, or final processing of their termination. This Sub-fund is not authorised in Hong Kong and is not available to Hong Kong residents.
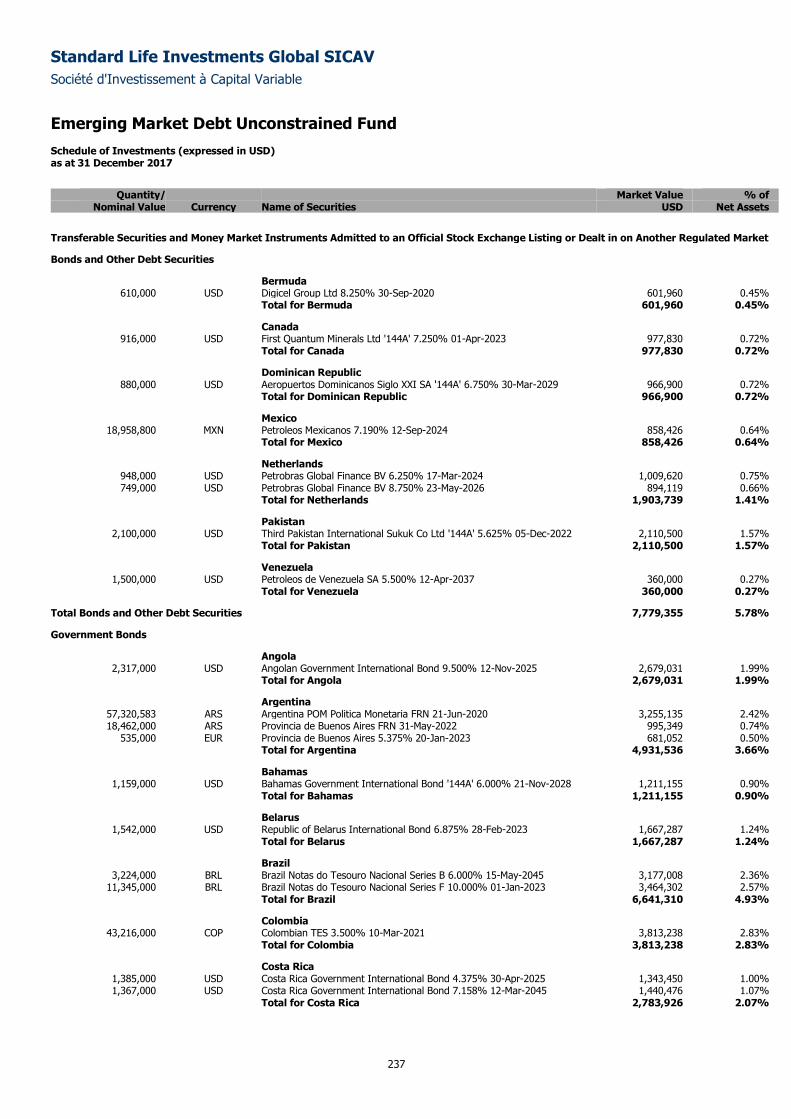
Standard Life Investments Global SICAV
Société d'Investissement à Capital Variable
Emerging Market Debt Unconstrained Fund Schedule of Investments (expressed in USD) as at 31 December 2017
237
Quantity/ Market Value % of
Nominal Value Currency Name of Securities USD Net Assets
Transferable Securities and Money Market Instruments Admitted to an Official Stock Exchange Listing or Dealt in on Another Regulated Market
Bonds and Other Debt Securities
Bermuda 610,000 USD Digicel Group Ltd 8.250% 30-Sep-2020 601,960 0.45%
Total for Bermuda 601,960 0.45%
Canada 916,000 USD First Quantum Minerals Ltd '144A' 7.250% 01-Apr-2023 977,830 0.72%
Total for Canada 977,830 0.72%
Dominican Republic 880,000 USD Aeropuertos Dominicanos Siglo XXI SA '144A' 6.750% 30-Mar-2029 966,900 0.72%
Total for Dominican Republic 966,900 0.72%
Mexico 18,958,800 MXN Petroleos Mexicanos 7.190% 12-Sep-2024 858,426 0.64%
Total for Mexico 858,426 0.64%
Netherlands 948,000 USD Petrobras Global Finance BV 6.250% 17-Mar-2024 1,009,620 0.75% 749,000 USD Petrobras Global Finance BV 8.750% 23-May-2026 894,119 0.66%
Total for Netherlands 1,903,739 1.41%
Pakistan 2,100,000 USD Third Pakistan International Sukuk Co Ltd '144A' 5.625% 05-Dec-2022 2,110,500 1.57%
Total for Pakistan 2,110,500 1.57%
Venezuela 1,500,000 USD Petroleos de Venezuela SA 5.500% 12-Apr-2037 360,000 0.27%
Total for Venezuela 360,000 0.27%
Total Bonds and Other Debt Securities 7,779,355 5.78%
Government Bonds
Angola 2,317,000 USD Angolan Government International Bond 9.500% 12-Nov-2025 2,679,031 1.99%
Total for Angola 2,679,031 1.99%
Argentina 57,320,583 ARS Argentina POM Politica Monetaria FRN 21-Jun-2020 3,255,135 2.42% 18,462,000 ARS Provincia de Buenos Aires FRN 31-May-2022 995,349 0.74%
535,000 EUR Provincia de Buenos Aires 5.375% 20-Jan-2023 681,052 0.50% Total for Argentina 4,931,536 3.66%
Bahamas 1,159,000 USD Bahamas Government International Bond '144A' 6.000% 21-Nov-2028 1,211,155 0.90%
Total for Bahamas 1,211,155 0.90%
Belarus 1,542,000 USD Republic of Belarus International Bond 6.875% 28-Feb-2023 1,667,287 1.24%
Total for Belarus 1,667,287 1.24%
Brazil 3,224,000 BRL Brazil Notas do Tesouro Nacional Series B 6.000% 15-May-2045 3,177,008 2.36%
11,345,000 BRL Brazil Notas do Tesouro Nacional Series F 10.000% 01-Jan-2023 3,464,302 2.57% Total for Brazil 6,641,310 4.93%
Colombia 43,216,000 COP Colombian TES 3.500% 10-Mar-2021 3,813,238 2.83%
Total for Colombia 3,813,238 2.83%
Costa Rica 1,385,000 USD Costa Rica Government International Bond 4.375% 30-Apr-2025 1,343,450 1.00% 1,367,000 USD Costa Rica Government International Bond 7.158% 12-Mar-2045 1,440,476 1.07%
Total for Costa Rica 2,783,926 2.07%
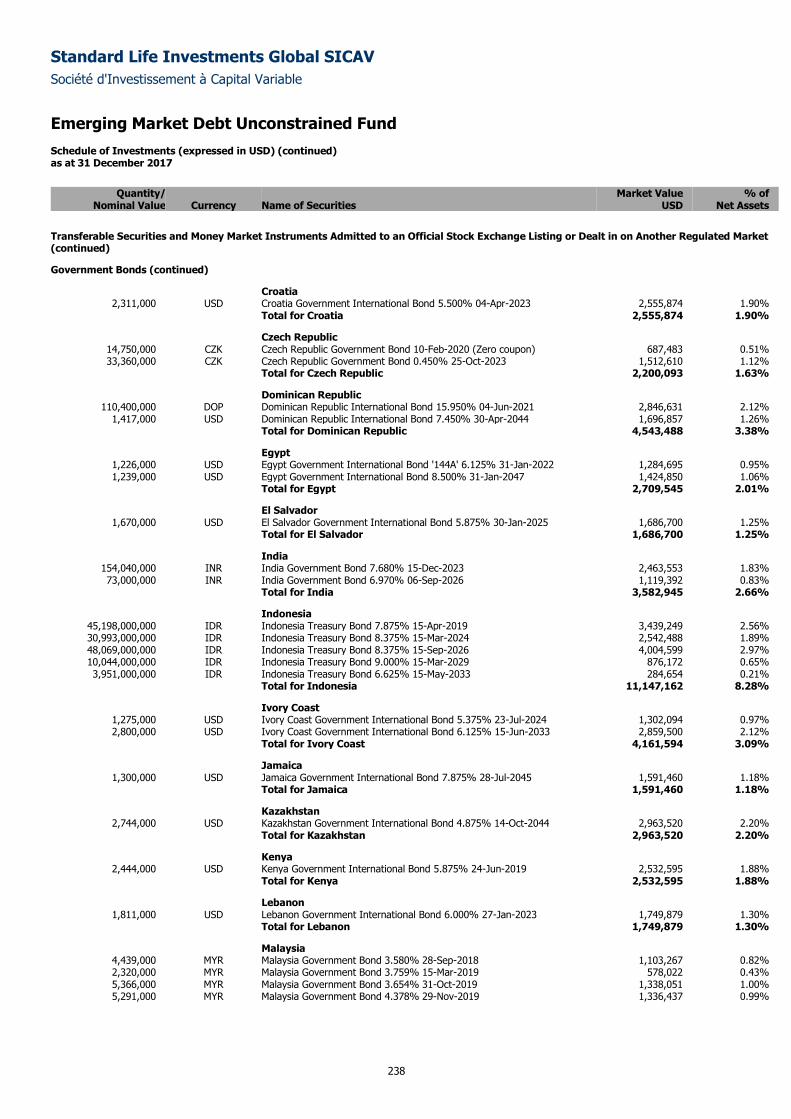
Standard Life Investments Global SICAV
Société d'Investissement à Capital Variable
Emerging Market Debt Unconstrained Fund Schedule of Investments (expressed in USD) (continued) as at 31 December 2017
238
Quantity/ Market Value % of
Nominal Value Currency Name of Securities USD Net Assets
Transferable Securities and Money Market Instruments Admitted to an Official Stock Exchange Listing or Dealt in on Another Regulated Market (continued)
Government Bonds (continued)
Croatia 2,311,000 USD Croatia Government International Bond 5.500% 04-Apr-2023 2,555,874 1.90%
Total for Croatia 2,555,874 1.90%
Czech Republic 14,750,000 CZK Czech Republic Government Bond 10-Feb-2020 (Zero coupon) 687,483 0.51% 33,360,000 CZK Czech Republic Government Bond 0.450% 25-Oct-2023 1,512,610 1.12%
Total for Czech Republic 2,200,093 1.63%
Dominican Republic 110,400,000 DOP Dominican Republic International Bond 15.950% 04-Jun-2021 2,846,631 2.12%
1,417,000 USD Dominican Republic International Bond 7.450% 30-Apr-2044 1,696,857 1.26% Total for Dominican Republic 4,543,488 3.38%
Egypt 1,226,000 USD Egypt Government International Bond '144A' 6.125% 31-Jan-2022 1,284,695 0.95% 1,239,000 USD Egypt Government International Bond 8.500% 31-Jan-2047 1,424,850 1.06%
Total for Egypt 2,709,545 2.01%
El Salvador 1,670,000 USD El Salvador Government International Bond 5.875% 30-Jan-2025 1,686,700 1.25%
Total for El Salvador 1,686,700 1.25%
India 154,040,000 INR India Government Bond 7.680% 15-Dec-2023 2,463,553 1.83% 73,000,000 INR India Government Bond 6.970% 06-Sep-2026 1,119,392 0.83%
Total for India 3,582,945 2.66%
Indonesia 45,198,000,000 IDR Indonesia Treasury Bond 7.875% 15-Apr-2019 3,439,249 2.56% 30,993,000,000 IDR Indonesia Treasury Bond 8.375% 15-Mar-2024 2,542,488 1.89% 48,069,000,000 IDR Indonesia Treasury Bond 8.375% 15-Sep-2026 4,004,599 2.97% 10,044,000,000 IDR Indonesia Treasury Bond 9.000% 15-Mar-2029 876,172 0.65% 3,951,000,000 IDR Indonesia Treasury Bond 6.625% 15-May-2033 284,654 0.21%
Total for Indonesia 11,147,162 8.28%
Ivory Coast 1,275,000 USD Ivory Coast Government International Bond 5.375% 23-Jul-2024 1,302,094 0.97% 2,800,000 USD Ivory Coast Government International Bond 6.125% 15-Jun-2033 2,859,500 2.12%
Total for Ivory Coast 4,161,594 3.09%
Jamaica 1,300,000 USD Jamaica Government International Bond 7.875% 28-Jul-2045 1,591,460 1.18%
Total for Jamaica 1,591,460 1.18%
Kazakhstan 2,744,000 USD Kazakhstan Government International Bond 4.875% 14-Oct-2044 2,963,520 2.20%
Total for Kazakhstan 2,963,520 2.20%
Kenya 2,444,000 USD Kenya Government International Bond 5.875% 24-Jun-2019 2,532,595 1.88%
Total for Kenya 2,532,595 1.88%
Lebanon 1,811,000 USD Lebanon Government International Bond 6.000% 27-Jan-2023 1,749,879 1.30%
Total for Lebanon 1,749,879 1.30%
Malaysia 4,439,000 MYR Malaysia Government Bond 3.580% 28-Sep-2018 1,103,267 0.82% 2,320,000 MYR Malaysia Government Bond 3.759% 15-Mar-2019 578,022 0.43% 5,366,000 MYR Malaysia Government Bond 3.654% 31-Oct-2019 1,338,051 1.00% 5,291,000 MYR Malaysia Government Bond 4.378% 29-Nov-2019 1,336,437 0.99%
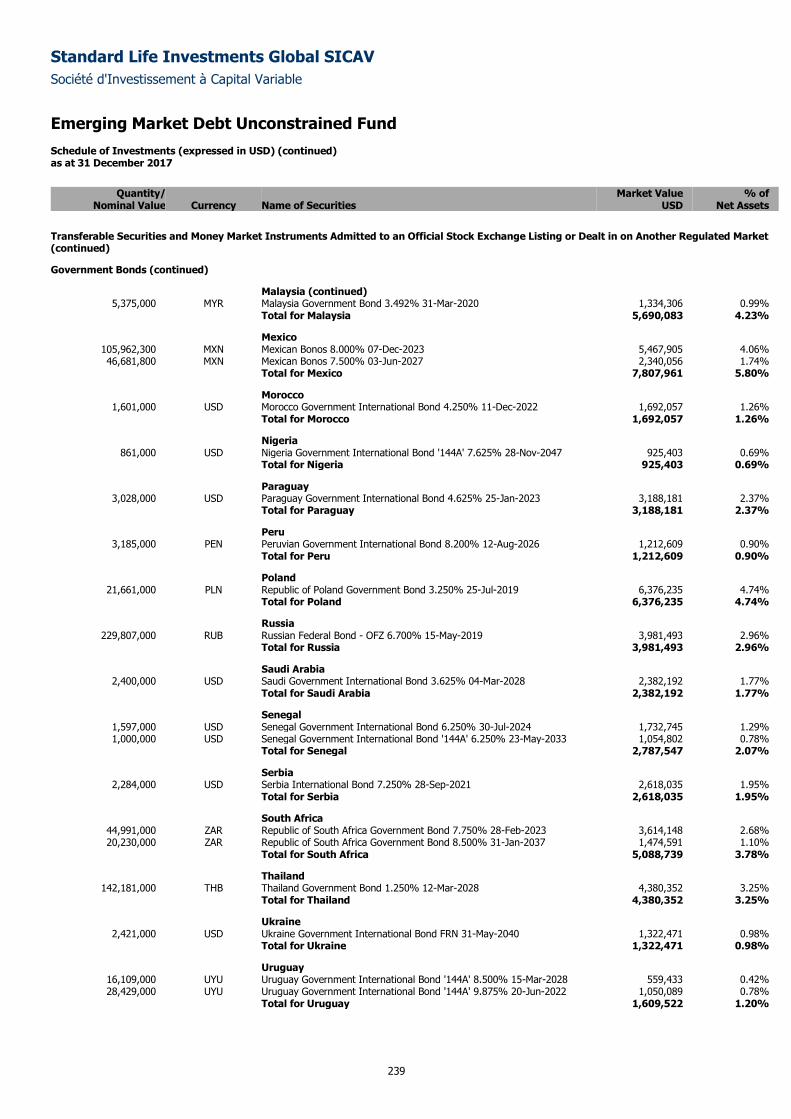
Standard Life Investments Global SICAV
Société d'Investissement à Capital Variable
Emerging Market Debt Unconstrained Fund Schedule of Investments (expressed in USD) (continued) as at 31 December 2017
239
Quantity/ Market Value % of
Nominal Value Currency Name of Securities USD Net Assets
Transferable Securities and Money Market Instruments Admitted to an Official Stock Exchange Listing or Dealt in on Another Regulated Market (continued)
Government Bonds (continued)
Malaysia (continued) 5,375,000 MYR Malaysia Government Bond 3.492% 31-Mar-2020 1,334,306 0.99%
Total for Malaysia 5,690,083 4.23%
Mexico 105,962,300 MXN Mexican Bonos 8.000% 07-Dec-2023 5,467,905 4.06% 46,681,800 MXN Mexican Bonos 7.500% 03-Jun-2027 2,340,056 1.74%
Total for Mexico 7,807,961 5.80%
Morocco 1,601,000 USD Morocco Government International Bond 4.250% 11-Dec-2022 1,692,057 1.26%
Total for Morocco 1,692,057 1.26%
Nigeria 861,000 USD Nigeria Government International Bond '144A' 7.625% 28-Nov-2047 925,403 0.69%
Total for Nigeria 925,403 0.69%
Paraguay 3,028,000 USD Paraguay Government International Bond 4.625% 25-Jan-2023 3,188,181 2.37%
Total for Paraguay 3,188,181 2.37%
Peru 3,185,000 PEN Peruvian Government International Bond 8.200% 12-Aug-2026 1,212,609 0.90%
Total for Peru 1,212,609 0.90%
Poland 21,661,000 PLN Republic of Poland Government Bond 3.250% 25-Jul-2019 6,376,235 4.74%
Total for Poland 6,376,235 4.74%
Russia 229,807,000 RUB Russian Federal Bond - OFZ 6.700% 15-May-2019 3,981,493 2.96%
Total for Russia 3,981,493 2.96%
Saudi Arabia 2,400,000 USD Saudi Government International Bond 3.625% 04-Mar-2028 2,382,192 1.77%
Total for Saudi Arabia 2,382,192 1.77%
Senegal 1,597,000 USD Senegal Government International Bond 6.250% 30-Jul-2024 1,732,745 1.29% 1,000,000 USD Senegal Government International Bond '144A' 6.250% 23-May-2033 1,054,802 0.78%
Total for Senegal 2,787,547 2.07%
Serbia 2,284,000 USD Serbia International Bond 7.250% 28-Sep-2021 2,618,035 1.95%
Total for Serbia 2,618,035 1.95%
South Africa 44,991,000 ZAR Republic of South Africa Government Bond 7.750% 28-Feb-2023 3,614,148 2.68% 20,230,000 ZAR Republic of South Africa Government Bond 8.500% 31-Jan-2037 1,474,591 1.10%
Total for South Africa 5,088,739 3.78%
Thailand 142,181,000 THB Thailand Government Bond 1.250% 12-Mar-2028 4,380,352 3.25%
Total for Thailand 4,380,352 3.25%
Ukraine 2,421,000 USD Ukraine Government International Bond FRN 31-May-2040 1,322,471 0.98%
Total for Ukraine 1,322,471 0.98%
Uruguay 16,109,000 UYU Uruguay Government International Bond '144A' 8.500% 15-Mar-2028 559,433 0.42% 28,429,000 UYU Uruguay Government International Bond '144A' 9.875% 20-Jun-2022 1,050,089 0.78%
Total for Uruguay 1,609,522 1.20%
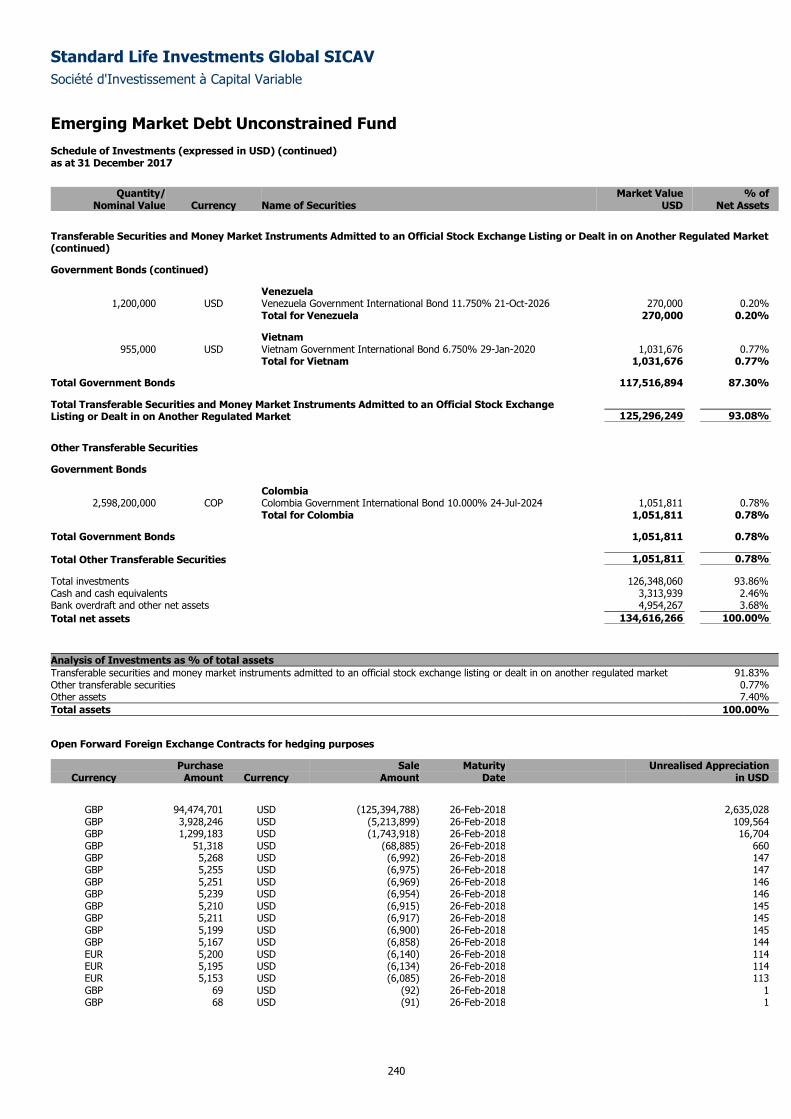
Standard Life Investments Global SICAV
Société d'Investissement à Capital Variable
Emerging Market Debt Unconstrained Fund Schedule of Investments (expressed in USD) (continued) as at 31 December 2017
240
Quantity/ Market Value % of
Nominal Value Currency Name of Securities USD Net Assets
Transferable Securities and Money Market Instruments Admitted to an Official Stock Exchange Listing or Dealt in on Another Regulated Market (continued)
Government Bonds (continued)
Venezuela 1,200,000 USD Venezuela Government International Bond 11.750% 21-Oct-2026 270,000 0.20%
Total for Venezuela 270,000 0.20%
Vietnam 955,000 USD Vietnam Government International Bond 6.750% 29-Jan-2020 1,031,676 0.77%
Total for Vietnam 1,031,676 0.77%
Total Government Bonds 117,516,894 87.30%
Total Transferable Securities and Money Market Instruments Admitted to an Official Stock Exchange Listing or Dealt in on Another Regulated Market 125,296,249 93.08%
Other Transferable Securities
Government Bonds
Colombia 2,598,200,000 COP Colombia Government International Bond 10.000% 24-Jul-2024 1,051,811 0.78%
Total for Colombia 1,051,811 0.78%
Total Government Bonds 1,051,811 0.78%
Total Other Transferable Securities 1,051,811 0.78%
Total investments 126,348,060 93.86%
Cash and cash equivalents 3,313,939 2.46%
Bank overdraft and other net assets 4,954,267 3.68%
Total net assets 134,616,266 100.00%
Analysis of Investments as % of total assets
Transferable securities and money market instruments admitted to an official stock exchange listing or dealt in on another regulated market 91.83% Other transferable securities 0.77% Other assets 7.40%
Total assets 100.00%
Open Forward Foreign Exchange Contracts for hedging purposes
Purchase Sale Maturity Unrealised Appreciation Currency Amount Currency Amount Date in USD
GBP 94,474,701 USD (125,394,788) 26-Feb-2018 2,635,028 GBP 3,928,246 USD (5,213,899) 26-Feb-2018 109,564 GBP 1,299,183 USD (1,743,918) 26-Feb-2018 16,704 GBP 51,318 USD (68,885) 26-Feb-2018 660 GBP 5,268 USD (6,992) 26-Feb-2018 147 GBP 5,255 USD (6,975) 26-Feb-2018 147 GBP 5,251 USD (6,969) 26-Feb-2018 146 GBP 5,239 USD (6,954) 26-Feb-2018 146 GBP 5,210 USD (6,915) 26-Feb-2018 145 GBP 5,211 USD (6,917) 26-Feb-2018 145 GBP 5,199 USD (6,900) 26-Feb-2018 145 GBP 5,167 USD (6,858) 26-Feb-2018 144 EUR 5,200 USD (6,140) 26-Feb-2018 114 EUR 5,195 USD (6,134) 26-Feb-2018 114 EUR 5,153 USD (6,085) 26-Feb-2018 113 GBP 69 USD (92) 26-Feb-2018 1 GBP 68 USD (91) 26-Feb-2018 1
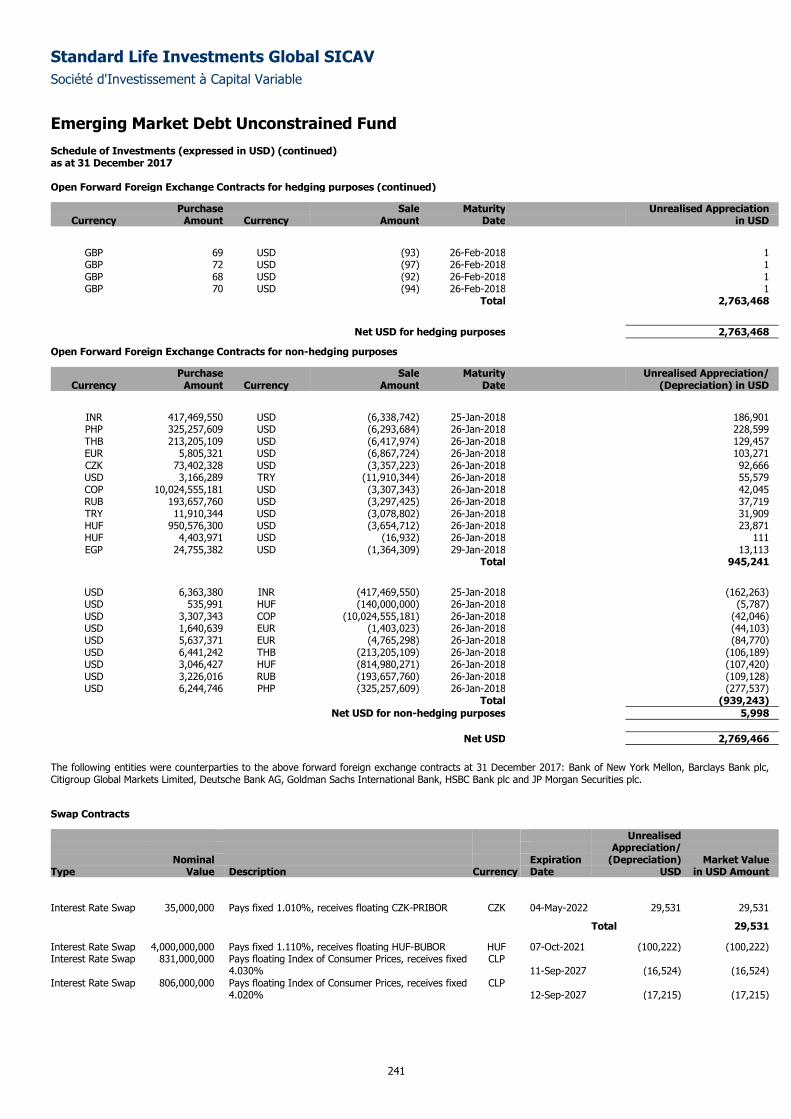
Standard Life Investments Global SICAV
Société d'Investissement à Capital Variable
Emerging Market Debt Unconstrained Fund Schedule of Investments (expressed in USD) (continued) as at 31 December 2017
241
Open Forward Foreign Exchange Contracts for hedging purposes (continued)
Purchase Sale Maturity Unrealised Appreciation Currency Amount Currency Amount Date in USD
GBP 69 USD (93) 26-Feb-2018 1 GBP 72 USD (97) 26-Feb-2018 1 GBP 68 USD (92) 26-Feb-2018 1 GBP 70 USD (94) 26-Feb-2018 1
Total 2,763,468
Net USD for hedging purposes 2,763,468
Open Forward Foreign Exchange Contracts for non-hedging purposes
Purchase Sale Maturity Unrealised Appreciation/ Currency Amount Currency Amount Date (Depreciation) in USD
INR 417,469,550 USD (6,338,742) 25-Jan-2018 186,901 PHP 325,257,609 USD (6,293,684) 26-Jan-2018 228,599 THB 213,205,109 USD (6,417,974) 26-Jan-2018 129,457 EUR 5,805,321 USD (6,867,724) 26-Jan-2018 103,271 CZK 73,402,328 USD (3,357,223) 26-Jan-2018 92,666 USD 3,166,289 TRY (11,910,344) 26-Jan-2018 55,579 COP 10,024,555,181 USD (3,307,343) 26-Jan-2018 42,045 RUB 193,657,760 USD (3,297,425) 26-Jan-2018 37,719 TRY 11,910,344 USD (3,078,802) 26-Jan-2018 31,909 HUF 950,576,300 USD (3,654,712) 26-Jan-2018 23,871 HUF 4,403,971 USD (16,932) 26-Jan-2018 111 EGP 24,755,382 USD (1,364,309) 29-Jan-2018 13,113
Total 945,241
USD 6,363,380 INR (417,469,550) 25-Jan-2018 (162,263) USD 535,991 HUF (140,000,000) 26-Jan-2018 (5,787) USD 3,307,343 COP (10,024,555,181) 26-Jan-2018 (42,046) USD 1,640,639 EUR (1,403,023) 26-Jan-2018 (44,103) USD 5,637,371 EUR (4,765,298) 26-Jan-2018 (84,770) USD 6,441,242 THB (213,205,109) 26-Jan-2018 (106,189) USD 3,046,427 HUF (814,980,271) 26-Jan-2018 (107,420) USD 3,226,016 RUB (193,657,760) 26-Jan-2018 (109,128) USD 6,244,746 PHP (325,257,609) 26-Jan-2018 (277,537)
Total (939,243)
Net USD for non-hedging purposes 5,998
Net USD 2,769,466
The following entities were counterparties to the above forward foreign exchange contracts at 31 December 2017: Bank of New York Mellon, Barclays Bank plc, Citigroup Global Markets Limited, Deutsche Bank AG, Goldman Sachs International Bank, HSBC Bank plc and JP Morgan Securities plc.
Swap Contracts
Unrealised Appreciation/ Nominal Expiration (Depreciation) Market Value Type Value Description Currency Date USD in USD Amount
Interest Rate Swap 35,000,000 Pays fixed 1.010%, receives floating CZK-PRIBOR CZK 04-May-2022 29,531 29,531
Total 29,531
Interest Rate Swap 4,000,000,000 Pays fixed 1.110%, receives floating HUF-BUBOR HUF 07-Oct-2021 (100,222) (100,222) Interest Rate Swap 831,000,000 Pays floating Index of Consumer Prices, receives fixed
4.030% CLP
11-Sep-2027 (16,524) (16,524) Interest Rate Swap 806,000,000 Pays floating Index of Consumer Prices, receives fixed
4.020% CLP
12-Sep-2027 (17,215) (17,215)
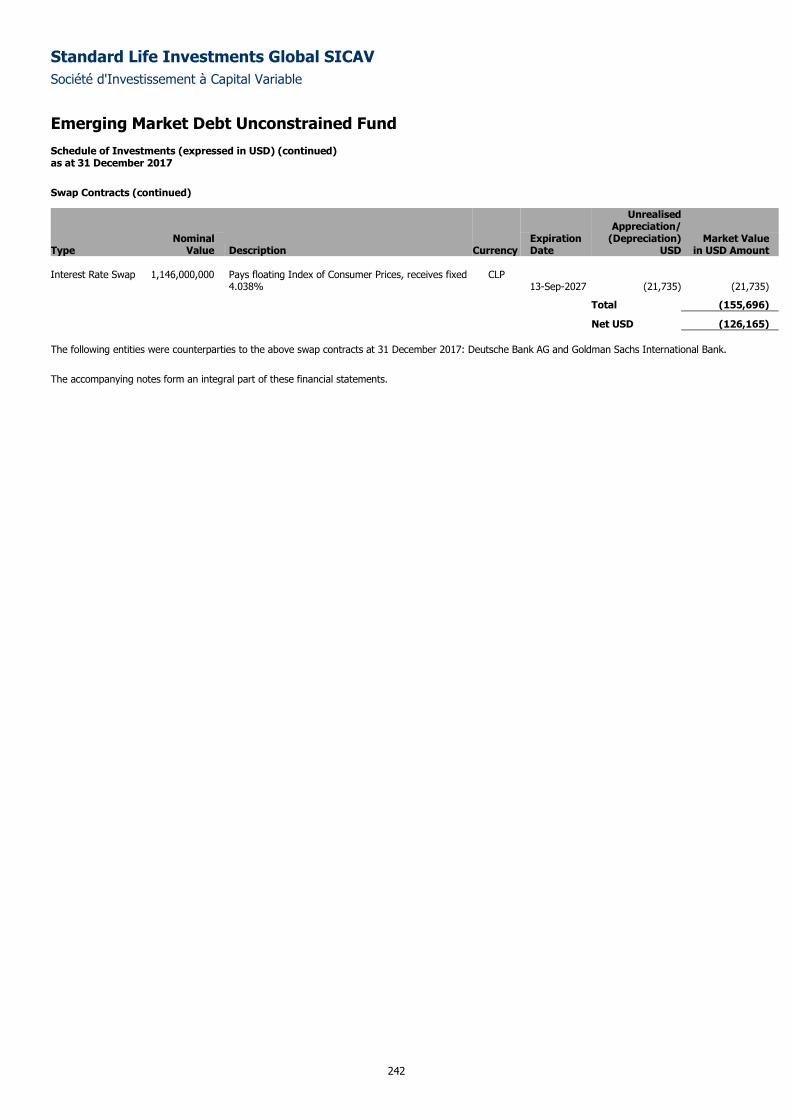
Standard Life Investments Global SICAV
Société d'Investissement à Capital Variable
Emerging Market Debt Unconstrained Fund Schedule of Investments (expressed in USD) (continued) as at 31 December 2017
242
Swap Contracts (continued)
Unrealised Appreciation/ Nominal Expiration (Depreciation) Market Value Type Value Description Currency Date USD in USD Amount Interest Rate Swap 1,146,000,000 Pays floating Index of Consumer Prices, receives fixed
4.038% CLP
13-Sep-2027 (21,735) (21,735)
Total (155,696)
Net USD (126,165)
The following entities were counterparties to the above swap contracts at 31 December 2017: Deutsche Bank AG and Goldman Sachs International Bank.
The accompanying notes form an integral part of these financial statements.
Standard Life Investments Global SICAV
Société d'Investissement à Capital Variable
243
Global Absolute Return Strategies Fund
Sub-fund Objective and Investment Policy The objective of the Sub-fund is to deliver a positive absolute return in the form of capital growth over the medium to longer term in all market conditions. The Sub-fund is actively managed, with a wide investment remit to target a level of return over rolling three-year periods equivalent to cash plus five percent a year, gross of fees. It exploits market inefficiencies through active allocation to a diverse range of market positions. The Sub-fund uses a combination of traditional assets (such as equities and bonds) and investment strategies based on advanced derivative techniques, resulting in a diversified portfolio. The fund can take long and short positions in markets, securities and groups of securities through derivative contracts. Leverage in the fund arises as a result of the use of derivatives.
The Sub-fund seeks strategies from across the entire investment universe, including both traditional asset classes and advanced strategies that span global markets. This means the sub-fund can generate returns in a wider variety of ways. By using this combination of diversified returns, we are able to minimise the impact of market volatility and therefore reduce risk. Indeed, we expect risk within the sub-fund to be between one third and one half of that of a conventional equity investment vehicle while maintaining comparable return objectives.
Examples of strategies that may be used at any time may include:
- An assessment of the performance of one equity market relative to another. Rather than investing in physical securities, the strategy could be implemented through the use of derivatives in the form of futures contracts.
- An assessment of the value of one currency relative to another. The strategy could involve the sale of the currency considered overvalued and purchase of the currency considered undervalued. Derivatives, in the form of forward foreign exchange contracts, could be used to implement the strategy.
- An assessment of the direction of interest rates. Derivatives, in the form of interest rate swaps, could be used to position the portfolio such that it could benefit from the future direction of interest rates.
The fund will invest in a diversified portfolio of permitted derivative contracts (including futures, options, swaps, forward currency contracts and other derivatives), fixed interest securities, equities and cash. Additionally the Sub-fund may invest in other forms of eligible transferable securities, deposits, money market instruments and undertakings for collective investment. The Sub-fund may, subject to and in accordance with the UCI Law and applicable CSSF circulars, take long and short positions in markets, securities and groups of securities through derivative contracts.
Performance Review The Sub-fund returned 1.91% over the period, compared to the 6-month EURIBOR return of -0.26%*. The global economy gathered pace through 2017, broadening out to include Europe and emerging economies. Meaningful corporate earnings growth and hopes of fiscal stimulus in the US propelled several key equity indices to successive record highs. As a result, a number of our equity exposures made a strong contribution to returns over the year, particularly US and European equities, with a notable positive from Korean equities. Also positive were our allocations to US investment grade credit and high-yield credit, with these asset classes supported by improving corporate fundamentals and persistent demand for yield. Similarly, our global REITS (real estate investment trusts) strategy benefited from the improving global economic outlook and investors’ quest for higher yields. Our relative-value strategies ended flat overall.
Collectively, our currency positions detracted from performance, with most contributing negatively over the year. For instance, those positions seeking to benefit from weakness in the Korean won suffered. Shrugging off heightened political tensions in the Korean Peninsula, the won strengthened on the back of export-led economic growth and demand for local equities from yield-seeking investors. Similarly, our preference for the US dollar over the British pound and the euro hurt performance, after the dollar weakened against a number of developed and developing market currencies. However, our currency pair preferring the Indian rupee over the Swiss franc gained. The rupee appreciated against the franc owing to encouraging economic trends in India and strong foreign demand for emerging market equities generally.
Our interest rate positions provided an overall positive return over the year. Our US real yields strategy, which was lifted by rising expectations of US inflation, was the strongest performer. However, US rates moved against our US front-end steepener strategy, which aims to profit from relative changes in specific shorter-term US interest rates. Elsewhere, our UK versus German interest rate position ended the year higher after UK government bonds outperformed German government bonds. Having raised UK interest rates in November for the first time in over 10 years, the Bank of England subsequently reiterated its cautious outlook for the economy, dampening expectations of further rate rises any time soon.
Notable in 2017 was the low and falling level of market volatility, especially in equity markets. This resulted in negative returns from our volatility positions in the earlier part of the year. We subsequently altered our positions to take advantage of the prevailing market environment.
*Sub-fund performance has been calculated over the stated period on the share price performance basis, based on the institutional share class (D Accumulation) and net of fees. Please note the benchmark return is quoted gross and contains no adjustment for fees. The sub-fund performance will also be impacted by any pricing basis changes, made under our single swinging price policy. More information on our swinging price approach can be found in note 8 of the Financial Statements.
Outlook Our central expectation is for continued modest broad-based global growth, albeit with regional variations. Fiscal policy and the changing monetary policies of central banks will be important drivers of asset returns, especially as the pace of change in policies remains uncertain. The US is moving to a tighter monetary environment, albeit on a gradual incline. Improving data in Europe may reduce the European Central Bank’s appetite for monetary easing. However, it will likely remain cautious in the near term given the elevated levels of uncertainty around the process of the UK’s withdrawal from the European Union. Japan, meanwhile, is likely to remain on a loose monetary path. Geopolitical tensions remain elevated and, on many metrics, asset prices look expensive. We will seek to exploit the opportunities that these conditions present by implementing a diversified range of strategies using multiple asset classes.
Please note that the absolute Value at Risk (“VaR”) approach has been used for risk measurement and calculation of global exposure for this Sub-fund.
Measurement of 1 month 99% VaR is based on a parametric calculation with an additional upwards scaling factor applied. Parametric risk model uses 180 weeks of equally weighted data with which to forecast risk.
On the above basis the VaR has been as follows: Highest: 5.38% Average: 4.22% Lowest: 2.81%
Standard Life Investments Global SICAV
Société d'Investissement à Capital Variable
244
Global Absolute Return Strategies Fund
Outlook (continued) Leverage is calculated as the sum of the notionals of the derivatives used. The level of leverage employed during the relevant period was 508.30%. The quoted leverage excludes the impact of the FX forwards used in currency hedged shareclasses which are held for those shareholders only. It also excludes the temporary impacts that arise when renewing currency forwards and when closing some exchange cleared derivatives. Although the renewal of currency forwards and closure of exchange traded derivatives results in no change in or a reduction in market exposure, gross derivative leverage would increase because new equal and offsetting derivative contracts are traded to facilitate this efficiently. The offsetting contracts are held to their maturity date, which is less than 5 working days for currency forwards, or final processing of their termination.
This Sub-fund is not authorized in Hong Kong and is not available to Hong Kong residents.
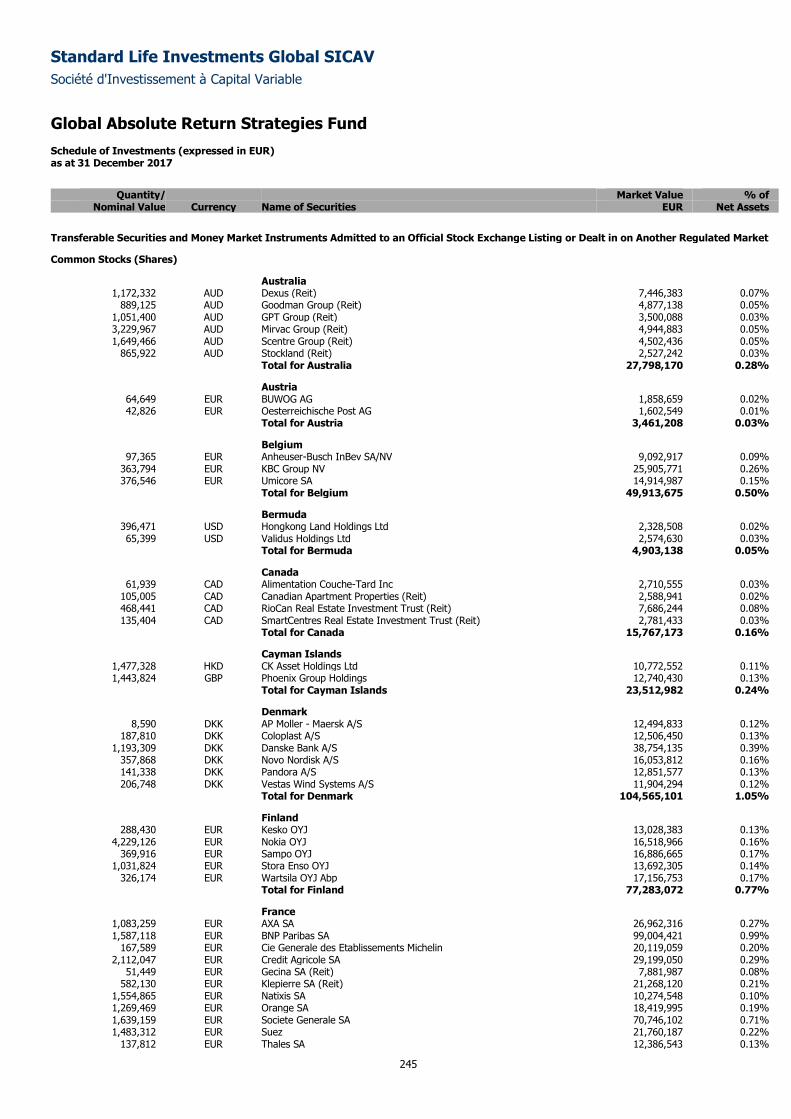
Standard Life Investments Global SICAV
Société d'Investissement à Capital Variable
Global Absolute Return Strategies Fund Schedule of Investments (expressed in EUR) as at 31 December 2017
245
Quantity/ Market Value % of
Nominal Value Currency Name of Securities EUR Net Assets
Transferable Securities and Money Market Instruments Admitted to an Official Stock Exchange Listing or Dealt in on Another Regulated Market
Common Stocks (Shares)
Australia 1,172,332 AUD Dexus (Reit) 7,446,383 0.07%
889,125 AUD Goodman Group (Reit) 4,877,138 0.05% 1,051,400 AUD GPT Group (Reit) 3,500,088 0.03% 3,229,967 AUD Mirvac Group (Reit) 4,944,883 0.05% 1,649,466 AUD Scentre Group (Reit) 4,502,436 0.05%
865,922 AUD Stockland (Reit) 2,527,242 0.03% Total for Australia 27,798,170 0.28%
Austria 64,649 EUR BUWOG AG 1,858,659 0.02% 42,826 EUR Oesterreichische Post AG 1,602,549 0.01%
Total for Austria 3,461,208 0.03%
Belgium 97,365 EUR Anheuser-Busch InBev SA/NV 9,092,917 0.09%
363,794 EUR KBC Group NV 25,905,771 0.26% 376,546 EUR Umicore SA 14,914,987 0.15%
Total for Belgium 49,913,675 0.50%
Bermuda 396,471 USD Hongkong Land Holdings Ltd 2,328,508 0.02% 65,399 USD Validus Holdings Ltd 2,574,630 0.03%
Total for Bermuda 4,903,138 0.05%
Canada 61,939 CAD Alimentation Couche-Tard Inc 2,710,555 0.03%
105,005 CAD Canadian Apartment Properties (Reit) 2,588,941 0.02% 468,441 CAD RioCan Real Estate Investment Trust (Reit) 7,686,244 0.08% 135,404 CAD SmartCentres Real Estate Investment Trust (Reit) 2,781,433 0.03%
Total for Canada 15,767,173 0.16%
Cayman Islands 1,477,328 HKD CK Asset Holdings Ltd 10,772,552 0.11% 1,443,824 GBP Phoenix Group Holdings 12,740,430 0.13%
Total for Cayman Islands 23,512,982 0.24%
Denmark 8,590 DKK AP Moller - Maersk A/S 12,494,833 0.12%
187,810 DKK Coloplast A/S 12,506,450 0.13% 1,193,309 DKK Danske Bank A/S 38,754,135 0.39%
357,868 DKK Novo Nordisk A/S 16,053,812 0.16% 141,338 DKK Pandora A/S 12,851,577 0.13% 206,748 DKK Vestas Wind Systems A/S 11,904,294 0.12%
Total for Denmark 104,565,101 1.05%
Finland 288,430 EUR Kesko OYJ 13,028,383 0.13%
4,229,126 EUR Nokia OYJ 16,518,966 0.16% 369,916 EUR Sampo OYJ 16,886,665 0.17%
1,031,824 EUR Stora Enso OYJ 13,692,305 0.14% 326,174 EUR Wartsila OYJ Abp 17,156,753 0.17%
Total for Finland 77,283,072 0.77%
France 1,083,259 EUR AXA SA 26,962,316 0.27% 1,587,118 EUR BNP Paribas SA 99,004,421 0.99%
167,589 EUR Cie Generale des Etablissements Michelin 20,119,059 0.20% 2,112,047 EUR Credit Agricole SA 29,199,050 0.29%
51,449 EUR Gecina SA (Reit) 7,881,987 0.08% 582,130 EUR Klepierre SA (Reit) 21,268,120 0.21%
1,554,865 EUR Natixis SA 10,274,548 0.10% 1,269,469 EUR Orange SA 18,419,995 0.19% 1,639,159 EUR Societe Generale SA 70,746,102 0.71% 1,483,312 EUR Suez 21,760,187 0.22%
137,812 EUR Thales SA 12,386,543 0.13%
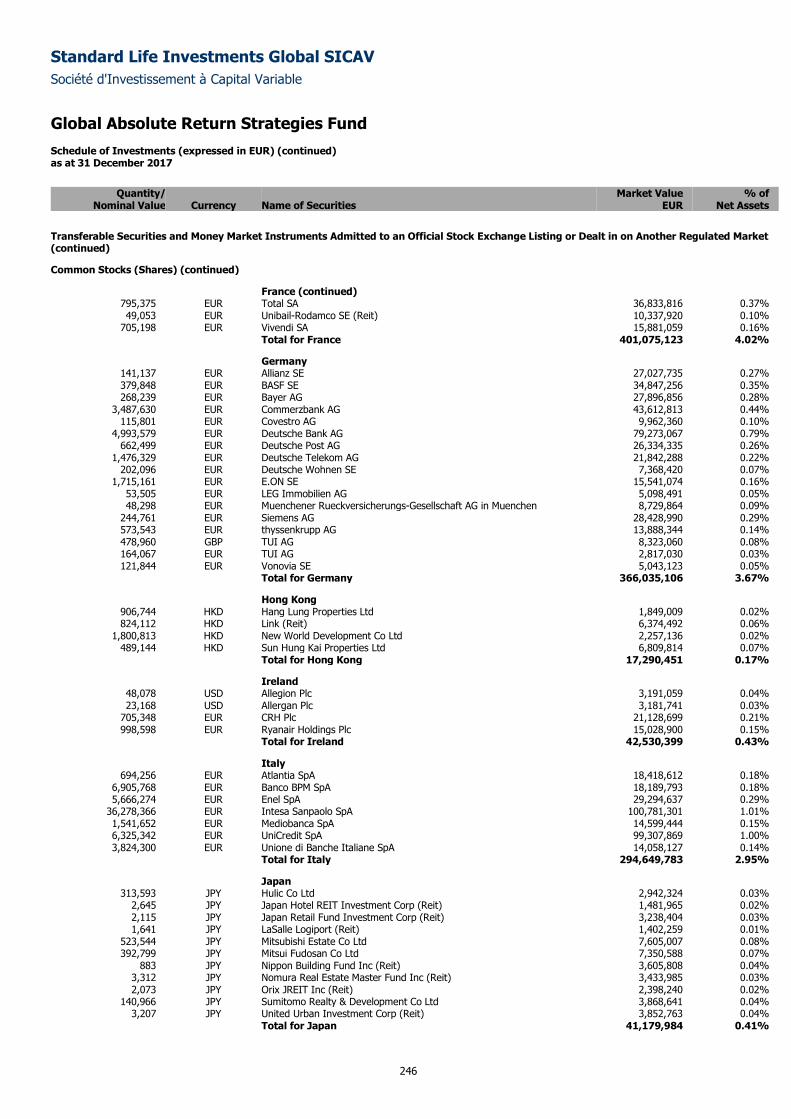
Standard Life Investments Global SICAV
Société d'Investissement à Capital Variable
Global Absolute Return Strategies Fund Schedule of Investments (expressed in EUR) (continued) as at 31 December 2017
246
Quantity/ Market Value % of
Nominal Value Currency Name of Securities EUR Net Assets
Transferable Securities and Money Market Instruments Admitted to an Official Stock Exchange Listing or Dealt in on Another Regulated Market (continued)
Common Stocks (Shares) (continued)
France (continued) 795,375 EUR Total SA 36,833,816 0.37% 49,053 EUR Unibail-Rodamco SE (Reit) 10,337,920 0.10%
705,198 EUR Vivendi SA 15,881,059 0.16% Total for France 401,075,123 4.02%
Germany 141,137 EUR Allianz SE 27,027,735 0.27% 379,848 EUR BASF SE 34,847,256 0.35% 268,239 EUR Bayer AG 27,896,856 0.28%
3,487,630 EUR Commerzbank AG 43,612,813 0.44% 115,801 EUR Covestro AG 9,962,360 0.10%
4,993,579 EUR Deutsche Bank AG 79,273,067 0.79% 662,499 EUR Deutsche Post AG 26,334,335 0.26%
1,476,329 EUR Deutsche Telekom AG 21,842,288 0.22% 202,096 EUR Deutsche Wohnen SE 7,368,420 0.07%
1,715,161 EUR E.ON SE 15,541,074 0.16% 53,505 EUR LEG Immobilien AG 5,098,491 0.05% 48,298 EUR Muenchener Rueckversicherungs-Gesellschaft AG in Muenchen 8,729,864 0.09%
244,761 EUR Siemens AG 28,428,990 0.29% 573,543 EUR thyssenkrupp AG 13,888,344 0.14% 478,960 GBP TUI AG 8,323,060 0.08% 164,067 EUR TUI AG 2,817,030 0.03% 121,844 EUR Vonovia SE 5,043,123 0.05%
Total for Germany 366,035,106 3.67%
Hong Kong 906,744 HKD Hang Lung Properties Ltd 1,849,009 0.02% 824,112 HKD Link (Reit) 6,374,492 0.06%
1,800,813 HKD New World Development Co Ltd 2,257,136 0.02% 489,144 HKD Sun Hung Kai Properties Ltd 6,809,814 0.07%
Total for Hong Kong 17,290,451 0.17%
Ireland 48,078 USD Allegion Plc 3,191,059 0.04% 23,168 USD Allergan Plc 3,181,741 0.03%
705,348 EUR CRH Plc 21,128,699 0.21% 998,598 EUR Ryanair Holdings Plc 15,028,900 0.15%
Total for Ireland 42,530,399 0.43%
Italy 694,256 EUR Atlantia SpA 18,418,612 0.18%
6,905,768 EUR Banco BPM SpA 18,189,793 0.18% 5,666,274 EUR Enel SpA 29,294,637 0.29%
36,278,366 EUR Intesa Sanpaolo SpA 100,781,301 1.01% 1,541,652 EUR Mediobanca SpA 14,599,444 0.15% 6,325,342 EUR UniCredit SpA 99,307,869 1.00% 3,824,300 EUR Unione di Banche Italiane SpA 14,058,127 0.14%
Total for Italy 294,649,783 2.95%
Japan 313,593 JPY Hulic Co Ltd 2,942,324 0.03%
2,645 JPY Japan Hotel REIT Investment Corp (Reit) 1,481,965 0.02% 2,115 JPY Japan Retail Fund Investment Corp (Reit) 3,238,404 0.03% 1,641 JPY LaSalle Logiport (Reit) 1,402,259 0.01%
523,544 JPY Mitsubishi Estate Co Ltd 7,605,007 0.08% 392,799 JPY Mitsui Fudosan Co Ltd 7,350,588 0.07%
883 JPY Nippon Building Fund Inc (Reit) 3,605,808 0.04% 3,312 JPY Nomura Real Estate Master Fund Inc (Reit) 3,433,985 0.03% 2,073 JPY Orix JREIT Inc (Reit) 2,398,240 0.02%
140,966 JPY Sumitomo Realty & Development Co Ltd 3,868,641 0.04% 3,207 JPY United Urban Investment Corp (Reit) 3,852,763 0.04%
Total for Japan 41,179,984 0.41%
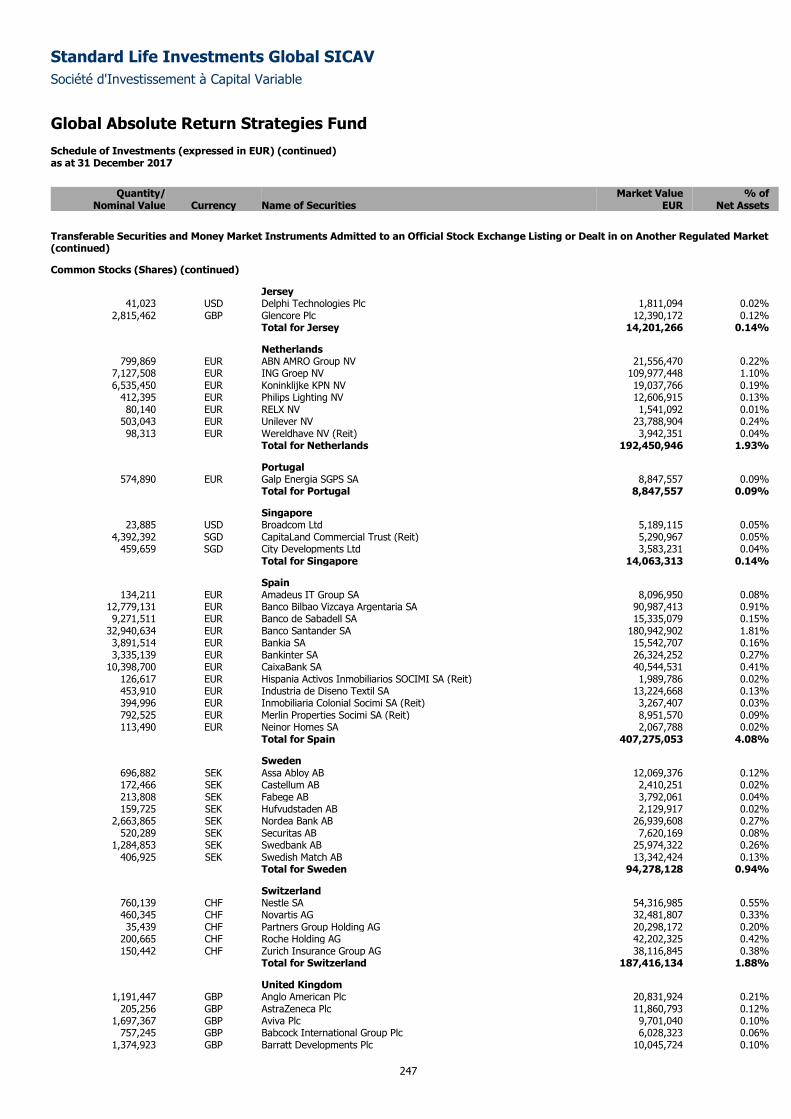
Standard Life Investments Global SICAV
Société d'Investissement à Capital Variable
Global Absolute Return Strategies Fund Schedule of Investments (expressed in EUR) (continued) as at 31 December 2017
247
Quantity/ Market Value % of
Nominal Value Currency Name of Securities EUR Net Assets
Transferable Securities and Money Market Instruments Admitted to an Official Stock Exchange Listing or Dealt in on Another Regulated Market (continued)
Common Stocks (Shares) (continued)
Jersey 41,023 USD Delphi Technologies Plc 1,811,094 0.02%
2,815,462 GBP Glencore Plc 12,390,172 0.12% Total for Jersey 14,201,266 0.14%
Netherlands 799,869 EUR ABN AMRO Group NV 21,556,470 0.22%
7,127,508 EUR ING Groep NV 109,977,448 1.10% 6,535,450 EUR Koninklijke KPN NV 19,037,766 0.19%
412,395 EUR Philips Lighting NV 12,606,915 0.13% 80,140 EUR RELX NV 1,541,092 0.01%
503,043 EUR Unilever NV 23,788,904 0.24% 98,313 EUR Wereldhave NV (Reit) 3,942,351 0.04%
Total for Netherlands 192,450,946 1.93%
Portugal 574,890 EUR Galp Energia SGPS SA 8,847,557 0.09%
Total for Portugal 8,847,557 0.09%
Singapore 23,885 USD Broadcom Ltd 5,189,115 0.05%
4,392,392 SGD CapitaLand Commercial Trust (Reit) 5,290,967 0.05% 459,659 SGD City Developments Ltd 3,583,231 0.04%
Total for Singapore 14,063,313 0.14%
Spain 134,211 EUR Amadeus IT Group SA 8,096,950 0.08%
12,779,131 EUR Banco Bilbao Vizcaya Argentaria SA 90,987,413 0.91% 9,271,511 EUR Banco de Sabadell SA 15,335,079 0.15%
32,940,634 EUR Banco Santander SA 180,942,902 1.81% 3,891,514 EUR Bankia SA 15,542,707 0.16% 3,335,139 EUR Bankinter SA 26,324,252 0.27%
10,398,700 EUR CaixaBank SA 40,544,531 0.41% 126,617 EUR Hispania Activos Inmobiliarios SOCIMI SA (Reit) 1,989,786 0.02% 453,910 EUR Industria de Diseno Textil SA 13,224,668 0.13% 394,996 EUR Inmobiliaria Colonial Socimi SA (Reit) 3,267,407 0.03% 792,525 EUR Merlin Properties Socimi SA (Reit) 8,951,570 0.09% 113,490 EUR Neinor Homes SA 2,067,788 0.02%
Total for Spain 407,275,053 4.08%
Sweden 696,882 SEK Assa Abloy AB 12,069,376 0.12% 172,466 SEK Castellum AB 2,410,251 0.02% 213,808 SEK Fabege AB 3,792,061 0.04% 159,725 SEK Hufvudstaden AB 2,129,917 0.02%
2,663,865 SEK Nordea Bank AB 26,939,608 0.27% 520,289 SEK Securitas AB 7,620,169 0.08%
1,284,853 SEK Swedbank AB 25,974,322 0.26% 406,925 SEK Swedish Match AB 13,342,424 0.13%
Total for Sweden 94,278,128 0.94%
Switzerland 760,139 CHF Nestle SA 54,316,985 0.55% 460,345 CHF Novartis AG 32,481,807 0.33% 35,439 CHF Partners Group Holding AG 20,298,172 0.20%
200,665 CHF Roche Holding AG 42,202,325 0.42% 150,442 CHF Zurich Insurance Group AG 38,116,845 0.38%
Total for Switzerland 187,416,134 1.88%
United Kingdom 1,191,447 GBP Anglo American Plc 20,831,924 0.21%
205,256 GBP AstraZeneca Plc 11,860,793 0.12% 1,697,367 GBP Aviva Plc 9,701,040 0.10%
757,245 GBP Babcock International Group Plc 6,028,323 0.06% 1,374,923 GBP Barratt Developments Plc 10,045,724 0.10%
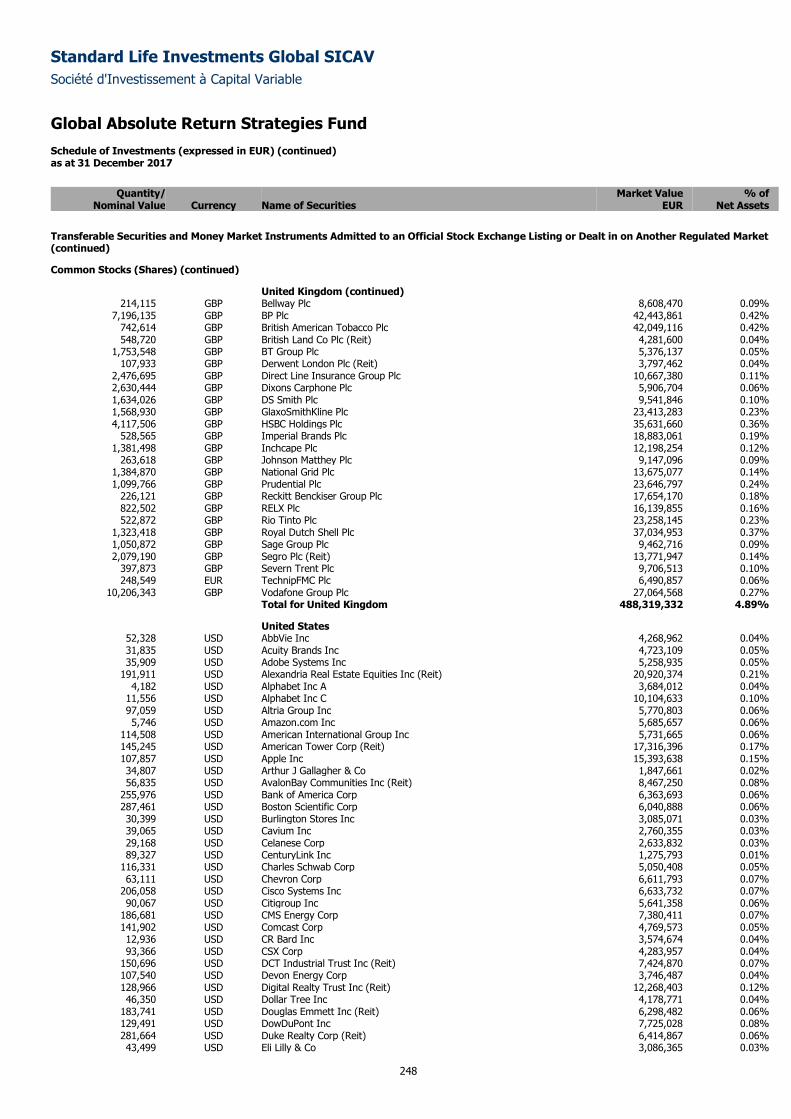
Standard Life Investments Global SICAV
Société d'Investissement à Capital Variable
Global Absolute Return Strategies Fund Schedule of Investments (expressed in EUR) (continued) as at 31 December 2017
248
Quantity/ Market Value % of
Nominal Value Currency Name of Securities EUR Net Assets
Transferable Securities and Money Market Instruments Admitted to an Official Stock Exchange Listing or Dealt in on Another Regulated Market (continued)
Common Stocks (Shares) (continued)
United Kingdom (continued) 214,115 GBP Bellway Plc 8,608,470 0.09%
7,196,135 GBP BP Plc 42,443,861 0.42% 742,614 GBP British American Tobacco Plc 42,049,116 0.42% 548,720 GBP British Land Co Plc (Reit) 4,281,600 0.04%
1,753,548 GBP BT Group Plc 5,376,137 0.05% 107,933 GBP Derwent London Plc (Reit) 3,797,462 0.04%
2,476,695 GBP Direct Line Insurance Group Plc 10,667,380 0.11% 2,630,444 GBP Dixons Carphone Plc 5,906,704 0.06% 1,634,026 GBP DS Smith Plc 9,541,846 0.10% 1,568,930 GBP GlaxoSmithKline Plc 23,413,283 0.23% 4,117,506 GBP HSBC Holdings Plc 35,631,660 0.36%
528,565 GBP Imperial Brands Plc 18,883,061 0.19% 1,381,498 GBP Inchcape Plc 12,198,254 0.12%
263,618 GBP Johnson Matthey Plc 9,147,096 0.09% 1,384,870 GBP National Grid Plc 13,675,077 0.14% 1,099,766 GBP Prudential Plc 23,646,797 0.24%
226,121 GBP Reckitt Benckiser Group Plc 17,654,170 0.18% 822,502 GBP RELX Plc 16,139,855 0.16% 522,872 GBP Rio Tinto Plc 23,258,145 0.23%
1,323,418 GBP Royal Dutch Shell Plc 37,034,953 0.37% 1,050,872 GBP Sage Group Plc 9,462,716 0.09% 2,079,190 GBP Segro Plc (Reit) 13,771,947 0.14%
397,873 GBP Severn Trent Plc 9,706,513 0.10% 248,549 EUR TechnipFMC Plc 6,490,857 0.06%
10,206,343 GBP Vodafone Group Plc 27,064,568 0.27% Total for United Kingdom 488,319,332 4.89%
United States 52,328 USD AbbVie Inc 4,268,962 0.04% 31,835 USD Acuity Brands Inc 4,723,109 0.05% 35,909 USD Adobe Systems Inc 5,258,935 0.05%
191,911 USD Alexandria Real Estate Equities Inc (Reit) 20,920,374 0.21% 4,182 USD Alphabet Inc A 3,684,012 0.04%
11,556 USD Alphabet Inc C 10,104,633 0.10% 97,059 USD Altria Group Inc 5,770,803 0.06% 5,746 USD Amazon.com Inc 5,685,657 0.06%
114,508 USD American International Group Inc 5,731,665 0.06% 145,245 USD American Tower Corp (Reit) 17,316,396 0.17% 107,857 USD Apple Inc 15,393,638 0.15% 34,807 USD Arthur J Gallagher & Co 1,847,661 0.02% 56,835 USD AvalonBay Communities Inc (Reit) 8,467,250 0.08%
255,976 USD Bank of America Corp 6,363,693 0.06% 287,461 USD Boston Scientific Corp 6,040,888 0.06% 30,399 USD Burlington Stores Inc 3,085,071 0.03% 39,065 USD Cavium Inc 2,760,355 0.03% 29,168 USD Celanese Corp 2,633,832 0.03% 89,327 USD CenturyLink Inc 1,275,793 0.01%
116,331 USD Charles Schwab Corp 5,050,408 0.05% 63,111 USD Chevron Corp 6,611,793 0.07%
206,058 USD Cisco Systems Inc 6,633,732 0.07% 90,067 USD Citigroup Inc 5,641,358 0.06%
186,681 USD CMS Energy Corp 7,380,411 0.07% 141,902 USD Comcast Corp 4,769,573 0.05% 12,936 USD CR Bard Inc 3,574,674 0.04% 93,366 USD CSX Corp 4,283,957 0.04%
150,696 USD DCT Industrial Trust Inc (Reit) 7,424,870 0.07% 107,540 USD Devon Energy Corp 3,746,487 0.04% 128,966 USD Digital Realty Trust Inc (Reit) 12,268,403 0.12% 46,350 USD Dollar Tree Inc 4,178,771 0.04%
183,741 USD Douglas Emmett Inc (Reit) 6,298,482 0.06% 129,491 USD DowDuPont Inc 7,725,028 0.08% 281,664 USD Duke Realty Corp (Reit) 6,414,867 0.06% 43,499 USD Eli Lilly & Co 3,086,365 0.03%
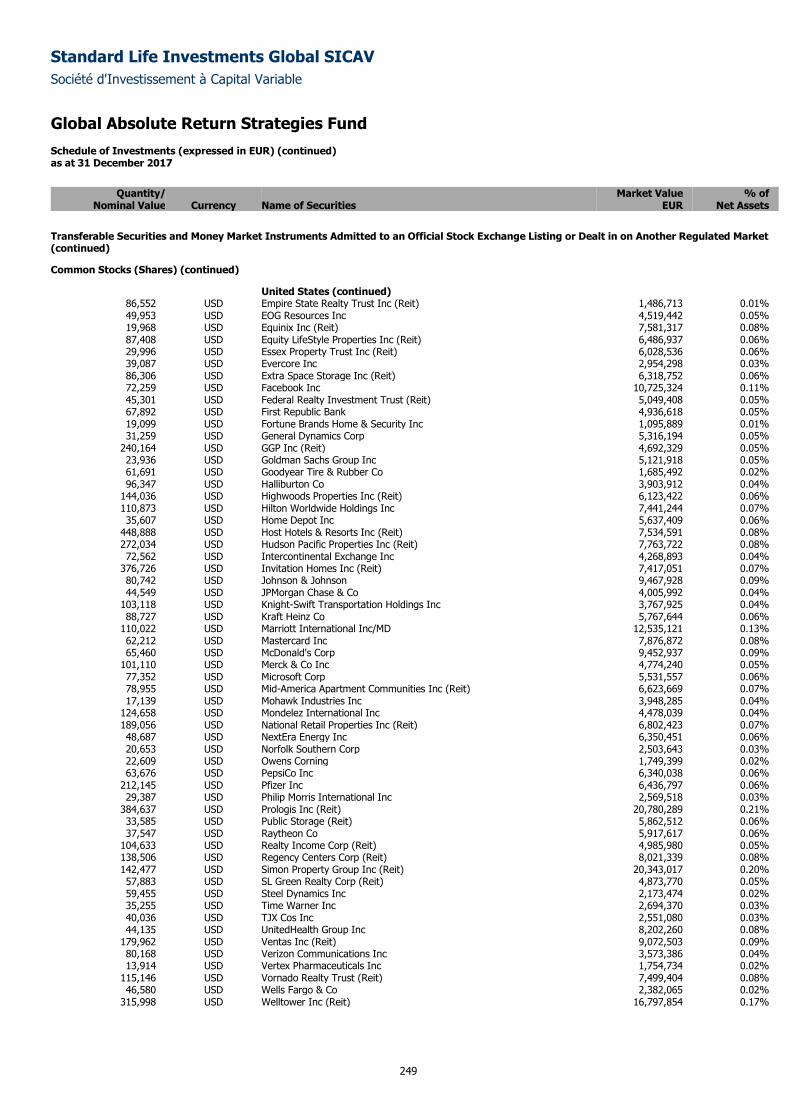
Standard Life Investments Global SICAV
Société d'Investissement à Capital Variable
Global Absolute Return Strategies Fund Schedule of Investments (expressed in EUR) (continued) as at 31 December 2017
249
Quantity/ Market Value % of
Nominal Value Currency Name of Securities EUR Net Assets
Transferable Securities and Money Market Instruments Admitted to an Official Stock Exchange Listing or Dealt in on Another Regulated Market (continued)
Common Stocks (Shares) (continued)
United States (continued) 86,552 USD Empire State Realty Trust Inc (Reit) 1,486,713 0.01% 49,953 USD EOG Resources Inc 4,519,442 0.05% 19,968 USD Equinix Inc (Reit) 7,581,317 0.08% 87,408 USD Equity LifeStyle Properties Inc (Reit) 6,486,937 0.06% 29,996 USD Essex Property Trust Inc (Reit) 6,028,536 0.06% 39,087 USD Evercore Inc 2,954,298 0.03% 86,306 USD Extra Space Storage Inc (Reit) 6,318,752 0.06% 72,259 USD Facebook Inc 10,725,324 0.11% 45,301 USD Federal Realty Investment Trust (Reit) 5,049,408 0.05% 67,892 USD First Republic Bank 4,936,618 0.05% 19,099 USD Fortune Brands Home & Security Inc 1,095,889 0.01% 31,259 USD General Dynamics Corp 5,316,194 0.05%
240,164 USD GGP Inc (Reit) 4,692,329 0.05% 23,936 USD Goldman Sachs Group Inc 5,121,918 0.05% 61,691 USD Goodyear Tire & Rubber Co 1,685,492 0.02% 96,347 USD Halliburton Co 3,903,912 0.04%
144,036 USD Highwoods Properties Inc (Reit) 6,123,422 0.06% 110,873 USD Hilton Worldwide Holdings Inc 7,441,244 0.07% 35,607 USD Home Depot Inc 5,637,409 0.06%
448,888 USD Host Hotels & Resorts Inc (Reit) 7,534,591 0.08% 272,034 USD Hudson Pacific Properties Inc (Reit) 7,763,722 0.08% 72,562 USD Intercontinental Exchange Inc 4,268,893 0.04%
376,726 USD Invitation Homes Inc (Reit) 7,417,051 0.07% 80,742 USD Johnson & Johnson 9,467,928 0.09% 44,549 USD JPMorgan Chase & Co 4,005,992 0.04%
103,118 USD Knight-Swift Transportation Holdings Inc 3,767,925 0.04% 88,727 USD Kraft Heinz Co 5,767,644 0.06%
110,022 USD Marriott International Inc/MD 12,535,121 0.13% 62,212 USD Mastercard Inc 7,876,872 0.08% 65,460 USD McDonald's Corp 9,452,937 0.09%
101,110 USD Merck & Co Inc 4,774,240 0.05% 77,352 USD Microsoft Corp 5,531,557 0.06% 78,955 USD Mid-America Apartment Communities Inc (Reit) 6,623,669 0.07% 17,139 USD Mohawk Industries Inc 3,948,285 0.04%
124,658 USD Mondelez International Inc 4,478,039 0.04% 189,056 USD National Retail Properties Inc (Reit) 6,802,423 0.07% 48,687 USD NextEra Energy Inc 6,350,451 0.06% 20,653 USD Norfolk Southern Corp 2,503,643 0.03% 22,609 USD Owens Corning 1,749,399 0.02% 63,676 USD PepsiCo Inc 6,340,038 0.06%
212,145 USD Pfizer Inc 6,436,797 0.06% 29,387 USD Philip Morris International Inc 2,569,518 0.03%
384,637 USD Prologis Inc (Reit) 20,780,289 0.21% 33,585 USD Public Storage (Reit) 5,862,512 0.06% 37,547 USD Raytheon Co 5,917,617 0.06%
104,633 USD Realty Income Corp (Reit) 4,985,980 0.05% 138,506 USD Regency Centers Corp (Reit) 8,021,339 0.08% 142,477 USD Simon Property Group Inc (Reit) 20,343,017 0.20% 57,883 USD SL Green Realty Corp (Reit) 4,873,770 0.05% 59,455 USD Steel Dynamics Inc 2,173,474 0.02% 35,255 USD Time Warner Inc 2,694,370 0.03% 40,036 USD TJX Cos Inc 2,551,080 0.03% 44,135 USD UnitedHealth Group Inc 8,202,260 0.08%
179,962 USD Ventas Inc (Reit) 9,072,503 0.09% 80,168 USD Verizon Communications Inc 3,573,386 0.04% 13,914 USD Vertex Pharmaceuticals Inc 1,754,734 0.02%
115,146 USD Vornado Realty Trust (Reit) 7,499,404 0.08% 46,580 USD Wells Fargo & Co 2,382,065 0.02%
315,998 USD Welltower Inc (Reit) 16,797,854 0.17%
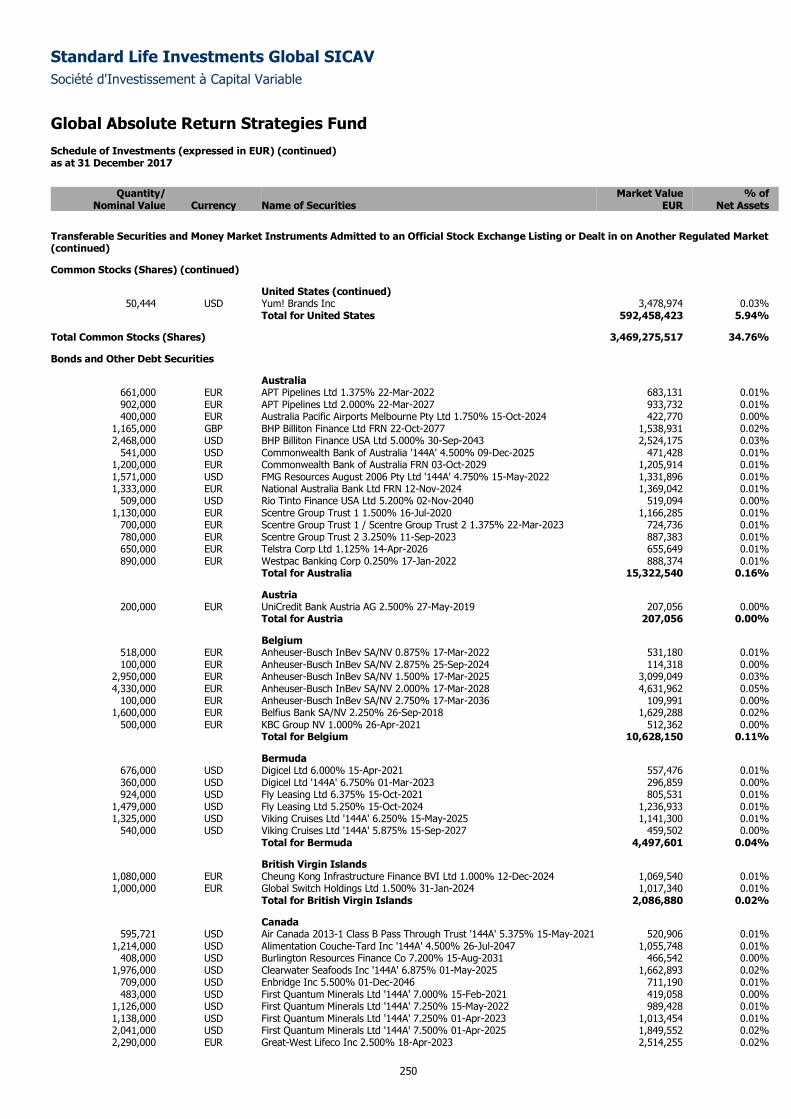
Standard Life Investments Global SICAV
Société d'Investissement à Capital Variable
Global Absolute Return Strategies Fund Schedule of Investments (expressed in EUR) (continued) as at 31 December 2017
250
Quantity/ Market Value % of
Nominal Value Currency Name of Securities EUR Net Assets
Transferable Securities and Money Market Instruments Admitted to an Official Stock Exchange Listing or Dealt in on Another Regulated Market (continued)
Common Stocks (Shares) (continued)
United States (continued) 50,444 USD Yum! Brands Inc 3,478,974 0.03%
Total for United States 592,458,423 5.94%
Total Common Stocks (Shares) 3,469,275,517 34.76%
Bonds and Other Debt Securities
Australia 661,000 EUR APT Pipelines Ltd 1.375% 22-Mar-2022 683,131 0.01% 902,000 EUR APT Pipelines Ltd 2.000% 22-Mar-2027 933,732 0.01% 400,000 EUR Australia Pacific Airports Melbourne Pty Ltd 1.750% 15-Oct-2024 422,770 0.00%
1,165,000 GBP BHP Billiton Finance Ltd FRN 22-Oct-2077 1,538,931 0.02% 2,468,000 USD BHP Billiton Finance USA Ltd 5.000% 30-Sep-2043 2,524,175 0.03%
541,000 USD Commonwealth Bank of Australia '144A' 4.500% 09-Dec-2025 471,428 0.01% 1,200,000 EUR Commonwealth Bank of Australia FRN 03-Oct-2029 1,205,914 0.01% 1,571,000 USD FMG Resources August 2006 Pty Ltd '144A' 4.750% 15-May-2022 1,331,896 0.01% 1,333,000 EUR National Australia Bank Ltd FRN 12-Nov-2024 1,369,042 0.01%
509,000 USD Rio Tinto Finance USA Ltd 5.200% 02-Nov-2040 519,094 0.00% 1,130,000 EUR Scentre Group Trust 1 1.500% 16-Jul-2020 1,166,285 0.01%
700,000 EUR Scentre Group Trust 1 / Scentre Group Trust 2 1.375% 22-Mar-2023 724,736 0.01% 780,000 EUR Scentre Group Trust 2 3.250% 11-Sep-2023 887,383 0.01% 650,000 EUR Telstra Corp Ltd 1.125% 14-Apr-2026 655,649 0.01% 890,000 EUR Westpac Banking Corp 0.250% 17-Jan-2022 888,374 0.01%
Total for Australia 15,322,540 0.16%
Austria 200,000 EUR UniCredit Bank Austria AG 2.500% 27-May-2019 207,056 0.00%
Total for Austria 207,056 0.00%
Belgium 518,000 EUR Anheuser-Busch InBev SA/NV 0.875% 17-Mar-2022 531,180 0.01% 100,000 EUR Anheuser-Busch InBev SA/NV 2.875% 25-Sep-2024 114,318 0.00%
2,950,000 EUR Anheuser-Busch InBev SA/NV 1.500% 17-Mar-2025 3,099,049 0.03% 4,330,000 EUR Anheuser-Busch InBev SA/NV 2.000% 17-Mar-2028 4,631,962 0.05%
100,000 EUR Anheuser-Busch InBev SA/NV 2.750% 17-Mar-2036 109,991 0.00% 1,600,000 EUR Belfius Bank SA/NV 2.250% 26-Sep-2018 1,629,288 0.02%
500,000 EUR KBC Group NV 1.000% 26-Apr-2021 512,362 0.00% Total for Belgium 10,628,150 0.11%
Bermuda 676,000 USD Digicel Ltd 6.000% 15-Apr-2021 557,476 0.01% 360,000 USD Digicel Ltd '144A' 6.750% 01-Mar-2023 296,859 0.00% 924,000 USD Fly Leasing Ltd 6.375% 15-Oct-2021 805,531 0.01%
1,479,000 USD Fly Leasing Ltd 5.250% 15-Oct-2024 1,236,933 0.01% 1,325,000 USD Viking Cruises Ltd '144A' 6.250% 15-May-2025 1,141,300 0.01%
540,000 USD Viking Cruises Ltd '144A' 5.875% 15-Sep-2027 459,502 0.00% Total for Bermuda 4,497,601 0.04%
British Virgin Islands 1,080,000 EUR Cheung Kong Infrastructure Finance BVI Ltd 1.000% 12-Dec-2024 1,069,540 0.01% 1,000,000 EUR Global Switch Holdings Ltd 1.500% 31-Jan-2024 1,017,340 0.01%
Total for British Virgin Islands 2,086,880 0.02%
Canada 595,721 USD Air Canada 2013-1 Class B Pass Through Trust '144A' 5.375% 15-May-2021 520,906 0.01%
1,214,000 USD Alimentation Couche-Tard Inc '144A' 4.500% 26-Jul-2047 1,055,748 0.01% 408,000 USD Burlington Resources Finance Co 7.200% 15-Aug-2031 466,542 0.00%
1,976,000 USD Clearwater Seafoods Inc '144A' 6.875% 01-May-2025 1,662,893 0.02% 709,000 USD Enbridge Inc 5.500% 01-Dec-2046 711,190 0.01% 483,000 USD First Quantum Minerals Ltd '144A' 7.000% 15-Feb-2021 419,058 0.00%
1,126,000 USD First Quantum Minerals Ltd '144A' 7.250% 15-May-2022 989,428 0.01% 1,138,000 USD First Quantum Minerals Ltd '144A' 7.250% 01-Apr-2023 1,013,454 0.01% 2,041,000 USD First Quantum Minerals Ltd '144A' 7.500% 01-Apr-2025 1,849,552 0.02% 2,290,000 EUR Great-West Lifeco Inc 2.500% 18-Apr-2023 2,514,255 0.02%
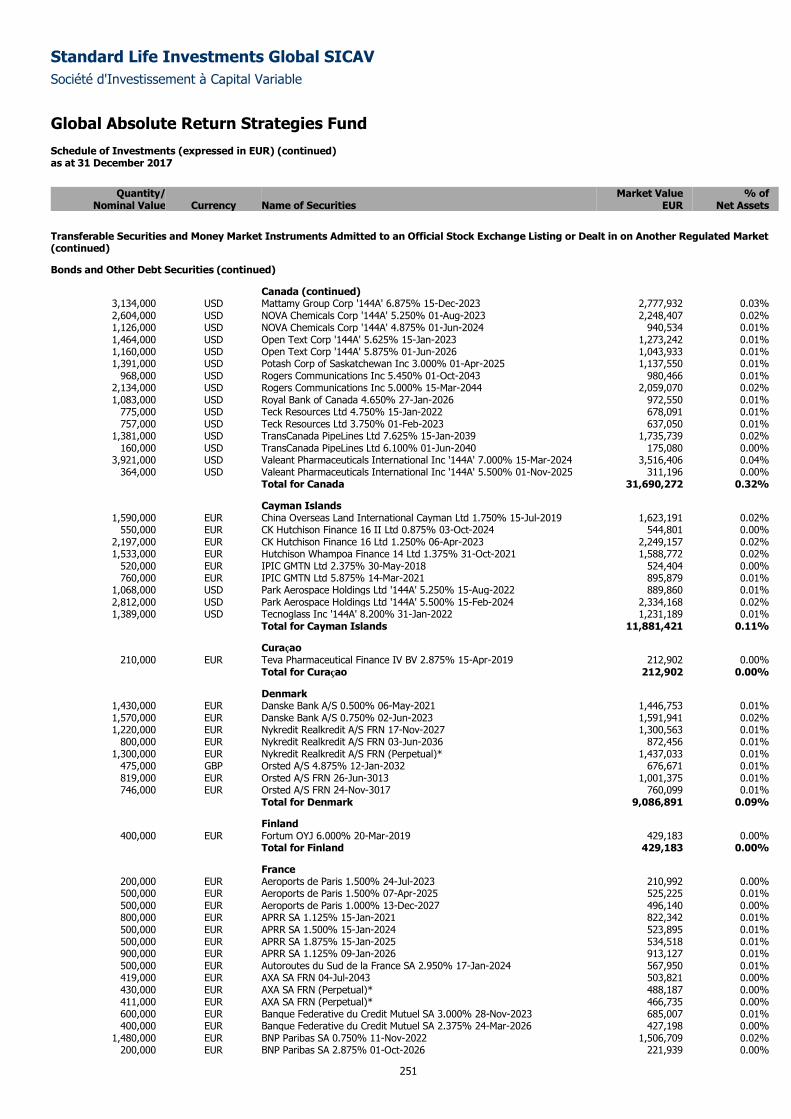
Standard Life Investments Global SICAV
Société d'Investissement à Capital Variable
Global Absolute Return Strategies Fund Schedule of Investments (expressed in EUR) (continued) as at 31 December 2017
251
Quantity/ Market Value % of
Nominal Value Currency Name of Securities EUR Net Assets
Transferable Securities and Money Market Instruments Admitted to an Official Stock Exchange Listing or Dealt in on Another Regulated Market (continued)
Bonds and Other Debt Securities (continued)
Canada (continued) 3,134,000 USD Mattamy Group Corp '144A' 6.875% 15-Dec-2023 2,777,932 0.03% 2,604,000 USD NOVA Chemicals Corp '144A' 5.250% 01-Aug-2023 2,248,407 0.02% 1,126,000 USD NOVA Chemicals Corp '144A' 4.875% 01-Jun-2024 940,534 0.01% 1,464,000 USD Open Text Corp '144A' 5.625% 15-Jan-2023 1,273,242 0.01% 1,160,000 USD Open Text Corp '144A' 5.875% 01-Jun-2026 1,043,933 0.01% 1,391,000 USD Potash Corp of Saskatchewan Inc 3.000% 01-Apr-2025 1,137,550 0.01%
968,000 USD Rogers Communications Inc 5.450% 01-Oct-2043 980,466 0.01% 2,134,000 USD Rogers Communications Inc 5.000% 15-Mar-2044 2,059,070 0.02% 1,083,000 USD Royal Bank of Canada 4.650% 27-Jan-2026 972,550 0.01%
775,000 USD Teck Resources Ltd 4.750% 15-Jan-2022 678,091 0.01% 757,000 USD Teck Resources Ltd 3.750% 01-Feb-2023 637,050 0.01%
1,381,000 USD TransCanada PipeLines Ltd 7.625% 15-Jan-2039 1,735,739 0.02% 160,000 USD TransCanada PipeLines Ltd 6.100% 01-Jun-2040 175,080 0.00%
3,921,000 USD Valeant Pharmaceuticals International Inc '144A' 7.000% 15-Mar-2024 3,516,406 0.04% 364,000 USD Valeant Pharmaceuticals International Inc '144A' 5.500% 01-Nov-2025 311,196 0.00%
Total for Canada 31,690,272 0.32%
Cayman Islands 1,590,000 EUR China Overseas Land International Cayman Ltd 1.750% 15-Jul-2019 1,623,191 0.02%
550,000 EUR CK Hutchison Finance 16 II Ltd 0.875% 03-Oct-2024 544,801 0.00% 2,197,000 EUR CK Hutchison Finance 16 Ltd 1.250% 06-Apr-2023 2,249,157 0.02% 1,533,000 EUR Hutchison Whampoa Finance 14 Ltd 1.375% 31-Oct-2021 1,588,772 0.02%
520,000 EUR IPIC GMTN Ltd 2.375% 30-May-2018 524,404 0.00% 760,000 EUR IPIC GMTN Ltd 5.875% 14-Mar-2021 895,879 0.01%
1,068,000 USD Park Aerospace Holdings Ltd '144A' 5.250% 15-Aug-2022 889,860 0.01% 2,812,000 USD Park Aerospace Holdings Ltd '144A' 5.500% 15-Feb-2024 2,334,168 0.02% 1,389,000 USD Tecnoglass Inc '144A' 8.200% 31-Jan-2022 1,231,189 0.01%
Total for Cayman Islands 11,881,421 0.11%
Curaçao 210,000 EUR Teva Pharmaceutical Finance IV BV 2.875% 15-Apr-2019 212,902 0.00%
Total for Curaçao 212,902 0.00%
Denmark 1,430,000 EUR Danske Bank A/S 0.500% 06-May-2021 1,446,753 0.01% 1,570,000 EUR Danske Bank A/S 0.750% 02-Jun-2023 1,591,941 0.02% 1,220,000 EUR Nykredit Realkredit A/S FRN 17-Nov-2027 1,300,563 0.01%
800,000 EUR Nykredit Realkredit A/S FRN 03-Jun-2036 872,456 0.01% 1,300,000 EUR Nykredit Realkredit A/S FRN (Perpetual)* 1,437,033 0.01%
475,000 GBP Orsted A/S 4.875% 12-Jan-2032 676,671 0.01% 819,000 EUR Orsted A/S FRN 26-Jun-3013 1,001,375 0.01% 746,000 EUR Orsted A/S FRN 24-Nov-3017 760,099 0.01%
Total for Denmark 9,086,891 0.09%
Finland 400,000 EUR Fortum OYJ 6.000% 20-Mar-2019 429,183 0.00%
Total for Finland 429,183 0.00%
France 200,000 EUR Aeroports de Paris 1.500% 24-Jul-2023 210,992 0.00% 500,000 EUR Aeroports de Paris 1.500% 07-Apr-2025 525,225 0.01% 500,000 EUR Aeroports de Paris 1.000% 13-Dec-2027 496,140 0.00% 800,000 EUR APRR SA 1.125% 15-Jan-2021 822,342 0.01% 500,000 EUR APRR SA 1.500% 15-Jan-2024 523,895 0.01% 500,000 EUR APRR SA 1.875% 15-Jan-2025 534,518 0.01% 900,000 EUR APRR SA 1.125% 09-Jan-2026 913,127 0.01% 500,000 EUR Autoroutes du Sud de la France SA 2.950% 17-Jan-2024 567,950 0.01% 419,000 EUR AXA SA FRN 04-Jul-2043 503,821 0.00% 430,000 EUR AXA SA FRN (Perpetual)* 488,187 0.00% 411,000 EUR AXA SA FRN (Perpetual)* 466,735 0.00% 600,000 EUR Banque Federative du Credit Mutuel SA 3.000% 28-Nov-2023 685,007 0.01% 400,000 EUR Banque Federative du Credit Mutuel SA 2.375% 24-Mar-2026 427,198 0.00%
1,480,000 EUR BNP Paribas SA 0.750% 11-Nov-2022 1,506,709 0.02% 200,000 EUR BNP Paribas SA 2.875% 01-Oct-2026 221,939 0.00%
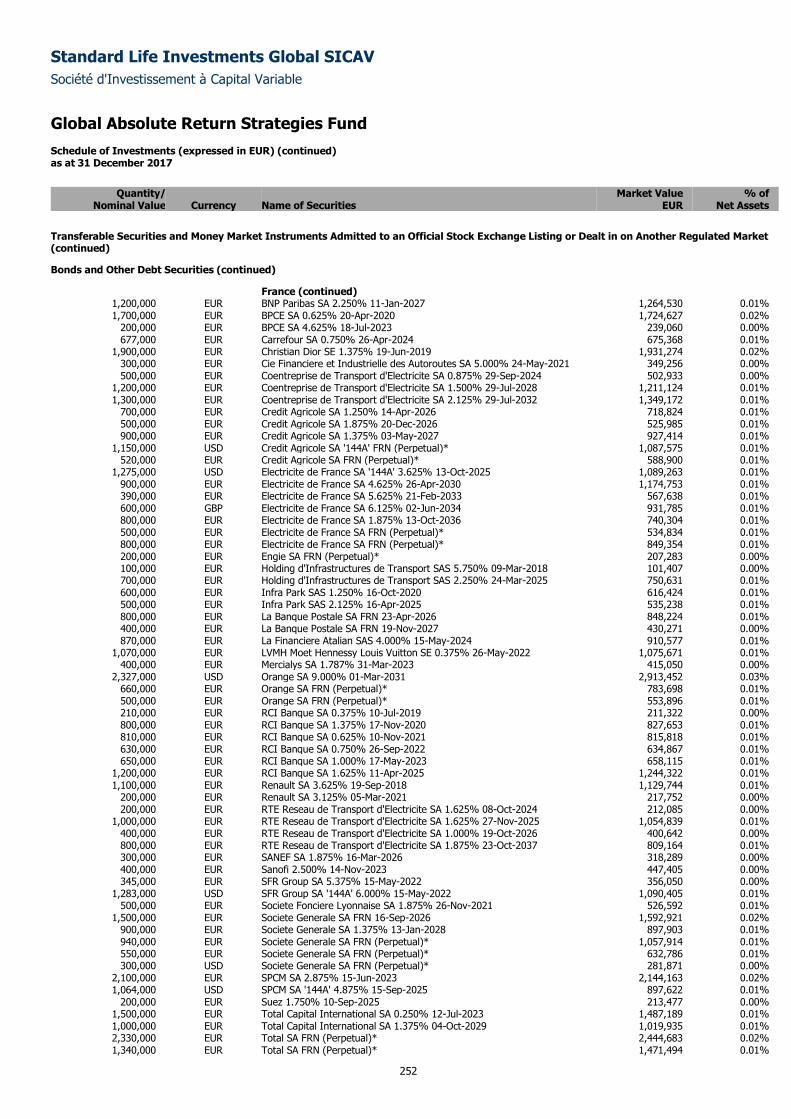
Standard Life Investments Global SICAV
Société d'Investissement à Capital Variable
Global Absolute Return Strategies Fund Schedule of Investments (expressed in EUR) (continued) as at 31 December 2017
252
Quantity/ Market Value % of
Nominal Value Currency Name of Securities EUR Net Assets
Transferable Securities and Money Market Instruments Admitted to an Official Stock Exchange Listing or Dealt in on Another Regulated Market (continued)
Bonds and Other Debt Securities (continued)
France (continued) 1,200,000 EUR BNP Paribas SA 2.250% 11-Jan-2027 1,264,530 0.01% 1,700,000 EUR BPCE SA 0.625% 20-Apr-2020 1,724,627 0.02%
200,000 EUR BPCE SA 4.625% 18-Jul-2023 239,060 0.00% 677,000 EUR Carrefour SA 0.750% 26-Apr-2024 675,368 0.01%
1,900,000 EUR Christian Dior SE 1.375% 19-Jun-2019 1,931,274 0.02% 300,000 EUR Cie Financiere et Industrielle des Autoroutes SA 5.000% 24-May-2021 349,256 0.00% 500,000 EUR Coentreprise de Transport d'Electricite SA 0.875% 29-Sep-2024 502,933 0.00%
1,200,000 EUR Coentreprise de Transport d'Electricite SA 1.500% 29-Jul-2028 1,211,124 0.01% 1,300,000 EUR Coentreprise de Transport d'Electricite SA 2.125% 29-Jul-2032 1,349,172 0.01%
700,000 EUR Credit Agricole SA 1.250% 14-Apr-2026 718,824 0.01% 500,000 EUR Credit Agricole SA 1.875% 20-Dec-2026 525,985 0.01% 900,000 EUR Credit Agricole SA 1.375% 03-May-2027 927,414 0.01%
1,150,000 USD Credit Agricole SA '144A' FRN (Perpetual)* 1,087,575 0.01% 520,000 EUR Credit Agricole SA FRN (Perpetual)* 588,900 0.01%
1,275,000 USD Electricite de France SA '144A' 3.625% 13-Oct-2025 1,089,263 0.01% 900,000 EUR Electricite de France SA 4.625% 26-Apr-2030 1,174,753 0.01% 390,000 EUR Electricite de France SA 5.625% 21-Feb-2033 567,638 0.01% 600,000 GBP Electricite de France SA 6.125% 02-Jun-2034 931,785 0.01% 800,000 EUR Electricite de France SA 1.875% 13-Oct-2036 740,304 0.01% 500,000 EUR Electricite de France SA FRN (Perpetual)* 534,834 0.01% 800,000 EUR Electricite de France SA FRN (Perpetual)* 849,354 0.01% 200,000 EUR Engie SA FRN (Perpetual)* 207,283 0.00% 100,000 EUR Holding d'Infrastructures de Transport SAS 5.750% 09-Mar-2018 101,407 0.00% 700,000 EUR Holding d'Infrastructures de Transport SAS 2.250% 24-Mar-2025 750,631 0.01% 600,000 EUR Infra Park SAS 1.250% 16-Oct-2020 616,424 0.01% 500,000 EUR Infra Park SAS 2.125% 16-Apr-2025 535,238 0.01% 800,000 EUR La Banque Postale SA FRN 23-Apr-2026 848,224 0.01% 400,000 EUR La Banque Postale SA FRN 19-Nov-2027 430,271 0.00% 870,000 EUR La Financiere Atalian SAS 4.000% 15-May-2024 910,577 0.01%
1,070,000 EUR LVMH Moet Hennessy Louis Vuitton SE 0.375% 26-May-2022 1,075,671 0.01% 400,000 EUR Mercialys SA 1.787% 31-Mar-2023 415,050 0.00%
2,327,000 USD Orange SA 9.000% 01-Mar-2031 2,913,452 0.03% 660,000 EUR Orange SA FRN (Perpetual)* 783,698 0.01% 500,000 EUR Orange SA FRN (Perpetual)* 553,896 0.01% 210,000 EUR RCI Banque SA 0.375% 10-Jul-2019 211,322 0.00% 800,000 EUR RCI Banque SA 1.375% 17-Nov-2020 827,653 0.01% 810,000 EUR RCI Banque SA 0.625% 10-Nov-2021 815,818 0.01% 630,000 EUR RCI Banque SA 0.750% 26-Sep-2022 634,867 0.01% 650,000 EUR RCI Banque SA 1.000% 17-May-2023 658,115 0.01%
1,200,000 EUR RCI Banque SA 1.625% 11-Apr-2025 1,244,322 0.01% 1,100,000 EUR Renault SA 3.625% 19-Sep-2018 1,129,744 0.01%
200,000 EUR Renault SA 3.125% 05-Mar-2021 217,752 0.00% 200,000 EUR RTE Reseau de Transport d'Electricite SA 1.625% 08-Oct-2024 212,085 0.00%
1,000,000 EUR RTE Reseau de Transport d'Electricite SA 1.625% 27-Nov-2025 1,054,839 0.01% 400,000 EUR RTE Reseau de Transport d'Electricite SA 1.000% 19-Oct-2026 400,642 0.00% 800,000 EUR RTE Reseau de Transport d'Electricite SA 1.875% 23-Oct-2037 809,164 0.01% 300,000 EUR SANEF SA 1.875% 16-Mar-2026 318,289 0.00% 400,000 EUR Sanofi 2.500% 14-Nov-2023 447,405 0.00% 345,000 EUR SFR Group SA 5.375% 15-May-2022 356,050 0.00%
1,283,000 USD SFR Group SA '144A' 6.000% 15-May-2022 1,090,405 0.01% 500,000 EUR Societe Fonciere Lyonnaise SA 1.875% 26-Nov-2021 526,592 0.01%
1,500,000 EUR Societe Generale SA FRN 16-Sep-2026 1,592,921 0.02% 900,000 EUR Societe Generale SA 1.375% 13-Jan-2028 897,903 0.01% 940,000 EUR Societe Generale SA FRN (Perpetual)* 1,057,914 0.01% 550,000 EUR Societe Generale SA FRN (Perpetual)* 632,786 0.01% 300,000 USD Societe Generale SA FRN (Perpetual)* 281,871 0.00%
2,100,000 EUR SPCM SA 2.875% 15-Jun-2023 2,144,163 0.02% 1,064,000 USD SPCM SA '144A' 4.875% 15-Sep-2025 897,622 0.01%
200,000 EUR Suez 1.750% 10-Sep-2025 213,477 0.00% 1,500,000 EUR Total Capital International SA 0.250% 12-Jul-2023 1,487,189 0.01% 1,000,000 EUR Total Capital International SA 1.375% 04-Oct-2029 1,019,935 0.01% 2,330,000 EUR Total SA FRN (Perpetual)* 2,444,683 0.02% 1,340,000 EUR Total SA FRN (Perpetual)* 1,471,494 0.01%
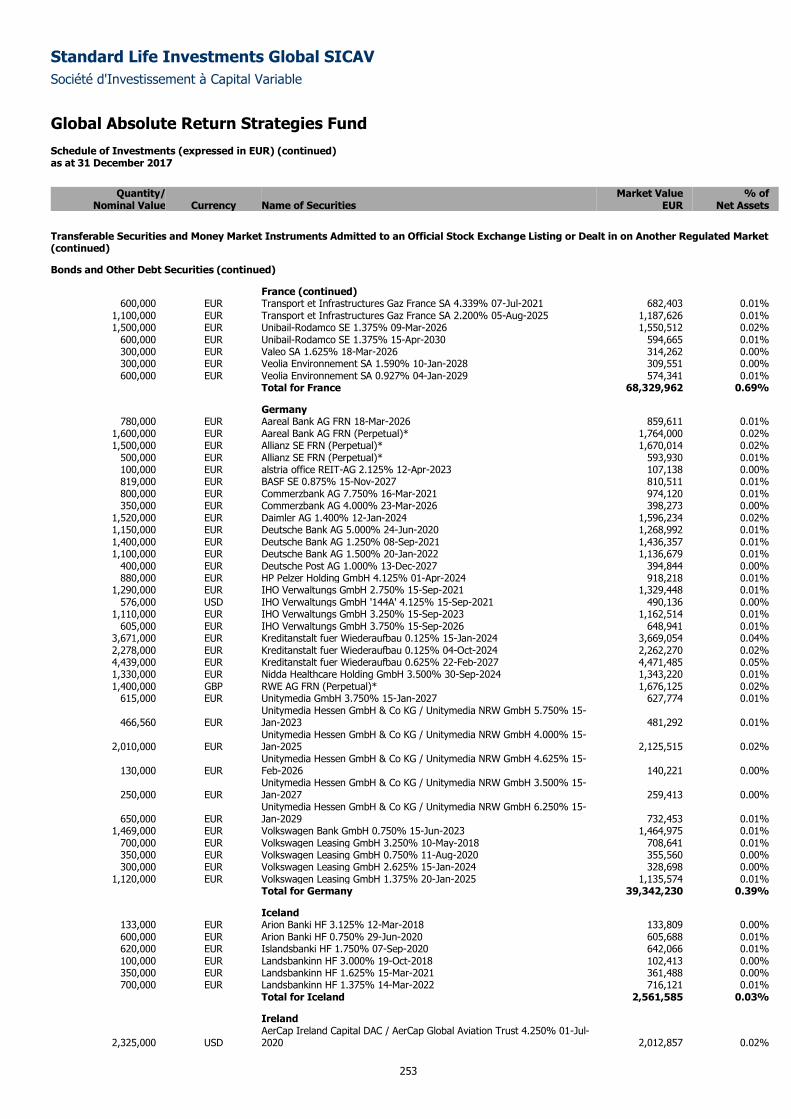
Standard Life Investments Global SICAV
Société d'Investissement à Capital Variable
Global Absolute Return Strategies Fund Schedule of Investments (expressed in EUR) (continued) as at 31 December 2017
253
Quantity/ Market Value % of
Nominal Value Currency Name of Securities EUR Net Assets
Transferable Securities and Money Market Instruments Admitted to an Official Stock Exchange Listing or Dealt in on Another Regulated Market (continued)
Bonds and Other Debt Securities (continued)
France (continued) 600,000 EUR Transport et Infrastructures Gaz France SA 4.339% 07-Jul-2021 682,403 0.01%
1,100,000 EUR Transport et Infrastructures Gaz France SA 2.200% 05-Aug-2025 1,187,626 0.01% 1,500,000 EUR Unibail-Rodamco SE 1.375% 09-Mar-2026 1,550,512 0.02%
600,000 EUR Unibail-Rodamco SE 1.375% 15-Apr-2030 594,665 0.01% 300,000 EUR Valeo SA 1.625% 18-Mar-2026 314,262 0.00% 300,000 EUR Veolia Environnement SA 1.590% 10-Jan-2028 309,551 0.00% 600,000 EUR Veolia Environnement SA 0.927% 04-Jan-2029 574,341 0.01%
Total for France 68,329,962 0.69%
Germany 780,000 EUR Aareal Bank AG FRN 18-Mar-2026 859,611 0.01%
1,600,000 EUR Aareal Bank AG FRN (Perpetual)* 1,764,000 0.02% 1,500,000 EUR Allianz SE FRN (Perpetual)* 1,670,014 0.02%
500,000 EUR Allianz SE FRN (Perpetual)* 593,930 0.01% 100,000 EUR alstria office REIT-AG 2.125% 12-Apr-2023 107,138 0.00% 819,000 EUR BASF SE 0.875% 15-Nov-2027 810,511 0.01% 800,000 EUR Commerzbank AG 7.750% 16-Mar-2021 974,120 0.01% 350,000 EUR Commerzbank AG 4.000% 23-Mar-2026 398,273 0.00%
1,520,000 EUR Daimler AG 1.400% 12-Jan-2024 1,596,234 0.02% 1,150,000 EUR Deutsche Bank AG 5.000% 24-Jun-2020 1,268,992 0.01% 1,400,000 EUR Deutsche Bank AG 1.250% 08-Sep-2021 1,436,357 0.01% 1,100,000 EUR Deutsche Bank AG 1.500% 20-Jan-2022 1,136,679 0.01%
400,000 EUR Deutsche Post AG 1.000% 13-Dec-2027 394,844 0.00% 880,000 EUR HP Pelzer Holding GmbH 4.125% 01-Apr-2024 918,218 0.01%
1,290,000 EUR IHO Verwaltungs GmbH 2.750% 15-Sep-2021 1,329,448 0.01% 576,000 USD IHO Verwaltungs GmbH '144A' 4.125% 15-Sep-2021 490,136 0.00%
1,110,000 EUR IHO Verwaltungs GmbH 3.250% 15-Sep-2023 1,162,514 0.01% 605,000 EUR IHO Verwaltungs GmbH 3.750% 15-Sep-2026 648,941 0.01%
3,671,000 EUR Kreditanstalt fuer Wiederaufbau 0.125% 15-Jan-2024 3,669,054 0.04% 2,278,000 EUR Kreditanstalt fuer Wiederaufbau 0.125% 04-Oct-2024 2,262,270 0.02% 4,439,000 EUR Kreditanstalt fuer Wiederaufbau 0.625% 22-Feb-2027 4,471,485 0.05% 1,330,000 EUR Nidda Healthcare Holding GmbH 3.500% 30-Sep-2024 1,343,220 0.01% 1,400,000 GBP RWE AG FRN (Perpetual)* 1,676,125 0.02%
615,000 EUR Unitymedia GmbH 3.750% 15-Jan-2027 627,774 0.01%
466,560 EUR Unitymedia Hessen GmbH & Co KG / Unitymedia NRW GmbH 5.750% 15-Jan-2023 481,292 0.01%
2,010,000 EUR Unitymedia Hessen GmbH & Co KG / Unitymedia NRW GmbH 4.000% 15-Jan-2025 2,125,515 0.02%
130,000 EUR Unitymedia Hessen GmbH & Co KG / Unitymedia NRW GmbH 4.625% 15-Feb-2026 140,221 0.00%
250,000 EUR Unitymedia Hessen GmbH & Co KG / Unitymedia NRW GmbH 3.500% 15-Jan-2027 259,413 0.00%
650,000 EUR Unitymedia Hessen GmbH & Co KG / Unitymedia NRW GmbH 6.250% 15-Jan-2029 732,453 0.01%
1,469,000 EUR Volkswagen Bank GmbH 0.750% 15-Jun-2023 1,464,975 0.01% 700,000 EUR Volkswagen Leasing GmbH 3.250% 10-May-2018 708,641 0.01% 350,000 EUR Volkswagen Leasing GmbH 0.750% 11-Aug-2020 355,560 0.00% 300,000 EUR Volkswagen Leasing GmbH 2.625% 15-Jan-2024 328,698 0.00%
1,120,000 EUR Volkswagen Leasing GmbH 1.375% 20-Jan-2025 1,135,574 0.01% Total for Germany 39,342,230 0.39%
Iceland 133,000 EUR Arion Banki HF 3.125% 12-Mar-2018 133,809 0.00% 600,000 EUR Arion Banki HF 0.750% 29-Jun-2020 605,688 0.01% 620,000 EUR Islandsbanki HF 1.750% 07-Sep-2020 642,066 0.01% 100,000 EUR Landsbankinn HF 3.000% 19-Oct-2018 102,413 0.00% 350,000 EUR Landsbankinn HF 1.625% 15-Mar-2021 361,488 0.00% 700,000 EUR Landsbankinn HF 1.375% 14-Mar-2022 716,121 0.01%
Total for Iceland 2,561,585 0.03%
Ireland
2,325,000 USD AerCap Ireland Capital DAC / AerCap Global Aviation Trust 4.250% 01-Jul-2020 2,012,857 0.02%
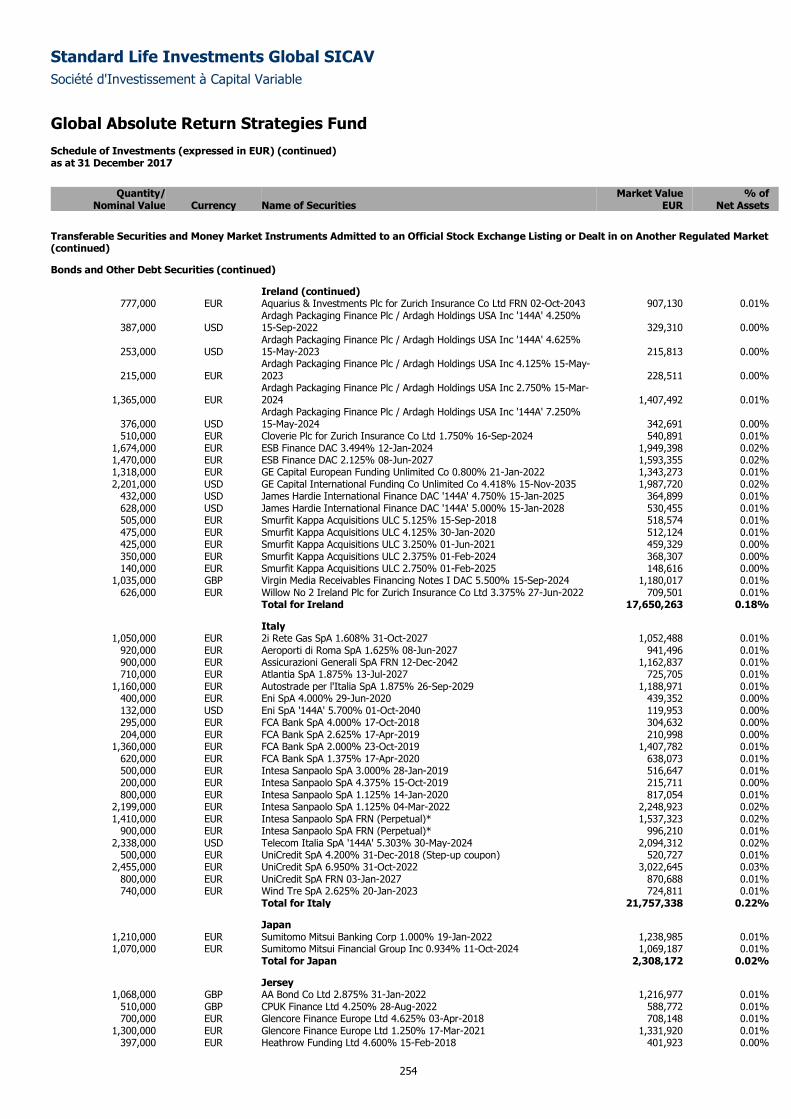
Standard Life Investments Global SICAV
Société d'Investissement à Capital Variable
Global Absolute Return Strategies Fund Schedule of Investments (expressed in EUR) (continued) as at 31 December 2017
254
Quantity/ Market Value % of
Nominal Value Currency Name of Securities EUR Net Assets
Transferable Securities and Money Market Instruments Admitted to an Official Stock Exchange Listing or Dealt in on Another Regulated Market (continued)
Bonds and Other Debt Securities (continued)
Ireland (continued) 777,000 EUR Aquarius & Investments Plc for Zurich Insurance Co Ltd FRN 02-Oct-2043 907,130 0.01%
387,000 USD Ardagh Packaging Finance Plc / Ardagh Holdings USA Inc '144A' 4.250% 15-Sep-2022 329,310 0.00%
253,000 USD Ardagh Packaging Finance Plc / Ardagh Holdings USA Inc '144A' 4.625% 15-May-2023 215,813 0.00%
215,000 EUR Ardagh Packaging Finance Plc / Ardagh Holdings USA Inc 4.125% 15-May-2023 228,511 0.00%
1,365,000 EUR Ardagh Packaging Finance Plc / Ardagh Holdings USA Inc 2.750% 15-Mar-2024 1,407,492 0.01%
376,000 USD Ardagh Packaging Finance Plc / Ardagh Holdings USA Inc '144A' 7.250% 15-May-2024 342,691 0.00%
510,000 EUR Cloverie Plc for Zurich Insurance Co Ltd 1.750% 16-Sep-2024 540,891 0.01% 1,674,000 EUR ESB Finance DAC 3.494% 12-Jan-2024 1,949,398 0.02% 1,470,000 EUR ESB Finance DAC 2.125% 08-Jun-2027 1,593,355 0.02% 1,318,000 EUR GE Capital European Funding Unlimited Co 0.800% 21-Jan-2022 1,343,273 0.01% 2,201,000 USD GE Capital International Funding Co Unlimited Co 4.418% 15-Nov-2035 1,987,720 0.02%
432,000 USD James Hardie International Finance DAC '144A' 4.750% 15-Jan-2025 364,899 0.01% 628,000 USD James Hardie International Finance DAC '144A' 5.000% 15-Jan-2028 530,455 0.01% 505,000 EUR Smurfit Kappa Acquisitions ULC 5.125% 15-Sep-2018 518,574 0.01% 475,000 EUR Smurfit Kappa Acquisitions ULC 4.125% 30-Jan-2020 512,124 0.01% 425,000 EUR Smurfit Kappa Acquisitions ULC 3.250% 01-Jun-2021 459,329 0.00% 350,000 EUR Smurfit Kappa Acquisitions ULC 2.375% 01-Feb-2024 368,307 0.00% 140,000 EUR Smurfit Kappa Acquisitions ULC 2.750% 01-Feb-2025 148,616 0.00%
1,035,000 GBP Virgin Media Receivables Financing Notes I DAC 5.500% 15-Sep-2024 1,180,017 0.01% 626,000 EUR Willow No 2 Ireland Plc for Zurich Insurance Co Ltd 3.375% 27-Jun-2022 709,501 0.01%
Total for Ireland 17,650,263 0.18%
Italy 1,050,000 EUR 2i Rete Gas SpA 1.608% 31-Oct-2027 1,052,488 0.01%
920,000 EUR Aeroporti di Roma SpA 1.625% 08-Jun-2027 941,496 0.01% 900,000 EUR Assicurazioni Generali SpA FRN 12-Dec-2042 1,162,837 0.01% 710,000 EUR Atlantia SpA 1.875% 13-Jul-2027 725,705 0.01%
1,160,000 EUR Autostrade per l'Italia SpA 1.875% 26-Sep-2029 1,188,971 0.01% 400,000 EUR Eni SpA 4.000% 29-Jun-2020 439,352 0.00% 132,000 USD Eni SpA '144A' 5.700% 01-Oct-2040 119,953 0.00% 295,000 EUR FCA Bank SpA 4.000% 17-Oct-2018 304,632 0.00% 204,000 EUR FCA Bank SpA 2.625% 17-Apr-2019 210,998 0.00%
1,360,000 EUR FCA Bank SpA 2.000% 23-Oct-2019 1,407,782 0.01% 620,000 EUR FCA Bank SpA 1.375% 17-Apr-2020 638,073 0.01% 500,000 EUR Intesa Sanpaolo SpA 3.000% 28-Jan-2019 516,647 0.01% 200,000 EUR Intesa Sanpaolo SpA 4.375% 15-Oct-2019 215,711 0.00% 800,000 EUR Intesa Sanpaolo SpA 1.125% 14-Jan-2020 817,054 0.01%
2,199,000 EUR Intesa Sanpaolo SpA 1.125% 04-Mar-2022 2,248,923 0.02% 1,410,000 EUR Intesa Sanpaolo SpA FRN (Perpetual)* 1,537,323 0.02%
900,000 EUR Intesa Sanpaolo SpA FRN (Perpetual)* 996,210 0.01% 2,338,000 USD Telecom Italia SpA '144A' 5.303% 30-May-2024 2,094,312 0.02%
500,000 EUR UniCredit SpA 4.200% 31-Dec-2018 (Step-up coupon) 520,727 0.01% 2,455,000 EUR UniCredit SpA 6.950% 31-Oct-2022 3,022,645 0.03%
800,000 EUR UniCredit SpA FRN 03-Jan-2027 870,688 0.01% 740,000 EUR Wind Tre SpA 2.625% 20-Jan-2023 724,811 0.01%
Total for Italy 21,757,338 0.22%
Japan 1,210,000 EUR Sumitomo Mitsui Banking Corp 1.000% 19-Jan-2022 1,238,985 0.01% 1,070,000 EUR Sumitomo Mitsui Financial Group Inc 0.934% 11-Oct-2024 1,069,187 0.01%
Total for Japan 2,308,172 0.02%
Jersey 1,068,000 GBP AA Bond Co Ltd 2.875% 31-Jan-2022 1,216,977 0.01%
510,000 GBP CPUK Finance Ltd 4.250% 28-Aug-2022 588,772 0.01% 700,000 EUR Glencore Finance Europe Ltd 4.625% 03-Apr-2018 708,148 0.01%
1,300,000 EUR Glencore Finance Europe Ltd 1.250% 17-Mar-2021 1,331,920 0.01% 397,000 EUR Heathrow Funding Ltd 4.600% 15-Feb-2018 401,923 0.00%
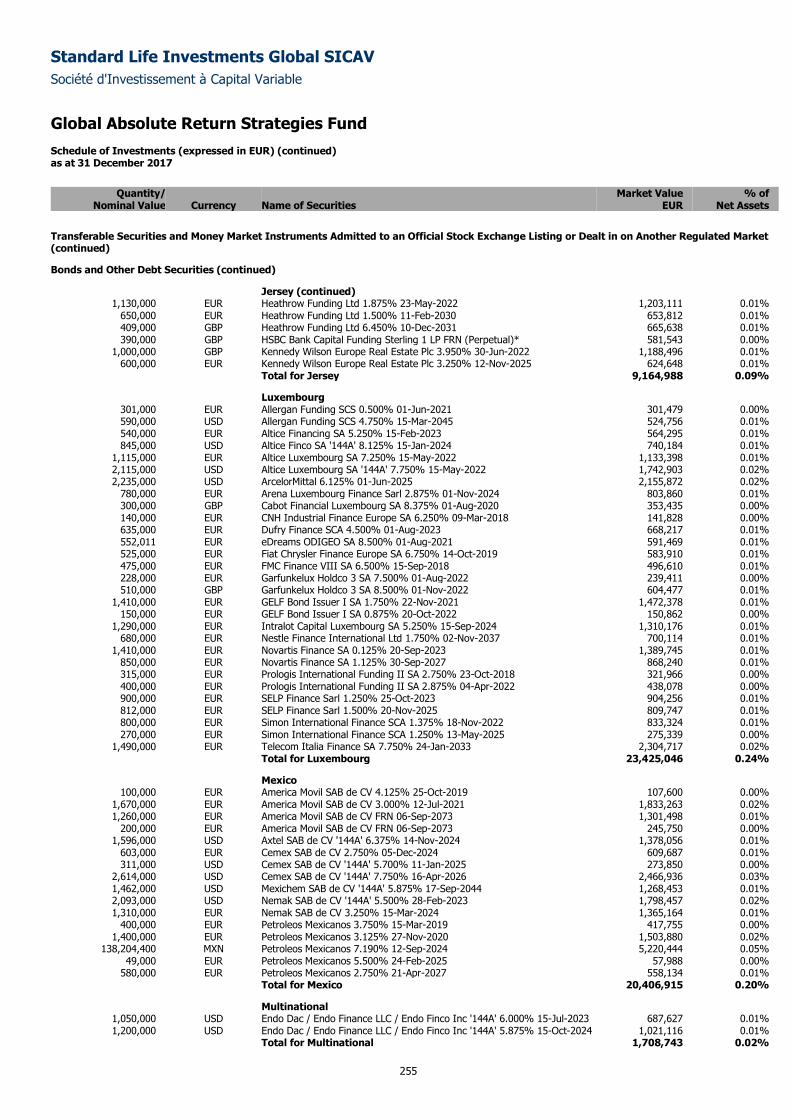
Standard Life Investments Global SICAV
Société d'Investissement à Capital Variable
Global Absolute Return Strategies Fund Schedule of Investments (expressed in EUR) (continued) as at 31 December 2017
255
Quantity/ Market Value % of
Nominal Value Currency Name of Securities EUR Net Assets
Transferable Securities and Money Market Instruments Admitted to an Official Stock Exchange Listing or Dealt in on Another Regulated Market (continued)
Bonds and Other Debt Securities (continued)
Jersey (continued) 1,130,000 EUR Heathrow Funding Ltd 1.875% 23-May-2022 1,203,111 0.01%
650,000 EUR Heathrow Funding Ltd 1.500% 11-Feb-2030 653,812 0.01% 409,000 GBP Heathrow Funding Ltd 6.450% 10-Dec-2031 665,638 0.01% 390,000 GBP HSBC Bank Capital Funding Sterling 1 LP FRN (Perpetual)* 581,543 0.00%
1,000,000 GBP Kennedy Wilson Europe Real Estate Plc 3.950% 30-Jun-2022 1,188,496 0.01% 600,000 EUR Kennedy Wilson Europe Real Estate Plc 3.250% 12-Nov-2025 624,648 0.01%
Total for Jersey 9,164,988 0.09%
Luxembourg 301,000 EUR Allergan Funding SCS 0.500% 01-Jun-2021 301,479 0.00% 590,000 USD Allergan Funding SCS 4.750% 15-Mar-2045 524,756 0.01% 540,000 EUR Altice Financing SA 5.250% 15-Feb-2023 564,295 0.01% 845,000 USD Altice Finco SA '144A' 8.125% 15-Jan-2024 740,184 0.01%
1,115,000 EUR Altice Luxembourg SA 7.250% 15-May-2022 1,133,398 0.01% 2,115,000 USD Altice Luxembourg SA '144A' 7.750% 15-May-2022 1,742,903 0.02% 2,235,000 USD ArcelorMittal 6.125% 01-Jun-2025 2,155,872 0.02%
780,000 EUR Arena Luxembourg Finance Sarl 2.875% 01-Nov-2024 803,860 0.01% 300,000 GBP Cabot Financial Luxembourg SA 8.375% 01-Aug-2020 353,435 0.00% 140,000 EUR CNH Industrial Finance Europe SA 6.250% 09-Mar-2018 141,828 0.00% 635,000 EUR Dufry Finance SCA 4.500% 01-Aug-2023 668,217 0.01% 552,011 EUR eDreams ODIGEO SA 8.500% 01-Aug-2021 591,469 0.01% 525,000 EUR Fiat Chrysler Finance Europe SA 6.750% 14-Oct-2019 583,910 0.01% 475,000 EUR FMC Finance VIII SA 6.500% 15-Sep-2018 496,610 0.01% 228,000 EUR Garfunkelux Holdco 3 SA 7.500% 01-Aug-2022 239,411 0.00% 510,000 GBP Garfunkelux Holdco 3 SA 8.500% 01-Nov-2022 604,477 0.01%
1,410,000 EUR GELF Bond Issuer I SA 1.750% 22-Nov-2021 1,472,378 0.01% 150,000 EUR GELF Bond Issuer I SA 0.875% 20-Oct-2022 150,862 0.00%
1,290,000 EUR Intralot Capital Luxembourg SA 5.250% 15-Sep-2024 1,310,176 0.01% 680,000 EUR Nestle Finance International Ltd 1.750% 02-Nov-2037 700,114 0.01%
1,410,000 EUR Novartis Finance SA 0.125% 20-Sep-2023 1,389,745 0.01% 850,000 EUR Novartis Finance SA 1.125% 30-Sep-2027 868,240 0.01% 315,000 EUR Prologis International Funding II SA 2.750% 23-Oct-2018 321,966 0.00% 400,000 EUR Prologis International Funding II SA 2.875% 04-Apr-2022 438,078 0.00% 900,000 EUR SELP Finance Sarl 1.250% 25-Oct-2023 904,256 0.01% 812,000 EUR SELP Finance Sarl 1.500% 20-Nov-2025 809,747 0.01% 800,000 EUR Simon International Finance SCA 1.375% 18-Nov-2022 833,324 0.01% 270,000 EUR Simon International Finance SCA 1.250% 13-May-2025 275,339 0.00%
1,490,000 EUR Telecom Italia Finance SA 7.750% 24-Jan-2033 2,304,717 0.02% Total for Luxembourg 23,425,046 0.24%
Mexico 100,000 EUR America Movil SAB de CV 4.125% 25-Oct-2019 107,600 0.00%
1,670,000 EUR America Movil SAB de CV 3.000% 12-Jul-2021 1,833,263 0.02% 1,260,000 EUR America Movil SAB de CV FRN 06-Sep-2073 1,301,498 0.01%
200,000 EUR America Movil SAB de CV FRN 06-Sep-2073 245,750 0.00% 1,596,000 USD Axtel SAB de CV '144A' 6.375% 14-Nov-2024 1,378,056 0.01%
603,000 EUR Cemex SAB de CV 2.750% 05-Dec-2024 609,687 0.01% 311,000 USD Cemex SAB de CV '144A' 5.700% 11-Jan-2025 273,850 0.00%
2,614,000 USD Cemex SAB de CV '144A' 7.750% 16-Apr-2026 2,466,936 0.03% 1,462,000 USD Mexichem SAB de CV '144A' 5.875% 17-Sep-2044 1,268,453 0.01% 2,093,000 USD Nemak SAB de CV '144A' 5.500% 28-Feb-2023 1,798,457 0.02% 1,310,000 EUR Nemak SAB de CV 3.250% 15-Mar-2024 1,365,164 0.01%
400,000 EUR Petroleos Mexicanos 3.750% 15-Mar-2019 417,755 0.00% 1,400,000 EUR Petroleos Mexicanos 3.125% 27-Nov-2020 1,503,880 0.02%
138,204,400 MXN Petroleos Mexicanos 7.190% 12-Sep-2024 5,220,444 0.05% 49,000 EUR Petroleos Mexicanos 5.500% 24-Feb-2025 57,988 0.00%
580,000 EUR Petroleos Mexicanos 2.750% 21-Apr-2027 558,134 0.01% Total for Mexico 20,406,915 0.20%
Multinational 1,050,000 USD Endo Dac / Endo Finance LLC / Endo Finco Inc '144A' 6.000% 15-Jul-2023 687,627 0.01% 1,200,000 USD Endo Dac / Endo Finance LLC / Endo Finco Inc '144A' 5.875% 15-Oct-2024 1,021,116 0.01%
Total for Multinational 1,708,743 0.02%
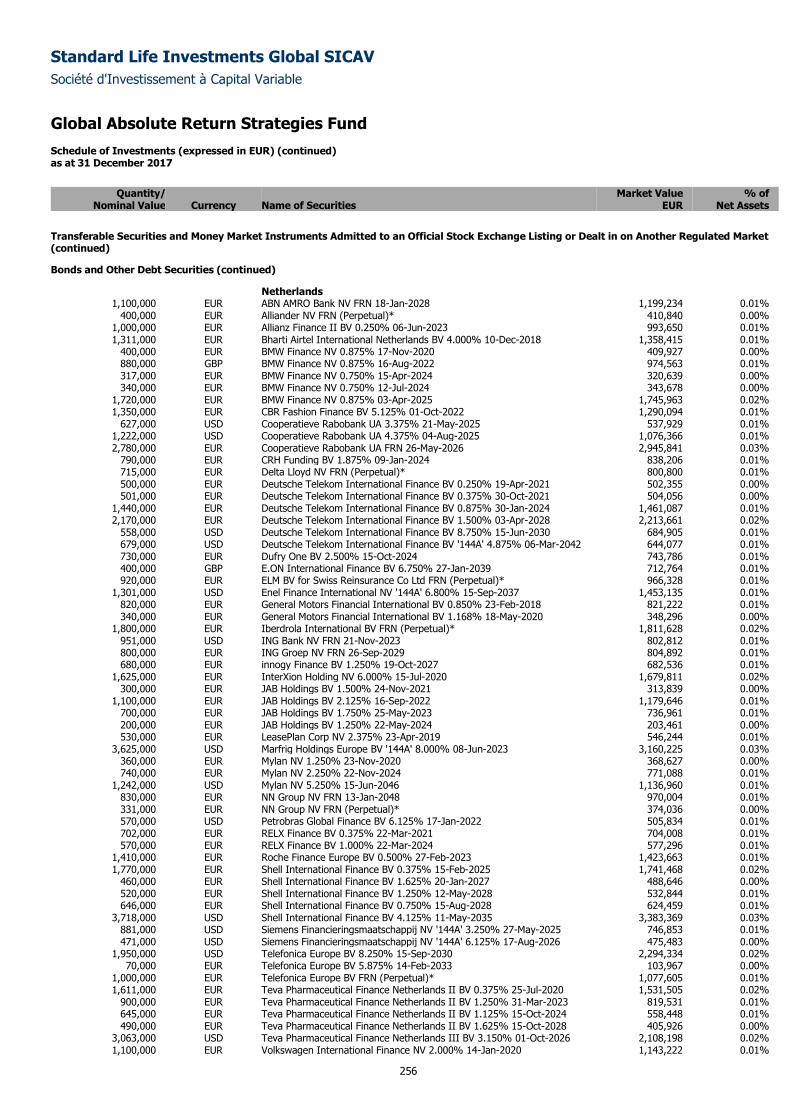
Standard Life Investments Global SICAV
Société d'Investissement à Capital Variable
Global Absolute Return Strategies Fund Schedule of Investments (expressed in EUR) (continued) as at 31 December 2017
256
Quantity/ Market Value % of
Nominal Value Currency Name of Securities EUR Net Assets
Transferable Securities and Money Market Instruments Admitted to an Official Stock Exchange Listing or Dealt in on Another Regulated Market (continued)
Bonds and Other Debt Securities (continued)
Netherlands 1,100,000 EUR ABN AMRO Bank NV FRN 18-Jan-2028 1,199,234 0.01%
400,000 EUR Alliander NV FRN (Perpetual)* 410,840 0.00% 1,000,000 EUR Allianz Finance II BV 0.250% 06-Jun-2023 993,650 0.01% 1,311,000 EUR Bharti Airtel International Netherlands BV 4.000% 10-Dec-2018 1,358,415 0.01%
400,000 EUR BMW Finance NV 0.875% 17-Nov-2020 409,927 0.00% 880,000 GBP BMW Finance NV 0.875% 16-Aug-2022 974,563 0.01% 317,000 EUR BMW Finance NV 0.750% 15-Apr-2024 320,639 0.00% 340,000 EUR BMW Finance NV 0.750% 12-Jul-2024 343,678 0.00%
1,720,000 EUR BMW Finance NV 0.875% 03-Apr-2025 1,745,963 0.02% 1,350,000 EUR CBR Fashion Finance BV 5.125% 01-Oct-2022 1,290,094 0.01%
627,000 USD Cooperatieve Rabobank UA 3.375% 21-May-2025 537,929 0.01% 1,222,000 USD Cooperatieve Rabobank UA 4.375% 04-Aug-2025 1,076,366 0.01% 2,780,000 EUR Cooperatieve Rabobank UA FRN 26-May-2026 2,945,841 0.03%
790,000 EUR CRH Funding BV 1.875% 09-Jan-2024 838,206 0.01% 715,000 EUR Delta Lloyd NV FRN (Perpetual)* 800,800 0.01% 500,000 EUR Deutsche Telekom International Finance BV 0.250% 19-Apr-2021 502,355 0.00% 501,000 EUR Deutsche Telekom International Finance BV 0.375% 30-Oct-2021 504,056 0.00%
1,440,000 EUR Deutsche Telekom International Finance BV 0.875% 30-Jan-2024 1,461,087 0.01% 2,170,000 EUR Deutsche Telekom International Finance BV 1.500% 03-Apr-2028 2,213,661 0.02%
558,000 USD Deutsche Telekom International Finance BV 8.750% 15-Jun-2030 684,905 0.01% 679,000 USD Deutsche Telekom International Finance BV '144A' 4.875% 06-Mar-2042 644,077 0.01% 730,000 EUR Dufry One BV 2.500% 15-Oct-2024 743,786 0.01% 400,000 GBP E.ON International Finance BV 6.750% 27-Jan-2039 712,764 0.01% 920,000 EUR ELM BV for Swiss Reinsurance Co Ltd FRN (Perpetual)* 966,328 0.01%
1,301,000 USD Enel Finance International NV '144A' 6.800% 15-Sep-2037 1,453,135 0.01% 820,000 EUR General Motors Financial International BV 0.850% 23-Feb-2018 821,222 0.01% 340,000 EUR General Motors Financial International BV 1.168% 18-May-2020 348,296 0.00%
1,800,000 EUR Iberdrola International BV FRN (Perpetual)* 1,811,628 0.02% 951,000 USD ING Bank NV FRN 21-Nov-2023 802,812 0.01% 800,000 EUR ING Groep NV FRN 26-Sep-2029 804,892 0.01% 680,000 EUR innogy Finance BV 1.250% 19-Oct-2027 682,536 0.01%
1,625,000 EUR InterXion Holding NV 6.000% 15-Jul-2020 1,679,811 0.02% 300,000 EUR JAB Holdings BV 1.500% 24-Nov-2021 313,839 0.00%
1,100,000 EUR JAB Holdings BV 2.125% 16-Sep-2022 1,179,646 0.01% 700,000 EUR JAB Holdings BV 1.750% 25-May-2023 736,961 0.01% 200,000 EUR JAB Holdings BV 1.250% 22-May-2024 203,461 0.00% 530,000 EUR LeasePlan Corp NV 2.375% 23-Apr-2019 546,244 0.01%
3,625,000 USD Marfrig Holdings Europe BV '144A' 8.000% 08-Jun-2023 3,160,225 0.03% 360,000 EUR Mylan NV 1.250% 23-Nov-2020 368,627 0.00% 740,000 EUR Mylan NV 2.250% 22-Nov-2024 771,088 0.01%
1,242,000 USD Mylan NV 5.250% 15-Jun-2046 1,136,960 0.01% 830,000 EUR NN Group NV FRN 13-Jan-2048 970,004 0.01% 331,000 EUR NN Group NV FRN (Perpetual)* 374,036 0.00% 570,000 USD Petrobras Global Finance BV 6.125% 17-Jan-2022 505,834 0.01% 702,000 EUR RELX Finance BV 0.375% 22-Mar-2021 704,008 0.01% 570,000 EUR RELX Finance BV 1.000% 22-Mar-2024 577,296 0.01%
1,410,000 EUR Roche Finance Europe BV 0.500% 27-Feb-2023 1,423,663 0.01% 1,770,000 EUR Shell International Finance BV 0.375% 15-Feb-2025 1,741,468 0.02%
460,000 EUR Shell International Finance BV 1.625% 20-Jan-2027 488,646 0.00% 520,000 EUR Shell International Finance BV 1.250% 12-May-2028 532,844 0.01% 646,000 EUR Shell International Finance BV 0.750% 15-Aug-2028 624,459 0.01%
3,718,000 USD Shell International Finance BV 4.125% 11-May-2035 3,383,369 0.03% 881,000 USD Siemens Financieringsmaatschappij NV '144A' 3.250% 27-May-2025 746,853 0.01% 471,000 USD Siemens Financieringsmaatschappij NV '144A' 6.125% 17-Aug-2026 475,483 0.00%
1,950,000 USD Telefonica Europe BV 8.250% 15-Sep-2030 2,294,334 0.02% 70,000 EUR Telefonica Europe BV 5.875% 14-Feb-2033 103,967 0.00%
1,000,000 EUR Telefonica Europe BV FRN (Perpetual)* 1,077,605 0.01% 1,611,000 EUR Teva Pharmaceutical Finance Netherlands II BV 0.375% 25-Jul-2020 1,531,505 0.02%
900,000 EUR Teva Pharmaceutical Finance Netherlands II BV 1.250% 31-Mar-2023 819,531 0.01% 645,000 EUR Teva Pharmaceutical Finance Netherlands II BV 1.125% 15-Oct-2024 558,448 0.01% 490,000 EUR Teva Pharmaceutical Finance Netherlands II BV 1.625% 15-Oct-2028 405,926 0.00%
3,063,000 USD Teva Pharmaceutical Finance Netherlands III BV 3.150% 01-Oct-2026 2,108,198 0.02% 1,100,000 EUR Volkswagen International Finance NV 2.000% 14-Jan-2020 1,143,222 0.01%
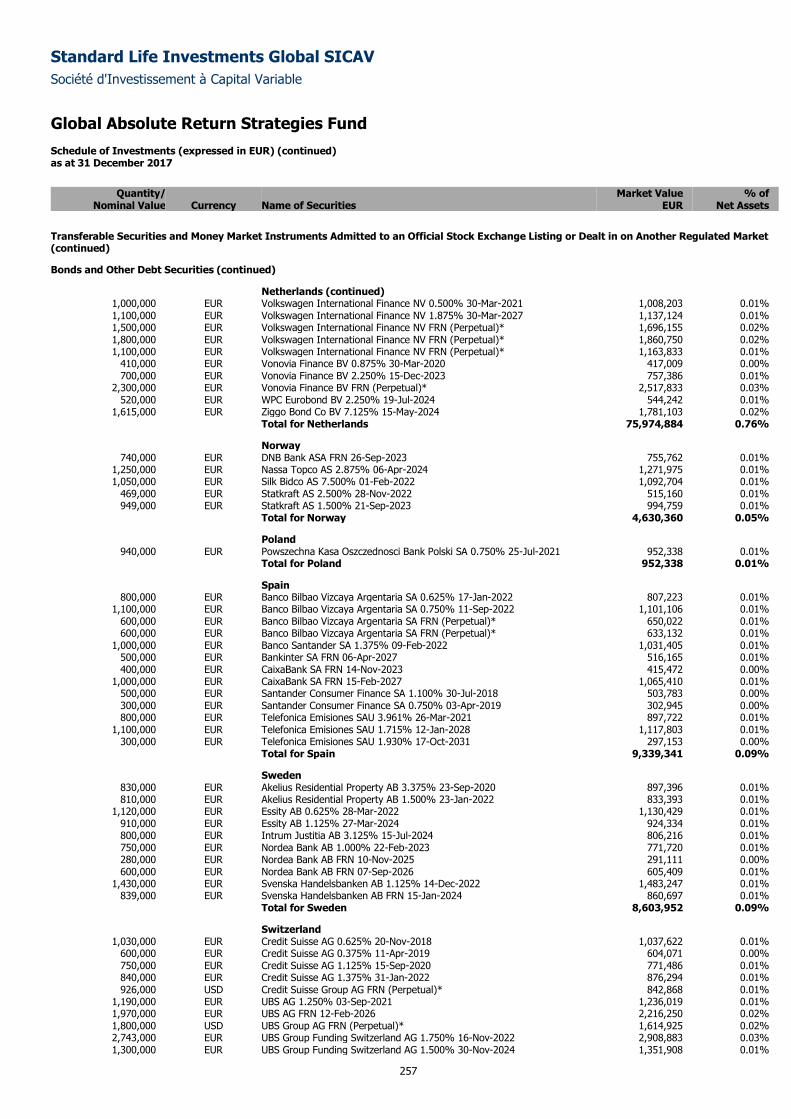
Standard Life Investments Global SICAV
Société d'Investissement à Capital Variable
Global Absolute Return Strategies Fund Schedule of Investments (expressed in EUR) (continued) as at 31 December 2017
257
Quantity/ Market Value % of
Nominal Value Currency Name of Securities EUR Net Assets
Transferable Securities and Money Market Instruments Admitted to an Official Stock Exchange Listing or Dealt in on Another Regulated Market (continued)
Bonds and Other Debt Securities (continued)
Netherlands (continued) 1,000,000 EUR Volkswagen International Finance NV 0.500% 30-Mar-2021 1,008,203 0.01% 1,100,000 EUR Volkswagen International Finance NV 1.875% 30-Mar-2027 1,137,124 0.01% 1,500,000 EUR Volkswagen International Finance NV FRN (Perpetual)* 1,696,155 0.02% 1,800,000 EUR Volkswagen International Finance NV FRN (Perpetual)* 1,860,750 0.02% 1,100,000 EUR Volkswagen International Finance NV FRN (Perpetual)* 1,163,833 0.01%
410,000 EUR Vonovia Finance BV 0.875% 30-Mar-2020 417,009 0.00% 700,000 EUR Vonovia Finance BV 2.250% 15-Dec-2023 757,386 0.01%
2,300,000 EUR Vonovia Finance BV FRN (Perpetual)* 2,517,833 0.03% 520,000 EUR WPC Eurobond BV 2.250% 19-Jul-2024 544,242 0.01%
1,615,000 EUR Ziggo Bond Co BV 7.125% 15-May-2024 1,781,103 0.02% Total for Netherlands 75,974,884 0.76%
Norway 740,000 EUR DNB Bank ASA FRN 26-Sep-2023 755,762 0.01%
1,250,000 EUR Nassa Topco AS 2.875% 06-Apr-2024 1,271,975 0.01% 1,050,000 EUR Silk Bidco AS 7.500% 01-Feb-2022 1,092,704 0.01%
469,000 EUR Statkraft AS 2.500% 28-Nov-2022 515,160 0.01% 949,000 EUR Statkraft AS 1.500% 21-Sep-2023 994,759 0.01%
Total for Norway 4,630,360 0.05%
Poland 940,000 EUR Powszechna Kasa Oszczednosci Bank Polski SA 0.750% 25-Jul-2021 952,338 0.01%
Total for Poland 952,338 0.01%
Spain 800,000 EUR Banco Bilbao Vizcaya Argentaria SA 0.625% 17-Jan-2022 807,223 0.01%
1,100,000 EUR Banco Bilbao Vizcaya Argentaria SA 0.750% 11-Sep-2022 1,101,106 0.01% 600,000 EUR Banco Bilbao Vizcaya Argentaria SA FRN (Perpetual)* 650,022 0.01% 600,000 EUR Banco Bilbao Vizcaya Argentaria SA FRN (Perpetual)* 633,132 0.01%
1,000,000 EUR Banco Santander SA 1.375% 09-Feb-2022 1,031,405 0.01% 500,000 EUR Bankinter SA FRN 06-Apr-2027 516,165 0.01% 400,000 EUR CaixaBank SA FRN 14-Nov-2023 415,472 0.00%
1,000,000 EUR CaixaBank SA FRN 15-Feb-2027 1,065,410 0.01% 500,000 EUR Santander Consumer Finance SA 1.100% 30-Jul-2018 503,783 0.00% 300,000 EUR Santander Consumer Finance SA 0.750% 03-Apr-2019 302,945 0.00% 800,000 EUR Telefonica Emisiones SAU 3.961% 26-Mar-2021 897,722 0.01%
1,100,000 EUR Telefonica Emisiones SAU 1.715% 12-Jan-2028 1,117,803 0.01% 300,000 EUR Telefonica Emisiones SAU 1.930% 17-Oct-2031 297,153 0.00%
Total for Spain 9,339,341 0.09%
Sweden 830,000 EUR Akelius Residential Property AB 3.375% 23-Sep-2020 897,396 0.01% 810,000 EUR Akelius Residential Property AB 1.500% 23-Jan-2022 833,393 0.01%
1,120,000 EUR Essity AB 0.625% 28-Mar-2022 1,130,429 0.01% 910,000 EUR Essity AB 1.125% 27-Mar-2024 924,334 0.01% 800,000 EUR Intrum Justitia AB 3.125% 15-Jul-2024 806,216 0.01% 750,000 EUR Nordea Bank AB 1.000% 22-Feb-2023 771,720 0.01% 280,000 EUR Nordea Bank AB FRN 10-Nov-2025 291,111 0.00% 600,000 EUR Nordea Bank AB FRN 07-Sep-2026 605,409 0.01%
1,430,000 EUR Svenska Handelsbanken AB 1.125% 14-Dec-2022 1,483,247 0.01% 839,000 EUR Svenska Handelsbanken AB FRN 15-Jan-2024 860,697 0.01%
Total for Sweden 8,603,952 0.09%
Switzerland 1,030,000 EUR Credit Suisse AG 0.625% 20-Nov-2018 1,037,622 0.01%
600,000 EUR Credit Suisse AG 0.375% 11-Apr-2019 604,071 0.00% 750,000 EUR Credit Suisse AG 1.125% 15-Sep-2020 771,486 0.01% 840,000 EUR Credit Suisse AG 1.375% 31-Jan-2022 876,294 0.01% 926,000 USD Credit Suisse Group AG FRN (Perpetual)* 842,868 0.01%
1,190,000 EUR UBS AG 1.250% 03-Sep-2021 1,236,019 0.01% 1,970,000 EUR UBS AG FRN 12-Feb-2026 2,216,250 0.02% 1,800,000 USD UBS Group AG FRN (Perpetual)* 1,614,925 0.02% 2,743,000 EUR UBS Group Funding Switzerland AG 1.750% 16-Nov-2022 2,908,883 0.03% 1,300,000 EUR UBS Group Funding Switzerland AG 1.500% 30-Nov-2024 1,351,908 0.01%
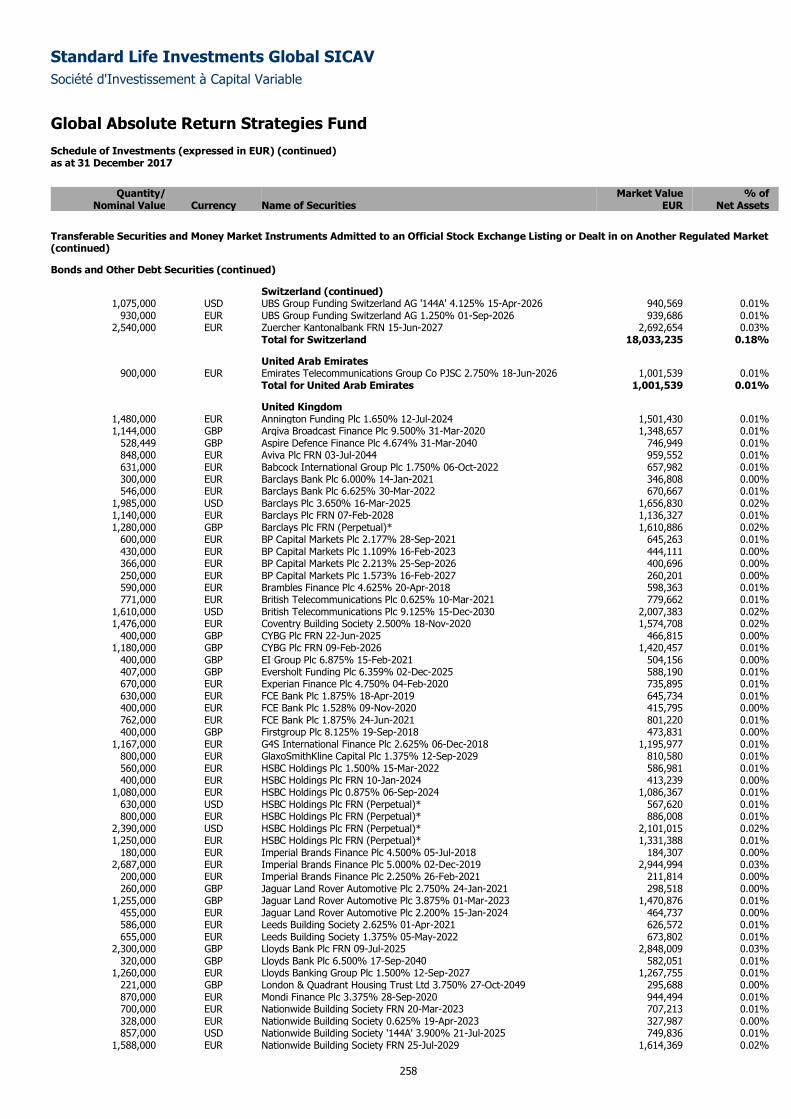
Standard Life Investments Global SICAV
Société d'Investissement à Capital Variable
Global Absolute Return Strategies Fund Schedule of Investments (expressed in EUR) (continued) as at 31 December 2017
258
Quantity/ Market Value % of
Nominal Value Currency Name of Securities EUR Net Assets
Transferable Securities and Money Market Instruments Admitted to an Official Stock Exchange Listing or Dealt in on Another Regulated Market (continued)
Bonds and Other Debt Securities (continued)
Switzerland (continued) 1,075,000 USD UBS Group Funding Switzerland AG '144A' 4.125% 15-Apr-2026 940,569 0.01%
930,000 EUR UBS Group Funding Switzerland AG 1.250% 01-Sep-2026 939,686 0.01% 2,540,000 EUR Zuercher Kantonalbank FRN 15-Jun-2027 2,692,654 0.03%
Total for Switzerland 18,033,235 0.18%
United Arab Emirates 900,000 EUR Emirates Telecommunications Group Co PJSC 2.750% 18-Jun-2026 1,001,539 0.01%
Total for United Arab Emirates 1,001,539 0.01%
United Kingdom 1,480,000 EUR Annington Funding Plc 1.650% 12-Jul-2024 1,501,430 0.01% 1,144,000 GBP Arqiva Broadcast Finance Plc 9.500% 31-Mar-2020 1,348,657 0.01%
528,449 GBP Aspire Defence Finance Plc 4.674% 31-Mar-2040 746,949 0.01% 848,000 EUR Aviva Plc FRN 03-Jul-2044 959,552 0.01% 631,000 EUR Babcock International Group Plc 1.750% 06-Oct-2022 657,982 0.01% 300,000 EUR Barclays Bank Plc 6.000% 14-Jan-2021 346,808 0.00% 546,000 EUR Barclays Bank Plc 6.625% 30-Mar-2022 670,667 0.01%
1,985,000 USD Barclays Plc 3.650% 16-Mar-2025 1,656,830 0.02% 1,140,000 EUR Barclays Plc FRN 07-Feb-2028 1,136,327 0.01% 1,280,000 GBP Barclays Plc FRN (Perpetual)* 1,610,886 0.02%
600,000 EUR BP Capital Markets Plc 2.177% 28-Sep-2021 645,263 0.01% 430,000 EUR BP Capital Markets Plc 1.109% 16-Feb-2023 444,111 0.00% 366,000 EUR BP Capital Markets Plc 2.213% 25-Sep-2026 400,696 0.00% 250,000 EUR BP Capital Markets Plc 1.573% 16-Feb-2027 260,201 0.00% 590,000 EUR Brambles Finance Plc 4.625% 20-Apr-2018 598,363 0.01% 771,000 EUR British Telecommunications Plc 0.625% 10-Mar-2021 779,662 0.01%
1,610,000 USD British Telecommunications Plc 9.125% 15-Dec-2030 2,007,383 0.02% 1,476,000 EUR Coventry Building Society 2.500% 18-Nov-2020 1,574,708 0.02%
400,000 GBP CYBG Plc FRN 22-Jun-2025 466,815 0.00% 1,180,000 GBP CYBG Plc FRN 09-Feb-2026 1,420,457 0.01%
400,000 GBP EI Group Plc 6.875% 15-Feb-2021 504,156 0.00% 407,000 GBP Eversholt Funding Plc 6.359% 02-Dec-2025 588,190 0.01% 670,000 EUR Experian Finance Plc 4.750% 04-Feb-2020 735,895 0.01% 630,000 EUR FCE Bank Plc 1.875% 18-Apr-2019 645,734 0.01% 400,000 EUR FCE Bank Plc 1.528% 09-Nov-2020 415,795 0.00% 762,000 EUR FCE Bank Plc 1.875% 24-Jun-2021 801,220 0.01% 400,000 GBP Firstgroup Plc 8.125% 19-Sep-2018 473,831 0.00%
1,167,000 EUR G4S International Finance Plc 2.625% 06-Dec-2018 1,195,977 0.01% 800,000 EUR GlaxoSmithKline Capital Plc 1.375% 12-Sep-2029 810,580 0.01% 560,000 EUR HSBC Holdings Plc 1.500% 15-Mar-2022 586,981 0.01% 400,000 EUR HSBC Holdings Plc FRN 10-Jan-2024 413,239 0.00%
1,080,000 EUR HSBC Holdings Plc 0.875% 06-Sep-2024 1,086,367 0.01% 630,000 USD HSBC Holdings Plc FRN (Perpetual)* 567,620 0.01% 800,000 EUR HSBC Holdings Plc FRN (Perpetual)* 886,008 0.01%
2,390,000 USD HSBC Holdings Plc FRN (Perpetual)* 2,101,015 0.02% 1,250,000 EUR HSBC Holdings Plc FRN (Perpetual)* 1,331,388 0.01%
180,000 EUR Imperial Brands Finance Plc 4.500% 05-Jul-2018 184,307 0.00% 2,687,000 EUR Imperial Brands Finance Plc 5.000% 02-Dec-2019 2,944,994 0.03%
200,000 EUR Imperial Brands Finance Plc 2.250% 26-Feb-2021 211,814 0.00% 260,000 GBP Jaguar Land Rover Automotive Plc 2.750% 24-Jan-2021 298,518 0.00%
1,255,000 GBP Jaguar Land Rover Automotive Plc 3.875% 01-Mar-2023 1,470,876 0.01% 455,000 EUR Jaguar Land Rover Automotive Plc 2.200% 15-Jan-2024 464,737 0.00% 586,000 EUR Leeds Building Society 2.625% 01-Apr-2021 626,572 0.01% 655,000 EUR Leeds Building Society 1.375% 05-May-2022 673,802 0.01%
2,300,000 GBP Lloyds Bank Plc FRN 09-Jul-2025 2,848,009 0.03% 320,000 GBP Lloyds Bank Plc 6.500% 17-Sep-2040 582,051 0.01%
1,260,000 EUR Lloyds Banking Group Plc 1.500% 12-Sep-2027 1,267,755 0.01% 221,000 GBP London & Quadrant Housing Trust Ltd 3.750% 27-Oct-2049 295,688 0.00% 870,000 EUR Mondi Finance Plc 3.375% 28-Sep-2020 944,494 0.01% 700,000 EUR Nationwide Building Society FRN 20-Mar-2023 707,213 0.01% 328,000 EUR Nationwide Building Society 0.625% 19-Apr-2023 327,987 0.00% 857,000 USD Nationwide Building Society '144A' 3.900% 21-Jul-2025 749,836 0.01%
1,588,000 EUR Nationwide Building Society FRN 25-Jul-2029 1,614,369 0.02%
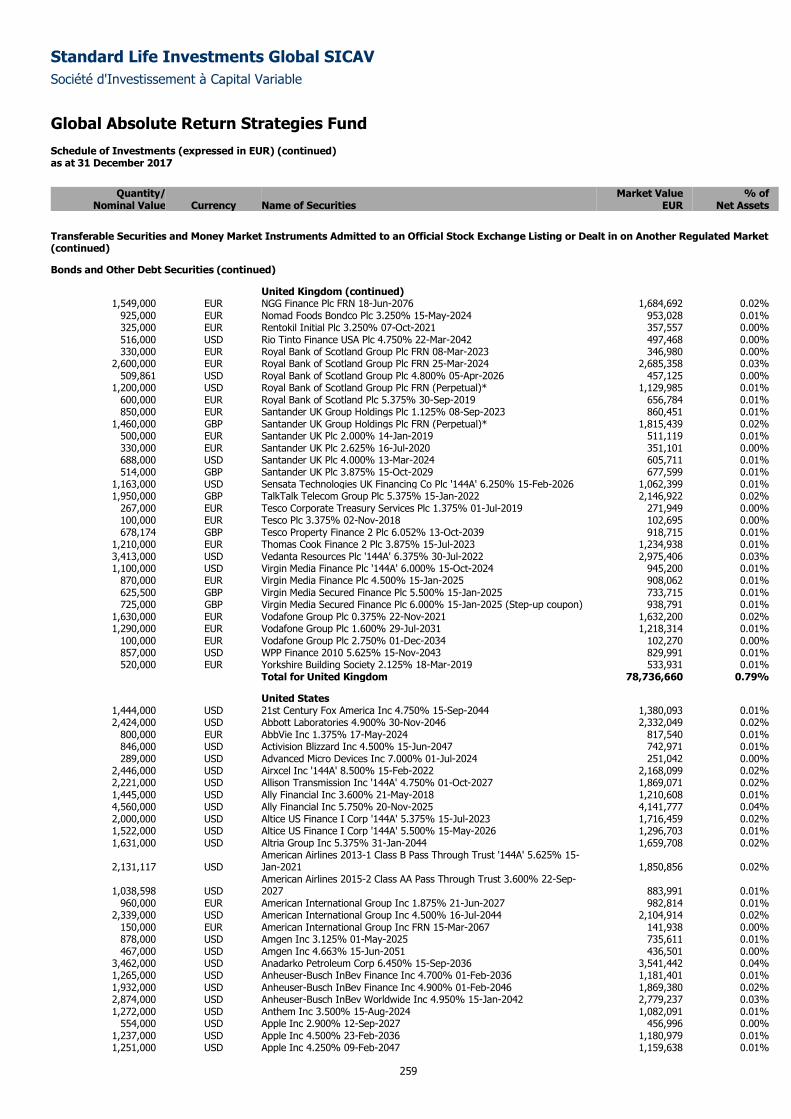
Standard Life Investments Global SICAV
Société d'Investissement à Capital Variable
Global Absolute Return Strategies Fund Schedule of Investments (expressed in EUR) (continued) as at 31 December 2017
259
Quantity/ Market Value % of
Nominal Value Currency Name of Securities EUR Net Assets
Transferable Securities and Money Market Instruments Admitted to an Official Stock Exchange Listing or Dealt in on Another Regulated Market (continued)
Bonds and Other Debt Securities (continued)
United Kingdom (continued) 1,549,000 EUR NGG Finance Plc FRN 18-Jun-2076 1,684,692 0.02%
925,000 EUR Nomad Foods Bondco Plc 3.250% 15-May-2024 953,028 0.01% 325,000 EUR Rentokil Initial Plc 3.250% 07-Oct-2021 357,557 0.00% 516,000 USD Rio Tinto Finance USA Plc 4.750% 22-Mar-2042 497,468 0.00% 330,000 EUR Royal Bank of Scotland Group Plc FRN 08-Mar-2023 346,980 0.00%
2,600,000 EUR Royal Bank of Scotland Group Plc FRN 25-Mar-2024 2,685,358 0.03% 509,861 USD Royal Bank of Scotland Group Plc 4.800% 05-Apr-2026 457,125 0.00%
1,200,000 USD Royal Bank of Scotland Group Plc FRN (Perpetual)* 1,129,985 0.01% 600,000 EUR Royal Bank of Scotland Plc 5.375% 30-Sep-2019 656,784 0.01% 850,000 EUR Santander UK Group Holdings Plc 1.125% 08-Sep-2023 860,451 0.01%
1,460,000 GBP Santander UK Group Holdings Plc FRN (Perpetual)* 1,815,439 0.02% 500,000 EUR Santander UK Plc 2.000% 14-Jan-2019 511,119 0.01% 330,000 EUR Santander UK Plc 2.625% 16-Jul-2020 351,101 0.00% 688,000 USD Santander UK Plc 4.000% 13-Mar-2024 605,711 0.01% 514,000 GBP Santander UK Plc 3.875% 15-Oct-2029 677,599 0.01%
1,163,000 USD Sensata Technologies UK Financing Co Plc '144A' 6.250% 15-Feb-2026 1,062,399 0.01% 1,950,000 GBP TalkTalk Telecom Group Plc 5.375% 15-Jan-2022 2,146,922 0.02%
267,000 EUR Tesco Corporate Treasury Services Plc 1.375% 01-Jul-2019 271,949 0.00% 100,000 EUR Tesco Plc 3.375% 02-Nov-2018 102,695 0.00% 678,174 GBP Tesco Property Finance 2 Plc 6.052% 13-Oct-2039 918,715 0.01%
1,210,000 EUR Thomas Cook Finance 2 Plc 3.875% 15-Jul-2023 1,234,938 0.01% 3,413,000 USD Vedanta Resources Plc '144A' 6.375% 30-Jul-2022 2,975,406 0.03% 1,100,000 USD Virgin Media Finance Plc '144A' 6.000% 15-Oct-2024 945,200 0.01%
870,000 EUR Virgin Media Finance Plc 4.500% 15-Jan-2025 908,062 0.01% 625,500 GBP Virgin Media Secured Finance Plc 5.500% 15-Jan-2025 733,715 0.01% 725,000 GBP Virgin Media Secured Finance Plc 6.000% 15-Jan-2025 (Step-up coupon) 938,791 0.01%
1,630,000 EUR Vodafone Group Plc 0.375% 22-Nov-2021 1,632,200 0.02% 1,290,000 EUR Vodafone Group Plc 1.600% 29-Jul-2031 1,218,314 0.01%
100,000 EUR Vodafone Group Plc 2.750% 01-Dec-2034 102,270 0.00% 857,000 USD WPP Finance 2010 5.625% 15-Nov-2043 829,991 0.01% 520,000 EUR Yorkshire Building Society 2.125% 18-Mar-2019 533,931 0.01%
Total for United Kingdom 78,736,660 0.79%
United States 1,444,000 USD 21st Century Fox America Inc 4.750% 15-Sep-2044 1,380,093 0.01% 2,424,000 USD Abbott Laboratories 4.900% 30-Nov-2046 2,332,049 0.02%
800,000 EUR AbbVie Inc 1.375% 17-May-2024 817,540 0.01% 846,000 USD Activision Blizzard Inc 4.500% 15-Jun-2047 742,971 0.01% 289,000 USD Advanced Micro Devices Inc 7.000% 01-Jul-2024 251,042 0.00%
2,446,000 USD Airxcel Inc '144A' 8.500% 15-Feb-2022 2,168,099 0.02% 2,221,000 USD Allison Transmission Inc '144A' 4.750% 01-Oct-2027 1,869,071 0.02% 1,445,000 USD Ally Financial Inc 3.600% 21-May-2018 1,210,608 0.01% 4,560,000 USD Ally Financial Inc 5.750% 20-Nov-2025 4,141,777 0.04% 2,000,000 USD Altice US Finance I Corp '144A' 5.375% 15-Jul-2023 1,716,459 0.02% 1,522,000 USD Altice US Finance I Corp '144A' 5.500% 15-May-2026 1,296,703 0.01% 1,631,000 USD Altria Group Inc 5.375% 31-Jan-2044 1,659,708 0.02%
2,131,117 USD American Airlines 2013-1 Class B Pass Through Trust '144A' 5.625% 15-Jan-2021 1,850,856 0.02%
1,038,598 USD American Airlines 2015-2 Class AA Pass Through Trust 3.600% 22-Sep-2027 883,991 0.01%
960,000 EUR American International Group Inc 1.875% 21-Jun-2027 982,814 0.01% 2,339,000 USD American International Group Inc 4.500% 16-Jul-2044 2,104,914 0.02%
150,000 EUR American International Group Inc FRN 15-Mar-2067 141,938 0.00% 878,000 USD Amgen Inc 3.125% 01-May-2025 735,611 0.01% 467,000 USD Amgen Inc 4.663% 15-Jun-2051 436,501 0.00%
3,462,000 USD Anadarko Petroleum Corp 6.450% 15-Sep-2036 3,541,442 0.04% 1,265,000 USD Anheuser-Busch InBev Finance Inc 4.700% 01-Feb-2036 1,181,401 0.01% 1,932,000 USD Anheuser-Busch InBev Finance Inc 4.900% 01-Feb-2046 1,869,380 0.02% 2,874,000 USD Anheuser-Busch InBev Worldwide Inc 4.950% 15-Jan-2042 2,779,237 0.03% 1,272,000 USD Anthem Inc 3.500% 15-Aug-2024 1,082,091 0.01%
554,000 USD Apple Inc 2.900% 12-Sep-2027 456,996 0.00% 1,237,000 USD Apple Inc 4.500% 23-Feb-2036 1,180,979 0.01% 1,251,000 USD Apple Inc 4.250% 09-Feb-2047 1,159,638 0.01%
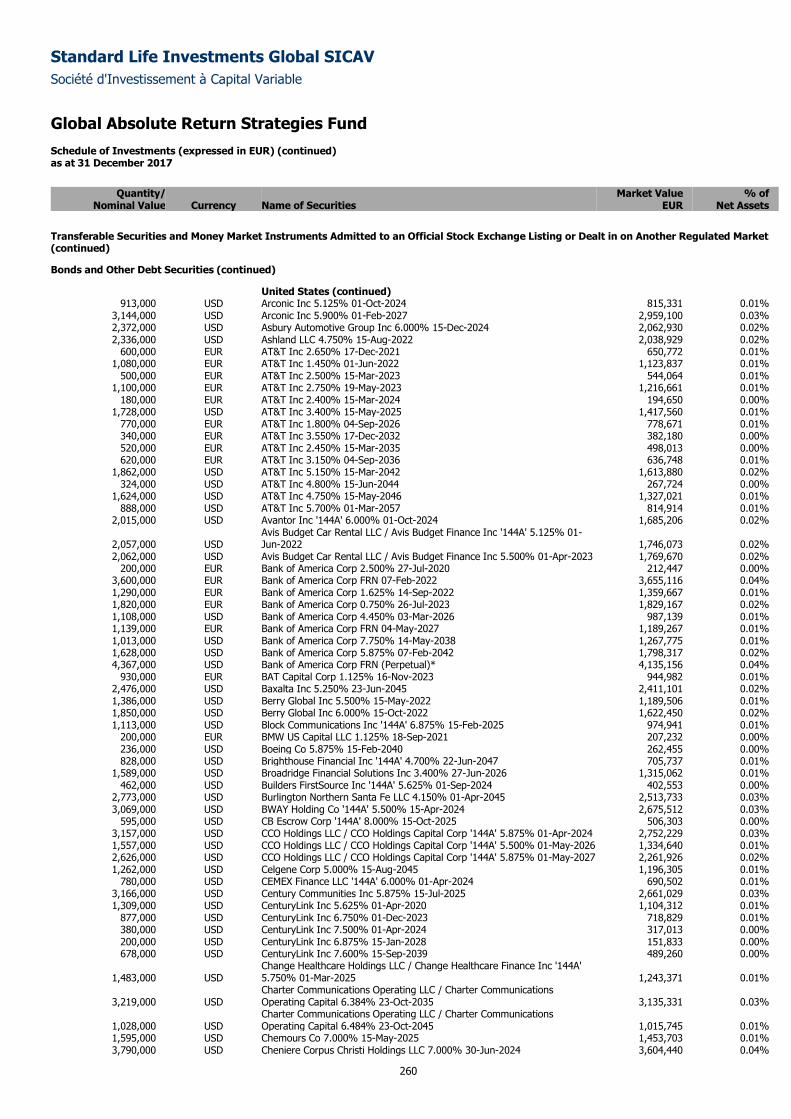
Standard Life Investments Global SICAV
Société d'Investissement à Capital Variable
Global Absolute Return Strategies Fund Schedule of Investments (expressed in EUR) (continued) as at 31 December 2017
260
Quantity/ Market Value % of
Nominal Value Currency Name of Securities EUR Net Assets
Transferable Securities and Money Market Instruments Admitted to an Official Stock Exchange Listing or Dealt in on Another Regulated Market (continued)
Bonds and Other Debt Securities (continued)
United States (continued) 913,000 USD Arconic Inc 5.125% 01-Oct-2024 815,331 0.01%
3,144,000 USD Arconic Inc 5.900% 01-Feb-2027 2,959,100 0.03% 2,372,000 USD Asbury Automotive Group Inc 6.000% 15-Dec-2024 2,062,930 0.02% 2,336,000 USD Ashland LLC 4.750% 15-Aug-2022 2,038,929 0.02%
600,000 EUR AT&T Inc 2.650% 17-Dec-2021 650,772 0.01% 1,080,000 EUR AT&T Inc 1.450% 01-Jun-2022 1,123,837 0.01%
500,000 EUR AT&T Inc 2.500% 15-Mar-2023 544,064 0.01% 1,100,000 EUR AT&T Inc 2.750% 19-May-2023 1,216,661 0.01%
180,000 EUR AT&T Inc 2.400% 15-Mar-2024 194,650 0.00% 1,728,000 USD AT&T Inc 3.400% 15-May-2025 1,417,560 0.01%
770,000 EUR AT&T Inc 1.800% 04-Sep-2026 778,671 0.01% 340,000 EUR AT&T Inc 3.550% 17-Dec-2032 382,180 0.00% 520,000 EUR AT&T Inc 2.450% 15-Mar-2035 498,013 0.00% 620,000 EUR AT&T Inc 3.150% 04-Sep-2036 636,748 0.01%
1,862,000 USD AT&T Inc 5.150% 15-Mar-2042 1,613,880 0.02% 324,000 USD AT&T Inc 4.800% 15-Jun-2044 267,724 0.00%
1,624,000 USD AT&T Inc 4.750% 15-May-2046 1,327,021 0.01% 888,000 USD AT&T Inc 5.700% 01-Mar-2057 814,914 0.01%
2,015,000 USD Avantor Inc '144A' 6.000% 01-Oct-2024 1,685,206 0.02%
2,057,000 USD Avis Budget Car Rental LLC / Avis Budget Finance Inc '144A' 5.125% 01-Jun-2022 1,746,073 0.02%
2,062,000 USD Avis Budget Car Rental LLC / Avis Budget Finance Inc 5.500% 01-Apr-2023 1,769,670 0.02% 200,000 EUR Bank of America Corp 2.500% 27-Jul-2020 212,447 0.00%
3,600,000 EUR Bank of America Corp FRN 07-Feb-2022 3,655,116 0.04% 1,290,000 EUR Bank of America Corp 1.625% 14-Sep-2022 1,359,667 0.01% 1,820,000 EUR Bank of America Corp 0.750% 26-Jul-2023 1,829,167 0.02% 1,108,000 USD Bank of America Corp 4.450% 03-Mar-2026 987,139 0.01% 1,139,000 EUR Bank of America Corp FRN 04-May-2027 1,189,267 0.01% 1,013,000 USD Bank of America Corp 7.750% 14-May-2038 1,267,775 0.01% 1,628,000 USD Bank of America Corp 5.875% 07-Feb-2042 1,798,317 0.02% 4,367,000 USD Bank of America Corp FRN (Perpetual)* 4,135,156 0.04%
930,000 EUR BAT Capital Corp 1.125% 16-Nov-2023 944,982 0.01% 2,476,000 USD Baxalta Inc 5.250% 23-Jun-2045 2,411,101 0.02% 1,386,000 USD Berry Global Inc 5.500% 15-May-2022 1,189,506 0.01% 1,850,000 USD Berry Global Inc 6.000% 15-Oct-2022 1,622,450 0.02% 1,113,000 USD Block Communications Inc '144A' 6.875% 15-Feb-2025 974,941 0.01%
200,000 EUR BMW US Capital LLC 1.125% 18-Sep-2021 207,232 0.00% 236,000 USD Boeing Co 5.875% 15-Feb-2040 262,455 0.00% 828,000 USD Brighthouse Financial Inc '144A' 4.700% 22-Jun-2047 705,737 0.01%
1,589,000 USD Broadridge Financial Solutions Inc 3.400% 27-Jun-2026 1,315,062 0.01% 462,000 USD Builders FirstSource Inc '144A' 5.625% 01-Sep-2024 402,553 0.00%
2,773,000 USD Burlington Northern Santa Fe LLC 4.150% 01-Apr-2045 2,513,733 0.03% 3,069,000 USD BWAY Holding Co '144A' 5.500% 15-Apr-2024 2,675,512 0.03%
595,000 USD CB Escrow Corp '144A' 8.000% 15-Oct-2025 506,303 0.00% 3,157,000 USD CCO Holdings LLC / CCO Holdings Capital Corp '144A' 5.875% 01-Apr-2024 2,752,229 0.03% 1,557,000 USD CCO Holdings LLC / CCO Holdings Capital Corp '144A' 5.500% 01-May-2026 1,334,640 0.01% 2,626,000 USD CCO Holdings LLC / CCO Holdings Capital Corp '144A' 5.875% 01-May-2027 2,261,926 0.02% 1,262,000 USD Celgene Corp 5.000% 15-Aug-2045 1,196,305 0.01%
780,000 USD CEMEX Finance LLC '144A' 6.000% 01-Apr-2024 690,502 0.01% 3,166,000 USD Century Communities Inc 5.875% 15-Jul-2025 2,661,029 0.03% 1,309,000 USD CenturyLink Inc 5.625% 01-Apr-2020 1,104,312 0.01%
877,000 USD CenturyLink Inc 6.750% 01-Dec-2023 718,829 0.01% 380,000 USD CenturyLink Inc 7.500% 01-Apr-2024 317,013 0.00% 200,000 USD CenturyLink Inc 6.875% 15-Jan-2028 151,833 0.00% 678,000 USD CenturyLink Inc 7.600% 15-Sep-2039 489,260 0.00%
1,483,000 USD Change Healthcare Holdings LLC / Change Healthcare Finance Inc '144A' 5.750% 01-Mar-2025 1,243,371 0.01%
3,219,000 USD Charter Communications Operating LLC / Charter Communications Operating Capital 6.384% 23-Oct-2035 3,135,331 0.03%
1,028,000 USD Charter Communications Operating LLC / Charter Communications Operating Capital 6.484% 23-Oct-2045 1,015,745 0.01%
1,595,000 USD Chemours Co 7.000% 15-May-2025 1,453,703 0.01% 3,790,000 USD Cheniere Corpus Christi Holdings LLC 7.000% 30-Jun-2024 3,604,440 0.04%
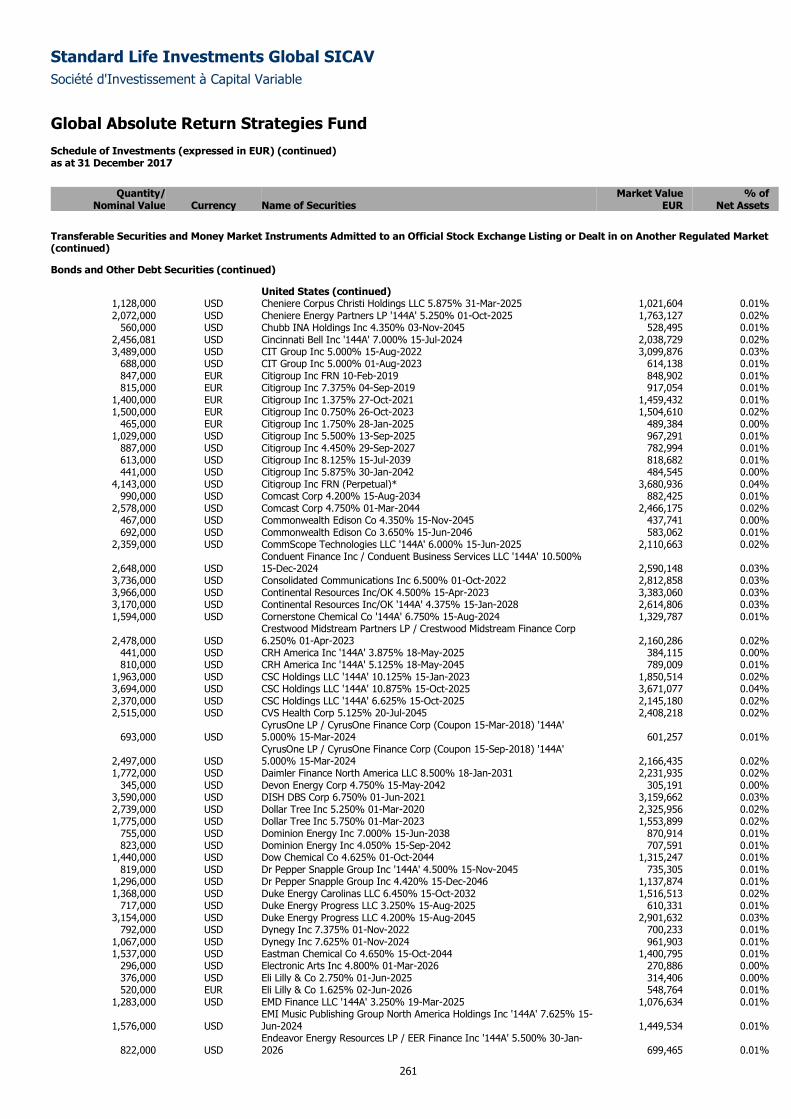
Standard Life Investments Global SICAV
Société d'Investissement à Capital Variable
Global Absolute Return Strategies Fund Schedule of Investments (expressed in EUR) (continued) as at 31 December 2017
261
Quantity/ Market Value % of
Nominal Value Currency Name of Securities EUR Net Assets
Transferable Securities and Money Market Instruments Admitted to an Official Stock Exchange Listing or Dealt in on Another Regulated Market (continued)
Bonds and Other Debt Securities (continued)
United States (continued) 1,128,000 USD Cheniere Corpus Christi Holdings LLC 5.875% 31-Mar-2025 1,021,604 0.01% 2,072,000 USD Cheniere Energy Partners LP '144A' 5.250% 01-Oct-2025 1,763,127 0.02%
560,000 USD Chubb INA Holdings Inc 4.350% 03-Nov-2045 528,495 0.01% 2,456,081 USD Cincinnati Bell Inc '144A' 7.000% 15-Jul-2024 2,038,729 0.02% 3,489,000 USD CIT Group Inc 5.000% 15-Aug-2022 3,099,876 0.03%
688,000 USD CIT Group Inc 5.000% 01-Aug-2023 614,138 0.01% 847,000 EUR Citigroup Inc FRN 10-Feb-2019 848,902 0.01% 815,000 EUR Citigroup Inc 7.375% 04-Sep-2019 917,054 0.01%
1,400,000 EUR Citigroup Inc 1.375% 27-Oct-2021 1,459,432 0.01% 1,500,000 EUR Citigroup Inc 0.750% 26-Oct-2023 1,504,610 0.02%
465,000 EUR Citigroup Inc 1.750% 28-Jan-2025 489,384 0.00% 1,029,000 USD Citigroup Inc 5.500% 13-Sep-2025 967,291 0.01%
887,000 USD Citigroup Inc 4.450% 29-Sep-2027 782,994 0.01% 613,000 USD Citigroup Inc 8.125% 15-Jul-2039 818,682 0.01% 441,000 USD Citigroup Inc 5.875% 30-Jan-2042 484,545 0.00%
4,143,000 USD Citigroup Inc FRN (Perpetual)* 3,680,936 0.04% 990,000 USD Comcast Corp 4.200% 15-Aug-2034 882,425 0.01%
2,578,000 USD Comcast Corp 4.750% 01-Mar-2044 2,466,175 0.02% 467,000 USD Commonwealth Edison Co 4.350% 15-Nov-2045 437,741 0.00% 692,000 USD Commonwealth Edison Co 3.650% 15-Jun-2046 583,062 0.01%
2,359,000 USD CommScope Technologies LLC '144A' 6.000% 15-Jun-2025 2,110,663 0.02%
2,648,000 USD Conduent Finance Inc / Conduent Business Services LLC '144A' 10.500% 15-Dec-2024 2,590,148 0.03%
3,736,000 USD Consolidated Communications Inc 6.500% 01-Oct-2022 2,812,858 0.03% 3,966,000 USD Continental Resources Inc/OK 4.500% 15-Apr-2023 3,383,060 0.03% 3,170,000 USD Continental Resources Inc/OK '144A' 4.375% 15-Jan-2028 2,614,806 0.03% 1,594,000 USD Cornerstone Chemical Co '144A' 6.750% 15-Aug-2024 1,329,787 0.01%
2,478,000 USD Crestwood Midstream Partners LP / Crestwood Midstream Finance Corp 6.250% 01-Apr-2023 2,160,286 0.02%
441,000 USD CRH America Inc '144A' 3.875% 18-May-2025 384,115 0.00% 810,000 USD CRH America Inc '144A' 5.125% 18-May-2045 789,009 0.01%
1,963,000 USD CSC Holdings LLC '144A' 10.125% 15-Jan-2023 1,850,514 0.02% 3,694,000 USD CSC Holdings LLC '144A' 10.875% 15-Oct-2025 3,671,077 0.04% 2,370,000 USD CSC Holdings LLC '144A' 6.625% 15-Oct-2025 2,145,180 0.02% 2,515,000 USD CVS Health Corp 5.125% 20-Jul-2045 2,408,218 0.02%
693,000 USD CyrusOne LP / CyrusOne Finance Corp (Coupon 15-Mar-2018) '144A' 5.000% 15-Mar-2024 601,257 0.01%
2,497,000 USD CyrusOne LP / CyrusOne Finance Corp (Coupon 15-Sep-2018) '144A' 5.000% 15-Mar-2024 2,166,435 0.02%
1,772,000 USD Daimler Finance North America LLC 8.500% 18-Jan-2031 2,231,935 0.02% 345,000 USD Devon Energy Corp 4.750% 15-May-2042 305,191 0.00%
3,590,000 USD DISH DBS Corp 6.750% 01-Jun-2021 3,159,662 0.03% 2,739,000 USD Dollar Tree Inc 5.250% 01-Mar-2020 2,325,956 0.02% 1,775,000 USD Dollar Tree Inc 5.750% 01-Mar-2023 1,553,899 0.02%
755,000 USD Dominion Energy Inc 7.000% 15-Jun-2038 870,914 0.01% 823,000 USD Dominion Energy Inc 4.050% 15-Sep-2042 707,591 0.01%
1,440,000 USD Dow Chemical Co 4.625% 01-Oct-2044 1,315,247 0.01% 819,000 USD Dr Pepper Snapple Group Inc '144A' 4.500% 15-Nov-2045 735,305 0.01%
1,296,000 USD Dr Pepper Snapple Group Inc 4.420% 15-Dec-2046 1,137,874 0.01% 1,368,000 USD Duke Energy Carolinas LLC 6.450% 15-Oct-2032 1,516,513 0.02%
717,000 USD Duke Energy Progress LLC 3.250% 15-Aug-2025 610,331 0.01% 3,154,000 USD Duke Energy Progress LLC 4.200% 15-Aug-2045 2,901,632 0.03%
792,000 USD Dynegy Inc 7.375% 01-Nov-2022 700,233 0.01% 1,067,000 USD Dynegy Inc 7.625% 01-Nov-2024 961,903 0.01% 1,537,000 USD Eastman Chemical Co 4.650% 15-Oct-2044 1,400,795 0.01%
296,000 USD Electronic Arts Inc 4.800% 01-Mar-2026 270,886 0.00% 376,000 USD Eli Lilly & Co 2.750% 01-Jun-2025 314,406 0.00% 520,000 EUR Eli Lilly & Co 1.625% 02-Jun-2026 548,764 0.01%
1,283,000 USD EMD Finance LLC '144A' 3.250% 19-Mar-2025 1,076,634 0.01%
1,576,000 USD EMI Music Publishing Group North America Holdings Inc '144A' 7.625% 15-Jun-2024 1,449,534 0.01%
822,000 USD Endeavor Energy Resources LP / EER Finance Inc '144A' 5.500% 30-Jan-2026 699,465 0.01%
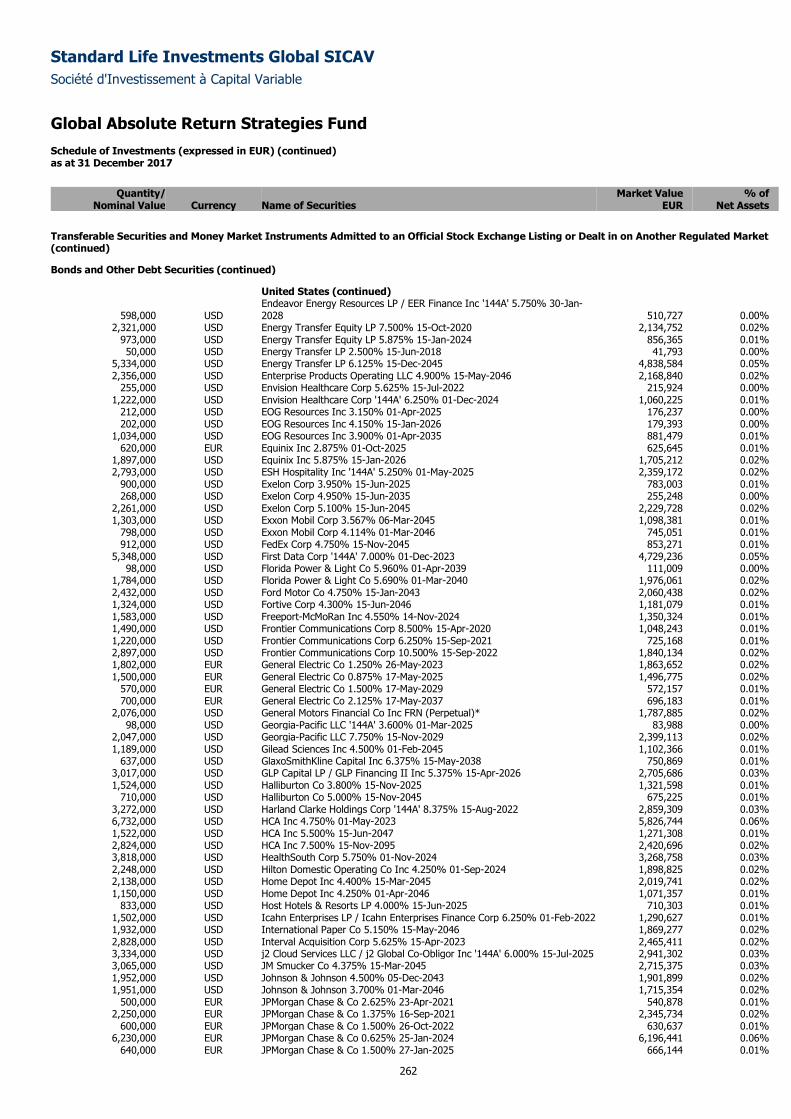
Standard Life Investments Global SICAV
Société d'Investissement à Capital Variable
Global Absolute Return Strategies Fund Schedule of Investments (expressed in EUR) (continued) as at 31 December 2017
262
Quantity/ Market Value % of
Nominal Value Currency Name of Securities EUR Net Assets
Transferable Securities and Money Market Instruments Admitted to an Official Stock Exchange Listing or Dealt in on Another Regulated Market (continued)
Bonds and Other Debt Securities (continued)
United States (continued)
598,000 USD Endeavor Energy Resources LP / EER Finance Inc '144A' 5.750% 30-Jan-2028 510,727 0.00%
2,321,000 USD Energy Transfer Equity LP 7.500% 15-Oct-2020 2,134,752 0.02% 973,000 USD Energy Transfer Equity LP 5.875% 15-Jan-2024 856,365 0.01% 50,000 USD Energy Transfer LP 2.500% 15-Jun-2018 41,793 0.00%
5,334,000 USD Energy Transfer LP 6.125% 15-Dec-2045 4,838,584 0.05% 2,356,000 USD Enterprise Products Operating LLC 4.900% 15-May-2046 2,168,840 0.02%
255,000 USD Envision Healthcare Corp 5.625% 15-Jul-2022 215,924 0.00% 1,222,000 USD Envision Healthcare Corp '144A' 6.250% 01-Dec-2024 1,060,225 0.01%
212,000 USD EOG Resources Inc 3.150% 01-Apr-2025 176,237 0.00% 202,000 USD EOG Resources Inc 4.150% 15-Jan-2026 179,393 0.00%
1,034,000 USD EOG Resources Inc 3.900% 01-Apr-2035 881,479 0.01% 620,000 EUR Equinix Inc 2.875% 01-Oct-2025 625,645 0.01%
1,897,000 USD Equinix Inc 5.875% 15-Jan-2026 1,705,212 0.02% 2,793,000 USD ESH Hospitality Inc '144A' 5.250% 01-May-2025 2,359,172 0.02%
900,000 USD Exelon Corp 3.950% 15-Jun-2025 783,003 0.01% 268,000 USD Exelon Corp 4.950% 15-Jun-2035 255,248 0.00%
2,261,000 USD Exelon Corp 5.100% 15-Jun-2045 2,229,728 0.02% 1,303,000 USD Exxon Mobil Corp 3.567% 06-Mar-2045 1,098,381 0.01%
798,000 USD Exxon Mobil Corp 4.114% 01-Mar-2046 745,051 0.01% 912,000 USD FedEx Corp 4.750% 15-Nov-2045 853,271 0.01%
5,348,000 USD First Data Corp '144A' 7.000% 01-Dec-2023 4,729,236 0.05% 98,000 USD Florida Power & Light Co 5.960% 01-Apr-2039 111,009 0.00%
1,784,000 USD Florida Power & Light Co 5.690% 01-Mar-2040 1,976,061 0.02% 2,432,000 USD Ford Motor Co 4.750% 15-Jan-2043 2,060,438 0.02% 1,324,000 USD Fortive Corp 4.300% 15-Jun-2046 1,181,079 0.01% 1,583,000 USD Freeport-McMoRan Inc 4.550% 14-Nov-2024 1,350,324 0.01% 1,490,000 USD Frontier Communications Corp 8.500% 15-Apr-2020 1,048,243 0.01% 1,220,000 USD Frontier Communications Corp 6.250% 15-Sep-2021 725,168 0.01% 2,897,000 USD Frontier Communications Corp 10.500% 15-Sep-2022 1,840,134 0.02% 1,802,000 EUR General Electric Co 1.250% 26-May-2023 1,863,652 0.02% 1,500,000 EUR General Electric Co 0.875% 17-May-2025 1,496,775 0.02%
570,000 EUR General Electric Co 1.500% 17-May-2029 572,157 0.01% 700,000 EUR General Electric Co 2.125% 17-May-2037 696,183 0.01%
2,076,000 USD General Motors Financial Co Inc FRN (Perpetual)* 1,787,885 0.02% 98,000 USD Georgia-Pacific LLC '144A' 3.600% 01-Mar-2025 83,988 0.00%
2,047,000 USD Georgia-Pacific LLC 7.750% 15-Nov-2029 2,399,113 0.02% 1,189,000 USD Gilead Sciences Inc 4.500% 01-Feb-2045 1,102,366 0.01%
637,000 USD GlaxoSmithKline Capital Inc 6.375% 15-May-2038 750,869 0.01% 3,017,000 USD GLP Capital LP / GLP Financing II Inc 5.375% 15-Apr-2026 2,705,686 0.03% 1,524,000 USD Halliburton Co 3.800% 15-Nov-2025 1,321,598 0.01%
710,000 USD Halliburton Co 5.000% 15-Nov-2045 675,225 0.01% 3,272,000 USD Harland Clarke Holdings Corp '144A' 8.375% 15-Aug-2022 2,859,309 0.03% 6,732,000 USD HCA Inc 4.750% 01-May-2023 5,826,744 0.06% 1,522,000 USD HCA Inc 5.500% 15-Jun-2047 1,271,308 0.01% 2,824,000 USD HCA Inc 7.500% 15-Nov-2095 2,420,696 0.02% 3,818,000 USD HealthSouth Corp 5.750% 01-Nov-2024 3,268,758 0.03% 2,248,000 USD Hilton Domestic Operating Co Inc 4.250% 01-Sep-2024 1,898,825 0.02% 2,138,000 USD Home Depot Inc 4.400% 15-Mar-2045 2,019,741 0.02% 1,150,000 USD Home Depot Inc 4.250% 01-Apr-2046 1,071,357 0.01%
833,000 USD Host Hotels & Resorts LP 4.000% 15-Jun-2025 710,303 0.01% 1,502,000 USD Icahn Enterprises LP / Icahn Enterprises Finance Corp 6.250% 01-Feb-2022 1,290,627 0.01% 1,932,000 USD International Paper Co 5.150% 15-May-2046 1,869,277 0.02% 2,828,000 USD Interval Acquisition Corp 5.625% 15-Apr-2023 2,465,411 0.02% 3,334,000 USD j2 Cloud Services LLC / j2 Global Co-Obligor Inc '144A' 6.000% 15-Jul-2025 2,941,302 0.03% 3,065,000 USD JM Smucker Co 4.375% 15-Mar-2045 2,715,375 0.03% 1,952,000 USD Johnson & Johnson 4.500% 05-Dec-2043 1,901,899 0.02% 1,951,000 USD Johnson & Johnson 3.700% 01-Mar-2046 1,715,354 0.02%
500,000 EUR JPMorgan Chase & Co 2.625% 23-Apr-2021 540,878 0.01% 2,250,000 EUR JPMorgan Chase & Co 1.375% 16-Sep-2021 2,345,734 0.02%
600,000 EUR JPMorgan Chase & Co 1.500% 26-Oct-2022 630,637 0.01% 6,230,000 EUR JPMorgan Chase & Co 0.625% 25-Jan-2024 6,196,441 0.06%
640,000 EUR JPMorgan Chase & Co 1.500% 27-Jan-2025 666,144 0.01%
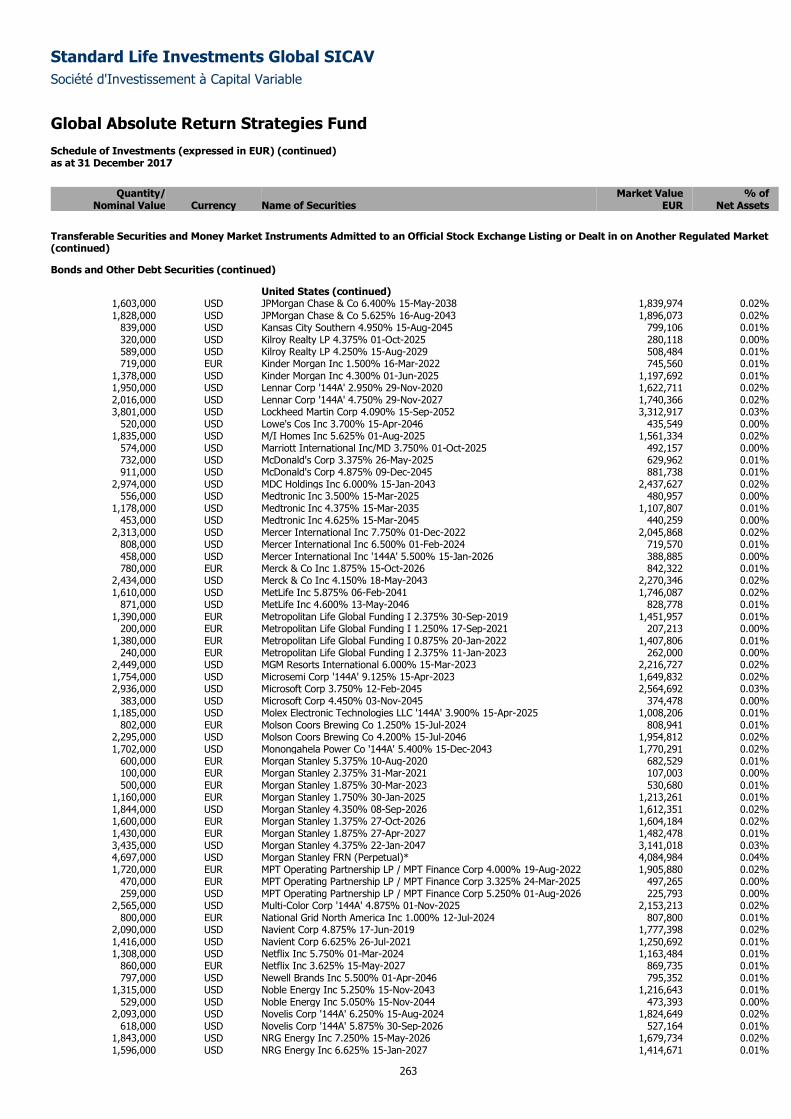
Standard Life Investments Global SICAV
Société d'Investissement à Capital Variable
Global Absolute Return Strategies Fund Schedule of Investments (expressed in EUR) (continued) as at 31 December 2017
263
Quantity/ Market Value % of
Nominal Value Currency Name of Securities EUR Net Assets
Transferable Securities and Money Market Instruments Admitted to an Official Stock Exchange Listing or Dealt in on Another Regulated Market (continued)
Bonds and Other Debt Securities (continued)
United States (continued) 1,603,000 USD JPMorgan Chase & Co 6.400% 15-May-2038 1,839,974 0.02% 1,828,000 USD JPMorgan Chase & Co 5.625% 16-Aug-2043 1,896,073 0.02%
839,000 USD Kansas City Southern 4.950% 15-Aug-2045 799,106 0.01% 320,000 USD Kilroy Realty LP 4.375% 01-Oct-2025 280,118 0.00% 589,000 USD Kilroy Realty LP 4.250% 15-Aug-2029 508,484 0.01% 719,000 EUR Kinder Morgan Inc 1.500% 16-Mar-2022 745,560 0.01%
1,378,000 USD Kinder Morgan Inc 4.300% 01-Jun-2025 1,197,692 0.01% 1,950,000 USD Lennar Corp '144A' 2.950% 29-Nov-2020 1,622,711 0.02% 2,016,000 USD Lennar Corp '144A' 4.750% 29-Nov-2027 1,740,366 0.02% 3,801,000 USD Lockheed Martin Corp 4.090% 15-Sep-2052 3,312,917 0.03%
520,000 USD Lowe's Cos Inc 3.700% 15-Apr-2046 435,549 0.00% 1,835,000 USD M/I Homes Inc 5.625% 01-Aug-2025 1,561,334 0.02%
574,000 USD Marriott International Inc/MD 3.750% 01-Oct-2025 492,157 0.00% 732,000 USD McDonald's Corp 3.375% 26-May-2025 629,962 0.01% 911,000 USD McDonald's Corp 4.875% 09-Dec-2045 881,738 0.01%
2,974,000 USD MDC Holdings Inc 6.000% 15-Jan-2043 2,437,627 0.02% 556,000 USD Medtronic Inc 3.500% 15-Mar-2025 480,957 0.00%
1,178,000 USD Medtronic Inc 4.375% 15-Mar-2035 1,107,807 0.01% 453,000 USD Medtronic Inc 4.625% 15-Mar-2045 440,259 0.00%
2,313,000 USD Mercer International Inc 7.750% 01-Dec-2022 2,045,868 0.02% 808,000 USD Mercer International Inc 6.500% 01-Feb-2024 719,570 0.01% 458,000 USD Mercer International Inc '144A' 5.500% 15-Jan-2026 388,885 0.00% 780,000 EUR Merck & Co Inc 1.875% 15-Oct-2026 842,322 0.01%
2,434,000 USD Merck & Co Inc 4.150% 18-May-2043 2,270,346 0.02% 1,610,000 USD MetLife Inc 5.875% 06-Feb-2041 1,746,087 0.02%
871,000 USD MetLife Inc 4.600% 13-May-2046 828,778 0.01% 1,390,000 EUR Metropolitan Life Global Funding I 2.375% 30-Sep-2019 1,451,957 0.01%
200,000 EUR Metropolitan Life Global Funding I 1.250% 17-Sep-2021 207,213 0.00% 1,380,000 EUR Metropolitan Life Global Funding I 0.875% 20-Jan-2022 1,407,806 0.01%
240,000 EUR Metropolitan Life Global Funding I 2.375% 11-Jan-2023 262,000 0.00% 2,449,000 USD MGM Resorts International 6.000% 15-Mar-2023 2,216,727 0.02% 1,754,000 USD Microsemi Corp '144A' 9.125% 15-Apr-2023 1,649,832 0.02% 2,936,000 USD Microsoft Corp 3.750% 12-Feb-2045 2,564,692 0.03%
383,000 USD Microsoft Corp 4.450% 03-Nov-2045 374,478 0.00% 1,185,000 USD Molex Electronic Technologies LLC '144A' 3.900% 15-Apr-2025 1,008,206 0.01%
802,000 EUR Molson Coors Brewing Co 1.250% 15-Jul-2024 808,941 0.01% 2,295,000 USD Molson Coors Brewing Co 4.200% 15-Jul-2046 1,954,812 0.02% 1,702,000 USD Monongahela Power Co '144A' 5.400% 15-Dec-2043 1,770,291 0.02%
600,000 EUR Morgan Stanley 5.375% 10-Aug-2020 682,529 0.01% 100,000 EUR Morgan Stanley 2.375% 31-Mar-2021 107,003 0.00% 500,000 EUR Morgan Stanley 1.875% 30-Mar-2023 530,680 0.01%
1,160,000 EUR Morgan Stanley 1.750% 30-Jan-2025 1,213,261 0.01% 1,844,000 USD Morgan Stanley 4.350% 08-Sep-2026 1,612,351 0.02% 1,600,000 EUR Morgan Stanley 1.375% 27-Oct-2026 1,604,184 0.02% 1,430,000 EUR Morgan Stanley 1.875% 27-Apr-2027 1,482,478 0.01% 3,435,000 USD Morgan Stanley 4.375% 22-Jan-2047 3,141,018 0.03% 4,697,000 USD Morgan Stanley FRN (Perpetual)* 4,084,984 0.04% 1,720,000 EUR MPT Operating Partnership LP / MPT Finance Corp 4.000% 19-Aug-2022 1,905,880 0.02%
470,000 EUR MPT Operating Partnership LP / MPT Finance Corp 3.325% 24-Mar-2025 497,265 0.00% 259,000 USD MPT Operating Partnership LP / MPT Finance Corp 5.250% 01-Aug-2026 225,793 0.00%
2,565,000 USD Multi-Color Corp '144A' 4.875% 01-Nov-2025 2,153,213 0.02% 800,000 EUR National Grid North America Inc 1.000% 12-Jul-2024 807,800 0.01%
2,090,000 USD Navient Corp 4.875% 17-Jun-2019 1,777,398 0.02% 1,416,000 USD Navient Corp 6.625% 26-Jul-2021 1,250,692 0.01% 1,308,000 USD Netflix Inc 5.750% 01-Mar-2024 1,163,484 0.01%
860,000 EUR Netflix Inc 3.625% 15-May-2027 869,735 0.01% 797,000 USD Newell Brands Inc 5.500% 01-Apr-2046 795,352 0.01%
1,315,000 USD Noble Energy Inc 5.250% 15-Nov-2043 1,216,643 0.01% 529,000 USD Noble Energy Inc 5.050% 15-Nov-2044 473,393 0.00%
2,093,000 USD Novelis Corp '144A' 6.250% 15-Aug-2024 1,824,649 0.02% 618,000 USD Novelis Corp '144A' 5.875% 30-Sep-2026 527,164 0.01%
1,843,000 USD NRG Energy Inc 7.250% 15-May-2026 1,679,734 0.02% 1,596,000 USD NRG Energy Inc 6.625% 15-Jan-2027 1,414,671 0.01%
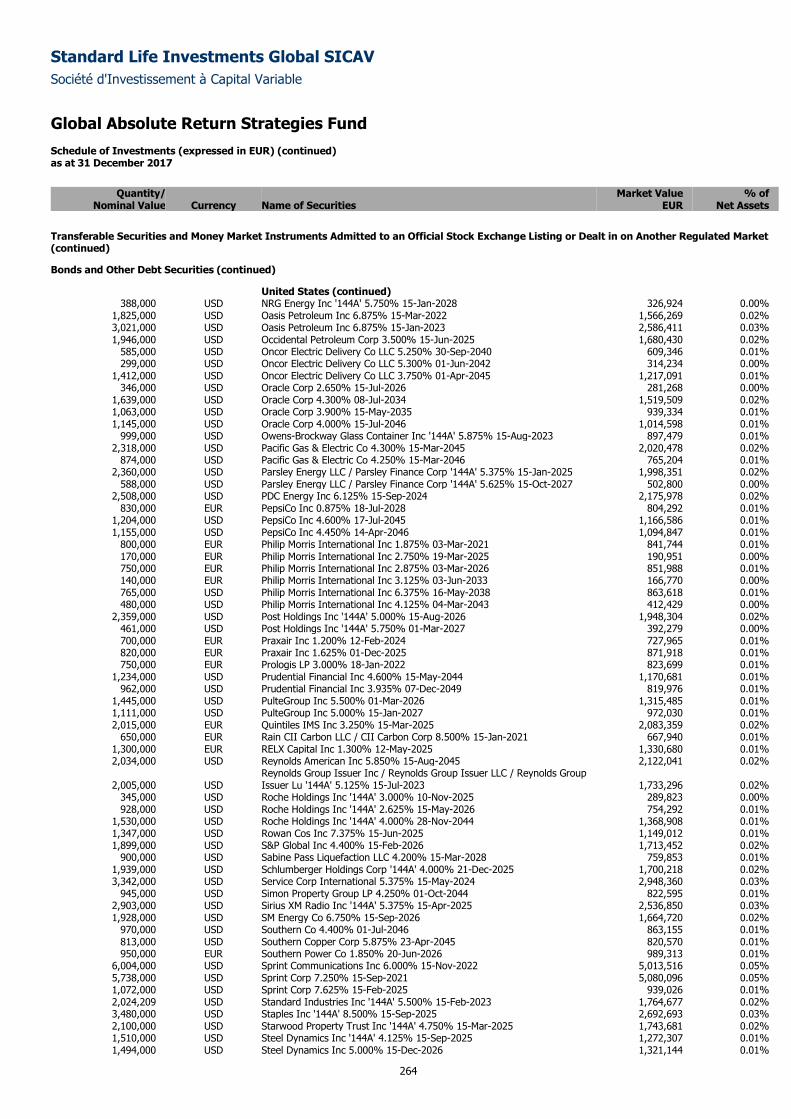
Standard Life Investments Global SICAV
Société d'Investissement à Capital Variable
Global Absolute Return Strategies Fund Schedule of Investments (expressed in EUR) (continued) as at 31 December 2017
264
Quantity/ Market Value % of
Nominal Value Currency Name of Securities EUR Net Assets
Transferable Securities and Money Market Instruments Admitted to an Official Stock Exchange Listing or Dealt in on Another Regulated Market (continued)
Bonds and Other Debt Securities (continued)
United States (continued) 388,000 USD NRG Energy Inc '144A' 5.750% 15-Jan-2028 326,924 0.00%
1,825,000 USD Oasis Petroleum Inc 6.875% 15-Mar-2022 1,566,269 0.02% 3,021,000 USD Oasis Petroleum Inc 6.875% 15-Jan-2023 2,586,411 0.03% 1,946,000 USD Occidental Petroleum Corp 3.500% 15-Jun-2025 1,680,430 0.02%
585,000 USD Oncor Electric Delivery Co LLC 5.250% 30-Sep-2040 609,346 0.01% 299,000 USD Oncor Electric Delivery Co LLC 5.300% 01-Jun-2042 314,234 0.00%
1,412,000 USD Oncor Electric Delivery Co LLC 3.750% 01-Apr-2045 1,217,091 0.01% 346,000 USD Oracle Corp 2.650% 15-Jul-2026 281,268 0.00%
1,639,000 USD Oracle Corp 4.300% 08-Jul-2034 1,519,509 0.02% 1,063,000 USD Oracle Corp 3.900% 15-May-2035 939,334 0.01% 1,145,000 USD Oracle Corp 4.000% 15-Jul-2046 1,014,598 0.01%
999,000 USD Owens-Brockway Glass Container Inc '144A' 5.875% 15-Aug-2023 897,479 0.01% 2,318,000 USD Pacific Gas & Electric Co 4.300% 15-Mar-2045 2,020,478 0.02%
874,000 USD Pacific Gas & Electric Co 4.250% 15-Mar-2046 765,204 0.01% 2,360,000 USD Parsley Energy LLC / Parsley Finance Corp '144A' 5.375% 15-Jan-2025 1,998,351 0.02%
588,000 USD Parsley Energy LLC / Parsley Finance Corp '144A' 5.625% 15-Oct-2027 502,800 0.00% 2,508,000 USD PDC Energy Inc 6.125% 15-Sep-2024 2,175,978 0.02%
830,000 EUR PepsiCo Inc 0.875% 18-Jul-2028 804,292 0.01% 1,204,000 USD PepsiCo Inc 4.600% 17-Jul-2045 1,166,586 0.01% 1,155,000 USD PepsiCo Inc 4.450% 14-Apr-2046 1,094,847 0.01%
800,000 EUR Philip Morris International Inc 1.875% 03-Mar-2021 841,744 0.01% 170,000 EUR Philip Morris International Inc 2.750% 19-Mar-2025 190,951 0.00% 750,000 EUR Philip Morris International Inc 2.875% 03-Mar-2026 851,988 0.01% 140,000 EUR Philip Morris International Inc 3.125% 03-Jun-2033 166,770 0.00% 765,000 USD Philip Morris International Inc 6.375% 16-May-2038 863,618 0.01% 480,000 USD Philip Morris International Inc 4.125% 04-Mar-2043 412,429 0.00%
2,359,000 USD Post Holdings Inc '144A' 5.000% 15-Aug-2026 1,948,304 0.02% 461,000 USD Post Holdings Inc '144A' 5.750% 01-Mar-2027 392,279 0.00% 700,000 EUR Praxair Inc 1.200% 12-Feb-2024 727,965 0.01% 820,000 EUR Praxair Inc 1.625% 01-Dec-2025 871,918 0.01% 750,000 EUR Prologis LP 3.000% 18-Jan-2022 823,699 0.01%
1,234,000 USD Prudential Financial Inc 4.600% 15-May-2044 1,170,681 0.01% 962,000 USD Prudential Financial Inc 3.935% 07-Dec-2049 819,976 0.01%
1,445,000 USD PulteGroup Inc 5.500% 01-Mar-2026 1,315,485 0.01% 1,111,000 USD PulteGroup Inc 5.000% 15-Jan-2027 972,030 0.01% 2,015,000 EUR Quintiles IMS Inc 3.250% 15-Mar-2025 2,083,359 0.02%
650,000 EUR Rain CII Carbon LLC / CII Carbon Corp 8.500% 15-Jan-2021 667,940 0.01% 1,300,000 EUR RELX Capital Inc 1.300% 12-May-2025 1,330,680 0.01% 2,034,000 USD Reynolds American Inc 5.850% 15-Aug-2045 2,122,041 0.02%
2,005,000 USD Reynolds Group Issuer Inc / Reynolds Group Issuer LLC / Reynolds Group Issuer Lu '144A' 5.125% 15-Jul-2023 1,733,296 0.02%
345,000 USD Roche Holdings Inc '144A' 3.000% 10-Nov-2025 289,823 0.00% 928,000 USD Roche Holdings Inc '144A' 2.625% 15-May-2026 754,292 0.01%
1,530,000 USD Roche Holdings Inc '144A' 4.000% 28-Nov-2044 1,368,908 0.01% 1,347,000 USD Rowan Cos Inc 7.375% 15-Jun-2025 1,149,012 0.01% 1,899,000 USD S&P Global Inc 4.400% 15-Feb-2026 1,713,452 0.02%
900,000 USD Sabine Pass Liquefaction LLC 4.200% 15-Mar-2028 759,853 0.01% 1,939,000 USD Schlumberger Holdings Corp '144A' 4.000% 21-Dec-2025 1,700,218 0.02% 3,342,000 USD Service Corp International 5.375% 15-May-2024 2,948,360 0.03%
945,000 USD Simon Property Group LP 4.250% 01-Oct-2044 822,595 0.01% 2,903,000 USD Sirius XM Radio Inc '144A' 5.375% 15-Apr-2025 2,536,850 0.03% 1,928,000 USD SM Energy Co 6.750% 15-Sep-2026 1,664,720 0.02%
970,000 USD Southern Co 4.400% 01-Jul-2046 863,155 0.01% 813,000 USD Southern Copper Corp 5.875% 23-Apr-2045 820,570 0.01% 950,000 EUR Southern Power Co 1.850% 20-Jun-2026 989,313 0.01%
6,004,000 USD Sprint Communications Inc 6.000% 15-Nov-2022 5,013,516 0.05% 5,738,000 USD Sprint Corp 7.250% 15-Sep-2021 5,080,096 0.05% 1,072,000 USD Sprint Corp 7.625% 15-Feb-2025 939,026 0.01% 2,024,209 USD Standard Industries Inc '144A' 5.500% 15-Feb-2023 1,764,677 0.02% 3,480,000 USD Staples Inc '144A' 8.500% 15-Sep-2025 2,692,693 0.03% 2,100,000 USD Starwood Property Trust Inc '144A' 4.750% 15-Mar-2025 1,743,681 0.02% 1,510,000 USD Steel Dynamics Inc '144A' 4.125% 15-Sep-2025 1,272,307 0.01% 1,494,000 USD Steel Dynamics Inc 5.000% 15-Dec-2026 1,321,144 0.01%
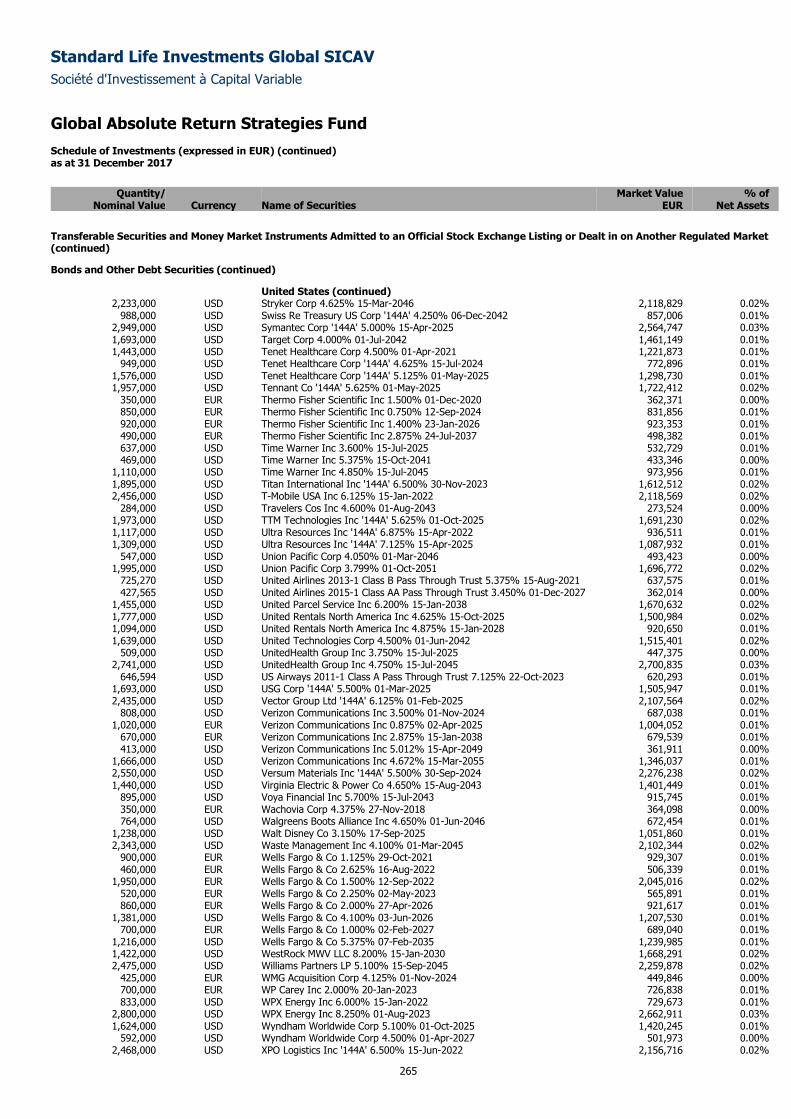
Standard Life Investments Global SICAV
Société d'Investissement à Capital Variable
Global Absolute Return Strategies Fund Schedule of Investments (expressed in EUR) (continued) as at 31 December 2017
265
Quantity/ Market Value % of
Nominal Value Currency Name of Securities EUR Net Assets
Transferable Securities and Money Market Instruments Admitted to an Official Stock Exchange Listing or Dealt in on Another Regulated Market (continued)
Bonds and Other Debt Securities (continued)
United States (continued) 2,233,000 USD Stryker Corp 4.625% 15-Mar-2046 2,118,829 0.02%
988,000 USD Swiss Re Treasury US Corp '144A' 4.250% 06-Dec-2042 857,006 0.01% 2,949,000 USD Symantec Corp '144A' 5.000% 15-Apr-2025 2,564,747 0.03% 1,693,000 USD Target Corp 4.000% 01-Jul-2042 1,461,149 0.01% 1,443,000 USD Tenet Healthcare Corp 4.500% 01-Apr-2021 1,221,873 0.01%
949,000 USD Tenet Healthcare Corp '144A' 4.625% 15-Jul-2024 772,896 0.01% 1,576,000 USD Tenet Healthcare Corp '144A' 5.125% 01-May-2025 1,298,730 0.01% 1,957,000 USD Tennant Co '144A' 5.625% 01-May-2025 1,722,412 0.02%
350,000 EUR Thermo Fisher Scientific Inc 1.500% 01-Dec-2020 362,371 0.00% 850,000 EUR Thermo Fisher Scientific Inc 0.750% 12-Sep-2024 831,856 0.01% 920,000 EUR Thermo Fisher Scientific Inc 1.400% 23-Jan-2026 923,353 0.01% 490,000 EUR Thermo Fisher Scientific Inc 2.875% 24-Jul-2037 498,382 0.01% 637,000 USD Time Warner Inc 3.600% 15-Jul-2025 532,729 0.01% 469,000 USD Time Warner Inc 5.375% 15-Oct-2041 433,346 0.00%
1,110,000 USD Time Warner Inc 4.850% 15-Jul-2045 973,956 0.01% 1,895,000 USD Titan International Inc '144A' 6.500% 30-Nov-2023 1,612,512 0.02% 2,456,000 USD T-Mobile USA Inc 6.125% 15-Jan-2022 2,118,569 0.02%
284,000 USD Travelers Cos Inc 4.600% 01-Aug-2043 273,524 0.00% 1,973,000 USD TTM Technologies Inc '144A' 5.625% 01-Oct-2025 1,691,230 0.02% 1,117,000 USD Ultra Resources Inc '144A' 6.875% 15-Apr-2022 936,511 0.01% 1,309,000 USD Ultra Resources Inc '144A' 7.125% 15-Apr-2025 1,087,932 0.01%
547,000 USD Union Pacific Corp 4.050% 01-Mar-2046 493,423 0.00% 1,995,000 USD Union Pacific Corp 3.799% 01-Oct-2051 1,696,772 0.02%
725,270 USD United Airlines 2013-1 Class B Pass Through Trust 5.375% 15-Aug-2021 637,575 0.01% 427,565 USD United Airlines 2015-1 Class AA Pass Through Trust 3.450% 01-Dec-2027 362,014 0.00%
1,455,000 USD United Parcel Service Inc 6.200% 15-Jan-2038 1,670,632 0.02% 1,777,000 USD United Rentals North America Inc 4.625% 15-Oct-2025 1,500,984 0.02% 1,094,000 USD United Rentals North America Inc 4.875% 15-Jan-2028 920,650 0.01% 1,639,000 USD United Technologies Corp 4.500% 01-Jun-2042 1,515,401 0.02%
509,000 USD UnitedHealth Group Inc 3.750% 15-Jul-2025 447,375 0.00% 2,741,000 USD UnitedHealth Group Inc 4.750% 15-Jul-2045 2,700,835 0.03%
646,594 USD US Airways 2011-1 Class A Pass Through Trust 7.125% 22-Oct-2023 620,293 0.01% 1,693,000 USD USG Corp '144A' 5.500% 01-Mar-2025 1,505,947 0.01% 2,435,000 USD Vector Group Ltd '144A' 6.125% 01-Feb-2025 2,107,564 0.02%
808,000 USD Verizon Communications Inc 3.500% 01-Nov-2024 687,038 0.01% 1,020,000 EUR Verizon Communications Inc 0.875% 02-Apr-2025 1,004,052 0.01%
670,000 EUR Verizon Communications Inc 2.875% 15-Jan-2038 679,539 0.01% 413,000 USD Verizon Communications Inc 5.012% 15-Apr-2049 361,911 0.00%
1,666,000 USD Verizon Communications Inc 4.672% 15-Mar-2055 1,346,037 0.01% 2,550,000 USD Versum Materials Inc '144A' 5.500% 30-Sep-2024 2,276,238 0.02% 1,440,000 USD Virginia Electric & Power Co 4.650% 15-Aug-2043 1,401,449 0.01%
895,000 USD Voya Financial Inc 5.700% 15-Jul-2043 915,745 0.01% 350,000 EUR Wachovia Corp 4.375% 27-Nov-2018 364,098 0.00% 764,000 USD Walgreens Boots Alliance Inc 4.650% 01-Jun-2046 672,454 0.01%
1,238,000 USD Walt Disney Co 3.150% 17-Sep-2025 1,051,860 0.01% 2,343,000 USD Waste Management Inc 4.100% 01-Mar-2045 2,102,344 0.02%
900,000 EUR Wells Fargo & Co 1.125% 29-Oct-2021 929,307 0.01% 460,000 EUR Wells Fargo & Co 2.625% 16-Aug-2022 506,339 0.01%
1,950,000 EUR Wells Fargo & Co 1.500% 12-Sep-2022 2,045,016 0.02% 520,000 EUR Wells Fargo & Co 2.250% 02-May-2023 565,891 0.01% 860,000 EUR Wells Fargo & Co 2.000% 27-Apr-2026 921,617 0.01%
1,381,000 USD Wells Fargo & Co 4.100% 03-Jun-2026 1,207,530 0.01% 700,000 EUR Wells Fargo & Co 1.000% 02-Feb-2027 689,040 0.01%
1,216,000 USD Wells Fargo & Co 5.375% 07-Feb-2035 1,239,985 0.01% 1,422,000 USD WestRock MWV LLC 8.200% 15-Jan-2030 1,668,291 0.02% 2,475,000 USD Williams Partners LP 5.100% 15-Sep-2045 2,259,878 0.02%
425,000 EUR WMG Acquisition Corp 4.125% 01-Nov-2024 449,846 0.00% 700,000 EUR WP Carey Inc 2.000% 20-Jan-2023 726,838 0.01% 833,000 USD WPX Energy Inc 6.000% 15-Jan-2022 729,673 0.01%
2,800,000 USD WPX Energy Inc 8.250% 01-Aug-2023 2,662,911 0.03% 1,624,000 USD Wyndham Worldwide Corp 5.100% 01-Oct-2025 1,420,245 0.01%
592,000 USD Wyndham Worldwide Corp 4.500% 01-Apr-2027 501,973 0.00% 2,468,000 USD XPO Logistics Inc '144A' 6.500% 15-Jun-2022 2,156,716 0.02%
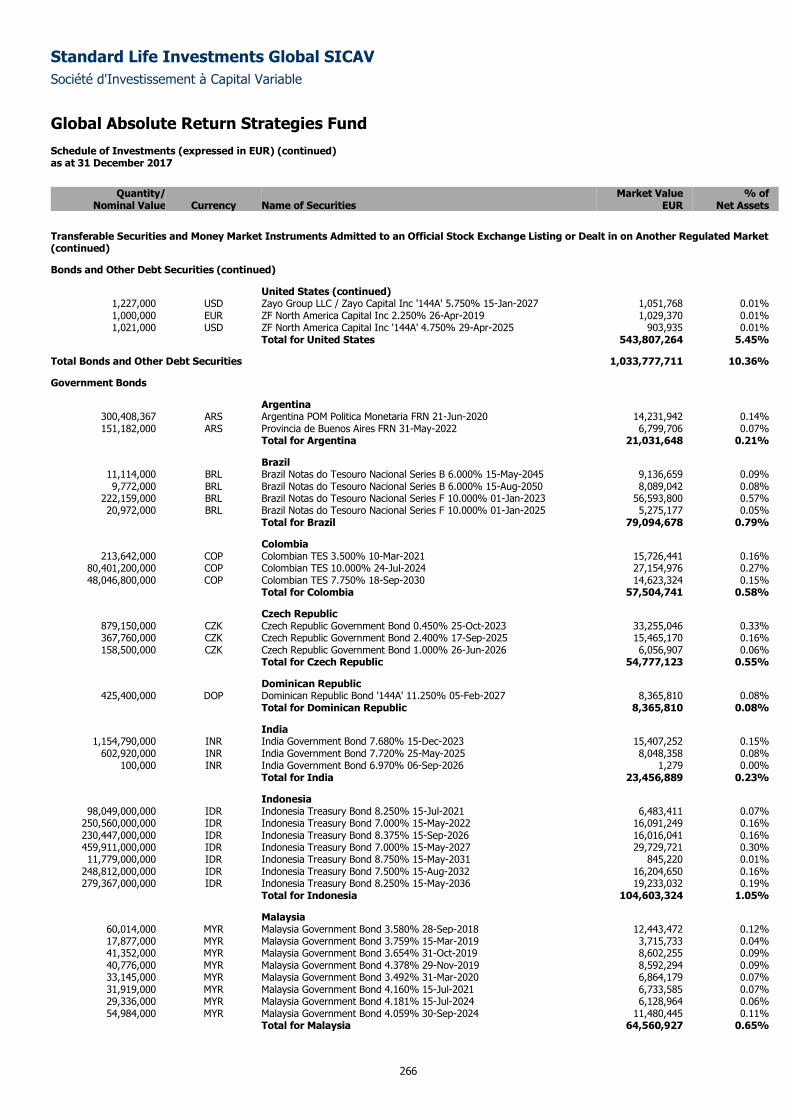
Standard Life Investments Global SICAV
Société d'Investissement à Capital Variable
Global Absolute Return Strategies Fund Schedule of Investments (expressed in EUR) (continued) as at 31 December 2017
266
Quantity/ Market Value % of
Nominal Value Currency Name of Securities EUR Net Assets
Transferable Securities and Money Market Instruments Admitted to an Official Stock Exchange Listing or Dealt in on Another Regulated Market (continued)
Bonds and Other Debt Securities (continued)
United States (continued) 1,227,000 USD Zayo Group LLC / Zayo Capital Inc '144A' 5.750% 15-Jan-2027 1,051,768 0.01% 1,000,000 EUR ZF North America Capital Inc 2.250% 26-Apr-2019 1,029,370 0.01% 1,021,000 USD ZF North America Capital Inc '144A' 4.750% 29-Apr-2025 903,935 0.01%
Total for United States 543,807,264 5.45%
Total Bonds and Other Debt Securities 1,033,777,711 10.36%
Government Bonds
Argentina 300,408,367 ARS Argentina POM Politica Monetaria FRN 21-Jun-2020 14,231,942 0.14% 151,182,000 ARS Provincia de Buenos Aires FRN 31-May-2022 6,799,706 0.07%
Total for Argentina 21,031,648 0.21%
Brazil 11,114,000 BRL Brazil Notas do Tesouro Nacional Series B 6.000% 15-May-2045 9,136,659 0.09% 9,772,000 BRL Brazil Notas do Tesouro Nacional Series B 6.000% 15-Aug-2050 8,089,042 0.08%
222,159,000 BRL Brazil Notas do Tesouro Nacional Series F 10.000% 01-Jan-2023 56,593,800 0.57% 20,972,000 BRL Brazil Notas do Tesouro Nacional Series F 10.000% 01-Jan-2025 5,275,177 0.05%
Total for Brazil 79,094,678 0.79%
Colombia 213,642,000 COP Colombian TES 3.500% 10-Mar-2021 15,726,441 0.16%
80,401,200,000 COP Colombian TES 10.000% 24-Jul-2024 27,154,976 0.27% 48,046,800,000 COP Colombian TES 7.750% 18-Sep-2030 14,623,324 0.15%
Total for Colombia 57,504,741 0.58%
Czech Republic 879,150,000 CZK Czech Republic Government Bond 0.450% 25-Oct-2023 33,255,046 0.33% 367,760,000 CZK Czech Republic Government Bond 2.400% 17-Sep-2025 15,465,170 0.16% 158,500,000 CZK Czech Republic Government Bond 1.000% 26-Jun-2026 6,056,907 0.06%
Total for Czech Republic 54,777,123 0.55%
Dominican Republic 425,400,000 DOP Dominican Republic Bond '144A' 11.250% 05-Feb-2027 8,365,810 0.08%
Total for Dominican Republic 8,365,810 0.08%
India 1,154,790,000 INR India Government Bond 7.680% 15-Dec-2023 15,407,252 0.15%
602,920,000 INR India Government Bond 7.720% 25-May-2025 8,048,358 0.08% 100,000 INR India Government Bond 6.970% 06-Sep-2026 1,279 0.00%
Total for India 23,456,889 0.23%
Indonesia 98,049,000,000 IDR Indonesia Treasury Bond 8.250% 15-Jul-2021 6,483,411 0.07%
250,560,000,000 IDR Indonesia Treasury Bond 7.000% 15-May-2022 16,091,249 0.16% 230,447,000,000 IDR Indonesia Treasury Bond 8.375% 15-Sep-2026 16,016,041 0.16% 459,911,000,000 IDR Indonesia Treasury Bond 7.000% 15-May-2027 29,729,721 0.30% 11,779,000,000 IDR Indonesia Treasury Bond 8.750% 15-May-2031 845,220 0.01%
248,812,000,000 IDR Indonesia Treasury Bond 7.500% 15-Aug-2032 16,204,650 0.16% 279,367,000,000 IDR Indonesia Treasury Bond 8.250% 15-May-2036 19,233,032 0.19%
Total for Indonesia 104,603,324 1.05%
Malaysia 60,014,000 MYR Malaysia Government Bond 3.580% 28-Sep-2018 12,443,472 0.12% 17,877,000 MYR Malaysia Government Bond 3.759% 15-Mar-2019 3,715,733 0.04% 41,352,000 MYR Malaysia Government Bond 3.654% 31-Oct-2019 8,602,255 0.09% 40,776,000 MYR Malaysia Government Bond 4.378% 29-Nov-2019 8,592,294 0.09% 33,145,000 MYR Malaysia Government Bond 3.492% 31-Mar-2020 6,864,179 0.07% 31,919,000 MYR Malaysia Government Bond 4.160% 15-Jul-2021 6,733,585 0.07% 29,336,000 MYR Malaysia Government Bond 4.181% 15-Jul-2024 6,128,964 0.06% 54,984,000 MYR Malaysia Government Bond 4.059% 30-Sep-2024 11,480,445 0.11%
Total for Malaysia 64,560,927 0.65%
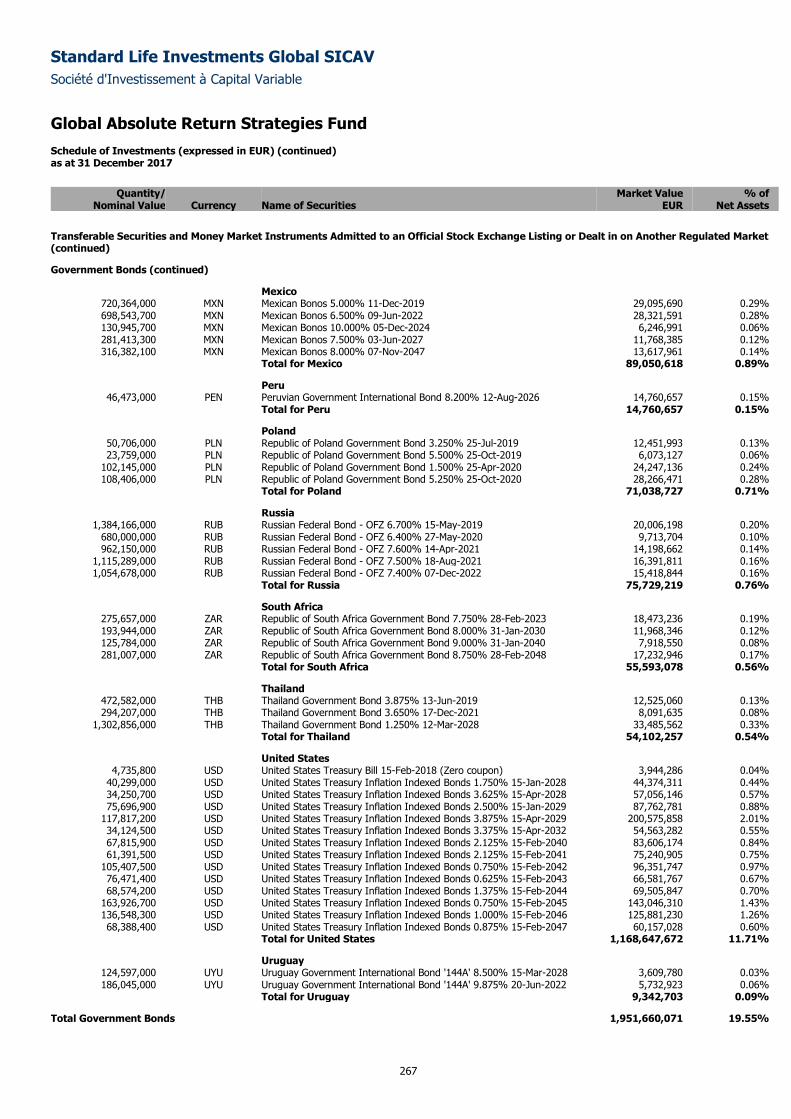
Standard Life Investments Global SICAV
Société d'Investissement à Capital Variable
Global Absolute Return Strategies Fund Schedule of Investments (expressed in EUR) (continued) as at 31 December 2017
267
Quantity/ Market Value % of
Nominal Value Currency Name of Securities EUR Net Assets
Transferable Securities and Money Market Instruments Admitted to an Official Stock Exchange Listing or Dealt in on Another Regulated Market (continued)
Government Bonds (continued)
Mexico 720,364,000 MXN Mexican Bonos 5.000% 11-Dec-2019 29,095,690 0.29% 698,543,700 MXN Mexican Bonos 6.500% 09-Jun-2022 28,321,591 0.28% 130,945,700 MXN Mexican Bonos 10.000% 05-Dec-2024 6,246,991 0.06% 281,413,300 MXN Mexican Bonos 7.500% 03-Jun-2027 11,768,385 0.12% 316,382,100 MXN Mexican Bonos 8.000% 07-Nov-2047 13,617,961 0.14%
Total for Mexico 89,050,618 0.89%
Peru 46,473,000 PEN Peruvian Government International Bond 8.200% 12-Aug-2026 14,760,657 0.15%
Total for Peru 14,760,657 0.15%
Poland 50,706,000 PLN Republic of Poland Government Bond 3.250% 25-Jul-2019 12,451,993 0.13% 23,759,000 PLN Republic of Poland Government Bond 5.500% 25-Oct-2019 6,073,127 0.06%
102,145,000 PLN Republic of Poland Government Bond 1.500% 25-Apr-2020 24,247,136 0.24% 108,406,000 PLN Republic of Poland Government Bond 5.250% 25-Oct-2020 28,266,471 0.28%
Total for Poland 71,038,727 0.71%
Russia 1,384,166,000 RUB Russian Federal Bond - OFZ 6.700% 15-May-2019 20,006,198 0.20%
680,000,000 RUB Russian Federal Bond - OFZ 6.400% 27-May-2020 9,713,704 0.10% 962,150,000 RUB Russian Federal Bond - OFZ 7.600% 14-Apr-2021 14,198,662 0.14%
1,115,289,000 RUB Russian Federal Bond - OFZ 7.500% 18-Aug-2021 16,391,811 0.16% 1,054,678,000 RUB Russian Federal Bond - OFZ 7.400% 07-Dec-2022 15,418,844 0.16%
Total for Russia 75,729,219 0.76%
South Africa 275,657,000 ZAR Republic of South Africa Government Bond 7.750% 28-Feb-2023 18,473,236 0.19% 193,944,000 ZAR Republic of South Africa Government Bond 8.000% 31-Jan-2030 11,968,346 0.12% 125,784,000 ZAR Republic of South Africa Government Bond 9.000% 31-Jan-2040 7,918,550 0.08% 281,007,000 ZAR Republic of South Africa Government Bond 8.750% 28-Feb-2048 17,232,946 0.17%
Total for South Africa 55,593,078 0.56%
Thailand 472,582,000 THB Thailand Government Bond 3.875% 13-Jun-2019 12,525,060 0.13% 294,207,000 THB Thailand Government Bond 3.650% 17-Dec-2021 8,091,635 0.08%
1,302,856,000 THB Thailand Government Bond 1.250% 12-Mar-2028 33,485,562 0.33% Total for Thailand 54,102,257 0.54%
United States 4,735,800 USD United States Treasury Bill 15-Feb-2018 (Zero coupon) 3,944,286 0.04%
40,299,000 USD United States Treasury Inflation Indexed Bonds 1.750% 15-Jan-2028 44,374,311 0.44% 34,250,700 USD United States Treasury Inflation Indexed Bonds 3.625% 15-Apr-2028 57,056,146 0.57% 75,696,900 USD United States Treasury Inflation Indexed Bonds 2.500% 15-Jan-2029 87,762,781 0.88%
117,817,200 USD United States Treasury Inflation Indexed Bonds 3.875% 15-Apr-2029 200,575,858 2.01% 34,124,500 USD United States Treasury Inflation Indexed Bonds 3.375% 15-Apr-2032 54,563,282 0.55% 67,815,900 USD United States Treasury Inflation Indexed Bonds 2.125% 15-Feb-2040 83,606,174 0.84% 61,391,500 USD United States Treasury Inflation Indexed Bonds 2.125% 15-Feb-2041 75,240,905 0.75%
105,407,500 USD United States Treasury Inflation Indexed Bonds 0.750% 15-Feb-2042 96,351,747 0.97% 76,471,400 USD United States Treasury Inflation Indexed Bonds 0.625% 15-Feb-2043 66,581,767 0.67% 68,574,200 USD United States Treasury Inflation Indexed Bonds 1.375% 15-Feb-2044 69,505,847 0.70%
163,926,700 USD United States Treasury Inflation Indexed Bonds 0.750% 15-Feb-2045 143,046,310 1.43% 136,548,300 USD United States Treasury Inflation Indexed Bonds 1.000% 15-Feb-2046 125,881,230 1.26% 68,388,400 USD United States Treasury Inflation Indexed Bonds 0.875% 15-Feb-2047 60,157,028 0.60%
Total for United States 1,168,647,672 11.71%
Uruguay 124,597,000 UYU Uruguay Government International Bond '144A' 8.500% 15-Mar-2028 3,609,780 0.03% 186,045,000 UYU Uruguay Government International Bond '144A' 9.875% 20-Jun-2022 5,732,923 0.06%
Total for Uruguay 9,342,703 0.09%
Total Government Bonds 1,951,660,071 19.55%
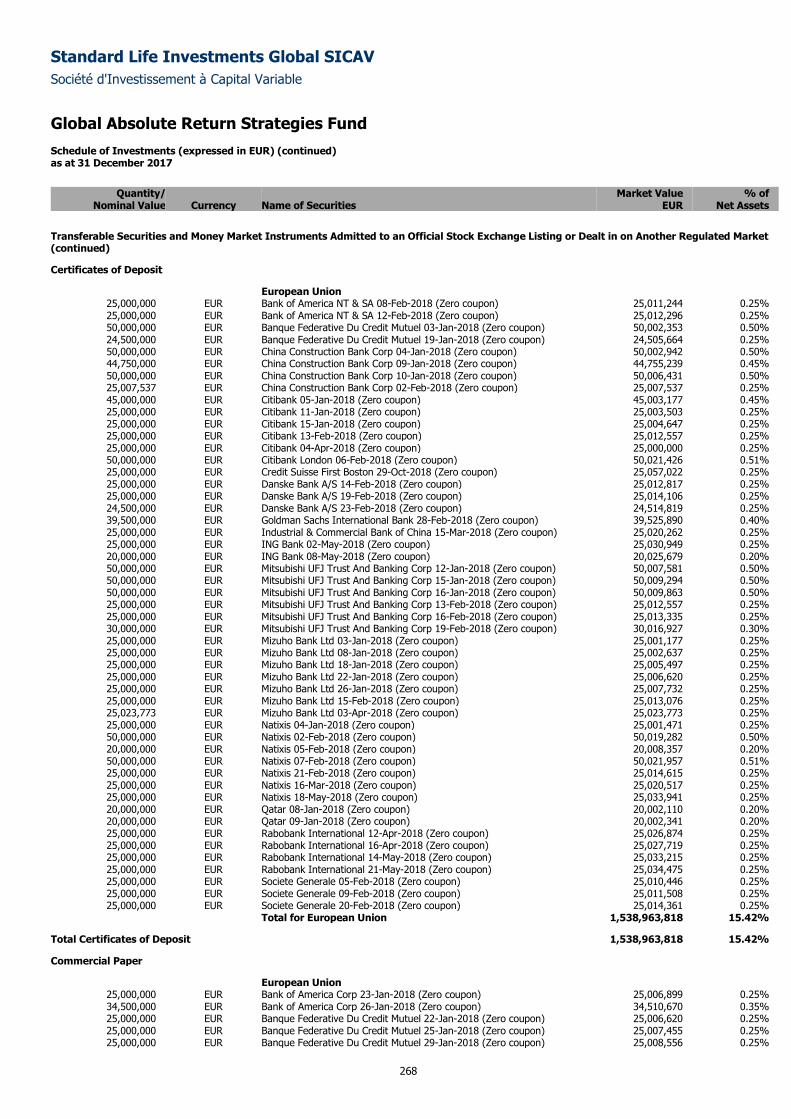
Standard Life Investments Global SICAV
Société d'Investissement à Capital Variable
Global Absolute Return Strategies Fund Schedule of Investments (expressed in EUR) (continued) as at 31 December 2017
268
Quantity/ Market Value % of
Nominal Value Currency Name of Securities EUR Net Assets
Transferable Securities and Money Market Instruments Admitted to an Official Stock Exchange Listing or Dealt in on Another Regulated Market (continued)
Certificates of Deposit
European Union 25,000,000 EUR Bank of America NT & SA 08-Feb-2018 (Zero coupon) 25,011,244 0.25% 25,000,000 EUR Bank of America NT & SA 12-Feb-2018 (Zero coupon) 25,012,296 0.25% 50,000,000 EUR Banque Federative Du Credit Mutuel 03-Jan-2018 (Zero coupon) 50,002,353 0.50% 24,500,000 EUR Banque Federative Du Credit Mutuel 19-Jan-2018 (Zero coupon) 24,505,664 0.25% 50,000,000 EUR China Construction Bank Corp 04-Jan-2018 (Zero coupon) 50,002,942 0.50% 44,750,000 EUR China Construction Bank Corp 09-Jan-2018 (Zero coupon) 44,755,239 0.45% 50,000,000 EUR China Construction Bank Corp 10-Jan-2018 (Zero coupon) 50,006,431 0.50% 25,007,537 EUR China Construction Bank Corp 02-Feb-2018 (Zero coupon) 25,007,537 0.25% 45,000,000 EUR Citibank 05-Jan-2018 (Zero coupon) 45,003,177 0.45% 25,000,000 EUR Citibank 11-Jan-2018 (Zero coupon) 25,003,503 0.25% 25,000,000 EUR Citibank 15-Jan-2018 (Zero coupon) 25,004,647 0.25% 25,000,000 EUR Citibank 13-Feb-2018 (Zero coupon) 25,012,557 0.25% 25,000,000 EUR Citibank 04-Apr-2018 (Zero coupon) 25,000,000 0.25% 50,000,000 EUR Citibank London 06-Feb-2018 (Zero coupon) 50,021,426 0.51% 25,000,000 EUR Credit Suisse First Boston 29-Oct-2018 (Zero coupon) 25,057,022 0.25% 25,000,000 EUR Danske Bank A/S 14-Feb-2018 (Zero coupon) 25,012,817 0.25% 25,000,000 EUR Danske Bank A/S 19-Feb-2018 (Zero coupon) 25,014,106 0.25% 24,500,000 EUR Danske Bank A/S 23-Feb-2018 (Zero coupon) 24,514,819 0.25% 39,500,000 EUR Goldman Sachs International Bank 28-Feb-2018 (Zero coupon) 39,525,890 0.40% 25,000,000 EUR Industrial & Commercial Bank of China 15-Mar-2018 (Zero coupon) 25,020,262 0.25% 25,000,000 EUR ING Bank 02-May-2018 (Zero coupon) 25,030,949 0.25% 20,000,000 EUR ING Bank 08-May-2018 (Zero coupon) 20,025,679 0.20% 50,000,000 EUR Mitsubishi UFJ Trust And Banking Corp 12-Jan-2018 (Zero coupon) 50,007,581 0.50% 50,000,000 EUR Mitsubishi UFJ Trust And Banking Corp 15-Jan-2018 (Zero coupon) 50,009,294 0.50% 50,000,000 EUR Mitsubishi UFJ Trust And Banking Corp 16-Jan-2018 (Zero coupon) 50,009,863 0.50% 25,000,000 EUR Mitsubishi UFJ Trust And Banking Corp 13-Feb-2018 (Zero coupon) 25,012,557 0.25% 25,000,000 EUR Mitsubishi UFJ Trust And Banking Corp 16-Feb-2018 (Zero coupon) 25,013,335 0.25% 30,000,000 EUR Mitsubishi UFJ Trust And Banking Corp 19-Feb-2018 (Zero coupon) 30,016,927 0.30% 25,000,000 EUR Mizuho Bank Ltd 03-Jan-2018 (Zero coupon) 25,001,177 0.25% 25,000,000 EUR Mizuho Bank Ltd 08-Jan-2018 (Zero coupon) 25,002,637 0.25% 25,000,000 EUR Mizuho Bank Ltd 18-Jan-2018 (Zero coupon) 25,005,497 0.25% 25,000,000 EUR Mizuho Bank Ltd 22-Jan-2018 (Zero coupon) 25,006,620 0.25% 25,000,000 EUR Mizuho Bank Ltd 26-Jan-2018 (Zero coupon) 25,007,732 0.25% 25,000,000 EUR Mizuho Bank Ltd 15-Feb-2018 (Zero coupon) 25,013,076 0.25% 25,023,773 EUR Mizuho Bank Ltd 03-Apr-2018 (Zero coupon) 25,023,773 0.25% 25,000,000 EUR Natixis 04-Jan-2018 (Zero coupon) 25,001,471 0.25% 50,000,000 EUR Natixis 02-Feb-2018 (Zero coupon) 50,019,282 0.50% 20,000,000 EUR Natixis 05-Feb-2018 (Zero coupon) 20,008,357 0.20% 50,000,000 EUR Natixis 07-Feb-2018 (Zero coupon) 50,021,957 0.51% 25,000,000 EUR Natixis 21-Feb-2018 (Zero coupon) 25,014,615 0.25% 25,000,000 EUR Natixis 16-Mar-2018 (Zero coupon) 25,020,517 0.25% 25,000,000 EUR Natixis 18-May-2018 (Zero coupon) 25,033,941 0.25% 20,000,000 EUR Qatar 08-Jan-2018 (Zero coupon) 20,002,110 0.20% 20,000,000 EUR Qatar 09-Jan-2018 (Zero coupon) 20,002,341 0.20% 25,000,000 EUR Rabobank International 12-Apr-2018 (Zero coupon) 25,026,874 0.25% 25,000,000 EUR Rabobank International 16-Apr-2018 (Zero coupon) 25,027,719 0.25% 25,000,000 EUR Rabobank International 14-May-2018 (Zero coupon) 25,033,215 0.25% 25,000,000 EUR Rabobank International 21-May-2018 (Zero coupon) 25,034,475 0.25% 25,000,000 EUR Societe Generale 05-Feb-2018 (Zero coupon) 25,010,446 0.25% 25,000,000 EUR Societe Generale 09-Feb-2018 (Zero coupon) 25,011,508 0.25% 25,000,000 EUR Societe Generale 20-Feb-2018 (Zero coupon) 25,014,361 0.25%
Total for European Union 1,538,963,818 15.42%
Total Certificates of Deposit 1,538,963,818 15.42%
Commercial Paper
European Union 25,000,000 EUR Bank of America Corp 23-Jan-2018 (Zero coupon) 25,006,899 0.25% 34,500,000 EUR Bank of America Corp 26-Jan-2018 (Zero coupon) 34,510,670 0.35% 25,000,000 EUR Banque Federative Du Credit Mutuel 22-Jan-2018 (Zero coupon) 25,006,620 0.25% 25,000,000 EUR Banque Federative Du Credit Mutuel 25-Jan-2018 (Zero coupon) 25,007,455 0.25% 25,000,000 EUR Banque Federative Du Credit Mutuel 29-Jan-2018 (Zero coupon) 25,008,556 0.25%
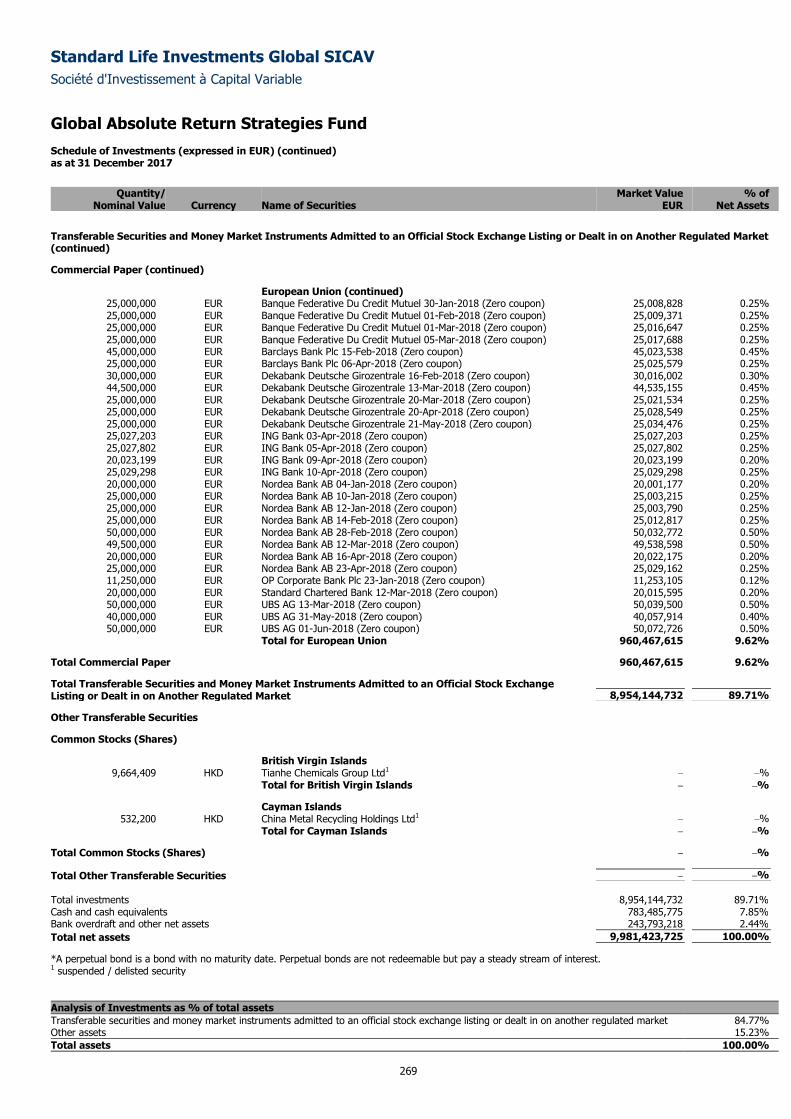
Standard Life Investments Global SICAV
Société d'Investissement à Capital Variable
Global Absolute Return Strategies Fund Schedule of Investments (expressed in EUR) (continued) as at 31 December 2017
269
Quantity/ Market Value % of
Nominal Value Currency Name of Securities EUR Net Assets
Transferable Securities and Money Market Instruments Admitted to an Official Stock Exchange Listing or Dealt in on Another Regulated Market (continued)
Commercial Paper (continued)
European Union (continued) 25,000,000 EUR Banque Federative Du Credit Mutuel 30-Jan-2018 (Zero coupon) 25,008,828 0.25% 25,000,000 EUR Banque Federative Du Credit Mutuel 01-Feb-2018 (Zero coupon) 25,009,371 0.25% 25,000,000 EUR Banque Federative Du Credit Mutuel 01-Mar-2018 (Zero coupon) 25,016,647 0.25% 25,000,000 EUR Banque Federative Du Credit Mutuel 05-Mar-2018 (Zero coupon) 25,017,688 0.25% 45,000,000 EUR Barclays Bank Plc 15-Feb-2018 (Zero coupon) 45,023,538 0.45% 25,000,000 EUR Barclays Bank Plc 06-Apr-2018 (Zero coupon) 25,025,579 0.25% 30,000,000 EUR Dekabank Deutsche Girozentrale 16-Feb-2018 (Zero coupon) 30,016,002 0.30% 44,500,000 EUR Dekabank Deutsche Girozentrale 13-Mar-2018 (Zero coupon) 44,535,155 0.45% 25,000,000 EUR Dekabank Deutsche Girozentrale 20-Mar-2018 (Zero coupon) 25,021,534 0.25% 25,000,000 EUR Dekabank Deutsche Girozentrale 20-Apr-2018 (Zero coupon) 25,028,549 0.25% 25,000,000 EUR Dekabank Deutsche Girozentrale 21-May-2018 (Zero coupon) 25,034,476 0.25% 25,027,203 EUR ING Bank 03-Apr-2018 (Zero coupon) 25,027,203 0.25% 25,027,802 EUR ING Bank 05-Apr-2018 (Zero coupon) 25,027,802 0.25% 20,023,199 EUR ING Bank 09-Apr-2018 (Zero coupon) 20,023,199 0.20% 25,029,298 EUR ING Bank 10-Apr-2018 (Zero coupon) 25,029,298 0.25% 20,000,000 EUR Nordea Bank AB 04-Jan-2018 (Zero coupon) 20,001,177 0.20% 25,000,000 EUR Nordea Bank AB 10-Jan-2018 (Zero coupon) 25,003,215 0.25% 25,000,000 EUR Nordea Bank AB 12-Jan-2018 (Zero coupon) 25,003,790 0.25% 25,000,000 EUR Nordea Bank AB 14-Feb-2018 (Zero coupon) 25,012,817 0.25% 50,000,000 EUR Nordea Bank AB 28-Feb-2018 (Zero coupon) 50,032,772 0.50% 49,500,000 EUR Nordea Bank AB 12-Mar-2018 (Zero coupon) 49,538,598 0.50% 20,000,000 EUR Nordea Bank AB 16-Apr-2018 (Zero coupon) 20,022,175 0.20% 25,000,000 EUR Nordea Bank AB 23-Apr-2018 (Zero coupon) 25,029,162 0.25% 11,250,000 EUR OP Corporate Bank Plc 23-Jan-2018 (Zero coupon) 11,253,105 0.12% 20,000,000 EUR Standard Chartered Bank 12-Mar-2018 (Zero coupon) 20,015,595 0.20% 50,000,000 EUR UBS AG 13-Mar-2018 (Zero coupon) 50,039,500 0.50% 40,000,000 EUR UBS AG 31-May-2018 (Zero coupon) 40,057,914 0.40% 50,000,000 EUR UBS AG 01-Jun-2018 (Zero coupon) 50,072,726 0.50%
Total for European Union 960,467,615 9.62%
Total Commercial Paper 960,467,615 9.62%
Total Transferable Securities and Money Market Instruments Admitted to an Official Stock Exchange Listing or Dealt in on Another Regulated Market 8,954,144,732 89.71%
Other Transferable Securities
Common Stocks (Shares)
British Virgin Islands 9,664,409 HKD Tianhe Chemicals Group Ltd1 – –%
Total for British Virgin Islands – –%
Cayman Islands 532,200 HKD China Metal Recycling Holdings Ltd1 – –%
Total for Cayman Islands – –%
Total Common Stocks (Shares) – –%
Total Other Transferable Securities – –%
Total investments 8,954,144,732 89.71%
Cash and cash equivalents 783,485,775 7.85%
Bank overdraft and other net assets 243,793,218 2.44%
Total net assets 9,981,423,725 100.00%
*A perpetual bond is a bond with no maturity date. Perpetual bonds are not redeemable but pay a steady stream of interest. 1 suspended / delisted security
Analysis of Investments as % of total assets
Transferable securities and money market instruments admitted to an official stock exchange listing or dealt in on another regulated market 84.77% Other assets 15.23%
Total assets 100.00%
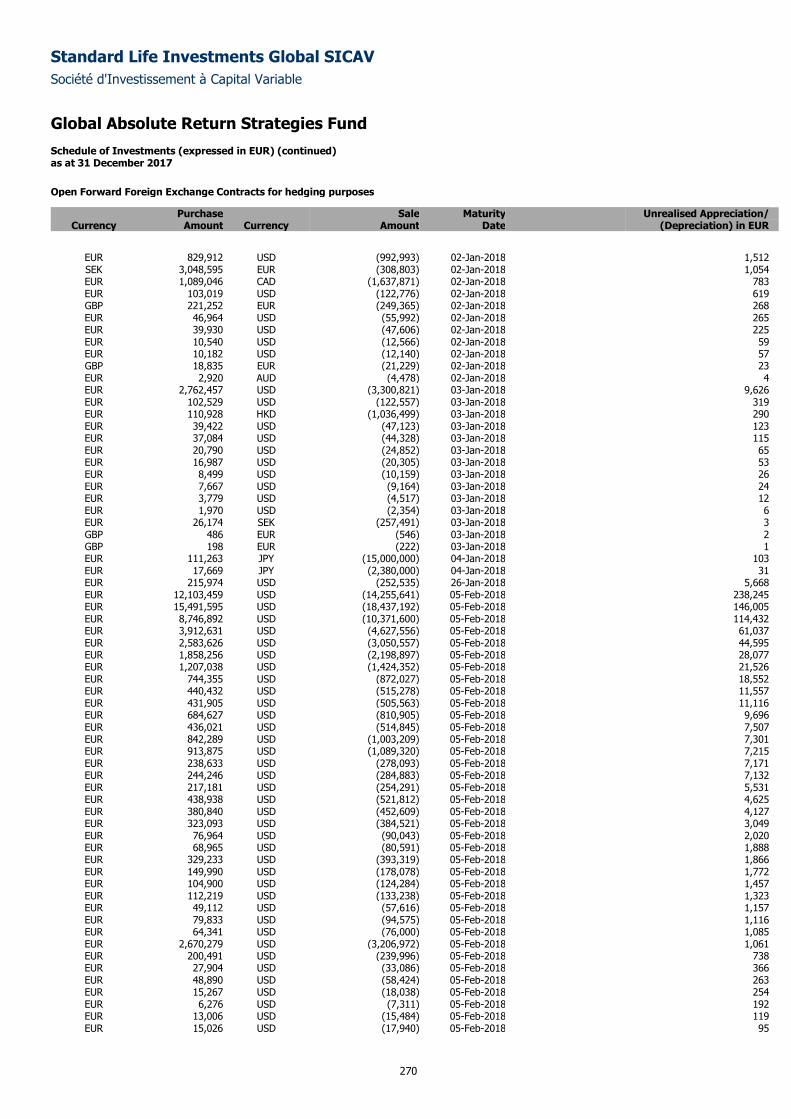
Standard Life Investments Global SICAV
Société d'Investissement à Capital Variable
Global Absolute Return Strategies Fund Schedule of Investments (expressed in EUR) (continued) as at 31 December 2017
270
Open Forward Foreign Exchange Contracts for hedging purposes
Purchase Sale Maturity Unrealised Appreciation/ Currency Amount Currency Amount Date (Depreciation) in EUR
EUR 829,912 USD (992,993) 02-Jan-2018 1,512 SEK 3,048,595 EUR (308,803) 02-Jan-2018 1,054 EUR 1,089,046 CAD (1,637,871) 02-Jan-2018 783 EUR 103,019 USD (122,776) 02-Jan-2018 619 GBP 221,252 EUR (249,365) 02-Jan-2018 268 EUR 46,964 USD (55,992) 02-Jan-2018 265 EUR 39,930 USD (47,606) 02-Jan-2018 225 EUR 10,540 USD (12,566) 02-Jan-2018 59 EUR 10,182 USD (12,140) 02-Jan-2018 57 GBP 18,835 EUR (21,229) 02-Jan-2018 23 EUR 2,920 AUD (4,478) 02-Jan-2018 4 EUR 2,762,457 USD (3,300,821) 03-Jan-2018 9,626 EUR 102,529 USD (122,557) 03-Jan-2018 319 EUR 110,928 HKD (1,036,499) 03-Jan-2018 290 EUR 39,422 USD (47,123) 03-Jan-2018 123 EUR 37,084 USD (44,328) 03-Jan-2018 115 EUR 20,790 USD (24,852) 03-Jan-2018 65 EUR 16,987 USD (20,305) 03-Jan-2018 53 EUR 8,499 USD (10,159) 03-Jan-2018 26 EUR 7,667 USD (9,164) 03-Jan-2018 24 EUR 3,779 USD (4,517) 03-Jan-2018 12 EUR 1,970 USD (2,354) 03-Jan-2018 6 EUR 26,174 SEK (257,491) 03-Jan-2018 3 GBP 486 EUR (546) 03-Jan-2018 2 GBP 198 EUR (222) 03-Jan-2018 1 EUR 111,263 JPY (15,000,000) 04-Jan-2018 103 EUR 17,669 JPY (2,380,000) 04-Jan-2018 31 EUR 215,974 USD (252,535) 26-Jan-2018 5,668 EUR 12,103,459 USD (14,255,641) 05-Feb-2018 238,245 EUR 15,491,595 USD (18,437,192) 05-Feb-2018 146,005 EUR 8,746,892 USD (10,371,600) 05-Feb-2018 114,432 EUR 3,912,631 USD (4,627,556) 05-Feb-2018 61,037 EUR 2,583,626 USD (3,050,557) 05-Feb-2018 44,595 EUR 1,858,256 USD (2,198,897) 05-Feb-2018 28,077 EUR 1,207,038 USD (1,424,352) 05-Feb-2018 21,526 EUR 744,355 USD (872,027) 05-Feb-2018 18,552 EUR 440,432 USD (515,278) 05-Feb-2018 11,557 EUR 431,905 USD (505,563) 05-Feb-2018 11,116 EUR 684,627 USD (810,905) 05-Feb-2018 9,696 EUR 436,021 USD (514,845) 05-Feb-2018 7,507 EUR 842,289 USD (1,003,209) 05-Feb-2018 7,301 EUR 913,875 USD (1,089,320) 05-Feb-2018 7,215 EUR 238,633 USD (278,093) 05-Feb-2018 7,171 EUR 244,246 USD (284,883) 05-Feb-2018 7,132 EUR 217,181 USD (254,291) 05-Feb-2018 5,531 EUR 438,938 USD (521,812) 05-Feb-2018 4,625 EUR 380,840 USD (452,609) 05-Feb-2018 4,127 EUR 323,093 USD (384,521) 05-Feb-2018 3,049 EUR 76,964 USD (90,043) 05-Feb-2018 2,020 EUR 68,965 USD (80,591) 05-Feb-2018 1,888 EUR 329,233 USD (393,319) 05-Feb-2018 1,866 EUR 149,990 USD (178,078) 05-Feb-2018 1,772 EUR 104,900 USD (124,284) 05-Feb-2018 1,457 EUR 112,219 USD (133,238) 05-Feb-2018 1,323 EUR 49,112 USD (57,616) 05-Feb-2018 1,157 EUR 79,833 USD (94,575) 05-Feb-2018 1,116 EUR 64,341 USD (76,000) 05-Feb-2018 1,085 EUR 2,670,279 USD (3,206,972) 05-Feb-2018 1,061 EUR 200,491 USD (239,996) 05-Feb-2018 738 EUR 27,904 USD (33,086) 05-Feb-2018 366 EUR 48,890 USD (58,424) 05-Feb-2018 263 EUR 15,267 USD (18,038) 05-Feb-2018 254 EUR 6,276 USD (7,311) 05-Feb-2018 192 EUR 13,006 USD (15,484) 05-Feb-2018 119 EUR 15,026 USD (17,940) 05-Feb-2018 95
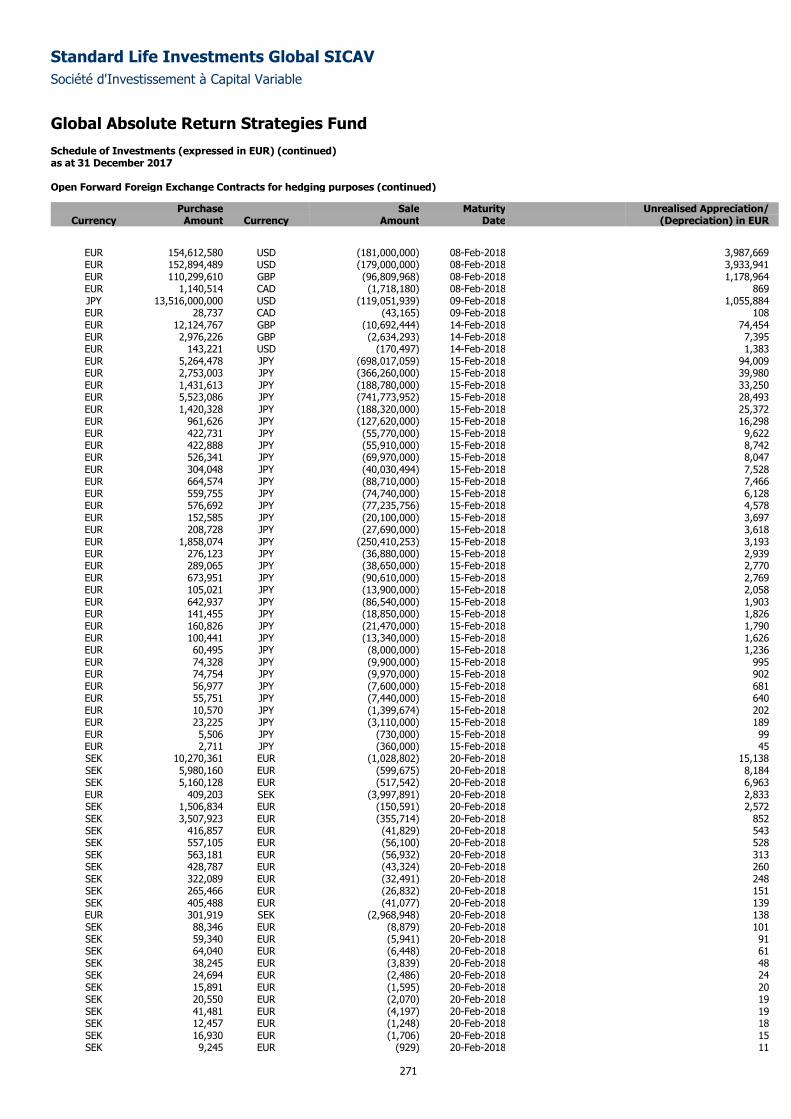
Standard Life Investments Global SICAV
Société d'Investissement à Capital Variable
Global Absolute Return Strategies Fund Schedule of Investments (expressed in EUR) (continued) as at 31 December 2017
271
Open Forward Foreign Exchange Contracts for hedging purposes (continued)
Purchase Sale Maturity Unrealised Appreciation/ Currency Amount Currency Amount Date (Depreciation) in EUR
EUR 154,612,580 USD (181,000,000) 08-Feb-2018 3,987,669 EUR 152,894,489 USD (179,000,000) 08-Feb-2018 3,933,941 EUR 110,299,610 GBP (96,809,968) 08-Feb-2018 1,178,964 EUR 1,140,514 CAD (1,718,180) 08-Feb-2018 869 JPY 13,516,000,000 USD (119,051,939) 09-Feb-2018 1,055,884 EUR 28,737 CAD (43,165) 09-Feb-2018 108 EUR 12,124,767 GBP (10,692,444) 14-Feb-2018 74,454 EUR 2,976,226 GBP (2,634,293) 14-Feb-2018 7,395 EUR 143,221 USD (170,497) 14-Feb-2018 1,383 EUR 5,264,478 JPY (698,017,059) 15-Feb-2018 94,009 EUR 2,753,003 JPY (366,260,000) 15-Feb-2018 39,980 EUR 1,431,613 JPY (188,780,000) 15-Feb-2018 33,250 EUR 5,523,086 JPY (741,773,952) 15-Feb-2018 28,493 EUR 1,420,328 JPY (188,320,000) 15-Feb-2018 25,372 EUR 961,626 JPY (127,620,000) 15-Feb-2018 16,298 EUR 422,731 JPY (55,770,000) 15-Feb-2018 9,622 EUR 422,888 JPY (55,910,000) 15-Feb-2018 8,742 EUR 526,341 JPY (69,970,000) 15-Feb-2018 8,047 EUR 304,048 JPY (40,030,494) 15-Feb-2018 7,528 EUR 664,574 JPY (88,710,000) 15-Feb-2018 7,466 EUR 559,755 JPY (74,740,000) 15-Feb-2018 6,128 EUR 576,692 JPY (77,235,756) 15-Feb-2018 4,578 EUR 152,585 JPY (20,100,000) 15-Feb-2018 3,697 EUR 208,728 JPY (27,690,000) 15-Feb-2018 3,618 EUR 1,858,074 JPY (250,410,253) 15-Feb-2018 3,193 EUR 276,123 JPY (36,880,000) 15-Feb-2018 2,939 EUR 289,065 JPY (38,650,000) 15-Feb-2018 2,770 EUR 673,951 JPY (90,610,000) 15-Feb-2018 2,769 EUR 105,021 JPY (13,900,000) 15-Feb-2018 2,058 EUR 642,937 JPY (86,540,000) 15-Feb-2018 1,903 EUR 141,455 JPY (18,850,000) 15-Feb-2018 1,826 EUR 160,826 JPY (21,470,000) 15-Feb-2018 1,790 EUR 100,441 JPY (13,340,000) 15-Feb-2018 1,626 EUR 60,495 JPY (8,000,000) 15-Feb-2018 1,236 EUR 74,328 JPY (9,900,000) 15-Feb-2018 995 EUR 74,754 JPY (9,970,000) 15-Feb-2018 902 EUR 56,977 JPY (7,600,000) 15-Feb-2018 681 EUR 55,751 JPY (7,440,000) 15-Feb-2018 640 EUR 10,570 JPY (1,399,674) 15-Feb-2018 202 EUR 23,225 JPY (3,110,000) 15-Feb-2018 189 EUR 5,506 JPY (730,000) 15-Feb-2018 99 EUR 2,711 JPY (360,000) 15-Feb-2018 45 SEK 10,270,361 EUR (1,028,802) 20-Feb-2018 15,138 SEK 5,980,160 EUR (599,675) 20-Feb-2018 8,184 SEK 5,160,128 EUR (517,542) 20-Feb-2018 6,963 EUR 409,203 SEK (3,997,891) 20-Feb-2018 2,833 SEK 1,506,834 EUR (150,591) 20-Feb-2018 2,572 SEK 3,507,923 EUR (355,714) 20-Feb-2018 852 SEK 416,857 EUR (41,829) 20-Feb-2018 543 SEK 557,105 EUR (56,100) 20-Feb-2018 528 SEK 563,181 EUR (56,932) 20-Feb-2018 313 SEK 428,787 EUR (43,324) 20-Feb-2018 260 SEK 322,089 EUR (32,491) 20-Feb-2018 248 SEK 265,466 EUR (26,832) 20-Feb-2018 151 SEK 405,488 EUR (41,077) 20-Feb-2018 139 EUR 301,919 SEK (2,968,948) 20-Feb-2018 138 SEK 88,346 EUR (8,879) 20-Feb-2018 101 SEK 59,340 EUR (5,941) 20-Feb-2018 91 SEK 64,040 EUR (6,448) 20-Feb-2018 61 SEK 38,245 EUR (3,839) 20-Feb-2018 48 SEK 24,694 EUR (2,486) 20-Feb-2018 24 SEK 15,891 EUR (1,595) 20-Feb-2018 20 SEK 20,550 EUR (2,070) 20-Feb-2018 19 SEK 41,481 EUR (4,197) 20-Feb-2018 19 SEK 12,457 EUR (1,248) 20-Feb-2018 18 SEK 16,930 EUR (1,706) 20-Feb-2018 15 SEK 9,245 EUR (929) 20-Feb-2018 11
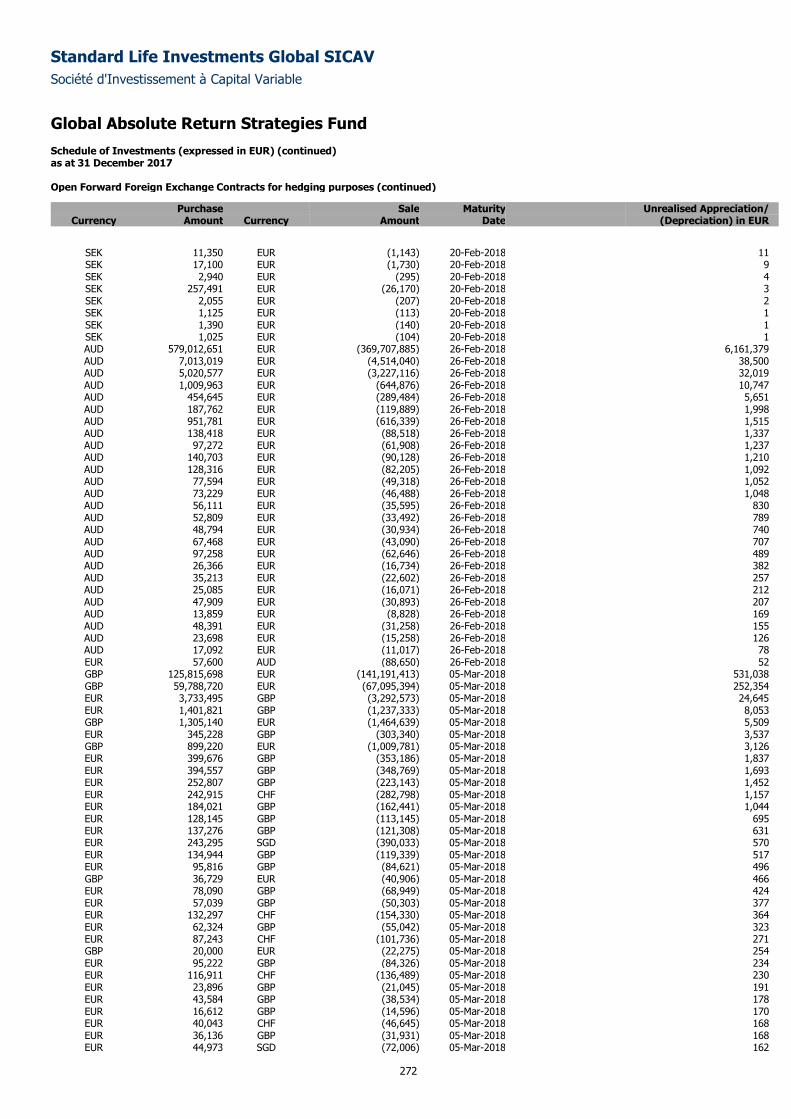
Standard Life Investments Global SICAV
Société d'Investissement à Capital Variable
Global Absolute Return Strategies Fund Schedule of Investments (expressed in EUR) (continued) as at 31 December 2017
272
Open Forward Foreign Exchange Contracts for hedging purposes (continued)
Purchase Sale Maturity Unrealised Appreciation/ Currency Amount Currency Amount Date (Depreciation) in EUR
SEK 11,350 EUR (1,143) 20-Feb-2018 11 SEK 17,100 EUR (1,730) 20-Feb-2018 9 SEK 2,940 EUR (295) 20-Feb-2018 4 SEK 257,491 EUR (26,170) 20-Feb-2018 3 SEK 2,055 EUR (207) 20-Feb-2018 2 SEK 1,125 EUR (113) 20-Feb-2018 1 SEK 1,390 EUR (140) 20-Feb-2018 1 SEK 1,025 EUR (104) 20-Feb-2018 1 AUD 579,012,651 EUR (369,707,885) 26-Feb-2018 6,161,379 AUD 7,013,019 EUR (4,514,040) 26-Feb-2018 38,500 AUD 5,020,577 EUR (3,227,116) 26-Feb-2018 32,019 AUD 1,009,963 EUR (644,876) 26-Feb-2018 10,747 AUD 454,645 EUR (289,484) 26-Feb-2018 5,651 AUD 187,762 EUR (119,889) 26-Feb-2018 1,998 AUD 951,781 EUR (616,339) 26-Feb-2018 1,515 AUD 138,418 EUR (88,518) 26-Feb-2018 1,337 AUD 97,272 EUR (61,908) 26-Feb-2018 1,237 AUD 140,703 EUR (90,128) 26-Feb-2018 1,210 AUD 128,316 EUR (82,205) 26-Feb-2018 1,092 AUD 77,594 EUR (49,318) 26-Feb-2018 1,052 AUD 73,229 EUR (46,488) 26-Feb-2018 1,048 AUD 56,111 EUR (35,595) 26-Feb-2018 830 AUD 52,809 EUR (33,492) 26-Feb-2018 789 AUD 48,794 EUR (30,934) 26-Feb-2018 740 AUD 67,468 EUR (43,090) 26-Feb-2018 707 AUD 97,258 EUR (62,646) 26-Feb-2018 489 AUD 26,366 EUR (16,734) 26-Feb-2018 382 AUD 35,213 EUR (22,602) 26-Feb-2018 257 AUD 25,085 EUR (16,071) 26-Feb-2018 212 AUD 47,909 EUR (30,893) 26-Feb-2018 207 AUD 13,859 EUR (8,828) 26-Feb-2018 169 AUD 48,391 EUR (31,258) 26-Feb-2018 155 AUD 23,698 EUR (15,258) 26-Feb-2018 126 AUD 17,092 EUR (11,017) 26-Feb-2018 78 EUR 57,600 AUD (88,650) 26-Feb-2018 52 GBP 125,815,698 EUR (141,191,413) 05-Mar-2018 531,038 GBP 59,788,720 EUR (67,095,394) 05-Mar-2018 252,354 EUR 3,733,495 GBP (3,292,573) 05-Mar-2018 24,645 EUR 1,401,821 GBP (1,237,333) 05-Mar-2018 8,053 GBP 1,305,140 EUR (1,464,639) 05-Mar-2018 5,509 EUR 345,228 GBP (303,340) 05-Mar-2018 3,537 GBP 899,220 EUR (1,009,781) 05-Mar-2018 3,126 EUR 399,676 GBP (353,186) 05-Mar-2018 1,837 EUR 394,557 GBP (348,769) 05-Mar-2018 1,693 EUR 252,807 GBP (223,143) 05-Mar-2018 1,452 EUR 242,915 CHF (282,798) 05-Mar-2018 1,157 EUR 184,021 GBP (162,441) 05-Mar-2018 1,044 EUR 128,145 GBP (113,145) 05-Mar-2018 695 EUR 137,276 GBP (121,308) 05-Mar-2018 631 EUR 243,295 SGD (390,033) 05-Mar-2018 570 EUR 134,944 GBP (119,339) 05-Mar-2018 517 EUR 95,816 GBP (84,621) 05-Mar-2018 496 GBP 36,729 EUR (40,906) 05-Mar-2018 466 EUR 78,090 GBP (68,949) 05-Mar-2018 424 EUR 57,039 GBP (50,303) 05-Mar-2018 377 EUR 132,297 CHF (154,330) 05-Mar-2018 364 EUR 62,324 GBP (55,042) 05-Mar-2018 323 EUR 87,243 CHF (101,736) 05-Mar-2018 271 GBP 20,000 EUR (22,275) 05-Mar-2018 254 EUR 95,222 GBP (84,326) 05-Mar-2018 234 EUR 116,911 CHF (136,489) 05-Mar-2018 230 EUR 23,896 GBP (21,045) 05-Mar-2018 191 EUR 43,584 GBP (38,534) 05-Mar-2018 178 EUR 16,612 GBP (14,596) 05-Mar-2018 170 EUR 40,043 CHF (46,645) 05-Mar-2018 168 EUR 36,136 GBP (31,931) 05-Mar-2018 168 EUR 44,973 SGD (72,006) 05-Mar-2018 162
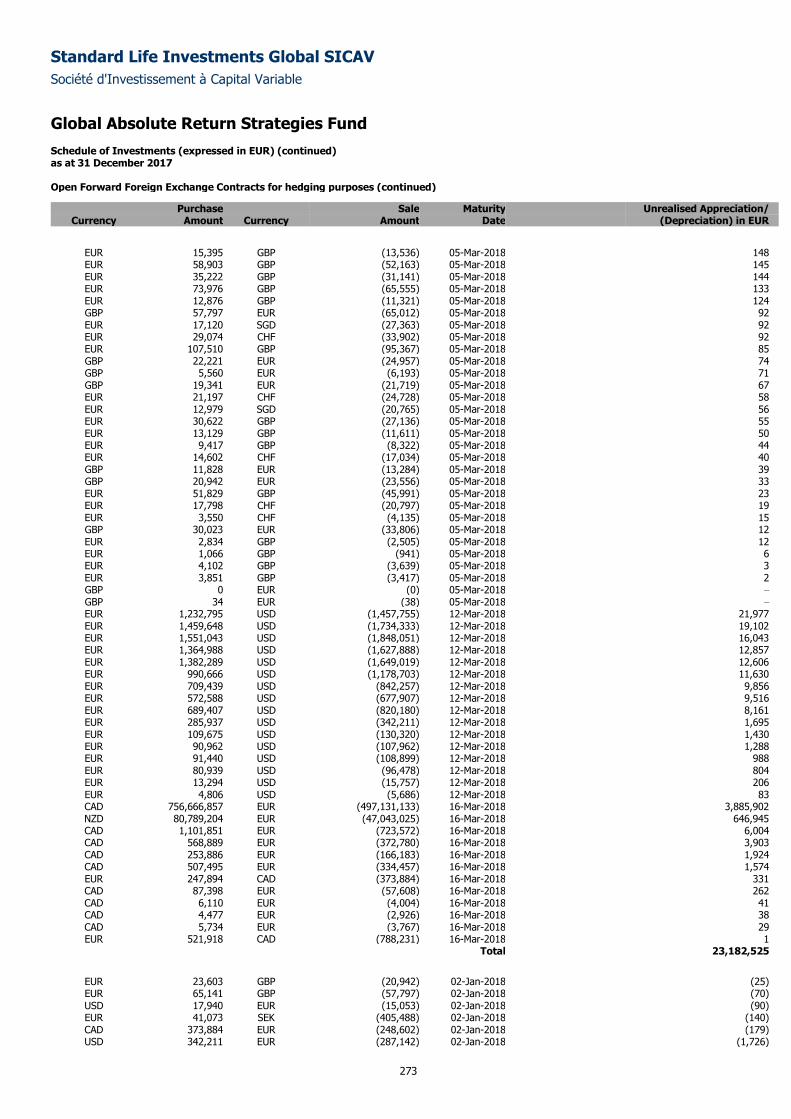
Standard Life Investments Global SICAV
Société d'Investissement à Capital Variable
Global Absolute Return Strategies Fund Schedule of Investments (expressed in EUR) (continued) as at 31 December 2017
273
Open Forward Foreign Exchange Contracts for hedging purposes (continued)
Purchase Sale Maturity Unrealised Appreciation/ Currency Amount Currency Amount Date (Depreciation) in EUR
EUR 15,395 GBP (13,536) 05-Mar-2018 148 EUR 58,903 GBP (52,163) 05-Mar-2018 145 EUR 35,222 GBP (31,141) 05-Mar-2018 144 EUR 73,976 GBP (65,555) 05-Mar-2018 133 EUR 12,876 GBP (11,321) 05-Mar-2018 124 GBP 57,797 EUR (65,012) 05-Mar-2018 92 EUR 17,120 SGD (27,363) 05-Mar-2018 92 EUR 29,074 CHF (33,902) 05-Mar-2018 92 EUR 107,510 GBP (95,367) 05-Mar-2018 85 GBP 22,221 EUR (24,957) 05-Mar-2018 74 GBP 5,560 EUR (6,193) 05-Mar-2018 71 GBP 19,341 EUR (21,719) 05-Mar-2018 67 EUR 21,197 CHF (24,728) 05-Mar-2018 58 EUR 12,979 SGD (20,765) 05-Mar-2018 56 EUR 30,622 GBP (27,136) 05-Mar-2018 55 EUR 13,129 GBP (11,611) 05-Mar-2018 50 EUR 9,417 GBP (8,322) 05-Mar-2018 44 EUR 14,602 CHF (17,034) 05-Mar-2018 40 GBP 11,828 EUR (13,284) 05-Mar-2018 39 GBP 20,942 EUR (23,556) 05-Mar-2018 33 EUR 51,829 GBP (45,991) 05-Mar-2018 23 EUR 17,798 CHF (20,797) 05-Mar-2018 19 EUR 3,550 CHF (4,135) 05-Mar-2018 15 GBP 30,023 EUR (33,806) 05-Mar-2018 12 EUR 2,834 GBP (2,505) 05-Mar-2018 12 EUR 1,066 GBP (941) 05-Mar-2018 6 EUR 4,102 GBP (3,639) 05-Mar-2018 3 EUR 3,851 GBP (3,417) 05-Mar-2018 2 GBP 0 EUR (0) 05-Mar-2018 –
GBP 34 EUR (38) 05-Mar-2018 –
EUR 1,232,795 USD (1,457,755) 12-Mar-2018 21,977 EUR 1,459,648 USD (1,734,333) 12-Mar-2018 19,102 EUR 1,551,043 USD (1,848,051) 12-Mar-2018 16,043 EUR 1,364,988 USD (1,627,888) 12-Mar-2018 12,857 EUR 1,382,289 USD (1,649,019) 12-Mar-2018 12,606 EUR 990,666 USD (1,178,703) 12-Mar-2018 11,630 EUR 709,439 USD (842,257) 12-Mar-2018 9,856 EUR 572,588 USD (677,907) 12-Mar-2018 9,516 EUR 689,407 USD (820,180) 12-Mar-2018 8,161 EUR 285,937 USD (342,211) 12-Mar-2018 1,695 EUR 109,675 USD (130,320) 12-Mar-2018 1,430 EUR 90,962 USD (107,962) 12-Mar-2018 1,288 EUR 91,440 USD (108,899) 12-Mar-2018 988 EUR 80,939 USD (96,478) 12-Mar-2018 804 EUR 13,294 USD (15,757) 12-Mar-2018 206 EUR 4,806 USD (5,686) 12-Mar-2018 83 CAD 756,666,857 EUR (497,131,133) 16-Mar-2018 3,885,902 NZD 80,789,204 EUR (47,043,025) 16-Mar-2018 646,945 CAD 1,101,851 EUR (723,572) 16-Mar-2018 6,004 CAD 568,889 EUR (372,780) 16-Mar-2018 3,903 CAD 253,886 EUR (166,183) 16-Mar-2018 1,924 CAD 507,495 EUR (334,457) 16-Mar-2018 1,574 EUR 247,894 CAD (373,884) 16-Mar-2018 331 CAD 87,398 EUR (57,608) 16-Mar-2018 262 CAD 6,110 EUR (4,004) 16-Mar-2018 41 CAD 4,477 EUR (2,926) 16-Mar-2018 38 CAD 5,734 EUR (3,767) 16-Mar-2018 29 EUR 521,918 CAD (788,231) 16-Mar-2018 1
Total 23,182,525
EUR 23,603 GBP (20,942) 02-Jan-2018 (25) EUR 65,141 GBP (57,797) 02-Jan-2018 (70) USD 17,940 EUR (15,053) 02-Jan-2018 (90) EUR 41,073 SEK (405,488) 02-Jan-2018 (140) CAD 373,884 EUR (248,602) 02-Jan-2018 (179) USD 342,211 EUR (287,142) 02-Jan-2018 (1,726)
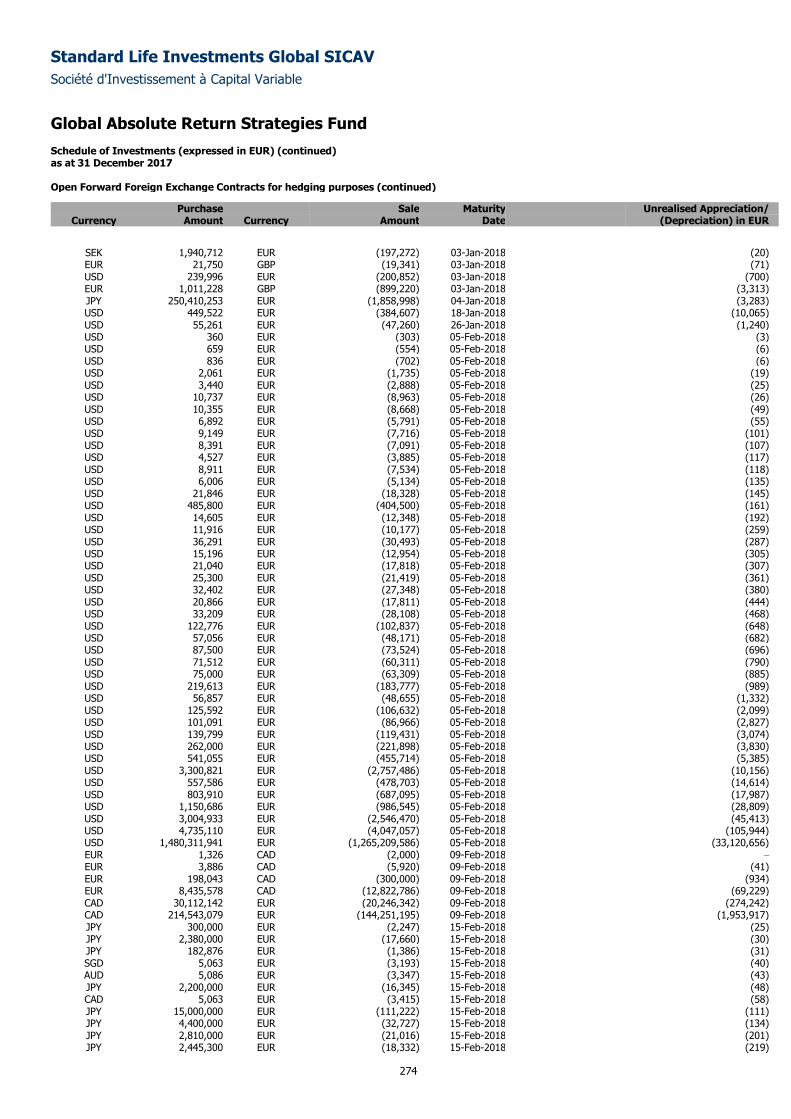
Standard Life Investments Global SICAV
Société d'Investissement à Capital Variable
Global Absolute Return Strategies Fund Schedule of Investments (expressed in EUR) (continued) as at 31 December 2017
274
Open Forward Foreign Exchange Contracts for hedging purposes (continued)
Purchase Sale Maturity Unrealised Appreciation/ Currency Amount Currency Amount Date (Depreciation) in EUR
SEK 1,940,712 EUR (197,272) 03-Jan-2018 (20) EUR 21,750 GBP (19,341) 03-Jan-2018 (71) USD 239,996 EUR (200,852) 03-Jan-2018 (700) EUR 1,011,228 GBP (899,220) 03-Jan-2018 (3,313) JPY 250,410,253 EUR (1,858,998) 04-Jan-2018 (3,283) USD 449,522 EUR (384,607) 18-Jan-2018 (10,065) USD 55,261 EUR (47,260) 26-Jan-2018 (1,240) USD 360 EUR (303) 05-Feb-2018 (3) USD 659 EUR (554) 05-Feb-2018 (6) USD 836 EUR (702) 05-Feb-2018 (6) USD 2,061 EUR (1,735) 05-Feb-2018 (19) USD 3,440 EUR (2,888) 05-Feb-2018 (25) USD 10,737 EUR (8,963) 05-Feb-2018 (26) USD 10,355 EUR (8,668) 05-Feb-2018 (49) USD 6,892 EUR (5,791) 05-Feb-2018 (55) USD 9,149 EUR (7,716) 05-Feb-2018 (101) USD 8,391 EUR (7,091) 05-Feb-2018 (107) USD 4,527 EUR (3,885) 05-Feb-2018 (117) USD 8,911 EUR (7,534) 05-Feb-2018 (118) USD 6,006 EUR (5,134) 05-Feb-2018 (135) USD 21,846 EUR (18,328) 05-Feb-2018 (145) USD 485,800 EUR (404,500) 05-Feb-2018 (161) USD 14,605 EUR (12,348) 05-Feb-2018 (192) USD 11,916 EUR (10,177) 05-Feb-2018 (259) USD 36,291 EUR (30,493) 05-Feb-2018 (287) USD 15,196 EUR (12,954) 05-Feb-2018 (305) USD 21,040 EUR (17,818) 05-Feb-2018 (307) USD 25,300 EUR (21,419) 05-Feb-2018 (361) USD 32,402 EUR (27,348) 05-Feb-2018 (380) USD 20,866 EUR (17,811) 05-Feb-2018 (444) USD 33,209 EUR (28,108) 05-Feb-2018 (468) USD 122,776 EUR (102,837) 05-Feb-2018 (648) USD 57,056 EUR (48,171) 05-Feb-2018 (682) USD 87,500 EUR (73,524) 05-Feb-2018 (696) USD 71,512 EUR (60,311) 05-Feb-2018 (790) USD 75,000 EUR (63,309) 05-Feb-2018 (885) USD 219,613 EUR (183,777) 05-Feb-2018 (989) USD 56,857 EUR (48,655) 05-Feb-2018 (1,332) USD 125,592 EUR (106,632) 05-Feb-2018 (2,099) USD 101,091 EUR (86,966) 05-Feb-2018 (2,827) USD 139,799 EUR (119,431) 05-Feb-2018 (3,074) USD 262,000 EUR (221,898) 05-Feb-2018 (3,830) USD 541,055 EUR (455,714) 05-Feb-2018 (5,385) USD 3,300,821 EUR (2,757,486) 05-Feb-2018 (10,156) USD 557,586 EUR (478,703) 05-Feb-2018 (14,614) USD 803,910 EUR (687,095) 05-Feb-2018 (17,987) USD 1,150,686 EUR (986,545) 05-Feb-2018 (28,809) USD 3,004,933 EUR (2,546,470) 05-Feb-2018 (45,413) USD 4,735,110 EUR (4,047,057) 05-Feb-2018 (105,944) USD 1,480,311,941 EUR (1,265,209,586) 05-Feb-2018 (33,120,656) EUR 1,326 CAD (2,000) 09-Feb-2018 –
EUR 3,886 CAD (5,920) 09-Feb-2018 (41) EUR 198,043 CAD (300,000) 09-Feb-2018 (934) EUR 8,435,578 CAD (12,822,786) 09-Feb-2018 (69,229) CAD 30,112,142 EUR (20,246,342) 09-Feb-2018 (274,242) CAD 214,543,079 EUR (144,251,195) 09-Feb-2018 (1,953,917) JPY 300,000 EUR (2,247) 15-Feb-2018 (25) JPY 2,380,000 EUR (17,660) 15-Feb-2018 (30) JPY 182,876 EUR (1,386) 15-Feb-2018 (31) SGD 5,063 EUR (3,193) 15-Feb-2018 (40) AUD 5,086 EUR (3,347) 15-Feb-2018 (43) JPY 2,200,000 EUR (16,345) 15-Feb-2018 (48) CAD 5,063 EUR (3,415) 15-Feb-2018 (58) JPY 15,000,000 EUR (111,222) 15-Feb-2018 (111) JPY 4,400,000 EUR (32,727) 15-Feb-2018 (134) JPY 2,810,000 EUR (21,016) 15-Feb-2018 (201) JPY 2,445,300 EUR (18,332) 15-Feb-2018 (219)
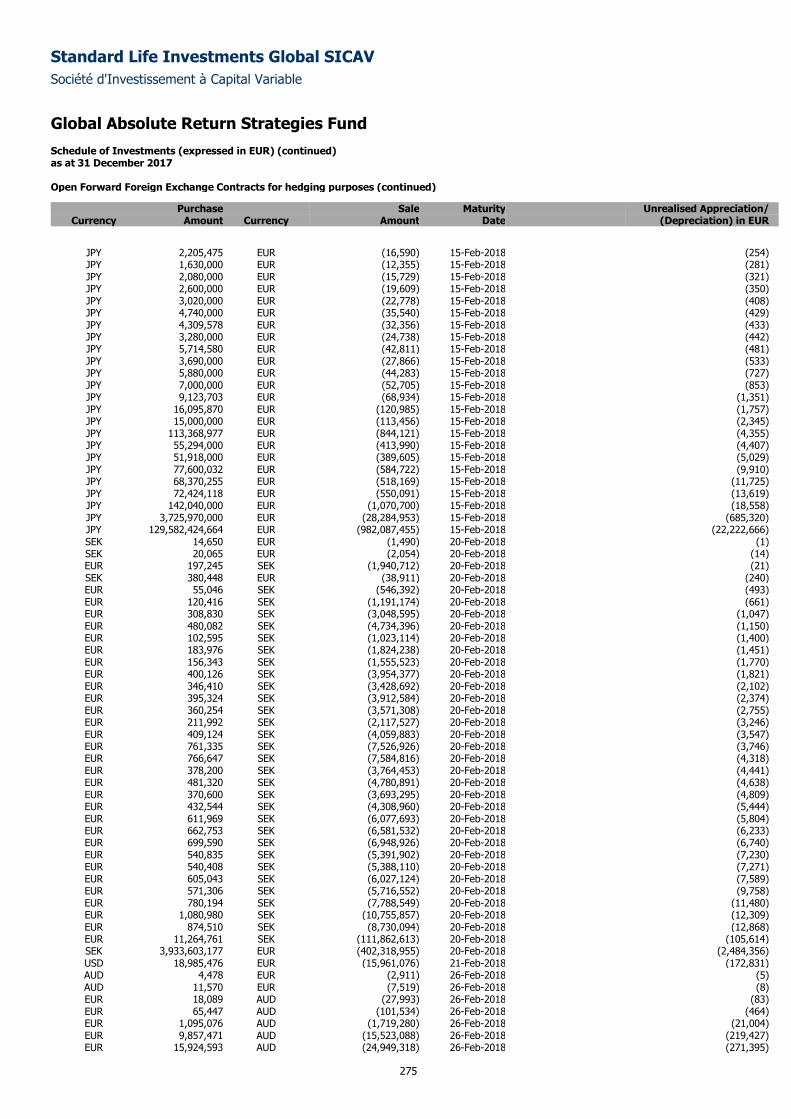
Standard Life Investments Global SICAV
Société d'Investissement à Capital Variable
Global Absolute Return Strategies Fund Schedule of Investments (expressed in EUR) (continued) as at 31 December 2017
275
Open Forward Foreign Exchange Contracts for hedging purposes (continued)
Purchase Sale Maturity Unrealised Appreciation/ Currency Amount Currency Amount Date (Depreciation) in EUR
JPY 2,205,475 EUR (16,590) 15-Feb-2018 (254) JPY 1,630,000 EUR (12,355) 15-Feb-2018 (281) JPY 2,080,000 EUR (15,729) 15-Feb-2018 (321) JPY 2,600,000 EUR (19,609) 15-Feb-2018 (350) JPY 3,020,000 EUR (22,778) 15-Feb-2018 (408) JPY 4,740,000 EUR (35,540) 15-Feb-2018 (429) JPY 4,309,578 EUR (32,356) 15-Feb-2018 (433) JPY 3,280,000 EUR (24,738) 15-Feb-2018 (442) JPY 5,714,580 EUR (42,811) 15-Feb-2018 (481) JPY 3,690,000 EUR (27,866) 15-Feb-2018 (533) JPY 5,880,000 EUR (44,283) 15-Feb-2018 (727) JPY 7,000,000 EUR (52,705) 15-Feb-2018 (853) JPY 9,123,703 EUR (68,934) 15-Feb-2018 (1,351) JPY 16,095,870 EUR (120,985) 15-Feb-2018 (1,757) JPY 15,000,000 EUR (113,456) 15-Feb-2018 (2,345) JPY 113,368,977 EUR (844,121) 15-Feb-2018 (4,355) JPY 55,294,000 EUR (413,990) 15-Feb-2018 (4,407) JPY 51,918,000 EUR (389,605) 15-Feb-2018 (5,029) JPY 77,600,032 EUR (584,722) 15-Feb-2018 (9,910) JPY 68,370,255 EUR (518,169) 15-Feb-2018 (11,725) JPY 72,424,118 EUR (550,091) 15-Feb-2018 (13,619) JPY 142,040,000 EUR (1,070,700) 15-Feb-2018 (18,558) JPY 3,725,970,000 EUR (28,284,953) 15-Feb-2018 (685,320) JPY 129,582,424,664 EUR (982,087,455) 15-Feb-2018 (22,222,666) SEK 14,650 EUR (1,490) 20-Feb-2018 (1) SEK 20,065 EUR (2,054) 20-Feb-2018 (14) EUR 197,245 SEK (1,940,712) 20-Feb-2018 (21) SEK 380,448 EUR (38,911) 20-Feb-2018 (240) EUR 55,046 SEK (546,392) 20-Feb-2018 (493) EUR 120,416 SEK (1,191,174) 20-Feb-2018 (661) EUR 308,830 SEK (3,048,595) 20-Feb-2018 (1,047) EUR 480,082 SEK (4,734,396) 20-Feb-2018 (1,150) EUR 102,595 SEK (1,023,114) 20-Feb-2018 (1,400) EUR 183,976 SEK (1,824,238) 20-Feb-2018 (1,451) EUR 156,343 SEK (1,555,523) 20-Feb-2018 (1,770) EUR 400,126 SEK (3,954,377) 20-Feb-2018 (1,821) EUR 346,410 SEK (3,428,692) 20-Feb-2018 (2,102) EUR 395,324 SEK (3,912,584) 20-Feb-2018 (2,374) EUR 360,254 SEK (3,571,308) 20-Feb-2018 (2,755) EUR 211,992 SEK (2,117,527) 20-Feb-2018 (3,246) EUR 409,124 SEK (4,059,883) 20-Feb-2018 (3,547) EUR 761,335 SEK (7,526,926) 20-Feb-2018 (3,746) EUR 766,647 SEK (7,584,816) 20-Feb-2018 (4,318) EUR 378,200 SEK (3,764,453) 20-Feb-2018 (4,441) EUR 481,320 SEK (4,780,891) 20-Feb-2018 (4,638) EUR 370,600 SEK (3,693,295) 20-Feb-2018 (4,809) EUR 432,544 SEK (4,308,960) 20-Feb-2018 (5,444) EUR 611,969 SEK (6,077,693) 20-Feb-2018 (5,804) EUR 662,753 SEK (6,581,532) 20-Feb-2018 (6,233) EUR 699,590 SEK (6,948,926) 20-Feb-2018 (6,740) EUR 540,835 SEK (5,391,902) 20-Feb-2018 (7,230) EUR 540,408 SEK (5,388,110) 20-Feb-2018 (7,271) EUR 605,043 SEK (6,027,124) 20-Feb-2018 (7,589) EUR 571,306 SEK (5,716,552) 20-Feb-2018 (9,758) EUR 780,194 SEK (7,788,549) 20-Feb-2018 (11,480) EUR 1,080,980 SEK (10,755,857) 20-Feb-2018 (12,309) EUR 874,510 SEK (8,730,094) 20-Feb-2018 (12,868) EUR 11,264,761 SEK (111,862,613) 20-Feb-2018 (105,614) SEK 3,933,603,177 EUR (402,318,955) 20-Feb-2018 (2,484,356) USD 18,985,476 EUR (15,961,076) 21-Feb-2018 (172,831) AUD 4,478 EUR (2,911) 26-Feb-2018 (5) AUD 11,570 EUR (7,519) 26-Feb-2018 (8) EUR 18,089 AUD (27,993) 26-Feb-2018 (83) EUR 65,447 AUD (101,534) 26-Feb-2018 (464) EUR 1,095,076 AUD (1,719,280) 26-Feb-2018 (21,004) EUR 9,857,471 AUD (15,523,088) 26-Feb-2018 (219,427) EUR 15,924,593 AUD (24,949,318) 26-Feb-2018 (271,395)
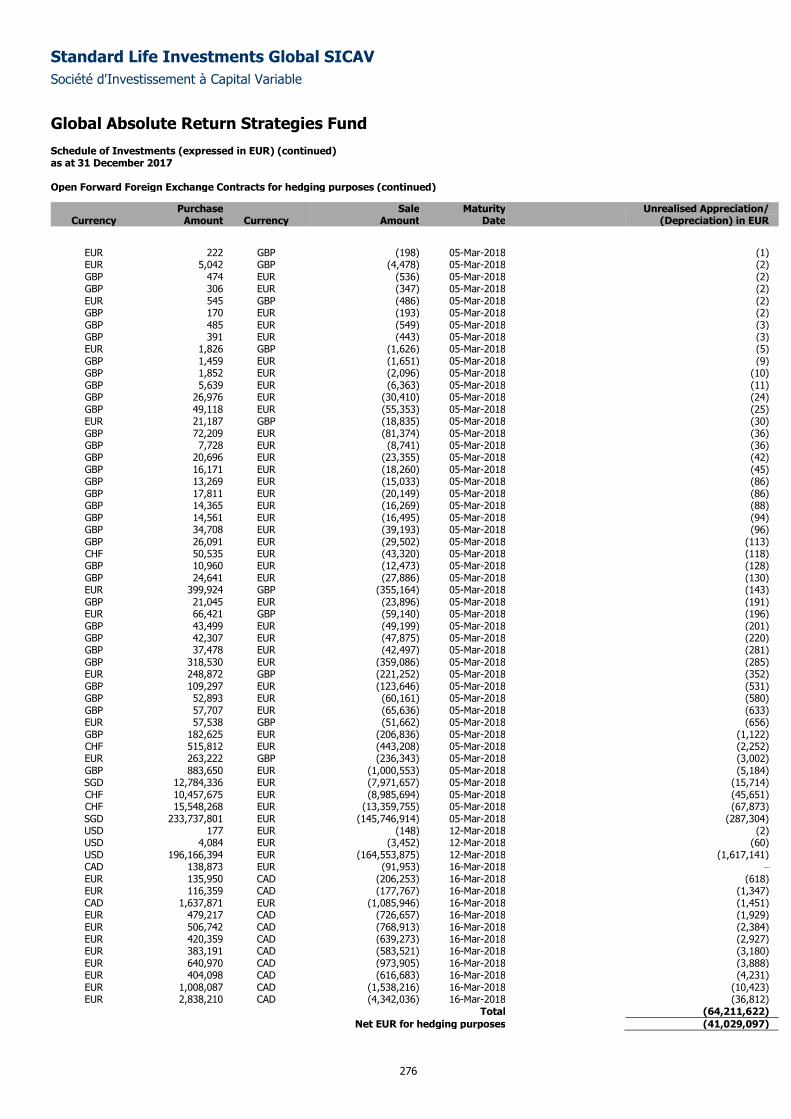
Standard Life Investments Global SICAV
Société d'Investissement à Capital Variable
Global Absolute Return Strategies Fund Schedule of Investments (expressed in EUR) (continued) as at 31 December 2017
276
Open Forward Foreign Exchange Contracts for hedging purposes (continued)
Purchase Sale Maturity Unrealised Appreciation/ Currency Amount Currency Amount Date (Depreciation) in EUR
EUR 222 GBP (198) 05-Mar-2018 (1) EUR 5,042 GBP (4,478) 05-Mar-2018 (2) GBP 474 EUR (536) 05-Mar-2018 (2) GBP 306 EUR (347) 05-Mar-2018 (2) EUR 545 GBP (486) 05-Mar-2018 (2) GBP 170 EUR (193) 05-Mar-2018 (2) GBP 485 EUR (549) 05-Mar-2018 (3) GBP 391 EUR (443) 05-Mar-2018 (3) EUR 1,826 GBP (1,626) 05-Mar-2018 (5) GBP 1,459 EUR (1,651) 05-Mar-2018 (9) GBP 1,852 EUR (2,096) 05-Mar-2018 (10) GBP 5,639 EUR (6,363) 05-Mar-2018 (11) GBP 26,976 EUR (30,410) 05-Mar-2018 (24) GBP 49,118 EUR (55,353) 05-Mar-2018 (25) EUR 21,187 GBP (18,835) 05-Mar-2018 (30) GBP 72,209 EUR (81,374) 05-Mar-2018 (36) GBP 7,728 EUR (8,741) 05-Mar-2018 (36) GBP 20,696 EUR (23,355) 05-Mar-2018 (42) GBP 16,171 EUR (18,260) 05-Mar-2018 (45) GBP 13,269 EUR (15,033) 05-Mar-2018 (86) GBP 17,811 EUR (20,149) 05-Mar-2018 (86) GBP 14,365 EUR (16,269) 05-Mar-2018 (88) GBP 14,561 EUR (16,495) 05-Mar-2018 (94) GBP 34,708 EUR (39,193) 05-Mar-2018 (96) GBP 26,091 EUR (29,502) 05-Mar-2018 (113) CHF 50,535 EUR (43,320) 05-Mar-2018 (118) GBP 10,960 EUR (12,473) 05-Mar-2018 (128) GBP 24,641 EUR (27,886) 05-Mar-2018 (130) EUR 399,924 GBP (355,164) 05-Mar-2018 (143) GBP 21,045 EUR (23,896) 05-Mar-2018 (191) EUR 66,421 GBP (59,140) 05-Mar-2018 (196) GBP 43,499 EUR (49,199) 05-Mar-2018 (201) GBP 42,307 EUR (47,875) 05-Mar-2018 (220) GBP 37,478 EUR (42,497) 05-Mar-2018 (281) GBP 318,530 EUR (359,086) 05-Mar-2018 (285) EUR 248,872 GBP (221,252) 05-Mar-2018 (352) GBP 109,297 EUR (123,646) 05-Mar-2018 (531) GBP 52,893 EUR (60,161) 05-Mar-2018 (580) GBP 57,707 EUR (65,636) 05-Mar-2018 (633) EUR 57,538 GBP (51,662) 05-Mar-2018 (656) GBP 182,625 EUR (206,836) 05-Mar-2018 (1,122) CHF 515,812 EUR (443,208) 05-Mar-2018 (2,252) EUR 263,222 GBP (236,343) 05-Mar-2018 (3,002) GBP 883,650 EUR (1,000,553) 05-Mar-2018 (5,184) SGD 12,784,336 EUR (7,971,657) 05-Mar-2018 (15,714) CHF 10,457,675 EUR (8,985,694) 05-Mar-2018 (45,651) CHF 15,548,268 EUR (13,359,755) 05-Mar-2018 (67,873) SGD 233,737,801 EUR (145,746,914) 05-Mar-2018 (287,304) USD 177 EUR (148) 12-Mar-2018 (2) USD 4,084 EUR (3,452) 12-Mar-2018 (60) USD 196,166,394 EUR (164,553,875) 12-Mar-2018 (1,617,141) CAD 138,873 EUR (91,953) 16-Mar-2018 –
EUR 135,950 CAD (206,253) 16-Mar-2018 (618) EUR 116,359 CAD (177,767) 16-Mar-2018 (1,347) CAD 1,637,871 EUR (1,085,946) 16-Mar-2018 (1,451) EUR 479,217 CAD (726,657) 16-Mar-2018 (1,929) EUR 506,742 CAD (768,913) 16-Mar-2018 (2,384) EUR 420,359 CAD (639,273) 16-Mar-2018 (2,927) EUR 383,191 CAD (583,521) 16-Mar-2018 (3,180) EUR 640,970 CAD (973,905) 16-Mar-2018 (3,888) EUR 404,098 CAD (616,683) 16-Mar-2018 (4,231) EUR 1,008,087 CAD (1,538,216) 16-Mar-2018 (10,423) EUR 2,838,210 CAD (4,342,036) 16-Mar-2018 (36,812)
Total (64,211,622)
Net EUR for hedging purposes (41,029,097)
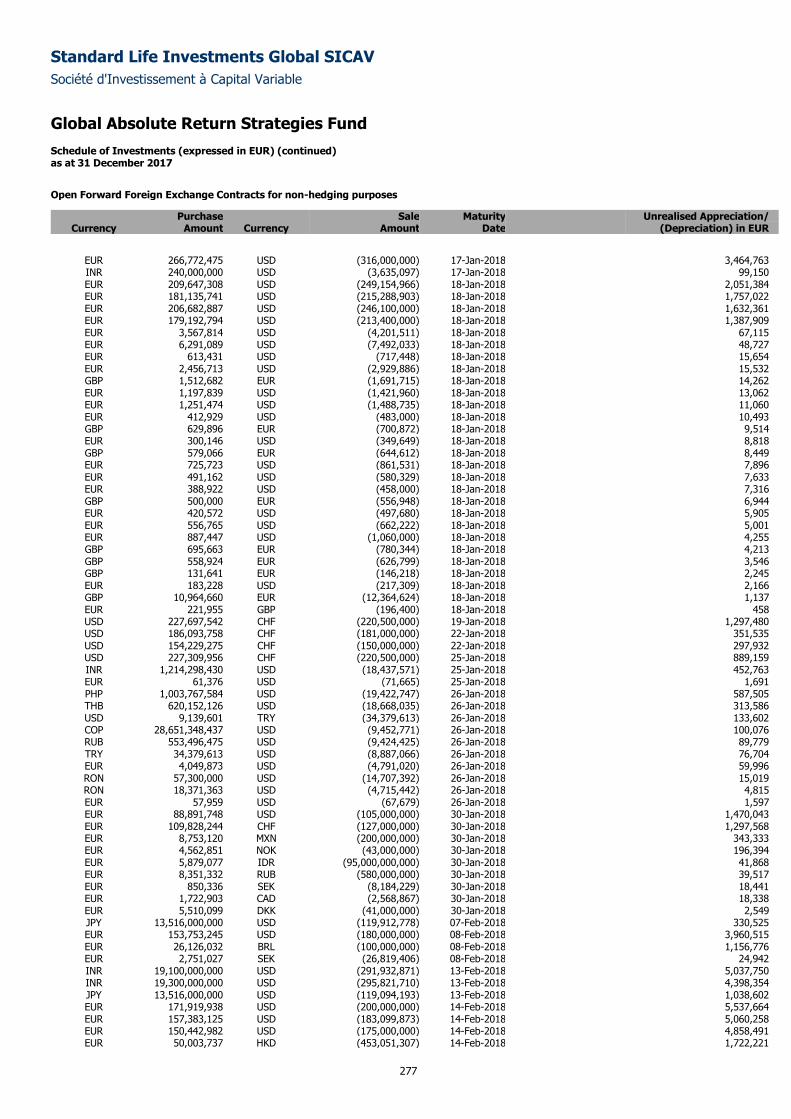
Standard Life Investments Global SICAV
Société d'Investissement à Capital Variable
Global Absolute Return Strategies Fund Schedule of Investments (expressed in EUR) (continued) as at 31 December 2017
277
Open Forward Foreign Exchange Contracts for non-hedging purposes
Purchase Sale Maturity Unrealised Appreciation/ Currency Amount Currency Amount Date (Depreciation) in EUR
EUR 266,772,475 USD (316,000,000) 17-Jan-2018 3,464,763 INR 240,000,000 USD (3,635,097) 17-Jan-2018 99,150 EUR 209,647,308 USD (249,154,966) 18-Jan-2018 2,051,384 EUR 181,135,741 USD (215,288,903) 18-Jan-2018 1,757,022 EUR 206,682,887 USD (246,100,000) 18-Jan-2018 1,632,361 EUR 179,192,794 USD (213,400,000) 18-Jan-2018 1,387,909 EUR 3,567,814 USD (4,201,511) 18-Jan-2018 67,115 EUR 6,291,089 USD (7,492,033) 18-Jan-2018 48,727 EUR 613,431 USD (717,448) 18-Jan-2018 15,654 EUR 2,456,713 USD (2,929,886) 18-Jan-2018 15,532 GBP 1,512,682 EUR (1,691,715) 18-Jan-2018 14,262 EUR 1,197,839 USD (1,421,960) 18-Jan-2018 13,062 EUR 1,251,474 USD (1,488,735) 18-Jan-2018 11,060 EUR 412,929 USD (483,000) 18-Jan-2018 10,493 GBP 629,896 EUR (700,872) 18-Jan-2018 9,514 EUR 300,146 USD (349,649) 18-Jan-2018 8,818 GBP 579,066 EUR (644,612) 18-Jan-2018 8,449 EUR 725,723 USD (861,531) 18-Jan-2018 7,896 EUR 491,162 USD (580,329) 18-Jan-2018 7,633 EUR 388,922 USD (458,000) 18-Jan-2018 7,316 GBP 500,000 EUR (556,948) 18-Jan-2018 6,944 EUR 420,572 USD (497,680) 18-Jan-2018 5,905 EUR 556,765 USD (662,222) 18-Jan-2018 5,001 EUR 887,447 USD (1,060,000) 18-Jan-2018 4,255 GBP 695,663 EUR (780,344) 18-Jan-2018 4,213 GBP 558,924 EUR (626,799) 18-Jan-2018 3,546 GBP 131,641 EUR (146,218) 18-Jan-2018 2,245 EUR 183,228 USD (217,309) 18-Jan-2018 2,166 GBP 10,964,660 EUR (12,364,624) 18-Jan-2018 1,137 EUR 221,955 GBP (196,400) 18-Jan-2018 458 USD 227,697,542 CHF (220,500,000) 19-Jan-2018 1,297,480 USD 186,093,758 CHF (181,000,000) 22-Jan-2018 351,535 USD 154,229,275 CHF (150,000,000) 22-Jan-2018 297,932 USD 227,309,956 CHF (220,500,000) 25-Jan-2018 889,159 INR 1,214,298,430 USD (18,437,571) 25-Jan-2018 452,763 EUR 61,376 USD (71,665) 25-Jan-2018 1,691 PHP 1,003,767,584 USD (19,422,747) 26-Jan-2018 587,505 THB 620,152,126 USD (18,668,035) 26-Jan-2018 313,586 USD 9,139,601 TRY (34,379,613) 26-Jan-2018 133,602 COP 28,651,348,437 USD (9,452,771) 26-Jan-2018 100,076 RUB 553,496,475 USD (9,424,425) 26-Jan-2018 89,779 TRY 34,379,613 USD (8,887,066) 26-Jan-2018 76,704 EUR 4,049,873 USD (4,791,020) 26-Jan-2018 59,996 RON 57,300,000 USD (14,707,392) 26-Jan-2018 15,019 RON 18,371,363 USD (4,715,442) 26-Jan-2018 4,815 EUR 57,959 USD (67,679) 26-Jan-2018 1,597 EUR 88,891,748 USD (105,000,000) 30-Jan-2018 1,470,043 EUR 109,828,244 CHF (127,000,000) 30-Jan-2018 1,297,568 EUR 8,753,120 MXN (200,000,000) 30-Jan-2018 343,333 EUR 4,562,851 NOK (43,000,000) 30-Jan-2018 196,394 EUR 5,879,077 IDR (95,000,000,000) 30-Jan-2018 41,868 EUR 8,351,332 RUB (580,000,000) 30-Jan-2018 39,517 EUR 850,336 SEK (8,184,229) 30-Jan-2018 18,441 EUR 1,722,903 CAD (2,568,867) 30-Jan-2018 18,338 EUR 5,510,099 DKK (41,000,000) 30-Jan-2018 2,549 JPY 13,516,000,000 USD (119,912,778) 07-Feb-2018 330,525 EUR 153,753,245 USD (180,000,000) 08-Feb-2018 3,960,515 EUR 26,126,032 BRL (100,000,000) 08-Feb-2018 1,156,776 EUR 2,751,027 SEK (26,819,406) 08-Feb-2018 24,942 INR 19,100,000,000 USD (291,932,871) 13-Feb-2018 5,037,750 INR 19,300,000,000 USD (295,821,710) 13-Feb-2018 4,398,354 JPY 13,516,000,000 USD (119,094,193) 13-Feb-2018 1,038,602 EUR 171,919,938 USD (200,000,000) 14-Feb-2018 5,537,664 EUR 157,383,125 USD (183,099,873) 14-Feb-2018 5,060,258 EUR 150,442,982 USD (175,000,000) 14-Feb-2018 4,858,491 EUR 50,003,737 HKD (453,051,307) 14-Feb-2018 1,722,221
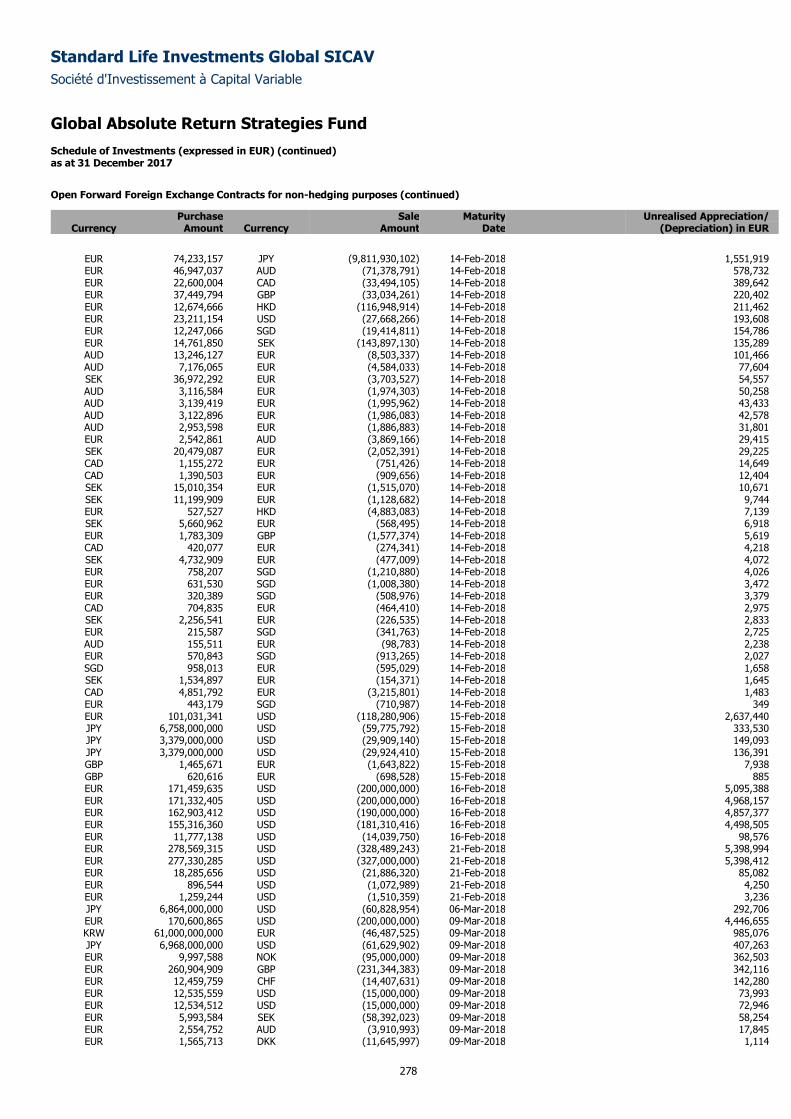
Standard Life Investments Global SICAV
Société d'Investissement à Capital Variable
Global Absolute Return Strategies Fund Schedule of Investments (expressed in EUR) (continued) as at 31 December 2017
278
Open Forward Foreign Exchange Contracts for non-hedging purposes (continued)
Purchase Sale Maturity Unrealised Appreciation/ Currency Amount Currency Amount Date (Depreciation) in EUR
EUR 74,233,157 JPY (9,811,930,102) 14-Feb-2018 1,551,919 EUR 46,947,037 AUD (71,378,791) 14-Feb-2018 578,732 EUR 22,600,004 CAD (33,494,105) 14-Feb-2018 389,642 EUR 37,449,794 GBP (33,034,261) 14-Feb-2018 220,402 EUR 12,674,666 HKD (116,948,914) 14-Feb-2018 211,462 EUR 23,211,154 USD (27,668,266) 14-Feb-2018 193,608 EUR 12,247,066 SGD (19,414,811) 14-Feb-2018 154,786 EUR 14,761,850 SEK (143,897,130) 14-Feb-2018 135,289 AUD 13,246,127 EUR (8,503,337) 14-Feb-2018 101,466 AUD 7,176,065 EUR (4,584,033) 14-Feb-2018 77,604 SEK 36,972,292 EUR (3,703,527) 14-Feb-2018 54,557 AUD 3,116,584 EUR (1,974,303) 14-Feb-2018 50,258 AUD 3,139,419 EUR (1,995,962) 14-Feb-2018 43,433 AUD 3,122,896 EUR (1,986,083) 14-Feb-2018 42,578 AUD 2,953,598 EUR (1,886,883) 14-Feb-2018 31,801 EUR 2,542,861 AUD (3,869,166) 14-Feb-2018 29,415 SEK 20,479,087 EUR (2,052,391) 14-Feb-2018 29,225 CAD 1,155,272 EUR (751,426) 14-Feb-2018 14,649 CAD 1,390,503 EUR (909,656) 14-Feb-2018 12,404 SEK 15,010,354 EUR (1,515,070) 14-Feb-2018 10,671 SEK 11,199,909 EUR (1,128,682) 14-Feb-2018 9,744 EUR 527,527 HKD (4,883,083) 14-Feb-2018 7,139 SEK 5,660,962 EUR (568,495) 14-Feb-2018 6,918 EUR 1,783,309 GBP (1,577,374) 14-Feb-2018 5,619 CAD 420,077 EUR (274,341) 14-Feb-2018 4,218 SEK 4,732,909 EUR (477,009) 14-Feb-2018 4,072 EUR 758,207 SGD (1,210,880) 14-Feb-2018 4,026 EUR 631,530 SGD (1,008,380) 14-Feb-2018 3,472 EUR 320,389 SGD (508,976) 14-Feb-2018 3,379 CAD 704,835 EUR (464,410) 14-Feb-2018 2,975 SEK 2,256,541 EUR (226,535) 14-Feb-2018 2,833 EUR 215,587 SGD (341,763) 14-Feb-2018 2,725 AUD 155,511 EUR (98,783) 14-Feb-2018 2,238 EUR 570,843 SGD (913,265) 14-Feb-2018 2,027 SGD 958,013 EUR (595,029) 14-Feb-2018 1,658 SEK 1,534,897 EUR (154,371) 14-Feb-2018 1,645 CAD 4,851,792 EUR (3,215,801) 14-Feb-2018 1,483 EUR 443,179 SGD (710,987) 14-Feb-2018 349 EUR 101,031,341 USD (118,280,906) 15-Feb-2018 2,637,440 JPY 6,758,000,000 USD (59,775,792) 15-Feb-2018 333,530 JPY 3,379,000,000 USD (29,909,140) 15-Feb-2018 149,093 JPY 3,379,000,000 USD (29,924,410) 15-Feb-2018 136,391 GBP 1,465,671 EUR (1,643,822) 15-Feb-2018 7,938 GBP 620,616 EUR (698,528) 15-Feb-2018 885 EUR 171,459,635 USD (200,000,000) 16-Feb-2018 5,095,388 EUR 171,332,405 USD (200,000,000) 16-Feb-2018 4,968,157 EUR 162,903,412 USD (190,000,000) 16-Feb-2018 4,857,377 EUR 155,316,360 USD (181,310,416) 16-Feb-2018 4,498,505 EUR 11,777,138 USD (14,039,750) 16-Feb-2018 98,576 EUR 278,569,315 USD (328,489,243) 21-Feb-2018 5,398,994 EUR 277,330,285 USD (327,000,000) 21-Feb-2018 5,398,412 EUR 18,285,656 USD (21,886,320) 21-Feb-2018 85,082 EUR 896,544 USD (1,072,989) 21-Feb-2018 4,250 EUR 1,259,244 USD (1,510,359) 21-Feb-2018 3,236 JPY 6,864,000,000 USD (60,828,954) 06-Mar-2018 292,706 EUR 170,600,865 USD (200,000,000) 09-Mar-2018 4,446,655 KRW 61,000,000,000 EUR (46,487,525) 09-Mar-2018 985,076 JPY 6,968,000,000 USD (61,629,902) 09-Mar-2018 407,263 EUR 9,997,588 NOK (95,000,000) 09-Mar-2018 362,503 EUR 260,904,909 GBP (231,344,383) 09-Mar-2018 342,116 EUR 12,459,759 CHF (14,407,631) 09-Mar-2018 142,280 EUR 12,535,559 USD (15,000,000) 09-Mar-2018 73,993 EUR 12,534,512 USD (15,000,000) 09-Mar-2018 72,946 EUR 5,993,584 SEK (58,392,023) 09-Mar-2018 58,254 EUR 2,554,752 AUD (3,910,993) 09-Mar-2018 17,845 EUR 1,565,713 DKK (11,645,997) 09-Mar-2018 1,114
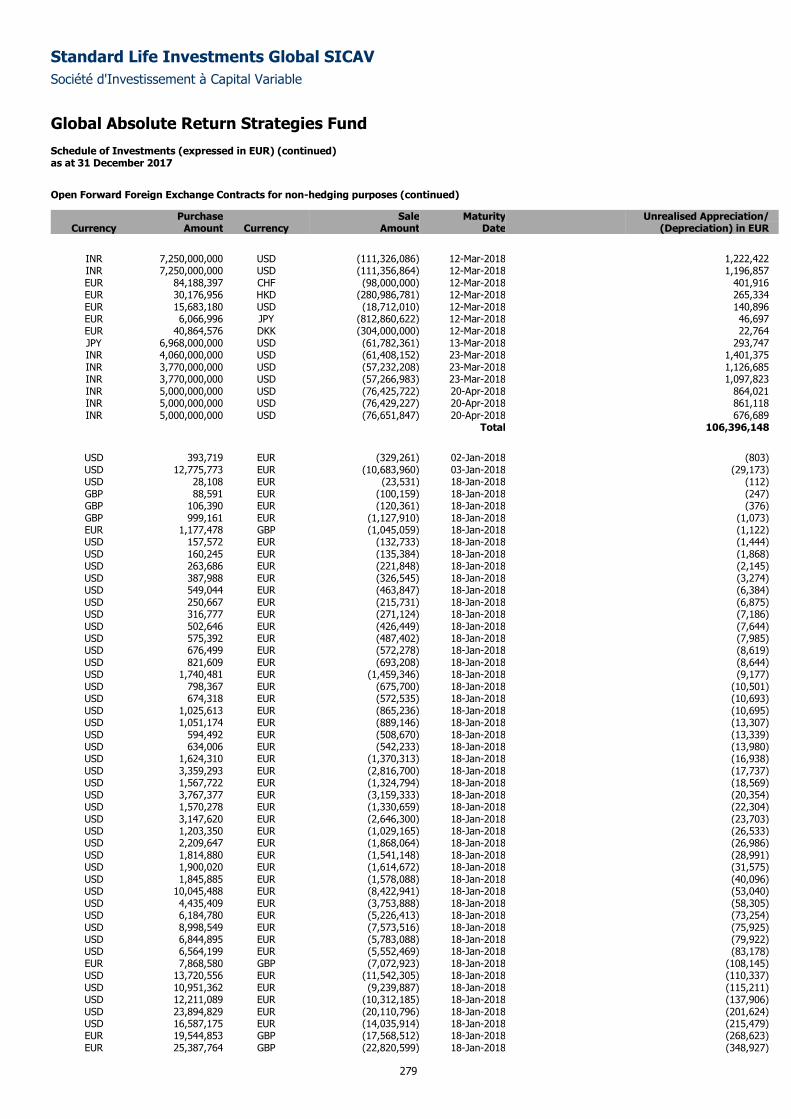
Standard Life Investments Global SICAV
Société d'Investissement à Capital Variable
Global Absolute Return Strategies Fund Schedule of Investments (expressed in EUR) (continued) as at 31 December 2017
279
Open Forward Foreign Exchange Contracts for non-hedging purposes (continued)
Purchase Sale Maturity Unrealised Appreciation/ Currency Amount Currency Amount Date (Depreciation) in EUR
INR 7,250,000,000 USD (111,326,086) 12-Mar-2018 1,222,422 INR 7,250,000,000 USD (111,356,864) 12-Mar-2018 1,196,857 EUR 84,188,397 CHF (98,000,000) 12-Mar-2018 401,916 EUR 30,176,956 HKD (280,986,781) 12-Mar-2018 265,334 EUR 15,683,180 USD (18,712,010) 12-Mar-2018 140,896 EUR 6,066,996 JPY (812,860,622) 12-Mar-2018 46,697 EUR 40,864,576 DKK (304,000,000) 12-Mar-2018 22,764 JPY 6,968,000,000 USD (61,782,361) 13-Mar-2018 293,747 INR 4,060,000,000 USD (61,408,152) 23-Mar-2018 1,401,375 INR 3,770,000,000 USD (57,232,208) 23-Mar-2018 1,126,685 INR 3,770,000,000 USD (57,266,983) 23-Mar-2018 1,097,823 INR 5,000,000,000 USD (76,425,722) 20-Apr-2018 864,021 INR 5,000,000,000 USD (76,429,227) 20-Apr-2018 861,118 INR 5,000,000,000 USD (76,651,847) 20-Apr-2018 676,689
Total 106,396,148
USD 393,719 EUR (329,261) 02-Jan-2018 (803) USD 12,775,773 EUR (10,683,960) 03-Jan-2018 (29,173) USD 28,108 EUR (23,531) 18-Jan-2018 (112) GBP 88,591 EUR (100,159) 18-Jan-2018 (247) GBP 106,390 EUR (120,361) 18-Jan-2018 (376) GBP 999,161 EUR (1,127,910) 18-Jan-2018 (1,073) EUR 1,177,478 GBP (1,045,059) 18-Jan-2018 (1,122) USD 157,572 EUR (132,733) 18-Jan-2018 (1,444) USD 160,245 EUR (135,384) 18-Jan-2018 (1,868) USD 263,686 EUR (221,848) 18-Jan-2018 (2,145) USD 387,988 EUR (326,545) 18-Jan-2018 (3,274) USD 549,044 EUR (463,847) 18-Jan-2018 (6,384) USD 250,667 EUR (215,731) 18-Jan-2018 (6,875) USD 316,777 EUR (271,124) 18-Jan-2018 (7,186) USD 502,646 EUR (426,449) 18-Jan-2018 (7,644) USD 575,392 EUR (487,402) 18-Jan-2018 (7,985) USD 676,499 EUR (572,278) 18-Jan-2018 (8,619) USD 821,609 EUR (693,208) 18-Jan-2018 (8,644) USD 1,740,481 EUR (1,459,346) 18-Jan-2018 (9,177) USD 798,367 EUR (675,700) 18-Jan-2018 (10,501) USD 674,318 EUR (572,535) 18-Jan-2018 (10,693) USD 1,025,613 EUR (865,236) 18-Jan-2018 (10,695) USD 1,051,174 EUR (889,146) 18-Jan-2018 (13,307) USD 594,492 EUR (508,670) 18-Jan-2018 (13,339) USD 634,006 EUR (542,233) 18-Jan-2018 (13,980) USD 1,624,310 EUR (1,370,313) 18-Jan-2018 (16,938) USD 3,359,293 EUR (2,816,700) 18-Jan-2018 (17,737) USD 1,567,722 EUR (1,324,794) 18-Jan-2018 (18,569) USD 3,767,377 EUR (3,159,333) 18-Jan-2018 (20,354) USD 1,570,278 EUR (1,330,659) 18-Jan-2018 (22,304) USD 3,147,620 EUR (2,646,300) 18-Jan-2018 (23,703) USD 1,203,350 EUR (1,029,165) 18-Jan-2018 (26,533) USD 2,209,647 EUR (1,868,064) 18-Jan-2018 (26,986) USD 1,814,880 EUR (1,541,148) 18-Jan-2018 (28,991) USD 1,900,020 EUR (1,614,672) 18-Jan-2018 (31,575) USD 1,845,885 EUR (1,578,088) 18-Jan-2018 (40,096) USD 10,045,488 EUR (8,422,941) 18-Jan-2018 (53,040) USD 4,435,409 EUR (3,753,888) 18-Jan-2018 (58,305) USD 6,184,780 EUR (5,226,413) 18-Jan-2018 (73,254) USD 8,998,549 EUR (7,573,516) 18-Jan-2018 (75,925) USD 6,844,895 EUR (5,783,088) 18-Jan-2018 (79,922) USD 6,564,199 EUR (5,552,469) 18-Jan-2018 (83,178) EUR 7,868,580 GBP (7,072,923) 18-Jan-2018 (108,145) USD 13,720,556 EUR (11,542,305) 18-Jan-2018 (110,337) USD 10,951,362 EUR (9,239,887) 18-Jan-2018 (115,211) USD 12,211,089 EUR (10,312,185) 18-Jan-2018 (137,906) USD 23,894,829 EUR (20,110,796) 18-Jan-2018 (201,624) USD 16,587,175 EUR (14,035,914) 18-Jan-2018 (215,479) EUR 19,544,853 GBP (17,568,512) 18-Jan-2018 (268,623) EUR 25,387,764 GBP (22,820,599) 18-Jan-2018 (348,927)
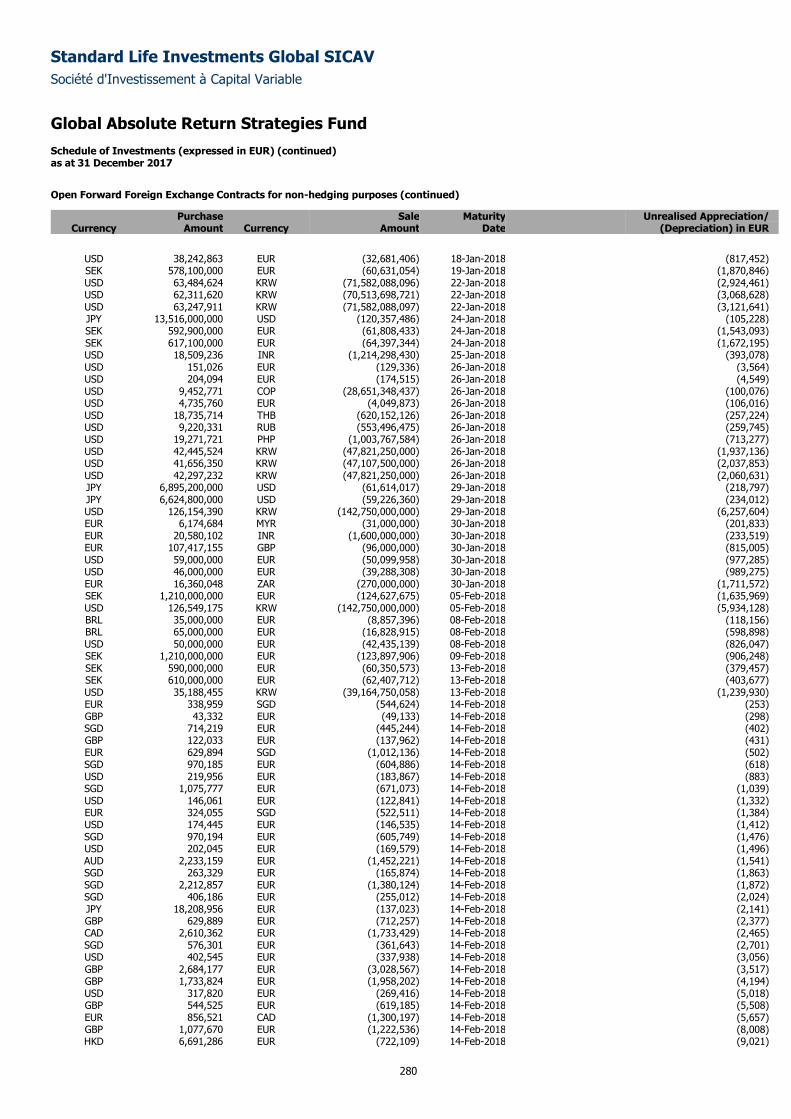
Standard Life Investments Global SICAV
Société d'Investissement à Capital Variable
Global Absolute Return Strategies Fund Schedule of Investments (expressed in EUR) (continued) as at 31 December 2017
280
Open Forward Foreign Exchange Contracts for non-hedging purposes (continued)
Purchase Sale Maturity Unrealised Appreciation/ Currency Amount Currency Amount Date (Depreciation) in EUR
USD 38,242,863 EUR (32,681,406) 18-Jan-2018 (817,452) SEK 578,100,000 EUR (60,631,054) 19-Jan-2018 (1,870,846) USD 63,484,624 KRW (71,582,088,096) 22-Jan-2018 (2,924,461) USD 62,311,620 KRW (70,513,698,721) 22-Jan-2018 (3,068,628) USD 63,247,911 KRW (71,582,088,097) 22-Jan-2018 (3,121,641) JPY 13,516,000,000 USD (120,357,486) 24-Jan-2018 (105,228) SEK 592,900,000 EUR (61,808,433) 24-Jan-2018 (1,543,093) SEK 617,100,000 EUR (64,397,344) 24-Jan-2018 (1,672,195) USD 18,509,236 INR (1,214,298,430) 25-Jan-2018 (393,078) USD 151,026 EUR (129,336) 26-Jan-2018 (3,564) USD 204,094 EUR (174,515) 26-Jan-2018 (4,549) USD 9,452,771 COP (28,651,348,437) 26-Jan-2018 (100,076) USD 4,735,760 EUR (4,049,873) 26-Jan-2018 (106,016) USD 18,735,714 THB (620,152,126) 26-Jan-2018 (257,224) USD 9,220,331 RUB (553,496,475) 26-Jan-2018 (259,745) USD 19,271,721 PHP (1,003,767,584) 26-Jan-2018 (713,277) USD 42,445,524 KRW (47,821,250,000) 26-Jan-2018 (1,937,136) USD 41,656,350 KRW (47,107,500,000) 26-Jan-2018 (2,037,853) USD 42,297,232 KRW (47,821,250,000) 26-Jan-2018 (2,060,631) JPY 6,895,200,000 USD (61,614,017) 29-Jan-2018 (218,797) JPY 6,624,800,000 USD (59,226,360) 29-Jan-2018 (234,012) USD 126,154,390 KRW (142,750,000,000) 29-Jan-2018 (6,257,604) EUR 6,174,684 MYR (31,000,000) 30-Jan-2018 (201,833) EUR 20,580,102 INR (1,600,000,000) 30-Jan-2018 (233,519) EUR 107,417,155 GBP (96,000,000) 30-Jan-2018 (815,005) USD 59,000,000 EUR (50,099,958) 30-Jan-2018 (977,285) USD 46,000,000 EUR (39,288,308) 30-Jan-2018 (989,275) EUR 16,360,048 ZAR (270,000,000) 30-Jan-2018 (1,711,572) SEK 1,210,000,000 EUR (124,627,675) 05-Feb-2018 (1,635,969) USD 126,549,175 KRW (142,750,000,000) 05-Feb-2018 (5,934,128) BRL 35,000,000 EUR (8,857,396) 08-Feb-2018 (118,156) BRL 65,000,000 EUR (16,828,915) 08-Feb-2018 (598,898) USD 50,000,000 EUR (42,435,139) 08-Feb-2018 (826,047) SEK 1,210,000,000 EUR (123,897,906) 09-Feb-2018 (906,248) SEK 590,000,000 EUR (60,350,573) 13-Feb-2018 (379,457) SEK 610,000,000 EUR (62,407,712) 13-Feb-2018 (403,677) USD 35,188,455 KRW (39,164,750,058) 13-Feb-2018 (1,239,930) EUR 338,959 SGD (544,624) 14-Feb-2018 (253) GBP 43,332 EUR (49,133) 14-Feb-2018 (298) SGD 714,219 EUR (445,244) 14-Feb-2018 (402) GBP 122,033 EUR (137,962) 14-Feb-2018 (431) EUR 629,894 SGD (1,012,136) 14-Feb-2018 (502) SGD 970,185 EUR (604,886) 14-Feb-2018 (618) USD 219,956 EUR (183,867) 14-Feb-2018 (883) SGD 1,075,777 EUR (671,073) 14-Feb-2018 (1,039) USD 146,061 EUR (122,841) 14-Feb-2018 (1,332) EUR 324,055 SGD (522,511) 14-Feb-2018 (1,384) USD 174,445 EUR (146,535) 14-Feb-2018 (1,412) SGD 970,194 EUR (605,749) 14-Feb-2018 (1,476) USD 202,045 EUR (169,579) 14-Feb-2018 (1,496) AUD 2,233,159 EUR (1,452,221) 14-Feb-2018 (1,541) SGD 263,329 EUR (165,874) 14-Feb-2018 (1,863) SGD 2,212,857 EUR (1,380,124) 14-Feb-2018 (1,872) SGD 406,186 EUR (255,012) 14-Feb-2018 (2,024) JPY 18,208,956 EUR (137,023) 14-Feb-2018 (2,141) GBP 629,889 EUR (712,257) 14-Feb-2018 (2,377) CAD 2,610,362 EUR (1,733,429) 14-Feb-2018 (2,465) SGD 576,301 EUR (361,643) 14-Feb-2018 (2,701) USD 402,545 EUR (337,938) 14-Feb-2018 (3,056) GBP 2,684,177 EUR (3,028,567) 14-Feb-2018 (3,517) GBP 1,733,824 EUR (1,958,202) 14-Feb-2018 (4,194) USD 317,820 EUR (269,416) 14-Feb-2018 (5,018) GBP 544,525 EUR (619,185) 14-Feb-2018 (5,508) EUR 856,521 CAD (1,300,197) 14-Feb-2018 (5,657) GBP 1,077,670 EUR (1,222,536) 14-Feb-2018 (8,008) HKD 6,691,286 EUR (722,109) 14-Feb-2018 (9,021)

Standard Life Investments Global SICAV
Société d'Investissement à Capital Variable
Global Absolute Return Strategies Fund Schedule of Investments (expressed in EUR) (continued) as at 31 December 2017
281
Open Forward Foreign Exchange Contracts for non-hedging purposes (continued)
Purchase Sale Maturity Unrealised Appreciation/ Currency Amount Currency Amount Date (Depreciation) in EUR
HKD 17,778,440 EUR (1,904,823) 14-Feb-2018 (10,181) CAD 4,633,209 EUR (3,082,624) 14-Feb-2018 (10,285) USD 979,389 EUR (825,168) 14-Feb-2018 (10,403) SGD 4,356,239 EUR (2,724,768) 14-Feb-2018 (11,538) GBP 644,804 EUR (738,262) 14-Feb-2018 (11,573) GBP 1,653,589 EUR (1,876,597) 14-Feb-2018 (13,014) GBP 1,839,798 EUR (2,087,077) 14-Feb-2018 (13,637) GBP 5,186,793 EUR (5,859,531) 14-Feb-2018 (14,049) HKD 18,231,760 EUR (1,961,724) 14-Feb-2018 (18,772) HKD 18,070,148 EUR (1,944,988) 14-Feb-2018 (19,259) HKD 12,874,312 EUR (1,392,831) 14-Feb-2018 (20,820) HKD 18,154,985 EUR (1,957,158) 14-Feb-2018 (22,387) JPY 394,989,084 EUR (2,948,333) 14-Feb-2018 (22,477) EUR 1,866,156 AUD (2,911,819) 14-Feb-2018 (25,388) JPY 402,658,882 EUR (3,008,420) 14-Feb-2018 (25,751) USD 2,333,284 EUR (1,969,730) 14-Feb-2018 (28,645) GBP 12,739,687 EUR (14,396,803) 14-Feb-2018 (39,260) EUR 3,700,118 SEK (36,793,534) 14-Feb-2018 (39,796) JPY 381,466,949 EUR (2,865,688) 14-Feb-2018 (39,996) USD 2,617,560 EUR (2,219,236) 14-Feb-2018 (41,658) USD 3,940,017 EUR (3,327,509) 14-Feb-2018 (49,764) JPY 385,052,182 EUR (2,911,024) 14-Feb-2018 (58,775) JPY 493,686,777 EUR (3,721,637) 14-Feb-2018 (64,684) HKD 109,962,393 EUR (11,827,275) 14-Feb-2018 (108,622) USD 27,786,693 EUR (23,227,572) 14-Feb-2018 (111,505) HKD 112,834,938 EUR (12,187,490) 14-Feb-2018 (162,711) JPY 2,054,913,839 EUR (15,394,820) 14-Feb-2018 (173,179) USD 25,023,775 EUR (21,002,619) 14-Feb-2018 (185,057) USD 18,243,860 EUR (15,369,248) 14-Feb-2018 (191,973) USD 32,900,568 EUR (27,620,623) 14-Feb-2018 (250,267) USD 32,402,673 EUR (27,252,505) 14-Feb-2018 (296,353) USD 97,087,602 EUR (81,550,420) 14-Feb-2018 (782,140) USD 625,411 EUR (521,604) 15-Feb-2018 (1,346) GBP 448,161 EUR (508,391) 15-Feb-2018 (3,329) USD 3,173,515 EUR (2,652,664) 15-Feb-2018 (12,724) USD 2,409,669 EUR (2,026,551) 15-Feb-2018 (22,029) USD 1,726,677 EUR (1,462,544) 15-Feb-2018 (26,180) USD 3,738,967 EUR (3,153,779) 15-Feb-2018 (43,458) USD 5,763,044 EUR (4,864,806) 15-Feb-2018 (70,724) USD 13,474,291 EUR (11,281,436) 15-Feb-2018 (72,627) USD 9,452,769 EUR (7,954,753) 15-Feb-2018 (91,313) USD 12,245,898 EUR (10,380,247) 15-Feb-2018 (193,297) USD 26,202,540 EUR (22,167,484) 15-Feb-2018 (370,474) USD 32,010,456 EUR (27,346,867) 15-Feb-2018 (718,447) USD 65,184,423 EUR (55,327,873) 15-Feb-2018 (1,103,148) USD 5,486,931 EUR (4,635,923) 16-Feb-2018 (71,777) SEK 610,000,000 EUR (62,581,105) 16-Feb-2018 (577,089) SEK 610,000,000 EUR (62,652,465) 16-Feb-2018 (648,448) USD 69,425,244 EUR (58,649,511) 16-Feb-2018 (900,118) USD 128,745,971 GBP (98,000,000) 21-Feb-2018 (3,361,283) USD 141,789,720 GBP (105,840,000) 05-Mar-2018 (1,395,001) USD 32,500,672 KRW (36,300,000,000) 06-Mar-2018 (1,248,691) EUR 134,892,996 GBP (120,000,000) 07-Mar-2018 (270,644) EUR 135,456,131 GBP (120,500,000) 07-Mar-2018 (270,691) USD 111,542,159 GBP (82,320,000) 08-Mar-2018 (47,387) USD 9,491,772 EUR (8,000,000) 09-Mar-2018 (114,511) USD 33,058,815 KRW (36,850,000,000) 09-Mar-2018 (1,213,814) BRL 340,000,000 EUR (87,859,838) 09-Mar-2018 (3,350,807) HKD 6,249,867 EUR (674,884) 12-Mar-2018 (9,573) EUR 30,952,783 TWD (1,100,000,000) 12-Mar-2018 (93,525) EUR 51,952,811 SEK (517,286,279) 12-Mar-2018 (627,473) USD 142,705,342 GBP (105,840,000) 12-Mar-2018 (665,311) BRL 310,000,000 EUR (79,273,750) 12-Mar-2018 (2,261,314) USD 32,940,020 KRW (36,850,000,000) 13-Mar-2018 (1,313,578) USD 56,863,300 KRW (62,300,000,000) 21-Mar-2018 (1,250,075) USD 52,672,312 KRW (57,850,000,000) 21-Mar-2018 (1,268,136)
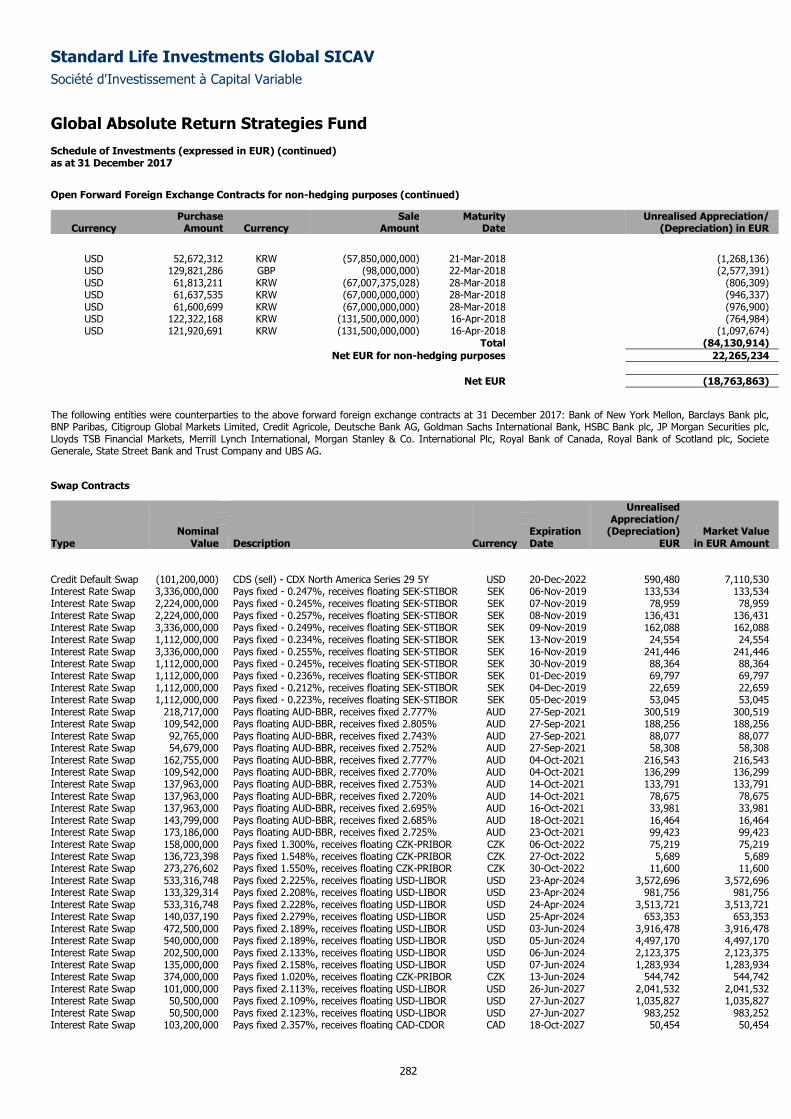
Standard Life Investments Global SICAV
Société d'Investissement à Capital Variable
Global Absolute Return Strategies Fund Schedule of Investments (expressed in EUR) (continued) as at 31 December 2017
282
Open Forward Foreign Exchange Contracts for non-hedging purposes (continued)
Purchase Sale Maturity Unrealised Appreciation/ Currency Amount Currency Amount Date (Depreciation) in EUR
USD 52,672,312 KRW (57,850,000,000) 21-Mar-2018 (1,268,136) USD 129,821,286 GBP (98,000,000) 22-Mar-2018 (2,577,391) USD 61,813,211 KRW (67,007,375,028) 28-Mar-2018 (806,309) USD 61,637,535 KRW (67,000,000,000) 28-Mar-2018 (946,337) USD 61,600,699 KRW (67,000,000,000) 28-Mar-2018 (976,900) USD 122,322,168 KRW (131,500,000,000) 16-Apr-2018 (764,984) USD 121,920,691 KRW (131,500,000,000) 16-Apr-2018 (1,097,674)
Total (84,130,914)
Net EUR for non-hedging purposes 22,265,234
Net EUR (18,763,863)
The following entities were counterparties to the above forward foreign exchange contracts at 31 December 2017: Bank of New York Mellon, Barclays Bank plc, BNP Paribas, Citigroup Global Markets Limited, Credit Agricole, Deutsche Bank AG, Goldman Sachs International Bank, HSBC Bank plc, JP Morgan Securities plc, Lloyds TSB Financial Markets, Merrill Lynch International, Morgan Stanley & Co. International Plc, Royal Bank of Canada, Royal Bank of Scotland plc, Societe Generale, State Street Bank and Trust Company and UBS AG.
Swap Contracts
Unrealised Appreciation/ Nominal Expiration (Depreciation) Market Value Type Value Description Currency Date EUR in EUR Amount
Credit Default Swap (101,200,000) CDS (sell) - CDX North America Series 29 5Y USD 20-Dec-2022 590,480 7,110,530 Interest Rate Swap 3,336,000,000 Pays fixed - 0.247%, receives floating SEK-STIBOR SEK 06-Nov-2019 133,534 133,534 Interest Rate Swap 2,224,000,000 Pays fixed - 0.245%, receives floating SEK-STIBOR SEK 07-Nov-2019 78,959 78,959 Interest Rate Swap 2,224,000,000 Pays fixed - 0.257%, receives floating SEK-STIBOR SEK 08-Nov-2019 136,431 136,431 Interest Rate Swap 3,336,000,000 Pays fixed - 0.249%, receives floating SEK-STIBOR SEK 09-Nov-2019 162,088 162,088 Interest Rate Swap 1,112,000,000 Pays fixed - 0.234%, receives floating SEK-STIBOR SEK 13-Nov-2019 24,554 24,554 Interest Rate Swap 3,336,000,000 Pays fixed - 0.255%, receives floating SEK-STIBOR SEK 16-Nov-2019 241,446 241,446 Interest Rate Swap 1,112,000,000 Pays fixed - 0.245%, receives floating SEK-STIBOR SEK 30-Nov-2019 88,364 88,364 Interest Rate Swap 1,112,000,000 Pays fixed - 0.236%, receives floating SEK-STIBOR SEK 01-Dec-2019 69,797 69,797 Interest Rate Swap 1,112,000,000 Pays fixed - 0.212%, receives floating SEK-STIBOR SEK 04-Dec-2019 22,659 22,659 Interest Rate Swap 1,112,000,000 Pays fixed - 0.223%, receives floating SEK-STIBOR SEK 05-Dec-2019 53,045 53,045 Interest Rate Swap 218,717,000 Pays floating AUD-BBR, receives fixed 2.777% AUD 27-Sep-2021 300,519 300,519 Interest Rate Swap 109,542,000 Pays floating AUD-BBR, receives fixed 2.805% AUD 27-Sep-2021 188,256 188,256 Interest Rate Swap 92,765,000 Pays floating AUD-BBR, receives fixed 2.743% AUD 27-Sep-2021 88,077 88,077 Interest Rate Swap 54,679,000 Pays floating AUD-BBR, receives fixed 2.752% AUD 27-Sep-2021 58,308 58,308 Interest Rate Swap 162,755,000 Pays floating AUD-BBR, receives fixed 2.777% AUD 04-Oct-2021 216,543 216,543 Interest Rate Swap 109,542,000 Pays floating AUD-BBR, receives fixed 2.770% AUD 04-Oct-2021 136,299 136,299 Interest Rate Swap 137,963,000 Pays floating AUD-BBR, receives fixed 2.753% AUD 14-Oct-2021 133,791 133,791 Interest Rate Swap 137,963,000 Pays floating AUD-BBR, receives fixed 2.720% AUD 14-Oct-2021 78,675 78,675 Interest Rate Swap 137,963,000 Pays floating AUD-BBR, receives fixed 2.695% AUD 16-Oct-2021 33,981 33,981 Interest Rate Swap 143,799,000 Pays floating AUD-BBR, receives fixed 2.685% AUD 18-Oct-2021 16,464 16,464 Interest Rate Swap 173,186,000 Pays floating AUD-BBR, receives fixed 2.725% AUD 23-Oct-2021 99,423 99,423 Interest Rate Swap 158,000,000 Pays fixed 1.300%, receives floating CZK-PRIBOR CZK 06-Oct-2022 75,219 75,219 Interest Rate Swap 136,723,398 Pays fixed 1.548%, receives floating CZK-PRIBOR CZK 27-Oct-2022 5,689 5,689 Interest Rate Swap 273,276,602 Pays fixed 1.550%, receives floating CZK-PRIBOR CZK 30-Oct-2022 11,600 11,600 Interest Rate Swap 533,316,748 Pays fixed 2.225%, receives floating USD-LIBOR USD 23-Apr-2024 3,572,696 3,572,696 Interest Rate Swap 133,329,314 Pays fixed 2.208%, receives floating USD-LIBOR USD 23-Apr-2024 981,756 981,756 Interest Rate Swap 533,316,748 Pays fixed 2.228%, receives floating USD-LIBOR USD 24-Apr-2024 3,513,721 3,513,721 Interest Rate Swap 140,037,190 Pays fixed 2.279%, receives floating USD-LIBOR USD 25-Apr-2024 653,353 653,353 Interest Rate Swap 472,500,000 Pays fixed 2.189%, receives floating USD-LIBOR USD 03-Jun-2024 3,916,478 3,916,478 Interest Rate Swap 540,000,000 Pays fixed 2.189%, receives floating USD-LIBOR USD 05-Jun-2024 4,497,170 4,497,170 Interest Rate Swap 202,500,000 Pays fixed 2.133%, receives floating USD-LIBOR USD 06-Jun-2024 2,123,375 2,123,375 Interest Rate Swap 135,000,000 Pays fixed 2.158%, receives floating USD-LIBOR USD 07-Jun-2024 1,283,934 1,283,934 Interest Rate Swap 374,000,000 Pays fixed 1.020%, receives floating CZK-PRIBOR CZK 13-Jun-2024 544,742 544,742 Interest Rate Swap 101,000,000 Pays fixed 2.113%, receives floating USD-LIBOR USD 26-Jun-2027 2,041,532 2,041,532 Interest Rate Swap 50,500,000 Pays fixed 2.109%, receives floating USD-LIBOR USD 27-Jun-2027 1,035,827 1,035,827 Interest Rate Swap 50,500,000 Pays fixed 2.123%, receives floating USD-LIBOR USD 27-Jun-2027 983,252 983,252 Interest Rate Swap 103,200,000 Pays fixed 2.357%, receives floating CAD-CDOR CAD 18-Oct-2027 50,454 50,454
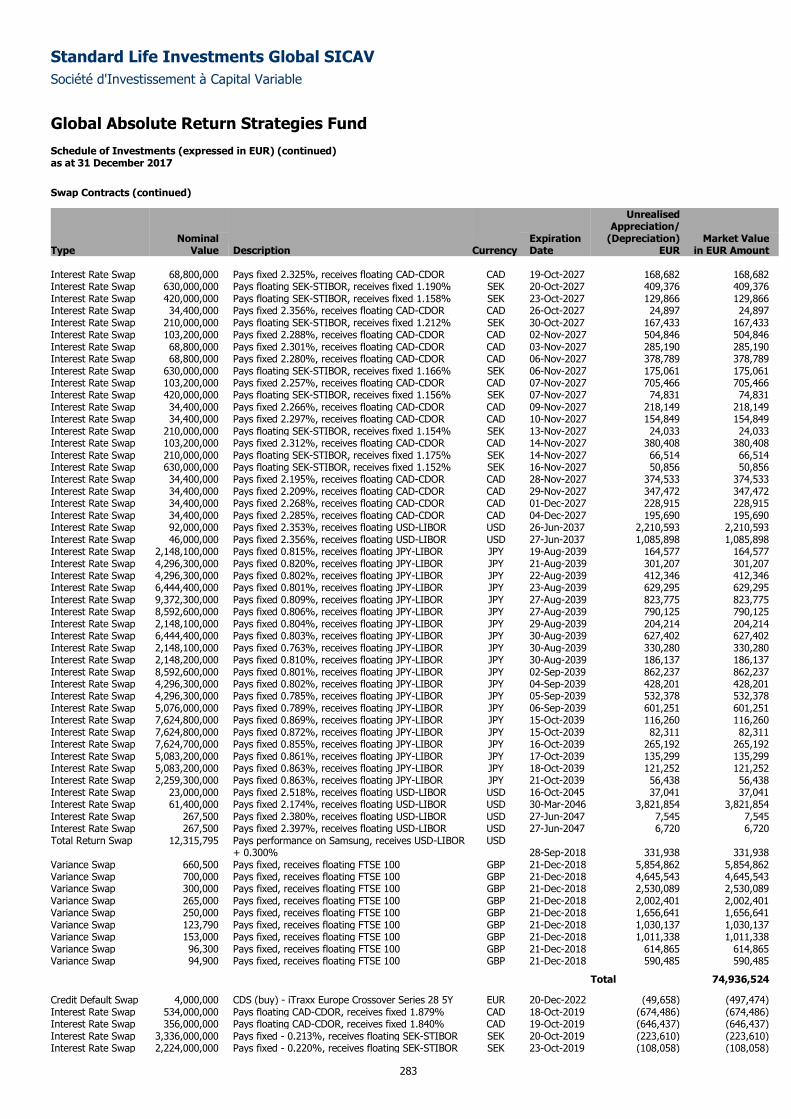
Standard Life Investments Global SICAV
Société d'Investissement à Capital Variable
Global Absolute Return Strategies Fund Schedule of Investments (expressed in EUR) (continued) as at 31 December 2017
283
Swap Contracts (continued)
Unrealised Appreciation/ Nominal Expiration (Depreciation) Market Value Type Value Description Currency Date EUR in EUR Amount Interest Rate Swap 68,800,000 Pays fixed 2.325%, receives floating CAD-CDOR CAD 19-Oct-2027 168,682 168,682 Interest Rate Swap 630,000,000 Pays floating SEK-STIBOR, receives fixed 1.190% SEK 20-Oct-2027 409,376 409,376 Interest Rate Swap 420,000,000 Pays floating SEK-STIBOR, receives fixed 1.158% SEK 23-Oct-2027 129,866 129,866 Interest Rate Swap 34,400,000 Pays fixed 2.356%, receives floating CAD-CDOR CAD 26-Oct-2027 24,897 24,897 Interest Rate Swap 210,000,000 Pays floating SEK-STIBOR, receives fixed 1.212% SEK 30-Oct-2027 167,433 167,433 Interest Rate Swap 103,200,000 Pays fixed 2.288%, receives floating CAD-CDOR CAD 02-Nov-2027 504,846 504,846 Interest Rate Swap 68,800,000 Pays fixed 2.301%, receives floating CAD-CDOR CAD 03-Nov-2027 285,190 285,190 Interest Rate Swap 68,800,000 Pays fixed 2.280%, receives floating CAD-CDOR CAD 06-Nov-2027 378,789 378,789 Interest Rate Swap 630,000,000 Pays floating SEK-STIBOR, receives fixed 1.166% SEK 06-Nov-2027 175,061 175,061 Interest Rate Swap 103,200,000 Pays fixed 2.257%, receives floating CAD-CDOR CAD 07-Nov-2027 705,466 705,466 Interest Rate Swap 420,000,000 Pays floating SEK-STIBOR, receives fixed 1.156% SEK 07-Nov-2027 74,831 74,831 Interest Rate Swap 34,400,000 Pays fixed 2.266%, receives floating CAD-CDOR CAD 09-Nov-2027 218,149 218,149 Interest Rate Swap 34,400,000 Pays fixed 2.297%, receives floating CAD-CDOR CAD 10-Nov-2027 154,849 154,849 Interest Rate Swap 210,000,000 Pays floating SEK-STIBOR, receives fixed 1.154% SEK 13-Nov-2027 24,033 24,033 Interest Rate Swap 103,200,000 Pays fixed 2.312%, receives floating CAD-CDOR CAD 14-Nov-2027 380,408 380,408 Interest Rate Swap 210,000,000 Pays floating SEK-STIBOR, receives fixed 1.175% SEK 14-Nov-2027 66,514 66,514 Interest Rate Swap 630,000,000 Pays floating SEK-STIBOR, receives fixed 1.152% SEK 16-Nov-2027 50,856 50,856 Interest Rate Swap 34,400,000 Pays fixed 2.195%, receives floating CAD-CDOR CAD 28-Nov-2027 374,533 374,533 Interest Rate Swap 34,400,000 Pays fixed 2.209%, receives floating CAD-CDOR CAD 29-Nov-2027 347,472 347,472 Interest Rate Swap 34,400,000 Pays fixed 2.268%, receives floating CAD-CDOR CAD 01-Dec-2027 228,915 228,915 Interest Rate Swap 34,400,000 Pays fixed 2.285%, receives floating CAD-CDOR CAD 04-Dec-2027 195,690 195,690 Interest Rate Swap 92,000,000 Pays fixed 2.353%, receives floating USD-LIBOR USD 26-Jun-2037 2,210,593 2,210,593 Interest Rate Swap 46,000,000 Pays fixed 2.356%, receives floating USD-LIBOR USD 27-Jun-2037 1,085,898 1,085,898 Interest Rate Swap 2,148,100,000 Pays fixed 0.815%, receives floating JPY-LIBOR JPY 19-Aug-2039 164,577 164,577 Interest Rate Swap 4,296,300,000 Pays fixed 0.820%, receives floating JPY-LIBOR JPY 21-Aug-2039 301,207 301,207 Interest Rate Swap 4,296,300,000 Pays fixed 0.802%, receives floating JPY-LIBOR JPY 22-Aug-2039 412,346 412,346 Interest Rate Swap 6,444,400,000 Pays fixed 0.801%, receives floating JPY-LIBOR JPY 23-Aug-2039 629,295 629,295 Interest Rate Swap 9,372,300,000 Pays fixed 0.809%, receives floating JPY-LIBOR JPY 27-Aug-2039 823,775 823,775 Interest Rate Swap 8,592,600,000 Pays fixed 0.806%, receives floating JPY-LIBOR JPY 27-Aug-2039 790,125 790,125 Interest Rate Swap 2,148,100,000 Pays fixed 0.804%, receives floating JPY-LIBOR JPY 29-Aug-2039 204,214 204,214 Interest Rate Swap 6,444,400,000 Pays fixed 0.803%, receives floating JPY-LIBOR JPY 30-Aug-2039 627,402 627,402 Interest Rate Swap 2,148,100,000 Pays fixed 0.763%, receives floating JPY-LIBOR JPY 30-Aug-2039 330,280 330,280 Interest Rate Swap 2,148,200,000 Pays fixed 0.810%, receives floating JPY-LIBOR JPY 30-Aug-2039 186,137 186,137 Interest Rate Swap 8,592,600,000 Pays fixed 0.801%, receives floating JPY-LIBOR JPY 02-Sep-2039 862,237 862,237 Interest Rate Swap 4,296,300,000 Pays fixed 0.802%, receives floating JPY-LIBOR JPY 04-Sep-2039 428,201 428,201 Interest Rate Swap 4,296,300,000 Pays fixed 0.785%, receives floating JPY-LIBOR JPY 05-Sep-2039 532,378 532,378 Interest Rate Swap 5,076,000,000 Pays fixed 0.789%, receives floating JPY-LIBOR JPY 06-Sep-2039 601,251 601,251 Interest Rate Swap 7,624,800,000 Pays fixed 0.869%, receives floating JPY-LIBOR JPY 15-Oct-2039 116,260 116,260 Interest Rate Swap 7,624,800,000 Pays fixed 0.872%, receives floating JPY-LIBOR JPY 15-Oct-2039 82,311 82,311 Interest Rate Swap 7,624,700,000 Pays fixed 0.855%, receives floating JPY-LIBOR JPY 16-Oct-2039 265,192 265,192 Interest Rate Swap 5,083,200,000 Pays fixed 0.861%, receives floating JPY-LIBOR JPY 17-Oct-2039 135,299 135,299 Interest Rate Swap 5,083,200,000 Pays fixed 0.863%, receives floating JPY-LIBOR JPY 18-Oct-2039 121,252 121,252 Interest Rate Swap 2,259,300,000 Pays fixed 0.863%, receives floating JPY-LIBOR JPY 21-Oct-2039 56,438 56,438 Interest Rate Swap 23,000,000 Pays fixed 2.518%, receives floating USD-LIBOR USD 16-Oct-2045 37,041 37,041 Interest Rate Swap 61,400,000 Pays fixed 2.174%, receives floating USD-LIBOR USD 30-Mar-2046 3,821,854 3,821,854 Interest Rate Swap 267,500 Pays fixed 2.380%, receives floating USD-LIBOR USD 27-Jun-2047 7,545 7,545 Interest Rate Swap 267,500 Pays fixed 2.397%, receives floating USD-LIBOR USD 27-Jun-2047 6,720 6,720 Total Return Swap 12,315,795 Pays performance on Samsung, receives USD-LIBOR
+ 0.300% USD
28-Sep-2018 331,938 331,938 Variance Swap 660,500 Pays fixed, receives floating FTSE 100 GBP 21-Dec-2018 5,854,862 5,854,862 Variance Swap 700,000 Pays fixed, receives floating FTSE 100 GBP 21-Dec-2018 4,645,543 4,645,543 Variance Swap 300,000 Pays fixed, receives floating FTSE 100 GBP 21-Dec-2018 2,530,089 2,530,089 Variance Swap 265,000 Pays fixed, receives floating FTSE 100 GBP 21-Dec-2018 2,002,401 2,002,401 Variance Swap 250,000 Pays fixed, receives floating FTSE 100 GBP 21-Dec-2018 1,656,641 1,656,641 Variance Swap 123,790 Pays fixed, receives floating FTSE 100 GBP 21-Dec-2018 1,030,137 1,030,137 Variance Swap 153,000 Pays fixed, receives floating FTSE 100 GBP 21-Dec-2018 1,011,338 1,011,338 Variance Swap 96,300 Pays fixed, receives floating FTSE 100 GBP 21-Dec-2018 614,865 614,865 Variance Swap 94,900 Pays fixed, receives floating FTSE 100 GBP 21-Dec-2018 590,485 590,485
Total 74,936,524
Credit Default Swap 4,000,000 CDS (buy) - iTraxx Europe Crossover Series 28 5Y EUR 20-Dec-2022 (49,658) (497,474) Interest Rate Swap 534,000,000 Pays floating CAD-CDOR, receives fixed 1.879% CAD 18-Oct-2019 (674,486) (674,486) Interest Rate Swap 356,000,000 Pays floating CAD-CDOR, receives fixed 1.840% CAD 19-Oct-2019 (646,437) (646,437) Interest Rate Swap 3,336,000,000 Pays fixed - 0.213%, receives floating SEK-STIBOR SEK 20-Oct-2019 (223,610) (223,610) Interest Rate Swap 2,224,000,000 Pays fixed - 0.220%, receives floating SEK-STIBOR SEK 23-Oct-2019 (108,058) (108,058)
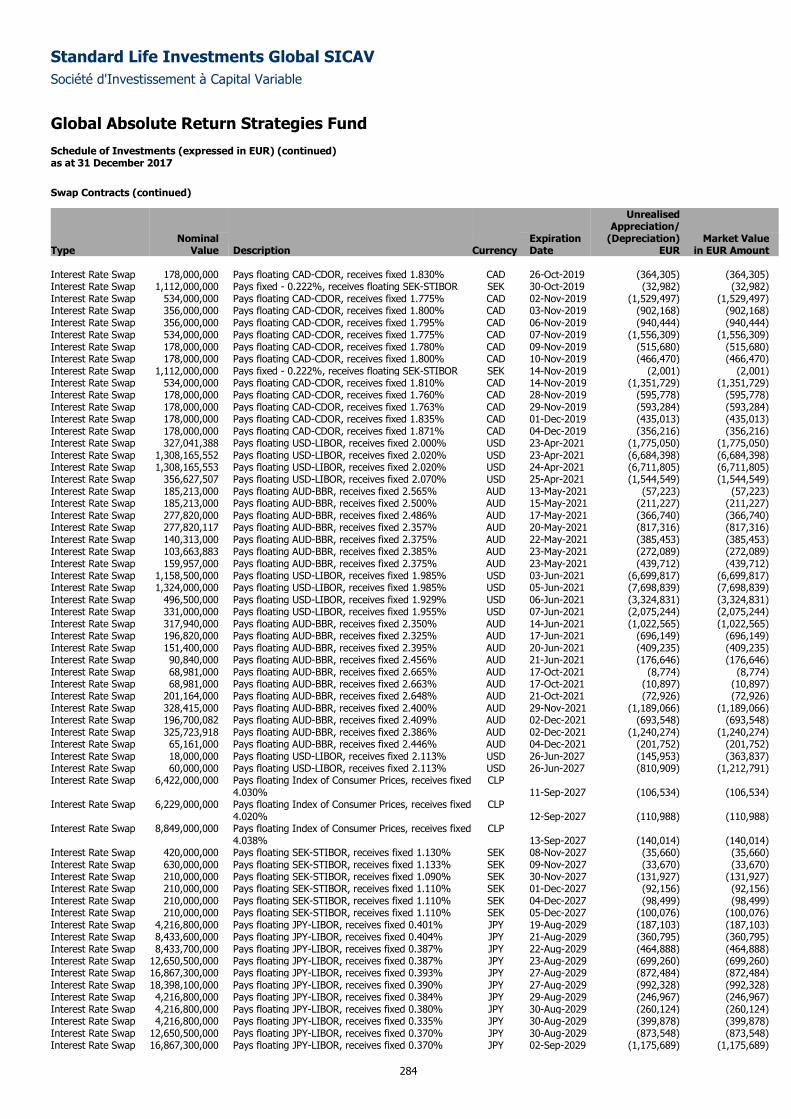
Standard Life Investments Global SICAV
Société d'Investissement à Capital Variable
Global Absolute Return Strategies Fund Schedule of Investments (expressed in EUR) (continued) as at 31 December 2017
284
Swap Contracts (continued)
Unrealised Appreciation/ Nominal Expiration (Depreciation) Market Value Type Value Description Currency Date EUR in EUR Amount Interest Rate Swap 178,000,000 Pays floating CAD-CDOR, receives fixed 1.830% CAD 26-Oct-2019 (364,305) (364,305) Interest Rate Swap 1,112,000,000 Pays fixed - 0.222%, receives floating SEK-STIBOR SEK 30-Oct-2019 (32,982) (32,982) Interest Rate Swap 534,000,000 Pays floating CAD-CDOR, receives fixed 1.775% CAD 02-Nov-2019 (1,529,497) (1,529,497) Interest Rate Swap 356,000,000 Pays floating CAD-CDOR, receives fixed 1.800% CAD 03-Nov-2019 (902,168) (902,168) Interest Rate Swap 356,000,000 Pays floating CAD-CDOR, receives fixed 1.795% CAD 06-Nov-2019 (940,444) (940,444) Interest Rate Swap 534,000,000 Pays floating CAD-CDOR, receives fixed 1.775% CAD 07-Nov-2019 (1,556,309) (1,556,309) Interest Rate Swap 178,000,000 Pays floating CAD-CDOR, receives fixed 1.780% CAD 09-Nov-2019 (515,680) (515,680) Interest Rate Swap 178,000,000 Pays floating CAD-CDOR, receives fixed 1.800% CAD 10-Nov-2019 (466,470) (466,470) Interest Rate Swap 1,112,000,000 Pays fixed - 0.222%, receives floating SEK-STIBOR SEK 14-Nov-2019 (2,001) (2,001) Interest Rate Swap 534,000,000 Pays floating CAD-CDOR, receives fixed 1.810% CAD 14-Nov-2019 (1,351,729) (1,351,729) Interest Rate Swap 178,000,000 Pays floating CAD-CDOR, receives fixed 1.760% CAD 28-Nov-2019 (595,778) (595,778) Interest Rate Swap 178,000,000 Pays floating CAD-CDOR, receives fixed 1.763% CAD 29-Nov-2019 (593,284) (593,284) Interest Rate Swap 178,000,000 Pays floating CAD-CDOR, receives fixed 1.835% CAD 01-Dec-2019 (435,013) (435,013) Interest Rate Swap 178,000,000 Pays floating CAD-CDOR, receives fixed 1.871% CAD 04-Dec-2019 (356,216) (356,216) Interest Rate Swap 327,041,388 Pays floating USD-LIBOR, receives fixed 2.000% USD 23-Apr-2021 (1,775,050) (1,775,050) Interest Rate Swap 1,308,165,552 Pays floating USD-LIBOR, receives fixed 2.020% USD 23-Apr-2021 (6,684,398) (6,684,398) Interest Rate Swap 1,308,165,553 Pays floating USD-LIBOR, receives fixed 2.020% USD 24-Apr-2021 (6,711,805) (6,711,805) Interest Rate Swap 356,627,507 Pays floating USD-LIBOR, receives fixed 2.070% USD 25-Apr-2021 (1,544,549) (1,544,549) Interest Rate Swap 185,213,000 Pays floating AUD-BBR, receives fixed 2.565% AUD 13-May-2021 (57,223) (57,223) Interest Rate Swap 185,213,000 Pays floating AUD-BBR, receives fixed 2.500% AUD 15-May-2021 (211,227) (211,227) Interest Rate Swap 277,820,000 Pays floating AUD-BBR, receives fixed 2.486% AUD 17-May-2021 (366,740) (366,740) Interest Rate Swap 277,820,117 Pays floating AUD-BBR, receives fixed 2.357% AUD 20-May-2021 (817,316) (817,316) Interest Rate Swap 140,313,000 Pays floating AUD-BBR, receives fixed 2.375% AUD 22-May-2021 (385,453) (385,453) Interest Rate Swap 103,663,883 Pays floating AUD-BBR, receives fixed 2.385% AUD 23-May-2021 (272,089) (272,089) Interest Rate Swap 159,957,000 Pays floating AUD-BBR, receives fixed 2.375% AUD 23-May-2021 (439,712) (439,712) Interest Rate Swap 1,158,500,000 Pays floating USD-LIBOR, receives fixed 1.985% USD 03-Jun-2021 (6,699,817) (6,699,817) Interest Rate Swap 1,324,000,000 Pays floating USD-LIBOR, receives fixed 1.985% USD 05-Jun-2021 (7,698,839) (7,698,839) Interest Rate Swap 496,500,000 Pays floating USD-LIBOR, receives fixed 1.929% USD 06-Jun-2021 (3,324,831) (3,324,831) Interest Rate Swap 331,000,000 Pays floating USD-LIBOR, receives fixed 1.955% USD 07-Jun-2021 (2,075,244) (2,075,244) Interest Rate Swap 317,940,000 Pays floating AUD-BBR, receives fixed 2.350% AUD 14-Jun-2021 (1,022,565) (1,022,565) Interest Rate Swap 196,820,000 Pays floating AUD-BBR, receives fixed 2.325% AUD 17-Jun-2021 (696,149) (696,149) Interest Rate Swap 151,400,000 Pays floating AUD-BBR, receives fixed 2.395% AUD 20-Jun-2021 (409,235) (409,235) Interest Rate Swap 90,840,000 Pays floating AUD-BBR, receives fixed 2.456% AUD 21-Jun-2021 (176,646) (176,646) Interest Rate Swap 68,981,000 Pays floating AUD-BBR, receives fixed 2.665% AUD 17-Oct-2021 (8,774) (8,774) Interest Rate Swap 68,981,000 Pays floating AUD-BBR, receives fixed 2.663% AUD 17-Oct-2021 (10,897) (10,897) Interest Rate Swap 201,164,000 Pays floating AUD-BBR, receives fixed 2.648% AUD 21-Oct-2021 (72,926) (72,926) Interest Rate Swap 328,415,000 Pays floating AUD-BBR, receives fixed 2.400% AUD 29-Nov-2021 (1,189,066) (1,189,066) Interest Rate Swap 196,700,082 Pays floating AUD-BBR, receives fixed 2.409% AUD 02-Dec-2021 (693,548) (693,548) Interest Rate Swap 325,723,918 Pays floating AUD-BBR, receives fixed 2.386% AUD 02-Dec-2021 (1,240,274) (1,240,274) Interest Rate Swap 65,161,000 Pays floating AUD-BBR, receives fixed 2.446% AUD 04-Dec-2021 (201,752) (201,752) Interest Rate Swap 18,000,000 Pays floating USD-LIBOR, receives fixed 2.113% USD 26-Jun-2027 (145,953) (363,837) Interest Rate Swap 60,000,000 Pays floating USD-LIBOR, receives fixed 2.113% USD 26-Jun-2027 (810,909) (1,212,791) Interest Rate Swap 6,422,000,000 Pays floating Index of Consumer Prices, receives fixed
4.030% CLP
11-Sep-2027 (106,534) (106,534) Interest Rate Swap 6,229,000,000 Pays floating Index of Consumer Prices, receives fixed
4.020% CLP
12-Sep-2027 (110,988) (110,988) Interest Rate Swap 8,849,000,000 Pays floating Index of Consumer Prices, receives fixed
4.038% CLP
13-Sep-2027 (140,014) (140,014) Interest Rate Swap 420,000,000 Pays floating SEK-STIBOR, receives fixed 1.130% SEK 08-Nov-2027 (35,660) (35,660) Interest Rate Swap 630,000,000 Pays floating SEK-STIBOR, receives fixed 1.133% SEK 09-Nov-2027 (33,670) (33,670) Interest Rate Swap 210,000,000 Pays floating SEK-STIBOR, receives fixed 1.090% SEK 30-Nov-2027 (131,927) (131,927) Interest Rate Swap 210,000,000 Pays floating SEK-STIBOR, receives fixed 1.110% SEK 01-Dec-2027 (92,156) (92,156) Interest Rate Swap 210,000,000 Pays floating SEK-STIBOR, receives fixed 1.110% SEK 04-Dec-2027 (98,499) (98,499) Interest Rate Swap 210,000,000 Pays floating SEK-STIBOR, receives fixed 1.110% SEK 05-Dec-2027 (100,076) (100,076) Interest Rate Swap 4,216,800,000 Pays floating JPY-LIBOR, receives fixed 0.401% JPY 19-Aug-2029 (187,103) (187,103) Interest Rate Swap 8,433,600,000 Pays floating JPY-LIBOR, receives fixed 0.404% JPY 21-Aug-2029 (360,795) (360,795) Interest Rate Swap 8,433,700,000 Pays floating JPY-LIBOR, receives fixed 0.387% JPY 22-Aug-2029 (464,888) (464,888) Interest Rate Swap 12,650,500,000 Pays floating JPY-LIBOR, receives fixed 0.387% JPY 23-Aug-2029 (699,260) (699,260) Interest Rate Swap 16,867,300,000 Pays floating JPY-LIBOR, receives fixed 0.393% JPY 27-Aug-2029 (872,484) (872,484) Interest Rate Swap 18,398,100,000 Pays floating JPY-LIBOR, receives fixed 0.390% JPY 27-Aug-2029 (992,328) (992,328) Interest Rate Swap 4,216,800,000 Pays floating JPY-LIBOR, receives fixed 0.384% JPY 29-Aug-2029 (246,967) (246,967) Interest Rate Swap 4,216,800,000 Pays floating JPY-LIBOR, receives fixed 0.380% JPY 30-Aug-2029 (260,124) (260,124) Interest Rate Swap 4,216,800,000 Pays floating JPY-LIBOR, receives fixed 0.335% JPY 30-Aug-2029 (399,878) (399,878) Interest Rate Swap 12,650,500,000 Pays floating JPY-LIBOR, receives fixed 0.370% JPY 30-Aug-2029 (873,548) (873,548) Interest Rate Swap 16,867,300,000 Pays floating JPY-LIBOR, receives fixed 0.370% JPY 02-Sep-2029 (1,175,689) (1,175,689)

Standard Life Investments Global SICAV
Société d'Investissement à Capital Variable
Global Absolute Return Strategies Fund Schedule of Investments (expressed in EUR) (continued) as at 31 December 2017
285
Swap Contracts (continued)
Unrealised Appreciation/ Nominal Expiration (Depreciation) Market Value Type Value Description Currency Date EUR in EUR Amount Interest Rate Swap 8,433,600,000 Pays floating JPY-LIBOR, receives fixed 0.370% JPY 04-Sep-2029 (589,893) (589,893) Interest Rate Swap 8,433,700,000 Pays floating JPY-LIBOR, receives fixed 0.353% JPY 05-Sep-2029 (700,232) (700,232) Interest Rate Swap 9,964,500,000 Pays floating JPY-LIBOR, receives fixed 0.357% JPY 06-Sep-2029 (795,947) (795,947) Interest Rate Swap 14,795,900,000 Pays floating JPY-LIBOR, receives fixed 0.442% JPY 15-Oct-2029 (355,163) (355,163) Interest Rate Swap 14,795,900,000 Pays floating JPY-LIBOR, receives fixed 0.440% JPY 15-Oct-2029 (380,981) (380,981) Interest Rate Swap 14,795,900,000 Pays floating JPY-LIBOR, receives fixed 0.429% JPY 16-Oct-2029 (503,338) (503,338) Interest Rate Swap 9,863,900,000 Pays floating JPY-LIBOR, receives fixed 0.434% JPY 17-Oct-2029 (301,012) (301,012) Interest Rate Swap 9,864,000,000 Pays floating JPY-LIBOR, receives fixed 0.433% JPY 18-Oct-2029 (310,143) (310,143) Interest Rate Swap 4,384,400,000 Pays floating JPY-LIBOR, receives fixed 0.434% JPY 21-Oct-2029 (137,413) (137,413) Interest Rate Swap 6,500,000 Pays floating USD-LIBOR, receives fixed 2.353% USD 26-Jun-2037 (59,077) (156,183) Interest Rate Swap 40,000,000 Pays floating USD-LIBOR, receives fixed 2.353% USD 26-Jun-2037 (59,313) (961,127) Total Return Swap 1,503,323 Pays performance on Samsung, receives USD-LIBOR
+ 0.050% USD
13-Apr-2018 (14,200) (14,200) Total Return Swap 5,051,070 Pays performance on Samsung, receives USD-LIBOR
+ 0.050% USD
13-Apr-2018 (47,711) (47,711) Total Return Swap 6,161,505 Pays performance on Samsung, receives USD-LIBOR
+ 0.050% USD
13-Apr-2018 (58,199) (58,199) Total Return Swap 8,269,451 Pays performance on Samsung, receives USD-LIBOR
+ 0.050% USD
13-Apr-2018 (78,110) (78,110) Total Return Swap 8,704,685 Pays performance on Samsung, receives USD-LIBOR
+ 0.050% USD
13-Apr-2018 (82,221) (82,221) Total Return Swap 12,254,785 Pays performance on Samsung, receives USD-LIBOR
+ 0.050% USD
13-Apr-2018 (115,754) (115,754) Total Return Swap 21,869,933 Pays performance on Samsung, receives USD-LIBOR
+ 0.050% USD
13-Apr-2018 (206,575) (206,575) Total Return Swap 23,460,295 Pays performance on Samsung, receives USD-LIBOR
+ 0.300% USD
01-Oct-2018 (318,638) (318,638) Total Return Swap 11,881,953 Pays performance on Samsung, receives USD-LIBOR
+ 0.300% USD
10-Oct-2018 (35,909) (35,909) Total Return Swap 76,223,541 Pays performance on Ibovespa Brasil Sao Paulo
Index, receives USD-LIBOR + 0.350% USD
06-Dec-2018 (1,249,203) (1,249,203) Total Return Swap 75,473,403 Pays performance on Ibovespa Brasil Sao Paulo
Index, receives USD-LIBOR + 0.350% USD
06-Dec-2018 (1,875,560) (1,875,560) Total Return Swap 73,243,204 Pays performance on Ibovespa Brasil Sao Paulo
Index, receives USD-LIBOR + 0.350% USD
07-Dec-2018 (3,740,605) (3,740,605) Variance Swap 919,000 Pays floating China Enterprises Index (Hang Seng),
receives fixed HKD
28-Dec-2018 (674,891) (674,891) Variance Swap 926,000 Pays floating China Enterprises Index (Hang Seng),
receives fixed HKD
28-Dec-2018 (678,307) (678,307) Variance Swap 1,500,000 Pays floating China Enterprises Index (Hang Seng),
receives fixed HKD
28-Dec-2018 (1,092,491) (1,092,491) Variance Swap 1,240,000 Pays floating China Enterprises Index (Hang Seng),
receives fixed HKD
28-Dec-2018 (1,147,062) (1,147,062) Variance Swap 2,430,000 Pays floating China Enterprises Index (Hang Seng),
receives fixed HKD
28-Dec-2018 (1,790,143) (1,790,143) Variance Swap 2,500,000 Pays floating China Enterprises Index (Hang Seng),
receives fixed HKD
28-Dec-2018 (2,090,045) (2,090,045) Variance Swap 3,000,000 Pays fixed, receives floating China Enterprises Index
(Hang Seng) HKD
28-Dec-2018 (2,902,375) (2,902,375) Variance Swap 6,829,550 Pays floating China Enterprises Index (Hang Seng),
receives fixed HKD
28-Dec-2018 (5,024,617) (5,024,617) Variance Swap 6,799,958 Pays floating China Enterprises Index (Hang Seng),
receives fixed HKD
28-Dec-2018 (6,886,044) (6,886,044)
Total (100,837,374)
Net EUR (25,900,850)
The following entities were counterparties to the above swap contracts at 31 December 2017: BNP Paribas, Deutsche Bank AG, Goldman Sachs International Bank, JPMorgan Chase Bank, Morgan Stanley & Co. International Plc and Societe Generale.
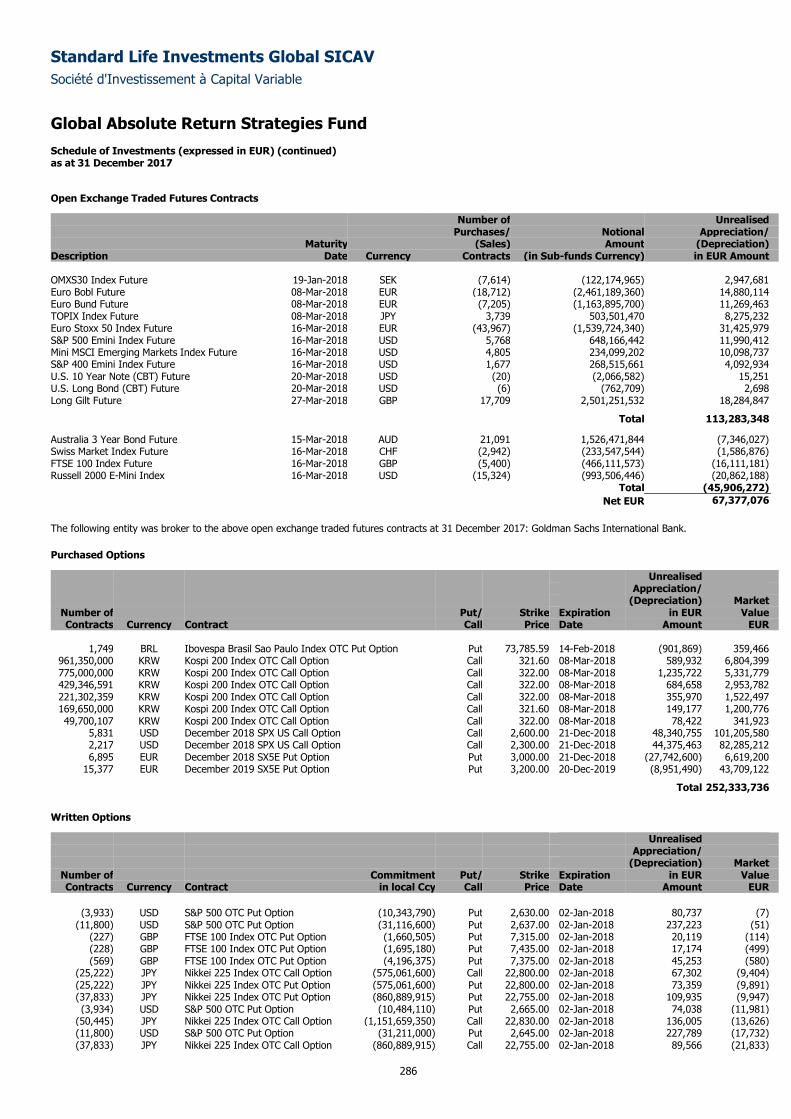
Standard Life Investments Global SICAV
Société d'Investissement à Capital Variable
Global Absolute Return Strategies Fund Schedule of Investments (expressed in EUR) (continued) as at 31 December 2017
286
Open Exchange Traded Futures Contracts
Number of Unrealised Purchases/ Notional Appreciation/ Maturity (Sales) Amount (Depreciation) Description Date Currency Contracts (in Sub-funds Currency) in EUR Amount OMXS30 Index Future 19-Jan-2018 SEK (7,614) (122,174,965) 2,947,681 Euro Bobl Future 08-Mar-2018 EUR (18,712) (2,461,189,360) 14,880,114 Euro Bund Future 08-Mar-2018 EUR (7,205) (1,163,895,700) 11,269,463 TOPIX Index Future 08-Mar-2018 JPY 3,739 503,501,470 8,275,232 Euro Stoxx 50 Index Future 16-Mar-2018 EUR (43,967) (1,539,724,340) 31,425,979 S&P 500 Emini Index Future 16-Mar-2018 USD 5,768 648,166,442 11,990,412 Mini MSCI Emerging Markets Index Future 16-Mar-2018 USD 4,805 234,099,202 10,098,737 S&P 400 Emini Index Future 16-Mar-2018 USD 1,677 268,515,661 4,092,934 U.S. 10 Year Note (CBT) Future 20-Mar-2018 USD (20) (2,066,582) 15,251 U.S. Long Bond (CBT) Future 20-Mar-2018 USD (6) (762,709) 2,698 Long Gilt Future 27-Mar-2018 GBP 17,709 2,501,251,532 18,284,847
Total 113,283,348
Australia 3 Year Bond Future 15-Mar-2018 AUD 21,091 1,526,471,844 (7,346,027) Swiss Market Index Future 16-Mar-2018 CHF (2,942) (233,547,544) (1,586,876) FTSE 100 Index Future 16-Mar-2018 GBP (5,400) (466,111,573) (16,111,181) Russell 2000 E-Mini Index 16-Mar-2018 USD (15,324) (993,506,446) (20,862,188) Total (45,906,272)
Net EUR 67,377,076
The following entity was broker to the above open exchange traded futures contracts at 31 December 2017: Goldman Sachs International Bank.
Purchased Options
Unrealised Appreciation/ (Depreciation) Market
Number of Put/ Strike Expiration in EUR Value Contracts Currency Contract Call Price Date Amount EUR
1,749 BRL Ibovespa Brasil Sao Paulo Index OTC Put Option Put 73,785.59 14-Feb-2018 (901,869) 359,466
961,350,000 KRW Kospi 200 Index OTC Call Option Call 321.60 08-Mar-2018 589,932 6,804,399 775,000,000 KRW Kospi 200 Index OTC Call Option Call 322.00 08-Mar-2018 1,235,722 5,331,779 429,346,591 KRW Kospi 200 Index OTC Call Option Call 322.00 08-Mar-2018 684,658 2,953,782 221,302,359 KRW Kospi 200 Index OTC Call Option Call 322.00 08-Mar-2018 355,970 1,522,497 169,650,000 KRW Kospi 200 Index OTC Call Option Call 321.60 08-Mar-2018 149,177 1,200,776 49,700,107 KRW Kospi 200 Index OTC Call Option Call 322.00 08-Mar-2018 78,422 341,923
5,831 USD December 2018 SPX US Call Option Call 2,600.00 21-Dec-2018 48,340,755 101,205,580 2,217 USD December 2018 SPX US Call Option Call 2,300.00 21-Dec-2018 44,375,463 82,285,212 6,895 EUR December 2018 SX5E Put Option Put 3,000.00 21-Dec-2018 (27,742,600) 6,619,200
15,377 EUR December 2019 SX5E Put Option Put 3,200.00 20-Dec-2019 (8,951,490) 43,709,122
Total 252,333,736
Written Options
Unrealised Appreciation/ (Depreciation) Market
Number of Commitment Put/ Strike Expiration in EUR Value Contracts Currency Contract in local Ccy Call Price Date Amount EUR
(3,933) USD S&P 500 OTC Put Option (10,343,790) Put 2,630.00 02-Jan-2018 80,737 (7) (11,800) USD S&P 500 OTC Put Option (31,116,600) Put 2,637.00 02-Jan-2018 237,223 (51)
(227) GBP FTSE 100 Index OTC Put Option (1,660,505) Put 7,315.00 02-Jan-2018 20,119 (114) (228) GBP FTSE 100 Index OTC Put Option (1,695,180) Put 7,435.00 02-Jan-2018 17,174 (499) (569) GBP FTSE 100 Index OTC Put Option (4,196,375) Put 7,375.00 02-Jan-2018 45,253 (580)
(25,222) JPY Nikkei 225 Index OTC Call Option (575,061,600) Call 22,800.00 02-Jan-2018 67,302 (9,404) (25,222) JPY Nikkei 225 Index OTC Put Option (575,061,600) Put 22,800.00 02-Jan-2018 73,359 (9,891) (37,833) JPY Nikkei 225 Index OTC Put Option (860,889,915) Put 22,755.00 02-Jan-2018 109,935 (9,947) (3,934) USD S&P 500 OTC Put Option (10,484,110) Put 2,665.00 02-Jan-2018 74,038 (11,981)
(50,445) JPY Nikkei 225 Index OTC Call Option (1,151,659,350) Call 22,830.00 02-Jan-2018 136,005 (13,626) (11,800) USD S&P 500 OTC Put Option (31,211,000) Put 2,645.00 02-Jan-2018 227,789 (17,732) (37,833) JPY Nikkei 225 Index OTC Call Option (860,889,915) Call 22,755.00 02-Jan-2018 89,566 (21,833)
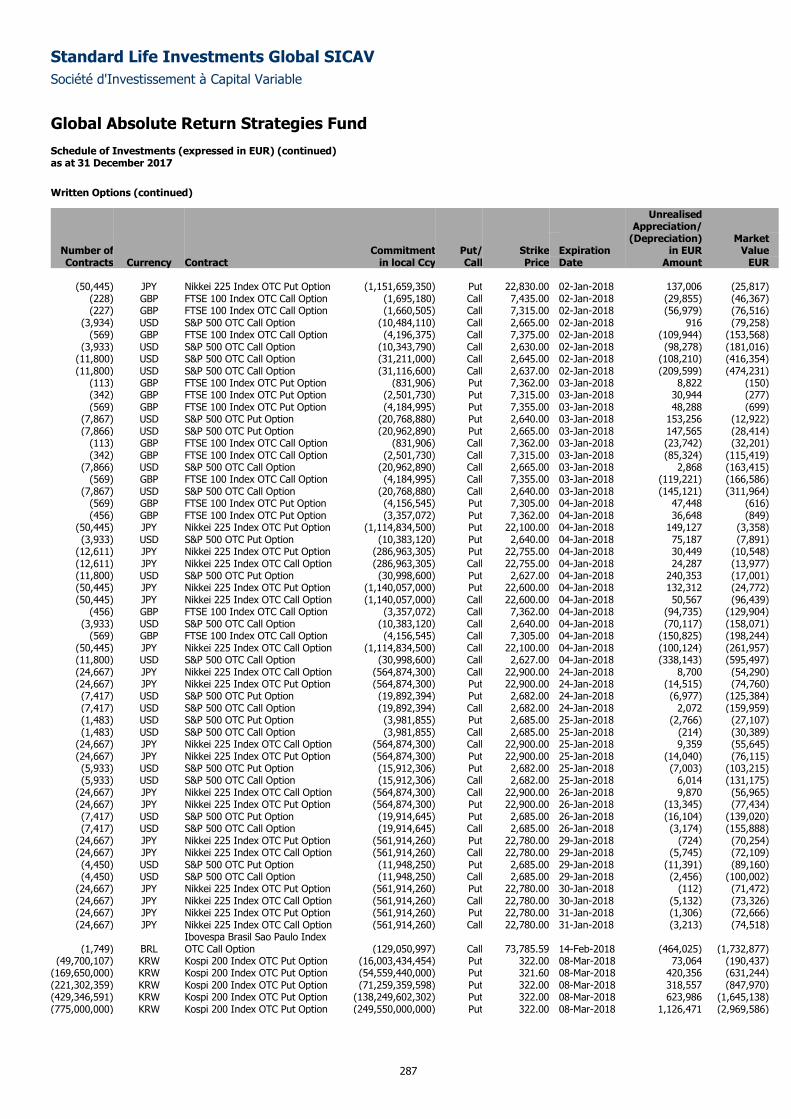
Standard Life Investments Global SICAV
Société d'Investissement à Capital Variable
Global Absolute Return Strategies Fund Schedule of Investments (expressed in EUR) (continued) as at 31 December 2017
287
Written Options (continued)
Unrealised Appreciation/ (Depreciation) Market
Number of Commitment Put/ Strike Expiration in EUR Value Contracts Currency Contract in local Ccy Call Price Date Amount EUR
(50,445) JPY Nikkei 225 Index OTC Put Option (1,151,659,350) Put 22,830.00 02-Jan-2018 137,006 (25,817)
(228) GBP FTSE 100 Index OTC Call Option (1,695,180) Call 7,435.00 02-Jan-2018 (29,855) (46,367) (227) GBP FTSE 100 Index OTC Call Option (1,660,505) Call 7,315.00 02-Jan-2018 (56,979) (76,516)
(3,934) USD S&P 500 OTC Call Option (10,484,110) Call 2,665.00 02-Jan-2018 916 (79,258) (569) GBP FTSE 100 Index OTC Call Option (4,196,375) Call 7,375.00 02-Jan-2018 (109,944) (153,568)
(3,933) USD S&P 500 OTC Call Option (10,343,790) Call 2,630.00 02-Jan-2018 (98,278) (181,016) (11,800) USD S&P 500 OTC Call Option (31,211,000) Call 2,645.00 02-Jan-2018 (108,210) (416,354) (11,800) USD S&P 500 OTC Call Option (31,116,600) Call 2,637.00 02-Jan-2018 (209,599) (474,231)
(113) GBP FTSE 100 Index OTC Put Option (831,906) Put 7,362.00 03-Jan-2018 8,822 (150) (342) GBP FTSE 100 Index OTC Put Option (2,501,730) Put 7,315.00 03-Jan-2018 30,944 (277) (569) GBP FTSE 100 Index OTC Put Option (4,184,995) Put 7,355.00 03-Jan-2018 48,288 (699)
(7,867) USD S&P 500 OTC Put Option (20,768,880) Put 2,640.00 03-Jan-2018 153,256 (12,922) (7,866) USD S&P 500 OTC Put Option (20,962,890) Put 2,665.00 03-Jan-2018 147,565 (28,414)
(113) GBP FTSE 100 Index OTC Call Option (831,906) Call 7,362.00 03-Jan-2018 (23,742) (32,201) (342) GBP FTSE 100 Index OTC Call Option (2,501,730) Call 7,315.00 03-Jan-2018 (85,324) (115,419)
(7,866) USD S&P 500 OTC Call Option (20,962,890) Call 2,665.00 03-Jan-2018 2,868 (163,415) (569) GBP FTSE 100 Index OTC Call Option (4,184,995) Call 7,355.00 03-Jan-2018 (119,221) (166,586)
(7,867) USD S&P 500 OTC Call Option (20,768,880) Call 2,640.00 03-Jan-2018 (145,121) (311,964) (569) GBP FTSE 100 Index OTC Put Option (4,156,545) Put 7,305.00 04-Jan-2018 47,448 (616) (456) GBP FTSE 100 Index OTC Put Option (3,357,072) Put 7,362.00 04-Jan-2018 36,648 (849)
(50,445) JPY Nikkei 225 Index OTC Put Option (1,114,834,500) Put 22,100.00 04-Jan-2018 149,127 (3,358) (3,933) USD S&P 500 OTC Put Option (10,383,120) Put 2,640.00 04-Jan-2018 75,187 (7,891)
(12,611) JPY Nikkei 225 Index OTC Put Option (286,963,305) Put 22,755.00 04-Jan-2018 30,449 (10,548) (12,611) JPY Nikkei 225 Index OTC Call Option (286,963,305) Call 22,755.00 04-Jan-2018 24,287 (13,977) (11,800) USD S&P 500 OTC Put Option (30,998,600) Put 2,627.00 04-Jan-2018 240,353 (17,001) (50,445) JPY Nikkei 225 Index OTC Put Option (1,140,057,000) Put 22,600.00 04-Jan-2018 132,312 (24,772) (50,445) JPY Nikkei 225 Index OTC Call Option (1,140,057,000) Call 22,600.00 04-Jan-2018 50,567 (96,439)
(456) GBP FTSE 100 Index OTC Call Option (3,357,072) Call 7,362.00 04-Jan-2018 (94,735) (129,904) (3,933) USD S&P 500 OTC Call Option (10,383,120) Call 2,640.00 04-Jan-2018 (70,117) (158,071)
(569) GBP FTSE 100 Index OTC Call Option (4,156,545) Call 7,305.00 04-Jan-2018 (150,825) (198,244) (50,445) JPY Nikkei 225 Index OTC Call Option (1,114,834,500) Call 22,100.00 04-Jan-2018 (100,124) (261,957) (11,800) USD S&P 500 OTC Call Option (30,998,600) Call 2,627.00 04-Jan-2018 (338,143) (595,497) (24,667) JPY Nikkei 225 Index OTC Call Option (564,874,300) Call 22,900.00 24-Jan-2018 8,700 (54,290) (24,667) JPY Nikkei 225 Index OTC Put Option (564,874,300) Put 22,900.00 24-Jan-2018 (14,515) (74,760) (7,417) USD S&P 500 OTC Put Option (19,892,394) Put 2,682.00 24-Jan-2018 (6,977) (125,384) (7,417) USD S&P 500 OTC Call Option (19,892,394) Call 2,682.00 24-Jan-2018 2,072 (159,959) (1,483) USD S&P 500 OTC Put Option (3,981,855) Put 2,685.00 25-Jan-2018 (2,766) (27,107) (1,483) USD S&P 500 OTC Call Option (3,981,855) Call 2,685.00 25-Jan-2018 (214) (30,389)
(24,667) JPY Nikkei 225 Index OTC Call Option (564,874,300) Call 22,900.00 25-Jan-2018 9,359 (55,645) (24,667) JPY Nikkei 225 Index OTC Put Option (564,874,300) Put 22,900.00 25-Jan-2018 (14,040) (76,115) (5,933) USD S&P 500 OTC Put Option (15,912,306) Put 2,682.00 25-Jan-2018 (7,003) (103,215) (5,933) USD S&P 500 OTC Call Option (15,912,306) Call 2,682.00 25-Jan-2018 6,014 (131,175)
(24,667) JPY Nikkei 225 Index OTC Call Option (564,874,300) Call 22,900.00 26-Jan-2018 9,870 (56,965) (24,667) JPY Nikkei 225 Index OTC Put Option (564,874,300) Put 22,900.00 26-Jan-2018 (13,345) (77,434) (7,417) USD S&P 500 OTC Put Option (19,914,645) Put 2,685.00 26-Jan-2018 (16,104) (139,020) (7,417) USD S&P 500 OTC Call Option (19,914,645) Call 2,685.00 26-Jan-2018 (3,174) (155,888)
(24,667) JPY Nikkei 225 Index OTC Put Option (561,914,260) Put 22,780.00 29-Jan-2018 (724) (70,254) (24,667) JPY Nikkei 225 Index OTC Call Option (561,914,260) Call 22,780.00 29-Jan-2018 (5,745) (72,109) (4,450) USD S&P 500 OTC Put Option (11,948,250) Put 2,685.00 29-Jan-2018 (11,391) (89,160) (4,450) USD S&P 500 OTC Call Option (11,948,250) Call 2,685.00 29-Jan-2018 (2,456) (100,002)
(24,667) JPY Nikkei 225 Index OTC Put Option (561,914,260) Put 22,780.00 30-Jan-2018 (112) (71,472) (24,667) JPY Nikkei 225 Index OTC Call Option (561,914,260) Call 22,780.00 30-Jan-2018 (5,132) (73,326) (24,667) JPY Nikkei 225 Index OTC Put Option (561,914,260) Put 22,780.00 31-Jan-2018 (1,306) (72,666) (24,667) JPY Nikkei 225 Index OTC Call Option (561,914,260) Call 22,780.00 31-Jan-2018 (3,213) (74,518)
(1,749) BRL Ibovespa Brasil Sao Paulo Index OTC Call Option (129,050,997) Call 73,785.59 14-Feb-2018 (464,025) (1,732,877)
(49,700,107) KRW Kospi 200 Index OTC Put Option (16,003,434,454) Put 322.00 08-Mar-2018 73,064 (190,437) (169,650,000) KRW Kospi 200 Index OTC Put Option (54,559,440,000) Put 321.60 08-Mar-2018 420,356 (631,244) (221,302,359) KRW Kospi 200 Index OTC Put Option (71,259,359,598) Put 322.00 08-Mar-2018 318,557 (847,970) (429,346,591) KRW Kospi 200 Index OTC Put Option (138,249,602,302) Put 322.00 08-Mar-2018 623,986 (1,645,138) (775,000,000) KRW Kospi 200 Index OTC Put Option (249,550,000,000) Put 322.00 08-Mar-2018 1,126,471 (2,969,586)
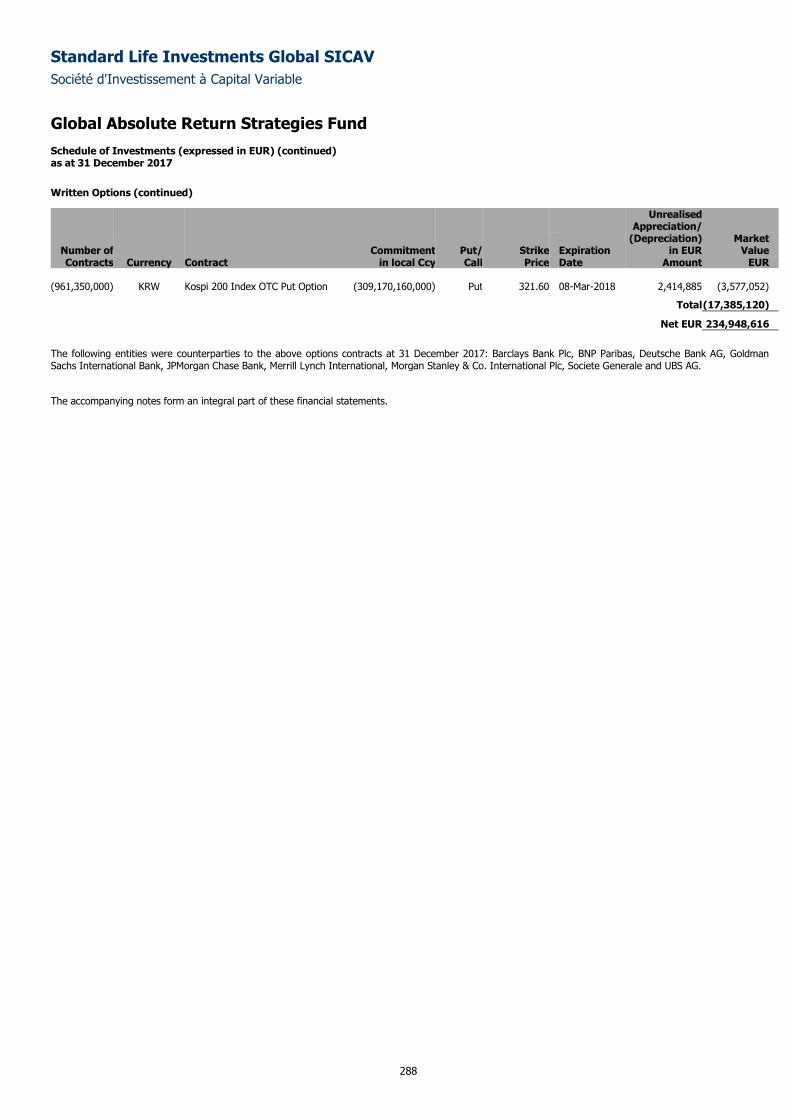
Standard Life Investments Global SICAV
Société d'Investissement à Capital Variable
Global Absolute Return Strategies Fund Schedule of Investments (expressed in EUR) (continued) as at 31 December 2017
288
Written Options (continued)
Unrealised Appreciation/ (Depreciation) Market
Number of Commitment Put/ Strike Expiration in EUR Value Contracts Currency Contract in local Ccy Call Price Date Amount EUR
(961,350,000) KRW Kospi 200 Index OTC Put Option (309,170,160,000) Put 321.60 08-Mar-2018 2,414,885 (3,577,052)
Total (17,385,120)
Net EUR 234,948,616
The following entities were counterparties to the above options contracts at 31 December 2017: Barclays Bank Plc, BNP Paribas, Deutsche Bank AG, Goldman Sachs International Bank, JPMorgan Chase Bank, Merrill Lynch International, Morgan Stanley & Co. International Plc, Societe Generale and UBS AG.
The accompanying notes form an integral part of these financial statements.
Standard Life Investments Global SICAV
Société d'Investissement à Capital Variable
289
Global Focused Strategies Fund
Sub-fund Objective and Investment Policy The objective of the Sub-fund is to deliver a positive absolute return in the form of capital growth over the medium to longer term in all market conditions
through a discretionary multi-asset approach. The Sub-fund invests actively within and between all major asset classes and across the capital structure of
firms, exploiting medium term investment views drawn from a broad expert research platform. The sub-fund targets a level of return over rolling three-year
periods equivalent to cash plus seven and a half per-cent per year, gross of fees. Operating distinct idea generation, strategy selection and portfolio
construction steps, the fund uses well established processes to target a particular level of positive return with a strong emphasis on risk awareness whatever
the economic environment. The fund can take long and short positions in markets, securities and groups of securities through derivative contracts. Leverage
in the fund arises as a result of the use of derivatives.
The Sub-fund seeks strategies from across the entire investment universe, looking for returns through a fusion of our macro and micro capabilities,
underpinned by our collaborative security research platform and multi-asset risk and portfolio management expertise. This means the Sub-fund can
generate returns in a wider variety of ways. By using this combination of diversified returns, we are able to minimise the impact of market volatility and
therefore reduce risk. Indeed, we expect risk within the Sub-fund to be between one half to two thirds of that of a conventional equity investment vehicle
while maintaining the Sub-fund’s return objective.
Examples of strategies that may be used at any time may include:
- An assessment of the potential performance of a selected number of equities compared to the performance of the market of which they form a part. This
strategy could be implemented by buying a selected number of equity securities and selling market exposure through the use of derivatives in the form of
futures contracts.
- An assessment of the value of one currency relative to another. The strategy could involve the sale of the currency considered overvalued and purchase of
the currency considered undervalued. Derivatives, in the form of forward foreign exchange contracts, could be used to implement the strategy.
- An assessment of the direction of interest rates. Derivatives, in the form of interest rate swaps, could be used to position the portfolio such that it could
benefit from the future direction of interest rates.
The fund will invest in a portfolio of equities, equity related investments, fixed interest securities, cash and permitted derivatives. “Equity related
investments” may include depositary receipts, convertible stocks and any other such investments which entitle the holder to subscribe for or convert into the
equity of the company and/or where the share price performance is influenced significantly by the stock market performance of the company’s ordinary
shares. Additionally the Sub-fund may invest in other forms of eligible transferable securities, deposits, money market instruments and undertakings for
collective investment. The Sub-fund may, subject to and in accordance with the UCI Law and applicable CSSF circulars, take long and short positions in
markets, securities and groups of securities through derivative contracts.
Performance Review Global Focused Strategies returned 1.43% over the period, compared to the 6-month EURIBOR return of -0.26%*. Notable in the year was the strong performance of global equities. Boosted by synchronised global growth and robust corporate earnings results, several key indices set successive record highs. During the first quarter of 2017, signs emerged that the global economic recovery was at last broadening out to include Europe. This resulted in positive returns from our European dividends strategy as well as our position preferring European telecom and utility stocks to Italian government bonds. Similarly, our exposure to CoCos (contingent capital bonds, also termed contingent convertible bonds) gained. Our position in Argentine equities delivered strong performance ahead of the potential inclusion of Argentina in key equity indices. In the US, our mid-cap equity holdings contributed positively. However, as the US Federal Reserve signalled a slower-than-expected path of future interest rate rises, our position preferring US banks to US consumer staples failed to produce a positive return, as banks typically are beneficiaries of rising rates. Our strategy favouring Russian equities to Brazilian equities also fell. Scope for lifting sanctions against Russia diminished after President Trump’s security adviser resigned. During the second quarter, fears for the future of the European Union (EU) were allayed by the election in May of a pro-European French president, providing a fillip to equity markets. Subsequently, the prospect of reduced support from global central banks led to a general decline in equity and government bond markets in June. Despite this, our exposure to Korean equities gained, thanks to positive earnings revisions and trade data. Also positive was our exposure to Argentine equities, which ended higher despite not being included in the MSCI Emerging Markets Index. Other positive contributors included our European dividends, European equity banks and CoCos strategies. Elsewhere, our US inflation curve steepener strategy contributed positively. Short-dated US inflation expectations fell more steeply owing to weaker oil prices and doubts over President Trump’s economic stimulus. However, the overall decline in US inflation expectations hurt our long US inflation strategy. In this environment, the US dollar weakened, penalising our positions preferring the US dollar over the British pound and Canadian dollar. Other negative contributors included our position preferring European telecom and utility equities over Italian government bonds. During the following three months, our equity positions again performed well in the environment of accelerating global growth and muted inflation. Argentine equities were one of the top performers, as President Macri’s reform measures started to bear fruit. Our strategy favouring the broad European equity market over European media stocks moved higher, after disappointing trading statements from a number of broadcasters. Similarly, our preference for European food producers over their US counterparts was rewarded after US companies issued poor trading statements while also facing mounting competitive pressures from Amazon in the food sector. The Bank of England’s unexpected communication that it might raise interest rates caused the British pound to strengthen, penalising our preference for the US dollar over the pound. This also contributed to the negative performance of our strategy favouring the broad UK equity market over the UK retail sector. The stronger pound reduced pressure on retailers from higher imported costs.
Standard Life Investments Global SICAV
Société d'Investissement à Capital Variable
290
Global Focused Strategies Fund
Performance Review (continued) During the final three months, our US equity, Argentine equity and European dividend stocks all benefited from ongoing global growth momentum. Our
position preferring the broader UK equity market over UK retail stocks more than recouped ground lost earlier to deliver a positive contribution for the year.
This was largely due to the underperformance of clothing retailers, as the broader UK index was lifted by rising commodity prices. Our Australian forward-
start interest rates strategy added to returns, as below-forecast retail sales and inflation data argued against the likelihood of interest rate increases. Among
the performance detractors was our short Italian government bonds versus European telecom and utility equities position. Italian bonds rose, while telecoms
stocks underperformed the broad market after Netherlands-based Altice released disappointing results. Our currency pair favouring the Japanese yen over
the Korean won also dragged on returns. The won strengthened on the back of Korea’s export-led economic momentum and subsiding geopolitical risks on
the Korean Peninsula. Elsewhere, our equity relative-value strategy preferring Russian equities over Brazilian equities contributed negatively. Domestic
Russian equities lagged commodity-related stocks and the broader market, while a rate cut by Brazil’s central bank caused Brazilian equities to move higher.
*Sub-fund performance has been calculated over the stated period on the share price performance basis, based on the institutional share class (D
Accumulation) and net of fees. Please note the benchmark return is quoted gross and contains no adjustment for fees. The sub-fund performance will also
be impacted by any pricing basis changes, made under our single swinging price policy. More information on our swinging price approach can be found in
note 8 of the Financial Statements.
Outlook Our central expectation is for continued modest broad-based global growth, albeit with regional variations. Fiscal policy and the changing monetary policies
of central banks will be important drivers of asset returns, especially as the pace of change in policies remains uncertain. The US is moving to a tighter
monetary environment, albeit on a gradual incline. Improving data in Europe may reduce the European Central Bank’s appetite for monetary easing.
However, it will likely remain cautious in the near term given the elevated levels of uncertainty around the process of the UK’s withdrawal from the EU.
Japan, meanwhile, is likely to remain on a loose monetary path. Geopolitical tensions remain elevated and, on many metrics, asset prices look expensive.
We will seek to exploit the opportunities that these conditions present by implementing a diversified range of strategies using multiple asset classes.
Please note that the absolute Value at Risk (“VaR”) approach has been used for risk measurement and calculation of global exposure for this Sub-fund.
Measurement of 1 month 99% VaR is based on a parametric calculation with an additional upwards scaling factor applied. Parametric risk model uses 180 weeks of equally weighted data with which to forecast risk.
On the above basis the VaR has been as follows: Highest: 6.99% Average: 5.86% Lowest: 4.36%
Leverage is calculated as the sum of the notionals of the derivatives used. The level of leverage employed during the relevant period was 664.05%.
The quoted leverage excludes the impact of the FX forwards used in currency hedged shareclasses which are held for those shareholders only. It also
excludes the temporary impacts that arise when renewing currency forwards and when closing some exchange cleared derivatives. Although the renewal of
currency forwards and closure of exchange traded derivatives results in no change in or a reduction in market exposure, gross derivative leverage would
increase because new equal and offsetting derivative contracts are traded to facilitate this efficiently. The offsetting contracts are held to their maturity
date, which is less than 5 working days for currency forwards, or final processing of their termination.
This Sub-fund is not authorized in Hong Kong and is not available to Hong Kong residents.
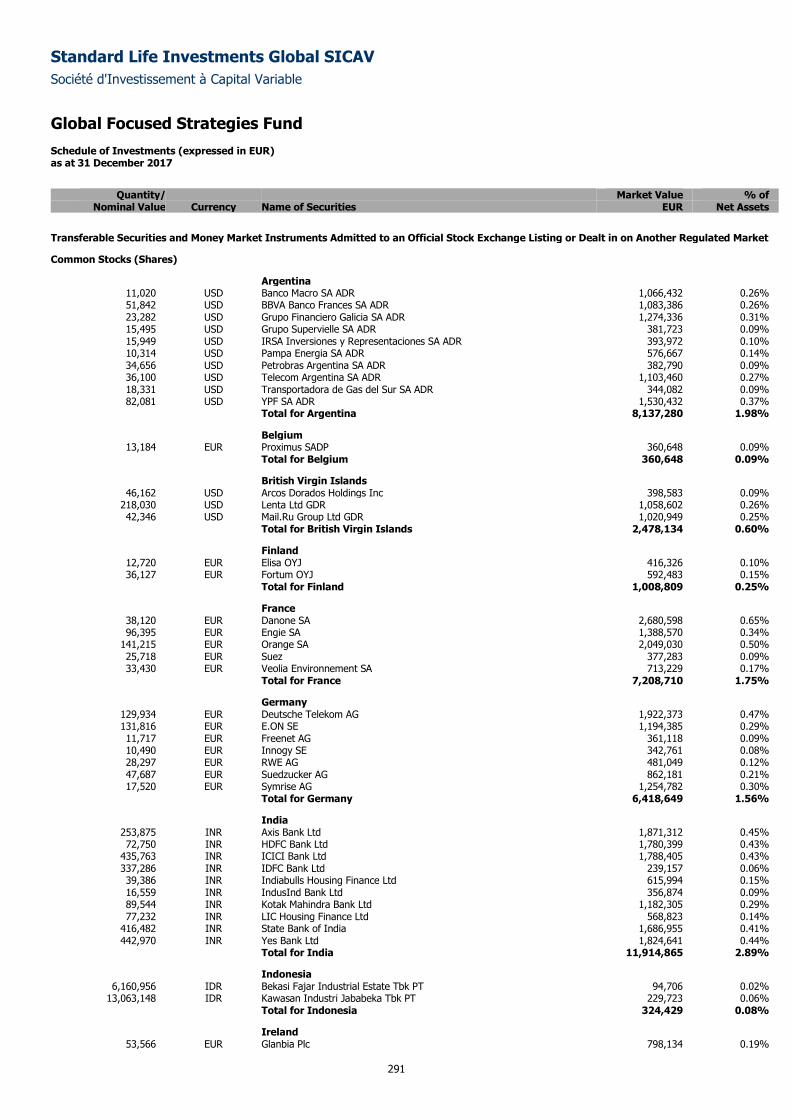
Standard Life Investments Global SICAV
Société d'Investissement à Capital Variable
Global Focused Strategies Fund Schedule of Investments (expressed in EUR) as at 31 December 2017
291
Quantity/ Market Value % of
Nominal Value Currency Name of Securities EUR Net Assets
Transferable Securities and Money Market Instruments Admitted to an Official Stock Exchange Listing or Dealt in on Another Regulated Market
Common Stocks (Shares)
Argentina 11,020 USD Banco Macro SA ADR 1,066,432 0.26% 51,842 USD BBVA Banco Frances SA ADR 1,083,386 0.26% 23,282 USD Grupo Financiero Galicia SA ADR 1,274,336 0.31% 15,495 USD Grupo Supervielle SA ADR 381,723 0.09% 15,949 USD IRSA Inversiones y Representaciones SA ADR 393,972 0.10% 10,314 USD Pampa Energia SA ADR 576,667 0.14% 34,656 USD Petrobras Argentina SA ADR 382,790 0.09% 36,100 USD Telecom Argentina SA ADR 1,103,460 0.27% 18,331 USD Transportadora de Gas del Sur SA ADR 344,082 0.09% 82,081 USD YPF SA ADR 1,530,432 0.37%
Total for Argentina 8,137,280 1.98%
Belgium 13,184 EUR Proximus SADP 360,648 0.09%
Total for Belgium 360,648 0.09%
British Virgin Islands 46,162 USD Arcos Dorados Holdings Inc 398,583 0.09%
218,030 USD Lenta Ltd GDR 1,058,602 0.26% 42,346 USD Mail.Ru Group Ltd GDR 1,020,949 0.25%
Total for British Virgin Islands 2,478,134 0.60%
Finland 12,720 EUR Elisa OYJ 416,326 0.10% 36,127 EUR Fortum OYJ 592,483 0.15%
Total for Finland 1,008,809 0.25%
France 38,120 EUR Danone SA 2,680,598 0.65% 96,395 EUR Engie SA 1,388,570 0.34%
141,215 EUR Orange SA 2,049,030 0.50% 25,718 EUR Suez 377,283 0.09% 33,430 EUR Veolia Environnement SA 713,229 0.17%
Total for France 7,208,710 1.75%
Germany 129,934 EUR Deutsche Telekom AG 1,922,373 0.47% 131,816 EUR E.ON SE 1,194,385 0.29% 11,717 EUR Freenet AG 361,118 0.09% 10,490 EUR Innogy SE 342,761 0.08% 28,297 EUR RWE AG 481,049 0.12% 47,687 EUR Suedzucker AG 862,181 0.21% 17,520 EUR Symrise AG 1,254,782 0.30%
Total for Germany 6,418,649 1.56%
India 253,875 INR Axis Bank Ltd 1,871,312 0.45% 72,750 INR HDFC Bank Ltd 1,780,399 0.43%
435,763 INR ICICI Bank Ltd 1,788,405 0.43% 337,286 INR IDFC Bank Ltd 239,157 0.06% 39,386 INR Indiabulls Housing Finance Ltd 615,994 0.15% 16,559 INR IndusInd Bank Ltd 356,874 0.09% 89,544 INR Kotak Mahindra Bank Ltd 1,182,305 0.29% 77,232 INR LIC Housing Finance Ltd 568,823 0.14%
416,482 INR State Bank of India 1,686,955 0.41% 442,970 INR Yes Bank Ltd 1,824,641 0.44%
Total for India 11,914,865 2.89%
Indonesia 6,160,956 IDR Bekasi Fajar Industrial Estate Tbk PT 94,706 0.02%
13,063,148 IDR Kawasan Industri Jababeka Tbk PT 229,723 0.06% Total for Indonesia 324,429 0.08%
Ireland 53,566 EUR Glanbia Plc 798,134 0.19%
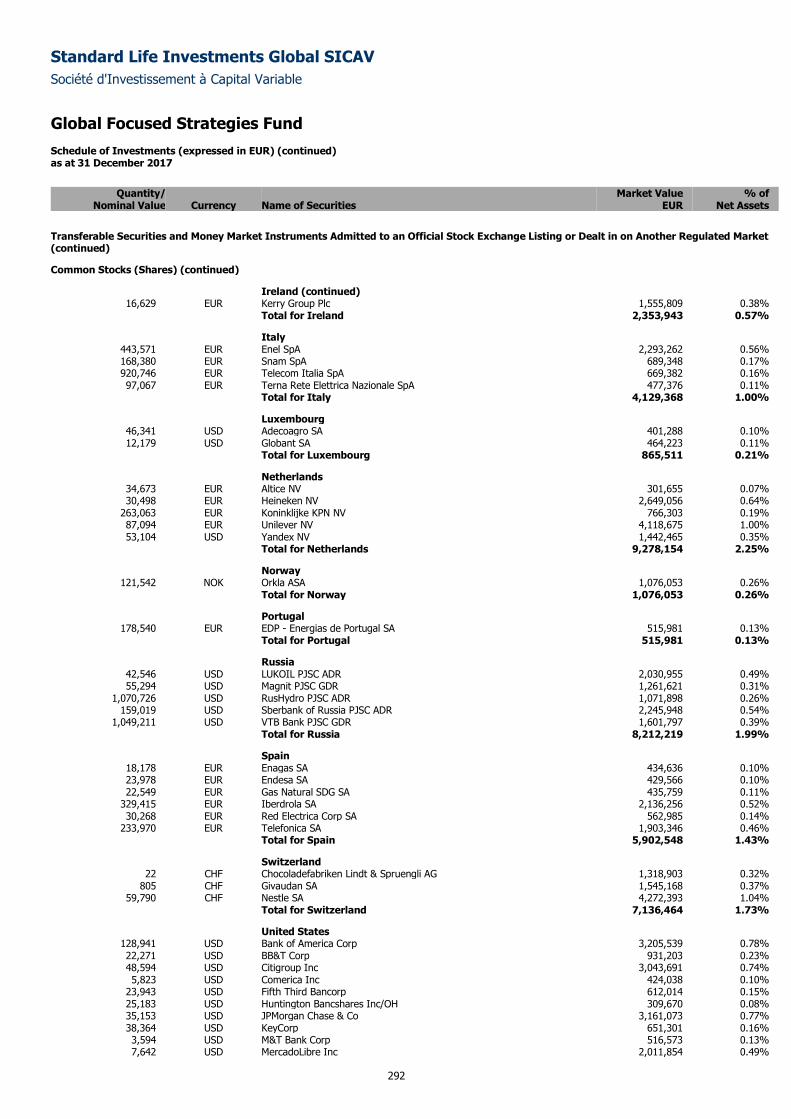
Standard Life Investments Global SICAV
Société d'Investissement à Capital Variable
Global Focused Strategies Fund Schedule of Investments (expressed in EUR) (continued) as at 31 December 2017
292
Quantity/ Market Value % of
Nominal Value Currency Name of Securities EUR Net Assets
Transferable Securities and Money Market Instruments Admitted to an Official Stock Exchange Listing or Dealt in on Another Regulated Market (continued)
Common Stocks (Shares) (continued)
Ireland (continued) 16,629 EUR Kerry Group Plc 1,555,809 0.38%
Total for Ireland 2,353,943 0.57%
Italy 443,571 EUR Enel SpA 2,293,262 0.56% 168,380 EUR Snam SpA 689,348 0.17% 920,746 EUR Telecom Italia SpA 669,382 0.16% 97,067 EUR Terna Rete Elettrica Nazionale SpA 477,376 0.11%
Total for Italy 4,129,368 1.00%
Luxembourg 46,341 USD Adecoagro SA 401,288 0.10% 12,179 USD Globant SA 464,223 0.11%
Total for Luxembourg 865,511 0.21%
Netherlands 34,673 EUR Altice NV 301,655 0.07% 30,498 EUR Heineken NV 2,649,056 0.64%
263,063 EUR Koninklijke KPN NV 766,303 0.19% 87,094 EUR Unilever NV 4,118,675 1.00% 53,104 USD Yandex NV 1,442,465 0.35%
Total for Netherlands 9,278,154 2.25%
Norway 121,542 NOK Orkla ASA 1,076,053 0.26%
Total for Norway 1,076,053 0.26%
Portugal 178,540 EUR EDP - Energias de Portugal SA 515,981 0.13%
Total for Portugal 515,981 0.13%
Russia 42,546 USD LUKOIL PJSC ADR 2,030,955 0.49% 55,294 USD Magnit PJSC GDR 1,261,621 0.31%
1,070,726 USD RusHydro PJSC ADR 1,071,898 0.26% 159,019 USD Sberbank of Russia PJSC ADR 2,245,948 0.54%
1,049,211 USD VTB Bank PJSC GDR 1,601,797 0.39% Total for Russia 8,212,219 1.99%
Spain 18,178 EUR Enagas SA 434,636 0.10% 23,978 EUR Endesa SA 429,566 0.10% 22,549 EUR Gas Natural SDG SA 435,759 0.11%
329,415 EUR Iberdrola SA 2,136,256 0.52% 30,268 EUR Red Electrica Corp SA 562,985 0.14%
233,970 EUR Telefonica SA 1,903,346 0.46% Total for Spain 5,902,548 1.43%
Switzerland 22 CHF Chocoladefabriken Lindt & Spruengli AG 1,318,903 0.32%
805 CHF Givaudan SA 1,545,168 0.37% 59,790 CHF Nestle SA 4,272,393 1.04%
Total for Switzerland 7,136,464 1.73%
United States 128,941 USD Bank of America Corp 3,205,539 0.78% 22,271 USD BB&T Corp 931,203 0.23% 48,594 USD Citigroup Inc 3,043,691 0.74% 5,823 USD Comerica Inc 424,038 0.10%
23,943 USD Fifth Third Bancorp 612,014 0.15% 25,183 USD Huntington Bancshares Inc/OH 309,670 0.08% 35,153 USD JPMorgan Chase & Co 3,161,073 0.77% 38,364 USD KeyCorp 651,301 0.16% 3,594 USD M&T Bank Corp 516,573 0.13% 7,642 USD MercadoLibre Inc 2,011,854 0.49%
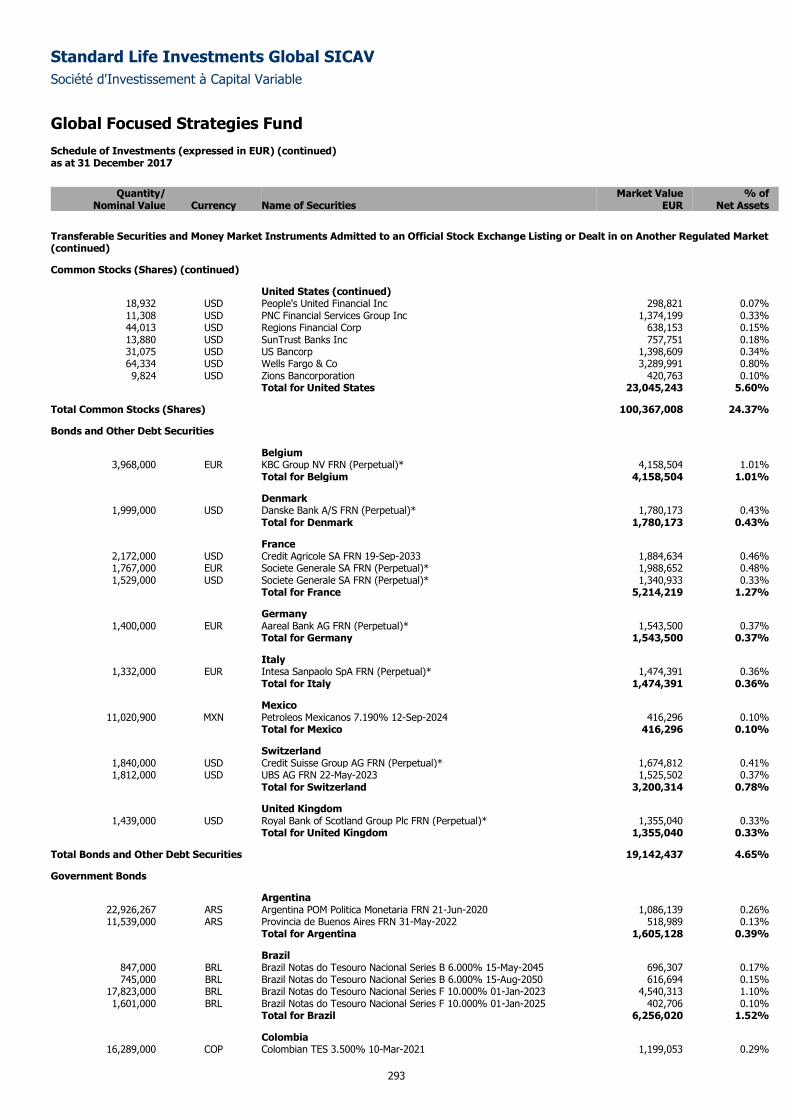
Standard Life Investments Global SICAV
Société d'Investissement à Capital Variable
Global Focused Strategies Fund Schedule of Investments (expressed in EUR) (continued) as at 31 December 2017
293
Quantity/ Market Value % of
Nominal Value Currency Name of Securities EUR Net Assets
Transferable Securities and Money Market Instruments Admitted to an Official Stock Exchange Listing or Dealt in on Another Regulated Market (continued)
Common Stocks (Shares) (continued)
United States (continued) 18,932 USD People's United Financial Inc 298,821 0.07% 11,308 USD PNC Financial Services Group Inc 1,374,199 0.33% 44,013 USD Regions Financial Corp 638,153 0.15% 13,880 USD SunTrust Banks Inc 757,751 0.18% 31,075 USD US Bancorp 1,398,609 0.34% 64,334 USD Wells Fargo & Co 3,289,991 0.80% 9,824 USD Zions Bancorporation 420,763 0.10%
Total for United States 23,045,243 5.60%
Total Common Stocks (Shares) 100,367,008 24.37%
Bonds and Other Debt Securities
Belgium 3,968,000 EUR KBC Group NV FRN (Perpetual)* 4,158,504 1.01%
Total for Belgium 4,158,504 1.01%
Denmark 1,999,000 USD Danske Bank A/S FRN (Perpetual)* 1,780,173 0.43%
Total for Denmark 1,780,173 0.43%
France 2,172,000 USD Credit Agricole SA FRN 19-Sep-2033 1,884,634 0.46% 1,767,000 EUR Societe Generale SA FRN (Perpetual)* 1,988,652 0.48% 1,529,000 USD Societe Generale SA FRN (Perpetual)* 1,340,933 0.33%
Total for France 5,214,219 1.27%
Germany 1,400,000 EUR Aareal Bank AG FRN (Perpetual)* 1,543,500 0.37%
Total for Germany 1,543,500 0.37%
Italy 1,332,000 EUR Intesa Sanpaolo SpA FRN (Perpetual)* 1,474,391 0.36%
Total for Italy 1,474,391 0.36%
Mexico 11,020,900 MXN Petroleos Mexicanos 7.190% 12-Sep-2024 416,296 0.10%
Total for Mexico 416,296 0.10%
Switzerland 1,840,000 USD Credit Suisse Group AG FRN (Perpetual)* 1,674,812 0.41% 1,812,000 USD UBS AG FRN 22-May-2023 1,525,502 0.37%
Total for Switzerland 3,200,314 0.78%
United Kingdom 1,439,000 USD Royal Bank of Scotland Group Plc FRN (Perpetual)* 1,355,040 0.33%
Total for United Kingdom 1,355,040 0.33%
Total Bonds and Other Debt Securities 19,142,437 4.65%
Government Bonds
Argentina 22,926,267 ARS Argentina POM Politica Monetaria FRN 21-Jun-2020 1,086,139 0.26% 11,539,000 ARS Provincia de Buenos Aires FRN 31-May-2022 518,989 0.13%
Total for Argentina 1,605,128 0.39%
Brazil 847,000 BRL Brazil Notas do Tesouro Nacional Series B 6.000% 15-May-2045 696,307 0.17% 745,000 BRL Brazil Notas do Tesouro Nacional Series B 6.000% 15-Aug-2050 616,694 0.15%
17,823,000 BRL Brazil Notas do Tesouro Nacional Series F 10.000% 01-Jan-2023 4,540,313 1.10% 1,601,000 BRL Brazil Notas do Tesouro Nacional Series F 10.000% 01-Jan-2025 402,706 0.10%
Total for Brazil 6,256,020 1.52%
Colombia 16,289,000 COP Colombian TES 3.500% 10-Mar-2021 1,199,053 0.29%
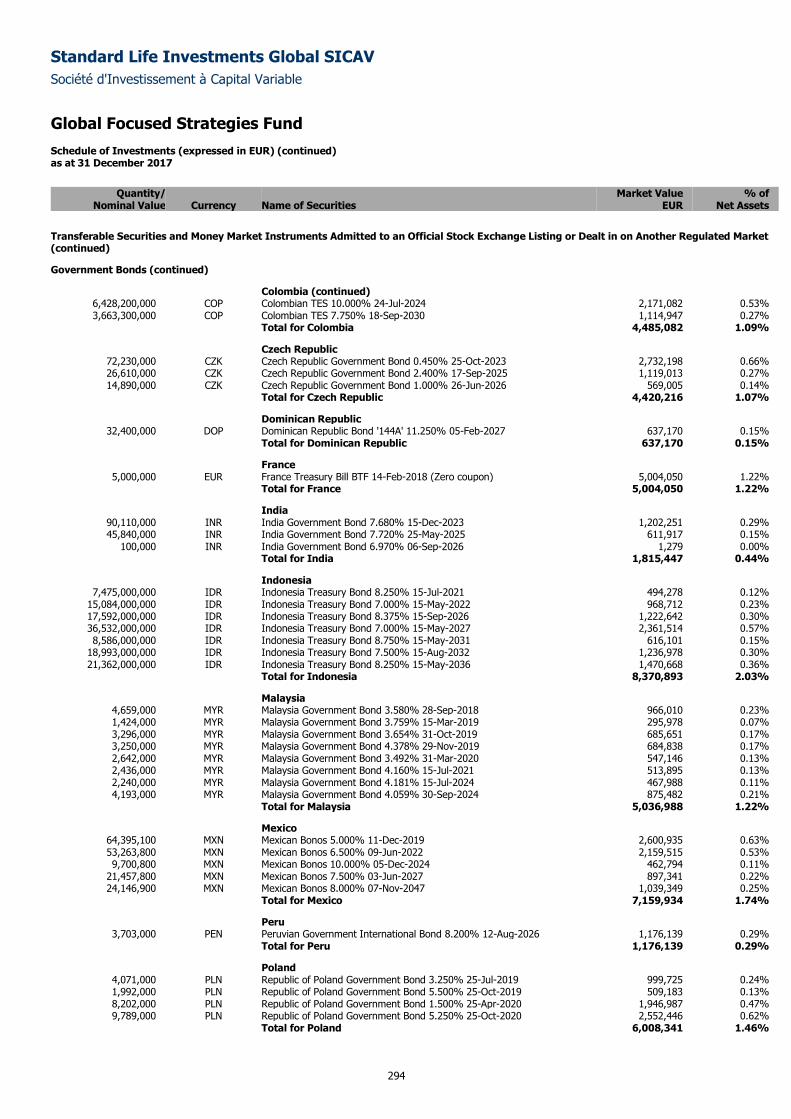
Standard Life Investments Global SICAV
Société d'Investissement à Capital Variable
Global Focused Strategies Fund Schedule of Investments (expressed in EUR) (continued) as at 31 December 2017
294
Quantity/ Market Value % of
Nominal Value Currency Name of Securities EUR Net Assets
Transferable Securities and Money Market Instruments Admitted to an Official Stock Exchange Listing or Dealt in on Another Regulated Market (continued)
Government Bonds (continued)
Colombia (continued) 6,428,200,000 COP Colombian TES 10.000% 24-Jul-2024 2,171,082 0.53% 3,663,300,000 COP Colombian TES 7.750% 18-Sep-2030 1,114,947 0.27%
Total for Colombia 4,485,082 1.09%
Czech Republic 72,230,000 CZK Czech Republic Government Bond 0.450% 25-Oct-2023 2,732,198 0.66% 26,610,000 CZK Czech Republic Government Bond 2.400% 17-Sep-2025 1,119,013 0.27% 14,890,000 CZK Czech Republic Government Bond 1.000% 26-Jun-2026 569,005 0.14%
Total for Czech Republic 4,420,216 1.07%
Dominican Republic 32,400,000 DOP Dominican Republic Bond '144A' 11.250% 05-Feb-2027 637,170 0.15%
Total for Dominican Republic 637,170 0.15%
France 5,000,000 EUR France Treasury Bill BTF 14-Feb-2018 (Zero coupon) 5,004,050 1.22%
Total for France 5,004,050 1.22%
India 90,110,000 INR India Government Bond 7.680% 15-Dec-2023 1,202,251 0.29% 45,840,000 INR India Government Bond 7.720% 25-May-2025 611,917 0.15%
100,000 INR India Government Bond 6.970% 06-Sep-2026 1,279 0.00% Total for India 1,815,447 0.44%
Indonesia 7,475,000,000 IDR Indonesia Treasury Bond 8.250% 15-Jul-2021 494,278 0.12%
15,084,000,000 IDR Indonesia Treasury Bond 7.000% 15-May-2022 968,712 0.23% 17,592,000,000 IDR Indonesia Treasury Bond 8.375% 15-Sep-2026 1,222,642 0.30% 36,532,000,000 IDR Indonesia Treasury Bond 7.000% 15-May-2027 2,361,514 0.57% 8,586,000,000 IDR Indonesia Treasury Bond 8.750% 15-May-2031 616,101 0.15%
18,993,000,000 IDR Indonesia Treasury Bond 7.500% 15-Aug-2032 1,236,978 0.30% 21,362,000,000 IDR Indonesia Treasury Bond 8.250% 15-May-2036 1,470,668 0.36%
Total for Indonesia 8,370,893 2.03%
Malaysia 4,659,000 MYR Malaysia Government Bond 3.580% 28-Sep-2018 966,010 0.23% 1,424,000 MYR Malaysia Government Bond 3.759% 15-Mar-2019 295,978 0.07% 3,296,000 MYR Malaysia Government Bond 3.654% 31-Oct-2019 685,651 0.17% 3,250,000 MYR Malaysia Government Bond 4.378% 29-Nov-2019 684,838 0.17% 2,642,000 MYR Malaysia Government Bond 3.492% 31-Mar-2020 547,146 0.13% 2,436,000 MYR Malaysia Government Bond 4.160% 15-Jul-2021 513,895 0.13% 2,240,000 MYR Malaysia Government Bond 4.181% 15-Jul-2024 467,988 0.11% 4,193,000 MYR Malaysia Government Bond 4.059% 30-Sep-2024 875,482 0.21%
Total for Malaysia 5,036,988 1.22%
Mexico 64,395,100 MXN Mexican Bonos 5.000% 11-Dec-2019 2,600,935 0.63% 53,263,800 MXN Mexican Bonos 6.500% 09-Jun-2022 2,159,515 0.53% 9,700,800 MXN Mexican Bonos 10.000% 05-Dec-2024 462,794 0.11%
21,457,800 MXN Mexican Bonos 7.500% 03-Jun-2027 897,341 0.22% 24,146,900 MXN Mexican Bonos 8.000% 07-Nov-2047 1,039,349 0.25%
Total for Mexico 7,159,934 1.74%
Peru 3,703,000 PEN Peruvian Government International Bond 8.200% 12-Aug-2026 1,176,139 0.29%
Total for Peru 1,176,139 0.29%
Poland 4,071,000 PLN Republic of Poland Government Bond 3.250% 25-Jul-2019 999,725 0.24% 1,992,000 PLN Republic of Poland Government Bond 5.500% 25-Oct-2019 509,183 0.13% 8,202,000 PLN Republic of Poland Government Bond 1.500% 25-Apr-2020 1,946,987 0.47% 9,789,000 PLN Republic of Poland Government Bond 5.250% 25-Oct-2020 2,552,446 0.62%
Total for Poland 6,008,341 1.46%
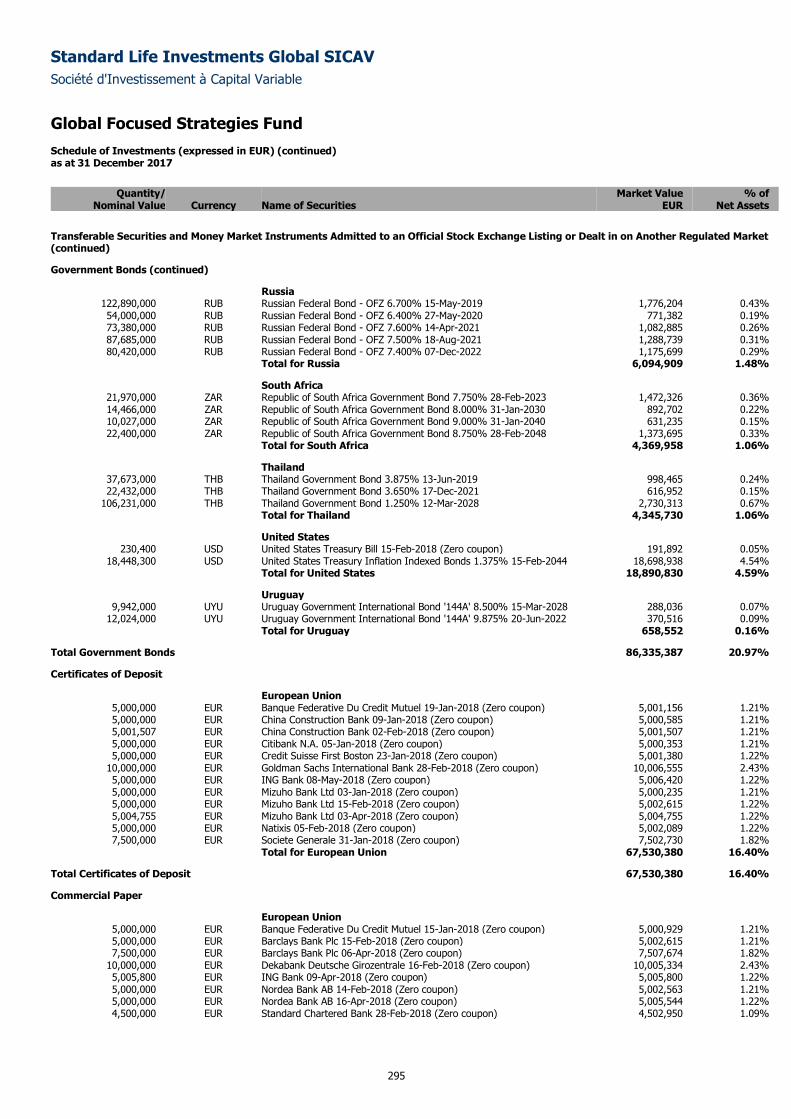
Standard Life Investments Global SICAV
Société d'Investissement à Capital Variable
Global Focused Strategies Fund Schedule of Investments (expressed in EUR) (continued) as at 31 December 2017
295
Quantity/ Market Value % of
Nominal Value Currency Name of Securities EUR Net Assets
Transferable Securities and Money Market Instruments Admitted to an Official Stock Exchange Listing or Dealt in on Another Regulated Market (continued)
Government Bonds (continued)
Russia 122,890,000 RUB Russian Federal Bond - OFZ 6.700% 15-May-2019 1,776,204 0.43% 54,000,000 RUB Russian Federal Bond - OFZ 6.400% 27-May-2020 771,382 0.19% 73,380,000 RUB Russian Federal Bond - OFZ 7.600% 14-Apr-2021 1,082,885 0.26% 87,685,000 RUB Russian Federal Bond - OFZ 7.500% 18-Aug-2021 1,288,739 0.31% 80,420,000 RUB Russian Federal Bond - OFZ 7.400% 07-Dec-2022 1,175,699 0.29%
Total for Russia 6,094,909 1.48%
South Africa 21,970,000 ZAR Republic of South Africa Government Bond 7.750% 28-Feb-2023 1,472,326 0.36% 14,466,000 ZAR Republic of South Africa Government Bond 8.000% 31-Jan-2030 892,702 0.22% 10,027,000 ZAR Republic of South Africa Government Bond 9.000% 31-Jan-2040 631,235 0.15% 22,400,000 ZAR Republic of South Africa Government Bond 8.750% 28-Feb-2048 1,373,695 0.33%
Total for South Africa 4,369,958 1.06%
Thailand 37,673,000 THB Thailand Government Bond 3.875% 13-Jun-2019 998,465 0.24% 22,432,000 THB Thailand Government Bond 3.650% 17-Dec-2021 616,952 0.15%
106,231,000 THB Thailand Government Bond 1.250% 12-Mar-2028 2,730,313 0.67% Total for Thailand 4,345,730 1.06%
United States 230,400 USD United States Treasury Bill 15-Feb-2018 (Zero coupon) 191,892 0.05%
18,448,300 USD United States Treasury Inflation Indexed Bonds 1.375% 15-Feb-2044 18,698,938 4.54% Total for United States 18,890,830 4.59%
Uruguay 9,942,000 UYU Uruguay Government International Bond '144A' 8.500% 15-Mar-2028 288,036 0.07%
12,024,000 UYU Uruguay Government International Bond '144A' 9.875% 20-Jun-2022 370,516 0.09% Total for Uruguay 658,552 0.16%
Total Government Bonds 86,335,387 20.97%
Certificates of Deposit
European Union 5,000,000 EUR Banque Federative Du Credit Mutuel 19-Jan-2018 (Zero coupon) 5,001,156 1.21% 5,000,000 EUR China Construction Bank 09-Jan-2018 (Zero coupon) 5,000,585 1.21% 5,001,507 EUR China Construction Bank 02-Feb-2018 (Zero coupon) 5,001,507 1.21% 5,000,000 EUR Citibank N.A. 05-Jan-2018 (Zero coupon) 5,000,353 1.21% 5,000,000 EUR Credit Suisse First Boston 23-Jan-2018 (Zero coupon) 5,001,380 1.22%
10,000,000 EUR Goldman Sachs International Bank 28-Feb-2018 (Zero coupon) 10,006,555 2.43% 5,000,000 EUR ING Bank 08-May-2018 (Zero coupon) 5,006,420 1.22% 5,000,000 EUR Mizuho Bank Ltd 03-Jan-2018 (Zero coupon) 5,000,235 1.21% 5,000,000 EUR Mizuho Bank Ltd 15-Feb-2018 (Zero coupon) 5,002,615 1.22% 5,004,755 EUR Mizuho Bank Ltd 03-Apr-2018 (Zero coupon) 5,004,755 1.22% 5,000,000 EUR Natixis 05-Feb-2018 (Zero coupon) 5,002,089 1.22% 7,500,000 EUR Societe Generale 31-Jan-2018 (Zero coupon) 7,502,730 1.82%
Total for European Union 67,530,380 16.40%
Total Certificates of Deposit 67,530,380 16.40%
Commercial Paper
European Union 5,000,000 EUR Banque Federative Du Credit Mutuel 15-Jan-2018 (Zero coupon) 5,000,929 1.21% 5,000,000 EUR Barclays Bank Plc 15-Feb-2018 (Zero coupon) 5,002,615 1.21% 7,500,000 EUR Barclays Bank Plc 06-Apr-2018 (Zero coupon) 7,507,674 1.82%
10,000,000 EUR Dekabank Deutsche Girozentrale 16-Feb-2018 (Zero coupon) 10,005,334 2.43% 5,005,800 EUR ING Bank 09-Apr-2018 (Zero coupon) 5,005,800 1.22% 5,000,000 EUR Nordea Bank AB 14-Feb-2018 (Zero coupon) 5,002,563 1.21% 5,000,000 EUR Nordea Bank AB 16-Apr-2018 (Zero coupon) 5,005,544 1.22% 4,500,000 EUR Standard Chartered Bank 28-Feb-2018 (Zero coupon) 4,502,950 1.09%
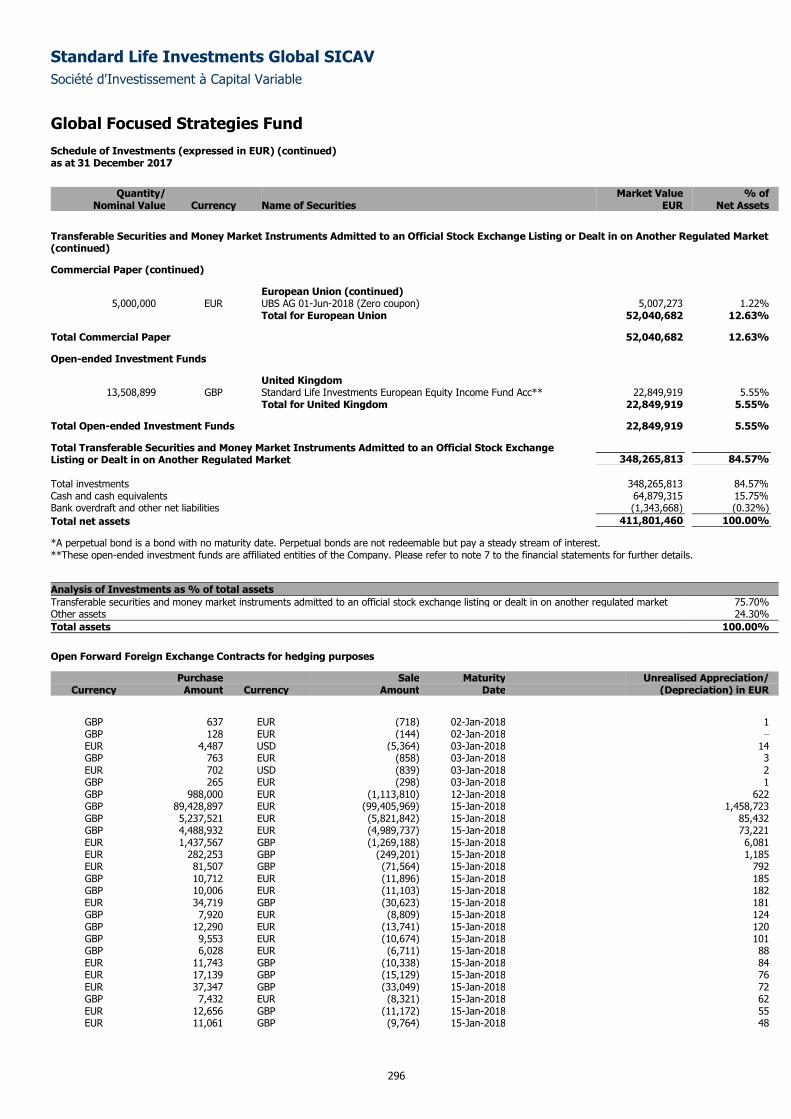
Standard Life Investments Global SICAV
Société d'Investissement à Capital Variable
Global Focused Strategies Fund Schedule of Investments (expressed in EUR) (continued) as at 31 December 2017
296
Quantity/ Market Value % of
Nominal Value Currency Name of Securities EUR Net Assets
Transferable Securities and Money Market Instruments Admitted to an Official Stock Exchange Listing or Dealt in on Another Regulated Market (continued)
Commercial Paper (continued)
European Union (continued) 5,000,000 EUR UBS AG 01-Jun-2018 (Zero coupon) 5,007,273 1.22%
Total for European Union 52,040,682 12.63%
Total Commercial Paper 52,040,682 12.63%
Open-ended Investment Funds
United Kingdom 13,508,899 GBP Standard Life Investments European Equity Income Fund Acc** 22,849,919 5.55%
Total for United Kingdom 22,849,919 5.55%
Total Open-ended Investment Funds 22,849,919 5.55%
Total Transferable Securities and Money Market Instruments Admitted to an Official Stock Exchange Listing or Dealt in on Another Regulated Market 348,265,813 84.57%
Total investments 348,265,813 84.57%
Cash and cash equivalents 64,879,315 15.75%
Bank overdraft and other net liabilities (1,343,668) (0.32% )
Total net assets 411,801,460 100.00%
*A perpetual bond is a bond with no maturity date. Perpetual bonds are not redeemable but pay a steady stream of interest. **These open-ended investment funds are affiliated entities of the Company. Please refer to note 7 to the financial statements for further details.
Analysis of Investments as % of total assets
Transferable securities and money market instruments admitted to an official stock exchange listing or dealt in on another regulated market 75.70% Other assets 24.30%
Total assets 100.00%
Open Forward Foreign Exchange Contracts for hedging purposes
Purchase Sale Maturity Unrealised Appreciation/ Currency Amount Currency Amount Date (Depreciation) in EUR
GBP 637 EUR (718) 02-Jan-2018 1 GBP 128 EUR (144) 02-Jan-2018 –
EUR 4,487 USD (5,364) 03-Jan-2018 14 GBP 763 EUR (858) 03-Jan-2018 3 EUR 702 USD (839) 03-Jan-2018 2 GBP 265 EUR (298) 03-Jan-2018 1 GBP 988,000 EUR (1,113,810) 12-Jan-2018 622 GBP 89,428,897 EUR (99,405,969) 15-Jan-2018 1,458,723 GBP 5,237,521 EUR (5,821,842) 15-Jan-2018 85,432 GBP 4,488,932 EUR (4,989,737) 15-Jan-2018 73,221 EUR 1,437,567 GBP (1,269,188) 15-Jan-2018 6,081 EUR 282,253 GBP (249,201) 15-Jan-2018 1,185 EUR 81,507 GBP (71,564) 15-Jan-2018 792 GBP 10,712 EUR (11,896) 15-Jan-2018 185 GBP 10,006 EUR (11,103) 15-Jan-2018 182 EUR 34,719 GBP (30,623) 15-Jan-2018 181 GBP 7,920 EUR (8,809) 15-Jan-2018 124 GBP 12,290 EUR (13,741) 15-Jan-2018 120 GBP 9,553 EUR (10,674) 15-Jan-2018 101 GBP 6,028 EUR (6,711) 15-Jan-2018 88 EUR 11,743 GBP (10,338) 15-Jan-2018 84 EUR 17,139 GBP (15,129) 15-Jan-2018 76 EUR 37,347 GBP (33,049) 15-Jan-2018 72 GBP 7,432 EUR (8,321) 15-Jan-2018 62 EUR 12,656 GBP (11,172) 15-Jan-2018 55 EUR 11,061 GBP (9,764) 15-Jan-2018 48

Standard Life Investments Global SICAV
Société d'Investissement à Capital Variable
Global Focused Strategies Fund Schedule of Investments (expressed in EUR) (continued) as at 31 December 2017
297
Open Forward Foreign Exchange Contracts for hedging purposes (continued)
Purchase Sale Maturity Unrealised Appreciation/ Currency Amount Currency Amount Date (Depreciation) in EUR
EUR 64,220 GBP (56,899) 15-Jan-2018 45 EUR 4,236 GBP (3,717) 15-Jan-2018 44 EUR 5,590 GBP (4,922) 15-Jan-2018 39 EUR 3,325 GBP (2,919) 15-Jan-2018 32 GBP 10,868 EUR (12,226) 15-Jan-2018 32 GBP 2,423 EUR (2,704) 15-Jan-2018 28 GBP 2,901 EUR (3,247) 15-Jan-2018 25 GBP 5,435 EUR (6,107) 15-Jan-2018 23 GBP 4,574 EUR (5,137) 15-Jan-2018 23 GBP 1,396 EUR (1,553) 15-Jan-2018 22 GBP 4,000 EUR (4,489) 15-Jan-2018 22 EUR 7,913 GBP (6,998) 15-Jan-2018 20 GBP 15,687 EUR (17,674) 15-Jan-2018 19 GBP 1,906 EUR (2,133) 15-Jan-2018 17 EUR 3,640 GBP (3,213) 15-Jan-2018 16 GBP 1,312 EUR (1,466) 15-Jan-2018 15 GBP 722 EUR (799) 15-Jan-2018 15 GBP 1,810 EUR (2,028) 15-Jan-2018 14 GBP 847 EUR (944) 15-Jan-2018 12 GBP 3,255 EUR (3,661) 15-Jan-2018 10 GBP 938 EUR (1,049) 15-Jan-2018 9 GBP 866 EUR (967) 15-Jan-2018 9 GBP 1,931 EUR (2,170) 15-Jan-2018 9 EUR 1,221 GBP (1,075) 15-Jan-2018 9 EUR 1,994 GBP (1,759) 15-Jan-2018 9 GBP 435 EUR (481) 15-Jan-2018 9 EUR 1,535 GBP (1,353) 15-Jan-2018 8 EUR 1,762 GBP (1,555) 15-Jan-2018 8 GBP 656 EUR (733) 15-Jan-2018 8 EUR 1,249 GBP (1,101) 15-Jan-2018 7 GBP 765 EUR (856) 15-Jan-2018 7 EUR 600 GBP (526) 15-Jan-2018 6 GBP 644 EUR (722) 15-Jan-2018 5 GBP 313 EUR (348) 15-Jan-2018 5 EUR 879 GBP (776) 15-Jan-2018 4 GBP 492 EUR (551) 15-Jan-2018 4 GBP 284 EUR (317) 15-Jan-2018 4 GBP 603 EUR (677) 15-Jan-2018 4 EUR 5,496 GBP (4,869) 15-Jan-2018 4 GBP 615 EUR (691) 15-Jan-2018 3 GBP 137 EUR (152) 15-Jan-2018 3 EUR 5,001 GBP (4,432) 15-Jan-2018 3 GBP 154 EUR (172) 15-Jan-2018 2 GBP 173 EUR (193) 15-Jan-2018 2 GBP 359 EUR (403) 15-Jan-2018 2 GBP 199 EUR (223) 15-Jan-2018 2 GBP 275 EUR (309) 15-Jan-2018 2 EUR 256 GBP (225) 15-Jan-2018 2 GBP 397 EUR (446) 15-Jan-2018 2 GBP 406 EUR (455) 15-Jan-2018 2 EUR 3,687 GBP (3,267) 15-Jan-2018 2 GBP 86 EUR (96) 15-Jan-2018 1 GBP 56 EUR (62) 15-Jan-2018 1 EUR 149 GBP (132) 15-Jan-2018 1 EUR 174 GBP (154) 15-Jan-2018 1 EUR 213 GBP (188) 15-Jan-2018 1 GBP 136 EUR (152) 15-Jan-2018 1 GBP 655 EUR (737) 15-Jan-2018 1 GBP 926 EUR (1,043) 15-Jan-2018 1 GBP 72 EUR (81) 15-Jan-2018 1 EUR 1,009 GBP (894) 15-Jan-2018 1 GBP 166 EUR (187) 15-Jan-2018 1 EUR 1,893 GBP (1,677) 15-Jan-2018 1 GBP 90 EUR (101) 15-Jan-2018 1 GBP 560 EUR (631) 15-Jan-2018 1 GBP 84 EUR (94) 15-Jan-2018 1 GBP 54 EUR (60) 15-Jan-2018 1
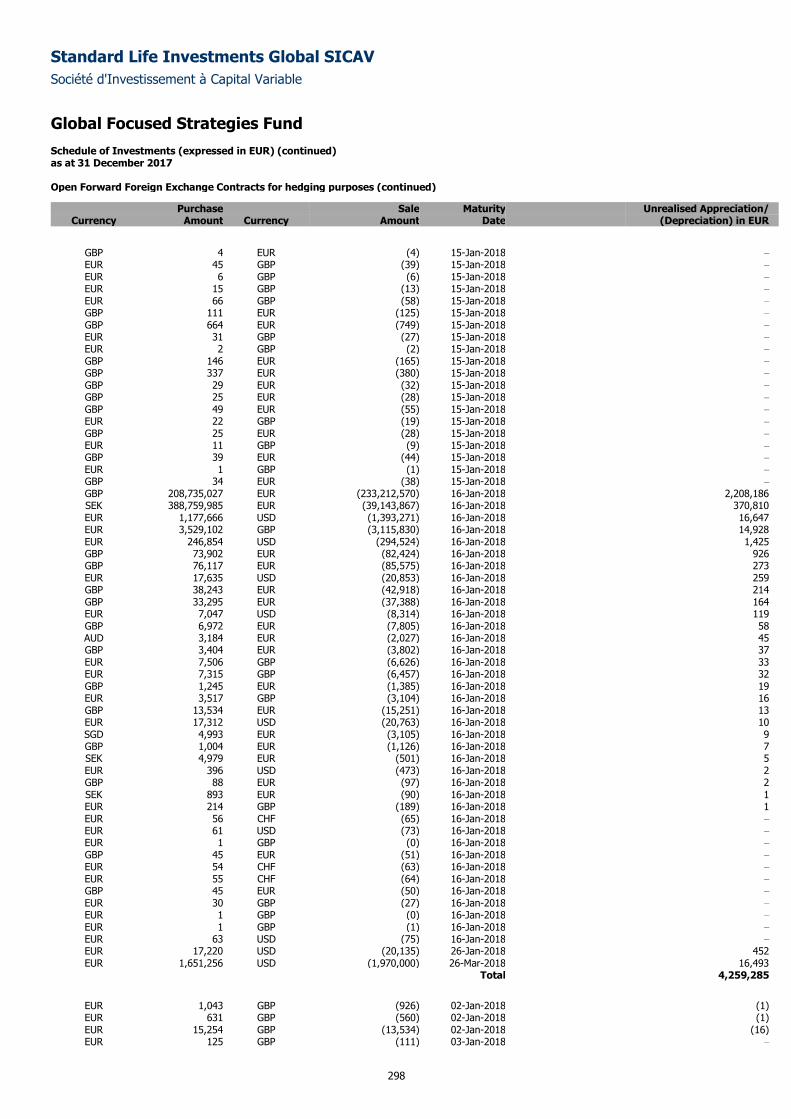
Standard Life Investments Global SICAV
Société d'Investissement à Capital Variable
Global Focused Strategies Fund Schedule of Investments (expressed in EUR) (continued) as at 31 December 2017
298
Open Forward Foreign Exchange Contracts for hedging purposes (continued)
Purchase Sale Maturity Unrealised Appreciation/ Currency Amount Currency Amount Date (Depreciation) in EUR
GBP 4 EUR (4) 15-Jan-2018 –
EUR 45 GBP (39) 15-Jan-2018 –
EUR 6 GBP (6) 15-Jan-2018 –
EUR 15 GBP (13) 15-Jan-2018 –
EUR 66 GBP (58) 15-Jan-2018 –
GBP 111 EUR (125) 15-Jan-2018 –
GBP 664 EUR (749) 15-Jan-2018 –
EUR 31 GBP (27) 15-Jan-2018 –
EUR 2 GBP (2) 15-Jan-2018 –
GBP 146 EUR (165) 15-Jan-2018 –
GBP 337 EUR (380) 15-Jan-2018 –
GBP 29 EUR (32) 15-Jan-2018 –
GBP 25 EUR (28) 15-Jan-2018 –
GBP 49 EUR (55) 15-Jan-2018 –
EUR 22 GBP (19) 15-Jan-2018 –
GBP 25 EUR (28) 15-Jan-2018 –
EUR 11 GBP (9) 15-Jan-2018 –
GBP 39 EUR (44) 15-Jan-2018 –
EUR 1 GBP (1) 15-Jan-2018 –
GBP 34 EUR (38) 15-Jan-2018 –
GBP 208,735,027 EUR (233,212,570) 16-Jan-2018 2,208,186 SEK 388,759,985 EUR (39,143,867) 16-Jan-2018 370,810 EUR 1,177,666 USD (1,393,271) 16-Jan-2018 16,647 EUR 3,529,102 GBP (3,115,830) 16-Jan-2018 14,928 EUR 246,854 USD (294,524) 16-Jan-2018 1,425 GBP 73,902 EUR (82,424) 16-Jan-2018 926 GBP 76,117 EUR (85,575) 16-Jan-2018 273 EUR 17,635 USD (20,853) 16-Jan-2018 259 GBP 38,243 EUR (42,918) 16-Jan-2018 214 GBP 33,295 EUR (37,388) 16-Jan-2018 164 EUR 7,047 USD (8,314) 16-Jan-2018 119 GBP 6,972 EUR (7,805) 16-Jan-2018 58 AUD 3,184 EUR (2,027) 16-Jan-2018 45 GBP 3,404 EUR (3,802) 16-Jan-2018 37 EUR 7,506 GBP (6,626) 16-Jan-2018 33 EUR 7,315 GBP (6,457) 16-Jan-2018 32 GBP 1,245 EUR (1,385) 16-Jan-2018 19 EUR 3,517 GBP (3,104) 16-Jan-2018 16 GBP 13,534 EUR (15,251) 16-Jan-2018 13 EUR 17,312 USD (20,763) 16-Jan-2018 10 SGD 4,993 EUR (3,105) 16-Jan-2018 9 GBP 1,004 EUR (1,126) 16-Jan-2018 7 SEK 4,979 EUR (501) 16-Jan-2018 5 EUR 396 USD (473) 16-Jan-2018 2 GBP 88 EUR (97) 16-Jan-2018 2 SEK 893 EUR (90) 16-Jan-2018 1 EUR 214 GBP (189) 16-Jan-2018 1 EUR 56 CHF (65) 16-Jan-2018 –
EUR 61 USD (73) 16-Jan-2018 –
EUR 1 GBP (0) 16-Jan-2018 –
GBP 45 EUR (51) 16-Jan-2018 –
EUR 54 CHF (63) 16-Jan-2018 –
EUR 55 CHF (64) 16-Jan-2018 –
GBP 45 EUR (50) 16-Jan-2018 –
EUR 30 GBP (27) 16-Jan-2018 –
EUR 1 GBP (0) 16-Jan-2018 –
EUR 1 GBP (1) 16-Jan-2018 –
EUR 63 USD (75) 16-Jan-2018 –
EUR 17,220 USD (20,135) 26-Jan-2018 452 EUR 1,651,256 USD (1,970,000) 26-Mar-2018 16,493
Total 4,259,285
EUR 1,043 GBP (926) 02-Jan-2018 (1) EUR 631 GBP (560) 02-Jan-2018 (1) EUR 15,254 GBP (13,534) 02-Jan-2018 (16) EUR 125 GBP (111) 03-Jan-2018 –
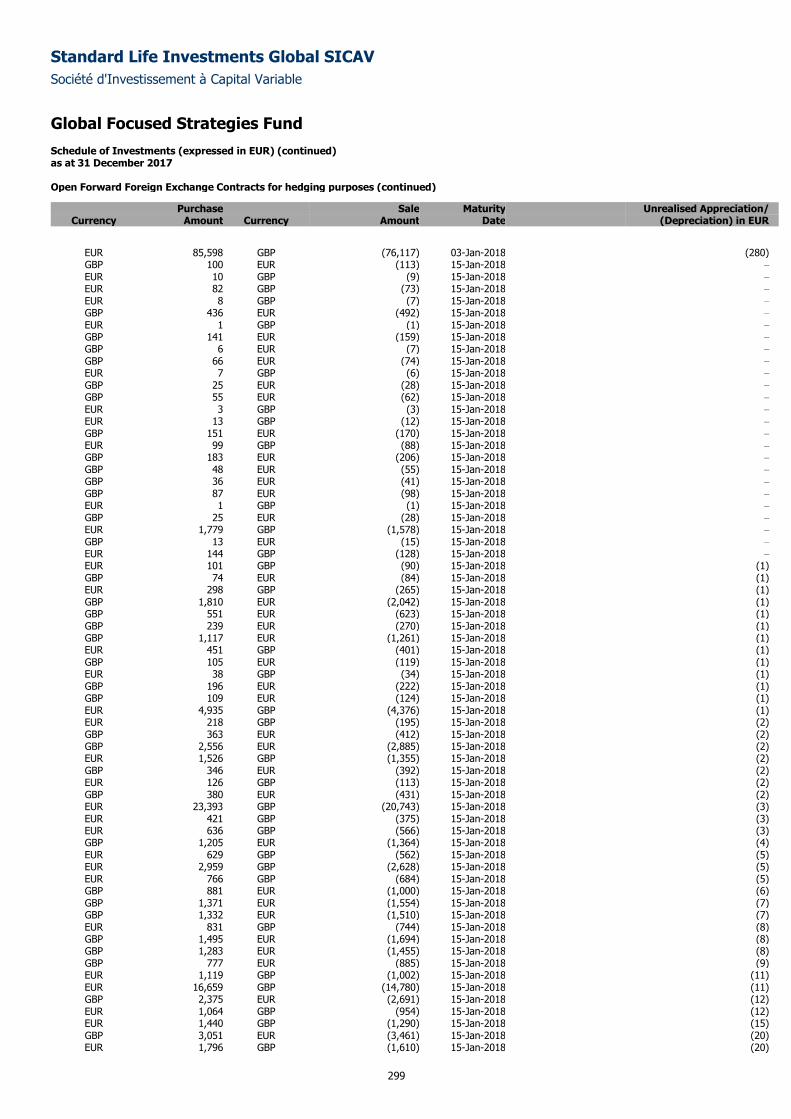
Standard Life Investments Global SICAV
Société d'Investissement à Capital Variable
Global Focused Strategies Fund Schedule of Investments (expressed in EUR) (continued) as at 31 December 2017
299
Open Forward Foreign Exchange Contracts for hedging purposes (continued)
Purchase Sale Maturity Unrealised Appreciation/ Currency Amount Currency Amount Date (Depreciation) in EUR
EUR 85,598 GBP (76,117) 03-Jan-2018 (280) GBP 100 EUR (113) 15-Jan-2018 –
EUR 10 GBP (9) 15-Jan-2018 –
EUR 82 GBP (73) 15-Jan-2018 –
EUR 8 GBP (7) 15-Jan-2018 –
GBP 436 EUR (492) 15-Jan-2018 –
EUR 1 GBP (1) 15-Jan-2018 –
GBP 141 EUR (159) 15-Jan-2018 –
GBP 6 EUR (7) 15-Jan-2018 –
GBP 66 EUR (74) 15-Jan-2018 –
EUR 7 GBP (6) 15-Jan-2018 –
GBP 25 EUR (28) 15-Jan-2018 –
GBP 55 EUR (62) 15-Jan-2018 –
EUR 3 GBP (3) 15-Jan-2018 –
EUR 13 GBP (12) 15-Jan-2018 –
GBP 151 EUR (170) 15-Jan-2018 –
EUR 99 GBP (88) 15-Jan-2018 –
GBP 183 EUR (206) 15-Jan-2018 –
GBP 48 EUR (55) 15-Jan-2018 –
GBP 36 EUR (41) 15-Jan-2018 –
GBP 87 EUR (98) 15-Jan-2018 –
EUR 1 GBP (1) 15-Jan-2018 –
GBP 25 EUR (28) 15-Jan-2018 –
EUR 1,779 GBP (1,578) 15-Jan-2018 –
GBP 13 EUR (15) 15-Jan-2018 –
EUR 144 GBP (128) 15-Jan-2018 –
EUR 101 GBP (90) 15-Jan-2018 (1) GBP 74 EUR (84) 15-Jan-2018 (1) EUR 298 GBP (265) 15-Jan-2018 (1) GBP 1,810 EUR (2,042) 15-Jan-2018 (1) GBP 551 EUR (623) 15-Jan-2018 (1) GBP 239 EUR (270) 15-Jan-2018 (1) GBP 1,117 EUR (1,261) 15-Jan-2018 (1) EUR 451 GBP (401) 15-Jan-2018 (1) GBP 105 EUR (119) 15-Jan-2018 (1) EUR 38 GBP (34) 15-Jan-2018 (1) GBP 196 EUR (222) 15-Jan-2018 (1) GBP 109 EUR (124) 15-Jan-2018 (1) EUR 4,935 GBP (4,376) 15-Jan-2018 (1) EUR 218 GBP (195) 15-Jan-2018 (2) GBP 363 EUR (412) 15-Jan-2018 (2) GBP 2,556 EUR (2,885) 15-Jan-2018 (2) EUR 1,526 GBP (1,355) 15-Jan-2018 (2) GBP 346 EUR (392) 15-Jan-2018 (2) EUR 126 GBP (113) 15-Jan-2018 (2) GBP 380 EUR (431) 15-Jan-2018 (2) EUR 23,393 GBP (20,743) 15-Jan-2018 (3) EUR 421 GBP (375) 15-Jan-2018 (3) EUR 636 GBP (566) 15-Jan-2018 (3) GBP 1,205 EUR (1,364) 15-Jan-2018 (4) EUR 629 GBP (562) 15-Jan-2018 (5) EUR 2,959 GBP (2,628) 15-Jan-2018 (5) EUR 766 GBP (684) 15-Jan-2018 (5) GBP 881 EUR (1,000) 15-Jan-2018 (6) GBP 1,371 EUR (1,554) 15-Jan-2018 (7) GBP 1,332 EUR (1,510) 15-Jan-2018 (7) EUR 831 GBP (744) 15-Jan-2018 (8) GBP 1,495 EUR (1,694) 15-Jan-2018 (8) GBP 1,283 EUR (1,455) 15-Jan-2018 (8) GBP 777 EUR (885) 15-Jan-2018 (9) EUR 1,119 GBP (1,002) 15-Jan-2018 (11) EUR 16,659 GBP (14,780) 15-Jan-2018 (11) GBP 2,375 EUR (2,691) 15-Jan-2018 (12) EUR 1,064 GBP (954) 15-Jan-2018 (12) EUR 1,440 GBP (1,290) 15-Jan-2018 (15) GBP 3,051 EUR (3,461) 15-Jan-2018 (20) EUR 1,796 GBP (1,610) 15-Jan-2018 (20)
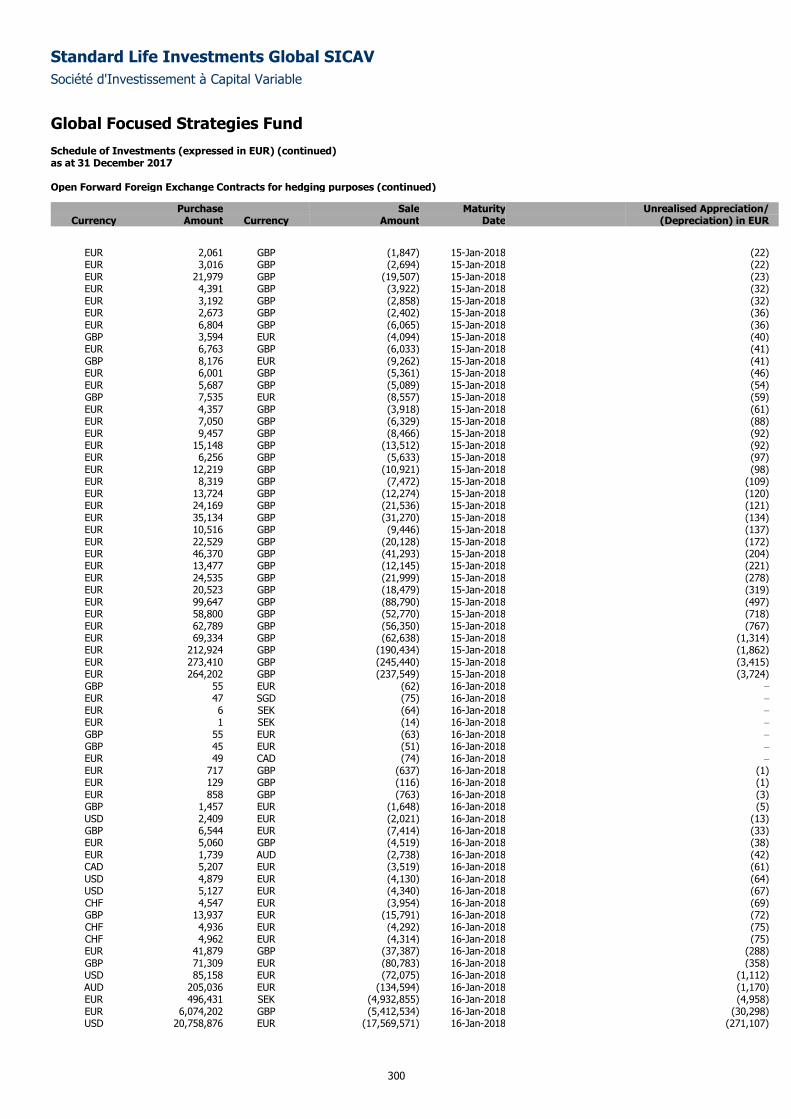
Standard Life Investments Global SICAV
Société d'Investissement à Capital Variable
Global Focused Strategies Fund Schedule of Investments (expressed in EUR) (continued) as at 31 December 2017
300
Open Forward Foreign Exchange Contracts for hedging purposes (continued)
Purchase Sale Maturity Unrealised Appreciation/ Currency Amount Currency Amount Date (Depreciation) in EUR
EUR 2,061 GBP (1,847) 15-Jan-2018 (22) EUR 3,016 GBP (2,694) 15-Jan-2018 (22) EUR 21,979 GBP (19,507) 15-Jan-2018 (23) EUR 4,391 GBP (3,922) 15-Jan-2018 (32) EUR 3,192 GBP (2,858) 15-Jan-2018 (32) EUR 2,673 GBP (2,402) 15-Jan-2018 (36) EUR 6,804 GBP (6,065) 15-Jan-2018 (36) GBP 3,594 EUR (4,094) 15-Jan-2018 (40) EUR 6,763 GBP (6,033) 15-Jan-2018 (41) GBP 8,176 EUR (9,262) 15-Jan-2018 (41) EUR 6,001 GBP (5,361) 15-Jan-2018 (46) EUR 5,687 GBP (5,089) 15-Jan-2018 (54) GBP 7,535 EUR (8,557) 15-Jan-2018 (59) EUR 4,357 GBP (3,918) 15-Jan-2018 (61) EUR 7,050 GBP (6,329) 15-Jan-2018 (88) EUR 9,457 GBP (8,466) 15-Jan-2018 (92) EUR 15,148 GBP (13,512) 15-Jan-2018 (92) EUR 6,256 GBP (5,633) 15-Jan-2018 (97) EUR 12,219 GBP (10,921) 15-Jan-2018 (98) EUR 8,319 GBP (7,472) 15-Jan-2018 (109) EUR 13,724 GBP (12,274) 15-Jan-2018 (120) EUR 24,169 GBP (21,536) 15-Jan-2018 (121) EUR 35,134 GBP (31,270) 15-Jan-2018 (134) EUR 10,516 GBP (9,446) 15-Jan-2018 (137) EUR 22,529 GBP (20,128) 15-Jan-2018 (172) EUR 46,370 GBP (41,293) 15-Jan-2018 (204) EUR 13,477 GBP (12,145) 15-Jan-2018 (221) EUR 24,535 GBP (21,999) 15-Jan-2018 (278) EUR 20,523 GBP (18,479) 15-Jan-2018 (319) EUR 99,647 GBP (88,790) 15-Jan-2018 (497) EUR 58,800 GBP (52,770) 15-Jan-2018 (718) EUR 62,789 GBP (56,350) 15-Jan-2018 (767) EUR 69,334 GBP (62,638) 15-Jan-2018 (1,314) EUR 212,924 GBP (190,434) 15-Jan-2018 (1,862) EUR 273,410 GBP (245,440) 15-Jan-2018 (3,415) EUR 264,202 GBP (237,549) 15-Jan-2018 (3,724) GBP 55 EUR (62) 16-Jan-2018 –
EUR 47 SGD (75) 16-Jan-2018 –
EUR 6 SEK (64) 16-Jan-2018 –
EUR 1 SEK (14) 16-Jan-2018 –
GBP 55 EUR (63) 16-Jan-2018 –
GBP 45 EUR (51) 16-Jan-2018 –
EUR 49 CAD (74) 16-Jan-2018 –
EUR 717 GBP (637) 16-Jan-2018 (1) EUR 129 GBP (116) 16-Jan-2018 (1) EUR 858 GBP (763) 16-Jan-2018 (3) GBP 1,457 EUR (1,648) 16-Jan-2018 (5) USD 2,409 EUR (2,021) 16-Jan-2018 (13) GBP 6,544 EUR (7,414) 16-Jan-2018 (33) EUR 5,060 GBP (4,519) 16-Jan-2018 (38) EUR 1,739 AUD (2,738) 16-Jan-2018 (42) CAD 5,207 EUR (3,519) 16-Jan-2018 (61) USD 4,879 EUR (4,130) 16-Jan-2018 (64) USD 5,127 EUR (4,340) 16-Jan-2018 (67) CHF 4,547 EUR (3,954) 16-Jan-2018 (69) GBP 13,937 EUR (15,791) 16-Jan-2018 (72) CHF 4,936 EUR (4,292) 16-Jan-2018 (75) CHF 4,962 EUR (4,314) 16-Jan-2018 (75) EUR 41,879 GBP (37,387) 16-Jan-2018 (288) GBP 71,309 EUR (80,783) 16-Jan-2018 (358) USD 85,158 EUR (72,075) 16-Jan-2018 (1,112) AUD 205,036 EUR (134,594) 16-Jan-2018 (1,170) EUR 496,431 SEK (4,932,855) 16-Jan-2018 (4,958) EUR 6,074,202 GBP (5,412,534) 16-Jan-2018 (30,298) USD 20,758,876 EUR (17,569,571) 16-Jan-2018 (271,107)
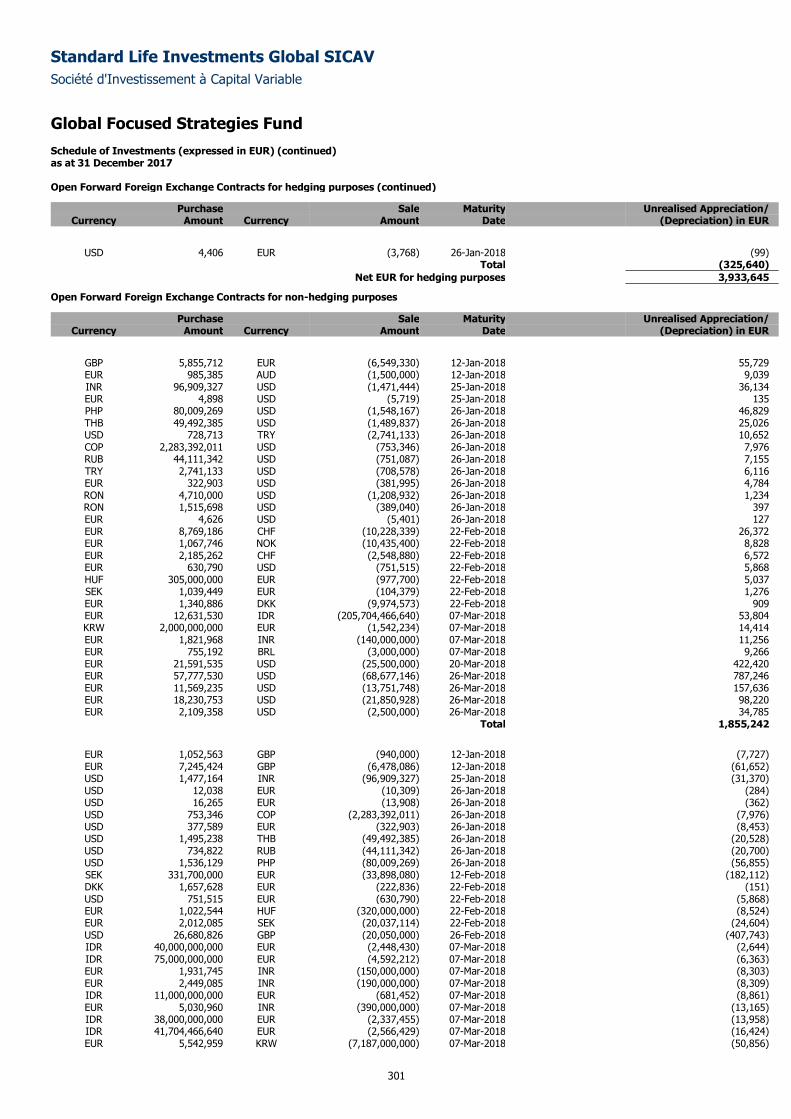
Standard Life Investments Global SICAV
Société d'Investissement à Capital Variable
Global Focused Strategies Fund Schedule of Investments (expressed in EUR) (continued) as at 31 December 2017
301
Open Forward Foreign Exchange Contracts for hedging purposes (continued)
Purchase Sale Maturity Unrealised Appreciation/ Currency Amount Currency Amount Date (Depreciation) in EUR
USD 4,406 EUR (3,768) 26-Jan-2018 (99) Total (325,640)
Net EUR for hedging purposes 3,933,645
Open Forward Foreign Exchange Contracts for non-hedging purposes
Purchase Sale Maturity Unrealised Appreciation/ Currency Amount Currency Amount Date (Depreciation) in EUR
GBP 5,855,712 EUR (6,549,330) 12-Jan-2018 55,729 EUR 985,385 AUD (1,500,000) 12-Jan-2018 9,039 INR 96,909,327 USD (1,471,444) 25-Jan-2018 36,134 EUR 4,898 USD (5,719) 25-Jan-2018 135 PHP 80,009,269 USD (1,548,167) 26-Jan-2018 46,829 THB 49,492,385 USD (1,489,837) 26-Jan-2018 25,026 USD 728,713 TRY (2,741,133) 26-Jan-2018 10,652 COP 2,283,392,011 USD (753,346) 26-Jan-2018 7,976 RUB 44,111,342 USD (751,087) 26-Jan-2018 7,155 TRY 2,741,133 USD (708,578) 26-Jan-2018 6,116 EUR 322,903 USD (381,995) 26-Jan-2018 4,784 RON 4,710,000 USD (1,208,932) 26-Jan-2018 1,234 RON 1,515,698 USD (389,040) 26-Jan-2018 397 EUR 4,626 USD (5,401) 26-Jan-2018 127 EUR 8,769,186 CHF (10,228,339) 22-Feb-2018 26,372 EUR 1,067,746 NOK (10,435,400) 22-Feb-2018 8,828 EUR 2,185,262 CHF (2,548,880) 22-Feb-2018 6,572 EUR 630,790 USD (751,515) 22-Feb-2018 5,868 HUF 305,000,000 EUR (977,700) 22-Feb-2018 5,037 SEK 1,039,449 EUR (104,379) 22-Feb-2018 1,276 EUR 1,340,886 DKK (9,974,573) 22-Feb-2018 909 EUR 12,631,530 IDR (205,704,466,640) 07-Mar-2018 53,804 KRW 2,000,000,000 EUR (1,542,234) 07-Mar-2018 14,414 EUR 1,821,968 INR (140,000,000) 07-Mar-2018 11,256 EUR 755,192 BRL (3,000,000) 07-Mar-2018 9,266 EUR 21,591,535 USD (25,500,000) 20-Mar-2018 422,420 EUR 57,777,530 USD (68,677,146) 26-Mar-2018 787,246 EUR 11,569,235 USD (13,751,748) 26-Mar-2018 157,636 EUR 18,230,753 USD (21,850,928) 26-Mar-2018 98,220 EUR 2,109,358 USD (2,500,000) 26-Mar-2018 34,785
Total 1,855,242
EUR 1,052,563 GBP (940,000) 12-Jan-2018 (7,727) EUR 7,245,424 GBP (6,478,086) 12-Jan-2018 (61,652) USD 1,477,164 INR (96,909,327) 25-Jan-2018 (31,370) USD 12,038 EUR (10,309) 26-Jan-2018 (284) USD 16,265 EUR (13,908) 26-Jan-2018 (362) USD 753,346 COP (2,283,392,011) 26-Jan-2018 (7,976) USD 377,589 EUR (322,903) 26-Jan-2018 (8,453) USD 1,495,238 THB (49,492,385) 26-Jan-2018 (20,528) USD 734,822 RUB (44,111,342) 26-Jan-2018 (20,700) USD 1,536,129 PHP (80,009,269) 26-Jan-2018 (56,855) SEK 331,700,000 EUR (33,898,080) 12-Feb-2018 (182,112) DKK 1,657,628 EUR (222,836) 22-Feb-2018 (151) USD 751,515 EUR (630,790) 22-Feb-2018 (5,868) EUR 1,022,544 HUF (320,000,000) 22-Feb-2018 (8,524) EUR 2,012,085 SEK (20,037,114) 22-Feb-2018 (24,604) USD 26,680,826 GBP (20,050,000) 26-Feb-2018 (407,743) IDR 40,000,000,000 EUR (2,448,430) 07-Mar-2018 (2,644) IDR 75,000,000,000 EUR (4,592,212) 07-Mar-2018 (6,363) EUR 1,931,745 INR (150,000,000) 07-Mar-2018 (8,303) EUR 2,449,085 INR (190,000,000) 07-Mar-2018 (8,309) IDR 11,000,000,000 EUR (681,452) 07-Mar-2018 (8,861) EUR 5,030,960 INR (390,000,000) 07-Mar-2018 (13,165) IDR 38,000,000,000 EUR (2,337,455) 07-Mar-2018 (13,958) IDR 41,704,466,640 EUR (2,566,429) 07-Mar-2018 (16,424) EUR 5,542,959 KRW (7,187,000,000) 07-Mar-2018 (50,856)
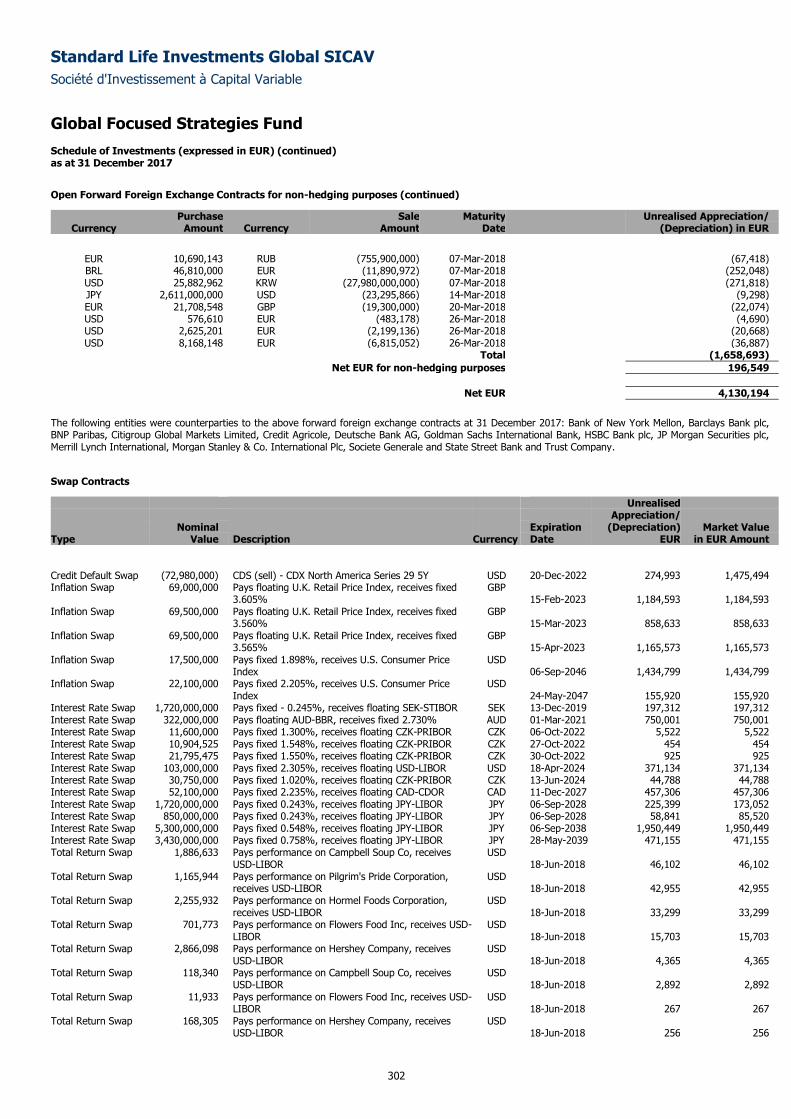
Standard Life Investments Global SICAV
Société d'Investissement à Capital Variable
Global Focused Strategies Fund Schedule of Investments (expressed in EUR) (continued) as at 31 December 2017
302
Open Forward Foreign Exchange Contracts for non-hedging purposes (continued)
Purchase Sale Maturity Unrealised Appreciation/ Currency Amount Currency Amount Date (Depreciation) in EUR
EUR 10,690,143 RUB (755,900,000) 07-Mar-2018 (67,418) BRL 46,810,000 EUR (11,890,972) 07-Mar-2018 (252,048) USD 25,882,962 KRW (27,980,000,000) 07-Mar-2018 (271,818) JPY 2,611,000,000 USD (23,295,866) 14-Mar-2018 (9,298) EUR 21,708,548 GBP (19,300,000) 20-Mar-2018 (22,074) USD 576,610 EUR (483,178) 26-Mar-2018 (4,690) USD 2,625,201 EUR (2,199,136) 26-Mar-2018 (20,668) USD 8,168,148 EUR (6,815,052) 26-Mar-2018 (36,887)
Total (1,658,693)
Net EUR for non-hedging purposes 196,549
Net EUR 4,130,194
The following entities were counterparties to the above forward foreign exchange contracts at 31 December 2017: Bank of New York Mellon, Barclays Bank plc, BNP Paribas, Citigroup Global Markets Limited, Credit Agricole, Deutsche Bank AG, Goldman Sachs International Bank, HSBC Bank plc, JP Morgan Securities plc, Merrill Lynch International, Morgan Stanley & Co. International Plc, Societe Generale and State Street Bank and Trust Company.
Swap Contracts
Unrealised Appreciation/ Nominal Expiration (Depreciation) Market Value Type Value Description Currency Date EUR in EUR Amount
Credit Default Swap (72,980,000) CDS (sell) - CDX North America Series 29 5Y USD 20-Dec-2022 274,993 1,475,494 Inflation Swap 69,000,000 Pays floating U.K. Retail Price Index, receives fixed
3.605% GBP
15-Feb-2023 1,184,593 1,184,593 Inflation Swap 69,500,000 Pays floating U.K. Retail Price Index, receives fixed
3.560% GBP
15-Mar-2023 858,633 858,633 Inflation Swap 69,500,000 Pays floating U.K. Retail Price Index, receives fixed
3.565% GBP
15-Apr-2023 1,165,573 1,165,573 Inflation Swap 17,500,000 Pays fixed 1.898%, receives U.S. Consumer Price
Index USD
06-Sep-2046 1,434,799 1,434,799 Inflation Swap 22,100,000 Pays fixed 2.205%, receives U.S. Consumer Price
Index USD
24-May-2047 155,920 155,920 Interest Rate Swap 1,720,000,000 Pays fixed - 0.245%, receives floating SEK-STIBOR SEK 13-Dec-2019 197,312 197,312 Interest Rate Swap 322,000,000 Pays floating AUD-BBR, receives fixed 2.730% AUD 01-Mar-2021 750,001 750,001 Interest Rate Swap 11,600,000 Pays fixed 1.300%, receives floating CZK-PRIBOR CZK 06-Oct-2022 5,522 5,522 Interest Rate Swap 10,904,525 Pays fixed 1.548%, receives floating CZK-PRIBOR CZK 27-Oct-2022 454 454 Interest Rate Swap 21,795,475 Pays fixed 1.550%, receives floating CZK-PRIBOR CZK 30-Oct-2022 925 925 Interest Rate Swap 103,000,000 Pays fixed 2.305%, receives floating USD-LIBOR USD 18-Apr-2024 371,134 371,134 Interest Rate Swap 30,750,000 Pays fixed 1.020%, receives floating CZK-PRIBOR CZK 13-Jun-2024 44,788 44,788 Interest Rate Swap 52,100,000 Pays fixed 2.235%, receives floating CAD-CDOR CAD 11-Dec-2027 457,306 457,306 Interest Rate Swap 1,720,000,000 Pays fixed 0.243%, receives floating JPY-LIBOR JPY 06-Sep-2028 225,399 173,052 Interest Rate Swap 850,000,000 Pays fixed 0.243%, receives floating JPY-LIBOR JPY 06-Sep-2028 58,841 85,520 Interest Rate Swap 5,300,000,000 Pays fixed 0.548%, receives floating JPY-LIBOR JPY 06-Sep-2038 1,950,449 1,950,449 Interest Rate Swap 3,430,000,000 Pays fixed 0.758%, receives floating JPY-LIBOR JPY 28-May-2039 471,155 471,155 Total Return Swap 1,886,633 Pays performance on Campbell Soup Co, receives
USD-LIBOR USD
18-Jun-2018 46,102 46,102 Total Return Swap 1,165,944 Pays performance on Pilgrim's Pride Corporation,
receives USD-LIBOR USD
18-Jun-2018 42,955 42,955 Total Return Swap 2,255,932 Pays performance on Hormel Foods Corporation,
receives USD-LIBOR USD
18-Jun-2018 33,299 33,299 Total Return Swap 701,773 Pays performance on Flowers Food Inc, receives USD-
LIBOR USD
18-Jun-2018 15,703 15,703 Total Return Swap 2,866,098 Pays performance on Hershey Company, receives
USD-LIBOR USD
18-Jun-2018 4,365 4,365 Total Return Swap 118,340 Pays performance on Campbell Soup Co, receives
USD-LIBOR USD
18-Jun-2018 2,892 2,892 Total Return Swap 11,933 Pays performance on Flowers Food Inc, receives USD-
LIBOR USD
18-Jun-2018 267 267 Total Return Swap 168,305 Pays performance on Hershey Company, receives
USD-LIBOR USD
18-Jun-2018 256 256
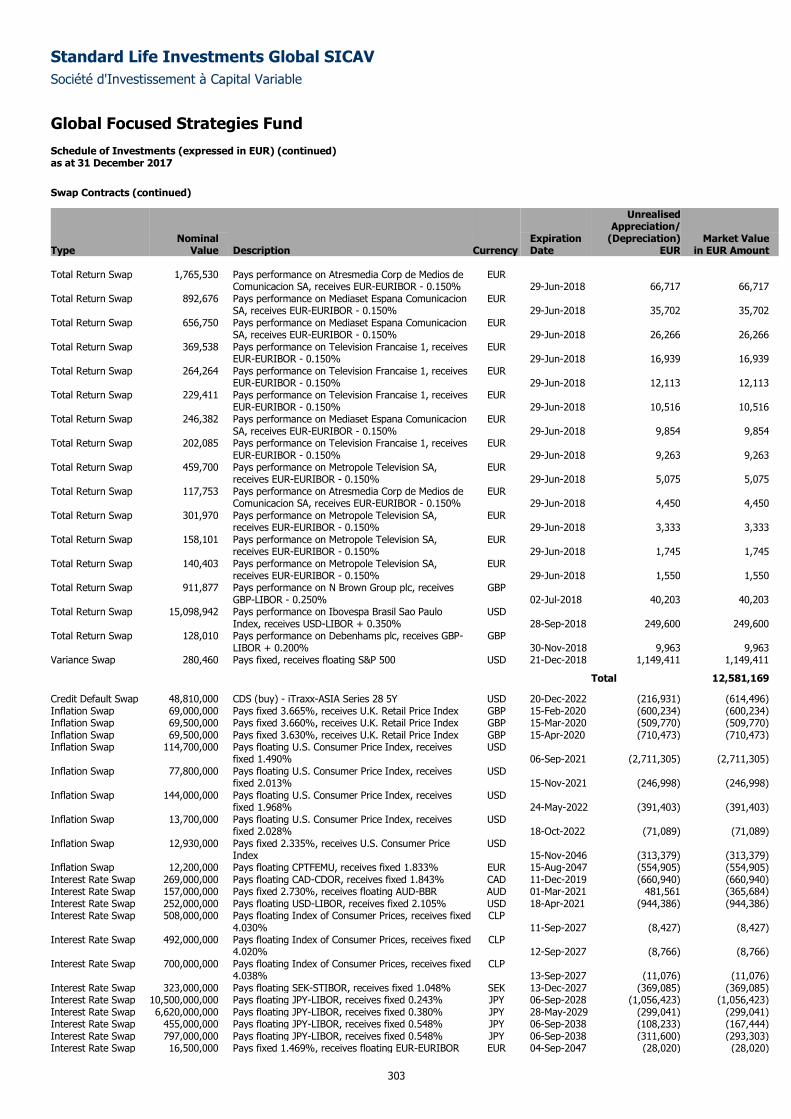
Standard Life Investments Global SICAV
Société d'Investissement à Capital Variable
Global Focused Strategies Fund Schedule of Investments (expressed in EUR) (continued) as at 31 December 2017
303
Swap Contracts (continued)
Unrealised Appreciation/ Nominal Expiration (Depreciation) Market Value Type Value Description Currency Date EUR in EUR Amount Total Return Swap 1,765,530 Pays performance on Atresmedia Corp de Medios de
Comunicacion SA, receives EUR-EURIBOR - 0.150% EUR
29-Jun-2018 66,717 66,717 Total Return Swap 892,676 Pays performance on Mediaset Espana Comunicacion
SA, receives EUR-EURIBOR - 0.150% EUR
29-Jun-2018 35,702 35,702 Total Return Swap 656,750 Pays performance on Mediaset Espana Comunicacion
SA, receives EUR-EURIBOR - 0.150% EUR
29-Jun-2018 26,266 26,266 Total Return Swap 369,538 Pays performance on Television Francaise 1, receives
EUR-EURIBOR - 0.150% EUR
29-Jun-2018 16,939 16,939 Total Return Swap 264,264 Pays performance on Television Francaise 1, receives
EUR-EURIBOR - 0.150% EUR
29-Jun-2018 12,113 12,113 Total Return Swap 229,411 Pays performance on Television Francaise 1, receives
EUR-EURIBOR - 0.150% EUR
29-Jun-2018 10,516 10,516 Total Return Swap 246,382 Pays performance on Mediaset Espana Comunicacion
SA, receives EUR-EURIBOR - 0.150% EUR
29-Jun-2018 9,854 9,854 Total Return Swap 202,085 Pays performance on Television Francaise 1, receives
EUR-EURIBOR - 0.150% EUR
29-Jun-2018 9,263 9,263 Total Return Swap 459,700 Pays performance on Metropole Television SA,
receives EUR-EURIBOR - 0.150% EUR
29-Jun-2018 5,075 5,075 Total Return Swap 117,753 Pays performance on Atresmedia Corp de Medios de
Comunicacion SA, receives EUR-EURIBOR - 0.150% EUR
29-Jun-2018 4,450 4,450 Total Return Swap 301,970 Pays performance on Metropole Television SA,
receives EUR-EURIBOR - 0.150% EUR
29-Jun-2018 3,333 3,333 Total Return Swap 158,101 Pays performance on Metropole Television SA,
receives EUR-EURIBOR - 0.150% EUR
29-Jun-2018 1,745 1,745 Total Return Swap 140,403 Pays performance on Metropole Television SA,
receives EUR-EURIBOR - 0.150% EUR
29-Jun-2018 1,550 1,550 Total Return Swap 911,877 Pays performance on N Brown Group plc, receives
GBP-LIBOR - 0.250% GBP
02-Jul-2018 40,203 40,203 Total Return Swap 15,098,942 Pays performance on Ibovespa Brasil Sao Paulo
Index, receives USD-LIBOR + 0.350% USD
28-Sep-2018 249,600 249,600 Total Return Swap 128,010 Pays performance on Debenhams plc, receives GBP-
LIBOR + 0.200% GBP
30-Nov-2018 9,963 9,963 Variance Swap 280,460 Pays fixed, receives floating S&P 500 USD 21-Dec-2018 1,149,411 1,149,411
Total 12,581,169
Credit Default Swap 48,810,000 CDS (buy) - iTraxx-ASIA Series 28 5Y USD 20-Dec-2022 (216,931) (614,496) Inflation Swap 69,000,000 Pays fixed 3.665%, receives U.K. Retail Price Index GBP 15-Feb-2020 (600,234) (600,234) Inflation Swap 69,500,000 Pays fixed 3.660%, receives U.K. Retail Price Index GBP 15-Mar-2020 (509,770) (509,770) Inflation Swap 69,500,000 Pays fixed 3.630%, receives U.K. Retail Price Index GBP 15-Apr-2020 (710,473) (710,473) Inflation Swap 114,700,000 Pays floating U.S. Consumer Price Index, receives
fixed 1.490% USD
06-Sep-2021 (2,711,305) (2,711,305) Inflation Swap 77,800,000 Pays floating U.S. Consumer Price Index, receives
fixed 2.013% USD
15-Nov-2021 (246,998) (246,998) Inflation Swap 144,000,000 Pays floating U.S. Consumer Price Index, receives
fixed 1.968% USD
24-May-2022 (391,403) (391,403) Inflation Swap 13,700,000 Pays floating U.S. Consumer Price Index, receives
fixed 2.028% USD
18-Oct-2022 (71,089) (71,089) Inflation Swap 12,930,000 Pays fixed 2.335%, receives U.S. Consumer Price
Index USD
15-Nov-2046 (313,379) (313,379) Inflation Swap 12,200,000 Pays floating CPTFEMU, receives fixed 1.833% EUR 15-Aug-2047 (554,905) (554,905) Interest Rate Swap 269,000,000 Pays floating CAD-CDOR, receives fixed 1.843% CAD 11-Dec-2019 (660,940) (660,940) Interest Rate Swap 157,000,000 Pays fixed 2.730%, receives floating AUD-BBR AUD 01-Mar-2021 481,561 (365,684) Interest Rate Swap 252,000,000 Pays floating USD-LIBOR, receives fixed 2.105% USD 18-Apr-2021 (944,386) (944,386) Interest Rate Swap 508,000,000 Pays floating Index of Consumer Prices, receives fixed
4.030% CLP
11-Sep-2027 (8,427) (8,427) Interest Rate Swap 492,000,000 Pays floating Index of Consumer Prices, receives fixed
4.020% CLP
12-Sep-2027 (8,766) (8,766) Interest Rate Swap 700,000,000 Pays floating Index of Consumer Prices, receives fixed
4.038% CLP
13-Sep-2027 (11,076) (11,076) Interest Rate Swap 323,000,000 Pays floating SEK-STIBOR, receives fixed 1.048% SEK 13-Dec-2027 (369,085) (369,085) Interest Rate Swap 10,500,000,000 Pays floating JPY-LIBOR, receives fixed 0.243% JPY 06-Sep-2028 (1,056,423) (1,056,423) Interest Rate Swap 6,620,000,000 Pays floating JPY-LIBOR, receives fixed 0.380% JPY 28-May-2029 (299,041) (299,041) Interest Rate Swap 455,000,000 Pays floating JPY-LIBOR, receives fixed 0.548% JPY 06-Sep-2038 (108,233) (167,444) Interest Rate Swap 797,000,000 Pays floating JPY-LIBOR, receives fixed 0.548% JPY 06-Sep-2038 (311,600) (293,303) Interest Rate Swap 16,500,000 Pays fixed 1.469%, receives floating EUR-EURIBOR EUR 04-Sep-2047 (28,020) (28,020)
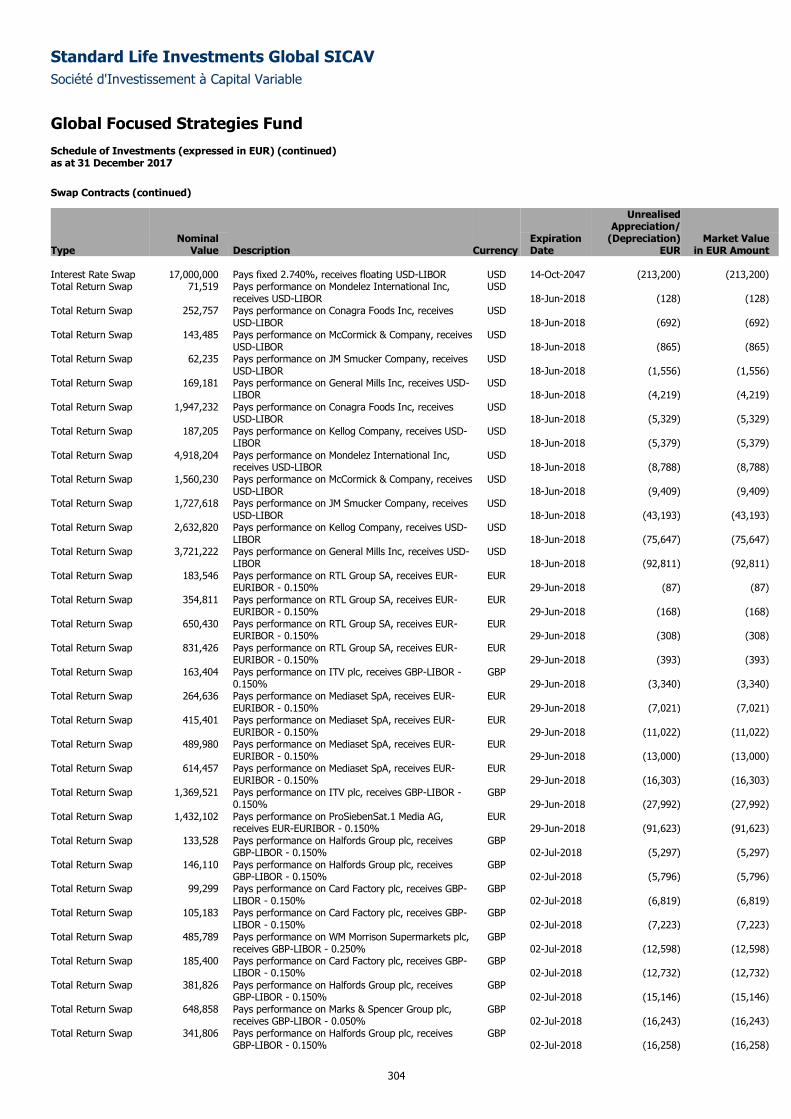
Standard Life Investments Global SICAV
Société d'Investissement à Capital Variable
Global Focused Strategies Fund Schedule of Investments (expressed in EUR) (continued) as at 31 December 2017
304
Swap Contracts (continued)
Unrealised Appreciation/ Nominal Expiration (Depreciation) Market Value Type Value Description Currency Date EUR in EUR Amount Interest Rate Swap 17,000,000 Pays fixed 2.740%, receives floating USD-LIBOR USD 14-Oct-2047 (213,200) (213,200) Total Return Swap 71,519 Pays performance on Mondelez International Inc,
receives USD-LIBOR USD
18-Jun-2018 (128) (128) Total Return Swap 252,757 Pays performance on Conagra Foods Inc, receives
USD-LIBOR USD
18-Jun-2018 (692) (692) Total Return Swap 143,485 Pays performance on McCormick & Company, receives
USD-LIBOR USD
18-Jun-2018 (865) (865) Total Return Swap 62,235 Pays performance on JM Smucker Company, receives
USD-LIBOR USD
18-Jun-2018 (1,556) (1,556) Total Return Swap 169,181 Pays performance on General Mills Inc, receives USD-
LIBOR USD
18-Jun-2018 (4,219) (4,219) Total Return Swap 1,947,232 Pays performance on Conagra Foods Inc, receives
USD-LIBOR USD
18-Jun-2018 (5,329) (5,329) Total Return Swap 187,205 Pays performance on Kellog Company, receives USD-
LIBOR USD
18-Jun-2018 (5,379) (5,379) Total Return Swap 4,918,204 Pays performance on Mondelez International Inc,
receives USD-LIBOR USD
18-Jun-2018 (8,788) (8,788) Total Return Swap 1,560,230 Pays performance on McCormick & Company, receives
USD-LIBOR USD
18-Jun-2018 (9,409) (9,409) Total Return Swap 1,727,618 Pays performance on JM Smucker Company, receives
USD-LIBOR USD
18-Jun-2018 (43,193) (43,193) Total Return Swap 2,632,820 Pays performance on Kellog Company, receives USD-
LIBOR USD
18-Jun-2018 (75,647) (75,647) Total Return Swap 3,721,222 Pays performance on General Mills Inc, receives USD-
LIBOR USD
18-Jun-2018 (92,811) (92,811) Total Return Swap 183,546 Pays performance on RTL Group SA, receives EUR-
EURIBOR - 0.150% EUR
29-Jun-2018 (87) (87) Total Return Swap 354,811 Pays performance on RTL Group SA, receives EUR-
EURIBOR - 0.150% EUR
29-Jun-2018 (168) (168) Total Return Swap 650,430 Pays performance on RTL Group SA, receives EUR-
EURIBOR - 0.150% EUR
29-Jun-2018 (308) (308) Total Return Swap 831,426 Pays performance on RTL Group SA, receives EUR-
EURIBOR - 0.150% EUR
29-Jun-2018 (393) (393) Total Return Swap 163,404 Pays performance on ITV plc, receives GBP-LIBOR -
0.150% GBP
29-Jun-2018 (3,340) (3,340) Total Return Swap 264,636 Pays performance on Mediaset SpA, receives EUR-
EURIBOR - 0.150% EUR
29-Jun-2018 (7,021) (7,021) Total Return Swap 415,401 Pays performance on Mediaset SpA, receives EUR-
EURIBOR - 0.150% EUR
29-Jun-2018 (11,022) (11,022) Total Return Swap 489,980 Pays performance on Mediaset SpA, receives EUR-
EURIBOR - 0.150% EUR
29-Jun-2018 (13,000) (13,000) Total Return Swap 614,457 Pays performance on Mediaset SpA, receives EUR-
EURIBOR - 0.150% EUR
29-Jun-2018 (16,303) (16,303) Total Return Swap 1,369,521 Pays performance on ITV plc, receives GBP-LIBOR -
0.150% GBP
29-Jun-2018 (27,992) (27,992) Total Return Swap 1,432,102 Pays performance on ProSiebenSat.1 Media AG,
receives EUR-EURIBOR - 0.150% EUR
29-Jun-2018 (91,623) (91,623) Total Return Swap 133,528 Pays performance on Halfords Group plc, receives
GBP-LIBOR - 0.150% GBP
02-Jul-2018 (5,297) (5,297) Total Return Swap 146,110 Pays performance on Halfords Group plc, receives
GBP-LIBOR - 0.150% GBP
02-Jul-2018 (5,796) (5,796) Total Return Swap 99,299 Pays performance on Card Factory plc, receives GBP-
LIBOR - 0.150% GBP
02-Jul-2018 (6,819) (6,819) Total Return Swap 105,183 Pays performance on Card Factory plc, receives GBP-
LIBOR - 0.150% GBP
02-Jul-2018 (7,223) (7,223) Total Return Swap 485,789 Pays performance on WM Morrison Supermarkets plc,
receives GBP-LIBOR - 0.250% GBP
02-Jul-2018 (12,598) (12,598) Total Return Swap 185,400 Pays performance on Card Factory plc, receives GBP-
LIBOR - 0.150% GBP
02-Jul-2018 (12,732) (12,732) Total Return Swap 381,826 Pays performance on Halfords Group plc, receives
GBP-LIBOR - 0.150% GBP
02-Jul-2018 (15,146) (15,146) Total Return Swap 648,858 Pays performance on Marks & Spencer Group plc,
receives GBP-LIBOR - 0.050% GBP
02-Jul-2018 (16,243) (16,243) Total Return Swap 341,806 Pays performance on Halfords Group plc, receives
GBP-LIBOR - 0.150% GBP
02-Jul-2018 (16,258) (16,258)
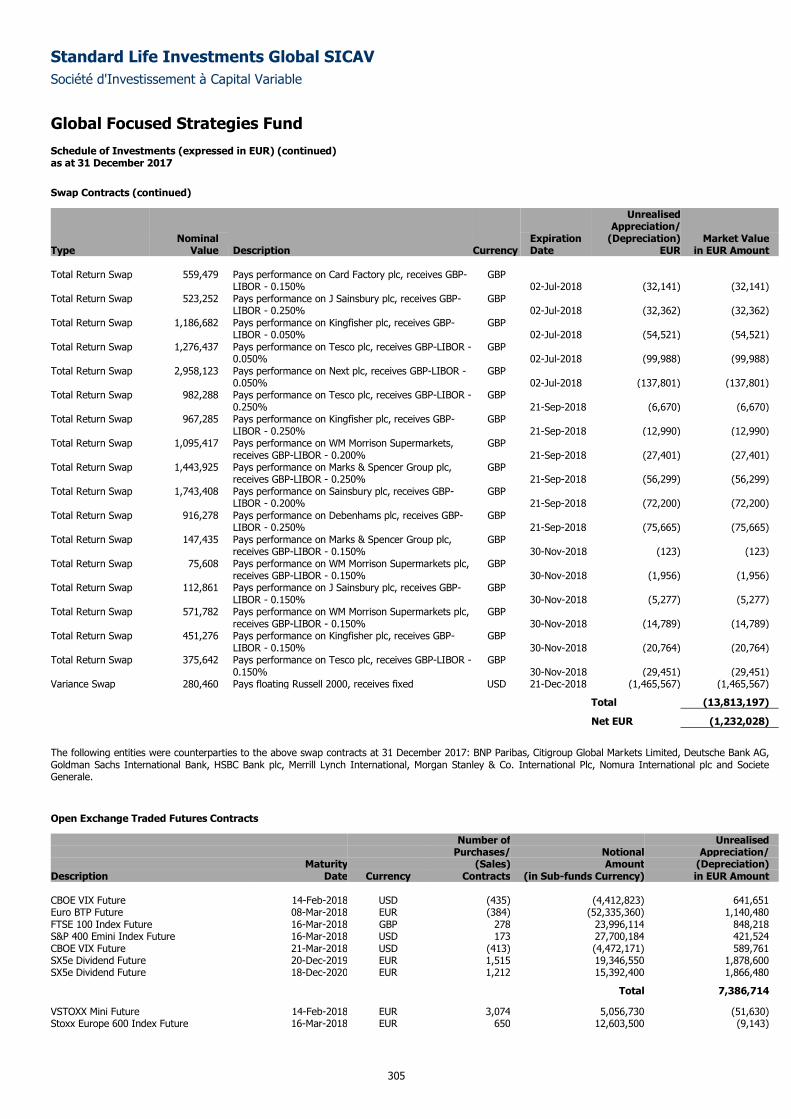
Standard Life Investments Global SICAV
Société d'Investissement à Capital Variable
Global Focused Strategies Fund Schedule of Investments (expressed in EUR) (continued) as at 31 December 2017
305
Swap Contracts (continued)
Unrealised Appreciation/ Nominal Expiration (Depreciation) Market Value Type Value Description Currency Date EUR in EUR Amount Total Return Swap 559,479 Pays performance on Card Factory plc, receives GBP-
LIBOR - 0.150% GBP
02-Jul-2018 (32,141) (32,141) Total Return Swap 523,252 Pays performance on J Sainsbury plc, receives GBP-
LIBOR - 0.250% GBP
02-Jul-2018 (32,362) (32,362) Total Return Swap 1,186,682 Pays performance on Kingfisher plc, receives GBP-
LIBOR - 0.050% GBP
02-Jul-2018 (54,521) (54,521) Total Return Swap 1,276,437 Pays performance on Tesco plc, receives GBP-LIBOR -
0.050% GBP
02-Jul-2018 (99,988) (99,988) Total Return Swap 2,958,123 Pays performance on Next plc, receives GBP-LIBOR -
0.050% GBP
02-Jul-2018 (137,801) (137,801) Total Return Swap 982,288 Pays performance on Tesco plc, receives GBP-LIBOR -
0.250% GBP
21-Sep-2018 (6,670) (6,670) Total Return Swap 967,285 Pays performance on Kingfisher plc, receives GBP-
LIBOR - 0.250% GBP
21-Sep-2018 (12,990) (12,990) Total Return Swap 1,095,417 Pays performance on WM Morrison Supermarkets,
receives GBP-LIBOR - 0.200% GBP
21-Sep-2018 (27,401) (27,401) Total Return Swap 1,443,925 Pays performance on Marks & Spencer Group plc,
receives GBP-LIBOR - 0.250% GBP
21-Sep-2018 (56,299) (56,299) Total Return Swap 1,743,408 Pays performance on Sainsbury plc, receives GBP-
LIBOR - 0.200% GBP
21-Sep-2018 (72,200) (72,200) Total Return Swap 916,278 Pays performance on Debenhams plc, receives GBP-
LIBOR - 0.250% GBP
21-Sep-2018 (75,665) (75,665) Total Return Swap 147,435 Pays performance on Marks & Spencer Group plc,
receives GBP-LIBOR - 0.150% GBP
30-Nov-2018 (123) (123) Total Return Swap 75,608 Pays performance on WM Morrison Supermarkets plc,
receives GBP-LIBOR - 0.150% GBP
30-Nov-2018 (1,956) (1,956) Total Return Swap 112,861 Pays performance on J Sainsbury plc, receives GBP-
LIBOR - 0.150% GBP
30-Nov-2018 (5,277) (5,277) Total Return Swap 571,782 Pays performance on WM Morrison Supermarkets plc,
receives GBP-LIBOR - 0.150% GBP
30-Nov-2018 (14,789) (14,789) Total Return Swap 451,276 Pays performance on Kingfisher plc, receives GBP-
LIBOR - 0.150% GBP
30-Nov-2018 (20,764) (20,764) Total Return Swap 375,642 Pays performance on Tesco plc, receives GBP-LIBOR -
0.150% GBP
30-Nov-2018 (29,451) (29,451) Variance Swap 280,460 Pays floating Russell 2000, receives fixed USD 21-Dec-2018 (1,465,567) (1,465,567)
Total (13,813,197)
Net EUR (1,232,028)
.
The following entities were counterparties to the above swap contracts at 31 December 2017: BNP Paribas, Citigroup Global Markets Limited, Deutsche Bank AG, Goldman Sachs International Bank, HSBC Bank plc, Merrill Lynch International, Morgan Stanley & Co. International Plc, Nomura International plc and Societe Generale.
Open Exchange Traded Futures Contracts
Number of Unrealised Purchases/ Notional Appreciation/ Maturity (Sales) Amount (Depreciation) Description Date Currency Contracts (in Sub-funds Currency) in EUR Amount CBOE VIX Future 14-Feb-2018 USD (435) (4,412,823) 641,651 Euro BTP Future 08-Mar-2018 EUR (384) (52,335,360) 1,140,480 FTSE 100 Index Future 16-Mar-2018 GBP 278 23,996,114 848,218 S&P 400 Emini Index Future 16-Mar-2018 USD 173 27,700,184 421,524 CBOE VIX Future 21-Mar-2018 USD (413) (4,472,171) 589,761 SX5e Dividend Future 20-Dec-2019 EUR 1,515 19,346,550 1,878,600 SX5e Dividend Future 18-Dec-2020 EUR 1,212 15,392,400 1,866,480
Total 7,386,714
VSTOXX Mini Future 14-Feb-2018 EUR 3,074 5,056,730 (51,630) Stoxx Europe 600 Index Future 16-Mar-2018 EUR 650 12,603,500 (9,143)
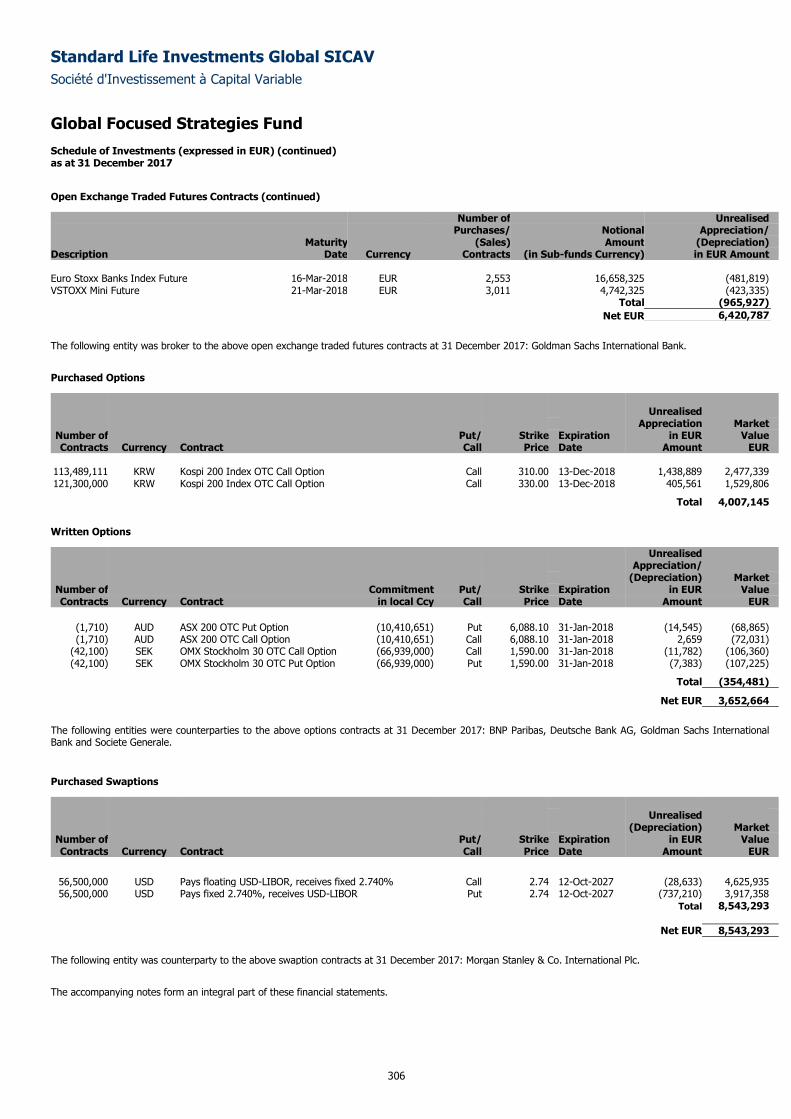
Standard Life Investments Global SICAV
Société d'Investissement à Capital Variable
Global Focused Strategies Fund Schedule of Investments (expressed in EUR) (continued) as at 31 December 2017
306
Open Exchange Traded Futures Contracts (continued)
Number of Unrealised Purchases/ Notional Appreciation/ Maturity (Sales) Amount (Depreciation) Description Date Currency Contracts (in Sub-funds Currency) in EUR Amount Euro Stoxx Banks Index Future 16-Mar-2018 EUR 2,553 16,658,325 (481,819) VSTOXX Mini Future 21-Mar-2018 EUR 3,011 4,742,325 (423,335) Total (965,927)
Net EUR 6,420,787
The following entity was broker to the above open exchange traded futures contracts at 31 December 2017: Goldman Sachs International Bank.
Purchased Options
Unrealised Appreciation Market
Number of Put/ Strike Expiration in EUR Value Contracts Currency Contract Call Price Date Amount EUR
113,489,111 KRW Kospi 200 Index OTC Call Option Call 310.00 13-Dec-2018 1,438,889 2,477,339 121,300,000 KRW Kospi 200 Index OTC Call Option Call 330.00 13-Dec-2018 405,561 1,529,806
Total 4,007,145
Written Options
Unrealised Appreciation/ (Depreciation) Market
Number of Commitment Put/ Strike Expiration in EUR Value Contracts Currency Contract in local Ccy Call Price Date Amount EUR
(1,710) AUD ASX 200 OTC Put Option (10,410,651) Put 6,088.10 31-Jan-2018 (14,545) (68,865) (1,710) AUD ASX 200 OTC Call Option (10,410,651) Call 6,088.10 31-Jan-2018 2,659 (72,031)
(42,100) SEK OMX Stockholm 30 OTC Call Option (66,939,000) Call 1,590.00 31-Jan-2018 (11,782) (106,360) (42,100) SEK OMX Stockholm 30 OTC Put Option (66,939,000) Put 1,590.00 31-Jan-2018 (7,383) (107,225)
Total (354,481)
Net EUR 3,652,664
The following entities were counterparties to the above options contracts at 31 December 2017: BNP Paribas, Deutsche Bank AG, Goldman Sachs International Bank and Societe Generale.
Purchased Swaptions
Unrealised (Depreciation) Market
Number of Put/ Strike Expiration in EUR Value Contracts Currency Contract Call Price Date Amount EUR
56,500,000 USD Pays floating USD-LIBOR, receives fixed 2.740% Call 2.74 12-Oct-2027 (28,633) 4,625,935 56,500,000 USD Pays fixed 2.740%, receives USD-LIBOR Put 2.74 12-Oct-2027 (737,210) 3,917,358
Total 8,543,293
Net EUR 8,543,293
The following entity was counterparty to the above swaption contracts at 31 December 2017: Morgan Stanley & Co. International Plc.
The accompanying notes form an integral part of these financial statements.
Standard Life Investments Global SICAV
Société d'Investissement à Capital Variable
307
Absolute Return Global Bond Strategies Fund
Sub-fund Objective and Investment Policy
The objective of the Sub-fund is to deliver a positive absolute return in the form of both income and capital growth over the medium to longer term in all
market conditions. The Sub-fund is actively managed, with a wide investment remit to target a level of return over rolling three-year periods equivalent to
cash plus three per-cent a year, gross of fees. It exploits market inefficiencies through active allocation to a diverse range of market positions. The fund
uses a combination of traditional assets (such as bonds, cash and money market instruments) and investment strategies based on advanced derivative
techniques, resulting in a diversified portfolio. The fund can take long and short positions in markets, securities and groups of securities through derivative
contracts. Leverage in the fund arises as a result of the use of derivatives.
The Sub-fund seeks strategies from across the entire fixed income and foreign exchange investment universe, looking for returns through dynamic
allocation to investment opportunities in traditional and advanced asset strategies. We combine the investment ideas produced by our fixed income and
multi-asset teams with the aim of producing a portfolio with stable performance. By using this combination of diversified returns, we are able to minimise
the impact of market volatility and therefore reduce risk. Indeed, we expect the volatility of the Sub-fund to be less than 5% in normal market conditions
while maintaining the return objective.
Examples of strategies that may be used at any time may include:
- An assessment of the direction of credit quality in one market compared to another. Changes in credit quality can influence the valuation of assets and this
strategy would position the portfolio to benefit from such changes. Rather than invest in physical securities, this strategy could be implemented through the
use of derivatives in the form of credit default swaps.
- An assessment of the value of one currency relative to another. The strategy could involve the sale of the currency considered overvalued and purchase of
the currency considered undervalued. Derivatives, in the form of forward foreign exchange contracts, could be used to implement the strategy.
- An assessment of the direction of interest rates. Derivatives, in the form of interest rate swaps, could be used to position the portfolio such that it could
benefit from the future direction of interest rates.
The fund will invest in a diversified portfolio of permitted derivative contracts (including futures, options, swaps, forward currency contracts and other
derivatives), fixed interest securities and cash. Additionally the Sub-fund may invest in other forms of eligible transferable securities, deposits, money
market instruments and undertakings for collective investment. The Sub-fund may, subject to and in accordance with the UCI Law and applicable CSSF
circulars, take long and short positions in markets, securities and groups of securities through derivative contracts.
Performance Review
The Sub-fund returned -1.03% over the period, compared to the 3-month LIBOR return of 0.36% (gross of fees).*
The early months of 2017 were marked by the US Federal Reserve’s (Fed) decision to raise interest rates and the UK government’s triggering of Article 50 to
begin formal negotiations for Britain’s withdrawal from the European Union (EU). During this time, expectations for UK inflation declined, boosting our UK
inflation position. However, news that one member of the Bank of England’s Monetary Policy Committee had voted to raise interest rates caused short-term
UK rates to rise relative to longer-term rates (i.e. the yield curve flattened). This hurt our UK yield curve steepener strategies. In Europe, new data pointing
to a greater-than-expected fall in inflation supported our strategies aimed at profiting from rising European real interest rates. In other developments, our
currency pair preferring the US dollar over the Australian dollar detracted from performance as both currencies moved against us. Offsetting this, the Indian
rupee benefited from a surge in foreign inflows and positive global and domestic developments. Consequently, our position preferring the rupee to the New
Zealand dollar gained.
In the second quarter, politics and central bank action remained dominant market forces. Fears about the future of the EU were allayed with the election in
May of moderate, pro-EU candidate Emmanuel Macron as French president. In the UK, Prime Minister Theresa May’s election gamble backfired as her
Conservative party lost its majority. In the US, the Fed raised interest rates for a second time that year. The prospect of reduced central bank support led to
a general decline in equity and government bond markets at quarter-end, which penalised our Australian and US interest rates strategies. Meanwhile,
government bonds in Europe benefited from the receding political risks, hurting our short Italian government bonds strategy. Offsetting this, our US versus
European real yields strategy gained as Eurozone real interest rates moved higher. Meanwhile, our US real yields strategy struggled. Designed to benefit as
US inflation expectations rise, inflation expectations in fact retreated during the second quarter.
As the year progressed, our currency pairs seeking to benefit from weakness in the Canadian dollar suffered after an unexpected rate hike by the Bank of
Canada lifted the Canadian dollar. Elsewhere, the Bank of England gave strong indications that it considered a rate rise in November appropriate to bring
inflation sustainably to target. This sent the British pound to its highest level in a year. Consequently, our position preferring the US dollar over the British
pound detracted from performance. After a strong rally early in the quarter, global sovereign bonds retreated in September (yields rose) as major central
banks spoke more earnestly about withdrawing monetary support and raising interest rates. Consequently, our Australian and US interest rates strategies
delivered negative returns. Conversely, our European long-end steepener strategy gained, as short and medium-term bonds posted stronger returns than
longer-dated bonds (i.e. short and medium-term yields fell further than long-term yields, causing the yield curve to steepen). Our short UK inflation strategy
also contributed positively. UK inflation expectations retreated in July after figures revealed inflation was below forecast.
Standard Life Investments Global SICAV
Société d'Investissement à Capital Variable
308
Absolute Return Global Bond Strategies Fund
Performance Review (continued)
During the final three months of 2017, volatility in the US interest rate market retreated amid low dispersion in economic growth and inflation forecasts, and
consistent central bank monetary policy. This environment was negative for our position seeking to benefit from higher interest rate volatility in the US. In
Germany, longer-dated government bonds fared better than their shorter-dated counterparts. This was advantageous for our interest rate strategy
expressing specific views at carefully selected points along the German interest rate curve. However, real interest rates in the UK and Eurozone were
supported by increasing inflation expectations towards year-end. This drove negative performance from our US versus UK real yields and outright short
European real yields strategies, which lost ground over the year. Similarly, interest rates moved against our strategy designed to profit from relative changes
in specific interest rates within the shorter-dated segment of the US bond market. Within emerging markets, South African government bonds and the rand
both rebounded amid easing political risk. Together with a generally weaker US dollar, this benefited our EM income strategy. Turning to currencies, our
preference for the Indian rupee over the Swiss franc was rewarded, as strong demand for Indian equities caused the rupee to appreciate. However, our
currency pair favouring the Japanese yen over the Korean won dragged on performance. Shrugging off heightened political tensions on the Korean
Peninsula, the won was boosted by export-led economic growth and the general weakness in the US dollar.
Throughout 2017, credit markets remained well-supported in an environment of continued synchronised global economic growth, improving corporate
fundamentals, persistent demand for yield and, latterly, mounting optimism around US tax reforms. As a result, our positions in high-yield credit and
contingent capital bonds (also called contingent convertible bonds or ‘CoCos’), were among the top performers over the year.
*Sub-fund performance has been calculated over the stated period on the share price performance basis, based on the institutional share class (D
Accumulation) and net of fees. Please note the index return is quoted gross and contains no adjustment for fees. The sub-fund performance will also be
impacted by any pricing basis changes, made under our single swinging price policy. More information on our swinging price approach can be found in note
8 of the Financial Statements.
Outlook
Our central expectation is for continued modest broad-based global growth, albeit with regional variations. Fiscal policy and the changing monetary policies
of central banks will be important drivers of asset returns, especially as the pace of change in policies remains uncertain. The US is moving to a tighter
monetary environment, albeit on a gradual incline. Improving data in Europe may reduce the ECB’s appetite for monetary easing. However, it will likely
remain cautious in the near term given the elevated levels of uncertainty around the process of the UK’s withdrawal from the EU. Japan, meanwhile, is likely
to remain on a loose monetary path. Geopolitical tensions remain elevated and, on many metrics, asset prices look expensive. We will seek to exploit the
opportunities that these conditions present by implementing a diversified range of strategies using multiple asset classes.
Please note that the absolute Value at Risk (“VaR”) approach has been used for risk measurement and calculation of global exposure for this Sub-fund.
Measurement of 1 month 99% VaR is based on a parametric calculation with an additional upwards scaling factor applied. Parametric risk model uses 180
weeks of equally weighted data with which to forecast risk.
On the above basis the VaR has been as follows:
Highest: 1.77%
Average: 1.56%
Lowest: 1.39%
Leverage is calculated as the sum of the notionals of the derivatives used. The level of leverage employed during the relevant period was 876.42%.
The quoted leverage excludes the impact of the FX forwards used in currency hedged shareclasses which are held for those shareholders only. It also
excludes the temporary impacts that arise when renewing currency forwards and when closing some exchange cleared derivatives. Although the renewal of
currency forwards and closure of exchange traded derivatives results in no change in or a reduction in market exposure, gross derivative leverage would
increase because new equal and offsetting derivative contracts are traded to facilitate this efficiently. The offsetting contracts are held to their maturity
date, which is less than 5 working days for currency forwards, or final processing of their termination.
This Sub-fund is not authorized in Hong Kong and is not available to Hong Kong residents.
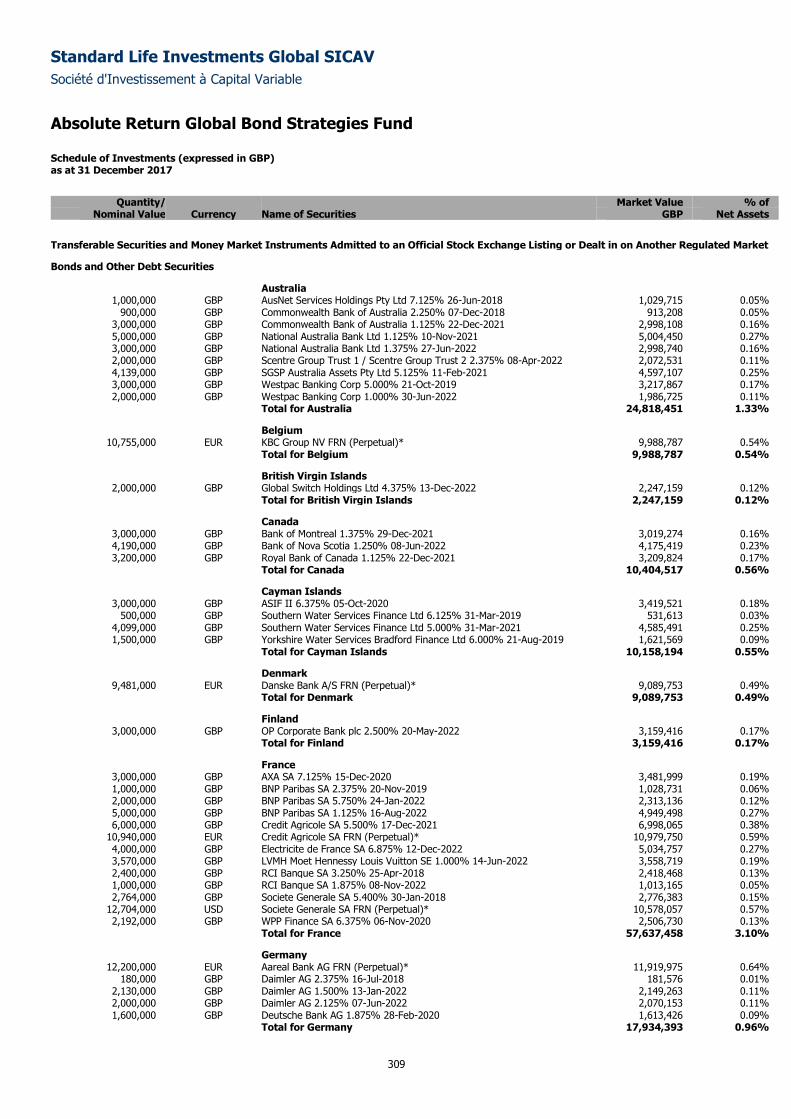
Standard Life Investments Global SICAV
Société d'Investissement à Capital Variable
Absolute Return Global Bond Strategies Fund Schedule of Investments (expressed in GBP) as at 31 December 2017
309
Quantity/ Market Value % of
Nominal Value Currency Name of Securities GBP Net Assets
Transferable Securities and Money Market Instruments Admitted to an Official Stock Exchange Listing or Dealt in on Another Regulated Market
Bonds and Other Debt Securities
Australia 1,000,000 GBP AusNet Services Holdings Pty Ltd 7.125% 26-Jun-2018 1,029,715 0.05%
900,000 GBP Commonwealth Bank of Australia 2.250% 07-Dec-2018 913,208 0.05% 3,000,000 GBP Commonwealth Bank of Australia 1.125% 22-Dec-2021 2,998,108 0.16% 5,000,000 GBP National Australia Bank Ltd 1.125% 10-Nov-2021 5,004,450 0.27% 3,000,000 GBP National Australia Bank Ltd 1.375% 27-Jun-2022 2,998,740 0.16% 2,000,000 GBP Scentre Group Trust 1 / Scentre Group Trust 2 2.375% 08-Apr-2022 2,072,531 0.11% 4,139,000 GBP SGSP Australia Assets Pty Ltd 5.125% 11-Feb-2021 4,597,107 0.25% 3,000,000 GBP Westpac Banking Corp 5.000% 21-Oct-2019 3,217,867 0.17% 2,000,000 GBP Westpac Banking Corp 1.000% 30-Jun-2022 1,986,725 0.11%
Total for Australia 24,818,451 1.33%
Belgium 10,755,000 EUR KBC Group NV FRN (Perpetual)* 9,988,787 0.54%
Total for Belgium 9,988,787 0.54%
British Virgin Islands 2,000,000 GBP Global Switch Holdings Ltd 4.375% 13-Dec-2022 2,247,159 0.12%
Total for British Virgin Islands 2,247,159 0.12%
Canada 3,000,000 GBP Bank of Montreal 1.375% 29-Dec-2021 3,019,274 0.16% 4,190,000 GBP Bank of Nova Scotia 1.250% 08-Jun-2022 4,175,419 0.23% 3,200,000 GBP Royal Bank of Canada 1.125% 22-Dec-2021 3,209,824 0.17%
Total for Canada 10,404,517 0.56%
Cayman Islands 3,000,000 GBP ASIF II 6.375% 05-Oct-2020 3,419,521 0.18%
500,000 GBP Southern Water Services Finance Ltd 6.125% 31-Mar-2019 531,613 0.03% 4,099,000 GBP Southern Water Services Finance Ltd 5.000% 31-Mar-2021 4,585,491 0.25% 1,500,000 GBP Yorkshire Water Services Bradford Finance Ltd 6.000% 21-Aug-2019 1,621,569 0.09%
Total for Cayman Islands 10,158,194 0.55%
Denmark 9,481,000 EUR Danske Bank A/S FRN (Perpetual)* 9,089,753 0.49%
Total for Denmark 9,089,753 0.49%
Finland 3,000,000 GBP OP Corporate Bank plc 2.500% 20-May-2022 3,159,416 0.17%
Total for Finland 3,159,416 0.17%
France 3,000,000 GBP AXA SA 7.125% 15-Dec-2020 3,481,999 0.19% 1,000,000 GBP BNP Paribas SA 2.375% 20-Nov-2019 1,028,731 0.06% 2,000,000 GBP BNP Paribas SA 5.750% 24-Jan-2022 2,313,136 0.12% 5,000,000 GBP BNP Paribas SA 1.125% 16-Aug-2022 4,949,498 0.27% 6,000,000 GBP Credit Agricole SA 5.500% 17-Dec-2021 6,998,065 0.38%
10,940,000 EUR Credit Agricole SA FRN (Perpetual)* 10,979,750 0.59% 4,000,000 GBP Electricite de France SA 6.875% 12-Dec-2022 5,034,757 0.27% 3,570,000 GBP LVMH Moet Hennessy Louis Vuitton SE 1.000% 14-Jun-2022 3,558,719 0.19% 2,400,000 GBP RCI Banque SA 3.250% 25-Apr-2018 2,418,468 0.13% 1,000,000 GBP RCI Banque SA 1.875% 08-Nov-2022 1,013,165 0.05% 2,764,000 GBP Societe Generale SA 5.400% 30-Jan-2018 2,776,383 0.15%
12,704,000 USD Societe Generale SA FRN (Perpetual)* 10,578,057 0.57% 2,192,000 GBP WPP Finance SA 6.375% 06-Nov-2020 2,506,730 0.13%
Total for France 57,637,458 3.10%
Germany 12,200,000 EUR Aareal Bank AG FRN (Perpetual)* 11,919,975 0.64%
180,000 GBP Daimler AG 2.375% 16-Jul-2018 181,576 0.01% 2,130,000 GBP Daimler AG 1.500% 13-Jan-2022 2,149,263 0.11% 2,000,000 GBP Daimler AG 2.125% 07-Jun-2022 2,070,153 0.11% 1,600,000 GBP Deutsche Bank AG 1.875% 28-Feb-2020 1,613,426 0.09%
Total for Germany 17,934,393 0.96%
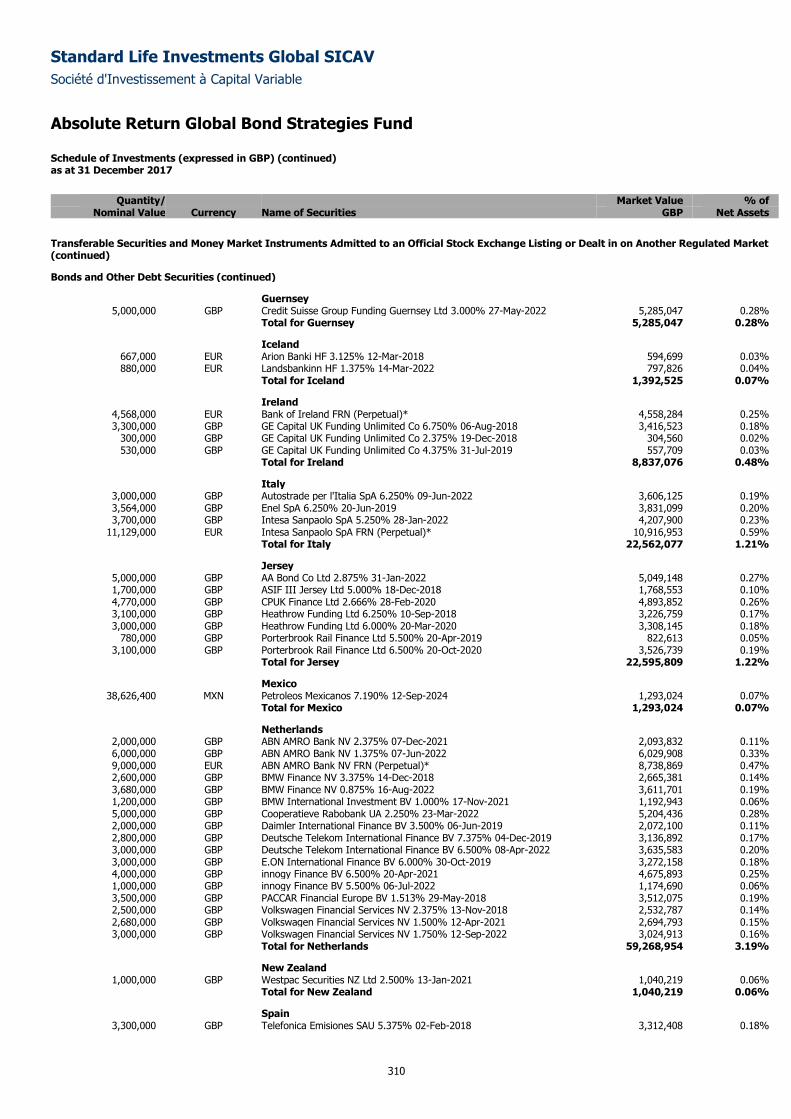
Standard Life Investments Global SICAV
Société d'Investissement à Capital Variable
Absolute Return Global Bond Strategies Fund Schedule of Investments (expressed in GBP) (continued) as at 31 December 2017
310
Quantity/ Market Value % of
Nominal Value Currency Name of Securities GBP Net Assets
Transferable Securities and Money Market Instruments Admitted to an Official Stock Exchange Listing or Dealt in on Another Regulated Market (continued)
Bonds and Other Debt Securities (continued)
Guernsey 5,000,000 GBP Credit Suisse Group Funding Guernsey Ltd 3.000% 27-May-2022 5,285,047 0.28%
Total for Guernsey 5,285,047 0.28%
Iceland 667,000 EUR Arion Banki HF 3.125% 12-Mar-2018 594,699 0.03% 880,000 EUR Landsbankinn HF 1.375% 14-Mar-2022 797,826 0.04%
Total for Iceland 1,392,525 0.07%
Ireland 4,568,000 EUR Bank of Ireland FRN (Perpetual)* 4,558,284 0.25% 3,300,000 GBP GE Capital UK Funding Unlimited Co 6.750% 06-Aug-2018 3,416,523 0.18%
300,000 GBP GE Capital UK Funding Unlimited Co 2.375% 19-Dec-2018 304,560 0.02% 530,000 GBP GE Capital UK Funding Unlimited Co 4.375% 31-Jul-2019 557,709 0.03%
Total for Ireland 8,837,076 0.48%
Italy 3,000,000 GBP Autostrade per l'Italia SpA 6.250% 09-Jun-2022 3,606,125 0.19% 3,564,000 GBP Enel SpA 6.250% 20-Jun-2019 3,831,099 0.20% 3,700,000 GBP Intesa Sanpaolo SpA 5.250% 28-Jan-2022 4,207,900 0.23%
11,129,000 EUR Intesa Sanpaolo SpA FRN (Perpetual)* 10,916,953 0.59% Total for Italy 22,562,077 1.21%
Jersey 5,000,000 GBP AA Bond Co Ltd 2.875% 31-Jan-2022 5,049,148 0.27% 1,700,000 GBP ASIF III Jersey Ltd 5.000% 18-Dec-2018 1,768,553 0.10% 4,770,000 GBP CPUK Finance Ltd 2.666% 28-Feb-2020 4,893,852 0.26% 3,100,000 GBP Heathrow Funding Ltd 6.250% 10-Sep-2018 3,226,759 0.17% 3,000,000 GBP Heathrow Funding Ltd 6.000% 20-Mar-2020 3,308,145 0.18%
780,000 GBP Porterbrook Rail Finance Ltd 5.500% 20-Apr-2019 822,613 0.05% 3,100,000 GBP Porterbrook Rail Finance Ltd 6.500% 20-Oct-2020 3,526,739 0.19%
Total for Jersey 22,595,809 1.22%
Mexico 38,626,400 MXN Petroleos Mexicanos 7.190% 12-Sep-2024 1,293,024 0.07%
Total for Mexico 1,293,024 0.07%
Netherlands 2,000,000 GBP ABN AMRO Bank NV 2.375% 07-Dec-2021 2,093,832 0.11% 6,000,000 GBP ABN AMRO Bank NV 1.375% 07-Jun-2022 6,029,908 0.33% 9,000,000 EUR ABN AMRO Bank NV FRN (Perpetual)* 8,738,869 0.47% 2,600,000 GBP BMW Finance NV 3.375% 14-Dec-2018 2,665,381 0.14% 3,680,000 GBP BMW Finance NV 0.875% 16-Aug-2022 3,611,701 0.19% 1,200,000 GBP BMW International Investment BV 1.000% 17-Nov-2021 1,192,943 0.06% 5,000,000 GBP Cooperatieve Rabobank UA 2.250% 23-Mar-2022 5,204,436 0.28% 2,000,000 GBP Daimler International Finance BV 3.500% 06-Jun-2019 2,072,100 0.11% 2,800,000 GBP Deutsche Telekom International Finance BV 7.375% 04-Dec-2019 3,136,892 0.17% 3,000,000 GBP Deutsche Telekom International Finance BV 6.500% 08-Apr-2022 3,635,583 0.20% 3,000,000 GBP E.ON International Finance BV 6.000% 30-Oct-2019 3,272,158 0.18% 4,000,000 GBP innogy Finance BV 6.500% 20-Apr-2021 4,675,893 0.25% 1,000,000 GBP innogy Finance BV 5.500% 06-Jul-2022 1,174,690 0.06% 3,500,000 GBP PACCAR Financial Europe BV 1.513% 29-May-2018 3,512,075 0.19% 2,500,000 GBP Volkswagen Financial Services NV 2.375% 13-Nov-2018 2,532,787 0.14% 2,680,000 GBP Volkswagen Financial Services NV 1.500% 12-Apr-2021 2,694,793 0.15% 3,000,000 GBP Volkswagen Financial Services NV 1.750% 12-Sep-2022 3,024,913 0.16%
Total for Netherlands 59,268,954 3.19%
New Zealand 1,000,000 GBP Westpac Securities NZ Ltd 2.500% 13-Jan-2021 1,040,219 0.06%
Total for New Zealand 1,040,219 0.06%
Spain 3,300,000 GBP Telefonica Emisiones SAU 5.375% 02-Feb-2018 3,312,408 0.18%
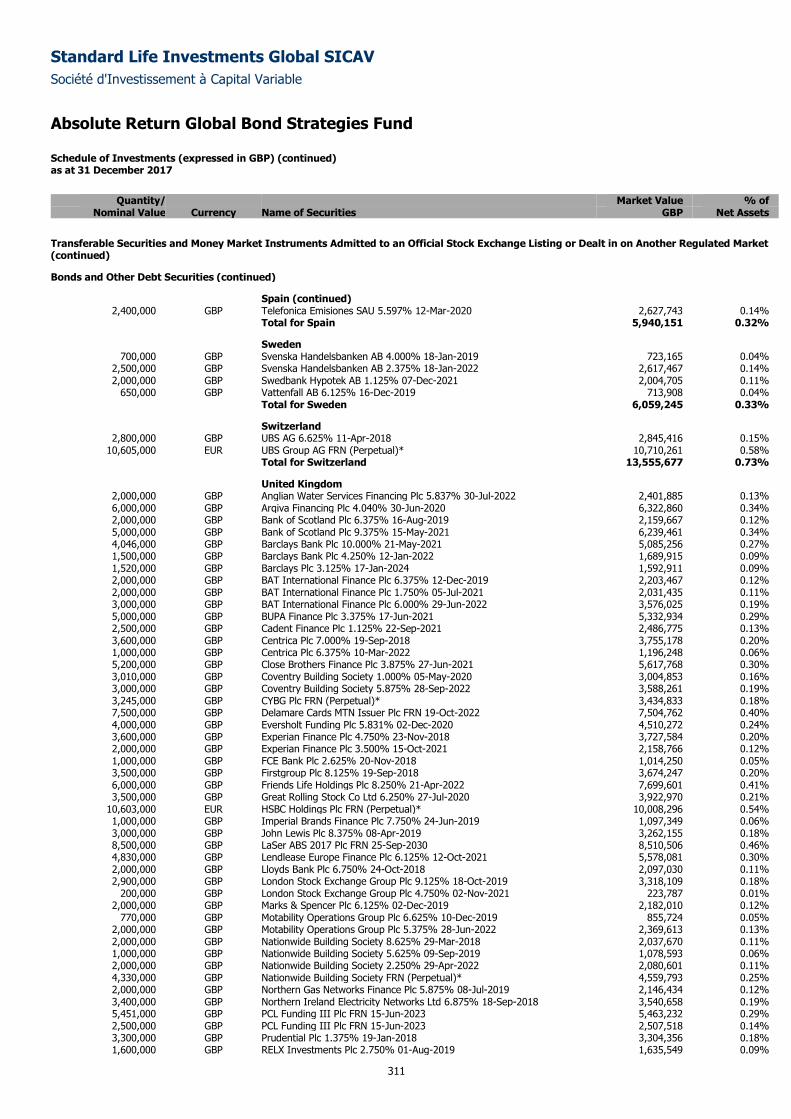
Standard Life Investments Global SICAV
Société d'Investissement à Capital Variable
Absolute Return Global Bond Strategies Fund Schedule of Investments (expressed in GBP) (continued) as at 31 December 2017
311
Quantity/ Market Value % of
Nominal Value Currency Name of Securities GBP Net Assets
Transferable Securities and Money Market Instruments Admitted to an Official Stock Exchange Listing or Dealt in on Another Regulated Market (continued)
Bonds and Other Debt Securities (continued)
Spain (continued) 2,400,000 GBP Telefonica Emisiones SAU 5.597% 12-Mar-2020 2,627,743 0.14%
Total for Spain 5,940,151 0.32%
Sweden 700,000 GBP Svenska Handelsbanken AB 4.000% 18-Jan-2019 723,165 0.04%
2,500,000 GBP Svenska Handelsbanken AB 2.375% 18-Jan-2022 2,617,467 0.14% 2,000,000 GBP Swedbank Hypotek AB 1.125% 07-Dec-2021 2,004,705 0.11%
650,000 GBP Vattenfall AB 6.125% 16-Dec-2019 713,908 0.04% Total for Sweden 6,059,245 0.33%
Switzerland 2,800,000 GBP UBS AG 6.625% 11-Apr-2018 2,845,416 0.15%
10,605,000 EUR UBS Group AG FRN (Perpetual)* 10,710,261 0.58% Total for Switzerland 13,555,677 0.73%
United Kingdom 2,000,000 GBP Anglian Water Services Financing Plc 5.837% 30-Jul-2022 2,401,885 0.13% 6,000,000 GBP Arqiva Financing Plc 4.040% 30-Jun-2020 6,322,860 0.34% 2,000,000 GBP Bank of Scotland Plc 6.375% 16-Aug-2019 2,159,667 0.12% 5,000,000 GBP Bank of Scotland Plc 9.375% 15-May-2021 6,239,461 0.34% 4,046,000 GBP Barclays Bank Plc 10.000% 21-May-2021 5,085,256 0.27% 1,500,000 GBP Barclays Bank Plc 4.250% 12-Jan-2022 1,689,915 0.09% 1,520,000 GBP Barclays Plc 3.125% 17-Jan-2024 1,592,911 0.09% 2,000,000 GBP BAT International Finance Plc 6.375% 12-Dec-2019 2,203,467 0.12% 2,000,000 GBP BAT International Finance Plc 1.750% 05-Jul-2021 2,031,435 0.11% 3,000,000 GBP BAT International Finance Plc 6.000% 29-Jun-2022 3,576,025 0.19% 5,000,000 GBP BUPA Finance Plc 3.375% 17-Jun-2021 5,332,934 0.29% 2,500,000 GBP Cadent Finance Plc 1.125% 22-Sep-2021 2,486,775 0.13% 3,600,000 GBP Centrica Plc 7.000% 19-Sep-2018 3,755,178 0.20% 1,000,000 GBP Centrica Plc 6.375% 10-Mar-2022 1,196,248 0.06% 5,200,000 GBP Close Brothers Finance Plc 3.875% 27-Jun-2021 5,617,768 0.30% 3,010,000 GBP Coventry Building Society 1.000% 05-May-2020 3,004,853 0.16% 3,000,000 GBP Coventry Building Society 5.875% 28-Sep-2022 3,588,261 0.19% 3,245,000 GBP CYBG Plc FRN (Perpetual)* 3,434,833 0.18% 7,500,000 GBP Delamare Cards MTN Issuer Plc FRN 19-Oct-2022 7,504,762 0.40% 4,000,000 GBP Eversholt Funding Plc 5.831% 02-Dec-2020 4,510,272 0.24% 3,600,000 GBP Experian Finance Plc 4.750% 23-Nov-2018 3,727,584 0.20% 2,000,000 GBP Experian Finance Plc 3.500% 15-Oct-2021 2,158,766 0.12% 1,000,000 GBP FCE Bank Plc 2.625% 20-Nov-2018 1,014,250 0.05% 3,500,000 GBP Firstgroup Plc 8.125% 19-Sep-2018 3,674,247 0.20% 6,000,000 GBP Friends Life Holdings Plc 8.250% 21-Apr-2022 7,699,601 0.41% 3,500,000 GBP Great Rolling Stock Co Ltd 6.250% 27-Jul-2020 3,922,970 0.21%
10,603,000 EUR HSBC Holdings Plc FRN (Perpetual)* 10,008,296 0.54% 1,000,000 GBP Imperial Brands Finance Plc 7.750% 24-Jun-2019 1,097,349 0.06% 3,000,000 GBP John Lewis Plc 8.375% 08-Apr-2019 3,262,155 0.18% 8,500,000 GBP LaSer ABS 2017 Plc FRN 25-Sep-2030 8,510,506 0.46% 4,830,000 GBP Lendlease Europe Finance Plc 6.125% 12-Oct-2021 5,578,081 0.30% 2,000,000 GBP Lloyds Bank Plc 6.750% 24-Oct-2018 2,097,030 0.11% 2,900,000 GBP London Stock Exchange Group Plc 9.125% 18-Oct-2019 3,318,109 0.18%
200,000 GBP London Stock Exchange Group Plc 4.750% 02-Nov-2021 223,787 0.01% 2,000,000 GBP Marks & Spencer Plc 6.125% 02-Dec-2019 2,182,010 0.12%
770,000 GBP Motability Operations Group Plc 6.625% 10-Dec-2019 855,724 0.05% 2,000,000 GBP Motability Operations Group Plc 5.375% 28-Jun-2022 2,369,613 0.13% 2,000,000 GBP Nationwide Building Society 8.625% 29-Mar-2018 2,037,670 0.11% 1,000,000 GBP Nationwide Building Society 5.625% 09-Sep-2019 1,078,593 0.06% 2,000,000 GBP Nationwide Building Society 2.250% 29-Apr-2022 2,080,601 0.11% 4,330,000 GBP Nationwide Building Society FRN (Perpetual)* 4,559,793 0.25% 2,000,000 GBP Northern Gas Networks Finance Plc 5.875% 08-Jul-2019 2,146,434 0.12% 3,400,000 GBP Northern Ireland Electricity Networks Ltd 6.875% 18-Sep-2018 3,540,658 0.19% 5,451,000 GBP PCL Funding III Plc FRN 15-Jun-2023 5,463,232 0.29% 2,500,000 GBP PCL Funding III Plc FRN 15-Jun-2023 2,507,518 0.14% 3,300,000 GBP Prudential Plc 1.375% 19-Jan-2018 3,304,356 0.18% 1,600,000 GBP RELX Investments Plc 2.750% 01-Aug-2019 1,635,549 0.09%
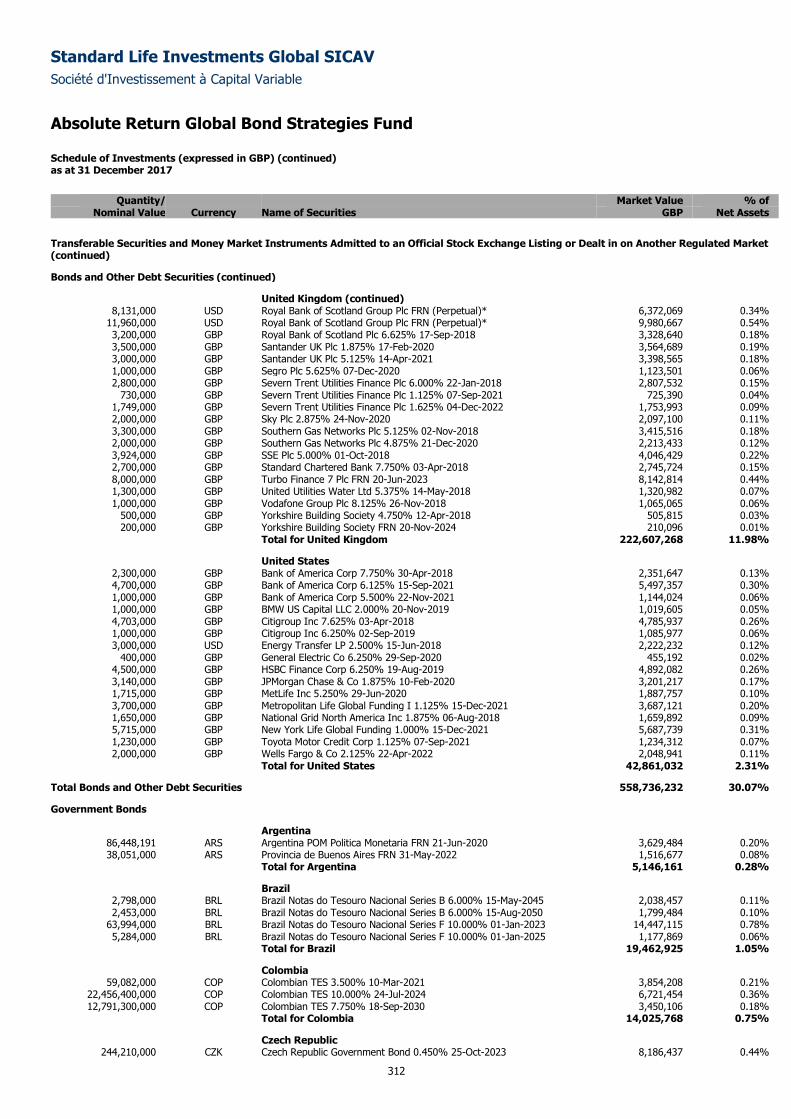
Standard Life Investments Global SICAV
Société d'Investissement à Capital Variable
Absolute Return Global Bond Strategies Fund Schedule of Investments (expressed in GBP) (continued) as at 31 December 2017
312
Quantity/ Market Value % of
Nominal Value Currency Name of Securities GBP Net Assets
Transferable Securities and Money Market Instruments Admitted to an Official Stock Exchange Listing or Dealt in on Another Regulated Market (continued)
Bonds and Other Debt Securities (continued)
United Kingdom (continued) 8,131,000 USD Royal Bank of Scotland Group Plc FRN (Perpetual)* 6,372,069 0.34%
11,960,000 USD Royal Bank of Scotland Group Plc FRN (Perpetual)* 9,980,667 0.54% 3,200,000 GBP Royal Bank of Scotland Plc 6.625% 17-Sep-2018 3,328,640 0.18% 3,500,000 GBP Santander UK Plc 1.875% 17-Feb-2020 3,564,689 0.19% 3,000,000 GBP Santander UK Plc 5.125% 14-Apr-2021 3,398,565 0.18% 1,000,000 GBP Segro Plc 5.625% 07-Dec-2020 1,123,501 0.06% 2,800,000 GBP Severn Trent Utilities Finance Plc 6.000% 22-Jan-2018 2,807,532 0.15%
730,000 GBP Severn Trent Utilities Finance Plc 1.125% 07-Sep-2021 725,390 0.04% 1,749,000 GBP Severn Trent Utilities Finance Plc 1.625% 04-Dec-2022 1,753,993 0.09% 2,000,000 GBP Sky Plc 2.875% 24-Nov-2020 2,097,100 0.11% 3,300,000 GBP Southern Gas Networks Plc 5.125% 02-Nov-2018 3,415,516 0.18% 2,000,000 GBP Southern Gas Networks Plc 4.875% 21-Dec-2020 2,213,433 0.12% 3,924,000 GBP SSE Plc 5.000% 01-Oct-2018 4,046,429 0.22% 2,700,000 GBP Standard Chartered Bank 7.750% 03-Apr-2018 2,745,724 0.15% 8,000,000 GBP Turbo Finance 7 Plc FRN 20-Jun-2023 8,142,814 0.44% 1,300,000 GBP United Utilities Water Ltd 5.375% 14-May-2018 1,320,982 0.07% 1,000,000 GBP Vodafone Group Plc 8.125% 26-Nov-2018 1,065,065 0.06%
500,000 GBP Yorkshire Building Society 4.750% 12-Apr-2018 505,815 0.03% 200,000 GBP Yorkshire Building Society FRN 20-Nov-2024 210,096 0.01%
Total for United Kingdom 222,607,268 11.98%
United States 2,300,000 GBP Bank of America Corp 7.750% 30-Apr-2018 2,351,647 0.13% 4,700,000 GBP Bank of America Corp 6.125% 15-Sep-2021 5,497,357 0.30% 1,000,000 GBP Bank of America Corp 5.500% 22-Nov-2021 1,144,024 0.06% 1,000,000 GBP BMW US Capital LLC 2.000% 20-Nov-2019 1,019,605 0.05% 4,703,000 GBP Citigroup Inc 7.625% 03-Apr-2018 4,785,937 0.26% 1,000,000 GBP Citigroup Inc 6.250% 02-Sep-2019 1,085,977 0.06% 3,000,000 USD Energy Transfer LP 2.500% 15-Jun-2018 2,222,232 0.12%
400,000 GBP General Electric Co 6.250% 29-Sep-2020 455,192 0.02% 4,500,000 GBP HSBC Finance Corp 6.250% 19-Aug-2019 4,892,082 0.26% 3,140,000 GBP JPMorgan Chase & Co 1.875% 10-Feb-2020 3,201,217 0.17% 1,715,000 GBP MetLife Inc 5.250% 29-Jun-2020 1,887,757 0.10% 3,700,000 GBP Metropolitan Life Global Funding I 1.125% 15-Dec-2021 3,687,121 0.20% 1,650,000 GBP National Grid North America Inc 1.875% 06-Aug-2018 1,659,892 0.09% 5,715,000 GBP New York Life Global Funding 1.000% 15-Dec-2021 5,687,739 0.31% 1,230,000 GBP Toyota Motor Credit Corp 1.125% 07-Sep-2021 1,234,312 0.07% 2,000,000 GBP Wells Fargo & Co 2.125% 22-Apr-2022 2,048,941 0.11%
Total for United States 42,861,032 2.31%
Total Bonds and Other Debt Securities 558,736,232 30.07%
Government Bonds
Argentina 86,448,191 ARS Argentina POM Politica Monetaria FRN 21-Jun-2020 3,629,484 0.20% 38,051,000 ARS Provincia de Buenos Aires FRN 31-May-2022 1,516,677 0.08%
Total for Argentina 5,146,161 0.28%
Brazil 2,798,000 BRL Brazil Notas do Tesouro Nacional Series B 6.000% 15-May-2045 2,038,457 0.11% 2,453,000 BRL Brazil Notas do Tesouro Nacional Series B 6.000% 15-Aug-2050 1,799,484 0.10%
63,994,000 BRL Brazil Notas do Tesouro Nacional Series F 10.000% 01-Jan-2023 14,447,115 0.78% 5,284,000 BRL Brazil Notas do Tesouro Nacional Series F 10.000% 01-Jan-2025 1,177,869 0.06%
Total for Brazil 19,462,925 1.05%
Colombia 59,082,000 COP Colombian TES 3.500% 10-Mar-2021 3,854,208 0.21%
22,456,400,000 COP Colombian TES 10.000% 24-Jul-2024 6,721,454 0.36% 12,791,300,000 COP Colombian TES 7.750% 18-Sep-2030 3,450,106 0.18%
Total for Colombia 14,025,768 0.75%
Czech Republic 244,210,000 CZK Czech Republic Government Bond 0.450% 25-Oct-2023 8,186,437 0.44%
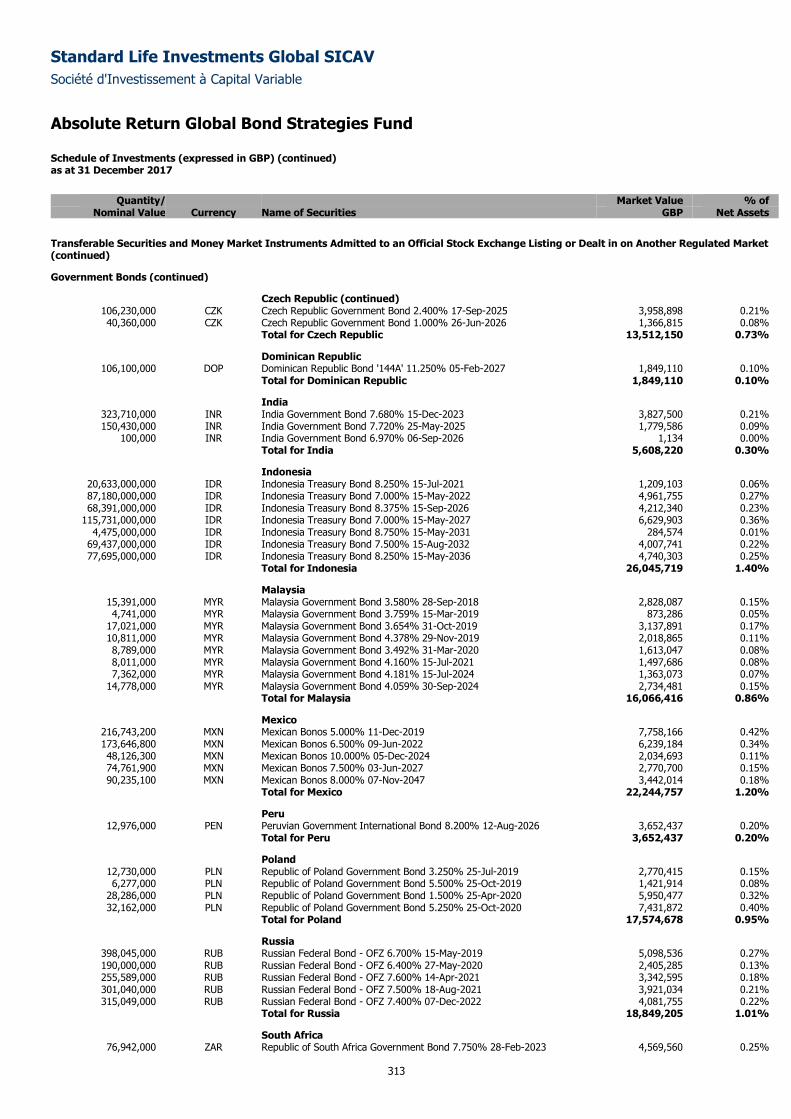
Standard Life Investments Global SICAV
Société d'Investissement à Capital Variable
Absolute Return Global Bond Strategies Fund Schedule of Investments (expressed in GBP) (continued) as at 31 December 2017
313
Quantity/ Market Value % of
Nominal Value Currency Name of Securities GBP Net Assets
Transferable Securities and Money Market Instruments Admitted to an Official Stock Exchange Listing or Dealt in on Another Regulated Market (continued)
Government Bonds (continued)
Czech Republic (continued) 106,230,000 CZK Czech Republic Government Bond 2.400% 17-Sep-2025 3,958,898 0.21% 40,360,000 CZK Czech Republic Government Bond 1.000% 26-Jun-2026 1,366,815 0.08%
Total for Czech Republic 13,512,150 0.73%
Dominican Republic 106,100,000 DOP Dominican Republic Bond '144A' 11.250% 05-Feb-2027 1,849,110 0.10%
Total for Dominican Republic 1,849,110 0.10%
India 323,710,000 INR India Government Bond 7.680% 15-Dec-2023 3,827,500 0.21% 150,430,000 INR India Government Bond 7.720% 25-May-2025 1,779,586 0.09%
100,000 INR India Government Bond 6.970% 06-Sep-2026 1,134 0.00% Total for India 5,608,220 0.30%
Indonesia 20,633,000,000 IDR Indonesia Treasury Bond 8.250% 15-Jul-2021 1,209,103 0.06% 87,180,000,000 IDR Indonesia Treasury Bond 7.000% 15-May-2022 4,961,755 0.27% 68,391,000,000 IDR Indonesia Treasury Bond 8.375% 15-Sep-2026 4,212,340 0.23%
115,731,000,000 IDR Indonesia Treasury Bond 7.000% 15-May-2027 6,629,903 0.36% 4,475,000,000 IDR Indonesia Treasury Bond 8.750% 15-May-2031 284,574 0.01%
69,437,000,000 IDR Indonesia Treasury Bond 7.500% 15-Aug-2032 4,007,741 0.22% 77,695,000,000 IDR Indonesia Treasury Bond 8.250% 15-May-2036 4,740,303 0.25%
Total for Indonesia 26,045,719 1.40%
Malaysia 15,391,000 MYR Malaysia Government Bond 3.580% 28-Sep-2018 2,828,087 0.15% 4,741,000 MYR Malaysia Government Bond 3.759% 15-Mar-2019 873,286 0.05%
17,021,000 MYR Malaysia Government Bond 3.654% 31-Oct-2019 3,137,891 0.17% 10,811,000 MYR Malaysia Government Bond 4.378% 29-Nov-2019 2,018,865 0.11% 8,789,000 MYR Malaysia Government Bond 3.492% 31-Mar-2020 1,613,047 0.08% 8,011,000 MYR Malaysia Government Bond 4.160% 15-Jul-2021 1,497,686 0.08% 7,362,000 MYR Malaysia Government Bond 4.181% 15-Jul-2024 1,363,073 0.07%
14,778,000 MYR Malaysia Government Bond 4.059% 30-Sep-2024 2,734,481 0.15% Total for Malaysia 16,066,416 0.86%
Mexico 216,743,200 MXN Mexican Bonos 5.000% 11-Dec-2019 7,758,166 0.42% 173,646,800 MXN Mexican Bonos 6.500% 09-Jun-2022 6,239,184 0.34% 48,126,300 MXN Mexican Bonos 10.000% 05-Dec-2024 2,034,693 0.11% 74,761,900 MXN Mexican Bonos 7.500% 03-Jun-2027 2,770,700 0.15% 90,235,100 MXN Mexican Bonos 8.000% 07-Nov-2047 3,442,014 0.18%
Total for Mexico 22,244,757 1.20%
Peru 12,976,000 PEN Peruvian Government International Bond 8.200% 12-Aug-2026 3,652,437 0.20%
Total for Peru 3,652,437 0.20%
Poland 12,730,000 PLN Republic of Poland Government Bond 3.250% 25-Jul-2019 2,770,415 0.15% 6,277,000 PLN Republic of Poland Government Bond 5.500% 25-Oct-2019 1,421,914 0.08%
28,286,000 PLN Republic of Poland Government Bond 1.500% 25-Apr-2020 5,950,477 0.32% 32,162,000 PLN Republic of Poland Government Bond 5.250% 25-Oct-2020 7,431,872 0.40%
Total for Poland 17,574,678 0.95%
Russia 398,045,000 RUB Russian Federal Bond - OFZ 6.700% 15-May-2019 5,098,536 0.27% 190,000,000 RUB Russian Federal Bond - OFZ 6.400% 27-May-2020 2,405,285 0.13% 255,589,000 RUB Russian Federal Bond - OFZ 7.600% 14-Apr-2021 3,342,595 0.18% 301,040,000 RUB Russian Federal Bond - OFZ 7.500% 18-Aug-2021 3,921,034 0.21% 315,049,000 RUB Russian Federal Bond - OFZ 7.400% 07-Dec-2022 4,081,755 0.22%
Total for Russia 18,849,205 1.01%
South Africa 76,942,000 ZAR Republic of South Africa Government Bond 7.750% 28-Feb-2023 4,569,560 0.25%
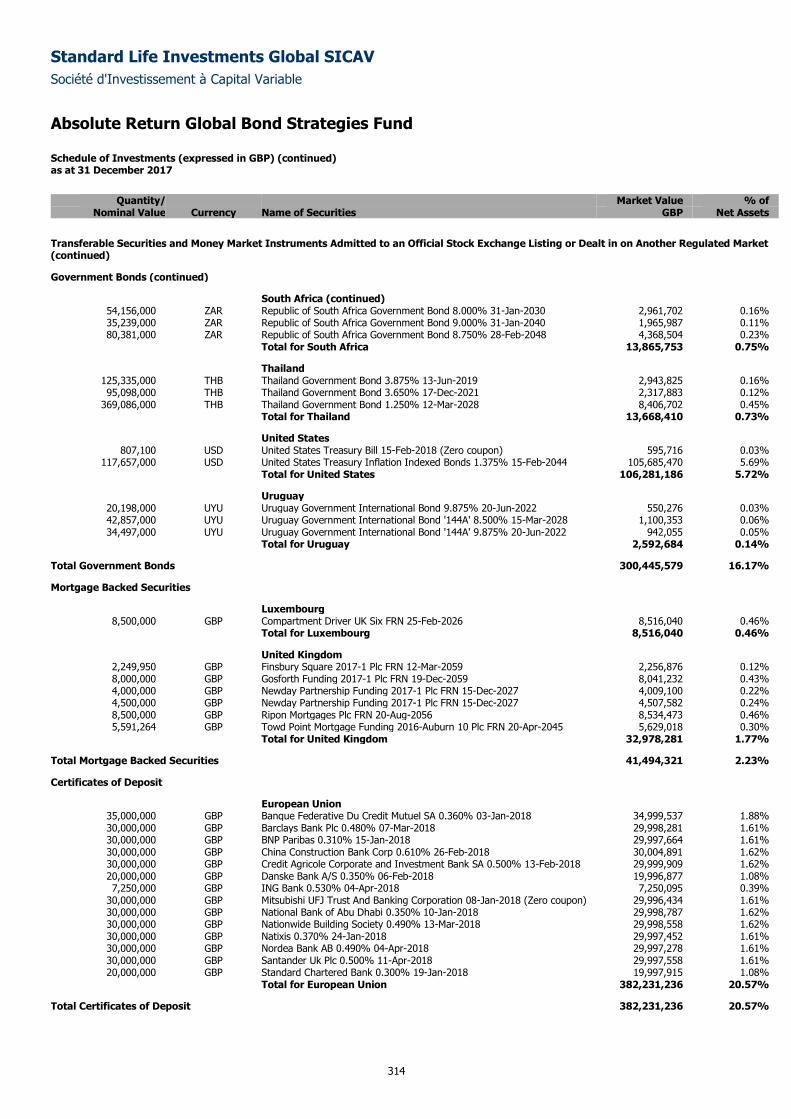
Standard Life Investments Global SICAV
Société d'Investissement à Capital Variable
Absolute Return Global Bond Strategies Fund Schedule of Investments (expressed in GBP) (continued) as at 31 December 2017
314
Quantity/ Market Value % of
Nominal Value Currency Name of Securities GBP Net Assets
Transferable Securities and Money Market Instruments Admitted to an Official Stock Exchange Listing or Dealt in on Another Regulated Market (continued)
Government Bonds (continued)
South Africa (continued) 54,156,000 ZAR Republic of South Africa Government Bond 8.000% 31-Jan-2030 2,961,702 0.16% 35,239,000 ZAR Republic of South Africa Government Bond 9.000% 31-Jan-2040 1,965,987 0.11% 80,381,000 ZAR Republic of South Africa Government Bond 8.750% 28-Feb-2048 4,368,504 0.23%
Total for South Africa 13,865,753 0.75%
Thailand 125,335,000 THB Thailand Government Bond 3.875% 13-Jun-2019 2,943,825 0.16% 95,098,000 THB Thailand Government Bond 3.650% 17-Dec-2021 2,317,883 0.12%
369,086,000 THB Thailand Government Bond 1.250% 12-Mar-2028 8,406,702 0.45% Total for Thailand 13,668,410 0.73%
United States 807,100 USD United States Treasury Bill 15-Feb-2018 (Zero coupon) 595,716 0.03%
117,657,000 USD United States Treasury Inflation Indexed Bonds 1.375% 15-Feb-2044 105,685,470 5.69% Total for United States 106,281,186 5.72%
Uruguay 20,198,000 UYU Uruguay Government International Bond 9.875% 20-Jun-2022 550,276 0.03% 42,857,000 UYU Uruguay Government International Bond '144A' 8.500% 15-Mar-2028 1,100,353 0.06% 34,497,000 UYU Uruguay Government International Bond '144A' 9.875% 20-Jun-2022 942,055 0.05%
Total for Uruguay 2,592,684 0.14%
Total Government Bonds 300,445,579 16.17%
Mortgage Backed Securities
Luxembourg 8,500,000 GBP Compartment Driver UK Six FRN 25-Feb-2026 8,516,040 0.46%
Total for Luxembourg 8,516,040 0.46%
United Kingdom 2,249,950 GBP Finsbury Square 2017-1 Plc FRN 12-Mar-2059 2,256,876 0.12% 8,000,000 GBP Gosforth Funding 2017-1 Plc FRN 19-Dec-2059 8,041,232 0.43% 4,000,000 GBP Newday Partnership Funding 2017-1 Plc FRN 15-Dec-2027 4,009,100 0.22% 4,500,000 GBP Newday Partnership Funding 2017-1 Plc FRN 15-Dec-2027 4,507,582 0.24% 8,500,000 GBP Ripon Mortgages Plc FRN 20-Aug-2056 8,534,473 0.46% 5,591,264 GBP Towd Point Mortgage Funding 2016-Auburn 10 Plc FRN 20-Apr-2045 5,629,018 0.30%
Total for United Kingdom 32,978,281 1.77%
Total Mortgage Backed Securities 41,494,321 2.23%
Certificates of Deposit
European Union 35,000,000 GBP Banque Federative Du Credit Mutuel SA 0.360% 03-Jan-2018 34,999,537 1.88% 30,000,000 GBP Barclays Bank Plc 0.480% 07-Mar-2018 29,998,281 1.61% 30,000,000 GBP BNP Paribas 0.310% 15-Jan-2018 29,997,664 1.61% 30,000,000 GBP China Construction Bank Corp 0.610% 26-Feb-2018 30,004,891 1.62% 30,000,000 GBP Credit Agricole Corporate and Investment Bank SA 0.500% 13-Feb-2018 29,999,909 1.62% 20,000,000 GBP Danske Bank A/S 0.350% 06-Feb-2018 19,996,877 1.08% 7,250,000 GBP ING Bank 0.530% 04-Apr-2018 7,250,095 0.39%
30,000,000 GBP Mitsubishi UFJ Trust And Banking Corporation 08-Jan-2018 (Zero coupon) 29,996,434 1.61% 30,000,000 GBP National Bank of Abu Dhabi 0.350% 10-Jan-2018 29,998,787 1.62% 30,000,000 GBP Nationwide Building Society 0.490% 13-Mar-2018 29,998,558 1.62% 30,000,000 GBP Natixis 0.370% 24-Jan-2018 29,997,452 1.61% 30,000,000 GBP Nordea Bank AB 0.490% 04-Apr-2018 29,997,278 1.61% 30,000,000 GBP Santander Uk Plc 0.500% 11-Apr-2018 29,997,558 1.61% 20,000,000 GBP Standard Chartered Bank 0.300% 19-Jan-2018 19,997,915 1.08%
Total for European Union 382,231,236 20.57%
Total Certificates of Deposit 382,231,236 20.57%
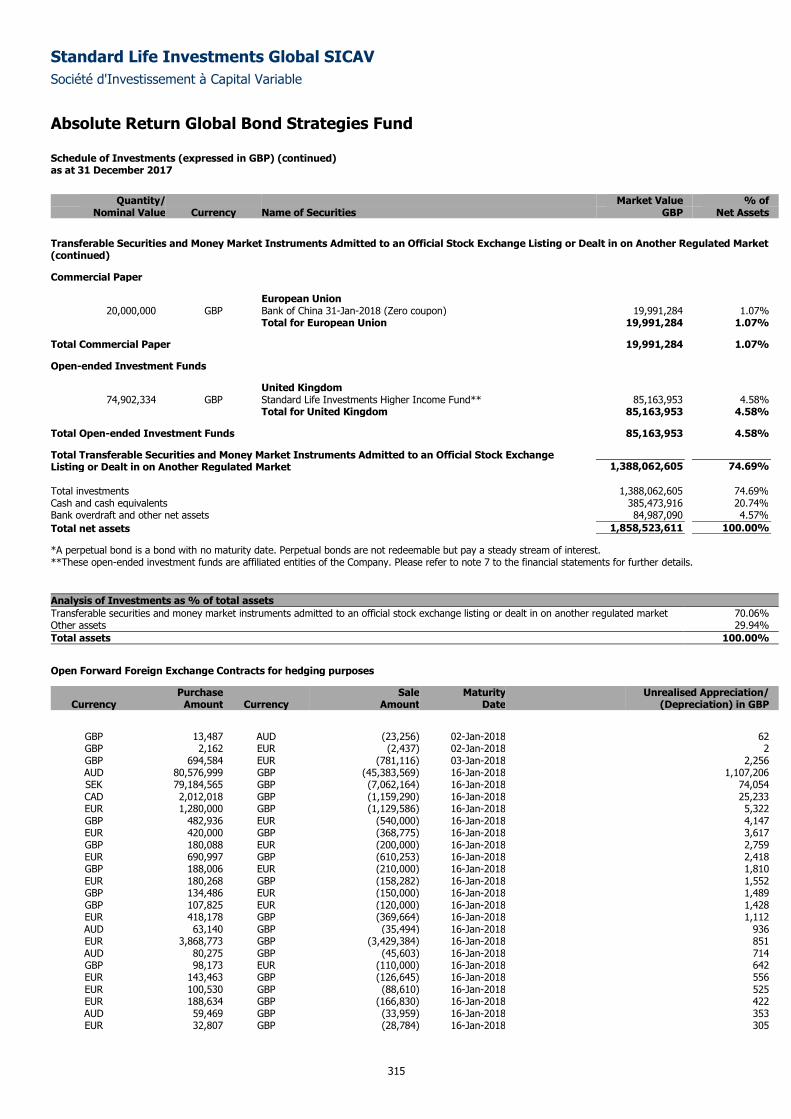
Standard Life Investments Global SICAV
Société d'Investissement à Capital Variable
Absolute Return Global Bond Strategies Fund Schedule of Investments (expressed in GBP) (continued) as at 31 December 2017
315
Quantity/ Market Value % of
Nominal Value Currency Name of Securities GBP Net Assets
Transferable Securities and Money Market Instruments Admitted to an Official Stock Exchange Listing or Dealt in on Another Regulated Market (continued)
Commercial Paper
European Union 20,000,000 GBP Bank of China 31-Jan-2018 (Zero coupon) 19,991,284 1.07%
Total for European Union 19,991,284 1.07%
Total Commercial Paper 19,991,284 1.07%
Open-ended Investment Funds
United Kingdom 74,902,334 GBP Standard Life Investments Higher Income Fund** 85,163,953 4.58%
Total for United Kingdom 85,163,953 4.58%
Total Open-ended Investment Funds 85,163,953 4.58%
Total Transferable Securities and Money Market Instruments Admitted to an Official Stock Exchange Listing or Dealt in on Another Regulated Market 1,388,062,605 74.69%
Total investments 1,388,062,605 74.69%
Cash and cash equivalents 385,473,916 20.74%
Bank overdraft and other net assets 84,987,090 4.57%
Total net assets 1,858,523,611 100.00%
*A perpetual bond is a bond with no maturity date. Perpetual bonds are not redeemable but pay a steady stream of interest. **These open-ended investment funds are affiliated entities of the Company. Please refer to note 7 to the financial statements for further details.
Analysis of Investments as % of total assets
Transferable securities and money market instruments admitted to an official stock exchange listing or dealt in on another regulated market 70.06% Other assets 29.94%
Total assets 100.00%
Open Forward Foreign Exchange Contracts for hedging purposes
Purchase Sale Maturity Unrealised Appreciation/ Currency Amount Currency Amount Date (Depreciation) in GBP
GBP 13,487 AUD (23,256) 02-Jan-2018 62 GBP 2,162 EUR (2,437) 02-Jan-2018 2 GBP 694,584 EUR (781,116) 03-Jan-2018 2,256 AUD 80,576,999 GBP (45,383,569) 16-Jan-2018 1,107,206 SEK 79,184,565 GBP (7,062,164) 16-Jan-2018 74,054 CAD 2,012,018 GBP (1,159,290) 16-Jan-2018 25,233 EUR 1,280,000 GBP (1,129,586) 16-Jan-2018 5,322 GBP 482,936 EUR (540,000) 16-Jan-2018 4,147 EUR 420,000 GBP (368,775) 16-Jan-2018 3,617 GBP 180,088 EUR (200,000) 16-Jan-2018 2,759 EUR 690,997 GBP (610,253) 16-Jan-2018 2,418 GBP 188,006 EUR (210,000) 16-Jan-2018 1,810 EUR 180,268 GBP (158,282) 16-Jan-2018 1,552 GBP 134,486 EUR (150,000) 16-Jan-2018 1,489 GBP 107,825 EUR (120,000) 16-Jan-2018 1,428 EUR 418,178 GBP (369,664) 16-Jan-2018 1,112 AUD 63,140 GBP (35,494) 16-Jan-2018 936 EUR 3,868,773 GBP (3,429,384) 16-Jan-2018 851 AUD 80,275 GBP (45,603) 16-Jan-2018 714 GBP 98,173 EUR (110,000) 16-Jan-2018 642 EUR 143,463 GBP (126,645) 16-Jan-2018 556 EUR 100,530 GBP (88,610) 16-Jan-2018 525 EUR 188,634 GBP (166,830) 16-Jan-2018 422 AUD 59,469 GBP (33,959) 16-Jan-2018 353 EUR 32,807 GBP (28,784) 16-Jan-2018 305
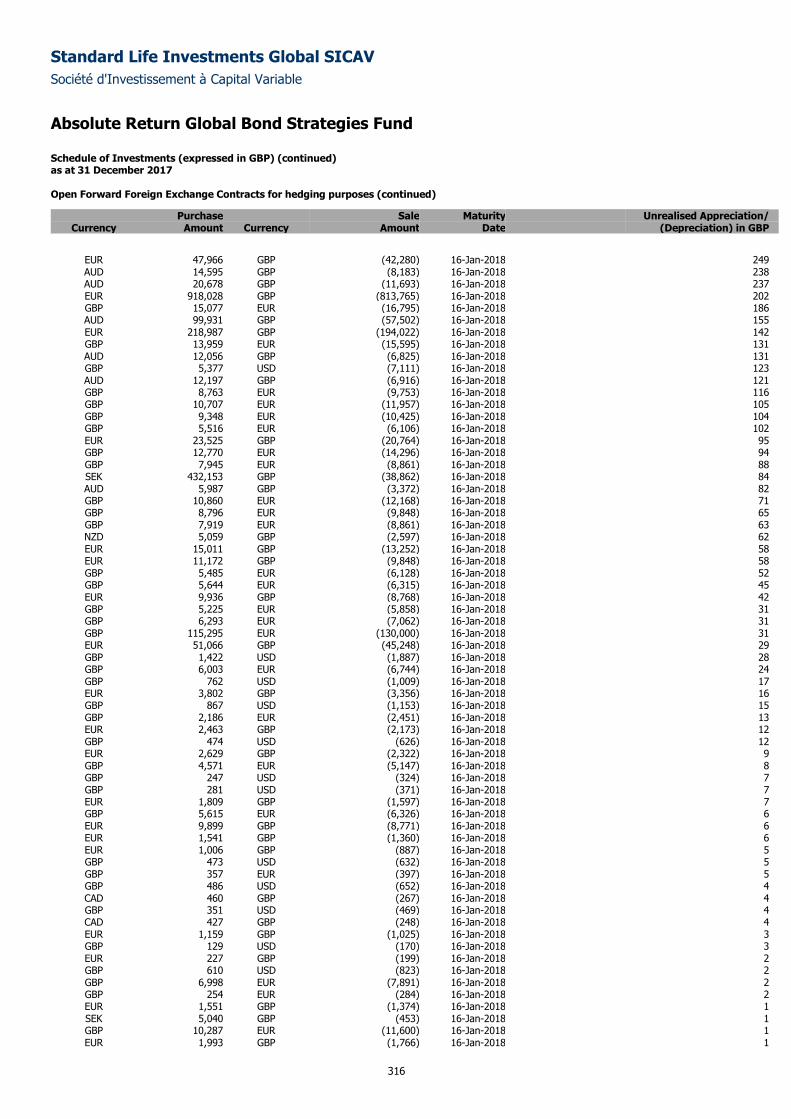
Standard Life Investments Global SICAV
Société d'Investissement à Capital Variable
Absolute Return Global Bond Strategies Fund Schedule of Investments (expressed in GBP) (continued) as at 31 December 2017
316
Open Forward Foreign Exchange Contracts for hedging purposes (continued)
Purchase Sale Maturity Unrealised Appreciation/ Currency Amount Currency Amount Date (Depreciation) in GBP
EUR 47,966 GBP (42,280) 16-Jan-2018 249 AUD 14,595 GBP (8,183) 16-Jan-2018 238 AUD 20,678 GBP (11,693) 16-Jan-2018 237 EUR 918,028 GBP (813,765) 16-Jan-2018 202 GBP 15,077 EUR (16,795) 16-Jan-2018 186 AUD 99,931 GBP (57,502) 16-Jan-2018 155 EUR 218,987 GBP (194,022) 16-Jan-2018 142 GBP 13,959 EUR (15,595) 16-Jan-2018 131 AUD 12,056 GBP (6,825) 16-Jan-2018 131 GBP 5,377 USD (7,111) 16-Jan-2018 123 AUD 12,197 GBP (6,916) 16-Jan-2018 121 GBP 8,763 EUR (9,753) 16-Jan-2018 116 GBP 10,707 EUR (11,957) 16-Jan-2018 105 GBP 9,348 EUR (10,425) 16-Jan-2018 104 GBP 5,516 EUR (6,106) 16-Jan-2018 102 EUR 23,525 GBP (20,764) 16-Jan-2018 95 GBP 12,770 EUR (14,296) 16-Jan-2018 94 GBP 7,945 EUR (8,861) 16-Jan-2018 88 SEK 432,153 GBP (38,862) 16-Jan-2018 84 AUD 5,987 GBP (3,372) 16-Jan-2018 82 GBP 10,860 EUR (12,168) 16-Jan-2018 71 GBP 8,796 EUR (9,848) 16-Jan-2018 65 GBP 7,919 EUR (8,861) 16-Jan-2018 63 NZD 5,059 GBP (2,597) 16-Jan-2018 62 EUR 15,011 GBP (13,252) 16-Jan-2018 58 EUR 11,172 GBP (9,848) 16-Jan-2018 58 GBP 5,485 EUR (6,128) 16-Jan-2018 52 GBP 5,644 EUR (6,315) 16-Jan-2018 45 EUR 9,936 GBP (8,768) 16-Jan-2018 42 GBP 5,225 EUR (5,858) 16-Jan-2018 31 GBP 6,293 EUR (7,062) 16-Jan-2018 31 GBP 115,295 EUR (130,000) 16-Jan-2018 31 EUR 51,066 GBP (45,248) 16-Jan-2018 29 GBP 1,422 USD (1,887) 16-Jan-2018 28 GBP 6,003 EUR (6,744) 16-Jan-2018 24 GBP 762 USD (1,009) 16-Jan-2018 17 EUR 3,802 GBP (3,356) 16-Jan-2018 16 GBP 867 USD (1,153) 16-Jan-2018 15 GBP 2,186 EUR (2,451) 16-Jan-2018 13 EUR 2,463 GBP (2,173) 16-Jan-2018 12 GBP 474 USD (626) 16-Jan-2018 12 EUR 2,629 GBP (2,322) 16-Jan-2018 9 GBP 4,571 EUR (5,147) 16-Jan-2018 8 GBP 247 USD (324) 16-Jan-2018 7 GBP 281 USD (371) 16-Jan-2018 7 EUR 1,809 GBP (1,597) 16-Jan-2018 7 GBP 5,615 EUR (6,326) 16-Jan-2018 6 EUR 9,899 GBP (8,771) 16-Jan-2018 6 EUR 1,541 GBP (1,360) 16-Jan-2018 6 EUR 1,006 GBP (887) 16-Jan-2018 5 GBP 473 USD (632) 16-Jan-2018 5 GBP 357 EUR (397) 16-Jan-2018 5 GBP 486 USD (652) 16-Jan-2018 4 CAD 460 GBP (267) 16-Jan-2018 4 GBP 351 USD (469) 16-Jan-2018 4 CAD 427 GBP (248) 16-Jan-2018 4 EUR 1,159 GBP (1,025) 16-Jan-2018 3 GBP 129 USD (170) 16-Jan-2018 3 EUR 227 GBP (199) 16-Jan-2018 2 GBP 610 USD (823) 16-Jan-2018 2 GBP 6,998 EUR (7,891) 16-Jan-2018 2 GBP 254 EUR (284) 16-Jan-2018 2 EUR 1,551 GBP (1,374) 16-Jan-2018 1 SEK 5,040 GBP (453) 16-Jan-2018 1 GBP 10,287 EUR (11,600) 16-Jan-2018 1 EUR 1,993 GBP (1,766) 16-Jan-2018 1
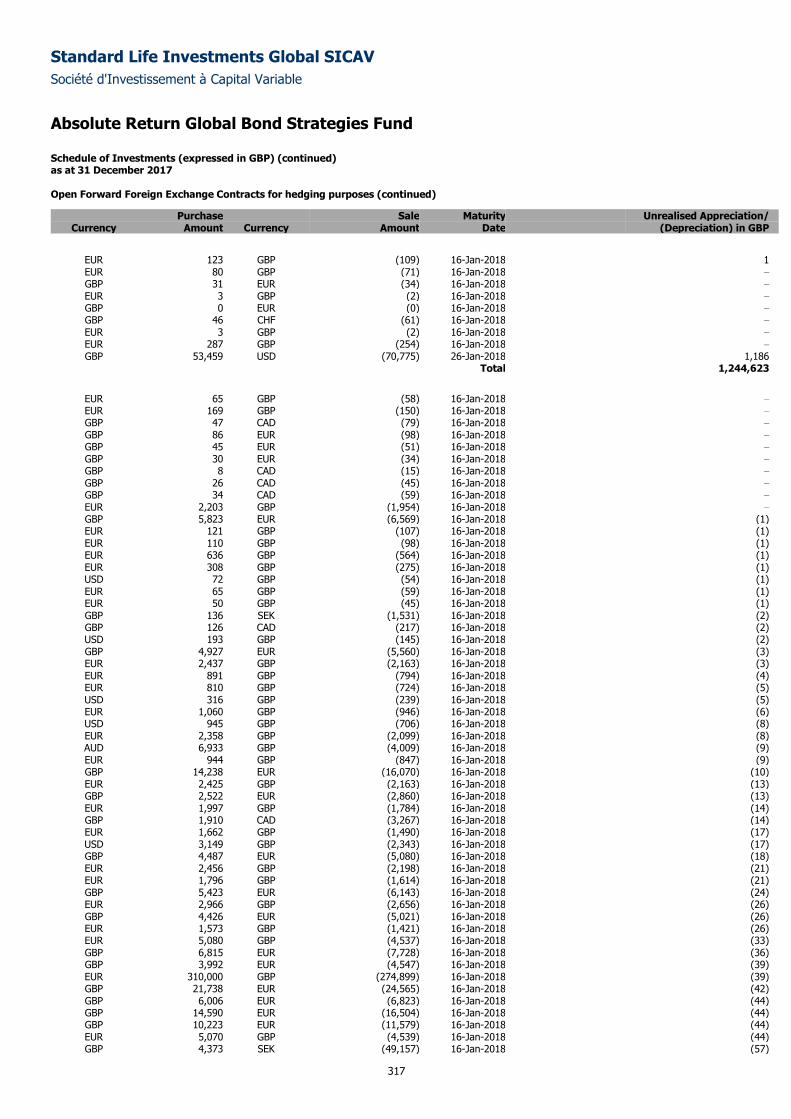
Standard Life Investments Global SICAV
Société d'Investissement à Capital Variable
Absolute Return Global Bond Strategies Fund Schedule of Investments (expressed in GBP) (continued) as at 31 December 2017
317
Open Forward Foreign Exchange Contracts for hedging purposes (continued)
Purchase Sale Maturity Unrealised Appreciation/ Currency Amount Currency Amount Date (Depreciation) in GBP
EUR 123 GBP (109) 16-Jan-2018 1 EUR 80 GBP (71) 16-Jan-2018 –
GBP 31 EUR (34) 16-Jan-2018 –
EUR 3 GBP (2) 16-Jan-2018 –
GBP 0 EUR (0) 16-Jan-2018 –
GBP 46 CHF (61) 16-Jan-2018 –
EUR 3 GBP (2) 16-Jan-2018 –
EUR 287 GBP (254) 16-Jan-2018 –
GBP 53,459 USD (70,775) 26-Jan-2018 1,186 Total 1,244,623
EUR 65 GBP (58) 16-Jan-2018 –
EUR 169 GBP (150) 16-Jan-2018 –
GBP 47 CAD (79) 16-Jan-2018 –
GBP 86 EUR (98) 16-Jan-2018 –
GBP 45 EUR (51) 16-Jan-2018 –
GBP 30 EUR (34) 16-Jan-2018 –
GBP 8 CAD (15) 16-Jan-2018 –
GBP 26 CAD (45) 16-Jan-2018 –
GBP 34 CAD (59) 16-Jan-2018 –
EUR 2,203 GBP (1,954) 16-Jan-2018 –
GBP 5,823 EUR (6,569) 16-Jan-2018 (1) EUR 121 GBP (107) 16-Jan-2018 (1) EUR 110 GBP (98) 16-Jan-2018 (1) EUR 636 GBP (564) 16-Jan-2018 (1) EUR 308 GBP (275) 16-Jan-2018 (1) USD 72 GBP (54) 16-Jan-2018 (1) EUR 65 GBP (59) 16-Jan-2018 (1) EUR 50 GBP (45) 16-Jan-2018 (1) GBP 136 SEK (1,531) 16-Jan-2018 (2) GBP 126 CAD (217) 16-Jan-2018 (2) USD 193 GBP (145) 16-Jan-2018 (2) GBP 4,927 EUR (5,560) 16-Jan-2018 (3) EUR 2,437 GBP (2,163) 16-Jan-2018 (3) EUR 891 GBP (794) 16-Jan-2018 (4) EUR 810 GBP (724) 16-Jan-2018 (5) USD 316 GBP (239) 16-Jan-2018 (5) EUR 1,060 GBP (946) 16-Jan-2018 (6) USD 945 GBP (706) 16-Jan-2018 (8) EUR 2,358 GBP (2,099) 16-Jan-2018 (8) AUD 6,933 GBP (4,009) 16-Jan-2018 (9) EUR 944 GBP (847) 16-Jan-2018 (9) GBP 14,238 EUR (16,070) 16-Jan-2018 (10) EUR 2,425 GBP (2,163) 16-Jan-2018 (13) GBP 2,522 EUR (2,860) 16-Jan-2018 (13) EUR 1,997 GBP (1,784) 16-Jan-2018 (14) GBP 1,910 CAD (3,267) 16-Jan-2018 (14) EUR 1,662 GBP (1,490) 16-Jan-2018 (17) USD 3,149 GBP (2,343) 16-Jan-2018 (17) GBP 4,487 EUR (5,080) 16-Jan-2018 (18) EUR 2,456 GBP (2,198) 16-Jan-2018 (21) EUR 1,796 GBP (1,614) 16-Jan-2018 (21) GBP 5,423 EUR (6,143) 16-Jan-2018 (24) EUR 2,966 GBP (2,656) 16-Jan-2018 (26) GBP 4,426 EUR (5,021) 16-Jan-2018 (26) EUR 1,573 GBP (1,421) 16-Jan-2018 (26) EUR 5,080 GBP (4,537) 16-Jan-2018 (33) GBP 6,815 EUR (7,728) 16-Jan-2018 (36) GBP 3,992 EUR (4,547) 16-Jan-2018 (39) EUR 310,000 GBP (274,899) 16-Jan-2018 (39) GBP 21,738 EUR (24,565) 16-Jan-2018 (42) GBP 6,006 EUR (6,823) 16-Jan-2018 (44) GBP 14,590 EUR (16,504) 16-Jan-2018 (44) GBP 10,223 EUR (11,579) 16-Jan-2018 (44) EUR 5,070 GBP (4,539) 16-Jan-2018 (44) GBP 4,373 SEK (49,157) 16-Jan-2018 (57)
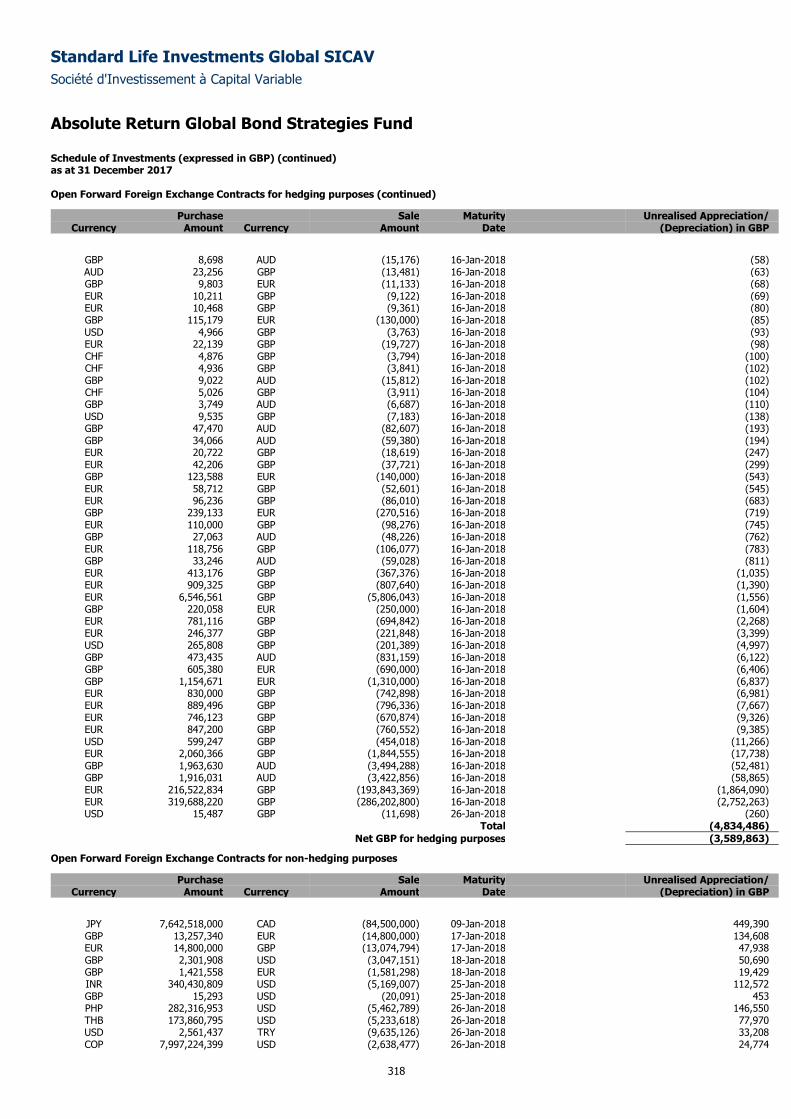
Standard Life Investments Global SICAV
Société d'Investissement à Capital Variable
Absolute Return Global Bond Strategies Fund Schedule of Investments (expressed in GBP) (continued) as at 31 December 2017
318
Open Forward Foreign Exchange Contracts for hedging purposes (continued)
Purchase Sale Maturity Unrealised Appreciation/ Currency Amount Currency Amount Date (Depreciation) in GBP
GBP 8,698 AUD (15,176) 16-Jan-2018 (58) AUD 23,256 GBP (13,481) 16-Jan-2018 (63) GBP 9,803 EUR (11,133) 16-Jan-2018 (68) EUR 10,211 GBP (9,122) 16-Jan-2018 (69) EUR 10,468 GBP (9,361) 16-Jan-2018 (80) GBP 115,179 EUR (130,000) 16-Jan-2018 (85) USD 4,966 GBP (3,763) 16-Jan-2018 (93) EUR 22,139 GBP (19,727) 16-Jan-2018 (98) CHF 4,876 GBP (3,794) 16-Jan-2018 (100) CHF 4,936 GBP (3,841) 16-Jan-2018 (102) GBP 9,022 AUD (15,812) 16-Jan-2018 (102) CHF 5,026 GBP (3,911) 16-Jan-2018 (104) GBP 3,749 AUD (6,687) 16-Jan-2018 (110) USD 9,535 GBP (7,183) 16-Jan-2018 (138) GBP 47,470 AUD (82,607) 16-Jan-2018 (193) GBP 34,066 AUD (59,380) 16-Jan-2018 (194) EUR 20,722 GBP (18,619) 16-Jan-2018 (247) EUR 42,206 GBP (37,721) 16-Jan-2018 (299) GBP 123,588 EUR (140,000) 16-Jan-2018 (543) EUR 58,712 GBP (52,601) 16-Jan-2018 (545) EUR 96,236 GBP (86,010) 16-Jan-2018 (683) GBP 239,133 EUR (270,516) 16-Jan-2018 (719) EUR 110,000 GBP (98,276) 16-Jan-2018 (745) GBP 27,063 AUD (48,226) 16-Jan-2018 (762) EUR 118,756 GBP (106,077) 16-Jan-2018 (783) GBP 33,246 AUD (59,028) 16-Jan-2018 (811) EUR 413,176 GBP (367,376) 16-Jan-2018 (1,035) EUR 909,325 GBP (807,640) 16-Jan-2018 (1,390) EUR 6,546,561 GBP (5,806,043) 16-Jan-2018 (1,556) GBP 220,058 EUR (250,000) 16-Jan-2018 (1,604) EUR 781,116 GBP (694,842) 16-Jan-2018 (2,268) EUR 246,377 GBP (221,848) 16-Jan-2018 (3,399) USD 265,808 GBP (201,389) 16-Jan-2018 (4,997) GBP 473,435 AUD (831,159) 16-Jan-2018 (6,122) GBP 605,380 EUR (690,000) 16-Jan-2018 (6,406) GBP 1,154,671 EUR (1,310,000) 16-Jan-2018 (6,837) EUR 830,000 GBP (742,898) 16-Jan-2018 (6,981) EUR 889,496 GBP (796,336) 16-Jan-2018 (7,667) EUR 746,123 GBP (670,874) 16-Jan-2018 (9,326) EUR 847,200 GBP (760,552) 16-Jan-2018 (9,385) USD 599,247 GBP (454,018) 16-Jan-2018 (11,266) EUR 2,060,366 GBP (1,844,555) 16-Jan-2018 (17,738) GBP 1,963,630 AUD (3,494,288) 16-Jan-2018 (52,481) GBP 1,916,031 AUD (3,422,856) 16-Jan-2018 (58,865) EUR 216,522,834 GBP (193,843,369) 16-Jan-2018 (1,864,090) EUR 319,688,220 GBP (286,202,800) 16-Jan-2018 (2,752,263) USD 15,487 GBP (11,698) 26-Jan-2018 (260)
Total (4,834,486)
Net GBP for hedging purposes (3,589,863)
Open Forward Foreign Exchange Contracts for non-hedging purposes
Purchase Sale Maturity Unrealised Appreciation/ Currency Amount Currency Amount Date (Depreciation) in GBP
JPY 7,642,518,000 CAD (84,500,000) 09-Jan-2018 449,390 GBP 13,257,340 EUR (14,800,000) 17-Jan-2018 134,608 EUR 14,800,000 GBP (13,074,794) 17-Jan-2018 47,938 GBP 2,301,908 USD (3,047,151) 18-Jan-2018 50,690 GBP 1,421,558 EUR (1,581,298) 18-Jan-2018 19,429 INR 340,430,809 USD (5,169,007) 25-Jan-2018 112,572 GBP 15,293 USD (20,091) 25-Jan-2018 453 PHP 282,316,953 USD (5,462,789) 26-Jan-2018 146,550 THB 173,860,795 USD (5,233,618) 26-Jan-2018 77,970 USD 2,561,437 TRY (9,635,126) 26-Jan-2018 33,208 COP 7,997,224,399 USD (2,638,477) 26-Jan-2018 24,774
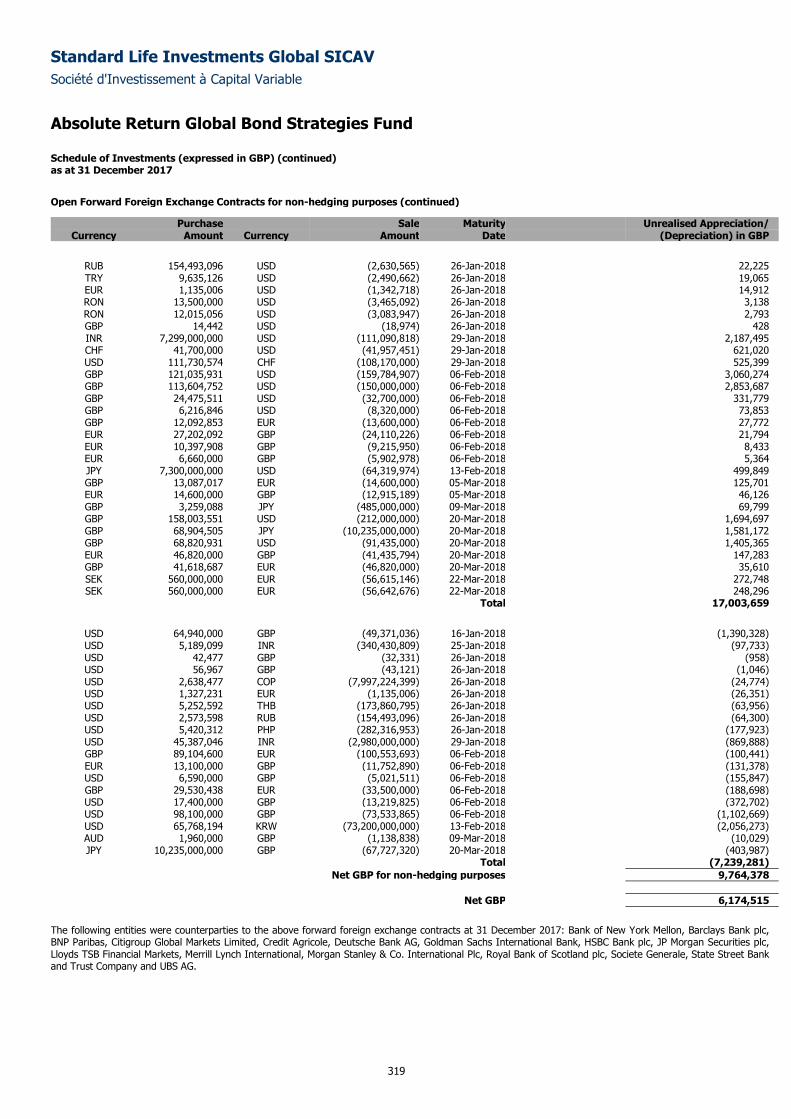
Standard Life Investments Global SICAV
Société d'Investissement à Capital Variable
Absolute Return Global Bond Strategies Fund Schedule of Investments (expressed in GBP) (continued) as at 31 December 2017
319
Open Forward Foreign Exchange Contracts for non-hedging purposes (continued)
Purchase Sale Maturity Unrealised Appreciation/ Currency Amount Currency Amount Date (Depreciation) in GBP
RUB 154,493,096 USD (2,630,565) 26-Jan-2018 22,225 TRY 9,635,126 USD (2,490,662) 26-Jan-2018 19,065 EUR 1,135,006 USD (1,342,718) 26-Jan-2018 14,912 RON 13,500,000 USD (3,465,092) 26-Jan-2018 3,138 RON 12,015,056 USD (3,083,947) 26-Jan-2018 2,793 GBP 14,442 USD (18,974) 26-Jan-2018 428 INR 7,299,000,000 USD (111,090,818) 29-Jan-2018 2,187,495 CHF 41,700,000 USD (41,957,451) 29-Jan-2018 621,020 USD 111,730,574 CHF (108,170,000) 29-Jan-2018 525,399 GBP 121,035,931 USD (159,784,907) 06-Feb-2018 3,060,274 GBP 113,604,752 USD (150,000,000) 06-Feb-2018 2,853,687 GBP 24,475,511 USD (32,700,000) 06-Feb-2018 331,779 GBP 6,216,846 USD (8,320,000) 06-Feb-2018 73,853 GBP 12,092,853 EUR (13,600,000) 06-Feb-2018 27,772 EUR 27,202,092 GBP (24,110,226) 06-Feb-2018 21,794 EUR 10,397,908 GBP (9,215,950) 06-Feb-2018 8,433 EUR 6,660,000 GBP (5,902,978) 06-Feb-2018 5,364 JPY 7,300,000,000 USD (64,319,974) 13-Feb-2018 499,849 GBP 13,087,017 EUR (14,600,000) 05-Mar-2018 125,701 EUR 14,600,000 GBP (12,915,189) 05-Mar-2018 46,126 GBP 3,259,088 JPY (485,000,000) 09-Mar-2018 69,799 GBP 158,003,551 USD (212,000,000) 20-Mar-2018 1,694,697 GBP 68,904,505 JPY (10,235,000,000) 20-Mar-2018 1,581,172 GBP 68,820,931 USD (91,435,000) 20-Mar-2018 1,405,365 EUR 46,820,000 GBP (41,435,794) 20-Mar-2018 147,283 GBP 41,618,687 EUR (46,820,000) 20-Mar-2018 35,610 SEK 560,000,000 EUR (56,615,146) 22-Mar-2018 272,748 SEK 560,000,000 EUR (56,642,676) 22-Mar-2018 248,296
Total 17,003,659
USD 64,940,000 GBP (49,371,036) 16-Jan-2018 (1,390,328) USD 5,189,099 INR (340,430,809) 25-Jan-2018 (97,733) USD 42,477 GBP (32,331) 26-Jan-2018 (958) USD 56,967 GBP (43,121) 26-Jan-2018 (1,046) USD 2,638,477 COP (7,997,224,399) 26-Jan-2018 (24,774) USD 1,327,231 EUR (1,135,006) 26-Jan-2018 (26,351) USD 5,252,592 THB (173,860,795) 26-Jan-2018 (63,956) USD 2,573,598 RUB (154,493,096) 26-Jan-2018 (64,300) USD 5,420,312 PHP (282,316,953) 26-Jan-2018 (177,923) USD 45,387,046 INR (2,980,000,000) 29-Jan-2018 (869,888) GBP 89,104,600 EUR (100,553,693) 06-Feb-2018 (100,441) EUR 13,100,000 GBP (11,752,890) 06-Feb-2018 (131,378) USD 6,590,000 GBP (5,021,511) 06-Feb-2018 (155,847) GBP 29,530,438 EUR (33,500,000) 06-Feb-2018 (188,698) USD 17,400,000 GBP (13,219,825) 06-Feb-2018 (372,702) USD 98,100,000 GBP (73,533,865) 06-Feb-2018 (1,102,669) USD 65,768,194 KRW (73,200,000,000) 13-Feb-2018 (2,056,273) AUD 1,960,000 GBP (1,138,838) 09-Mar-2018 (10,029) JPY 10,235,000,000 GBP (67,727,320) 20-Mar-2018 (403,987)
Total (7,239,281)
Net GBP for non-hedging purposes 9,764,378
Net GBP 6,174,515
The following entities were counterparties to the above forward foreign exchange contracts at 31 December 2017: Bank of New York Mellon, Barclays Bank plc, BNP Paribas, Citigroup Global Markets Limited, Credit Agricole, Deutsche Bank AG, Goldman Sachs International Bank, HSBC Bank plc, JP Morgan Securities plc, Lloyds TSB Financial Markets, Merrill Lynch International, Morgan Stanley & Co. International Plc, Royal Bank of Scotland plc, Societe Generale, State Street Bank and Trust Company and UBS AG.
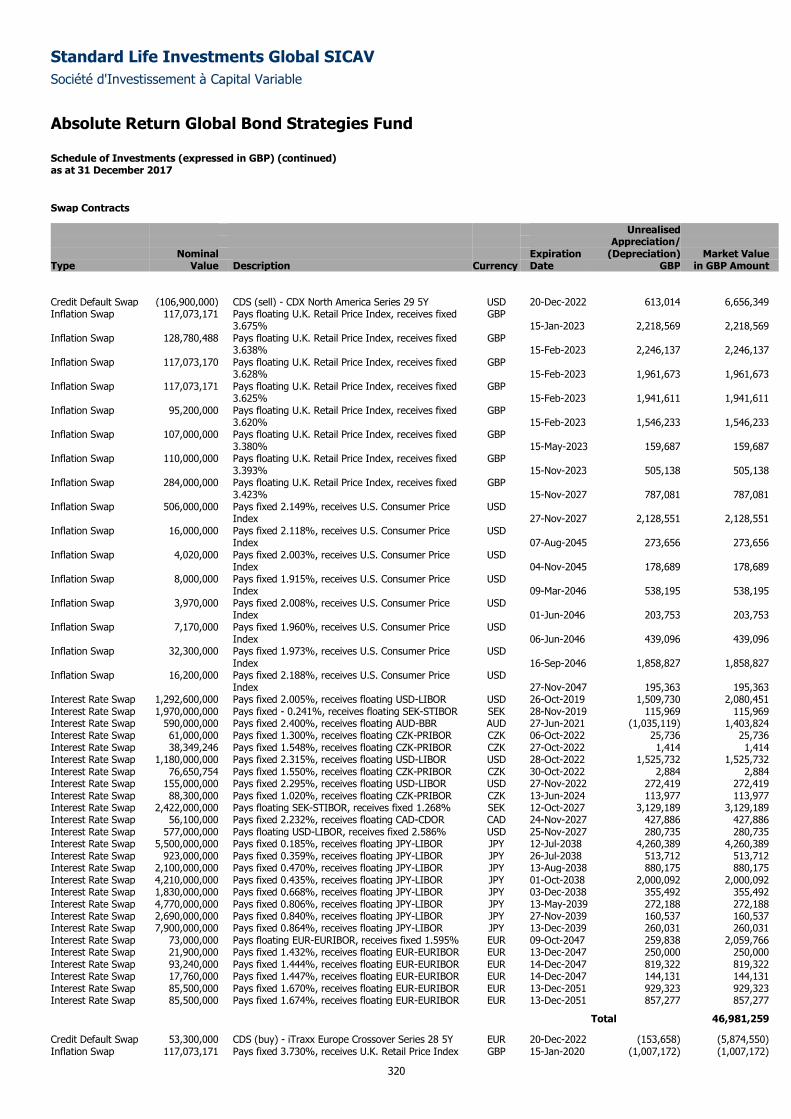
Standard Life Investments Global SICAV
Société d'Investissement à Capital Variable
Absolute Return Global Bond Strategies Fund Schedule of Investments (expressed in GBP) (continued) as at 31 December 2017
320
Swap Contracts
Unrealised Appreciation/ Nominal Expiration (Depreciation) Market Value Type Value Description Currency Date GBP in GBP Amount
Credit Default Swap (106,900,000) CDS (sell) - CDX North America Series 29 5Y USD 20-Dec-2022 613,014 6,656,349 Inflation Swap 117,073,171 Pays floating U.K. Retail Price Index, receives fixed
3.675% GBP
15-Jan-2023 2,218,569 2,218,569 Inflation Swap 128,780,488 Pays floating U.K. Retail Price Index, receives fixed
3.638% GBP
15-Feb-2023 2,246,137 2,246,137 Inflation Swap 117,073,170 Pays floating U.K. Retail Price Index, receives fixed
3.628% GBP
15-Feb-2023 1,961,673 1,961,673 Inflation Swap 117,073,171 Pays floating U.K. Retail Price Index, receives fixed
3.625% GBP
15-Feb-2023 1,941,611 1,941,611 Inflation Swap 95,200,000 Pays floating U.K. Retail Price Index, receives fixed
3.620% GBP
15-Feb-2023 1,546,233 1,546,233 Inflation Swap 107,000,000 Pays floating U.K. Retail Price Index, receives fixed
3.380% GBP
15-May-2023 159,687 159,687 Inflation Swap 110,000,000 Pays floating U.K. Retail Price Index, receives fixed
3.393% GBP
15-Nov-2023 505,138 505,138 Inflation Swap 284,000,000 Pays floating U.K. Retail Price Index, receives fixed
3.423% GBP
15-Nov-2027 787,081 787,081 Inflation Swap 506,000,000 Pays fixed 2.149%, receives U.S. Consumer Price
Index USD
27-Nov-2027 2,128,551 2,128,551 Inflation Swap 16,000,000 Pays fixed 2.118%, receives U.S. Consumer Price
Index USD
07-Aug-2045 273,656 273,656 Inflation Swap 4,020,000 Pays fixed 2.003%, receives U.S. Consumer Price
Index USD
04-Nov-2045 178,689 178,689 Inflation Swap 8,000,000 Pays fixed 1.915%, receives U.S. Consumer Price
Index USD
09-Mar-2046 538,195 538,195 Inflation Swap 3,970,000 Pays fixed 2.008%, receives U.S. Consumer Price
Index USD
01-Jun-2046 203,753 203,753 Inflation Swap 7,170,000 Pays fixed 1.960%, receives U.S. Consumer Price
Index USD
06-Jun-2046 439,096 439,096 Inflation Swap 32,300,000 Pays fixed 1.973%, receives U.S. Consumer Price
Index USD
16-Sep-2046 1,858,827 1,858,827 Inflation Swap 16,200,000 Pays fixed 2.188%, receives U.S. Consumer Price
Index USD
27-Nov-2047 195,363 195,363 Interest Rate Swap 1,292,600,000 Pays fixed 2.005%, receives floating USD-LIBOR USD 26-Oct-2019 1,509,730 2,080,451 Interest Rate Swap 1,970,000,000 Pays fixed - 0.241%, receives floating SEK-STIBOR SEK 28-Nov-2019 115,969 115,969 Interest Rate Swap 590,000,000 Pays fixed 2.400%, receives floating AUD-BBR AUD 27-Jun-2021 (1,035,119) 1,403,824 Interest Rate Swap 61,000,000 Pays fixed 1.300%, receives floating CZK-PRIBOR CZK 06-Oct-2022 25,736 25,736 Interest Rate Swap 38,349,246 Pays fixed 1.548%, receives floating CZK-PRIBOR CZK 27-Oct-2022 1,414 1,414 Interest Rate Swap 1,180,000,000 Pays fixed 2.315%, receives floating USD-LIBOR USD 28-Oct-2022 1,525,732 1,525,732 Interest Rate Swap 76,650,754 Pays fixed 1.550%, receives floating CZK-PRIBOR CZK 30-Oct-2022 2,884 2,884 Interest Rate Swap 155,000,000 Pays fixed 2.295%, receives floating USD-LIBOR USD 27-Nov-2022 272,419 272,419 Interest Rate Swap 88,300,000 Pays fixed 1.020%, receives floating CZK-PRIBOR CZK 13-Jun-2024 113,977 113,977 Interest Rate Swap 2,422,000,000 Pays floating SEK-STIBOR, receives fixed 1.268% SEK 12-Oct-2027 3,129,189 3,129,189 Interest Rate Swap 56,100,000 Pays fixed 2.232%, receives floating CAD-CDOR CAD 24-Nov-2027 427,886 427,886 Interest Rate Swap 577,000,000 Pays floating USD-LIBOR, receives fixed 2.586% USD 25-Nov-2027 280,735 280,735 Interest Rate Swap 5,500,000,000 Pays fixed 0.185%, receives floating JPY-LIBOR JPY 12-Jul-2038 4,260,389 4,260,389 Interest Rate Swap 923,000,000 Pays fixed 0.359%, receives floating JPY-LIBOR JPY 26-Jul-2038 513,712 513,712 Interest Rate Swap 2,100,000,000 Pays fixed 0.470%, receives floating JPY-LIBOR JPY 13-Aug-2038 880,175 880,175 Interest Rate Swap 4,210,000,000 Pays fixed 0.435%, receives floating JPY-LIBOR JPY 01-Oct-2038 2,000,092 2,000,092 Interest Rate Swap 1,830,000,000 Pays fixed 0.668%, receives floating JPY-LIBOR JPY 03-Dec-2038 355,492 355,492 Interest Rate Swap 4,770,000,000 Pays fixed 0.806%, receives floating JPY-LIBOR JPY 13-May-2039 272,188 272,188 Interest Rate Swap 2,690,000,000 Pays fixed 0.840%, receives floating JPY-LIBOR JPY 27-Nov-2039 160,537 160,537 Interest Rate Swap 7,900,000,000 Pays fixed 0.864%, receives floating JPY-LIBOR JPY 13-Dec-2039 260,031 260,031 Interest Rate Swap 73,000,000 Pays floating EUR-EURIBOR, receives fixed 1.595% EUR 09-Oct-2047 259,838 2,059,766 Interest Rate Swap 21,900,000 Pays fixed 1.432%, receives floating EUR-EURIBOR EUR 13-Dec-2047 250,000 250,000 Interest Rate Swap 93,240,000 Pays fixed 1.444%, receives floating EUR-EURIBOR EUR 14-Dec-2047 819,322 819,322 Interest Rate Swap 17,760,000 Pays fixed 1.447%, receives floating EUR-EURIBOR EUR 14-Dec-2047 144,131 144,131 Interest Rate Swap 85,500,000 Pays fixed 1.670%, receives floating EUR-EURIBOR EUR 13-Dec-2051 929,323 929,323 Interest Rate Swap 85,500,000 Pays fixed 1.674%, receives floating EUR-EURIBOR EUR 13-Dec-2051 857,277 857,277
Total 46,981,259
Credit Default Swap 53,300,000 CDS (buy) - iTraxx Europe Crossover Series 28 5Y EUR 20-Dec-2022 (153,658) (5,874,550) Inflation Swap 117,073,171 Pays fixed 3.730%, receives U.K. Retail Price Index GBP 15-Jan-2020 (1,007,172) (1,007,172)
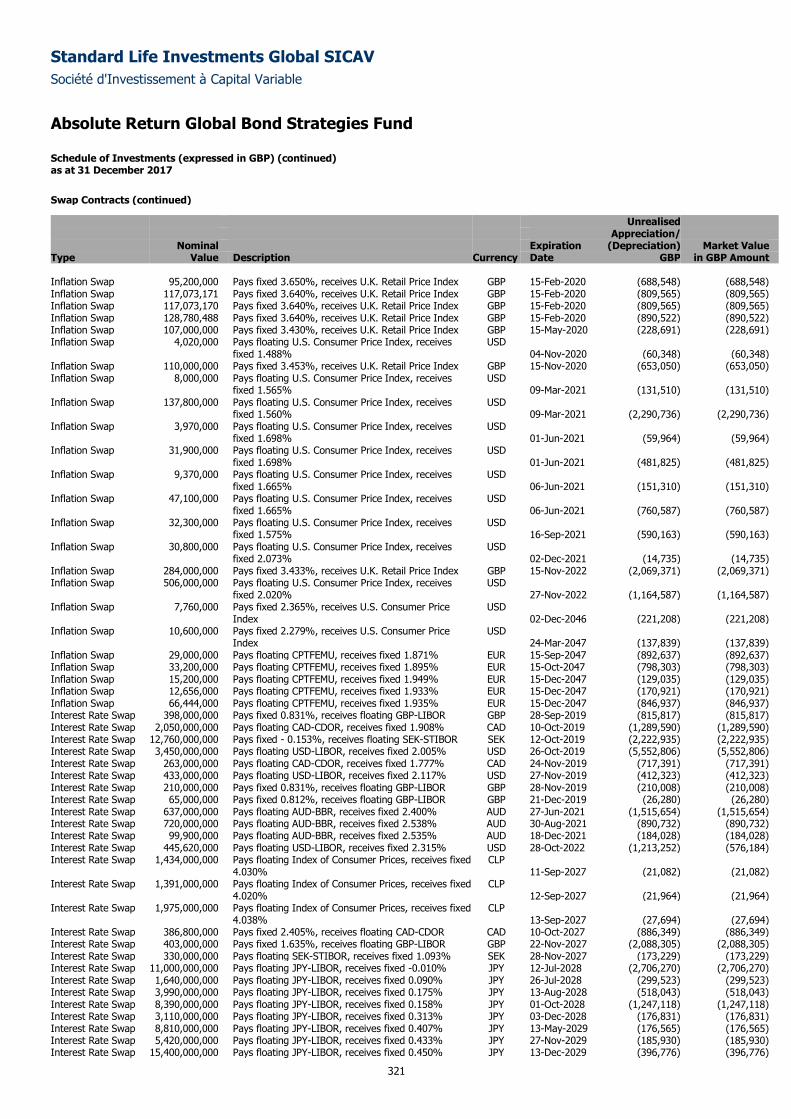
Standard Life Investments Global SICAV
Société d'Investissement à Capital Variable
Absolute Return Global Bond Strategies Fund Schedule of Investments (expressed in GBP) (continued) as at 31 December 2017
321
Swap Contracts (continued)
Unrealised Appreciation/ Nominal Expiration (Depreciation) Market Value Type Value Description Currency Date GBP in GBP Amount Inflation Swap 95,200,000 Pays fixed 3.650%, receives U.K. Retail Price Index GBP 15-Feb-2020 (688,548) (688,548) Inflation Swap 117,073,171 Pays fixed 3.640%, receives U.K. Retail Price Index GBP 15-Feb-2020 (809,565) (809,565) Inflation Swap 117,073,170 Pays fixed 3.640%, receives U.K. Retail Price Index GBP 15-Feb-2020 (809,565) (809,565) Inflation Swap 128,780,488 Pays fixed 3.640%, receives U.K. Retail Price Index GBP 15-Feb-2020 (890,522) (890,522) Inflation Swap 107,000,000 Pays fixed 3.430%, receives U.K. Retail Price Index GBP 15-May-2020 (228,691) (228,691) Inflation Swap 4,020,000 Pays floating U.S. Consumer Price Index, receives
fixed 1.488% USD
04-Nov-2020 (60,348) (60,348) Inflation Swap 110,000,000 Pays fixed 3.453%, receives U.K. Retail Price Index GBP 15-Nov-2020 (653,050) (653,050) Inflation Swap 8,000,000 Pays floating U.S. Consumer Price Index, receives
fixed 1.565% USD
09-Mar-2021 (131,510) (131,510) Inflation Swap 137,800,000 Pays floating U.S. Consumer Price Index, receives
fixed 1.560% USD
09-Mar-2021 (2,290,736) (2,290,736) Inflation Swap 3,970,000 Pays floating U.S. Consumer Price Index, receives
fixed 1.698% USD
01-Jun-2021 (59,964) (59,964) Inflation Swap 31,900,000 Pays floating U.S. Consumer Price Index, receives
fixed 1.698% USD
01-Jun-2021 (481,825) (481,825) Inflation Swap 9,370,000 Pays floating U.S. Consumer Price Index, receives
fixed 1.665% USD
06-Jun-2021 (151,310) (151,310) Inflation Swap 47,100,000 Pays floating U.S. Consumer Price Index, receives
fixed 1.665% USD
06-Jun-2021 (760,587) (760,587) Inflation Swap 32,300,000 Pays floating U.S. Consumer Price Index, receives
fixed 1.575% USD
16-Sep-2021 (590,163) (590,163) Inflation Swap 30,800,000 Pays floating U.S. Consumer Price Index, receives
fixed 2.073% USD
02-Dec-2021 (14,735) (14,735) Inflation Swap 284,000,000 Pays fixed 3.433%, receives U.K. Retail Price Index GBP 15-Nov-2022 (2,069,371) (2,069,371) Inflation Swap 506,000,000 Pays floating U.S. Consumer Price Index, receives
fixed 2.020% USD
27-Nov-2022 (1,164,587) (1,164,587) Inflation Swap 7,760,000 Pays fixed 2.365%, receives U.S. Consumer Price
Index USD
02-Dec-2046 (221,208) (221,208) Inflation Swap 10,600,000 Pays fixed 2.279%, receives U.S. Consumer Price
Index USD
24-Mar-2047 (137,839) (137,839) Inflation Swap 29,000,000 Pays floating CPTFEMU, receives fixed 1.871% EUR 15-Sep-2047 (892,637) (892,637) Inflation Swap 33,200,000 Pays floating CPTFEMU, receives fixed 1.895% EUR 15-Oct-2047 (798,303) (798,303) Inflation Swap 15,200,000 Pays floating CPTFEMU, receives fixed 1.949% EUR 15-Dec-2047 (129,035) (129,035) Inflation Swap 12,656,000 Pays floating CPTFEMU, receives fixed 1.933% EUR 15-Dec-2047 (170,921) (170,921) Inflation Swap 66,444,000 Pays floating CPTFEMU, receives fixed 1.935% EUR 15-Dec-2047 (846,937) (846,937) Interest Rate Swap 398,000,000 Pays fixed 0.831%, receives floating GBP-LIBOR GBP 28-Sep-2019 (815,817) (815,817) Interest Rate Swap 2,050,000,000 Pays floating CAD-CDOR, receives fixed 1.908% CAD 10-Oct-2019 (1,289,590) (1,289,590) Interest Rate Swap 12,760,000,000 Pays fixed - 0.153%, receives floating SEK-STIBOR SEK 12-Oct-2019 (2,222,935) (2,222,935) Interest Rate Swap 3,450,000,000 Pays floating USD-LIBOR, receives fixed 2.005% USD 26-Oct-2019 (5,552,806) (5,552,806) Interest Rate Swap 263,000,000 Pays floating CAD-CDOR, receives fixed 1.777% CAD 24-Nov-2019 (717,391) (717,391) Interest Rate Swap 433,000,000 Pays floating USD-LIBOR, receives fixed 2.117% USD 27-Nov-2019 (412,323) (412,323) Interest Rate Swap 210,000,000 Pays fixed 0.831%, receives floating GBP-LIBOR GBP 28-Nov-2019 (210,008) (210,008) Interest Rate Swap 65,000,000 Pays fixed 0.812%, receives floating GBP-LIBOR GBP 21-Dec-2019 (26,280) (26,280) Interest Rate Swap 637,000,000 Pays floating AUD-BBR, receives fixed 2.400% AUD 27-Jun-2021 (1,515,654) (1,515,654) Interest Rate Swap 720,000,000 Pays floating AUD-BBR, receives fixed 2.538% AUD 30-Aug-2021 (890,732) (890,732) Interest Rate Swap 99,900,000 Pays floating AUD-BBR, receives fixed 2.535% AUD 18-Dec-2021 (184,028) (184,028) Interest Rate Swap 445,620,000 Pays floating USD-LIBOR, receives fixed 2.315% USD 28-Oct-2022 (1,213,252) (576,184) Interest Rate Swap 1,434,000,000 Pays floating Index of Consumer Prices, receives fixed
4.030% CLP
11-Sep-2027 (21,082) (21,082) Interest Rate Swap 1,391,000,000 Pays floating Index of Consumer Prices, receives fixed
4.020% CLP
12-Sep-2027 (21,964) (21,964) Interest Rate Swap 1,975,000,000 Pays floating Index of Consumer Prices, receives fixed
4.038% CLP
13-Sep-2027 (27,694) (27,694) Interest Rate Swap 386,800,000 Pays fixed 2.405%, receives floating CAD-CDOR CAD 10-Oct-2027 (886,349) (886,349) Interest Rate Swap 403,000,000 Pays fixed 1.635%, receives floating GBP-LIBOR GBP 22-Nov-2027 (2,088,305) (2,088,305) Interest Rate Swap 330,000,000 Pays floating SEK-STIBOR, receives fixed 1.093% SEK 28-Nov-2027 (173,229) (173,229) Interest Rate Swap 11,000,000,000 Pays floating JPY-LIBOR, receives fixed -0.010% JPY 12-Jul-2028 (2,706,270) (2,706,270) Interest Rate Swap 1,640,000,000 Pays floating JPY-LIBOR, receives fixed 0.090% JPY 26-Jul-2028 (299,523) (299,523) Interest Rate Swap 3,990,000,000 Pays floating JPY-LIBOR, receives fixed 0.175% JPY 13-Aug-2028 (518,043) (518,043) Interest Rate Swap 8,390,000,000 Pays floating JPY-LIBOR, receives fixed 0.158% JPY 01-Oct-2028 (1,247,118) (1,247,118) Interest Rate Swap 3,110,000,000 Pays floating JPY-LIBOR, receives fixed 0.313% JPY 03-Dec-2028 (176,831) (176,831) Interest Rate Swap 8,810,000,000 Pays floating JPY-LIBOR, receives fixed 0.407% JPY 13-May-2029 (176,565) (176,565) Interest Rate Swap 5,420,000,000 Pays floating JPY-LIBOR, receives fixed 0.433% JPY 27-Nov-2029 (185,930) (185,930) Interest Rate Swap 15,400,000,000 Pays floating JPY-LIBOR, receives fixed 0.450% JPY 13-Dec-2029 (396,776) (396,776)
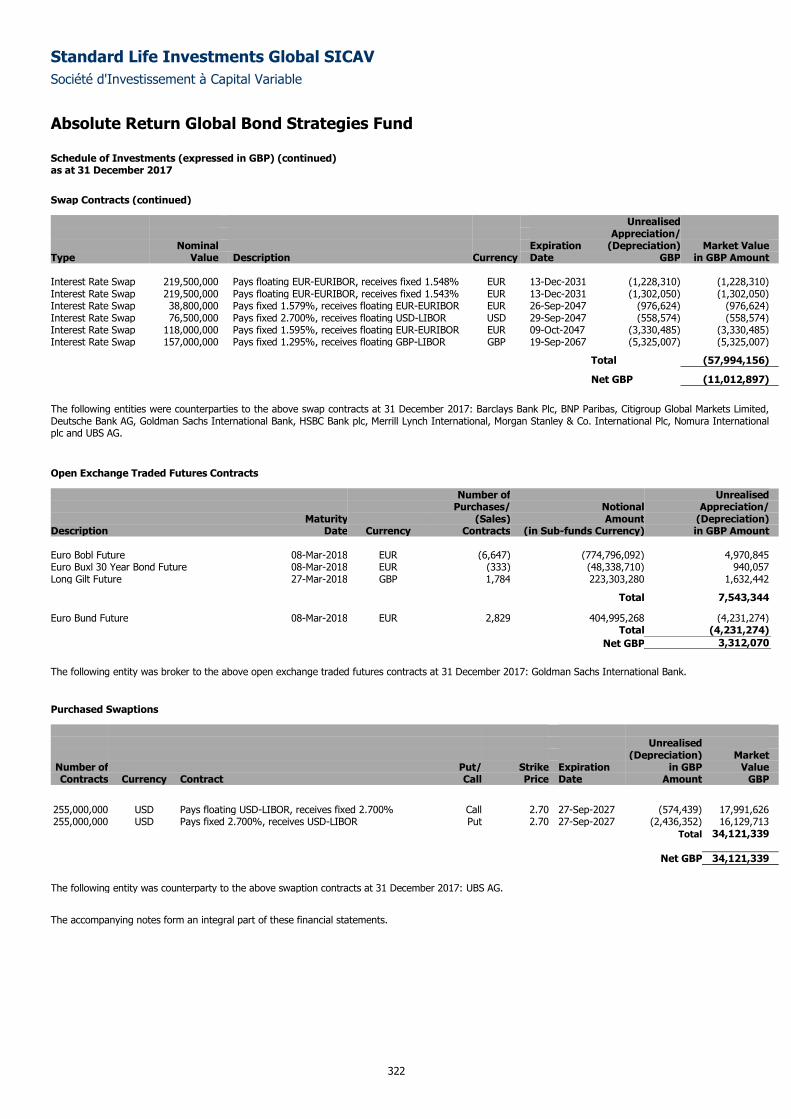
Standard Life Investments Global SICAV
Société d'Investissement à Capital Variable
Absolute Return Global Bond Strategies Fund Schedule of Investments (expressed in GBP) (continued) as at 31 December 2017
322
Swap Contracts (continued)
Unrealised Appreciation/ Nominal Expiration (Depreciation) Market Value Type Value Description Currency Date GBP in GBP Amount Interest Rate Swap 219,500,000 Pays floating EUR-EURIBOR, receives fixed 1.548% EUR 13-Dec-2031 (1,228,310) (1,228,310) Interest Rate Swap 219,500,000 Pays floating EUR-EURIBOR, receives fixed 1.543% EUR 13-Dec-2031 (1,302,050) (1,302,050) Interest Rate Swap 38,800,000 Pays fixed 1.579%, receives floating EUR-EURIBOR EUR 26-Sep-2047 (976,624) (976,624) Interest Rate Swap 76,500,000 Pays fixed 2.700%, receives floating USD-LIBOR USD 29-Sep-2047 (558,574) (558,574) Interest Rate Swap 118,000,000 Pays fixed 1.595%, receives floating EUR-EURIBOR EUR 09-Oct-2047 (3,330,485) (3,330,485) Interest Rate Swap 157,000,000 Pays fixed 1.295%, receives floating GBP-LIBOR GBP 19-Sep-2067 (5,325,007) (5,325,007)
Total (57,994,156)
Net GBP (11,012,897)
The following entities were counterparties to the above swap contracts at 31 December 2017: Barclays Bank Plc, BNP Paribas, Citigroup Global Markets Limited, Deutsche Bank AG, Goldman Sachs International Bank, HSBC Bank plc, Merrill Lynch International, Morgan Stanley & Co. International Plc, Nomura International plc and UBS AG.
Open Exchange Traded Futures Contracts
Number of Unrealised Purchases/ Notional Appreciation/ Maturity (Sales) Amount (Depreciation) Description Date Currency Contracts (in Sub-funds Currency) in GBP Amount Euro Bobl Future 08-Mar-2018 EUR (6,647) (774,796,092) 4,970,845 Euro Buxl 30 Year Bond Future 08-Mar-2018 EUR (333) (48,338,710) 940,057 Long Gilt Future 27-Mar-2018 GBP 1,784 223,303,280 1,632,442
Total 7,543,344
Euro Bund Future 08-Mar-2018 EUR 2,829 404,995,268 (4,231,274) Total (4,231,274)
Net GBP 3,312,070
The following entity was broker to the above open exchange traded futures contracts at 31 December 2017: Goldman Sachs International Bank.
Purchased Swaptions
Unrealised (Depreciation) Market
Number of Put/ Strike Expiration in GBP Value Contracts Currency Contract Call Price Date Amount GBP
255,000,000 USD Pays floating USD-LIBOR, receives fixed 2.700% Call 2.70 27-Sep-2027 (574,439) 17,991,626 255,000,000 USD Pays fixed 2.700%, receives USD-LIBOR Put 2.70 27-Sep-2027 (2,436,352) 16,129,713
Total 34,121,339
Net GBP 34,121,339
The following entity was counterparty to the above swaption contracts at 31 December 2017: UBS AG.
The accompanying notes form an integral part of these financial statements.